Economic Tables, Part II-B (i), Series-10 - Linguistic Survey Of ...
372
CENSUS OF INDIA 1971 SERIFS-IO MADHYA PRADESH PART II-B (i) ECONOMIC TABLES A. K. PANDYA OF THE INDIAN ADMINISTRATIVE SERVICE Director of Census Operations, Madhya Pradesh
-
Upload
khangminh22 -
Category
Documents
-
view
1 -
download
0
Transcript of Economic Tables, Part II-B (i), Series-10 - Linguistic Survey Of ...
CENSUS OF INDIA 1971
SERIFS-IO
MADHYA PRADESH
PART II-B (i)
ECONOMIC TABLES
A. K. PANDYA
OF THE INDIAN ADMINISTRATIVE SERVICE
Director of Census Operations, Madhya Pradesh
© P1tG. 2.71 (M.P.) (N)
500
Cover Motif: A worker at a fly-shuttle sley pit loom (a variety of handloom) in Maheswa,r, Madhya Pradesh. Handloom weaving is one of the predominant household industry in Madhya Pradesh.
PRINTED BY THE MANAGER, GOVERNMENT OF INDIA PRESS COlMllATORE-6410l9
AND PUBLISHED BY THE CONTROLLER OF PUBLICATIONS DELHI-I 10006,
1974
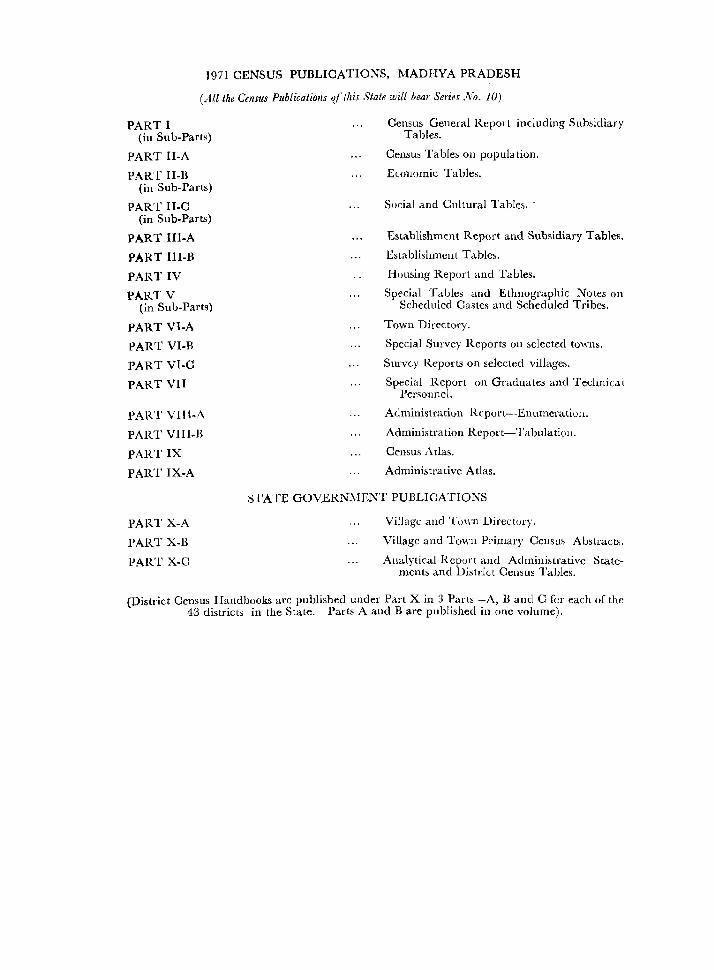
1971 CENSUS PUBLICATIONS, MADHYA PRADESH
(All the Census Publicatiolls oj this State will bear Series No. JO)
PART I (in Sub-Parts)
PART II-A
PART II-B (in Sub-Parts)
PART II-C (in Sub-Parts)
PART III-A
PART IlI-B
PART IV
PARTV (in Sub-Parts)
PART VI-A
PART VI.B
PART VI·C
PART VII
PART Vlll·A
PART VIII-B
PART IX
PART IX·A
PART X·A
PART X-B
PART X·C
Census General Report including Subsidiary Tables.
Census Ta ble, 011 popuJa tion.
Economic Tables.
Socia) and Cultural Tables ..
Establishment Report and Subsidiary Tables.
Establishment Tables.
Housing Report and Tables.
Special Tables and Ethnographic Notes on Scheduled Castes and Scheduled Tribes.
Town Directory.
Special Survey Reports on selected towns.
Surve.y Reports on selected villages.
Special Report on Graduates and Technicai Personnel.
Administration Report--Enumeratioll.
Administration Report-1'abulatioll.
Census Atlas.
Administrative Atlas.
STATE GOVERN~1ENT PUBLICATIONS
Villngc and Town Directory.
Village and Towll Primary Cellsus Abstracts.
Analytical Repon and Adrnini~trative State-ments and District Census Tables.
(District Census Handbooks are published under Part X in 3 Parts-A, 13 and C fer each of the 43 districts in the State. Parts A and B are published in one volume).
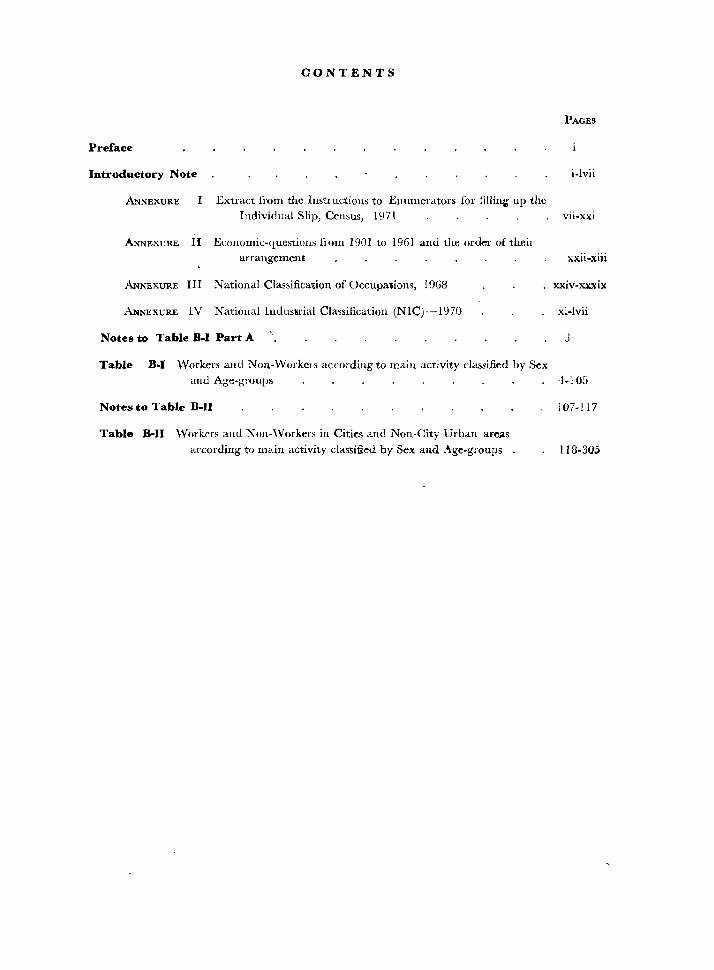
CONT~NTS
PAGES
Preface
Introductory Note i-lvii
ANNEXURE I Extract fi'om the Illstructiom to Enumerators for tillill~ up the Individual Slip, Census, 1971 VIl-lOO
ANNEXURE Ii Ecollomic-q uestiollS from 1901 to 1961 and the order of tllCir
arrangement
ANNEXURE III National Classification of Occupalions, 1968
ANNEXURE IV National Indus1irial Classification (NIC)--1970
Notes to Table B-1 Part A
Table B-1 Workers and N on-vVorker s according to main activity classified by Sex
xxii-xiji
xxiv-xx:xix
xl·Lvii
and Age-groups -+-105
Notes to Table B-II
Table B·II Workers and Non-\Vorkers in Cities and Non-City Urban are;ilS
according to main activity classified by Sex and Age-groups _
107-117
118-305
PREFACE
The initial decision was to present all the B-Series Economic Tables in one volume as Part II·B. But consistent with desire of the organisers of the Centenary Census to make available finalised figures as early as possible, it has now been decided to split Part II-B into more than one volume based on tables compiled on fun count and sample basis. In this volume, the two full count tables-B-I Part A and B-II-are being presented which gives break up of population into workers and non-workers by broad age-groups. The other B-Series tahles arc likely to be available only in the latter half of 1973.
An Introductory Note has been given in the beginning to give III brief the growth and importance of Economic Tables. The Notes allude to the contents of the tables.
I would like to place on record here my thanks to Shri M. L. Sharma, Assistant Director of Census Operations, and his team of workers fi)r the care taken in the preparation of the Tables, and to the Manager, Government of India Press, Coimbatorc, [or the promptness with which this publication has been brought out.
BHOPAL:
1-12-1972.
A. K. PANDYA
INTRODUCTORY NOTE
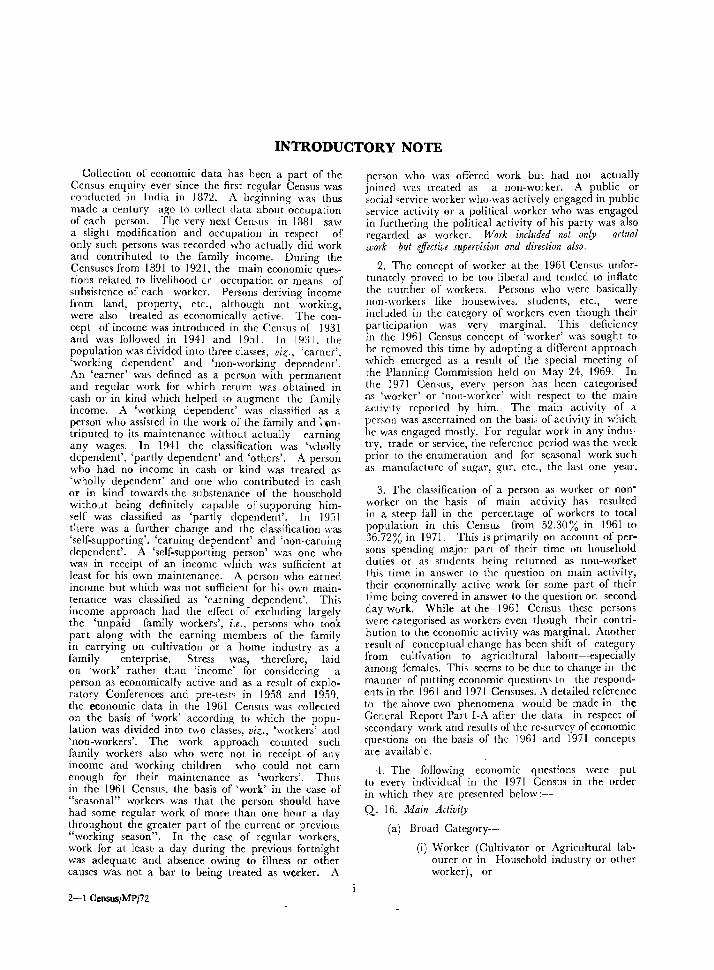
Collection .of econoJ?ic data has been a part of the Census enqUIry ever smce the first regular Census was conducted in India in 1372. A beginning was thus made a century ago to collect clata about occupation of each person. The very next Census in 1331 saw a slight modification and occupation in respect of only such persons was recorded who actually did work and contributed to the family income. During the ~ensuscs from I ~91 .to 1921, the main economic questlOn~ related to livelihood cr occupation or means of subSistence of each worker. Persons deriving income from land, property, etc., although not working, were also treated as ecoIlomically active. The concept of income was introduced in the Censlls of 1931 and was followed in 1941 and 1951. In 1931, the population was divided into three classes viz. 'earner' 'working dependent' and 'non-worki~g d~pendent': An 'earner' was defined as a person with permanent and regular work for which return was obtained in ~ash or in kind w~ich helped to augment the family IIlcome. A 'workmg dependent' was classified as a p~rson who .assiste? in the wo~k of the family and ~'1IltrIbuted to Its mamtenance wIthout actually earning any wages. In 1941 the classification was 'wholly dependent', 'partly dependent' and 'others'. A person who had no incomc in cash or kind was treated as ',,,-·holly dependent' and one who contributed in cash or in kind towards the sllbstenance of the household without being definitely capable of supporting him,elf was classified as 'partly dependent'. In 19:il there was a further change and the classification was 'self-supporting', 'earning dependent' and 'non-earning dependent'. A 'sclf-supporting person' was one who was in receipt of an income which was sufficient at least for his own maintenance. A person who earned income but which was not sufficient for his own main~enance was classified as 'earning dependent'. This lI1come approach had the effect of exduding largely the 'unpaid family workers', i.e., persons who took part alo?g with th~ e-:rning members of the family 111 c;arrymg on c~ItIvation or a home industry as a famIly enterpnse. Stress was, therefore, laid on 'work' rather than 'income' for considering a person as economically active and as a result of exploratory Conferences and pre-test~ in 1953 and 1959 the economic data in the 1961 Census was collected on. the basis. ~f 'w~rk' according to which the populatIon was diVIded mto two classes, viz., 'wOlkers' and 'no~-workers'. The work approach counted such famIly workcrs also who were not in receipt of any income and working children who could not earn enough for their maintenance as 'workers'. Thus in the 1961 Census, the basis of 'work' in the case of "seasonal" workers was that the person should have had some regular work of more than one hour a day throughout the greater part of the current or previous "working season". In the case of regular workers, work for at least' a day during the previous fortnight was adequate and absence owing to illness or other causes was not a bar to being treated as weder. A
2-1 Census/MPJ72
person who was offered work but had not actually joined was treated as a non-worker. A public or social service worker who ,was actively engaged in public service activity or a political worker who was engaged in furthering the political activity of his party was also regarded as worker. Work included not only actual work but e.lfective supervision and direction also.
2. Thc concept of worker at the 1961 Census unfortunately proved to be too liberal and tended to inflate the number of workers. Persons who were basically non-workers like housewives, students, etc., were included in the category of workers even though their participation was very marginal. This deficicncy in the 1961 Census concept of 'worker' was sought to be removed this time by adopting a different approach which cmcrged as a result of the special meeting of the Planning Commission held on May 24, 1969. In the 1971 Census, every person has been categorised as 'worker' or 'non-worker' with respect to the main aClivity reported by him. The main activity of a person was ascertained on the basis of activity in which he was engaged mostly. For regular work in any indm· try, trade or service, the reference period was the week prior to the enumeration and for scasonal work such as manufacture of sugar, gur, etc., the last one year.
3. The classification of a person as worker or nonworker on the basis of main activity has resulted in a steep fall in the percentage of workcrs to total population in this Census-from 52.30% in 1961 to 36.72% in 1971. This is primarily on account o[persons spending major part of their time on household duties or as students being returned as non-worker this time in answer lo the question on main activity, their economically active work for some part of their time being covered in answer to the question on second day work. While at the 1961 Census these persons were categorised as workers even though their contribution to the economic activity was marginal. Another result of conceptual change has becn shift of category from cultivation to agricultural labonr--especially among females. This seems to be due to change in the manner of putting economic questions to the respondents in the 1961 and 1971 Censuses. A detailed reference to the above two phenomena would be made in the General Report Part I-A after the data in respect of ,econdary work and results of the fe-survey of economic questions on the basis of the 1961 and 1971 concepts are available.
-to The following economic questions were put to every individual in the 1971 Census in the order in which they are presented below:--
Q. 16. Main Acliviry
(a) Broad Category--
(i) Worker (Cultivator or Agricultural labourer or in Household industry or other worker), or
ii
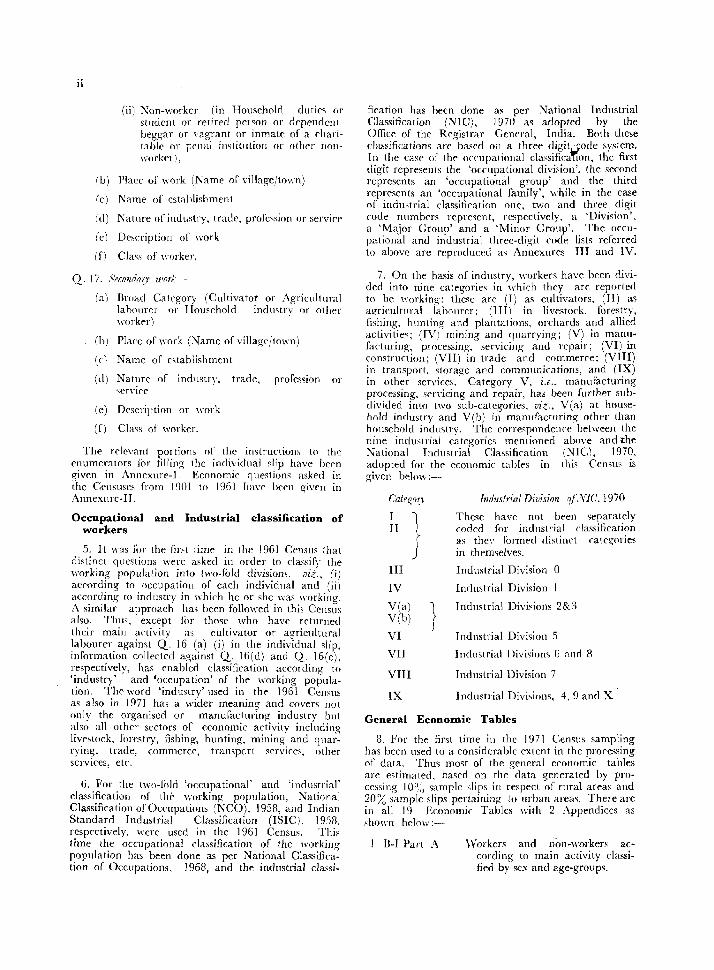
(ii) Non-worker (in Household duties or student or retired per 'on or dependellt beggar or vagTant or inmate of a charitable or r:enal imlillllion or ollwr nonwork!,! ),
(b) Place of work (Name of village/town)
(c) Name of establishment
(dl Nature of industry, trade, profession or service
(e) Description of work
(f) Class of worker.
Q. I 7. Srcolltiol'}, If'nrk -
(a) Broad Category (Cultivator or Agricultmai labourer or IIouschold indmtry or other workt'r)
(b) Placc o[\\'ork (Name of village/l own)
(el Name of establishment
(d) Nature of industry, trade, profes'iion or ""rvicc
(e) Oeseription or work
(fl Class of worker.
The relevant portions of the instructiom to the enumerators lor filling the individual slip have been given in Annexure-I. Economic questions asked in the Censuses [rom I CJO I to 19G I haw' heen givm 111
Annexure-II.
Occupational and Industrial classification of workers
5. It was for the first time in the 196 I Ct'nslls that distinct questions werc asked in order to classify the working population into two-fold divisions. viz., (i) according to occupation of each individual and (ii) according to industry in \\'hich he or she was working. A similar approach has been followed in this Census also. Thus, except {or those who havc returned their main activity as cultivator or agricultural labuurer against Q. 16 (a) (il in the individual slip, information collected a.~ainst Q. lo(d) and Q. 16(e), respectively, has enabled classification according to 'industry' and 'occupation' of the working population. Thl' word 'industry' used in the 19G I Census as also in 1971 has a wider meaning and covers not only the organiscd or m:iI1ufacturing industry but also all other sectors of economic activity including' livestock, forestry, fishing, hunting, mining and quarrying, trade, commerce, transpcrt serviel's, othcr services, etc
6. For the two-fold 'occupational' and 'industrial' classification of Ihi' working population, National Classification of Occupations (NCO), 1958, and Indian Standard Industrial Classification (ISIC), 1953, respectively. werc used in the 1961 Censlls. This time the occupational classification of the working population has been done as per National Classificalion of Occupations, 1968, and the industrial classi-
fication has been done as per National Industrial Classification (NIC), 1970 as adopted by the Office of the Registrar General, India. Both these classifications arc basrd Oll Ii three digit ~ode system. In the case of' the o('('upational c1assificat'on, the first digit represents the 'occupational division', the second represents an 'occupation,\! group' and the third reprcsents an 'occupational family', while in thc case of indmtrial classification one, two and three digit rode numbers l'eprc~ent, respectively, a 'Division', a 'Major Group' and a 'Minor Group'. The occupational and industrial three-digit mde lists referred to above are reproduced as Annexure, III and IV.
7. On the basis of industry, workers have becn divided into nine categories in which they are reported to bc working; these arc (I) as cultivators, (II) as agrimltl1ral lahourer; (III) in livestock, forestry, fishing, hunting and plantations, orchards and allied activities; (IV) mining and qlJarrying; (V) in manufacturing, processing', servicing and repair; (VI) in construction; (VII) in trade and commerce; (VIII) in transport. storage and communications, and (IX) in other services. Category V. i.e., manufacturing processing. servicing and repair, has been further subdivided into two sub-categories, viz., V(a) at h()Usehold industry and V(b) in manufacturing other than household industry. The correspondence between the nine industrial categories menlioned above and Ithe ~ational Industrial Classification (NIC). 1970, adopted for the economic tables III this Census is given helm\- ;--
Categnr~
I I II I
~ j
III
IV
V(a) V(h)
VI
VII
VIII
IX
"I )-J
Irll/us/rial Division orNIC. 1970
These have not been separately codcd [or industrial [,lassification as the',' formed distinct categories in thern~dves.
Industrial Division 0
Industrial Division
Industrial Divisions 2&3
Industrial Division 5
Indllstrial Divisions 6 and R
Industrial Division 7
Industrial Divisions, 4.9 and X
General Economic Tables
3. For the first time in the 1971 Census sampling has becn used to a considerable extent in the processing of data. Thm mmt of the general ~coJJomic tables are e~timated, bast'n on tht' data gen~rated by processing I Oo,~ sample slips in respect of rural areas and 20% sample slips pertaining to urban area~. There are in all I CJ Economic Tables with 2 Appendices as ,howll below;--
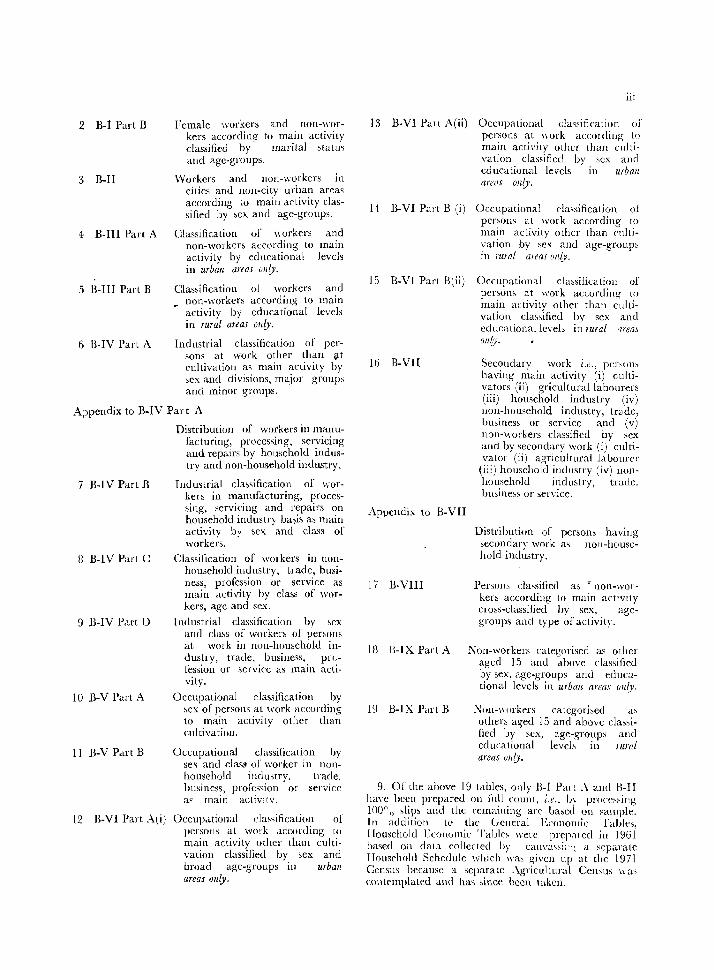
I B-1 Part A \Vorkers and non-workers according to main activity classified by sex and age-groups.
2 B-I Part D
3 B-II
4 B-IlI Part A
5 B-IlI Part B
6 H-IV Part A
Female workers kers accmding classified by and age-groups.
and non-worto main activity
marital otatm
\Vorkers and non-worken in cities and non-city urban area5 according to main activity classified by sex and age-groups.
Classification of workers and non-worker> according to main activity by educational levcls in urban areas onlY.
Classification ot workers and , non-\vorkers according to main
activity by educational levels in rural areas DillY.
Industrial classification of persons at work other than Olt cultivation as main aClivity by sex and divisions, major groups and minor gruups.
A?pendix to B-IV Par t A
7 B-IV Part B
8 B-lV Parl C
9 B-IV Part 1)
Distribution of workers in manufacturing, processing, servicing and repairs by household industry and non-household industry.
I ndustrial classification of wor-kers in manufacturing, processing, servicing and repairs on household industry ba5is as main activity by ~ex and class of workers.
Classification of workers in nonhousehold industry, trade, business, profession or service as main activity by class of workers, age and sex.
Industrial classification bv sex and class of workers of penmls at work in non-household industry, trade, business, pn .. -ression or service as main activity.
10 B-V Part A Occupational classification by ,cx of persons at \\'ork according to main activity other than cultivation.
II H-V PMt B Occupational classification by sex and c1asJ of worker in nOllhousehold industry, trade. business, proiession or service a~ main activity.
12 B-Vl Part Ali) Occupatiunal da,sificatioll of persons at work according to main activity other than cultivation classified by sex and broad age-groups in urban areas onlY.
iii
13 E-VI Pal t A(ii) Occupational classification of persons at \Iork acconling to main activity uther than cultivation classified bv sex and educational levels 'm urban areas onlY.
14 B-VI Part B (i) Occupational classification of pen,ons at work according to main activity other than cultivation by sex and age-groups in rural areas onlY.
15 B-VI Part Blii) Occupational classificatioll of persons at work according" to main activity other than cultivatioll cla.,sifled bv scx and educational levels i~ lural are/lj OIlIY.
16 B-VII Secondary work i.t!., pen,om having main activity (i) cultivators (ii) griculturallabourers (iii) household industry (iv) non-household industry, trade, business or service and (v) non-workers classified by sex and by secondary work (i) cultivator (iii agricultural labourer
(i:;) household industry (iv) nOll
household industry, trade, business or service.
Appendix to H-VII
Distribution of persons having secondary work as nOll-household industry.
17 B-VIII Persons classified as ~ non-wor-kers according to main activity cross-classified by ~ex, agegroups and type ofaclivily.
18 B-IX Part A Non-workers categorised as other
19 B-lX Part B
aged 15 and above classified by sex, age-groups and educational levels in urban (jreal UIlIY.
Non-\\orkers categori!>ed a.' others a!Sed 15 and above classified by sex, age-groups and educational levels in IUral areas DillY.
9. Of the above 19 tables, only H-I Part .\ allli B-lI ha\'e been prepared on full count, i.e .. b) proc(;"illg 100° () ,lips and the remaining alT based on salllple. In addition to the Gencral Economic Tables, Houschold Economic Tables \1'eIT prep'lted in 1961 based Oil data collected by canvassill·, a separate Household Schedule which was given up at the 1971 Census because a separate .\gricultural Census \I'as contemplated and has since been taken.
iv
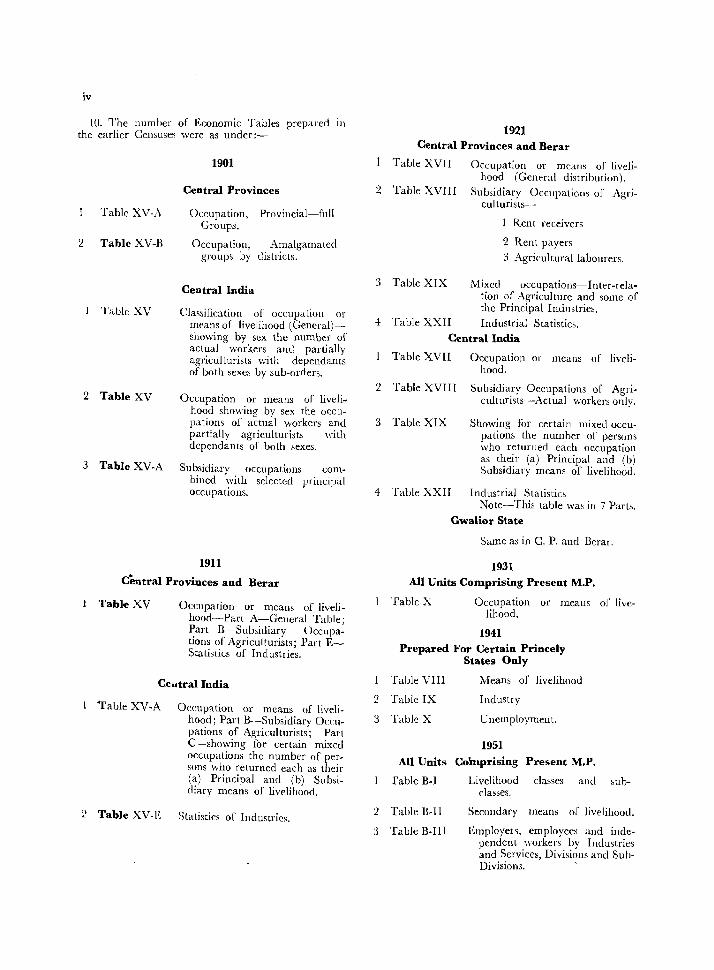
10. The number of Economic Tables prepared III
the earlier Censuses were as under;-
Table XV-A
2 Table XV-B
1901
Central Provinces
Occupation, Provincial-full Groups.
Occupation, Amalgamated groups by districts.
Central India
Table XV Classification of occupalion or means of livelihood (Gencral)showing by sex the number of actual workers and partially agriculturists with dependants of both sexes by sub-orders.
2 Table XV Occupation or means of liveli-hood showing by sex the occupations of actual workers and partially agriculturists with dependants of both sexes.
3 Table XV-A Subsidiary occupations com-bined with selected principal occupations.
1911
central Provinces and Berar
Table XV Occupation or means of livelihood-Part A-General Table; Part B---Subsidiary Occupations of Agriculturists; Part EStatistics of Industries.
Ceutral India
Table XV-A Occupation or means of liveli-hood; Part B---Subsidiary Occupations of Agriculturists; Part C-showing for certain mixed occupations the number of persons who returned each as their (a) Principal and (b) Subsidiary means of livelihood.
~) Table XV-E Statistics of Industries.
1921 Central Provinces and Berar
Table XVII Occupation or means of livelihood (General distribution).
2 Table XVIII Subsidiary Occupations of Agriculturists-
I Rent receivers
2 Rent payers
3 Agrieulturallabourers.
3 Table XIX Mixed occupations-Inter-rela-tion of Agriculture and some of the Principal Industries.
4 Table XXII Industrial Statistics.
Central India
Table XVII Occupation or means of livelihood.
2 Table XVIII Subsidiary Occupations of Agriculturists-Actual workers only.
3 Table XIX Showing for certain mixed occu-pations the number of persons who returned each occupation as their (a) Principal and (b) Subsidiary means of livelihood.
4 Table XXII Industrial Statistics
2
3
2
3
Note-This table was in 7 Parts.
Gwalior State
Same as in C. P. and Berar.
1931 All Units Comprising Present M.P.
Table X Occupation or means of livelihood.
1941 Prepared For Certain Princely
States Only
Table VIII Means of livelihood
Table IX Industry
Table X U nemploymell t.
1951 All Units Co'l11prising Present M.P.
Table B-1 Livelihood classes and sub-classes.
Table B-ll Secondary means of livelihood.
Table B-IlI Employels, employees and inde-pendent workers by Industries and Services, Divisions and Sub-Division3.
-,
i96!
General Economic Tables
Table B-1
2 Table B-II
3 Table B-II Part A
4
5
G
Table B-III Part B
Table B-IV Part A
Table B-IV Part B
Table B-IV Par.t C
8 Table B-V
9 Table B-VI
10 Table B-VII Part A
II Table B-VII Part B
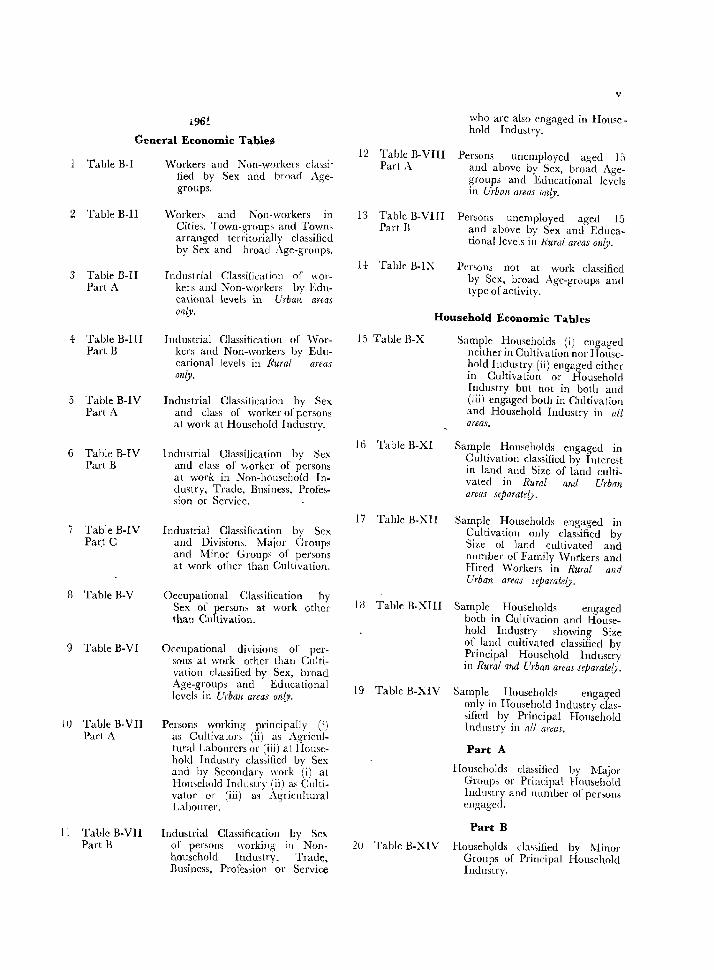
Workers and Kon-workcrs classified by Sex and broad Agegroups.
Workers and Non-workers in Cities, Town-groups and Towns arranged territorially classified by Sex and broad Age-groups.
Industrial Classification of workers and Non-workers by Educational levels in Urban areas only.
Industrial Classification of \Vorkers and Non-workers by Educational levels in Rural areas only.
Industrial Classification by Sex and class of worker of persons at work at Household Industry.
Industrial Classification by Sex and class of worker of persons at work in Non-household Industry, Trade, Business, Profession or Service.
Industrial Classification bv Sex and Divisicms, Major C~roups and Minor Groups of persons at work other than Cultivation.
Occupational Classification by Sex of persons at work other than Cultivation.
Occupational divisions of persons at work other thall Cultivation d,lssified by Sex, broad Age-groups and Educational levels in Urban area>' only.
Persons working' principally (i) as Cultivators (ii) as Agricultural Labourers or (iii) at Household Industry classified by Sex and by Secondary work (i) at HOllsehold Industry (ii) as Cultivator or (iii) as Agricultural Lahourer.
Industrial Classification by Sex of persons working in Nonhousehold Industry, Trade, Business, Profession or Service
1:2 Table B-VIII Part.\.
13 Table B-VIII Part B
v
who are also engaged in Household Industry.
Persons unemployed aged I;)
and above by Sex, broad Agegroups and Educational levcls in Urban areas only.
Persons unemployed aged 15 and above by Sf'X ami Educationallevels in Rural areas only.
1 i: Table B-IX Pen,ons not at work classified
15 Table B-X
16 Table B-XI
by Sex, broad Age-groups and type of activity.
Household Economic TabJes
Sample Households (i) engaged neither in Cultivation nor Household Industry (ii) engaged either in Cultivation or Household Industry but not ill both and (iii) engaged both in Cultivation and Household Industry in all areas,
Sample Households engaged in Cultivation classified bv Interest in land and Size of l~nd cultivated in Rural alld Urban areas separately.
17 Table B-XII Sample Households engaged in Cultivation only classified by Size of land cultivated and nllmber of Family \Vorkers and Hired Workers in Rural and Urban areas separately.
18 Table R-XIII Sample Households engaged both in Cultivation and Household Industry showing Size of land cui ti v a ted classified bv Principal Household Industry in Rural and Urban areas separately.
19 Table B-XIV Sample Households engaged only in Household Industry classified by Principal Household Industry in all areas.
Part A
Households classified by Major Groups or Principal Household Indmtry and number or pen,ons engaged.
Part B
20 Table B-XIV Households classified by Minor Groups of Principal Household Industry.
vi
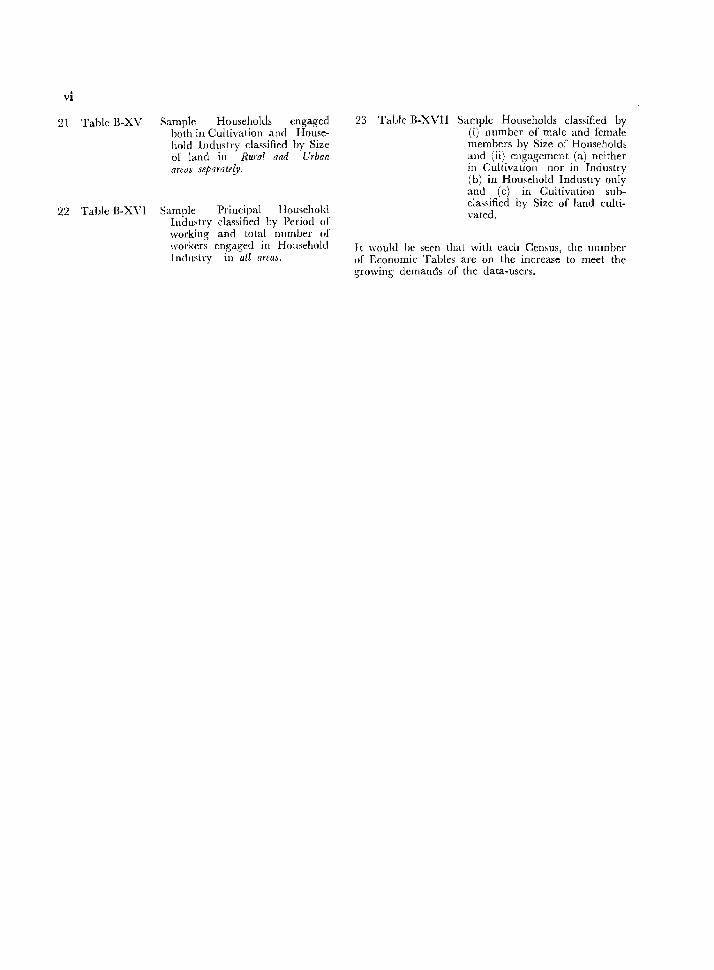
21 Tablc B-XV Sample Households engaged both in Cultivation and Household Industry classified by Size of land in Rural and Urban areus separately.
22 Table B-X\7I Sample Prineipal Homehold Industry classified by Period of working and total number of workers engaged in H01lsehold Industry in all areas.
23 Table B-XVII Sample Households classified by (i) number of male and femalc members by Size of' Household" and (ii) engagement (a) neithef in Cultivation nor in Industry (b) in Household Industry only and (e) in Cultivation subclassified by Size of land cultivated.
It would be seen that with each Cemus, the number of Economic Tables afe on the increase to meet the growing demands of the data-users.
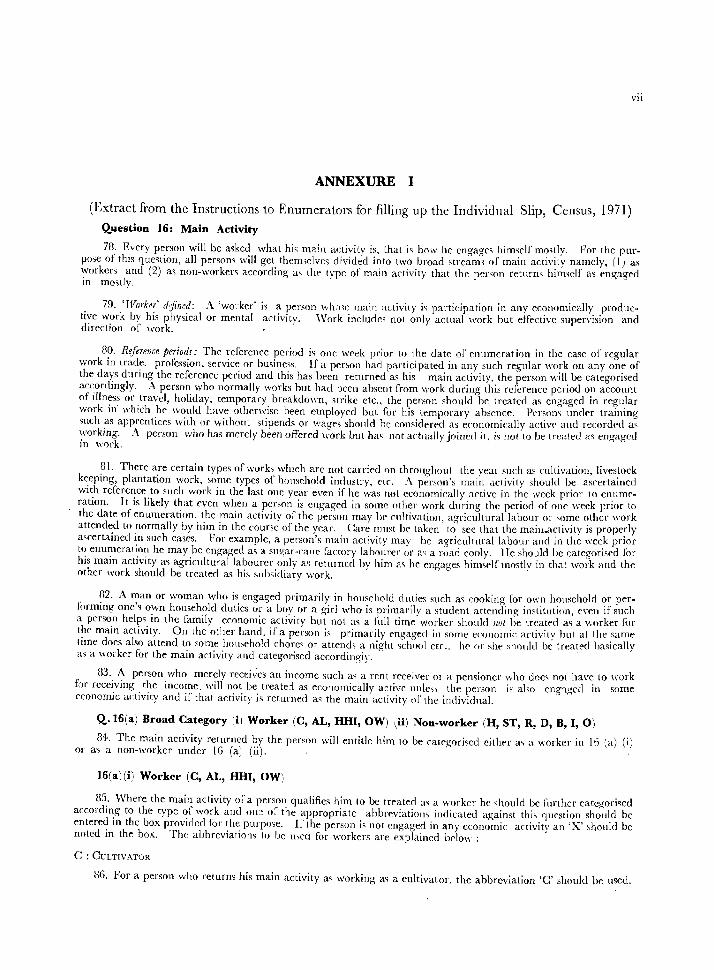
ANNEXURE I
(Extract from the Instructions to Enumerators for filling up the Individual Slip, Census, 1971) Q.uestion 16: Main Activity
vii
78. Every person will be a~ked what hi, main activity is, that is how he engages himself mOldy. For the purpme of this question, all persom will get them,c[ves divided into two broad stream, of main activ!ty na,mcly, (I) as workers and (2) a, non-workers according as tIl!' type of main activity that the per,on returns hlmsclf as engaged in mostly.
79. 'Worker' d'fined: A 'wo:'ker' is a person wh.'),c main activity is participation in any economically produc-tive work by his physical or mental activity, 'York includes not only actual work but effective supervision and direction of work,
30. Reference periods: The reference period is one wl'ek prior to the date of cnumerat ion in the case of regular work in trade, profession, service or busine". If a per.,on had participated in any such regular work on any on~ of the days during the re[erence period and this has been returned as his main activity, the person will be categonsed accordingly. A person who normally works but had been absent from work during this reference period O;t aCCOUl:t of illness or travel, holiday, temporary breakdown, strike etc., the person should be treated as engaged III regular work in which he would have otherwise been employed but [or his temporary absence. Persom undN tramIllg sneh as apprentices with or without stipends or wages should be considered as ecollomically activp and recorded as working, A person who has merely been offered work out has not actually joined it, i~ not to be treated as engaged in work.
81. There are certain types of works which arc not carricd (1l1 throughout the year such as cultivation, lives,tock keeping, plantation work, some types of hOllSchold industry, etc. A pers()u's main <lctivity should be ascertamed with reference to such work in the last one year even i[ he was not economically active in the week prior to enumeration, It is likely that even when a person is engaged in some other work during the period of one week Frior to the date of enumeration, the main activity of the persoll may Ilf' cultivation, agricultural labour or ,ome other work attended to normally by him in the course of the year. Care mllst he takm to sec that the main.activity is properly ascertained in such cases. For example, a person's main activity may be agricult'urallabour and in the wce,k prior to enumeration he may be engaged as a sugar-calle factory labourer Of as a road cooly. lIe should be categOrIsed [or his main activity as agricultural labourer only as returned by him as he engages himself mostly in that work and the other work should he treated as his subsidiary work.
82, A man or woman who is engaged primarily in household duties such as cooking for own household or performing one's own household duties or a boy or a girl who is primarily a student attending institution, ('\'('11 if such a person helps in the family economic activity but not as a lidl time worker ,hould nut be treated as a wnrker RH' the main activity, On the o~her hand, if a person is primarily engaged in some economic activity but at the same lime does also attend to wme hOllseho1d chores or attends a night school etc .. h(' or slw shoukl be treated basically as a worker j()r the main activity and categorised accordingly.
83, A person who merely receives an income slIch as a rent receiver or a pensioner who docs not have to work for receiving the income. will not be treate:! as eCO'JOrnically active unlel' the person is also eng'lged in some economic activity and if that activity is returned as the main activity or the individuaL
Q..I6(a) Broad Category (iJ Worker (C, AL, HHI, OW) (ii) Non-worker (H, ST, R, D, B, I, 0)
84. The main activity returned by the perSOIl will entitle him to be categorised eilh,.r a, a worker in ]fi (a) (i) or as a non-worker under 16 (a) (ii).
I6(a) (i) Worker (C, AL, HHI, OW)
85, vVhere the main activity or a person qualifies him to be treated a, a worker he ,hould be lill'ther categorised according to the type of work and Ole 0:' the appropriate abbreviation, indicated against this question should be entered in the box provided for the purpo'E. If the person is not engaged in any ceo nomic activit), an 'X' ,hould be noted in the box. The abbrevialio'ls to be lb('d for workers are explained bclo\\' :
C : CULTIVATOR
(16. For a person who returns his main activity as working as a cultivator, the abbreviation 'c' should be used,
viii
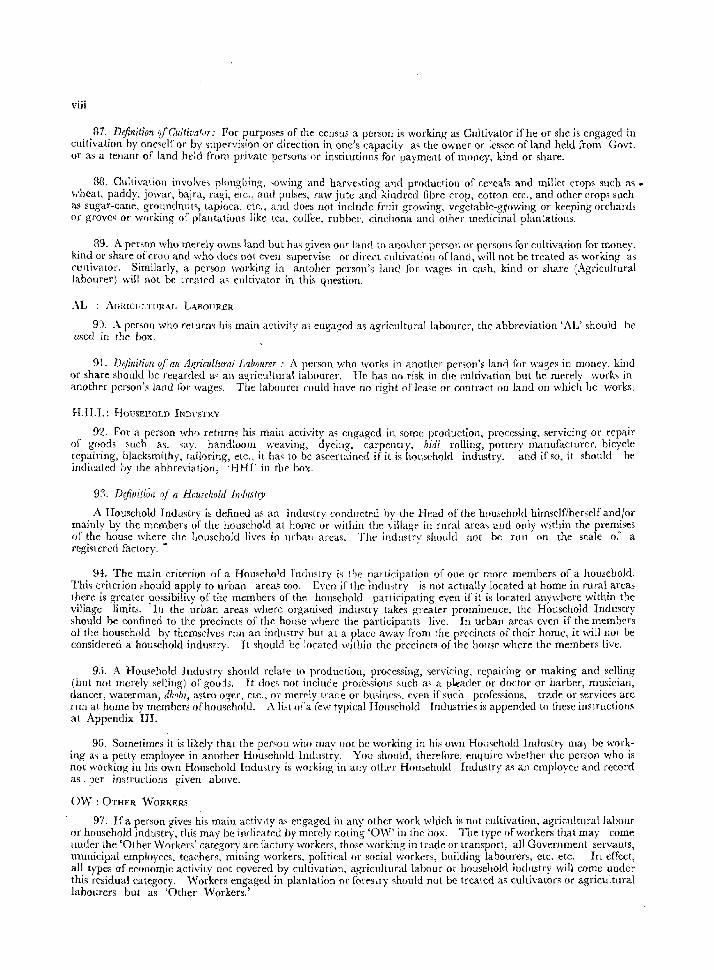
87. Definition rifCultivator: For purposes of the census a person is working as Cultivator ifhe or she is engaged in cultivation by onc~clf or by ~upervision or direction in one's capacity as the owner or lessee ofland held from Govt. or as a tenant of land held from private persons or institutions for payment of money, kind or share.
88. Cultivation involves ploughing, sowing and harvesting and production of cereals and millet crops such as • wheat, paddy. jowar, bajra, rag-i, etc., and pulses, raw jute and kindred fibre crop, cotton etc., and other crops such as sugar-cane, groundnuts, tapioca, etc., and does not include fruit growing, vegctable-g~owing or keeping orchards or groves or working of plantations like tea, coffee, rubber, cinchona and other medicinal planlati(llls.
89. A person who merely owns land but ha, given out laml to anolher person (If persons for cultivation for money, kind or share of crop and who does not even supervise or direct cultivation ofland, will not be treated as working as cultivator. Similarly, a person working in antoher person's lanel lor wages in cash, kind or share (Agricultural labourer) will not be treated a~ cultivator in thi:; question.
AL : AG!Umrl.T[lRAL LABOllRER.
93. A person who relLlI'm his main astivity as etlgaged as agricultural labourer, the abbreviation 'AL' should be u.sed in the box.
91. D~jiniti()n of an Agricultural L1bourer : A person who works in another person's land for wages in money, kind ()r share should be regarded as an all'ricllltnrallabnurer. He has no risk in the cultivation but he merely works in another person's land [or wages. The labourer could have no right oflease or contract on land on which he works.
H.H.I.: HOUSEHOLD INDPSTRY
92. For a person who returns his main activity as engaged in some production, processing, servicing or repair of goods such as, say, handloom weaving, dyeing, carpentry, bidi rolling, pottery manufacturer, bicycle repairing, blacksmithy, tailoring, etc., it has to be ascertained if it is household industry, and if so, it should be indicated by the abbreviation, 'HHl' in the box.
9:1. DejiniliJn ~/ a Household Industry
A Household Industry is defined as an industry conducted by the Head nf the household himself/herself and/or mainly by the members of the household at home or within thE villagl:' in rural areas and only within the premises of the house where the household lives ill urban areas. The industry should not be run on the scale of a registered factory. • .
9+. The main criterion of a Household Industry is the participation of Olle or more members of a household. This criterion should apply to urban areas too. Even if the industry is not actually located at home in rural areas there is greater possibility of the members of the household participating even if it is located anywhere within the village limits. In the urban areas where organised industry takes greater prominence. the Household Industry should be confined to the precincts of the house where the participants live. In urban areas even if the members of the household by themselves rLin an industry but at a place away from the precincts of their home, it will not be considered a household industry. It should be located within the precincts of the house where the members live.
95. A Household Industry should relate to production, processing, servicing, rcpairing or making and selling (but not merely ~elling) oj' goo:ls. It doe~ not include proJessions such as a pkader or doctor or barber, musician, dancer, waterman, dhrlbi, a'ltrologer, etc., or merely trade or business, even if~uch professions, trade or services are rlln at home by memhers of household. A list of a few typical HOllsehold Industries is appended to these instructions at Appendix III.
95. Sometimes it is likely that the person who may not be working in his own HOllsehold Industry may be working a, a petty employee in another Household Industry. Yon should, therefore, enquire whether the person who is not working in his own Household Industry is working in any other Household Industry as an employee and record as per imtructions given above.
OW: OTHER. WORKERS
97. If a person gives his main activity as engaged in any other work which is not cultivation, agricultural labour or househnld industry, this may be indicated by merely noting '0\'\1' in the box. The type of workers that may come under the 'Other Workers' category are factory workers, those working in trade Of transport, all Government servants, municipal employees, tea('hers, mining workers, political or social workers, building labourers, etc. etc. In effect, all types of economic activity uot covered by cultivation, agricultural labour or household industry will wme under this residual calegory. \\'orkers engaged in plantation or forestry should not be treated as cultivators or agricultural labourers but as 'Other Workers,'
ix
98. Further details pertaining to this 'Other' category of workers, as also those engaged in household industry will be recorded in the subsequent sub-parts (b) to (f) of question 16.
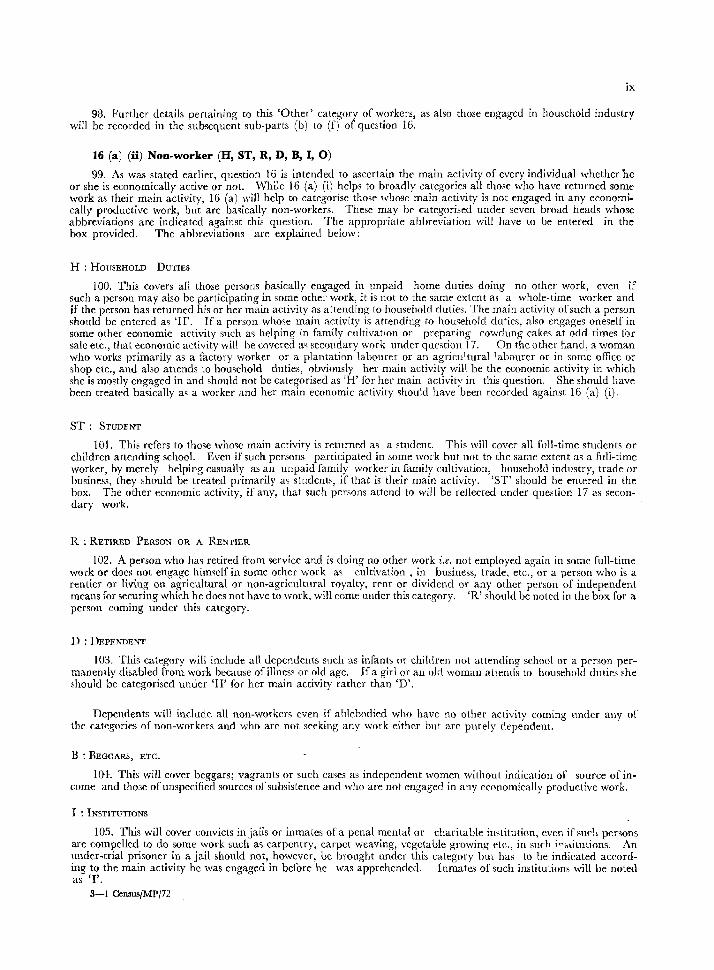
16 (a) (ii) Non-worker (H, ST, R, D, B, I, 0)
99. As was stated earlier, question 16 is intended to ascertain the main activity of every individual whether he or she is economically active or not. While 16 (a) (i) helps to broadly categories all those who have returned some work as their main activity, 16 (a) will help to categorise those whose main activity is not engaged in any cconomi. cally productive work, but are ba~ieally non-workers. These may be categorised under seven broad heads whose abbreviations are indicated against this question. The appropriate abbreviation will have to be entered in the box provided. The abbreviations are explained below:
H : HOIJSEHOLD DUTIES
100. This covers all those persons basically engaged in unpaid home duties doing no other work, even if such a person may also be participating in some other work, it is not to the same extent as a whole-time worker and if the person has returned his or her main activity as attending to household duties. The main activity of such a person should be entered as 'H'. If a person whose main activity is attending to homehold duties, also engages oneself in some other economic activity such as helping in family cultivation or preparing cowdung rakes at odd times for sale etc., that economic activity will he covered a~ secondary work under question 17. On the other hand, a woman who works primarily as a factory worker or a plantation labourer or an agricultural labourer or in some office or shop etc., and also atlends to household duties, obviously her main activity wiII be the economic activity in which she is mostly engaged in and should not be categorised as 'R' for her main activity in this question. She should have been treated ba~ically a~ a worker and her main economic activity should have been recorded against 16 (a) (i).
ST: STUDENT
101. This refers to those whose main activity is returned as a student. This will cover all full-time students or children attending school. Even if such persons participated in some work but not to the same extent as a full-time worker, by merely helping casually as an unpaid family worker in family cultivatioll, household industry, trade or business, they should be treated primarily as students, if that is their main activity. 'ST' should be entered in the box. The other economic activity, if any, that such persons attend to will be reflected under question 17 as secondary work.
R : RETIRED PERSON OR A RENTIER
102. A person who has retired from service and is doing no other work i.e. not employed again in some full-time work or does not engage himself in some other work as cultivation, in business, trade, etc., or a person who is a rentier or living on agricultural or non-agricultural royalty, rent or dividend or any other person of independent means for securing which he does not have to work, will come under this category. 'R' should be noted in the box for a person coming under this category.
D : DEPENDENT
103. This category will include all dependents sl1ch as infants m children not attending school or a person permanently disabled from work because of illness or old age. If a girl or an old woman attends to household duties she should be categorised under 'H' for 111:;1' main activity rather than 'D'.
Dependent~ will include all non-workers even if ablebodied who have 110 other activity coming under any of the categories of non-workers and who are not seeking any work either but are purely dependent.
B : BEGGARS, ETC.
104. This will cover beggars; vagrants or such cases as independent women without indication of source of income and th03e of unspecified sources of subsistence and who are not engaged in any economically productive work.
I : INSTITUTIONS
105. This will cover convicts in jails or inmates of a penal mental or charitable institution, even if sud. persons are compelled to do some work such as carpentry, carpet weaving, vegetable growing etc., in such ini>litutions. An under-trial prisoner in a jail should not, however, be brought under this category but has to be indicated according to the main activity he was engaged in before he was apprehended. Inmates of such institutions will be noted as '1'.
3-1 Census/MP/72
x
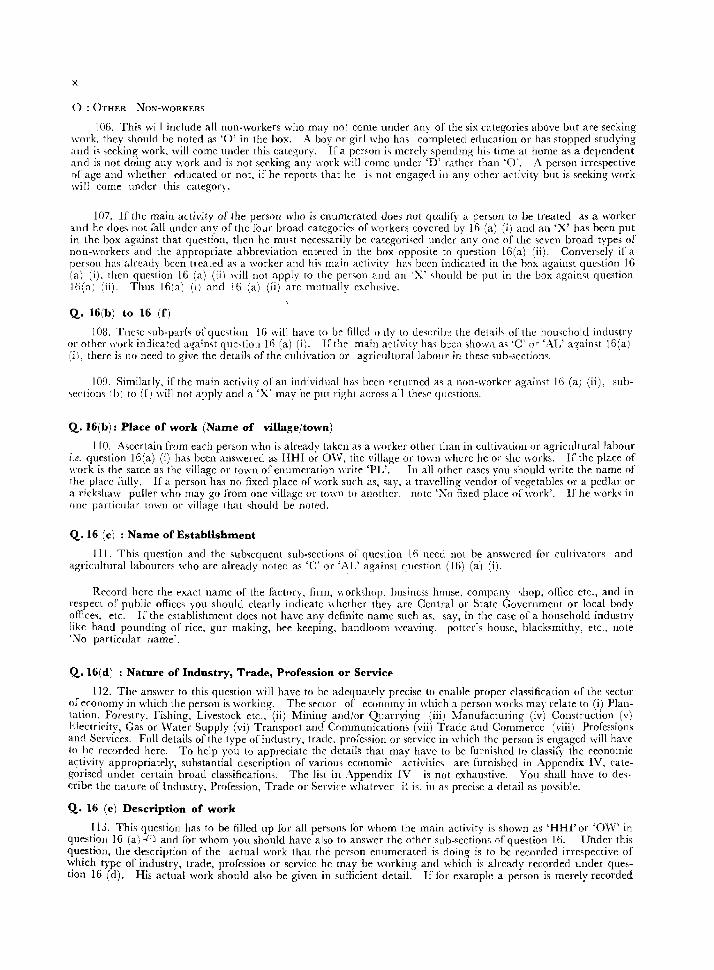
o : OTHER NON-WORKERS
106. This will include all non-workers who may not ceme under any of the six categories above but are seeking work, they should he noteo as '0' in the box. A boy or girl who has completed e(lucation or has stopped studying aIld is seeking work, will come under this category. If a person is merely spending' his time at horne as a dellendent and is not doing any work and is not seeking any \\'ork will rome under 'D' rather than '0'. A person irrespective of age and whether educated or not, if he reports that he is not engaged ill any other activity but is seeking work will come under this category.
107. If the main activity of the person who is enumerated does not qualify a person to be treated as a worker and he does not fall under any of the four broad categories of workers covered by 16 (a) (i) and an 'X' has been put in the box against that que~tion, then he must necessarily be categorised under anyone of the seven broad types of non-workers and the appropriate abbreviation entered in the box opposite to question 16(a) (ii). Conversely if a person has already been treated as a worker and his main activity has bem indicated in the bol<. against question 16 (a) (i), then question 16 (a) (ii) will not apply to the person and an 'X' should be put in the box against question Hi(a) (ii). Thus 16(a) (i) and 16 (a) (ii) are ml1l1lally el<.clusive.
Q. 16(b) to 16 (f)
108. Theie mb·parts of question 16 will have to be filled () lly to de,r.rib~ the detaih of the household industry or other work indicated a~ain't qlle,tion 16 (a) (i). lethe main activity has been shown as 'C' w 'AL' asaimt 16(a) (i I, there is no need to give the detail<; of the cultivation Ol" agricultllrallabour in these sub-sections.
109. Similarly, if the main activity of an individual has been returned as a nnn-worker against Hi (a) (ii), sub'e('tions (b) to (f) will not apply anel a 'X' may be put right across allthe'p questions.
Q. 16(b): Place of work (Name of village/town)
110. Ascertain from each person who is already taken as a worker other than in cultivation or agriclllturallabour i.e. question 16(a) (i) has been answered as IIHI or OW, the village or town where he or she works. rr the place of work is the same as the village or town of enumeration \\Tite 'PL'. In all other cases you should write the name of the place fully. If a person has no fixed place of work such as, say, a travelling vendor of vegetables or a pedlar or a rickshaw puller who may go from onc village or town to another. notc 'i\o fixed place o[\mrk'. Hhe works in one partimlar town or village that should be noted.
Q.16 (c) : Name of Establishment
Ill. This question and the subsequent sub-sections of question 16 need not be answered for cultivators and agricultmal labourers who are already noted as 'C' or 'AI,' against qllestion (16) (al (i).
Record here the ('xact name of the factory, firm, workshop, Imsiness house, company ,hop, office etc., and in respect of public offices you should clearly indicate whether they are Central or State Government or local body offiee~, etc. Il'the establishment does not have any definite name such as, say, in the case of a household industry like hand pounding of rice, gur making, bee keeping, handloom weaving, potter's house, blacksmithy, etc., note '~o particular name'.
Q.16(d) : Nature of Industry, Trade, Profession or Service
112. The answer to this qnestion will have to be adeqnately precise to enable pmper classification of the sector of economy in which the person is working. The sector of economy in which a person works may relate to (i) Plantation. Forestry, Fishing, Livestock etc., (ii) Mining and/or Quarrying (iii) Manufacturing (iv) Construction (v) ji,lectricity, Gas or Water Supply (vi) Transport and Communications (vii) Trade and Commerce (viii) Profes~ions and Services. Full details of the type of industry, trade, pro[ession or service in which the person is engaged will have to he recorded here. To help you to appreciate the details that may have to be furnished to classify the econo,nie ac;tivity appropriately, substantial description of varioU' economic activities arc furnished in Appendix IV, categorised under certain broad classifications. The list in Appendix IV is not exhaustive. You shall have to des· cribe the nature of Industry, Profession, Trade or Service whatever it is. in m precise a detail as po,sible.
Q. 16 (e) Description of work
I Li. This question has to be filled up for all persons lor whom the main activity is shown as 'HHI' or 'nw' in question 16 (a; ,.j;) and for whom you should have also to answer the other sub-sections of question 16. Uhder this qu~stion, the ·description of the actual work that the pel'son enumerated is doing is to be recorded irrespective of ,:hleh type of industry, trade, profession or service he may be working and which is already recorded under questIOn 16 (d). His actual work should also be given in sufficient detail. Hfor example a person is merely recorded
XI
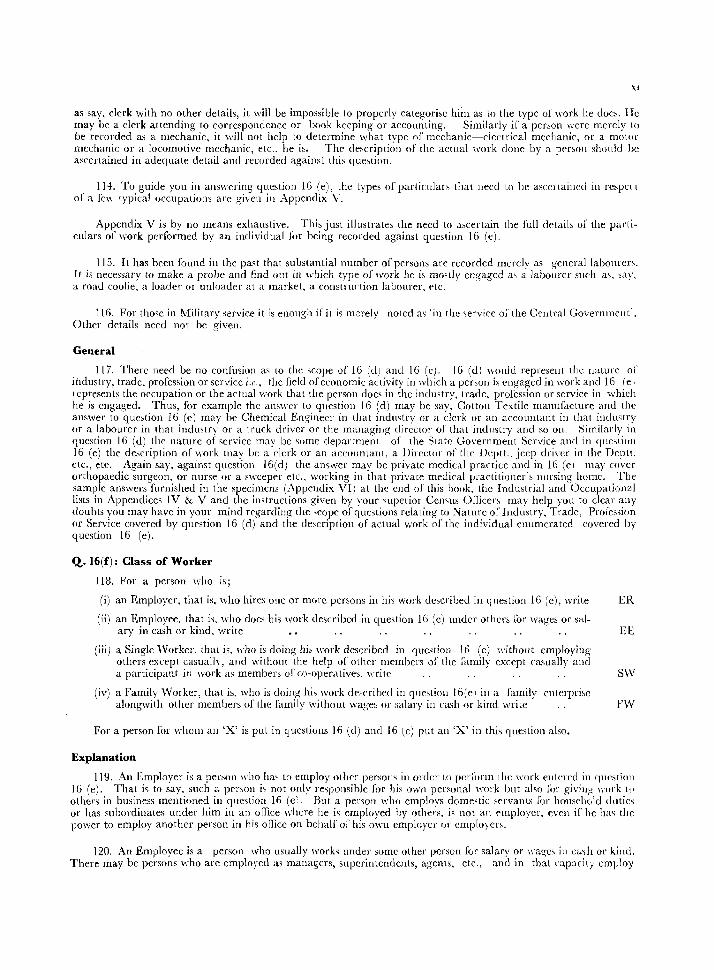
as say, clerk with no other details, it will be impossible to properly categorise him as to the type of work he does. He may be a clerk attending to correspondence or book keeping or accounting. Similarly if a pcrson wcre merely to be recorded as a mechanic, it will not hclp to determine what type of meehanic--clcctrical mechanic, or a motor mechanic or a locomotive mechanic, etc .. he is. The de,cription of the actual work done by a persoll should bc ascertained in adequate detail and recorded against this question.
I H. To guide you in answering question 16 (e), the types of particulars that !leed to be aseet taineci in respect or a few typical occupatiom are given in Appendix V.
Appendix V is by no means exhaustive. This jmt illustrates the need to ascertain the full details of the particulars of work performed by an individual lor being recorded against question Hi (e).
115. It has been found in thc past that substantial number of persons are recorded merely as generallabonrer,. It is necessary to make a probe and find out in which type o[work he is mo,tly' engagcd m a labourcr such as. say. a road coolie, a loader or unloader at a market, a construction labourer, etc.
116. For those in Nfilitary service it is enough if it is m~rely noted as 'in the service 0;' the Central Governmcnt'. Other details need not be given.
General
117. There need be no confmion a~ to the scope of 16 (d) and 16 (e). 16 (dJ would represent the nature of industry, trade. profession or service i.e., the field of economic activity in which a person is engaged in work and 16 Ie' t cpresents the occupation or the actual work that the person does in the industry, trade. profession or service in which he is engaged. Thus, for example the amwcr to question 16 (d) may be say, Cotton Textile manufacture and thc answer to question 16 (e1 may be Chemical Engineer in that industry or a clerk or an accountant in that indu,try or a labourer in that industry or a truck driver or the managing director of that industry and so on. Similarly in question 16 (d) the nature of service may be some department. of the State Government Service anel in qnestioll 16 (e) the description of work may be a clerk or an accountant. a ])irector of the Dept!.. jeep driver in the Deoll. etc., etc. Again say, against question 16(d) the amwer mav be private medical practice and in 16 (cJ may cover orthopaedic surgeon, or nurse or a sweeper etc., working in that private medical practitioner's nursing home. The sample answers furnished in the specimens (Appendix VI) at the end of this book, the Industrial and Occupational lists in Appendices IV & V and the instructions given by your o;uperior Cen'us Officer, may help you to clear any doubts you may have in your mind ITgarding the scope of questions relating to Nature oCIndustry. Trade, Pro{cssion or Service covered by question 16 (d) and the description of actual work of the individual cnumerated covered by question 16 (el.
Q. 16(f): Class of Worker
113. For a person who IS;
(i) an Employer, that is, who hires one or more persons in his work described in question 16 (e), write ER
(ii1 an Employee, that is, who does his work described in question 16 (e) under othen. lor wages or sal-ary in cash or kind, write EE
(iii) a Single Worker, that is, who is doing his work described in questioll 16 (c) without employing others except casually, and without the help of other members of' the [amily exccpt casually and a participant in work as members of co-oper,ltives. write S\V
(iv) a Family Worker, that is, who is doing his work described in question 16(e) in a family enterprise alongwith other members of the family without wages or salary in cash or kind write FW
For a person for whom an 'X' is put in questions 16 (d) and 16 (e) put an 'X' in this question also.
Explanation
119. An Employer is a perSOll who has to employ other persons in order to per;;)rl11 the work elttered in questioll 16 (el. That is to say, such a penon i, not only re5ponsible [or his own personal work !Jut also jill' giving work ti' others in business mentioned in q\lestion 16 (e\. But a person who employs domestic servants [or household duties or has 'lIbordinates under him in an office where he is employed by otbe"s, is not an t'mployer. even if he has the power to employ another person in his office on behalf or his O\\'n empkyer or crnplo) ers.
120. An Employee is a person who usually works under some other person for salary or wage, ill ca\h or kind. There may be persons who arc employed as managers, superintendents, agents, etc., and in that capacity employ
xli
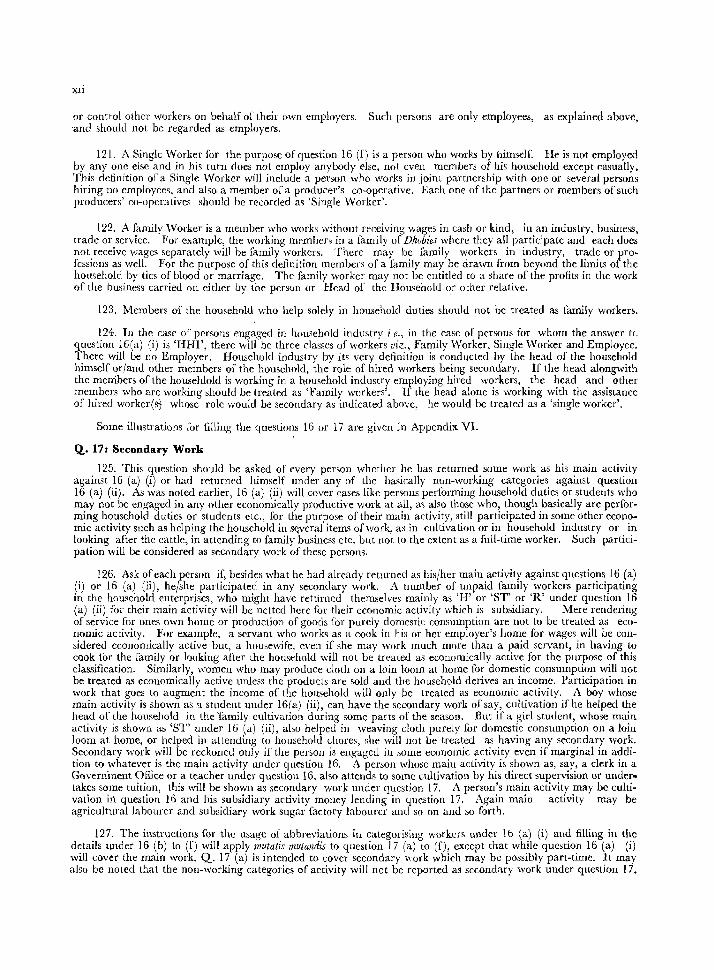
or control other workers on behalf of their own employers. Such persons are only employees, as explained above, and should not be regarded as employers.
121. A Singlc Worker for the purpose of question 16 (f) is a person who works by himself. He is not employed by anyone else and in his turn does not employ anybody else, not cven mcmbers of his household except casually. This definition of a Single Worker will include a person who works in joint partnership with one or several persons hiring no employees, and also a member of a producer's co-operative. Each one of the partners or members of such producers' co-operatives should be recorded as 'Single Worker'.
122. A family 'Vorker is a member who works without receiving wages in cash or kind, in an industry, business, trade or service. For eJ<.ample, the working members in a family of Dhobies where they all partic;pate and each does not receive wages separately will be family workers. There may be family workers in industry, trade or profcssions as well. For the purpose of this definition members of a family may be drawn from beyond the limits of the household by tics of blood or marriage. The family worker may not be entitled to a share of the profits in the work of the business carried on either by the person or Head of the Household or other relative.
123. Members of the household who help solely in household duties should not be treated as family workers.
124. In the case of persons engaged in household industry i.e., in the case of persons for whom the answer tf; question 16(a) (i) is 'HHI', there will be three classes of worken viz., Family Worker. Single Worker and Employee. There will be no Employer. Household industry by its very definition is conducted by the head of the household himself or/and other members of the household, the role of hired workers being secondary. If the head alongwith thc members of the househlold is working in a household industry employing hired workers, the head and other members who are working should be treated as 'Family workers'. If the head alone is working with the assistance of hired worker(s) whose role would be secondary as indicated above, he would bc treated as a 'single worker'.
Some illustratiolls for filling the questinns 16 or 17 are given in Appendix VI.
Q.. 17: Secondary Work
125. This question should be asked of every person whether he has returned some work as his main activity against 16 (a) (i) or had returned himself under any of the basically non-working categories agaillSt question 16 (a) (ii). As was noted earlier, 16 (a) (ii) will cover cases like persons performing household duties or students who may not be engaged in any other economically productive work at all, as also those who, though basically are performing household duties or students etc., for the purpose of their main activity, still participated in some other economic activity such as helping the household in s~veral items of work, as in cultivation or in household industry or in looking after the cattle, in attcnding to family business etc. but not to the extent as a full-time worker. Such participation will be considered as secondary work of thesc persons.
126. Ask of each person if, besides what he had already returned as his/her main activity against questions 16 (a) (i) or 16 (a) (ii), he/she participated in any secondary work. A number of unpaid family workers participating in the household enterprises, who might havc rettirned themselves mainly as 'H' or 'ST' or 'R' under question 16 (a) (ii) for their main activity will bc netted hcre for their economic activity which is subsidiary. Mere rendering of service for ones own home or production of goods lor purely domestic consumption are not to be treated as economic activity. For example, a servant who works as a cook in his or her employer'o home for wages will be COIl
sidered economically active but, a housewife, even if she may work much more than a paid servant, in having to cook for the family or looking after the househuld will not be treated as economically active for the purpose of this classification. Similarly, women who may produce cloth on a loin loom at horne for domestic consumption will nut be treated as economically active unless the products are sold and the household derives an income. Participation in work that goes to augment the income of the household will only be treated as economic activity. A boy whose main activity is shown as a student under 16(a) (iil, can have the secondary work of say, cultivation ifhe helped the head of the household in the 'family cultivation during some parts of the season. But if a girl student, whose main activity is shown as 'ST' under 16 (a) (ii), also helped ill weaving cloth purely for domestic consumption 011 a loin loom at home, or helped in atlelllling to household chores, she will 110t he treated as having any secondary work. Secondary work will be reckoned only if the person is engaged in some economic activity even if marginal in addition to whatever is the main activity under question 16. A person whose main activity is shown as, say, a clerk in a Government Office or a teacher under question 16, also attends to some cultivation by his direct supervision or undertakes some tuition, this will be shown as secondary work under question 17. A person's main activity may be cultivation iIi question 16 and his subsidiary activity money lending in question 17. Again main activity may be agricultural labourer and subsidiary work sugar factory labourcr and so on and so forth.
127. The instructions for the usage of abbreviations in categorising workers under Hi (a) (i) and filling in the details under 16 (b) to (f) will apply mutatis mutandis to question 17 (a) to (f), except that while question 16 (a) (i) will cover: the main work. Q. 17 (a) is intended to cover secondary 'work which may be possibly part-time. It may also be noted that the non-working categories of activity will not be reported as secondary work under question 17.
xiii
ApPENDIX II I
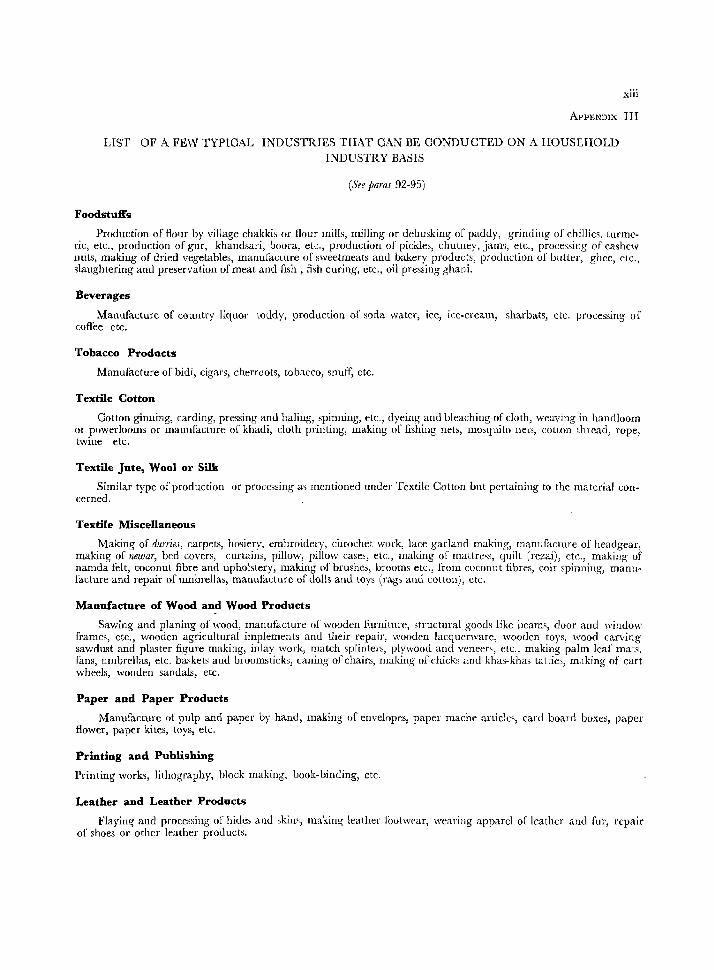
LIST OF A FEW TYPICAL INDUSTRIES THAT CAN BE CONDUCTED ON A HOUSEHOLD INDUSTRY BASIS
(See paras 92-95)
Foodstuffs
Production of Hour by village chakkis or flour mills, milling or dehusking of paddy, grinding of chillies, turmeric, etc., production of gur, khandsari, boom, ek., production of pickles, chutney, jam\ elc., processing of cashew nuts, making of dried vegetables, manufacture of sweetmeats and bakery products, production of butter, ghee, etc., slaughtering and preservation of meat and fish, fish curing, etc., oil pressing ghani.
Beverages
Manufacture of country liquor toddy, production or soda water, ice, ice-cream, sharbats, etc. processing of coffee etc.
Tobacco Products
Manufacture of bidi, cigars, cherroots, tobacco, snuff, etc.
Textile Cotton
Cotton ginning, carding, pressing and baling, spinning, etc., dyeing and bleaching of doth, weaving in handloom or powerlooms or manufacture of khadi, cloth printing, making of fIShing nets, mosquito nets, cnllon thread, rope, twine etc.
Textile Jute, Wool or Silk
Similar type of production or processing a~ mentioned under Textile Cotton but pertaining to the material concerned.
Textile Miscellaneous
Making of durries, carpets, hmiery, embroidery, chrochet work, lac!: garland making, manufacture of headgear, making o[ newar, bed cover~, curtains, pillow, pillow cases, etc., making o[ mattress, quilt (rezai), etc., making of namda felt, coconut fibre and upholstery, making of brushes, brooms etc., from coconut fibres, coir spinning, manufacture and repair ofumbrelJas, manufacture of dolls and toys (rags and cotton), etc.
Manufacture of Wood and Wood Products
Sawing and planing of wood, manufacture of wooden furniture, structural goods like beams, door and window frames, etc., wooden agricultural implements and their repair, wooden lacquerware, wooden toys, wood carving sawdust and plaster figure making, inlay work, match splinters, plywood and veneers, etc., making palm leaf mats, fans, umbrellas, etc. baskets and broomsticks, caning of chairs, making of chicks and khas-khas tat ties, m'lking of cart wheels, wooden sandals, etc.
Paper and Paper Products
Manufacture of pulp and paper by hand, making of envelopes, paper mache articlcs, card board boxes, paper flower, paper kites, toys, etc.
Printing and Publishing
Printing works, lithography, block making, book-binding, etc.
Leather and Leather Products
Flaying and processing of hides and skins, making leather footwear, wearing apparel 0[" leather and fur, rcpair of shoes or other leather products.
XIV
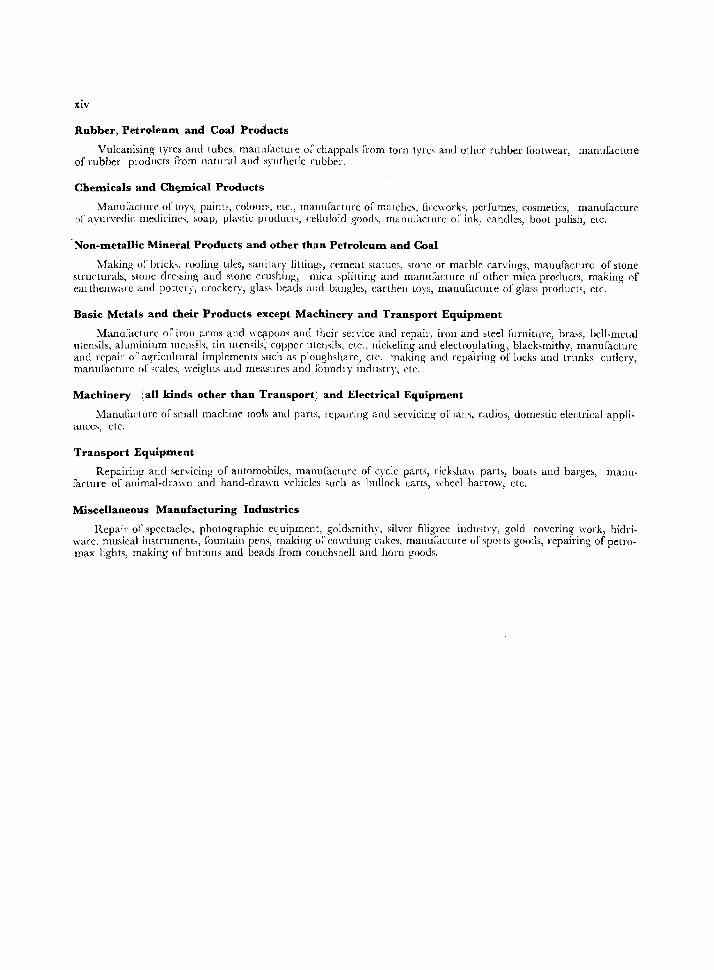
Rubber, Petroleum and Coal Products
Vulcanising tyres and tubes, manu/aelure 0; chappals from torn tyres and other rubber footwear, manufacture of rubber prodllcts [rom natural and synthetic rubber.
Chemicals and Ch~ical Products
Manuiactlll'c of toys, paints, colollrs, etc., manuJacture OJ matches, fire\\'orb, perfumes, cosmetics, manufacture of ayul'vedic mediciIlt"s, soap, plastic products, celluloid good" mallui:tcturc or ink, candles, boot polish, etc.
Non-metallic Mineral Products and other than Petroleum and Coal
l\·faking 0; brick" roofing Liles, sanitary fitting~, cement statuee, stone or marble carvillgs, manufacture of stone structurals, stolle dressilLg and stone crushing, mica splitting and manu[auure of other mica products, making of earthenware and potter)", crockery, glass beads and ballgles, earthen toys, manufacture of glass products, etr.
Basic Metals and their Products except Machinery and Transport Equipment
Manu;actllre of iron arms and \\'e~pom and their service and repair, iron and steel furniture, brass, bell·metal Iltcmils, aluminium lllemih, tin utemils; copper utcmils, etc., nickeling and electroplating, blacksmithy, manufacture and repair of agricultural implements such as ploughshare, ctc. making and repairing of locks and trunks cutlery, manuiacture nf scales, weights and measures and foundry industry, etc.
Machinery (all kinds other than Transport) and Electrical Equipment
Manu(ilcture 01 small machine tools and parts, repairing and servicing ot" [am, radios, domestic electrical appliances, etc.
Transport Equipment
Repairing and scrvicing of automobi!cs, manufacture of cycle parts, richhaw parts, boats and barge" mauu[aetUle of animal·dra\\·n and hand·drawn vehicles such as bullock carts, wheel barrow, ctc.
Miscellaneous Manufacturing Industries
Repair of spectacles, photographic equipment, goldsmithy, silver filigrec indmtry, gold covering work, bidriware, musical instrumenb, fountain pens, making 0:' cowdllng cakes, manu:acture or sports goods, repairing of petro· max lights, making of buttons and beads from conchshell and horn goods.
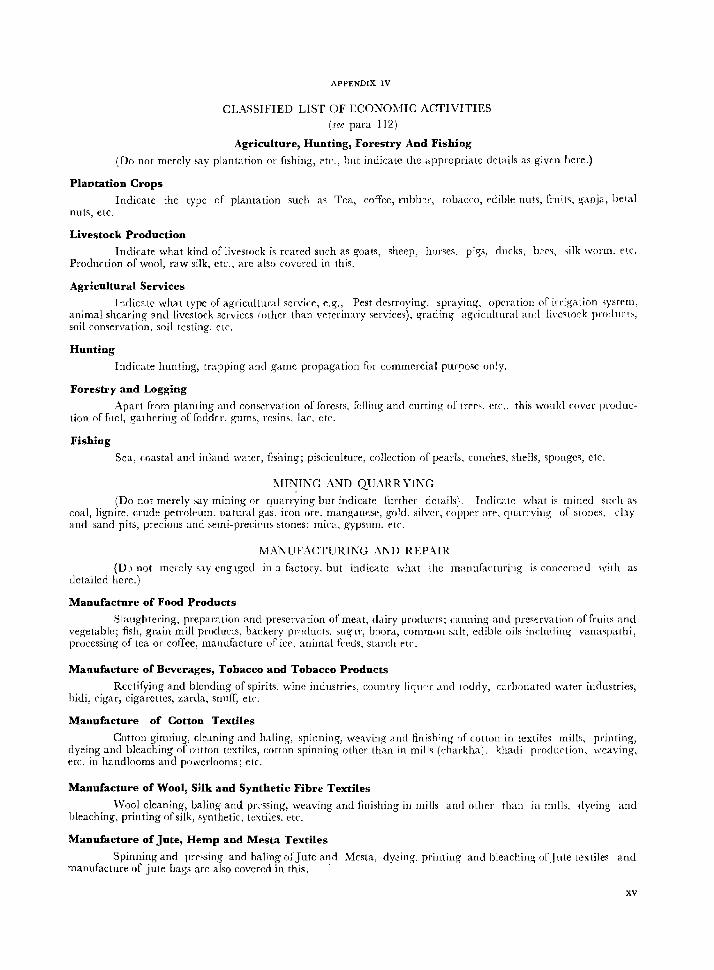
APPENDIX IV
CLASSIFIED LIST OF ECONO.:vnC ACTIVITIES
(see para 112)
Agriculture, Hunting, Forestry And Fishing
(Do not merely say plantation or fishing, ric., but indicate the appropriate det<lils as give.n here.)
Plantation Crops
Indicate the type of plantation such a~ Tea, mffee, rubb~r, tobacro, ediblc nnts, frnit~, .~,mja, betal nuts, etc.
Livestock Production
Indicate what kind of livestock is reared such as goats, sheep, horses, pig." ducks, b:'e~, silk worm, ('tc. Production of wool, raw silk, etc., arc also covered in this.-
Agricultural Services
Indicate what type of agricultural senrice, e.g., Pest e!estroying, spraying, operation of irrig,ltion system, animal shearing ;Jnd livestock services (other than v'~terinary services), grading agcicultural ami li\'c<;tock pro:Jucts, soil conservation, soil testing, etc-.
Hunting
Indicate hunting, trapping and g<lme propagation for commercial purpose only.
Forestry and Logging
Apart frnm planting and conservation afforests, felling and cutting of trees. etr., this woulcl rover pmduction offuel, gath(:ring of foddfr, gums, resins, lar, etr.
Fishing
Sea, coastal ane! inland water, fishing; pisciculture, collection of pearls, conches, shells, sponges, etc.
;"1JNINC AND QU1\RR VINC
(Do not merely say mining or quarrying but indicate further details\. Indicate what is minco such as coal, lignite, crude petroleum, natural gas, iron OfP. manganese, gold, silver, copper nre, quarrying of stones, clay and sand pits, precious and scmi-preci('lIS stones; mica. gypsum. etr.
MANUFACTURING AND REPAIR
(D,,) nut merely say engaged in a factory, but indicate what the mcwufarturing is concerned with as detailed here.)
Manufacture of Food Products
Slaughtering, preparation and preservation of meat, d'liry products; canning and preSErvation of fruits and vegetable; fish, grain mill products, backery prnoucts. SligH, b()ora, common salt, edible oils inclwlillg vanctsparhi, processing of tea or coffee, manufacture of ict', animal fecds, starch t'tc.
Manufacture of Beverages, Tobacco and Tobacco Products
Rectifying and blending of spirits, wine industries, country liqwT <md toddy, carbonated W<lter industries, bidi, cigar, cigarettes, zarda, snuff, etc
Manufacture of Cotton Textiles
Cotton ginning, clcaning and IMling, spinning, wC'aving ano finishing of cotton in textiles mills, printing, dy~ing and blc:aching of c(}tton textiles, cotton spinning other than in mills (charkha), khadi proelurtion, weavlllg, etc. in hand looms and powerlooms; etc.
Manufacture of Wool, Silk and Synthetic Fibre Textiles
"Vool cleaning, baling and pressing, weaving and finishing in mills and other than in mills, dyeing and bleaching, printing of silk, synthetic. textiles, etc.
Manufacture of Jute, Hemp and Mesta Textiles
Spinning and p~essing anel baling of Jute and Mesta, dyeing, printing and bleaching of jute textiles and manufacture uf jute bags are also covered in this. '
xv
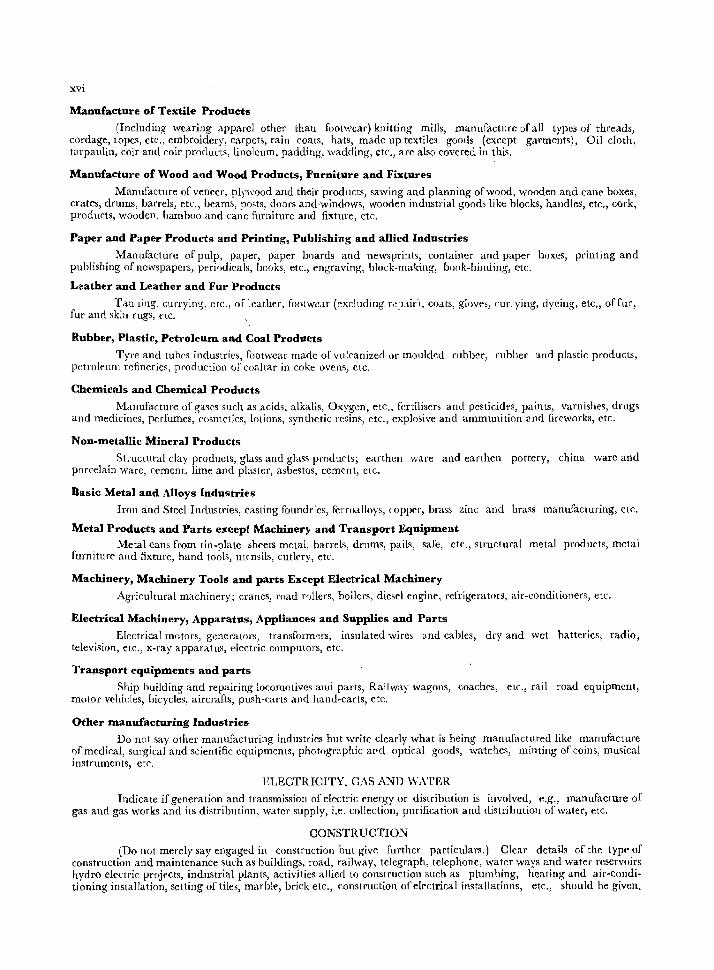
xvi
Manufacture of Textile Products
(Including wearing apparel other than footwear) knitting mills, manufacture of all types of threads, cordage, ropes, etc., embroidery, carpets, rain coats, hats, made up textiles goous (except garments), Oil cloth, tarpaulin, coir and coir products, linoleum, padding, wadding, etc., are also covered in this.
Manufacture of Wood a«d Wood Products, Furniture and Fixtures
Manufacture of veneer, plywood and their products, sawing and planning of wood, wooden and can!" boxes, crates, drums, barrels, etc., beams, posts, doors and'windows, wooden industrial goods like blocks, handles, etc., cork, pI'oduet" wooden, bamboo and cane furniture and fixture, etc.
Paper and Paper Products and Printing, PubHshing and allied Industries
Manufacture of pulp, paper, paper boards and newsprints, container and paper boxes, printing and publishing of newspapers, peri'Jdicals, books, etc" engraving, block-making, book-binding, ctc.
L1!ather and Leather and Fur Products
, ~an ling, curryill~, etc., of lealh~r, foolwc<lr (~xcluding r,:p.lir), COMS, gloves, cut'J'ying, dyeing', etc., of fur, fur and skm rugs, rtc. .
Rubber, Plastic, Pett'oleum and Coal Products
Tyre and tubes industries, footwear madc ofvlllcanized or mould"d rubber, ruhber and plastic products, petroleum refineries, production of coallar in coke ovens, etc.
Chemicals and Chemical Products
Manufacture of ga~es such as .acid~, alkalis, Oxygen, etc., fertilisers and pesticides, paints, varnishes, drugs and medicines, perfumes, cosmetics, lotions, synthetic resins, etc" explosive and ammunition <lnd fireworks, etc.
Non-metallic Mineral Products
Structural clay produot$, glass and glass products; earthen ware and earthen pottery, china ware and porcelain ware, cement, lime and plaster, asbestos, cement, etc.
Basic Metal and Alloys Industries
Iron and Steel Industries, casting foundries, ferroalloys, (opper, brass zinc and brass manufacturing, etc.
Metal Products and Pat'ts except Machiner), and Transport Equipment Metal cans from tin-plate sheets metal, barrels, drums, pails, safe, et('., structural metal produl'ts, metal
furniture" and fixture, hand tools, utensils, cutlery, etc.
Machinery, Machinery Tools and parts Except Electrical Machinery
Agricultural machinery; cranes, road r<)llers, boilers, diesel engine, refrigerators, air-conditioners, etc.
Electrical Machinery, Apparatus, Appliances and Supplies and Parts
Electrical motors, generators, transform-"fs, insulated wires and cables, dry and wet batteries, radio, television, etc., x-ray apparatus, electric computors, etc.
Trapsport equipments and parts
Ship building and repairing locomotives and parts, Railway wagons, coaches, elc., rail road equipment, motor vehicles, hi cycles, aircraft..~, push-carts and hand-carts, etc.
Other manufacturing Industries Do not say other manuJacturing industries but write clearly what is being manufactured like manufacture
I)f medical, surgical and scientific equipmcnts, photographic ard optical goods, watches, minting of coins, musical instruments, etc.
ELECTRICITY, GAS AND WATER
Indicate if generation and transmission of electric energy or distribution is involved, e.g., manufacture of gas and gas works and its distribution, water supply, i.e. collection, purification and distributioll of water, etc.
CONSTRUCTION
(Do not merely say engaged in construction but give further particulars.) Clear details of the tYPf" of construction and maintenance such as buildings, road, railway, telegraph, telephone, water ways and water reservoirs hydro electric projects, industrial plants, activities allied to construction such as plumbing, heating and air-conditioning installation, setting of tiles, marble, brick etc., construction of electrical installations, etc., shlluld be given,
XVIl
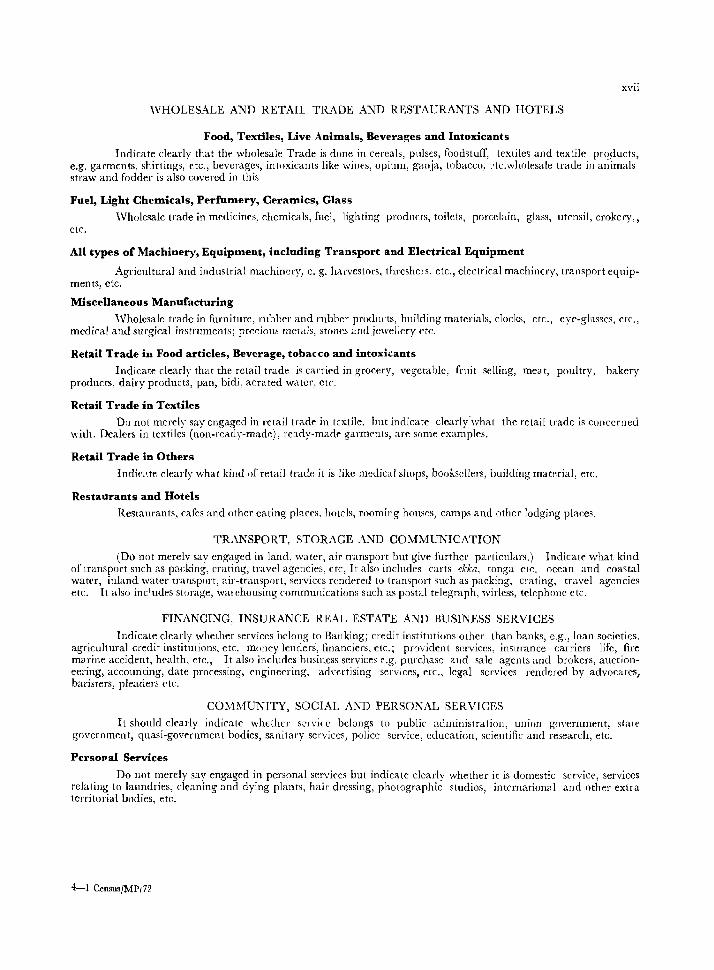
WHOLESALE AND RETAIL TRADE AND RESTAURANTS AND HOTELS
Food, Textiles, Live Animals, Beverages and Intoxicants
Indicate clearly that th~ wholesale Trade is done in cereals, pulSES, foodstuff, textiles and textile pro_ducts, e.g. garmEnts, shirtings, etc., beverages, intoxicants like wines, opium, ganja, tobacco, :·tc.wholesale trade in animals straw and fodder is also covered in this
Fuel, Light Chemicals, Perfumery, Ceramics, Glass
\Vholesale trade in medicines, chemicals, fuel, lighting products, toilets, porcelain, glass, utensil, erokery" etc.
All types of Machinery, Equipment, including Transport and Electrical Equipment
Agricultural and industrial machinery, e. g. harvcstors, thresher s, etc., electrical machinery, transport equipments, etc.
Miscellaneous Manufacturing
\Vholesale trade in furniture, rubber and rubber products, building materials, clocks, ctc., eye-glasses, etc., medical and surgical instruments; precious metals, stones andjcwellery etc.
Retail Trade in Food articles, Beverage, tobacco and intoxicants
Indicate clearly that the retail trade is carried in grocery, vegetable, fruit selling, meat, poultry, bakery products, dairy products, pan, bidi, aerated water, etc.
Retail Trade in Textiles
Do not merely say engaged in retail trade in t~xtile, but indicate clearly what the retail trade is concerned with. Dealers in textiles (non-rcady-made), ready-made garm!'nts, arc some examples.
Retail Trade in Others
Indic:,te clearly what kind of retail trade it is like medical shops, booksellers, building material, etc.
Restaurants and Hotels
Restaurants, cafes and other eating places, hotels, rooming houses, camps and othcr lodging places.
TRANSPORT, STORAGE AND COMMUNICATION
(Do not merely sav engaged in land, water, air transport but give ftlrther particulars.) Indicate what kind of transport such as packing, crating, travel agencies, etc, It also includes carts ekka, tonga etc. ocean and coastal water, inland water transport, air-transport, services rendered to transport such as packing, crating, travel agencies etc. It also includes storage, walchousing communications such as postal telegraph, wirless, telephone etc.
FINANCING, INSURANCE REAL ESTATE AND BUSINESS SERVICES
Indicate clearly whether services belong to Banking; credit institutions other than banks, e.g., loan societies, agricultural credit institutious, etc. mOlley lenders, financiers, etc.; ppwident services, insurance carriers life, fire morine accident, health, etc., It also includes business services e.g. purchase and sale agents and brokers, auctioneering, accounting, date processing, engineering, advertising services, etc., legal services rendered by advocates, baristers, pleaders ctc.
COMMUNITY, SOCIAL AND PERSONAL SERVICES
It should clearly indicate wh{.[her Service belongs to public ,~dIllinistratioll, union government, statf' government, quasi-government bodies, sanitary services, police service, education, scientific and research, etc.
Persopal Services
Do not merely say engaged in personal services but indicate clearly whether it is domestic service, services relating to laundries, cleaning and dying plants, hair dressing, photographic studios, international and other extra territorial bodies, etc.
4-1 Census/Mp,72
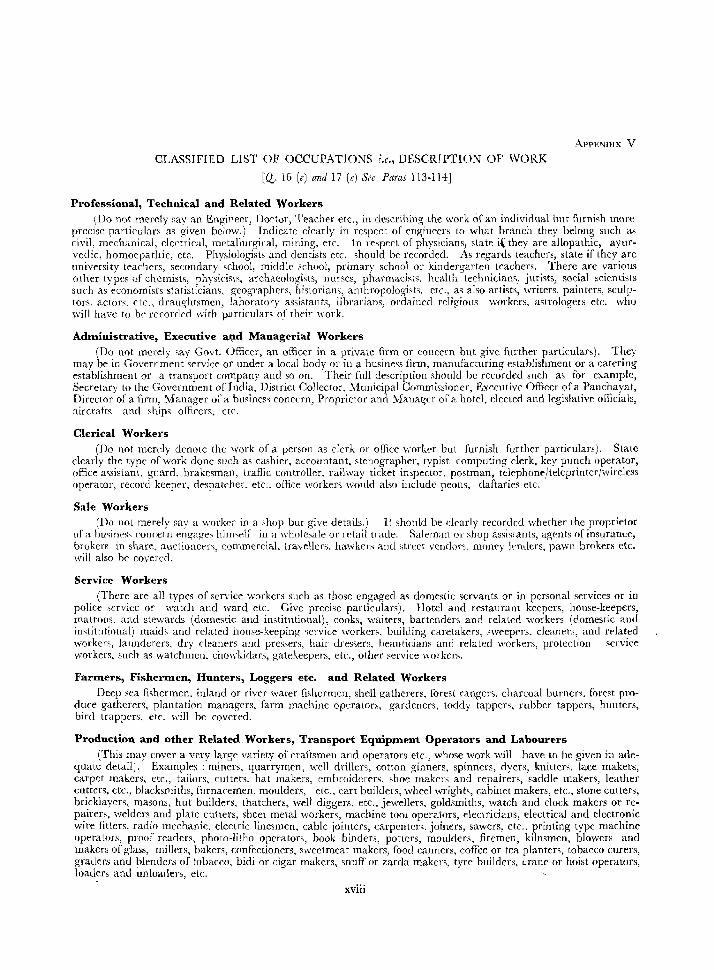
CLASSIFIED LIST OF OCCUPATIONS i.e., DESCRIPTION OF WORK
[Q, 16 (e) and 17 (e) See Paras 113-114]
Professional, Technical and Related Workers
ApPENDIX V
(Do not merely sayan Engineer, noet;)r, Teacher etc" in describing the work of an individual but furnish more precise particulars as given below,) Indicate clearly in respect of engineers to what branch they belong such as civil, mechanical, electrical, metallurgical, mining, etc, In respect of physicians, state i( they are allopathic, ayurvedic, homoepathic, etc, Physiologists and dentists etc. should be recorded, As regards teachers, state if they are university teachers, secondary school, middle school, primary school or kindergarten teachers. There are various other types of chemists, physicists, archaeologists, nurses, pharmacists, health technicians, jurists, social scientists such as economists statisticians, geographers, historians, anthropologists, etc., a~ also artists, writers, painters, sculptors, actors, ctc., drallghtsmen, laboratory assistants, librarians, ordained religious workers, astrologers etc. who will have to be' recorded with piuticulars of their \\ork.
Administrative, Executive a'lld Managerial Workers (Do nnt merely say Govt. Officer, an officer in a private firm or concern but give further particulars). They
may be in Government service Of under a local body or in a business firm, manufacturing establishment or a catering establishment or a transport company and so on. Their full description should be recorded slieh as for example, Secretary to the Government orIndia, District Collector, :Municipal Commissioner, Executive Officer ofa Panehayat, Director of a firm, Manager or a busines~ concern, Proprietor and :Manager 01" a hotel, elected and legislative officials, air crafts and ships officers, etC'.
Clerical Workers (Do not merely denote the work of a person as clerk or office work!:'f but furnish further particulars), State
clearly the type of work done such as cashier, accountant, stenographer, typist.. computing clerk, key punch operator, office assistant. guard, brakesman, traffic controller, railway ticket inspector, postman, telephone/teleprinter/wireless operator, record keeper, despatcher, etc., offiee workers would also include peons, daftaries etc.
Sale Workers (Do not merely say a worker in a shop but give details.) It should be clearly recorded whether the proprietor
of a business con~ern engag-es himself in a wholesale or retail trade, Saleman or shop assistants, ag-ents of insurance, brokers in share, auclionens, commercial, travellers, hawkers and street vend()f~, mmwy l!:'nclers, pawn brokers etc. will also bc covered.
Service Workers (There are all types of service workers sllCh as those engaged as domestic servants or in personal services or in
police service or watch and ward etc. Give precise particulars). Hotd and restaurant keepers, house-keepers, matrons, and stewards (domestic and institutional), cooks, waiters, bartenders and related workers (domestic. and institlltional) maids and related house-keeping service workers. building caretakers, sweepers. cleaners, and rf'lated workers, launderen, dry cleaners and pressers, hair dressers, beautic.iam and related workers, protection service workers, such as watchmen, chowkidars, gatekeepers, etc., othn service workers,
Farmers, Fishermen, Hunters, Loggers etc. and Related Workers Deep sea fishermen, inland or river water fishermen, shell gatherers, forest rangers, charcoal burners, forest pro
duce gathcrer~, plantation managers, farm machine operators, gardeners, toddy tappers, rubher tappers, hUllters, bird trappers, etc. will be covered.
Production and other Related.Workers, Transport Equipment Operators and Labourers (This may cover a very large variety of craftsmen and operators etc., whose work will have to be given in ade
quate detail), Examples: miners, quarrymen, well drillers, cotton ginners, spinners, dyers, kniUers, lace makers, carpet makers, etc., tailors, cutters, hat makers, embroiderers, shoe makers and repairers, saddle makers, leather cutters, etc" hlacksmiths, furnacemen, moulders, etc., cart builders, wheel wrights, cabinet makers, etc., stone cutters, bricklayers, masons, hut builders, thatchers, weIl diggers, etc., jewellers, goldsmiths, watch and clock makers or repairers, welders and plate cutters, sheet metal workers, machine tool operators, electricians, electrical and electronic wire fitters. radio mechanic. electric linesmen, cable jointers, carpenters, joiners, sawers, etc., printing type machine operators, proof readers, photo,litho operators, book binders, potters, moulders, firemen, kilnsmen, blowers and makers of gla~s, millers, hakers, confectioners, sweetmeat makers, lood canners, coHee or tea planters, tobacco curers, graders and blenders of tobacco, bidi or cigar makers, snuH' or zarda makers, tyre builders, crane Of hoist operators, loaders and unloarlers, etc,
xviii
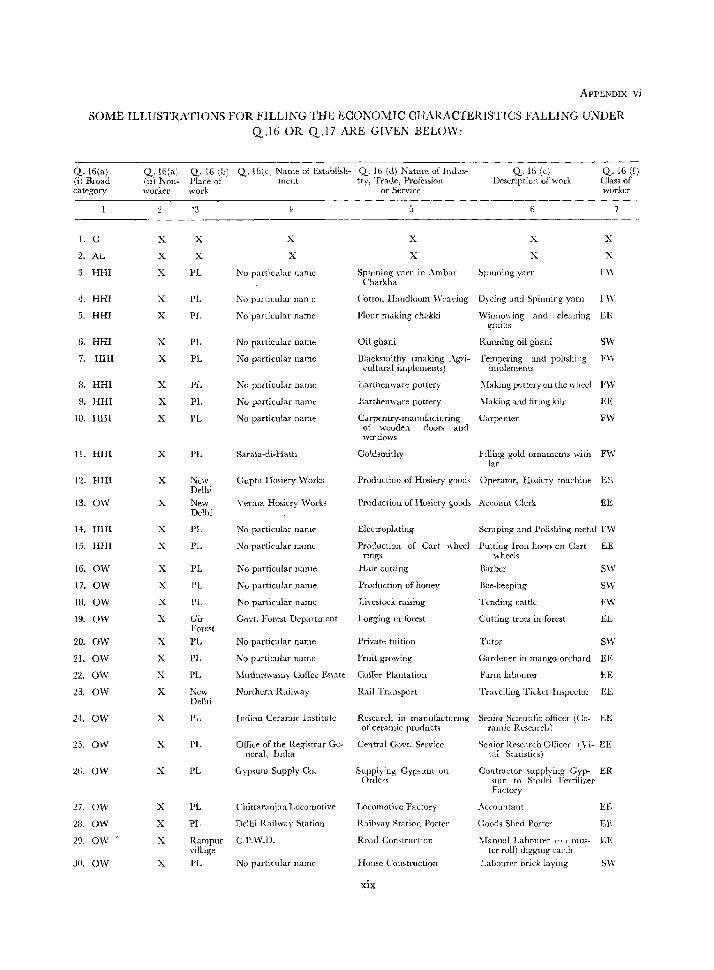
ApPENDIX VI
SOME ILLUSTRATIONS FOR FILLING THE ECONOMIC CHARACTERISTICS FALLING UNDER Q.16 OR Q.17 ARE GIVEN BELOW:
Q.16(a) (i) Broad category
1. C
2. AL
3. HHI
4. HHI
5. HHI
G. HHl
7. HHI
8. HHI
9. HHI
10. HHI
11. HIlI
12. HHI
13. OW
14. HHI
15. Inn
16. OW
17. OW
lB. OW
19. OW
20. OW
21. OW
22. OW
23. OW
24. OW
25. OW
26. OW
27. OW
23. OW
29. OW
30. OW
Q.16(a) (ii) Nonworker
x x x
x x
x x
x x x
x
x
x
x X
X
X
X
X
X
X
X
X
x
x
X
x X
X
X
Q. 16 (b) Q. 15(c) Name of Establish- Q. 16 (d) Nature of Indus- Q.16 (e) Description of work
Q.16 (f) Class of worker
Place of ment try, Trade, Profession work or Service
'3
x X
PL
PL
PI,
PL
PL
PL
PL
PL
PL
New Delh;
New Delhi
PL
PL
PL
PL
PL
Gir Forest
PI,
PI,
PI,
New Delhi
PI,
X
X
No particular name
No particular name
No particular name
No particular name
No particular name
No particular name
No particular nanw
No particular name
Sarafa-di-Hatti
Gupta Hosiery'Norks
\' crma Hosiery Works
No particular name
No particular nanle
No particular uarne
No particular llaIne
No particular name
Govt. Forest Department
No particular name
No particular narne
Muthuswamy Conee Estate
Northern Railway
Indi;:ll1 Ceramic Institute
5
x X
Spinning yarn in Ambar Charkha
Cotton Handloom \\'ca\·ing
Flour making chakki
Oil ghani
Blacksmithy (making Agricultural implements)
narLhen\vare pottery
6
x X
SlJluning yarn
Dyeing" nel Spinning yarn
"Villllo", ing and cleaning grajns
Running oil ghani
fempering and poltshing implements
X
X
FW
F\\,
EE
sw I'W
l\Iaking potttIy on the whed FW
Earthenware pottery Making and firing kiln EE
Carpentry-manufac turing Garpenter FW of wooden doors and windows
Goldsmithy Fllling gold ornaments with FW lac
Production of Hosiery goods Operator, Hosiery machine EE
Production of Hosiery goods Account Clerk EE
Electropbting
Production of Cart wheel rings
Hair cutting
Production of honey
Livestock raising
Logging m forest
Private tuition
}'ruit growing
Coffee Plantation
Rail Transport
Research in manuractunng of ceramic products
Scraping and Polishing metal FW
Putting Iron hoop on Cart EE "heel,
Barber SW
Bee-keeping SW
Tending cattle fW
Cutting trees in forest EE
Tntor SW
Gardener ill mango orchard EE
Farm labourer BE
Travelling Ticket Inspector EE
Senior SClentific officer (Ce- EE ramie Research i
PL Office of the Registrar Ge- Central Go"t. Service Senior Research Olliccr (Vi- EE tal SLltistics) , neral, Iudia
PL Gypsum Supply Co.
PL Chittaranjan Locomotive
PL Delhi Railway Station
Rumpur C.P.W.D. village
PL No particular name
Sllpplyin~ Gypsum on Orders
Locomotive Factory
Railway Station Porter
Road Construction
House Construction
XIX
Contractor supplylng Gyp- ER sum to SUlCiri Fertilizer Factory
,,,"ccountant EE
Goods Shed Porter EE
Manllal Lahourer "I mllS- EE ter roll) dlgglllg earth
Labourer brick laying SW
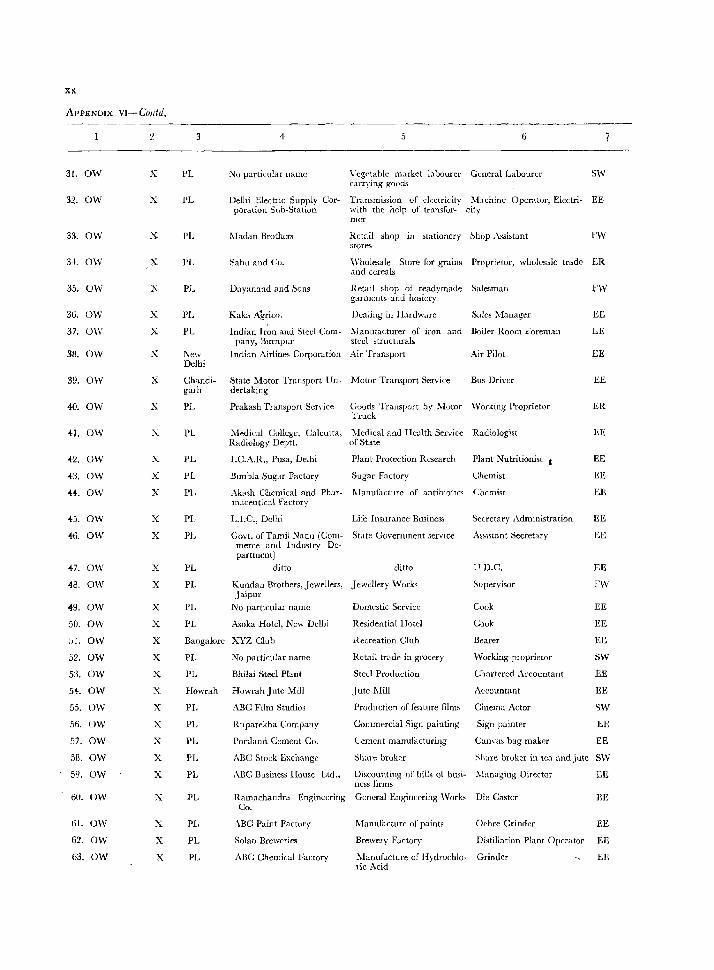
xx:
ApPENDIX VI-COlltd.
31. OW
32. OW
33. OW
3+. OW
35. OW
36. OW
37. OW
Sil. OW
39. OW
40. OW
41. OW
42. OW
43. OW
H. OW
45. OW
+6. OW
f7. OW
48. OW
49. OW
50. OW
51. OW
52. OW
53. OW
54. OW
5.5. OW
56. OW
57. OW
58. OW
59. OW
60. OW
iiI. OW
62. OW
63. OW
2
x
x
x
x
x X
x
x
X
x X
X
x X
X
X
X
X
X
X
X
X
X
X
X
X
X
x
x X
X
PL
PL
PL
PL
PL
PL
PL
3
New Delhi
Chandigarh
PL
PL
PL
PL
PL
PI.
PL
PL
PL
PL
PL
4 5 6 7
Nu particular name Vegetable market labourer General Labourer SW carrying goods
Delhi Electric Supply Corporation Sub-Station
Transmission of cleetriclty Machine Operator. Electri- EE with the help of transfor- city
Madan Brothers
mcr
Retail shop in stationery Shop Assistant stores
FW
Sahu and Co. Wholesale Store for grains Proprietor, wholesale trade ER and cereals
Dayanand and Sons Retail shop of readymade Salesman garments ami hosiery
Kaka Agrico.
Indian J ron and Sled Company, Burnpur
Indian Airlines Corporation
Dealing in Hardware
1\lanufacturer of iron and steel structurals
Air Transport
Sales :VIanager
nailer Room F oreluan
Air Pilot
State Motor Transport Un- Motor Transport Service Bns Driver dertaking
Prakash Transpor( Service Goods Transport by MOLor Working Proprietor Truck
Medical College, Calcutta, Medical and Health Service Radiologist Radiology Deptt. of State
I.C.A.R., Pusa. Delhi Plant Protection Research Plant Nutritionist
Bimbla Sugar Factory Sugar Factory Chemist
Akash Chemical and Ph"r. Manufacture of antibio\lc, Chemist luaceutical Factory
L.I.C., Delhi Life Insurance BlLSines& Secretary Administration
Gov!. of Tamil Nadu (Com- State Government service ASSIstant Secretary merce and Indmtry De-partment)
ditto ditto U.D.C.
Kundan Brothers, Jewellers, Jewellery Works Jaipur
Nu particular nanle
Asoka Hotel, New Delhi
Domestic Service
Residential Hotel
Supervisor
Cook
Cook
FW
EE
BE
EE
EE
ER
EE
EE
EE
EE
EE
EE
EE
FW
Bangalore XYZ Club Recreation Club Bearer
EE
EE
EE
SW
EE
EE
SW
EE
EE
PL No particular name Retail trode in grocery Working proprietor
PL Bhilai Steel Plant Steel Production Chartered .\ccountant
Howrah Howrah Jute Mill Jute Mill Accountant
PI, ABC Film Studios Production of feature films Cinema Actor
PL Ruparekha Company Commercial Sign paintiug Sign painter
PL Portland Cement Co. Cement rnanufacturil~g Cam·as bag maker
PL
PL
PL
PI,
PL
PL
ABC Stock Exchange Share broker Sktre broker in tca and jutc S\V
ABC Business House Lld.. Di>couuling or bill. or bus i- Managiug Director EE ness finns
Ramachanrlra Engineering General Engineering Works Die Caster EE Co .
. -\BC Paint Factory Manufacture of paints Ochre Grinner EE
Solan Breweries Brewery Factory Distillation Plant Operator EE
ABC Chemical Factory l\fanufdcture of Ii ydl'ochlo- Grinder EE ric Acid
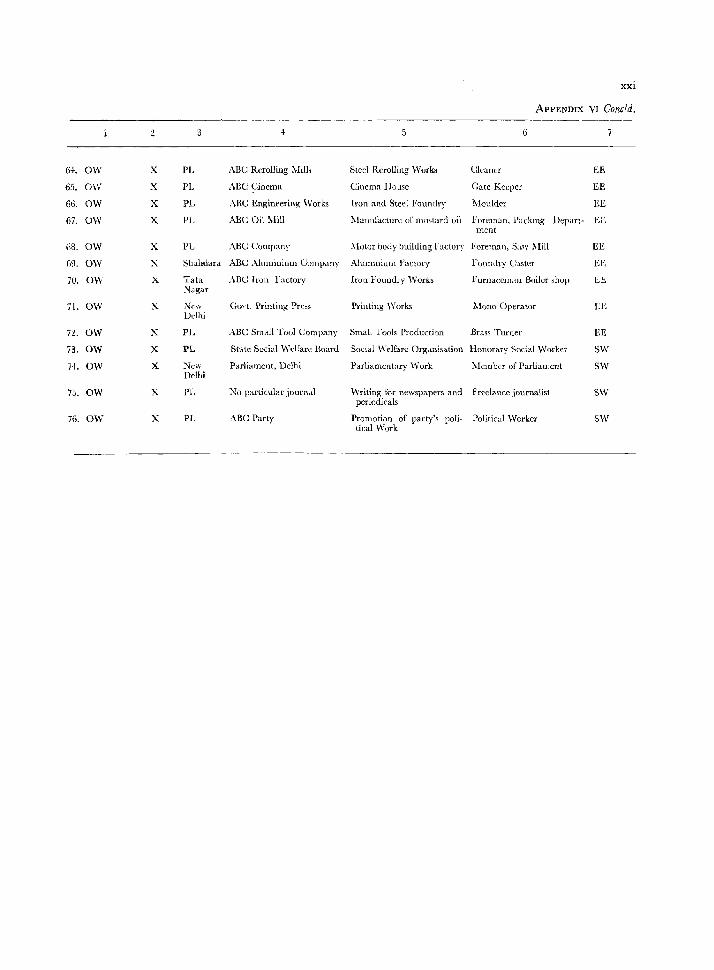
xxi
ApPENDIX VI COllcld.
2 5 6
64. OW X PI. ABC Rerolling Mills Steel Rerolling Works Cleaner EE
65. OW X PL ABC Cinema Cinema House Gate Keeper EE
66. OW X PL ABC Engineeriilg Works Iron and Steel Foundry Moulder EE
67. OW X PL ABC Oil Mill Manufacture of mu>tard oil Foreman. l'ackmg Depart- EE ment
68. OW X PL ABC Compan)' :\[o(ur body building Fadury Fureman, Saw 1I[ill EE
69. OW X Shahdara ABC .\Iuminium Company Alullunium Factory Foullury Caster EE
70. OW X Tata ABC Iron Factory Irati Foundry Works }<'ufnacemau Boiler shop EE N"gar
71. OW X New GO\'t. Printing Prc~s Printing Works :\[ono Operator t~E Delhi
72. OW X PL ABC Small Toul Company Small Tools Production Brass Turner EE
73. OW X PL State Social Welfare Board Social Welfare Organisation Honorary Social Worker SW
7+. OW X New Parliament, Delhi Parliamentary Work :-[em ber of Parliament SW Delhi
75. OW X PI. No particular journal Writing for newspapers and Freelance journalist SW periodicals
76. OW X PL ABC Party PromotinD of party's poli- Political Worker SW tical Work
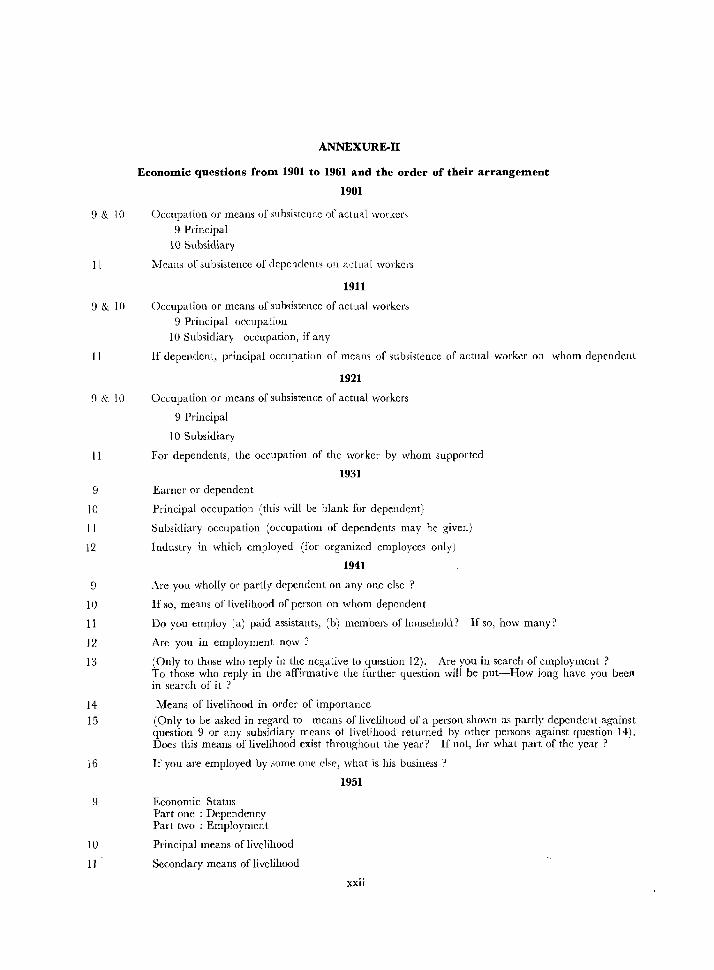
9 & 10
11
9 & 10
11
9 & 10
11
9
10
11
12
9
10
11
12
13
14
15
16
10
II
ANNEXURE-II
Economic questions from 1901 to 1961 and the order of their arrangement
1901
Occupation or means of subsi~tence of actual worker,
9 Principal 1 (j Subsidiary
Means of subsistence of depelldents 011 actual workers
1911
Occupation or means of subsistence of actual workers 9 Principal occupalion
10 Subsidiary occupation, if any
If dependent, principal occupation of meam of sublistence of actual Wvrkcr on whom depl"ndent
1921
Occupation or means of subsistence of actual workers
9 Principal
10 Subsidiary
For dependents, the occupation of the worker by whom supported
1931 Earner or dependent
Principal occupation (this will be blank for dependent)
Subsidiary occupation (occupation of dependents may be given)
Industry in which cmployed (for organized employees only)
1941
Are you wholly or partly dependent on anyone else
If so, means of livelihood of person on whom dependent
Do yon employ (a) paid assistants, (b) members !If hOllsehold? If so, how many?
Are you in employment now ?
(Only to those who reply in the negative to question 12). Are you in search of employment ? To those who reply in the affirmative the further question will be put-How long have you been in search of it ?
Means of livelihood in order of importance
(Only to be asked in regard to means of livelihood of a person shown as partly dependent against question 9 or any subsidiary means of livelihood returned by other persons against question 14). Does this means of livelihood exist throughout the year! If not, [or whal part of the year?
If you are employed by SOIIle Olle else, what is his business?
Economic Status Part one : Dependency Parl two : Employment
Principal means of livelihood
Secondary means of livelihood
1951
XXll
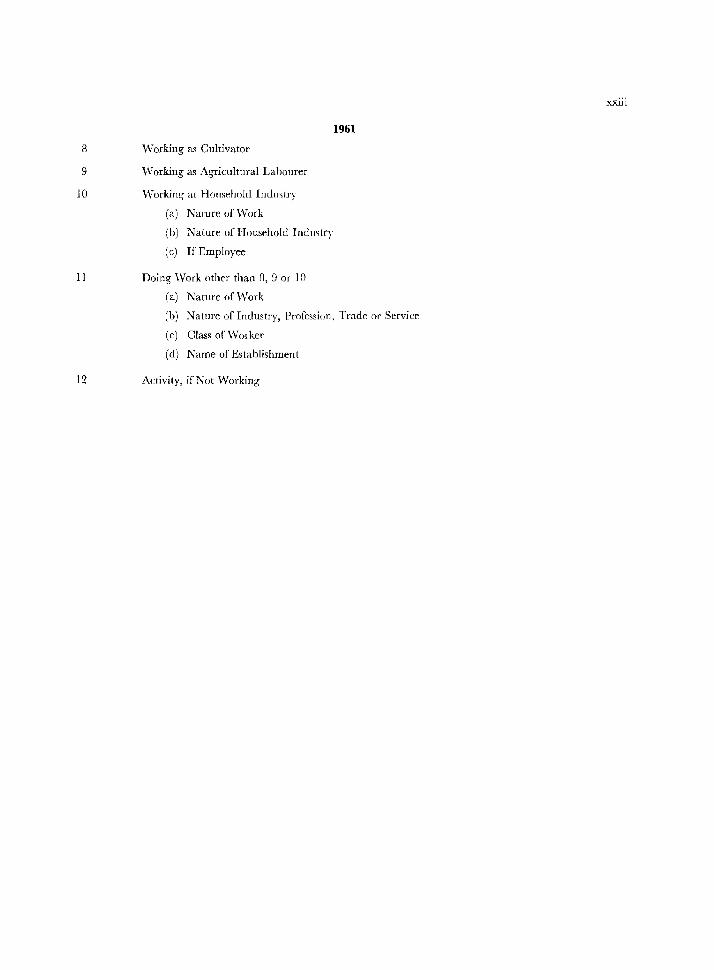
8
9
10
11
12
Working as Cultivator
Working as Agricultural Labourer
Working at Household Industry
(a) Nature of Work
(b) Nature of Household Indmtry
(c) If Employee
Doing Work other than 8, 9 or 10
(a) Nature of Work
1961
(b) Nature of Industry, Profession, Trade Of Service
(c) Class of Worker
(d) Name of Establishment
Activity, if Not Working
XXlll
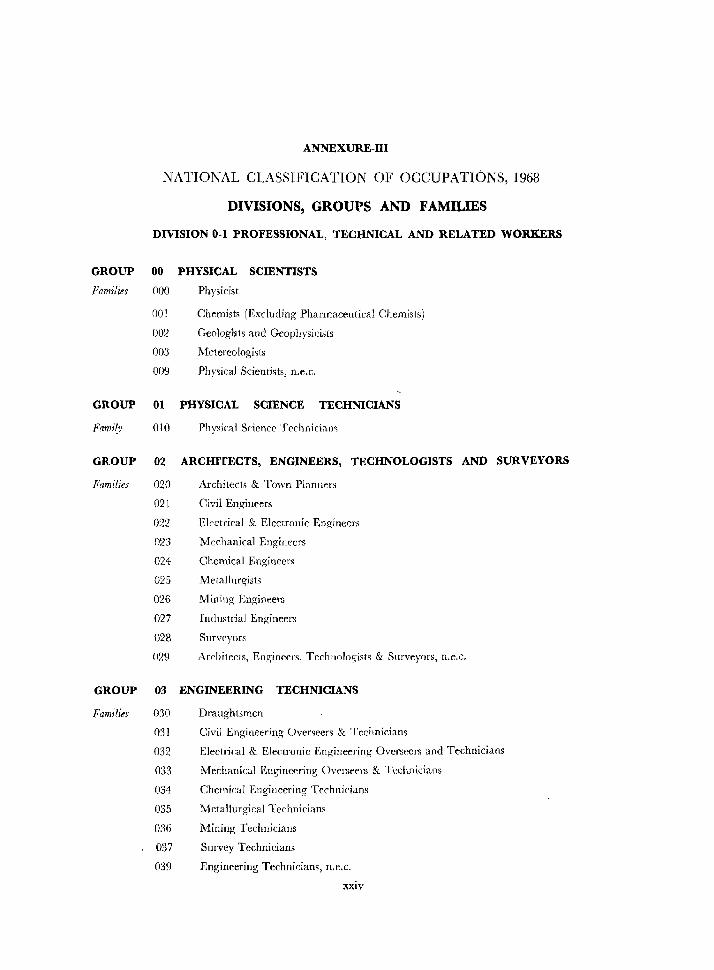
ANNEXURE-III
NATIONAL CLASSIFICATION OF OCCUPATIONS, 1968
DIVISIONS, GROUt'S AND FAMILmS
DIVISION 0-1 PROFESSIONAL, TECHNICAL AND RELATED WORKERS
GROUP 00 PHYSICAL SCmNTISTS
Families 000 Physicist
001 Chemists (Excluding Pharmaceutical Chemists)
002 Creologl:$ts and Geophysicists
003 Metereologists
009 Physical Scientists, n.e.c.
GROUP 01 PHYSICAL SCIENCE TECHNICIANS
Family 010 Physical Science Techniciam
GROUP 02 ARCHITECTS, ENGINEERS, TECHNOLOGISTS AND SURVEYORS
Families 020 Architects & Town Planners
021 Civil Engin('ers
022 El,'ctrical & Electronic Engineers
023 Mechanical Engin('ers
024 Chemical Engineers
025 Metallurgists
026 Mining En.gineers
027 IndllStrial Engineers
028 Snrveyors
029 Architects, Engineers, Technologists & Surveyors, n.e.c.
GROUP 03 ENGINEERING TECHNICIANS
Families 030 Draughtsmen
031 Civil Engineering Over~eers & Tcchnicians
032 Electrical & Electronic Engineering Overseers and Technicians
033 Mechanical Engineering Ovt'rseers & Tcchnici,Uls
034 Chemical Engineering Technicians
035 Metallurgical Technicians
036 Mining Technicians
037 Survey Technicians
039 Engineering Technicians, n.e.c.
XXIV
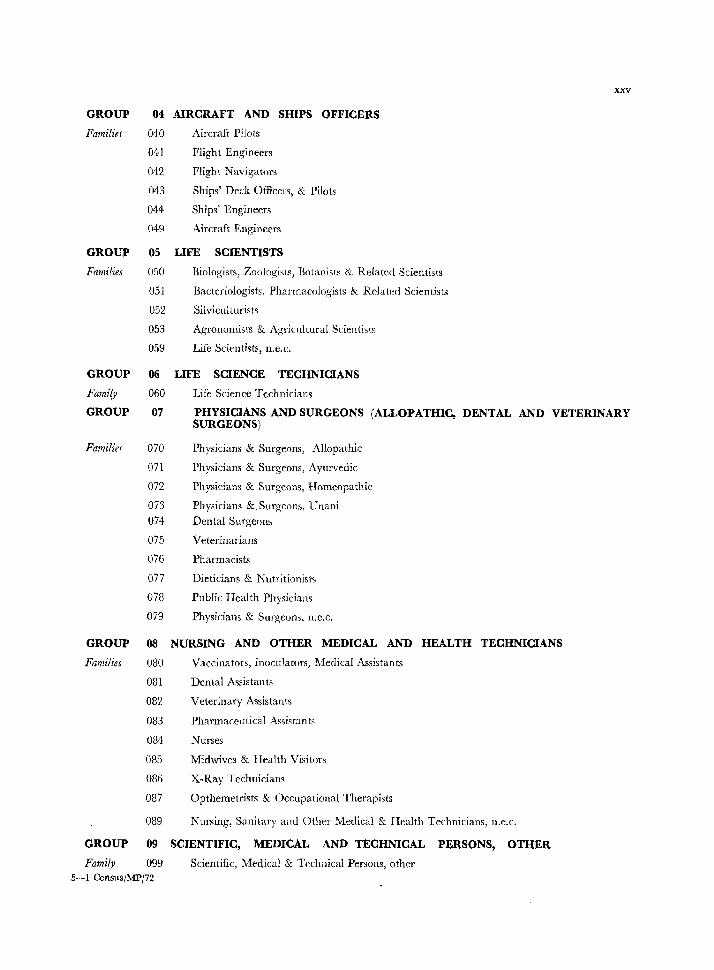
GROUP
Families
GROUP
Families
GROUP
Family
GROUP
Families
GROUP
Families
GROUP
xxv
04 AIRCRAFT AND SHIPS OFFICERS
040 Aircraft Pilots
041 Flight Engineers
042 Flight Navigators
043 Ships' Deck Officers, & Pilots
044 Ships' Engineers
049 Aircraft Engineers
05 LIFE SCIENTISTS
Biologists, Zoologists, Botanisl~ & Relater! Scientists
051 Bacteriologists, Pharmacologists & Relater! Scientists
052 Silviculturists
053 Agronomists & Agricultural Scientists
059 Life Scientists, n.e.c.
06 LIFE SCIENCE TECHNICIANS
060 Life Science Technicians
07 PHYSICIANS AND SURGEONS (ALLOPATHIC, DENTAL AND VETERINARY SURGEONS)
070
071
072
073
074
075
076
077
078
079
08
080
081
082
083
084
085
086
087
089
Physicians & Surgeons, Allopathic
Physicians & Surgeons, Ayurvedic
Physicians & Surgeons, Homeopathic
Physicians &. Surgeons, Unani Dental Surgeons
Veterinarians
Pharmacists
Dieticians & Nutritionists
Public Health Physicians
Physicians & Surgeons, n.e.c.
NURSING AND OTHER MEDICAL AND HEALTH TECHNICIANS
Vaccinators, inoculators, Medical Assistants
Dental Assistants
Veterinary Assistants
Pharmaceulical Assistants
Nurses
Midwives & Health Visitors
X-Ray Technicians
Opthemetrists & Occupational Therapists
Nursing, Sanitary and Other Medical & Health Technicians, H.e.c.
09 SCIENTIFIC, MEDICAL AND TECHNICAL PERSONS, OTHER
Familp 099 Scientific, Medical & Tcchnical Persons, other 5-1 Census/MP/72
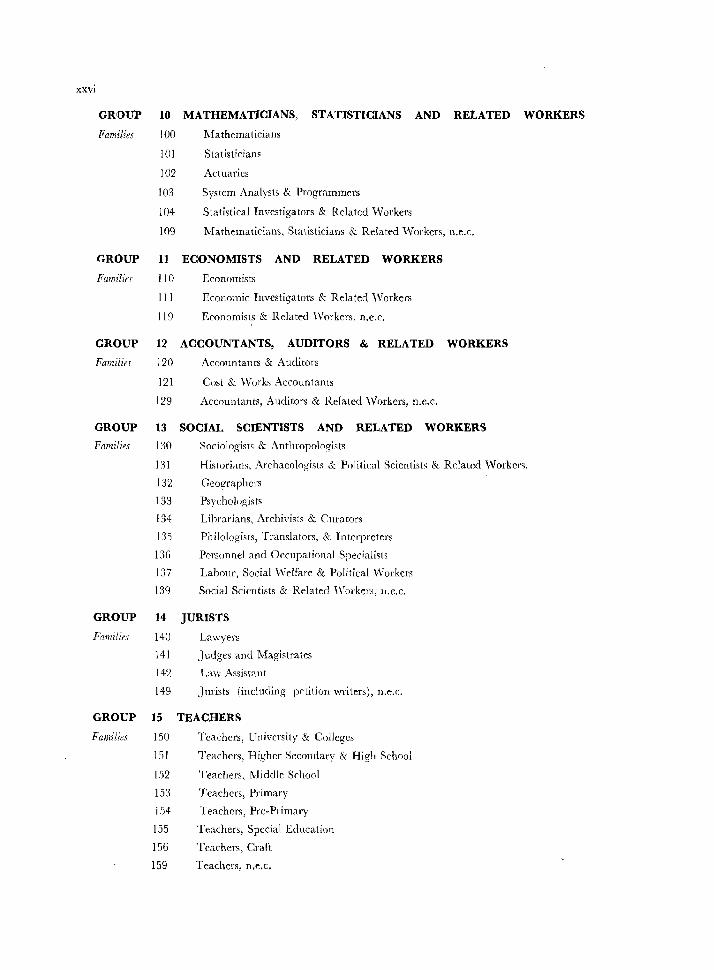
XXV]
GROUP 10 MATHEMATICIANS, STATISTICIANS AND RELATED WORKERS
Families 100 Mathematicians
101 Statisticians
102 Actuaries
103 System Analysts & Programmers
104 Statistical Investigators & Related Workers
109 Mathematicians, Statisticians & Related Workers, n.e.c.
GROUP II ECONOMISTS AND RELATED WORKERS
Families 110 Economists
I I I Economic Investigators & Related Workers
119 Economists & Related Workers. n.e.c.
GROUP 12 ACCOUNTANTS, AUDITORS & RELATED WORKERS
Families
GROUP
Familips
GROUP
Fmnilifs
GROUP
Families
120 Accountants & Auditors
121 Cost & Works Accountants
129 Accountants, Auditors & Related VVorkers, n.e.c.
13
130
131
132
133
134
135
136
137
139
14
140
141
142
149
15
ISO
151
152
153 ]54
155
156
159
SOCIAL SCIENTISTS AND RELATED WORKERS
Sociologists & Anthrop01ogists
Historians. Archaeologisls & Political Scientists & Related Workers.
Geographers
Psychologists
Lihrarians, Archivists & Curators
Philologists, Translators, & Interpreters
Personnel and Occupational Specialists
Labour, Social Welfare & Political VVorkers
Social Scientists & Related \\'orkers, H.e.C.
JURISTS
Lawyers
Judges and Magistrates
1,aw Assistant
Jurists (including petition writers), n.e.c
TEACHERS
Teachers, University & Colleges
Teachers, Higher Secondary & High School
Teachers, Middle School
Teachers, Primary
Teachers, Pre-Primary
Teachers, Special Education
Teachers, Craft
Teachers, n.e.c.
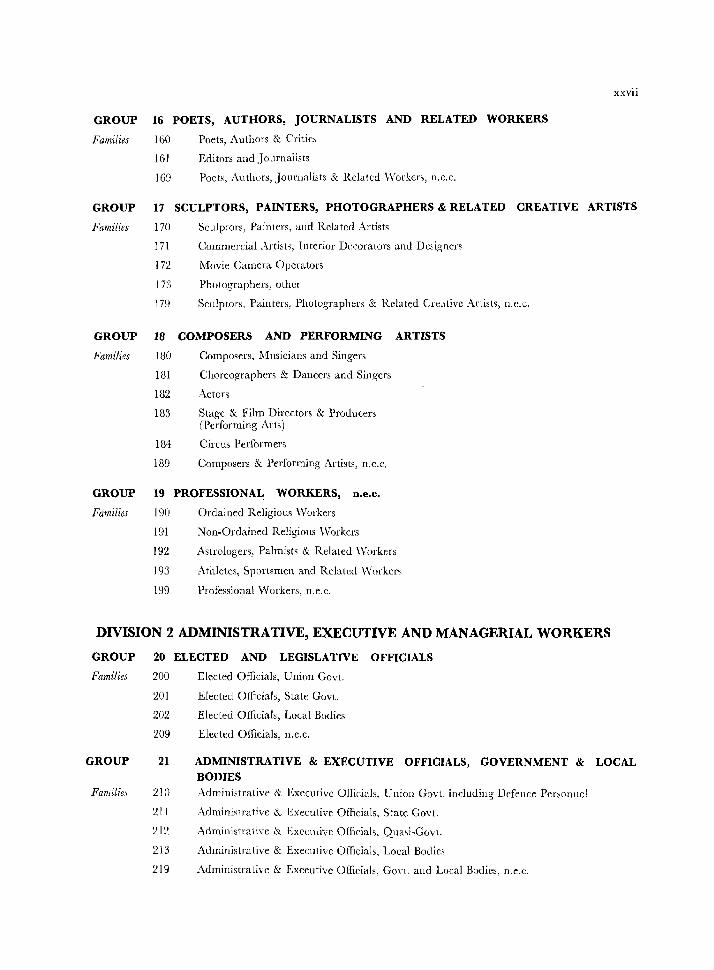
GROUP 16 POETS, AUTHORS, JOURNALISTS AND RELATED WORKERS
Families 160
161
Poets, Authors & Critic)
Editors and Journalists
169 Poct~, Authors, Journalists & Related \\'orkers, n.c.c.
xxvii
GROUP 17 SCULPTORS, PAINTERS, PHOTOGRAPHERS & RELATED CREATIVE ARTISTS
Families 170 Sculptors, Painters, and Related Artists
171 Commercial ,\rtists, Interior Decorators and Designers
172 Movie Camera Operators
173 Photographers, other
179 Sculptor~, Painters, Photographers & Related Creative Artists, n.e.c.
GROUP 18 COMPOSERS AND PERFORMING ARTISTS
Families 180 Composers, Musicians and Singers
181 Choreographers & Dancers and Singers
182 Actors
183 Stage & Film Directors & Producers (Performing Arts)
184 Circus Performers
189 Composers & Performing Artists, n.c.c.
GROUP 19 PROFESSIONAL WORKERS, D.e.c.
Families 190
191
Ordained Religious Workers
Non-Ordained Religious Workers
192 Astrologers, Palmists & Related IVorkers
193 Athletes, Sportsmen and Related ~Workers
199 Professional Workers, n.e.c.
DIVISION 2 ADMINISTRATIVE, EXECUTIVE AND MANAGERIAL WORKERS
GROUP 20 ELECTED AND LEGISLATIVE OFFICIALS
Families
GROUP
FamilieJ
200 Elected Officials, Union Govt.
201 Elected Officials, State GovL
202 Elected Officials, Local Bodies
209 Elected Officials, n.e.c.
21
210
ADMINISTRATIVE & EXECUTIVE OFFICIALS, GOVERNMENT & LOCAL BODIES Administrative & Executive Officials, Union Govl. includini5 Defence Personncl
211 Administrative & Executive Officials, State Govt.
212 Administrative & Executive OHicials, Qua,i-Govt.
213 Administrative & Executive Officials, Local Bodies
219 Administrative & Executive Officials, Go\'t. and Local Bodies, n.e.c.
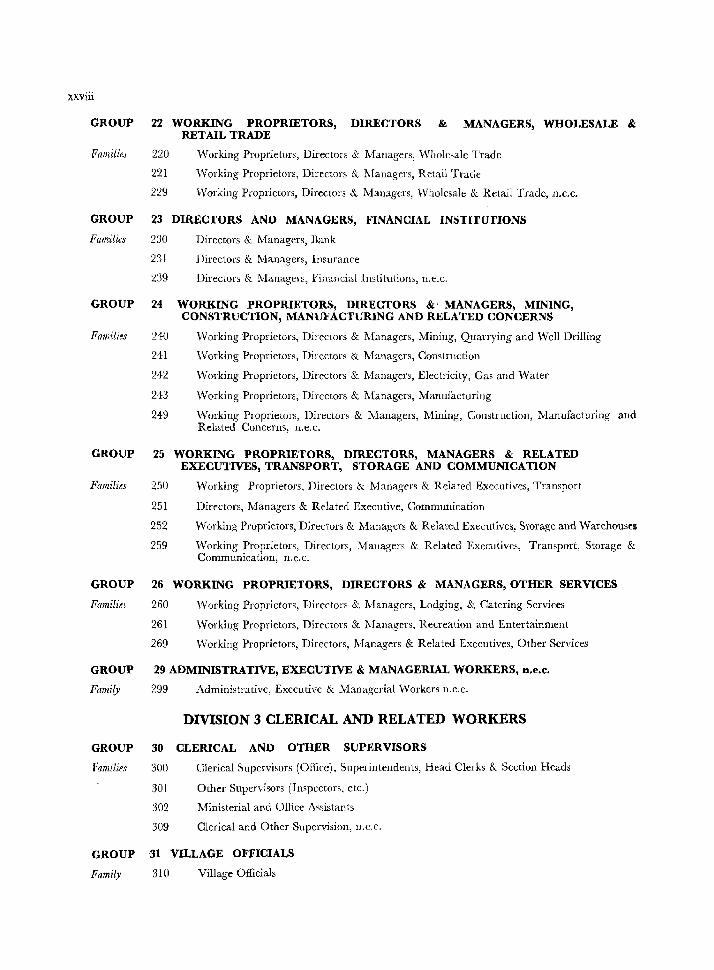
xxviii
GROUP 22 WORKING PROPRIETORS, DIRECTORS & MANAGERS, WHOLESALE &
FamilieJ 220
221
RETAIL TRADE
Working Proprietors, Directors & l\1anagers, Wholesale Trade
\'Vorking Proprietors, Directors & Managers, Retail Trade
229 Working Proprietors, Directors & Managers, Wholesale & Retail Trade, 11.C.C.
GROUP 23 DIRECTORS AND MANAGERS, FINANCIAL INSTIfUTIONS
Families
GROUP
Families
GROUP
Familits
230 Directors & Managers, Bank
231 Directors & Managers, Insurance
239 Directors & Managers, Financial Institutions, n.e.c.
24
:l40
241
2'12
243
249
25
250
251
252
259
WORKING PROPRIETORS, DIRECTORS & MANAGERS, MINING, CONSTRUCTION, MANUFACTURING AND RELATED CONCERNS
Working l)roprietors, Directors & Managers, Mining, Quarrying and Well Drilling
\"lorking Proprietors, Directors & Managers, Construction
Working Proprietors, Directors & Managers, Electricity, Gas and Water
Working Proprietors, Directors & Managers, Manufacturing
""lorking Proprietors, Directors & Managers, Mining, Construction, :Manufacturing and Related Concerns, n.c.c.
WORKING PROPRIETORS, DIRECTORS, MANAGERS & RELATED EXECUTIVES, TRANSPORT, STORAGE AND COMMUNICATION
Working Proprietors, Directors & Managers & Related Executives, Transport
Directors, Managers & Related Executive, Communication
Working Proprietors, Directors & Managers & Related Executives, Storage and Warehouses
Working Proprietors, Directors, Managers & Related Executives, Transport, Storage & Communication, n.e.c.
GROUP 26 WORKING PROPRIETORS, DIRECTORS & MANAGERS, OTHER SERVICES
FamilitJ 260 Working Proprietors, Directors & Managers, Lodging, & Catering Services
261 Working Proprietors, Directors & Managers, Recreation and Entertainment
269 Working Proprietors, Directors, Managers & Related Executives, Other Services
GROUP 29 ADMINISTRATIVE, EXECUTIVE & MANAGERIAL WORKERS, D,e.C.
Family 299 Administrative, Executive & Managerial Workers n.e.C.
DIVISION 3 CLERICAL AND RELATED WORKERS
GROUP 30 CLERICAL AND OTHER SUPERVISORS
Families 300 Clerical Supervisors (Of lie e) , Superintendents, Head Clerks & Section Heads
301 Other Supervisors (Inspector5, etc.)
302 Ministerial and Oflice Assistants
309 Clerical and Other Supervision, n.c.c.
GROUP 31 VILLAGE OFFICIALS
Family 310 Village Officials
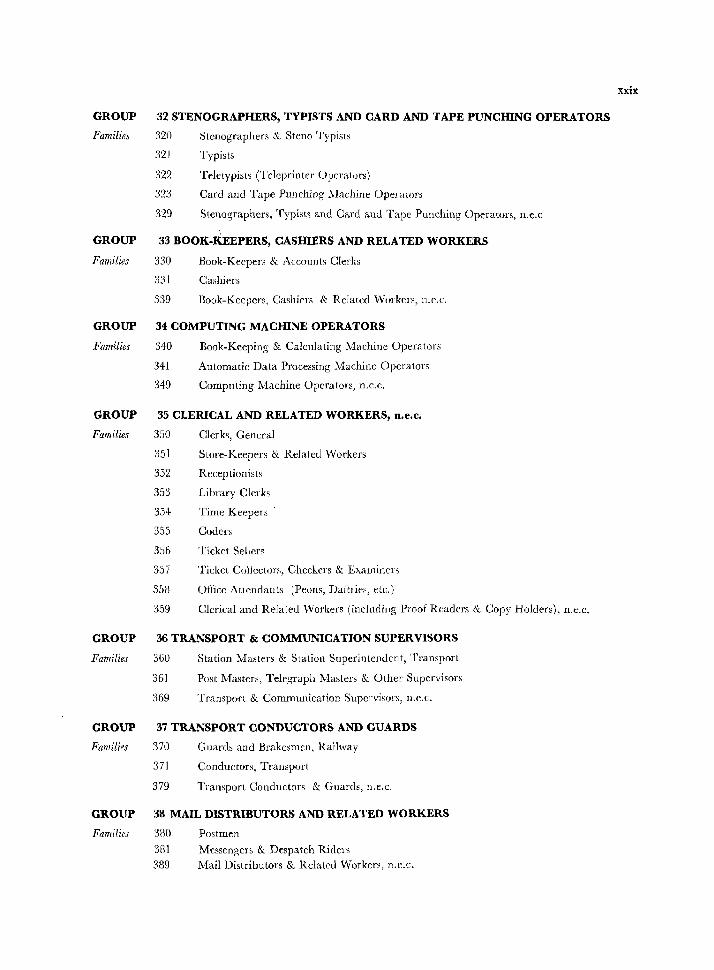
GROUP
Familie;
GROUP
Families
GROUP
Families
GROUP
Families
GROUP
Families
GROUP
Families
GROUP
Families
32 STENOGRAPHERS, TYPISTS AND CARD AND TAPE PUNCHING OPERATORS
320
32]
322
Stenographers & Steno Typists
Typists
Teletypists (Teleprinter Operators)
323 Card and Tape Punching Machine Opelators
329 Stenographers, Typists and Card and Tape Punching Operators, n.e.c
33 BOOK-KEEPERS, CASHIERS AND RELATED WORKERS
330 Book-Keepers & Accounts Clerks
331 Cashiers
339 Rook-Keepers, Cashiers & Related Wnrkers, n.e.c.
34 COMPUTING MACHINE OPERATORS
340 Book-Keeping & Calculating Machine Operators
341 Automatic Data Processing Machine Operators
349 Computing Machine Operators, n.e.c.
35 CLERICAL AND RELATED WORKERS, n.e.c.
350 Clerks, General
351 Store-Keepers & Related Workers
352 Receptionists
353 Library Clerks
354 Time Keepers
355 Coders
356 Ticket Sellers
357 Ticket Collectors, Checkers & Examiners
35H Oflice Attendants (Peons, Daftries, etc.)
359 Clerical and Related Workers (including Pronf Readers & Copy Hnlders), n.e.c.
36 TRANSPORT & COMMUNICATION SUPERVISORS
360 Station Masters & Station Superintendent, Transport
361 Post Masters, Telegraph Masters & Other Supervisors
369 Transport & Communication Supervisors, n.e.c.
37 TRANSPORT CONDUCTORS AND GUARDS
370
371
379
Guards and Bl'akcsmcn, Railway
Conductors, Transport
Transport Conductors & Guards, n.e.c.
38 MAIL DISTRIBUTORS AND RELATED WORKERS
3(10
381 389
Postmen
Messengers & Despatch Riders Mail Distributors & Related Workers, n.e.c.
xxix
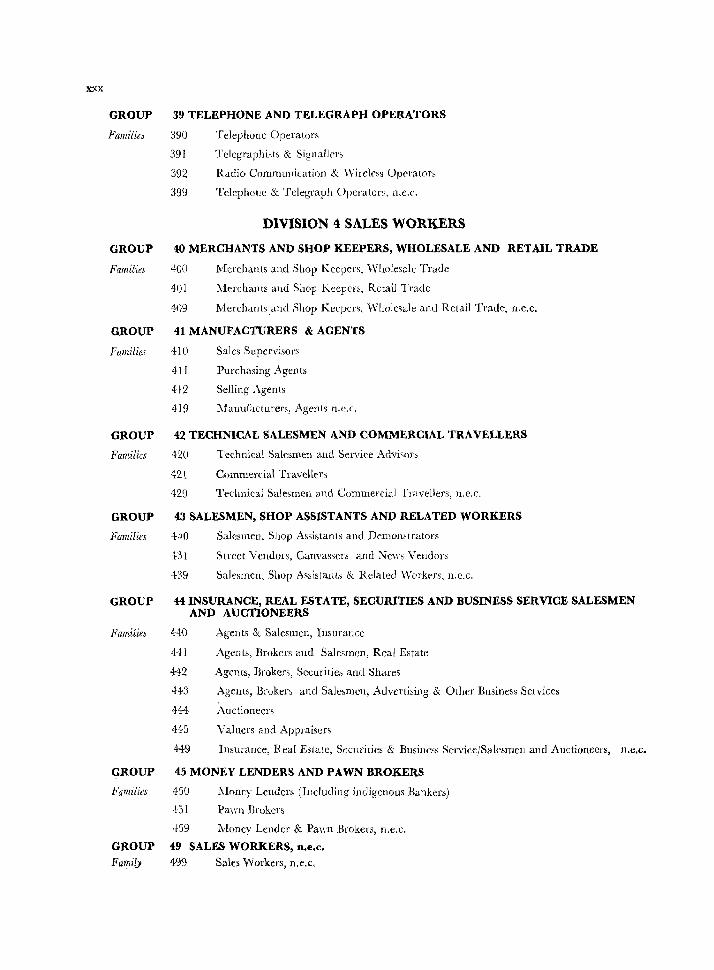
xxx
GROUP 39 TELEPHONE AND TELEGRAPH OPERATORS
FamilieJ 390 Telephone Operators
391 Telegraphists & Signaller;
392 Radio Communication & Wireless Operators
399 Telephone & Telegraph Operators, n.e.c.
DIVISION 4 SALES WORKERS
GROUP 40 MERCHANTS AND SHOP KEEPERS, WHOLESALE AND RET AIL TRADE
Families 400 IVlerchauts and Shop Keepers, Wholesale Trade
401 l\ferehants and ShoF Keepers, Retail Trade
409 Merchants and Shop Keepers, 'Wholesale and Retail Trade, n.e.c.
GROUP 41 MANUFACroRERS & AGENTS
Families 410 Sales Supervisors
411 Purchasing Agents
412 Selling Agents
419 Manufacturers, Agents n.e.c.
GROUP 42 TECHNICAL SALESMEN AND COMMERCIAL TRAVELLERS
Families 420 Technical Salesmen and Service Advisors
GROUP
Families
GROUP
Familiej
GROUP
Families
421 Commercial Travelh:rs
429 Technical Salesmen and Commercial Travellers, n.e.c.
43 SALESMEN, SHOP ASSISTANTS AND RELATED WORKERS
4·)0 Salesmen. Shop Assistants and Demonstrators
431 Street Yeadon, Canvassers alld ;_\lew, Vendors
439 Salesmen, Shop Assistants & Related \Vorkers, n.e.c.
44 INSURANCE, REAL ESTATE, SECURITIES AND BUSINESS SERVICE SALESMEN AND AUCTIONEERS
440 Agents & Salesmen, Insurance
441 Agents, Brokers and Salesmen, Real Estate
442 Agents, Brokers, Securities and Shares
443 Agents, Brokers and Salesmen, Advertising & Other Business Services
444 Auctioneers
445 Valuers and Appraisers
449 Insurance, R cal Estate, Stxuritics & Business Service/Salesmen and Auctiuncen;, n.e.c.
45 MONEY LENDERS AND PAWN BROKERS
450 Money Lenders (Including illciigcnous Bankers)
-!j 1 Pawn Brokers
-!59 Money Lender & Pawn Brokers, n.e.c.
GROUP 49 SALES WORKERS, n.e.c.
FamilY 499 Sales Workers, n.e.c,
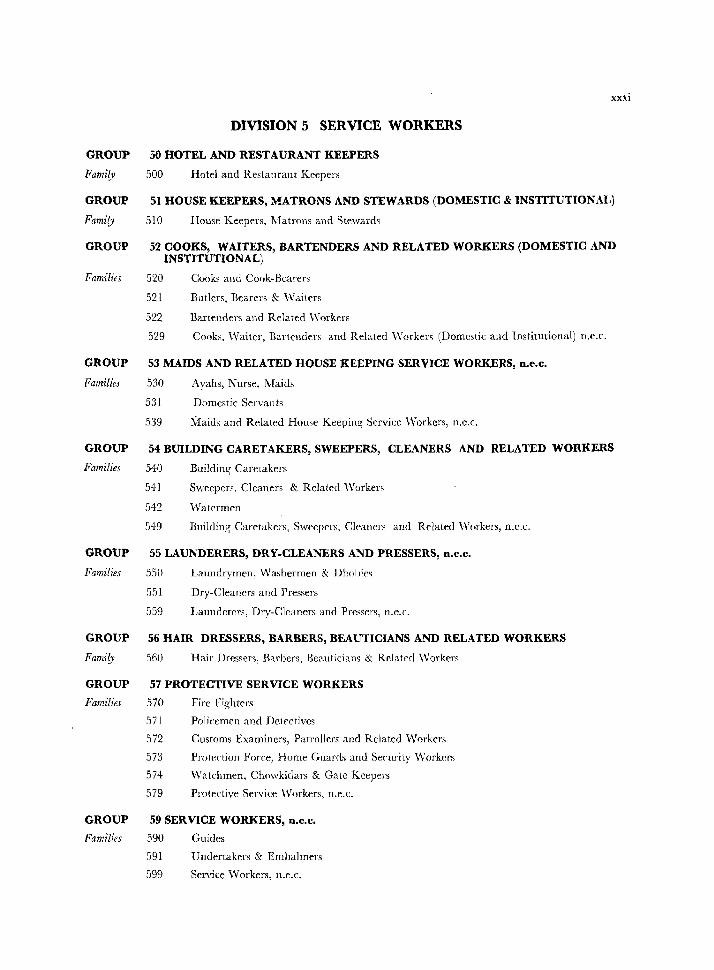
xxxi
DIVISION 5 SERVICE WORKERS
GROUP 50 HOTEL AND RESTAURANT KEEPERS
Family 500 Hotel and Restaurant Keepers
GROUP 51 HOUSE KEEPERS, MATRONS AND STEWARDS (DOMESTIC & INSTITUTIONAL)
Family
GROUP
Families
510 House Keepers, Matrons and Steward~
52 COOKS, WAITERS, BARTENDERS AND RELATED WORKERS (DOMESTIC AND INSTITUTIONAL)
520 Cooks and Cook-Bearers
521 Butlers, Bearers & Waiters
522 Bartenders and Related Workers
529 Cooks. Waiter, Bartenders and Related Workers (Domestic and Institutional) n.e.c.
GROUP 53 MAIDS AND RELATED HOUSE KEEPING SERVICE WORKERS, D.e.C.
families 530 Ayahs, Nurse, Maids
531 Domestic Servants
539 Maids and Related House Keepin~ Service Workers, n.e.c.
GROUP 54 BUILDING CARETAKERS, SWEEPERS, CLEANERS AND RELATED WORKERS
Families 540 Buildin~ Caretakers
541 Sweepen. Cleaners & Related Workers
542 Watermen
549 Building Caretakers, Swt'cprrs. Clt'aners and Related 'Workers, n.e.c.
GROUP 55 LAUNDERERS, DRY-CLEANERS AND PRESSERS, D.e.C.
Families 550 Laundrymen, Washermen & Dhobies
.,}51 Dry-Cleaners and Pressers
559 Launderers, Dry-Cleaners and Pressers, n.e.r.
GROUP 56 HAIR DRESSERS, BARBERS, BEAUTICIANS AND RELATED WORKERS
Family 560 Hair Dressers, Barbers, Beauticians & Related'Vorkers
GROUP 57 PROTECTIVE SERVICE WORKERS
Families 570 Fire Fighters
571 Policemen and Detectives
572 Customs Examiners, Patrollers and Related Workers
573 Protection Force, Home Guanl.s and Security \'Vork~rs
574 Watchmen, Chowkidars & Gate Keepers
579 Protective Service \Vorkers. II.e.c.
GROUP 59 SERVICE WORKERS, D.e.C.
Families 590 Guides
59! Undertakers & Embalmers
599 Service Workers, n.e.c.
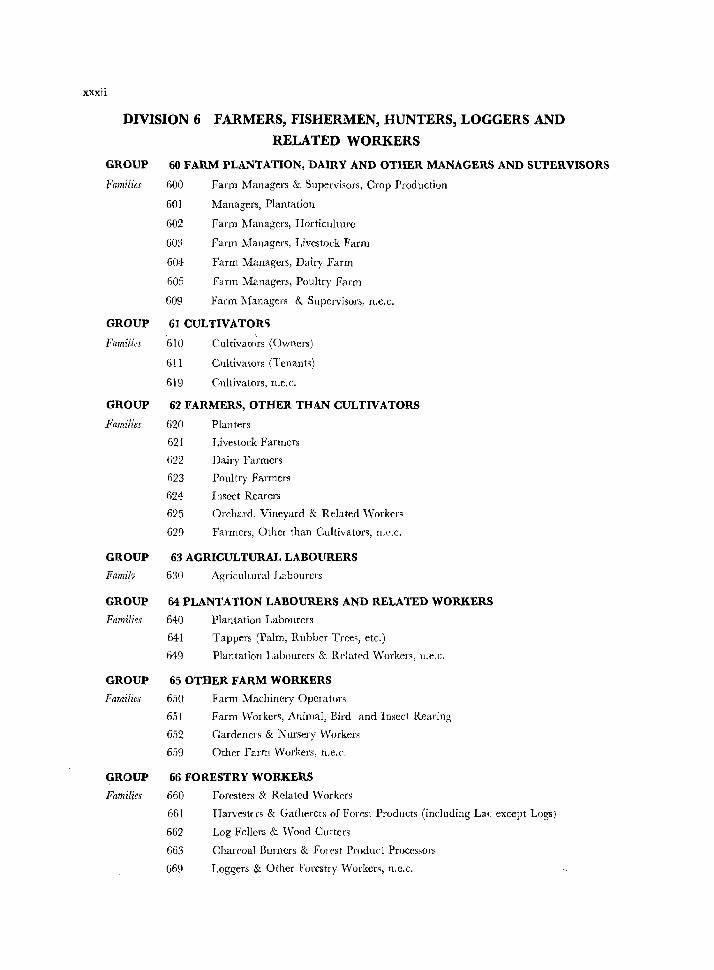
xxxii
DIVISION 6 FARMERS, FISHERMEN, HUNTERS, LOGGERS AND
RELATED WORKERS
GROUP 60 FARM PLANTATION, DAIRY AND OTHER MANAGERS AND SUPERVISORS
families 600 Farm Managers & Supervisors, Crop Production
601 Managers, Plantation
602 Farm Managers, Horticulture
603 Farm Managers, Livestock Farm
604 Farm Managers, Dairy Farm
605 Farm Managers, Poultry Farm
609 Farm Managers & Supervisors, H.e.C.
GROUP 61 CULTIVATOR~
Families 610 Cultivat~rs (Owners)
611 Cultivators (Tenants)
619 Cultivators, n.e.c.
GROUP 62 FARMERS, OTHER THAN CULTIVATORS
Families 620 Planters
GROUP
Fami/p
GROUP
Fomi/its
GROUP
Families
GROUP
Families
621 Livestock Farmers
622 Dairy Farmers
623 Poultry Farmers
624 r nsect Rearers
625 Orchard, Vineyard & Related Workers
629 Farmers, Other than Cultivators, n.C.c.
63 AGRICULTURAL LABOURERS
630 Agricultural Labourers
64 PLANTATION LABOURERS AND RELATED WORKERS
640
641
Plantation Labourers
Tappers (Palm, Rubber Trees, etc.)
649 Plantation l,abourers & Rrlated "Vorkers, n.e.c.
65 OTHER FARM WORKERS
650
651
Farm Machinery Operators
Farm "Yorkers, Animal, Bird and Insect Rearing
652 Gardeners & Nursery "Yorkers
659 Other Farm Workers, n.e.c.
66 FORESTRY WORKERS
660 Foresters & Related Workers
661 Harvestus & Gatherers of Forest Products (including Lac except Logs)
662 Log Fellers & Wood Cutters
663 Charcoal Burners & Forest Produ('t Processors
669 Loggers & Other Forestry Workers, n.c.c,
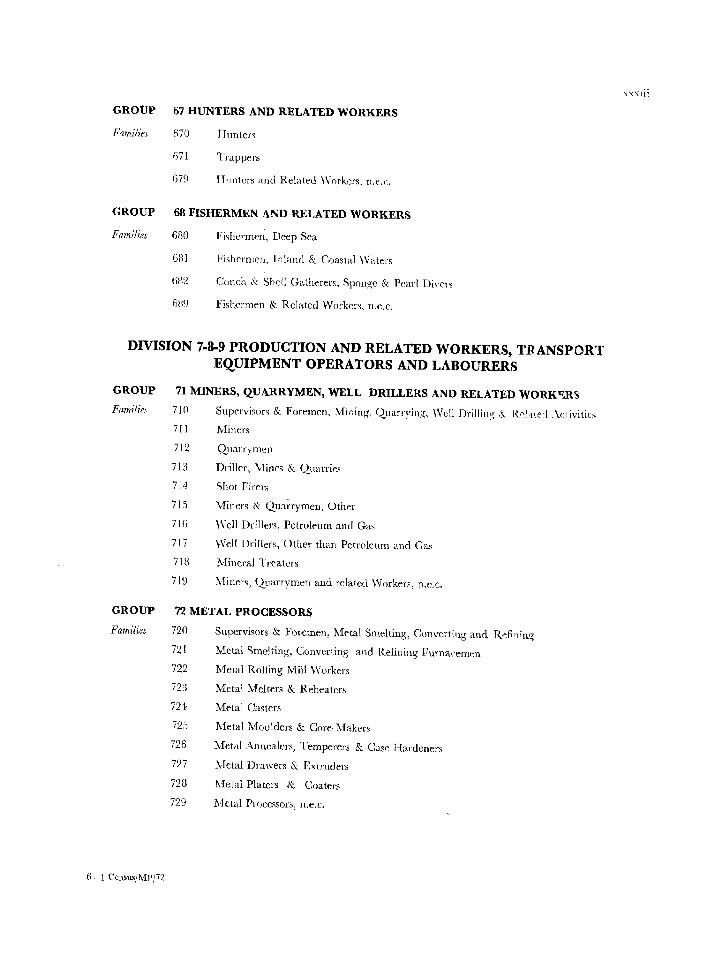
GROUP 67 HUNTERS AND RELATED WORKERS
Families 670 Hunter~
671 Trappers
679 HIlJllers and Related \Vorkers, n,(',c.
GROUP 68 FISHERMEN AND RELATED WORKERS
Families 680 FishermeJ;, Deep Sea
6B! Fishermen, Inland & Coastal Waters
682 Conch & Shell Gatherers, Sponge & Pearl Divel';
689 Fishermen & Related 'Worker\ TLC.C.
DIVISION 7-8-9 PRODUCTION AND RELATED WORKERS, TRANSPORT EQUIPMENT OPERATORS AND LABOURERS
GROUP 71 MINERS, QUARRYMEN, WELL DRILLERS AND RELATED WORK~RS Familie,\ 710 Supervisors & Foremen, Mining, Quarrying, ,Vell Drilling & Rd'ltd .\r,eivitics
711 Miners
712 Quarrymen
713 Driller, Mines & Q.uarries
714 Shot Firf'ls
715 Miners & QuaiTymen, Other
716 'VeIl Drillers, Petroleum and Gas
71 i Well Drillers, Other than Petroleum and Gas
718 Mineral Treaters
719 l\'liners, Quarrymen and relatecl Workers, n.e.c.
GROUP 72 METAL PROCESSORS
Families 720 Supervisors & Foremen, Metal Smelting, Converting and Rdining
721 Metal Smelting, Converting and Refining Furnaremf:!1
722 Mel'll Rolling Mill Workers
723 Metal Melters & Reheaters
724 Melal Casters
72':, Metal Moulders & Core-Makers
726 l\fetal Annealers, Temperers & Case Hardeners
727 Metal Dra\\-ers & Extruders
728 Metal Platers & Coaters
729 1,fet<lI Processors, H.e.C.
6 -1 CcnsusjMPj72
XXXIii
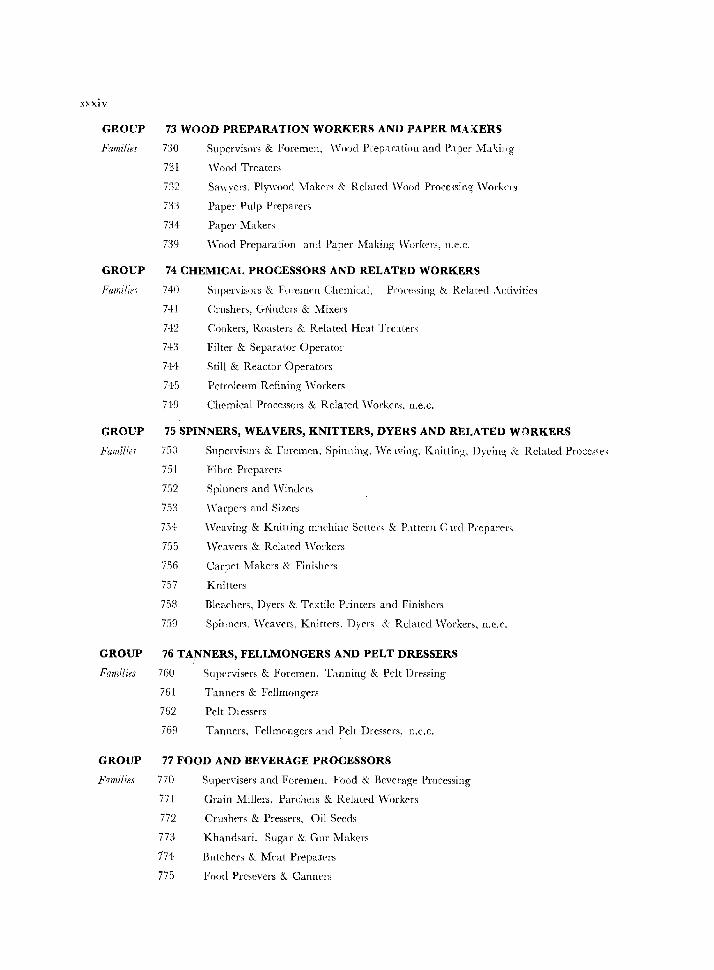
XXXIV
GROUP 73 WOOD PREPARATION WORKERS AND PAPER MAi{ERS
Families 730 Supervisor, & Foremen, \Yond Pcep<lratiol1 and P.lper \;fa~ill g
731 \Vood Treaters
732 Sawyers, Plywood ~{akpl'g & Related \Yood Proce;sin'l" \VOl'kc,s
733 Paper Pulp Preparers
7:14 Paper Makers
T19 \Vood Preparation and Paper Making \Vorkers, n.('.c.
GROUP 74 CHEMICAL PROCESSORS AND RELATED WORKERS
Familin 740 Supervisors & Forpmen Chemical, Proceising & Related .\ctivities
741 Cmshprs, GI'inders & 1-lixers
742 Cookers, Roasters & Related Heat Treaters
743 Filter & Separator Operator
744 Still & Reactor Operators
7+5 Petroleum Refining \Vorkers
7+9 Chemical Proccsscrs & Related \Yorkers, n.e.c.
GROUP 75 SPINNERS, WEAVERS, KNITTERS, DYERS AND RELATED WORKERS
Familin 750 Supervisal"> & Foremen. Spinning. \Vcwing. Knitting. Dycin::: & Related Pro~eN's
751 Fibre Preparcrs
752 Spinners and \Yinckrs
75:) Warpen and Sizers
7.14 \Veaving & Knitting m1.chinc Settei', & P.tttern C Ird Pfeparers
755 \Yt'avers & Related \Vmkers
756 Carpet Makers & Finishers
757 Knitters
753 Bleachers, Dyers & Textile Peinters and Finishers
759 Spinners, \Vcavcrs, Knitters. Dycrs & Related \Yorkers, n.e.c.
GROUP 76 TA~NERS, FELLMONGERS AND PELT DRESSERS
Families 760 Snpt'I'visers & Foremen, Tanning & Pdt Dressing
GROUP
F(lmilies
761 Tanners & Fcllmongers
762 Pel t Dl essers
769 Tanners, Fellmongers and Pelt Dressers, n.e.c.
77 FOOD AND BEVERAGE PROCESSORS
770
771
Supervisers and Foremen. Food & BevFrage Processing
Grain Millers. Pare hers & Rt'latf'd \,\'orkcrs
772 CrllshfTs & Pressrrs, Oil Sf'eds
773 Khandsari. Sugar & Gur l\Ltkers
774 Bntcht'rs & Mt'at Prepalt'rs
775 Food Presevers & Canners
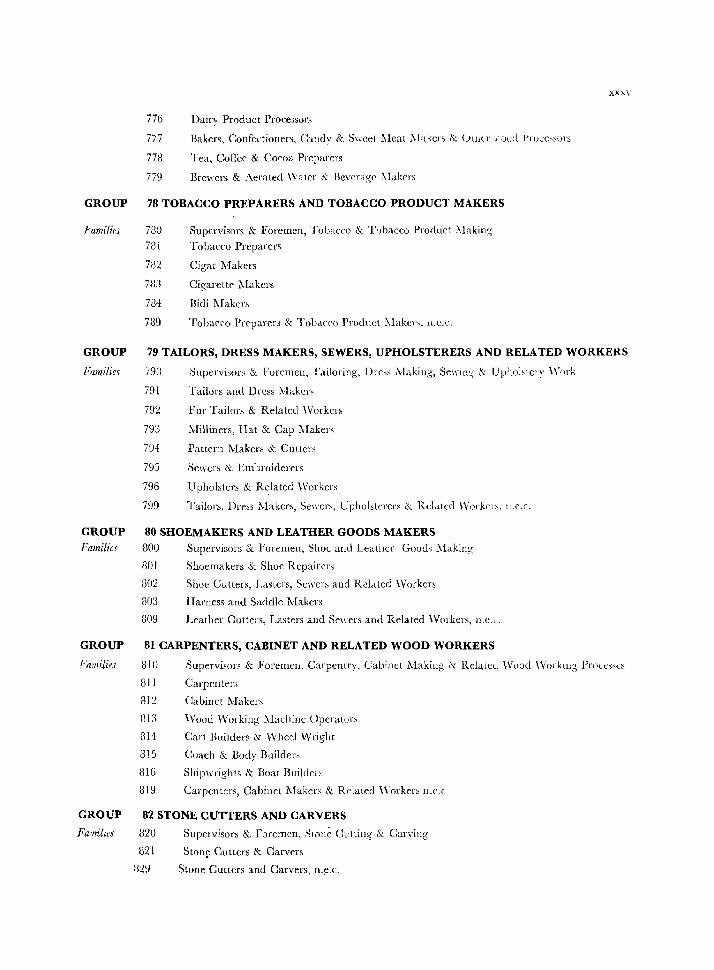
GROUP
Fam,'{irs
776 Dairy Product Processors
777 Bakers, Confectioners, Candy & S\I'cet 11eat )'lakers &. (.1l1,tr ,'dud l'jU~C';SOl'S
778 Tea, Coffee & Cocoa Prcparers
779 Brewers & Aerated Water & Bcverag .. J\[akers
78 TOBACCO PREPARERS AND TOBACCO PRODUCT MAKERS
780 781
Supervisors & Foremen, Tobacco & Tobacco Product I\Iaking
Tobacco Preparers
782 Cigar Makers
7Wl Cigarette Makers
784 Bidi l\fakers
789 Tobacco Prcparcrs & Tobacco Product I\lakcl'. 1l.C.l'.
xxxv
GROUP 79 TAILORS, DRESS MAKERS, SEWERS, UPHOLSTERERS AND RELATED WORKERS
Families 79D Supervisors & Foremell, Tailoring, Dress Making, Se\\'ing & Uphf)b~ery \Vork
791 Tailors anG Dress Makers
792 Fur Tailors & Related Worker,
793 Milliners, Hat & Cap Makers
794 Pattern Maken, &. Cullers
795 Sewers & Embroiderers
796 Upholsters & Related Workers
799 Tailors, Dress Makers, Sewers, Upholsterers &. ReLttccl Worker" ll.e.c.
GROUP 80 SHOEMAKERS AND LEATHER GOODS MAKERS Families 800 Supervisors & Foremen, Shoe and Leather Goods Making
80 I Shoemakers & Shoe Repairers
GROUP
./.,'alililies
GROUP
Fa'flilles
802 Shoe Cutters, Lasters, Sewers and Related \Vorkers
803 Harness and Saddle Makers
809 Leather Cutters, Lasters and Se\\-ers and Related \Vorkers, n.C.L.
81 CARPENTERS, CABINET AND RELATED WOOD WORKERS
810 Supervisors &. Foremen, Carpentry, Cabinet _Making & Related \Vood \Vorklllg Prr,<<::"o's
811 Carpenters
8I~ Cabinet Makers
813 \Vood Working Machine Operatlli'>
814 Cart Builders & Wheel Wright
315 Coach & Body Builden
816 Shipm'ights & Boat Buihlen
819 Carpenters, Cabinet Makers & Related \Vorkers ll.L(_
82 STONE CUTTERS AND CARVERS
H20
821
Supervisors & Foremen, ,')lolle Cut ling & Carving
Stonf Cutters & Carven
U2~ Stone Cutters and Carvers, l1.e.c,
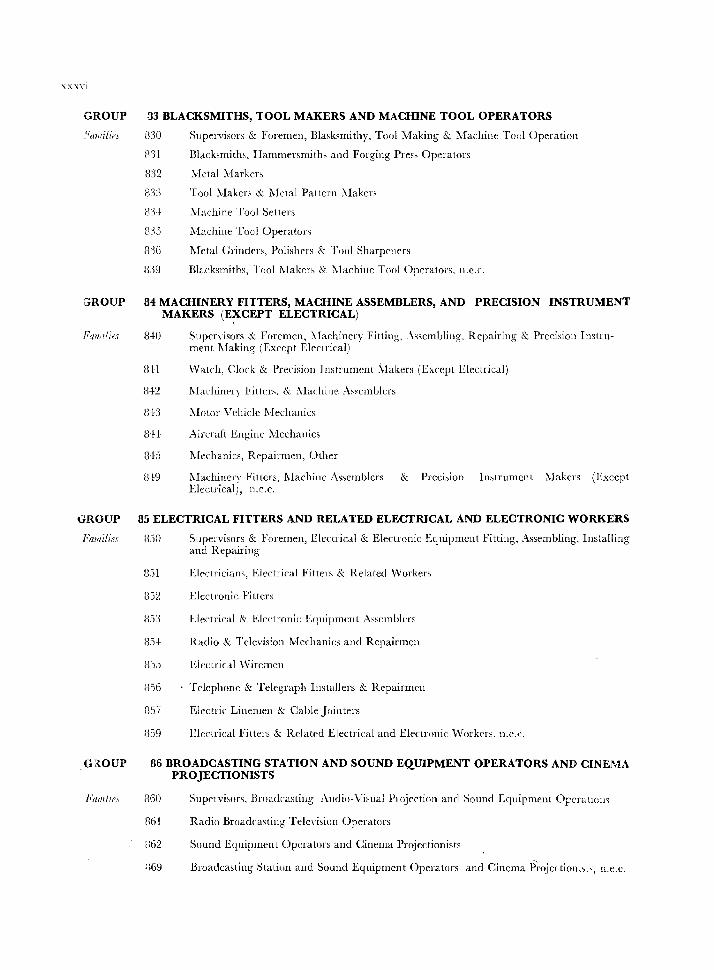
XXXVI
GROUP
GROUP
Families
33 BLACKSMITHS, TOOL MAKERS AND MACIDNE TOOL OPERATORS
830 Supervisors & Foremen, Blasksmithy, Tool Making & 1fachine Tool Operation
8'31 Blacksmith" Hammersmith, and Forging Pres, Operators
832 .'.letal Marker:,
833 Tool Makers & .Metal Pattern i\lakers
831 .\{achine Tool Setters
[nj Machine Tool Operators
8~~(i Metal C;rinders, Polishers & Tool Sharpellers
l:l:lY Blacksmiths, Tool l\laker, & ?>.Iachine Tool Operators, I1.C.C.
84 MACHINERY FITTERS, MACHINE ASSEMBLERS, AND PRECISION INSTRUMENT MAKERS (EXCEPT ELECTRICAL)
840 "
Supervisors & Foremen, i\lachinery Fitting. ,\"embling. Repairing & Precision Instrument l\laking (Except Electrical)
BH Watch, Clock & Precision I nstrumcnt .\Iakers (Except Electrical)
B+2 Machincry Fillers, & l\Iachine A,,'emblers
il43 l\Iotor Vehicle Mechanics
il·t t Aircraft Engine Mechanics
lH5 Mechanics, Repairmen, Other
il f9 l\!achillerv Fillers, l\Iachine Assemblers & Preci,ion Instrument i\Iakers (Except Electrical;, n.e.c.
GROUP 85 ELECTRICAL FITTERS AND RELATED ELECTRICAL AND ELECTRONIC WORKERS
Families
. GI{OUP
/lam/If'
S50 Supervisors & Foremen, Electrical & Electronic Equipment Fitting, Assembling, Installing and Repairing
il'il Electricians, Ekctrical Fitter, & Related "Vorker,
il52 Electronic Fitters
H5:l Electrical & Electronic Equipment Asscmblt'rs
8.~4 Radio & Television Mechanics and Repairmen
835 Electrical \Viremcn
ilS6 T('lephone & Telegraph IllStallers & Repairmen
[l57 Electric Linemen & Cable Jointers
859 Electrical Filters & Related Electrical and Electronic Workers. n.e.":.
86 BROADCASTING STATION AND SOUND EQUIPMENT OPERATORS AND CINEMA PROJECTIONISTS
B60 Supervisors. Broadcasting Audio-Visual Projection and Sound Equipment 0rcratlO!l';
861 Radio Broadcasting Telel'ision OperatOl's
U62 Sound Equipment Operators and Cinema Projectionists
:;69 Broadcasting Station and Sound Equipment Operators and Cinema Projellionist" n.e.c.
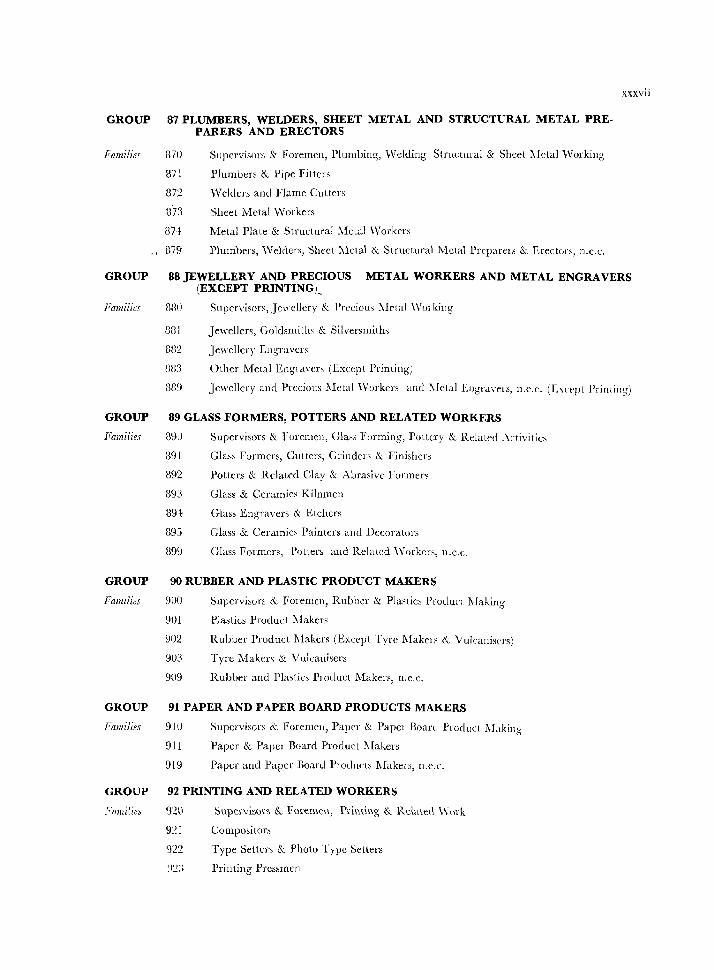
xxxvii
GROUP 87 PLUMBERS, WELDERS, SHEET METAL AND STRUCTURAL METAL PRE-
Families
GROUP
Families
GROUP
Families
GROUP
Families
GROUP
Families
GROUP
870
371
372
373
874
. ' 879
PARERS AND ERECTORS
Supervisors & Foremen, Plumbiw:;, \Velding Structural & Sheet :\lc(al \Vorking
Plumuers & Pipe Fitters
\Velders and Flame CuUers
Sheet Metal "Vorkers
Metal Plate & Structural .\fetal Workers
Plumbers, \Velders, Sheet I\letal & Structural :lv1etal Preparers & Erectors, n.c.c .
88 JEWELLERY AND PRECIOUS METAL WORKERS AND METAL ENGRAVERS (EXCEPT PRINTING)_
8Ull Supervisors, Jewellery & Precious Metal \VOl king
881 Jewellers, Goldsmiths & Silversmiths
3U2 Jewellery Engravers
un3 Other Metal Engravers (Except Printing)
339 Jewellery and Precious ~Ietal \\Torkers and :\le(al Engr,l\'cts, n.e.c. (E:'(('('pt Printing)
89 GLASS FORMERS, POTTERS AND RELATED WORKERS
390
891
Supervisors & roremell, Glass Forming, Pottery & Relatf'd .\ctivitics
Glass Formerf, Cutters, Grinders & Finishcrs
392 Potters & Related Clay & Abrasive FormeI"'
393 Glass & Ceramics Kilnmen
391: Glass Engravers & Etchers
895 Glass & Ceramics Painters aud Decorators
899 Glass Formers, Potters and Related \Vorkers, n.e.c.
90 RUBBER AND PLASTIC PRODUCT MAKERS
900
901
Supervisors & Foremen, Rubber & Plastics Product Making
Plastics Product Makers
902 Rubber Product 11akers (Except Tyre Makel S & Vulcanisers)
903 Tyre Makers & V ukanisers
909 Rubber and Plastics Product Makers, n.e.c.
91 PAPER AND PAPER BOARD PRODUCTS MAKERS
91U
911
Supervisors & Foremell, Papt"]" & Paper Board Product r.faking
Paper & Paper Board Product !\Iakers
919 Paper and Paper Board Products 1Iakers, ll.e.c.
92 PRINTING AND RELATED WORKERS
920 Supnvis\}l's & Fmcmcn, Printing & Rel<\\e(\ \\ork
921 Compositors
922 Type Setters & Photo Type Selters
~l:!:; Printing Prcssmen
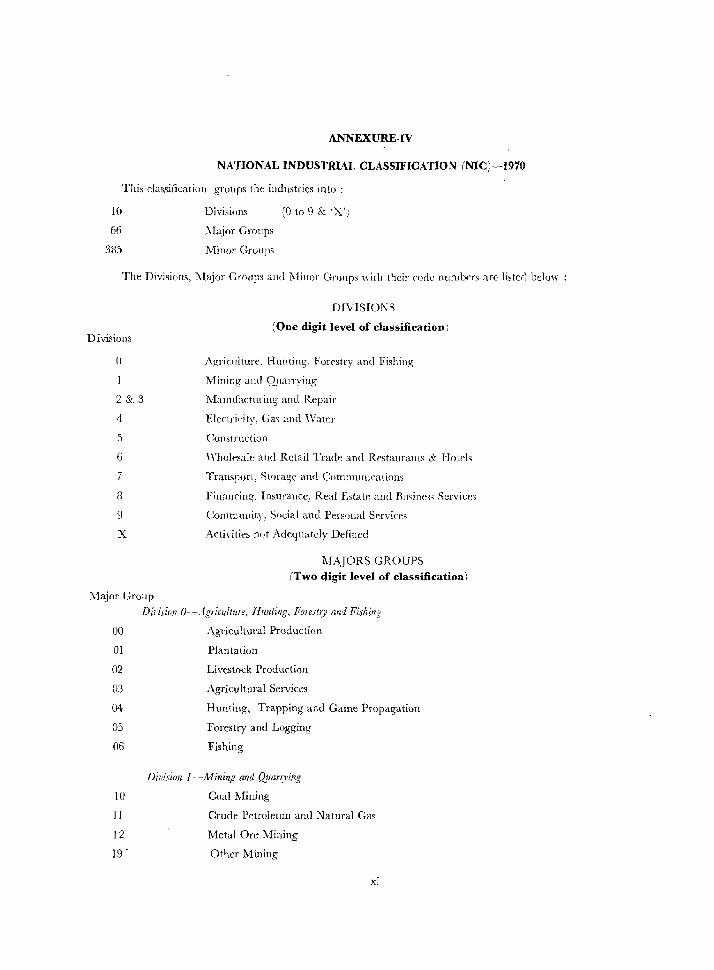
ANNEXURE-IV
NATIONAL INDUSTRIAL CLASSIFICATIO;\/ (NIC)-1970
This classification gruups the industries into:
10
66
335
Divisions (0 to 9 & "X')
Major Groups
Minor Groups
The DivisirJns, :Major Groups and Minor GI'OUpS with their corle numb!'rs arc listed below:
Divisions
o
2 & 3
4
5
6
7
8
9
X
Major Croup
OfVIS[ONS
(One digit level of classification I
Agriculture, Hunting, Forestry and Fishing
Mining and Quarrying
Manufac(nring and Repair
Electricity, Gas and 'Vater
Construction
'''hole-sale and Retail Trade and Restaurants & Hotf:ls
Transpurt, Storage' and CormmmicaliollS
Financing', Inourance, Real Estate and RlIsin(~" Ser\'ic(~,
Community, Social and Personal Services
Activities not Adequately Defined
MAJORS GROUPS (Two digit level of classification I
Dil'isio/l O-~Agriculture, Hunting, FOiestry md Fishing
00 Agricultural Production
01 Plantation
02 Livestock Production
03 Agricultural Services
04 Hunting, Trapping and Game Propagation
05 Forestry and Logging
06 Fishing
DilJi,rion l~Mi'(ling and Quarrying
10 Coal Mining
1) Crude Petroleum and Natural Gas
12 Metal Ore Milling
19 - Other Mining
xl
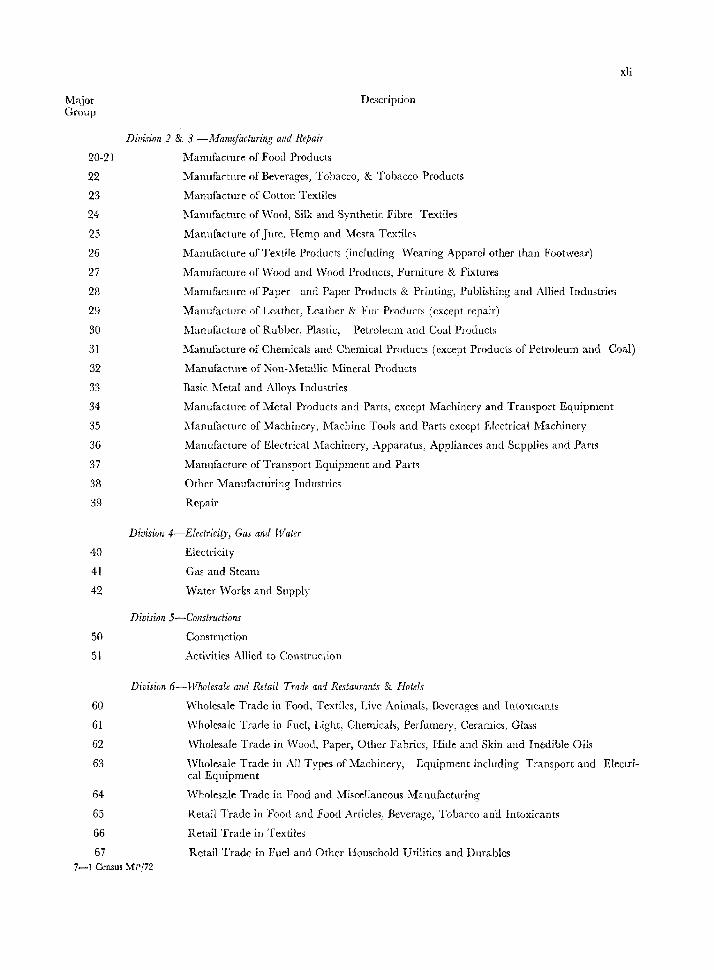
Major Group
20-21
22
23
24
25
26
27
28
29
30
31
32
33
34
35
36
37
38
39
40
41
42
50
51
60
61
62
63
64
65
66
67
Division 2 & 3 -Manufacturing alld Repair
Manufacture of Food Products
Description
Manufacture of Beverages, Tobacco, & Tobacco Products
Manufacture of Cotton Textiles
Manufacture of\'\Tool, Silk and Synthetic Fibre Textiles
Manufacture of Jute, Hemp and Mesta Textiles
Manufacture of Textile Products (including \'\Tearing Apparel other than Footwear)
Manufacture oflNood and \'\Tood Products, Furniture & Fixtures
Manufacture of Paper and Paper Products & Printing, Publishing and Allied Industries
Manufacture of Leather, Leather & Fur Products (except repair)
Manufacture of Rubber, Plastic, Petroleum and Coal Products
xli
Manufacture of Chemicals and Chemical Products (except Products of Petroleum alld Coal)
Manufacture of Non-Metallic Mineral Products
Basic Metal and Alloys Industries
Manufacture of Metal Products and Parts, except Machinery and Transport Equipment
Manufacture of Machinery, Machine Tools and Parts except Electrical Machinery
Manufacture of Electrical Machinery, Apparatus, Appliances and Supplies and Parts
Manufacture of Transport Equipment and Part~
Other Manufactliring Industries
Repair
Division 4-Electricity, Gas and Water
Electricity
Gas and Steam
Water Works and Supply
Division 5-Collstructions
Construction
Activities Allicd to Construction
Division 6-Wholesale and Retail Trade and Restaurants & Hotels
Wholesale Trade in Food, Textiles, Live Animals, Beverages and IntOXicants
Wholesale Trade in Fuel, Light, Chemicals, Perfumery, Ceramics, Glass
Wholesale Trade in Wood, Paper, Other Fabrics, Hide anel Skin and Inedible Oils
Wholesale Trade in All Types of Machinery, Equipment including Transport and Electrical Equipment
Wholesale Trade in Food and Miscellaneous Manufacturing
Retail Trade in Food and Food Articles, Beverage, Toba{'co and Int()xicants
Retail Trade in Textiles
Retail Trade in Fuel and Oth('1' Household Utilities and Durables 7-1 Census MPj72
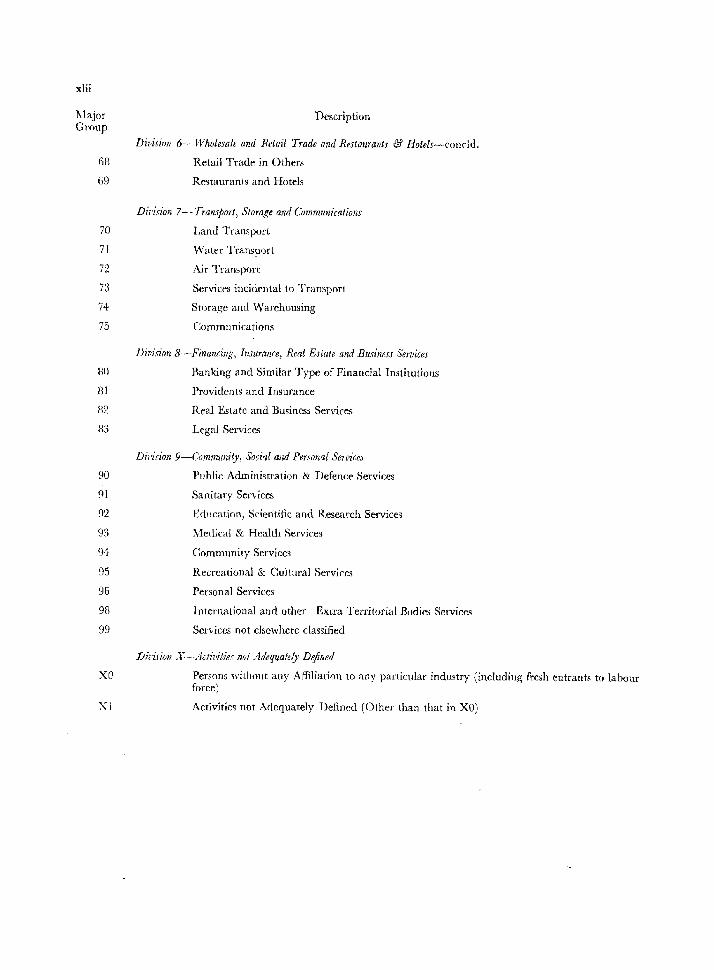
xlii
Major Group
Description
fiS
1I9
Dil,isinn 6-Wholesale and Retail Trade Gild Restaurants & Hotels-roncld.
Retail Trade in Others
Restaurants and Hotels
Division 7-- Transport, Slomge and Communications
70 Land Transport
7! Water Transport
72 Air Transport
73 Services incidental to Transport
74 Storage and Warehousing
75 Communications
l>i1,ision 8--Financing, Insurance, Real Estate and Business Services
SO Banking and Similar Type of Financial Institutions
Sl Providents and Insurance
82 Real Estate and Business Services
S3 Legal Services
Division 9-Communily, Social alld Personal Service>
90 Public Administration & Defence Services
91 Sanitary Services
92 Education, Scientific and Re~earch Services
93 Medical & Health Services
94 Community Services
95 Recreational & Cultural Servicr.s
96 Personal Services
98 International and other Extra Territorial Bodies Services
99 Services not elsewhere classified
xo
XI
Dil'isioll ){~ Adiz,ities no/ Adequately Difined
Persons without any Affiliation to allY particular industry (including fresh entrants to labour fnrce)
Activities not Adequately Defined (Othcr than that in XO)
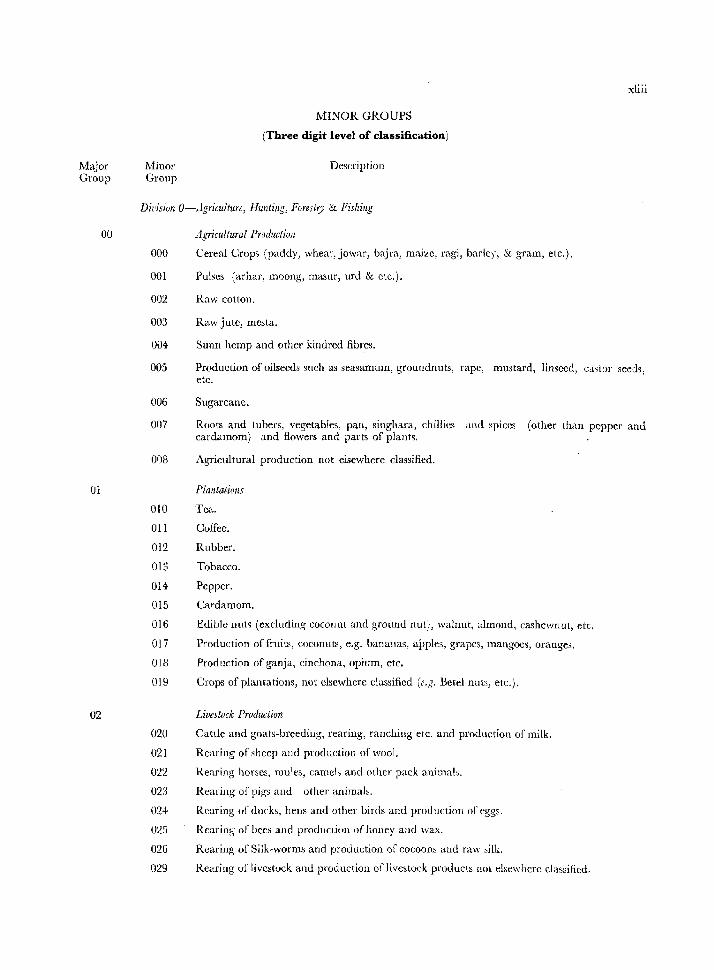
Major Group
ou
01
02
Minor Group
MI~OR GROUPS
(Three digit level of classification)
Description
xliii
Dit'isiun O-Agriculture, Hunting, Forestry & Fishing
000
001
002
003
004
005
006
007
008
010
011
012
013
014
015
016
017
018
019
020
021
022
023
02-t
02:1
026
029
Agricultural Production
Cereal Crops (paddy, wheat,jowar, bajra, maize, ragi, barley, & gram, etc.).
Pulses (arhar, moong, masur, urd & etc.).
Raw cotton.
Raw jute, mesta.
Sunn hemp and other kindred fibres.
Production of oilsecds such as seasamum, groundnuts, rape, mustard, limeed, ca,tor seeds, etc.
Sugarcane.
Roots and tubers, vegetables, pan, singhara, chillit'-S and spices (other than pepper and cardamom) and flowers and parts of plants.
Agricultural production not elsewhere classified.
Plantations
Tea.
Coffee.
Rubber.
Tobacco.
Pepper.
Cardamom.
Edible nuts (excluding coconut and ground nut), walnut, almond, cashewnut, etc.
Production of fruits, coconuts, e.g. bananas, apples, grapes, mangoes, oranges.
Production of ganja, cinchona, opium, etc.
Crops of plantations, not elsewhere classified (e.g. Betel nuts, etc.).
Livestock Production
Cattle and goats-breeding, rearing, ranching etc. and production of milk.
Rearing of ~heep and production of wool.
Rearing horses, mules, camels and other pack animals.
Rearing of pigs and other animals.
Rearing oj'ducks, hens and other birds and prmJuction or eggs.
Rearing of bees and production of honey and wax.
Rearing of Silk-worms and production of cocoom and raw silk.
Rearing of livestock and production oflivestock products not elsewhere classified.
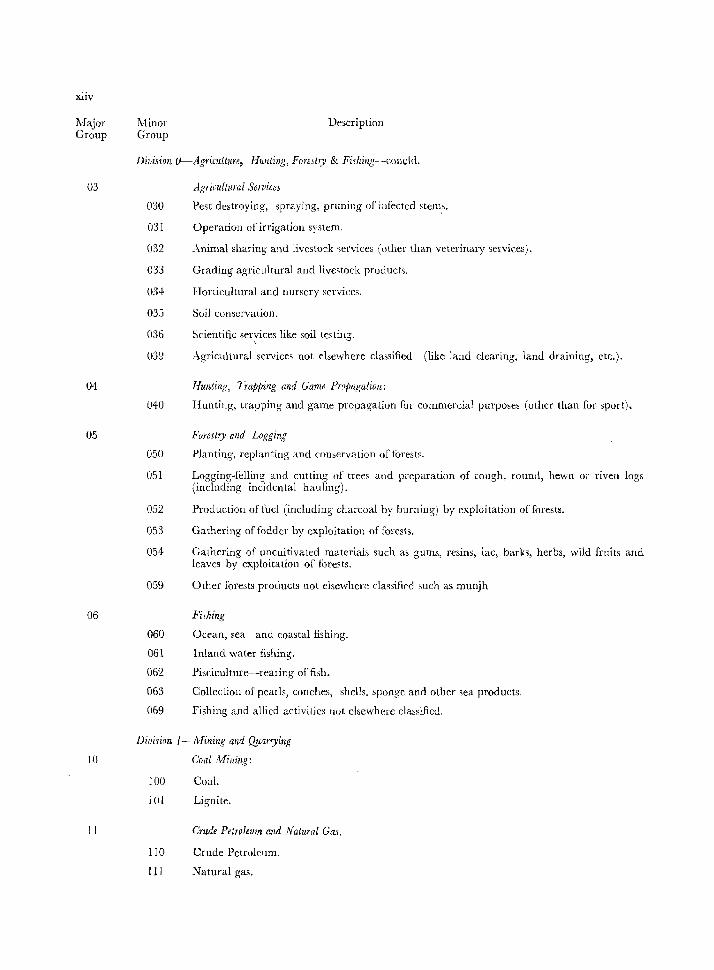
xliv
Major Group
03
04
05
06
10
11
Minor Group
Description
Division O-AgricultllYe, Hunting, Fore;try & Fishing- -coucld.
030
031
032
033
034
035
036
039
040
050
051
052
053
054
059
060
061
062
063
069
Agricultural Services
Pest destroying', spraying, pruning of infected stems.
Operation of irrigation system.
Animal sharing and livestock services (other than veterinary services).
Grading agricultural and livestock products.
Horticultural and nursery services.
Soil conservation.
Scientific ser~ices like soil testing.
Agricultural services not elsewhere classified (like land clearing, land draining, etc.).
Hunting, Trapping and Game Propagation:
Hunting, trapping and game propagation for commercial purposes (other than for sport).
Forestry and Logging
Planting, replanting and conservation of forests.
Logging-felling and cutting uf trees and preparation of rough, round, hewn or riven logs (including incidental hauling).
Production offuel (including charcoal by burning) by exploitation offiJrests.
Gathering of fodder by exploitation of forests.
Gathering of uncultivated materials such as gums, resins, lac, bark~, herbs, wild fruits and leaves by exploitation of ti}rests.
Other [orests products not elsewhere dassifif'd such as munjh.
Fi,hing
Ocean, sea and coastal fishing.
lnland water fishing.
Pisciculture--rearing of fish.
Cullection of pearls, cOIlches, shells. sponge and other sea products.
Fishing and allied activities not elsewhere classified.
Division l·~ Mining alld Q.uanying
Coal },1Iining:
100 Coal.
101 Lignite.
Crude Petrolevm and Natural Gas.
110 Crude Petroleum.
III Natural gas.
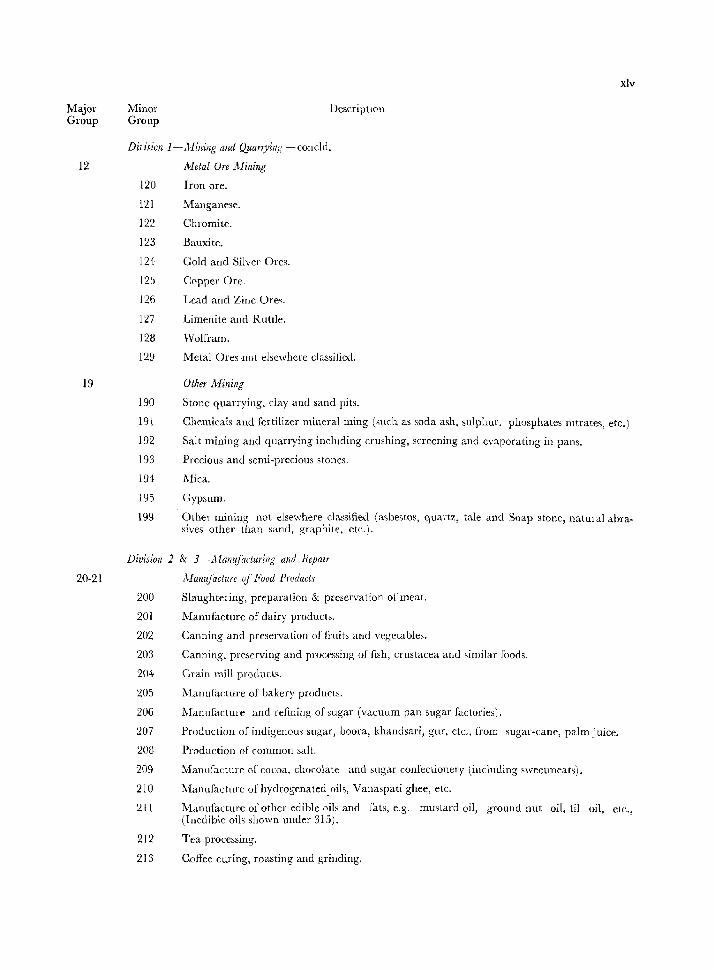
Major Group
12
19
20-21
Minor Group
Description
Division i-.Hining and QuarlJing -coneld.
120
121
122
123
124
12~
126
127
128
129
190
~letal Ore Alining
Iron ore.
Manganese.
Chromite.
Bauxite.
Gold and Silver Ores.
Copper Ore.
Lead and Zinc are,.
Limenite and Rutile.
Wolfram.
Metal Ores lIot elsewhere classified.
Other Mining
Stone quarrying, clay and sand pits.
xlv
191
192
Chemicals and fertilizer mineral ming (such as soda ash, sulphur, phosphates mtrates, etc.)
Salt mining and quarrying including crushing, screening and evaporating in pans.
193
194
195
199
Prccious and semi-precious stones.
Mica.
Gypsum.
Other mining not elsewhere classified (asbestm, qual't7., tale and Soap stone, natural abrasives other than sand, graphite, etc.).
Division 2 & 3-1Uanz!f'acturing and Repair
Alallufacture of Food Products
200 Slaughtering, preparation & preservation of meat.
201 Manufacturc of dairy products.
202 Canning and preservation of fruits arld vegetables.
203 Canning, preserving and processing of fish, crustacea and similar foods.
204 Grain mill products.
205 Manufacture of bakery products.
206 .Manufacture and refining of sugar (vacuum pan sugar factories).
207 Production of indigenous sugar, boora, khandsari, gur, etc" from sugar-cane, palm juice.
208 Productioll of common salt.
209 Manufacture of cocoa, chocolate and sugar confectionery (including sweetmeats).
210 Manufacture of hydrogenated. oils, Vanaspati ghee, etc.
211 .l'vIanufacture of other edible oils and fats, e.g. mustard oil, ground nut oil. til oil, etc., (Inedible oils shown under 315).
212 Tea processing.
213 Coffee curing, roasting and grinding.
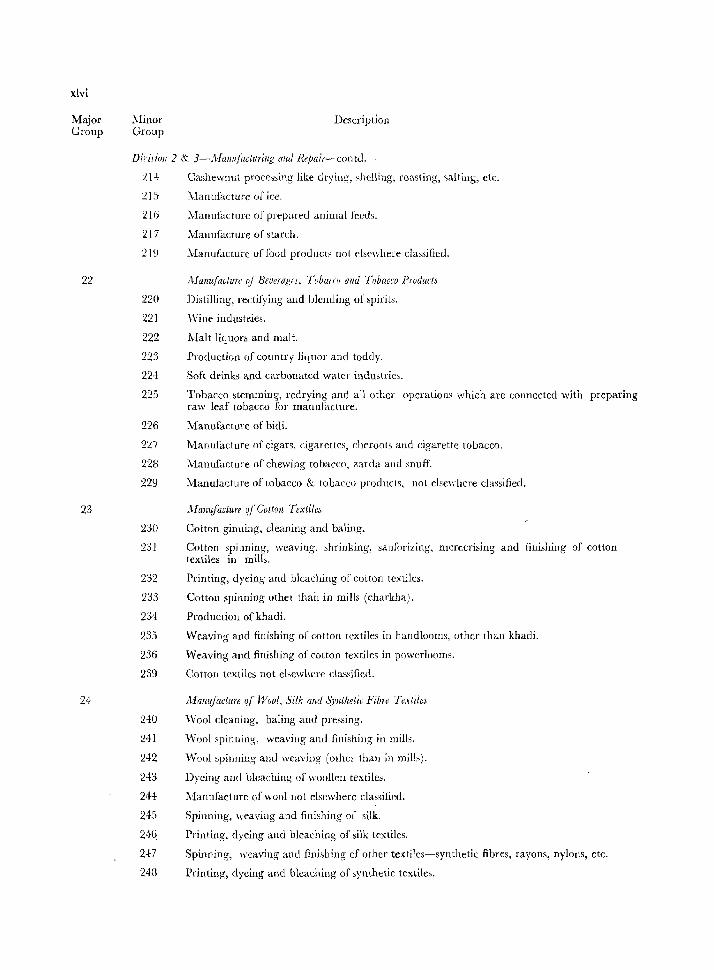
xlvi
Major Group
22
23
24
:'Iinor Group
Description
Dil'isioll 2 & 3-.Uwwfacturing and Repair-contel.
214
215
216
217
219
220
221
222
223
224
225
226
227
22H
229
230
231
232
233
234
235
236
239
240
241
242
243
244
246
2,,(-7
248
Cashewnut processing like drying, shelling, roasting, salting, etc.
::\lanufacturc of ice.
Manufacture of prepareu allimal feeus.
Mallufacture of starch.
.Manufacture of food products not elsewhere classified.
,Uan/{!aclure of Beveragts, Tobaa() and Tobacco P'odutls
Distilling, rectifying and blending of "pirits.
Wille industries,
i\Jalt liquors and malt.
ProductioJl of country JilplOr and toddy,
Soft drinks and carbonated water industries.
Tobacco stemming, redrying and all other operations which are connected with preparing raw leaf tobacco for manufacture,
Manufacture of bidi.
Manufacture of cigars, cigarettes, cheroots and cigarette tobacco.
Manufacture of chewing tobacco, zarda and snuff.
Manufactl1re of tobacco & tobacco products, not elsewhere classified.
JI,[anufacture ~/ Cotton Textiles
Cotton ginning, cleaning and baling.
Cotton spinning, weaving. shrinking, sanforizing. mcrcerising and finishing of cotton textiles in mills.
Printing, dyeing and bleaching of cotton textiles.
Cotton spinning other than in mills (charkha).
Production of khadi.
Weaving and finishing of' cotton textiles in handlooms, other than khadi.
Weaving and finishing of cotton textiles in powerlooms.
Cotton textiles not elsewhere classified,
A1(J1wjacture fif Wool, Silk and .)),Jttlietic Fibre Textiles
\Vool cleaning, baling and pressing.
Wool spinning, weaving auu finishiu)S in mills.
Woo] spinning ami weaving (other than ill mills),
Dyeing ami bleaching of woollen textiles.
J\Tanufac(ure 01\,,001 not elsewhere classified,
Spinning, weaving and finishing of silk,
Printing, dyeing and bleaching of silk textiles,
Spinning, weaving and finishing of other textiles-synthetic fibres, rayom, nylons, etc,
Printing, dyeing and bleaching of synthetic textile$.
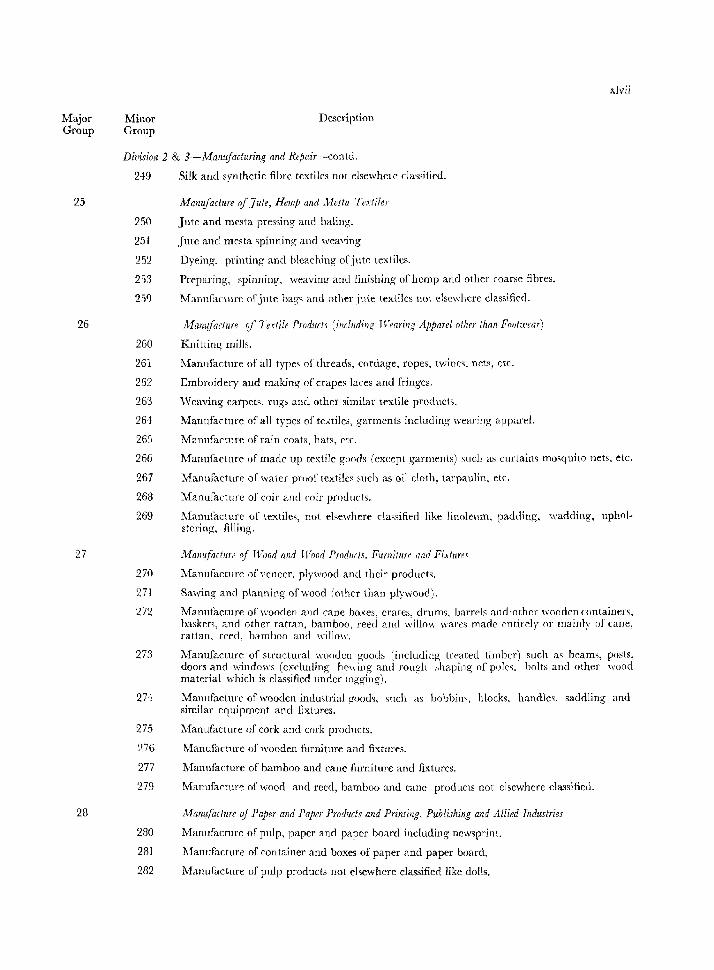
Major Group
25
26
27
28
Minor Group
Description
xlvii
Dh'isioll 2 & 3--Mallufacturing alld Repair-contd.
249
250
251
252
2~3
25q
260
261
262
263
26'~
265
266
267
263
269
270
271
27'2
273
274
275
276
277
279
Silk and synthetic fibre textiles not elsewhere rla~sified.
Malllifacture of Jute, Hemp and JIesta Textile.'
Jute and mesta pressing and baling.
Jute and mesta spinning and weaving
Dyeing, printing and bleaching of jute textiles.
Preparing. spinning. weaving and finishing of hemp and other coarse fibres.
Manufactme of jute bag,; and other jute textiles not elsewhere classified.
}vfan1!facture of Tettiff l'roducl\ (incflldin.I; Wearing Apparel othrr than Fovttt'ear)
Knitting mills.
Manufacture of all types of threads, cordage, ropes, twines. nets, etc.
Embroidery and making of crapes laces and fringes.
\:Vcaving carpets. rugs and other similar textile products.
Manufacture of all types of teA tiles, garments including wearing apparel.
Manufactlll'e of rain ('oats, hats. etf'.
l\1'anufacture of made up textile goods (except garments) such as curtains mosquito nets. etc.
:Manufacture of water proof textiles slich as oil cloth, tarpaulin, etc.
Manufacture of coil' ami coir products.
Manufacture of textiles, not elsewhere classified like linoleum. padding. wadding, upholstering, filling.
Manufacture of Wood alld Wood Produrls, Furniturr and Fi.llllrel
Manufacture of veneer, plywood and their products.
Sawing and planning of wood (other than plywood).
Manufacture of wooden and cane hoxes, crates, drums. barrels and 'other wooden containers. baskets. and other rattan, bamboo, reed and willow wares made entirely OJ' mainly of cane, rattan. rc('d, bamboo and willow.
Manufacture of structural wooden Konels (including treated timber) such as beams, posts. doors am! windows (excluding he\\'ing and rough shaping of poles. bolts and other wood material which is classified under logging).
Manufacture of wooden industrial goods, sllch as bobbin', blocks. handlc~. saddling and similar equipment and fixtures.
~1'anufacture of cork and cork products.
Manufacture of wooden furniture and fixtures.
Manufacture of bamboo and cane furniture and fixtures.
Manufactur~ of wood and reed, bamboo and cane products not elsewhere classified.
Mamifarture of Paper and Paper Products and Printing, Publishing and Allied Industries
230 Manuf..'lcture of pulp. paper and paper board including newsprint.
281 Manufacture of container and boxes of paper <lnd paper board.
232 Manufacture of pulp products not el~ewhere classified like dolls.
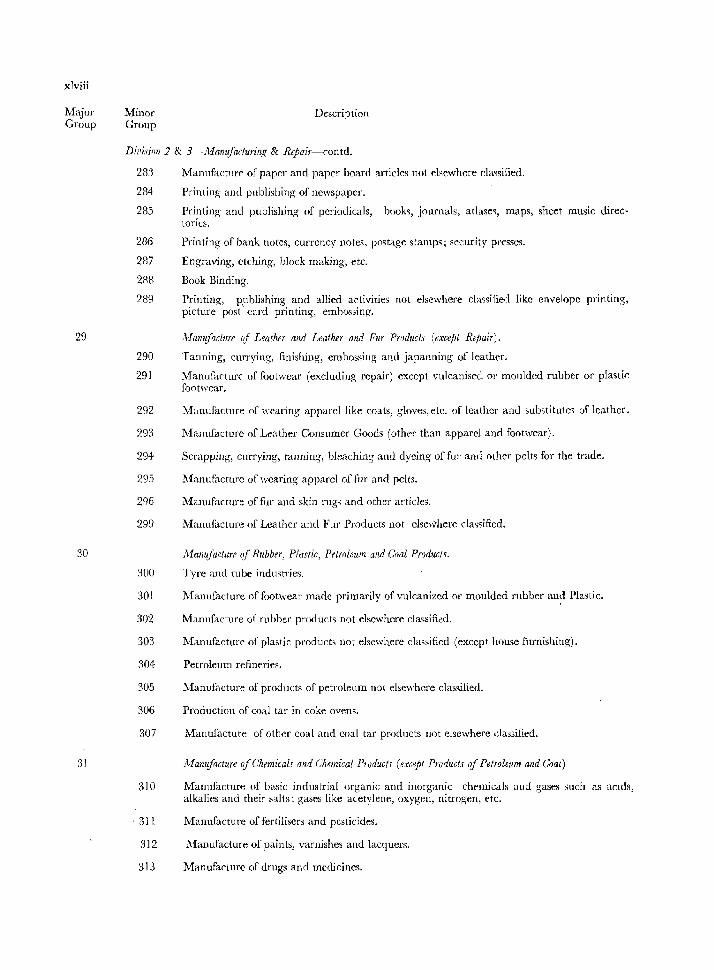
xlviii
Major Group
29
30
31
Minor Group
Description
Dh'isiDn 2 & 3-Manujaduring & Repair-rontd.
28'1
284
285
286
237
288
289
290
291
292
293
294
295
296
299
300
301
302
303
304
305
306
307
310
. 311
312
313
Manllfactllfe of paper and paper board articles not elsewhere c1a~sified.
Printing and publishing of newspaper.
Printinl,!; and publishing of periodicals, books, journals, atlase~, maps, sheet music directories.
Printing of bank notes, currency notes, postage stamps; security presses.
Engraving, etching, block making, etc.
Book Binding.
Printing, publishing and allied actlvltles not elsewhere classified like envelope printing, picture post \ card printing, embossing.
Afallu/aclure of Leather Ilnd Leather and Fur Products (except Repair).
Tanning, currying, finishing, embossing amI japanning of leather.
Manufacturf of footwear (excluding repair) except vulcanised or moulded rubber or plastic footwear.
Manufacture of wearing apparel like coats, gloves, etc. of leather and substitute, of leather.
Manufacture of Leather Consumer Goods (othe-r than apparel and footwear).
Scrapping, currying, tanning, bleaching and dyeing of fur and other pelts for the trade.
l\fanufacture of wearing apparel of fur and pelts.
Manufacture of fur and skin rug, and other articles.
Manufacture of Leather and Fur Products not elsewhere c1a~~ified.
Manufacture ~f Rubber, Plastic, Petroleum and Coal Products.
Tyre and tube industries.
Manufacture of footwear made primarily of vulcanized or moulded rubber all~t Plastic.
Manufacture of rubber products not elsewhere classifi,~d.
Manufacture of plastic products not elsewhere classified (except house filrnishing).
Petroleum refineries.
Manufacture of products of petroleum not elsewhere classified.
Production of coal tar in coke ovens.
Manufacture of other coal and coal tar products not elsewhere t:lassified.
Manufacture of Chemicals and Chemical Products (except Products oj Petroleum and Coat)
Manufacture of basic industria! organic and inorganic chrmic;ab ;:lIJd gases such as aClds, alkalies and their salts; ga~es like aletylene, oxygen, nitrogen, etc .
Manufacture of fertilisers and pesticides.
l\1anufacture of paints, varnishes and lacquers.
Manufacture of drugs and medicines.
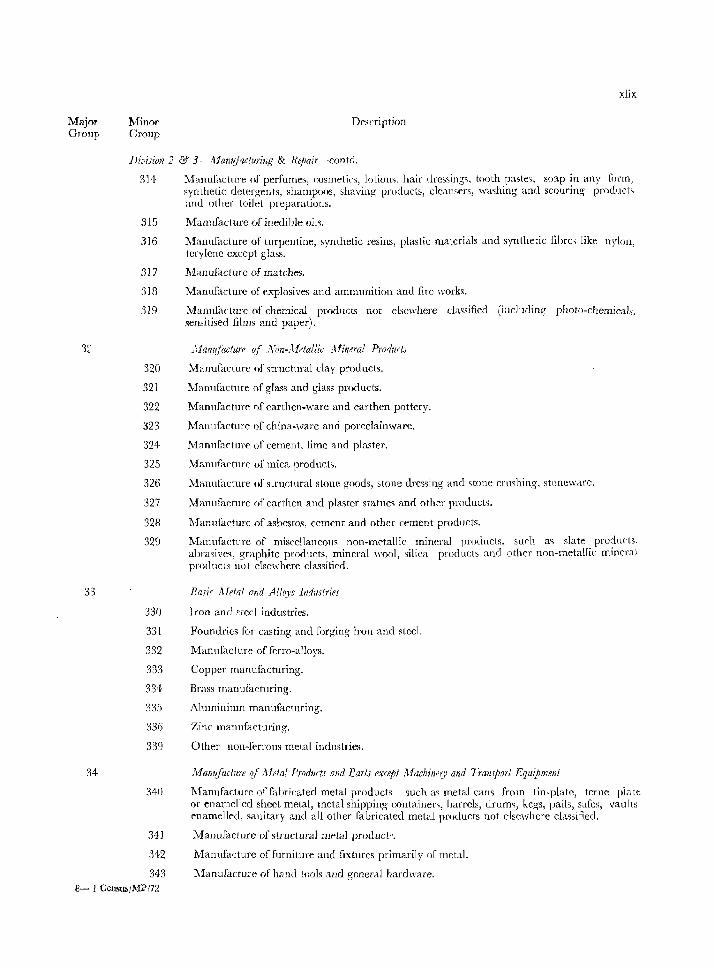
Major Group
Minor Group
xlix
Descri ption
Divisioll 2 & 3~,Uallllfactl1ring & Repair-contd.
32
33
34
314
315
316
317
318
319
320
321
322
:523
324
325
326
327
323
329
330
331
332
333
331
335
:136
339
340
341
342
343 8- 1 Census/Ml'/72
Manufacture of perfumes, msrnetics, lotions. hair dressings, tooth paste,. soap in any form, synthetic detergents, shampoos, shaving products, cleansers, washing and scouring procluct~ and olher toilet preparations.
Manufacture of inedible oils.
Manufacture or turpentine, synthetic resins, plastic materials and synthetic fibre; like nylon, terylene except glass.
l\1anufacture of matches.
Manufacture of explosives and ammunition and fire works.
Manufacture of chemical products not elsewhere classified (including photo-chemicals. sensitised films and paper).
Jlanufacture of }'{on-llfetallic Jlineral Product_.
Manufacture of structural clay products.
Manufacture ()f glass and glass products.
Manufacture ()f earthen-ware and earthen pottery.
Manufacture of china-ware and porcelainware.
Ivfanufacture of cement, lime and plaster.
Ivrannfactnre of mica products.
Manufacture of stnwtnral sione goods, stone dre~sing' and stone crmhing, stoneware.
Manuf.'lcture of earthen and plaster statues and other pr()ducts.
1vfanufacture of asbestos, cemcnt and other cement prodllctS.
Ivianufactme of miscellaneous non-metallic mineral products, such a~ slate products, abrasives, graphite products, mineral wool, silica products and other non-metallic mineral proclllct~ not elsewhere classified.
Basic Udal and A/I~ys Industries
Iron and ~tccl industries.
Foundries for casting and forging iron and steel.
Manufacture of ferro-alloys.
Copper manufacturing.
Brass manufacturing.
Aluminium manufacturing.
Zinc manufacturing.
Other non-ferrous metal industries.
A1a!lllfaclure Qf Affla! Produds and Earls except Jfachinny and Tranrj)orl Equipmenl
Ivfanufacture of fabricated metal products such as met.al cans from lin-plate, terne pla It or enamelled sheet metal, metal shipping containers, barrels, drmm, kegs, pails, safes, vaults enamelled, sanitary and all other fabricated metal products not elsewhere classified.
Manufacture of structural mt'tal product".
Manufacture of furniture and fixtures primarily Ol metal.
l\Ianufacture of hand tools and general hardware.
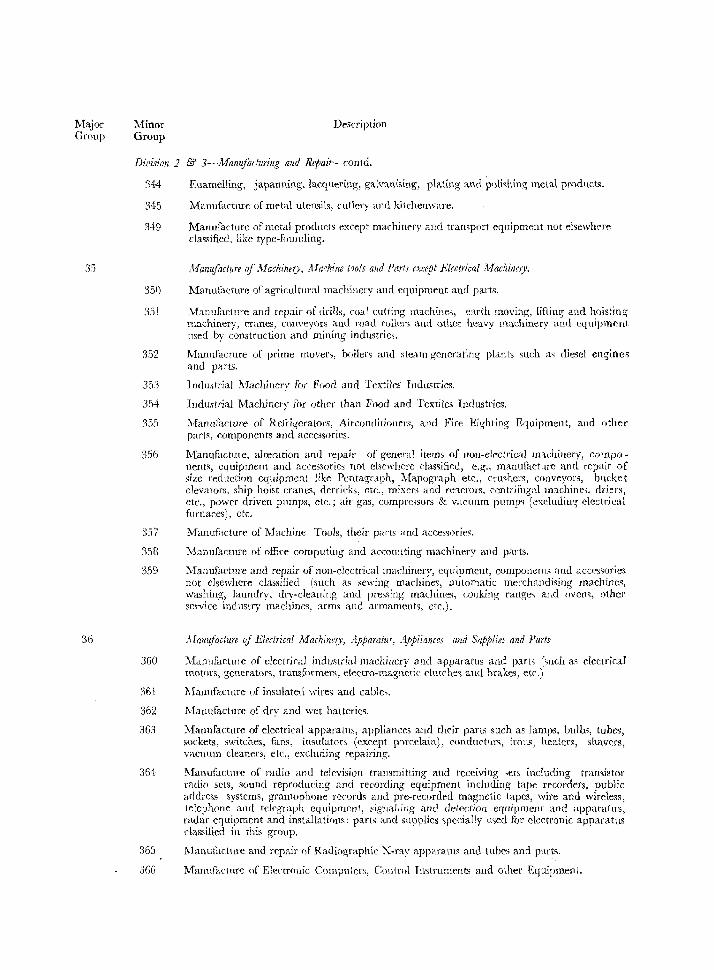
Major Group
35
Minor Group
Description
Dil,ision 2 & 3~;Vlanufa/'furi1Zg and Repair-contd.
344
345
:149
350
351
352
353
354
:~55
356
357
35R
359
3GO
361
362
36:l
364
365
366
Enamelling, japanning, lacquering, galvanising, plating and p<>\ishing metal product~.
Manufactnre of met'll utensils, cutlery aJl(1 kitchenware.
Manufacture of metal products except machinery and trampart equipment not elsewhrre classified, like type-founding.
,VlanufaCilire of .Uachinery, Afachine tools and Paris except Electrical AfachilltlY.
M>lnufaC(ure of agricultural machinery and erluipment and parts.
Manufacture and repair of drills, coal cutting machine" earth moving, liftin.g and hoisting machinery, cranes, conveyors and road rollers and other heavy machinery ami equipment Hsed by construction and mining indlLstrie,.
Manufacture of prime movers, boilers and sleam generating plants such a, diesel engines and parts.
Jmlu~trial Machinerv for Food and Textiles IndustTies.
Industrial Machinery for other than Food and Textiles Industries.
:Manufacture of Refrigerators, AircOll(iitioners, and Fin~ Righting Equipment, and other p<trts, components and accessories.
Mamlfacture, alteration anrl repair of general items of non-electrical machinery, componen\.\ equipment and accessories not elsewhere classified, e.g., manufacture qnd repair of size reduction equipment like Pcntagraph, N[<lpograph etc., crushers, (.onveY01·" bucket elevators, ship hoist cranes, derricks, etc., mix~rs and rC:l.ctors, centrifug"l mlchinc;. rlriers, etc., power driven pumps, etc.; air gas, compressors & vacuum pumps (cxcluding' electrical furnaces), etc.
Manuf;;cture of Machine Tools, their parts and acces~ories.
Manuriicture of office computing and accounting machinery and parts.
Manufacture and repair of non-electrical machinery, equipment, components and acces~ories not elsewhere classified (slich as sewing machines, automatic merchandising machines, washing, laundry, dry-cleaning and pressing machines, conking range, and ovem, other service indllstry machine\ arms and armaments, etc.).
Mamgactl.lre of Hlectrical i\1achinery, Apparatus, Appliances and Supplies and Pal'is
Manufactnre of electrical industrial machinery and apparatus and parts (s!Jch as electrical motors, generators, transformers, electro-magnetic clutches and hrakes, etc.)
Manufacture of insulated wires and cable"
MaJl1(facture of dry and wet batteries.
Manufacture of electrical apparatus, appliances and their parts such as lamps, bulbs, tubes, sockets,~ switches, fans, insulators (exc~ept prm:elain), conductors, trOllS, healers, shavers, V<1.euurn cleaners, etc., excluding repairing.
Manufacture of radio anr! television transmitting and receiving sets including transistor radio sets, sound reproducing and recording equipment including tape recorders, public address systems, gramophone records and pre-recorded magnetic tapes, wire and wireless, ielephone and telf',g-raph eqlJipm~tJt, signalling and deteciinn equipment and apparatlls, radar equipment and installations: parts and supplies ,pecially u~ed for electronic apparatus classified in this group.
I\lanufacture and repair of Radiographic X-ray apparatus and tubes and parts.
Manufacture of EleC'tronic Computers, COJlimj Tllstruments and other Equipment.
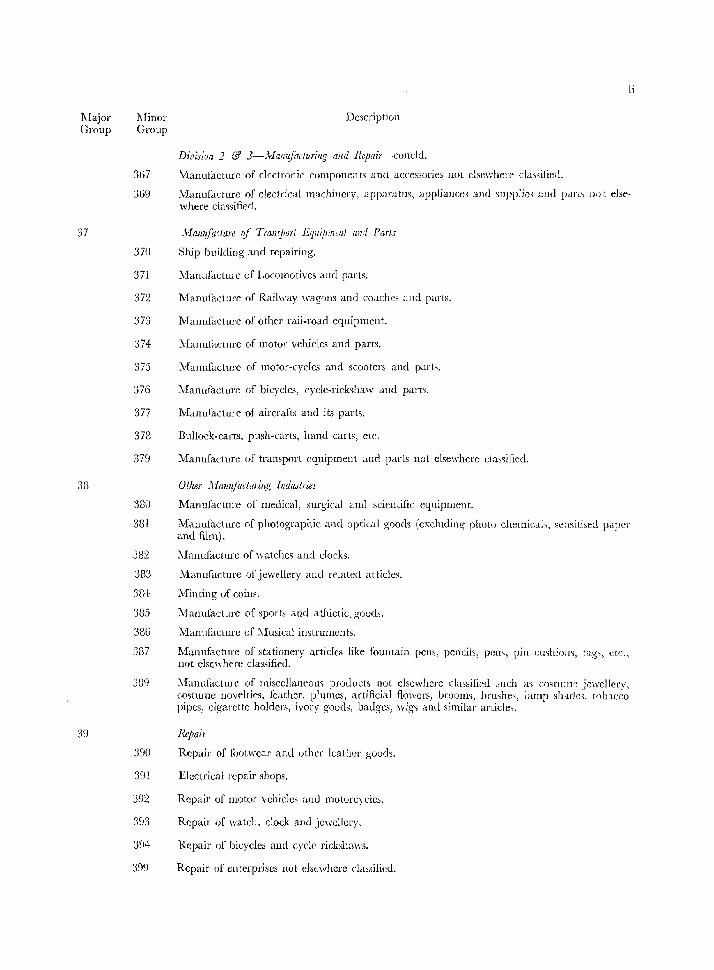
l\lajor Group
37
38
39
l\Jinor Group
367
369
370
371
372
373
374
375
376
377
378
379
380
381
382
383
38i-
385
386
3[;7
3UCJ
390
391
392
393
39+
399
Ii
Description
Divisiun 2 &' 3-.Hanufacllo·ing and lIepair -concld .
. Manufacture of elrctronic components ami accessories Hot elsewhere das,ifieri.
JI,:[anuElcture of electrical machinery, apparatus, appJiarH:e, and ,mppJie, and lJdrt> nlJ t dst:>where classified .
. Wamliactare of TrallJport Equipment mid Parts
Ship building and repairing.
]\1anulacture of Locomotives and parts.
Manufacture of Railway wagons and coaches and parts.
Manufacture of other rail-road equipment.
]\-fanufacturc of motor vehicles and parts.
l\,Ianufacture of motor-cycles and scooters and parts.
Ivfanufaeturc of bicycles, cyclc-ricbhaw ,md parts,
ManuClcture of aircrafts and its parts.
Bullock-carts, push-carts, hand carts, ctc.
Manufacture of transport cquipment and parts not elsewhere classified.
Other .Hmm/acluring Industries
Manufaclme of medical, surgical and scienlific equipment.
Manufacture of photographic and optlcal goods (excludln~ photo chemical" sensitised paper and film).
:\Ianufacture of watches and clocks.
Manufacture of jewellery and f('lated articles.
:\1inting of coins.
Manufacture of sports and athletic. goods.
Manufaclure of Musical instruments.
Manufacture of stationery articles like fountain pens, pcncih, pellS, pin cmlliom, tagi, t.:t':., not else'lherc classified,
Manufacture of miscellaneom products not elsewhere classified such as costume jewellery, costume novelties, feather, plumes, artificial flowers, brooms, brushes, lamp shade" tobacco pipes, cigarette holders, ivory goods, badges, wigs and similar article;.
Rellail
Repair of /i)otwear and other leather goods.
Elcctrical repair shops.
Repair of motor vehicles amI ll1otorc} cles.
Repair of watch, clock and jewellery.
Repair of hicycles and cyck rickshaws.
Repair of enterprises Hot elSEwhere classified.
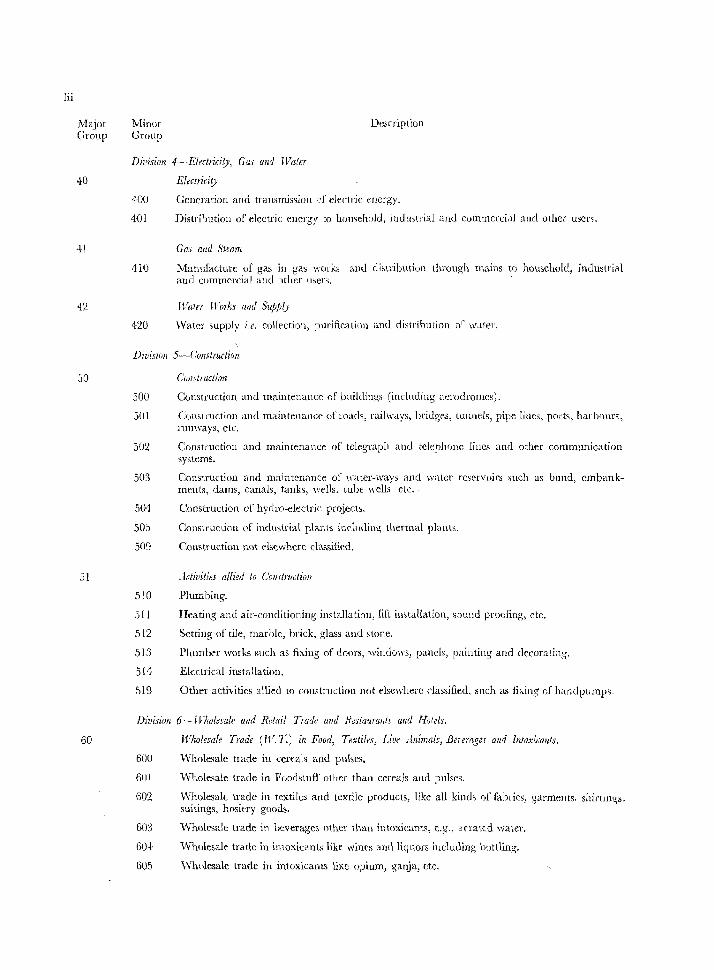
Iii
Major Group
Minor Group
Dh'ision 4- Electricity, Ga,' and Water
Description
40 Electricity
41
42
50
51
60
40U
40]
410
420
Generation and transmission d electric energy.
Distribution of electric energy to homehold, industrial awl commercial and other men.
Ga.1 and Steam
Manufacture of gas in gas works and di,tribution through mains to household, jnelustri~l and commercial and Jttter users.
Water Works and Supply
\Vater supply i.e. coll!:'ction, p1ll'ification a.mJ. distribution 0[' w,lte!'.
Division 5-CollJtruction
50U
501
5U2
50:1
504
505
509
510
51]
5]2
513
514
519
COlljtruction
Construction and maintenance of buildings (including aerodromes).
Construction and maintenance of roads, railways, bridges, tunnels, pipe lilles, ports, harbour" runways, etc.
Construction and maintenance of telegraph and telephone Jines and other cOrllmunic<ttion systems.
Construction and maintenance of water-ways and water reservoirs such as bUIld, embankments, darns, canals, tauks, wells, tube \vclls etc.,
Construction of hydro-electric projects.
Construction of indu\\trial plants including thermal plants.
Construction not elsewhere classified.
,ldivities allied 10 ConJtructioll
Plumbing.
Heating and air-conditioning installation, lift installation, SJulld proofing, etc.
Setting of tile, marble, brick, glass and stone.
Plumber works such as fixing of doors, winelo\\',), paneb, painting and decoraling.
Electrical installation.
Other activities allied to construction not elsewhere dassiiied. sLlch as fi;,.ing of handpurnps,
Division 6- Wholesale oild Retail Trade and Restaural/ts and Hotels.
60U
60]
602
603
60}
605
Wholesale Trade (11'.7.) in Food, Textiles, rive :lnimals, fJeverages awi Intoxicants.
Wholesale trade in cereals and pulses.
'Wholesale trade in Foodstuff' other than cereals and pulse,~.
Wholesak trade in textiles and textile products, like all kind, of fabrics, garments, shirtllw;s. sLlitings, hosiery goods.
Wholrsale trade in beverages other than intoxicants, e.g., <1nated water.
Wholesale trade in intoxicants like wines and liquors incluJing brltlling.
Wholesale trade in intoxicants liKe opium, ganja, etc.
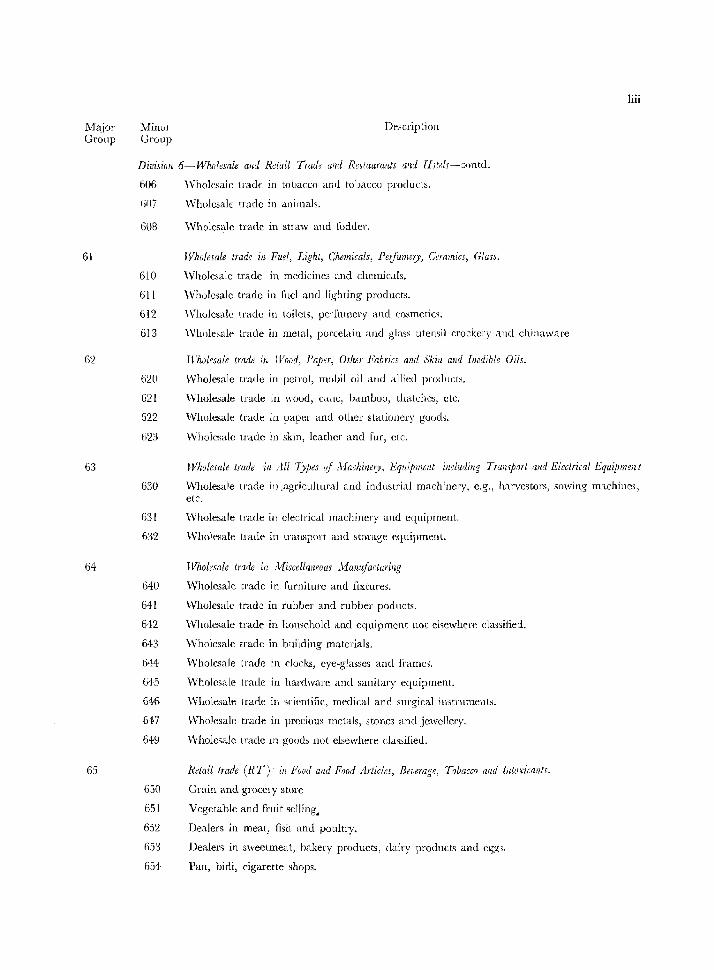
Major Group
61
63
64
65
Minol Croup
Description
liii
Division 6-Whnlt!.mle and Relail Trad" alld Restaurants ana HJtels-:ontd.
606
608
610
611
612
613
620
621
622
623
630
631
632
640
641
642
643
6H
645
646
647
649
650
651
652
fi5:3
654
'Wholesale lradf. in tobacco and tobacco products.
WholesalE trade in anirnah.
Wholesale trade in straw and fodder.
Wholesale trade in Fuel, Lighl, Chemicals, Perfumery, Ceramics, Glass.
\Vholesale trade in medicines and chemicals.
Wholesale trade in fuel and lighting products.
\ Vltolcsale trade ill toilets, perfumery and cosmetics.
\Vholesale trade in metal, porcelain and gla~s utensil crockery amI chinaware,
Wholesale trade in Wood, Paper, Other ~Fl!hrics alld Skill and Inedible Oils.
'Wholesale trade in pctrol, llIobil oil and allieu prOllucls.
\Vholesale trade in wood, callC, bamboo, thatches, etc.
\Vholesale trade in paper and other stationery good~.
'Wholesale trade in skin, leather and fur, etc.
Wholesale trade ill All Types of jlachinel)', Equipment including Transport and Electrical Equipmell t
Wholesale trade ill .agricultural and industrial machinery, e.g., harvestors, sowing machinel, etc.
\,yholesale trade in electrical machinery and equipment.
\Vholesale trade in transport amI storage equipment.
Wholesale trade in i\;[isceilaneous .lianujactllring
Wholesale trade in furniture and fixtures.
Wholesale trade in rubber and rubber poducts.
\Vholesale trade in household and equipment not elsewhere ela3Sifiei.
Wholesale trade in building materials.
Wholesale trade in clocks, eye-glasses and fi'ame,.
Wholesale trade in hardware and sanitary equipment.
\VhoJesale trade in scientific, medical and surgical instmments.
vVholesale trade in precious metals, stones and jewellery.
\Vholesale trade in goods lIot elsewhere classified.
Retail trade (RT)' in Food and Food Articles, Beverage, Tobacco and Intoxicants.
Grain and grocery store
Vegetable and li'uit selling.
Dealers in meat, fish and poultry.
Dealers in sweetmeat, bakery products, dairy products and eg:!;>.
Pan, bidi, cigarette shops.
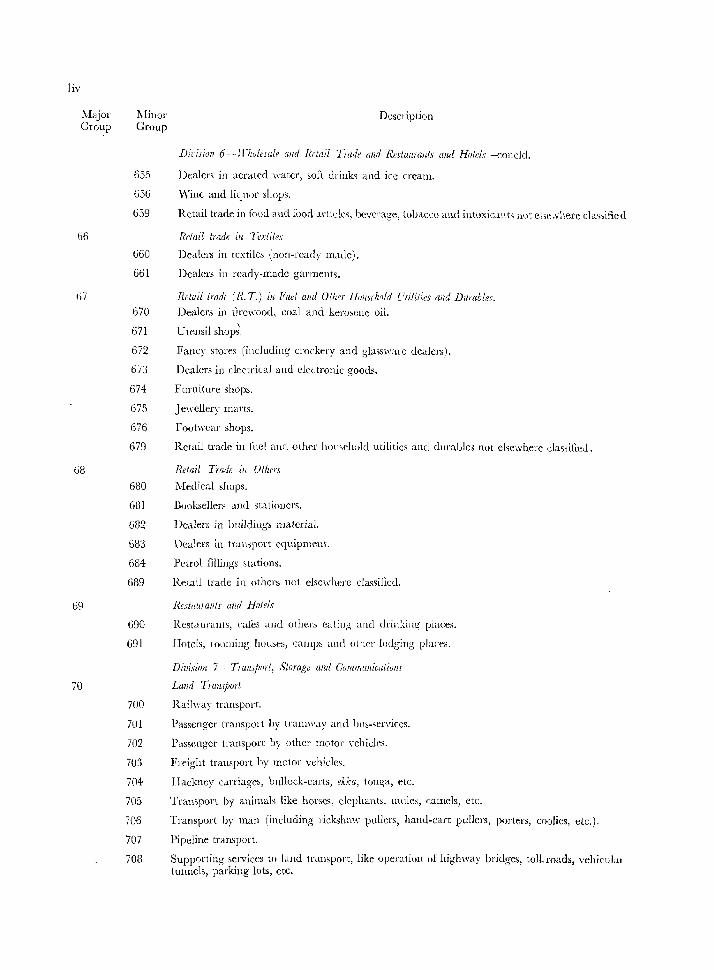
liv
Major Group
b6
li7
68
69
70
11inor Group
655
656
659
660
661
670
671
672
673
674
675
676
679
680
{ill!
682
683
684
689
690
691
700
701
702
703
704
705
706
707
703
Description
Dirision 6 -_ Trlwlesule and lIetail Trode and Restaurants and Hotels -concld.
Dealers in aerated \\'ater, soft drink~ and ice cream.
V\'jne and liq w)r ,hops.
Retail trade in food and food anic\c" beverage, tobaccu and intoxicant, nul: cL;c.v!\erc cb'"ificd
Retail trade in Textiles
Dealers in tcxtiles (non-ready made).
Dealers ill ready-made garments.
Retail trade (R. T.) in Fiwl and Oiher Hu/{sthn!d L'tililies alld Durables.
Dealers in firewood, coal and kerosene oil.
Utensil shopi.
Fancy stores (including crockery and glassware dealers).
Dealers in electrical alld electronic goods.
Furniture shops.
Jewellery marts.
Footwear shops.
Retail trade in fuel and mhe!' hon,ehold utilities and durable, not elsewhere da"ilieJ.
Retail Trade ill Others
Medical shops.
noobeller~ and stationers.
Dealer~ in buildings material.
Dealers in transport equipment.
Petrol fillings stations.
Relail trade in others not elsewhere claslified.
Rcs[(llllanis amI Holds
Restaurants, caies alld others eating and drinking places.
Hotels, looming houses, campo and other joclging plares.
Division 7 _. Transj}(lrl, Storage awl Cummllllic<&iiollS
Land TwnsjJort
Railway transport.
Passcnger transport by tramwdY amI blls-services.
Passcnger transport by other motor \·chicles.
Freight transport by motor vehicles.
IIackney carriages, bullock-carts, ..Aka, tonga, etc.
Transport by animals like horses, elephants. mules, camels, etc.
Transport by man (including rickshaw pullers, hand-cart pullers, porters, coolies, etc.).
Pipeline transport.
Supporting services to i<llld trdnsport, like operatioll of highway bridges, tolL roads, vehicu);u tunnels, parking lots, etc.
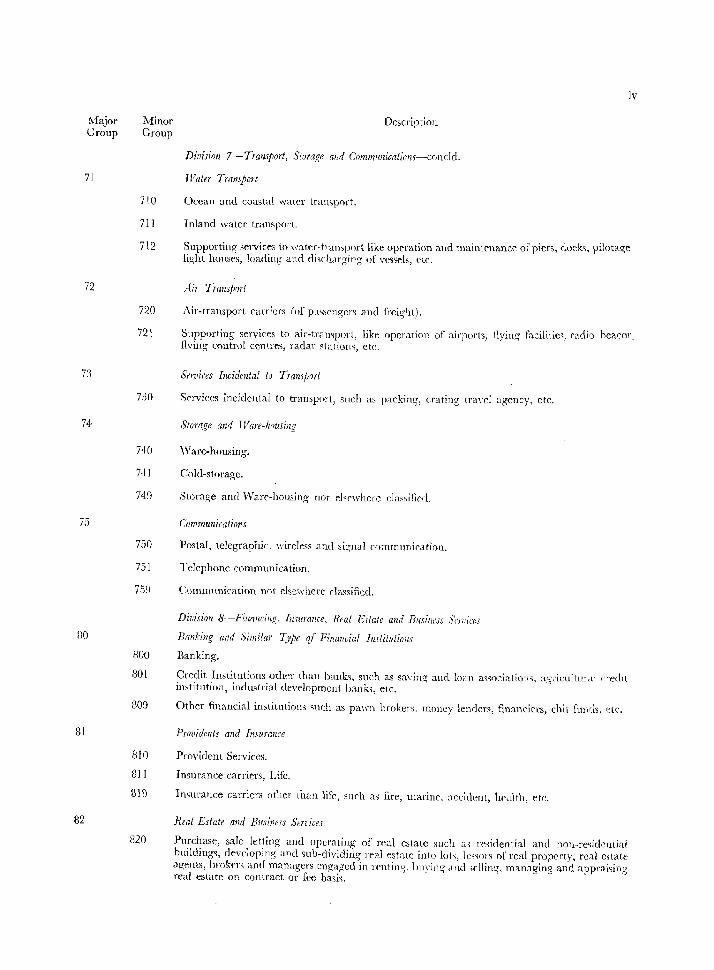
Major Group
71
72
73
74
75
80
81
82
Minor Group
710
711
712
720
721
730
740
7·11
]4<"1
7.')0
751
759
800
801
809
810
811
31'1
820
Iv
Description
Division 7-Transport, Storage alld Communicatiolls--conclcL
Water Transport
Ocean and coastal water transport.
Inland water transport.
Supporting services to water-tl'amport like operation and maintenance of piers, dacb, pilotage light houses, loading alld di5charging of vessels, etc,
Air Transjmrt
Air-transport carriers (of passcngers and freight).
Supporting services to air-tramporl, like operation of airports, flying" facilit1e' .. radio beaco". flying control centres, radar stations, etc,
Sen,ices Incidental to Transport
Services incidental to transport, snch as packing, crating travel agency, etc.
Storage and Ware-housing
\Vare-housing.
Cold-storage.
Storage and ""'arc-housing not eI~rwherc clas,ifird.
Commullicalions
Postal, teiegraphir, wireless and sl~na.l m;nmunication.
Telephone communication.
Communication not elsewhere classified.
Division g-Finnncing. Insurance, Real Estate and Business Services
Banking and Similar T;pe if Financial Iwlil/ilion.,'
Banking.
Credit Institutions other thall bank~. such as s,wing and 10iln as'iociations, a,";L'icultllLd ",'celit institution, industrial development bank" etc.
Other financial institutions such as pawn brokers, money lenders, financiers, chit fund" etc.
PrOlJidents and Insurance
Provident Services.
Insurance carriers, Life.
Insurance carriers other than life, such as fire, marine. :lccident, h(,<11th, etc.
Real Estate and Business Services
Purchase, sale letting and operating of real estate such ai residential and non-residential buildings, devt'loping and suh-dividing neal estate into lots, lessors of real property, real e,tate agents, brokl'l's and managers engaged in relllin.g, Imying ,llld selling. m'lnaging and apprai,ing real estate on contract or fee basis.
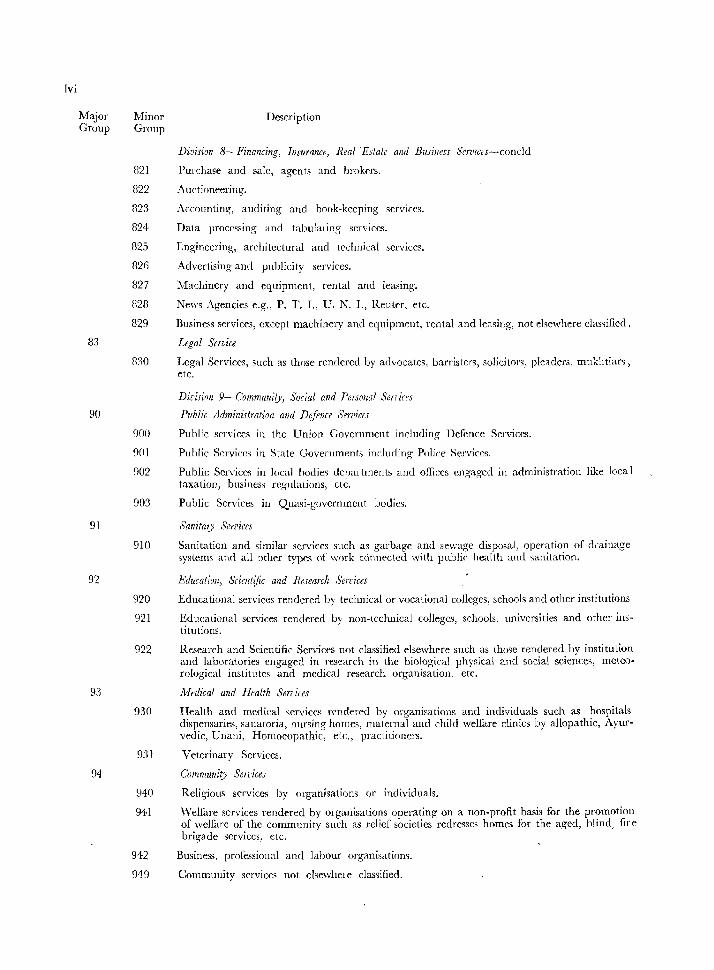
Ivi
Major Group
83
90
91
9'2
93
94
Minor Group
821
822
82:3
824
825
826
827
828
829
830
(jOO
901
902
903
910
920
')21
')22
930
931
Description
Division 8~Financing, Insurance, Real 'Estate alld Business Sm1lces-concld
Purchase and sale, agents and brokers.
Auctioneering.
Acrouuting, auditing and book-keeping services.
Data processing and tabulating services.
Engineering, architectural and tcchnical serVlce~.
Advertising and publicity services.
Machinery and equipment, rental and leasing.
News Agen~ies e.g., P. T. 1., U. N. 1., Reuter, etc.
Business services, except machinery and equipment, rental and leasing, not elsewhere classified.
Legal Service
Legal Services, such as those rendered by advocates, barristers, solicitors, pleaders. mukhtiars, etc.
Dh'ision 9-Commllrtily, Sorial and Personal Sen,jcfs
Public Administration alld D~lenrr Sen·icfs
Public servic~s in the Union Government including Defence Services.
Public Services in State Governments inclllding Police Services.
Public Services in local nodies departments and offices engaged in administration like local taxation, business regulations, etc.
Public Services in Quasi-government bodies.
Sanitary Serl'iccs
Sanitation and similar services such as garbage and sewage disposal, operation of drainage systems and all ~ther types of work conn('cted with public health and sanitation.
Education, Scientific and Research Sen'ices
Educational services rendered by technical or vocational colleges, schools and other institutions
Educational services rendered by non-technical colleges, schools, universities and other institutions.
Research and Scientific Services not classified elsewhere such as thoge rendered by institution and laboratories engaged in research in the biological physical and social sciences, meteorological institutes and medical research organisation, etc.
lvfedical and Health Serl.ires
Health and medical services rcndered by organisations and individuals such as hospitals dispensaries, sanatoria, nursing homes, maternal and child welfare clinics by allopathic, Ayur-vedic, Unani, Homoeopathic, e(c., practitioners.
Veterinary Services.
Community Sen'ices
940 Religious services by organisations or individuals.
941 vVelfare services rendered by organisations operating on a non-profit basis for the promotion of welfare of the community such as relief societies redresses homes for the aged, blind, fire brigade services, ctc.
942 Business. professional and labour organisatiom.
949 Community services not elsewhere classified.
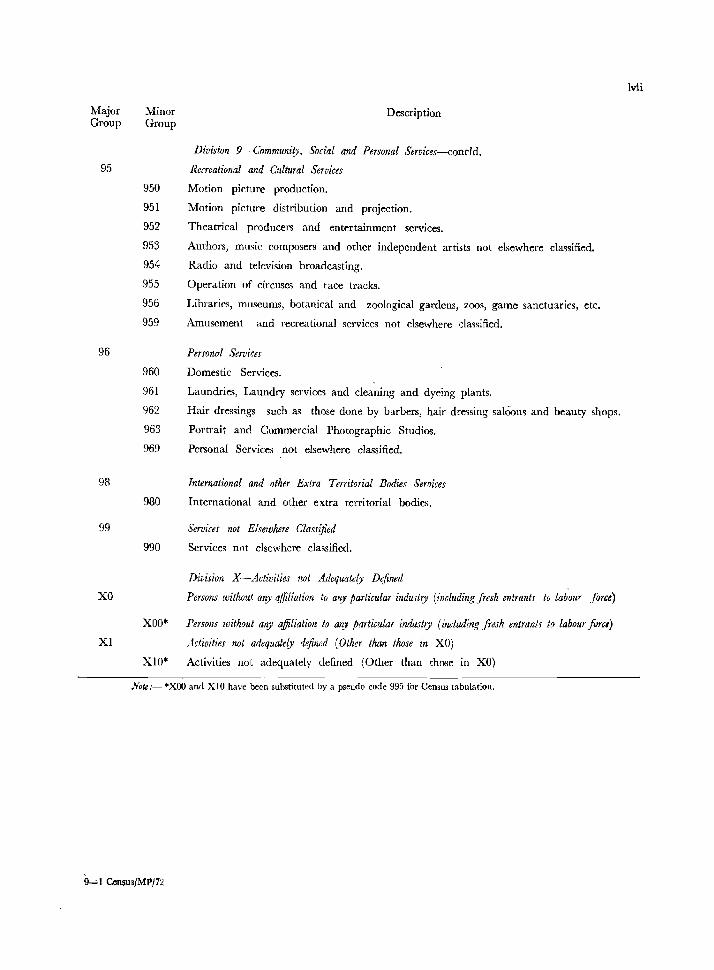
Major Minor Group Group
95
950
951
952
953
954
955
956
959
96
960
961
962
963
969
98
980
99
990
XO
XOO*
XI
XIO*
Description
Division 9~Cnmmunity, Social and Personal Services-conrld.
Recreational and Cultural Services
Motion picture production.
Motion picture distribution and projection.
Theatrical producers and entertainment services.
Authors, music composers and other independent artists not elsewhere cla~sified.
Radio and television broadcasting.
Operation of circuses and race tracks.
Libraries, museums, botanical and zoological gardens, zoos, game sanctuaries, etc.
Amusement and recreational services not elsewhere da~sified.
Personal Services
Domestic Services.
Laundries, Laundry service~ and cleaning and dyeing plants.
Hair dressings such as those done by barbers, hair dressing saloom and beauty shops.
Portrait and Commercial Photographic Studios.
Personal Services not elsewhere classified.
International and other Extra Territorial Bodies Services
International and other extra territorial bodies.
Services not Elsewhere Classified
Services not elsewhere classified.
Division X ~Acti1Jilies not Adequately Difmed
Persons without any affiliation to any particular industry (including jresh entrants to labor/" force)
Persons without any affiliation to any particular industry (includirlg fresh entrants til labour ji.·rcl)
Activities not adequately difined (Other than those in XO)
Activities not adequately defined (Other than those III XO)
Note:- *XOO and XIO have been substituted by a pseudo code 995 for Census tabulation.
9-'-1 CensusJMP/72
Ivii
TABLE B-1 Part A WORKERS AND NON·WORKERS ACCORDING TO
MAIN ACTIVITY CLASSIFIED BY SEX AND AGE-GROUPS
Table B-1 Part A
Notes
This table is the main economic table based on full count data. It gives distribution of population into two broad classes of "workers" and "non-workers". Workers have oeen further divided into nine broad indmtrial categories.
2. There is a departure from the 1961 Census as regards presentation of data into nine industrial categories in this table. Mining and quarrying have been assigned a separate category,i.e., Category IV, as against the combined category III in 1961, viz., mining, quarrying, livestock, forestry, fishing, hunting and plantations, orchard and allied activities. The 1961 category IV of household industry is included in Category V (manufacturing, processing, servicing or repairing) treating it as sub category V(a). At the 1961 Census, "household industry" also covered establishments falling under Division '0' and '1' of the Indian Standard Industrial Classification such as cattle rearing, beekeeping, orchardry, plantations, etc., apart from those falling under Division 2 & 3. At the 1971 Census, "household industry" is confined to Division 2 & 3, I\e., it covers only manufacturing, processing, servicing and repairing.
-3. As against four age-groups, viz., 0-14, 15-34,35-59 and 60+ in the 1961 Census, each category of workers and non-workers have becn cross-classified into eight age-groups, viz., 0-14, 15-19,20-24,25-29,30-39,40-49,50-59,60+ and a further group returning no age in this Census.
4. As in 1961, the data presented in this table relates to the territorial units-State/Division/District for Total Rural and Urban areas.
3
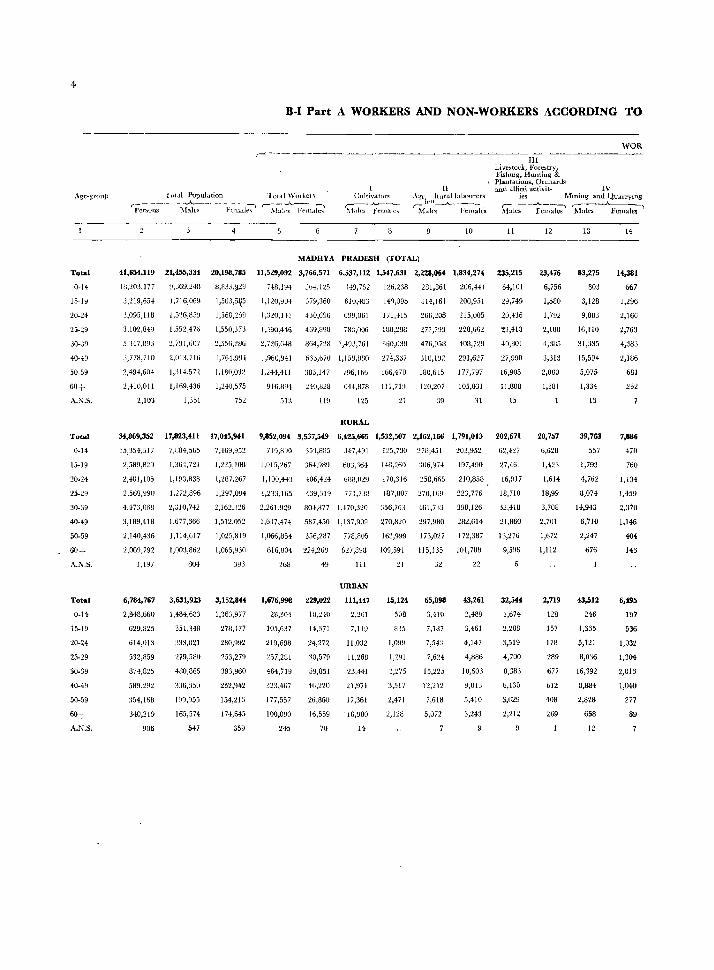
4
Total
0-14
15-19
20-24
30-J9
40--19
50-59
60+
A.N$.
Total
0-14
15-19
25-29
30-39
40-49
50-59
60+
A.N.S.
Total
0-14
15-19
20-24
25-29
30-39
~O-49
50-59
60+
A.N.S.
B-1 Part A WORKERS AND NON-WORKERS ACCORDING TO
WOR ~-----------------------------....:___--~ ~---------
~
Pcr:JUI1S
{_;ultiyators ,--_J...~~_
~Ialc~ F(,lllale~
II \gr, lturallabourers ~ lCll____.....__~._ ,
~1d.k'S Females
10
MADHYA PRADESH (TOTAL]
II! Live!>(od, Fore!>try,
, Fishmg, Huotiug & Plautatiolls, Orchards and allied activit. IV
ies .Mming and Quarrying
M~d('s -;;-e-;;~~ 'hl~~~ak;'
11 12 13 14
41,654,119 21,455,334 20,198,785 11,529,092 3,766,571 6,537,112 1,541,631 2,228,OM 1,834,274 235,215 23,476
6,756
1,580
1,792
2,t88
4,385
3,313
2,080
1,381
83,275 14,381
lU,:!OJ,177 9,369,24U 8,833.~~ H8,lg4 J6~,145 ).1.9,752 U6,238 281,861 ~06,4H
3,219,654 1,716,069 i,50J,Sq? 1,120,9D-l J79,360 610,483 14~,095 314,161 200,951
3,095,118 1,5:!6,359 1,568,:!59 l,nO,141 4JO,696 699,061 171,415 266,208 215,005
:LlO'l,G4:!J 1,552,476 l,550,37J 1,49U,446 469,898 i8~,006 188,298 277,793 228,662
5.'H7,81J3 2,7:11,607 ~,556)~H6 :':,726,648 864,7:.!8 1,49J,761 3IjO,O:W 47ti,95U 40B,729
3,778)10 2,013,716 i,76f.99·j. 1,960,941 633,b7U 1,15~,HB{l :274,3:17 3lU,192 291,627
2,491,604
2,410,011
2,103
1,3]4,572
1,169,436
1,351
1,180,03:.!
1,240,575
752
1,244,411 383,147 796,166 166,170 180,6-15 177,797
916,89-1 240,828 6-11,878 111,719 120,207 105,031
513 119 125 21 J9 31
RURAL
64,101
29,749
20,436
23,410
40,801
27,990
16,905
11,808
15
34,869,352 17,823,41l 17,045,941 9,852,094 3,537,549 6,425,6fi5 1,532,507 2,162,16fi 1,791,013 202,671
15,354,517 7,H84,565 7,469,952 719,890 351,885 347,491 125,730 278,451 203,952
L,589,829 1,:364,nl J,225,108 1,01.'),267 J6.J.)~HN liOJ,:1ti4 148,2t-i() :-:I()6,97" 197,490
2,481,105 1,193,838 1,287,267 1,100,4-1-:3 406,424 bHH,[)'!~l 170,316 258,665 210,858
2,569,990 1,272,896 1,297,W4 1,233,165 439,319 711,738 187,007 270,169 223,776
4,473,068 2,310,742 2,162,326 2,261,929 804,877 1,470,320 356,763 461,733 398,126
3,189,418 1,677,366 1,512,052 1,637,474 587,450 1,137,909 270,820 297,980 282,614
2,140,436
2,O(j9,792
1.197
1,114,617
l,003,U62
804
1,025,819
1,065,930
393
6,784,767 3,631,923 3,152,844
2,848,660 1,484,683 1,363,977
629,82:; 351,348 278,477
614,013 333,021 280,992
:'32,859 279,580 253,279
874,82:; 480,865 393,960
5B~'292 336,:150 252,942
354,168 199,955 154,213
310,219 165,574 17'1,645
906 547 359
1,066,854 356,287 778,805 163,999 173,027 172,387
816,804 224,26~ 627,898 109,591 11:;,135 101,788
268 49 111
URBAN
1,676,998 229,022 111,447
28,304 10,240 2,261
105,637 14,371 7,119
219,698 24,272 11,032
257,281 30,579 11,268
464,719 59,851 23,441
3:!3,467 46,2~O 21,971
177,557 26,860 17,361
100,090 16,559 ' 16,980
245 70 14
21
15,IH
50B
83:;
1,099
1,291
2,471
:!,12B
65,898
3,410
7,187
7,543
7,624
15,225
12,212
7,618
5,072
22
~3,261
2,489
3,461
4,147
4,886
10,603
9,013
5,410
3,243
62,4~7
27,461
16,917
18,710
32,418
21,860
13,276
9,596
32,544
1,674
2,288
3,519
4,700
fI,3B3
6,130
3,629
2,212
20,757
6,628
1,123
1,614
18,99
3,708
2,701
2,719
128
1:;7
178
289
677
612
408
269
803
3,128
9,883
16,110
31,:)35
15,594
5,075
1,334
13
39,763
557
1,793
4,762
8,074
14,943
6,710
2,247
676
43,512
246
1,335
5,121
8,0%
16,392
8,884
2,828
6:;8
12
667
1,296
2,166
2,763
4,383
2,186
681
232
7,886
470
760
1,134
1,45~
2,370
1,146
104
143
6,495
197
536
1,032
1,304
2,013
1,040
277
89
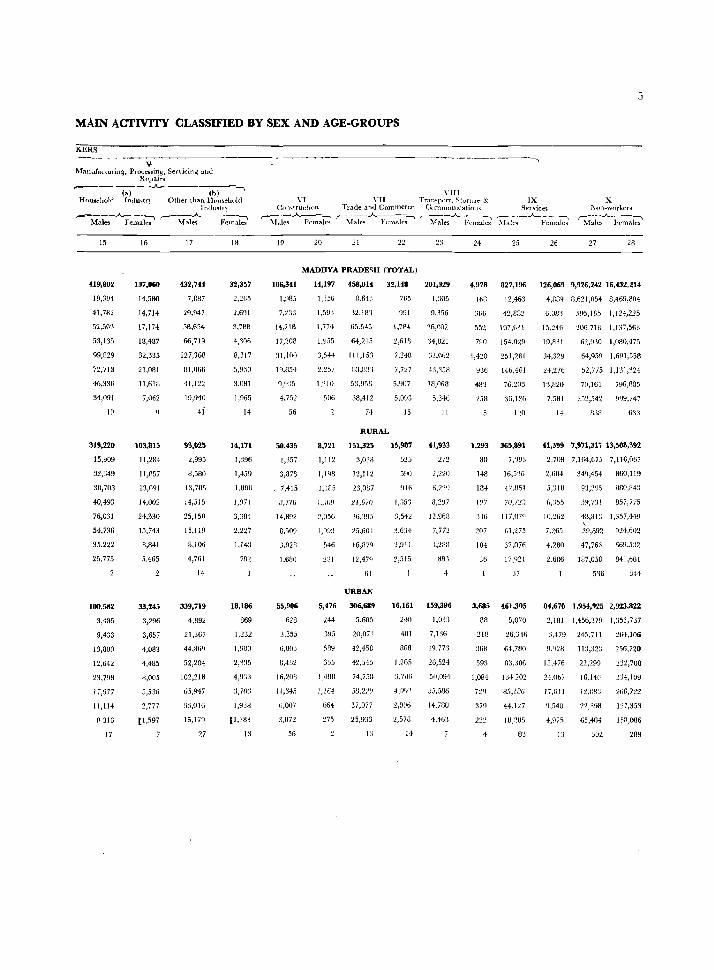
5
MAIN ACTIVITY CLASSIFIED BY SEX AND AGE-GROUPS
KERS
V Manufacturing, Processing, Servicing an<l
Repairs ,----- (a)- --,,---~-,
Household Indu~tq Other tha.n HOllSeh(lld Tllllmll'l
'-M;.I;,--" Fe""I;:;' "-~':ki
15
419,802
19,391
41,782
52,503
53,135
99,829
72,713
46,336
34,091
ID
319,220
15,909
32,349
SR,703
40,493
76,031
54,736
35,222
25,775
IOO,5lI2
3,fR5
9,433
13,800
12,642
23,798
17,977
11,114
H 316
17
16
137,DfiO
14.580
14,714
17,174
18,487
32,335
21.081
11,OW
7,062
103,815
11,284
1l,057
13,091
14,002
24,330
15,743
8,841
.1,465
33,245
3,296
3,657
4,083
4,485
8,005
5,338
2,777
[1,597
17
432,744
7,887
29,947
58.654
66,719
127,%8
1ll,0on
41,122
19,9'10
4i
93,025
2,995
8,580
1.1,7flS
14,515
25,150
15,119
8,106
4,701
14
339,719
21,367
44,869
52,204
102,218
6.5,94;
:-1:1,016
15,179
27
18
32,357
2.265
2,691
3.788
4,10fi
8,317
3,081
1,965
J.!
14,171
1,396
1,459
I.BIlI!
1/;71
3,384
2,227
1,143
7f1:l
18,186
869
1.232
2,335
4,933
:1,711:;
1,938
(1,181
13
"III VI "II Trall<,port, Storag-{" & IX X
;'\()l1-worlers ,-----...A.._~
~fales Females
Cl)n~tructlon Trade and Commerce Cnmn1unicatiollS Service'! ~...A..._~ ~131e~ }'emale<; '--\faIe;.A. Fc;~b r-Male'i .A.~;l~~ ~~;J>._ Fe~ki
19
106,3f!
1.985
7,23:~
14,21B
17,208
31,100
19.11.14
~l,q:15
4,752
56
50.435
1,357
3,878
7.41.1
D,776
14,892
8,509
.1,92B
1.680
55,906
62B
3.355
6,803
8,432
16,208
11,345
6,007
3.072
56
20 21 22
MADHYA PRADESH (TOTAL)
14,197 458,014 32,148 201,329
1/156 B.64:1 765 1.305
1,593 32,ml
1.774 65,545
1,955 64,215
3,544 111,15:1
2.257 rn,W)'1
53,956
38,412
71
RURAL
8,721 151,325
1,112 3,03B
1,198
1.1115
1 •. :00
2,056
J,OY3
546
2:31
12,112
23,087
21,671)
36.'395
25,601
16,879
12,47fJ
61
URBAN
5,476 306,689
244
395
589
655
1,4118
1,164
664
275
5,605
20,M!
42,458
42,545
74.7.'111
5H,2L'Y
37,077
25,933
10
1)91
1.784
1,6IH
7,248
7,727
5,9tJ7
5,093
15
15,987
590
916
1,:151
3,542
3.634
2,911
2,515
9,356
26,O()2
34,B21
03,062
4:1,358
11l,OfiB
5,346
11
~1,933
27~
2.220
8,297
12.91i8
7,772
Cl.2RR
SBcl
16,161 159,396
240
401
8G8
1.26'>
:J,7tHi
2,578
14
1,033
7,136
19.773
26,524
5(),094
35,586
14,780
4,463
24 25 26 27 28
4,978 827,196 126,069 9,926,242 16,432,214
Ih8 12,463 4,Om 8.621,054 8,469,804
366 4:1,832
:\5~ 107,631
790 154,029
1,420 251,2111
936 1+6,461
48'3
258
76,203
3fi,126
1 ~()
1,293 365,891
80 7,193
148
184
1!!7
16,53G
41,1151
7U,72:1
336 117,07"
207
104
36
Gl,275
32,076
17ml
37
3,685 461,305
88 5,070
218 26,346
368 61.780
593 83,306
1,084 134 202
i'l/J 85,18G
379 44,127
22~ Hl,2[)5
83
6,08'1 595,165 1,12+,225
15,246 206,ilB 1,137,563
19,831 62,(>30 1,080,475
34,329 64,Q59 1.691,558
24,276 52,775 1,131,324
11,mO 70,161 796,885
7,581 252,542 999,747
1I:1Il
41,399 7,971,317 13,503,392
2,708 7,164,675 7,116,067
2,604 34",454 860,119
5,'J18 93,3')5 BllO,84:J
0,::55 .'N,TH R57,775
10,262 48,813 1,357,149 , 7.~65 39,892 9:.H,602
4.280 47,763 669,532
2,606 1R7,058 841,b61
516 344
84,670 1,954,925 2,923,822
2,181 1,156,370 1,353,737
:),479 245,711 264,10ij
9,028 113,323 2')6,72()
13.476 22,299 222,700
24.067 16,140 334,109
17,011 12,SP.:; 2(]6)22
9,540 22,398 127,353
4,9" 65,4fJ4 ISH,illJ6
13 302 28~

6
Age-group
Total
0-14
15-19
20-24
25-29
30-39
40-49
50-59
611+
A.N.S.
Tot.1
0_14
15_19
20-24
25-29
30-3~
40-49
50-59
60+
A.N.S.
Total
0-14
15-19
20-24
25-29
30-39
40-49
50-59
60+
A.N.S.
Total Population ,---___ .J..---________ -..
Males Fema1('s Persons
B.I Part A WORKERS AND NON.WORKERS ACCORDING TO
Total Workers ~.A..~.----,
Males Fetn:l.1f:S
6
III Livestock. Forestry, Fishing, Hunting & Plantations, Orchards
II and allied a(:tivi - IV
WOR
Cultivator~ Agricultural labourers ties Mining and Quarrying ~..)...---~ ~.)~-.. r---~~ ~--~
Males Females Mal~s FeIllales Males FemaJes Males Females
10 11 12 13 14
I GWALIOR DIVISION (TOTAL)
4,352,880 2,350,545 2,002,335 1,224,875 134,850 824,009 .',730 118,139 67,Q28
5,247
5,9R4
7,B71
8,900
15,199
12,232
8,058
3,535
19,225 1,269
218
91
III
115
27:1
194
170
97
2,359
58
231
300
347
67:1
421
240
300
19
42
39
54
70
45
16
15
1,873,27J 1,022,258
357,022 195,365
351,616 179,197
335,525 175,442
542,920 295,848
395,248 217,196
270,235 148,839
226,560 116,082
4Bl 318
851,015
161,657
172,419
16U,.083
247,072
178,052
121,396
1l0,478
163
3,524,625
1,525,773
274,387
275,915
272,717
442,457
323,001)
1,900,837 1,623,788
224,589
184,785
196
828,255
347,5(10
82,635
75,701
62,808
100,463
71,412
45,646
41,775
285
834,641 691,132
149,3:10 125,051
138,064 137,851
141,8% 130,821
241,336 201,121
177.227 146,579
12:1,299
94.884
154
449,1011
187,617
46,029
41,133
33.546
54.512
39,969
25,540
21,198
164
101,290
89,901
42
378,541
159,883
36,606
34,568
29,262
45,951
31,473
20,106
20,577
121
52,872
114,846
15:1,015
169,817
291,516
2]:1,367
9,468 32,338
10.925 77,932
15,047 97,751
16.924 107 ,son 30.820 191,039
25,794 146,269
141,140
88,210
72
17,136 102,276
8,731 68,336
RURAL
1,023,578 119,872 805,744
49,564 9,026 32,477
101,137 1O,2G9 76,611
J25,920 13,651 95,842
138,894 15,052 105,495
23[1.623 26,764 187,057
J 74,797 22,474 142,709
IlB,735
75,889
19
15.0YU
7,542
4
201,297 _ 14,9711
3,308 442
13,709 656
27,095 1,:196
30,92:1 1,872
52,893 4,056
38,570 3,320
22,405 2,046
12,341 1,189
53
99,619
(j5j9~7
UJ{BAN
18,265
%1
J,521
1,909
2,065
3,982
3,.160
2,657
2,409
3,285
:1,9 IS
~,192
.1,454
1O,27B
~J,372
6,481
3,751
46,558
3,259
3,849
5,088
5,337
10,029
9,126
6.202
3,536
1,172
26
66
104
117
249
246
199
165
12,170
17,:IYI
16,475
16,IiM
25,749
15,68:1
9,114
4,890
111,494
11,896
16,520
15,604
15,785
24,223
14,454
B,42B
4,481
6,645
274
771
B7l
879
1,526
1,229
686
409
65,239
5,172
5,8!J5
7.725
8,701
14,749
11,828
7,775
3,402
1,78!1
75
99
146
199
450
404
283
133
3,985
2,467
1,924
2,1R'1
:1.628
2,528
1,614
B94
14,188
3,808
2,104
1,437,
1,416
2,288
1,465
1,021
587
5,037
177
303
487
767
1,340
1,063
59:1
307
823
188
50
74
73
158
118
102
55
446
30
41
37
37
115
76
68
42
88
1,482
42
173
205
238
412
241
125
46
877
16
58
95
109
261
180
115
42
193
16
27
26
39
46
25
107
J5
13
15
24
20
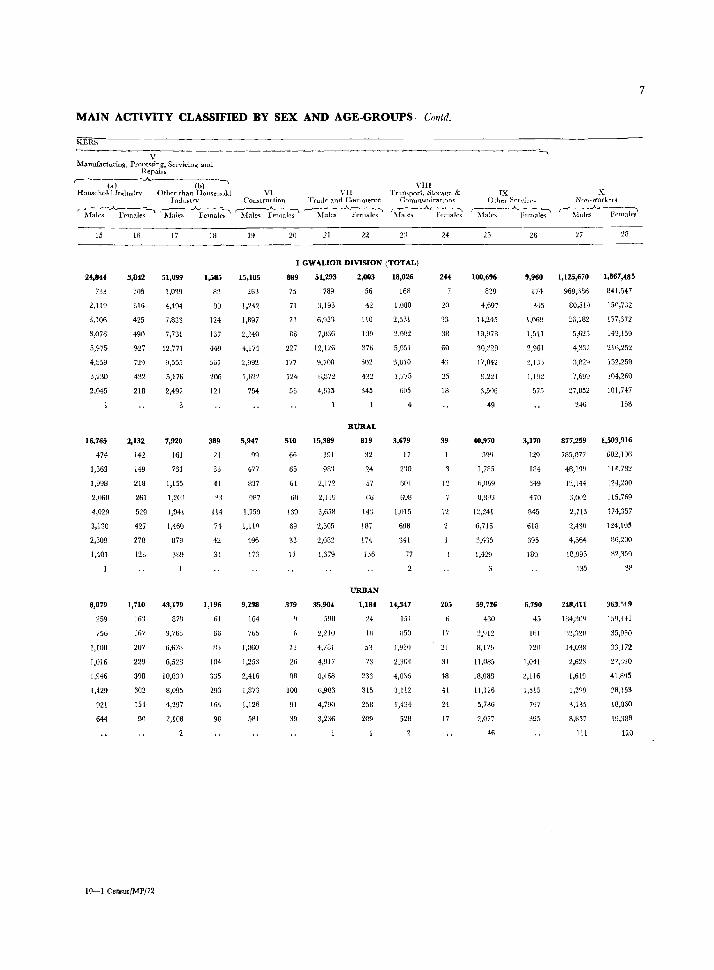
MAIN ACTIVITY CLASSIFIED BY SEX AND AGE-GROUPS-Contd.
KERS
V ~fanufacturiug, Processing, Servicing and
H.epairs ~-) __ .A__~~_-.. HntL'tf'hold fndustrv Other than Household
Industrv
'-M~J:;-~('mal; ~ ~;;-_A_Female~
15
24,844
733
2,119
3,106
3,076
5,975
4,559
3,230
2,045
16,765
414
1,363
1,99B
2,060
4,029
3,130
2,309
1,401
8,079
259
756
1,10B
1,016
1,946
1,429
921
644
16
3,842
305
316
425
490
927
729
432
21B
2,132
142
149
21B
261
529
427
278
128
1,710
16:3
167
207
229
398
302
154
90
10~1 Census/MP/72
17
51,099
4,494
7,833
7,731
12,771
9,555
5,176
2,497
7,920
161
731
1,155
1,203
1,941
1,460
879
389
41,179
878
3,763
6,678
6,528
10,830
8,095
4,297
2,108
18
1,585
82
124
137
449
367
206
121
389
21
33
41
')3
114
71
42
31
1,196
61
6fj
U:;
104
335
293
164
90
VI YII COllstrndirm TraJt' and C:omnlt"rce
~-"----, ~ ___ ....A..~ :!\hlc.. Females ~Iales F{"mall"'s
19 20 21 22
VIII Trarl<lport, Stm-at:'e &
Comm\.lni("atl0n~
~.A..--------:---l ~fales Femalt's
23 24
I GWALIOR DIVISION (TOTAL)
15,185
263
1,242
I,B97
2.240
4,175
2,992
1,622
754
5,947
9~
477
837
9117
1,759
1,110
196
173
9,238
IG4
76.\
1,060
1,253
2,416
1,873
1,126
5Bl
889 51,293 2,003 18,026
75
71
71
86
227
177
]24
56
510
66
65
. 61
611
139
69
33
17
379
I ~
26
88
108
91
39
789
3,193
6,953.
7,036
12,126
9,70n
6,872
4,615
15,389
191
981
2,119
3,65H
2,805
2,082
1,379
35,904
598
2,210
4,781
4,917
8,468
6,903
4,790
3,236
56
42
110
139
376
S02
345
RURAL
819
32
24
57
fiG
143
187
174
136
URBAN
168
1,080
2,531
3,M2
5,051
:1,Ul0
1,775
605
3,679
17
2~0
[jnl
{i9S
1,015
698
341
77
1,184 14,347
24
1B
5'1
73
233
315
258
209
151
1150
I,Y30
2,304
4,036
3,112
1,434
528
2H
38
60
4:;
18
39
12
12
205
17
21
31
18
-II
24
17
IX Other Scrvi:::t·~
r----..A_~ "\-f<lles Female"
25
100,696
829
4,697
14,245
19,978
30,329
17,1142
!1,221
3,506
49
<10,970
39q
1,785
R,(lG9
8,fN:1
12,241
6,716
~\,4'15
1,429
59,726
430
8,175
11,085
18,088
11,126
5,786
2,077
46
26
9,960
174
'145
1,069
1,511
2,961
~,l3'J
1,192
575
3,170
129
184
~\49
47U
845
618
3%
130
6,790
45
HiJ
nil
1,041
2,116
1,515
797
395
X Non-worker ..
r-~s_"__~~
27
1,125,670
969,~\86
80,510
26,182
5,625
4,332
7,699
'27,852
246
877,259
785,077
4B,199
12,144
3,(102
2,713
2,430
4,564
18,995
1,867,485
841,5<7
150,7clZ
137,372
143,159
216,252
152,253
101',260
101,747
158
1,503,916
682,1 Of)
J 14,782
124,200
115.7r,9
171,357
124,100
86,200
82,35Q
135 38
UB,.Jll
184,309
14,0:18
2,623
1,619
1,399
~,135
B,857
III
363, ~f 9
1.1Q,++1
35,950
33.172
27,390
41,8'15
28,153
18,060
19,388
12Q
7
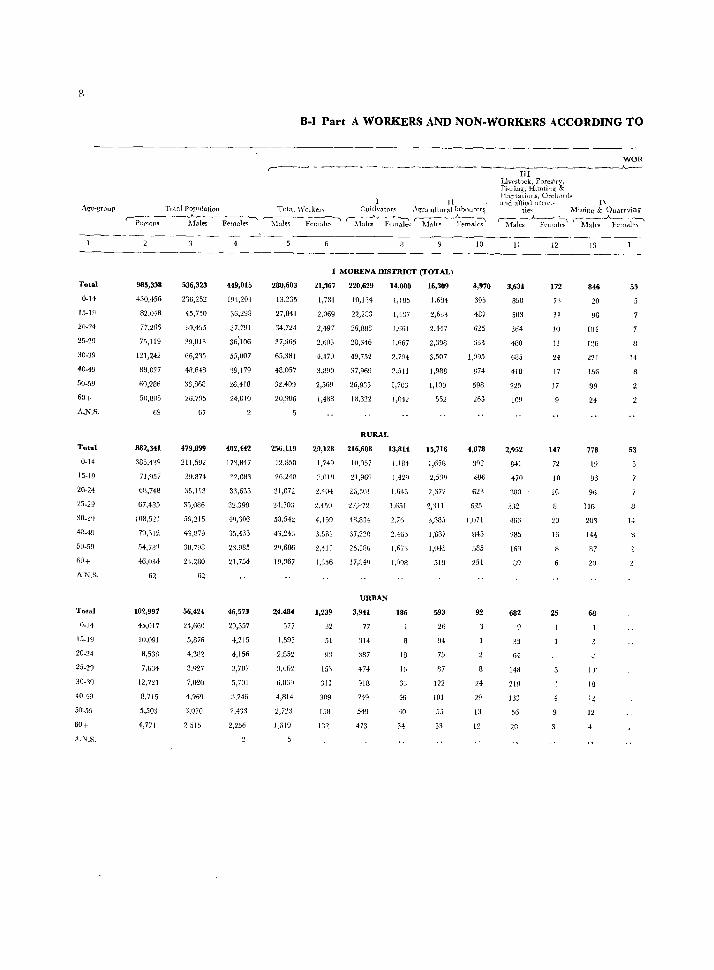
8
Total
0.14
15.19
20·24
30·39
40·49
50·59
60+
A.N.S.
0-14
20-24
?5·29
30.39
40·49
50·59
AN.S.
Total
0·14
15-19
20·24
2.1·29
30·19
4049
50·59
60+
A.N.S.
B-1 Part A WORKERS AND NON-WORKERS ACCORDING TO
WOR r--~-~·~----·~----~---~-------rrr-------.A---
I II TotaI Popu!ation Tntnl Worken r:uJtivator~ r\~ri{ultlln,llabnurers,
~----~~-..-"---- -__ . ~ ,...-----------, r----"~-_, ~-._-A---_.... Per'loos 1.fales Ff'male~ !\!a!e<; Fem<l.ic<; :\Iales Frmalt:" ~blt'" Ff>rnalt's
9115,338
430,456
82,048
77,286
75,119
121,242
88,027
60,281i
50,DOS
69
882,341
385,419
71,957
68,748
67ABS
108,521
79.11"
54,78'1
46,034
62
102,997
45,017
10.091
8,538
7,fi34
12,721
8,715
5,503
4,771
536,323
236,252
45,750
39,495
39,013
66,29;'j
48.848
:13,868
26,7!15
67
479,899
211,592
39,871
35,113
35,086
5~,215
43,879
30,7"8
24,280
62
56,424
24,660
5,876
4,3112
3,Q27
7,[l?O
4,969
3,070
2,515
449,015
194,204
36,298
37,791
36~06
55,007
39,179
26,418
24,010
4112,442
17'1,847
'12,081
33,635
32,399
4~,306
35,4:13
23,~85
21,7.G4
46,573
20,357
4,215
4,156
3,707
5,7[l1
:1.746
2,433
2,256
280,603
13,235
27,841
34,721
37,965
65,381
48,057
32,409
256,119
12,8511
26,21B
31,872
31.303
58,5-12
43,243
ZQ,686
19,367
24,484
177
1,593
2,852
4,814
2,723
1,519
1 MORENA DISTRICT (TOTAL)
21,367 220,629
1,781
2,069
2,497
2,603
4,470
3,890
2,569
1,488
10,1'14
22,283
26,888
28,316
49,75'1
37,969
26,9.15
18.322
14,000
1,I1l5
1,4:l7
1,661
1,667
2,704
2,511
1,703
1,042
RURAL
20,128 216,688
1,74Q 111,057
:\Olfl ~I,96'l
2.404 2G,501
2.410 27,872
4,159
3.531
2,'!11
1,356
1,239
32
51
93
153
311
309
158
IS2
4~,834
26,JR6
17,84Q
U1tBAN
3,941
77
314
387
474
918
749
549
473
13,814
1.184
1,429
1,643
1,651
2,761
~,465
1,673
1,008
186
18
16
33
46
30
16,309
1.684
2,633
2,447
2,398
3,507
1,988
1,100
552
15,716
1,658
2,5:19
2,312
2,:111
'1,385
1,837
1,0015
519
593
26
94
7;'
87
122
101
55
33
10
~,970
395
437
625
633
1,095
!J74
598
263
4,878
486
62:,
615
1,071
B45
585
251
92
11
LivestGck, Forestry, Pi~hillg. Hl1nting & Plantations, OrchOlrrls :tnd :t11icu ;trtn'l' IV
tie~ Mininer & Quarrving ~...A--~----:~ /.~~....A_..--.,
Males Ft'"m:1.ies ]\.tales Fema1f'<;
11
3,634
850
503
364
480
685
418
225
109
2,952
841
470
'\00
332
46(l
285
l(-iS!
g0
682
33
6·!
148
219
133
56
12
172
73
11
10
11
24
17
17
147
n 10
10
8
20
25
13
846
20
96
104
126
221
156
99
24
778
19
96
116
203
144
117
20
68
jj'
18
12
53
14
53
I"
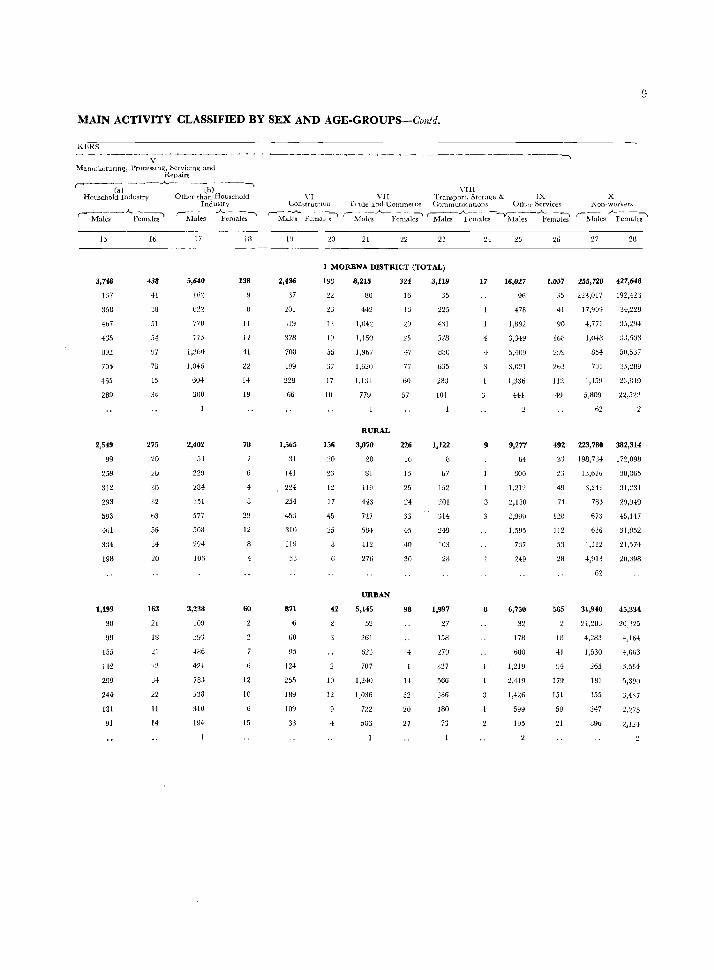
MAIN ACTIVITY CLASSIFIED BY SEX AND AGE-GROUPS-Contd.
KEHS - --------y-- --~-~--~-~---~----------~--------~--~-----------.. Manuf<LctUl'lOg, Processmg, Servicmg and
Repairs ,.-----~)----..A..-~---(b)- ----,
Household industry Other than Household lndu~trv
VI Con"tructIull
YII! VII Transport, StOla~e & IX
Tr'1.ue und Commelce CommUlllcutlOlls Other Services X
Non-worker:-
9
r--M- a-lc-, - A. Fem~ (~~W(;~--~;;lai~l r--Mal:S-- Fem.l-k:' (---.......... --- -1 ~-_.A,._----~-_.A._-:-l
!>.falcs Females Males Females Males Females r- :.\lalcs .A..F~m~e~
15
3,748
IJ7
4b7
4:35
U~11
705
'165
289
2,549
99
259
:112
293
593
461
3:34
198
1,199
3~
99
155
l!~
299
244
131
91
Ie
438
41
38
51
5f
78
45
34
275
~o
~o
3U
32
b3
56
:34
20
163
21
18
21
J4
22
11
14
17
5,640
770
775
1,300
1,046
004
300
2,402
53
229
284
:151
577
503
294
IOn
3,238
109
393
486
424
733
533
310
194
18
138
II
H
41
14
19
78
4
12
60
12
10
15
19
2,436
37
~01
J19
:-;78
70U
499
66
1,565
31
141
2H
254
453
310
119
871
60
95
124
255
189
109
33
:W 21 23
1 MORENA DISTRICT (TOTAL)
198
12
19
:37
17
10
156
20
12
17
45
42
10
12
8,215
80
442
1,042
1,150
1.9b7
1.ti~O
I,U4
77~
RURAL
3,070
28
181
419
443
127
584
412
276
URBAN
5,145
52
261
62:3
707
1,240
1,036
722
503
324
16
25
47
77
60
57
226
Iv
13
25
24
33
45
40
30
98
4
14
32
20
27
3,119
35
225
431
528
880
635
101
1,122
h7
152
201
31-1
249
103
28
1,997
27
158
'.!.7fJ
327
566
386
180
73
17
4
8
25
16,027
478
1,892
3,349
5,40Y
:1,021
1,336
4H
9,277
64
300
1,212
L,130
2,990
1,595
7:37
249
6,750
32
171l
080
1,219
2,419
1,426
599
195
26 27 28
1,057 255,720 427,648
35 22'1,017 192,423
41 17,909 34,229
90
854
7Ul
1,-159
5,809
62
35,294
50,537
35,23U
23,849
492 223,780 382,314
33 198,734 172,098
120
112
53
28
565
Hl
41
94
179
151
59
21
3,241
733
673
636
1,112
4,913
62
31,940
24,283
4,283
1,530
:265
181
155
347
896
30,065
31,231
:20,949
45,117
31,352
21,574
20,398
45,334
20,325
4,164
4}H:i3
3.554
5,390
:;,4::;7
:2,275
:[,124
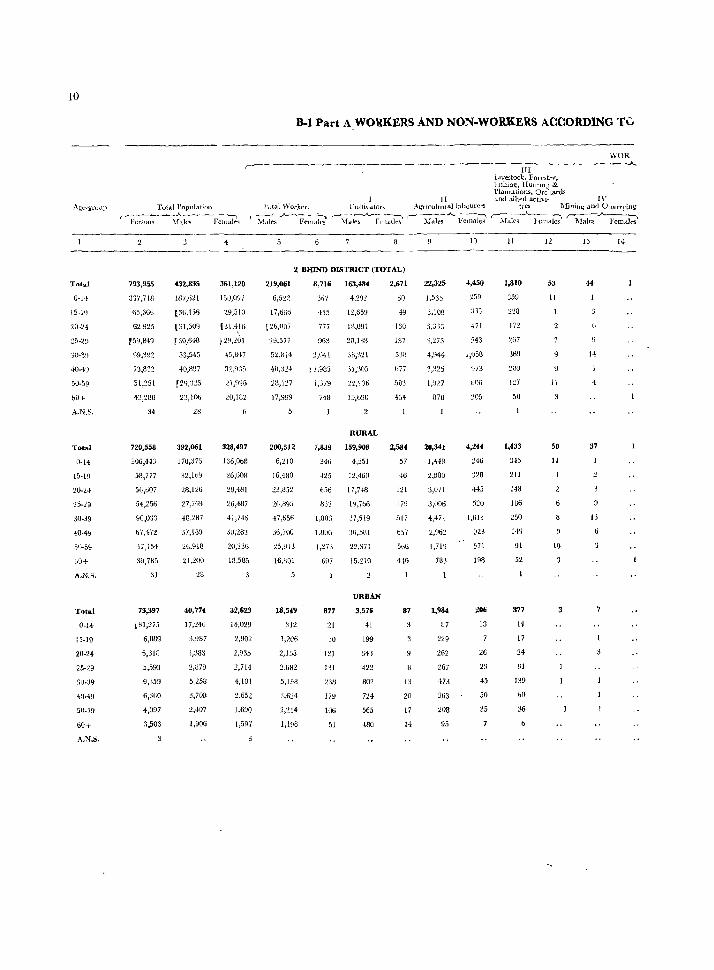
Total
30-39
40-49
&0+
A.N.S.
'Cotal
6[H
A.N.S.
Total
0-1~
15-19
20-24
25-29
,~O.:l9
60+
A.N$.
Tuh~.l Populatioll
B-J Part A WORKERS AND NON.WORKERS ACCORDING T\:,
r--......... -----~-HI
LlYestocl.. FOfc~trvJ hshiIl~, IIuntmg & Plantations, Orchards
II and alhed actiH- IV
WOR ~.A..
(;tlUi\..ttor~ A~I1cultI11al lrtbulll'Cl'S ties !\'fining and (lilarr}'iug ,-___ ---...A....----_~~
Per.'IOIJ-S ~fale., Pelllall"<;
'l'ptal Worken ~-_;.._~----- ~
"I.ll .. ,; F<:"llJ3les r-\falf'!. ~:h r-~A.·}'~~l~ ~a~.A.J.'~;al~ r-1\lalc;-"- FcmaJ~
793,955
337,71H
()S,66ti
62925
'5~,849
99,392
73,832
51,251
34
720,558
306,443
58,777
56,607
54,256
90.033
67,472
17,154
39,785
31
73,397
~31,275
6,889
6,318
5,593
9,359
6,360
4,097
3,503
432,835
187,6H
[36,156
(31,309
f 30,648
53,545
40,897
r2q,:\~S
2[\,106
28
392,061
170,375
32,1&9
28,126
27J(j~
43,'LH7
37,189
26.918
21,200
28
40,77t
17,UG
3,~B7
3,383
2,879
5,258
3,70a
2,407
1,906
361,120
150,097
29,510
[31,416
" 4S,iH7
'32,435
~1,9~&
20,182
32M97
136,0&8
26)G08
:t8)~81
"6,4117
41,7-16
;O,t83
20,:1;6
18,585
32,62:1
14,029
2,902
2,935
2,714
4,101
2,652
1,690
1,.597
2 BHIND DISTRICT (TOTAL)
219,061 8,716 163,484 2,671
6,5:12
17,6Uo
[26,007
29,577
52,814
40,3H
21J,1~7
17,999
200,512
6,210
16,480
23,852
26,895
47,n5n
:16,700
t5,~13
16,~OI
18,519
312
1,206
2,155
2,682
5,158
3,624
3h7
455
7n 963
11,93"
1,379
74B
11,659
16,091
20,lBB
38,321
3J,30J
:,n,~)36
RURAL
7,839 159,908
346 41~51
1,803
1.80G
1,273
697
877
21
30
121
I'll
179
106
51
12,460
17,748
19,7&6
37,519
30,5~1
22,371
15,110
URBAN
3,576
41
199
34'J
422
802
724
565
480
60
49
130
IB7
530
L77
5Wl
454
2,584
57
46
121
179
5L7
b57
5b6
410
87
13
20
17
14
22,325
3,1()9
4,%4
3,325
S73
20,341
1,448
2,830
3,07]
3,OOfj
4,47]
1,719
783
1,984
87
262
~67
473
363
208
95
10
4,450
:JJj
~71
543
I,05B
~173
{JOG
~05
4,244
H6
:':28
+15
5~O
I,UI3
~)23
571
198
206
13
26
23
45
50
35
11
1,810
=:59
L!7
1,433
:.145
14U
lU6
250
[49
91
52
377
14
17
24
Ul
139
bO
:16
12
53
11
II
50
11
10
3
13 14
44
14
4
37
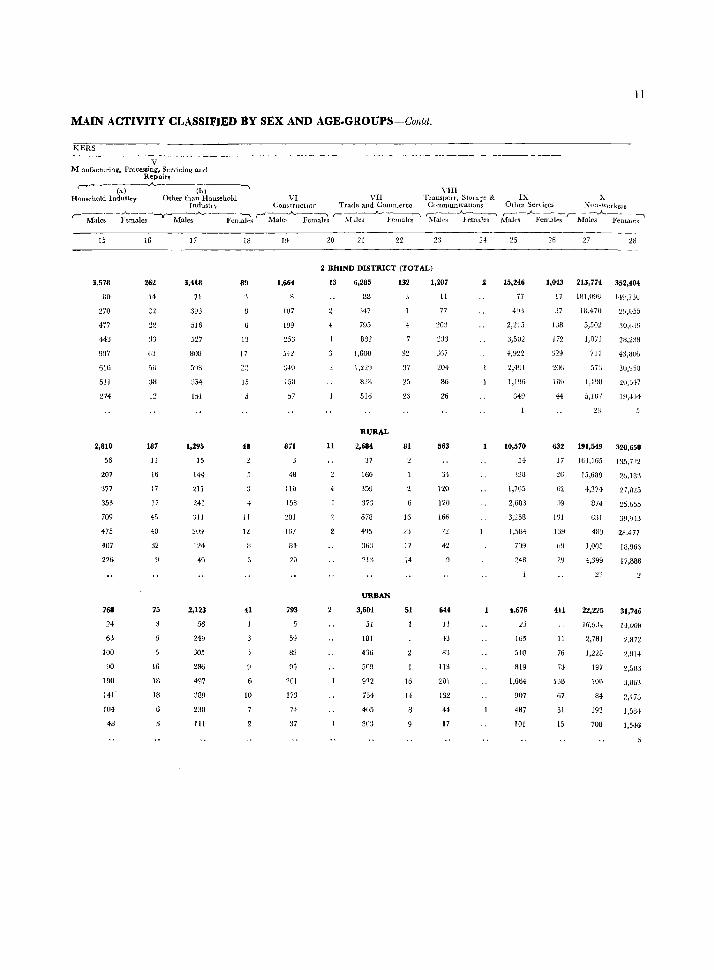
II
MA1N ACTIVITY CLASSIFIED BY SEX AND AGE.GROUPS-Contd.
KERS -~ -----v--------M nufacturing, Processing, Servicing and
Repairs r----(:0----'-~---~ibl---"'
Hl)usehold Industry Other than Household VI VII Industry COll.'>tructlOn Trade and Conuuercc
'-M~~--F';~~--v-~--~y:;~ '-~l~-n~ r-~W;-_A... Females
15 16 17 18 19 20 21 22
YIII TJansport, Stora(!e & IX X
CommunlCations Other Sen ices X OlH'\·{lI kel S r:----_A_-~ r-:- -..A--_--___ ,~.A. __ -- __ _.
l\!ales Females Male<> Femalf's Males .Female ..
23 25 25 '27 23
2 BHIND DISTRICT (TOTAL)
3,578
80
270
477
443
907
616
511
274
2,810
56
207
377
353
709
475
407
226
768
24
63
100
90
198
141'
104
48
262
14
:13
63
SB
3M
12
187
11
16
17
17
45
40
:12
75
16
IB
18
3,418
71
303
516
5'27
808
5IJij
354
151
1,295
15
144
211
241
311
'iO!)
124
40
2,123
56
249
305
286
497
389
~30
111
89
13
17
15
48
4
11
12
41
10
1,664
107
199
253
542
15H
57
871
18
110
IS8
281
167
IH
20
793
59
W
~15
201
173
74
37
13
11
4
6,285
US
347
795
882
1.600
i.n!:!
82H
51b
RURAL
2,684
:37
166
359
373
678
URBAN
3,601
51
181
436
5119
922
734
465
su:!
132
81
16
23
17
14
51
16
14
1,207
11
77
203
233
J67
2M
86
26
563
34
120
120
166
7'2
42
644
11
43
83
113
201
132
44
17
15,246
77
'l,4~1
1,196
349
10,570
'328
1,705
2,GB3
3,258
7()9
248
4,676
23
165
510
819
1,664
907
487
101
1,043 213,774 352,404
li lBJ,O~H.l 14~l,7JU
37
1J8
172
:]29
~(I(i
Inti
lil,47 0
5,,)02
1,071
731
57:)
2~,lJ55
30,6J9
28,238
43,806
20,5-17
632 191,549 320,658
17 161,165 135,]:!:l
46
62
101
LI~
2~)
411
11
76
73
13B
67
31
15
15,689
4,274
874
6:>1
4WJ
1,00,)
4,399
23
22,215
16,Y3-1:
2,781
1,228
197
100
84
193
708
26,Hn
'27,\1~5
25,655
39,Y4-3
28.477
18,963
17,BB8
31,746
l-I,OOB
2,872
'2.HI4-
~,5g3
3,863
2,473
1,58}
1,546
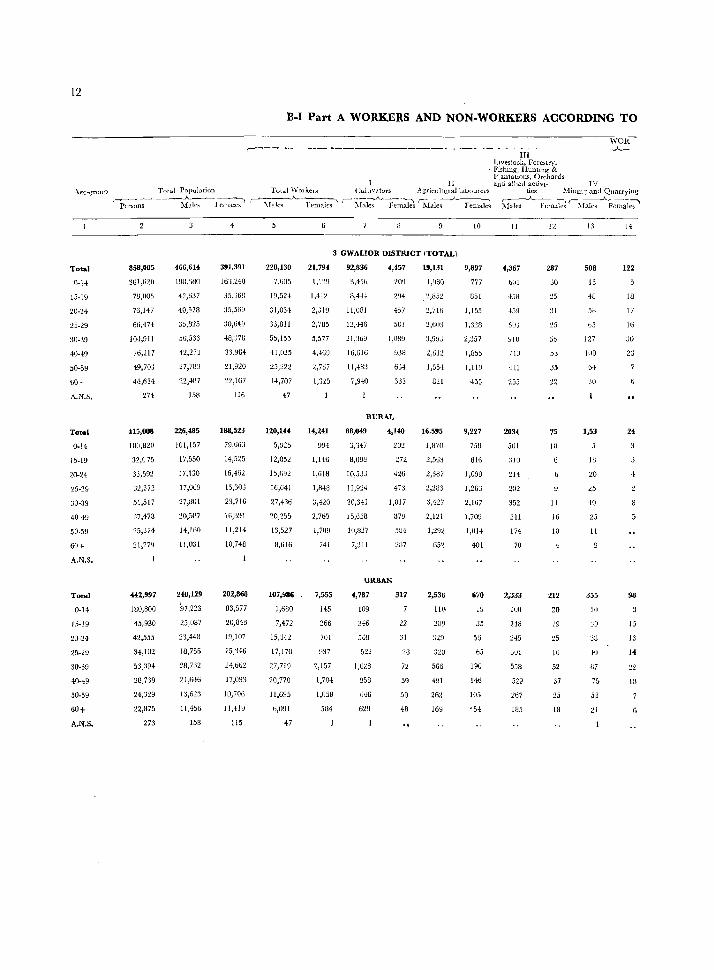
12
H-I Part A WORKERS AND NON-WORKERS ACCORDING TO
---------------------------------------------------------------------------------------------,,'VOR-,-.----------- ------ ---. ------------A--
III LLvestock. Forestry,
, Fishing, Huntmg & PlantatIOns, Orchards
II and alhed activl~ IV .\gC-gTOUp Total Population Tol,tl \\TOlkels Culllv.ttors Agricu}tulallaJJuuttTS ties ::VIinIn~ and Quarryillg'
Total
O-H
25-29
:lD-39
-10-49
50-59
60+
A.N.S.
Total
0-14
~5-19
20-24
25-29
30-39
40-19
50-59
60+
A.N.S.
Total
0-14
15·19
20-24
25--29
30-39
40-~9
50-59
60+
A.N.S.
'Per:;,---~-te-,--I,-'e;-"-al-es' r-;~-Fe-rr-m-I~ ---:-\r:I~_A_ Females lIlales Femaki ~--F-en-,.,kir-l\Wc-;-'F':;;;;;i~
858,005
361,G20
71J,005
76,147
66,47f
10·1,911
76,217
49,70J
44,654
274
415,OOB
IBO,820
32,C 75
33,592
32,372
51,517
37,478
25,:.174
21,779
442,997
180,800
45,93ll
42,555
34,102
53,394
38,739
24,329
22,1J75
273
466,614
H1H,'j8U
42,637
'10.'18
35,tt!5
56,533
42,2:1:.1
27,783
22,487
1513
226,485
101,157
17.550
17,130
17,069
27,801
20,5U7
14,160
11,031
240,129
'[0,223
25,087
23,448
18,756
28,7:12
21,&16
13,623
11,456
158
391.391
16'1,210
35,'36B
35,569
30J6lJ;.~
48,J7U
33.984
21,920
22,167
ll6
IOB,523
79,663
14,525
16,462
15,30J
23,716
16,mn
11,214
10,748
I
202,868
20,843
19,107
15,3-16
24,662
17,093
1O,iOG
11,-!l9
115
228,130
7,605
19,524
33,811
55,15;
41,025
1-1,707
47
120,144
5,!J25
12,052
15,692
16,641
27,436
20,255
13,527
8,616
107,986
1,680
7,472
15,342
17,170
27,719
20,770
11,695
6,091
47
9
3 GWALIOR DISTRICT (TOTAL)
21,794
1,119
1,412
2,319
2,785
5,577
4,469
2,767
14,241
994
1,146
1,618
1,848
3,-120
2,765
1,7U9
741
7,553
140
266
7U1
937
2,157
1,704
1,05B
584
92,836
U,-IH
II,U81
12.-146
21,369
16,616
11,483
7,940
4,457
2m 2~14
457
501
1,089
938
6J4
RURAL
88,049
3;H7
8,098
10,53}
11,924
20,3-11
15,6SB
10,837
7,311
4,140
202
:m. 426
473
1.017
879
504
287
URlIAN
4,787
109
316
,)48
522
1,028
958
646
629
317
22
31
28
72
59
50
48
19,131
1}980
"2,1352
~,71o
2,603
~,9!JJ
2,612
1,55,
821
16.595
1,870
2,563
2,387
2,283
3,427
2,121
1,29:l
652
2,536
110
J:.W
566
491
262
16Y
to
9,897
777
851
1,155
1,328
2,357
1,855
1,11U
455
9,227
758
816
1,099
1,263
2,167
1,709
1,014
401
670
19
35
50
65
190
14ti
105
'54
II
4,367
001
458
450
5UJ
910
7·W
HI
255
2034
5UI
:lI0
214
202
352
211
174
70
2,333
100
148
245
JOI
558
529
267
185
1<
287
JO
31
61i
53
75
10
1·1
16
10
212
20
19
25
16
52
37
25
18
1:1
508
15
43
58
b5
127
1110
b4
30
1,53
13
20
25
40
25
11
355
to
JO
38
-II)
87
75
53
21
122
18
17
16
:30
23
24
98
15
13
14
22
13
6
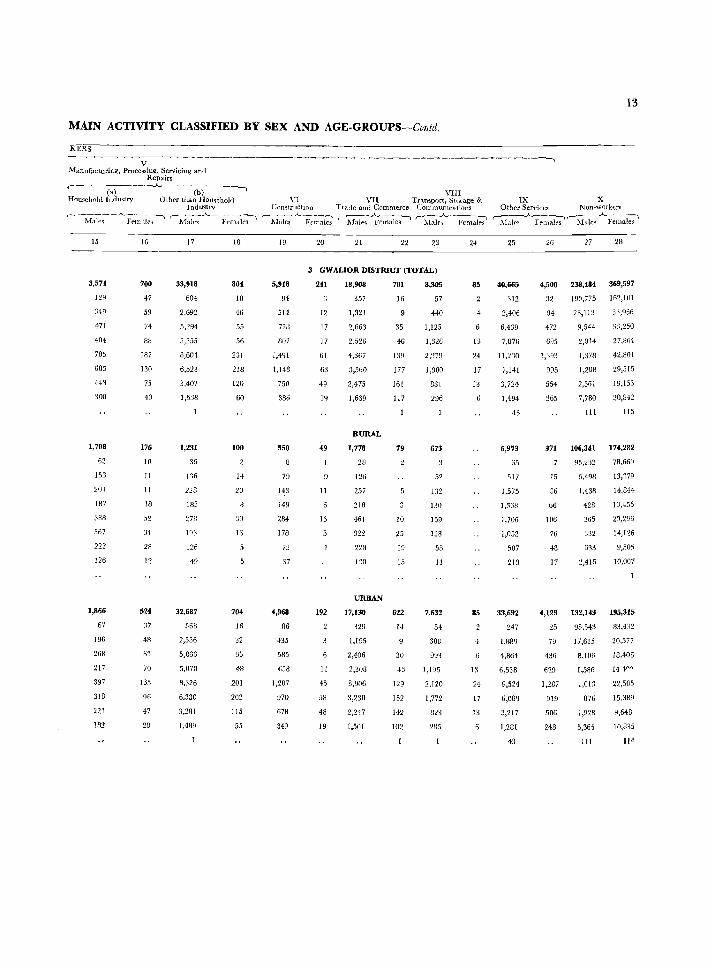
13
MAIN ACTIVITY CLASSIFIED BY SEX AND AGE-GROUPS-Col1td.
KERDOS----------------------------------------------------------------------------------------------V
Manufacturing, Processin~, Servicing and Repairs
,.---- -(a-)------'--- -- (b) - ----, Household I ndmtry Other than Hou<ichold
Indmtrv
,- ~f.'l~; -_A_Ft.-;;;~le~-' rMa~_A_-· F~~~;ksl
15
3,574
119
349
471
404
785
685
443
308
1,708
62
153
20'1
187
388
367
222
126
1,866
67
196
268
217
397
318
221
182
16
700
47
59
74
83
187
130
75
40
176
10
11
11
18
.'l2
34
28
12
524
37
48
6'1
70
135
96
47
28
17
33,918
60-1
2,692
5,294
5,255
8,601
6,523
3,407
1,538
1,231
36
116
228
185
32,687
568
2.556
5,066
5,070
8,326
6.330
3,281
1,489
18
804
18
46
55
56
231
218
120
60
100
11
20
30
16
704
16
32
35
48
2IJI
202
115
55
VIII VI VII Transport) Storage &
ConstructIOn Trade and Commerce (;ommumcations
r-1f~e--;_A_ Fe~~ l\fal~~ ~~~j~~ r-hl~e~~~~~
19
5,918
94
514
721]
807
1,491
1,148
750
386
950
79
143
149
284
17A
37
4,968
86
435
585
658
1,207
970
678
349
20 21 22 23
3 GWALIOR DISTRICT (TOTAL)
241
12
17
17
61
63
49
19
49
II
16
192
11
4.5
58
48
19
18,908
357
1,321
2,663
2,526
4,367
3,560
2,475
1,639
RURAL
1,778
28
126
257
218
461
322
223
URBAN
17,130
329
1,195
2,406
2,308
3,906
3,238
1,501
701
16
35
46
139
177
161
117
79
10
25
19
1.5
622
1-1
SO
43
129
152
142
102
8,305
57
440
1,125
1,326
2,279
1,900
881
296
673
52
13:?
130
159
128
58
11
7,632
54
388
993
1,196
2.120
1,772
823
285
24
85
4
13
17
13
85
13
24
17
13
----._.
IX X Other Service~ Non-workers
~J;~~;~~,--;l-al~~ A-F~~al~
25
40,665
312
2,406
6,439
7,876
lJ,:no
7,141
3,721
1,494
43
6,973
65
517
1,575
1,338
1,706
1,052
507
213
33,692
247
1,889
4,864
6,538
9,524
6,089
3,217
1,281
43
26 27
4,500 238,484 369,597
32
94
472
695
1,193
995
554
265
190,775 162,101
23,113
9,544
2,014
1,378
1,208
2,561
7,780
III
3:;'956
:13,250
27,864
42,301
29,515
19,153
20,842
115
371 106,341 174,282
15
36
66
106
76
48
17
5,498
1,438
428
365
332
633
2,41.5
78,669
13,179
14,844
1:3,455
20,296
14,126
9,50.'t
10,007
4,129 132,143 195,315
25
79
·136
629
1,287
919
506
248
95,543
17,615
8,106
1,586
1,013
876
1,928
5,365
HI
83,432
20,577
18.406
141"')
22,505
15.:lH4
4,648
10,835
114

14
Total
0-14
30-30
40-49
50-59
60+
A.N.S.
Total
0-1'1
15-19
20-24
25-29
60+
A.N.S.
Total
0-14
15-19
20-24
25-29
010-39
40-4~1
50-09
60+
A.N.S.
Total popuJation r-----....___J,._~~--- '~
Pen.om ]\1nJe') Ff'J1J.:l1t'5
255,267
100,715
ZO,]55
1~,059
32,893
24,741
16.S'13
13,580
34
217,831
92,695
16,687
16,297
16,544
28,403
:!1,'185
14,527
11.259
34
37,436
16,020
3,468
2,960
2,515
4,490
3,356
2,306
2,321
135,742
59,101
10,953-
9,4114
9,530
11,680
13,396
9.172
6,392
28
115,962
00530
~),om
7,871
8,300
15,340
11,620
7,959
5,287
28
19,780
8,562
1,935
1,613
1.236
2.340
1,776
1,213
1,105
4
119,525
4'1,614
9,202
9, \,73 9,523
15;i.13
11,:145
7,661
7,188
101,869
42,156
7,669
8,426
8,24+
13,063
9,765
6,568
:),972
17,656
7,458
1,5:1'1
1,347
1,279
2,150
1,580
1,093
1,216
B-1 Part A WORKERS AND NON-WORKERS ACCORDING TO
WOR ---__"'~--...A...----
III LiV"estock, F(lrestrv, Fishing, Hunting & Plantations, Orchard ..
II and :Ilhed actki- IV Total 'Yorkers Cultivators At!:ricl1ltural1abm1rl~rs tie" MinilH{ & Quarrying
r:--:-----"----... ~1;J~')--~;':1~1 ~1~l~')-AF~ ~('s- -"-}~('~:D~ ~~~~~
71,382
3,064
6,7i9
8,IN
9,253
17.432
13,164
8,718
4.793
62,986
2,!144
6,~69
7,200
8,155
15,193
11,167
7,641
4,112
8,396
IZO
510
974
1,098
2,23~
1,697
1,077
681
4 DAnA DISTRICT (TOTAL)
10,894
583
801
1,164
1,306
2,511
1,456
740
9,979
760
1,096
1,211
2,~78
2,089
1,326
648
95
239
235
130
92
46,902
1,457
4,192
5,l'18
5,GSI
11,430
9,008
6,1.15
3,507
RURAL
46,017
1,4:19
4,145
5,114
.1,869
11,2112
8,826
6,011
3,348
URBAN
885
18
47
84
82
168
182
145
159
2,324
61
lll7
373
262
2,209
GI
WI
230
498
5:15
359
245
115
10
14
30
24
14
17
9,040
1,O~H
1,48~
1,246
1,177
1,88,>
1,188
698
323
8,702
1,0:]0
1,457
1,2(10
1,137
1,804
1,128
6Sf!
288
338
28
45
40
81
60
40
35
10
6,878
443
fi07
819
874
1,571
1,389
832
341
6,780
441
60:1
816
863
1,359
814
334
98
4
11
23
30
IB
II
1,426
:36U
239
136
128
201
165
117
71
1,168
356
2(]6
107
99
143
117
85
54
258
12
33
29
29
58
48
32
17
12
172
24
11
14
38
37
24
10
105
22
10
4
16
21
20
67
4
4
22
16
4
:\lal('~ Female-s
13
38
5
16
4
24
4
4
]4
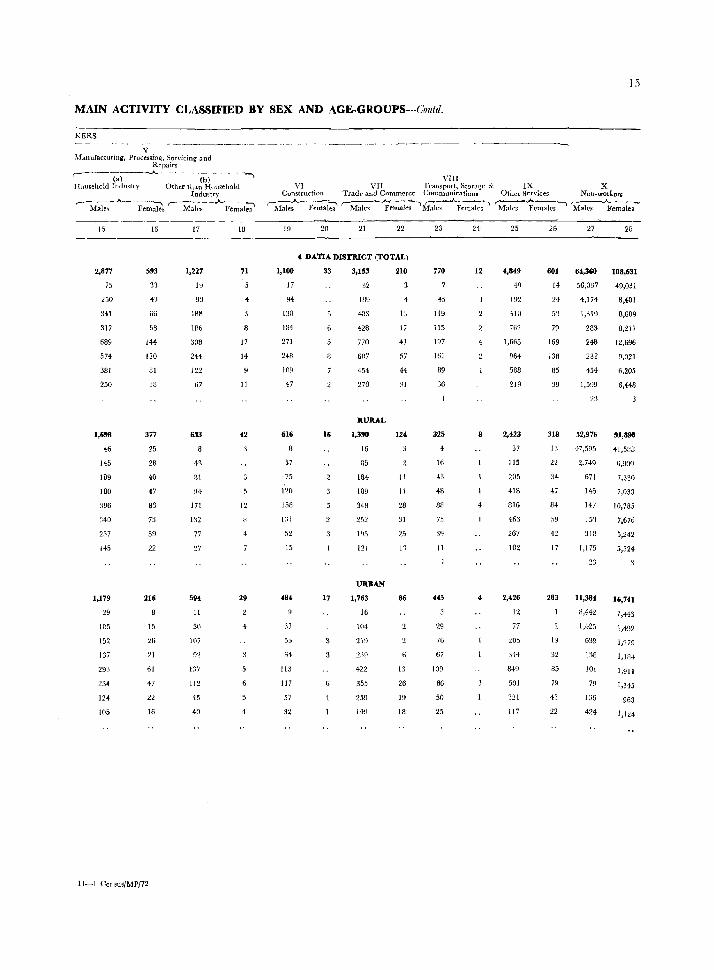
l!i
MAIN ACTIVITY CLASSIFIED BY SEX AND AGE·GROUPS---Cmdd,
KERS
V ]l.fanufacturingl Processing, Servicing and
Rrpairs .-----~-) --.A- -~--- ·(b)- --- --, Household Indm(ry Other than HOllsehold
rndustn'
r-M~};~ --A.---h~ r-- M~s- -Aremal;'
15
2,877
75
250
:1~1
317
689
574
381
250
1,6'8
46
145
IB9
IBO
396
340
257
145
1,179
29
105
152
137
29:1
234
124
105
IG
593
33
43
1i5
68
IH
120
81
38
377
25
28
40
47
83
73
59
22
216
15
26
21
61
-!7
22
16
11-1 Ccnsu,/MP/72
17
1,227
19
93
188
186
:;08
214
122
67
633
1'~
HI
94
171
132
77
27
594
11
50
107
137
112
45
40
18
11
8
17
14
11
42
12
29
4
--------_------------------------_.
VIII VI VII Transport, Storage & IX X
Ounstruction Trade ana Commerce Uommunications Other Services Non-workers
~~Fe~~-;' ("Male'! --F{'tnale9~~--~emale~- Males -~ema-Ies"l M~emales-
19
1,100
17
94
130
IB4
271
248
109
47
616
57
75
120
1513
1:i1
52
15
37
55
64
113
117
57
32
20 21 22
4 DAnA DISTRICT (TOTAL)
33
16
17
3,153
32
189
40:1
428
770
607
454
270
RURAL
1,390
16
85
IB4
lB9
348
252
121
URBAN
1,763
16
104
219
422
355
259
14!)
210
13
17
41
57
44
31
124
11
11
28
31
25
I"
86
13
26
19
18
23
770
45
119
115
197
161
89
36
325
4
16
43
48
88
75
3q
II
445
29
76
67
109
86
50
25
24
12
8
4
25
4,849
49
410
762
1,665
964
588
219
2,423
37
115
205
418
816
46:1
267
102
2,426
12
77
205
344
849
501
321
117
26
601
14
24
5'1
79
169
138
85
39
318
13
22
34
47
84
42
17
283
32
85
79
43
22
27
64,360
56,037
4,174
1,310
283
24B
232
454
1,599
23
52,976
47,595
2,749
671
14'>
147
153
31f1
1,175
23
11,384
8,442
1,42:;
639
138
101
79
136
424
28
108,631
49,031
8,401
8,609
8,217
12,696
9,021
6,205
6,448
91,8911
41,58B
6,90Q
7,330
7,033
10,783
7,676
5,242
5,324
16,74)
7,443
1,492
1,279
1,184
1,911
1,345
963
1,124
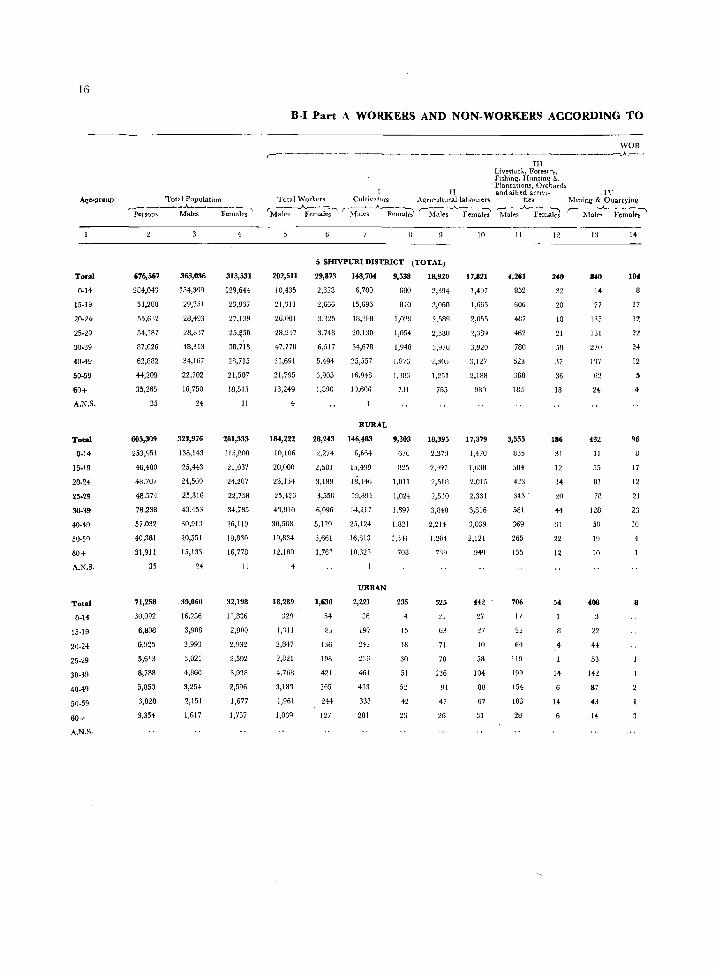
16
Age--greup Total Population
To.,,1
0·14
15·19
20·24
25.~9
30,39
40·49
50-59
60+
A.N.S.
Total
0·14
15·19
20.24
25·29
3U.39
40·49
5U-SQ
60+
A.N.S_
Total
O·H
15-19
20-24
25-29
30-39
40-49
50·59
60+
A.N.S.
,..--____ -.J...--_____ ~
Pel sons Males Females
676,567
284,043
53,283
55,632
54,187
87,026
62,882
44,209
35,265
35
605,309
253,%1
46,480
48.707
48.574
78.23B
57 _032
40_381
31,911
35
71,258
30,092
6,808
6,925
5,613
8,78B
5,850
3,828
3,354
363,036
154,399
29,35]
28,49'1
28,837
48,313
34,167
22,702
16,750
24
323,976
138,143
25,443
24,500
25,816
43,453
30,91J
20,551
15,133
24
.39,060
16,2.)6
3,908
3,993
3,021
4,860
3,254
2,1!;1
1,617
313,531
129,644
23,937
27,139
25,Q50
38,713
28,715
21,507
18,515
11
281,333
115,flOfl
21,037
24,207
22,758
34,785
26,119
19,830
16,778
11
32,198
D,B36
2,900
2,932
2,592
3,928
2,596
1,677
1,737
B·I Part A WORKERS AND NON·WORKERS ACCORDING TO
WOR ,-----~- --.------------_ -------------------.A.--
., Tntal \<\'orkers Cultivators A{rnC'lllturallaboruer~
'M~;-_A.F;;a~~ ~~~k:-_A_ Femaki ~;;AF-;~~k?
202,511
10,435
21,3] J
26,001
28,247
47,778
33,691
21,795
13,249
4
184,222
10,106
20,000
23,154
25,426
43,010
30,508
19,834
12.180
4
18,289
1;11 I
2,847
2,821
4,768
3,183
1,961
I,06Q
5 SHIVPURI DISTRICT (TOTAL)
29,873
2,328
2,666
3,')25
3,748
6,517
5.49'1
3,ry03
1,890
148,704
6,700
15,696
]a':~flU
20,130
34,678
25,557
16MB
IM06
RURAL
28,243 146,483
2,274
2,581
3,189
3,550
6,096
5,121)
3,661
1,761
1,630
54
85
l:l6
198
421
365
244
127
6,664
I~),499
lIi,146
19,894
3+,217
2.1,124
16,613
10,325
URBAN
2,221
36
197
24~
236
461
433
335
2S1
9,538
680
840
1,029
1,054
1,948
1.873
1,'183
731
9,303
67ii
1,011
I,OH
1,897
I.B21
1:141
708
235
15
18
30
51
42
23
18,920
2,394
3,060
2,589
2,5UO
:1,976
2,305
1.251
765
18,395
2,373
2,997
2,510
2,510
3,840
2,214
1.204
7'14
525
!.!1
71
70
136
91
47
26
10
17,821
1,497
1,665
2,055
3,920
3,127
2,188
980
17,379
1,470
1,638
2,015
2,331
3,816
3,039
2,121
9-4£1
H2
'27
40
58
104
88
67
31
III Live')toc1., Forestry, Flshin~, Hunting &
. Plantations, Orchards anrlanl~d acttvl-
ties r---:-.A.---,-., Males }' el(.ales
11
4,261
852
GOG
487
462
780
523
368
183
3,555
835
5{14
423
343 .
581
369
265
155
706
17
22
64
119
199
154
103
28
12
240
32
20
18
21
5H
:17
36
18
186
31
12
14
20
H
31
22
12
54
14
1\Mming & Quarryjn~ ,.-----_--.-A--__ ....._
Ma lr'l Femaif's'
13
140
14
77
125
131
270
137
62
432
11
55
OJ
78
128
50
19
10
408
22
44
53
142
87
43
H
104
17
12
22
24
12
4
96
17
12
21
23
10
8
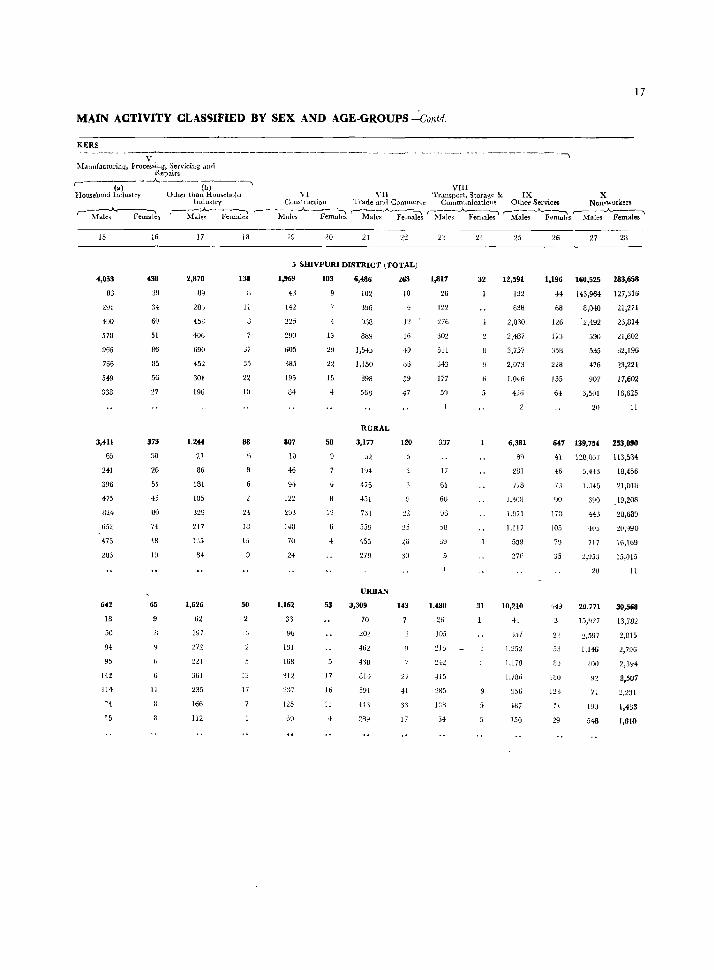
17
MAIN ACTIVITY CLAS§IFIED BY SEX AND AGE-GROUPS -':_Contd.
KERS - ------v------------------------- -- ------.----.-----------, M.l!lufactt1l'in~, ProCeloSiug, Serviclng" awl
Repairs ,----(-.)--.--.)1..---- (b) .-...., Househuld Industry Olher than Household ,-__ .A.. ___ ,
Males Females
15
4,053
83
~91
490
570
966
766
549
338
3,411
li5
241
396
475
824
652
475
283
642
18
50
94
95
142
111
'']
55
(38
39
3{
60
51
86
85
56
'1.7
373
30
26
51
80
H
48
65
11
IndU'itry ,..-_-.A.-....._..-."
Males Females
17
89
453
406
690
452
301
190
1,2"
27
86
181
185
~29
217
1::5
84
1,626
62
197
272
361
235
166
112
18
138
II
37
35
22
10
88
6
24
IB
15
50
1:)
17
VIII V[ VII Tr..tllsport, Storage & IX X
Construction Trade aml Commerce Communications Other Services Non-wurkers
,- -", "1\1:aks .A_~~~~i;l '-M--;j;;·A_-~~~ rl\1ale;-~1~;' r-:~ale;--A.Fe~~s'IYi-;I~ Fem;:Ie~
19 20 21
5 SmVPURI DISTRICT lTOTAL)
1,969
43
142
:!25
290
605
385
195
84
807
10
46
94
122
29'>
143
70
24
1,162
33
90
131
1GB
'll~
:.n7
125
60
103
13
22
15
4
50
12
53
17
Iii
11
6,486
102
'J96
938
8H~J
1.545
1,150
89B
568
RURAL
3,177
I\)4
4)6
{51
731
455
27Y
URBAN
3,309
70
462
4'38
814
5!.11
28Y
263
10
16
.;9
06
59
47
120
143
27
41
3:1
17
23
1,817
26
122
276
302
511
343
177
59
337
I)
61
60
'36
58
39
1,480
26
105
~I5
·H5
28;;
13[1
54
24
32
31
25
12,591
132
638
2,030
2,487
3,757
2,073
1,046
426
6,381
89
231
))8
1,308
I,D71
L117
559
J..7F
10,210
4:1
J57
1,179
1,786
956
4117
150
27 28
1,196 160,525 283,658
44 143,964 127,316
68
126
17J
358
228
135
64
8,040
'2,492
590
535
476
907
3,501
21,271
23,814
21,602
32,196
23,221
17,602
16,625
20 11
647 139,75' 253,090
41 128,037 113,534
46
90
173
IDS
7~1
35
53
fll
180
123
29
S,H3 18,456
l.J4G 21,013
390 19,208
44:1
·105
717
2,!.I53
28,68~
:W,!)90
16,169
15,015
20 11
20.771
15,Y27
2,597
1,146
'!DO
l!JO
548
30,568
13,782
2,815
2,796
2,3Y4
3,507
2,231
1,433
1,610
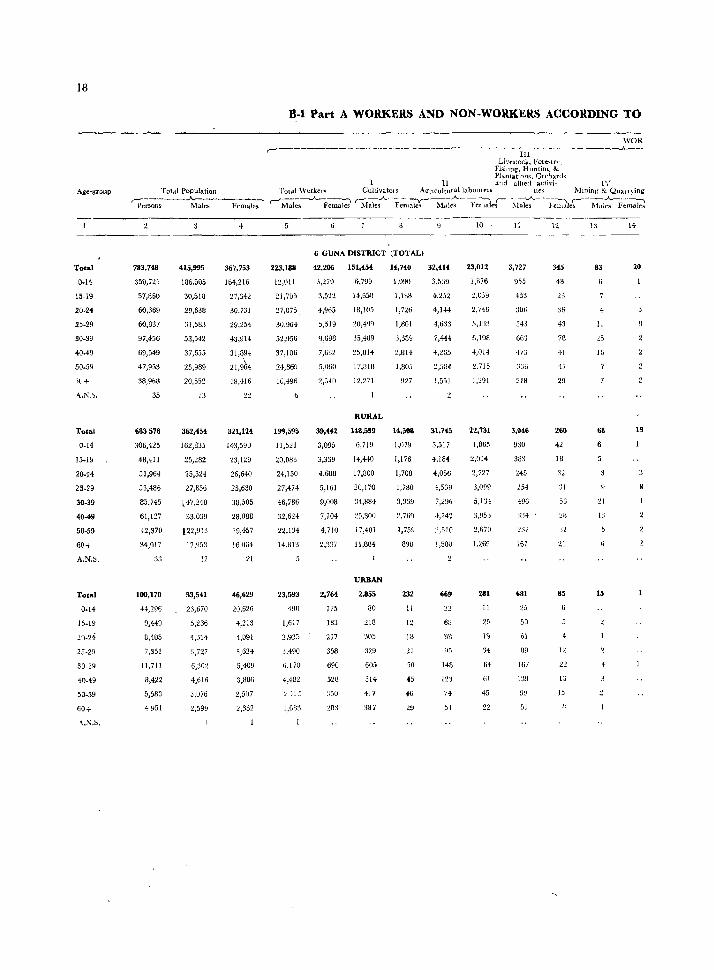
18
Total
0-14
15-19
20-24
25-29
30-39
40-49
50-59
_)/_,+
'Iotal
0-14
15-1~
20-24
25-29
30-39
40-49
50-59
60+
A.~.~.
Tata]
0.14
15-19
20.'24
25-29
30-3Y
40-49
50-59
60+
\.N.S.
B-1 Part A WORKERS AND NON-WORKERS ACCORDING TO
WOR ,---------------------~- ----·------i£l--·--- -------.A.--
Li\'C::SLOd j Fore~lr"_ Fishmg, Hunting & Plantations, Orchal'ds
11 :<tnd alhed aclivi- IV Total Population Total WOl'.kefs CultivatOls AgnculturallahoUl~Is tte<j Mininlt & QU~tll)inli!
rp;~--~~·-Fem£tles r-i"W;~"""'-Fcmalei ~Iale:- Fe~l~ill;;--- F~n~~ ~1-a~~-}~;;~dJ6-i1a"I~-F~~b
783,748
:150,741
57,850
60,369
60,837
97,456
69,549
47,953
38,9GB
35
683578
306,425
48,411
51,964
53,486
85,745
61,127
42,370
34,017
100,170
44,296
9,449
8,405
7,351
11,711
8,422
415,995
136,505
30,518
29,638
31,583
53,542
37,655
25,989
20,552
13
362,454
162,835
25,282
~5,321
27,856
,,47,240
33,039
L22,913
17,953
12
53,541
23,670
5,236
4,314
3,727
6,302
4,616
3,076
2,599
367,753
104,216
27,34~
30,731
29,254
43,914
31,89-1
21,9'64
18,416
321,124
J43,5BO
'23,129
26,640
25,630
38,505
28,088
19,457
16,064
21
46,629
20,626
4,213
4,()!)L
3,624
5,409
3,806
2,507
2,352
1
223,188
12,011
21,705
:!7,075,
30,964
52,956
37,106
24,869
16,496
19'1,595
11,521
20,088
24,150
27,4H
46,786
32,624
22,134
14,8n
23,593
490
1,617
2.925
3,490
6,170
4,482
I,GB3
6 GUNA DISTRICT (TOTAL)
42,206 151,45l
3,270
5,519
Q,698
7,632
S,()60
6,799
14,658
18,1O.'i
20,49g
35,41J9
25,814
17,lllU
12,271
RURAL
39,442 148,599
3,095
3,339
4,688
5,161
9,008
7,104
4,710
'1,337
2,764
175
183
277
358
690
528
350
6,719
14,440
17,800
20,170
34,884
25,300
17,401
11,884
URBAN
2,855
80
218
329
605
514
417
:lSl
14,740
1,090
1,188
1,126
1,801
3,389
2,814
I,UOS
n7
14,508
1,079
1,176
1,708
1,730
3,339
2,769
1,759
898
232
11
12
18
so
~5
,6 29
32,414
3,5~9
4,252
4,144
4,633
7,444
4,265
2,5(14
1,5>1
31,7~'
3,517
4,184
4,056
4,53B
7,296
4,142
2,510
1,50U
669
68
88
148
123
74
51
10
23,012
1,876
2,039
2,746
5,1911
4,014
2.715
1,291
22,731
1,865
2,014
2,727
3,099
5,134
3,~)5:)
2,670
1,269
281
11
25
I~
~14
6+
61
45
22
11
3,727
955
433
306
343
663
473
:)36
218
3.046
930
383
245
254
496
167
681
50
61
89
167
139
99
51
12
345
48
23
36
43
78
41
47
29
260
42
18
32
:JI
56
32
21
85
12
22
13
15
13
83
4
II
25
16
68
:n I:,
15
14
20
19
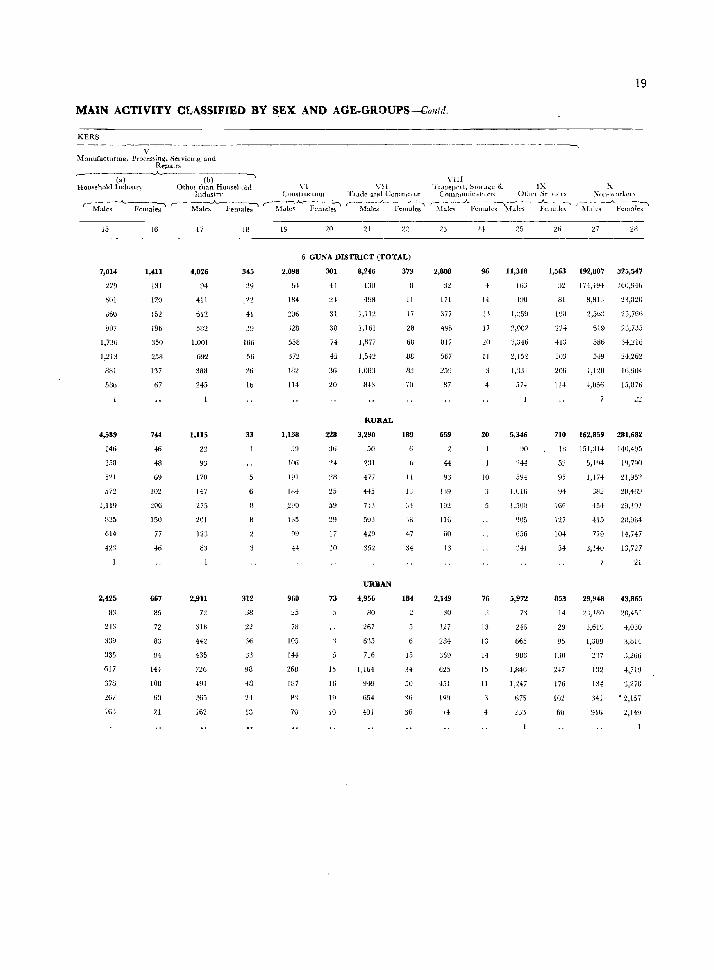
19
MAIN ACTIVITY CLASSIFIED BY SEX: AND AGE-GROUPS-~OIlfd,
KERS
V l\fallutacturmg, Pl'oces~in~~ SeLvicmg and
Repairs ,---~C;;)--""'___---- (b)--~----'
Household lndmcrv Other than Hou~ellold \'1 Vir , Industrv Consil uctlOll TI.1de and Cammer( e
,-M-;I~g-..A_-~;~;, ,.-- Ma~.A.Fe~n:J;;-' '-·lli~_A.F~:ale-:' (---;bks_A_-l~~;~;Ie-;,
15
7,014
~29
Mil
~6U
~Oi
1,7:16
1,'1.1:1
881
58b
4,589
146
358
521
572
614
41:1
2,425
83
j:J9
335
GI7
378
267
16
1,411
131
120
152
196
350
258
137
67
744
46
48
69
10'1.
150
77
46
667
H5
72
83
94
IH
108
fin
2!
17
4,026
94
411
612
58:1
1,001
692
388
245
1,115
22
170
147
201
123
2,911
7'2
442
435
7:W
491
205
162
18
345
39
.22
41
106
56
26
Ib
33
312
.18
22
:]6
98
i8
H
13
19
2,098
04
18{
558
3n 182
114
1,138
106
lYl
1114
IB5
960
78
105
IH
268
187
H'l
70
20 21 22
6 GUNA DISTRICT (TOTAL)
301
41
31
30
74
45
36
228
29
17
10
73
15
HI
19
10
8,246
I.~O
4U3
1,11~
1,161
1,877
1,5+2
I ,OWl
84,
RURAL
3,290
50
231
477
445
713
59:>
429
352
URBAN
~,956
SO
267
6',5
716
1,164
949
654
491
373
II
17
28
6B
88
83
ill
189
II
I:;
'J4·
184
15
34
50
36
.----..,
\'Ill TI.1.lIsporl, ::'1()I .. H~e & IX
COlllnlllllit:dtlUn~ Olllt'l Sf"I\I(('~ XOIl-1I orkel'~
~fale<;"-.A.l~~~-;I~~~~-I;~-- - ~~l:al~~ ri131~<;-__''-.;:~II-*-;'
2,808
:12
171
3i7
498
HI7
.567
259
87
659
44
116
60
13
2,149
3D
127
284
350
625
451
H
96
1,1
17
11
20
10
76
13
14
15
11
4
25
11,318
IhJ
2,152
1,331
57+
5,346
594
1,016
1,50(1
656
5,972
7'{
246
665
986
1,846
1,247
1i75
'27 28
1,563 192,807 325,547
:):~ 1 H,-l-Y4 jtiO,44b
81
IUO
41:':
SOJ
206
IH
B,81J
2,563
619
586
1,120
+,05f;
2'1,8211
25,766
2J,7J5
34,216
24,262
16,904
15,1376
710 162,859 281,682
W 151,314 J.lO,4U5
95
166
117
104
54
853
H
29
95
130
247
176
102
m
5,1 1)4
1,174
454
415
779
3,140
29,948
:!:J,ISO
3,619
1,389
132
134
:141
19)90
21,95:.!
20,'JB4
14,H7
13,727
21
43,865
20,451
41030
3,814
:;,266
4)19
'3,27B
·2,15i
2,149
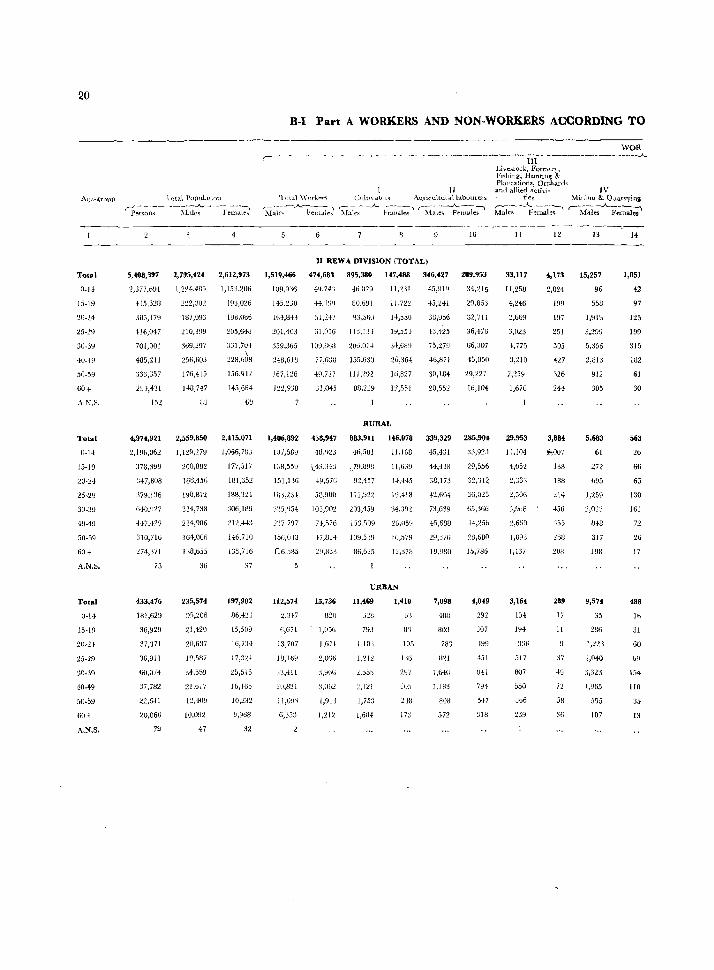
20
B-1 Part A WORl{ERS AND NON-WORKERS ACCORDING TO
,----------------- ----_--_-.---WOR
.---~~--- --~----~- ---- --.------~----..A_
11
III Livcl>tock, Fore~t!'}, FlShiug, Huntlllg &-. P1alltatioTI!l, Orchanl .. OI.nd allied acuvi- IV
Age-group 'lotall?opul.l.tliltl tir:g r--.----I...... ----~
'loul \\'l)rJ,. ... r~ Culu\d.tul'i .~tlcuttUldllabourels Mil\hl~ & Quarrying
Total
O-H
15-19
25-29
30-39
4U-49
50-59
60+
AN.'.
Total
0-14
15-19
~O-Z4
25·29
30-39
40-49
60+
A.N.S_
Total
0-14
15-19
20-H
25-29
30-39
40-49
A.N.S.
~ _______ _..._..A.. _____ - ____ .......,
Persons ).blcs FemaJ~., r---~--A---~ r----_A,.------~ ~~ ___ _A__~ 1\-Ia1h hmJ.I("~ ~Iale~ Females Male~ FeulaII.':l>
10
II REWA DIVISION (TOTAL)
5.408,397 2,7~5,.U 2,612,973 1,519,466 474,683 895,380 U7,488 346,427 289,953
2/.1 77,(j[) ! 1,2~4,4B5 I,153,:Wti 109,9% 49,74'\ 41),U29 1l,'!JI +.\9]9 :14,:("15
-t-1.5,:tW 2:!2,:5U:! 193,O:l6 145.:!JO ++.:l9lJ BU.GY! I L7::!:.! 45,~+1 :!9,86')
3B:i,17Y 187,\)9:1 19B.USn 164,843 ,)1,247 9:l,,)60 14,55U 38,956 32,711
416,017 ~10,399 205,648 2Ul,W3 61,016 11:l.1J4 19,554 43.425 ~l6,476
701,001 369,297 :13l.70-l 359,365 109,H6B ZOo.I)]4 H,68Y 75,279 66,3U7
485,211 2.56,603 228,(J6H 2+8,6lU 77,6:38 1.>5.630 26,364 4-0,871 45,050
')33,357 176,415 156,q-l~ 167,126 49,727 111,292 16,827 30,184 29,227
294,431 148,747 145,6B4 122,938 31,045 88,229 12,551 20,552 16,104
152
4,974,921 2,559,850 2,415,Q71
2,19b,062 1,1:29,279 i,066,7BJ
373,:199 200,882 177 ,517
347,808 166,456 181,352
319,136 190,Bl:2 IB8,'J:14
040.'J27 334,738 306,109
447.429 234,9110 212.443
:110,716 164,006 146,710
274,371 n8,655 135,716
73
433,476
181,629
37,371
36,911
(;0,071
37,782
20,060
36
235,$74
95,206
21,420
20,637
:!L617
12,4{)!:J
10,092
47
37
197,902
86,4:.!J
15,509
16,734
17,:t.~-!-
25,515
16,165
10,2:{2
9,9GB
32
RURAL
1,406,892 4.6,947 883,911 H6,078 339,329 285,904
107,52~ -18.'123 '}n,501 11.168 45,4:;1 ~:l,923
138.55H L4:1,343 r_79,l:HJ8 11,ti39 44,438 29,556
15]'!:!6 49,576 92,457 14,445 38,17J 32,312
IBl,2:l4 58,980 111,922 1V,418 42.60. 36,025
3~J,954 l05,90:.! 203,459 'H,J92 73,G39 65,:.166
J,}_7,7~)7 74,576 153,509 2G,05~~ 4-5,688 H,256
15(j,(j:~3 47,Bl4 109,S:m lIi,f)7!-l 29,:l7f:i 28,680
06,585 :l!-),833 86,625 12.378 19,080 15,786
112,$74
2,347
6,G71
13,707
J8,169
:U,411
20,821
11,OLH
6,35:;
1$,736
1,05&
],671
:5,062
1,91l
1,112
URIlAN
11,469
328
793
1,103
1,212
'L55S
2,121
1,75:1
1,604
1,410
6',
3'l
IDS
I III
JU5
H8
J 73
7,098
488
803
783
1121
1,640
1,183
80B
572
4,049
292
J07
')99
451
!J4:1
791-
547
318
Males Females
11
33,111
11,258
4,246
2,669
,,023
4,775
:3 j 210
2.259
1,676
29,953
11.104
4,052
::,968
:!,oof)
1,89:1
1,,37
3,16~
lj4
194
:::16
317
007
550
:366
239
12
4,173
2,024
199
251
305
0127
326
244
3,884
.0;007
1118
188
';S5
~6B
208
17
Il
,7
19
72
58
36
r-----A ___ -"\ Males Females
13
1$,2$7
96
.1.\11
1,9lB
3,2!J!J
5,351)
912
305
5,683
61
272
('95
1 ,'.!59
2,0:]3
U43
317
lY8
595
107
1,051
42
97
125
199
315
182
61
30
563
16
66
63
no 161
72
~6
17
488
10
31
GO
(,9
154
110
35
13
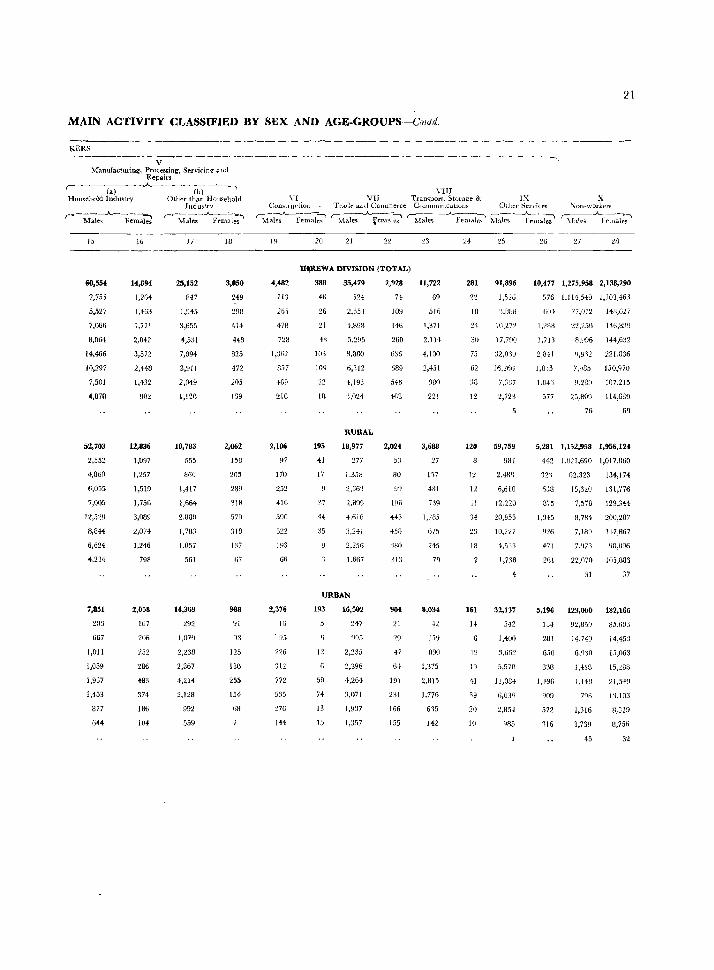
21
MAIN ACTIVITY CLASSIFIED BY SEX AND AGE-GROUPS-Colltrl.
KERS
V Manuracturinr:, Processing'. Sen"king- Rlld
Rep~irs ,- - - --la)- -.A.--
Household Industry
r-----Jo..------:--, Male,> Fem . .ales
15
&0,554
2,751
5,527
7,066
8,064
14,466
10,297
4,878
52,703
2,552
4,860
6,055
7,005
12,.129
8,844
6,624
4,234
7,851
203
667
1,011
1,059
1,937
1J453
877
6H
16
14,894
IJ 2G4
1,403
1,771
2,042
3,572
2,448
1,432
902
12,836
1,1)97
1,257
1,519
1,756
3,08Y
2,074
1,246
7gB
2,058
167
20fi
252
286
+83
374
laG
104
~ (b) -~--..., Other than House1101d
Industry ~-_._..A.---_~---.
~Ia.les Females
17
25,152
847
1,945
:{,655
4,531
7,094
3,911
2,049
1,120
10,783
555
866
1,417
1,564
2,880
1,78:1
1.057
561
14,369
292
I ,07~J
2,238
2,B67
4,214
2,128
992
.'iS9
18
3,050
2~9
414
448
825
472
205
139
2,062
158
289
318
.o7Il
318
137
67
983
91
93
125
130
2,5
154
68
VIII \"1
COIlstrudLUIl vn Transport, Storage & IX
Tr<lde aIld Commerce Communico.ttluIlS Odler Sen-j( es
~;:k:--Fe;~~ ~--~_A_~-'----... ,-._-- _ _A._--:-_~ r---~_A_~ ~1ales females Male<; fem~le.., M:lle~ remales
19 20 21 13 24 25 26
X l\,'ou-workers
r----_A._----~ 1h.lt"B females
27 211
n~REWA DIVISION (TOTAL)
4,482
113
26,
478
728
1,:362
857
460
ZIG
2,106
97
170
252
416
322
193
66
2,376
If_)
. 95
226
172
~7G
144
383
46
26
21
'B
195
41
17
44
:J5
35,479
524
2,:15:1
4,ll9B
5,295
8,880
6,112
4,193
'1,024
RURAL
18,977
277
1.358
2,66'3
2,899
4,616
:1,241
2,256
1.667
URBAN
193
12
59
74
13
15
16,502
247
2,235
2,396
4,264
3,071
1,937
1,357
2,928
74
109
146
260
636
689
546
2,024
53
80
99
191)
445
458
'180
313
904
21
47
6-1
191
231
166
15.'i
11,722
69
516
1,371
2,114
4,100
2,451
880
221
3,688
27
1 ~7
481
1,::85
675
245
7~
3,034
890
1,375
2.815
l,77G
615
142
231
iii
24
75
62
:18
12
120
12
12
II
'34
~:1
lB
161
14
12
lq
41
,9
10
91,896
1,5~G
VlIJll
1O,27:!
17,790
32,019
16,266
7,:187
2,723
59,759
2,4S8
6,610
12,220
20,955
1Il,227
4,533
1,738
32,137
542
1,400
3,662
S,570
11,084
6,03'1
2,85-1
985
10,477 1,275,958 2,138,290
,,76 1.114,549 1,103,463
1 ,'l!:lR
1,713
2.811
1,815
1.04'1
~77
77,0)2 1411,617
8,~196 144,632
'1,9'2 221.836
7,')85 150,970
9,280 107,215
25,809 114,639
76 69
5,281 1,152,958 1,956,124
442 1,021,690 1,017,860
32'1
6:18
875
1,345
926
471
2fil
G2,323 134,174
15,320 131,776
7,57B 129,344
8,784 200,287
7,189 137,1167
7/171 (lfl,B96
22,070 InS,fUl3
31 37
5,196 123,000 182,166
lJ4
281
650
838
1,+91:i
90U
572
116
92,850
14,749
6,')'30
1,418
1,148
7%
1,316
3,739
85,603
14,453
[5,063
15,281l
21,549
['1,103
A,J!9
8,756
45 3')
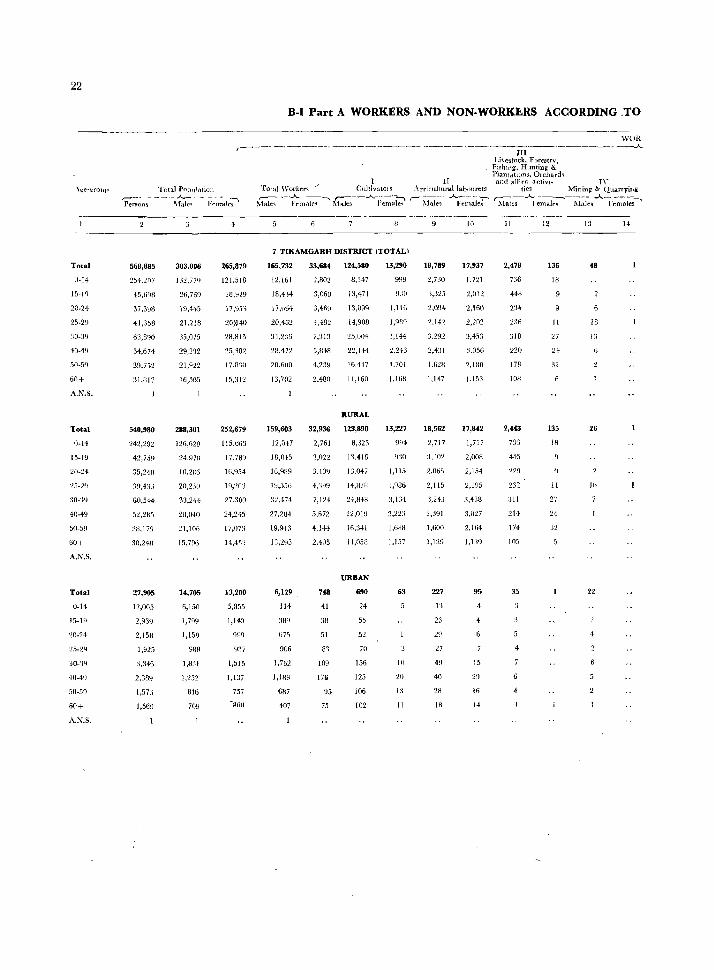
22
\<;e·'1rOllp
Total
0-14
15-19
20-24
25-29
40-49
50-5'1
60+
A.N.S.
Total
0-14
15-19
20-24
40-49
50-59
60+
A.N.S.
Total
0-14
15-19
20-24
25-24
30-'14
40-49
50-59
60+
A.N.S.
B-1 Part A WORKERS AND NON-WORKI.RS ACCORDING .TO
WOR r------ .------.. ~--.-.-- -~-~-~--- -~---~~--~m---~----~----A
TDtai Pn:lH1<ltion .---- _ - _ -- .A..:__ - -- ~-- ~ Persons \LtlN F("malt"s
568,885
254,297
15,6(18
37,398
41,358
63,890
54,674
:l9,752
540,980
242,29:l
42,75~
35,240
60,544
:18,179
30.241l
27,905
12,005
2,939
2,158
1,925
:1,346
2,389
1,573
1,569
303,006
26,769
19,415
21.218
35,075
29,292
21,Qn
16,.505
288,301
126,629
24,97()
13,2116
20,230
33,244-
211,040
21,106
15,7%
14,705
6,150
1,799
1,15Q
9SR
1,831
1,252
816
709
4
265,879
121.518
18,929
17,951
20,H()
18,813
25,382
17,830
]5,JI~
252,679
115,663
17,7Sq
27,:100
24,245
17,07:1
14,45'
13,200
5,855
1,140
937
1,515
1,137
757
-SGO
Li\~stock. Forestry, Fisillng. Hunting & Plantatlum. Orchard'!.
r II and allied activl~ n-Total \\'orker<: ".. CnltivatOls ,\g-riru1turallabl)urer,s tics Mining &. QmlJ'ryir'i
~-- ~m.ili~l ~~..A_-F-e-;a;~ r-~W~~ .A..r;;~i~f1 :\Ialcs -~;~-hl;~F;~~ks-'
7 TIKAMGARH DISTRICT (TOTAL)
165,732
12,161
18,414
17,664
20,462
~BA7'2
20.nOO
13,702
159,603
12,047
ISl,556
32.474
27,284
19.913
1'},295
6,129
114
:180
67,\
906
1,762
1,188
687
407
33,684 124,580
2,802
3,060
3,4M
4,-l82
7,:1l3
:l,n48
4.23D
2.480
8,347
10,471
13,mlQ
14,908
~5,O()4
22,144
16,117
11,160
RURAL
32,931i 123,890
2,761
3,022
3.409
4,'349
7,1:!.J.
5,6n
4,IH
2.405
748
41
51
83
189
17S
95
75
8,323
1'1.416
13.047
14,8:18
24,848
22.019
W.3.Jl
11,0511
URBAN
690
24
55
52
70
156
125
106
102
13,290
999
930
1,116
1,98Q
:1,144
2.243
1.701
1,168
13,227
1,11.')
IjfJ86
3,13-1
2,22~)
1,688
1.1.17
63
10
20
13
11
18,789
2,730
3,325
2.094
2.142
3.292
2,431
1.628
1,147
18,562
2,717
Vlb.,
~,115
1,600
1,129
227
23
27
49
40
28
18
10
17,937
1,721
2,012
2,160
2,202
3,4.,:1
:1.056
2,180
]'153
17,842
1,717
2,008
2,1.,4
2,1~5
3,433
3,027
2,164
I.nq
95
15
29
16
1.J
11
2,478
736
448
234
236
~1l8
220
178
108
232
311
214
174
105
35
12
136
18
11
27
24
32
135
18
II
27
24
32
13 14
48
18
26
1[>
22
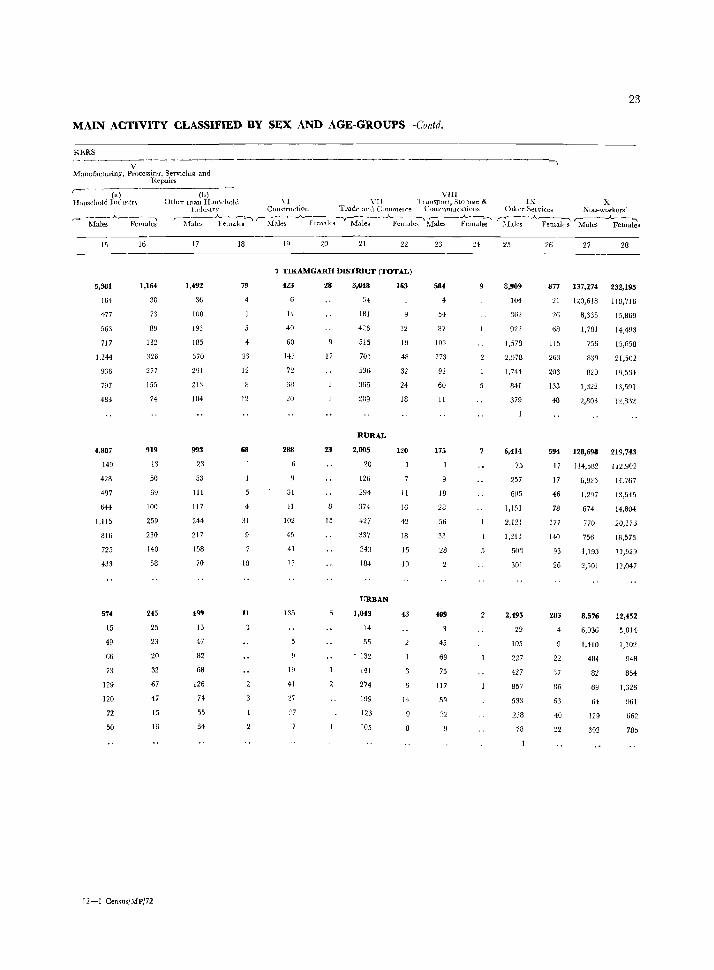
MAIN ACTIVITY CLASSIFIED BY SEX AND AGE-GROUPS-Contd.
KERS
V Manufacturing, Proccssinl{, Servicin~ and
Rt>pairs ,--------- '--(CC"b)-- vm (a) Household Imiuo::tn Otht'"f than HOllsehold \'1 VII Transport, Srnrage &
Imlu ... tr}' Con~truction Trade al1(\ Uommeln-" {~ommnlllcatinns
15
5,381
164
477
56:1
717
1.244
936
797
483
4,807
149
428
497
644
1,115
816
725
433
574
15
49
6" 73
129
120
72
50
16
1,164
38
73
8U
132
326
277
155
74
919
13
50
69
100
259
230
140
58
245
25
23
20
32
67
47
15
IG
12-1 Census!MP!72
'-M;~~~:-i~:-"} ~M~e--;-.A.-f.emal~-")Mal~--.A. Fem~ Mab-~nl<tl;-'
17
1,492
36
100
193
185
370
291
213
IIl4
993
23
53
111
117
244
217
158
70
499
13
47
82
68
126
74
15
34
18
79
33
12
12
GO
31
10
II
19 20 21 22
7 TIKAMGARH DISTRICT (TOTAL)
423
14
40
60
143
lill
20
288
31
41
102
45
41
13
135
19
41
'27
28
17
23
15
5
3,048
34
181
426
515
701
536
2119
RURAL
2,005
20
126
294
374
427
337
243
184
URBAN
1,043
14
55
- 132
141
274
199
123
105
163
12
19
48
32
24
18
120
11
16
18
15
W
43
14
23
584
54
87
103
173
92
60
II
175
18
28
56
33
28
409
45
69
75
117
sq
:12
9
23
IX X Otl1er &en'ices Non-workers'
~~-..A_ Fenl.llf's '"Males -"-P;;-aks
25
8,909
104
922
1,578
2,978
1,744
841
379
6,414
75
257
695
1,151
2,121
1,211
603
301
2,495
29
105
227
427
857
533
238
78
26 27 28
877 137,274 232,195
21 120,618 118,716
2G
613
115
263
203
133
48
8,335
1,781
756
3;)9
820
1,322
2,803
15,869
14,493
21,502
19,534
13,591
12,8:12
594 128,698 215,743
17 114,5U2 112.9C2
17 6,925 )4.767
46
78
177
140
93
26
283
22
37
86
63
40
1,297
674
770
756
L!93
~J501
8,576
6,036
1,410
4B4
82
69
64
129
302
1:1,545
14,804
20,173
18,573
!2,920
12,047
5,814
1)02
948
854
1,326
961
662
785
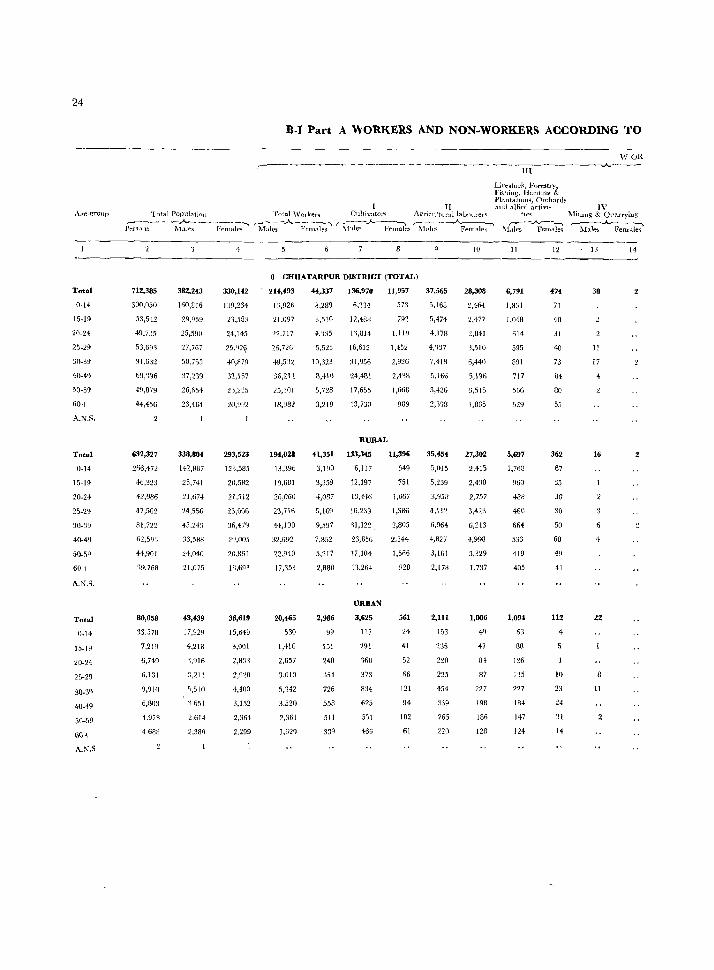
24
B-1 Part A WORKERS AND NON-WORKERS ACCORDING TO
WOR ,.---------~----~ - - ------~~-----------~-------.-..A--.-~-
I II
i~~'I~ir{I~~ki I ~~~f~~ry& Plantation'!, Orchards awi alli('rl aC'tiVl- IV
,\ge·group 'lo1£d Populatj(1ll Total "VO] kers Cultivators Ag'ric.llltural1abnllrerS
]~~~---~~--F:~~-" ~1~1~-A-l~o~;}t';' ~;~~~-;~~~~I~!l-~~ tIt'S Milung & QnarrYlng
,-- -...A...---~ r---..A..~~----..
\fales Femaleq Male!> Femd.ies
--------_._-------_----_._------_. _,._---_-
Total
0·14
15-19
20-24
25-29
~m-39
50-59
60+
A.N,S.
Total
0-14
15-19
20-24
25-29
30-39
40-49
Total
0_14
15-19
20.24
25-29
30.39
40-49
50_5~l
60+
A,N.S
712,385
300,050
53,542
53.693
91,632
49,879
44,456
632,327
266,472
46,323
42,986
47,5(;2
81,722
62,59:,
44,9QI
19,768
80,058
33,578
7,219
6,749
6,13l
0,1)10
6,803
4,978
468H
382,243
160,816
29,%9
27,767
50,753
el) ,239
26,6:;4
23,464
338,804
142,887
25,741
21.674
24,556
45,24'1
33,588
24,040
21,075
43,439
17,920
4,218
'1,9W
:::,:l11
;',510
'j 651
2,614
2,389
4
330,142
139,234
23,583
24,145
25,O~
40,B79
32,157
293,523
12'),585
20,582
21,112
2~\,OOO
36,479
29,005
20,851
18,691
36,619
15,649
3,001
2,831
2,920
4,400
3,152
2,354
2,299
8 CIIHATARPUR DlSTRICT (TOTAL)
214,493
13,926
21,Q97
22,717
26,726
49,532
36,212
25,:101
18,982
194,028
13,396
19,681
20,060
23,716
44,190
:12,692
22,940
17,153
20,465
530
1,416
2,657
3,010
5,342
3,520
2,361
1,629
44,337
3,289
:;,510
+.'):35
5,523
10,323
B,4\O
5,728
3,219
136,970
6,214
12,488
1'1,3]4
J6,612
31,956
H,-IBI
17,655
13,730
RURAL
41,351 133,345
3,100 6,117
3,359
4,087
0,109
9,.197
7,852
5,217
2,880
2,986
99
151
248
726
553
51 t
339
12,197
13,446
16,239
'11,122.
23,856
17,10'1
n,264
URBAN
3,625
117
291
%8
373
834
625
5)1
466
11,957
57:;
792
1.119
1,452
2,920
2,4'lf\
1,668
989
11,396
549
751
1,067
1,386
2,805
2,344
1,566
928
561
24
41
52
fi6
121
94
102
61
37,565
5,168
5,4)4
4,178
4,'1>7
7,418
0,166
3,426
2,308
35,454
5,239
3,958
4,112
6,964
4,827
3,161
2,178
2,111
153
'235
2~O
225
454
:139
265
220
10
28,308
2,464
2,477
~.84t
3,510
6,440
5,J96
3,515
1,865
27,302
2,415
2,430
2,757
3,423
6,213
4,998
3,329
1,737
1,006
49
47
84
87
227
198
186
128
II
6,791
1,831
1,048
614
595
891
717
5G6
.129
5,697
1,768
960
488
460
664
533
419
405
1,094
63
38
1211
115
227
184
147
124
12
474
71
40
31
40
73
84
80
55
362
67
35
30
30
50
60
49
41
112
4
10
23
24
31
14
• 13
38
II
17
16
22
II
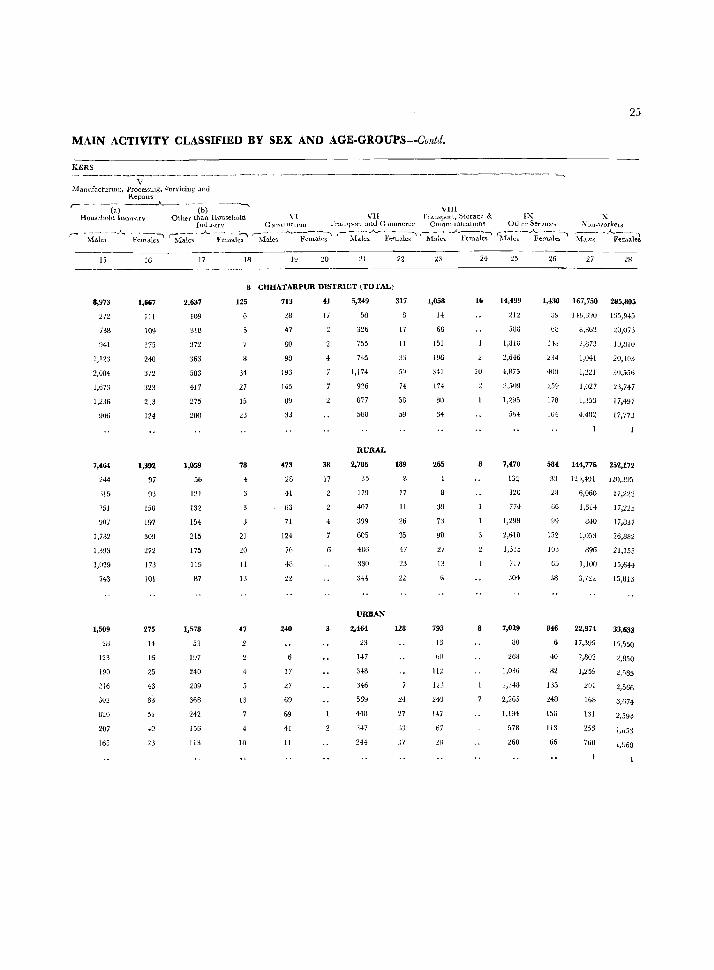
25
MAIN ACTIVITY CLASSIFIED BY SEX AND AGE-GROUPS-Cvntd.
KERS - -------y------- -----------------------------------------, ~fanufactur11lg'. PrOC~SUlg, ':)cfviciug .and
Repairs r- ---- ·--0)~----..--.---(b-)------ VI1i
Househol.i Inamtr.,. Oth("t' than Household VI VII 'i'rampart, Stora!!e & IX X Indl1~tr" C.)t1'W Uctlf)n l'rall;;port alld Ci_llilrnerCe COlllnlllllicatlOl1S Other Servlc.n ,'uTI-workers
r--M~e~ ~-"-.-~~;k;-' r-:-VI--';l~ .A.-F-;~k~ '11ale;-A-F:~~k-;-' ~ak~_A..--~k~ 'hl:b-~Fem~ ~,J~-~:~k~ M~e~-A~-;kl
15
8,973
272
73B
941
1,!23
2,D84
1,673
1,236
906
7,464
244
)15
'51
~07
1,782
1,393
1,029
143
1,509
213
123
i90
2i6
302
820
207
165
16
1,667
III
109
175
240
323
213
124
1,392
97
150
197
309
272
173
101
275
14
16
25
43
63 51
40
23
17
2,637
109
SIB
312
363
5B3
417
275
200
1,059
56
121
132
154
215
175
119
87
1,578
53
1~7
240
209
368
242
15G
] 13
111
125
34
27
15
23
78
4
21
20
11
13
47
4
13
10
1£1 20 21
CHHATARPUR DISTRICT (TOTAL)
713
47
BO
98
193
145
89
33
473
28
41
63
71
124
7G
48
n
240
17
27
69
69
41
Jl
41
17
4
38
17
4
5,249
511
326
755
745
1,1701
926
677
5BU
RURAL
2,785
35
179
407
:399
605
41lti
:330
URBAN
2,464
23
147
348
346
569
44{)
:H7
2H
22
317
17
II
33
5~
74
56
59
189
17
11
26
35
47
23
128
.>7
1,058
H
68
151
196
341
174
SO
34
265
73
98
~7
13
793
13
60
I,"
ILl
243
147
67
!H
24
16
10
8
14,499
588
I,BIU
2,646
4,875
2,509
1,295
7,470
32U
774
1,298
1,010
1,315
717
304
7,029
BO
263
1,036
1,343
2,265
1,194
578
260
26 27
1,430 167,750 285,805
J~ 1 Hj,fY)O 1 ~j5,945
bO
H8
234
400
259
178
104
tl,Hb~
2,873
1,041
1,221
1,027
1,J~J
4,482
:W,073
19,}lW
20,40:::;
30,556
23,747
17,497
17,773
584 144,776 252,172
33 1:.!:),4~1 llO,J:'_):,
28
66
99
152
!O3
65
846
6
40
82
135
HU
156
113
66
6,060
1,614
040
89G
l,lOO
22,974
17,3!J9
2,802
1,259
401
16B
131
25J
760
17,223
17,225
17,837
26,882
21,153
15,644
15,813
33,633
J5,55()
:1,850
L,585
2,566
0,674
2,5Y4
1,E/53
1,960
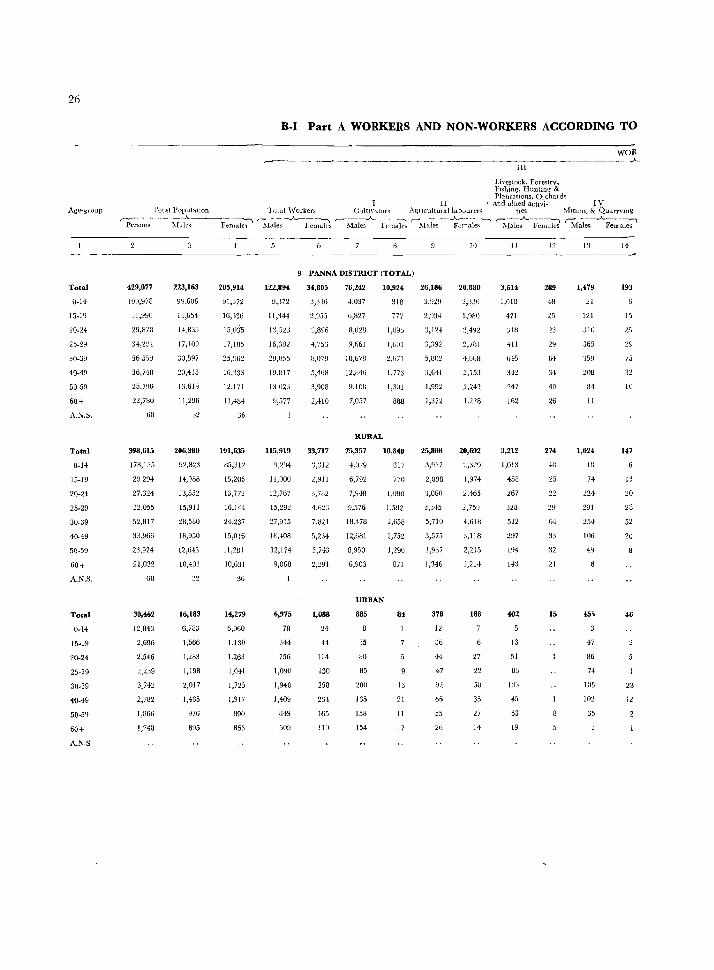
26
Total
0-14
15_19
~O-~4
25-29
3U-39
40-49
50-59
60+
A.N.S.
Total
0-14
15-19
20-24
25-29
30-39
40-49
50-59
60+
A.N.S.
Total
0-14
15-19
20-24
25-29
30-39
40-49
50-5Q
60+
A.!\.S
B-1 Part A WORKERS AND NON-WORKERS ACCORDING TO
waR -------------------- ~
III
Livestock, Forestrv. Fishing, HuntHlg' & PlantatlOus, 01 chard'!
II and a1lied achvi· IV L'ut:tl Popuiatlon '1 ()tal \Vorkers Cultivators A!.{IlcultUlal labuurer.; ties 1fllllllg & QuarrYlll,~
P~~~~~----F-em~~~ ~1~1~ -¥'--F~~-~ Ma~-A.. l'crna0 r-I\lal~s --~~~·~l-es-~ r;,Ltk:t;;;~ 'M.J;-_A..Fe;*~
429,07;
190,978
J1,990
29,870
56 55~
36,74B
25,790
22,780
68
398,615
17B,I:15
29294
27.321
32,055
52,817
33,966
23,924
21,032
68
30,462
12,843
2,696
2,546
..!,'!.j9
3)4~
2,782
I,B66
223,163
99,606
1 ',654
1+,835
17,IU9
30,597
20,415
13,619
11,296
n
206,980
9'2,823
14,088
13,552
15,911
28,580
18,950
12,643
10,401
32
16,183
6,783
1,566
1,283
1,198
2,017
1,465
976
B95
205,9U
91,J72
IG,'3'3G
15,03's
17,iU5
25,%2
16,333
12,171
11,484
36
191,635
H5,31'2
15,206
13,772
16,144
24,237
15,016
36
14,279
6,060
1,130
1,263
1,041
1,725
1,317
B90
853
5
122,894
!;I,J72
11)'344
13,523
16,382
29,855
19,817
13,023
9,577
115,919
9,2%
11,000
12,767
15,292
27,915
18,408
12,174
9,068
6,975
78
344
756
1,090
1,940
1,409
849
509
9 PANNA DISTRICT (TOTAL)
34,805
3,336
2,%5
3,896
4,75~~
8,079
5,468
3,908
2,410
33,717
3,312
:l/lll
3,782
4,623
7,821
5,234
3,743
2,291
1,088
24-
44
114
130
258
234
165
lEI
76,242
4,037
1J,0211
~J,661
18,678
12,816
9,108
7,057
10,924
818
777
1,6[)}
2,671
1,773
1,3Ul
888
RURAL
75,357
-1-,():l9
6,792
7,948
9,576
18,478
12,681
8,950
6,903
10,840
B17
770
1,090
1,592
2,658
1,752
1,290
871
URBAN
885
35
80
85
200
165
158
154
84
13
21
II
17
26,186
3,929
2,934
J,l~N'
3,392
5,802
:),641
1,992
1,372
25,808
2,898
3,080
3,345
5,710
3,575
1,937
1,346
378
12
36
44
47
92
66
55
26
10
20,880
2,336
1,980
2,781
4,668
3,153
2.242
1)228
20,692
1,~{:l9
1,974
2,465
2,759
4,618
3,118
2,215
1,2H
188
27
22
50
:'5
27
14
11
3,614
1,018
471
31B
411
615
342
247
162
3,212
1,013
453
267
328
512
297
194
1+3
402
13
51
83
1:13
45
53
19
12
289
48
25
64
31
40
26
274
48
25
22
:W
64
33
32
21
15
13
1,479
21
121
:no 365
359
208
84
11
1,024
1H
74
224
291
25-1
106
4~
47
86
74
105
102
35
14
193
15
29
75
32
IV
147
20
28
52
20
46
23
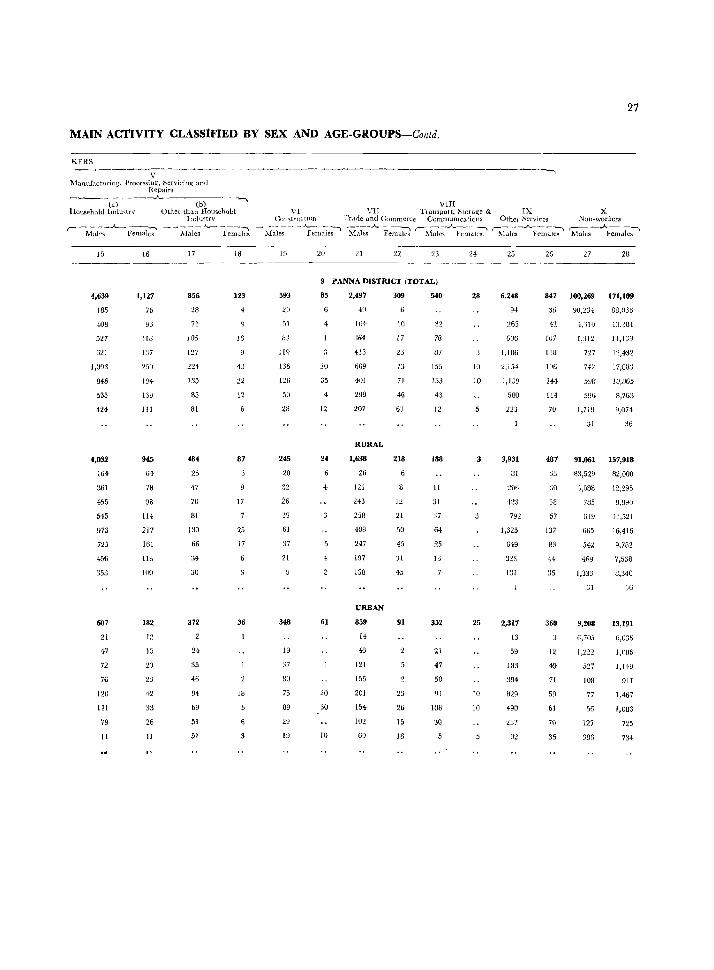
MAIN ACTIVITY CLASSIFIED BY SEX AND AGE-GROUPS-Contd.
KERS ---------------v l\ianufacturing, l'roccssinr;. ,servicing and
Repairs
---..A.-----(-b l-- -----, VIII
27
(al Hausehnld lndmtrv Other than Household V L VII TI £lllSpOJ t~ Stora~e & IX X
Indu~trv ComtructlOn 'l'r.iae and CommerCe Communications Othel Services Nun~workers
--- ~I:;j~ ~- -F~-:~ ,- ~i~le;~' --'Fe;n~ie;t M~i~;..A- Fe~~ r-:0a1cs ~~ S~~J...F;~~ ~~f'emdk:'
15 16 17 18 19 20 21 23 24 25 26 27 28 -~------------
4,639
185
408
527
621
1,093
846
535
424
4,032
164
~,61
455
545
973
725
456
353
607
2!
47
72
76
120
121
79
II
1,127
76
93
118
137
~5Y
194
13~
III
945
64
78
98
IH
217
161
113
100
182
12
Jo
20
23
42
33
26
II
856
28
71
105
1~7
135
85
81
484
26
47
70
81
130
66
?04
30
372
24
35
46
94
69
51
51
123
4
18
43
22
12
87
17
25
17
36
18
593
20
51
119
136
126
50
28
245
20
32
26
39
GI
37
21
348
19
37
80
75
89
29
19
9 PANNA DISTRICT (TOTAL)
85
20
35
12
24
4
61
20
30
10
2,497
40
164
413
609
401
299
207
RURAL
1,638
26
121
243
258
408
247
197
ISB
URBAN
859
14
43
J21
155
201
154
102
69
309
10
17
73
71
4. 63
218
12
21
50
45
3!
45
91
2:l
26
15
18
540
78
87
155
133
43
12
188
II
31
37
64
25
13
352
21
47
50
91
108
30
28
10
10
25
10
]()
6,248
94
265
G06
1,186
2,154
J,139
580
223
3,931
Ul
206
792
1,325
649
323
1:31
2,317
13
59
183
394
829
490
257
92
847 100,269 171,109
36
41
107
13B
196
lH
111
70
487
33
:10
58
67
137
83
H
35
360
12
49
71
5~
61
70
35
!)O,234-
4;llO
1,312
7'J.i
598
596
1,719
88,036
13,381
11,139
12,432
17,BUg
10,865
8,263
9,074
:il 36
91,061 157,918
83,529
'J,088
785
619
665
542
409
1,333
82,000
12,295
9,9~O
11,521
\6,416
9.782
7,538
8,340
31 36
9,208
6,705
1,:.222
527
103
77
56
127
386
13,191
6,036
1,1\86
1,149
911
1,467
1,083
725
734
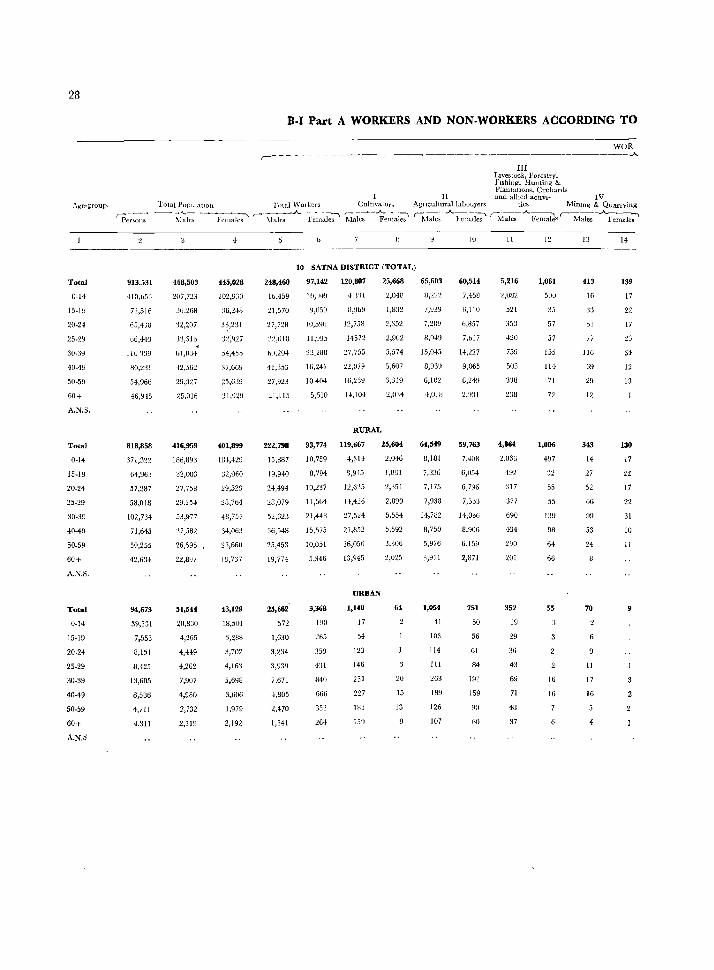
28
.'\gc-group.
Total
0-14
15·19
20·24
40·49
50·59
60+
A.N.S.
Total
0·]4
15·19
20·24
25-29
30·39
40-49
50.59
60+
A.K.S.
Total
0-14
15·19
20·24
25-29
30-39
40-49
50·59
60+
A.N.S
B-1 Part A WORKERS AND NON-WORKERS ACCORDING TO
,,------ - - ----waR
._---_.-----------------------._,_ III
Livestock, Forestry, Fishing, Hunting & PlantatlOlls, Orchards
II and allied actlvl- IV Total POf)uiatlOll Total V\'Olkers Cultivator,> Agllculturall..l.bOllfCrS ties MinIng & Quarrying
rp:;r:::;~-- ~1~~---;;;:;;1;;' r--Ma~.A. i~~n~J;' Mak-;--~en~ai~ ~~~;-A.J,~~:I-;;- ~1ak;A. Females r-M~ks--.A.Fe~
10 11 12 13 14 ---------------------
913.531
-110,653
12,516
6J,4jU
116 't39
80,l3!
54,966
46,915
818,858
:171,322
64,~J6:j
57,287
58,018
102,734
71,645
50,255
42,6~~4
94,673
39,331
7,553
3,151
8,425
13,605
8,586
4,711
4,311
468,503
207,723
36,268
'32,207
33,516
I-il,HiH
42,562
29,327
25,016
416,959
rHb,B9:;
32,003
27,758
':,3,977
37,582
26,595
:.l:l,WJ7
51,544
20,830
4,265
4,449
4,262
7,907
4,980
2,732
2,119
445,028
202,!JJO
36,248
3~,231
n:927
54,455
37,669
25,639
401,899
1111,429
:32,960
29,529
28,764
48,757
34,063
I!J,737
43,129
18,501
3,288
3,702
4,163
5,698
3,606
1,979
2,192
248,460
10,459
:11,570
27,nS
J~,()III
h(),2~H
41,353
27,923
:!1,115
222,798
15,887
19,940
24,494
23,079
52,623
3G,548
25,453
19,774
25,662
572
I,G30
3,234
7,671
4,805
2,470
1,341
10 SATNA DISTRICT (TOTAL)
97,142 120,807
10,:)4.9 4,)'-n
Y,05:1 H,9bY
JO,5~Jh 12,758
11,9U5 145n
22_288 27,755
16.241 22,079
10404 16,239
5,610 H,104
25,668
2,0411
1,832
2,352
2,902
3.574
RURAL
93,774 119,667
10,759 4,3B
8,794 8,915
10,237 12,6'15
11 ,5G4 14,4~6
21,4411 27,524
15,575 21,U52
10,051 16,056
5,346
3,368
IgO
265
359
431
840
666
353
264
URBAN
1,140
17
54
123
146
231
227
183
159
25,604
2,046
1,831
2,351
2,899
5,554
0,592
3,3U6
64
20
15
13
65,603
7,g3~
7,lU9
8,049
15,0+5
8,939
6,102
+,OIH
64,549
8,181
7,836
7,175
7,938
14,782
8,750
5,976
3,911
1,054
41
103
114
111
263
18Y
126
107
60,514
7,458
b,110
b,857
7,b17
14,n7
9,065
6,249
2,931
59,763
7,408
6,054
6,796
14,036
8,906
6,159
2,371
751
50
56
61
84
191
159
90
60
5,216
~,tlU2
521
,53
420
759
5u5
338
2:m
4,864
:,l,063
492
:J17
377
690
434
290
201
352
19
29
36
43
69
71
4a
37
1,061
5UU
:l.1
57
57
155
114
71
72
1,006
497
55
55
98
64
66
55
16
16
413
16
33
bl
77
116
69
29
12
343
14
27
52
6G
99
53
24
70
11
17
16
139
17
22
17
34
12
13
130
17
22
17
22
31
10
11
9
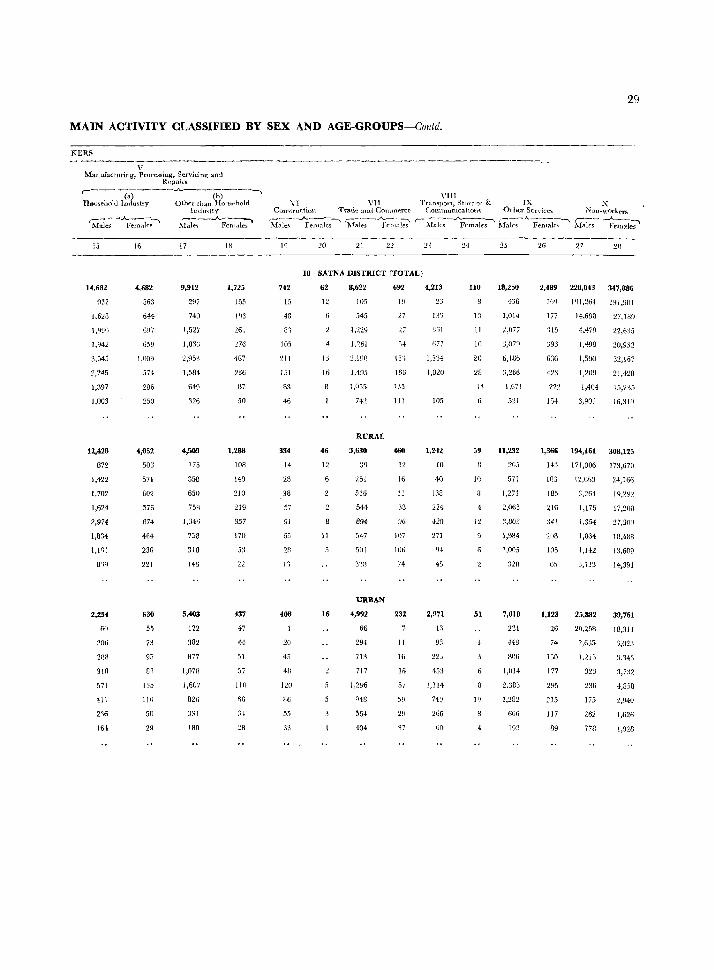
29
MAIN ACTIVITY CLASSIFIED BY SEX AND AGE-GROUPS-CuIM
KERS
V Manufacturing, Processing, Servicinq' and
Repairs. r-----(;)---__._----(b)--·-., Househ(llJ Industry Other tllan Homwholrl
htumtry
~;ie: -~~i~~~ Mak,,--A. Felll.tle":""'
15
14,682
1.628
I,qaO
J,Q42
3,545
2,245
1,397
1,003
12,428
872
1,422
1,702
1,621
2,974
1,834
1,Ir.l
8':Q
2,254
60
206
288
SIR
571
411
216
164
16
4,682
563
644
659
1,009
574
286
250
4,052
SOB
571
602
576
874
464
236
221
630
55
73
95
8:1
135
110
50
29
17
g,912
297
740
1,527
1,836
2/~5'3
1,584
649
326
4,509
175
358
650
758
1,346
758
ell 8
146
5,403
122
382
877
1,[)71l
1,607
826
331
180
18
1,725
155
]t13
261
~76
457
236
87
50
1,288
108
149
210
219
357
170
22
437
47
44
57
110
oG
34
28
\'111 VI VlI Trampor-t, Stor;wf'" & IX X
Call"lructtOll Trade and COHlInt':fce CommunLcatiom. Other Services Nou·wol"kers
~ale~ -~:;:~~ ~*7~~'~ks' r--A-Ia-le-s-~;-' kfuJ;;-"F;;;1~;:----1faks-~;;Je7
I~
742
15
48
81
105
111
15]
83
46
334
14
28
38
57
91
65
1',
408
20
45
411
120
B6
55
33
20 21 22
10 SATNA DISTRICT (TOTAL)
62
U
B
16
46
12
6
II
16
8,622
105
545
1,229
1,261
2,l90
1,495
1,055
742
RURAL
3,630
:19
251
516
544
894
:;47
"Ill
3,m
URBAN
4,992
66
294
713
717
1,296
948
554
404
692
19
27
'27
54
15:',
166
III
<1<;0
12
16
II
38
96
107
106
74
232
II
16
16
57
5~
29
37
4,213
23
13'1
%1
677
1,534
1,020
IDS
I,HZ
10
.-40
138
224
420
271
45
2,971
13
93
nJ
453
1,114
748
266
60
24
110
]3
11
10
20
28
11
59
10
12
51
25
18,250
436
1,014
'2,Oi7
3,079
6,186
3,266
1,671
521
I1,232
205
571
1,271
2,065
3,803
1,984
1.005
:128
7,018
231
-143
AOti
1,014
2.333
1,282
666
193
26 27
2,489 220,043 347,886
i6!) JlJI,261 191,9Hl
177
'H5
423
222
154
14,693
4,479
1,498
1,590
J,2fl9
1,404
3,901
27,lB9
22,635
20,932
32,167
21,428
15,n5
lfl.:H4
1,366 194,161 308,125
14:1 171,006 173,670
103
185
216
341
20S
105
65
1,123
26
74
177
295
:]15
117
89
12,003
3,264
1,175
1,354
1,034
1,142
3,113
25,8112
20,25R
2,635
175
262
77B
24,166
17,200
27,309
!B,4SS
13,609
14,391
3g,761
18,311
3,023
3,143
3,732
4,858
2,940
1,626
1,928
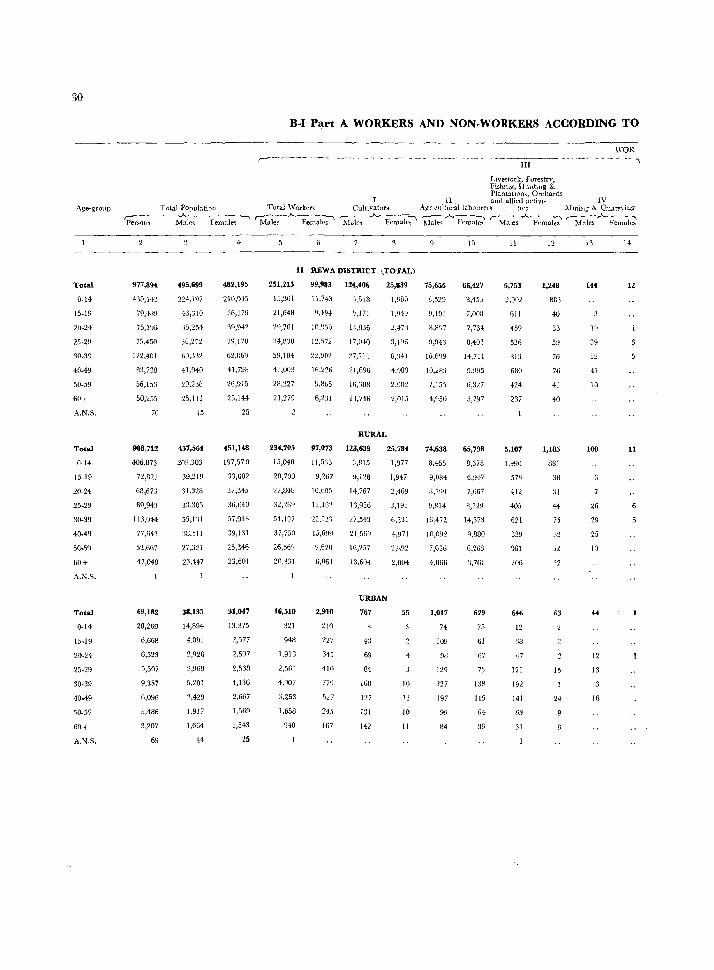
30
Age-group
Total
0-14
15-19
30_39
40-49
50-5~J
6th
A.N.S.
Total
0-14
15-19
20-24
25.29
30·39
40.49
50·5'1
60+
A.N.S.
Total
0·14
15·19
20-24
25-29
30-39
40·49
60+
A.N.S.
B-1 P~rt A WORKERS AND NON·WORKERS ACCORDING TO
Total Population Total W'orker'l
WOR .--~-- ,
Llve~tock. Forestrv. Fish11l~, Hunt~ng & PlantatIOns, Orchards
11 . and allied uctiVl- IV Cultivators A!1:nculturallabourer<: tIes Mtning & Qu.ur) iug
r-- ~----- ---J....~ __ -,___.._,.-----.., ~-_-.Jo......-~ __ ~
Person'> Male,> female') ~1ale~ Femalt"s 'hl;le<; _..J--_ ie;;aJ";-:;, ~h~:ki 'M~s-"""'Fc;;i~ f""Males-Afemalei
977,894
415,142
79,489
75,185
75,450
122,401
8:1,738
56,15:1
50,255
70
908,712
406,873
72,821
6B,673
69,943
113,044
77,"42
51,667
47,04B
69,182
28,269
6,668
6,523
5,507
9,357
11,096
3,4H6
3,207
69
495,699
224,1()?
43,310
35,254
3G,272
60,332
41,940
29,238
25,111
15
457,564
209.303
39,219
31,328
33.:10:1
55,1 '11
38.511
27,321
23,447
38,135
14,894
4.091
l,n6
2,969
5,201
3,429
].91 i
1,664
44
4
482,195
210,945
36,179
39,942
~19, 17B
62.069
41,7!J8
26,U\S
25,\44
25
451,148
197,570
33,602
37,345
36,640
57,913
39,131
25,346
23,601
31,047
13,375
2,577
2,597
2,53R
4,156
2,667
1,,569
1,543
25
251,215
lS,'361
21,648
29,761
:H,B30
59,104
41,00:1
28,227
21,279
234,705
lS,040
20,700
27,840
32/~69
54,197
37,750
26,560
2(1,gSI
16,510
321
948
1,913
2,561
4,907
3,253
1,658
948
11 REWA DISTRICT (TOTAL)
99,933 124,406 25,839
11,743
9,494
10.'}50
12,572
n,~)02
16,2~fi
9,865
1.818
f),l il
Il,836
17,0-10
27,711
21,69G
16,3811
13,746
RURAL
3,196
6,341
4,083
~,O()~
2,015
97,073 123,639 25,784
1,977
1,947
2,469
3,193
6,331
4,971
11,533
9,267
10,605
12,162
22,1:!'~
15,69!l
6,064
2,910
~J(]
227
345
410
527
245
167
3,815
9,128
14,767
16,956
27,543
21),}()9
16,257
13.604
URBAN
767
43
69
84
168
127
131
142
2,001
55
10
12
10
II
75,655
8,529
9,193
R,8g7
9,94::1
16,609
10,289
7,155
4,950
7.,638
8.455
9,084
0,799
9,814
16,472
10,092
7,GS6
4,866
1,017
74
109
98
lZQ
197
99
84
66,427
8,4jJ
7,008
7,734
8,402
14,711
9,995
6,327
3,797
65,798
8,378
6.947
7,667
8,329
14,573
Q,880
6,263
'l,761
629
75
61
67
73
138
115
36
5,753
2,002
611
459
526
813
680
424
237
5,107
1.990
573
'112
405
621
539
646
12
38
·17
12i
192
141
63
31
12
1,248
883
40
33
59
76
76
41
40
1,185
881
38
3(
44
75
63
15
24
13
144
39
32
41
10
100
26
29
25
10
44
12
13
16
14
11
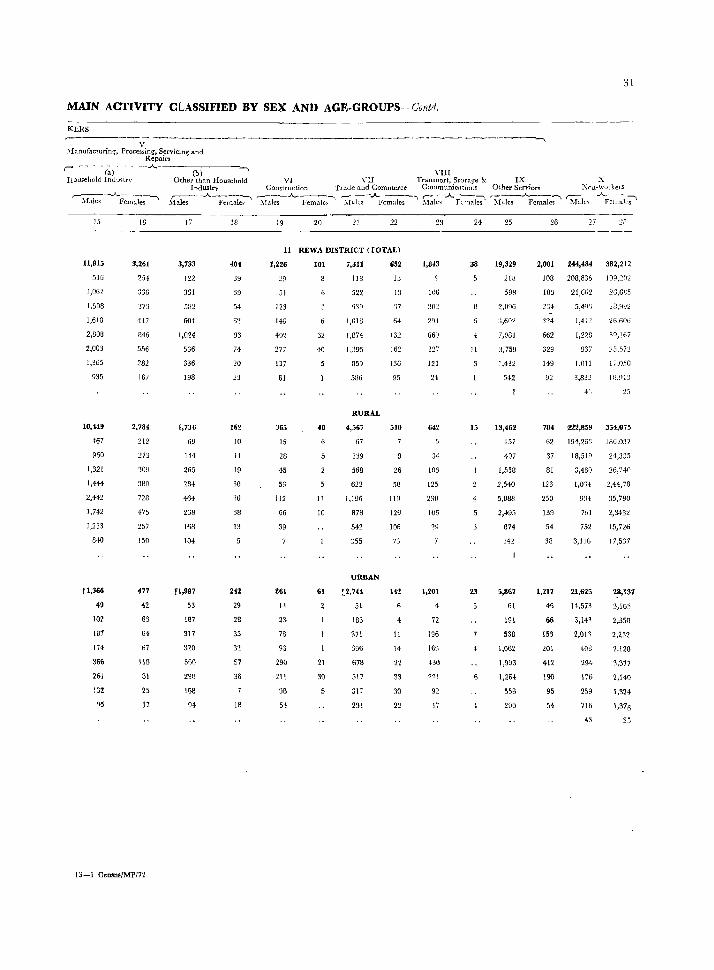
31
MAIN ACTIVITY CLASSIFIED BY SEX AND AGE·GROUPS Contd,
KERS
V .\ianufacturinq, Processing. Servicing and
Repairs r- ~- -~ -r;;-)~- -- --...... ---C-b-) ----_, Household Inuu<;trv Other than Homehold
15
11,815
516
1,06!
1,50B
1,618
2,808
2,003
1,365
935
10,449
467
960
1,321
1,444
2,442
1,742
1,233
840
r 1,366
49
102
187
174
36&
261
132
qs
16
3,261
254
336
373
147
846
556
282
167
2,784
212
273
309
380
728
475
257
150
177
42
63
64
67
lIB
81
25
17
13-1 Cen.n./MPI72
Industry ,-------~..A._ ___ ~
l\1ales Females
17
3,733
122
331
_102
604
1,021
536
336
198
1,736
69
1H
265
284
464
23B
168
104
f1,997
53
187
317
320
5~0
298
168
94
18
404
39
39
54
62
93
74
20
23
162
10
11
19
30
%
38
J:l
242
29
28
35
32
51
36
IS
VIII V I VII Transport, Storage & IX X
Construction Traue and Commerce Communiclltions Other Services l':nU-Wol kers
S"~;-A.~~ ~fales A~, ~~·..A.-Femal~ r~hmalc~ ~le;-..A-ic;~;e~
19 20 21 22
11 REWA DISTRICT (TOTAL)
1,226
51
123
146
4m
277
137
61
365
15
28
45
53
112
66
39
351
14
2S
73
290
211
93
54
101
40
40
11
10
61
21
so
7,311
118
522
939
J ,018
J ,874
1,395
859
586
RURAL
4,567
67
3S9
568
622
1,196
878
542
:155
URBAN
:2,744
51
183
371
396
678
517
317
231
652
13
64
131
162
136
95
510
26
50
110
129
106
7:1
142
11
14
22
33
30
22
23
1,343
106
102
294
660
327
121
24
642
34
106
125
230
106
29
1,201
4
72
196
16~
430
221
92
11
24
38
11
15
23
25
19,329
218
598
2,0%
:l,60~
7,081
3,759
1,432
542
13,462
157
107
1,558
2,540
5,088
2,49"
874
5,867
61
191
533
1,062
1,993
1,264
55B
200
26 27
2,001 244,484 382,212
108 208,836 199,20~
103
~:14
324
662
329
149
92
21,6G2
5,491
1,228
937
1,011
3!832
26,Gfl5
26,606
39,167
:.!5,57:.!
1;,050
Hl,91:::
4') 15
784 222,859 354,075
62 194,263 186,037
37
81
123
250
139
54
38
1,217
46
68
153
201
412
190
95
54
18,519
3,480 26,740
1,014 2,44,78
934
7bl
752
3,JlG
21,625
14,573
3,143
2,011
40S
294
175
259
116
35,790
2,3432
15,726
17,537
23,137
3,165
2,350
2,252
2,128
3,377
2,140
1,324
1,370
43 25
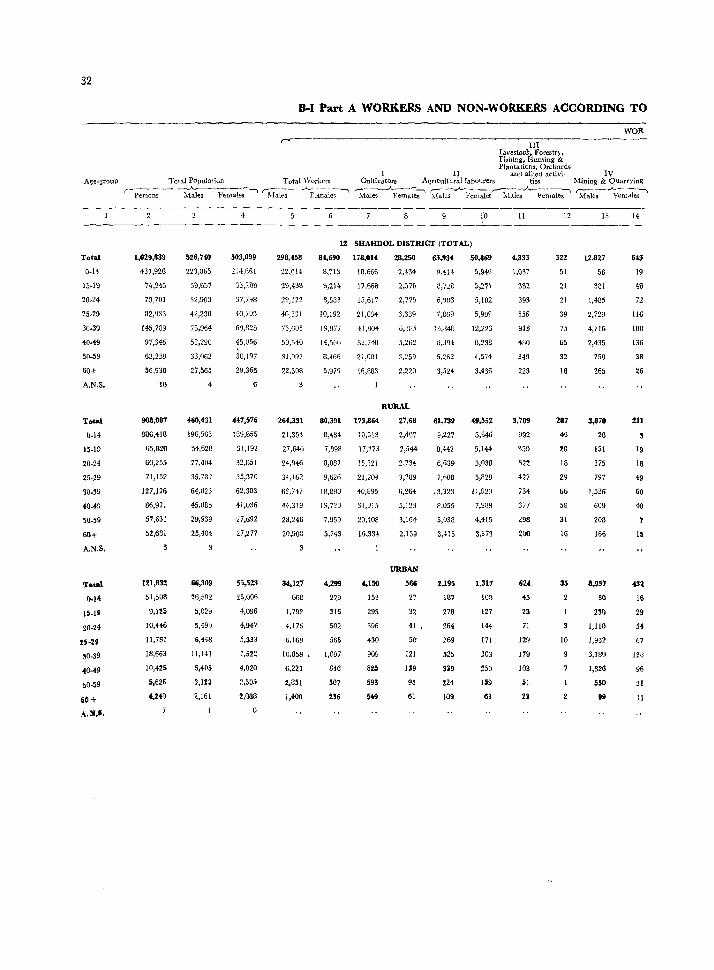
32
Total
0-14
15-1~
20-24
25-29
30-39
40-49
50-59
60+
A.N.S.
Total
0-14
15-19
20·24
25-29
30-'9
40_~9
50-59
60+
A.N.S.
Total
o-H 15-19
20·24
U-2j
30·39
40-49
50·59
60+
A.M.'.
r--------..---Persons
1,029,839
437,926
7~,945
70)01
82,433
145,789
97,346
63,259
56,930
10
908,007
386,418
65,820
60,255
71,152
127,126
86,921
51,631
52,6Bl
UI,B32
51,508
9,1!5
10,446
1I,7SI
18,663
10,425
5,62&
4,2.9
D·I Part A WORKERS AND NON·WORKERS ACCORDING TO
!Il Livestock, Forestf), Fishing, Hunting & Plantations, Orchards
1I and allIed activi- IV
WOR
Total Population Total'Vorl,ers Cultivators Agrlcultura1labollrers ties Mining & Quarrying
Males Females ~ ~~----"'-h;al-~ r-----.A..-----------., ~.,)_--------. r--::~-..A.-~--, r----"----~ Males Felllales )"Ialcs Females M"les females Males females
526,740
223,065
'3~,fj5?
32,903
4~,230
75,964
52,290
33,062
27,565
4
460,431
196,563
34,620
27,404
35,782
64,823
45,885
29,939
25,404
1ii,309
16,502
5,029
5,499
6,448
11,141
6,405
S,Ul
2,161
503,099
214,861
'JS,2&l
37,748
40,703
69,825
45,056 \
30,197
29,365
6
447,576
189,855
31,192
32,051
35,370
62,303
41,036
27,692
27,277
55,523
25,006
4,096
4,947
5,333
7,522
4,020
2,505
2,088
12 SHAHDOL DISTlUCT (TOTAL)
298,458
22,014
29,432
29,122
40,331
73,605
50,540
31,097
22,308
84,690 178,014 28,250 63,934 50,869
264,331
21,354
27,646
24,946
34,162
62,747
44,319
28,246
20,903
34,127
660
1,792
4.176
6,169
8,713
8,214
8,583
10,192
19,977
14,566
B,466
5,979
10,656
17,668
15,617
21,634
41,804
:l2,74D
21,001
16,883
I
80,391 173,864
8,484 10,513
7,898 11,373
B,081 15,221
9,626 2 I ,2M
IB,880 40,895
13,720 31,915
7,959 20,4D8
5,743 16,334
(,299
229
~16
502
566
,,150
153
295
10.S58. 1,097
396
430
909
825
593
549
6,221 846
2,851 507
1,400 Us
2,434
2,576
2,775
3,339
6,185
5,262
3,259
2,220
RURAL
27,68
2,407
2,544
2.734
3,289
6,264
5,123
3,161
2,159
URBAN
566
27
32
41 ,
50
121
139
95
61
9,414
8,720
6,903
7,869
13,8411
11,394
5,262
3,524
61,739
9,227
8,442
6,639
7,600
13,323
8,055
5,03B
3,415
2,195
lB7
278
264
269
525
Sl9
124
109
5,946
5,271
5,182
5,999
12,22J
8,238
4,574
3,436
49,552
5,846
5,144
5,038
5,B28
11,920
7,988
4,415
3,373
1,317
100
127
144
171
303
250
159
G3
II
4,333
1,037
38:!
393
556
913
480
349
223
3,709
992
359
322
427
734
377
298
200
624
45
23
71
129
119
103
51
a
12
322
51
21
21
39
75
65
32
18
287
49
!O
18
29
66
5B
31
16
35
10
13
12,827
58
381
1,485
2,729
4,716
2,435
758
265
3,870
2B
151
375
797
1,536
609
20B
166
8,957
SO
230
1,110
1,932
3,IBO
1,826
5S0
99
14
643
19
4a
72
116
IBB
136
38
26
211
19
18
49
60
4D
15
432
16
29
54
61
128
96
31
II
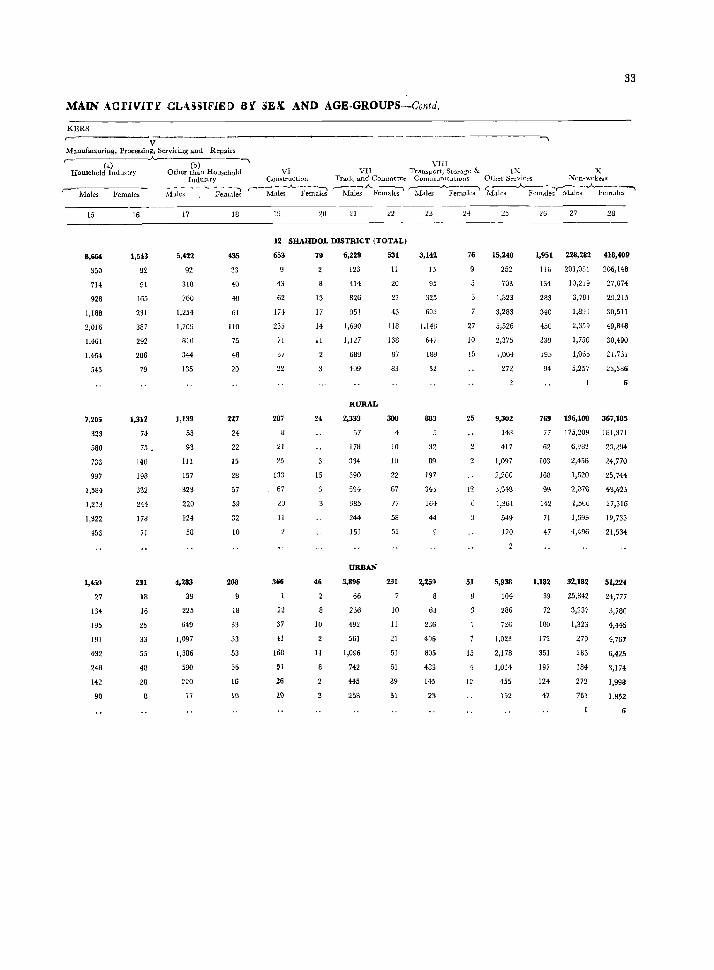
33
MAIN ACrIVlrY CLHSlflE[) BY 3EX AND AGE·GROUPS-Colltd.
KllRS
r--------------v Mauufacturiug, Processing, Servicing and Repairs
r- (a) (b)-' Household Industry Other than Household VI
15 16
Industry
:'\l..iles
17
'-- - -:-'\ Fem<lles
18
Construction r-~~--..A_~--:-l
Males Females
19 20
-.
VIII VII Transport, Storage & IX X
Traue and Commerce G.HllIHumc4l1011s OHler ,services Non-wokers
Males"" Females ~ Fem;;b' Mal" Female~''M:,Ie;-''F~.;;;;;--,
21 27 28
12 SHAHDOL DISTRICT (TOTAL)
8,664
350
714
928
1,188
2,016
1,461
1,464
543
7,205
323
580
733
997
1,584
1,213
1,322
453
1,459
27
134
195
191
432
248
142
90
1,5n
92
91
165
231
387
292
206
79
1,312
74
75 ,
140
198
332
244
178
71
231
18
16
25
33
55
48
28
5,422
92
318
760
1,254
1,709
810
344
135
1,139
53
93
111
157
323
220
<24
58
4,283
39
225
649
1,097
1,386
590
220
77
n5
33
40
48
61
110
75
48
20
227
24
22
15
28
57
39
32
10
208
18
33
33
53
36
16
10
653
43
62
IH
235
71
37
22
287
21
25
133
67
II
366
22
37
41
168
51
26
20
70
8
13
17
14
11
24
15
46
10
11
6,229
123
414
826
951
1,690
1,127
689
409
RURAL
2,333
57
178
334
390
59.
385
244
151
URBAN
3,896
66
236
492
561
1,096
742
445
258
531
11
20
21
43
118
138
97
83
300
10
10
22
67
77
58
52
231
10
11
21
51
61
39
31
3,142
13
95
325
6~j
1.148
647
189
32
883
32
89
197
343
16+
44
2,259
63
236
496
805
483
145
23
76
27
10
15
25
12
51
15
12
15,240
252
703
1,823
3,283
5,526
1,004
272
9,302
148
417
1,097
2,260
3,'348.
1,361
549
120
5,938
104
286
726
1,023
2,178
1,014
455
152
1,951 228,282 418,409
116 201,051 206,148
134
283
340
450
339
195
94
10,219
3,781
1,89)
2,359
1,750
1,955
5,257
27,074
29,215
30,511
49,848
30,+90
21,731
23,386
769 196,188 367,185
77 175,209 1S1,S71
62
103
168
99
142
71
47
1,182
39
72
180
172
351
197
124
47
6,902
2,458
],020
'l/J7£
1,566
1,693
4,496
32,182
25,842
3,237
1,323
279
283
184
272
761
23,294
24,770
25,744
43,423
27,316
19,733
21,534
51,224
24,777
3,780
4,445
4,767
6,425
3,174
1,998
1.852
6
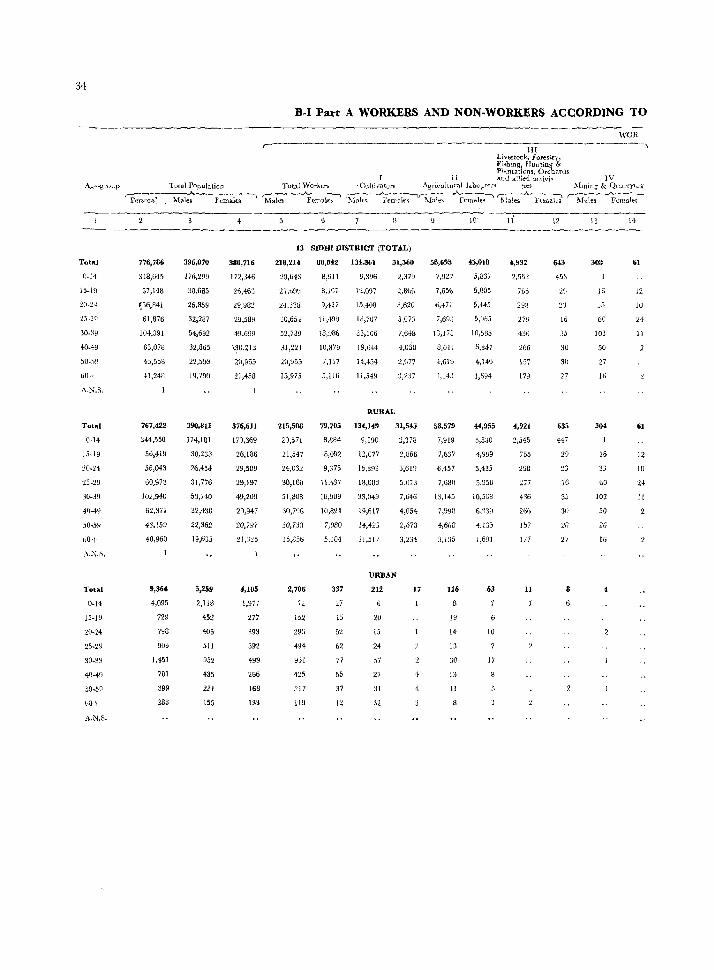
34
Tata)
0-14
1:;'1\)
:20-21
30-39
W-49
60+
11.:-.1.5.
Total
0,14
15-19
:!0-24
JO-39
40-49
60+
,\.1';.:;.
Total
0-14
A,N.S.
D.I Part A WORKERS AND NON·WORKERS ACCORDING TO
,-----------1II
Livestock, Forestry, Fi .. hmg, Hunting & Plantations. Orchards
II allJ allied ~(.tivi ..
WOR .~--~-~-~
IV 10t<11 POf.ulation Total Workers - Cultivators Agricultural labOl,lfe;s tIeS ..\11ning & ( ... h.larrYHlg
,---~
Persons:
776,786
3411,645
57,148
~56,841
61,876
104,391
63,078
43,558
-11,248
767,422
344,550
56,419
56,043
60,973
102,940
62,371
43,159
40,960
9,364
4,095
729
798
903
1,451
701
399
288
--... ~_..A,_- ~,--- --A-~-Ir7-~ A-----~l r---..A.--~ l.1ales Females Males Females '!\ble, Females MaJe,> fenlnles foda!es Females
r-~__""-- --~ Males FCIIlale~ \
396,070
176,299
30,685
26,859
32,287
54,692
32,865
22,5"3
19,790
390,811
174,181
30,233
26,454
31,776
53,740
32,430
22,362
19,635
5,259
2,118
452
405
511
952
435
231
155
380,716
172,346
26,-l6:~
29,982
29,58~
49,699
1;30,213
20,965
2J,458
376,611
170,369
26,186
29,589
29,J97
49,200
29,947
20,797
21,315
4,105
1,97 }
277
393
392
499
266
168
133
10'
13 SIIlHI DISTlUCT (TOTAL)
210,214
10,613
2,1.328
30,65.
52,739
31,221
20,955c
15,975
215,508
20,571
21,547
24,032
30,160
51,808
30,7%
20,73H
15,856
2,706
n I~
296
494
9:11
425
217
119
80,042 134.361 31,560 58,695 45,018
8,;)11 9,396
B,10; 12,097
9,127 15,408
11,499 18,707
13,98& 33,106
10,879
1,117
5,116
19,644
14,454
11,549
RURAL
~,:l79 7,927 5,837
2,8t6 7,65" 5,005
3,620 G,m 5.445
5,075 7,69:3 5,%::;
7,648 13,173 10,565
4,058
2,677
::,2:17
8,011
~,619
3,143
6,347
4,140
1,694
79,705 134,149 31,543 58,579 «,955
5,830
4,999
5,435
5,958
10,5G8
6,139
8,B84 9,390
8,092 12,077
9,375 15,3\'3
11,437 18,6B3
10,909 33,049
10,824
7,080
5,104
3$7
27
)5
52
62
77
55
37
12
19,611
14,423
11,517
URBAN
212
20
15
24
57
27
31
32
:1,378
~,866
3,619
7,646
4,054
2,673
3,~34
17
4
7,919
7,637
6,457
7,6BO
13,145
1,99B
4,608
3,1:15
U6
19
14
13
30
13
Il
4,13.1
1,601
63
10
17
4,932
2,55~
765
298
279
436
266
157
179
4,921
2,545
765
298
277
436
266
157
177
U
12
16
35
30
30
27
635
447
29
23
16
35
30
28
27
13
308
16
J5
60
103
50
27
16
304
16
3J
60
IOZ
50
26
16
14
61
12
10
24
Il
61
12
10
11
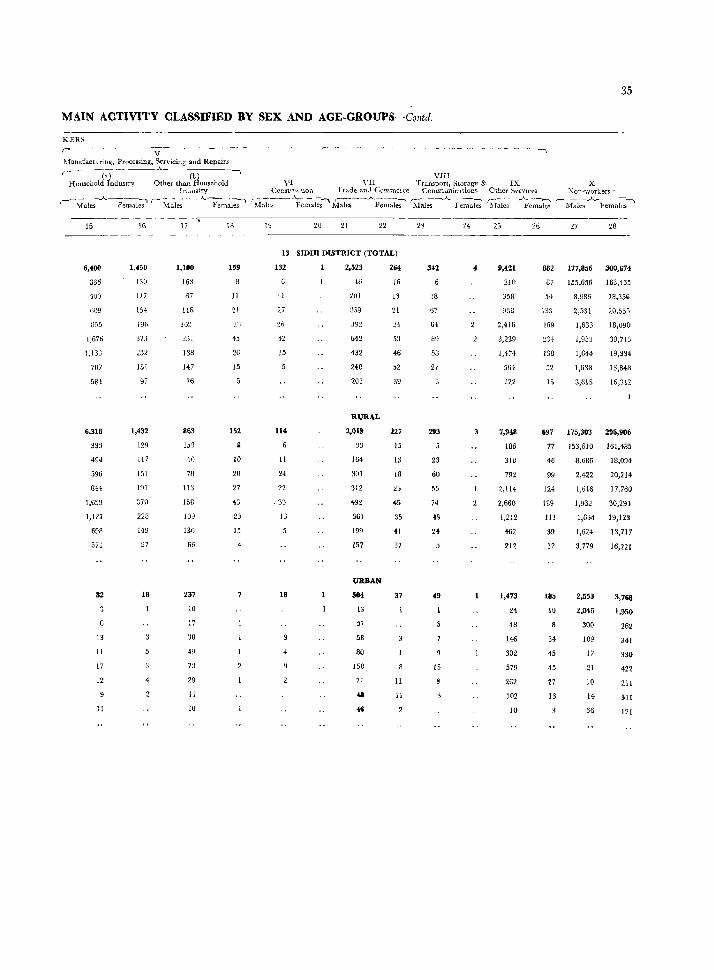
35
MAIN ACTIVITY CLASSIFIED BY SEX AND AGE.GROUPS-Contd.
KERS I----------y---------------------------'---'--- -' ,-- --,-, --'-..., l\{anufacturing, Processing, Servicing and Repairs
(al Household Industry
(t) -. VIII Other than Huusehold VI VII Transport, Storage & IX X
Inuustry Constrw .. tlOn Trade anJ Commcl.ce Communications Other ServIces i\on-workers-
f~ ~~l~~~.A.-Fe-;~~ (" M~~;-' -A..F;m~le~~ {M~-;-- ~~~al~' ~ks--_A._ Femal~ 'hl~l;;--A..Femalei s:i;l~ -~-;~lci (" Mal;_A_F~t1a~ ~
15
6,400
336
500
609
855
1,676
1,13:l
707
581
6,318
333
494
596
844
1,659
1,121
698
573
82
13
II
17
12
11
IG
1,450
130
lli
1.54
1911
:17.l
232
lSI
97
1,432
129
117
151
191
:no 228
149
97
18
4
17
1,100
163
67
IIG
lW
231
138
147
76
863
153
511
711
11:3
15B
109
136
66
237
10
17
38
49
73
29
II
10
18
159
11
21
45
26
15
152
10
20
'27
43
2:;
15
\~ 20 21
13 SIDH! DISTRICT (TOTAL)
132
11
27
15
114
II
24
22
.33
IJ
18
4
2,523
46
201
359
392
432
248
203
RURAL
2,01'
33
164
301
312
492
361
199
157
VRBAN
504
13
37
58
80
150
7!
4a
-Hi
264
16
13
21
24
53
46
52
39
227
15
13
18
23
.. 5
35
41
37
37
11
11
23
342
:w 67
6~
89
sa 27
293
23
60
55
14
+9
24
49
15
24 25
9,421
210
358
2,416
3,239
1,474
564
222
7,948
186
310
792
2,114
2,660
1,212
462
212
1,473
24
48
146
302
579
262
)02
10
l6 27 28
882 117,856 300,674
81 155,656 163,435
54
133
169
~3+
138
52
I,
8,986
2,531
1,633
1,953
1,644
1,638
3,81'
18,35.
20,555
18,090
30,713
19,334
13,B48
\6,342
697 175,303 296,906
77 153,610 161,485
46
99
124
139
111
39
12
185
10
34
45
45
21
13
8,686 1 B,094
2,422 20,214
1,616 11,760
1,932 30,291
1,634 19,123
1,624
3,779
2,553
2,046
300
109
17
21
10
14
36
13,117
16,221
3,768
1,950
262
341
330
422
211
311
121
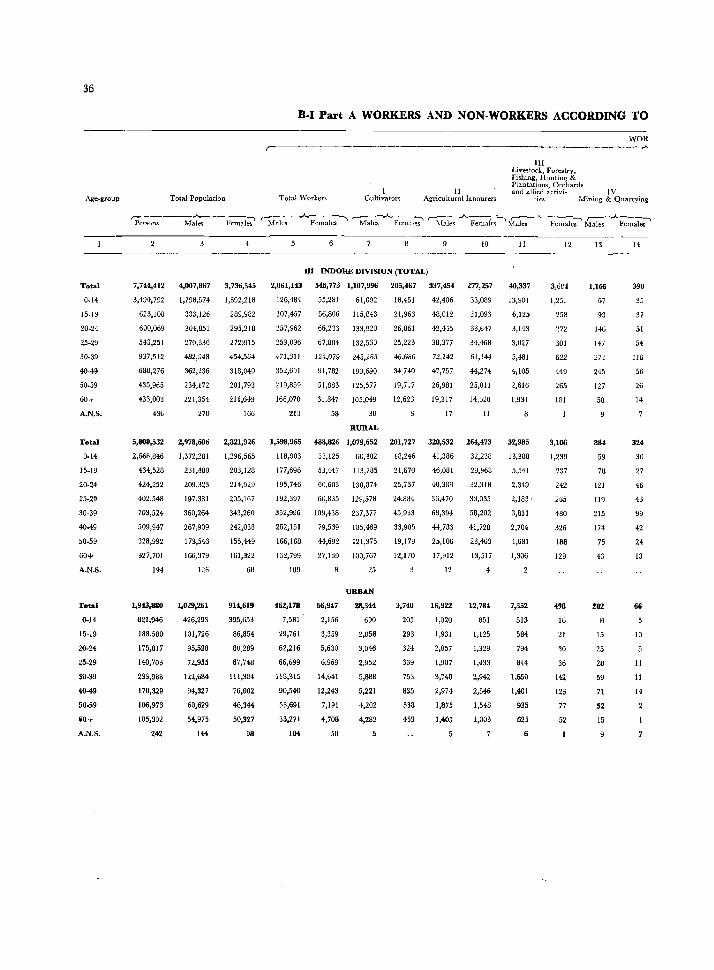
36
Age-group
Total
0_14
15-19
20-24
25-49
30-39
40-49
60+
A.N.S.
Total
0.14
15.19
20·24
25-2S
30-39
40.49
50·59
60+
A.N.S.
Total
0-14
15·19
20-24
25-29
30·39
40-49
50-59
1i0+
A.N.S.
,.Persons
Total Population
7,744,412 4,007,867 3,736,545
3,490,792
623,108
600,069
543,251
937,512
680,276
435,965
433,003
436
1,798,574
333.126
304,851
270,336
482,948
362,236
234,172
221,354
270
1,692,218
289,982
295,218
272;B15
454,564
318,040
201,793
211,649
166
5,800,532 2,978,60~ 2,821,926
2,668,846
434,528
424,252
402,548
703,524
509,947
328,992
327,701
194
1,943,880
821,946
188,580
175,817
140,703
233,988
170,329
106,973
105,302
242
1,372,281
231,400
209,323
197,381
360,264
267,909
173,543
166,379
126
1,029,Z61
426,293
101,726
95,528
72,955
122,684
94,327
60,629
54,975
144
1,296,565
203,128
214,929
205,167
343,260
242,038
155,449
161,322
6U
914,619
395,653
86,854
80,289
67,748
111,304
76,002
46,344
50,327
98
B-1 Part A WORKERS AND NON-WORKERS ACCORDING TO
,---._--_.
Total '",,'arkers I
Cultivator'3 II
Agricultural labourers
DI INDORE DIVISION (TOTAL)
2,061,143 545,773 1,107,996 205,467 337,454 277,257
126,484 55,281 61,092
207,457 56,806 115,843
~57,962 66,233 133,920
259,096 67,804 132,530
471,311 124,019 243,265
352,691 91,782 190,690
219,859 51,883 125,577
166,070 31,847 105,049
213 58 30
RURAL
18,451
21,963
26,061
25,223
46,686
34.140
19,717
12,623
42,406
48,012
42,445
38,377
12,142
47,757
26,981
19,317
17
33,089
31,093
33,647
34,468
61,144
44,274
25,011
II
1,598,965 468,826 1,079,652 201,727 320,532 26<1,473
118,903 53.125 60,402
177,696 53,447 113,785
195,746 60,603 130,374
192,397 60,835 129,578
352,996 109,438 237,377
262,151 19,539 185,469
166,168 44,692 121,375
132,799 27,139 100,767
109
462,178
7,581
29,761
62,216
66,699
1!8,315
90,540
53,691
33,271
104
56,947
2,156
3,359
5,630
6,969
14,641
12,243
7,191
4,708
50
25
URBAN
28,344
690
2,058
3,046
2,952
5,888
5,221
4,202
4,282
5
18,246
21,670
25,737
24,884
45,933
33,905
19,179
12,170
3,740
205
293
324
339
753
835
538
453
41,386
46,081
40,388
36,470
68,394
44,783
25,106
17,912
12
16,922
1,020
1,931
2,057
1,907
3,748
2,974
1,875
1,405
32,238
29,968
32,318
33,035
58,202
41,728
23,463
13,517
12,784
851
1,125
1,329
1,433
2,942
2,546
1,548
1,003
HI Livestock, Forestry, rishing, Hunting & Plantations, Orchards and allied activi~ IV
WOR A
ti ... s Mining & Quarrying
11 12 13 ._--_._----
40,337
13,901
6,125
3,143
3,027
5,481
4,105
2,616
1,931
3Z,985
13,388
5,541
2,349
2,183 '
3,831
2,704
1,681
1,306
7,352
513
584
794
844
1,65Q
1,401
935
625
6
3,60!
1,25:
258
272
301
622
449
265
181
3,106
1,239
237
242
265
480
326
188
129
498
16
21
30
36
142
123
77
52
1,166
67
93
1-16
147
27-!
245
127
58
884
59
78
121
119
215
174
75
43
282
15
25
28
,9
71
52
15
14
390
35
37
51
54
110
56
26
14
324
30
21
46
<13
99
42
24
13
66
10
11
II
14
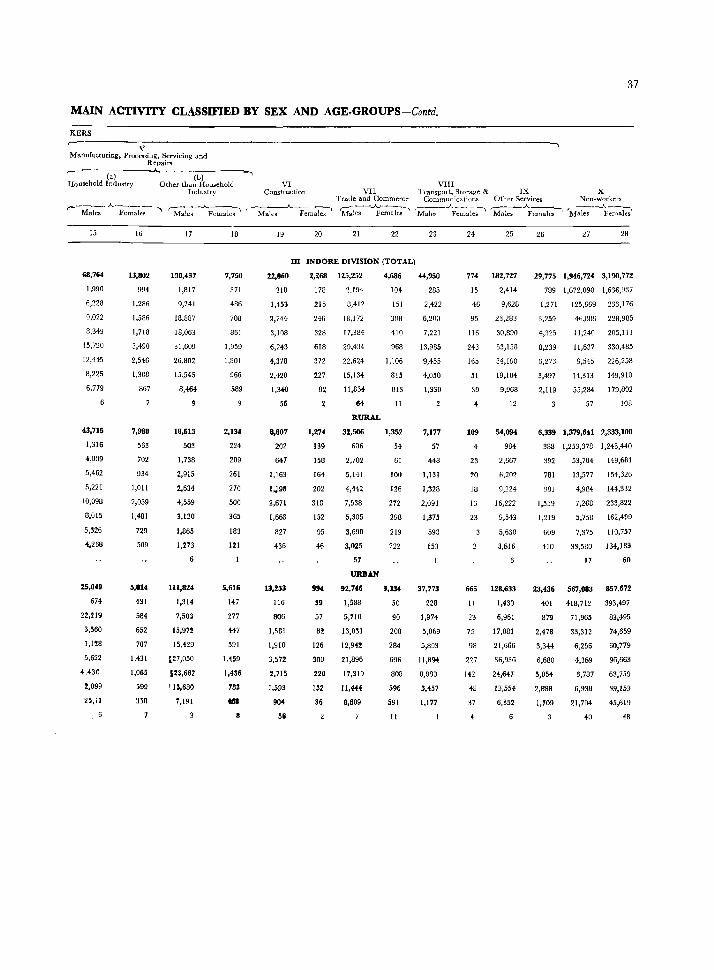
37
MAIN ACTIVITY CLASSIFIED BY SEX AND AGE·GROUPS-Contli.
KERB
r-~-------------------------V Manufacturing, Processing, Servicin~ and
Repairs ' ,-- ~(a-)------~------(-b)-----~ Household Industry Other than HOWiChold
Imlustl'Y VI
Construction VIII
VII Transport, Storage & IX Trade and Commerc~ Communicatiuns Other Services
X Non-workers
(""-~k'; A.-F~---;le:----""I 'M-;~-..A...FelHale~ "-M~ Females rM;I~;-~cmale;' Ma1es -.A.pernaks---' 'M-:r~~ 'M~~~~ks'
15
68,764
1,990
6,228
9,022
8,349
15,720
12,445
B,225
6,779
43,715
1,316
4,009
5,462
5,221
10,098
8,015
5,326
4.26B
25,049
674
22.%19
3,56()
1,1%8
5,622
4,430
%,899
16
13,802
994
1,286
1,586
1,718
3,490
2,546
1,308
867
7,988
563
702
934
1,011
2,059
1,481
729
509
5.814
431
584
652
707
1,431
1,065
,99
350
17
130.437
1,817
9,241
18.887
18,063
31,609
26,802
15.545
8,464
18,613
503
1,738
2,915
2.634
4,559
3,120
1,865
1,273
111,824
1.314
7,503
15,972
15,429
[27,050
(23,682
i 1$,680
7,191
3
18
7,750
371
486
708
861
1,959
1,801
966
589
2,134
224
209
261
270
500
365
183
1%1
5.616
147
211
447
591
1,159
1.436
183
49
19
2%,060
318
1,453
2,744
3,10B
6,243
4,378
2,420
1,340
56
8,807
202
647
1,163
1.)98
2,671
1,6&3
827
436
13,253
116
806
1,0581
1,910
3,572
2.715
1,593
904
55
20 21 22
m INDORE DIVISION (TOTAL)
2,~68 125,252 4,686
178
215
24fi
328
618
372
227
82
1.274
139
158
164
202
318
152
95
46
994
39
57
82
126
300
220
132
36
2.194
8,412
18,172
17,384
29,434
22,624
15,134
11,834
84
RURAL
32,506
606
2,702
5,141
4,442
7,538
5.305
3,690
~.025
57
URBAN
92,746
1,588
5,710
13,031
12,942
~1,896
17,319
11,444
8.809
104
151
3IJB
410
968
1,106
815
813
11
1,352
54
61
100
126
272
298
219
222
3.334
50
90
208
284
696
SOB
596
591
11
23
44,950
285
2,422
6,200
7,221
13,985
9,455
4,050
1,330
7,177
57
448
1,131
1,328
2,091
1,375
593
153
37.773
228
1,974
5,069
5,893
11,894
B,080
3,457
1,177
24
774
15
46
95
116
243
165
51
39
109
4
23
20
IB
16
23
665
11
23
75
98
227
142
48
37
25
182,727
2,414
9,628
23,283
30,890
53,158
34,190
19.184
9,968
12
54,094
984
2,667
6,202
9,224
16,222
9,543
5,630
3,616
128,633
1,430
6,961
17,081
21,666
36,936
24,647
13,554
6,352
6
26 27 28
29,775 1,946,724 3,190,772
789 1,672,090 1,636,9:17
1,271 125,669 233,176
3,259 46,889 228,985
4,325 11,240 205,111
8,239 11,637 330,485
6,273 9,545 226,258
3,497 14,313 149,910
2,119 55,284 179,802
3 57 108
6,339 1.379,641 2,333,100
388 1,253,378 1,243,440
392
781
981
1,559
1,219
609
410
23,436
401
879
2,478
3,344
6,680
5,054
2,888
I,J09
53,704 149,681
13,577 154,326
4,984 144.332
7,268 233,822
5,758 162.499
7,375 110,757
33,580 134, I 83
17
567.083
418.712
71,965
33,312
6,256
4,369
3,787
6,938
21,704
40
60
857,672
393.497
83,495
74,659
60,779
96,663
63,759
39,153
45,619
48
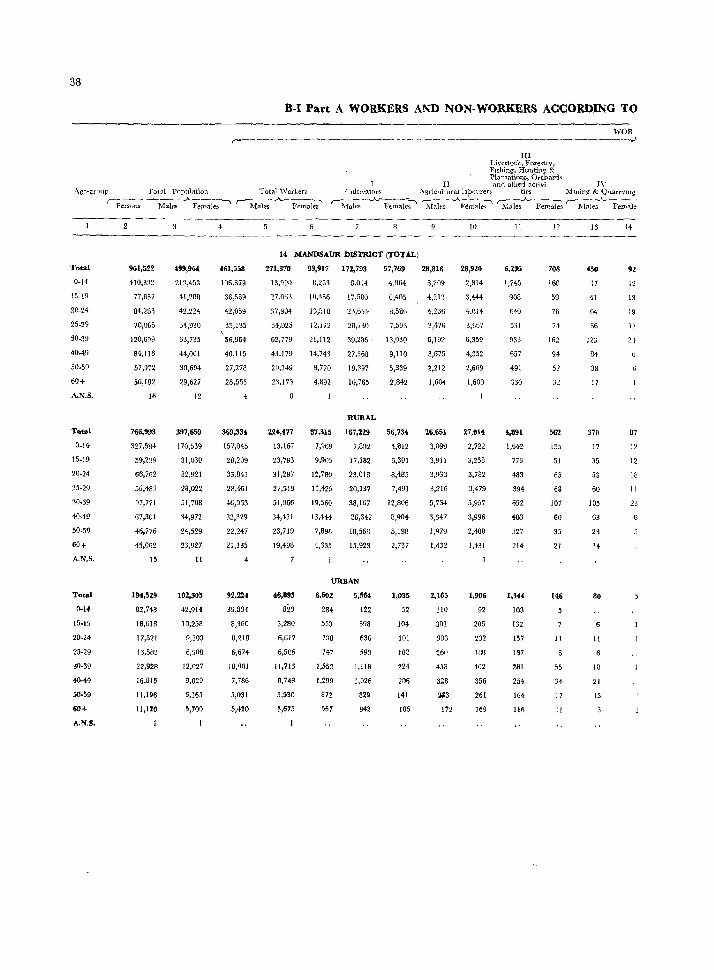
38
B-1 Part A WORKERS AND NON-WORKERS ACCORDING TO
WOR ,~-~'----~-~~.----- -~-. ----- .----------------~---..}
III Livestock, Forestry, FlShing. Hunti!1g & Plantations, Orchatds
II i'l.nd allled activi- 1\' Age~gfDlIp Total Population Total Wor1.ers CiJ]tl\'atofs "\gricllj1uralbbourers ties MIning & QuarrYJn~
Total
0-14
15-19
20-24
25-29
30-39
40-49
50-59
60+
A.N.S.
TG ... 1
O-H
15-19
20-24
25-29
~0-39
40-49
50-59
60+
A.l'-t.S.
Total
0-14
15-19
20-24
25-29
30-39
40-49
50-59
50+
A.N.S.
'Pe;;:;ls- ~es- -"-Females '"""""\ '--Male;- A.- Ft"mal;;' r-~fal;;-..A..-;;;~;-" ~e;-..A-l<;';;le~ ~..A.-F~ ~;-;,'-~afe
961,522
410,332
77,357
84,283
70,065
120,699
84.116
57,972
56,182
16
766,993
327,584
59,239
66,762
56,483
97,771
61,301
46,776
45,062
15
1!14,529
82,748
18,618
17,521
13,582
22,928
16,815
11,196
11,120
I
499,96(
213,453
41,288
42.224
34.930
63,735
44,001
30,694
29,627
12
397,6,9
170,539
31,030
32,921
28,022
51,708
34,972
23,927
11
102,305
42,914
W,258
9,303
6,908
12,027
9,029
6,165
5,'00
1
461,558
1~6,S79
36,SS9
42,059
35,135 \ 56,964
40,115
27,278
26,555
369,334
157,045
28,209
33,841
28,461
46,053
32,329
22,247
21,135
4
92,224
39,834
8,360
8,218
6,674
10,901
7,786
5,031
5,420
14 MANDSAUR DISTIUCT (TOTAL)
271,370
13,990
27,063
:17,904
31,025
62,779
43,179
29,249
23,171
22!l,i77
13,167
23,763
31,267
27,519
51,066
34,431
23,719
19,496
7
46,893
823
3,280
6,617
6,506
11,713
8,748
5,530
~,675
93,917 172,793 57,769 28,816
8,253 8,014 4,864 3,209
IO,4SS 17,580 6,405 4,212
13,518 23,654 B,586 4,236
12,172 20,7:10 7.593 3,476
21,112 39.285 - 13,030 6,192
14,743
8,770
4,892
27,356
19.391
16,765
RURAL
87,315 167,229
7,969 7,892
9,903 17,162
12,780 23,018
11,425 20,137
19,560 3tl,167
13,444
7,898
4,335
26,342
18,568
15,923
URBAN
6.602 5,564
284
553
ns 747
1,552
1,299
872
357
122
398
636
593
1,118
1,026
829
842
9,110
5,339
2,842
56,734
4,812
6,301
8,485
7,491
12,BO€
8,904
5,198
2,737
1,035
52
104
101
102
224
206
141
105
3,675
2,212
1,604
26,651
3,099
3,911
3,933
3,216
5,734
3,347
1,979
1,432
2,165
liD
301
303
26D
458
328
:113
172
JO
28,920
2,814
3,444
4,014
3,667
6,359
4,352
2,669
1,600
27,614
2,722
3,238
3,782
3,479
5,957
3,996
2,408
1,431
1,906
92
20G
232
lOR
402
356
261
169
II
6_235
1,74:)
908
64()
531
933
657
491
330
4,891
1,642
776
483
394
652
403
327
214
1,144
103
132
157
137
281
254
164
m
12
708
160
58
76
74
162
94
52
31
562
15.\
51
65
68
107
60
35
21
146
11
55
34
17
II
13
450
17
41
64
66
123
84
38
17
370
17
35
53
60
105
63
23
14
80
11
18
21
15
14
92
12
13
19
II
21
87
12
18
11
23
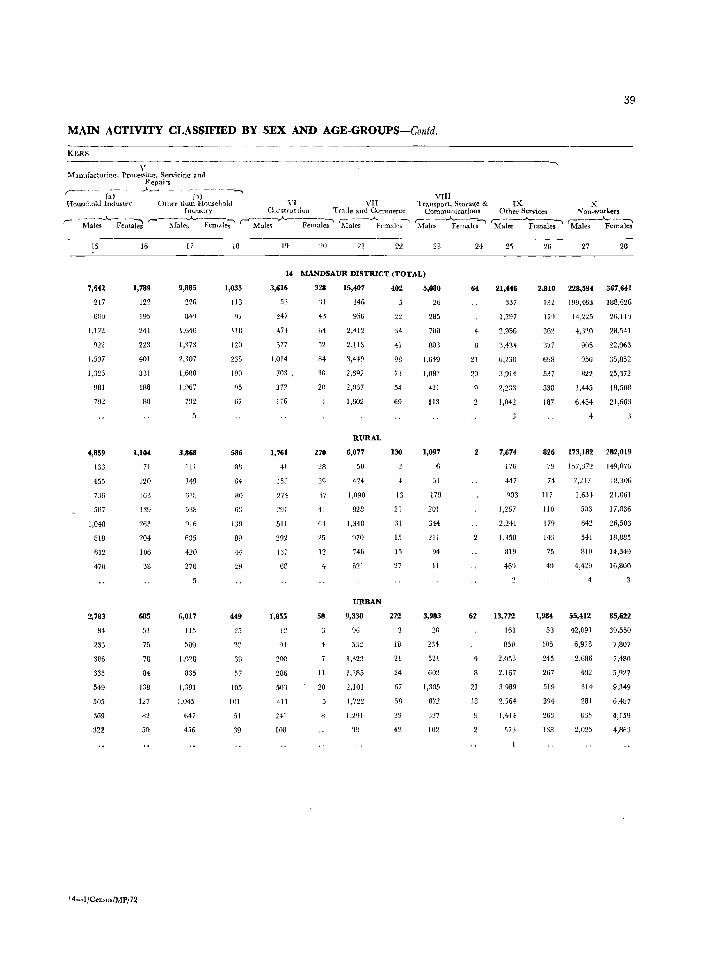
39
MAIN ACTIVITY CLASSIFIED BY SEX AND AGE-GROUPS-Contd.
KERS ~-------\,--- - ----_------ ~.----------------------- ------, Manufacturing, Proces'ling, Servicinl{ and
Repairs ~-"------(h)--""'\ VIiI
(al Household Industr,· Other than Hnusehold VI VII Transport, Storage & IX X
Industry CO[lstruction Trade and Commerce Communications Other Services ""{on-workers
( - ~{-;j~-A.F~~ ~a;:--Fem.~7' r-~~~A--P;;;;]~ 'iW~-AF~mal~~-" ~~-~;;~, 'M~;-~emale~ 'M;J~~
15
1,122
1.537
1.323
981
792
4,859
133
455
736
587
1,048
818
612
470
2,783
H4
233
386
335
549
505
369
~22
16
1,789
[22
195
241
223
401
331
188
88
1,104
71
120
163
263
204
106
38
6R5
75
78
S4
138
127
82
50
14-[/Censu./MP/72
17
9,885
226
84')
1,{-)4fj
1;173
2,,07
1.680
1,067
732
3,868
111
349
(-ill!
5:lA
916
635
420
276
6,017
115
500
],028
835
1,391
1,045
647
456
10
1,035
113
47
[HI
[20
235
[90
67
586
88
64
80
h:l
I~O
89
44
28
449
'13
38
57
[05
[0[
51
39
20 21 22 23
14 MANDSAUR DISTRICT (TOTAL)
3,616
53
247
474
177
1,014
703 ,
37'J
1 i6
1,761
41
15:3
274
~?g I
511
~92
1,1
68
1,855
2oo
286
501
4[1
241
WB
328
'lJ
4J
04
52
B4
10
20
270
28
17
41
04
20
12
4
58
II
20
15,407
146
goo
2,412
2.113
3,419
2,6Q?
2,037
[,602
RURAL
6,077
50
424
1,090
828
1,318
070
746
621
URBAN
9,330
532
[,122
1,285
2,10[
1,722
1,2Q1
'HI
402
22
34
47
98
73
54
69
130
4
13
21
31
[5
15
27
272
18
2[
24
67
58
39
5,080
26
285
700
80'1
[,619
1,08~
421
113
1,097
:;1
179
201
344
211
94
[[
3,983
234
521
602
[,305
872
327
102
24
64
4
21
20
62
4
21
18
21
21,446
337
1,297
2,956
:\,4:14
ti,230
2,2:33
1,042
7,674
17(j
447
903
1,267
2,241
[,350
819
469
13,772
161
850
2,053
2,[67
3,989
2,564
1,414
573
26 27 28
2,810 228,594 367,641
[32 199,463 188,626
17')
362
59!]
537
33B
187
14,225
4,320
905
056
B22
1,445
6,454
2fi,II'3
2B,041
22,963
35,852
25;n2
la,50B
21,663
826 173,182 282,019
79 157,312 149,076
74
117
110
179
14:1
75
49
1,984
53
105
245
267
5[9
394
263
138
7,247
1,63.
503
642
541
810
4,42~
55,412
42,091
6,978
2,686
402
314
281
63,\
2,025
18,3mi
21,061
17,036
26,503
18,885
14,349
lG,BOO
85,622
39,550
7,B07
7,480
5,fl27
9,349
6,4B7
4,159
4,863
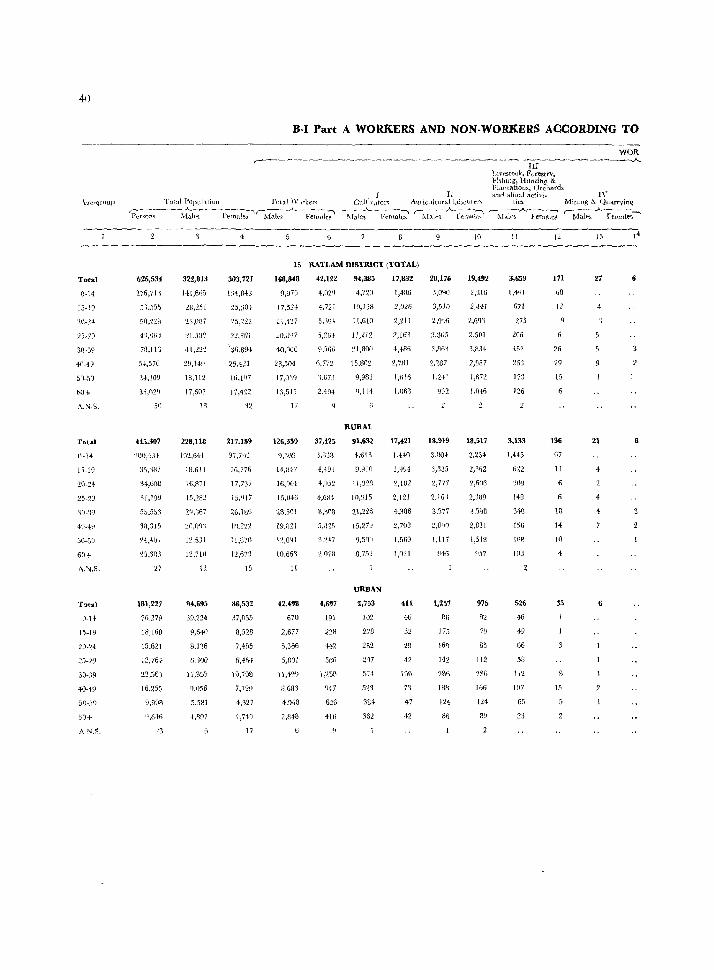
41)
B·I Part A WORKERS AND NON· WORKERS ACCORDING TO
WOR ,--------------~--------------------- -m-~-------A
LivestoCk, Forestrv, Fhhmg. Hlintiltl! & Plantations, Otchacds
J II fln(t allied acti"i~ IV \!.!e~qrour '1'01;11 POj)uhtton Total 'VcJl'ker~ CU!tl\'.ltor" A~ricultural I.lOl)Ut('r<; ties Mining & Quarryint:
Total
0-14
15-19
30-39
40-49
50.,1
00+
A.NS.
Total
0·14
15-19
20-24
25-2J
Total
15-19
~5-19
30·39
40-19
50+
A N.S_
~;~;~~--~\t~L~~-~~--F;;'*~ ~;-A-~li~~ -;r;l~;~ V~;~;' ~-i~l~~ -.A.-l7~1;t~ r-;.i;J~~.A.F-;~;b ~;e:-_,t-F;;'';i~~-'
626,534
276,71 \
5 ),35)
4'i,96J
7a,IIG
5+,570
3~,309
35,OZQ
Sf)
415.307
'lOn,4J+
35,387
34,608
31,199
55.55:1
3F1,JJ5
24,401
27
191,227
76,27~
18,16B
15,621
12,76+
22,56)
9,908
Q,6·lIi
23
322,81.1
141,865
28,~51
'?1,.ilJ'!
4l,:!'2'~
2!J,149
IH,IIZ
17,607
III
228,118
102,0-11
lR,Gll
16,871
15.282
24.167
~O,Oqj
l~.5JI
12,7[0
U
94,695
39,224
9,640
8.116
(i,'U)O
11,3:)S
4,056
5.581
·j,897
4
303,nl
U4,B48
15.JOJ
'L5,'l22
22,181
',G,894
2",4~1
16,U17
17.4'22
')2
211.189
IG,776
17,7'37
15,QI7
26,186
IR.222
II,U7ll
!~.67:1
!5
86,532
37,055
8,528
7,4R5
6,41i4
\0,708
7,199
4.327
4·,749
11
15 RATLAM DISTRICT (TOTAL)
169,948
O,970
17,524
21,42i
20,847
4O,nOO
28,504
!7,o1Q
1:1,511
17
126,350
9,109
14,B47
16,061
15,046
28.501
19,821
I~,O"!
10.661
II
42,493
670
2,677
5,366
5,801
1\,49~'
8.683
4,948
2,848
42,122
4.():Z~1
4,721
5,191
1,261
~1,566
6,772
'1,87J
2,494
37,425
1.838
4,+9,]
+,684
8,?-08
5,W!5
:~,'14 7
2mU
4,697
191
:/28
142
5HO
\",,8
947
416
94,385
4,720
10,138
11,6\0
11,212
2I,80()
15,802
9,981
q,t 14
RURAL
91.632
+,618
9,910
1 1,:l2n
10,915
21,221)
15,279
~1,5qf)
8,752
URBAN
2,753
102
228
2R2
Zry7
514
523
384
362
17,832
1,4HG
2,O~6
2,~ll
Z,161
4 ,.fRo
2,71ll
1,6!6
I,O'B
17,421
I,Wl
1,')91
~,W2
2,121
4,386
2,708
1,569
1,021
411
·~6
32
29
42
\OD
73
47
42
20,176
2,3()5
3,H6::i
2,237
1.241
18,919
3.004
"3,335
2,777
2,161
3,577
2,0~q
1,\ 11
IHG
1,2;7
86
175
16q
142
286
188
124
86
10
19,492
2,116
2,441
2,691
2,501
S,H]4
2,987
1 ,fin
1,1146
18,517
2,234
2,362
2,fiOB
2,"389
.3,3gg
2,821
1,548
q57
975
82
79
85
112
2el€.
166
114
89
11
3,659
l,t.ql
G71
275
206
126
3.133
1,445
622
148
340
156
108
103
526
46
.f9
66
58
112
W?
65
23
12
171
68
12
26
15
136
67
11
6
IS
14
to
35
15
13
27 6
4
21
4
6
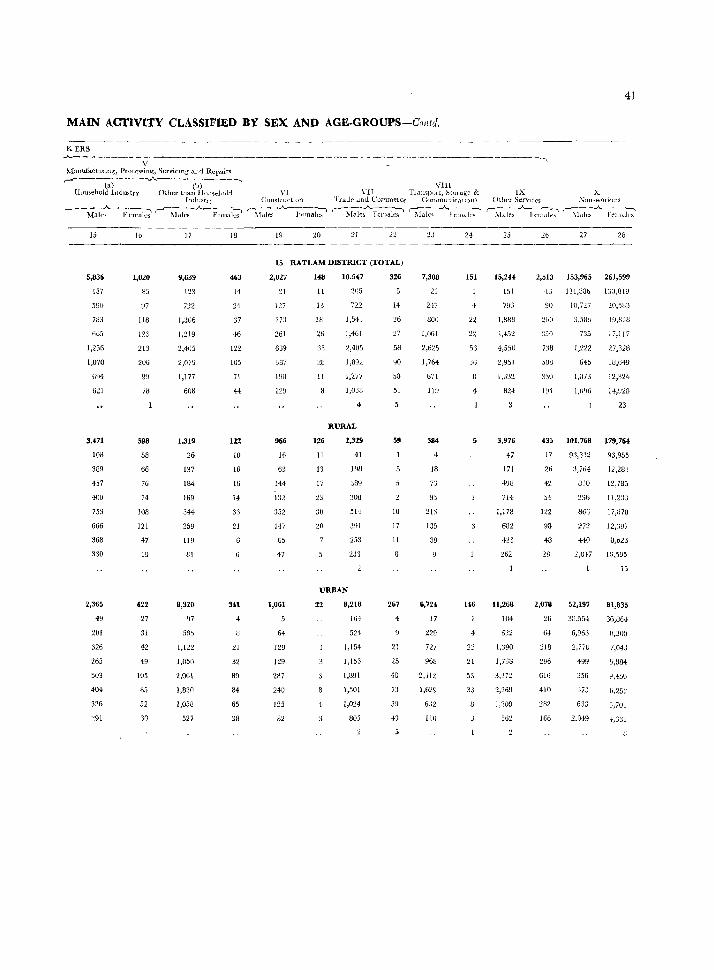
41
MAIN ACTIVITY CLASSIFIED BY SEX AND AGE·GROUPS-Contd.
KERS ...A...---____ ~ ~-v------~-~----------- _----- .... --~--~----------------.--., !\'fanu[actulUU~, Proces"in~) ServicIng and Repi:\i.rs ~-.------~-_\...--------~
lal (b) How,ehold Indu.~trY Other than Huu~ehuld
Indust!') COU'I[I uctlon VI
VIII \TII Tlamp01t, Stulage &
TraJe .. md CommelCe Communication"
- --Mal:':'-F-;;;;i;; r-~~~A..-Ft>l1lal;;, ':\f~;..A..-hrnal~ ~---~---~{--~~--~ .Male~ Females i\Ialc~ h:rnalf'S
15
5,836
157
590
783
66;'
1,256
1,070
{)~)4
621
3,~71
108
389
457
400
753
666
368
330
2,365
49
201
326
265
503
404
326
~91
1b
1,020
B5
97
118
123
213
20G
99
78
598
58
66
76
74
lOB
121
47
48
422
27
31
42
49
105
35
52
30
17
9,639
123
712
1,306
1,219
2,405
2,079
1,177
608
1,319
26
I:l7
184
169
344
259
119
81
8,320
97
.\85
1,122
1,050
2,061
1,820
1,058
527
18
463
14
24
J7
46
122
105
71
44
122
10
16
16
14
3:1
21
341
21
32
89
84
65
38
19 20 21 22
15 RATLAM DISTRICT (TOTAL)
2,027
~1
127
27J
261
639
387
190
129
966
16
63
144
132
352
117
65
47
1,061
64
129
129
287
240
125
82
148
11
13
18
26
33
11
126
11
13
17
23
:.;0
10.5~7
205
722
1,54J
1,461
2,405
1,892
1,277
1,038
RURAL
2,329
41
198
"BY
308
514
391
253
233
URBAN
22
4
8,218
164
524
],154
1,153
1,891
1,501
1,024
805
326
14
'27
58
90
50
51
59
10
17
II
267
21
25
48
73
39
43
7,308
~l
247
800
1,061
2,625
1,764
671
11~1
584
18
71
93
213
135
39
6,724
17
229
727
968
2,-112
1,629
6J2
110
24
151
53
4
146
21
53
33
x Other ServH"CS J';"on-w01 kC!:l
~M*~~;::J::: rhl~:s-.A.l:~;l~~
25
15,244
151
793
1,8SS
2,452
4,550
2,951
824
3,976
47
171
4~18
71+
1,178
682
423
262
11,268
104
1,390
1,738
3,372
2,269
1}209
562
26 27 28
2,513 153,965 261,599
-13 131,88b IS0,SW
~lU
200
718
508
:l,()
lU4
10,727
3,58V
735
1,222
645
I,On
~(l,5BJ
1~,828
17,1l7
V,328
18,649
] 2,~~24
1+,~2B
23
435 101,768 179,764
17
26
42
U2
48
28
2,078
26
64
:.us 2(Jti
616
410
282
1GG
~3,3n
3,761
810
866
272
440
93,955
12,283
12,785
] 1,23J
17,1J7t!
12,307
8,623
1,017 10,SU5
52,197
3/),55.
6,96:1
2,770
499
356
3iJ
633
2,049
15
81,835
36,864
11,300
7,043
5,804
B,450
6,251
J,7U1
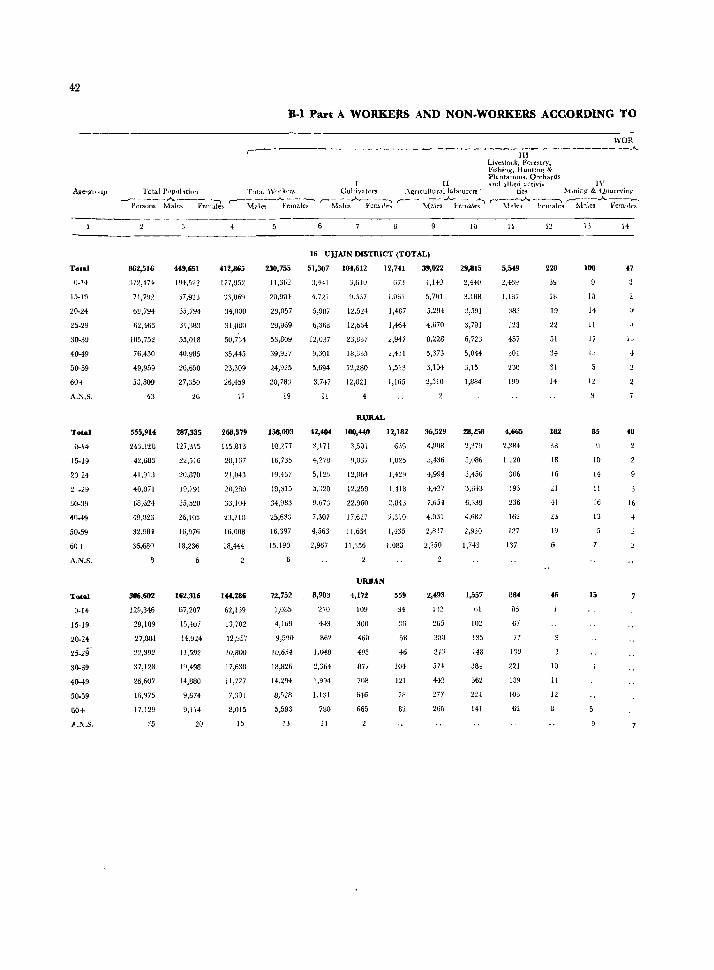
42
B.I Part A WORKERS AND NON.WORKERS ACCORDING TO
WOR r- ---------------------------111-.-------- ---"-
Livestod, forestry, , Fishing. Huntin~ &
PlantatIOns, OrchardS I II and allied ;;tcti.vi.~ IV
Age-gloup Total Pop,ll-l.tinn Total WOlker:; Gultivator3 .\1{rlculturallahourcrs ties ?YIIning & Qnarn'inv
0-14
15-19
20-24
2'-29
30-39
40-49
50-59
60+
A,N,S,
Total
0-14
15-19
2024
2 .29
30-39
<W_49
50.59
60+
A.N.S.
Total
0-14
15-19
20-24
25-29
30-39
40-49
60+
".,,\,,S,
-Pers:n;~;1;':---V;~~5 r--~'{:i;;~.A.F;~~~ r-~Ial~~ ,-- - ~~~:a)e~ r-~;:~ -~~ ~t·~l~~.A.f~~:;
862,516
372,474
71,791
Ml,7~4
62,4li3
105,752
76,430
49,959
53,809
43
555,91'
H'J,12S
42,683
41,913
40,071
68,624
49,823
32,984
36,680
306,602
129,346
29,109
27,881
22,392
37,123
26,607
16,Q75
17,129
:'5
449,651
194,522
37 ,9~J
35,794
31,:\83
55,018
26,650
27,350
26
287,335
127,3\5
22,516
20\870
19,791
35,520
26,105
16,976
18,236
162,316
67,207
15,407
14,924
11,592
1;),498
14,B80
9,674
9,114
:20
412,865
177,952
33,869
34,000
31,{IS0
50,734
35,445
23,309
~6,459
17
268,579
! 15,SI3
20,167
21,043
20,280
33,104
23,713
16,008
1M44
IH,286
62,139
13,702
12,957
10,800
17,6:10
11,727
7,301
8,015
15
230,755
11,362
20,904
29,057
29,969
53,809
39,927
24.,925
20,783
19
158,003
lG,'l77
16,735
19,467
19,315
34,983
25,633
16,397
15,190
72,752
1,085
4,H19
9,5~0
10,654
IH,S26
14,294
8,528
5,593
'3
9
16 UJJAlN DISTRICT (TOTAL)
51,307 104,612 12,741
:1,441
i,n1
5,9B)
6,368
1~,037
9.301
5.694
3,747
II
:::,610
9.337
12,S:H
12,664
23,837
18,335
12,280
12,021
4
RURAL
42,404 100,440
~', 171
4,27B
5,1::!5
,)20
9,67J
7,307
4,563
2,967
8,903
270
4+3
862
I,WIl
2,364
1,994
1,131
780
II
3,501
9,037
12,U64
12,259
22,960
17,627
11,634
11,356
URBAN
4,172
109
300
.till
4115
877
708
641i
665
673
1,061
1,437
1,46-1
2,947
2,431
1,513
1,165
12,182
639
1,025
1,42!-)
1,418
2,843
2,310
1,4:l5
1,083
559
34
36
of!
46
1M
121
78
81
39,022
4,140
5,701
5,294
4,670
8,228
5,373
3,104
2,510
2
36,529
.,008
5,436
4,994
'f,42)
7,654
4,931
2,827
2,250
2,493
1:)2
265
300
2·13
5H
442
277
260
10
29,815
2,440
3,18H
3,791
6,723
5,044
3,15
1,884
28,258
'l,37Q
3,U86
3,456
3,643
6,339
4,682
2,930
1,743
1,557
til
102
135
148
381
362
224
141
11
5,549
2,469
1,187
383
457
301
VO
199
4,665
2,384
1 120
306
193
236
\62
127
137
884
B5
67
77
130
221
139
103
62
228
39
18
19
22
51
34
31
14
182
3a
18
16
21
41
23
19
46
10
11
12
13
11)0
10
14
II
17
12
85
10
1<1
11
16
13
15
14
40
16
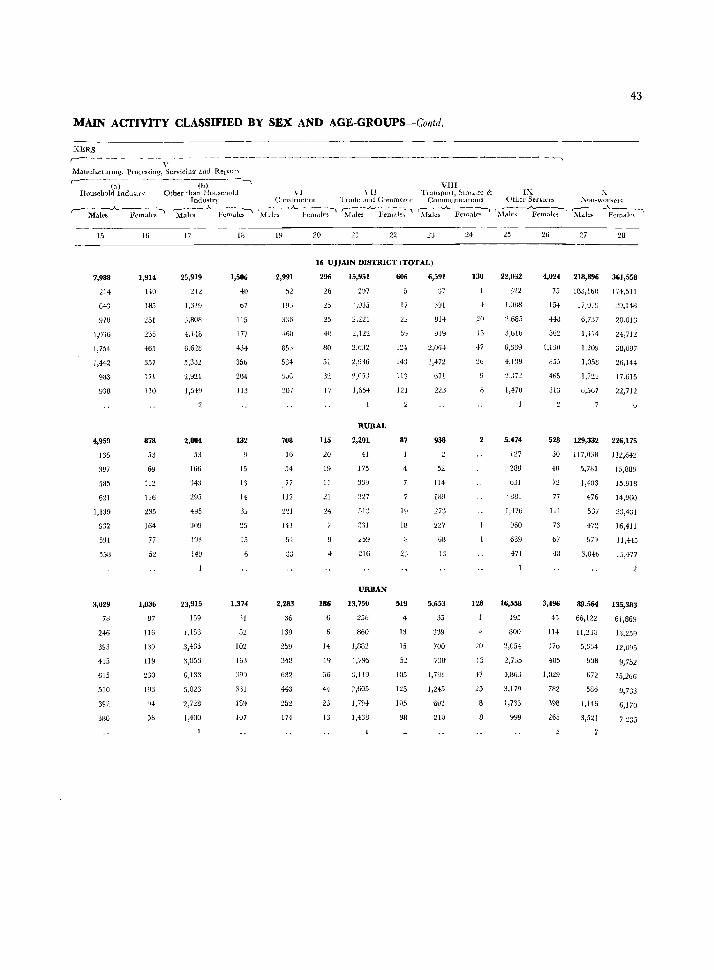
43
MAIN ACTIVITY CLASSIFIED BY SEX AND AGE-GROUPS-Contd.
KERS r----~-- --~--------------~------~-------------\
V .Manufacturmg, Pl'ocessillg, Servicing and Rellalf'l
,.-----;-;;)-- -- ---(i;")---'" HouseholrJ lndustn' Other than Huusehnld
IlJ(_ill~try
r-Males ~;n~l~-' M;i;;-~ _A._~;:~~
15
1,988
214
6+3
97U
1,030
1,754
1,442
933
938
4,9>9
136
397
585
6U
1,130
932
591
55U
3,029
78
246
393
415
615
510
392
3UO
16
1,914
140
H-l5
251
235
465
:;57
171
110
878
53
69
112
116
235
164
77
52
1,036
87
! 16
139
I19
230
193
17
25,919
:.!12
1,319
:.1,8013
.J..H3
6.6:W
5,33"
2,921
1,549
53
166
'143
4~15
149
23,915
159
1,153
3,465
:1,853
6,133
5,023
2,728
1,400
18
1,506
41)
67
115
177
434
356
204
113
132
15
l'l
14
15
1,314
31
102
16)
394
331
189
107
\ I \ [j COllstrllctJOI! Trade ,Hld C:oml1l('l(e
(M~:-- A..F;I~:le~\ 'hl:ie-: A.f:;I:I~ ~
19 20 :!1 22
VIII TJ ansporl, flt(Jra~c & IX
Communu:cltlOllS Uther Servlces
~~~~~~~~~aIF~-~~~
23 24 25 26
X A(IIl~worket<;
,-----"--------. Male~ Femdle:.'
27 28
16 UJJAlN DISTRICT (TOTAL)
2,991
HJJ
853
584
207
708
16
54
77
112
2:11
141
5+
2,283
36
139
:.HO
632
443
252
174
296
26
25
40
80
51
3:l
17
115
20
19
1I
21
~4
186
14
14
56
23
13
15,951
2~)
1,035
2.221
:L,U2
3,6:.12
2,9'16
2,05J
1,654
RURAL
2,201
41
175
339
~27
51:1
3:11
259
216
URBAN
13,150
256
860
1,B82
1,?~5
3,11D
2,605
l,nl
1,438
606
17
14:)
113
121
87
4
1~
18
2;;
519
13
15
52
105
]25
105
98
6,591
'J7
81+
2,Ofj';
1,472
671
938
52
114
189
'273
13
5,653
:35
339
700
7ll)
1,791
1,245
603
210
130
:20
15
47
26
2
128
20
15
47
,8
22,032
;':,685
6,339
4,139
1,+7U
5,474
127
288
631
, UUI
1,+76
£160
639
471
16,558
195
800
-:!,054
2,J~_l5
4,863
3,179
1,733
999
4,024 218,896 361,558
75 18.),100 174-,511
154
-148
\,150
855
r 7,019
6,737
1,,14
1,209
1,058
0,567
29,14U
28,01:;
",,712
J8,W7
26,144
17,~15
22,712
528 129,332 226,175
30 1I 7,038 112,642
';0
7'2
77
67
3,496
4:-:'
1H
:176
485
I,U29
782
398
265
5,781
1,403
476
5:37
472
579
3,04b
15,88U
15,918
14,960
2:3,4Jl
16,411
89,564 135,383
66,122
lUJ8
5,334
9J8
612
586
1,145
3,521
6],86~
13,25~
12,095
9,752
15,266
9,733
6,]70
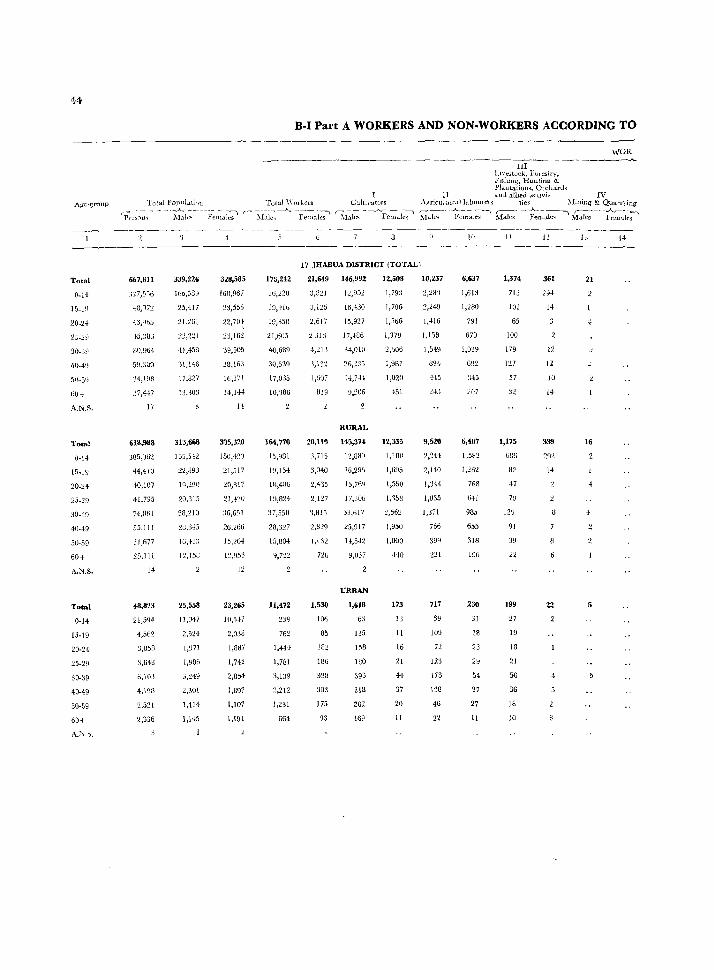
44
}'l..gc-group
Total
0-14
15-19
20-24
30-39
40-49
6U+
A.N.S.
'rotal
0-1-1
15.1~)
20-24
25-29
30-:.\9
40-49
50-59
60+
A.N.S.
Total
0-14
15-19
20-24
25-29
30-39
40-49
50-59
60+
B-1 Part A WORKERS AND NON·WORKERS ACCORDING TO
III Llve_,;tock, FUlesirr, F1Sluog. HUflting & Plautatiolls, Otchanls
II and alLled .u;tlvi. IV
WOR .A.
Total1)opul.ttinn Total \\'orlers Cultl\'atOls AgriC'ultUf.ll bbuurc'rs ties )'lininq & QUarrying
'rt>t~o:~-- ~-~\-;;I~--~F~l~aks""" r-~1:~~---"- Fema-l~~ ~1:1~ -___A..Femd.le~ ~ale~ - ~;;nalc~ 1 ~ ---;;~~l ~--- -~;;l~~
667,811
TU,5"16
48,fJ7:_!
4:),Qb5
-l5,~8J
HO,Hti4
59,309
34,1~8
27,H7
17
618,988
44,4IU
40,107
4l,735
74,861
55,111
Jl,677
25,111
14
48,823
21,594
4,562
3,858
3,648
h,lO]
4,198
2,521
2,336
339,226
16b,j89
25,417
21.261
41,459
'\1,146
11,827
l3,,0~1
313,668
155,542
22,893
19,290
20,'315
38,210
28,1143
16,41:J
I ~>1.1()
25,558
11,047
2,524
1,971
1,Y06
3,249
2,301
1,114
1,B5
328,585
160,~161
:U,555
22,70~
23,162
39,505
l8,163
W,37t
14,IH
14
:J.~5,3Z0
150,4~O
21,517
20,817
~I,4~IO
:16,G51
26,266
15,26-1
12
23,265
10,547
2,038
1,8B7
1,742
2,851
1,891
1,107
1,191
176,242
16,220
19,910
19,850
21,605
40,689
30,539
17,035
164,776
15,931
19,154
IB,40G
1~,824
37,550
28J~I:!7
1.1,804
11,472
23'1
762
1,44+
1,7S1
3,139
2,212
1,231
664
a
17 JHABUA. DISTRICT tTOTAL)
21,649 146,992
3,821
3,l:L5
2,61 )
4,211
l,132
l,u07
819
t:';,95~
16,430
15,927
17,-186
34,010
'26,:'35
14,741
RURAL
20, 119 14,,374
~~}715
:1,040
2,435
2,127
'1,8IS
2,829
1,+32
146
1,530
101;
85
182
186
398
303
175
93
12,8H9
15,76Y
17,301)
33,h17
25,917
1l,5.!2
9,031
URBAN
1,618
63
135
158
180
393
318
202
169
12,508
1,793
1,706
1,066
1,37!)
2,b06
1,9B7
1,020
451
12,335
1,":00
1,695
1,550
1,%3
~,56c
1,950
1,000
410
173
13
II
16
21
44
31
20
II
10,237
1,416
IJ 158
l,54Y
894
415
9,:>26
2,:244
2,140
1,344
1,035
1,:l71
166
717
g9
109
123
I 'is
46
22
6,637
1,613
1,280
791
670
1,039
692
:145
~07
6,407
768
6j]
985
655
SI8
196
230
31
18
23
29
54
37
27
II
II
1,374
7lJ
101
65
100
179
57
32
1,175
63,
82
41
79
12')
ql
39
2.
199
27
19
18
21
50
36
16
10
l~
361
294
14
12
12
tU
14
339
292
14
22
4
14
21
4
16
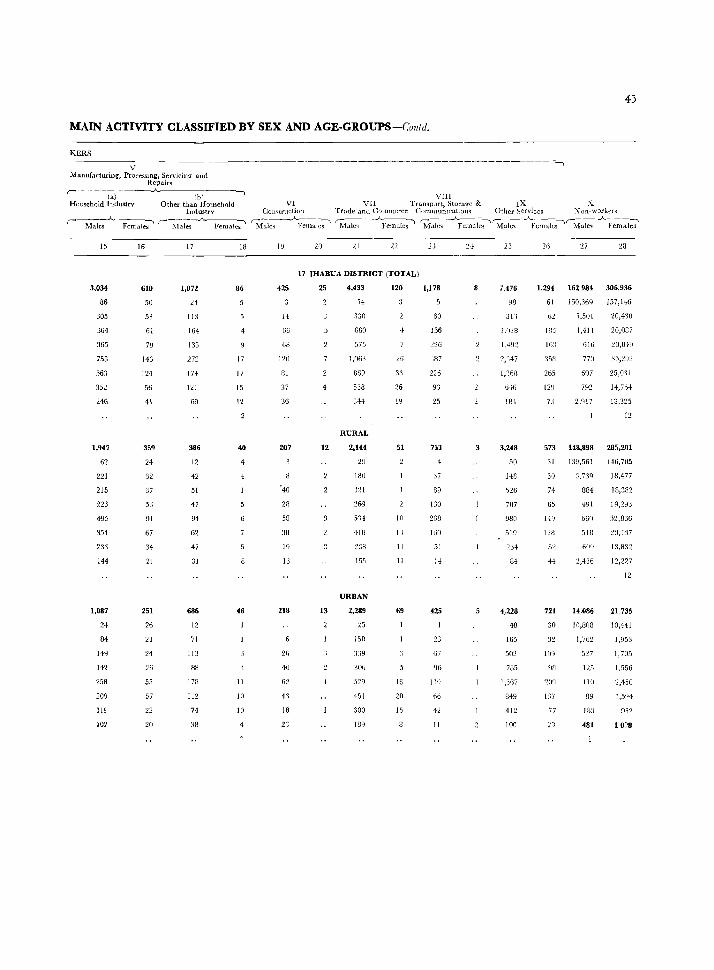
45
MAIN ACTIVITY CLASSIFIED BY SEX AND AGE-GROUPS-Collld,
KERS
V Manufacturing, Pror:rssmg, Servicing and
Hcpairs r-----~(a~)----~A-------(b-l----~
Household Industrv Other than Household
15
3,034
86
305
364
365
753
563
352
246
1,947
62
221
215
223
495
354
2:l:l
144
1,087
84
142
258
209
lH
10Z
16
610
50
53
61
79
146
124
56
41
359
24
32
37
53
91
67
34
21
251
26
21
24
26
5,\
57
22
20
17
1,072
24
113
164
135
272
17+
121
69
386
12
42
51
47
94
62
47
31
686
12
71
113
88
178
112
74
38
18
86
17
17
15
12
40
46
11
10
10
-------------------------------- ~1
VIII VI VII TranspJrt, Storage & IX X
Comtruction Trade and C'),nmerce CommUntCatl0n~ Other ServiCC3 X on-worker,;
Male~-_____A.:R~l~;-' ~Lllc,> -~'emate~ ~·em:lk~S1~~~~\{a~.AF~~~
19
425
H
66
68
120
~1
37
36
Z07
'40
28
58
:lll
19
13
218
21i
40
62
1'1
18
21 22
17 JHABUA DISTRICT (TOTALl
25
4
12
13
4,433
1+
:130
660
575
1,Ofl3
869
538
344
RURAL
2,144
29
180
321
269
534
418
238
155
URBAN
2,289
23
150
'1:IY
:1(10
529
,lSI
300
IB9
120
21i
3'1
26
19
51
111
11
11
11
69
16
20
15
1,178
60
156
:m7
226
93
25
753
37
89
130
268
!(if)
51
H
425
23
67
119
fi6
42
11
5
7,476
98
311
1.IL!8
1,49:?
2,147
I,jlill
6{6
lBI
3,248
50
He 526
707
980
519
34
165
502
785
1,'367
849
412
100
21} 27 28
1,294 162 984 306,936
61
62
183
163
35B
265
12!J
150,36<) 157,H6
),501
1,411
616
770
607
792
2,017
20,430
20,087
20.U4~1
:{~,~~)1
:25,0')1
14,76{
13,325
12
573 148,898 285,201
31
30
74
65
14q
721
30
32
98
137
-, "
1311,561
3,73<)
884
4!Jl
GGO
,5111
oW)
2,436
14,086
10,808
1,762
527
125
1111
89
183
481
146,705
18,477
18,382
19,293
32,836
2:1,437
13,832
12,227
12
2U35
10,441
1,953
1,705
J ,556
2,456
1,5~4
1 0~8
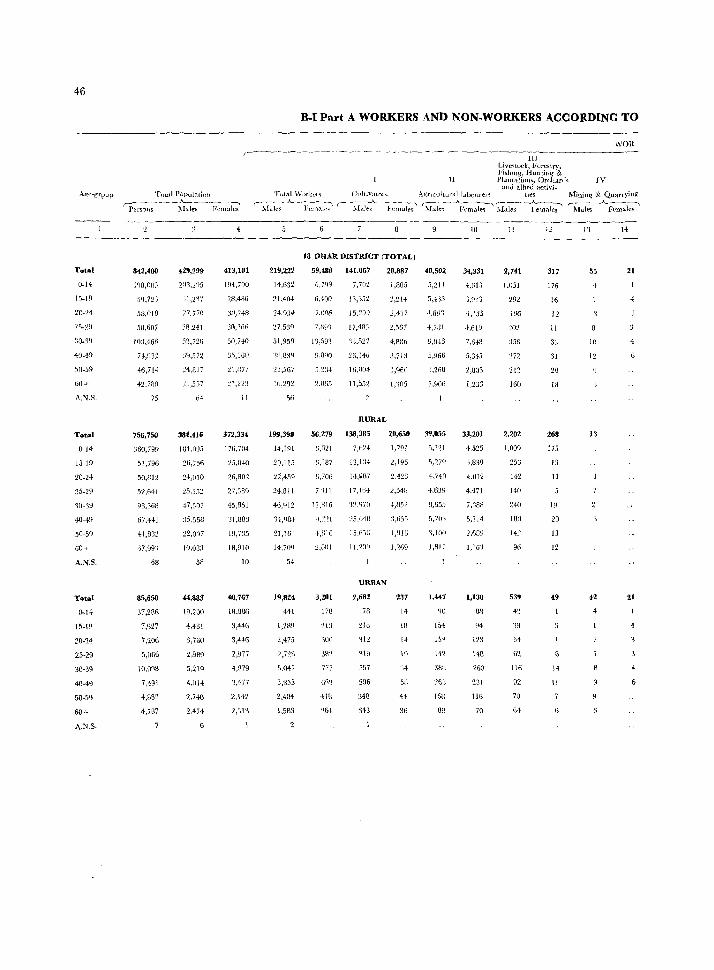
46
A!?f'-grl;lUp
Total
0-14
15_19
10_?4
25-29
:10_39
40-49
50_59
00+
A.:\f.S.
Total
0-14
15-19
20-24
25-29
10-39
40-49
50-5Q
60+
A_N,S,
Total
O-H
15-1~
20-24
25-29
30-39
40-49
50-5"
60+
A,~,S.
Total Population r::~-~~---A--~~:---..
Persons Males Females
842,400
Nfl,08)
54,723
58,013
58,607
10:1,466
7},f13~
46,714
42.7BO
75
756,750
360,799
5J,796
50,812
52,641
93,368
67,441
41,832
'i7,99'
68
35,650
37,286
7,S27
7,206
5,966
10.008
7,491
4,882
4,787
429,299
2fl1,295
Jl,2,37
27.7i()
28,241
52,721)
:19,572
~4,8J7
~1,557
38(,416
184,095
26,)56
24,010
47,50)
:l5,55U
22,0')7
19,083
58
44,833
19,200
4,481
3,760
2,9B~
5,ZIQ
4,014
2,740
2,474
413,101
194,790
28,486
50,7+0
3.\:JGO
21,1177
~J,223
11
372,334
176,704
25,040
26,802
27,3WI
45,861
'31.883
19,735
18,910
10
((),767
18,086
3,44G
3,446
2,977
4,a79
'1,477
2,142
2,",1'\
B-1 Part A WORKERS AND NON·WORKERS ACCORDING TO
II
WOlt ---n:-:-] -~---~--
Live~tock, Forestry, Fislllllg, Huutinl;,(' & Pl.lnt<llioll!., OrcllarJ<i
and alht"d activi-IV
Total \\\wkel's Cultivator... Ar:rLcultunll Llbourer~ ties MiniOf~ &-- Quartyil1g'
r-~falc5 j._- }'emal;' r-~f<~-- }'emaJ;;' ~lak~ -~~Mak;-~~-Inale-;' ~a(;;- ......_y;~k-;'
219,222
14,632
21,404
24m4
27,539
51,959
'~!lJ83q
21,567
16,~92
56
199,398
14,191
20,115
22,459
24,811
46,912
'34,98,1
~1,16'l
19,824
441
1,2Sg
2,475
2,na ,1.047
3,855
2,404
1,583
18 PHAIt DISTRICT (TOTAL)
59,480 [41,067
6,40()
?J)o6
7.69'1
l1,59']
9,U90
2,8G5
7,702
J'1,352
15.299
17,483
'1~.527
26.140
16,1104
11,552
RUltAL
56,279 138,385
6,621
6,187
6,706
7'111
12,f1l6
'1,1116
2,GOl
3,2111
178
771
418
7,024
13,U4
14.~U7
17.lii4
'12,LJ7()
~~5Ji4()
15,6')(;
11,201)
URBAN
2,682
78
218
,157
506
:148
343
20,887
1,805
.!,43i
2,567
4,836
3,71J
1,960
I ,'{05
40,502
5,211
.),433
4,89']
<,7D!
O,O.}3
5,966
'1.268
1.906
20,650 '9,055
1,791
2,196
2.4:23
2,548
4)152
3,655
I,YIG
1.~~69
237
14
W
14
",4
511
41
36
5.121
5,279
+,740
<.639
]l,65S
,>,70',
:1.10(1
1,817
I,H7
154
15'j
14'2
161l
](I
34,331
+.61.1
'),933
4,135
+,619
7,648
33,201
4.525
3,839
4.012
4,471
7,388
5,114
2,689
J,163
1,130
1JH
123
1411
260
Z:n 116
70
11
2,741
J,051
2a2
196
356
272
212
160
2.202
1,009
253
142
140
240
180
14:?
96
539
'19
54
62
116
92
70
61
317
176
16
I:?
11
33
31
2(1
18
268
175
13
11
19
20
13
J2
49
14
11
6
1'1
55
10
13
42
4
21
4
4
6
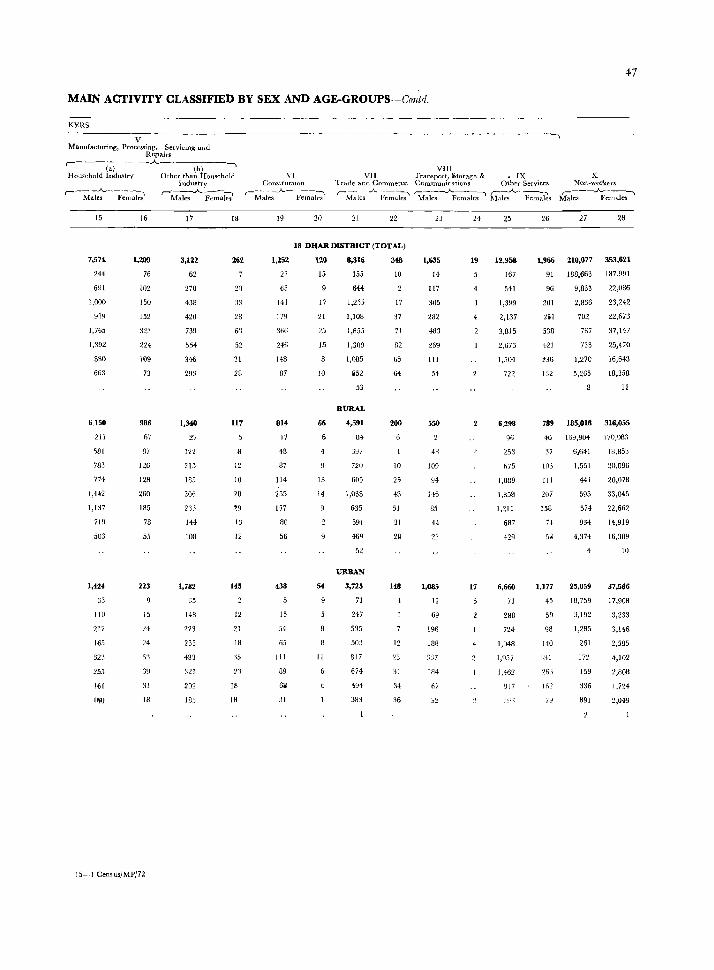
47
MAIN ACTIVITY CLASSIFmD BY SEX AND AGE-GROUPS-Contrl.
V Manufacturing, Processing. Servic1Jlg anJ
Repairs: -------~------~, (a) (b)
Household Industry Oth~r than IIousehnld
,-~~-...A. ____ :-,\
Males .Fema.lt':~
15
7,574
244
691
1,000
9:19
1,765
1,392
8BO
663
6,150
211
181
783
774
1,442
1,137
503
1,424
33
110
217
165
323
255
161
160
16
1,209
76
102
150
152
:t~3
224
\09
73
986
67
87
126
128
260
185
78
55
223
IS
24
24
6:1
31
18
15-1 Census/MP/72
Industry ,.....-----"--------,
l\{ales Females
17
3,122
62
270
438
420
739
5.14
346
293
1,340
27
In
215
185
306
233
144
~ 011
1,782
35
148
223
235
433
321
202
185
18
262
33
28
6'1
52
31
28
117
12
10
19
13
12
145
12
21
18
:15
?'l
18
18
VI Com.truchon
r-Ma1es _),._- Fem-;i;;'
19 20
--~----~
VII! VII Transport, i;torage & • IX X
Trade and Commerce Communications Other Services Non-wol'kr:TS
r-Males _.\"P~~ 'M~~.A.Fe-male:-' llik:--~s Nlai-;--~Fe~k;'
21 22 23 24 25 26 27 28
18 DQAR DISTRICT (TOTAL)
1,252 UO 8,316 348
22
63
141
179
30ti
246
148
87
814
17
48
87
114
255
157
80
56
438
15
54
III
89
611
31
15
17
21
25
15
66
6
4
13
14
11
155
644
1,255
1,108
1,855
1,309
1,085
1152
53
RURAL
4,591
84
397
7211
605
1,038
635
591
46q
52
URBAN
3,725
71
247
535
50'\
817
674
494
383
10
17
37
71
82
65
64
200
]0
2,
48
51
31
2@
148
12
23
31
34
36
1,635
14
!l7
305
282
483
~69
III
54
550
4H
109
94
146
85
44
22
1,085
12
69
196
188
337
1114
67
19
4
17
12,9511
167
541
1,399
2,137
3,815
2,673
1,504
722
6,298
96
253
675
1,089
1,858
1,211
687
429
6,660
71
288
724
1,048
1,957
1,462
HI7
1,966 210,077 353,621
91 188,663 187,991
96 9,833 22,086
201
~i1
538
421
t36
132
2,836
702
767
733
1,270
5,265
23,242
22,673
37,147
25,470
16,643
18,358
II
789 185,018 316,055
46 169,904 170,DB:l
37
103
111
207
158
7-!
1,177
45
59
98
140
162
79
6,,641
1,551
441
595
574
934
4,374
4
25,059
18,759
3,192
1,285
261
In
159
336
891
18,853
20,096
20,078
33,045
22,662
14,919
lli,J09
10
37,566
17,908
3,233
3,146
2,595
4,102
2,80B
1,)24
2,049

4$
B-1 Part A WORKERS AND NON.WORKERS ACCORDING TO
II
III Livestock, Fore'dry, Fishing, Huntin~ & Plantatiom, Orchards and allied adivities IV
Age~group Total Population Total Worken Cultivators Agricultural labotlren. Mining & Quarrying
Total
0.14
15·19
20-24
25-29
30-30
40-49
50·59
60+
",N.S.
T"",l
0-14
15-19
25·29
:10·39
40·49
50.59
60+
A.N.S.
Total
0.14
15·19
20-24
25-29
30-39
40-49
50-59
60+
A.N.5.
P~rs(Jns ~ Ma~ FeUlal~ r- ]!"b.~- Pema~;-' ~~tt1alc;-' ~ale~ ......... FemaIe;' r:-~I;-~~lale;' 'M-:~-AP;;ak;-
1,025,150
436,082
96,097
91,067
74,040
122,437
90,77~
5B,012
56,493
a3
382,251
172,239
:11,225
28.788
25,650
44,527
33,593
22,639
23,582
6f2,89S
263,843
64,»72
62,279
48,390
77,910
57,186
35,373
32,911
13S
545,413
228,256
.11,669
49,814
39,156
64,116
49/855
3:1,017
29,443
87
199,269
90,724
17,007
14,633
12,925
22,816
[7,467
12,145
11,549
346,144
137,532
34,662
35,181
26,231
41,300
32,388
20,872
17,894
84
4
"9,737
207,826
44,428
41,253
3MB4
58,321
40,924
\ 24,995
27,0.\0
~6
182,982
14,21R
14)55
12.725
21,711
Ifj,IZ6
10,494
12,033
296,75.
126,311
30,210
27,098
22,)59
36,6W
24.798
1+,501
15,017
51
255,711
<i,770
19.054
33,869
35,898
61,932
4B,166
30,175
19,771
76
101,095
5,172
10,147
12,671
12.428
22,394
17,064
11,653
9,~66
4,616
1,598
8,707
21,19B
23,470
39,538
31,102
18,522
10,405
76
19 INDORE DISTlUC-r (TOTAL)
42,391
2,151
3,375
4,589
5,227
10,$56
8,512
4,73Q
2,918
21
27,649
1,980
2,790
3,29n
:1,26'1
6,736
5,087
2,838
1,765
14,742
274
585
1,299
1,964
4,120
3,425
1,401
1,153
21
53,113
1,426
4.841
6,480
6,J03
[1,491
9,482
6,943
6,1-11
RlJRAL
51,371
1,408
4,747
6.111
11,165
9,147
6,684
5,813
URBAr.;
1,7~2
IS
94
184
192
326
31.,
264
328
6,757
575
756
706
1,645
1,350
791
6(14
6,499
315
,53
72')
675
1,589
1,295
763
580
258
22
27
31
56
55
34
2+
9
29,011
2,255
3,691l
3,785
3,450
6,325
4,625
2,810
2.068
3
27,906
2,209
3,588
~1,G59
3,"20
6,066
4,434
2,677
1,953
1,165
46
102
126
130
259
191
133
115
10
19,'37
1,4<1
2,120
2,364
1,357
4,615
3,473
1,904
1,079
4
18,705
1,384
2,061
2,294
2,278
4.493
1,343
1,813
1,039
632
37
59
70
79
122
1:10
91
40
11
4,~
1,245
738
357
347
624
525
355
28B
2,863
1,198
6'36
190
],\9
256
191
119
114
1,621
47
1Q2
167
IB8
368
334
2:36
174
12
265
32
20
31
35
57
18
21
186
30
14
26
25
:35
27
11
18
79
10
22
12
17
13
309
30
27
34
26
74
66
33
19
261
26
2'3
30
20
61
54
29
18
48
4
4
13
12
14
192
16
17
19
32
52
36
16
4
162
12
15
30
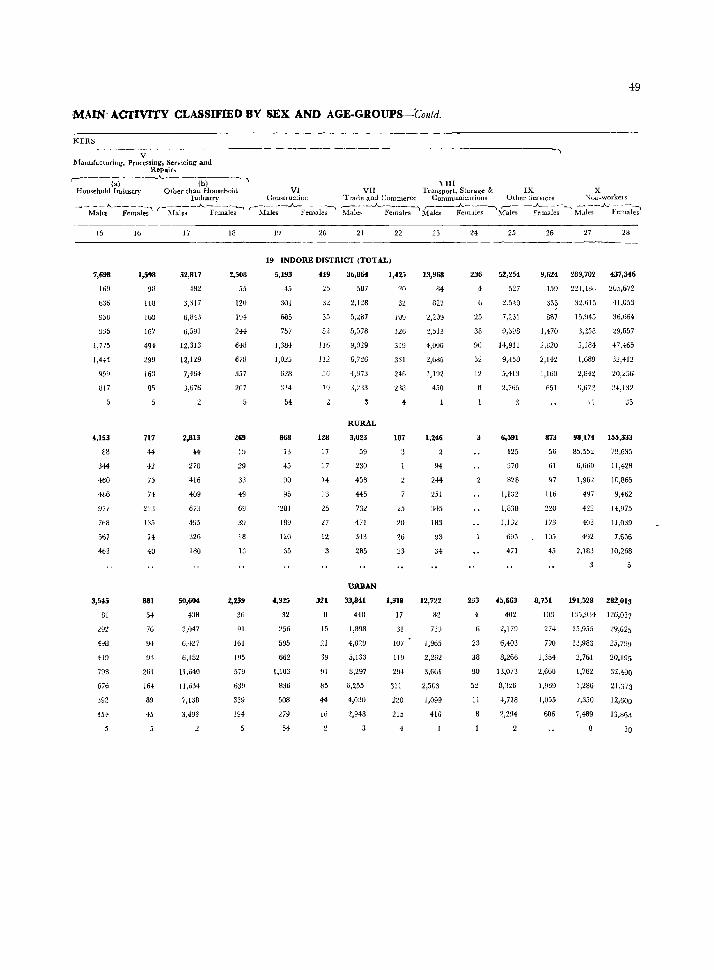
-MAIN ACTMTY CLASSIFIED BY SEX AND AGE-GROUPS-Colltd.
KER~
V Mauufacturing, Processing, Servicing ami
Repairs r-----w------.A. --(b-)-- -, \,111
49
Household Inuustn' Other than Household VI VII TWrlsport, Storage & IX X Indwtry Construcdon Trade and Commerce Communrcations Other 0ervlces ~olJ~WOrkels
-Ma~~-Fe;;;~;' r---;-I;:t;-~...A...~ks-" r-Maks-A FeOlale~l 'M:1e:-.A.. :FeU1ales~Males Fe:~l~:e-;.:le:-;M:I~-A..; Fcm~~
15
7,698
16~
636
935
1,775
l,f41
959
Sl7
4,153
88
344
460
486
977
768
567
463
3,5'5
81
798
676
392
35+
16
1,598
98
IW
169
167
494
299
163
85
111
44
42
iJ
74
233
1:15
74
40
881
54
76
261
164
89
45
17
52,817
+82
3,317
6,813
6,591
12,313
12,129
7,464
3,076
2,813
44
270
fl6
409
67:J
495
326
180
50,004
438
3,()47
6,427
6,182
11,640
11,634
7,1:38
3,496
18
2,508
55
120
244
648
678
357
207
269
19
29
:33
49
6~J
39
18
1:3
%,239
36
91
161
195
579
639
339
194
19 20 21 22
19 INDORE DISTRICT (TOTAL)
5,193
45
301
685
757
1,384
1,025
628
31-1
54
868
13
45
90
95
'281
189
120
35
4,325
32
256
595
662
1,103
836
508
279
54
419
25
35
52
II"
liZ
56
I~
128
17
17
14
13
25
27
12
321
15
21
'39
~1
85
44
10
36,864
50)
2,128
5,n7
5,578
9,029
G,nG
RURAL
3,023
59
230
458
445
73~
471
:1-13 285
URBAN
33,841
4411
1,898
5,133
8,297
6,255
4,030
2,948
1,425
20
32
lOa
126
319
331
246
2311
4
107
25
20
26
23
1,318
17
31
107
119
294
311
220
215
23
13,968
114
827
2,209
2,513
4,006
2,686
1,192
450
1,246
94
244
251
345
ISS
93
H
12,722
82
73~
1,965
2,262
3,661
2,503
1,099
416
24
236
25
38
90
52
12
233
4
23
38
90
52
II
25
52,254
527
2,549
7,231
9,3V8
14,911
9,4,)8
5,413
~,7ti.\
6,591
125
370
828
I,B~
I,S:m
L,LJ2
695
471
45,663
402
2,179
6,403
8,266
13,073
8,326
4,718
2,294
26 27 28
9,624 289,702 437,346
J 5~J 221 ;H36 105,672
,35 32,615 41,053
B87
1,470
2.820
2,142
1,160
651
873
56
61
97
116
173
105
45
8,751
IOJ
27+
790
1,354
2,600
1,969
1,055
606
15,945
3,258
2,13-1
1,639
2,842
11
36,664
:'W,657
47,465
32,412
20,256
24,l3~
:;5
98.174 155,333
B5,552
6,660
1,902
497
422
403
492
2,183
79,635
11,428
10,865
9,462
14,975
ll,039
7,656
10,268
191,528 282.013
135,934 126,037
25,955
13,983
2,761
1,762
1,286
7,489
29,625
25,799
20,19"
32,490
21,373
12,600
13,864
30
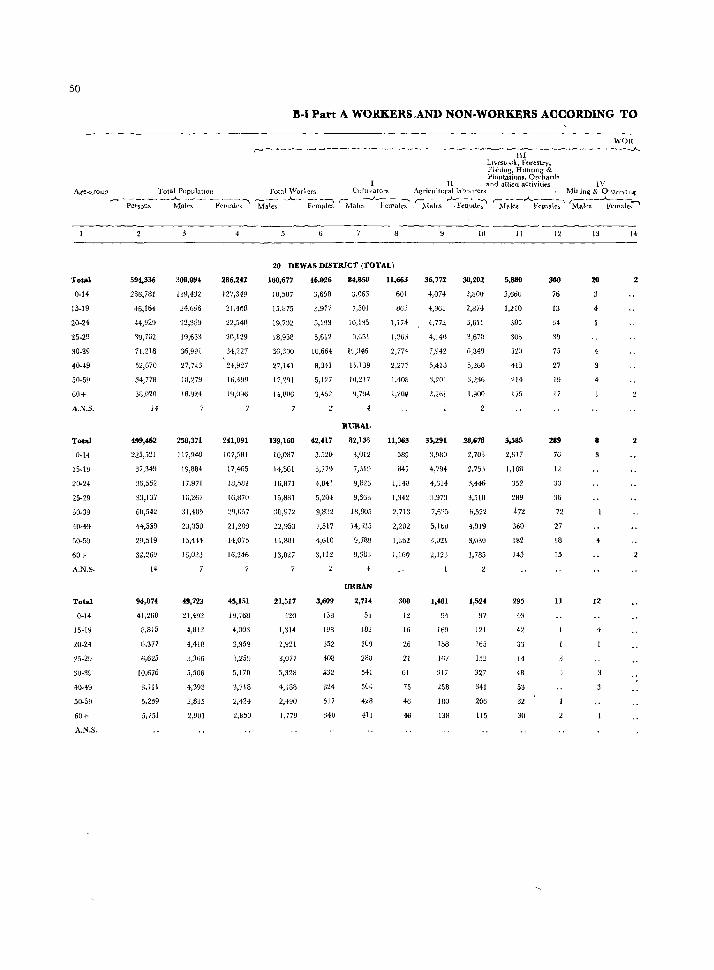
50
Ag'e-(;roup Total Popt.Uattoll
l'otjlj
0-14
15-19
20-24
30-39
40-49
50-59
GO+
A.N.S.
Total
0-14
15-19
20-24
25 .. 29
30-39
40-~9
5U-59
60+
A.N.S.
Total
0-14
15-19
20-24
25-29
30-39
40-49
50-59
60+
A . .N.S,
r- - - ------..;.._ ---------, PCts.)f1S Males F~1U:1k.)
59~,336
266,781
46,16.
44,929
19,762
71,218
52,670
34,778
3B,U20
1f
499,462
22\521
37,349
36,552
3],137
60,.142
44,5.9
29,519
3£,269
14
94,874
41,260
8,815
8,377
6,625
10,676
B,1I1
5,259
5,751
308,094
139,4n
24,696
22,389
19,633
36,991
27,743
iII,279
18,9H
258,371
117,94(l
19,884
17,971
IG,267
:11,485
23,350
15,144
16,023
49,723
21,492
4,812
4,41B
3,366
5,506
4,393
2,835
2,901
4
286,24Z
1'27,349
21,4~8
22,540
20,129
34,227 \ ~4,'127
16,499
1~,096
241,091
107,581
17,465
18,.'U1
16,870
:!9,057
21,20~
11,075
16,246
45,151
19,768
4,DOl
3,959
:3,259
5,170
3,718
2,.124
2,850
D.I Part A WORKERS,AND NON·WORKERS ACCORDING TO
'VOl! r-------------- - -~-~~ - . --..------------------J....... III
Livestock, Forestry. Pi~hing, Hunting & Plantations. Orchard'!
II nnd a.Llied <'.ctivhies lV 1'otal WorJ\crs Cllitll'ators Agriculturallabl)rlrers
r---~...A..--------:--i r --J.-~--- 1 r-- --...._-~~ ~ Males female!. Male" Fewalcs - Males ·FetUale~
20 DEWAS D1STRIC'l' ('l'OTAL)
160,671
10,507
15,875
19,7~2
18,958
36,300
27,141
17,291
14,BOG
139,160
10,087
l4,5(il
16,871
15,881
:;0,972
22,953
14,801
13,027
21,517
420
1,:H4
2,921
3,077
5,328
4,18B
2,490
1,779
3,977
5,193
5,612
10,664
8,341
5,127
3,452
42,417
3,520
3,779
4,841
5,204
9,832
7,517
4,610
3,112
2
3,609
138
198
352
408
~32
B24
517
540
84,8511
3,063
7,501
10,13:"
9,GSl
19,:146
15.139
IO,:,!]7
~,794
J\URAL
82,136
3,012
7,319
9,826
9,363
18,805
14,6:15
9,789
9,383
4
URBAN
2,714
51
182
309
288
541
504
42B
411
11,663
601
863
1,174
1,363
2,774
2,277
1,408
I,2lltl
ll,:lfi3
589
347
1,148
1,?42
2,713
2,202
1,362
1,160
300
12
16
26
21
61
75
46
4<l
36,772
4,074
4,772
4,140
7,942
5,4W
3,201
2,2(;1
35,291
3,980
4,794
4,614
:1,973
7,625
5,lbO
3,021
2,123
1,481
94
lfi9
158
1Ii7
:H7
25B
180
138
10
:10,202
2,800
2,874
3,611
3,670
6,849
5,2&0
3,236
1,900
28,678
2,703
2,75~1
:1,446
3,518
6,522
3,030
1,785
1,524
97
121
165
152
327
341
206
115
Milling & O'Jan"lll~ f --_..A.. ___ --. r-:-:~-A--
Males l'emale':l Males Ff:"m"le;'
II
5,880
2,660
1,210
385
303
520
413
214
I i5
5,585
2,617
1,1611
352
28Y
472 360
182
145
295
43
3:J
14
48
53
32
30
12
:roo 76
13
34
39
75
27
19
17
289
76
12
3:J
'l6
n 27
18
15
11
13
20
4
4
8
12
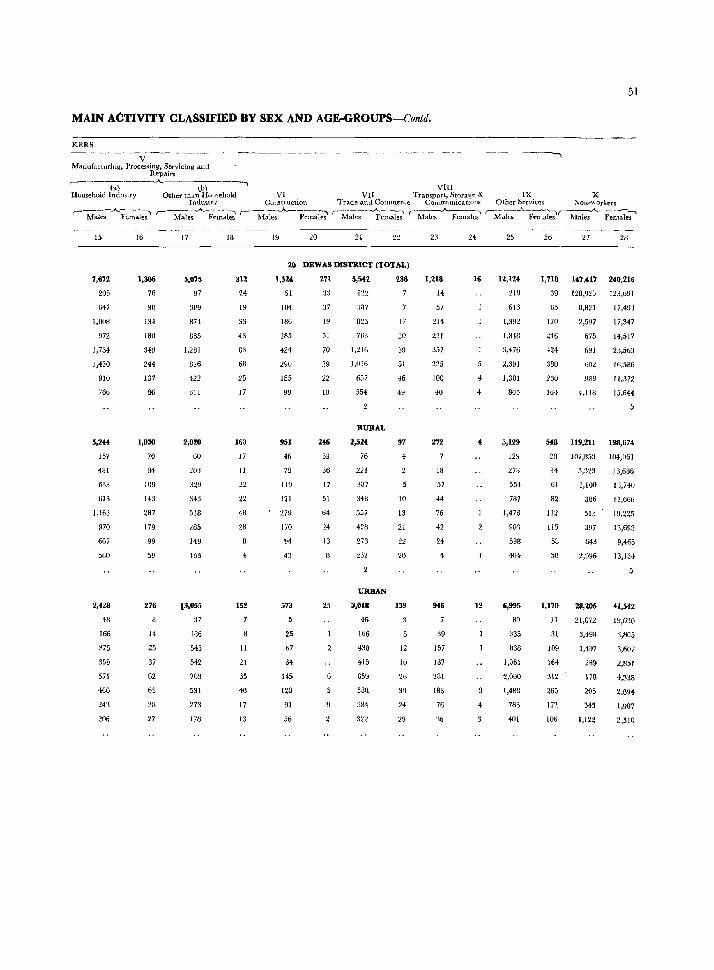
MAIN ACTIVITY CLASSIFIED BY SEX AND AGE-GROUPS-Conld.
KERS
V Manufacturing, Proces'ling, Servicing and
Rep.lirs
51
,-------w-------..A...----;:b-)-----.. VIII Household Industry Other than H()usehold VI VII Transport, Storage & IX X
Indus1ry Consttuction Trade and CQUllllerCe Communications Qiller Services NQll~"Orkers
r- Mal~-.A.F~~-l~ r--M;Je~~F~~ks' r-M.;J~F-;~ r-M~e;-~~~ fM;le~~ ~ Fem-;t;'~~--Female';'
15
7,672
205
647
1,008
972
1,734
),430
910
766
5,244
157
481
633
613
1,163
970
6G7
560
2,428
48
166
,75
359
571
460
243
206
16
1,306
78
98
134
180
349
244
137
86
1,030
70
84
109
143
287
179
99
59
276
14
25
37
62
65
38
27
17
5,075
97
3~9
874
885
1,281
816
422
311
2,0:10
60
203
329
:>43
518
l85
149
133
p,055
37
186
545
542
763
531
273
178
18
3lZ
24
19
33
43
83
68
25
17
160
17
11
48
28
152
11
21
35
40
17
13
19 20 21 22
20 DEWAS DISTRICT (TOTAL)
1,5211
51
104
186
185
424
290
185
99
951
46
79
119
121
279
170
94
43
573
25
67
64
145.
120
91
56
271
33
37
19
51
70
29
22
10
246
33
36
17
51
64
24
13
25
G
5,542
:187
82:;
763
1,:!16
I,U16
6,7
554
RURAL
2,524
76
221
387
34H
5';;/
428
273
URBAN
3,018
45
166
438
415
659
588
334
236
17
20
39
51
45
49
97
4
10
13
21
22
20
139
12
10
26
30
24
29
23
1,218
14
57
214
211
357
225
100
40
272
18
57
44
76
42
24
4
946
39
157
167
2S1
183
76
36
24
16
12
4
25
12,12'
11U
613
1,392
1,848
3,476
~,391
1,331
805
5,129
129
273
554
787
1,476
90'l
598
404
6,995
89
335
838
1,061
2,000
1,488
783
WI
26 27 28
1,718 1",417 240,216
39 128,Q2;; 123,691
65 8,821 17,491
170
246
424
380
230
164
2,597
675
691
602
988
4,118
17,347
14,517
23,563
16,586
11.372
15,644
548 119,211 198,674
23 ](17,85:1 104,061
34 5,323 13,6M6
61 1,100 1 :),740
82
112
115
58
58
1,170
11
31
109
164
312
265
In 106
386
513
397
643
2,996
:10,206
21,On
3,498
1,497
289
178
205
345
1,122
11,666
13,692
9,465
13,134
41,542
19,630
3,805
3,607
2,851
4,338
2,B94
1,907
2.510
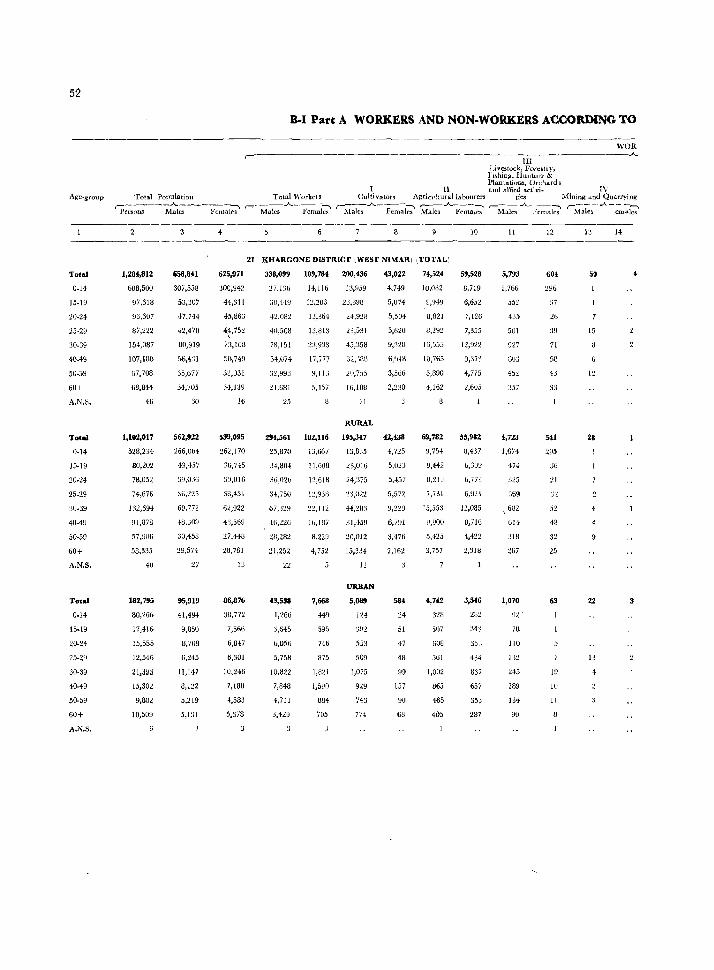
52
Total
0-14
15-19
20-H
25-2U
30-39
40-49
50-59
6U+
A.N.~.
Total
0-14
J!j-19
20-24
25-29
3U-39
40-49
5Q-5V
60+
A.N.S.
Total
0-14
15-19
2U-24
25-29
30-39
40-49
50-59
60+
A.N.S.
B.I Part A WORKERS AND NON-WORKERS ACCORDING TO
1Il Livestock, Forestl}"
}'l:<ihing, Hunting- & Plantations, Orchard s
II and allie-d activj. IV
WOR .A.
Total PopUlation Total,"",rorkels Cultivators Agrin'!t~rallabDurers ties Mining <md Quarrying r-------.A..--------~ ~---.A.--__:_,
Persons .Males Femo.le-s Males Females Males A_ Fcm~l~ Males ..A.,F~~l~ '-M~),';m---:i;i (Ma1e~--..A-~-;l;;'
1,284,812
60B,500
97,618
93,607
87,222
154,087
I07,IUO
67,708
68,844
46
1,10:1,017
528,234
80,202
78,052
74,676
J:lt,694
91,878
57,906
58,335
40
182,795
80,26b
17,4Hi
15,555
12,546
21,393
15,302
9,802
10,509
658,8U
307,558
53,307
47,744
42,470
80,919
56,4~1
34,705
30
562,922
266,01;4
43,457
39,036
36,'225
69,772
:H.I,:;mJ
30,458
29,574
27
95,919
41,494
9,850
B,71)8
6,245
11,H7
8,122
5,219
5,131
6 8 10
21 KHARGONE D1STRICr ,WEST NI\{ARI ,TOTAL)
625,971 338,099 109,78i 200,~36 43,022 74,524 59,523
300,942
44,311
45,863
4~.75:!
73,168
50,749
32,031
34,139
16
539,095
262,170
36,745
3'J,016
38,451
6~,022
27,448
28,761
1:)
86,876
38,7n
7,566
6,847
6,301
10,246
7,181)
+,583
5,378
27,131)
:>8.449
42,082
40,508
78,151
54,074
24,681
14,116 13,959
12,203 23,398
13,364 24,928
lJ,813
23,933
17,777
~.ILi
5,457
23,531
45,358
3Z;leU
20,755
16,108
11
RUI\AL
294,561 102,116 195,347
25,870 13,667 13,835
34,804 11,608 23,016
30,02(,
34.750
46,226
28,282
21,252
43,538
1,266
6,056
5,758
10,822
7,848
+,711
3,429
12,618
1~,93a
~2,1 12
16,Wi
8,229
-l,752
7,668
449
595
746
875
884
705
24,375
23,0"2
44,~8:~
::l1,!S!)
20,012
15,334
11
URBAN
5,089
124
553
509
1,075
929
743
774
4,749
5,074
5,504
5,620
9,323
6,9+1-'.
3,566
2,230
4,725
5,02~
5,{57
5,572
6,7~1
3,-176
2,162
584
24
51
47
48
99
157
90
68
10.082
8,821
8,292
16,555
10,765
5,390
4,162
69,782
9,754
9,442
8,213
7,131
15,553
\/,900
5,425
3,757
4,742
328
507
608
561
1,002
865
465
405
8,719
6,652
7,355
12,922
4,775
2,6U5
55,982
8,437
(',31)9
b,773
6,921
12,085
8,716
4,422
2,3U:I
3,546
282
343
35~i
434
807
657
353
287
II
5,793
1,766
552
435
501
927
iJU3
45~
357
4,723
1,674
47-1
325
267
1,070
92 .
7H
110
13:.!
245
189
134
90
12
60t
296
37
26
39
71
58
43
33
541
295
~l
25
19
11)
11
50
15
12
28
22 3
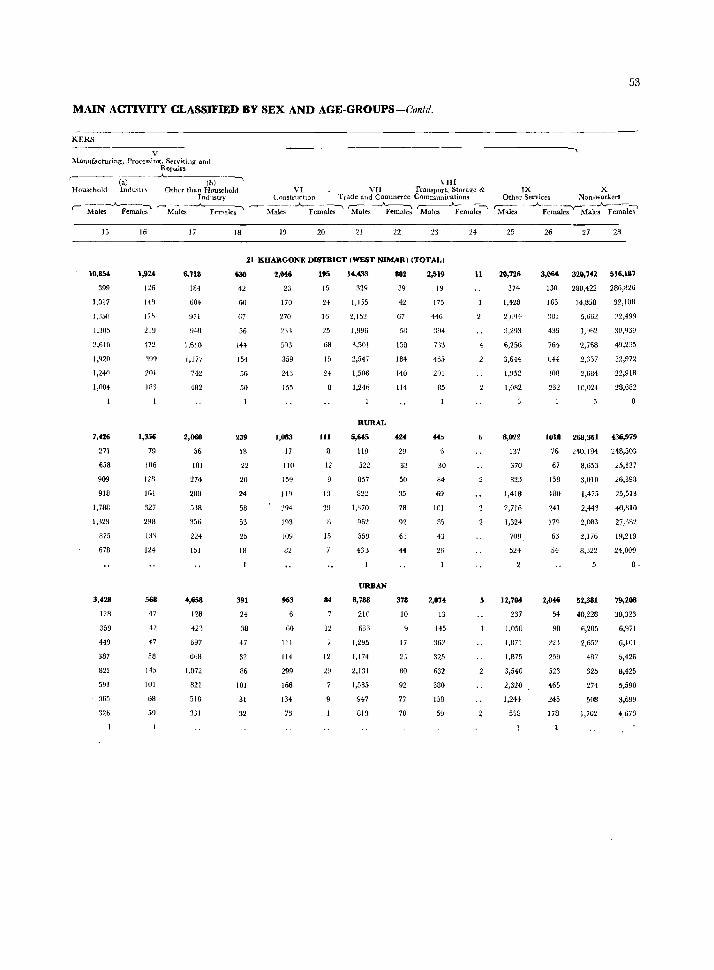
MAIN ACTIVITY CLASSIDED BY SEX AND AGE-GROUPS--Contd.
KERS
y Manufacturing, Processing, Servicing and
Repalrs
,- (al -'- (h) -, VIII Household Inou~tl\ Other than Household VI VII Transport, Storag-e &
Industry Constru('tion Trade and Commerce Communications (.-~---"----\ r--~----.A.----, ,------'------., ~-~-:--. ~..J<------__...
Males Females Males F('males Males Females Males Females Males Females
J5
1.017
J,::5fl
1.30_\
7,426
271
653
909
913
1,78B
1,329
375
678
3,428
12H
359
449
337
822
591
3G5
326
16
1,924
126
143
17_\
219
4n j99
201
18S
1,356
79
106
128
]61
327
29B
13,
124
568
47
42
17
58
145
101
68
59
17
6,718
184
604
'171
943
1,610
1,177
742
482
2,1NiO
56
181
274
280
538
35ti
224
151
.,658
128
421
697
668
1,072
B21
518
331
18 1~ 20 2! 22 23
21 KHARGONE DISTRICT (WEST NIMAR) (TOTAL)
638
42
60
67
56
IH
154
56
50
239
18
22
20
24
58
53
25
18
391
24
38
47
32
86
101
31
32
2,046
21
170
270
233
5q~1
359
243
155
1,1183
17
110
159
119
~94
193
109
82
963
60
111
114
299
166
134
73
195
15
24
16
63
15
24
III
12
13
39
15
12
12
29
14,433
329
1,J5~
2}15~
1,9Yf)
3.501
2,547
1,506
1.24()
RURAL
5,645
119
522
857
822
1,370
96t
559
433
URBAN
8,788
210
1,295
1,174
2,131
1,585
947
813
802
39
42
67
153
181
140
114
424
29
33
50
35
78
92
6:1
44
378
10
17
23
80
92
77
70
2,fH9
19
175
446
~194
)')3
165
201
85
445
30
84
69
101
85
43
26
2,074
13
145
:162
325
632
380
158
59
24
11
4
5
53
IX X Other Services Non-workerS
r----'---::--:-y----"-- ----, 1fales Fema1es Males Female<;
25
20,726
374
1,428
2p14
3,293
6,256
3,644
1,952
1,082
8,022
137
370
823
1,418
2,716
1,324
70[1
524
12,704
237
1,050
I/B71
1,875
3,540
2,320
1,244
558
26 27 28
3,06!!. 320,742 516,187
130 280,422 286,826
165 14!858 32,10B
381 5,662 3~,499
439 1,96~ ~~O/)39
764
644
108
232
2,768
2,3:'7
2,684
10,024
49,235
32,972
22,918
28,682
1018 268,361 436-,979
76 240,194 248,503
67
158
180
241
179
63
54
2,0440
54
9R
223
259
523
465
245
178
8,653
3,010
1,475
2,443
2,083
2,176
8,322
52,381
40,228
6,205
2,652
487
325
274
508
1,702
25,137
26,398
25,513
40,310
27,382
19,21~
24,009
8·
79,2118
38,323
6,971
G,IOl
5,426
8,425
5,590
3,699
4_673
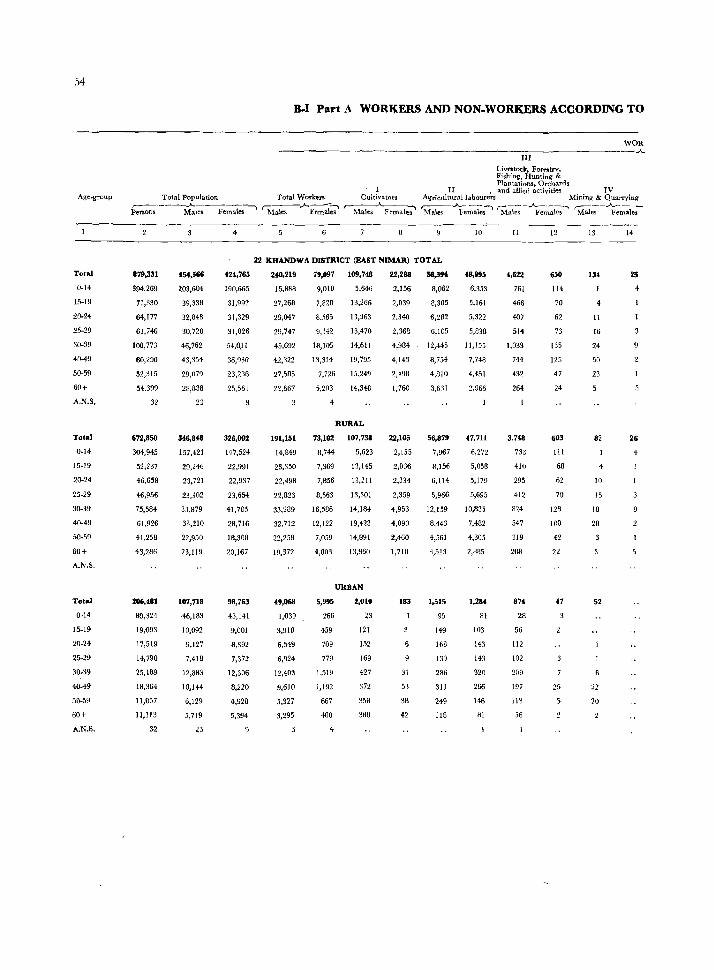
54
Age-.group
Total
0-14
15-19
20-24
25-29
30-39
40-49
50-59
60+
A.N.S.
Total
0-14
15-19
20-24
25-29
30-39
40-49
50-59
60+
A.N.S.
Total
0-14
15-19
20-24
25-29
30.39
40.49
51)..59
60+
A.N.S.
:&..1 PaJ't A WORKERS AND NON.WORKERS ACCORDING TO
I Total Population Total Workers Cultivators
III Livestock. Forestry, Fishing, Hunting & Plantations. Orchards
It , and allied activities IV
WOR .A.
Agricultural bbourers Mining & Quarrying
~--~~les--F-em-'-les-~ 'M~""""~;' r-~Fernai;' Male, --'F~';;;'les-:' 'M:;;;~;-_'_Females--' r;;1al~--'F~;'les-
879,331
394,269
71,330
64,177
61,746
100,773
80,290
52,315
54.399
32
672,850
304,945
52,237
46,658
46,956
75,584
61,926
41,258
43,286
2Ofj,481
89,324
19,093
17,519
14,790
25,189
18,364
11,057
11,113
32
~54,566
203,604
39,338
32,848
30,720
46,762
43,354
29,079
28,038
23
346,848
157,421
29,246
23,721
23,302
33,879
33,210
22,950
23,119
107,718
46,183
10,092
9,127
7,418
12,883
10,144
6,129
5,719
23
4
424,765
190,665
31,992
31,329
31,026
54,(\! 1
36,936
23,216
25,561
326,002
147,524
22,991
22,937
23,654
41,705
28,716
IB,303
20,167
98,763
43,141
9,00]
8,392
7,372
12,306
B,220
4,928
5,394
9
22 KHANDWA msnucT (E4ST NIMAR) TOT.u.
240,219
15,888
27,26B
29,047
29,747
45.692
42,322
27,535
22,067
191,151
14,B49
23,350
22,49B
22,B23
33,2B9
32,712
22,258
19,372
49,068
1,039
~!,9]B
6,549
6,924
12,403
9,610
,,327
3,295
79,097 109,748
9,010 5,646
7,823 13,266
8,565
9,342
18,105
13,314
7,72"
',203
4
13,363
13,470
14,611
19,795
1.1,24Q
14,318
RUR4L
73,102 107,738
8,744 5,623
7,369 13,145
7,B56 13,211
8,563 13,301
16,586
12,122
7,059
4,803
5,995
266
459
709
779
1,519
1,192
667
400
14,184
19,423
14,891
13,960
URBAN
2,010
23
121
152
169
427
372
30B
30B
22,288
2,156
2,039
2.340
2,368
4,984
4,143
2,49B
1,760
22,105
2,155
2,036
2,334
2,359
4,953
4,090
2,460
1,718
183
6
31
53
3B
42
58,394
8,062
8,305
6,2B2
6,105
12,445
8,754
4,810
3,6~!l
56,879
7,967
8,156
6,114
5,966
12,159
B,443
4,561
3,513
1,515
95
149
168
]39
286
311
249
118
10
48,995
6,353
5,161
5,322
5,83B
11,155
7,74B
4,451
2,960
47,7U
6,272
5,05B
5,179
5,6!l5
10,B35
7,4B2
4,305
2,R05
1,284
8]
103
143
143
320
266
146
81
II
4,622
761
466
407
514
1,033
744
432
264
3,748
733
410
295
412
B24
547
319
208
874
28
56
112
102
209
]97
113
56
12
650
114
70
62
73
135
125
47
24
603
III
68
62
70
12B
100
42
22
.7
25
13
134
4
11
16
24
50
23
82
10
15
18
28
52
22
20
14
25
26
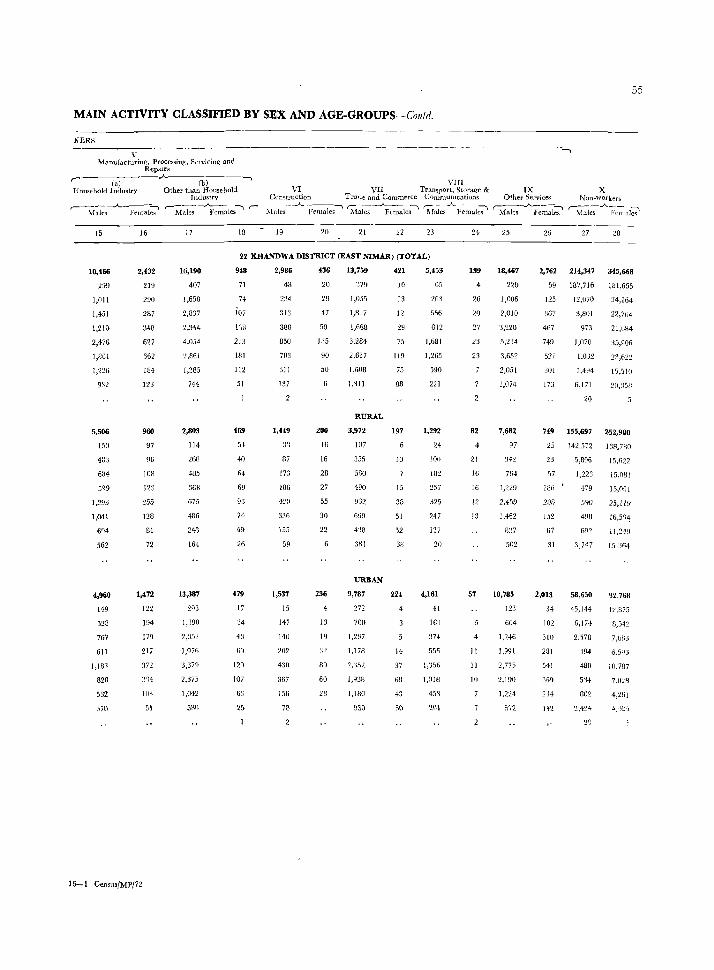
55
MAIN ACTIVITY CLASSIFIED BY SEX AND AGE-GROUPS -Coliid.
KERS
V ------._-- -----~-- --.----.------------~
Manufacturillg, Processing. SClvicing and Repairs
(a) T-[clUsehoJd Industry
A---Cb-) ----, VIII
Other than HOllseho]d VI VII Transport, Storage & Industrv Comtruction Tr::lde and Commerce Commulllcations
r--iJ;i;,,-"""_ Fem~k;' ,-M~~-~'cmales ,-- :\Ial~-;---__A_ -Femaks' 'M~;~cm~les' rr\f~cs .A.Femal~
15
10,466
299
1,011
1,451
1,2W
2,476
1,361
1,226
932
5,506
150
433
684
],293
1,041
694
562
4,960
119
528
767
611
1,133
820
532
370
16
2,432
219
290
287
340
627
362
184
123
960
97
96
lOS
123
255
128
81
72
1,472
122
194
179
217
372
c34
103
51
16-1 Census/MP/n
17
16,190
407
1,658
2,837
2,344
4,054
2,861
1,285
744
2,803
114
26n
485
368
675
486
241
164
13,387
2q3
1,390
2,352
1,976
3,379
2,:175
1,042
580
18 19 20 21 22 23
22 KHANDWA DISTRICT (EAST NlMAR) (TOTAL)
948
71
74
107
1',R
213
181
112
51
469
Sf
40
64
69
7-4
49
26
479
17
J4
43
69
120
107
63
25
2,986
48
2~14
:113
388
850
703
311
137
1,449
1'1
87
173
186
120
336
155
59
1,537
15
147
140
202
4:10
367
156
n
436
20
2~J
47
59
1:15
90
50
200
16
16
28
27
55
30
22
236
4
13
lq
80
60
28
13,759
:179
1,055
1,817
1,668
3,284
2,637
1,608
1,111
RURAL
3,972
107
355
580
490
932
699
418
381
URBAN
9,787
272
700
1,237
1,178
2,:~:J2
1,938
1,180
930
421
10
13
12
29
75
119
75
IlB
197
10
15
38
51
12
38
224
4
14
37
68
43
50
5,453
65
263
556
812
1,681
1,265
590
221
1,292
24
lOll
182
257
325
217
137
20
4,161
41
161
374
555
1,%6
1,018
45'1
139
4
26
27
23
23
82
21
16
16
12
13
57
4
II
II
10
IX X Other Services Non-workers
~fa~..A-Fe~~~ '-M;k~.A]7~"lJ~
25
18,467
220
1,006
2,010
3,220
5,214
3,652
2,051
1,074
7,682
97
764
1,229
2,459
1,462
827
502
10,785
123
664
1,246
1,991
2,775
2,190
1,224
572
26 27
2,762 214,347 345,668
59 187,716 181,655
125 12,070 24,164
%7 3,801 22,764
467 973 21,684
749 ] ,070 35,906
521 1,032 23,622
:101
173
J ,4~4
6,171
20
1~,510
20,358
749 155,697 252,900
25 142,572 138,780
2:1
57
1/36
lOB
152
67
31
2,013
3+
102
310
281
541
369
2~4
5,896
1,223
479
590
4gB
69~
3,747
58,650
45,144
6,174
2.578
494
4BO
534
002
':_!,4'H
15,622
15,081
15,091
25,119
I6,5Q4;
11,249
15,~H,4
92.768
42,875
8,512
7,683
10,787
7,on 4,261
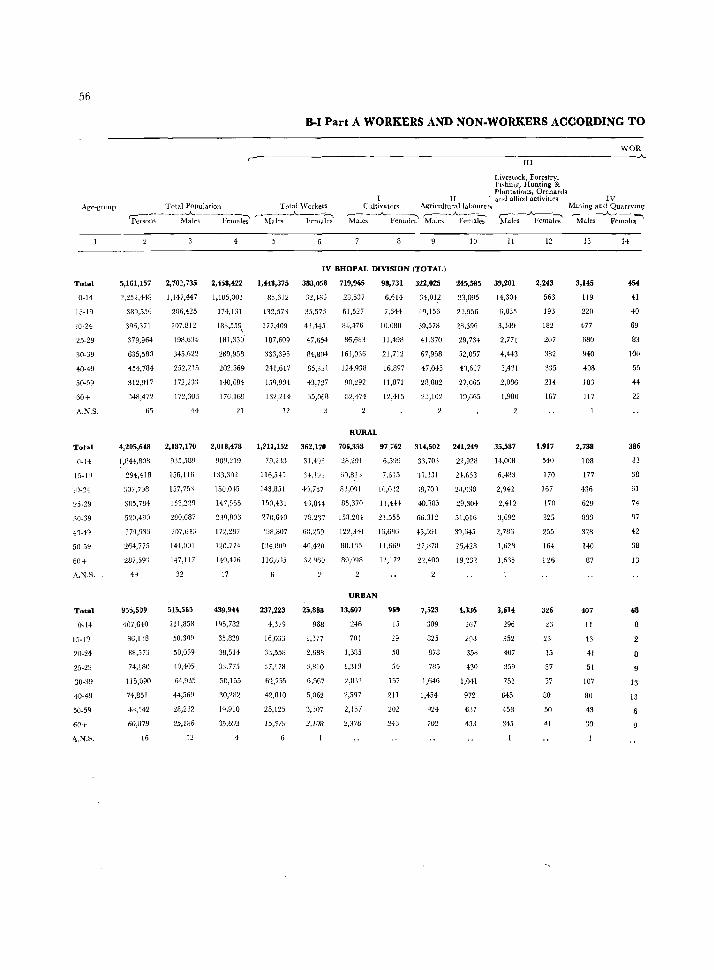
56
Total
0-14
15-19
20-24
25-29
30-39
40-49
50-59
60+
A.'l.S.
Total
O-H
1.>-19
30-39
40-41
50 S9
60+
A_'i.S.
Total
{}-14
I.\-Iry
~()-24
25-29
30-39
40-49
50-59
60+
A.'l.S.
D-l Part A WORKERS AND NON-WORKERS ACCORDING TO
WOR --------------------------------------------------------------------------~
III
l.ivcstock, Forestry, l(loshing, Hunting & Plantations, Orchards
II ' and allied activities Total Population Total \\'orkers Cultivators Agricultnra11abourets
~~~~~---;~~-[,~~ (M~le" --..A.~~~ ~~c;-.A_ Femal;;: 'M*~-~~~k; Mak;-Aft;-;i;;'
4 10. 11
IV BHOPAL DIVISION (TOTAL)
5,161,157 2,702,735 2,458,422 1,448,375 388,058 719,9ti5 98,731 322,025 245,585 39,201
2.252,443 1,117,447 1,105,001 83,612 32,463 28,537 6,6H 34,012 23,095 14,304
330,556 206,~25 174,131 132,573 35,573 61,527 7,644 40,156 2-1,956 6,835
396,171 207,812 188,559, 177,409 43M3 8-1,H6 10,080 39,578 23,396 3,3-19
379,964 198,634 IBI,330' IB7,609 47,654 86,683 11,498 41,370 29,734 2,771
635,580 345.622 289,958 333,395 84,80-1 161,036 21,712 67,958 52,057 4,443
454,784 252,215 202,569 241,617 65,321 124,Q38 16,897 47,045 41,617 3,431
312,917 172,233 I-IO,6B4 15Q,934 43,727 90,292 11,071 2n,802 27,OG5 2,00G
348,472 In,3m 176,169 132,214 35,068 82,474 12,415 23,102 1~,665 1,980
6\ H 21 12 3
4,205,64,8 2,1B7,170 2,018,478
1,8H,808 935,589 909,219
294,418 156,116 133,302
307,738 157,751 150M5
305,734 158,22!1 147,~'S5
520,490 280,6B? 2JQ,B03
379,933 2rI7,6l:i 172,287
264,775 1H,()01 1,0,71+
2U7,59:: H7,117 140,476
955,5a9
407.6,10
86,138
88,573
74,180
115,090
74,851
4B,142
on,R79
16
32
515,565
211,858
50,309
50,059
40,-105
64,9:15
44,569
28,232
25,186
12
17
439,914
1%,782
35,829
38,514
33.775
50,155
30,2132
19,910
3,),693
4
RURAL
I,Zll,152 362,170 706,358 97.;62 314,502 241,249
79,213 31,41,0 2R,2!11 6.599 33.70) 21,,928
116,511 31,196 0),826 7,013 '31.331 H.653
1{3,851 40,757 83,091 10,022 18,70) 28,033
150,431 4'3,844 85,370 11,444 40.'>85 29,304
270.640 78,231 1.18,204 21.555 66,312 51,016
198.807 68,259 122,HI 16,6116 45,591 39,645
IJ4,e09 40, .... 20 BII, I '\5 11,66!J :!7,1l7H 26,428
1I6,W15 :12.'160 SO,WIS 12,172 2~,400 19,Zn
237,223
4,379
16,033
33,558
37,178
62,755
42,010
25,125
15,:379
25,388
968
1,377
2.688
3,810
6,567
5,062
3,307
2. lOa
URBAN
13,607
246
701
1,385
1,313
2,83?
2,597
2,157
2,376
969
15
29
58
54
157
211
201
243
7,523
J09
825
878
785
1,646
1,454
924
70::!
4,336
167
298
358
430
1,041
972
637
433
35,587
H,008
6,483
2,942
2,412
3,692
2,786
1,628
1,6:15
3,614
296
352
407
359
751
645
45B
345
12
2,243
563
193
18Z
207
382
335
214
167
1,917
540
170
167
170
325
255
lGf
126
326
23
23
15
37
57
80
50
41
IV Mming and Quarrvmg r---..A....~-l
Males Females
13
3,145
119
220
477
68U
940
40B
183
117
2,738
108
177
436
629
833
328
140
B7
407
11
13
41
51
107
80
43
SO
14
454
41
40
69
83
100
55
44
22
386
33
38
61
74
87
42
38
13
68
13
13
6
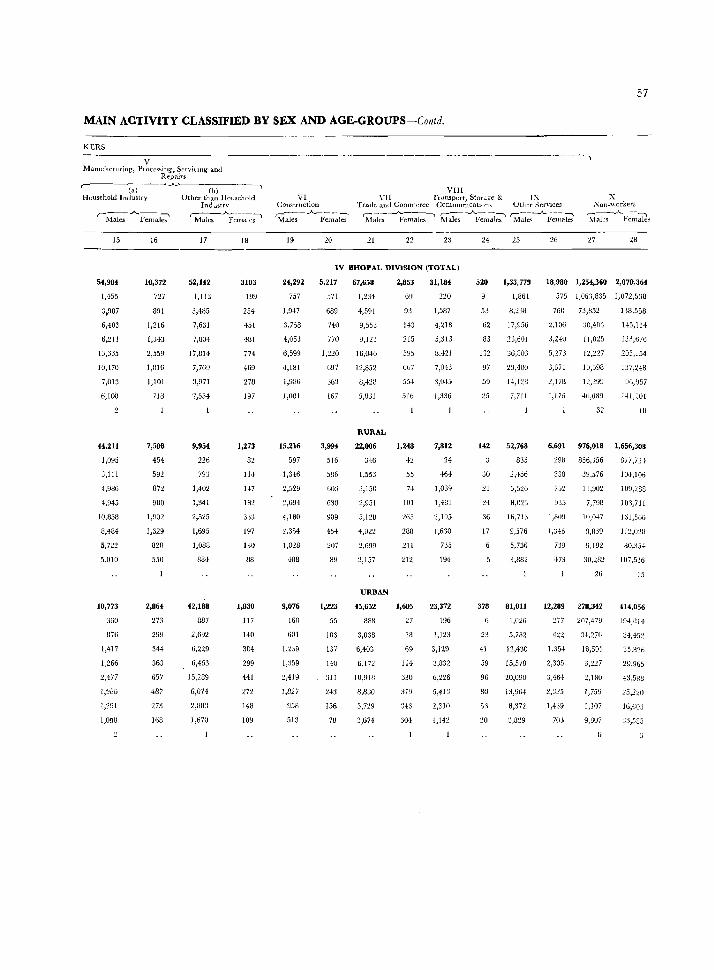
57
MAIN ACTIVITY CLASSIFIED BY SEX AND AGE-GROUPS-Contd.
KERS
V Manufacturing, Proces!>iug, Servlung and
r-'---~-
(aJ Household Industry
Repairs ~-----(b-)-----'
Other than Ilomehoid Industrv
r--.A..---, :Males F em aJe~
15
54,984
1,455
3,987
6,403
6,211
13,335
10,470
7,013
6,100
44,211
1,095
3,111
4,986
4,945
10,858
3,484
5,722
5,010
10,773
360
876
1,417
1,266
2,477
I,Y8G
1,'291
1,098
16
10,372
727
891
1,216
1,043
2,559
1,816
1,101
7IB
7,50B
454
592
872
900
1,9()2
1,329
828
550
2,864
273
299
344
363
657
487
273
168
Males .A..P;;,~ak~
17
52,142
1,113
3,485
7,631
7,804
17,814
7,769
3,971
2,554
9,954
226
793
1,402
1,341
2,525
1,695
1,083
884
42,188
887
2,692
6,229
6,463
15,289
6,074
2,8m
1,670
18
3103
199
254
451
481
774
469
278
197
1,273
82
114
147
182
3:n
197
130
88
1,830
117
140
304
299
441
272
148
109
VI Construction
~~;;- A-F;~j;;'
19 20
VIII VII Tluusport, Stor,u;e & IX
Trade and Commerce UommuDlcahom Olher Services r----..A..----, r---..A..--~ r--__;"_--~ Males Females Males Females .YJale~ Females
21 22 23 24 26
X Xon-,~orkefs
'M~F~~:k5
'27 28
IV BHOPAL DIViSION (TOTAL)
24,292
757
1,947
3,768
4,053
6,599
4,181
1,986
1,001
15,216
597
1,346
2,529
:2,694
4,180
~,354
1,028
488
9,076
160
601
1,2>9
1,359
2,419
1,827
~158
513
5,217
571
689
740
770
1,220
G!.t7
~U3
167
3,994
516
586
603
630
909
454
207
89
1,223
55
103
137
140
31 I
156
73
67,658
1,234
4,591
9,553
9,12J
16,046
12,852
8,428
5)8J1
RURAL
22,806
346
1,553
:3,150
2,951
.5,128
4,()n
2,699
2,157
URBA-III
45,652
888
3,038
6,403
6,172
10,918
8,830
5,719
:},674
2,853
6:J
93
143
215
595
667
554
516
1,248
42
55
74
101
2fi5
288
211
212
1,605
27
38
69
114
330
379
343
304
31,184
220
1,587
4,218
5,313
8,.!21
7,043
3,045
J,336
7,812
24
464
1,089
1,4U1
V95
1,630
735
194
23,372
196
1,123
3,129
3,832
6,226
5,413
2,310
1,142
520
53
62
83
132
97
59
142
:30
21
24
:16
17
378
23
41
59
96
80
53
20
1,33,779
1,861
8,238
17,956
23,601
36,803
23,480
14,128
7,711
52,768
835
2,456
5,526
8,023
Hi,71:)
9,576
5,736
3,882
81,011
1,026
5,;82
12,430
15,578
20,090
13,904
8,372
:3,829
18,980 1,254,360 2,070,364
575 1,053,835 1,072,538
760 73,852
2,106 ,0,403
3,H0 11,025
5,273 1:1,227
3,671 10)98
2,17ll 1'2,'!99
l,l76 4(J,0139
U8,558
145,114
205,154
137,H8
!ol6,957
141,101
32 IU
6,691 976,018 1,656,308
298 856,;)56
338
752
935
1,8()~
1,346
739
473
39,576
13,902
7,798
111,[1+7
8,839
9,192
877,72 ;
104,106
109,288
10'3,711
161,566
112,028
80,354
107,516
26 15
12,289 278,342
277 207,479
422
1,354
2,305
3,464
2,325
1,-139
703
34,276
16,501
3,227
2,180
1,7:)9
3,107
9,007
414,056
19-1,BI4
34,452
35,32ti
29,965
43,588
25,220
16,603
33,5<.15
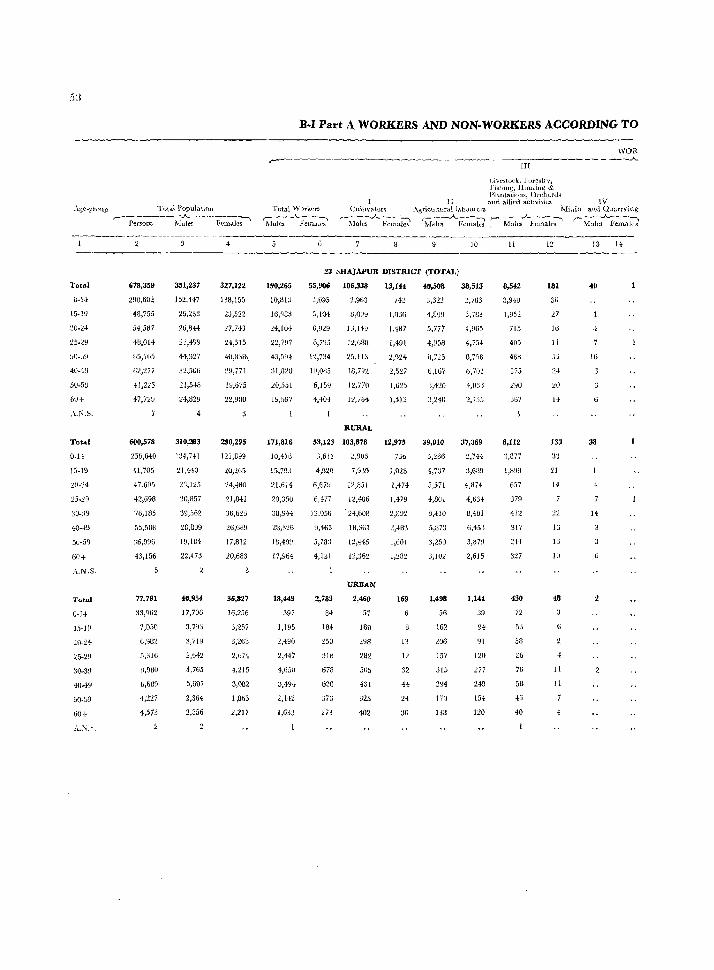
5J
~\ge-~t\)up Total Population
,_- Persons --'-M~;w~~-Females-"
Total
5U-5U
Total
O-).!
1::;-19
30-39
40-49
50-59
60+
A.N.S.
l'otal
0-1·'
25-29
30-39
40-49
50-59
60+
'78,359
290,602
48,755
48,014
85,165
6'!..,'277
H,243
47,72U
600,578
256,640
41,705
47)605
42,698
76,185
55,588
:36,996
43,156
77,781
33,962
7,OjO
6,982
5,:116
B,980
6,689
4,227
4,573
351,237
152,447
25.233
26,844
23,499
44,327
::12,506
21,548
24,82!J
4
310,:1113
134,),)1
21,440
23,125
:!O,H57
:>9,562
28,899
19,184
22,473
40,954
17,706
3,193
3,71Y
2,542
4,765
3,50)
2,364
2,356
4
327,122
138,155
23,522
'1.7,743
14,515
4(),83Eh.
:!9,771
1~,675
12,900
3
290,295
121,899
20,265
24,480
21,841
3ti,623
26,689
17,812
20,683
36,827
16,256
3,257
3,263
2,674
4,2J5
3,082
1,863
2,217
B·I Part L\ WORKERS AND NON· WORKERS ACCORDING TO
,...--. HI
L.ive~tock, ForestryI' J'ishing, Hunting & Plantati()n~, Orchards
WOR .A.
1I and alli{'d achvitics IV Total \Vork<.::rs
r-~~\....---:-... Males _Fctndl('s
Cuitlvaton. .\grictllturallaboluers
190,265
10,81~
IG,98tl
H, I 0';
22,797
43,594-
31)8~f)
20,551
19,597
171,816
10,416
15,793
21,614
20,350
:38~944
28,316
18,409
17,964
18,449
397
1,195
2,490
2,147
4,6oU
3,494
1,63:.J
r-~-..A..---:-. ,- _....A.. __ ~-~ .:\la.lcs Female!> ~Idles Females
23 ~HAJAPUR DISTRICT (TOTAL)
55,~ 106,338 13,144 40,508
3,695
5,104
G,929
6,785
11,734
lU,01J5
6,159
4,404
2.963
8,099
U,149
12,688
~5,U3
lU,792
12,770
12,764
RURAL
53,123 103,878
J,611 :l,90o
4,920 7 ,93~1
6,67" 12,851
6,477 12,406
12,056 . 24,608
9,465
5,783
4,101
2,783
84
184
250
318
678
620
376
.7:>
18,3{)1
12,445
12,362
URBAN
2,460
57
160
298
282
5U5
431
325
402
1,036
1,481
1,491
2,~H
2,5:!7
l,G:.?5
1,:1l2
12,975
730
1,028
1,474
1,419
~,4B3
1,601
1,282
169
13
12
32
44
24
30
3,322
4,89V
5,77?
4,9:;8
8,725
6,lG7
39,010
3,266
4,137
.5,571
4,8UI
8,410
5,U7:J
3,250
3,102
1,498
162
206
157
315
294
170
138
10
38,513
:!,783
3,783
4,965
4,754
8,7:;8
b,7ln
4,O:n
37,369
:.!,744
3,689
4,874
4,634
8,481
6,453
3,879
2,615
1,144
39
94
91
1:/0
277
249
154
120
1\1inin aHd Quanying
:Male~~'emal~ ~Mal~~~~~
II
8,542
3,94-9
1,952
715
40~
:.175
290
367
8,112
3,877
657
379
41:!
317
2H
3:!7
430
72
53
58
26
76
58
4fl
40
12
181
36
27
W
11
U3
:n
21
H
22
1:.;
13
10
48
6
4
II
H
7
13
40
16
38
14
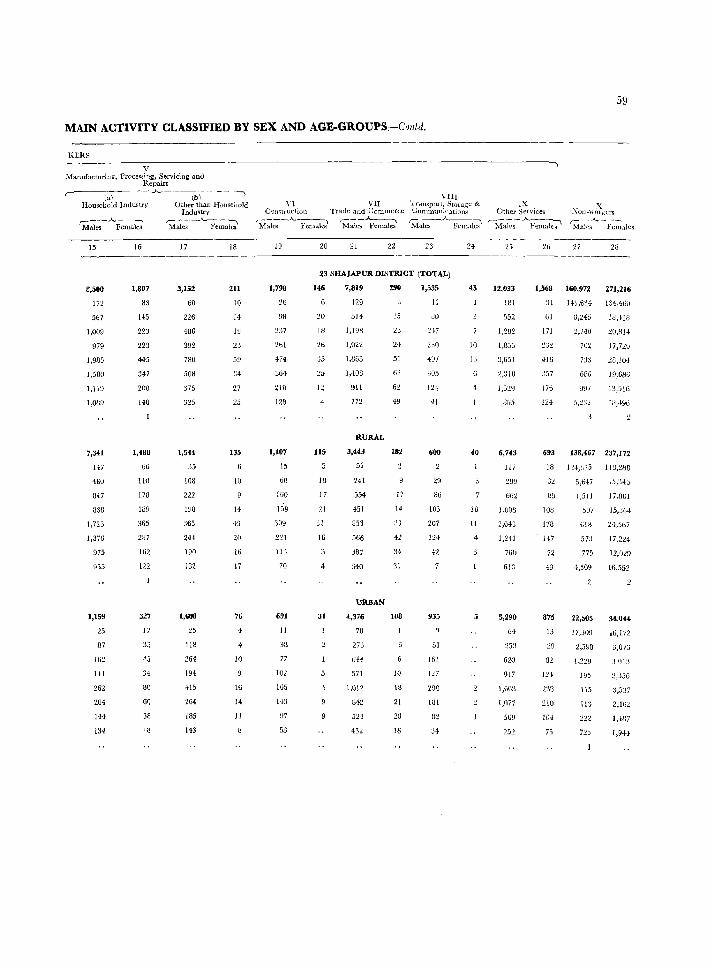
MAIN ACTIVITY CLASSIFIED BY SEX AND AGE-GROUPS:-Contd.
KERS
V T\1anufacturing, Processing, Servicing ano
Repairs ...-----(a-) _- -~ -'------(-b)-------,
Household Industry Other than liousellOld Indu~tI'y
r----..A..~ r-_---___A._--:--, Males Females Males Females
15
8,500
In 567
1,009
979
1,985
1,580
1,1lY
1,089
7,341
147
480
817
[J3B
1,723
1,376
975
955
1,159
25
m
!6~
14!
262
201
141
134
16
1,807
8,
145
22~
223
445
347
200
140
1,480
66
110
178
189
365
287
162
122
327
J7
33
-i5
34
sO
6~
38
17
3,152
60
226
436
392
780
50S
,75
;)25
1,544
:15
108
222
1!J3
:>65
244
190
182
1,608
25
lIB
264
194
415
264
185
143
IB
211
10
14
lU
23
59
27
25
135
10
14
43
20
16
17
76
4
10
16
14
11
n VI! G)n~trucliotl Trade and Uommerce
~:i;--A.. Fem~l~ rM:ie:-~-:l~
19 20 21 22
VIII TraHspOi t, Stol'aqe & Commuuic.ltions r---.A------:-, "",lales ,Fem,\ies
23 24
23 SHAJAPUR DISTRICT (TOTAL)
1,798
26
~bl
474
:;64
210
128
1,107
15
60
lUO
159
30!]
II)
70
691
II
33
77
102
IG5
143
Y7
58
U6
20
III
3S
12
4
115
18
17
21
16
31
-I
7,819
129
514
1,1911
1,022
1,865
1,·108
911
772
RURAL
3,443
51
241
554
451
853
566
387
340
URBAN
4,376
78
27:3
644
571
812
524
432
290
15
23
24
51
63
62
49
182
17
14
3J
42
34
31
108
10
18
21
28
18
1,535
11
80
147
497
305
124
41
600
29
Bu 103
207
124
42
935
51
J61
1:.:7
290
181
82
45
10
1 ~i
40
10
11
IX Other Services
r-:_---__A_-~""""\
Males Femaks
59
0;on-w~kcrs r- - . .A_ __ _
Males FemJ.les
27 28
12,033
IBI
1,568 160,972 271,216
552
l,2S2
1,835
:3,65l
2,3Hl
1,3~Y
865
6,743
117
:!!J9
662
1,008
2,(J.t3
1,241
760
613
5,290
64
253
620
847
I,GI)8
1,077
56!:!
31 141,634 134,460
61
171
416
J.\7
176
124
693
CI,:l45
2,740
702
733
68G
997
18,-113
20,814
11,720
28,104
J9,686
13,"16
lU,+96
138,467 237,172
18 1~4,325 118,288
89
108
178
H7
72
4G
875
13
29
82
210
lIH
75
5,617
!,5! 1
15,:143
17,801
507 15,%4
nIB 21,5b7
573
775
4,509
22,505
17,J09
2,598
1.229
1!J5
\15
113
17,2~4
12,(J29
16,552
Jf),I72
3,07::>
J,n!:)
2)56
,,5J7
2,16~
1,487
1,9H

60
Age-glollp
Total
IJ-H
15-10
:20~24
25~29
JO-39
40-4~
50-59
60+
A,:'>f.S.
Total
0_14
15_19
25-29
30-39
40-49
50-59
60+
A.N.'.
Total
O-H
15-19
20-24
2~<!9
30-39
40-49
50-59
60+
A.N.'.
Tot.-tt Popnl..ttiou r-- -~---- --J,,_~-----l
Pel50m Males Females
644,346
282,1)72
·16,012
47,700
45,509
79,832
+1,6116
-13,0.10
582,566
255,028
-10,-158
{Z,47-!
41,3Ul
7'1.975
51,167
J8,OIJO
39,992
61,780
27,OH
5,551
5,226
4,188
6.857
5.456
337,810
HO,533
44,263
3:2,1%
:!J,4JlI
305,265
21,446
21,867
21,939
40,781
29,268
21,456
22,20Y
32,545
H,284
3,176
2,602
2.034 _
0,484
~,~68
1,9U2
:.!,024
306,536
141,48U
:)5,567
~5,J87
18,2..J.fJ
1'),617
277,301
128,729
19~012
20,607
19,44:2
32,194
22.809
16,6~l+
)7,783
29,235
12,760
2,378
2,534
2,154
:),373
2,538
1,614
1,83';
r----
B-1 Part A WORKERS AND NON-WORKERS ACCORDING 'fO
III Livestock. Forestry, }<'ishmg', Hunting & Plantations. Orchards
Total \\'olker:> ItlvatOls lJ and allied ~ctiVlt- IV
AgriC'ulturallaboUiers leg Mining & Qual!') lIl!;.
/~Llks-J... -~~~es I~~;----~;~~I~~ fMales--"-F~;, 'M~;--~emalesl ~-;:t~-.A.~~-;l~
187,689
1:>,482
17,631
22,430
42,1'10
:30,463
21,62b
173,615
n.041
16,662
19,787
20,035
3U,853
27,701
19,1177
17,059
14,U74
441
969
1,736
1,815
2,762
1,7+9
1,',64
U RMGARH DISTRICT (TOTAL)
44,301 117,905
3.90B
4';300
5,270
5,280
~1,7(:jH
6,94:L
5,719
4,737
9,5!JU
1~,967
H,3il
21,4%
20,2H
15,47b
13mB
15,200
1,470
1,794
1,7lJJ
3,487
2,406
1,033
RURAL
29,902
3,58B
-h17:;
4,O .. t!
J,527
(i,12f)
J,lIn
:!,33:J
2,181
42,722 116,902 15,134 129,552
5,112
5,lOS
9,410
6,607
5,505
2,868
1,579
89
93
158
177
358
JJ5
214
155
4,709
9,531
12,855
14,278
27,279
15,3+2
12,865
~157
1,468
1,786
1,778
3.476
2,390
2/.!58
l,o:n
URBAN
1,003
28
67
112
217
l!Jl
11-l
151
66
II
16
II
l~
3,580
+,140
4,010
:3,496
3,75H
2,29:!
2,231:
350
33
31
8+
H
41
4)
10
25,630
2,634
2,679
3,007
3,041
5,4711
3,13132
3,106
1,761
25,462
2,630
2,673
3,044
3,025
5,439
3,H40
:1,074
1,737
168
13
16
3i
42
11
8,65ti
4,360
1,769
680
361
435
+37
351
8,231
4,326
1,727
623.
328
351
366
201
309
425
34
42
57
33
s+ 71
62
42
231
1+3
14
10
10
1'1
14
13
207
14']
13
10
4
12
13
4
24
184
15
21
14
41
39
16
16
94
I"
4
I:;
18
21
11
17
U
23
18
10
14
19
15
+
4
4

MAIN ACTIVITY CLASSIFIED BY SEX AND AGE·GROUPS-Contd.
KERS ------ ---------------
V Manufacturin,g, Processing, ~ervicing ~md
Repairs ---(a-)-----"----(I;)- ----,
Household Industry Other than Househ(lld VI VII YIII
Transpolt StOla~e & IX
61
---,
x Indu<;tfY Comtructwn Trade and Commerce CommUOlcatwm Othet' Scr\'i('e~ Non_wnl ken;.
r::-:----_A_-------... ,------'----) Males Females Male<; Female~
15
8,027
201
569
917
933
2,145
1,455
956
851
6,840
161i
480
769
809
1,876
1,234
797
709
1,187
89
148
124
269
221
!59
142
16
1,059
8~
90
170
180
239
160
86
52
743
29
08
128
141
171
120
62
34
316
53
32
42
39
68
40
24
10
17
2,977
152
292
423
345
6~H
523
313
233
1,465
34
116
178
lfi~
410
27+
158
133
1,512
llU
176
245
183
281
254
155
lOa
lB
212
14
17
14
21
67
36
28
15
94
31
17
16
118
II
12
36
_l9
12
12
,--_ A ___ ---.,
~[nles Females r-M~~~ Fen~i~;' r-M~l';;.A_ --F~-~s r-M~e~f"em~ ,-__ ..A.... ___ -,
:\falcs Females
19
1,674
30
101
205
245
517
306
162
108
1,042
27
66
13~
154
361
171
76
53
632
::5 71
91
156
135
86
55
20 21 22 23
24 RAJGARH DISTRICT (TOTAL)
247 6,820 220 1,080
21
31
40
'm
61
21
10
215
21
27
38
35
54
19
11
32
4
201
519
l/tH
379
1,484
1.200
730
773
RURAL
3,466
67
265
5fl7
465
781
637
341
321
URBAN
3,354
134
204
447
114
70J
563
387
452
11
19
12
50
53
34
33
80
17
19
10
15
140
10
II
33
34
24
18
19
90
158
153
29fl
22']
93
16
375
25
63
61
106
74
24
17
705
14
65
95
192
149
69
29
24
40
11
15
4
25
10,464
179
638
5,648
112
'108
562
869
638
407
4,816
67
191
5~1
2JJ
26 ~7
1,443 150,121 262,235
44 127,101 1 '17_581
GO 6,991 17,000
165
Ptl
:172
347
159
104
757
31
40
90
102
206
184
57
46
686
13
20
75
89
166
16'3
102
58
3,0%
1,523
~,075
1,673
1,812
5,910
17.071
16,311i
25,799
18,545
1:1,529
16,594
131,650 234,579
]]3,258 124,910
4,784
2,080
1,304
1,{)2fl
1,567
1,579
5.150
18,471
l'3,843
2,207
956
219
147
106
233
760
14.715
15,495
l4,3:·J!)
22.784
16.292
11.129
14,915
27,656
12 G71
2,285
2,8V6
1,977
3.015
2,253
1.-100
I 679
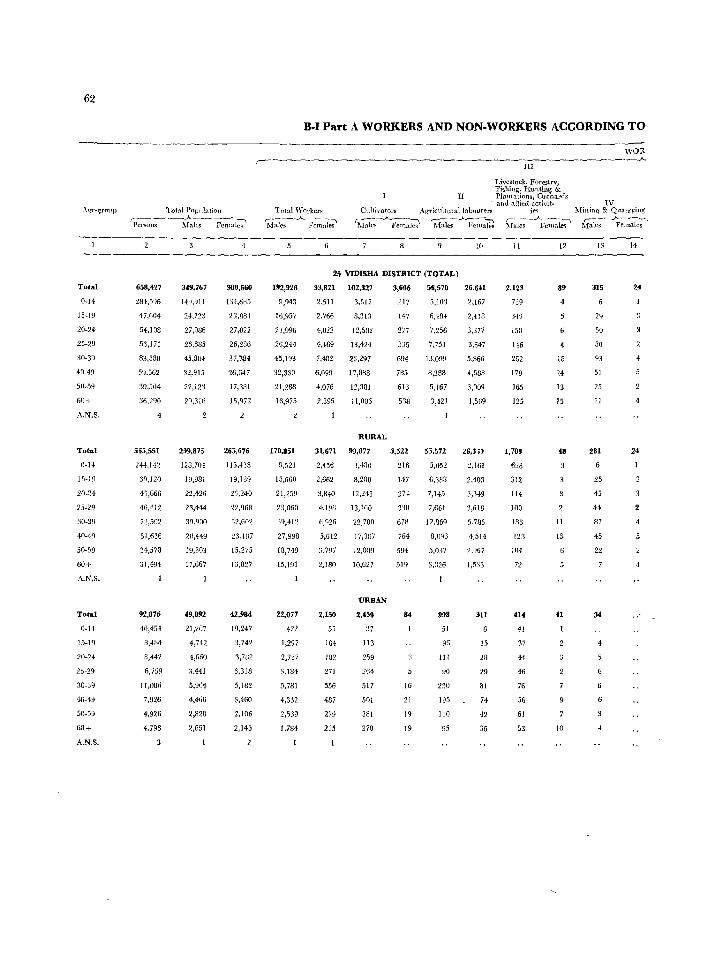
62
Total
0-14
15-19
20-24
25-29
30-39
40-49
50-S9
60+
A_N.S.
Total
0-14
15-]9
20-24
:10-39
40-49
50-59
60+
A.N.S.
Total
0-14
15-P)
20-24
25-29
30-39
40-49
60+
A.N.S.
Total POplllation , __ ~--...A..~ __ ~ ___ -:....,
Persons I\-fale5: Females
658,427
47,604
54,108
51,171
83,5BB
59.562
39,504
36,290
4
565,551
244,142
3~,120
4::1,666
46,412
n,5!l2
51,636
31,578
31,494
1
92,876
40,454
0,404
8,442
6,759
11,086
7,926
4,926
4,796
349,161
14!),911
24,723
27,086
26,885
45,804
32,915
22,123
21l,31U
2~9,875
128,704
19,981
22,426
23,444
39,900
211,449
19,303
17,667
49,892
21,207
4,742
4,G60
3.441
5,904
4,466
2,820
2,651
4
308,660
134,6B5
22,1181
27,022
26,286
g7,~4
26,647
17,381
15,G72
26:;,676
115,f38
19,139
23,240
22,%8
32,60'2
:!3,IB7
15,275
13,827
42,984
19,247
:1,742
3,7H2
3,318
5,182
3,460
2,106
2,145
B·I Part A WORKERS AND NON· WORKERS ACCORDING TO
III
Livestock, Forestry. Fishing, Hunting &
II Plantations, Orchards , and alUed acdVlt~ IV
WOR ..)...
'I'(ltal 'Vorkers r----...A----~....., Malt's Females
Cuili\'ators Agricultural labourers ie~ Miniul{ & QW.l!"tying
'M~~--.A-Fem-;i;;' ~~;-.A.~rna-m M71-1;;--_AFem:tle~ Maks-~~~:ale;-l
192,928
16,957
2:1,996
26,244
45,193
32,330
21,288
16,975
170,851
15.660
23,060
:14,41 ~!
27,998
18,749
15,191
22,077
422
1,297
2.737
3,184
D,781
4,332
2,~39
1,784
25 VIDISIIA DISTRICT (TOTAL)
33,821 102,327
2,511
2.766
1,022
4.469
7.482
6,099
4,076
2,395
3,517
0,31::
12,502
13,421
23,297
17,888
12,381
11,003
II.URAL
31,671 99.877
2.456
2,662
1,.liW
8,200
3,840 12,143
4,198 13,WO
6,G26 22,780
5,612 17,387
3.797 12,OlJO
2,180
2,150
55
104
271
556
487
279
215
10,627
UII.BAN
2,450
37
113
2>9
264
517
501
381
378
3,606
217
147
277
335
694
785
613
538
3,52Z
216
147
274
310
678
764
594
519
84
16
21
19
19
56,570
5,103
6,40+
7,256
7,751
13,099
8.288
5,167
3,421
5,052
6,188
7,145
7,661
12,869
8,093
5,0:17
998
51
96
III
90
230
195
130
95
26,6H
2.167
2,41B
3,377
3,647
5.866
4,588
3,009
1,569
26,3;[)
2.161
2,403
3,349
3,618
5,785
4,514
2,~67
1,533
311
15
28
29
81
74
42
36
11
2,123
739
:149
153
1-46
262
179
165
]25
1,709
698
312
114
100
186
123
104
72
414
41
37
44
46
76
56
61
53
12
89
4
1
18
24
13
15
48
3
2
11
15
41
10
l:l
315
6
29
50
50
93
51
25
11
281
25
45
B?
45
22
4
14
24
4
4
24
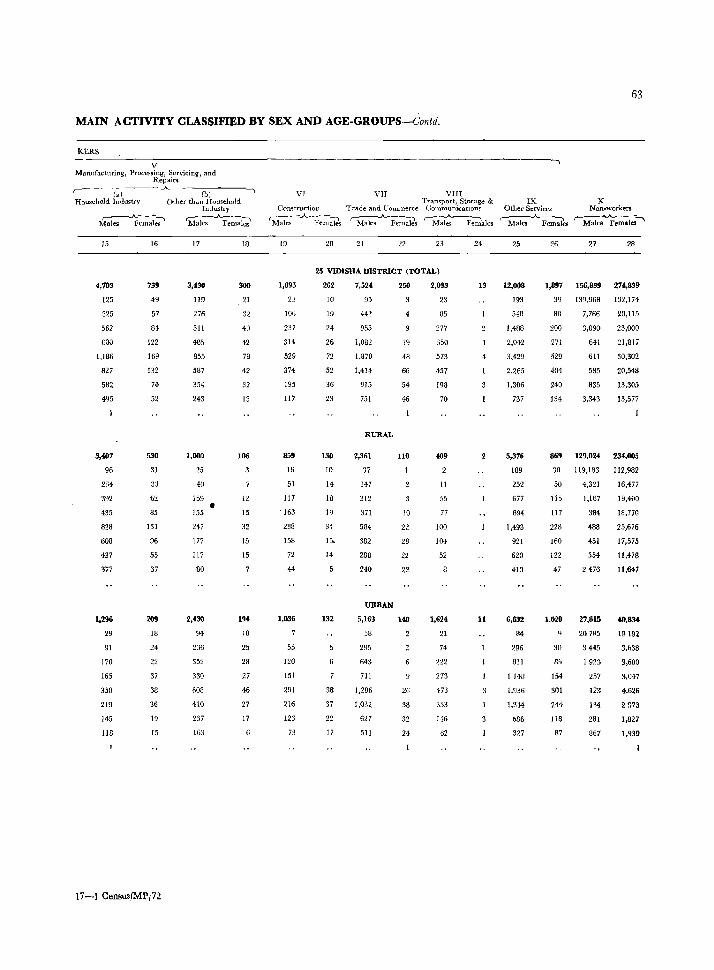
MAIN ACTIVITY CLASSIFIED BY SEX AND AGE-GROUPS-Contd.
KERS
V Mamlfacturing, Processing, Servicing, and
Repairs ,..---(-:".:-) --- .A.---(""b:-) ----,
Household Industry Other than Household
r---.A.-~-, Males Females
15
4,703
125
325
562
600
1,186
827
582
495
3,407
96
234
392
435
828
608
437
3ii
1,296
29
91
170
165
358
219
145
118
16
739
49
57
84
122
169
132
74
52
530
31
03
62
85
131
96
55
37
209
18
24
22
37
38
36
19
15
17-1 Census/MP/72
Ill(iustry ~----, Males Females
17
3,430
119
276
511
485
855
587
354
243
1,000
25
40
159
155
2'17
177
117
80
2,430
94
236
352
330
608
410
237
163
•
300
21
32
40
42
78
12
32
13
106
12
15
32
15
15
194
10
25
28
27
46
27
17
VI
Construction
'Male~ ..A.):em~
19 20
VIn Tramport, Storage &
Trade and Commerce CommunicatlOn~
r:-:-:-..A.----""":",\ r---....A.r---~ Males Females Males Females
Vll
21 22 23 24
25 VIDiSHA. DISTRICT (TOTA.L)
1,895
2:1
106
237
314
529
374
195
117
859
15
51
117
. 163
238
158
72
44
1,036
55
120
151
291
216
123
73
262 7,524 250 2,033
10
19
24
26
72
52
36
23
130
10
14
18
I?
34
15-
14
132
38
37
22
17
95
442
955
1,082
1.870
1,414
915
751
RURAL
2,361
37
147
312
371
584
382
288
240
URBAN
5,163
58
295
6H
711
1,286
1,032
627
511
19
48
66
54
46
liD
10
22
28
22
22
ao
26
38
32
24
23
35
277
350
573
457
198
70
409
11
55
77
100
104
52
1,624
21
74
222
273
473
353
116
62
13
4
11
63
IX X Other Services Non-workers
,-Males .A... Fem~s ,-Males Females ~
25
12,008
193
548
1,4B8
2,042
3,429
2,265
1,306
737
5,376
109
252
677
894
1,493
921
620
410
6,632
84
295
811
114f]
1.930
1.344
686
327
26 27 28
1,897 156,839 274,839
39 139,968 132,174
80 7,766 20,115
200
271
529
404
240
134
3,090
641
611
585
835
3,343
23,000
21,817
30,302
20,548
13,305
13,577
869 129.024 234.005
30 119,183 112,982
50 4,321 16,477
115
Il7
228
160
122
47
1,028
30
R" 154
301
244
118
87
1,167
384
~8
451
554
2476
27,815
207aS
3445
1923
257
123
134
281
867
19,400
18,770
25,676
17,575
11.478
11,641
'4>.834
19192
3.638
3,600
~,047
4,6~6
2973
1,827
1,930
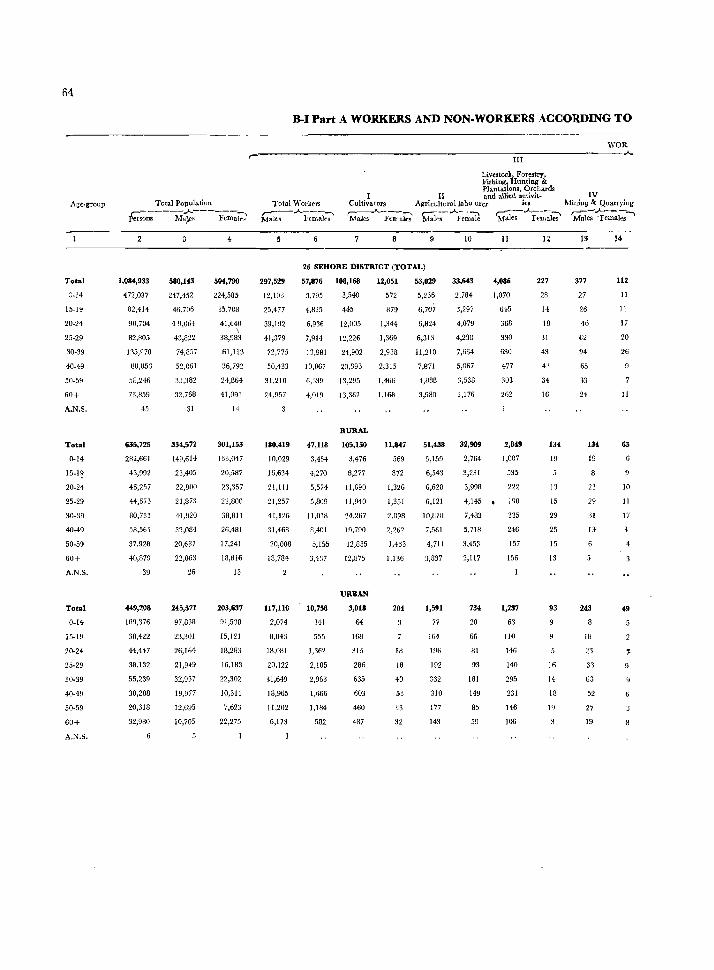
64
Age-group
Total
J-14
15-19
20-24
25-29
30-39
40-49
50-59
60+
A.N.S.
Total
0-14
15-19
20-24
25-29
30-39
40-49
50-59
60+
A.N.S.
Total
0-14
15-19
20-24
25-29
30-39
40-49
50-59
60+
A.N.S.
Total Population r-------_,._,------~ Persons Ma;.cs FemaI~~
1,084,933
472.037
82.414
90,704
82,305
135,970
Sa,B53
58,246
73,859
45
635,725
282,661
43,992
46,257
44,673
80,731
58,565
37,928
40,879
39
449,208
IB9,376
30,422
44,447
38,132
55,239
30,288
20,318
32,980
580,143
217,452
46,706
49,064
43,822
74,857
52,061
33,382
32,768
31
334,572
149,614
23,405
22,900
21,87:1
41,920
32,084
20,687
22,063
26
245,571
97,838
23,301
26,164
21,949
32,937
19,977
12,695
10,705
4
504.790
:124,585
35,708
41,640 \
38,983
61,113
36,792
24,864
41,091
14
301,153
133,047
20,587
23,357
22,800
38,811
26,481
17,241
18,816
13
203,637
91,538
15,121
18,283
16,183
22,302
10,311
7,623
22,275
B-1 Part A WORKERS AND NON.WORKERS ACCORDING TO
WOR ----------I=I~I-----------------~
Livestock, Forestry, F'isbing, Hunting & Plantations, Orchards
II and allied activit- IV Cultivators Agricullurallabo urq i~s ~Iinil1g & Quarrying Total '\o\'orkers
r---",A..----., Males Females ~F;~~ Ma1e~-..Aie~1~ 'M;i;s-~~~ 'Ma1;~-;-m-;l:;~
26 SEHORE DISTRICT (TOTAL)
297,529 57,876 108,168 12,051
12,103 3,705 3,540 572
25,477 4,825 445 879
39,192 6,936 12,M5 1,344
41,379 7,914 12,226 1,369
72,775 13,981 24,902 2,938
50,433
31,210
24,957
180,419
10,029
16,634
21,111
21,257
41,126
:l1,468
20,008
18,784
117,110
2,074
8,843
lR.081
20,122
31,649
18,965
11,202
6,173
10,067
6,339
4,019
20,393
13,295
13,362
RURAL
47,118 105,150
3,454 3,476
4,270
5,574
5.809
11,mS
8,401
5,155
3,437
10,758
341
555
1,:162
2,105
2,963
1,666
1,184
582
8,277
11,690
11,940
24,267
19,790
12,835
12,875
URBAN
3,018
64
168
315
286
635
603
460
487
2,315
1,466
1,168
11,847
569
872
1,326
1,351
2,fl98
2,262
1,433
1,136
204
IH
18
40
53
33
32
53,029
5,236
6,707
6,824
6,313
11,210
7,871
4,8RR
3,980
51,438
5,159
6,543
6,628
6,121
10,878
7,561
4,71 I
3,837
1,591
77
Hi4
196
102
332
310
177
143
10
33,643
2.784
3,297
4,079
4,238
7)664
5,867
3,538
2,176
32,909
2,764
3,231
11
4,086
1,070
645
368
330
630
477
303
262
2,849
1,007
535
3,990 222
4,145 • 190
7,483 335
5,718 246
3,453 157
2,117
734
20
66
81
~3
181
149
85
59
156
1,237
63
110
146
140
295
231
146
106
12
227
28
14
18
31
43
4:l
34
16
134
19
13
15
29
25
15
13
93
9
16
14
18
lq
13
377
27
26
46
62
94
65
:13
24
134
19
23
29
31
1~
243
18
21
33
63
52
27
19
14
112
11
11
17
20
26
11
63
10
11
17
4
49
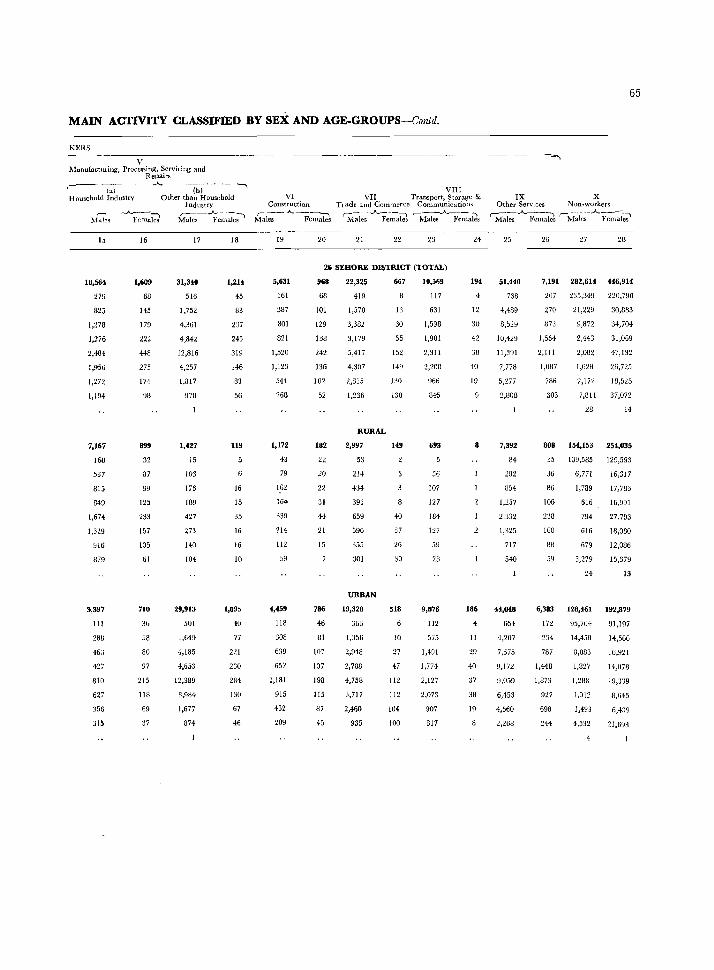
MAIN ACTIVITY CLASSIFffiD BY SEX AND AGE-GROUPS-Conid.
KERS
V .ManufactUling, Processing, Servicing and
Repairs ,------w---- .A.------(b}-------, Household Industry Other than Household
Industry r---..A-~~~ r---".I<-.-.-~)
Mcllcs Females Males Females
15
10,564
279
82:;
1,278
1,276
2,4M
1,956
IP2
1,194
7,167
168
537
815
849
1,674
1,329
916
879
3,397
III
288
46:1
427
810
627
356
JI.
16
1,609
68
145
179
222
448
275
174
98
899
32
87
99
125
233
157
105
61
710
58
80
97
215
118
69
37
17
31,340
516
1,752
4,361
4,842
12,816
4,257
1,317
978
1,427
15
103
176
189
427
273
140
104
29,913
501
1,649
4,185
4,653
12,389
3,984
1,677
874
18
1,214
45
83
237
245
319
146
83
56
119
16
15
35
16
16
10
1,095
40
77
221
230
284
130
67
46
VI COIl!:truction
r---.A_--~ Males Females
19 20
VIII VII Transport, Storage &
Ttade and Cornmen:e CornmunicJ.tioIl~ ,,--- --"----~ r----.A.----------.:\
Males Females Males Females
21 22 23 24
26 SEHORE DISTRICT (TOTAL)
5,631
161
387
801
821
1,520
1,12~
544
268
1,172
43
79
162
164
339
214
112
59
4,459
118
308
639
657
1,181
915
432
209
!Hi8 22,325 667 10,569
68
101
129
138
242
136
102
52
182
22
20
22
31
44
21
15
786
46
81
107
107
198
115
87
45
419
1,570
3,382
3,179
5,417
4,307
2,815
1,236
RURAL
2,997
53
214
434
391
659
590
355
301
URBAN
19,328
366
1,356
2,918
2,788
4,758
3,717
2,460
935
13
30
55
152
149
ISO
130
149
40
37
26
30
518
10
27
47
112
112
104
100
117
631
1,901
2,311
2,200
%6
34>5
693
56
107
127
184
127
59
23
9,876
112
575
1,191
1,771
2,127
2,073
907
817
194
.. 12
30
42
38
40
19
8
186
11
29
40
37
38
19
65
----......
IX X Other Services N ou.workers
r--~-"-----:-. ,-_--_;.._~~~ Males Females Males Females
25
51,440
738
4,489
8,529
10,429
11,391
7,778
5,277
2,808
7,392
84
282
854
1,257
2,332
1,325
717
540
44,048
654
4,207
7,675
V,I72
9,059
6,153
4,560
2,268
26
7,191 282,614 446,914
207 235,349 220,790
270
873
1,554
2,111
1,087
786
303
21,229
9,872
2,443
2,082
1,628
2,172
30,883
34,704
31,069
47,132
26,725
!H,525
7,811 37,072
28 14
808 154,153 254,035
35 139,585 129,593
36 6,771 16,317
86
106
238
160
38
59
[,789
616
794
616
679
3,279
17,783
16,991
27,793
18,080
12,086
15,379
24 13
6,383 128,461 192,879
172
234
787
1,418
1,873
927
698
244
95,76+
14,45R
8,083
1,827
1,288
C012
1,493
4,532
91,197
14,56G
16,921
14,073
19,339
8,645
6,4:19
21,693
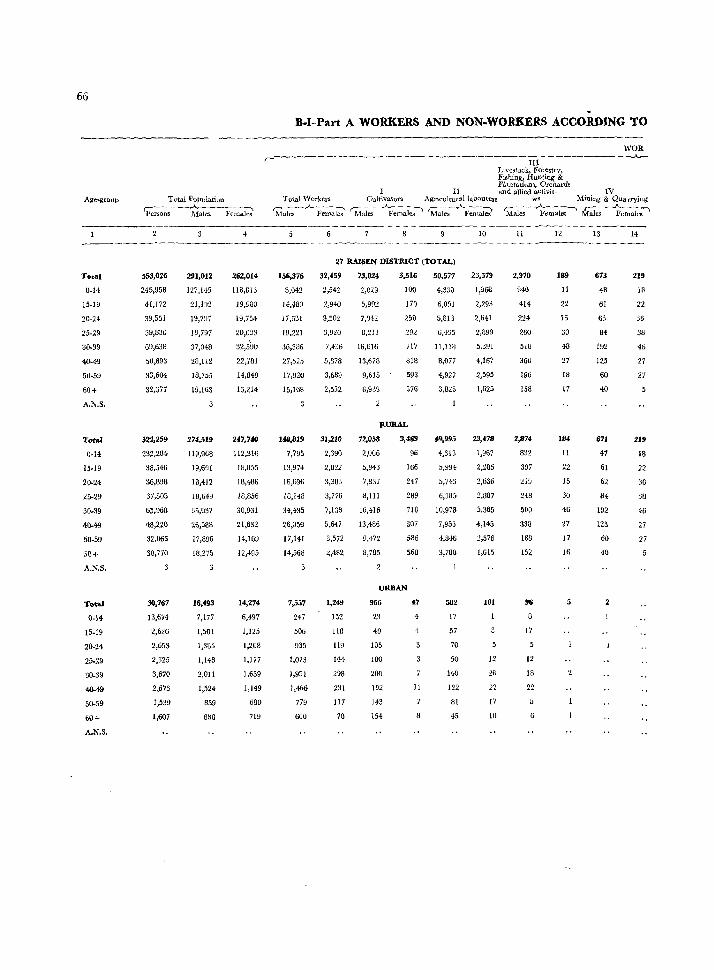
66
Total
0-14
15-19
20-24
25-29
30-39
4(J.49
50-59
60+
A.N.S.
Total
0-14
15·19
20·24
25·29
30.39
40·49
50.59
50+
A.N.S.
Total
0-14
15·19
20-24
25·29
30·39
40-49
50-59
60+
A.N.S.
Total Population
~~alcs Fcmak;
553,026
245,958
41.172
39,551
39,830
69,638
50,893
33,604
32,377
522,25'
232,284
38,546
37,505
65,968
48,220
32,065
30,770
30,767
13,674
2,626
2,653
2,325
3,670
2,673
1,539
1,607
291,012
127,14:;
21,192
19,791
19,797
37,048
28,112
18,755
19,163
274,519
119,968
19,691
18,412
18,649
35,037
26,588
17,896
18,275
16,493
7,177
1,5()1
1,385
1,148
2,011
1,524
859
sas
4
262,014
11B,813
19,980
19,754
20,033 \
32,59U
22,781
14,849
13,214
247,740
112,316
1B,655
18,486
18,856
30,931
21,632
14,169
12,495
14,274
6,497
1,125
1,268
1,177
1,659
1,149
680
719
B.I-Part A WORKERS AND NON.WORKERS ACCORDING TO
III Llvestock~ F01cstry, FIshing, Hunting & Plantations, Orchards
II and allied activit- IV Total \Vorkers
r--A- -----:--, Males Eemalcs
Cultivators Agn('ultural labou1ers ies Mini.ng &. Quarrying:
156,376
8,042
14,480
17,6Jl
19,221
3(i,386
27,525
17,920
15,168
148,81'
7,795
13,974
16,696
18,148
34,435
26,059
17,141
14,568
3
7,557
247
506
935
1,073
1,951
1,406
779
600
~;l~~~~ksl 'M~_"_F~~lei' Mal~~~;~-l~~ ~ks--~-ak;-'
27 II.AISEN DISTRICT (TOTAL)
32,459 73,024
2,542 2,049
2,940 5,992
3,502 7,~42
s,no 8,211
71430 16,616
5,B78 13,678
3,689 9,615
2,5:;2 8,939
3,516
100
170
~50
292
717
818
593
576
llURAL
31,210
2,390
<,822
3,3U3
3,776
7,138
5,647
3,572
2,482
1,249
152
lIB
119
144
298
231
117
70
72,058
2,006
5,943
7,837
B,111
16,416
13,486
9,472
8,785
3,469
96
166
247
289
710
SQ7
586
568
URBAN
966
23
49
105
100
200
192
143
154
47
4
4
l!
8
50,577
4,33Q
6,051
5,813
614~5
11,11U
8,077
4,927
3,82>
49,995
4,313
5,994
5,74:J
6,365
10,978
7,955
4,846
3,780
1
582
17
57
70
50
140
122
Bl
45
10
23,579
1,968
2,293
2,041
2,899
5,~91
4,167
2,595
1,625
23,.78
1,967
2,285
2,636
2,887
4,145
2,578
1,615
101
12
26
22
17
10
11
2,970
840
414
224
260
518
360
196
158
2,874
832
397
219
248
500
338
188
152
96
8
17
12
18
22
12
189
II
22
16
:lO
48
27
IS
17
IB4
11
22
15
30
46
27
17
16
5
13
673
48
61
63
84
192
125
60
40
671
47
61
62
84
In 125
60
40
2
14
2U
18
22
36
38
4t;
27
27
219
18
22
36
38
46
27
27

67
MAIN ACTIVITY CLASSIFIED BY SEX AND AGE-GROUPS-Contd.
KERS
Ma-um~a-c-tu~rm-g-,~Pr-oc-~-s~in-g.~S~er-vi~ci-ng-a-n~d-------------------------------------------------------,
Repairs. r------(-a)----~·----(-b-)----·-,
Household Industry Other than Household
15
6,551
225
556
78S
740
1,539
1,256
829
(i21
5,358
128
419
611
602
1,309
1,043
71B
528
1,193
97
137
174
138
230
213
111
93
16
1,624
172
19U
1%
203
369
266
144
84
1,009
71
102
122
134
244
172
100
04
615
101
88
74
69
125
94-
44
20
Industry
'M~-F-em-~
17
2,189
99
178
274
287
533
383
229
206
1,598
45
143
210
214
:364-
277
176
169
591
54
35
64
73
169
106
53
37
18
287
55
19
35
4()
76
25
21
16
23~
23
19
31
30
71
22
18
14
53
4
VI VII Gonstl'uctloll Trade and Commerce l-~-_A_---~ r--_A._----:-----,
Ma]es FeJIlales Males Females
19 20 21 22
VIII Transport, StotJ.ge &
(~OInmunications r------A.-~ Males Females
23 24
27 RAISEN DISTRICT (TOTAL)
2,862
174
255
4fiO
485
757
423
208
JOO
2,748
171
241
414
471
725
409
200
87
114
14
16
14
32
14
13
973
134
131
152
133
2S5
110
53
25
962
134
131
152
132
231
108
49
25
11
4
4
~,644
58
297
616
617
1,111
875
581
489
RURAL
3,327
43
210
439
419
803
632
433
348
UlUlAN
1,317
15
87
177
198
308
243
148
141
248
4
19
20
57
62
40
39
214
17
20
40
56
37
33
34
17
1,237
7B
190
217
348
267
99
29
1,012
64
149
180
275
232
85
24
225
14
41
37
73
35
14
20
16
4
4
IX Other Services r:-:---_A_~ 1vbles Female>
X Non_workers r---A ---... l\faks l'tlI,ales
25
ll,M9
230
598
1,'264
1,885
3,654
2,081
1,176
761
9,178
207
5G2
9U2
1,434
2.873
1,562
963
655
2,471
23
96
282
451
781
519
213
106
26 27 28
1,804 134,636 229,555
80 !l9,103 116,271
78
157
264
491
373
196
164
6,712
2,166
576
662
587
835
3,995
17,040
16,252
16,113
25.154
16,903
11,160
10,662
1,425 125,700 216,530
66 112,173 109,926
127
~ml
:';1-\1
280
158
141
379
14
15
30
55
III
93
38
23
5,717
1,716
501
602
529
755
3,707
8,936
6,930
995
450
75
60
58
80
2DB
16,033
15,103
15,080
23,793
15,985
10,597
10,013
13,025
6,345
1,007
1,149
1,033
1,361
918
563
649
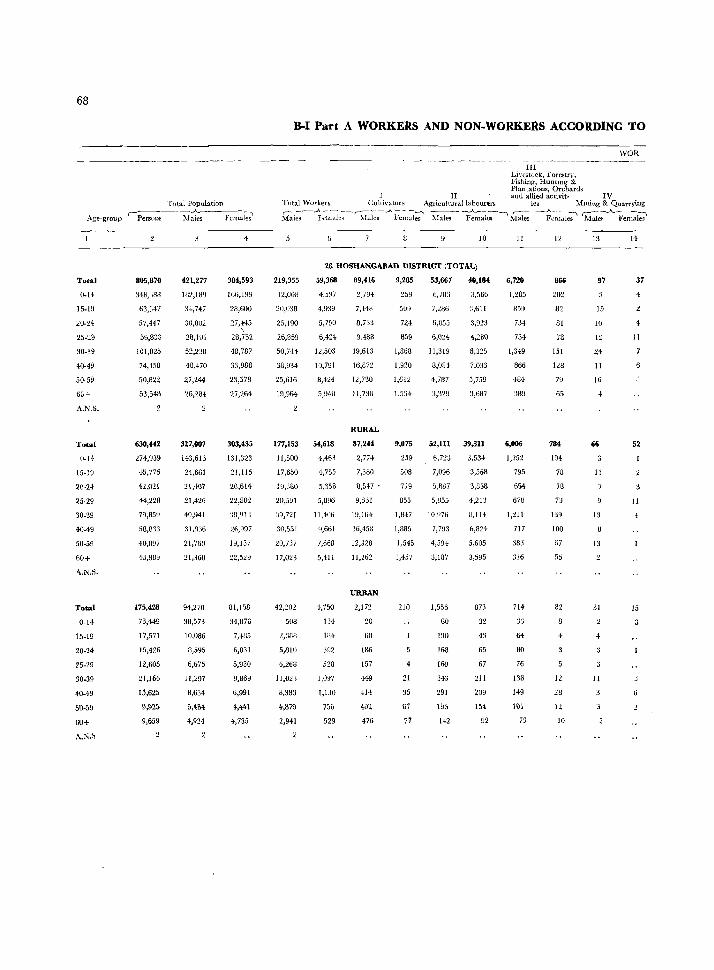
68
D·I Part A WORKERS AND NON.WORKERS ACCORDING TO
WOR --------------------~------- ----------
T()tal Population r-~--~--_.A_----:----l
Age-group Persons Mates Females
Tota1
0.14
2U·24
25·29
30·39
40-49
50·59
6(;+
A.N.&.
Total
0·14
15-19
20·24
25·29
30·39
40-49
50·59
60+
".N.S.
Total
0·14
15·19
20·24
25·29
30-39
40·49
5U·59
60+
A.N.~
805,870
34B,~88
57,447
56,833
101,025
74,458
50,822
53,548
630,H2
274,939
45,776
42,021
H,228
79,859
50,813
40,897
43,889
175,428
73,H9
17,571
15,426
12,605
21,166
15,625
9,925
9,659
421,277
1ll:l,189
:0+,747
30,OU2
28,101
52,238
40,470
27,244
26,284
327,007
H3,616
24,661
21,407
21,426
40,941
:lI,IJ36
21,76f)
21,360
94,270
38,573
10.086
n,595
6,675
11,297
8,634
5,484
4,924
4
384,593
166,19~
2B,600
27,445 '.
28,7'32
48,787
33,988
23,578
27,264
303,435
131,323
21,115
20,614
22,802
'38,910
1fi,997
19,137
22,529
81,158
34,876
7,485
6,1131
5,930
9,869
6,991
4,441
4,735
III Livestock, Forestry, Fi~hing-, HuntIng' & Plantations, Orchards
II and allied activit~ IV Total Woekers Culti.vators Agri.cultural1abour~rs ies Mming & Quarrying
Mal;--~'~I:Je:--~raks-_.A_ilt:~l;:t~ Males -~~~~Mai~ --~~~.tl-;;;' 'M~e:-_A_F~n~l~
10
28 HOSHANGABAD DISTRICT (TOTAL)
219,355
I~,OOU
20,O:m
25,190
26,859
50,744
38,934
25,616
19,%4
59,368
4,5Y7
4,939
5,750
6,424
12,503
10,791
8,424
5,940
177,153 54,618
11,500 4,463
17,650
19,380
20,59]
39,721
30,551
20,7:37
17,023
42,202
508
2,338
5,BlO
6,268
1l,023
8,383
4,a79
2,941
4,755
5,353
5,896
11,406
9,661
7,668
5,.Hl
4,750
134
IU4
392
528
1,097
1,130
75&
529
89,416
1,794
7,H8
8,733
MBB
19,613
16,872
12,730
11,738
RURAL
87,244
2,7H
7,380
8,547 •
9,331
19,164
16,458
12,328
11,262
URBAN
2,172
20
613
186
157
<149
414
402
476
9,285
25~J
50~
nl 859
1,868
1,920
1,612
1,534
53,667
6,7113
7,286
6,055
6,Q24
11,319
3,084
4,787
3,329
40,lM
,;,566
3,611
4,280
8,325
7,033
5,759
3,687
9,075
259
508
719
52,111 39,311
6,n:! 3,53~
855 5,US5
I,un IO,976
1,885 7,793
1,545 4,594
1,457
210
21
35
67
77
3,187
1,556
60
190
168
16~
343
291
1~3
142
3,568
3,8JB
4,213
B,I11
5,605
3,595
873
4:1
65
67
211
209
1,4
92
11
6,720
1,285
859
734
754
1,349
866
484
389
6,006
1,252
795
654
678
I,:!ll
717
383
:l16
714
33
64
80
76
138
149
lQI
73
12
866
<02
81
78
151
128
79
65
784
194
78
78
73
1:19
100
67
55
32
4
12
16
13
97
15
10
12
24
11
16
66
II
13
13
31
11
14
37
4
4
11
52
11
15
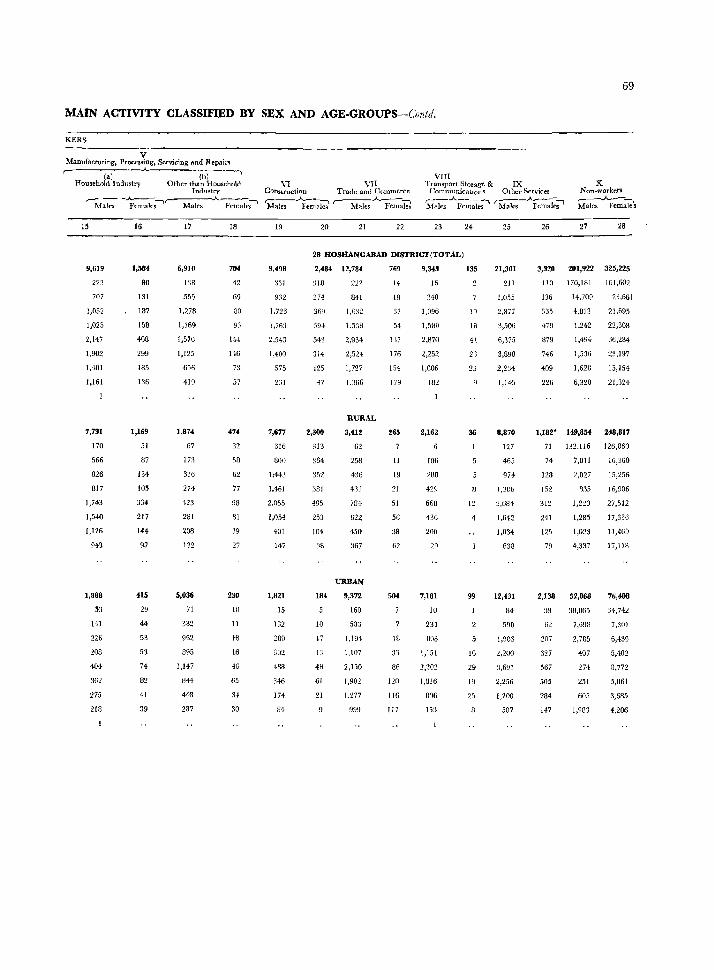
69
MAIN ACTIVITY CLASSIFmD BY SEX AND AGE-GROUPS-Contd.
KERS
V Manufacturing, Processing, Servicing and Repairs
r- Ca).A. (b) Household Industry Other than Household
IoduMry ~ - -.A..---~ J.-. ___ ,
Malt'S Fnnalc!il Males Ferr:ales
15
9,619
223
707
1,052
1,025
2,147
1,902
1,401
1,161
7,731
170
566
826
817
1,743
1,540
1,126
943
1,888
53
141
226
20B
404
~162
275
218
16
1,584
80
131
187
158
408
299
185
136
1,169
51
H7
134
105
334
217
144
!l7
415
29
44
53
53
74
82
41
39
17
6,910
138
555
1,278
1,169
1,570
1,125
656
419
1,874
67
173
316
274
423
281
208
132
5,036
71
382
962
895
1,147
844
418
287
18
704
42
69
80
141
146
73
57
32
SR
62
77
98
81
39
27
230
10
11
18
16
46
65
34
30
VI vn COhstruction Trade and Commerce r---A--:--\ ,--__ A. __ ,
Males Females Males Females
19 20 21 22
VIII Transport Storagf: & IX
Communications Other Services
Males ..A..~;I 'M~Fem.Jes'
23 24 25 26
X Non-workers
,.--....A-----.. Males Females
27 28
28 BOSHANGABAD DISTRICT(TOTAL)
9,498
:131 932
1,723
1,763
2,543
1,400
575
2:11
7,677
316
800
];443
1,461
2,055
1,054
401
147
1,821
15
132
280
302
488
346
174
84
2,484 12,784
:\18
374
369
39,
543
314
125
47
2,300
313
364
352
:181
495
253
104
38
184
10
17
13
48
61
21
222
841
1,632
1,538
2,934
2,524
1,727
1,:166
RURAL
3,412
62
258
438
4:11
784
622
450
367
URBAN
9,372
160
583
1,194
1,107
1,902
1,277
999
769
14
18
37
54
117
176
154
179
265
11
19
21
51
56
38
62
584
18
33
86
120
116
117
9,343
16
340
1,096
1,580
2,870
2,252
1,006
18~
2,162
106
288
429
668
436
200
7,181
lU
231
808
1,151
2,202
1,816
8~6
15:,
135
10
18
4\
23
25
36
I:!
4
99
10
29
19
21,301
211
1,055
2,877
3,506
6,375
3,898
2,234
1,145
8,870
127
465
974
1,30G
2,684-
1,642
1,034
638
12,431
84
590
1,903
2,2(JO
3,691
2,256
1,200
507
3,320 201,922 325,225
110 170,lBl 161,602
136
335
479
879
746
409
226
14,709
4,812
1,242
1,494
1,536
1,623
6,320
23,661
21,695
22,308
36,284
23,197
15,154
21,324
1,182' H9,854 248,817
71 132,Il6 126,860
74 7,OIl 16,360
128 2,027 15,256
1.\2
312
241
125
79
B.15
1,220
1,285
1,023
4,337
2,138 52,068
39
62
327
567
505
284
147
38,065
7,69B
2,785
407
274
251
605
1,983
J6,906
27,512
17,336
11,469
17,118
76,408
34,742
7,:101
6,439
5,402
8,772
5,861
3,685
4,206
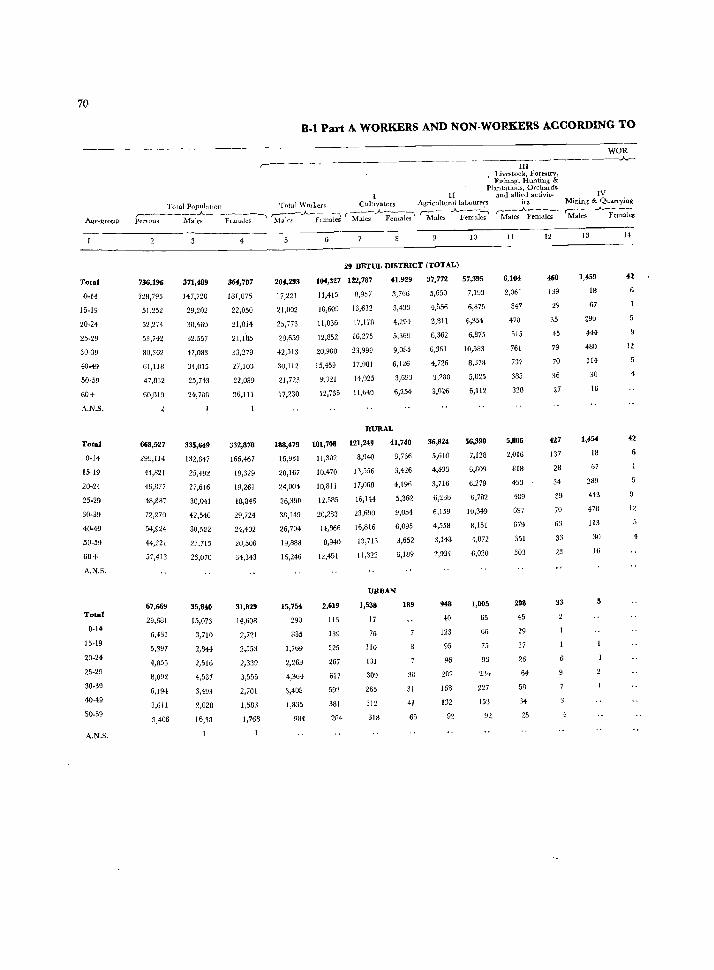
70
Total
0-14
15-19
20-24
25-29
30-39
40-49
50-59
60+
A.N.S.
Total
0-14
15-19
20-24
25-29
30-39
40-49
50-59
60+
A.N.S.
Total
0·14
15-19
20-24
25-29
30·39
40-49
50-59
A.N.S.
B-1 Part A WORKERS AND NON-WORKERS ACCORDING TO
r-'-~---
II
III Livestock, Forestry. lhsrung, Hunting &
Plantations, Orchards and aHied activit~
ies Total Popubtion Tntal \Voll,ers CuhIVators AgriculLurallabourers
P;~;--M-;}~- -F:;;:;s--' 'M;J~~A-i~';a~ r~A~~ r-Mak;-.A.F~~~ r::--A ---Males Females
736,196
3281795
51,252
52,274
53,742
80,362
Gl,ll~
47.832
60,aI9
668,527
299,114
44,821
46,877
48,887
72,270
54,924
44,221
57,413
67,669
29,681
6,431
5,397
4,855
8,092
6,194
3,611
3,406
371,489
147,720
29,202
30,460
32,557
17,083
34,015
25,713
24,703
335,649
132,647
25,492
27,616
30,041
42,546
30,522
23,715
23,070
35,840
15,073
3,710
2,844
2,516
4,537
3,49~
2,028
16,33
I
4
364,707
181,075
22,050
21,814
21,11is
33,279
27,103
22,089
36,111
332,878
166,467
19,329
19,261
18,846
29,724
24,402
20,506
34,343
31,829
14,608
2,721
2,553
2,339
3,555
2,701
1.583
1,768
204,233
17,221
21,002
25,773
~8,659
42,513
30,112
21.723
17,230
188,479
16,931
20,167
24,004
26,390
38,149
26,704
19,888
16,H6
15,734
290
835
1,769
2,269
4,364
3,408
1,835
984
10
29 BETUL DISTRICT (TOTAL)
104,327 122,787 41,929 37,772 57,395
11,415 8,957 3,766 5,650 7,193
10,609 13,632
11,036 17,178
12,852 16,275
20,900
15,459
9,321
12,735
23,999
17,081
14,025
11,640
4,204
5,369
9,084
6,126
6,254
RURAL
101,708
11,302
10,470
10,811
12,585
20,283
14,860
8,940
1~,451
2,619
113
139
225
267
617
593
381
204
121,249
8,940
13,550
17,068
16,144
23,690
16,816
IS,7n
11,322
41,740
3,766
3,426
4,196
5,362
9,051
6,095
3,652
6,Hl9
URBAN
1,538
17
76
110
131
309
265
312
318
189
30
31
41
65
4,556
3,811
6,362
6,$51
4,726
3,2RO
3,026
36,824
5,610
4,433
3,716
6,266
6,159
4,.158
3,148
2,934
948
40
123
95
96
202
168
132
92
6,875
6,354
6,875
10,533
8,378
5,025
6,112
56,390
7,128
6,B09
6,279
6,7B2
10,349
3,151
4,072
6,020
1,005
65
66
75
93
234
227
153
92
II
6,104
2,061
847
470
515
761
737
385
328
5,806
2,016
81B
453
439
697
679
351
303
293
45
29
17
26
64
58
34
25
12
460
139
29
35
45
79
70
36
27
427
137
28
34
39
70
63
33
23
33
IV
WOR .A.-
Mining & Quarrying C---...A------MaId Females
13
1,t59
18
67
290
444
480
114
30
16
1,454
18
67
289
443
478
113
30
16
14
42
12
4
42
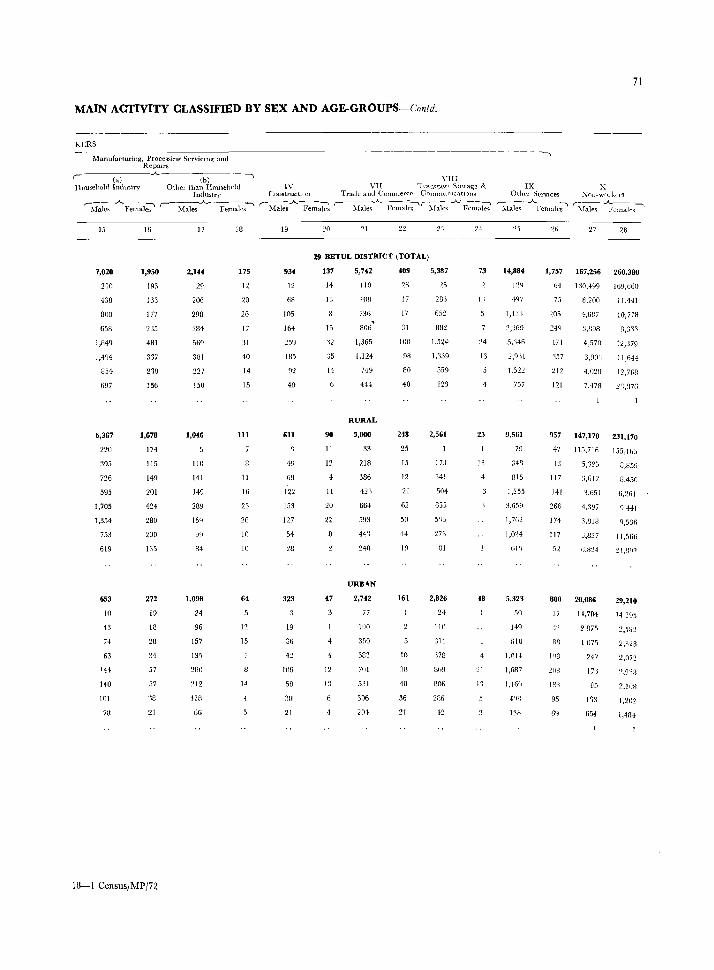
MAIN ACTIVITY CLASSIFIED BY SEX AND AGE-GROUPS-Conld.
Kl:RS
Manufacturing, Processinl? Scrvicm~ and RepaIrs
'----(a-)----A.-----(-b)-- --, YIII
Household Industry Otllel than Household IV VII Tlampml SlOla~e & Industry Constructioll Tl'ade ami COlUlllerce COlmHulllcaholls
r:\Iaks-A. Fem~~ ("-~- -Femal{'s~ r- Male~..A..l;;~-a~ r--~I~~:-A-I"emale~r-~~le~_A._F~_;~
15
7,020
210
438
800
658
1,849
1,4~J4
854
697
6,367
220
395
726
595
1,705
1,354
753
619
653
10
13
7+
63
'41
HO
101
7a
16
1,950
193
133
177
23.1
41J1
337
218
156
1,678
174
115
149
201
424
280
200
135
272
19
18
28
34
57
57
:18
21
HI-l CensusjMPj72
17
2,lH
29
206
298
284
381
227
150
1,046
110
HI
149
289
16q
99
84
1,098
2~
96
157
131J
280
212
12R
66
IS
175
12
20
26
17
31
40
14
15
III
11
16
23
26
10
10
64
12
15
14
19
934
12
68
105
164
259
IB5
92
49
61l
49
69
122
153
127
54
28
323
19
36
42
lOG
58
311
21
21 22
29 BETUL DISTRICT (TOTAL)
137
14
15
'12
35
14
90
II
12
II
20
22
47
4
12
1:1
4
5,742
110
4011
736 , 806
1,365
1.124
749
444
RURAL
3,000
33
218
386
421
664
593
44'(
240
URB\N
2.742
77
190
350
38~,
7111
531
306
20f
409
26
17
17
31
100
98
80
40
248
25
15
12
21
62
50
44
I ~)
161
10
:m
43
36
21
5,387
~~5
2B3
652
832
1.524
1.339
5~9
123
2,561
17J
341
504
655
5'13
273
81
2,826
24
110
311
'\78
Ufi9
006
286
42
73
Ii
24
13
25
48
~I
11
71
IX X Otht'1" Services ~(\n-wOl kCI'J
~...A..I'ernale~ Slale'! ~cmal~~
14,884
447
1,43'\
5,:\46
2/nt
},S2:!
757
9,561
70
3411
815
1.255
1,762
1,024
613
1.014
1,687
4'1f\
1311
27 28
1,757 167,256 260,380
64 130,499 169,660
7}
IH
157
212
121
8,200
4,687
:],898
4,5m
3.90'1
4.020
11.441
10,778
12,:379
11,644
12,760
7,+78 23,376
957 147,170 231,170
47 115,710 155,165
4:1
117
141
266
174
117
52
5,'32:;
::,612
'U1.!)]
4,:197
3.818
800 2fJ,086
17
88
208
12~
95
11,784
2075
107\
24'1
17'1
A;,
1~3
654
8,859
8,450
6,261
9,441
II,,%G
:1 !,(J!)~
29,210
14395
2,llJ2
2,32B
2,072
2m3
2,108
1,202
1,484
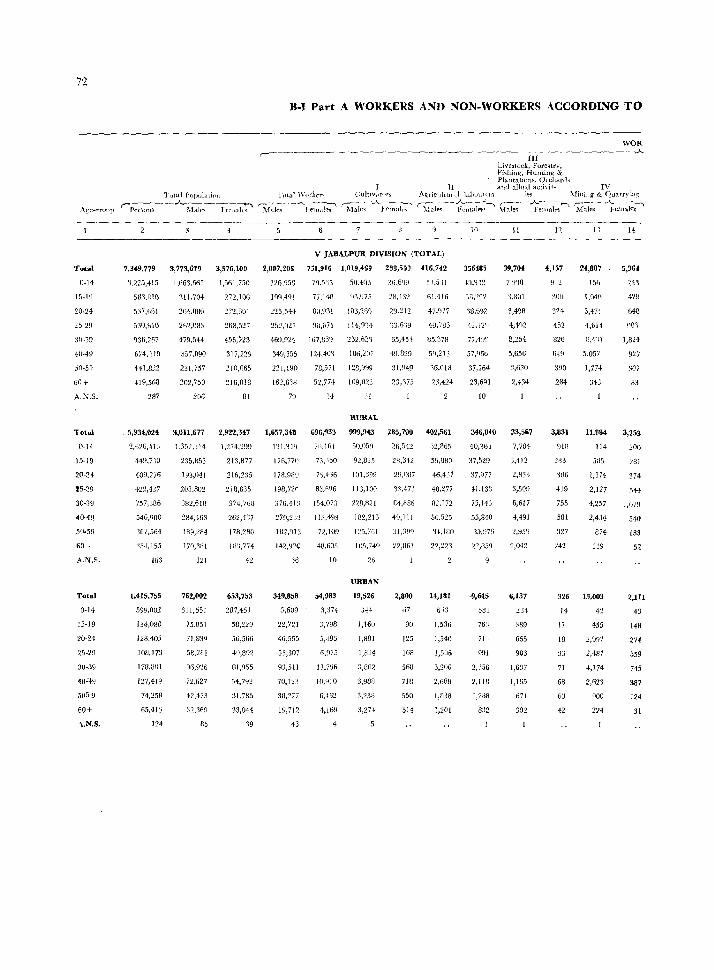
72
B-1 Part A WORKERS AND NON-WORKERS ACCORDING TO
~--------------------------------------
Tutal POpublipn Tlltal '\'()rb.:T~ Culuv,ltors
WOR ------~~..}...
III Livestock, Forefltrv, Fhhin[, Hunting & PlantatIOns. Orchard~
II and alhed acth'it- IV A~rjcIIltIlI'll la}JoulC1S ies ).Iining & Quarry;u~
Ag'~-i!roup ,-~~~-.A...Mrtl~~'lk7'" ~~k,;--A-lie~,J~ ~ie~ -.A.J.:-~~l-('~ ~-- ---A-~', ~--.A.---~. r-----'--- --~ 1.Ia1f',\ Fcmajps' M"de~ Femal('!> Males Females
Total
n~14
10-19
20-24
25~29
3D~39
40-49
50-5'
60+
A,N.S.
Total
O~14
15~19
20~24
25-29
30-39
40-49
50-59
60+
A.N.S.
Total
0-14
15-19
20-24
25-29
30-39
5059
"0+
A,N.S.
4 10 II
V JABALPUR DIVISION (TOTAL)
7,349,779 3,773,679 3,576,100 2,007,205 751,916 1,019,469 2BB,5~O 416,742 356485 39,704
'3,2:;5,415 1,1163/165 1,5fil,750 1:l6,95S 7Q,Yi5 50.403 ~6,6(_)9 53,531 i:;),lJ~~ 79'lfl
53'l.810 311,704 272,106 199.491 77,148 Q3m" "H.{:12 61.416 ~3,~"~ 'I,Rn!
537,681 264-.rmO ~7'!,flOl ~'.!5J;l44 SU,931 I03/1BD 29,'212 47/)77 ')8,692 3,4c)S
5:10,010 201,083 268.527 25,,027 91l,67l 114,91'1 13,6'19 19,783 42.12'1 4,102
936.207 47~,544 456,723 469.921 167.869 232,6~1 65,45~j 85,378 77.4~1' 8,254
674.119 357.090 317,229 349,355 IHAD1 186,201 49.829 5Q,21'J 57,'166 5,656
441,8~2 231,757 210,065 221,190 78,571 I 28,'IQ9 31,%9 16,018 37,264 3,630
419,568 202 1750 :1]6,818 162,6SR 5~,77+ 109,023 23,'175 23,424 23,6(11 2,434
287 206 81 79 14 :l!
RURAL
5,934,024 3,1111,677 2,922,347 1,657,348 696,933 999,943 285,700 492,561
2,W6,413 1,3;)2, 114 1,~74,29~ 12 t;:W) 7F;,J61 50.05~ 26,51::! :)2,36;;'
449,710 235,P'53 2l3,877 176.77)) i.l,l50 92.815 28,342 59,880
1{)9,276 193,041 216,235 178.989 75.4>6 101,399 211,087 46,4]7
422,437 203,802 2 i 8,635 198,72(1 83,096 113, I on 3:'.471 48,277
757,386 382,618 374,768 376,41:1 154.073 228,>321 (4,886 82.172
54G,QOO ~84,463 262,4'37 279,231 113,493 182,213 49,111 56,525
167,SG4 189,284 178,280 182,913 72,lC)9 125.761 '31,:199 ',4,180
<35+,155 17n,3H I 111'1,774 142,92( 48,605 J 1l5, 74~1 22,B(j I 22,223
103
1,41:;,755
599,002
134,080
1~8.405
108,17:1
178,BIII
127,419
74,258
65,413
124
121
762,002
311,551
75.851
71,839
58.281
Y6,92G
n,527
42,473
32,369
85
42
653,753
287,451
58,229
56,566
4Y,892
HI ,055
5+,7q~
:H,785
33,044
'19
:l5
349,858
5,609
22,721
46,555
53,307
9:1,511
38,~77
19,712
13
10 26
URBAN
54,983 19,526
3,374 3+4
3,798 1,160
5,+95 1,881
6,975 1,834
13,790 :i,802
lO,91O 3.988
6,452 3,238
1,169 3,27+
2,800
90
125
168
568
718
550
511
14,181
1,536
1,540
1,506
3,206
2,688
1,838
1,201
10
346,840 33,567
40,361 7,704
37,529 3,412
37,977 2.813
41.138 3,509
75,143 6,617
!j5.843 4,491
35,970 2,95')
~~,8.'/) 2,042
-9.645
581
763
71,
991
2,356
2,118
1,288
832
6,137
389
665
933
1,637
1,165
671
392
11
4,157 24,8B7
9lL 156
:Ion 1,()4()
324 3,+71
452 1,614
826 8,1~1
649 5,057
390 1,774
284 34:)
3,831
918
755
581
327
142
11,884
114
5115
1,174
2,127
4,257
2,434
874
119
326 13,003
14 42
17 455
18 2,097
33 2,487
71 4,174
68 2,621
63 900
42 224
14
5,36(
241
42~l
648
~lO'\
1,824
927
307
83
3,253
281
374
,IH
1,079
5,10
183
52
2,111
43
HS
274
359
745
387
124
31
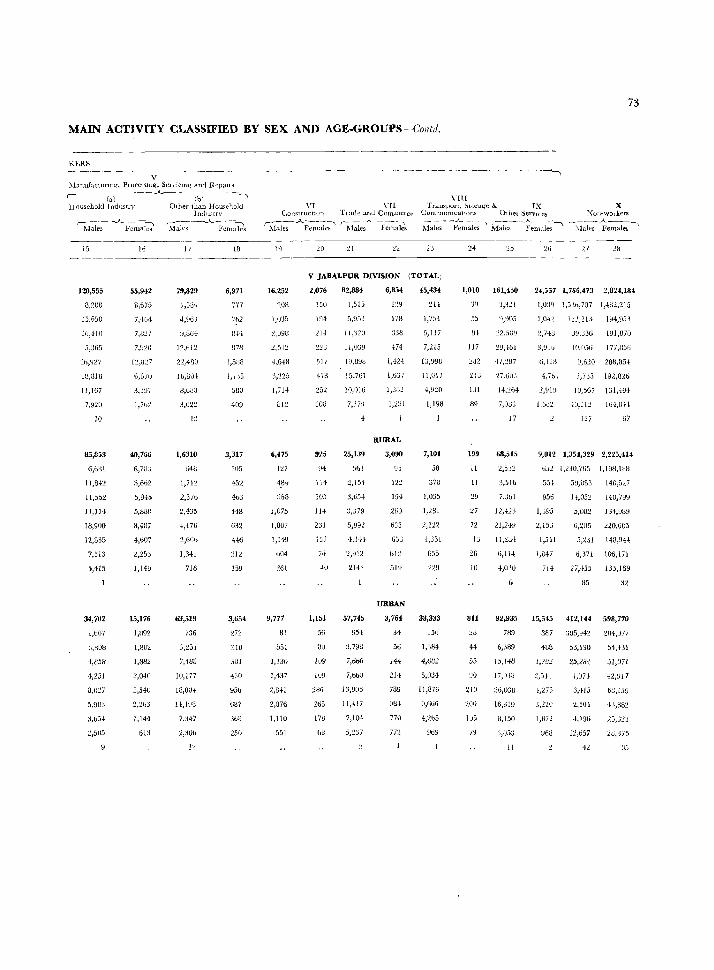
73
MAIN ACTIVITY CLASSIFIED BY SEX AND AGE-GROUPS--Coiltd.
V :\!;lnu[aciunng, PTOCb<;lJlg, Selvicmg and Repalls
---..,...._-- (b\------ -_,
Otl-Ler tha;' Household ]ndustrv
(,) 11ousehold Industry
IS
120,555
8,288
15,6:)0
16,410
15,%5
18,B18
11,167
7,92U
10
85,853
6,G!!1
1 ),842
ll,552
11,1]4
18,900
12,83;;
7,513
5,415
34,702
1,607
:1,808
4,858
1,251
3,():!i
5,983
3,634
:!,505
16
55,942
8,675
7,464
7,827
7,1)20
6,871)
3.3U7
1,70:1
40,766
6,7UJ
5,662
5,045
5,880
8,487
4,607
2,253
I,WI
15,176
I,B92
1,802
1,882
2,040
:J j 54U
2,2b3
1,144
613
'Males ---_"_-i~n~le's
11
79,829
1,JlH
4,96J
9,864
12,612
22,4BO
Iv,30l
8,688
3,022
12
1,6310
648
1,712
2,376
2,435
4,476
2,606
1,341
716
63,519
736
3,231
7,488
10,177
18,004
1~,198
7,3~7
18
6,971
7i7
762
UH
8713
1,5lJ8
l,l'!3
580
409
3,317
505
463
118
632
446
212
15~
3,654
~72
310
381
430
956
6tl7
368
250
Hll VI \"II Trallsport, ~tol'al!e & IX X
ConStructIOn '1'1 ade and Commerce CUrmUllrllCattoos Olhel Servl( .. es ~(ln~wotkers r--.... '---~ f---_A__--~
Males Fernale5 Males Ferna1es ~1a~s--~~I;~' Male;-~e;.11:S~ I~~~~emal~---'
19 2[) 21 22 23 27 28
V JABALPUR DIVISION (TOTAL;
16,252
2U8
1,W~
~,lI9IJ
i,Gitl
~),225
C7H
812
6,475
In
484
1,075
1,807
1,149
u04
2Gl
9,777
81
551
1,130
1,137
2,841
2,076
1,110
5,)1
2,076
15tl
194
214
517
418
252
108
925
94
114
105
114
231
15~
7+
+0
1,151
56
8U
lUg
lU9
286
263
178
u8
82,884
1,515
5,951
1 J,'J2U
11,039
1~.8913
15,761
10,016
7,37!1
2..~,139
~)6l
2,154
3,654
:;,37.9
5,992
4,3H
~,912
2142
57,745
J,79B
7,6fJ6
7,b60
13,906
11,417
7,104
6,854
1~9
1IH
:.l:38
474
1,424
1,637
1,J32
RURAL
3,O~O
!J5
12~
194
260
635
6:JJ
612
519
URBAN
3,764
:>4
56
144
214
789
98-1
770
7n
45,434
~14
1,754
5,117
7,:215
13,998
11,017
4,920
1,198
7,101
58
370
1,035
1,281
2,122
1,3::'1
65~
38,333
156
1;184
4,082
5,934
11,876
1,010 161,430
55 ':),905
84 ~2,5WJ
117 29,161
2t1:! 47,287
131 14,264
89 7,Odo
199
11
17
68,515
11 ::i,5Ib
29 7,:';bl
V 12,;20
72 21,248
U 11,284
26 G,l14
10 4,030
24,557 1,766,473 2,824,184
I,O:Jq 1,5..$0,707 1,48l,Zt5
1,042 111,2H 1~4,953
:!,7-tS 39,'336 191,870
:~,!J.jb ]0,056 177,850
ti,4~1{ U,5:!O 288,854
4,7bl J,n5 192,826
2,~1~) 10,567 131,iU4
1,632 40,112 164,OH
IV 67
9,012 1,354,329 2,225,414
6jL 1,230,765 1, 191J,WI!
554 5::t,083 i 4t),5~ 7
956 14,052 I {O, 79V
l,J95 5,082 J 34,989
2,153 6,205 220,603
1,541 5,LH 148,944
1,04) 6,371 106,171
714 27,-155 135,169
85 3'2
811 92,935 15,545 412,144 598,770
28
44
55
~o
210
l0U
105
789 387 :i05,~4t! '2114,077
6,3~9 438 53,130 54,4:1I
15,1-18 1,792 25,28+ 51,071
17,1))8 2,3H ·l,~n "-12,917
2o,OJti .f,DS 3,413 68,159
16,31B J,'220 :l,50-l- 4J.,B82
<5,150 l,e72 -t,196 2j,J23
:3,05:.1 ~61J 11,657 :W,875
II
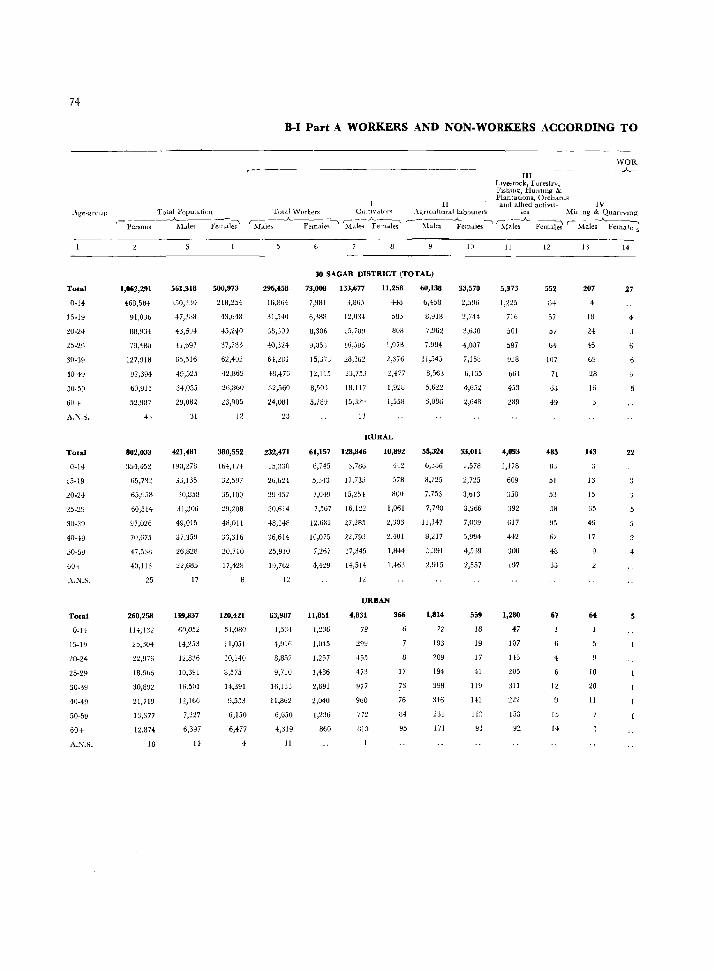
74
.\ge-group
Total
0·14
15·19
20·H
l5·l~)
30-'39
40·49
50·59
60+
A.N.S.
Total
0·14
15·19
20·24
:10·39
40"19
'}0-59
(>0+
.\.N.S.
Total
0·14
15·19
20·24
25·29
30.39
40·49
50-59
60+
A.N.S.
B-1 Part A WORKERS AND NON-WORKERS ACCORDING TO
WOR ,-----~
III -~-----A--
Total Population -------~---~
f PersolL': ~1.ates Fem.lles
1,062,291
468,58-1
91,OJ6
1111,9:1+
79,4~O
127,918
!.J2,391·
60,915
.>2,987
43
802,033
354,452
65,7'32
65,Y5H
60,514
97,026
70,675
47,53U
40,113
25
260,258
11+,1:12
22,976
18,%6
30,8V2
21,719
13,377
12,874
18
561,318
250,3:m
47,3~8
43,6Y-I
H,697
65,516
49,525
34,055
29,082
31
421,481
1~(),27B
33,135
30,858
31,306
49,015
37,359
26,828
22,685
17
139,837
60,052
14,253
12,836
10,391
16,501
12,lb6
7,227
6,397
14
500,973
:!lH,254
43,648
45,2*0
37,733
62,4U2
42,869
26,800
23J 905
12
380,552
164,174
32,5!J7
35,100
:!9,208
48,011
33,316
20,710
17,428
120,421
54,U80
11,051
10,140
8,575
14,391
9,553
6,150
6,477
4
I Total \Vorkers CultIv,itor'i
Ll\'e~tock, ForesLry, F1Shtlls", Huntmg & Plantations, Orcharus
II and alhed actiVl1-.\grtr:ultural laboUlel'S ies
IV
~W~-.A- Fernal~~ k(,Je-:~~-::i~ ,.--~1.1-1es -~cm<.des ~ S;l~_A_ Milllng & Quarrymg
-~::-I r---...A.---~ Fem..lles Males Female s
296,458
lti,Hti4
31,540
40,324
6-1,281
48,476
32,560
24,081
23
232,471
15,:nu
26,624
2U 457
48,148
36,614
25,910
19,762
12
63,987
1,534
4,916
8,852
9,710
16,133
11,86,
6,650
4,319
II
30 SAGAR DISTRICT (TOTAL)
73,008 133,677
7,481
ti,3HH
.1,865
12,O:H
8,306 15,7l)~}
9,OS'j iti,Y[}5
15,J 7 J 28,262
12,115 23,733
8,50J H:l,117
5,2(1)
11,258
448
583
8U8
1,078
2,376
2,-177
1,928
RURAL
61,157 128,846
6,745 3,7H6
5,,'13 11,735
7,049 15,254
7,567 16,122
12,682 27,485
10,075 22,793
7,267
4,429
17,345
14,514
12
10,892
578
SUli
1,061
2,303
2,401
1,844
I ,41:i~1
URBAN
11,851
1,236
1,045
1,257
1,486
2,691
2,040
1,236
8GO
4,831
79
299
455
473
977
960
772
1115
366
17
73
76
114
95
60,138
6,'158
8,918
7,962
7,984
11,54:;
3,563
5,6:!2
:.l,OIJ6
58,324
o,J86
8,725
7,753
7,790
11,147
8,~17
5,:191
2J 915
1,814
72
193
209
194
398
346
231
171
10
33,570
:'::,596
:?,744
3,630
4,007
7,15~
6,1:35
4,652
2,648
33,011
2,578
2,725
3,bl3
3,!J66
7,0:';9
5,994
4,539
2,557
5,9
18
19
17
41
119
141
11:1
91
II
5,373
1,225
716
501
597
9~8
064
453
;l89
4,093
1,178
609
J58
392
617
442
300
197
1,280
47
107
l-l3
205
311
92
12
552
U4
57
57
6{
107
71
oj 49
485
ILl
51
53
58
95
35
67
6
4
15
1+
13
207
18
24
45
28
16
143
I:l
15
35
49
17
64
10
20
11
27
22
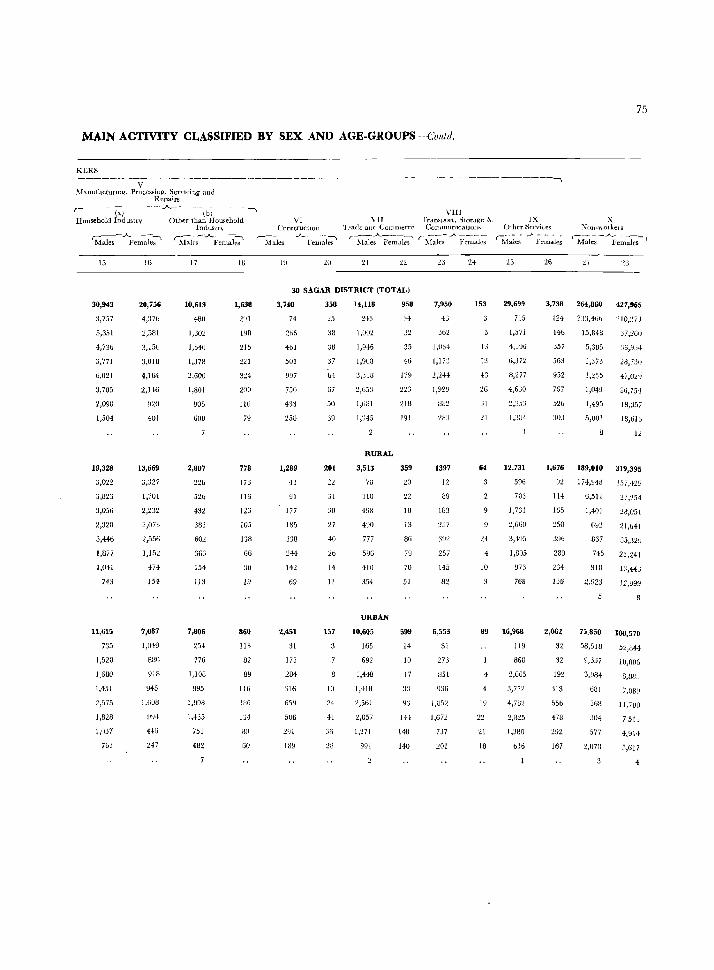
75
MAIN ACTIVITY CLASSIFIED BY SEX AND AGE-GROUPS ---Collid.
KERS
V Afanufactuflug, Processing, Servicing and
Repairs ,-----(a-) ---- .A_--- - (1;;-- -- ------Household Induf,try Other than Household VI
Induscry C('nstTuctLOll
I\fales --Ai--;l;-;Ie~ ~lah:~-""'_Fe~~~ r-~~e~ _A_·F;~;;l~
1:> 16 17 IH 19 20
.. ------ _._--------------\
VIII YII Trd.n!>port, Storage & 1 X X
'Ira(le and COIIIUH:!'rce CunlnlUDlCaLlOw. Other Serviu:~s XOI1-'\OlkcIS
r-Ma1e:-Fem~~ r Ma"k:- .A-f~;:i;-' ~\fak~--" l;-e:ale; '1fui~ -~m~ks- 1
21 22 24 27
30 SAGAR DISTRICT (TOTAL)
30,943
'J,757
5,3.11
4,736
3,771
6,021
3,705
2,098
1,504
19,328
3,056
2,:120
3,446
1,877
1,041
743
11,61.
735
1,528
I,GUO
1,-151
2,575
1,828
1,057
7bJ
20,756
4,~76
:2,581
3,150
3,OJ8
4,164
2,146
401
13,669
1,701
2,073
2,556
1,152
474
154
7,087
1,049
918
945
L60B
4-16
247
10,613
480
1,302
1,540
1):378
2,600
1,80J
Y05
GOO
2,807
52f:J
602
366
J54
lJ8
7,806
776
J,JOU
995
J,998
J,'135
751
482
1,638
2~J
J98
215
221
324
200
110
79
778
17B
116
126
105
138
66
~iU
860
113
82
89
116
1IJ6
1:H
80
60
3,740
7!
:.!bfi
{tiJ
50J
997
750
433
258
1,289
,13
91
177
338
244
142
Ij9
2,451
31
175
284
:116
6')9
506
189
358
25
38
:.lB
37
64
67
50
39
201
:..i1
:';0
27
40
26
14
11
]()
24
4J
36
:W
14,118
2-13
1,UU2
1,9'l6
J,9U8
3,:338
:1,653
1,OBI
1,:345
RURAL
3,513
78
310
490
777
596
41D
354
URBAN
10,6Q5
165
692
J,448
1,+lU
2,561
2,057
1,271
991
958
H
35
46
179
223
218
191
359
20
22
IB
13
86
79
70
51
599
14
10
J7
JH
148
140
7,950
43
362
1,034
1,17:3
:!.244
1,92~
BS:!
1397
12
89
257
145
82
6,553
31
273
851
1,CJ52
1,672
737
:!Ol
153
13
13
43
Ll
64
10
29,699
715
1,571
4,3!J6
6,312
3,277
4,630
:!,:i53
1,3134
12,731
596
703
1,731
2,660
1,805
!.I73
768
89 16,968
119
8G8
2,665
4
19
21
18
:~, 712
4,782
2,825
1,380
bJ6
3,738 264,860 427,965
12<1 2:1:;,466 210,27 J
J46 15,848 J7,26U
357
563
952
767
526
3lU
5,385
1,373
1,235
1,04!J
1,495
5,U01
~:(j,93+
:'W,730
47,029
3U,754
18,357
18,610
12
1,676 189,010 319,395
n 174,9,18 157,429
114
lu5
250
289
136
2,Q6Z
32
32
192
:;J3
55b
478
292
167
6,511
1,401
867
745
9111
2,92:3
27,154-
28,05l
2J,641
J3,32U
23,24J
J3,44J
12,~9~
7.,850 108,570
58,511J 52,844
9,337
3,984
681
368
.lO4
577
2,U7[1
10,006
8,1111.;
7,OB~
J 1,700
75lJ
4,914
\617
4
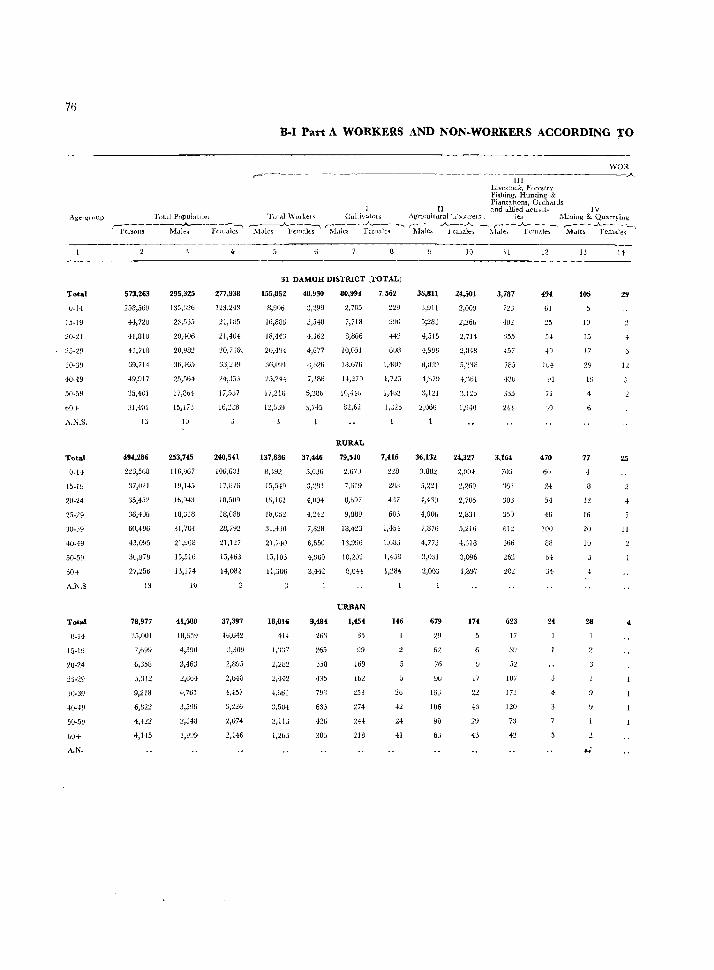
76
Total
0-11
15-1~
20-24
25<!9
50-5~}
bO+
A.K.S.
Total
0-14
15-l9
20-24
25-29
~1J-j9
40-49
50-59
60+
A.NoS
Total
0-14
l5·19
20-24
:HJ-39
40-49
50-59
bO+
A.N.
Total PopulatilJu r---~-----"""__------...
llcrsons Males Females
573,263
25B,569
44,72U
41,81O
41,7l8
69,7l4
-1-9,917
J5,40l
31,-101
13
494,286
223,568
37,021
35,452
36,406
60,406
43,095
30,!)7~
27,256
13
78,977
35,001
5,312
9,2[8
6,(122
4A:!2
4,145
295,325
135,J:lb
23,535
20,406
20,982
36,465
25,564
17,Db'}
15,l73
10
253,745
1[6,%7
19,).!5
Ib,g .. n
18,:;18
31,70{
21,968
15,516
13,174
10
41,580
4,390
+,761
a,5~6
277,938
]23,243
24-,J53
17,5J7
240,541
]06,601
]7,876
18,5U9
18,088
28,792
21,127
15,463
14,032
37,397
]6,(;42
:';,309
B.I Part A WORKERS AND NON.WORKERS ACCORDING TO
lJ[ Livestock, Forestry J:iishing, Hunting & PlantatIOns, Orchards
II und allied aC'tli/lt- IV
WOR A
Tot<tl \VOll..et<; Cultivatols Agnc.:ulturalla.bomcls, ies Mming & Quarryiw;
~14lc~ A1'cmak;' 'iY~~k;-" ~ia-l:S--~~clJla~- --:\f:i~~~;dtes--' ~f~;-AF-;~ak .. -~'
31 DAMOH DISTRICT (TOTAL)
155,852
fl,!JOti
16,886
]8,443
20,194-
36,09]
25.24-}
17,2Hi
137,836
8,49~
]5,519
16,le]
18,U5~
31,4JO
21,HIJ
15,]03
11,306
18,016
414
'1,b6]
40,930
J,299
3,548
4,:;62
4,677
D,b26
3,7-13
3,036
4,004
4,24~
7,8:!B
6,650
4,~tjO
3,H2
3,484
263
265
358
435
7911
636
426
303
80,99!
2,705
7,718
8,866
10,05]
l8.b70
10,H0
B:!,62
RURAL
79,540
2,670
7,619
U,h97
9,889
18,423
13,996
10,202
8,OH
URBAN
1,454
3.>
~9
169
Ib:!
253
274
244
218
7,562
220
442
GOB
1,41:1)
1.725
i,4u:.!
7,416
2U1l
437
603
1,151
1,683
146
42
24
41
36,811
3,911
S;::WJ
4,515
'},996
8,039
4,U)!)
::',121
36,132
3.882
5}2:!1
1,4:J9
4,906
7,876
4,?iJ
3,OJl
2,OOJ
679
29
62
76
90
16J
106
gO
63
]0
24,501
2,OOU
+,'\61
24,327
2,004
2,260
2,705
2,801
5,216
'I,JI8
3,096
I,B~7
174
17
22
43
29
43
]]
3,787
i2J
402
:355
457
785
:JOJ
350
61~
366
26:1
623
]7
52
lU7
17:1
120
7:3
41
12
494
0]
54
lu4
470
6U
24
51
40
100
83
b';
24
4
105
1O
15
17
29
l~
4
77
.;
]6
20
]0
28
29
12
Z5
11
4
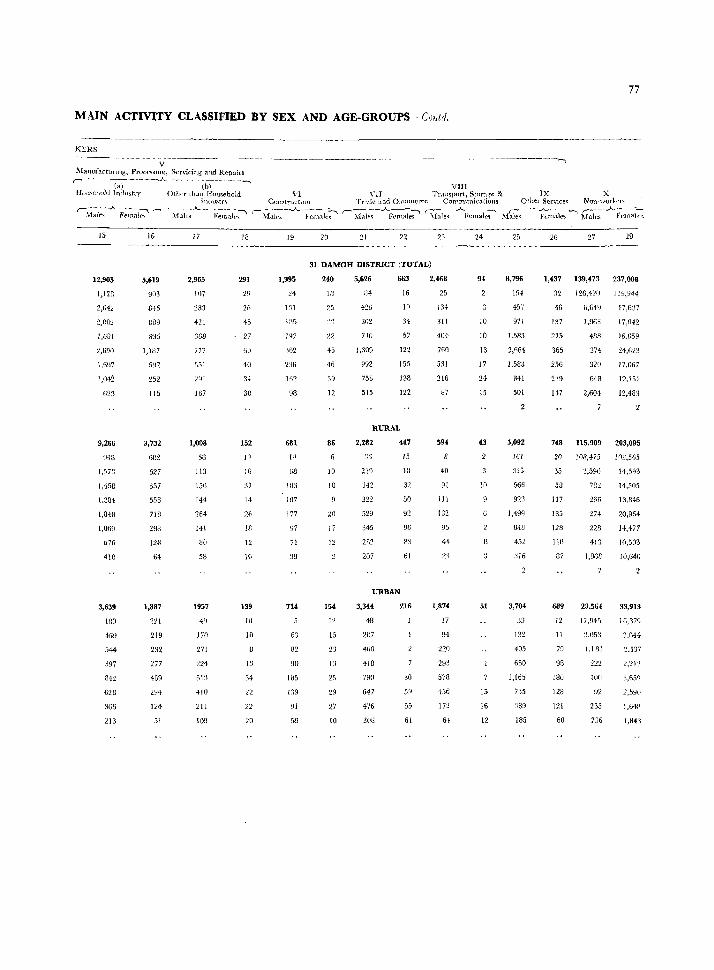
77
MAIN ACTIVlTY CLASSIFIED BY SEX AND AGE·GROUPS-Contd.
KERS
V ~Ianu[actlJrlng, Proce'>Slng, Servicing and Repairs r----W-~--J-..----(b-)-- -- -, VIII
Hou<;chold InJru,try Other th<tll HOl~sehold VI VII Tran5port, StofCl.!::'e & IX X Illllustrv CfJllMructlnn Tr Ide and Commerce Communications Othel" Set'1,'LceS Nan~wQder<>
r-Afnk;..A. Femal;:' '--M~~:_A_ - -i~~~I~;" f:\lcll~--...A-·fu~-'~--" r-~~I('~·-..A..r::-male-;' '\Inle,,-~i"emalc~'" M~;--:;~a]e<; ~ Males ,.A..Fe~;~
15
12,905
1,128
2,042
1,681
2,690
1,647
1,042
623
9,266
1,57::3
1,158
1.28'1
1,848
1,06'1
67"
410
3,639
180
469
544
397
842
628
366
213
16
5,619
9(o3
846
389
835
1,187
592
252
115
3,732
68:2
627
657
558
718
298
128
£4
1,887
2:21
219
232
277
469
294
124
51
17
2,965
107
283
421
369
177
551
291
167
1,008
58
113
150
144
264
141
80
58
1957
170
271
224
51:1
410
211
109
18
291
29
26
45
27
51)
40
34
30
152
lq
16
37
14
26
18
12
10
139
10
10
13
34
~2
22
20
19
1,395
24
nl
IB5
1Y7
'\62
236
J62
9S
681
1'1
68
103
!O7
177
97
71
39
7H
63
82
90
185
n9 91
59
20 21 22 23
31 DAMOH DISTRICT (TOTAL)
240
III
25
22
45
46
39
12
86
10
10
17
12
154
12
5,626
114
426
802
710
1,309
992
758
515
663
16
10
34
57
122
155
138
122
RURAL
2,282
.36
342
322
529
345
207
447
15
18
32
50
92
96
WI
61
URBAN
3,344
4IJ
207
4(10
418
780
647
476
308
216
30
59
55
61
2,468
25
134
311
40.1
760
531
216
87
S94
40
91
III
132
95
H
2'\
1,874
17
94
220
293
578
436
172
24
94
10
10
13
17
24
15
43
to
51
15
16
12
25
8,796
194
457
971
1,583
2,661
1,583
341
501
5,092
161
566
92:1
1,499
MU
452
:JlG
3,704
,1:1
132
405
660
1,165
735
389
185
26 27 28
1,437 139,473 237,008
:12 126,420 119,944
46 6,649 17,637
137
215
365
256
219
117
1,903
4RB
374
320
648
2,601
7
17,042
16,059
24,"23
17,OS7
12,151
12,48~
748 115,909 203,095
35
58
117
18;;
128
IW
87
689
12
11
79
98
180
128
121
60
3,596
782
266
274
228
413
1,868
23,S64
17,945
1,181
100
92
235
736
1(18.565
14,5~3
14,505
13,846
20,964
1+,477
10,503
10,640
33,913
16,379
'),D44
'~,537
2,213
:1,659
2,.1)90
1,64[1
1,84:1
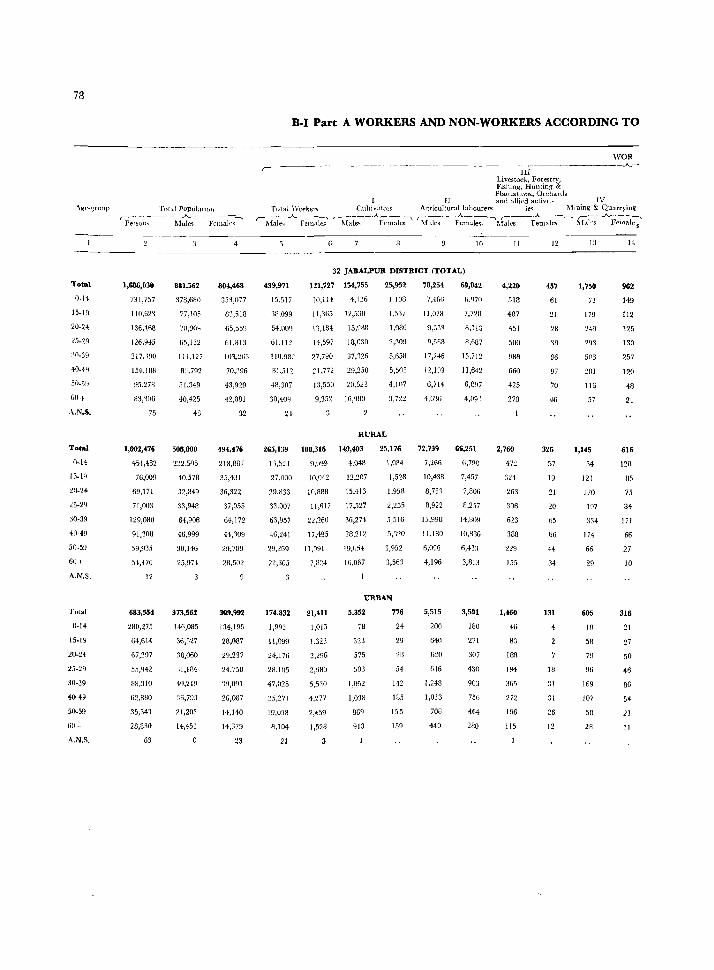
78
\gt"~'~T(JllP Total POPUlatlOH
Total
0-14
15-19
20-24
25-29
'Hl-39
40-4Q
50-5~
60+
A.N.S.
Total
0-14
15-lq
2fl..24
25·2'1
30-39
+0-49
50-59
60+
A.N.S.
TOlal
0-14
15·19
20-24
25-29
30-39
40..49
~59
60+
A.N.S.
,---- --- - ...A..-- _ _---., Pen.on" Male'l Female,>
1,686,030
731,757
140,02'1
136,408
126,9{5
217.190
154,188
95,278
83,306
75
1,002,476
451,482
76.009
69,171
71,003
129,080
91)3f)S
59,9:3.1}
54,476
12
683,554
280,275
64,614
67,297
5."Q42
88,310
62,880
35,343
28,830
63
881,562
378,680
77,105
)1l,9OY
65,132
111.127
51.349
40,425
43
508,000
232,5c)5
40.578
32,849
33,948
64,90B
46,999
30,146
25,974
373,562
146,085
36,527
:18,060
'\1,184
49,219
36,793
21,203
14,451
o
804,468
353,077
m,518
65,55!J
61,813
10\263
70,396
43,929
42,881
32
494,476
213,88)
35,.131
36,322
37,055
64,172
44,109
29,709
28,502
309,992
134,190
28,087
29.237
24,758
'jQ,091
26,087
14,110
14,379
23
D-I Part A WORKERS AND NON-WORKERS ACCORDING TO
r-~----~~. ~-- .~-~
WOR ~------..A....-
III Livestock, Forestry, Flshmg, Hunting & Plantations,Orcllanls
II and aliif'd aclivll- IV Tot:\} Worker,> Cultivatms A~ricultural labourers ie" AJining & Qllarryin~
r- - _A_ ---.., ,--___ ...A.. ___ --..-..., ,..--_----------A.... __ --., ,-__ ...A.. ___ _", ,..--.A_ ___ -,. !\iaie'i Females Male.;; Females Males Female~, Males Female~ :-'Ialf's FelOales
439,971
15,517
38,099
54,nUQ
61.112
111l,982
31,512
48,307
30,40Q
32 JABALPUR DISTRICT (TOTAL)
121,727 154,755
10,114 4,126
11,365 12,530
l'l,IB4 15,988
14,597 18,030
27,790 37,326
:?J ,772 29,250
13,550 20,523
9,352 IG,0f10
25,9!,,»2
I lOB
1.5.17
1,986
2,309
5,658
5,505
4,107
3,7:!2
RURAL
78,254
7,4(11)
11,078
9,568
17,246
12,Ef3
6,714
4,616
69,842
fi.'l70
7,728
8,113
8,687
15,712
11,642
6,897
4,091
265,139 100,316 149,403 25,176 72,739 65,251
1'\,524 '1,099 ';,048 1,084 7,266 6,790
27,000 10,0<12 12,207 1,528 10,438 7,457
29,833 1O,88B 15,413 1,958 B,731 7,806
33,007 11,~17 17,527 2,255 8,922 8,257
63,957 22,260 36,274 5,516 15,998 14,309
46,241 17.495 28,212 .0,'120 11,180 10,886
29,269 11,091 EI,hot 3,952 6,006 6,43:1
22,305 7,024 16,067 3,563 4,196 3,813
174,832
1,993
11,099
24,176
28,105
47,025
:1.\,271
19,038
8,104
21
21,411
1,013
1,323
2,2%
2,980
5,5:10
4,277
2,.59
1,528
3
URBAN
5,352
78
323
575
503
1,052
1,038
869
913
776
24-
29
28
54
142
185
155
159
5,515
200
fi40
620
616
1,248
1,013
70B
440
3,591
180
271
307
130
903
756
464
280
II
4,220
.s18
407
451
500
988
660
425
270
2,760
472
321
263
306
623
388
229
155
1,460
46
83
188
194
36\
272
196
115
12
457
61
21
28
'W
96
97
70
46
326
;..,7
19
21
20
65
66
44
34
131
18
:11
31
26
12
13
1,750
179
249
503
2Rl
116
57
1,145
54
121
170
197
331
174
66
29
605
1B
58
79
96
169
107
50
28
14
962
149
112
125
130
257
120
48
21
616
128
H:;
75
at 171
66
27
10
316
21
27
50
46
86
54
21
II
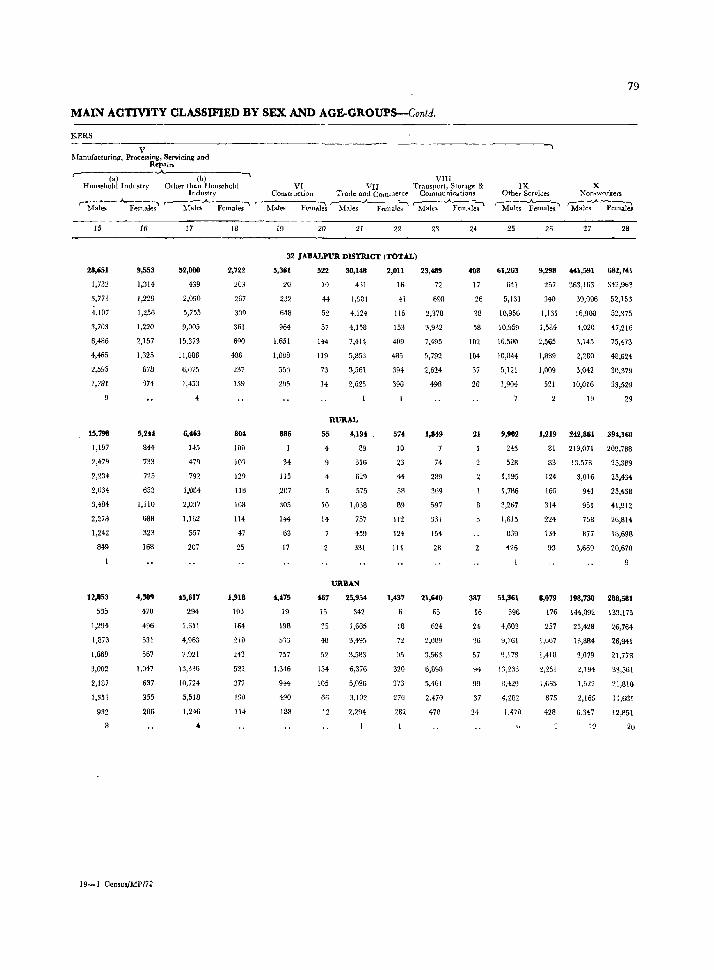
MAIN ACTIVITY CLASSIFIED BY SEX AND AGE-GROUPS-Contd.
KERS
V hfanufacturin~. Processing, Servicing and
Repairs r-·------(a-)-------~~-----(-b)--------;
HOllseil()ld Indust]1' Other than Household
r-.------"---~ Males Females
15
28,651
1,732
3,773
4,107
3,703
6,486
4,465
2,595
1,781
9
15,798
1,197
2,479
2,234
2,034
3,484
2,278
1,242
849
12,853
535
1,294
1,873
1,669
3,002
2,187
1,353
932
16
9,553
1,314
1,229
1,256
1,220
2,157
1,325
678
314
5,244
844
733
725
653
1,110
688
323
168
4,3O!l
470
496
531
567
1,047
637
355
206
19-1 Cen,u,/MP172
Industry ,-__ -..A. ____ -,
~fales Females
17
52,0110
439
2,090
5,75;
9,005
15,373
11,886
6,015
1,453
4
6,463
145
479
792
1,084
2,037
1,162
557
207
45,617
294
1,611
4,963
7,921
13,336
10,724
5,518
1,246
4
18
2,722
203
267
33~
361
690
486
237
]]9
804
100
103
129
118
163
114
47
25
1,913
103
164
210
243
522
372
190
114
VIlI VI VIJ Transpurt) Storage &
Construction Tracie and Commerce Communications
r Males Fem~ r-.Males ~ak-;' ~lales ~7'
20 21 22
32 JABALPUR DISTRICT (TOTAL)
5,361
20
232
648
964
1,651
1,08B
553
205
886
34
115
.207
:105
144
63
17
4,475
19
19B
.s·n 757
1,346
944
490
183
522
19
H
52
5)
144
119
73
14
30,148
431
1,931
4,124
4,158
7,414
5,853
3,561
2,625
I
RURAL
55
4
9
4
10
14
467
15
35
48
52
134
105
66
12
4,194
89
316
629
575
1,038
7.37
459
331
URBAN
25,954
342
1,6G5
3,495
3,583
6,376
5,096
3,102
2,294
2,011
16
41
116
153
409
485
394
39G
574
10
23
44
58
89
112
124
114
1,437
6
18
72
95
320
373
270
2B2
23
23,489
72
693
2,378
3,932
7,495
5,792
2,624
498
1,849
74
289
369
597
331
154
2B
21,640
65
624
2,089
3,563
6,898
5,461
2,470
470
24
408
17
26
38
58
102
104
37
26
21
387
16
24
3G
57
94
99
37
24
79
IX Other Services
X Non~W0rj:efS
,-:--..A.-::---:-, Male! Femalel '-Mak;~-;;}~
25
61,263
641
5,131
10,956
10,959
16,500
10,044
5,121
1,904
9,902
245
528
1,195
1,786
3,267
1,615
839
426
51,361
396
4,603
9,761
9,173
13,233
M19
4,282
l,H~
26
9,298
257
340
1,131
1,584
2,565
1,889
1,009
521
27 28
<Kl,591 682,"1
363,163 342,963
39,006 52,153
16,900 52,375
4,020 ~7,216
3.145 75,473
2,280 48,624
3,042 30,379
10,016 33,529
19 29
1,219 242,861 39i,l60
81 219,071 209,788
83 13,578 25.389
124 3,016 25,434
16G 941 25,438
314 951 41,912
224 753 26,814
134
93
877
3,669
lU,698
20,678
8,079 198,730 288,581
176 144,092 133,175
257 25,428 26,764
1,007 13,884 26,941
1,418 3,079 21,773
2,251 2,194 33,%1
1,665 1,522 21,810
B75 2,165 11,681
428 6.3H 12,851
'0 20
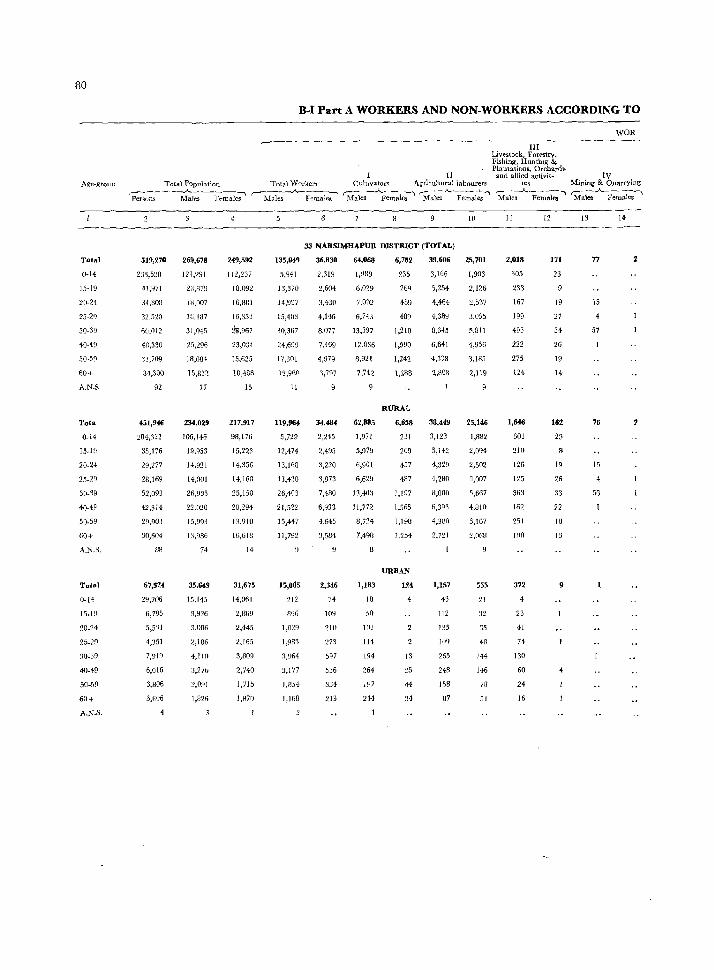
80
D·I Part A WORKERS AND NON-WORKERS ACCORDING TO
IJI Livestock, ForestrYJ Fishing, H1mting & PlantatiDlls, Orchards
If and allied activit~ IV
WOR
Ag~-grlllil) Tntal Population Total Worker'i CulttvatOt's Agricultural labourers leg Mining & Quarrying
Total
0-14
15-19
20-24
25-29
30-39
10-49
50-59
~O+
A.N$
l'ota
0-14
15-19
20-24
25-29
30-39
40-49
50_59
GO+
.~.N.s.
Total
0_14
15.1 ~)
20_24
25-29
:lD_39
40-49
50-59
60+
A.N.S.
r--~----~----~ r--h--------.. ~A~--; '--~~_"_-~-_"l ,...--........._A.. ___ ..... c-~.A.---l Persom Males V'emales 1;..lales Females Males Females Males Femalll:s Males Feml\l~ Males Females
519,270
23g15~[l
41,971
:14.808
32,520
1}(),OI2
18,330
~3,i09
34,300
92
451,946
204,322
35,176
29,277
28,169
52,093
42,311
29,90.l
30,604
B8
67,324
2'1,206
6,795
5,5'31
4,351
7,919
6,016
3,806
3,6'16
269,678
121,2'11
2:1,879
IB,Il07
IG,H.l7
31,0+5
25,296
18,08·!
15,812
77
234,029
106,146
19,~53
14,921
14,001
26,93,
22,020
15,993
35,649
15,145
3,926
3,OR6
2,ID6
4,liO
:1,276
~,O!--Il
1,826
249,592
112,237
18,092
16,801
16,333
21l,967
23,03·\
15,625
18,\88
15
217,917
15,223
14,306
14,168
25,158
20,294
13,910
16,618
14
31,675
14,061
2,869
2,445
2,165
3,809
2,740
1,715
1,8m
135,049
5,941
13,370
14,997
15,403
30,367
24,699
17,301
12,960
11
119,964
5,729
12,474
13,168
13,420
26,403
21,522
15,447
11,792
15,0~5
212
896
J,829
1,981
3,91i4
3,177
1,854
!,168
33 NARSIMHAPUR D1STRIOT (TOTAL)
36,830
2,319
2,604
3,430
4,1%
8,077
7,159
1,979
,,797
34,484
2,245
2,495
3,220
3,873
7,480
6,933
4,645
3,584
2,346
74
I09
210
273
597
536
3.14
213
64,068
1,989
6,029
7.002
6,74.]
13,597
12,036
8,921
7,742
62,885
1,971
5,979
6,901
6,629
13,403
1l,772
8,724
7,498
1,183
18
50
IOJ
114
194
264
1~7
244
6,782
235
269
459
489
1,210
1,590
1,242
1,288
RURAL
6,658
231
269
457
487
1,197
1,565
1,198
1,254
URBAN
124
13
41
34
39,606
3,166
1,254
4,464
4,389
8,345
6,641
4,538
2,808
38,449
3,123
5,142
4,329
4,280
8,080
6,39']
4,3110
2,721
1,157
43
112
1:15
109
265
248
1.58
87
IO
25,701
1,903
2,126
2,537
3,055
!i,811
4,956
3,185
2,119
25,146
J,882
2,094
2,502
3,007
5,6fi7
4,810
3,107
2,O(m
555
21
32
35
48
141
146
78
51
11
2,018
305
233
167
199
493
222
275
124
1,646
301
210
126
125
363
162
251
lOA
372
4
23
41
74
130
60
24
16
12
171
23
19
27
34
26
19
14
162
23
19
26
33
22
18
13
9
13
77
15
4
57
76
15
5G
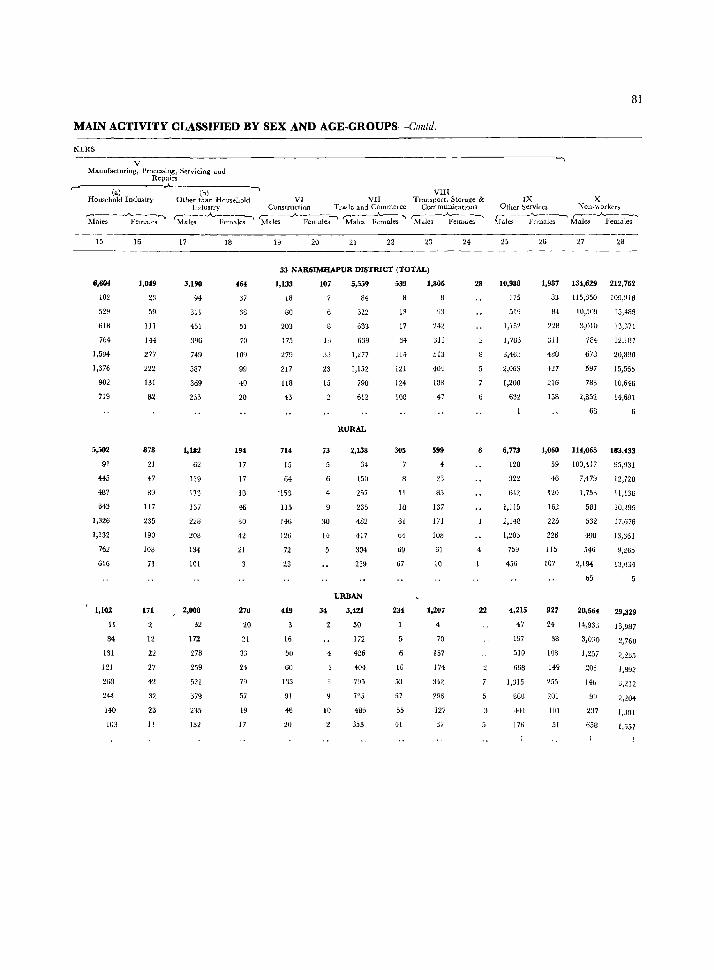
MAIN ACTIVITY CLASSIFIED BY SEX AND AGE-GROUPS -CorM
KERS
V Manufacturing, Processing, Servicing and
Repairs r----(-a)----.A.---(b-)----,
Household Industry Other than Household VI VII Construction Trade and Commerce
r-----..A..~:----. Males Females
llltlustry r---___.""A.,~-~ Males Females
,.....--.A.-----,. r---..A--- ., Males Females Males liemales
VIII Transport, Storage &
Communicatlons r_-_--..A....---, Males Females
IS
6,601
102
529
618
764
1,594
1,376
902
719
5,502
91
445
487
643
1,~26
1~132
762
616
1,102
11
84
131
121
26B
244
110
103
16
1,0#9
23
59
111
IH
277
222
131
82
878
21
47
89
117
235
190
108
71
171
12
22
27
42
32
23
I!
17
3,190
94
311
451
396
749
587
369
233
1,182
62
139
173
137
228
208
134
101
2,008
32
172
278
259
521
379
235
132
18
464
37
38
51
70
109
90
40
20
194
17
17
18
46
30
42
21
270
20
21
33
24
79
57
19
17
19 20 21 22 23
33 NARSIMHAPUR DISTRICT (TOTAL)
1,133 107 5,559 539 1,806
18
80
203
175
~79
217
118
43
714
15
64
'153
115
146
126
72
23
419
16
50
60
133
91
46
20
6
13
33
23
15
73
4
30
H
34
4
10
84
322
683
639
1,277
1,152
790
1)12
RURAL
2,138
34
150
257
235
482
417
304
259
URBAN
3,421
50
172
426
404
795
7:15
486
353
13
17
34
114
121
124
108
305
II
18
61
61
69
67
234
10
53
5)
55
41
93
2n
311
513
404
[88
47
599
4
2']
85
137
171
108
61
10
1,207
70
157
174
342
296
127
37
24
28
4
22
81
IX X Other ~en'iccs Non-\\.-orker:;
,..-----A-----, r-~~-.A.---~ ~-ralcs .Females Males Females
25
10,988
175
519
1,151
1,783
3,16:1
2,063
1,200
632
6,773
128
322
&n
1,115
2,148
1,203
759
456
4,215
47
197
510
668
1,315
860
441
176
26 27 23
1,987 134,629 212,762
83 115,350 109,918
311
480
427
216
158
10,509
3,010
784
678
597
783
2,852
66
15,483
13,371
12,187
20:890
15,565
10,646
14,691
1,060 IH,065 183,433
59 100,417
46 7,479
120
11)2
225
226
115
107
927
24
38
108
149
255
ZUl
lin
5[
1,753
581
532
498
546
2,194
b5
20,564
14,933
3,030
1,257
203
146
99
237
658
95,931
12,728
11,136
10,295
17,678
13,361
9,265
13,034
29,329
13,987
2,760
2,235
[,892
3,212
2,204
1,381
1,657
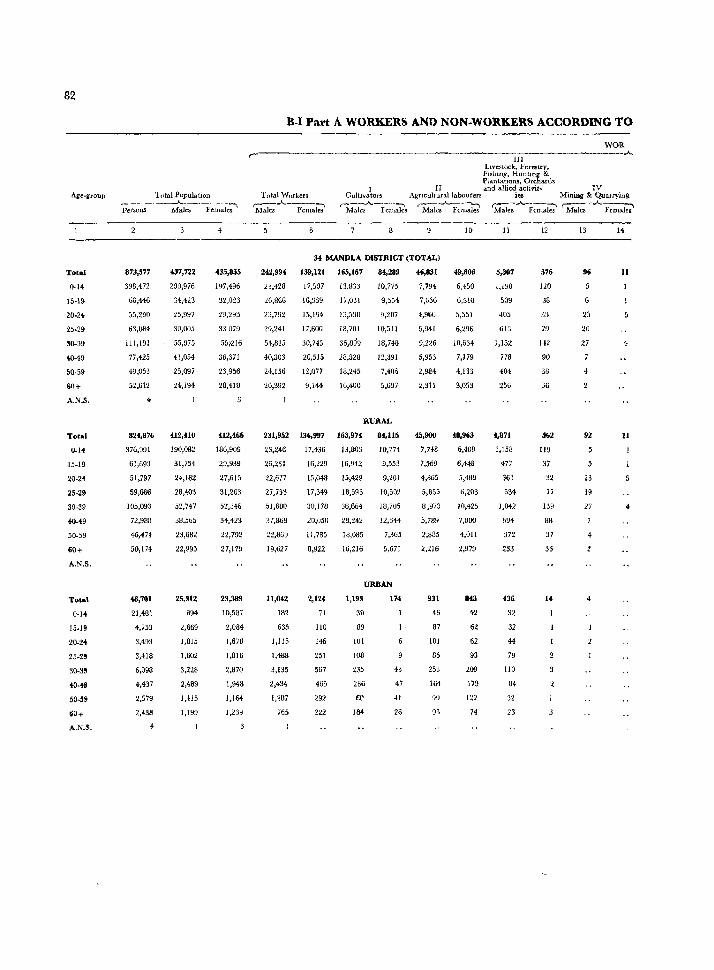
82
Total
0-14
15-19
20-24
25-29
30-39
40-49
50-59
60+
A.N.S.
Total
0-14
15-19
20-24
25-29
30-39
40-49
50-59
60+
A.N.S.
Total
0-14
15-19
20-H
25-2~
30-3!
4O-4S
50-5S
~O+
A-N_~.
,-Pel'SOIlS
873,517
398,472
66,446
55,290
63,084
111,191
77,425
49,053
52,612
4
8Z4,876
376,991
61,693
51,797
59,666
105,093
72,933
46,474
50,174
48,701
21,481
4,753
3,493
3,418
6,og8
4,437
2,438
Total Population
Males F emalc:-'
437,722
200,976
34,423
25,997
30,005
55,975
41,054
25,097
24,194
412,410
190,082
31,754
24,182
28,403
52,747
38,565
23,682
22,995
25,312
B94
~,669
1,815
1,602
3,228
2,489
1,415
1,199
4
435,855
197,496
32,023
29,293
33079
55,'216
36,371
23,956
28,418
412,466
186,909
29,939
27,615
31,263
52,346
34,423
22,792
27,179
23,389
10,587
2,084
1,678
1,816
2,870
1,948
1,164
1,239
B-1 Part A WORKERS AND NON.WORKERS ACCORDING TO
WOR r-----------------------------------------------------JI-I---------------------~
Livestock, }'orestry, Fisillng, Huntmg & Plantations, Orcha.rds
Total Workers ,---"----:---, Males Female. ..
CUltiva10rs Agncult~rallabourers and allicdi.!ctivit.. Mining & I&arrying r--A~--:-". r-..A..-----~ r:-:-:-..A.--:-",\ ~-.A.-=---:--,\
Males Females Males Fcmal~s Males Females Males Females
34 MANDLA DISTRICT (TOTAL)
242,994 139,121 165,167
23,428
26,866
23,792
29,241
54,815
40,303
24,156
20,392
17,507
15,339
15,194
17,600
30,745
20,515
12,077
9,144
13,833
17,031
15,530
18,701
35,899
28,528
18,245
16,400
84,289
10,775
9,554
9,207
10,511
18,748
12,391
7,406
RURAL
231,952 136,997 163,974
23,246
26,231
22,677
27,753
51,680
37,869
22,869
19,627
17,436
16,229
15,048
13,803
16,942
15,429
17,349 18,593
30,178 36,664
20,050 28,242
11,785
8,922
18,085
16,216
84,115
10,774
9,553
9,201
10,502
IB,7U5
12,344
7,365
5,671
URBAN
11,042
182
635
1,115
1,4B8
3,135
2,434
1,297
765
2,IU
71
110
146
251
567
465
292
1,193
30
89
101
108
235
286
0:
184
174
43
47
41
26
46,831
7,794
7,656
4,966
5,941
9,226
5,953
2,984
2,311
45,900
7,748
7,569
4,865
5,855
8,973
5,789
2,885
2,216
931
46
87
101
86
253
164
99
95
49,806
6,450
6,510
_>,551
6,296
10,634
7,179
4,133
3,053
48,963
6,408
6,448
5,489
6,203
W,425
7,000
4,011
2,979
843
42
62
62
93
209
179
122
74
II
5,307
1,190
!l09
405
613
1,152
778
404
256
4,871
1,158
477
361
534
1,042
694
372
233
436
32
32
44
79
110
84
23
12
576
120
38
33
79
HZ
90
38
36
562
IW
37
32
77
139
88
37
33
13
96
6
25
20
27
4
92
23
19
27
4
4
14
11
11
4
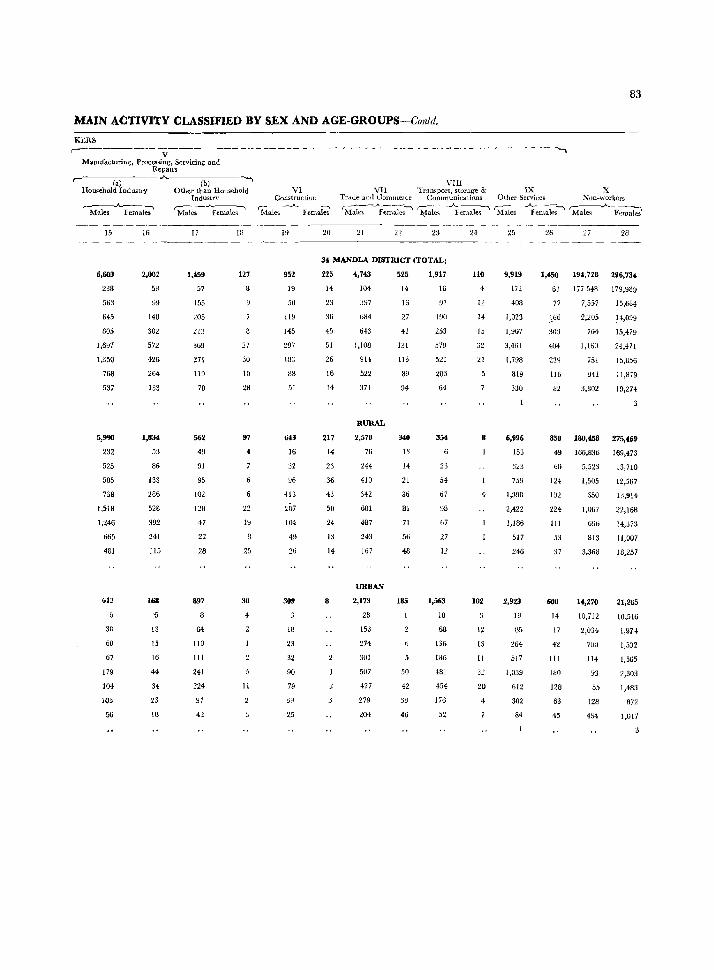
S3
MAIN ACTIVITY CLASSIFIED BY SEX AND AGE-GROUPS-Conld.
KBRS r----------y---------------- ---------------- ---- -----------------.
Manufacturing, Processing, Servicing and Reptul's
r-------(-a)-------~'------(-b-)------·~
Household Industry Other than Household
15
6,603
238
563
645
805
1,697
1,350
768
531
5,9'10
232
525
585
738
1,518
1,246
665
481
613
38
60
67
179
104
103
56
16
2,002
58
99
148
302
572
426
264
133
1,634
53
86
133
286
528
392
241
115
168
t;
13
15
16
44
34
23
18
Industrv r---~-----' 'Males females
17
U59
57
155
205
21:1
369
271
119
70
562
49
91
95
102
128
47
22
28
897
64
110
111
241
224
97
42
111
127
'27
30
10
28
97
22
19
25
30
11
VI Construction
~-A.--" Males Females
19 20
VII! VII Transport, storag-e & IX X
Tl'dUe awl UommeH .. e CommunicathJlls Other Services Non-workers .-=-__ .-A.. _____ -.. ~-.-~--.-A---.... c-_---..A----.. r----.A--_, Males Females lylales Females Males Females Males Females
21 22 26 27 28
34 MANDLA DISTRICT (TOTAL)
952
19
50
119
145
297
183
88
51
643
16
32
96
26
309
18
23
32
90
79
3Q
25
225
14
23
36
45
51
26
16
14
217
14
23
36
43
50
24
13
14
8
4,743
104
397
684
643
1,108
914
522
371
RURAL
2,570
76
244
410
342
601
487
243
167
URBAN
2,173
28
153
274
301
507
427
279
204
525
14
15
27
41
131
113
89
94
340
13
14
21
36
81
71
56
48
165
50
42
33
46
1,917
16
~I
190
253
57U
521
203
64
354
23
54
67
98
67
27
12
1,563
10
68
136
186
481
454
176
52
110
4
12
14
15
32
21
4
102
12
13
II
3~
20
9,919
172
408
1,023
1,907
3,461
1,798
819
330
6,996
153
:123
75"
1,390
2,422
1,186
517
246
2,923
19
U5
264
517
1,039
612
302
84
1,450 194,728 296,734
6J 177 548 179,989
n 166
:lOg
404
239
116
82
7,557
2,205
764
1,lon
751
941
3,802
15,684
14,099
15,479
24,471
15,856
11,879
19,274
850 180,458 275,469
49 166,836 169,473
60
124
192
224
III
53
37
600
14
17
42
III
180
128
63
45
5,523
1,505
650
1,067
696
813
3,368
14,270
IO,712
2,034
700
114
~3
55
128
434
13,710
13,914
22,168
14,373
1I,007
18,257
21,265
10,516
1,974
1,532
1,565
2,303
1,483
872
1,017
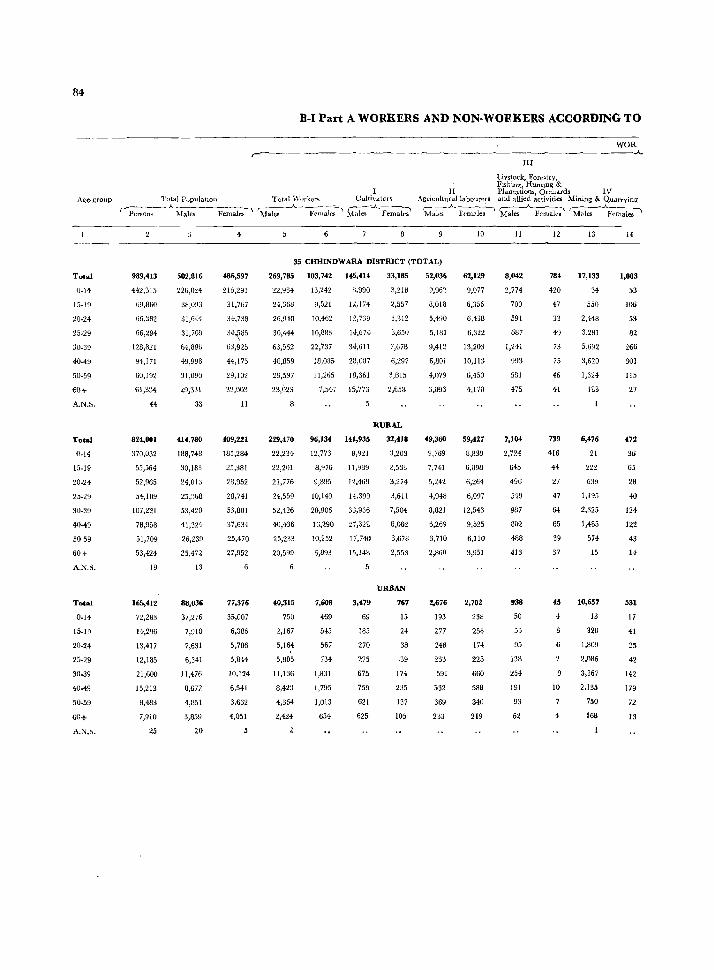
84
Age~group
Total
0-14
15.19
20-24
25·29
30·39
40·49
50-59
60+
A.N.~.
Total
0·14
15·19
20-24
25·29
30.39
40·49
50·59
60+
A.N.S.
Total
0-14
15·19
20·24
25·29
30-39
40-49
50-59
fjG+
A.N.'.
H-I Part A WORKERS AND NON-WORKERS ACCORDING TO
r-.---------------------------------------------------------------------III
Livstock, Forefotry, FlShiut{, Huntlug &
II Plantations, Orchards IV
WOR ..A.
Total PopulatlOu Total \Vorkers Cultivaiols Agl·jt:ulturallabourers and allied activiti.es Mining & QUoirrying
{Perso-n-s--.A.Males Females~ ~~~ks\ ~...A·Fem;:J~ Mili-;-..A- Fem:tles' M~ Ferllal~; '"M-:I~ernaks~
989,413
442,31.5
69,860
66,382
66,294
128,821
94,171
60,192
61,334
8U,OOl
370,032
55,564
52,965
54,109
107,221
78,953
51,709
53,424
19
165,412
72,283
14,2%
13,417
12,135
21,600
15,213
8,483
7,910
25
502,816
226,024
!IS,O!J3
31,644
31,709
64,896
49,996
31,090
29,331
33
414,780
188,748
30,183
24,013
25,368
53,420
41,324
26,239
25,472
13
88,036
37,~76
7,910
7,631
6,341
11,476
8,672
1,851
3,859
20
4
486,597
216,291
31,767
34,738
34~85
63,925
44,175
29,102
II
409,221
181,284
25,381
2lJ,952
28,741
53,801
37,634
25,470
27,952
77,376
35,007
6,386
5,786
5,344
10,124
6,541
3,632
4,051
35 ClIlIINDWARA DISTRICT (TOTAL)
269,785
21,Y84
24,36H
26,940
30,444
63,562
48,8S9
29,597
~3,U23
229,470
22,234
22,201
21,776
24,559
52,426
40,436
25,233
20,599
40,315
750
2,167
5,164
5,885
11,136
8,423
4,364
2,424
2
103,742 1<15,414
1.1,242 8,990
9,521 12,174
10,462 \2,739
10,883 14,67<1
22,737 34,611
18,085 2!l,087
11,265 IB,:j61
7,547 15,773
96,134 141,935
12,773 3,921
8,476 1l,989
9,895 12,469
10,149 14,399
20,906 33,936
16,290 27,323
10,252 17,740
6,893 15,148
7,608
469
515
567
734
I,S:H
1,795
1,013
654
3,479
69
185
270
275
675
759
621
625
33,185
3,218
2,557
3;312
3,650
7,678
6,297
3,815
2,658
nURAL
32,418
3,203
2,533
3,274
3,611
7,504
6,062
3,678
2,553
URBAN
767
15
24
38
.39
174
235
137
105
52,036
9,962
3,018
5,490
5,181
9,412
6,801
4,079
3,093
49,360
9,769
7,741
5,242
4,948
8,821
6,269
3,710
2,860
2,676
193
277
248
233
591
532
369
233
10
62,129
9,077
6,356
6,438
6,322
13,203
10,113
6,450
4,170
59,427
8,839
6,098
6,264
6,097
12,543
9,525
6,IlO
3,951
2,702
238
258
174
225
660
588
340
219
11
8,042
2,774
700
591
687
1,241
993
581
475
7,104
2,724
645
496
549
987
802
488
413
938
50
95
ISB
254
191
93
62
12
784
420
47
33
49
73
75
46
41
739
4lG
44
27
47
64
65
39
37
45
4
6
10
4
13
17,133
34
550
2,448
3,281
5,692
3,620
1,324
183
6,476
21
222
639
1,195
2,325
1,485
574
15
10,657
13
328
1,809
2,086
3,367
2,135
750
168
14
1,003
53
106
53
82
266
301
115
27
472
36
65
28
40
124-
122
43
H
531
17
41
25
42
142
179
72
13
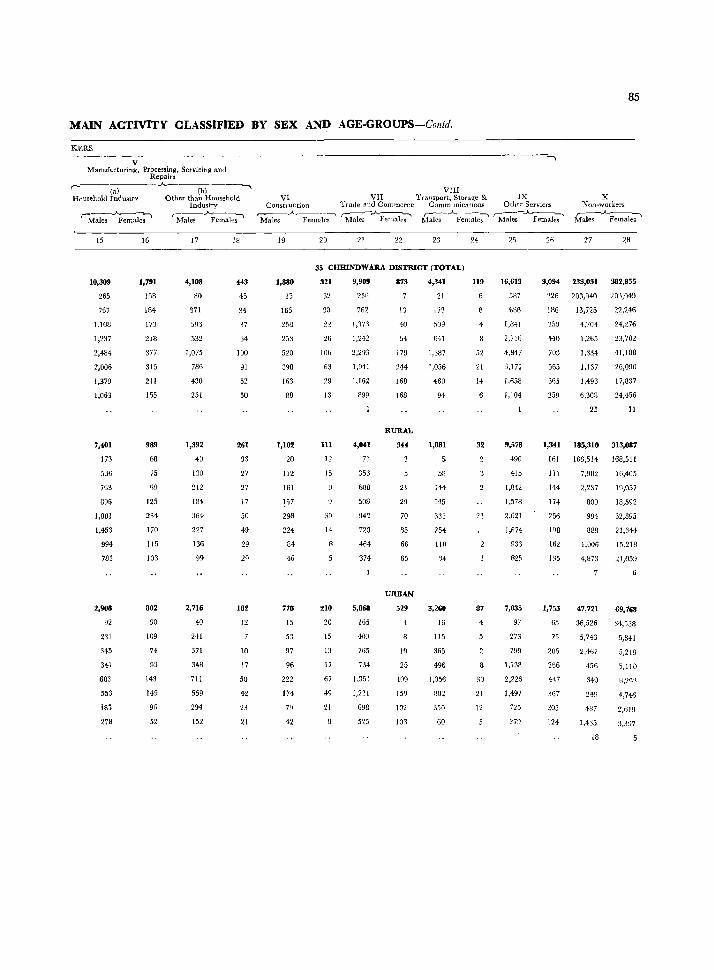
85
MAIN ACTIVITY CLASSIFIED BY SEX AND AGE-GROUPS-Contd.
KERS
V Manufacturing, Processing, Servicing and
Repairs
r-"'---C-.)---- -,,-,---C-bC-) ------Household Industry Other than Household
r---.A.--~ Males Females
15
10,309
265
767
1,108
1,237
2,484
2,006
1,379
1,063
7,401
173
_>36
763
896
1,801
1,453
994
785
2,908
92
231
345
341
683
553
27B
16
1,791
158
184
173
2lR
377
315
211
155
989
6B
75
99
125
234
170
115
103
802
90
109
74
93
143
145
96
52
Indu'Itry
'M-.-Ies- Female;'
17
4,108
80
371
SWI
532
1,075
786
430
251
1,392
41l
130
212
184
364
227
136
99
2,716
40
241
371
34B
711
559
294
152
18
443
45
34
37
34
100
91
52
50
261
33
27
27
17
50
49
29
29
182
12
10
17
50
42
23
21
VIII VI VII Tnmsport, Stora~e & IX X
Constluction Trade and Commerce CommunicatIons Other Services Non~workers ,.---....A...~
Males Females Males _A_ Fema-l~~ '1'Iales-"""'_Pernale-;' l\lales _A_Fem~;-' ~ales-~Female~
19
1,880
35
165
258
25:1
520
39B
163
8B
1,102
20
112
161
157
29B
224
B4
46
778
15
53
97
96
222
174
79
42
21l 21 22 23
35 CHffiNDWARA DISTRICT (TOTAL)
321
32
30
26
106
63
29
13
III
1')
15
39
14
210
20
15
13
17
67
49
11
9,909
236
762
1,11'1
1,242
2,203
1,941
1,162
899
4,041
71
353
608
508
942
720
464
374
5,868
165
40)
765
734
1,351
1,221
698
525
873
13
40
54
179
244
168
168
RURAL
344
21
29
70
85
66
65
URBAN
529
19
25
109
159
102
103
4,341
21
173
509
641
1,387
1,056
460
94
1,081
58
144
145
331
254
110
14
3,260
15
115
365
496
1,056
802
3,J0
GO
24
119
4
52
21
11
32
22
87
30
21
12
25
16,613
537
£BB
1,841
2,716
4,847
3,171
1,658
1,104
9,578
490
415
1,042
1,578
2,621
1,674
933
B25
7,035
97
273
799
1,138
2,226
1,497
725
279
26 27 2B
3,094 233,031 382,855
226 203,040 20\049
IflG
'l50
HI)
703
565
365
259
13,725
4,704
1,265
1,33,4
1,137
1,493
6,30B
25
22,246
24,276
23,702
41,188
26,090
17,837
24,456
11
1,341 185,310 313,087
161
III
144
174
256
108
162
135
1,753
65
75
206
266
447
367
203
124
166,514 168,511
7,902
2,237
80a
994
888
1,006
4,873
47,721
36,52G
5,743
2,467
456
340
249
187
1,435
18
Ili,405
19,057
18,592
32,895
21,344
15,218
21,059
69,768
34,538
5,841
5,219
5,110
8,293
4,746
2,619
3,397
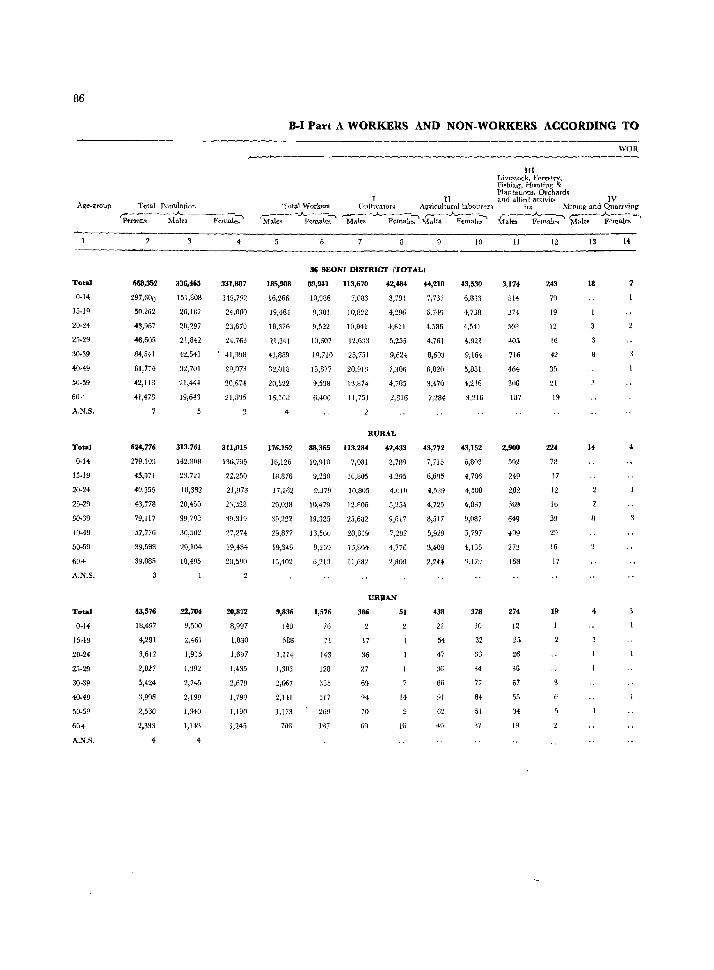
86
Total
0-14
15-19
20-24
25-29
30-39
40-49
50-59
60+
A.N.S.
Total
0-14
15·19
20-24
25-29
40-49
50-59
60+
A.N.S.
Total
0-14
15-19
20-24
25-29
30-39
40-49
50-59
60+
A.N.S.
T<ltal Population
rp.-~--n,----~~,s-----t-'e-m-"~I~
668,:152
297,6°0
50,262
.3,967
46,605
64,541
61,774-
42,11fl
41,473
7
624,176
279,103
45,971
40,355
43,778
79,117
57,776
39,588
39,085
43,576
18.497
4,291
3,612
2,827
5,424
3.99B
2,530
2,393
4
336,465
151,808
26,182
20,297
21,842
42,543
3:1,701
21,4H
19,641
313,761
142,308
23,721
18,332
20,450
39,798
30,502
20,104
18,495
22,704
9,500
2,461
1,915
1,392
2,745
2,199
1.340
J,148
4
331,8117
115,7~2
24,080
23.670
24,763
, 41,998
29,073
20,67~
21,835
311,015
136,795
22,250
2J,973
23,328
39,319
27,274
19,484
2(},.5!)O
20,872
8,997
I,S30
J,697
1,435
2,679
1,799
I,J90
1,245
B·I Part A WORKERS AND NON-WORKERS ACCORDING TO
III Livel:itoc:k. Forestry. Fishing, Hunting & Plantations, Orchards
II and a.lIied activit~ IV
WOR
Total Workers Cuitl\'atofs Agricultural labourers ies Minmg and Quarrying-
~---"-Fcmak;-' ~ales -..)....-Fe-rtl-a-Ie~ ~~..A..F-<-m-al~~ ~;~~mate~ M~";Fe~alcs _.,
185,988
16,266
19,464
18.376
!l,341
41,889
32,018
20,522
16,W3
176,152
15,125
18.876
17,262
20,038
39.222
29,877
19,349
15,402
9,836
140
5SB
1,114
J,303
2,667
2,141
1,173
70G
36 SEONI D1SntICT (TOTAL)
89,941 113,670 ~2,484 ",210
10,986 7,OB3 3,791 7,737
9,301 10,822
9,522 10.841
10,607 12,633
19.710 25,751
13,877 20,913
9,538 13,874
6.400 11,751
4,296
4,611
5,255
9,624
7,306
4,785
2,816
RURAL
88,365 113,284
10,910 7,081
9,230 10,805
9,379
10,479
19.325
J3,560
9,269
6,213
10,805
12,606
25,682
20,819
13,804
11,682
42,433
3,789
4.295
4.6JO
5,2.34-
9,617
7,292
4,776
2,301]
URJlAN
1,576
76
71
143
128
:l85
317
269
1M
386
17
36
27
W
~4
70
69
51
J4
16
6,H9
4.586
4,761
8,603
6,020
3,470
2,294
43,772
7,715
6,695
4,539
4,725
8,517
5,929
3,408
2,244
438
22
54
47
36
86
91
62
40
lO
43,530
6,813
4,738
4,541
4,921
9,164
5,881
4,236
3,216
43,152
6,803
4,706
4,508
4,887
9,087
5,797
~,13,
1,179
378
30
32
33
34
77
84
51
37
11
3,174
514
274
- 308
405
716
464
306
W7
2,900
502
249
369
649
409
214
12
25
26
36
67
55
34
19
12
243
79
19
12
16
42
35
21
19
224
78
17
12
16
39
29
16
17
19
13
18
4
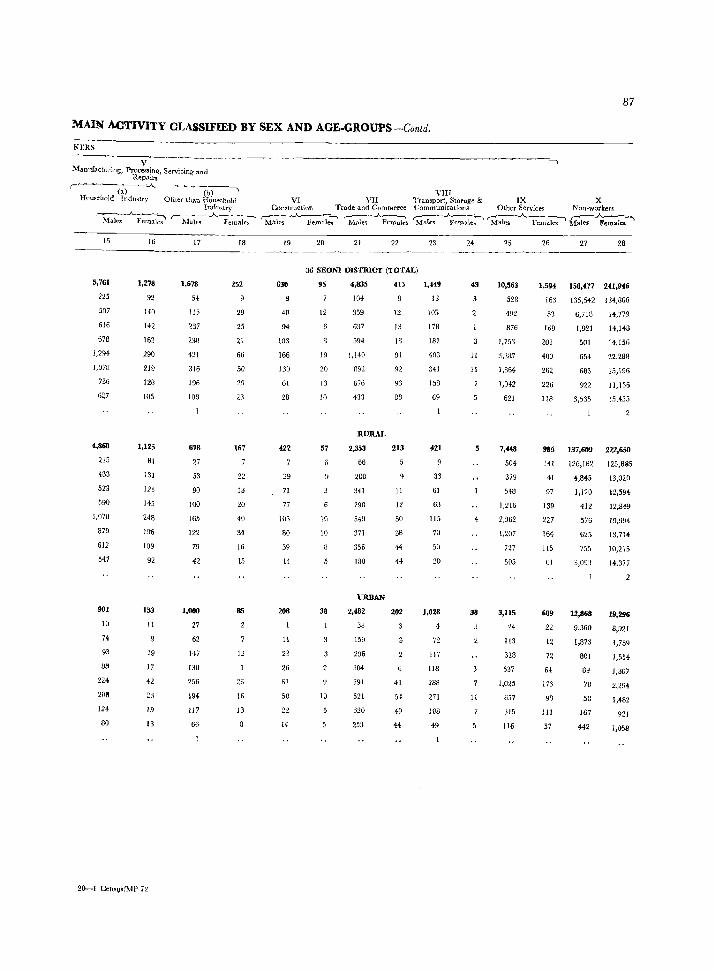
87
MAIN ACTIVITY CLASSIFIED BY SEX AND AGE.GROUPS-Contd.
KERS
V -----------------------.------------------------~-. Manufacturing, PrR~~!\~:' Servicing and
I--~~..A..------(b-)---,
Household Indu~try Other than Household VI VII Industry Construction Trade and Commerce
Male;.A.. _Femal;' r--~I~~-~ale~ ~_.A. llemaks~ ~lal~ -...A..Fcm~
YIII Transport, Storage & IX X Communications Other Service~ Non~workr.:r~ ,.....-----"-----, r----A~ r--..A..-~-'I Males Fcmale~ Males Females Males Female.
15 16 17 18 19 20 21 22 24 25 26 27 28
36 SEONI DISTRICT (TOTAL)
5,761
225
507
616
678
1,294
1,078
736
627
4,860
215
433
523
.090
1,070
870
612
547
901
10
74
93
86
224
208
124
80
1,278
92
140
142
162
290
219
128
105
1,125
81
131
123
145
248
196
IO~
92
153
11
19
17
42
23
19
13
20-1 Censl)s(MP 7'l,
1,673
54
liS
237
230
421
316
196
IOn
618
27
53
90
100
165
122
79
42
1,000
27
62
147
130
256
194
117
66
252
29
25
21
66
50
29
23
167
22
13
20
40
34
16
15
as
12
26
16
13
630
40
94
103
166
130
61
28
422
29
71
77
105
80
39
14
208
11
23
26
61
50
n 14
95
12
19
20
13
10
57
6
III
10
38
10
4,835
104
3;)9
637
594
1,140
R92
676
433
RURAL
2,353
66
200
341
290
549
371
356
180
UIUlAN
2,482
38
159
296
3M
591
521
320
253
415
12
13
18
91
92
93
88
213
11
12
50
38
44
44
202
41
54
49
44
1,449
13
10:;
17B
181
403
341
158
69
421
33
61
63
llS
70
50
20
1,028
4
72
117
118
288
271
108
49
43
11
II
5
4
38
11
10,563
528
492
876
1,753
3,3U7
1,864
I,M2
621
7,448
504
319
548
l,tl6
2,362
1,207
727
505
3,115
24
113
328
537
1,025
657
31,
116
1,594 150,'77 241,946
163 135,542 I:H,1!{)6
53
169
203
400
262
226
118
6,713
1,921
501
654
683
922
3,535
14,779
14,148
14,156
22,288
15,196
11,13.
).1,435
2
985 137,609 222,650
141
41
97
139
227
164
115
61
609
22
12
72
64
113
98
111
57
126,182 125,885
4,845 13,020
1,120
412
576
625
75.5
3,093
12,868
9,360
1,873
8DI
89
78
58
167
442
12,59~
12,849
19,994
13,714
10,215
14,377
2
19,296
8,921
1,75~
1,554
1,307
2,294
1,~82
921
1,058
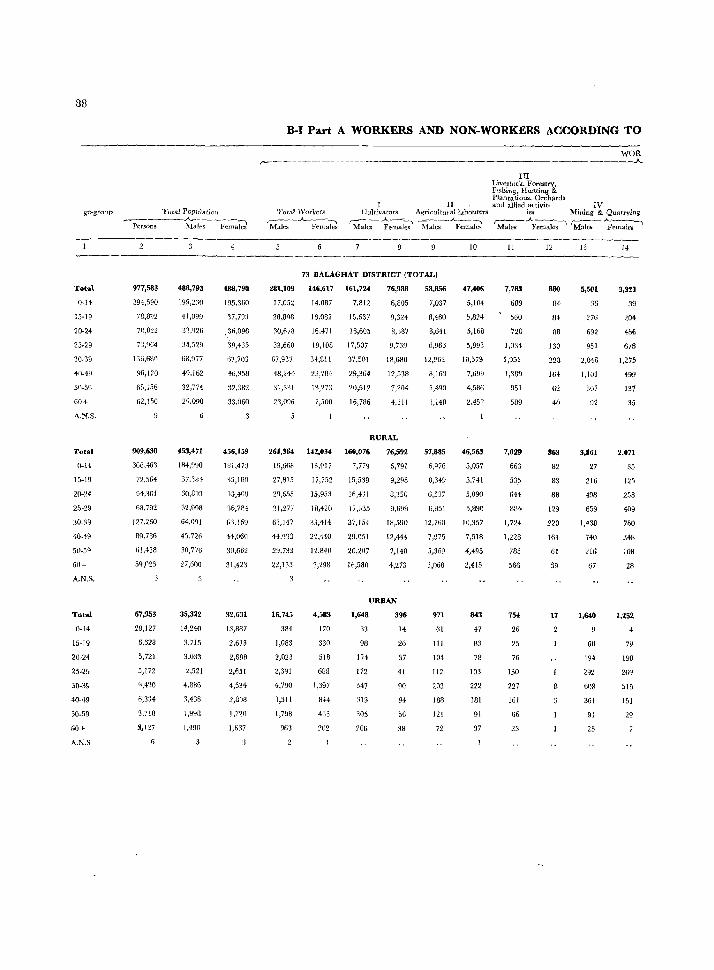
88
ge-gt(JU]J
T<>tal
0-14
15-19
20-24
25 .. 29
30-39
40-49
50-59
60+
A,N,S,
Total
0-14
15-19
20-24
25-29
30-39
40-49
50-59
60+
A-N,S,
Tatal
0-14
15-1~
20-24
~5-2~
30-%
4-0-49
50-09
60+
A,N,S
Total Poplilatioll
-P-cr-,o-n-s---~~~leJ
977,583
394,590
78,892
70,022
Tl,964
IJrl,6AO
96,120
65,156
62,150
909,630
366,461
72,,064
64,,01
68,792
127,260
89,786
61,438
59,(123
67,953
28,127
6,328
5,721
5,172
9,420
6,334
3,718
',127
488,793
199,230
41,099
31,926
34,529
bB,977
49,162
32,774
29.090
453,471
184,990
37,384
30,893
32,008
64,091
45,7<6
30,776
27,600
35,322
14,24-0
3,715
3,033
2,521
4,886
~,436
1,998
1,490
4
4118.790
195,360
37,793
,36,Q96
39,435
67,703
46,958
32,3K2
33,060
456,159
181,473
'35,180
,13,408
:l6,784
61.169
44,060
30,662
31,423
32,631
1:1,887
2,613
2,688
2,651
4,534
2,898
1,720
1,637
B·I Part A WORKERS AND NON·WORKERS ACCORDING TO
r---------------------------------III
Livestock. Forestry, FIshing, Huntin.g & Plantations, Orchar&s
WOR .A.
Total W(wkets ~_....A...._-~
M.des FenJales
II ' and allied .activit- IV Cultivators Agricuhurall."ivourers les ~fjuing & Quarrying
,----....A..--1 ~ __ .A__~ ~_J... __ ~ ~..A"~
Males Females Males FeTIlale~ MaJes Females M:lles Females
73 BALAGHAT DISTRICT (TOTAL)
281,109
17,052
28,898
10,678
33,668
67,937
48,244
:\1,1',1
23,006
5
146,617 161,724
14,087 7,812
18,082 15,637
16.471 16,605
19,108 17,507
34,811 37,501
23,2114 29,364
13,273 20,512
7,500 16,786
1
76,938
6,805
9,324
S,3a7
9.739
13,680
12/138
7,2()4
4,311
RURAL
264,364 142,034 160,076
16,068 13,917 7,779
27,815 17,752 15,539
211,65" 15,953 16,431
31,277 18,420 17,:1:lS
63,117 33,414 37,154
44.933 22,140 29,051
29,733 12,840 20,207
22,133 7,298 16,580
76,592
6,791
9,298
8,'350
9,698
18,590
12,444
7,148
1,273
URBAN
16,745
384
1.083
2,023
2,391
4,790
9,311
1,798
963
4,583
170
330
518
688
1,397
844
4:13
2U2
1,648
33
98
li4
172
347
313
305
206
396
14
26
37
41
94
56
38
58,856
7,037
8.460
6,641
6.963
12,96:!
8,163
5,490
:1,140
8,349
6,537
G,a5]
12.760
7/175
5,369
3,068
971
61
111
104
112
202
188
121
72
10
47,406
5,104
5,824
5,168
5,993
10,579
7,699
4,581i
2,452
46,563
5,057
5,741
5,090
5,890
10,357
7,518
4,495
2,415
843
47
K3
78
103
222
181
91
37
11
7,783
689
560
720
1,034
1,351
1,389
851
509
7,029
663
53;5
644
884
1,724
1,228
785
566
754
26
25
76
150
227
161
66
23
12
880
84
84
88
130
228
164
62
411
863
82
83
88
129
no 161
61
39
17
s
13
5,501
36
276
692
951
2,046
1,101
107
92
3,861
27
216
498
659
1,438
74-0
216
67
1,6(0
60
194
292
60S
361
91
25
3,323
39
~04
456
678
1,275
499
131
35
2,071
35
125
258
409
760
34B
lOB
28
1,252
4
79
190
269
515
151
29
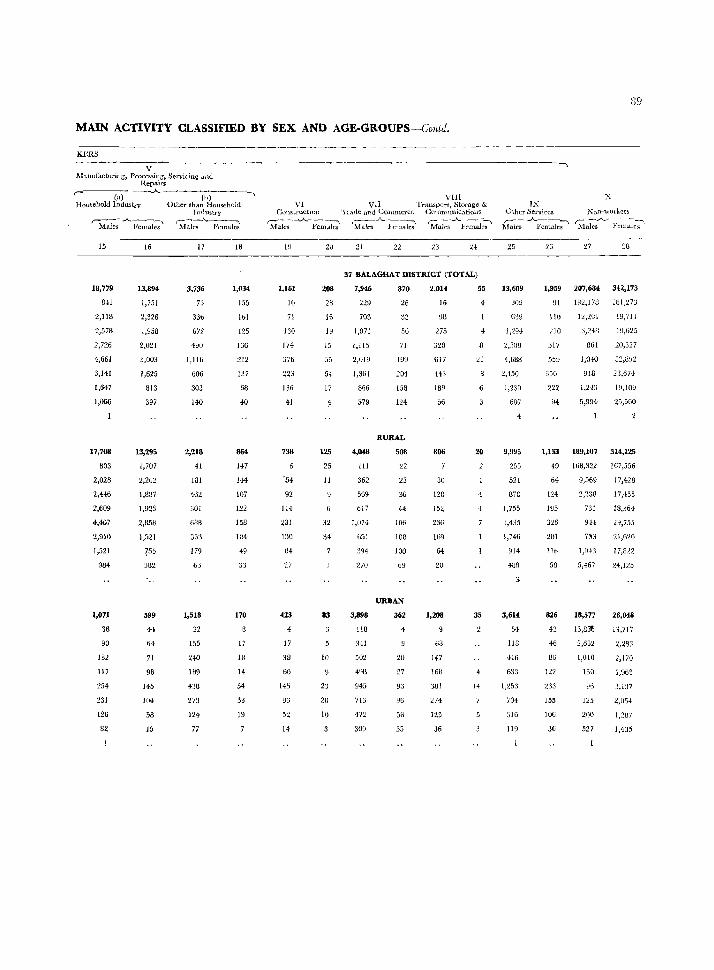
MAIN ACTIVITY CLASSIFIED BY SEX AND AGE-GROUPS-Contd.
KERS
V Manufacturing, Processing, Servicing dlld
Hepairs
r-'-----(-a)-----~-------(b-)--------,
Hou~ehold Industrv Other than Household
r-"':---~----., Males Females
15
18,779
Ml
2,118
2,578
2,726
4,661
3,141
1,647
1,066
17,708
803
2,028
2,446
2,609
4,407
2,910
1,521
984
1,071
38
90
132
117
254
231
126
82
16
13,89~
1,751
2,326
1,958
2,021
3,000
1,625
813
397
13,295
1,707
2,262
1,887
1,923
2,858
1,521
?55
382
599
44
64
?1
98
145
104
58
15
Tndu~lr¥ r-.A.-------,
Males Fc-males
17
3,736
73
336
672
490
1,116
606
303
140
2,218
41
181
432
301
688
333
179
63
1,518
32
155
240
IB9
273
124
77
18
1,0H
155
101
125
136
212
137
68
40
8640
147
144
107
122
158
104
49
33
170
17
13
14
54
33
19
VIII VI VII fransport, Storage &
Cl)11sttuchon Ttade anrl Comrcercc CommuniCatiuns ~-~...A_-_-, .-_./ ____ :""\ ,-__ -"------, Males Females Males Females Malt'S Females
19
1,161
10
71
130
174
376
223
L36
~1
738
'51
92
114
231
130
84
27
423
4
17
38
bO
145
93
52
14
20 21 22 23
37 BALAGHAT DISTRICT (TOTAL)
208 7,946 870 2,014 55
28
L6
19
15
55
54
17
125
25
Jj
32
34
83
10
23
2u
10
229
703
1,071
1,115
2,OHJ
1,364
866
579
4,048
111
362
569
617
1,074
651
394
270
3,898
118
341
502
4~U
945
713
472
309
26
32
56
71
199
204
L58
124
RURAL
508
n 23
36
44
106
108
100
69
URBAN
362
20
27
9:1
90
53
55
16
98
275
320
617
443
189
56
806
30
128
152
236
169
64
20
1,208
68
147
1GB
381
274
125
36
4
4
21
20
4
35
14
89
IX Other Services NOn-wolker:; ,-----.A. ____ -. C -..A------~
Malf:3 Females l\falcs Females
2S
13,609
309
639
1,294
2,:11)8
4,68H
2,450
1,230
607
4
9,99>
255
521
878
1,755
:>,435
1,74li
914
438
3,614
54
118
416
633
1,25:1
704
316
119
27 28
1,959 207,68~ 342,173
91 182,173 181,273
110
210
317
559
356
222
94
12,201
861
I,04{)
918
1,243
5,994
19,71 J
1~J,6:l5
20,327
32,892
23,674
19,109
25,560
1,133 189,107 314,125
49 168,322 167,556
64
124
195
326
201
116
58
826
42
4li
86
1'22
233
155
106
36
9,569
2,238
731
9H
7~3
1,041
5,467
18,577
13,851;
2,632
1,010
13{)
125
200
527
17,455
18,364
29,755
21,620
17,822
28,048
13,717
2,283
2,170
3,137
2~054
1,287
1,435
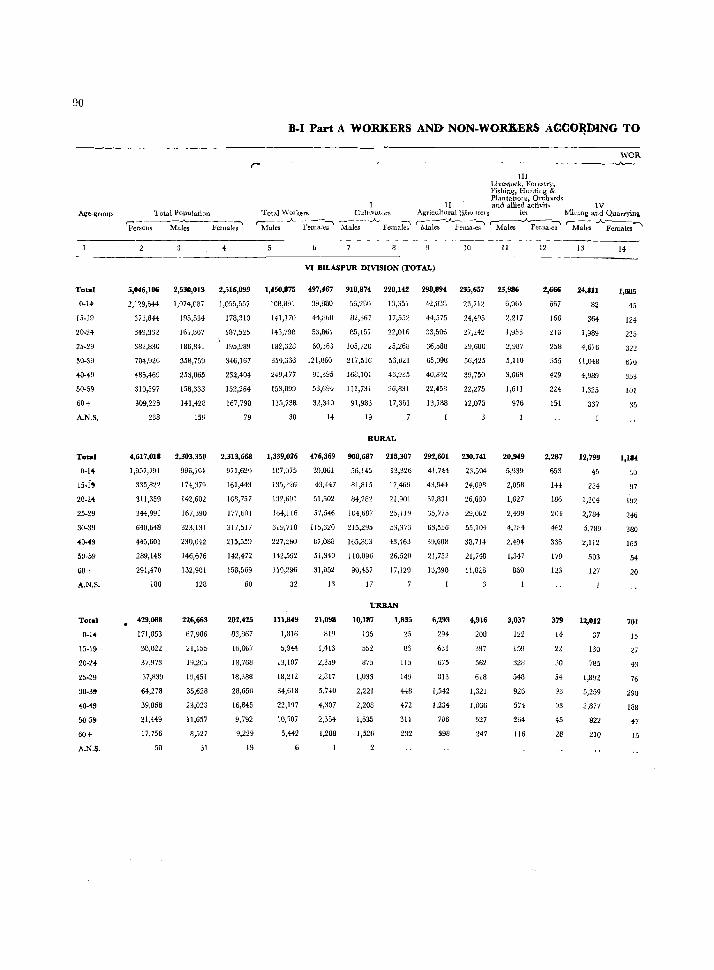
90
H.I Part A WORKERS AN& NON.WORKERS AGCO~DlNG TO
III Livestock, !.<'Olestry. Fishing", Hunting & PJantatlOns, Orchards
II and allied activit.. IV
WOR
Age-group Total Population Total \VOlkers Cultivators Agricuit.urall;}buurelg ies Mining and Quarrying
Total
0-14
15-19
20-H
25-29
30-39
-«>-+9
50-59
60+
A_N.S.
Total
0-14
15-i~
20-2~
25-29
30-39
40-49
50-59
60+
A.N.S.
To .. l
0-14
15-19
20-H
25-29
30-3~
40·H
50·59
60+
A.N.S.
rpe~~~-s --Ma~ Fem;Ie~ ~ie~- _,A___~-;, 'M.;J;-~...A.. Femaleb ~1aks-_.oI-H;:n;I;' "--Male;-.A.~;;" rMale~A Females ~
5,046,106
2.129,644
373,844
349,332
382,830
704,926
485,469
310,597
309,226
238
4,617,018
1,957,791
335,822
311,359
344,991
640,648
445,601
289,148
291,470
188
429,088
171,853
38,022
37,973
37,839
64,278
39,868
21,449
17,756
50
2,530,013
1,074,087
195,534
161,807
186,841
358,759
253,065
158,333
141,423
159
2,303,350
986,101
174,379
142,602
167,390
323,131
230,042
146,676
132,901
128
226,663
87,936
21,155
19,205
19,451
35,628
23,023
1]'657
8,527
31
2,516,093
1,055,557
178,310
lB7,525
J95,989
346,167
232,404
152,264
167,798
79
2,313,668
971,690
161,443
168,757
177,601
317,517
215,559
142,472
158,569
60
202,425
33,867
16,867
18,768
18,388
28,650
16,845
9,792
9,229
19
10 11
VI BILASPUR DIVISION (TOTAL)
1,450,875 497,467 918,874 220,142 298,894 235,657 23,986
108,891 39,flll0 56,280 13,351 42,038 23,712 6,061
14],17U 44,1160 U:L,::i67 17,552 44,575 24,495 2,217
145,798 53,861 85,157 22,016 :13,506 27,HZ 1,955
182,328 60,063 105,nO 25,268 36,588 29,680 2,987
354,336 121,060 217,516 53,821 65,098 56,425 5,110
249,477 91,395 168,101 43,935 40,842 39,750 3,068
153,099 53,694 111,731 26,831 22,458 22.275 1,611
115,738 32,340 91,983 17,361 13,788 12,075 975
38 14 19
RURAL
1,339,026 476,369 908,687 218,307 292,601 230,741
107,075 39,061 56,145 l:l,326 41,744 23,504
135,226 43,+47 81,815 17,469 43,944 24,098
132,691 51,502 84,282 21,901 32,831 26,680
164,116 57,546 104,687 25,ll~ 35,77.\ 29,062
319,718 115,320 215,295 53,373 63,556 55,104
227,280 87,088 165,893 43,463 39,608 38,714
142,592 51,340 110,096 26,520 21,752 21,748
110,296 31,052 90,457 17,129 13,390 11,828
32 13 17 3
111,849
1,H16
5,944
13,107
18,212
34,618
22,197
10,507
5,442
21,098
R19
1,413
2,359
2,817
5,740
4,307
2,354
1,288
URBAN
10,187
135
552
875
1,033
2,221
2,208
1,635
1,526
2
1,835
25
83
115
149
448
472
311
232
6,293
294
631
675
813
1,542
1,234
706
398
4,916
208
SQ7
562
618
1,321
1,036
527
247
20,949
5,939
1,627
2,439
4,W4
2,494
1,347
860
3,037
122
159
3211
543
926
574
264
116
12
2,666
667
166
216
258
555
429
224
151
2,287
653
144
186
204
4&2
336
179
123
379
14
22
30
54
93
93
45
28
24,811
82
364
1,989
4,676
1l,048
4,989
1,325
337
12,799
45
234
1,204
2,784
5,789
2,112
503
127
12,012
37
130
785
1,892
5,259
2,877
822
210
14
1,1185
45
124
235
322
670
353
101
35
1,184
30
97
1~2
246
380
165
54
20
701
15
V
43
76
290
188
47
15
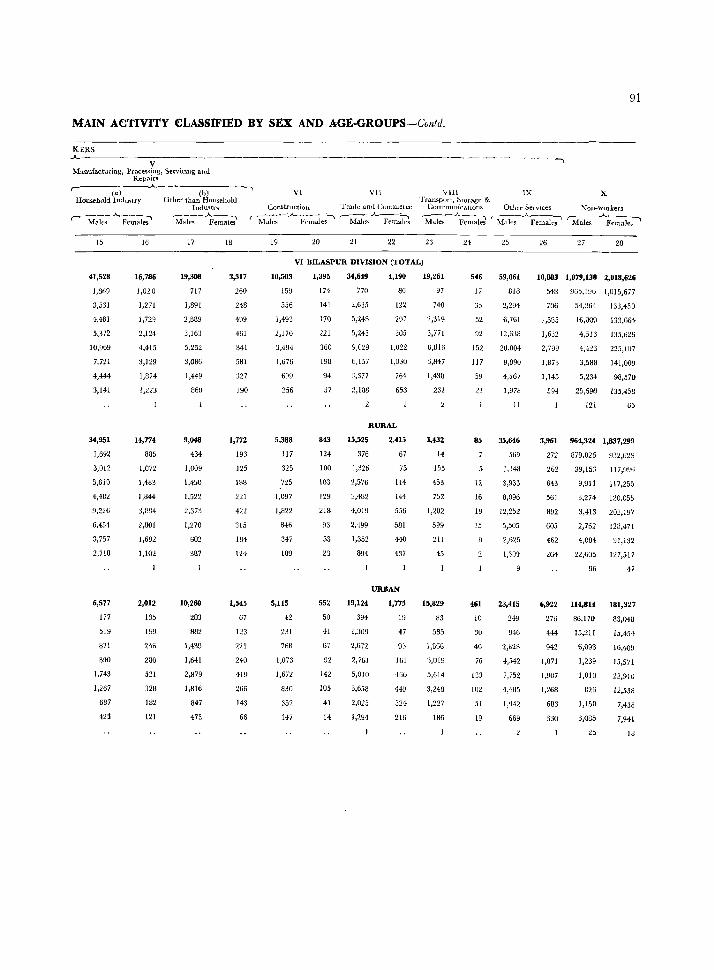
91
MAIN A{:TIVITY (:LASSIFIED BY SEX AND AGE-GROUPS-Colltd.
--------------------,------------KERS -"-
V Manufacturing, Processing, Servi.clllg anJ
Repairs
<'----(a-)---.A.- (h) -..
Household Indu~trY Other than Household VI VII
Con~tfllction Trauc and Curnmetce ,.-------.A...--,
Males Females
Industrv ~_..A.._---...
Males Females r----..A----~ r--~-..A..-~.,..,
Males Females Males Femrtles
'vIII Transport, ,storage &
Communicatmns ,--_ __..___.."
Males Females
15
41,528
1,869
3,531
4,431
5,372
10,969
7.721
4,444
3,141
34,951
1,692
3,012
3,610
4,432
9,226
6,454
3,757
2,718
6,577
177
519
871
890
1,743
1,267
687
423
16
16,786
1,020
1,271
1,729
2,124
4,415
3,129
1,874
14,774
835
1,072
1,483
1,844
~,894
2,801
1,692
1,102
2,012
135
199
216
280
521
323
132
121
17
19,308
717
1,891
3,163
5,252
3,086
1,449
36()
9,048
434
1,009
1,450
1,522
2,37:1
1,270
602
387
10,260
283
8H2
1,439
1,641
2,879
1,816
847
473
18
3,317
260
248
409
461
841
581
1,772
193
125
188
221
421
:lIS
184
1H
1,545
67
123
221
240
419
266
143
66
19
10,503
15U
556
1,493
2,170
3,494
1,676
699
256
5,388
117
325
725
1,097
1,822
846
347
109
5,115
42
231
76B
1,073
1,672
830
352
147
20 21 22 23
VI BILASPUR DIVISION (TOTAL)
1,395
174
141
170
221
360
198
94
37
843
124
100
103
129
218
93
53
23
552
50
41
67
92
142
105
41
14
34,649
770
2,635
5,248
5,243
9,029
6,157
:l,377
2)188
4,190
36
122
201
305
1,022
1,030
764
653
RURAL
15,525
376
1,326
2,576
~,482
4,019
2,499
1,352
894
19,124
394
1,309
2,672
2,761
5,010
3,658
2,025
1,294
2,415
67
75
114
144
556
581
440
437
URBAN
1,775
19
47
93
Hil
46G
44£1
32'l
216
19,261
97
740
2,319
3,771
6,816
3,847
1,438
231
3,432
14
1.55
453
752
1,202
599
211
45
15,829
83
585
1,SG6
3,019
5,614
3,248
1,227
186
24
546
17
;)5
52
9:!
152
117
59
21
85
12
16
19
15
B
461
10
30
40
76
133
102
51
19
25
59,061
8W
6,761
12,638
20,004
9,990
4,567
1,978
11
35,646
569
1,348
3,933
8,096
12,252
5,505
2,625
1,309
23,415
249
946
2,828
4,542
7,752
4,485
l,942
669
IX x
26 27 28
10,883 1,079,138 2,018,626
548 905.196 1,015,677
70ti 54,:;64 133,450
1,585 16,009 133,664-
1,632 4,513 135,626
2,799 4,423 225,107
1,873 3,588 141,009
1,145 5,234 98,570
594 25,690 135,458
121 65
3,961 964,324 1,837,299
272 879,026 9:12,629
262
643
561
892
605
462
264
39,153 117,9~)6
9,911 117,255
3,274 120,055
3,413 202,197
2,762 128,471
4,084 91,132
22,605 127,517
% 47
6,922 114,814 181,327
276 86,170 83,048
444 15,211 15,454
942 6,098 16,409
1,071 1,239 15,571
1,907 1,010 22,910
1,268 326 12,538
633 1,150 7,438
330 3,085 7,941
25 18
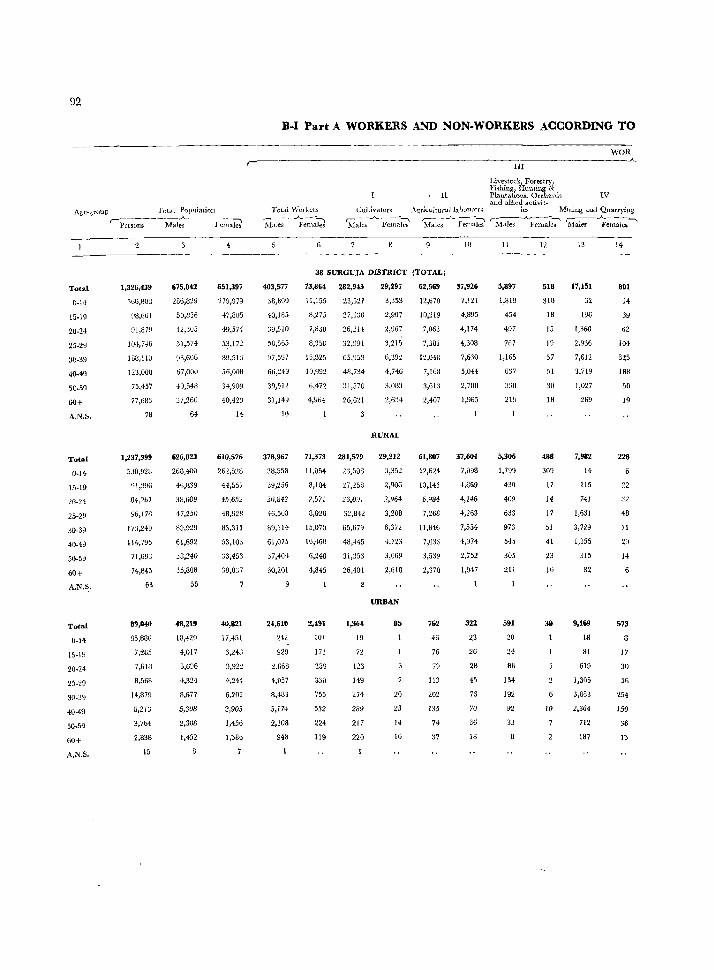
92
Agc.gl'OUp TOt.1( Popillatioll r--------~_.A.",----- --:-.
Total
0-14
15-19
20·24
25.29
30·39
40-49
50-59
60+
A.N.S,
Total
0·14
15·19
20-24
25-29
30-39
40-49
50-59
60+
A.N.S,
Total
0.14
15·1~
20·24
25·29
30·3Y
40-49
50·59
60+
A.N.S.
Persons Males Females
1,326,439
5G6,BOB
9U,661
U1,879
lU,I,7+6
138,119
123,008
75,457
77,683
7B
1,237,399
530,928
91,396
84,2bl
96,178
17:),240
1I4,7!!5
71,69:]
74,845
63
89,040
35,600
7,265
7,618
8,563
14,87!!
8,213
3,764
2,838
15
675,042
286,829
50,856
42,305
51,570)
VB,GOG
67,000
40,548
37,260
64
626,823
263,400
4ti,H39
38,609
47,250
B~,929
61,692
38,240
35,808
56
43,219
18,429
4,017
3,696
4,324
8,677
5,308
2,308
1,452
B
651,397
279,919
47,805
49,574
~,172
89,513
56,008
H,909
40,423
14
610,576
44,557
45,652
48,92B
83.311
53,103
33,453
39,037
40,821
17,4S1
3,24R
3,922
4,244
6,202
2,905
1,456
1,386
7
D-I Part A WORKERS AND NON-WORKERS ACCORDING TO
,-'------------------------------------------------1-11---------------WOR
-"-
n Total \,\,'olkcrs
r- -~_A_-----:-\ ~fOl}eS Females
Cultivators .\qricultura11abo,urr:rs
403,577
38,800
40,185
39,510
50J~165
97,597
66,~49
39,512
31,149
10
378,967
38,553
39,256
36,842
+6,508
89,114
61,075
37,404
30,201
~
24,610
242
929
2.668
4,057
8,483
5,174
2,108
948
r-----"'- --:-\ ,--- ---.._--~~ Male~ .Females Males females
38 SU:RGUJA DISTRICT (TOTAL)
73,864 282,943
11,155 23,5U
8,27.5 27 ~330
7,BJO 26,214
8,350 32,991
15,B25 65,V:>3
10,992 48,734
6,472 31,570
4,964 26,G21
29,297
3,353
2,907
1,067
3,215
6,39~
4,7+6
3,OU3
2,634
RURAL
71,373 281,579 29,212
11,054 23,50[1 3,352
8,104 27,258 2,906
7,571 26,091 2,964-
8,020 32,842 3,208
15,070 65,679 6,372
10,4"0 48,445 4,723
6,248 31,353 3,069
4,845 26,401 2,618
2,491
101
171
259
330
755
532
224
119
1,3M
19
n 123
149
274
289
217
220
URBAN
85
20
23
14
16
62,569
12,670
10,219
7,063
7,,)81
12,048
7,168
3,613
2,407
61,807
12,W4
10,143
6,984
7,268
11,846
7,033
3,539
2,370
762
46
76
7~
113
202
135
74
37
!O
37,926
7,121
4,895
4,174
4,308
7,630
5,044
2,7B8
1,965
37,604
7,098
4,869
4,14.
4,263
7,554
4,974
2,752
1,947
322
23
26
2B
45
76
70
36
18
Livest()(:k, }'orestry I Fishing, Hunting & PlantatLQl\'S. Orchanl<; IV aud allied activit.
ies Mining ami Quarrying
'Males _A...Fem~-;-- ~aIes --;::~lales --...
11
5,897
1,819
454
497
767
1,165
GJ7
:nB
21!J
5,306
1,799
430
409
633
973
545
305
211
591
20
24
88
134
192
92
33
12
518
310
18
15
19
57
51
3ll
18
488
309
17
14
17
51
41
23
16
30
10
13
17,151
32
196
1,360
2,936
7,612
3,719
),027
269
7,982
14
115
741
1,631
3,729
1,355
315
82
9,169
18
81
619
1,305
3,883
2,364
712
187
14
801
14
104
325
188
50
19
228
22
J2
48
71
29
14
573
17
30
56
254
159
36
13
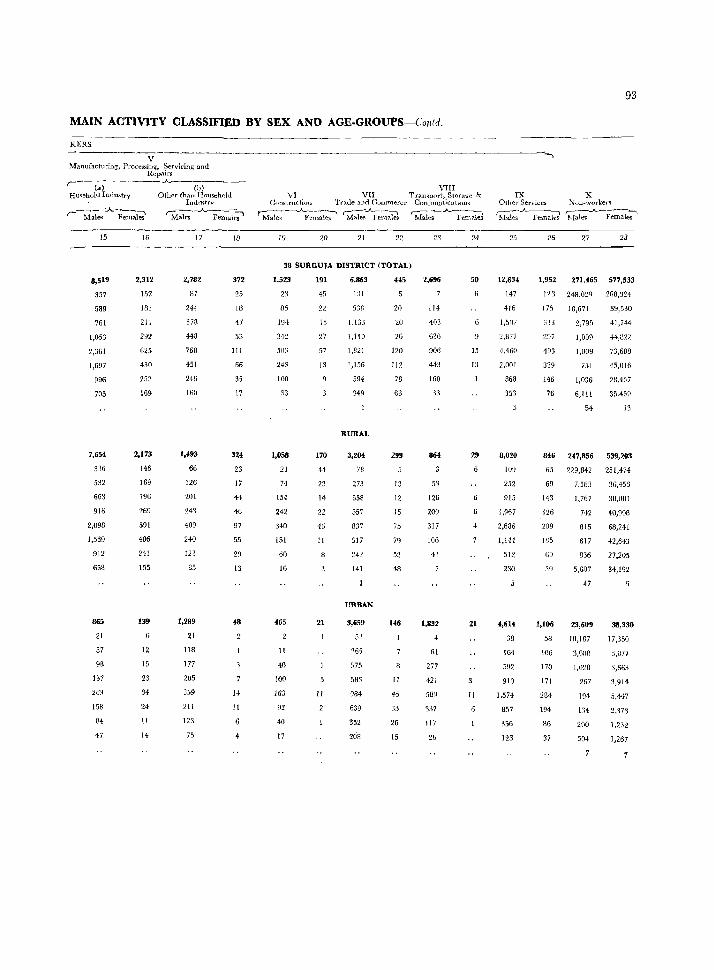
MAIN ACTIVITY CLASSIFIED BY SEX AND AGE·GROUPS-C01!1d.
KIiRS
V Manufacturing, PrO(essiIlt:~ Servicing and
Repairs .------__.:.~.------
(al (b) Hu<:ehold Inollstry Other than HI)useh(}lJ.
InJm.trv ,---~-"'---"
'Males Ferrl<\}es Sr~-;-_A_~;;~l
VIII VI VII T ramport, Storalle &
C'mslnlctiotJ Trade <tllr1 Commerce Conllnunic~tlon'\:
PM~____'~~~k;' 'Males~l:,Jci r;1ales _A_ Females
93
IX X Other Services Non-worKer" ~_A_--~ r-~_A_----~
Males Females Males FC"'.mai.es
----------------------------------------------------------------------------------------15
8,519
357
589
761
1,053
2,361
1,697
996
705
7,654
336
532
663
916
2,098
1,539
912
658
865
21
57
98
137
263
158
84
47
16
2,312
152
Inl
211
292
625
430
252
169
2,173
146
169
196
269
591
406
2'fl
155
139
12
15
23
34
24
11
14
17
2,782
H7
244
378
448
768
451
246
160
1,493
66
126
201
24'1
409
240
123
85
1,289
21
118
177
205
359
211
1'/;3
70
372
25
18
47
53
III
66
35
17
324
23
17
44
46
97
55
29
13
48
14
11
4
19 21 22
38 SURGUJA DISTRICT (TOTAL)
1,523
23
0.>
194
3·\2
503
243
100
~3
1,058
21
74
154
242
340
151
60
16
465
II
40
100
163
92
40
17
191
45
15
27
57
13
170
44
22
14
46
11
21
II
6,863
131
.>:10
1,133
1,110
1,821
1,156
594
349
RURAL
3,204
78
273
558
557
837
517
242
141
URBAN
3,659
53
265
583
984
639
352
268
445
20
20
26
120
112
78
63
299
13
12
15
75
7q
52
48
146
11
45
33
26
15
23
2,696
114
403
630
906
443
160
'13
864
53
126
209
317
106
4'1
1,832
4
61
277
421
589
337
117
26
50
15
13
29
21
11
25
12,634
147
416
1,5m
::!.877
4,460
2,001
868
353
8,020
109
252
915
1,967
2,886
1,144
512
230
4,614
38
164
592
910
1.574
857
356
123
26 27 28
1,952 271,465 577,533
175 10,671
:113 2,795
297 1,009
193
329
146
76
1,009
751
1,036
6,111
39,530
41,744
44,H22
73,688
45,016
28,437
35,459
54 13
846 247,856 539,203
65 229,842 251,474
69
143
126
209
135
60
30
1,106
58
106
170
171
284
194
86
37
7,SIn
1,767
H2
815
617
836
5,607
47
23,609
18,187
3,mm
1,028
267
191
134
200
504
36,453
38,081
40,908
68,211
42,643
27,205
34,192
38,330
17,350
3,077
3,663
3,014
5,447
2,373
1,232
1,267
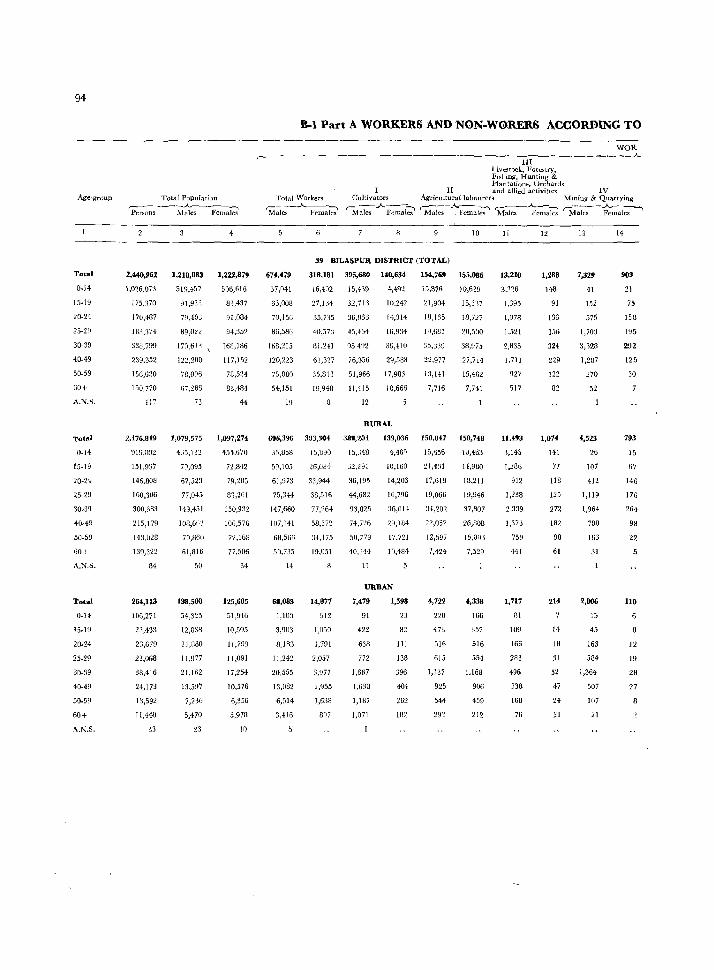
94
Age~group
Total
0.14
15·19
20.24
25·29
30·39
40·49
50.59
60+
A.N.S.
Total
0·14
15·19
20-24
25·29
30·39
50.59
60+
A.N.S.
Total
0·14
15.19
20.24
25·29
30·39
40·49
50.59
60+
A.N.S.
Total Population r--~-" Persons Males Females
2.440,962
1,026,073
175,370
170,487
W3,374
338,799
239,352
156,620
150)70
2,176,849
919,B02
151,937
146,808
160,306
300,383
215,179
14:1,()28
139,322
B4
264,113
106,271
B,433
23,679
23,068
38,416
24,173
13,592
11,448
33
1,218,083
519,457
91,93'1
79,403
89,02~
170,613
122,:200
78,096
67,286
73
1,079,575
465,132
79,095
67,523
77,045
149,451
108,6()'J
71l,860
61,B16
50
138,508
54,325
12,833
11,880
11,977
21,162
13,597
7,236
5,470
23
1,222,879
506,616
83,437
91,084
94,352
1611,186
117,152
78,524
83,484
H
1,097,274
454,570
72,842
79;285
83,261
150,932
106,576
72,168
77,506
34
125,605
51,946
10,545
11,799
11,091
17,254
10,576
6,356
5,978
10
B-1 Part A WORKERS AND NON-WGRERS ACCOR9ING TO
III J~i_ve~tock, Forestry, Fishing, Hunting & Plantations. Orchards
II and allied activitle<i
WOR • ___ ...A-
IV Total Workers Cultivators Agricultural labourers
MaJcs Femak; ,-~-A--l ~--... .A...--"1 "--..A.._-:_-.,,
Males Females Males Female!'; :Males Females
Mlning & Quarrying r::---.A_~
Males Female);
674,479
37,041
63,008
70,156
86,58G
168,215
120,223
75,080
54,151
19
10
39 BILASPUR DISTRICT (TOTAL)
318,181 395,680 140,634 154,769 155,086
16,402 15,439 4,492 )5,876 )0,629
27,1>4 :12,71'1 10.242 21,904 15,337
35,735 36,833 14,314 lB,ll5 18,727
40,573 45,454 16,434 1'),61]1 20,500
B1.241 954')2 36,410 35,339 38,975
61,327 76,35G 29,588 22,977 27,714
35,813 51,966 17,983 13,141 15,462
19.948 41,415 10,666 7,716 7,741
12
RURAL
606,396 393,304 3JlO,201 139,036 150,047 150,7-18
10,463
14,980
18,211
19,946
37,807
26,80B
15,OOS
7,529
3:;,858 15,890 15,348
59,105 26,084 32,291
61,973 33,944 36,195
75,344 38,516 44,682
147,660 77,264 93,825
107,141 58,372 74,726
68,566 34,175 50,779
50,735
14
19,051 1(],344
11
4,46~ 15,~56
10,160 21,431
14,203 17,619
16,796 19,066
36,01+ 34,202
24,1 H4 22,052
17.721 12,597
10,484
5
7,124
URBAN
68,083
1,183
3,903
8)83
11,242
20,555
13,082
6,514
14,877
1,050
1,791
2,057
3,977
2,Q55
1,638
897
7,479
91
422
638
772
1,667
1,630
1,187
1,071
1,598
23
82
III
138
396
404
2G2
102
4,722
221)
473
516
615
1,137
925
544
29'!
4,338
1[;6
357
516
554
1,168
906
459
212
!1
13,210
3,225
1,395
1,078
1521
2,83.1
1,711
927
517
11,493
3,145
1,286
912
1,238
2,339
1,373
759
441
1,717
HI
109
166
283
496
338
168
76
12
1,288
H8
91
13G
156
324
229
122
32
1,074
141
77
118
125
272
182
98
61
14
18
:11
52
47
24
21
13
7,329
41
152
575
1,703
3,328
1,207
270
52
4,523
26
107
412
1,119
1,964
700
163
31
2,806
15
45
163
584
1,364
507
107
21
14
903
21
75
158
195
292
125
30
793
15
67
146
176
264
98
22
110
12
19
2B
27
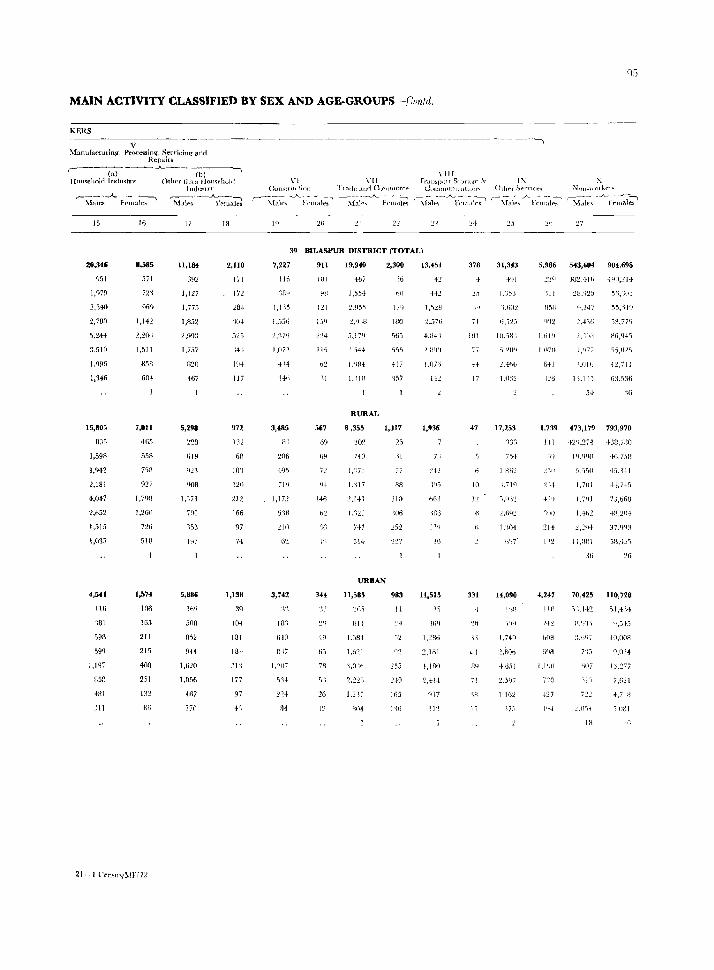
MAIN ACTIVITY CLASSIFIED BY SEX AND AGE-GROUPS -,Cnlltd,
KERS ---,-,---- - ,-,--,------- --------,------------------ ---- -,- ------,
~fanuractUl'ing, Processing, SCITicinr{ and Repairs ,------w- -~--- -A...----{b-) ----,
HnmelloJd rndll~tT"· Otht'r 111::\0 Homrhvld IlIdmtn"
r~~-.A.. --~~ r:-----~---A.._--":\ ~lal(':!;, Ft"wa\f':s Mall"s Vf'males
15
20,34'
2,540
2,730
5,244
::i,SIn
IMfi
1,346
15,80.,
OJ"
1,,19B
I,Q,12
2.181
4.M7
2,652
1,515
4,541
l\(i
']81
16
1,585
571
n'l
1,142
1,511
B5n
fi04
7,011
465
558
71B
927
1,7f)H
1,2G()
51ft
1,574
106
165
211
215
40B
2,11
81i
17
11,104
1,127
1,775
1,352
2,993
1,7.')7
8Z(j
467
5,298
223
619
1,'173
7()1
15~
EI7
5,886
H-i~j
son
8,2
9+4
1,620
1,(156
41,7
IB
2,110
171
17~
284
',04
14::
LU+
117
972
J:12
fiR
101
120
2J2
166
97
74
1,138
10+
lSI
18+
.11'\
177
97
4'1
"I \,11 (:UrlstrtU tin!"] 'I'lade :llld CI)llUuerrf'
'---;hJ~~ -_A_i'~"~:l~ .-~I;;~:_A_-F~~~lc1~
I"
\'III rfall!>opnI t SJ!)rHI.(t' &
L!l.lnlllllnll·~ltl{)II' , ____ -A..._ , ___ ~
'-{alt''> b:'lnd_lf'~
:24
39 BILASPUR DISTRICT (TOTAL)
7,227
116
1,115
1,53ti
).(172
+14
14~)
3,4:85
III
~06
S'W
110
3,742
:\'\
18',
114
~II
101
~n
121
110
11
567
69
1i4
72
q+
146
b2
'}()
1'1
344
26
1"
1~,~40
1,554
2.95'i
2,Ym
I, :1"
RURAL
8,355
740
1,121
747
514
2,300
16
01)
1_llj
180
417
1,317
l5
,106
252
URBAN
11,585
1,0 ill 255
1,217 Hi5
1'\0
13,451
+2
J,!j()[)
I,OIIi
112
1,936
7:
242
lHo
J'VI
,10
11,515
! 12
378
2:1
77
17
47
10
J:!
331
,I
1,
IX \: ()thel -",..rYI(("~ N"II_WOlk{"l~
(-\lal~~ ~ l'~IJ;~~I;;:-' r~Ll~~ _ _A_~.;~~~~
:!5
31,343
1,'J53
1.0:t!
17,253
Tn
I H6:2
1,71()
1:104
14,090
1 162
5,986 543,604 ~04,698
III
IL,n
:W,4:.!5
4.247
1'U11
5:~.'iiq
HG,(}4'l
5'i,H'l.'1
42,711
6:1.536
54 %
1,739 473,179 793,970
] 11 4c2Q.2i-1 4-38,7BO
2H
'lOi)
214
4,247
liP.
).p
1.1'Hl
427
1.71)1
1.402
II,om
4S,Hl
H,H5
7J,6613
..j.~,20..j.
37/N:1
70,425 110,728
i \.14~
007
').1,4Q·
10,008
I),O'H
l'J.~77
7.1';21
+,71H
18 1(',
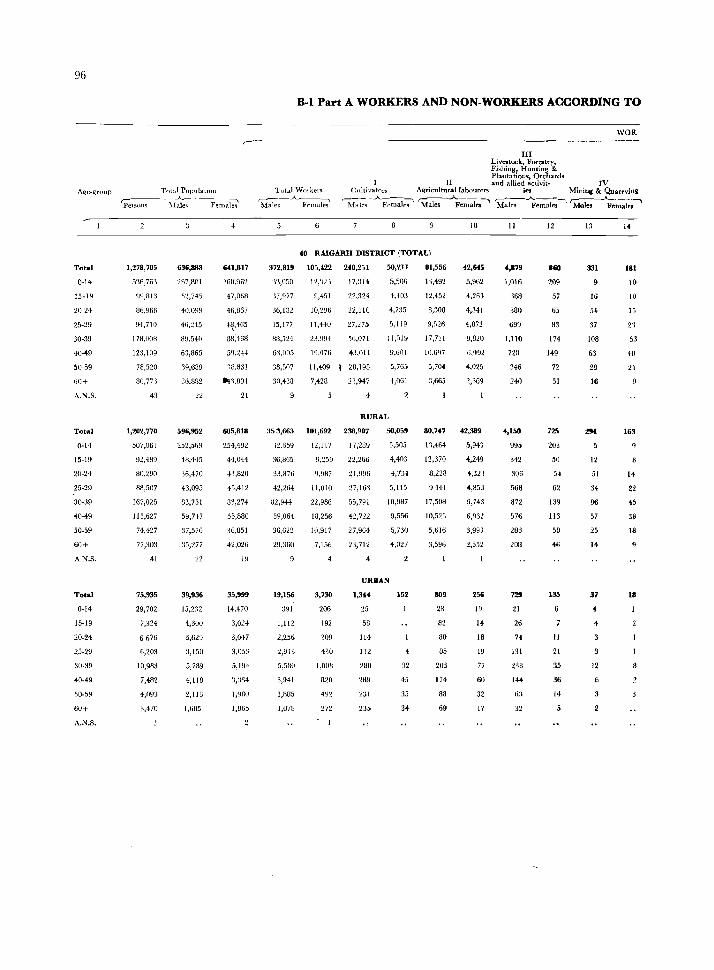
96
Age-group
Total
0·14
15·19
2024
25·29
30·39
40·49
50·5~
60+
A.N.S.
Total
0·14
15·19
20·24
25·29
30·39
40·49
50·59
60+
A.N.S.
Total
0·14
15·19
20·24
25·29
30·39
40·49
50·.>9
60+
A.N.S.
Tot:tl PopulatIOn
'Pe-"-",-"---11~- Femak~
1,278,705
5'16,763
~J~,n13
86,966
94,710
178,00B
123,109
78,520
80,773
43
1,202,770
507,061
92,489
80,290
88,507
167,025
lIS,627
74,427
77,303
41
75,935
29,702
7,324
6676
6,203
10,983
7,482
4,093
3,470
636,888
267,3nI
Y2,745
40,09~J
46,245
89,540
63,865
~9,689
36,882
596,952
252,569
48,445
36,470
43,095
83,751
59,747
37,576
35,277
22
39,936
15,232
4,300
3,629
3,150
S,789
4,118
2,113
l,b05
641,817
47,U6B
46,867
4~.465
88:468
59,244
'18.831
,",'3,891
21
605,818
254,492
4'1,041
43,820
45,412
8'3,274
55,380
36,851
42,026
19
35,999
14,470
3,OH
3,047
3,053
1,865
B-1 Part A WORKERS AND NON-WORKERS ACCORDING TO
III LLvestock, Forestry~ Fishi.ng, Hunting & Plautatiolls, Orchards
II and allied actlvit- IV
WOR
Tot.!1 WOlkers. (~--.A..--:-1 Male!> Fr:maJes
(:II!tivaton Agricnltl1rallabour~TS ie, Mining. &- Quarrving
~ks_A_Femal;' ~~ma)('S:" 'M~~emab--' ~~l~;"l
10
40 RAlGARH DISTRICT (TOTAL)
372,819 105,422 240,251
'13,050 12,~'21 17,:114
'17,977 9,451 22,3H
36,1:12 10,2% 22,110
45,177 11.440 27,275
88,524 23,994 56,071
6'1,005 19,076 43,011
38,507 11,400 28,195
30,438 7,428 2'1,947
50,211
5,50G
4,403
4,735
5,119
11,019
9,601
5,765
4,061
2
RURAL
:153,663 101,692 238,907 50,059
5,505
4,403
4,734
12,659
36,865
33.876
42,264
82,944
59,064
36,622
29,:lOO
19,156
391
1,112
2,256
2,913
5,580
3,941
I,BB5
1,078
12,117
9,259
9,987
11,010
22,986
18,256
10,917
7,IS6
3,730
206
192
309
430
1,008
820
272
. I
17,289
22,266
21,996
27,16'1
55,791
42,7'22
27,964
2:~, 712
4
5,115
10,987
9,556
5,730
4,027
URBAN
1,3it 152
25
58
114
112
280
289
Z:lI
235
4
32
35
81,556
1'1,492
12.452
8,308
9,526
17,711
10,697
5,70-4
:1,665
42,645
5,902
4,263
4,341
4,872
9,820
6,()92
4,025
2,369
80,747 42,389
1'1)464
12,370
8,228
9HI
17,508
10,523
5,616
3,596
809
28
82
80
85
203
174
88
69
5,943
4,249
+,32'3
4,85:l
9,743
6,932
3,993
2,352
256
19
14
18
19
77
60
32
17
II
4,.79
1,016
:168
380
699
1,110
no 346
240
4,150
095
342
306
568
872
~76
283
20U
729
21
26
74
131
238
144
(i.'{
32
12
860
209
57
65
83
174
149
72
51
725
203
50
5~
62
139
113
58
46
135
11
21
35
36
14
13
331
9
16
54
37
108
63
28
16
294
12
51
34
96
57
25
14
37
12
6
14
181
10
10
15
2'1
5:1
40
21
163
14
22
45
38
18
18
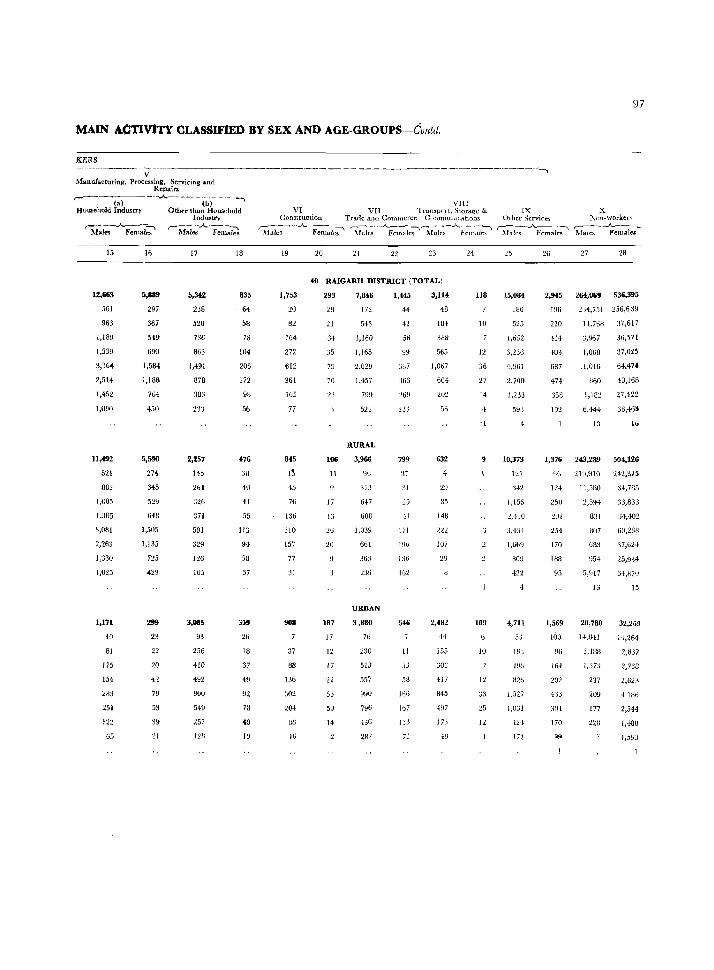
97
MAIN ACTIVITY CLASSIFIED BY SEX AND AGE-GROUPS-Contd.
KERS
V --~---------·-----l
Manufacturing, Processing, Servicing and Repairs
r---~- ---.A. '--(b-)-----,
Household Industry Other than Household Industry
r:~-;i;$-~aJ~ r--M~~.A.- Feln~~
15
1:1,663
561
963
1,180
1,539
3,J6~
2,514
1,452
I,U90
11,492
521
D82
1.005
1,385
3,081
2,263
1,330
1,171
10
81
175
154
283
:lS1
65
16
5,889
297
367
549
690
1,584
1,ISU
704
450
274
345
529
648
1,505
1,135
125
429
299
23
22
20
79
53
21
17
5,342
238
520
736
863
1,491
878
383
2,257
145
164
326
371
591
329
126
105
256
410
492
900
549
257
1211
18
835
64
58
78
104
205
172
98
476
3£1
4U
41
55
113
94
58
37
359
26
18
37
49
92
78
40
I ~I
VI Construction
,,------:-_ .. -.A. __ -c, ~{dJC'i Females
19 20
VIII VII Transpol t, Storage &
Trade and Commerce CommUmCrl.tlOos r--..A..--- -:...-, ____ -...A..----:-----...
'-Cales FemalC'5 Males i't':mdle..
21 22 24
40 RAIGARH DISTRICT (TOTAL)
1,753
20
82
164
272
612
361
165
77
845
I~
45
76
136
310
157
77
31
37
88
136
302
41j
293
2B
34
35
79
70
lOG
II
17
13
26
20
187
17
12
17
5:;
50
14
7,846
172
513
1,160
1,165
2.029
1,457
79~
521
RURAL
3,966
%
313
617
608
1,039
661
363
URBAN
3,880
76
230
513
557
990
796
1,«5
44
42
58
99
337
363
269
233
799
37
:11
25
11
171
190
136
646
II
OJ
58
166
167
133
71
3,114
48
184
388
565
1,067
604
202
56
632
4
us 148
107
29
2,482
H
155
:;0:1
417
845
4!:li
173
48
lI8
10
12
36
27
14
109
10
12
25
IX X Other Servic.r-s l\on-workel ~ r--.A.--~ ~----...A....---_
Malr:s F~males j\Jak:-. Females
25
15,084
180
525
1,652
3,236
4,961
2.700
1,233
593
10,373
\'27
:142
1,156
2,410
3,.134
1,669
BOD
4,711
53
183
496
826
1.527
1,031
4H
171
26 27 28
2,945 264,069 536,395
196
220
Hi
403
687
474
358
192
2')4,751 256,639
1-1.768 37,617
3,967
1,068
,1,016
860
1,182
6,444
13
36,171
37.025
64.47'
40,168
27,422
36,465
IS
1,376 243,289 504,126
96 'll~ •• ~HO 'l4'l.31~
124
250
2UI
251
170
188
93
1,569
100
164
202
4';3
304
170
11,5U[)
2,5~-t.
831
807
683
954
5,917
:H,785
:13,83~l
34"W2
60,288
37,624
25,934
34,870
13 15
20,780
H.H41
3,IBB
1,37:;
237
2lJ9
177
228
32,269
14,264
2,832
2,738
~,623
41B6
2,544
1,488
J,59:]
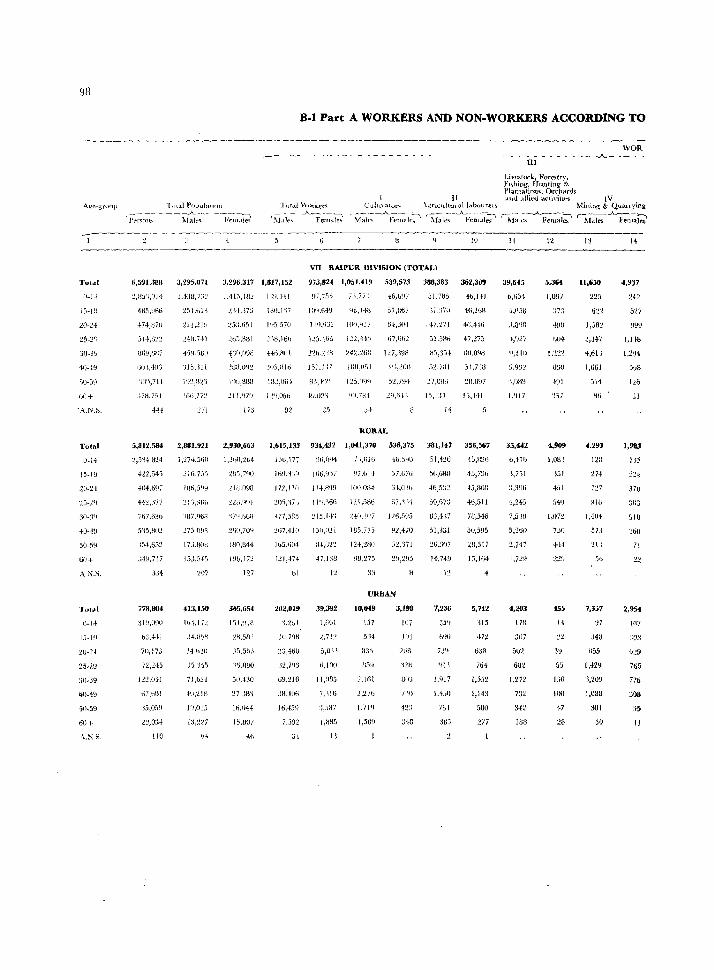
911
Total
II-I-!
l5-tD
40-49
b(]+
-A,N.",
Total
0-14
40-49
50-5!!
6U+
AN.S,
Total
()-I-l
:;O-~19
~0-49
50_59
60 I
'\.N S,
B-1 Part A WORKERS AND NON-WORKERS ACCORDING TO
WOR r- - --~ - - - - -- - - - - - -- ---- - - -- -- ---- ------IU-- - - ------'-- ----~
l.ivestock. Forestry, t'l!,hhlg. Hunting & Plantations. Orchards
([ <lIHl.tUiet.l <'IctivitH!S IV "1 otal PO.[.JUlatIflu Total \\ ()tkers: Cl11tl'"atut'\ .\I,~TlcldtUlal [ot.bouren, ~ti.ning &. Qu.allying
rPe~o:~" ----~e~---· --I,'~I:~ (,\1'\{(>:-- ~l~k: M-:I~:--A~I~ r~1aI:s~_A_~;::I~? ~f~l;s-..A_F~;I~ ,.~.A.c Fell~
4~5,V8ti
4-74,UiO
I)() 1,40'}
'\011,711
,i7H,7SJ
HI
221,11!1
'liS, III
27J
VII R4.1PUR DIVISION (TOTAL)
:1,296,317 1,817,15~ 973,824 1,051,419 539,573 388,383 :162,309
1.413.lHl I ;~l,H! !..I7,;'.)') 7:;,77'] -l-6,Wi ,)1.785 46.!H
.!,)-1,i7:i 180.1·~i 101f.649 (J8,I-t-H 57,B67 ,~}7,J70 '1:6,2()S
253.651 fC1557(J 1 Jl),(jJ2 100,417 64,3(14 +7.:271 4(-i,4Hi
~bS,S»i 2 )8,iljb l~~), }o6 U2,44':'") 67,1)02 j1.!)l-li6 47,.l73
-f,'lf),n98 Hr.i)1()1 :!'l:h,:2'-!.H ~~4:~,~61l 12i)398 i:l.):I.5-! BI),O~m \
18H,1J4:! HIS,HIt! 157,'317 IBH,O,,)] ~1,200 .)~.7al 31,7lU
l%,am.l W!,(\G~ 8K,1-11Q 1'2.5.')\)<1 5'2,794 17,oaa ~II.U~7
211,lj7~) U'I,Oob ·~~),[)2'3 ')~I.7CH 2(),6H 15,!J4 1),Ht
J 73
RURAL
5,812,584 2,881,921 2,930,663 1,615,133 934,432 1,041,370 536,375 381,147 356,567
:.!,S'14 3:.!4 1,'274-,560 1,21")0,264
422545 .2J6,7YJ :W5,7<1f)
+(}4,6~1 lBh,Sqy 211J,09U
7ti7,6:?b '~87,r163 'P'l.h6R
5·~5.Bo2 27) (l~3 ,2tJ(J,70Q
";·19,717 13),[\4S I YO, 17').
,134
778,804
0:1,+11
70,!73
n.~45
12~,051
ti7,b{ll
110
~07
413,150
io·tI7l.
34,h2'0
J5:351
7I,b~I
40;1111
1'1,015
I:;,~17
""
127
365,654
lH,~ll.j{
1H.5lH
J5,S:d
'jlj.m1O
Jtl,430
~7,JR3
10.1144
15,BU7
4~
1:1ti,171' 96,f)14-- 7 ),tlltJ 46,SQO 51,4.!6 4~,1l26
169,~J(1 106/1'17 07,h14 57,676 5f,,6»n 4~,7!1t-;
17:1,1 Iii 1]4,3'19 ] ()O,OB4: 64,0% 46!5:1~ l\BOH
~()'),'i7'1 ll'I,'156 11l5Bti 67,'~:H SU,07:_) 46,511
177,j85 :!!5.J-}'1 L4!t.!()7 J:!6,5:15 8'3,1':7 7U,546
:.!67,41U IjO,O:!l 185.775 fl2,470 51)331 5(),,j!)5
Ib5 j (i04 34,ltt! 124,:.':110 :,2,'371 ::!ti,J07 :.::a,:H7
J:!I,474 47,1:18 :-IB,275 :!Y,2~5 14-)49 )5,164
bl
202.019
~3,400
,12,7tI:1
69,216
JR, Hl6
16,~5!l
7.J9:!
31
39,392
1,6EoI
L,7U
5,O~\ 1
fl.100
1 J ,OB5
7.)lti
:;,51:17
LaBS
11
URBAN
157
5'34
3:n U54
:l,Ull
3,198
107
T!.H
:348
I')
7,236
4
5,742
'1I5
412
61~
764
1,552
1,1+3
5UU
217
39,645
6,ti3+
'\,(}U~
1.917
35,442
lr,47h
'J,7:i1
7,8311
5,260
2,141
I,TN
4,203
17B
:]07
502
682
1,272
71~
342
!US
5.3&4
:!51
4,909
1,OBI
l51
4-!iJ
7:W
-1-11
45.
14
J50
II)()
47
:.w
ll,ti50
2,3-4-7
4,6lJ
1,661
:'14
Hti
4,293
1211
t74
7'27
I,W,!
573
7,357
!i7
<155
1,429
1,08U
301
30
4,917
1,118
I,2u4
Jv8
1:.!6
J3
1,9tI:J
ll:'
224
370
183
518
'!tiO
71
o:.!9
7G5
776
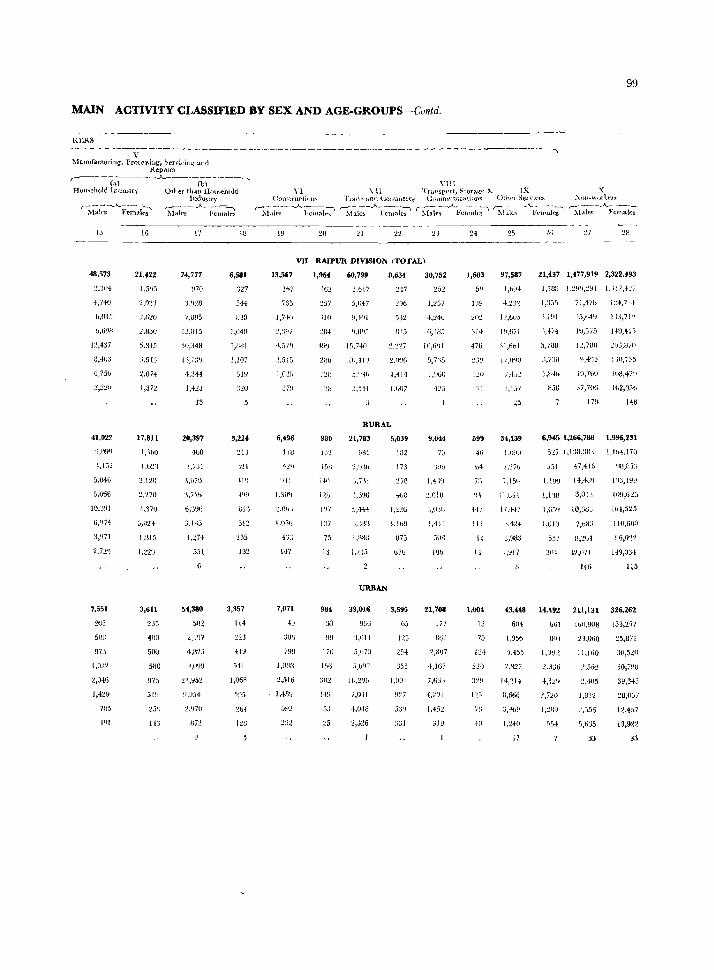
99
MAIN ACTIVITY CLASSIFIED BY SEX AND AGE-GROUPS-Culltd.
- - ------ - --------------------------------- ---------------------- --, V
:\ianufacturing. Proc.c~~ilJg, :'C'rvicing and Rep.tlfS
,.--------W-- -- --"-------rbl--......, Household Indu1Itry Odler than HOH'Jehold
IudUstrr
':"VI-:l;s-..A_fem.tl~ ~I('~ -"'--l~:!r';
15
48,573
:!,:W4
4,74(1
b,{JI5
I>.691l
J:!,437
tl.4tJ3
4,751>
41,022
:':,tfJIJ
5.'HU
5,(i66
10.,>9]
6/114
3,'171
2,7~9
7.5:;1
Sill!
97,1
I.O.~2
2,04:6
1,429
7V5
16
21,422
:!,(i20
2.850
5.345
:;,51'J
M74
1,37:!
17,811
1,'lhO
1,6:!'}
'2,}20
3,611
235
400
50()
5110
975
51~1
113
17
74,777
970
':L!1:!8
7,U95
t..!,BJ:i
:1O,:148
20,397
408
\,nl
J,1)71)
'~,7Ih
33l
6
2)91
4.II'IS
!!,lJ54
872
1M
6,581
')27
544
U33
J,1I411
1 ,1I1l 1
1,107
51!}
~lJ
19~
3,357
114
41 ~I
141
1,068
Vlll \"1 \ 1I Transp'lrt, StofMe &. IX X
"\')II-~OlleJ~ UOll~trurti('.i'" TlcHle and (.;onuuel{:r CflmmUHtCa1inils Othet Se1vLces
r:\f~~k;---A l'cn~;:' ~k;-J,._l;cmal-c-;' ~We;-A-F~,:~i~:;' ~!~l~~ ..A..l<:t'-Il\:it~--;' r-- __ .~...A.__ ----
~[.dles Females
19
13.587
107
735
1,740
4.57',
147
7,071
4~
:106
1,01l11
~,516
1,48V
~() 21
VII RAIPUR DIVISION (TOTAL)
1.964
162
:!57
110
980
1:;7
75
13
\70
J5(j
1+~
5J
60,799
1,617
5,()47
8,634
~17
296
ilL')
'2,It!J6
RURAL
21,783
),731
l,LI:>
URBAN
39,016
'1,011
5,fJ70
,,),1,97
1(1,L%
7,1)'11
-1,0,18
2,Jl6
5,039
132
173
~7S
l,I.,g
B73
ti7~
3,595
65
254
:355
1.{)OI
"01
30.752
J,:t;'j7
4.24G
6,1U5
IO,tilJl
5~7,')5
),%0
9.044
):)
1,4 ~9
J,4H
IU\)
21,708
177
Utji
~,1::I1J7
4,]67
7,f):):)
4,291
1,45~
24
1,603
59
471j
120
iB
147
II·l
12
II
1,oot
13
75
1~4
220
ill
+l'
25
97,587
1,W+
4-.1:.11
1:!,L()5
I ~1,6/1
:;l,tibl
17,W~t_)
.1,D7
54,139
I ,()~\O
1,15(\
\1.8H
lU47
;;,1·24
'27
21,437 1,477,919 2,322.493
1,1813 1.~9lj,~91 L i17,4~;
1,474 lU,5)5 HO,4:-'
5,7138 1:.!, 7H8 ~:W,J,87[\
.\7:.lU ~),4,)5 130,7:'3
l.U4\) 10,760 WIl,4il'
H5B ,)7,706 IQ2,9.3v
17~ 14B
6,9', 1,26G,788 1,9%,231
5'!.7 I.UU,:ilH 1,lh4,170
5:)1 47,416
1,10/J l4J'HN
1,I'lU B,OU
1,VIO 7/)~U
5:17 B,lll-t-
301 :12,071
146
'IH,B):;
ItH./,6:L.J
lh·l,525
110.63"
115
13,H3 14,l92 2Ll,I31 326,262
6"4 ~61 [,,'l,908 153,2)7
[,95" 801 N,060 25,87!
'J,-I55 t,rJ~jl 11,100 30,540
14,214 4,l:2~' 1,405 39,345
U,666 ~,no 1,812 ~0,007
1.:!4(J 554 5,6:.15 13t9l2
j) 33
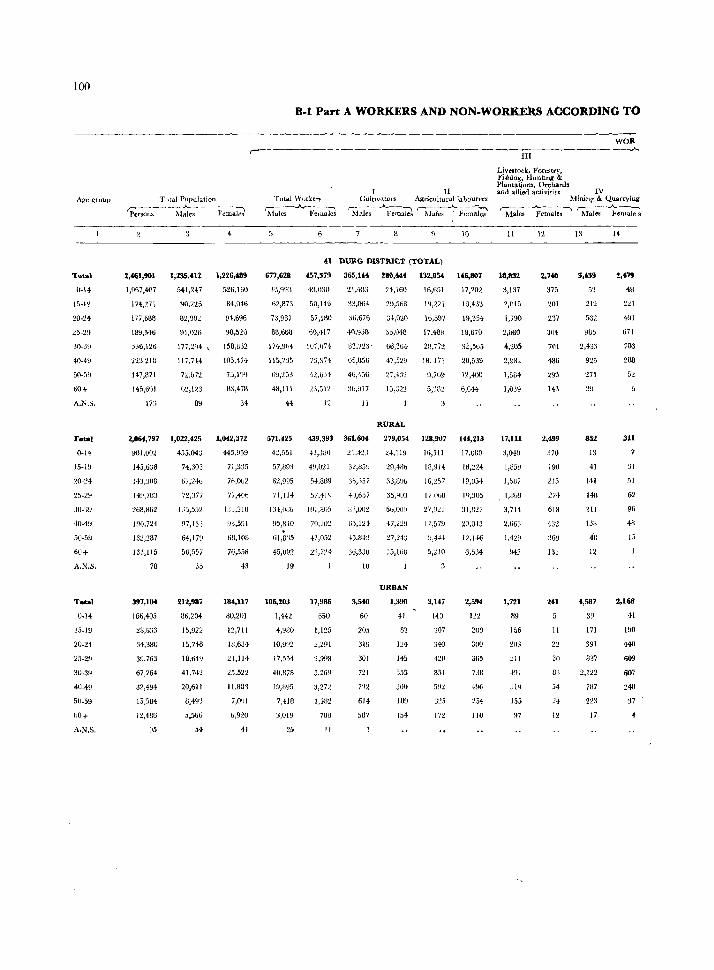
100
Total
0-14
15-1~
20-24
30-39
40-49
60+
A.N.S.
Total
0-14
15-19
~W-:!'"
t5-l~1
40-W
50-59
60+
A.KS.
T.la'
U-14
15-19
20-24
25-29
30-39
40-49
50.59
Toral PoPulation ~_~ __ . __ ...A..._ --~- -~':'l
Personr,. Males Females
2,~1,901
1,067,407
174,~71
177,088
189,>46
336,126
223 21tl
147,871
145,601
17:,
1,235,412 1,226,489
541,247 526,160
90,225 84,046
!t.lJ91J',! 9'1,696
!)1,026 9B,520
177,2')4 \ 158,832
117,744 105.474
7'2.b7'1. 75,194
83,473
84
2,06i,797 1,022,425 1,042,372
901.002
145,6:;8
143,3U8
14~),7UJ
2tiU1!:lG:l
lav,n4
132,287
133,115
78
397,104
166,4Q5
28,6:13
34,380
39,763
67,264
32,494
15,5B4
12,4U6
~5
74,303
67,240
n,:177
U5,55~
97,133
64,179
56,557
35
212,987
86,204
15,922
15,746
18,64~
41,742
20,611
8,493
5,566
54
445.959
71,3J.J
76.002
77,40"
I:JJ.:3W
U3,5!.l1
68,108
76,558
43
1801,117
BU,ZUI
1Z,711
18,634
21,114
25,522
11,88'l
7.0~JJ
6!920
41
B.1 Part A WORKERS AND NON.WORKERS ACCOJWIN(;. TO
Total Worker.; r:--.A.-- ---:--. Males Females
Ii CultlVi1.tors Agri.culturallabourers
f" - --A.~":1 ,--------"- ---~"-"\ Malts Females Males Females
10
41 DURG DISTRICT (TOTAL)
677,6211
62,873
n,937
88,668
1 74,9h4
11,,735
4f),111
H
457,379
5U,146
57,130
60,117
107,074
73,374
4~,tl'J4
12
365,144 280,444 132,054 146,807
21,41l:1 24,160 16,651 17,202
33.064 29,5113 1~,221 13,433
36,676 :;+,020 16,597 19,354
40,~58 36,1)48 17.488 19,670
83.723' 66,364 23,772 32,565
65,S56 47,5,9 la.171 20,539
4ti,45ti 27,'t1:l 'JJ1l9 12,400
:J0/117
11
1:1,322
RURAL
5,'JU2 G,GH
57l,425 439,393 361,604 279,054 128,907 144,213
42,551 42,::WO
57,1393 4~,011
62,995 54,889
71,114 57,f1tJ
134,086 WI,BU5
95,8-1-0 70, JU:.!
61,835 {I,052
45,092
19
106,%03
1,442
4,!J80
10,992
17,554
40,878
19,B95
7,418
22,7N
17,986
1i50
1,125
2,291
2,998
5,2n9
3,2n
1,,182
7110
II
21,423
3~,85~
30,357
+n,657
8'),OO::!
65,124
45.842
36,3:30
10
3,540
60
205
319
301
721
614
587
24,119
29,480
33,8%
35,4U3
tib,OOY
47,2:2~
'27,24J
13,168
URBAN
1,390
41
82
I:!4
145
355
300
lU9
154
16,511
13,914
16,257
17,(I6U
27,Sl21
17,579
\1,4+4
5,210
3,147
14U
:307
851
3:!5
172
17,080
18,224-
19,054
lQ):J05
:H,B27
:W,G-!3
12,HIi
6,5:54
2,594
122
209
300
365
738
496
254
]W
III
Livestock. Forestry, Fishing, Hunting & Plantl1tions, Orchards and allied activities IV
Mining & Quarrying r--~ --..,A_--~ r-:_- -A-___
Males Females Males Female s
11
18,832
:1,137
2,IH5
1,790
2,080
4,205
2,982
1,584
1,039
17,111
3,048
1,869
3,714
2,tJ63
1,429
942
1,721
89
156
203
111
314
155
~7
12
2,7.0
375
143
2,499
370
190
215
274
6111
402
269
1>1
2U
11
22
30
83
54
c4
12
5,'39
,!)~
211
532
852
13
41
141
1411
311
138
48
12
.,587
39
171
391
837
2,l22
787
22:1
17
2,47S
48
221
491
671
703
288
311
31
51
62
96
48
IJ
2,168
41
190
440
609
607
240
~7
4
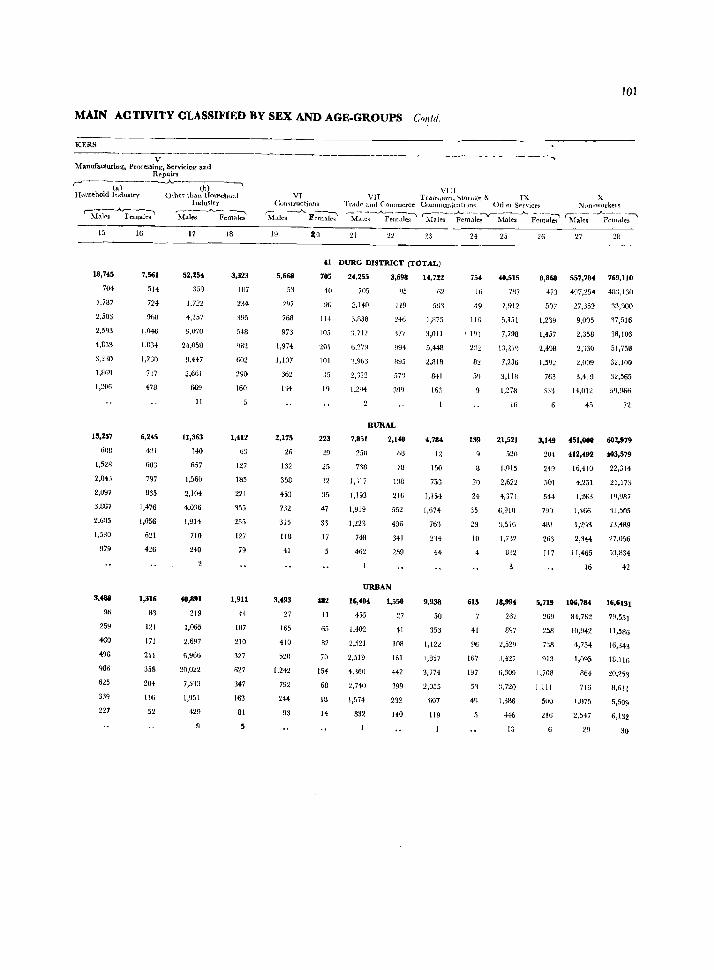
101
MAIN AC TIVITY CLASSIFIED BY SEX AND AGE.GROUPS- Gnu/d,
KERS
V Manufacturing, Processing, Servicing and
Repairs r- (aJ ~--.A --(-h)-~~
HOl1s~hold Indu. ... try Other than Hml'l(:bohl Industry
!":----...A.,,-.---., r-~--.A.-~~ :!\Jales Females Males Females
15
18,745
704
J,j87
2,503
2,5~3
4,853
:1,2:lfJ
1,869
1,~06
15,257
60B
1,528
2,043
2,097
3,067
2,605
1,5~O
979
3,488
96
259
460
~%
486
625
S:N
227
16
7,561
514
72-1
%8
1,046
1,334
1,2GO
737
478
6,245
4:11
60J
797
B35
1,476
1,056
621
426
1,316
33
121
171
211
358
204
116
52
17
52,254
:151)
1,722
4,257
9,U70
24,058
9,447
2,661
669
II
11,363
140
657
1,:'60
2,104
4,036
1,914
710
240
40,8'1
219
1,065
2,697
6,966
20,022
7,5'1:1
1,951
429
18
3,323
1(17
234
395
548
602
290
160
1,412
63
127
185
221
155
255
127
79
1,911
44
107
210
~27
627
347
163
81
VI Con"tl'uctiotls
~~cs---A. J!~~~
19
VIn vn TrdnS)_1Ol't, Stor'ilg~ & IX
TraJC' and Commerce C:ODllllunicahuo<; Othel S("fvices
':'\1:k:_'..A..-F-'e>-n"-le~ ~I-al-es--~~;'-es---V--M-a-le-s --'- Fe~~-;-l~
21 23 25 26
X ~un-workels
r- --- .--'"--------.., Males Females
27 28
41 DURG DISTRICT (TOTAL)
5,668
5~
768
973
1,974
1,107
362
114
2,175
26
132
358
453
7,12
sis 118
41
3,493
27
165
410
520
1.242
792
2#
93
705
40
90
114
105
:!Ol
101
J5
223
29
25
12
:IS
47
33
17
482
II
65
82
70
154
68
IS
14
24,255 3,698
705
2,14-0 119
'177
B95
2;122 57'J
399
RURAL
7,851
250
7~18
1, 117
1,1'13
1.919
1,223
748
462
2,148
1i8
78
138
216
552
496
341
259
URBAN
16,404
455
1,402
2,521
2,519
4,'160
2,740
1,574
832
1,550
27
41
108
161
442
399
232
140
14,722
51)'1
1,U75
3,011
5,448
2.818
841
16:1
4,784
12
ISO
753
1,IH
l,oH
763
9,938
50
353
1,122
1,857
3.774
2,055
607
119
754
16
49
110
l191
139
20
24
35
29
10
4
615
167
197
51
49
40,515
)U7
J,~n2
5,151
7,798
7,236
3,118
1,278
16
21,521
520
1,015
2,622
4,371
6,910
:1,516
1,732
832
18,994
267
897
~.529
3,4'21
6,309
~.720
1,31\6
H6
13
8,868 557,784 769,IJO
473 4~7,254 4fU,l3U
507 27,352 33,900
1,239 9,005 17,516
1,457 2,358 18,103
2,498 2.BO 51,758
1,592 2,009 32,100
763 3,419 32,565
14,012
45 72
3,149 451,000 602,979
204 412,492 403,579
24~ 16,410 22,314
501
544
7YO
4UI
263
117
4,251
1,2~3
1,466
l,t9~1
2,344
11,465
21,173
1'1,987
'[I,sns
'1.l,~89
27,056
53,834
16 42
5,719 1116,784
269
258
738
913
1,708
1.111
500
216
84,762
10,942
4,754
I,O~5
864
716
'.075
2,5'17
29
16,6131
79,551
11,586
16,343
18,116
20,253
8,611
5,509
6,132
30
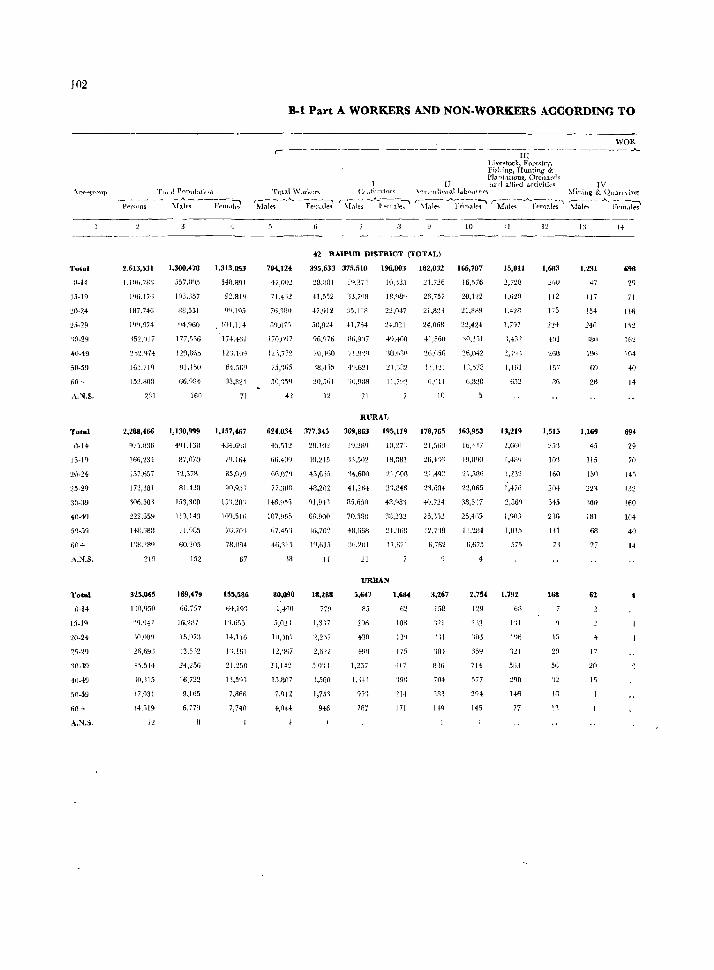
102
Toml
1)-14
1.,-19
"0-24
'1Il-39
~(\-49
5(l-59
fiO f
,\."1.s.
Total
0-14
15-11)
5'1-59
(JO+
_'.N.S.
Total
'l-H
15-19
A.:-I.S.
2,613,531
1,II/h.78t;
14 0.17,;
IH7.741;
]!)(I,n74
i5~,()17
152.ROR
231
Tnl \1 POf!llbl.illH
~1~-;---r~;'tQ
1,300,478 1.313.053
3.57,WI.') 5+fl.89I
103.:157 92,814
'I4.c~(;() \ 1(14,] 14
177Sl6 '174-,461
1'1~I,fW,!) l:h,lWI
fl1.I:,(1 8'L5fi9
66,084 R'"BH
160 71
2,2118,466 1,130,!I'I9 1,157,467
166,234 <l7mo 7'I.11i4
157.657 72,~j~ B5.07\)
172,381 RI,42R qr),q;) j
106,501 153,300 lY1.201
~~2,G5~' 113,143 1()f),516
HH,fjSB 71,0f15 7Ii.70'"\
118.~Bq 60.205 78.084
219
2G,69,;
h.114
10,H5
17,<131
14.319
I')
152
169,479
66.i57
Hi;W7
15,l)n
13.5:t~
24.256
16,72~
9.[65
6,779
67
155,SSG
64.19'1
1'1,65j
H.ll0
l';,!fiJ
n,5~1
7,860
7,740
8-1 Part A WORKERS AND NON·WORKERS ACCORDING TO
r--- ------------- -------------- ---- -------111 -- -I.ivestock, FOl'e<;tIT. FisJdn!!:~ Hunting & PlantaliOns~ Orchard~
II :iwi aliiI'd a('ti"itie~ TOi~l \V\}l'kCf'$ C1l\tiV:'ltm ..
(---~-A..---~:-1 r---- _ _A_-:--___ ~ l\'lale<; Ft'Ill..t1e'! ~(.lb: 1't'lIla!e.,
.\~n"Uh\l,a114b('\IIe:l'" r----A------, ~-'--_,A----.'1
\fal~o; rro'ma\I"'1 Malt'" Fem:'lle-s
704,124
47,002
71.4':2
170,01)7
l'2~,77~~
75;165
42
10
42 RAIPUR DISTRICT (TOTAL)
395.633 375.510 196,803 182,0:12 166,707
47.912 ~5.11H
50,ftU 41,Ti4
96/176 Bti,907
IH,t ~):=. {(f,G:?1
:':O,5i1 J '~G,9BH
12 21
10;,35
18,9gQ
2:!,047
]4!1~1
+!),.t.()()
'\8J:":l,fI
IJ ,7~!~
RURAL
21.726
26,757
21,R!~
24,0(;8
41,56ft
:H1,05G
16,576
20,In
21,889
2:!,424
'{Q,l r)1
1~,o78
6.820
6U,034 377,345 369,863 195,119 178,765 163,953
4!i,51'! ~1l.JO~ l~),'2fN 10,27'\ 21,flfifl 16,447
(ifi,4W) +0.215 '~3.5n:! 18,:181 26.-t'ifl 19,BI)O
G6.01'1 45,():l5 ·H.6flO 21 '<)011 2i.4Q2 21.5fl€
77,10<1 48,202 41,264 2'1.84fi 23.684 2~,065
1 46,W;r, <)1,9+3 R5,fj50 4R.r18·~ 40.7:24 :l8,,1)')7
107 ,96S 6(J.~OO il),SSB 1B.'!3~ 2:', Vl2 2S,-+n~
1;7.45'1 'Hi.70~) 4B,6G8 :!l;lfil3 J:l,7'\fl 1~1/U14
46;111 1Q,IlJ5 36.201 11,ti;!] 6,762 6.675
'18 II 21
URBAN
II
15,01l
2,728
1,620
I,Ifil
13,219
l,ti(;O
1,GO'!
1,01.1
575
80,090
1:4-(j()
5,0, )
18,268 ;,647
85
1,634 3,267
158
2,7S4 1,792
11),101
1:!.'H-j7
lo,n07
7m2
+,n4~
1,317
,i.O'1 :
946
2!)tl
1.257
1,1+1
931
187
62
lOR
I is -Il7
191)
"[4
17[
'1'21
H\
'\Sf
B16
1~9
'2 ~12
'11\3
359
71'1
145
68
I'll
11)11
'~21
146
77
12
1,683
112
175
4111
2GB
1,5]5
25'{
101
16()
2M
345
141
71
168
21)
56
12
WOR -------..A-
IV ~finill2 & Qn,;ul'\ill~
Si~I .. ~- - A l~~m~l-;;'
1,231
+7
[Ii
15+
:!4{)
mo
1%
flJ
2fl
1,169
45
115
15(1
22~
~60
18\
6B
2i
62
+ 17
20
]5
698
2~
71
W2
1M
4()
H
694
29
70
145
132
160
10+
40
14
4
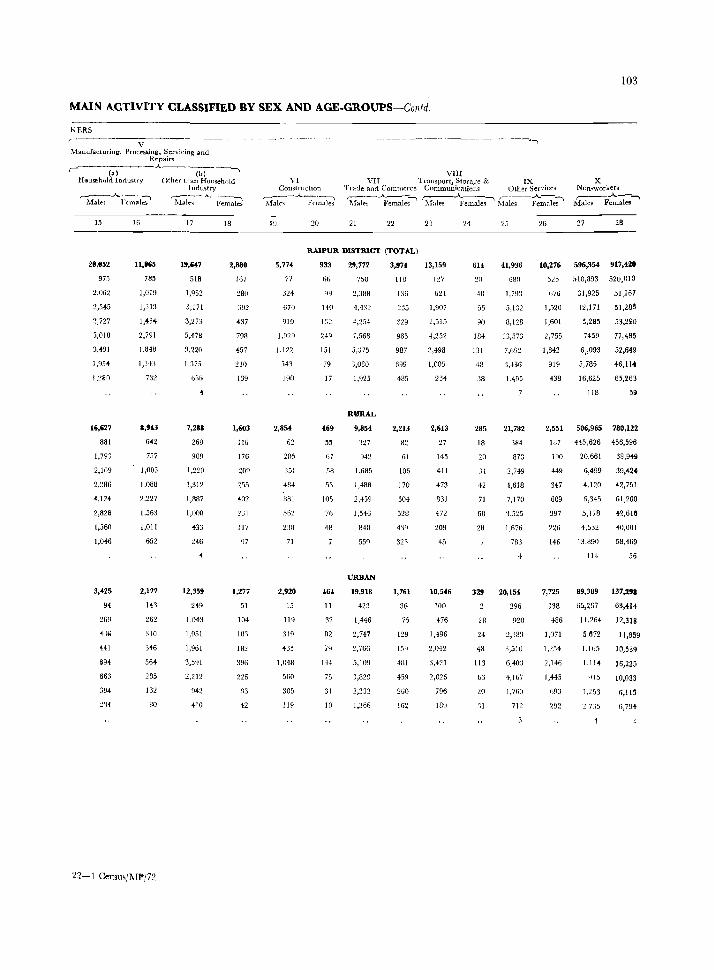
103
MAIN ACTIVITY CLASSIFIED BY SEX AND AGE-GROUPS-Colltd.
KEltS (------V-~- --- ------------------------------------------------,
:'vlanuf~cturin(, Proce-!j.sin~, Servicing and R,=,paLl'S
"'---(a-) ___ _A_ ___ (bj---' H0Ullr'hold Inrlmtry Other than Household
Industry
~~--A Femal;' ~~-__A. }.,~
15
28,152
975
2,062
5,0]8
3,491
1,954
li,'27
881
1,793
2,109
2,286
4,IH
2,825
1,360
1,046
3,425
94
HI
89<1
663
394
2'H
16
11,1165
785
1,019
1,313
l,i3~
2,791
I.B4B
l,l-n
732
',U3
642
757
1,003
1,0BB
'2.227
1.563
1,011
652
2,122
H1
~62
310
3i6
564
285
132
80
22-1 CeITsus/]\[1"/72
17
19,'47
518
1,f)52
3,171
3,273
5,478
3,220
1,:J75
6:'["
7,288
269
909
1,220
1,312
I,BB7
l,nOf.!
~33
246
12,359
249
1,043
1,951
1,961
3,591
2,212
942
410
18
2,880
167
280
437
798
+57
210
139
1,603
116
176
2::'5
117
1,277
51
104
101
182
396
226
~3
42
YI COllstrUCtIon
~_A__-., Mal!!"" Females
19 20
VlIl VII Trallsport, Storalre & IX
Trade and Commerce Communicatio~s Other Sel'vict'"s
'MaJe~ -~~ ~fales ~<;--... iful~---:e-male-;--
21 22 23 24 25 26
X Non·workers ,--.----:....A.._~
Males Females
27 28
RAlPUR DISTRICT (TOTAL)
5,774
77
324
670
919
1,929
l.l22
34'3
J90
2,854
62
205
351
484
IlSl
!ifi2
238
71
2,920
15
119
319
435
1,048
560
305
119
933
Iili
~9
140
132
24-9
151
79
17
469
55
67
58
51
105
76
48
464
II
32
82
79
144
75
31
10
29,772
75U
2,388
4,432
4,254-
7.568
5,:375
'1,080
Rlo!RAL
9,854
127
942
1.685
1,488
2,459
1,546
848
URBAN
19,918
423
1,446
2,747
2,766
5,lm
3,829
2,232
1,366
3,974
118
136
235
329
985
98i
699
485
2,213
82
61
106
170
504
528
414
321
1,761
36
75
129
159
481
459
260
162
13,159
127
621
1,907
2,515
4,252
2,498
1,00::'
234
2,613
27
145
411
473
831
472
209
45
10,546
100
476
1,496
2,042
~~,421
2,026
796
189
614
20
40
55
90
184-
131
48
38
285
18
31
42
71
68
23
41,936
680
1,79']
5,132
8,128
13,573
7,692
'),436
1,495
21,782
'184
873
2,749
4,618
7,170
'1,525
1,676
7B:J
329 20,154
296
28 920
24 2,383
48 3,510
113 6,403
63 4,167
20 1,760
'li 712
10,276 596,354 917,42'
525 :>10,393 520~OlO
fi76 31,925 51,267
1,520 12,171 51,283
1,601 5,285 53,2~0
2,755 7459 77,485
1,842 6,,093 52,649
919 5,785 46,114
438 16,625 65,263
118 5~
2,551 506,965 780,122
187 445,626 456,596
190 20,661 38,949
449 6,499 39,424
347 4,120 42,751
609 6,345 61,260
397 5,178 42,618
226 4.532 40,001
146 13.890 58,469
114 56
7,725 89,389 137,298
338 65,267 63,414
486 11,264 12,318
1,071 5,872 11,859
1,254 1.165 10,539
2,146 1.114 16,225
1,445 '115 10,033
693 1,253 6,113
292 ~ 7:)5 6,794
4
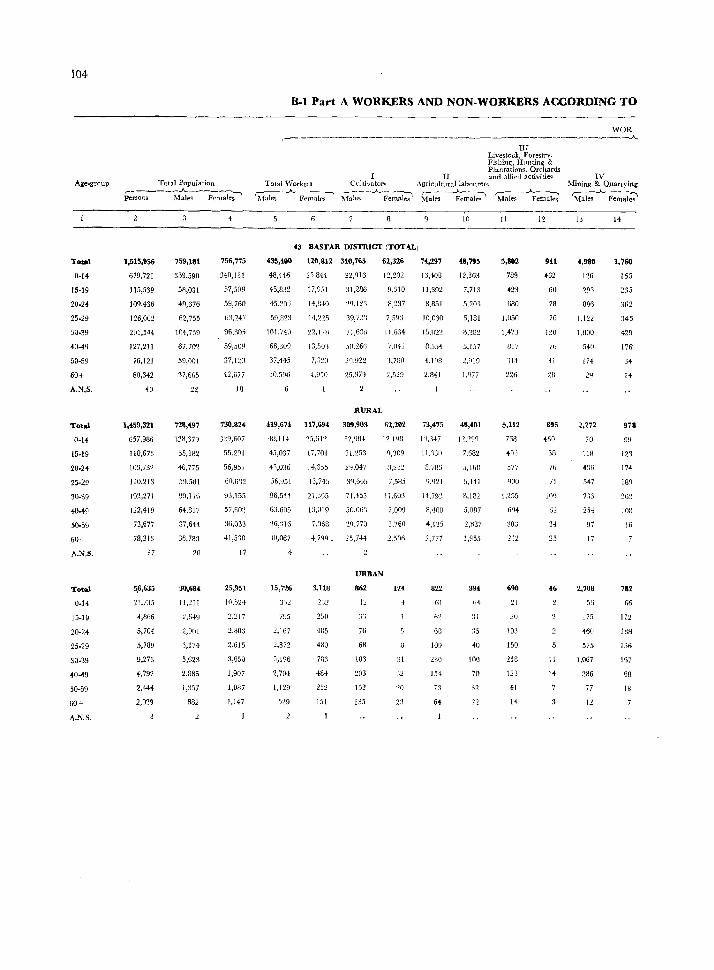
104
Age"group
Total
0-14
15-19
20-U
25·29
30-39
40-19
50-59
60+
A.N.S.
Total
0-[4
15-19
20·24
25·29
30·39
40--19
50·59
60+
A.N.S.
Total
0·1.
15-19
20·24
25·29
30·39
40.-19
50-59
60+
A.N.S.
Total Population r-------A -----_, persons Male'i Females
1,.15,956
679,721
115,539
109.436
126,002
201,544
127,211
76,121
80,342
40
1,459,321
657,986
110,673
103,732
110,213
192,211
122,419
73,617
78,313
37
5.6,635
:!J.7:l5
4,866
5,704
5,789
9,273
.,792
2,444
2,029
759,181
339,590
58,031
49,676
62,755
104,739
67,702
39,001
17,665
22
728,(97
g~8,379
55,382
46,775
59,5Bl
~)fI, 1111
64.817
37,614
36,783
20
30,684.
Il!~ll
2J;..J.~
2,901
3,174
5,623
2,885
1,351
882
4
756,775
340,131
59,760
6:l,247
96,~O.>
59,500
37,120
42,677
18
730,824
56,957
60.632
93,155
57,60~
36,033
41)5~O
17
25,951
10.SH
2,:2J7
2,803
2,6]5
3,650
1,907
1,087
1,147
8-1 Part A WORKERS AND NON-WORKERS ACCORDING TO
WOR ~------------------------~----------------____ A
III Livestock, Forestry, Fishinll;, HUilting & Plantations, Orchards
I n anrl al1i('(i actlvitie~ Total Workets Cultivators Agric111turallabour~r<;
'Ma1e,) ..A.. fern ales M<1le~-J....F~~~ ~~e-;-' ~e-;--~ema~
43 BASTAR DISTRICT (TOTAL)
435,400 120.812 310,76:; 62,326
48,446
45,832
45,20:1
5!1,823
101.74\)
66,309
37.445
30.596
::!5,844
17,051
14,8<10
'l2,17H
[3,50'1
7,320
4.950
32,916
31,286
29,123
39,7J'\
7J,63H
50.26f1
21),922
25,87~
RURAL
419,674 117,694 309,903
4-H,114 25,(11'1 :n,QO+
45,037 17,701 '31.'1!l3
4\036 1+,355 24,047
56,951 13,745 3'1,665
%,511 21.395 71.455
63.605 1:1,019 50.06')
'~6,:n6 7 '()68 2Q,nO
10,067
4
12,202
9,310
8,237
7,59:1
11.634
7.041
·1,780
2,529
G2,202
12JLJB
Q,309
7.585
11.60:1
7,009
3.760
2,500
15,726
312
795
3,118
URBAN
862 124
2,167
2,872
5,196
2,70<1
1,129
529
2't!
485
480
7a3
484
252
151
I:':
76
68
183
203
135
31
23
H,297
l:l,408
11,392
a,S5t
10,030
15.02'2
B,SSo!
4,lQn
2.B41
73,475
1'1.147
11.'130
13,711:;
il,Q21
14,79~
8,'100
4,125
2.,777
822
61
154
73
6.
10
48,795
12,363
7,713
5,203
5,131
B,232
5.157
2,919
1.977
48,401
12.2f1il
7.6B2
3,1611
5,141
3.182
5,Ofl7
2,tl87
1,955
39.
:15
{O
100
70
32
II
5,802
789
~23
680
1,050
1,47.\
817
·H4
126
5,112
7GB
577
gOo
1.255
69{
',103
212
690
21
20
103
150
218
123
41
14
12
SU
462
60
78
76
120
76
41
2B
895
oIGO
JR
76
71
]C9
34
25
46
11
It
IV Mining & Quart yiug r----A--,__--. Male'! Fema.les
13
.,980
126
293
896
1,122
1,800
540
174
24
2,272
70
lIB
436
.147
7.1:1
254
97
17
2,708
5(,
17.~
460
575
1,067
286
77
14
1,760
165
235
362
345
429
176
H
14
973
12'3
174
189
lOB
16
f)6
112
laB
156
IG7
68
18
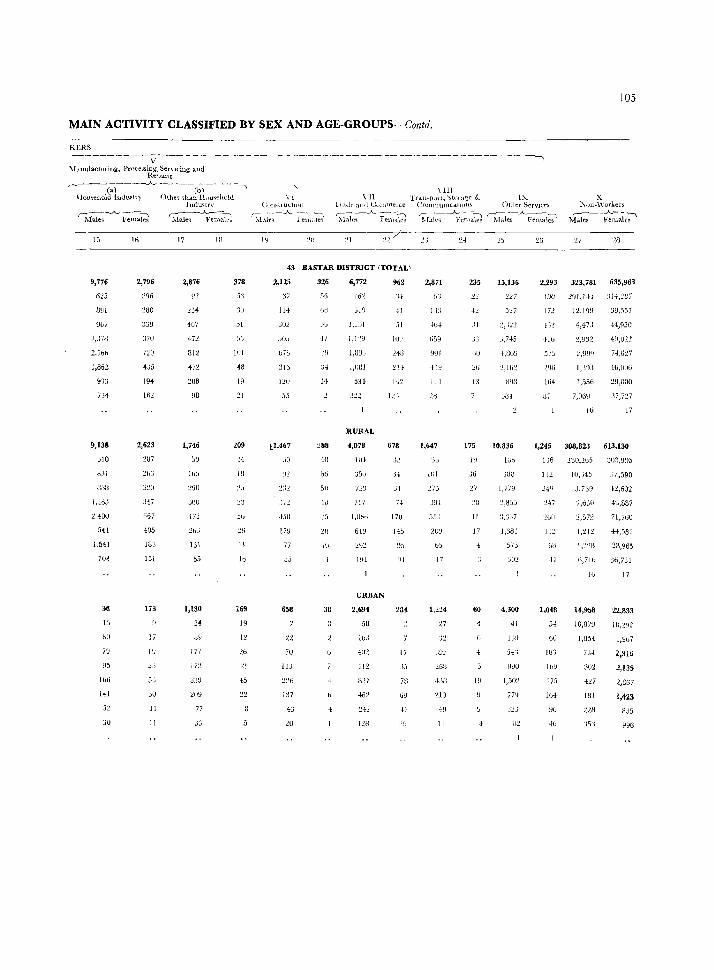
105
MAIN ACTIVITY CLASSIFIED BY SEX AND AGE-GROUPS-- Contd.
KER5
V ~lanufactlll iU2, P['l)cessing, S(:f\lcing- and
Rep.Hls (-~--;i----..A- -----(1;,. ----.....,
l-Iou~eh(}ld Imlw.tl). Other th.ln Hlm"iehuld Indu~tn'
~~-_A_l~;=ki S-r~~~:~
[5
9,776
625
1,S02
933
734
9,131
Gl0
HJI
\JaB
I ,'2tlJ
240U
5H
1,541
704
38
15
60
70
U5
IGo
141
JU
16
2,796
29(1
280
:i70
nu 4:;5
19f
16~
2,623
2U7
667
+05
183
151
173
[7
10
5J
3U
11
II
17
2,876
467
-In
81:'!
472
208
98
1,746
JIlU
473
131
b5
1,130
34
177
J72
:lUU
J:.J
lH
378
nil
4~
~l
209
50
26
II
Ib
169
19
12
-- - ----~---------------- ----------------- -- ------l
\[ CUll~tlw: .. tH)1l
r~I:\I~ _ _A_}~~~
lY
\HI \ 11 TrJ.uc..pml, '-}tt\lagc 8._
l'latle ::inti COlnJIl~l(_e COHlmUlJlCd.twn~
'i[-al-e,-_A_~~~ S:-I~\l~-;-~:;I:lJ
:':1
[:(
Othel' SerY1Ce~ r------A..~-~
Males l"emaks '
25 2G
X ::'-iull-\Vorkers
f-~-_)o._-·-··\
1.-lalt:s Females
'27
43 BASTAR DISTRICT ITOTAL]
2,125
bl0
31b
120
:;5
ll,467
3D
.i1'2
4.111
17U
77
Jj
658
7U
lJJ
1:17
43
2U
326
56
14
~88
511
-Ill
+5
:ZIl
IU
38
6,772
162
::'19
1,H~J J
RURAL
4,078
Ill,
717
1,{)b!i
61Y
URBAN
2,694
5~
IbJ
962
34
-II
51
240
678
..I..!
7-1
17U
2,871
13]
(;59
991
-IIY
11-1
1,6n
:)"
101
.35J
b5
17
'J1
210
11
235 15,136
23 227
JJ J,745
4,aw 20 :.!, 1 (i:!
13
Jill
175 10,836
..16 JBU
'27 1,771)
~W '!,B~5
+t :':,:367
17 1,:183
60
575
4,300
41
1,502
,-$:':J
2,293 323,781 635,963
172 12,199 :39,557
VI:! 4,47 J 44,920
4lo ~,932 49,021
5J5 2,9!YI 74,ti~7
2% 1,'39,1 46,OUO
164 1,::;56 19,800
H7 7,06!:J 37,717
10 17
1,245 308,823 613,130
136 28U,2b5 JU3,993
112 10,::;45 :;7,590
2i/) J, 7 3~ .J.2,602
:.:47 :l,6JO 46,B87
:loU ~,57~ 71,760
LJ2 1.21~ ·H,583
-II
1,048
54
vD
lU3
IW
'275
Iv;
911
1,:J'2.B 23,965
G,7Jb :;6,7:31
10 17
14,958
IO,37U
n,833
lU,1~j2
2,3W
2,135
2,867
1,423
835
996
TABLE B-II WORKERS AND NON-WORKERS IN CITIES AND NON-CITY
URBAN AREAS ACCORDING TO MAIN ACTIVITY
CLASSIFIED BY SEX AND AGE-GROUPS
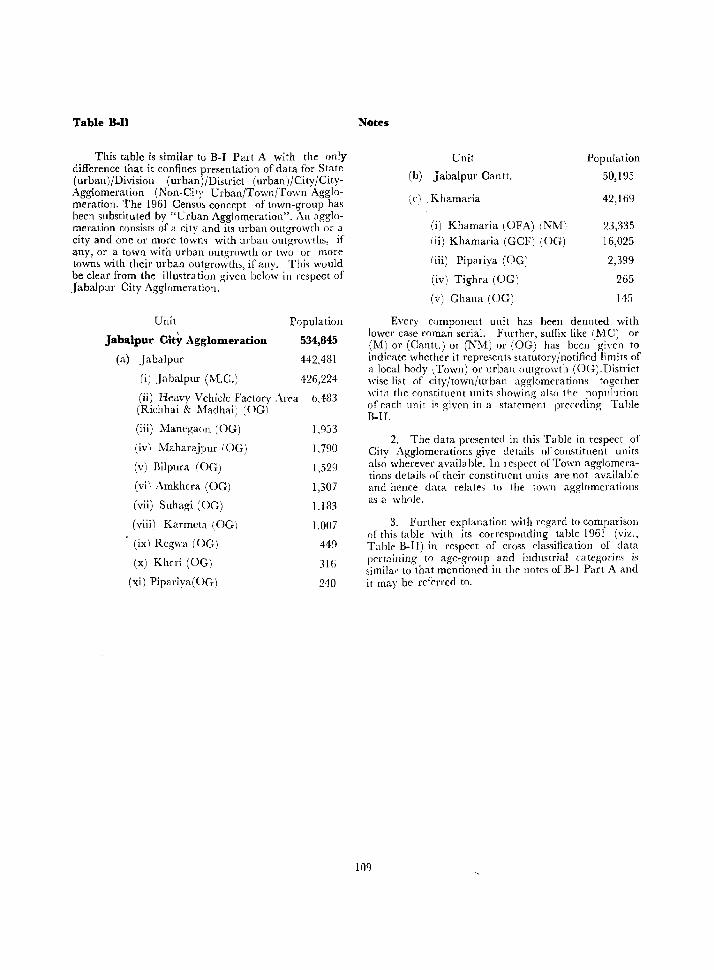
Table B-Il
This table is similar to B-I Part A with the only difference that it confines pre-sen tat ion of da ta for State (urbanl/Divisioll (urban)/District (urbanJ/City/CityAgglomeration (Non-Cit~, Urban/Town/Town Agglomeration. The 1961 Oensll~ concept of town-group has been substituted by "Urban Agglomeration". An agglomerat.ion consists of a cit.y and its urban outgrowth or a city and one or morc towm with urban outgrowths, if any, or a town with urban outgrowth or two or more towns with their urban outgrowths, if any. Thi~ would be clear from the illmtra tion given below in respect of Jaba!pur Oity Agglomeration.
Unit
Jabalpur City Agglomeration
(a) Jabalpur
(i) Jabalpur (M.C.)
Population
534,845
442.481
426,224
(ii) Heavy Vehiclc Factory .\rra b,483 (Richhai & Madhai) :OG)
(iii) Manegaon (OG)
(iv) Maharajpur lOG)
(v) Bilpura (OG)
(vii Amkhera (OG)
(vii) Suhagi (OG)
(viii) Karmcta (OG)
(ix) Rcgwa (C)G)
(x) Kheri (OG)
(xi) Pipariya(OG)
1,953
i,790
1,529
1,307
1.183
1,007
449
31b
240
Notes
Unit
(b) Jabalpur O,mtt.
\ c) Khamaria
(i) Khamaria (OFA) INtvl)
(ii) Khamaria (GOF) lOG)
(iii) Pipariya (OG)
(iv) Tighra (OG)
(v) Ghana (OG)
Population
50,195
42,169
23,335
16,025
2,399
265
14:i
Every component unit has been denoted with lower case roman serial. Further, suffix like (MO) or (M) or (Oantt.) or (NM) or (OG) has been giyen to indicate whether it represcnts statutory/notified limits of a local body (Town) or urban outgrowth (OG).District wise list of city/town/urban agglomerations together with the constituent units ~howing also the popnhtion of each unit is givt'n in a statemrnt prccfoing Tahle B-lT.
2. The data presented in this Table in respect of City Agglomerations give details of constituent units also wherever availa ble. In 1 espcct of Town agglomerations details of their constituent units are not availahle and hence data relates to the tOWl} agglomeratiollS as a whole.
3. Further explanation with regard to comparison of this table with its corresponciing table 1961 (viz., Tablt' B-II) in respect of cross classification of c1ata pertaining to age-group Hnd industrial categorirs i.s simila" to that mentioned in thr notes of B-1 Part A and it may be referred to.
109
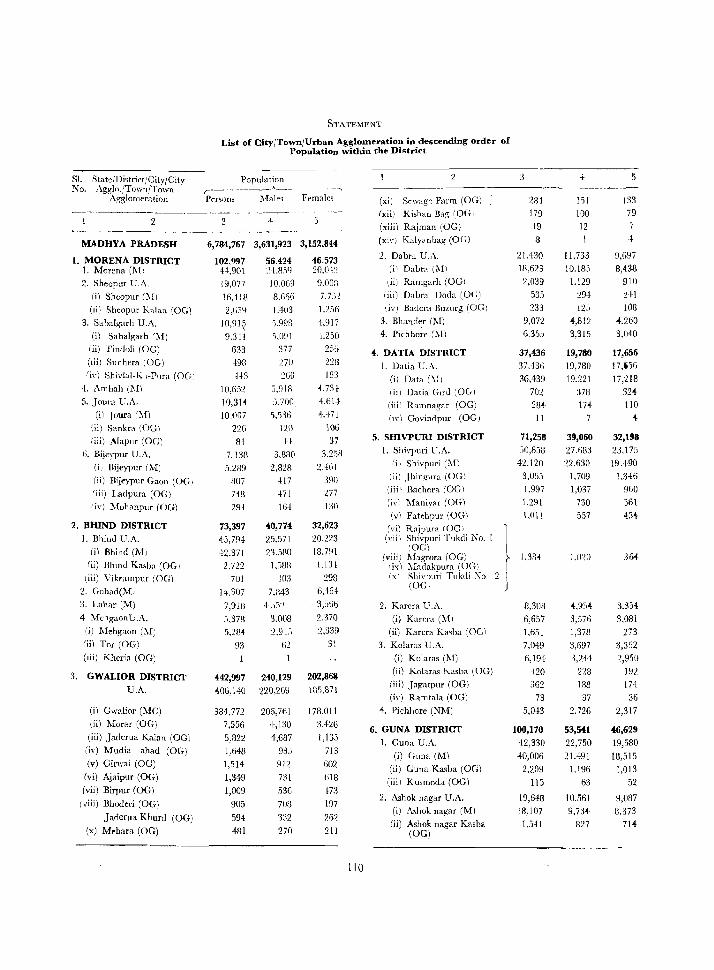
STATEMENT
List of City/Town/Urban Agglomeration in descending order of Population within the District
SI. State/Ohtrirt/City/Citv Population .. 5 ,",,0. Agglo./TownJTown . ,--____ ~ _ _J,_ __
- -- --------, Agglomeration PC'Tsons l\lalr, femal" (xi) Sewage Farm (OG) 234 Iii 133
-~.----------.---------~- ----- Ixii) Kishan Bag (OGI 179 100 79 4
---~----~-------~-------~- --~---------(xiii) Rajman (OG) 19 12 7
MADHYA PRADESH 6,784,767 3,631,923 3,152.844 (xi,') Kalyanbag (OG) (I } 4
1. MORENA DISTRICT 102.997 56.424 46.573 2. Dabta UA 21,430 11,733 9,697
I. Morena (M I 4+,901 :J·1.8')Q 20.(lt~ (i I Dabra (]\1I 18,623 10.185 8,438
2. Sheopnr U.II. 19,077 10,069 9,OOn iii) Ramgarh (OGI ~,O39 1.129 910
(i) Sheopur (M) 16,118 8,666 7, 7'>'~ (iii) Oabra noda (or;) 53.1 29+ 2+1
(Ii) Sheopur Kalan (OG) 2,(j:i9 1.+03 1,2.16 (iv) Badera Buzurg (OG) 233 125 108
3, Sahalgarh U.A. IO,q],? 'i,998 4,917 3. Bhand~r (1\1) 9,072 4,812 4,260
(i) Sabalgarh (]\f) 9.:HI 5,091 +,2.10 4, Pichhore (An 6.355 3,31.1 3,040
(ii) Tindoli (OG) 633 377 25(; 4, DATIA DISTRICT 37,436 19,780 17,656 (Iii) Sllnhera (OG) 49[1 27[1 ns I. Datia L'.,\. 37.+36 19,780 17,.'i6 Ii,') Shivlal-K.,-P',ra (OG) H3 ~GO 183 (i) O~ta (:\11 36,439 19,221 17,218
I. Ambah (j\1) 10,6:-)2 j,~lR {,734 (ii) Datia GIrd (OG) 702 37H 324 5. Joura U,II. 10,314 5,700 4.614 (iii) Ramn(lgnr (OG) 284 174 110
(il Joura (1\1) 10.007 1,1% +.471 (1\' 1 Govindpur (OG) 11 4 ~ii) Sankra (OG) 226 120 106
(iii) Alapm 10C) Rl H 37 5. smvPURI DISTRICT 71,258 39,060 32,193
Ii, Bijeypur U.A. 7.138 3,SIlO 3,2.18 L Shi\'l'uri V.II. ';0,858 27,683 23,175
Ii) Bijeypur (M) ,'i,289 2,828 ~,'Hil Ii) Shivpuri (MI 42,120 22,630 19,+90
(ii) Bijeypur Gaon (OG) X07 +17 390 (ii) .lhingum (OGI 3,053 1,709 1.3+6
liii) Ladpura (OG) Hi! +71 277 (iii) Rachora (OGI 1,997 1,037 %0
Ii,,) Mohanpur (OG) 29+ 16+ 130 (ivi Manivar (OG) 1,291 730 551
(VI Fatehpur (OG) LO\ 1 557 +:;., 2. BHIND DISTRICT 73,397 40,774 32,623 (vi) Rajpura (OGI
I. Bhind U.II, +5,794 25~571 20,223 (\'iii Shivpuri Tukdi No.1
(i) Bhind (M) 42,371 23,580 18.791 lOG)
Iii) Bhind Ka>ba (Om 2.722 L-,88 1.134 (viii) l\bgrora lOG) J,3i!{ 1.020 %~
li,,' Madakpura (OGI (iii) Vikrampur (OCI 701 103 298 (xl Shi,,[)uri Tllkrli \'0. 2
2. Cohad(MI 14,307 7.843 6,164-(OCI
3. I.ahar (M) 7,910 4Ji2 3,566 2. Karel'a L'.A. 8,30B 4,954 3,354
4 MchgaonG.A. 5,373 3,008 2,370 (i) Karel'a (M) 6,657 3,576 3,081
(i) Mehgaon (l\!) 5,284 2,91~, 2,339 (ii) Karera K",ha (Oe\ 1,651 1,378 273 (iil Tor (OG) 93 li2 31 3. Kolaras U,II. 7,1)49 3,697 3,352 (iii) Kheria (OG) (i) Kolaras (M) 6,194 3,244 2,950
3, GWALIOR DISTRICT 442,997 240,129 202,868 (iil Kolaras Kasba (OG) 420 228 192
U.A. 406,140 220,26Y \85,871 (iii) Jagatpllr (OG) 362 IRS 174
(iv) Ramtala (OG) 73 37 36
Ii) Gwaliol' (Me) 384,772 206,761 178,011 4. Pichhore (NMJ 5,043 2,726 2,317
(ii) Moral' (OG) 7,556 +,130 3,426 6, GUNA DISTRICT 100,170 (iii) Jaderua Kalan (OG) 5,822 1,687 1,13S
53,541 46,62!1 L Gnn" U.A, 42,330 22,750 19,580
(iv) Mudia ahad (OG) 1,648 93:' 713
(v) Girwai (OG) 1,514 912 G02 (il Guna (M) 40.,006 21.491 18,515
(vi) Ajaipnr COG) 1,349 731 618 (ii) Guna Kasha (OG) 2,209 1,196 1,013
(vii) Birpur (OG) 1,009 536 +73 (iii) Kusmoda (OG) 115 63 52
(viii) Bhoderi (OG) 905 708 197 2. Asbok nagar U.A, 19,648 10,561 9,087
Jaderua Khure! (OG) 594 332 262 (i) Ashok nagar (MI 18,107 Y,73-4- 8,373
(x) M~hara (OG) 481 270 211 (ii) Ashok nagar Kasba 1,541 827 714
(OG)
110
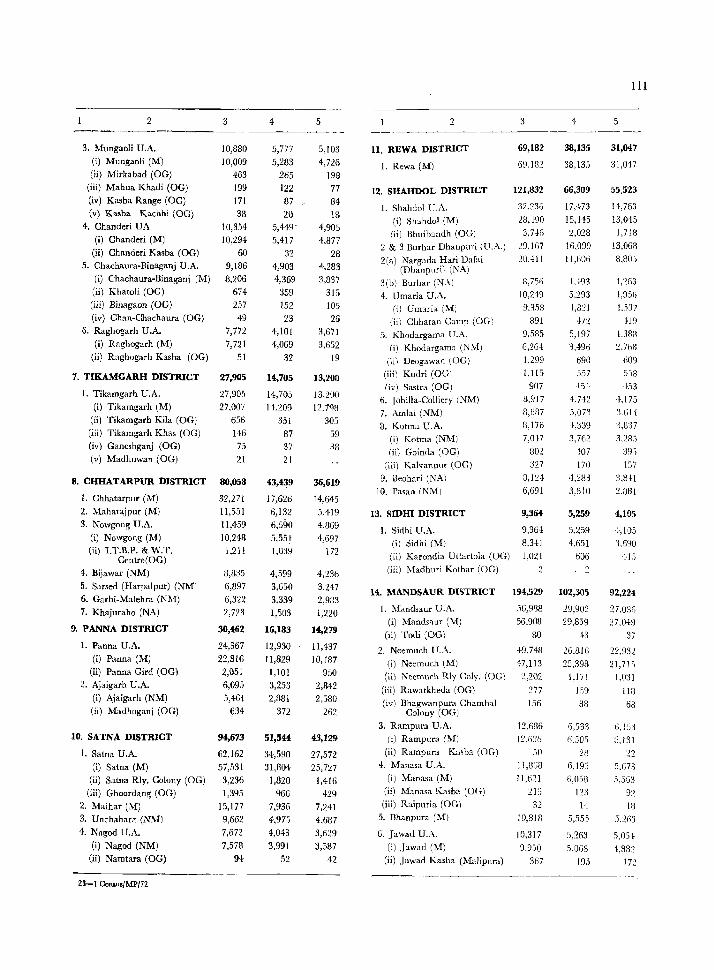
III
2 3 4 5 2 3 4 5 --~~--------------------
3. Mungaoli U.A. 10,830 5,777 5,103 II. REWA DISTRICT 69,182 38,135 31,047
(i) Mungaoli (M) 10,009 5,233 4,726 ]. Rewa (M) 69,132 38,135 31,047 (ii) Mirkabad (OG) 463 265 198
(iii) Mahua Khadi (OG) 199 122 77 12. SHAHDOL DISTRICT 121,832 66,309 55,523 (iv) Kasba Range (OG) 171 87 - 84
l. Shahdol B.A. 32,236 17,473 14,763 (v) Kasba Kachhi (OG) 38 20 18
(il Shahdol (M) 28,190 15,1-15 13,045 4. Chanderi UA 10,354 5,449 4,905
(ii) Bhuihandh (OG) 3,746 2,028 1,713 (i) Chanderi (M) 10,294 5,417 4,877
2 & 3 Burhar Dhanpuri (U.A.) 29,167 lfi,099 13,06i! (ii) Chanderi Kasba (OG) 60 32 28
2(a) Nargada Hari Dafai 21),411 11,606 8,80., 5. Chachaura-Binaganj U.A. 9,186 4,903 4.283 (Dhanpllril (NA)
(i) Chachaura-Binaganj (M) 8,206 4,369 3,837 3 (b) Burhar (N, \ I R,7.'i6 1,193 1,263 (ii) Khatoli (OG) 674 359 315 4. Umaria U.A. 10,249 5.293 4,95G (iii) Binagaon (OG) 257 152 10.5 (i) Umaria (M) 9,.1.18 1,821 -+.537 (iv) Chan-Cbachaura (OG) 49 23 26 (ii) Chhatan Camp (OG] 391 +12 41~
6. Raghogarh U.A. 7,772 4,101 ~,671 5. Khodargama U.A. 9,:iR5 .'),197 [,388 (i) Raghogarh (M) 7,721 4,069 3,652 (i) Khodargama (NM) 6,264 1,496 VG8
(ii) Raghogarh Kasba (OG) 51 32 19 (ii) Deogawan I.OG) 1.299 690 609
(iii) Kudri (OG) 1,115 5:i7 538 7. TIKAMGARH DISTRICT 27,905 14,705 13,200 (iv) Sastra (OG) 907 ~')j. k~3
1. Tikamgarh U.A. 27,905 14,705 13,2()0 6. Johilla-Colliery (NM) 8,917 4,H2 +,175
(i) Tikamgarh (M) 27,007 11,209 12,7<)8 7. Amlai (:'<M) 8,687 .1,073 3.lil·[
(ii) Tikamgarh Kila (OG) 656 351 30j 8. Kolma U.A. 13,176 ~.339 'l,U'l7
(iii) Tikarngarh Khas COG) 146 87 59 (i) Kotma (NM) 7,0[7 3,762 3,2R~
(iv) Gancshganj (OG) 75 37 38 (ii) Goinda (OG) 802 -t07 39-, (v) Madhuwan (OG) 21 21
(iii) Kalyanpur (OG) 327 170 117
8. CHHATARPUR DISTRICT 80,058 43,439 36,619 9. Beohari (NA) 3,1~4 4,~83 3,8!1
10. Pa,an (NMI 6,691 3,810 2.881 1. Chhatarpur (M) 32,271 17,626 14,645 2. Maharajpur (M) 11,5;:'1 6,132 5,419 13. SIDHI DISTRICT 9,364 5,259 4,105 3. Nowgong U.A. 11,459 6,590 4,869 1. Sidhi U.A. 9,36+ 5,259 +,105
(i) Nowgong (M) 10,248 5,551 1,697 (i) Sidhi (M) 8,3+1 4,6.'11 1.690 (ii) I.T.B.P. & W.T. 1,211 1,039 172 (ii) Karondia Uttartola (OG) 1,021 606 415 Centre(OG)
(iii) Madhnri Kothar (OG) 2 2 4. Bijawar (NM) 3,335 4,599 4,236 5. Sarsed (HarpaJpur) (NM) 6,897 3,650 3,247 14, MANDSAUR DISTRICT 194,529 102,305 92,224 6. Garhi-Malehra (NM) 6,322 3,339 2,933
1. Mandsaur U.A. ,)6,938 29,902 27,0% 7, Khajuraho (NA) 2,723 1,503 1,220 (i) Mandsaur (M) 56,')08 29,859 27,049
9, PANNA DISTRICT 30,462 16,183 14,279 (ii) Todi (OG) 80 ",3 37 I. Panna U.A. 24,367 12,930 11,437 2. Neemuch U.A. +9,748 26,ll1G 22,932
(i) Panna (M) 22,316 11,829 10,+87 (i) Neemuch (M) 47,113 25,398 21,71 " (ii) Panna Gird (OG) 2,051 1,101 950 (ii) Neemurh Rly Coly. (OG) 2,202 1,171 1,031
2. Ajaigarh U.A. 6,095 3,253 2,842 (iii) Rawatkheda (OG) 277 159 118 (il Ajaigarh (NM) 5,461 2,ll81 2,580 (iv) Bhagwanpura Chambal 156 88 68 (ii) Madhoganj (OG) 634 372 2h2 Colony (OG)
3. Rampura U.A. 12,68!) 6,533 6,153 10, SATNA DISTRICT 94,673 51,544 43,129 (i) Rampura (M) 12,630 (),50~ :),131
1. Satna U.A. 62,162 34,590 27,572 (ii) Rampura Kasb::t (OG) 50 28 22
(il Satna (M) 57,531 31,804 25,727 4. Manasa U.A. 11,8G8 6,19j .1,673
(ii) Satna Rly. Colony (OG) 3,236 1,820 1,416 (i) Manasa (M) J 1,621 6,053 5,553
(iii) Ghoordang (OG) 1,395 966 429 (ii) Manasa Kasba (OG) 215 123 g.)
2. Maihar (M) 15,177 7,936 7,241 (iii) Raipuria (OG) 32 14 18
3. Unchahara (NM) 9,662 4,971 4,G87 5. Dhanpura (M) 10,818 5,555 5.263
4. Nagod U.A. 7,672 4,043 3,629 6. Jawad U.A. 10,317 .1,263 .1,O5~ (i) Nagod (NM) 7,578 3,991 3,587 (i) Jawad (M) 9,950 .1,OG8 ~,88:'
(ii) Namtara (OG) 94 52 42 (ii) Jawad Kasba (MaJipura) 367 J~5 172
23-1 Cen.u'IMPI72
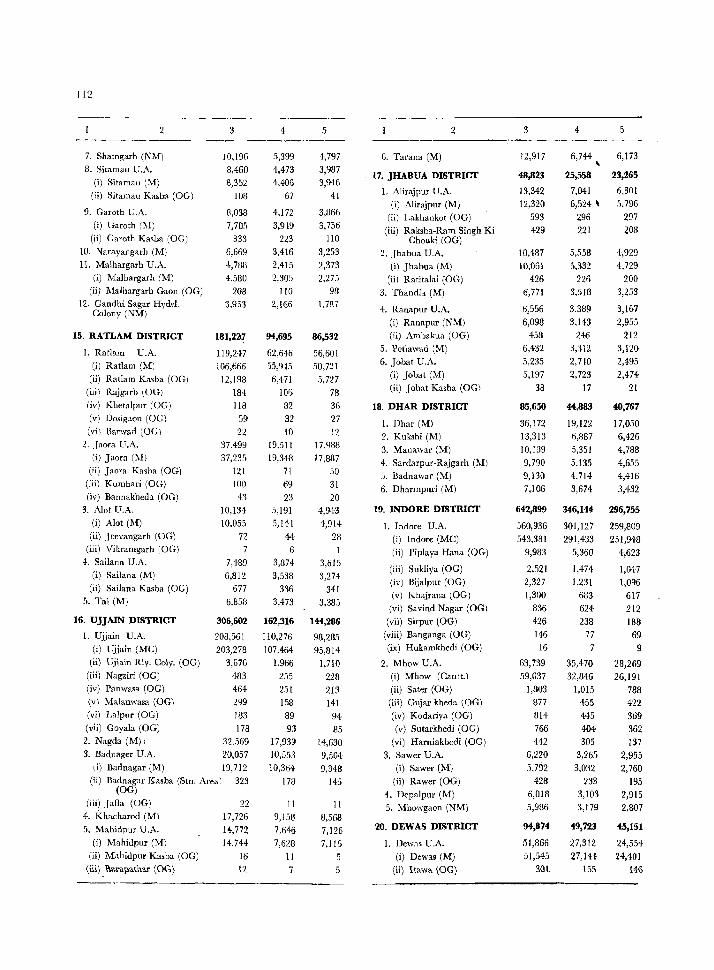
112
2 4 5 2 3 4 5
7. Shamgarh (NM) 10,196 5,399 4,797 6. Tarana (M) 12,917 6,744 6,173
B. Sitamau U.A. 8,460 4,473 3,987 - 17. JHABUA DISTRICT 48,823 25,558 23,265
(i) Sitamau (M) 8,352 4,405 3,946
(ii) Sitamau Ka.b" (OG) lOB 67 41 1. Alirajpur U.A. 13,342 7,041 6,301
(i) Alirajpur (M) 12,320 6,524 \ 5,796 9. Garoth U.A. 8,038 4,172 3,866 (ii) Lakhankot (OG) 593 296 297
(i) Garoth (l\1) 7,70.1 3,9f9 3,756 (iii) Raksha-Ram Singh Ki 429 221 208 (ii) Garoth Kasba (OG) 333 223 110 Chouki (0 G)
10. Narayangarh (M) 6,669 3,416 3,253 2. Jhabua U.A. 10,487 5,558 4,929 11. Malhargarh U.A. 4,788 2,415 2,373 (i) Jhabua (M) 10,061 5,332 4,729
(i) Malhargarh (M) 4,580 2,305 2,275 (ii) Ratitalai (OG) 426 226 200 (ii) Malhargarh Gaon (OG) 20B no 98 3. Thandla (M) 6,771 3.518 3,253
12. Gandhi Sagar Hyde!. 3,953 2,165 1,787 4. Ranapur U.A. 6,556 3,389 3,167 Colony (NM)
(i) Rallapur (NM) 6,098 3,143 2,955
15. RATLAM DISTRICT 181,221 94,695 86,532 (ii) Amhakua (OG) 458 246 212
I. Ratlam U.A. 119,247 62,646 56,601 5. Petlawad (M) 6,432 3,312 3,120
(i) Ratlam (M) 106,666 55,%') 50,721 6. Jobal U.A. 5,235 2,740 2,495
(ii) Ratlam K",ba (OG) 12,198 6,471 5,727 (i) Jobat (M) 5,197 2,723 2,474
(iii) Rajgarb (0 G) 18·f 106 78 (ii) Jobat Kasha (OG) 33 17 21
(iv) Khetalpur (OG) 118 82 36 18. DHAR DISTRICT 85,650 44,883 40,767 (v) Dosigaon (OG) 59 32 27 I. Dhar (M) 36,172 19,122 17,050 (vi) Bat'wad (OG) 22 10 12 2. Kukshi (M) 13,313 6,887 6,426
2. Jaora U.A. 37.499 19,511 17,<)88 3. Manawar (M) 10,139 5,351 4,788 (i) Jaora (M) 37,235 19,348 17,8S7 4. Sardarpur-Rajgarh (]\f) 9,790 5,135 4,655
(ii) Janra Kasha (OG) 121 71 50 5. Badnawar (M) 9,130 4,714 4,416 (iii) Kumhari (OG) 100 69 31 6. Dharmpuri (M) 7,106 3,674 3,432 (iv) Bannakheda (OG) 43 23 20
3. Alot U.A. 10,13+ 5,191 4,943 19. INDORE DISTRICT 642,899 346,144 :zg6,755
(i) Alot (M) 10,055 5,141 4,914 I. J ndore U.A. 560,936 301,127 259,809 (ii) Jcevangarh (0 G) 72 44 28 (i) Indore (MC) 543,381 291,433 251,948
(iii) Vikramgarh (OG) 7 6 I (ii) Piplaya Hana (OG) 9,983 5,360 4,623 4. Sailana U.A. 7,489 3,874 3,615
(iii) Sukliya (OG) 2,521 1,474 1,047 (i) Sailana (M) 6,812 3,538 3,274
(i\') Bijalpur (0 G) 2,327 1,231 1,096 (ii) Sailana Kasba (OG) 677 336 341
(v) Khajrana (OG) 1,300 683 617 .1. Tal (M) 6,858 3,473 3,383
(vi) Savind Nagar (OG) 836 624 212 16. UJJAIN DISTRICT 306,602 162,316 144,286 (vii) Sirpur (0 G) 426 238 188
I. Ujjain U.A. 208,561 110,276 98,285 (viii) Banganga (OG) 146 77 69
(il Ujjain (MC) 203,278 107,464 95,814 (ix) Hukamkhedi (OG) 16 7 9
(ii) Ujjain Rly. Coly. (OG) 3,676 1,966 1,710 2. Mhow U.A. 63,739 35,470 28,269 (iii) Nagziri (OG) 183 255 228 (i) Mhow (Cantt.) 59,037 32,846 26,191 (iv) Panwasa (OG) 464 251 213 (ii) Sater (OG) 1,803 1,015 788 (v) Malanwasa (OG) 299 158 141 (iii) Gujar kheda (OG) 877 455 422 (vi) l"alpllf (OG) 183 89 94 (iv) Kodariya (OG) 814 445 369 (vii) Goyala (OGj 178 93 85 (v) Sutarkhedi (OG) 766 404 362
2. Nagda (M) I 32,569 17,939 14,630 (vi) Harniakhedi (OG) 442 305 137 3. Badnager U.A. 20,057 10,553 9,504 3. Sawer U.A. 6,220 3,265 2,955
(i) Badnagar (M) 19,712 10,364 9,348 (i) Sawer (M) 5,792 3,032 2,760 (ii) Badnagar Kasba (Stn. Area) 323 178 145 (ii) Rawer (OG) 428 233 195
(OG) 4. Depalpllr (M) 6,018 3,103 2,915 (iii) Jalla (OG) 22 II 11 5. Mhowgaon (NM) 5,986 3,179 2,807
4. Khacharod (M) 17,726 9,158 8,568 5. Mahidpur U .A. 1+,772 7,646 7,126 20. DEW AS DISTRICT 94,874 49,723 45,151
(i) Mahidpur (M) 14,744 7,628 7,116 I. Dew~s U.A. .'il,866 27,312 24,554 (ii) Mahidpur Kasba (OG) 16 11 (i) Dewas (M) 51,545 27,144 24,401
(iii) ~rapathar (OG) 12 7 5 (il) hawa (OG) SOL 15:' 146
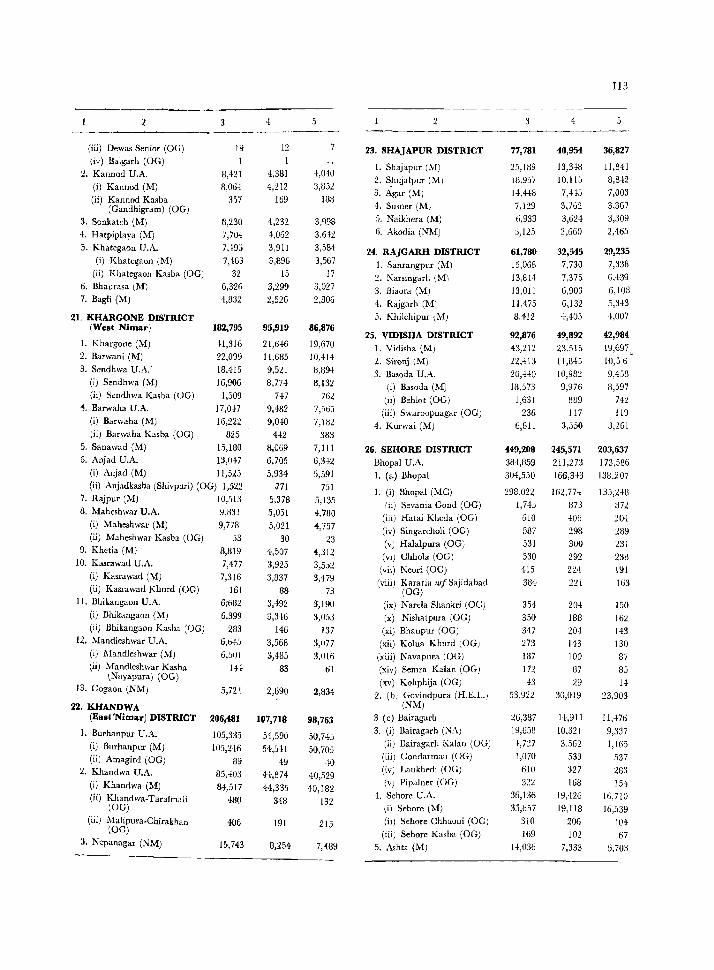
Il3
2 3 4 5 2 4 5
(iii) Dewas Senior (OG) 19 12 23. SHAJAPUR DISTRICT 77,781 40,954 36,827 tiv) Balgarh (OG) 1
1. Shajapur (M) 25,189 13,348 11,841 2. Kannod U.A. 8,421 4,381 4,040
2. S.hujalpur (M) 18,957 10,115 8,8·12 (il Kannod (M) 8,06+ 4,212 3,852
3. Agar (M) 14,H8 7,445 7,003 (ii) Kannod Kasba 317 169 188
4. Sumer (M) 7,129 3,762 3,367 (Gandhigram) (OG) 3. Sonkateh (M) 8,230 4,232 3,998 ;,. Nalkhera (M) 6,933 3,624 3,309
4. Hatpiplaya (M) 7,704 4,062 3.642 6. Akodia (NM) 5,125 2,660 2,465
5. Khategaon U.A, 7,49:; 3,911 3,584 24. RAJGARH DISTRICT 61,780 32,545 29,235 ei) Khategaon (M) 7,463 3,896 3,567 I. Sanrangpur (M) 15,068 7,730 7,338
(ii) Khategaon Kasba (OG) 32 15 17 2. Narsingarh (Mi 13,814 7,375 6,439 6. Bhaurasa (M) 6,326 3,299 3,027 3, Biaora (M) 13,011 6,903 6,108 7. Bagli (M) 4,832 2,526 2,306 4. Rajgarh (M) 11,475 G,132 5,343
21. KHARGONE DISTRICT 5. Khilchipur \M) 8,412 4,40:; 4,007 (West Nimar) 182,795 95,919 86,876
25. VIDISHA DISTRICT 92,876 49,892 42,984 I. Khargone (Ml 41,316 21,646 19,670 I. Vidisha (M) 43,212 23,515 19,697 u 2. Barwani (M) 22,099 11,685 10,414 2. S;ronj (M) 22,413 1l,G45 10,56 3. Scndhwa U.A.- 18,415 9,521 8,894 3. Basoda U.A. 20,410 10,982 9.458
(i 1 Sendhwa (M) 16,906 8,774 8,132 (i) Basoda (M) 18,573 9,976 8,597 (ii) Sendhwa Kasba (OG) 1,509 7+7 762 (ii) Behlot (OG) 1,631 889 742
4·. Barwaha U.A. 17,047 9,482 7,3uJ (iii) Swaroopnagar (OG) 236 117 119 (il Barwaha (M) 16,222 9,0+0 7,182 4. Kurwai (M) 6,G!1 3,550 3,261 liil Barwaha Kasba (OG) 825 142 383
5. Sanawad (M) 15,180 8,069 7, III 26. SEHORE DISTRICT 449,208 245,571 203,637 6. Anjad U.A. 13,0+7 6,705 6,3+2 Bhopal U.A. 384,859 211,273 173,586
(i) Anjad (M) 11,525 5,934 5,591 I. (a) Bhopal 304,550 166,343 138,207 (ii) Anjadkasba (Shivpuri) (OG) 1,522 .7]1 751 I. (i) Bhopal (MO) 298,022 162,7H 13.),2+8
7. Rajpur (M) 10,513 5,37B 5,135 Iii) Sevania Gond (OG) 1,745 873 872 8. Maheshwar U.A. 9,831 5,051 4,780 (iii) Hatai Kheda (OG) 610 406 204
(i) Maheshwar (M) 9,778 5,021 4,'157 (iv) Singarcholi (OG) 587 298 289 (ii) Maheshwar Kasba (OG) 53 30 23 (v) Halalpura (0 G) 531 300 231
9. Khetia (M) 8,819 4,507 4,312 (vi) Chhola (OG) 530 292 238 10. Kasrawad U.A. 7,477 3,925 3,552 (vii) Neor; (0 G) 415 22+ 191
(i) Kasrawad (M) 7,316 3,837 3,479 (viii) Kararia wi Sajidabacl 384 221 163 (ii) Kasrawad Khurd (0 G) 161 88 73 (OG)
II. Bhikangaon U.A. 6;682 3,492 3,190 (ix) Narela Shankr; (OG) 354 20+ 150 (i) Bhikangaon (M) 6,399 3,346 3,053 (x) Nishatpura (OG) 350 188 162 (ii) Bhikangaon Kasba (OG) 283 146 137 (xi) Bhanpur (OG) 317 204 143
12. Mandleshwar U.A, 6,645 3,568 3,077 (xii) Kolua Khurd (OG) 273 143 130 (i) Mandleshwar (M) 6,501 3,485 3,016 (xiii) Nayapura (OG) 187 100 87 (iii Mandleshwar Kasba IH 33 61 (xiv) Semra Kalan (OG) 172 37 85
\Nayapura) (OG) (xv) Kohphija (OG) 43 29 14
13. Gogaon \NM) 5,n{ 2,890 2,834 2. (bi Govindpura (H.E.L.) 53,922 30,019 23,903 22. KHANDWA (NM)
(East'Nilllar) DISTRICT 206,481 107,718 98,763 3 (c:) Bairagarh 26,387 H,911 11, .. 76
1. Burhanpur U.A. 105,335 54,590 3. (i) Bairagarh (NA) 19,658 10,321 9,337
50,7+5 (ii) Bairagarh Kalan (OG) 4,727 3,562 1,165 (i) Burhanpur (M) 105,246 54,5f! 5U,705
(iii) Gondarmau (OG) 1,070 533 537 (ii) Amagird (0 G) 89 49 ·to (iv) Laukhedi (OG) 610 327 283 2. Khandwa U.A. 85,403 44,874 40,.129 (V) Pipalner (OG) 322 168 154 (i) Khandwa (M) 84,517 44,335 40,182
4. Sehore U.A. 36,136 19,426 16,710 (ii) Khandwa-Taralina1i 480 348 132 Ii) Sehore (M) 35,657 19,118 16,539 (OG)
(iii) Malipura-Ohirakhan 4U6 191 215 (il) Sehore Chhaoni (0 G) 310 206 IU4 (OG) (iii) Sehore Kasba (OG) 169 102 67
3, Nepanagar (NM) 15,743 8,254 7,489 5. Ashta (M) 1-1,036 7,333 6,703
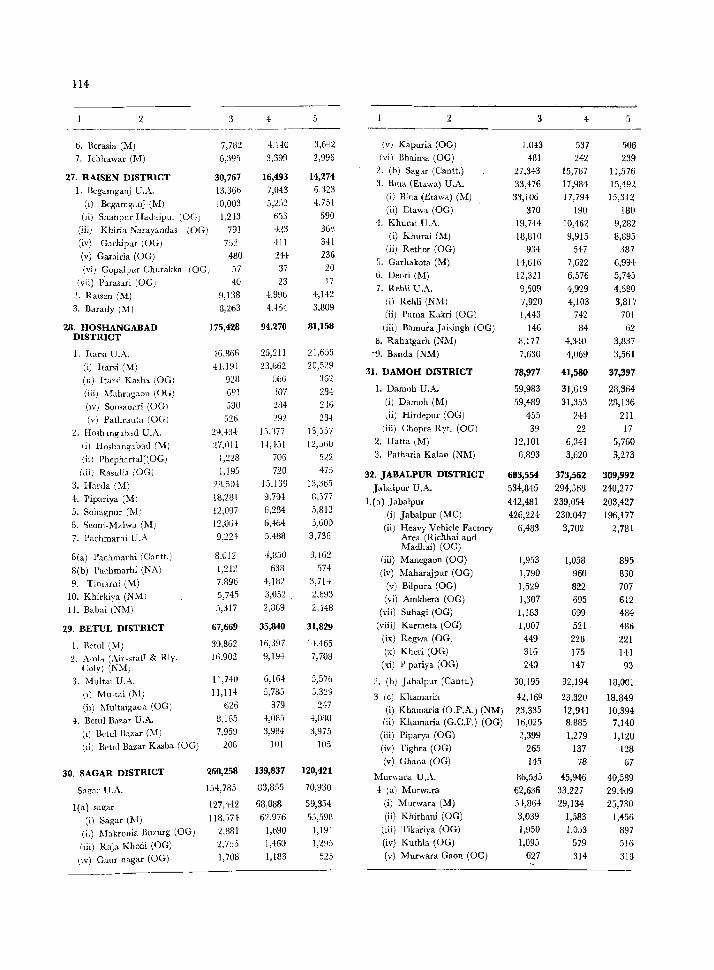
114
3 4 5 2 3 4 5 . ----.--~----~--~ ---- ------~- -----
6. BenlSia (M) 7,782 ",,l~0 3,642 (v) Kapuria (OG) 1,043 537 506 7. Ichha\var (M) 6,391 3,399 2,996 (vi) Bhaima (OG) 481 242 239
30,767 16,493 14,274 2. (b) Sagar (Cantt.) 27,343 15,767 11,576
27. RAISEN DISTR1CT 3. BUll< (Etawa) U.A. 33,476 17,984 15,492
1. Begamganj U.A. 13,366 7,043 6.323 (i) Bina (Etaw,l) (M) 33,106 17,794 15,312
(I) Bcgamganj (M) 10,003 5,252 +,751 (ii) Etaw'i (OG) 370 190 180
(Ii) Shahpuf IIadaipur (0(;) 1,2+3 6:;3 .190 4. Khurai U.A. 19,7H 10,462 9,282
(iii) Khiria Narayandas (OG) 791 +23 361! (i) Khurai (1\1) W,810 9,915 8,895
(iv) Garhipur (OG) 752 HI 3+1 (ii) Rethar (OG) 934 547 387
(v) Gamiria (OG) 480 244 236 'i. Garhakota (M) 14,616 7,622 6,994
(vi) Gapalpur Churakka 10G/ ')7 37 20 12,321 6,576 5,745
(vii) P~rasari (OG) 40 23 17 ti. Del'ri (M)
7. RohE U.A. 9,509 4,929 4,580 2. RalSen (M) 9,138 4.996 4,HZ
(i) Rehli (NM) 7,920 4,103 3,817 3. Rmtlly (M) 3,263 ·H54 3.309
(ii) Patna Kakri lOG) 1,443 742 701 28. HOSHANGABAD 175,4~8 94,270 81,158 (iii) Bamura Jaisingh (OG) 146 84 62
DISTRICT <:I. Rahatgarh (Nl\I) 8,177 -1,310 3,837 1. Itarsi U .A. 46,S66 25,211 21,655 -9. Banda (NM) 7,630 4,069 3,561
(i) Itarsi (M) H,191 23.662 20,529 31. DAMOH DISTRICT 78,977 41,580 37,397
(II) Itarsi Kasba (OG) 928 5ti6 352
(iii) Mallragaol1 (OG) 691 107 23-1 I. Damoh U."'. 59,983 31,619 28,364
(IV) Sonsaonri (OG) :;30 234 2-16 (i) Damah (M) 59,489 31,353 28,136
(v) Pathrauta (OG) 526 292 234 Iii) Hirdepur (OG) 455 244 211
2. Hmhlngahad U.A, 29,43+ 1.:;m7 13,557 (iii) Chopra Ryt. (OG) 39 22 17
(i) Hoshangab:~d (M) 27,011 H,151 12,560 2. Hatta (M) 12,101 6,341 5,760
(iiI Phephartal:(OG! 1,228 705 522 3. Patharia Kalan (NM) 6,893 3,620 3,273
(iii) Rasulia (OG) 1,195 720 475 32. JABALPUR DISTRICT 683,554 373,562 309,992 3. Harda (M) 28,50+ 15,139 13,365 Jabalpur U.A. 534,845 294,568 240,277 4. Pipariya (M) 18,281 9,701 G,577
I.(a) Jabalpur 442,481 239,054 203,427 5. Sohagpur (M,l 12,097 6,234 5,813 (i) Jabalpur (MC) 426,224- 230,047 196,177 6. ~cani-M"lwa (M) 12,01;4 6,+64 5,600
(ii) Heavy Vehicle Factory 6,483 3,702 2,781 7. Pachmarhi U.A 9,22 t 5,488 3,736 Area (Richhai and
Madhai) (OG) S(a) Pachmarhi (Cantt.) 8.012 4,850 3,IW (iii) Manegaun (OG) 1,953 1,058 895 S(b) Pachmarhi (NA) 1,212 638 .17+ (iv) Maharajpur (OG) 1,790 960 830 9. Timarni (M) 7,896 4,132 3,714 (v) Bilpura (OG) 1,529 822 707
10. Khirkiya (NM) 5,745 3,052 . 2,693 (vi) Amkhera (OG) 1,307 695 612
11. Bahai (NM) 5,317 2,869 2,448 (vii) Suhagi (OG) 1,133 699 484
29. BETUL DISTRICT 67,669 35,840 31,829 (viii) Karmeta (OG) 1,007 521 436
30,362 16,397 H.465 (ix) Rcgwa (OG) 449 228 221 1. Retul (NI)
(x) Khori (OG) 316 175 141 2. Amid (Air"sta[1 & Rly. 16.902 9,194 7,708
(xi) Pipariya (OG) 240 147 93 Coly) (NM)
3. Multai U.A. 11,740 6,164 5,576 2. (b) Jabalpur (Cantt.) 50,195 32,194 18,001 (l) Multai (M) 11,11+ 5,785 5,3~9 3 (c) Khamaria 42,169 23,320 18,849 (il) Multaigaon (OG) 626 379 21,7
(i) Khamaria (O.F.A.) (NM) 23,335 12,911 10,394 4. Betul Bazar U.A. 8.165 4,085 +,080 (ii) Khamaria (G.C.F.) (OG) 16,025 8,885 7,140
(I) Betul Bazar (M) 7.959 3,98+ 3,975 (iii) Piparya (OG) 2,399 1,279 1,120 (Ii) Retul Bazar Kasba (OG) 206 101 105 (iv) Tighra (OG) 265 137 128
(v) Ghana (OG) 145 78 67 30. SAGAR DISTRICT 260,258 139,837 120,421
Murwara U.A. 85,535 45,946 40,589 Sagar U.A. 15+,785 83,855 70,930 4- (al Murwara 62,636 33,227 29,409
I(a) sagar 127,142 68,088 59,354 (il Murwara (M) 5f,8G4 29,134 25,730
(il Sagar (1\1) lIS,SH 62,976 55,59B (ii) Khirhani (OG) 3,039 1",83 1,456
(ii) Makronia Bumrg (OG) 2.831 1,690 1,19] (iii) Tikariya (OG) 1,950 1,053 897
(iii) Kaja l';:hedi (OG) 2)55 1,460 1,295 (iv) Kuthla (OG) 1,095 579 516
\iv) Gaur nagar (OG) 1,708 1,183 525 (v) Murwara Gaon (OG) 627 314 313
------
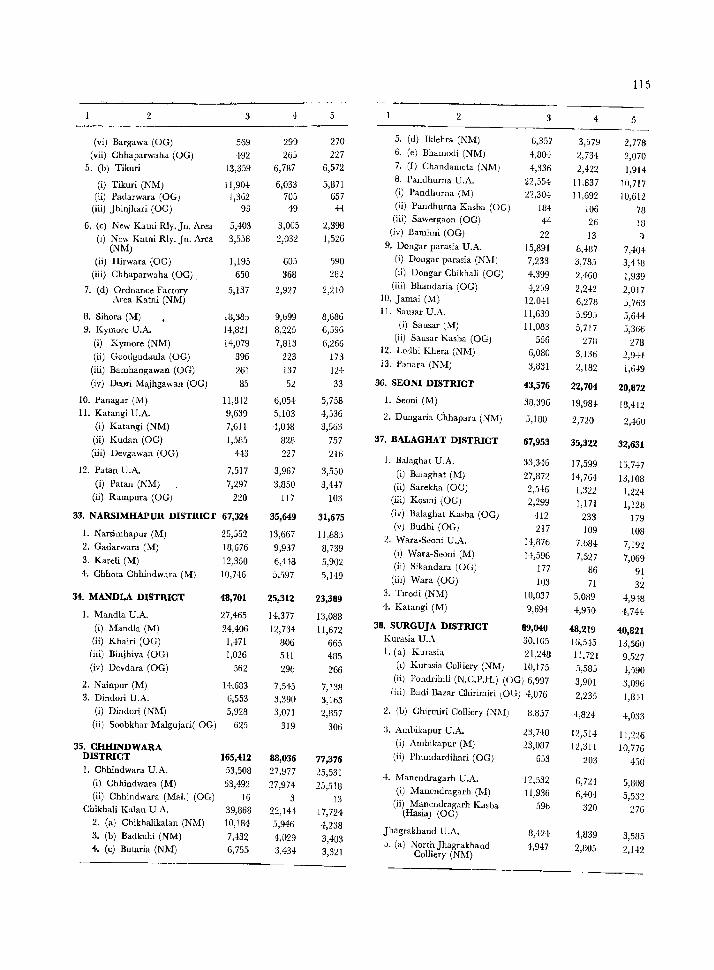
115
2 3 + 5 2 3 4 5
(vi) Bargawa (OG) 569 299 270 5. (d) Iklehra (NM) 6,357 3,579 2,778 (vii) Ghhaparwaha (OG) +92 205 227 6. (e) Bhamodi (NM) 4,130+ 2,734 2,070
5. (b) Tikuri 13,359 6,787 6,572 7. (f) Chandameta (NM) 4-,336 2,4-22 1,914-
(i) Tikuri (NM) 11,90-! 6,033 5,871 8. Pandhurna U.A. 22,554- 11.837 10,717
(ii) Padarwara (OG) 1,362 70j 657 (i) Pandhurna (M) n,30-! 11,692 10,612 (iii) Jhinjhari (OG) 93 49 44 (ii) Pandhurna Kasha (OG) 113+ 106 78
6. (c) New Katui Rly.Jn. Area 5,403 3,005 2,398 (iii) Sawergaon (OG) 44 26 18
(1) New Katni Rly. In. Area 3,558 2,032 1,526 (iv) Bamhni (OG) 22 13 ')
(NM) 9. Dong"r parasia U.A. 15,891 8,+87 7,40-! (ii) Hirwara (OG) 1,195 605 590 (i) Dongar parasia (NM) 7,233 3,785 3,118
(iii) Chhaparwaha (OG) . 650 368 282 (ii) Dongar Chikhali (OG) 4,399 2,460 1,939
7. (d) Ordnance Factory 5,137 2,927 2,210 (iii) Bhandaria (OG) +,2:;9 2,242 2,017 Area Katni (NM) 10. Jamai (M) 12,0+1 6,278 5,763
8. Sihora (M) 13,385 9,699 8,686 I!. Sausar U .A. 11,639 5,995 5,644
9. Kymore U.A. 14,821 8,225 G,596 (i) Sausar (M) 11,083 5,717 5,366
(i) Kymore (NM) 14,079 7,813 6,266 (ii) Saus.r Kasba (OG) 556 278 278
(ii) Guougudaula (OG) 395 223 173 12. Lodhi Khera (NM) 6,080 3,135 2,944
(iii) Bamhangawan (OG) 261 137 124 i3. Panara (NM) 3,831 2,182 1,6+9
(iv) Dcori Majhgawan (OG) 85 52 33 36. SEONI DISTRICT 43,576 22,704 20,872
10. Panagar (M) 11,812 6,054- 5,758 1. Seuni (M) 38,396 19,984 113,412 II. Katangi U.A. 9,639 5,103 4,j36 2. Dungaria Chhapara (NM) 5,180 2,720 2,46U (i) Katangi (NM) 7,611 +,U48 3,563
(ii) Kudan (OG) 1,585 828 757 37. BALAGHAT DISTRICT 67,953 35,322 32,631 (iii) Devgawan (OG) 443 227 216
1. Balaghat U.A. 33,346 17,599 15,7+7 12. Patau U.A. 7,517 3,967 3,550 (i) Balaghat (M) 27,872 14,764- 13,108 (i) Patau (NM) 7,297 3,850 3,4+7 (ii) Sarekha (OG) 2,546 1,322 1,221 (ii) Rampura (OG) no 117 103 (iii) Kosmi (OG) 2,299 1,171 1,128
33. NARSIMHAPUR DISTRICT 67,324 35,649 31,675 (iv) Balaghat Kasba (OG) +12 233 179
I. Narsimhapur (M) 25,552 13,667 11,885 (v) Budhi (OG) Z17 109 108
2. Gadarwara (M) 2. Wara-Seoni U.A. 1+,876 7,684 7,192 13,576 9,937 8,739
3. Kareli (M) 12,350 6,4+8 5,902 (1) Wara-Seoni (M) 1+,596 7,527 7,069
4. Chhota Chhindwara (M) 10,7+6 5,597 .5,149 (ii) Sikandara (OG) 177 86 91 (iil) Wara (OG) 103 71 32
34. MANDLA DISTRICT 48,701 25,312 23,389 3. Tlrodi (NM) 10,037 5,089 +,9+8
1. Mandla U.A. 27,465 14,377 4. Katangi (M) 9,694 +,930 1,74+ 13,088
(iJ Mandla (M) 24,406 12,734 11,672 38. SURGUJA DISTRICT 89,040 48,219 40,821 (ii) Khairi (OG) 1,471 806 665
Kurasia U.,\ 30,105 IG,5+5 13,560 (iii) Binjhiya (OG) 1,026 541 485 1. (a) Kurasia 21,248 11.721 9,.527 (iv) Devdara (OG) 562 29G 266
(1) Kurasia Colliery (NM) 10,175 S,585 +,'i90
2. Nainpur (M) 14,683 7,545 7,138 (ii) Pondrihill (N.C.P.H.) (OG) 6,997 3,901 3,09b
3. Dindori U.A. 6,553 3,390 3,163 (id) Badi Bazar Chirimiri lOG) 4,076 2,235 1,8H
(i) Dindori (NM) 5,928 3,071 2,857 2. (h) Chirmiri Colliery (NM) 1J,8j7 1,824 +,033 (ii) Soobkhar Malgujari( OG) 625 319 30G :1. Ambikapur U.A. 23,740 12,5H 11,226
35. CHHINDW ARA (i) Ambikapur (M) 23,087 12,311 10,776 DISTRICT 165,412 88,036 77,376 (ii) Phundardihari (OG) 653 203 450 1. Chhindwara U.A. 53,508 27,977 25,531
(i) Chhindwara (M) 53,492 27,974- 25,518 4. Manendragarh U.A. 12,532 6,724 5,808
(ii) Chhindwara (Mal.) (OG) 16 3 13 (i) Manendragarh (M) 11,936 6,40+ 5,532
Chikhali Kalan U.A. 39,868 22,144 17,724 (ii) Manendragarh Kasba 596 320 276 (HaBia) (OG)
2. (a) ChikhaIikalan (NM) 10,184 5,946 4,238 Jhagrakhand U.A.
3. (b) Badkuhi (NM) 7,432 4,029 3,403 8,+2+ 4,839 3,585
-4-. (c) Butaria (NM) 6,755 3,434 3,321 5. (a) North Jhagrakhand 4,947 2,8U5 2,ll2 Colliery (NM)
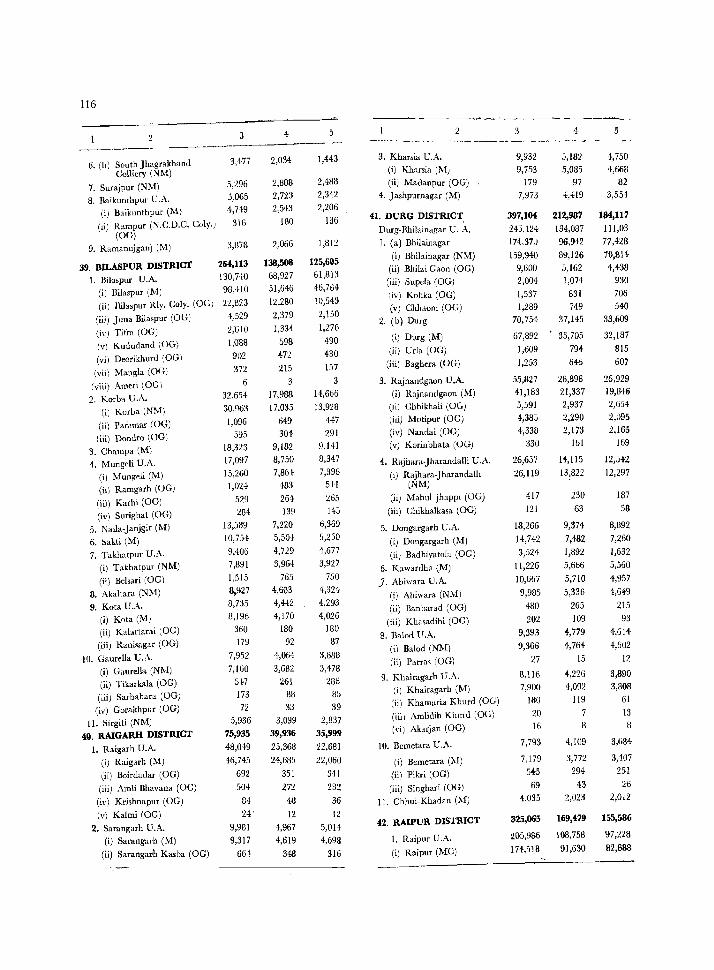
116
2 3 4 5 2 4 5 ------~--~
6. (b) South Jhagrakhand 3,477 2,034 1,443 3. Kharsi. U.A. 9,932 5,182 4,750
Colliery (NM) Ci) Kharsia (M) 9,753 5,085 4,668
7. Surajpur (NM) 5,296 2,808 2,4H8 (ii) Madanpur (OG) 179 97 82
8. Baikunthpul' U.A. 3,065 2,723 2,342 4. Jashpurn.gar (M) 7,973 4,419 3,554
(i) Baikunthpur (M) 4,749 2,543 2,206
(ii) Rampur (N.C.O.C. Coly.) 316 180 136 41. DURO DISTRICT 397,IOf 212,987 184,117
(OG) Durg-Bhilainagar U .• \. 245,12+ 134,087 111,03
9. Ramanujganj (M) 3,878 2,06G 1,812 I. (a) Bhilainagar 174,370 96,942 77,428
39. BlLASPUR DISTRICT 264,113 138,508 125,605 (i) Bhibinagar (NM) 159,940 89,126 70,814
I. Bilaspur U.A. 130,NO 68,927 61,813 (iil Bhibi Gaon (OG) 9,600 5,162 4,438
(i) Bilaspur (M) 98,410 51,GiG 46,764 (iii) Snpda (OG) 2,004 1,074 930
(ii) nilaspur Rly. Coly. (OG) n,823 12,230 10,543 (iv) Kohka (OG) 1,537 831 706
(iii) Juna Bilaspur (OG) +,529 2,379 2,150 (v) Chhaoni (OG) 1,289 749 540
(i\') Tifr. (OG) 2;610 1,331 1,276 2. (b) Durg 70,754 37,145 33,609
(v) Kududand (OG) 1,0'88 598 490 (i) Ourg (M) 67,892 35,705 32,187
(vi) Deorikhurd (OGI 902 H2 430 (ii) Urla (OG) 1,609 79+ 815
(viiI ~langla (OG) 372 215 157 (iii) Baghera (OG) 1,253 646 607
(viii) Ameri (OGI 6 3 3 3. Rajnandgaon U.A. 55,327 28,898 26,929
2. Korba U.A. 32,654 17,988 14,666 (il RajnandgaoIl (M) 41,183 21,337 19,846
(i) Korba (NM) 30,963 17,035 13,928 (Ii) Chhikhali (OG) 5,591 2,937 2,654
(iii Pad,mar (OG) 1,096 649 447 (iIi) Motipur (OG) 4,385 2,290 2,095
(iii) Dondra (OG) 595 304 291 (iv) Nandai (OG) 4,338 2,173 2,165
3. Champa (M\ 18,323 9,Hl2 9,141 (v) Korinbhata (OG) 330 Hil 169
4. Mungeli U.A. 17,097 8,750 8,347 4. Rajham-Jharandalli UA 26,637 14,115 12,5+2
(i) Mungeli (M) 15,260 7,861 7,396 (1) Rajhara-Jharandalh 26,119 13,822 12,297
(ii) Ramgarh (OG) 1,02+ 483 5H (NM)
(iii) Karhi (OG) 529 264 265 (ii) Mahul jhappi (OG) 417 230 187
(iv) Surighat (OG) 284 139 145 (iii) Chikhalkasa lOG) 121 63 58
5. Naila-Janjgir (M) 13,589 7,220 6,369 5. Dongargarh U.A. 18,266 9,374 8,892
6. Sakti (M) 10,75l 5,50+ 5,250 (i) Dongargarh (M) 14,742 7,482 7,260
7. Takhatpur U.A. 9,406 4,729 4,677
(i) Takhatpur (NM) 7,891 3,964 3,927 (ii) Badhiyatola (OG) 3,524 1,892 1,632
(ii) Behari (OG) 1,515 765 750 6. Kawardha (M) 11,226 5,666 5,560
8. Akaltara (NM) 8,927 4,603 4,324 J. Ahiwara U.A. 10,667 5,710 4,957
9. Kota U.A. 3,735 4,442 4,293 (i) Ahiwara (NM) 9,985 5,336 4,649
(i) Kota (M) 8,196 4,170 4,026 (ii) Banbarad (OG) 41:l0 265 215
(ii) Kalartarai lOG) 360 180 180 (iii) Khasadihi (OG) 202 109 93
(iii) Ranisagar (OG) 179 92 37 8. Balod U .A. 9,393 4,779 4,614
10. Gaurella U.A. 7,952 4,064 3,888 (il Balod (NM) 9,366 +,764- 4,602
(il Gaurella (NMl 7,160 3,682 3,478 (ii) Parr" (OGl 27 15 12
(ii) Tikarkala (oG) 5+7 261 286 9. Khairagarh U.A. 8.116 4,226 3,890
(iii) Sarbahara (OG) 173 88 85 (i) Khairagarh (M) 7,900 4,092 3,308
(iv) Gorakhpur (OG) 72 33 39 (ii) Khamaria Khurd (OG) 180 119 61
11. Sirgiti (NMJ 5,936 3,099 2,837 (iii) Amlidih Khurd (OG) 20 7 13
40. RAIGARH DISTRICT 75,935 39,936 35,999 ("i) Akarjan (OG) 16 8 3
I. Raigarh U.A. 48,0+9 25,368 22,681 10. Bemetara U .A. 7,793 4,109 3,684
(i) Raigarh (M) 46,745 24,61:l5 22,060 (i) Bernetara (III) 7,179 3,772 3,407
(ii) Boirdadar (OG) 692 351 341 (ii) Pikri (OG) 545 294 251
(iii) Amli Bhavana (OG) 504 2n 232 (iii) Singhari (OG) 69 43 26
(iv) Krishnapur (OG) 84 43 36 11. Chhui-Khadan (M) 4,035 2,023 2,012
(v) Kalmi (OG) 24' 12 12
2. Samngarh U.A. 9,981 4,967 5,014 42. RAlPUR DISTRICT 325,065 169,479 155,586
(i) Sarangarh (M) 9,317 4,619 4,698 I. Raipur U .A. 205,9B6 108,758 97,228
(ji) Sarangarh Kasba (OG) 66+ 343 316 (i) Raipur (MC) 174,518 91,630 B2,B88
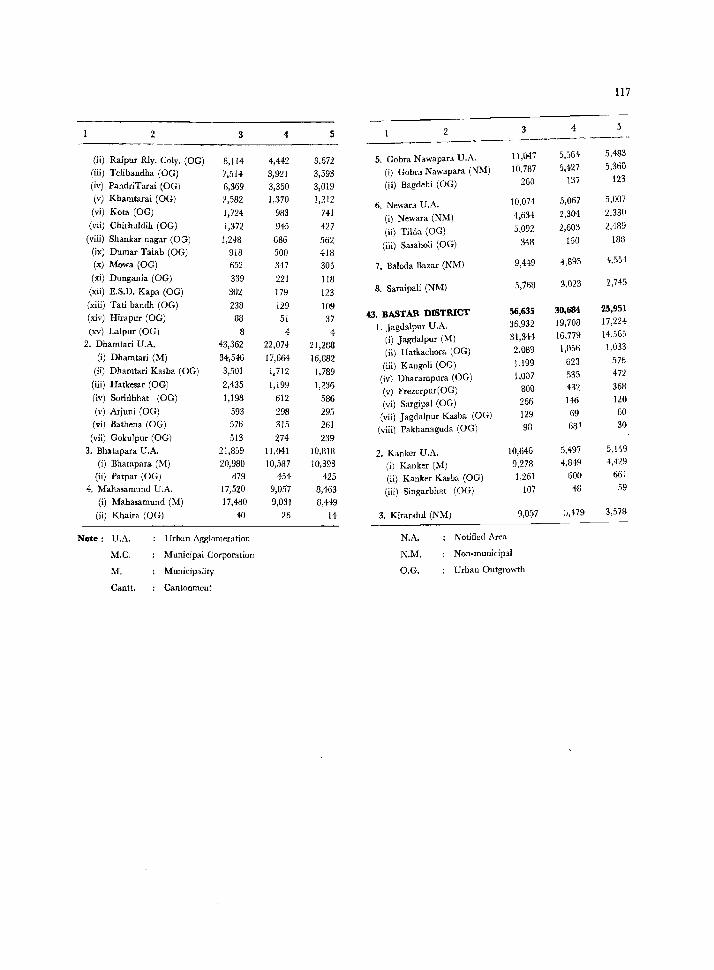
117
3 4 5 2 3 4 5
(ii) Raipur Rly. Coly. (OG) 8,114 4,442 3,672 5. Gobra Nawapara U.A. 11,047 5,564 .1,483
(iii) Telibandha (OG) 7,514 3,921 3,593 (i) Gobra Nawapara (NM) 10,787 5,427 5,360
(iv) PandriTarai (OG) 6,369 3,350 3,019 (il) Bagclehi (OG) 260 137 123
(v) Khamtarai (OG) 2,582 1,370 1,212 (vi) Kota (OG) 1,724 983 741
6. Newara U./I.. 10,OH 5,067 5,007
(vii) Chirhuldih (OG) 1,372 945 427 (i) Newara (NM) 4,634 2,301 2,330
(viii) Shankar nagar (OG) 1,248 686 .162 (iil Tilda (OG) 5,092 2,603 2,189
(ix) Dumar Talab (OG) 918 500 418 (iii) Sa,ahol; (OG) 348 160 188
(x) Mowa (OG) 652 317 305 7. Baloda Hazar (NM) 9,449 4,895 4,554
(xi) Dungania (OG) 339 221 118 (xii) E.S,D. Kapa (OG) 302 179 123
8. Saraipali (NM) .1,768 3,023 2,745
(xiii) Tati bandh (OG) 238 129 109 (xiv) Hirapur (OG) 88 51 37
43. BASTAR DISTRICT 56,635 30,684 25,951
(xv) Lalpur (OG) 8 4 4 I. J agdalpur U.A. 36,932 19,708 17,224
2. Dhamtari U.A. 43,362 22,074 21,288 (i) ]agda1pur (M) 31,344 16,779 14,565
(i) Dhamtari (M) 34,546 17,664 16,882 (ii) Hatkachora (OG) 2,089 1,056 1,033
(ii) Dbamtari Kasba (OG) 3,501 1.712 1,789 (iii) Kangoli (OG) 1,199 623 .176
(iii) Hatkesar (OG) 2,435 1,199 1,236 (iv) Dharampura (OG) 1,007 ~35 472
(iv) Soridbhat (OG) 1,198 612 586 (v) Frezerpur (OG) BOO 432 368
(v) Arjuni (OG) 593 298 29.1 (vi) Sargipa! (OG) 266 1+6 120
(vi) Bathena (OG) 576 31.1 261 (vii) Jagdalpur Kasba (OG) 129 69 60
(vii) Goku1pur (OG) .113 274 (viii) Pakhanaguda (OG) 98 68' 30
239 3. Bhatapara U,A. 21,859 11,041 10,818 2. Kanker U.A. 10,646 5,497 5,149
(i) Bhatapara (M) 20,980 10,.187 10,393 (i) Kanker (M) 9,278 4,849 4,"29
(ii) Patpar (OG) 879 454 425 (ii) Kanker Kasba (OG) 1-. Maha,amund U.A.
1,261 600 661
17,520 9,05'7 8,463 (iii) Singarbhat (OG) 107 48 59
(i) Maha,amund (M) 17,480 9,031 8,4+9 (ii) Kbaira (OG) 40 26 14 3. Kirandul (NM) 9,0.')7 5,479 3,578
Note: U.A. Urban Agglomeration N.A. Notified Area
M.C. Municipal Corporation N.M, Non-municipal
M. Municipality O,G, Urban Outgrowth
Canlt. Canlonment
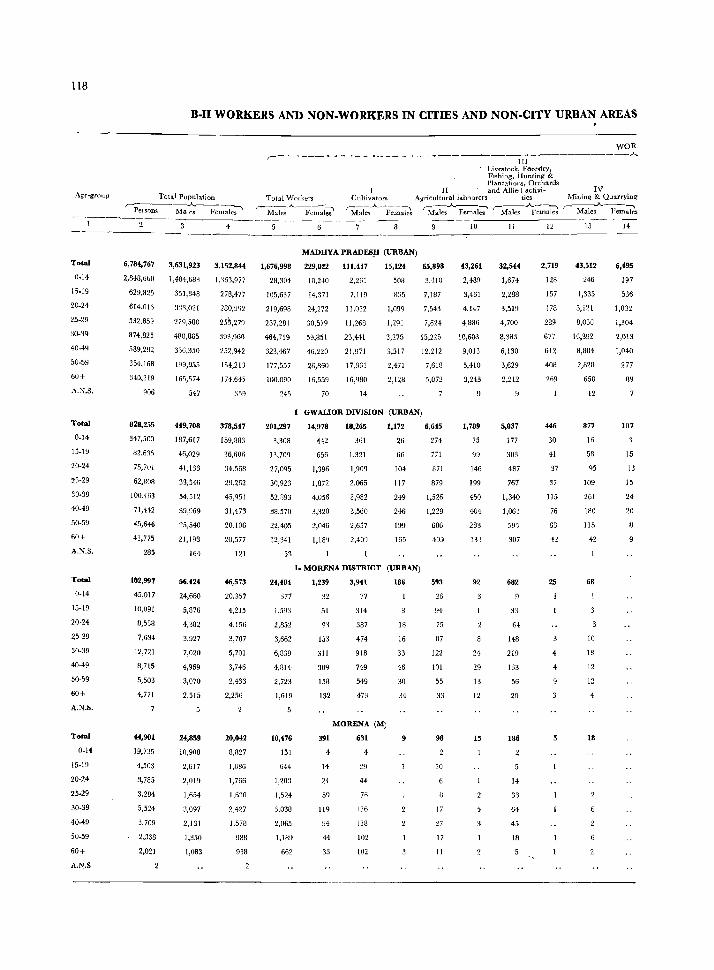
118
Total
0.14
15.19
20·24
25·29
:lO·Q9
40.49
50·59
60+
A.:-;.S.
Total
0·14
15-19
20·24
25·29
30·39
40·49
50.59
60+
A.N.S.
Total
0·14
15-19
20·24
25-29
30·39
40-49
50-59
60+
A.N.S.
Total
0·14
15.·19
20·24
25·29
30·39
40-49
50-59
60+
A.N.S
B-n WORKERS AND NON-WORKERS IN CITIES AND NON-CITY URBAN AREAS
6,784,767 3,631,923 3,152,844
2,848,660 1,484,683 1,163,977
629,825 351,348 278,477
614,013 3J3,021 280,992
532.859 279,580 25~,279
874,825 480,865 393,960
589,292 336,350 252,942
354,168 199,955 154,213
340,219 165,574 174.645
906
828,255
347,500
82,6:1.0
75,701
62,308
100.463
71,442
45,646
41,775
285
102,997
45,017
10,091
8,538
7,634
12,721
8,715
5,503
4,771
44,901
19,735
4,503
3,785
3,284
5,524
3,709
2,338
2,021
547
449,708
187,617
46,029
41,133
33,546
54,512
39,969
25,540
21,198
164
56,424
24,660
5,876
4,382
3,927
7,020
4,969
3,070
2,515
24,859
10,908
2,617
2,019
1,654
:1,097
2,131
1,350
1,033
359
378,547
159,383
36,606
34,568
29,262
45,951
31,473
20.106
20,577
121
46,573
20,357
1,215
4,156
3,707
5,701
3,746
2,433
2,256
20,042
8,827
1,886
1,766
1,6:10
2,427
1,578
983
938
. WOR _____________________________________ J....
,- III J ,iveo;tock, Foredry, Fl<;hing, I funting & Plantations, Ol'chards
II and AlIi('d activi-Total "Vorkers Cultivators Agricullurallabourcrs tics
,-__ _A_ __ ~-,
Males FemaJes 'Male'S..A.-Fem~ 'M:ales ..A...pemal:' ,.-Males ~emaki
MADHYA PRADES!l (URBAN)
1,676,998 229,022 111,417
23,304 10,UO 2,261
10,5,637 14,371 7,119
219,698 24,272 11.032
257,281 30,579 11,268
464,719 59,851 23,441
323,467 46,220 21,971
177,557 26,860 17,361
100.090 16,559 16,980
245 70 14
15,124
508
835
1,099
2,471
2,128
10
65,898 43,261
3,."0 2,489
i.187 3,461
7,543 4,147
7,6H 4,886
15,225 10,603
12.212 9,013
7,618 5,410
5,072 3,243
GWALIOR DIVJSION (URBAN)
201,297
3,308
13,709
27,0%
30,923
52,893
38,570
22,405
12,341
53
24,484
371
1,593
2,852
3,662
6,839
4,814
2,723
1,619
5
10,476
151
644
1,203
1,524
3,038
2,O£',
1,189
662
14,978
H2
656
1,'396
1,872
4,056
3,320
2,046
1,189
18,265
361
1,321
1,909
2,065
3,982
3,560
2,657
2,409
1,172
26
66
104
117
249
246
199
163
1. MORENA DISTRICT (URBAN)
1,239
32
51
g,
153
311
309
158
132
391
4
14
24
59
119
94
44
33
3,941
77
314
337
474
913
749
549
473
MORENA (M)
631
4
29
44
76
116
138
102
102
186
18
16
33
46
30
34
6,645
274
771
871
879
1,526
1,229
686
403
593
26
91
75
87
122
101
55
33
98
10
17
27
17
II
1,789
75
99
146
199
450
404
283
13'3
92
21
29
13
12
15
II
32,5U
1,674
2,283
3,519
4,700
8,%3
6,130
3,629
2,212
5,037
177
303
487
761
1,340
1,063
591
307
682
33
M
148
219
133
56
20
186
14
31
64
45
18
12
2,719
128
157
178
289
677
612
408
269
446
30
41
37
37
115
25
4
4
IV MiniU!~ & Quarrying
,---.A.---...,.., Males Females
13
43,512
246
1,335
5,121
8,036
16,392
8,884
2,828
658
12
877
16
53
95
109
261
180
115
68
10
18
12
12
18
14
6,495
197
536
1,032
1,304
2,013
1,040
277
89
107
15
13
15
24
20
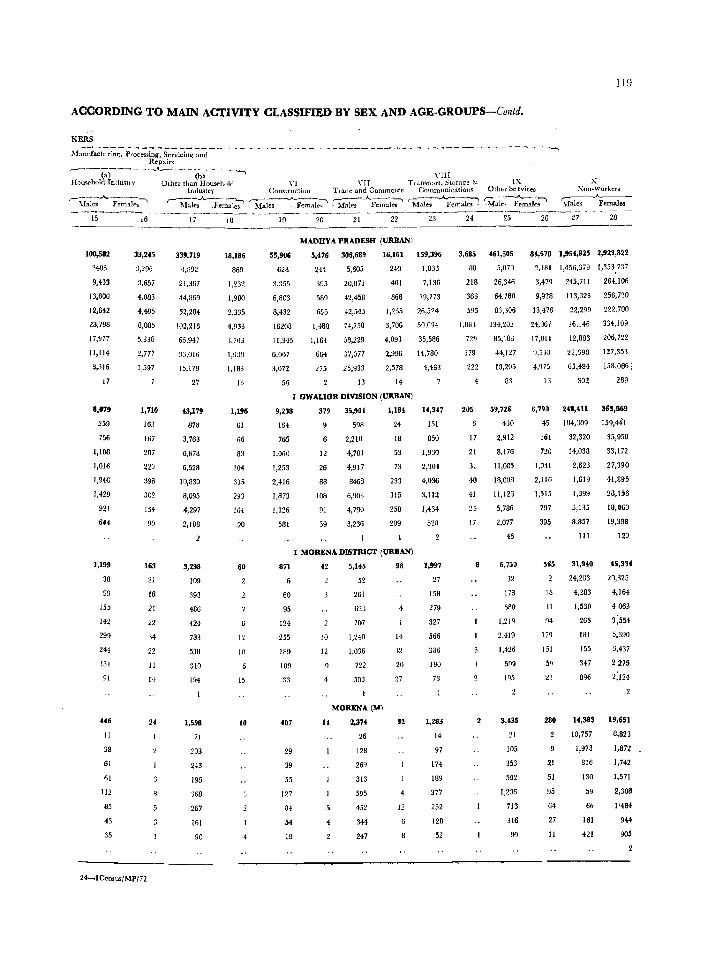
119
ACCORDING TO MAIN ACTIVITY CLASSIFIED BY SEX AND AGE-GROUPS-Contd.
KERS M~~~t~~Z Pr'~;s~;:-&~ici~~r:i--- ~- - -- --- -- -- ------.- ------ ~.----------- ----"--- -~
Repairs r-----(;)--- ---.A..-----(b)-· --~ \TIII
Hou'\.f>h0Id Indml,'y Other than HOUSf"hold \T! \'II Tt',m"port. Stor:lq-e ~ IX Indl1,~try Constmctiun TI adc and Cammel ce ConunlinicatlOIls Other Se rvices
r-U~;.A.F~m~~-" r--;fuks-A.~~*7' '"""ifa~femal(>~ :-M~~~ ~r;I~.A.~a1c~ ~l-;:-~al~~
X Xon~workers
~-~emale:-
100,582
3485
9,433
13,800
12,642
23,798
17,977
11,114
8,316
17
8,079
259
756
1,108
1,016
1,946
1,429
921
641
1,199
38
99
155
142
299
244
131
91
446
II
38
61
61
112
85
43
35
33,245
'),296
3,657
4,083
4,485
8,005
5,338
2,777
1,597
1,710
163
167
207
229
398
302
154
90
163
21
18
21
22
34
22
11
14
24
24-ICen,us/MP/72
339,719
-1,892
21,367
44,869
52,204
102,218
65,947
:13,016
15,179
27
43,179
878
3,763
6,678
6,528
10,830
8,095
4,297
2,108
3,238
109
393
486
424
783
538
310
19"
1,598
71
203
243
195
368
267
161
90
18,186
869
1,232
1,980
2,335
4,933
3,703
1,9311
1,183
13
1,19&
61
66
83
104
335
293
16.
90
60
12
10
15
10
55,906
628
3,355
6,803
8,432
16208
11,345
6,007
3,072
56
MADHYA PRADESH (URBAN)
5,476 306,689 16,161 159,396
244 5,605 240 1,033
395 20,071
589 42,458
655 42,545
1,488 7+,758
1,I6i 58,229
654
275
37,077
25,933
13
401 7,136
868 19,773
1,265 26,524
3,706 50,094
4,093 35,586
2,996 14,780
2,578 4,463
14
I GWAUOR DMSION (URBAN)
9,238
164
765
1,060
1,253
2,416
1,873
1,126
581
871
60
95
124
255
189
109
,]3
407
29
39
55
127
84
54
19
379 35,901
12
26
88
108
91
39
598
2,210
4,781
4,917
8468
6,90.1
4,790
3,236
1,18'
24
18
53
73
233
315
258
209
1 MORENA DISTRICT (URBAN)
10
12
4
5,145
52
261
623
707
1,240
1,036
722
503
MORENA(M)
2,374
26
128
269
313
595
452
344
247
98
4
14
20
27
32
12
14,347
151
850
1,930
2,304
4,036
3,112
1,434
528
1,997
27
ISS
279
327
566
386
180
73
1,283
14
97
174
189
377
252
128
52
3,685
88
218
368
593
1,084
729
379
222
205
17
21
31
48
41
H
17
461,305
5,070
26,346
64,780
83,308
134,202
85,18,
14,127
18,205
83
59,72&
4:30
2,912
8,176
II,OB5
18,088
11,126
5,786
2,077
46
6,750
3?
178
680
1,219
2,419
1,426
599
195
3,435
21
105
353
592
1,236
713
316
99 -
84,670 1,954,925 2,923,822
2,181 1,456,379 1,353,737
3,479 245,711 264,106
9,928 113,323 256,nO
13,476 22,299 222,700
24,067 16,146 334,109
17,011 12,883 206,722
22,398 127,353
65,484 158,0861
302 289
&,790 248,411 363,569
45 184,309 159,441
161
720
1,041
2,116
1,515
797
395
565
18
41
94
179
151
59
21
280
21
51
95
64
27
II
32,320
14,038
2,623
1,619
1,399
3,135
8,857
III
31,940
24,283
4,283
1,530
265
181
155
347
896
35,950
33,172
27,390
41,895
28,15~
18,060
19,388
120
45,314
21),325
4,164
4063
3)54
5,390
3,437
2275
2;124
14,383 19,651
10,757
1,973
816
130
59
66
161
421
8,823
1,812
1,742
1,571
2,308
1'484
944
905
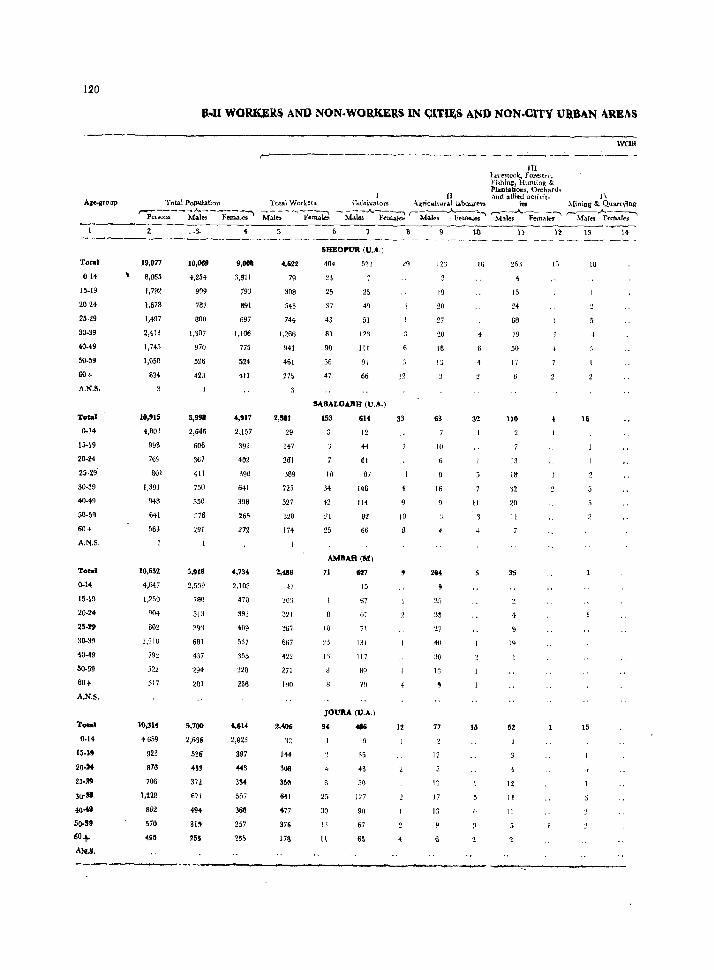
120
ll-Il WORKERS AND NON· WORKERS IN <;:lT~S AND NON.CITY UltBAN AUAS
·----------------------------------------------------------------------won~
Ag~r.up
Total
014
15-19
2024
25·29
30-39
40-49
50-59
60+
A.N.S.
Toeat
0.14
15-19
20-24
25·29
30-39
40-49
50·59
60+
A.N.S,
Total
0·14
15·19
20-24
25-29
30·39
~049
M·59
60+
A.N.S.
T_' 0.14
15·1'
20-24
25-~
30-511
40-49
~O-"
60+
AIU.
Total PoPUlation Tota' \Votk~rl'L
II! bvestoc.L::. Forestry. Fighitlgl Hunting &. Plantationll, Orch-ard~
II ;).nd alH~ activit. 1\'
'Pe;~;;;;:-- M~;--F-;.;;;.k.""'" M:;i; - '--F.';'~ Cuhi.v:alots- A.gt1~~dl\lral labcw.te~ ies ~Iining &. Quar['Ylng
~ M~-;-A.F-;~ki r~~ 'M-;.;J....~1 r-Mares "F~ates}_
19,077
8.065
1.792
1.678
1,497
2,413
1,745
1,050
834
10,915
4,803
998
769
801
1)91
94B
641
563
10,652
4,647
1,250
Q04
802
1,218
792
522
51;
\1),314
4659
923
876
706
1,228
862
570
490
--$.
10,069
4,254
999
787
800
1.307
97{)
526
423
5,998
2,646
606
367
411
750
550
~76
291
5,918
2,539
7SO
513
39'1
6B1
437
~94
281
5.700
2,03.
52li
H!
3n 6)1
494
SIt
255
4
9,008
3>~11
793
691
697
1,106
775
524
411
4,911
2,157
392
402
390
641
398
265
272
.{,734
2,108
470
391
~U9
:155
na 236
"514
2,e2~
397
443
334
557
368
257
2!S
5
4,622
79
308
545
744
1,266
941
461
275
!,i181
29
147
261
389
725
527
228
174
2,488
47
~03
321
367
667
422
'32
1+1
308
35n
Ml
477
l76
17S
SHEOPtlR (U.A,)
404
25
:17
43
83
90
56
47
5?J
25
4~
51
123
III
91
66
"SAl-OUR (U.A.)
153
18
34
42
21
25
5H
12
H
61
87
148
114
~2
66
AMIIAR(M)
11
10
1'\
6t7
15
67
67
1:11
117
89
711
JOURA (l).A,)
g, 486
25
30
13
l\
35
43
50
127
91l
67
G~
12
33
10
12
123
19
20
27
:!o
18
13
63
16
17
+11
:10
I~
77
12
13
17
13
lfi
32
11
5
J5
4
15
24
6A
79
50
17
116
13
111
'12
20
11
3'5
~)
19
52
H
II
1't 13
18
16
15
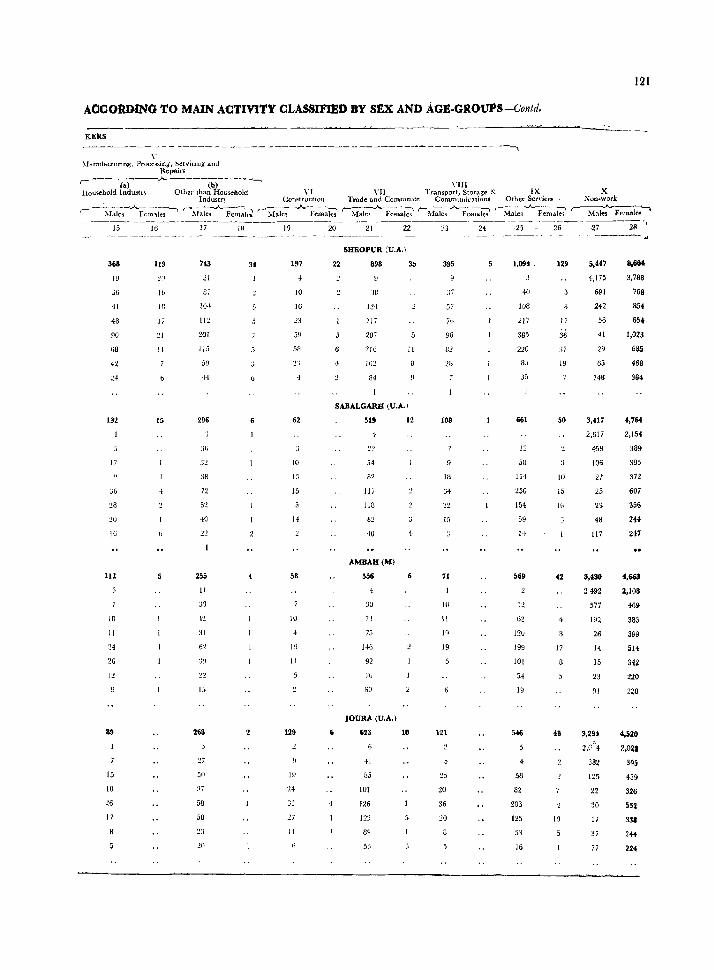
ACCORDING TO MAIN ACTIVITY CLASSmED BY SEX AND AGE-GROUPS-Contd.
KERS --------~- - ----- -- ----_ --_-------------------_- _---_ ------ - - ---~
y .\fallulactunng, Procc~sing, Serviclllg and
Repa.irs
121
r----(.)----A. ----(bi------, \'III
l-iomehold Indush ~ Other than Household YI VII Tmnsport, Storage &: IX X Indus,tn COnstructlOll Trade and Commerce Commullications Other Services N"u·work
,. --\~ks-"""Y;;~*-;~ r-~i~~hm~b '-·;'-I~I~--AF~;;~b rMale~ ....... F~~--;l~ f~1:1~;-A.F~~~~ ~M~-sF~~:Ie;' r- Male~l~ ----~-1-5---iEi---17---Iil----1-9-~-20----2-1---22--~-- -2-4~- --:2 i- -26--:-- ---.v--~"
368
:>6
·Il
43
90
68
42
132
17
:.;6
:!o
16
112
18
11
26
15
10
26
17
119
::0 lb
18
17
21
15
743
21
87
10+
112
201
115
59
H
296
38
72
51
40
255
11
:3'3
{1
31
268
'27
50
58
50
20
197
10
16
23
.59
58
:n
4
62
10
15
58
19
II
129
14
Jl
'27
11
SHEOPUR (U.A.l
898
'3B
1:!4
1] i
216
102
35
II
SABALGARH (U.A.)
519
54
117
118
82
40
AMBAH(M)
556
30
75
146
92
76
Gil
JOURA (U.A.)
6~3
41
85
101
126
1')')
8"
12
4
10
395
:;7
57
i6
98
82
:18
108
HI
34
15
71
10
11
1"
19
121
25
20
36
20
1,094,
4(J
lOB
217
385
220
85
35
661
12
58
11·1
250
154
59
14
569
120
199
101
54
19
5-16
5n
82
203
125
]6
129
17
36
37
19
50
JO
15
16
42
4
17
48
19
--------_
.,4*7
4,175
691
242
56
41
29
65
148
3,417
8,606
3,788
768
854
65+
1,023
685
468
364
4,764
2,617 2,154
459
106
22
25
23
46
117
3,430
2492
577
192
26
11
15
23
91
~,29~
382
125
22
30
11
3i
ii
389
395
372
607
356
244
247
4,663
2,108
46~
383
399
514
342
220
228
4,520
39.
439
326
531
33.
244
224
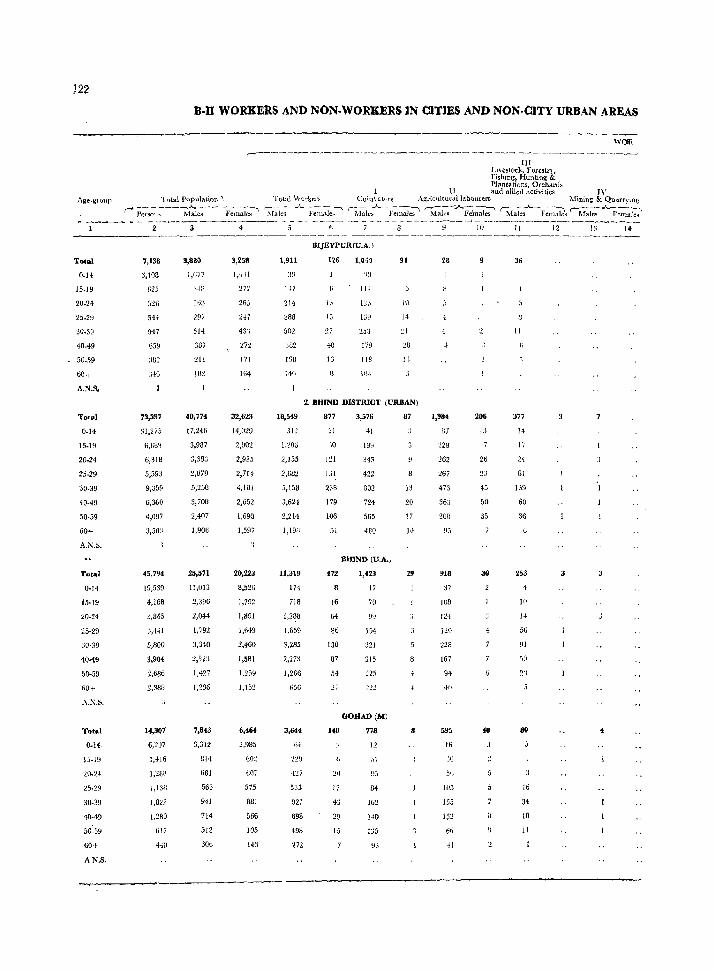
Age-gJoup
B.n WORKERS AND NON·WORKERS lN CIT1ES AND NON· CITY URBAN AREAS
r----~------------~-----~~---.~-~----~~ ---.. ------~------
Tutal PQPulati()n ; Total Worker"
,-p;S(:j;--A.~l~-- -fu;ak~ r:\I-;J~---·"'!.'-~11aIe-~~
III LJ\estock,l'ol'cslr), Fislung~ Hunting & PJanta tions. Orchards
11 and allied activities IV CullJ\ atl)fg Agl'icultUl'd.l labourers 11ining & Quarrylng
r~1;k:--femalc-;' r;fu~--AFelnale~ r:~k:--Fc~-:.is '-~fa]e-;_''-F~~i;;
--------~--------------- ----- ~---- - ----------~-----------------
Total
O.H
15.19
20.2~
25.29
30.39
40.49
5o_,,9
60+
A.N,S.
Total
0·14
15.19
20·24
25-29
30·39
40·49
50·59
60'1-
A.KS.
Total
0·14
15·19
20-24
25-29
30·39
40-'19
50-59
60+
k1'\.S.
Total
0·14,
IS.l!)
30·39
4()'49
50-59
60+
A,N.S.
7,138
3,108
625
544
!}47
659
73,397
31,275
6,nag
6,318
5,593
9,359
6,300
4,097
3,503
~5,794
19,539
4,188
3,845
J,Hl
5,800
$,904
'1,686
1,388
14,307
6,297
1,416
1,138
1,8<2
1,280
617
H9
3,880
514
387
211
181
40,774
17,246
>,987
2,879
5,250
3,708
2,407
1,906
25,571
11,013
2,396
2,044
1,79:.t
3,340
2,32:1
1,+27
1,236
7,843
3,312
81,1
661
563
941
714
512
306
3,258
1,-t)1
263
U7
43'J
272
171
164
32,623
14,029
2,902
2,935
2,714
4.!01
1,690
1,597
20,223
8,526
1,792
1,801
1,649
2,460
1,581
l.259
1, 15~~
6.464
2,985
b02
607
575
SBI
566
105
143
1,911
IV
2H
288
502
382
19B
14f1
18,549
31~
1.201i
2,155
2,682
5,158
3,624
2,214
1,190
11,319
IN
718
1,288
1.659
3,285
2,273
1,266
65G
3,644
64-
-r.!7
535
921
698
498
V2
JllJEYPUR(U.A. )
lZ6
IJ
'l.i
+0
16
1,050
':0
IH
IJ~'
253
179
118
9{
III
14
:21
28
]'1
2. BHIND DISTRICT (URBAN)
877
21
'IQ
121
JJI
238
179
lW
51
472
16
64
86
130
87
5.
ltO
17
43
20
15
199
343
422
802
724
565
4BO
lIHlND (U.A,)
1,423
17
70
15'}
J21
315
225
GOHAD(M)
778
12
;'7
84
162
140
Li5
93
87
13
20
17
H
29
2&
1,!l84
87
n9 262
267
473
363
208
918
37
J08
12-1
1'20
228
167
94
41l
595
16
30
30
105
155
1:12
66
-11
206
13
23
50
35
30
36
II
377
1+
17
24
Bl
139
60
36
253
10
1-1
56
91
50
2')
80
16
34
10
11
~
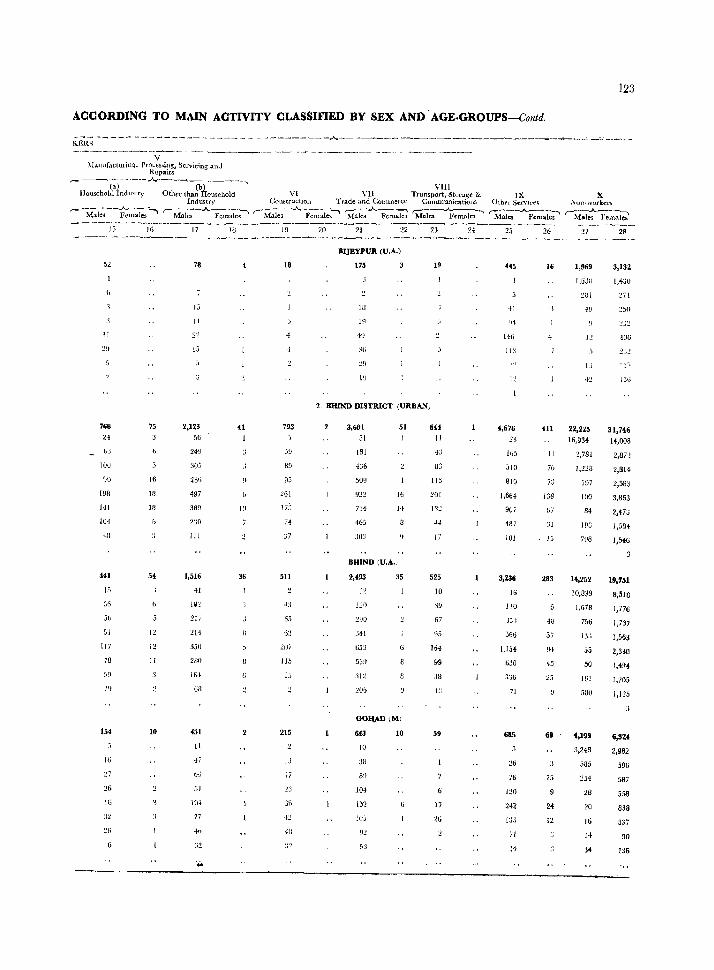
123
AOCORDING TO MAIN AOTIVITY OLASSIFIED BY SEX AND 'AGE.GROUPS-COlltd,
- -_ -_ ------------------- - - ~---------A----·--~---~-------____ __, _______ ·· ____ ~~......: ~. _ _...;. .. _ __.. [(ERS
V ~l.UlUfdctuljn~, Processin~, Servicing otllJ
Repairs r- --<.)-- --.A. ----- ., \'Ill
Household Inclustl·y Othel' tl13~lIQusehold VI \"11 Transport, Storage & IX Industry Uon~tructlO11 1'rade and Commerce Communications Otbrr Servlct:'~
r- M-;ks~-~rnale;l r-M~.A..Female~-' ~~e--;--.A.F~;~~ ~ales J.... Femaki ~~ 'MaI~-F.;a.le;-' 15
52
11
768 24
6:;
100
!J{)
198
141
104
40
441
15
:]6
51
117
78
154
IG
27
26
16
16
75
16
18
IS
54
12
12
II
10
17
78
10
II
13
2,123 56
249
305
:WG
497
399
2:;0
III
1,516
41
217
214
350
2HO
164
G3
431
II
47
51
In4
77
' ..
IS
trJ
36
19
18
4
793
.:;9
8D
95
7i
J7
511
6:!
207
115
15
215
IJ
17
4U
20 21 22
BlJEYPUR (U,".)
175
49
36
l~
23
19
2. BHlND DlSTRICT (URBAN)
3,601 jl
181
1:16
50()
922
734
51
16
14
BHIND (U,A.I
2,493
1:':()
:;41
65:3
~39
:112
:Wi>
35
GOllAD\M)
643
10
:JB
80
104
53
10
644 II
43
113
201
I'J~
H
17
525
10
39
67
16i
99
38
59
24 25
445
41
It6
110
12
4,676
23
165
jlD
81(1
1,664
907
fHI
101
3,236
16
110
366
1,15t
630
.1%
71
685
26
76
120
71
14
26
16
'Ill
11
70
7:]
138
67
:;1
Ij
283
57
94
45
69
15
24
12
X "Son-worker!>
,-.A.--" Males }'ema)es
~I 2B
1,969 3,132
I,GJU t,.\-:]O
~Ol
l~
IJ
22,225
16,934
2,781
197
100
Bi
193
7118
H,252
10,839
1,678
756
13.1
55
50
161
580
.,199
3.248
585
:.!54
2B
20
16
14
:!71
250
406
at,746
H,OOa
2,872
2,B14
2,583
3,863
2,41:)
1,58'"
1,546
19,151
8,510
1,776
1,737
1,563
2,330
1,494
1,205
1,125
6,324
2,982
596
587
558
838
537
90
136
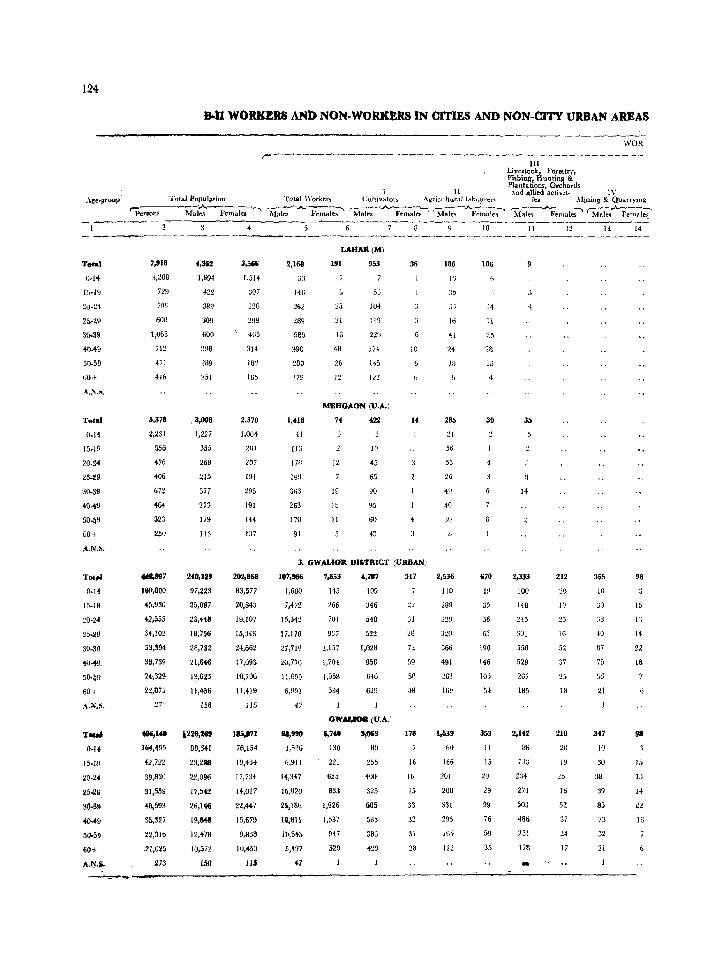
124
T .... '
o.a 15·19
2u.2~
2".29
3().S9
~9
50-59
60+
A.1".;;.
T .. tal
o·a 15·19
20·24
25·29
30·39
40.;9
50·5~
60+
A.N .•.
Tot'"
0.14
15·19
~o·u
30·39
~.i9
50·:;9
60+
A.l\.S.
T .... 0·1+
15·19
20·24
25011n
30-%
40 ... 9
50-59
60+
A.l'1.j.
JJ..lI WOJ.tK!:R8 AND NON-WORKERS IN CrrlES AND NON-CITY URBAN AREAS
WOR
,--------------------------_.--- -----.-------- ---_--1lI
L!ve~toc:kH Fo.r~try,
~~~~~on~6~~!ds 1 11 and allied activit~ IV
Totall'0pulation Total W()fker~ (;ulti\rator~ Agricultural \abo}u"er'\ ies ~\riuing & QuarrYll1g
~P;;;;;--M~~kl-\ ~-;;--.A..~;-, 'Males .A- F~m~k;' '"if~.A-~~ 'M:~;-AFemale;' ~ales.A..F;;:i~
7,918
:1,208
729
iO~
608
',065
)12
4)1
41&
5,378
2,231
556
476
406
672
i64
323
250
ue.!I97
180,800
.:;,930
42,>55
34,102
53,394
S8,739
2+,329
22,875
273
.... , .. 164,495
42,722
39,B~O
31,559
48,593
22,316
.21,025
273
4,352
1,694
f2t
38<J
309
600
398
2U9
251
.3,ooa 1,227
355
269
215
377
273
179
113
2tO,12'
97,223
25,087
23,H8
18,1,6
28,7a2
21,646
13,823
11,456
158
~220,2"
88,S41
23,2118
17,542
26,146
19,641
12,~7a
10,572
4
3,56ti
1,514
307
:!99
465
314
lB2
165
2,370
1.004
:!Ol
207
191
295
191
14+
1J7
202,868
83,:;77
20,843
19,107
15,346
U.662
17,093
10,706
11,419
115
185,171
76,154
19.434
17,734
14,017
22,4+7
15,679
10,453
IJS
2,168
146
262
289
,83
390
280
179
1,418
·11
113
178
lW
363
263
170
91
LARAR(M1
191
25
46
48
26
12
953
53
104
!l9
'1,29
174
145
122
MEHGAON (U.A.)
74
It
19
15
11
19
45
65
90
95
60
36
6
10
3. GWALIO'R DISTRICT (URBAN)
186
1')
;]5
16
01
24
If!
285
:!l
56
55
26
49
40
30
IOt,H6 1,553 ,,717 317 2,536
1,680
7,47'I
15,312
17,170
27,719
20,770
11,6»:;
6,091
47
11,990
1)526
6,911
H,347
16,020
2',186
18,811
In,6~5
5,~97
H
145
266
701
937
2,157
1,704
1,058
109
:H6
,48
522
1,028
958
646
629
Oll'AUOa (U.A.l
5,741 J,Oi3
130 80
221
625
833
1,926
1,537
9~7
520
~oo
325
605
585
383
:31
28
59
17B
16
Ib
15
33
32
31
28
110
289
329
320
491
26~
169
1,539
60
166
201
200
33t
295
164
122
10
lOG
Ii
11
15
30
670
19
35
65
190
146
lO~
54
353
11
15
~9
2"9
99
76
59
35
II
9
35
14
2,333
100
148
245
301
558
529
267
185
2,142
36
LJJ
271
503
486
251
178
-
12
212
20
1~
16
52
37
25
18
210
20
19
25
16
5Z
J7
24
17
I~
355
10
JB
40
87
75
21
347
10
30
:18
39
83
73
52
21
14
93
15
13
14
n IS
911
15
~-.---------------------------------~----------~~----~--~----~~-----------------
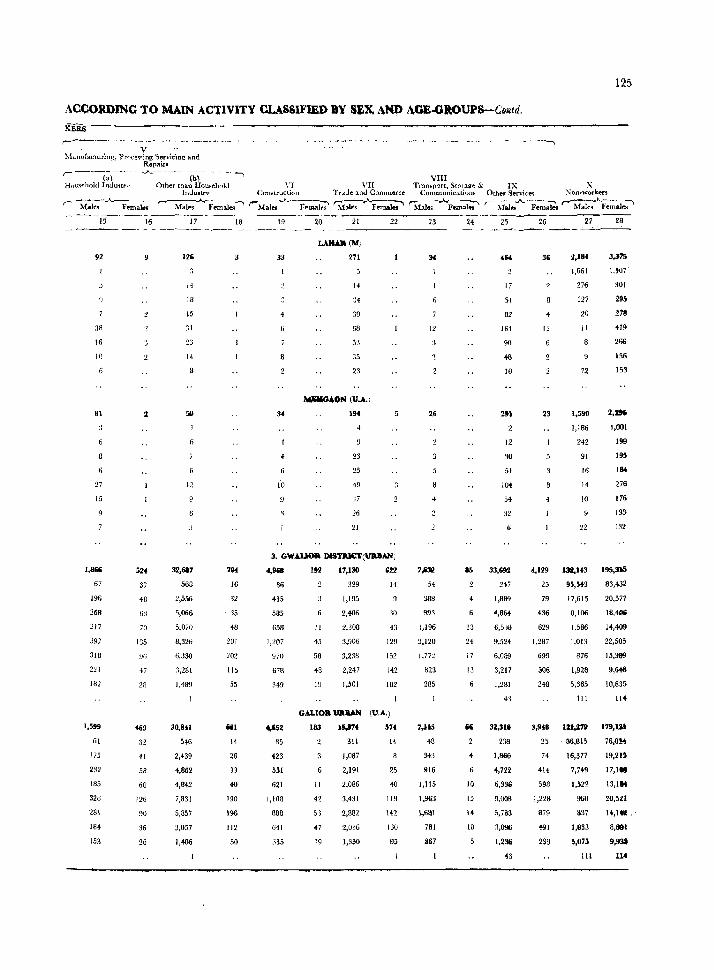
125
ACCOlU)ING TO MAIN ACTIVITY CLASSU'lEl> BY Si-x, AND AGE-GltOUPS-Ctmtd.
KERS
,....--- .- --_ ~- .----_..------~---.--- --~~--------~~~
V 'hianufacturin~:J PI'()ce<;~lng ServicioQ' and
Rctpai-rs ,....-(:)-- -.A.---(b) -, VIII Household Indmtn- Othlrr than Household '"r VII T,-amp')rt, SWI a~e & IX X
Industrv ConsU'uction Tr&Je and Conllnerce Communications Othet Services ~oll .. work~rs
r M.ks--....-~~~ r--~i;~ '-Males :.A-- Fe~;;' ~~Fellla~ ~ales--..A-~ (~1aJ~ Fem~'- Mal~"'-F;;;;a)~ 15
92
38
16
10
81
27
15
1,81ifi
67
196
268
217
397
318
221
182
1,599
GI
175
232
ISS
32S
281
IS4
153
16
2
524
37
48
63
70
135
47
2R
32
41
58
60
126
9Q
36
26
17
12j;
18
IS
31
14
8
12
32,687
568
2,556
5,066
S,07()
8.326
6,330
:l,2S1
1,489
30,S.1
546
2,439
4,862
4.842
7,831
5,B57
3,057
1,400
18
784
16
32
35
{B
201
202
115
55
iiI
14
26
33
+0
190
196
112
50
19
33
34
20 21
LAHAR (M)
271
14
34
39
68
53
35
23
MliII040N (U.A.)
194
23
25
'19
'jl
26
21
22
3. GWAlJOJl DlSTN€lT(\Jl\]IAN)
4,968 192 11,190 '22
86 329 14
435
585
658
1,207
970
678
349
~52
85
423
551
621
1,108
888
641
335
II
45
58
48
19
1,19.>
2,406
2,30B
:1,906
3,238
2,247
1,501
:10
43
129
152
142
102
GALlO. UIlUH (V.A.)
183 tt,374 574
II
42
5'3
47
19
3\1
1,087
2,191
2,086
3.431
2,882
2,036
1,350
25
40
119
142
130
95
23
12
26
7,1i31l.
54
S8S
993
1,196
:!~120
1.772
823
285
7,115
48
30+3
~16
1.115
1,96:1
1,6111
781
i67
24
115
13
24
17
13
10
IS
H
10
25
17
51
82
16{
9Q
+8
10
12
:10
51
104
54
32
33,6!1'l
247
1,889
4,864
6,5:1II
9,5U
6,089
3,211
1,281
4l
32,31&
239
1,800
4,722
6,336
9,000
5.7S3
3,096
1.236
43
26
36
2
12
23
27 28 --_-_-_-__ - _-
2,184 3,3?5
1,661 l.!!O7'
276
127
20
II
72
1,590
1,186
242
91
16
14
10
301
~5
278
~19
266
2,_ 1,001
199
195
184
276
176
133
132
4,129 131l,1'l 195,:115
25 95,543 83,4.32
79
436
629
1,287
699
506
248
17,615
S,I06
1.586
1.013
876
1,928
5,365
III
20,577
18.-uIIi
14,409
22,505
15,389
9,64&
10,835
114
3,9U 111,279 179,W
25 ,86.615
74 16.377
414
598
1,223
879
491
239
7,7+9
1,522
960
a:17
1,833
5,015
III
76,Ol~
19.213
17,1111
13,11M
20,521
1.,ltt .
8.11&1
9,9~
11.4
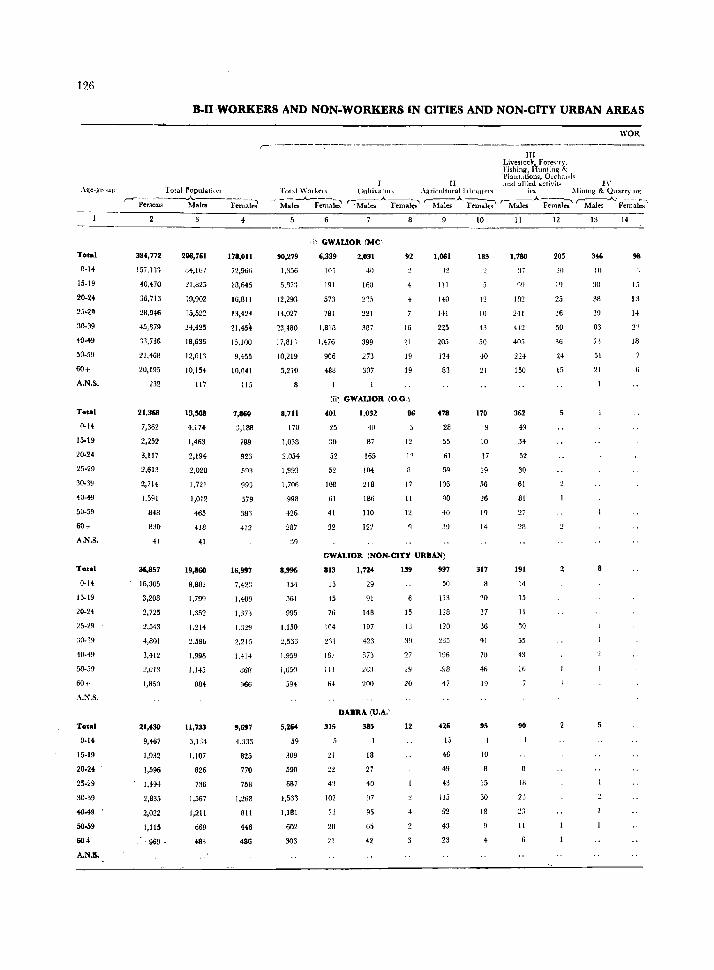
126
:o.D ·WORKERS AND NON·WORKERS IN CITIES AND NON-CITY URBAN AREAS
.\~.e·~TOUI; Total Population
'---PeTso~·--t~-F~ki
Total
0-14
15-19
20-24
30-'19
40~9
50.5~
60+
A.N.S.
To •• 1
0-14
15·19
20-24
25-29
:lO-39
40-4!J
50.59
60+
A.N.S.
Total
0-14
15·19
20.24
40-49
50-59
60+
A.N.S.
To.a!
0-1+
15-19
20·2+
25.29
30.39
40-49
:lO-S9
604-'
A.M.!.
384,772
157.l en
40.470
36.713
28,946
45,879
T~,736
21,46B
20,195
232
21.3fi8
7,362
2,252
3,117
2,613
2,714
1,591
848
830
41
36,857
16,305
3,208
2,725
2,543
4,801
3,412
2.013
1,850
21,438
9,467
1,932
1,596
1,494
2,835
2,022
1,115
. 969·
206,761
B4.1u7
21,825
19,902
15,522
24,425
18,636
10,154
117
13,508
4,174
1,463
2,194
2,020
1.721
1,012
465
418
41
19,860
8.882
1.799
1.352
1.214
2.58b
1.998
1,145
884
11,733
3,134
1.107
826
736
1,567
1,211
669
483
4
178,011
72.966
10,645
16,811
13,42-1
21.454
15.100
9.455
10.041
115
7,860
3,188
789
923
.193
993
579
381
412
16,997
7,42~:
1,409
1,373
1.329
2.215
1,+14
86R
966
',"7 4.333
825
770
758
1,268
811
446
486
WOR r-----'--- --:---------------------------- ---------
III Livestock. Fore<;tl'Y. Fishing, Huntinl{ & 'Plalll.\tiolls,OICh:l[tl"
II :md allied Olcrivil. 1\' Tot:1.1 \\'olk("[\ Culthatob ,\griculturall"bulIlt'r'i iC!. .\Iinmg & Quan,}'illg
- M;i;A.-P;m-:i;' r:-~_A_~I;' ,-~.A..~~, r-~_A_F~:aJ;' ~A.~;;,
90,279
1.9~6
5,n71
12,293
14,027
23,480
1 i,811
10,219
5.210
8
8,711
170
1,038
2,054
1,993
1.706
99B
426.
287
8,_
154
561
995
1,150
2,533
1,959
1,050
594
5,264
59
309
590
687
1,531
1,181
602
:lOg
ii\ GWAUOR (MC'
6,339
10')
191
573
781
1.818
1.476
906
488
2,031
+0
168
21.1
221
387
399
273
307
92
4
16
21
19
19
(iil GWAUOR (O.G.\
25
:10
52
52
108
61
41
32
1,032
40
87
165
104
218
186
110
12?
86
12
1 ~
17
II
12
1,061
111
140
HI
225
205
124
81
478
28
55
61
106
GO
40
:l9
GWALIOR (NON-CITY URBAN)
813
15
45
76
104
167
III
114
315
1l
22
43
102
7:1
21
1,724
29
91
148
197
423
~73
26:1
200
DABRA (U.A.'
385
18
27
40
97
95
65
42
139
15
I.l
39
27
19
20
12
4
997
50
123
128
120
235
196
47
426
Ij
4G
49
43
113
92
43
23
10
183
12
10
43
50
40
21
170
10
17
19
56
26
lQ
14
317
20
27
36
91
70
46
19
95
10
15
30
18
4
II
1,780
241
4-12
405
224
150
362
49
34
52
30
61
81
27
191
14
15
II
~o
55
43
10
90
23
II
6
12
205
25
16
50
36
24
15
13
3'6
JO
30
38
39
83
71
51
21
14
98
1.')
13
14
18
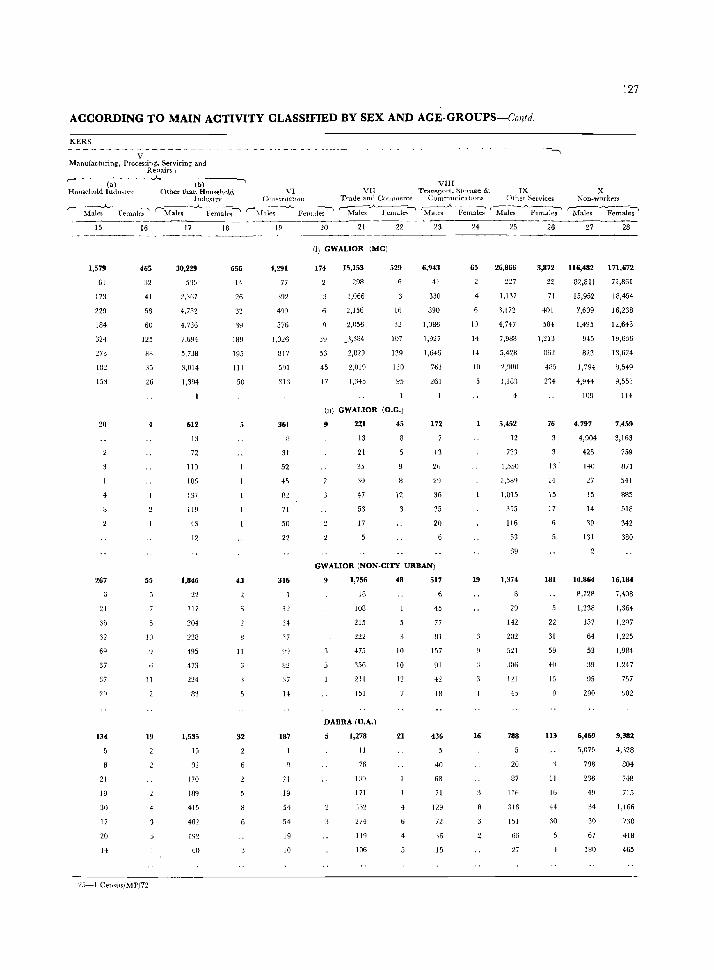
127
ACCORDING TO MAIN ACTIVITY CLASSIFIED BY SEX AND AGE-GROUPS-Colztd,
KERS
V Manufacturing, Processing. Servicing and
Repairs I
,- - --(-a)---h- (b)
Household Innu..,tn· Other than Household
15
1,579
61
17:1
229
184
324
273
IS:!
153
20
267
21
36
32
60
37
37
29
134
21
19
30
\7
20
14
16
465
32
41
58
60
125
ail 35
26
55
10
11
19
25-1 Ceu'<,us/MP/n
Indu')lrv
(M~·-J- -F~,~alc;"
17
30,229
5'13
~,'1[i7
4,752
4,736
7,694
5,738
3,014
1,394
612
13
72
110
lOG
1 ~\7
119
43
12
1,846
22
117
204
228
495
473
214
1,535
15
92
J 70
Ing
415
402
60
18
656
14
2f)
'39
189
195
III
50
43
11
32
VIII VI VII Tran"purt. Sl'Jrage & IX
Comtrl1ctlOll Trade ami C(J!llmerce Cummunicatlons Other Services X
N on·wor kt'r~
,- \fal-;;-.A- Fe~=~~ ~ales :A-~., 'M~_A_~ '""ifub-......._~~~ ~fales A-~;*~
19 20 21 22 23 24 25 26 27 28 ------------------------------(i) GWALIOR (Me)
4,291
77
174 15,153
298
529 6,943
41
330
890
65 26,866 3,872 116,482 17l,6n
499
576
1,026
817
501
313
361
31
52
4>
112
71
50
22
316
I:?
17
H2
37
14
187
21
19
54
54
19
10
39
53
45
17
1,066
2,156
2,056
_J,~134
2,829
2,01 ~l
1,:H5
16
32
107
139
ISO
95
(II) GWALIOR (O,G,)
9 221 45
13
21
35
3U
47
53
17
12
1,086
1,927
1,646
761
261
172
13
2(,
35
20
GWALIOR (NON-CITY URBAN)
1,756
18
108
215
222
475
356
211
151
DABRA (U,A.)
1,278
11
76
139
171
274
106
48
10
10
1')
21
517
45
77
81
157
91
42
III
436
40
68
71
129
72
16
15
4
10
14
14
10
19
16
227
1,137
'1,172
4,747
7,988
5,428
2,9!1n
1,IW1
5,452
723
1,550
1,015
355
116
53
39
1,374
29
142
202
521
1~1
788
20
87
1 IIi
316
151
66
27
22
7I
401
584
1,213
HG~
4115
2~4
76
1:1-
14
15
17
181
22
31
59
40
15
113
11
16
44
:10
82,811
15,952
7,609
1,495
945
823
1,794
4,!J44
72,861
18,454
16,238
12,643
19,636
13,624
B,549
9,553
109 lIt
4,797
4,004
425
140
27
15
14
39
131
10,864
8,728
1,238
357
64
53
39
95
290
6,469
J,07J
798
236
34
30
67
180
7,459
3,163
759
1171
541
835
518
342
380
16,184
7,408
1,364
J ,297
1,225
1,984
1,247
757
902
9,382
4,128
804
748
715
1,166
7:l8
418
465
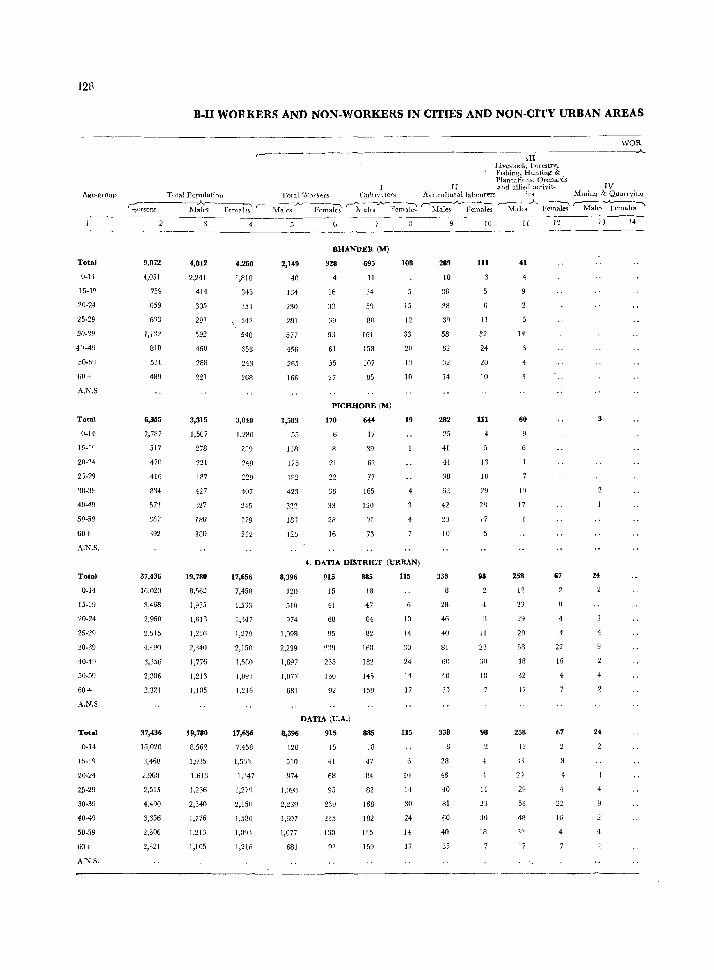
128
Age-group
Total
0-14
15-1.
20-24
4~-49
60+
A.N.S.
Total
0-14
15-1'
20.24
25-29
40-4~
50-59
60+
A.N.S.
Tota'
0·14
15.19
20·24
25.29
30·39
40-19
50-59
60+
A.N.S.
Total
0·14
20·24
25·29
30-39
40·49
50-59
60+
A:N.S.
B-II WORKERS AND NON-WORKERS IN CITIES AND NON·CITY URBAN AREAS
WOR . ______ . ____________ . ____ .A.
III J ,ivestock, Forestry. Fishing, Hunting & Plantations. Orchards
II ::\nd allied acti"it- IV Tota1 Population To1al 'Nnrkt:rs CllltJvato"S Agli('ultuluLlaboMers if'S Mmiul,{ & Quurryinl{
,- _. ----.A.-----, ,----A·----, "tlersDns ]\.Iak" FemaJ ~s \fales Females ,.-~> alt>s ~-·FClIl?l~ r-l\faies J.....-rc:ai:;' r-iIale'l -"- Fema~ '--~~emale~\
9,012
4,051
759
659
6~3
1,1:12
BIB
s:n
6,355
2,787
517
470
416
834
572
:167
392
37,436
16,020
3,468
2.960
2.515
4,4!10
3,356
2,306
2.321
37,436
16,020
:1,46B
2.960
2,515
4,4g0
3,356
2,306
2,321
4,812
2,241
414
305
291
592
460
2BB
221
3,315
1,507
27B
221
187
427
327
188
180
19,780
8,56~
1,935
1,611
1,23G
2,340
1,776
1,213
1,105
19,780
1,935
1,613
1.236
2,340
1,776
1,213
1,105
4,260
1,810
345
35~
\ 342
510
358
243
268
3,040
1,280
239
249
407
245
179
212
17,656
7,458
1.533
1,347
1,279
2,150
1,finO
1,09:;
1,216
17,6!W
7,458
1,513
1,"·47
1,279
2,150
1,580
1,093
1,216
2,149
40
134
230
281
577
456
265
166
1,583
55
llR
175
182
423
322
18~
125
8,396
120
510
974
1,098
2,239
1,697
1,077
681
8,396
120
510
974
I,U9H
2,239
1,697
1,077
681
BHANDER (M)
328
Ib
33
39
93
61
55
27
695
II
:14
5~
80
161
158
107
85
PICHHORE (M)
170
21
22
36
33
28
16
&14
17
39
62
77
165
120
91
73
108
15
12
33
20
13
10
19
4. DATIA DlSTRICT (URBAN)
915
15
41
68
95
239
235
130
92
DATIA (U.A.)
915
15
41
68
95
23!)
235
130
92
88S
18
47
84
82
168
182
145
159
885
18
47
84
82
168
182
145
159
lIS
10
14
3D
24
11
17
115
10
H
30
24
1-1
17
289
10
36
38
39
58
62
32
14
282
25
41
41
38
62
42
23
10
338
28
46
40
81
60
40
35
338
28
46
40
81
60
40
35
10
III
II
32
24
20
10
111
4
13
10
29
211
17
4
II
23
98
II
23
30
18
II
41
60
19
17
258
12
33
29
08
48
32
17
258
I ~
\1
:21
2fl
53
48
17
67
4
22
16
67
16
4
13 14
3
24
4
24
4

ACCORDING TO MA1N ACTIVITy CLASSIFIED BY SE" AND A :;E-GROUPS· em/d.
KERS
V ~I.inufactLlnng, Proce:.~ing, Servl(;ing and
Repairs
- -----~
129
(a) (b) VIII HJlI'H!hoIJ Indmtry Other than Household VI VI[ Tr,tn')port, Stor.H~':; & IX X
Industry CO,1StJ llctlon Tl,Hl~ <.Hld COlrlmerce C 'lnlmcme.ltion_ Other "'t;:r\ lees '\Ton_workel'l
---;:r:h ~---r::l~\'-~I~;.A. Femcl~ r-M~l~s-..A..-Fem-;~d '-~JJ.1:S'----.~-;~l~·Si~l~-A_l;'~~ ~\Lks-__A_lt(~l~;i~ '---;We~F;;;j; "" ----;;~- ---jfj- -- --17-----18-- ---}9----2"0--- - 2t----22--- -23----~4-----25-- ---26--- - 17- ---~8 ------------------------____,~-------------------------------_.
83
10
10
20
1.1
14
50
19
1,179
29
105
152
137
12{
103
1,179
105
15:!
137
2(JJ
124
105
20
4
4
16
216
15
26
21
61
47
16
216
26
21
61
47
22
177
11
4B
32
16
15
134
14
12
12
39
16
594
11
:;0
107
92
137
40
40
594
11
50
107
92
IJ7
112
40
40
29
4
4
29
4
98
13
40
19
J:I
31
t34
37
55
64
113
117
57
:J2
484
37
55
64
113
117
57
:12
BHANDER(M)
351
27
53
44
94
.Ill
38
32
PICHHORE (M)
127
23
29
24
24
n
25
4
4. DATIA DISTRICT (URBAN)
17
6
4
1,763
16
IOf
219
2J9
422
355
259
DATlA(U.A. '
86
26
19
IB
17 1,763 86
16
104
219
355
259
149
IU
IS
54
16
II
27
- 12
445
29
76
67
109
86
50
445
29
76
67
109
86
50
25
361
11
54
127
~B
225
73
57
10
11
2,426
12
77
205
:JH
849
501
321
117
2,426
77
205
344
349
501
321
117
51
13
10
17
283
19
8.5
79
43
22
283
79
43
2,663 3,932
:2,201 ',BU6
280
75
10
15
4
1.732
32 ~)
321
303
447
297
188
2,870
1,452 1,27-t
160
46
55
11,384
8,442
1,4~5
b \9
Li8
lUI
79
136
424
11,384
8,442
1,425
1'111
lUI
79
231
ns ~07
371
212
III
196
16,741
7,443
1,492
1)279
1,184
1,911
1,345
963
1124
16,741
7,H;
1,492
1.!79
1.184
1,~11
1,345
'163
1,1:2+
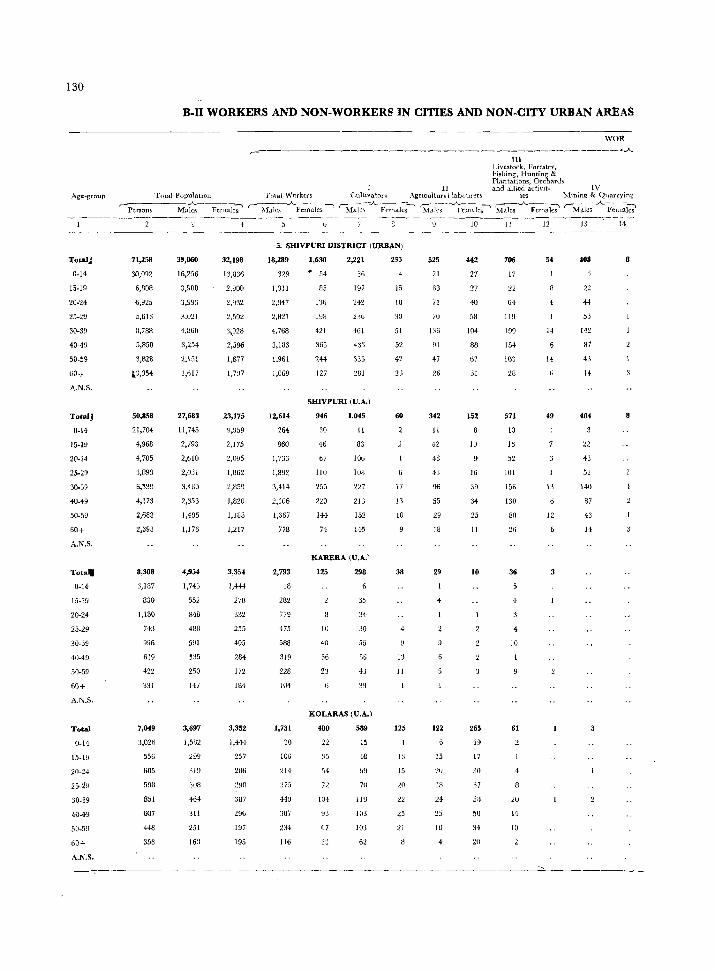
130
TotaIJ
0-14
15.19
20·24
25·29
30·39
40·49
50·59
60+
A.N.S.
Total)
0·14
15·19
20·24
25·29
3Q.39
40·49
50·59
60+
A,N,S.
Totall
0·14
15·19
20·24
25·29
30·39
40·49
50.59
60+
A.N.S.
Total
0.[<1
15·19
20·24
25·2'9
30·39
40.49
50.59
60+
A,N.S,
B-I1 WORKERS AND NON-WORKERS IN CITIES AND NON-CITY URBAN AREAS
III Livesto( k, F nrestrY, Fishing1 Hunting & Plantations, Orchards
II and allied activit. IV
WOR
Total }lopulatlOu Total Worhrs Cuhwaton Agncuhurall.ab(Jurers ics ~\l111ing & QuarryinJ;
'-'-P-cr-so-n-,-- Ma~-~-I?etna1e-;' ~ M.tb..A..Females -; '-Malc~...A.. F(';:i~~ ~~c~--~'cma!~;' Males .A..Fcmai~ ~~es-..A..-F~~~
71,258
30,092
6,808
6,925
5,613
8,788
5,850
3,828
l3,354
50,858
21,704
+,968
4,705
3,893
6,~39
4,173
2,683
2,393
8,308
:1,1H7
830
1,180
743
996
619
422
331
7,049
3,020
556
605
59B
851
607
448
358
3~,060
16,256
3,908
:),99:1
:1.021
4,860
3,254
2,151
1,617
27,683
11,745
2,793
2,610
2,031
3,430
2,353
1,495
1,176
4,954
1,743
552
848
488
591
~35
250
147
3,697
1,582
299
319
:lU8
464
311
251
163
32,198
13,836
2,900
2,Y32
2,59l
\928
2,596
1,677
1,737
23,175
8,959
2,175
2,095
1,862
'2,S59
1,820
1,188
1,217
3,354
1,444
278
332
255
405
284
172
1H4
3,352
1,444
2S7
286
387
296
197
195
5, SHIVPURI DISTRICT (URBAN)
18,289
329
1,311
2,847
2,821
4,768
3,183
1.961
1,069
12,614
264
860
1,733
1,892
3,414
2,:]06
1,367
778
2,793
18
282
779
475
588
319
228
104
1,731
30
lOG
214
:275
H~
307
234
116
1,630
#I 54
85
nti
198
421
365
244
127
2,221
36
197
242
236
461
43'1
33:'
:!81
SH1VPURI (U.A,)
946
30
46
07
110
255
220
144
74
1,0*5
II
83
106
108
227
213
152
145
KARERA (U,A,)
125
10
40
36
23
b
298
35
31
30
55
4J
KOLARAS (U,A,)
480
22
35
54
n 104
93
67
33
589
15
48
69
70
119
lU3
103
62
235
15
18
30
51
52
42
23
60
17
13
10
38
4
13
II
125
13
15
20
22
25
21
525
21
63
71
70
136
91
47
26
3*2
II
42
48
.}3
96
55
29
18
29
122
15
20
IS
24
10
4
10
442
27
27
4(}
58
104
88
67
:11
152
8
10
16
39
34
25
11
10
265
19
17
30
37
5a
50
34
20
11
70ti
17
22
119
199
154
103
28
571
10
16
52
101
156
130
80
26
36
4
10
61
20
14
10
12
54
11
14
49
13
12
13
408
22
H
53
142
87
43
14
404
22
43
52
14U
87
13
14
14
8

ACCORDING TO MAIN ACTIVITY CLASSIFIED BY SEX AND AGE-GROUPS - Contd.
KERS
V ~lanufacturing. Proce<;sing, Servicing and
Repa.u's
,.----W---.A.---(-b-) ----, VIII
Household Industrv Other than Household \'1 VIT Trampoft. St(Jfage & IX Industry Comtruction Trade and Commerce COlIullunicaLwtls Other Services
131
r -M-a-Ie-, .A.-F-e-m-al-es~ r---:r--!a-.I",-A.Female~ r- M;~-Fem~-;' ~fuic~---.A.F~~-;' ~f~.A.~ 'M-;;-.A.F~~~I~
X Nowwolken
c----..A..-----. Males Females
- ---_-- ----- ----15 16
642
18
50
94
95
~62
13
41
68
60
95
84
54
47
78
13
18
23
!O
69
10
12
16
11
65
11
4
16
17
1,626
62
197
27'2
221
361
235
166
112
1,309
58
169
225
179
272
182
131
93
147
17
23
19
42
24
13
96
14
14
25,
17
11
18
50
13
17
28
13
20
4
19 20 21 22 23 24 26 27 28 ------------------------_
5. SHIVPURI DISTRICT (URBAN)
1,162
33
96
131
168
312
l37
125
60
997
31
89
110
157
263
206
108
53
51
13
66
12
17
JU
53
17
16
11
3,309
70
202
462
43B
B14
591
143
289
SHIVPURI (U.A.)
49
15
15
11
2,360
64
154
323
300
586
4L2
301
210
KARERA (U.A.)
449
26
71
63
113
71
KOLARAS (U.A.)
64
39
309
11
43
48
78J
58
H
26
143
27
41
33
17
109
19
32
23
I:?
13
1,480
26
105
215
242
415
285
138
54
1,369
25
99
193
219
388
268
129
48
45
13
12
33
10
31
24
4
6,210
43
357
1,252
1,179
1,786
956
487
150
3,755
38
145
565
693
1,191
659
340
124
1,660
190
620
326
310
131
70
10
383
12
31
80
IW
68
42
10
549
22
53
180
123
56
29
20,771
15,927
2,597
1,146
2UO
92
71
190
548
30,568
13,782
2,815
2,7:Jb
2,394
3,507
2,231
1,433
1,610
423 15,069 22,229
18
46
70
132
87
45
22
56
26
16
46
15
11
11,481
1,933
877
139
66
47
12B
398
2,161
9,929
2,129
2,028
1,752
2,604
1,600
1,044
1,143
3,229
1,725 1,444
270
69
13
Hi
22
43
1,966
276
324
245
365
248
149
178
2,872
1,552 1,422
193
lOS
33
15
17
47
222
232
-----------------------------------------------------------------------
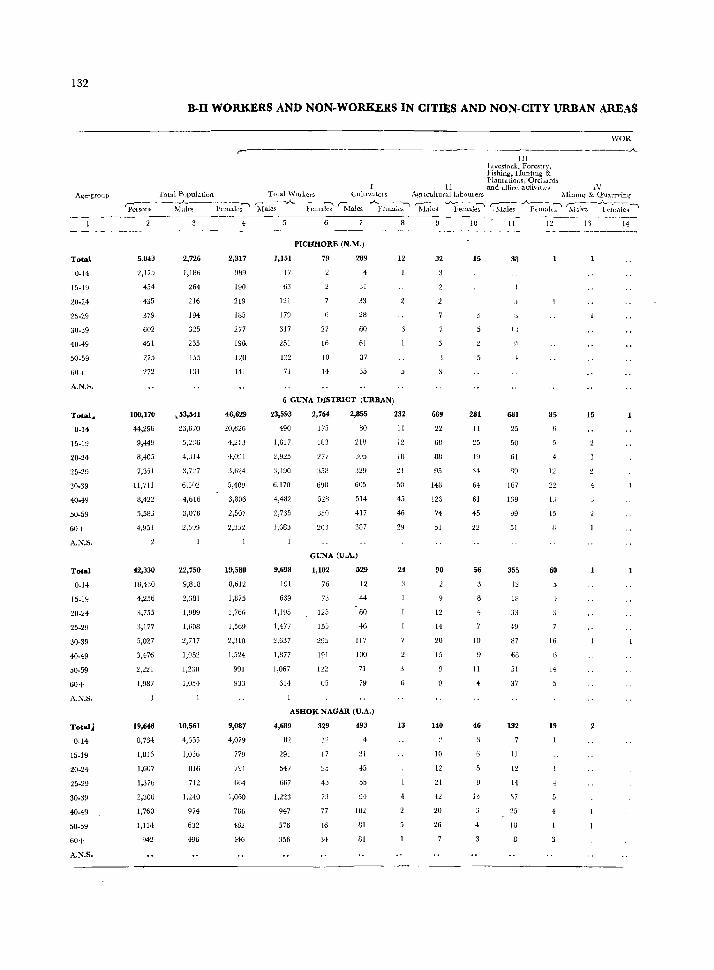
132
Age-group
Total
0-14
15-10
20-24
25-29
30-39
40-49
50-59
60+
A.N.S.
Total ..
0-14
15-19
20-24
25-29
30-39
40-49
50-59
60+
A.N.S.
Total
0-14
15-19
20-24
25-29
30-39
40-49
50-59
60+
A.N.S.
Totall
0-14
15-19
20-24
30-39
40-49
50-59
60+
A.N.S.
B-ll WORKERS AND NON-WORKERS IN CITfES AND NON-CITY URBAN AREAS
III LIvestock. Forestry, Fishing, Huntmg & Plantations, OrcJhlrds
II and allied actlvitl.cs 1 V
WOR
Total Pupulation Total Wad,ers LlllllVU.tOlS A~llcultur<l.l Llbourers 1fiullIr: & Q11arrving
rpc~~s - ~ ~~les-'--~F~~l:;l~;-' 'M~-A.. - }<~e~ r--::-\tf~~~~~~:-' 'I\l~les ·.A.Fem~7' ~A F(nt~lt:' ~ulcs -"':F~-I~;'1 ~
5,043
2,175
454
435
379
602
451
275
272
100,170
44,296
9,449
8,405
7,351
11,711
8,422
5,583
+.~51
42,330
18,430
4,256
3,755
3,177
5,027
3,476
2,2t1
1,987
I
19,M8
8,734
1,815
1,607
1,376
2,300
1,760
1,114
942
2,726
I,W6
264
216
194
255
155
lJI
~53,541
23,670
4,314
:1, 7:!. 7
4,bI6
3,076
2,J:J9
22,750
9,818
2,381
1,989
1,608
2,717
IJ95~
1,2:W
1,054
10,561
l,mli
BI6
712
I,21{)
974
632
496
4
2,317
9B9
180
219
ISS
2i7
19(1.
120
HI
46,629
:.!O,6:.!6
4,213
4,091
3,624
5,109
3,306
2,507
2,352
19,580
8,612
1,875
1,766
1,56!:)
2,310
1.5~4
991
9,087
4,079
779
791
664
1,060
786
482
446
1,151
17
63
l:!l
179
317
251
71
PICHHORE (N.M.)
79
22
16
10
l·j
289
4
31
33
28
60
61
37
35
6 GUNA DISTRICT (URBAN)
23,593
490
1,617
:2,925
3,490
6,170
4,482
2,735
1,683
9,698
191
639
1,195
1,477
2,637
1,877
1,067
614
2,764
175
183
277
:158
690
52(1
350
20:1
2,855
80
2W
:lU5
329
6U5
514
417
387
GUNA (U.A.)
1,102
76
7J
125
15:>
295
191
65
529
12
44
60
46
117
100
71
79
ASHOK NAGAR (U.A.)
4,689
82
291
547
667
]'223
947
576
356
329
1:2
17
40
7:3
77
46
493
31
45
55
94
102
81
81
12
232
II
12
IH
21
50
45
46
29
24
13
4
32
669
68
88
95
14(1
123
74
51
90
12
14
20
15
140
10
12
21
42
20
26
10
15
281
II
19
56
10
II
46
13
4
II
38
1,
681
25
50
61
WI
167
139
99
51
355
12
1B
33
49
87
68
51
37
132
11
12
14
37
12
85
12
22
13
15
60
16
14
19
1'1 14
15
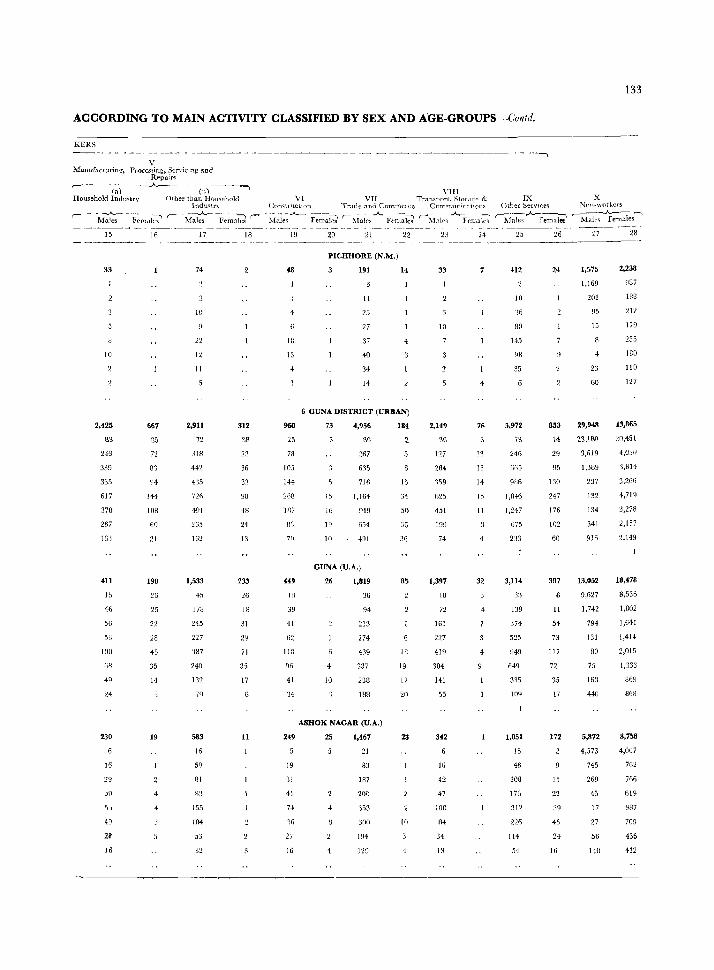
133
ACCORDING TO MAIN ACTIVITY CLASSIFIED BY SEX AND AGE-GROUPS -Colltd.
KERS -~- --~-- - -~~---------------------- ---- _--_ ------------~----------,
V !\f3nuf.::zcturin!?", P.r()ccs9ing, Servicing and
Repair<; ,..--------------_,;.,___------- .------~
(a) (I;) Household Induc;try Other than Household
lndu<;tl')-r- - - -..A__ - ------~ r--- ---..A.,- --- .-~ r-
Males Ff'1l1.dC-3 Males Fem:"lles
15
33
10
2,425
B3
243
339
335
617
37B
267
163
411
46
56
53
100
68
230
16
2']
jIJ
49
2~
16
16
667
i2
8'3
94
144
108
60
21
198
26
25
22
28
45
35
14
19
17
74
10
22
12
II
2,911
72
318
442
4'35
491
265
162
1,533
45
178
245
227
'387
240
132
7')
583
16
59
31
83
15.5
104
53
32
18
312
38
22
36
33
9U
48
24
13
233
26
18
31
29
71
35
17
11
YIII VI VII Transport, StoraC"e &
Comtt 1lcholl Trade and ComCllelce Crnnmllni.crrtJ.{lIlS
-)"fale~..A...- Fe~;~ ,- :\Ioll'~-A.. F;~~~ki '-~I~~.A. FemD~ 19
48
18
13
4
960
25
78
105
144
26B
'IRi
In
70
40
lU
39
41
62
lIB
96
41
34
20 21 22
PICHHORE (N.M.)
191
II
25
27
37
40
34
14
14
4
6 GUNA DISTRICT (URBAN)
73
15
16
19
to
4,956
SO
267
635
716
1,164
949
654
491
GUNA(U.A.)
26
10
1,819
36
94
213
274
439
337
238
188
ASHOK NAGAR (U.A.)
lSi
IS
34
5(]
36
36
85
IB
19
17
20
249 25 1,467 23
19
31
41
74
1G
27
16 4
21
83
187
200
353
300
194
129
JO
23
33
10
2,149
3il
127
284
1'19
625
451
199
74
1,397
lU
72
161
227
419
304
141
55
342
16
42
47
100
114
34
13
24
7.
13
13
14
15
II
32
IX X Other Set\th~e" Nml.wofl.ers
r-~ialeq .J...1'emales "-M~~~;-~l~s-' 25
412
10
'16
80
145
98
35
5,972
246
GG5
9116
I,R-t-6
1,247
675
233
3,114
:1:1
139
371-
525
949
649
335
109
1,051
15
46
108
17G
226
114
54
26
853
14
29
95
247
176
102
60
387
11
54
73
117
72
35
17
172
IS
22
39
45
24
16
'27 28
1,575 2,238
1,169 937
201
95
15
23
60
29,948
23,100
3,GJ9
1,389
237
132
134
341
916
13,052
9,627
1,742
794
131
80
75
16~1
440
5,872
4,573
745
269
45
17
'27
56
140
ISB
212
179
255
180
110
127
43,865
20,451
4.030
'1,814
3,266
4,7IQ
3,278
2,157
2,149
18,478
8,536
1,802
1,641
1,414
2,015
1,333
869
868
8,758
4,067
762
766
619
~87
709
436
412
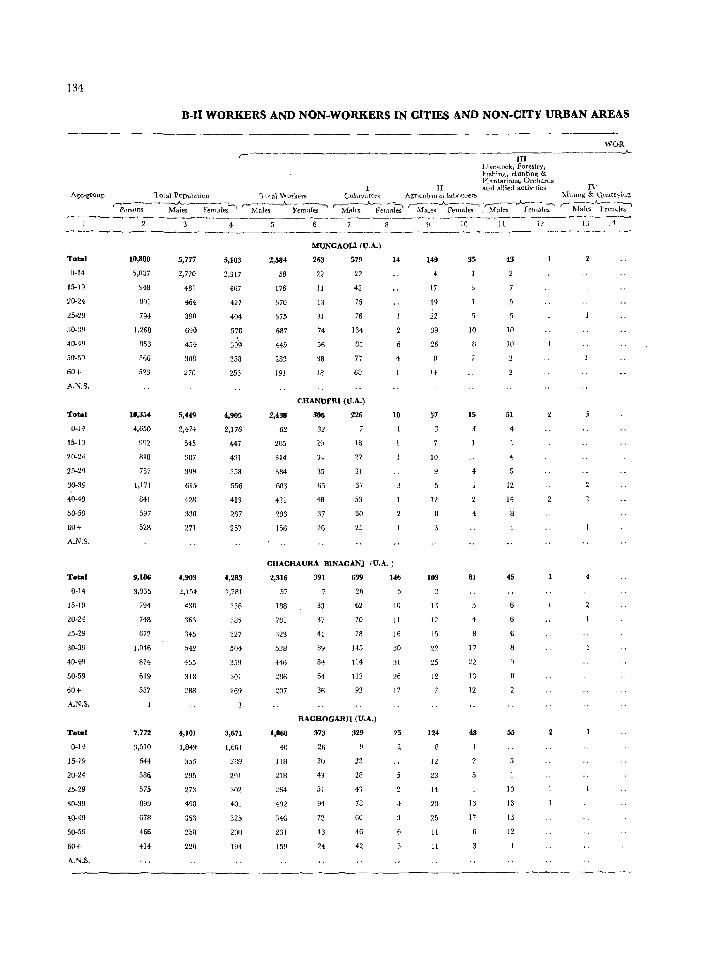
134:
Age-group
To"'}
0-14
15-19
2()..24
25-29
30-39
40-49
50-59
60+
A.N.S.
To""
0-14
15-19
20-24
25-29
30-39
40-49
50-59
60+
A.N.S.
To"'}
0-14
15-19
20-24
25-29
30-39
40-49
50-59
60+
A.N.S.
Total
0-14
15-19
20-24
25-29
30-39
40-49
50-59
60+
A.N.S.
B-II WORKERS AND NON-WORKERS IN CITffiS AND NON·CITY URBAN AREAS
,----WOR ----------- -------'-
III Live~tock, Forestry, FJ~hi.ng, Hunti.ng & Plantations, Orchards
II and alli(."d activi.ties IV Total "Po[)Ula110n Tutal WorKers CultlVat(lrs. AgnculHlral lah()ul'ers. 1\hllmg &. Q\larr)in~
'P~-~--~;;:~ r-Mak~ FerrtaIes"1 ~~~~ ~..A_~~,''M:~~~ f~-~Fcmale~
10,880
5,037
948
891
794
1,268
853
SfJS
523
10,354
4,650
992
818
757
1,171
841
597
528
9,186
~1,935
794
748
672
],046
814
619
557
7,772
3,510
644
586
575
899
678
466
414
5,777
2,720
461
464
390
690
454
308
270
5,449
2,474
545
387
399
615
428
330
271
4,903
2,154
438
363
345
,1)42
455
31B
288
4,101
1,849
355
295
273
498
353
258
220
-----------_--
5,103
2,317
467
427
404
578
JD9
258
253
4,905
2,176
447
431
358
556
413
267
257
4,283
1,781
356
:185
327
504
359
301
269
3,671
1,661
ZfJg
291
302
401
325
20A
194
2,584
58
176
370
375
687
445
282
191
2,438
62
20~
314
384
603
421
293
156
MUNGAOLl (U.A.)
263
22
II
13
31
74
56
38
18
579
22
42
75
76
134
85
77
68
CHAN'DERI (U.A.)
306
32
29
H
65
48
37
26
226
16
27
31
37
_>3
30
25
14
10
CHACHAURA BIN'AGANJ rU.A.)
2,316
57
188
281
+46
286
207
1,868
40
118
21S
264
492
346
~31
159
391
33
37
41
89
84
64
3"
699
26
62
70
78
115
il4
112
92
RAGHOGARH (U.A.)
373
26
20
43
51
94
72
43
24
:129
23
28
43
78
60
46
42
146
10
il
16
30
:ll
26
17
25
149
4
17
19
22
39
26
14
57
10
12
}09
13
12
15
22
25
12
124
12
23
14
20
25
II
II
10
35
!O
15
81
17
22
13
12
48
13
17
11
43
10
10
5}
12
14
45
55
10
13
13
12
i2 13 11
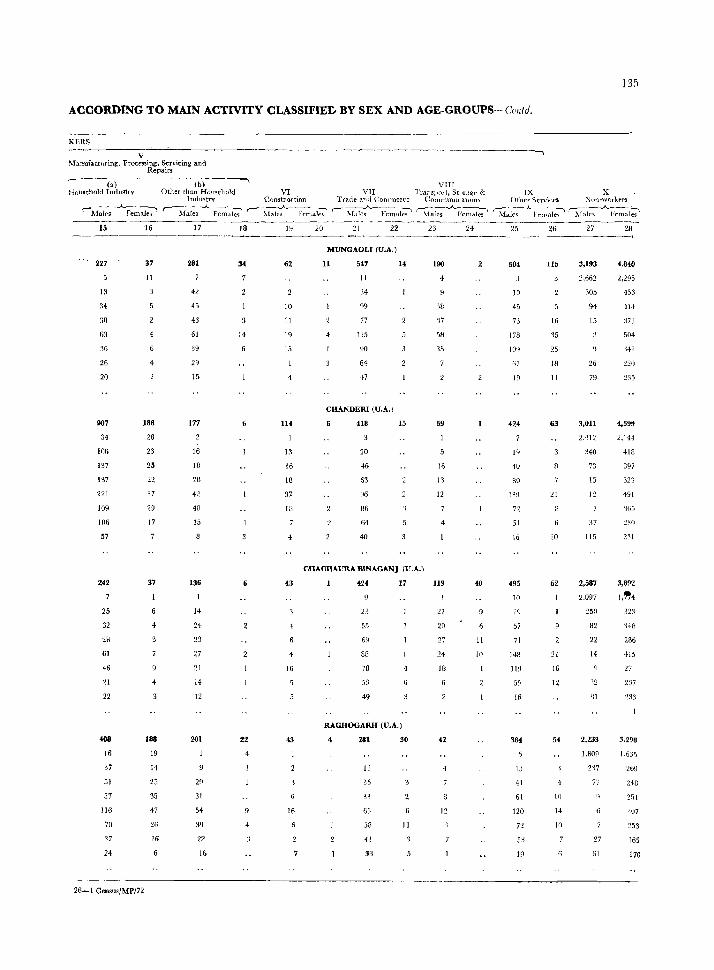
ACCORDING TO MAIN ACTIVITY CLASSIFIEr.. BY SEX AND AGE-GROUPS-Contd.
KERS ,--------,~~-----
V Manufactlll'ing. Processing, Servicing and
Repairs ,---(-.)---- fb)
Household Industry Other tha.n Homehold VI
------~--l
VIII VII Tl'anS1JOJ t. Stor:-J.gf' & IX X
13,1
Indu"trv Constr.)(,tion Trade and Crmmlcrcc Commuw( atlOn'" 01l-If"r Services ;"':on-wnrhers
C-ii~k;--A.h~ak;' r--~i,*s --A.F~-:J:-' '--!\(;k:-- F('m;I~ ,_- :\fa~~-F;~*7' r-\fa~.A.-;:.~~ ~1ak~-_A_~,::*~ 'ir.:l;;-.A.V;;~;' 15
227
13
34
:10
63
36
26
20
907
34
106
137
137
221
109
106
57
242
25
32
28
61
46
21
22
408
16
37
51
57
116
7n
37
24
16
37
II
4
188
28
23
25
n 37
29
17
37
IB8
19
14
25
35
47
16
26-1 Census/MP/72
17
281
42
45
43
61
39
29
15
177
16
18
28
42
48
15
136
14
24
27
21
!4
12
201
29
31
54
3q
22
16
18
34
14
6
6
22
14
62
10
II
19
15
114
13
16
IS
3,
18
43
4
16
43
16
20 21 22
MUNGAOLI (U,A,)
Jl 547
11
34
09
77
J~5
64
f7
CHANDERI (U.A,)
418
20
46
63
96
86
64
40
14
15
CHAGHAURA BINAGANJ (U,A.)
424
23
55
69
88
78
5:1
49
17
RAGHOGARH (U.A,)
4 2Bl 30
13
35
33
63
58
41
3H
11
23
190
18
'J7
58
,15
59
16
lq
12
n9
21
20
27
24
18
42
12
24
40
II
to
25
504
10
45
73
178
IO'J
67
19
424
I"
40
80
109
7'2
51
16
495
j{)
1'J
57
71
148
119
55
16
384
1:1
41
61
120
72
53
19
26
115
16
35
18
11
63
21
10
62
21
16
12
54
4
10
14
10
27
3,193
~,662
305
94
15
26
79
3,011
2,112
340
73
13
I')
37
115
2,587
2,OG7
250
82
22
14
111
2,233
1.80~1
2'll
77
27
61
28
4,840
2,295
456
414
373
504
'H'~
235
4,59~
2,IH
418
397
323
491
'J65
~3()
231
3,89'l
1,"4
323
'HR
286
415
27
237
233
269
218
'107
253
165
170
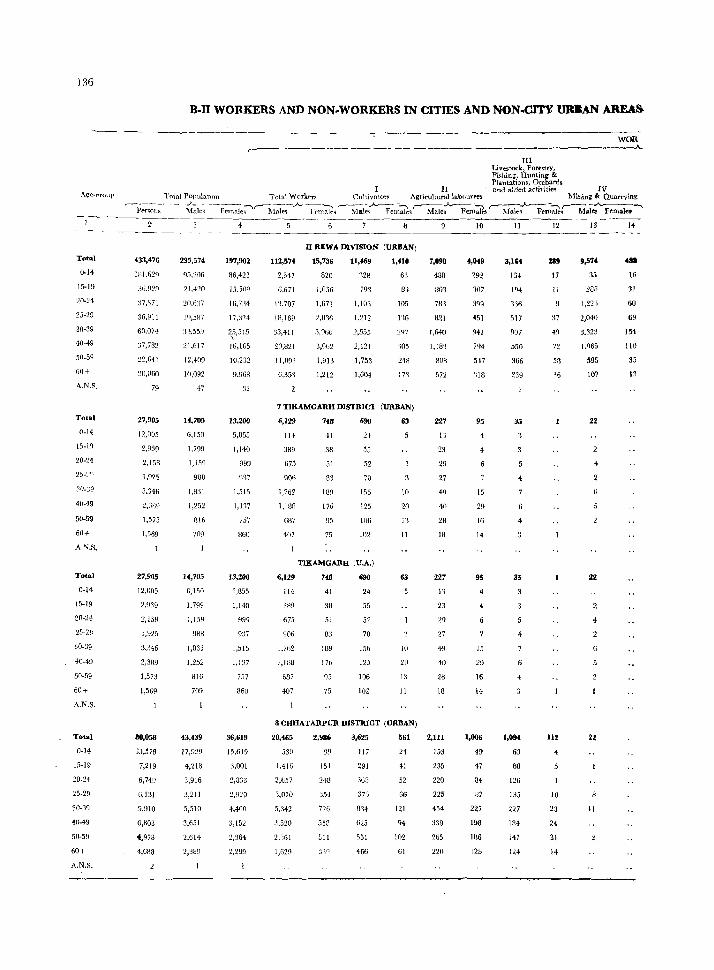
136
B.n WORKERS AND NON·WORKERS IN CITIES AND NON-CITY URBAN AREAS
woo ,.-----------------------------
_________ .A.
III Livestock, Forestry, Fi~hing. Huntin&, & Plantations, Orchards
11 and aJJied .a{'ti"itle~ IV Al:!;c·rrf(1Ilfl Tnti'L1 Population Total Workt"r~ Cultivnton Agricuhnrallabout'(LTs Milling A. Quarrying
r-p~:- -~ '~f-;Ie~ ~Ft'mate~r-" Male;-..A- -R~~sr---;hl~;- Femili,'- Male;""' Fem~~t-h;~rMak;'-F~--' -1~---------
4 - ---~------------ -------
Total
0·14
15-1~
20·24
25-29
30-39
40-49
50-59
60+
A.N.S.
Total
0-14
20-24
25_""
:1O·39
411·49
50-59
60+
A.N.S.
Tota]
0-14
15-19
20-24
30·39
40-49
50-59
60+
A.N.S,
Total
0-14
15-19
20·24
30-3~
40-49
50-59
60+
A.N.S.
433,476
1Il1,62fJ
, :16.929
37,171
36,911
60.074
37,782
22,641
20,060
79
27,905
12,1105
2,939
2,158
1,925
3.346
2,38~)
1,573
1,569
27,905
12,005
:!,~139
2,l58
1,925
3.346
2,389
1,573
1,569
80,058
33,578
7,219
6,749
6,131
9,910
6,803
.,978
4,688
235,574
95.206
21,+20
20.637
10,587
31,559
21,617
12,409
10,092
47
14,705
6,150
1,799
1,15~
988
1,8:11
1,252
BIG
700
14,705
6,150
1.799
1,159
~J8R
1,831
1.252
816
709
43,439
17,929
4,218
3,916
3,211
5,510
3,651
2,614
2,389
197,902
86,423
15.5{)()
1 r..7~14
17.:l~4
2.1,515 \
16,165
10,232
9,968
32
13,200
5,855
1,140
999
037
1,515
\,117
757
860
13,200
!'i,B55
1,140
999
1,515
1,137
757
860
36,619
15,649
3,001
2,833
2,920
4,400
3,152
2,364
2,29!1
112,574
2,347
6,671
!'l.707
111,169
33,411
20,821
11,093
6,35'1
n REWA DlVISION (URBAN)
15,736
820
1,056
1,671
3,%6
3,062
1,913
1,212
11,469
328
793
1,103
1,212
2,555
2,121
1,753
1,604
1,410
63
a'l
]05
1'16
305
248
171
7 TIKAMGARH D1STRIC'l (URBAN)
6,129
11-1
389
675
906
1,762
1,188
687
407
6.129
114
389
675
~lO{j
1.762
1,188
687
407
748
41
38
51
83
180
176
95
75
690
24
55
52
70
156
125
106
102
TiKAMGARH (U.A.)
7~
41
38
51
83
lOY
176
%
75
690
24
55
52
70
156
125
106
102
10
20
I')
II
63
]()
20
13
11
8 CHHATARPUR DISTRICT (URBAN)
7,098
488
801
783
821
I ,friO
1, \83
808
572
227
11
23
29
27
4'1
40
28
18
227
n 23
29
27
49
40
28
18
20,465 2,986 3,625 561 2,111
530
1.416
2,657
1,010
5,342
3,520
2,161
1,629
99
151
218
:l54
726
558
511
117
291
368
37',
551
466
21
41
52
66
121
94
102
['1
153
235
220
225
454
339
26S
220
10
4,049
292
107
399
451
941
794
547
:lIB
9., 4
4
29
16
14
95
4
6
1.1
29
16
14
1,006
19
17
84
87
227 1!J8
186
128
11
3,154
1.j4
1~4
136
517
807
550
366
239
4
35
l,O!H
63
88
126
l:l5
227
134
147
124
12
:189
17
11
:17
49
n 58
%
112
10
23
24
31
14
13
35
286
1,22:1
2,040
3,323
1,%5
595
107
22
2Z
11
14
481
16
31
60
69
154
110
35
D
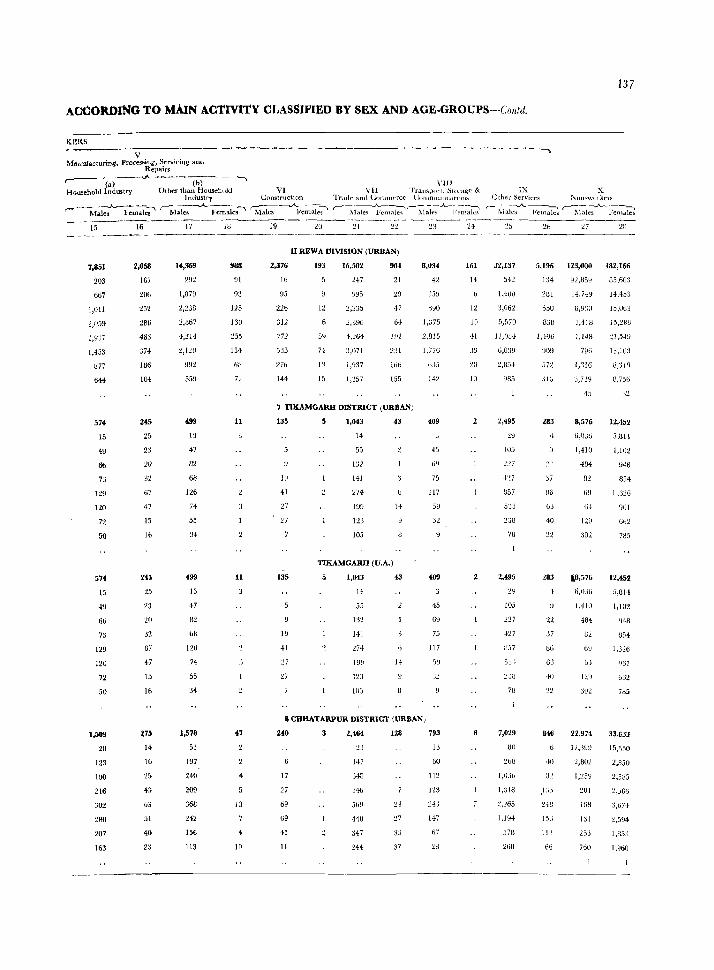
137
AOOOkDlNG TO MAIN ACTIVITY CLASSIFIED BY SEX AND AGE-GROUPS-Contd.
KIIRS
V Manufacturing, Processing, Sl!rvicing and
Repain
nIl ,----(~---(h)-Household Industry Other than Household VI .
Industry ConstructlOn Vll '1'rallspurt, SluralSC &
Trade and UorUITI('fCC UomnllllllccltJ(JIlS
~ -~~k:-Y;:ili-;, r-M~~'~ks~ ~~"cm~ks"1 '---;'ral~s ~~~~'-~1~;,-.A_1.'~~k? \5
7,851
203
667
\,011
1,059
u77
644
574
15
7'3
U9
120
n 50
574
15
~y
6b
7:1
129
120
72
50
1,5119
18
123
190
216
'J02
280
207
\63
16
2,058
167
~06
25~
286
483
374
186
104
,17
15
16
245
25
23
'l.0
32
67
+7 15
Iii
275
14
16
25
H
63
51
40
23
17
14,369
~92
1,079
2,238
2,867
992
559
499
1~
47
8'l.
68
1'1.6
74
55
499
13
47
1:12
b8
121:i
74
55
34
1,578
53
197
HI)
209
368
H2
156
113
IB
988
91
93
125
130
2S5
154
68
n
11
11
13
10
19
2,376
16
22t)
312
772
276
141
2{) :!! '.1'2
11 REWA DIVISION (URBAN)
193
1'l.
74
13
15
16,502
2,'l.35
2,396
4,:164
3,071
1,937
1,357
904
21
·17
1)4
191
VI
166
155
7 TIKAMGARH DISTRICT (URBAN)
B,03t
42
lj!)O
1,375
1,776
035
1+2
135 1,043 43 409
19
41
27
'27
135
19
41
'27
27
14
In 141
274
123
105
TIKAMGARH (U.A.)
1,043
14
55
132
141
274
19~1
105
8CHHATARPUR DISTRICT (URBAN)
240
17
27
69
69
41
11
2,t6t
:.u 147
348
j<Hi
56!)
11{)
347
244
128
JJ
37
69
75
117
4119
45
69
75
117
';2
793
lJ
60
112
123
243
1-17
67
161
14
12
19
41
39
10
8
IX X Othel" Services ~on-wOlkcls
r--~i-;)~.A.. ]~b '--~~I~.A--}~n-:16
32,137
542
1,400
3,662
5,570
11,'184
0,039
2,854
985
2,495
105
In U57
5'J3
2J8
78
2,495
105
'1.27
4'l.7
1137
73
7,029
8tl
~bU
1,036
1,318
:!,:!65
1,1!J.l
j7B
~60
'l.7 2B
5,196 123,000 182,166
134
281
650
833
1,+96
909
,lib
~83
:,7
36
oj
40
283
4
37
80
846
{O
156
113
66
92,1:159
1-1,),]9
6,9:)0
1,418
1,148
796
1,316
3,739
8,576
ti,0Jti
1,410
484
(t?
18,576
(),036
I,HO
484
82
6D
22,974
17,3U9
2,802
1,15D
201
16B
131
253
760
05,603
14,453
15,063
15,238
21,5·W
1,,103
8;119
8,756
12,452
5,~H
l,lU2
948
854
1 ;326
')111
662
785
12,452
5,814
1,102
~48
854
1,326
%1
0ti2
33,63l
15,550
2,850
2,SUj
2,366
3,674
2.594
1,1l.':1
1,960
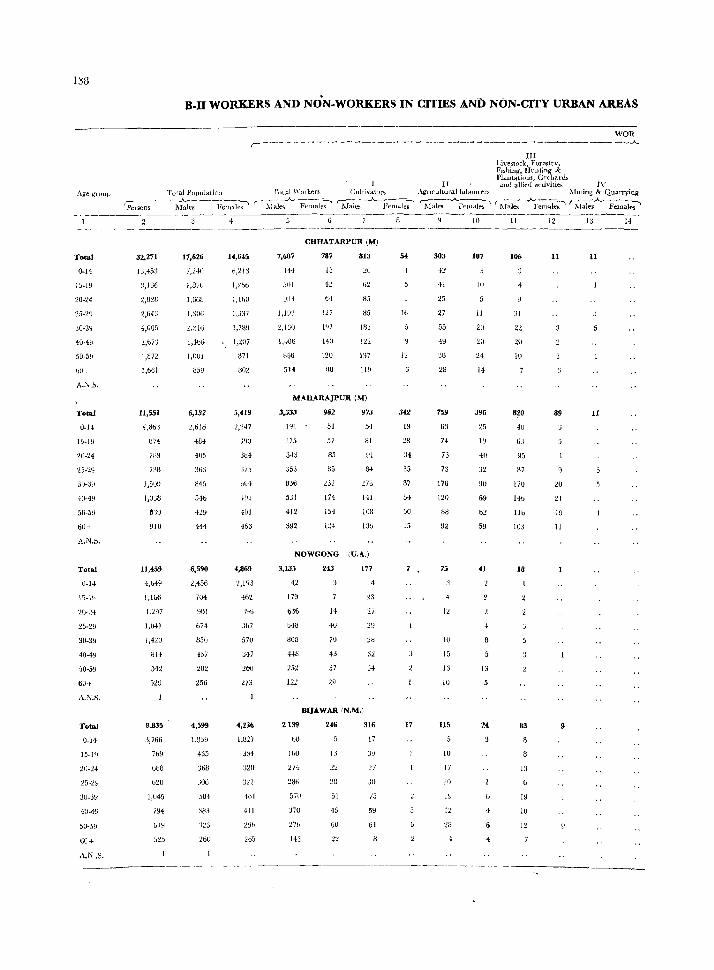
1~3
B.I1 WORKERS AND NON-WORKERS IN CITIES AND NON·CITY URBAN AREAS
r ----- --- ---- - ------III
Livestock, Forestrv, FJshing, Hunting & Plantations, Ordw.nls
WOR ------_..A-
] r aw] allit':d activitie~ IV Age.grouJl Total Pnpululicn ['ol,t] \\'0( ker~ tiultivatur~ .\gnculturallahollrers ~IHlillg & Quarrring
~ -- - M';le-;- --1;e~1~ r-M;I~FeIJlale~ r~~f~~;' ~[aJ;-~re'Jldlt'~ ~JaJ;--~'eIlt ... I~ ~.A_-F;~);'~
Total
0-14
15-19
20-24
25-29
.10-39
40-49
5D-59
00+
A-N,',
Total
0-14
15-19
20-24
50-59
tiO+
A.N.:;.
Total
0-14
2U·~4
2S-2Y
30-Cl9
4U-49
5U-59
60 T
A.N.S.
Total
0,14
15-1"
20,U
30-39
4U,49
50·59
60+
A.N.:;.
32,271
13,453
1,872
1,661
11,551
4.3bo
074
7U9
no 1,5U9
1,0:'.\8
~lO
11,459
4,049
1,1b6
1,'197
1,041
814
542
8,835
3,766
ib~
l>B8
b28
1,045
'iY4
b]!-I
17,626
7,140
I,BiO
1,66H
1,:W6
'.!.,'!.l0
1,ltu
],001
85V
6,132
2,616
4M
405
30:'
845
540
429
444
6,590
2~456
JU4
4111
674
850
4b7
282
256
4,599
1,~o~
J6B
.106
584
~tiO
14,645
6,~13
1,266
1,lbO
1,J:1)
1,7U9
" 1,'207
871
U02
:;75
-lUI
466
4,869
2,193
462
',%
3b'J
570
,17
273
296
7,687
144
:)01
:.!,IJO
1,406
800
CHHATARPUR (M)
787
15
813
62
85
85
ISJ
MAHARAJPUR (M)
3,333
275
.In
.153
BJo
531
-l12
392
962
51
57
85
85
232
174
154
1:!4
973
54
81
91
84
:.!78
HI
IOU
130
NOWGONG IU.A.)
3.135
~2
179
~.I6
0·18
808
HB
252
12~
Z 139
GO
jlJO
274
570
.170
27b
143
243
14
40
70
4,
37
29
177
4
23
'1.7
34
BIJAWAR IN.M.)
246
13
51
45
6U
316
17
'27
,,0 75
59
61
54
Ib
342
19
28
35
87
35
17
303
H
25
27
55
49
28
759
6~1
74
73
7:l
176
120
88
75
12
10
15
13
10
us
10
17
19
:.w
107
10
11
20
396
25
40
90
69
59
41
13
4
106
lU
8?0
40
63
87
170
14b
I1b
103
18
19
10
12
11
89
20
21
19
11
9
11
11
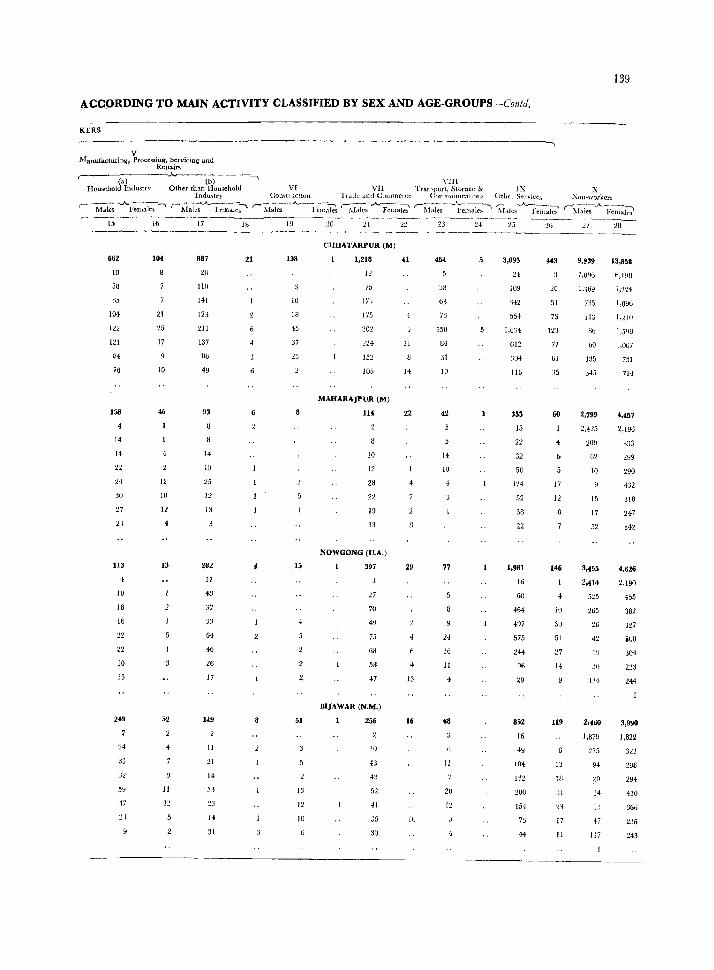
ACCPRDING TO MAIN ACTIVITY CLASSIFIED BY SEX AND AGE-GROUPS-Collid.
KERS
V Manufac'udn~, Processing, Sl!fvicmg and
Repairs r-----~~------~
(b) --, VIII (a) Household InJustrv Other than Household VI VII Tramport, t:ltorage & IX X
139
Indmtry COll'ltl LtctlOn Tl .. .H1t! and COlllmerce (:OI1UulinJca!lO]JS Otllel Service:. ,:xoll-wor.kcn.
r- -Males A}'elllale~l I~\f:ie-;.A..~i;:~ r-'Males --.A.--f~~lci '-l\~,.A. Femai;i (M~s~ Fcmal('s~ ~~lc~-A~'t:maJ~ '-iw~;-"-l;~;ki 15
662
10
115
104
1~2
121
C4
~8
1511
14
14
22
24
30
21
23
113
10
16
16
22
22
10
13
24
5!1
41
:11
16
104
21
25
17
10
46
12
10
12
13
52
4
11
17
887
211
110
141
123
211
137
UB
4~
93
14
10
25
1:l
282
II
48
37
33
64
46
26
17
149
11
21
14
33
14
31
18
21
8
19
138
lU
IB
45
:17
15
51
Il
10
20 21
CHHATARPUR (M)
1 1,218 41
12
75
17')
17.1
302
224
152
105
MAHARAJPUR (M)
114
10
12
28
22
19
13
NOWGONG (U.A.)
397
27
70
4~
75
611
58
47
BIJAWAR (N.M.)
1 256
111
43
43
52
35
30
11
14
22
4
29
13
lfi
It;
23
454
150
84
31
10
42
14
10
77
24
16
11
4
fi8
11
20
25
3,095
109
'142
554
1.0~4
G12
::U4
lIb
355
15
22
32
50
124
52
38
22
1,981
16
60
464
497
575
244
96
29
852
16
49
ILl4
132
:WO
443
20
51
73
It~
77
61
35
60
4
17
12
146
10
30
51
27
14
119
18
:31
17
11
27
lU
Hu
bO
]:35
345
2,799
2.425
209
10
15
17
52
3.455
2.414
525
:!65
26
19
1~4
2.460
I,H7~
275
94
20
14
1J
47
117
13,858
I,O~G
1,210
1,0Ui
751
714
432
318
247
342
4,626
2,190
455
382
32)
iUO
304
223
244
3,990
1,822
321
298
294
410
366
236
243
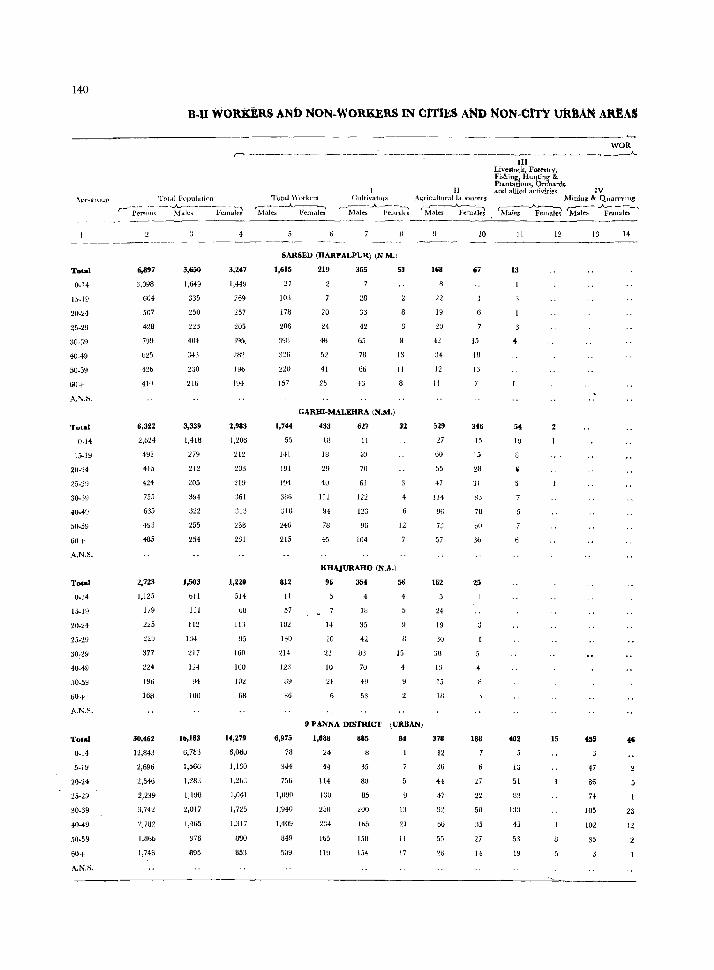
140
B-H WORKERS AND NON-WORKERS IN CttlES AND NON-CITY URBAN AREA8
WOR r--~---- ---~-" _F ___ • ____ ~ _________________ ~ ___ .... _____ • ___ __A_
JII Livestock, Forestry, Fishing, HUIlting & flantations, Orchards
II ami allied activitieo;; IV A~e-qtuup TotAl Popu[tttinll Tutal \,\'o.)rhrs CliltivatoL's Agl'icu!turallahouf'ers Miuillg & Quarnill.g
r-~,,~;;----t<tle~--ful~aJei 'M~~~b fMaIe~-_A._-fu~~ '1i:i~~ki 'M~-~~~Q rM-.;t;;-.A_Fe;;~·-'
- --- _-----_. ------------------
Total
0-14
I.~.19
20-24
40-49
5()-J9
60+
A.J\'.S.
Total
0-14
15-19
20-24
25-29
30-39
60+
A.N.~.
Total
0·14
15.19
20.24
25.29
30:39
40-49
50·59
00+
A.N.S.
Total
U·14
5·19
20·24
25·29
30.39
40-49
50.59
60+
A.N.S.
6,897
3,098
604
507
428
410
6,322
2,b24
491
415
424
755
635
493
485
2,723
1,125
179
225
:!29
377
HJti
16U
30,462
12,843
2,696
2,546
2,239
3,742
1,8bb
1,74B
3,650
1,649
335
:.150
223
404
:143
216
3,339
1,418
279
212
205
394
322
155
254
1,Ii03
bil
111
112
134
217
124
~'4
100
16,183
6,783
1,566
1,28'J
1,19B
2,017
1,465
976
695
3,247
1,449
269
257
205
'lQ!\
1%
194
2,983
1,206
212
20:1
219
J61
:)1:1
238
231
1,220
514
68
IIJ
95
160
IOU
102
68
14,279
6,06U
1,130
1,20',\
1,041
1,725
1,317
890
S53
SARSED (HARPALPUR) (NM.I
1,615
2']
103
178
206
3911
::!2U
157
1,744
55
141
191
194
3Bti
:316
246
215
812
II
57
102
130
214
219
20
24
48
41
25
365
:.w 33
42
65
78
G6
45
GARHI·MALEHRA (N.M.)
433
W
IS
4U
111
78
45
627
11
40
7U
61
12:2
123
96
104
KHAJURAHO (N.A..)
96
H
10
23
10
21
354
4
W
35
42
8:1
70
49
53
53
13
II
32
12
56
IS
4
9 PANNA DISTRICT (URBAN)
168
19
20
42
12
II
529
27
60
55
47
114
7;]
57
162
24
19
SO
1:1
15
6,975 1,088 885 84 378
78
344
755
1,090
1;940
1,409
849
50\}
24
H
114
130
253
165
ll~
35
SO
85
200
158
154
1:1
21
II
17
12
36
H
47
bG
55
10
67
15
IU
n
346
15
78
tiU
30
25
186
27
22
50
27
14
11
13
54
10
1:.1
51
Wl
1:J3
45
53
1~
12
2
15
13
455
47
86
74
105
102
35
14
46
23
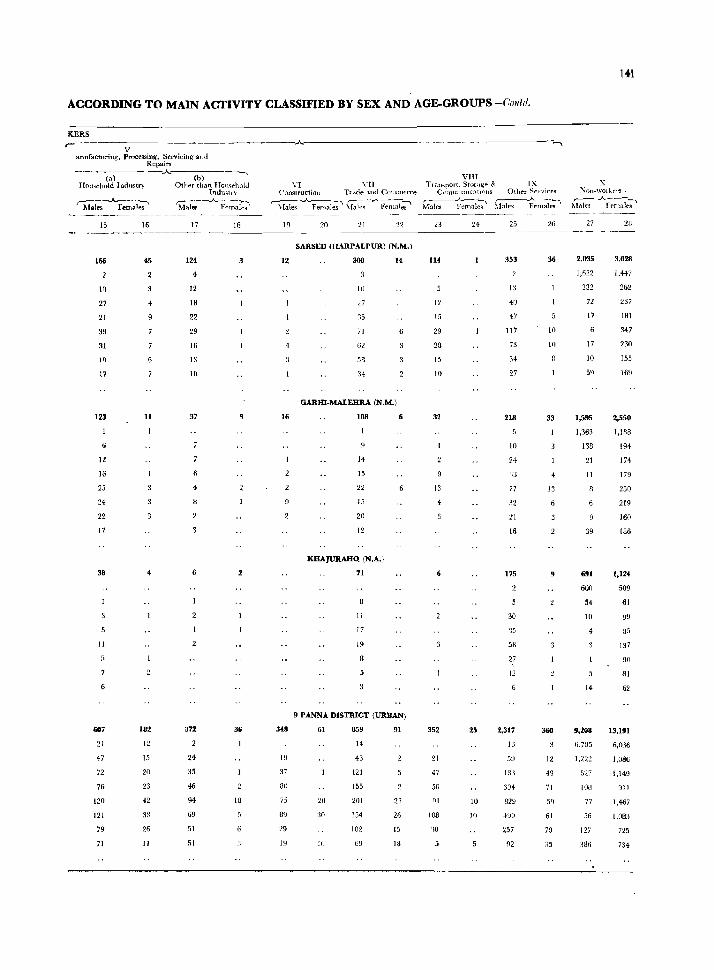
ACCORDING TO MAIN ACTIVITY CLASSIFIED BY SEX AND AGE-GROUPS-(,'mild.
KERS
V anllfactlJring, Proce8sing, Servicing and
Repairs --------- --.A._----
(a) Hou~(':hold Indllstry
~----..A.r--------, }.faJes Females
15
166
In 27
21
39
31
1"
17
123
6
12
16
25
24
22
17
38
II
607
21
47
12
76
120
121
79
71
16
45
4
11
182
12
15
20
23
42
33
26
II
(b) 01her than Home-hold
Indmtrv
'Mal~;-.A_J,~{"~;i~
17
124
4
12
18
22
29
16
13
10
37
372
24
35
46
94
69
51
51
IS
.1
36
18
VI YII Construction T,"-,dl" and Commerce
r-:_-~ -A-- --.. r~----"------.., ~[ales Females i\bJf'~ Ft'maies
19
12
16
348
19
37
80
75
89
29
20 21 22
SARSED (HARPALPUR) (N.M.)
300
10
27
~5
71
62
5B
34
GARm-MALEHRA (N.M.)
108
14
15
22
IS
20
12
KHAJURAHQ (N.A.)
71
8
11
17
19
8
5
9 PANNA DISTRICT (URBAN)
61
20
:10
10
859
14
43
121
155
201
l54
102
69
91
21
26
15
18
VJII IX TI all.,port, Storag!'" &
C(lmIll1mlcatlllllS Olht"r S~rvi.~s r---_"__-~ ,-----------..A_ ---. .Males Female-; ~fales Females
114
12
1.1
29
28
15
10
32
13
352
21
47
50
91
108
'10
24
25
!O
10
25
353
t:l
40
47
117
73
34
27
218
10
24
1:1
77
32
21
16'
175
30
15
58
27
12
2,317
13
59
13']
394
H29
490
257
92
26
36
10
10
33
13
360
12
49
71
59
61
70
1+1
X ::\OIl-WOIh.c!'S,
,-- .A-~--.._
~1ale5 F('mal("s
27
2,035
1,622
232
72
17
17
10
5"
1,595
28
3,028
1.447
262
237
181
347
230
1.15
169
2,550
1,363 1,188
138
21
II
39
ti~1
194
174
179
250
219
160
186
1,124
600 509
54
10
4
61
99
85
137
90
81
14 62
9,208
6,705
1,222
527
loa
77
56
127
386
13,191
6,036
1,086
1,149
911
1,467
1,083
725
734
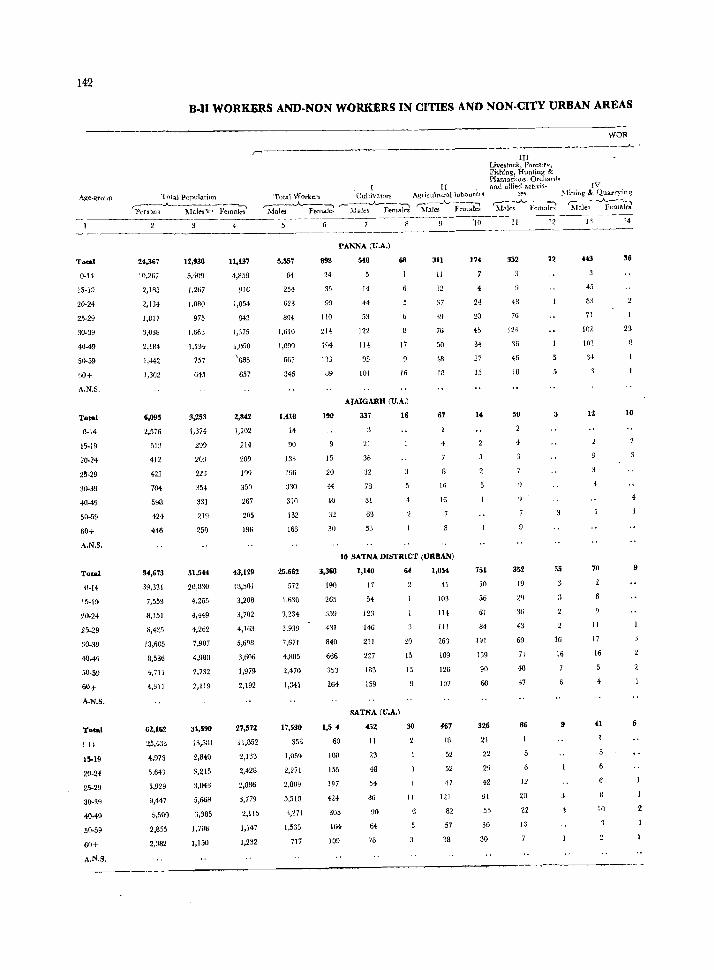
142
B-I1 WORKERS AND-NON WORKERS IN CITIES AND NON-CITY URBAN AREAS
Total Populatiun
rp~~"""__-~Ial('S"t. Femal~
II Total Vlorkers Cultivators A~ricu1tnral1ab(}urer'
r Mal" A.. F'ema~ ,- Mal".,.A.-&m~jJ ':\[~
III Livestock~ Forestrv, Fisbinl.1'. Hunting & Plantntlons, Orchard~ and allied activit·
ir-~
r:-:-----.A..--~ Maks l"emalr-~
WOR
IV ~Iining &. Quarry1n~ ~---"--:-'i
1\.1 ale~ Females
--------.--------------------------- 10-------1-1------12- 13 H
T<>taI
0·14
15·19
20·24
25·29
30·39
40-49
50·59
nOT
A.N.S.
Total
0·14
15·19
20·24
25·29
3(]'39
40-49
50·59
60+
A.N.S.
Total
Q·I4
15.19
20·24
25-29
30·39
40-49
50·59
60;
A.N.S.
Total
It}
15·19
20·24
25-29
30·39
40·49
50·59
60+
A.N.S.
24,367
10,267
2,183
2,134
1,817
3,030
2,184
1,442
1,302
6,095
2,576
513
412
422
704
59R
424
446
94,673
39,331
7,553
8,151
13,1)05
8,586
4,711
4,311
62,l62
25,433
4,973
5,643
5.929
9,447
5,5DO
2,855
2,382
1~,93O
5,409
1,267
1,080
975
1.663
1,134
757
645
~,253
1,374
299
203
223
354
331
219
250
51,544
20,830
4,265
4,449
4,262
7,907
4,980
2,732
2,119
34,590
13,581
2,840
3,215
3,043
5,668
3,385
1,708
1,150
11,437
4,858
916
1,054
842
1,375
1,050
\685
657
2,842
1,202
214
209
)!J9
350
267
205
196
43,129
1S,501
3,288
3,702
4,163
5,698
3,606
1,979
2,192
27,572
11,S52
2,133
2,428
2,886
3,179
2,115
1,147
1,232
5.557
61
254
u23
894
1.610
1,099
667
346
1,418
14
90
J3q
196
330
310
182
163
25,662
572
1.630
3,234
3,939
7,671
4,805
2,470
1,341
11,530
358
1,059
2,271
2,809
5,510
:~,271
1,535
717
898
24
35
99
110
214
194
lq3
U9
190
J5
20
44
4()
32
30
PANNA (U.A.)
548
1-1
44
53
lH
95
101
68
17
16
AJAIGARH (U.A.)
337
21
36
32
78
51
63
53
16
311
11
32
37
76
50
4B
lB
67
16
16
10 SATNA DISTRICT (URBAN)
3,368 1,140 64 1,054
190
265
359
431
840
666
353
264
1,5 4
60
100
155
197
424
305
164
109
17
54
]2~
146
231
227
IR3
159
SATNA rU.A.)
452
11
23
48
54
Bu 90
64
76
20
15
13
30
II
41
103
114
III
263
189
126
107
467
18
52
52
121
82
57
38
174
4
24
20
45
34
27
13
751
50
56
61
84
191
159
90
60
326
21
22
29
42
91
55
36
30
352
48
76
124
36
46
10
50
352
19
29
3G
43
69
71
48
37
86
12
20
22
13
12
55
16
16
443
4.0
83
71
102
102
3+
12
70
11
17
16
41
10
36
10
9
6
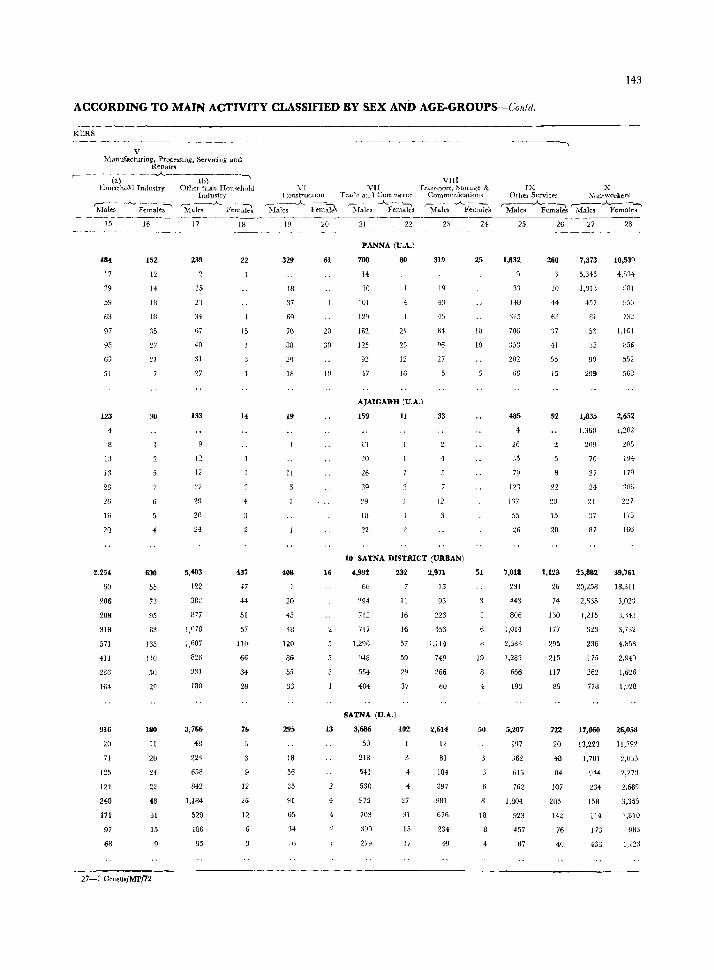
141
ACCORDING TO MAIN ACTIVITY CLASSIFIED BY SEX AND AGE-GROUPS-Conlrl.
KERS
V !\ianufacturing~ Processing, Servicing and
Repairq
r--~(;)--------'-----Ib-) ----_, Household Indmtry Other than Hom~h()ltl
Industrr
~-;Je; ~~~~e~ 'Mal("Q ~A.-F~~
15
(114
17
39
59
63
97
95
63
51
123
1
8
13
13
23
26
Ifi
21!
2,254
60
206
2119
:llR
571
ill
236
164
916
20
71
125
124
240
171
97
68
16
152
12
14
18
IH
27
21
30
630
55
73
95
U3
135
110
50
29
180
II
20
2i
22
48
31
15
27-1 Censu./MP/72
17
239
15
21
34
67
40
31
27
133
12
12
'27
29
20
24
5;W3
122
382
877
1,078
1,607
826
331
180
3,766
48
224
658
842
1,184
529
186
95
18
22
15
14
4
437
47
44
51
57
Ill>
66
34
28
76
12
26
12
n VI! Construction Tradt" an·l Commerce
~i~-l~-J.._ l~~:;k<; ~We~-..A..F~n-~
19
329
18
37
m
70
88
18
20
61
20
30
10
21 22
PANNA (U.A.)
700
14
30
101
162
125
47
80
21
25
12
VIII Tramport, Stma!;e &
C:omm1lnicatioJl,) ~ -~-A. -,- --:-I
Males Femal~
23
319
19
43
45
84
96
27
21
25
10
10
AJAIGARH IU.A.1
19
11
408
20
45
48
120
86
55
33
295
18
36
35
91
65
34
J{j
16
13
4
159 II 33
20
26
12
22
10 SATNA DISTRICT (URBAN)
4,992
66
294
713
ill
1,296
948
554
404
SATNA (U.A.)
3,686
50
213
541
530
975
70S
3~IO
279
232
11
16
16
57
59
29
37
102
4
27
31
15
17
2,971
13
93
453
1,114
749
266
60
2,614
U
81
18-1
397
981
676
234
49
51
19
4
50
13
4
IX X Othel Services Non~workerti ~-~ ,---~~-..
Ivrales Females Males Females
25
1,83Z
33
148
315
706
J53
202
66
481i
26
35
79
12'>
)'17
55
26
7,018
231
443
806
1,014
2,383
1.282
666
193
5,207
1~7
362
615
762
1,804
923
457
87
26
268
10
H
6:;
')7
41
55
15
92
22
20
15
20
1,123
26
74
130
177
295
215
117
89
722
20
48
B4
107
205
142
76
40
27
7,373
5,345
1,0n
457
81
53
35
90
299
1,835
l.:l60
209
70
27
24
~I
:17
87
25,882
20,258
2,635
1,215
:123
236
175
262
778
17,060
13,223
1,7UI
944
~34
158
114
17J
433
28
10,539
4,8'14
1181
732
1,161
1J56
552
2,652
:100
227
11:1
166
39,761
18,311
3,023
J,'WI
3,7.i2
M5B
2,940
1,626
1,928
26,058
11,792
2,In.l
~,273
2,689
3,355
1,81D
983
1,123
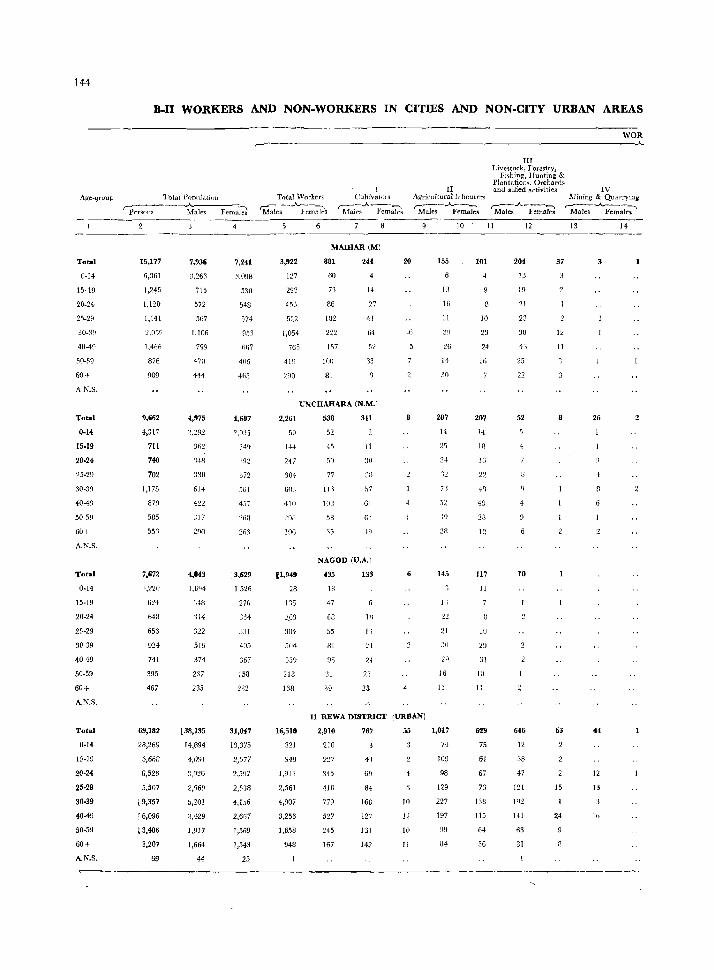
144
Age-group
Total
0-14
15-19
20-24
2,-29
30-39
40-4!1
50·.19
60+
A,N.S,
Total
0-14
15-19
20-24
25·29
30-39
40-49
50-59
60+
A,N.S,
Total
0-14
15-19
20-24
25-29
30-39
40-49
50-59
60+
A.N.S.
Total
0-14
15-19
20-24
25-29
30-39
40-49
50-59
60+
A,N.S.
B.II WORKERS AND NON·WORKERS IN CITIES AND NON.CITY URBAN AREAS
1'o(a] POPllJation
'P'-o-"-m-"----- tales Fen'a~ Total 'Workers
~---- .A.-:--:l Males }ema.k-;
I Cultivatols
'M::l~.A.Fe;~ ----------------~--~
15,177
6,361
1,2,45
1,120
U41
1,466
876
909
9,662
4):317
711
740
702
1,175
879
585
551
7,672
'l,220
6:!4
64B
653
924
741
395
467
7,936
3,26~
715
572
5m
1,106
799
470
444
~,975
36:!
14B
330
614
422
4,043
1,6~4
'148
:1l4
322
519
371
237
235
7,241
~,09B
530
548
574
953
nli7
406
4G5
4,687
34~
5GI
4.'17
'2fiB
263
: 3,629
1526
27(,
334
TJI
405
367
158
232
3,922
127
292
45J
522
1,054-
765
419
290
MAIHAR(M)
881
60
71
86
102
222
157
100
HI
244
4
14
27
41
64
52
33
UNCHAHARA (N.M.l
2,261
59
1-14
247
304-
410
19G
fl,949
28
1 '15
50+
218
138
538
52
77
11'1
lOB
58
,5
311
11
3(1
57
61
6'1
I~
NAGOD (U.A,)
435
18
47
68
55
81
96
SI
39
133
1>1
1'1
24
21
25
20
II Agrlculturall[lbourcn;
'Males-.A..;~~
WOR ---------------------------~
III Livestock, Forestry,
Fi~hin~, Hunting & l)lantation"l, Orchards and allied activities
~-_..A.. ____ -:-.
M ales Females
10 11 12 13 14
155
13
16
II
26
14
30
287
14
25
32
:w
145
II
22
2(
:lO
101
4
10
24
16
207
!{
In
15
48
4a
28
12
117
II
10
29
31
10
II
204
13
19
21
33
43
25
22
52
4
10
37
12
II
4
26
11 REWA DISTRICT (URBAN)
69,182
20,269
6,668
6,523
5,507
(9,357
, 6,096
(3,486
3,207
69
L 38,135
14,894
4.()~)l
J,926
2,%9
3,429
1,917
1,664
44
31,047
13,375
2,577
2,597
2,538
4,156
2,657
1,569
1,543
25
16,510
321
948
1,913
2,561
4,907
3,253
1,658
948
2,910
210
2~7
345
110
779
527
245
167
767
43
69
84
163
127
131
142
55
4
10
12
In
11
1,017
74
109
98
129
227
197
99
U4
fi29
75
61
67
73
138
115
64
36
646
12
38
47
121
192
141
fi3
31
63
15
24
12
13
10
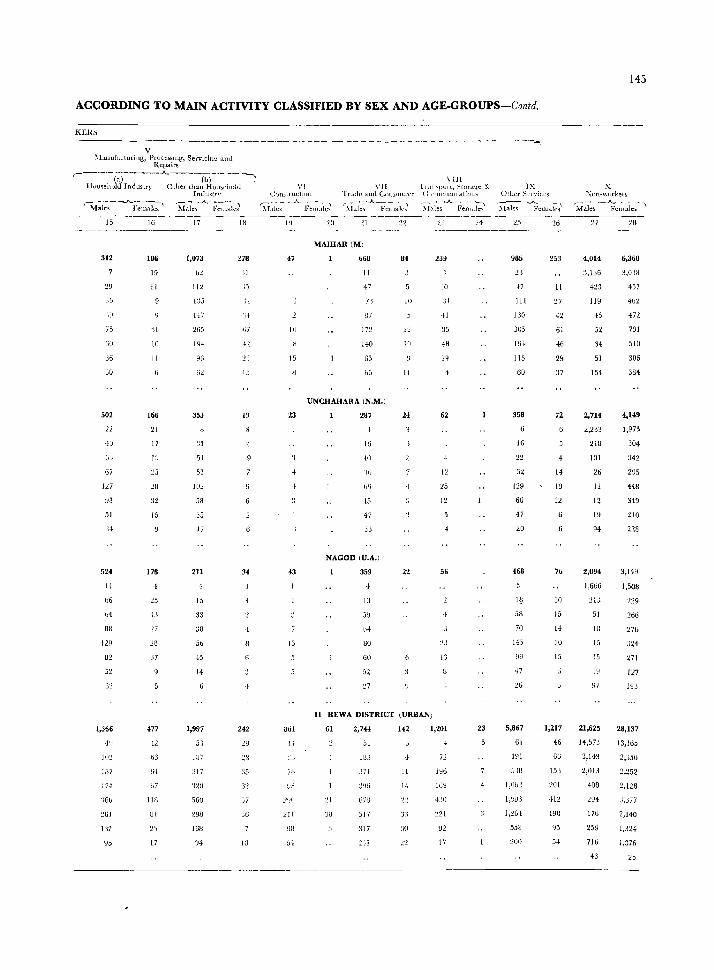
ACCORDING TO MAIN ACTIVITY CLASSIFIED BY SEX AND AGE.GROUPS-Contd.
KERS
V .\Ianufacturing, Proce~sUlg, Servicing and
Repairs -,-----Z;;)---A.---(b)-~- -- -_,
Household Industry Other than HQusel,old
15
312
30
is fjO
36
30
502
22
4U
67
In 98
51
';4
524
11
06
04
88
129
82
32
1,366
J02
W7
17·1
'.\61.1
261
137
16
106
19
II
'j(
10
;J
166
21
17
19
28
32
15
178
25
'27
'J.B
:.37
177
07
IlB
UI
2,
17
Indu~tr\' , ___ ~A _____ :----\
l\.Iale\ Females
17
1,073
02
135
1-l7
265
194
90
353
Jl
51
.II
102
58
35
17
211
33
38
50
45
14
1,997
53
107
:;(7
'tw
560
298
loB
III
278
II
j')
II
'1+
137
!')
15
34
4
+
242
35
'j7
VI VII Cun"lrllc!lon 'l'r..lde ami C'JllllllCrCe
S:J~;-~~.A rell~~~ ()'I:Je-;~ema~ lY
47
III
15
23
IJ
20 21
MAIHAR(M)
660
II
47
7;
87
].10
G5
UNCHAHARA (N,M.)
287
16
40
'lh
!5
47
n
NAGOD IU.A.)
359
80
60
:27
22
84
10
II
22
\ III rJ.tit"PUI1, St()r<t~e & (~, I"' 1!\11 Ulildtiou<;
~~J~_A_-F~:,~
23
239
10
85
48
IY
62
12
25
12
56
+
:.!J
24
II REWA DISTRICT (URBAN)
861
II
iB
211
54
61 2,744 142 1,201
:!l
::0
51
IlU
::71
mu 517
317
2_;1
II
14
:)0
72
IYG
IG:J
4JO
92
17
23
IX Othey Sel"ViLeS
,---~-" ~fa]e" Femates
985
2)
!7
III
IJO
JUS
115
60
358
IG
52
129
6G
47
20
468
I" 58
70
145
5,867
61
191
5JU
l,Ub:2
1,\)\)3
558
2UO
26
253
11
27
42
61
46
29
:)7
72
19
12
76
10
15
14
10
15
, 1,217
46
G0
153
190
145
X Non-, ... 'orket!>
~-;ks ~~emaJt:~--~
'27
4,014
3,136
{23
119
45
52
34
51
154
2,714
2.233
218
101
26
II
12
19
94
2,094,
1,666
213
51
lU
15
15
I ~I
~J I'
21,625
14,573
3,143
2,013
40B
176
259
716
28
6,360
3,038
457
402
472
731
5]1)
306
381
4,149
1.973
304
342
295
448
349
210
228
3,149
1,508
229
266
276
;)24
127
193
28,137
13,165
J,377
2,140
1,324
1,376
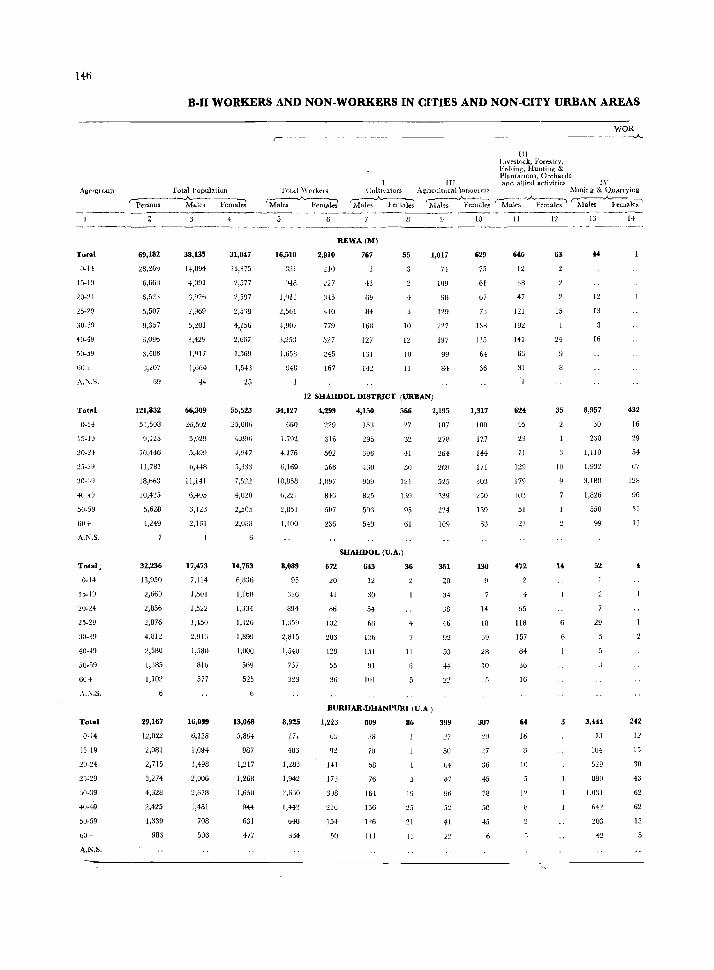
146
B.II WORKERS AND NON-WORKERS IN CITIES AND NON-CITY URBAN AREAS
Tota} Population
'-~---~alcs Fcma~ Total \Vllrkers
~-------.A.--:-; Mall's Females
III I ,1vestock, Forestry, b<;hing, Hunting & Pll:lntatlons,Orr:hat'ds
WQR ------.-------.A-
[II and allied activitic!'i 1\" {JLlltl\-ators AltriculturallaooulclS }'Ilning & QUdfl'yinl,{
'Malt's ~n~~ 'ilales --"}'cma~ 'Mal~-,.I-Femalc7' r;.I;~_A...I·'em<lk-;' 10 II 12 13 14
-.~-~ --'--~-' -----~-----
Total
().14
15-1 ~I
20-:!4-
25·29
,0·39
~0·49
50·59
60 T
AAS.
Total
O·H
15-1~
bU+
A.!'\.S.
Total~
0.14
15-19
"Uf
A.~.S.
Total
0·14
15·19
20·24
23:29
4().4il
50-59
60+
A.K,S.
69,182
6,66B
6,52:1
5,507
9,357
6,096
3,4U6
69
121,832
51,5U8
~,125
IV,H6
11,781
18,663
1{],4~5
5,628
4,249
32,236
13,950
~,669
2,856
2,876
4,812
2,530
1,385
1,102
29,lti7
12,022
2,081
2,715
3,274
4,328
2,425
1,339
983
38,135
1+,894
4,091
5,101
3,429
1,"17
1,664
H
66,309
26,502
5,029
5,499
0,++8
11,141
6,405
3,123
2,161
17,473
7,114
1,501
1,522
1,450
~.91J
1,580
81G
577
16,099
6,128
1,09-1
1,498
1,481
708
506
31,047
13,375
2,577
2,597
2,5')8
4~55
2,667
1,569
1,543
25
55,523
25,OOb
4,O~6
+,947
1,52:!
4,(W)
t,505
2,088
14,763
6,BJ6
I,I6H
1,334
1,426
1)89!;l
1,000
569
525
13,068
5,894-
987
1,217
1,268
1,6511
944
531
477
16,510
321
1,(JlJ
2,5til
4,907
3,25:J
1,658
!.J48
34,127
660
1,792
4,176
6,169
10,858
fi,:Z~l
2,851
1,100
8,089
95
894
1,J5~
:!,1315
1,540
737
8,925
171
483
1,283
1,942
;(,(j~j()
1,44~
640
334
2,910
;145
,10
779
527
245
167
REWA(M)
767
43
69
84
16B
127
131
142
55
10
1::
10
11
1,017
7+
109
9B
129
227
197
99
84
12 SHAHDOL DISTRICT (VIlBAN)
4,299
229
316
502
,j66
1,097
840
507
236
672
20
41
flo
102
203
129
55
4,150
I.J:J
'295
3V6
430
gOY
825
593
549
566
27
-II
50
121
61
SHAHDOL (V.A,)
643
12
30
54
611
13b
151
91
101
36
4
11
2,195
IH7
525
339
224
J09
351
20
34
:38
46
55
BURHAR·DHANPUIlI (U.A.)
1,223
6U
141
Ii:>
:JOG
2%
154
50
809
:m 'i()
b8
76
164
15G
1~6
III
86
19
21
13
399
'27
50
b4
47
U6
41
629
75
61
G7
73
US
115
64
36
1,317
100
127
144
171
30:1
250
159
63
130
J4
18
23
10
307
J6
45
78
50
45
646
12
38
47
121
192
141
6:;
31
624
45
71
129
179
l(]:l
51
23
472
55
118
157
84
3b
IG
64
16
10
12
63
15
24
35
10
12
13
16
8,957
30
230
1,110
1,932
3,18f)
1,826
550
99
52
29
3,U4
13
104
529
UBI)
1,11:11
203
432
16
29
54
67
128
96
31
11
242
12
15
30
43
62
62
13
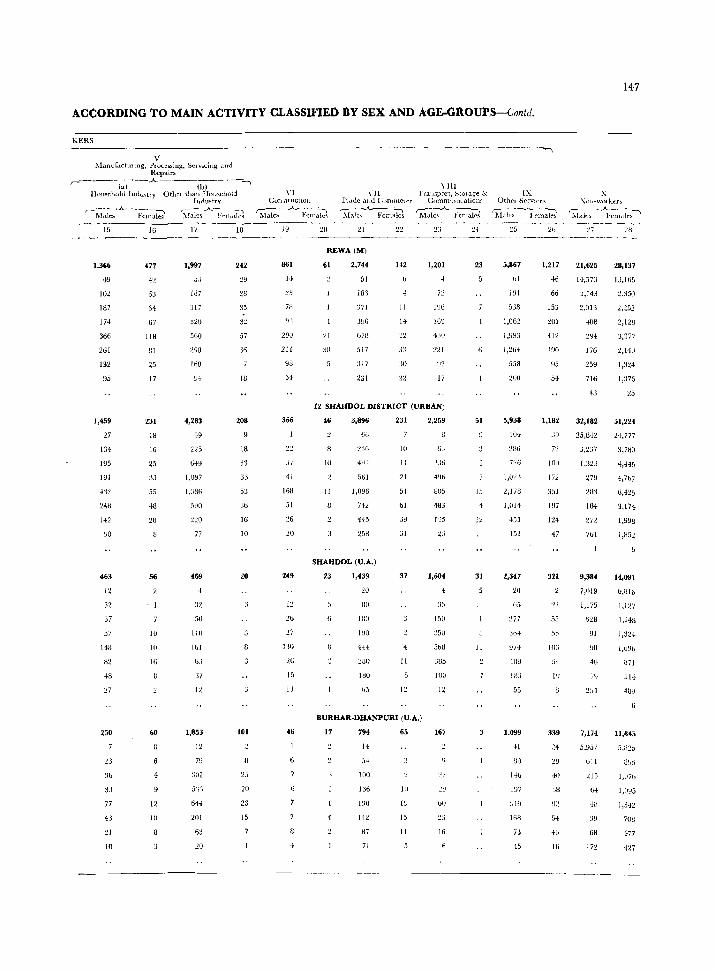
147
ACCORDING TO MAIN ACTIVITY CLASSIFIED BY SEX AND AGE-GROUPS-Contil.
KERS
V l'.ianufdcfUling, Pruce~ing, SelvJ(~illg and
Repairs r------W--.A----~-~--;
Househokl rndu~try Othet l.lmn IIou"e:!lOld IIltiustry
r-~~---~~~~alei ~~lcs _A_J~:~L~alJ
15
1,366
'19
102
IU7
174
366
261
132
95
1,459
'27
134
195
1~1
24M
142
uo
463
12
32
57
57
14<1
48
'.!.7
250
:;b
:;3
77
43
21
10
16
477
64
67
118
81
25
17
231
18
16
25
33
55
48
28
56
10
IU
16
bO
4
12
](I
17
1,997
5J
187
317
:120
560
298
168
4,283
::;9
225
1,:IB6
59(1
220
77
469
32
50
1111
1&1
tjJ
37
I:!
1,853
12
79
:jOI
5')')
544
201
63
'20
242
29
28
35
57
36
w
208
18
33
33
5~1
J6
16
10
20
101
25
20
23
15
_-- - ----_----------~------~---------,
\ III Yll i"rallsport, StOiage &
l't.vlc dJld ConllllcJ('f': CommUlllLation~
S""l~e-:_A_I~I~~ ~l~~~.A--Fcm~ 19 20 21 22 ---------_----~--------
861
[.j
7U
29U
21I
98
54
366
J7
41
16B
51
:lO
2(9
'17
DO
15
13
REWA(M)
61
21
:,11
2,744
51
181
~71
J~6
678
517
317
231
142
11
H
30
1,201
72
1!J6
lW
430
221
U2
17
12 SHAHDOL DISTRICT (URBAN)
4fi
10
11
3,896
66
4~1
561
1,096
742
445
SHAHDOL (U.A.)
23 1,439
20
lJlJ
1Il0
190
lBO
ISO
231
10
II
21
:31
37
11
BVRHAR-DHANPURI (V.A.)
17 794
14
J+
1110
LI6
I~IJ
1'12
87
71
65
III
IU
15
11
2,259
{jJ
2J6
805
483
145
23
1,604
4
35
15()
J50
5bS
:JU5
1(1)
1:2
167
00
16
23
51
15
12
31
IX Othel Scrvicc~
r;\i .. tle~ -~'('male" 26
X '\\)!I-wOl!...cn
fM~~:-~;;:~.tlt"~-' 27
-----------------
5,867
bl
191
538
1,062
1,!1!-J:'"
1,264
558
200
5,938
104
2RG
1,023
2,l'l8
1,011
455
152
2,347
20
u5
'277
~74
-109
55
1,099
H
Ui)
].1(,
1 ~17
168
n 15
1,217
46
66
15:3
~Ol
412
190
1,182
39
7'1
WII
172
351
1~1
124
47
321
55
55
lOG
5f
1')
339
"4
fl)
::18
54
4b
16
21,625
14,37J
3,143
-l08
176
25Y
716
28,137
13,165
2,350
2,'252
:!,LW
3,377
:!,14u
1,324
1,376
4J ~5
32,182
25,84:'2
J,237
1,323
27Y
283
184
761
9,384
7,U19
1,175
028
40
7,IH
5,!)')7
b11
'215
31,224
24,777
3,780
4.-145
4,7"7
6,425
3,174
1,998
I,B52
14,091
b,Blb
1,127
1.248
1,32+
1,Wu
B71
514
11,845
5.11~S
1,342
708
477
4n
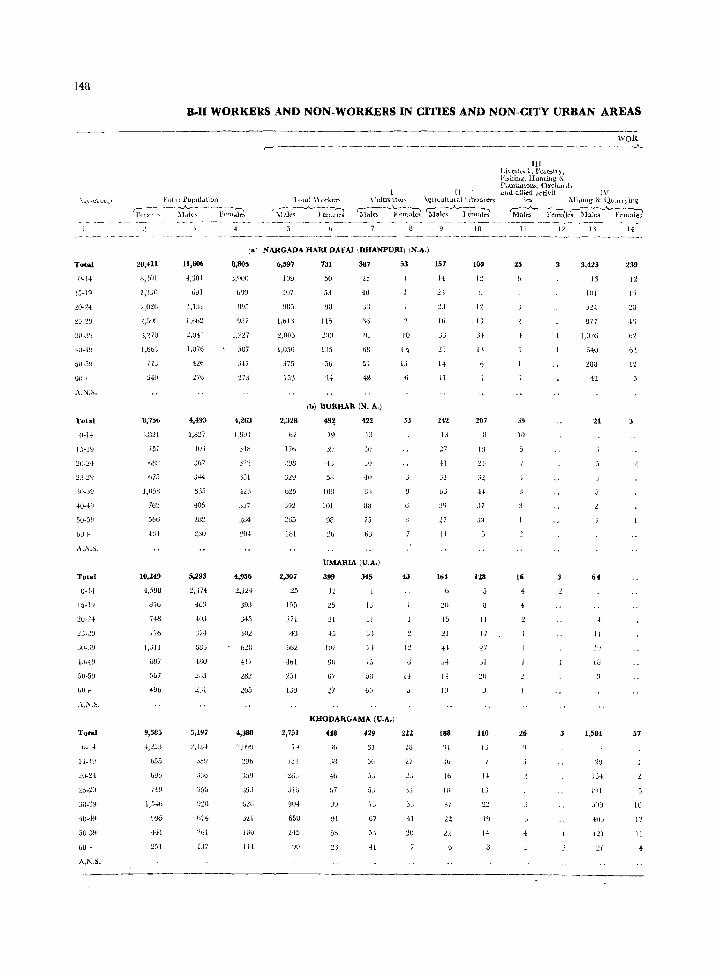
148
Total
0-14
15-19
20-24
5n-j~
til) ~
Tvtal
(l-B
15-I!)
JO-J9
4U-4~
50-.)!:!
oUt
A.S.S.
Total
u·J.l
Jlk;~i
5U-5!J
Tutal
11_1-4
15.-! ~i
4U-4~
50-09
bU+
A.!\.S.
20,411
(),201
l;{jl)
'2,5')9
8,756
.1,H2l
151
b7,.'j
J,051:1
762
5b6
lO,U9
BJU
1,";11
U!J7
[Ju7
1,!Jt.J
9,58-,
iJ55
HI
251
B-1( WORKERS AND NON-WORKERS IN CITIES AND NON-CITY URBAN AREAS
11,606
4,:301
691
I,l:11
l.tib:!
1,07t1
4,493
1,H27
4UJ
Jb7
635
405
5,293
{UU
5,197
LJ7
r- ------- -----.~--. ~-----------------~---.---
WOR --..A..
II '1 utal \\ orktt" CUitl¥atul" _\gllt..uhUlal }.:l:b\)UlerS
'\£~i:;-_A_-hr:~ Si~Jc~ ---'f-:;;iri ~a~.A~~l~~ 10
(a1 NARGADA HARI DAFAI IDHANPUJ{I) IN.A.)
a,805
b'J~J
oB7
J47
'273
4,263
423
J57
4,956
l,:t24
393
.;4:;
b211
:..: ,[ I~ I~J
18D
114
6,597
109
:Hl7
l,bl:1
~,(l(1.)
l,05()
375
13'.)
2,328
lIb
'2G5
lIJi
2,307
:!5
155
~7I
hb2
~bI
2,751
jy
1:)2
1UJ
.Btl
65U
731
50
53
Uti
115
1:)5
387
40
JiJ
')1.
~I
tiB
\b) IIURHAR (N_ A.)
422
J~)
4J JV
IOU tU
75
liJ
UMARIA (U.A.)
399
L!
l5
JI
1M
9U
(j7
J.7
jCJ
"u
KHODAII.GAMA (V.A.)
448
}h
.:lJ
91
5B
:0
429
31
67
41
53
10
1 q
33
43
II
222
IU
'1.1
~.i
41
:10
157
14
2 i
if)
I{
II
24~
I..,
'27
:;1
('3
27
II
164
:.;0
15
.H
II
/0
188
'j/
_til
Ih
IOU
I:!
I~
lJ
.H
lJ
207
H
37
128
II
17
.11
.J
110
IJ
1')
III I.i ... c~lud., l'Ole:.-ll,!,. Fu.,hiIlg, HUllti.ng & Planta.tion::;, GrthalLh alld allied Jctivit- J V
ie:; ~liillllg & {.llUI r} il1k;
'M~'ll;;----·-l<-~~Je~~Ia1e.~ -~F~~
11
25
39
l\)
Ii
26
12 ]'1
3,123
13
lot
1,026
640
20Q
4'l
64
4
1/
1')
113
1,504
U4
I'll
121
:11
239
I~
I'>
.t'j
57
Iii
17
II

ACCORDING TO MAIN ACTIVITY CLASSIFIED BY SEX AND AGE.GROUPS- (,fIIlld,
KERS . ---_-----_"_ -.---------------~------------~--.-----..
V "_I\fanufacturing, Proressing, Ser\'icin~ and
. Rt"pair<: .----(;)------"------(b)~- -....._, Household Indust] v Ot1ler than Hom~hol«(
Indu<;try
'--;hks~:;ks ~~-"-F~~
134
II
21
19
38
29
116
12
15
14
39
14
12
87
12
10
12
16
1'3
14
48
II
16
4
26
18
17
1,689
II
272
506
598
174
164
16
27
48
27
17
IfMi
24
37
'111
14
13
291
II
26
35
104
79
26
18
96
25
20
J9
14
5
18
4
10
VIII YII Tran<iport. Storn!Ze & IX VI
(~()n~trll('tiOlt Trade and CC/IIlllLt'I(f' Commnnication... Ollie! S("I \ Ices
~i:Je~----_A.._-Fema~ s;r;;-,.A..--rema~ r- ~ral~:--~~~<; r;,i;l('~_A_ -i:;m:t;:'" 19 20 21 22 :rl
ra: NARGADA HARl DAFAI (DHANPURII :N.A.\
17 11 296 26 28
29
4
13
11
21
J6
68
77
48
22
l~
(h) BURHAR IN.A.)
6 498 39
3,
04
68
111
G5
0[1
UMARIA IU.A.\
424
4
36
60
54
113
So
44
28
10
11
19
KHODARGAMA (V.A.)
79
22
10
15
17
14
139
17
23
20
182
SB
16
:N 25
441
2-1
:19
511
82
1':;8
()O
29
11
658
17
·11
88
115
211
108
H
850
54
100
14.1
287
160
83
15
157
20
26
38
10
26
169
l:'j
l~
57
17
1I
170
17
14
15
35
37
35
164
10
JIi
21
51
19
4
14<)
X :\"OlJ-work(']'c;
rir,~I('~ ·J-Femal~
27
26
51
123
2,165
J,7li.1
227
69
15
10
I'J
J7
2,986
2.149
JOB
l'J2
']1
'1,1
J'J
'14
2,4410
28
SS6
797
3,771
1,975
309
279
273
31!j
256
186
17B
4,557
2.2[2
163
'J14
357
521)
:]17
215
2JH
3,940
2,D?') 2,063
20,
16
24
1£)
-17
3J3
336
527
122
9J
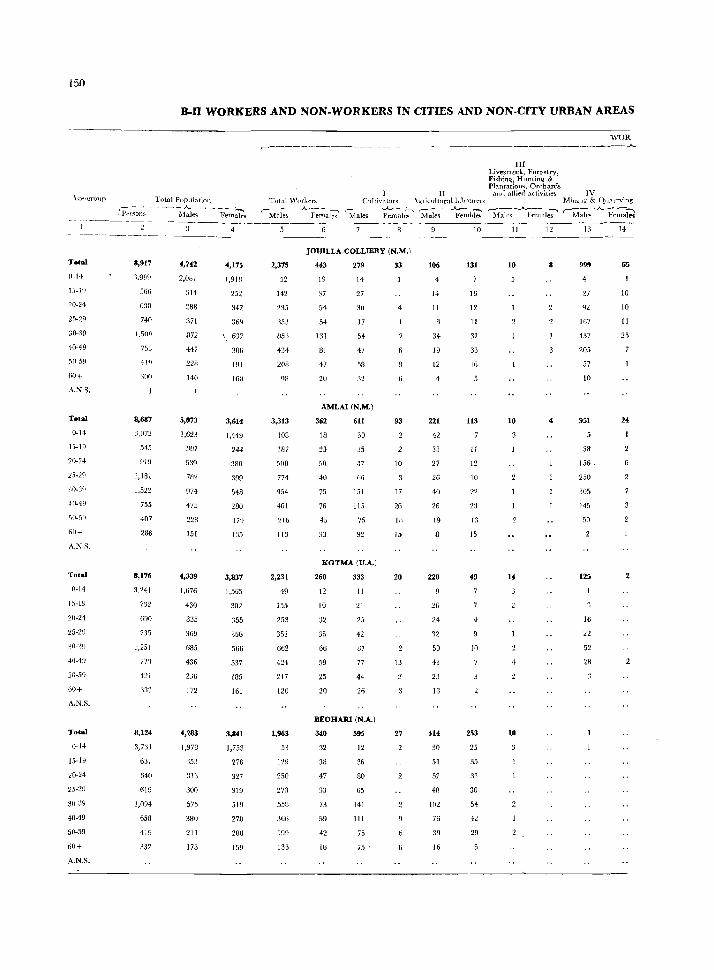
150
B-n WORKERS AND NON-WORKERS IN CITIES AND NON-CITY URBAN AREAS
\l.it'·~n)l!p Total POpll!(Ifinn
"rpe;;;~~ . ---~~;--Fem~;ks
Total
0-14
20-24
25-29
gO-j9
40-49
50-59
W+
A.N.S.
Total
0-14
l~-Iq
20-2+
25·29
~'O·3q
4fl.49
'fl·5~
ofl+
A.N.S.
Total
0·14
15-19
20·24
25·29
:10-'19
41l-19
50-59
60+
A.N.S.
Total
0-14
15-19
20-24
25-29
3()<19
40-49
50-59
60+
A.N.S.
8,917
:1.999
,)66
G]O
740
1.5Qq
753
301]
8,687
J,07~
545
H19
1,IB1
1,522
755
407
286
8,176
3.241
732
G~O
735
r,251
77')
4:21
8,124
3,7:1I
631
640
619
1,094
658
419
332
4,742
2,081
314
ZBB
371
272
447
228
140
5,073
1,623
301
539
782
974
475
228
151
4,339
1,676
430
335
369
685
436
236
172
4,283
1,978
353
300
575
~l80
211
173
4
4,175
1,91B
252
342
369
'. 037
:lOfi
191
160
3,614
1,449
244
380
399
548
280
179
135
3,837
1,565
302
355
366
566
337
185
161
3,841
1,753
278
327
319
519
278
208
159
WOR ____ -.A.
1II Livesctod, Forestry, Fi"hin~, H llnlin~ & PlantatioIl", Orchard!>
IT and allied activit.ies IV Total 'Norkers Clllti\'3tor~ \i.{liclllturallahnqrers MinUl~ & QU;1rrving
r-~i~_A_P;;a~~ ~1ale;---;;~~ 'M~~---'F;~~~ ~1~_A_F;;~--;I~ '-M:k~A_fu:iJ
2,375
52
142
235
'153
lI5']
4:14
208
3.313
108
187
500
774
954
461
211i
113
2,231
49
1,5
253
351
662
424
217
120
1,963
53
129
250
27:1
558
onn 199
135
JOIDLLA-COLLIERY (N.M.l
443
19
37
54
54
131
81
47
Z(J
279
14
27
30
17
54
47
58
32
AMLAI (N.M.)
362
18
25
50
40
75
76
33
611
30
35
47
{," 151
115
75
92
KOTMA (U.A.)
260
12
10
32
36
66
59
25
20
333
II
21
25
42
87
77
44
26
BEOHARI (N.A.)
340
32
39
47
3~l
73
59
42
16
595
12
36
80
65
141
111
75
75 •
33
93
10
17
26
111
15
20
13
27
106
14
II
34
19
12
1
221
42
33
27
26
40
26
19
220
26
24
32
50
43
23
13
04
30
51
52
4D
102
76
39
16
10
131
16
12
II
31
33
16
113
11
12
10
22
23
15
49
4
10
253
25
35
:13
30
54
42
29
11
10
10
,1
u
10
12
8
13
999
4
27
q2
lfi7
437
205
57
10
951
39
156 _
250
305
145
50
125
16
22
52
28
14
65
10
10
11
25

ACCORDING TO MAIN ACTIVITY CLASSIFIED BY SEX AND AGE-GROUPS-Contd.
KERS
V Manufacturinq-,;"Processing, Servicing and
, Repairs -----.A.
(a) Housr.hold I nrlustry
15
174
21
21
25
59
16
18
10
1R
41
28
67
21
141
II
19
23
43
22
13
10
16
49
14
13
2l:1 1 Uen,uslMPln
(b) Otlir-r than Household
Industry r--..A-.---_..., 1'.Iales Females
17
114
18
15
10
27
31
1,020
II
41
187
317
313
106
40
246
22
28
39
69
48
26
12
102
10
26
26
20
4
18
4
4
29
4
8
VIII VI VII Tramport, Storatte & IX
Comtruction Trade and Commerce Communications Other Services
~-"'--'Female-;-' Ma~..A..;Fem~;;' M~-.A.. Femaks ~W~F-~ 19 20 21 22 23 24 25 26
JOHlLLA.COUoIERY (N.M.l
16
In
19
226
13
37
73
49
17
27
AMLAI (N.M.)
199
12
15
35
47
52
lQ
15
4
KOTMA (U.A.)
399
19
47
45
111
84
54
30
BEOHARI (N.A.)
304
4
12
36
39
87
60
39
27
32
22
4
4
13
22
11
4
4
101
4
15
25
35
16
99
10
27
38
11
76
16
19
28
5
«~
17
22
54
80
163
64
36
13
160
16
29
37
39
25
528
12
:14
62
114
177
75
38
16
316
36
53
129
68
21
105
20
17
38
14
55
10
12
11
146
25
25
41
27
15
26
10
151
X NOIl .. worken r---.A.--..,
Males Females
27
2,367
2,029
172
53
18
10
13
20
42
1,760
1,515
114
39
20
14
12
38
2,108
1,627
275
82
18
23
12
19
52
2,320
1,925
224
63
27
17
14
12
38
28
3,732
1,899
215
288
315
506
225
144
140
3,252
1,431
219
330
359
473
204
134
102
3,577
1,553
292
323
330
500
278
160
141
3,501
1,721
240
280
286
446
219
166
143
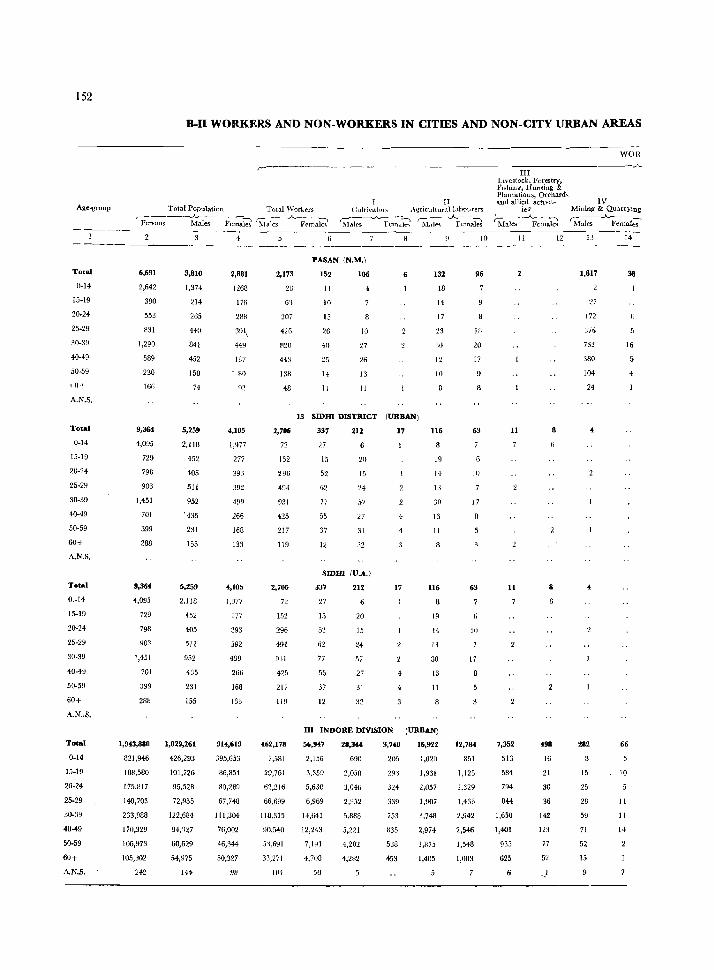
152
Age~group
Total
0-14
15.}9
20-24
25-29
30-39
40-49
50-59
,0+
A.N.S.
Total
0-14
15-19
ZO-24
25-29
30-39
40-49
50-59
60+
A.N.S.
Total
0.-14
15-19
20-Z4
25-29
30-39
40-49
50-59
60+
A.N"S.
Total
0-14
15.19
20-24
25-29
3[)"39
40-49
50-59
60+
A.N.S.
B-II WORKERS AND NON-WORKERS IN CITIES AND NON-CITY URBAN AREAS
WOR
r------------- ------------------------~II=I------------------~
II Total Population Total 'Yorkers Clllti\'ator~ Agricultural labourers
Livestock. Forestry, flshinl?, Hunting & Plantatiol1s, Orch.ud" fl.Dd allied actIVlt- IV
Mining & Quarrying
~~- -Fcmab 'M~~A F{'mal~ .---------"-----.,. ,..----..A..--"':'} \ laiC's female-" Malt'''i Females
ies r-~~~
MaJes Females r;~ .A.~~~~I;--
6,691
2,642
390
553
831
1,290
589
230
166
9,364
4,095
729
798
903
1,451
701
399
288
9,364
4,095
729
798
903
1,451
701
:J99
2BB
1,943,880
821,946
188,580
175,817
140,703
233,988
170,329
106,973
105,302
242
3,810
1,374
214
265
440
841
452
150
74
5,259
2,IW
452
405
511
952
'435
231
155
5,259
2,118
452
405
511
952
435
231
155
1,029,261
126,293
101,726
95,528
72,955
122,684
94, ~27
60,629
54,975
144
2,881
1268
176
288
39\
449
137
- 80
4,105
1,977
277
392
499
266
168
133
4,105
1,~77
277
393
392
499
266
168
133
914,619
395,653
86,854
80,289
67,748
111,304
76,002
46,344
50,327
98
2,173
23
6')
20i
426
H2O
44:1
138
48
2,706
72
152
296
494
931
425
217
119
2,706
n 152
296
494
931
425
217
119
462,178
7,581
29,761
62,216
66,699
118,315
90,540
5'~.691
33,271
]1)4
PASAN (N.M.l
152
11
10
15
26
40
25
14
11
106
10
27
26
13
11
6 132
18
14
17
23
12
10
13 SIDm DISTRICT (URBAN)
337
27
15
52
55
37
1<
212
20
15
57
n 31
32
SIDm IU.A.)
337
27
15
62
77
55
37
12
212
6
20
15
24
57
27
31
32
17
4
4
17
4
116
19
14
13
30
13
11
116
Iq
14
11
30
13
11
III INDORE DIVISION (URBAN)
56,947
2,156
3.359
5,630
6,969
14,641
12,243
7,1~1
4,700
.'>0
28,344
691)
2,058
3,046
2,9:>2
5,888
5,221
4,202
4,282
3,UO
205
324
339
753
835
538
4-53
16,922
I,OZO
1.~J31
2,057
1,907
:1,748
2,974
1,875
1,405
10
96
lU
20
17
63
17
63
10
17
12,7"
851
1,125
1.329
1,433
2,942
2,546
1,548
1,003
11
11
7,352
513
584
794
844
1,650
1,401
935
625
6
II
8
498
16
21
30
36
142
123
77
52
,_I
12 13
1,817
27
172
376
732
380
104
24
282
15
25
28
59
71
52
15
14
16
66
10
II
11
14
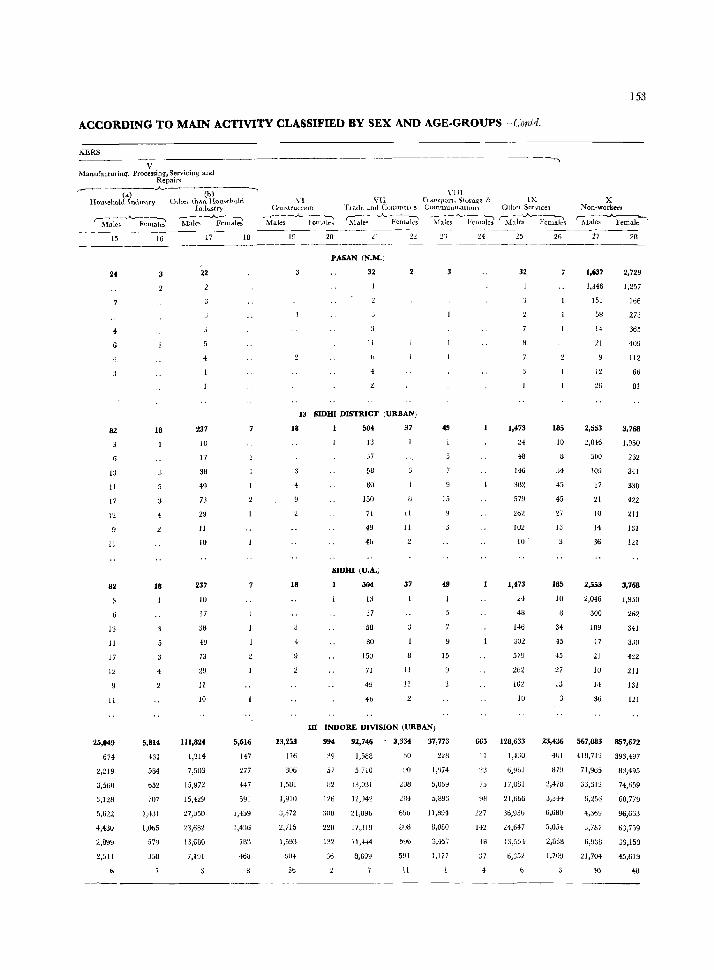
153
ACCORDING TO MAIN ACTIVITY CLASSIFIED BY SEX AND AGE.GROUPS-~(,'nntd.
KERS ------------------ ~-------~--
V ManufattUi in~, Processing, Servicing and
Repair.; ,--- -~-(a-)--.A.----(b)-----.
Hou<,ehold Industry Other LIMn HOUM".hold In{iustry
(~lu~5- ~·A.Fe~~ ~I:i;-~-;n~~
15
24
4
6
82
13
11
17
11
82
13
11
17
It
11
25,049
674
2,219
3,560
3,ltU
4,HO
2,899
2,511
16
18
4
18
5,814
431
584
b5t
707
1,431
1,OaS
5711
358
17
22
237
10
17
38
49
73
29
11
10
237
III
17
3H
4U
73
29
11
10
111,824
1,314
7,503
15,972
15,429
27,050
23,68~
13,6BO
7,191
18
7
5,616
147
277
447
591
1,436
7H3
468
n vn Uou<;tructlOll Tlade ctlld Connneice
'Males -~-;~1~~ S;f-:l~<;- -.A.. ~'~-:hi
\"Ill l'1d.nSrmn, ~tul'age & IX C()lllmUnl<-atlun~ Othe. SerVices
~fai~A.- FctIlak; ~{;k:-·i~:*\
X Non-workers
r--.A.---, Males Female
----~--- -- ~---~~--- _---- --~~----_ ----19
18
IB
4
13,253
116
auo
1,51l1
1,!:110
:;,572
t,715
1,5!.13
VO!
51>
20 21
PASAN (N.M.I
32
II
13 SmHI DISTRICT (URBAN)
504
13
Ji
58
au 150
71
49
40
SIOHI (U.A.)
504
13
37
58
au 150
71
49
4b
37
II
II
37
II
II
49
15
15
III INDORE DIVISION (URBAN)
994
39
57
U2
I~ti
:lOll
2:W
132
36
92,746
1,588
5,710
13,031
J2,~-t2
~1,B%
1 7 ,::i I ~J
II,H4
3,334
50
bUll
SOB
5UI
11
37,773
228
1,974
5,U6!:1
5,893
11,U94
a,080
3,457
1,177
24 25
32
1,473
H
48
146
302
579
~ti2
102
lU
1,473
U
48
H6
3U2
579
262
10~
lU
665 128,633
11 1,4:]0
:t3 o,!:Jbl
75 17,OBI
98 21,666
227 3b,93b
H2 24,647
4,8 1'J,55·~
:]7 6,J52
26
185
10
a 3<1
<IS
45
V
13
185
10
34
45
45
27
13
27 28
1,637 2,729
I,J46 1,257
151 166
5~ 273
14
21
365
409
112
12 66
26 81
2,553
2,046
3UO
109
17
21
10
14
36
2,553
2,046
300
109
17
21
10
14
36
3,768
1,950
262
341
330
422
~Il
131
121
3,768
1,950
262
HI
330
4t2
211
131
121
23,436 567,083 857,672
4Ul 4lU,712 393,<197
879 71,%5 83,495
:!,47B 3:l,31~ 74,659
3,:H4 6,256 (JO,779
6,680 4,3b!.! 96,66:1
5,05-1- :3,71:17 63,759
:l,3BS fi,~);)l:} 39,153
1.709 21,7U4 45,619
40
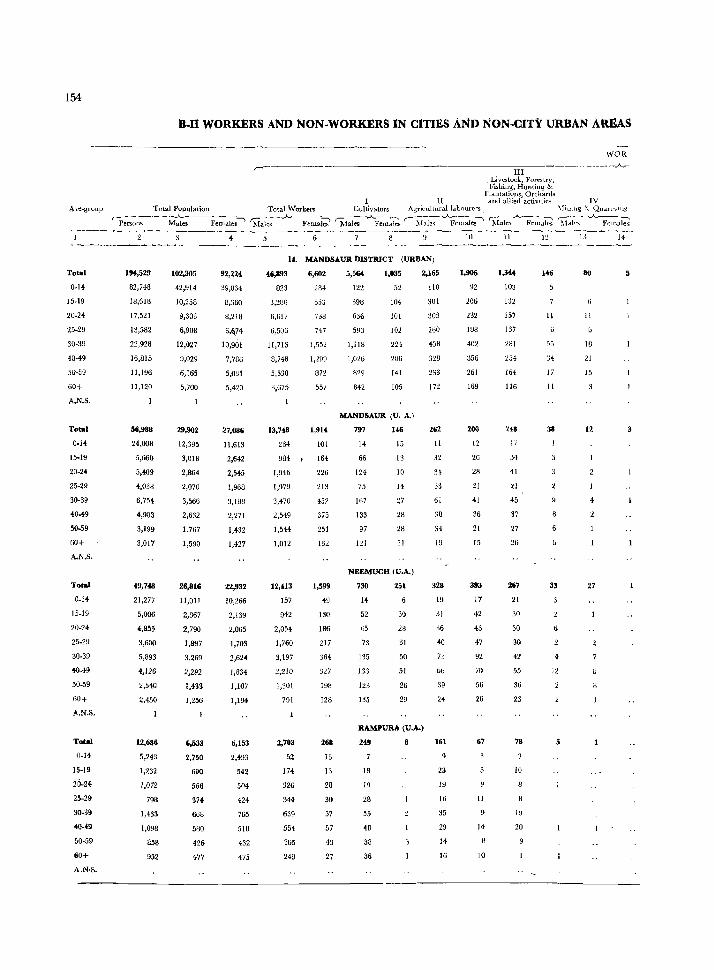
154
A!'!-grvup
Total
O-H
20-2.
25-29
30·39
40·49
50·59
60+
A.N.S.
Total
0.14
15-19
20-24
25·29
30·39
40.+9
50-59
60+
A.N.S.
Total
0-14
15-19
20-24
25-29
30-39
+0-49
50-59
60+
A.N.S.
Total
0·14
15-19
2i\-2~
25-29
30-39
40-49
50-59
60+
A.N·S.
B-Il WORKERS AND NON-WORKERS IN C1TIES AND NON-CITY URBAN AREAS
III ,Livestock, Forestry: Fishing, Hunting &
Plautations, Orclmnls II and allied activltie~ IV
"'OR A-
T(jtal Population Total Workers Cultivators Agricultural labourers :\liulIlg s... QU<l.l'n'1 11g
rp;~l;---- -M~-- Female,~ 'M~le;· -~~ 'j\~Fem~ '--M~..A-FelllaIes~ (l~i~i~.A-Fe::~ s:i~I:-.. --_A._Fe::ak;
194,529
82,748
18,618
17,521
13,582
22,928
16,815
11,196
11,120
I
56,988
24,008
5,660
5,409
4,038
6,75.
4,903
3,199
3,017
49,748
21,277
5,006
4,855
3,600
5,893
4,126
2,540
2,450
12,686
1,232
1,072
798
1,433
1,098
858
952
102,305
42,914
10,258
9,303
6,908
12,027
9,029
6,165
5,700
29,902
12,395
3,018
2,864
2,070
3,566
2,632
1,767
1,590
26,816
11,01l
2,867
2,790
1,897
3,269
2,292
1,433
1,256
6,533
2,750
690
568
374
668
580
426
477
92,224
39,834
8,360
8,218
6,1\74
10,901
7,786
5,031
5,420
27,086
1l,613
2,642
2,545
1,968
3,188
2,271
1,432
1,427
22,932
10,266
2,139
2,065
1,703
2,624
1,834
1,107
1,194
6,153
2,493
542
504
424
765
518
432
475
1'. MANDSAUR DISTRICT (URBAN)
(6,893
823
3,~B()
6,617
6,506
11,713
8,748
5,530
3,675
13,748
264
984
1,946
1,979
3,470
2,549
1,544
1,012
12,U3
157
942
2,054
1,760
3,197
2,210
1,301
791
2,703
52
174
326
344
639
554
365
249
6,602 5,564 1,035 2,165
284
553
738
747
1,552
1,299
an 557
1,914
101
164
226
21:1
452
375
251
132
1,599
49
130
186
217
364
327
19B
128
268
13
13
28
30
57
57
43
27
122
39B
636
593
1,118
1,026
829
842
52
104
101
102
224
206
141
105
MANDSAUR (U. A.)
797
14
66
124
75
167
133
97
121
146
10
13
10
14
27
28
28
11
NEEMUCH (U.A.)
730
H
52
65
73
1'35
13:3
123
135
251
30
28
31
50
51
26
29
RAMPURA (U.A.)
249
18
19
28
55
48
38
36
110
301
303
260
n8
2:13
172
262
11
3~
34
33
61
38
34
I~
328
19
31
36
40
7:;
66
39
24
161
23
19
16
35
29
14
16
10
1,906
92
206
232
188
402
356
261
169
200
12
26
28
21
41
36
21
15
393
17
42
43
47
92
70
56
26
67
II
14
10
II
15i
137
2HI
::!54
164
116
~48
17
34
H
~I
45
37
27
267
21
30
30
30
4~
55
36
23
7B
10
19
20
12
146
11
6
55
:}4
17
II
38
33
6
4
i2
80
11
IS
21
15
12
27
14

ACCORDING TO MAIN ACTIVITY CLASSIFIED BY SEX AND AGE.GROUPS-Collid.
KERS
V ~\ILl.uufacturillg, 1', uccssmg, Servicing all!t
Repmrs ,-----w----..A..-----(10---- ~-- ~
J louscbold IHelUSli Y Otilet tlwn HouscllOlcl jndu~tq
~fuk;-.A.Fe~~~ ~al~~-.A. Fema~
15
2,783
84
JI3G
54~
505
654
34
58
67
109
196
H
60
59
109
87
61
bb
231
20
:lB
H
50
:/0
10
685
51
75
78
84
121
H2
50
267
26
34
'll
33
28
IU
176
lU
:J8
42
17
6,017
115
.')00
1,028
f.t15
1,391
l,tH5
b47
456
2,742
66
~35
485
360
619
486
000
lK\
1,464
134
~55
355
127
381
17
50
41
67
59
50
18
449
33
38
51
105
](11
51
:;9
241
15
15
20
b7
,5 2:;
13
142
15
26
']1
10
:w
17
\ III \'1 \"11 Transport, Stulagc &
ComtlllCtllJll Trade and C\)lIlHlCIle (.:ommuUlcatioIlS
~ia-,~~--.A.·-I~cm~ki ~~-~;.A. i'CllIJI6 ~f-a-Ics-A~
I"
1,855
11
94
50:1
411
Ilia
345
25
42
48
fl5
73
38
777
J7
l~ti
1'14
174
95
78
~o
20 21 22 23
14. MANDSAUR DISTRICT (URBAN)
58
II
9,330
90
5:32
I!~UJ
272
MANDSAUR (U.A.)
2 3,411 131
50
224
JOl
503
740
l::ill-)
NEEMUCH (U,A.j
51
11
18
2,298
25
12U
301
346
550
4:m
,1I3
213
RAMPURA(U.A.)
124
20
51
47
87
91
70
5:3
10
10
60
Iii
13
1-1
3,983
20
758
51
107
121
229
14)
6:1
33
2.007
120
261
titifJ
4-7!J
175
56
140
26
34
41
14
62
~ 1
14
14
IX Utbcl SCI ViCes
r-------..A..----.., J\fale... Females
13,772
161
850
:1,167
1,414
.\7:;
4,519
6f;
258
515
742
1,389
908
46:1
181
4,019
373
~74
575
I,Ob4
,\55
321
127
952
lB
JJ
106
144
I~J4
IE)
2ti
1,981
105
167
5El
138
880
31
63
lIb
100
11B
170
126
56
20
75
6U
112
86
53
26
121
10
16
2)
lSS
X _:\joll~\\'orhcl's
,,--A---~_
l\lalc~ Female,
27
55,412
42,091
6,978
2,bUti
402
314
281
635
16,154
12,131
2,034-
~18
91
96
03
12')
578
14.403
10,354
1,925
iJti
117
82
465
3,830
2,698
J16
242
JO
til
2U
85,622
.19,550
7,807
7,480
6,487
4,159
4JHf):~
25,172
11,512
2,478
2,31Y
1,755
1,1l96
1,181
1,295
21,333
10,217
2,009
1,879
1,+Bh
1,50;
1,066
5,885
2,480
476
70U
4bl
:389
443
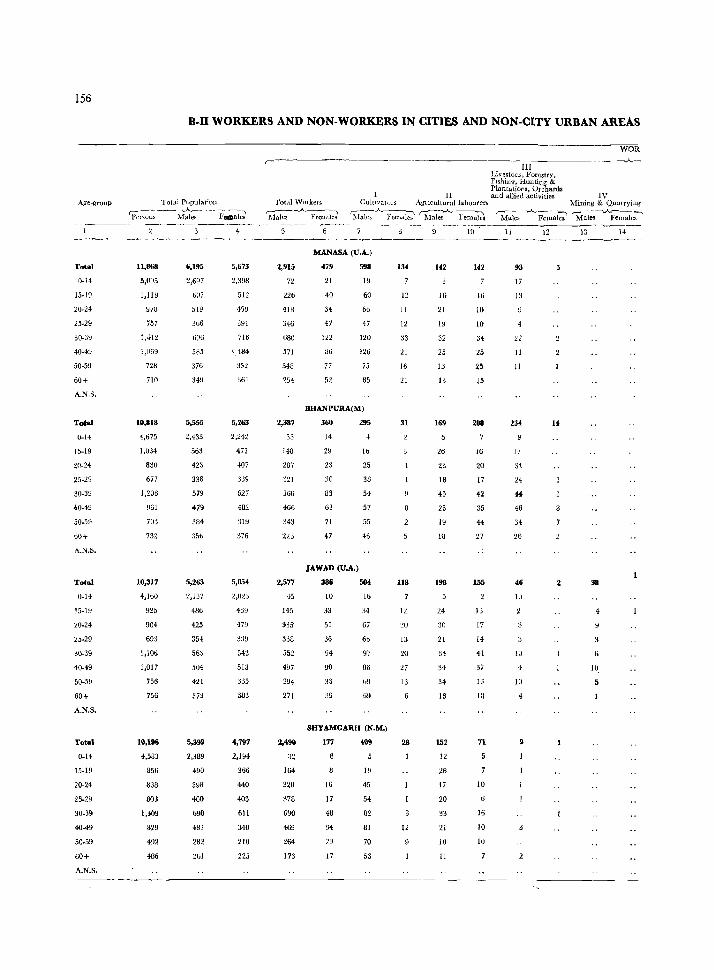
156
Age-group
Tota1
0·14
15·19
20·24
25·29
30·39
40·4~
50-59
60+
A.N.S.
ToW 0·14
15·19
20·24
30·39
40·49
50.59
60+
A.N.S.
Total
0·14
15.J9
20.24
25·29
30·39
40·49
50·59
60+
A.N.S.
Total
0·14
15·19
20·24
2~·29
30.39
40.49
50.59
60+
A.N.S.
B.n WORKERS AND NON-WORKERS IN CITIES AND NON·CITY URBAN AREAS
Tot"ti Popuiatiull ~--.---A----" Pel wm, ~Males Females
1l,868
5,095
1,119
978
757
1,412
1,069
nu 710
10,818
1,675
1,034
830
677
1,206
961
70~
10,317
4,100
925
904
693
1,1%
1,017
756
756
10,196
4,583
856
838
803
1,309
829
492
486
6,195
0117
519
366
696
585
376
349
5,555
2,433
563
423
338
579
479
384
5,263
2,137
4116
425
354
563
504
421
373
5.399
2,389
490
398
400
698
481
282
261
5,673
2,:198
512
1·59
391
716
\484
352
361
5,263
2.242
471
t07
339
627
482
319
376
5,054
2,O~::l
43!:1
479
3J!)
543
513
383
4,797
2,194
366
440
403
611
348
210
225
WOR
----~I~II~--------------~
Livestock, Forestry, Flshing, Hunting & Plantations, Orchards
Total ,tV ul·ker~ II and allied activities IV
CuiUvatols Agllculturallabouters ,.... ___ .A.. __ "
.Males Femdles 'hl~-;-A.. Fcmdk; (Maleso.A.--Fem~
n 220
41B
346
680
571
348
254
2,387
33
118
287
321
566
466
343
2,577
45
145
335'
338
552
497
394
271
2,490
32
164
320
378
690
469
264
173
6
MANASA (U.A.)
479
21
40
34
47
112
86
77
52
598
19
60
60
47
120
126
75
85
BHANPURA(M)
360
14
2~
23
:lO
83
63
71
47
JAWAD (U.A.)
386
10
33
51
36
94
90
33
:39
295
10
25
38
54
57
55
46
504
16
34
67
66
97
86
09
69
SHYAMGARH (N.M.)
177
16
17
48
34
29
17
409
19
45
54
82
81
70
53
13
11
12
33
21
16
21
31
118
12
~o
13
20
27
13
28
12
9
142
16
21
19
32
25
13
13
169
26
23
18
45
23
19
10
198
24
30
21
34
34
34
16
152
12
28
17
20
33
21
10
11
10
142
16
10
10
34
25
25
15
2011
16
20
17
42
35
155
13
17
14
41
37
13
lU
71
10
16
10
10
Mining & Quarrying
~ales -.A.~i~ 'M-a~.A.f;male~
II
93
17
13
22
II
11
234
j 7
34
24
44
46
34
26
46
10
10
10
4
9
12
14
38
Ii
10
14
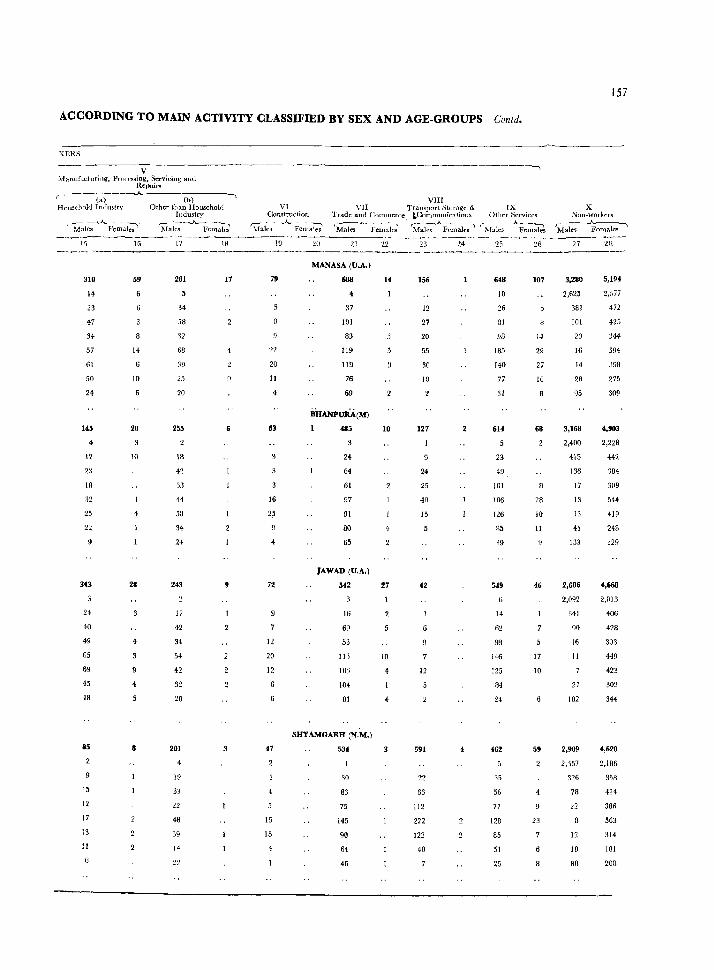
ACCORDING TO MAIN ACTIVITY CLASSIFIED BY SEX AND AGE-GROUPS Contd.
KERS
V ~\{anuf"cluring, Prl1l'essing~ Servicing and
Repairs _____ ~_-.A..
,-- (a) HOllse-I101d Industrv
(b) Other than Household
Industry
~~~~-"- }'emalei
310
14
23
47
34-
57
61
50
24
145
4
12
2:1
18
:12
25
22
343
24
40
49
G5
69
45
48
B5
'5
12
17
13
11
59
14
10
20
4
28
4
281
34
58
32
68
39
25
20
255
18
42
~~
44
58
34
24
243
17
42
34
54
42
32
20
201
4
19
33
22
48
39
14
22
17
4
9
VIII VI
Construction VII Tran~port Storag-e & IX
,!'rade ancf Comlnerce L(~oIIlmunications Otht':r Services
'Males ArcOlai;;' 'Males·..A.... FelI~ks' MaJes _A.... Female;' Slales ~~
79
22
20
11
4
63
16
2.5
9
4
72
12
20
12
47
15
15
4
21
MANASA (U.A.)
Ii08 14
37
101
83
119
119
76
69
24
64
61
97
91
80
65
JAWAD (U.A.)
542
16
69
53
113
103
104
81
SHYAMGARH (N.M.)
534
30
83
75
145
90
64
46
10
27
10
4
4
156
12
27
20
55
30
10
127
24
25
48
15
42
12
591
22
66
112
222
122
40
25
648
10
26
81
98
185
140
77
:ll
614
23
49
101
1n6
126
85
19
549
14
62
SS
146
125
84
24
462
:15
56
77
128
85
51
25
26
107
14
29
27
16
68
28
10
11
46
17
10
59
23
157
X Non-workers
r----..A..~ l\-Iale<; Fomalt':.<i
27
3,280
2,625
381
101
20
16
14
28
95
3,168
2,400
415
136
17
13
13
41
133
2,686
28
5,194
2,377
472
425
344
594
398
275
309
4,903
2,228
442
384
309
544
419
248
329
4,fi68
2,092 2,013
341
90
16
11
27
102
2,909
2,~57
326
78
22
12
IS
88
406
428
303
449
423
302
344
4,620
2,186
358
424
386
563
314
181
208
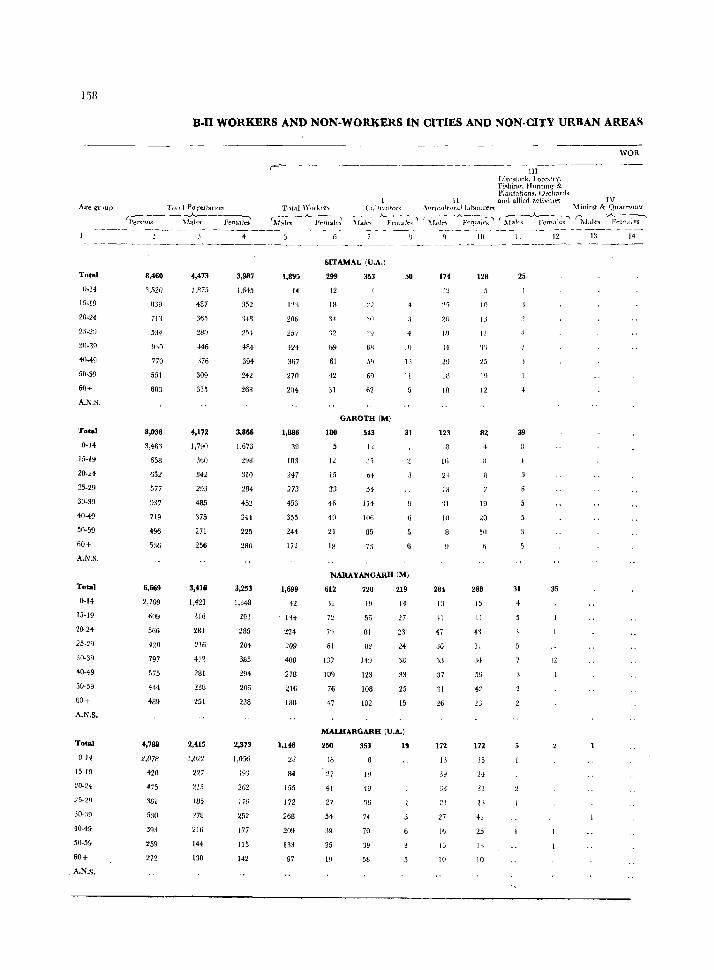
158
B·n WORKERS AND NON·WORKERS IN CITIES AND NON-CITY URBAN AREAS
A~e-gL' .up [otal Po pulatron
Total
0-14
15-19
20-24
2.,-29
30-39
40-49
50-59
60+
A.N.S.
Total
0-14
15-19
20-24
25-29
30-39
40-49
50-59
60+
A.N.S.
Total
0-14
20-24
25-29
30-39
40-49
50-59'
60+
A.N.S.
Total
0-]4
15-19
20-24
30-:19
40-49
50-59
60+
A.N.S.
c-------"-----_, Per~nll3 :H,alri jl(>males
8,460
1,.>20
1139
711
534
770
551
603
8,038
3,461
658
652
577
937
719
496
536
6,669
2,769
009
566
420
797
575
444
489
4,788
2,078
420
475
361
.'30
3qg
259
272
4,473
J,R75
487
365
280
-146
376
309
33.\
4,172
l,7HO
:160
342
293
485
375
271
256
3,416
1,421
316
2Bl
216
412
281
238
251
2,415
1,1122
227
213
185
27U
216
144
130
4
3,987
1.615
:152
4R{
394
242
268
3,866
1,673
298
310
284
45"
314
225
280
3,253
1,348
293
285
204
385
294
206
238
2,373
1,056
19'3
262
176
252
177
115
142
r--- ------- .--.. --~-.----III
I,ivr-stock, Fore:;tt'-, Fi~hiw~. Huntmg & Plantations', Orchnrrh
II and allied activihe'l IV
WOR
Tout! ,\V(),ker,. C!/ltl"M()r~ A~ncliltur.1.1 labl)urers Mining & Quarrvw~ r:"--.A...-'~ - -- - -,A_~ --~ (_-~~..A....--;---~ r::------"--,- ---, r:- ---A---., ~\1ales ]"t'm31es J\fa}"", Ft'"JJJ",Jc~ :'\IaJt'"'> F('"[paks ]\Iak.. J ern;lle~ 1\.f.lles Fern.des
1,895
H
206
257
4U
367
270
204
1,886
39
10:1
247
273
453
355
244
172
1,699
42
n4
224
209
408
27B
216
IS8
1,1~
28
84
155
172
268
209
133
97
SITAMAU (U.A.I
299
12
18
34
'32
69
61
42
31
188
12
15
23
46
40
21
18
353
';0
GAROTH (M)
,43
73
50
4
10
n II
31
NARAYANGARH 1M)
612
11
61
137
109
76
47
720
I~
56
81
82
149
123
lOB
102
219
J4
27
23
24
58
33
25
15
MALHARGARH eU.A.)
250
18
27
41
27
54
39
25
19
3,3
1!1
19
36
74
70
39
58
19
174
12
20
18
14
29
III
18
123
Hi
18
'II
10
284
1:1
'll
H
36
53
37
31
26
172
]3
33
21
27
Ie
13
10
10
128
10
13
II
'J'1
25
19
12
82
19
20
III
288
15
II
4'l
31
:H
42
172
15
24
31
l'l
41
25
13
10
II 12 13 14
25
31 35
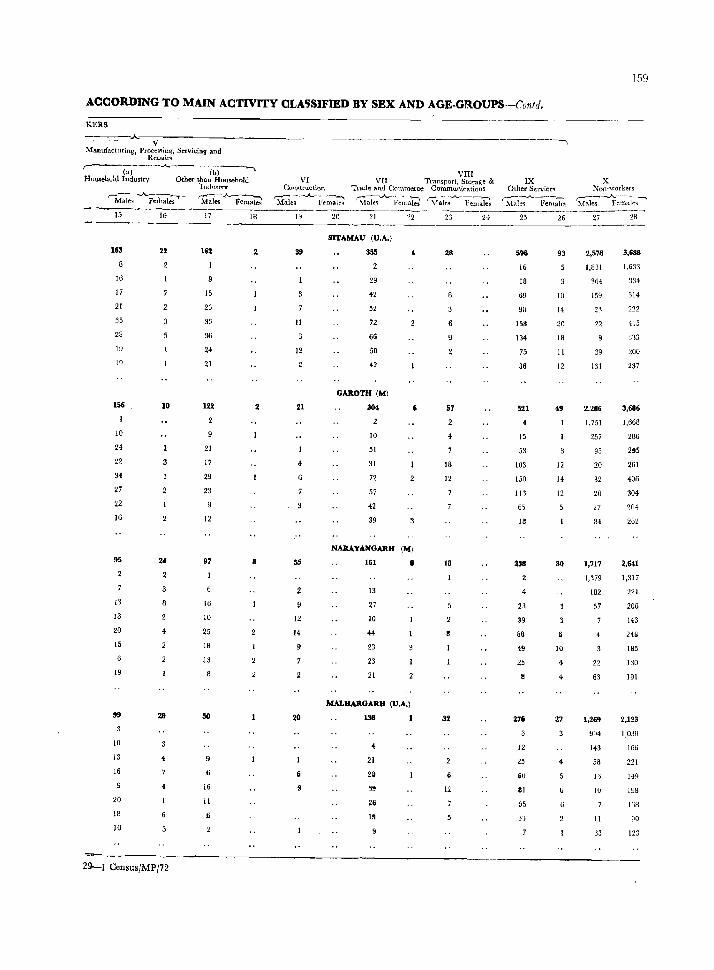
ACCORDING TO MAIN ACTIVITY CLASSIFIED BY SEX AND AGE-GROUPS--Conld.
KERS
-----·----·~~~v~----------------------~------~ --------------~
ManufaC'tnring, Proces'Iing, Servicing and RepaiN
r--(;;-j--.A.-----Cb
-) Household Industry Other than Household
lndu"tf"v
r-~l~s-_"'_~rhal~ - 'MJ;~f~
15
163
8
J6
17
21
35
28
19
156
10
24
22
34
27
22
16
95
13
13
20
15
19
99
10
13
16
20
18
10
16
10
24
4
28
4
4
29-1 Census/MP/72
17
162
15
23
33
36
24
21
122
9
21
17
29
23
9
12
97
16
10
25
18
13
6
16
11
Ii
18
2
VIII VI
r:.on~truction r"*--.-_A.,.-~-~
Males F("male~
VII Transport, Stara!2:e &
19
39
11
12
21
55
12
14
20
1
6
T~'ad~ and Commerce Communintions
~~~~..A..-F~~~ '\.fale/\"- FeI~I~~ 20 21 22
SlTAMAU (U.A.)
355
29
42
52
72
66
50
42
GUOTH (M)
30<1
10
51
31
72
57
42
39
6
NAllAYANGUH (M)
161
13
27
10
44
23
23
21
MALIfARGARB (U,A.)
138
• 21
2&
39
26
I!
23
28
57
18
12
18
32
12
24
IX Other Service'!
~r;i~AFe;;;k\
25
596
16
18
69
90
158
134
75
36
521
4
15
53
103
150
ll~
65
13
238
4
23
39
8a
49
25
27&
12
25
tiO
81
55
33
26
93
10
14
20
18
11
12
49
12
14
12
30
10
4
27
]59
X Non-workers
M~~~-;~~
27
2,578
1,831
364
159
23
22
39
131
2,286
1,751
257
95
20
32
20
27
Il4
1,717
28
3,688
1,633
334
314
2:!2
415
3'13
2UO
237
3,686
1,668
286
295
261
406
304
204
262
2,641
1,~79 1,317
182
57
22
63
1,269
221
20G
143
242
185
130
191
2,123
994 I,U38
143
58
13
10
II
33
166
221
149
198
13B
90
123
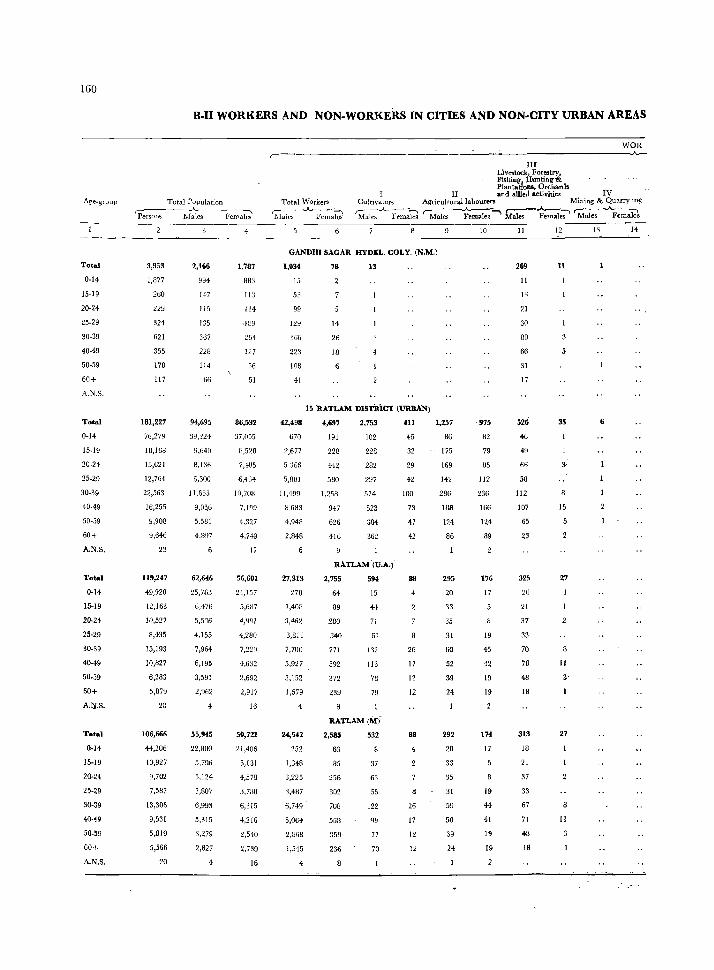
IGO
Age-group
Total
0-14
15-19
20-24
25-29
30-39
40-49
50-59
60+
A.N.S.
Total
0-14
15-19
20-24
25-29
30-39
40-49
50-59
60+
A.N.S.
Total
0-14
15-19
20-24
25-29
30-39
40-49
50-59
60+
A.J:I.S.
Total
0-14
15-19
20-24
25-29
30-39
40-~9
50-59
60+
A.N.S.
B-I1 WORKERS AND NON-WORKERS IN CITIES AND NON· CITY URBAN AREAS
Total Population r=----...}I.._~--~
Persous Males Females
3,953
1,877
260
229
324
621
355
170
117
181,227
76,279
18,168
15,621
12,764
22,563
16,255
9,908
9,646
23
119,247
49,920
12,163
10,527
8,435
15,193
10,827
6,283
5,879
20
106,666
44,206'
10,927
9,702
7,587
13,308
9,531
5,819
5,566
20
2,166
994
147
115
135
367
228
114
66
94,695
39,224
9,640
8,1:16
6,300
I1.855
9,05,6
5,501
4,897
62,646
25,763
6,476
5,536
4,155
7,964
6,195
3,591
2,962
4
55,945
22,800
5,79£
5,124
3,807
6,993
5,315
3,279
2,827
4
4
1,787
883
113
114
·lUg
254
127
56
51
86,532
37,055
0,528
7,105
6,464
10,708
7,199
4,327
4,7+9
17
56,601
24,157
5,6B7
4,9~H
4,280
7,229
4,632
2,692
2,917
16
50,721
21,406
5,131
4,5m
:1,780
6,315
4,216
2,540
2,739
16
,----.------~-~
WOR --~-~--------------~
HI Livestock, Forestry,
~~~!~~~t!ts I II and allied activities IV
CultivatoN Agl'iru!turallabourers Mining & Quarry ing Total ""orkers ,---_.....A..---_ -----:-i Mules Females 'Males ~~~ ~--. ~~;;-' ~~';;~k1
GANDHI SAGAR HYDEL, C:OLY. (N.M.)
1,034
15
53
99
129
366
223
108
41
42,498
670
2,677
5366
5,801
11,499
3~683
4,943
2,843
27,313
270
1,400
3,462
3,811
7,700
5,927
3,152
1,579
4
24,542
252
1,348
3,225
'),487
6,749
5,06.
2,868
1,545
4
78
14
26
18
13
15 RATLAM DISTRici (URBAN)
4,697
191
228
442
500
1,258
947
626
116
2,755
64
89
280
340
771
592
372
239
2,753
102
228
282
297
574
523
384
362
594
15
44
71
61
132
113
78
79
RATLAM(M)
2,585
63
85
256
302
708
5SB
359
236
8
532
37
63
55
122
qg
77
70
411
46
32
29
42
100
73
~7
42
88
26
17
12
12
88
4
26
17
12
12
1,257
86
175
169
142
286
188
124
86
295
20
33
~5
:11
60
52
39
24
292
20
33
35
31
59
50
39
24
10
. 975
82
79
85
112
236
166
124
89
176
17
8
19
45
42
19
19
174
17
19
44
41
19
19
11
269
11
13
21
30
80
66
31
17
526
46
49
1i6
58
112
107
65
23
325
20
21
37
33
70
78
48
18
313
18
21
37
33
67
71
48
18
12
11
35
15
27
11
3'
27
11
I~ 14
6
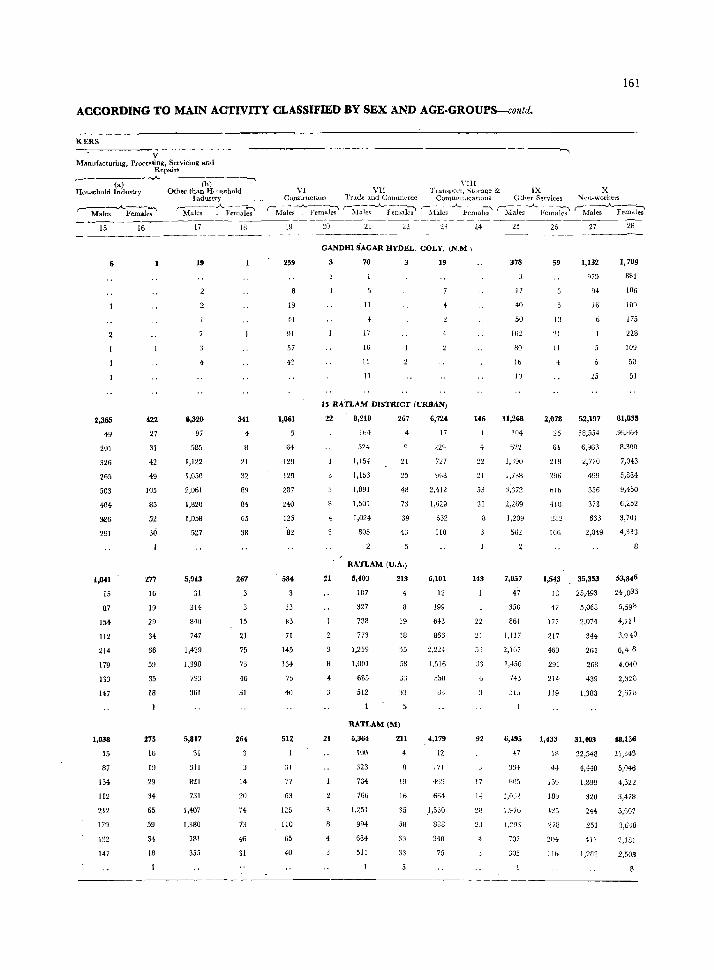
161
ACCORDING TO MAIN ACTIVITY CLASSIFIED BY SEX AND AGE-GROUPS-contd_
KERS
v Manufacturing, ProCessing, Servicing and
Repair!! r---(-a-)--.A. (b) .~----;
Household Indu5try Other than Household Industry
\'IlI VI VII Tlansp0rt, Storag'e & IX X
Co..nstructwn Tr<iue and Commerce ComttnlmcatlOTIS Other Services Non-workers r---------.A.---,
Males }'emales r-Aful~-~F~ma~ ,-M~--A. Fe~~ '-M~~F~~;" 'hl:i~;--"- F·e~~;l;' 'Atfales .A- Fe~J~ f Ma]es ~;:i~ 15
6
326
265
503
404
3:/6
291
1,041
15
B7
154
Il2
214
179
133
147
1,038
15
87
154
Il2
212
179
1:12
147
16
(22
27
31
42
49
105
85
52
30
277
16
I9
29
34
66
59 35
IB
275
16
19
29
34
65
59
34
18
----------------17
19
8,320
97
585
1,122
1,050
2,061
1,820
1,058
:>27
5,913
31
314
840
747
1,429
1,398
793
361
5,817
31
311
821
731
1,407
1,380
781
355
18
341
4
21
32
89
84
65
38
267
15
21
75
73
46
31
14
211
74
73
46
31
19
259
19
41
91
57
43
1,061
64
129
129
287
240
125
'82
33
83
71
145
134
)5
40
512
:ll
77
63
125
110
65
40
~o 21 23
GANDHI SAGAR HYDEL. COLY. (N.M.)
70
II
I)
10
II
II
3 19
15 RATLAM DISTRICT (URBAN)
22
4
21
21
8,218
164
524
1,15.
1,153
1,891
1,501
1,024
805
267
4
21
25
48
73
39
43
RATLAM (U,A.)
5,403
107
327
738
773
1,259
1,001
685
512
213
4
19
18
35
58
3::
:13
RATLAM(M)
9,364
IUO
323
734
766
1,251
994
684
511
211
4
19
16
35
58
33
33
6,724
17
727
U6B
2,412
1,629
632
IlO
6,101
12
199
643
866
2,224
1,516
.\5B
83
4,179
12
171
664
1,530
888
3·10
75
24
146
4
53
33
143
:!1
51
:33
92
17
:ZJ
25
378
17
40
50
162
80
16
10
11,2G8
104
622
1,.:90
1,738
3,:372
2,269
1,209
562
7,057
47
350
861
1,117
2,167
1,456
7+3
:Jl5
6,495
47
1105
l,(]:J2
J ,~76
1.293
702
305
26
59
13
'21
11
2,078
26
64
218
h1n
410
166
1,~3
18
47
177
217
460
291
214
119
1,433
18
H
15~
lUg
425
2()4
116
27 28
1,132 1,709
979 881
94
16
25
52,197
38,554
£,963
2,770
499
356
373
633
2,049
35,333
25,493
5,068
2,OH
344
264
268
439
1,383
31,403
22,548
4,448
1,899
320
244
251
411
J ,282
106
109
175
228
109
50
51
81,83~
36,864
8,300
7,043
5,884
9,450
6,252
3,701
4,333
4,7]1
3,940
6,4 8
4,040
2,328
2,678
48,136
21,343
5,046
4,322
3,47B
5,607
3,648
2,181
2,503
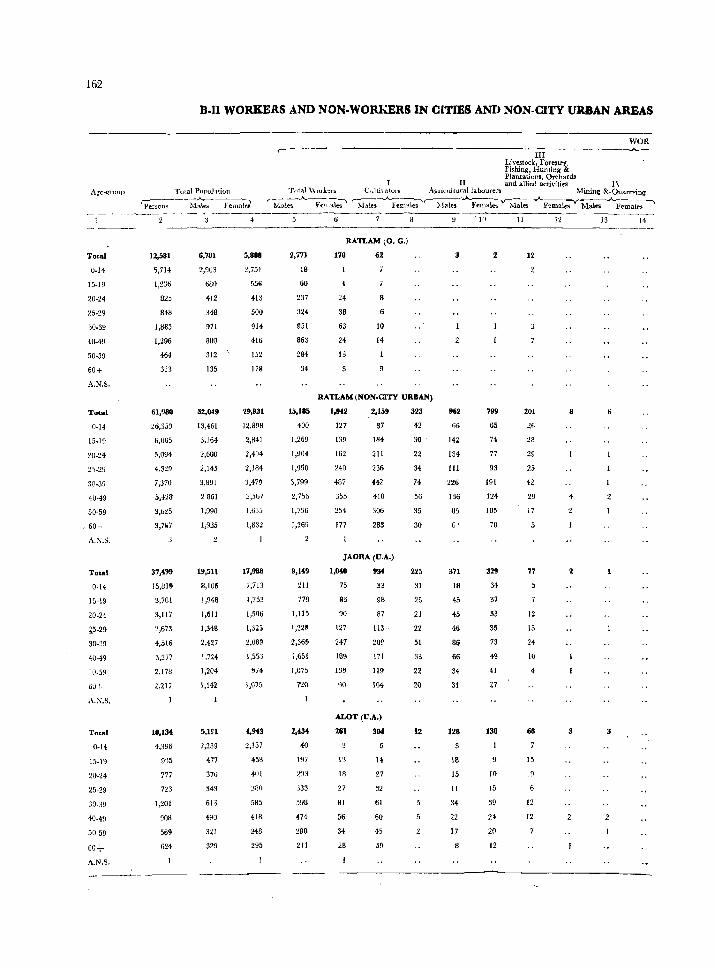
162
Age-group
Total
0-14
15-19
20-24
30-39
40-49
50-59
60+
A.N.S.
Total
0-14
15-19
20-24
2'}-29
30-39
40-49
" 60+
A.N.S.
Total
0-14
15"19
20-24
.. 5-29
30-39
40-49
-0-5~
60+
A.N.S.
Total
0-14
15-19
20-24
25-29
30-39
40-49
50-59
60+
A.N.S.
B.11 WORKEAS AND NON.WORKERS IN CITIES AND NON-CITY URBAN AREAS
T utal PopuJ ltLon ~ ____ ~_..A--~ __ :--\
Per:>ons Males Female!'.
12,581
1,714
1,236
825
848
1,885
1,296
464
:)13
61,980
26,359
6,005
5,094
4,329
7,370
5,428
3,625
3,7.7
37,499
15,81~
3,701
3,(17
2,675
4,516
3,277
2,178
'2,211'
10,13i
4,396
935
777
723
1,201
908
569
624
6,701
2,%3
680
412
348
971
880
312
135
32,049
13,461
3,164
2,600
2,145
3,891
2861
1,990
1,935
19,511
8,105
1,948
1,~11
1,348
2,427
1,72+
1,204
1,142
S,lSl
2,239
477
376
343
61·3
4~U
:121
329
4
5,888
~,751
556
413
500
914-
416
152
178
29,931
12,898
2,841
2,184
3,47~
2,567
1,635
1,832
17,988
7,713
1,753
1,506
1,')23
2,089
~74
1,075
4,9"
2,157
458
40!
:mo 585
418
248
295
WOR ·--------A -
III Livestock, F orestty, Fishing, Hunting & PlantatioJ1', Orchards
II and allied activities I\ Culti .. aluJ"S Ag'iculturalla~ure!"S Mining &-Quarrving
~~Fe~""",,{~A~e7"r;~..A-Femal;;,~.A.F~~ Total \\OIk-:n
r~;-_A._~:i;,'
2,771
18
60
~37
324
951
863
284-
34
15,185
400
1,269
],904
1,990
3,799
2,756
1,796
1,269
9,H9
211
779
1,115
1,22~
2,36'
1,651
1,075
720
2,434
40
197
293
:133
5'lll
474
288
211
RATLAM (0. G.)
170
24
38
63
24-
13
62
10
14
RATLAM (NON.ClTY URBAN)
l,9i2
127
139
162
240
487
:l55
254
177
2,159
87
184
211
236
442
410
306
283
]AORA (U.A.)
1,040
75
83
90
127
247
189
13~
90
934
33
98
87
113 -
20~
\71
119
104
ALOT(U.A.)
261
13
18
27
81
56
34
28
304
It
27
32
61
60
45
59
323
42
30 -
22
34
74
56
35
30
225
31
25
21
22
51
33
22
20
12
3
962
66
142
134
111
226
136
US
c'
371
18
45
45
46
86
66
34
31
128
18
15
11
34
22
17
10
799
65
74
77
93
191
J24
105
70
329
34
37
33
35
73
49
41
27
130
9
10
15
39
24
20
12
II
12
201
26
28
29
25
42
29
17
77
12
15
24
10
4
68
15
.9
12
12
12 13 14
8
4
3 3
2
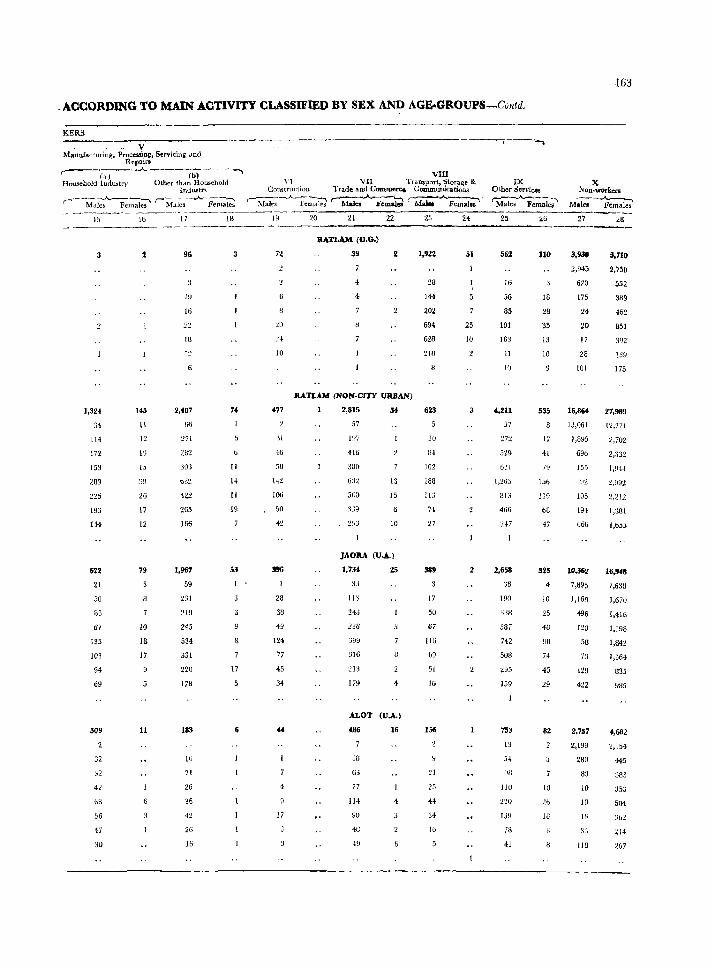
. ACCORDING TO MAIN ACTIVITY CLASSIFIED BY SEX AND AGE-GROUPS-Colltd.
KERS
V Manufacturing, Processing, S~rvicing ,mel
R~pain ,--____ .A. __________ -.,
r,t) (b) HOll:oiebold ludustry Otb('f thdn Household
Industf\ r~-~...A..--_'__'~ ~--...)...-~---:-,
Mules FemaJes M,.tles Females
15
1,324
34
114
172
153
2U9
193
144
622
21
50
03
67
135
103
94
69
309
32
32
42
bS
56
47
30
16
145
11
12
if_}
15
26
17
12
79
8
10
18
17
11
17
I ~,
16
18
6
2,f07
66
271
282
30:1
632
422
265
166
1,967
59
231
245
534
331
220
IZ8
183
16
21
26
36
42
26
16
IS
3
74
11
14
11
19
53
9
17
6
VIII \'] VII Tra'DIport) Storag~ &
Const['UUloa Trade alld Commerce Couunurucations
'-Males -..A- Fep,,1ei ~"';i ~~. I~
10
477
'H
46
58
142
106
50
28
38
49
124
77
45
34
44
17
20 21
RATLAM (O.G.)
39
4
-}
22
2
RATLAM (NON-CJTY URBAN)
2,815
57
197
416
380
632
500
54
13
15
10
JAORA (V.A.)
110
243
238
'3Y!:J
316
213
179
25
ALOT (V.A.)
486
3H
63
77
114
9U
4U
49
16
23
1,922
28
144
202
694
628
623
30
U4
102
188
113
7-!
27
389
17
50
67
IIG
69
51
16
156
21
25
34
10
24
51
25
10
3
2
IX OUler Services r----.A..----- ., Males Females
25
562
16
56
85
I~I
163
41
J(j
4,211
57
27:!
5~9
f::i:!l
[,20:;
813
466
~47
2,658
38
190
338
38,
742
508
295
159
753
13
54
~'H
Ilfl
220
139
78
41
26
110
18
28
35
IS
10
535
17
41
79
156
119
08
47
325
4
10
25
41l
90
;4
45
29
82
10
13
163
X Non .. workers ---.A.~
Males Females
27 28
9,930 5,710
2,945 2,750
620
175
24
20
17
28
101
16,864
13,061
696
155
92
105
194
666
10,362
7,895
1,169
496
l~O
58
7J
129
422
2,757
2,199
280
83
10
18
10
3:,
118
552
389
462
851
392"
139
175
27,989
12,771
2,i02
2,:132
1,941
2,992
1,381
l,b5~
16,948
7,638
1,670
1,416
1.198
1,842
1,364
835
9H5
f,682
2,154
445
383
353
504
414
267
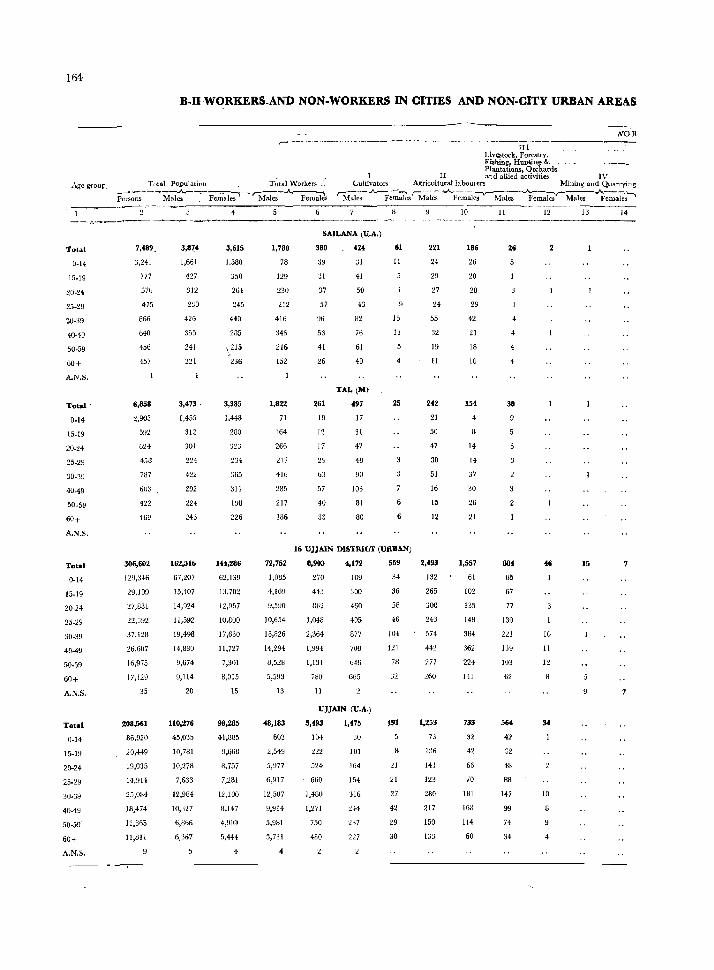
164
B-I1 WORKERS_AND NON-WORKERS IN CITIES AND NON-CITY URBAN AREAS
,--------------III
Livestock, Forestry, Fishing, Hllllting·& _ -Plantati.ons., Orchards
NOR
Age-group__ Tutal Population T~tal Worktrs :_" _------~ ...... -_A~____:__--""-~. -_ r:---.A.~
II and aHied activities IV Ltiltivators AgriculturallaboUlers Mining and Quarl'ying
'11alcs AFe;~s r-Maks ~..A.F;;ie7'(-M-;i";--~~ki'-~~'~\
Tota~
0·14
15.19
20·24
25-29
4O·4a
50-59
60+
A.N.S.
Total'
0-14
15.19
20-24
25-29
30·39
40·49
50·59
60+
A.N.S.
Total
0-14
15-19
20·24
25·29
30·39
40-49
50-59
60+
A.N.S.
Total
0-14
15-1.9
20-24
25-29
40-49
50·59"
60+
A.N.S.
persons Males . Females Males Females
7,489.
3,241
777
576
475
866
640
456
457
6,858
2,903
592
('24
458
787
60"
422
469
306,602
129,346
29,109
27,881
:!2,J92
37,128
26,607
16,975
17,129
35
208,561
86,920
20,449
19,035
14,914
25,084
18,474
11,865
11,SIl
3,874
1,661
427
312
230
426
355
241
221
3,473·
1,455
312
301
224
422
292
224
243
162,316
67,207
15,407
14,924
11,592
19,498
14,880
9,674
9,114
20
110,276
45,035
10,781
10,278
7,633
12,984
10,327
6,BbG
6,367
3.615
1.580
350
264
245
440
285
3,385
1.448
280
:3:':3
144,286
62,139
13.702
12,957
10,800
17,630
11,727
7,301
8,015
15
98,285
41,885
9,668
8,757
7,281
12,100
B,1.47
5,444
4
1,780
78
129
230
212
416
345
216
152
1,822
71
164
266
217
416
285
217
186
72,752
1,085
4,169
9,590
10,654.
18,826
14,294
8,528
5,593
13
48,183
603
2,549
5,977
6,917
12,5U7
5,981
3,731
SAILANA (V.A.)
380
;>9
31
37
57
96
53
41
26
261
10
12
17
29
63
57
40
33
424
31
41
50
B2
76
61
40
TAL(M)
497
17
31
47
48
9U
103
81
80
61
11
15
11
25
16 UJJAlN DISTRICT (URBAN)
8,903
c:!70
443
862
1,048
2,364
1,994
1,131
780
II
i,172
109
300
460
405
877
708
646
665
VJjAIN (V.A.)
5,493
104
222
524
660
1,48U
1,271
750
480
1,475
30
101
164
154
316
2:17
2'27
559
:14
36
58
46
104
121
78
U2
27
42
29
38
221
24
29
27
24
55
32
19
II
242
21
50
47
30
51
16
15
12
2,493
132
265
300
243
574
442
277
:!6U
1,253
73
136
141
123
280
217
150
133
10 11 12 13 -------~--"--~-
186
26
20
20
29
42
21
18
10
154
14
14
37
30
26
21
1,557
61
102
135
148
384
362
224
141
733
32
42
66
70
181
168
114
60
26
4
4
4
4
30
884
85
67
77
130
221
139
103
62
564
42
32
48
88
147
99
74
34
4ti
10
11
12
10
4
15
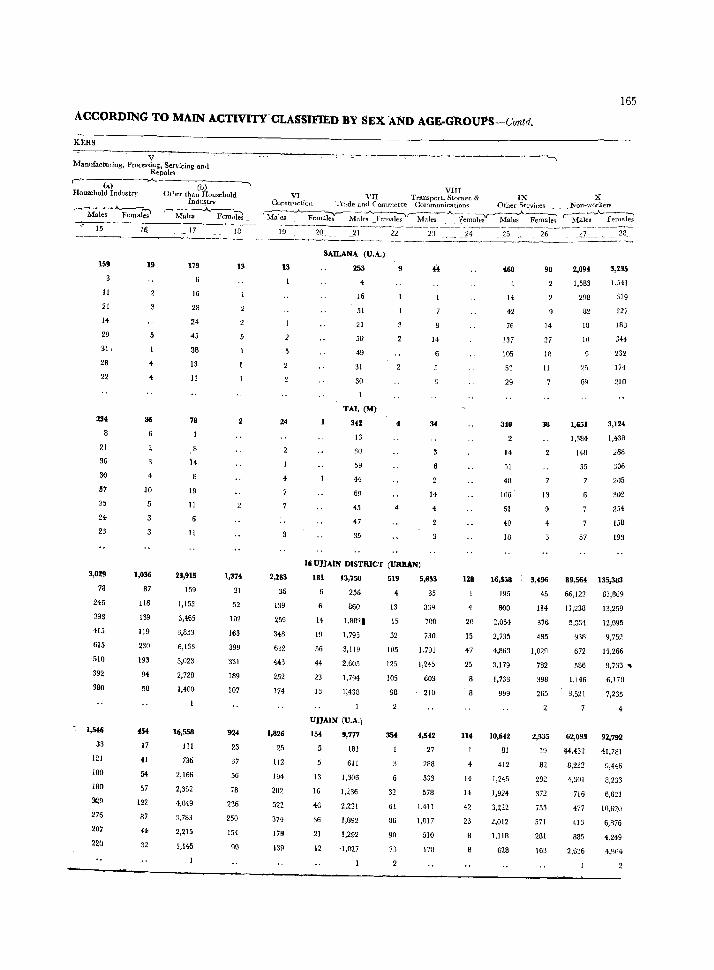
165
ACCORDING TO MAIN ACTIVITY~CLASSIFIED BY SEX AND AGE-GROUPS-Contd.
KERS
V Manufactnring, Proces~ing, Servicing and
Repairs -'-
(a) Household Industry
r-------A..--~ Males Females
159
II
21
14
29
31,
28
22
234
21
36
30
07
35
24
23
3,029
78
246
393
415
615
510
392
380
1,546
33
121
180
18~
009
276
207
220
II;
19
4
4
4
10
1,036
87
116
139
119
230
193
94
58
454
17
41
54
57
122
87
44
32
(0) Other than Household
Industry r---:-~ ._:____)..._---:---)
Males Females
17
179
16
28
24
43
38
13
II
78
8
14
19
II
II
23,915
159
1,153
3,465
3,853
6,133
5,023
2,728
1,400
I
16,558
III
736
2,166
2,352
4,049
~,783
2,215
1,145
13
5
2
1,374
31
52
102
163
399
331
189
107
924
23
37
56
78
236
250
154
90
VIII VI VII Transport, Stol'agc & IX
Construction Trade and Commerce CommunicatiDns Other St'rvices :x
Non~wOl'ker~ ~--_A_--~:-v-- -~A_~ -~~_A..__ r-~:""""'1 Males. Female~ Malt'",> _.Females ,---. Males __ fernaki_ 1\1ales F~male~
~-_"_--:-, _ Male!l_ __ Fen~ales
13
24
4
2,283
36
139
259
348
632
443
252
174
~ 1,826
25
112
194
282
522
374
178
139
S.uLANA (U.A.)
253
4
16
51
21
50
49
31
30
TAL (M)
342
13
30
59
44
69
45
47
35
9
4
4
14
34
14
4
16 UJJAtN' DISTRICT (URBAN)
181
6
14
19
56
44
23
13
13,750
256
860
1,8821
1,795
3,119
2,605
1,794
r,438
UJJAIN (U.A,)
154
13
16
46
36
21
12
9,777
181
611
1,306
1,236
2,231
1,892
1,292
'1,027
519
4
13
15
52
105
12,
105
98
354
32
61
86
90
B
;,653
35
339
700
730
1,791
1,24,
603
210
4,542
27
288
533
578
1.411
1,017
510
178
128
4
20
15
47
25
~ 8
114
14
14
42
23
14
42
76
137
105
53
29
340
14
51
40
106 ~
61
40
18
16,558
195
800
2,054
2,735
4,863
3,179
1,733
9~9
10,642
81
412
1,245
1,924
3,222
2,012
1,IIS
628
90
14
27
18
11
38
13
3,{OO
45
114
376
485
1,029
782
398
265
2,094
1,583
298
82
18
10
25
69
1,651
1,384
148
35
57
28_
3,235
1,541
319
227
lAB
344
232
174
210
3,124
1,438
268
306
205
302
254
158
193
89,564 135,383
66,122 61,869
11,238 13,259
5,334 12,095
938 9,752
672 15,266
586 9,733 ..
1,146 6,170
3,521 7,235
2,535 62,093 92,792
41,781
9,446
3,233
6,621
10,620
6,876
4,249
4,%4
19 44,432
82 8,232
292 4,301
372 716
755 477
571 413
201 B85
J63 2,636
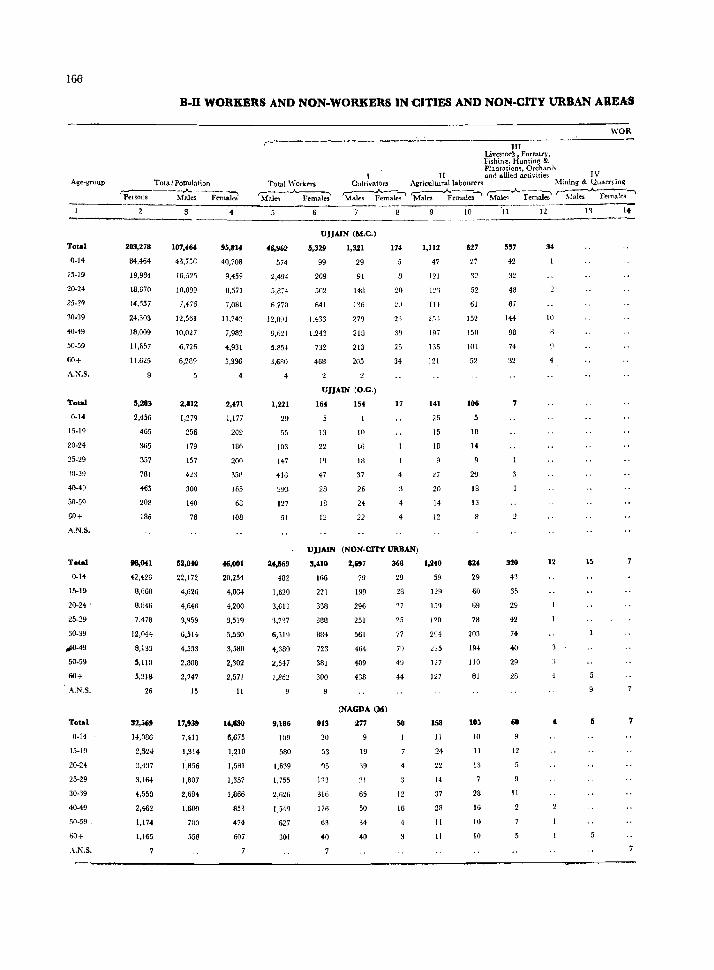
166
Ag~-group
Total
0-14
15-19
20-24
30-39
40-49
50-59
fiO+
A.N_S,
Total
0-14
15.19
20·24
25-29
'\0-39
40-49
60+
A,N,S_
TonI
()'14
15·19
20-24 '
25-29
30-39
,.w-49
50.59
60+
A.N.S,
Total
0.14
15-19
20-24
25-29
30·19
40-49
60+
.\.N.S.
B-I1 WORKERS AND NON.WORKERS IN CITIES AND NON.CITY URBAN AREAS
Total Population ,-,-----,..,.._~ Pel sons ~Sales Fema]es
203,278
84,464
19,984
18,67Q
14,557
~4,303
18,009,
lI,n57
11.625
5,283
2,456
465
365
357
781
465
208
186
!l8,OH
42,426
8,660
8,1146
7,478
12,044
8,133
5,110
5,318
26
32,569
14,086
2,524
3,437
3,164
4,550
2,462
1,174
1,165
107,464
43,756
10,525
10,099
7,476
12,561
10,027
6,726
6,289
2,812
1,279
256
179
157
423
300
140
78
52,040
22,172
4,626
4,646
3,959
6,514
4,553
2,808
2,747
15
17,939
7,411
1,314
1',856
1,807
2,684
1,609
700
558
4
95,814
40,708
9,459
n,571
7,081
11,742
7,982
4,931
5,336
2,471
1,177
209
136
200
358
165
68
108
46,001
20,254
4,034
4,200
3,51Q
5,530
3,580
2,302
2,571
11
1',630
6,675
1,210
1,581
1,357
I,S66
853
474
607
,---------------------III
Ll"estoc'k J Forestr)', Fishin~, Hunting & Plantation~. Orehard<;
II and allied activities IV
WOR
Total ,,,'orkt'rs Cultivator! Agricultural1abourers Mining & Qllarr~>in~ ,-, __ . .A.-, ~fa]~ Females ~~-:;~~ 'M~~~ '!:i~.A.F~~1ei ~~ feJUa!e~~
46,962
574
2,494
5,Ba
6,770
12,fV)1
9,621
5,854
3,680
4
1,221
29
55
103
147
416
293
127
51
2',569
482
1,620
3,613
1,717
6,119
4,380
2,5H
1,862
9,186
109
580
1,639
1,755
2,626
1,54Q
627
301
UJJAIN (M.e.)
5,329
99
209
502
641
1,433
1,243
732
468
1,321
29
91
148
1';6
279
218
213
205
UJJAlN (O.G,)
164
13
22
Iq
47
2B
IB
12
154
10
lB
18
37
26
24
22
lU
20
21
25
34
17
3
4
4
UJJAlN (NON-CITY tTRBAN)
3,410
166
221
338
gB8
BIH
723
381
300
913
30
53
95
133
316
176
63
40
2,&17
79
199
296
251
561
464
409
438
(NAGDA (M)
277
19
39
21
65
50
34
~O
368
29
28
17
25
77
7q
49
H
50
12
16
1,112
47
J21
IH
2JJ
]97
136
121
141
26
15
lB
27
20
14
12
1,240
59
129
15C)
120
204
225
127
127
158
11
24
22
14
37
28
II
II
10
627
27
52
61
152
150
101
52
106
10
14
29
18
13
824
29
60
fi~1
78
203
194
110
81
105
IO
11
IS
28
16
10
10
12 ,----
557
42
32
48
3i
144
98
74
32
320
43
35
29
42
74
40
29
28
60
12
II
34
10
12
11 14
15
5 7
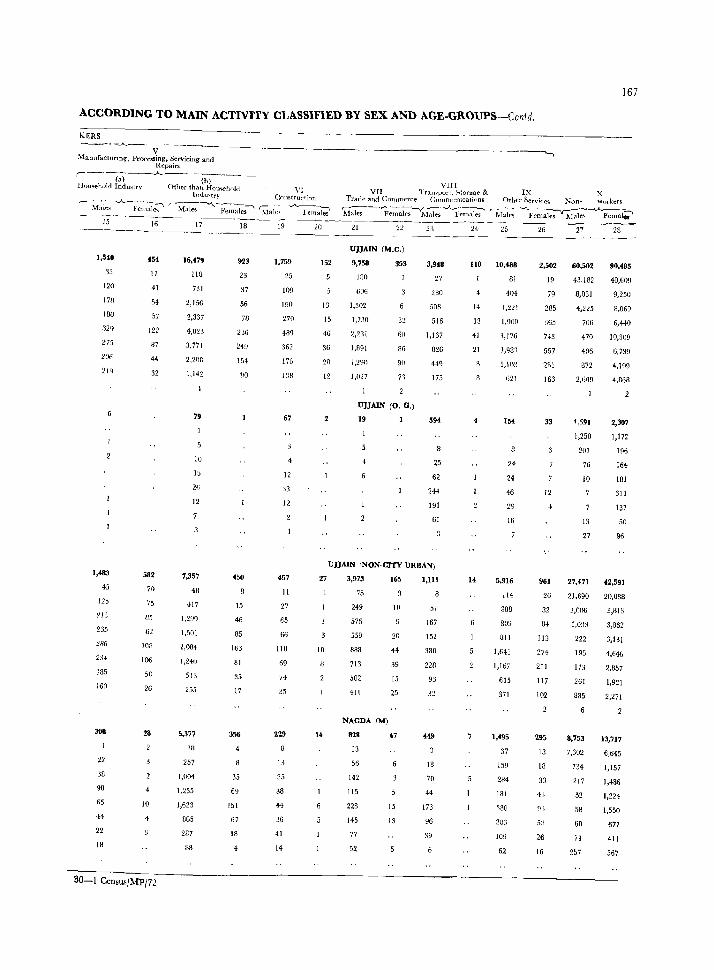
167
ACCORDING TO MAIN ACTIVITY CLASSIFIED BY SEX AND AGE.GROUPS-Contd.
KERS ----_A_ V
.\{anufacturlnq:, Processing, Servicing and Repairs
~---__ _A_ . ____ _
(a) Hou'!ehnld Industn'
(b) Other than Houo;ehold VI
Industry Construction
--,i:l~-_A_~l;' r-~-....\._j.~-' ~~ie.~ --.A..~~ 15
1,540
33
120
178
180
329
275
l06
16
454
17
41
54
57
122
87
44
32
17
16,479
110
731
:l,J5()
2,337
4,023
3,771
2,208
I,H2
19
10
15
26
12
18
923
23
37
56
78
236
249
154
!IO
19
1.759
25
109
190
270
489
362
176
1.18
67
12
:13
12
20
152
13
15
46
36
20
12
VIII VII Tramport, Storage & IX X
Trade and C01nmerce C:ommunlCatinos Other Services Non- workers
'M~-~emaJes ~-Ay;~~-;-' '!vhi~-~:~Ia1;:--.A.. FcmaJ;-'
21 22
UJJAIN (M.e.)
9,758
180
606
1,302
1.230
2,231
1.891
l,29n
1,027
353
32
60
86
90
71
UJJAlN (0, G,)
19
23
3,948
27
280
508
516
1,167
026
44q
175
59f
25
62
244
191
61
2+
110 10,488
14
13
41
21
81
404
1,221
1.900
1,17(;
1,981
1,IM
621
154
24
24
46
29
16
2,502
19
79
285
365
743
567
281
163
33
12
27
60,502
43,182
8,031
4,225
706
470
406
872
2,609
1,591
28
90,485
40,609
9,250
8,OW
6,440
10,309
6,739
~,199
2,307
1,250 1,172
201 196
76
10
13
16+
181
311
137
50
27 96
1,483
45
UJJAlN INON-CITY URBAN)
125
235
:286
284
185
160
308
:12
38
98
44
22
18
582
70
75
62
Ion
106
50
26
28
10
30-1 Cen,us/MP/72
7,357
48
417
1,20Q
1,501
2,084
1,240
513
255
5,371
IU
257
1,004
1,235
1,623
865
287
38
450
15
%
85
163
81
35
17
356
35
69
151
67
18
4
457
11
27
65
66
110
69
74
35
229
13
35
38
H
36
41
14
21 3,913 165 1,111
to
75
249
576
559
888
713
502
411
NAGDA (M)
828
13
56
142
115
228
145
77
52
10
20
44
39
15
25
47
15
13
51
167
152
380
228
93
32
449
18
70
44
173
96
39
14 5,916
114
388
809
811
1,641
1,167
615
371
1,495
37
159
284
181
380
283
109
62
961
26
32
at
113
274
211
117
102
295
13
18
33
43
93
5:1
26
16
21,411
21,690
3,006
1,033
222
195
173
261
885
8,753
7,302
734
217
52
58
GO
73
257
42,591
20,088
3,813
3,862
3,131
4,646
2,857
1,921
2,271
13,717
6,645
1,157
1,486
1,224
1,550
677
411
567
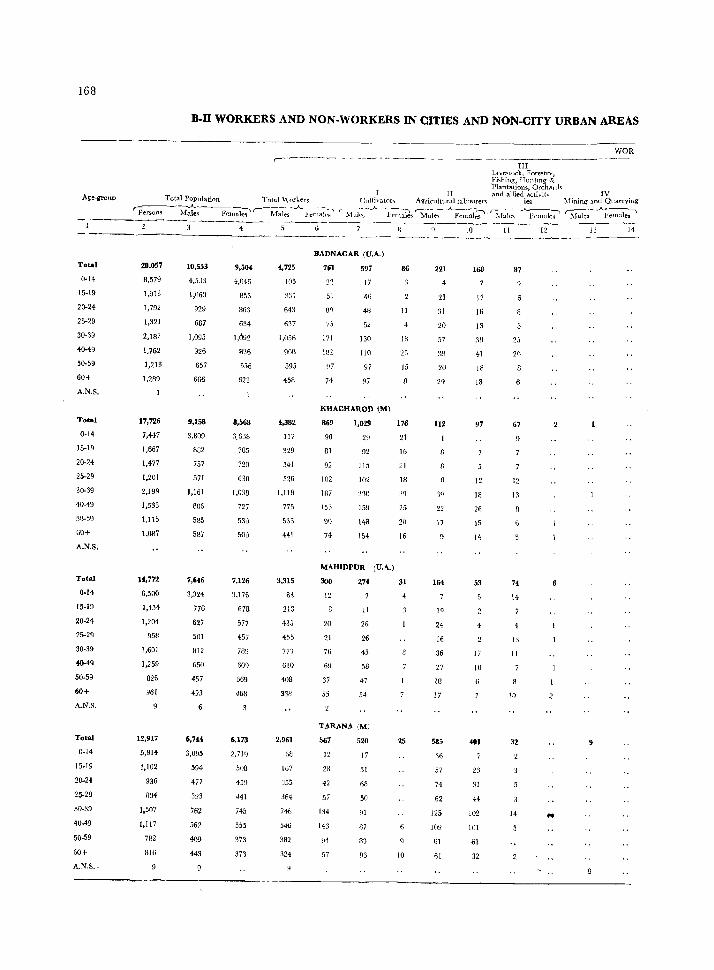
168
Age-group
Total
0-14
15-19
20-24
25-29
30-39
40-49
50-59
60+
A.N.s.
Total
0-14
15-19
20-24
25-29
30-39
40-49
!l0-59
60+
A.N.S.
Total
()'14
15-19
20-24
25-29
30-39
4O-4Q
50-59
60+
A_N.S.
Total
0-14
15-19
20-24
25-29
~0-39
4U-49
50-59
60+
A.N.S._
20,057
8,579
1,913
1,792
1,321
2,187
1,762
1,213
1,289
17,726
7,447
1,667
1,477
1,201
2,199
1.533
1,115
1,087
14,772
6,500
1,454
1,204
958
1,601
1,259
826
961
12,917
5,814
1,102
936
834
1,507
1,117
782
816
B.n WORKERS AND NON-WORKERS IN CITIES AND NON-CITY URBAN AREAS
10,553
4,5J3
1,060
929
687
1,095
926
657
666
9,158
3,809
882
757
571
1,161
806
585
587
7,646
3,324
776
627
501
B12
650
457
493
6,744
3,095
594
477
393
762
562
409
443
9,504
4,046
853
863
634
1,092
836
556
623
8,568
~.6:l8
785
720
630
1,038
727
530
500
7,126
3,176
678
577
457
789
609
369
468
6,173
2,719
508
441
745
555
373
371
WOR ,-------..~---------.---------_-_
~,725
105
331
643
0:17
1,056
gOO
595
458
4,382
117
329
541
526
1,118
775
535
441
3,315
83
213
435
4.\5
773
610
408
318
2,961
fi8
IG7
'355
364
74;;
546
382
324
III Ll .. e~tod. Fore..,trv, Fi"hing, H untmg & Plantations,Orchaflh
II and allied activit- IV Cultivat0r~ Agrieulturallabo\1rer~ ies !>.lininLr and Quarrying
'-Mal~--.A.. Fem;ks '--Mal~_A_Femal;-" ~Iale,,-.A..Fem;(e~ S1ales ~;' ~--- _--_---_-_-------_-__ --__
BADNAGAR (U.A.)
761
22
51
80
75
171
182
97
74
597
J7
46
48
52
130
Iln
97
97
K.HACHAROD (M)
869
90
81
92
102
IA7
153
91)
74
1,029
29
92
115
102
~30
159
143
154
MAHIDPUR (U.A.)
300
12
20
21
76
69
37
55
274
II
26
26
45
58
47
54
TARANA (M)
567
12
28
42
.17
134
143
94
_57
520
17
31
68
50
91
87
83
93
86
II
4
18
25
15
176
21
16
21
18
25
20
16
31
4
25
10
221
4
21
31
20
57
20
29
112
19
22
17
164
1Q
24
16
36
27
IB
17
585
36
57
74
62
125
J09
61
61
10
168
17
16
13
38
41
18
13
97
12
18
26
15
14
53
4
17
10
401
2:1
31
44
102
101
61
32
II
87
25
20
67
12
13
4
13
II
10
32
14
12 13 14
..
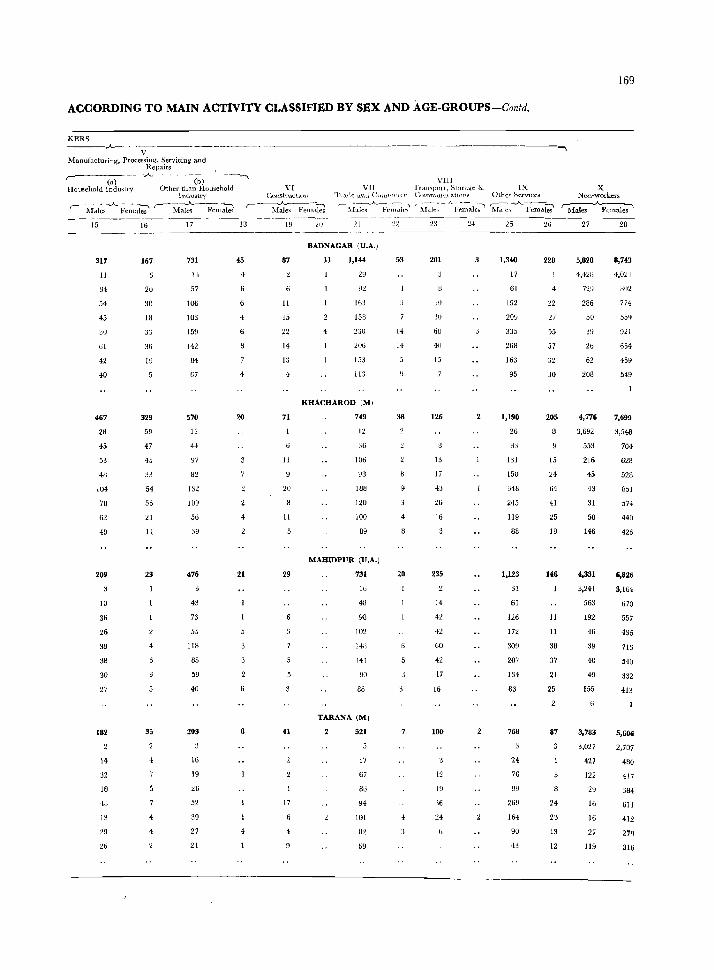
ACCORDING TO MAIN ACTIVITY CLASSIFIED BY SEX AND AGE-GROUPS-Contd_
KERS ----,.)....~. ---__ ----~--~--
V Manufacturing, Processin~. Servicing and
Repairs ;---w- ---A ----(-b-) -' --_..,
Household Industry Other than Household VI Indul'>try c.om.trut:il.oll
VIII V[J rrall<ij1uIl, Storage & IX
'l\,\de and CU!UI\1Cl( ~ COInn1.ul\l( ations Other SexVlces
r- -iIrll~ -..A..F~al;;' r--M;~-Fe~1J r--M-:J~~l-:~~ '-~ale .. __A_fe::k:: 'ifu~_A_~~~i~ 'M~F'emaki
15
317
11
H
54
45
~u
til
42
40
467
28
45
53
48
104
78
62
49
209
10
36
26
39
38
30
'27
182
\4
32
18
48
13
29
26
16
167
20
30
18
33
36
19
329
59
47
45
33
54
56
21
H
23
35
4
4
17
731
13
57
lU6
103
159
142
84
67
570
11
44
97
82
132
109
56
39
476
43
73
55
118
85
59
40
203
16
19
26
52
39
27
21
18
45
4
20
4
21
8
\9
87
II
15
22
14
13
71
II
20
11
29
41
17
4
2fl :.n
BADNAGAR (U.A.)
11
4
1,144
29
163
158
230
206
153
113
KHACHAROD (M,
749
12
36
106
98
IS8
120
100
89
MAHlDPUR (U.A.)
731
16
48
98
HI)
141
88
TARANA (M)
521
17
67
86
94
101
82
09
53
14
14
38
4
20
201
JU
30
68
4(1
15
126
13
17
43
26
16
235
J.l
42
42
60
42
17
16
100
12
19
36
24
1,340
17
61
192
209
335
268
163
95
1,190
26
83
131
150
3<18
U5
119
88
1,123
31
61
126
172
309
207
134
83
768
24
76
99
269
164
90
43
26
228
:!.7
55
57
n 30
205
15
24
64
41
25
19
146
11
11
3B
37
21
25
87
24
23
13
12
169
X Non-workers
~~_A_~
27
5,828
4,428
729
286
50
39
20
62
208
4,776
3,692
55:1
216
45
43
31
50
146
4,331
3,241
563
192
46
39
40
49
155
3.783
28
8,743
4,021
802
774
55'1
921
654
459
549
7,699
3,548
704
628
528
851
574
44[)
426
6,826
3,164
670
557
436
713
540
332
413
5,606
3,027 2,707
427
122
29
16
16
27
1I9
4UO
417
384
611
412
27q
316
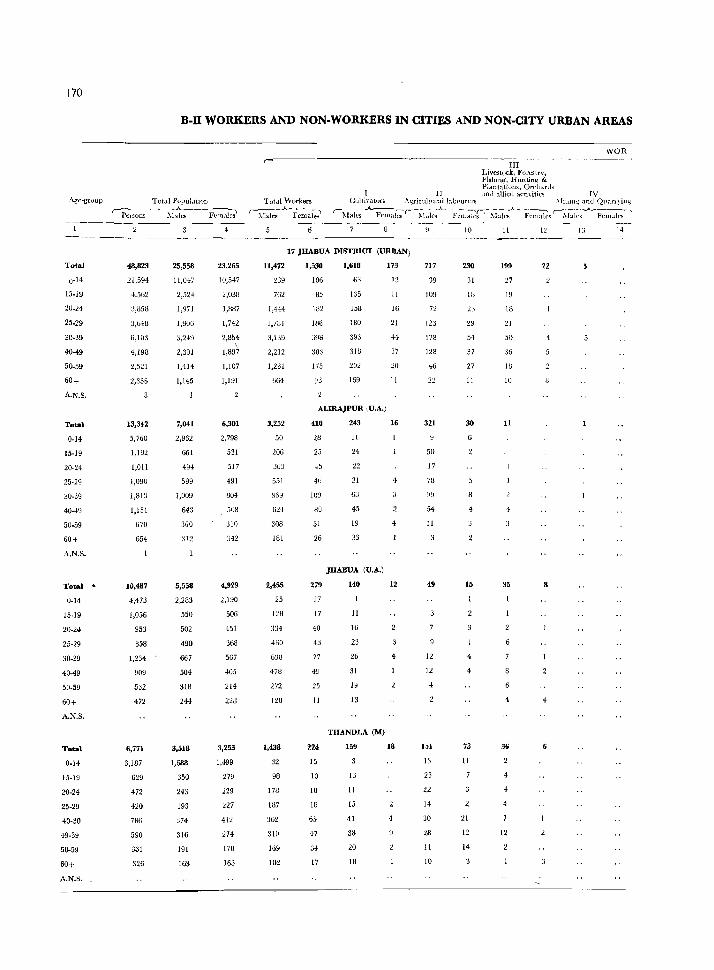
170
B-I1 WORKERS AND NON-WORKERS IN CITIES AND NON-CITY URBAN AREAS
III LivC:ltock, Forestrv. Fislung, Huntin!; & Plantations. Orchards
II ;tn,J allied acth hie') IV
WOR
Age.group Tot.1J PopulatIOn TotJ.l "" orkers ~.A---"
Cuiti\'3.lorS .\~ricultl1ral bbnuren; ~llUlIl!.i and Qllan~iH~
TotaJ
0-14
15-19
20-24
25-29
30-39
40-49
50-59
60+
A.N.S.
Total
0-14
15-19
20-24
25-29
30-39
4049
50-59
60+
A.N.S.
Total •
0-14
15-19
20-24
25-29
30-39
4049
50-59
60+
A.N.S.
Total
0-14
15-19
20-24
25-29
40-30
49-39
5()"59
60+
A.N.S.
,-Pelso~es F~rn.l1ei .\JaJes Females ,-~A~l-;'--~~~r-~l*:-F~') '-~W~-"-fem.ll~-' 10 11 13
-----------------------.--.. ----~---
48,823
21,594
4,562
3,858
3,648
6,103
4,198
13,342
5,760
1,192
1,011
1,090
1,813
1,151
670
654
10,487
4,473
1,056
953
858
1,234
909
5;]2
472
6,771
3,187
629
472
420
786
590
301
326
25,556
11,047
2,524
2,301
1,414
1,145
7,041
2,962
661
494
599
1,009
643
360
312
5,556
2,283
550
502
490
667
504
318
244
3,518
1,688
350
243
193
37.
316
191
163
23,265
10,547
2,U:m
1,887
1,742
2,854 \
1,897
1,107
1,191
6,301
2,798
531
517
491
OU4
508
310
:342
4,929
2,190
506
451
368
567
405
21.
Z20
3,253
1,499
279
229
227
412
274
170
163
11,472
239
762
1,4+4
1,781
3,139
2,212
1,231
664
3,252
50
206
363
551
~69
624
308
181
2,455
25
120
334
460
638
478
272
120
1,438
32
98
170
IH7
362
310
169
102
17 JHABUA DISTRICT (URBAN)
1,5:10
106
85
Jil2
W6
J98
303
175
83
1,618
63
135
158
180
393
318
202
169
ALlRAJPUR (U.A.)
no 28
25
45
46
lU9
80
51
26
279
17
17
40
43
77
49
25
11
224
15
10
18
18
65
47
34
17
243
11
24
22
21
68
45
19
33
JHABUA (U.A.)
140
11
16
23
26
31
19
13
THANDLA (M)
159
13
11
15
41
38
20
18
173
13
11
16
21
44
37
20
11
16
4
12
18
717
39
lU9
72
123
178
128
46
22
321
50
17
78
54
11
49
12
12
151
13
23
22
14
30
28
11
10
31
54
37
27
11
30
15
4
73
11
21
12
14
199
27
19
18
21
5U
36
1B
10
11
35
36
4
4
12
22
4
8
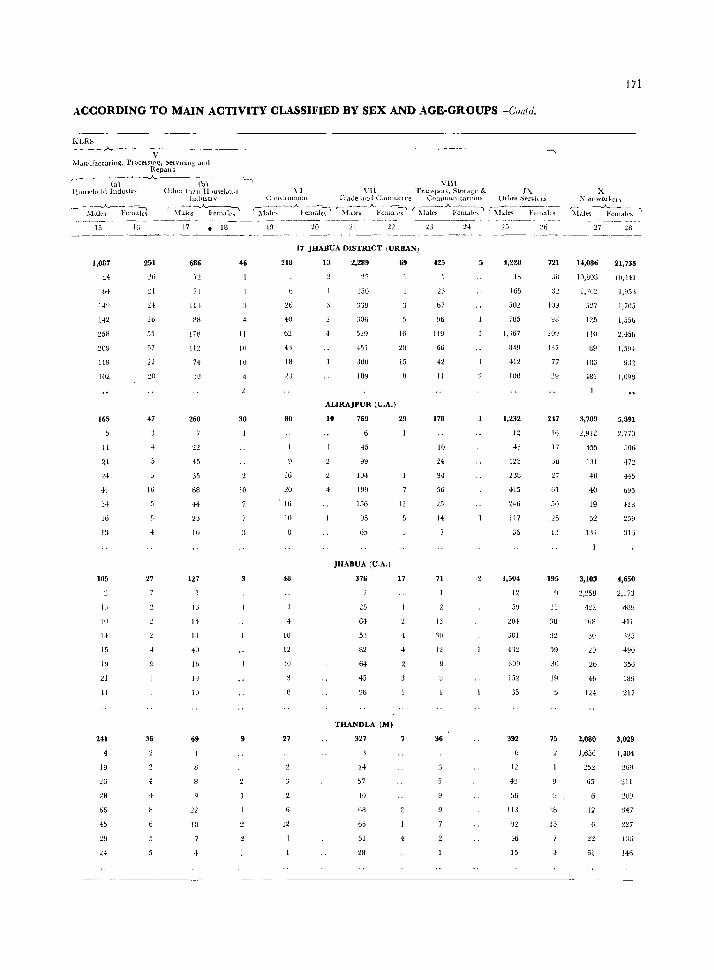
ACCORDING TO MAIN ACTIVITY CLASSIFIED BY SEX AND AGE-GROUPS-Culltd.
v :\lo.l11'lfacturin~, PlucehSmg, Ser\,Lcilt~ ducl
Repalls
r-----(~)---,A. --- -(b)
liuu'>ellOld Induf-ln Olliel th<lll HI)meiwld In,[llhtlv
,---:\l~k-:--~'e::iJ r::\f:ks~.A."l<em:Jc-::-'
15
1,087
84
Hl
258
:!09
119
102
165
II
21
:24
41
3.f
Ili
n
105
I:;
10
14
15
1~
21
II
241
19
25
60
45
16
251
~I
55
57
22
47
27
36
17
686
71
III
BB
17e
III
74
38
260
22
-15
35
68
H
23
Hj
127
n
14
H
4U
1"
19
69
10
• 18
46
II
10
10
30
10
9
-----~
V[([ \ [ Vll Tr,l.1l.,purl, StOld~e & I::\.
GUIl~lIU"':l!llll rlaJe <1Ild. Cl!l!IIIH'lCe C:omllllllllcatlOtlS Otllel SeniLes
S~k:--._A_F~;l;.J~ ~l:;s-.A-F~~u~~ ~l~les _A_P;~;:i;"Z' ""ilale~- -~~~~,-~-19
218
26
40
b2
23
80
16
20
, lti
III
48
10
12
10
27
12
20
17 JHABUA DISTRICT (URBAN,
13 2,289
2J
ISO
:,:H.l
306
529
451
300
189
ALIRAjPUR (U.A.)
10 769
4
45
104
199
156
ti5
JHABUA (U.A.)
376
25
61
53
82
64
45
36
THANDLA 1M)
327
l.f
57
40
6B
60
51
28
69
16
20
15
29
12
17
4
4
23
425
67
U6
119
66
42
II
170
10
2.
34
56
25
14
71
13
'30
12
36
24
4,228
41\
165
~Ol
iBS
1,367
849
412
100
1,232
12
43
125
238
415
246
I I 7
36
1,504
12
59
:.!O,}
JOI
309
152
35
392
I:.!
66
IJ3
16
15
721
.10
137
77
247
16
17
')8
27
GI
51)
25
13
195
II
3U
59
30
19
75
15
171
X 1\:UII-W01 ~tn
S<de;~-Cnldkf>~ 27
14,086
Ill,BOD
1,762
[25
110
89
13,
481
3,789
2,912
455
131
48
40
19
52
131
3,103
2,258
422
16U
,0
29
26
46
124
2,080
21,735
IO,HI
1,550
2,'150
1,5V4
5,891
~,770
506
445
4,650
2,173
4U9
411
490
356
18~
217
3,029
1,636 1,.f84
252
65 ~Il
12
l:Jo
61 146
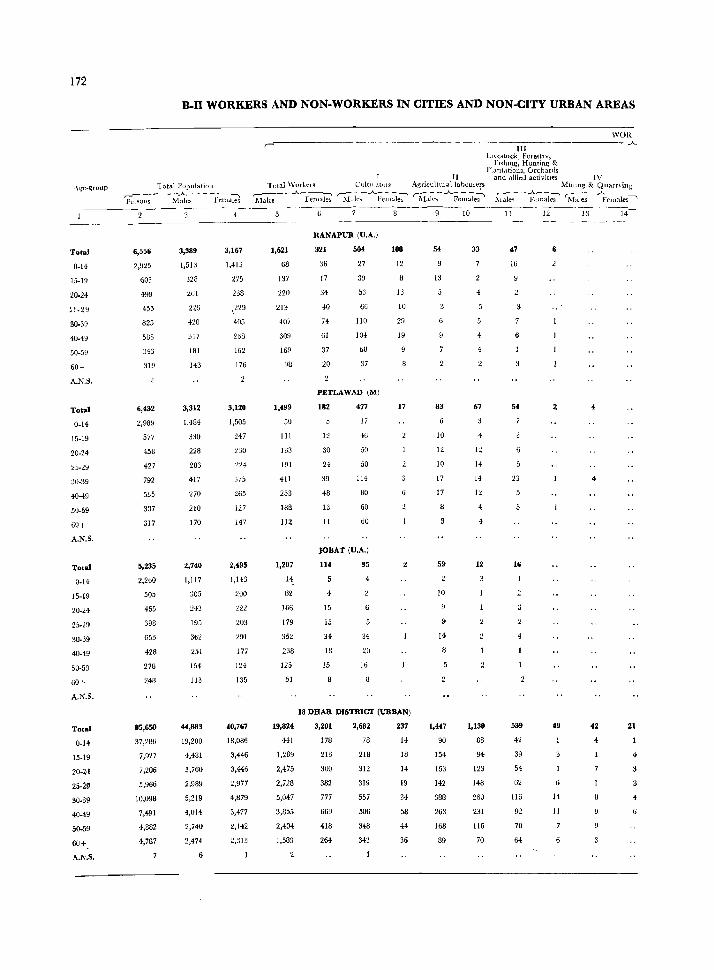
172
Total
0-[4
15-19
20-24
30-3~
40-49
50-59
60+
A.NoS.
Total
0-14
15-19
20-24
25-29
:\0-39
40-49
50-59
60+
A.N.S.
Total
0-[4
15-19
20-24
25-29
30-39
40-49
50-59
60+
A.N.S.
Total
0-14
15-19
20-2-+
25-2g
30-39
40-49
50-59
60+
A.N.S.
B-II WORKERS AND NON-WORKERS IN CITIES AND NON-CITY URBAN AREAS
'1 ntal Populatioll
~-;;u~ ~~t":- - -l':e~l-.;jJ
6,556
2,925
603
499
455
825
585
343
319
6,432
2,9B9
577
458
427
792
535
337
317
5,235
2,260
505
465
398
653
428
278
24B
85,650
37,286
7,927
7,206
5,966
10,098
M91
4,882
4,787
3,389
1,513
>28
261
226
420
317
lSI
143
3,312
1,484
330
228
203
417
270
210
170
2,740
1,117
J05
195
362
251
154
113
44,083
[9,200
4,481
3,760
2,989
5,219
4,014
2,740
2,474
3,167
1,412
275
238
,229
405
268
162
176
3,120
1,505
247
230
.i75
265
127
147
2,495
1,143
200
222
2U3
291
177
124
135
40,767
[8,086
3,446
3,446
2,977
4,879
3,477
2,142
2,313
II Tota1 \Vorkel';: Cultt\3.totS AgcicuitUl0411ab()utel's
rt::i~--"..A...-Fema~ r;1"lle~-_A_Pe~\~e~ ~I.tk~- -"-Fe~;Je~
1,621
68
137
220
213
407
309
169
98
1,499
50
III
IS3
191
4[1
253
188
112
1,207
14
82
166
[79
352
238
125
51
19,824
441
[,289
2,475
2,728
5,047
3,855
2,404
1,583
RANAPUR (U.A.)
321
36
17
:14
40
74
61
37
20
504
27
39
53
66
110
104
68
37
PETLAWAD (M)
182
12
30
24
39
48
13
11
477
17
46
50
50
114
80
60
60
JOBAT (U.A.)
114
15
15
34
[8
15
95
4
34
20
16
108
12
13
[0
29
19
17
18 DHAR DISTRICT (URBAN)
3,201
178
2[3
300
382
777
669
418
264
2,682
78
218
312
3[9
557
506
348
343
237
14
18
14
[9
34
58
44
36
54
13
83
10
12
10
17
17
59
10
14
5
1,447
90
154
153
142
3BB
263
16B
89
10
33
4
67
12
14
14
12
4
4
12
1,130
88
94
[23
148
260
231
[16
70
III Ll\'e~tock, Foresttv,
l'Ishmg, Hunting & Plantations, Orchards
WOR ----- .A.
and allied activitIes IV ~11IImg & Quarnill"
~ks- - ~~:i~ ~~l~ - ~~Jl~~~s:' 11
47
16
54
23
16
539
42
39
54
62
116
92
70
64
12
6
49
14
II
13
42
4
14
21
4
4
6
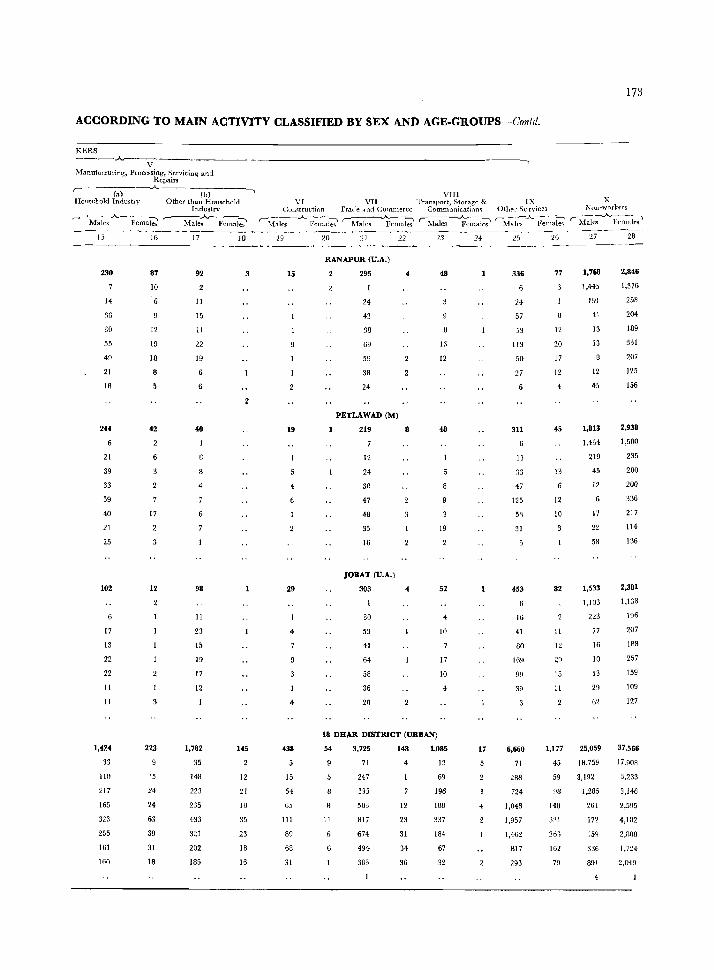
173
ACCORDING TO MAIN ACTIVITY CLASSIFIED BY SEX AND AGE-GROUPS-Confd.
KERS ----.A..
V Manufacturing, Processing, Serviciuq' and
Repairs
(a) Household Industl y
15
230
14
36
30
55
49
21
18
244
21
39
33
59
40
21
25
102
17
13
22
22
11
II
1,424
33
110
217
165
323
255
161
160
.A..
16
87
10
12
19
18
42
17
12
223
IS
24
24
63
39
31
18
--(b-)----""""\
Other than HDusehold Industrv
r Male-;-- .Fcma~ 17
92
11
15
II
22
19
6
6
4
98
11
23
15
19
17
12
1,782
35
148
223
235
433
321
202
185
18
3
145
12
21
IB
35
23
18
16
VIn x \' I VTI Transport, Storag~ & IX C()n~truction Trade ilnd Comm_erce Commnnication<; Othf'r Services NUJl-worken
'-~1~1~..A._F;:;~ '-Mal;;-~('"maki r-fiIa]~ F~~~ '-Malr-s :.A-Fel~~ fM";1e-;AFemal;;'
19
15
19
29
4
15
54
65
III
89
68
31
20 2)
RANAPUR (U.A.)
295
24
42
38
69
59
38
24
PETLAWAD (M)
219
12
24
30
47
48
35
16
JOBAT (U.A.)
303
30
53
41
64
58
36
20
22
8
4
48
16
12
19
52
4
10
17
10
18 DHAR DISTRICT (URBAN)
54
II
3,725
71
247
535
503
BI7
674
494
383
148
12
23
31
34
36
1,085
12
69
196
IB8
337
184
67
32
24
17
336
24
57
113
50
27
311
11
33
47
125
53
31
453
16
41
BO
16~)
99
39
6,660
71
288
724
1,048
1,957
1,462
B17
293
26
77
12
20
17
12
45
13
6
12
10
82
11
12
29
15
11
1,177
45
59
98
140
331
26~
162
79
27
1,768
1,445
191
41
13
13
12
4S
1,813
1,434
219
45
12
17
22
58
1,533
1,103
223
77
16
10
13
29
62
25,059
18,759
3,192
1,285
261
172
159
:136
891
28
2,846
1,376
258
204
189
331
207
125
156
2,938
1,500
235
200
200
336
217
114
136
2,381
1,138
196
207
188
257
159
109
127
37,566
17,908
3,233
3,146
2,595
4,102
2,ROIJ
1,724
2,049
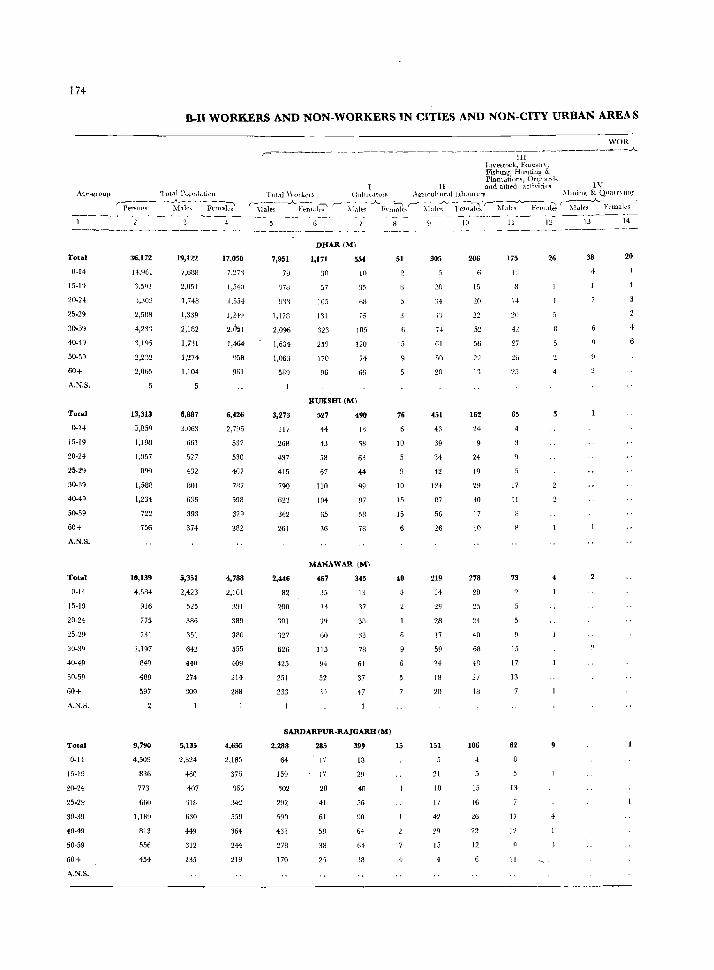
174
B-Il WORKERS AND NON-WORKERS IN CITIES AND NON-CITY URBAN AREAS
Ac,I"'-group 1 ota] PoPU).:ttiOH r~----- ~ _A__ --- - --:"""'\
Per~lll1" rvrale~ Females
WOR r----------------- --.---- ------ii-] ___________ ...A....
I ,lv~tock, Forestl", Fisbmq, Hunting & Plalltdtion~, Orchard ..
II and allIed aclivitie<;. IV Total '\011..('15 (:U)tl\.J.t01S .\g"llruI1ur.ll L.l.homers ~rll1jll~ & UI:LUlnlll~
r-:\raks--_A_l~~-;;:l;::' r- ~\I .. t1t's _A._F;;'~"r-- )'l~tle-:-·-:Fem~'r- }'Ldp:-~y~j~S (-M:I('~_.A...--f~;nales -1---~~-2- -- -----------~~---~--- ----- - ------
Total
0-14
15-1~
20-24
25·29
~0-39
40·4~
50-59
60+
A.N.S.
Total
0.14
J5·J9
20·24
25·29
30-3Q
40-49
50-59
60+
A.N,S.
Total
0·14
J5·19
20·24
25-29
30-39
40·49
50-59
60+
A,N,S,
Total
0.14
15·19
2(1·24
30·39
40·49
50-59
60+
A.N.S,
36,172
14.961
2,588
4,2'1']
3,195
2,065
13,313
1,198
1,057
80g
1,588
1,234
722
756
10,139
4..olH
916
775
731
J,197
84g
488
597
9,790
4,509
836
773
6fin
I.IBY
R13
556
454
19,122
7,688
2,051
J,748
1,339
2,J82
1,7'1I
1,274
1,104
6,887
3,063
661
527
432
801
636
393
374
5,351
2,423
525
386
351
642
440
274
309
5,135
2,324
460
407
'1I8
6SH
449
312
235
17,050
1,5411
1,554
1,2ifl
2,11;1
1,464
958
961
6,426
2,706
537
530
4G7
7fl7
>98
329
382
4,788
2,161
391
389
380
555
409
214
288
4,655
2,185
376
366
342
364
244
2J9
7,951
19
q78
9'n
1,17B
2,096
J,634
1,063
589
3,273
117
268
437
4J5
790
fi23
:162
261
2,446
82
200
:101
127
626
425
25J
233
DHAR(M)
1,171
30
J7
J05
lSI
323
259
17()
96
;6
105
120
74
66
KUKSHI(M)
527
44
43
58
67
110
104
('is
36
490
n 38
63
44
MANAWAR (M)
467
115
94
52
345
13
97
Sf!
:13
18
61
37
47
SARDARPUR.RAJGARH (M)
51
15
76
10
JO
15
15
6
40
2,288 285 399 15
64
159
102
292
590
433
278
110
17
J7
28
41
61
58
38
2)
18
29
40
5G
90
64
64
3B 4
305
n
61
20
451
43
39
'14
42
124
m
56
26
219
14
29
28
17
59
14
18
20
151
21
18
17
4L
15
206
15
:!o
22
5~
56
22
13
162
24
24
Ig
29
30
J7
10
278
28
24
40
68
48
27
18
106
15
16
26
22
12
175
1:1
20
42
27
65
17
II
73
15
17
13
82
13
17
12
II
26 38 20
4
9
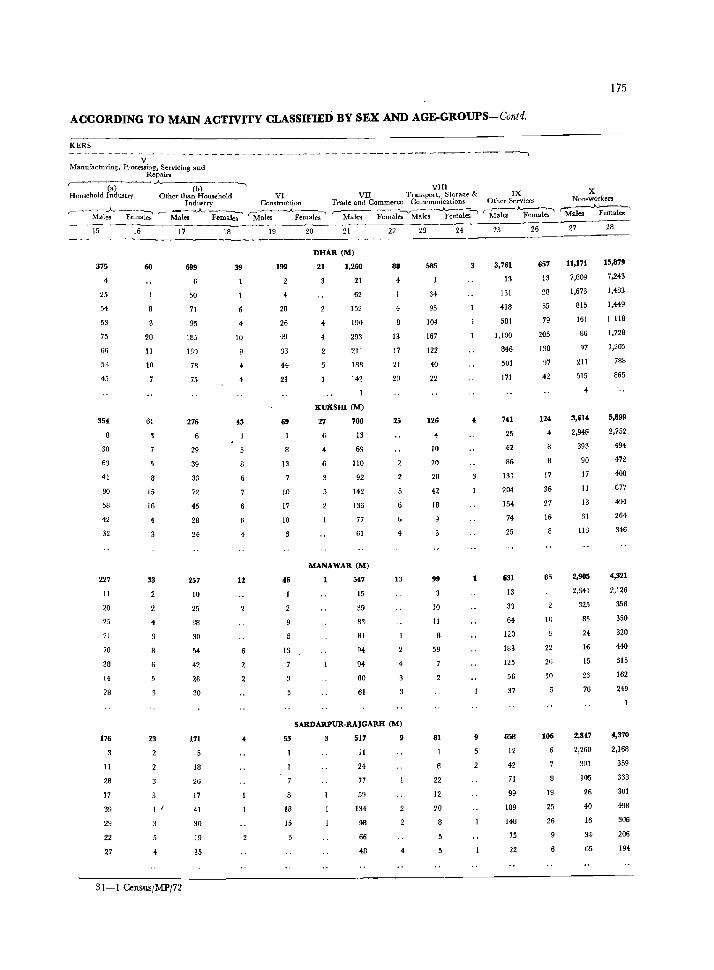
ACCORDING TO MAIN ACTIVITY CLASSIFIED BY SEX AND AGE-GROUPS-Contd.
KERS
V Manufacturing, Processing, Servicing and
Repairs ,.----·--(-a-) --
Household Ind~try (b)
Oth(';r than Householrt Industry
r~;;-~ki '-Ma~_A_~
VI Construction
~ales -.A. Felllale~ 20
VIII VII Transport, Storag;e & IX
Trade and Commerce Communications Other Service;
,-~ ~ili-;'tMa~~~-;-D1:;~ ~fa~..A-~~
21 22 23 24 25 26
175
X Non .. workers
~.A.--, Males Females
27 28 __ 1_5 ______ 16 ______ ~17 ______ ~1~8 _____ 19
------ -----------------------------375
4
25
54
53
75
66
53
45
354
30
63
41
80
58
42
32
ZZ7
II
20
25
21
70
38
14
28
176
11
28
17
39
29
22
27
60
20
II
10
61
15
16
4
33
4
23
1 I
4
31-1 Census/MPj72
699
50
71
95
185
139
78
75
276
6
29
39
33
72
45
28
24
257
10
25
38
30
54
42
28
30
171
18
26
17
41
30
19
15
10
4
4
4
12
199
20
26
49
33
44
21
69
13
ID
17
10
46
13
53
18
15
DHAR (M)
21
4
4
1,260
21
62
152
190
293
211
188
142
KUKsm (M)
27 700
13
69
110
92
142
136
77
61
MANAWAR (M)
547
15
39
83
BI
94
94
80
61
88
4
4
13
17
21
20
25
4
SARDARPUR·RA}GARH (M)
3 517
11
24
77
59
134
98
66
48
585
34
95
104
167
122
40
22
126
4
10
20
20
42
18
99
10
11
58
81
22
12
20
9
3,761
13
131
418
581
1,100
846
501
171
741
25
42
86
131
204
154
74
25
631
13
33
64
120
183
125
56
37
658
12
42
71
99
189
148
75
22
657
13
28
55
79
205
138
97
42
124
4
8
17
36
27
16
8
85
10
22
26
10
106
19
25
26
11,171
7,609
1,673
815
161
86
97
211
515
.. 3,614
2,946
393
90
17
11
13
31
113
2,905
2,341
325
85
24
16
15
23
76
2,847
2,260
301
105
26
40
16
34
65
15,879
7,243
1,483
1,449
I 118
1,728
1,205
788
865
5,899
2,752
494
472
400
677
494
264
346
4,321
2,126
358
350
320
440
315
162
249
4,370
2,168
359
338
301
493
306
206
194
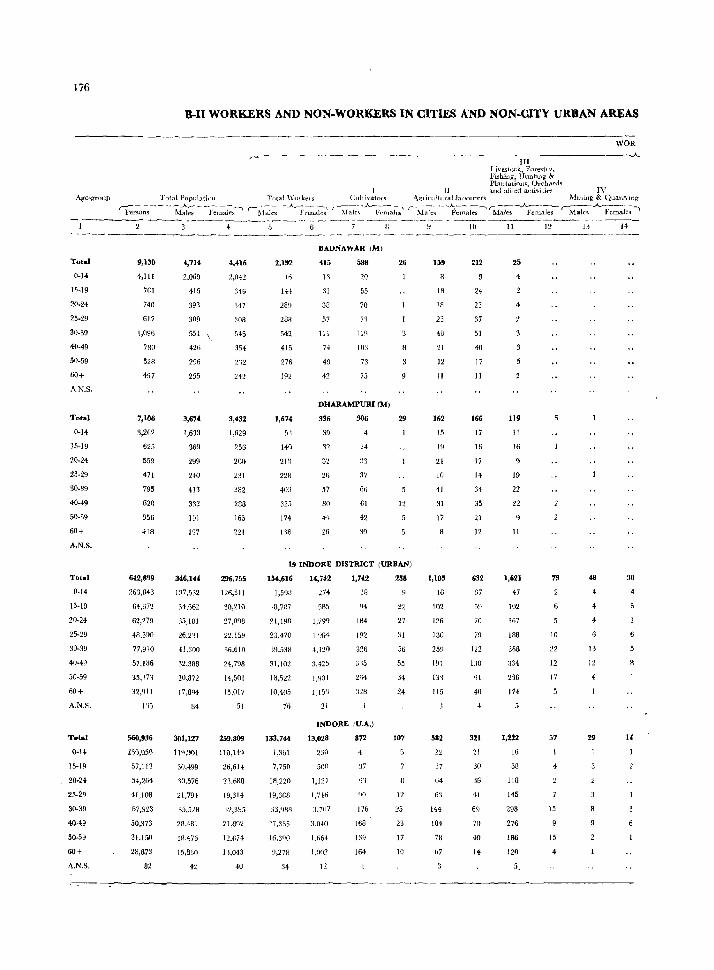
176
Agc~grollp
Total
0-14
15-19
20-24
25-29
30-39
40-49
50-59
60+
A.N.S.
Total
0-14
15-19
20-24
25-29
30-39
40-49
50-59
60+
A.N.S.
Total
0-14
15-19
20-24
25-29
30-39
40-49
50-59
60+
A.N.S.
Total
0-14
15-19
20-24
25-29
30-39
40-49
50-59
60+
A.N.S.
B-II WORKERS AND NON.WORKERS IN CITIES AND NON,CITY URBAN AREAS
WOR --______________ JL
JII Livestock, Fnresh v. Fishing, Hunhng & Plantal.ioltS, Orchards
II and allied activitir:o: IV Total Population Total "'(llkt-iS Clll1i\-ators A~ljcll!lural1abnurf'r.. .Mllling & Quarf)mg
rp~r;o': - - - 'ifaJ; - -}~;I:a;~~ ~1-:1;;; -.A_ FelIlaki r-M;e-;-A.~~aJ~ r-!\I;:J:-,-- ---'telilales -. 'MaJt:s -~;:::k;-- ~\1ale .. ..A.. Female: '\
9,130
4,111
761
740
617
1,096
780
528
497
7,106
3,262
62.0
559
471
795
620
356
418
642,899
263,843
64,B72
62,279
48.390
77,910
57,186
35,371
32,1111
1%
560,936
57,113
54,264
·11,108
67,923
50,373
31,150
28,873
82
4,714
2,069
415
391
309
551
426
296
255
3,674
1,633
369
299
240
413
332
101
197
346,144
1~7,5J2
34,662
~t),I8J
26,2'11
+1,300
32,388
20,872
17,894
84
301,121
lIQ,9'll
30,499
10,576
21,791
:J5,52H
28,481
18,476
15,830
42
4,416
2.a·}:!
34.
147
308
545
354
2'12
242
3,432
1,629
256
2m 231
382
288
165
221
296,755
126,311
30,210
27,O~8
nl59
36.610
24,798
14,501
15,017
51
259,809
110,149
26,614
21,688
19,3 14
:12,395
21,89~
12.674
13,043
40
2,192
16
1014
289
288
542
415
275
192
1,674
5'~
140
21:,
228
403
325
174
l'l8
BADNAWAR (M)
415
n :ll
38
57
III
7-1
49
42
588
20
55
70
7:1
110
109
73
75
DHARAMPURI eM,
336 306
39 4
,7
80
H
26
24
:13
37
66
61
42
39
26
29
12
19 INDORE DISTRICT (URBJ\N)
154,616
1,598
·8,707
21,193
23,470
39,538
31,102
18,,\22
10,405
76
133,144
1,361
7,750
IH,220
19,368
:13,988
~7,355
16,300
0,278
34
14,742
ZH 585
1,290
1,964
4,120
3,125
I,YOI
1)53
21
1,742
18
'11
184
192
326
315
2';4
318
INDORE (U.A,)
13.028
500
1,127
1.740
:un7
3.040
1.664
1,002
11
872
37
90
176
168
139
164
258
22
27
31
56
55
34
24
107
n
12
25
23
17
IQ
159
18
18
23
48
21
12
11
162
15
19
21
10
41
31
17
1,105
4{;
102
126
130
259
l~H
582
22
:17
64
6:1
144
101
78
67
10
212
24
23
37
51
40
17
II
166
17
16
17
14
34
35
21
12
632
37
59
70
79
122
130
ql
40
4
321
21
30
:16
41
69
70
40
14
II
25
119
II
16
19
22
22
11
1,621
47
1112
167
IBB
36B
334
236
174
1,222
16
58
liB
145
298
276
186
120
I'>
5
79
10
22
12
17
57
15
15
4
1:1
48
4
4
13
12
4
29
14
30
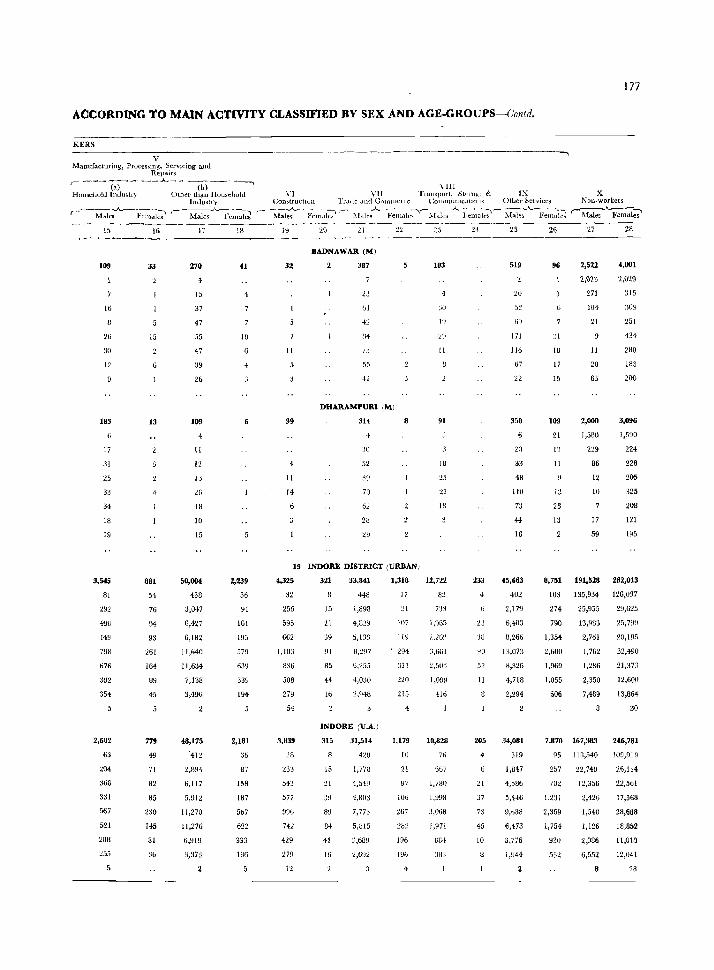
177
ACCORDING 1'0 MAIN ACTIVITY CLASSIFIED BY SEX AND AGE-GROUPS-Contd.
KERS
V Manufacturing, PrU{ .. essmg. Servicing and
Repairs ,.. __ (;:)"_--A._ '~--(-b)--- -,
Household Industry Other than Househuld IIltJLlstry
f--~~-l;;:~~ ,-~~_A.}:e;l~lJ
15 16 17 18
\ III \,1 V[1 Tlamport, Stol'agc & IX
Con')tructlUll Tr.l~lC' .lIlt! Com/HeILe (:Olllmutllc<lllOll~ OthCl' Set'vices
,- "'-~--F~n:l~ ,- -;I-:ks..A..l;enlal~~~i:~c~-_A..l~e~ulld-- ~~l-e~..A..-~F;l~l~~
1~ 21 24 26
X Non-workcls
r- Males .A..~;?
27 28 ._----_----------------------- -------------------------
109
16
26
:lU
12
D
183
17
31
25
33
34
18
19
292
498
676
392
354
2,602
63
204
368
3,1
567
521
288
:!55
33
15
13
881
54
76
94
93
261
164
89
45
779
49
71
B2
85
230
145
81
3b
270
4
15
,7
47
55
47
39
26
109
4
II
12
13
18
10
15
50,004
43B
3,047
6,427
G,182
11,64(J
JI,634
7,13B
48,175
'·H:!
2,39-1
6,117
5,U1:!
11,270
11,276
6,919
3,373
41
4
10
+
6
2,239
36
91
161
195
579
639
339
194
2,181
3{;
87
158
IB7
5b7
622
333
186
32
II
39
4
11
14
BADNAWAR (M)
387
42
114
7:,
55
42
DHARAMPURI (M)
314
30
52
39
70
62
2B
29
19 INDORE DISTRICT (URBAN)
103
11
91
18
IB
4,325 321 33,841 1,318 12,722
32
256
595
662
1,1O:~
836
508
279
54
3,839
2B
5-13
577
99b
742
429
279
12
15
39
91
85
44
16
448
1,898
4,829
5,133
8,297
6,255
4,030
2,(148
INDORE (U.A.)
315
15
:!l
B9
84
41
16
:n,514 420
1,770
'1,549
4,3U:)
7,773
5,B15
3,689
2,692
17
31
iOI
119
294
Jl1
220
215
4
1,179
10
21
97
106
267
196
1%
3,661
2,5U3
1,099
416
10,828
76
667
1,7BO
1,99B
j,068
1,971
S!].!
383
233
90
52
11
8
205
4
41
37
73
45
10
519
20
S2
ti9
171
116
ti7
22
350
20
33
48
110
73
44
16
45,663
402
2,179
6,403
8,266
13,073
8,326
4,718
2,294
34,081
319
1,847
4,586
5,4-16
9,688
6,473
3,776
1,U44
96
:11
IB
17
15
109
21
13
11
28
13
2,522
2,023
271
1U4
21
11
20
63
2,000
1,500
229
86
12
10
17
59
4,001
'l,O!,}
315
:IU9
251
434
280
183
200
3,096
1,590
224
228
205
325
208
121
195
8,751 191,528 282,013
103 135,934 126,037
274
79Q
1,354
2,600
1,969
1,055
606
25,955
13,9B}
2,761
1,762
2,350
7,489
7,870 167,383
95 110,540
257 22,749
702
1,231
2,369
1,754
930
532
12,356
2,426
1,540
1,126
2,086
6,552
29,625
25,79~
20,195
32,490
21,373
12,600
13,864
30
246,781
lU9,919
26,114
22,561
17,568
28,688
18,852
11,010
12,041
28
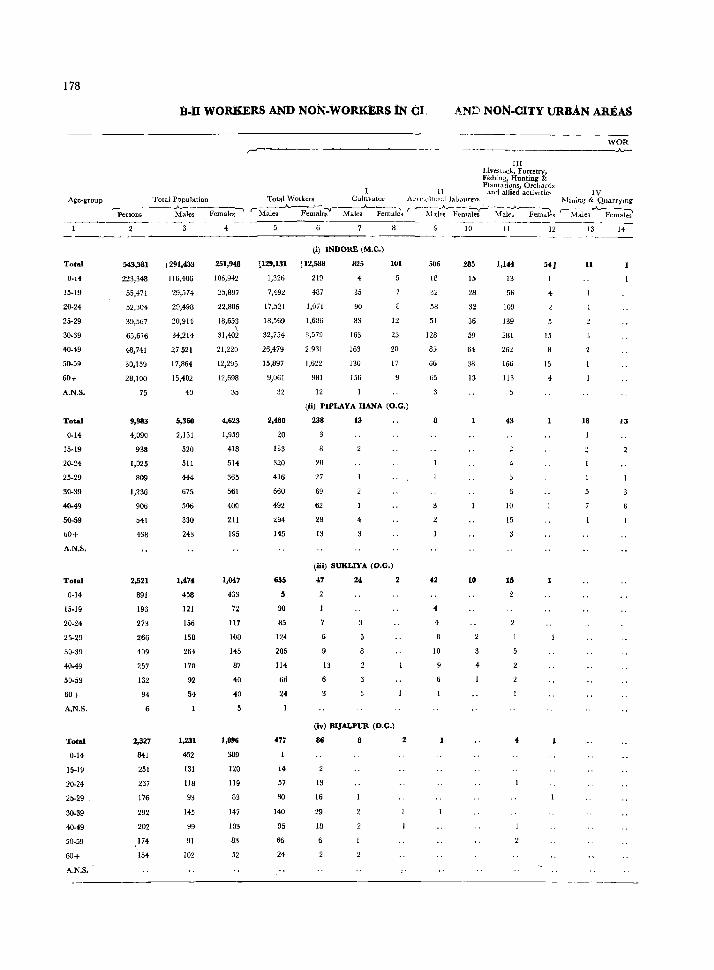
178
Age-aroup
Total
U.14
15·19
20·24
25·29
30·39
40-49
50-59
60+
A.N.S.
Total
0·14
15-19
20-24
25·29
30-39
40.49
50-59
60+
A.N.S.
Total
0-14
15·19
20·24
25·29
30·39
40-49
50·59
60+
A.N.S.
Total
0·14
15-19
20-24
25-29
30-39
40-49
50-59
60+
A.N.S.
lI.iI WORKERS AND NON.WORKERS:IN CL AND NoN.CITY URBAN AREAS
III Livestock, Forestry, Fishing, Hunting & Plantations, Orchards
II and allied activltie') IV
WOR ~
Total Population Total Workers CultlVator A!1l1cultUl:d lauourers Mil1~ng & QuarrYing
rp~;----~~e-;~ f~~;~ks~s r-"il;l~-}~~~-i1"~k~-F~~s r- Males~-'-Fc~a~
5<13,381
223,348
55,471
52,3U4
39,567
65,616
48,7H
30,159
28,100
75
4,090
938
1,025
809
1,236
906
541
438
2,521
891
193
273
266
409
257
132
94
6
2,327
841
251
237
176
292
202
174
154
1291,433
116,406
29,574
29,498
20,914
34,214
27521
17,864
15,402
40
5,360
2,131
520
511
444
675
506
330
243
1,474
458
121
156
158
264
170
92
54
1,231
452
131
118
93
145
99
91
102
4
251,948
106,942
25,897
22,806
18,653 \
31,402
21,220
12,295
12,698
35
4,623
1,959
418
514
365
561
400
211
195
1,047
433
72
117
108
145
87
40
40
1,096
389
120
119
83
147
103
83
52
1129,131
1,326
7,492
17,521
18,569
32,754
26,479
15,897
9,061
32
2,480
20
133
320
416
660
492
294
145
655
5
30
85
124
206
114
66
24
477
14
57
80
140
95
66
24
(il INDORE (M.e.)
112,588
219
487
1,071
1,636
3,579
2,931
1,622
9H1
12
825
4
35
90
83
163
163
130
150
101
12
23
20
17
(ii) PIPLAYA HANA (O.G.)
238
28
27
69
62
28
13
13
4
(iiil SUKLlYA (O.G.)
47 24 2
13
(iv) BIJALPUR (O.G.)
86
13
16
29
18
8
506
18
32
58
51
128
85
66
65
8
42
4
4
10
10 11 12 13 14 -----------.------.~-----
285
15
28
32
36
50
64
38
13
10
4
1,144
13
56
109
139
281
262
166
113
43
10
15
15
541 11
4
15
15
18 13
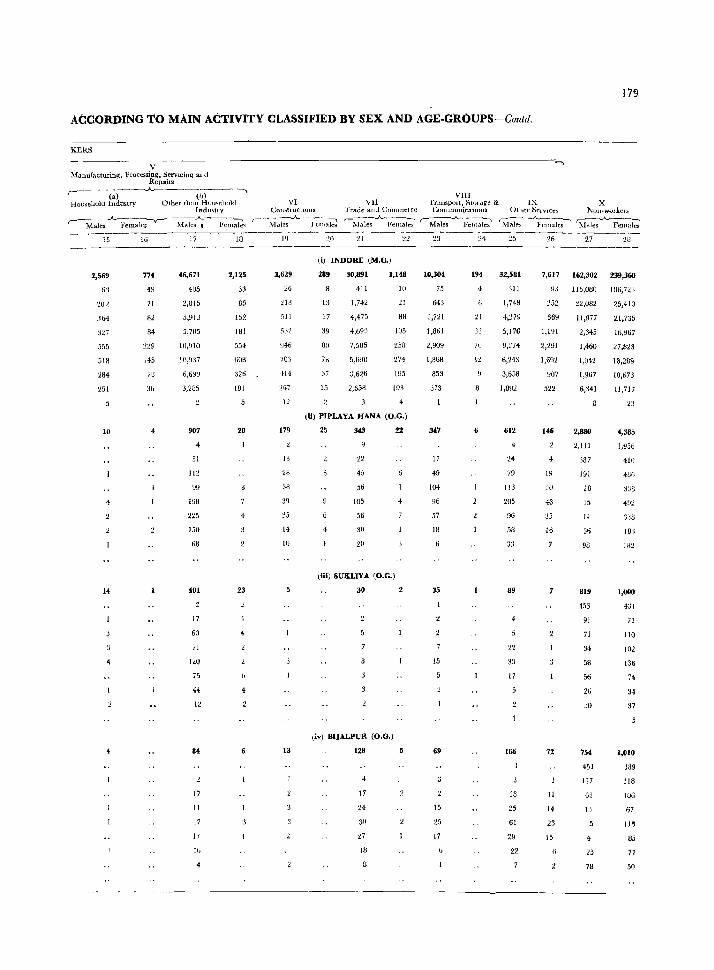
179
ACCORDING 1'0 MAIN ACTIVITY CLASSIFIED BY SEX AND AGE-GROUPS-Contd.
KERS
V Manufacturing, Processing, ServIciug and
Repairs r--~ - (a)-.A.--(b-)---~""" Household Industry Olher thau Homeholu
Ir'Jdm.tty r-------"----:---v-~---J...---~
Males .Females Male~ , Females
15
2,569
63
202
364
327
555
518
~84
251
10
I4
4
15
774
49
71
82
H4
229
145
78
17
46,671
405
2,H15
5,913
5,705
10,910
10,937
6,6Y~
3,285
907
51
1I2
uo 19H
225
150
68
17
50
71
120
75
44
12
84
17
11
17
17
16
4
18
2,125
33
85
152
181
554
608
326
181
20
4
23
VIII VI VII Transport, ~torage & IX X
COTl<;tructLOflS Trade and Commerce C:oITlmlmicatlOllS Other Services Non-wulkel.!.
,- ·-M~ks.A..--·I~~a~ f" I\JJal;;~~~~ '-lliI~_A._~i;i 'Male" ~ks~ 'M~~ki lY
011
532
~J46
703
414
267
1:':
11
(i) INDORE (M.e.)
289
13
17
39
SO
7H
3i
15
30,891
411
1,742
4,47.'J
4,693
1,5B5
5,698
3,626
2,658
1,148
[(I
21
88
105
25[1
274
195
193
(il) PIPLAYA HANA (O.G.)
179 25 3411 22
13
28
38
39
35
14
to
5
13
~2
45
56
105
56
30
(iii) SUKLIYA (O.G.)
30
(iv) BI]ALPUR (O.G.)
128
4
17
30
~7
W
4
5
23
10,304
75
643
1,721
1,861
2,909
I,H68
853
373
347
17
49
104
96
57
18
15
69
15
25
17
24
194
21
33
7()
42
32,581
311
1,748
4,~79
5,176
9,274
6,243
3,658
1,892
612
4
24
79
113
205
96
58
33
89
33
17
166
18
25
61
29
22
26 27 28
7,617 162,302 239,360
93 1I5,UBO 1tI6,723
252
669
1,191
2,291
1,692
907
522
146
4
19
20
43
35
16
7
72
11
14
23
15
22,082
1l,9i7
2,345
1,460
1,042
1,967
6,341
2,880
2,111
387
191
28
15
1.j
36
98
819
25,410
21,735
16,967
27,823
18,289
10,673
11,717
23
4,385
1,956
410
486
338
492
338
18'!
182
1,000
453 HI
91
71
34
56
26
30
754
71
110
102
136
74-
34-
37
1,010
451 389
117
61
4-
25
78
118
lOG
67
11~
65
77
50
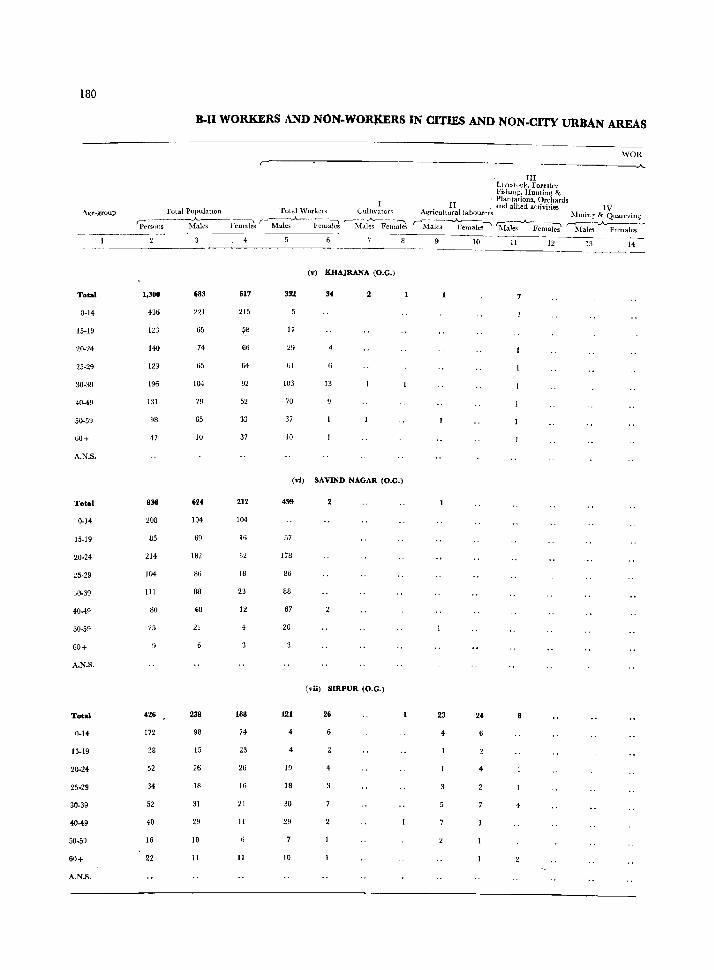
180
A~e-gl'oup
Total 1,300
0-14 436
15-19 IV
20-24 140
25-29 129
30-39 196
40-49 lSI
50-59 9B
60+ 47
A.N.S.
Total 836
0-14 20B
15-19 85
20-24 214
25-29 1M
30-39 111
40-49 80
50-59 25
60+
A.N.S.
Total 426
0-14 172
15-19 38
20-24 52
25-29 34
30-39 52
-«J..f9 40
50-59 16
60+ 22
A.N.S.
B-II WORKERS AND NON-WORJ{ERS IN CITIES AND NON-CITY URBAN AREAS
Total PopulatlOn
683 617
221 215
65 98
74 66
65 64
104 92
79 52
65 33
10 37
624 212
104 1M
69 16
182 32
86 18
8B Z3
.8 12
21
238 188
98 74
15 23
26 26
18 16
31 21
29 11
10 6
11 11
Total Workers Cuht\"ator~
5
(v) KHAJRANA (O.G.l
332 34
17
29 4
61
103 13
70
37
10
(vi) SAVlND NAGAR (O.G.)
499
57
178
86
88
67
20
(vii) SIRPUR (O.G.)
121 26
4
4
19 4
18
30
29
10
III I.,l\,·estock. Forestry Fisluu~, Hunting & Plantations, Orchards
WOR
II , awl allied activities 1 V Agriculturallabourel's l\llllin~ & QLlarrvilJg
"--;'i~-~:ks ~ 'M~~F~~~i;\ r-1-1ale~A Fenutl:;-
9 10 11 12 13 14
23 24 8
4
4
4
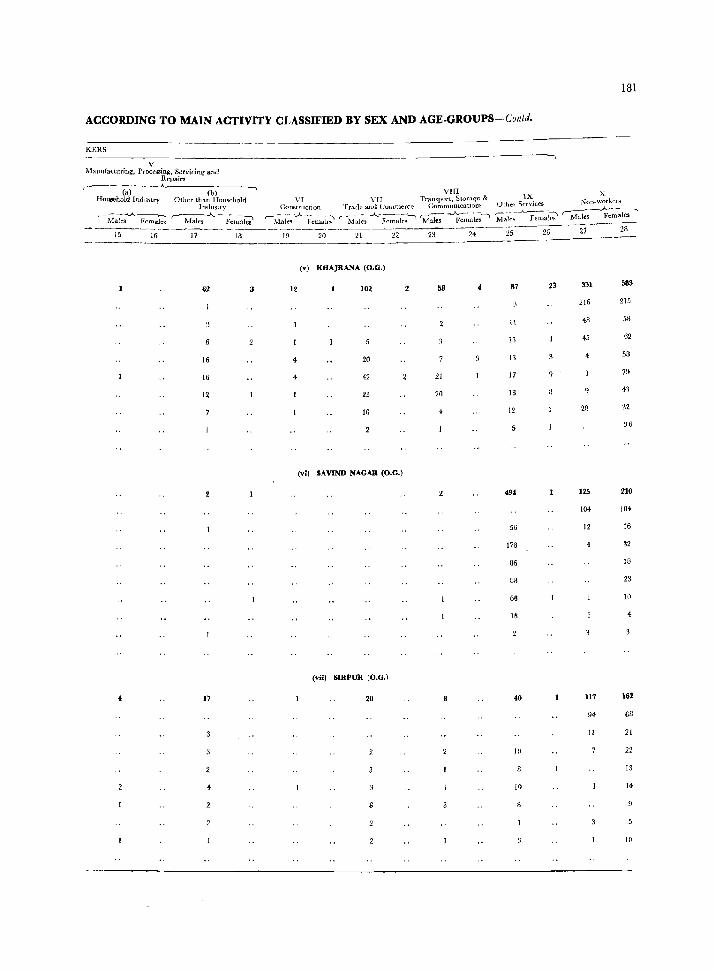
ACCORDING TO MAIN ACTIVITY CLASSIFIED BY SEX AND AGE-GROUPS-Colltd.
KERS ~~--~v------------------------------------------------------~~
Manufacluring, Processing, Servicing and Repairs .----_.A..
62
16
16
12
3 12
4
4
(v) KHAJRANA (O.G.)
102
20
42
2:1
10
(vi) SAVINO NAGAR (O.G.)
58 87 23
11
13
21 17
20 13
4 12
5
494
56
178
86
88
66
18
181
351
216 215
48 58
45 62
4 58
79
28
125 210
104 104
12 16
32
18
23
10
4
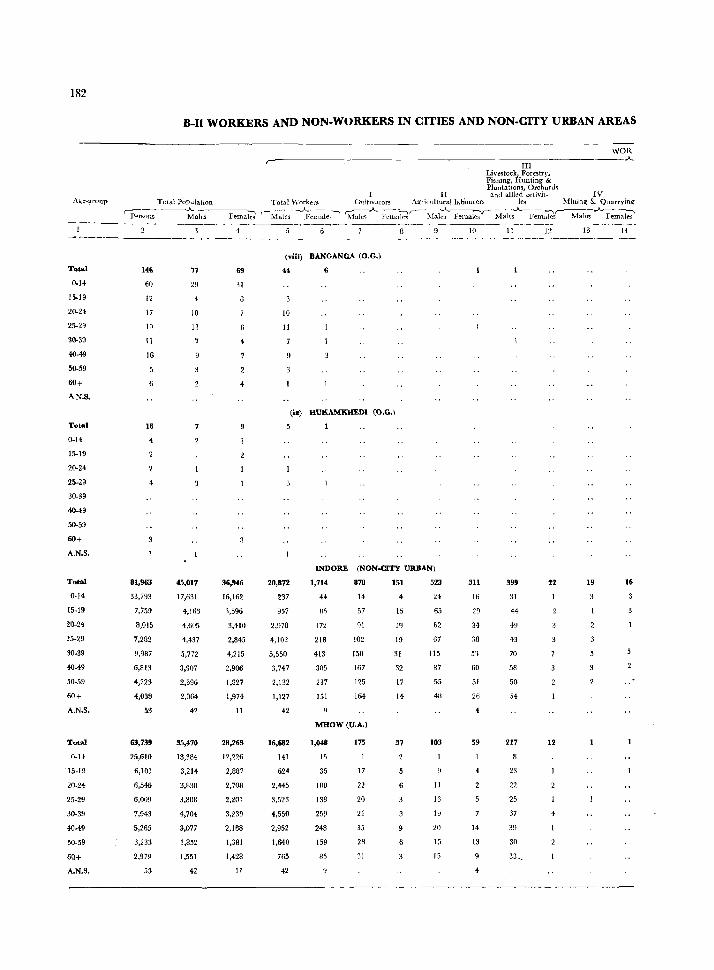
182
Total
0-14
15-19
211-24
25-29
30-39
40-49
50-59
60+
AN.S.
Total
0-14
15-19
20-24
25-29
30-39
40-49
SO-59
60+
A.N.S.
Total
0-14
15-19
20-24
25-29
30-39
40-49
50-59
60+
A.N.S.
Total
0-14
~ 15-19
20-24
25-29
30-39
40-49
50-59
6Q+
A.N.S.
B-I1 WORKERS AND NON-WORKERS IN CITIES AND NON-CITY URBAN AREAS
WOR r-.--------------------------------------- -------------------------.~
III Livestock, Forestq-. Fishmg, Hunting & Plantatlons, Orchard,
II anc1 allied activit~ IV Total Population Total \Vorkers CultIvators AgtiLulturallab'ourers ies ),fining & Quarryim;
'P:::S:;;- - ·.)M~a-I-cs-----F-e-m-a·};i r-M~le-;~cmale~~ ~:l~~.A.F~~a~'-- -r.-Ial;:--Pemale;'r- ~lalc~_A_-F;~~'-- :Male~·~e~~
146
60
12
17
1Q
11
16
16
4
4
81,963
33,793
7,759
8,015
7,282
9,Q87
6,813
4,223
4,038
53
63,73'
25,610
6,101
6,546
6,009
7,943
5,265
3,233
2,979
53
77
29
10
13
45,017
17,631
4,163
4,605
4,437
5,772
3,907
2,396
2,064
42
35,470
13,384
3,214
:1,838
3,808
4,704
3,077
1,852
1,551
42
69
31
-4
36,946
16,162
S,596
3,410
2,845
4,215
2,906
1,827
1,974
11
28,269
12,226
2,887
2,708
2,201
3,239
2,188
1,381
1,428
11
10 ~----' - - -_-- . , .. ~
(viii) BANGANGA (O.G.)
10
11
6
lit) HUKAMKllEDI (O,G.)
5
INDORE (NON-CITY URBAN)
20,872
237
957
2,978
4,102
5,550
3,747
2,132
1,127
42
16,682
141
624
2,445
3,523
4,550
2,952
1,640
765
42
1,714
44
Ito
172
218
413
385
237
151
870
14
57
~1
102
150
167
125
164
MHOW(U.A.)
1,048
15
35
100
138
259
248
159
85
175
17
22
20
21
35
28
31
151
4
15
19
19
31
32
17
14
37
523
24
65
62
67
115
87
55
411
103
11
13
19
20
15
15
311
16
29
34
38
53
60
51
26
59
14
13
II
399
44
49
43
70
58
50
54
217
23
22
25
37
39
30
33,_
J2 13 14
22 19 16
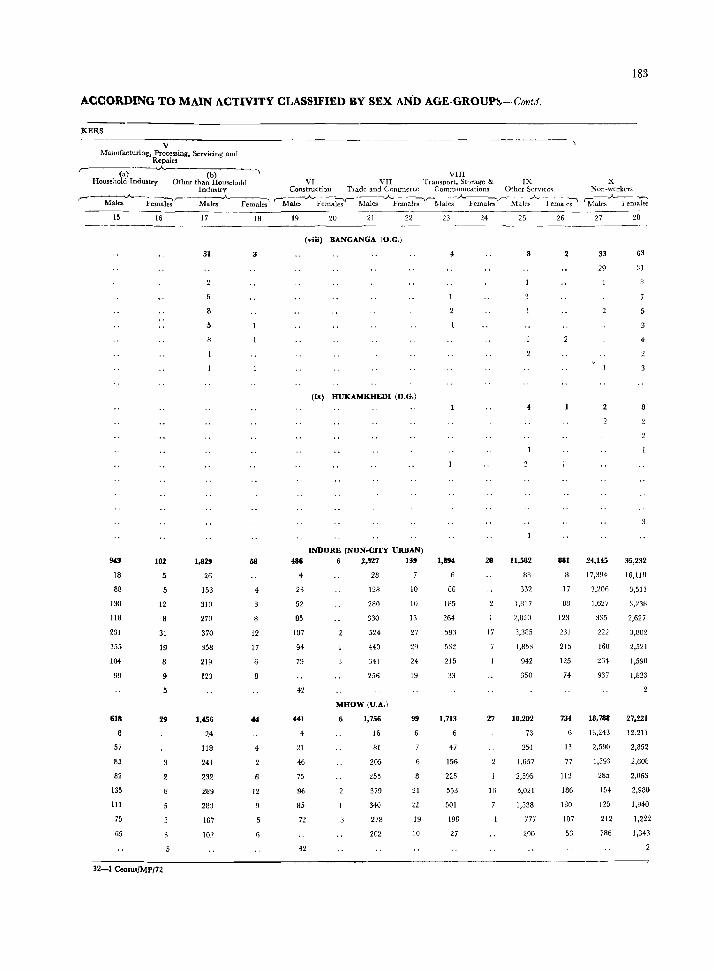
ACCORDING TO MAIN ACTIVITY CLASSIFIED BY SEX AND AGE-GROUP~- Contd.
KERS
--------------v--·------------------------------------------------------------------, Manufacturing} Processing, Servicing and
Repairs
r- (a) -'-.A.-----(-b)----' VIII Household Industry Other than Household VI VII Transport. Storage & IX
Industry Construction Tl adc and Commerce CommunIcations Other Service'!
,--~A-~ks',--_~W~.A---F;~;:~i_;' rMal~~a~r-Ma~..A..~~r-~.A. Fcmak;'r-~..A.~~
15 16 17 18 19 20 21 22 23 24 25 26
(viii) BANGANGA (O.G.)
31 3 4 8
(lx) HUKAMKHEDI (O.G.)
INDORE (NON.CITY URBAN)
943 102 1,829 58 486 6 2,327 139 1,894 28 11,582 881
18 26 28 83
as 153 4 23 128 10 66 332 17
130 12 310 52 280 10 185 I,Bl7 38
liB 270 85 330 13 264 2,820 123
231 31 370 12 107 524 27 59~~ 17 :1,:185 231
15.> 19 358 17 94 440 29 532 1,853 215
104 8 219 79 341 24 215 942 125
99 9 123 256 19 33 350 74
42
MHOW(U.A.l
613 29 1,456 44 441 6 1,756 99 1,713 27 10,202 734
24 16 73 6
57 118 4 21 81 47 251 13
85 NI 46 205 156 1,657 77
82 232 75 255 225 2,595 112
135 289 12 96 379 21 553 16 3,021 186
III 283 85 340 22 501 1,538 180
75 167 72 278 19 198 777 107
65 102 202 10 27 290 53
42
32-1 Cen,u./II1PI72
183
x Non-workers
~~-..}.._.--~
Males Females
27 28
33 63
29 31
4
24,145 35,232
17,394 16,118
3,200 3,511
1,627 3,238
335 2,627
222 3,802
160 2,521
264 1,590
937 1,823
18,788 27,221
13,243 12,211
2,590 2,852
1,393 2,608
285 2,063
154 2,980
125 1,940
212 1,222
786 1,343
2
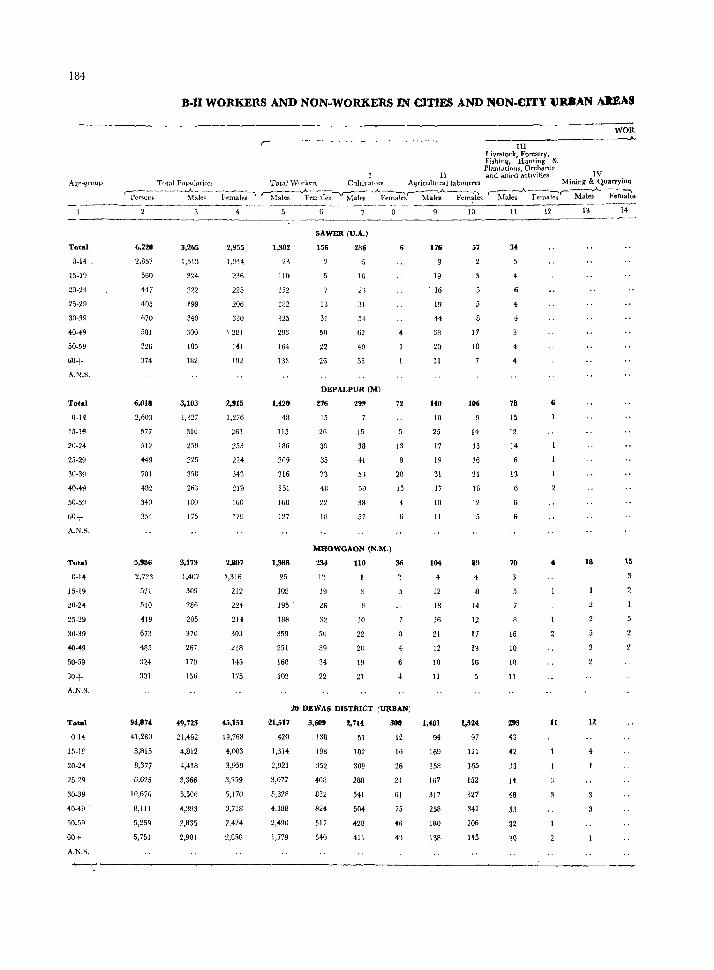
184
Age-group
Total
0-14
15-19
20-24
25-29
30-39
40~9
50-59
60+
A.N.S.
Tot,,1
0-14
15-1~
20-24
25-29
30-39
40-49
50-59
60+
A.N.S.
Total
O-H
15-19
20-2-\
25-29
30-39
40-49
50-59
60+
A.N.S.
Total
0-14
15·1~
20-24
25-29
30-39
40-49
50_59
60+
A.N.S.
6,220
2.357
560
447
405
670
581
6,018
2,603
577
512
<49
701
4B2
340
354
5.936
2.723
521
510
419
673
485
3H
331
94,874
41,260
3,315
8,377
6,625
10,676
8,111
5,259
5,751
B-lI WORKERS AND NON-WORKERS IN CITIES AND NON·CITY \JUAN U]£AS
3,265
1,51:1
324
222
199
340
300
l85
132
3,103
1,327
316
259
225
3:'8
263
18n
175
3,179
1,407
309
286
205
370
267
179
156
.9,723
21,492
4,812
4,413
3,366
5,506
4.393
2,835
2,901
2,955,
1,344
236
225
206
330
\ 281
141
192
2,915
1,276
261
253
224
343
219
160
179
2,007
1.311i
212
224
214
303
218
145
J75
45,151
19,768
4.003
3.959
3.259
5,170
3.718
2.424
2.850
,.----------WOR
-----------~I=ll~--------------'~ Livestock, Forestry, Fi1hilig, Hunting &
II Plantations1 Orcharrl~ and allied a("hviti~s IV
Total \Vorken, Cultivators AgricullurallabolJrers Mining & Quarryinl;'
r-M~e-m-a-Ie-~ "lr;:Ia~_A_ F~m*1r-;:1al:-r~-;~s --~10~-----1-1-----1-2----~13~-~1~4-
(r:fui;;Ali'~i;'--J\.~ Fe-;;;;~s
1,382
n J 10
152
182
325
293
164
133
1,420
43
115
186
209
316
251
168
J27
1,388
25
J08
195
188
359
251
160
102
21,517
420
1,314
2.921
3.077
5,328
4,188
2.490
1,779
SAW£R (U.A.)
156
13
31
50
22
26
286
16
23
31
54
62
40
55
DEPALPUR (M)
276
15
26
3n
35
73
48
22
18
299
15
38
41
53
50
38
57
72
13
20
15
MliOWGAON (N.M.)
3"
50
39
34
22
110
10
22
20
19
21
36
4
20 DEWAS DlSTIUCT (URBAN)
3,609
138
198
352
~08
332
324
517
340
:!,7l{
51
182
309
288
541
504
428
411
300
12
16
26
21
61
75
46
43
9
176
19
16
19
H
38
20
11
140
10
25
17
19
31
17
10
11
104
4
12
18
16
21
12
10
11
1,481
94
169
158
167
317
258
180
138
57
17
!O
106
14
13
16
21
16
12
89
4
14
12
17
13
16
1,524
97
121
165
152
327
341
206
lIS
4
4
4
4
78
15
12
14
6
13
70
16
10
10
11
295
42
33
14
48
53
32
18 15
11 12
4
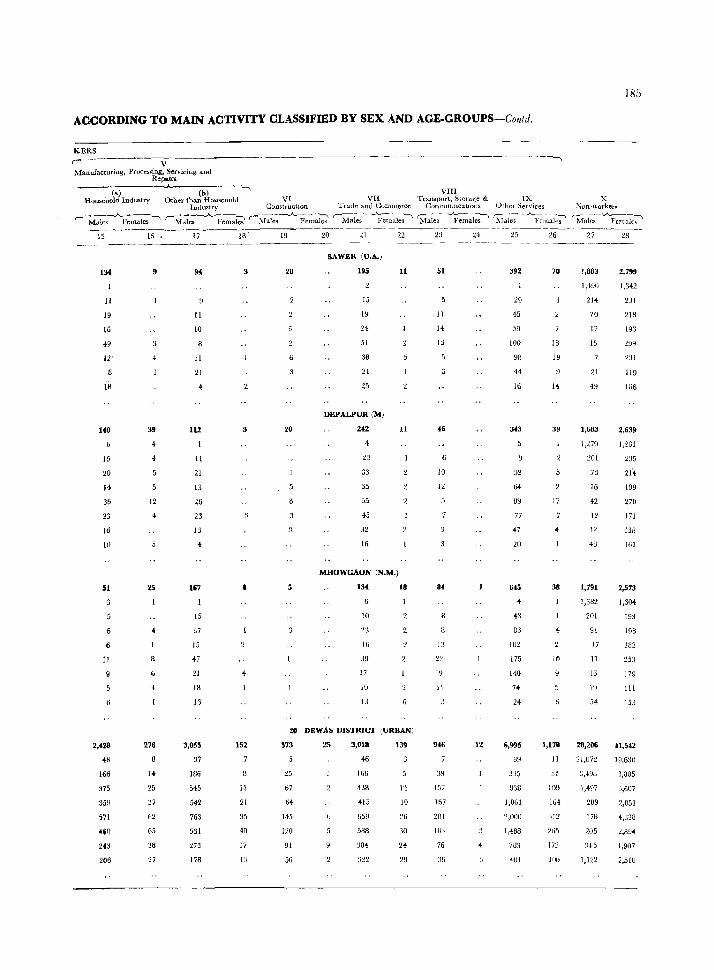
ACCORDING '1'0 MAIN ACTIVITY CLASSIFIED BY SEX AND AGE-GROUPS-Contd.
KERS
V .Manufacturiugj Processing, Seniciug and
Repaio:
Cal (bl -. VIII Household Industry Other than Household VI VI[ Transport, St01age & IX
Inuustry ConstructIOn Trade amI Commerce CommumcatlOlls Othel Services
r-Maks-..A-Femalcs ~ f Mdl~--.A.. Femab r}'1aI~Fe~;;-ki r-Ma~-~'emales ~~~emales SIales -_"'_~;al~-;' ---1-5----16-:---[7""---18-,-----19---20--21--22---2:3---i4----;;---26
134
II
19
16
49
12'
l~
140
15
20
14
36
23
16
10
51
" 6
11
2,42&
48
166
375
359
571
HiO
243
206
3'
5
12
4
25
8
276
14
25
37
62
65
36
27
94
II
10
B
31
21
4
112
11
21
13
26
23
13
4
1&7
15
37
15
47
21
IB
13
3,055
37
186
545
542
763
5:31
273
178
3
3
•
152
II
21
35
40
17
20
20
5
SAWER (U.A.)
195
15
19
24
51
38
21
25
DEPALPUR (M)
242
:13
35
55
45
32
16
MHOWGAON (N.M.)
13i
III
23
Hi
:19
17
In
11
11
18
20 DEWAS DISTRICT (URBAN!
573
~5
67
64
145
120
91
56
25 3,018
46
166
415
659
5U8
:1[14
139
12
10
30
2f
29
51
11
14
13
46
10
12
84
19
11
946
3Y
157
167
281
18~
76
%
12
392
29
15
59
100
98
44
16
343
645
4
43
83
102
175
140
H
24
G,995
89
335
83B
1,061
2,000
1,4SS
783
fOI
70
18
19
39
17
38
16
1,170
II
:31
164
312
205
172
IOn
185
x :x on-workers
~f;l~-;-.A.~~:, 27 28
1,883 2,799
1,490 1,342
214
70
17
15
21
4~
1,683
131
2IB
193
299
231
119
166
2,639
l,n9 1,2Gl
:lOI
73
16
42
12
12
43
1,791
1,382
201 91
17
II
IG
19
54
28,206
21,072
3,490
1,497
289
17B
;!05
1,122
235
2f4
189
270
171
138
161
2,573
1,304
193
19B
182
253
179
111
153
41,542
19,630
3,805
3,607
2,851
4,333
2,894
1,907
2,510
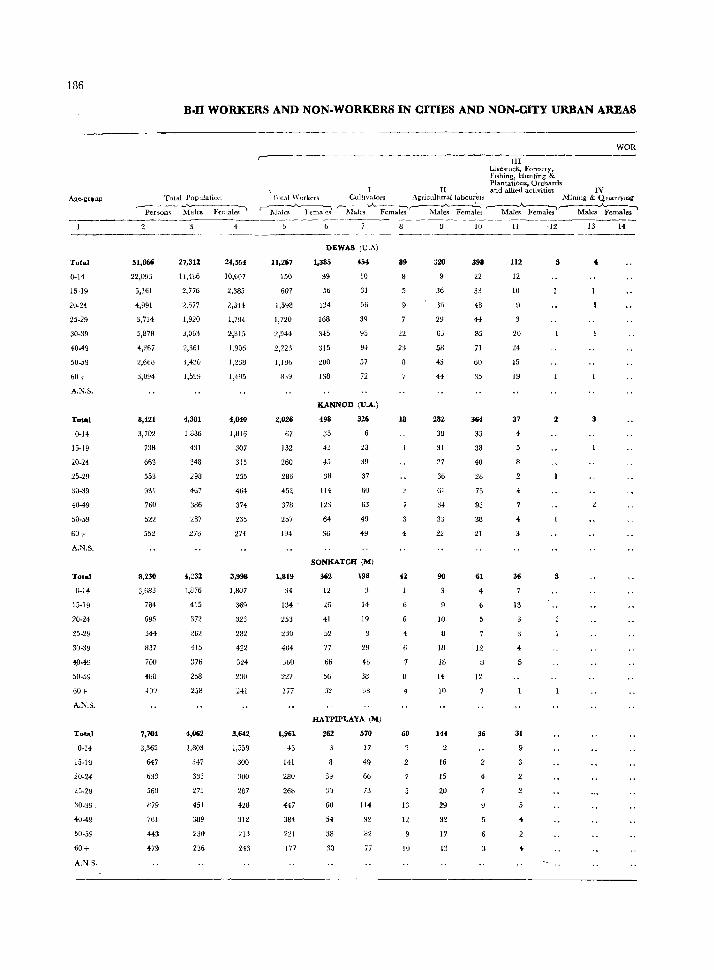
186
Total
0-14
15-19
20-24
25-29
~0-39
40-49
50-59
60+
A.N.S.
Tota.
0-14
15-19
20-24
25-29
30-39
40-49
50-59
60+
A.N.S.
Total
O-If
15-19
20-24
25-29
30-3Y
4:0-49
50-59
60+
A.N.S.
Total
0-14
15-19
20-24
25·29
:10·39
~049
50·59
60+
A.N.S.
B.n WORKERS AND NON-WORKERS IN CITIES AND NON.CITY URBAN AREAS
Tulal Population ~~-..A.-----,
Persons Males Female!;
51,866
22,093
5,161
4,991
3,714
5,878
4,267
2,66B
8,421
3,702
738
663
553
931
760
522
552
8,230
3,683
784
695
544
837
700
483
49U
7,704
3,362
647
633
560
H79
)01
443
479
27,312
11,486
2,776
2,677
1,920
3,063
2,361
1,430
4,381
1,886
431
348
298
467
386
287
278
415
372
262
415
376
258
258
4,062
1,803
347
333
273
451
389
230
236
4
24,554
10,607
2,385
2,314
1,794
~815
1.906
1,238
1,495
4,040
1,816
307
315
155
4G4
374
235
274
3,998
1,807
369
323
282
422
3H
Z30
241
3,642
1,559
300
300
287
428
312
2]:)
243
III Livestock. F'orestry, .FIshing, Hunting & Plantations, Orchards
\ II ,and aUied acti.vitie~ IV
WOR
Tot.tl 'Yorkers GultJvators Agriculturallilbourel~ ]\iining & Quarrying
r-llic-;A Femaki r-~fu~...A... Fernakir- 1\laie'; Fcm~'- "Males )"emales'-- Males :..A..F-;male~
1l,267
150
607
1,598
1,720
2,944
l,lU6
HJ9
2,026
67
132
260
286
452
378
257
194
1,819
34
134
:l53
~30
404
SliD
227
177
1,961
43
141
280
268
447
384
221
177
DEWAS lU.A)
1,385
39
56
124
168
345
315
200
138
454
10
31
39
Y5
9;
5)
72
KANNOD (V.A.)
498
35
43
45
38
114
123
64
36
326
23
39
37
60
63
49
49
SONKATCH (M)
362
12
26
41
52
77
00
56
32
198
14
19
HATPIPLAYA (M)
262
39
30
60
54
38
30
570
17
49
66
73
114
~2
82
77
89
18
42
6
4
60
13
12
10
320
36
%
2~
63
58
45
H
282
38
31
27
36
61
34
3~1
22
90
10
8
18
18
14
10
144
16
15
20
29
32
17
13
10
398
22
33
48
H
71
6U
35
364
JJ
38
40
28
73
93
38
21
61
4
6
12
B
12
36
4
II
112
12
10
20
24
15
19
37
4
13
31
9
13 14
2
3
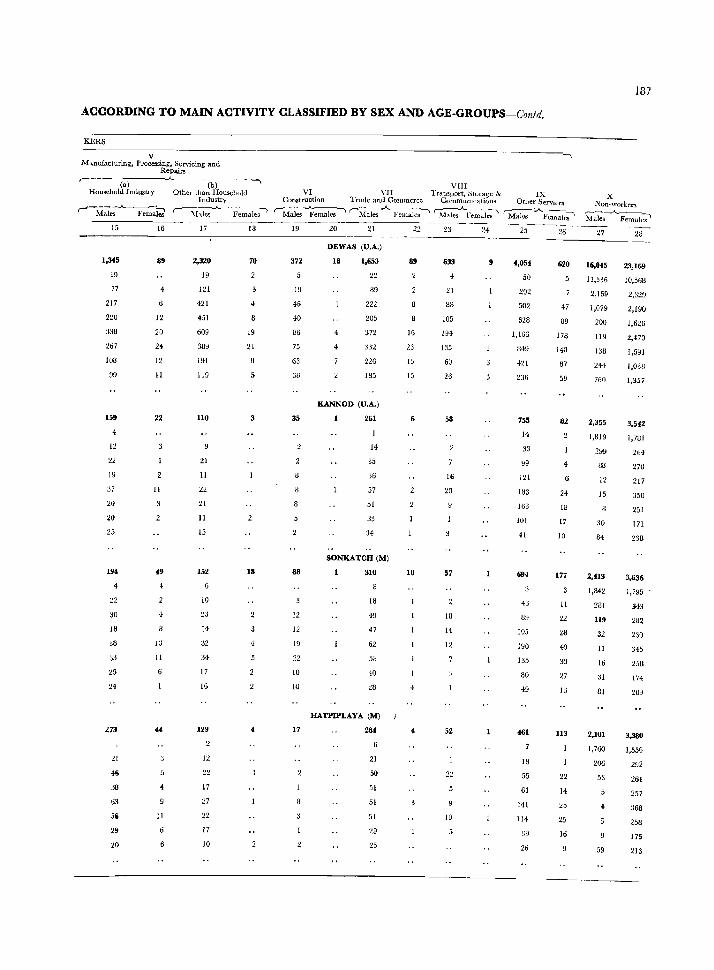
ACCORDING TO MAIN ACTIVITY CLASSIFIED BY SEX AND AGE-GROUPS-Contd.
KERS ==~----------------------------------------------------------------------~~ V Manufacturing, Processing, Servicing and
Repairs ------.A..---__ _
(a) Household IndustJ y
~.A. ___ :-.
Males Females
15
1,345
19
77
217
220
338
267
108
99
159
4,
12
22
19
37
20
20
25
194
22
30
18
38
:;3
25
24
273
21
46
38
63
5i
29
20
16
89
4
12
20
24
12
11
22
II
49
4
11
44
11
(b) Other than Household
Indus:try r---.A.-~ ~~----,
:Males Females
17
2,320
19
121
421
451
609
389
191
119
110
21
II
22
21
11
15
152
10
23
14
32
:>4
17
16
129
12
22
17
27
22
17
10
18
70
4
19
21
U
18
VIn VI VII Transport, Storage & IX
Construction Trade and Commerce CommuUlcalions. Other ,services
r-r..i~1~emalesl '-M~~ ~M~~ ~.A.Femal~ 19
372
19
46
40
86
75
63
:m
35
88
12
12
19
22
10
10
17
20 21
DEWAS (U.A.)
18
4-
1,653
22
89
222
205
372
332
226
185
KANNDD (U.A.)
261
14
35
36
57
51
33
34
SONKATCH (M)
310
18
49
47
62
58
'10
:!8
HATPIPLAYA (M)
284
21
50
51
51
51
29
25
22
89
16
23
15
15
6
10
4
6:13
4
21
88
105
19-1
135
60
26
58
16
20
57
18
14
12
52
22
10
24
9
25
4,054
50
202
502
628
1,166
849
421
236
755
14
33
99
121
183
163
lUI
41
694
105
190
135
80
49
461
18
61
141
J 14
39
26
26
620
47
89
178
148
87
59
82
4
24
IS
17
10
177
11
22
28
40
3:3
27
13
113
22
14
25
16
187
X Non-workers
'M~~F~~:1e~ 27
16,045
11,336
2,169
1,079
200
119
lJ8
244
760
2,355
1,819
299
88
12
15
30
84
2,413
1,842
281
119
32
11
16
31
81
, 2,101
28
23,169
10,568
2,329
2,190
1,626
2,470
1,591
1,03B
3,542
1,781
264
270
217
350
251
171
238
3,636
1,785
343
282
230
345
258
174-
209
3,380
1,760 1,556
206
53
59
292
261
257
368
258
175
213
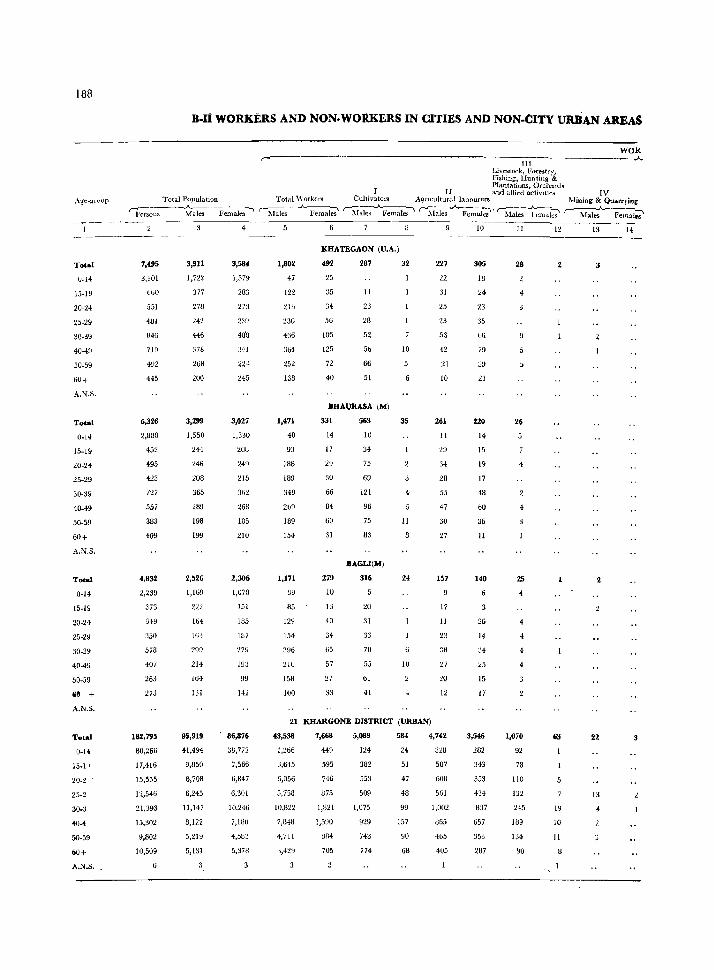
188
Total
0-14
15-19
20-24
25-29
30-39
40-4~
50-59
60+
A.N.S.
Total
U-H
15-19
20-H
25-29
30-39
40-49
50-59
60+
A.N.S.
T_l
0-14
15-19
20-24
25-29
30-39
40-49
50-59
ie + A.N.S.
Total
0-14
20-2
25-2
30-3
40-~
SO-59
60+
A.N.S.
B.II WORKtRS AND NON.WORKERS IN CITIES AND NON·CITY URBAN AREAS
WOR ---------------------------~Il7I-------------- ~
Livestock, Forestry, Fishing, Hunting & Plantations~ Orchards
II and allied actiVIties IV Total Population Total Worken; Cultivators AgrIcultural labourers Mining & Quarrying
rp~I-:fl.--~;k;- -.-Fe;.~ r-Maks _" .A. Eemal;' r-Maies _.o.._Females""' r-Male;~~J~' '-Male;-~~~ r-~-' FeU1aJ~
7,495
3,301
bOO
551
481
846
719
492
445
6,326
2,880
452
495
423
727
557
383
409
4,832
2,239
373
349
350
578
407
263
273
182,795
80,266
17,416
15,555
12,546
21,393
lJ,302
9,802
10,509
6
3,911
1,722
377
278
242
446
378
268
200
3,299
1,550
244
246
2U8
365
289
198
199
2,526
1,169
222
164
163
299
214
164
131
95,919
41,494
9,850
8,708
6,245
11,147
8,122
5,131
4
3,584
1,579
203
V3
209
40il
341
245
3,027
1,3,0
203
249
215
362
268
185
210
2,306
1,070
151
IUS
lU7
279
193
99
142
86,876
38,772
7,566
6,847
6,3Ul
10,246
7,lUO
4,583
5,378
1,802
47
122
213
230
4'36
J64
252
138
1,471
40
9:3
JU8
J89
349
209
189
154
1,171
39
85
129
154
210
158
100
KHATEGAON (U.A,)
492
25
35
34
56
105
125
72
40
287
11
23
28
52
50
66
51
BHAIJRASA lM)
331
14
17
20
30
66
84
60
31
279
10
J3
40
34
65
57
27
33
563
10
J4
75
69
121
96
75
83
BAGU(M)
316
20
31
33
70
55
61
41
32
10
35
11
24
1U
227
22
3J
25
23
53
42
21
10
261
11
29
34
28
55
47
30
27
157
17
11
23
38
27
20
12
21 KHARGONE DISTRICT (URBAN)
43,538
1,266
3,645
6,056
5,758
10,822
7,U48
4,711
3,429
7,668
449
595
746
875
1,821
1,5~jQ
3M
7U5
5,089
124
382
553
509
1,075
929
743
774
584
24
;;1
47
48
99
157
90
68
4,742
328
507
600
561
1,002
IJG5
455
405
10
305
18
24
23
35
65
79
J!J
21
220
14
15
19
17
48
00
36
11
140
26
14
34
25
15
17
3,546
282
343
353
434
837
657
353
287
II
28
4
5
26
4
4
25
~
4
4
4
4
1,070
92
78
110
132
245
1U9
134
90
12
2
10
11
13 14
3
22 3
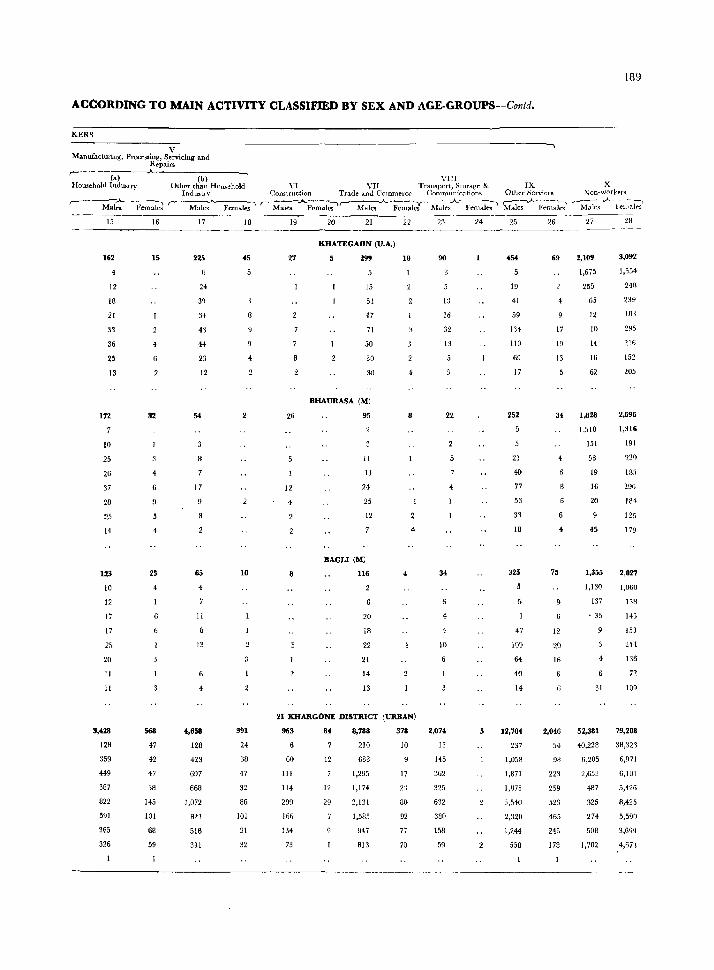
ACCORDING TO MAIN ACTIVITY CLASSIFIED BY SEX AND AGE-GROUPS--Contd.
KERS
V Manufacturing, Proc~ssing, Servicing and
Repairs
189
,-'---('"'a)---.A-·-----:(b:c)-----, VIII
Househo1d IndUstry Other than Household VI \~II Tramport, Storage &- IX X InduslrV Construction Trade and Commerce ComlUunications Other Services Non-worhrs
'---M-~~L;i r- Male!! A..._~~ f~A~;:k-;'r-~_A._~krMaks-A--~~ M;Je~A-~i~ ,.-~.A--i'~~'ll-;;'
15
162
12
18
21
33
36
25
13
172
10
25
26
37
28
25
14
123
10
12
17
17
2:\
20
11
11
3.'28
128
359
449
387
822
591
365
326
16
15
4
25
4
568
47
42
47
58
145
101
68
59
17
225
8
17
65
4
II
13
6
4
4,658
128
423
697
66B
1,072
821
51B
331
IB
45
10
391
24
38
47
32
86
101
31
32
19
27
12
8
20 21
KHATEGAON (U.A.)
299
15
51
47
71
50
30
30
BHAURASA (M)
95
11
II
24
25
12
BAGLI (M)
116
6
20
18
22
21
14
13
22
18
8
4
21 KHARGONE DISTRICT (URBAN)
963
60
III
114
299
166
134
73
84
12
12
29
8,788
210
633
1,295
1,174
2,131
1,585
947
813
378
10
17
2:1
80
92
77
70
23
90
13
16
32
13
22
34
4
10
2,074
13
145
~62
325
632
380
158
59
4
5
25
19
41
59
134
110
69
17
252
21
40
77
53
33
18
325
47
109
64
40
14
12,704
237
1,058
1,871
1,875
~,54O
2,320
1,244
558
26
69
17
19
13
34
75
9
12
20
16
6
2,046
54
98
22~
259
523
465
245
178
27 28
2,109 3.092
1,675 1,554
255
65
12
10
14
16
62
1,828
24B
239
WI
295
152
205
2,696
1,510 1,316
151
58
19
16
20
45
1,355
1,130
137
. 35
9
31
52,381
40.228
6,205
2,652
487
:125
274
508
1,702
191
21()
296
184
125
179
2,027
1,060
DR
14>
15)
21'1
136
72
10~
79,208
38,32'1
6,971
6,101
5,425
8,425
5,590
3,699
4,67'1
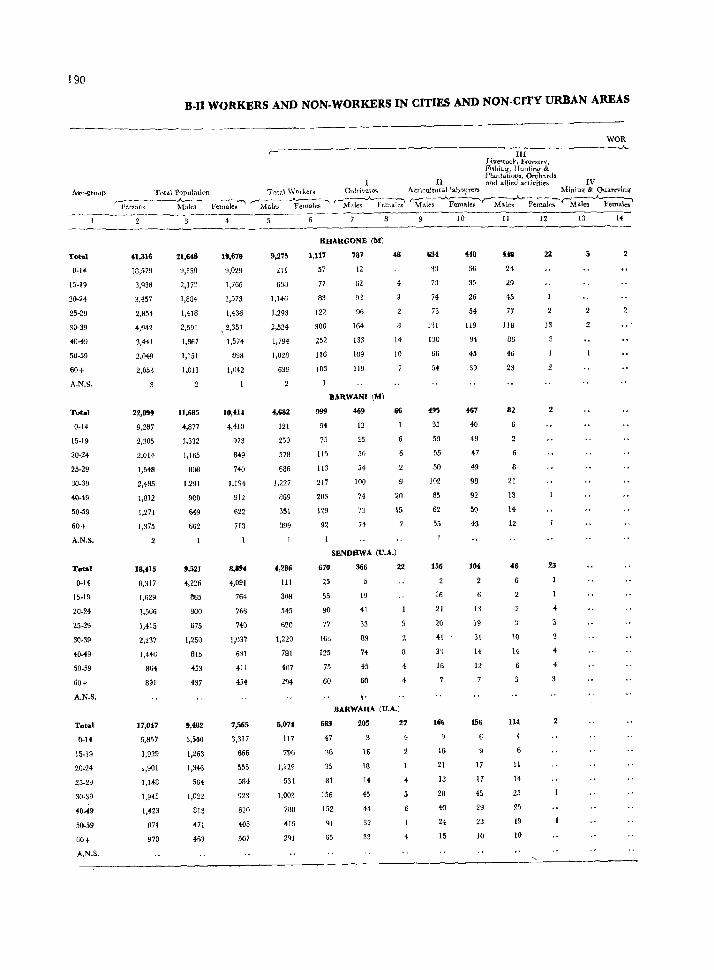
190
TGtal
0-14
15-19
20-24
25-29
30-39
+0-49
50-59
60+
A.N.S,
Total
0-14
15-19
20-24
25-29
30-39
40-49
50-59
60+
A.N.S_
Total
0-14
15·19
20.24
25·29
30·39
40-49
50.59
60+
A.N.S.
Total
0-14
15-19
20.24
25-29
30-39
40-49
50-59
60+
A.N.S.
B-Il WORKERS AND NON-WORKERS IN CITIES AND NON-CITY URBAN AREAS
WQR
--------------------------------------------- ~ III Livestock, Forestry, Fi!;hing, Hunting & Plantatio[}s~ Orchards
I II alld alIieJ activitit"s IV Total Population Tota.' WClJkel's CnltivatO'l. Aqrtc:u]tura) laho";lrers Minim~ ~ Quarrvin~
'l~'er~m;---~*~~F~tale~~ r'Males '~-e'-'''-l-es \ r-~~ales .A.Yentat;' r-M.'\~oA.F~,-._Ma~--~;_r-~~
~1,316
W,S79
3,"38
3,457
2,854
4,942
3,441
2,049
2,053
22,099
9,287
2,305
2,014
1,548
2,485
1,312
1,271
1,375
2
18,f15
8,317
1,629
1,566
1,415
2,2&7
1,446
864
891
17,047
6,857
1,929
1,901
I,HB
1,945
IJ23
874
970
21,6!6
9,550
2,ln
1,884
1,418
2,591
I,B67
1,151
1,011
1l,685
4,877
1.332
1,165
BOB
1,291
900
649
662
9,521
4,226
A65
800
675
1,250
815
453
437
9,482
3,540
1,263
1,346
564
1,022
813
471
463
19,670
9,029
1,766
1,573
1,436
'.2,351
1,574
898
1,042
10,414
4,410
973
B49
740
1,194
912
622
713
8,894
4,091
764
766
740
1,037
631
411
454
7,565
3,317
666
555
584
92~
610
+03
507
9,275
211
633
1,146
1,293
2,524
1,794
1,023
639
4,682
121
250
57B
686
1,227
369
551
399
4,286
III
30B
545
620
1,220
781
407
294
5,074
117
796
1,129
531
1,003
708
419
291
KHARGONE (M)
1,117
57
77
83
122
306
252
116
103
787
12
62
D:?
96
164
133
109
119
BARWANI (!If)
999 469
54 13
75 25
115
113
217
203
129
92
56
54
100
74
73
74
8
48
14
10
66
20
15
SENDlfWA (U_A.)
670 366 22
25
55
90
71
163
l25
75
60
19
41
33
89
74
45
60
\. BARWAHA (U.A.)
8
663 205 27
47 4
16 16
35 18
81 14
156 45
152 44
91 32
65 33 4
634
~3
73
74
73
111
130
66
54
495
35
50
55
50
102
85
62
55
156
16
21
20
41
33
16
166
16
21
13
28
+0
24
15
10
448
36
35
26
54
119
94
45
39
467
40
48
47
49
98
92
50
43
104
13
19
31
14
12
156
9
17
17
45
29
23
10
II
U8
24
29
45
77
118
36
46
23
82
21
13
14
12
46
10
14
114
6
11
14
25
25
19
10
12
22
13
23
4
4
I~ 14
2
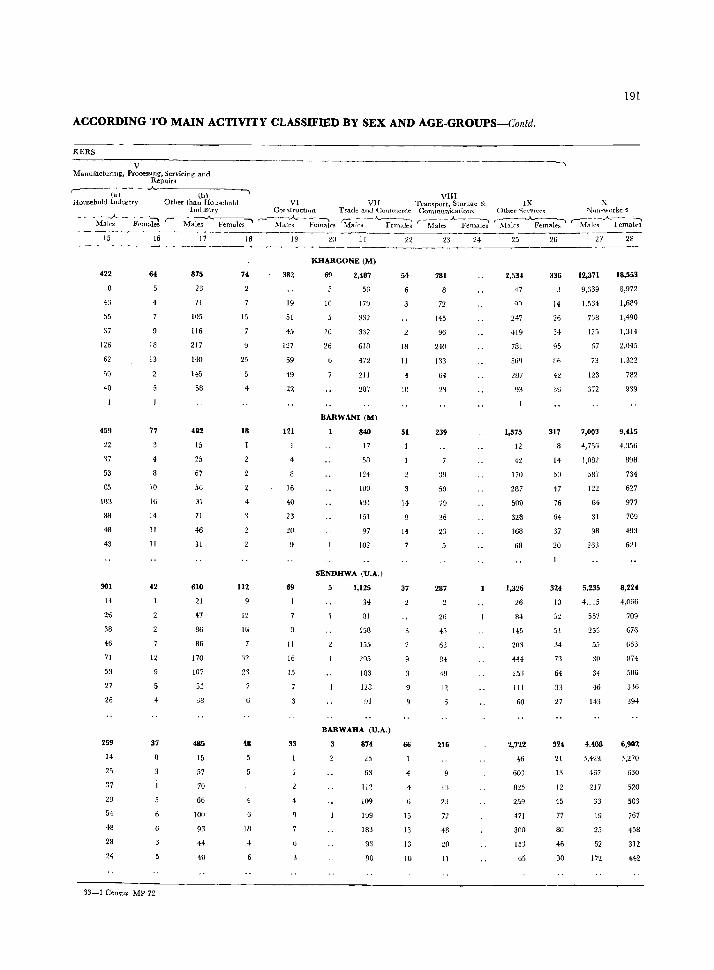
ACCORDING TO MAIN ACTIVITY CLASSIFmD BY SEX AND AGE-GROUPS-Contd.
KERS
V Manufacturiug~ Processlflg, Servicing and
Repairs' ,--__ ~_ ~~;-- -..J.-.
Household lrldustry (b) VIII
Other than Household VI VI r Tramport, Sturage & IX Industry Comtructtrm Tradt" and C01!lOlen:e Communicati.ons Other "ervi("("~
~ --M~ --Fp~~W r--Mal~ Females ~ r--Mat~¥~t's ~aJes - "--F-e-n-la~ ,- Mal~_A...Femaki 'ifal{'~ ..A.. Female;' - -----._ .- .-----~
15 16 17
422
4:1
55
37
126
62
50
40
459
22
'17
53
G5
103
BS
48
43
301
14
26
38
46
71
53
27
26
259
14
25
:\7
2~
54
48
28
24
4
18
13
17
4
10
16
14
11
11
42
12
37
33-1 Cemu. MP 72
875
23
]I
105
116
217
140
145
58
402
15
25
67
56
91
71
46
31
610
21
47
86
86
170
107
5.3
38
485
15
57
70
66
100
93
44
40
18
74
15
25
-I
18
112
1~
15
'32
:n
-I
IB
6
19
382
19
51
4,
127
69
49
22
121
16
40
23
20
69
11
16
15
33
21
KHARGONE(M)
69
10
10
26
2,407
56
179
332
332
6IH
472
211
207
BARWANI (M)
840
17
5n
124
100
191
151
97
102
SENDHWA (U.A.1
1,125
34
81
158
]55
295
183
12B
91
BARWAHA (U.A.)
3 874
25
63
112
109
199
183
93
90
22
18
11
111
51
14
37
66
4
15
13
13
10
23
781
72
145
96
2-lD
133
64
239
39
50
79
36
23
287
26
4;;
6'3
84
12
216
3:1
23
72
48
20
II
24 25
2,534
47
90
2-17
419
781
287
93
1,575
12
42
170
287
500
328
168
68
1,326
26
8~
203
44-1
~5:1
III
60
2,722
46
603
H2S
259
471
300
153
65
26
336
14
26
34
95
86
42
36
317
14
50
47
76
64
37
20
324
10
32
51
34
73
64
33
27
324
21
13
12
15
77
80
46
30
191
X ~(lll-Workers
'-hlales ..)\... Fc~~~ 27
12,371
9,339
1,534
738
125
[;7
73
123
372
7,003
4,71)6
1,082
587
122
64
31
98
26:1
5,235
4,115
557
255
55
30
34
46
143
4,408
:1,423
467
217
33
19
25
52
172
28
18,553
8,972
1,689
1,490
1,314
2,045
1.322
782
939
9,415
4,:J56
898
731
627
977
709
493
621
8,224
4,066
709
676
663
374
506
336
394
6,302
:1,270
630
520
503
767
458
312
442
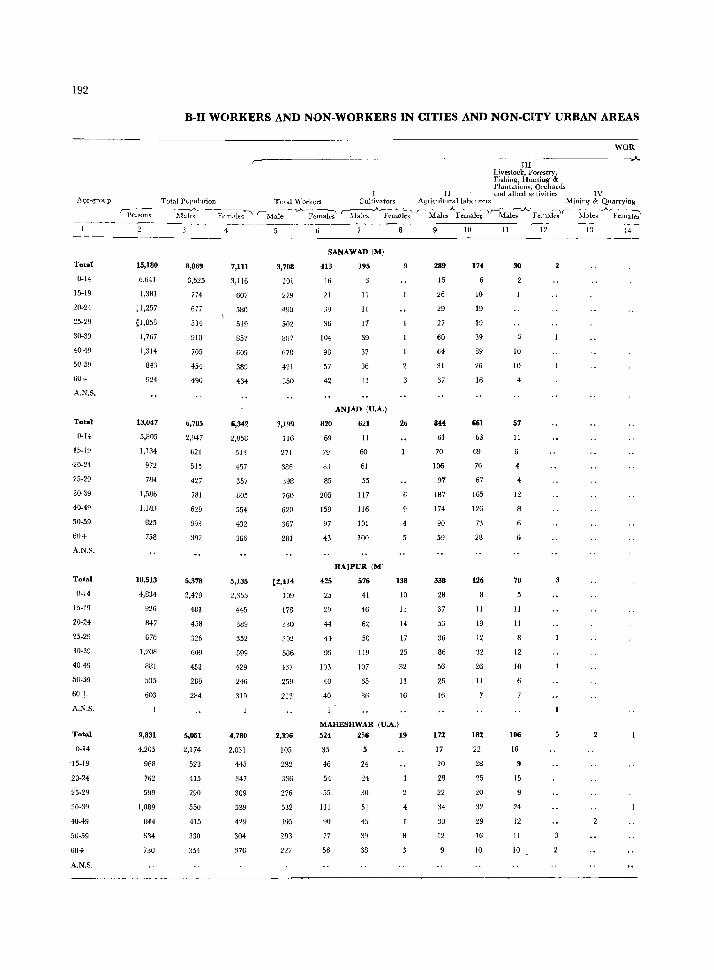
192
Age-group
B-ll WORKERS AND NON-WORKERS IN CITIES AND NON-CITY URBAN AREAS
,-.-----------------III
~~:hir~~~kH~~~f~~T}~ Planlatiolls, Orchards
II aml d]h~d activi.ti.es IV
WOR
-"-
Total P{_,I~ubtion Toeal V{orkel's Culti"ators Agriculturallabourr-rs Mining & Quarr-ying
1bleo: Fel1~le<;' r--i\1;t;---.A-pr:mal:? r-~...A-~~ r-~-'F--;;;-ak;:,'-M~..A..~~r--~~.A.~~ ---------------------
Total
0-14
15-19
20-24
25-29
30-39
40-19
50-59
60+
A.N.S.
Total
(I-B
'20-24
25-29
30·39
40·49
50-59
60+
A.N.S.
Total
0-14
15-19
20-24
~5-29
30-39
40-49
50-59
60-1
A.KS.
Total
0-14
"15-19
20-24
25-2Y
30-:lY
40-49
50-59
6Q ..
A.N.S.
15,180
6,641
1,381
,1,257
~1,053
1,767
1,314
84:1
924
13,047
5,805
1,134
9n 7B4
1,586
1,183
825
758
10,513
4,834
926
847
678
1,:?OH
RBI
5:1.>
603
9,831
4,205
968
762
599
1,089
1144
6:14
730
8,069
3,525
774
677
534
910
705
454
490
6,705
2,947
621
515
427
781
629
393
:192
5,378
2,479
481
458
326
609
452
289
284
5,051
2,174
523
415
290
550
415
330
354
4
7,111
3,116
607
580
519
857
609
389
434
6,342
2,858
513
457
357
805
554
432
366
5,135
2,355
445
389
352
599
429
246
319
4,780
2,031
445
347
309
539
429
304
376
3,708
10(
279
490
502
887
678
421
350
3,199
116
271
386
398
760
620
367
281
[2,414
109
178
330
3D:!
586
437
259
213
2,396
105
232
336
276
532
395
293
227
SANAWAD (M)
413
16
21
39
36
104
98
57
42
820
69
79
83
85
205
159
97
43
425
25
29
44
44
99
103
40
40
195
11
11
17
39
37
36
41
ANJAD (U.A.)
621
11
60
61
55
117
116
101
100
RAJPUR (Ml
576
41
46
62
50
119
107
65
86
26
4
138
10
13
14
17
25
32
11
16
MAHESHWAR (UA.)
524 256 19
35
46
54
55
111
gO
77
56
5
24
24
30
51
4!)
38
4
289
15
26
29
27
60
64
31
37
844
61
70
106
97
187
174
90
59
338
28
37
53
36
86
56
26
16
172
17
20
28
22
34
30
12
]()
174
10
19
19
39
39
26
16
661
63
69
70
67
165
126
73
28
126
11
19
12
32
26
II
182
22
28
25
20
32
29
16
10
II
30
10
10
4
57
11
4
12
70
11
11
12
10
106
16
15
24
12
11
10
12 13 14
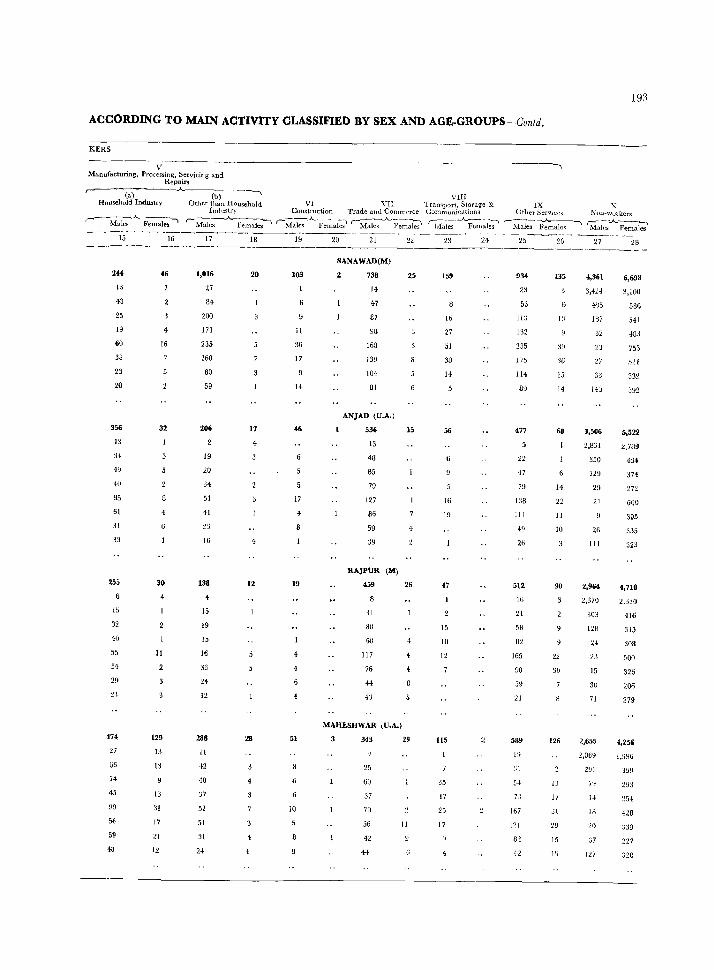
ACCORDING TO MAIN ACTIVITY CLASSIFIED BY SEX AND AGE-GROUPS-Cuntd.
KERS
V Manufacturing, ProcessingJ Servicing a.nd
Repairs ,----(.-)--- -'----(-b-)--' -, vlIl
Household Industry Other than Household VI YII Tramport, Storage & IX Indllslry Construction Trade alHI Commt'fce GommllnicJtions Other Servlccs
193
,--____ .A ___ ,
Males Females; 'M-;J~~ r-Mait'S :-A.. Femal~ ,---Males-_A_.F;;:;i~ ~-..A-Fem~~l "-M~1e-; }:~~1
X NouMwurkers
~aks;A.~" - ~--- -_ . -----___,--~~~-_---__ -----_ .-------~--15
244 I. 43
25
19
60
38
23
20
356
13
34
49
40
95
61
31
33
255
15
32
40
.05
54
29
'27
66
74
45
tl9
56
59
4&
16
46
4
16
32
4
30
4
11
129
Ll
13
13
31
17
21
12
17
1,016
27
84
200
171
235
160
80
59
206
19
20
34
01
41
23
16
138
4
15
19
IS
16
33
24
12
288
11
42
40
37
52
51
31
24
18
20
17
4
12
28
19
103
11
36
17
14
46
17
4
19
4
4
4
51
10
20 21
SANAWAD(M)
2 738
14
47
87
98
168
1:l9
104
81
ANJAD (U.A.)
536
13
48
85
79
127
86
59
39
RAJPUR (M)
459
31
80
60
117
76
44
43
MAHESHWAR ,U.A.)
22
25
15
4
26
343 29
25
tiU
37
70
56
42
H
11
23
159
11)
27
51
3D
14
56
16
19
47
15
to
12
lI5
35
17
20
17
24 25 26 27 28 '------ . __ ._-__ --
934
23
53
ILl
132
235
175
114
89
477
22
47
79
138
111
49
26
512
16
58
165
90
09
589
19
:;1
C"J
7J
167
121
82
42
U5
J6
15
14
68
14
22
11
10
90
22
3U
126
13
17
Jl
15
1')
4,361
3,424
4~S
IB7
32
23
27
33
140
3,506
2,831
350
129
29
21
26
III
2,964
2,370
303
128
24
15
30
71
2,655
2,069
].I
IH
2()
:37
127
6,698
3,100
586
541
433
753
SII
332
392
5,522
2.78~
434
374
272
600
3~5
335
323
4,710
2.:130
416
345
303
500
326
206
279
4,255
293
339
227
320
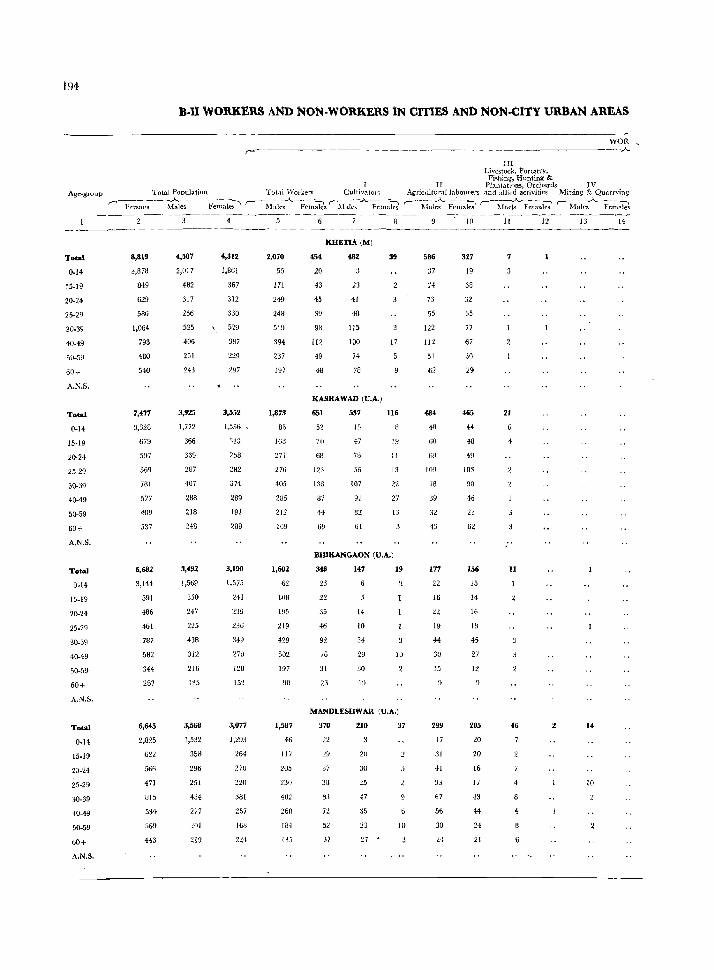
194
Age-group
Tuta1
0-14
15-19
20-24
25-29
30-39
40-49
50-09
60+
A.N.S.
Total
0-14
15-19
20-24
25-29
30-39
40-49
50-59
60+
A.N.S.
Teta)
0-\4
15~19
20-24
25-29
30-39
40-49
50-59
60+
A.N.S.
Total
0-14
15-19
20-24
25-29
30-39
40-49
50-59
60+
A.N.S.
boll WORKERS AND NON-WORKERS IN CITIES AND NON-CITY URBAN AREAS
,_--------
I Total Population "rotal \Varkers Cultivatols
III Livc:itock, Forestry,
Fi..,h1ng, Hunting & II Plantations, Orchards IV
WOR - -.A-
Agriculturallabourers and allied activities Mining & Quarrying
'--P-<-rs-O"-s--~I~ -l'e~al~ r- l\fules..A..Fem~'l '-;:y~~--.A.&m:W ,- l\Ial~ FC;11aki '-~Ia;;-Femai~ ,- Males..A..Fc~~
8,819
3,878
849
629
586
1,064
793
480
540
7,477
3,328
679
597
569
7S1
577
409
531
6,682
3,144
591
486
461
787
582
344
287
6,645
2,825
622
560
411
U15
534
:169
443
4,507
2,017
482
317
256
535
406
251
243
3,925
1,772
366
339
281
401
288
218
248
3,492
1,569
350
247
225
43B
312
216
135
3,568
1,5~2
3.':8
296
25t
434
277
WI
219
4,312
1,861
367
312
330
529
387
229
297
3,552
1,5:;6
313
258
282
374
289
191
289
3,190
1,57:>
241
239
236
349
270
120
15~
3,077
1,2!J3
264
270
3UI
251
168
214
2,070
55
171
249
248
519
394
237
197
1,873
86
IbB
271
276
405
286
212
169
1,682
62
ID8
195
219
429
302
197
90
1,587
4b
117
205
2:10
402
268
184
135
454
20
43
45
39
98
112
49
48
KHETIA (M)
482
23
41
48
115
100
74
78
KASRAWAD (U.A.)
651
52
711
6B
123
I:lS
87
44
69
537
1:;
47
78
56
107
91
82
61
39
17
116
19
II
13
22
27
13
BHIKANGAON (U.A.)
34B 147 19
23
22
:15
46
92
70
31
23
6
14
10
34
29
30
19
10
MANDLESHWAR (U.A.)
370
37
:18
83
72
52
37
210
20
30
25
47
35
27
37
6
10
586
37
74
73
55
122
lIZ
51
62
484
4a
GO
69
109
7S
39
32
49
177
22
16
22
19
44
30
15
9
299
17
31
41
33
61
56
30
H
10
327
19
38
32
35
77
67
30
29
465
H
48
49
103
90
,16
23
62
156
15
14
16
IB
45
27
12
205
20
20
16
17
43
44
24
21
l\ 12 14
21
11
46
4 10
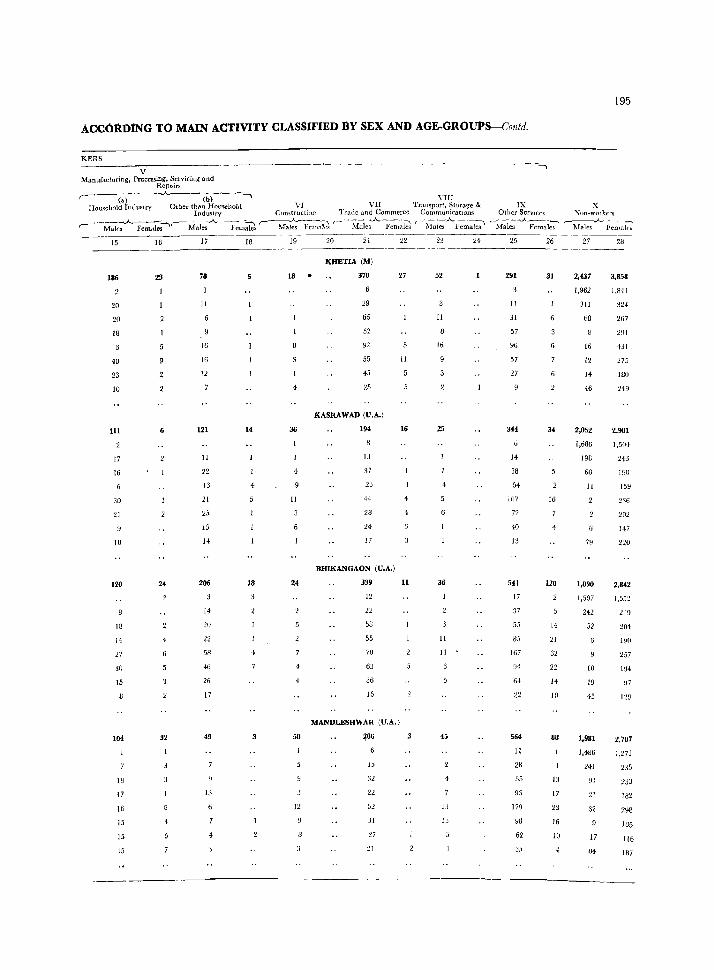
ACCORDlNG TO MAIN ACTIVITY CLASSIFIED BY SEX AND AGE-GROUPS-Cnntd.
KERS
V Manufacturing, Processing, Servicing and
Repairs
195
'--(-a)----'--'---(b-)- -. YIlT
Housebold Iuuuslry Other th(ln HouseholJ VI VII 'l'wllsport, Storage & IX X Industry Comtruction Trade and Commerce CommunicatIOns Other SerVices Non-wor kers
r--M~_A..~-V-M~~.A.~:~ ~-M~--;:;~ r--M~_A_ FemaiJ r-M-;i;-"-~ (~~a1~ ~..A..- Fe~~
15
186
20
20
18
40
23
10
111
17
16
30
21
10
120
18
14
17
30
15
104
18
17
16
15
15
15
16
23
24
17
78
II
16
16
12
121
II
22
13
21
25
15
14
14
22
58
46
26
17
49
13
18
14
4
18
19
18
4
36
11
24
50
12
20 21 22
KHETIA (M)
370 27
29
66
52
92
55
45
KASRAWAD (U.A.)
194
13
37
23
44
28
24
17
BHIKANGAON (U.A.)
339
22
53
55
78
15
MANDLESHWAR (U.A.)
~06
15
32
22
31
27
11
11
16
11
23
52
II
16
25
4
36
II
II
45
lJ
13
24 25
291
11
31
57
96
57
27
344
14
38
54
107
72
40
13
541
17
37
55
85
167
64
22
564
11
28
55
96
179
98
62
3,\
26 27 28 ----
31
34
16
120
14
21
32
22
14
10
88
13
17
23
16
10
2,437 3,85l1
1,962 1,841
311
68
16
12
14
1{)
2,052
324
267
291
431
275
IBU
249
2,901
1,686 1,504
198
68
II
79
1,890
1,507
242
10
19
45
1,981
1,486
241
91
21
32
17
84
213
190
15Y
236
202
147
no
2,842
1,552
219
204
190
257
194
97
129
1HZ
298
105
116
IS7
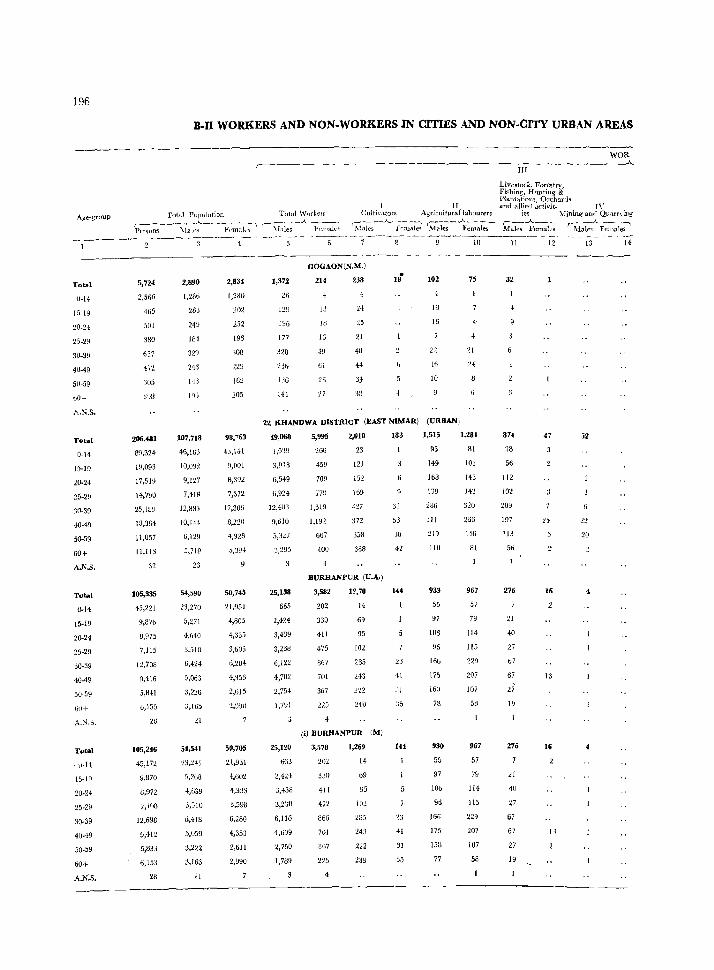
196
Ag-e-group
Total
0-14
15-19
20-24
25-29
30-39
40-49
50-59
bO+
A.N.S_
Total
0-14
15-19
20-24
25-29
:10-39
40-49
50-59
60+
A_N.S.
Total
0-14
15-19
20-24
25-29
30-39
40-49
A.N.S.
Total
. ()-14
15-19
20-24
25-29
30-39
40-49
60+
A.N:S.
B-U WORl{ERS AND NON-WORKERS IN CITIES AND NON-CITY URBAN AREAS
II rotal POjlulation Total Wnrkels Cultivators AI£ricultura[ labourers
r------.-~-_;.___.--- ---., r--------------A.~--. Pf"lSpfiS ~ralrs Femal~'S ~fales Felllak~
,--------'---, ~---.!\fales F('male~ Males Female-s
5,724
2,566
465
501
380
637
4n 'J05
398
200,481
89,324
19,093
17,519
14,790
25,189
18,364
11,057
11,113
32
105,335
45,221
9,876
8,975
7,115
12,708
9,416
5,HH
u,155
105,246
45,ln
9,B70
8,972
7,10[}
12,698
9,412
5,833
6,153
28
2,890
1,286
263
249
184
329
243
HJ
19)
107,718
46,185
IO,09~
9,127
7,418
12,883
10,114
0,129
5,719
23
54,590
23,270
5,271
4,640
:1,510
6,424
04,541
5,2GB
4,639
3,510
1:),418
5,059
;),222
3,163
21
2,834
1,280
202
252
196
308
229
162
205
98,'63
43,141
9,001
8,392
7,312
12,306
8,220
50,745
21,951
4,605
4,335
3,605
6,284
4,35::1
2,615
50,705
ll,931
4,602
4,333
3,598
6,280
4,353
2,011
2,990
1,372
26
129
1%
177
328
2J/i
13G
14!
GOGAON(N.M.J
214
w
16
49
61
238
+ 24
25
21
48
44
3J
:113
102
18
16
22
Iii
10
22 J{HANDWA DISTRICT (EAST NlMAR) (URBAN)
49,0fiB
],0')9
3,918
6,549
fJ,924
12,41l3
9,610
5,327
:3,:295
25,138
6.5
2,424
3,439
3,238
6,122
4,702
2,754
1.791
25,120
fi6J
2,1H
3,43B
3,238
6,116
4,699
:;:,750
1,789
5,995
266
459
709
779
1,519
1,191
667
400
2,010
23
121
152
372
358
388
BURHANPUR (U_A.)
3,582
202
330
411
475
867
701
367
12,70
14
69
95
102
285
213
(il BURHANPUR (M)
3,578
202
33U
411
412
86G
7UI
367
2~5
4
1,269
H
09
95
102
183
9
31
53
38
42
144
23
41
JI
144
41
31
35
1,515
95
149
168
139
286
311
U9
IW
933
5S
97
106
96
166
175
160
7~
930
55
97
lOb
96
166
175
158
77
10
75
4
1,281
BI
103
143
14:1
320
206
146
81
967
57
79
114
115
229
207
107
967
57
79
114
115
229
207
107
58
III
Livestock, Forestry, Fishing, Hunting & Plantations, Orcharus and aUieli d.ctivit- 1\'
waR --A.
ies Mining and Qtlarrying' ,______.).,__-- r:--A..-~-............-.. Malt's FemaJes Male.:: Females
11
32
4
87t
28
56
112
102
209
197
Il3
56
276
21
40
27
b7
I~
276
21
40
27
67
67
27
19
12 13 14
47
2S
20
16
16
13
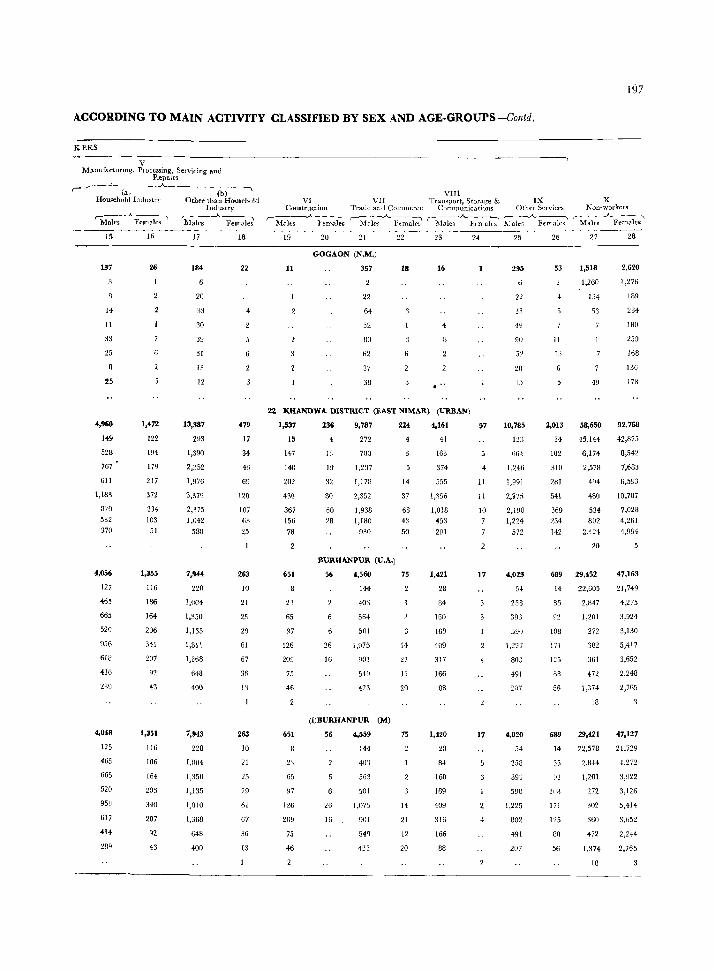
197
ACCORDING TO MAIN ACTIVITY CLASSIFIED BY SEX AND AGE-GROUPS-Contd.
KERS - ----~v----------------
Manufacturmg, Plocessing, Servicing and Repai.rs
(a, -'------(-b-) ----,
Household (ndustry Other than Household
r:c~----, Males Fernalt:s
15
137
14
11
33
25
25
149
528
767
611
1,183
820
532
370
4,056
127
465
665
520
956
61B
416
2R9
4.048
125
465
665
520
953
617
414
2[lQ
16
26
1,472
122
194
179
217
371
234 103
51
1,355
116
186
164
206
341
207
92
43
1,351
116
lB6
164
203
340
207
92
43
Industry c------"---., M o.les Females
17
184
20
33
30
39
31
13
12
13,387
293
1,390
2,352
1,976
3,379
2,375
1,042
580
7,944
22[1
1,(KI4
1,350
1,135
1,811
1,368
648
400
7,943
228
1,004
1,350
1,135
l,fIIO
1,36B
64B
400
18
22
479
17
34
B
69
120
107
63
25
263
10
~1
25
29
61
67
36
263
10
21
25
61
67
36
13
VIIl VI
Construction r----"-~--
VII Transport, Storage & IX X Trade and Corrunerce Communications Other Services Non-workers
MDlu; lEn'ales M'lc~ ~ J;;*,~ r-M~I~s....A.F.:;;;;;k,' 19
11
20 21
GOGAON (N.M.)
357
22
64
52
II()
62
37
38
22 23
18 16
22 KHANDWA DISTRICT (EAST NIMAR) (URBAN)
24
1,537 236 9,787 224 4,161 57
15
147
140
202
430
367
156
78
651
23
65
97
126
209
75
46
651
2'-)
65
~J7
126
209
75
46
4
13
19
80
60 28
272
700
1.237
1,I7l!
2,352
1,938
1,180
930
BURIIANPUR (U.A.)
56
26
16
4,560
144
403
564
SDI
1,075
901
549
423
(;)BURHANPUR (M)
56
26
16
4,559
144
401
5G3
501
1,075
901
54q
4:?3
14
37
68 43
50
75
14
21
12
20
75
14
21
12
20
41
163
374
-'55
1,356
1,018
453
201
1,421
28
84
160
169
409
317
166
88
1,420
8. 160
109
409
:l16
166
88
11
11
10
7
17
17
25
295
22
33
49
90
28
15
10,7B5
123
664
1,246
1,991
2,775
2,190
1,224
572
4,023
54
258
.')~JO
1,227
80J
491
2()7
4,020
5-1
258
39:]
590
1,225
002
491
207
26
53
II
13
2,013
34
102
310
2BI
541
369
234
112
14
35
108
171
125
88
56
689
14
35
IOq
171
125
8f!
56
27 28
1,518 2,620
1,260 1,276
134
53
58,650
45,144
6,174
2,578
494
480
534
802
2,424
20
22,G05
2,847
1,201
272
302
361
472
1,374-
18
29,421
22,573
2,8H
1,201
272
302
360
472
1,:174
18
189
234
180
259
168
136
178
92,768
42,875
8,542
7,633
6,593
10,787
7,023
4,261
4,994
47,163
21,749
4,275
3,924
3,130
5,417
3,652
2,248
2,7(;5
47,127
21,729
4,272
3,922
3,126
5,414
3,652
2,244
2,765
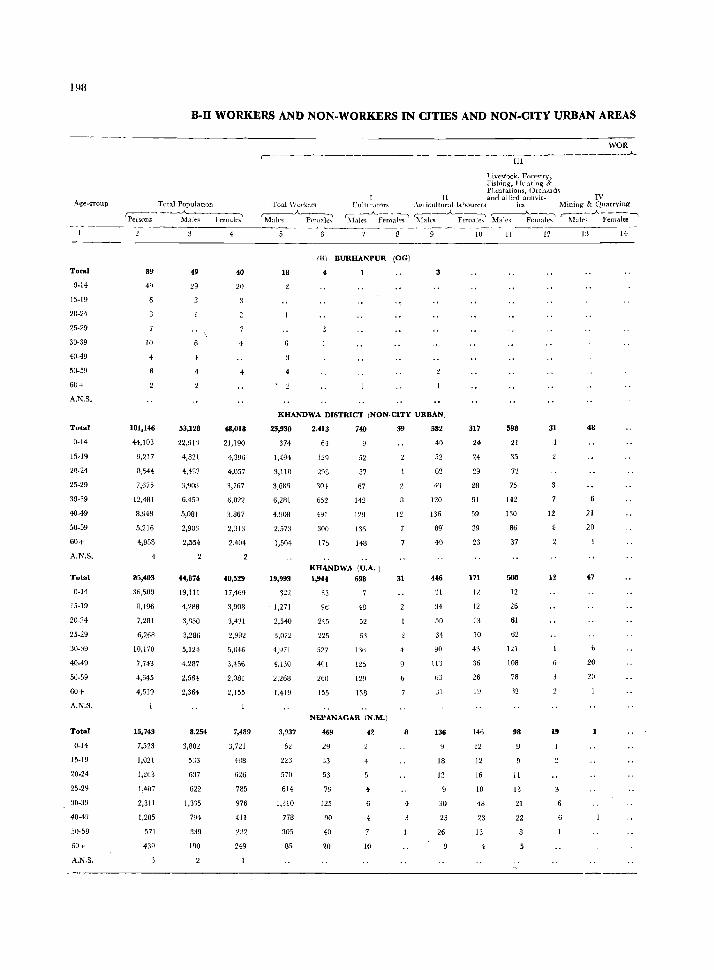
193
Age-group
Total
0·14
15·19
20·24
25·29
30·39
40-49
50-59
60+
A.N.S.
Total
0·14
15·19
20-24
25-29
30·39
40·49
50-59
60+
A.N.S,
Total
0·14
15·19
20-24
25·29
30-39
40.49
50-59
60+
A.N.S.
Total
0-14
15·19
20.24
25·29
30-39
40·4Y
50·59
60+
A.N.S.
B-I1 WORKERS AND NON-WORKERS IN CITIES AND NON-CITY URBAN AREAS
Total PopulatlOTl
PeI5())1~
89
49
10
4
101,146
44,103
9,217
8,544
7,675
12,481
8,948
5,216
4,958
85,403
S6,5HU
8,196
7,281
6,268
10,170
7,743
4,645
4,519
15,743
7,523
1,021
1,263
1,407
2,311
1,205
571
439
49
29
!>3,128
22,913
4,821
4.4R7
:1,908
6,459
5,081
2,903
2,554
44,8"
19,111
4,288
3,R50
3,286
5,124
4,287
2,564
2,364
8,254
3,802
533
6:17
622
1,335
794
339
190
4
40
20
4
4
48,018
21,190
+,396
4,057
3,767
6,022
3.867
2,313
2,404
40,529
17,469
3,908
3,431
2,QR2
5,046
3,456
2,081
2,155
7,4B9
3,721
488
626
785
976
411
232
249
WOR ------------~-------..).._
III
Livestock, Forestry, Fishing, I hlllting & Plantations,Orch,ud ..
II and allif'd adi .. it- IV 1'00.1 \Vorker<l (_'ultl'",tlnrs. _\glicultuqllaboUlt"fs les Mining & Quarrying
Males Ft"male-. ~____,.____._--:---. ,--_ _.A__~ ,.-------.A--~ ~,.A ---....., _\I<lles Females ~.rales Female!> Male'l Female'> :Malf", Females
(ii) BURHANPUR (OG)
18
KHANDWA DISTRICT (NON-CITY URBAN)
23,930
374
1,494
3,110
3,686
6,2111
4,90R
2,573
1,504
19,993
322
, 1,271
2,540
3,072
4,471
4,130
2,268
1,419
3,937
52
223
570
614
1,310
778
305
85
2,413
64
120
293
30}
652
441
300
175
740
52
57
67
142
129
136
148
KHANDWA (U.A.)
1,!I44 698
35
96
245
225
52)
401
260
155
48
52
63
125
129
138
NEPANAGAR (N.M.)
469
29
33
53
79
125
90
40
20
42
4
10
39
12
31
6
582
40
52
62
4'\
120
136
89'
40
446
:.\1
50
31
90
113
63
j1
136
18
12
30
23
26
10
317
24
24
29
28
91
59
39
23
171
12
12
13
10
43
36
26
19
14li
12
12
16
13
48
23
13
4
11
598
21
35
n 75
142
130
86
37
>00
12
26
61
62
121
lOa 78
98
II
13
21
22
12
31
12
48
21
20
6
20
14
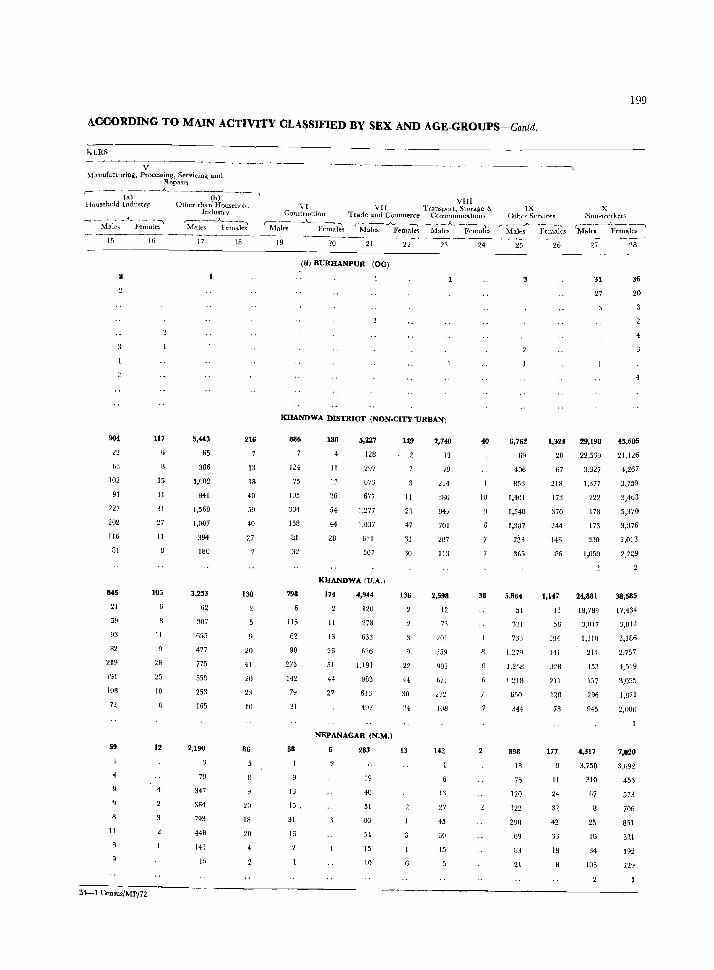
199
ACCORDING TO MAIN ACTIVITY CLASSIFIED BY SEX AND AGE-GROUPS-Contd.
KERS
V Manufacturing, Processing, Servicing and
Repairs
;--- - - -(a-)- --A-----(b-)------,
Household Industry Othr.r than Household
_____ ~ _.A... ___ ---...,
rvblcs Females
15
6:1
102
91
227
202
116
81
1145
21
59
93
82
219
191
lOB
72
59
S
11
34-1 Cen,u,/MP/72
16
117
15
11
31
27
11
105
11
28
25
10
12
4
Industry r-----A...~~ Males Females
17
5,443
65
386
1,002
841
1,568
1,007
394
180
3,253
62
307
655
477
775
559
253
165
2,190
79
347
364
793
448
141
15
18
216
13
18
40
59
40
27
12
130
20
41
20
23
10
86
20
18
20
-- -------------.
VIII VI
Construction ,-------------._).._-- --:--.
VII Transport, Storage & Trade and Commerce ComrnuntCatlOllS
Males Fcmalt"s ,-----------'----,_ - - _ A_ __ ~
l\hlell Female" Males Females ._-----20 21 22
(H) BUnHANPUR (OG)
KHANDWA DISTRICT (NON-CITy-unBAN)
886
124
75
105
304
158
81
32
798
115
62
90
273
14'2
79
31
88
13
15 .
31
15
180
11
13
26
54
44
28
5,227
128
297
673
677
1,277
1.037
631
507
KHANDWA eU.A.)
174
11
13
26
51
44
27
4,944
120
278
633
6211
1,191
983
616
497
NEPANAGAR (N.M.)
283
19
40
51
86
54
15
10
U9
11
23
47
31
·)0
136
22
44
30
13
2,740
13
79
214
~B6
947
701
287
113
2,598
12
73
201
359
272
108
142
27
45
30
15
24
40
10
38
IX 01 her Sf'rV1CeS
r-___».._ - ---------:"I Males Females
25 26
X N()n~workr:rs
~----__).._____._-------. Males Females
27 28
31 36
27 20
4
6,762
69
1,324 29,198 45,605
21,126
4,267
3,759
3,463
5,370
3,376
2,013
2,229
406
853
1,4UI
1,548
1,387
733
365
5,864
51
'3:J1
733
1.258
650
344
898
IB
75
120
122
290
169
83
21
20
67
218
173
370
244
146
86
1,147
II
56
194
141
328
211
128
78
177
11
24
32
42
" 18
22,539
3,327
],377
222
178
173
330
1,050
24,881
18,789
3,017
1,310
214
153
157
296
945
4,317
3,750
310
67
25
16
34
105
38,585
17,434
3,812
3,186
2,757
4,519
3,055
1,82 1
2,000
7,020
3,692
455
573
706
851
321
192
229
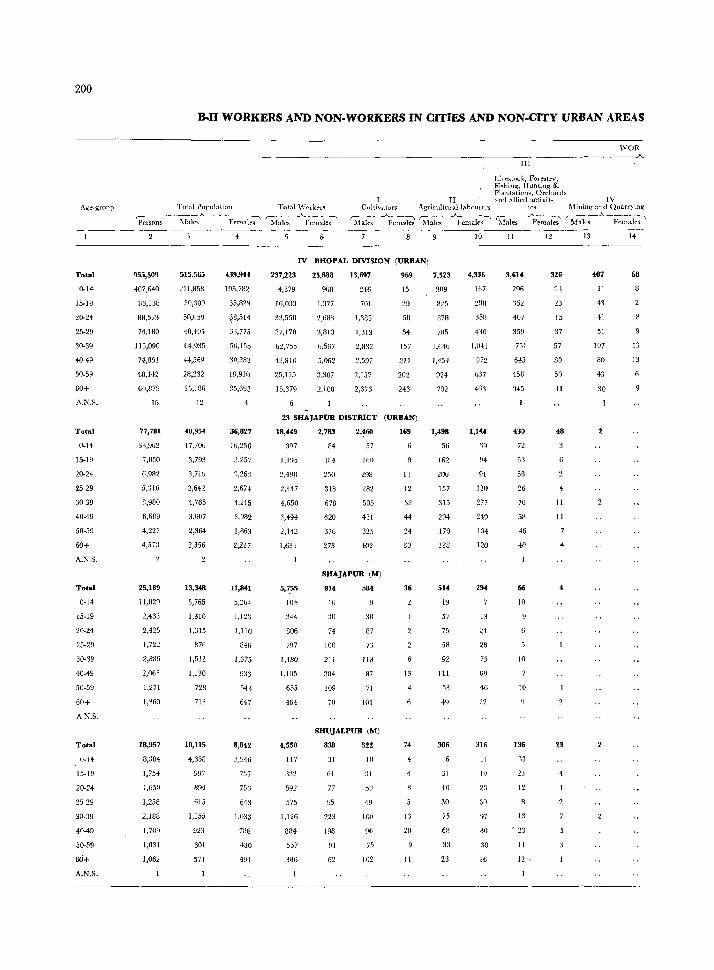
200
Total
0-14
20-24
25-29
30-39
40-49
50-59
60+
A,KS.
Total
0.14
15-19
20-24
25-29
30-39
40-49
50·59
60+
A.N.S.
Total
0-14
15-19
20-24
25-29
30-39
40-49
50-59
60+
A,N.S.
Total
0-14
15-19
20-24
25-29
30-39
40-49
50-59
66+ A.N.S.
B-II WORKERS AND NON.WORKERS IN CITIES AND NON·CITY URBAN AREAS
Toti1.1 1"l0Tml:Jt;on Total \\Torkc"l~
III
Livestock, Forestrv, Fidlinq, Hunting & PlantaliuII">, Orchard ..
II and alli ... rl activit- IV
WOR -'-
Cuhivaturs Agri('uIturallabout"f'rs i("<; Mining and Quarning
rre~-~_A_~ -~e~ S1:1.]~ -__A_Fe;~~;' rr;1~~_A..Fe~lei ~I-ai~s -~~ ~fales -~ ~-1ale~~Fe;~
955,509
407,640
116,1:1H
88,573
71,180
115,090
74,851
48,142
60,879
16
77,781
30,962
7,050
6,QS2
5,316
R,980
6,689
4,227
4,57B
25,189
11,029
2,433
2,425
1,722
2,886
2,063
1,271
1,960
18,957
8,304
1,754
1,650
1,258
2,188
1,709
1,031
1,062
515,565
211,11511
5(),:lOry
50,059
40,405
64,935
44,569
28,232
25,186
12
40,954
17,706
3,793
R,719
2,642
4,765
3,607
2,364
2,356
13,348
5,765
1,310
1,315
876
1,511
1,130
728
713
10,115
4,358
997
894
615
1,155
923
601
571
439,941
19.1,782
35,82Q
~B,514
33,775
50,155
30,28:l
19,910
35,693
4
36,827
16,~5G
3,257
'1,26::
2,674
4,215
3,082
1,863
2,217
11,841
5,264
1,123
1,110
846
1,375
933
543
647
8,842
J/14G
757
756
643
1,033
7116
430
491
237,223
4,379
16,033
~3,00n
37,178
62,755
4~,81O
25,125
15,379
IV BHOPAL DIVISION (URBAN)
25,888
9f)8
l,?!77
2,688
:~,810
6,567
.I,mi2
3,307
2,108
13,607
246
701
J, '185
1,313
2,8~2
2.597
2,157
2,376
969
15
29
oll
54
157
211
202
243
23 SHAJAPUR DISTRICT (URBAN)
18,449
397
1,195
~,400
2,447
4,650
3,494
2,142
1,633
5,75.';
1114
:144
806
797
1,480
1,105
655
464
4,550
117
:1:12
592
575
1,126
884
537
3B6
2,783
84
1H4
2:')()
31B
678
620
376
273
2,460
57
UiO
298
282
505
431
325
402
SHAJAPUR (M)
814
74
100
211
204
109
70
584
:18
87
73
118
B7
71
101
SHUJALPUR (M)
838
31
61
77
95
223
198
91
62
522
10
49
100
75
102
169
11
12
32
44
24
30
36
13
74
13
20
II
7,523
309
825
87B
7115
1,646
1,454
924
702
1,498
56
162
2116
157
315
294
170
138
514
19
57
75
58
92
111
53
4q
306
31
40
30
75
68
33
23
10
4,336
11i7
Z9n
358
410
1,041
972
637
4'33
1,144
1Q
94
91
120
277
249
154
120
294
13
24
2B
75
(i9
46
32
316
11
19
23
so
97
BO
:10
26
II
3,614
296
'152
407
359
7>1
6-<5
453
'l45
430
72
53
58
26
76
58
46
40
66
10
10
10
136
'lj
12
13
, 23
11
12 -
12
326
2)
:n
15
37
57
80
50
41
48
4
11
II
23
13
407
11
43
11
51
t07
8n
43
30
14
68
13
13
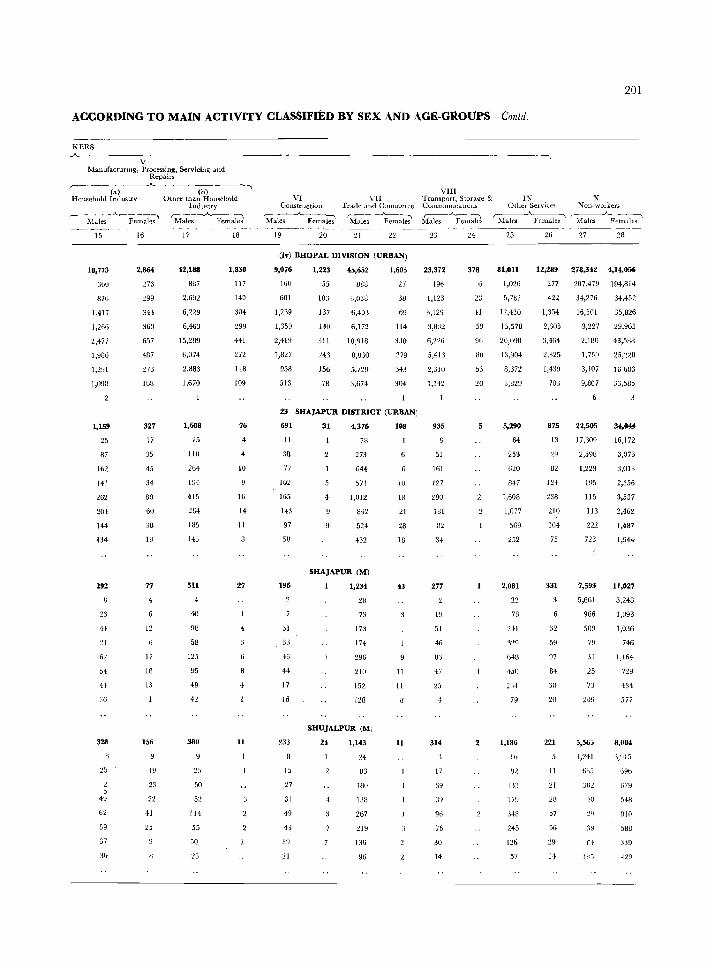
201
ACCORDING TO MA1N ACTIVITY CLASSIFIED BY SEX AND AGE-GROUPS-Contd.
KERS
~ ----\-.-_----------------------------_-------_---~ ?\tfanuractunug) Processing, Servicing And
Repairs
,- --- (:;)---------------- ----(b-)-
Household Industry Other th4n Household
15
10,773
360
876
1,417
1,266
~,477
1,986
1,291
1,091:1
1,159
25
87
162
141
262
204
144
1>4
292
23
~l
6~
54
4+
36
328
25
2 5
49
59
37
,6
16
2,864
~73
299
344
363
657
4B7
273
168
327
17
35
45
34
80
60
38
lB
77
12
17
18
13
156
23
22
41
25
Illdu<;try r----______..._~ -:---l Males Females
17
42,188
887
2,692
6,229
6,4{;3
15,289
6,074
2,883
1,670
1,608
25
lIB
264
184
415
264
185
14:3
511
40
58
125
95
49
42
380
50
52
114
55
50
25
18
1,830
117
140
304
299
441
272
118
109
76
10
16
14
11
27
4
11
VI Constructiou
r-: -----A-___ --.,
Males F emaJes
19 20
VI[ Trade and Commerce r---- --"---~ Males Females
21 22
(iv) BHOPAL DIVISION (URBAN)
9,076 1,223 ~5,652 1,605
160
601
1,239
1,359
2,419
1,827
958
513
55
103
137
140
311
243
156
78
888
3,038
6,401
6,172
10_918
8,830
5,729
:1,674
'27
38
69
114
330
379
343
304
23 SHA]APUR DISTRICT (URBAN)
691 31 4,376 108
11
38
77
102
165
143
97
58
196
31
33
·16
44
17
16
233
15
27
31
49
43
39
21
78
273
644
571
1,012
842
524
432
SHAJAPUR (M)
1,234
28
73
173
174
296
210
152
128
SHUJALPUR (M)
24 1,143
24
83
lUll
138
267
219
136
B6
W
lH
21
28
18
43
11
II
11
VlIl Transport, Storage & CUTtlmUlllCatwIls
~-_----,
Males Females
23
23,372
196
1,123
3,129
3,8n
6,226
5,413
2,310
1,142
935
51
161
127
200
181
32
34
277
19
51
46
m
47
25
314
17
39
96
76
30
14
24
378
23
41
59
9G
SII
53
20
IX X Other Selvi(.es NonMwDlker~
r----..-A.~,---------------~ Males Females ~1ales Females
25
81.011
1,026
5,782
12.430
15,578
20,090
1:1,904
8,372
3,829
5,290
64
253
620
847
1,608
1,077
569
252
2,081
22
78
241
~=tl9
6-Ul
450
79
1,186
10
112
179
3-18
245
126
57
26 27 28
12,289 278,342 <1,14,056
277
4'J')
1,354
2,305
:1,464
2,,25
1,439
703
875
13
29
82
124
238
:.no 104
75
331
:12
59
97
84
30
:W
221
11
:II
28
57
56
14
207,479 194,814
34,276 34,452
16,501 35,826
3,227 29,965
2,100 43,588
1,75Y 25/!:lO
3,107 Hi 603
9,807 33,585
22,505
17,309
195
115
113
222
723
7,593
5,661
966
500
70
31
25
73
N9
5,565
.,241
fib5
3D::!
40
:19
r-!
IUS
34044
16,172
3,073
3,013
2,356
3,537
2,462
1,487
1,944
11,027
5,248
1,093
1,036
746
1,164
729
434
577
8,004
:3/IJ5
6%
o7~
54~
310
588
339
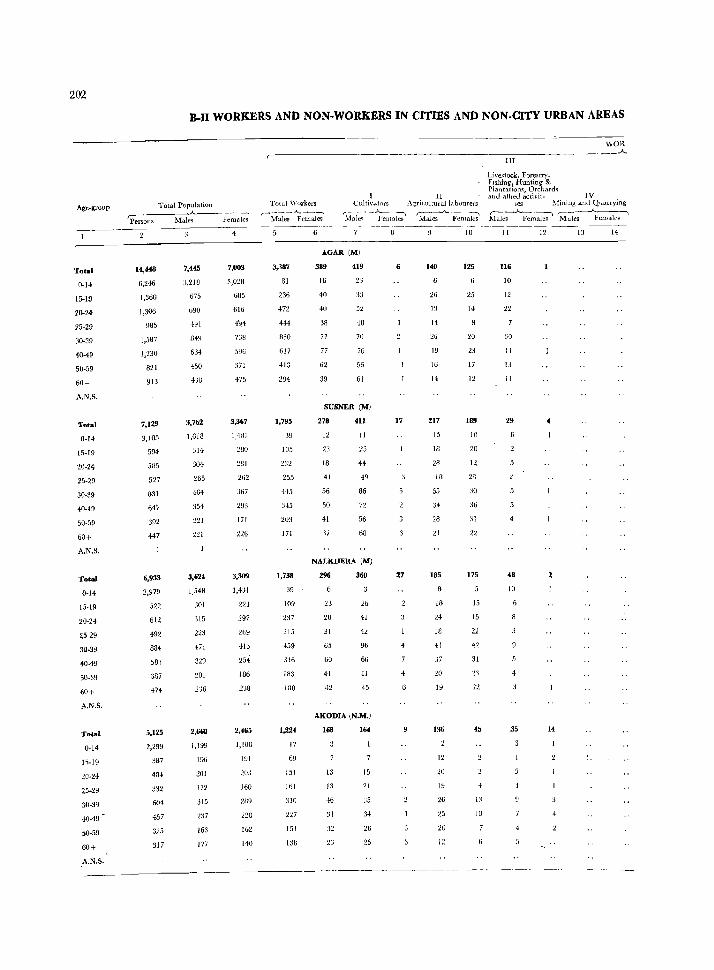
202
Age-group
Total
0-14
15-19
20-2+
25-29
30-39
40-49
50-59
60+
A.N.S.
-rota!
0-14
15-19
20-24
25-29
30-39
40-49
50-59
60+
A.N's_
Total
0-14
15-19
20-24
2529
30.3~
40-49
SO-59
60+
A.N.S.
Total
0-14
11-19
20-24
25-29
30-39
40-49
50-59
60+
A.N's.
B-II WORKERS AND NON-WORKERS IN CITIES AND NON-CITY URBAN AREAS
I II TOlal Population Total Workers Cuiti\-.ltors Aqriculturallabuurers
r:-P~ers-o-n-s--M-al~e~--F;~ks' r-M;je;~e~;' ~e<:-- Females ~ales ~ Females
.~==~---------------------------
14,448
6,246
1,360
1,306
985
1,587
1,~30
821
913
7,129
3,10S
594
53.\
527
831
647
392
447
6,933
2,979
522
612
-192
884
583
387
474
5,125
2,299
:l87
40-1
:532
604
457
325
317
7,445
3,2lB
675
690
491
849
634
-150
3,762
1,618
314
304
265
464
:154
221
:l:!l
3,624
1,.>48
301
:315
223
471
329
201
2~6
2,660
1,199
196
201
172
315
237
163
177
4
7,003
3,028
6U5
616
4'14
738
596
371
47.,
3,367
1.4117
280
281
262
367
293
171
226
3,309
1,431
221
297
269
41J
254
186
2,465
1,IUO
HJJ
203
160
2lJ9
no 162
140
3,387
81
236
472
44-1
830
617
413
294
1,795
105
232
255
445
3-15
203
171
1,738
39
109
237
215
459
316
W3
180
1,224
17
6~
151
161
310
n7 151
IJH
AGAR (M)
389
16
10
40
38
77
77
62
39
419
3:3
52
48
70
76
56
61
SUSNER (M)
278
12
23
18
41
56
50
41
37
411
11
44
49
86
72
56
68
NALKHERA (M)
296
23
28
31
65
60
41
,2
360
26
41
42
96
66
41
45
AKODIA \N.M.)
168
13
13
46
31
32
23
164
15
21
:;5
34
26
17
27
-I
140
26
1 ~J
14
26
19
16
14
217
15
18
28
55
21
185
18
N
18
41
37
19
136
12
20
19
26
20
12
10
125
25
14
20
23
17
12
189
10
20
28
30
36
31
22
175
15
15
22
42
31
11
45
13
10
III
Livestock, Forestry; FIShing, Hunting & Plantations~ Orchard~ aud allied actidt- IV
WOR ..A..
les ~fining and Quarrying ~ ,-------"-----, Males Female~ Males Females
II
116
10
12
22
SO
11
13
11
29
48
J[)
35
4
12 13 14
4
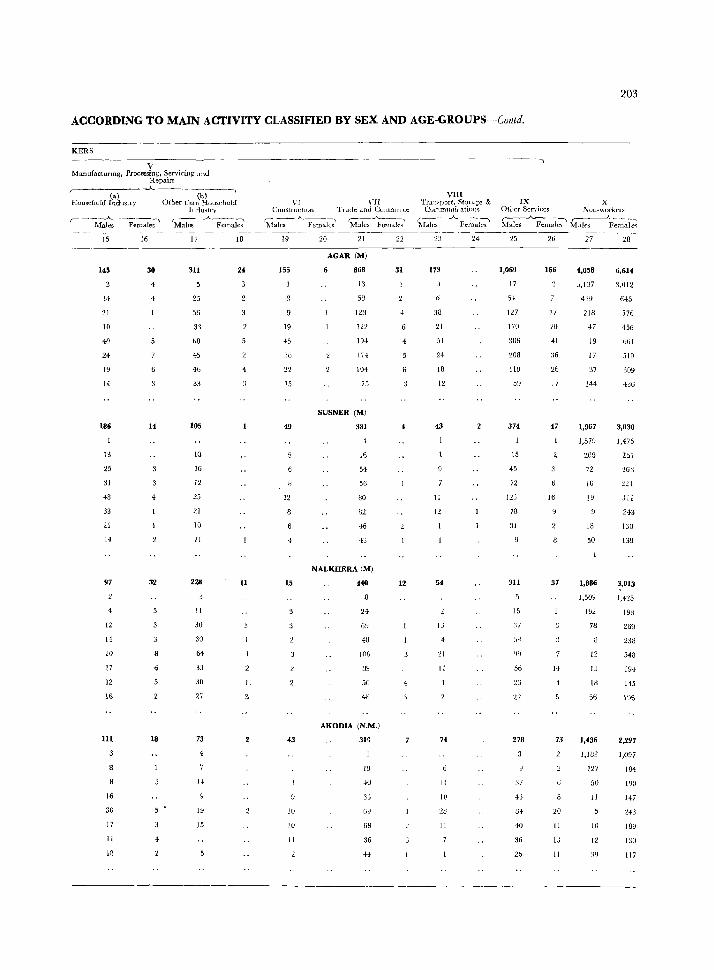
203
ACCORDING TO MAIN ACTIVITY CLASSIFIED BY SEX AND AGE-GROUPS -Colltd.
KERS
V Manufacturing, Processing, Servicing ,lJ1U
Repairs ,-_____ -----.A. --__ ~ ___ -,
<a) _ (b) HouseIlOIti Industry (hher than Household
Indm1ry r- ___ ....A. ---~ ,-- ~---....
Males Females Males Females
15
145
16
30
4
4
17 18
311 24
25 14
21
10
40
24
19
14
56
33
bO
45
46
33
4
186
\3
25
31
48
33
21
14
97
4
12
H
20
17
12
16
111
16
30
17
II
W
14
32
18
105
to
16
12
21
10
1I
2211
II
30
30
64
33
30
27
73
19
15
11
1.
VI HI (jnUSt! 11ctIOn TI.}(le and C(Jmmt'fcc
'hlale--;-_A_ Fcma~ ~l~ 19
155
19
-IS
1.\
49
12
15
43
10
10
II
20 21
AGAR (M)
868
13
58
128
122
19-1
17-1
104
75
SUSNER (M!
381
I~
51
56
80
82
46
43
NALKHERA (M!
440
24
G9
48
JOG
89
50
4\i
AKODIA (N.M.)
3tH
19
3:.1
69
68
36
H
22
31
4
12
VIII Transport. Storage &
Cornmunkations ,.---------...)...___.._~ Males Females
113
:m 21
51
24
18
12
43
II
12
54
13
21
II
74
11
10
:W
11
IX X Other Services l\'on~work("lS r----"----., ,.-------.A - -- -, Males Female.;; Males Female<;
25
1,060
17
51
127
17(1
JOG
208
59
314
15
45
72
113
78
31
3Il
15
'n
54
l)9
56
278
37
43
84
40
36
2b
26
166
17
2U
41
:16
26
17
47
37
73
20
11
lJ
II
27
218
47
19
17
37
1+4
1,967
28
6,614
3,012
645
576
456
661
519
309
430
3,030
J,57U ],475
72
10
19
18
50
1,886
257
:!63
221
:;11
243
130
139
3,013
J,509 1,425
192
78
12
13
W
5<i
1,436
198
269
:.!38
348
194
145
11J6
2,297
1,1U2 1,097
It7
50
11
10
12
184
Fll)
147
243
189
130
117
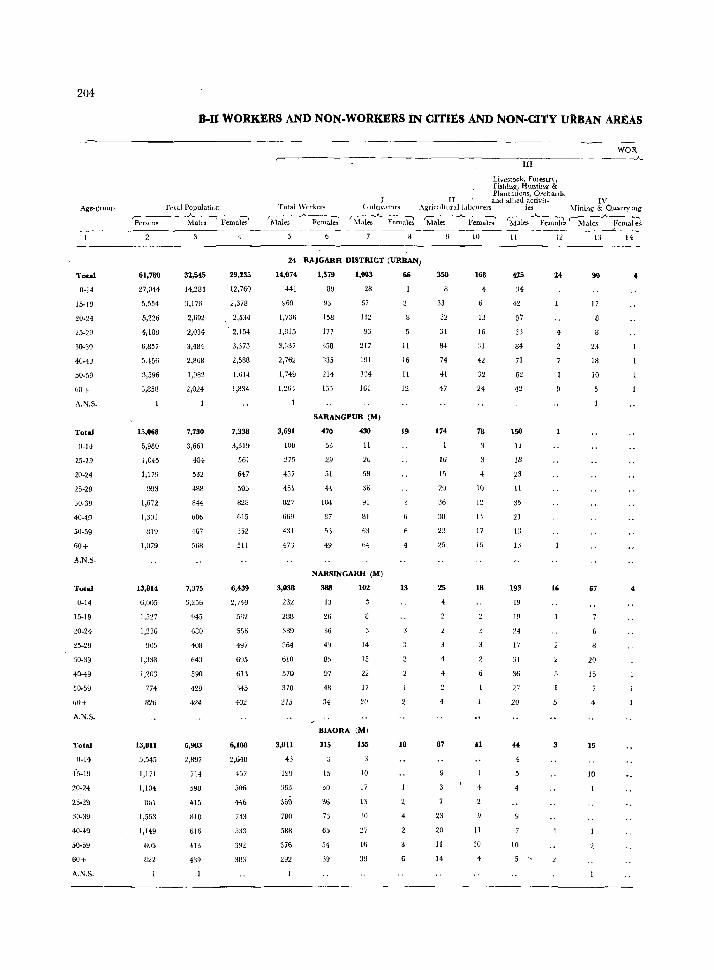
204
Age-group
Total
0-14
15-19
20-~4
25-29
30-30
40-4~
50-59
&0+
A.N.S.
Total
0-14
15-19
20-24
25-29
30-39
40-49
50-59
60+
A.N.S.
Total
0-14
15-19
20-24
25-29
30-39
40-49
:'0-59
61H
A.N.S.
Total
0-14
15-19
20-24
25-2\1
30-39
40-49
50-59
60+
A.N.S.
B·Il WORKERS AND NON·WORKERS lN CITIES AND NON·CI1'Y URBAN AREAS
Total PopulatiOll ,------ --.).._-- -"- -::---l Persons Malts' 'Females
61,780
27,044
5,554
5,226
4,188
6,857
5 .. 156
3,596
3,858
15,008
6,980
1,0+5
1,179
993
1,672
1,301
819
1,079
13,814
6,005
1,527
1,236
905
1,338
1,203
774
826
13,OB
.1,545
1,171
1,104
Hol
1,553
1,149
U05
32,545
14,284
3,176
2,692
2,034
3,484
2,868
1,982
2,024
7,730
3,661
484
532
433
844
bBb
467
508
7,375
3,256
945
680
408
643
590
429
424
6,!HI3
2,897
714
59B
415
810
616
413
439
29,235
12,760
2,378
2,534
2,154
3,373
2,588
1.614
1,834
7,338
3,319
56]
647
505
828
615
352
511
6,439
2,749
582
556
497
695
613
345
402
6-,108
2,648
457
506
446
743
38:;
I Total Wmker~ LnihvdtIJrs
'hl-;1;; -.A. F ema'ki ~-~ 1-1al~s Females
III
Livestock, FOlcstr" Fishin~l Huntin~ & Plantations, Orchards
WOR -----.A.
II and allted activit- IV .\griculturall.tuourers ies Mining & Quarry mg
Males -__.}. Femal~ ~1;~--"-Fcm;}d:- .-~.,.A..(,,'~-m~~
10 11 12 13 14
24 RAJGARH DISTRICT (URBAN)
14,074
441
%9
1,736
1,815
3,337
2,762
1,749
1,264
1
3,691
lOB
275
457
451
827
66Y
431
3,038
232
288
389
364
610
570
370
215
3,011
43
199
363
';69
780
588
376
292
1,579
158
1i7
35B
335
214
135
1,003
28
67
112
93
217
191
134
IGI
SARANGPUR eM)
470
53
29
51
H
104
87
53
49
430
11
26
58
h4
NARSINGARH (M)
388
13
26
36
49
85
97
48
34
102
14
15
22
17
20
BIAORA (M)
315
15
30
51>
65
51
155
10
17
13
30
'27
16
39
11
16
11
12
19
6
13
18
2
4
350
33
32
31
B4
74
41
47
174
16
15
20
36
:1Il
2:1
4
87
23
:20
II
14
168
13
16
31
42
32
78
4
10
l~
14
17
15
18
41
4
II
10
lIl5
:H
42
57
33
B4
71
62
150
11
18
.23
1l
35
21
W
IJ
193
19
19
24
17
31
36
'1.7
2Q
44
-4
10
24
-4
16
3
90
17
23
18
10
67
20
15
4
15
10
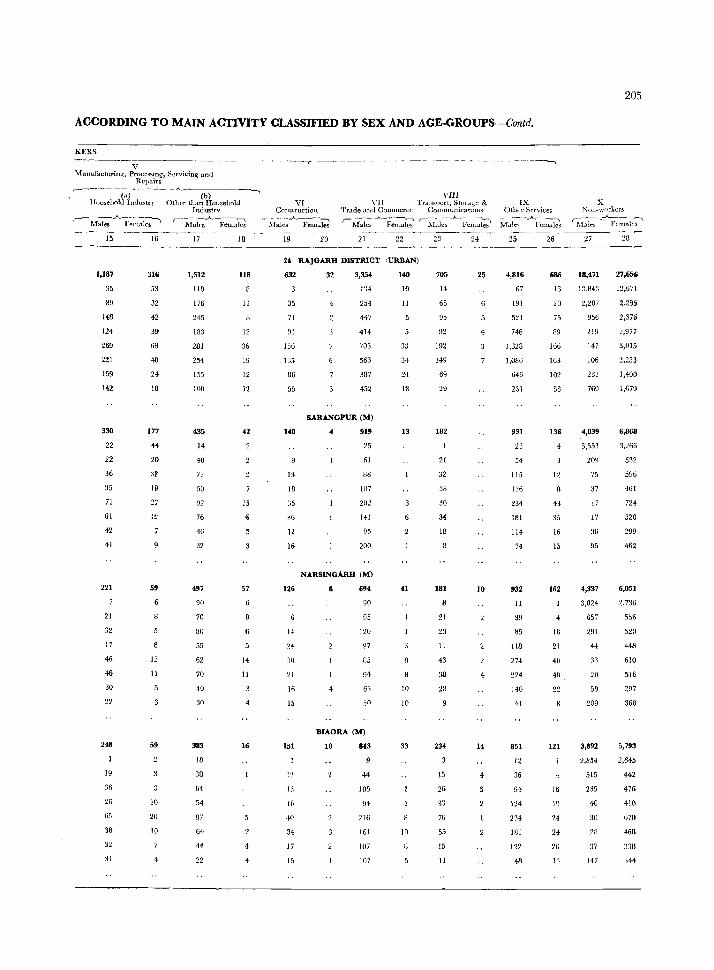
ACCORDING TO MAIN ACTIVITY CLASSIFIED BY SEX AND AGE-GROUPS-Contd,
KERS
V Mallufactnring-, Proceso:mg, Servicin~ and
Hepairs -,-----'------__ -~ __ _A_. ___ _
(") (b) Household Industrr Othf'f tlJan Household
Industrv ~.---_A_----:---,
.Males Females
15 16 11 18
VI ComtructitJn
_--_A._---:--'I Males Females
19 20
- - ---- - ------,
VIII \'11 Tr<lfIspul"l, Storage & IX
Trade and Commerce CommunicatlOns Other Services
r-M;l~.A-F~:lei r-hl:I~-_A_F~:i;;\ ~r:k:--.A.F;~ak1
21 22 23 24 25 26 ----_ ---------------------
1,187
35
89
148
124
269
221
159
142
330
22
22
36
35
71
61
42
41
221
21
32
17
46
46
30
248
19
36
26
65
38
32
:11
316
53
32
42
39
68
40
24
18
177
44
20
3!
19
27
19
59
13
11
59
10
20
10
1,512
110
176
245
183
281
254
155
iOO
435
14
40
77
50
92
76
46
32
497
90
70
80
55
62
70
40
30
383
10
38
64
54
87
64
44
22
118
11
12
36
19
12
12
42
15
6
57
14
11
16
4
4
24 RAJGARH DISTRICT tURBAN)
35
71
91
156
135
86
55
140
13
18
36
36
12
16
126
14
24
3n
21
16
15
151
13
13
lH
40
34
17
15
32
4
3,354
1':4
254
447
414
103
563
387
452
SARANGPUR (M)
4 919
25
61
88
107
202
141
95
200
NARSINGARH (M)
8 694
90
95
120
97
85
94
63
50
BIAORA (M)
10 843
44
105
94
21G
161
107
1n7
140
10
11
33
34
24
13
41
10
10
33
10
705
14
65
95
92
192
149
69
29
182
21
32
38
30
34
18
181
21
23
1l
43
38
28
234
15
26
33
76
55
15
11
25
10
4
4
4,816
67
191
521
746
1,328
1,086
646
231
931
23
54
115
1:16
234
181
114
74
932
11
39
85
118
274
224
140
41
851
12
36
94
124
234
181
122
48
686
13
2~
75
89
166
163
102
58
136
4
12
43
35
16
15
162
4
18
21
40
4H
22
121
4
16
1~
24
24
20
13
205
X !'\on-worlers
r----....A...----." !\Ltl(""s Fe-malrs
27
18,471
13,84:1
2,:W7
956
219
147
106
233
760
4,039
3,553
20Q
7_>
37
17
17
36
95
4,337
3,024
657
291
44
33
20
59
209
3,892
2,854
515
235
4G
30
28
:l7
147
28
27,656
12,671
2,285
2,376
1,977
3,015
2,253
1,400
1,679
6,868
3,266
532
596
461
724
528
299
462
6,051
2,736
556
520
448
610
516
297
368
5,793
2,645
442
476
410
670
468
:131l
344
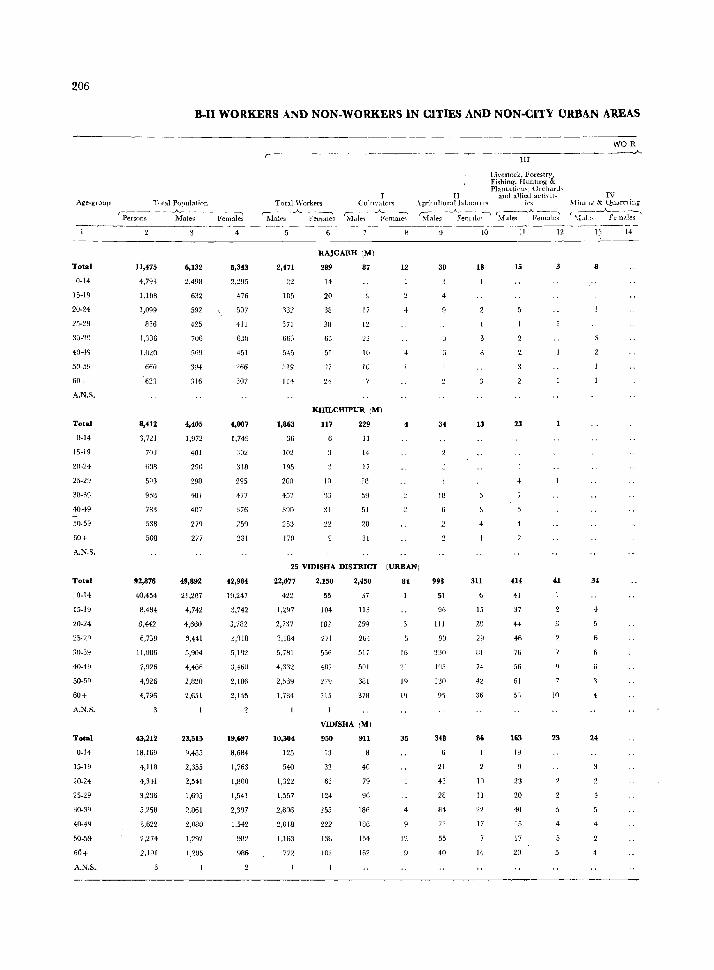
206
Age-group
Total
0-14
15-19
20-24
25-29
40-49
50-59
60+
A.N.S.
Total
0-14
15-19
~{)-24
25-29
30-39
40-49
50-59
60+
A.N.S.
Total
0-14
20-24
25-29
:1{)-3Y
40-49
50-59
60+
A.N.S.
Total
0-14
15-19
20-24
25-29
:10_34
40-49
50-59
60+
A.N.S_
B.Il WORKERS AND NON.WORKERS IN CITIES AND NON·CITY URBAN AREAS
Total Populatiun ,-::-- ~_ ~ _-A..- .- -__ ----,
Persons Males Fema.]e~
11,475
4,793
1,10B
1,099
836
1,336
1,020
66(1
'6ZQ
8,412
3,721
703
608
593
90a
78:1
538
508
92,876
40,454
8,484
8,442
6,759
11.086
7,926
4,926
4,795
43,212
18,169
4,118
4,341
3,236
5.258
3,622
2,274
2,191
6,132
2,498
632
592
425
706
569
394
:1l6
4,405
1,972
401
290
298
481
407
279
277
49,892
21,207
4,742
4,660
3,441
5,904
4,466
2,820
2,&51
23,515
9,485
2,355
2,541
1,695
2,861
2,080
1,2~2
1,2115
4
5,343
2,~95
476
507
411
630
451
2fl6
307
4,007
1,749
302
318
295
477
376
259
231
42,984
19,247
3,742
3,782
3,118
5,1RZ
~1,46()
2,106
2,145
19,697
8,684
1,763
1,800
l,541
2,397
1,542
~R2
~86
Tot:ll Workt"rs ,-- _~ _ _A._~
Malt's Ff"male~
I Cultl\'~tlors
r-_-- __;.__-~
Mdle~ FemaJe~
RAJGARH (MI
2,471
2~
105
371
663
545
114
1,863
36
102
195
2GO
457
253
170
289
14
20
38
38
63
55
'17
87
17
12
22
to
1(1
KHILCHIPUR (Ml
117
In
229
11
14
17
18
59
51
28
31
12
4
WOR
--------------------~ III
IJvestQck, I"ol'estry, Fi'lhing, Huntwg & Pla!ltatioll"~ OrcharJ"
II and allied acti\'l(. ,\gri(lll(llrallab01lrer~ ies
~i~les-·_}l?e;~ll~'i~ Male.. Ferna~ 10 11 12
30 18 15
34 13 23
4
IV Minillg & QUdrnil1g ~_.---.A...-.-_,
.\Ltl;!, Fern.'l.le'i
Ij 14
8
25 VIDISHA DISTRICT (URBAN)
22,077
4')')
1,297
2,737
3,184
5.781
4,:1:12
2,.1:19
1,784
10,304
125
540
1,322
1,557
2,806
2,018
1,163
77'2
2,150
55
104
182
271
556
4flJ
215
2,450
37
113
2[;4
51 i
501
381
378
VIDISHA (Ml
950
13
32
63
124
~55
222
ISB
102
911
40
79
18G
IS6
154
162
81
16
~l
19
19
35
4
12
998
51
96
111
90
130
95
348
21
43
28
114
71
55
40
311
15
28
29
Bl
74
42
86
10
13
17
11
414
41
37
44
46
76
56
61
51
163
19
23
20
40
15
17
20
41
10
23
4
34
4
24
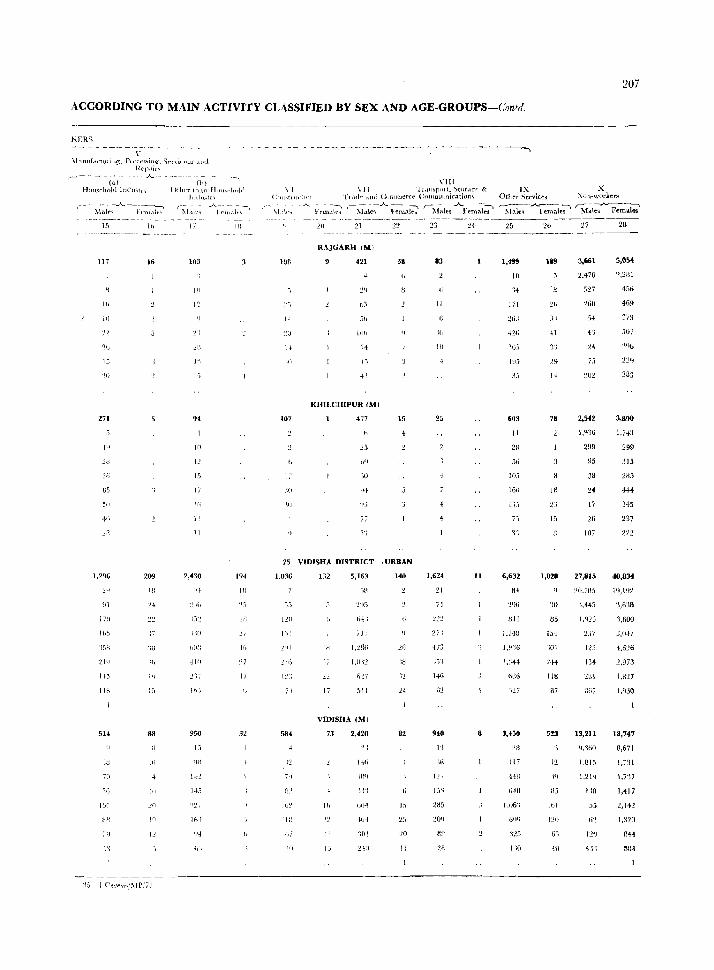
207
ACCORDING TO MAIN ACTIVITY CLASSIFIED BY SEX AND AGE-GROUPS-Conld.
\. \f2l.I1Uf,lClUllllg. p,,)('("'~~ing, 't"(\i( (lib! aPlt
Uf'p,]i" ,,------ ~- -~ -- - -_A -_ - ------- ---
(,I HOll.s.,.,hoJd Illdll~tl\
15
117
II>
10
'!1
10
271
1'1
:W
In
16
1,296 209
1711
II"
514 88
III
10
"iG III
HI{ 1'1
11
4'j
(t))
()Hwrtil.lll H"II,,·jIl11,] JIHI'I,l!\
r;f,~l~'~ .Al-'~l~'~l\~"\ lH
103
III
I',
:.W
J'I
]()
15
17
If;
I'
11
2,430 [94
'I, 1/1
1)0
ljn
17
11) j
950 32
13
14.1
"27
lh-l-
'14
------~~
\'l!l \ I YlI TI<IIJ~pill i, ....,t(}r.H.~r & I X X
(:(I!l~tIIJ(tI(Jll TI,ul-' MHI (;,jnIllJerc(" Communication" Other SCl'vi"cs :-":on-workers
\blt." A. Fr~\.:~ 1--\1~le~.A.. ;~l.~i;; r-1Ia(~; ~l~~)-~I~ '---;~k:-.A.~~;'e~ S~~..A-F~:i~ 1'1
1·1
}(\
107
I ~
to
II
2(1 :?1
R.-I.JGARH (MI
421
4!
KHIl,llIlIPUR (MI
477
60
77
33
15
4-
25 VIDISHA DISTRICT ,URBAN
1.036
LW
216
584
IV!
111I
h7
-III
132
(;-!-1
ill
1,:Uili
l,Ot?
VIDISHA (MI
73 2,420
14(;
H'i
ili h04
II 'WI
If 0
82
:to 11
83
11
UI
25
Zl
;1
146
940
1'1
'Iii
IJ7
I J'~
285
24
II
8
25
I,m In
'14
lil
263
603
11
23
5t;
I ()~)
i6(l
11j
3'1
6,632
H-I
3,450
28
1I7
HB
640
1,1)6';
6WI
325
110
26
119
)9
14
78
1,028
115
15-1
'101
2H
118
117
523
12
Ilj
Ihl
I:!()
6,
-10
27
3,661
2.476
527
~GO
54
4'J
75
2,542
299
95
38
17
26
IOi
27,815
'\,H5
1.C)2:)
'2.17
131
'281
llG7
13,211
1.219
1m
55
41'1
28
5,0;4
567
3,890
1,743
299
315
285
4+4
345
222
40,834
19,192
:l,mB
'1,1)00
J,0+7
-1.626
2,973
I.S~7
1830
18,747
8,671
1,731
1.7')7
1,417
2,142
1,320
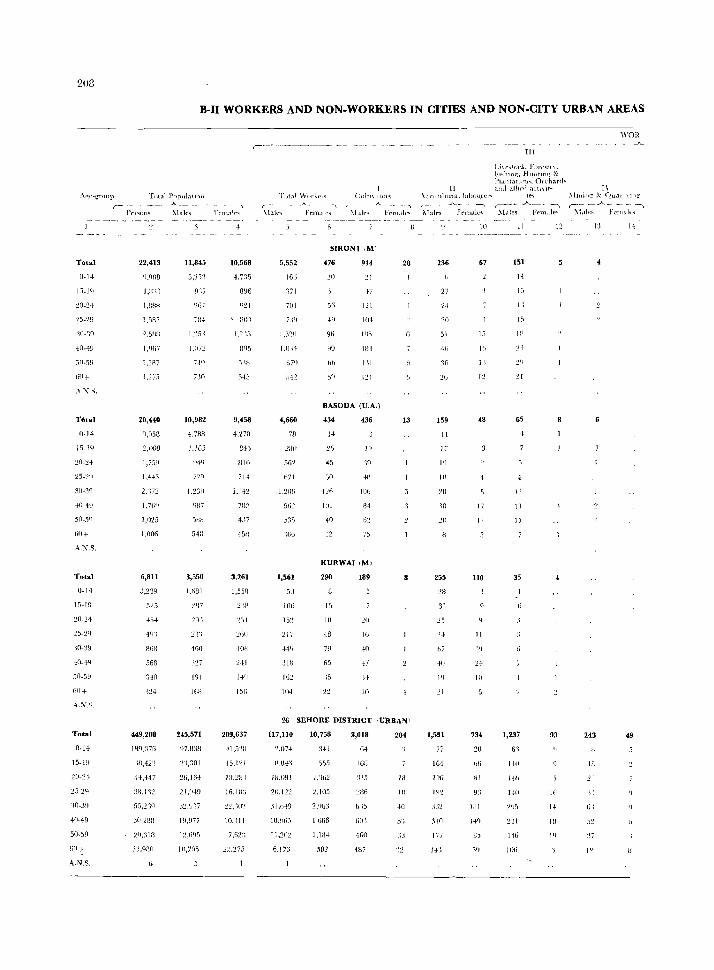
203
Total
0-14
1~_14
25-29
40-4~
'felta)
0_14
30-3"
.J.O-49
AC\'.S.
Total
0-14
15-10
:?O-24
')O-3Y
40-44
50·59
Total
0-14
15-19
20-21-
';0-39
A.N.S.
B-II WORKERS AND NON-WORKERS IN CITIES AND NON-CITY URBAN AREAS
Tlltal Population
Pl""!<;on<;
22.413
1.B'1l
I,BBR
2,5HIl
20,440
2'(lOS
1,759
1.441
2:17:2
1.761)
1,025
1,006
6,8II
J,239
525
868
568
:140
124
449,208
'm,42'2
44.447
:l()"SR
20,:11il
:iJ,QRO
_A___ __ _ __
Malt'"
11,845
5,:F/)
ill,!
1.:151
10,982
4.788
1,IW
729
3,550
1,1)81
~ln7
160
327
191
InR
245,571
97,83H
26,164
19.977
lO,70~
10,568
4,7:}5
896
1101
9,458
4,270
3.261
1,558
2·11
1%
203,637
~1,5'-IIl
J5,1~1
10,111
2;:,275
r--- --~------------------ ---~ ----
TlIt:ll \Vorl..f'I<; 1
(:llitl\.l101<1
,-_ .A..____-----., ,- --"-_ -, ~talC'"'> Fem.dc" .\Ll.k~ Frm,t1N
5,552
166
:)71
701
4,660
711
28()
5G2
(-i71
L'206
53'>
1,561
106
IS:!.
217
JIfJ
16:!
104
SIRONT ,M]
476
'\1
5(;
00
5"
9H
:!1
l2l
](ll
1H.'
lfH
III
I~ !
BASODA rU.A.l
434
14
.5 ;0
]1)1
~O
436
I"
411
l[)fi
84
75
KURWAIIM.
290
15
ltl
48
79
65
\5
:u
189
Hi
20
28
13
26 SEHORE DISTRICT ',Ull.BAN'
117,IIO
H,lWl
IIl,OBI
18,%5
11.2()2
6.17:1
10,758
341
515
1,'162
2.105
2,%J
1,666
l,lfH
582
3,018
64
Ibll
6 ~5
60')
460
-18)
204
III
111
+0
5'j
:13
liT
J~.i\t'.t(ICJ.., Fure~t!', L'1~hll1g, HUlltmg- & P'dntatll't}"Olchan\<.
[l ami aJlll'd attl\tt-'';rll ulllll 211 lahourCl'~ le" '-' __ ....A..~ _. -" ( ___ ~_ ..A.. __ ~
1\[alf's Ft'rnak, 11.tles F('m,lle~
236
27
:20
51
4h
159
II
17
1'1
IH
20
255
31
li7
411
1')
1,591
77
164
Iq')
:1I0
177
10
67
IIi
10
1')
48
17
110
11
10
734
HI
85
11
151
H
13
11
15
65
1:2
II
11
35
1,237
6'~
110
l4I,
140
146
JOIl
1:2
93
III
1"
\I'OR
1\ ~rlJlillC:- &. QU.lll \ 111(,"
r-~ ~_.A..._ -- p-- ~
:\[~lles FCJJ1alt~
14
243 49
IS
'\:1
G \
]"
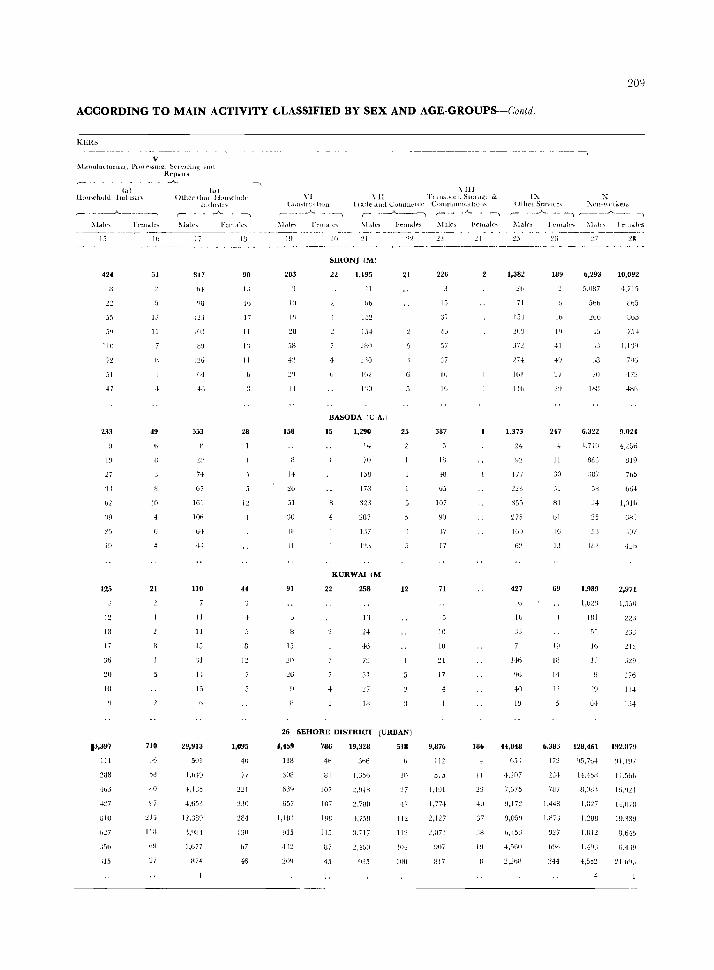
2ULJ
ACCORDING TO MAIN ACTIVITY (.LASSIFIED BY SEX AND AGE-GROUPS-Coilid.
KERS
V j\,l<tllllla(_ilullIg, PI(lfr"'~UJg, ~(,I"JliHt:: .:lud
RrpOilt .. -
(a) Hou~dHJld Illdus[t ...
,-- _______ A ___ . __ ~
:"'Ldle... F('U1.tle~
15
424
;;5
110
72
oj!
{I
233
19
') ;
~5
19
125
13
17
jti
10
13,397
111
~SS
{oj
H1U
;15
1"
51
LI
11
49
10
21
710
.:6
5B
uo
-.A.
(lJ) Other lltall Hpu~(hoJd
lncilhtlv r- - ----___./ ....... -----..., !-.1al(", Felll,tIe ..
17
"I
411
553
74
b7
161
106
110
11
1J
15
'31
15
29,913
501
l,hE)
{,ISS
1~.J8!)
],h77
Hi4
90
LI
1(>
17
11
1'1
11
28
1~
1,095
40
71
:!JO
:W4
130
,,7
46
\ 111 \'I \ 11 Ttall~pOI t, Stur,Hie &
CUIl~lIULLlOll
,..-------"- --~
lta(le .1lHl CUIllIHL'tCC COllll1lUnltatlolh
r- --_______..._---~ r- -------"----" !\1(l]r" I'Fllla1c ... l\fal~s
El
203
III
1'1
1+
158
14
31
:10
1H
11
91
15
2G
21
SIRONj IMI
22 1,195
~l
bb
J5+
Ih:2
1':0
BASODA IU.A.I
15
70
ljl:l
1 itl
323
287
1J7
KURWAl 1M,
22 258
1'j
24
46
79
07
li1
F~1I1al('s
21
25
12
26 SEHORE DISTRICT (URBAN)
4,459
lIB
JOS
639
657
1,181
HIS
786
4"
81
107
107
liS
H7
45
19,328
3h6
1.J5f:i
4,758
3,717
:!,luO
SIB
HI
·17
11:!
112
]II{
lOO
22(;
15
4;;
57
:37
II.
II.
387
lU
18
65
W7
90
17
71
10
10
17
,I
9,876
III
575
1,'1!:l1
1,77-1
2,127
!IOi
817
I'Fluak ..
186
11
{I)
37
:18
IH
----- ------,
1:-" x ()tl,ct ScrvlLc~ :\(lll-\\lllleJ/,
r-----_j.._. ~- ~ r---'--_...A.._--
!\lalr:, rem.lieS \ Ldr~ h:11l ... 1f's
2.)
1,382
71
[j]
274
IIlI
lib
1,373
14
177
:.UB
:i55
'275
IbO
427
10
71
146
{O
El
H,048
bJ I
,L.!07
7,675
9,172
9,05~1
0,4Si
1,2bB
189
1(>
1')
217
11
:lO
,\1
81
61
IIj
1J
69
19
1-1
'27
6,293
5.1)(37
56b
15
i()
6,322
88]
:187
3H
24
25
SJ
1111
1,989
10,092
.~, i'15
805
1 ,I 'J~;
472
+lJG
9,024
819
705
bH
1,01(>
681
J97
2,971
l,lllU 1,5,)0
Hll
51
10
JI
G{
176
11+
lJ4
6,383 128,461 19l,1I79
17:2
7117
1,448
1,H7J
B,Ot: \
I,ll:!!
1.2UU
I,OL1
~JI , I ~17
Ih.'I~1
14,078
19.13U
8,645
!;.41~1
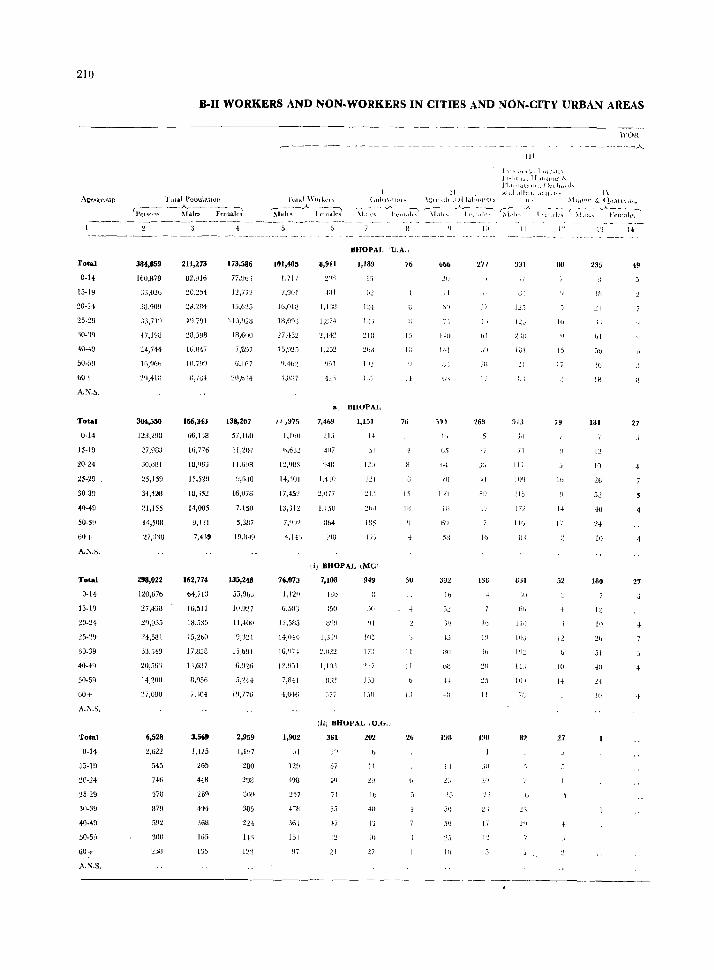
210
rot ...
0-14
15-19
20-24
25-~!)
50-59
bQ+
A . .''i.b.
Total
0-14
15-19
20-24
25-29
30-39
40-49
50-59
601-
A.N.S.
Total
0-14
30-39
~0-49
60+
A.S.S.
Total
0-11
-15-19
2C-t4
25-29
30-39
~-49
;'0-5"
60+
/>.'1.8.
8-11 WORKERS AND NON.WORKERS IN CITIES AND NON-CITY URBAN AREAS
Total l'oilUlahu\1 r----~-A-----,.., Pel<;on~ ~Ip.lcs Females
JJ,026
33,711}
47,19S
~4,744
IG,9f)h
304,550
123,298
30,6UI
25,159
34,4:18
21,155
14,508
298,022
120,671;)
:!7,4J8
29,U35
:!4,5Ul
'H,549
:W,56'J
14,201J
~7,OUU
6,528
2,622
545
716
57U
879
30U
211,273
1 ~j, j~ll
H:i.U4i
166,343
66,1')8
16,776
15,529
18,)52
14,005
~I J 1 :! I
7,439
162,774
b4,7t:l
16,511
18,53S
15,2bO
17,U:;8
13,6:37
U,956
7. :04
3,569
1,'125
265
448
'269
494
368
t:35
173,586
77.~6 ;
18,6()O
7,f1D7
138,207
57,16U
11,2<l7
11.6~8
~,6.10
16,U76
1,IS0
5,3117
19,fN~1
135,248
5:;,%3
1O,!Jn
11,40l)
9,:t!1
151b91
6/1:26
5,24-1
l!lJnt)
385
224
IH
l'..n
.----~~--~ _-------- ------
l"nlnJ \\"olk\!,> ,--_-----A -~---:___'I ~lal(s. lellldln
101,405
1,71i
7.g0l
Ilo,(liU
lB,{)1)_)
27,.t.j2
,i ,975
1,160
h,632
12,1183
14,'HJI
17,45~
13,312
4.11'1
76,073
ti,5lJ'j
H,OH
16,IJ71
l'l,!)j)
7,841
4,046
U,911
2'111
Jill
I,IGU
1,o7-t.
7,469
213
41)1
1.410
1,150
Uh4
7,108
1Gb
i50
2,{)22
1,10.1
']77
BHOPAL ·U.A"
1,189
h2
1,151
1+
01
[21]
121
1115
III
949
j(l
'II
17:.;
~l i
J jj
jjU
76
IS
III
II
76
IS
PI
I{
II
II
Ll
(ii) BHOPAL (O.G.)
1,902
12!1
+~II
36[
l;";l
361
57
jj
.ji
20Z 26
)\
JO
'27
It . \''::l\f ,d('I~,tI L\bol\l'ct~
..!I!
,I
h'l
140
1+1
:u
59.)
h5
I,. 7(1
li()
Illl
.11l
II,
loU
II
41:
1!J8
I:
3()
If)
..... '-.-----
III
'1.77
"I
Ii
26B
.1 ~ J
:7
I"
136
II>
I ~ I
;"
II
no
20
17
1 '~
- - - -- -------....A...
lJl
1 III ,\lll\., l'lllC,U\,
1 hll(d:':. 1I Jlltlll£.!: 0.. j'L1111~ttl(JlI .. (hl h,,:d, ,wll ,dtJ'_d .j( II' li- 1 \
II nl.lk~
II I'.!
!J91 uo
12.J
l..u 110
lUI IS
1":1 17
9lJ 79
71
117
Ib
215
172
11f, I;
II)
831 52
;\)
111l
to.; 12
1 !l'!
11.: 10
27
~1IHHH' & <!\li\\l.')\ll,",
(-- . ---"--- ----., ~\Ld(_, J'efll:1ln
235
III
~ I
"I
.!b
III
131
I'
10
26
52
4U
10
130
I"
10
51
-III
21
IU
14
49
27
27
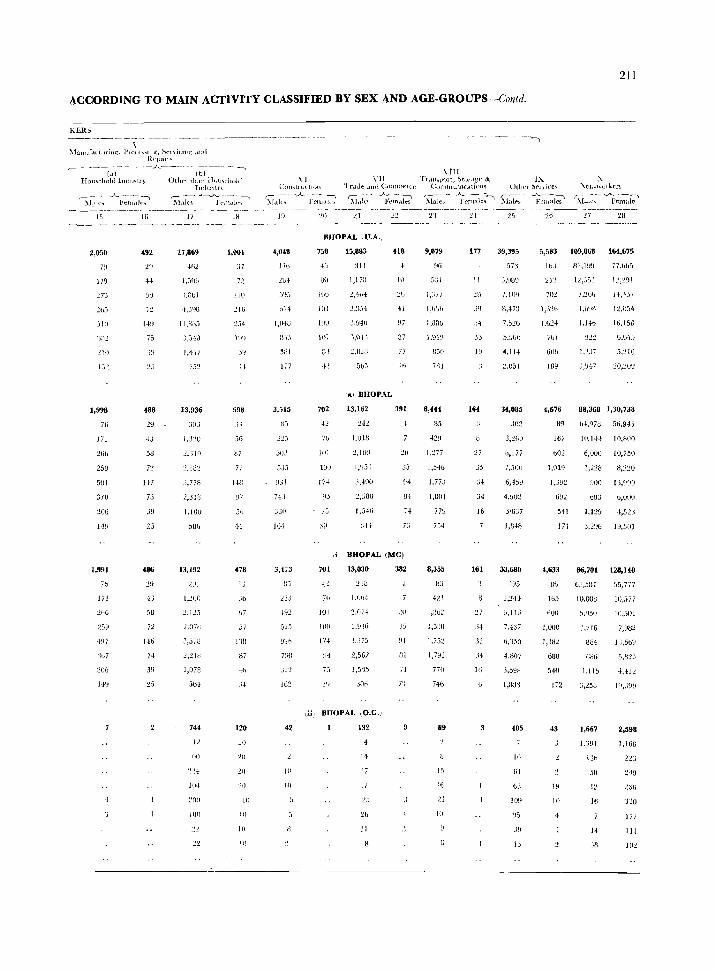
211
ACCORDING TO MAIN ACTIVITY CLASSIFIED BY SEX AND AGE-GROUPS-Colltd.
KERS
y "\lanuf<H tllli[lg, Plm f"~llH!J Sn \ lum; .llHi
I{{'pall" -_ ~_~ ____ -- -~ --..A....-~--"
(.1) Hou~cbold 111(111 ... 11)
1.\
2,Q50
ll!)
273
JIll
'j}12
1,998
70
171
20b
259
501
37U
2U6
1,991
,b III
250
:367
206
149
16
492
H
7S
488
+3
58
7'!.
147
75
39
486
-IJ
53
i'2.
140
14
3Y
(bl OtlJ(,1 til,111 HUll\('liolJ
Tndll~tl'\
r- ----- ~_..A....: -- - -, :'\Ll1c~ ]'('!1idk.,
17
27,869
1.30b
i.robl
J,:J4B
1,41)7
13,936
JOJ
1.320
3,778
2,318
I.IOU
586
13,192
2~J
2,123
J,378
1,073
.')G4
744
12
hI)
~oo
I()O
18
1,001
:17
~10
\\fl
H
598
.Il
56
U7
77
140
5b
478
13
310
h7
:'7
1';0
87
120
20
III
III
III
III
\llJ YI
(:un"llt.t flOn \'ll TI.I.I!~IY)ltJ ~tl)/J.g-e &
'lrdde ,wei CO.llHlU'lle COlllUlUrHC.JtiuJls
~<d(~ ---__"'_-]~l.ik? ~.,i(''(- ~~~.lk' ~::tk~ ~t'UJak~-"
1,11-10
In
302
jJj
~31
3Jf1
lvf
3,173
515
1(1
1(1
:n :t.!
BHOPAL. U.A.,
7:>8 15,883 418
~lll
3U 1,17:1 H\
I ~)O
(Ill BHOPAL
702
ib
101
IUt)
17+
::EJ
13,162
142
I,U18
l,lt):\
l/J5',
~l,iOO
2.58JJ
1,546
JI4
391
jj
a4
74
73
,j BHOPAL (Me)
701
4 !
;b
lOt
100
17-1
~14
i5
13,030
1,(J(J-!
3,375
2,561
1,5·1.5
.lOti
\ii) BHOPAL I,O.G.)
132
f
If
Ii
II
382
3S
;1
:n
9,079
96
JJl
1,:1/)
I,b'lu
I.U3b
iHl
8,H4
1,277
1,5-16
t,i7J
1,801
77!1
i5~
8,355
1,262
1,S:}O
,iO
74G
89
15
1G
lU
II
2+
177
II
~n
lU
lU
Jj
:>4
16
161
:!.7
34
34
](i
1:--. Other ;'t'l\ icc!o
r---~lalf'"S
25
:--. :'\Ull~,,,,uller~
r:-:-------..A-~---~
M.tlc:-. .Female
17 28
39,395 5,583 109,868 164,675
B,4B
7.5:!6
f,ll4
34,085
j(J2
3,160
10,177
7,5(J(J
6,4SU
4,VU2
3'637
I,B43
33,680
7.437
6,']50
4.807
3,59H
l,UYl
405
lG
61
b~\
109
Jy
IJ
70:!
l,.t!b
1.1021
tiOb
189
4,676
89
167
(>02
1,019
1,302
5·11
171
4,633
Ub
Ib.J
60il
I,OUO
1,182
68B
5¥J
172
43
19
III
77.G65
7.:!bh 14,4.17
l.11b Iti.ISD
1,':';7
.;,~'·17 20,2UU
88,368 1,30,738
104,Q78 56,945
10,1-1-1 10,800
6,OOU 10,750
I,22M 8,220
UOO t 3.98~
6[13 6,000
I,J29 4,52:)
3,2!'6 J ~,501
86,701 128,140
(i:I,5B-I-
5.'I5U
1,:!.16
884
bUb
1.115
3,253
1,667
jn
I, 16
14
;u
55,777
10,577
10,51)1
7,!IS1
lJ,6b!1
5,823
4.412
2,598
1,lGS
2'43
330
l77
III
lU2
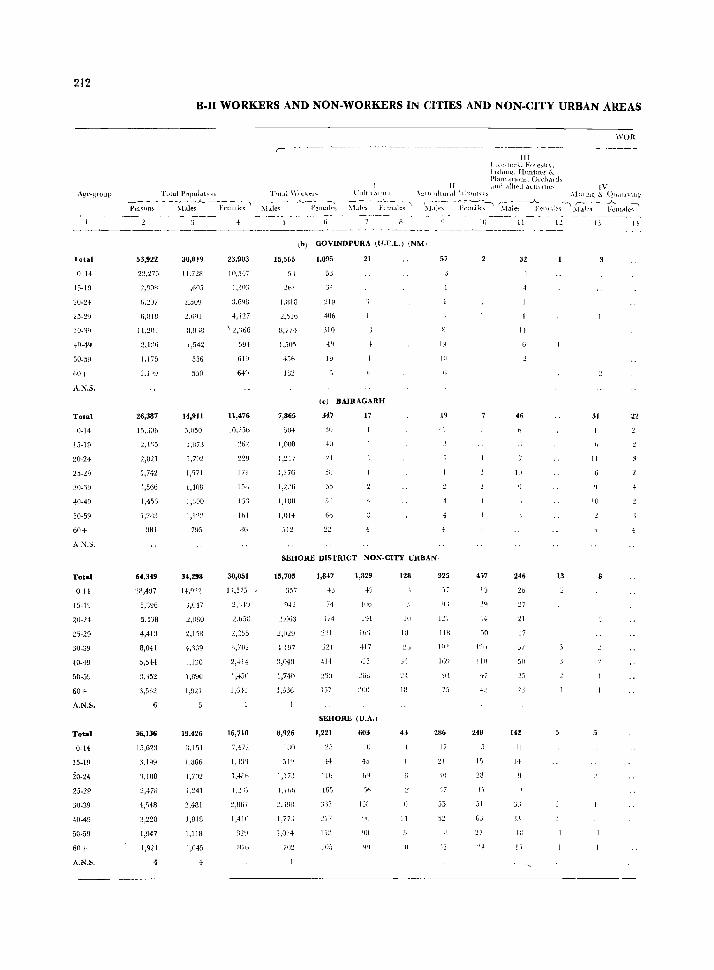
212
lotal
o 14
15-19
20-2+
25-2D
30-'3<)
40-14
30-59
60+
,\.:\".5.
Total
1l-14
15-19
20-24
25-29
30-'1!.1
40-49
50-59
60+
AN.'),.
Total
0-11
15-1!J
2U-l}
30-39
1-0-49
60+
A.N.S.
Total
25-29
3U-39
40-49
50-59
A.N.S.
B-I1 WORKERS AND NON-WORKERS IN CITIES AND NON-CITY URBAN AREAS
Total POpul..li1f)1l
~~----~--~-----l Pel <;Otl~ [\['-tles rl'lll,th·<;
53,922
2~,:O.J
:l,f]()H
G.:.!U7
1.175
26,387
I5,jOb
2,02]
:,566
1,4\i
l,2Kl
3HI
64,349
5;.>!:J6
5,538
8,041
5,5H
:},152
3,502
36,136
15,6'23
:~.1l}~
'{,1m3
2,47B
1,'>48
3,228
1,947
1,921
4
30,019
II.72B
l.tiOS
B,B ;R
, ,54:!
556
550
H,911
j,050
1,Hn
1,,)7i
1,408
1,300
1,1:':~
7~S
34,298
l,017
:!,UIlO
2,158
j,LlQ
1,896
I,D21
19,426
iI,111
!,IJG6
l,in2
I.Z4I
'?,481
1,81B
1.118
1,045
4
4
23,903
10,5·(,7
I ,,,n:;
3.648
4,127
594
619
1l,476
IO,Db
171
lSU
lhl
30,051
1_;.57~)
2,b5U
I,G-II
16,710
7,4n
1,1:1'1
l,4,llh
I,':;;
~,[)(j7
I,-lln
Tnt].1 \\'lJlI..t"l" ____ A ___ "_~
~Lll("R Fell1aks
I l'liltl\,ll r )fS
hld~>~- -}.'~l:tl~;'
II
III I [, l',(iwl. For c~tl \. 1, Isil!ll~. HllHtHl~ S .. PlallLttl~llb, (>l'{_:h,Hd~ ,IUd .Illu'd adl1 lIIe~
WOR
IV \C:!llllllUlall.t~'('H!I'I~ .\l1lllug & Ql.dll\IUi,;
';1'11:-::-" -~l:~~"~~ \laJ~"~t'~n I:e~-\ .llil~~ - ~lll;l-c~ 10 II I' 13 1-1
\b) GOVlNDPURA (If_c.L.1 INM,
15,565
5j
I.BW
2.')16
R,i7+
456
lE12
7,865
504
1,008
J!~l i
1,~76
1,095
5J
34
406
:lI0
I!;
21
(c) BAIRAGARH
347 17
~lf )
41)
11
.Ill
55
6t1
57
Iy
III
19
SEHORE DISTRICT ,NON-CITY URBAN,
15,705
357
.!,O(i3
2,019
l ]~7
3,040
1,740
1,336
8,926
. an
1,17.i
1,lbl)
1,77J
I,OJ4
1,8·17
i4
174
2'\1
GIl
1:17
1,829
4'.1
lift)
lh'j
417
SEHORE (U_A.)
1,221
25
H
165
3')7
.!.II
II,
It);}
603
III
45
':ill
1311
l)()
128 925
q:
III 1..'/
118
Ill!
16~1
4J 286
:':1
')1
35
1·1
I)
H
.\0
1:':0
111)
248
1\
51
GJ
:':7
32
II
46
1"
246
2b
:27
21
17
50
25
23
142
" 1+
I::
51 22
11
'0
13
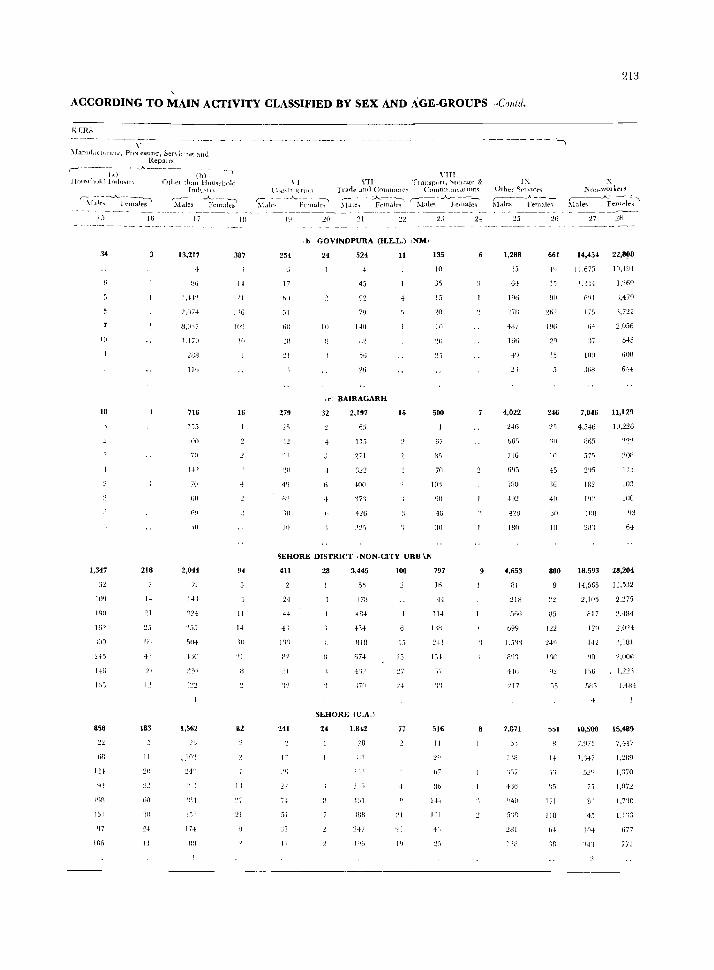
ACCORDING TO MAIN ACTIVITY CLASSIFIED BY SEX AND AGE.GROUPS-Colltd.
K[RS
\' ~Iaf!lIC((LlnIJI!l. PJO(t'SSlJl;l', SenklTle: alill
Repairs r------ - - - - -..A.---__ • __ _
(,.) Houv'h"I,) Indll,(t\
1,1 16
34
1(1
18
1,347 218
]1)9 14
~ I
Hj~
:00 Iji;
4'j
HG if)
I'
858 183
22
II
~Il
151 ~lll
'17
lOG II
(h) Othet thall Huu<;cilnld
Indu~I"
'M:Jes --~~-;fJ~ 17
13,217
) A4~
2,07+
1.171l
28B
llh
716
I j5
100
70
7(1
i"iO
iO
2,044
',9
14'1
~55
5tl4
1:!2
1,562
21)
.. )():.!
~4-')
IlH
174
flO
387
II
III
I \6
10'2
](1
16
94
II
1+
"I
82
II
\I C,n)',tlL1(ti('jl
nIl ,'II 'flansport ..... tt)I~U~t' &
Trarle .tIlII (:OtnlIlCICp Ctllllmlltllt,(ILOn<;
';1dl~~- --..A..i~~lal~ 5t:le~ -~;I~I~' ~\1;~ -_A._f~;I:J~
254
17
hll
jl
~I
279
42
4'1
f)')
III
21
,b GOVINDPURA (H.E.L.) iNMI
24
10
524
4
4, 92
1,10
, c) BAIRAGARH
32 2.197
115
:271
'!.7'1
11
16
23
135
10
3'>
15
In
500
67
70
10'1
40
30
SEHORE DISTRICT ,NON·CITY URB\N'
411
24
4 :
]'1',
It!
.11
241
17
28 3,445
1 i8
G74
SEHORE tv.A.)
24 1.842
28
+31
1UP.
247
1%
100
I"
77
:21
14
797
16
H
114
liB
~'II
)1
51ti
II
hi
llb
1++
III
4'1
- --- --_- - ------,
IX ()Iher ';el \.H't'~ ~----_A---_
Males Female,;
25
1,288
23
u4 11),:;
~7H
487
1(16
2\
4,022
2+6
716
Isn
4,653
81
:!IB
('99
wn
217
2.871
j'l
1'\11
4 Hi
5 :n
lW
26
661
l'j
!lO
1%
LI
246
'H)
45
'16
411
30
iO
800
122
551
ns
171
118
'18
213
x Non_wOltrls
( __ __A_-_____ .:..,
l\IoJe<; Fenldlt""
27
14,454 22,808
11,67:'
l,3H
1 is
6-1:
31
100
JG8
1f).4~)4
1.~69
';,47!)
:l.721
2,(156
545
600
6H
7,046 11,129
4,546
il65
37~
2<15
182
IllS
1ll.226
:~m-l
11:j
18.593 28,204
14,565 IJ.;32
2.l1l5
HI7
141
~ II)
2,~75
2,484
J,ISI
2J10lJ
1,48'1
10,SUO 15,489
7.ml
1.'.147
n I
45
In4
7,447
].,89
1,:170
1,07:.!
1.7'10
1,1'11,
fin
771

214
Total
I!~ 14
2.V?0
40-4~
50-50
60+
A.)!.S.
Total
0_14
15-19
iO 49
.\.~.s.
To'.]
0-14
15-19
20-24
13-2<)
~lO_3~1
()O+
A.'i.S.
Total
0·1+
l.l_lf)
20-24
40-19
60 I
B-II WORKERS AND NON.WORKERS IN CITIES AND NON.CITY URBAN AREAS
Tf)tal POPul:\tlon
I--~----------~--------- -~--
JIl 1 ,h (',>tuck. F~),e~tf\-, Fl~hUl~. HIlIlt,n-:{ & Pl.lllt.lU(IJI,>.Olc:I,ln!"
I II and ,llht'd .lC'U\ ilIC' [\-
WOR
rotal \\' 01 k~r~ Cl~)tl\"(t'J!" ,\<.ptr nltlll.tl LtC'-Huel;, .\lllllll!.; & (2uatlYI)l1_{
,.-------. -~--...----- -----"':1 r- -----"----------... Person!> ~Iale" Ft"males :,\1ale:. F{'malt>~ r;i~It'~ ./l'~;II'~~\ ~bl;~- -~~'t1lJ~' ~\I;i~-~ --"-i~~;~~~' ~;i~l>- -~~~:I;-"
14,03'
6,445
1,127
1.1R2
1.7()4
I,OB,
6nn 820
7,782
1 ,()~; ",
()1)7
1+1
411
'.395
~.860
51~
505
427
756
:JiG
30,707
13.674
2.653
~.:t25
1.670
:.',67 ~
I.5j~
,1,fW7
7,333
i)fl5
hll
'":76
420
'126
246
531
4114
1B6
3,399
1,5tfl
280
~4)
220
406
16,493
7,177
1.\01
1,3B5
1.1411
:!,Oll
1.524
6,703
577
'112
400
3,6"2
1/)5')
.10il
2"3
IS.\
2,996
l.3H
21Cl
.150
17'1
14,274
1, 1 :~.l
1.177
! ,f;54
3.319
i2
4JG
4'2G
3511
'106
1.828
:34
IO~
~:13
IH5
j(iH
H;4
1,'32
71
I(\()
:!Ol
1[;4
7,!lS7
sor-;
IJ17'1
I ,~II) J
1.4!io
f)()()
ASHTA 1M)
290 472
15 :?O
25
'Ii) lb
H7 IU
15
'il)
BERASlA IMI
112
14
",!l
IR
14
~07
I">
II
47
H
ICHllAWAR IMI
204 547
'Jt
10
5H 120
70
10
61
15
14
II
27 RAISEN DISTRICT ,URBAN
1,249
l'i:!
IIH
IH
IIi
70
966
IllS
100
:W(l
1-11
15+
47
II
17
.'1
.« 70
21~
III
;0
~1
1'1
III
128
11
12
15
:!O
I;
1'2
582
17
\0
III
In
II
III
41)
:'1
II;
59
1'1
101
12
17
10
11
50
I"
12
42
In
17
18
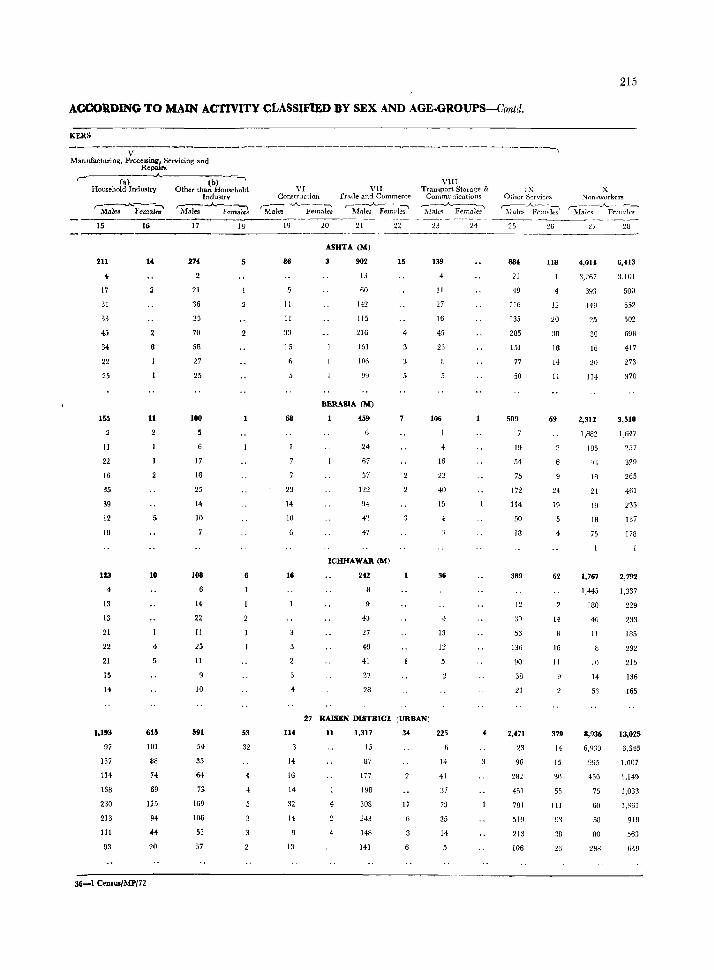
ACCORDING TO MAIN ACTIVITY CLASSIFIED BY SEX AND AGE·GROUPS--Contd.
KEllS
-------v------------------------------------------------------, ]\.fanufacturitlg, Pl'ocessingJ Servking and
Repairs ,-.----(.-)-- A·-----(-b)- --,
Household Industry Other than Household Industry
"-~Fcn1aJ:' 'M-~ FemaJci
15
211
4
17
31
33
45
34
22
25
155
II
22
16
35
39
12
18
123
13
13
21
22
21
15
14
1,193
97
137
174
133
230
213
III
93
16
11
10
4
615
101
88
74
69
125
94
44
20
36-1 Cens",/MP/72
17
274
21
36
35
70
58
27
25
100
17
16
25
14
10
108
14
22
11
25
11
10
591
54
35
64
73
169
105
53
37
18
5
6
53
32
4
4
VI Construction
VII Trade and Commerce
,--_.A.. ___ ':"'"""I Mares Females ~1I.la~i~~f~
86
11
11
33
1 5
68
23
14
10
6
16
4
20 21
ASHTA (M)
3 902
13
60
142
115
216
151
IOn
~9
BERASlA (M)
459
24
67
57
122
94
42
47
ICHHAWAR (Ml
242
43
27
49
41
37
28
22
15
4
VIII Tramport Storag'e &
Communications r-.---"""_-~
~ [a]cq F emnles
23
139
4
II
27
16
45
23
106
16
23
40
15
36
4
13
12
24
27 RAISEN DISTRICT (URBAN)
114
14
15
14
32
14
13
Il
4
4
1,317
15
87
177
198
308
243
148
141
17
225
14
41
37
73
35
H
IX Other Servicf's
::\lllle.~ -'},'rmaki 25
884
21
49
116
135
285
151
77
50
509
1~
51
75
172
114
50
13
389
12
30
53
136
90
38
21
2,471
23
96
282
451
?AI
51~
213
106
26
ll8
12
20
38
18
14
11
69
24
19
4
62
14
16
11
379
14
15
30
55
111
38
23
215
X Non-work~r!!
~Iale" ........._Frmal~ 27
4,014
3,267
393
149
25
30
16
20
114
2,312
1,882
185
93
1B
21
19
18
75
1,767
1,445
180
46
11
10
14
51
8,936
6,<1:10
995
450
75
60
58
110
2AB
28
6,413
:1,101
500
552
502
698
417
273
370
3,510
1,647
257
329
265
461
235
137
178
2,792
1,337
229
233
185
292
215
136
155
13,025
6,345
1,007
1,149
1,033
1,361
918
563
649
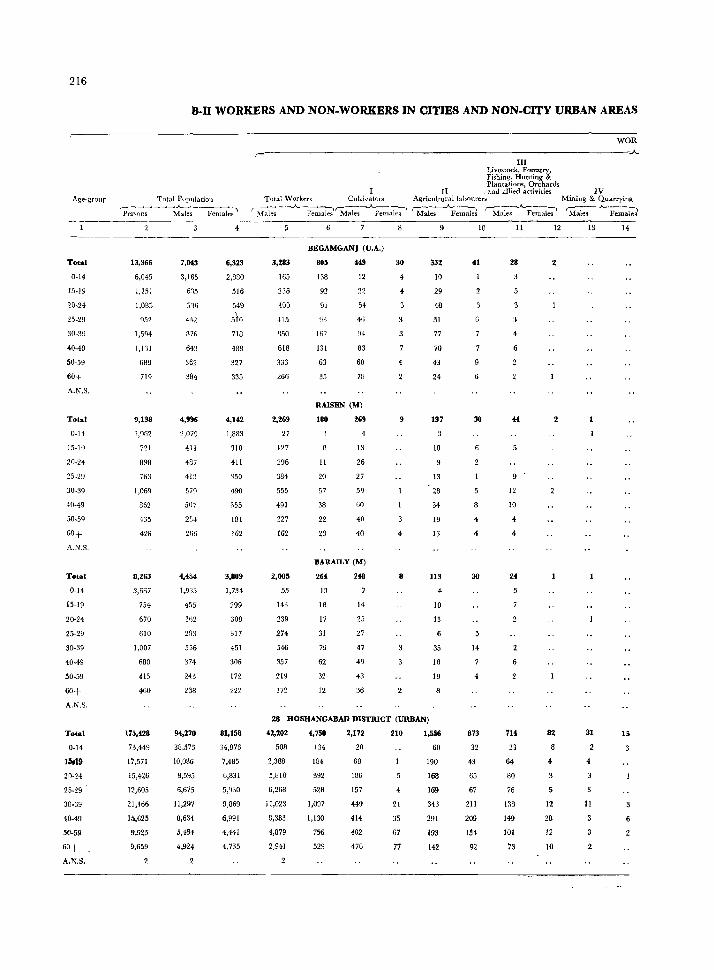
216
Age-group
Total
0-14
15.19
20-24
2.1-29
30-~9
40-49
50-59
60+
A.N.S.
Total
ll-14
15-1')
20-24
25-29
30-39
40-49
60+
A.N.S.
Total
0-14
15-19
20-24
25-29
30-39
40-49
A,N.S.
Total
0-14
15019
2~-24
25-29
30-39
40-49
50-59
60+
A.N.S.
B-I1 WORKERS AND NON-WORKERS IN CITIES AND NON-CITY URBAN AREAS
Total POPlilation ,.--- ~~------"------.~ Penom Males Females
13,366
6,045
1,151
1,OB5
9,138
\%2
721
R9f1
763
1,069
862
435
428
8,263
3,667
754
670
610
1,007
680
415
460
175,ti8
73,449
17,571
15,426
12,605
21,166
15,625
9,925
9,659
2
384
4,996
2,079
411
487
413
57fi
507
266
4,454
1,9)3
455
3~2
556
374
243
238
94,270
38,573
10,OB6
8,595
6,675
11,297
8,634
5,484
4,924
4
6,323
2,880
516
718
488
327
335
4,142
1,883
310
411
150
190
355
181
162
3,809
1,734
299
308
317
451
306
172
222
81,158
34,876
7,485
6,831
5,ggO
9,869
6,991
4,441
4,735
,----------------------------------------------!II
Livesto(;k, Forestry, Fishing) Hunting & 'Plantations, Orchards
WOR
-----oA..
II , and aWed activities IV Total Workers Cultilfators Agricultura1labonrers Mining & Quarrying
,-M-a-le-s---A-F~~~-.__A_Fe";:*;' ~r;l~~~ ~\i~F~~ ~ _ _A_ Fem-;~
3,283
165
236
400
415
B50
618
333
266
2,269
27
127
2%
384
555
491
227
162
2,005
55
143
239
274
548
357
219
172
BEGAMGANJ (U.A.)
805
138
92
91
93
162
131
63
35
449
12
22
54
41i
94
83
60
78
RAISIilN (M)
180
II
20
57
38
22
23
269
13
26
27
59
60
40
40
BARAILY (M)
264
13
18
17
31
79
62
32
12
248
14
25
27
30
4
+
9
4
8
332
10
29
48
31
77
70
43
24
137
18
9
13
28
34
19
13
113
4-
10
13
35
18
19
8
28 HOSHANGABAD DISTRICT (URBAN)
(2,202
508
2,388
5,810
6,268
11,023
8,383
4,879
2,941
4,750
134
184
392
528
1,097
1,130
756
529
2,172
20
68
186
157
449
414
402
476
210
4
21
35
67
77
1,556
60
190
168
169
343
291
193
142
10
41
6
3
4
4
30
14
7
4-
873
32
43
65
67
211
209
154
92
11
28
4
12
10
4-
4
24
714
33
64
80
76
138
149
101
73
12
2
82
8
..
12
28
12
10
13
31
2
4
11
14
15
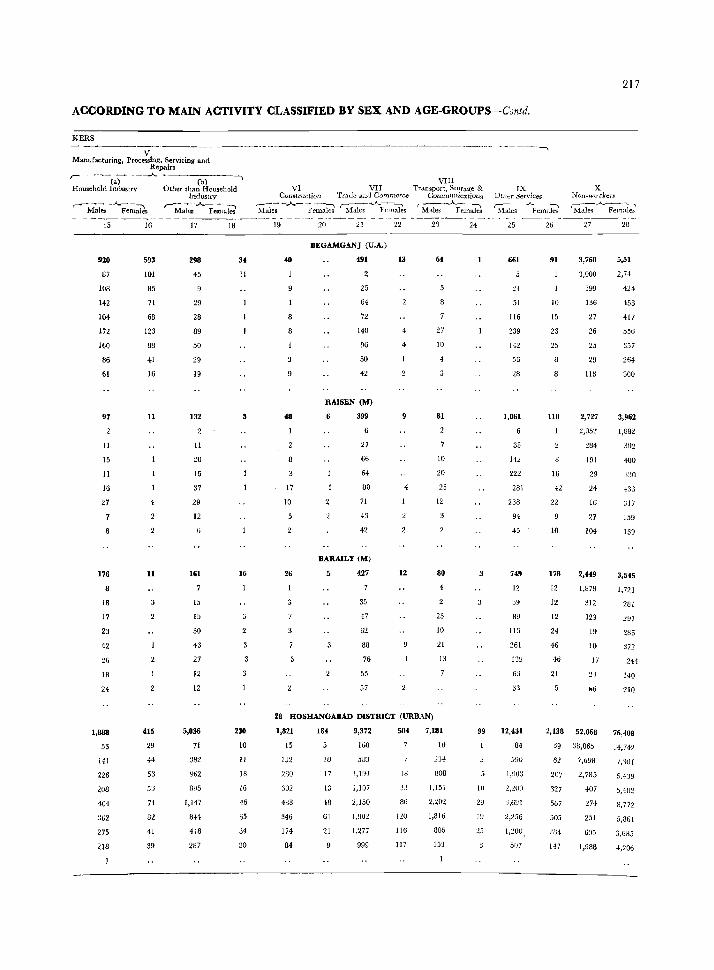
217
ACCORDING TO MAIN ACTIVITY CLASSIFIED BY SEX AND AGE-GROUPS~Cuntd.
KERS
V Manufacturing, Processing, Servicing and
Repairs ,---(:0-----"- ---(b-)---'
Household Industry Other than HOUl!ehold Industry
r--M~ks -A.Fe-;;'~s r-M-;i~.A.Fe~~b
15
920
87
108
142
104
172
160
86
61
97
II
15
11
16
27
176
8
18
17
23
42
26
18
24
1,_
53
HI
226
208
404
~62
275
218
16
593
101
85
71
68
123
88
41
16
11
4
11
415
29
44
53
53
74
82
41
39
17
298
45
29
28
89
50
29
19
132
II
20
15
37
29
12
161
15
15
30
43
27
12
12
5,036
71
382
962
R95
1,147
844
448
237
34
31
16
230
10
11
18
16
46
65
34
30
VIII VI VII Transport, Slora!.{e &
Cunstruction Tl'aJe and Commerce Communicatiolls
'M;;i;-.A.~:;;;ki 'Ma~-_A_Fem;;ks ~F;;,;jci
19
48
17
10
26
2D 21
BEGAMGANJ (U.A.)
491
25
64
72
140
96
50
42
RAlSEN (M)
399
27
66
64
80
71
43
42
BARAlLY (M)
5 427
35
47
62
88
76
55
57
22
13
4
4
12
21
64
27
10
4
81
10
20
25
12
80
23
10
21
13
28 HOSHANGABAD DISTRICT (URBAN)
1,821 184 9,372 504 7,181
15
132
280
302
488
346
174
84
10
17
13
48
61
21
100
583
1,194
1,107
2,150
1,!102
1,277
999
86
l:W
116
117
1IJ
23,)
808
1,151
2,202
1,816
806
153
24
3
99
In
2:.1
19
25
IX Otlier Services ~-._.A_---:--\ ~lales Females
661
24
51
116
239
142
1,061
33
142
222
281
238
94
45
749
12
39
89
II:}
261
139
63
33
26
91
10
15
23
25
110
16
42
22
10
178
12
12
12
24
46
46
21
X Non-wurkers ,-_ _A_ __ "
Males Female!>
27
3,760
3,000
399
136
27
26
25
29
llH
2,727
28
5,51
2,H
424
453
417
556
357
264
300
3,962
1,052 1,882
284
191
29
24
16
27
104
2,449
1,878
312
123
19
10
17
.6
:;02
400
:130
,)33
:317
159
139
3,545
1,721
281
291
286
372
244
140
210
12,431
84
2,138 52,068 76,408
590
3,691
2,256
1,200.
51)7
39 38,065
6t
207
327
567
50.'j
284
147
7,698
2,785
,)07
274
251
605
1,988
7;llll
6.439
5,402
8,772
5,861
3,6H5
4,206
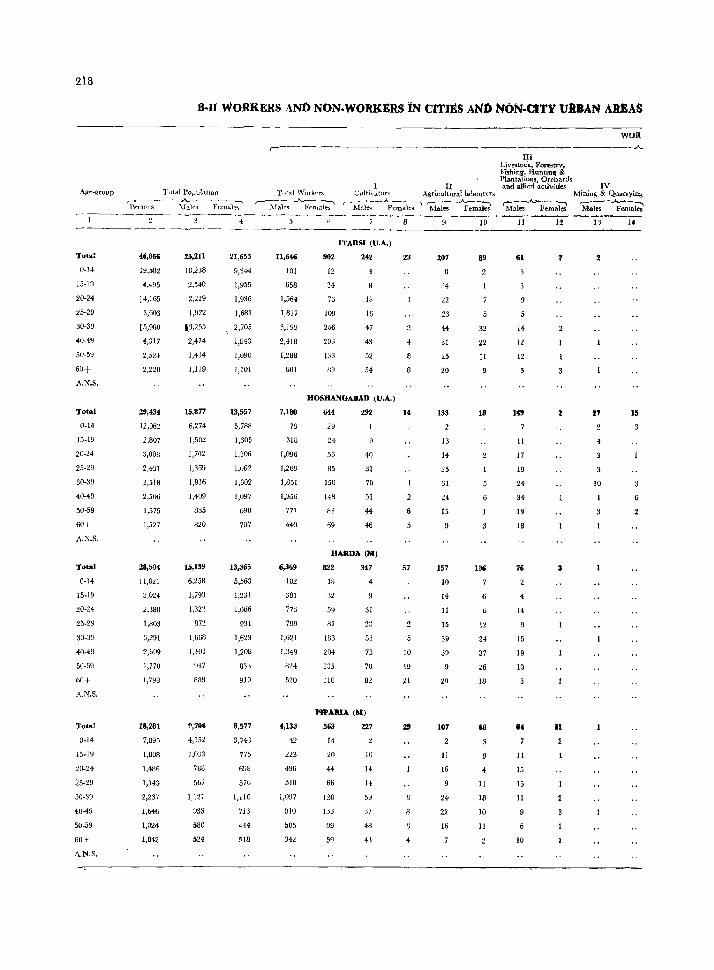
218
Age-group
TOla:
0-14
15-19
20-24
25-29
30-39
40-49
50-59
60+
A,]'(,S,
Total
0-14
15-19
20-24
25-29
30-39
411-49
50-59
60+
A,N,S,
Total
0-14
15-19
20-24
25-29
30-39
40-49
50-59
60+
A.N,S.
Tota:
0-14
15-19
20-24
25-29
30-39
40-49
50-59
60+
A,N,S,
.8-11 WORKERS AND NON-WORKERS IN CITIES ANt) NoN.CITY U:RBAN AREAS
TIlta1 POjJulatlOtl
~~~-- ~~ Fcm;}~
46,866
19,582
4,495
,4,165
3,603
[5,960
4,317
29,434
12,062
2,807
3,008
2,431
3,518
2,506
1,575
1,527
28,504
11,821
3,024
2,388
1,803
3,291
2,b09
1,770
1,798
18,281
7,895
1,808
1,48G
1,143
2,237
1,046
1,024
1,042
25,211
10,238
2,540
2,229
1,922
13,255
2,474
1,4:14
1,119
15,877
6,274
1,502
1,702
1,369
1,916
1,4U9
885
B20
15,139
6,258
1,793
1,3n
812
1,66B
1,401
937
883
4,152
J,():33
788
567
1.127
933
580
524
21,655
9,344
1,955
1,936
1,681
2,705
1,343
1,090
1,101
13,557
S,73R
1,305
1,306
1,062
1,602
1,097
690
707
13,365
5,563
1,231
1,066
931
1,623
1,208
8S:1
910
8,577
3,743
775
693
576
J,110
713
444
:;18
r-------------
I II Tnbl WorkeN
r-------"-~ Ct1ltivator~ ..\gri.culturallauuurers.
1\falf's Fr:males ,-___ .A__---, r-_---A-~
Males Females Males Females
11,646
101
658
1,564
1.817
3,199
2,418
1,288
601
1,180
79
318
1,096
1,269
1,851
1,356
771
440
6,369
102
381
773
799
1,621
1,349
824
520
4,133
42
223
496
51R
1,097
910
b05
342
902
12
34
73
109
246
206
133
n9
ITARSI (O.A.)
242
18
16
47
43
52
54
HOSHANGABAD (V.A.)
644
29
24
56
35
150
14R
83
69
292
40
31
70
51
44
46
HARnA eM)
822
13
32
59
81
183
204
1:15
110
347
31
23
53
75
70
32
PI\' AlllA (MJ
563
14
20
44
66
128
n3 99
59
227
10
14
H
37
43
43
23
51
to
19
21
4
207
:14
22
23
44
31
25
20
133
13
14
25
31
24
15
157
10
14
II
15
39
39
20
107
11
16
9
24
22
16
)0
89
32
22
II
18
6
136
6
12
34
27
26
18
4
11
18
10
11
WOR -----,"""-
III Livestock, Fqn,strv, FisbiuS'. liuntin~ & PlantatiOI1S, Orchards and allied a-cttvi ties IV
Mining & Quarrying r-------.A_---::--:---, ~....__-,--., Males }<'emales Males Females
Jl
6l
11
12
12
149
11
17
19
24
34
19
18
76
4
14
15
19
10
11
15
15
11
10
J2
2
3
II
2
I
2
3
)'1 14
27 15
10
3
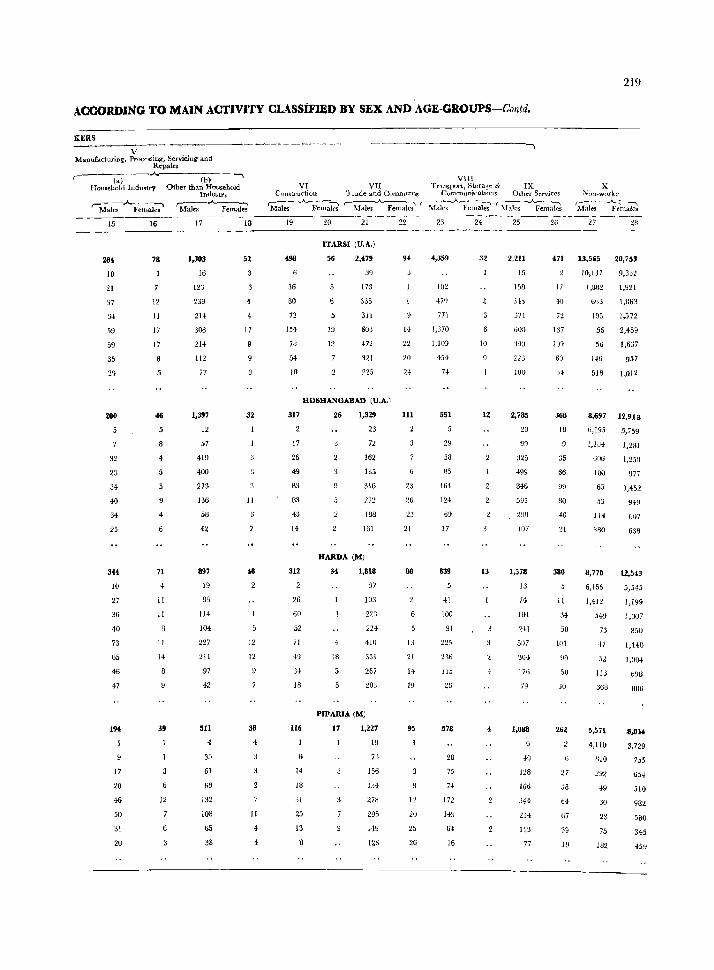
219
AOOORDING TO MAIN ACTIVITY CLASSIFmD BY SEX AND AGE-GROUPS-Contd.
KERS
V Manufacturing, Processing, Servicing and
Repairs
(a) Homebold Industry
~ ....... ----. Ma1e~ females
15
284
10
21
37
34
59
59
35
29
200
32
23
34
40
34
25
3H
10
27
36
40
73
1i5
46
47
194
16
78
12
II
17
17
46
4
71
4
II
11
II
14
39
(b) -, Other than HousehoJd
Inclustrv r:'".-'~.A.~ Males Females
17
1,303
16
123
23~
214
308
214
112
17
1,397
12
57
419
400
273
136
53
42
897
19
83
114
104
227
211
97
42
18
52
4
4
17
32
11
12
12
38
4
17
20
46
50
:ll
20
12
511
4
35
01
68
l:l2
100
65
38
6
11
4
VI Constl'uction
'M~P;;a~ 19 20
VIll VII Transport, Storage & IX
'1 fade and Commerce Cummunic.atlOns Other Servjces
.-Males Females ,-~~~ Males ...A.Females
21 22 23 24 25 26
ITARSI (U.A.)
X ~utl-worke
( ___ _A_~ ~
,Males Females
27 28
498 56 2,479
39
173
335
311
603
94 4,359 32 2,211
15
158
31>
471 13,565 20,753
36
SO
72
154
78
54
19
12 4n 321
225
HOSHANGABAD (U.A.)
317
17
26
49
83
03
43
14
312
26
60
52
71
,19
JJ
18
116
14
J8
31
25
13
26 1,329
23
72
162
135
3IG
272
188
161
HARDA (M)
18
1,818
)7
103
223
224
410
351
267
203
PIPARIA (M)
17 1,227
IY
7)
156
134
278
295
149
123
22
20
24
111
23
23
21
so
2l
it
19
95
I:!
20
25
26
102
479
771
1,370
1,10J
454
H
551
29
58
85
164
IN
69
17
839
41
100
91
225
:B6
115
26
578
28
75
74
172
64
16
10
12
13
4
j71
000
223
IOU
2,785
20
99
325
499
846
5!Jl
107
1,578
13
74
184
241
51J7
17(j
79
1,088
40
J28
J66
344
214
113
77
i7
40
n 137
11)1
6J
3~
368
18
:35
66
99
80
40
21
380
II
34
50
101
~9
5U
10
262
64
67
39
J9
IO,lJ7
i,SIl2
665
105
56
56
146
518
9,3n
1,921
1,363
1,572
2,459
1,637
957
1,012
8,697 12,913
6,195
1,184
606
100
65
53
114
380
8,770
6,156
1,412
5H
73
47
113
368
5,571
4,110
/110
292
+9
30
75
182
5,759
1,231
1,250
977
1,452
949
607
638
12,543
5,545
J,J99
I,IJ07
8.>0
1,440
I,U04
098
8UO
3,014
3,729
755
65.
510
982
530
345
459
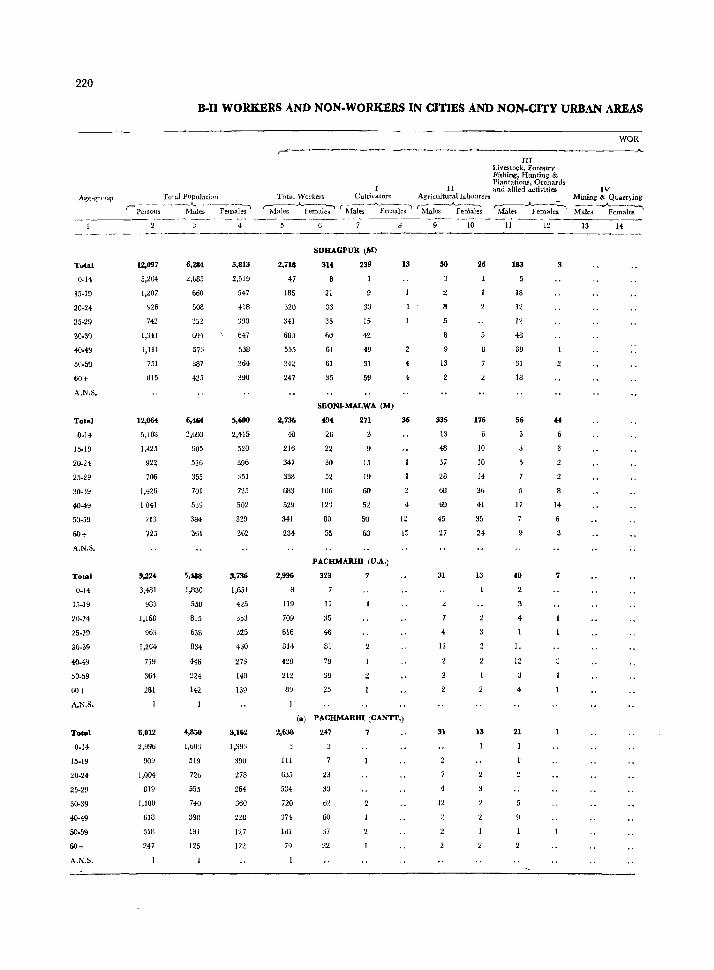
220
Total
0-14
15-19
20-24
25-29
30·39
40·49
50·59
60+
A,N,S.
Total
0·14
15·19
20-24
25-29
30-39
40-49
50-59
50+
A,N,S_
Total
0·14
15.19
20.24
25·29
30-39
40-49
50·59
60+
A.N,S.
Total
0·14
15·19
20·24
25-29
30-39
40-49
50·59
60+
A.N.S.
8-11 WORKERS AND NON.WORKERS IN CITIES AND NON·CITY URBAN AREAS
Total Populatio1l r- -- - - - -- ----------A...--- .-----:------,
PCtSOllS Males Females
lZ,097
5,204
1,207
Y26
742
1,341
I,ll I
751
815
12,_
5,108
1.425
n2 706
1,426
1041
713
723
9,224
3,481
983
1,168
96:1
1,264
719
364
281
8,012
2,996
909
1,004
819
1,100
618
31S
247
6,284
2,685
660
508
b94
573
387
425
6,464
2,693
905
526
355
701
539
384
361
5,488
1,830
558
815
638
834
416
224
142
4,850
1j 603
519
726
555
740
390
191
125
4
5,813
2,519
547
418
39(1
5·\7
538
364
390
5,600
2,415
520
396
351
725
502
320
362
3,736
1,65t
4~5
353
430
273
140
139
3,162
1,393
390
278
264
360
228
127
122
~------------------~
III Livestock. Forestry .Fishing, HWltlng & Plantations, Orchards
II and aWed d.divities Total Workers CultiVator" Agrit.:ultural1abourers
r~-A---, rc--.A_---... ~-~ ~.,.A...--~-~ Males fem.1.les Males Females ~1ales Females Male, Females
2,718
47
186
320
341
680
555
342
247
2,736
43
216
347
338
683
529
341
234
2,996
ll9
709
616
814
428
212
89
2,638
III
635
534
720
374
181
79
SOHAGPUR (M)
314
8
'21
33
35
6{1
61
61
35
239
1
15
42
49
31
59
SEONI·.MALWA (M)
13
'94 271 36
26
22
30
52
106
12')
80
55
15
19
GO
52
50
63
PACHlIURHI (V.A.)
323 7
Il
35
46
81
79
39
25
4
12
15
(a) PACHMARHI (CANTT.)
247
23
33
62
60
37
22
50
8
13
335
13
48
37
28
6B
69
45
27
31
4
12
31
2
7
4
12
10
26
176
6
10
10
14
36
41
35
24
13
13
11
183
IS
12
l~
48
39
31
18
56
[7
9
40
4
11
12
4
21
12
3
14
6
7
IV
WOK .A.
Mining &. Quarr)ing _--.A.-_:--, Males F ernales
13 I~
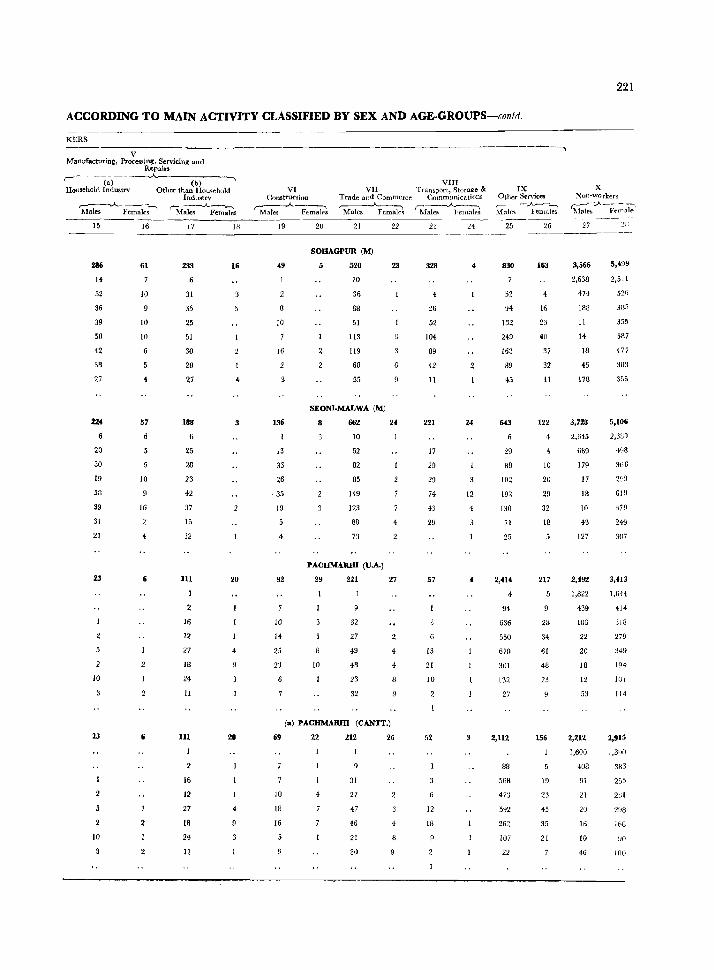
ACCORDING TO MAIN ACTIVITY CLASSIFIED BY SEX AND AGE·GROUPS-contd.
KERS
V Manufacturing, Processing, Servicing and
Repairs r-'--~(a~)----~'-----(-b)----~ Household Industry Other than Hom:ehold
Indmtry
M~~~~ ,-~.A_~;ks 15
286
14
32
36
39
58
42
38
27
224
20
SO
19
58
39
31
21
23
10
23
2
10
16
61
IO
9
10
10
57
5
10
16
1-
17
233
31
35
25
51
30
28
27
188
6
25
28
23
42
37
15
12
III
16
12
27
18
24
lJ
III
16
12
27
18
24
11
18
16
4
20
20
4
VIII VI
Construction VII TrampOt't, Storage &
Trade and Commerce Communications
~ Femalt"s ~~ rr:fale!l l"emal~s 19
49
10
16
2
136
13
33
26
·35
19
4
92
!O
14
25
2:)
20 21
SOHAGPUR (M)
520
10
36
68
51
113
lJ9
68
55
SEONI.MALWA (M)
22
23
9
662 24
10
52
82
85
149
123
88
73
PACHMARHl (U.A.)
29
10
221
32
27
49
49
23
32
27
Ca) PACHMARJD (CANTT.)
69
10
13
16
22
4
212
31
27
47
46
21
30
26
23
328
26
52
104
89
42
II
221
17
29
29
74
43
29
57
13
21
10
52
12
18
24
4
24
12
4
3
.~-----------,
IX Other Services ~--..A--._---_ Ma]c'l Fet:nales
25
830
52
9~
132
249
162
89
45
64.1
29
8B
102
192
130
71
25
2,414
4
94
636
550
670
301
132
27
2,112
88
568
473
592
262
107
22
26
163
4
16
23
40
37
32
11
122
10
20
29
32
18
217
2B
34
61
48
23
156
19
23
45
35
21
221
x Non-workers
3,566
2,638
474
188
II
14
18
45
178
3,728
2.645
689
179
17
18
10
43
127
2,492
1,322
439
106
22
20
19
12
53
2,212
1,600
40B
91
21
20
16
10
46
5,499
2,51 [
526
3H5
355
587
477
303
:155
5,106
2,389
49B
366
619
379
249
307
3,413
1,644
414
318
279
349
194
lOt
114
2,915
255
2:)1
298
168
~JO
Hill
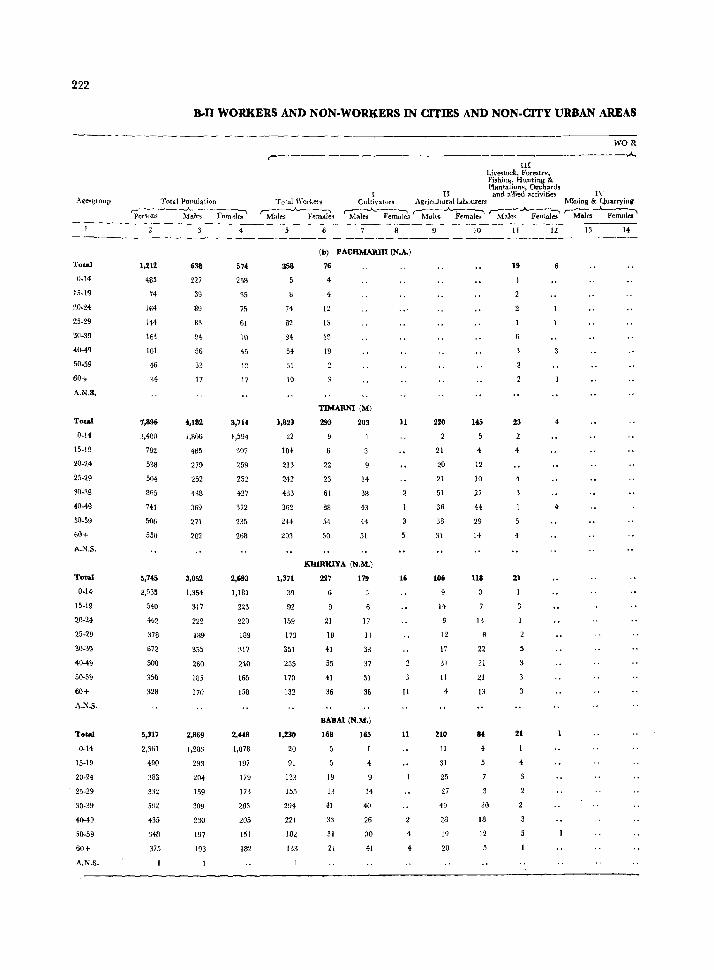
222
Boll WORKERS AND NON·WORKERS IN CITIES AND NON.CITY URBAN AREAS
Age-group Tutal Population
P~~~~---'F;~ -I-------~-~-
Totad
(J.\4
15.19
20·24
25·29
30·39
-10-49
50·59
60+
A.N.S.
Total
0-14
15-19
20·24
25-29
30·39
40-49
50.59
60+
A.N.S.
Total
0·14
15-19
20·24
25-29
30-3\1
40-49
50-59
60+
A.N.S.
Total
0-14
15-19
20-24
• 25-29
30-39
4[)..49
5[)"59
60+
A.N.S.
1,212
465
74
164
144
\64
101
46
34
7,896
3,400
792
538
504
865
741
506
550
.,745
2,535
540
442
378
672
500
350
328
5,311
2,361
490
383
332
592
435
348
375
'38 227
39
89
83
94
56
33
17
4,182
1,805
485
219
252
438
369
271
2B2
3,052
1,354
317
222
la9
355
260
185
110
2,869
I,Z83
Z93
204
159
309
230
197
193
574
258
35
75
61
70
45
1:1
17
3,714
1,594
307
259
252
427
372
235
268
2,693
1,181
223
220
189
317
240
165
158
2.448
1,078
197
179
173
283
205
151
182
III Livestock, Fotestrv.
WOR
---..........
~~~~iio~~~~t!d~ II and allied activities IV
Total Woriers r---..A..---~
Cultivators AgricuhurallaLoUl'ers MSning & Quarrying
Males Female9 ~le~~-F~~ r~fui~~~ ~;--..A.F~~ rMal~e-;;;'
358
74
82
94
54
31
10
1.323
22
104
213
242
433
362
244
203
1.371
39
92
159
173
351
255
170
132
1,230
20
91
133
155
294
221
182
133
(b) PACHMAllID (N.A.)
76
4
4
12
13
19
19
TlMARNI (M)
293
22
23
61
BB
54
30
203
14
38
43
44
51
KHIRlUYA (N.M.)
227
21
18
41
55
41
36
179
17
II
38
37
31
36
BABAI (N.M.)
168
19
13
41
33
31
21
165
14
40
26
30
41
11
16
II
n
220
21
20
21
51
36
38
31
106
12
17
31
11
210
II
31
25
27
49
28
19
20
10
145
4
12
10
27
44
29
14
118
13
22
31
21
13
84
4
30
18
12
11
19
1
6
23
4
21
1
21
12 13 14
4
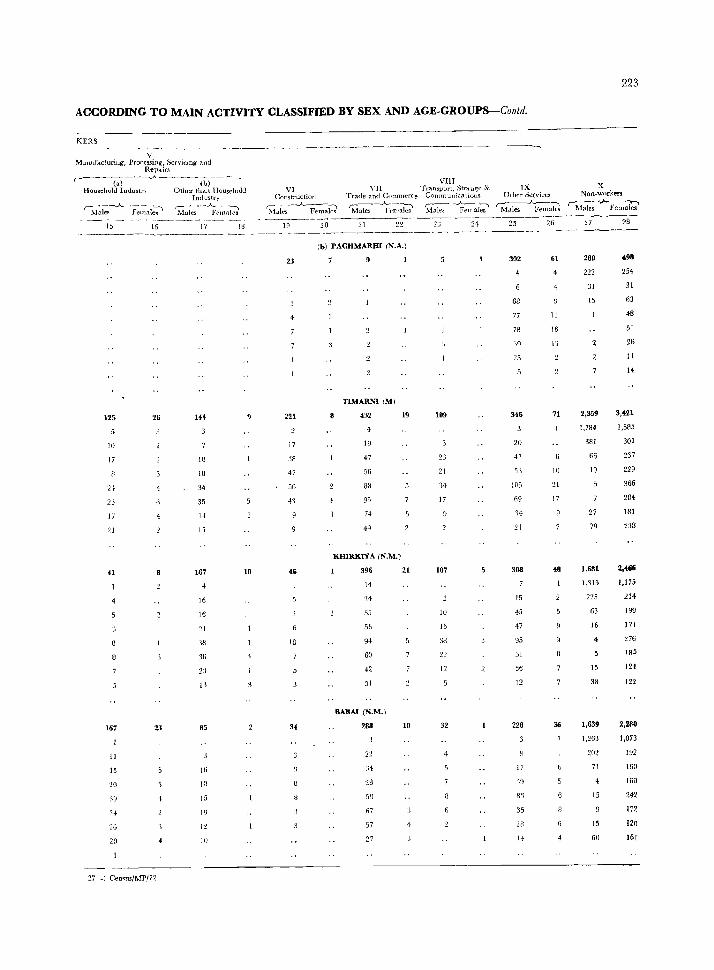
223
ACCORDING TO MAIN ACTIVITY CLASSIFIED BY SEX AND AGE.GROUPS--Contd.
KERS
V Manufacturing, Proc'R~~;fr~Cr\1i(:ing and
_----------- _~_------------(a)
Huusehohl Imlustrv Ib)
Other than Household Industry
M~'; --~c~;'~lci
VI c.:onstrllction
~_..A_~--.
Mdles Females
VIII Yll Transport, StoJ'a~e &
Trade and Commerce Comrnunicatious r---_;.._----:-l ,.--~ Males Femmes Males Females
(b) PACHMARHI IN. A.)
23
TIMARNIIM)
125 26 144 9 221 432 19 109
10
17
2!
23
17
21
41
167 23
11
15
20
39
14
26
20
37-1 Cen,u,/MP/72
18
18
34
35
H
II
167
16
16
21
~n
:31)
:23
Il
85
Iii
10
15
I'J
12
10
10
17
3R
47
56
41
18
34
4
19
47
56
88
95
74
4q
KHIRKIYA (N.M.)
396
J4
24
55
5n
94
60
42
51
BABAI (N.M.,
288
21
34
28
50
67
57
27
21
10
2:1
21
14
17
107
10
15
32
IX Other S.::x:vices
rc----A----, Males Females
X Non-workers
r-:---.."._..._----:--. Males Females
--~--------
302 61 280 498
4- 222 254
31 31
68 15 63
77 II ~B
7B 16 51
lq I.', 26
25 II
14
346 71 2,359 3,421
1,784 1,585
20 381 301
41 66 237
5~ 10 10 229
10~ 21 366
69 17 2B4
14 27 IBI
21 79 238
308 48 1,681 2,466
1,115 1,175
15 225 214
45 63 199
47 16 171
95 4 276
51 185
36 IS 124
12 33 122
228 36 1,639 2,2ftO
1,263 1,073
202 192
17 71 160
'39 160
81 15 242
35 172
2B 15 120
14 60 161
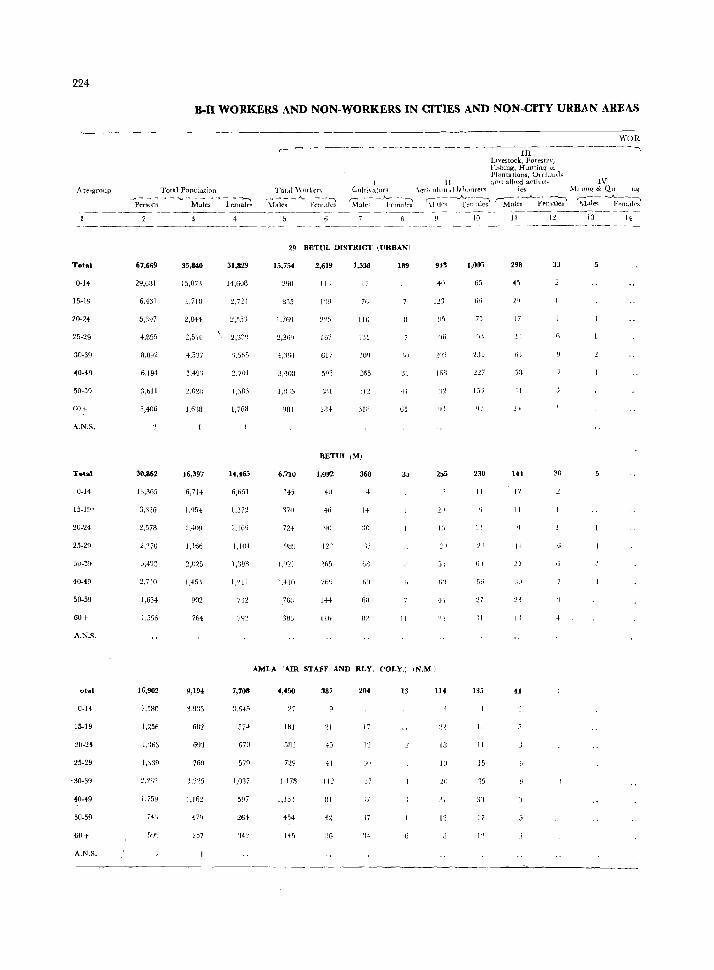
224
B.ll WORKERS AND NON-WORKERS IN CITIES AND NON-CITY URBAN AREAS
Total Population _.. - - - - - '._- - - - - ~ -~ P~rsun~ Males l' emalf"~
- ------ --------_
Total 67,669 35,840 31,829
0-14 29.6BI 14,;;08
15-19 6,431 3,710 2,721
20-24 5,:197 2,844 2,.15'3
4,855 2,516
30-39 8.092 4.5~7 '1.5,15
6,194 3,40') 2,iOl
50-59 3,bll :2.0~1l
60+ 3,406 1,6'38 1,768
A.N.S.
30,862 16,397 14,465
0-14 1:1,365 6,714 6,6S1
15-19' :1,326 1,954 1.372
20-24 2.578
25-29 1,166 I,HH
J,4'23 1,19B
40-49 2,710 1,46'\ t,'!L
50-59 1,634 902 732
60+ 1,556 764
A.N.S.
ohd 16,902 9,194 7,708
0-14 7,5RO
15-19 1,256 682 574-
21l-24 1,'\63 6~l:.1 670
25-29 1,339 760 579
-30-39 2,21;2 1,01'
40-49 j ,759 1,162 597
50-59 264
6fJ+
A.N.S.
,----~----------~----- --_ -_-WOR
-~-In- -------------- '"' Livestock, Forestl'\', n~illng, Huntin~ 0:.
l'lantations, 01 (!,.lIll. .. 1 II al1 l { ~lhed a("thlt. IV
Total ,,"or ]..Cl~ Cldti"ators \IZIIUlhIU .. IIJhl)l1rer<; ie'S ~11I!Ul1{ & Qu llg ~---A_--~l
J\fale.'\ Fetll.1lcs r;;;;};; -~~.~~Ie;: ~ ~l~- ~~'-1-1~ rlliks~..A. Ft>m:;~ \i:ili; -~~~ 10 II 13 14
29 BETUL DISTRICT (URBANl
15,754 2,619 1.538 189 918 298 33
290 III 17 41) 65
835 12] GIl
1,769 lIn 73 17
',!67 131 'IG
(i17
3,408 501 :\1 !fiH
I,B'lS '11',1 ''0 l:~ 1:-12 Ij j ;1
9tH 3 III tiS
BETUL (M)
6.710 1,092 368 35 230 141
145 4lJ II 17
,iO H II
724 90 :I(l II
H
bB I)) 21
J,410 t;'1 5ti ,Ill
7Gll 144 6B 4-, ~ 7
31U IIfi JI " II
AMLA (AIR STAFF AND RLY. (,OLY.) IN.M)
4,450 387 204 13 114 135 41
181 '21 Ii II
SU'3 18 II
41 -j!) II) 15
I 178 II:? 10
1,15i UI
414 li 12 17
HS :IG '14 I"
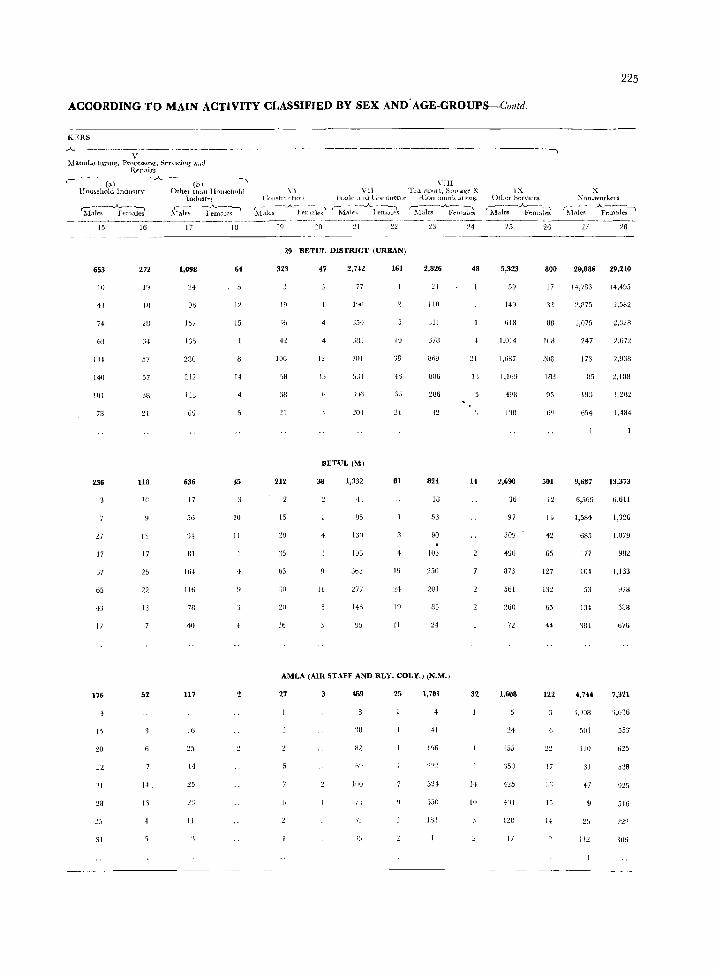
ACCORDING TO MAIN ACTIVITY CLASSIFIED BY SEX AND' AGE-GROUPS--Cvntd .
..A-----~~--------____ --- _- .--_ -----------------------------_------ -V
Manufd,{,.t\lrm~, Processing, S~f\.ldn>;:: .. md Repairs ,..-- -w- --- .A.--- '(l;' --. "'
H ou~eho1d Indu<;tn' Othel tkl.ll H0\l~eh()ld lndllst ... ~
lliJ-~~ 11~-;Je~"1
\"III VI VII TJ.ln~nort, St!l"",{<'" & I:\:
(:f!JJ,tlmtlOl' ltdlk .1tHI COllllllerce _'{";ommunil.ltions Other ~en'ICF.~
'iU.:l:;-_A_l"t'lj-'~~l;;' '~fa k~ -.A.l'-(";.~ ~I-a-Ie-, --A...~
,
X :,\(Jn~wnr)..Cf5
225
'hlales~ ~~;:~-. -----~-
15 16 17 13 22 24 25 26 '27 28 ---------------------._-
29 BETUI. DISTRICT (URBAN)
653 272 1,098 64 323 47 2,712 161 2,826 48 5,323 800 29,08i 29,210
10 ]'J 24 77 50 17 14,783 14.4U.1
43 III 12 19 l'IO 110 14~ 2,375 2,582
74 157 15 311 618 BB 1,075
63 :14 :;lLl 10 :::711 1,014 1(18 247 2,072
IH 57 230 lUG 701 I,GB7 208 173
1411 ;'7 ~12 I~ ;>.;1 806 1; 1 >16~1 1001
101 I:" ;"6 '}G 286 95
i8 21 21 21 I'm 654 1,484
BETUL (Ml
236 118 636 212 38 1,332 81 8U 14 2,696 501 9,687 13,373
17 ,II 18 36 12 6,569 6,611
10 15 85 ,53 97 1-1 1,584 1,326
l' 'J! 11 130 90 309 685 1,079
17 17 ill 103 490 65 177
;'7 25 161 63 Jtd 19 250 873 127 104 1,133
22 II!; :]0 II '277 201 561 5:1 ~j78
43 13 78 I4h 19 8S 260 63 134 588
17 16 !J5 11 14 'ml 676
AMLA (AIR STAFF AND RLY. COLY,) (N.M.)
176 52 117 27 25 1,701 32 1,608 122 4,7U 7,321
3,')[}8 'j,b'j6
16 'm 4) 501 5Sg
'20 25 H2 110 625
14 h'l '_\50 17 31 538
31 11 25 1110 14 4'25 47 925
29 13 III +')4 lj 516
II JiJl t.18 25
31 Ii 17 'lO6
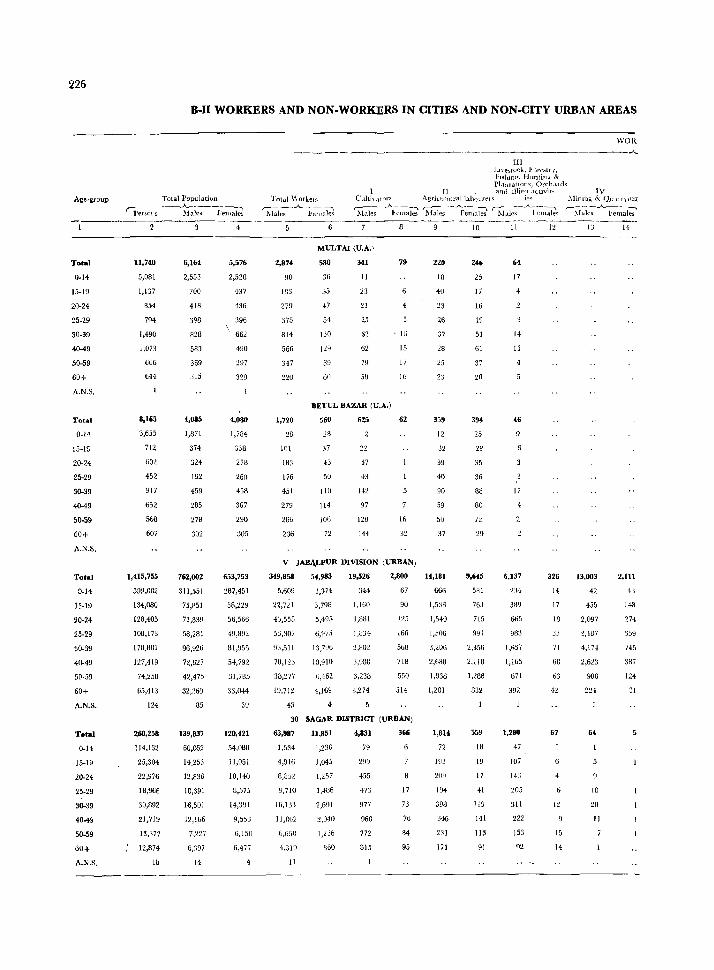
226
B·I1 WORKERS AND NON·WORKERS IN CITIES AND NON-CITY URBAN AREAS
Total Population
{tenor s ~~~'F~ --------:c---
Tota]
0-14
15-19
20-24
25-29
30-39
40-49
50-59
60+
A.N.S.
Total
0-14
20-24
25-29
30-39
40-49
50-59
60+
A.N.S.
Total
0-14
10-19
20-24
25-29
30-39
40-49
50-59
60+
A_N.S.
Total
0-14
15-19
20-24
25-29
SO-39
4O-4~
50-59
60+
A_ll<_S_
11,740
5,081
1,137
854
794
1,490
666
644
8,165
3,655
712
602
452
917
652
56B
607
1,415,755
599,00<
134,080
128,405
108,173
17U.BBl
127,419
74,258
65,413
124
260,258
114,m
25,304
22,976
18,966
30,892
21,719
13,377
12,874
18
6,164
2,553
700
418
398
828
583
369
315
',OBS
1,871
374
324
192
459
285
278
302
762,002
311,551
75,851
71,839
58,281
96,926
72,627
42,473
32,:l69
85
139,837
60,052
14,253
12,836
10,391
16,501
12,166
7,227
6,397
14
4
5,576
2,528
437
436
396
662
490
297
329
4,080
1,781
338
278
260
458
367
290
:105
653,753
287,451
58,229
::;6,566
·49,892
m,955
54,792
31,785
33,014
3U
120,421
54,080
11,051
10,140
8,575
14,391
9,55:1
6,150
6,477
4
WOR
------------------------------------------~ III
LIVC::.t(Jck, foreo,h'y', Ftslutl~, HUllting & PlaiitatlOIl",OfCh .. uds
II , atld .lllied <1ulvit- IV Total \\ Orkelf,
~-----"- ----:---'I
Culthatars Agril.lllturallabouTt>ls ' ~\lirllng &. Qu l1t\lng
~lales ~~:;k; l\fales --~~-;;~te;' 'M,~1~~_A._~1~~ r-M:it':--A.lemal~ Alales Females
MULTAl (U,A.\
2,874
90
183
279
375
814
566
3~7
220
580
36
35
47
54
130
124
89
60
341
II
23
21
25
62
62
79
50
79
16
15
17
Ib
BETUL BAZAR (U,A,)
1,720
28
lGI
183
176
451
279
2"6
2%
560
37
43
5U
110
114
106
72
625
22
47
43
142
97
128
144
62
16
32
V JAB.\LPUR DIVISION (URBAN)
349,858
5,609
22,7:!1
40,55!i
53,307
93,511
7U,1:t)
38,277
19,712
43
54,983
3,374
3,798
6,97.\
13,1%
10,910
(i,462
4.169
4
19,526
344
1,160
1,881
1,uJ4
:1,H[)2
3,988
3,238
3.274
2,800
67
90
125
1611
568
71S
550
514
30 SAG4R DISTRlCT (URBAN)
63,987 11,851 4,831 366
1,534
4,916
8,852
9,710
16,nl
Il,Pob2
6,650
4,319
11
1,236
1,045
1,2.17
1,406
2,691
2,O·1-Il
1,~36
860
79
299
455
413
977
960
772
815
17
73
76
84
95
220
18
40
23
26
37
28
25
23
359
12
32
39
40
90
59
50
37
14,181
666
1,536
1,540
1,50G
3,206
2,688
1,838
1,201
1,8U
72
193
20~
194
398
346
231
171
10
246
25
17
16
19
51
61
37
~O
394
25
2~'
35
36
88
80
72
9,645
581
763
715
991
2,356
2.118
1,288
832
559
13
19
17
41
119
141
113
91
11
64
17
4
14
15
46
6
17
6,137
2H
384
665
983
1,637
1,165
671
392
1,280
47
107
14J
205
311
222
153
92
12
326
14
17
10
3J
71
68
63
42
67
12
15
14
13,003
42
455
2,097
'!,487
4,114
2,623
900
22·1
64
10
20
1I
2,111
43
148
274
359
145
387
124
31
5
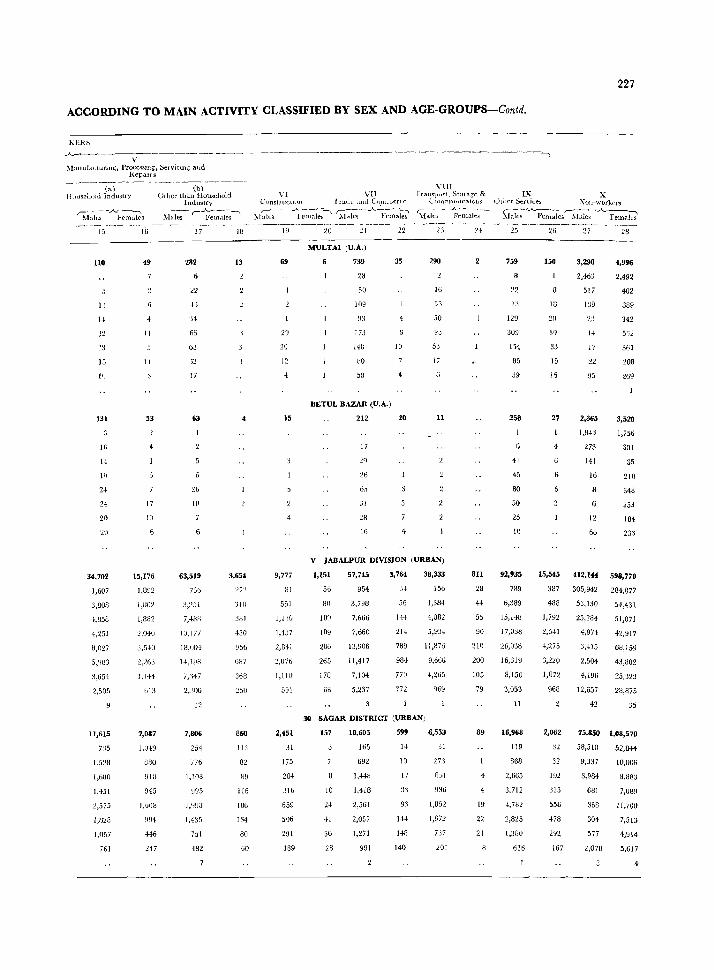
227
ACCORDING TO MAIN ACTIVITY CLASSIFIED BY SEX AND AGE-GROUPS-Contd.
KERb A------
v------ ----~---------------------------·-----1
~lanllfaLtllnllg~ l)rocc~slllg. Sefvictn~ alJd Repairs
.,) lI.)useiHlid Industry
,-' - - -A- -_, Mak~ FrmalC"s
(b\ Otller than Household
Industry
'\1~1~ r~~~l~l
'lilT VI V[] I ratlSpu·-t, StOi age & IX X
CUUSLJ Ilctl(1I1 j l<lIJc ;mJ CmnnJt:rt f'
I\1:;tt,;-'- _.Ar~~l~"leb~ 'i{dles .--_A~~;;;';~ CmnrnUI11CalolJs uthcr Sen ices Non-,vorkers
'Maks-~~~;~I;;-' hlak~.Ac l·'em;Je~r--:\L.ks -..A..fu~ki --- _-- ----------;:- -_ ~ ---------- - - _- --------------~------------- ---_._------------_---_ 15
no
23
13
131
Hi
14
10
24
H
20
211
34,702
1,607
3,808
~,858
+,251
3,654
2,505
11,615
715
1,5:!8
1,680
1,+51
2,575
I,H28
1,057
761
16
49
II
11
53
4
17
10
15,176
1,8~2
1,802
1,882
2,O~0
3,5~()
~,263
1,144
hJ:l
7,087
1.()+9
880
913
9'15
1.608
991
H6
17
232
+l
'H
fi5
(jJ
17
63
I[l
63,519
73b
3,251
7,4811
W,I77
IS,Il()+
1+,1~8
7;147
2,.lD6
12
7,806
254
776
1,108
995
1,998
1,435
701
432
18
13
3,654
3111
:lSl
130
956
687
368
:250
860
113
89
116
186
134
80
60
19
69
29
15
9,777
31
551
1,130
1,437
2,341
1,076
1,llV
551
2,451
31
175
28+
:.J16
659
291
189
20 ::!!
MULTAI (U.A.)
739
28
SO
109
173
143
80
58
BETUL BAZAR (U.A.)
212
17
26
ti5
31
2S
16
22
35
10
20
290
16
53
50
93
53
Ii
11
V JABALPUR DIVISION (URBAN)
1,151
56
80
IOU
109
286
265
173
68
57,745
954
3,798
7,066
7,660
13,906
11,417
7,104
5,237
3,764
56
144
214
739
984
no 712
38,333
156
1,384
4,082
5,934
11,876
9,666
4,2ti5
969
30 SAGAR DISTRICT (URBAN;
157
10
U
41
36
:28
10,605
165
692
1,448
1,413
2,561
2,057
1,271
991
599
14
10
17
3')
93
144
1-18
140
6,553
31
273
fiJI
930
1,352
1,672
7'37
201
811
28
44
55
90
210
200
lOS
79
89
4
4
19
22
21
759
22
129
309
85
39
258
41
45
80
50
25
10
92,935
739
6,339
15,148
17,038
26,038
16,319
8,150
3,053
11
16,968
119
868
2,665
3.712
4,732
2,825
1,380
616
26
150
IIJ
2U
3'1
33
15
16
27
4
6
27
3,290
2A6:J
517
139
23
1+
17
22
95
2,365
28
4,996
2,492
402
389
342
361
208
269
3,520
1,8+3 1,756
273
141
16
12
6[;
301
35
210
348
253
184
233
15,545 412,144 598,770
387 305,942 284,077
488 53,130 54,431
1,792 25,284 51,071
2,541 4,974 42,917
4,275 3,415 68,159
3,220 2,504 43,882
1,872 4,196 25,323
968 12,657 28,875
2,062
32
n 192
313
556
478
292
167
42 35
75,850 1,08,570
58,518
9,337
3,934
681
363
304
577
2,078
52,844
10,006
3,883
7,089
11,700
7,513
4,914
5,617
4
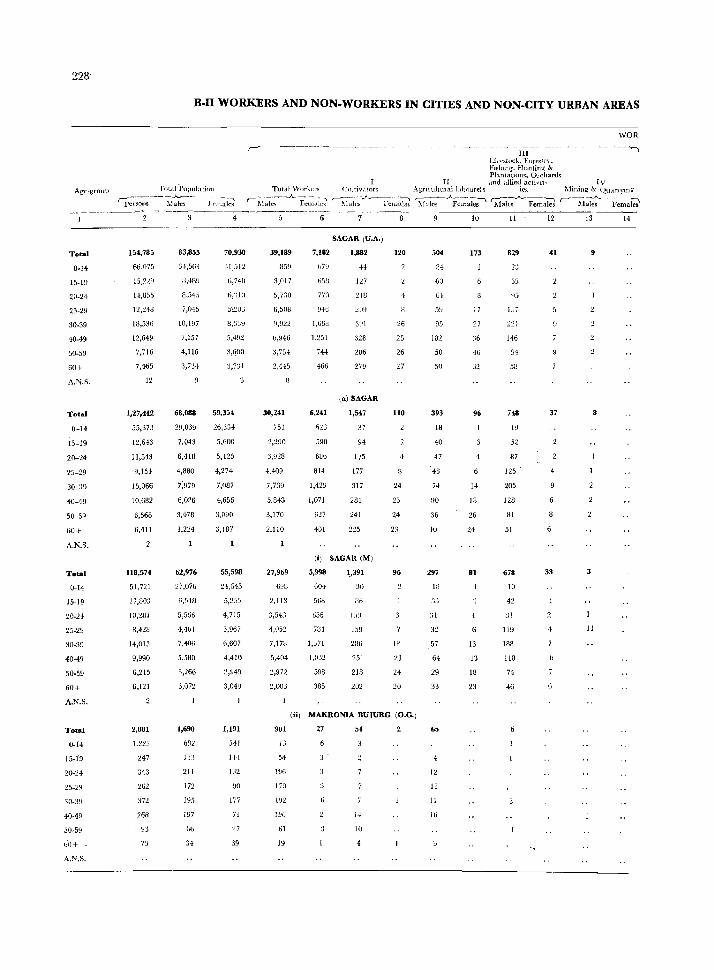
:!28
Age-group
Total
0-14
~5-19
20-24
25-29
30-39
40-49
50-59
60+
A.N.S.
Total
0-14
15-19
20-24
25-29
30-39
40-49
50-59
60+
A.N.S.
Total
0-14
15-19
20-24
25-2!:l
30-39
40-49
50-59
60+
A.N.S.
Total
0-14
15-1"9
25-2Y
'0-39
40-49
50-59
60+
A.N.S.
B-n WORKERS AND NON-WORKERS IN CITIES AND NON-CITY URBAN AREAS
Tot..t!"l'opulatiml
'l~~--~tak-;-----}~ll:;ki
154,78;
66,075
15,229
14,H~).')
12,248
18,536
12,649
7,716
7,465
12
1,27,442
55,373
12,643
11,543
9,154
15,066
10,682
6,568
6,411
118,574
51,721
11,803
]O,2t1l
R,428
14,013
9,990
6,215
,6,121
2,881
1.220
247
313
262
372
268
93
73
~J,a;5
34,563
U,.W!l
8.545
7/145
10,197
7,157
4,116
3,734
68,088
2~.039
7.043
6,418
4,880
7;979
6,026
3,478
3,224
62,976
27,076
1-i,548
4,101
7,f06
5,580
'1,266
3,072
1,690
682
211
172
195
197
[,(,
34
4
70,936
G,74[)
6,'llO
5\:..!UJ
8,339
3,600
3,7~1
59,3;4
26,334-
5,600
5,125
4,274
7,087
4,656
3,090
3,187
55,598
24,645
4,715
3,967
6,607
4,410
~,949
3,04~
1,191
:;41
II,
132
90
177
7j
'27
39
WOR
r---~-~--~--~------~--"---- -------III
Li .... estock, Foreo;tn, Flslung, Buntin\{ & Plantations, OJ chards
II ,·md allied acti"lt- IV Tuta1 Wurl..ers (;UltiV.ltOf5 AgTllu]tUlal1..J.boureh ies ~Jinillg' & (!u,trIym1.\
r-ii~l;.:-_A_ hl~:.llei fii~i-~~-A-r~:;b ~~-~~ale;' ~~_A..-Fe;~ r'hl~F;;;ki
39,189
3,017
5,7:lO
6,508
2,445
30,241
751
2,290
3,928
4,409
7,739
5,843
3,170
2,110
27,969
698
2,1 J:l
4,052
7,178
5,404
2,972
2,003
6
7,182
658
no ~J+6
1,663
1,251
744
466
6,241
590
6Ub
814
1,429
1,071
627
401
SAGAR (U.A.)
1,882
44
127
218
3Dl
328
286
ta) SAGAR
1,547
37
94
115
177
317
281
241
225
(iJ SAGAR (MJ
5,998
604
5bH
656
7UI
1,:371
I,on
598
385
1,391
30
86
15!)
286
251
218
202
120
4
26
25
26
27
110
24
23
24
23
96
20
(u) MAKRONlA BUIURG (O.G.)
901
jJ
54
196
liO
192
196
61
19
27
14
10
..
5~J
U5
102
50
50
393
18
40
47
, 48
74
90
36
40
297
18
:a
32
57
64
29
33
65
12
13
11
16
10
173
17
27
36
46
;)2
96
6
14
18
26
24
81
13
13
18
23
11
829
116
94
58
52
87
125
205
128
81
51
678
10
42
81
119
188
118
74
46
6
12 13 14
9
37 8
8
33 3
II
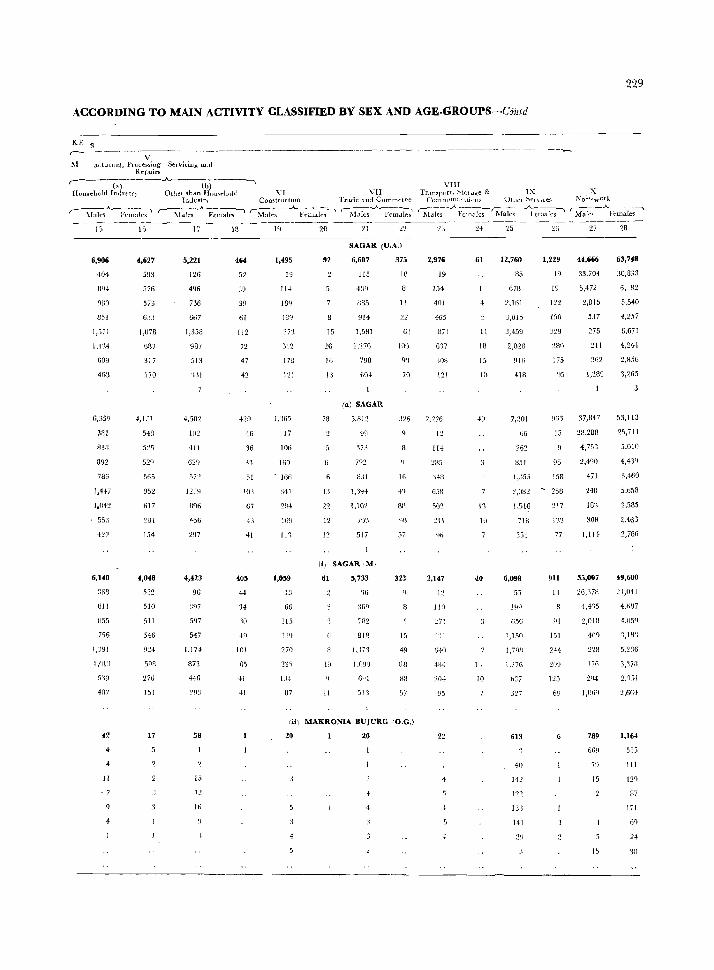
229
ACCORDING TO MAIN ACTIVITY CLASSIFffiD BY SEX AND AGE·GROUPS--Cj}ud
KE ~ ,-~I
V adunJlg, Processing S~nricillg aJ,d
Rrpairs
(a) House}U1Jrl Imiustr}
-"-----( b)-----------' Othet than Hou~ ... h(jld YI VII
InJw'itrv ComtrudiOn Trade <lJld CommctC'c
( "hIe'> ~Ie~ r- U.lles ... kFelllales ~-..A...~:'__'_'" '-Malt:~ ~~~ki 15
6,906
404
894
030
851
1,571
1.134
G09
463
6,:>50
381
838
392
786
1,447
1,042
5,,:1
6,140
:JGB
Ull
1J55
750
1,:191
1,013
5'-l!1
407
42
4
4
II
- 7
16
4,627
593
576
573
GJ3
1,078
687
317
170
4,1:1
548
5:'5
565
952
1i17
154
4,048
532
510
511
546
50S
276
151
17
17
5,221
126
496
736
667
1,358
987
513
'Ill
4.582
l()~
411
620
5'J2
12 J ~I
4%
297
4,423
96
597
547
1,174
873
446
58
15
I~
Ifi
18
464
52
30
til
112
n 47
42
+6
36
'l'l
51
101
G7
43
+1
405
+4
34
~O
40
101
GI
41
41
19
1,495
19
114
ISl-J
189
3)')
312
178
1'21
17
106
Ifl9
. Hill
341
111
1,059
13
66
115
110
270
87
20 '21
SAGAR (U.A.)
92
15
::w IG
13
73
12
I'
6,607
115
439
!lB5
~1l4
1.581
1.~70
798
GO>
(a) SAGAR
),8l2
:\73
B31
l,'lY4
1,](]2
70~
517
Ii) SAGAR IMI
61
II
5,733
96
36"
7112
818
1,\73
I,Oel')
(m
51 '3
375
10
11
12
61
16
+" B!~
57
323
15
57
(il] MAKRONIA BUJURG (O.G.)
20 20
VIII Ti.tlllipnrt, StOl Jge & IX
Comm,ml',l.li{)Jl_s Olliel ~f'l\:'LeS r-::----..A...-:-----.,.- -- _)...__ --~~
Males }onaks l\faks 1 rmales
2,976
19
154
41ll
465
871
G'17
'lOB
121
2,:126
12
114
2B5
:1411
65B
502
~II
2,147
1~
110
:.!71
.J~4
20+
~15
22
24
61
II
18
15
]()
40
1 ~
10
12,760
B5
6711
J,015
:1,459
2,028
411l
7,201
66
262
851
l,.i55
26
1,229
19
19
122
190
LBO
175
'15
13
96
158
:?,08~ - 25B
1516
71B
6,098
65G
1,150
1,70B
1.'276
327
613
411
142
122
13l
:Il7
lTJ
77
911
U
151
244
125
X !\'ol'~wOIl
rMa[c<--AFema(e~-'
27
44,666
33,70{
5,472
2,815
537
275
211
362
1,289
37,847
28,288
4,753
2,400
471
240
!G']
308
I,ll!
35,007
ZG,37B
4.435
2,018
4(lC)
2'28
17G
2'14
1,OGQ
789
6G!1
79
15
28
63,748
30,833
6, 82
5,5~0
4,257
6,671
4,241
2,856
3,2';5
53,113
25,iJ I
5.010
4,439
3,460
5,658
3,585
2,163
2,786
49,600
:.?i-,041
4,fiB7
\10'\
3,3i8
2,'151
2,66·!
1,164
III
120
87
171
141 69
2!) 24
15 3B
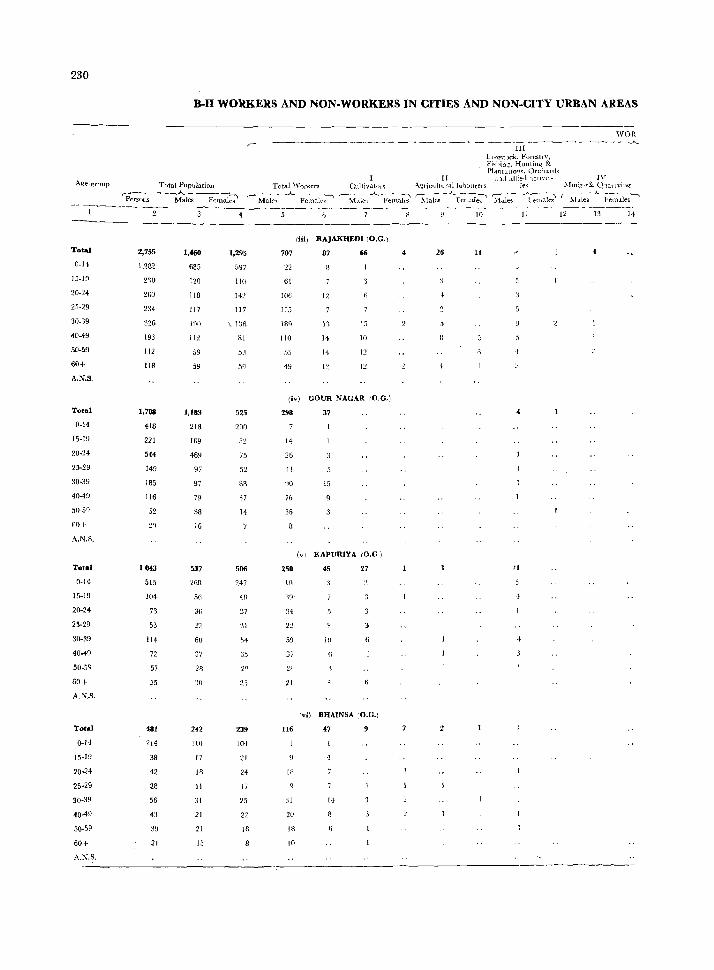
230
Total
0-11
15~1~
20-24
25-29
30-39
40-49
50-59
60+
A.N.S.
Total
0-14
15-19
20-24
25-29
:10-39
40·49
.10-50
60+
A.N.S.
Total
0-14
20-24
25-29
30-~9
40-49
50~!j9
60+
A-"1.S.
Total
0-14
15-19
20-24
25-29
30-39
40-49
50-59
60+
A.N.S.
B-I1 WORKERS AND NON-WORKERS IN CITIES AND NON-CITY URBAN AREAS
II Total Population Total Workers Cultivator'S -\gric •. llrurallab()lU,'ers
HI 11"e>t )ck, forestl\', Fi~hin..;'. HUlltin~ & PLlntatlo'l~, ,)rclntd~
WOR --~~--_A__
.1.1,\ .tllie,1 J.ctIVlt- IV ie, .\Ill1iu!.\"& (~rlallvin{{
rpe~;; -----;;~~ -Fe~nal~ ,- __ ---..A... ___ --"I r---~--.I ..... --- ---, ,..----- --A.... ----..,
Male.. Fcnnk" M.1.lc<:, Females Males Fetlla.l~s ~:1~; ~~m;ki fM:L~-_l-J.~
4 10 II 12 13 14
liH) RAJAKHEDI (O.G.)
2,755 1,460 1,295 707 87 66 26 14
1.282 685 ~!:l? 22
211) 120 lIn 61
260 lIB 14:.! 106 12
2:14 117 117 J 15
326 190 \ 130 IS" I'J 15
193 I J~ HI 110 14 ](J
112 59 5:1 .').'j 14 l~
118 59 5~J 4~ I ~~ 12
(Iv) GOUR NAGAR 10.G.)
1,708 1,183 525 298 37
418 218 200
221 169 52 14
544 469 75 26
149 97 52 41
185 97 88 90 15
116 79 37 76
52 38 14 36
21 16
(VI KAPURIYA (O.G)
J 043 537 500 250 45 27 Jl
515 26R 247 111
104 56 4B :1 ~l-
73 3~ :;) 34
53 2~ 31 22
111 60 54 59 III
72 37 35 ~7
57 28 2" 2f
55 ~I) 21 21
(vi) BHAINSA (O.G.)
481 242 239 116 47
214 WI 1()4
3B 17 21
42 IS 24 18
28 II 17
56 31 25 31 14
43 21 22 20
39 21 18 18
21 13 10
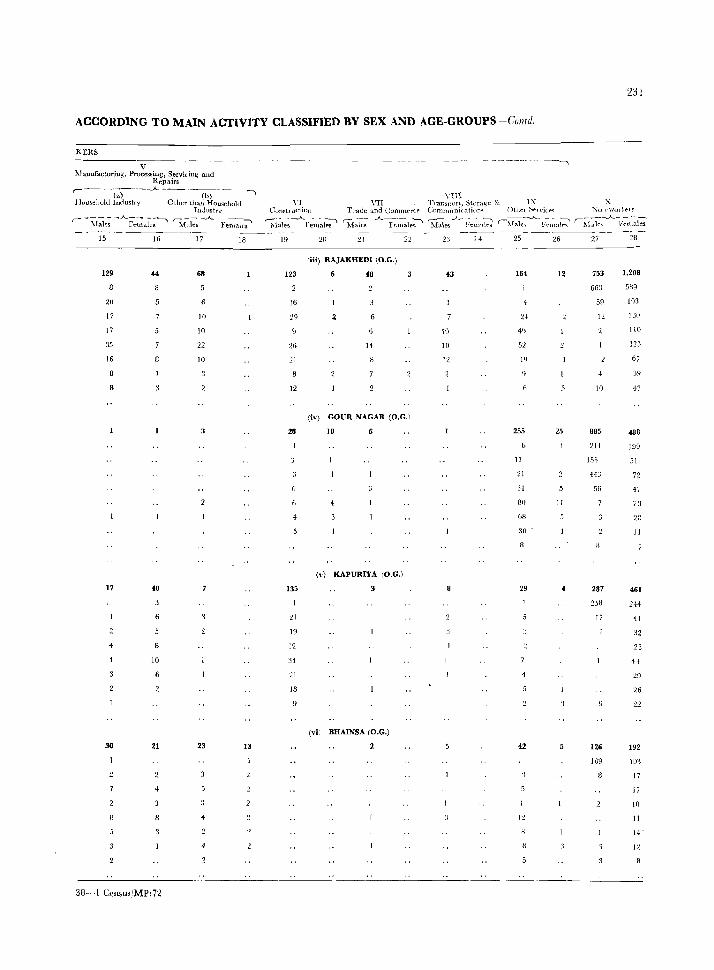
231
ACCORDING TO MAIN ACTIVITY CLASSIFIED BY SEX AND AGE-GROUPS-Cunld.
KERS
V 1..1anufacturing, Proces.siug, Servicing and
Repairs ,-- ---w---..A---~- -------, Household Iudustry Oliler than Household
JLh.lustrv
r- - kWc: _'-A...F:.:.:le~ r-M:k:-A Femalc-;-'
15 16 17 18
129 44 68
20
17 10
17 10
35 22
16 10
R
17 40
10
30 21 23 13
4
4
38-1 Ccnsu.IMP/72
n Constl uction
Yin VII TraJ.1sJ)ort, Storage &
TrHoe and Comm(,fct" Conmluni( atil\fl~ IX
Other ~t'l\'i(_('~ ~un·wO\l(")s
r;1~1~ -.A_Fem~i~.s' r;:1~1~; .A~~~;lf'~' 'M-;Jes -'-~~~ rMal~.AFer~~ (hl:k;.A_-r;;;l~i~~'
19 20 2l
liii) RAJAKHEDl (O.G.)
123 6 48
16
29
26
21
12
14
(iv) GOUR NAGAR (O.G.)
28 )0
4
135
21
19
12
:14
21
IS
(v) KAPURIYA (O.G.)
(vi) BHAINSA (O.G.)
2
23
43
10
10
12
~~-------------------
24 25 26 27 28
164 12 753 1,208
66J !JB9
59 103
24 1~ 130
4" 110
52 123
19 67
4 ~)9
10 47
255 25 885 488
211 199
II IS~) 51
21 443 72
31 56 47
80 11 7:1
68 2B
30 11
29 287 46)
258 244
17 41
32
23
H
29
26
2:!
42 126 192
109 101
17
17
10
l~ II
14~
12
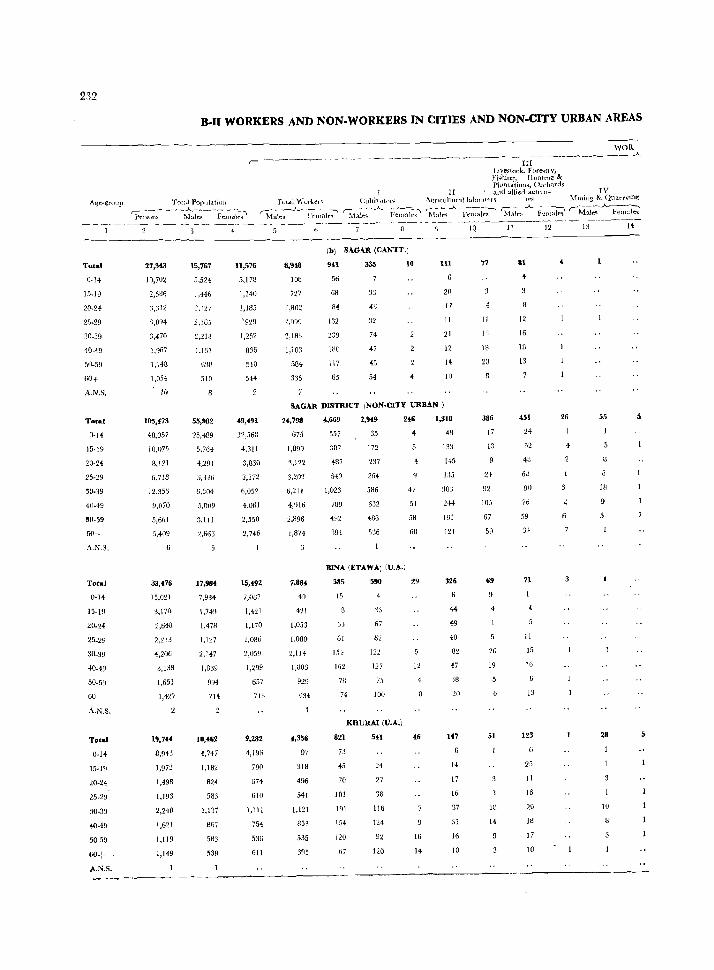
232
Total
0-14
15-19
20-24
25.29
30-39
40-49
50-59
60+
A.N.S.
Tota]
15-19
20-2~
25-29
30-39
40-49
'0-59
60+
A,N.S,
Tota]
0-14
15-19
20-24
25_29
30-39
40-49
50-59
60+
A,IS.S.
Total
0-14
15-19
20-24
25·29
30-39
~-49
50·59
60+
"'.N.S.
ft..11 WORKERS AND NON.WORKERS IN CITIES AND NON·CITY URBAN AREAS
WOR ~--~----
_-._---- ------------.--~---- ------_------"-III
LIvestock. Fot'e1!trv, Fishin15, Ulmhn~ & Plantatioll~, Orchards
Tow.} Poplllation Totdl Wor1.er~ II artdaUiedactl'lt- IV
CLlltj, aLo('" AQ"ncuhural1ahoLllf'r" les ~1ltli!lg & Quarrvtng
r:'~--~~~A__"---~ ~)
¥-:'Il'Om; ~lal:r:B Fema\~s rMa1es-J"-i:~~al~~ ~1~~~-..A..- fe~*~ 'Male.; ..A._~~~1 ~-;i~..A..-F-t::ll-:~ (M~~_A.. Fem~\t~
27,3.3
10,702
2,5Bfj
1.312
'1,094
3,470
1,967
1,148
1,054
10
105,.73
4B.057
lO,O?5
8,121
6,718
12.356
9,070
5,661
5,409
33,476
15,021
3.170
2,648
2,213
4,206
3,138
1,651
1,427
2
19,7H
8,943
1,972
1,49B
1,193
2,248
1,62\
\1l9
1,119
15,767
5,524
1,446
2,(27
1,165
2,218
U31
6~\8
510
55,982
25,489
5,764
4,29\
3,3-16
6,304
5,009
3.1\1
2,66,
17,984
7,934
\,749
1,47A
1.127
2.147
1.839
~94
714
10,.62
4,747
1,182
824
583
1.131
867
583
538
U,576
5,178
1,140
1j 185
'929
1.252
B36
510
544
49,491
4,311
3,830
3,172
6,052
4,061
2,550
2,746
15,492
'I,()U)
1,421
1,170
1,086
1,299
657
713
9,282
+,196
790
674
610
1,111
754
,36
611
8,948
108
727
'l,lB3
1,103
584
315
(b) SAGAR (CAN'IT.)
941
56
6B
84
132
lBO
117
65
335
74
47
54
10 111
20
17
\1
21
12
14
!O
SAGAR DISTRICT (NON.CITY URBAN)
24,798
675
1,899
3.122
'~.201
6,211
4,916
2.896
1,871
7.884
H
42\
1,053
['080
2,114
1.1J03
929
43~
4,356
97
3\8
496
541
1,121
853
535
395
4,669
557
3137
487
540
1,023
78~
'194
2,9"
35
\72
23)
2G4
586
632
486
536
246
47
51
5B
68
BINA (ETAWA) (U.A.)
585
15
33
61
154
162
71J
74
590
62
In 127
7"
100
KHURAI (V.A.)
821
73
45
70
101
191
154
120
67
541
24
27
'38
116
\24
92
120
29
12
46
16
14
l~:no
48
133
145
l:l5
:103
244
18\
121
326
H
49
,10
82
47
38
20
147
14
17
16
37
31
16
10
IQ
77
II
I'.
18
20
386
J7
13
2t
92
105
67
59
69
20
19
51
18
14
1l
81
4
12
16
10
13
451
24
52
48
6B
90
76
71
11
15
16
13
123
25
11
16
20
18
17
10
12 13
26 55
18
28
10
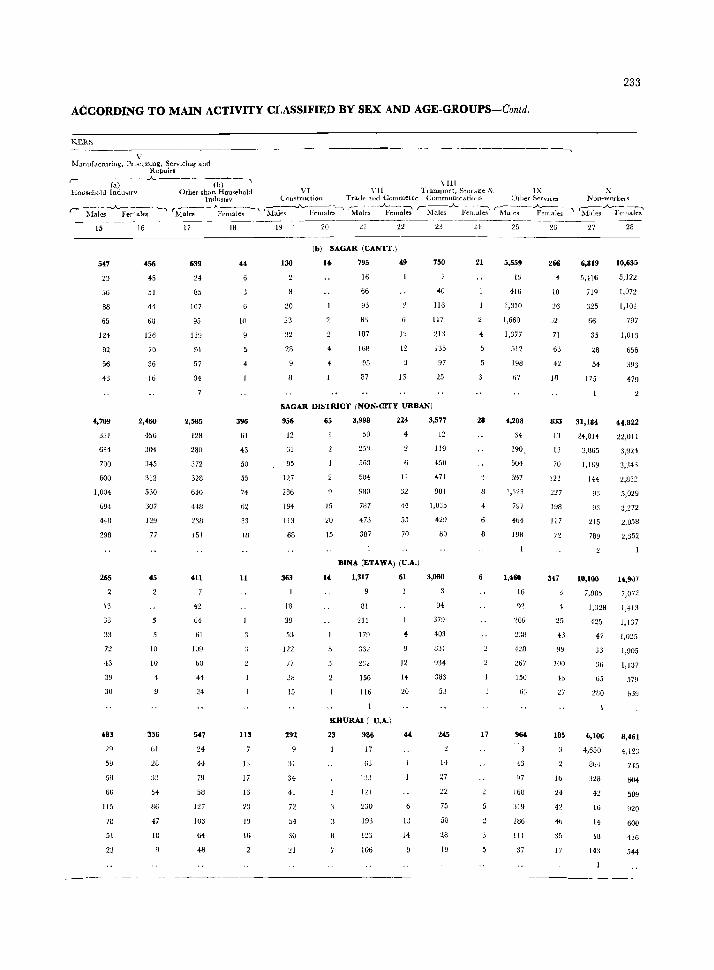
ACCORDING TO MAIN ACTIVITY CLASSIFIED BY SEX AND AGE-GROUPS-Contd.
KERS
Ii :Manufdctllring, PJOccssmg, Servicing and
Repairs ,---(~) ... ~ .~.A. -- - -(b-) --., \ III
Household Indu,>u'v Other than Household VI \'U Tlallsport, Stntd~e &. IX rndulltrv CO[Jstnlction Trad .. alld Gomrnet(e CommunlcatiOltS {hila St:r\'l(_l~~1
r---;r;i~s-..A-Fema1;--~ rr:1ai~-~~---' ~~~--u\._-~~-, ~~~~~k; r-~~~aki ~iili:---"ii~~
15
547
23
56
88
65
124
92
56
43
16
456
45
51
44
6~
126
70
36
16
17
639
24
85
107
95
139
91
57
34
18
10
19
130
20
23
32
23
20 21
(b) SAGAR (CANTT.)
I~ 795
16
66
93
8'3
107
16H
95
87
22
49
12
l2
13
SAGAR DISTRICT (NON-CITY URBAN)
23
750
40
116
117
135
97
24
21
25
5,559
19
416
1,310
1,660
1,377
512
198
67
16
26ti
10
26
71
63
42
18
233
x Non-work("J ~
27
6,819
5,416
719
325
66
35
28
54
175
28
10,635
5,122
1,012
1,101
797
1,013
656
393
479
4,709 2,460 2,585
128
280
372
328
640
448
396
61
43
50
55
74
62
33
956 65 3,998 2U 3,577 28 4,208
34
190
833 31,184 H,822
22,011
3,924
3,:lH
2,832
5,029
3,272
2,058
2,352
331
614
700
600
1,004
694
4411
298
265
13
33
:;3
72
·13
39
30
483
29
59
611
60
115
78
51
23
456
304
345
312
530
:J07
129
77
45
10
lU
336
01
28
54
Il(j
47
18
238
1.>1
411
42
64
61
109
60
44
24
547
24
79
58
127
103
64
48
1H
11
113
13
17
16
23
19
16
12
61
95
127
286
194
11"
68
363
18
39
53
122
77
38
15
292
31
34
41
n 54
15
20
15
50
253
563
5U4
9H{)
787
473
387
4
11
32
44
55
70
BINA (ETAWA) (U.A.)
1,317
81
211
179
232
156
116
KHURAI ( U.A.)
23 986
17
oj 133
121
:130
193
I:!J
106
61
12
14
20
14
12
119
450
HI
981
1,035
429
80
3,080
379
403
831
934
383
53
245
14
27
22
75
58
:.w 19
17
504
697
1,323
797
164
198
1,4fiQ
16
91
206
467
150
964
43
97
168
:119
lUti
111
37
13
13
70
123
2'.!7
198
117
72
317
25
43
99
1011
Ii>
:!.7
18,
1(;
24
42
46
17
U,8H
",865
1,169
144
a3
93
215
78a
10,100
7,885
1,328
425
47
J3
J6
65
2UU
6,106
4,650
8M
328
16
14
!8
143
a,90?
7,072
1,413
1,137
1,025
1,905
1,137
579
039
8,461
4,123
745
6(14
509
no 600
416
544
-------------------------------------------------------------------
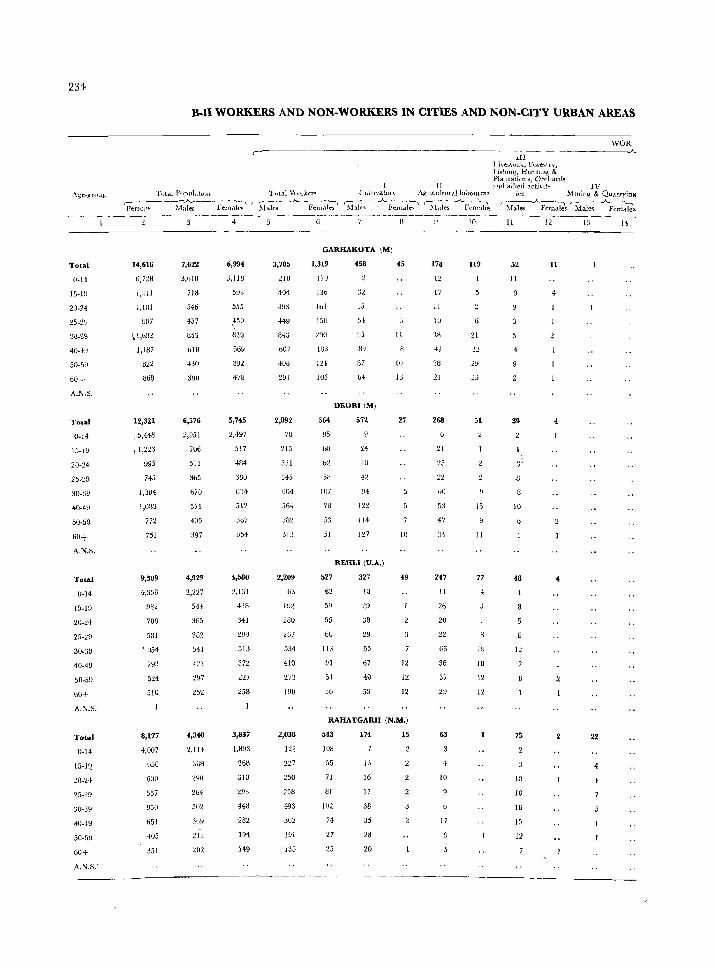
234
Age-group
Total
0-14
15-19
20-24
3\J-'JS
40-4~1
50-5~
60+
A.N.S.
Total
U-H
15-1~
20-24
25-29
:,0-39
40-4~
50-59
60+
A.N_S_
Total
0-14
15-1~
20-H
25-:W
30-:39
40-49
50-59
b(J+
A.N.S.
Total
0-14
15-1~
2(1-2-1-
25-29
JO-39
4<J-49
50-59
60+
A_N.S.-
B-Il WORKERS AND NON-WORKERS IN CITIES AND NON-CITY URBAN AREAS
<II 1 ives.toc~.l:·urestL'v, Fi~hlllg, Huntlllg & PlantatiuHs: OrChal"ds
II Clud allied activIt- IV
WOR .A.
Tulal JlOpuhtlOll TUlal \-\'llkcn C'LoltnratoH Agll(.u1rurallaooulers ies 11lUjn~ & Quarrying
r&-;;\_~)I!-,----:<r;i:;;-Fe:l:i;;' ~\l.Je:--A.-F-e<-n-dl~ 'Mal;" - .A.1'enlclJe" ~1;I{'~r.;~~5 S~~e~ 'Mai;;-~~~ks
14,616
G,n8
J ,::11
I,Hll
0fJ7
~ l,bG2
1,187
822
868
12,321
,5,448
I 1,2~3
995
745
1,304
I,U83
772
751
9,509
4,3SB
982
706
581
I 054
793
524
510
8,177
4,007
b5G
GOO
557
ti51
405
351
7,622
3,610
718
54t)
457
oW
430
,,~O
6,576
2)9~1
706
511
365
670
571
405
397
4,929
2,ln
544
365
282
541
421
297
252
4,340
2,114
:JBB
'lYU
50:!
211
2\12
4
6,994
J,II8
593
555
478
5,745
~,497
517
484
380
634
51~
057
354
4,580
:l,l31
438
341
513
372
227
258
3,837
1.893
268
:]10
293
448
282
194
149
3,705
llU
·104
493
449
84J
,,07
40U
291
2,092
78
215
331
~45
604
564
2,209
0:1
l!n
280
267
534
410
273
190
2,038
122
217
250
258
493
362
1~1
135
GARFIAKOTA \MJ
1,319
17n
13"
101
150
IUS
564
95
bO
b2
5B
1\1)
78
53
51
527
55
60
113
91
51
36
458
J5
54
87
b4
DEORI \M)
572
94
l12
114
127
REHLl (U.A.)
327
29
38
29
67
40
5~
45
It
27
10
49
12
12
12
RAHATGARH (N.M.)
543
108
55
71
81
102
74
27
25
174
13
16
17
38
35
28
20
15
173
12
17
11
lU
38
41
2S
2l
268
21
25
22
DO
53
47
:14
247
II
26
20
22
66
36
37
29
63
't
10
17
10
119
ZI
51
15
11
77
HJ
18
12
12
II
52
11
39
10
48
12
75
10
10
IG
15
12
12
II
4
13
22
4
4
14
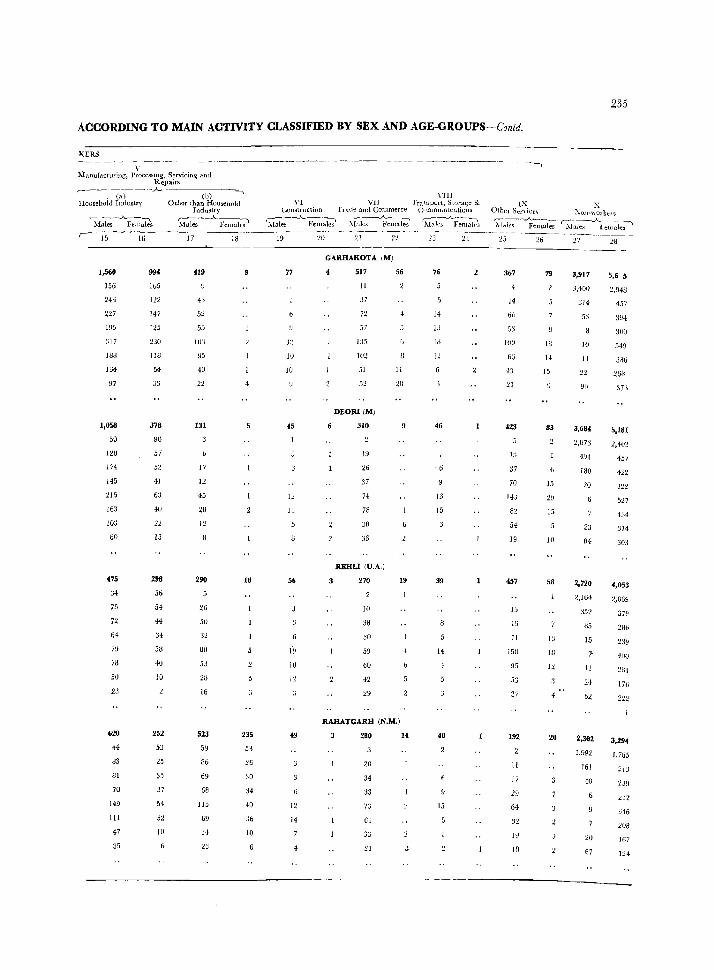
235
ACCORDING TO MAIN ACTIVITY CLASSIFIED BY SEX AND AGE-GROUPS-Contd.
KERS
v :K1anufacturing1 llroces~mg, Servicing and
Repairs r--~;)---·-.A. ---r-b)C-
Household Industry Otller than Household ___ ..A._-:.
Males F t'filales
Indllstty ,-----A---, Males Fcmalt-s
1,561)
150
2-16
227
195
317
183
97
1,058
50
I~U
174
145
115
163
103
BO
475
34
75
72
64
7~
78
50
23
620
+4
33
31
70
1~9
111
47
35
994
1('5
U2
147
125
230
113
54
33
378
90
57
52
41
63
4U
13
298
56
54
44
34
40
10
252
25
35
37
54
32
10
fl9
43
55
IU:!
95
40
131
17
45
290
26
5U
32
ao 53
28
16
523
59
86
69
68
115
18
235
53
25
30
34
40
3b
10
VIII VI
c.Ollstruction r-----.A. -----:~ Male~ Females
VIl Trallsport, Sturage &
77
3c
W
10
45
56
19
lU
12
49
12
14
flade and Commerce (i'lmmlltlications
~r~-Ic-s-~eIllaI~ 'hl~.A_FeHi~
GARHAKOTA (M)
517 56
11
:i7
3)
51
52
DEORl (M)
310
19
20
37
H
78
38
:;6
REHLl (U.A.)
270
10
38
30
59
60
42
29
II
20
19
4
RAHATGARH (N.M.)
3 280
20
34
33
73
63
33
21
14
76
14
IJ
III
46
13
15
39
14
40
15
IX X Otllel Seni<.:e<, Xon.\\oJkt',,>
~~k~~~I-; ~la~.Ahl~~l
367
00
5, 100
60
n :n
423
I:!
,7
70
143
82
54
19
457
15
46
71
150
95
53
27
192
11
17
29
64
19
18
79
IU
14
15
83
15
2iJ
15
10
58
13
18
20
3,917
3,400
S]f
5:)
10
11
n 99
3,684
2,873
4~J
180
20
23
84
2,720
2,164
,52
85
15
r 11
24
2,302
1,992
161
4U
Ii
2U
67
5,6 5
:.!,94U
457
394
300
54~)
386
2GB
373
5,ISI
2)402
457
422
322
527
4:H
314
303
4,053
2,069
:179
3,294
1,785
213
239
212
346
208
167
124
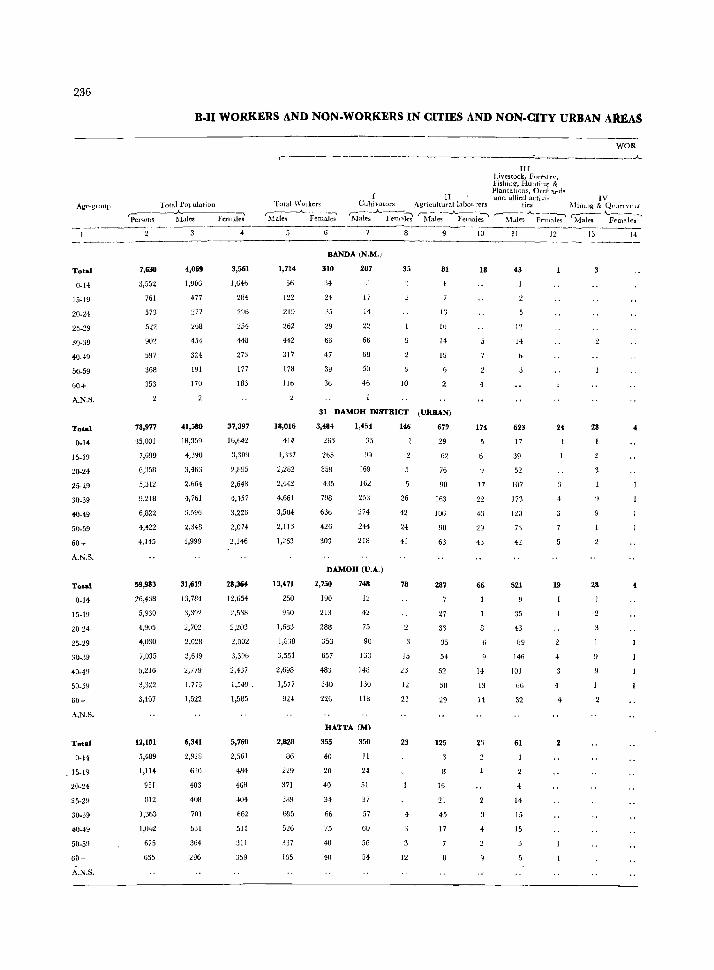
236
B-II WORKERS AND NON-WORKERS IN CITIES AND NON-CITY URBAN AR£AS
Total POI ulation ~_~ __ .A..--------_~
[lcl-,om l\lJ.Jes Females
---------
Total
0-14
15_19
20-H
25-29
30-39
40-49
50-59
60+
A_N.S.
Total
0-14
15_19
20-24
25-29
30,39
40-49
50-59
60+
A.N.S.
Total
0-lf
15-19
20-24
25-29
30-39
40-49
50-59
60+
A.N.S_
Total
O-H
, 15-19
20-24
25-29
30-39
40-49
50-59
60+
A_N.S.
7,630
3,552
761
573
597
363
353
78,977
35,001
7,699
5,312
9,213
6,822
4,145
59,983
26,433
5,930
4,Y()5
4,0:;0
7,035
5,216
3,322
3,107
12,101
5,489
1,114
951
812
1,363
1,042
675
655
4,069
1,90G
477
'277
268
45·)
324
191
170
41,580
18,359
4,390
3,463
2,664
'1,761
3,596
2,343
1,999
31,619
13,7134
~{,:~92
2,702
2,028
3,639
2,779
1,773
1,522
6,341
2,923
630
483
408
701
.131
364
296
3,561
I,G46
284
2Y6
254
148
273
177
183
37,397
16,642
3,309
2,648
4,{57
3,226
2,074
2,146
28,364
12,654
2,538
2,203
2,002
3,3!)G
2,437
1,549.
1,585
5,760
2,561
484
46B
404
662
511
311
359
WOR r----~-- ---------.-~ ... -----------__ . __________ .A..
I II Total \Vulkers Culti\alors AgriCllIturallaoolJrer.o:
cc~---Jo._--~
1:!ale.. Females r:M;Je;.A.F~~~ ~f~!~-..A-Fem~e7"
1,714
56
1:!2
219
262
442
317
178
lib
18,016
414
1;1:17
2,282
2,442
4,661
3,50~
2,113
1,263
13,471
250
950
1,683
1,838
3,551
2,698
1,577
9H
2,828
86
229
371
389
695
526
337
IUS
BANDA (N.M.I
310
3.
24
35
29
66
47
3~
36
287
17
14
66
68
50
46
35
10
81
13
15
14
18
31 DAMOH DISTRICT (URBAN)
3,48.
265
358
435
798
636
426
303
1,454
35
99
169
162
253
274
244
218
DAMOH (U_A.)
2,750
190
21:1
288
353
657
483
340
226
748
12
42
75
90
143
130
liB
MATTA (M)
355
40
20
40
34
5&
75
40
40
350
11
24
51
:17
57
60
56
54
146
26
42
24
41
78
15
23
23
23
12
679
29
G2
76
90
163
lU6
90
63
287
27
33
35
54
52
50
29
125
16
21
45
17
10
18
174
17
22
4,
29
43
66
14
13
14
23
III Livestock. Fort-.,trv, Fjshin~. Huntinloj & PlantatIOns, Orch<ll'd~ and allied act.ivi- IV
ties Minillg &. Q",mvmg
r--~r:i;s..A..F~~~ 'Male, - "-Female~ Jl
43
12
b
623
17
39
52
107
173
l~l)
7:1
42
521
35
43
89
146
101
ti6
32
61
4
14
15
15
12 13 14
24 28
19 28
4
4

ACCORDING TO MAIN ACTIVITY CLASSIFIED BY SEX AND AGE-GROUPS-Contd.
KERS
Manufacturing, ProcessiuJ:" Sen'icing and Repairs --------_A_. ______ ~
(al Househuld Industry
(b) Other than HOllsr:hotl.
Indnstrv
----A. ____________________ -----,
YIlT YI YII Transport, ~hora~e & IX
CrlllstI'llrtton Trarl~ and Commerce Communication Ii: Other Services
~.A.-F~l~7' 'M~~ --A._Fe~-;' ~fales --'-~;~ ~~~~;-' ~--'I~~i6 15 16
248
16
30
45
33
57
33
24
10
3,639
180
469
544
397
842
628
366
213
2,592
112
323
395
295
610
439
261
157
767
40
104
110
77
175
145
79
37
157
29
18
29
16
29
20
11
1,1187
221
219
232
277
469
294
124
51
1,560
158
182
189
235
397
214
109
46
188
:16
17
26
21
40
33
10
17
264
21
33
41
42
61
40
16
10
1,957
49
170
271
224
513
410
211
)09
1,508
33
116
199
170
405
330
171
84
268
10
27
4()
31
68
48
24
20
18
5
139
10
10
13
34
22
22
20
106
26
17
20
17
11
19
74
12
17
16
11
714
63
82
90
185
139
91
.19
552
57
67
74
136
102
71
44
95
11
28
19
14
21
BANDA (N.M.)
12 318
23
49
47
77
59
30
27
22
21
23
51
!O
10
15
31 DAMDH DISTRICT (URBAN)
154
12
15
23
13
25
29
27
JO
3,344
48
207
460
4W
780
647
476
30R
DAMOH rU.A.)
140
12
15
23
13
24
21
24
2,674
36
171
371
320
627
524
369
256
HATTA(MJ
14 453
29
56
61
100
87
80
31
216
30
59
55
61
186
28
43
43
56
16
10
1,874
17
94
220
293
578
436
172
64
1,661
12
83
ISB
251
516
401
154
56
146
11
22
32
32
25
13
24
51
15
16
12
45
13
14
11
25
345
35
fiB
119
69
34
13
3,704
33
132
405
660
1.165
735
389
185
2,!lOO
27
9~
309
513
915
592
304
146
563
21
65
105
175
110
59
25
26
61
12
18
10
689
12
11
79
98
100
128
121
60
546
10
60
77
147
104
95
47
72
13
10
14
11
14
237
x Non_workers
27
2,355
1.850
355
58
12
13
54
23,564
17,945
3.053
1,181
222
100
92
235
736
18,148
1::.534
2,442
1,019
190
88
81
196
5Yfl
3,513
2,842
401
112
19
27
!O1
23
3,251
1,612
260
261
225
382
226
138
147
33,913
16.379
3,044
2.537
2,213
3,659
2,590
1,648
1,843
25,614
12,464
2,325
1,!H5
1.649
~,739
1,954
1,209
1,359
5,~5
2,521
464
428
370
596
~36
271
319
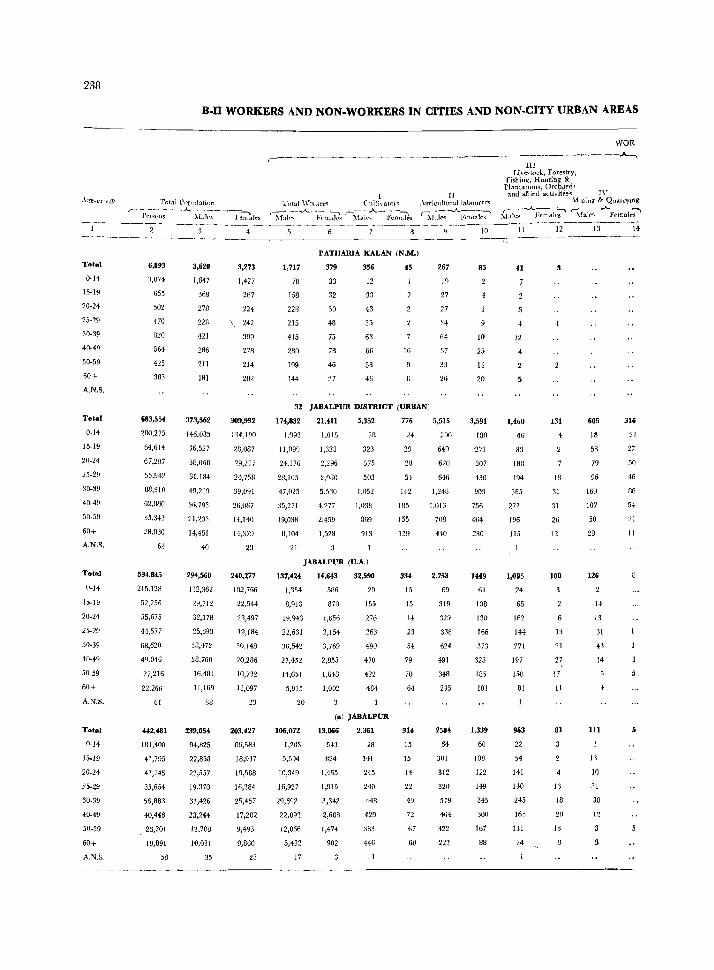
238
B.I1 WORKERS AND NON. WORKERS IN CITIES AND NON·CITY URBAN AREAS
WOR ,-___________________ ~ _____________________ .JI"._""\
III Livestock, Forestry,
Fishing, Hunting & Plant3hon~, ()rcbJ-rd~
I H and allied adivitie~ IV Total Pn(~ll!:.ttion Total \\tolker'l Culti\atot~ .\(('riculrl1rallal>o\lrr-~ MIning- & QmurYlt'lg'
'--J;;;;(-:rl;~-A.~l-.3~l~----~~les I~~.A.-~~l~lci r-llil~:-~~~~:ks rr:b~-..A..F'_'!Il;J~~ ~~~.A.Ft"m*7' ~1--;i~;--"-P;~na1~ -------~~-----~-----~----------·----------------10---1-1---12----1-3----)4
-- ---------------
Total
0-14
10-19
20-24
25-29
30-39
40-49
50-59
60+
A.N.S.
Total
0-14
15-19
25-29
30-39
40-49
50-59
60+
A.N.S.
Total
0-14
15-19
20-24
20-29
30-39
40-49
50·59
60+
A.N.S.
Total
0-14
15-19
20-24
25-29
30-39
40-49
50-59
60+
A.N.S.
6,893
3,074
655
502
470
820
564
425
383
683,554
2RO,275
64,614
67,297
5.5,942
88,310
62,880
35,343
28,830
63
534,845
215.128
52,256
55,675
44,577
68,620
49,046
27,216
22,266
61
442,481
181,408
41,795
41,145
35,654
56,883
40,446
, 23,201
19,891
58
3,620
1,647
368
278
421
286
211
181
373,562
146,08.1
36,527
38,060
31,184
49,219
36,793
21,203
14,451
W
294,568
112,362
~9,7J2
32,178
25,393
:18,472
28,760
16,484
1l,169
38
239,054
94,825
22,858
23,557
19,370
31,426
23,244
13,708
10,031
35
3,273
1,427
287
224
242
399
278
214
202
309,992
1'14,190
28,087
29,2::17
24,758
39,091
26,087
14,140
14,379
23
240,277
102,706
22,544
23,497
19,184
30,148
20,286
10,732
11,097
23
203,427
66,.>83
18,937
19,588
16,284
25,457
17,202
9,493
9,860
23
1,717
78
158
228
215
415
Z8n
199
144
PATHARIA KALAN (N.M.1
379
33
32
30
48
75
78
46
37
356
12
33
43
35
63
66
58
46
45
16
32 JABALPUR DISTRICT (URBAN)
174,832
1,!J93
1l,099
24.176
28,10.1
47,025
35,271
19,038
8,104
21
21,411
],015
1,323
2,296
2,980
5,530
4,277
2,459
1,528
5,352
78
323
575
503
1,052
1,038
869
913
JABALPUR (U.A.)
137,424
1,354
8,913
19,946
22,631
36,542
27,452
14,651
5,915
20
106,072
1,203
5,594
10,349
16,927
29,692
22,092
12,066
5,432
17
14,643
586
870
1,656
2,154
3,769
2,955
1,648
1,002
32.590
29
155
276
263
490
470
422
484
(a) JABALPUR
13,066
543
824
1,455
1,915
3,342
2,608
1,474
902
2,361
28
141
245
240
448
429
38:1
446
776
24
29
23
54-
142
18.1
155
159
334
1.1
15
23
54
79
70
64
314
15
15
11
22
49
72
67
60
267
19
27
27
~H
64
37
33
26
5,515
200
640
620
616
1,243
1,01~
708
440
2,753
69
319
329
338
624
491
348
235
2584
64
301
312
320
579
464
322
222
85
10
25
14
20
3,591
130
271
307
430
903
756
464
280
1449
61
108
130
166
373
325
IDS
101
1,339
60
JOB
122
149
345
300
167
88
41
12
4
1,460
46
83
183
194
365
272
196
115
1,095
24
65
162
144
271
197
150
81
963
22
54
141
130
245
165
131
74
3
131
18
31
31
26
12
100
13
21
27
17
II
81
4
13
18
20
13
605
I" 58
79
96
169
107
50
28
126
14
13
31
43
14
111
1:1
10
31
38
12
3
316
21
27
50
46
86
54
21
11
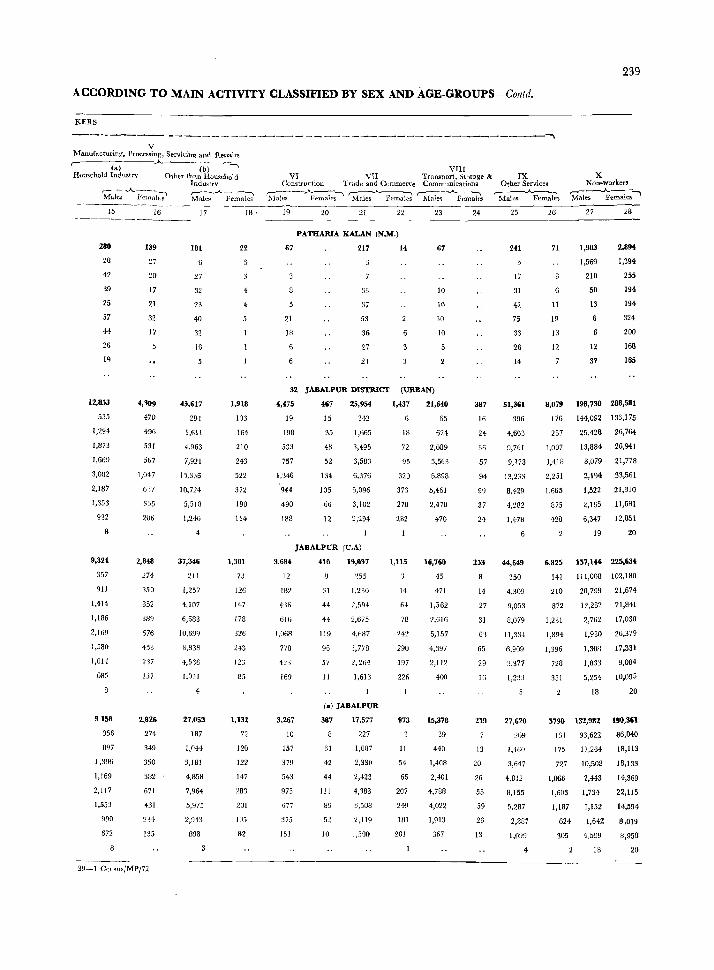
239
ACCORDING TO MAIN ACTIVITY CLASSIFIED BY SEX AND AGE-GROUPS-Contd.
KERS
------------ ----~----~--------------------------------. V
Manufacturing, Proc,("s,5i.Tlg, Servidn~ and Repairs r- (a) A-----(-b-)-----,
Household Industry Other than HOllSeilo1d
15
280
28
42
39
25
57
44
21)
ICY
12,853
535
1,294
1,873
1,669
3,002
2,187
1,353
932
9,324
357
911
1,414
1,186
2,169
1,580
1,014
685
9.158
356
897
1,396
1,169
2,117
1,553
990
672
16
139
27
20
17
21
32
17
4,309
470
496
531
567
1,047
6:;7
355
2()6
2,848
271
350
352
389
676
433
2'17
137
2,826
274
349
350
382
671
431
2'H
135
39-1 Ccusus/MP /72
Industrv
17
181
27
32
23
40
32
IG
45,617
294
1,611
4,963
7,921
13,336
10,724
5,518
1,246
37,3'16
211
1,257
4,107
6,683
10,699
8,338
-1,516
1,011
27,0.3
IS7
1,044-
3,181
4,858
7,964
2,94:1
898
18 '
22
1,918
103
164
210
243
522
372
190
114
1,301
73
126
147
178
326
2-13
123
85
1,132
72
120
122
147
283
201
82
VIlI VI VII Transport, Storage &
Construction Trade and Commerce Communications ~~.--..A-----.. ~__...._~ ~--.,_.A._~ ~1.aJe~ f,'pm3-h·s Males Females J\1ale~ Females
IX Other Services
~Fema(i~
X Non-workers
'-:-:--""""'--""1 Males Females
19 20 21 22 23 -2-4--~2~5--~2~6--'~277----:2~8
PATHARIA KALAN (N.M,)
67
21
18
6
217
33
37
53
36
27
21
32 JABALPUR DISTRICT
4,475 467 25,954
19
198
533
757
1,346
944
490
188
3,6B!
12
4H)
611i
I,OBR
778
423
169
3,267
10
157
379
543
975
677
375
151
15
35
48
52
134
105
66
12
342
1,665
3,495
3,583
6,376
5,096
3,102
2,294
JABALPUR (U.A)
410
31
44
44
119
96
57
II
19,097
255
1,230
2,5Q4
2,675
4,687
:1,778
2,264
1,613
(a) JABALPUR
387
31
42
44
111
89
52
10
17,.77
227
1,087
2,330
2,423
4,183
3,508
~,119
1,500
14 67
10
10
30
10
(URBAN)
1,437 21,640
18
72
95
320
373
270
282
1,115
14
6-}
7B
242
290
197
226
973
II
54
66
207
249
IBI
201
65
624
2,089
3,563
6,898
5,461
2,470
470
16,760
45
471
1,562
2,616
5,157
4,397
2,112
400
1.,378
39
440
1,408
2,401
4,788
4,022
1,913
367
387
16
24
36
57
94
99
37
24
14
27
31
6'3
65
29
16
219
13
20
26
55
59
26
13
241
17
31
42
75
33
26
14
51,361
396
4,603
9,761
9,173
13,233
8,129
4,282
1,478
44,6'19
350
4,309
9,053
8,079
11,334
6,909
3,377
1,233
27,620
1,460
3,647
4,812
8,155
5,287
2,887
1,099
4
71
11
19
13
1Z
8,079
1,903
1,569
2ID
50
13
12
37
2,894
1,394
255
194
194
324
200
168
165
198,730 288,581
176 144,092 133,175
257
1,007
1,118
2,251
1,665
875
428
25,428
13,884
3,079
2,194
1,522
2,165
6,347
19
26,764
26,941
21,778
33,561
21,810
11,681
12,851
20
6,825 157,144 225,634
141 111,008 102,180
210
872
1,231
1,894
1,396
728
351
5790
131
175
727
1,066
1,603
1,187
624-
305
20,799 21,674
12,232 21,841
2,762 17,030
1,930 26,379
1,308 17,331
1,833 9,084
5,254 10,095
W 20
132,982
93,622
17,264-
10,508
2,443
1,734
1,152
1,642
4,599
18
190,361
86,040
18,113
18,133
14,369
22,115
14,594
8,019
8,958
20
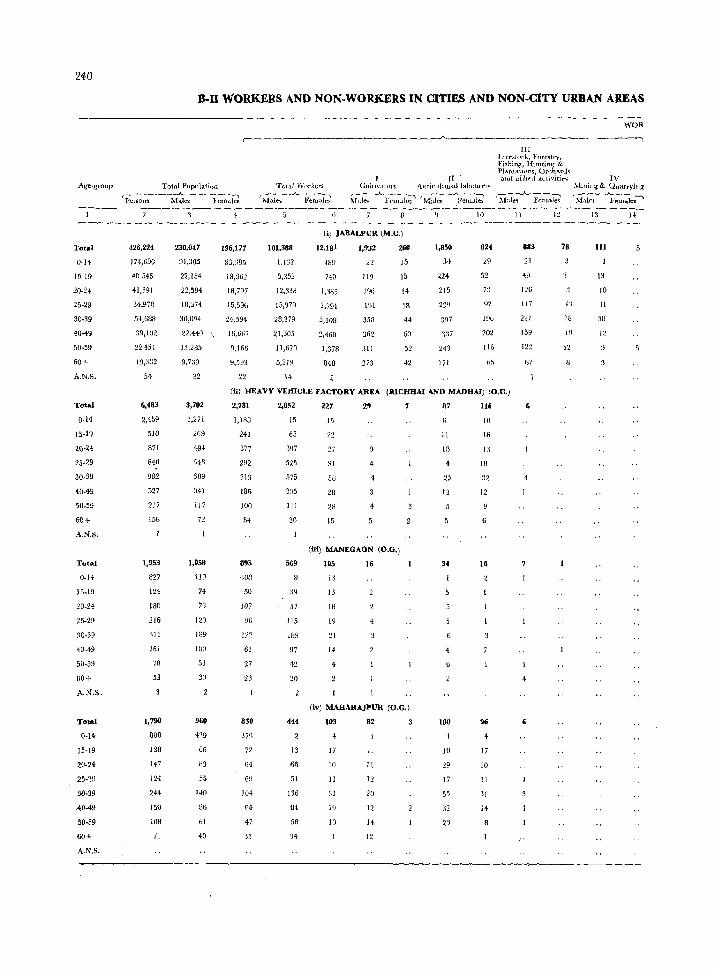
240
Age-group
Total
0-14
15-19
20-24
25-2~
30-39
40-49
50-59
60+
A.N.S.
Total
0-14
15-19
20-24
25-29
30-39
40-49
50-59
60+
A.N.S.
Tota)
0-14
15.19
20·24
25-29
30-39
40-49
50-59
60+
A.N.S.
TotAl
0-14
15-19
20-24
25·29
30-39
40·49
50·59
60+
A.N.S.
B-U WORKERS AND NON-WORKERS IN CITIES AND NON-CITY URBAN AREAS
Total Population r----~-A....----__
Pers.Oll!i ~fa.les f'entales
426,224
174,690
40546
41,391
34,970
54,688
39,lf)2
224,1
54
230,047
91.305
22,184
22,594
196,177
83,385
)8,362
lS,797
18,374 15,5%
30,094 24,594
22,440 \. 16,662
1:1,285 9,166
9,593
32 22
TQtal WLlrkers r-._~-_"'_--" Mates Females
II Ctt!tlv,ltOl~ A~ri('ultllrallilbuur("J'>;
,....~-_A_,.~_~--., r:-:~--..A,.-:--""I
:Mal~s Fenl"des M~tles ,Females
10
Ii) JARALPUR (M,C.)
101,388
1,132
5,352
)2,338
15,979
28,379
21,305
11,670
5,219
14
12,181
489
740
),165
1,791
3,108
2,460
1,378
848
1,932
22
119
191
358
362
311
313
260
15
15
14
18
44
60
52
42
1,850
34
224
2J5
22~
397
137
24'l
171
824
29
52
42
196
202
116
65
1Il Ijw·~tor'k, .Fnre<'itry. Fishing, Hunting & ll!antahons, Orchard;;; and a.lhf'fi activities
r-~-..A..---, . .Males F~male.'\
11
883
21
126
117
2,1
159
122
67
12
78
1:1
lB
J ~)
12
(il) lffiAVY VEHICLE FACTORY AREA (lUCHHAI 4ND MAAHAI) (O.G,)
6,483
2,459
510
B71
840
902
527
217
156
1,953
827
124
180
215
311
161
1B
53
1,790
808
138
147
)24
244
150
108
71
3,102
1,271
269
494
-'348
589
341
I) 7
n
1,058
410
71
73
120
189
)UO
51
30
96P
429
66
n3 55
)+0
86
61
40
2,781
1,188
241
377
292
313
186
100
84
895
408
50
107
96
122
61
27
23
830
379
72
64
69
104
64
47
31
2,052
15
63
525
575
335
1)1
30
569
:19
57
115
189
97
:!o
227
Ei
22
27
:14
58
28
28
15
29
4
4
(Iii) MANEGAON (O,G,)
105
13
13
)8
19
:II
14
16
(iv) MAHARAJPUR (O.G.)
444 ~03 82 3
13
66
51
)36
84
58
,\4
17
10
II
31
19
10
11
).)
20
12
14
12
87
)1
lB
4
25
13
34
180
10
29
17
55
32
116
10
)6
1:1
18
12
6
16
!16
4
) 7
10
11
31
14
4
WOR
IV :\1ulinq- & Quarrying ,-____,--.~~--.
:\f<1k~ Females
III
13
10
31
3il
J:!
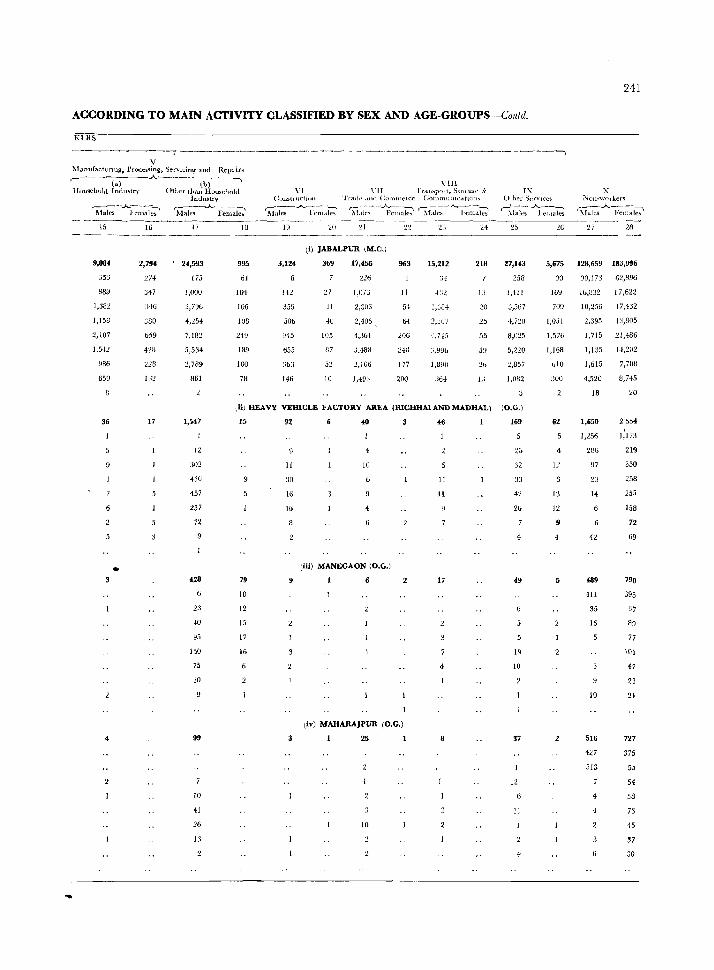
241
ACCORDING TO MAIN ACTIVITY CLASSIFIED BY SEX AND AGE-GROUPS-Colltd.
KLR~
-------------:--~--~--------------------------------------,
V Manu[acturmg, Proces.-'iing, Servlt:in~ and Rep"iu
.- (al -'-----w-----, Household Iodll~try Otller tllan Household
Ylli Y11 l'r,lIl:-.pott. StOlage &
...
IX Industry CUL!>ltllCtJ!JIl Trade ,uui (;omlll('lcc GomrrlUl1lcdt(On~ o h~r Serv ICt..:"
~hi~--~}~nlal;;;' 'M~~~Femat;; 'hl~I~_A_r~::h 'iilk;-~~rnak:' S1"al('.'\ "- re~:l.] r-~:t;1~ ~.'elHa~
X Non-wolken
r:--..A....---~ lo.lales Female~
15
9,084
35:.i
88~
1,:182
1,150
2,107
986
659
36
3
4
•
16
2,794
~74
347
:_j4ti
380
659
428
228
IJ:!
17
17
24,593
175
l,flOO
4,254
7,182
5,534
2,789
861
1,547
12
302
436
457
257
72
428
40
95
150
75
995
61
104
106
IU8
249
189
100
78
1~
3,124
142
35[1
506
945
655
3bJ
146
(il JABALPUR (M.C.)
369
:!.7
11
40
105
87
5,
10
17,456
:126
l,U7J
2,303
2,106
4,361
2,106
1,493
%3
II
54
64
206
UU
177
200
15,212
::4
4:',2
1,:.18+
2,Jb7
+,715
1,890
:;64
218
20
25
55
2b
27,143
258
1,411
5,220
2,857
1,082
Iii) HEAVY VEHICLE FACTORY AREA (RICHHAIANDMADHAL) (O.G.)
15
79
10
12
15
17
16
92
II
30
16
16
40
4
10
ti
4
(iii) MANEGAON (O.G.)
6
46
II
II
17
169
20
32
33
42
26
4
49
19
10
26 '27 28
5,675 128,659 183,956
169
709
1,051
1,576
1,168
(>10
JOO
62
4
l:!
13
12
90,173 82,896
16,832 17,622
10,256 17,432
2,395 10,805
1,715 .21,486
1,135 14,202
1,615 7,7B8
4,520 8,745
18 20
1,650
206
97
23
14
12
489
411
35
16
2554
219
350
258
255
158
72
69
790
395
37
89
77
101
47
~ n
99
41
26
Ll
(iv) MAHARAJPUR (O.G.)
2,
10
8 37
II
10 21
516 727
427 375
513 55
4 73
45
~7
JO
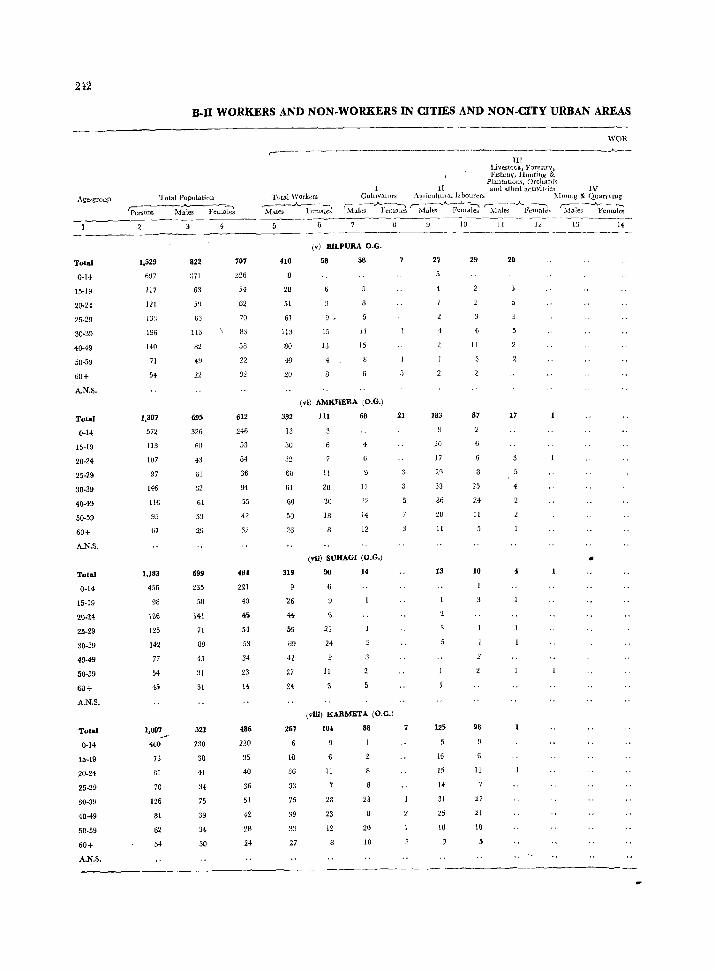
21:2
Total
0·14
15·19
20·24
25-29
30·39
40·49
50-59
60+
A.N.S.
Total
0-14
15·19
20·24
25·29
30'39
4().49
50-59
60+
A.N.s.
Total
0-14
15-19
21)·24
25·29
30·39
40·49
50·59
60+
A.N.S.
Total
0·14
15·19
20·24
25·29
30·39
40·49
50·59
60+
A.N.S.
B-ll WORKERS AND NON-WORKERS IN CITIES AND NON-CITY URBAN AREAS
III Live&t()c.k. Forestry, FISbwt:;, Huoting &:
PlantatlOll'l, Orchard') It and allied activit~ic~ IV
WOR
-"---
Totall'opulation Total \Vorkers C:ultlvaturs A~ricultlilallabour('rs 1lI!HIl~ & QuarnUlg
~-on-s---rvWes FeUla~ ~..A...~~a~ .\fales ~'enHilci r-M;r;-_A..~~ r;1:;i;~ ~.A-F~~s ~s-_"'_Fema~
1,529
6~7
117
121
l::lJ
196
140
71
54
1,307
572
113
107
97
146
116
95
61
1,183
456
98
IS6
125
142
77
54
45
1,007
460
73
SI
70
126
81
62
54
----------------------------------
822
~71
63
5')
63
113
82
49
:!2
695
326
60
13
£1
62
61
53
29
699
235
141
71
89
4:3
~I
31
521
230
38
41
~4
75
39
34
30
\
107
326
54
62
70
US
58
22
32
612
246
53
64
36
84
55
42
32
484
221
40
~5
54
53
S4
23
J4
486
230
35
40
36
51
42
28
24
410
2U
51
61
113
80
4~
20
332
13
30
32
60
01
60
SO
26
(vJ BILPURA O.G.
58 58
15 11
15
(vi) AMKllERA (O.G.)
III
11
28
30
18
68
4
II
I~
14
12
(vii) SUIiAGI (O.G.)
319 90 14
26
44
59
89
41
27
24
267
18
36
33
75
:39
33
27
Ii
22
24
11
(viii) KARMETA (O.G.)
104
6
II
28
23
12
88
23
20
18
21
27
183
20
17
29
33
36
:W
11
125
16
15
14
31
25
10
9
ID
29
Il
87
25
24
II
10
96
11
~7
21
10
II 12 13 14
20
17
.. 4
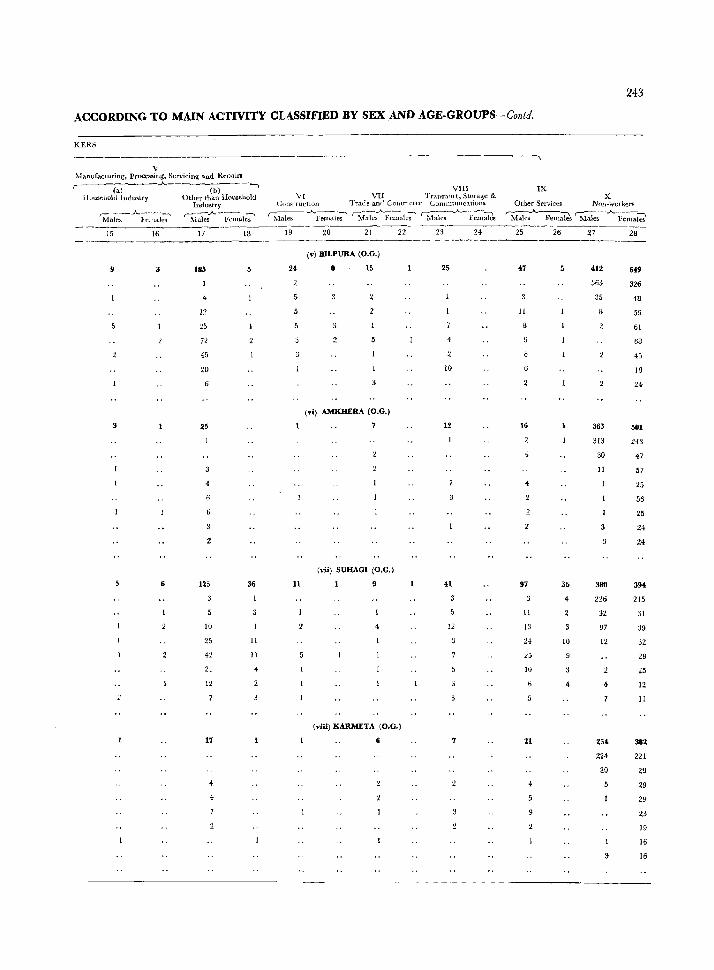
243
ACCORDING TO MAIN ACTIVITY CLASSIFIED BY SEX AND AGE·GROUPS-Contd.
KERS
'J ~fanufaduringJ PrOC(".."ising, Servicing and R('vairs
r- (a) .A. (b) -, Huusehold Industry Other than Househo1d
In'lu!ltry ,..-----....A.._--.o_~ ~..A..---_,
Males FemaJes :Males Females
15 16 17 18
3 185 :;
4
12
25
72
45
2U
25
4
5 6 125 36
10
25 11
42 11
21
12
17
4
4
VIII VI VII TranST)fllt. Storage &
CunstructlOll Trade and COHullelcc LonllnUlllcatilins
S-w;----A...Femal~ 'h~[~:--~t~ ~talt's _A~P;;;;~
19 20 21 22 23 24
(v) BILPURA (O_G.)
24 8 15 25
4
10
(vi) AMKHERA (O.G.)
12
(vii) SUHAGI (O.G.)
11 9 41
4 12
(viii) KARMETA (O.G.)
6
IX X
Other ,services Non-workers
'hiaks-A. Fem~s ~lale;--..A..-Femaki --26'--27---2-8-25
47 5
11
8
16
4
4
97 35
4
II
13
24 10
25
10
21
412 649
363 326
35 48
59
61
68
45
18
2 24
363 501
313 243
30 47
II 57
25
56
25
24
24
380 394
226 215
32 31
97 3~
12 32
29
25
4 12
II
254. 382
224 221
20 29
29
29
23
19
16
16
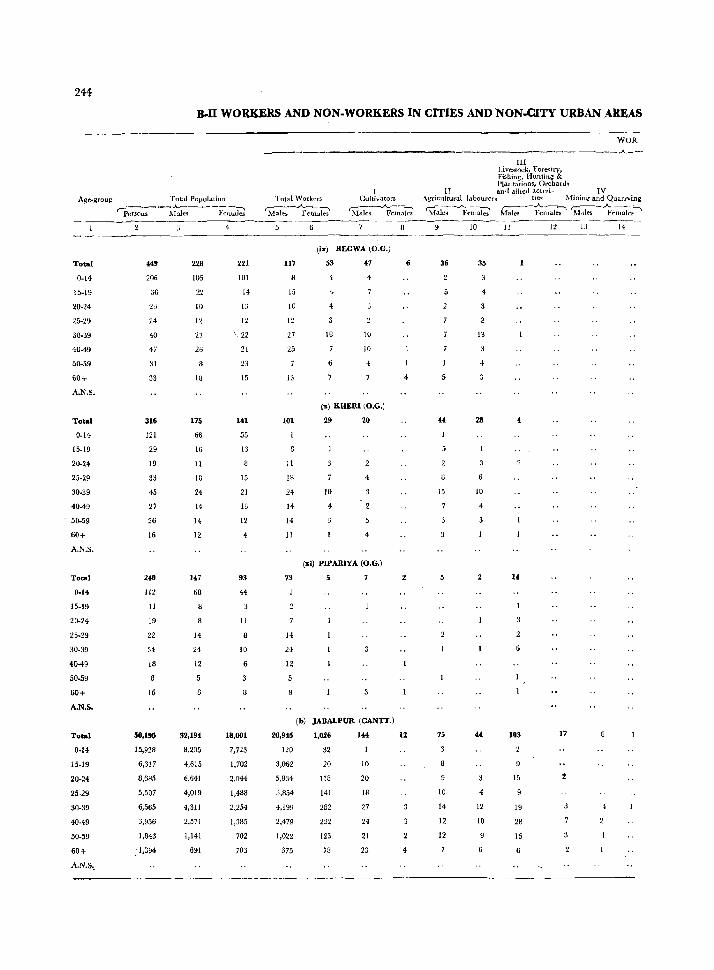
244-
:s.n WORKERS AND NON-WORKERS IN CITIES AND NON-CITY URBAN AREAS
-----WOR
- ____ -A.. __
III Livestock, Forestry, Fishing, Huntiu;! & Plantations. Orchard'i
I II and a!heo actlVi~ IV Age·group Total Population Total Workers Cultivators Agricultural idbol1rC'rs tle~ Mining and Quarr"ing
rp;.;;;---:r;i-;~--- -Y;;l~~ r:-_------.A.----., 'M~~~ki ,-----"--.,..._, r-~~..A...--. r~~.A----
Males Females Males Females Males Females M,des .Fcmalcs~
4 10 II It 13 14
(ix) REGWA (O.G.)
Total 449 228 221 117 53 47 6 36 35
0-14 206 1U5 101 4 4
15-19 ~6 22 14 15 4
20-24 23 1U 13 10 4
25-29 24 12 12 12
30-39 43 27 \, 22 27 18 lU 13
40-49 47 26 21 25 10
50-59 31 23 4 4
60+ 33 18 15 13 4
A.N.S.
(,,) KHERl (O.G.)
Total 316 175 HI !01 29 ~o 44 28 4
0-14 121 66 55
15-19 29 16 13
20-24 19 11 II
25-29 33 18 15 18 4
30-39 45 24 21 24 10 15 10
40-49 27 14 13 14 4
50-59 26 14 12 14
60+ 16 12 11
A.N.S.
(:oi) PIPARIYA (O.G.)
Total 240 147 93 73 7 5 14
0-14 112 68 44
15-19 11
20-24 19 8 11
25-29 22 14 14
30-39 34 24 10 24
40-49 18 12 6 12
50-59 8 5
60+ I. 8
A.N.S.
(b) JABALPUR (CANTT.)
Total 50,195 32,194 18,001 20,945 1,026 144 12 75 44 103 17
0-14 15,928 8,205 7,723 120 32
15-19 6,317 4,615 1,702 3,062 20 10 9
20-24 8,685 6,641 2,044 5,804 118 20 15
25-29 5,507 4,019 1,488 3,854 141 18 10 4
30-39 6,565 4,3)1 2,254 4,199 282 27 14 12 19
40-49 3,956 2,571 1,385 2,479 232 24 12 10 28
50-59 1,843 1,141 702 1,022 123 21 12 15
60+ ·1,394 691 703 375 78 23 4
A.N.S.,
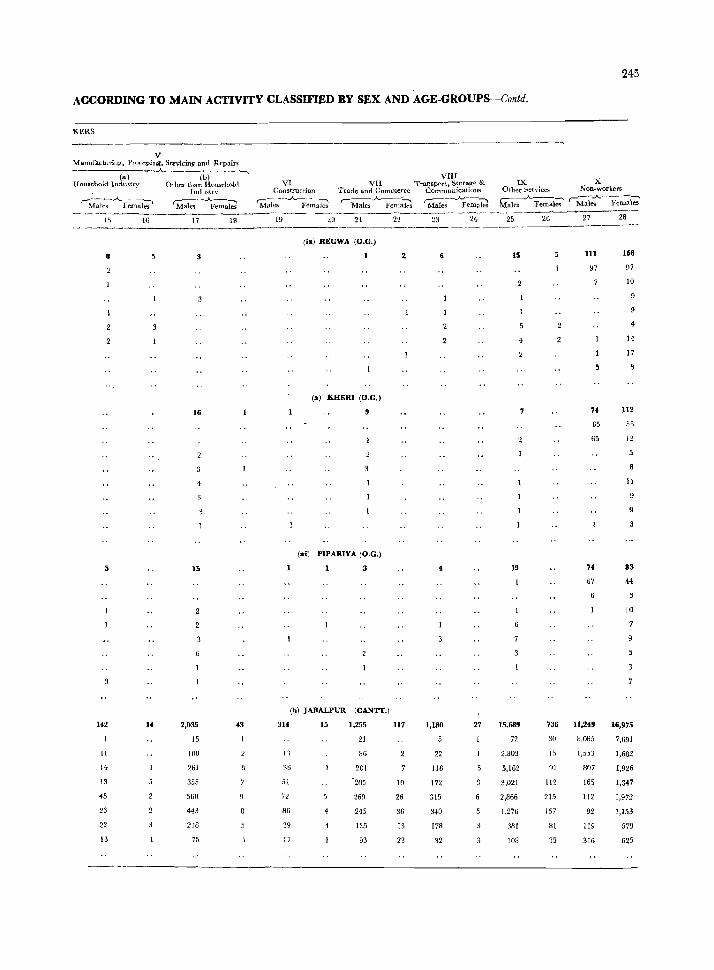
245
ACCORDING TO MAIN ACTIVITY CLASSIFIED BY SEX AND AGE-GROUPS---Contd.
RIIRS
V Manufacturing, Processing, Servicing and Repairs
(al Household Indmtry
,---A--_, Malt's Females
15 16
8
142 14
II
14
13
45
23
22
13
(oj 01 her tlmJ' Househnll1
Iudustrv
'Males -~~Ie; 17 18
16
4
15
2,035 43
15
100
261
355
56H
44.1
218
75
VIII VI
Construction VII Transport, Stora~e &
Trade and Commerce Communications
r"M_~es---_A_F~~lai6 r- Males ~kl ')\{-.-le-5 --"-Femu~
19 20 21 22 23 24
(is) REGWA eO.G.)
6
(x) KHERI eO.G.)
ex;) PIPARIYA eO.G.)
4
(h) JABALPUR eCAN'IT.)
314 15 1,255 117 1,180 27
21 5
I'J 86 22
% 201 116
:;( -205 10 172
72 269 26 315
86 4 245 36 340
39 4 135 13 178
17 93 23 32
IX X Other Services Non-workers
~~l~ rMal~¥ema\;' 25 26 27 28
15 5 III 168
~7 97
10
9
4
14·
17
74 ll2
65 fj~
6, 12
II
9
19 74 83
67 44
10
'}
15,689 736 11,249 16,975
72 :10 8,085 7,691
2,803 15 1,55:3 1,682
5,162 91 907 1,926
3.021 lIZ 165 1,347
2,866 215 112 1,972
1,276 157 92 1,153
381 81 119 579
108 35 316 625
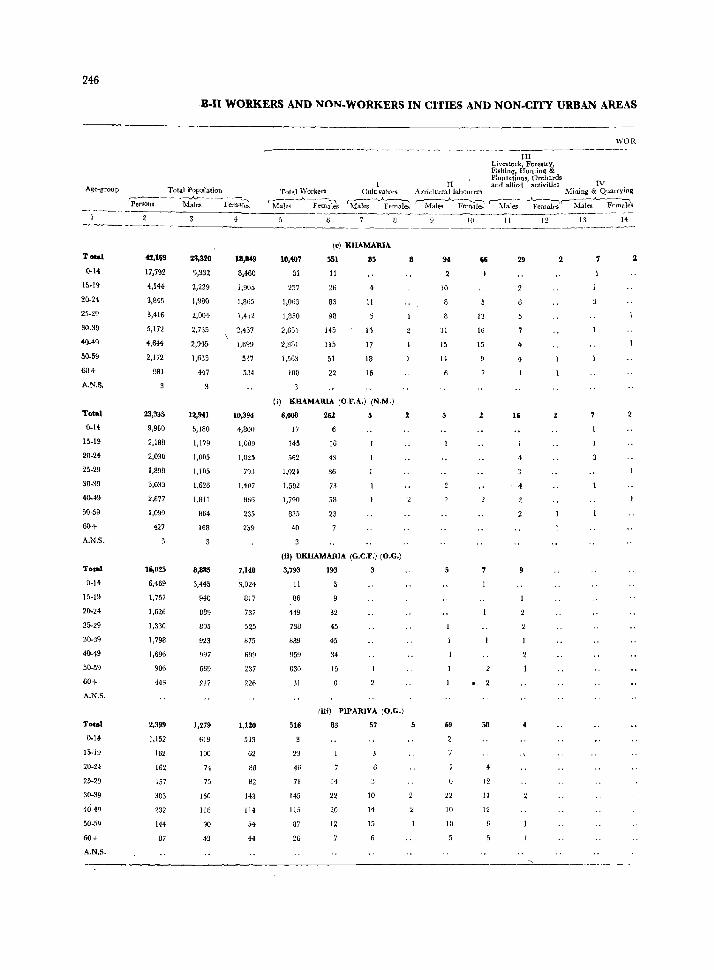
246
B.I1 WORKERS AND NON. WORKERS IN CITIES AND NON.CITY URBAN AREAS
Age~group Total Popu1ation
~~--:M~;--F~~
T~
Q·14
15·19
20·24
25.29
30.39
40..49
50.59
60+
A.N.S.
Total
0.14
15.19
20.24
25·29
30.39
40-49
50-59
60-!
A.N.S.
Total
0·14
15·19
20-24
25·29
30·39
40-49
50·59
60+
A.N.S.
Total
0·14
15-19
20-24
25-29
30-39
40-49
50-59
60+
A.N.S.
42,169
17,792
4,144
3,845
3,416
5,172
4,644
2,112
981
23,335
9,980
2,18B
2,030
1,898
3,033
2,677
1,099
427
16,025
6,469
1,757
1,626
1,330
1,798
1,696
906
443
2,399
),152
162
162
157
303
232
144
07
23,320
9,332
2,239
1,980
2,004
2,735
2,945
1,635
447
12,9U
5,180
1,179
1,005
1,105
1,626
1,811
864
16B
8,885
3,445
940
BS9
B05
923
997
669
217
1,279
619
100
74
75
160
liB
90
4~
1,865
1,412
2,437
1,699
517
5J4
10,394
4,800
1,009
1,025
793
1,407
860
235
259
7,140
~,024
BI7
737
525
875
699
237
226
1,120
533
62
88
82
143
114
54
44
WOR ,.------~----~~----------,..-----+---~---m---------·-----
Total Worl:ers ~----:'.
Livestock, Forestry, Fishing. Hunting & Plantations. Orchards
I II and allied ac:fivities IV. Cultivators AgricltllraJ iahouren ~ining & Quarrymg
Males Females ~--"yema~ r- Males .A-~lei fiful;--~'-;-~ks'r- Male:- Fem;ks
10,407
31
257
1,063
I,B50
2,BRI
1,563
lOB
(0) KHAMAIUA
551 85
11
26
83
98
B5
115
51
22
4
1I
15
17
18
15
(I) KIJAMARIA (O.F,A.) (N.M.)
6,008 262 5
17
145
562
1,0H
1,592
1,790
835
40
16
43
36
73
53
23
(ii) UKHAMARIA (G.C.F.) (o.G.)
3,793
1I
86
449
738
889
959
630
:ll
516
23
46
71
145
IlS
87
26
193
32
45
45
34
15
riii) PIPARIYA (O.G.)
83
14
22
20
12
57
10
14
15
10
31
15
14
69
n 10
10
10
66
13
16
15
50
12
11
12
11 12 1:1 14
29 2 1 2
4
16
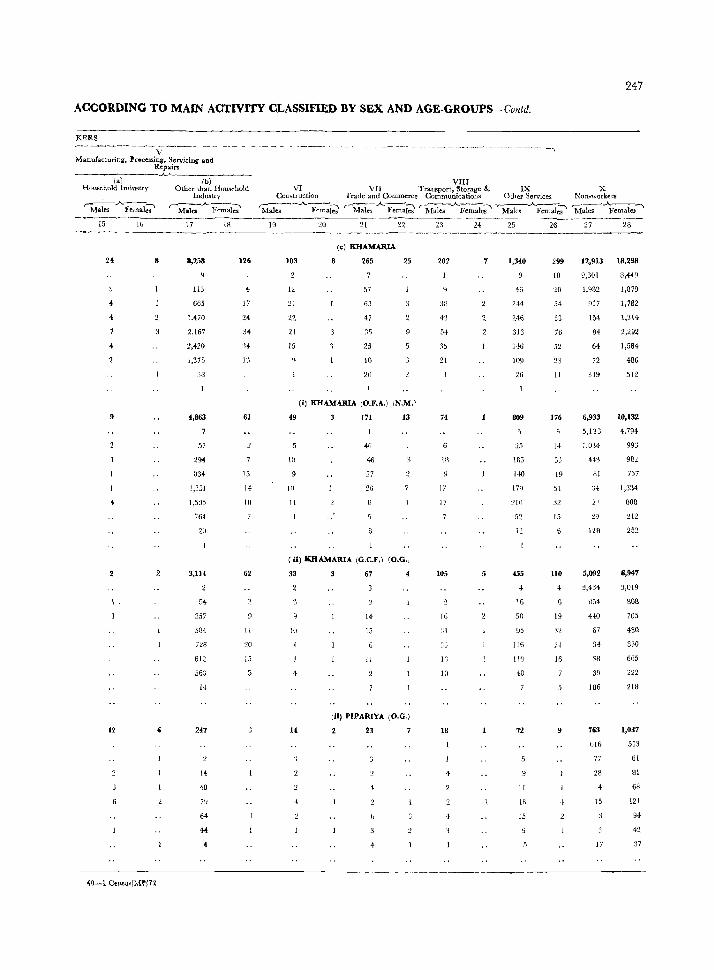
247
ACCORDING TO MAIN ACTIVITY CLASSIFIED BY SEX AND AGE-GROUPS-Colltd.
KERS -- -----\-.-~-------- --- - "_- .-~~- --~--. - ------~------------------"---....
Manufacturing, Precessing, Servicine' asd Repairs
------[-a)-------~~· -----(~b~)----
Hous~hold Industry Other than Hou~ehold
,-----A---.., Malea Females
15 16
2. 8
2
2
12
Industr y
r-~-F-em-a];'
17
8,258
113
665
1,~70
2,167
2,420
1,375
38
.,863
57
294
33.
1,351
J,5:15
764
2{l
3,114
54
3.17
584
728
812
563
14
247
14
40
79
64
H
4
18
126
~
17
61
13
If
18
62
11
20
15
VIII VI
Constluction ~-__ A--_" Males };'emaJes
VII Transport, Storage & IX X Trade and Commerce Communications Other Services Non-work~rs
"--)I,I-,-le-, -"--F-em-;k;' "~b_.A..; Female7' - Males ......_ Fernal~ ~~~emale.s ' ----------------
19
103
21
2.2
21
15
49
10
[0
II
20 21
(c) KHAMARIA
265
57
63
41
3,
25
10
20
22
25
(i) KHAMARIA (O.F.A.) (N,M.'
3 171
46
46
27
26
13
(ii) KHAMARIA (G.C.F.:. (O.G.,
33
10
14
4
67
14
15
11
(II) PIPARIYA (O.G.)
23
4
23
202
38
43
54
35
21
74
18
[7
17
105
16
1')
10
18
4
24 25
1,340
46
2-14
246
313
~+6
109
26
809
25
183
140
IN
5'2
455
IG
50
g5
116
48
72
II
18
15
26
299
10
54
53
76
52
II
176
19
51
:]2
15
110
4
19
:IL
21
16
9
28
12,913 18,298
9,301
1,982
~17
154
84
64
n 339
6,933
5,13)
1,03+
443
81
34
21
29
128
5,092
3,434
ti54
4<0
67
34
38
39
186
763
U,449
1,879
1,782
1,314
2,292
1,584
486
512
10,132
4.794
993
9B2
757
1,334
B08
212
252
6,947
3)019
80B
705
480
830
665
222
218
1,037
bJ6 533
77 61
28
15
17
81
68
121
94
42
37
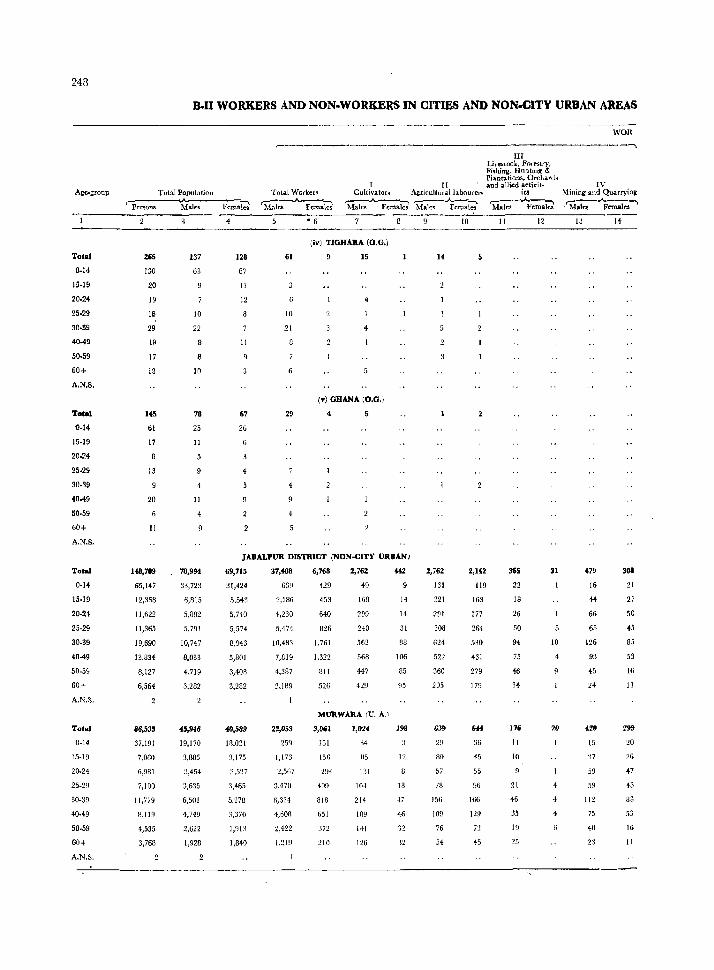
24R
Age.gronp
Total
0-14
15-19
20-24
25-29
30-39
40-49
50-59
60+
A.N.S.
Total
0-14
15-19
20-24
25-29
30-39
40-49
50-59
60+
A.N.S.
Total
0-14
15-19
20-24
25·29
30-39
40·49
50·59
60+
A.N.S.
Total
0·14
15-19
20-24
25-29
30-39
40·49
50·59
60+
A.N.S.
B.II WORKERS AND NON.WORKERS IN CITIES AND NON-CITY URBAN AREAS
Total Population r-:_-----...A---:-;
P('tsons Ma.l~ Females
265
130
20
19
18
29
19
17
13
US
61
17
13
20
11
137
63
10
22
10
78
25
II
11
4
128
67
II
12
8
11
67
36
4
WOR
r----...---..,.._---------------------------------......
Toul WOl"ker)1 r7"~"-' ~lnks Females.
°6
III Livestocx, Fort'stry, Fishin2, Ht1nti~ &: Plan~tiansf Orchard,~
I I [ and allied activit. Cultivators Agricutturallabourers iea ~:-"'\ ~-_A_--:-.. ~_..,.I.",.~ Males Females ~tales 'Female! Males Female!
10 11 12
61
(;v) TlGHARA (O.G.)
15 14 5
10
21
29
4
4
4
(v) GHANA (O.G.)
IV Mining and Quarryini: ,.--:---.A.-_-. 'Ma.1a Femal~
13
JABALPUR DISTltICT (NON-CITY tlItBAN)
148,709
65,147
12,~58
11,622
11,365
19,690
13,834
8,127
6,564
86,5~5
37,191
7,060
6,981
7,100
11,779
8,119
4,535
3,768
78,994
33,723
6,815
5,882
5,791
10,747
8,033
4.719
3,282
45,946
19,170
:1,885
3,454
:1,635
6,501
4,749
2,622
1,928
69,115
:1l,424
5,543
5,740
5,574
8,943
5,801
3,408
3,282
40,589
18,021
3,175
3.527
3,465
5,278
3,370
1,913
1,840
37,488
639
2,186
4,230
5,171
10,483
7,819
4,387
2,189
22,053
1,173
2,567
3,470
6,334
4,608
2,422
1,219
6,768
429
453
640
826
1,761
1,322
811
526
2,762
49
16B
299
240
562
568
447
429
MURWARA rU. A.I
3,061
151
1~6
294
818
651
372
210
1,024
34
BS
J:ll
104
214
189
141
126
14
14
31
88
106
85
95
198
12
18
H
46
'32
2,762
131
321
291
308
624
360
205
639
80
57
78
156
109
76
54
2,142
119
163
177
264
530
431
279
179
644
%
45
55
96
166
129
72
~;
22
18
26
50
94
75
46
34
17i
II
10
21
46
35
19
25
31
10
4
20
4
t79
16
H
66
65
126
93
45
24
420
15
:17
59
59
112
75
40
~08
21
27
50
45
85
53
16
II
299
~o
26
H
43
83
53
16
II
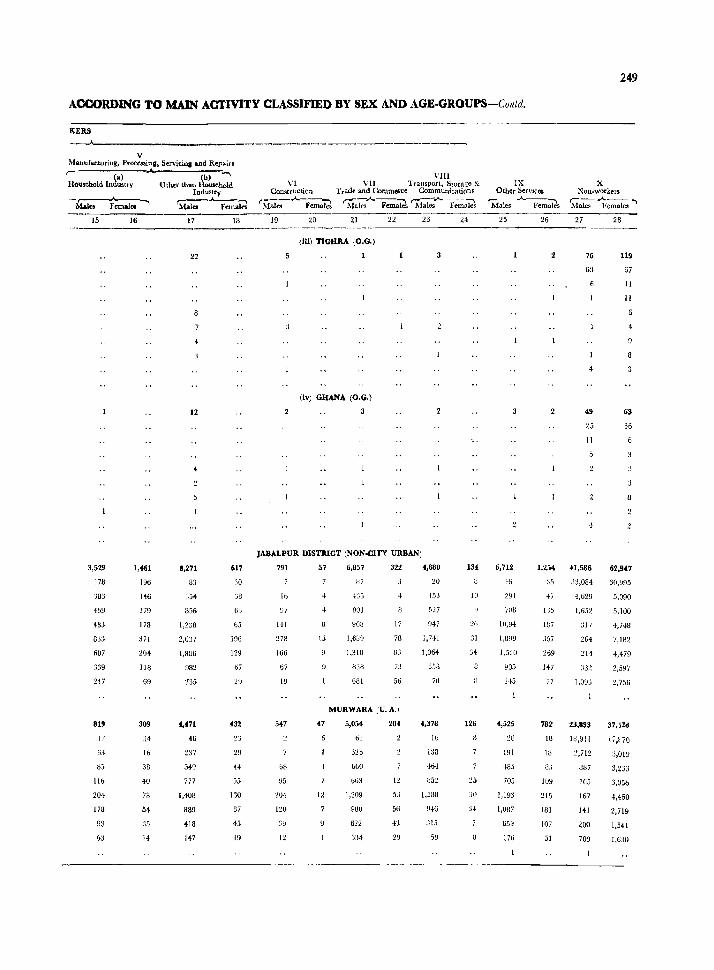
249
ACCORDING TO MAIN AaI'IVlTY CLASSIFIED BY SEX AND AGE-GROUPS-Coilid.
KERB ............A.-___ _
V Manufacturing, PrOCGS!ina:J Serviciua and Repain
,- (a) (b) ~ Household Industry Other than Household
Industry
-~~~ 'M=-~Q 15
3,529
178
,83
483
833
607
339
247
819
17
Ii,;
lib
204
178
93
OJ
16
1,461
196
He 179
178
371
204
li8
69
309
:;4
Ib
38
40
78
54
:15
14
17
22
12
8,271
35.
856
1,238
2,637
1,886
982
:!35
4,471
.6 237
777
1,408
889
418
147
18
617
30
33
6:;
b5
1~6
129
67
432
55
130
87
45
19
------------_...._.,.
VIII VI VlI Transpol·tt Storage &
{!Qnstruction Trade and Conunerce Communications
t~[-al-"'-"""-FemaTei ~.A.-Fe-m-.;ji,. ~jal':--F-e-m.;jd
19 20 21 22 23
(iiiJ TlGHRA eO.G.)
elV) GHANA CO.G.)
JABALPUR DISTRICT (NONoC1TY URBAN)
791
Iii
HI
278
166
67
19
547
b8
204
120
12
57
lJ
47
6,857
87
435
!JOt
HOB
1,689
1,318
838
631
322
17
78
73
56
MURWARA (U. A.)
5,054
61
b63
980
622
5J4
204
5J
56
43
4,880
~O
15J
527
947
1,741
1,064
:J58
70
4,378
1b
138
464
1,588
946
315
59
24
134
IU
:31
126
25
:)0
IX Other ServIces
"'Males .A. Fem~s 25 26
X NOll~worker9
,---..k-- .... l\lales Females
27 28
76 119
63 67
49
11
11
6
4
25 36
11
6,712
46
1,254 41,586 62,947
30,995
5,090
1(I,9f
1,899
1,5;0
805
4,525
~8
HJl
'185
iOj
1,193
I,OB7
G59
176
:35
47
115
187
357
269
147
77
782
IU
13
8.1
109
215
WI
107
31
j3,084
4,629
1,652
317
264
:!11
332
1,OflJ
23,893
18,9l1
~,712
887
165
167
141
200
709
4,748
7,182
4,479
2,5!J7
2,756
37, ;2<1
1;.l70
3,019
3,2:33
3,05b
4,460
2,719
1,541
1,630
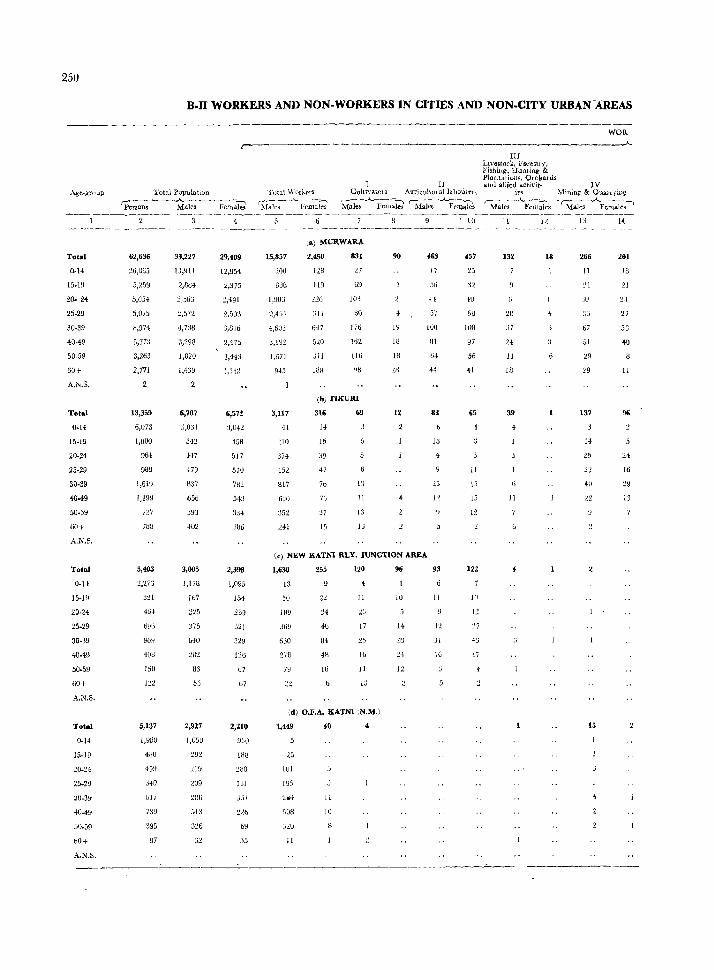
250
Age~group
Total
0.14
15.19
20. 24
25·29
30·39
40-49
50-59
60+
A.N.S.
Total
U.14
15-19
20-24
25·29
30·39
~0·49
50·59
60+
A.N.S.
Total
Q·H
15-19
20·24
25·29
30.39
40·49
50.59
60+
A.Cl.S.
Total
0-14
15-19
~O-:24
25-29
~0·3Y
40.49
50.59
bO+
A.N.S.
B.Il WORKERS AND NON-WORKERS IN clTms AND NON·CITY URBAN AREAS
WOR
r---------.---.----.-----------------------__...J....
Total Populatiun
rpe-,·s-on-s---~·-al-es---F-e-.,;:;IJ
62,636
26,865
8,574
5,773
3,263
2,771
13,359
6,073
1,000
964
989
1,619
1,199
727
)88
S,W3
~,27J
3~1
464
90~
408
150
1""
5,137
1,980
48U
310
GP
395
87
33,227
13,911
2,884
:!,57'l
4,738
3,298
1,820
1,439
2
6,787
3,031
542
44)
479
837
65IJ
393
3,005
1,178
167
225
375
64U
83
55
2,n7
1,05Ll
~U9
2Sii
3:!6
29,409
l2,954
2,375
:!,491
2,503
517
5lU
78~
54;)
3,4
3U6
2,398
1,095
154
239
321
329
126
67
07
2,210
1JI
69
55
I I! Totill \\'orkers
r-:--.A,_ .. ---:-~ .i\Iale'i Females
Culuvatols A\;(rj(ultmallabout~r:-,
~;t;;..A... Fen:ai6 Males -..A... FeIl};k's
15,857
20U
1,671
9-15
3,117
41
::10
374
152
817
630
352
2,450
128
119
':\J1
617
520
J11
188
831
'27
IU3
80
176
162
Jl6
')8
(b) TIKURI
316
1-1
15
39
47
73
37
15
69
13
jj
13
jJ
90
IY
lH
18
28
12
463
17
H
5)
IOU
Bt
64
H
83
13
L?
(c) NEW KATNI RLY. JUNCTION AREA
1,630
13
50
189
369
630
278
79
255
:14
40
84
48
16
120
11
:.U
17
10
11
1J
(d) O.F.A. KATNI IN.M.)
101
195
508
32.U
11
II
10
4
96
10
14
12
93
11
I:!
31
Hi
. 10
457
~U
1118
87
56
41
GO
11
15
15
10
l'
'27
+:J
17
!II Ll'vostock, Flirestry, Fishing, Hunting & Plantations} Orcllards and allied activit- IV
ies. Mining & QUanyillg
r-M~l~ --..A. Fem;Rs • (M~ -.A.Fe;;al~s~
11
132
20
:37
11
18
39
II
lL
II
13
266
11
:?1
:HI
67
51
29
29
137
15
14
201
18
21
27
53
11
24
16
29
13
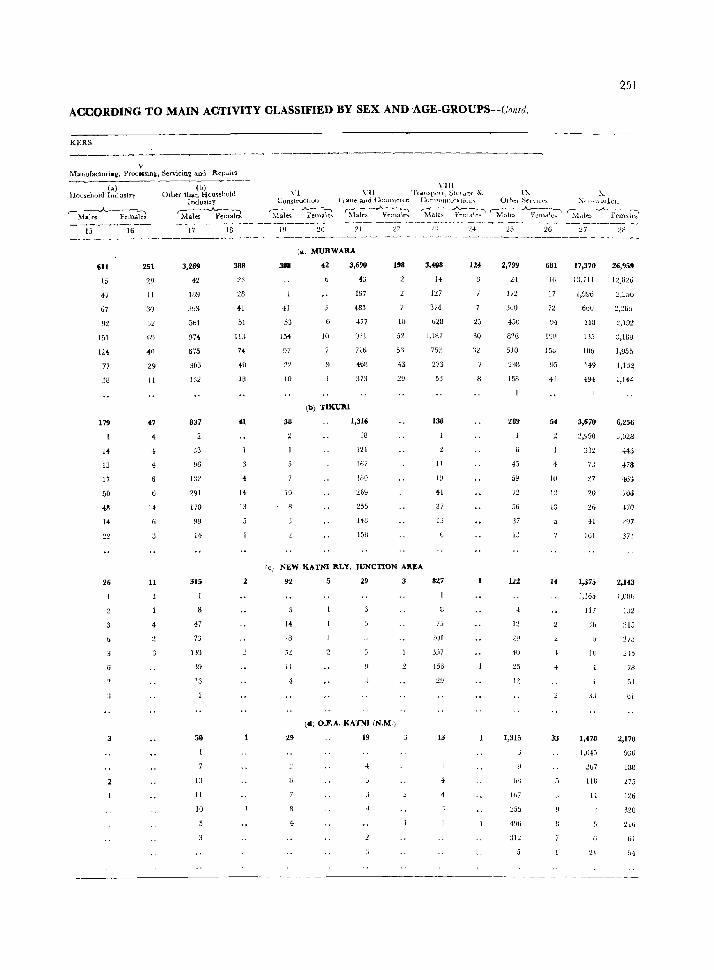
251
ACCORDING TO MAIN ACTIVITY CLASSIFIED BY SEX AND AGE-GROUPS-C'ontrl.
KERS
------------------- -~~--"'-__,----------------------------.~
v h-bnufaduri.i!. PrOC.Slll~J t>el'vicing and R.ep~il'3
(al llousdlold lnrluslry
(b) Olher than Hou~ehuhl
Indust!y ;:-'----"---"-:1
Males l<'(:males
\,111 \"l \"11 l'lolll':>pml, Sl(lIa.:!;c &.. 1)" ~
Constructwll i'!liI.de alld CO!llllleH,e COnl!nllllic .. ti{)ll~ Orh~l S~l\lCt'~ .'\1I11-\\O!l.Clb
S"lal~ ~~:a~ ~.Jal~s -'l~al;: 'Malc~ ~:\~ ~l~l~-·_"__i~~:i~~ r:\l<~~--A--~F-~:}~k; -.. _,..-------_-- --.--~- - ~--~-~--~-~- -----~---~--~---------------~----.-- ---------
21 15 16
6U
15
47
ti7
92
151
IH
77
j8
179
14
13
17
50
26
2
251
29
11
3Q
69
~0
29
11
.7
14
11
17
3,269
42
lfl9
5bl
914
675
303
132
837
33
96
132
291
170
99
315
·17
13
50
I::
II
10
18
388
28
.1 51
1lJ.
U
40
III
14
13
19
3811
"I 53
15-1
97
10
38
:lO
(aJ MURWARA
42 3,690
10
lb) TIKUIU
1&7
485
477
71li
4liH
373
1,314;
18
121
167
lUO
255
H8
158
10
52
5:1
43
29
rC) NEW KATNI P.LY. JUNCTION AP.EA
92
II
29
4
29
(41) O.r.A. KA'fNI (N.M.)
19
3
~'j
3,408
H
127
374
b28
I,W7
7.\2
273
53
131)
11
19
H
37
13
827
75
201
3:,7
156
13
124
3Q
25
2,799
24
172
360
4:)1)
82G
510
'293
158
289
4>
56
37
I"
122
t.!
40
12
1,315
bll
lil7
26
681
16
17
72
IIjU
15ll
95
41
54
IU
12
14
4
33
:27 :!8
17,370
1:;,711
1.8~6
6tO
IW
U3
lOb
149
3,670
2,990
332
7J
41
161
1,375
26,959
12,1J2ti
:2.,:2.65
:..i,189
1,955
1,132
1,IH
6,256
J,028
44:3
478
463
70G
-170
371
2,143
1,165 I,GUb
117 IJ2
215
lu
78
51
JJ Gl
1,478 2,170
1,043 9:W
lW
14
1&l
:l75
JI:! lil
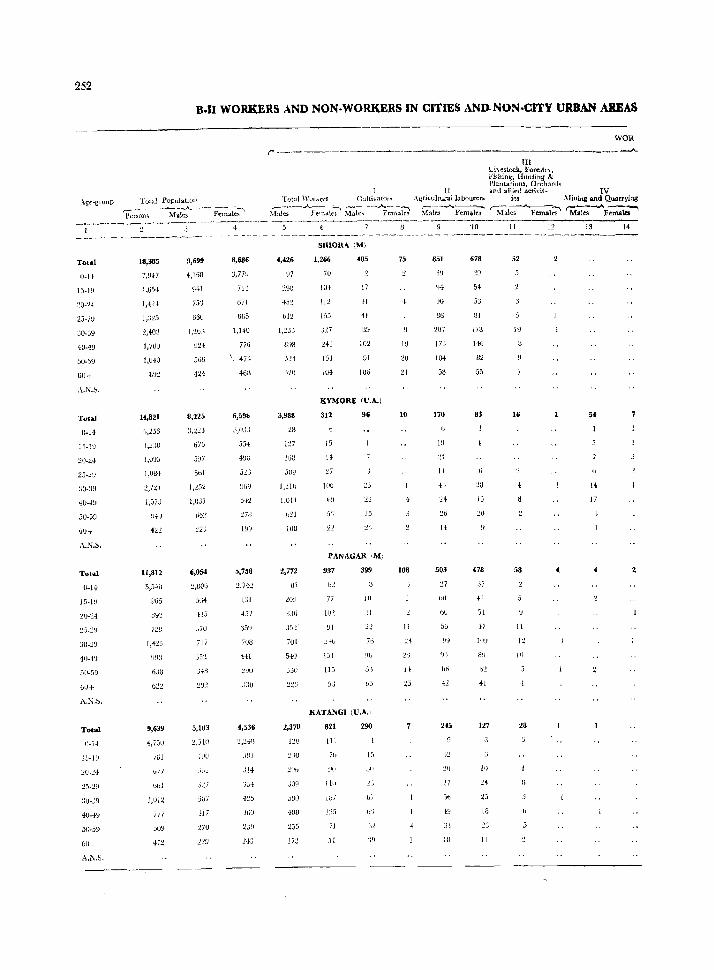
252
B.ll WORKERS AND NON·WORKERS IN CITIES AND-NON·CITY URBAN AREAS
Total Populatwil
'Pe-;o~-·M~~- ----- r;l~al~;:'
WOR
r -.......,......-- ---------------------------------,----- _.;.._ 1Il
Lhestock. Fore:.tn,
~1~~~1io~s~ng~c\~rds 11 a.nd allied a~i\'.it- IV
Total Wud .. ers Clllthatol'; Agrit:ultural Jabou~ers ies Miuinr and Quarrying
llil~-Af~~ale~ ~k~ ----'F~~:ki lli;-~Fem~'~ r;.r;l-;;-.A..~~ ~F~ '10 II 12 IS
-- .. -----~--~------------. ----_-_- --------.--~--------~---____.--------~--~------~---
Total
o-u
30-:19
4(J-4~)
50-59
GU+
.\.N.'.
Total
(>u+
.\.N.~.
Total
O-B
40-4U
50-5~
w+ A.:-;.~.
Total
O·B
2U.:.!4
15-2\_1
bO-I
A.i\.S.
18,385
7,947
1,654-
1,421
1,:J:!5
2,403
1,70U
1,040
H,B21
6,2.36
L,:':3U
1,OU,""
'2,'J:J.I
1,37J
!HU
-t')"
1l,812
5,5-)0
!;l65
1,+:':.1
!J9'J
6JB
9,639
4,i:iU
ILU
vi J
1>,,1
I,UI2
ii7
so~
9,699
+,158
941
506
8,22;;
tiib
5bJ
l,U!1
·1llU
-iii
8,686
'J,77!!
71 _}
671
6135
1,140
776
6,596
554
!J(j'J
:!/IJ
451
7US
HI
:::!}u
J30
1,536
JUI
314
J60
4,426
V7
~9()
45~
bl~
898
.)24
3,988
LB
1:!7
jjj3
1,:l.lb
I,Ull
0:;1
lOB
'l..,772
HI
SJ!)
7Ul
5-1U
J30
:'::.Hj
JOf,l
.3BO
-lUU
172
smORA (M)
1,266
70
10-)
112
155
J'}.7
J4J
151
lUf
485
17
!l
41
lU2
!Jl
I Uti
KYMORE (U.A.)
312 96
15
'17
IUb
15
PANAGAR'M)
937
77
ijl
115
OJ
399
III
J1
KATANGI (U.A.!
821
111
:10
1111
Wi
J ~5
)1
:;1
290
I" :_jU
J2
'j~
75
IV
JO
HI
108
11
851
3~J
Bli
207
17J
104
sa
170
'24
503
'27
hO
50
:,!fJ
'!..7
IU
678
54
5J
81
178
146
82
55
83
1)
(78
'>7
127
II)
18
II
52
16
58
11
28
4
14
17
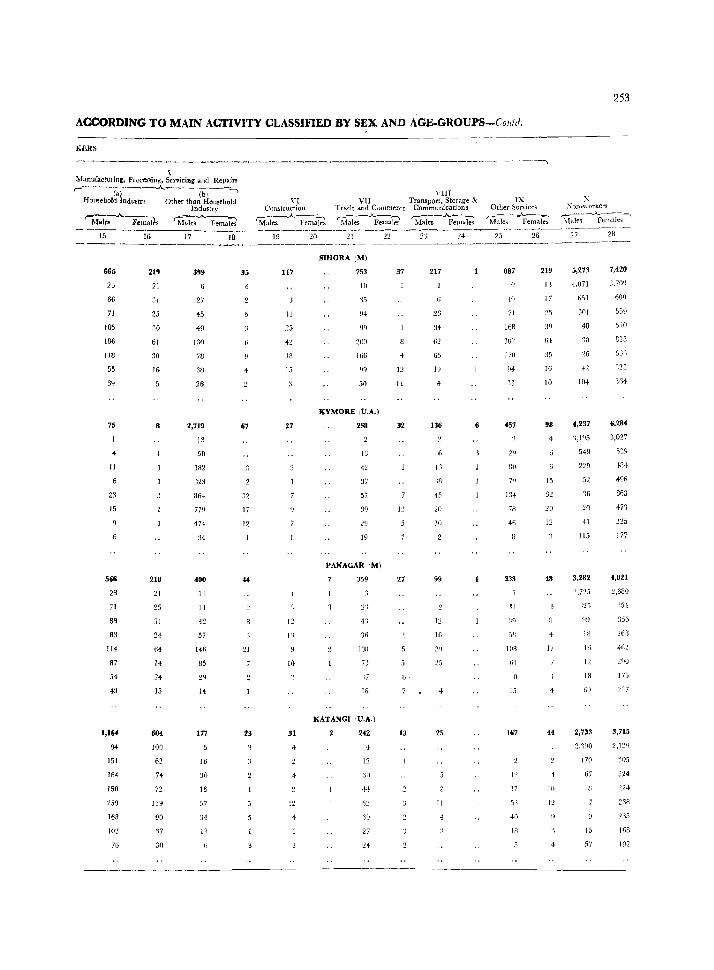
253
ACCORDING TO MAIN ACTIVITY CLASSIFIED BY SEX AND AGE·GROUPS-Coliitl.
KERS
V ~anufacturin:j PlOcessing, Servicing and Repairs '--·~--Ia)--A.----(b-' ---"
Household Industry Other than Household Industry
~~ilis ~~ Fern.lei 15
665
25
66
71
105
lB6
118
55
39
75
11
Z:l
15
566
26
71
88
83
114
87
.\4
43
1,164
9+
151
164
150
259
168
]02
76
16
219
21
:11
25
~o
61
30
16
8
218
21
31
2+
64
14
15
604
100
62
74
72
90
37
17
399
27
45
49
I~O
78
38
26
2,719
13
50
182
J2:l
864
779
474
34
400
n 14
42
57
146
85
177
16
30
16
57
34
13
18
35
67
17
12
44
23
VI Construction
r-:----..A----, Male~ Fema}r.'i
'I'll I VI[ Transport, Stof..lge &
Trade and Commerce Communications
~fales AFema~ S1ales ~;~~
-----;
IX Other ~er\'ic~" ~-~A~---.
M:tle~ Females
X :\on .. \\orkcl's
ru~;;--"r~~~ ------.-------------~----- .. --~ --~-----~~----
28 19
117
II
25
1.1)
27
12
1'1
[0
31
4
12
20 21
SIHORA (M)
753
10
94
99
200
loG
50
KYMORE IU.A.}
238
12
37
57
30
2!)
19
PANAGAR 1M)
359
2'1
lOB
7)
:7
16
KATANGI ,U.A.)
242
12
62
19
27
24
:!2 .?'j
37
12
11
32
L!
27
13
217
26
34
62
65
lH
136
'18
45
20
10
99
IG
25
I[
2.1
887
{II
71
168
457
811
7~}
134
78
46
333
II
51]
10H
GI
+0
15
167
l:!
37
33
40
In
26
219
I')
17
35
16
10
98
15
20
12
48
4
17
44
27
5,273
·1.071
651
301
26
104
4,237
'l,1'15
549
229
52
20
41
115
3,282
)25
18
11;
12
18
2,733
2,')90
170
67
HI
15
57
7,420
.\10
813
123
6,284
3,027
863
473
177
4,821
217
3,715
:105
224
224
238
~35
168
l!l2
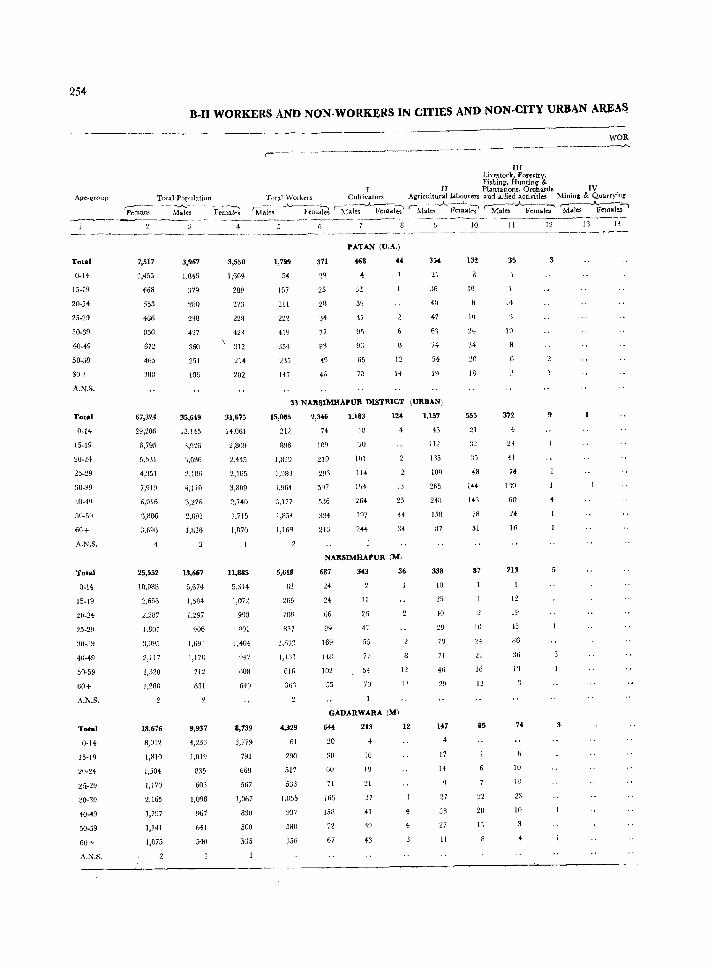
254
Age-qToup
Total
0-14
15-19
20-24
25-29
30-39
40-49
50-59
@r)+
A.N.S.
Tot:'"
0-14
15-19
20-21
::0-R9
40-40
60+
A.N.S.
Total
0-14
15-19
25-29
40-49
50-59
W+
A.N.S.
Tatal
0·]4
15-19
20·24
:!5.-29
30-39
40 .... 9
50-59
60+
A.N.S.
B-II WORKERS AND NON-WORKERS IN CITIES AND NON-CITY URBAN AIU:AS
WOR
r---~-----------------'-------
~ ______________ ~ ___ ~_A
III LivestDck., For~stry. Fishing, Hunting &
II Plantations l Orchards IV Total \Vorl("'ls CultiVAtors .o\jiricuiturallabouJers and alHed activitid Minin,. & Quarryine Total Population
r------ .~...A..--- --'~':"'"""I
Persons Ma.lcs Females r;i~i~~ --..A.-Fe;;~ '-~f;k;.A.~I~ (Male .. A'F~~l~ ':\{ale!< A Femal;-' ~:;,t;--'F-;;;-"'\
7,517
~,455
668
553
466
850
672
465
388
67,324
29,206
6,795
5/)~1
4,351
6,016
3,806
25,552
10.988
2.656
2.287
1.807
3,005
2,ll7
1,320
1,280
18,676
8,012
1,810
1,504
J,J70
2,165
1,797
1,141
1,075
3,967
1,846
37g
280
238
427
360
251
186
15,145
3,926
1,086
2.1f16
4,J10
2,091
1,821)
13,667
5,674
1,584
1.297
Q06
1,691
1,170
712
fi31
9,937
4,23::
1,019
835
603
1,098
967
641
540
3,550
1,6{\9
289
271
228
42,
312
21-1
202
:n,675
14,061
2,869
2,445
2,16~
3,809
2,HO
1,715
I.S70
11,885
5,314
1,072
608
649
8,739
3,779
791
669
567
I,U67
830
500
535
1,799
5{
157
211
222
419
354
2:15
147
371
PATAN (U.A.)
32
59
47
12
21
:.6
{O
47
61
H
33 NAllSIMHAPUR DISTRICT (URBAN)
15,085
212
R96
1,fl29
J,98J
1,964
3,177
1,B5'
1,1oB
5,618
61
265
701l
837
1,6';2
I,D'j
6J6
36'1
4,329
61
290
517
533
1.0.15
937
580
356
2,346
H
lO~
21D
1.183
18
00
101
lH
264
197
2·H
lU
4
J3
25
H
3f
NAIlSIMHAPUR (M)
fiS7
H
H
fi6
99
169
H8
102
55
343
11
26
47
55
77
54
70
36
12
II
GADARWARA (M)
6.1i
20
30
GIJ
71
166
J58
72
67
213
10
18
37
41
'l9
43
12
4
4
1,157
43
112
135
IO~
265
158
338
JO
35
40
29
7R
71
46
141
17
]{
27
38
27
11
JO
to
10
34
20
555
21
7R
51
87
]0
24
~]
16
12
85
28
IJ
11
35
.4
10
372
;,
41
74
no
213
I:!
19
43
86
:16
l'j
74
10
18
23
10
12 J'j If
3
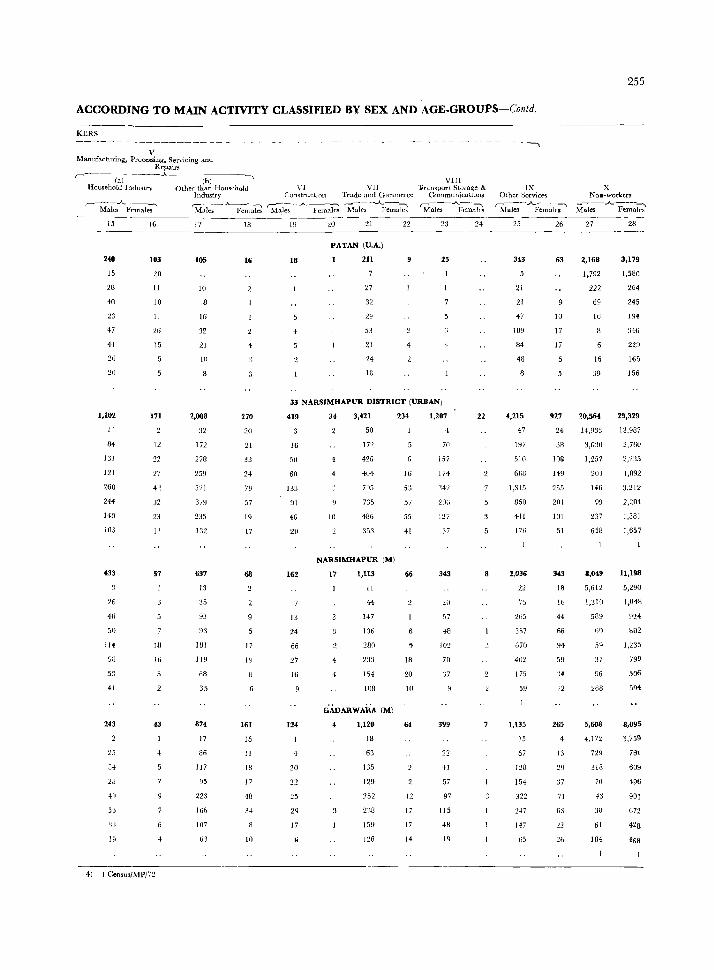
ACCORDING TO MAIN ACTIVITY CLASSIFIED BY SEX AND AGE-GROUPS-Contd.
KERS
V Manufacturing, Pr(lcessing, Servicing and
Repairs r-----(a-)----"- ---(b-)------. VJ[I
Household Industry OLller than Household VI VII 'J:ran'lport Stora.ge &
r-----A..~ Males Females
Industry CO"lstructJOll Trade and Commerce Communicatlons
'Malts ~_A_F;r:~ 'i:fal~ -_A_-F-'e-n-la~ ~fui~--'r,~~~ ~~~A.~~~ ~I~5----I-C----1-7------18
:LO 21 22 23 24
240
15
28
40
23
47
41
26
20
1,102
II
84
131
121
268
244
140
103
433
26
411
50
114
a8
53
41
243
25
J4
28
4"
53
33
19
103
20
II
10
I)
IS
171
12
27
32
23
II
57
]II
1Ii
43
41-1 Census/MP/72
105
10
8
16
32
21
W
2,008
32
172
278
259
521
37~J
235
132
637
13
35
93
~3
lUI
119
68
35
874
17
86
117
95
223
166
107
63
16
270
20
21
33
24
79
57
14
17
68
17
19
161
15
II
18
17
48
34
18
PATAN lU.A.)
211
27
32
2~j
53
21
24
18
25
33 NARSIMHAPUR DISTRICT (URBAN)
419
16
50
60
133
91
46
20
162
13
24
66
27
16
124
20
22
29
17
34
4
10
3,421
50
172
426
404
795
735
486
353
NARSIMHAPUR (M)
17 1,113
II
44
147
136
2flO
n;
154
108
. . . . GADARWARA (M)
1,120
18
63
135
129
252
159
126
234
16
53
57
55
41
66
18
20
10
64
12
17
17
14
1,207
4
7IJ
157
174
142
2%
127
37
343
20
57
48
102
70
399
22
41
57
97
lIS
48
19
22
IX Other Service<;
~fales -A..,;Femalt';'
25
343
21
21
47
109
84
48
4,215
47
197
510
6611
1,315
860
HI
176
2,036
22
75
265
367
G7n
4112
175
59
1,135
15
57
(28
154
322
2-17
147
(i5
26
63
10
17
17
927
24
38
102
149
255
201
101
51
343
18
16
44
66
94
12
265
4
13
29
37
71
63
26
255
x NOR-workers
_--.A..--"", Males Females
27
2,168
1,792
222
69
16
16
39
20,564
14,933
s,mo 1,257
203
146
99
237
658
8,049
5,612
1,319
5n~
59
54
:17
96
268
5,608
4,172
729
318
70
43
30
51
184
28
3,179
1,580
264
245
IY4
346
229
165
156
29,329
13,987
2,760
2,2:1.>
I,S92
3,212
2,204
1,381
1,657
11,198
1,1l4R
924
802
1,235
799
506
594
8,095
3,759
7~i
609
496
901
672
428
468
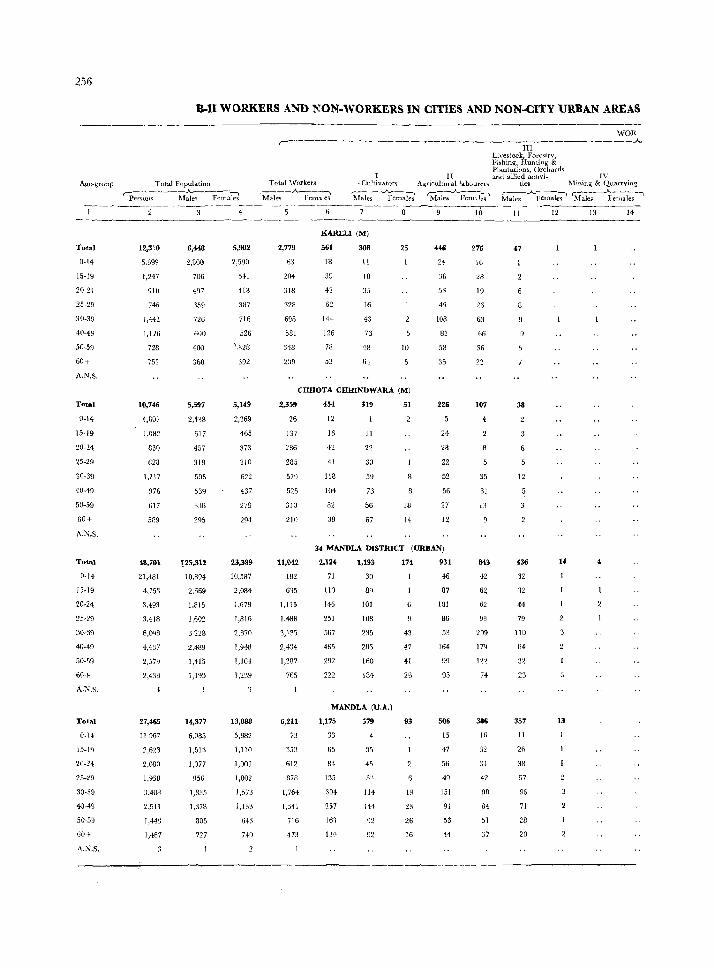
256
B-II WORKERS AND NON·WORKERS IN CITIES AND NON·CITY URBAN AREAS
Age-gruup Tutal Population
Total
0-14
15-I!l
2fi-24
25-29
30-39
40-49
50-59
60+
A.N.S.
Total
0-14
15-19
20-24
25-29
30-39
40-49
51)..59
60+
.... KS.
Total
0-14
20-24
25-29
40-49
50-59
60+
A.N.S.
Total
0-\4
lS-F-)
20-24
25-~9
30-39
4D-49
50-5~
60+
A.N.S.
rpeI'sol~--1~~~~ki
12)3'10
5.399
1,247
910
74Fi
1,442
1,116
728
752
10,746
4,807
I,OB2
830
628
1,217
976
617
5D9
43,701
21,181
4,751
3,493
3.418
6,0~B
4,437
2,57Q
2,4311
27,465
11 967
2,080
1,958
~:.40R
2,511
I,H8
1,467
6,448
2,800
706
497
726
600
400
360
5,597
2,4,B
617
457
31B
595
539
338
295
[25,312
10,894
2,(;69
1,815
1,602
3228
2.489
1.415
1,199
14,377
6.085
1,513
1,077
956
l,m.1
1,37B
805
727
5,002
2,599
.,41 413
387
716
526
"328
392
5,149
2,369
465
373
310
622
437
279
294
23,339
10,587
2,084
1,678
1,816
2.870
1,948
1,164
1,239
13,088
5,882
1,110
1,003
1,002
1,573
1,133
643
740
WOR r------------~-------~----~---------------.,....-.-..A..
II
III Livestock, Forc'5lrv, Fishing, Hunting & PlantativLJs, Orch;.trds and allied actlvi- JV
T otal T~ Vorkers ,---~ 1vlales FCLualr:1>
- Cuttivatot'i Ag\-icultural !abQuren ties MLni.ng & Q.l1arrying
'1j-al-e,-' -~'ema~ ~ales ....A_-I'e-m-"-I~ Mar;;-..A-;cma1e-;' 'M;};-~~;~:i~~-l -------_---------
2,779
63
204
318
328
693
581
348
239
KARELI (M)
561
18
39
42
62
144
126
78
52
308
11
lH
35
16
43
73
48
61
25
10
CHHOTA CHHINDWARA (M)
2,359
26
137
286
285
579
526
310
210
454
12
16
42
41
118
104
82
39
319
II
22
30
59
73
56
67
51
18
14
446
24
%
49
lOS
83
58
35
226
24
28
22
52
56
27
12
34 MANDLA DISTRICT (URBAN)
11,012
182
615
1,115
1.4-88
2,434
1,287
765
6,211
73
35:1
612
1l7S
1,764
1,341
716
473
2.124
71
110
146
251
567
465
292
222
1,193
30
89
101
108
235
286
160
184
MANDLA (U.A.)
1,175
33
65
84
135
304
257
161
134
579
35
45
114
144
92
174
43
47
41
26
93
19
23
26
16
931
46
87
101
86
53
164
99
95
506
15
47
56
49
151
91
53
44
1~ II 12 13 14 -----------------------276
16
28
19
26
22
107
35
31
13
843
42
62
62
93
2~9
17g
12'1
74
386
16
3.)
42
90
84
51
37
38
12
~36
32
32
44
79
110
84
32
23
357
II
38
67
96
71
28
20
13
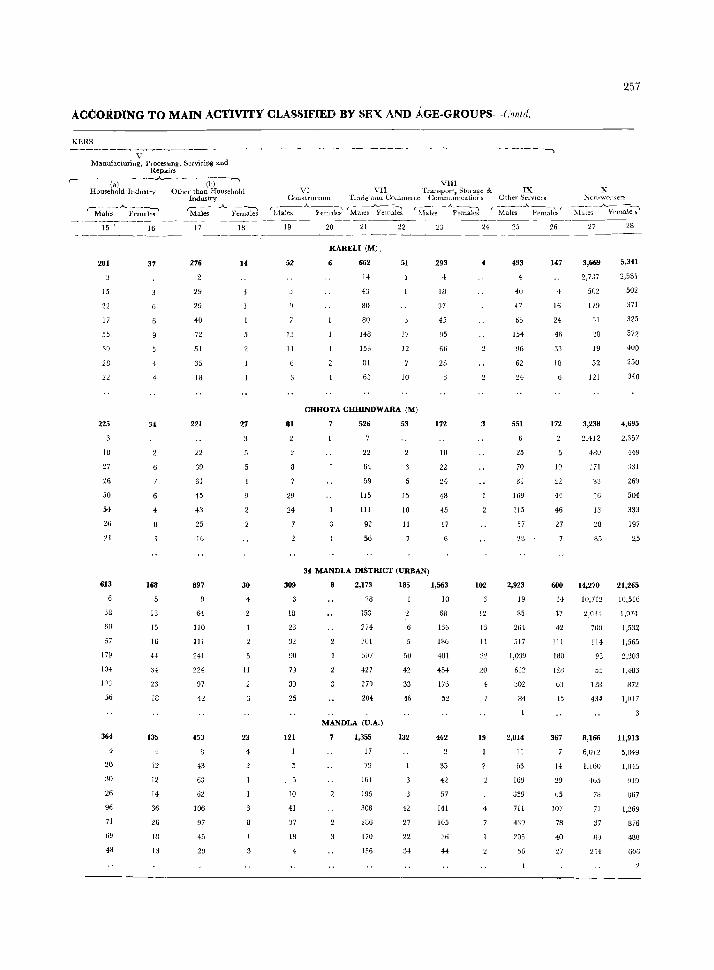
257
ACCORDING TO MAIN ACTIVITY CLASSIFIED BY SEX AND AGE.GROUPS-Cnnld.
KEltS ------------------------------------ ~--~-------- ----'---------- -------""
V Manufacturing, llrocesslllg, Servicing and
Repairs ,-~-~(:;)--~"""·------:lb)--"'
Household Industry Other than Household
r----.A_-----.., Males F emale~
15
201
IS
22
17
55
28
225
1B
27
15
50
54
26
11
613
3G
6U
67
179
104
56
364
4
20
:JO
26
96
71
69
48
16
37
34
4
8
168
13
15
16
H
34
23
18
135
12
12
14
36
26
IIJ
13
Industry r:-::---"----~ Males Y cwa~es
17
276
29
29
4U
72
51
35
IB
221
22
39
31
15
43
25
16
897
64
110
111
241
224
97
42
453
43
6J
106
97
45
29
18
14
27
30
-4
11
23
-4
VIII VI VII TransIJOCi. Sturage & IX X
COllstrucnun Tlade a,ul Commerce CODUnUtllCatior!i Other Services :\"on-workt'rs
(iA~-Fema\e;' 'M_ales~emalJ ~l-;i~s __A._F-;~lJ r:,\1ak:AFem~~r- ~·<ble:;-_A._~mal~ 19
52
13
II
81
29
24
20 21
KARELI (M).
6 662
14
43
80
80
148
153
81
63
22
51
17
12
10
CHHOTA CHHINDWARA (M)
526
22
64
59
115
111
92
56
53
15
10
II
34 MANDLA DISTRICT (URBAN)
23
293
-4
18
37
45
95
66
25
172
10
22
24
18
45
17
6
309 8 2,173 185 1,563
18
23
32
90
79
39
25
121
10
41
37
W
4
28
153
274
:lOl
507
427
27~
204
MANDLA (U.A.)
7 1,355
17
79
164
195
308
286
170
136
50
42
33
46
132
42
27
22
10
68
136
186
4Gl
454
176
52
462
35
57
141
105
36
H
24
102
12
13
11
2()
-4
19
493
4
40
47
6b
154
96
62
551
25
70
81
169
115
57
2,923
19
85
264
517
1,039
61~
302
84
2,014
11
63
lGU
359
711
439
205
5G
26
147
16
24
46
33
IG
172
19
44
46
27
600
14
lJ
42
III
180
12B
63
45
367
65
107
78
40
27
27
3,669
2,7J7
502
179
31
'!8
19
52
121
3,238
28
5,341
2,581
502
371
325
572
400
250
340
4,695
2,412 2,35'/
480
J 71
33
16
13
28
85
14,270
10,712
2,034
7UO
114
93
55
121]
4H
8,166
6,llU
1,160
-!tJ5
73
71
37
254
;)31
269
504
333
197
25
21,265
10,516
1,9H
1,532
1,565
2,303
1,483
an 1,017
11,913
5,1\49
1,045
~Jl9
867
1,269
876
480
606
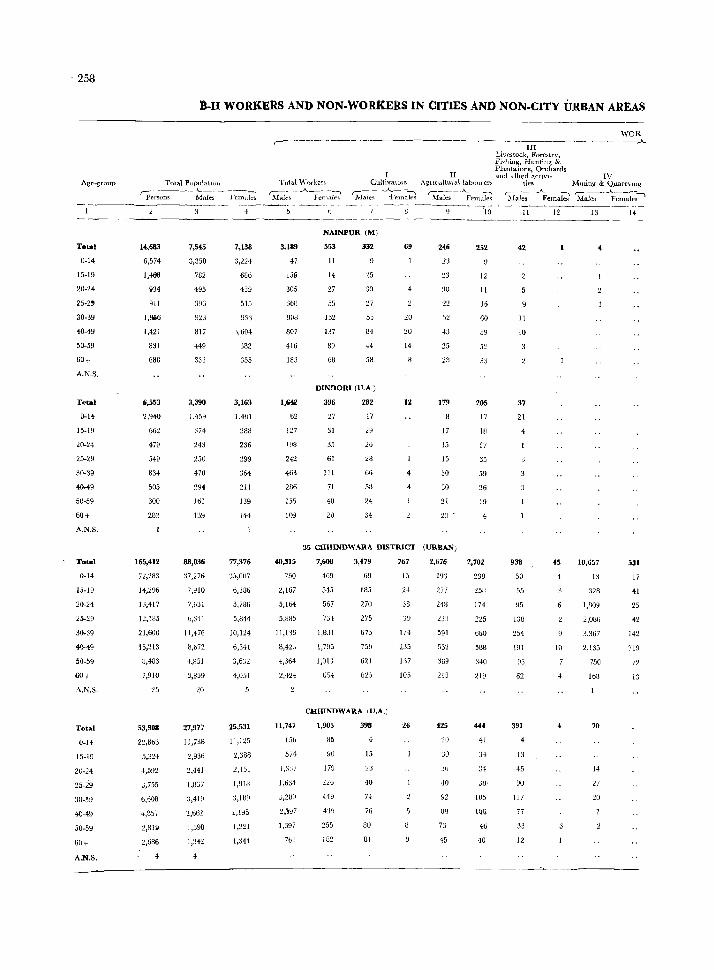
, 258
Age-gwup
Total
0-14
15-19
20-24
25-2~
30-39
~0-49
50-59
60+
A.KS.
rotal
0-14
15-W
20-24
25-29
30-39
40-49
50-59
60+
A.N.S.
Total
lJ-14
15-19
20-24
25-29
00-39
40-49
50-59
60+
A.N.S.
Total
0-14
15-19
20-24
25-29
30-39
40-49
50-59
60+
A.N.S.
B-II WORKERS AND NON-WORKERS IN CITIES AND NON-CITY URBAN AREAS
Total Fupulalluu
'Persuns ~ ~~"emat6
1~683
6,574
1,400
~34
gil
1,986
1,421
831
688
6,553
2,940
662
479
549
834
505
300
283
165,412
72,28:1
14,2%
13,417
1:!,185
21,600
15,213
8,483
7,910
25
53,308
2:.!,Bb3
5.3:!4
'1,092
J,755
b,608
4,S51
2,81g
2,686
7,545
3,350
782
495
:196
923
817
449
333
3,390
1,459
$74
243
250
470
294
161
139
88,036
:17,276
7,~IO
7,631
0,341
11,476
BJti72
4,851
3,859
20
27,971
11,738
~,936
~,441
1,837
3,419
J,598
1,342
7,138
3,224
686
439
515
3,163
1.4m
288
236
299
364
211
139
144
77,376
~)5,()07
6,386
5,786
5,811
10,124
6,541
3,632
4,0-'>1
25,531
11,125
2,388
2,151
1,9W
J,Il:lY
'L,195
1,221
1,0H
r-- ----------------=----------~-------
II
Live.stock, Fore .. try, Fi"hiug, Huntin~ & Plautaions, On.:hards amI allJ(~d actlvl- IV
WOR --.A-
Total vVorkcr~ Cultiv<\'1.0Is Agllcultmallabuulcrs ties Muung & Quarnlng r:--:-:--"-----~ Ables Femall"S 'M~~-~:n~~ 'M-;i;;-~~e~ ~-;Je-;-_) Fem~~\ 'Ma~~';-m~le~~
3,189
47
155
305
36B
908
807
416
183
1,6411
62
127
198
2-12
463
236
155
109
40,315
750
2,167
5,164
5,885
11,136
4,364
2,424
1l,747
15b
57'1
1,337
1,634
3,289
2.,~(j7
1,397
7bJ
NAINPUR (M)
553
II
14
27
55
152
137
89
68
332
30
55
84
H
58
DINI)ORI (1.1.A )
396
27
31
05
61
III
71
40
20
282
17
29
26
28
66
SI1
24
34
69
20
20
14
12
4
4
:.U
23
22
52
43
25
:.W
179
17
15
50
30
21
35 CHHlNDWARA DISTRICT (URBAN)
7,608
469
515
567
734
1,8,11
1,795
1,013
654
3,479
69
185
270
275
675
759
621
025
CHHlNDWARA (U.A.)
1,905
85
179
449
4'39
255
182
398
15
40
74
76
80
81
767
15
24
38
39
174
V5
137
105
26
2,676
1~3
277
248
233
591
532
369
233
425
20
:)0
36
·10
92
89
73
45
'10
252
12
11
16
60
59
33
205
17
HI
17
35
59
36
19
2,702
238
~5U
IH
660
5BB
340
41
:H
34
38,
105
IQG
46
40
II
II
10
37
21
4
938
50
55
95
138
254
H.I1
93
62
391
4
13
45
117
77
33
12
12
45
10
13
10,657
13
328
1,1109
2,OB6
3,367
2,1:15
750
!ti8
70
H
27
20
14
531
17
41
25
~2
142
719
72
13
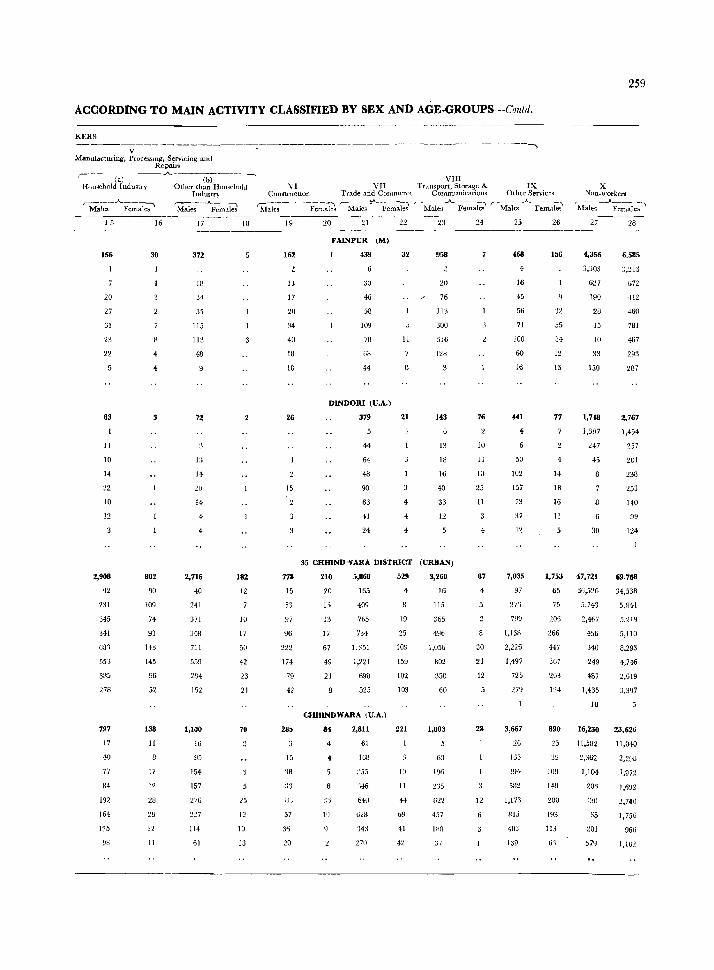
259
ACCORDING TO MAIN ACTIVITY CLASSIFIED BY SEX AND AGE-GROUPS-Contd.
KERB
v Manufacturing, Proces._<;ing, Servicing and
Repairs -----.A.----
<a) Household Industry
r:----"------.. Males Females
1 5
166
20
27
61
23
22
83
11
10
14
22
10
12
2,908
92
231
345
341
6B~
55'3
335
278
797
17
40
77
84
192
164
125
~)8
16
30
4
802
90
109
74
93
143
145
96
52
138
11
17
I?
28
II
<b) Other than HousellOld
Industf) r----.A.....-~
Males Females
17
372
34
30
liS
11:1
48
J:l
14
20
14
4
2,716
40
241
371
348
711
559
294
152
1,100
16
95
154
157
276
'2'27
114
61
I~
182
12
]{)
17
50
42
23
21
70
12
10
13
VIll \,1 VII Trd.nsport j Storal,{e & IX
Construction Tr:).ue and Commerce Communications Olher Services
r;1-.ti;-- --F~~;k1 r-~faks--Y'--~';-m:lei r-M~~ Fema~ r-~-F-;~~ 19
162
n 17
20
34
40
IH
18
26
15
21
FAINPUR (M)
439
30
46
58
109
711
68
DINDORI (U.A.)
379
44
64
48
90
63
41
24
22
32
11
21
4
4
4
23
958
20
76
113
300
316
128
143
13
18
16
40
33
12
35 CHmND'VARA DISTRICT (URBAN)
24
76
10
II
10
25
11
468
4
16
45
56
71
lOa
60
16
HI
4
50
102
157
73
37
12
156
32
55
34
12
13
77
4
H
18
16
II
X Non-workers
r-:~-..A-.--..., Malec:; Females
4,356
3,:303
627
190
28
I:;
III
33
150
1,7-18
1,397
247
45
8
6
30
6,585
672
412
460
781
457
29:1
287
2,767
1,454
257
201
238
253
110
99
124
778
15
53
210
20
1 > 13
17
67
49
21
5,868
165
4{)9
765
734
529 3,260
16
115
87 7,035
97
1,753 47,721 69,768
222
174
79
42
285
15
'18
:13
H;
57
3f)
20
1.~51
1,121
698
525
CHHINDWARA (U.A.l
84
4
19
2,811
61
168
~'5S
';46
64(1
6,8
34:>
270
19
25
109
159
102
103
221
10
II
44
b9
41
42
365
496
1,056
802
350
60
1,803
63
196
622
457
IH8
3;
21
12
5
28
12
:!7'1
799
1.138
2,226
1,497
725
279
3,667
394
5B2
1,(73
~15
4U3
139
65
75
205
266
447
367
203
12-1
890
39
109
I~II
20U
3o,5~!G
5,743
2,4{,7
456
340
249
487
],435
16,230
11,582
2,362
1,104
20';
1:30
05
201
579
34,538
5,841
5,21Y
5,110
8.293
4.746
2,619
3.397
23,626
l1,U'1O
2.29U
1,972
l,1i92
2,740
1,756
966
1,162
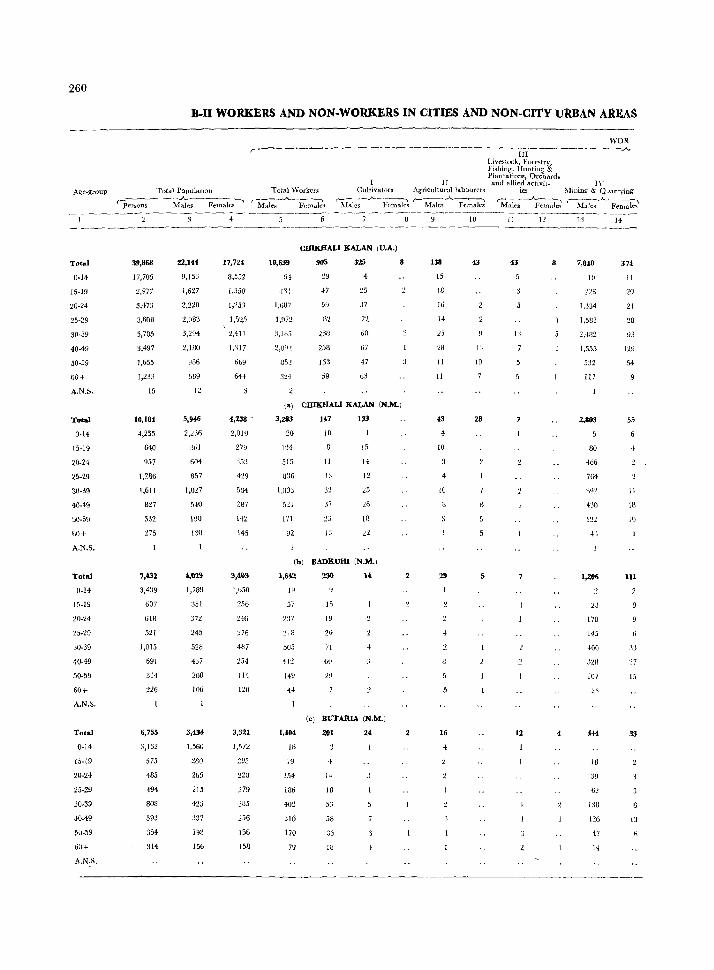
260
Age-group
Total
0·]4
15·19
20·24
25·29
30·39
40·49
50·59
60+
A.N.S.
Total
0-14
15-19
20·24
25·29
30·39
40·49
50-5~1
50+
A.N.S.
Tot.1
0·]4
20·24
25·29
:m·39
40-49
50·59
60+
A.N.S.
Total
0·14
15·19
20·24
25-29
30·39
4049
50·59
60+
A.N.S.
3',868
17,705
2,977
3,47:!
3,608
5,705
3,497
1,655
1,233
15
10,184
4,255
640
957
1,286
1,611
827
332
275
7,l32
3,439
607
618
521
1,015
691
314
226
6,755
3,13::!
575
485
494
808
593
354
314
B.II WORKERS AND NON· WORKERS IN CITIES AND NON-CITY URBAN AREAS
22,144
9,153
1,627
2,220
2,083
3,294
2,WO
~lB6
589
12
5,946
2\2:16
361
604
857
1,0'17
5-\(J
190
13U
l,019
1,789
351
372
245
528
437
200
106
3,434
1,560
280
265
215
42j
337
198
156
4
17,724
8,552
1,350
1,253
1,525
'2,411
1.'317
669
64+
4,238
2,019
279
'153
429
584
287
142
145
3,403
1,650
~56
H6
~76
487
254
114
120
3,321
1,571
295
220
279
385
256
156
158
WOR r-----------~----'----~----·---------In-------·-~---~-..A..
IG,639
91
rn 1,687
1,972
3,W:;
I II Cultivators Agricultural labourers
r-----"--~--:i r----....... ~~ ~Iales Fema1{''I;. MaJe~ Femalt~
to
CHIKflALl KALAN (U,A.)
905
47
59
32
2:111
2,\H
133
59
325
4
25
37
n {ill
ti7
47
63
8 138
15
18
ttl
14
25
28
II
II
43
13
10
(a) CHIKlIALI KALAN (N.M.)
3,283
20
124
515
8~;fj
I,OO~
,m 111
147
10
II
13
37
1:13
15
14
12
25
26
18
22
(bl BADKUHI (N.M.)
1,M2 2:10 14
19
57
:Z:17
2J8
505
412
149
44
1,404
111
79
154
186
402
316
170
70
15
19
20
71
60
29
CC) BUTARIA (N.M.)
201
1-1
58
18
10
4
lO
29
16
-I
28
5
Live~tO(:k, Forestry, .Fi~hing. Hunting & Plantations, Orchards and allied activit- IV
ies Minin!? & Quarrying r----...A..~:--\ ~. --__ ;-.,
Males F ernall!'\ Males F ema Ie<>
11
43
13
12 4
7,840
10
1,334
1,583
2,-182
1,555
532
II7
2,803
80
466
764
892
430
12'2
1,206
23
178
145
400
3211
10)
<'I
444
18
39
l:lU
126
47
H
14
374
11
29
21
28
93
129
54
55
11
18
III
111
33
:17
15
33
--------------------------------------------------------------------------~----------
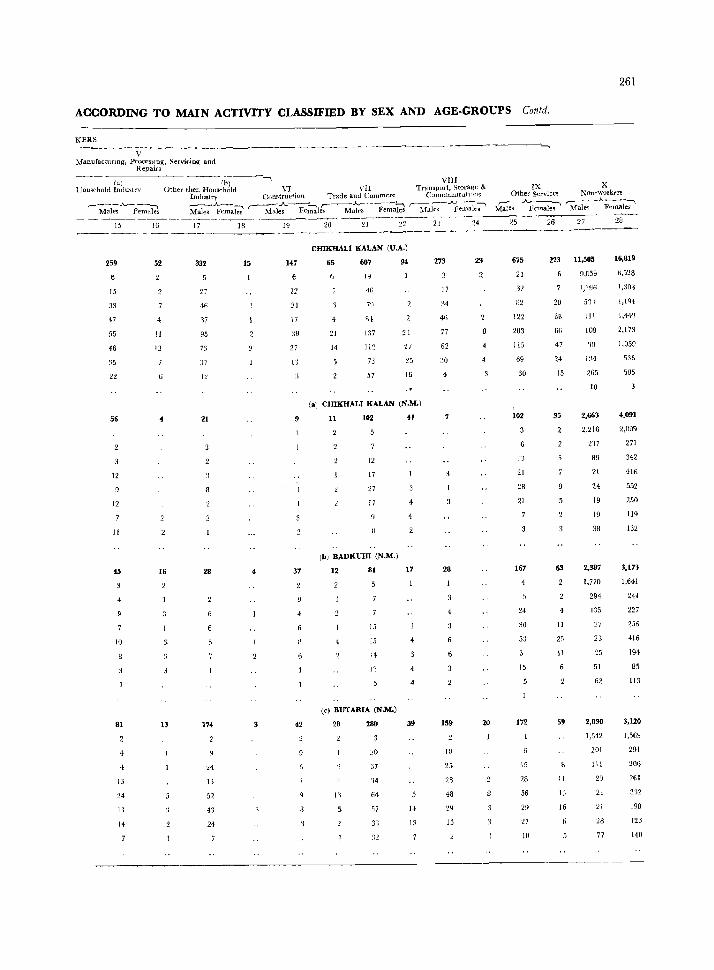
261
ACCORDING TO MAIN ACTIVITY CLASSIFmD BY SEX AND AGE-GROUPS-Cotltd.
KERS
V Manufacturing, ProcessIng, Servicing and
Repairs --- "ia)---- ---(bj-----, vln llousehold IndU'>trv O~her then HOUSt':hnlrl VI VII Transpmt, Storage &
Industry Construetion Trade and Cornmcrc CnmmuntCatlOm r-------.A....--~:""'I
M;'lles Females
15
259
15
3~
47
55
46
:15
56
12
12
11
45
4
10
81
13
24
II
14
16
52
11
13
16
13
M*~~lei ~;;-~F~~lr;-M~; '-'F~;;lJ l\faJ;;-.A.Fe~!;;-' 17
332
27
46
37
95
73
'J7
1'2
21
28
174
24
1)
52
24
18
15
19
147
22
21
17
38
27
9
37
42
20 ~l
CHIKHALl KALAN (U.A.)
65
4
21
14
607 94
21
27
2S
16
(a) CHIKHALl KALAN (N.M.)
11 102
12
17
27
17
(bj BADKUHI (N.M.)
12 81
15
15
'4
I')
te) BUTARIA (N.M.)
28
1'\
280
:.:0
37
14
64
57
31
41
17
4
39
14
13
23
273
17
4G
77
62
:)0
28
159
10
25
28
48
29
15
24
23
20
IX X Other Services N owwork("rs
~-~~~I'e7'
675
21
~?
H2
122
203
115
69
30
102
13
21
28
21
167
24
30
53
15
172
\5
28
56
29
27
10
26 27
21.3 11,505 16,819
20
38
66
47
15
35
63
II
25
II
59
II
I:;
16
9,05,
1,196
513
III
109
1H
134
265
10
2,663
8,'1'28
1,301
1,lg4
1,44'1
2,173
1,059
5.%
585
4.091
2,216 2,009
2)7 271
89
21
24
19
342
416
552
250
19 Ilg
2,387
1,770
294
135
'27
23
~5
51
62
2,030
132
3,173
1,641
241
227
2.16
416
194
85
113
3,120
1,542 1,,16Y
201
III
2~
21
21
28
77
291
206
261
332
198
123
140
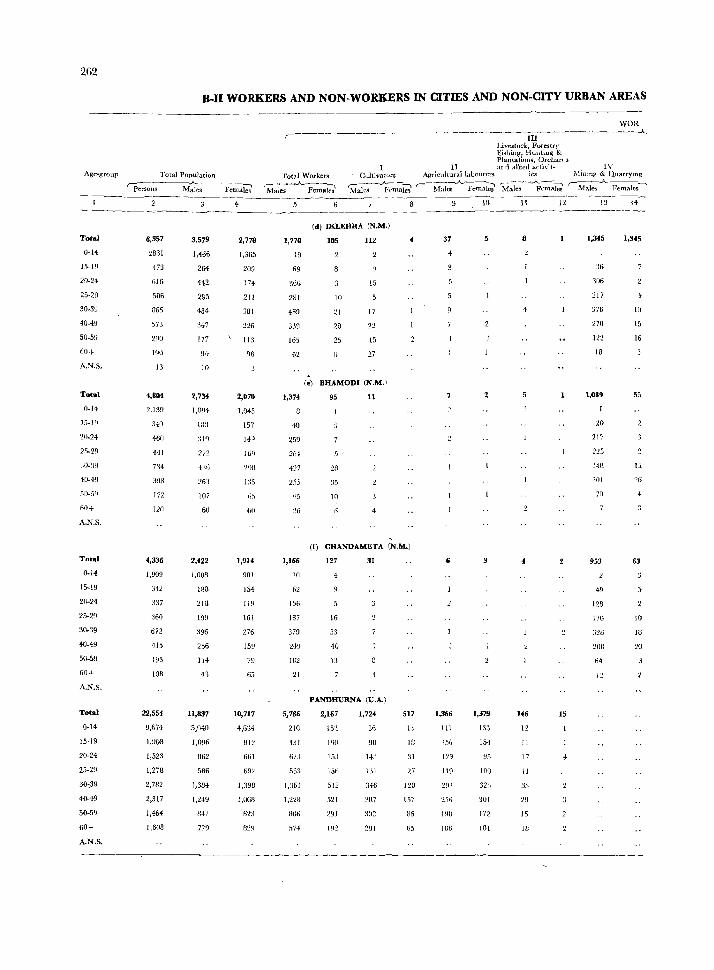
262
B-I1 WORKERS AND NON-WORKERS IN CITIES AND NON-CITY URBAN AREAS
Age-group Total Population
rpersOl~~-;~- - -F;-m~i;i
WOR ________ ~ __ ~ __________________________ A
r ill
Total Workers , ___ -A---~
Males Femalt's
Livestock, Forestry Eishing, Hunting & Plantations, Orchards
II ano aUieu acti-vit- 1 V Cultivators Agricultural labt;lurers ies MinlOg & Qllarryin~
Mak;-~~~~Ie;' r--M~~A. Ft'maki ~~~-~emaki r-~..A_~~ ----_.- - -_-
13 14 ----------_---------
Total
n-14
15-19
20·24
25·29
30.39
40-49
50-59
60+
A.N.S.
Total
0-14
J5-1~
1iG+
A.N.S.
Total
0.14
15-19
20·24
25·29
:10.:19
W.49
50.59
60+
A.N.S.
Total
0·14
15·19
20·24
25·29
30,39
40·49
50·5~
60+
A.N.S.
6,357
2831
473
GIG
506
865
573
29U
lY{)
13
4,804
2.1:19
3{0
460
441
734
398
172
120
4,336
1,909
342
337
360
672
415
193
lOB
22,554
9,674
1,908
1,523
1,278
2,782
2,317
1,464
1.608
3,573
1,466
264
442
295
484
347
177
9+ In
2,734
1,094
183
:~lq
272
263
1U7
60
2,422
1,008
Hl3
213
199
396
256
114
43
II,837
5,040
862
586
1,384
1,249
841
779
2,778
1,3&5
209
174
211
381
226
113
2,070
J,045
157
14'
16q
298
1:15
fl.')
fill
1,914
901
154
119
161
276
159
79
65
10,717
4,634
B12
61i1
692
1,398
1,068
fi2:{
1,770
19
69
:166
281
469
339
165
62
1,374
40
259
2M
427
255
1,166
HI
62
156
187
379
2·19
102
21
5,786
2lO
4:Jl
6Z:1
55:1
1,%1
1,228
BOn
574
(d) IKLEHRA (N.M.)
lOS lI2
15
10
21 17
23 22
25 15
27
(e) BHAMODI (N.M.I
95 11
5 '
35
10
4
(f) CHANDAMETA (N.M.)
127
4
16
33
40
13
31
PANDHURNA (U.A.)
2,167
l5~
lQO
15J
15ri
512
521
291
1,724
91l
14:]
UI
:146
307
~BI
517
1.1
If!
31
27
120
L17
86
liS
37
1,366
III
156
'25(-j
198
lOti
5
1,379
133
154
9S
100
323
301
172
101
8
4
146
12
11
17
11
33
29
15
10
15
1,345
306
:.!17
376
270
18
1,089
20
217
148
201
70
953
{9
128
170
200
1~
1,345
10
15
16
55
15
26
4
63
IO
18
:10
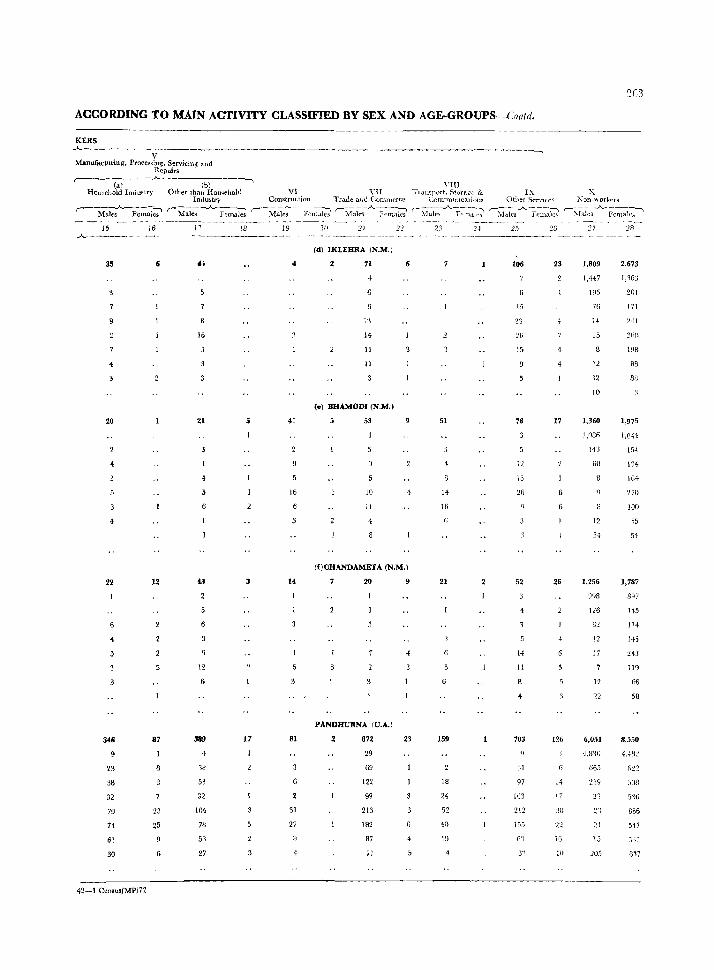
?W
ACCORDING TO MAIN ACTIVITY CLASSIFIED BY SEX AND AGE-GROUPS-Contd.
KERS .A. _______ ~ ________ ~ __________
V -,
Manufacturing, ProceS'Itng, Servicing and ]~epairs
.A. -, (a) (b) VIII
Hom:chold Industry Other than Hou",rhold VI VII Tt amport, S'tOl'UgC & IX X Industry Constnl(.tion Trade <l.lJO CfJmmerce Communtcations Other SCrYla~ ~()n-\\orkt'f3
,.-___ ..A..--__ ~ ........
Males Females r-~--_A_--':l ,..----,- --"--- - ----:---, ,,----- - --"-----, (---.....A...-~-_~ ,--- __,.._- --:---'I
Males Females Males Fem .. des Male~ Ff'mnles :-":1ale~ Femalf''i -:Vld.lcs Fernalc~ r-~Iales -....A- Females-" ------------.----~.-- --_--- -_-_- -----------------.--~-~--- _-- ---~-.
15 16 P 18 19 2(1 2J 2:1 2:3 2-1: 25 2G 27 18 ...... _------- ~--------- - -- ~ _---- _- _-_-------
(d) lKLEHRA (N.M.)
35 6 4; 2 71 106 23 1.809 2,673
1,417 1,963
1~15 201
15 76 171
1:1 23 I{ ~'II
16 14 ~G 15 36n
11 15 198
4 11 9 12 88
12 88
10
(e) BHAMODI (N.M.)
20 21 5 41 5 53 51 76 17 1,360 1,975
1,086 1,044
14:\ 154
4 9 12 fiG 134
4 15 16+
16 10 14 26 no II 16 100
4 4 \2 55
34 54
(£)CHANDAMETA (N.M.)
22 12 43 3 14 7 20 21 52 26 1,256 1,787
098 8>7
4 126 115
6 6~ 114
4 12 145
~ 14 17 2~3
12 II lIq
6 6 12 66
4 22 58
PANDHURNA IV.A.!
346 87 389 17 81 872 23 159 703 126 6,051 8,550
4 29 4,R'1O 4,4H~
23 8 38 69 31 665 f)~:2
38 53 6 122 18 97 14 219 508
32 32 99 24 103 ]7 31 5%
79 23 104 SI 213 52 2\2 38 ::n 886
74 25 78 27 182 40 155 22 ~I 547
61 53 87 \9 fi'\ 16 15 :n~
30 27 71 4 3'1 III 205 6~7
42-1 Cen,u,/MP/72
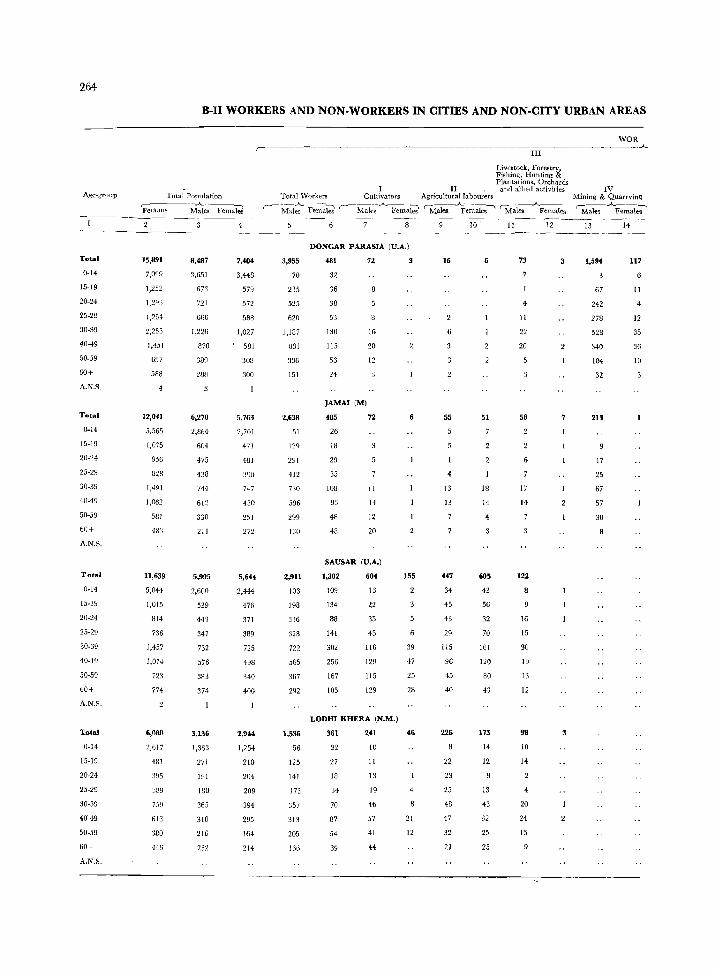
264
Age-group
Total
0-14
15-19
20-24
25-29
30.39
40·49
50·59
60+
A.N.S.
Total
(].14
1.\·19
2[)·24
25-~!1
30·39
40-49
50·59
00+
A.N.S.
Total
0·14
15·19
20·24
25·29
30·39
40·49
50-59
60+
A.N.S.
T<>tal
0·14
15·19
20-24
25-29
30-39
4()-49
50-59
60+
A.N.S.
B-Il WORKERS AND NON-WORKERS IN CITmS AND NON-CITY URBAN AREAS
WOR ,----------~ ________________ ~ _________________ ...,A_
1II
Total Population ,------..A..---." Persons Males Female:>
15,891
7,099
1,252
1,2G3
1,254
2,253
1,451
697
588
12,041
5,565
1,075
956
828
1,491
1,062
581
483
11,639
5,044
1,015
814
736
1,457
1,074
723
774
6,OBO
2,617
481
389
759
613
3ao 446
8,487
3,651
673
721
666
1,226
870
38~l
2aB
6,278
2,864
6(]4
475
438
744
612
330
211
5,99S
2,600
539
443
347
732
576
383
374
3,136
1,363
271
180
365
318
216
232
7,404
3,448
579
572
588
1,027
581
308
300
5,763
2,701
471
481
300
747
450
251
272
5,644
2,444
476
371
389
725
498
340
400
2,944
1,254
210
204
209
394
295
164
214
Livestock, Forestry, Fishing, Hunting & Plantations, Orchards
II and allted activilies Total 'Workers Cultivators Agricultural labourers
r--1{al;:- Female; r- Ma[~s-.A. Female;' ~1al~s ~;males --.., 'M~Femal~3
IV Mining & Quarryin~ ".--..A...-~l
Males Females
--- -------- ------ - ------------------
3,955
70
235
525
620
1,137
831
336
151
2,ti38
51
2~1
412
730
596
299
130
2,911
103
198
336
328
722
565
367
292
1,536
56
125
141
173
357
313
205
166
DONGAR PARASIA (U,A,)
481
32
36
38
53
130
115
53
24
72
16
20
12
JAMAl (M)
405
26
18
35
108
93
48
48
72
11
14
12
20
SAUSAR (U,A.)
1,302
109
134
88
141
302
256
167
105
604
13
22
35
45
116
129
115
129
LODHI KHERA (N.M,)
361
32
27
18
34
70
87
54
39
241
10
11
13
19
46
57
41
44
6
155
39
47
25
28
46
4
21
12
16
55
4
13
13
447
34
45
43
29
115
96
45
40
226
22
23
25
48
47
32
21
51
18
14
4
605
43
56
32
70
161
120
80
43
173
14
12
13
43
32
25
25
73
4
11
22
20
58
17
14
122
16
15
30
19
13
12
98
10
14
20
24
15
3
7
3
1,594
67
242
278
528
340
104
32
213
17
25
67
57
30
117
11
4
12
35
36
10
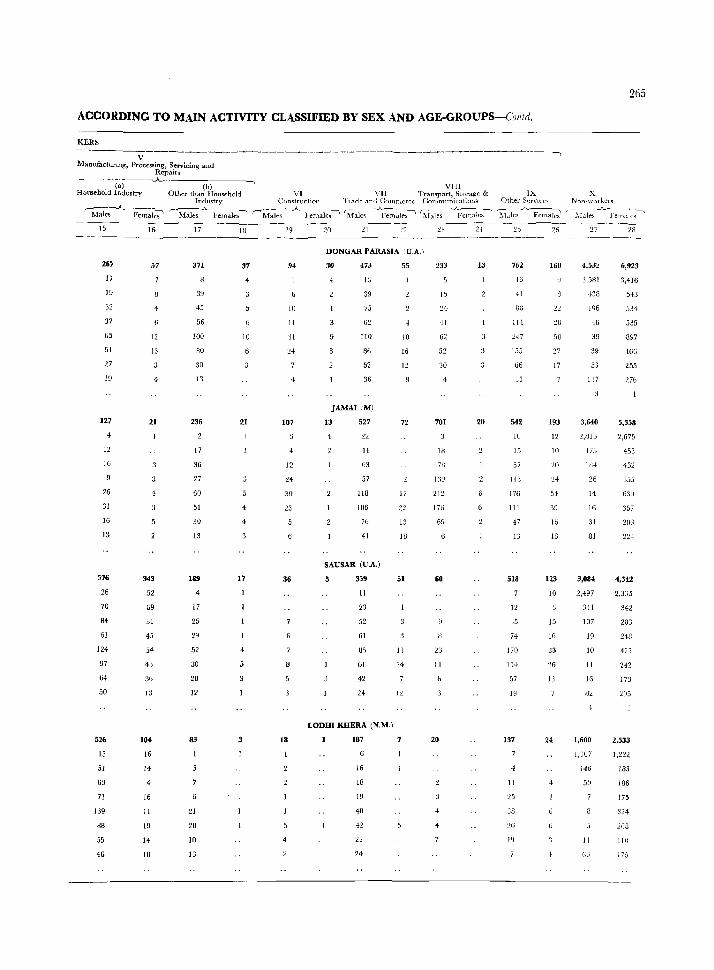
ACCORDING TO MAIN ACTIVITY CLASSIFIED BY SEX AND AGE-GROUPS-Conld.
KERS
V Manufacturing, .Processing, Servicing aud
Repairs ---~-----W ~ ~ ~ll
265
Household Industry Other than Household VI VB Transport, Storage & IX X Industry ConstrlldiOll Tlade all(1 C:ommer,e C011l1111lnications Other Scrv[cc~ Non-workers
r-:M"ak;-..... - Fem~?;-Mal~.A.. Femal~s----' r-M~_A_ :Femalcs----' 'M:alc~ --"pema!es~ ~-:l~--"pcm<lles~ ~-:Je--;A Femak"i '-~Yem~~l 15
26'
17
19
32
37
65
51
27
19
127
4
12
16
26
31
16
13
576
26
70
84
61
124
97
64
50
526
13
51
63
71
139
88
55
46
16
57
12
13
21
343
52
69
31
45
54
13
104
16
14
4
16
11
19
14
10
17
371
39
45
56
100
80
30
13
236
17
36
27
60
51
30
13
189
4
17
25
29
52
30
20
12
83
21
20
10
13
18
37
10
21
17
4
19
94
10
11
'j[
4
107
12
H
30
23
36
18
20 21 22
DONGAR PARASIA IU.A.)
30
4
473
1:1
39
75
62
Ito
86
52
36
JAMAl (M)
13 527
22
H
63
57
118
106
76
41
SAUSAR (U.A.)
5 359
11
23
52
61
8.1
61
42
24
LODHI KHERA (N.M.I
187
16
10
19
40
+2
22
24
55
4
10
16
12
72
17
22
13
18
51
11
14
12
233
15
H
62
52
30
701
7H
212
176
69
60
23
11
20
13
20
25
762
16
41
88
114
247
155
(i6
J5
542
10
15
57
Ill;
176
III
47
13
518
12
74
170
lH
57
19
137
II
38
19
26
160
20
50
17
193
12
10
20
54
39
16
18
123
10
15
16
33
26
13
24
27
137
3,640
2,1313
470
1B4
26
14
16
31
81
3,084
2,497
341
107
19
10
11
IG
82
1,600
1,307
1-16
50
11
66
2B
6,923
11,416
54:1
534
535
897
466
255
276
5,358
2,675
453
452
355
611~
357
203
22f
4,342
2,335
342
283
248
423
242
173
2!JS
2.533
1,222
183
186
175
324
208
110
175
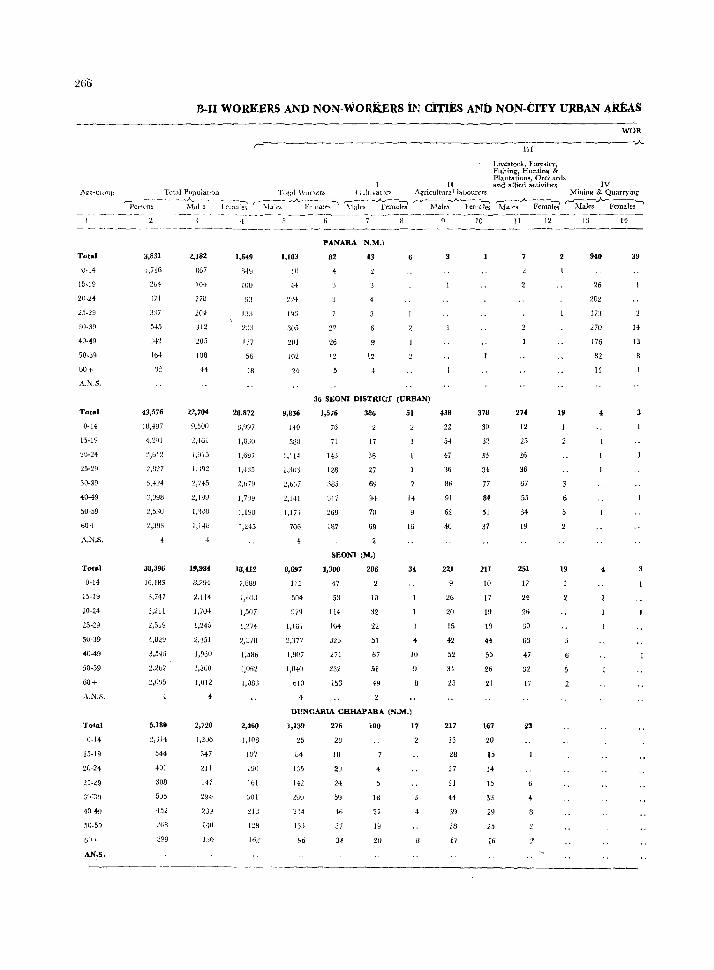
B-II WORKERS AND NON-WORKERS IN cITIES AND NON-CITY URBAN AREAS
111
1.lve.'itock, F orestq.", Fishing, Huntin~ & Plantations, Orchards
WOR
-----.J.,..
1 [ and allied activities. IV Ag"e~gltJllP Total Populatlon Tuwl \Vof'.ers Cn!t:vatoI's AgI"iculturallabourcrs Mining & Quarrying
r;:~r~~ --~~~~.-;- - I C~~r;{ r ~ :\1 ale!> ~A7e llaJi"~ ~~;; -~~:i;' ~~...A...~ Fenlc~ 'Mal~~.A. Fcmab ,.. Males ~~s"' - ---~--.----- -~~--- _- -_ - -~-~-----~--~------------~~---~- -~-------~--~
fl H q IG II 12 14 - ------------~------~-----~------~--------------------------
Total
Q-14
15-19
20-24
25-29
30-30
40-49
00+
A.N,S.
Total
0-14
30-39
40-49
50-59
60+
A.N.S.
0-14
15-19
20-24
25-29
30-39
40-49
50-59
00+
A.N.S.
Total
0-14
15-19
2D-21
23-29
50-59
AN.s.
3,831
1,716
204
'171
337
545
Ib4
')~
43,576
18,-1[17
4,2"1
~,bI2
2,1J27
5,+24
2,5:;0
38,396
16,183
3,747
3,211
2,519
4,8<9
3,5-16
2,202
5,180
:1,314
544
401
308
5')5
45"
168
298
2,182
867
164
278
204
312
205
108
44
22,704
~~)461
1,,:)15
I,J9:.!
2,7+5
:2,199
I,'HO
1,148
19,984
8,294
2,114
1')04
1,245
2,-ljl
1,960
1,200
1,012
2,720
347
211
147
294
2Jl:l
1,649
lOll
2:::1
1J7
56
,18
20,872
(l,997
1,8:10
1,435
2.6ig
1,7~~
1,190
1,245
18,412
7,889
1,WJ
1,507
%,:J7B
1,586
1,062
1,083
2,460
1,108
JU7
I~O
Ibl
:';01
LW
16~
1,103
JO
44
J43
:105
201
J{J2
24
9,836
140
SUB
1,114
1,3()'j
2,141
1,173
706
8,697
115
504
979
1,161
'2,:)77
1,907
1,04-0
bll)
4
PANARA IN.M.)
82 43
4
26
12 12
36 SEONI DIStRICT (URBAN)
1,576
76
7\
143
128
385
317
269
1~7
386
17
36
27
69
94
70
69
SEON) (M.)
1,300
47
53
114
104
326
271
232
153
286
10
22
51
67
51
49
51
14
16
34
II)
DUNGARlA CHHAPARA (N.M.)
1,139
25
84
135
142
2\JO
1'l:1
96
276
18
2~
24
5')
46
37
34
100
18
27
19
20
17
3
438
22
54
47
36
86
91
62
40
221
26
2U
15
42
52
34
23
217
13
28
27
21
44
39
28
17
378
30
32
33
34
77
84
51
37
211
10
17
19
19
H
55
26
21
167
20
15
14
15
33
29
25
16
274
12
25
,6 67
55
34
19
251
12
24
26
gO
63
47
32
17
4
2
19
19
940
26
202
173
270
176
82
11
4
39
14
13
3
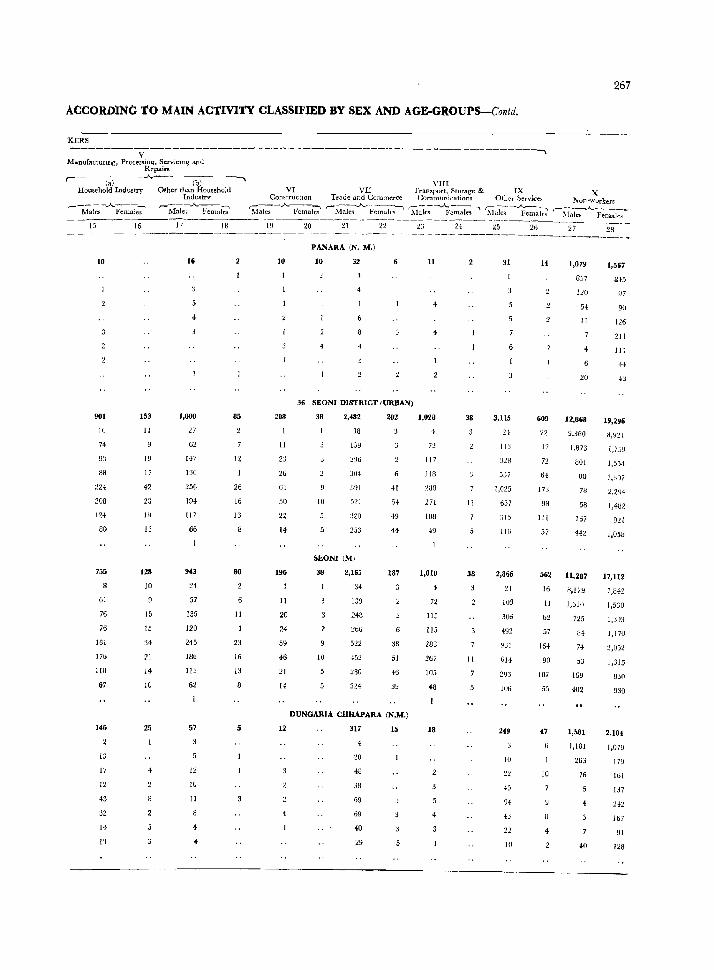
267
ACCORolNG 'to MAIN AC'tIVI'fY cLASSIFIED BY SEX AND AGE.GROUPS-Contd.
KERS
------------------------------~-------------------------------~ y Manufactu!ulg, Processing, Servit:lD~ awl
Repairs r---(;)---..A. (bl
Household Industry Other than Household
10
901
10
74
93
88
224
208
124
80
755
61
76
76
181
176
110
67
146
13
17
12
43
32
14
1'1
153
II
19
17
42
23
HI
13
128
10
15
15
34
21
J4
10
25
Industry
'-ii~I;;A Fernai'd
16
1,000
27
62
147
130
256
194
117
66
9U
24
57
135
120
245
186
IlJ
62
57
12
10
11
18
85
12
26
16
13
80
II
23
16
13
5
VII! VI VII Tran~port. Storage & IX
ConstructIOn Trade and Commerce Communications OtlLcr Servic~s
~ale.~ -..A.Pcmaks' r-:\1ale'l .A..¥emale.,~ ':\I;J'e~-~;~~-' 'iiaks---'Fema-i;i
X Non-workers
,--...A.---__
~Iales Females
--_ - -_-- ----------------------
10
208
11
2J
26
61
50
22
14
196
11
20
24
59
46
21
14
12
PANARA (N. M.l
10 32
4
36 SEON! DISTRICT (URBAN)
38
10
2,482
38
159
:W6
304
591
521
120
253
SEON1 (MJ
38
10
2,165
34
139
248
522
.52
280
224
202
-II
49
H
187
38
51
46
39
DUNGARIA CHHAPARA (N.M,)
317
48
38
69
40
29
15
11
1,028
117
liB
:W(J
271
108
49
1,010
72
115
115
283
267
105
+8
18
38
11
38
II
31
3,115
21
113
jJ7
1,025
657
:;]5
116
2,866
:!l
103
306
492
2CJ3
106
10
22
45
94
43
22
10
14
609
12
72
64
173
98
III
57
1,079
8.')7
120
54
II
1,567
S45
Y7
90
126
211
111
H
20 43
12,868
9,360
1,873
BOI
uo 78
58
167
442
19,296
2,294
1,4132
nl 1,058
562 11,287 17,112
7,842 16
11
62
57
164
90
107
55
10
4
8.179
l,b10
725
B4
74
53
169
402
1,58]
1,5:]0
1,590
1,170
2,052
1,315
830
930
2,184
1,181 ],079
26::>
76
40
179
161
137
H2
167
91
128
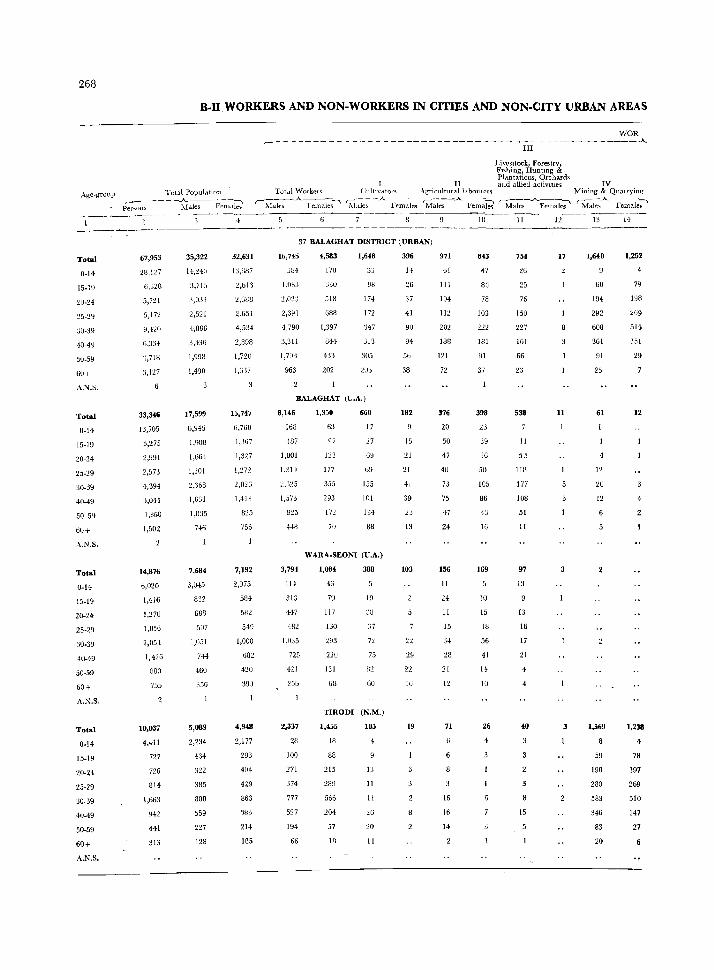
268
Age~group
Total
U·14
15·19
:lO-24
30·39
40·49
50·59
60+
A,N.S,
Total
0.14
15·19
20-24
25·29
30·39
40-49
50 59
60+
A.N.S.
Total
0·14
15-19
20.24
25·29
40-49
50·59
60+
A.N.S.
Total
0·[4
15.19
20·24
25·29
30·39
40-49
50·59
60+
A.N.S.
B-II.WORKERS AND NON-WORKERS IN CITIES AND NON-CITY URBAN AREAS
Total Population ,------ -- --"----,--:-1 P-er~on~ ~1.J.les l~ em.lle<:.
67,953
2B,I"7
6,328
5,7:.n
5,172
9,420
6,334
':,718
3,127
33,346
IJ,70~
3,275
2,991
2,573
4,394
3,044
1,860
C502
14,876
1,116
1,270
1,056
2,051
1,426
HDO
755
10,037
4,411
727
7'26
814
1,663
Y42
441
313
35,322
14.:!40
:1,7Ifi
:1,0,13
2,521
{,SS6
3,436
1,908
1,490
17,599
6,Y45
1,908
1,664
1,301
2,368
1,631
1,0:15
7+0
7,684
3,045
832
688
507
1,051
744
460
356
5,089
2,234
385
800
559
227
128
32,631
1:1,11117
",bl')
2,688
2,651
4,534
2,898
1,720
1,G'17
15,747
6,760
1,J67
1,327
1,272
1,413
825
756
7,192
2,975
fill4
532
549
1,000
682
420
39)
4,948
2,177
293
404
429
863
'183
214
185
WOR r-- -- ----- -- -- - -- -- __________________________________ ..A..
III
II
Livesltock, Forestry, F1Shi ng, Huntmg & Plantations, Orchards aI1d aUieu. activmes IV
TuL.t1 \Varker" CU]jI\;c1tor" Agricultural JaboUlcrs Mining & Qua.lrying
(Males _...A. Fema~-'" 'hl:J~~-_A.._ Fr-males 'M~-...A...~~ r:~ks-__A_Felll:I~ r;V[ale"A.. Female;'
,--------------------37 BALAGHAT DISTRICT (URBAN)
16,745
.. ;(34
1,033
:1,on
2,391
4,790
3,311
1,74l1
963
4,583
170
:)30
,118
688
1,397
844
43']
202
1,648
174
172
:347
:H3
305
::!Ub
BALAGHAT (U.A.)
8,146
168
487
1,001
1,214
1,57,
923
448
3,794
114
H7
482
1,G35
725
421
250
2,337
28
100
271
374
777
527
194
66
1,350
6:3
123
177
355
293
172
70
660
17
27
b9
155
101
134
88
WARA.SEONI (U.A.)
1,084
46
79
117
130
293
220
131
68
388
19
:JB
:;7
7'1.
75
B2
TIRODI (N.M.)
1,455
18
88
215
289
566
204
57
18
105
4
13
11
11
26
20
11
396
H
26
37
41
90
94
5n
38
182
15
21
41
39
23
13
103
22
16
19
971
61
111
104
112
202
188
121
n
376
20
50
47
40
73
75
47
24
156
11
24
11
15
34
28
21
12
71
16
16
14
10
843
47
K1
78
103
222
181
91
37
398
23
39
36
50
105
86
16
169
lU
15
18
56
41
14
10
26
4
II
754
26
25
76
150
227
161
66
23
538
11
55
llU
177
108
51
11
97
13
13
16
17
21
4
40
15
17
11
3
1,640
60
194
292
608
361
91
25
61
]2
2U
12
1,569
59
190
280
583
346
83
20
14
1,252
79
198
269
515
151
29
12
4
1,238
4
78
197
269
510
147
27
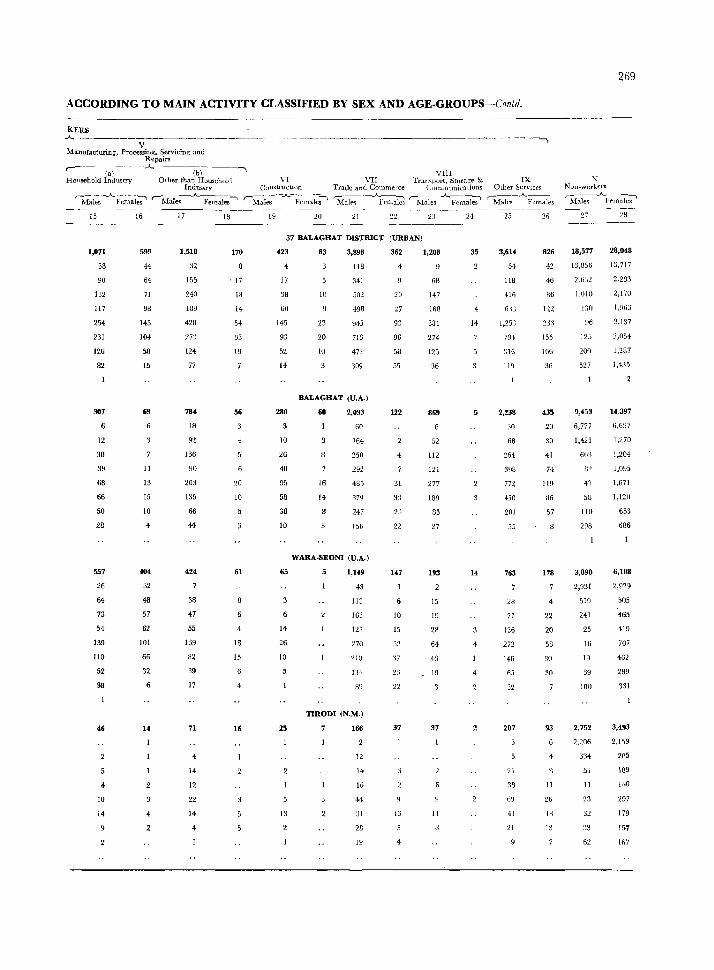
ACCORDING TO MAIN ACTIVITY CLASSIFIED BY SEX AND AGE.GROUPS--Contd.
KERS _.4._ _______________ ~ ___________ --
V -----------------......,
Manufacturing, Processing, Servicing and Repairs
r----W -- ~-·.A.---(b)---l VIII
Household Industry Other than Household VI VII Tramport, Stora~e & IX Industry Construction Trade and Commerce Communications Other Services
r:\fui;s-_"'_Female~ r-Ma1e", ..A_ Femal~-' r-Ma1es -..A..~l~---- 'M~i~--~;;~iJ r-Mnles ..A_Fcm~;-' r:~~-_A._Females 15
1,071
3B
90
132
117
254
231
126
82
807
12
:18
39
68
66
50
28
557
26
64
73
54
139
110
52
38
46
4
10
14
16
599
44
64
71
98
145
104
58
15
69
11
13
15
10
4
404
32
4B
57
62
101
66
32
14
17
1,518
32
155
240
189
42U
27:,
124
77
784
18
92
136
90
203
135
66
44
424
38
47
55
139
82
39
17
71
4
14
12
22
14
4
18
170
, 17
13
14
54
33
19
56
20
10
61
4
18
15
4
16
19 20 21 22
37 BALAGHAT DISTRICT (URBAN)
423
4
17
38
60
145
93
52
14
280
10
26
40
95
58
38
10
65
6
14
26
10
25
13
83
10
23
20
10
3,898
118
341
502
498
945
71:l
472
309
BALAGHAT (U.A.)
60
16
14
2,033
60
164
250
292
485
379
247
156
WARA.SEONI (U.A.)
1,149
43
liS
163
127
270
8'J
T1RODI (N.M.)
7 166
12
14
16
44
31
28
19
362
4
20
27
93
96
58
55
122
4
31
33
147
10
15
33
:17
22
37
13
23
1,208
6B
147
168
381
274
125
36
869
52
ll2
121
277
189
85
27
193
15
19
28
64
43
19
37
6
II
24
35
4
14
5
14
4
4
25
3,614
5~
118
416
6U
1,25'1
704
316
Ilq
2,238
30
68
264
398
772
450
201
55
763
2B
77
136
272
146
65
32
207
21
38
69
41
21
26
826
42
46
86
122
155
106
%
435
20
30
41
74
119
R6
57
178
4
22
20
58
30
30
93
4
a 11
26
18
IS
x
18,577
13,856
2,63~
1,010
1:10
%
125
20n
527
9,453
6,777
1,421
663
4'J
58
110
298
3,890
2,931
519
241
25
16
19
39
100
2,752
269
28,048
13,717
2,283
2,170
1,963
3,137
2,054
1,287
1,435
14_397
6,697
1,270
1,204
1,095
1,671
1,120
653
686
6,108
2,929
505
~65
419
707
462
289
331
3,493
2,200 2,11)9
334
51
11
23
32
33
62
2P5
189
140
297
179
1,7
167
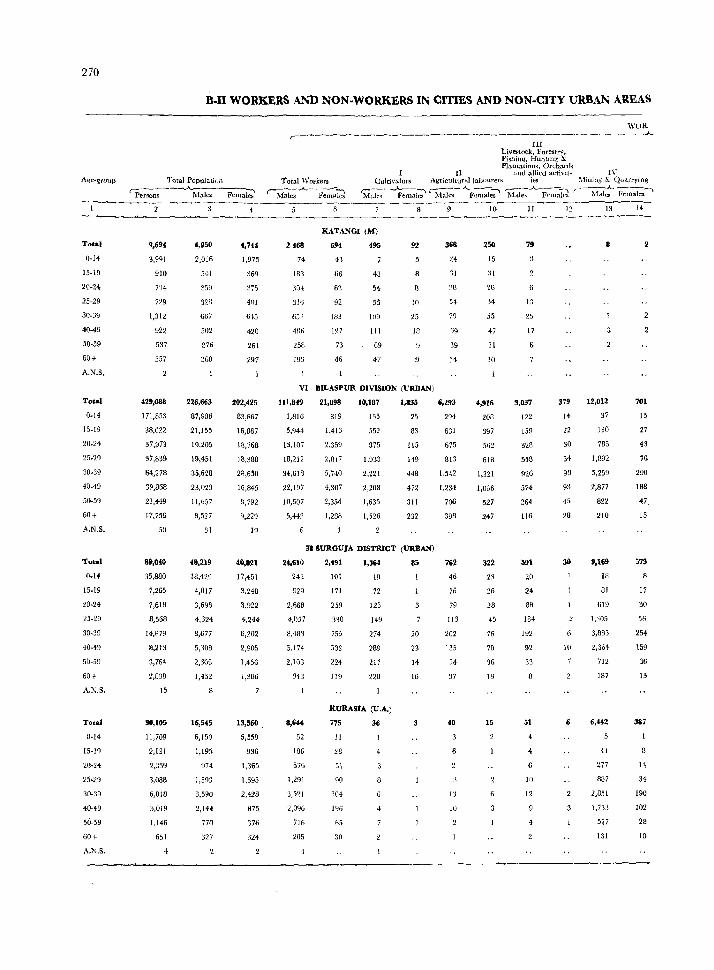
270
n-n WORKERS AND NON-WORKERS IN CITIES AND NON-CITY URBAN AREAS
'NUR ,--_______________________________ ~ _____ ~_~ ___ .J._
III Livestock, ForestrY'. Fishinq, HuntJn,! &. Plantations, On::h::l.rds
II and ullit'd activlt- I\' A~e·group Tota) Population Total \Vorkers Cultivators Agricu}turallabourefs ies .\lining & Quarrying
'Persons Males Femai;;' ~...A... -F~i6 'M;Ic;----'Femal~'ifales-A..Fem~7 ~;;_.A...F;;l:Te1 ( Ma]~ Females~ ----
Tatal
0-14
15-1~J
20-24
25-29
30-39
40-49
50-59
60+
A.NoS.
To.al
0-14
15_19
20.24
25-29
30_39
40.49
50-59
60+
A.N.S.
Total
0-14
15-19
20-24
25-29
30·39
40-49
50-59
60+
A.N.S.
Total
0·14
15-19
21l-24
25-29
:10-:19
40-49
50-59
60+
A.N.S.
9,694
3,991
910
)'34
729
1~31'2
922
537
557
428,088
171,853
38,022
37,973
37,839
64,278
39,868
21,449
17,756
5{)
~,040
35,880
7,265
7,618
8,568
14,R79
B,2IS
3,764
2,838
15
30,105
11,709
2,131
2,339
3,088
6,018
3,019
1,146
651
4
4,950
2,016
541
359
32B
667
5U2
276
260
226,663
87,986
21,155
19,205
19,451
35,628
23,023
11,657
8,527
31
48,219
18,429
4,017
3,696
4,124
8,677
5,30B
2,308
1,452
16,545
6,150
1,19,
974
3,590
2,144
770
327
4,744
1,975
369
315
40]
645
420
261
297
202,425
83,867
16,867
18,768
18,388
28,650
16,845
9,792
9,229
19
4&,821
17,451
3,248
3,922
4,244
6,202
2,905
1,456
1,386
13,560
5,559
936
1,365
1,695
2,428
875
376
324
2468
74
lR3
30,
3lfJ
486
258
193
KATANGI (M)
694
43
66
63
92
183
117
73
46
495
43
54
55
109
111
69
47
92
U
10
25
13
VI BlLASPUR DIVISION (URBAN)
111,849
1,816
5,944
13,107
18,212
34,618
22,197
10,507
5,442
2<1.610
242
92q
2,668
4,D57
8,483
5,174
2,103
943
8,644
52
186
576
1,291
:1,52]
2,0%
716
205
21,098
919
1,413
2,359
2,817
5,740
4,307
2,354
1,288
10,187
135
552
875
1.033
2,221
2,208
1,635
1,526
1,835
25
83
115
149
448
472
311
232
3D SURGtJJA DISTRICT (URBAN)
2.491
101
171
259
330
755
532
224
119
1,364
19
72
123
149
274
289
217
220
KURAstA CU.A.)
775
11
28
51
90
304
HI6
65
:10
36
85
20
23
14
16
368
24
~j]
:IH
54
79
6,293
294
631
675
813
1.542
1,234
706
398
762
46
76
79
113
202
135
74
37
40
{o
10
10
250
15
26
34
55
47
31
10
4,916
20n
397
562
61S
1,321
1.036
527
247
322
23
26
28
45
76
70
36
18
15
11
79
l:l
25
17
3,037
122
159
328
518
926
574
264
116
591
20
24
88
134
192
92
33
51
4
4
6
10
12
12
379
H
22
30
54
93
93
45
28
30
111
6
13
12,012
37
130
785
1,892
5,259
2,877
822
210
9,169
18
81
619
1,305
3,883
2,364
712
187
6,442
41
277
887
2,851
1,733
517
131
14
701
15
27
43
76
290
188
47,
15
573
17
30
56
254
159
36
13
387
14
34
190
102
28
10
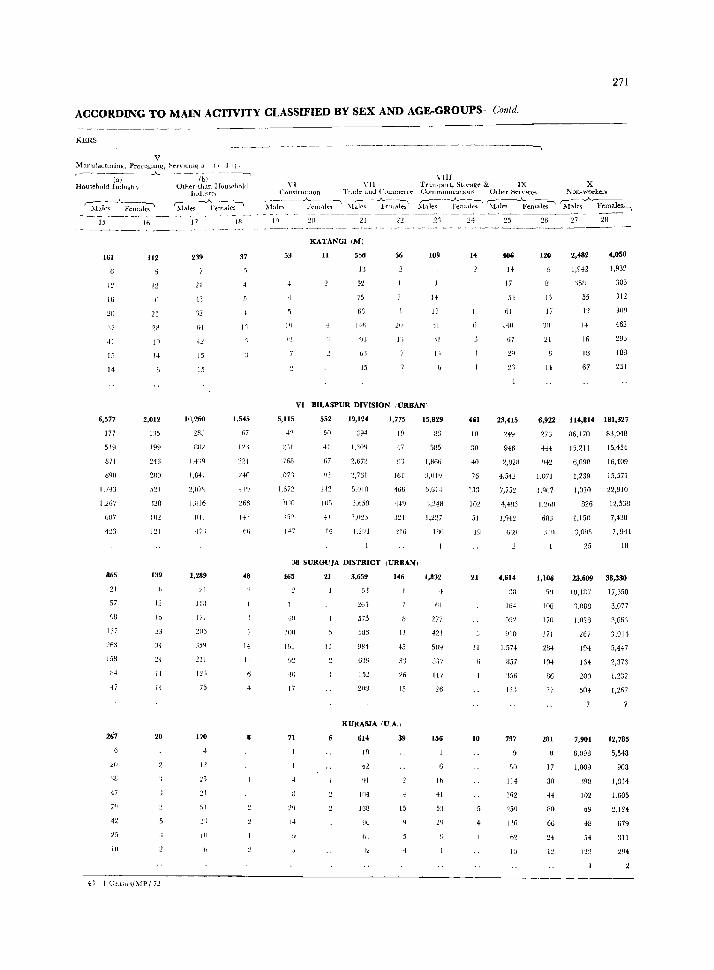
271
ACCORDING TO MAIN ACTIVITY CLASSIFIED BY SEX AND AGE-GROUPS-Conld.
KERS
V 1\.ianufacttuilli;, Processwg, Sf'n'lClll~ a J ( 1 (! .
r Col) ----"- -.--(b).----, Homehold Industrv Other than Homehohl
Indu<,tr\'
~\~I~~ -A Fem~:' ~al;~ -~'''~i1le~""l 15 16 17 III ---.. ~----- '_- _----,
16i
I"
16
41
15
I!
6,577
177
519
n71
890
1,741
1.267
687
123
865
21
57
'18
158
114
2f!
47
42
III
112
12
2:1
2fl
19
14
2,012
1:15
199
216
2110
521
')28
IB':!
121
139
12
1.5
11
14
20
4l ·1 C~llills/.\{P /72
'12
(;4
15
1.1
10,260
283
HJJ2
1,1",9
1,641
2,fl79
1,1116
['.-17
1,289
IlK
177
:!()3
211
i5
170
I'
21
37
1'1
1.545
67
I ~.\
~40
·j1!)
266
14<
14
II
------------------------------~
HI COJl<;tructton TI.llle awl COIHllIero·
~;Je~----~emal~ ~l~~ - ~~l~'~;; Iq
53
]1)
L!
KATANGI (M)
11 550
U
52
75
61
141i
(d
·j5
56
20
nil Tran~pon, Storagt' & ]X CommUI1lCa(lOn~ Other Sel Vice,>
fu~---;':;~;Je:' S1~I~-";'emales-' 2',
109
1+
IJ
'll
11
II
14
25
406
14
17
,\4
61
1+0
:n
26
120
11
17
'30
21
II
X Non-workers
~;:J~~-..A. Fcma]es~ 27
2,482
1,942
:15U
55
I:!
16
18
67
28
4,050
1,932
303
312
309
462
293
188
251
VI BILASPUR DIVISION (URBANI
5,115 552
50
;:'11 41
1,07'l
147
19,124
:J94
1,:lWI
2.67~
2,i61
,1,0 III
3,1i58
1,2~J4
1,775
I~
47
161
466
216
38 SURGUJA DISTRICT (URBANI
465
11
411
JOO
16J
,10
Ii
71
14
21
II
3,659
5;5
5u3
984
(j3~1
351
146
11
15
15
KURASIA (U,A,I
39
91
1114
lOll 15
12
15,829
5115
1,866
5,61+
'1,248
1.:t?7
IHt;
1,832
(i]
'!.i7
~21
5A9
J:l7
117
26
156
Ih
41
53
461
10
J()
40
i6
11:1
102
01
19
21
11
10
23,415
24Y
946
2,1l2B
4,512
7,752
6ri~J
4,614
:111
l(i+
910
1,574
857
123
797
50
114
162
259
12G
15
6,922 114,814 181,327
276 86, I 70 83,048
414 15.211 15,454
'142 6,0913 16,409
1,071 1,239 15,571
1.'107 1,010 22,910
1.2(;il 826 12,538
6n, 1,150 7,438
\'10 3,OH,\ 7,911
1,106
513
lOG
170
171
2134
194
66
37
281
17
30
H
80
GG
25 18
23.609 38,330
W,187
1.088
1,028
267
194
134
200
504
7,901
6,09B
1,009
,198
102
69
48
17,350
3,077
3,663
:3.011'
5,4+7
2,373
1.232
1,267
12,785
5,543
903
1,314
1.605
~,124
679
311
294
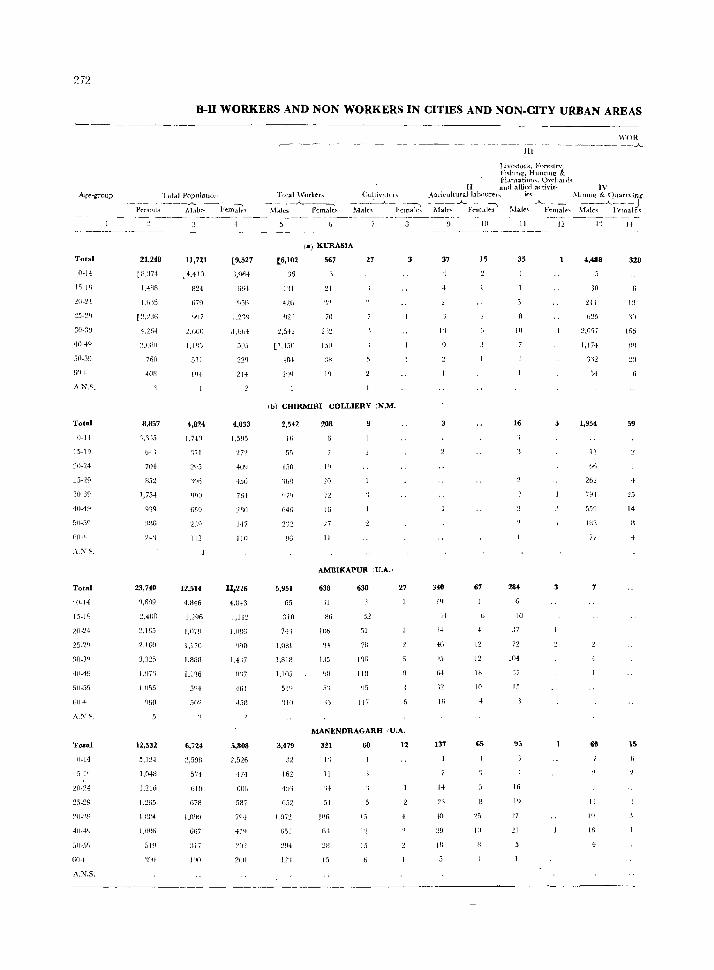
Age~grou.p
Total
0·14
50-59
(;0+
Total
0·14
15·10
:';':;-20
3(j-:J~
40·40
flO-I
ASS.
Total
. 0·14
15-J(j
2(1-24
25"2~!
1)(1+
Total
0.14
60+
A.NS.
B-Il WORKERS AND NON WORKERS IN CITIES AND NON.CITY URBAN AREAS
Total Populatioll
-Pe~~;;--------:~l~- F~m~~
21,248
l n.j74
1.4HB
4,201
!,OHO
i{)O
8,857
'),T~5
852
23,740
2,4(111
2,165
2,160
1,97';
1 ,(ISS
12,532
5, I:!.!
l.O·1Il
1.216
I ,Om.,
519
11,721
.4.410
824
1)79
2.(-j{)O
1,-185
5'11
4,824
1.740
Til
2~)5
fi59
Il.l
12,514
4.B46
1,1 iO
1.888
1.116
s()')
6,724
~,!i08
574
610
G7B
61;7
19,527
1,064
nIJ4
~J5C.
1.2'19
d ,fi(-)-t-
22f1
4,033
I ,5~15
40Q
-iSt:i
761
:1:10
147
110
11,216
-1.8+3
I ,ll~
l,onG
1,4 ;7
il ' ~ i
5,808
2.526
+74
COn
5Ri
2()O
WOR r----. -- ----~----.----- -- ----------.- ---~-------- ---.-A...
Total \Vorkl"rs ------~
1.1 ""-ll:."s FcmaI~s
(;ulti\·[tt(1J~ _~_":__..A.- ._~-."
.'\-ble" )'eltla1c"
(6,102
36
111
420
(l2 l
2,,14~
[l.4.,O
WI
(a) KURASIA
567
7f1
15()
I'>
27 3
Ib) CHIRMIRI COLLIERY (N.M.'
2,542
]f1
150
G4G
5,951
['5
310
7·[1
1.081
I.SIIl
1,10,)
'110
3,479
32
16'2
4f(1
652
l,nn
1)51
t:n
208
I"
20
+G
'17
II
AMBIKAPUR IU.A.'
638
II
8f)
lOti
135
.'}'\
'{')
630
31
7G
1'111
I If!
III
27
MANENORAGARH IU.A.'
321
1'1
II
'1+
51
106
f1\
15
60 12
15
I')
15
III
I-ive"tock, Fore"tl'v, Fl"hm~. HunwllZ &. 1'1.1.ntation,.Ol't'llillth
II ann allied :\ctivit- IV .A.l!rit'ultl1rallal?nl1r~l... je<.: .\IIHlllg &., (lilarr\in,f
-:'1,,,, --'---;.:;011:;];;-' !\ial" ..A.F;,;,;;J~. ~!ak;-.AF<-;;,;;;i,
37
11
340
14
14
.1+
·HI
6-1-
12
Hi
137
14
23
-10
18
10
15
67
l~
12
III
10
65
11
35
10
16
284
10
.:7
101
'il
15
16
:!.7
:Il
12
4,488
30
211
625
'>4
1,954
11
or.
55'>
i7
II
I')
16
328
1:1
'-HI
11)5
59
14
15
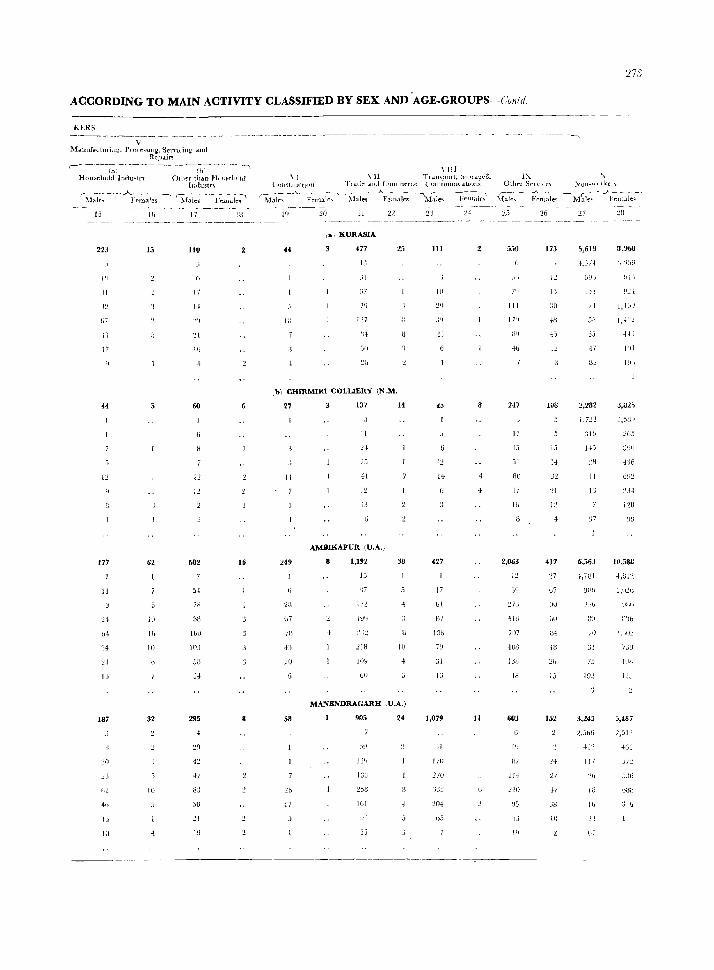
:n:3
ACCORDING TO MAIN ACTIVITY CLASSIFIED BY SEX AND ·AGE-GROUPS-Conld.
V Manufiieblrill:!, rn1ll':""1Il1l. St'rn<iul: t!lud
Rcp ... iN ~~--------- ~- -_-_ ----_-- ---
(hi fal Hou:,chold lIldu~tl'Y Other tllan H(,u:-dH1lcl
Iwlustn
15
223
h,
17
177
11
04
'34
;!I
187
:20
.23
4"
IJ
lU
1&
15
62
W
1b
10
32
1(1
17 III
1I0
17
1-1
Ie
60
22
582 16
54
7B
lO.l
5U
295
8:;
jO
21
19
\'lII \ J
(,()U~ll UCtlOll
'-II Tr'lll~pf!II. ;"",rdgc& Tlad(' Allll Commerce: COnlmUlllldt!OIlS
1\1-;1~ --A.17-;[~~1~~ _A __ ~_---...,.---_______ :--->
~Ial~s Female!! .:\1ale,> Fcllla\e,
1'1
\1:
:20 :21
,.' KVRASIA
477
31
,;7
7'i
127
III
Ji)
25
,h'l CHlllMIRI COLLIERY iN.M.,
27
11
249
:.:0
0)
7:1
58
:";b
I)
137
It
H
12
13
AMBIKAPUR IV.A"
1,192
J5
ill
1/2
:1.)'2
(,0
14
38
IU
MANENDRAGARH IV.A.)
905
IJ:J
258
101
~J ;
:2'3
III
III
12
14
427
Ii
bl
7!J
:>1
1,079
.11
l70
270
14
11
--,
1'( " OtlleJ SelvIle, .\;Ull-'''(llkcl'>
,-- - ...A-._ _, r. - - ./<--- ----)..fale:. F~nlale~ Male., l<enLtle~
15
550
7'1
III
17~
2-17
II
J1
80
JI
Ih
2,063
l~
)1»)
lUll
Ull
48
603
I'J
117
Il-l
210
I',
26
173
12
JO
12
108
15
32
~t
L'
417
"<I B-1:
152
'1.1
II
10
5,619
un w;
33
:116
6,563
U'J
:;1
75
19":
3,243
28
8,9bO
l,IW
1,.J.':":
.jjj
I'll
265
J'.W
~J')b
7J!'
5,487
:.!,.JbG 2,513
-Il~ -!G'J
117 .'i7'2
S.;~i
IH LiHB
II, :; b
2 ;
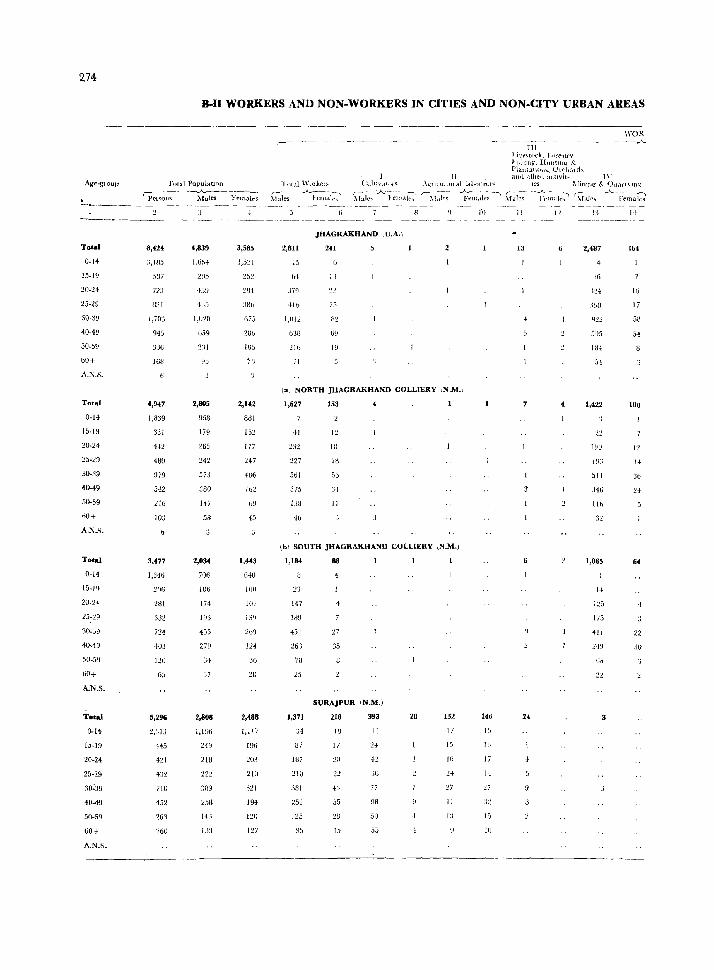
274
Age~~poup . -----
Total
O-H
15-19
20-24
25-29
30-39
40-49
50-59
60+
A."'.S.
Total
0-14
15-1~
20-24
25-29
30-39
40-49
.'>0-59
60+
A.N.~_
Total
0-14
15-19
20-"·}
25-29
4U-49
50-59
60+
A.N.S.
Total
0-14
15-19
20-H
25-29
30:-:J9
40-49
5U-59
60 t
A.N_S.
8,4:24
:;,IH.5
u:u
1,iOJ
945
3J6
163
4,947
1,839
331
442
48!J
9i9
542
216
10:.;
3.477
1,346
:206
:332
724
403
120
5,296
:!,3U
H5
421
432
7j()
452
263
~60
B·II WORKERS AND NON·WORKERS IN CITIES AND NON-CITY URBAN AREAS
Tutal Vopu}atlon ---..A_-----_
:Males }'emUIr-s'
4,839
1.66+
4J5
1,!J:m
2,805
958
1 i9
:l65
573
J80
147
58
2,034
706
106
174
19:3
279
84
'J7
2,808
1,196
218
222
:lR9
2SS
14.1
133
3,585
675
2Hb
105
i':I
2,142
881
151
177
U7
406
162
b9
45
1,443
640
100
107
124
:>6
28
2,488
1,117
Itl6
:!U3
2lU
321
194
i:!O
127
Jl1 Li\'('\w('k, Fl)r('~lrv l'l.,hlll~, HuntlTlq S: Plant..\t\O\\,>,Ot<,!';ltd"
WOR -----...A-
I II awl .1Ule,l actlVlt- 1\-'1 ol,li \\'mken.
r---_A._-~~--..
:\lales }cllhllt'\
(:uil1\',\llllo; ,\,(.[1 j( ultw.ll taLollru" lCS i\rinHl~ &. QU,1fl \ Ill!:
:Valc~-..A..--j.~~~~~,tl~ r-:\l~J;~- ~;m.de~~ --, {~1;,-- --~t';;1~1;.:' (~r.1JI~ _A._ -i:;;;;~~
2,811
15
J79
He
1,012
638
~lb
7I
JHAGRAKHAND '. u.A.·,
241
IJ
IY
(0) NORTH JHAGRAKHAND COLLIERY ,N.M.,
1,627 153
41
'227
5tH
375
138
'!b
12
IB
18
31
II
(hI SOUTH JHAGRAKHAND COLLIERY IN.M.)
1,184
23
147
189
45J
263
7U
25
1,371
J4
U7
187
21U
252
125
88
27
35
StJRAjPUR IN.M.l
218
18
Ii
20
28
15
393
11
J6
77
98
50
5J
28 132
17
15
16
'J7
II
13
1'0 11 I"
13
U6
15
I"
17
27
15
10
I:l
2,.87
'Jf)
1,422
I!J3
511
:.Hti
1[0
1,065
175
411
tiC!
3
I+
16t
10
17
5U
54
lOU
14
:Jb
24
30
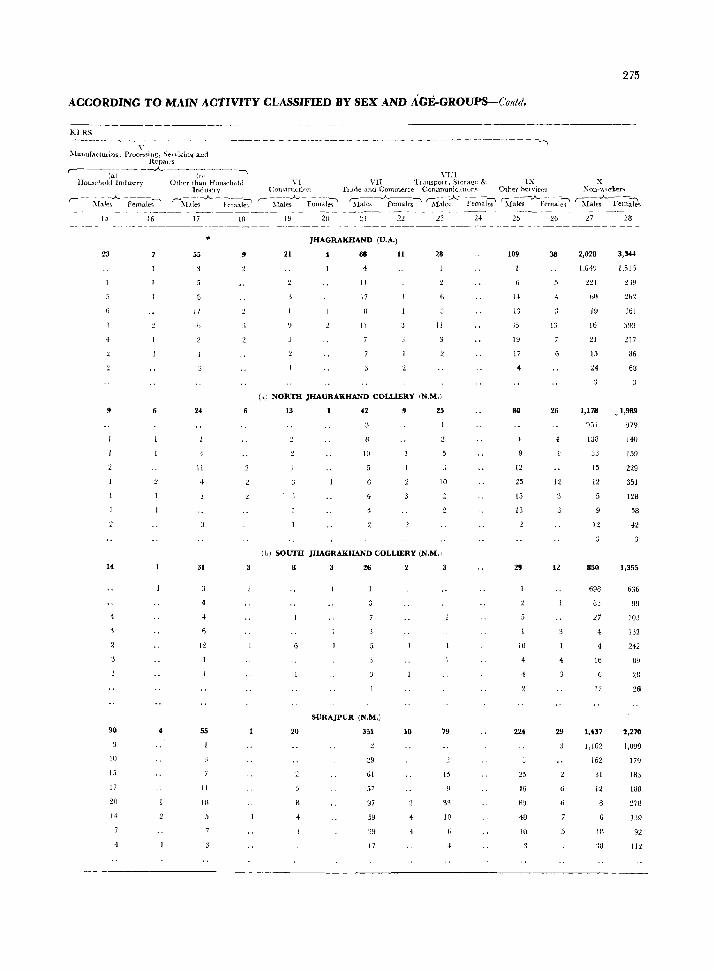
ACCORDING TO MAIN ACTIVITY CLASSIFIED BY SEX AND AGE-GROUPS-C(Jntd.
KLRS ~----~~~--v-----~ ----- ~---- --------~---------- ---------------- --~ ~lautlf.lcturil]e:, ProCI"SSiflg, S~lviciJl!{ and
)tepam .. ,------- ----A~---~--~.--~
fa) (b,' YIlI \-r VII 'f1J.llspmt. Storage & IX X
275
Household Industry Otller than Household lndustry Cml<,trUltion TI.Hie and Commerce COOimunkdtlUn<; Other ~eJvice~ ~on-"f,rker<;
:\I~I~~.A. -P--;;;ak;' r-~f~~ -J...--f;~-:I~
15
4
90
III
I:;
Ii
20
14
4
16 17
55
17
16
24
11
31
12
55
II
IH
r- ~<t~~:--- F~n~;i~~ ~f;J;-~emales\ '1f;k~--~;: ~fales -J-F~~a-l~ ~Iale~-F--;;~k\; 19
21
20 21
JHAGRAKHAND (U.A.)
68
II
17
II
22 23
11 28
11
(a) NORTH JHAGRAKHAND COLLIERY IN.M.)
13 42 25
10
10
Ib) SOUTH JHAGRAKHAND COLLIERY (N.M.I
8 3
SURAJPOR IN.M.)
20 351 10 79
:!9
61 15
5'
97 33
59 10
29 4
17
25 26
109 38
1-1 4
11
'}5 13
1~
17
80 26
"j<
12
25 12
15
13
29 12
10
22~ 29
15
46
8~ 6
48
10
27 28
2,028 3,344
l,IJ«.IJ LSIS
2~1 ~_lY
6(1 2b'l
1 ~, ;}61
16 }93
21 217
1) 86
H 68
1,178 _1,989
9;)1 Un}
138 140
33 159
15 229
12 351
126
58
12 42
850 1,355
698 636
83 99
27 103
4 132
4 242
16 8~
2B
12 26
l,i37 2,278
1,162 1,099
162 17U
31 183
12 188
:!78
139
J3 92
:111 112
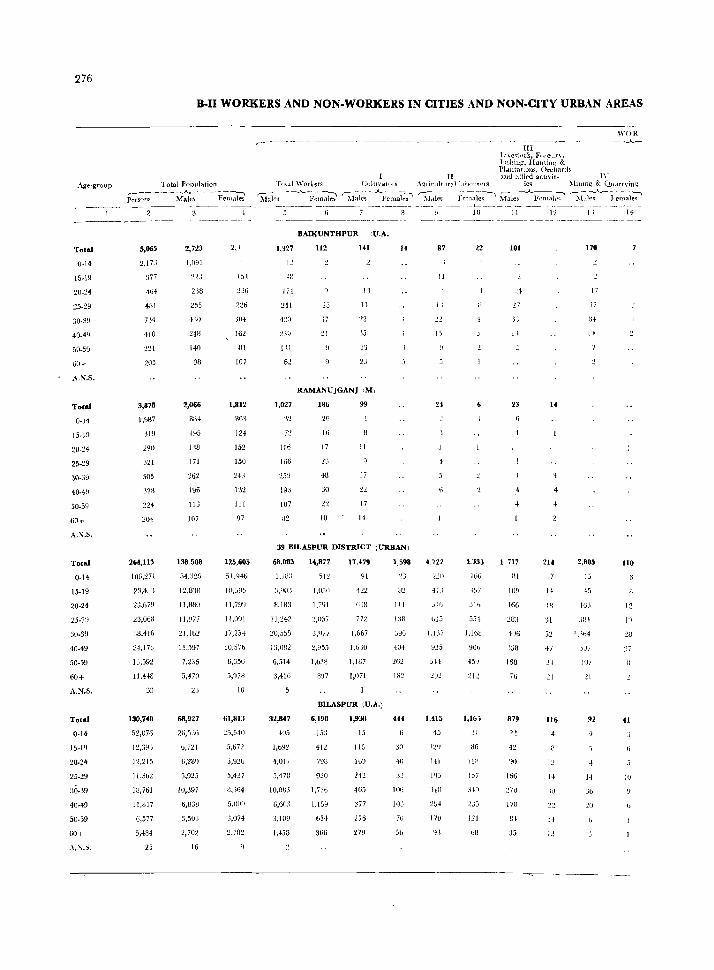
276
Age~grollp
Tot .. 1
0-14
15-19
20-24
JO-39
40-49
SO.59
60+
.t\.S.S.
Total
0-14
15-19
20-24
25-~9
30-39
40-49
50-59
60+
A,N,S,
Total
0-14
15-19
20-24
45-29
:lO-3~1
40-49
50-59
60+
A,N.S.
0-14
15-19
:(0.24
40-49
50-59
60+
A.N.S.
B·I1 WORKERS AND NON·WORKERS IN CITIES AND NON·CITY URBAN AREAS
Total Population r_------·,...A.. ------:---, Persons l\faJe'> }·~IlI..l1es
5,005
:.!,17J
37i
,164
4[11
7:14
flO
221
203
3,878
1,&87
JI9
290
.m
505
323
204
2U,113
106,271
23,4TI
2::,6)~1
23,06~
::8.416
24,17J
1:),592
I).HV
130,740
52,U76
l:!,:jY:;
12,215
11,3ut
lB,761
11,817
O,577
5,484
25
2,723
1,091
~2J
2J8
255
430
140
98
2,066
BS4
195
J'lE
171
196
I1J
107
138.508
12,B'IH
II,SBO
11/177
21,1b:!
13.597
7,236
5,470
68,927
2ti,JJG
6,7'21
t:),28~
5.925
IU,397
6,338
3,503
2,702
16
l5t
226
]04
16:.!
III
107
1,812
gO')
124
152
150
243
132
111
97
125,605
51,l14li
!I,ll'll
17,25-1
10,57b
6,J5ti
5,978
10
61,813
:!S,540
5,672
J,92u
5,437
U,J64
5.00!1
3,074
:l,782
III l.l\c~tnck. Fj,re",tn, }'l»ilillP'. Huntlfl1! & Pl.l1ltatlOlls, Orchards
II ::!.lId allied actlvit- lY
WOR ._--...A.._-
T(JLll \Vorkers Cuitn'atlOls Agri{,lLltural td)f)UteIS ie<; :\tilHng & Q1JJrrvinr,;:
~ull'~ --..A-}'~:n-';~ SI~ks-.A..&~~al~ Sl~l-;--i:~r~;}~~-'t M;-t;~-..A..I;ml.ll~ ~i~d;:--};~l~e~
1.327
I!
Ii!
~41
420
III
62
1,027
:n
116
166
193
107
32
BAlKUNTHPUR (U.A.,
112 HI
11
,7
21 lj
23
RAMANUJGANJ (M,
186
2G
16
17
4B
30
10
99
II
17
'2'1
17
14
39 BILASPUR DISTRICT I URBAN I
68,083 14,877
1:l.IH3
11,242
20,555
1:1,082
6,514
3,416
5
5]2
1,050
I,illl
~,OJ7
17,479
91
GJB
772
1.567
1,6JO
I,1H7
1,1)71
BILASPUIt IU.A.)
32,847
405
+,017
5,17U
10,083
6,60;,
3,109
1,458
6,198
15~
41:!
1,736
1.159
366
1,9JD
13
115
1,598
111
138
JYG
404
4H
41l
10J
70
87
11
I:
4.722
l.U7
511
1,415
43
HI
It),)
2!)4
170
'II
)0
22
166
Jib
55!
I.lb8
YUo
459
2L!
1,163
JI
8G
liB
157
3l!l
2J5
121
11
101
\1
1\
23
1 717
HI
109
166
283
4'J6
)J8
163
76
879
42
90
166
~71)
170
BI
35
I"
214
31
4)
~I
116
12
II
170
17
_i7
2,805
I:;
45
.3!l1-
!,'104
JfJ,
107
21
92
14
:.W
14
no
12
I')
IU
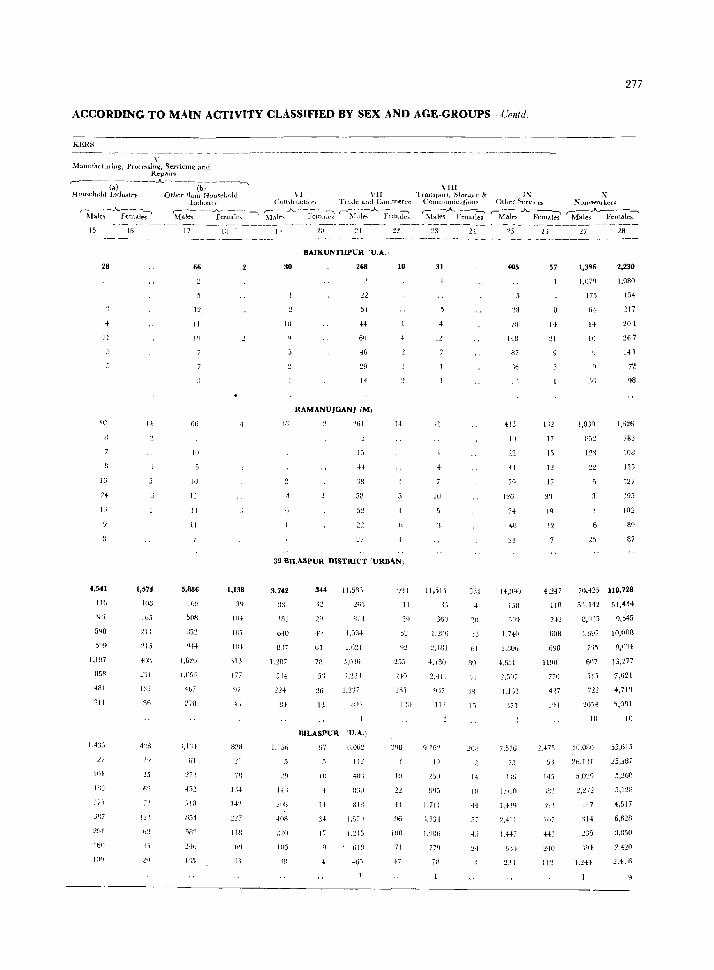
277
ACCORDING TO MAIN ACTIVITY CLASSIFIED BY SEX AND AGE-GROUPS-Colilil.
KERS
\" :\fanUfa(tulillg, Pro{eo;;sing, Serviclnq ant!
Repairs '---W~·---.A..----(bl~ ~---,
Homehold Industry Othe)' th;m Huu-;efll,ld Iudusl1\'
~1~0. -.A.~~~al:s--"1 'hl~ --~~~:l::---" 15
28
+ II
16
~,541
lIb
']HI
858
+81
'ill
101
!By
171
Ifi(l
J6
1,574
106
165
'lIt
215
4IUI
:..'')]
"I 15
1\
17
66
II
1'1
li6
II)
10
12
" 11
5,886
I () ~ I
50~
1,620
j,056
,"j)()
'i/l'l
":.\
III
1,138
34
10·1
lEI
HI+
'11J
177
4\
711
I:.4
14"
2!7
liS
h'l
VI \' II ( ;oll~tl'uction Tl'aue and Commerce
30
Ii)
[6
BA1KUNTHPUR iV.A.'
268
51
44
46
14
RAMANUJGANJ (M,
:!fil
13
m
58
52
,7
10
39 D1LASPUR DISTRICT (URBAN)
3,742
18:3
640
S,:;
l,10i
224
Bl
1,)3t}
14:
408
!O3
341 11,5R)
6; l,t):!!
7>1 3,010
26 1,2'37
BILASPUR ru.A.)
97
111
1+
:H
17
11,015:1
(\~;O
8lfl
1.S;f1
1.21 :'I
II
255
IWj
I j~)
41
96
lOR
71
47
\ III Transport, J":itor.dgt' &. I,\: X
CommuniCiltions Other Sen'it es ~on~wolkel"<'
(~1:J;..A.. ~~:t~ '-~,ialr~ >·"-FelIl.i~ 'Males..A..Female:;-'
23
31
10
11,'>1'1
1.2nr;
GJ7
II:?
1.711
1/186
77q
2+
J:il
jJ
61
Ii
14
III
5i
4,)
24
405
'J3
78
148
87
'16
11
4Il
II)
41
1~6
74
40
~l
14,OQ;)
l.JH
l,UO
~,B()(i
4.651
1.1 f) ~
:ii
7,57G
75
1\1;
I,OW
1,414
2,411
I,Hi
liJ>
23
57
14
21
17
l~
17
31
4,247
lln
li08
fjY8
II~O
770
4,U
I'll
51
1-15
1'11
+Li
II ~
27 28
1,3~6 2,230
l,Il)') I,OSO
175
"" 10
J(i
l,O.N
B5~
154
217
201
267
141
72
q8
1,626
)8}
108
1'35
127
195
102
89
87
ji}.-I-25 110,728
5'1,142 .11,434
8,rU:) fJ,545
,~.G9i 1 (),nOB
6m 13,277
il \ 7,621
722 4,71(1
10 Ii)
~fi,OflO
1ti,J il
5,02()
417
'\14
235
1.:!4+
55,615
25,387
,\,260
5,1211
4,517
6,6:!B
J,850
2,411}
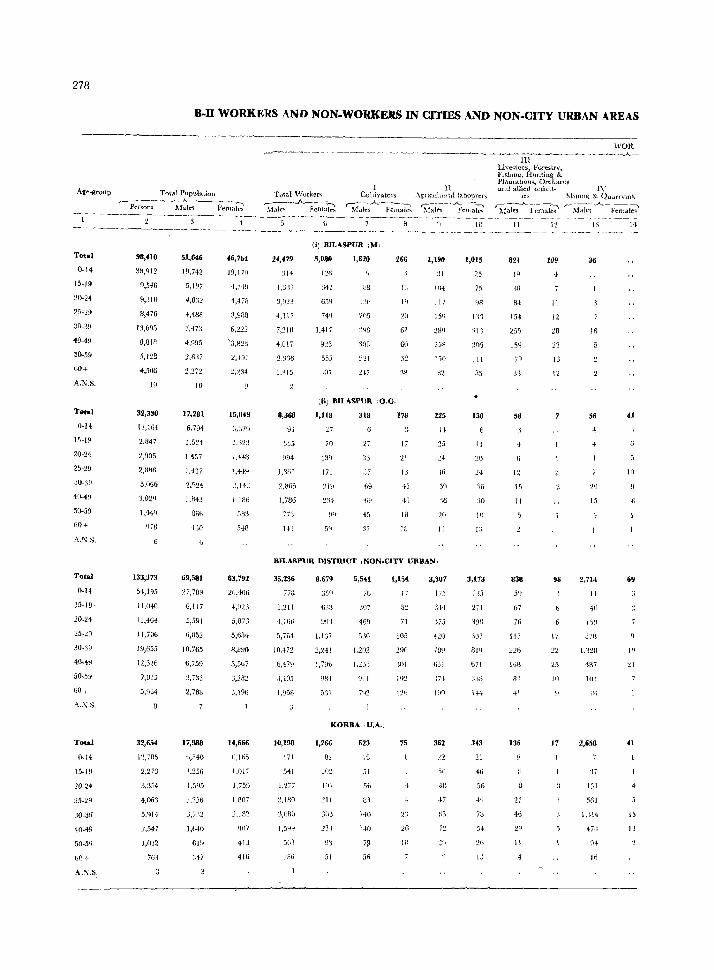
278
B-II WORKERS AND NON-WORKERS IN CITIES AND NON-CITY URBAN AREAS
Alle.~roup Talal Population
r- Pers~;-itaI~-Fe~~~
Total
0-14
15-19
20-24
25-29
30-39
40-49
50-59
60+
A.':'i.S.
Total
0-14
15-19
20-2'
25-29
30-39
40-19
50-59
60+
A.N.S.
Total
0-14
15-19·
20-24
25-29
30·39
40·49
50·.\9
60+
A.S.S.
Total
(l-14
15-19
20-U
25-29
30-39
4(l-i9
50-5Q
60 c
..... S.S.
~),546
9,310
8,476
13,695
8,818
5,128
4,506
19
32,330
13,164
2.847
:l,905
2,8B6
5.066
3,OZQ
1,444
GiB
133,373
54,145
lIMO
11,464
11,706
19,655
]2,126
7,015
5,964
32,654
1~,705
2,273
:1,354
4,063
5.414
2.547
l,m2
iG3
51,M6
19,742
S,Ul7
4.8~2
4,488
i,473
2,6:17
10
17.281
6,794
1.524
1457
1.137
69,581
~i,789
6,117
J,591
6,052
10,765
6,759
3.733
2,768
17,9.88
ti,540
1.~56
J,')95
:!.256
J,?J:t
1,64()
6];.
347
46,764
19,170
4.3-HI
4,nn
3/.188
6.222
\3.823
2.191
2,:!34
15,049
6,370
1,'12:1
1,448
1,44~
~,142
1.1116
5H:l
548
63.792
26,406
4,923
5.87:1
5,654-
8.mW
5,567
3.196
14,666
li,lG5
1,(>17
1,i59
1,8Oi
2,18'2
!JOt
41J
416
WOR r--~-~.-- - ---~-~- --_ --~ ....... -~_________.------____..___--~-- ~~- -...A.--
Tota! "Vorkers I
Cultivators
~f~ ... .JI.-km~~ ,----"'-~-"':1 Males Female"
24,479
:1I4
1)17
3,(\23
4,117
7,2W
4,817
2,3'16
1.315
8,368
91
~55
1,'3111
2,8(;5
1,786
77'~
1+3
(i) BILASPUR 1M,
5,080 1,620
749
9~5
553
Wi
kB
I:lf-
H7
266
1'1
1'1
:W t')l
60
38
\Ii) BILASPUR /O.G.·,
1,118 318
27
70 2.7
171
69
178
17
21
IJ
45
43
IS
18
II Agl(Cu\ll1ral labourers
~-:J~~~ema~
1,190
31
104
117
225
14
'16
11
1,015
25
75
<.s
III
150
11
20
%
30
10
Ij
BILASP\JR DISTRICT ,NON.ClTY URBAN,
35,236
~.211
4,16ti
5,764
10.472
6.47~
3,405
10,198
171
541
1,277
:1,180
~\,1i80
561
111(.
8,679
638
~'_)l
5,541
i6
307
46!)
5.10
1,202
!_Ill
7'1::!
KORBA 'U.A.,
1,266
8'1
Hl'1
211
91
51
623
18
51
B3
140
I {II
70
5fi
1,154
17
71
105
Ini
1211
75
26
10
3,307
175
:114
:l75
420
789
611
362
47
72
3.173
1').1
271
3:.17
671
21
{Ii
4'l
73
54
IJ
III Live"tock, Forestry, F1Shul1{, Hunting & PL1.utaholl ... OrdlanJ~ ami allied activlt- IY
Minml';: & QU.1rrvm!:!;
'11~;;_A_F;n;~~ r-ii~t'~_A._-F~~~
II
821
10
'lG
B4
154
255
70
58
14
15
JI
833
(>7
76
117
135
21
46
2~
II
12
lQ9
II
12
28
13
12
7
98
17
22
25
10
17
13
36
In
56
20
15
2,714
II
40
LTDl
/1,.K7
]01
lB
2,658
151
561
1,'114
47B
If)
14
41
10
69
10
2l
41
15
1:1
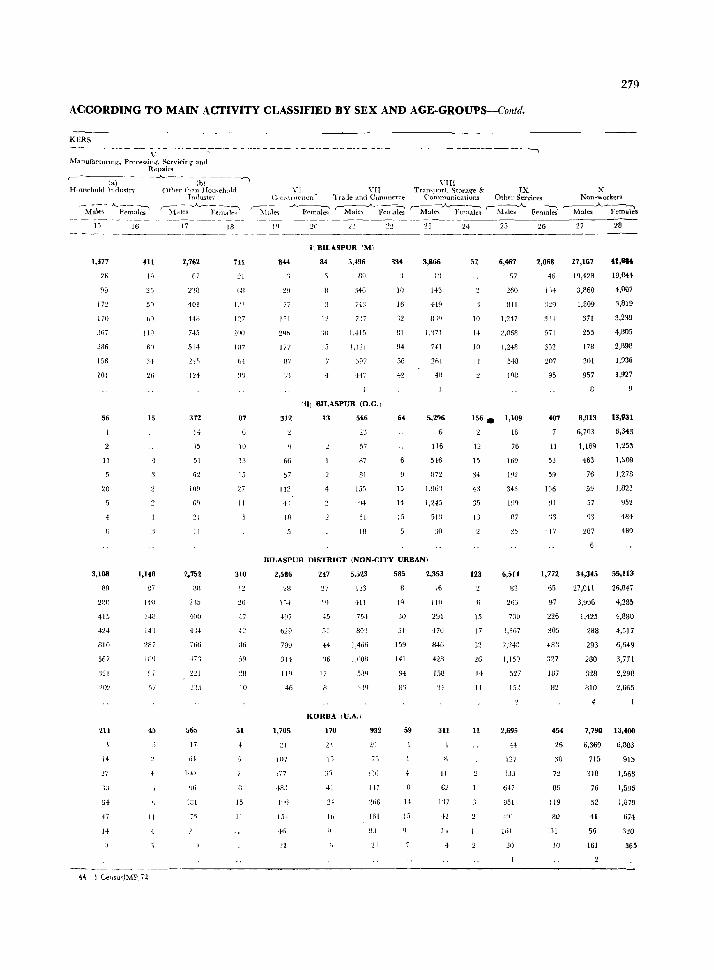
279
ACCORDING TO MAIN ACTIVITY CLASSIFIED BY SEX AND AGE-GROUPS-Contd.
KERS
V ~fanufacturmg, Prnce'{sin..:'. Servicin~ and
Repair<; -r------~- - -"- -----
la) (h\ HomeilOltl }JI{IlIstrv OdH'r tfl<ln Homehnld
Imlu;;irv
'-Mak~- A_F:,;~;-' r-;t~~_A_-F~l-:-i~;'
15
1,377
J 72
liO
;iG7
2Bfi
lSI)
101
56
Il
20
3,108
89
2SD
410
424
810
567
J~I
211
14
:!i
64
16
411
1~
25
5'1
2G
15
4
1,148
87
14<)
H8
14')
,57
45
II
44- -1 CellsusJMP,72
17
2,762
6)
401
148
745
514
124
372
H
15
51
62
21
II
2,752
lIB
414
7Go
+7'3
565
17
1(1,)
WI
18
741
'_II
121
127
200
107
64
87
10
13
15
27
II
310
12
47
42
:16
59
~!B
10
51
15
11
-_ -~------~------l
\'1II VI VII
enllSt! n{'tlOn' Tra.de :ind Commerce Tramport, Storaq-e & IX X
Communications Other Services Non-workers
r I\Iale--;-_A.. F('mai;" r-Ma1eo,; _A_ Fen:ki ,-Mal;;-"-~~~ "-~I:i~~~ r- Males.A. Fem;ks
1'1
844
77
J 51
24h
In
B7
3')
312
6(i
57
112
4 :
IB
21
") BILASPUR (M)
B4 5,496
7'13
I:!
;0
15 1,111
447
(UI BILASPUR (O.G.)
566
57
87
81
51
III
334
1tJ
16
'~2
81
94
:;6
64
15
H
15
3,866
1:1
143
419
U71
7-11
4H
5,296
6
116
546
B72
1,96')
1,245
SID
:10
BILASPUR DISTRICT (NON-CITY URBAN)
2,586
2H
} ~)..}
b29
799
314
119
46
1,705
"1 \07
21
Z!7
45
51
H
'16
17
1,,3
411
i5-l
80']
1,466
1.00S
5fl9
'j PI
KORBA IU.A.I
170 932
lJll
,I I-H
2 t
II, 161
585
1<)
51
159
141
94
S')
59
15
2,353
16
110
2!Jl
470
84G
4213
J!l8
'j.-f.
311
41
l'l7
52
II)
]<I
10
II
25
6,467
57
1HI
1,217
1.068
1,248
54B
108
156. 1,109
2 IS
12
1)
3,
43
:35
IJ
123
15
17
32
2G
14
11
11
76
169
192
343
25
6,il!
83
263
i:JO
1,367
2,24!J
1,150
527
152
2,695
H
1::!7
(i17
951
4:11
lfil
:';0
26
2,06&
46
1H
3H
571
352
207
95
407
II
53
59
136
91
'13
'17
1,772
60
97
226
305
483
327
1117
82
454
26
:10
72
86
119
80
31
10
27
27,167
19,428
3,860
1,809
371
255
178
301
957
11,913
6,703
1,169
463
76
59
57
93
287
41,6&(
19,0+4
4,007
3,819
3,239
4,005
2,898
1,936
1,927
13,931
6,343
1,253
1,'>09
1,278
1,823
~)52
484
489
34,345 55,113
27,011
3,906
1,420
288
293
280
328
BID
4
26,047
4,285
4,880
4,517
6,649
3,771
2,290
2,665
7,790 13,{OO
6,369
715
31B
76
52
41
56
161
6,OB3
915
11[168
1,596
1,879
674
365
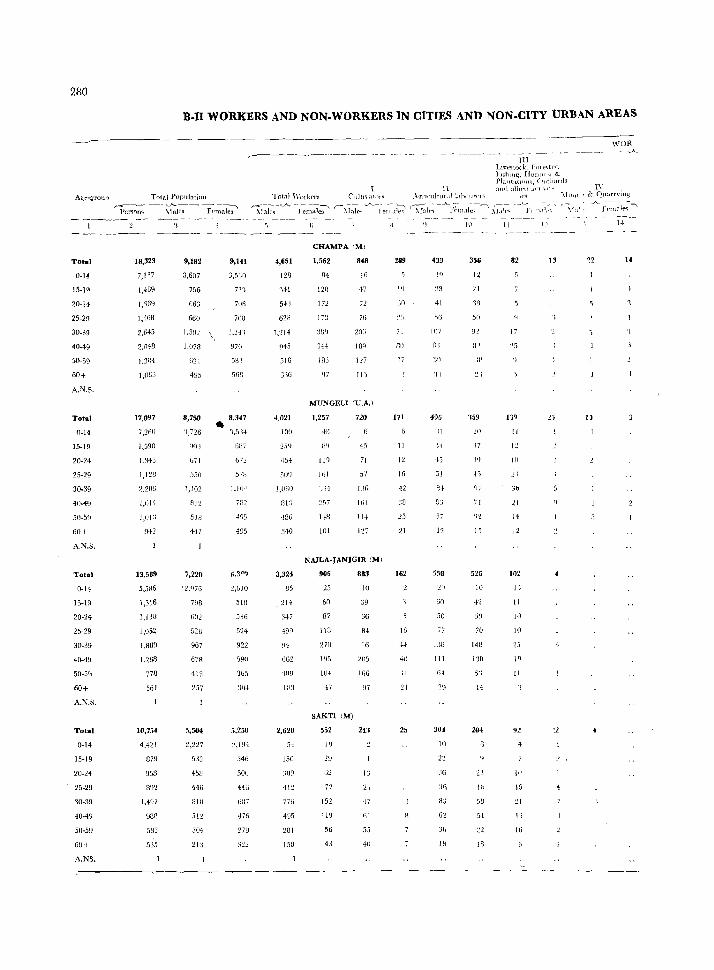
230
B-II WORKERS AND NON-WORKERS IN CITIES AND NON-CITY URBAN AREAS
r----- ---------"---III
Ll\-cstock, F(lfc,trY. Fl~hlll(:::, HlIJll[[I'~ &. Pl:lllt3.t!IHI", (hcllarrls
II :l(l(\ allw,\ .,rtl\d- lY
WOR ---.-A_
Total \\'OIkcl's Cultl\all)l~ ,\gfl('uitur.11 L\b(ll1reJ~ :\fll11l" & f2uarr\'ing
'11~~--A-}<~;;I~ r- :\r~h ..A--l~er~~i;? r;,r;~ -_"'_}~-I~:;I~;----" ~f.:I; --' F( 'I d(: ' r~\1:tl', --"_f;~;1~1(';\ At;r'-grollp Total Populntion
Total
0-1f
15-1'
20-24
25-20
30-39
40-49
50-59
60+
A.NoS.
Total
0-14
20·24
25-29
30-39
40·49
.'jO-5H
60+
A.N.S.
Total
0-14
15-19
20-24
25-29
30-39
40-49
50-5~
60+
A.N.S,
Total
0·14
15-19
~O·~4
25·29
40-49
50·59
60+
A.NS.
'i~;; --~l~-- -~~~l~~
18,323
7,117
1,4B9
1,'lIN
1.~68
17,097
7,260
1,590
l.343
1,128
2,206
1,014
1,0J:)
942
13,589
5,586
1,316
1,138
1,052
1,889
1,268
778
5f31
10,754
4.421
879
~158
B~)2
1.497
~18S
58:3
5'35
9,182
3.607
756
663
660
9,141
3,511)
73,
71)6
708
1.302 \ 1,3·f1
1,078 970
621
495
8,750
~1,726
671
550
1,102
8:12
5IR
+17
7,220
. 2,076
798
G02
5:2B
967
678
413
5,504
~,n7
5.13
458
Hli
Illll
304
213
sin 51)8
8,347 • Gill
6n 5711
1,10+
732
495
405
51B
336
524
922
5,250
~,194
346
500
446
687
476
17!)
4,651
l28
~41
543
628
1.214
945
516
4,021
lOll
45+
sm I,OW
fH3
486
340
3,324
.214
347
499
661'
131
2,628
5+
150
::09 41'1
776
495
281
ISO
CHAMPA'M)
1,562
84
120
In
1 i~
3B~
848
Hi
47
71
7G
127
11')
MUNGELIIU.A.)
1,257
·HI
WI
II~
161
','H
25i
HS
101
no
45
71
57
1~7
NA.lLA-JANJGIR (M)
906
25
GO
87
118
270
195
III'
47
SAKTl (M)
552
I'J
2Y
62
7'2
152
110
56
8B3
10
39
66
84
IG
16(i
I:;
'21
47
53
40
289
I~
Jf}
71
171
II
I~
16
42
33
21
162
16
40
.\l
21
25
433
14
41
]()7
B,
'11
406
'I
8t
12
553
60
50
77
1::0
III
304
10
23
]\\
356
12
21
'lB
50
III
'1.9
:.!(l
'7
I"
IS
525
10
42
70
148
130
5:1
H
204
I"
58
51
18
II
82
17
1'1~
II
12
10
30
11
14
12
102
J'l
II
I,)
10
25
19
II
91
lU
15
21
lJ
22
I)
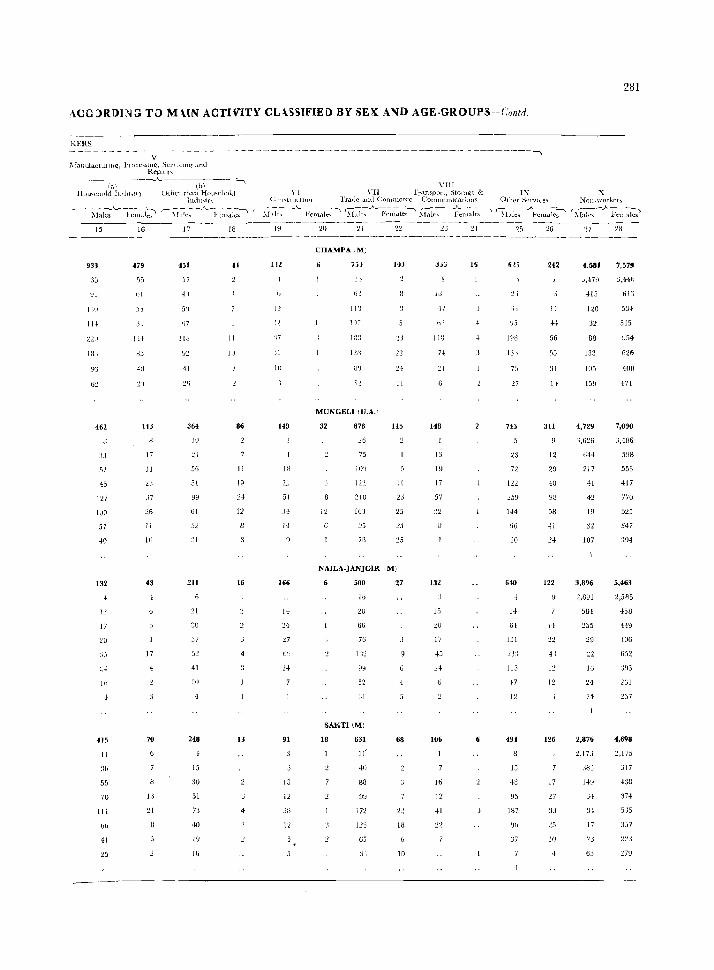
281
ACC)RI>I~G Tn MUN ACTIVITY CL \sSIFIE I> BY SEX: A"lD AGE·GROUPS-Colltd.
KER~
v ~rallufactul1tH~, hocc<;smg, SCf\'jC1n~ and
Rep.lUl; -------- -------"- -------~-\
(ai (hI Houc,ehold Iwlthu) OLiln thall Hcw~ellUld
Indu"tn r- -----_A_ _____ --"
)'l.lte~ l't.:m.tles
15 16 17 18
\'II[ \-r '-I] i'r,lnsport, Stor,-u;;c & IX X
C l't<;tlllctIOJl Trade <.tnt! Commerce COlllllllllllcatiDll'l Other St'rvlLes NOll_\\'ork('f~
,- ~1.:ie-:- -_A_-I,'el~~~-' SiJ;,,-.A.{,:;;~le~~ ~l{':---~;~I~" -, ~I~i~~-~~llalc~ ~Iale<; ;A_F~l~-;J~ [9 20 j_lj 25 '17 28
,---- - - ._--- ------------- - -_--- ---------- ----
933
110
11.
221)
IH i
93
61
462
33
45
127
100
57
40
132
17
La
jj
10
415
11
:36
55
7V
III
00
41
479
(;1
55
JJ
12+
85
411
:1'1
143
17
II
37
26
Ii
j(I
43
I7
70
13
11
--------'
50
IIH
41
364
10
21
56
51
99
61
31
211
21
:10
:37
52
41
:!()
248
15
30
51
73
40
19
Hi
41
11
I,)
86
11
19
:2-1
12
8
16
13
III
l'
'\7
10
149
13
21
51
.14
J4
166
27
ti'J
91
13
12
:38
12
CHAMPA (M)
7j)
11')
I');
lG3
121J
{PJ
i?
MUNGELIIU,A,I
32 878
:26
75
10')
1')')
210
12 lti~
95
78
103
22
11
115
It
25
25
NAILA·JANJGIR 1M)
500
I()
:W
66
76
52
:il
SAKTI (M)
18 631
II'
411
88
In
123
6,)
27
68
22
10
3J:J
47
b)
11'3
H
21
148
13
19
17
57
132
15
17
106
16
12
41
16 6!i
'!i
63
l(jB
L'3i)
)"
27
745
23
1')')
2S!J
144
JO
6iD
I. 6~
151
113
.7
I~
491
15
48
95
187
37
242
JJ
56
:;1
311
12
29
58
41
122
22
12
12
126
17
1.7
33
j(J
4,581
'J,'7~
410
1,0
8B
133
[05
15~
4,729
'),626
644
217
41
42
19
:32
107
3,896
2,8!Jl
584
~35
29
Iv 24
)4
2,876
1,l7J
3lJJ
17
7,579
3,440
61:1
534
535
!J54
626
400
471
553
417
770
525
347'
394
5,463
2,585
458
4+9
4U6
652
261
4,698
2,175
317
438
374
5J5
337
'1.7':1
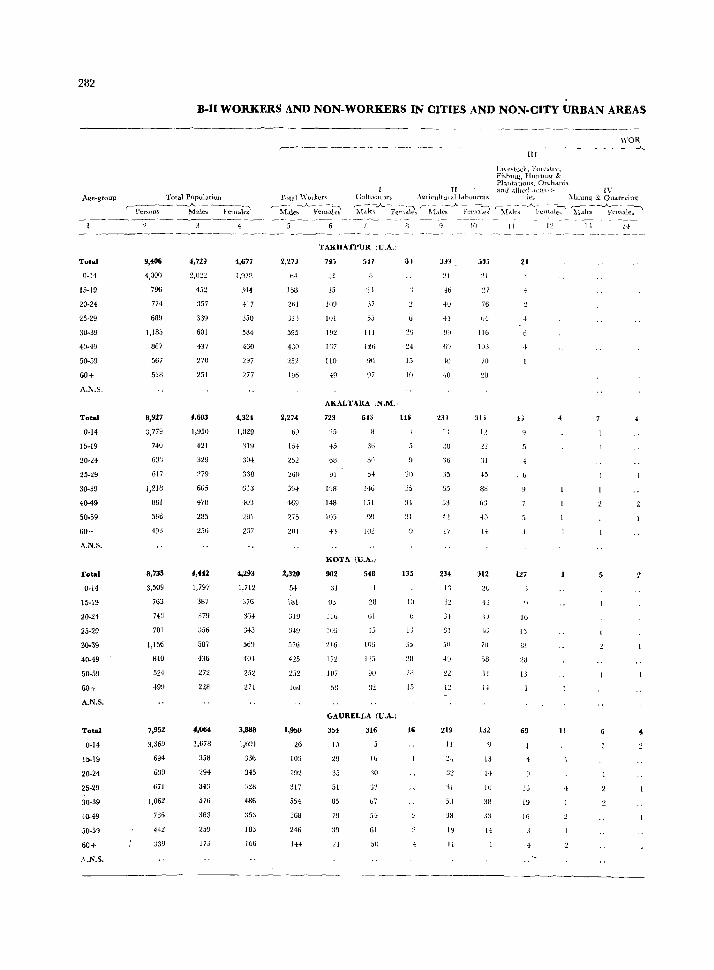
2S2
B-II WORKERS AND NON-WORKERS IN CITIES AND NON· CITY URBAN AREAS
Age-group Total Populatiun
,.- Per",,()n~ ~ales Fell~-;:lei
Total
0-14
15-19
20-24
25-29
30-39
40-49
50-59
60+
A.N.S.
Total
0-14
15-19
20-24
25-29
30-39
40-49
50-59
60+
A.N.S.
Total
0-14
15-19
20-24
25·29
30-39
~0-49
50-59
60+
A.N.S.
Total
0-14
15-19
20-24
25-29
30-39
40-49
50-59
60+
"_N.S.
9,40&
4,OOQ
7%
774
63U
1,185
867
5ti7
528
8,927
3,779
740
63"3
617
1,218
HSI
5ti6
493
8,735
3,509
763
743
701
1,156
840
524
·199
7,952
3,369
694
639
671
1,062
736
442
4.729
~,fJ22
45:!
357
339
601
437
270
251
4,603
1.950
421
329
279
605
478
285
256
4,442
1,797
387
379
:;56
587
436
272
2:W
4.064
1,678
358
294
:;4:1
576
3B3
173
4,677
1,97B
341
+17
350
584
430
297
277
4,324
1,829
'jI9
304
338
GI3
403
281
237
4.293
1,712
37G
364
:H3
404
252
271
3.888
1,691
~%
345
18~
166
_--.-------_._---
III
Ll\e ... tuck, F(IIe~\(v, Fh,hulg', HlIlltl[l!{ & PlantatIOJ1'i, Orch .. ud'i
H and aJh\?d ,iCtn I t- IV
WOR .A.
Total 'Vulk~rs (------''-.~~~
CultiV<llOl"\ .1\gli('ultwalldh"urns ies ':\{Illlllg & Quarr~'ins.:
~1.1.1es }"em<\le~ 'hl,J~_A.. F;n~~li~ r-hl.\k;_A_F~~~ ~1:1e~ -_A_1 ~m,t~~ hl:1e; -~'~l~~i~~~
2,27J
158
261
4JO
252
1!)6
2,274
W
15-1
252
~60
4"9
275
201
2,320
5+
181
319
3409
576
252
Lh4
1,950
lti
103
192
317
554
368
H6
144
TAKHATPUR (U.A.I
793
15
HU
101
192
167
110
49
5i7
'u 37
5j
111
110
~J 7
AKALTARA ,N.M.I
723
:25
-IS
(is
91
HB
10::'
4'1
615
36
50
5-1
146
lSI
~l
102
K01'A \\).A,)
902
31
116
10!)
~t6
In 107
sa
5tB
61
lOti
90
GAURELLA (U,A.)
354
15
35
51
85
79
L'J
316
Ib
.\0
:.i:5
67
5+
61
.50
3)
15
I()
IIIi
3-1
31
133
to
IJ
:.15
211
15
16
:!.L
-16
-10
H
!J9
-10
23J
I;
'36
015
65
53
17
234
I·j
31
5:IJ
10
219
II
:ll
53
38
19
II
10
so,>
:U
'27
76
b-l
lib
103
70
31)
12
31
-15
8tl
o:l
4,)
1+
ll2
:lU
711
58
1-1
IJl
13
1-1
10
3H
33
H
11 1'1 I; 1+
21
Ii
127
16
13
iU
IJ
69 Il
13
19
16
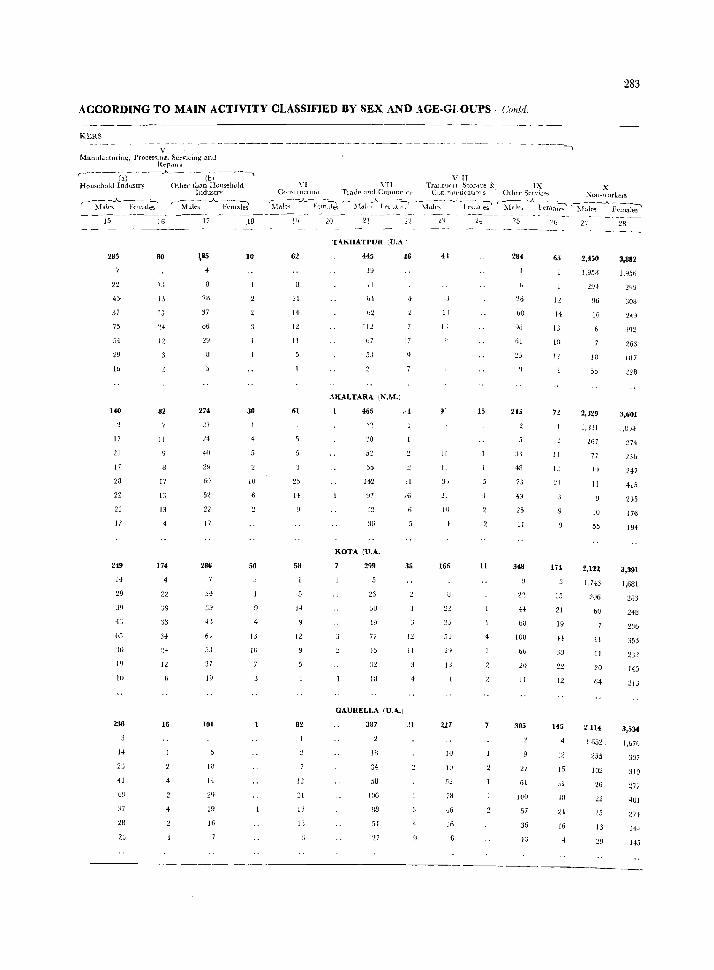
283
ACCORDING TO MAIN ACTIVITY CLASSIFIED BY SEX AND AGE-GJ.OUPS - (;(mtd.
KJ:.RS
V ~lanufacturing, Proces<;in~, Servicing and
Re-p,-nrs
,-----la)-----"------(bi-----. Hou~eh()ld Industry Other tb,:m HOllseLlIJld
]5
285
37
75
54
29
10
140
17
:?1
17
2U
22
21
12
249
14
29
39
4:';
'Jl)
I')
II)
238
14
2:1
41
:17
2:)
16
80
13
12
32
II
17
n 13
174
22
39
33
3f
12
16
4
Industrv ----....A...---
r- Ma.les Fema'ki
17
2H
37
b6
274
21
24
40
52
17
236
24
39
43
61
.13
37
101
III
19
16
_IS
10
30
10
50
13
III
V'll \'1 "II TralJs1)(l)\ StoT<tl.;e & IX X
C()mtlllctiod Tuttle and CorulHe Cc CIJI1,'llll'tICQtlOIJS - Other SCI\·ic·~s SOIl-worl..t'Ts
';:ial~---.A.-F~t~~ r-~\L.\lf :'-f'~I:'~C ~<I.,k,--_)-~e:,~;-' (~\1."t~.A-¥l:;;~l~ 'i~ks~__A_~male~
62
II
14
12
II
61
25
58
14
12
82
12
31
13
13
20 21
TAKHATPUR I,U,A 1
445
19
0"
112
67
53
AKALTARA IN.M.!
466
12
52
55
142
42
36
KOTA (U.A.I
299
23
50
77
GAURELLA i,U.A.)
387
J8
::14
58
106
'17
46
~ I
36
L!
II
41
II
I:
11
1_
II)
165
5 f
V
13
227
10
1J
;u
16
24
15
11
25
284
20
00
(il
2&i
3,
411
73
43
11
348
H
bB
IlIU
bo
211
II
305
27
fil
1(10
57
36
13
65
12
14
IJ
II
l'
21
171
IS
21
1~
H
22
12
145
12
15
.il
16
2:' 28
2,450
1.95H
~6
16
18
2,329
1,1)1
16i
77
1~
II
10
55
2,122
1.7-13
206
nO
II
II
20
64
2114
3,882
1.456
308
24~
263
IH7
3,601
,,111-1
274
2Jb
247
415
2:;5
176
194
3,391
1,681
283
248
2:Jb
232
145
2jJ
3,534
I 652 1,lt76
102
26
22
15
13
29
3U7
JIO
401
47+
IH
145
------------
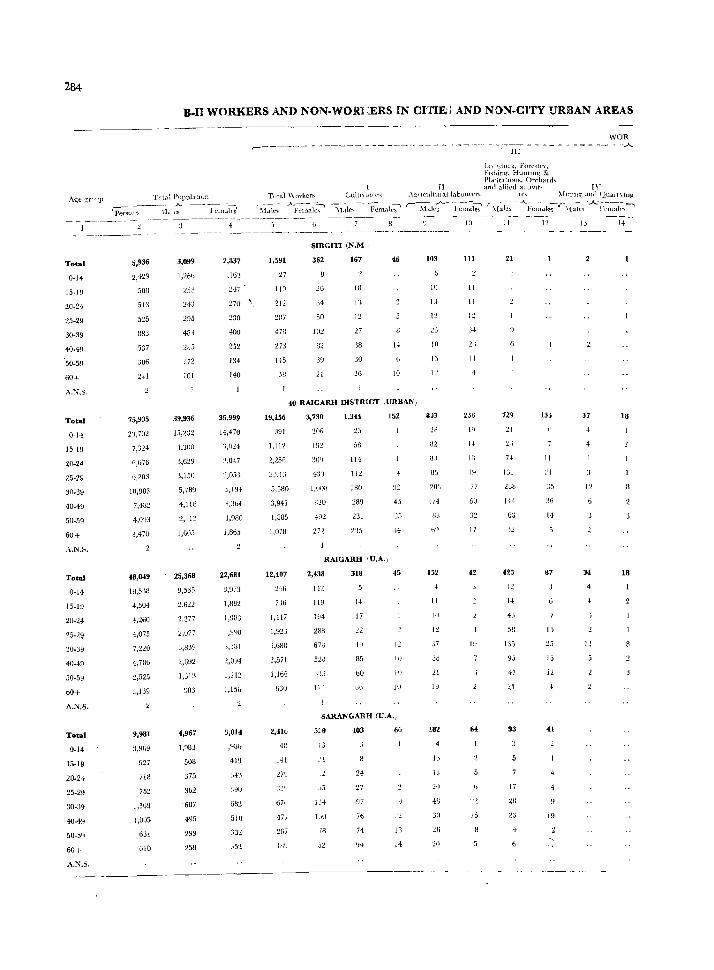
284
B-II WORKERS AND NON-WORI :.ERS IN ClTIE:; AND NON-CITY URBAN AREAS
T(tJ~ PopulatLvn
~rso~-~ --~1, -~-- -- hr~lili:i
WOR ,-----~------~-- - -- ----- ---- -_- ---- -'-lir--------------..A...
(,1\ ,~t{)ck, F(lrt'strY, Fl<;I,inq. HUnhn[! & P],dtatL0I1S. Orella! cJ<,
II and allied actJVlt- 1\" ,\gllcultUiallaboun:r;. )'Il:tlllll: .1Ild Quarnmg
r-- ~fdJe:--F~l:J~ SfuJ~--A._Pel-;;-.J~~(;-,la~<;--J...J-';~~;~
10 11 12 14 --------- ----- ------------~---- - -------- ----_-----_--_--_----_--_
Total
0·14
15-19
20-24
25-29
30-39
40.49
'50-59
60+
A.N.S.
Total
0-14
15-19
20-24
25-29
30-39
40-49
50.59
60+
A,N.S.
Total
0-14
15-19
20-24
25·29
30.39
50-59
60+
A.N,S.
Total
0·14
15-19
20-24
25-29
30-39
40-49
50-5"
60+
A,N.S,
5L5
883
537
306
241
75,935
2'),702
7,314
G,676
G,203
10,983
7,482
4,093
3,470
48,049
18,s:~n
4,504
4,260
4,075
7,220
1,786
2,525
2,139
9,981
:.J,969
927
718
752
1,369
1,005
631
Gl0
3,099
1,26h
:1.13
243
2!15
483
285
172
101
39,936
15,2:32
1.300
3.629
3.150
5,789
4,118
2,113
1,G05
25,368
9,565
2,622
2,277
3,839
2,692
1,31:1
9113
4,967
1,983
508
375
3bt
687
49.1
258
7,837
1,163
:2+i
270 \,
230
400
252
134
140
35,999
14,470
'l,024
:<,047
3,194-
J,:lb4
1,980
1,865
22,681
8,973
1,882
J ,~lIJJ
1,15b
5,014
:,GlIh
41~1
39U
68:!
,:IS:!
27
110
212
287
478
273
145
SIRGITI (N.M ,
362
26
~4
50
102
82
39
21
167
I:!
'1.7
')3
30
26
46
1+
10
40 RAiGARH DISTRICT ,URHAN)
19,156
391
1,112
2,25fi
5,580
3,941
1,885
1,078
12,407
7Jb
1,117
1,923
1,6l:lB
2,571
1,16G
630
2,Ub
4G
141
67l,
471
2G7
3,730
+3')
I,Ol)H
820
272
1,341
23
58
114
112
::!80
289
231
2'J5
RAIGARH 'U,A.)
2,438
It!
]19
288
67J
520
:32J
318
14
17
B5
bO
152
45
JS
:-14
45
12
10
10
SARANGARH (U.A.,
.'1
lH
Loll
18
24
27
97
76
74
')4
66
13
:4
103
10
12
25
11)
15
12
833
28
82
81
85
20:3
174
88
152
11
III
37
38
21
19
!82
lb
18
48
30
26
~Il
III
11
1+
12
23
II
235
14
In
19
77
60
j"
17
42
III
64
i5
21
729
21
1:;(
144
63
32
425
12
14
4:\
sa
135
47
93
11
:;5
:16
14
87
1\
25
15
12
19
37 18
I"
18
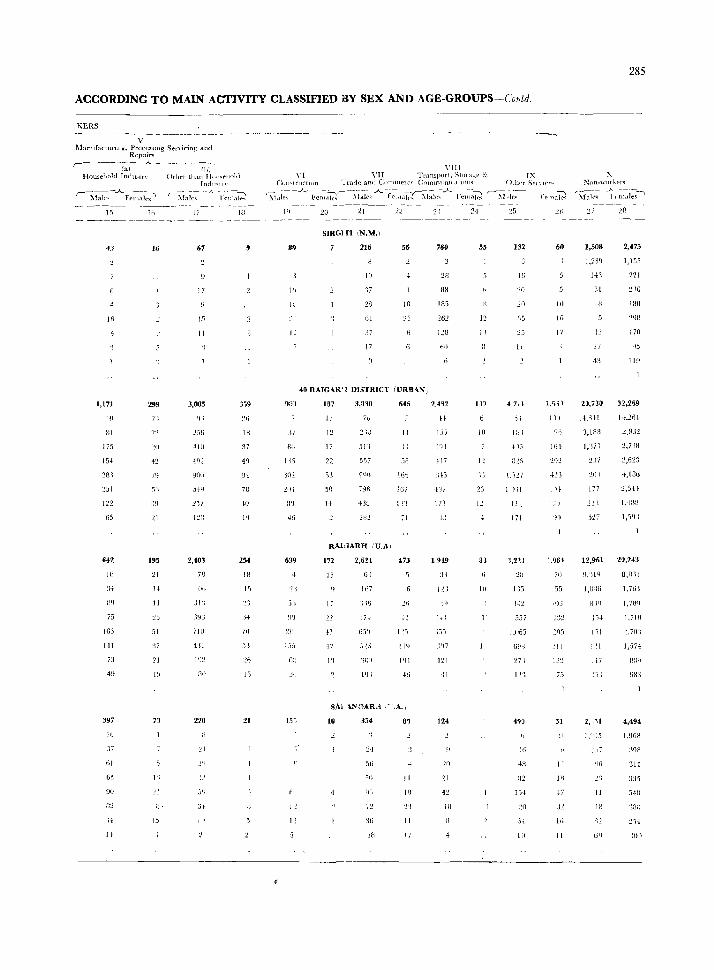
ACCORDING TO MAIN ACTIVITY CLASSIFIED BY SEX AND AGE-GROUPS~Collld.
KERS
v 1ianut1.,tnrmg. Processing Sel\-ic-in[!; ann
Repairs ,---------...A.... ________ _ (a) Ibi
Homehold Industn- Other th<ll} lI"m .. hoIJ
15
1,171
40
fll
175
15+
251
122
05
642
III
".4
119
75
163
HI
73
397
J7
61
90
II>
16
299
21
39
21
195
21
I~
II
2 I
13
1'1
~l
/I.
15
f nrlll~i I\"
17
67
Ii
15
II
3,005
lSI)
~11l
'217
2,403
78
Oil
710
411
220
:!I
31
[ I
lB
3~9
I ~
37
40
0"
73
1O
254
13
15
H
)1]
.n
Ii
21
- ---1
\'111 YI "II Transport. Slot a~f" & IX
COI1'tru('tl(lO r_~radc and C(llllillel['f' COlOtYlUnH .tll"ll" ()ther Set
'hl~J~~ -_A_ Fen~.l~~;-r:i~~--A--P~,:~~l~c_: ..A-I,:~;;~~ r--~-i,-I~;-
80
[ ~
37
4G
639
~ (] : I
f,::
I,
20 ,1
SIRGlfI IN.M.)
216
III
'17
28
61
17
,56
10
40 RAIGAR'! DISTRICT (URll\"j
187
17
I~
17
50
7i)
5[ I
~N()
796
436
RAluARH rU.AI
172
[;
-17
1'1
2,6H
G I
1(37
'Ill;
~ 7-+
(jS'j
.1 ~ (-i
Sf,
36
[[
38
1 ti';)
In7
In
71
473
125
[1
IR
II
'7
760
88
lR5
262
128
<i0
2.H2
H
LJJ
J'H
Hi
-t'}i
171
fJ
1,919
33
I2J
i3S
1')7
I'll
12~
21
42
55
12
I:
10
I~
25
II
8)
111
I'
25
132
16
20
4,711
II
1."}27
I III
171
1.2!1
55i
1,065
6~18
1')'1
]6
'12
54
1:1
60
!O
1['
17
1.51 )
j))
'J)
:.961
71)
55
51
I'
IB
47
32
Iii
II
285
~ 1\'nn-worl~t"r"
'\W;;-_;l'-~:i:S -,
1,508 2,475
1.239 ],1~5
14'1
1~
:n
221
IBO
17(l
05
43 lEI
2J,730 32,269
['1,3f!
3,IR3
1,171
237
527
1-1.264
2,£\32
~,738
:!,623
4,186
1,4!l8
1,'lQ I
12,961 20,243
9,'HQ
I,8 i H:;
15-l
[')1
1'1
17
1, '}5
1)(,
2 '~
[1
'12
8,Rl1
1,iliJ
1,78<1
1.)11l
~,7Wl
1,574
4,494
1,968
:198
311
33\
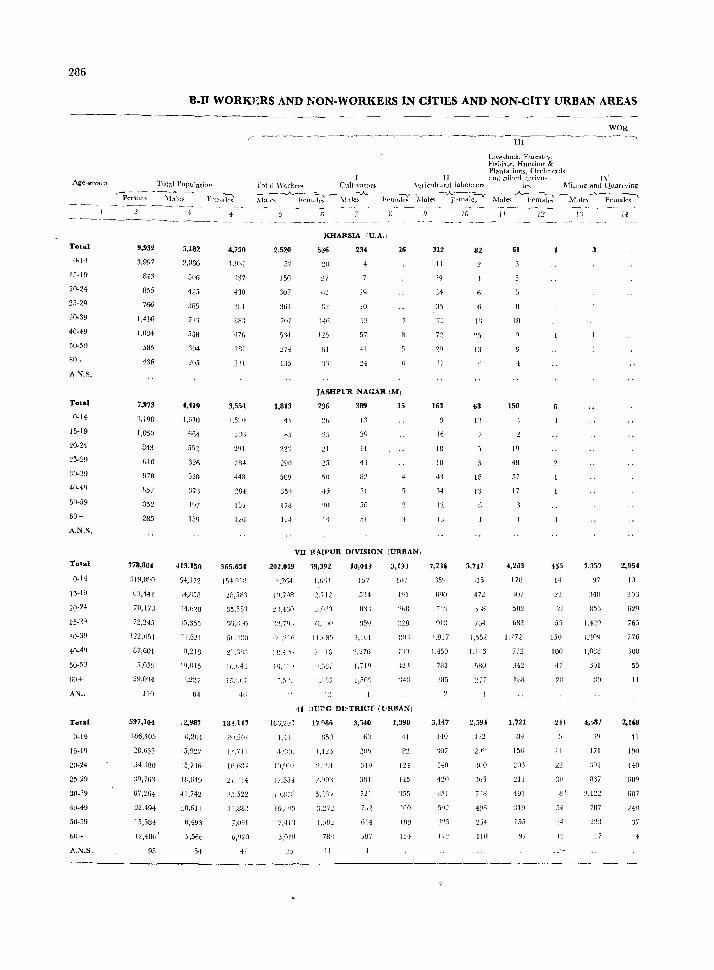
286
Total
1).1+
15·19
20·24
30-39
40·49
50·59
60+
A.N.S.
Total
0·14
15·19
20·24
30.39
40·44
50·59
60+
A.N.S.
Total
0·14
15.19
20.24
25.24
30·:iQ
40-4t)
61)+
A 'I ..
'rotal
0·14
15·IQ
~0·24
25·29
30.39
50·5Y
00+
A.N.S.
9,932
3,997
813
855
766
1,416
1.034
5fJ5
430
7,973
3,]98
1,050
34'1
610
978
557
352
285
778,804
::;19,090
63,441
70,17J
72,245
122,051
07,601
'15,(l5~
110
397,104
166,405
28.633
34,380
39,761
67,264
32,494
15,584
1'2,481; ,
95
B.Il WORKERS AND NON·WORKERS IN CIT1ES AND NON-CITY URBAN AREAS
5,182
506
425
385
7'n
4,419
1.61B
664
530
19i
15q
413,150
04,172
14,1158
;4,620
~5,355
:1.621
10,213
'q,OI5
1,227
64
02,987
15,7':1{;
IB,619
41,742
~O,611
B,493
5,566
54
WOR r ------------~--------------~----ll-I-------------,
4,750
1/)')1
'137
430
~1Il1
281
2'H
3,55~
1,5(111
:33G
284
12G
365,654
15!.9In
2f.,581
35,5:;'1
.51.'LU
](,,()41
1",'.(,;
46
18!,117
1:',711
IHHH
'21,) 14
2'),522
1 t .gB:~
7,091
41
Live~tock, FOlestl'V, _hslli:ng, HUllting & Plantations,Orchnrad"
II and ,<lIlted ,1.diYlt~ TV rot 11 Worker~ CulUvators .\~"I'i('ulturcll labourers if"" Minin!r and (..!uarrving
~j~I~-At:~ll,~J;i C--;I~e~A--- h~n~~ ~~Ie-:; -~f"rnd1;:-V-~I~e~ _A_-l'-;m--:~ r- :vrJl~~.A_-~;:~k;-'
2,520
51
150
307
11"11
71)7
135
1,813
115
22']
509
35~~
178
124-
J{HARS1A (U.A.,
536
'27
G2
HG
1'."!5
234
57
·fl
26
JASHPlTR NAGAR (MJ
236
21
~o
14
389 15
H
71
5(i
fll
VII RAtPUR DIVISION (URRAN,
202,019
1,2G4
j(l,jQR
~ ),460
)Ij,r'
1 i.551
7,4 iJ
3,019
19,392 10,019 3,01
J,f)()J 157
~, 712 S'H 101
HTl ~)h!l
II., S:; 2,161 flO l
I G 2.276 7'11)
1,719
1,.10'1
13
-ll '}UP-G DI~TRICT ({·RRAN;
7Htl
II
3,140
(i()
319
301
614
SUi
1,390
41
124
145
JOO
IfJ~
IS,}
312
II
'19
014
13
29
17
163
16
1H
18
41
34
I:?
13
7,21S
'~S~)
7'19
IJI:i
1,017
1,450
731
3,147
uo
II~
10
82
lfl
13
68
I',
18
11
3,712
115
7f;4
1 ,55:~
I.H3
.1110
'277
2,.194
:;no
I][J
11
61
18
150
19
4B
57
17
4,2~3
173
bH2
732
342
188
1,721
8"
156
2t)3
211
491
319
1.15
~J7
J2
455
14
55
15(1
lOll
47
213
241
II
3::
54
I~
1'1
97
1:120
I,OBS
301
30
4,'>87
171
2,12~
7117
j 7
14
2,954
10
776
lOB
55
II
2,168
41
190
HO
G07
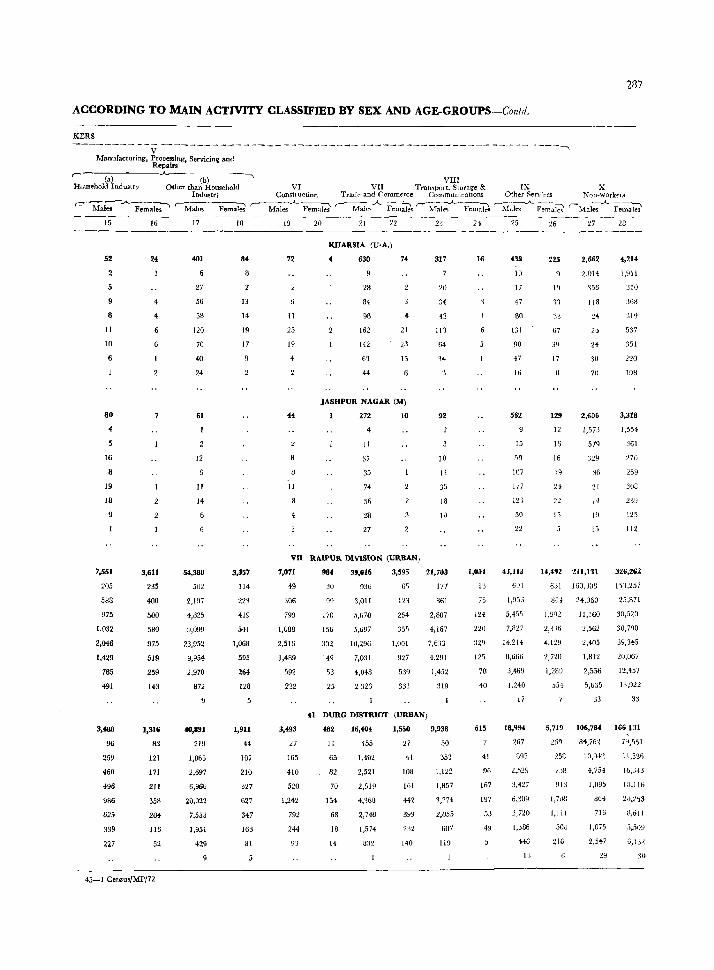
287
ACCORDING TO MAIN ACTIVITY CLASSIFIED BY SEX AND AGE-GROUPS-Contd.
KERS
----------~----------------------------------------------------~ Manufacturing, Processing, Servicing and
Repairs r----:-(a-)-----..A..---
C-b-) ----. VIII
Howehold Industry Other than Household VI VII Tran'iport, Storage & IX X Industry Const! uction Trade and C:ommerce CommunicatIOns Other Services Non-workets
r::' Males :.A. Fema~-' r-Male<; Fema"ki ~-;}~ FemaW (- Mal~..)....F:;;'~r-~fui~...A..Fe;;;-~r-Males ....A..Fe~~ r-Ma~.A.--Fe~1ei -----
15
52
II
IO
80
4
16
19
IS
9
7,551
205
588
975
1,032
2,046
1,429
785
491
3,_
96
259
460
496
986
625
339
227
16
24
7
3,611
235
400
500
580
975
519
259
143
1,316
83
121
171
211
358
204
116
52
45-1 Censu,/MP/72
17
401
27
56
58
120
70
40
24
61
12
11
14
54,380
502
2,197
4,825
~,099
23,952
9,954
2,970
872
40,891
219
1,065
2,697
6,966
20,022
7,533
1,951
429
18
84
8
13
14
19
17
3,357
114
223
419
541
1,068
595
264
128
1,911
44
107
210
327
627
347
163
81
19
72
II
25
19
II
20 21 22
KHARSIA (U·A.)
630
28
84
98
162
142
63
44
21
23
15
JASHPUR NAGAR CM)
272
II
37
35
74
56
28
27
10
Vll RAIPUR DIVISION (URBAN)
7,071
49
gOB
799
1,088
2,516
1,489
592
232
984
30
99
170
156
302
149
53
25
3',016
936
3,011
.1,670
5,697
10,296
7,031
4,048
2326
3,595
GI
254
355
1,001
927
539
331
23
317
:H
42
113
64
3,
92
10
14
35
18
10
21,703
177
Hoi
2,807
4,167
7,633
4,291
1,452
319
41 DURG DISTRICT (URBAN)
3,493
27
165
410
520
1,242
792
2*4
482
11
65
82
70
154
68
18
14
16,404
455
1,402
2,521
2,519
4,%0
2,740
1,574
S:12
1,550
27
41
108
151
442
399
2:;2
140
9,938
50
353
1,122
1,857
3,774
2,055
n07
119
24
16
1,001
13
75
124
220
329
125
78
40
615
41
96
167
1~7
53
49
25
438
III
17
47
80
131
90
47
I"
562
15
59
1117
177
123
50
22
4J,IU
6,jf
1,95;
5,455
7,827
14,214
8,666
3,469
1.210
17
3,427
6,309
3J20
I,JB6
4-16
13
26
225
19
31
33
67
39
17
129
12
16
16
19
24
22
15
27
2,662
2.014
';,16
118
20
H
30
7()
2,606
1,573
579
329
~6
21
H
19
35
28
4,214
1,911
310
363
:119
537
351
220
3,318
1,554
:161
270
259
308
239
125
112
U,49l 211,131 326,262
,iSI 160, Jas 1)1,257
801 24.060 25,871
1,9Q2 11,160 30,520
2,3)6 2,562 30,7,)0
~,129 2,~05 39,3~5
2,nO 1,812 20,067
1,2H9 2,556 12,457
55-1 5,635 13,922
33 33
5,719 106,784 166131
269
~58
7:m
913
I,Ml
1,111
50J
216
S~,762
IO,~-l2
4,75-1
1,095
864
716
1,075
2,547
74.;J')1
11,5B6
Ib,:'W~
111,116
2d,1'}3
[\,611
6,1J~
30
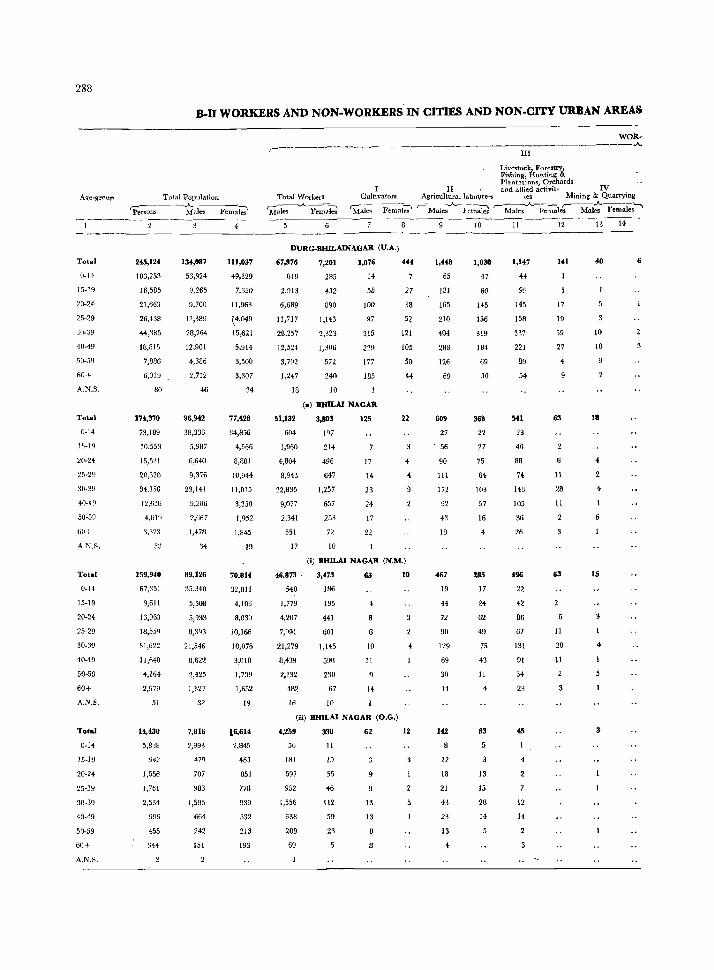
288
B-II WORKERS AND NON-WORKERS' IN CITIES AND NON-CITY URBAN AREAS
Tolal Population
~rgons---~ales Femai;i - ----- .. ---------
Total
0-14
15-19
20-24
25-29
30-39
40-49
50-59
60+
A.N.S.
Total
0-14
IS-I')
20-24
25-29
:1O-39
40-49
50-59
60+
A.N.S.
Total
0-14
15-19
20-24
25-29
30-39
40-49
50-59
60+
A.N.S.
Total
0-14
15-19
20-24
25-29
30-39
40-49
50-59
60+
A.N.S.
245,124
103,253
16,585
21,663
26,438
44,385
18,815
7,886
6,019
80
174,3'70
73,189
10,553
15,521
20,320
34.IS6
12,636
4,619
3.323
5:1
159,940
67,351
9,611
13,963
IS,55g
31,622
11,640
4,164
2,979
51
14,430
5,818
942
1,558
1,761
2,534
996
455
344
134,087
53,924
9,265
9,700
12,389
28,764
12,901
4,386
2,712
46
96,942
38,333
5,987
6,640
9,376
23,141
9,286
2,667
1,478
34
89,126
:{5,340
5,508
5,933
8,393
21,545
8,622
2,425
1,327
32
7,816
2,993
479
707
983
1,595
664
242
151
111,037
49,329
7,320
11,963
~4,049
15,621
5,914
3,500
3,307
34
",428
34,856
4,566
8,881
10,944
11,015
3,350
1,952
1,845
19
70,814
32,011
4,103
8,030
10,166
10,076
3,018
1,739
1,652
19
16,614
2,845
463
851
773
939
332
213
193
r----III
Livestock, ForeSIl"h Fil'.hing, Hunting & Plantations, Orchards
II and allied activit- IV
wolt· ..A.
Total Workers --------..J-.----
Cultivators Agricultural ]abo\lreNi (cs Mining & Quarrying
'Males Femaki 'Males Fem~l~ r-~;A~~ r-r:w;;.A.FeT~~~~ ~e~ales~
DURG_BUILAINAGAR (U.A.)
67,976
B19
2,913
6,689
11,717
28,257
12,524
3,792
1,247
18
51,132
604
1,960
4,804
8,943
22,835
9,077
2,341
551
17
7,201
285
432
390
1.143
2,323
1,306
572
240
10
1,076
14
58
100
97
215
229
177
185
Ca) BUlLA! ~AGAR
3,803
197
214
496
647
1,257
657
253
n 10
125
17
14
23
24
17
22
444
27
38
5?
121
105
50
44
22
4
4
(I) BUILAI ~AGAR (N.M.)
46,873
548
1,779
4,207
7,991
21,279
8,439
2,132
482
16
3,473
186
195
441
601
1,145
5gB
230
67
10
63
4
10
II
14
(ii) BIDLAI ~AGAR (O_G.)
10
4,259 330 62 12
56
181
597
952
1,556
638
209
69
11
19
55
46
112
59
23
13
13
1,448
65
121
165
210
404
288
126
69
609
27
• 56
90
111
172
92
43
18
467
19
44
72
90
129
69
30
14
142
12
18
21
43
23
13
10
1,038
47
80
145
156
319
184
69
30
368
22
27
75
64
103
57
16
:!115
17
24
62
49
75
43
11
4
83
13
15
28
11
II
1,147
44
99
145
158
337
221
89
54
541
23
46
88
74
143
105
35
26
496
22
42
86
67
131
91
34
2~
45
12
H
2
3
12
141
17
19
59
27
4
63
Jl
28
11
63
Jl
28
11
13
40
10
10
18
4
6
15
4
14
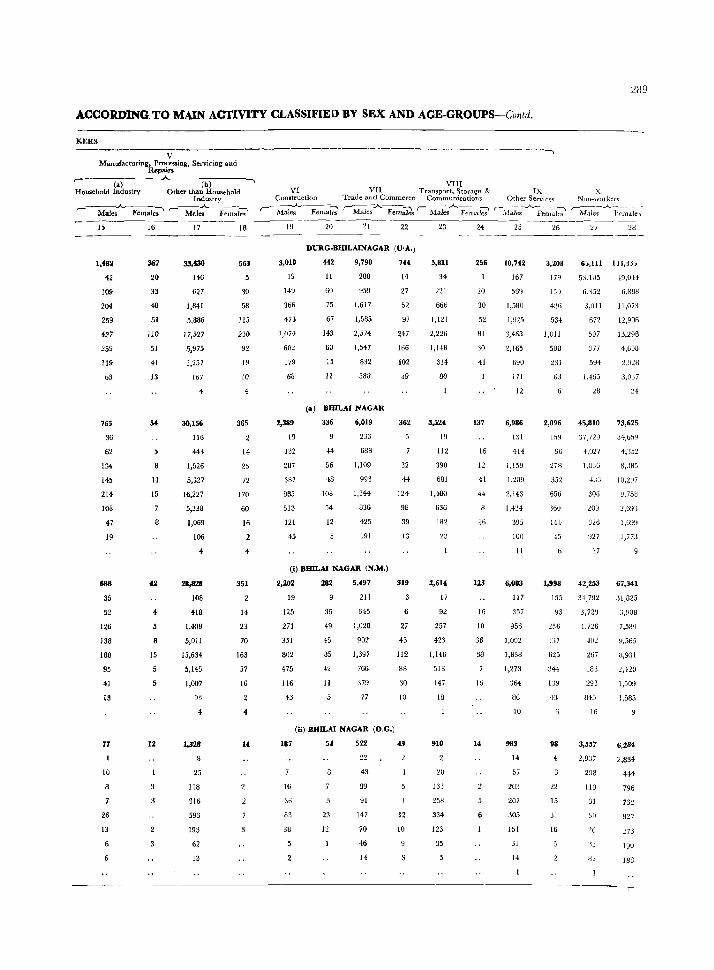
ACCORDING TO MAIN ACTIVITY CLASSIFIED BY SEX AND AGE-GROUPS-Contd.
KERS
V Manufacturing, Procrssing, Servicing and
R,.epai1'!J.
r-------(.-)-------.~·------(-b-)-------.
Household Industry Other than Household Industry
'--Males..A..~~ '-~:-----r;~;;, 15 16 17 18
-------------------------~
VIII VI VII Transport, Storage & IX
Construction Trade and Commerce Communications Other Servlr:r'.~
r-- Male-:- Fernalei '-Ma]~.A..~""iis r-r:l--;i~·A.-F~~l:1~ r-:'\faJes-.A.~~~ 19 20 21 22 23 24 25 26
-----------------------------------------
1,482
42
109
204
259
427
259
119
63
145
214
108
47
19
688
35
52
126
138
188
95
41
13
77
10
26
13
6
361
20
33
48
51
110
51
41
13
11
15
4
8
15
12
33,iJO
146
627
1,841
5,336
17,527
5,975
1,257
167
4
30,156
116
443
1,526
5,327
16,227
5,338
1,069
106
4
28,828
108
418
1,408
5,011
15,634
5,145
1,007
93
4
1,328
25
118
316
593
193
62
13
563
30
53
115
230
92
19
10
365
14
25
72
170
60
16
4
351
14
23
70
163
57
16
4
14
DURG·BHlLAINAGAR (U·A.)
3,010
19
149
366
473
J,074
682
179
63
7,339
19
132
287
337
385
513
121
45
442
11
60
75
67
143
60
15
11
9,790
283
959
1,617
1,535
2,574
1,547
832
388
(aJ BHlLAI NAGAR
336
H
56
.43
lOB
54
12
6,019
233
68B
1,109
993
1,544
836
425
191
(i) BlliLAl NAGAR (N.M.)
2,202
19
125
271
351
802
475
116
43
187
16
30
83
33
282
36
49
45
85
42
11
5,497
211
645
1,020
902
1,397
766
379
77
(Ii) BHlLAl NAGAR (O.G.)
54
23
12
522
22
43
89
91
147
70
46
14
744
14
27
52
97
247
166
102
39
362
32
44
124
98
39
10
319
27
43
112
88
30
10
43
12
10
5,811
34
221
666
1,1~1
2,226
1,148
314
80
3,524
19
112
390
631
1,480
636
182
23
2,614
17
92
257
423
1,146
513
147
18
910
20
133
258
334
123
35
256
:W
30
52
81
:10
41
137
16
12
41
44
16
123
16
10
36
38
16
14
6
10,742
167
SSg
1,580
1,925
3,463
2,165
690
171
12
6,986
I:H
414
1,159
1,209
2,143
LJ+~4
395
100
11
6,003
117
357
956
1,002
1,838
1,273
'164
116
10
983
14
57
203
207
305
151
31
14
3,208
179
151)
426
534
1,011
5aa
231
83
2,096
159
96
278
352
656
'16U
14-1
45
1,998
155
93
337
625
344
139
41
98
15
31
16
2H9
X Non-wolker<;
r-----A..~--
.i\Ialei F('male~
'27
6;,111 1)),H,
53,1l)5
6,'332
3,011
672
507
377
594
1,46j
28
45,810
37,729
4,Oa
1,336
433
306
927
17
42,253
34,792
3,72~
1,726
40~
267
183
293
845
16
3,557
2,937
293
110
31
gq
'tJ
'19,044
6,838
11,073
1!,906
13,298
4,60B
:!,~J:!8
3,007
2·1
73,625
34,65~J
8,385
to,l!)7
U,75B
2,69')
1,099
1,773
67,341
31,825
7,589
Y,565
~,931
2,420
1,509
1,585
6,284
2,834
-1-14
796
732
827
273
188
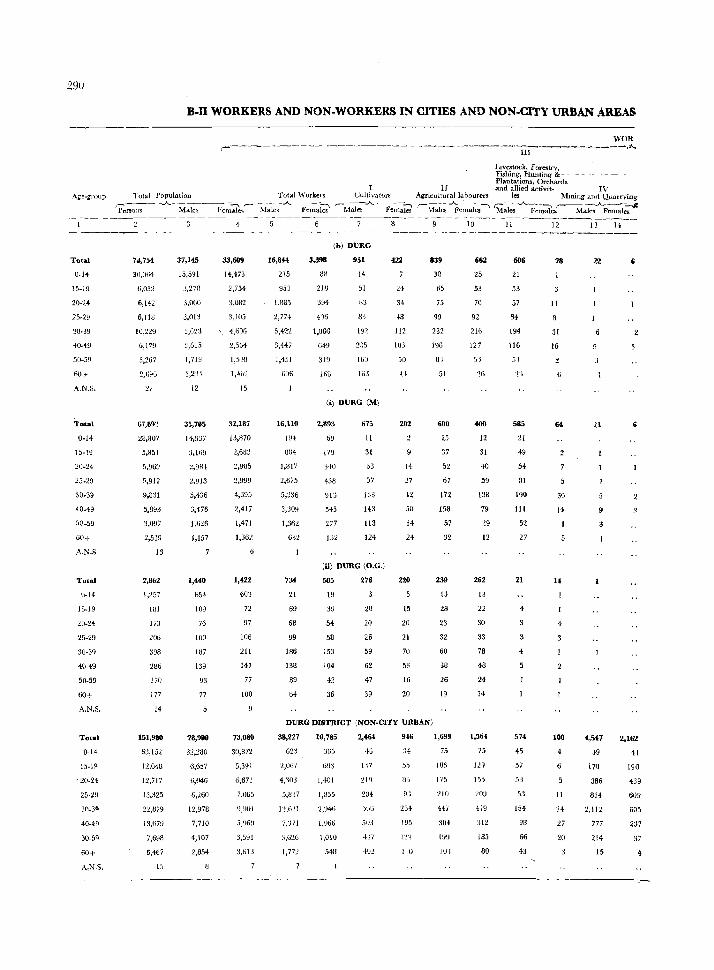
29u
B.I1 WORKERS AND NON·WORK.ERS IN CITIES AND NON.CITY URBAN AREAS
------------------------------------------------.------------------------
Ajje-gmup
Total
O-H
15-19
20-2~
25-29
30-39
40-49
50-59
60+
A.N.S.
Total
O-H
15-19
20-24
25.29
30·39
40.49
50.59
60+
A.N.S
Total
U-14
15-19
40-49
50-59
60+
A.N.S.
Total
0-14
15-1~
-20-24
25-29
60+
A..N.S.
WOR r-----------------------------------·ln-------~--.A.
Livestock, For~tfY, Fishing, Hunting &Plantaticns. Orchards
I II and alJied activit- IV Total Population Total ''''orlers Cultivators Agricultural la'hourer5 ies MlDing and QuarrYing
(hrsons ~ -..A.-Md.te':>-~~ik .. (~M:-a~~--A.. Femaki (Males AFe~lei r- \1ale~ ~e~al;~ 'M;I~s-..A..p~~l:ks'- Males ..A.Fema'e~
7J,754
30,064
6,032
6,142
6,118
10,229
6,179
3,267
2);90
:0
G7>89~
28,807
5,851
5,969
0,912
9,831
5,893
3,097
2,519
13
2,862
1,257
J!ll
173
206
398
286
170
177
14
151,980
63,152
12,Q43
12,717
13,325
22,879
13.679
7,698
6,467
15
37,145
15,591
3,278
3,060
3,013
3,615
1,719
1,23+
12
3,169
l,9tH
i,913
5,436
3,476
1,626
1,157
1,440
654
109
76
100
187
139
93
77
78,900
32,280
6,657
6,046
6,260
12,978
7,710
4,107
2,854
33,609
H,473
2,754
3,082
3,105
'- 4,60G
2,564
1,5lO
1 .. ~b2
15
32,187
13,'370
2,985
4,395
2,417
1,471
1,362
1,422
603
72
97
106
211
147
77
100
73,080
30,872
5,'391
6,671
7,01i5
Y,9Dl
5,969
3,591
3,6lJ
16,844
215
953
1,885
2,7H
5,422
3,447
1,451
G~6
16,110
IV4
8B4
1,817
2,675
5,236
3,309
1,362
632
7st
21
69
68
99
186
138
89
64
(b) DURG
3,398
83
218
394
416
1,06G
649
319
16B
951
14
51
63
83
192
2.)5
161)
lo,j
(il DURG (M)
2,393
tiU
340
438
9lJ
545
277
1:32
675
11
31
63
57
133
143
113
124
(il) DURG (O.G,)
585
19
39
54
58
153
104
42
36
276
20
20
26
59
62
47
39
i22
24
34
48
112
103
50
H
202
14
'27
42
50
34
24
220
15
20
21
70
53
16
20
839
33
65
75
qg
232
196
81
51
tiOO
25
37
52
67
172
158
57
32
239
13
28
23
32
60
38
26
19
DURG DISTRICT (NON·CITY URBAN)
38,227
623
2,OG7
4,'J03
5,1337
12,021
7,371
3,6~6
1,772
10,785
36,)
693
1,401
I,B5!:;
2/)46
{,!..loG
1,010
54G
2,4£4
46
147
219
204
sao
5lU
4.11
402
916
34
55
9.l
234
1!J5
IT;
1111
1,699
75
186
175
210
H7
304
Ej~J
101
662
25
53
70
92
216
127
51
26
12
31
40
59
138
79
29
12
262
13
22
30
33
78
48
24
14
1,564
75
In
209
419
312
185
80
606
21
53
57
84
194
116
5J
2lJ
585
21
49
54
81
190
111
52
27
21
4
574
45
57
.08
5:1
154
98
66
43
78
II
31
16
64
30
14
4
100
4
II
24
27
20
22
4,5H
39
170
386
834
2,112
777
214
15
6
6
2,162
41
190
439
609
605
2:;7
37
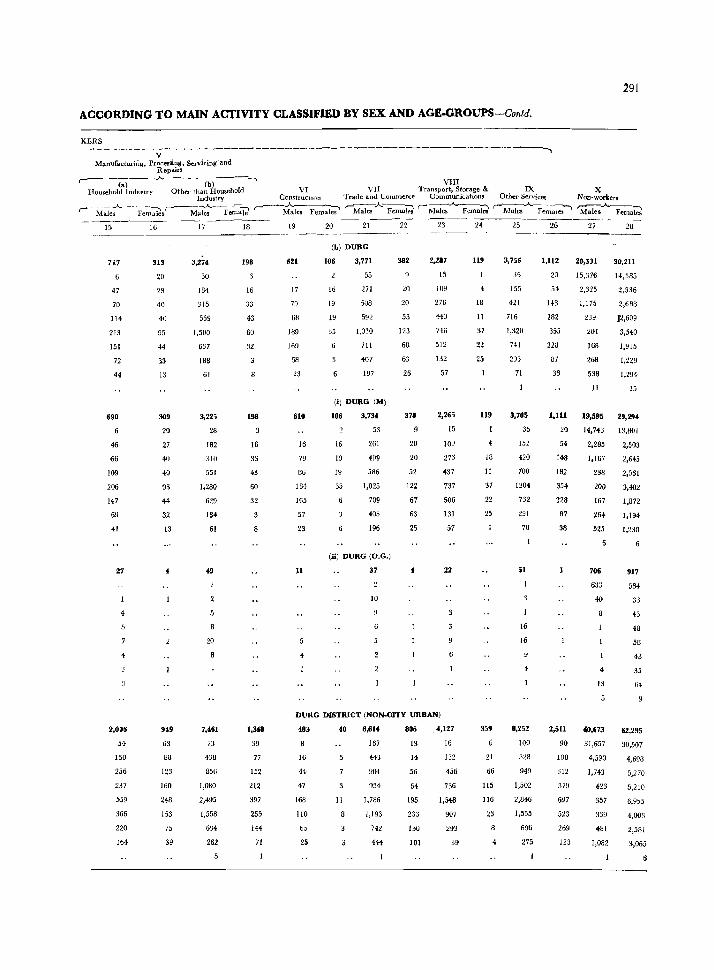
291
ACCORDING TO MAIN ACTIVITY CLASSIFIED BY SEX AND AGE.GROUPS-Cortld.
KERS ---_-----V-----------------------------------------------., Manufacturing, Processing, Servicing-and
. Repair.s .-___ (_._) ___ .A. ---- (t;;-----. VIII
Household Industry Oth~r than Household VI VII Tran~portJ Sforage & IX X Industry ConstructIOn Trade auJ C:OtulOer.;e Communications Other Services Non-workers
,- -Male~ Fe~~s'-----M~~li r---~les Females '-Maks.A-~lr) ,-~..A..--Fema~ r:Males Female~~ 'Males~~ 15
47
70
114
213
151
72
44
690
46
66
109
206
147
69
41
27
2,006
54
150
256
237
559
366
220
104
16
313
20
29
40
40
95
44
a3
13
309
20
27
40
40
93
44
32
13
4
949
63
83
123
160
248
153
75
39
17
3,274
30
184
315
559
1,300
637
188
61
3,225
28
182
310
551
1,280
629
184
61
49
20
7,461
73
438
856
1,080
2,495
1,558
W4
262
18
198
16
33
43
60
:12
8
198
16
33
43
60
32
1,348
39
77
152
212
397
255
144
71
19
621
17
79
68
189
1W
58
23
610
16
79
Ub
184
165
57
23
11
20 21
(b) DURG
106
16
19
19
35
3,771
55
271
508
592
1,030
711
407
197
(I) DUllG (M)
106
16
19
19
35
3,734
33
261
499
586
1,025
709
405
196
(Ii) DURG (O.G.)
37
IU
22
382
:w 20
53
123
68
63
26
378
20
20
52
122
67
63
25
23
2,287
15
109
276
440
HI)
512
132
57
2,265
15
109
273
437
737
506
131
57
22
DURG DISTRICT (NON-CITY URBAN)
483 40 6,614 806 4,127
8
16
44
47
168
110
b5
25
11
167
443
904
9:14
1,786
1,193
7i2
444
13
14
56
64
195
233
130
101
16
132
456
736
1,~
907
293
39
U9
18
11
37
U
25
119
18
11
37
22
25
359
6
21
66
115
116
23
..
25
3,751;
35
155
421
716
1,320
7<1
2)5
71
3,705
35
152
420
700
1304
732
2~1
70
51
16
16
4
8,252
100
328
949
1,502
2,046
1,555
696
275
26
1,112
20
51
US
182
355
2lB
87
38
1,111
20
54
143
182
354
228
A7
38
2,511
27
20,3Jl
15,:176
2,:315
1,175
239
201
168
268
538
28
30,211
14,385
2,536
2,683
)2,609
3,540
1,915
1,229
1,294
11 15
19,595 29,294
14,74:) 13,801
2,285
1,167
238
200
167
264-
525
706
2,503
2,645
2,561
3,482
1,872
1,194
1,230
917
633 584
40 33
43
48
50
43
35
13 64
40,673 62,295
90 31,657 30,507
100 4,590 4,Li98
312 1,743 5,270
:l79 423 5,210
697
523
269
133
357
339
481
1,082
6,955
4,003
2,531
3,065
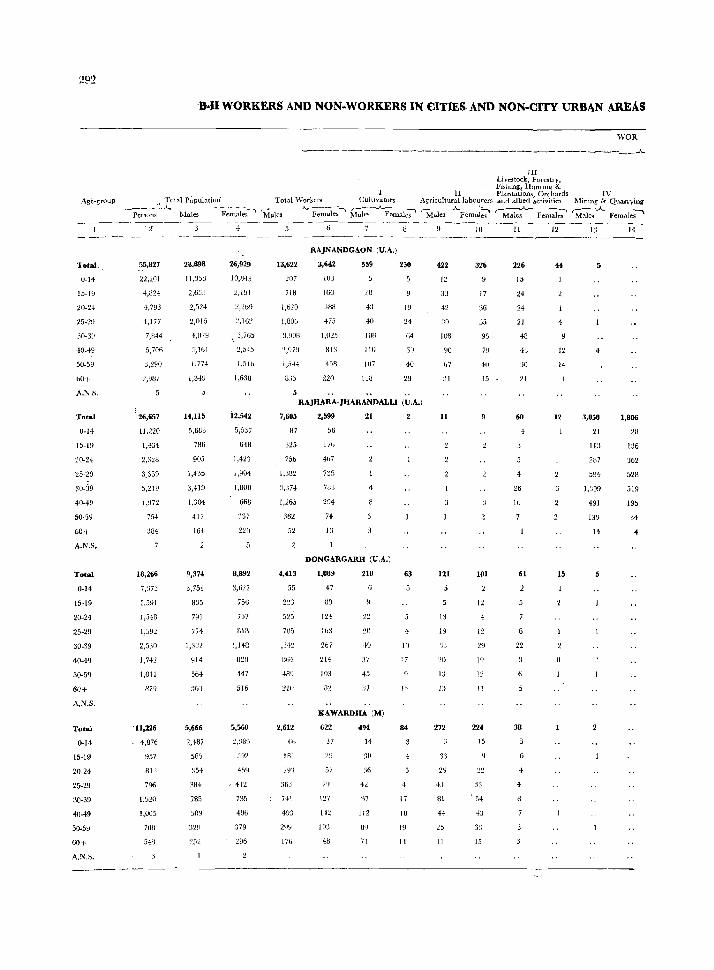
29Z
Total, ,
0-14
15-19
20-24
25-29
30-39
40-49
50-59
60+
A_]\.~.
Total
0-14
15-1!)
~O-24
25-19
30-39
40-49
50·5~
60+
A.N.S.
Total
0-14
15·19
20-24
25-29
30-39
40-49
50-59
60+
A.N.S.
Toia}
0-14
15-19
20-24
25-29
30-39
40-49
60+
A.N.S.
·0..11 WORKERS AND NON.WORKERS IN CITIES AND NON·CITY URBAN AREAS
WOR
~~~.- --~ -------------------____________ ...A..
HI Livt'stock, Forestry, Fishing, H1LOtmg &
I II Plantations, 0(( hards IV Total P~pu1atiuri Total '''':orkers Cultivators Agricultural labourers and allIed activities
~Pe;:;o~s~.A.-l\Ii~~- -F-;~~' 'M~e-; - -~'-~l Ma~-.A.~malc-;-' ~~ks··..A..Fe~~~ r-Ma1e-:-- Fcn~~ Mining & Quarrying
'Malc'lJ...A... l;-;maJes~
55,827
22,401
4,U24
4,793
4,177
7,1)44
5,706
3,290
2,!!U7
26,657
11.220
1,434
2,3:.w
3.339
5,219
1,972
754
384
18,266
7.:>73
I,S91
1,548
1,592
2,530
1,742
1,011
879
11,226
4,876
957
813
796
15'.W
I,OU5
70S
54H
28,898
J 1,3JU
2,6:3:3
2,524
2,015
4,[)7~j
:J,lbl
1,77-1
1,:H:9
14,115
,\,683
786
900
1,43;
3,419
1,304
417
164
9,374
:1,751
835
791
774
1,31)2
914
56-1
:.H:/:I
5,666
2,-187
565
:354
384
7115
SOY
::2!1
26,929
10,IH3
2,1~1
:!,IG~
\, 3,765
:!,545
1,51b
1,638
i2,542
5,537
648
1,4~)
1,~04
I,BOO
668
337
2~0
8,892
3,G22
75G
757
310
1,14B
B~8
447
516
5,560
1.389
392
. 412
135
496
379
296
13,622
207
71B
1,6~0
1,80h
3,908
1,544
8J';'
S
RAjNANDGAON (U.A,)
3,642
103
160
lUll
475
1,m5
81:1
458
220
559
28
43
-10
IllH
11lJ
lll7
118
250
19
24
04
GU
40
29
RAJHARA-JHARANDALLI (U.A.)
7,605
87
ns 75b
1,3B2
J,J74
1,265
362
.52
4,413
55
525
705
1,;j4~
tl64
4WJ
2,612
66
181
HI
4~3
176
2,599
56
17b
467
7:;5
783
294
13
21
DONGARGARH (U.A.)
1,089
47
89
Ib3
2b7
lU3
81
210
2U
40
:17
45
:1]
KAWARDHA (M)
622
37
29
5)
7"
127
142
103
>18
494
14
42
Y7
112
63
If)
17
"1
84
>I
17
lB
19
14
£12
12
42
39
108
90
67
31
11
121
13
19
'J3
13
1:1
272
3')
29
43
HI
4+
25
II
10
326
17
35
95
40
15
101
12
4
12
29
1'1
12
II
224
15
:l3
54
>I:]
3:;
15
II
226
15
24
24
21
48
4J
30
21
60
26
10
61
22
5
38
4
4
12
12
14
12
15
1~
4
3,058
21
11:1
2H7
594
1,399
491
139
14
14
1,806
28
136
362
52B
519
195
34
4
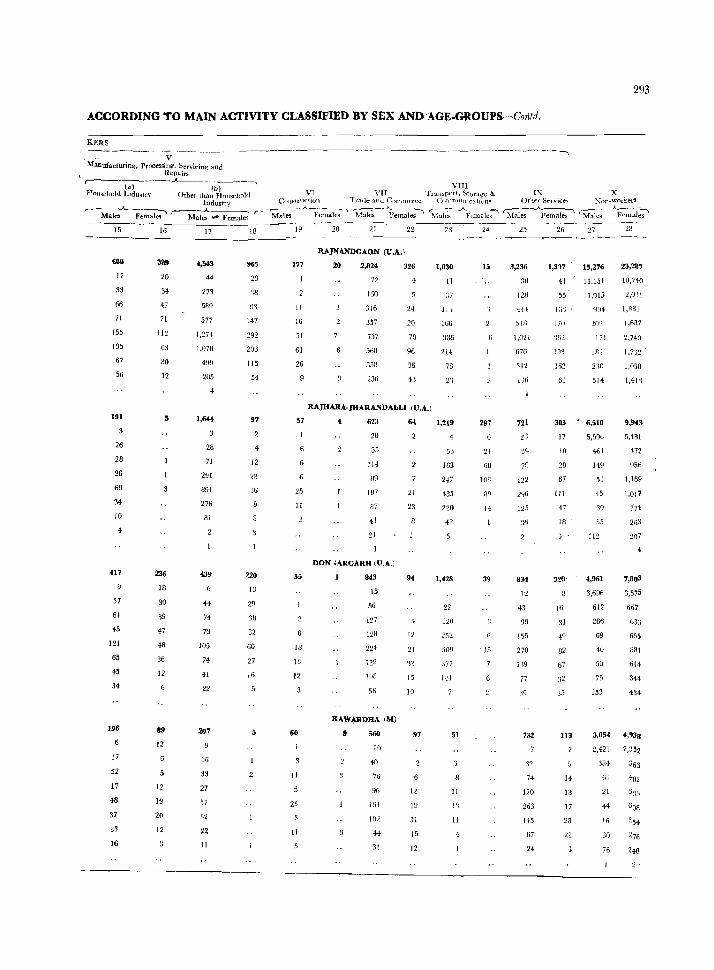
ACCORDING TO MAIN ACTIVITY CLASSIFmD BY SEX AND AGE·GROUPS-Cmitd.
KERS ---.------------~~------------------------------~- - -~
. . V Manufacturing, Processing'. Servicing' and
Repairs r-·----:-(a'"C)-
HOtl~ehold Intlustrv
15
tiOO
17
33
66
71
155
I ~15
67
56
191
26
28
26
60
34
10
4
417
37
61
45
121
65
45
34
196
17
22
17
48
37
33
16
16
3a9
20
34
47
71
112
63
30
12
5
236
18
30
39
47
48
36
12
89
12
12
19
20
12
17
4,M3
44
273
S8t}
577
1,274
1,078
499
205
4
1,644
28
71
291
891
276
81
439
44
74
73
105
74
41
22
207
16
33
27
57
32
22
11
18
965
23
38
91
147
292
203
115
54
97
4
12
22
36
220
13
29
38
32
60
27
16
19
177
11
16
51
61
26
57
25
II
55
IB
13
12
60
11
23
11
20 21 22
RAlNANDGAON (U.A.)
20 2,824
72
IGO
316
357
737
568
:J5fJ
236
326
4
24
20
78
96
06
43
RAJHARA-JHARANDALLI (U.A.)
4 623
28
35
114
89
187
87
41
21
DON lARGARH (V.A.)
843
15
56
127
128
224
56
KAWARDHA 1M)
560
20
40
76
96
151
102
44
31
6(
21
23
94
12
21
'~2
15
10
97
12
19
31
15
12
1,030
!l
37
III
1Gb
336
214
78
2"
1,219
53
163
2+7
485
220
42
1,428
22
120
252
509
377
141
51
II
11
11
24
15
297
21
60
106
sq
14
39
. 15
25
3,236
30
128
41f
51R
1,021
676
112
1J6
1:2
43
99
155
270
139
77
~,q
132
32
74
120
263
145
07
H
26
1,3a7
41
55 .
l'lll
'162
162
61
303
17
10
28
67
111
47
Iff
o·
320'
16
31
82
67
~12
35
113
14
18
17
28
21
27
15,276
11,151
1,!l15
Q04
171
182
210
514
6,510
5,596
461
149
53
45
39
55
112
4,961
3,696
612
266
69
40
51)
75
153
293
28
23,2117
10,740
2,011
1,881
1,687
2,740
1.7'12 '
1,058
1,418
9,943
5,481
472
956
1,169
1,017
374
7,s03
3,575
667
63~1
6.55
881
614
344
434
3,054 4,938
2,421 2.352
384
61
21
44
16
30
76
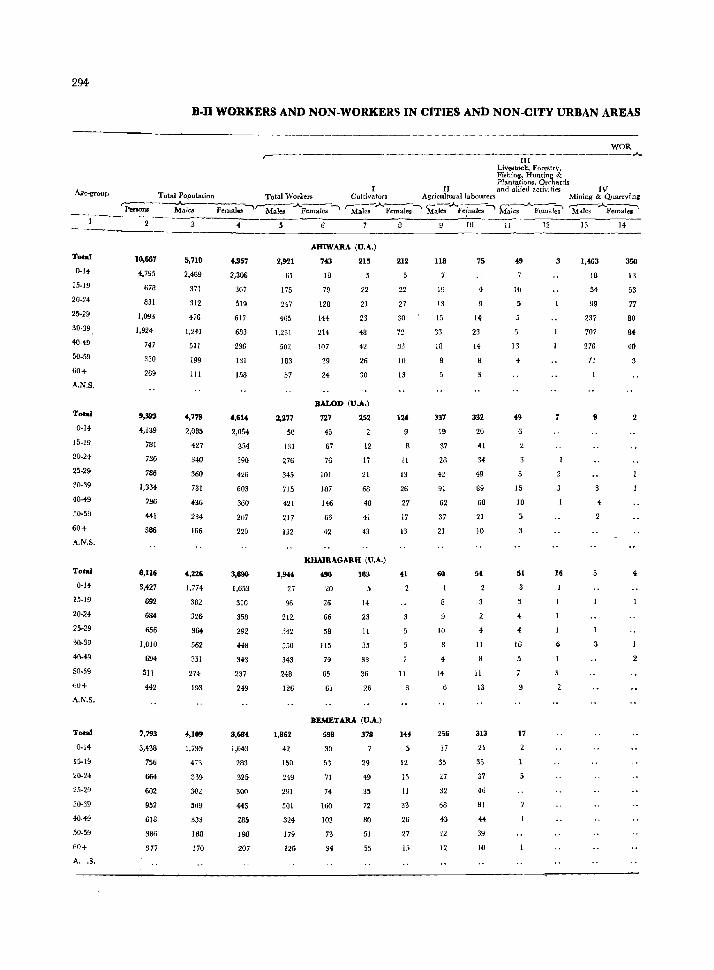
294
Total
(j..14
15-19
20-24
25-29
30-39
40-49
60+
A_N.S.
Total
0-14
15-19
20-24
25-29
30-39
40-49
50-59
60+
A.N.S.
Total
0-14
15-19
20-24
25-29
30·39
40-49
SO-59
A.N.S.
Total
0·]4
15-19
20-24
25-29
30-31)
40-49
50-59
60+
A .. S.
B-ll WORKERS AND NON-WORKERS IN CITIES A~ NON-CITY URBAN AREAS
WOR ---_____________ .A.
III Live!oock, Forestry, Fishing) Hunting & Plantations. Orchards
II and allied activjties IV Total Population Total Workers Cultivators Agricultural labourers Mining & Quarrying
,.----~ ,,--:-:-:--..A.;.---_, ~.A.--~~ ,----..A..o-'--""l ,-----.A...--_, r.---:;A..---. Persons MaIC8 Females Males Female, Males Females Males Fe~ales Males Females Males Females
10,667
4,795
618
831
1,093
1,924
747
330
269
9,393
4,139
781
730
786
1,334
796
4\1
SB6
8.U6
9.427
692
684
656
1,010
694
511
442
7.793
3,438
756
664
602
952
61B
386
317
5,710
2,489
371
312
416
1,241
511
199
111
',779
2,085
427
340
360
731
436
234
166
',226
1,774
382
326
364
562
351
274
193
4,109
1,795
473
339
302
509
333
la8
170
4
4,957
2,300
307
519
617
683
236
131
158
'.614
2,054
354
390
426
603
360
207
220
3.0!I0
1,653
310
358
292
448
343
237
249
3,684
1,643
283
325
300
443
285
198
207
5
2,921
61
175
247
465
1,231
502
183
57
2,277
50
131
276
345
715
421
217
122
1,944
27
96
212
342
550
343
248
126
1,862
42
150
249
291
501
324
179
126
AHIWARA (V.A.)
743
18
79
128
144
214
107
29
24
215
22
21
23
48
42
26
30
BALOD (V.A.)
727
45
67
76
101
187
146
63
42
252
12
17
21
68
48
41
43
KHAlRAGARH (U_A.)
496
20
26
66
58
115
79
65
61
183
14
23
11
35
33
36
26
BEMETARA (U.A.)
598
30
5:1
71
74
160
103
73
34
378
29
49
35
72
80
51
55
212
22
27
30
72
33
10
13
124
9
8
11
J:l
26
27
17
13
11
S
12
15
11
33
26
27
118
19
13
15
33
W
337
\9
37
28
42
91
62
37
21
60
10
8
4
14
256
17
35
27
32
68
43
22
12
10
75
4
14
23
1+
332
20
41
34
49
89
68
21
10
54
4
11
11
13
313
21
35
37
46
81
44
39
10
11
49
10
13
4
'9 6
15
10
51
4
4
16
11
12
7
16
13
1,463
18
54
99
237
707
276
71
9
14
350
13
53
77
80
84
40
2
4
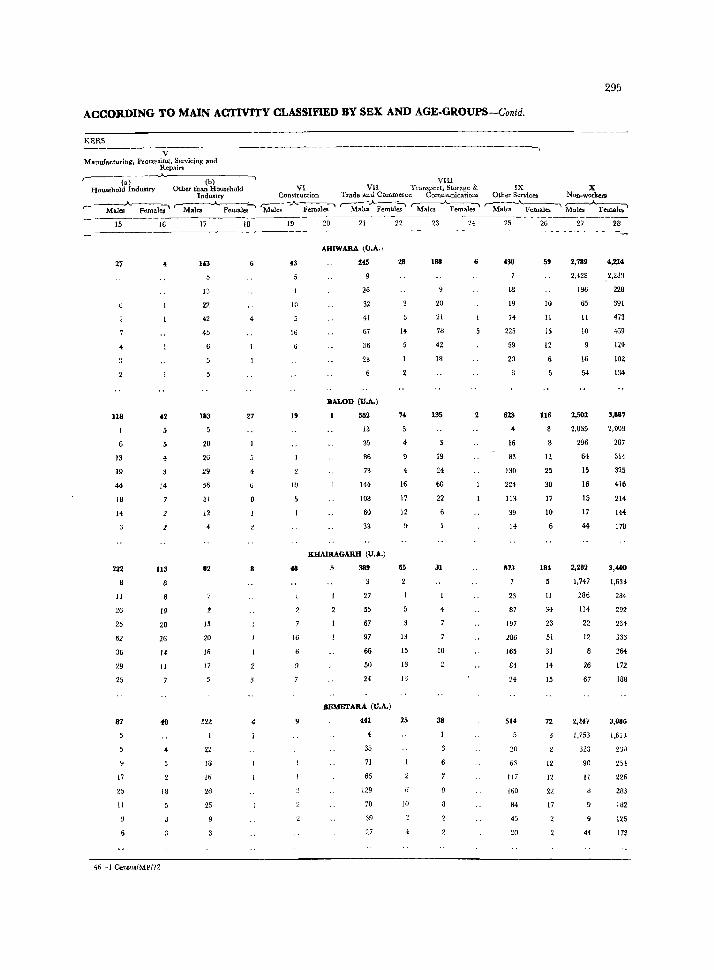
ACCORDING TO MAIN ACTIVITY CLASSIFIED BY SEX AND AGE·GROUPS-Contd.
KERS
V ManufachJring, hocessing, Servicing and
Repairs
295
r-----w--------"Household Industry
(b) VIII Other than Household Vl VII Transport, Storage & IX X
Industry Construction Trade and Commerce Communicatlons Other Services Non-workers
r- Mal~~? ~.A.~~ 'M~"'_ Femalo~ ~~~~ ~ 'M~ Maks"~ 15
27
118
13
19
44
18
)4
222
Il
26
25
62
36
29
25
87
17
25
11
16
42
4
14
113
19
20
26
14
11
40
18
46~1 Cen,u,/MP/72
17
143
13
22
42
45
183
:;
20
26
29
:;6
31
12
f
82
J3
20
18
17
!22
22
18
Iii
28
25
18
6
27
19
43
10
16
19
10
J6
20 21
AHlWARA (U.A.I
245
2<i
32
41
67
36
28
BALOD (U.A.)
552
13
35
86
73
144
108
60
33
KHAIRAGARH (V.A.)
389
27
5:;
67
97
66
50
24
BEMETARA (V.A.)
441
35
71
66
129
70
39
27
28
14
4
16
17
12
9
65
13
I:;
13
13
25
JO
23
188
20
21
78
42
18
155
19
24
60
22
31
4
10
38
24 25
18
19
74
225
59
20
623
+ 16
83
130
224
113
39
14
873
23
87
197
286
165
84
24
514
20
63
tt7
160
84
45
20
26
59
10
11
15
12
6
lI6
12
25
3D
17
10
18t
II
34
23
51
31
14
15
72
12
12
22
17
27
2.789
196
65
11
10
16
28
4,214
228
391
473
4G9
1',9
102
54 134
2,502
2,035
296
64
15
16
15
17
44
2,282
3,887
2,Q09
287
314
325
416
214
144
178
3,400
1,747 1,633
286
114
22
12
B
26
67
2,247
284
292
234
333
264
172
188
3,086
1,753 I,6D
323
90
11
44
231}
~5!
226
283
1.I32
125
173
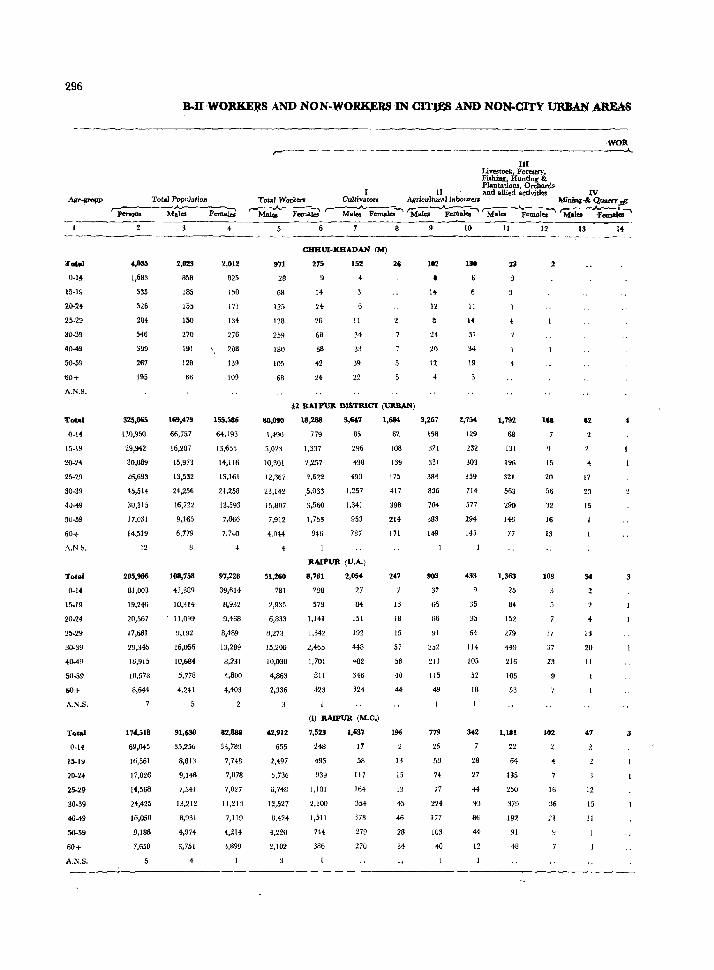
296
T~
O.I~
15·19
20·24
25-29
30-39
40-49
50-59
60+
A,N.S.
ToW
0-14
15-19
20·24
25·29
30-39
~J-49
50·59
60+
.\.N~.
Total
0.14
15.19
20.:U
25.29
31l-39
41l-49
50.59
60+
A.N.S.
Total
0.14
15.19
21l-24
25·29
30.39
40-49
50-59
60+
A.KS.
:o..U 'WO;RKEl,{S AND NON-WO~RS IN CI'l1ES AND NON-CITY URBAN ,AREAS
Total Population
~~---D-.---M~ F~~
.,1135
1,683
335
326
284
546
399
267
195
325,065
130,950
29,942
30,089
26,693
45,514
30,315
17,031
14,519
12
205,986
81,003
19,H6
20,567
17,681
29,345
18,915
10,578
8,6#
174,518
69,045
16,561
17,026
14,568
24,425
16,050
9,188
7,650
2,m
858
185
155
150
270
191
128
B6
169,479
66,757
16,287
15,973
13,532
24,256
16,722
9,165
6.779
108,758
41,389
10,314
11,099
~,192
16,056
to,684
5,778
4,241
91,630
35,256
8,813
9,146
7,541
13,212
8,931
4,974
3,751
4
2,012
825
150
171
134
276
'. 206
139
109
155,586
64,193
!:l,6S5
14,116
13,161
21,258
13,593
7.866
7,740
97,228
39,614
8,932
9,468
8,489
13,289
8,231
4,800
4,403
82,888
33,789
7,748
7,878
7,027
11,213
7,119
4,214
3,899
1
WOR ,.-------~----------------------__....~~--------______.__
III Live!tock~ FORltrY, .Fishing, Hunting & Plantations, Orchards
I II and allied activiti.. IV Total Work... Oultivators Agricultural labour... MininIJ..t Quarry ri'
,-~ Fomai;''- Males"_ Females -, 'M~."'aleo-' ~.I.. Femal .. "' ~-;;;;;.:..--
971
28
68
125
13B
254
ISO
105
68
80,090
1,490
10,301
12,367
23,142
15,807
7,912
4,044
51,280
781
2,935
6,833
8,21:J
15,206
to,030
4,863
2,336
42,912
655
2,497
5,736
6,748
12,527
8,424
4,220
2,102
6
CHIIlJI·]{SADAN (I'd)
275
11
34
33
39
22
26
.2 RAIJ'UR DlSTRICT (URBAN)
18,288
779
1,337
2,257
2,622
,5,033
3,560
1,753
946
5,647
85
296
438
-190
1,257
1,341
953
787
RAIP'Ult (U.A.)
8,761
298
579
1,141
1,342
2,465
L701
811
423
2,054
27
84
151
192
448
482
346
324
(I) RAIPUR (M.e.)
7,523
248
493
939
1,101
2,10U
1,51 I
744
386
1,631
17
58
117
164
354
378
279
270
1,6M
62
108
139
175
417
398
214
171
247
13
18
15
57
58
40
44
196
13
15
13
45
46
28
34
182
H
12
24
20
12
4
3,267
158
:121
331
381
836
704
383
149
903
32
66
86
~1
252
2!l
115
49
779
25
58
74
77
224
177
103
40
10
1"
11
14
37
34
19
2,7M
129
232
303
359
714
577
294
145
433
35
35
64
]]4
105
52
IB
28
27
44
93
86
44
12
11
1,792
68
131
196
321
563
'290
146
77
1,363
25
B4
1,2
279
449
216
105
53
1,181
22
64
135
250
379
192
91
48
12
15
20
56
'12
16
13
108
17
37
23
21
13
62
4
17
20
15
U
20
11
47
12
15
11
14
3
------~------------------------------------------------------------.-----
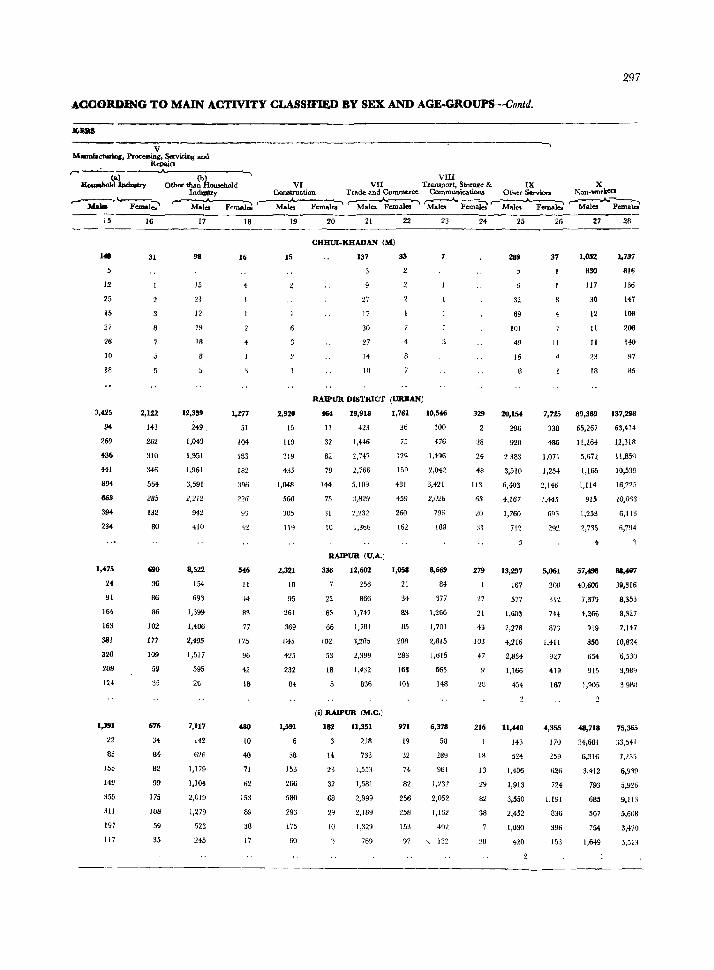
297
ACCORDING TO MAIN ACTIVITY CLASSIFIED BY SEX AND AGE-GROUPS-Contd .
(0.) ~..-hold lnd .. try
'-Mak.-' FemaI;"
15
1.
12
25
15
37
26
10
18
3,425
94
269
~36
141
894
663
394
234
1,.75
2i
91
164
163
381
320
208
IH
1,J!11
22
85
155
149
355
31l
197
117
16
31
2,122
143
262
310
346
564
285
132
8<J
690
36
86
86
102
177
109
59
676
34
M
82
99
175
108
59
35
. _-- ---------------.--------.,
(b) -. VIII Other than .!Ioweho1d VI VII Transport, Storage & IX X
Ind~ Construction Trade and Commerce Communications Other ~ Non~worken
~ '-"""M;~ ~ ~~'-M.i.......A.~ ,-~.A.-;~~ 17
98
15
1l
12
19
18
8
12,359
249
1,043
1,951
1,961
3,591
2.212
912
410
8,522
154
693
1,399
1,406
2,495
1,517
595
26
7,1l7
142
626
1,179
1,104
2,019
1,279
523
245
18
16
4
1,211
51
104
183
182
396
226
42
546
II
44
83
77
175
~6
42
IS
~
10
40
71
62
15:1
89
38
17
19
15
2,920
15
119
319
435
1,048
560
305
119
2,321
10
95
261
369
H45
425
232
84
1,591
5S
153
266
580
293
175
60
20 21 22
CHHVI-KHADAN (M)
137 33
27
17
30
27
14
10
4
8
RAIPUR DISTRICT (URBAN)
464
II
32
82
79
114
75
:Jl
10
19,918
423
1,446
2,747
2,766
5,109
3,829
2,232
1,3G\)
RAIPUR (U,A.)
336
22
63
66
102
53
18
12,602
256
866
1,747
1,781
:1,285
2,.399
1,432
836
(I) RAIPUR (M.C.)
182
14
23
32
68
29
10
11,351
218
733
1,553
1,581
2,999
2,169
1,329
769
1,761
36
75
129
159
481
459
260
162
1,058
21
34
S3
85
lBB
283
163
101
911
19
32
74
82
256
258
153
97
23
10,546
100
476
1,4%
2,042
3,421
2,026
796
189
3,669
84
377
1,266
1,701
2,815
1,615
663
148
6,378
58
961
1!232
2,052
1,162
492
, 132
24
329
2B
24
48
113
63
Zl)
31
279
27
21
43
103
47
18
216
18
13
29
82
38
25
289
32
69
101
49
16
20,154
296
920
nS3
3,510
6,403
4,167
1,760
712
13,297
167
577
1,603
2,278
4,216
2,834
1,166
454
11,«0
143
524
1,406
1,913
3,550
2,452
1,030
420
26
37
8
II
4
27
1,052
830
117
30
12
II
II
23
18
28
1,737
816
136
147
108
208
140
97
as
7,725 89,389 137,298
338
486
1,071
1,254
2,146
1,145
6~)3
291
5,061
208
31l
7-H
873
1,411
927
419
167
17l)
626
724
1.191
836
396
153
65,267
1l,264
5,672
1,165
I,IJ4
915
1,253
2,735
4
57,~
40,608
7,379
4,266
919
850
654
91~
1,905
48,718
34,601
6,316
3,412
793
685
507
754
1,649
63,414
12,318
, 1,85<1
10,539
16,225
1O,Oq~
6,113
6.7~14
88,467
39,316
8,353
8,327
7,147
to,824
3,989
3,9BIl
75,365
'B,541
1,255
6,939
5,926
9,113
5,608
3,470
3,513
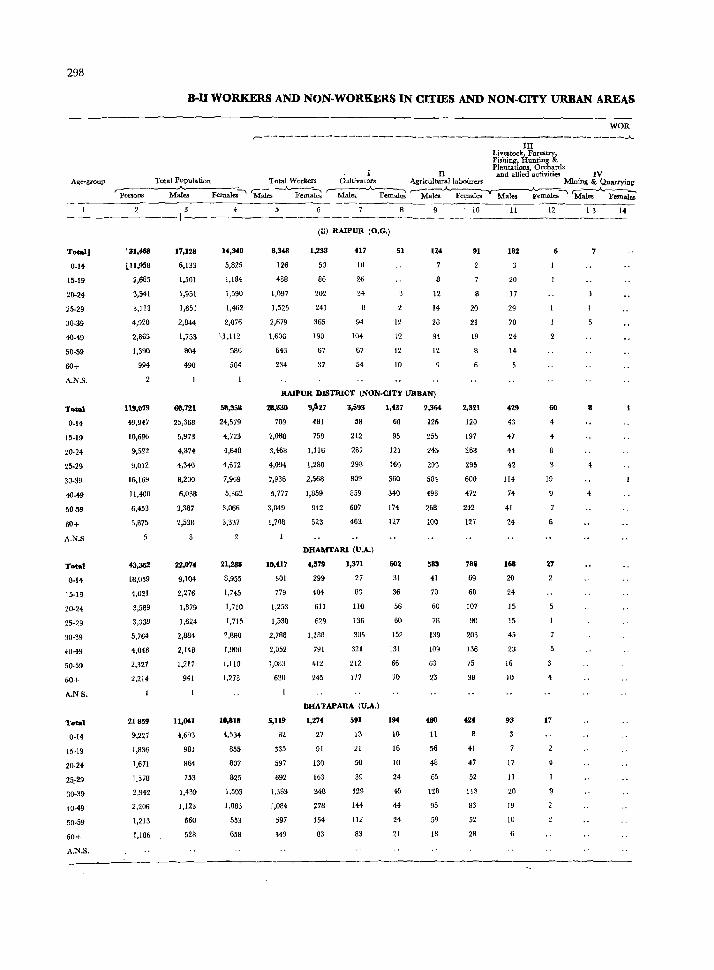
298
B·n WORKERS AND NON-WORKERS IN CITIES AND NON·CITY URBAN AREAS
WOR
r--~ ---- ----~---~ -----. -~----------------------- --- -----A-III
~~hl!~~H!~ti~~ Plantations, Orc't.ards
Age .. group Total 'Population Total Workers Cultivators Agricult~allabourers and allied activiti.es Mining iVQuarrying
~ Males FemaIesl 'M~ -..A..~~ ,- Male~ ~~ r-~A~~emales -"l 'M~k; I 2 3 4 5 6 - --------1---.~------~------
Total]
0-1.
15-19
20-24
25-29
30-39
.0-49
50-59
60+
A.N.S.
f31,468
tll,9S8
2,685
3,541
3,113
4,920
2,B65
1,390
9g4
17,128
6,133
1,501
1,951
1,651
2,844
1,753
804
490
14,340
5,825
1,184
1,590
1,462
2,076
\1,112
586
504
8,348
126
438
1,097
1,525
2,679
1,606
643
234
(U) RAIPUR (O.G.)
1,238
50
86
202
241
365
190
67
37
417
10
26
34
94
104
67
54
51
12
12
12
10
124
12
14
28
34
12
RA1PUR DISTRICT (NON.ClTY URBAN)
Total
0·14
15·19
20-24
2;·29
30·39
40-49
50-59
60+
A.N.S
Total
0-14
15-19
20-24
25-29
30·39
40-49
50·59
60+
A.NS.
Total
0·14
15·19
20·24
25:29
3().39
40-49
50·59
60+
A.N.S.
119,079
~9,947
10,696
9,522
9,012
16,169
11,400
6,453
5,875
5
43,3Il2
18,059
4,021
3,589
3,339
5,764
4,048
2,327
2,214
21859
9,227
1,836
1,671
1.578
2,942
2,206
1,213
1,186
6O,7!l
25,368
5,973
4,874
4,340
8,200
6,038
3,387
2,53B
22,074
9,104
2,276
1,879
1,624
2,884
2,148
1,217
941
n,Ml
4,6Q3
981
864
753
1,439
1,123
660
528
58,358
24,579
4,723
4,648
4,672
7,969
5,362
3,066
3,337
21,288
8,955
1,745
1,710
1,71:;
2,880
1,900
1,110
1,273
10,8UI
4,534
855
807
825
1,503
1,083
553
658
211,830
709
2,088
3,468
4,094
7,936
5,777
3,049
1,708
10,417
301
779
1,253
1,530
2,788
2,052
l,OS:J
630
5,119
82
335
597
692
\,383
1,084
597
349
9,527
481
758
1,116
1,280
2,568
1,859
942
523
3,593
58
212
287
298
809
859
607
463
DHAMTAlU (U.A.l
4,579
299
404
611
629
1,188
791
412
245
1,371
27
as 110
136
305
321
212
177
BHATAPARA (U.A.)
1,274
27
91
130
163
348
278
154
83
591
13
21
50
39
129
144
112
83
1,437
60
95
121
160
360
340
174
127
602
31
36
56
60
152
131
66
70
194
10
16
10
24
45
44
24
21
2,364
126
255
245
293
584
493
2&8
100
583
41
70
60
78
139
109
63
23
480
11
56
48
65
128
95
59
18
10
91
20
21
19
2,321
120
197
268
295
600
472
242
127
786
69
68
107
90
203
136
75
38
41
47
52
113
83
52
28
11
182
20
17
29
70
24
14
429
43
47
44
42
I14
74
41
24
168
20
24
15
15
45
23
16
10
93
17
11
20
19
10
6
12
6
60
4
4
8
19
27
4
17
4
1 3 14
7
8
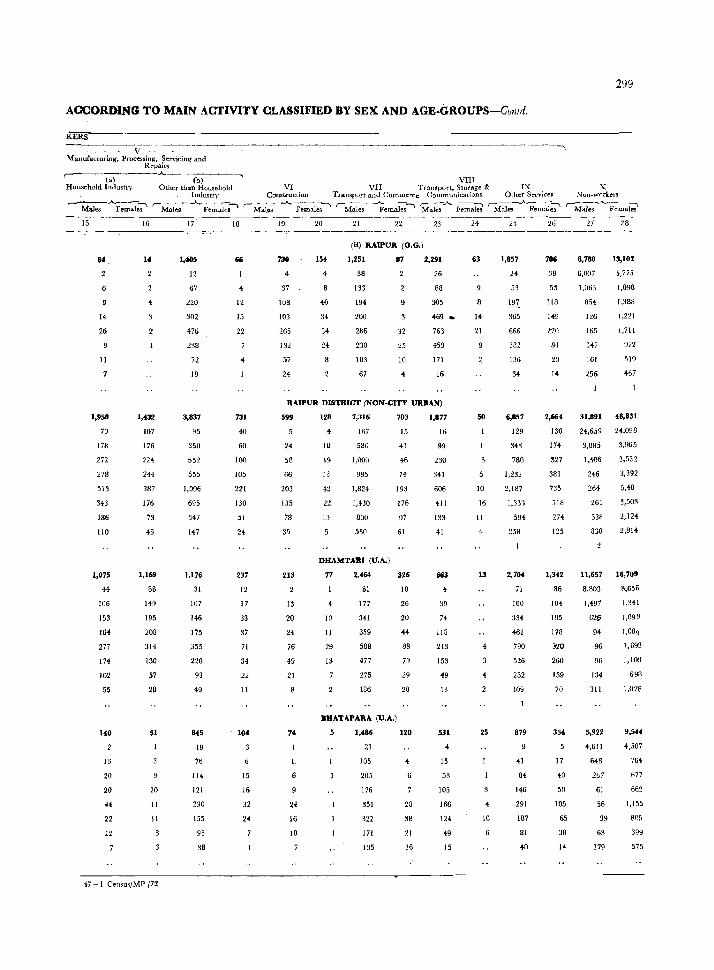
ACCORDING TO MAIN ACTIVITY CLASSIFmD BY SEX AND AGE·GROUPS-Conld.
KERS --------y------ ""-~-------~--------------------~--------~----, Manufacturing, Processing, Servicing and
Repairs r--w---A.---(b-)------' Household Industni Other than Household
Industry
VIII VI VII Transport, Storage & IX
Construction Transport and Commerce Communications Other Ser .... ice.
299
X Non-workers
~~-;' ~.le;-> r- M~;---_A.. Fema~' '~ -~emales-' 'M~i;"""_ _Femat;' ,="\-fales -..A..~m~~ r-M~F~~~id 15
84,
14
26
11
1,950
70
178
272
27B
513
343
IB6
llO
1,075
44
106
153
164
277
174
102
55
13
20
20
44
22
12
16
14
4
1,432
107
IJ6
224
244
387
176
73
45
1,169
88
149
195
208
314
130
57
28
51
10
11
II
41-1 Censu'iMP /72
1,.05
12
67
220
302
476
238
72
18
3,837
95
350
552
555
1,096
695
347
147
1,176
31
107
146
175
.355
220
93
49
845
18
76
114
121
230
155
93
38
18
4
12
15
22
731
40
60
100
105
221
130
51
24
237
12
17
33
37
71
34
22
11
104
15
16
32
24
19
730
4
37
lOB
103
265
132
57
24
20
154
40
34
34
24
21 22
(Ii) RAlPUR (O.G.)
1,251
38
133
194
200
286
230
103
67
87
9
32
25
10
4
23
2,291
26
88
305
469
763
453
171
16
RAIPUR DlSTRlCT (NON..cITY URBAN)
599
24
58
66
203
135
78
35
213
13
20
24
76
49
21
74
24
16
10
128
10
19
13
42
22
13
7,316
167
580
1,00(1
985
1,824
1,430
800
530
DHAMTAIU (tf.A.)
77
10
IJ
29
13
2,464
61
177
341
359
588
477
275
186
703
15
41
46
74
193
176
97
61
326
10
26
20
44
88
79
39
20
BliATAPAJU (V.A.)
5 1,486
21
105
205
176
351
322
171
135
120
4
28
38
21
16
1,877
16
99
230
:141
606
411
133
41
663
4
39
7f
118
213
153
49
13
531
15
53
105
166
124
49
15
24
63
8
1+
21
50
10
16
II
13
4
25
4
10
25
1,857
24
53
197
365
666
382
136
34
6,157
129
343
780
1,232
2,187
1,33'1
594
258
2,704
71
160
334
461
790
526
252
109
879
41
84
146
291
lB7
81
40
26
706
38
53
118
H9
220
91
23
14
2,664
130
174
327
381
735
518
274
125
1,342
86
104
185
178
~20
260
139
70
334
17
+0
50
105
65
38
14
27
8,780
6,007
1,063
854
126
165
H7
161
256
28
13,102
5,77,\
1,098
1,388
1,221
1,711
922
519
467
31,891 48,831
24,659 24,098
3,885
l,iQ6
U6
264
261
338
830
3,965
3,532
3,392
5,40
3,503
2,124
2,814
11,657 16,709
8,303
1,497
62G
94
96
96
134
311
5,922
4,611
646
267
61
56
39
63
179
~,656
1,3H
1,099
1,03g
1,692
1,109
698
9,544
4,507
764
677
662
1,155
805
399
575
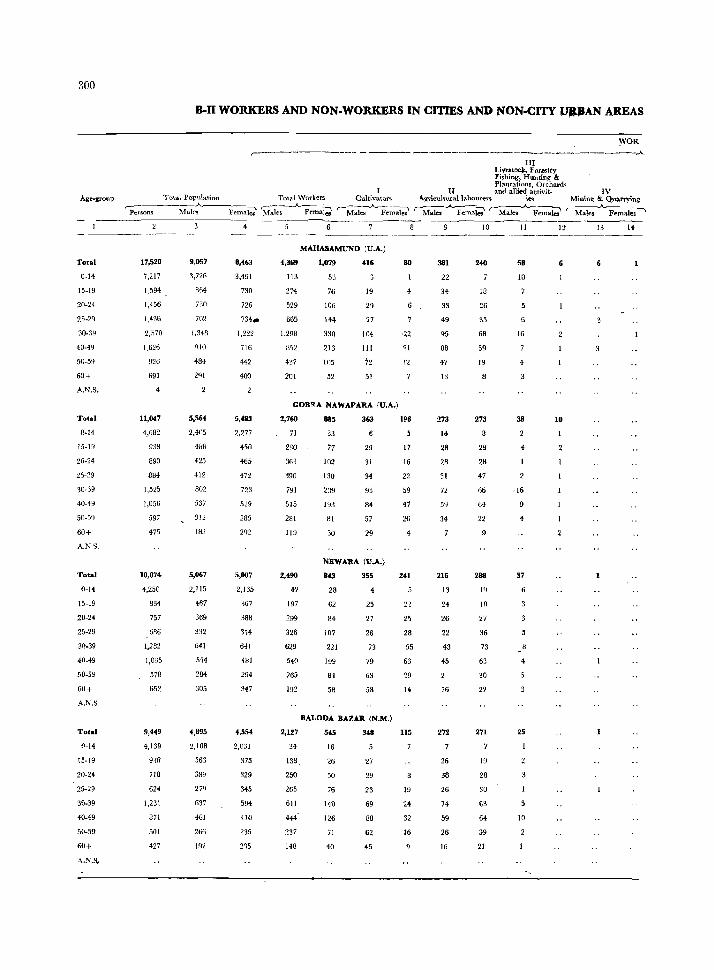
300
Age-lroup
Tota.l
0-14
15-19
20-24
25-29
30-:N
40-49
50-59
60+
A."I.S.
Total
0-14
15-19
20-24
25-~9
30-19
40-49
50-59
60+
A.NS.
Total
0-14
15-19
20-24
25-29
30-39
40-49
50-59
60+
A.N.S.
Total
~-14
15-19
20-24
25-29
30-39
40-49
50-59
60+
A.N.S,
B-n WORKERS AND NON-WORKERS IN clTms AND NON-CITY VJlJJAN AREAS
WOR r-------------- - --------------------____________ .A-
I Total Population Total Work~rs Culti.vatof'!,
'Persons Males PernaI;' M;:Ie;-.A... Fcmai;i r-M~~.A..~;, ------~---------
17,520
7,217
1.594 _
(,456
1,436
2,570
1,626
926
691
4
11,047
4,682
93B
890
884
1,525
1,056
597
475
10,07~
4,250
834
757
6R6
1,282
578
652
9,449
4,139
goB
718
624
1,231
871
501
427
9,057
S,72£,
864
7:10
702
1,348
910
484
291
5,564
2,405
48B
425
412
802
.537
312
183
5,067
2,115
41;7
369
332
641
51)4
284
305
4,895
2,108
563
389
279
637
461
266
192
8,463
3,491
730
726
734.
1,222
716
442
400
5,483
2,277
450
465
472
723
519
285
292
5,007
2,135
%7
388
354
641
481
294
347
4,554
2,031
375
329
345
594
410
235
2%
MAHASAMUND (V.A.)
4,369
113
274
529
665
1,298
8>2
437
201
1,079
53
76
106
144
330
213
105
52
416
19
29
27
104
111
72
51
GOBRA NAWAPARA (V.A.)
2,160
71
230
363
390
791
515
281
119
2,490
)97
299
326
629
540
265
192
2,127
34
138,
250
265
611
4-14'
237
148
885
33
77
102
130
2:19
19:1
81
30
363
29
31
34
93
84
57
29
NEWARA (V.A.)
843
28
62
84
107
221
199
84
58
355
4
25
27
26
73
79
63
58
BALOOA BAZAR (N.M.)
545
16
26
50
76
110
126
71
40
348
27
29
23
69
88
62
45
80
21
12
1~6
17
16
22
59
47
26
4
241
21
2'\
28
55
63
14
lI5
19
2~
32
16
9
III Livestocl::. F or,estty Fishing, Hunting" & Plantations, Orchard"
II and allied activit- IV Agriculturallarn;mrers i~ M~ning & Q\1arrying
I Males A FernaIe;' r-Males,_A_ Femaks' r-~--..
381
22
34
33
49
95
88
47
13
273
14
28
28
31
72
59
34
216
13
24
26
22
43
45
16
272
26
38
26
74
59
26
16
10
240
18
26
35
68
59
19
8
273
29
28
47
66
64
22
288
19
Ifl
27
36
73
63
30
2?
271
19
28
30
63
64
39
21
II
58
10
16
4
38
4
,16
4
31
4
25
10
12 13
6
10
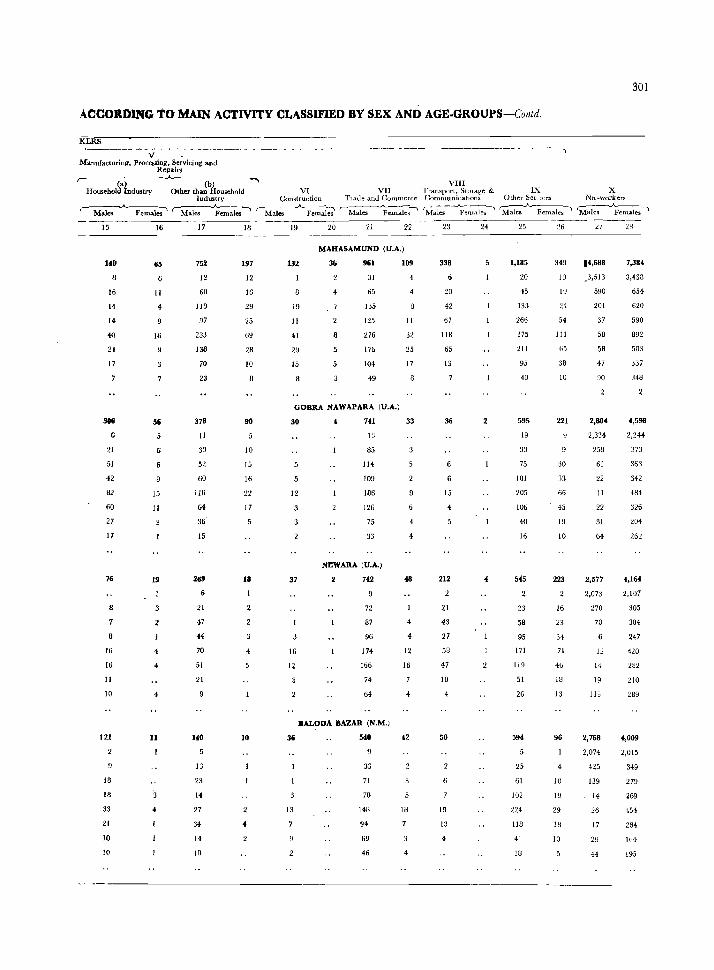
ACCOR:otNG 10 MAIN ACTIVITY CLASSIFIED BY SEX AND AGE-GROUPS-Contd.
KERB ----------y- -:------------ --------------------------------, Manufacturing. Processing I Servicing and
Repa.irs
(b) ---., VIII Other than Household VI VII frausport. StOlage & IX
Industry Constructiou Tlaue aml Cummercl": Communications Other Scr Ices
r-~~~ r-~~ r-~~-;;, r-~~-' 'M~enlales~ 'M~..A..Females--" 15
140
16
14
14
40
U
17
·21
51
42
82
60
27
17
76
8
16
16
11
10
Ul
1B
18
33
21
10
10
16
65
11
4
16
56
15
11
19
4
•
'"
11
17
752
12
6U
119
97
233
138
70
23
378
11
30
52
60
lID
&I
36'
15
269
21
47
44
70
51
21
140
13
23
14
27
34
14
10
IB
197
12
16
29
25
69
28
10
90
10
15
16
22
17
18
4
10
19 20 21 22
MAHASAMUND (U.A.)
132
19
II
H
29
15
36 9til
31
65
n5
125
276
17b
104
49
GOBRA NAWAPARA (U.A.)
30
12
37
16
12
4 741
13
85
114
109
lU6
126
75
33
NEWARA (U.A.)
742
72
87
96
174
166
74
64
BALODA BAZAR (N.M.)
36
13
540
33
71
70
148
94
69
46
109
4
II
32
25
17
33
4
48
4
4
12
16
4
42
18
4
23
338
20
42
67
118
65
13
36
15
212
21
43
27
58
47
10
4
50
18
13
4
25
1,185
20
45
133
266
375
211
95
40
595
19
33
75
101
Z05
106
40
16
545
23
58
95
171
119
51
26
594
25
61
102
llU
H
1U
19
19
24
54
111
65
38
10
221
30
:13
66
45
19
10
223
16
23
34
71
40
18
13
96
4
10
19
29
IS
10
301
X Nn~workers
'M~~~sl
14,688
_3,613
590
201
37
50
58
47
90
2,804
2,334
258
62
22
II
22
31
64
2,577
7,384
3,438
654
620
590
892
503
337
348
4,598
2,244
373
363
342
484
326
204
26~
4,164
2,073 2,107
270
70
12
14
19
113
2,768
305
304
247
420
282
210
289
4,009
2,074 2,015
425
139
14
26
17
29
349
279
269
454
284
164
195
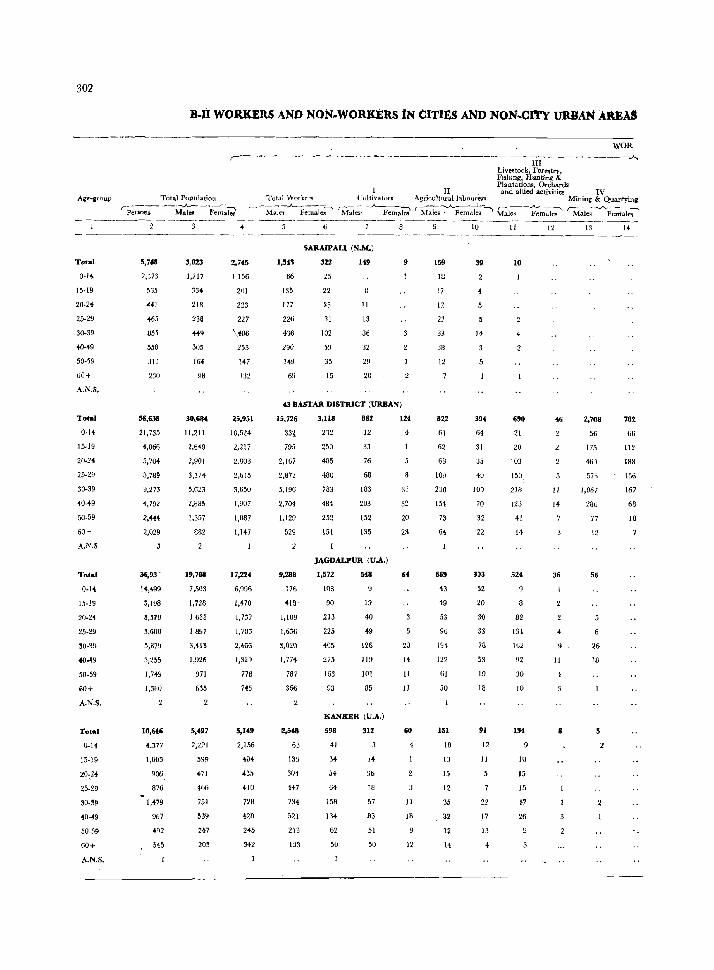
302
Total
O·H
15·19
20·2.
25·29
30·39
40·.9
50·59
60+
.~.N.S.
Total
0·14
15·19
20·2+
25·29
30-39
40,'9
50·59
60+
A.N.S.
Total
O·H
15·19
20·24
25·29
~0·39
40..-19
50.59
60+
A.N.S.
Total
O.H
15·19
20:24
25-29
30·39
40·49
50-59
50+
A.N.S.
B.II WORKERS AND NON~W()RKERS IN CITIES AND NON-CI'rY URBAN AREAS
Tot"l Pupulation
WOR ,--------------------·----------li-I--~----~-~-.A,
Total Wor"kers
Livestock, Forestry, FIshing, Hunting & Plantations, Orchards
Cultivators Agricultu~~llaLourets and allied activities Mining' IV Quarrying
rperlo~--M~ct-- Fen:Ie;-,---__ ...A.... ___ ""
Male! Females 'M~e-;-~Iei ~-W;s---:.A.Fem~;-~ Mal-;--~~ Males .A.Fental~
5,7"
2,'j73
535
4.1
465
851
558
311
56,635
21,735
4,866
5,704
5,7Sg
~,273
4,792
Z,.H
Z,fj29
36,93 ~
1',~9
3,198
~,570
3,600
5,B7g
10,646
4,377
1,003
906
876
1,.79
967
3,023
1,217
334
218
238
.'Q 305
164
98
30,684
11,211
2,tH
2,901
3,IH
5.623
2,885
1,357
882
19,708
7.503
1,728
1633
1897
3.41~
1,926
971
635
5,497
2,:/21
599
.71
4(>6
751
539
247
2()~
2,745
1 ~156
2111
223
227
\406
253
147
25,951
10,524
2,217
2.803
2,bl5
3,650
1,907
1,087
1,147
17,224
6,'196
1,-170
1,737
1,703
2,%6
1,329
778
745
5,149
2,156
~04
~35
4J[)
na 428
24S
342
1,54~
66
13;
177
226
436
290
149
69
SARAlPAU (S.M.)
322
25
22
,I
102
5~
35
15
149
II
13
36
"l2
29
20
43 BASTAR DISTRICT (URBA')I)
15,726
33~
795
2,167
2,872
5,196
2,704
1,129
;29
9,288
176
418-
1,109
1,636
3,020
1,774
787
366
2,548
63
133
304
H7
734
521
213
133
3,118
212
250
485
480
783
484
252
151
862
12
33
76
58
183
203
152
135
JAGDALPUR (V.A.)
124
31
32
20
23
1,572 54B 64
108
90
213
225
40;
275
163
93
19
40
49
126
119
101
85
KANKER CU.A.)
598
41
34
54
64
158
134
62
50
312
H
So
18
57
83
51
50
20
J4
II
II
60
4
JI
18
12
159
IS
17
12
22
33
38
l~
822
61
62
68
109
230
154
73
64
669
43
49
53
96
1%
122
61
50
151
18
13
15
12
35
32
12
14
10
39
14
394
64
31
35
40
100
70
32
22
3)3
;2
20
30
33
78
53
19
18
91
12
II
22
17
13
4
II
10
690
21
20
103
150.
218
123
41
14
524
82
131
162
~2
30
10
134
10
15
15
H
26
12
46
11
14
36
11
8
13
2,7Q8
56
175
46)
57~
1,067
286
77
12
56
6
26
18
H
182
66
112
ISH
156
167
68
18
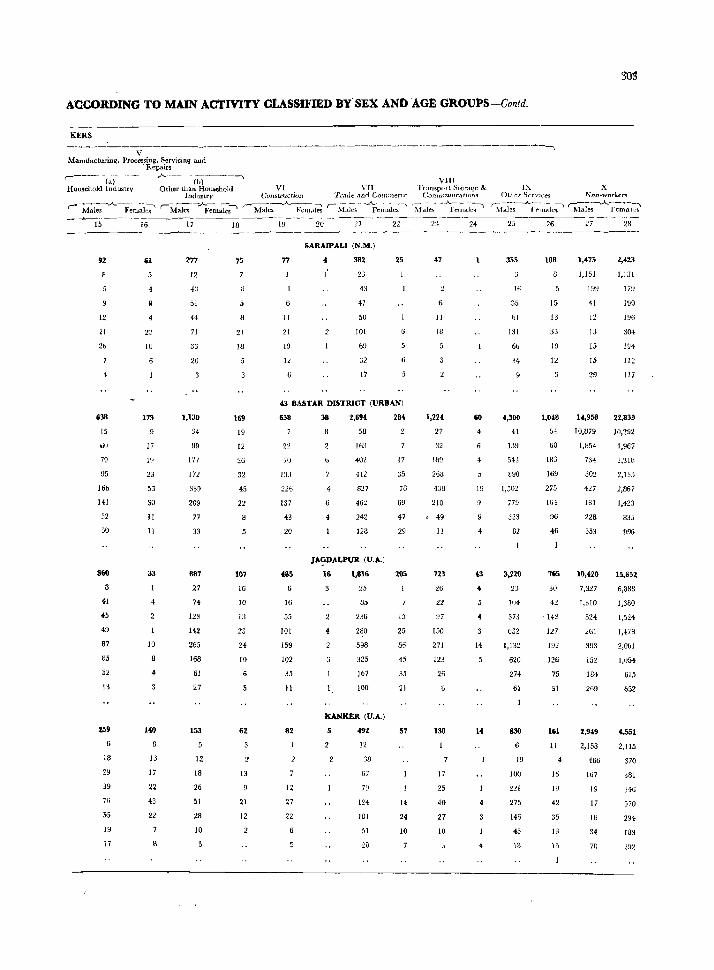
30g
ACCORDING TO MAIN ACTIVITY CLASSIFIED BY SEX AND AGE GROU:PS-Contd.
KERS ------..:.__-------------------------.---------~---------------------"'""1
V Manufacturing, Processing, Servicing and
'Repairs
VIII ,--- -(;)--- ---A---(b)._--' HOUsehold Industry Other than Household VI
Industry CUlJStructiun VII T[ alJsport Stural5e &
Trade and Commerce ConWlUmCittJons
rM~-.A. Fenlale? r-~~""'Female~ r-~~ ,-__ _A_ ___ ~ ,---_---___ ...A.. __ ~
M.des. Females' Malef> FerIlaJes
82
12
26
4
638
15
,,0 79
95
16b
141
30
360
41
45
49
87
U5
32
13
%59
18
29
39
75
55
19
\7
61
20
10
6
173
17
l!-l
23
53
30
11
11
33
4
10
4
140
13
17
22
43
22
277
12
4J
51
44
71
33
20
1,130
34
n9
177
172
339
209
77
33
887
27
74
123
142
265
168
61
27
153
12
18
26
51
28
10
75
5
21
18
169
19
12
32
45
22
107
16
10
n 23
24
10
62
13
21
12
77
11
21
19
12
SARAIPALI (N.M.)
382
43
47
50
101
b9
32
17
25
43 BASTAR DISTRICT (URBAN)
658 38 2,694 284
58
70
n;
226
137
43
20
485
6
16
55
101
159
102
35
Il
82
12
27
22
16:1
4(12
412
827
462
242
128
JACfDALPUR (U.A.)
16
4
1.
1,816
15
85
236
280
598
325
167
100
KANKER (U.A.)
5
7~
124
101
51
20
17
35
78
69
47
29
205
15
25
56
45
35
21
57
14
24
10
23
47
6
11
18
1,224
27
:12
189
268
43B
210
49
11
723
26
22
97
150
271
123
26
130
17
25
40
27
10
24
60
4
19
U
4
H
14
4
IX x OthrT Srrvlces Non~wor.k~r.5
r:-Mal~:-_A_Jr'f'tn;]e;' ~fu~.A..~I~
355
16
35
61
131
66
34
4,300
41
]39
543
1,502
779
323
82
3,220
23
104
373
632
1,132
620
274
61
830
19
100
2:!l
275
145
45
1~
26
108
15
13
:;3
19
12
60
16~
275
154
96
46
765
30
42
, 142
127
19:/
126
75
31
161
11
4
16
19
42
35
18
15
27
1,475
1,151
199
41
12
13
15
15
29
14,958
IO,~79
1,854
734
302
427
181
228
353
10,420
7.327
1,310
5H
261
393
152
184
269
2,949
2,158
466
167
19
17
18
34
71l
28
2,423
1,131
ItY
190
196
304
194
112
117
22,833
10,292
1,967
2,'3lU
2,135
2,867
1,423
835
996
15,6;2
6,888
1,380
1,524
1,478
2,001
1,054
615
652
4,551
2.115
370
381
346
570
294
183
29~
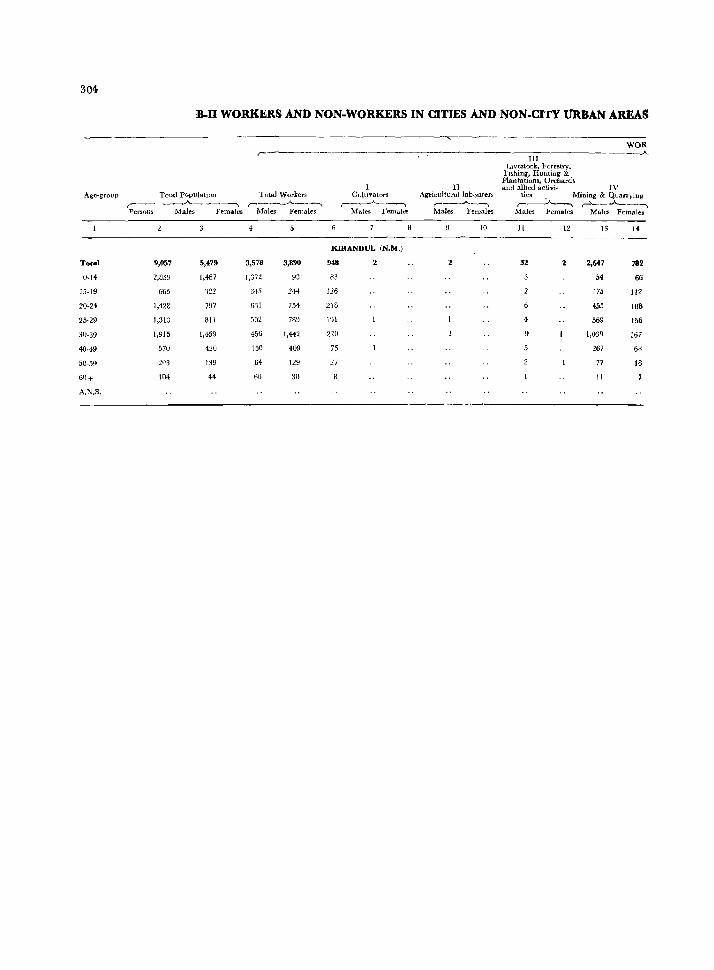
304
Total
0.14
15·19
20·24
25·29
30-39
40,49
50-5~
6~+
A.N.S.
B-II WORKERS ANt> NON-WORKERS IN CITIES AND NON-CITY URBAN AREAS
Total PopulatIOn Total Workers ,-_____ .A ____ -, r---_.A... __ ~
Persons Males Females Males Females
4
9,057 5,i79 3,578 3,890
2,859 1,487 1,374 ~3
665 'm 343 244
],422 797 6';1 754
1,313 81 \ J[)~ 789
1,915 1,4-59 456 1,442
570 420 150 409
21'::3 139 64 129
104 44 60 30
I CultIvators
r______..-A--·~ MaJes Femak"S
KlRANDUL (N.M.)
9i8 2
33
126
218
191
220
75
27
II Agricultural labourers
,-__ .A.----,
Males Females
10
2
JlI Livestock, }>'orrstry.
Fishing, Hunting & Plantations, Orchard~ and allied activi~ IV
WQR ..A.
tics. Mining & Quarrying r---~ ,-'--___"'____l
Males Females Males Females
11 12 13 1+
32 2,6f7 782
54 66
j 75 112
455 188
4 569 156
1,039 167
~67 6B
77 18
1\
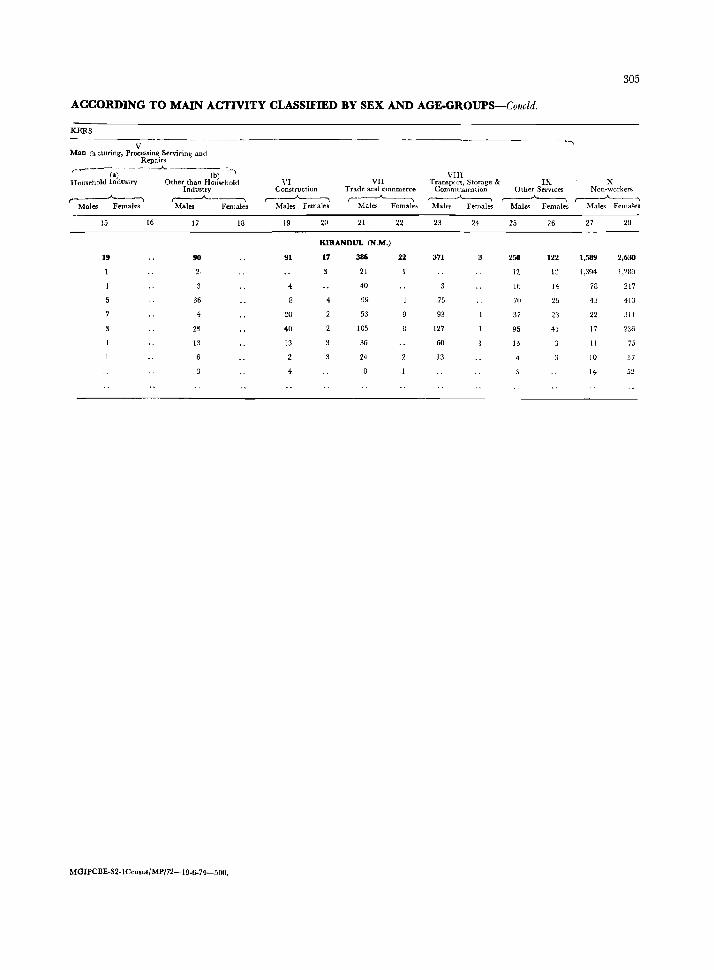
305
ACCORDING TO MAIN ACTIVITY CLASSIFmD BY SEX AND AGE.GROUPS-Concld.
KERS
V Man fa cturing, Processing Serviring and
Repairs
~---(~----~-----(~--, Household Industry Other than Household
Industry r---__.A...--l ,----A. __ ---,
Males Females Males Females
15 16 17 18
19 90
2,
36
4
25
13
MGIPCBE.S2·ICensu,/MP/72-19.6.74--500.
-----------------.-,
VI Construction
r-----"--~ Males Females
19 20
VII Trade and commerce r--____.A._~
Males Femalet>
21 22
KIRANDUL (N.M.)
91 17 386 22
21
40
4 99
20 53
40 105
13 36
24
4
VIII Transport, Storage &
Comoll:mcation r--..........-"-.~
Males Females
23 24
371
75
93
127
60
13
IX X Other Sel'vLces Non~workers
r----'-~ ,-___..A.._-----. Males Females Males Females
25 26 27 28
250 122 1,589 2,630
12 13 1,:;94 I,n~
16 14 78 217
70 25 43 413
37 23 22 311
95 41 17 236
13 11 75
10 37
14 5:!

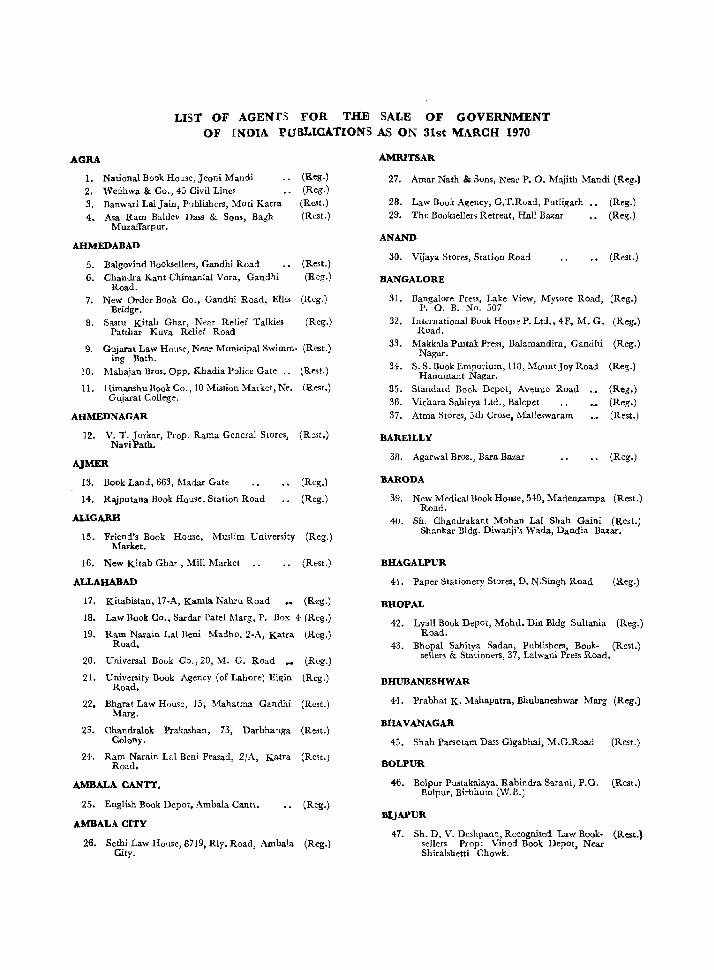
LIST OF AGENTS FOR THE SALE OF GOVERNMENT OF INDIA PuBLICATIONS AS ON 31st 1\IARCH 1970
AGRA
1. National Book Home,jeoni Mandi 2. Wedhwa & Co., 45 Civil Lines 3. Banwari LalJain, Publishers, Moti Katra 4. Asa Ram Baldev Da .. & Sons, Bagh
Muzaffarpur.
AHMEDABAD
5. Dalgovind Booksellers, Gandhi Road
6. Chandra Kant Chimanlal Vora, Gandhi Road.
7. New Order Book Co., Gandhi Road, Ellis Bridge.
S. Sastu Kitab Ghar, N~ar Relief Talkies Patthar Kuva Relief Road
9. Gujarat Law House, Near Municipal Swimm-ing Bath.
10. Mahajan Bros. Opp. Khadia Police Gate ..
11. HimanshuBook Co., 10 Mission Market, Nr. Gujarat College.
AHMEDNAGAR
(Reg.) (Reg.)
(Rest.) (Rest.)
(Res!.) (Reg.)
(Reg.)
(Reg.)
(Rest.)
(Rest.)
(Rest.)
12. V. T. Jorkar, Prop. Rama General Stores, (Rest.) NaviPath.
AJMER 13. Book Land, 663, Madar Gate (Reg.)
14. Rajputana Book House, Station Road (Reg.)
ALIGARH
15. Friend's Book House, Muslim University (Reg.) Market.
16. New Kitab Ghar, Mill Market
ALLAHABAD
17. Kitabistan, 17-A, Kamla Nahru Road
(Rest.)
(Reg.)
18. LaW Book Co., Sardar Patel Marg, P. Box 4 (Reg.)
19. Ram Narain Lal Beni Road.
Madho, 2-A, Katra (Reg.)
20. Universal Book Co., 20, M. G. Road - (Reg.)
21. University Book Agency (of Lahore) Elgin Road.
(Reg.)
22. Bharat Law House, 15, Mahatma Gandhi (Rest.) Marg.
23. Chandralok Prakashan, 73, Darbhanga (Rest.) Colony.
24. Ram Narain Lal Beni Prasad, 2/A, Katra (Rest.) Road.
AMBALA CANTT.
25. English Book Depot. Amba.la Cantt. (Reg.)
AMBALACITY
26. Sethi Law House, 8719, Rly. Road, Alllba!a (Reg.) City.
AMRITSAR
27. Amar Nath & Sons, Near P. O. Majith Mandi (Reg.)
28. Law Book Agency, G.T.Road, Putligarh
29. The Booksellers Retreat, Hall Ba~ar
ANAND
30. Vijaya Stores, Station Road
BANGALORE
31. Bangalore Press, Lake View, P. O. B. No. 507
Mysore Road,
32. International Book House P. Ltd .• 4F, M. G. ROad.
33. Makkala Pustak Pres., Baiamandira, Gandhi Nagar.
34. S. S. BOok Emporium, 118, MountJoy Road Hanumant Nagar.
35. Standard Book Depot, Avenue Road 36. Vichara Sahitya Ltd., Balcpet
37. Atma Stores, 5th Crose, Malleswaram
BAREILLY
38. Agarwal Bros., Bara Bazar
BARODA
(Reg.)
(Reg.)
(Rest.)
(Reg.)
(Reg.)
(Reg.)
(Reg.)
(Reg.) (Reg.) (Rest.)
(Reg.)
39. New Medical Book House, 5iO, Madenzampa (Rest.) Road.
40. Sh. Chandrakant Mohan Lai Sbah Gaini (Rest.) Shankar Bldg. Diwanji's Wada, Dandia Bazar.
BHAGALPUR
41. Paper Stationery Stores, D. N.Singh Road (Reg.)
BHOPAL
42. Lyall Book Depot, Mohd. Din Bldg Sultania (Reg.) Road.
43. Bhopal Sahitya Sadan, Publishers, Book- (Rest.) sellers & Station"rs, 37, Lalwani Press Road.
BHUBANESHWAR
44. Prabhat K. Mahapatra, Bhubaneshwar Marg (Reg.)
BHAVANAGAR
45. Shah Parsotam Dass Gigabhai, M.G.Road (Rest.)
BOLPUR
46. Bolput Pustakalaya, Rabindra Sarani, P.O. (Res!.) Boipur, Birbhum (W.E.)
B[jAPUR
47. Sh. D. V. Deshpane, Recognised Law Book. (R~t.) sellers Prop: Vinod Book Depot, Near Shiralshetti Chowk.
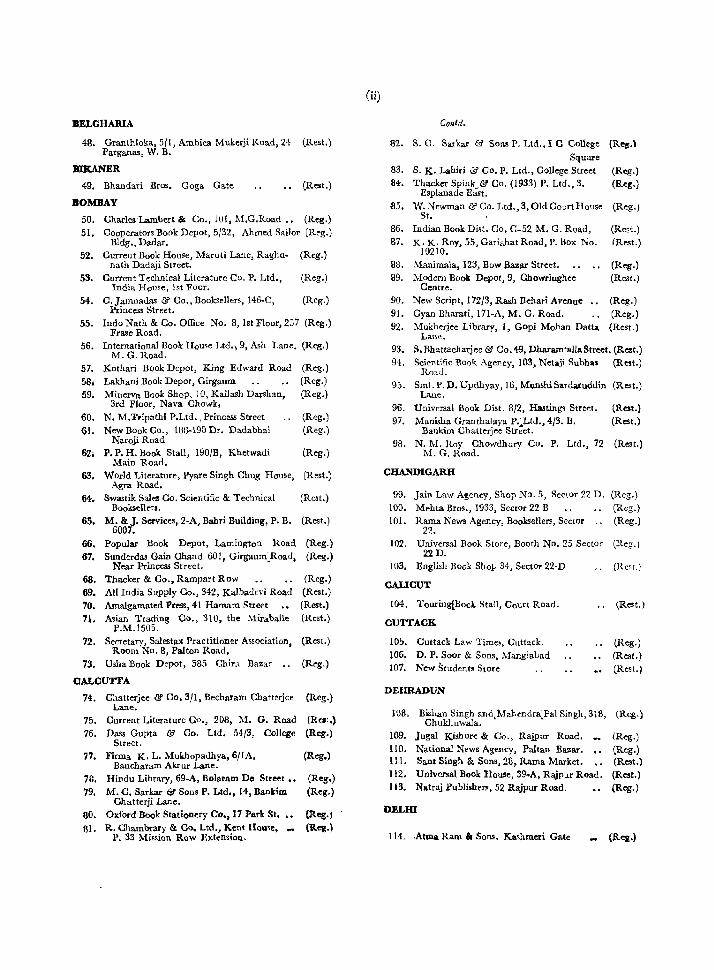
BELGHARIA
48. Granthloka, 5/1, Ambica. Mukerji Road, 24 (Rest.) Parganas, W. B.
BlKANER
49. Bhandari Bros. Goga Gate (Rest.)
BOMBAY
50. Charles Lambert &I Co., 101, M.G.Road ., (Reg.) 51. Cooperators Book Depot, 5/32, Ahmed Sailor (R~g.)
Bldg., D~dar. 52. Current Book House, Maruti Lane, Raghu- (Reg.)
nath Dadaji Street. 53. Current Technical Literature Co. P. Ltd., (Reg.)
India House, 1st Foor. 54. C. Jamnadas & Co., Booksellers, 146-C, (Reg.)
Princess Street. 55. Indo Nath & Co. Office No.8, lst Floor, 257 (Reg.)
Frase Road. 56. International Book House Ltd.\ 9, Ash Lane, (Reg.)
M. G.Road. 57. Kothari Book Depot, King Edward Road 58. Lakhani Book Depot, Girgaum 59. Minerva Book Shop, 10, KaiJash Darshan,
3rd Floor, Nava Chowk, 60. N. M.Tripathi P.Ltd., Princess Street 61. New BOok Co., 183-190 Dr. Dadabhai
NarojiRoad 62. P. P. H. Book Stall, 190/B, Khetwadi
Main Road.
(Reg.) (Reg.) (Reg.)
(Reg.) (Reg.)
(Reg.)
63. World Literature, Pyare Singh Chug House, (Rest.) Agra Road.
64. Swastik Sales Co. Scientific & Technical (Rest.) Booksellers.
65. M. & J. Services, 2-A. Bahri Building, P. B. (Rest.) 6007.
66. Popular Book Depot, Lamington Road 67. Sunderdas Gain Chand 601, Girgaum Road,
Near Princess Street. -68. Thacker & Co., Rampart Row 69. All India Supply Co., 342, Kalbadevi Road 70. Amalgamated Press, 41 Hamam Street 71. A.ian Trading Co., 310, the Mirahalle
P.M.1S05. 72. Secretary, Salestax Practitioner Association,
Room No.8, Palton Road, 73. Usha Book Depot, 585 Chir;!. Bazar •.
CALCUTTA
74. Chatterjee & Co. 311, Becharam Chatterjee Lane.
75. Ourrent Literature Co., 208, M. G. Road 76. Dass Gupta & Co. Ltd. 54/3, College
Street. 77. Firma K. L. Mukbopadhya, 6/ 1A,
Bancharam Akrur Lane. 78. Hindu Library, 69-A, Bolaram De Streel •• 79. M. C. Sarkar & Sons P. Ltd., 14, Bankim
Chatterji l4ne. 80. Oxford Book Stationery Co., 17 Park St. 81. R.. Chambrary & Go, Ltd., Kent Hou'e,
P. 33 Mission Row ExtensioQ.
(Reg.) (Reg.)
(Reg.) (Rest.) (Rest.) (Rest.)
(Rest.)
(Reg.)
(Reg.)
(R{.,.)
(Reg.)
(Reg.)
(Reg.) (Reg.)
(Reg., (R.eg.)
(ii)
Conld.
82. S. C. Sarkar & Sons P. Ltd., I C College (R~.l
Square 83. S. K. Lahir; & Co. P. Ltd., College Street 84. Thacker Spink & Co. (1933) P. Ltd., 3.
Esplanade East.
(Reg.) (Ret;.)
85. W. Newman & Co. Ltd., 3, Old Court House (Reg.) St. .
86. Indian Book Dist. Co. C-52 M. G. Road, (Rest.) 87. K. K. Roy, 55, Gariahat Road, P. Box No. (Rest.)
10210. 83. Manimala, 123, Bow Bazar Street. 89. Modern Book Depot,9, Chowringhee
90. Centre.
New Script, 172/3, Rash Dehari Avenue Gyan Bharati, 171-A, M. G. Road.
(Reg.) (Rest.)
(Reg.) (Reg.) 91.
92. Mukherjee Library, I, Gopi Mohan Datla (Rest.) Lane.
93. 94.
S. Bhattacharjee & Co.49, DharamtallaStreet. (Rest.) Scientific Book Agency, 103, Netaji Subhas (Rest.)
Road. 95. SmeP.D. Updhyay, IG,MunshiSardaluddin (Rest.)
Lane. 96. Universal Book Disl. 8/2, Hasting. Streer. (Rest.) 97. Manisha Granthalaya P; Ltd., 4/3. D. (Rest.)
Bankim ChatteIjee Str;et. 98. N. M. Roy ChOWdhury Co. P. Ltd., 72 (Rest.)
M. G. Road.
CHANDIGARH
99. Jain Law Agency, Shop No.5, Sector 22 D. (Reg.) 100. Mehta Bros., 1933, Sector 22 B (Reg.) 101. Rama News Agency, Booksellers, Sector
22. (Reg.)
102. Universal Book Store, Booth No. 25 Sector (Reg.) 22 D.
103. English Book Shop 34, Sector 22-D (Re,t.)
CAUCUT
104, TouritJgiBocI. Stall, Court Road. .. (Rest.)
CUTTACK
10;'. Cuttack La.w Time;, Cuttack. 106. D. P. Soor & Sons, ManglaLad 107. 'New Students Store
DEHRADUN
108. Bishan Singh and,Mahendra~Pal Singh, 318, Chukhuwala.
109. Jugal Kishore &; Co., Rajpur Road. 1I0. National News Agency, Paltan Bazar. 111. Sant Singh & Sons, 28, Rama Market. 112. Universal Book House, 39.A, Rajpur Road. 113. Natraj Publishel'll, 52 Rajpur Road.
DEI.m
(Reg.) (Rest.) (Rest.)
(Reg.)
(Reg.) (Reg.) (Rest.) (Rest.) (Reg.)
114. ,AtlDa Ram & Sons. Ka.hmeri Gate _ (Reg.)
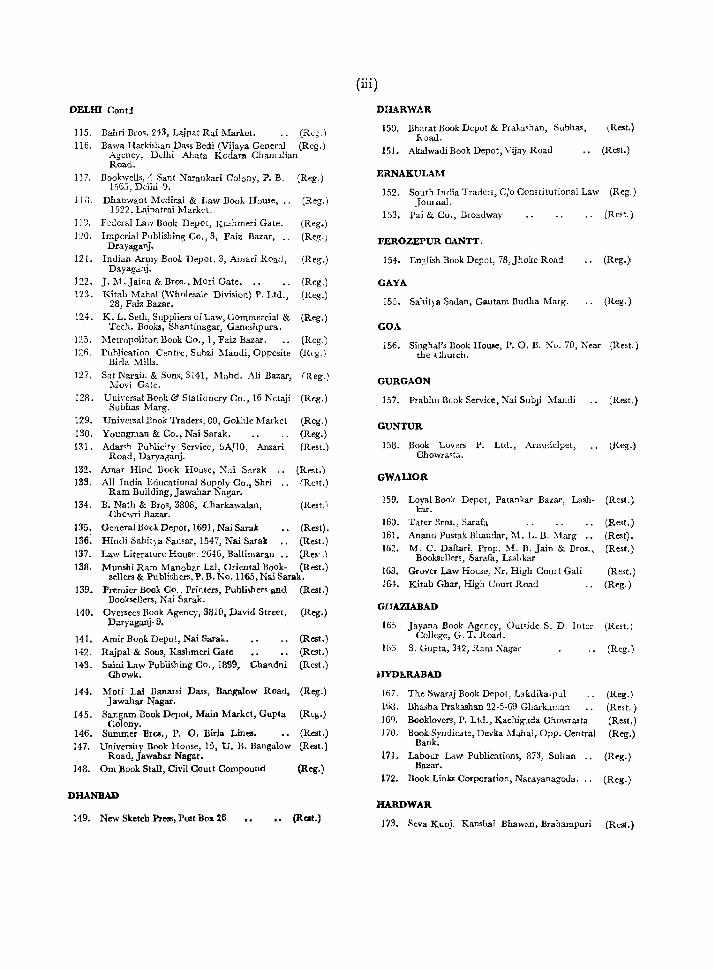
DELID Contj
lIS. 116.
117.
1 J O.
Bahri Bros. 2+3, Lajpat Rai Market. (ReC(.) Bawa Harkishan Dass Bedi (Vijaya General (Reg.)
Agency, Delhi Ahala Kodara Chamalian Road.
Bookwells,4 San! Narankari Colony, P. B. (Reg.) 1563, Delhi-9.
Dhanwant Medical & Law Book House, .. (Reg.) 1522, Lajpatrai Market.
119. Federal Law Book Depot, Kashmeri Gate. (Reg.) (Reg.) 120. Imperial Publishing Co., 3, Faiz Bazar, ..
Drayaganj. 121. Indian Army Book Depot. 3, Ansari Road,
Dayaganj. 122. J. M.Jaina & Bros., Mori Gate. 123. Kitab Mahal (Wholesale Division) P. Ltd.,
28, Faiz Bazar.
124. K. L. Seth, Suppliers of Law, Commercial & Tech. Books, Shantinagar, Ganeshpura.
125. Metropolitan Book Co., 1, Faiz Bazar. 126. Publication Centre, Subzi l\fandi, apposite
Birla Mills.
127. Sat Naraill & Sons, 3141, Mohd. Ali Bazar, Movi Gate.
(Reg.)
(Reg.)
(Reg.)
(Reg.)
(Reg.) (Reg.)
(Reg.)
128. Unh'ersal Book & Stationery Co., 16 Nctaji (Reg.) Subhas Marg.
129. 130. 131.
132. 133.
134.
135. 136: 137. 138.
139.
140.
141. 142. 143.
144.
145.
146. 147.
148,
Universal Book Traders, 80, Gokhle Market (Reg.)
Youngman & Co., Nai Sarak. (Reg.) Adarsh Publicity Service, 5A/I0, Ansari (Rest.)
Road, Daryaganj.
Amar Hind Book House, Nai Sarak (Rest.) All India Educational Supply Co., Shri IRest.)
Ram Building, J awahar Nagar. B. Nath & Bros, 3808, Charkawalan, (Rest.)
Chowri Bazar.
General Book Depot, 1691, Nai Sarak (Rest). Hindi Sahitya f'ansar, 1547, Nai Sarak (Rest.)
Law Literature Hous ... 2646, Ballimaran (Res'.) Munshi Ram Manohar Lal, Oriental Book- (Rest.)
s"ners & Publishers, P. B. 'No. 1165, Nai Sarak. Premier Book Co., Printers, Publishers and (Rest.)
Booksellers, :t'i!ai Sarak. Oversees Book Agency, 3810, David Street, (Reg.) Daryaganj-9.
Amir Book Depot, Nai Sarak. (Rest.) Rajpal & Sons, Kashmeri Gate (Rest.) Saini Law Publishing Co., 1899, Chandni (Rest.)
Ghowk.
Moti Lal Bamu's; Da'8, Bangalow Road, Jawahar Nagar.
(Reg.)
Sangam Book Depot, Main Market, Gupta (Reg.) Colony.
Summer Elm., P. O. Birla Lines. (Rest.) University Book House, 15, U. B. Bangalow
Road,Jawahar Nagar. (Rest.)
am Book Stall, Civil Court Compound (Reg.)
DHANBAD
149. New Sketch Pre&'l, Post Box 26 IRest.)
(iii)
DHARWAR
150. Bh,crat Book Depot & Prah,han, Subhas, (Rest.) Roacl.
151. Akalwadi Book Depot, Vijay Road (Rest.)
ERNAKULAM
152. South India Traders, C/o Constitutional Law (Reg.) JOUlna!.
153. Pai & Co., Broadway (Rest.)
FEROZEPUR GANTT.
154. En31ish Book Depot, 7B,Jhoke Road (Reg.)
GAYA
155. Sahitja Sadan, Gautam Budha Marg. (Reg.)
GOA
156. Singhal'S Book HOUle, P. O. B. Ko. 70, Near (Rest.) the ChUlch.
GURGAON
157. Prabhu Book Service, Nai Subji Mand;
GUNTUR
158. Book Lovers P. Ltd., Arnuclelpet, Chowrast.l.
GWAUOR
159. Loyal Book Depot, Patankar Bazar, Lash-kar.
160. Tater Bros., Sarafa 161. Anand Pustak Bhandar, M. L. B. ]\larg 162. M. C. Daftari, Prop. M. B. Jain & Bros.,
Booksellers, Sarafa, Las1.kar
163. Grover Law House, Nr. High Court Gali 16-1. Kitab Ghar, High Uourt Road
GHAZIABAD
Hb Jayana Book Agency, Outside S. D. Intcr College, G. T. Road.
166, S. Gupta, 342, Ram Kagar
lIYDf.RABAD
[67. The Swaraj Book Depol, L3kdika·pul H;a. Bhasha Prakashan 22·5·69 Gharklman 169. Booklovers, P. Ltd., Kachiguda Chowrasta 170. Book Syndic.Jte, Devka Malial, Opp. Central
Bank. 171. Lahour Law Publications, 1l73, Sulian
Bazar.
172. Book Link. Corporation, Narayanagoda.
}lA.RDWAR
(Rest.)
(Reg.)
(Res!.)
(Rest.) (Rest). (Rest.)
(Resc.) (Reg.)
(Rest.)
(Reg.)
(Reg.) (Rest. ) (Rest.)
(Reg.)
(Reg.)
(Reg.)
173. Seva Kunj. Kanshal Bhawan, Brahampuri (Rest.)
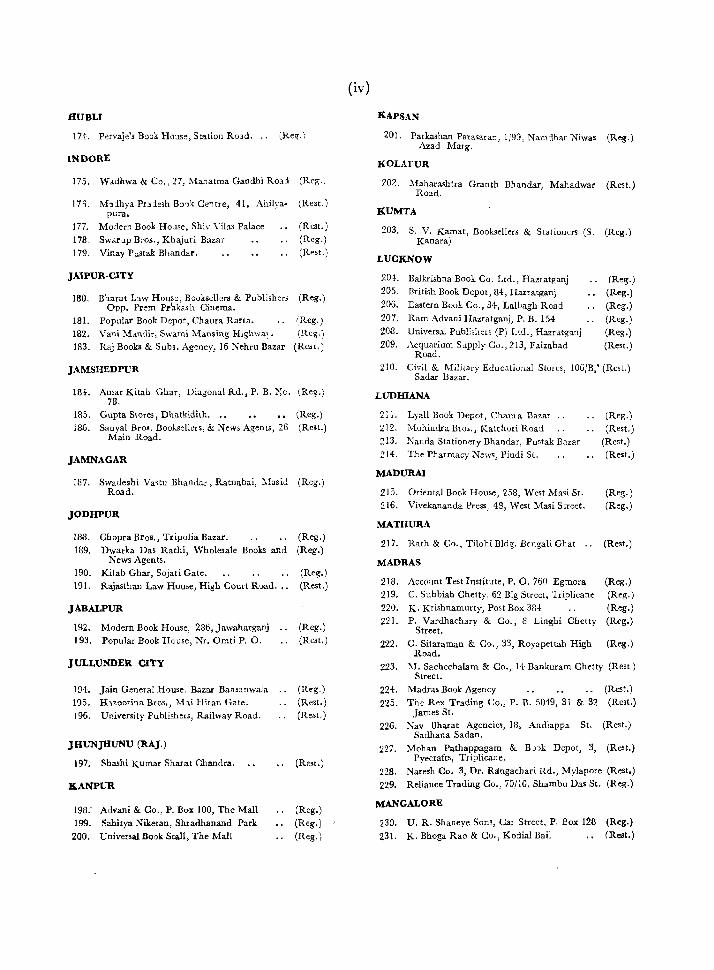
HUBLI
174. Pervaje's Book House, Station Road. (Re~.)
INDORE
175. W~dhwa & Co., 27, ]\Iahatma Gandhi Road
176. Mlihya Puiesh Book Ce~tre, 41, Ahilya-pura.
177. Modern Book Hone, Shi,' Vilas Palace
178. Swarclp Bros., Khajuri Bazar
179. Vinay Pustak Bhandar.
JAIPUR·CITY
180. Bharat L:lw House, Booksellers & Publisher; OPp. Prem Pr'akash Cinema.
181. Popular Book Depot, Chaura Ras.a.
182. Vani Mandir. Swami Mansiug Highwa:. 183. Raj Books & Subs. Agency, 16 Nehru Bazar
JAMSHEDPUR
(Reg.)
(Rest.)
(Rest.)
(Reg.) (Rest.)
(Reg.)
(Reg.) (Reg.)
(Rest.)
18~. Amar Kitab Ghar, Diagonal Rd., P. B. t-\o. (Reg.) 78.
185. Gupta Stores, Dhatkidith. •• (Reg.) 186. Sanyal Bros. Booksellers, & News Agents, 26 (ResL)
Main Road.
JAMNAGAR
lll7. Swadeshi Vastu Bhandar, Ratnabai, Masid (Reg.) Road.
JODHPUR
1ll8. Chopra Bros., Tr ipolia Bazar. 189. Dwarka Das Rathi, Wholesale Books and
News Agents.
190. Kitab Ghar, Sojati Gate. 191. Rajasthan Law House, High Court Road .•.
JABALPUR
192. Modern Book House, 286, Jawaharganj 193. Popular Book House, Nr. Omt; P. O.
J ULLUNDER CITY
194. Jain General House. Bazar Bansanwala 195. H:noorina Bros., ~bi Hiran Gate.
196. University Publishers, Railway Road.
JHUNJHUNU (RAJ.)
197. Shashi Kumar Sharat Chandra.
KANPUR
[98. Advani & Co., P. Box 100, The Mall 199. Sahitya Niketan, Shradhanand Park
200. Universal Book Stall, The Mall
(Reg.) (Reg.)
(Reg.) (Rest.)
(Reg.) (Rest.)
(Reg.) (Rest.) (Res!.)
(Res!.)
(Reg.)
[Reg.) (Reg.)
(iv)
KAPSAN
201. Palkashan Para,ara", IJ9~, Nal,,:!har Niwas (Reg.) Azad Marg.
KOLAFUR
202. Maharashtra Granth Bhandar, Mahadwar (Rest.) Road.
KUMTA
203. S. V. Kamat, Booksellers & Stationers (5. (Reg.) Kanara)
LUCKNOW
20+. Balkrishna Book Co. Ltd., Hazratganj 205. British Book Depot, 8+, Ha~ratganj 20G. Eastern Book Co., 3+, Lalbagh Road
207. Ram Advani Hazratgani, P. B. 154
208. Universal Pllbli3~1ers (P) Ltd., HazratgaCli 209. Acquarium Supply Co., 213, Faizahad
Road.
(Reg.)
(Reg.)
(Reg.)
(Reg.) (Reg.) (Rest.)
210. Civil & Military Educalioi1al Stales, lO6[B,' (Rest.) Sadar Bazar.
LUDHIANA
211. Lyall Book Depot, Cham a Bazar 212. MohinruaB,oi., Kalcholi Road 213. Nanda Stationery Bhandar, Pustak Bazar
214. The Phumacy News, Pindi 51.
MADURA)
215. Oriental Book House, 258, West Masi St. 2 [6. Vivekananda Press, 43, West Masi Street.
MATHURA
217. Rath & Co., Tilohi Bldg. Bengali Ghat
MADRAS
218. Account Test Institute, P. O. 760 Egmora
219. C. Subbiah Chetty, 62 Big Street, Triplicane 220. K. Krishnamurty, Po,t Box 38+ 221. P. Vardhachary & Co., 8 Linghi Chetty
Street.
(Reg.)
(Rest.) (Rest.) (Rest.)
(Reg.) (Reg.)
(Rest.)
(Reg.) (Reg.)
(Reg.) (Reg.)
222. C. Sitaraman & Co., 33, Royapettah High (Reg.) Road.
223. -:\1. Sacheehalam & Co., 14 Bankuram Chetty (Rest) Street.
224. Madras Book Agency (Rest.) 225. The Rex Trading Co., P. B. 5049, 31 & 32 (Rest.)
James St. 226. ;>;av Bharat Agencies, 18, Andiappa St. (Res!.)
Sadhana Sadan. 227. Mohan Pathappagam & B YJk Depot, 3, (Rest.)
Pyecrafts, Triplicane.
228. Naresh Co. 3, Dr. Rangachari Rd., Mylapore (Rest.) 229. Reliance Trading Co., 70/:0, Shambu Das St. (Reg.)
MAN GALORE
230. U. R. Shaneye Sons, Car Street. P. Eox 128 (Reg.)
231. K. Bhoga Rao & Co., Kodia! Bail (Rest.)
311ED.UT
232. Loyal Book Depot, Ohhipi Tank 233. Prakash Educational ~Stores, Subhash
Bazar.
-MUZAFFAR NAGAR
234. B. S. Jain & Co., n, Abupura 235. Gargya & Co., 139, G. New Market
MUZAFFARPUR
(Reg.) (Reg.)
(Reg.) (Rest.)
235. Scientific & Educational Supply Syndicate (Rest.)
MYSORE
237. H. Vankataramiah & Sons, Krishnaragendra (Reg.) Circle.
238. People Book House, Opp. Jagan Mohan (Reg.) Palace.
239. Geeta Book House, New State Circle 24{). Indian Mercantile Corpn. Ramvilas
MANDSAUR
241. Nahta Bros., Booksellers & Stationers
'MUSSOURI
(Reg.) (ReSL)
(Rest.)
242. Hind Traders, N. A. A. Centre, Dick Road. (Rell.)
NAGPUR
243. Western Book Depot, ResidencylRoad (Reg.) 244. The Executive Se~.retary, Mineral Industry (Rest.)
"",sociation ~I ;n '7:11 HouSe Near' All India -Radio SqUatl.
lULGIRIS
245. Mary Martin Booksellers, Kotagiri. Madras (Ilest.) States.
NAINITAL
246. Cousal Book Depot, Bara Bazar
NADIAD
247. R. S. Desai, Station Road
-NEW DELHI
248. Amrit Book Co., Connaught Circus 249. Aapki Dukan,15/5777, Dev Nagar 250. Bhawani & Sons, 3 P, Connaught Place 251. Central News Agency, [23/90, Connaught
Circus.
(Reg.)
(Rest.)
(Reg.) (Reg.) (Reg.) (Reg.)
252. English Book Stores, 7-L, Connaught Circus, (Reg.) P. R. No. 328.
253. Jain Book Agency, C/9, Prem Hou'e, [Can- (Reg.) naught Place.
254. Jayana Bo.ok Depot, P. B. 2505, Karol tBagh (Reg.) 255. Luxmi Book Store, 72, Janpath P. O. Box (Reg.)
553.
256. Mehra Bros., 50-G, Kalkaji, New DeIlli-19 (Reg.) 257. Navyug Traders, Desh Bandhu Gupta Road (Reg.)
DevNagar, '
258. New Book Depot, Latest Books, Periodical. (Reg.) Sty. P. B. 96, Oonnaught Place.
(~)
IUW DELHI-CDlltd.
259. Oxford Book &: Stationery Co., Scindia House (lte!!.) 260. Peoples Publishing House (P) Ltd., Rani (Reg.)
Jhansi Road. 261. Ram Krishna & Sons (Of Lahore) 16/B, (Reg.)
Connaught Place. :z62. R. K. Publishers, 23, Beadonpura, Karol (Reg.)
Bagh 263. Sharma Bros., 17, New Market, Moti Nagar (Reg.) 264. The Secretary, Indian Met. Society, Lodi (Reg.)
Road. 265. Suncja Book Centre, 24/90, Conn aught
Circus. 266.
257.
268.
259.
270.
271.
272.
273.
United Book Agency, 31 Municipal Market, Connaught Circus.
Hindi Book House, 82, Janpath Lakshmi Book Depot., 57, Ragarpura, Karol
Bagh. N. C. Kaunchal & 00., 40, Model Basti,
P. O. Karol Bagh, New Delhi-5. Ravindra Book Agency, 4D/50, Double Storey
Lajpat Nagar. Sant Ram Booksellers, 16, New Municipal
Market, Lodi Colony. Subhas Book Depot, Shop No. 111, Central
Market, Srinivaspuri. The Secy. Federation of Association of Small
Industry ofIndia, 23-B/2, Rohtak Road.
(Reg.)
(Reg.)
(Reg.) (Rest.)
(Rest.)
.(Reg.)
(Rest.)
(Rest.)
(Rest.)
274. Glob Publications, C-33 Nizamudin East.. (Rest.) 275. ,standard Booksellers, Stationers, PaIam (Rest.)
Enclave. 276. Scientific Instruments Stores, :A-355 New (Rest.)
Rajendra NagaI', 277. Shyam Pustak Bhandar, 3319, Arya Samaj (Reat.)
- Road.
PATIALA
278. Jain Ie. Co., 17, Shah Nashin Bazar
PATNA
279. Luxmi Trading Co., Padri-ki-Haveli 280. J. N. P. Agarwal & Co., Padri-ki·Haveli 281. Mod Lal Banarsi Dass & Co., Padri-ki
Haveli. 282. Today & Tommorrow, Ashok Rajpath
POOlSA
283. Deccan Book Stall, Deccan Gymkhana
284. Imperial Book Depot, 266, M. G. Road 285. Sarswat f 67, Patel Flats, 2, Bombay Poona
Road. 286. International Book Service, Deccan Gym.
khana. 287. Ram Book Agency, Opp. Natu's
Near Appa Ba1want Chowk. Chawl,
288. Secy. Bharati Itibasa Samshodhana Mandil, 1321, Sadashiv Peth.
PONDICHl:RRY
289. Honfsty Book Hou,e, 9 Rue Duplix
(Reg.)
(Reg.) (Reg.) (Reg.)
(Reit.)
(Reg.) (Reg.) (Rest.)
(Reg.)
(Reg.)
(Re't.)
(Relit.)
PtJJ>(JJ[KO'ITAl
290. Memakathil.Pattippalam, 4142, East Mainll(Re&t.) 5t.
~~h. P.~ 5waminatban[Shivam' & Co., IEastfJRest.) :wain Road.S
1\AJ1l\)T
292. Wohan Lal Dl)$Sbbai Sbab~ Booksellers lit (R~.) Illbs. It Adyt. "'ellt ••
:a.uPua
293. Pustak; Pratisthan, Sati] Bazar (~est.)
294. Crown Book D~pot, Upper l!azrul •• (lteg. )
UWAlUJ
2!5. Tiki. Ram Sine_La! (Rest.)
SA-GAIl
296. Yadav~Book~ Stall, Publishels &~ Booksellers (ReB!.)
ti:!CUNDKIlABAD
297. Hindustan~ Diary Publishers, Market Street (Rest.)
SIV AUSIj
298. Ganesh Stores, South Car Street (Rest.)
299. Minerva Book Shop, The Mdl .. (Reg.)
8UllAT
300. Shri Gl\iananlPustakalaya, Tower Road I.·. (!ter·) SOl. Gujarat Subs. Agency, Jawahar Lal Nehru (Rest.)
Mart;, Athwa Lines.
TUTICOJUN ,
S02. Shri K. LThiaprajan,'_51, Freneh Chapail(RCllt.) Road.
TlUClDNOPOLLY
!lO3. S. KrlBhnaJwami & Co., 35, Subhash (!lSI., Chandra Bose Road.
TlUPUllA
SM. G. R. Dlltta It C •• , Scieatl'c Equipmellti (Ileat.) Suppliers,
(vi)'
305. International Book Depot, Ullin R<nd (Reg,}-
306. Reddiar Press & Book Depot, P. B. No.4 (Rest.)
TEZPUlt
l307, Jyoti PrakaShan:H~wan, Tezput, Assam~. (Rest,)
UD.uPVl'.
~oa. Book Centr~, Maharana Bhopal Coil •• , (R.est.) Con.umer Co-Op. Society Ltd.
1309. Ashutosh &; Co., Station Road, Opp., Univcr- (Reot.) .ity of Udaipur.
UJJAlN
310. Rami Bros., 41, Mal1ipura
VAlUM.A.SI
1~1l· The Manager, BuuaJ lHindu Book Depot.
Univer,ity
312. Chowkbamba S~nskrit SarieB Office, Gopa1 Mandir Lane, P. B. No.8.
313. Kohinoor Stores, University Rud Lanka .,
314. Viawavidyalaya Pralcashan, K <{Olla, Bhairo Nath Mar,.
l315. Globe Book Centr~. P. O. Hindus University
VlZEGAPATAM
(.It st.)
(R.er·)
(Rq.)
(Rtc·)
(Rec·)
(Rest.)
316. Gupta lBros., Vizia Building (Reg.)
317. The Secretary, 'Andhra University General (R~t.) Co-Op. Stores.,
VELLOU:
318, A. Venkata.subban, tLaw Boobellers
WA.IlDH.A.
319. Swarajeya Bhandar, Ratbi Market
FOR~LOCAL SALE.
•• (It,,.)_.
1. Government of India Kitab Mahal, ]anpath, Opp. India Co:lltt House, New Delhi. Phone No. 44561.
2. Government ofIndia Book Depot, 8, Hastinrs Street, Calcutta, Phone No. 23-3813.
S. High Commissioner for Indian in London, India House, London W. C. 2.
(Vii};
S • R AGENTS AS ON 31..;g·72
I. The Assistant Director, Exten.ioD Centre, Bhuli Road, Dhanhad.
2; The Assistant Director, Extenlion C"ntre, Sl.ntnav.r. Hyderabad-18.
3. The Assistant Director Government of India, S. 1. S. 1. Ministry of C &: i, Extenlion Centre, Kl.piklhwar Road, lldgl.UDl.
4. The Assistant Director, Extemion Cenlre, Krilhna Distt· (A. P.).
5. The AMistant Director, Footwear, Bxtemien Centre Pol" Ground No. I, Jodhpur.
6. The Assistant Director, IndustrW Exleruion Centre, Nadiad (Guj.).
7. The Development Commissioner, Small Seale Indliltrie', Udyog Bhawan, New Delhi.
8. The Dy. Director, Incharge, S. I. S. I. CJo Chief C;-,U Admn., Goa, Paujim.
9. The Director, Govl. PreiS, Hyderabad. 10. The Director, Indian Bureau of Mines, GOyt. of Indil.,
Ministry of Steel, Mines & Fuel, Nagpur.
11. The Director, S. 1. S.L Indultrial ExtenlioD Centre Udhna-Surat.
12.
13.
14-. 15.
_16.
17. 18.
19.
20.
21.
22.
24.
25.
26.
27.
28. 29.
30.
The Employment Officer, Employment Excbanre, Dbar, Madhya Prad~,h.
The Employment Officer, Employment Exchange, Gopa.l Bh"van, Morena.
The Employment Officer, Employment Exchange, Jhabua' The Head Clerk, Govt. Book Depot, Ahmedabad. The Head Clerk, Photozincographic Press, 5 Fina.nce
Ro~d, Poona. The Officer-in. charge, Assam, Govt. B. D., Shillon!:. The Officer-in-charge, Extension Centre, CI",b Road,
Muzaffarpur. The Officer-in-charge, Extension Centre, Industrial
ioatate, Kokar, Ranchi. The OlBcer-in-charie, ,State Information CCIltre,
Hyderabad. The O1!ict:r-in-c~argt:, S. I. S. I., Extension Centre
Malda. The Officer-ill-char,t:, S. I. S. 1., :Habra Tabaluria, 24
~ Parean.,.
The Offi.t:r-ia-cbar!i:e, ,University Employment Bureau, Lnekn.w.
The Officer-in-charge, S. I. S. I. Ohrontannn.g ."tonlion CeDtre, Tangra 33[1, North Topsia Road, Calcutta-46,
The OSicer-ill-char,e, S. I. S. I., tExteruion Oentre (F4IOtwear), Calcutta-2.
The OIIicer-in-eharge, S. I. S. 1., Model Oarpentry Workshop, Puyali Nagar, P. O. Baruipur, 2~ Parganaa.
Publication DivisioD, Salel Depot, North Block, New Delhi.
'Phe Press Oiicer. Orissa Sectt., Cuttaclr:.
'Phe Reristrar ef OOlDpanie.s, Andhra lIaak Bide., 6, Linghi Chotty Street, P. 13. 1530, Madras.
The Registrar .f Companiel, AlaaDl, Man1put aad TripllI'a, ShillODC·
31.
'2. S3.
M.
35. 16.
57.
ss.
39.
+0.
+1. 42.
+3.
44.
+5. 46. 47.
48. 49.
50.
51.
52. 53.
54. 55.
56. 57. 58. 59.
60.
61. 62.
63. 64.
65.
The Registnr of Companies, Bihar J oumal Road, Pabla-I The Registrar of Companies, 162, Brigade Road, Bangalore. The Registrar of Companies, Everest, 100 Marine Driver.
Bombay. The Registrar of Companies, Gujarat State Samachar
Bldg. Ahmedabad. The Registrar of Companies, Gwalior (M. P.). The Registrar of Companies, H. No. 3-5-837, HydOl'
Guda, Hyderabad. The Registrar of Companies, Kerala, 70, Feet Road,
Ernakulam. Tht: Regiltrar of Companies, M. G. Road, West Cott
Bldg. P. B. 334, Kanpur.1
The Registrar of Oompanies, Narayani Bldg Barbottrne Road, Calcutta.
The Registrar of ~Companies, Orissa, Cuttak Chndi, Cuttack.
The Registrar of Companit', Pondicherry,
The Registrar of 'Companies, Punjab &; Himachal Pradesh, Link Road, Jullundur City.
The Registrarlof Companies, Rajasthan, & Ajmer, Sh. Kumta Pra.ad House, 1st Floor, 'C'Scheme, Ashok Marg, Jaipur.
The Registrar-of Companies, Sunlight IMurance Building. Ajmeri.lGatqExtension, New Delhi.
The Regi.trar of Trade Union', Kanpur.
Soochna Sahitya Depot (State Book Depot) Lucknow. Supdt., Bhupendra State Press, Patiala.
Supdt., Govt. Press & Book Depot, Nagpur. Supdt., Govt. Press. Mount Read, Madras.
Supdt., Govt. State, Store, and Pubs. P. O. Gulzenbagh. Palna.
Supdt.,.Govt. Printing & Stationery Depot, Rajasthan,Jaipur Clty.
Supdt., Govt. Printing and Stationery, Rajkot.
Supdt. Govt. Printing and Stationery, PUyUab, Chandigarh.
Supdt., Govt. State Emporium, V. P., Rewa.
Dy. Controller, Printing & Stationery Office Himachal Pradesh, Simla.
Supdt., Printin~and Stationery, Allahabad, Uttar Prddes~
Supdt. Printing and Stationery, Madhya Pradesh, Gwalior Snpdt., Printing and Stationery, Charni Road, Bombay. Supdt., State Govt. Press, Bhopal.
The AsSlt. Dir,et:tor,1 Publicity & Information, Vidban Sandha, Bangalore-I.
Supdt., Govt. Press, Trivandrum.
Asstt. InformatiOD [Officer, PreY Information Bureau, InformationlCentre, Srinagar.
ChIef Controller of Imports & Exports Panjirn Goa :Employment Officer, Employment Excha~e (N~r Bu:
Stop) Sidbi (M. ~P.)
The Director, Regiollai Mcterological Centre. Aliplll', Calcutta.
66. The Asm. Director, State Information Centre, HlIbli.
67.
68.
69. 70,
71.
73·
74.
75.
76.
77.
78.
79.
80.
81. 82.
a5.
The Director of Supplies and Disposa Deptt. of 1 Supply. 10, Mount Road, Madras-2.
Director General of Supplies and Disposals, N. 1. C. Bldg. New Delhi.
The Controller of Imports & Exports; Rajkot. Tte Inspector, Dock Safety, M/L&E Madras Harbour'
Madras.!' The Inspecting Asstt. Commissioner of Income TalC'
Kerala, Ernakulam.
The Under Secretary, . Raha Sabha Seett., Parliament House, New Delhi.
Controller ofImports & Exports, 7, Porlland Park, Visa" khapatnam.
The Senior Inspector, Dock Safety, Bo!ewalla Chambers Sir P. M. Road, Bombay.
Controller of Imports & Exports, 1. ll. 14·P, Pondicherry.
Dy. Director In charge , S. 1. S. I., Sahakar llhavan, Trikon Bagicha, Rajkot.
The Publicity and Ll'>Ision Officer Forest Re.'learch Institute & Colleges, Near Forest, P.'O. Dehradun.
The Asstt. Controller of Imports and Exports Govt. of India, MinistIy of Commerce, New Kandla. '
The Dy. Director General (S. D.) 6, Esplanade East, Calcutta.
The Director, Govt. of India, S. I. S. I. Ministry of I & S. Industrial Areas-B, Ludhiana.
The Govt. Epigraphist for India. The A"tt. Director, Incharge, S. r. S. 1. Extension Centre
Varansi. The Director of Supplies, Swarup Nagar, Kanpur. The Asstt. Director (Admn.) Office of the Dte. of
Supplies & Disposal, Bombay. Tile Chief Controller of Imports & Exports, Ministry of
International Trade, Madras. Dy. Collector of Customs, Custom House,
Visakhapatnam. 87. The Principal Officer, Mercantile Marine Departmeut
Calcutta. ' -88. The Direetor, S. 1. S I. Karan Nagar, Srinagar. 89. The Director, I/C, S. 1. S.1., 107, Industrial Estate,
Kanpur. "90. The Director of Inspection, lNe\'{ Marine LinCl,
Bombay.I. '91. The Dy. Chief Controller of Imports & Exports, T. D.
Road, Ernakulam. 92. The Asstt. Director, Govt. Stationery & Book Depot,
Aurangabad. 93. The Asstt. Director I/C., S. I. S. 1. Club Road, Hubli.
94. The Employment Officer, Talcher. 95. The Director ofInspection, Dte. G & S, Disposal.l,
Ganem Chandra Avenue, Calcutta. 96. The Collector of Customs, New Custom House, Bombay. 97. The Controller ofImpolts & Exports, Bangalore. "98. Tie Admn. Officer, Tariff Commissioner, 101, Queen's
Road, Bombay. 99. The Conunissioner ofIncome Tax, Patiala.
100. The Director, Ministry of 1. & Supply (Deptt. ofIndu· stry), Cuttaek.
101. The Dy. Director of Public Relations State Information, Centre, Patva.
101. Tho: Officer-in· Charge, State Information Centre, },(t.dras
to!!. The Nott. Director, S. t. S. I. M. I. Road,Jaipur. 104. The Collector of Customs, Madras. 105. National Building Org., Nirman Bhavan, New Delhi. 106. The Controller of Communication, Bombay Region,
Bombay, 107. The Karnatak University, Dharwar. 108. The Sard"" Patel University, Vallabh Vidyanagar.
109. The Principal Publlcatior.s Officer sending comms~ion for Scientific & Tech., Terminology, UCC, Building, New Delhi.
110. The Officer. in· Charge, Information Centre, Swai Ram Singh Road,J"ipur.
Ill' . The Director General of Civil Aviation, New Delhi.
112. Controller of Aerodromes, Delhi. ll3. Controller of Aerodromes, Calcutta. 114. Conttaller of Aerodromes, Bombay. 115. Controller of Aerodromes, J\Iadras. 116. The Registrar, Punjab Agrl. University, Ludhiana. 117. The Land & Development Officer, M. of Health Family
Planning W. H. & U. D., Nirman Bhavan, New Delhi.ll.
118. Acting Secretary, Official Language (Leg.) Commission, Ministry of Law. Bhagwan Dass Road, New Delhi.
CENSUS J. Registrar General India, 2/A, Mansingh Road, New,
Delhi.ll. 2. The Director of Census Operations, Andbra Prade'lh
Khusro Manzi!, Hydetabad·4. 3. The Director of Census Operations, Assam BO!:lfvle Roa,l,
Shillong·l . 4. The Director of Census Operations, Bihar, Boring Canal
Road, Patna. 5. The Director of Census Operations, Guj:u-at, Ellis Bridge.
Ahmedaba 6. 6. The Director of Census Operations, Haryana, Kothi No. I,
Sector 10·A, Chandigarh. 7. The DirectQr of Census Operations, Himachal Pradesh,
Boswel, Simla-5. 8. The Director of Census Operations, Jammu &. Kashmir,
19 Karan Nagar, Srinagar. 9. The Director of Census Operations, Kerala, Kowdiar
Avenue Road, Trivandrum.3. 10. The Director of Census Operations, Madhya Pradesh, Civil
Lines, Bhopal·2 (M. P.) II. The Director of Census Operations, Maharashtra, Sprott,
Road, Bombay·l (BR). 12. The Director of Census Operations, M',Inipur.lmphal. 13. The Director of Census Operations, [Meghalzya, Nangri
Rills, Shillong-S. H. The Direct!)r of Census Operations, Mysore, Basappa CrOSS
Road, Shanti Nagar, Bangalore.l. 15. The Director of Census Operations, Nagaland, Kohima. 16. The Director of Census Operations, Orissa, Chandni
. ,Chouk, Cut tack· 1
17. The Director of Census O;:>erations, Punjab, No. 72, Sector·5, Cbandigath.
18. The Director of Census Operations, Rajasthan.Rambag Palace, J aipur. .
19. .The Director of . Census .Qperations, Tamil Npdl!, ~ 10' Poes Carden, Madra.,·86.
20. The Director of CenSuS Operations, lripura, Durga Bari West Compound, Agartala.
21. The Director or Census Operations, Uttar Pradesh, 6-Park Road, Lucknow.
22.
23.
24.
25,
26,
The Director of Census Operations, '~est Bengal, 20 British Indian Street, Calcutta-!'
The Director of Census Operations, Andaman and Nicobar hlands, Port Blair.
The Directot' of Census Operations Arunachal Pradesh, Laithumkhrah, Shillong. '
The Director of Census Operations, Chandigarb, Kotbi No. 1012. Sector, 8-C, Chandigarh.
The Director of Census Operations, Dadra and Nagar Haveli, Panaji,
GCPB--201-DC0-27-9-73- 18000.
(ix)
27,
28.
29,
The Director of Census Operations Delhi 2 Unde! Hill Road, Delhi-6, " ,
The Director of Census Operations Goa Daman & Diu Dr. A. Borkar Road, Panaji, ' ,
The Director of Census Operations, L, M, & A, Islands Kavaratti.
30. The Director of Census Operations, Pondicherry, Madras