bihar - Linguistic Survey Of India
287
CENSUS OF INDIA 2001 SERIES-11 DISTRICT CENSUS HANDBOOK Part -A & B BIHAR SHEOHAR DISTRICT VILLAGE & TOWN DIRECTORY VILLAGE AND TOWNWISE PRIMARY CENSUS ABSTRACT Sudhir Kumar Rakesh of the Indian Administrative Service Director of Census Operations, Bihar
-
Upload
khangminh22 -
Category
Documents
-
view
4 -
download
0
Transcript of bihar - Linguistic Survey Of India
CENSUS OF INDIA 2001
SERIES-11
DISTRICT CENSUS HANDBOOK
Part - A & B
BIHAR
SHEOHAR DISTRICT
VILLAGE & TOWN DIRECTORY
~
VILLAGE AND TOWNWISE PRIMARY CENSUS ABSTRACT
Sudhir Kumar Rakesh of the Indian Administrative Service
Director of Census Operations, Bihar


IN D I A 8 I H A R
v'> '0 :;,1%
- <\; ~
DISTRICT SHEOHAR " ~'I)
'-. . ( \
Km 5 o \. "
, Bara!ll Mohan " 5 Km
, "' • I i Bakhar Chr,mdlha \
\ @/ I I d
I PURNJiHIYA (
To(af Kuraf
I • I \
"
Kh~ufa Pahan . mwa Kalan -I' --. / cfl
/'(-). 'PrP~~ffl©.} ,'- -__.:... -'"'\,...;1 Area(SqKm) 34900 933
Popuialion 515961
33967
494699 21al2 J 'I' _,. '\., _ • I. I.. • ,) , '~'L .-'__"~. Basahw
/Sh6:h/ /'
" \ \.,. (IMaSaUra ) ';() No of Village<> 203 r'· \ ...... __ /'_' \ . __ No of Town, 01 \ Sugw \,<a esn • \ '_, "" ...-'
. ~ eha anpur /Mlnapur Balha' Dlslance of DIstrict Head QUdrters , TaJpur A \-' • \ (1 10 Slate Head Quarters 132 Km '. ".'\ "'IlJJ1 ,
(I)
© Naya Gavn
r. /. II I ~ ~ ~ J '.;" \ \. Dhankaul ITo
_ • _, _ • oJ' Jah:ngl~U \ SHEO R \ . _ ' -,_ ~ _. ' S~~marhl I Naya Gaon \ /' . , _
(.. '\...- /.1 0 \ Sham pur _ ,/ / I ,
BOUNDARY DISTRICT
C D BLOCK
IMPORTANT METALLED ROAD
RIVER AND STREAM
DISTRICT HEADQUARTERS
C D BLOCK HEADQU ARTERS
VILLAGES HAVING 5000 AND ABOVE POPULATION
URBAN AREA WITH POPULATION SIZE
CLASS 1Il
Kursa_hElr __ . ...... \
I I
I To Duma
I • •
Khurpattl' \
RIANI CHOWK'
@ "' - I Chhaprj
I \
I
urf Narwara ,
/
~-
:J> RumsaJdpur
~
td upon ~urvey of indict map wllh the pellTIl%IOn of the Surveyor Generdi of India C GoverllnPnl of Indld {opYllgh, Z004


Bbubnesbwar Temple - Deokuli, Sbeobar
The ancient Bhubneshwar Temple of Lord Shiva is situated 5 kms. east of Sheohar town between Sheohar-Sitamarhi sector on National Highway no. 104 near the river Bagmati. The legend is that the great mythological warrior, Parsurama - the famous devotee and disciple of Lord Shiva established here the SHIVALINGA and worshiped the deity for thousands of years. During the month of SHRAWA"!A a big fair is held every year around the temple.


Foreword
Preface
Acknowledgements
Contents
Pages
xi
xiii
xv
XVII
XIX
xxi
District Highlights - 2001 Census
Important Statistics in the District
Ranking of C.D. Blocks in the District
Statement - 1 to 9 xxii - xxviii
Statement-l
Statement-2
Statement-3
Statement-4
Statement-5
Statement-6
Statement-7
Statement-8
Name of the headquarters of district/tehsils, their rural-urban status and distance from district headquarters, 2001
Name of the headquarters of district/C.D. block, their ruralurban status and distance from district headquarters, fOO 1
Population of the district at each census from 190 I to 200 I
Area, number of villages/towns and population in the district and C.D. Blocks, 200 I
C.O. Block wise number of villages and rural population, 2001
Population of Urban Agglomerations (including constituent units)/ Towns
Villages with population of 5,000 and above at C.D. Block level as per 2001 census and amenities available
Statutory towns with population less than 5000 as per 200 I census
XXII
XXII
XXIJI
XXIV
xxv
xxv
xxvi
and amenities available XXVIlJ
Statement-9 Houseless and Institutional population of C.O. Blocks, rural and urban, 200 J xxviii
Diagrams
Analytical Note
(i) History and the scope of the District Censlls Hand Book
(ii) Brief History of the District
(iii) Administrative Set-up
(i\l) Physical features
(v) Census Concepts
(vi) Non-Census Conc.epts
(vii) 2001 Census findings - Population, its distribution J.J II Jill!> ~ "
XXIX
3 - 51
3
5
5
6
9
16
21

Pages
(a) Brief analysis of PCA data based on inset tables I to 36 21
(b) Brief analysis of the Village Directory and Town Directory data based on inset tables 37 to 47 40
(c) Brief analysis of the data on houses and household amenities ( Houselisting Operations. Census of India 200 I) based on inset tables 48 to 52 46
(viii) Major social and cultural events, natural and administrative developments and significant activities during the decade 5 I
(ix) Brief description of places of religious, historical or archaeological importance in villages and places of tourist interest in the towns of the district 51
(x) . Major characteristics of the district, contribution of the district in the form of any historical figure associated with the district 51
(xi) Scope of Village Directory and Town Directory - column heading wise explanation and coverage of data - 5 I
PART-A: VILLAGE AND TOWN DIRECTORY
Section-I: Village Directory
(a) Note. explaining the abbreviations used in Village Directory
.(b) List of villages merged in towns and outgrowths at 2001 Census
(c) C.D. Blockwise presentation of Village Directory Data
(i) C.D.Block Map showing C.D.Block boundary (ii) Alphabetical list of Villages alongwith location code 1991 and 200 I (iii) Presentation of Village Directory Data in prescribed format
I. C.D. Block Purnahiya
2. C.D. Block Piprarhi
3. C.D. Block Sheohar
4. C.D. Block Dumri Katsari
5. C.D. Block Tariyani Chowk
(d) Appendixes to Village Directory
Appendix-I Abstract of Educational, Medical & other amenities in villages - C.D. Block level
Appendix IA: Villages by number of primary schools
59
62
63 - 107
63
73
83
97
107
128 - ]40
}lS'
131
Appendix IB Villages by primary, middle and secondary schools 13 I
Appendix IC Villages with different sources of drinking water facilities available 132
Appendix II : Villages with 5,000 and above population whi~h do not have one or more amenities 132
Appendix I1A: Census Towns which do not have one or more amenities 133

Appendix III : Land utilization data in respect of censlis towns/non~
municipal towns
Appendix IV : C.D. Blockwise list of inhabited villages where no amenity
Pages
133
other than drinking water facility is available 133
Appendix V Summary showing number of villages not having Scheduled Castes population 134
Appendix VI Summary showing number of villages not having
Scheduled Tribes population 134
Appendix VIlA: List of villages according to the proportion of Scheduled
Castes to the total population by ranges J 35
Appendix VIIB: List of villages according to the proportion of Scheduled
Tribes to the total population by ranges 140
Appendix VIII : Number of Villages under each Gram Panchayat
(C.O. block wise) 141
Appendix IX : Statement showing number of girls schools in the villages 142
Sectjon~lI : Town Directory
(a) Note explainIng the abbreviations used in Town Directory
Town Directory Statements (J to VII)
(b) Statement I Status and growth history
145
ISO ~ 164
150
(c) Statement II Physical aspects and location of towns 152
(d) Statement III : Municipal finance 154
(e) Statement IV : Civic and other Amen ities 156
(t) Statement V : Medical, Educational, Recreational and Cultural facilities ) 58
(g) Statement VI : Trade, Commerce, Industry and Banking 160
(h) Statement VII: Civic and other amenities in slums ]62
(i) Appendix to Town Directory - Towns showing their outgrowth with population 164
PART-B : PRIMARY CENSUS ABSTRACT
(a) Brief note on Primary Census Abstract
(b) District Primary Census Abstract (General)
(c) Appendix to District Primary Census Abstract i.e., Urban blockwise
figures of total, SC and ST population
Primary Census Abstract for Scheduled Castes
Primary Census Abstract for Scheduled Tribes
C.D. Blockwise Village Primary Census Abstract
J. C.D. Block Purnahiya
2. C.D. Block Piprarhi
167
170
176
178
184
}90 - 232
190
196
3 C O. Block Sheohar
4. C.D. Block Oumri Katsari
5. C.O. Block Tariyani Chowk Urban Primary CensLls Abstract
Annexure 1
Annexure 11
Annexure III
Annexure IV
Annexure V
Annexure VI
Annexure VII :
Annexure VIII:
Number of Villages under each Gram Panchayat
Estimates of child mortality, 1981 and 1991 Census
Various measures of fertility and mean age at marriage 1991 Census
Percentage distribution of migrants by place of birth/place of last residence, 200 I Census
Brief account of main religions in the District/C.O. Blocks as per 2001 Census
Marital status of population as per 2001 Census
Age, Sex and Education in the district, 2001 Census
Distribution of.difft!rent mother tongues returned in 2001 Census
Pages
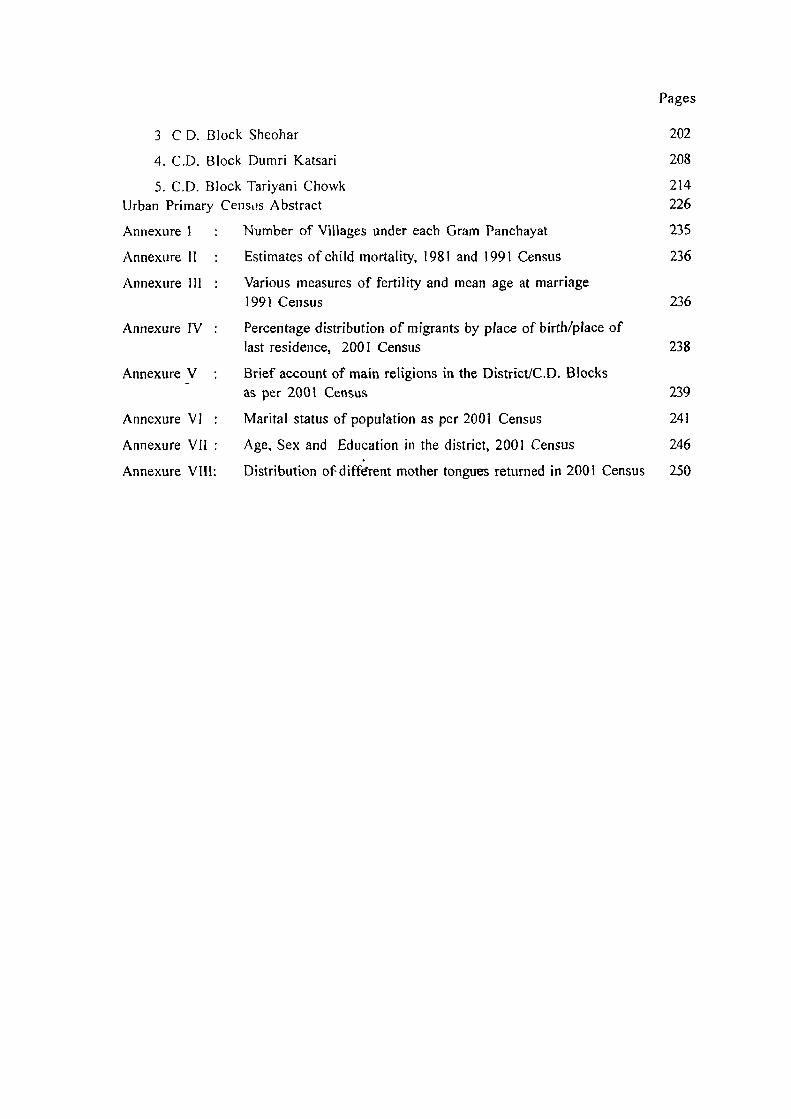
202
208
214 226
235
236
236
238
239
241
246
250

Foreword
T.he District Census Handbook (DCHB) published by Census Organization since 1951 census, is one of the important publication in the context of planning and development at grass-root level. The publication,
which is brought out for each district, contains several demographic and socio-economic characteristics vi II agewise and town-wise of the district along with the status of availability of civic amenities, infrastructure facilities, etc.
The scope of the DCHB was initially confined to a few Census Table and Primary Census Abstract (PCA) of each village and town within the district. Thereafter, at sllccessive cenSllses, its scope and coverage has been enlarged. The DCHB published at the 1961 census provided a descriptive account of the district, administrative statistics. censlIs tables and a village and town directory including PCA. The 1971 censllsDCHB series was in three parts: Part-A related to village and town directory, Part-B to village and town PCA and Part-C comprised analytical report, administrative statistics, district census tables and certain analytical tables based on PCA and amenity data in respect of villages. TAe 1981 censlls DCHB was in two parts: PartA contained village and town directory and Part-B the PCA of village and town including the SCs and STs PCA up to tahsil! town levels. New features along with restructtlring of the formats of villages and town dire rectory were added into it. In village Directory, all amenities except electricity were brought together and if any amenity was not available in the referent village, the distance in broad ranges from the nearest place having such an amenity, was given. Information on new items such as adults literacy centers, primary health sub-centers and community health workers in the villages were provided so as to meet the requirements of some of the Revised Minimum Needs Programme. Information on approach to the village was-provided for the first time in the Village Directory so as to given the details on number of inaccessible villages in each district. In Town Directory, a statement (IV-A) on slums was introduced to provide the details on civic and other amenities in the notified slums of Class I and ClasslI towns.
The 1991 census DCHB, by and large, followed the pattern of presentation of 1981 census, except the format of PCA was restructured. Nine-fold industrial classification of main workers was given against the four-fold industrial classification presented in the) 981 census. In addition, sex-wise population in 0-6 age group was included in the PCA for the first time with a view to enable the data users to compile more realistic literacy rate as all children below 7 years of age had been treated as illiterate at the time of 199) census. One of the important innovations in the 1991 census was the Community Development Block (CD block) level presentation of vi II age directory and PCA data instead of the traditional tahsil/ talukiPS level presentation. It was excepted that the presentation of village directory aRd PCA data at CD block level will help the planners in formulation of micro level development"plans; ·CD b1E)~k being lowest administrative unit.
The present series of 2001 census DCHBs have been made more informative and exhaustive in terms of coverage and content. The Village Directory has been enlarged in scope by including a number of other facilities like banking, recreational and cultural facilities, newspapers and magazines and 'most important commodity' manufactured in village. Income and expenditure of gram panchayat, wherever possible, has been provided. Apart from these, more details On distance (s) at which basic amenities are available (if not available in the village), are given. This includes educational facilities (namely Primary and middle schools and college), medical facilities (viz. Allopathic Hospital, Maternity & Child Welfare Center and Primary Health Center), drinking water, post & telegraph (post office and phone), cornmunic1tion, bank, credit societies and recreational facilities. In Town Directory, the statement on slums has been modified and its coverage enlarged by including

details on all slums instead of ' notified slums'. The information is given in case of all statutory towns irrespective of their class, against only ClassI and Class II towns in the 1981 and 1991 censuses. The basic amenities
available in village and towns are analyzed in depth with the help of a number of cross-classified inset tables
and statements. Two other significant additions in the publication are inclusion of 'motif' highlighting significant characteristic of the district and analytical notes as annexure. The analytic notes on (i) fertility and mortality and (i i) various measures of ferti 1 ity and mean age at marriage are prepared based on 1991 Census. Whereas,
in the notes relating to (i) percentage distribution of migrants by place of birth/ place of last residence, (ii) main religions. (iii) marital status of population, (iv) age, sex and education, and (v) dIstribution of spectrum of mother tongue, nature and extent of changes occurred in the district in its basic socio-demographic features during the decade 1991-2001 are analyzed. The eight digits permanent location code (PLCN) to all the villages
and towns have been assigned keeping in view the future needs.
The village and town level amenity data have been collected, compiled and computerized in prescribed
record structure under the supervision of Shri Sudhir Kumar Rakesh, Director of Census Operations, Bihar,
Patna. Thereafter, efforts have been made to ensure comparability of the information with that of 1991 census data and the information brought out by the respective state govern~ent in their annual reports and statistical handbooks for various years after 1991. The task of planning, designing and coordination of this
publication was carried out by Sri R.G.Mitra, Deputy Registrar General (C&T) and Dr.I.C.Agarwal, Senior
Research Officer of Social Studies Division. Dr.R.P.Singh,Deputy Registrar General (Map) provided the
technical guidance in the preparation of maps. Whereas, Shri Anil Kumar Arora Deputy Director of Data
Processing Division who worked under the overall supervision of Shri Himakar, Addl. Director (EDP) helpf.d _ in preparati.on of record structure for computersation of village and directory data and the programme for
the generation of Village Directory and Town Direcotry statements including analytical inset tables. The draft
DCHB manuscripts received from the Census Directorates have been scrutinized in the Social Studies Division under the guidance of Shri S.LJain, Deputy Director and Shri R.K. Mehta, Assistant Director. I am thankful
to all of them and others who have contributed to make this publication possible
New Delhi
Dated: 17.10.2006
(xii)
D.K.Sikri
Registrar General &
Census Commissioner, India

Preface
The history of the publication of District Census Handbooks goes back to the 1951 Census and these are printed in every Census because of their wide ranging utility. Census after Census much innovations!
modifications have taken place in the District Census Handbooks in terms of coverage and content ofpopulation
data. This is the most valuable district level publication brought out by the Census Organisation on behalf of the State Government. Its inter-alia, provides data/information on some of the basic demographic and socioeconomic characteristics and availability of certain important civic amenities/facilities in each village and town of the respective district. This publication has, thus, proved to be of immense utility to the planners, administrators, academicians and researchers. It is hoped that this publication will serve the purpose of the ever increasing demand for the micro-level data in_ this era of planned development.
The District Census Handbook project is joint venture of the State Government and the Census organisation,
and is brought out in two parts, viz. (i) part A--containing the village and town directories and (ii) part B -village and townwise Primary Census Abstracts pertaining to total populatjon. It also contains the District Primary Census Abstracts for the total population and the Scheduled Caste and the '~cheduled Tribe Population by rural-urban break-up.
The present volume of the District Census Handbook (DCHB) in 200 I Census has been made more informative and exhaustive in terms of coverage and content. The village Directory mainly covers educational, medical, drinking water, post & telegraph, banking, credit societies, recreational & cultural and communication
facilities and approach to villages available in the villages, besides, population and land use data, The content of Village Directory has been broadened by including additional facilities such as availability of banking, recreational and cultural facilities and reach of newspapers and magazines in villages. For the tirst time in this volume information on the most important commodity manufactured in village is provided: The Town Directory basically contains growth trend of towns since 1901, physical aspects and location, municipal finance, civic and other amenities, medical, educational, recreational and cultural facilities, tfade, commerce, industry and banking and civic and other amenities available in slums. In Town Directory, information on all types of slums, whether notified/recogn ized by respective town authorities or not is provided for each statutory town. However, during 1981 and 199 I Censuses this information was restricted to class I and class II towns only.
The various basic amenities available in the villages and towns are analysed in depth with the help of a number of cross-classified inset tables and statements. A significant addition in the publication is the inclusion of analytical notes presented as annexures on important aspects concerning, CenslJ'S dat~ on (i} mortality (ii) various measures of fertility and mean age at marriage, (iii) perc!!n'tage distributfon of migrants by place
ofbirthl place of last residence, (iv) main religions, (v) marital status of population, (vi) age, sex and education, and (vii) distribution of different mother tongues, based on 1991 and/or 200 I Census, with the prime objective of analysing the extent of changes taken place in socio-cultural demographic and economic tield during the last decade. The eight digit permanent location code (PLCN) has bee~ assigned to an the vilrages to facilitate the comparision of data with future censuses.
It is worth mentioning that the District Census Handbooks of the Census of India, 2001 are being made available for the tirst time in electronic format in addition to printed volumes Keeping in view the demands of the data users.
(xiiO
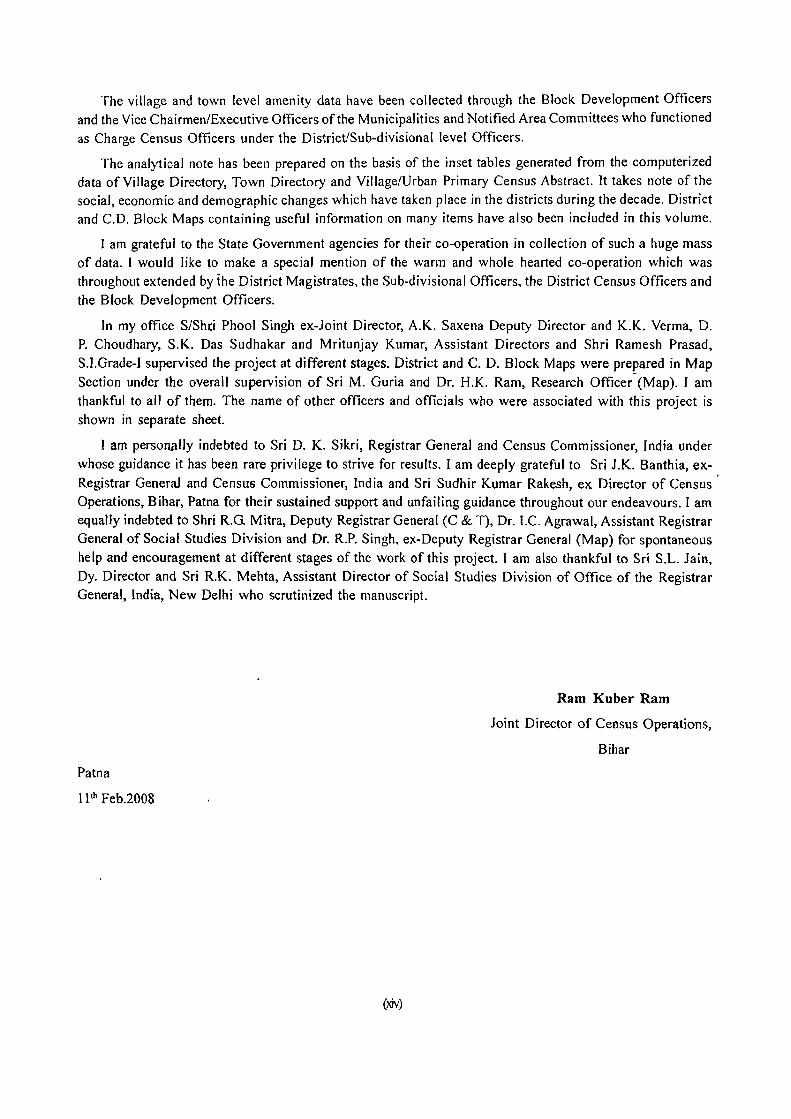
The village and town level amenity data have been collected through the Block Development Officers and the Vice Chairmen/Executive Officers of the Municipalities and Notified Area Committees who functioned
as Charge Census Officers under the District/Sub-divisional level Officers.
The analytical note has been prepared on the basis of the inset tables generated from the computerized data of Village Directory, Town Directory and Village/Urban Primary Census Abstract. It takes note of the social, economic and demographic changes which have taken place in the districts during the decade. District and C.D. Block Maps containing useful information on many items have also been included in this volume.
I am grateful to the State Government agencies for their co-operation in collection of such a huge mass
of data. I would like to make a special mention of the warm and whole hearted co-operation which was
throughout extended by the District Magistrates, the Sub-divisional Officers, the District Census Officers and
the Block Development Officers.
In my office S/Sh[i Phool Singh ex-Joint Director, A.K. Saxena Deputy Director and K.K. Verma, D.
P. Choudhary, S.K. Das Sudhakar and Mritunjay Kumar, Assistant Directors and Shri Ramesh Prasad,
S.I.Grade-J supervised the project at different stages. District and C. D. Block Maps were prepared in Map Section under the overall supervision of Sri M. Guria and Dr. H.K. Ram, Research Officer-(Map). I am
thankful to all of them. The name of other officers and officials who were associated with this project is
shown in separate sheet.
I am persolUllly indebted to Sri D. K. Sikri, Registrar General and Census Commissioner, India under
whose guidance it has been rare privilege to strive for results. I am deeply grateful to Sri J.K. Banthia, ex
Registrar General and Census Commissioner, India and Sri Sudhir Kumar Rakesh, ex Director of Census Operations, Bihar, Patna for their sustained support and unfailing guidance throughout our endeavours. I am equally indebted to Shri R.G. Mitra, Deputy Registrar General (C & T), Dr. I.C. Agrawal, Assistant Registrar General of Social Studies Division and Dr. R.P. Singh, ex-Deputy Registrar General (Map) for spontaneous
help and encouragement at different stages of the work of this project. I am also thankful to Sri S.L. Jain,
Dy. Director and Sri R.K. Mehta, Assistant Director of Social Studies Division of Office of the Registrar General, India, New Delhi who scrutinized the manuscript.
Patna
11th Feb.2008
(xiv)
Ram Kuber Ram
Joint Director of Census Operations,
Bihar
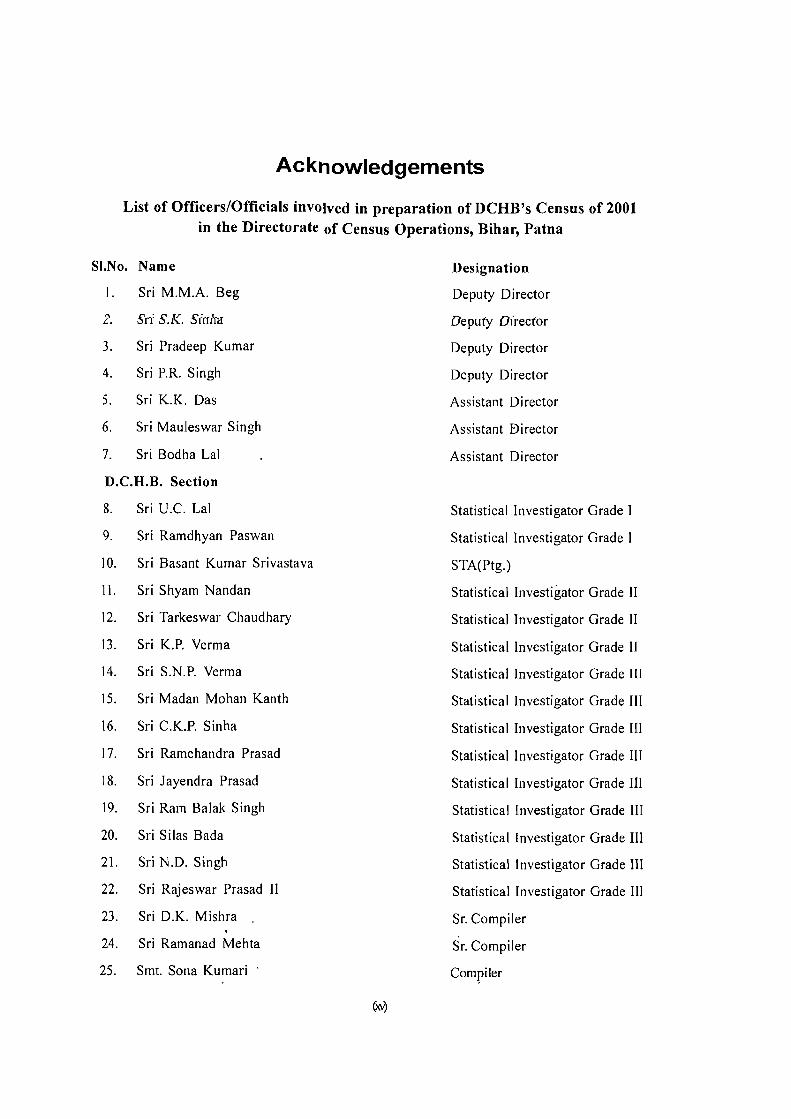
Acknowledgements
List of Officers/Officials involved in preparation of DCHB's Census of 2001 in the Directorate of Census Operations, Bihar, Patna
SI.No. Name Designation
Deputy Director
Oeputy O{rector
Deputy Director
Deputy Director
Assistant Director
I. Sri M.M.A. Beg
" L.. Sn' S.K. Sinha
3. Sri Pradeep Kumar
4. Sri P.R. Singh
5. Sri K.K. Das
6. Sri Mauleswar Singh
7. Sri Bodha Lal
D.C.H.B. Section
8. Sri U.C. Lal
9. Sri Ramdhyan Paswan
10. Sri Basant Kumar Srivastava
11. Sri Shyam Nandan
12. Sri Tarkeswar Chaudhary
13. Sri K.P. Verma
14. Sri S.N.P. Verma
15. Sri Madan Mohan Kanth
16. Sri C.K.P. Sinha
17. Sri Ramchandra Prasad
18. Sri J ayendra Prasad
19. Sri Ram Balak Singh
20. Sri Silas Bada
21. Sri N.D. Singh
22. Sri Rajeswar Prasad II
23. Sri O.K. Mishra
24. Sri Ramanad Mehta
25. Smt. Sona Kumari
Assistant Birector
Assistant Director
Statistical Investigator Grade I
Statistical Investigator Grade I
STA(Ptg.)
Statistical Investigator Grade II
Statistical Investigator Grade II
Statistical Investigator Grade II
Statistical Investigator Grade III
Statistical Investigator Grade III
Statistical Investigator Grade III
Statistical Investigator Grade III
Statistical Investigator Grade III
Statistical Investigator Grade III
Statistical Investigator Grade III
Statistical Investigator Grade III
Statistical Investigator Grade III
Sr. Compiler
Sr. Compiler
Compiler

SI.No. Name Designation
26. Sri Akhilesh Kumar Compiler
27. Sri Indradev Das Compiler
28. Sri Asheesh Kumar Singh Compiler
29. Md. Serajuddin Assistant Compiler
30. Md. Asharful Hoda Lower Division Clerk
31. Sri Surendra Mohan Prasad Lower Division Clerk
32. Sri S.S. Srivastava D.E.O. "B"
33. Sri Ranj it Kumar Singh D.E.O. "B"
34. Sri Raj Kapoor Rajak D.E.O. "8"
35. Sri Sanjeev Kumar Srivastava D.E.O. "B"
36. Sri Jagjit Lakra D.E.O. "8"
37. Md. Shakeel Ahmed D.E.O. "B"
Map Section
38. Sri Utpal Kumar Mandai Senior Geographer
39. Sri Indrakant Mishra Senior Drawing Assistant
40. Sri P.K. Sinha D.E.O. "8"
41. Sri P.L. Khandait D.E.O. "8"
42. Md. Nasimuddin Khan Draughtsman
43. Sri Ratan Kumar Roy Draughtsman
(XVI)
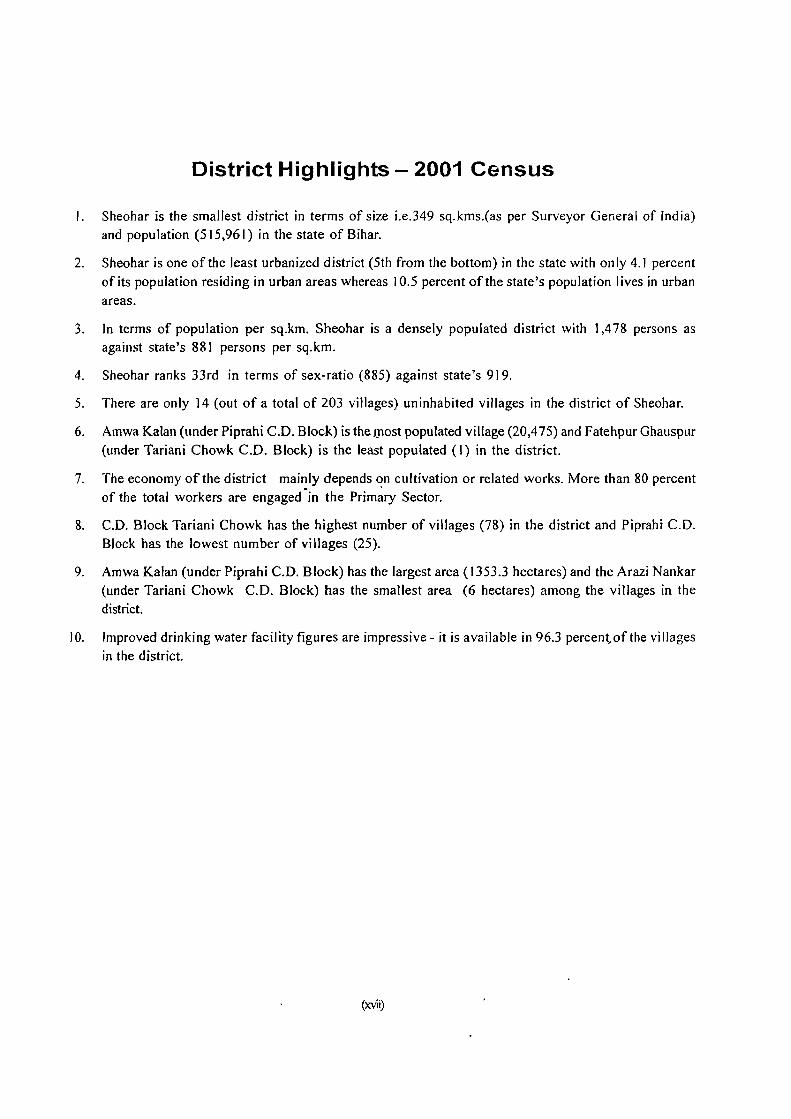
District Highlights - 2001 Census
I. Sheohar is the smallest district in terms of size i.e.349 sq.kms.(as per Surveyor General of India) and population (515,961) in the state of Bihar.
2. Sheohar is one of the least urbanized district (5th from the bottom) in the state with only 4.1 percent of its population residing in urban areas whereas 10.5 percent of the state's population lives in urban areas.
3. In terms of population per sq.km. Sheohar is a densely populated district with 1,478 persons as against state's 881 persons per sq.km.
4. Sheohar ranks 33rd in terms of sex-ratio (885) against state's 919.
5. There are only 14 (out of a total of 203 villages) uninhabited villages in the district of Sheohar.
6. Amwa Kalan (under Piprahi c.o. Block) is the most populated village (20,4 75) and Fatehpur Ghauspur (under Tariani Chowk C.D. Block) is the least populated (I) in the district.
7. The economy of the district mainly depends on cultivation or related works. More than 80 percent of the total workers are engaged -in the Prim~ry Sector.
8. C.D. Block Tariani Chowk has the highest number of villages (78) in the district and Piprahi c.O. Block has the lowest number of villages (25).
9. Amwa Kalan (under Piprahi C.D. Block) has the largest area (1353.3 hectares) and the Arazi Nankar (under Tariani Chowk C.D. Block) has the smallest area (6 hectares) among the villages in the district.
10. Improved drinking water facility figures are impressive - it is available in 96.3 percent" of the villages in the district.
(xviO

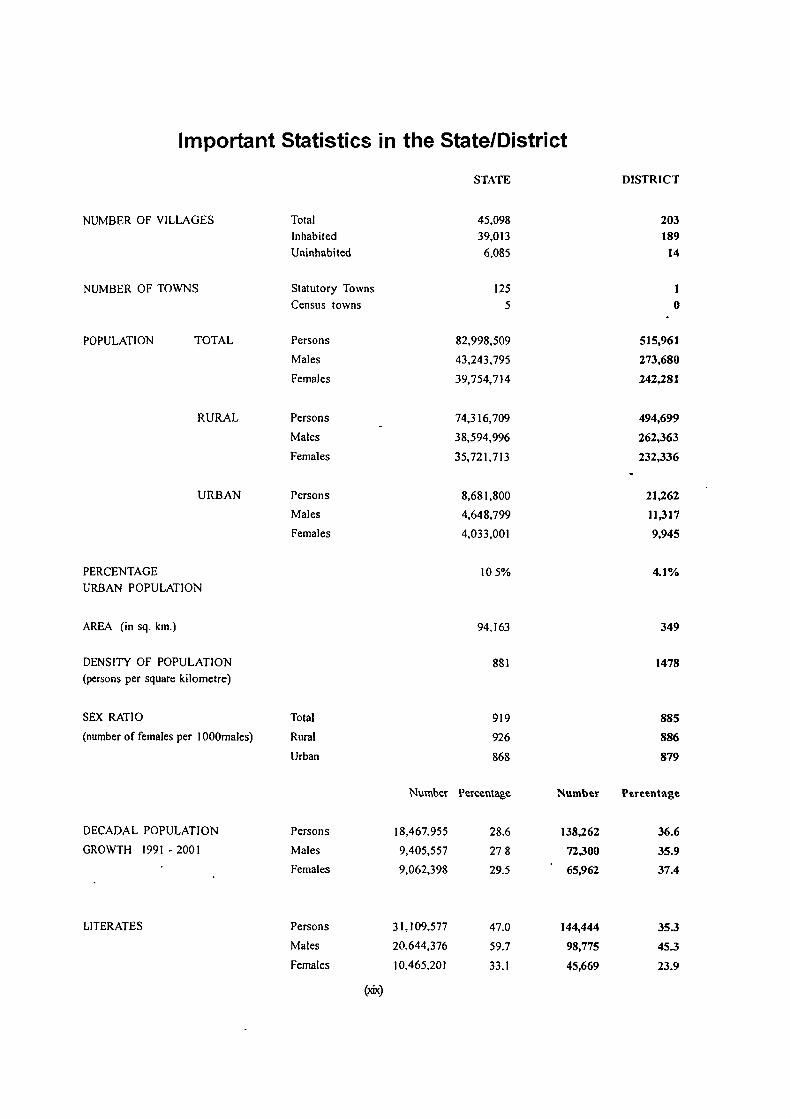
Important Statistics in the State/District
STATE DISTRICT
NUMBER OF VILLAGES Total 45.098 203 Inhabited 39,013 189 Uninhabited 6,085 14
NUMBER OF TOWNS Statutory Towns 125 1 Census towns 5 0
POPULATION TOTAL Persons 82.998,509 515,961
Males 43,243.795 273,680
Females 39,754,7J4 242,281
RURAL Persons 74,316,709 494,699
Males 38,594.996 262,363
Females 35,721.713 232,336
URBAN Persons 8,681,800 21,262
Males 4,648,799 11,317
Females 4,033,001 9,945
PERCENTAGE 105% 4.1% URBAN POPULATION
AREA (in sq. km.) 94,163 349
DENSITY OF POPULATION 881 1478 (persons per square kilometre)
SEX RATIO Total 919 885
(number of females per 1000males) Rural 926 886
Urban 868 879
Number Percentage Number Perc~ntag~
DECADAL POPULATION Persons 18,467.955 28.6 138,262 36.6
GROWTH 1991 - 2001 Males 9,405,557 278 72,300 35.9
Females 9,062,398 29.5 65,962 37.4
LITERATES Persons 31,109,577 47.0 144,444 35.3
Males 20.644,376 59.7 98,775 45.3
Females 10,465,201 33.1 45,669 23.9
(xix)
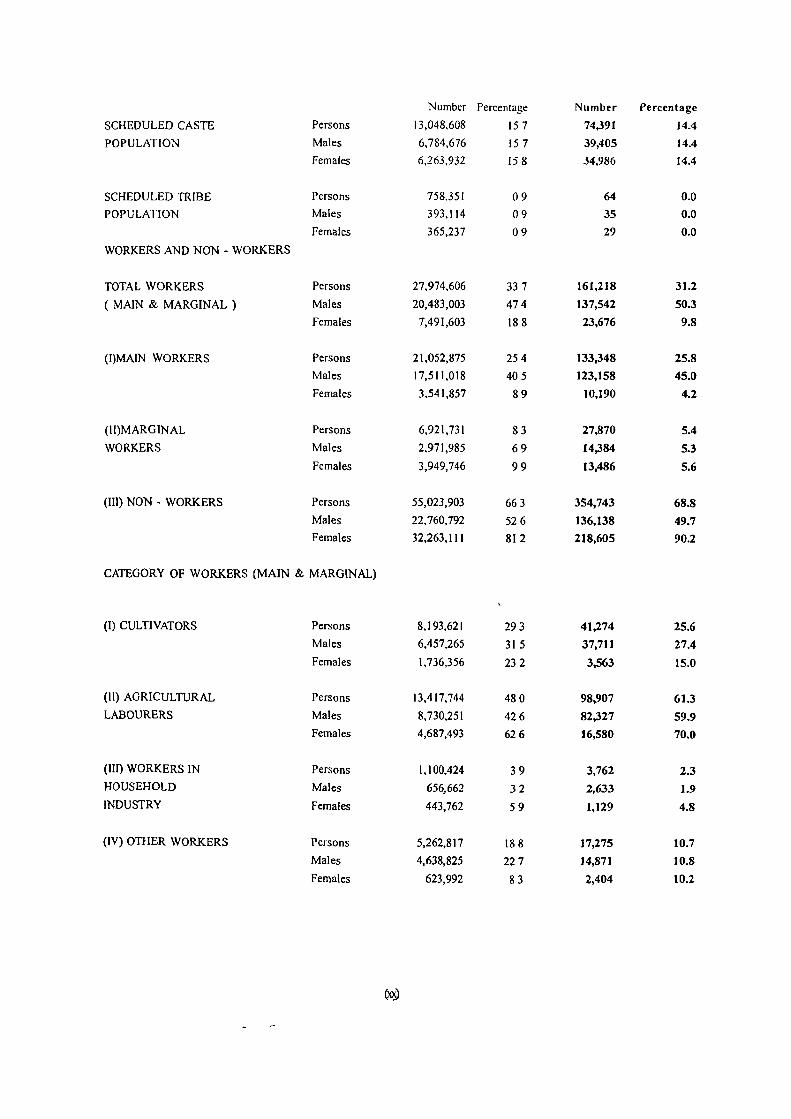
Number Percentage Number Percentage
SCHEDULED CASTE Persons 13,048,608 157 74,391 14.4
POPULATION Males 6,784,676 157 39,405 14.4
females 6,163,932 158 34,986 14.4
SCHEDULED TRIBE Persons 758,351 09 64 0.0
POPULATION Males 393,114 09 35 0.0
Females 365,237 09 29 0.0
WORKERS AND NON - WORKERS
TOTAL WORKERS Persons 27,974,606 337 161,218 31.2
( MAIN & MARGINAL ) Males 20,483,003 474 137,542 50.3
Females 7,491,603 188 23,676 9.8
(J)MAIN WORKERS Persons 21,052,875 254 133,348 25.8
Males 17,511,018 405 123,158 45.0
Females 3.541,857 89 10,190 4.2
(I1)MARGINAL Persons 6,921,731 83 27,870 5.4
WORKERS Males 2.971,985 69 14,384 5.3
Females 3,949,746 99 13,486 5.6
(III) NON - WORKERS Persons 55,023,903 663 354,743 68.8
Males 22,760,792 526 136,138 49.7 Females 32,263,111 812 218,605 90.2
CATEGORY OF WORKERS (MAIN & MARGINAL)
(I) CULTIVATORS Persons 8,193,621 293 41,274 25.6
Males 6,457,265 315 37,711 27.4
Females 1,736,356 232 3,563 15.0
(II) AGRICULTURAL Persons 13,417,744 480 98,907 61.3 LABOURERS Males 8,730,251 426 82,327 59.9
Females 4,687,493 626 16,580 70,0
(Ill) WORKERS IN Persons 1,100,424 39 3,762 2.3 HOUSEHOLD Males 656,662 32 2,633 1.9 INDUSTRY Females 443,762 59 1,129 4.8
(IV) OTHER WORKERS Persons 5,262,817 188 17,275 10.7
Males 4,638,825 227 14,871 10.8
Females 623,992 83 2,404 10.2
(J05)

Ranking of C.D. Blocks in the District
Scrial Purnahlya Piprarhi Sheohar Dumri Kalsan Tariani Chowk
Number In Terms of Value Rank Value Rank Value Rank Value Rank Value Rank
2 3 4 5 6 7 8 9 10 II 12
Total Population 71.722 4 95.441 3 122.340 2 71.405 5 155.053
2 Total area (in sq. kms.) 64.1 5 827 3 92.8 2 66.6 4 1368
DensIty of population
per sq.km. 1.119 4 1.154 2 1.318 1.072 5 1.133 3
4 Sex Ratio 877 5 896 &81 4 887 2 885 :3
5 Proportion Urban 4.1 I
6 Proportion Scheduled Castes 15.8 130 5 155 2 13.2 4 14.4 3
7 Proportion Scheduled Tribes 0.0 4 0.0 5 0.0 2 0.0 0.0 3
8 Proportion Literates 40.5 35.0 4 37.2 3 37.7 2 30.4 5
9 Work participation rate
(Main + Marginal Workers) 31.7 2 308 4 30.4 5 31.8 31.7 3
10 Percentage ohillages having
Primary School 96.2 2 95.7 3 97.6 88.9 4 69.0 5
II Percentage ofviIlages having
Primary Health Sub-Centre 23 I 17.4 2 14.3 4 148 3 7.0 5
12 Percentage of villages having
Well 100.0 95.7 2 90.5 3 59.3 5 88.7 4
13 Percentage of villages having
Post Office 42.3 34.8 2 28.6 4 29.6 3 21.1 5
14 Percentage ofviJIages having
Bus facility 34.6 4.3 3 7.0 2
15 Percentage of villages having
approach by Pucca Road 34.6 4 43.5 2 35.7 3 3.7 5 46.5
16 Percentage of villages having
Electricity for domestic purpose 3.8 5 348 2 54.8 11.1 4 11.3 3
17 Percentage of villages having
Forest area 41.0
18 .PerC!:nt~~e of vjl!ages h~vini
Irrigated area 100.0 1000 100.0 93 I 2 100.0

STATEMENT-l
NAME OFTHE HEADQUARTERS OF DISTRICT /TAHSIL, THEIR RURAlrURBAN STATUS AND DISTANCE
FROM DISTRICT HEADQUARTERS, 2001
Senal Name of Dlstnct I Name of Dlstnct I Tahsil Whether Distance from Tahsil headquarters to distnct
headquarters by road (In km ) nlll11bc:r Tahsil headquaners Urban I Rural
Serial
number
2
3
4
5
Note: l.
2 3 4 5
There is no Tahsil In Bihar
STATEMENT-2
NAME OFTHE HEADQUARTERS OF DISTRICT/CD. BLOCK, THEIR RURAlrURBAN
STATUS AND DISTANCE FROM I)JSTRICT HEADQUARTERS, 2001
Name of Dlstnct I Name of District/C.D. Whether urban I Distance from C.D. Block headquarters
CD. Block Block headquarters rural to district headquarters by road (in kms)
2 3 4 5
Sheohar Sheohar Urban· 0
Purnahiya Purnahiya Rural 13
Plprahi Piprahi Rural 7
Sheohar Sheohar Urban· 0
Dumn Katsari Dumari Katsari Rural 12
Tanyani Chowk Tariyani Chowk Rura"!" 20
Asterisk in column 4 denotes that the District / C D.Block headquarters is a statutory town.
(xxiO

STATEMENT-3
POPULATION OFTHE DISTRICT AT EACH CENSUS FROM ]90] TO 200]
Total! Decadal population variation
Rural! Census
District Urban Year Persons Males Females Absolute Percentage
2 3 4 5 6 7 8
Sheohar Total 1901 157.686 75.470 82.216
1911 162.800 77.821 84.979 5.114 3.2
1921 157.618 75.806 81.812 -5.182 -3.2
1931 168.264 82.606 85.658 10.646 6.8
1941 185.635 90.641 94.994 17.371 10.3
1951 201.431 100.269 101.162 15.796 8.5
1961 228.420 113.077 115.343 26.989 13.4
1971 258.839 131.557 127.282 30.419 13.3
1981 304.431 158.322 146.109 45.592 17.6
1991 377.699 201.380 176.319 73.268 24.1
2001 515.961 273.680 242.281 138.262 36.6
Rural 1901 157.686 75.470 82.216
1911 162.800 77.8'-1 84.979 5.114 3.2
1921 157.618 75.806 81.812 -5.182 -3.2
1931 168.264 82.606 85.658 10.646 6.8
1941 185.635 90,641 94.994 17,371 10.3
1951 201,431 100.269 101,162 15.796 8.5
1961 228.420 113.077 115.343 26,989 13.4
1971 258.839 131.557 127.282 30.419 13.3
1981 304.431 158.322 146.109 45.592 17.6
1991 363.784 193,899 169.885 59.353 19.5
2001 494.699 262.363 232.336 130.915 36.0
Urban 1901
1911
1921
1931
1941
1951
1961
1971
1981
1991 13.915 7.481 6.434 13.915
2001 21,262 11.317 9945 7.347 52.8
(xxiii)

STATEMENT-4
AREA, NUMBER OF VILLAGESfTOWNS AND POPULATION
IN DISTRICT AND C.D. BLOCK, 2001
District! Total! Aream Populallon No. of "ill ages No. of No of Population Serial C.D. Block! Rural! square per square Statutory Census No. of
number UArrown Urban kIlometres kilometres Inhabited Un-inhabited towns towns households Persons Males Females
2 3 4 5 6 7 8 9 10 II 12 13
Sheohar* Total 349.0 1,478 189 14 1 0 J06,808 515,961 273,680 242,281
Rural 339.7 1,456 189 14 0 0 102,614 494,699 262,363 232,336
Urban 9.3 2,279 0 0 0 4194 21,262 I1,3J7 9,945
I Purnahlya Total 64.1 1.119 26 0 0 0 14.949 71.722 38.209 33,513
Rural 64 I 1.119 26 0 0 0 14.949 71.722 38.209 33.51J
Urban 0.0 0 0 0 0 0 0 0 0 0
2 Plprarhl Total 82.7 1,154 23 2 0 0 22.112 95.441 50.325 45,116
Rural 82.7 1.154 23 2 0 0 22,112 95,441 50.325 45.)16
Urban 0.0 0 0 0 0 0 0 0 0 0
3 Sheohar Total 92.8 1,318 42 3 I 0 23,687 122,340 65,039 57,301
Rural 83.5 1,211 42 3 0 0 19,493 101,078 53,722 47,356
Urban 9.3 2,279 0 0 0 4.)94 21,262 11,317 9.945
Sheohar (NA) Urban 9.3 2.279 0 0 0 4,194 21.262 11.3 17 9.945
4 Dumri KatsariTotal 66.6 1,072 27 2 0 0 12.930 71,405 37,837 33.568
Rural 66.6 1.072 27 2 0 0 12.930 71.405 37.837 33.568
Urban 0.0 0 0 0 0 0 0 0 0 0
5 Tariani Total 136.8 1,133 71 7 0 0 33.130 155.053 82.270 72.783
Chowk Rural 136.8 1,133 71 7 0 0 33.130 155.053 82,270 72.783
Urban 0.0 0 0 0 0 0 0 0 0 0
* - Newly created district in 2001 Census
(xxiv)

STATEMENT-S
CD. BLOCK WISE NUMBER OFVILLAGESAND RURAL POPULATION, 2001
Serial Number of vi lJages Rural population
number Name of C.O. Block Totnl Inhabited Persons Males Females
2 3 4 5 6 7
Purnahiya 26 26 71.722 38.209 33.513 2 Piprarhi 25 23 95.441 50.325 45,116 3 Sheohar 45 42 101.078 53.722 47.356 4 Oumri Katsari 29 27 71.405 37.837 33,568 5 Tariani Chowk 78 71 155.053 82.270 72,783
District (Rural) Total: 203 189 494,699 262,363 232,336
STATEMENT-6
POPULATION OF URBAN AGGLOMERATIONS (INCLUDING CONSTITUENT UNITSyrOWNS, 2001
Serial Name of C.O. Block Population
number Name of UAffown Urban status where town is located Persons Males Females
2 3 4 5 6 7
Sheohar N.A. Sheohar 21,262 11,317 9,945
District (Urban) total: 21,262 II,317 . 9,945
(xxv)

STATEMENT -7
VILLAGES WITH POPULATION OF 5,000 AND ABOVE AT CD. BLOCK LEVEL AS PER 2001 CENSUS AND AMENITIES AVAILABLE
Whether Whether 'lenal Name of LocatIOn code It IS Tahsil 11 IS C D Bloc!..
number CD Block Name of vIllage number PopulatIOn headquarters headq uarters 2 3 4 5 6 7
Purnahlya Barahl Mohan 00280600 5019 No
2 Purnahlya Bakhar Chandlha 00280900 6856 No
3 Purnahlya Khalra Pahan 00282800 6311 No
4 Plprarhl Masaura 00283600 5593 No
5 Plprarhl Amwa Kalan 00284200 20.475 No
6 Plprarhl BasahIa Shekh 00284300 10326 No 7 Plprarhl Mmapur Balha 00284700 8289 No
8 Plprarhl Dhankaul 00284800 7470 No
9 Sheohar Kursahar 00285500 9.114 No 10 Sheohar Chamanpur 00286800 7,387 No
Il Sheohar Sugla Karesn 00288300 6,857 No 12 Sheohar TaJPur 00288500 5,087 No
13 Dumn Katsan Jahanglrpur 00290000 5,574 No
14 Dumn Katsan Naya Gaon 00290700 10,465 No IS Dumn Katsan Shampur 00291000 5.311 No 16 Dumn Katsan Maksudpur Karana 00291400 9,928 No 17 TananI Chowk Khurpattl 00294000 5,354 No 18 TananI Chowk Hlrauta Duma 00296000 8601 No 19 TananI Chow).. Bmdraban 00297200 6592 No 20 TananI Chowk ChhataunI 00297300 6638 No
21 TananI Chowk Kishunpur UrI
Narwara 00299000 8.604 No
22 Tanam Chowk Chhapra 00300500 10,032 Yes

STATEMENT -7 (Concld.)
VILLAGES WITH POPULATION OF 5,000ANDABOVE ATC.D. BLOCK LEVEL AS PER 2001 CENSUS AND AMENITIES AVAILABLE
Amentties available
DrinJ...mg Communl-
Educational Medical Water catIon BanJ...mg
Senior Primary Primary
Senal Name of Secondary Health Health Sub- Railway Commercial Co-operative
number village school College Centre Centre Tap water station Bank Bank
3 8 9 10 II 12 13 14 15 Barahi Mohan 0 0 0 0 No No 0 0
2 Bakhar Chandiha 0 0 0 No No 0 0
3 Khaira Pahari 0 0 0 0 No No 0 0
4 Masaura 0 0 0 0 Yes No
5 Amwa Kalan 0 0 0 No No 0 0
- 6 Basahla Shekh 0 0 0 0 Yes No 0 0
7 MlOapur Balha 0 0 0 0 No No 0 0
8 Dhankaul 0 0 0 No No 0
9 Kursahar 0 0 0 No No 0
10 Chamanpur 0 0 0 I No No 0 0
II Sugla Karesri 0 0 0 0 No No 0 0
12 Tajpur 0 0 0 0 No No 0 0
13 Jahangirpur 0 0 0 0 No No 0 0
14 Naya Gaon 0 0 0 1 No No 1 0
15 Shampur 0 0 0 0 No No 0 0
16 Maksudpur
Kararia 0 0 0 No No 0 0
17 Khurpatti 0 0 0 0 No No 0 0
18 Hirauta Duma 0 0 0 0 No No 0 0
19 BlOdraban 0 0 0 1 Yes No 0
20 Chhatauni 0 0 0 0 No No 0 0
21 Klshunpur Urf
Narwara 0 0 No No 0
22 Chhapra 0 0 0 No No 0 0
(xxviQ

<)enal
number
Senal
number
2
3
4
5
Name of
Town
2
STATEMENT-8
STATUTORY TOWNS WITH POPULATION LESS THAN 5000 AS PER 2001
CENSVSAND AMENJTJESAVAJLABLE
AmenitIes avallabie
Whether Whether Improved
It IS It IS EducatIOnal drInkIng Commu-
Location Tehsd C D Block Senior MedIcal water mcatlon ---code head- head- Secondary Health Tap RaIlway
number PopulatIOn quarters quarters School College HospItal Centre water statIon
3 4 5 6 7 8 9 10 II 12
ThIs DIstrict has no such Statutory Town
STATEMENT-9
BankIng
Bank
13
HOUSELESS AND INSTITUTIONAL POPULATION OF CD. BLOCK, RURAL AND URBAN, 2001
Dlstnct! Total/ Houseless PopulatIon InstItutIOnal PopulatIon
CD Block! Rural/ No of No of
UA/Town Urban household Persons Males Females household Per~ons Males Females
2 3 4 5 6 7 8 9 10 II
Sheohar Total 17 51 28 23 112 845 495 350
Rural 17 51 28 23 102 759 416 343
Urban 10 86 79 7 Purnahlya Total 3 13 5 8 18 135 81 54
Rural 3 13 5 8 18 135 81 54
Urban
Plprarhl Total 8 17 II 6 25 175 91 84 Rural 8 17 II 6 25 175 91 84
Urban
Sheohar Total 4 2 2 25 204 145 59
Rural 4 2 2 15 118 66 52
Urban 10 86 79 7
~heohar (NA) Urban 10 86 79 7
Dumn Katsan Total 24 189 96 93
Rural 24 189 96 93
Urban
TananI Chowk. Total 5 17 10 7 20 142 82 60
Rural 5 17 10 7 20 142 82 60
Urban
(xxvliO

DIAGRAMS

z 0 .... 1-0 « ...l :;l Q.,
0 Q.,
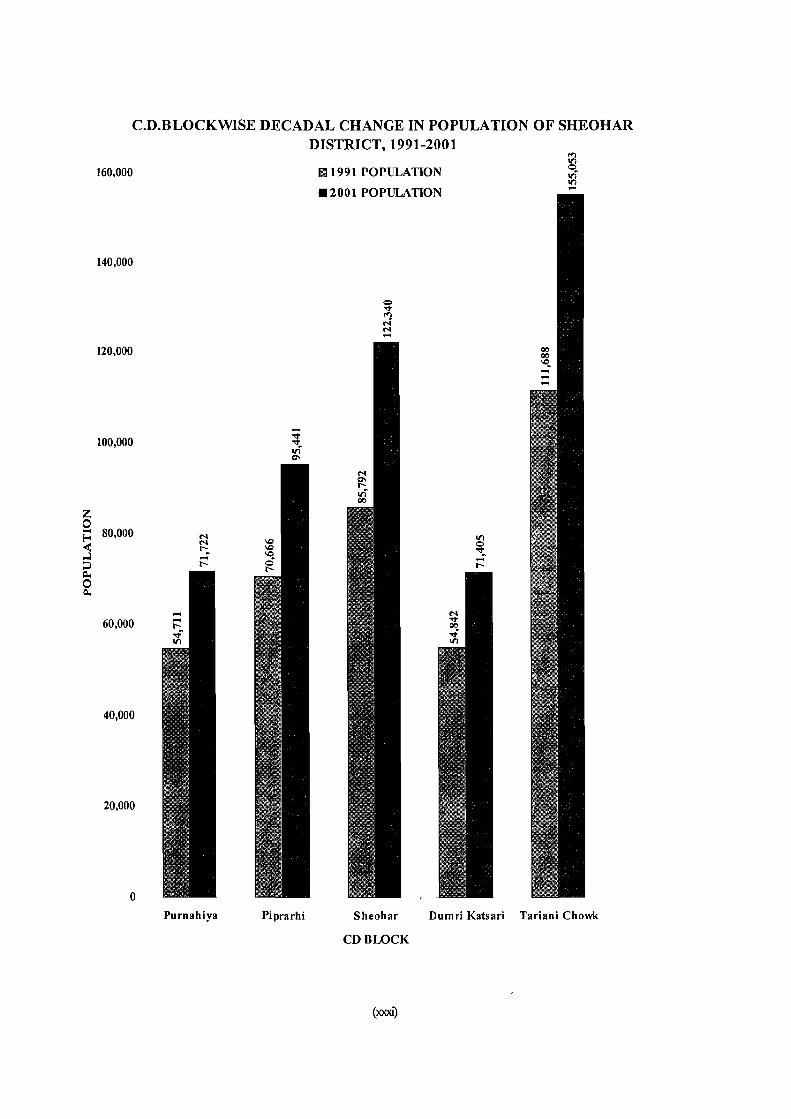
C.D.BLOCKWISE DECADAL CHANGE IN POPULATION OF SHEOHAR DISTRICT,1991-2001
160,000
140,000
120,000
100,000
80,000
60,000
40,000
20,000
o
M M r-~ -r-
Purnahiya Piprarhi
111991 POPULATION
.2001 POPULATION
III Q
"""~ -r--
Sheohar Dumri Katsari Tariani Chowk
CD BLOCK
(XXXI)

C.D. BLOCKWlSE DENSITY OF SHEOHAR DISTRICT, 2001
IIlIDFNSITY 1,500
1,450 '
1,400
1,350 :
1,300 ~ I
},250 j
1,150 4
1,100 (~
1,050
1,000
Purnahiya Piprarbi Sheohar Dumri Katsari Tariani Chowk
C.D.BWCK

C.D. BLOCKWISE SEX RATIO OF SHEOHAR DISTRICT, 2001
1000
950
I 900 1
850 t -
Purnahiya
,-I I!IIII SEX RATIO
Piprarhi
-00 00
Sheohar
C.D.BLOCK
(xxxiiD
Dumri Katsari
Tariani Chowk
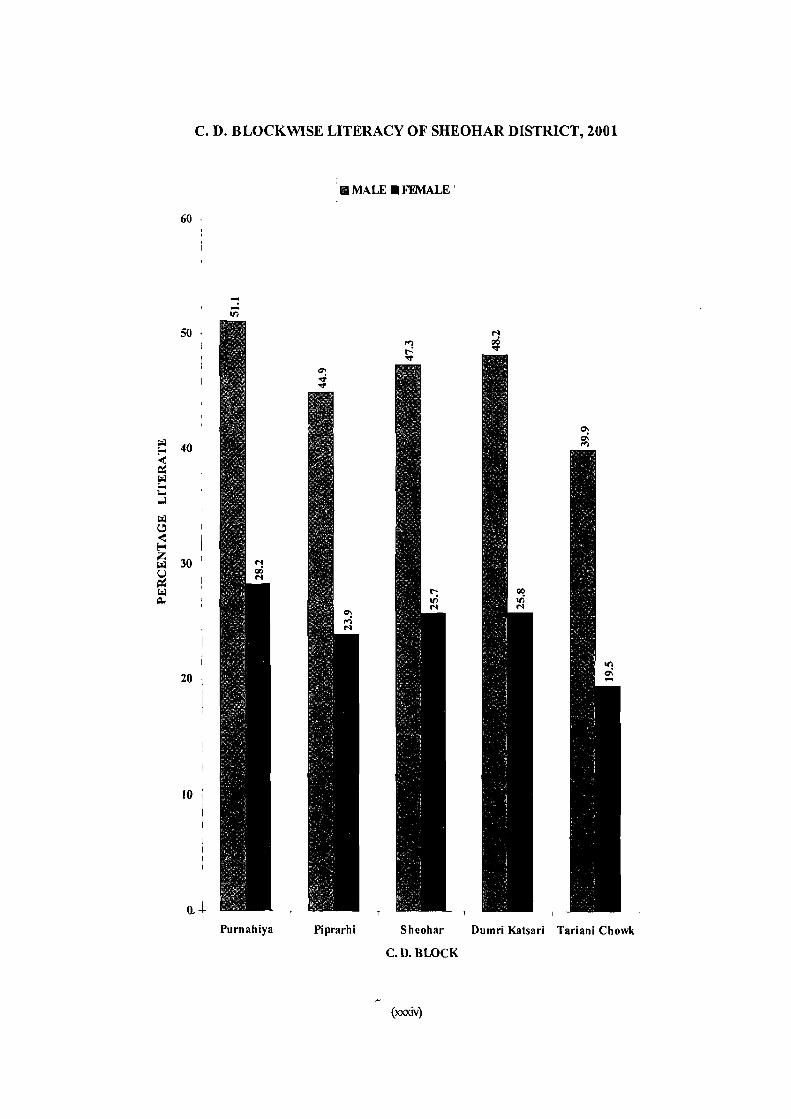
C. D. BLOCKWISE LITERACY OF SHEOHAR DISTRICT, 2001
i II MALE. FEMALE ' l_
60
--In
50 • "! t'l go
r..: .., .., Q'I ..; ..,
Q'I
~ c:.
40 t'l E-<
~ ~
E:: ,.J
~ e" « E-< Z 30 ~ U ~ ~ ~
20
10
oA Purnahiya Piprarhi Sheohar Dumri Katsari Tariani Chowk
cn.BLOCK
(xxxiv)

:z 0 ... (-.
j ;;J Il. 0 I)..
C.D. BLOCKWISE TOTAL POPULATION / WORKER / NON WORKER OF SHEOHAR DISTRICT, 2001
fIIlIJTOTALPOPULATION
• WORKER
180,000 o NON WORKER
160,000
140,000 I c:> .". "l. N N ...
120,000
.... """ 100,000 """ vi' 0'1
80,000 I M III M c:> r-: """_ .... .... t'- t'-
60,000 1
40,000
20,000
o j Purnahiya Piprarhi Sheohar Dumri Katsari Tariani Chowk
CD. BLOCK
(xxxv)

z o .... r-j
~
180000 "
160000
140000
120000
I
100000 11
80000 l
I
\ 60000 1
\
40000
20000 ~
o
C.D. BLOCKWISE TOTAL / SC / ST POPULATION OF SHEOHAR DISTRICT,2001
II TOTAL POPULATION
• SC POPULATION
o ST POPULATION (NEGLlGffiLE)
00 00 - --,
Purnahiya Piprarhi Sheohar Dumri Katsari Tariani Chowk
C.D.BWCK

ANALYTICAL NOTE

Analytical Note
(i) History and scope of the District Census Handbook
The District Census Handbook, brought out by the Census Organization, is one of the most valuable district level publications. It provides, inter-alia,
compilation of the requisite material. As far as the state of Bihar is concerned, this Third Part or PartC could be published in respect of a few districts only. For the remaining districts, this volume was kept in the office library in mimeographed form.
information on the basic demographic and socio~ At the 1981 Census, new features along with economic characteristics and availability of important restructuring of the format of Village and Town civic amenities/facilities in each village and town of Directory were introduced in the DCHB. These were the respective districts.This publication has proved to published in two parts for each district. While Part-be of immense utility to the planners, administrators, A comprised Village and Town Directories, the PCA academicians and researchers. of Villages and Towns (ward wise), including
The District Census Handbook, a joint venture Scheduled Castes and Scheduled Tribes PCA up to
of the State Government and the Census Organization, Cp Block/Town level, was provided in Part-B. To is one of the richest data sources, particularly in the ilIostrate, all the amenities, except electricity, were context of planning and development at the grass root brought together in the Village Directory and if an level. It is rather the only source that gives village amenity was not available in the concerned village, and town level information concerning several the distance (in broad ranges) from the nearest place demographic and socio-economic characteristics and having such amenity was given. Information on some also on availabi lity of important civic amenities.This new items such as adult literacy centres, primary publication was brought out in the 1951 Census for health sub-centres and community health workers in
the first time. In fact, it is the replacement of 'Village the village were provided so as to meet some of the Statements' which used to be prepared in the requirements of the Revised Minimum Needs Censuses of Pre-Independence period, and since 1951 Programme. Similarly, information on approach to the it has been published after each decennial census with village was also provided for the first time in the some innovations/improvements. Village Directory so as to give an ~dea about the
Initially the scope of the DCHB was confined to number of inaccessible villages in each district. In . case of Town Directories also, keeping in view the
certam important census tables on population1 . requirements of the Minimum Needs Programme, a economic and socio-cultural aspects as also the Primary Census Abstract (PCA) of each village and Statement (IV-A) on slums was provided so as to
town of the district. The DCHB published after the e.nab~e .the ~I~ners to. ~orm.ulate programmes for 1961 Census contained a descriptive account urthe ... proYl.dmg .CIVIC amenIties In the slums. In this
statement details on civic and other amenities were district, administrative statistics, census tabres and
'11 presented for the notified slums of Class I and Class VI age and Town Directories including PCA (Primary
II towns. Apart from this, one column on the Scheduled Caste and Scheduled Tribe population and another on adult literacy classes/centres were added
Census Abstract). At the 1971 Census, the DCHB was brought out in two parts, viz., Part-A comprising Village and Town Directories and Part-B comprisi'ng Village and Town PCA in respect of all the States and Union Territories. The Third Part of the DCHB , comprising administrative statistics and district census tables, which was also to be brought out, could not
be published in many StateslUTs due to delay in
3
in Statements IV and V respectively. .
The manner of presentation of the DCHB for the 1991 Census wa~, by and large, the same as followed during 1981 Census. However, the format
of PCA was restructured sl ightly in the 1991 Census
for the benefit of data users and nine-fold industrial
classification of main workers was given as against
four fold industrial classification presented in the 198 J Census. In addition to this, the sex-wise population in the 0-6 age group was also included in the PCA for
the first time with a view to enabling data users to compute more realistic literacy rates as all children below 7 years of age had been treated as illiterate at
the time of the 1991 Census. It was expected that
the above mentioned modifications would help the
planners in chalking out more effective developmental
programmes.
At the country level, one of the most important innovations in the 1991 Census was the C.D.Block level presentation of data in the Village Directory and PCA instead of the traditional TahsillTaluka/PS level presentation across the country. For the state of Bihar,
however, the Community Development Block level presentation of data in the Village Directory and PCA had been adopted since 1971 Census itself. During
1951 a~d J 961 Censuses the presentation of data was made at the Anchal level in the State of Bihar. In fact, Anchat and Community Development Block used to be more or less co-terminus till 1991 census. However, the situation has changed after 1991 Census and now Anchal and Community Development Block
no longer remain co-terminus in all the cases. It was expected that the presentation of Village Directory and PCA data at C.D. Block level will help the planners in formulation of micro level developmental
plans, as the C.D. Block is now 1hcreasingly being used as the key administrative unit for developmental planning. In order to facilitate the task of administrators, planners and researchers intending to use Village Directory/PCA data, either from the
magnetic tapeslfloppies or from the published records, both computerized and manual codes for each village
were provided for the 1991 Census along with the corresponding codes of 1981.
The District Census Handbook of Census oflndia, 2001 is more informative and exhaustive in terms of coverage and content. The coverage in Village Directory has been further broadened by including a number of other facilities like banking, recreational and cultural facilities, availability of newspapers & magazines and most important commodity (ies) manufactured in the Village etc. Apart from these,
more details on distance(s) at which basic educational
4
DISTRICT CENSUS HANDBOOK SHEOHAR
facilities (viz., Primary and Middle Schools and College) and medical facilities (viz. Allopathic Hospital, Maternity and Child Welfare Centre and Primary Health Centre) etc. are available, if not already available in the village. are being provided for the
first time in DCHB.
The type and extent of basic amenities available in the villages & towns have been analyzed in depth
with the help of a number of cross classified inset
tables & statements. Brief analytical notes/accounts on important aspects concerning respective districts viz. (i) mortality (ii) various measures of fertility and
mean age at marriage (iii) percentage distribution of migrants by place of birth/place of residence, (iv) main refigions, (v) maritaf status of popufation, (vi) age, sex and education & {vii) distribution of different mother tongues, based on 199 I and/or 200 I Census, are
being given at the end of the text as separate annexures.
For the District Censlls Hand Book of the C~nsus
of India, 200 I, emphasis has been given on the quality of village and town level amenity data. With a view
to find out erratlc or aberrant trends of lnexpHcab\e fluctuations in amenity data, efforts have been made to verify the V.D. & T.D. data with the help of similar information brought out by the State and Central
Governments as also by Government/SemiGovernment institutions.
The processing of data and maps to be
incorporated in the District Census Hand Book this
time has been done both manually and digitally (with the help of computer technology). Another innovation
of Census of India 200 J is that the hard copy of the
maps of the Districts and C.D. Blocks have been
converted into the digital database. During 1991 census
the village wise information/amenities were .shown
manually in the maps of District <;:el)sus'Hand Boak.
But during 200 I Census the -depiction of the information/amenities in the maps has been done by
utilizing Computer Assisted Cartography. The editing,
annotation, incorporation of amenities and other
concerned work related with district and C.D.Block
maps have been done simultaneously, as far as
possible, except the incorporation of population size
of the villages which became ready when the UrbanI"
Village Primary Censlls Abstract was made available
through Computer Scanner.

ANALYTICAL NOTE
(ii) Brief history of the district
The district ofSheohar. which till the 1991 Census was a part of Sitamarhi district as one of its subdivisions, was elevated to the status of a district on 61h October, 1994 by the Government of Bihar vide its Notification No. 286. The district is situated In the northern part ofTirhut Division and lies on the extreme north region of the state of Bihar. It is
surrounded on the north and east by the district of Sitamarhi, on the south by the district of Muzaffar pur and on the west by the district of Purba Champaran. It is the smallest district in the State of Bihar both in terms of size of population and total area of the district. The district has only one subdivision viz. Sheohar and five C.D. Blocks viz., Sheohar, Piprarhi, Purnahiya, Dumri Katsari and Tariyani Chowk. Sheohar is the only town in the district. There are
altogether 203 villages in the district.
The geographical configuration and history of the district ofSheohar is very much in line with the history and geography of its parent district Sitamarhi. Before the reorganisation of the district, in post independent Bihar, the old district ofMuzaffarpur was divided into three subdivisions with their headquarters at Muzaffarpur, Hajipur and SitamarhLThe subdivisional headquarters of Sitamarhi was located at Sitamarhi town until 1935. The town ofSitamarhi faced one of the worst natural calamities in January, 1934 when it was rocked by a massive earthquake.The earthquake, which lasted for only one minute and a few seconds, had disastrous effects. Buildings were reduced to debris and fissures and depressions occurred all around.The roads of Sitamarhi were damaged extensively and the town was completely cut off for some time. Rail communication was dislocated and at many places railway lines were twisted and they lost the original alignment.The topography changed considerably and the town of Sitamarhi was so badly damaged that at one time it was feared that it wou Id have to be abandoned as unsafe for rebuilding purposes. As a sequel to this havoc and apprehension, the subdivisional headquarters and courts were shifted to Dumra in 1936, five kilometres away from Sitamarhi town.Since then the subdivisional headquarters has continued at Dumra and even after the upgradation of the subdivision to the status of a district, the headquarters of the subdivision as wen as the district is located at Dumra.
5
Sitamarhi is a sacred place in Hindu mythology. Tradition has it that Sita sprang to life out of an earthen pot while Raja Janak was ploughing his land somewhere near Sitamarhi town. A tank, called the Janaki-kund, is still pointed out as the place out of which she is said to have emerged. But Punaura, a village about five kilometres to south-west of Sitamarhi town, also stakes its claim as the birth place of Sita. The town, however, contains no relics of any archaeological interest.The temple of Janaki, i.e., Sita - the daughter of Raja Janak. is apparently modern and not more than \ 00 years old. It contains three stone figures with eyes of mother of pearl which. represent Rama, Sita and Lakshman.The legend associated with the temple mentions, however, that it occupies an old site. It is said that Raja Janak excavated a tank at the place where Sita sprang to life and after her marriage set up the figures of Ram a, Sita and Lakshman to mark the site.This tank is known as the Janakl-kund just to the south of the Janaki Mandir. In course oftime, the land lapsed into a jungle until about 500 years ago, when a Hindu ascetic, named Birbal Das, came to know the site by divine inspiration where Sita was born. He came down from Ayodhya and cleared the jungle and found the images set up by Raja Janak. He built a temple over them and commenced worship of Janaki or Sita. The income of the temple is mainly derived from the offerings by the pilgrims. In the same compound there are three other temples of Hanuman, Mahadeo and Ganesh which are quite recent.The e'ntire campus of these temples is popularly known as Janaki Asthan and is of great religious importance where hundreds of Hindu devotees go everyday and perform puja. Vivah Panchmi and Ram Navami, commemorating the marriage of Sita to Rama, and the birth of Ram respectively are celebrated at Sitamarhi every year. On these occasions people, mainly ladies from far and wide, throng Janakpur and SitamarhLOn these two occasions the congregation is regaled with stories about the adventures of Rama who had conquered Lanka and killed the demon king Ravana. Religious dramas and dances depicting episodes from Rama's life, known as Ramalila, are organised.
(iii)Administrative set -up
The district forms a part oftre north Bihar Plain and lies in the northern portion of the state of Bihar.
The district was carved out by taking away three "
CO. Blocks viz .. Piprarhi. Sheohar and Tariyani
Chowk from the district of Sitamarhi in the year 1994.
After the creation of the district on the 6th of October, 1994 the erstwhile Piprarhi C.D. Block was bifurcated
into 2 C.D. Blocks viz., Purnahiya and Piprarhi.
Sheohar C.D. Block was bifurcated into 2 C.D.
Blocks viz .. Sheohar and Dumri Katsari.Thus there are 5 C.D. Blocks viz., Sheohar, Piprarhi, Purnahiya,
Dumri Katsari and Tanyani Chowk in the district of
Sheohar.There is only one subdivisions i.e. Sheohar in the district. Sheohar (NAC) is the only town in the
district.There are altogether 203 villages in the
district.Total area of the old Sitamarhi district during
1991 Census was 2643 sq. kms. Newly created
district of Sheohar was carved out of old Sitamarhi
district with the area of 349sq. kms.
District Magistrate is posted in the district who
is the top most official of Revenue and civil
administration. He belongs to LA.S. cadre. District
Magistrate conducts development and\velfare works
in the district. AOM and other officers are posted in
order to help O.M. in the administration. The district
has only one subdivision which is headed by a
subdivisional officer either from LA.S. or B.P.S.C.
cadre. S.O.O. is under direct authority ofO.M. There
are five C.D. Blocks in the district where B.O.Os.
are posted who undertake development and welfare
projects.
Judicial Administration : The Jydges and Munsif
magistrates are posted at district and subdivision who
administer and deliver justice of different kinds.The
district judiciary is part of Indian judicial system as
envisaged in Indian Constitution and independent of
district administration.
Police Administration: The Superintendent of
Police, Sheohar is the head of the. district poli(1e
administration who is eith~r from·the Indian Folice Service or the Bihar Police Service. In the subdivision
of the district, the Deputy Superintendent of Police is
posted who keeps control on police administration.
(iv) Physical Features
Location and size
The district lies between 26° 18" and 26° 36"
north latitudes and 85° lO"and 8$<>-24" east longitudes.
It is bounded in the east and north by the district of Sitamarhi, on the west by the district of Purba
6
DISTRICT CENSUS HANDBOOK SHEOHAR
Champaran and on the south by the district of Muzatfarpur.The total area of the district is 349 sq. kms. It is the smallest district in the state of Bihar in terms of area. Sheohar district ranks 37th in terms of area in the State. Only 0.47 percent of the total area of the state of Bihar is covered by this district.
Physiography
The entire region is plain with a gentle slope from north to south. River Bagmati, along with its tributaries, flows through the western part of the region.The region has a gentle slope of 70 meters in the north to 59 meters in the south above the mean sea level. The height from mean sea level ofSheohar district is 189 to 20 I meters. Average annual rainfall in the district is 1302.3 mm. Paddy, Wheat, Millets, Pulses and Sugarcane are the main crops of the area.
Climatic condition
There are three well marked seasons, Winter, Summer and the Rainy seasons.The cold weather
begins in November and continues upto February, though March is also somewhat cool. Westerly winds
and dust storms begin to blow in the second half of
March and the temperature rises considerably. May
is the hottest month when the temperature goes up
to 40° C. Rains set in towards the middle of June.
The rains continue till the end of September or middle of October. With the cessation of rains the temperature
falls and the climate becomes rather pleasant.The rainy season is very useful for agriculture and fishery.
The road communication between Muzaffarpur and
Sheohar becomes disrupted due to flood during rainy season
Soil
The soil of the district can be classified as loam,
sandy-loam, clay and clay-loam in different regions.
In the Bagmati zone alluvial soil is found which is
very good for Rabi cultivation. The soil of the district is rich in mineral elements except zinc needed for good crops.
Cropping pattern
The main crops of the district are Paddy, Wheat and Khesari. Besides, Gram, Oil seeds and other pulses are also grown. Marua and Bhadai paddy are
two main Bhadai crops.
With Kharif and Rabi drives being launched every
year by the Agriculture Department of the State

ANALYTICAL NOTE
Government, there has been perceptible improvement
in land use, cropping pattern. scientific cultivation, use of improved seeds, chemical fertilizers and plant protection in the district. This has resulted in substantial overall increase in agricultural production
and the district has become self sufficient in respect
of rice.
Irrigation facilities
In matters of irrigation this district is stilI very backward. Cultivators have to make their own arrangements to irrigate their crops. A large number of private tube-wells, bamboo-boring tube wells and private diesel pump sets are available with the progressive cultivators of the district. The State Government has provided a few types of irrigational
facilities for the cultivators of the district, which are:
~ State Tube well
i~ Miror Irrigation schemes
iii) Bagmati Project
Industry and Trade
Sheohar is mainly an agricultural district with
more than 75 percent of population engaged in agriculture.The main industries and trades are also agro-based.
After independence, the development of industries in the small scale sector has been receiving the attention of the Government in the district in order to help and assist the entrepreneurs to set up industries
by making available to them the technical know-how, project-profiles, arrangements for finance, working capital, raw material, etc.
Apart from small scale units, rural artisans are being encouraged to pursue their traditional vocation
to increase p~oduction.and attain self sufficiency. ....
As regaras trad'e, the most important item is rice - both milled and hand-pound.The other important items are pulses and Tisi (Linseed). Trade in Sal wood, which is mostly obtained from Nepal, is also signific~nt.
Live stock
Live stock .is very important fn a di'strict like Sheoh~j. with a' predo'min~ntly agricultural economy.
In the district number of cattle is fairly high. The people of the area have not taken to poultry farming
7
on large scale.
No special fodder grass is grown on an extensive scale for feeding the cattle. Straw-from paddy, wheat hush, leaves of maize and sugarcane provide fodder.
Public Health
There are a number of district dispensaries known as Primary Health Centres and Health Sub-centres located in different blocks of the district. Apart from allopathic dispensaries the district has a few Ayurvedic dispensaries also. Some of the state dispensaries are quite old and started before 1950.
Land Revenue and Land Reforms
The district had Permanent Zamindari System of Land Revenue Settlement before the abolition of Zamindari System. The state Govt. has acquired the Zamindaries and the intermediary system between the raiyat and Government has since been abolished. But the early history of Land Revenue System of the combined district of Muzaffarpur prior to 1875, when it was separated from Darbhanga is very interesting. The first assessment of land revenue in Tirhut Division was made in 1582 by Raja Todar Mal, the famous
Diwan of Akbar, consequently an area of81,737 acres in Tirhut was settled at a revenue of Rs. 1,63,020. Subsequently, during the reign of Aurangzeb in 1685 the above assessment was raised to Rs.I, 79&,576. Again in the year 1750, during the time of Nawab Alivardi Khan of Bengal, the land revenue assessment
./ was reduced to Rs. 1,648,142. From the Farman of Aurangzeb, issued in the thirteenth year of his reign, it appears that Tirhut included 102 Mahals. From the same Farman it appears that the Mughal revenue administration conferred the office of Kanungo for the whole of Subah Bihar on three persons only. They lIsed to collect the revenue of the whole Subah and
receive 8 annas per hundred rupees as rem!lneration besides 'dastur' and 'nankar'. A subsequent Farman issued in 1783-84 by Shah Alam confirmed the descendents of the above three persons in the office of Kanungo for the whole' of Bihar on the same terms and condition. .
By the Diwani Grant of 1765 the right of collecting revenue in Bengal, Bihar and Orissa was transferred to the East India COTtt_pany. But actually collection continued, to be in the hands of the Nawab's officers. The East India company appointed Raja Sitab
Roy to supervise the revenue collection in Bihar.The dual control resulted in much confusion and apprehensIOn to tenure holders. Hence in 1769 European Supervisors were appointed. In 1770 a Revenue Council was established at Patna, and it was decIded to transfer the con to I of revenue collection to the servants of the East India Company. Accordingly, in the year 1771 a European Collector was appointed in Tirhut for the first time. But this
experiment failed and in 1772 the control of a Provincial Council at Patna and quinquennial settlement of land was made.This experiment also failed. Hence annual settlement was made from 1778. But this system also proved to be a failure and Tirhut was again placed under a European collector in } 782. Francois Grand was appointed Collector ofTirhut in 1782. Annual settlement of land continued till 1789. During this period, the collector had to face immense difficulties both in the matters of settling revenue and realising it. In the year 1783 the Board of Revenue at Calcutta deputed Mr. John Shore to Patna for effecting a new settlement of the province of Bihar. The collector of Tirhut was accordingly asked to prepare immediately a Jamma Wasul Baky c:>f the 'mahals' of his district. In May 1789, the Governor General in council resolved to carry out the orders of the court of Directors for a new settlement of Bihar for a period of ten years, which if approved by the court, would become permanent without any further change or modification. The Zama which each
/
Zamindar was to pay, was to be fixed by the collector on fair and equitable princfples. Although systematic attempts were made to collect information and make settlements on the principles of equity and fairness but the decennial settlement was concluded more hastily than steadily with the result that when
permanent settlement was effected in 1793 about sixty
percent of the total area of the district e~c!;lped settlement. The total land revenue fixed was Rs, 9,83,642 out of which Rs. 4,36,000 represented the demand of the old district of Muzaffarpur, Subsequently efforts were made to cover up the unassessed land by resumption of revenue free grants, Nevertheless, all out efforts were also made to make the Revenue Records up-to-date and consolidate the Permanent Settlement. The Revenue Sales Act of
1850, the Land Registration Act of 1876, and the Estates Partition Act of 1876 were enacted. The
DISTRICT CENSUS HANDBOOK SHEOHAR
implementation and enforcement of the provisions of these Acts enabled the British Government to prepare Revenue Rolls and other details of proprietors of Revenue paying and Revenue free estates on scientific line.
Before the enactment of Land Reforms Act 1950, there were thus, three categories of estates in the district of Muzarffarpur, namely (I) Revenue paying Estates (2) Revenue free Estates numbered 25,575 yielding a total revenue of Rs.9,58,539,123 and (3) Government Khas Mahal numbered 52 with a total revenue of Rs. 97,792,] 04
Land Reforms
Abolition of Zamindari - The problems relating to land revenue system had engaged the attention of
the publicmen in Bihar and Bengal where the permanent settlement of 1793 prevailed. Towards the end of 1938 the Government of Bengal had appointed a ~and Revenue Commission to examine the existing land revenue system with particular reference to the permanent settlement. After examining the question in all its aspects the commission gave its report in 1940. The serious defects in the Zamindari system were pointed out and the commission recommended abolition ofZamindari system and replacing the same by Raiyatwari system for improving the economic
condition of the cultivators. With the Congress Ministry in Bihar this question was actively taken up. As the vital interest of the state required immediate steps to be taken up for improving the agricultural production and the condition of the cultivators the Legislature enacted various laws such as amendments to the Bengal Tenancy Act, the Chotanagpur Tenancy Act, Bakast Dispute Settlement Act, 1947, etc. The Bihar State Management of
E.states Bill, 1947, and the Bihar State Acquisition of ··.Zamilidari Bill 1947 were also passed. Two years
later the Bihar State Management and Tenure Act, 1949 (Bihar Act XXi of \949) was passed. The Bihar Abolition of Zamindari Act, 1948 required the assent of the Governor General on the 6th July 1949. The vatidity of the Act was challenged and while petitions were pending in the High Court the State Act was replaced by the State Legislature and another measure called the Bihar Land Reforms Bill, J 949 was
introduced in the month of December, 1949. This bill was passed and became later the Bihar Land
8

ANALYTICAL NOTE
Reforms Act, 1950. On the 25th of September, 1950,
The Land Reforms Act, 1950 was also challenged. Parts of the Act were declared ultra vires by the Patna High Court. The Constitution was amended by the Constitution Amendment Act, 1952. Even after the amendments of the Constitution, the Act was challenged but the Supreme Court declared the Act to be intra vires except for some minor sections. The State Government later decided to take over the entire
Zamindaris. Under the provisions of section 3(b) of the Bihar Land Reforms Act, 1950 all the estates and all the tenure had passed to and become vested in the state with effect from the 26th January, 1955.
At the time of vesting ofZamindari into the state there were 12, I 02 proprietors, tenure holders and under tenure- holders in the district ofSitamarhi (then
a subdivisions) with a collectable rental demand of Rs. 8,11083.16 only. The take over of Zamindaris which commenced in 1952 was finally completed in the year 1956. The implementation of the provisions of the Land Reforms Act involved a lot of difficulties at the initial stage for the local administration. However, these were got over through the perseverance of the local revenue administration the annual rental demand was firmed up and the new revenue system started functioning properly.
Communication
The district is devoid of any rail facilities. Sheohar
road provides road link to the district and connects
its district headquarters, Sheohar town with the district
headquarters of Sitamarhi. This road which is about
25 Kms. in length provides links to the various Block
headquarters of the district. All the Block headquarters of the district is connected by metalled road. However,
during rains road communication is severely affected
due to flood which damages the roads very badly.
Institutional Finance Agencies
Adequate provision of rural credit for the socioeconomic development of rural population is of paramount importance. The nationalisation of commercial banks was done mainly with a view to providing easy credit to the rural masses to better their lot. Besides, Regional Rural Bank has been set lip exclusively for the credit requirements of weaker
section of the population. Lead Bank Scheme has also been introduced and the Central Bank of India
9
is the Lead Bank for this district. Branches of
different commercial banks, Regional Rural Bank, Land Development Bank and Central Co-operative Bank are operating in the areas of different blocks of the district.
Social Welfare Plans
A number of Social Welfare Programmes have
been launched in the district. Since independence a
large number of schemes for the welfare of
Scheduled Caste and backward class have been taken up. The statewise scheme of old-age pension has
been implemented in Sheohar district also. Widows
and indigent persons have also been brought within
the fold of the scheme.
A number of other schemes such as National
Rural Employment Programme, Jawahar Rozgar
Yojna and Prime Minister Rural Employment
Programme etc. have also been undertaken in this
district. . (v) Census concepts
Building
A 'Building' is generally a single structure on the ground. Sometimes it is made up of more tl)an one
component unit which are used or likely to be used
as dwellings(residences) or establishments such as shops, business houses, offices, factories, workshops,
worksheds, Schools, places of ej1tertainment, places
of worship, godowns, stores etc. It is also possible
that building which have component units may be used
for a combination of purposes such as shop-cum
res idence, workshop-cum-res idence,office-cumresidence, etc.
Usually a structure will have four walls and a roof. But in some areas the ver,y nature of
construction of houses is such that there may not be
any wall. Such is the case of conical structures where
entrance is also provided but they may not have any walls. Therefore, such of the conical structures are
also treated as separate buildings.
Permanent houses
Houses, the walls and roof of which are made of permanent materials. The material of walls can be anyone from the following, namely, galvanized irop
sheets or other metal sheets, asbestos sheets, burnt bricks, stones or concrete. Roof may be made of from anyone of the following materials, namely, tiles, slate. galvanized iron sheets, metal sheets, asbestos "heets. bricks, stones or concrete.
Semi-permanent houses
Houses in which either the wall or the roof is made of permanent material and the other is made of temporary material.
Temporary houses
Houses in which both walls and roof are made of materials, which have to be replaced frequently. Walls may be made from anyone of the following temporary materials, namely, grass, thatch, bamboo, plastic, polythene, mud, unburnt bricks or wood. Roof may be made from anyone of the following temporary materials, namely .. grass, thatch, bamboo, wood, mud, plasti~ or polythene.
Room
A room should have four walls with a doorway with a roof over head and should be wide and long enough for a person to sleep in, i.e., it should have a length of not less than 2 metres and a breadth of at least 1.5 metres and 2 metres in height. A room, however, which is used in common for sleeping, sitting, dining, storing and cooking, etc., should be regarded as a room. An unenclosed verandah, kitchen, store, garage, cattle-shed and latrine and rooms in which a household industry such as a hand loom is located, which are not normally used for living or sleeping are excluded from the definition of a living room for the purpose of this question.
One is likely to come across conical shaped hut • Q~. tent, in which' human beings reside. In such
improvised accommodation, there will be no four walls to a room and therefore, the above definition would not strictly apply to such types of accommodation. In such cases, the tent or conical hut etc., have been construed to be a room.In certain par,ts of the country, particularly in rural areas, the pattern of housing may present some problems. For example, a household may be in occupation of several huts put to different uses such as main residence, sitting room, store and e"en for sleeping at night. By strict application of the definition each one will be reckoned as a censuS
. -10
DISTRICT CENSUS HANDBOOK SHEOHAR
house, but this does not reflect the real situation. While huts used as store or cattle shed pose no problems, those used as sleeping rooms beyond the main residence, shouid be counted as rooms rather than separate census houses. If a garage is used by a servant and he lives in it as a separate household, it should be reckoned as a room available to the servant's household. If the servant is considered as a member of the household then the garage room should be reckoned as an additional room of the household.
Dwelling Room
A room is treated as a dwelling room if it has walls with a doorway and a roof and should be wide and long enough for a person to sleep in, i.e. it should
have a length of not less than 2 metres and a breadth of at least I.S metres and a height of 2 metres. A dwelling room would include living room, bedroom, dining room, drawing room, study room, servant's room and other habitable rooms. Kitchen, bathroom, latrine, store room, passageway and verandah which are not normally usable for living are not considered as dwelling rooms. A room, used for multipurpose such as sleeping, sitting, dining, storing, cooking, etc., is regarded as a dwelling room. In a situation where a census houses is used as a shop or office., etc., and the household also stays in it then the room is not considered as a dwelling room. But if a garage or servant quarter is used by a servant and if she/ he also lives in it as a separate household then this has been considered as a dwelling room available to the servant's household. Tent or conical shaped hut if used for living by any household is also considered as dwelling room.
A dwelling room, which is shared by more than one household, has not been counted for any of them. If two households have a dwelling room each but in addition also share a commOn dwelling room, then the common room has not been counted for either of the households.
Census house
A 'census house' is a building or part ofa building used or recognised as a separate unit because of having a separate main entrance from the road or common courtyard or staircase, etc. It may be occupied or vacant. It may be used for residential or non- residential purpose or both. _-
ANALYTICAL NOTE
In certain peculiar situations, the manner in which buildings and census houses were identified for numbering in the field by the enumerators is described
hereunder:
Sometimes a series of different buildings are found along a street which are joined with one another by
common walls on either side looking like a continuous structure. These different units are practically
independent of one another and are likely to have
been built at different times and owned by different persons. In such cases, though the whole structure
with all the adjoining units apparently appears to be one building, each portion was treated as a separate building and its constituent units as separate census
houses.
On the other hand, one may come across cases, particularly in large cities of multi-storeyed ownership
flats. In these cases while the structure looks like
one building, different persons own the flats. In case of such multi-storeyed structures, having a number
of flats owned by different persons, the entire structure was treated as one building and each flat
as a separate census house.
If within a large enclosed area, there are separate
buildings owned by different persons then each such
building is treated as a separate building. There can
be a situation where within an enclosed compound
there are separate buildings owned by an undertaking
or company or even government that are actually in
occupation of different persons. For example, Indian
Oil Corporation colony where the buildings are owned
by the Corporation but these are in occupation of
their employees. Each such building was treated as
a separate building. But if in anyone of these buildings
there were flats in occupation of different households,
each such flat was reckoned as a separate census
house.
Sometimes it becomes difficult to apply the
definition of census house strictly in certain cases. For example, in an urban area, if a flat has five rooms,
each room having direct entrance from the common staircase or courtyard. By definition, this has to be
treated as five census houses. If all these five rooms
are occupied by a single household it was notIealistie
to treat them as five census houses. In such a
case,'singleness' of use of these rooms along with
11
the main house should be considered and the entire flat was treated as one census house. On the other hand, if two independent households occupy these
five rooms, the first household living in 3 rooms and the second household occupying 2 rooms, then considering the use, the first three rooms together were treated as one census house and the remaining rooms as another census house. But if each room
was occupied by an independent household, then each
such room was treated as a separate census house.
In case of hostels, hotels, etc., even if the door
of each room in which an inmate lives opens to a common verandah, staircase, courtyard or a common
room, as it happens almost invariably, the entire hostel/
Hotel building was treated as one census house. but if such hostels/ hotels have out- houses or other structures used for different purposes or the same
purpose, then each such structure attached to the main
hostel/hotel was treated as a separate census house.
In some parts of the country, in rural areas, the
pattern of habitation is such that a group of huts,
located in a compound, whether enclosed or
unenclosed, is occupied by one household. While the
main residence may be located in one hut, other huts
may be used for sleeping, as a kitchen, bath room,
baithak, etc. Though each of the huts was a separate
structure, they form a single housing unit and
therefore, have to be treated collectively as one
building and one census house. If some of the huts
are used by one household and the others by a second
household as residence, then the two groups of huts
were treated as separate census houses. However,
if there were also other huts in the compound used
for other purposes and not as part of the household's
residence such as, cattle shed, workshed, etc., these
were treated as separate census houses.
On the other hand, in urban areas, where more
than one strupture within an enclosed or open
compound (premises) belonging to the same person, e.g., the main house, the servant's quarter, the garage,
etc., only one building number was given for this group
and each of the constityent a separate census house
number.
Only cases where a structure with roof and pillars
has come up was treated as a building.

Village
The basic unit for rural areas is the revenue village which has definite surveyed boundaries. The revenue village may comprise of one or more hamlets but the entire village is treated as one unit for presentation of data. In unsurveyed areas, like villages within forest areas, each habitation area with locally recognized boundaries is treated as one village.
Rural-Urban area
The data in tables on Houses, Household Amenities and Assets are presented separately for rural and urban areas. The unit of classification in this regard is 'town' for urban areas and 'village' for rural areas. In the Census of India 2001, the definition of urban area adopted is as follows:
a) All places with a municipality, corporation, cantonment board or notified town area committee, etc.
b) A place satisfying the following three criteria simultaneously:
i)A minimum popUlation of 5,000;
ii)at least 75 per cent of male working popUlation engaged in non-agricultural pursuits; and
iii) a density of population of at least 400 per sq. km.(l,OOO per sq.mile)
For identification of places which would qualify to be classified as 'urban' all villages, which, as per the 1991 Census had a popUlation of 4,000 and above, a population density of 400 persons per sq. km. and having at least 75 per cent of male working population engaged in non-agricultural a~tivity were considered. To work out the proportion of male working population referred to above against b) (ii), the data relating to main workers were taken into account.
Apart from these, the outgrowths(OGs) of cities and towns have also been treated as urban under 'Urban Agglomerations'. Examples of out-growths are railway colonies, university campuses, port areas, military camps, etc.,_ that may have come up near a statutory town or city but within the revenue limits of a village or villages contiguo~s to the town or city. Each such individual area, by itself may not satisfy the demographic criteria laid down at (b) above to qualify it to be treated as an independent urban unit but may deserve to be clubbed with the towns a~ a
12
DISTRICT CENSUS HANDBOOK: SHEOHAR
continuous urban spread. Thus, the town level data, wherever presented, also includes the data for outgrowths of such towns.
City
Towns with popUlation of 1,00,000 and above are called cities.
Urban Agglomeration
An Urban Agglomeration is a continuous urban spread constituting a town and its adjoining urban outgrowths (OGs) or two or more physically contiguous towns together and any adjoining urban outgrowths of such towns. In some cases railway colonies, university campuses, port areas, etc., may come up near a city or statutory town outside its statutory limits but within the revenue limits of a village or villages contiguous to the town or city. Each such individual area by itself may not satisfy the minimum population limit to qualify it to be treated as an independent urban unit but may deserve to be clubbed with the town as a continuous urban spread.
For the purpose of delineation of Urban Agglomerations during Census ofIndia 2001, following criteria are taken as pre-requisites:
(a) The core town or at least one of the constituent towns of an urban agglomeration should necessarily be a statutory town; and
(b) The total population of all the constituents (i.e., towns and outgrowths) of an Urban Agglomeration should not be less than 20,000 (as per the 1991 Census).
With these two basic criteria having been met, the following are the possible different situations in which Urban Agglomerations would be constituted:
i) a city or town with one or more contiguous outgrowths;
ii) two or more adjoining towns with their outgrowths; and
iii) a city and one or more adjoining towns with their outgrowths all of which form a continuous spread.
Household
A 'household' is usually a group of persons who normally live together and take their meals from a common kitchen unless the exigencies of work

ANALYTICAL NOTE
prevent any of them from doing so. Persons In a
household may be related or unrelated or a mix of both. However, if a group of unrelated persons live in a census house but do not take their meals from the common kitchen. then they are not constituent of a common household. Each such person was to be
treated as a separate household. The important link in finding out whether it was a household or not was
a common kitchen. There may be one member
households, two member households or multi-member households.
Institutional household
A group of unrelated persons who live in an institution and take their meals from a common kitchen is called an Institutional Household. Examples
of Institutional Households are boarding houses, messes, hostels, hotels, rescue homes,jails, ashrams,
orphanages, etc. To make the definition more clearly perceptible to the enumerators at the Census 2001,
it was specifically mentioned that this category or households would cover only those households where a group of unrelated persons live in an institution and share a common kitchen.
Houseless household
Households who do not live in buildings or census houses but live in the open on roadside, pavements, in hume pipes, under fly-overs and staircases, or in the open in places of worship, mandaps, railway platforms, etc., are treated as Houseless Households.
Scheduled Caste and Scheduled Tribe :
Article 341 of the Constitution provides that the
President may, with respect to any State or Union
territory, specify the castes, races or tribes or parts
of or groups within castes, races or tribes which shall
for the purposes of the Constitution be deemed to be
Scheduled Castes in relation to that State or Union
territory. Article 342 similarly provides for specification of tribes or tribal communities or parts
of or groups within tribes or tribal communities which are to be deemed for the purposes of the Constitution
to be Scheduled Tribes in relation to the various States and Union territories. In pursuance of these provisions,
the list of Scheduled Castes and/or Scheduled Tribes are notified for each State and Union territory and
13
are valid only within the jurisdiction of that State or Union territory and not outside.-It is important to mention here that under the Constitution (Scheduled Castes) Order, 1950, no person who professed a religion different from Hinduism was deemed to be a member of a Scheduled Caste in addition to every member of the Ramdasi, Kabirpanthi, Majhabi or Sikligar caste resident in Punjab or Patiala and East
Punjab States Union were in relation to that State
whether they professed the Hindu or the Sikh religion. Subsequently, in September 1956, by an amendment,
the Presidential Order of 1950 and in all subsequent Presidential Orders relating to Scheduled Castes, the
Hindu and the Sikh religions were placed on the same footing with regard to the specification of Scheduled
Castes. Later on, as per the amendment made in the
Constitution (Scheduled Castes) Order 1990, the Hindu, the Sikh and the Buddhist were placed on the
same footing with regard to the recognition of the Scheduled Castes.~.
The I ists containing the names of the Scheduled
Castes and the Scheduled Tribes applicable for the Census of India 2001 in the State of Bihar are given
below:
Scheduled Castes:
1. Bantar
2. Bauri
3. Bhogta
4. Bhuiya
5. Bhumij (excluding North
Chotanagpur and South Chotanagpur
divisions and Santal Parganas district) . . . 6. ··Chamar, Mochi
7. Chaupal
8. Dabgar
·9. Dhobi
10. Dom, Dhangad
11. Dusadh, Dhari, Dharhi
12. Ghasi
13. Halalkhor
14. Hari, Mehtar, Bhangi
15. Kanjar
16. Kurariar
17. Lalbegi
18. Musahar
19. Nat
20. Pan, Sawasi
21. Pasi
22. Rajwar
23. Turi
Scheduled Tribes. :
1.
2.
3.
4.
5.
6.
7.
8.
9.
10.
11.
12.
13.
14.
IS.
16.
17.
18.
Asur
Baiga
Banjara
Bathudi
Bedia
Bhumij (in North Chotanagpur and
South Chotanagpur divisions and
Santal Parganas district)
Binjhia
Birhor
Bitjia
Chero
Chik Baraik
Gond
Gorait
Ho
Karmali
Kharia
Kharwar
Khond
14
DISTRICT CENSUS HANDBOOK SHEOHAR
19. Kisan
20. Kora
21. Korwa
22. Lohara, Lohra
23. Mahli
24. Mal Paharia
25. Munda
26. Oraon
27. Parhaiya
28. Santal
29. Sauria Paharia
30. Sayar
Language and Mother tongue
As per the census concept, each language is a
group of mother tongues. The census questionnaire
collects information on the mother tongue of each
person and mother tongue is defined as the language
spoken in childhood by the person's mother to the
person. If the mother died in infancy, the language
mainly spoken in the person's home in childhood will
be the mother tongue. In the case of infants and deaf
mutes, the language usually spoken by the mother is
considered as mother tongue. It is not necessary that
the language spoken as mother tongue should have
a script. The mother tongues returned by the
respondents in census are classified and grouped under
appropriate languages according to their linguistic
characteristics.
Literate
A person age 7 years and above who can o9th
read and write with understanding in any language is
taken as literate. A person who can only read but
cannot write is not literate. It is not necessary that
to be considered as literate, a person should h~ve
received any formar education or passed any minimum
educational standard. Literacy could also have been
achieved through adult literacy classes or through any
non-formal educational system. People who are blind
and caJ:l read in Braille are treated as literates.

ANALYTICAL NOTE
Literacy rate
Literacy rate of the population is defined as the
percentage of literates in the age group seven years
and above. For different age groups the percentage
of literates in that age group gives the literacy rate.
Educational level
The highest level of education a person has
completed.
Work
Work is defined as participation in any
economically productive activity with or without
compensation, wages or profit. Such participation may
be physical and/or mental in nature. Work involves
not only actual work but also includes effective
supervision and direction of work. It even includes
part time help or unpaid work on farm, family
enterprise or in any other economic activity. All
persons engaged in 'work' as defined above are
workers. Persons who are engaged in cultivation or
milk production even solely for domestic consumption
are also treated as workers. Reference period for
determining a person as worker and non-worker is
one year preceding the date of enumeration.
Main worker
Person who has worked for major part of the
reference period ( i.e. six months or more during the
last one year preceding the date of enumeration) in
any economically productive activity is termed as
'Main worker'.
Marginal worker
A person who worked for less than six months
of the reference period (i.e. in the last one year
preceding the date of enumeration) in any economic
activity is termed as 'Marginal worker' .
·Non worker
A person who has not worked at all in any
economically productive activity during the reference
period ( i.e. last one year preceding the date of
enumeration) is termed as 'Non worker'.
15
Cultivator
For purposes of the Censlls a person is classified as cultivator if he or she is engaged in cultivation on land owned or held from government or held from private persons or institutions for payment in money, kind or share. Cultivation includes effective supervision or direction in cultivation.-A person who has given out herlhis land to another person or persons
or institution(s) for cultivation for money, kind or share
of crop and who does not even supervise or direct cultivation in exchange of land, is not treated as cultivator. Similarly, a person working on another person's land for wages in cash or kind or a
combination of both (agricultural labourer) is not treated as cultivator.-Cultivation involves ploughing, sowing, harvesting and production of cereals and millet
crops such as wheat, paddy, jowar. bajra, ragi. etc.,
and other crops such as sugarcane, tobacco, groundnuts, tapioca, etc., a~d pulses, raw jute and kindred
fiber crop, cotton, cinchona and other medici~al plants, fruit growing, vegetable growing -or keeping orchards or groves, etc. Cultivation does not include the following plantation crops - tea, coffee, rubber,
coconut and betel-nuts (areca).
Agricultural labourer
A person who works on another person's land for wages in money or kind or share is regarded as
an agricultural labourer. She/he has,llo risk in the cultivation, but merely works.on another person's land for wages. An agricultural labourer has no right of lease or contract on land on which she/he works.
Household industry worker
Household industry is defined as an industry
conducted by the head of the household herselflhimself
and or by the members of the household at home or within the village in rural areas and only within the precincts of the house where the household lives in urban areas. The larger proportion of workers in household industry should col1sist of members of the household including the head. The industry should not be run on the scale of a registered factory which
would qualify or has to be registered under the Indian Factories Act and should be engaged in manufacturing, processing, servicing and repairs of goods.- It does
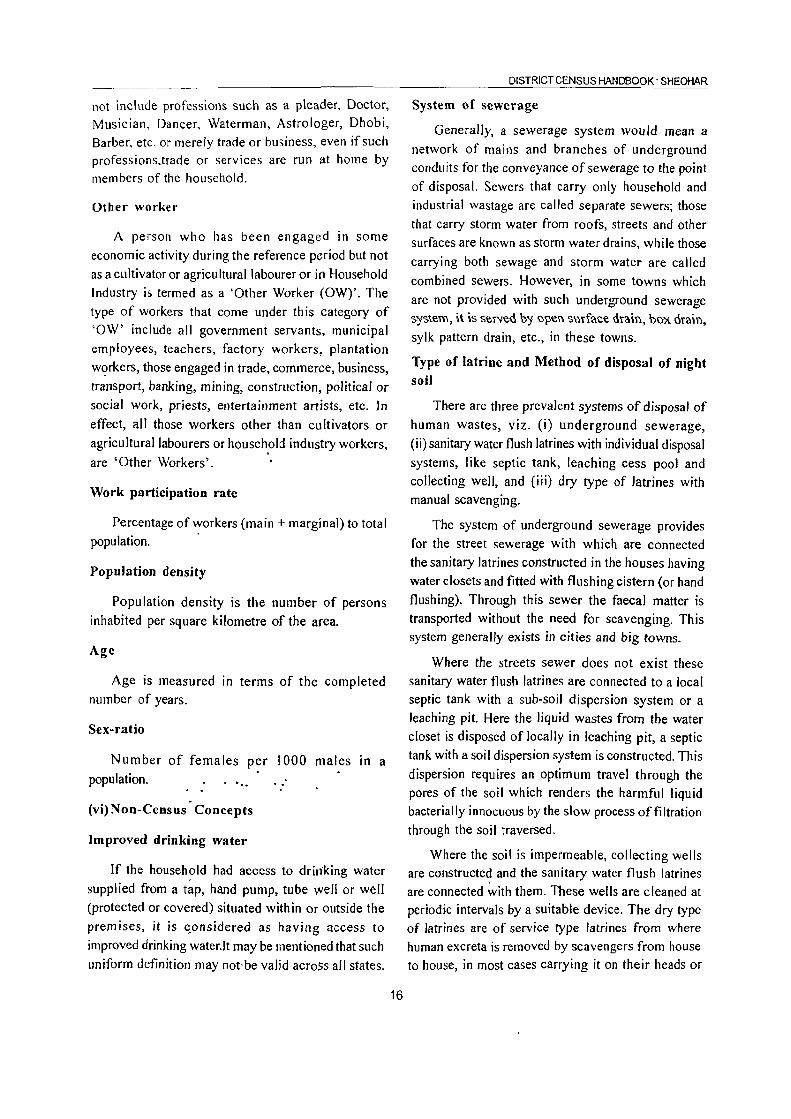
not include professions such as a pleader, Doctor, Musician, Dancer, Waterman, Astrologer, Dhobi,
Barber. etc. or merely trade or business, even ifsuch professions.trade or services are run at home by members of the household.
Other worker
A person who has been engaged in some
economic activity during the reference period but not
as a cultivator or agricultural labourer or in Household
Industry is termed as a 'Other Worker (OW)'. The
type of workers that come under this category of
'OW' include all government servants, municipal
employees, teachers, factory workers, plantation
w<_>rkers, those engaged in trade, commerce, business,
transport, banking, mining, construction, political or
social work, priests, entertainment artists, etc. In
effect, all those workers other than cultivators or
agricultural labourers or househ,old industry workers,
are 'Other Workers'.
Work participation rate
Percentage of workers (main + marginal) to total popUlation. .
Population density
Population density is the number of persons
inhabited per square kilometre of the area.
Age
Age is measured 10 terms of the completed number of years.
Sex-ratio
Number of females per 1000 males in a population.
(vi)Non-Census' Concepts
Improved drinking water
If the household had access to dririking water
supplied from a tap, hand pump, tube well or well
(protected or covered) situated within or outside the
premises, it is ~onsidered as having access to
improved drinking water.It may be mentioned that such
uniform definition may not'be valid acroSs all states.
16
DISTRICT CENSUS HANDBOOK' SHEOHAR
System of sewerage
Generally, a sewerage system would mean a
network of mains and branches of underground condu its for the conveyance of sewerage to the point
of disposal. Sewers that carry only household and
industrial wastage are called separate sewers; those
that carry storm water from roofs, streets and other
surfaces are known as storm water drains, while those
carrying both sewage and storm water are called
combined sewers. However, in some towns which
are not provided with such underground sewerage system, it is served by open sourface drain, box drain,
sylk pattern drain, etc., in these towns.
Type of latrine and Method of disposal of night soil
There are three prevalent systems of disposal of
human wastes, viz. (i) underground sewerage,
(ii) sanitary water flush latrines with individual disposal
systems, like septic tank, leaching cess pool and
collecting well, and (iii) dry type of latrines with
manual scavenging.
The system of underground sewerage provides
for the street sewerage with which are connected
the sanitary latrines constructed in the houses having
water closets and fitted with flushing cistern (or hand
flushing). Through this sewer the faecal matter is
transported without the need for scavenging. This
system generally exists in cities and big towns.
Where the streets sewer does not exist these
sanitary water flush latrines are connected to a local septic tank with a sub-soil dispersion system or a
leaching pit. Here the liquid wastes from the water
closet is disposed of locally in leaching pit, a septic
tank with a soil dispersion system is constructed. This
dispersion requires an optimum travel through the
pores of the soil which renders the harmful liquid bacterially innocuous by the slow process offiltration
through the soil traversed.
Where the soil is impermeable, collecting wells are constructed and the sanitary water flush latrines
are connected with them. These wells are cleaned at periodic intervals by a suitable device. The dry type
of latrines are of service type latrines from where human excreta is removed by scavengers from house
to house, in most cases carrying it on their heads or
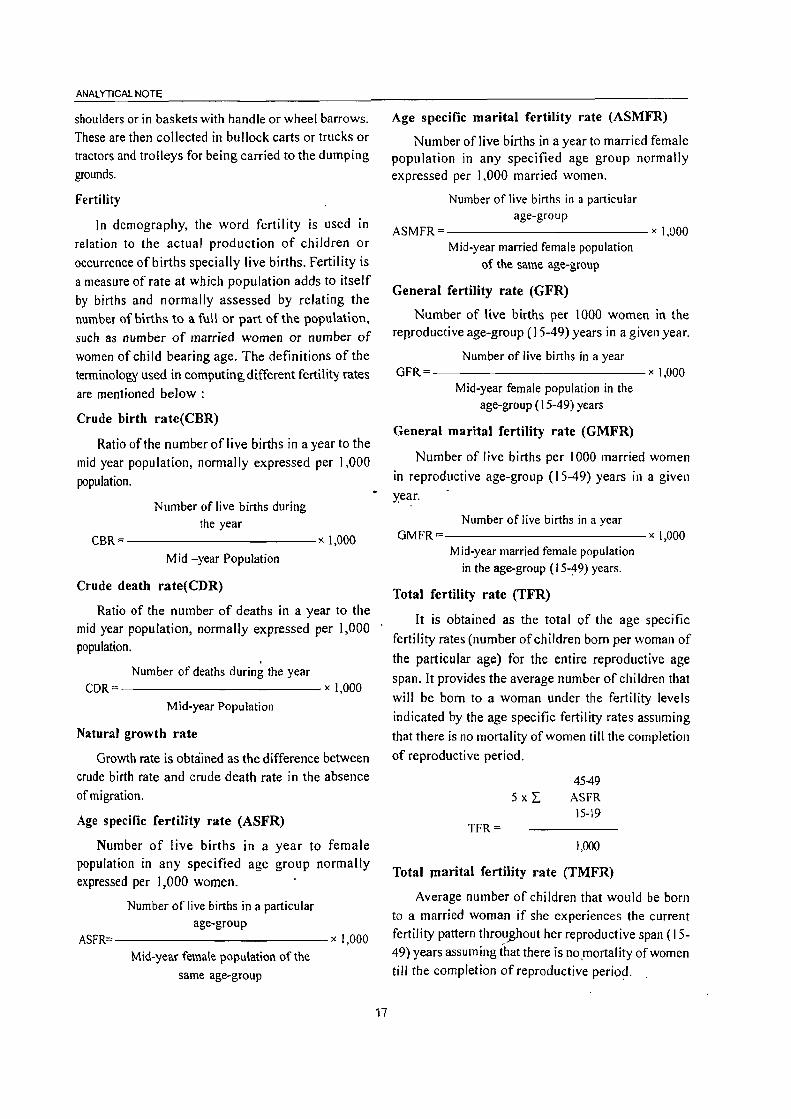
ANALYTICAL NOTE
shoulders or in baskets with handle or wheel barrows. These are then collected in bullock carts or trucks or tractors and trolleys for being carried to the dumping grounds.
Fertility
In demography, the word fertility is used In
relation to the actual production of children or occurrence of births specially live births. Fertility is a measure of rate at which population adds to itself by births and normally assessed by relating the number of births to a fuB or part of the popuiation,
such as number of married women or number of women of child bearing age. The definitions of the terminolog)' used in computing different fertility rates are mentioned below:
Crude birth rate(CBR)
Ratio of the number of live births in a year to the mid year population, normally expressed per 1,000
population.
Number of live births during the year
CBR=-----------x 1,000
Mid -year Population
Crude death rate(CDR)
Ratio of the number of deaths in a year to the mid year population, normally expressed per 1,000 population.
Number of deaths during the year CDR=------------x 1,000
Mid-year Population
Natural growth rate
Growth rate is obtained as the difference between crude birth rate and crude death rate in the absence of migration.
Age specific fertility rate (ASFR)
Number of live births in a year to female population in any specified age group normally expressed per 1,000 women.
Number of live births in a particular age-group
ASFR= x 1,000 Mid-year female population of the
same age-group
Age specific marital fertility rate (ASMFR)
Number of live births in a year to married female population in any specified age group normally expressed per 1,000 married women.
Number of live births in a particular age-group
ASMFR =------------x 1,000 Mid-year married female population
of the same age-group
General fertility rate (GFR)
Number of live births per 1000 women in the rep.roductive age-group (15-49) years in a given year.
Number of live births in a year GFR=-------------x 1,000
Mid-year female population in the age-group (15-49) years
General marital fertility rate (GMFR)
Number of live births per 1000 married women in reproductive age-group (15-49) years in a given y'ear.
Number of live births in a year GMFR= )( 1,000
Mid-year married female population in the age-group (15-49) years.
Total fertility rate (TFR)
It is obtained as the total of the age specific fertility rates (number of children born per woman of
the particular age) for the entire reproductive age span. It provides the average number of children that will be born to a woman under the fertility levels indicated by the age specific fertility rates assuming that there is no mortality of women till the completion
of reproductive period.
5 x L
TFR=
4549 ASFR 15-19
1,000
Total JIlarital fertility rate (TMFR)
Average number of children that would be born to a married woman if she experiences the current fertility pattern throu_ghout her reproductive span (15-49) years assuming ihat there is nO,mortality of women till the completion of reproductive period.

5 x I
TMFR=
45-49 ASMFR
15-19
1,000
Age-specific mortality rate (ASMR)
Number of deaths in a particular age and sex
DISTRICT CENSUS HANDBOOK: SHEOHAR
life (28 days or under) in a year per 1,000 live births
of the same year.
Number of infant deaths aged 28 days or under during the year
NMR= x 1,000
Number of live births during the year
group per 1,000 population of the same age group. Early neo-natal mortality rate
Number of deaths in a particular age-group
ASMR = x 1,000 Mid-year population of the same
age-group
ql
Probability of dying between birth and age). This
can be used as approximate value of Infant Mortality
Rate (IMR) which gives the ratio of number of deaths
in a year of children aged less than one year to the
number of births in that year.
q2 :
Probability of dying between birth and age 2.
q5 :
Probability of dying between birth and age 5. This
indicator is also known as Under Five Mortality Rate
(USMR).
Infant mortality rate (IMR)
Ratio of the number of infanYdeaths (deaths of
children below one year) -in a year to the number of
live births in that year.
Number of infant deaths during the year
IMR = - x 1,000
Number of live births during
the year
Infant mortality rate comprises of two parts, viz.,
Neo-natal mortality rate and Post neo-natal mortality
rate. The neo-natal mortality ~ate also comprises of
two parts 'viz:, Early neo-natal mortality rate and late
neo-natal mortality' rate: These are defined as :
Neo-nataI mortality rate (NMR)
Number of infants dying within the first month of
18
Number of infant deaths of less than 7 days During the year
-------------- x 1,000 Number of live births during the year
Late neo-natal mortality rate
Number of infant deaths of 7 days to less than 29 days during the year
--------------x 1,000 Number of live births during the year
Post neo-nataI mortality rate (PNMR)
Number of deaths of 29 days to less than one year during the year
--------------)( 1,000
Number of live births during the year
Peri-natal mortality rate (PMR)
Number of still births plus deaths within) st week of delivery per 1,000 births in a year.
Number of still births and infant deaths of less than 7 days during the year
PMR=-------------x 1,000 Number of live births and still births
during the year
Still birth rate (SBR)
Number of still births during the year
--------------x 1,000 Number of live births and still births
during the year
Maternal mortality rate (MMR)
Number of deaths of women in the age group
15-49 while pregnant or within 42 days of termination of pregnancy from any cause 'related to pregnancy
and child birth per 1,00,000 live births in a given year.
Number of maternal deaths to women in the age group 15-49
MMR= x 100,000 Number of live birth

ANALYTICAL NOTE
Eligible couple (Couples per 1000 population)
Number of currently married females in the age
group 15-44 years per 1000 persons of all ages.
Child woman ratio (0-4)
Number of children in the age group 0-4 yeais
per 1000 women in the age group 15-49 years.
Child woman ratio (5-9)
Number of children in the age group 5-9 years
per 1000 women in the age group 15-49 years.
Migration
Migration is the third component of population
change, the other two being mortality and fertility.
A person is considered as a migrant by place of birth if the place in which he/she is enumerated during
the census is other than the place of his/her birth.
Similarly a person is considered as a migrant by
place of last residence if the place in which he/slie
is enumerated during the censlls is other than his/her place of immediate last residence outside the village
or town and not simply in another house or locality in the same village or town.
Certain aspects concerning temporary movement!
migration of people has been explained below as these
are important components concerning migration:
(i) Migration of persons in search of job is high
in the country. In many cases stich migrants
are only seasonal in nature. People migrate to
other places for work in a particular season
and come back again to their usual place of
residence after three or four months. All such
workers are treated as migrants. Similarly, if a
person moved to any other place for attending
short term vocational or educational course that
lasted for on Iy few months o~ a .year, 'SRe/he· .:
too were considered as a migrant.
(ii) Where a person had merely gone out to
another place or had been shifting from one
place to another purely on tour, pilgrimage, visit
to hospital for treatment or for temporary
business purposes, such persons are not deemed
to have had another residence different from
the place where she/he or her/his family
normally resides. She/he is not considered as
migrant.
19
(iii) A woman temporarily moves into a hospital or to her parents or other relative's house for
delivery and if the hospital or the parents/ relatives houses is in a place different from
usual place of residence, the place where the hospital or parents/relative's house is the place
of last residence of the child but not of the mother.
A new response category 'Moved after birth' was
added in Census of India 200 I in the question on
'reasons for migration' to bring out additional
migration patterns. Natural calamities or distress
migration as a reason for migration for last residence
migrants included in 1991 Census, is covered under
category of 'Others'. The reason for migration has
been determined as applicable at the time of migration
and not in reference to any point of time after that.
For example, if a person had moved from the place
of her/his last residence for the purpose of education
and subsequently at some point of time got
employment there only, the reason for migration would
be 'education' and not 'work/employment'.
Internal and International migration
The migrational movements are of three types (i)
Migration within the state itself with its components (a)
Migration within the district of enumeration (intra district
migration) (b) Migration from one district of state to
another district of state (inter district migration), (ii)
Migration from one state to another State of the country
(inter-state migration), (iii) Migration from one country
to another country. The first two streams together
constitute internal migration, while the last type of
movement is called international migration.The present
name of the country, state or district and not the name
by which they were known at the time of herlhis birth
or last residence were recorded.
Rural-Urban components of migration
Rural or Urban status in respect of migrants have
been determined as applicable at the time of migration
and not'with reference to any point of time after that.
The flow of migrants consists of tour streams viz. rural
to rural, rural to urban, urban to rural and urban to urban.
Civic status of urban units
Civic Status of a town/city is determined on the
basis of Civic Administrative authority of the town e.g., ,.

Municipal Corporation/Corporation, Municipal
Committee/Municipal council. Municipality etc.
Size class of UArrown
Size-class of UA/Town is based on the population size of the UNCity/Town UAs.lTowns with 1,00,000
and above population are classified as Class I UAs./ towns. These Class I UAslTowns are now further sub
classified into seven sub classes namely M 1 to M7
depending on the population size of UNCitylTown. These are M7('),OOO,000 and above); M6 (2,000,000 to 4,999,999); M5 (1,000,000-1,999,999) M4 (500,000-
999,999); M3(300,000-499,999), M2 (200,000-299,999)
& MI (100,000-199,999) towns with 50,000 to 99,999 population are classified as Class II towns, 20,000 to
49,999 population are Class III towns, population with
10,000-19,999 are Class IV towns, population with 5000
and 9999 are Class V towns and towns with less than
5000 population are Class VI towns.
Slum area
The Slum"Areas (Improvement and Clearance) Act,
1956 which was enacted by the Central Govt. defined slums as a) Areas where buildings are in any respect
unfit for human habitation; or b) are by reasons of
dilapidation, overcrowding, fault arrangement and design
of such buildings, narrowness or faulty arrangement of
streets, lack of ventilation, light or sanitation facilities, or
any combination of these factors, are deterimental to safety ,health or morals.
Mega city
The concept of 'Mega city' is a recent phenomenon in the Urban Sociology and is defined in term of
metropolitan city in the fonn of large size, problem of management of civic amenities and capacity to absorb the
relatively high growth of population. Indian Census in 1991
treated the population size of 5 million and above as the cut
off point to identify a place as the mega city. Whereas, for
the purpose of inclusion in Centrally Sponsored Scheme
for Infrastructure Development in Mega cities the Ministty
of Urban Affairs and employment, Department of Urban
Development adopted the criteria of 4 million and above
population as per 1991 Census for Mega Cities_ In 2001 Census, cities with 10 millions and above population have been treated as Mega cities.
Note on religion
The population of the Sitamarhi district (from
20
DISTRICT CENSUS HANDBOOK SHEOHAR
wh icll the distl ict of Sheohar was carved out) during
1991 was 2,391,495. H indus constitute over 80 per
cent (1,919,514 persons) of the population in the
district followed by Muslims 19.7 percent (471,508 persons). All other four major religious communities
have almost negligible percentages.
Note on mother tongue
Spoken language, which is medium of
conversation, is an important attribute ofpopulation.
The Census Of India has been the richest source of
language data collected and published during the
successive decennial censuses over a century. During
1991 census, as in the previous censuses, the mother
tongue as returned by each individual was collected.
The population orthe Sitamarhi district (from
which the district of Sheohar was carved out) during
1991 was 2,391,495. As per distribution of different
mother tongues (languages mentioned under 8'h
Schedule of Constitution of India) as returned during.
the 1991 Census for Sitamarhi district, Hindi, the main
mother tongue of the district was returned by 84.1
percent (2,0 II ,617 persons) of the population. The
corresponding percentage for the Urdu, the second
most prominent language spoken in Sitamarhi district, was 15.9 percent (379,186 persons). Speakers of
other Scheduled languages were very thin in number
than the two described above.
Note on important SCs and STs in the district of Sitamarhi during 1991 Census
The population of the Scheduled Caste in the
Sitamarhi district (from which the district of Sheohar
was carved out) during 1991 was 2,89,834. Numerically
five important SCs were namely, Dusadh/Dhari (ii)
Chamar/Mochi (iii) Musahar (iv) Dhabi and (v) Pasi.
The population of Dusadh/Dhari was 1,08,082 whieh
constituted 37.3 percent of the Schedu led- Castes - .
population. The population of Chamar/Mochi was
1,00,372 which constituted 34.6 percent of the
Scheduled Castes population. Musahar had 36,233
population which constituted 12.5 percent of the
Scheduled Caste population. Dhobi had 32,192
population while Pasi had 5088 population. Dhobi
constituted 11.1 percent while Pasi constituted only
1.8 percent of the Scheduled Castes population.
The population of the Scheduled Tribes in the
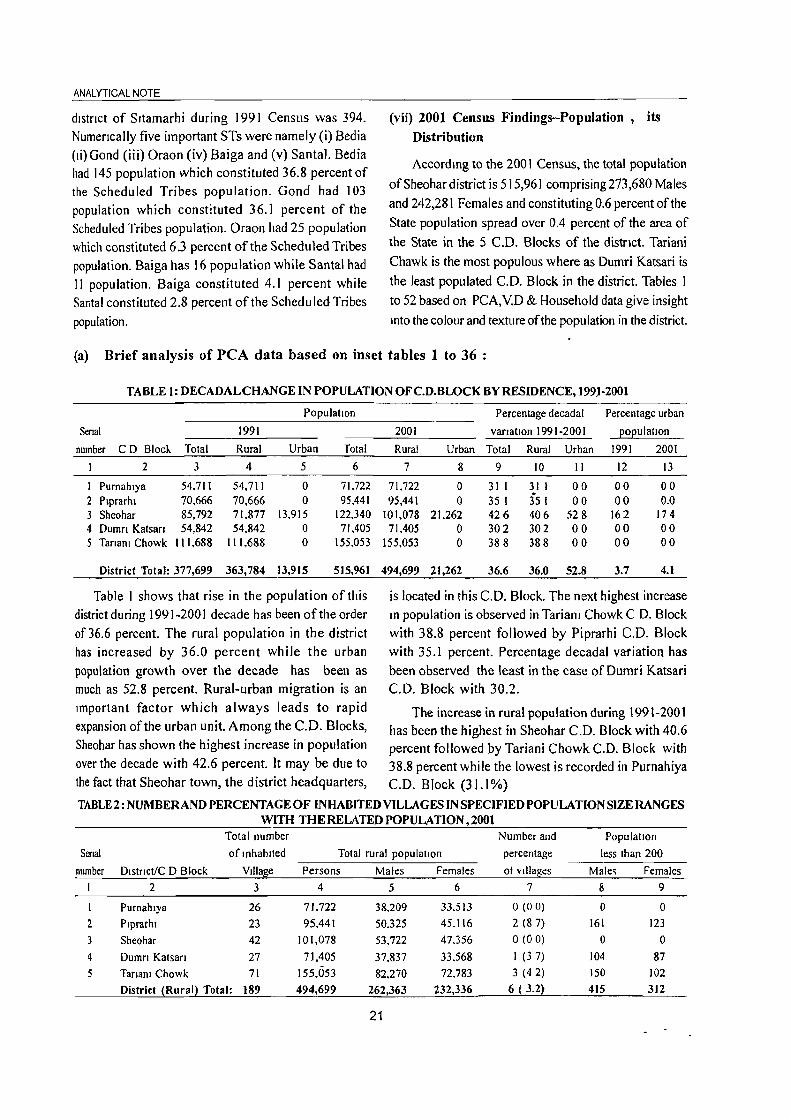
ANALYTICAL NOTE
dlstnct of Srtamarhi during 1991 Census was 394. Numerically five important STs were namely (i) Bedia (Ii) Gond (iii) Oraon (iv) Baiga and (v) Santa!. Bedia had 145 population which constituted 36.8 percent of the Scheduled Tribes population. Gond had 103 population which constituted 36.1 percent of the Scheduled Tribes population. Oraon had 25 population which constituted 6.3 percent of the Scheduled Tribes population. Baiga has 16 population while Santa I had II population. Baiga constituted 4.1 percent while Santal constituted 2.8 percent of the Scheduled Tribes population.
(vii) 2001 Census Findings-Population, its
Distribution
According to the 2001 Census, the total population
of Sheohar district is 515,961 comprising 273,680 Males and 242,281 Females and constituting 0.6 percent of the State population spread over 0.4 percent of the area of the State in the 5 C.O. Blocks of the distriCt. Tariani Chawk is the most populous where as Dumri Katsari is the least populated C.D. Block in the district. Tables I to 52 based on PCA, Y.O & Household data give insight mto the colour and texture of the population in the district.
(a) Brief analysis of PCA data based on inset tables 1 to 36 :
TABLE 1: DECADALCHANGE IN POPULATION OFC.D.BLOCK BY RESIDENCE, 1991-2001
Population
Senal 1991
number CD Block Total Rural Urban Total
2 3 4 5 6
I Purnahlya 54.711 54,711 0 71,722 2 Plprartu 70,666 70,666 0 95,441 3 Sheohar 85,792 71,877 13,915 122.340 4 Dumn Katsan 54,842 54,842 0 71,405 5 Tanan! Chowk 111.688 111.688 0 155.053
District Total: 377,699 363,784 13,915 515,961
Table I shows that rise in the population of this district during 1991-200 I decade has been of the order of 36.6 percent. The rural population in the district has increased by 36.0 percent while the urban popUlation growth over the decade has been as much as 52.8 percent. Rural-urban migration is an Important factor which always leads to rapid expansion of the urban unit. Among the C.O. Blocks,
Percentage decadal Percentage urban
2001 vanatlon 1991-200 I eoeulatlon
Rural Urban Total Rural Urban 1991 2001
7 8 9 10 II 12 13
71.722 0 31 1 31 I 00 00 00 95,441 0 35 1 35 I 00 00 0.0
101,078 21.262 426 406 528 162 174 71,405 0 302 302 00 00 00
155.053 0 388 388 00 00 00
494,699 21,262 36.6 36.0 52.8 3.7 4.1
is located in this C.D. Block. The next highest increase III population is observed in Tariam Chowk C D. Block with 38.8 percent followed by Piprarhi C.D. Block with 35.1 percent. Percentage decadal variation has been observed the least in the case of Dumri Katsari C.D. Block with 30.2.
The increase in rural population during 1991-2001 has been the highest in Sheohar C.D. Block with 40.6
Sheohar has shown the highest increase in population percent followed by Tariani Chowk C.D. Block with over the decade with 42.6 percent. It may be due to 38.8 percent while the lowest is recorded in Purnahiya the fact that Sheohar town, the district headquarters, C.O. Block (3 1.1 %)
TABLE 2 : NUMBER AND PERCENTAGE OF INHABITED VILLAGES IN SPECIFIED POPULATION SIZE RANGES WITH THE RELATED POPULATION, 2001
Total number Number and PopulatIOn
Senal ofmhablted Total rural populatron percentage less than 200
number Dlstnct/C D Block Village Persons Males Females ot vlllagt:s Male~ Females
2 3 4 5 6 7 8 9
I Purnahlya 26 71.722 38.209 33.513 0(00) 0 0
2 Plprarh! 23 95,441 50.325 45.116 2 (87) 161 123
3 Sheohar 42 101,078 53.722 47.356 0(00) 0 0
4 Dumn Katsan 27 71,405 37.837 33.568 I (37) 104 87
Tanam Chowk 71 155.053 82.270 72.783 3 (42) 150 102
District ~RuraQ Total: ]89 494,699 262,363 232,336 6 ~ 3.2) 415 312
21

DISTRICT CENSUS HANDBOOK SHEOHAR
TABLE 2: NUMBERAND PERCENTAGE OF INHABITED VILLAGES IN SPECIFIED POPULATION SIZE RANGES WITH THE RELATED POPULATION ,2001 (Contd.)
Number and PopulatIOn Number and PopulatIon Number and Population
Senal per~entage 200-499 percentage 500-999 percentage 1000-1999
T.umber Dlstnct/C D Block of villages Males Females ofvlflages Males Females of villages Males Females .. 10 II 12 13 14 15 16 17 18 .t.
PUrnahl)d 0(00) 0 0 4 (154) 1526 1.307 7 (269) 5,850 5,091 2 Plprarhl 0(00) 0 0 0(00) 0 0 5 (21 7) 3.964 3.590
3 ':iheohar 2 (48) 461 41 I 3 (7 I) I 101 956 20 (47 6) 15.)08 13.563 4 Dumn Katsan 2 (74) 286 236 4 (148) 1762 1.509 7 (25 9) 5,573 4.885
5 Tanam Chow"- 9 (127) 1.509 1.290 8 (I I 3) 2.979 2.632 24 (33 8) 18.756 16.627
Districts (Rural) Total: 13 ( 6.9) 2,256 1,937 19 ( 10.1) 7,368 6,404 63 ( 33.3) 49,451 43.756
TABLE 2: NUMBER AND PERCENTAGE OF INHABITED VILLAGES IN SPECIFIED POPULATION SIZE RANGES WITH THE RELATED POPULATION ,200] (Cone/d.)
Number and PopulatIOn Number and PopulatIOn Number and PopulatIOn
Senal percentage 2000-4999 percentage 5000-9999 percentage I 0000 and above
number DlstnctlC D Block. of vIllages Males Females of vIllages Males Females of villages Males Females ) 2 19 20 21 22 23 24 25 26 27
I Purnahlya 12 (462) 21,155 18.607 3 (I I 5) 9.678 8.508 0(00) 0 0 2 Plprarhl I I (47 8) 18.912 16.538 3 (13 0) 11.230 10.122 2 (8 7) 16.058 14,743 3 Sheohar 13 (31 0) 21.740 19.093 4 (9 5) 15.112 13.333 0(00) 0 0 4 Dumn Katsan 9 (33 3) 13,568 12.1 17 3 (II I) 10.987 9.826 I (37) 5.557 4.908 5 Tanam Chowk 21 (296) 34.504 30.683 5 (70) 19.071 16.718 I (I 4) 5.)01 4.731
District (Rural) Total: 66 (34.9) 109.879 97.038 18 ( 9.5) 66,078 58,507 4 ( 2.1) 26,916 24.382
It may be observed in the Table 2 that the maximum number of villages in the district lie in the
population range of 2000-4999 accounting for 34.9 percent of the total inhabited villages closely
followed by villages in the population range of 1000-
1999 accounting for 33.3 percent of the total inhabited villages. The proportion of population in
the above two population ranges are 41.8 percent
and 18.8 percent of!he tot~1 rural p~pulation of the
district respictivefy: The .... iillages in the population
range of 500-999 constitute 10.1 percent of the total inhabited villages and in these villages the proportion
of population is only 2.8 percent.There are 18 villages
In the populatIon range of 5000-9999 accountmg for 9.5 percenr of the total inhabited villages and in these
villages the proportion of population is 25.1 percent
of the total rural population. There are ]3 villages in
the popu lation range of 200-499 accounting for 6.9
percent of the total inhabited villages and in these
villages the proportion of population is only 0.8
percent of the total rural population. There are only
6 villages in the population range of less than 200
accounting for 3.2 percent of the total inhabited
villages and in these village the proportion of
population is only 0.1 percent There are only 4
villages in the highest popUlation range of J 0,000
and above accounting for only 2 1 percent of the
total inhabited villages and in these villages the
percentage of population is 10.4.
TABLE 3: NEW TOWNS, DENOTIFIED, DECLASSIFIED AND MERGED TOWNS IN 2001 CENSUS
Above table IS not appIJcale In respect of Sheohar dlstnct as there has been no change between 1991 Census and 200 I Cen'\us
22

ANALYTICAL NOTE
TABLE4: DISTRIBUTION OFVILLAGES BY POPULATION DENSITY, 2001
Range of population density Total number of villages In each
(Eer sguare kilometre) EOEulation density ranBe I 2
0-10 J
11-20 0
21-50 0
51-100 0
101-200 2
201-300 3 301-500 6
SOl + 177
Not known 0
District Total: 189
Population Density (Rural) of the district:
The data presented in the above table highlight the fact that ma~imum proportion of villages in Sheohar district lies in the density range (per square kilometer) of 501 + with 93.7 percent of the total inhabited villages followed by villages in the density range of 301-500 which account for 3.2 percent. It would further be seen that small number of villages
Percentage ofvIllagc~ In each populatIon Percentage distribution
densit~ range Population of population
3 4 5
0.5 1 0.0
0.0 0 0.0
0.0 0 00
00 0 0.0
1.1 284 0.1
1.6 1,057 0.2
3.2 3.423 0.7
93.7 489,934 99.0
00 0 0.0
100.0 494,699 100.0
1,165
fall in the density range of 201-300 which account for 1.6 percent of the total inhabited villages.
Maximum number of villages fall in the density
range of 501 + covering 99.0 percent of the population
followed by villages in the density range of301-500
which account for 0.7 percent of the population.
TABLES: SEX RATIO OF STATE AND DISTRICT, 1901-2001
State
Census Year Total Rural Urban Total
2 3 4 5
1901 1.061 1,064 1.003 1.089
1911 1.051 1.056 942 1.092
1921 1,020 1,027 886 1.079
1931 995 1,005 820 1,037
1941 1,002 1,012 842 1.048
1951 1.000 1.010 859 1.009
1961 1,005 1,020 832 1,020
1971 957 968 833 968
1981 948 959 852 923
1991 907 913 857 876
2001 919 926 868 885
Note: Sex ratio has been defined here as the number of females per 1000 males
23
District
Rural
6
1.089
1.092
1,079
1,037
1.048
1.009
1,020
968
923
876
886
Urban
7
860
879

Table 5 sho"Ws that sex ratio for the urban areas of Sheohar district is marginally high as compared
to the urban al eas of the state during 1991 and 2001 Censuses. However, on the other hand, the sex ratio for the rural areas of the state is found to be comparatively high as compared to the rural areas of Sheohar district during 1991 and 2001 Censuses. It has already been discussed that the district ofSheohar was created after 1991 Census.!t is found that in case of sex ratio in the total population in the district It is lower than the sex ratio of the State of Bihar
both in 1991 and 2001 Censuses.
TABLE 6: SEX RATIO BY C.D. BLOCKS, 2001
Serial number
2
3
4
5
Name of CD Block
2
Purnahlya
Plprarhl
Sheohar
Dumri Katsan
Tanani Chowk
District Total:
Total
3
877
896
881
887
885
885
Sex ratIo
Rural Urban
4 5
877
896
882 879
887
885
886 879
In Sheohar district as a whole there are 885 females for every thousand males. Within the district,
the Sex ratio varies from 896 in Piprarhi C.D. Block to 877 in Purnahiya C.D. Block. The sex ratio of Dumri Katsari CD. Block is 887 while the sex ratio
of Tariani chowk C.D. Block is 885. The sex ratio
of Sheohar C.D. Block is 881. The sex ratio figures
DISTRICT CENSUS HANDBOOK SHEOHAR
for rural and urban areas of Sheohar district are 886 and 879 respectively.
The sex ratios ofPiprarhi and Dumri Katsari C.D. Blocks are higher than the district rural average of 886 while Purnahiya (877), Sheohar (882) and Tariani Chowk (885) C.D. Blocks have sex ratios below the district rural average. The urban sex ratio of the district is 879 which is lower than the total and rural averages of the district.
TABLE 7 : SEX RATIO BY CD BLOCKS, 2001
Senal
number
2
3
4
5
Name of C D block
2
Purnahlya
Plprarhl
Sheohar
Dumri Katsari
Tariani Chowk
District (Rural) Total:
Sex ratIo
3
877
896
882
887
885
886
As for nual in Sheohar district there are 886 females for every thousand males. With in the district, the sex ratio varies from 896 in Piprarhi C.D. Block to 877 in Purnahiya C.D. Block. The sex ratios of Sheohar, Dumri Katsari and Tariani Chowk C.D. Blocks are 882, 887 and 885 respectively. The sex ratios ofPiprarhi and Dumri Katsari C.D.Blocks are higher than the district rural average of 886 while
Purnahiya (877), Sheohar (882) and Tariani Chowk
(885) C.D. Blocks have sex ratios below the district
rural average.
TABLE 8 : SEX RATIO OF RURAL POPULATION BY RANGES, 2001
Range of sex ratio Number of mhabited Percentage of villages In Population Percentage distributIOn for VIllages VIllages each range 2001 of population
I- 2 3 4 5
Less than 700 3 16 286 01
700-749 2 II 967 02
750-799 7 37 6,583 13
800-849 32 16.9 60,160 122
850-899 85 450 252,664 51 I
900-949 46 243 151,356 306
950·999 9 48 16.868 34
1000-1099 5 26 5.815 I 2
1100+ 0 00 0 00
District Total: 189 100.0 494.699 100.0 Sex ratio (Rural) for District: 886
24
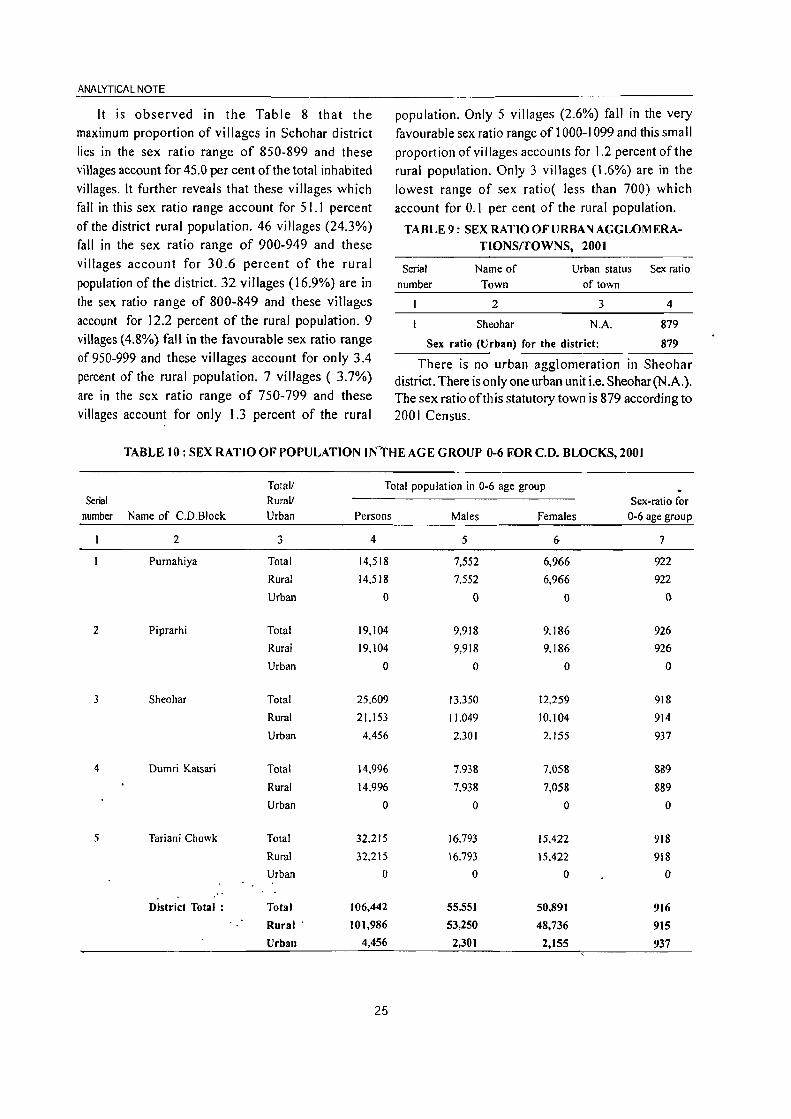
ANALYTICAL NOTE
It is observed In the Table 8 that the
maximum proportion of villages in Sehohar district lies in the sex ratio range of 850-899 and these villages account for 45.0 per cent of the total inhabited
villages. It further reveals that these villages which fall in this sex ratio range account for 51.1 percent
of the district rural population. 46 villages (24.3%) fall in the sex ratio range of 900-949 and these
villages account for 30.6 percent of the rural
population of the district. 32 villages (16.9%) are in
the sex ratio range of 800-849 and these villages
account for 12.2 percent of the rural population. 9
villages (4.8%) fall in the favourable sex ratio range of 950-999 and these villages account for only 3.4
percent of the rural population. 7 villages ( 3.7%)
are in the sex ratio range of 750-799 and these
villages account for only 1.3 percent of the rural
popUlation. Only 5 villages (2.6%) fall in the very
favourable sex ratio range of 1 000-1 099 and this small
proportion of villages accounts for 1.2 percent of the rural population. Only 3 villages (1.6%) are in the
lowest range of sex ratio( less than 700) which
account for 0.1 per cent of the rural popUlation.
TABLE 9: SEX RATIO OF URBAN AGGLOMERATIONSrrOWNS, 2001
Serial number
Name of Town
2
Sheohar
Urban status Sex ratio of town
3 4
N.A. 879
Sex ratio (Urban) for the district: 879
There is no urban agglomeration in Sheohar district. There isonly one urban unit i.e. Sheohar(N.A.). The sex ratio of this statutory town is 879 according to 200 I Census.
TABLE to: SEX RATIO OF POPULATION INTHEAGEGROUP 0-6 RORC.D. BLOCKS,200t
Total/ Total population in 0-6 age group Serial Rural! Sex-ratio tor
number Name of C.D.Block Urban Persons Males Females 0-6 age group
2 3 4 5 6 7
Purnahiya Total 14,518 7,552 6,966 922
Rural 14.518 7.552 6,966 922
Urban 0 0 0 0
2 Piprarhi Total 19,104 9.918 9.186 926
Rural 19,104 9,918 9,186 926
Urban 0 0 0 0
3 Sheohar Total 25.609 13.350 12.259 918
Rural 21.153 11.049 10.104 914
Urban 4.456 2.301 2.155 937
4 Dumri Katsari Total 14.996 7.938 7.058 889
Rural 14.996 7.938 7,058 889
Urban 0 0 0 0
5 Tariani Chowk Total 32.215 16.793 15.422 918
Rural 32.215 16.793 15.422 918
Urban 0 0 0 0
District Total : Total 106,442 55,551 50,891 916
Rural' 101,986 53,250 48,736 915
Urban 4,456 2,301 2,155 937
25

It is observed from the above table that the sex ratio in the age group 0-6 in the district varies from 922 in Purnahiya CO. Blo~k to 889 in Oumri Katsari CO.Block.The sex ratio in the age group 0-6 of Sheohar C.O.Block is 918 while the sex ratio of
Piprarhi CD. Block is 926.
DISTRICT CENSUS HANDBOOK: SHEOHAR
The sex ratio figures in the age group 0-6 of Pumahiya, Piprarhi, Sheohar and Tariani Chowk C.D. Blocks are higher than the district total and mral averages
while Oumri Katsari has sex ratio below the district total and mral averages. The urban sex ratio ofSheohar district
is higher than the total and rural sex ratios of the district.
TABLE 11 : SEX RATIO OF POPULATION IN THE AGE GROUP 0-6 FOR C.D. BLOCKS, 200]
Serial Total population in 0-6 age group Sex ratio for 0-6 age
number Name of C.D. Block Persons Males Females Group
2 3 4 5 6
I Purnahiya 14.518 7.552 6.966 922
2 Piprarhi 19.104 9.918 9.186 926
3 Sheohar 21, 153 11.049 10,104 914
4 Dumri Katsari 14,996 7.938 7.058 889
5 Tariani Chowk 32,215 16,793 15,422 918
District (Rural) Total: 101,986 53,250 48,736 915
It is observed in table II that the sex ratio in the sex ratio of Tariani Chowk C.D. Block is 918. The
age group 0-6 among the rural population in the CD. sex ratio figures of Purnahiya, Piprarhi and Tariani
Blocks of the district varies from 926 in Piprarhi Chowk C.D. Blocks are higher than the district rural C.D. Block to 889 in Dumri Katsari C.D. Block. The average while Sheohar and Dumri Katsari C.D.
sex ratio of Purnahiya C.D. BI~ck is 922 while the Blocks have sex ratios below the district rural average.
TABLE 12: SEX RATIO OF RURAL POPULATION INTHEAGEGROUP0-6 BY RANGES, 200]
Range of sex ratio Number of Percentage distribution Population Percentage distribution
for villages inhabited villages of villages 2001 of population
I 2
Less than 700 5
700-749 10
750-799 12
800-849 24
850-899 38
900-949 29
950-999 33
1000-1099 28
1100+ J.Q
District (Rural) Total 189
Sex ratio (Rural) for District:
It is observed in the above table that 20.-1 percent
of inhabited villages in Sheohar d~strict lies in the sex ratio range of 850-899 in the age group b~6. 29 villases (15.3%) faII"in the sex.ratio range of 900:'949 in the
age group 0-6. 33 villages (17.5%) are in'the sex ratio
range of950-999. 28 villages (14.8%) are in the sex
3 4 5
2.6 414 0.4
5.3 2,793 2.7
6.3 2,603 2.6
12.7 10.702 10.5
20.1 26.367 25.9
15.3 24.438 24.0
17.5 19,249 18.9
14.8 12,705 12.5
5.3 2,715 2.7
100.0 101,986 100.0
915
ratio ra.nge. of 1 OOO~l 099 an'd 19 villages (5.3%) are in
the sex ratio range of 1100 +. These villages having . favourable sex ratio'constitute '15.2 per cent of the . rural populatio"n of the district. There are 24 villages
(12.7%) in the district which lie in the !.mfavourable
sex ratio range of800-849. These villages account for
26

ANALYTICAL NOTE
10.5 percent of the rural population of the district. There are 5 villages in the district having very unfavourable
sex ratio range ofless than 700 which account for 0.4 percent of the rural population of the district.
TABLE 13: SEX RATIO OF POPULATION IN THE AGE GROUP 0-6 OF
URBAN AGGLOMERATIONffOWNS, 2001
Senal Urban status Total populatIon In 0-6 age group Sex ratIo for 0-6
age group number Name of Town of town Persons
2 3 4
Sheohar NA 4.456
District(Urban) Total 4,456
There is no urban agglomeration in Sheohar district. It is apparent from the above table that there is only one
Males Females
5 6 7
2.301 2155 937
2,301 2,155 937
statutory town in Sheohar district i.e. Sheohar NA. The sex ratio in the age group 0-6 of Sheohar NA is 937.
TABLE 14: NUMBER AND PERCENTAGE OF SCHEDULED CASTES AND SCHEDULED TRIBES POPULATION IN CD. BLOCKS, 2001
Total
Total/ Scheduled
SerIal Name of Rural! Total Castes number CD Block Urban populatIOn populatIon
2 • 3 4 5
Purnahiya Total 71.722 11.361
Rural 71.722 11361
Urban 0 0
2 Plprarhi Total 95,441 f2,357
Rural 95,441 12,357
Urban 0 0
3 Sheohar Total 122,340 18,992
Rural 101,078 15,733
Urban 21,262 3,259
4 Dumri Katsan Total 71,405 9,399
Rural 71,405 9.399
Urban 0 0
5 Tariani Chowk Total 155<053 22,282
Rural 155,053 22.282
Urban 0 0
District Total: Total 5J5,961 74,39J
Rural 494,699 71,132
Urban 21,262 3,259
The above table shows that the percentage of Scheduled Castes in Sheohar district is 14.4 percent of the total population in the district. Within the district highest percentage of Scheduled Castes population is in Purnahiya C.D. Block with 15.8 percent closely followed by Sheohar,Tariani Chowk, Dumri Katsari and Piprarhi C.D. Blocks with 15.5. 14.4, 13.2 and 12.9
27
Total Percentage Percentage
Scheduled Scheduled Castes Scheduled Tnbes
Tribes populatIOn to total population to total populatIOn populatIOn population
6 7 8
8 158 00
8 158 00
0 0 00
3 129 00
3 129 00
0 0 00
17 155 00
8 156 00
9 153 00
18 132 00
18 132 00
0 0 00
18 144 00
18 144 00
0 0 00
64 14.4 D.D
55 14.4 0.0
9 15.3 0.0
percent respectively. The percentage of Scheduled
castes population in Sheohardistrict for the urban areas
is 15.3 percent wh ich is higher than the rural areas
(14.4%) of the district. The percentage of Scheduled
tribes population in the C.O. Blocks ofSheohar district
is almost negligible.
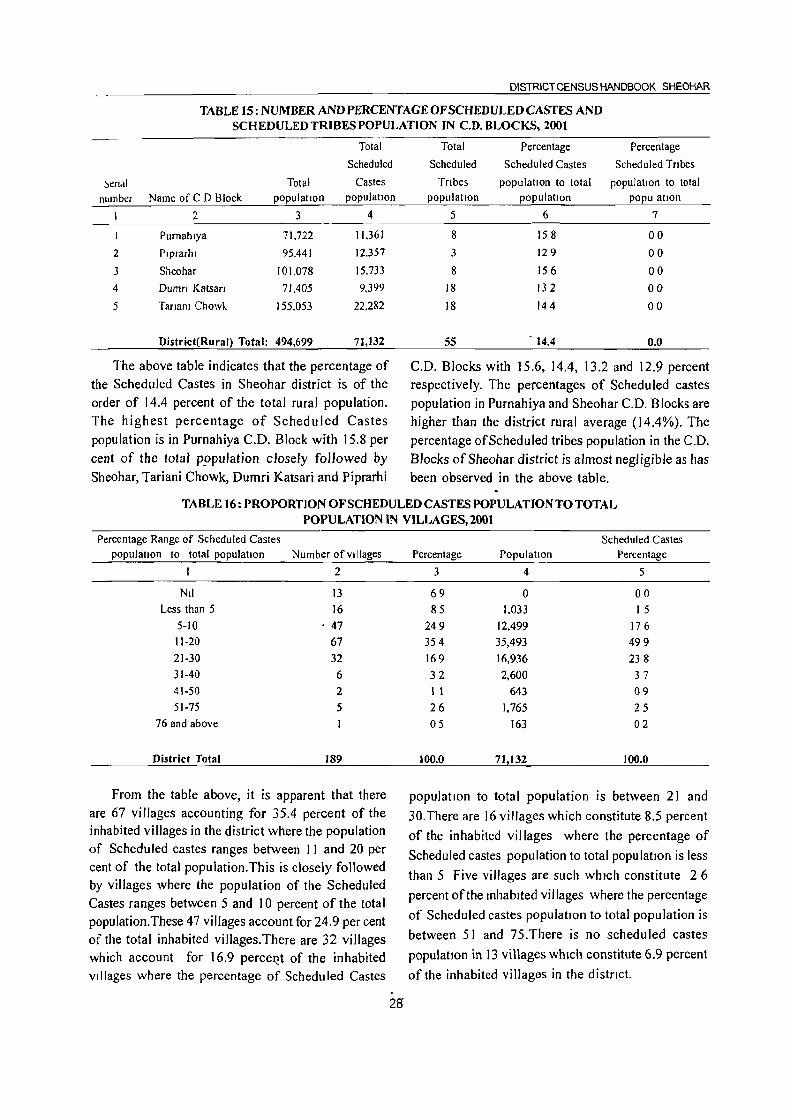
DISTRICT CENSUS HANDBOOK SHEOHAR
TABLE IS: NUMBER AND PERCENTAGE OF SCHEDULED CASTES AND SCHEDULED TRIBES POPULATION IN C.D. BLOCKS, 2001
Total
Scheduled
!:lena I Total Castes number Name of C D Block populatIOn populatIOn
2 3 4
Purnahlya 71.722 11.361
2 Plprarhl 95.441 12.357
J Sheohar 101.078 15.733
4 Dumfl Katsan 71.405 9,399
5 Tanam Chowk 155.053 22.282
District(Rural) Total: 494,699 71,132
The above table indicates that the percentage of the Scheduled Castes in Sheohar district is of the order of 14.4 percent of the total rural population. The highest percentage of Scheduled Castes population is in Purnahiya C.D. Block with 15.8 per
cent of the total p~opulation closely followed by
Sheohar, Tariani Chowk, Dumri Katsari and Piprarhi
Total Percentage Percentage
Scheduled Scheduled Castes Scheduled Tribes
Tnbes populatIOn to total population to total population populatIOn population
5 6 7
8 158 00
3 129 00
8 156 00
18 132 00
18 144 00
5S 14.4 0.0
C.D. Blocks with 15.6, 14.4, 13.2 and 12.9 percent respectively. The percentages of Scheduled castes population in Purnahiya and Sheohar C.D. Blocks are higher than the district rural average (14.4%). The percentage of Scheduled tribes population in the C.D.
Blocks ofSheohar district is almost negligible as has been observed in the above table.
TABLE 16: PROPORTION OF SCHEDULED CASTES POPULATJON TO TOTAL POPULATION IN VILLAGES, 2001
Percentage Range of Scheduled Castes populatIOn to total population Number of villages
I 2
Nil 13 Less than 5 16
5-10 ' 47 11-20 67 21-30 32 31-40 6 41-50 2
51-75 5 76 and above
District Total 189
From the table above, it is apparent that there are 67 villages accounting for 35.4 percent of the inhabited villages in the district where the population of Scheduled castes ranges between II and 20 per cent of the total population.This is closely followed by villages where the population of the Scheduled Castes ranges between 5 and 10 percent of the total population. These 47 villages account for 24.9 per cent of the total inhabited villages. There are 32 villages which account for 16.9 perceI:)t of the inhabited villages where the percentage of Scheduled Castes
Scheduled Castes Percentage PopulatIOn Percentage
3 4 5
69 0 00 85 1.033 IS
249 12,499 176 354 35,493 499 169 16,936 238
32 2,600 37 1 1 643 09
26 1,765 25 05 163 02
100.0 71,132 100.0
populatIOn to total population IS between 21 and
30.There are 16 villages which constitute 8.5 percent
of the inhabited villages where the percentage of
Scheduled castes population to total populatIon is less
than 5 Five villages are such whIch constitute 2 6
percent of the mhablted villages where the percentage
of Scheduled castes populatIOn to total population is
between 51 and 75.There is no scheduled castes
population in 13 villages which constitute 6.9 percent
of the inhabited villages in the distrICt.
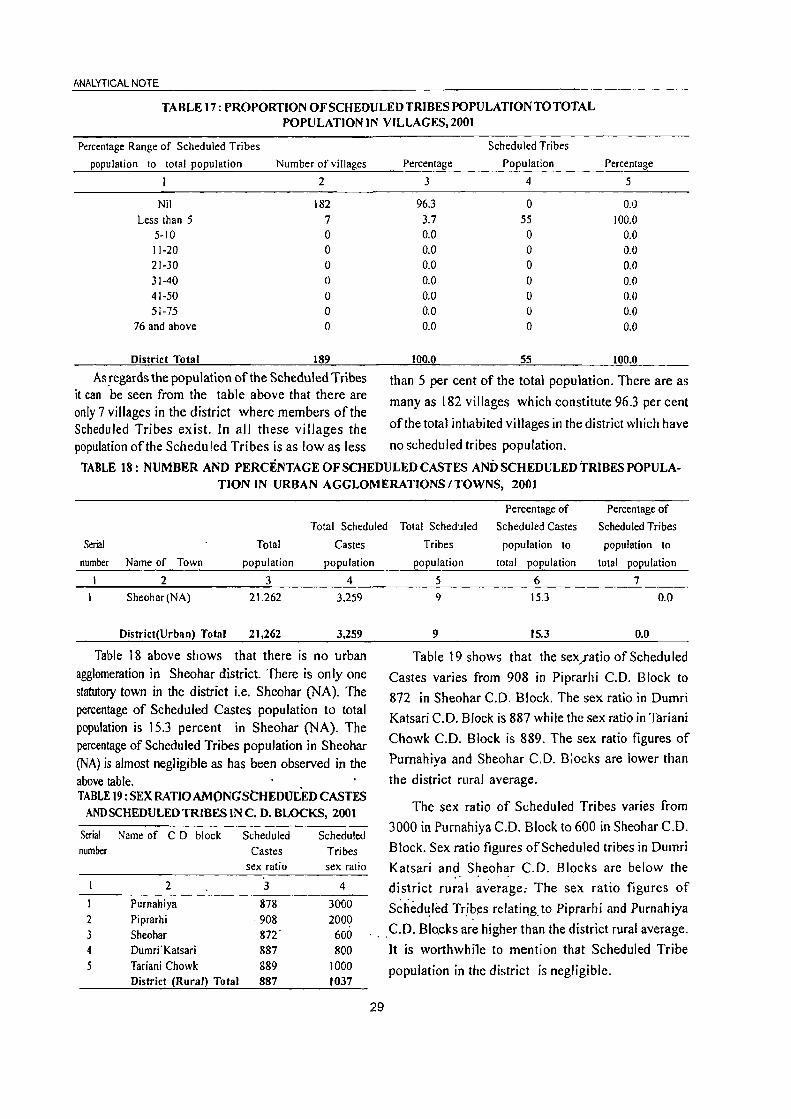
ANALYTICAL NOTE
TABLE 17: PROPORTION OF SCHEDULED TRIBES POPULATION TO TOTAL POPULATION IN VILLAGES,200l
Percentage Range of Scheduled Tribes
population to total population Number of villages
2
Nil 182 Less than 5 7
5-10 0 11-20 0 21-30 0 31-40 ()
41-50 0 51-75 0
76 and above 0
District Total 189
As !egards the population ofthe Scheduled Tribes it can be seen from the table above that there are only 7 villages in the district where members of the Scheduled Tribes exist. In all these villages the
Scheduled Tribes
Percentage Population Percentage
3 4 5
96.3 0 0.0 3.7 55 100.0 0.0 0 0.0 0.0 0 0.0 0.0 0 0.0 0.0 0 0.0 0.0 0 0.0 0.0 0 0.0 0.0 0 0.0
100.0 55 100.0
than 5 per cent of the total population. There are as
many as 182 villages which constitute 96.3 per cent
of the total inhabited villages in the district which have
population of the Scheduled Tribes is as low as less no scheduled tribes population.
TABLE 18: NUMBER AND PERCENTAGE OF SCHEDULED CASTES AND SCHEDULED TRIBES POPULA-TION IN URBAN AGGLOMERATIONS/TOWNS, 2001
Percentage of
Total Scheduled Total Scheduled Scheduled Castes
Percentage of
Scheduled Tribes
population to
total population
Serial Total Castes Tribes population to
number Name of Town population population population total population
2 3 4
Sheohar (NA) 21.262 3.259
District(Urban) Total 21,262 3,259
Table 18 above shows that there is no urban agglomeration in Sheohar district. There is only one statutoI)' town in the district i.e. Sheohar (NA). The percentage of Scheduled Castes population to total population is 15.3 percent in Sheohar (NA). The percentage of Scheduled Tribes population in Sheohar (NA) is almost negligible as has been observed in the above table. TABLE 19: SEX RATIO AMONGSCHEDOiED CASTES
AND SCHEDULED TRIBES IN C. D. BLOCKS, 2001
Serial Name of CD block Scheduled Scheduled number Castes Tribes
sex ratio sex ratio
2 3 4
I Purnahiya 878 3000 2 Piprarhi 908 2000 3 Sheohar 872' 600 4 Dumri' Katsari 887 800 5 Tariani Chowk 889 1000
District (Rural) Total 887 1037
5 6 7
9 15.3 0.0
9 15.3 0.0
Table 19 shows that the seX,Iatio of Scheduled
Castes varies from 908 in Piprarhi C.O. Block to
872 in Sheohar C.D. Block. The sex ratio in Oumri
Katsari C.D. Block is 887 while the sex ratio in Tariani
Chowk C.D. Block is 889. The sex ratio figures of
Purnahiya and Sheohar C.D. Blocks are lower than
the district rural average.
The sex ratio of Scheduled Tribes varies from
3000 in Purnahiya C.D. Block to 600 in Sheohar C.D.
Block. Sex ratio figures of Scheduled tribes in Dumri
Katsari and Sheohar C.O. Blocks are below the . . district rural average, The sex ratio figures of
Sched~led Trjb~s relatil1g.to Piprarhi and Purnahiya
... C.D. Blo.cks are higher than the district rural average.
29
It is worthwhi1e to mention that Scheduled Tribe
population in the district is negligible.

• DISTRICT CENSUS HANDBOOK SHEOHAR
TABLE 20: SEX RATIO AMONG SCHEDULED CASTES There is no urban agglomeration in Sheohar AND SCHEDULED TRIBES IN URBAN district. There is only one statutory town in the AGGLOM ERATIONSrrOWNS, 2001
district i.e. Sheohar (N .A). The sex ratio of Serial Name of Town Scheduled Scheduled
number Castes Tnbes Scheduled castes in Sheohar (NA) is 915 while the
sex ratIo sex ratio sex ratio of Scheduled Tribes is only 125 which is 2 3 4 very adverse.
Sheohar (NA) 915 125
Sex ratio (Urban) for the district: 915 125
TABLE 2J : NUMBER AND PERCENTAGE OF LJTERATESAND ILLJTERATES BY SEX IN C.D.BLOCKS,2DOI
Total! Number of literates and illlterales Gap in Serial Name of Rural! Number of literates Number of illiterates Percentage of literates male-female
Number C.D.Block Urban Persons Males Females Persons Males Females Persons Males Females literacy rate
2 3 4 5 6 7 8 9 10 II 12 13
Purnahiya Total 23.152 15.655 7.497 48.570 22.554 26,016 40.5 51.1 28.2 22.8
Rural 23,152 15,655 7.497 48,570 22.554 26.016 40.5 51.1 282 22.8
Urban 0 0 0 0 0 0 0 0 0 0
2 Piprarhi Total 26,730 18,129 8,601 68,711 32.196 36.515 35 44.9 239 20.9
Rural 26,730 18,129 8,601 68.711 32,196 36.515 35 44.9 239 20.9
Urban 0 0 0 0 0 0 0 0 0 0
3 Sheohar Total 36,006 24,441 11,565 86,334 40,598 45,736 37.2 47.3 25.7 21.6
Rural 28,667 19,531 9.136 72,411 34,191 38.220 35.9 45.8 24.5 21.2
Urban 7,339 4.910 2,429 13.923 6.407 7.516 43.7 54.5 31.2 23.3
4 Dumri Katsari Total 21,248 14.402 6.846 50.157 23.435 26.722 37.7 482 258 22.3
Rural 2].248 14.402 6.846 50.157 23.435 26.722 37.7 48.2 258 22.3
Urban 0 0 0 0 0 0 0 0 0 0
5 Tariani Chowk Tolal 37,308 26,148 11,160 117,745 56,122 61,623 30.4 39.9 19.5 20.5
Rural 37,308 26,148 11,160 117.745 56,122 61,623 30.4 39.9 195 205
Urban 0 0 0 0 0 I) . -"0 - :0 ·0 0
District 'rota I: Total ]44,444 98,775 45,669 371,517 174,905 196,612 35.3 45.3 23.9 21.4
Rural 137,105 93,865 43,240 357,594 168,498 189,096 34.9 44.9 23.6 21.3
Urban 7,339 4,910 2,429 13,923 6,407 7,516 43.7 54.5 31.2 23.3
30

ANALYTICAL NOTE
TABLE 22 : NUMBER AND PERCENTAGE OF LITERATES AND ILLITERATES BY SEX IN C. D. BLOCKS, 2001
Number of literates and illiterates Gap in
Serial Name of Number of literates Number of illiterates Percentage of literates male-female
Number CD.Block Persons Males Females Persons Males Females Persons Males Females literacy rate
2 3 4 5 6
Purnahiya 23.152 15.655 7.497 48.570
2 Piprarhi 26.730 18,129 8.601 68,711
3 Sheohar 28,667 19.531 9,136 72,411
4 Dumri Katsari 21,248 14,402 6,846 50,157
Tariani Chowk 37.308 26.)48 11.160 117,745
District (Rural) Total: 137,105 93,865 43,240 357,594
Table 21 and 22 show that among the C.D. Blocks in the district Purnahiya C.D. Block has the
highest proportion of literate population (40.5%) followed by Dumri Katsari C.D. Block (37.7%). The
literacy rates for Sheohar, Piprarhi and Tariani Chowk
C.D. Blocks are 37.2, 35.0 and 30.4 percent
respectively. Male literates out number female literates in all the C.D. Blocks of Sheohar district. The highest proportion of male literates is in Pumahiya C.O. Block with 51.1 percent closely followed by Dumri Katsari,
7 8 9 10 I I 12
22.554 26.016 40.5 51.1 28.2 22.8
32,196 36.515 35.0 44.9 23.9 20.9
34.191 38.220 35.9 45.8 24.5 21.2
23,435 26,722 37.7 48.2 25.8 22.3
56,122 61,623 30.4 39.9 19.5 20.5
168,498 189,096 34.9 44.9 23.6 21.3
Sheohar, Piprarhi and Tariani chowk C.D. Blocks with 48.2, 47.3, 44.9 and 39.9 percent respectively.
Purnahiya C.D. Block has the highest female literacy rate with 28.2 percent while Tariani chowk C.O.Block
has the lowest literacy rate among the females with
19.5 per cent. Male literacy rates for Purnahiya, Sheohar and Dumri K"atsari C.D. Blocks are higher than the corresponding figures of Sheohar district.
Only Tariani chowk C.O. Block has the lower female literacy rate than the district average.
TABLE 23 : DISTRIBUTION OF VILLAGES BY LITERACY RATE RANGE, 2001
Range of Number Percentage
literacy rate of inhabited distribution
for villages villages ofviIJages
I 2 3
0 2 1.1 1-10 2 1.1 11-20 II 5.8 21-30 50 26.5 31-40 70 37.0 41-50 40 21.2 51-60 10 5.3 61-70 3 1.6 71-80 1 0.5 81-90 0 0.0 91-99 0 0.0
100 0 0.0
District Total: 189 JOo.o
. Literacy. rate for District: 35.3
The above table shows that in 37.0 percent of the inhabited villages, literacy rate ranges between
31 and 40 percent. In these 70 villages 50.4 percent of the district rural popUlation live. This is the largest group of villages in the district. This is closely followed
31
Percentage
distribution of
Population population
4 ,5
290 0.1 435 0.1
16.387 3.3 122,854 24.8 249.124 50.4
88,227 17.8 14.760 3.0 2.242 0.5
380 0.1 0 0.0 0 0.0 0 0.0
494,699 100.0
by 50 villages with 24.8 percent of the district rural population. 26.5 percent of the inhabited villages are
such where literacy rate ranges between 21 and 30 percent. 21.2 percent of the inha,bited villages i.e. 40 villages are such where literacy rate ranges between

41 and 50 percent. These villages account for 17.8 percent of the district rural population. 5.3 percent of the inhabited villages i.e. 10 villages are such where literacy rate ranges between 51 and 60 percent and these villages account for 3.0 percent of the district rural population. 5.8 percent of the inhabited villages i.e., II villages are such where literacy rate
DISTRICT CENSUS HANDBOOK: SHEOHAR
ranges beetween II and 20 percent. These villages account for 3.3 percent of the district rural population. There are only 3 villages accounting for 1.6 percent of the inhabited villages where literacy rate ranges between 61 and 70 percent and these villages account for only 0.5 percent of the district rural population.
TABLE 24: NUMBERAND PERCENTAGE OF LITERATES AND ILLITERATES BY SEX IN URBAN AGGLOMERATIONS/TOWNS, 2001
Number of literates and illiterates Gap in
Serial Name and urban Number of literates Number of illiterates Percentage of literates male-female
Number status UA/Town Persons Males Females Persons Males Females Persons Males Females literacy rate
2 3 4 5 6 7 8 9 10 II 12
Sheohar (NA) 7,339 4.910 2,429 13,923 6,407 7,516 43.7 54.5 31.2 23.3
District(Urban) Total 7,339 4,910 2,429 13,923 6,407 7,516 43.7 54.5 31.2 23.3
There is no urban agglomeration in Sehohar district. There is only one statutory town in the district i.e. Sheohar (NA). The literacy rate for Sheohar (NA) is 43.7 percent. -Male literates
greatly out number female literates as the male
literacy rate for Sheohar (NA) is 54.5 percent while the female literacy rate is only 31. 2 percent.
TABLE 25: NUMBER AND PERCENTAGE OF SCHEDULED CASTES LITERATES AND ILLITERATES BY SEX IN C.D. BLOCKS, 2001
Number of literates and illiterates Gap in
Serial Number of literates Number of illiterates Percentage of literates male-female
Number Name of C.D.Bloclc Persons Males Females Persons Males Females Persons Males Females literacy rate
2 3 4 5 6 7 8 9 10 II 12
Purnahiya 1.842 1,:112 430 9,519 4.636 4,883 21.0 29.9 10.6 19.3
2 Piprarhi 1,581 1.235 346 10,776 5,243 5.533 16.3 24.1 7.6 16.5
3 Sheohar 2,074 1,586 488 13,659 6,818 6,841 17.3 24,7 8.8 15.9
4 Dumri Katsari 1,412 1,069 343 7,987 3,911 4,076 19.6 28.0 10.1 17.9
5 Tariani Chowk 2,407 1,877 ·530 19,875 9,916 9,959 13.8 20.3 6.5 13.8
District (Rural) Total:9,316 7,179 2,137 61,816 30,524 31,292 16.9 24.4 8.3 16.1
The table above shows that literacy rate among
the schedu led castes is highest i.e. 21.0 percent in
the Purnahiya C.O. Block where as it is lowest i.e
13.8 percent in the Tariani Chowk C.D. Block in the
district. It is observed' that the literacy rate among
the schedule castes for the district is 16.9 percent
only. As regards percentage of male literacy rate
among the schedul~d castes it is highest i.e 29,9
percent in Purnahiya C.O. Block where as it is
32
lowest i.e. 20.3 percent in the Tariani Chowk C.D.
Block. In case of female literacy rate among the scheduled castes also it is highest i.e. 10.6 percent
in Purnahiya C.O. Block and the lowest i.e. 6.5
percent in Tariarii Chowk C.D. Block. It is found
that the gap between male and female literacy rate
is highest i.e. 19.3 percent in Purnahiya C.D. Block.
where as it is lowest i.e. 13.8 percent in Tariani
Chowk C.O. Block.
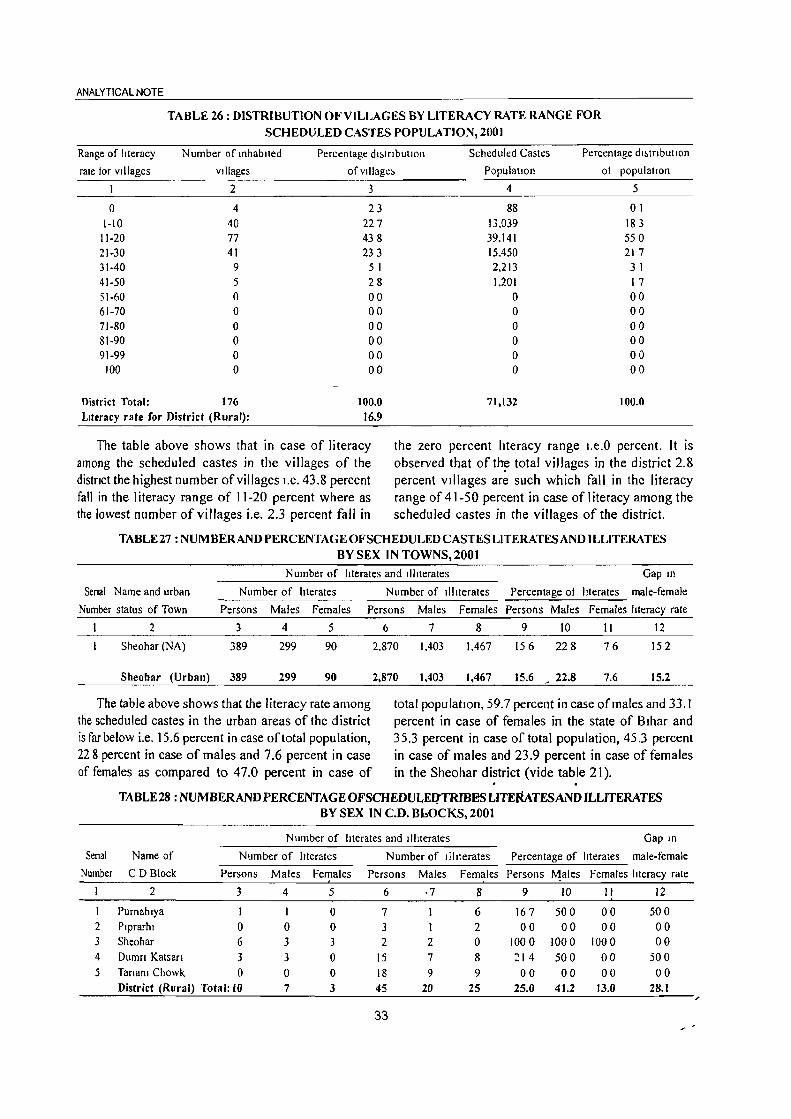
ANALYTICAL NOTE
TABLE 26: DISTRIBUTION OFVILLAGES BY LITERACY RATE RANGE FOR
SCHEDULED CASTES POPULATION, 200)
Range of literacy Number of mhablled Percentage dl~lnbutlon Scheduled Castes Percentage dl~tnbutlOn
rate tor vJllages villages ofvlllage~ Population 01 populatIOn
I 2 3
0 4 23 1-10 40 227
11-20 77 438 21-30 41 233 31-40 9 5 I 41-50 5 28 51-60 0 00 61-70 0 00 71-80 0 00 SI-90 0 00 91-99 0 00 100 0 00
District Total: 176 100.0 Literacy rate for District (Rural): 16.9
The table above shows that in case of literacy among the scheduled castes in the villages of the district the highest number of villages I.e. 43.8 percent fall in the literacy range of 11-20 percent where as the lowest number of villages i.e. 2.3 percent fall in
4 5
88 01 13,039 183 39,141 550 15,450 21 7 2.213 3 I 1.201 17
0 00 0 00 0 00 0 00 0 00 0 00
71,132 100.0
the zero percent literacy range l.e.O percent. It is observed that of t~ total villages in the district 2.8 percent villages are such which fall in the literacy range of 41-50 percent in case of literacy among the scheduled castes in the villages of the district.
TABLE27 : NUMBER AND PERCENTAGE OF SCHEDULED CASTES LITERATES AND ILLITERATES
BY SEX IN TOWNS, 2001
Number of literates and Illtterates Gap tn
Senal Name and urban Number of literates Number of Illiterates Percentage ot literates male-female
Number status of Town Persons Males Females Persons Males Females Persons Males Females literacy rate
2 3 4 5
Sheohar (NA) 3S9 299 90
Sheohar (Urban) 389 299 90
The table above shows that the literacy rate among the scheduled castes in the urban areas of the district is far below i.e. 15.6 percent in case of total population, 228 percent in case of males and 7.6 percent in case of females as compared to 47.0 percent in case of
6 7 8 9 10 II 12
2.870 1.403 ).467 156 228 76 152
2.870 1.403 1.467 15.6 22.8 7.6 15.2
total populatIOn. 59.7 percent in case of males and 33.1 percent in case of females in the state of Bihar and 35.3 percent in case of total population, 45.3 percent in case of males and 23.9 percent in case of females in the Sheohar district (vide table 21). . .
TABLE28 : NUMBER AND PERCENTAGE OFSCHEDULEQ'TRJB~S LITEf{ATESAND ILLITERATES BY SEX IN C.D, BLOCKS, 2001
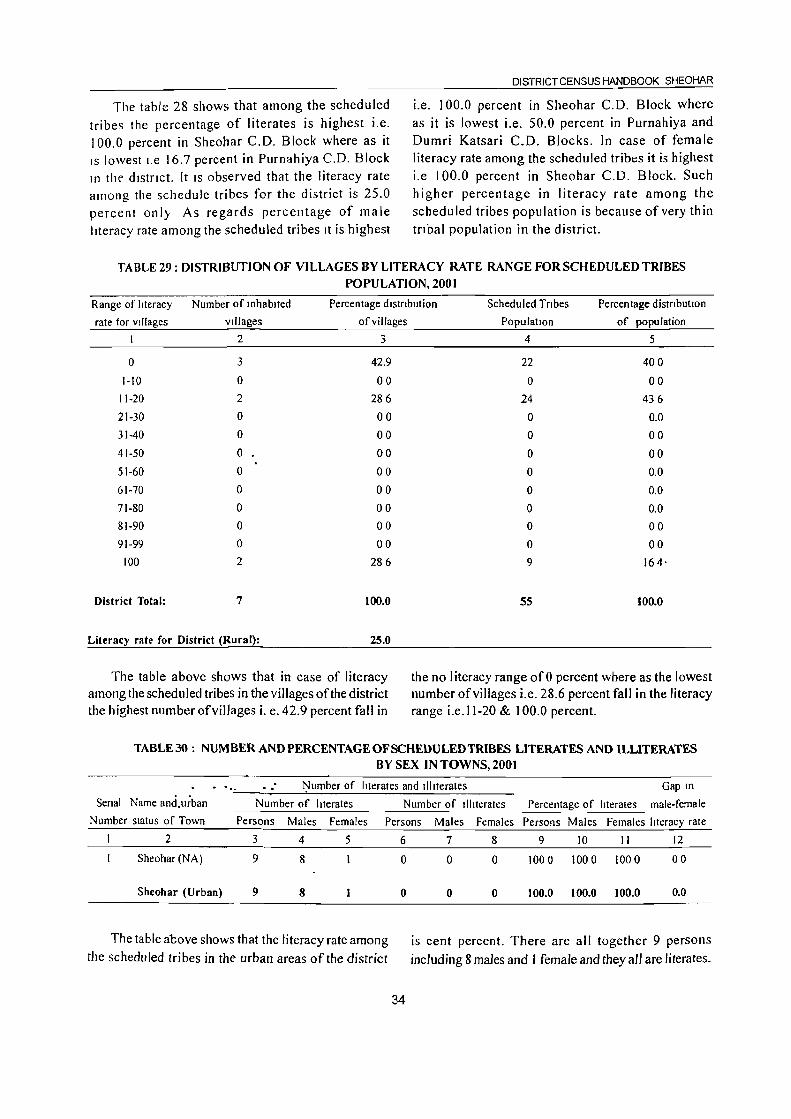
The table 28 shows that among the scheduled
tribes the percentage of literates is highest i.e.
100.0 percent in Sheohar C.O. Block where as it IS lowest I.e 16.7 percent in Purnahiya C.O. Block In tht' dlstnct. [t IS observed that the literacy rate among the schedule tribes for the district is 25.0
percent only As regards percentage of male
literacy rate among the scheduled tribes It is highest
DISTRICT CENSUS HANDBOOK SHEOHAR
i.e. 100.0 percent in Sheohar C.O. Block where
as it is lowest i.e. 50.0 percent in Purnahiya and Oumri Katsari C.O. Blocks. [n case of female literacy rate among the scheduled tribt:s it is highest
i.e 100.0 percent in Sheohar C.O. Block. Such higher percentage in literacy rate among the
schedu led tribes popu lation is because of very th in
tnbal population in the district.
TABLE 29: DISTRIBUTION OF VILLAGES BY LITERACY RATE RANGE FOR SCHEDULED TRIBES POPULATION,2001
Range of literacy Number of inhabited Percentage dlstnbution Scheduled Tribes Percentage distnbutlOn
rate for Villages Villages of villages PopulatIOn of population
2 3
0 3 42.9
1-10 0 00
11-20 2 286
21-30 0 00
31-40 0 00
41-50 0 00
51-60 0 00
61-70 0 00
71-80 0 00
81-90 0 00
91-99 0 00
100 2 286
District Total: 7 100.0
Literacy rate for District (Rural): 25.0
The table above shows that in case of literacy among the scheduled tribes in the villages of the district the highest number of villages i. e. 42.9 percent fall in
4 5
22 400
0 00
24 436
0 0.0
0 00
0 00
0 0.0
0 0.0
0 0.0
0 00
0 00
9 164·
55 100.0
the no literacy range of 0 percent where as the lowest number ofvillages i.e. 28.6 percent fall in the literacy range i.e.11-20 & 100.0 percent.
TABLE 30 : NUMBER AND PERCENTAGE OF SCHEDULED TRIBES LITERATES AND ILLITERATES BY SEX IN TOWNS, 2001
' .. . . ~lImber of literates and Illiterates Gap In
Serial Name and.u;ban Number of literates Number of Illiterates Percentage of literates male·female
Number status of Town Persons Males Females Persons Males Females Persons Males Females literacy rate
2 3 4 5
Sheohar (NA) 9 8
Sheohar (Urban) 9 8
The table above shows that the literacy rate among
the scheduled tribes in the urban areas of the district
6
a
0
34
7 8 9 10 II 12
0 0 1000 1000 lOaD 00
0 0 100.0 100.0 100.0 0.0
is cent percent. There are all together 9 persons
including 8 maJes and 1 femaJe and they a11 are literates.

ANALYTICAL NOTE
TABLE 31: NUMBERAND PERCENTAGE OF MAIN WORKERS, MARGINAL WORKERS, AND NON-WORKERS BY SEX IN C.D.BLOCKS, 2001
Total workers
Persons / (MaIO and margInal
SerIal Name of Males / Total MaIO ""orker Marginal worker Workers) Non workers
number C D Block Females Population Number Percentage Number Percentage Number Percentage Number Perlentage
I 2 3 4 5 6 7 8 9 10 II 12
I Purnahlya Persons 71,722 18996 265 3.749 52 22745 31 7 48.977 683 Males 38,209 17.400 455 1,865 49 19,265 504 18.944 496 Females 33,513 1,596 48 1.884 56 3.480 104 30,033 896
2 Plprarhl Persons 95,441 24,674 259 4,675 49 29,349 30 &- 66,092 692 Males 50,325 22,873 455 3.173 63 26,046 518 24,279 482 Females 45,116 1,801 40 1.502 33 3.303 73 41,813 927
3 Sheohar Persons 122,340 31,554 258 5,664 46 37.218 304 85.122 696 Males 65.039 29,238 450 2,924 45 32,162 495 32,877 505 Females 57,301 2.316 40 2.740 48 5,056 88 52.245 912
4 Dumn Katsan Persons 71,405 19,455 272 3,229 45 22,684 31 8 48,721 682 Males 37,837 18,133 479 973 26 19,106 505 18,731 495 Females 33,568 1,322 39 2,256 67 3,578 107 29,990 893
5 Tanam Chowk Persons 155,053 38,669 249 10,553 68 49,222 317 105,831 683 Males 82,270 35,514 432 5,449 66 40,963 498 41,307 502 Females 72,783 3.155 43 5.104 70 8.259 II 3 64.524 887
District Total: Persons 515,961 133,348 25.8 27,870 5.4 161,218 31.2 354,743 - 68.8 Males 273,680 ]23,158 45.0 14,384 5.3 137,542 50.3 ]36,]38 49.7 Females 242,281 10,190 4.2 13,486 5.6 23,676 9.8 218,605 90.2
TABLE 32: NUMBERAND PERCENTAGE OF MAIN WORKERS, MARGINAL WORKERS, AND NON-
WORKERS BY SEX IN C. D. BLOCKS, 2001
Total workers
Persons / (MaIO and margInal
Senal Name of Males / Total Mam worker Margmal worker Workers) Non workers
number C 0 Block Females PopulatIOn Number Percentage Number Percentage Number Percentage Number Percentage
I 2 3 4 5 6 7 8 9 10 II 12
I Purnahlya Persons 71,722 18,996 265 3,749 52 22.745 317 48,977 683 Males 38.209 17.400 455 1,865 49 19,265 504 18,944 496 Females 33,513 1.596 48 1.884 56 3,480 104 30,033 896
2 Plprarhl Persons 95.441 24674 259 4.675 49 29.349 308 66,092 692 Males 50,325 22,873 455 3,173 63 26.046 518 24.279 482 Females 45.)16 1.801 40 1502 33 3.303 73 41.813 927
J Sheohar Persons 101,078 26.575 263 4184 41 30.759 304 703/9 696 Males 53.722 24.539 457 2.073 39 26.612 495 27110 505 Females 47.356 2.036 43 2.111 45 4.147 88 43,209 91 2
4 Dumn Katsan Persons 71,405 19.455 272 3,229 45 22.684 318 48,721 682 Males 37,837 18,133 479 973 26 19.106 505 18,731 495 Females 33,568 1,322 39 2,256 67 3,578 107 29,990 893
5 Tanam Chowk Persons 155.,053 38,669 249 10,553 68 49,222 317 105,831 683
Males 82,270 35,514 432 5.449 66 40.963 498 41.307 502 Females 72,78J 3,155 43 5,104 70 8.259 113 64.524 887
DIstrict Persons 494,699 ]28,369 25.9 26,390 5.3 154,759 31.3 339,940 68.7
(Rural) Total: Males 262,363 118,459 45.2 ]3,533 5.2 131,992 50.3 130,371 49.7 Females 232,336 9,9]0 4.3 12,857 5.5 22,767 9.8 209,569 90.2
35

The work participation rate for total workers is
defined as the percentage of total workers to total population. In a similar way it is defined for main and marginal workers. Table-31 show that the work participation rate (WPR) in the Sheohar district is 25.8 percent as main workers and 5.4 percent as marginal workers. The proportion of non workers in the district is 68.8 percent.
Among the main workers male work participation rate in the district is 45.0 percent while that of females is only 4.2 percent as per 2001 Census. The proportion of main workers is the highest (27.2%) in Dumri Katsari C.D. Block and the lowest (24.9%) in Tariani chowk C.D. Block. Out of 5 C.D. Blocks, WPR of three C.D.
DISTRICT CENSUS HANDBOOK: SHEOHAR
Blocks are above the district average. The proportion of marginal workers is the highest (6.8%) in Tariani
chowk C.D. Block and the lowest (4.5%) in Dumri Katsari C.D.Block. The proportion of total workers is the highest (31.8%) in Dumri Katsari C.D. Block and the lowest (30.4%) in Sheohar C.D. Block.
The proportion of non workers among males in the district is 49.7 percent while that of females is 90.2 percent as per 2001 Census.The proportion of non workers is the highest (69.6%) in Sheohar C.O. Block and the lowest (68.2%) in Dumri Katsari C.O. Block.
Table 32 deals with the same topic as Table 31, the only" difference being that it deals with the rural areas of the district and its C.D. Blocks.
TABLE33: NUMBERANDPERCENTAGE OFMAIN WORKERS, MARGINAL WORKERS, AND NON-WORKERS BY SEX IN URBAN AGGLOMERATIONS I TOWNS, 2001
Total workers
Name and urban Persons I (Main and marginal
Serial status of Males / Total Main worker Marginal worker Workers) Non workers
number Town Females Population Number Percenta~e Number Percentage Number Percentage Number Percentage
2 3 4 5 6 7 8 9 10 II 12
Sheohar (NA) Persons 21.262 4.979 23.4 1,480 7.0 6.459 30.4 14.803 69.6 Males 11,317 4.699 41.5 851 7.5 5.550 49.0 5.767 51.0 Females 9.945 280 2.8 629 6.3 909 9.1 9.036 90.9
District (Urban) Total: Persons 21,262 4,979 23.4 1,480 7.0 6,459 30.4 14,803 69.6 Males 11,317 4,699 41.5 851 7.5 5,550 49.0 5,767 51.0 Females 9,945 280 2.8 629 6.3 909 9.1 9,036 90.9
There is no urban agglomeration in Sheohar 7.0 percent as marginal workers. The proportion of district.The only urban unit in the district is Sheohar non workers in the town is 69.6 percent. The
(NA). The work participation rate for total workers proportion of male and female main workers are 41.5 is defined as the percentage of total workers to total percent and 2.8 percent respectively. The proportion population. In a similar way it is defined for main and of marginal workers among males is 7.5 percent and marginal wokers.For Sheohar (NA) the work that of for females is 6.3 percent.The proporltion of
participation rate (WPR) recorded is 23.4 percent of male and female non workers are 51.0 percent and the total popUlation of the town as main workers and 90.9 percent respectively. TABLE 34: DISTRIBUTION OF WORKERS BY SEX IN FOUR CATEGORIES OF ECONOMIC ACTIVITY IN
CD.BLOCKS, 2001 Category of workers
Persons! Total number of Household
Serial Name of Males! Total workers (Main + Agricultural Industry Other
number C.D.BlocK Females popolation Marginal) Cultivators Labourers workers workers
2 3 4 5 6 7 8 9
Purnahiya Persons 71.722 22.745 5.989 13.179 708 2.869 (31.7) (26.3) (57.9) (3.1) ( 12.6)
Males 38.209 19.265 5.500 10.761 471 2.533 (50.4) (28.5) (55.9) (2.4) (13.1 )
Females 33.513 3.480 489 2.418 237 336
( 10.4) ( 14.1) (69.5) (6.8) (9.7)
36

ANALYTICAL NOTE
TABLE 34: DISTRIBUTION OF WORKERS BY SEX IN FOUR CATEGORIES OF ECONOMIC ACTIVITY IN
CD.BLOCKS, 2001 (Concld.)
Category of workers
Persons/ Total number of Household
Serial Name of Males! Total workers (MaIO + AgrIcultural Industry Other
number C DBlock Females populallon Margmal) CultIvators Labourers workers workers
2 3 4 5 6 7 8 9
2 Plprarhl Persons 95,441 29349 6682 18.)31 830 3,506 (308) (228) (625) (28) (119)
Males 50325 26.046 6.262 16,385 514 2.885 (51 8) (240) (629) (20) (11 1)
Females 45,116 3.303 420 1,946 316 621 (73) (127) (589) (96) (188)
3 Sheohar Persons 122,340 37.218 9,355 21,619 943 5,301 (304) (25 1) (58 I) (25) (142)
Males 65,039 32,162 8,488 18,113 727 4.834 (495) (264) (563) (23) (150)
Females 57,301 5,056 867 3.506 216 467 (88) (17 I) (693) (43) (92)
4 Dumn Katsan Persons 71,405 22,684 7,471 12.735 488 1,990 (31 8) (329) (56 I) (22) (88)
Males 37,837 19,106 6.738 10,496 335 1,537 (505) (353) (549) (I 8) (80)
Females 33,568 3,578 733 2,239 153 453 (107) (205) (626) (43) (127
5 Tanam Chowk Persons 155.053 49,222 11,777 33,043 793 3,609 (31 7) (239) (671) (16) (73)
Males 82.270 40,963 10,723 26.572 586 3.082 (498) (262) (649) (14) (75)
Females 72,783 8.259 1.054 6.471 207 527 (II 3) (128) (784) (25) (64)
District Total: Persons 515,961 161,218 41,274 98,907 3,762 17,275 (31.2) (25.6) (61.3) (2.3) (10.7)
Males 273,680 137.542 37,711 82,327 2.633 14.871 (50.3) (27.4) (59.9) (1.9) ,- (10.8)
Females 242,281 23,676 3,563 16,580 1,129 2.404 (9.8) (15.0) (70.0) (4.8) (10.2)
Note: Percent of Workers to total workers are given In brackets
From the above table, the relative importance
of the main spheres of economic activity may be
gauged from the pattern of distribution of total workers according to the broad four fold
classIfication namely, cultivators, agricultural
labourers household industry workers and other workers. The economic activity in the rural and urban areas in the district is primarily dependent on agriculture which is supported by the fact that the cultIvators (25.6%) and agricultural labourers (613%) together constitute 86.9 per cent of the total workers of the district. The agriculture sector has absorbed more than three fourth of the total
workers. The proportion of cultivators varies between
37
32.9 percent for Dumari Katsari C.D. Block to 22.8 percent for Piprarhi C.D. Block. Proportion of
agricultural labourers varies between 67.1 per cent
in Tariani chowk C.D. Block to 56.1 per cent in
Dumri Katsari C.D. Block. The proportion of
Household Industry workers is only 2.3 percent of
the total workers of the district. ProportIon of household industry workers varies between 3.1
percent in Purnahiya C.D. Block to 1.6 percent in Tariani chowk C.D. Block. The proportion of other workers is 10.7 per cent of the total workers of the district. Proportion of other workers varies between
142 percent in Sheohar C.D. Block to 73 percent in Tariani chowk C.D. Block.

DISTRICT CENSUS HANDBOOK: SHEOHAR
TABLE 35: DISTRIBUTION OF WORKERS BY SEX IN FOUR CATEGORIES OF ECONOMIC ACTIVITY IN C.D.BLOCKS, 2001
Category of workers
Persons! Total number of Household
~erial Name of Males! Total workers (Main + Agricultural Industry Other
number C.D.Block Females population Marginal) Cultivators Labourers workers workers
2 3 4 5 6 7 8 9
Purnahiya Persons 71.722 22.745 5.989 13,179 708 2.869 (31. 7) (26.3) (57.9) (3.1 ) (12.6)
Males 38,209 19.265 5.500 10,761 471 2,533 (50.4) (28.5) (55.9) (2.4) (13.1 )
Females 33,513 3.480 489 2,418 237 336 (10.4) (14.1) (69.5) (6.S) (9.7)
2 Piprarhi Persons 95,441 '29,349 6,682 18,331 830 3.506 (30.8) (22.8) (62.5) (2.8) (11.9)
Males 50,325 26,046 6,262 16,385 514 2,885 (51.8) (24.0) (62.9) (2.0) (11.1 )
Females 45.116 3,303 420 1,946 316 621 (7.3) (12.7) (58.9) (9.6) (18.8)
3 Sheohar Persons 101,078 30,759 8.676 18.967 605 2.511 (30.4) (28.2) (61.7) (2.0) (8.2)
Males 53.722 26,612 7.928 15.895 469 2,320 (49.5) . (29.8) (59.7) ( 1.8) (8.7)
Females 47.356 4.147 748 3.072 136 191
(8.8) (18.0) (74.1 ) (3.3) (4.6)
4 Dumri Katsari Persons 71.405 ?2,681 7.471 12,735 488 1,990 (31.8) (32.9) (56.1) (2.2) (8.8)
Males 37,837 19,106 6.738 10.496 335 1.537 (50.5) (35.3) (54.9) ( 1.8) (8.0)
Females 33,568 3.578 733 2,239 153 453 (10.7) (20.5) (62.6) (4.3) (12.7)
5 Tariani Chowk Persons 155,053 49,222 11.777 33,043 793 3.609
(31. 7) (23.9) (67.1) (1.6) (7.3) Males 82,270 40.963 10,723 26,572 586 3,082
(49.8) (26.2) (64.9) (1.4) (7.5) Females 72.783 8.259 1,054 6,471 207 527
(11.3) (12.8) (78.4) (2.5) (6.4)
District (Rural) Total: Persons 494,699 154,759 40,595 96.255 3.424 14.485 (31.3) (26.2) (62.2) (2.2) (9.4)
Males 262,363 131,992 37,151 80,109 2,375 12,357 (50.3) (28.1 ) (60.7) (1.8) (9.4)
Females 232,336 22,767 3,444 16,146 1,049 2,128 (9.8) (15.1) (70.9) (4.6) (9.3)
Note: Percent of Workers to total work~rs are given in brackets
From the above table, the relative importance of workers and other economic activities. The economic the main spheres of economic activity may be gauged activity in the rural areas of the district is primarily from the pattern of distribution of total workers dependent on agriculture which is supported by the according to the broad four fold classification namely, fact that the cultivators (26.2%) and agricultural cultivators, agricultural labourers, household industry labourers (62.2%) together constitute 88.4 per cent of
38

ANALYTICAL NOTE
the total workers of the district. The agriculture sector
has absorbed more than three fourth of the total main workers. The proportion of cultivators varies between 32.9 percent for Dumari Katsari CD. Block to 22.8 percent for Piprarhi CD. Block. The Proportion of agricultural labourers varies between 67.1 percent for Tariani chowk C.D. Block to 56.1 percent for Dumri
Katsari C.D. Block. The proportion of Household
Indu!>try workers is only 2.2 percent of the total workers
of the district. The Proportion of household industry workers varies between 3.1 percent for Purnahiya C.D. Block to 1.6 percent for Tariani chowk C.D. Block. The proportion of other workers is 9.4 percent of the total workers of the district. The Proportion of other workers varies between 12.6 percent for Purnahiya C.D. Blockto 7.3 percent for Tariani chowk C.D. Block.
TABLE 36: DISTRIBUTION OF WORKERS BY SEX IN FOUR CATEGORIES OF ECONOMIC ACTIVITY OF
URBAN AGGLOMERATIONS/TOWNS, 2001
Category of workers
Persons/ Total number of Household
Senal Name and urban Males/ Total workers (MaIO + Agricultural Industry Other
number status of Town Females populallon Margmal) Cu Illvators Labourers workers workers
2 3 4 5 6 7 8 9
Sheohar (NA) Persons 21.262 6,459 679 2,652 338 2,790 (304) (10.5) (41 I) (52) (432)
Males 11,317 5,550 560 2,218 258 2,514 (490) (10.1) (40.0) (46) (453)
Females 9,945 909 119 434 80 276 (9.1) (13 I) (477) . (88) 004)
District (Urban) Persons 21,262 6,459 679 2,652 338 2,790 Total: (30.4) (10.5) (41.1) (5.2) (43.2)
Males 11,317 5,550 560 2,218 258 2,514 (49.0) (10.1) (40.0) (4.6) (45.3)
Females 9,945 909 119 434 80 276 (9.1) (13.1 ) (47.7) (8.8) (30.4)
Note - Percentage of workers to total workers are given in brackets
There is no urban agglomeration in Sheohar
district. There is only one statutory town in the district
i.e. Sheohar (NA). From the above table, the relative
importance of the main spheres of economic activity
may be gauged from the pattern of distribution of
total workers according to the broad four fold
classification namely, cultivators, agricultural labourers,
household industry workers and other economic
activities. The cultivators constitute 10.5 percent and
agriculturallabourares constitute 41.1 percent of the
total workers of Sheohar (NA). The proportion of
male and female cultivators are 10.1 and 13.1 percent
respectively. The proportion 'Of male and female
agricultural labourers are 40.0 and 47.7 percent
respectively. The Household industry workers
constitute 5.2 percent of the total workers of Sheohar
(NA). The proportion of household industry workers
among males is 4.6 percent and that of females is
8.8 percent. Other workers constitute 43.2 percent
of the total workers of Sheohar (NA). The proportion
of male and female other workers are 45.3 and 30.4
percent respe~tively.
39
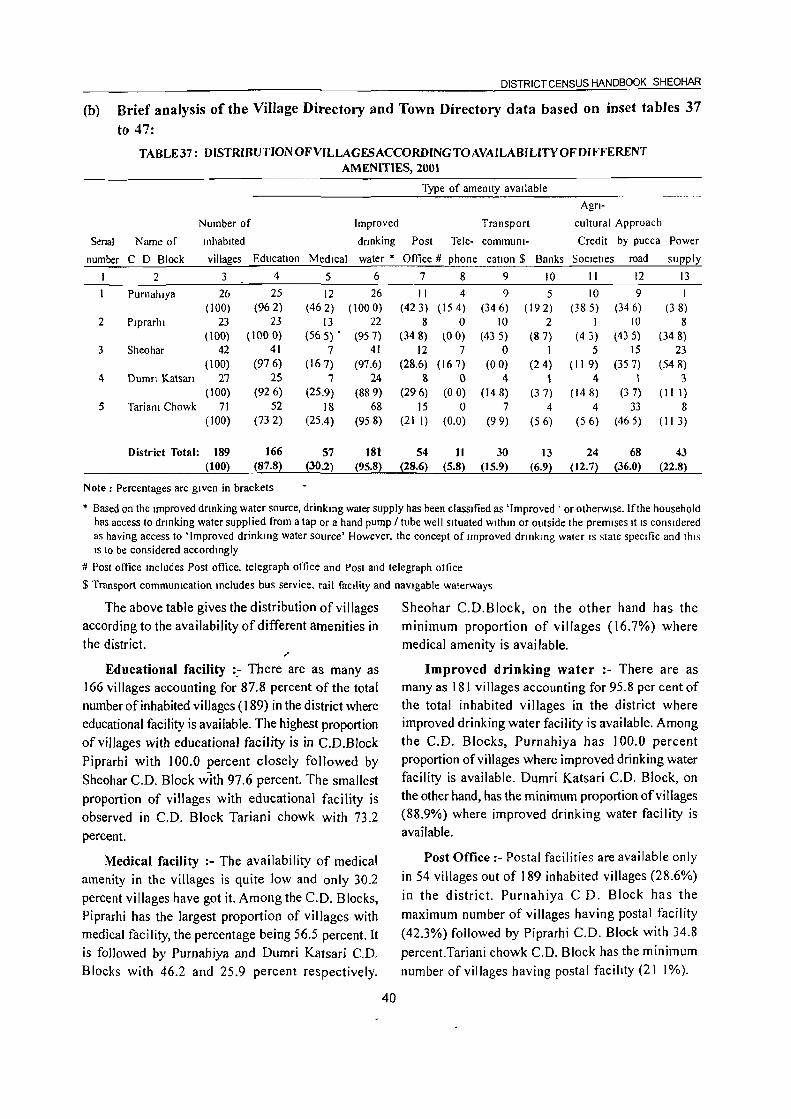
DISTRICT CENSUS HANDBOOK SHEOHAR
(b) Brief analysis of the Village Dit'ectory and Town Directory data based on inset tables 37
to 47: TABLE37: DISTRIBUTION OFVILLAGESACCORDING TOAVAILABILITY OF DIFFERENT
AMENITIES, 2001
Senal
number
2
3
4
5
Number of
Name of inhabited
C 0 Block villages
2 3
Purnahlya 26 ( 100)
Plprarhl 23 (100)
Sheohar 42 (100)
Duron Katsan 27 (100)
Tarianl Chowk 71 (100)
District Total: 189 (100)
Education
4
25 (962)
23 (1000)
41 (976)
25 (926)
52 (732)
166 (87.8)
Note: Percentages are given in brackets
Medical
5
12 (462)
13 (565) .
7 (167)
7 (25.9)
18 (25.4)
57 (30.2)
Improved
dnnking
water * 6
26 (1000)
22 (957)
41 (97.6)
24 (889)
68 (958)
181 (95.8)
Type of amemty available
Post Tele-
Office # phone
7 8
II 4 (423) (154)
8 0 (348) (00)
12 7 (28.6) (167)
8 {}
(296) (00) 15 0
(21 I) (0.0)
54 II (28.6) (5.8)
Transport
communl-
cation $ Banks
9 10
9 5 (346) (192)
10 (435)
0 (00)
4 (148)
7 (99)
30 (15.9)
2 (87)
I (24)
I (37)
4 (56)
13 (6.9)
Agn·
cultural Approach
Credit by pucca Power
Societies
II
10 (385)
I (43)
5 (II 9)
4 (148)
4 (56)
24 (12.7)
road
12
9 (346)
10 (435)
15 (357)
\ (37)
33 (465)
68 (36.0)
supply
13
I (38)
8 (348)
23 (548)
3 (II I)
8 (II 3)
43 (22.8)
* Based on the Improved drmking water source, drinkmg water supply has been classified as 'Improved' or otherwise. If the household has access to drinking water supplied from a tap or a hand pump / tube well situated wlthm or outside the premises It IS considered as having access to 'Improved drinkmg water SOurce' However. the concept of Improved dnnklng water IS state specific and thiS IS to be considered accordmgly
# Post olIice Includes Post office. telegraph office and Post and telegraph ottice
$ Transport communication mcludes bus service. tail facility and naVIgable waterways
The above table gives the distribution of villages
according to the availability of different amenities in
the district.
Educational facility :_- There are as many as 166 villages accounting for 87.8 percent of the total
number of inhabited villages (189) in the district where
educational facility is available. The highest proportion
of villages with educational facility is in C.D.Block
Piprarhi with 100.0 percent closely followed by
Sheohar C.D. Block w-ith 97.6 percent. The smallest
proportion of villages with educational facility is
observed in C.D. Block Tariani chowk with 73.2
percent.
Medical facility :- The availability of medical
amenity in the villages is quite low and only 30.2
percent villages have got it. Among the C.D. Blocks,
Piprarhi has the largest proportion of villages with medical facility, the percentage being 56.5 percent. It is followed by Purnahiya and Dumri Katsari C.D.
Blocks with 46.2 and 25.9 percent respectively.
40
Sheohar C.D.Block, on the other hand has the minimum proportion of villages (16.7%) where
medical amenity is available.
Improved drinking water :- There are as many as 181 villages accounting for 95.8 per cent of the total inhabited villages in the district where improved drinking water facility is available. Among the C.D. Blocks, Purnahiya has 100.0 percent proportion of villages where improved drinking water
facility is available. Dumri Katsari C.D. Block, on the other hand, has the minimum proportion ofvillages (88.9%) where improved drinking water facility is available.
Post Office :- Postal facilities are available only
in 54 villages out of 189 inhabited villages (28.6%)
in the district. Purnahiya C D. Block has the
maximum number of villages having postal facility
(42.3%) followed by Piprarhi C.D. Block with 34.8
percent.Tariani chowk C.O. Block has the minimum
number of villages having postal facihty (21 1%).

ANALYTICAL NOTE
Telephone :- The availability of telephone facility
in the villages is quite low and only 5.8 percent villages
have got it. Among the C.D. Blocks, Sheohar has
the maximum number of villages having telephone
facility (16.7%) followed by Purnahiya C.D. Block
with 15.4 percent while the villages ofPiprarhi, Dumri
Katsari and Tariani chowk C.D. Blocks still do not
have telephone facility.
Transport communication :- Transport comm
unication facilities are available only in 30 villages
out of 189 inhabited villages (15.9%) in the district.
Majority of villages still do not have this facility.
Piprarhi C.D. Block has the highest proportion of
villages (43.5%) which are connected by bus or rail
or navigable river/canal services, etc., followed by
Pumahiya and Dumri Katsari C.D. Blocks with 34.6
and 14.8 percent respectively. The villages ofSheohar
C.D. Block still does not have any transport
communication facility.
percent. Sheohar has the minimum number of villages
having banking facility (2.4%).
Agricultural Credit Societies :- Agricultural
Credit Societies are available only in 24 villages out
of 189 inhabited villages (12.7%) in the district.
Purnahiya C.D. Block has the maximum number of
villages having agricultural credit facilities (38.5%)
while Piprarhi C.D. Block has the minimum number
of villages with 4.3 percent.
Approach by Pucca road :- This facility is
available in 68 villages out of 189 inhabited villages
(36.0%) in the district. Among C.D. Blocks, Tariani
Chowk has the highest proportion of villages
(46.5%) having pucca approach road followed by
Piprarhi C.D. Block (43.5%) while Dumri Katsari
C.D. Block has the least number of villages having
this facil ity with only 3.7 percent.
Power Supply :- Electrified villages in the
district constitute as low as 22.8 percent of the
Bank :- Banking facility is available only in 13 total number of inhabited villages. Among the C.D.
villages out of 189 inhabited villages (6.9%) in the Blocks, Sheohar has the maximum number of
district. Among C.D. Blocks, Purnahiya has the electrified villages with 54.8 percent while
maximum number of villages having banking facility Purnahiya has the minimum number ofviIJages with
(19.2%) followed by Piprarhi C.D. Block with 8.7 only 3.8 percent.
Serial
number
2
3
4
5
TABLE 38 : NUMBERAND PERCENTAGE OF RURAL POPULATION SERVED BY DIFFERENT AMENITIES, 2001
Type of amenity available
Total Agri-
population Improved Transport cultural' Approach
Name of of inhabited drinking Post Tele- communi- Credit by pucca
C. D. Block villages Education Medical \~ater * Otlice # phone cation $ Banks Societies road
2 3 4 5 6 7 8 9 10 " 12 Purnahlya 71.722 71,178 38.791 71.722 37.463 16.722 27.864 12.823 30.747 25.888
(100) (99.2) (54 I) (l00.0) (52.2) (23.3) (38.9) (17.9) (42.9) (36.1) Piprarhi 95,441 95.441 70,268 95,254 52.004 ° 29,407 13.063 4,617 59.192
(100) (100.0) (73.6) (99.8) (54.5) (0.0) (30.8) (13.7) (4.8) (62.0) Sheohar 101,078 99,666 33,017 99,602 50,367 22,535 0 9,114 16,938 50,666
(100) (98.6) (32.7) (98.5) (49.8) (22.3) (0.0) (9.0) (16.8) (5QJ) Dumri Katsari 71,405 70,438 33,641 63,784 42,770 0 2,784 10,465 21,119 9,928
(100) (98.6) (47.1) (89.3) (59.9) (0.0) (3.9) (14.7) (29.6) ( 13.9) Tariani Chowk 155,053 143,903 69.706 152.048 70,216 ° 21,923 17.724 14.076 96.368
(100) (92.8) (450) (98.1) (45.3) (0.0) (14.1 ) (11.4) (9 I) (62.2)
Power
supply
13
3.026 (4.2)
42,025 (44.0)
61,662 (61.0)
15,627 (21.9)
32.954 (21 3)
District Total: 494,699 (JOO)
480,626 245,423 482,410 252,820 39.257· 81.978 63,189 87,497 242,042 155,294 (97.2) (49.6) (97.5) (51.1) (7.9) (J6.6) (12.8) (17.7) (48.9) (31.4)
Note Percenlages are given in brackets. • Based on the improved dnnkmg water source. drlnkmg water supply has been claSSified as 'Improved' or otherWIse If the household
has access to dnnkrng water supplied from a tap or a hand pump/tube well SItuated WIthin or outSide the premises It IS consldert!d as havrng access to 'Improved drlnkmg water source·. However. the concept of improved drrnkrng \\ater is state specllic and thIS IS to be consIdered accordingly
# Post office rneludes Post office. telegraph odice and Post and telegraph office $ Transport communlcatron rneludes bus service. rarl faellrty and naVigable waterW8)S
41

It would be seen from table no.38 that educational
facil ity is available to 97.2 per cent of the rural
population of the district. The proportion varies
between the maximum of 100.0 percent in Piprarni
C.O. Block and the minimum of 92.8 percent in
Tariani chowk C.D. Block. It may be of interest to
note that proponion of villages in the district enjoying
educational facility is less (being 87.8 percent vide
table 37) than the proportion of population which is
as high as 97.2 percent. This may be attributed to
the fact that villages which possess educational facility
usually contain larger population as compared !o those
villages which do not have this facility at all.
DISTRICT CENSUS HANDBOOK. SHEOHAR
In the case of medical facility also it can be seen
that the proportion of rural population served by the amenity
is of the order of 49.6 percent which is more than the proportion of villages served by medical facility in the
district.
In the case of improved drinking water facility also
it may be observed that proportion of rural population
served by the amenity is of the order of 97.5 percent
which is more than the proportion of villages served by
this facility in the district.
Similar trend can be observed in respect of other
amenities also both in the district as also in its various C.D. Blocks.
TABLE39: DlSfRIBUTIONOFVILLAGESNOTHAVINGCERTAINAMENITIES,ARRANGED BYDlSfANCE RANGES FROM THE PLACES WHERE THESEAREAVAILABLE, 2001
Distance range of place from the villages where the amenity is available
Village not having the amenity of Less than 5 kilometres
2
I. Education :-
(a) Primary School ·27 (b) Middle School 117 (c) Degree College 30
2. Medical:-(a) Hospital 50 (b) PHC 51
3. Post Office 110 4. Telephone 21 5. Bus Service 52 6. Banks
(a) Commercial Bank 77 (b) Co-operative Bank 28
7. Agricultural Credit Societies 75
As regards educational facility it would be seen that there are 28 villages in the district (14.8%)
which do not have any primary school but the
facility is available at places situated within 5 kms. for 27 villages and only 1 village within the range
of 5-10 kms. There are as many as 133 villages in the district (70.4%) which do not have middle schools but the facility is available at places situated within 5 kms. for 117 villages, 15 villages within the range of 5-1 0 kms and 1 village within the range of 10 + Kms. It is interesting to observe that cent percent inhabited villages of the district are deprived of college but the facility is available at places situated within 5 kms for 30 villages, 41
42
5-10 kilometres 10+ kilometres Total (Col. 2-4)
3 4 5
0 28 15 I 133 41 118 189
77 50 177 80 49 180
21 4 135 61 96 178 64 58 174
60 39 176 57 103 188 67 23 165
villages within the range of 5-10 kms and 118 villages within the range of 10+ kms.
There are 177 villages in the district (93.7%)
which are without the facility of hospital and as many as 50 villages enjoy this facility at a distance range of 10 + kms. The number of villages enjoying this
facility at a distance range of 5-1 0 kms is 77 where as the same is available at a distance of less than 5 Kms for 50 villages. There are 180 villages in the district (95.2%) which do not have primary health centre.
Similar trend can be observed in respect of other
amenities in the district.
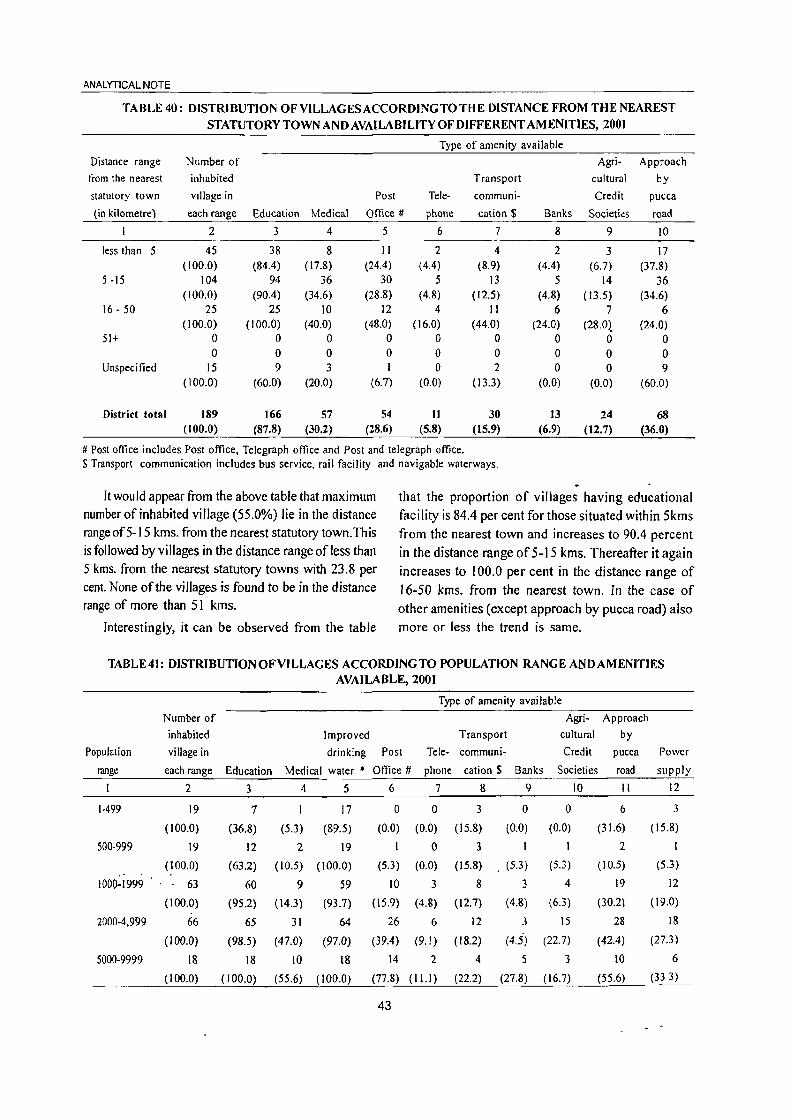
ANALYTICAL NOTE
TABLE 40: DISTRIBUTION OF VILLAGESACCORDING TO THE DISTANCE FROM THE NEAREST STATUTORY TOWN AND AVAILABILITY OF DIFFERENT AMENITIES, 2001
Type of amenity available
Distance range Number of Agri. Approach
from the nearest inhabited Transport cultural by
statutory town village in Post Tele- communi- Credit pucca
(in kilometre) each range Education Medical Office # phone cation $ Banks Societks road
I 2 3 4 5 6 7 8 9 10
less than 5 45 38 8 II 2 4 2 3 17 (100.0) (84.4) ( 17.8) (24.4) (4.4) (8.9) (4.4) (6.7) (37.8)
5 -15 104 94 36 30 5 13 5 14 36 (100.0) (90.4) (34.6) (28.8) (4.8) (12.5) (4.8) ( 13.5) (34.6)
16 - 50 25 25 10 12 4 II 6 7 6 (100.0) (100.0) (40.0) (48.0) (16.0) (44.0) (24.0) (28.0)_ (24.0)
51+ 0 0 0 0 0 0 0 0 0 0 0 0 0 0 0 0 0 0
Unspecified 15 9 3 I 0 2 0 0 9 (100.0) (60.0) (20.0) (6.7) (0.0) (13.3) (0.0) (0.0) (60.0)
District total 189 166 57 54 11 30 13 24 68 (100.0) (87.8) (30.2) (28.6) (5.8) (15.9) (6.9) (12.7) (36.0)
# Post oftice includes Post office, Telegraph office and Post and telegraph office. $ Transport communication includes bus service. rail facility and navigable waterways.
It would appear from the above table that maximum number of inhabited village (55.0%) lie in the distance range of 5-15 kms. from the nearest statutory town. This is followed by villages in the distance range ofless than 5 kms. from the nearest statutory towns with 23.8 per cent. None of the villages is found to be in the distance range of more than 51 kms.
Interestingly, it can be observed from the table
that the proportion of villages having educational facility is 84.4 per cent for those situated within 5kms from the nearest town and increases to 90.4 percent in the distance range of 5- ) 5 kms. Thereafter it again increases to 100.0 per cent in the distance range of 16-50 kms. from the nearest town. In the case of other amenities (except approach by pucca road) also more or less the trend is same.
TABLE 41: DISTRIBUTION OFVILLAGES ACCORDING TO POPULATION RANGE A~D AMENITIES AVAILABLE, 2001
Type of amenity available
Number of Agri- Approach
inhabited Improved Transport cultural by
Population village in drinking Post Tele- communi- Credit pucca Power
range each range Education Medical water ,. Office # phone cation $ Banks Societies road supply
2 3 4 5 6 7 8 9 10 II 12
1-499 19 7 I 17 0 0 3 0 0 6 3
( 100.0) (36.8) (5.3) (S9.5) (0.0) (0.0) (15.S) (0.0) (0.0) (31.6) ( 15.S)
500-999 19 12 2 19 I 0 3 I I 2 1
(100.0) (63.2) (10.5) (100.0) (5.3) (0.0) (15.8) . (5.3) (5.3) (10.5) (5.3)
1000-1999 63 60 9 59 10 3 8 3 4 19 12
(100.0) (95.2) ( 14.3) (93.7) {I 5.9) (4.8) (12.7) (4.8) (6.3) (30.2) (19.0)
2000-4,999 66 65 31 64 26 6 12 3 15 28 IS
(100.0) (98.5) (47.0) (97.0) (39.4) (9.1) (18.2) (4.5) (22.7) (42.4) (27.3)
5000-9999 18 18 10 \8 14 2 4 5 3 10 6
(100.0) ( 100.0) (55.6) (100.0) (77.8) (ILl) (22.2) (27.8) (16.7) (55.6) (333)
43

DISTRICT CENSUS HANDBOOK: SHEOHAR
TABLE41: DlSTRIBUTIONOFVILLAGES ACCORDING TO POPULATION RANGE ANDAMENITIES AVAILABLE, 2001 (Concld.)
Type of amenity available
Numher of Agri- Approach
inhabited Improved Transport cultural by
Poplilation village in drinking Post Tele- communi- Credit pucca Power
range each range Education Medical waler * Dtlke # phone calion $ Banks Societies road supply
J 2 3 4 5 6 7 8 9 10 II 12
10000 + 4 4 4 4 3 0 0 1 3 3 (J 00.0) ( 100.0) (100.0) ( 100.0) (75.0) (0.0) (0.0) (25.0) (25.0) (75.0) (75.0)
District Iota I 189 166 57 181 54 11 30 13 24 68 43 ( 100.0) (87.8) (30.2) (95.8) (28.6) (5.8) (15.9) (6.9) (12.7) (36.0) (22.8)
* Based on Ihe improved drinking water source, drinking water supply has been classified as 'Improved' or otherwise. If the household has access to drinking water supplied from a tap or a hand pump/tube well situated within or outside the premises it is considered as having access to 'Improved drinking water source'. However, the concept of improved drinking water is state specific and this is 10 be considered accordingly.
# Post office includes Post office, Telegraph office and Post & Telegraph office.
$ Transport communication includes bus service, rail facility and navigable waterways.
It can be seen from the table no. 41 that the maximum number of vi llages, i.e., 66 (34.9%) in the district fall in the population range of 2000-4999
followed by 63 villages (33.3%) having a popUlation range of 1000-1999. The lowest number of villages
is observed in the population range of 10,000+ being only 4 (2.1%).
The proportion of villages having different
amenities varies in direct relation to their population range. Generally, the maximum percentage of villages
having different amenities have a population range of 5000-9999 and 10,000 + Which further corroborates the fact that more facilities are generally available in larger villages than in smaller ones.
TABLE 42: DISTRIBUTION OFVILLAGESACCORDING TO LAND USE, 2001
Serial Number of Percentage of cultivable Percentage of irrigated area number Name of C. D. Block inhabited villages Total area area to total area to total cultivable area-
2 3 4
1 Purnahiya 26 6,410 2 Piprarhi p 7,856 3 Sheohar 42 8,281 4 Dumri Katsari 27 6,562 5 Tariani Chowk 71 13,372
District Total: 189 42,481
Note: Cultivable area = irrigated area + unirrigated area
Table 42 gives the percentage of cultivable area and also the proportion of irrigated area to total
cultivable area in the district and its various C.D. Blocks.
It would be seen from the table that 76.2 percent of the total area of the district is utilised for cultivation (cultivable area) and of this only 45.1 percent area
is found to be irrigated. Among the C.D. Blocks, the highest percentage of cultivable area is found in
Sheohar C.D. Block with 87.1 percent closely followed by Purnahiya and Piprarhi C.D. Blocks with
44
5 6
77.3 70.4 76.5 23.4 87.1 38.7 64.0 46.5 74.9 49.6
76.2 45.1
77.3 and 76.5 percent respectively. The lowest cultivable area is found in Dumri Katsari C.D. Block which is 64.0 percent.
The highest proportion of irrigated area (70.4%) to total cultivable area is found in Purnahiya c.o. Block followed by Tariani Chawk and Dumri Katsari C.D. Blocks with 49.6 and 46.5 percent respectively, The least proportion of irrigated area is found in Piprarhi C.D. Block with 23.4 per cent which indicates that the villages in this block are deprived of required
irrigational facilities.
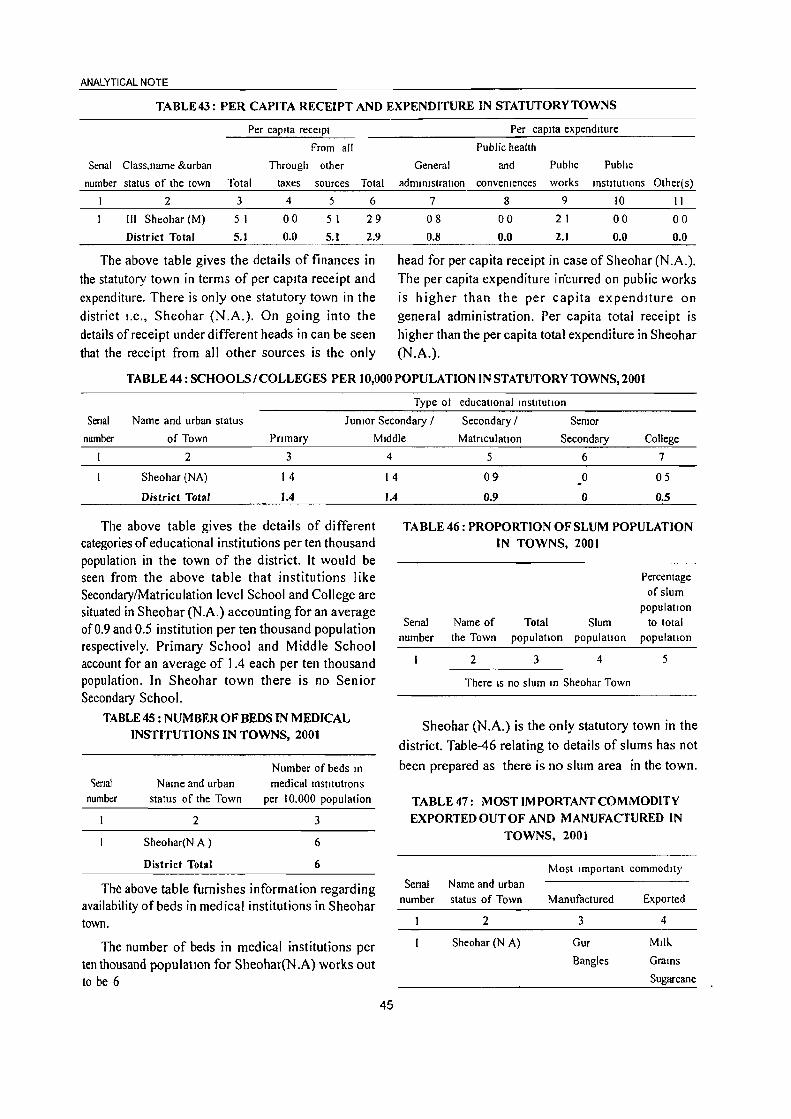
ANALYTICAL NOTE
TABLE43: PER CAPITA RECEIPT AND EXPENDITURE IN STATUTORY TOWNS
Per capita receipt
From all
Serial Class, name &urban Through other
number status of the town Total taxes sources Total .... 3 4 5 6 "-
III Sheohar (M) 5 I 00 5 I 29 District Total 5.1 0.0 5.1 2.9
The above table gives the details of finances in the statutory town in terms of per capIta receipt and expenditure. There is only one statutory town in the district I.e., Sheohar (N .A.). On going into the details of receipt under different heads in can be seen that the receipt from all other sources is the only
Per capita expenditure
Public health
General and Public Public
administration convenrences works institutions Other(s)
7 8 9 10 I I
08 00 2 I 00 00
0.8 0.0 2.1 0.0 0.0
head for per capita receipt in case of Sheohar (N .A.). The per capita expenditure in"curred on public works is higher than the per capita expendIture on general administration. Per capita total receipt is higher than the per capita total expenditure in Sheohar (N.A.).
TABLE 44 : SCHOOLS I COLLEGES PER 10,000 POPULATION IN STATUTORY TOWNS, 2001
Type 01 educattonal InSlltutlon
Serral Name and urban status Junror Secondary / Secondary / Seoror
number of Town Pnmary Middle Matnculatlon Secondary College
2 3
Sheohar (NA) 14
District Total 1.4
The above table gives the details of different categories of educational institutions per ten thousand population in the town of the district. It would be seen from the above table that institutions like Secondary/Matriculation level School and College are situated in Sheohar (N.A.) accounting for an average of 0.9 and 0.5 institution per ten thousand population respectively. Primary School and Middle School account for an average of 1 .4 each per ten thousand population. In Sheohar town there is no Senior Secondary School.
TABLE 45: NUMBER OF BEDS IN MEDICAL INSTITUTIONS IN TOWNS, 2001
<;erral number
Name and urban status of the Town
2
Sheohar(N A )
District Total
Number of beds In
medical institutions per 10.000 population
3
6
6
The above table furnishes information regarding availability of beds in medical institutions in Sheohar town.
The number of beds in medical institutions per ten thousand populatIOn for Sheohar(N.A) works out to be 6
4
14
1.4
45
5 6 7
09 0 05 -0.9 0 0.5
TABLE 46: PROPORTION OF SLUM POPULATION IN TOWNS, 2001
Senal number
Name of Total Slum the Town populatIOn population
2 3 4
There IS no slum In Sheohar Town
Percentage of slum
population to total
population
5
Sheohar (N.A.) is the only statutory town in the district. Table-46 relating to details of slums has not
been prepared as there is no slum area in the town.
TABLE 47: MOST IMPORTANT COMMODITY EXPORTEDOUTOF AND MANUFACTURED IN
TOWNS, 2001
Serral Name and urban number status of Town
2
Sheohar (N A)
Most Important commodity
Manufactured
3
Gur
Bangles
Exported
4
Milk
Grams
Sugarcane
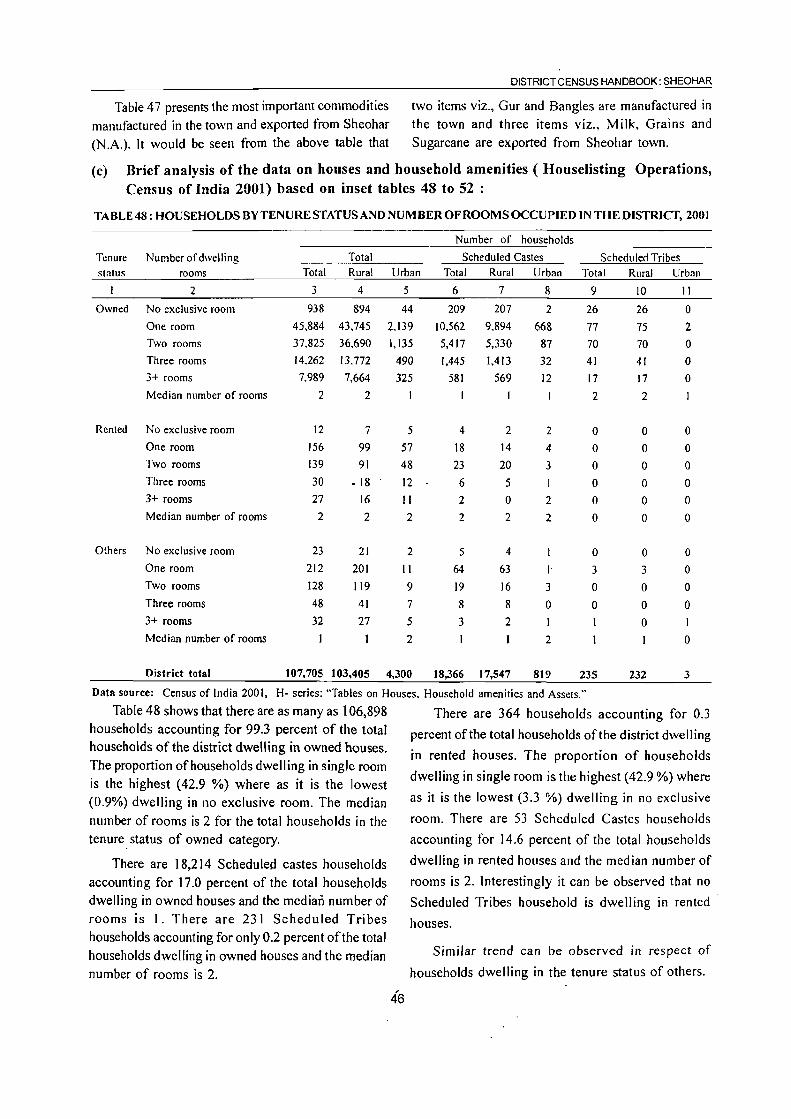
Table 47 presents the most important commodities manufactured in the town and exported from Sheohar (N.A.). It would be seen from the above table that
DISTRICT CENSUS HANDBOOK: SHEOHAR
two items viz., Gur and Bangles are manufactured in the town and three items viz., Milk, Grains and Sugarcane are exported from Sheohar town.
(c) Brief analysis of the data on houses and household amenities (Houselisting Operations, Census of India 2001) based on inset tables 48 to 52 :
TABLE 48: HOUSEHOLDS BY TENURE STATUS AND NUMBER OF ROOMS OCCUPIED IN THE DlSTRICf, 2001
Number of households Tenure Number of dwelling Total Scheduled Castes Scheduled Tribes status rooms Total Rural Urban Total Rural Urban Total Rural Urban
2 3 4 5 6 7 8 9 10 II
Owned No exclusive room 938 894 44 209 207 2 26 26 0
One room 45.884 43.745 2.139 10.562 9.894 668 77 75 2
Two rooms 37,825 36,690 1,135 5,417 5.330 87 70 70 0
Three rooms 14.262 13,772 490 1,445 1,413 32 41 41 0
3+ rooms 7,989 7,664 325 581 569 12 17 17 0
Median number of rooms 2 2 2 2
Rented No exclusive room 12 7 5 4 2 2 0 0 0
One room 156 99 57 18 14 4 0 0 0
Two rooms 139 91 48 23 20 3 0 0 0
Three rooms 30 • 18 12 6 5 0 0 0 3+ rooms 27 16 II 2 0 2 0 0 0
Median number of rooms 2 2 2 2 2 2 0 0 0
Others No exclusive room 23 21 2 5 4 I 0 0 0
One room 212 201 II 64 63 I 3 3 0
Two rooms 128 119 9 19 16 3 0 0 0
Three rooms 48 41 7 8 8 0 0 0 0
3+ rooms 32 27 5 3 2 0 1
Median number of rooms I 2 2 0
District total 107,705 103,405 4,300 18,366 17,547 819 235 232 3
Data source: Census of India 2001, H- series: "Tables on Houses. Household amenities and Assets," Table 48 shows that there are as many as 106,898 There are 364 households accounting for 0.3
households accounting for 99.3 percent of the total percent of the total households of the district dwelling households of the district dwelling in owned houses.
in rented houses. The proportion of households The proportion of households dwelling in single room is the highest (42.9 %) where as it is the lowest dwelling in single room is the highest (42.9 %) where
(0.9%) dwelling in no exclusive room. The median as it is the lowest (3.3 %) dwelling in no exclusive
number of rooms is 2 for the total households in the room. There are 53 Scheduled Castes households
tenure. status of owned category. accounting for 14.6 percent of the total households
There are 18,214 Scheduled castes households dwelling in rented houses and the median number of
accounting for 17.0 percent of the total households rooms is 2. Interestingly it can be observed that no dwelling in owned houses and the median number of Scheduled Tribes household is dwelling in rented rooms is I. There are 23 I Scheduled Tribes houses. households accounting for only 0.2 percent of the total
Similar trend can be observed in respect of households dwelling in owned houses and the median number of rooms is 2. households dwelling in the tenure status of others.
, 46
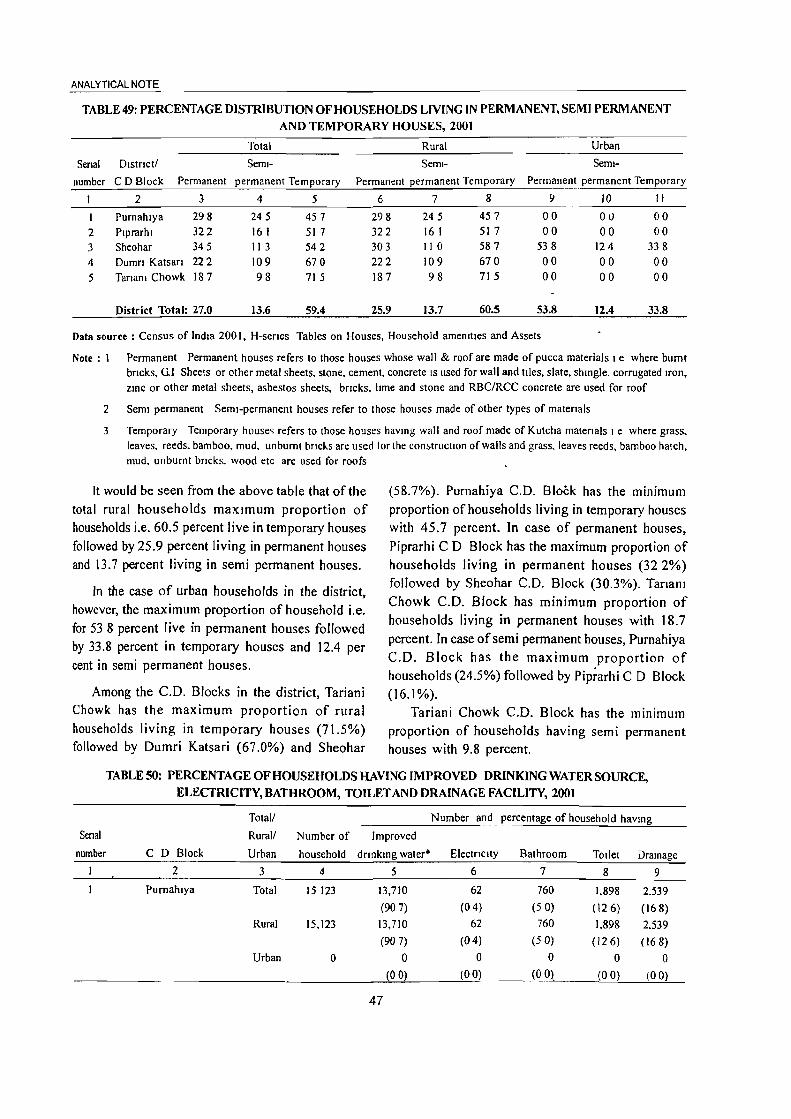
ANALYTICAL NOTE
TABLE 49: PERCENTAGE DISTRIBUTION OF HOUSEHOLDS LIVING IN PERMANENT, SEMI PERMANENT
AND TEMPORARY HOUSES, 2001
Total Rural Urban
Serial Dlstnct! Semi- Semi- Semi-
number CD Block Permanent permanent Temporary Permanent permanent Temporary Permanent permanent Temporary
2 3 4 5 6 7 8 9 10 II
I Purnahlya 298 245 457 298 245 457 00 00 00 2 Plprarhl 322 161 517 322 161 517 00 00 00 3 Sheohar 345 11 3 542 303 110 587 538 124 338 4 Dumn Katsan 222 109 670 222 109 670 00 00 00 5 Tanam Chowk 187 98 715 187 98 71 5 00 00 00
District Total: 27.0 13.6 59.4 25.9 13.7 60.5 53.8 12.4 33.8
Data source: Census of India 200 I, H-senes Tables on Houses, Household amemtles and Assets
Note : I Permanent Permanent houses refers to those houses whose wall & roof are made of pucca materials I e where burnt bricks, Gl Sheets or other metal sheets, stone, cement, concrete IS used for wall and tiles, slate, shingle, corrugated Iron, zmc or other metal sheets, asbestos sheets, bncks, lime and stone and RBCIRCC concrete are used for roof
2 Semi permanent Semi-permanent houses refer to those houses made of other types of matenals
3 Temporary Temporary house~ refers to those houses having wall and roof made of Kutcha matenals I e where grass. leaves. reeds. bamboo. mud. unburnt bncks are used for the con!:>tructlon of walls and grass, leaves reeds. bamboo hatch, mud. unburnt bncks. wood etc are used for roofs
It would be seen from the above table that of the
total rural households maxImum proportion of households i.e. 60.5 percent live in temporary houses followed by 25.9 percent living in permanent houses and 13.7 percent living in semi permanent houses.
In the case of urban households in the district, however, the maximum proportion of household Le.
for 53 8 percent live in permanent houses followed by 33.8 percent in temporary houses and 12.4 per cent in semi permanent houses.
Among the C.D. Blocks in the district, Tariani Chowk has the maximum proportion of rural
households living in temporary houses (71.5%) followed by Dumri Katsari (67.0%) and Sheohar
(58.7%). Purnahiya C.D. Block has the minimum
proportion of households living in temporary houses with 45.7 percent. In case of permanent houses, Piprarhi C D Block has the maximum proportion of households living in permanent houses (322%) followed by Sheohar C.D. Block (30.3%). Tananl
Chowk C.D. Block has minimum proportion of households living in permanent houses with 18.7
percent. In case of semi permanent houses, Purnahiya C.D. Block has the maximum proportion of households (24.5%) followed by Pip~arhi C D Block (16.1 %).
Tariani Chowk C.D. Block has the minimum proportion of households having semi permanent houses with 9.8 percent.
TABLE 50: PERCENTAGE OF HOUSEHOLDS HAVING IMPROVED DRINKING WATER SOURCE,
ELECTRICITY, BATHROOM, TOILET AND DRAINAGE FACILITY, 2001
Total! Number and percentage of household having
Senal Rural! Number of Improved
number C D Block Urban household drlnkmg water* ElectriCity Bathroom Toilet Drainage
2 3 4 5 6 7 8 9
Purnahlya Total 15123 13,710 62 760 1.898 2.539 (907) (04) (50) (126) (168)
Rural 15,123 13,710 62 760 1,898 2.539 (907) (O4) (50) (126) (168)
Urban 0 0 0 0 0 0 (00) (00) (00) (00) (00)
47
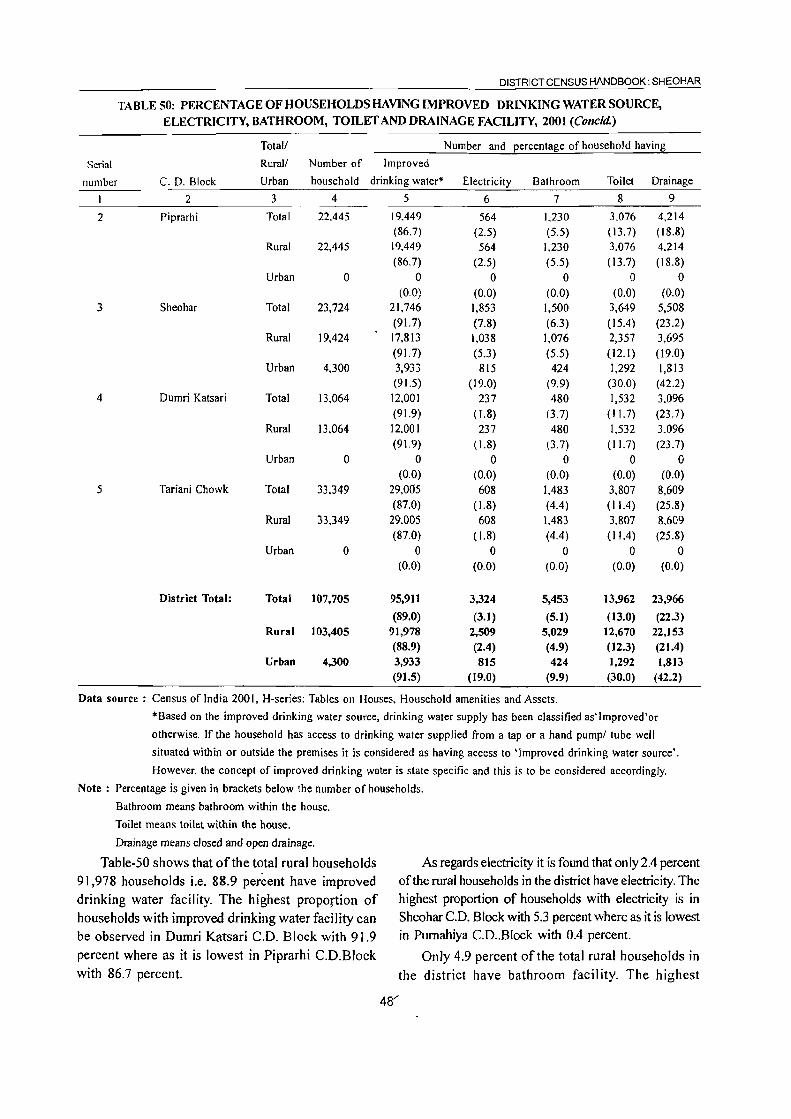
DISTRICT CENSUS HANDBOOK: SHEOHAR
TABLE 50: PERCENTAGE OF HOUSEHOLDS HAVING IMPROVED DRINKING WATER SOURCE,
ELECTRICITY, BATHROOM, TOILET AND DRAINAGE FACILITY, 2001 (ConcJd.)
Total/ Number and percentage of household having
Serial Rural/ Number of Improved
number C. D. Block Urban household drinking water* Electricity Bathroom Toilet Drainage
2 3 4 5 6 7 8 9
2 Piprarhi Total 22.445 19.449 564 ).2JO 3.076 4,214 (86.7) (2.5) (5.5) ( 13.7) ( 18.8)
Rural 22,445 19.449 564 ).2JO 3,076 4,214 (86.7) (2.5) (5.5) (13.7) (18.8)
Urban 0 0 0 0 0 0 (0.0) (0.0) (0.0) (0.0) (0.0)
3 Sheohar Total 23,724 21,746 1,853 1,500 3,649 5,508 (91.7) (7.8) (6.3) (15.4) (23.2)
Rural 19,424 17,813 1,038 1,076 2,357 3,695 (91.7) (5.3) (5.5) (12.1) (19.0)
Urban 4,300 3,933 815 424 1,292 I,S13 (91.5) (19.0) (9.9) (30.0) (42.2)
4 Dumri Katsari Total 13,064 12,001 237 480 1,532 3,096 (91.9) ( 1.8) (3.7) ( II. 7) (23.7)
Rural 13.064 12.001 237 480 1.532 3.096 (91.9) ( 1.8) (3.7) ( 11.7) (23.7)
Urban 0 0 0 0 0 0 (0.0) (0.0) (0.0) (0.0) (0.0)
5 Tariani Chowk Total 33.349 29,00"5 608 1.483 3,807 8,609 (87.0) ( 1.8) (4.4) ( 11.4) (25.8)
Rural 33,349 29.005 608 1,483 3.807 8,609 (87.0) ( 1.8) (4.4) (11.4) (25.8)
Urban 0 0 0 0 0 0 (0.0) (0.0) (0.0) (0.0) (0.0)
District Total: Total 107,705 95,911 3,324 5,453 13,962 23,966
(89.0) (3.1) (5.1) (13.0) (22.3) Rural 103,405 91,978 2,509 5,029 12,670 22,153
(88.9) (2.4) (4.9) (12.3) (2104) Urban 4,300 3,933 815 424 1,292 1,813
(91.5) (19.0) (9.9) (30.0) (42.2)
Data source: Census of India 200 I, H-series: Tables on Houses. Household amenities and Assets.
*Based on the improved drinking water source, drinking water supply has been classified as'lmproved'or
otherwise. If the household has access to drinking water supplied from a tap or a hand pump! tube well
situated within or outside the premises it is considered as having access to 'Improved drinking water source'.
However, the concept of improved drinking water is state specific and this is to be considered accordingly.
Note: Percentage is given in brackets below the number of households.
Bathroom means bathroom within the house.
Toilet means toilet within the house.
Drainage means closed and open drainage.
Table-50 shows that of the total rural households 91,978 households i.e. 88.9 percent have improved
drinking water facility. The highest proportion of households with improved drinking water facility can be observed in Dumri Katsari C.D. Block with 91.9
percent where as it is lowest in Piprarhi C.D.Block with 86.7 percent.
As regards electricity it is found that only 2.4 percent of the rural households in the district have electricity. The highest proportion of households with electricity is in Sheohar C.D. Block with 5.3 percent where as it is lowest in Pumahiya C.D.,Block with 0.4 percent.
Only 4.9 percent of the total rural households in
the district have bathroom facility. The highest
48"
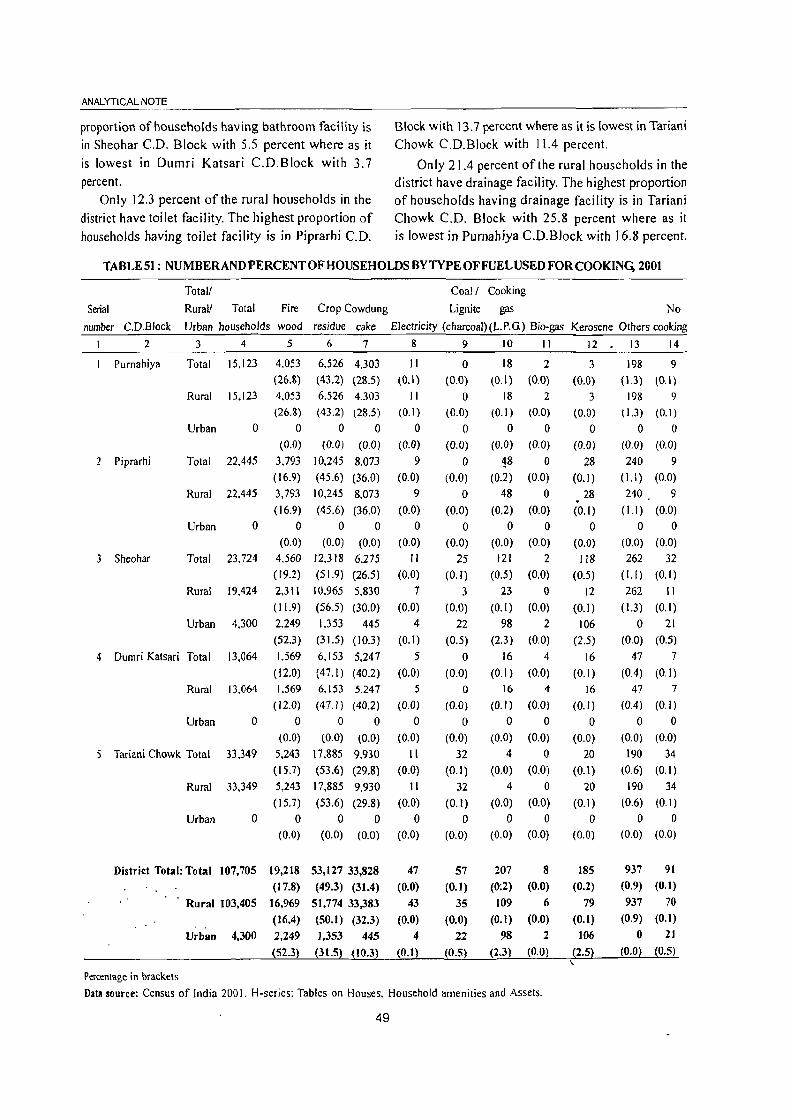
ANALYTICAL NOTE
proportion of households having bathroom facility is Block with 13.7 percent where as it is lowest in Tariani
in Sheohar C.D. Block with 5.5 percent where as it Chowk C.D.Block with 11.4 percent.
is lowest in Dumri Katsari C.D.Block with 3.7 Only 21.4 percent of the rural households in the percent. district have drainage facility. The highest proportion
Only 12.3 percent of the rural households in the of households having drainage facility is in Tariani district have toilet facility. The highest proportion of Chowk C.D. Block with 25.8 percent where as it households haying toilet facility is in Piprarhi C.D. is lowest in Purnahiya C.D.Block with 16.8 percent.
TABLES1: NUMBERANDPERCENTOFHOUSEHOLDSBYTYPEOFFUELUSEDFORCOOKING, 2001
Total! Coal! Cooking
Serial Rural! Total Fire Crop Cowdung Lignite gas No
number C.D.Block Urban households wood residue cake Electricity (charcoal)(L.P.G) Bio-gas Kerosene Others cooking
2 3 4 5 6 7 g 9 10 11 12 13 14
I Purnahiya Total 15,123 4.053 6.526 4,303 Jl 0 18 2 3 198 9 (26.8) (43.2) (28.5) (0.1 ) (0.0) (0.1) (0.0) (0.0) ( 1.3) (0.1)
Rural 15.123 4,053 6.526 4.303 II 0 18 2 3 198 9 (26.8) (43.2) (28.5) (0.1) (0.0) (0.1 ) (0.0) (0.0) ( 1.3) (0.1)
Urban 0 0 0 0 0 0 0 0 0 0 ()
(0.0) (0.0) (0.0) (0.0) (0.0) (0.0) (0.0) (0.0) (0.0) (0.0)
2 Piprarhi Total 22.445 3.793 10,245 8.073 9 0 18 0 28 240 9
(16.9) (45.6) (36.0) (0.0) (0.0) (0.2) (0.0) (0.1 ) (l.l ) (0.0)
Rural 22,445 3,793 10,245 8,073 9 0 48 0 28 240 9 . (16.9) (45.6) (36.0) (0.0) (0.0) (0.2) (0.0) (0.1) (I.I ) (0.0)
Urban 0 0 0 0 0 0 0 0 0 0 0
(0.0) (0.0) (0.0) (0.0) (0.0) (0.0) (0.0) (0.0) (0.0) (0.0)
3 Sheohar Total 23.724 4.560 12.3 18 6.275 II 25 121 2 118 262 32
(19.2) (51.9) (26.5) (0.0) (0.1) (0.5) (0.0) (0.5) (l.l ) (0.1)
Rural 19,424 2.311 10.965 5,830 7 3 23 0 12 262 II
(II. 9) (56.5) (30.0) (0.0) (0.0) (0.1 ) (0.0) (0.1) ( 1.3) (0.1)
Urban 4,300 2.249 1.353 445 4 22 98 2 106 0 21
(52.3) (31.5) (10.3) (0.1) (0.5) (2.3) (0.0) (2.5) (0.0) (0.5)
4 Dumri Katsari Total 13,064 1.569 6,153 5,247 5 0 16 4 16 47 7
(12.0) (47.1) (40.2) (0.0) (0.0) (0.1 ) (0.0) (0. I) (0.4) (0. I)
Rural 13.064 1.569 6.153 5,247 5 0 16 4- 16 47 7
(12.0) (47.1 ) (40.2) (0.0) (0.0) (0.1 ) (0.0) (0.1) (0.4) (O.l)
Urban 0 0 0 0 0 0 0 0 0 0 0
(0.0) (0.0) (0.0) (0.0) (0.0) (0.0) (0.0) (0.0) (0.0) (0.0)
Tariani Chowk Total 33,349 5.243 17,885 9,930 II 32 4 0 20 190 34
(15.7) (53.6) (29.8) (0.0) (0.1) (0.0) (0.0) (0.1 ) (0.6) (0.1)
Rural 33,349 5,243 17.885 9,930 II 32 4 0 20 190 34
(15.7) (53.6) (29.8) (0.0) (0.1) (0.0) (0.0) (0.1) (0.6) (0.1)
Urban 0 0 0 0 0 0 0 0 0 0 0
(0.0) (0.0) (0.0) (0.0) (0.0) (0.0) (0.0) (0.0) (0.0) (0.0)
District Total: Total 107,705 19,218 53,127 33,828 47 57 207 8 185 937 91
(17.8) (49.3) (31.4) (0.0) (0.1) (0;2) (0.0) (0.2) (0.9) (0.1)
Rural 103,405 16,969 51,774 33,383 43 35 109 6 79 937 70
(16.4) (50.1) (32.3) (0.0) (0.0) (0.1) (0.0) (0.1) (0.9) (0.1)
Urban 4,300 2,249 1,353 445 4 22 98 2 106 0 21
(52.3) ~31.5} (to.3) ~O.t} (0.5) (2.3} (0.0) ~2.5} (O.Ol (0.5) \
Percentage in brackets
Data source: Census of India 200 I. H-series: Tables on Houses. Household amenities and Assets.
49
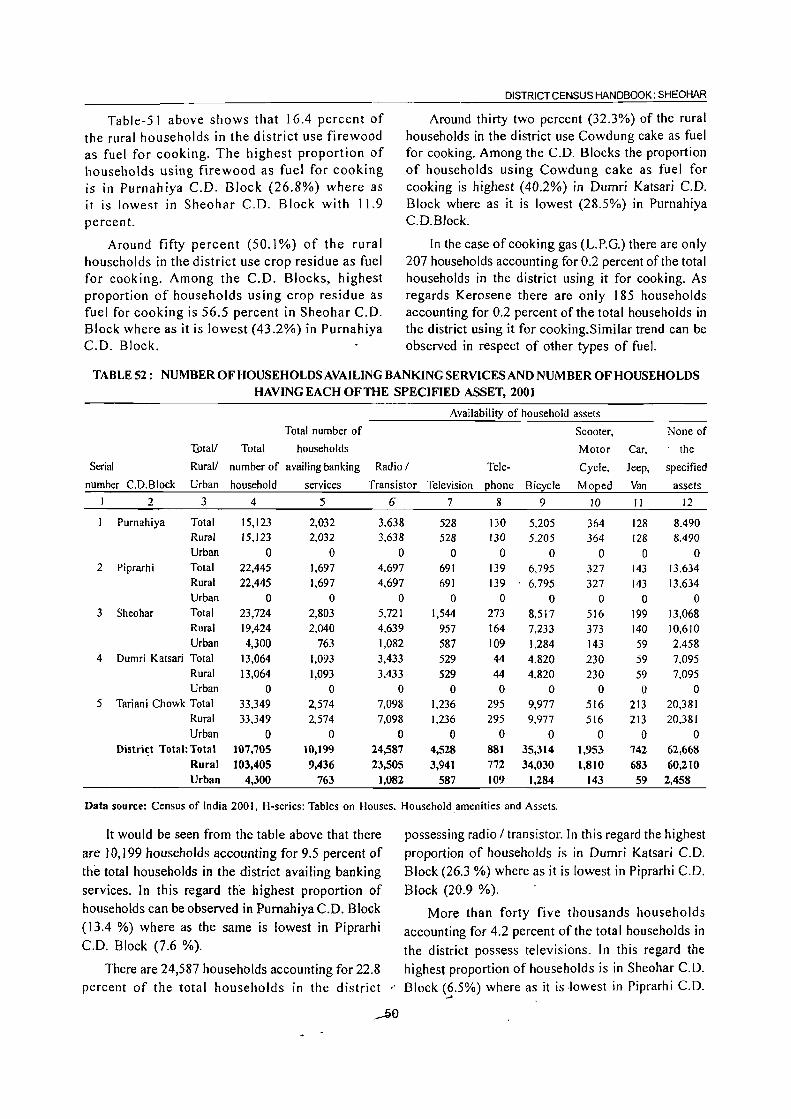
Table-5 I above shows that 16.4 percent of the rural households in the district use firewood as fuel for cooking. The highest proportion of households using firewood as fuel for cooking is in Purnahiya C.D. Block (26.8%) where as it is lowest in Sheohar C.O. Block with 11.9 percent.
Around fifty percent (50.1 %) of the rural households in the district use crop residue as fuel for cooking. Among the C.D. Blocks, highest proportion of households using crop residue as fuel for cooking is 56.5 percent in Sheohar C.D. Block where as it is lowest (43.2%) in Purnahiya C.D. Block.
DISTRICT CENSUS HANDBOOK: SHEOHAR
Around thirty two percent (32.3%) of the rural households in the district use Cowdung cake as fuel for cooking. Among the C.D. Blocks the proportion of households using Cowdung cake as fuel for cooking is highest (40.2%) in Dumri Katsari C.D. Block where as it is lowest (28.5%) in Purnahiya C.D.Block.
In the case of cooking gas (L.P.G.) there are only 207 households accounting for 0.2 percent of the total households in the district using it for cooking. As regards Kerosene there are only 185 households accounting for 0.2 percent of the total households in the district using it for cooking.Similar trend can be observed in respect of other types of fuel.
TABLE 52 : NUMBER OF HOUSEHOLDS AVAILING BANKING SERVICES AND NUMBER OF HOUSEHOLDS
HAVING EACH OFTHE SPECIFIED ASSET, 2001
Availability of household assets
Total number of Scooter, None of
1:otall Total households Motor Car, the
Serial RuraV number of availing banking Radiol Tele- Cycle, Jeep, specified
number C.D.Block Urban household services Transistor Television phone Bicycle Moped Van assets
2 3 4 :5 6 7 8 9 10 II 12
Purnahiya Total 15,123 2,032 3,638 528 130 5.205 364 128 8.490 Rural 15,123 2,032 3.638 528 130 5.205 364 128 8,490 Urban 0 0 0 0 0 0 0 0 0
2 Piprarhi Total 22,445 1,697 4,697 691 139 6,795 327 143 13.634 Rural 22,445 1,697 4,697 691 139 6.795 327 143 13.634 Urban 0 0 0 0 0 0 0 0 0
3 Sheohar Total 23,724 2,803 5,721 1,544 273 8,517 516 199 13,068 Rural 19,424 2,040 4,639 957 164 7,233 373 140 10,610 Urban 4,300 763 1,082 587 109 1,284 143 59 2.458
4 Dumri Katsari Total 13,064 1,093 3,433 529 44 4.820 230 59 7.095 Rural 13,064 1,093 3,433 529 44 4.820 230 59 7,095 Urban 0 0 0 0 0 0 0 0 0
5 Tariani Chowk Total 33,349 2,574 7,098 1,236 295 9,977 516 213 20,381 Rural 33,349 2,574 7,098 1,236 295 9.977 516 213 20,381 Urban 0 0 0 0 0 0 0 0 0
District Total: Total 107,705 10,199 24,587 4,528 881 35,314 1,953 742 62,668 Rural 103,405 9,436 23,505 3,941 772 34,030 1,810 683 60,210 Urban 4,300 763 1,082 587 109 1,284 143 59 2,458
Data source: Census of India 2001, H-series: Tables on Houses. Household amenities and Assets.
It would be seen from the table above that there
are 10,199 households accounting for 9.5 percent of the total households in the district availing banking services. In this regard the highest proportion of households can be observed in Purnahiya C.D. Block (13.4 %) where as the same is lowest in Piprarhi C.D. Block (7.6 %).
There are 24,587 households accounting for 22.8 percent of the total households in the district
possessing radio / transistor. In this regard the highest
proportion of households is in Dumri Katsari C.D. Block (26.3 %) where as it is lowest in Piprarhi C.D. Block (20.9 %).
More than forty five thousands households accounting for 4.2 percent of the total households in
the district possess televisions. I n this regard the highest proportion of households is in Sheohar C.D.
" Block (6.5%) where as it is ·Iowest in Piprarhi C.O. _.

ANALYTICAL NOTE
Block (3.1 %).
As regards telephone there are only 881
households accounting for only 0.8 percent of the total
households in the district availing telephone services.In
this regard the highest proportion of households is in
Sheohar C.D. Block (1.2%) where as it is lowest in
Dumri Katsari C.D. Block (0.3%).
More than thirty five thousand households
accounting for 32.8 percent of the total households in
the district possess bicycles. In this regard the highest
proportion of households is in Dumri Katsari C.D.
Block (36.9%) where as it is lowest in Tariani Chowk
C.D. Block (29.9%).
Similar trend can be observed in respect of other
specified assets.
(viii) Major social and cultural events, naturaland
administrative developments and significant
activities during the decade
The district of Sheohar which till the 1991 Census
was a part of Sitamarhi district as one of its sub
divisions, was elevated to the status of a district on
6th October, 1994 by the Government of Bihar.
(ix) Brief description of places of religious,
historical and archaeological importance in
villages and places of tourist interest in the
towns of the district
Deokuli (Dhekuli) :
The ancient Bhubaneshwar Temple of Lord Shiva
is situated 5 kms. east of Sheohar town between
Sheohar-Sitamarhi sector on National Highway no.
104 near the river Bagmati. The legend is that the
great mythological warrior, Parsurama - the famous
devotee and disciple of Lord Shiva established here
the SHIVALINGA and worshiped the deity for
thousands of years. During the month of
SHRAWANA a big fair is held every year around
the temple.
Certainly, there exists a number of small temples
and mosques in almost all the villages in the district
but these are not of archaeological importance. Visited
by local residents these provide places of worship
for the neighbourhood.
51
(x)Major characteristics of the district,
contribution of the district in the form of any
historical figure associated with the district
The erstwhile district of Sitamarhi from which
the district of Sheohar was created in the year 1994
is smallest district both in terms of popUlation and
area. The district is prone to flood. Almost every
year major areas of the district is inundated by the
flood water of the river Bagmati.
(xi)Scope of Village Directory and Town Directory
- column beadingwise expianati9D and coverage
of data
The District Census Handbooks are the only
publications which furnish information down to the
village level in case of rural areas and by the level
oftowns/wards (circles) in case of urban areas. This
facilitates research scholars and academicians to
analyse data upto the lowest administrative unit. It is
of vital importance for the planners also since it offers
micro-level data and thus enable them to identify the
areas undeveloped in terms of infrastructure and
channelise efforts and inputs accordingly so that
optimum utilization of the resources could be made.
The present series of the DCHB in 2001 Census have been made more informative and exhaustive in terms of coverage and content. The content of village
directory has been broadened by includjng more types of facilities such as bank, re~reational and cultural
facilities, newspapers and magazines available in villages. Information on most important commodity
manufactured in village, wherever possible are provided. Specific details on distances, in case a basic amenity is not available in the referent village is also
given. These include distances in respect of availability of primary and middle school and college (in respect
of the educational facility), Allopathic Hospital,
Maternity & Child Welfare Centre and Primary Health Centre (in respect of the medical facility), drinking water, Post Office and phone, communication, bank, credit societies and recreational facj.Jities. In
town directory, information on all types of slums,
whether notified/re,cognised by the respective
town authority or not and in respt:_ct of all statutory towns irrespective of their class as against
,.

only Class I and Class II towns of the t 981 and t 991
Censllses are provided. With reference to the town
concerned, the nearest city with 5 lakh and above
population has also been given in addition to I lakh
and above population. The varied basic amenities
available in the villages and towns are analysed in
depth with the help of a number of cross-classified
inset tables and statements.
Village and Town Directories included in the
District Census Handbook give the list of villages and
towns, their areas, population and amenities.
The details of each column of village .directory
are explained as below:
Column-}
Serial number of the village is indicated in this
column.
Co)umn-2
Gives the name of the village and permanent
location code number (PLCN) assigned to each. village
in serpentine manner from north-west to south
direction and is essential for identification of village.
The concept of permanent location code number has
been introduced first time in 2001 Census by assigning
eight digit number starting from the first village of
the first tehsil of first district of the state to the Jast
village of tast tehsH of the last district. In the state
of Bihar first PLCN 00000 J 00 has been assigned to
village 'KALAPANI' in Sidhaw C.D. Block of /
Pashchim Champaran district and the last PLCN
04509800 has been assigned to the last village 'TOLA
SUNDARI' of the state in Chakai C.D. Block of
Jamui district which happens to be last as per
procedure adopted for assigning location code number.
The district census handbook of 1991 Census as well
as updated district and C.D. Block maps and services
of local revenue officers/officials have been used to
assign the PLCN to the villages. The last two zeros
will be used if new villages are created out of existing
villages in subsequent census. Before 2001 census,
viUage location code number used to change from
one census to other due to change in jurisdictions or
creation of villages or merger of villages in urban
areas. The district handbook of 1991 Census has been
used as basis for filling up the name of the village
DISTRICT CENSUS HANDBOOK' SHEOHAR
including the forest and uninhabited villages. But to
ensure the accuracy, the list of vi lIages and their
names were got authenticated from the respective
B.D.o's of each C.D.Block.
Column-3
Shows the area (in hectares) of the village as
indicated by the State Revenue Department.
Columns - 4 & 5
Gives the population and number of households
in each village which facilitate the correlation between
the amenities available to the population and number
of households in village.
Columns 6 to 9
Dea\ with the amenities like education, medical,
drinking water, post, telegraph and telephone etc. The information relating to these amenities were filled by
the Patwari of concerned village in village directory
booklet which were subsequently cross checked with district census handbook of \ 99 \ as well as with the
information collected from the various departments
to ensure the accuracy of information provided. In
such cases where no facility is available within a
village, a dash (-) has been shown in the column and
next to it in brackets, the distance from the village in
broad ranges viz. upto 5 kms., 5-10 kms. and 10+
kms. of the nearest place where the facility is
available has been given. This will help not only for
local area planning but in regulating the provisions of
goods and services as well, so as to minimize the
regional imbalance in the process of development.
The abbreviations used to indicate these amenities
have been explained separately in the subsequent
section.
Column-lO
Shows the number of banks - Commercial banks
and Co-operative banks. In addition to this, the list of
banks procured from the lead bank of the district has
also been added in this book.
Column-ll
Relates to number of credit societies. such as
agricultural credit societies, non-agricultural credit
societies and other cooperative societies.
52/
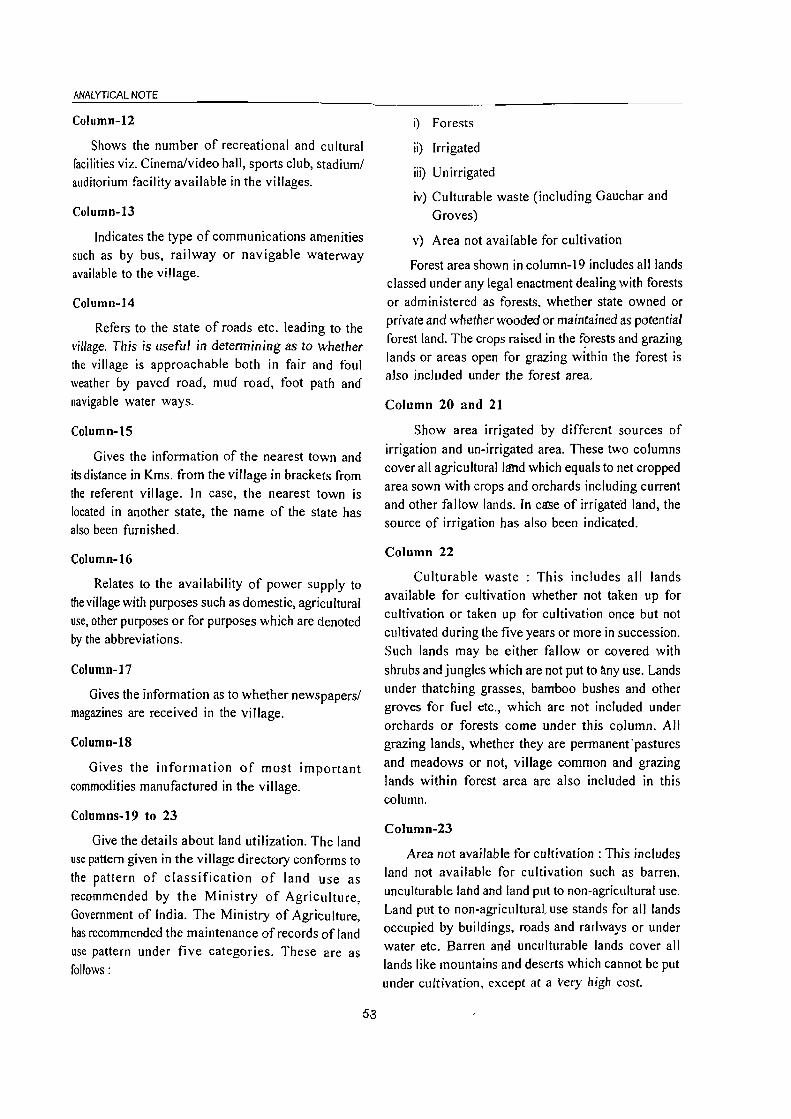
ANALYTICAL NOTE
Column-12
Shows the number of recreational and cultural facilities viz. Cinema/video hall, sports club, stadium/ auditorium facility available in the villages.
Column-13
Indicates the type of communications amenities such as by bus, railway or navigable waterway available to the village.
Column-14
Refers to the state of roads etc. leading to the village. This is useful in determining as to whether the village is approachable both in fair and foul weather by paved road, mud road, foot path and navigable water ways.
Column-IS
Gives the information of the nearest town and its distance in Kms. from the village in brackets from the referent village. In case, the nearest town is located in another state, the name of the state has also been furnished.
Column-16
Relates to the availability of power supply to the village with purposes such as domestic, agricultural lise, other purposes or for purposes which are denoted by the abbreviations.
Column-I7
Gives the information as to whether newspapers/ magazines are received in the village.
Column-IS
Gives the information of most important commodities manufactured in the village.
Columns·I9 to 23
Give the details about land utilization. The land use pattern given in the village directory conforms to the pattern of classification of land use as recommended by the Ministry of Agriculture, Government of India. The Ministry of Agriculture, has recommended the maintenance of records of land use pattern under five categories. These are as follows:
53
i) Forests
ii) Irrigated
ii~ Unirrigated
iv) Culturable waste (including Gauchar and Groves)
v) Area not available for cultivation
Forest area shown in column-19 includes all lands classed under any legal enactment dealing with forests or administered as forests. whether state owned or private and whether wooded or maintained as potential forest land. The crops raised in the forests and grazing lands or areas open for grazing within the forest is also included under the forest area.
Column 20 and 21
Show area irrigated by different sources of irrigation and un-irrigated area. These two columns cover all agriculturall!flld which equals to net cropped area sown with crops and orchards including current and other fallow lands. In ca'Se of irrigated land, the source of irrigation has also been indicated.
Column 22
Culturable waste: This includes all lands available for cultivation whether not taken up for cultivation or taken up for cultivation once but not cultivated during the five years or more in succession. Such lands may be either fallow or covered with shrubs and jungles which are not put to any use. Lands under thatching grasses, bamboo bushes and other groves for fuel etc., which are not included under orchards or forests come under this column. All grazing lands, whether they are permanent'pastures and meadows or not, village common and grazing lands within forest area are also included in this column.
Column-23
Area not available for cultivation: This includes land not available for cultivation such as barren, unculturable land and land put to non-agricultural use. Land put to non-agriculturaL use stands for all lands occupied by buildings, roads and railways or under water etc. Barren and unculturable lands cover all lands like mountains and deserts which cannot be put under cultivation, except at a Very high cost.
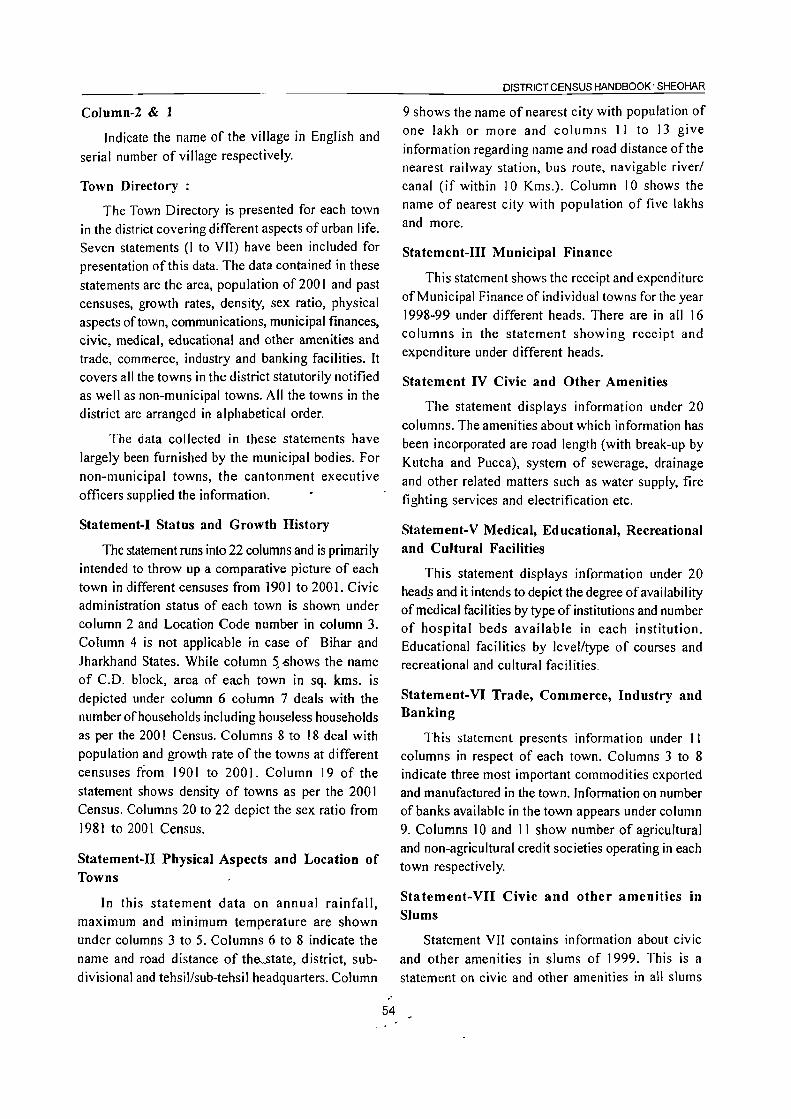
Column-2 & 1
Indicate the name of the village in English and
serial number of village respectively.
Town Directory :
The Town Directory is presented for each town in the district covering different aspects of urban life. Seven statements (I to VII) have been included for presentation of this data. The data contained in these
statements are the area, population of 2001 and past censuses, growth rates, density, sex ratio, physical aspects of town, communications, municipal finances, civic, medical, educational and other amenities and trade, commerce, industry and banking facilities. It covers all the towns in the district statutorily notified as well as non-municipal towns. All the towns in the district are arranged in alphabetical order.
The data collected in these statements have largely been furnished by the municipal bodies. For
non-municipal towns, the cantonment executive
officers supplied the information.
Statement-I Status and Growth History
The statement runs into 22 columns and is primarily intended to throw up a comparative picture of each
town in different censuses from 1901 to 2001. Civic administration status of each town is shown under
column 2 and Location Code number in column 3. Column 4 is not applicable in case of Bihar and
lharkhand States. While column ~ .£hows the name of C.D. block, area of each town in sq. kms. is depicted under column 6 column 7 deals with the number of households including houseless households as per the 200 I Census. Columns 8 to 18 deal with population and growth rate of the towns at different
censuses from 1901 to 2001. Column 19 of the statement shows density of towns as per the 200 I Census. Columns 20 to 22 depict the sex ratio from
1981 to 2001 Census.
Statement-II Physical Aspects and Location of Towns
In this statement data on annual rainfall,
maximum and minimum temperature are shown under columns 3 to 5. Columns 6 to 8 indicate the
name and road distance of the._state, district, subdivisional and tehsil/sub-tehsil headquarters. Column
54
DISTRICT CENSUS HANDBOOK' SHEOHAR
9 shows the name of nearest city with population of one lakh or more and columns II to 13 give
information regarding name and road distance of the nearest railway station, bus route, navigable river/
canal (if within 10 Kms.). Column 10 shows the name of nearest city with population of five lakhs
and more.
Statement-III Municipal Finance
This statement shows the receipt and expenditure of Municipal Finance of individual towns for the year 1998-99 under different heads. There are in all 16 columns in the statement showing receipt and expenditure under different heads.
Statement IV Civic and Other Amenities
The statement displays information under 20
columns. The amenities about which information has been incorporated are road length (with break-up by
Kutcha and Pucca), system of sewerage, drainage
and other related matters such as water supply, fire fighting services and electrification etc.
Statement-V Medical, Educational, Recreational and Cultural Facilities
This statement displays information under 20 head_s and it intends to depict the degree of availability of medical facilities by type of institutions and number of hospital beds available in each institution. Educational facilities by level/type of courses and recreational and cultural facilities.
Statement-VI Trade, Commerce, Industry and Banking
This statement presents information under II columns in respect of each town. Columns 3 to 8 indicate three most important commodities exported and manufactured in the town. Information on number of banks available in the town appears under column
9. Columns 10 and II show number of agricultural and non-agricultural credit societies operating in each town respectively.
Statement-VII Civic and other amenities in Slums
Statement VII contains information about civic
and other amenities in slums of 1999. This is a
statement on civic and other amenities in all slums

ANALYTICAL NOTE
whether notified or not and for all towns having statutory bodies, like municipality, municipal corporations, Notified Areas, etc.
Generally, in cities or towns with slums, the local authority, such as municipality or municipal corporation or even the development authority notifies the recognized slums. It is linked up with the availability of funds from the State Government for slum clearance/improvement. It is possible that some of the states or local bodies have not formally notified slums under their jurisdictions. But in such cases, there is likelihood that they are maintaining a list of such areas which are officially treated as slums. The intention is that the information is to be provided m respect of such localities as are officially recognised as slums, whether actually notified or not. Though the magnitude of slum problem is greater in class I and class II towns, it is acknowledged that they are associated with smaller towns also. Hence the information on slums in this statement has been compiled in respect of all towns having statutory bodies. Columns I, 2 need no explanation. Under
55
column 3 the names of slum(s) has been provided in an alphabetical order in separate lines under the town which they belong. The particulars with regard to status of slum whether notified or not has been collected under column 4 and recorded as 'Yes' or 'No'. Under column 5 the no. of households (approximate) in the slum pertaining to 1999 has been recorded whereas in column 6 the population figures (approximate) based on the year 1999 have been recoded. Column 7 denotes the road length of paved road in km . upto two decimal places. Column 8 to 13 give information about system of sewerage, number of latrines and method of disposal of night soil. Column 14 gives information about the no. of tap points/public hydrants as ascertained from civic authorities as well as through local enquiry. Column 15, 16 & 17 give information about electricity connections. Column 15 gives information about domestic electricity, connections, column 16 gives information about road lighting (electric points) whereas column 17 gives information about electric connections other than collected under columns 15 & 16.


Part-A : Village and Town Directory

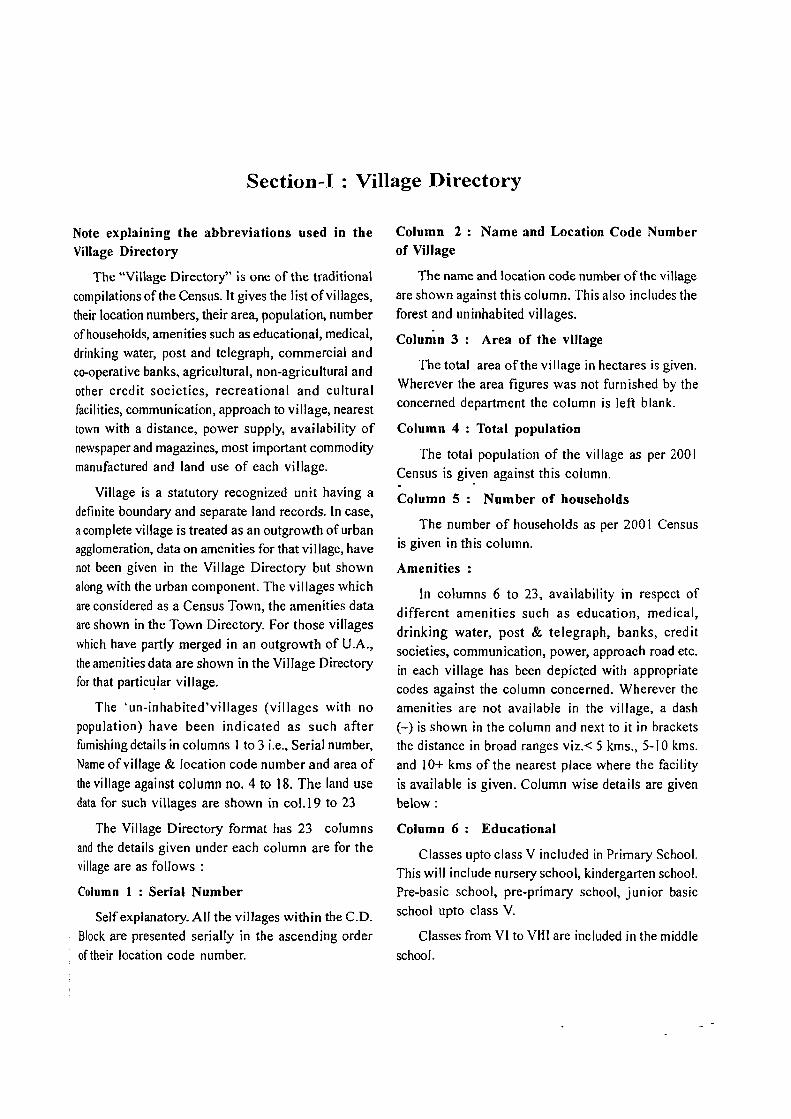
Section-I: Village Directory
Note explaining the abbreviations used in the Village Directory
The "Village Directory" is one of the traditional
compilations of the Census. It gives the list ofvillages,
their location numbers, their area, population, number
of households, amenities such as educational, medical,
drinking water, post and telegraph, commercial and co-operative banks, agricultural, non-agricultural and
other credit societies, recreational and cultural
facilities, communication, approach to village, nearest
town with a distance, power supply, availability of
newspaper and magazines, most important commodity
manufactured and land use of each village.
Village is a statutory recognized unit having a
definite boundary and separate land records. In case, a complete village is treated as an outgrowth of urban agglomeration, data on amenities for that village, have
not been given in the Village Directory but shown
along with the urban component. The villages which
are considered as a Census Town, the amenities data
are shown in the Town Directory. For those villages
which have partly merged in an outgrowth of U.A.,
the amenities data are shown in the Village Directory
for that particl!lar village.
The 'un-inhabited'villages (villages with no
population) have been indicated as such after furnishing details in columns I to 3 i.e., Serial number,
Name of village & location code number and area of
the village against column no. 4 to 18. The land use
data for such villages are shown in col.l9 to 23
The Village Directory format has 23 columns
and the details given under each column are for the
village are as follows :
Column 1 : Serial Number
Self explanatory. All the villages within the C.D.
Block are presented serially in the ascending order
of their location code number.
Column 2: Name and Location Code Number of Village
The name and location code number of the village
are shown against this column. This also includes the
forest and uninhabited villages.
Column 3: Area of the village
The total area of the village in hectares is given.
Wherever the area figures was not furnished by the concerned department the column is left blank.
Column 4 : Total population
The total population of the village as per 200 I Census is given against this column.
Column 5: Number of households
The number of households as per 2001 Census
is given in this column.
Amenities:
In columns 6 to 23, availability in respect of
different amenities such as education, medical,
drinking water, post & telegraph, banks, credit
societies, communication, power, approach road etc.
in each village has been depicted with appropriate
codes against the column concerned. Wherever the
amenities are not available in the village, a dash
(-) is shown in the column and next to it in brackets
the distance in broad ranges viz.< 5 kms., 5-10 kms.
and 10+ kms of the nearest place where the facility
is available is given. Column wise details are given
below:
Column 6: Educational
Classes upto class V included in Primary School.
This will include nursery school, kindergarten school. Pre-basic school, pre-primary school, junior basic
school upto class V.
Classes from VI to VIiI are included in the middle
school.

Classes from IX and X Included in High secondary school Classes XI and XII are included
in sen ior secondary school.
In case of cOPlposite schools like middle school with primary school or secondary school with middle school. these are also included in the number of primary and middle schools, respectively.
Accordingly any of the following types of institutions if exists within the village is shown as per codes given below:
(i) Primary School P
(ii) Middle School M
(iii) Secondary School S
(iv) Senior Secondary School PUC (v) College C
(vi) Industrial School
(vii) Training School Tr
(viii) Adult literacy class/centre AC
(ix) Others (specify) e.g. Sanskrit 0 Pathshala, Senior basic school, Navodaya Vidyalaya, Makhtab, etc.
More than one institution of a type in the village is indicated by the number within brackets against the abbreviation, e.g. P(3), M(4), etc.
Column 7: Medical
Availability of medical facility within the village is indicated by following codes:
(i) Allopathic Hospital H
Ayurvedic Hospital HA
Unani Hospital HU
Homeopathic Hospital H Hom
(ii) Allopathic Dispensary D
Ayurvedic Dispensary DA
Unani Dispensary DU
Homeopathic Dispensary DHom
(iii) Maternity & Child Welfare MCW
(iv) Maternity Home MH
(v) Child Welfare Centre CWC
(vi) Health Centre HC
60
DISTRICT CENSUS HANDBI)OK: SHEOHAR
(vii) Primary Health Centre PHC
(viii) Primary Health Sub-Centre PHS
(ix) Family Welfare Centre FWC
(x) T.B. Clinic TB
(xi) Nursing Home NH
(xii) Registered Private Medical RMP
Practitioner
(xiii) Subsidised Medical Practitioner SMP
(xiv) Community Health Worker CHW
(xv) Others 0
More than one institution of a type in the village is indicated by the number within brackets against
the abbreviations, e.g. H(3), D( 4), etc.
Column 8: Drinking Water
The type of the drinking water supply sources
available within the village are indicated by codes as follows:
(i) Tap Water T
(ii) Well Water W
(iii) Tank Water TK
(iv) Tubewell Water TW
(v) Handpump HP
(vi) River Water R
(vii) Canal C
(viii) Lake L
(ix) Spring S
(x) Others 0
(xi) Summer Source SS
Column 9 : Post, Telegraph and Telephone
It is indicated by codes as shown below whether within the village exists the following amenities ~ . ...... . .:
(i) Post Office '. . PO
(ii) Telegraph Office TO
(iii) Post & Telegraph Office PTO
(iv) Telephone Connection P.H
Column 10 : Commercial and Co-operative
Banks
If the village is served by any banking service,
commercial bank, co-operative bank etc. the same is

VILLAGE DIRECTORY
indicated in codes mentioned below along with the
number of banks in brackets. If not available the distance of nearest place where the facility exists is
given:
(i) Commercial Bank
(ii) Co-operative Bank
Column 11 : Credit Societies
CM
CP
If the village enjoys the services of Credit Societies i.e. Agricultural Credit Societies, Non Agricultural Credit Societies or Other Credit Societies, the same is indicated in codes mentioned below along with the number of such societies in brackets. In case the facility is not available within the village the distance of the nearest place where such facility exists
is given:
(i) Agricultural Credit Society ACS
(ii) Non- Agricultural Credit Society NCS
(iii) Other Credit Society OCS
Column 12: Recreational and cultural facilities
If facilities such as CinemalVideo hall, Sports Club, Stadium/Auditorium are available in the village,
the same is recorded in this column. If not available the particulars of the nearest place with the facility are recorded. The information is indicated in codes mentioned below along with the number of such facilities in brackets:
(i) Cinema/Video Hall
(ii) Sports Club
(iii) Stadium/ Aud itorium
Column 13: Communications
CY SP
ST
If the village is served by any mode of publicI Private transport I ike Bus, Railway station or Navigable water ways these are to be mentioned as follows:
(i) Bus
(ii) Railway Station
(iii) Navi~abl.e W~terway
C6lu~n ~4·: Approach· to village
BS
RS
NW
Approach to ·village refers to the state of road
leading to village. The approach to the village IS
indicated in following codes:
(i) Paved Road PR
61
(ii) Mud road MR
(iii) Foot path FP
(iv) Navigable River NR
(v) Navigable Canal NC
(vi) Navigable waterways other
than River, Canal NW
Column 15 : Nearest Town and distance
The distance is given in kilometers in brackets
against the name of the town nearest to the village.
Column 16 : Power supply
Availability of Power Supply in the village,
whatever may be the form of its use is given by using
following codes:
(i) Electricity for domestic use ED
(ii) Electricity for agricultural use EAG
(iii) Electricity for other purposes EO
(iv) Electricity for all purposes EA
Column 17 : News Paper / Magazine
Ifvillage receives any News Paper/Magazines the
same is noted in this column using following codes:
(i) News Paper
(ii) Magazine
N
M
Column 18 : Most important commodities manufactured
./
The name of three most important commodities
manufactured in the village is recorded against this
column.
Columns 19 to 23 : Land use i.e. area under different types of land use
Land use data maintained by the State/UT Govts.
are furnished against these columns. The data
concerning area under Forest, Irrigated land (by
source), Un-irrigated land, Culturable waste and Area
not available for cultivation in the village are shown against these columns. The area figures are given in
hectare(s) up to one d~cimal. Desh (-) is recorded
wherever the information is not made available by
the concerned department. The codes lIsed for
different types of irrigation facilities available in the
village are indicated below:
(i) Government Canal GC

(ii) Private Canal PC
(iii) Well (without electricity) W
(iv) Well (with electricity) WE
(v) TlIbewell (without electricity) TW
(vi) TlIbewell (with electricity) TWE
(vii) Tank TK
(viii) River R
(ix) Lake L
(x) Waterfall WF
(xi) Others 0
(xii) Total T
The village directory also carries the following llppendices.
Appendix I
Appendix IA
Appendix IB
Appendix IC
Appendix II
Appendix lIA
It gives the abstract of educational, medical and other
amenities available in villages CD
Block wi~e of the district.
Indicates number of villages CD Blockwise having one or more primary schools.
Indicates number of vi II ages CD Blockwise having primary, middle and secondary schools.
Shows number of villages CD Blockwise with different sources of drinking water facilities.
Indicates the lis~ofvillages with
5,000 and above population which do not have one or more important amenities.
Indicates list of Census Towns
Appendix III
Appendix IV
AppendixV
Appendix VI
Appendix VIlA
Appendix VIIB
Appendix VIII
Appendix IX
DISTRICT CENSUS HANDBOOK SHEOHAR
which do not have one or more
amenities.
It gives the land utilization data in
respect of Census Towns/non
municipal Towns.
CD Block wise list of inhabited
villages where no amenity other
than drinking water facility is
available.
Summary showing number of
villages not having Scheduled
Castes population.
Summary showing number of
villages not having Scheduled
Tribes popUlation.
The appendix shows the list of
villages according to proportion of
the Scheduled castes to the total
population by ranges
The appendix shows the Jist of
villages according to proportion of
the Scheduled Tribes to the total
population by ranges.
Number of Villages under each
Gram Panchayat( C.D. block
wise)
Statement showing number of
girls schools in the villages
LIST OF VILLAGES MERGED IN TOWNS AND OUTGROWTHS AT 2001 CENSUS
Serial
number Name of Towns 2
Name of villages
Name ofvillages identIfied for Location Code Number
merged in towns . outgrowth 1991 Census
3 4 5
Tnere IS no such VIllage In the district of Sheohar
" 62
Location Code Number
2001 Census
(m case of partly OG) 6
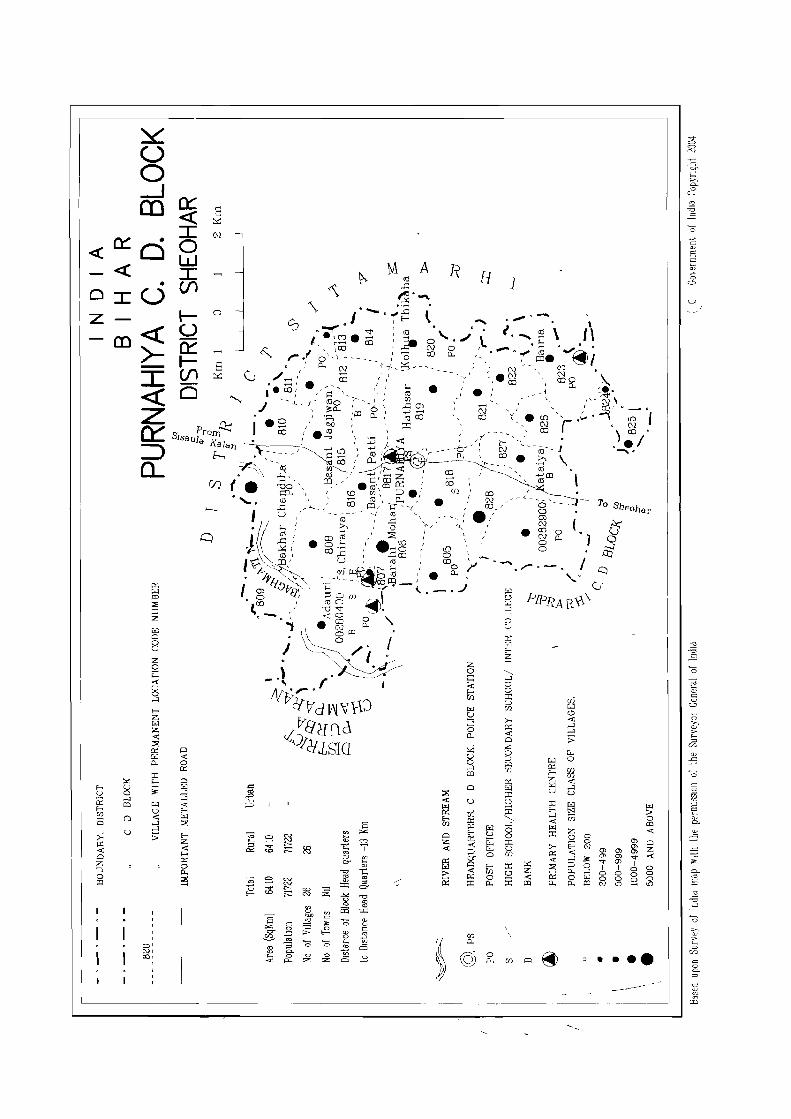
b U p: b [/)
25 ~ ~ ...: 0 ;z; ::> 0 o:l
~ u o _J CD
• 0:::0 «
CD
:,.:: U 0 _, "'" Cl
u
~ o 8 ;z: o 1= «: u o _,
(:)
...: 0 ~
0 c: ~ .e _, _,
«: ;::> E-I'Cl ;:.:
e E-
'" ;z;
eo: «: E-~
§: ro 21 <> E-<
'" g "" ~ c.c ..... r:: C'> <0
"" "'" I' e:: '" t
g ~
"" ~ ... !:::. ;z; CD l'-
'" == 0"
"0 $
w ::t::
~ c
"0 '" <= '" 1h
6 _3
0
1':; ,_, '0 '" '" -;;; 0
6 z
R
;:.: «: I'Cl ~ .... lf1
Cl ;z; <I:
0:: ~ >
~ p:
~
~ u :3 o p_.
Cl
u
u5 0::
""" & «: ::> 0-0 «: ~ ::r:
'" p_.
©
H
r.:l u E;:;
"" 0
.... iii 0 p_.
0 p_,
1
~ Cl z 8 ~ [/)
~ ::.:I ::r: 0 5: '--_, 0 0 ;:r:: U [/)
;:r:: ::2 ;:r::
iii
~ Z «: "'"
II> 8l
---
•• co • 0 0 •
c.
'" ~ ]
cO
-- = '.._


Alphabetical list of Villages Name of the District: Sheohar
Serial
number Name of villages
2
Name of CD Block: Purnahiya
Location code of C.D. Block: 0001
Adauri
2 Asogi Chhapra Dhani
3 Asopur
4 Bairin
5 Bakatpur.Chaki
6 Bakhar Chandiha
7 Barahi Jagdish
8 Barahi Mohan
9 Basan! lagjiwan
10 Basant Patti
II BedaulAdam
12 Bedaul Baz
J3 Chak Sonaul
14 ClThapra lurawan'
15 Chiraiya
16 Dosti Mahamadpur
17 Hathsar
18 Kashipur
19 Kataiya
20 Khaira Pahari
21 Kolhua Thikaha
22 Madan Chhapra
23 Pakri
24 Purnahia Chandandih
25 Pursauni Gape
26 Sonaul Sultan
200lCensus locallon code
number 3
00280400 00281000 00282600
00282300
00282400
00280900
00280500
00280600
00281500
00281600
00281400
00281200 00281100
00280700
00280800
00282900 00281900
00282200
00282700
00282800
00282000
00281300 00282500
00281700
00282100 00281800
199 I Census locallon code
number 4
140010001000100089 14DOI0001000IOO096
140010001000100119 140010001000100109
J400JOOOJOOOJOOJJ4
140010001000100095 140010001000100091
140010001000100092
140010001000100101
140010001000100102
140010001000100100
140010001000100098 140010001000100097
140010001000100093
140010001000100094
140010001000100122 140010001000100105
140010001000100108
140010001000100120 140010001000100121
140010001000100106
140010001000100099
140010001000100115
140010001000100103
140010001000100107 140010001000100104

DISTRICT CENSUS HANDBOOK SHEOHAR
Census of India 2001 -Amenities and
Amemtles avaIlable (If not available WIthin the village, a dash (-) IS shown In the column and
next to II In brackets the dIstance In broad ranges VIZ < 5 kms, 5-10 kms and 10+ kms of the
e ~ nearesllllace where the faclhtv IS available Is_gIVen)
" ~ -0 ~~ "0 '" " c
0 U ~ U '" <.> " ~ " " -e ;:; <.> .; c: ..r= c: ;; c: > "5t u 0 .§. .,
0 0 ~ a ~~ iii u t:!. .c: ~&. ~ ~ 15 ~ ;; ~ e- 8. a -e"'-_ 1l .. t: ..J ~ 0 -0 0 ~VJ
~ ~ ~ " " t:!. "0 -0 6 .. !! OJ -~ ;;: .<; c.> ';;,'~ ~
c: c: ti ~ .. c: '" "0 g g u 0 ... c .s 0 !1 .r:; I: a(:f u 9 0 r£
~ ..'!! "- iii 0 "- to -0 -~ 0 .<:
~ t:! ....: ~ OJ;>:'g .0 ;;: 0 :; '- OJ OJ e '" u ~ E .. 0. 0 t: en ~ ,,-0 g~~ C ::> .... 13 0 ... g oll .. ::. ~ c 0 0. " OJ c 1l " ~ ~ ~ ::> >-... ..0 'iii <.> ,.;;;; E '" " u E '" "§ g OJ E c.> -0 ~ g t; E ;!: E " " E"'" ... c: "0
~ ~ 0 (5 :::s \i',
u ~ 3~ oll .<: J!G,~ ~~ l- I- 'Z. ':2: tJ., <t'O
I 2 3 4 5 6 7 8 9 10 II 12 13
CD Block: Purnahiya (DODI)
Adaur. 6310 4,809 1,126
P(4) M S HPHCPHS HPWRSS- PO PH
CM ACS NCS{S- CV{~O+) BSNW (O0280400) pucqIO+) MCW(IO+) CP(IO+)
10) RS(IO+) OCS(IO+) SP(IO+)
ST(IO+)
Bamh. Jagdlsh P{2) M« 5) HCHW ACS NCS(S- CV(~O+) BS«5)
2 (00280500)
2290 4,029 804 C(IO+)
MCW(IO+) HPWSS- PO PH CM«5) 10) RS{IO+)
PHC« 5) CP(IO+) OCS(IO+) SP(IO+) ST(IO+) NW«5)
Barah. Mohan pM« 5) H«
ACS« 5) CV(IO+) BS« 5) 2790 5,019 960 5) MCW( 10+) HP W SS- PO(" 5) CM«S)
(00280600) C(lO+) PHC« 5) PH(IO+) CP(IO+)
NCS(5-10) SP(IO+) R!>(IO+)
OCS(IO+) ST(IO+) NW( ~)
Chhapra Jurawan pM S PUC DPHCPHS
PO CM ACS NCS(5- CV(;O+) BS
4 390 957 240 CHWH(IO+) HPWSS- 10) SP(IO+) RS(IO+) (00280700) C(lO+)
MCW(IO+) PH(IO+) CP(IO+)
OCS( 10+) ST(IO+) NW(5-IO)
Ch.ralya PM«5) NHRMPH«
ACS« 5) CV(5-1O) BS« 5) S 3240 3,283 604 5)MCW(10+) HPWSS- PO{< 5) CM«S)
(00280800) C(lO+) PHC« 5) PH« 5) CP(1O+)
NCS(S-IO) SP(IO+) RS(IO+)
OCS(IO+) ST(IO+) NW(IO+)
P(4) PHS H(S·
- CM Bakhar Chand.ha 10) PO ACS«5) CV(IO+) BS(5-1()
6 (00280900)
5210 6,856 1,420 M(5-IO) MCW(IO+)
HPW SS-PH(IO+)
(5-10) NCS(5-IO) SP(IO+) RS(IO+)
C(lO+) PHC{S·lO}
CP(IO+) OCS(IO+) ST(IO+) NW(IO+)
Asog. Chhapra PM« 5) H(IO+) ACS(" 5) CV(IO+) BS
7 1640 2,968 621 HPWSS- PO{< 5) CM« 5) RS(IO+) Dha", (00281000) C(lO+) MCW(IO+)
PH(IO+) CP(IO+) NCS(5-10) SP(IO+)
NW(IO+) PHC« 5) OCS(IO+) ST(IO+)
8 Chak Sonaul
550 605 123 PM«5) H(IO+)
HPW SS- PO« 5) CM(IO+) ACS« 5) CV(IO+) 8S(5-IO)
(00281100) C(lO+) MCW(IO+) PH(IO+) CP(IO+)
NCS(S-IO) SP(IO+) RS(IO+) PHC(IO+) OCS(IO·) ST(IO+) NW(IO+)
Bedaul Baz PM« 5) H(lO+) HPWSS-
PO CM(IO+)
ACS(5-10) CV(IO+) BS(5-10) 9
(00281200) 2160 1,605 316 C(IO+) MCW{lO+) PH(lO+) NCS(5-IO) ~P(IO·1 RS(lO+)
PHC« 5) CP(IOT)
OCS(lO-) ~T(lO+) NW(lO+)
Madan Chhapra PM«5) H(lO+) HPWSS- PO«5) CM(IO·)
ACS(5-IO) CV(IO+) BS(5-10) 10
(00281300) 280 727 212
C(lO+) MCW(IO+) NCS(5-10) SP(IO+) RS( 10+) PHC(IO+)
PH(IO+) CPIIO+) OCS(lOT) ST(IO+) NW(IO+)
,.
.,96

VILLAGE DIRECTORY
Village Directory Land Use (As on 1999)
14 15
MRfP Sheohar (30)
PRMR Sheohar (18)
FP
MRFP Sheohar (22)
MRFP Sheohar (30)
MR Sheohar (25)
MRfP Sheohar (30)
PRMR Sheohar (18)
FP
MRFP Sheohar (17)
MRFP Sheohar (16)
MRfP S.tamarh. (18)
16 17 18
NM Pottery. Woods hem
POltery
Pottery. Woods hem
Pottery. Woods Item
Pottery. Woods hem
Pottery. Woods Item
Land use (I e area under dIfferent types ofland use In
hectare)
19 20 21 22 23
TW(IOOO) R(IOO 0)
231 I 1000 0(1000) T(300 0)
TW(500) R(23 8) 0(500) 54 I 509 T( 1238)
TW(IOOO) 0(793) 534 466 T(1793)
TW(IOO) R(5 0) 0(9 3) 100 50 T(243)
TW(IOOO) 0(438) 145 I 102 247 T(1438)
TW(1500) 0(1208) 500 2000 T(270 8)
Adaun
~ ,,:g ;;
.... o
" E '" Z 2
Barahl Jagd.sh
Barah. Mohan
Chhapra Jura wan
ChlfDlya
Bakhar Chand.ha
TW(460) 665 6 I
8 5 Asog. Chhapra 0(370) T(83 0) Dham
T.W(j'50) ' .. 0" 00) T(25 0)
2111 100 Chak Sonaul
TW(690) 0(420) 1048 Bedaul Baz T(III 0)
TW(7 0) 0(50) S3 105 Madan Chhapra
T(120)
67
2
4
5
6
7
8
9
10

DISTRICT CENSUS HANDBOOK SHEOHAR
Census of India 2001 -Amenities and
Amemues available (Irnot aVailable wlthm the village a dash (-) IS shown In the column and
next to II III brackets the dlstanLe III broad ranges VIZ < 5 kms 5-) 0 killS and ) 0+ kms of the
'" nearest place \\ here the facllitv IS available IS given) ~ 5l
'" <:: "0 ~~ -0 2
'" " <:: 8 '-' u
" " '" '" u .;
<:: ..c: :g - " .,
E - '" u 0
== " '" g > :; ~ ~~ '" ~ 3 ~ ~ U c:!- .t: tE g_ .. >. u M, 8 '" e- .. :; caen ~ ~ 0 c. u - ..!2 "0 ]l 0 ~~ 3=ie '" .. dd ~ c:!- o 6 CIl -..c: "0 u ~ i1 :i..L: = ~'"
" <:: '" ~ ~ " c: '" '" "0 u 0 ....
-= 0 '" J ..c: c: g g dd.gg g c .... ~ 0 .. "
.... ..c: c. i;; (;;,>"'g '" 0 ..0 ;; 0 :; .... ca e ca '" -E '" c. 0 c 01) ~ ",-0 15"O! ~ ~ ~ '" .... ~ 8:: .... 0 01) ..
~ ~ c 0 " ~ ca c ]l .. 3 5 ~ '" >-.. .0 u _;;: E '" '" u ~ ~ ~ E ~ ~ E " -0 == ~ E"'" g b
gG~ " Jl co ~ ~ :> -0 ..
Ci o c 01) .c 0-=
Z Z IJJ ::2: Il. u2 « <; ex: tI) e I 2 3 4 5 6 7 8 9 10 II 12 13
Bed.ul Ad.m PM«5) H(IO+) ACS(5-10) CV(IO+) BS
II 1820 1,712 344 HP W SS- PO« 5) CM(IO+) RS(IO+) (00281400) C(IO+) MCW(IO+)
PH(IO+) CP(IO+) NCS{5-10) SP(IO+)
NW(IO+) PHC« 5) QCS(lO+) ST(IO+)
Basant JagJlwan H(IO+) PO ACS NCS(S- CV(~O+) BS 12 3610 4,273 822 P M C(IO+) HPWSS- CM«5) RS(IO+)
(00281500) MCW(IO+) PH(IO+) 10) SP(lO+)
PHC« 5) CP(IO+) OCS(IO+) ST(IO+) NW(IO+)
Basant Path P(2) M CHWH(IO~)
PO CM ACS NCS(~ CV(;O+) BS 13
(00281600) 3320 3,306 671
qIO+) MCW(IO+) HPWSS- ~) SP( 10+) RS(IO+) PHC(,5)
PH(IO+j CP(IO+) OCS(IO+) ST(IO+) NW(IO+)
Purnahla PM«5)
H DAPHC 14 Chandandlh 1390 2,178 379 PHSCHW HPWSS- PO«5)
CM ACS« 5) CV(IO+) BS(-- 5)
(00281700) C(IO+)
MCW(IO+) PH(IO+) CP(IO+) NCS«5) SP(IO+) RS(IO+)
OCS(lO+) ST(IO+) NW(IO+)
H(5-
15 Son.ul Sultan
2820 1,514 294 PMSPUC 10) PO ACS« 5) CV(IO+) BS{< 5)
(00281800) C(lO+) MCW(IO+) HPWSS-
PH(IO+) CM«5)
NCS« 5) SP(IO+) RS( 10+) PHC(IO+)
CP(IO+) OCS(IO+) ST(lO+) NW(IO+j
Hathsar P(2) M« 5) CHWH«5) ACS NCS« CV(~O+) BS« 5)
16 (00281900)
3570 2.757 536 C(lO+)
MCW(IO+) HPW SS- PO« 5) CM«5) 5) PHC(IO+) PH(IO+) CP(JO+) OCS(IO+) SP(IO+) RS(IO+)
ST(IO+) NW(IO+)
Kolhua Thd,aha P(2)M« 5) CHWH«5)
PO ACS NCS('" CV(;O+) 8S«5) 17 (00282000)
2910 3.692 796 C(lO+)
MCW(IO+) HPW SS- CM«5) 5) SP( 10+) PHC« 5)
PH(5-IO) CP(IO+) OCS(IO+)
RS(5-10) ST(IO+) NW(IO+j
PHSCHW ACS NCS(" CV(~O+) BS
18 Pursaum Gope
2400 2.045 370 PM«5) H« 5)
HPW SS- PO« 5) CM«5) RS(IO+) (00282100) C(lO+) MCW(IO+) 5) SP(IO+)
PHC« 5) PH(5-10) CP(IO+) OCS(IO+) ST(IO+) NW(IO+~
CHW ACS NCS« CV(;O+) 'BS
19 Kashlpur
1800 1.483 255 PM«5) H(5-10)
HPWSS- PO«5) CM«5) RS(IO+) (00282200) C(IO+)
5) MCW(IO+)
PH(5-10) CP(IO+) OCS 10+) SP(IO+) NW(IO+) PHC(5-10) ( ST(IO+)
PHC PHS ACS NCS(-
20 Bama
3470 3.396 826 P(2) M CHW
HPWSS-PO
CM«5) 5) CV(lO+) 8S(5-IO)
(00282300) C(lO+) H(5-10) PH(5-fO) CP(IO+) OCS(IO+)
SP(IO+) RS(IO+) MCW(IO+) ST(IO+) NW(IO+)
P(5-H(5-
8akatpur Chal.l 10) CM ACS(" 5) CV(IO+) 8S(5-10) 21 500 544 100 JO)M(JO+) HPWSS- PO(5-10)
(00282400) MCW(lO+) (5-10) NCS(5-10) SP(IO+) R~(IO+) C(10+)
PHC(5-10) PH(5-10)
CP(lO+) OeS( 10+) STIIO+) NW(IO+)
.
6tr

VILLAGE DIRECTORY
Village Directory Land Use (As on 1999)
Land use (I e area under dIfferent Ivpes 01 land lise In
hella'e)
c E 9
"'" ;; <= e- oJ> ~ .:;.. c 1l -is -i5 :;
0 " u c u E U ~
~ c J2 ~ a. g .,. c: ~ _ V>
-i5 ~ _u u ~ t) ::> u > :0 ~ o(j '" c: g ~ 0
~ :; ~
:a ~ ~ ~
.9 ~ .e- {!""3 >.. ~: ;; " c.. -0 > :; ..0
.r: g c.. &. &.£1 e .!l ..!! a " E u ~ " sJ! "0
~ -e ~ 0 ... :::J
e :;; c.. .!l 0 c
" t ~ _ ::s
~ gj, ".t:: C U OJ c.. :a ~ V> c: _ " ~ E c.. '" 0 u o '" 0 .§ C "'3 ~ '" ~ -< Z. 0... Z. ::a E "- ::l Uoa -< z.
14 15 16 17 18 19 20 21 22 23 2 1
MRFP Sltamarhl (15) TW(563)
757 42 147 Bedaul Adam 11 0(30 8) T(87 I)
PRMR Sltamarhl (16)
TW(865) 1903 302 453 Basont JO!lllwan 12
FP 0(90) T(95 5)
PR·MR TW{750)
FP Sheohar (26) 0(360) 1619 282 308 Bas.nt PattI 13
T(IIIO)
MRFP Sheohar (25) Pottery, Woods TW(440)
46 32 369 Pumahla 14 Item 0(500) T(94 0) Chandandlh
Pottery, Woods TW(500)
MRFP Sheohar (20) 0(825) 626 21 853 Sonaul Sultan 15 Item T( 132.5)
PRMR TW(1850)
FP Sheohar (17) 0(350) 57 I 20 I 602 Hathsar 16
T(220 0)
PRMR TW(1700)
FP Sltam~rhl ( 14) TK(5 0) 0(30 0) 357 75 425 Kolhua Thl~aha 17
T(20S 0)
PRMR TW(1150)
f:p Sltamarhl ( t.S) TK(5 0) 0(25 0) 425 124 404 PursaunI Gope 18
' .. T(1450)
PRMR TW(850)
FP Sltamarhl (15) TK(4 0) 0(20 0) 349 34 324 Kashlpur 19
T( 109 0)
TW(IOO 0)
MRFP Sit.marhl (18) Pottery, Woods TK(53)
516 147 75 I Salrta 20 Item 0(1000)
T(2053)
MR FP Suamarhl (15) TW(lS 2)
308 13 Bakatpur Chakl 21 T(182)
69

DISTRICT CENSUS HANDBOOK SHEOHAR
Census of India 2001 -Amenities and
Amemlles avaIlable (Ifnot avaIlable wlthm the vIllage. a dash (-) IS shown m the column and ne"<t to II In brackets the dIstance m broad ranges VIZ < 5 kms • 5-10 kms and 10+ kms of the
'" nearest place where the facIlity IS avaIlable IS gIven 1:' i;l
~~ '" OJ 1; -0 -0 c: 8 ;:; '" (.) '" .; ... i;l - " '" e ::: u
" ..c: - '" u
" 0 g ~ ;:; t 1:~ :2 .§. 0) 0
~ 3 'iii (.) ~
..c: ,_E 8. ~ ~ 0. :;
" 1;0 - '" ... 0.. U e GI'l~_ .3 _g 0 '0 !l 0 ~~ ~ 6 <:>
.§ ~ ~ e '0 '0 6 CD _
o'(j ;;: ..c: u 9 ;; ';;;'~ :il c c: '" <U ... C OJ -0 u 0 ~
01) -5 2 " ::; ..c: c: ~ ~ ;g ... .9 § C ] ~ 0 '" "0 -.... 'iii ..c: <5 0.
(ij>~ ::: 0 0 ;;; b'b ;;; et::: OJ -;;: :; .... ;;: E ~ E OJ 0.. 0 c:
~ :::>"0 g ~ ~ " .... ~ 0 ~ 0 ;;;
01) 0) .:::: ~ c: 0 0.. 0) ~ c !l " u ::: E E " » 0) .0 U _;;; E '" ~ u :2 § ~ OJ g g u ~ ~ ~ E E " r:: 1;) E-'" t; = 11 ~ ~ ~ ~
::l -0 ~ ~ 0 to 2 ~~ ~u- 0-:::: Z Ul a.. ~C/) u e
I 2 3 4 5 6 7 8 9 10 II 12 13
H(5-BS(5-10)
10) ACS« 5) CV(IO+) 22 Pal.n (00282500) 1000 1.335 275 P MC(IO+)
MCW(IO+) HPW SS- PO« 5) CM«5)
NCS(5-10) SP(IO+) RS(IO+)
PHC« 5) PH(5-10) CP(IO+)
OCS(IO+) ST(IO+) NW (S-ID)
H(5-BS(5-10)
Asopur P M« 5) 10) CM (5 ACS« 5) CV(10+) 23
(00282600) 1360 1.719 348 C(10+) MCW(IO+)
HPWSS- PO(5-10) 10) NCS(5-1O) SP{1O+)
RS(IO+)
PHq5-10) PH(5-10)
CP(IO+) OCS(IO+) ST(10+) NW (5-10)
Kalalya P M("5) H(IO+) HPWSS·
PH CM ACS« 5) CV(IO+) BS« 5) 24
(00282700) 2750 1,573 324 C(10+) MCW(IO+) PO(<- 5) CP(IO+) NCS« 5) SP(IO+) RS(ID+)
PHC( 10+) OCS(IO+) ST(IO+) NW(5.10)
Khalra Pahan P(2) M H(lO+) PH ACS« 5) CV(IO+) BS
25 2340 6,311 1444 HPWSS· CM«5) RS(IO+) (00282800) C(10+) MCW(IO+) PO« 5) NCS{< 5) SP(lO+)
PHC« 5) CP(IO+)
OCS(IO+) ST(IO+) NW«5)
DOSII P M«5) H(IO+) PO ACS« 5) CV(IO+) BS«5)
26 Mahamadpur 4180 3.026 739 C{10+) MCW(IO+) HPWSS-
PH(IO+) CM«5)
NCS« 5) SP(IO+) RS(IO+) (00282900)
PHC(5-10) CP(IO+)
OCS(IO+) ST(IO+) NW«5)
" H(3) D DA
P(37) M(S) PHC(4)
W(26) PO(IJ) Block Total 6410.0 71722 14949 S(3) Pl1C(3) I'HS(6) NH
HI'(26) R PH(4) CM(S) ACS(10) BS(9) NW
RMP CHW(9)
(0

VILLAGE DIRECTORY
Village Directory Land Use (As on 1999)
14
PRMR FP
15
SlIamarht (14)
MR FP Sheohar (20)
MRFP NR
MRFP NR
Stlamarht (25)
Sttamarht (25)
MR FP Sttamarht (32)
PR(9) MR(26) FP(2S) NR(2) NW
16 17
ED
ED NM
18
Pottery, Woods Item
Pottery, Woods Item
Land use (I e. area under dIfferent types of land use In
hectare)
19 20
TW(400) 0(200) T(60 0)
TW(500) 0{39 7) T(89 7)
TW(1950)
R(9 0) 0!20 0) T(2240)
TW(1200) TK(IOO) 0(140) T(1440)
TW(2250) R( IS 0) 0(35 0) T(27S 0)
TW(2262.0S) TK(29.25)
0.0 R(l52.82) 0(1044.17) T(J488.29)
71
21 22 23 2
190 212 Palrt
226 93 14 I Asopur
88 13 405 Karatya
193 09 703 Khatra Pahan
655 4 I 734 Doslt M.hrunadpur
1468.5 207.9 1245.4
22
23
24
25
26


IN D I A B I H A R
PIPRARHI C. D. BLOCK ~~t-~ill-· ~,~~ .s'Y; r ~ ~( •. A iJr:. ·\841 839 l._ U1>A.
r-, -«: 'I 840} '<VA '._) '$' " '1£.
DISTRICT SHEOHAR ~ I ~ • PO 838.' ?/p. Of Sfl~l ;Sengahl Indar~a r.g, <1
(}... CO\ '" <;ll C'
Km 1 o 2 Km
I I I I I -., I S""l /J
f)/::J j I 'J <;ll '6 8, "'" ./ '€. B <'OCl(
~<\ .)il
• ,I ~ / PS -. ,,() 842 "...... .-. . ..... :® @ ~ .' /" / - . ../ • ' -< ,.. . J 831 <y
Amwa Kalan PIPRARHI \ r' - ... 'Mohan pur • \ ?> .,; • 837.,r"....... . "" I
I\~ ..... Basahla Shekh, PO r -- ' r. 833 ~ ",I 'J) " \ r -. \ ...... _...- -', ~ I 834 po.,' A _
. \' 843. r" N •. , .... ~._ ) \ 836 B ..._ ..:, arayanpur 832 ,,,/ n
8 Ii e o
Total Rural Urban
Area (Sq Km) 8268 8268
Popul.lIon 95«1 95441
No of Vlliages 25
No of Towns Nil
Dlslance of Block Head Quarlers
10 Dlslncl U .. d Quarters 71(rn
BOUNDARY DISTRICT
C D BLOCK
. -. , , _ '1asa ura 835 ... -. ~ /' . ...... ~ • - • - '\ X 844 • J
(1
C] ....... - " I, _.'"'._ !5l 845 ,., ~ Cf)
~ 0> ..,
From )
\,/
• 851
846
• 850
PO
PO
•
• 847
Mmapur
..... ...... Balha '.
I 848 , .
';)7
Dhankau~....... ..... \ ';0 . '\"
BI "';:.(. Sheohar : -c.. PO
d
o
,-, 't • ~------:-~----~_.::.~\ To Parsa lin] ....-'
Harpur ....... _.-., _. _. _.., "'T. - ....... 849 ._
\ -._ ........ , • .J lQ .,..;
~ 853 I PO
I • ./ <f><t ~7
"-'..j
i 00285400( • Harkarwa;
(' -'''- ........ J
RIVER AND STREAM
@ PS HEADQUARTERS C D BLOCK POLICE STATION
PO POS'I' OI'FICE
B
HIGH SCHOOL/HIGHER SECONDARY SCHOOL/INTER COLLEGE
BANK
PRIMARY HEALTH CENTRE
POPULATION SIZE CLASS OF VILLAGES
BELOW 200 VILLAGE WITH PERMANENT LOCATION CODE NUMBER • 200-499
IMPORTANT METALLED ROAD
UNMETALLED ROAD
&..d upon Survey 01 India map With the permissIon 01 lbe Surveyor Generi\1 of India
• • •
500-999
1000-4999
5000 AND ABOVE
UNINHABITED VILLAGE
C Government 01 India Copynghl 2004

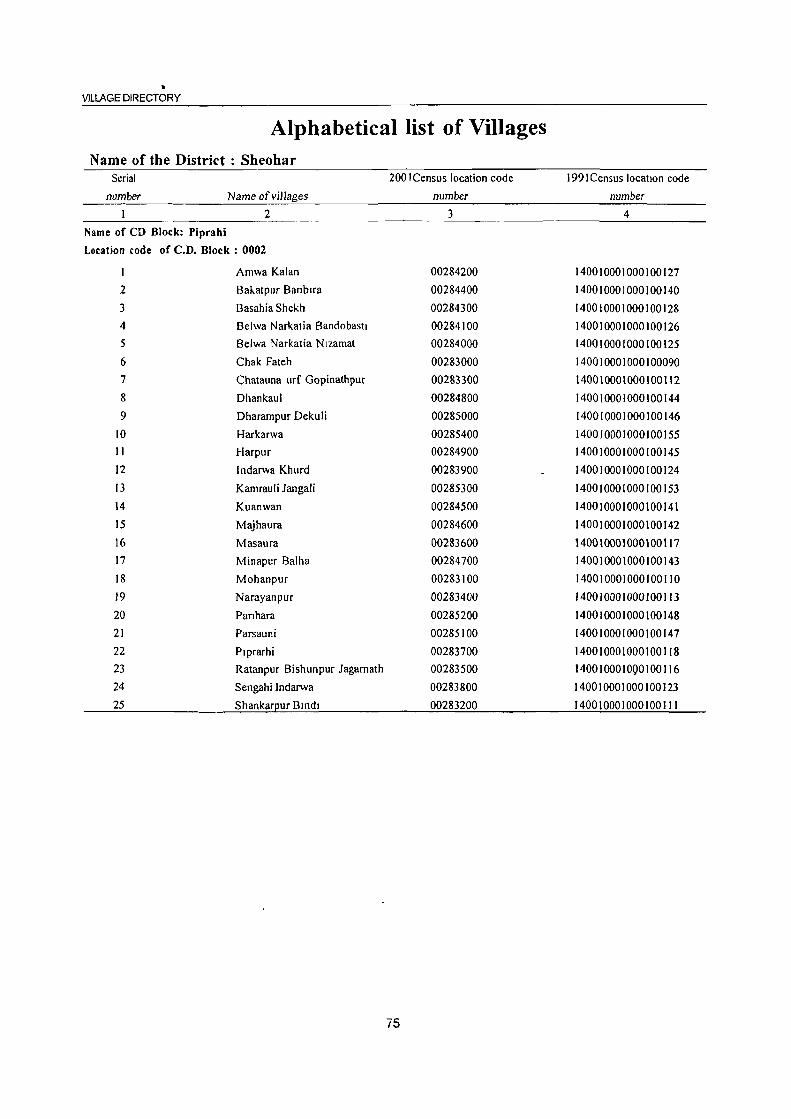
VILLAGE DIRECTORY
Alphabetical list of Villages Name of the District: Sheohar
Serial 200 I Census location code 1991 Census locatIOn code
numbe-r Name- of villages number number
2 3 4 Name of CD Block: Piprahi
Location code of C.O. Block: 0002
1 Amwa Kalan 00284200 140010001000100127 2 BaJ,.atpur Banblra 00284400 140010001000100140 3 Basahia Shekh 00284300 140010001000100128 4 Belwa Narkatia Bandobasll 00284100 140010001000100126 5 Belwa Narkatia Nlzamat 00284000 140010001000100125 6 Chak Fateh 00283000 140010001000100090 7 Chatauna urf Gopinathpur 00283300 140010001000100112 8 Dhankaul 00284800 140010001000100144 9 Dharampur Dekuli 00285000 140010001000100146
10 Harkarwa 00285400 140010001000100155 11 Harpur 00284900 140010001000100145 12 Indarwa Khurd 00283900 140010001000100124 13 Kamrauli Jangali 00285300 140010001000100153 14 Kuanwan 00284500 140010001000100141 15 Majhaura 00284600 140010001000100142 16 Masaura 00283600 140010001000100117 17 Minapur Balha 00284700 140010001000100143 18 Mohanpur 00283100 140010001000100110 19 Narayanpur 00283400 140010001000100113 20 Panhara 00285200 140010001000100148 21 Parsauni 00285100 140010001000100147 22 Plprarhi 00283700 140010001000100118 23 Ratanpur Bishunpur Jagamath 00283500 14001oo010QOI00116 24 Sengahi Indarwa 00283800 140010001000100123 25 Shankarpur Bmdl 00283200 140010001000100111
75
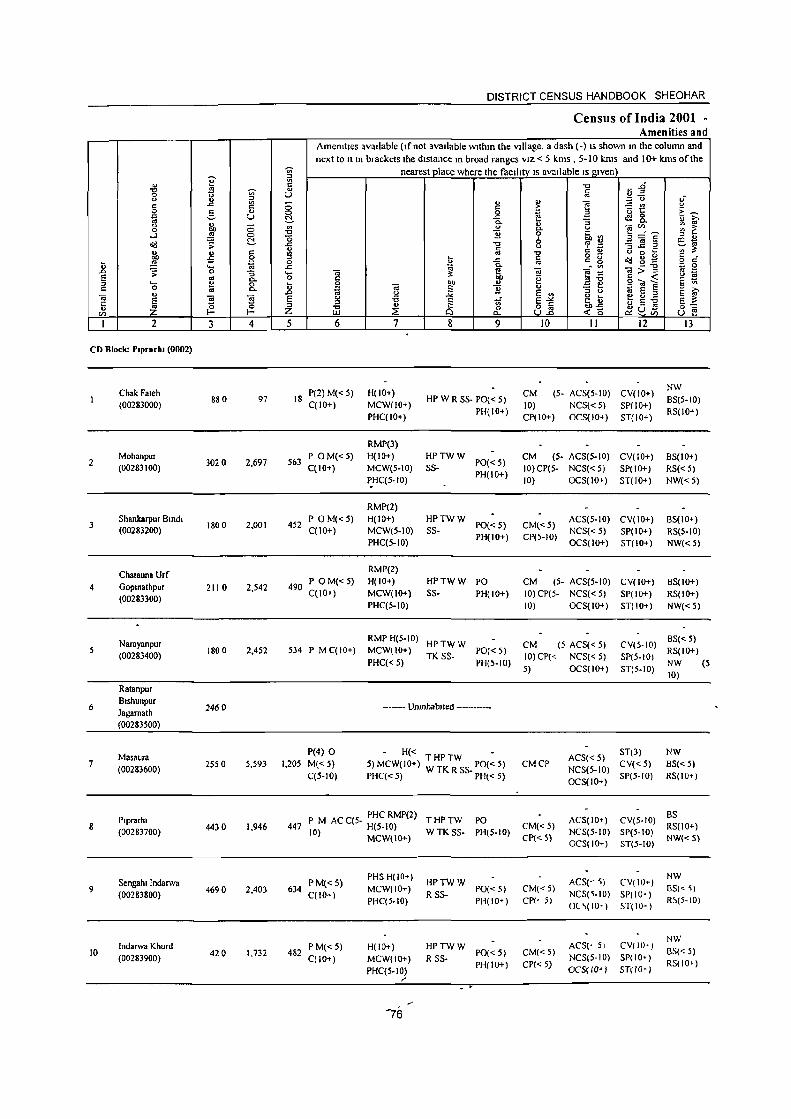
DISTRICT CENSUS HANDBOOK SHEOHAR
Census of India 2001 -Amenities and
Amemtles avaIlable (If not avaIlable wlthm the village, a dash (-) IS shown In the column and
next to It In brackets the dIstance In broad ranges VIZ < 5 kms , 5-10 kms and 10+ kms of the -;;;- nearest place where the facility IS avaIlable IS gIven
~ '" '" ~ -0 ~j ." ~ '" c::
0 <.> U '" v ... '" ~ ;:; <.> ,,-
c; .s:: '" 0 .. e - '" " c: c: u t: ~ -.::> c ... 0 0 ~ a ~ c. U ~ .s:: ~g_ OJ ;;.,
M. ;:; 0- ... ::; E":_ '" '" 0 '" ... 0- " '" 1: ." }i ;: '" ....l ~ 0 "0
0
~~~ " .. c .;, ~~ cc -o<! ;; .s:: -0 ';;'~ .. t: <.> c ... M. u c '" os -0 <.> 0 ~ o - o'll '" 9
c; ~ 0 '" 2 .c c: c g 0 c
~ ~ ~ 0 '" -0 -._ .s= 0- . '" ~>--g ~ 2 .D ;; 0 :; ..... "iii ~ f! "iii e'" ~ E os 0 r:: Ol) ~ §"'~ <.>
..... e 0-0 ~ "
",-0 E " 0 0 ~
"iii }i '" .:= ~ ~ E E " C 0-.,
~ » os .D <.> _;:; E '" '" <.> E '" .. <.> ... CJ u :2 ~ E ~ S E <.> -0 c: t{ E~ iil! ~ c ." E :: :> :>
'" is ~c~ ., ~ "'C 0 fli 0":: ... Z ::E < (5 u f! til Z UJ c..
I 2 3 4 5 6 7 8 9 10 II 12 13
CD Block: Plprarhl (0002)
Chak Faleh P(2) M«5) H(lO+) CM (5- ACS(5-10) CV(IO+) NW
(00283000) 880 97 18
C(lO+) MCW(lO+) HP W R SS- PO« 5)
10) NCS«5) SP(lO+) BS(5-10)
PHC(IO+) PH(IO+)
CP(IO+) OCS(JO+) ST(lO+) RS(IO+)
RMP(3)
2 Mohanpur
3020 2.697 563 P OM«5) H(IO+) HPTWW
PO«5) CM (5- AC5(5-10) CV(IO+) B5(10+)
(00283100) C(IO+) MCW(5-10) SS- 10) CP(5- NC5«5) SP(IO+) RS« 5) ~HC(5-IO)
PH(IO+) 10) OCS(IO+) ST(IO+) NW«5)
RMP(2)
3 Shankarpur Blndl
1800 2.001 452 P OM«5) H(IO+) HPTWW
PO«5) CM«5) ACS(5-10) CV(IO+) BS(IO+)
(00283200) C(10+) MCW[5-10) SS- NCS«5) SP(IO+) RS(S-IO) PHC(5-10)
PH(IO+) CP(5-10) OCS(IO+) ST(IO+) NW«5)
Chatauna Urf RMP(2)
4 Gopmathpur 2110 2.S42 490 P OM« S) H(IO+) HPTWW PO CM (5- ACS(5-10) CV(IO+) BS(IO+)
(00283300) C(IO+) MCW(IO+) S5- PH(IO+) 10) CP(S- NCS«5) SP(IO+) RS(IO+)
PHC(5-IO) 10) OCS(IO+) ST(IO+) NW«5)
Namyanpur RMP H(5-IO)
HPTWW CM (5 ACS« S) CV(S·IO) B5«5)
(00283400) 1800 2.452 534 P MqIO+) MCW(IO+)
TKSS-PO« 5)
10)CP(" NCS« 5) SP(5-10) R5(10+)
PHC« 5) PH(S·IO) 5) OC5(10+) ST(5-10)
NW (S 10)
Ratanpur
6 Blshunpur
2460 --.--- UnmhabJle<! --------Jagamath (00283500)
Masaura P(4) 0 - H« THPTW ACS«5)
ST(3) NW 7
(00283600) 2550 5,593 1.205 M«5) 5) MCW(IO+) WTK R SS- PO« 5) CMC?
NCS(5-10) CV«5) 8S« 5)
C(5-10) PHC« 5) PH« 5) OCS(IO+)
SP(5-10) RS(IO+)
P'prarhl P M AC C(5- PHC RMP(2) THPTW PO ACS(IO~) CV(5·IO) BS
8 (00283700) 4430 1.946 447 H(5-10)
WTKSS- PH(5-10) CM«5)
NCS(5-IO) SP(S-IO) RS(IO+)
10) MCW( 10+) CP« 5) OCS(IO+) ST(5-10)
NW«S}
Sengahl Indanva PM«5) PHS H(IO+)
HPTWW ACS(? ~) CV(IO+) NW
9 (00283800)
4690 2,403 634 C(lO+)
MCW(IO+) R SS-
PO« 5) CM«5) NCS(~-IO) SP(IO+)
BS« ~)
PHC(5-10) PH(IO+) CPl' 5) Ol \(10+) ~T(lO-)
R~(5·IO)
ACS(' 5) CV(lO+) NW
10 Indarwa Khurd
482 PM«5) H(IO+) HPTWW
CM«S) BS(" 5) (00283900) 420 1,732
C[IO+) MCW(IO+) RSS-PO{< 5)
NCS(5-IO) SP(lO+) PH(IO+) CP« 5) R5(10+)
PHC(5-IO) OC$(IO·) SnlO+ )
"
-76
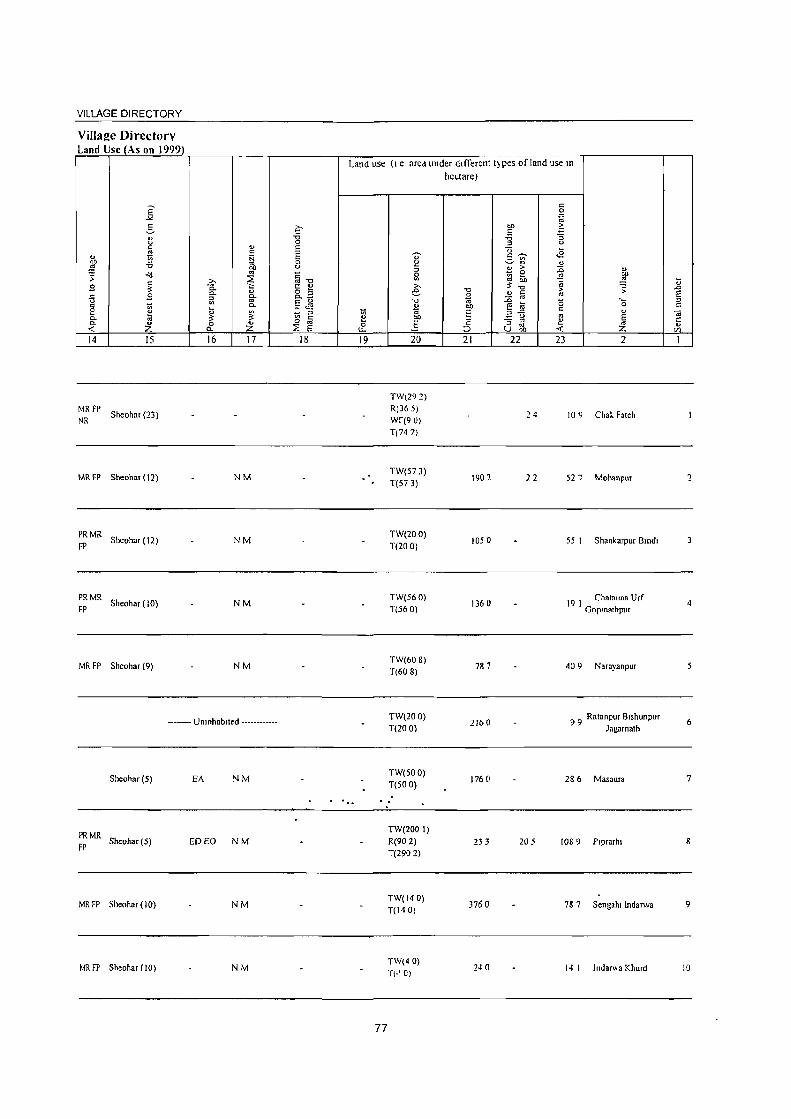
VILLAGE DIRECTORY
VilJa2e Directory Land Use {As on 1999J
14 15
MR FP Sheohar (23)
NR
MRFP Sheohar ( 12)
PRMR FP Sheohar ( 12)
:: MR Sheohar ( 10)
MR FP Sheohar (9)
16 17
NM
NM
NM
NM
------ Unmhablled ------------
Sheohar (5) EA NM
PRMR F?
Sheohar(S) ED EO NM
MR FP Sheohar ( 10) NM
MR FP Sheohar (10) NM
18
Land lise (I e area under different t)pes of land use In
hel.tare)
19
77
20
TW(292) R(365) WF(90) T(747)
TW(573) T(573)
TW(200) T(2DD)
TW(560) T(56 0)
TW(608) T(60 8)
TW(200) T(20 0)
TW(500) T(500)
TW(200 I)
R(90 2) T(290 2)
TW(140) T(140)
TW(40)
T\" 0)
21
1902
1050
1360
787
2160
1760
233
3760
240
22
24
22
205
23
10 q
527
l :;
.... o ... g Z 2
Cha~ Faleh
Mohanpur
55 I Shankarpur Bmd.
19 I Chat.una Urr GoplOathpur
40 q Narayanpur
9 9 Ratanpur Bishunpur Jagamath
286 Masnura
1089 Plprarhl
787 Sengahl lndarwa
14 I Indama Khurd
2
3
4
6
7
S
9
10
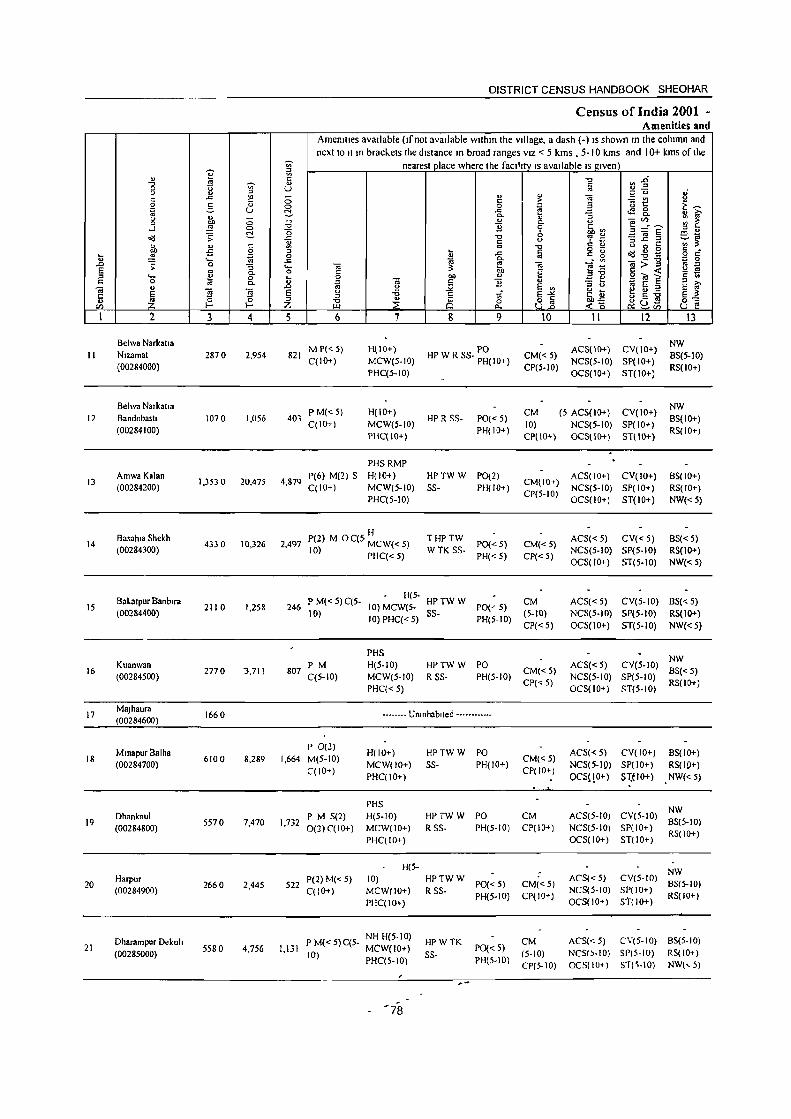
II
... _g § c
-.; r::: t> en
12
13
14
15
16
17
18
19
20
21
OJ "0 o ()
E ~ ..J
o(J
~ :; ... o o E ~ 2
Belwa Narka!la N,zamat (00284000)
Belwa Narka!13 BandobaslI (00284100)
Amwa Kalan (00284200)
Basahla Shekh (00284300)
Balatpur Banblra (00284400)
Kuanwan (00284500)
MaJhaura (00284600)
Mmapur Balha (00284700)
Dhankaul (00284800)
Harpur (00284900)
Dharampur Dekuh (00285000)
3 4
2870 2.954
1070 1,056
1,3530 20,475
4330 10,326
211 0 1,2S8
2770 3,71 I
1660
6100 8,289
5S70 7,470
2660 2,445
5580 4,756
DISTRICT CENSUS HANDBOOK SHEOHAR
Census of India 2001 -Amenities and
Amemlles available (If not available Wlthm the village. a dash (-) IS shown In the column and next to II m brad.ets the distance m broad ranges VIZ < 5 kms • 5-10 kms and 10+ kms of the
nearest place where the faCIlity IS available IS given)
5 6
821 MP«5) C(lO+)
403 ? M« 5) C(IO+)
7
H(IO+) MCW(5-IO) PHC(5-IO)
H(IO+) MCW(5-10) PHC(IO+)
8 9
PO HP W R SS- PH(IO+)
HP R SS- PO« 5) PH(IO+)
10
CM«5) CP(5-IO)
CM 10) CP(IO+)
II 12
ACS(IO+) CV(IO+) NCS(5-10) SP(IO+) OCS(IO+) ST(IO+)
(5 ACS(lo+) CV(IO+) NCS(5-10) SP( 10+) OCS(IO+) ST(IO+)
13
NW BS(5-IO) RS(IO+)
NW BS(IO+) RS(IO+)
PHSRMP
4,879 ?(6) M(2) S H( 10+) C(lO+) MCW(5-10)
PHqS-IO)
HPTW W P0(2) SS- PH(IO+)
CM(IO+) ACS(IO+) CV(JO+) CP(S-IO) NCS(5-10) SP( 10+)
OCS(IO+) ST(IO+)
BS(IO+) RS(IO+) NW«5)
H 2,497 ?(2) M 0 C(> MCW« S)
10) PHC« S)
THPTW WTK SS- PO«5}
PH« 5)
? M( 5) C(S H(S- HP TW W 246 < - 10) MCW(5- PO(; S)
10) 10}PHC«5) S5- PH(5-10}
CM«S) CP«S}
CM (5-IO) CP«5)
807 PM C(5-10}
PHS H(5-1O) MCW(5-10) PHC« 5)
HPTWW PO R 5S- PH(5-10) CM« 5)
CP« 5)
-.------ Unmhablted -----.-----
P 0(2) 1,664 M(5-10)
C(lO+)
1,732 P M S(2) O(l} C(IO+)
522 P(2) M« 5} C( 10+)
H(lO"') MCW(IO+) PHC(IO+)
PHS H(5-10) MCW(IO+) PHC(1O+)
H(S-10) MCW(IO+) PHC(IO+)
P M« 5)C(5- NH H(5·IO) 1,131 MCW(IO+)
10) PHC(5-IO)
HPTWW PO SS- PH(IO+)
CM«5) CP( 10+)
HPTWW PO CM R SS- PH(5-10) CP(IO+)
~~;_WW PO«5} PH(5-10)
HPWTK SS-
PO« 5) PH(5-IOl
CM«5) Cpe 10+)
CM (5·10) CP(5·10)
ACS« S} CV« 5) NCS(5-10) SP(5-10) OCS(IO+) ST(5-10)
BS«5) RS(lo+) NW«5)
ACS«S) CV(5-10) BS«5) NCS(S-IO) SP(S-IO} RS{IO+) OCS(IO+) ST(S-IO) NW« 5)
ACS«5) NC5(S-10) OCS(IO+)
NW CV(S-IO) 8S«5) SP(S-IO) ST(5-10) RS(IO+)
ACS«5) CV(IO+) NCS(5-ID) SP( 10+) OCS(!O+) SlJIO+)
8S(10+) RS(lD+) NW«5)
NW ACS(5-10) CV(5-10) BS(5-10) NCS(5-1O) SP(lO+} OCS( 10+) ST(lO+) RS(10+)
ACS« 5) CV 5 10) NW ( - 8S(5-10)
NCS(5-10) SP(lO+) RS(IO+) OCS(IO+) St(IO+}
ACS« 5) C\'(5-10) 8S(5.IO) NCSf~-IO) SP(5-IO) RS(IO+) OCS(lO+) SI('\-IO) NWl~ 5)

VILLAGE DIRECTORY
Village Directory Land Use (As on 1999)
14 15
~: FP Sheohar (18)
MRFP Sheohar (21)
NR
PRMR Sheohar (I I)
FP
PRMR Sheohar(S)
FP
MR FP Sheohar (8)
MRFP Sheohar (8)
16 17
ED EO NM
NM
----- Unmhablled ------
MRFP Sheohar (II)
PRMR FP Sllamarhl (18) EDEAG N M
MRFP Sllamarh,(18) EDEAG -
;: MR Sheohar (S) EA NM
18
Land use (I e area under dl fferent types of land use In
hectare)
19
79
20
TW(ISO) T(180)
TW(150) T(150)
TW(1623) TK(344) R(1506) T(3473)
TW(920) T(n 0)
TW(ISO) T(180)
TW(220) T(22 0)
TW(120) T(llO)
TW(850) T(SS 0)
TW(420) T(420)
TW(320) T(32 0)
TW(160) T(160)
21
1820
720
5840
2800
1300
1780
1420
4150
3600
1600
440 a
22
77
23
1 :> ... o ., E ~ 2
870 Belwa Narkal,. N,zamal
196 Belwa Nar~alla Bandobasll
414-3 AmwaKalan -
609 Basahla Shekh
62 6 B.katpur Banblra
767 Kuanwan
124 MaJhaura
1100 Mmapur Balha
154 5 Dhankaul
742 Harpur
102 3 Dharampur Deluh
II
12
13
14
15
16
17
18
19
20
21

22
23
24
25
Parsaum (00285100)
Parlhara (00285200)
Kamrauh Jangalt (00285300)
Harkarwa (00285400)
Block Total
4050 4,872
1120 187
332 0 4,617
1780 1,562
8268,0 95441
DISTRICT CENSUS HANDBOOK SHEOHAR
Census of India 2001 -Amenities and
Amemtles available (If not available withIn the vIllage, a dash (-j IS shown In the column and next to It In brackets the distance In broad ranges viZ < 5 kms , 5-10 kms and 1 (}+ kms ofthe
nearest place where the faCIlity IS available IS given
pM« 5}C« 1,139 5)
NH(2} H« 5} MCW(IO+} PHq<5)
9
TW W SS- PO« 5} PH«5}
H« 39 pM«5)C« 5)MCW(10+) WSS-
5) PHq< 5} PO« 5) PH« 5)
He RMP(2)
1,058 P M 0(4) C(5 CHW(2) H« TW W TK PO 10) 5)MCW(10+) SS- PH{<S)
PHqIO+)
P OM«S) 349 C« 5)
p(33) M(9)
22112 S(3) AC 0(14)
- H('-5) MCW( 10+) HP TW W PO« S)
PHqlo+) SS- PH(S-IO)
H HC PHC PHS(4) NH(3) RMP(13) CHW(2)
T(3) W(22) TK(6) HP(20) PO(9) TW(IS) R(9)
tQ
CM«5) CP«5)
CM«5) CP« 5)
CM«S) CP{<5)
eM (5-10) CP(5-1D}
It tl
ACS« 5) CV« 5}
NCS(5-10) SP« 5) OCS( 10+) ST« 5)
ACS« 5) CV« 5) NeS(5-IO) SP« 5) OCS(IO+) ST« 5)
ACS NCS{S- CV(~ S)
10) SP(S-IO) OCS( 10+) ST(S-IO)
ACS«5) CV(5-IO) NCS(S-IO) SP« 5) OCS(I 0+) ST( < 5)
CM(2) CP ACS ST(3)
BS« 5) RS(IO+) NW (5-10)
BS« 5) RS(IO+) NW (5-10)
BS« 5}
RS(IO+) NW (S-ID)
BS(5-IO) RS(IO+) NW (5 10)
BS NW(9)
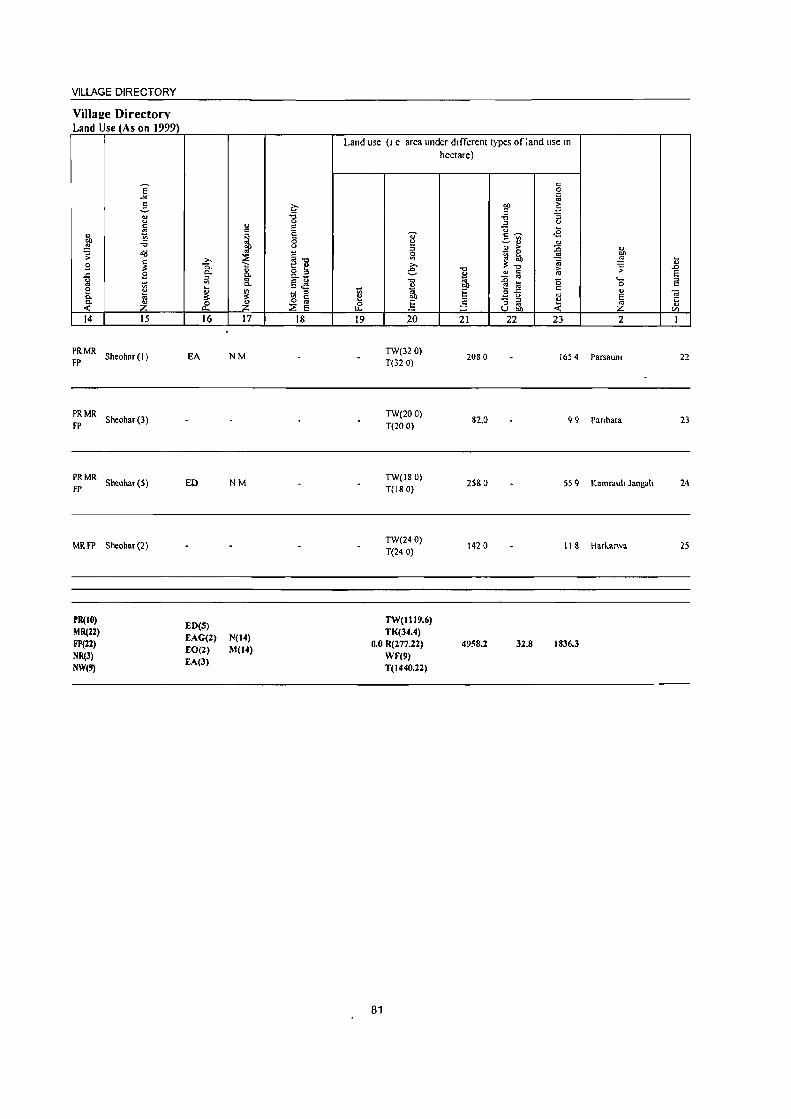
VILLAGE DIRECTORY
VilIa2e Directory Land Use (As on ]999)
14 15
PRMR FP Sheohar (1 )
:: MR Sheohar (3)
:: MR Sheohar (5)
MR FP Sheohar (2)
PR(IO) MR(22) FP(22) NR(3) NW(9)
16
EA
EO
ED(5) EAG(2) EO(2) EA(3)
17
NM
NM
N(14) M(14)
18
Land use (I e area under different types of land lise In
hectare)
19 20
TW(320) T(n 0)
TW(200) T(20 0)
TW(180) T(180)
TW(240) T(24 0)
TW(1l19.6) TK(34.4)
0.0 R(277.22) WF(9) T(1440.22)
81
21
2080
82.0
2580
1420
4958.2
22 23 2
165 4 Parsaum
99 Panhara
55 9 Kamrauh Jangah
11 g Hallarwn
32.8 1836.3
22
23
24
25


Tolal Rural Urban
Area (Sq Km) 92.82 33.49 9.33
Populallon 12Zl40 101078 21262
No 01 Villages - 45
No 01 ToW!" - 01
IlisUinc> 01 Block Head Quarters
to Ilistncl Head Quarters - 0 Km
BOUNDARY DISTRICT
C D BLOCK
873 VILLAGE WITH PERMANENT LOCATION CODE NUMBER
IMPORTANT METALLED ROAD
UNMETALLED ROAD
URBAN AREA WITH CODE NUMBER
&si!I "(XI" Survey of India map With the permission of lbe Surveyor General of India
~
/ /
IN D I A 8 I H A R
SHEOHAR C. D. BLOCK
~
©PS I'll
B
• • • • X
DISTRICT SHEOHAR Km o 2 Km
RIVER AND STREAM
HEADQUARTERS, C D BLOCK POLICE STATION
POST OFFICE
BANK
POPULATION SIZE CLASS OF VILLAGES
BELOW 200
200-499
500-999
1000-4999
5OIJO AND ABOVE
UNINHABITED VILLAGE
r GOV1fnmenl 01 India lopynglil 2004


VILLAGE DIRECTORY
Alphabetical list of Villages Name of the District: Sheohar
Serial number Name of villages
2
200lCensus location code
number 3
Name of CD Block: Sheobar Location code of C.D. Block: 0003
Az Rakba Kursahar 00285600 2 Azrakbe Pota 00287400 3 BasahiaRam 002&7600 4 Bhagwanpur Bheli 00288000 5 Bhagwanpur Bheli Nankar 00286100 6 Bhaluahi 00289700 7 Bhaluahi urf Pharuaha 00289500 & Bisahi 002&5900 9 Bishunpur Kishundeo 00287900
10 Bishunpur Maniari 00289300 II Chak Bishunpur 00286900 12 Chamanpur 00286800 13 ChhapraGobindpururfGopinathpur 00289400 14 Chiknauta 00287200 15 Daud Chhapra 00288800 16 Dharampur Rajwan Bandobasti 00286400 17 Dharampur Rajwan Mal 00286500 1& Fatehpur 002&7700 19 Garahia 00285800 20 Garhwa 00286300 21 Gopaia 00289600 22 Hanumannagar 00288900 23 Harnahi 00287300 24 Jafarpur 00288700 25 Kanuani Kalyanpur 00289200 26 Khairwa Darap 00287800 27 Kothia Dharampur Dharamaghat 00286600 28 Kursahar 00285500 29 Madhopur Anan! 00288100 30 Mahuaria 00287000 31 Mali Pokhar Bhinda 00286000 32 Mathurapur Kahtarwa 00289000 33 Mirzapur Dhobahi 00289\00 34 Mohari 00285700 35 Pardesia urf Madhubani 00288400 36 Parrahi 00289900 37 Parsauni Taiyab 00286200 38 Pota 00287500. 39 Rampur Jadu 00289800 40 Shahi)U~ 00288600 41 Sisaula 00286700
·42 Sugia Karesri 00288300
43 Sugia Katesri Jagir 00288200 44 Sundarpur Kharauna 00287100 45 Tajpur 00288500
85
1991 Census location code
number 4
140020002000200002 140020002000200159 140020002000200161 140020002000200166 140020002000200132 140020002000200200 140020002000200198 140020002000200130 140020002000200165 140020002000200184 140020002000200150 140020002000200139 1400200020002001&5 140020002000200157 14002000200020017& 140020002000200135 140020002000200136 140020002000200162 140020002000200129 140020002000200134 140020002000200199 140020002000200179 140020002000200158 140020002000200177 140020002gp0200183 140020002000200164 140020002000200137 140020002000200001 140020002000200167 140020002000200154 140020002000200131 140020002000200181 \40020002000200\&2 140020002000200018 140020002000200170 140020002000200202 140020002000200133 140020002000200160 140020002000200201 1 4002000200020CH 76 140020002000200138 I 40020002000200 [69 140020002000200168 140020b02000200156 140020002000200171
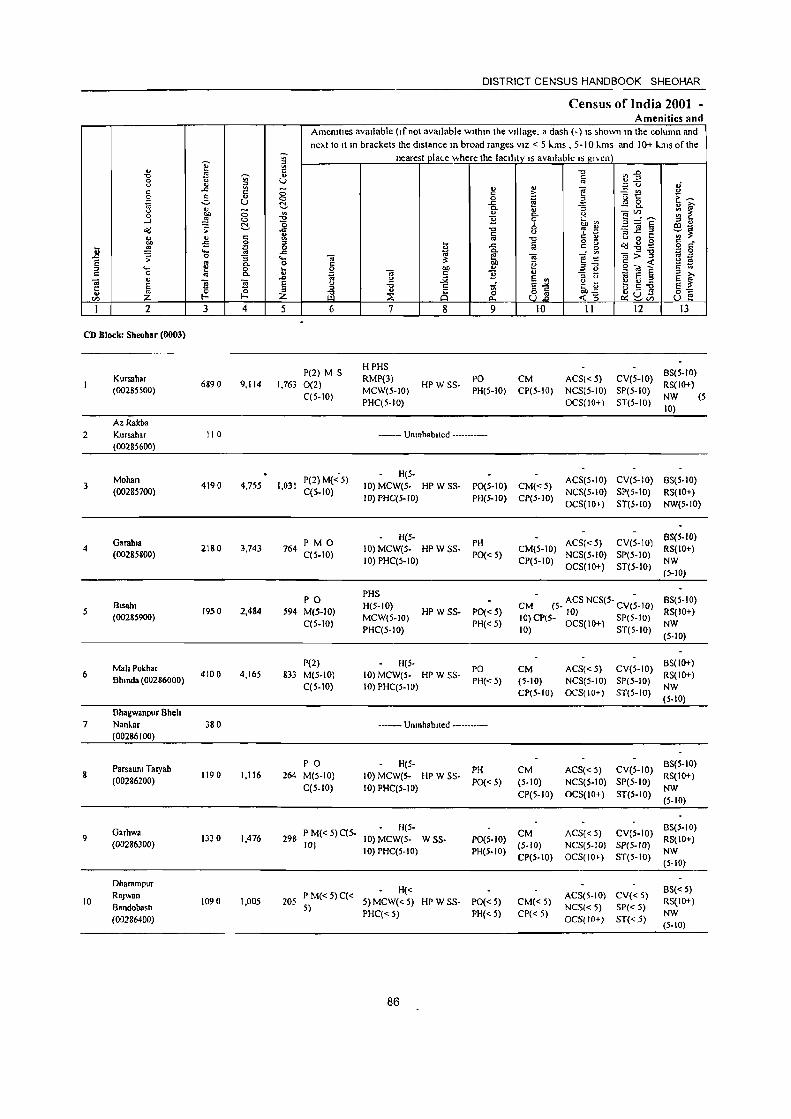
DISTRICT CENSUS HANDBOOK SHEOHAR
Census of India 2001 -Amenities and
Amemlles aVailable (Ifnot available wlthm the Village. a dash (-) 15 shown 10 the column and
next to It In brackets the distance In broad ranges VIZ < 5 )..ms • 5-10 )..ms and 10+ )..ms of the
:; nearest plaLe where the laclhtY_ls available Isglven) ~ V>
'" t:: -0 rlE -0 '" Vi' " '" 0 U V OJ U ., ::> ;:: u oj c .r:: V> - ., .,
f! - '" 0 c <:> c: ::: 0 t: " <:> 0 1§ 2 ~ 5 E~ ~ .::;. V ~ .<: .. >-
" 0- ., :; - 0.. V> ~ U ;; V> " ~~E 0 on C- u
....J ,g <:> -0 ]l 0 ~tn !9 " ~ "0 6 ill -o<! ;; .<: "0 u <'! M .!§jga -;~ c " " c :II .. -0 c: ... u 0 ~ on -5 0 ::> ~ c o - ~ II.) B
c: _
.8 ~ ~ 0
~ .<: .. c: g -0 - o c: .... .c 0.. _ V> m;>-g ;:: 0
;; 0 :; ... .. e .. e - ~ ~ E ~ 0- 0 c: on e § <a ~ ::> '- 0 ~ 0 00 ... ,,-0 '" '" c: 0 '" 0.. .. ~ ] c: B " ..:::! ~ ~ E E ::> >-
.&> .;;; E v> ::I U
E ~ "§ " "5 "5 E U -6 ~ 0 I1J OJ :: E ::> c ~ E~ .... c: "0 g-:: ~ '" ~ ~ " -0 ..
25 8~ 00 .c ~u~ til Z Z ~ ~ 0- « 15 u e
I 2 3 4 5 6 7 8 9 10 II 12 13
CD Block: Sheohar (0003)
P(2) M S HPHS
BS(S-IO) Kursahar
6890 9.114 1.763 0(2) RMP(3)
HP WSS-PO CM ACS«5) CV(S-IO)
RS(rO+) (00285500)
C(S-IO) MCW(S-IO) PH(S-IO) ep(5-IO) NCS(5-10) SP(5-10)
NW (5 PHC(5-10) OCS(IO+) ST(5-rO)
10)
Az Rakba 2 Kursahar 110 ------- UnmhabJled ------------
(00285600)
Mohan P(2) M« S) H(5-
ACS(S-IO) CV(S-IO) BS(S-IO) 3
(00285700) 4190 4.755 1,031
C(S-IO) 10) MCW(5- HPWSS- PO(S-IO) CM«S)
NCS(S-IO) SP(5-10) RS(IO+) 10) PHC(S-IO) PH(S-IO) CP(S-IO)
OCs(ro+) ST(5-10) NW(S-IO)
Garahla PM 0 H(5-
PH ACS«S) CV(S-IO) 8S(5-10)
4 (OO285800)
2180 3.743 764 C(5-10)
10) MCW(5- HPWSS-PO{< S)
CM(5-10) NCS(S-IO) SI>(S-IO)
RS(IO+) 10) PHC(S-IO) CP(5-1O)
OCS{IO+) ST(S-IO) NW (S-IO)
PO PHS
CM (5- ACS NCS(S· CV(;-IOl BS(5-10) Blsahl H(5-10)
S 1950 2,484 594 M(S-IO) HPWSS- PO{< 5) 10) RS(IO+) (00285900)
C(5-10) MCW(S-IO)
PH«5) 10)CP(5- OCS(IO+) SP(5-10) NW PHC(5-10) 10) ST(5-1O)
(5·10)
Mah Pokhar P(2) H(S-
PO CM ACS«S) CV(S-IO) BS(IO+)
6 4100 4,165 833 M(5-10) 10) MCW(5- HP W SS- RS(IO+) Bhmda (00286000)
C(5-10) 10) PHC(S-IO) PH«S) (5-10) NCS(S-IO) SpeS-to)
NW CP(S-IO) OCS(IO+) ST(S-IO)
(5-10)
Bhagwanpur Bheh 7 Nanlar 380 ----- Uninhabited ----------
(00286100)
Parsaum Talyab PO H(S-
PH CM ACS« 5) CV(S-IO) BS(S-IO)
8 1190 1,116 264 M(5-10) 10) MCW(5- HPWSS- RS(IO+) (00286200)
C(5-10) 10) PHC(S-IO) PO{< 5) (5-10) NCS(5-IO) SP(S-IO)
NW CP(5-10) OCS(IO+) ST(S-IO)
(5-10)
Garhwa P M« 5) C(5-H(S-
eM ACS«5) eV(5-IO) BS(5-10)
9 1330 1,476 298 10) MCW(5- WSS- PO{S-IO) RS(IO+) (00286300) 10)
10) PHC(5-IO) PH(5-10) (S-IO) NCS(S-IO) SP(S-IO)
NW ep(S-IO) OCS(IO+) ST(S-IO)
(S·IO)
Dharampur H« BS« 5)
RaJ "an P M{< 5) C« ACS(5-IO) CV«5) 10
BandobaslJ 1090 1,005 205
5) 5) MCW«5) HPWSS- PO«5) CM«S)
NCS« 5) SP« 5) RS(IO+)
(00286400) PHC« 5) PH«5) CP«5)
OCS(fO+) ST«5} NW (5-10)
86
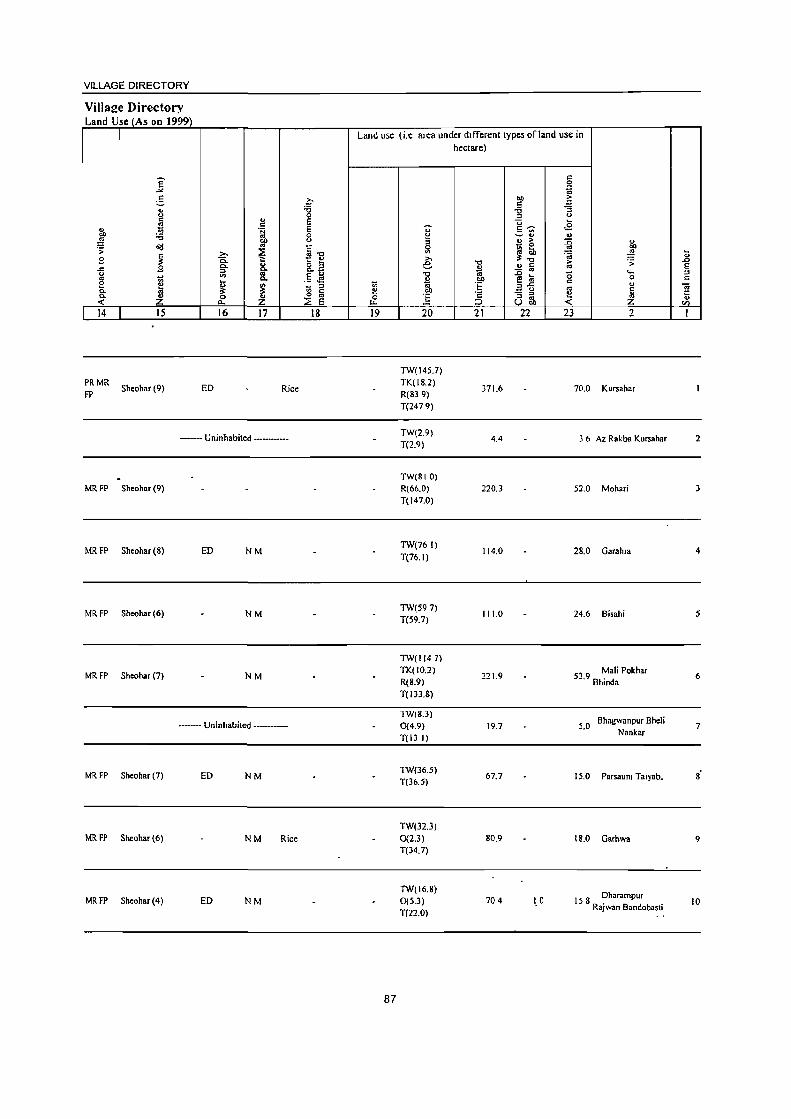
VILLAGE DIRECTORY
Village Directory Land Use (As on 1999)
14 IS
PRMR Sheohar(9)
FP
16
ED
... c .~
~
I ~ :z 17
Rice
---- Uninhabited ------
MR FP Sheohar(9)
MRFP Sheohar (8) ED NM
MRFP Sheohar(6) NM
MRFP Sheohar(7) NM
------ Uninhabiled ------
MRFP Sheohar(7) ED NM
MRFP Sheohar (6) NM Rice
MRFP Sheohar (4) ED NM
18
Land use (i.e area under different types of land use in hectare)
19 20 21 22 23 2
TW(145.7) TK(18.2)
371.6 70.0 Kursahar R(839) T(2479}
TW(2.9) 4.4 J 6 Az Rakba Kursahar
T(2.9)
TW(810) R(66.0) 220.3 52.0 Mohari T(147.0}
TW(76 I) 114.0 28.0 Garahla
T(76.1)
TW(S97) 111.0 24.6 Bisahi
T(59.7)
TW(l147) TK(10.2)
221.9 53 9 Mali Pokhar R(8.9) . Bhinda
T( 133.8)
TW(8.3) Bhagwanpur Bhdi
0(4.9) 19.7 S.O T(13 I)
Nankar
TW(36.5) 67.7 15.0 Parsaum Talyab_
T(36.5)
TW(32.3) 0(2.3) 80.9 18.0 Garhwa T(34.7)
TW(16.8) 15 8 Dharampur 0(5.3) 704 1.0
T(22.0) Rajwan Bandobasti
87
2
J
4
5
6
7
8'
9
10
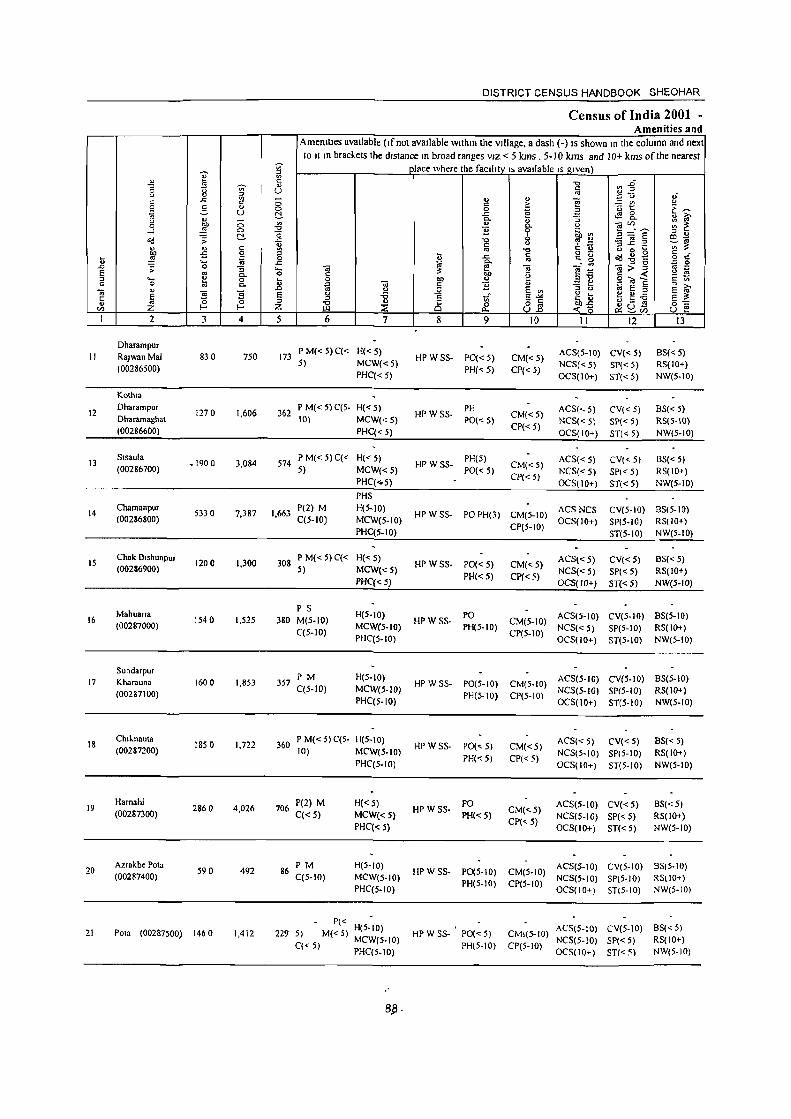
;;;-., ;:J
'" " l§ c: -0
'" " 0 " u U " ~ -C
J:; C 0 0 !': " 0
iii u t!. " " - V> 0 "" 0 -0 ...J ~ 0 -0 C!. "d ;; ..::
~ " ... c: 00 -5 0
~ _g iii 0 u '- J:; .J:> ;; 0 "5 "-E to Co 0
" '- ~ 0 t " 0 '" c. ..0
~ " '5 '5 E ~ ~ ~ ::l
" Z CIl Z I 2 3 4 5
Dharampur II Raj wan Mal 830 750 173
(00286500)
Kothm
12 Dharampur
1270 1.606 362 Dharamaghat (00286600)
13 Slsaula
_1900 3,084 574 (00286700)
14 Cbamanpur
5330 7.387 1.663 (00286800)
15 Chak Blshunpur
1200 1.300 308 (00286900)
Mabuan. 16 1540 1,52S 380
(00287000)
Sundarpur 17 Kharauna 1600 1.853 357
(00287100)
18 Chllnauta
1850 1.722 360 (00287200)
19 Hamahi
2860 4.026 706 (00287300)
20 Azrakbe Pota
590 492 86 (00287400)
21 Pota (00287500) 1460 1,412 229
DISTRICT CENSUS HANDBOOK SHEOHAR
Census of India 2001 -Amenities and
Amenities available (Ifnat available within the village. a dash (-) IS shown In the column and next
to II In brad.ets the distance In broad ranges VIZ. < 5 kms. 5-10 kms and 10+ kms of the nearest place where the faCIlity I~ avaIlable IS gIven)
-0 ~1 " C3 ,; " " e .§ u c: > V> U
0 ~ 3 u 1: ~~ -§_ ~ 0 :; 0-
:;: ~ '" " u "'§ C/) .. _ "§
Q. i: 0
::l = E " " b 00'" C!l --0 '" '" ~~ ::l ~ to C " c is V> 3: '" -0 o - (.) 0 C
" ~
J:: C <: g ~".8 0 C to -0 -Q. _- "' "'iO;>-g ~ 2 <Ii e! <Ii !'! -= u 1;i
" 00 2 ",-0 g..,~ 2 to 0 00 " -3 ~ ~ "3 c "§ " ~ ~ ~ ::I >. _Q E E '" g -ij '" ~ ti E 3: = '" E"'" ~GS -0
.., cs 8] Qj)J:; 0'::
::E 0 UJ Q.. <>: (5 O::~CIl u e! 6 7 8 9 10 II 12 13
P M« 5)C« H«S) ACS(S-IO) CV«S) BS« 5) HPWSS- PO«5) CM«5) 5) MCW«5) NCS«5) SP«5) RS(IO+)
PHC« 5) PH«5) CPt< 5)
OCS(IO+) ST« 5) NW(5-IO)
P M« 5) C(5- H« 5) HP WSS-
PH CM«5)
ACS(<..5) CV«5) B5« 5) 10) MCW«5} PO«5} NCS«5) SP« 5) RS(5-IO)
PHC« 5) CP«5)
OCS( 10+) ST« 5) NW(5-IO)
P M« 5) C« H« 5) HPWS5-
PH(5) CM«5)
ACS«5} CV«5) BS« 5) 5) MCW«5) PO« 5) NCS«5) SP« 5) RS(IO+}
PHC(<.S) CP«5) OCS(IO+) ST«5) NW(5-10)
PHS P(2) M H(5-10)
HPWSS- POPH(3) CM(5-IO) ACSNCS CV(5-IO) BS(5-IO)
C(5-10) MCW(S-IO) OCS(IO+) SP(5-10) RS(IO+) PHC(5-10)
CP(S-IO) ST(5-10) NW(5-10)
P M«5)C« H« 5) HPWSS- PO« 5) CM«S)
ACS« 5) CV«5) BS« 5) 5) MCW«5)
PH«5) CPC< 5) NCS«5) SP« 5) RS(IO+)
PHC«5) OCS(IO+) ST«5) NW(5-1O)
P S H(S-IO) PO ACS(5-10) BS(5-10) M(S-IO) HPWSS- CM(S-IO)
CV(5-10)
C(5-10) MCW(5-10) PH(5-IO}
CP(5-10) NCS«S) SP(S-IO) RS(IO+)
PHC(5-IO} OCS(IO+) ST(S-IO) NW(5-10)
PM H(S-IO) ACS(5-10) CY(S-IO) BS(5-IO) HPWSS- PO(S-IO) CM(5·10) C(S-IO) MeW(S-IO)
PH(S·IO) CP(5-10) NCS(S-IO) SP(S-IO) RS(IO+)
PHC(5-10) OCS(IO+) ST(5-10) NW(5-10)
P M« 5) C(5- H(S-IO) HP WSS- PO(" 5) CM«S}
ACS« 5) CV« 5) BS« 5) 10) MCW(5-IO)
PH« 5) CP« 5) NCS(5-IO} SP(5-10) RS(IO+)
PHC(S-IO) OCS(IO+) ST(5-IO} NW(5-tO)
P(2) M H«5) HP W 55-
PO CM«S)
ACS(S-IO) CY«5) BS«5) C« 5) MCW«S) PH«5) NCS(5-10) SP« 5) RS(IO+)
PHC« 5) CP«5)
OCS(IO+) ST«S) NW(5-10)
PM H(5-IO) HPW SS- P0(5-10) CM(S-IO}
ACS(5-10) CV(5-10) BS(5-tO) C(S-IO) MCW(S-IO)
PH(5-10) CP(S-IO) NCS(S-IO) SP(S-IO) RS(IO+)
PHC(S-IO) OCS(IO+) ST(5-IO} NW(5-IO)
P« H(5-IO) ACS(5-10) CV(5-10) 3S« 5)
5) M«S) MCW(5-10)
HPW 5S- PO«5) CMs(S-IO) NCS(5-10) SP« S) RS(IO+)
C« 5) PHC(5-10)
PH(S-IO) CP(S-IO) OCS(IO+) ST« 5) NW(5-10)
Btl -

VILLAGE DIRECTORY
Villaae Directory Land Use (As on 1999)
Land lise (I e area under different types of land lise In
hectare)
e c: 2
-" ~ s a 00 c:
" ~ ~ :;
" ... 0 ;;J u c E "
... ~
c: ~ <2 ... ~
E .. 5~
~ ~ 0 ~ ~ .. .. c.> ::> u > :0 lib ~ c - 0 ;;; ::E
0 '" ~ .!l!
~ >- "'-0 '" '" 01) ;;; ~ ~
!a c.. "'i:: t:: u >, " -0
..a u o ~ :e -0 .. c: > ;;: E .<: S 0- 0. o.Z ~ - '" '" u ;;J
'" c: c.> -0 ~ :0 0 ..... " '" '" '" 0- =~ " OIl 0 c: E ~ '" 1;; 'iii E 3£ c: OJ
~ - ::> OJ (0 "- " '" c: e OJ> ;: 8~ 1! E c: "'- " 0 .. o '" 0 E '" u -<: z n. Z 2 E LL. ;:) <t: Z V)
14 15 16 17 18 19 20 21 22 23 2 1
TW(2S 3) 8 2 Dharampur
MRFP Sheohar(4) NM 0(32) 466 II T(286)
RaJ wan Mal
PRMR TW(329) Kothla
Sheohar(5) ED Rice 769 17 0 Dharampur 12 FP T(329)
Dharamaghat
PRMR TW(405)
Sheohar(3) EDEO NM TK(94) 116 l 24 I SlSaula 13 FP
T(498)
PRMR TW(1789)
FP Sheohar(8) ED NM Rice 0(49) 2757 739 Chamanpur 14
T(1838)
PRMR TW(lS ~)
FP Sheohar(3) NM R(6 I) 61 J 168 Chak Bishunpur 15
T(416)
TW(450} MRFP Sheohar(7) NM TWE(61) 767 100 167 Mahuana 16
T(51 I)
PRMR TW(46I)
40 0 Sundarpur FP
Sheohar(S) TWE(IOO) 642 17 T(56 I)
Kharauna
PRMR TW(609}
FP Sheohar (5) ED TK(40) 973 23 I Ch,knauta 18
T(649)
TW(826) MRFP Sheohar (4) R(204) 1544 290 Hamahl 19
T( 1030)
PRMR TW(l50)
FP Sheohar(8) ED TK(52) 302 90 Azral,.be Pota 10
T(202)
PRMR Sheohar(3) ED NM
FP TW(SI5)
773 T(~l 5)
170 Pota 21
89
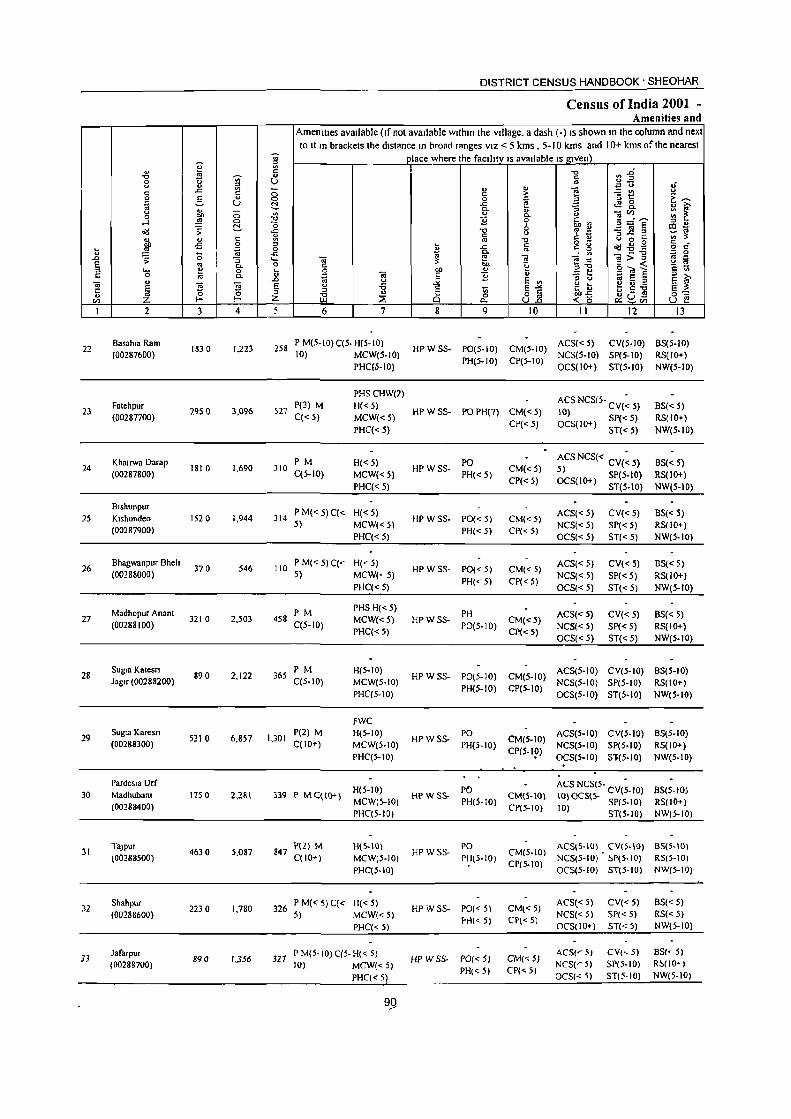
~ .. "0 .. ;;;-0 OJ u .. " .c: '" c: C ~ .s u
'" U -<.> ~ 0 0
~ C> ...J !::!. o<! ;:
" ., c
Ob -5 0 ~ ~ ~ u '0 .r> ;: :; E .. 0. :::l ..... !:? 0 c 0 .. Co .. " l'i l'i t: E u .. 0 0
In ;Z l- I-
I 2 3 4
22 Basahla Ram
1830 1,223 (00287600)
23 Fatehpur
2950 3,096 (00287700)
24 Khalrwa Darap
1810 1,690 (00287800)
B,shunpur
25 Klshundeo 1520 1.944 (00287900)
26 Bhagwanpur 8heil
370 546 (00288000)
Madhopur Ananl 27 3210 2,503
(00288100)
28 Sugln Kalesn
890 2,122 Jag" (00288200)
29 SugJa Karesn
5310 6,857 (00288300)
Pardesla urr 30 Madhubam 1750 2,281
(00288400)
31 T3Jpur
4630 5.087 (00288500)
31 Shahpur
2230 1,780 (00288600)
33 Jafarpur
890 1,356 (00288700)
;;;-" '" " u U -0 <:> ~
'" "0 "0 .c: .. '" " 0 .c: ._ <>
.8 E " ;Z
5
258
527
310
314
110
458
365
1,301
DISTRICT CENSUS HANDBOOK' SHEOHAR
Census of India 2001 -Amenities and
AmenIlleS available (If not avaIlable wlthm the vIllage. a dash (-) IS shown In the column and next
to It In brackets the dIstance In broad ranges VIZ < 5 kms, 5-10 kms and 10+ kms of the nearest
f lace where the faclhty IS avaIlable IS gIven)
~~ '" " .. ;: u .; ., u .. ~f! u c: ,.
3 E~ 0 ~ .c: t:!8. ~ ~ c.. .. :; ., ~~E c.. ~ !l 0
~!! :::l u
6 co--0 <.> -3~2 ';;;'~ c: '= U .. "0 g U u 0 ~ c:
~ .c: C o<l~g 2 C .. .. 0
W c..
'" --;;:>11 '" 0 .. ~ .. .. ~
~ ~'-6 '5.,~ u
C C ;;; 0 Ob ... ::! ~
~ "iii !: ~ u ~ E E '" u E " u E ~ u -6 "'" '" ~ 0 U e,) 2
" !: Vi E ... 2G~ E ~
ill " a 0 o c Ob.c: 0-= ~ C- ull -< "0 c.: In u e
6 7 8 9 10 II 12 13
P M(5-10) C(5· H(5-10) HPWSS- PO(5-10) CM(5-10)
ACS« 5) CV(5-10) BS(5-10) 10) MCW(5·10) NCS(5-10) SP(5-10) RS(IO+)
PHCf,S-IO) PH(5-10) CP(S-IO)
OCS(IO+) ST(5-10) NW(5-10)
PHS CHW(2) ACS NCS(5- CV ~ 5) P(3) M H«5)
HPWSS- POPH(7) CM« 5) 10) ( BS« 5) C« 5) MCW« 5)
CP«5) OCS(IO+) SP« 5) RS(IO+)
PHC« 5) ST« 5) NW(S-IO)
PM H«5) HPWSS-
PO CM« 5)
ACS NCS« CV(~ 5) BS« 5) C(5-10)
5) MCW«5) PH« 5)
CP« 5) OCS(IO+) SP(5-10) RS(IO+)
PHC« 5) ST(5.10) NW(5-IO)
PM« 5)C« H«S) ACS« 5) CV« 5) BS« 5) HP WSS- PO« 5) CM{<5)
5) MCW«5) PH« 5) CP« 5)
NCS«5) SP« 5) RS(IO+)
PHC« 5) OCS« 5) ST« 5) NW(5-IO)
PM«5)C« H(~ 5) HP WSS- 1'0« 5) CM«5)
ACS« 5) CV«5) BS« 5) 5) MCW(· 5)
PH(<" 5) CP«5) NCS«5) SP« 5) RS(IO+)
PHC« 5) OCS« 5) ST«5) NW(5-IO)
PM PHS H«S)
PH ACS«5) CV« 5) BS« 5) MCW«5) HP WSS- CM«S)
C(5-10) PHC« 5)
PO(5-10) CP« 5)
NCS« 5) Sp« 5) RS(lO+)
OCS«5) ST«5) NW(5-10)
PM H(S-IO) HPWSS-
ACS(S-IO) CV(S-IO) BS(S-IO) C(S-IO) MCW(S-IO)
PO(5-10) CM(5-10) NCS(S-IO) SP(S·IO) RS(IO+)
PHC(S-IO) PH(5-10) CP(S-IO)
OCS(S-IO) ST(5-IO) NW(S-IO)
FWC P(2) M H(5-10)
HPWSS-PO
CM(5-10) AeS(5-10) CV(S-IO) BS(5-10)
C(lO+) MCW(5·10) PH(5-10) NCS(5-10) SP(5-IO) RS(IO+) PHC(S-IO)
CP(5-1~) OCS(5-IO) St(5-1O) NW(S-IO)
ACS NCS(S- CV(;-IO) 339 P MCCIO+)
H(5-10) HP WSS-
PO CM(S-IO)
8S(5-10) MCW(5-10) PH(5-10) 10) OCS{5- SP(5-IO) RS(IO+) PHC(5-IO)
(,P(S-IO) 10) ST(5.IO) NW(5-10)
847 P(2) M H(S-In)
HP W SS-PO
CM(5-IO) ACSIS-IO) CV{5-IO) BS(5-10)
C(IO+) MCW(5-10) PH(5-IO) CP(5-I"Ol
NCS(S-IO) !>P(5·IO) RS(S-IO)
PHC(5-IO) OCS(S-IO) ST(5-IO) NW(5-10)
326 P M« 5) C« H« 5)
HP WSS- PO« 5) CM«5) ACS« 5) CV«5) BS« 5)
5) MCW« 5) NCS« 5) SP/<5) RS« 5)
PHC« 5) I-H« 5) CP« 5)
OCS(IO+) ST«5) NW(5·10)
317 P M(5-10) C(5- H{< 5)
HPWSS· PO«5) CM«5) ACS('- 5) CV,·.5) BSr' 5)
10) MCW« 5) NCS!" 5) SP(5·10) R!>(lO· )
PHC« 5) PH« 5) CP«5)
OCS« ~) ST(5·IO) NW(5·IOj
99

VILLAGE DIRECTORY
ViIla2e Directorv Land Use (As on 1999)
Land use (I e area under different types of land use In
hectare)
E c: 0
.:.I. ~ _§. c- oo E;
"" c
" "" "3 u
'" 0 :> u c E .... £! c '0
" i g " " - <8 - '" DI)
"" !:! ~ " " .!!! u ::> " ... ::0 " o<:! C ~ - 0 00 ;:
~ ~ lib ..E c: :>-. '" -0 ;;; ~ t 9 3 Q. t ., € 3 -0 ;: ..0
~ 8.3 "0 > E .<: 9 c.. g .. C to a - '" " ~ t; c.. §~ "0 '" ~~ <> '0 c e ~ ~ g OJ) c v
~ - ~ '" ~ E "§ c. '" c: ~ a u '" E c. 0 _Z o '" 0 .§ c - ::l ~ '" ~ -< Z 0.. ~ E LI. ;:J U ~ < Z 14 15 16 17 18 19 20 21 22 23 2 I
TW(600) MRFP Sheohar (7) TK(45) 967 223 BasahJa Ram 22
T(64 5)
PRMR Sheohar (4) ED NM TW(1027)
379 Falehpur 23 FP T(1027) 1540
PRMR Sheohar (5) ED NM Rice TW(624)
250 Khalrwa Darap 24 FP T(624) 937
MRFP Sheohar (4) NM ._ TW(523) 785
21 0 B,shunpur 25 ItS23) K,shundeo
MRFP Sheohar(3) NM TW(64) 207 70 Bhagwanpur Bheh 26
0(24) T(S 9)
TW(947) MRFP Sheohar(5) ED NM R(162) 1663 440 Madhopur Anant 27
T( 110 8)
TW(167) 12 0 Sug .. Katesn MRFP Sheohar (5) ED NM R(IO 2) 498 28
T(268) Jaglr
PRMR TW(1262) Sheohar(8) ED NM R(587) 2773 688 Sugla Karesn 29 FP
T(1849)
MRFP Sheohar (9) NM TW(53 I) 986
23 0 PardesJa Urf 30 T(53 I) Madhubam
PRMR Sheohar (8) NM TW(1613)
60 I TaJpur 31 FP T(1613) 2420
TW(609) MRFP Sheohar(J) ED N R(166) 1163 290 Sh,hpur 32
T(77 5)
TW(20 6) MRFP Sheohar (8) R(65) 503 120 Jalarpur 33
T(27 I)
91

.. ~ ." ~ 0
" ... .z= II> c c !2 .§. " ;;; U
:W -" 0 0 0 ,_J ~ <16 ;;
~ .. c -5 0
l> .!!! ii '-.D 0 :; e ;; .,
C-
" '- e 0 C 0 ., 0. .. ~ -;; g E ~ " ~ ~ z I 2 3 4
34 Daud Chhapra
660 1,384 (00288800)
35 Hanumannagar
440 1.203 (00288900)
Mathurapur
36 Kantar",a ~350 3.948 (00289000)
37 Mlrzapur Dhobahl
1250 2.018 (00289100)
Kanuanl
38 Kalyanpur 900 1,212 (00289200)
Bishunpur 39 Manoan 1680 2.608
(00289300)
Chhapmgobmdpur 40 urfgoplOathpur SOO 380
(00289400)
Bhaluahl Urf 41 Pharuaha IS 0
(00289500)
42 Gopala
650 761 (00289600)
43 Bhaluahl
910 1,297 (00289700)
44 Rampur Jadu
970 I.S76 (00289800)
Parraol 45
(00289900) 760 1,191
v;-~ c " U
(3 0 ~
'" ." "0 oS: u :; 0 ..c .... o ... .., .D E " z 5
241
232
726
347
249
415
75
120
DISTRICT CENSUS HANDBOOK SHEOHAR
Census of India 2001 -Amenities and
Amenllles available (Ifnot available Wlthm the Village. a dash (-) IS shown In the column and next lQ Il m brackels the dIstance In broad ranges VIZ. < 5 k.ms • 5-\ 0 kms and \ ()-t kms Qf the nearesl
I lace where the faclh!Y_IS available Is_glVel!2_ '0 ~ ~" ~ of _g " .. " ~
u c ;>
] t! E~ 0 ~ .c 0 .. iO' C- o :i C- :: ~ " 0. <.)
~~E ~ 0 ~Ul :J u 6 <XI -." '" !:! ~~ ;:l ~" c " C. U II> :: .. -0 V 0 ;:: c • ... c 0 g a(J~g !! oS:
'" " !2 c C- • II> -;;;>:-g 3
0 -;;
., l'! -;; -;; § c ~ "" i:! $-6 g..,~ C 0 00 .,
~ ~ '" -;; c ~ '" ~ fi ~ ::t g ::I u E f " ..i< E <It " ... u .;:; :J = ;;; E~ 1~
"'c-o 5-= "0 U Ci 0 o .. ~ sa LJ.I ::!: "- U.D U e
6 7 8 9 10 II 12 13 . P M{< 5) C« H«S)
HPW SS· PO« S) CM«S) ACS« 5) CV«5) BS«S)
5) MCW«5) PH« S) CP« S)
NCS«5) SP«5) RS(IO+) PHC« 5) OCS{< 5) ST«5) NW(5·IO)
P M« 5) CIS· H«5) HPWSS- PO« 5) CM{< 5)
ACS« 5) CV« S) BS«5) 10) MeW«5) NCS«5) SP(S·IO) RS(IO+)
PHC« S) PH«S) CP« 5)
OCS«5) ST(S·IO) NW(S·IO)
P(3) M« 5) H«5) PO ACS«5) CV«5) 6S«S) HPWSS· CM«5) C« S) MCW«5) PH«5) NCS«S) SP«S) RS(IO+)
PHC«S) CP«5)
OCS« 5) ST«S) NW(S·IO)
P M(S-IO) C(S· H(S-IO) HPWSS· PO« 5) CM(5·10)
ACS(S·IO) CV(S·IO) BS(S·IO) 10) MCW(S-IO) NCS(S·IO) SP(S·IO) RS(IO+)
PHq5-IO) PH(S·IO) CP(S·IO)
OCS«S) ST(S·IO) NW(S-IO)
PM«S) H(S-IO) ACS«S) CV(JO+) BS(IO+) C(lO+) MCW(S-IO)
HPWSS- PO« 5) CM(IO+) NCStS·IO) SP(IO+) RS(IO+)
PHqS.IO) PH(IO+) CP(IO+)
OCS« 5) ST(IO+) NW(5·10)
PM«5) H(lO+) ACS(IO+) CV(IO+) BS(I()-+') C(IO+) MCW(IO+)
HPSS- PO(IO+) CM(IO+) NCS(IO+) SP(S·IO) RS( 10+)
PHC(IO+) PH(lO+} CPt 10+)
OCS(IO+) ST(S·IO) NW(S·IO)
P M(S-IO) H(IO+) ACS(IO+) CV(IO+} BS( 10-) HPSS· PO(S·IO) CM(IO+) C(10+) MCW(lO+) NCS(lO+) SP(IO+) RS(lO+)
PHqIO+) PH(IO+) CP(IO+)
OCS(IO+) ST(IO+) NW(S·IO)
._-_. Unmhablled -_ •••• -
P M(S·IO) H(IO+) HPWSS- PO(S.IO) CM{IO+)
ACS(5.IO) CV(lO+) BS(IO+) C(lO+) MCW(IO+) NCS(S·IO) SP(lO+) RS(lO+)
PHC(IO+) PH(lO+) CP{IO+)
OCS(IO+) ST{IO+) NW(S·IO)
220 P M(S-IO) H( 10+) HPWSS· PO(S·IO) CM(IO+)
ACS(S·IO) CV(IO+) BS(IO+) C(IO+) MCW(IO+) NCS«5) SP(lO+) RS(IO+)
PHC(IO-+) PH(IO+) CP(IO+)
OCS(IO+) ST(IO+) NW{S·IO)
PHSSMP(2)
269 PMC<S) H(IO+)
HPSS· PO(..::5) CM(IO+) ACS«5) CV(lO+) BS(IO+)
C(lO+) MCW(IO+) PH(lO+) CP(IO+)
NCS« S) SP(IO+) RS(IO+,
PHC{JO+) OC5(IO+) STIIO+) NW(S·IO)
PM« 5) H(IO+) PO ACS(S-IO) CV(I(J+) as( 10-) 167
C(lO+) MCW(IO+) HPSS·
PH(IO+) CM(IO+)
NCS(5·IO) SPIJO-) RS( 10+)
PHC« 5} CP(IO+)
O(S(IO-) STII ()-) NW«5)
-92

MRFP Sheohar (7)
PRMR Sheohar (3)
FP ED
PRMR Sheohar (8)
FP ED
MR FP Sheohar ( 14) ED
MRfP Sheohar(13) ED
MRfP Sheohnr(14) ED RIce
-------- Umnhablted -----.---
MR FP Sheohar ( 12)
MR FP Sheohar (II) RICe
MR FP Sheohar ( 10) ED RIce, Pulse
MR FP Slleohar (12) ED RIce Pulse
Land use (I e area under different types ofland use In
hectare)
'" ~ 0 "'-19
0;-
5 ~
€ "" ~ .;; 20
TW(I72)
T(172)
TW(70)
R(45)
T(114)
TW(1188) T( 1188,·,
TW(433) T(433)
TW(lI3) TK(lO I) T(314)
TW(527)
R(65)
T(592)
TW(169)
T(l69)
TW(45)
T(45)
TW(229)
·T('?2.9)
93
TW(324)
T(324)
TW(339) T()) 9)
TW(267)
T(267)
21
40 I
267
1787
649
471
8& 7
254
67
343
477
508
400
22 23
100
~ :;: 'o
" E "" Z 2
9 0 Daud Chhapra
6 0 Hanumannagar
27 8 Mathurapur Kahtarwa
16 7 Mlrzapur Dhobahl
II I Kanuom Kalyanpur
20 0 Blshunpur Maman
8 0 Chhapragobmdpurur fgopmathpur
41 Bhaluahl Urf
Pharuaha
80 GOpal'
I I I Bhaluahl
12 0 Rampur Jadu
92 Parrahl
34
35
36
37
38
39
40
41
42
43
44
45
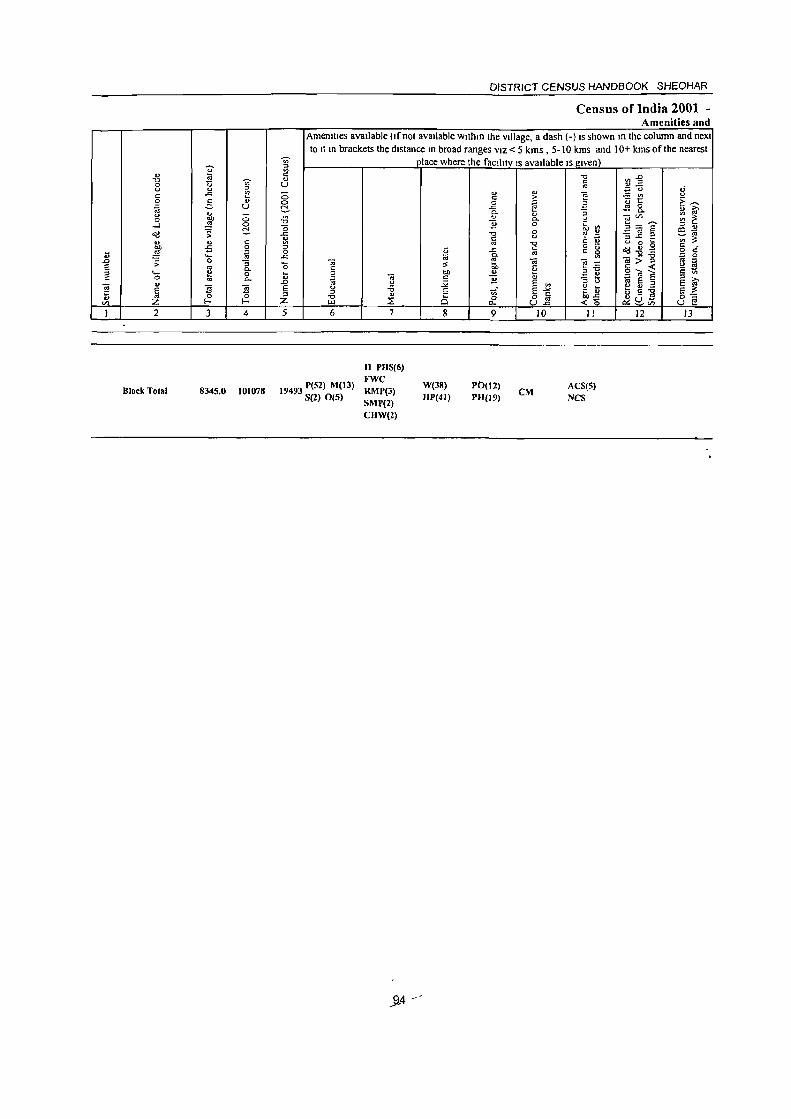
" -0
8 c o ~ g ...J
<><:l
~ ;; 'o
" ~ 2
Block Total
3
8345.0
V>
;;: c " U
4
101078
5
DISTRICT CENSUS HANDBOOK SHEOHAR
Census of India 2001 -Amenities and
AmemlJes available (Ifnot avaIlable wlthm the vIllage, a dash (-) IS shown m the column and next to It m brackets the dIstance m broad ranges VIZ < 5 kms, 5-10 kms and 10+ kms of the nearest
~ lace where the faclhty IS avaIlable IS j(lven)
6 1 8
" c o
..c fr ~ -0 C ~
.<: 0-
~ ... ~
9 10 II 12 13
19493 P{S2) M(13) S(2) 0(5)
H PHS(6) FWC RMP(3) SMP(2) CHW(2)
W(38) HP(41)
PO(12) PH{l9) eM ACS(5)
NCS
jt4

VILLAGE DIRECTORY
Villaee Directory Land Use (As on 1999)
~ ;; s
1 0. 0. -< 14
PR(IS)
MR(42) FP(42)
~ '" " z 15 16
ED(2J) EO
17
N(22) M(21)
18
Land use (I e area under different types ofland use In
hectare)
19 20
TW(2403.01) TWE(l6.12) TK(61.53)
0.0 R(304.38)
95
0(22.99) T(2808.03)
21 22 23
4453.9 21.0 1065.9
2
" .0 E " "


~ o o _J CD
0::: 8
~ ci ~ ~ o « .w
0:1: 0:1:-(/)-
et::r « (_) 0
cnCflO::: I- r «(/) ~ O~
-et:: ~ :::) o c
m .0 m
.~ G.l
/ -"
o
""
.... '"' p;; fn Q ,.. il:: ..: 0
'" ;:0 0
""
'" u 0 ...J OJ
0
u
.S2 G.l
.S:l OJ / (\l ., .... ,:
:5 ~I co •
x::::: ,c m !Ii ",,', ' .' ./
WVHJ
/
(
I /
('") N m
• N N m
• co i::: co ~. ~
" . v
•
0 0.
o . 0. ro./O
~~'~ :J (\) ,c. m co (\) I
OJ 8· •
['- I N •
\ I \
I
G.l ~\ 1
----------

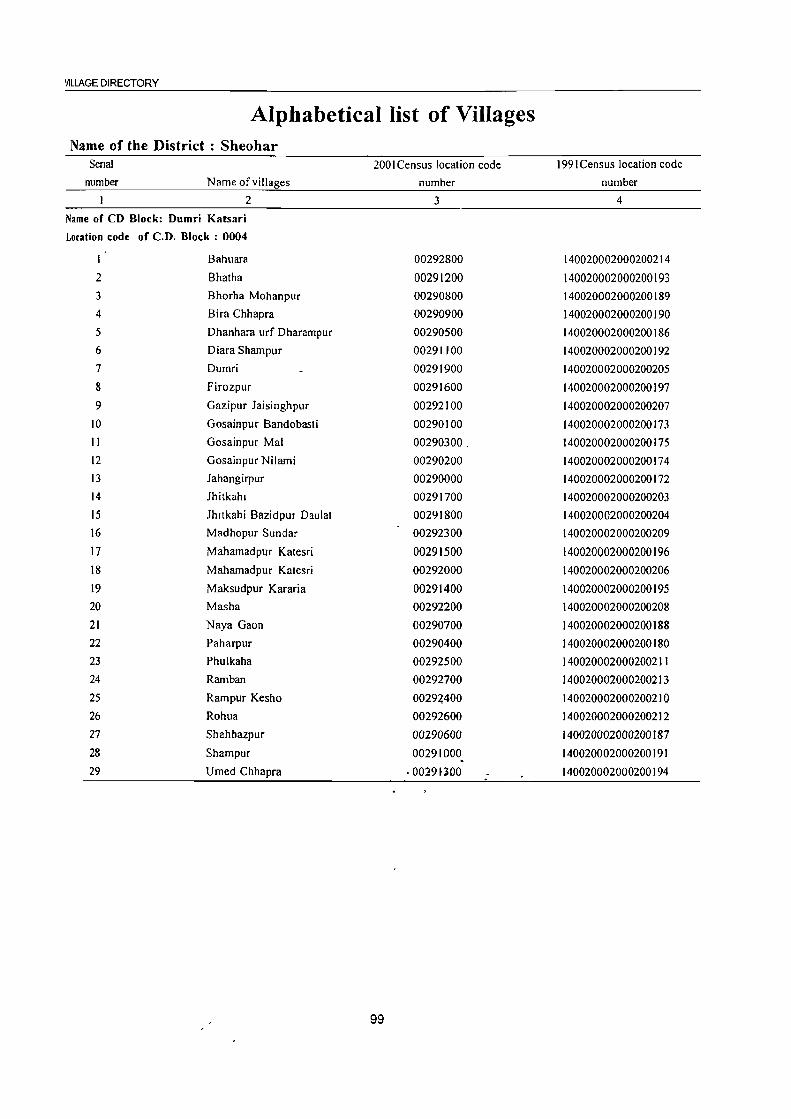
VILLAGE DIRECTORY
Alphabetical list of Villages Name of the District : Sheohar
Serial 200 I Census location code 1991 Census location code number Name of villages number number
2 3 4
Name of CD Block: Dumri Katsari
Location code of C.D. Block: 0004
I Bahuara 00292800 140020002000200214
2 Bhatha 00291200 140020002000200193 3 Bhorha Mohanpur 00290800 140020002000200189 4 Bira Chhapra 00290900 140020002000200190 5 Dhanhara urf Dharampur 00290500 140020002000200186 6 Diara Shampur 00291100 140020002000200192 7 Dumri 00291900 140020002000200205 8 Firozpur 00291600 140020002000200197 9 Gazipur Jaisinghpur 00292100 140020002000200207
10 Gosainpur Bandobasti 00290100 140020002000200173 II Gosainpur Mal 00290300. 140020002000200175 12 Gosainpur Nilami 00290200 140020002000200174 13 Jahangirpur 00290000 140020002000200172 14 Jhitkahl 00291700 140020002000200203 15 .Ihltkahi Bazidpur Daulat 00291800 140020002000200204 16 Madhopur Sundar 00292300 140020002000200209
17 Mahamadpur Katesri 00291500 140020002000200196 18 Mahamadpur Katesri 00292000 140020002000200206
19 Maksudpur Kararia 00291400 140020002000200195 20 Masha 00292200 140020002000200208 21 Naya Gaon 00290700 140020002000200188 22 Paharpur 00290400 140020002000200180 23 Phulkaha 00292500 140020002000200211 24 Ramban 00292700 140020002000200213 25 Rampur Kesho 00294400 140020002000200210 26 Rohua 00292600 140020002000200212 27 Shahbazpur 00290600 140020002000200187 28 Shampur 00291000 140020002000200191 29 Umed Chhapra ·00291300 . 140020002000200194
99

DISTRICT CENSUS HANDBOOK SHEOHAR
Census ofIndia 2001 -Amenities and
Amemlles avaIlable (If not avaIlable withIn Ihe VIllage, a dash (-) IS shown III the column and
next to It In brackets the dIstance In broad ranges VIZ < 5 kms, 5-10 kms and 10+ kms of the 'Vl nearest place where the facIlI!Y_ls avaIlable IS given
e a ~ 2" '" c: "0
"0 !'! '"
.. c: 0 u U " .; u " ::::J
'" .:: <>
.c '" 8 " e - '" :! c: c: c: :> c:; 1:: 1:~ 0 c: .. 0 ~ .::! ~ ..:::. U C!- .c ~ 8.. : f .. - c. '"
:; -;;;(1) u bJl <:> '" " 0- U 0 ~
"0 '§ 9 ;: '" S:::s " " ....I 0 (5 C!- o ,~ 3~= a:l ~
o(! ;; ..c "0 ~~ ., c: u
'" " c .. -0 C OJ
~ 3 g !9 o - c: _ 01) .,s 0
J .c g c g o c ~ ~ 0 "0 -is ._ ..c 0. - '" -;;;;>-g N ~ .0 ;; 0 :; ..... OJ e -;;; -;;; -E .. 0 co ~ :;~ B-.a-< - :g c. c:
'" c: '" " ..... ~ 0 .... 0 bJl .:: ~ c 0 Co OJ ~ OJ c: '§ '" .:: E E " >, .0 '" _;;; e '" " u g; G.) :! e ~ -;;; '" g S E u -<; 1i E'>< <> ....
E :: ;: ., .... c: "0 8-= ;:; " ::::J
'" 82 ~Gtl .. ~ ~ "0 0 0 bJl.c
" Z ~ -<0 u e (/) z W Q..
1 2 3 4 5 6 7 8 9 10 II 12 13
CD Block: Dumr; Katsar; (0004)
J ahanglrpur 5350 5,574 963 P M q< 5)
H NH MCW(5. HP TW W PO CM«5)
ACS(5-IO) CV(IO+) BS(5-10) (00290000) 10)PHC(10+) TKSS- PH(IO+)
CP(5·IO) NCS(IO+) SP«5) RS(IO+)
OCS(lO+) ST« 5) NW«S)
Gosampur PM«5)C«
H(5· CM (5- ACS(5-10) eV(s·IO) B5(5·10)
Bandobasll 640 915 204 5)
10) MCW(5- HPSS· PO«5) 10)ep(S- NCS(5.10} SP« 5) RS(IO+)
(00290100) 10) PHC(S·IO) PH(5-10) 10) OCS(IO+) ST« 5) NW«S)
Gos8mpur Nllaml P« H(5· • CM (5- ACS(5·10) CV(5·10)
NW 490 753 120 5) M«5) 10) MCW(5- HPWTKR P0(5.10) BS(5.10)
(00290200) q<5) 10) PHC(5.10) SS- PH(5.10)
10)CP(S. NCS(5-10) SP«5) RS(5-10)
10) OCS(IO+) ST«S)
Gosampur Mal PM«5)C« H(5·
CM (5- ACS(5·10) CV(5·1O) NW
4 600 191 33 10) MCW(5- HP W R SS· PO« 5) 8S(5-1O) (00290300) 5)
10) PHC(5·10) PH(5-10) 10) CP(S· NCS(5-10) SP« 5)
RS(IO+) 10) OCS(IO+) ST«5)
Paharpur 2610 3,156 524
P M« 5) C« H(lO+) HPSS· PO(IO"') CM«S)
ACS(S·IO) CV(IO+) BS(IO+) (00290400) S) MCW(5·10)
PH(5·10) CP(5-10) NCS(IO+) SP« 5) RS(IO+)
PHC(IO+) OCS(IO+) ST« S) NW«5)
Dhanhara Urf PM« 5)C«
H HPTWW CM ACS(5-IO) CV(5·10)
NW 6 Dharampur 1800 1,532 281 MCW(5.10) PO« 5) BS(5·10)
(00290500) 5)
PHC« 5) TKRSS-
PH(IO"') (5·IO) NCS(lO+) SP«5)
RS(IO+) CP(S.IO) OCS(IO+) ST«5)
$.hahbazpur PM«5) C« • H«
CM ACS(IO+) CV(5-10) NW
'_.7 400 308 SO 5) MCW(5.10) HP TW W PO« 5) BS(5·10) • (00290600) 5) PHC(5.1O) TK R SS- PH(5·10) (5·10) NCS(lO+) SP« 5)
RS(IO+) CP(5·IO) OCS(IO+) ST« 5)
DAPHS ACS NayaGaon
6800 10,465 1,825 P(6) M O(4) H(5-10)
HPSS-PO CM
NCS(IO+) CV{5-IO) BS(5·10)
(00290700) C(S-IO) MCW(5·10) PH(5.1O) CP(S·IO) OCS(IO+)
SP(5·10) RS(IO+) PHC(5·10) ST(5·10) NW«5)
Bhorha Mohanpur PMO H(5·
PO ACS
CVI5·10) BS(5·10) 9 2120 2,471 421 10) MCW(5· HP SS· CM«5) NCS(IO+) (00290800) C(5-IO)
10) PHC(5·10) PH(5·10)
CP(,-5) OCS(IO"') SP(S·IO) RS(lO+) ST(5·10) NW«5)
31ra Chhapra 1380 2,169
P OM« 5) H(IO+) PO(5·lll)
CM ACS(5-IO) CV(5-10) BS(5-10) 10
(00190900) 371
C(5·10) MCW(5.IO) HP SS (5.10) NCS(lO"') SP(S-IO) RS(IO+)
PHC(5·10) _ _/ - 'PH(5.10)
CP(S-IO) OCS(5.10) ST(S·IO) NW«5) --~
100

i VILLAGE DIRECTORY
Villa2e Directory Land Use (As on 1999)
14 IS
MR Sheohar (4)
16 17 18
Land lise (I e area under dlfferenl types ofland use In
hectare)
19 20 21 22 23 2
1878 1878 159 3 Jahanglfpur
l MRFP Sheohar(3) GC(224) 32 190 Gosampur 2
1 ____________________________________________________ O_(_1_9_1_)T_(_4_1_6_l _______________________ B_.n_d_o_ba_s_t. ________ ___
~ MR FP Sheohar (0) TW(52) 13 7 I 2 87 Gosampur ~ R(20 I 1 T(25 3) N.I.m.
3
I MR Sheohar (0) - - - - GC(179)
208 39 176 Gosampur Mal 4 T(179)
MRFP Sheohar (I) ED EO - - -GC(788)
919 116 788 Pah.rpur 5 T(788)
MRFP Sheohar (I) - - - - GC(344) 826 9 I
54 4 Dhanham urr 6 T(344) DharamptJr
- -GC(lI9) - . -- . -
MRFP Sheohar (I) . - - 13 9' • 20 117 'Shahbazpur 7 T(119) -
MRFP Sheohar (5) ED NM - . GC(20S I) 2392 31 I 2050 NayaGaon 8
T(205 I)
MRFP Sheohar (5) - NM - GC(638) 745 106 629 Bhorha 9
T(638) Mohanpur
MRFP Sheohar (5) - - . GC(417) 486 69 41 I BIf. Chhapra 10
T(417)
101

DISTRICT CENSUS HANDBOOK SHEOHAR
Census of India 2001 -Amenities and
Amemlles avallable (Ifnol available wllhm the vlllage, a dash (-) IS shown m the column and
nexllo It III brackets the dIStance m broad ranges VIZ < 5 kms, 5-10 kms and 10+ Ions of the ~
nearest place where the facIlity IS available IS given '" ~ '" '" ~ 2~ '" C '0
'0 13 Ul ... c 0 <.> U " oJ <.> ., ::> ... ::: <.>
.c <n ;:; '" 1! - '" l.l C C C > ;:; t E~ 0 _§_ " 0 0 e ~ ~ u t!. .c tE g_ " ~ "-OJ
., - <n " ...
~ -.u"" ::: ~ 01) 0 c.. 0 ~
'0 11 0 3 ~~ E ....l 0 Oo~ ::> .. t!. (5 (;, Cl -<1(l ;;: .c "0 '? .:: ~..c~ ~ " ... "
u '" ;:: '" ., c '" .. -0 t: ... () 0 .... o - c •
1 .;; 0 '" I ..c: 16 c g ~ _g g o c ... ~ 0
" "- .c "- . '" Cii>"g ;: 0
f! -.u .. -.0 >' 0 :; .... -.u e..a ~ ~ E " "- 0 c 00 ~ §<a~ ::> .... !:! 0 03 0 00 " E f! c 0 ., "- ~ -.u c 11 u 3 ~ ~ ;;l >. .0 <.> -" E '" '" u E ..
~ " ~ '3 E u -0 <.> ... E ;:: § ;;l :: u{ E-'" ;:: " 8 :: 'g " ~ '" "'0 " is 0 o C OIl"" ~SVi
0-= en Z f- Z UJ ~ 0- u~ ..( 15 u E I 2 3 4 5 6 7 g 9 10 II 12 13
Sham pur P(3) M H(5.
PO ACS
CV(5-10) 8S(5-10) II 5290 5,311 943 10) MCW(5- HPSS- CM«5) NCS(IO+)
(00291000) C« 5) 10) PHC(5-10)
PH(5-10) CP(5-10) OCS(IO+)
SP« 5) RS(IO+) ST{< 5) NW{<5)
12 Dmra Shampur
440 -------- Unlnhab,ted ------------(00291100)
Bhatha PHS H(IO+)
PO ACS
CV(lO+) BS(lO+) 13
(00291200) 3220 2,871 503 P M q<5) MCW(IO+) HPSS-
PH(IO+) CM«5) NCS(IO+)
SP« 5) RS{IO+) PHC(IO+) CP{IO+) OCS(IO+)
ST« 5) NW« 5)
Umed Chhapra P M« 5) q< H«
ACS(IO+) CV(IO+) 8S(10+)
14 1190 1,096 ISO 5) MCW(IO+) HP W 5S- PO{<5) CM(IO+) RS(IO+) (00291300) 5)
PHC(IO+) PH(IO+) CP(IO+) NCS(IO+) SP« 5)
NW OCS(IO+) ST« 5)
(5-10)
Maksudpur Karana HPHS
PO IS 1,2760 9,928 1,644 P(5) M S C« MCW(IO+) HPWSS- CM(IO+)
ACS(IO+) CV(IO+) 8S(10+) (00291400)
5) PHC(IO+) PH(IO+) CP(IO+)
NCS(IO+) SP« 5) RS{lO+)
OC5(IO+) ST«5) NW«S)
Mahamadpur P M« 5) H(5-
CM ACS(5-10) CV(5-10) BS(IO+) 16
Katesn (00291500) 2110 2,638 445
C(lO+) 10) MCW(5- HPW SS· PO« 5)
(5-10) NCS(IO+) SP(IO+) RS(IO+) 10) PHQ5·1 0) PH(5·10)
CP(5·10) OeS(IO+) ST(IO+) NW«5)
17 Fuozpur
530 -----. Unmhablted ._oO,,_oO. (00291600)
Jhltlah, P M« 5) C« H(S.
ACS(S·IO) CV(S'IO) 8S(5.10)
18 1150 2,006 408 10) MCW(5· HPSS- PO{<5) CM«5) RS(lO+) (00291700) 5)
10) PHC(5·10) PH(5·10) CP(5·10) NCS(5-10) SP(S-IO)
NW (5 OCS(5-10) ST(5·10)
10)
Jhltkah' Baz,dpur P« H(S· ACS(5·10) CV(5·tO)
BS(5·10) 19 510 214 47 5) M«5) 10) MCW(5· HP SS- PO« 5) CM«5) RS(IO+)
Daulat (00291800) C«5) 10) PHC(5·10) PH(5-10) CP(S·IO)
NCS(S-IO) SP(S-IO) NW (S
OCS(5·10) ST(5·10) 10)
Dumn PM« 5) H(5-
PO CM ACS(5-10) CV(5-10) 85(5-10)
20 1250 1,833 360 10) MCW(S- HPWSS- RS(10+) (00291900) C(IO+)
10) PHC(5-IO) PH(5·10) (5-10) NCS(IO+) SP(5·1O)
NW (5 CP(S-ID) OC5(IO+) ST(S·IO)
(0)
Mahamadpur H(ro+) eM ACS(5·1O) CV(IO+) 85(10+)
21 57 () 966 199 P MC(IO+) HPWSS· PO(S·IO) R5(lO+) Katesn (00292000) MCW(S·IO)
PH(S·IO) (5·10) NCS(IO+) SP(S-IO)
NW PHC( 10+) CP(IO+) OeS(lo+) ST(5·10)
(5 (0)
Gaz,pur 327 P M« 5)
PHS H( 10+) CM ACS(~·IO) CV(IO.,.)
85(10·)
22 Ja,smghpur 1840 1,707 C(10+)
MCW(5-!9) HPW S5- POI" 'i) (5. fa) NCS( 10+) SP(5·1O)
R~(I0·)
(00292100) PHCCIO+) PH(lO+) CPt ro+) OC5(10+) 5T(5·10)
NW 15 (0)
--102

VILLAGE DIRECTORY
ViIla2e Directorv Land Use (As on 1999)
E "'" c: e;. ..;:. .., -6 0 0 ... c: E :'! c:
~ ~ E
-6 0 ~ 0
I1d '" :;: ~ ;:
~ » '" "" 9 0.. t:: ~
9 "'- ~ o :> .c: " a. ~
g VI §J§ l;; ... 0.
E ~ ... VI " Q. " " V> til '" 0 Q. <0 0 ~ <: z "" ::E E 14 15 16 17 18
MRFJ> Sheohar(l) NM
---- Umnhablted .--------
MRFP Sheohar(l}
MRFP Sheohar (2)
PRMR Sheohar (0)
FP
MRFP Sheohar ( 10) Rice
----- Unmhablted -----
MRFP Duman (3) ED NM
MR FP Duman (3) NM '"
MRFP Sheohar(IO) NM Rice
MR FP Sheohar ( 10) NM
MR IT Sheohar (10) NM
Land use (I e area under different types of land use In
t> ~ 0 .... 19
~
" l:! " 0 In >. e
"0
" iii (1)
_g 20
GC(1594) TW(lSI2) TK(81)
T(3187)
GC(133) T(133)
GC(970} T(97 0)
GC(357} T(357)
GC(384 5) T(J845)
GC(636) T(636)
GC(184) T(IS 4)
GC(346) T(346)
GC(IS3) T(153)
GC(378) T(378)
GC(17 I) T(lll)
OC(556) T(556)
103
h~tare)
"" u iii (1)
E C ;:)
21
1116
289
113 I
417
4486
742
315
404
178
440
200
640
otl c:
-6 " (j 5~
.._. " ~ ~ ~::; ... " ::c '" e ~ ".z :::: g " os U ()IJ
22
87
266
54
1584
100
3 I
53
25
63
26
93
c: ~ iii E :;
<) ... 02 ... ::c .. .!! OIl
~ iO 10 :;:
15 '-0 c: ...
'" E 1:! '" « z 23 2
898 Sham pur
20 Dlara Sham pur
852 Bhatha
357 Umed Chhapra
2845 Maksudpur Karana
63 2 Mahamadpur Katesn
Flrozpur
346 Jhllkahl
15 3 Jhllkahl Bazldpur Daulat
371 Dum"
17 I Mahamadpur Katesfi
556 Gazlpur Jalsmghpur
... u
.D E " " "§ ~
U)
J
II
12
13
14
15
16
17
18
19
20
21
22
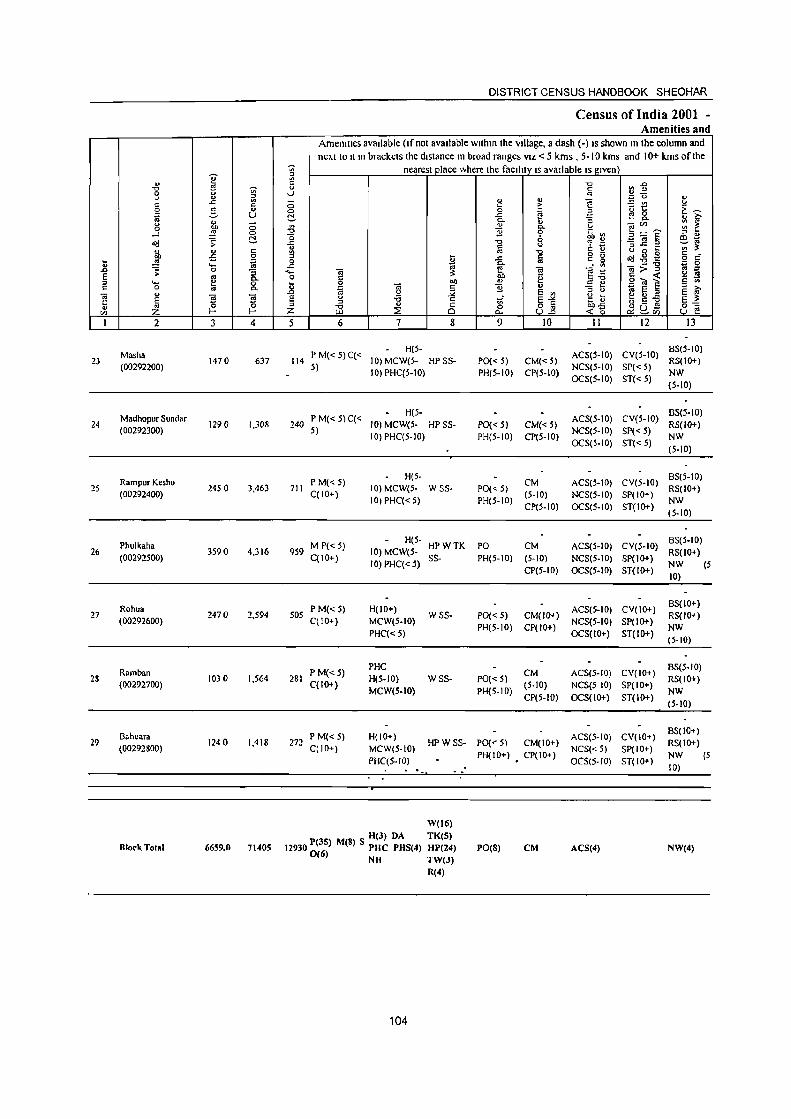
DISTRICT CENSUS HANDBOOK SHEOHAR
Census of India 2001 -Amenities and
Amemtles avaIlable (Ifnot available wlthm the vIllage, a dash (-) IS shown m the column and
next to It In brackets the dIstance In broad ranges VIZ < 5 kms • 5-10 kms and 10+ kms of the
'" nearest place where the faclhty IS available IS gIven) :l
~ '" u
'" i1 "0 ~:2 '0 0 '" '" 0 ._; '" .. " '" " == <> " .t: '" - " e - '" u c " 0 " ~ g 5 E~ !2 S '" 0 0 e B ;; u !::!. .r:;
III ~ " - 0.
" :; - c.
" '" <U u ]~E 0 "" 0 ~
0. '" c: ...J .!3! <:> '0 0
~!1 " u !::!. "0 6 co -a'Il ;; .r:; "0 <J ~.2~ ';;;'~ ... c C: t) ... " '" ~ '" '"0 g g ~.gg c
"" £ 0 ~ J: C 0 C ~ ,g iii 0
~ 0. to ~ 0 .... .r:; • <II -.;-;;'g S> ;; 0 :; .... -.; e Ol E <;;: <J N E '" 0 co i;1 §<di c.. c
0() v ,,'"0 ;: '" " .... !! 0 _g 0 -= ~ c a ., 0. ~ -.; c ~ " " u ~ e " >. u -" E '" L~ ~
... ~ J E u .;; ...: u ~
~ 5 ~ E ::I C E-'" ;:: OJ
~ '" " til .,
is c: 8] 0I).c o -t/l Z I- Z :::t .,_ -< '0 ~ ~V) u e I 2 3 4 5 6 7 8 9 10 II 12 13
Masha PM«5)C« H(5·
ACS(S·IO) CV(S-IO) BS(5-tO)
23 t470 637 114 10) MCW(5- HP SS- PO« 5) CM«5) RS(IO+) (00292200) 5)
10) PHC(S-IO) PH(5-10) CP(5-1O) NCS(S-IO) SP« 5)
NW OCS(5-10) ST« 5)
(5-10)
Madhopur Sundar P M« S)C« H(5·
ACS(S-IO) CV(S.IO) 6S(5-1O)
24 (00292300)
1290 1,308 240 5)
10) MCW(S· HPSS· PO« S) CM« S) NCS(S·IO) SP« 5)
RS(IO+) 10) PHC(5·10) PH(5·10) CP(5·10)
OCS(5·10) ST« 5) NW
(5·10)
Rampur Kesho PM« S) H(5·
CM ACS(5-10) CV(5-10) BS(S·IO)
25 (00292400)
2450 3,463 711 C( 10+)
10) MCW(5· WSS· PO« 5) (5·10) NCS(5·10) SP(IO+)
RS(IO+)
10) PHC« 5) PH(5·10) CP(5.1O) OCS(5·10) ST(IO+)
NW
(5·10)
Phulkaha M P«5) H(5·
HPWTK PO CM ACS(S·IO) CV(S-IO) BS(S-IO)
26 (00292500)
3590 4,316 959 qIO+)
10) MCW(5· Ss. PH(5·10) (5-10) NCS(S-IO) SP(IO+)
RS(IO+)
10) PHC« 5) CP(5-10) OCS(5-1O) ST(IO+)
NW (5
10)
Rohua P M«5) H(IO+) ACS(5·10) CV(IO+) BS(IO+)
27 (00292600)
2470 2,594 505 qIO+) MCW(S-IO)
WSS- PO« 5) CM(IO+) NCS(S·IO) SP( 10+)
RS(IO+)
PHC« 5) PH(S·IO) CP(IO+)
OCS(IO+) ST(IO+) NW
(5·10)
Ramban PM« 5) PHC
CM ACS(5·IO) CV(IO+) 8S(5-10)
28 (00292700)
1030 1,564 281 C(IO+)
H(S·IO) WSS- PO«5) (5.10) NCS(S 10) SP(IO+)
RS(IO+)
MCW(5-IO) PH(S·IO) NW CP(5-IO) OCS(lO+) ST(IO+)
(5-10)
Bahuara PM« 5) H(IO"') ACS(5·10) CV(IO+) 8$(10+)
29 1240 1,418 272 HP WSS- PO('- 5) CM(IO+) RS(IO+) (00292800) C( 10+) MCW(5-IO) NCS« 5) SP(IO+)
PHC(S-IO) PH(IO+) CP(lO+)
OCS(5-IO) ST(IO+) NW (5
10)
W(J6)
Block Total H(3) DA TK(S)
12930 P(3S) M(8) S PHC PHS(4) HP(24) 0(6) NH TW(3)
ACS(4) NW(4) 6659.0 71405 PO(S) CM
R(4)
104
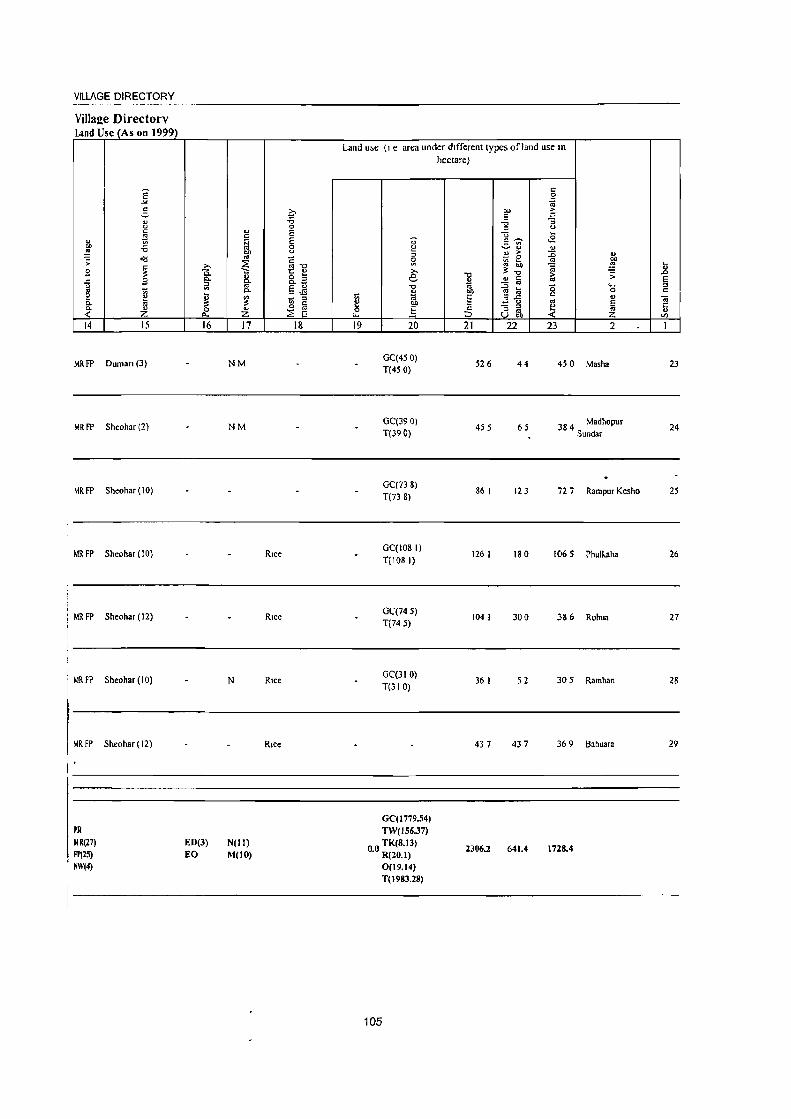
VILLAGE DIRECTORY
Villaee Directory Land Use (As on 1999)
e--'" ;: ~
OJ u 0::
~ ~ -<; ~
~ ;: ~ g
.c .9 " <C
~ e Q. .. Co ., ..: z 14 15
MR FP Duman (3)
MR FP Sheohar (2)
MR FP Sheohar (10)
MR FP Sheohar (10)
MR FP Sheohar ( 12)
MR FP Sheohar (10)
MR FP Sheohar ( 12)
PR MR(17) FPI2S) NW(4)
,., C.
"'" '" '" ~ .,e 16
ED(3) EO
OJ 0::
~ OIl
'" ::E "0::::
" 0. .. 0.
'" ~ " z 17
NM
NM
N
N(lI) M(IO)
2:--<; 0 E E 0 u
c oJ.", t:: ., o ... 0.3 E U -<!!!
" '" 0:: 0 '" ::E E 18
RIce
RIce
Land u~e (I e area under dIfferent types ofland use In
~ 0
"" 19
" f:! " ~ '" e
-0 OJ
~ .§ 20
GC(45 0) T(45 0)
GC(39 O~ T(39 tr)
GC(73 &~ T(738)
GC(108 I) T(IOS I)
GC(745) T(745)
GC(310) T(JIO)
GC(I779.54)
TW(lS6.37)
00 TK(S.13) • R(20.1)
0(19.14) T(l983.28)
105
hectare)
OIl 0::
-<;
" U S~ ~ " " ;>
Vi e ~;
" " 0:: .ll os " J5 bl) e a E .3~ t: - " 8 gs" :::>
21 22
526 44
455 65
86 I 123
1261 180
104 I 300
36 I 52
437 437
2306.2 641.4
o:: 0
~ ~ :; U ~
~
" ~ " OIl .!!! ;;;
r; :;
" "-0
0::
'" .. ~ e
...: z 23 2
450 Masha
384 Madhopur Sundar
72 7 Rampur Kesho
106 5 Phulkaha
386 Ronua
305 Ramban
369 Bahuara
1728.4
~ ., "" E '" c:
OJ t: ., '" I
23
24
25
26
27
28
29

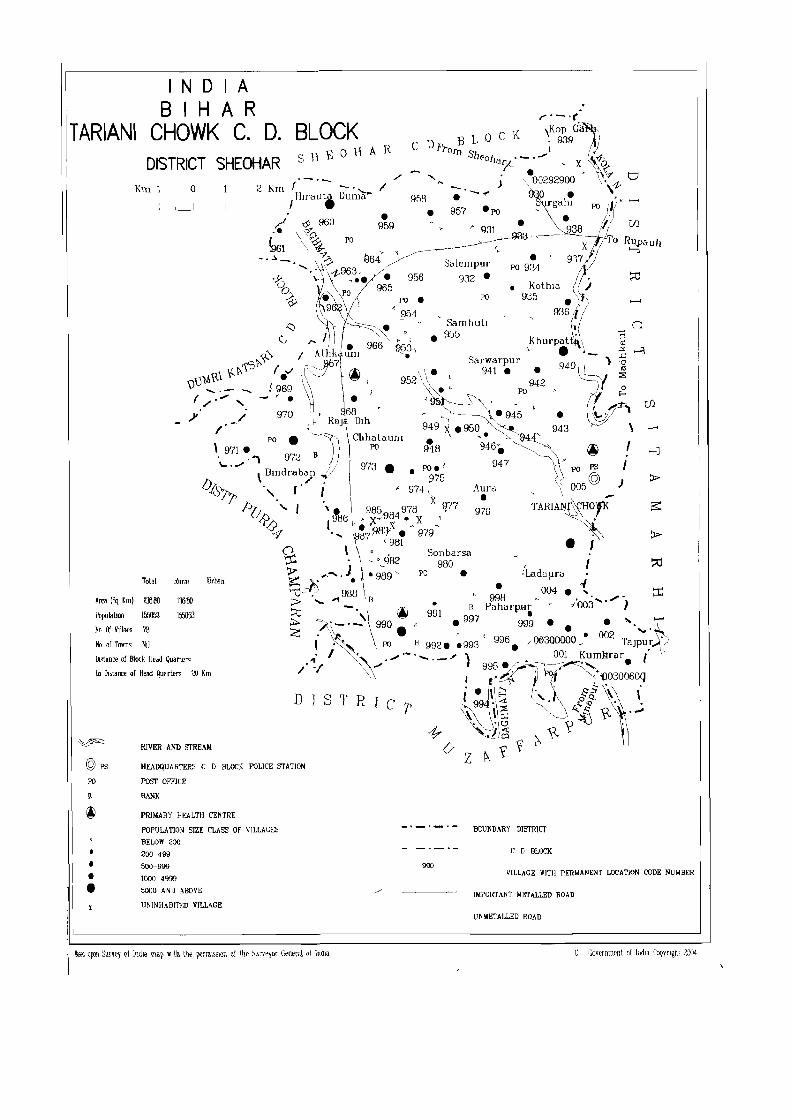
IN 0 I A I B I H A R T ARIANI CHOWK C. D. BLOCK
DISTRICT SHEOHAR Km 1
Total
Area (Sq Km) 13680
Pupulahon If:li053
No Of Vlllaes 'Ill
No of Town< Nil
o 2 Km r' - . - -....... /./ I Hlrau1 Duma~ 958
• -. . -- .... 957 .PO • ,,--( OJ 960 959 - •
.• \ {:;., ,_ ~ 931
~61 \~ PO ~~ _ • ~ _ • '7~ 964' Y •
..... ~963, / Salem pur PO 934 ,.. • 956 932 •
965 • KothJa PO • PO 935
954 '> ~ • c ~ Sam hutl n
I ~ •• ~ ~ (, " • 966' ~53 KhurpaU' III
~'<;-\. / Ali6k\um "-. ' Sarwarpur ). • ) ~ ...:l
\)D~Rl \(».~S /.J I~~ 7 ~ ( \ \. 941.. 940iJ.=-)~! ~o ( ./.".." _.". • " . (7';: rJ}
'- . _ --. . 969 I 952 \~i~-_~ PO 942
)'. / 970 ,68 , • 945 • W-'
Rural
l:viOO
1551Yi3
/' - (I- Raj Dlh 9 X. 950 943 \ ...-< · l ChhataunI ,~. ~ (: \ 971 • PO B) PO 9'8 946. ~"~~ ~ I --3 .\_ ........ .., 972 / 973 PO.' 947 ~> I
\ Bmdraban ..v •• i)75 PO ©PS
/)11../' A 005 0)
IS]']' '. r, I- 974, ~rd \ .~\
P(J "I ". 985 978 X ~77 976 ~ARIA~~O .• 'F," ~-& (986 ~. r'9~4 ." J( ~'
'f . .... 87 :9B:y'. 979 .~ • 1 o '.. Sonbarsa
,.,.. . - °_982 980 I ~ "' ...... ) \.989' po. :iadallra "",,~. . . '" '\j ~ 988 998 004 • ... ~ ........, B. /003' ..... ,.. "J ~ - . '\ @ 991 9~7 Paharpu~ ~ • • , • • OOZ ~. I' PO B 992. .993 996. I Ql13QOOOO ~ TaJPu_r .
llrMn
DI'llance of Block Hedd Quar',er'
;J:> i~'-~'- 990,· 999 • • '. ~-'t' I '-, ........ -._._/' ~ 001 Kumlinlr {
/ 'f \'\ : ~,2fID~\,(q to DI,tance of Head Qua rters 2() Km
RIVER AND mEAl!
DISTRICr 1- \~I\ ~V~l'I( uZ}\y1~
HEADQUARTERS C D BLOCK POLICE STATION
PO POST OFFICE
B BANK
@ PRIMARY HEALTH CENTRE
POPULATION SIZE CLASS OF VILLAGES
BELOW 200
• • • 200 499
500-_
1000 4999
5000 AND ABOVE
UNINHABITED VILLAGE
I 10.'111 "I"n ,umy of Inc", ma~ • til tile permlSS\On 01 tl\e ~urvejor General o! India
BCUNDARY DlSTRlCf
C 0 BLOCK
990 VILLAGE W1TH PERMANENT LOCATION CODE NUMBER
IMPORTANT METALLED ROAD
UNMETALLED ROAD
C Government of Itldla CO~jn~l\t GOO4


VILLAGE DIRECTORY
Alphabetical list of Villages Name of the District: Sheohar
Serial
number Name of villages
2
200 I Census location code
number
3
Name of CD Block: Tariani Chowk
Location code of C.D. Block: 0005
I Arazi Nankar 00296300 2 Arazi Rakbe Narwara 00298800 3 Athkauni 00296700 4 Aura 00297600 5 Az Rakbe Athkauni urf Benipur 00296900 6 Az Rakbe Pacbra Bansi 00298lDD 7 Az Rakbe Raja Dih Barahi 00297000 8 Baijnathpur 00294800 9 Baijnathpur 00294900
10 Bariarpur 00299200 II Basant Param 00297100 12 Basarpur urf Nasirpur 00298700 13 Belahi Dullah 00295700 14 Belahi urf Balha Barjnathpur 00294200 15 Bhandiha 00294600 16 Bindraban 00297200 17 Bisambharpur 00294700 18 Bishunpur Bindi 00297800 19 Brshunpur Dharanand 00297500 20 Bishunpur Fakira 00297400 21 Bochhan urf Az Rakbe Pojhial) 00295300 22 Chak Surgahi 00292900 23 Chhapra 00300500 24 Chhatauni 00297300 25 Fakapur 00297900 26 Fatehpur Ghaus 00295100 27 Fatehpur Ghauspur 00295400 28 Ganga Dharampur 00300100 29 Ghorha 00293300 30 Gularia . 00293700 31 Hiramma 00296200 32 Hirauta Duma 00296000 33 Hurraha 00294400 34 J afarpur urf Sharifnagar 00299500 35 Jagdishpur 00293400 36 Jagdishpur 00299900 37 Kasturia 00293.100 38 Khajepur 00295000 39 Khurpatti 00294000 40 Kishunpur Narwara 00298900 41 Krshunpur Narwara TolaRamn~gar 00299600
109
1991 Census location code
number
4
140030003000300147
140030003000300172
140030003000300151 140030003000300160
140030003000300153 J40D3DD030DD30D165
140030003000300154 140030003000300132
140030003000300133
140030003000300176
140030003000300155
140030003000300171
140030003000300141 140030003000300126 140030003000300130
140030003000300156 140030003000300131
140030003000300162
140030003000300159 140030003000300158
140030003000300137
140030003Q00300003 140030003000300189
140030003000300157
140030003000300163 140030003000300135
140030003000300138 140030003000300185
140030003000300007
140030003000300DI4 140030003000300146
140030003000300144 140030003000300128
140030003000300179 1"40030003000300008
140030003000300183
140030003000300005
140030003000300134
140030003000300124 140030003000300173
140030003000300180
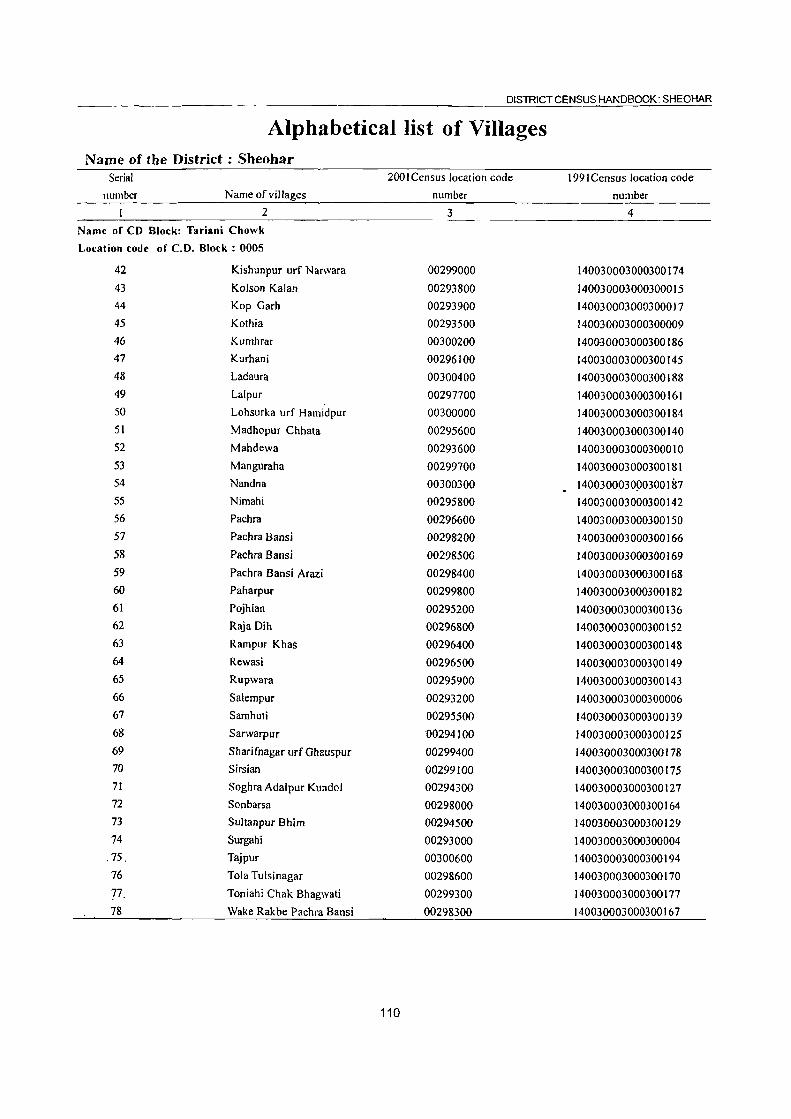
DISTRICT CENSUS HANDBOOK: SHEOHAR
Alphabetical list of Villages Name of the District: Sheohar
Serial 2001 Census location code 1991 Census location code number Name of villages number number
2 3 4 Name of CD Block: Tariani Chowk Location code of C.D. Block: 0005
42 Kishunpur urf Narwara 00299000 140030003000300174 43 Koison Kalan 00293800 140030003000300015 44 Kop Garh 00293900 140030003000300017 45 Kothia 00293500 140030003000300009 46 Kumhrar 00300200 140~30003000300186
47 Kurhani 00296100 140030003000300145 48 Ladaura 00300400 140030003000300188 49 Lalpur 00297700 140030003000300161 50 Lohsurka urf Hamidpur 00300000 140030003000300184 51 Madhopur Chhata 00295600 140030003000300140 52 Mahdewa 00293600 140030003000300010 53 Manguraha 00299700 140030003000300181 54 Nandna 00300300 140030003090300187 55 Nimahi 00295800 140030003000300142 56 Pachra 00296600 140030003000300150 57 Pachra Bansi 00298200 140030003000300166 58 Pachra Bansi 00298500 140030003000300169 59 Pachra Bansi Arazi 00298400 140030003000300168 60 Paharpur 00299800 140030003000300182 61 Pojhian 00295200 140030003000300136 62 Raja Dih 00296800 140030003000300152 63 Rampur Khas 00296400 140030003000300148 64 Rewasi 00296500 140030003000300149 65 Rupwara 00295900 140030003000300143 66 Salempur 00293200 140030003000300006 67 Samhuti 00295500 140030003000300139 68 Sarwarpur -00294100 140030003000300125 69 Sharifnagar urf Ghauspur 00299400 140030003000300178 70 Sirsian 00299100 140030003000300175 71 Soghra Adalpur Kundol 00294300 140030003000300127 72 Sonbarsa 00298000 140030003000300164 73 Sultanpur Bhim 00294500 140030003000300129 74 Surgahi 00293000 140030003000300004
.75. Tajpur 00300600 140030003000300194 76 Tola Tulsinagar 00298600 140030003000300170 77 Toniahi Chak Bhagwati 00299300 140030003000300177 78 Wake Rakbe Pachra Bansi 00298300 140030003000300167
110

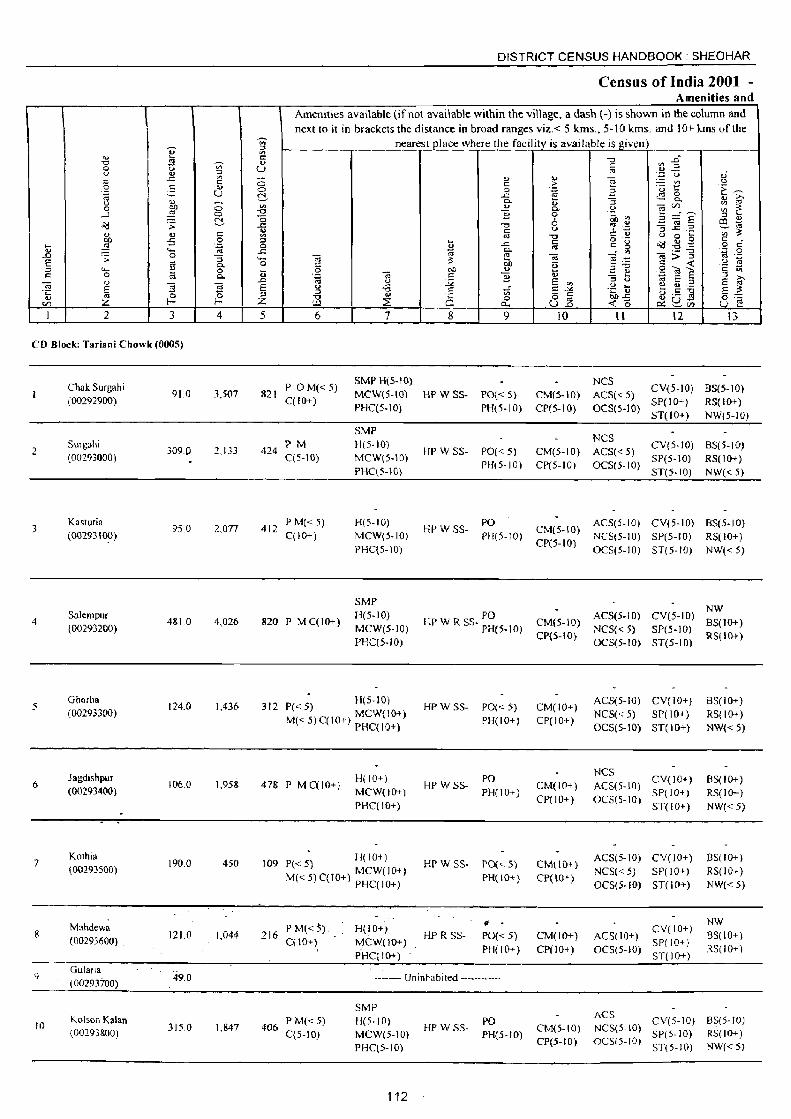
\ ~ ~ " .", ,!3 0 '-> u Q)
'" .c
.9 .!: <;;
_. u OJ 0 eo
..l ~
"d >-., OJ eo -5 ,_ .!2 0) '-..0 0 E ;,-
'" ::J "- e c 0
'" " -;;:; 'l'i E ·c 0 ., til
<I] :z; l-
I 2 3
CD Block: TaTiani Chowk (0005)
2
3
4
5
6
7
8
10
Chak Surgahi
(00292900)
Surgahi
(00293000)
Kasturia
~00293100)
Salempur
(00293200)
Ghorha (00293300)
Jagdishpur (OO2934(lO)
Kothia (00293500)
Mahdewa
(00293600) .
Guiana,
(00293700)
Kolsc>o Kalan (002'f3&OQ)
91.0
309.D
95.0
481.0
124.0
106,0
190.0
121.0
49,0
3J5.0
v;-'" '" '" ., U _ 0 0 !'::!.
<= 0 .~
::; ""' 0 0..
0; '0 I-
4
3,507
2,133
2,077
4,026
J,436
1,958
450
1,044
1,847
DISTRICT CENSUS HANDBOOK: SHEOHAR
Census of India 2001 -Amenities and
Amenities available (if not available within the village, a dash (-) is shown in the column and next to it in brackets the distance in broad ranges viz,< 5 kms" 5-10 kms. and 10+ kIns of the
-;;;- nearest Qlace where the facilityis available is_gjven) '" '" <:: .,
U
;; 0 ~
'" "0 "0 ..c: ., '" ::J 0 .c '- ~ 0
u (3 .~ ..0
E u ;;::J :::>
-0 :z; UJ
5 6
P OM«5) 821
C(IO+)
PM 424 C(S.IO)
412 PM«5) C(IO+)
820 P M C(10+)
'" U 't:i OJ
:2 7
SMP H(5-IO)
MCW{S-IO)
PHC(5-10)
SMP H(S.IO)
MCW(5-101
PHC(5-10)
H( 5-10)
MCW(5·10)
PHC(5-10)
SMP H(5-IO)
MCW(S·IO)
PHC(5-10)
H(5-IO) 312 P«5) MCW(IO+)
M« 5)C(IO+) PHC(IO+)
478 P M C( 10+) H( 10+)
MCW(IO+}
PHC(IO+)
109 H(IO+)
1'« 5) MCW{IO+) M« 5) qro+) PHC( 10+)
PM«:;) 216
H( l 0+)
C(lO+) MCW(IO+)
PHqIO+}
_o ;;1 '" :; iij .!! -. '-> .; ..,
" .. '" '" is ::: § u 1:' .~ ..c: e ~~ 0 ;,-,
0- 0) Cl. <;- :; ooVl '" '" <1)
""' L> on 3: "§ 0 .~ ~ §:g~ '" ~
" co ~ '0 "? ·z ""3 ..c_= ~ .. t:: U
Vl 3: ro "0 c ., u 0 ... ... c: o ._
Q;d.g.g c C u .c
'" c g 0
0; Co '" ,_ -a
.~ ,Q ~ 00 ""§ :::: 'iii > :; ~ <:: ~ u N 00 .~ ::>'U ;:: eo u _ u
Q~E on c '2 OJ - ... '" :;., :.;;; E '"
::> <J 0; E '" E ~ <J ... e ~:.o c V; 1:.:.0 -~ QJ
is (3 c: 00 .c u ,_ 19 E_ 0 8 'E 0... u_g ~ '5 ~s:::!'cn
8 9 10 II 12 13
NCS CV{5-IO) BS(5-10)
HP W SS- PO« 5} CM(5-IO) ACS« 5) PH(5-IO) CP(5-10} OCS(5-10)
SP(IO+} RS{IO+)
ST(IO+) NW(5-IO)
NCS CV(5-IO) BS(5-10)
HP W SS- PO«5) CM(5-IO) ACS« 5) SP(5-IO) RS(JO+)
PH(5-W) CP(5-fO) OC5(5-IO) 5T(5-10) NW« 5)
HP W SS- PO CM(5-10) ACS(5-10) CV{5-IO) BS(S-IO} PH(5·rO) CP(5-IO) NCS(S-IO) SP(S-IO) RS(IO+}
PO HI' W R SS- PH(5-1 0)
HP W SS- PO« 5)
PHi 10+)
HP W S5- PO PH(JO+)
HI' W SS- PO« 5)
I'H(IO+)
• . HP R SS- PO{< 5)
PH(IO+)
OCS(5-10) ST(5-10) NW« S)
CM(5-IO) ACS(5.10) NCS« 5)
NW CV(S·ID) B5(JO+) SP(5-IO) RS(IO+) ST(5-10) CP(5-10} OC5(5-10)
CM(IO+}
CP(IO+ )
CM(lO+)
CP(IO+)
CM(IO+)
CP(\O+)
CM(IO+)
CP(IO+)
ACS(S·IO) CV(IO+)
NCS«5) SP(10+)
OCS(5-IO) ST(IO+)
NCS ACS(S-IO) CV{JO+)
OCS(S-I(}) SP(10+) ST(IO+)
ACS(5-IO) cvcro+)
NCS« 5) SP(IO+)
OCS(5-1O) ST(IO+)
CV( 10+) ACS(lO+)
OCS(5-10) SP(IO+)
ST(IO+)
SS( 10+)
RS( 10+)
NW{< 5)
as{ 10+) RS(IO+)
NW«5)
8S(10+)
RS( 10+)
NW« 5)
NW BS(lO+)
RS( 10+)
--_.--- Uninhabited --------.---
SMP ACS
406 P M«5) H(5·IO}
HP W 5S-PO
CM(5-IO) NCS(5-1O) CV(5-JO) 85(5-10)
C(5-IO) MCW(5-IO} PHis-tO) SP(5-l0) RS(IO+)
PHC(5-IO) CP(5- ra) OCS(5-10)
ST(5-IO) NW«5)
112

VILLAGE DIRECTORY
Villaee DiJectorv Land Use (As on 1999)
14 15
MRfP Sheabar (10)
MRFP NR
Sheabar(5)
MR FP Sheohar (I)
MR FP Sheonar (5)
MR FP Sheohar (IO)
MR FP Sheohar (10)
MR FP Sheohar (II)
MRFP Sbeahar (12)
16 17
_._. Unmhablted "'-_ ••••••
MRfP Sheoh.r(S)
18
Land use {I e area under different types of land use In
hectare)
19 20 •
35 TW(1l 2) T(112)
TW(IOI9) TWE(629) T( \64 7)
TW(25I) R(31 7) T(56 8)
GC(954)
234 TK(34 I) 0(72 0) T(2015}
\2 I GC(41 5) T(415)
125 GC(174) T(174)
152 GC(53 0) T(53 0)
139 GC(30 9) T(30 9)
I 7 GC(6 2) T(6 2)
195 TW(87 6) T(&76)
.---113
21
42 I
704
238
1750
215
202
533
197
244
1027
22
168
\ 9
112
14
12
122
8 I
9 I
24
23
337
571
~ ;; 'o .. E '" Z 2
Cbak Surgahl
Surgahl
12 I Kastuna
70 I Salem pur
480 Ghorh.
546 Jagdlshpur
562 Kathla
482 Mahdewa
79 Guiana
1024 Koison Kalan
2
4
6
7
9
10
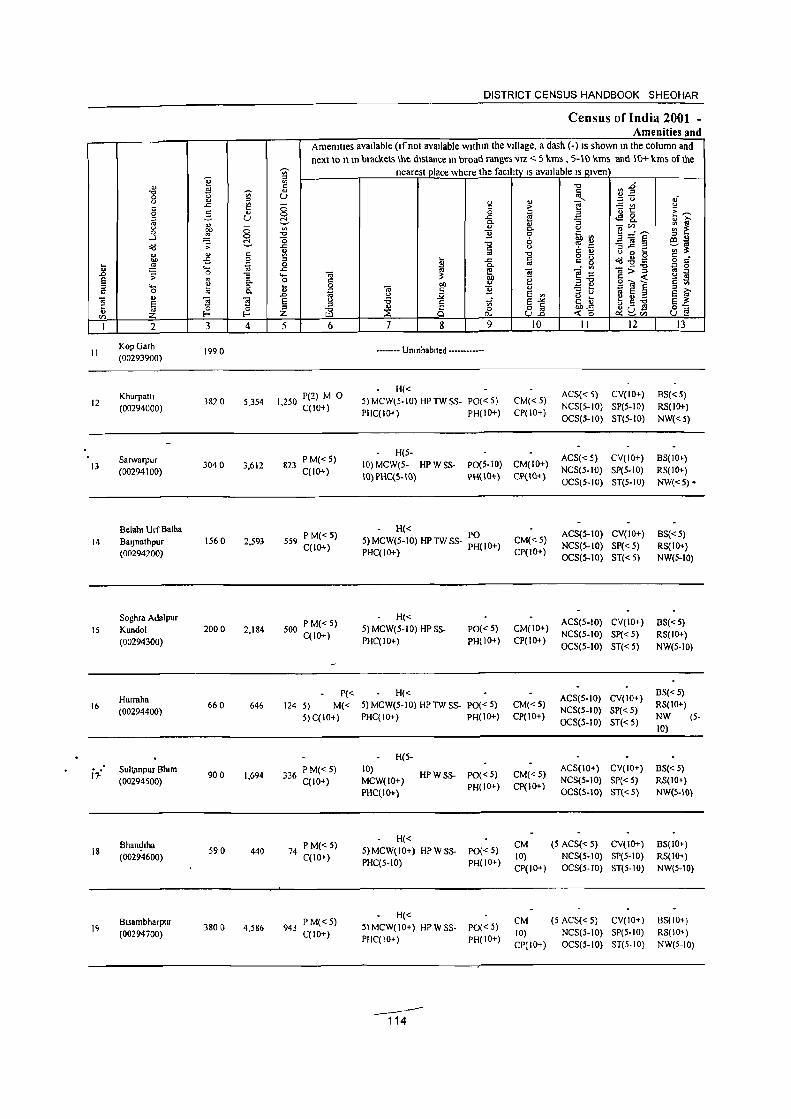
II
12
13
14
15
16
. i1-'
18
I~
2
KopGarh (00293900)
Khurpattl (00294000)
Sarwarpur (00294100)
Belahl Urr Balba BalJnathpur (00294200)
Soghr. Adalpur Kundol (00294300)
Hurrah. (00294400)
Sul\ilnpur Shim (00294500)
Bhan~lha
(00294600)
Bisambharpur (00294700)
3
1990
3820
3040
1560
2000
660
900
590
380 ()
v;-" Vl
" ... u
4
5,354
3,612
2,593
2,184
646
1,694
440
4,586
DISTRICT CENSUS HANDBOOK SHEOHAR
Census of India 2001 -Amenities and
'V;' :>
Amemlles available (If not available wllhm the village, a dash (-) IS shown In the column and next to It In brackets the dIstance In broad ranges VIZ < 5 kms , 5- \() kms and \()+ kms oflhe
nearest place where the faclhtv IS avmlable IS 1!.IVen
'" " ., u o
~ '" "0
"0 ..c ., ~ o
..c ... o ~
.0 E :> z 5 6
1250 P(2) M 0 , C(1O+)
823 P M« 5) C(lO+)
559 P M« 5) C(lO+)
500 P M« 5) C(IO+)
P« 124 5) M«
5)C(10+)
336 P M« 5) C(IO+)
PM«5) 74
C(IO+)
PM«5) 943
C(lO+)
7 8
-------- Umnhablted -----------
H«
t;; o
0..
9
5) MCW(5-1O) HP TW SS- PO« 5) PHC( 10+) PH( 10+)
H(5-
10
CM« 5) CP(IO+)
10) MCW(5- HP W SS- P0(5-IO) CM(IO+) lO) PHC(S-lO) PH(lO+) CP(IO*)
• H« PO 5) MCW(5-10) HPTWSS- PH(IO+) PHC(IO+)
H« 5) MCW(5-10) HPSS· PO«5) PHC(IO+) PH(IO+)
H« 5) MCW(5·10) HPTWSS- PO«5) PHC(IO+) PH(IO+)
H(5-10)
HPWSS- PO«5) MCW(IO+)
PH(IO+) PHC(IO+)
H« 5)MCW(10+) HPWSS- PO«5) PHC(5·10) PH(IO+)
H« S\MCW(IO+) HPW SS- PO« 5) PHC( 10+) PH( 10+)
_-114
CM« 5) CP(IO+)
CM(IO+) CP(IO+)
CM«5) CP(IO+)
CM«5) CP(IO+)
CM 10) CP(IO+)
CM 10) CP(IO+)
II 12
ACS« 5) CV(IO+) NCS(S-IO) SP(5-10) OCS(S-IO) ST(5-10)
ACS« 5) CY(IO+) NCS(S-IO) SP(S.IO) OCS(S.IO) ST(5·10)
ACS(S-IO) CY(IO+) NCS(5·10) SP« 5) OCS(5-10) ST« 5)
ACS(S-IO) CY(IO+) NCS(S-IO) Sp« 5) OCS(5-10) ST«5)
ACS(S-IO) CY(IO+) NCS(S-IO) SP« 5) OCS(S-IO) ST«5)
ACS(IO+) CY(IO+) NCS(S-IO) SP« 5) OCS(5-10) STt< 5)
(5 ACS« S) CY(IO+) NCS(5-10) SP(5-10) OCS(5·fO) ST(5-10)
(5 ACS« S) CV(IO+) NCSp·IO) SP(S-IO) OCS(5-10) ST(5·10)
13
BS«5) RS(lO+) NW«S)
BS(IO+) RS(IO+) NW«5) •
BS«S) RS(IO+) NW(5-10)
BS«5) RS(IO+) NW(5·10)
BS«5) RS(lO+) NW (5-10)
BS«5) RS(IO+) NW(5-IO)
BS(lO+) RS(IO+) NW(5·IO)
BS(IO+) RS(IO+) NW(5·10)

VILLAGE DIRECTORY
Villaee Directorv Land Use (As on 1999)
E ..l<
S ~
u <.> c: ., S '" ... .~ '" 0() .;;
~ oJ)
OIl '" .;:: ~ ~
;>. B 0.
" -5 9 "- Co
" '" '" <II 0-e 11 l; '" 0. oS
~ ~ c. ., " ...: z z
14 15 16 17
------ Uninhabited ------.-••
MR FP Sheohar(O)
PR MR Sheohar (I 0)
PRMR FP
MRFP
• MRFP
PRMR FP
MRFP
PRMR
Sheohar (I)
Sheohar (I)
Sheohar(O)
Sheohar (I)
Sheohar (0)
Sheohar (0)
.. .
c-:;:; 0 E E 0 ... " ~~ o ~ ;:>.3 E ~ ._ "" 10 ::> 0 § ::! E
18
Land USI! (Le. area under different types orland lise in
~ 0
t.t.
19
hectare)
0' f:! ::> 0 '" ;>. e
"C
.~ }:;
20
TW(42.2) 11 3 R(J4.9) T(57.1)
140 GC(16 3) · T1I63)
TW(30.3)
T(30.3)
GC(210) 10.6 T(21.0)
20 GC(J3.0) · T(13.0)
GC( 15.8} 2.1 R( 10.9) T(26. 7)
46·GC(40.3) · T(40J)
0.9 GC(&.2) T(&.2)
GC(89.2) 2.~ W(37 0)
T(126.2)
"C
l;i 01)
'E '2 ;:J
21
59.8
136.8
129.8
40.7
110.8
25.6
32.1
47.1
206.8
Ol) c: ] U c:~ ._ '" ~" ~ ~
~~ u C
:0 «I
e :a "..c ~ g 8 llh
22
1.6
846
40.1
53.8
2.7
1.1
10
0.7'
12
c: .S! 'iii .~ ;; ... ~
.2
" :0 1.1> ~ .;; ~ > .;:: .. .... 15 0 <::
" '" ~ E '" ...: z
23 2
68.8 KopGarb
130.1 Khurpatti
103.9 Sarwarpur
29.6 ~elahi Urr Balha BalJnathpur
71 6 Soghra Adalpur . Kundol
10.2 Hurraha
12.5 Sultanpur Bhim
2.1 . Bhandiha
43 I Bisambharpur
.B E ;;J c: -.;
-~ 1
II
t2
13
14
15
16
17
18
19

20
21
22
23
24
25
26
27
28
29
2
BalJnathpur (00294800)
BalJnathpur (00294900)
KhaJepur (00295000)
Fatehpur Ghaus (00295100)
POjhlan (00295200)
Bochhan Urf Az Rakbe POJhlan (00295300)
Falehpur Ghauspur (00295400)
SamhuII (00295500)
Madhopur Chhat. (00295600)
Belahl Dullah (00295700)
4
1090 1,342
110
1440 1,430
630 922
197.0 2,515
350 289
270
2450 2,693
3360 4.570
15.5 0 1,714
DISTRICT CENSUS HANDBOOK. SHEOHAR
Census of India 2001 -Amenities and
AmeOltles avaIlable (If not avaIlable wlthm the VIllage. a dash (-) IS shown m the column and next to II m brackets the dIstance m broad ranges VIZ < 5 kms , 5-10 kms and 10+ kms of the
nearest place where the facIl1ty IS avaIlable IS gIven
g ~ {l "0 ..c
~ o
..c ... o .. _g E ::> Z
5 6
251 P M« 5) C(lO+)
7
H(IO+) MCW(IO+) PHC«5)
8 9
HP W SS- PO« 5) PH(lO+)
•... _._. Unmhablted ........... .
P M(2) 32~ C(IO+)
232 M P« 5) C(lO+)
595 P(2) M C{IO+)
H(5· 10) MCW(IO+) PHC(5-10)
HRMP MCW(IO+) PHqIO+)
H(IO+) MCW(IO+) PHC« 5}
P« 65 5) M« H( 10+)
5)C(1O+) MCW(IO+) PHC«5)
P« 5) M« H(IO+) 5)C(IO+) MCW(IO+)
782 P M« 5) C(lO+)
P(2l M 984
C(lO+)
399 P M« 5) C(IO+l
PHC«5)
PHSH(IO+) MCWtIO+) PHqIO+)
DAH(5-1O) MCW(S·IO) PHqS·IO)
H(S· -10) MCW{IO+) PHC(5-10)
·-n15
HP W SS- PO(IO+) PH(IO+)
HP W SS- PO(IO+) PH(lO+)
HP W SS- PO« 5) PH(IO+)
HP W SS· PO« 5) PH(IO+)
HPSS· PO« 5) PH(IO+)
HP W SS- PO« 5) PH(lO+)
PO HPWSS-
PH(5·10)
HPWSS· PO« 5) PH(5·IO)
,/
10
CM(IO+) CP(IO+)
CM(IO+) CP(IO+)
CM(IO+) CP(tO+)
CM(IO+) CP(lO+)
CM(IO+) CP( 10+)
CM(IO+) CP(IO+)
CM(IO+) CP(IO+)
CM«5) CP(IO+)
CM«5) CP(5·10)
--
II 12
ACS« 5) CV(IO+) NCS(5-10) SP(5-10) OCS« 5) ST(5·10)
13
BS RS(IO+) NW(5-10)
ACS(5·10) CV(IO+) BS(lO+) NCS(5-10) SP(IO+)". RS(IO+) OCS(S·IO) ST(IO+) NW« 5)
ACS« 5) eV(IO+) NCS(5·10) SP( 10+) OCS« 5) ST(IO+)
ACS« 5) eV(IO+) NCS(5-IO) SP(IO+) OCS(IO+} ST(IO+)
ACS« 5) CV(IO+) NCS(5-10) SP(IO+) OCS« 5) ST(IO+)
ACS(5·10) eV(lo+) NCS(5·10) SP(IQ+) OCS« 5) ST(IO+)
ACS(S·IO) eV(IO+) NCS(5-10) SP(IO+) OCS« 5) ST(IO+)
ACS(5·10) eV(S-IO) NCS(5·10) SP(IO+) OCS(5-10) ST(IO+)
ACS(<" 5) CV,5·IO) NCS« 5) SP(5-10) OCS(5-10) ST(5·IO)
BS RS( 10+) NW«5)
BS(IO+) RS(IO+) NW«5)
BS(IO+) RS(IO+) NW«5)
BS(IO+) RS(IO+) NW(.5-IO)
. -.. BS(IO+) RS(IO+) NW(5-10)
BS(IO+) RS(IO+) NW(5-IO)
BS{5.1O) RS(IO+) NW(5·10)

VILLAGE DIRECTORY
ViIlaee Directory Land Use lAs on 1999)
14
PRMR FP
15
Sheohartl)
16 17
.- .- Uninhabited _.-.-
PRMR FP
MRFP
MRFP
Sheohar (10)
Sheohar(IO)
Sheohar (10)
MR FP Sheohar (10)
~ MR Sheohar(IO)
PRMR FP
MRFl'
MRFP
Sheohar (I ')
Sheohar ( I 0)
Sheohar(5)
18
Land use (I e area under dl tTerenl types ofland use In
hectare)
19 20
I 6 TW( 13 5) R(8 I) T(lI6)
08 TW(4 5) T(4 5)
195 TW(443) T(443)
69 TW(116) T(II6)
216 TW(564) T(564)
77 TW(4 9)T(4 9)
I 2 TW(5 0) T(5 0)
21 g GC(91 I) T(91 I)
GC(88 I) TW(9(f0)
13 4 TWE(70 0)
T(248 I)
8 I GC(I4 I) T(14 I)
-----117
21 22
334
01
45 I
290
57 I
49
89
563
387
1019
_-
20
09
07
08
18
04
06
36
39
06
23
~ ;;:
.... o
'" E -£.. 2
50 5 !:laljnalhpur
43 Baljnathpur
34 5 Khajepur
14 4 Fatehpur Ghaus
'7 3 Bochhan Urf Az Rakbe POjhlan
I I 4 Falehpur Ghauspur
72 7 Samhu!1
32 I Madhopur ehhal.
30 9 8elahl DuHah
20
21
22
23
24
25
26
27
28
29

DISTRICT CENSUS HANDBOOK SHEOHAR
Census'of India 2001 -Amenities and
Amenities avatlable (Ifnol available wlthm the village, a dash (-) IS shown m the column and
next to It m brackets the distance In broad ranges VIZ < 5 kms, 5-10 kms and 10+ kms of the
"' neares! place \\here the facllllv IS available IS given " ~ V>
'" C "'0 .6 '" " "0 ti '" c '" " 0 lJ '" "'-U <U " ;:: u .;
c .s= '" - <U ~ , e -= '" " c 0 c u t:: E~ S! 5- " 0 0 e 3 ~
lJ C!. ..c ~ 8.. '" » 0. :; u " - '" '" '" ~ :~e ~ ~ 0 00 0 c. u ...J ~ 0 '" }! 0 foll ::> '" c:!. '0 6 ~ -~ :;: .s= "'0 u ~ .::l 3~~ ';;;'~ .. c '" '" c: ., oJ "0 c: " ~ g g 00 -5 0 ::> ti a g~ ~
c: c ..8 ~ il 0 ..c
"'0 - 2 .... .s= ;a 0. "iii:>"'§ <U 0
;; 0 :; "iii ~ "iii "'§-=: ~ E .. 0 ~ e gtil~ u
0. C ,,"'0 C " '- '" 0 ~ Q 00 ~ ~ t: 0 1i! 0. '" "iii c }! u ~ ~ § E ~ '" .c 'i<i u _;;; E ., ::J U
"iii g g E u .;; u ~ E ~ ;: E ::J ==
;i E-"" ;: <U ~ c ." u oJ ~
0 ::J "'0 U i5 0 o C 00"<: ~ Q3l 0-=
Vl Z f-o Z ILl :2 0- lJjg -< 0 lJ i'! I 2 3 4 5 6 7 8 9 10 II 12 13
N,mah, P M«S) - H(5-
CM (5- ACS« 5) CV(5-10) BS(5-10) 30 1490 1,771 308 10) MCW(5- HP TW W PO« 5)
(00295800) qlD+) 10) PHC(S-IO) SS- PH(5-10)
10)CP(S- NCS«5) SP(S-IO) RS(ID+) 10) OCS(5-10) ST(5-IO) NW(S-IO)
Rupwara P M« 5)C(S-- H(5- CM (5 ACS NCS« CV(;-IO) BS(S-IO)
31 1670 1349 270 10) MCW(S- HPWTK PO« 5) (00295900) 10)
10) PHC(S-JO) SS- PH(5-IO) 10)CP(S- 5)OCS(5- SP(5-10) RS(1O+) 10). 10) ST(5-10) NW(S-IO)
Hlrauta Duma P(3) M - H(5-
PO ACS NCS CY(S 10) BS(S-IO) 32 6390 8601 1.548 10) MeW(S- HP W TK CM(5-1O)
(00296000) C(5-JO) 10) PHC(5-10) SS- PH(5-IO)
CP(S-IOl OCS(5-10) SP(5-10) RS(IO+)
ST(S-IO) NW(S-IO)
Kurham P M« 5)C(5-H(S-
ACS{< S) CV(S-IO) BS(S-IO) 33 350 500 93 10) MCW(S- HPWSS- PO« 5) CM(S-IO)
(00296100) 10) 10) PHC(S-I 0) PH(S-IO) CP(5-1O)
NCS« 5) SP(5-10) RS(IO+) OCS(S-IO) ST(S-IO) NW(S-IO)
34 Huamma
1590 2.784 555 MP«5}C(S- H(IO+) HPWSS-
PO CM(ID+)
ACS« 5} CY(ID+) BS(IO+) (00296200) 10) MCW(IO+) PH(lO+)
CP(IO+) NCS« 5) SP(S·IO) RS( 10+)
PHC« 5) OCS(5-10) ST(S-IO) NW(5-1O)
P« H(S-
35 Anu, Nankar
60 214 40 S) M« IO}
HPWSS- PO« S) CM«5) ACS(S-IO) CV(S-IO) BS(5-10)
(00296300) 5) C(5- MCW(IO+) NCS(5-IO) SP(5-1O) RS(IO+) 10) PHC(5-IO)
PH(IO+) CP(5-1O) OCS(S-IO) ST(5-1O} NW(5-1O)
H(S-
36 Rampur Kilas
650 1.927 327 P M('- 5) C(5- 10)
HPWSS- PO« 5) • __ CM«.5).- ACS(S-IOl CY(S-IO) BS(S-IO} (00296400) 10) MCW(IO+)
l'H(5-10) CP(S-IO") NCS(5-IO) SP(5-10) RS(IO+)
PHC(5-10) OCS(S-IO) ST(5-10) NW(5-10)
H(S-
37 Rewas,
1220 1,848 351 P M« 5) C(S- 10) ACS(S-IO) CV(S-IO) BS(S-IO)
HP W SS- PO« 5) CM«5) (00296500) 10) MCW(IO+) PH(5-10) CP(5-1O)
NCS(S-IO) SP(5-IO) RS(IO+) PHC(S-IO) OCS(S-IO) ST(S-IO) NW(IO+)
38 Pachra
2160 2,243 542 P(2) M H(lO+) ACS«5) CV(S-IO) BS(IO+)
HPWSS- PO« 5) CM«5) (00296600) C(lO+) MCW(IO+) PH(IO+) CP(IO+)
NC.S(S-IO) SP(S-IO) RS(IO+) PHC(IO+) OCS(S-IO) ST(5-10) NW(IO+)
39 Athkaunl
3100 PM«S) PHCH(IO+) ACS(S-IO) CV(S-IO) BS(IO+) 4.173 839 HPWSS f1O« 5) CM(IO+) (00296700) C(IO+) MCW(IO+)
PH(I~-eP(T6+) NCS(S-IO) SP(S-IO) RS(IO+)
.....- OCS(5-10) ST(5-IO) NW(IO+)
~~
--tt8""-
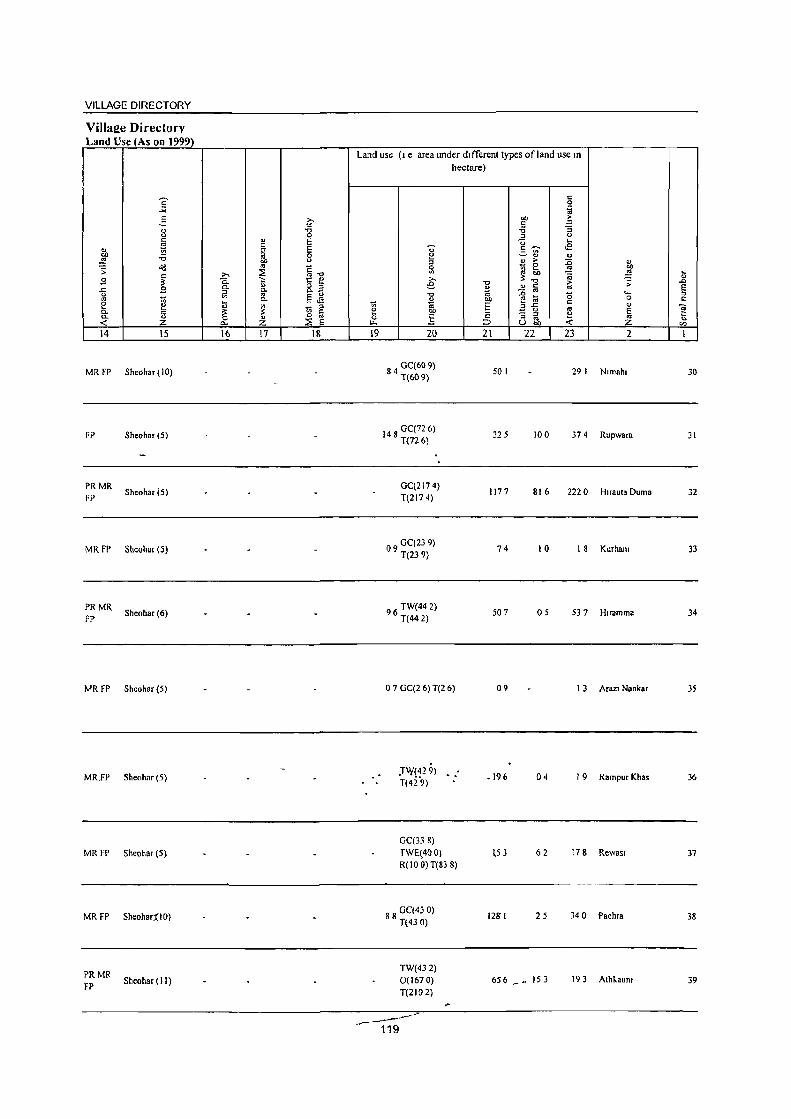
VILLAGE DIRECTORY
ViJlaee Directorv Land Use (As on 1999)
I c:
_;;;
2 OJ
" C
OJ ; OIl
~ -0
:; oa c
9 " .t: £ " " ~ e Q. .. "- OJ
-< z 14 15
MR FP Sheohar (10)
FP
PRMR FP
MRFP
PRMR FP
Sheohar (S)
Sheohar (5)
Shcohar (5)
Sheohar (6)
lVR FP Sheohar (5)
MR.FP Sheohar (5)
MRFP Sheohar(5)
MRFP Sheohar:(IOJ
PRMR Sheohar ( II)
FP
16 17 18
Land use (I e area under dIfferent types of land use In
hectare)
19 20
84 GC(60 9} T(609}
148 GC(n 6} T(72 6)
GC(2174) T(2174)
09 OC(23 9) T(239)
96 TW(442) T(442)
07 OC(2 6) T(2 6)
.TW{~2 9) T(429)
GC(338)
TWE(400) R(IO 0) T(S3 8)
88 GC(43 0) T(43 0)
TW(432) 0(1670) T(2102) _---
.,.- 119
21 22
SO I
325 100
1177 816
74 10
507 os
09
.196 04
l53 62
1281 25
656 __ IS 3
23
~ ;; 'o
OJ g Z 2
29 I Nlmahl
374 Rupwara
2220 HI,a"!a Duma
18 Kurhan!
537 Hlfamma
I 3 AraZl Nankar
I 9 Rampur Khas
178 Rewasl
340 Pachra
193 Alh,aum
30
31
32
33
34
35
36
37
38
39

DISTRICT CENSUS HANDBOOK: SHEOHAR
Census of Iqdia 2001 -Amenities and
Amenities available (ifnot available within the village, a dash (-) is shown In the column and nel(t to it in brackets the distance in broad ranges viz. < 5 kms .• 5-10 kms. and 10+ kms of the
U> nearest_lllace where the facility is available is given " .g ~ E "'" ~~ 19 ~ " " 0 " '" U .,
" " Si - " '" co ';:::;; u .;
" ..c <: 0 <: > ~ t! " 0 c " 0 a ~ 3' ~~
~ -::.. U ~ ..c ~ &. '" >. u u - "" " :; '" !;!
0 CD 0 '" " Co. u e U) .. _ ;: 5 -J ~ 0 '0 !l a '~.!! t!- O " ~~~ CIl _
~ .:; ..c " u ";,"~ " " c u II) ., <: '" co '0 '-' a ~ CD .c 0 " ~ c g 'g ~ " B
<: ~ ~ .::: .~ 0 '" ..c .. -0 _ o r:!
" ..c ~ "" '" ._ -0 ;;: a
.s;, ;:: 0 :; '- OJ ~ OJ OJ - OJ>,, '" ._ E .,
0. a c ~ :; -6 g""Q ::: E ~ '" ..... " 0 ~ 0 01> .., ~ ~ c 0 ~
"- II) .~ OJ s !l " ~ E § ::l >. .. "
.s;, u -"" E '" " u E ~ OJ S ~ E u ~
u ~ e u ._ c E " .S B
E-" 'C' Q) " <: "0 E .-
" " 0 ::l "0 Ci o c oo..c u _ " 0==
Vl ;Z; !- !- ;Z; UJ ~ Co. u.2 « 15 e>:~ci) u e I 2 3 4 S 6 7 8 9 10 11 12 13
40 Raja Dih
237.0 3,413 651 P M« 5) H(IO+)
HPWSS- PO« 5) CM(IO+) ACS« 5) CV(IO+) BS RS(IO+) (00296800) C(lO-l") MCW(lO+)
PH(IO+) CP(IO+) NCS(5-IO) SP(5-10) NW(IO+)
PHC(IO+) - OCS(5-1O) ST(5-10)
AzRakbe
41 Athkauni Urf
84.0 1,116 188 PM« 5) H(IO+)
T HP W SS- PO« 5) CM«5) ACS(5-10) CV(JO+) BS(IO+)
Benipur C(IO+) MCW(IO+) PH(IO+) CP(IO+)
NCS(5-1O) SP(5-10) RS(IO+) (002%900) PHC« 5) OCS(5-10) ST(5-10) NW(IO+)
Az Rakbe Raja P« H(IO+) ACS(IO+) CV(IO+) BS(5-1O)
42 bih Barahi 51.0 783 220 5) M« T HP W SS- PO« 5) CM«5) (00297000) 5)C(IO+)
MCW(IO+) PH(IO+) CP(IO+) NCS(5-10) SP(5-10) RS(IO+)
PHC« 5) OCS(5-10) ST(5-10) NW(IO+)
43 Basanl Param
115.0 1,432 267 PM« 5) H(lO+)
T HP W SS- PO« 5) CM«5) ACS(IO+) CV(IO+) BS(IO+)
(00297100) COO ... ) MCW(IO+) PH(IO+) CP(IO+)
NCS(5-IO) SP(5-10) RS(IO+) PHC(5-10) OCS(5-10) ST(5-IO) NW(IO+)
Bindraban P(3) M PHS H( 10+)
PO CM ACS(5-1O) CV(IO+) BS(IO+) 44
(00297200) 578.0 6,592 1,192
C(IO+) MCW(IO+) THPWSS- PH(IO+) CP(IO+) NCS(IO+) SP(5-IO) RS(IO+) PHC(IO+)
OCS(5-IO) ST(5-10) NW(IO+)
NH(2)SMP
45 Chhatauni
683.0 P(3) M H(5-10) HPTWW PO CM (5 ACS(IO+) CV(IO+) BS(IO+)
(00297300) 6,638 1,435
C(IO+) MCW(IO+) TKSS- PH(IO+) 10) NCS(IO+) SP(5-10) RS(IO+) PHC(5-1O) CP(lO+) OCS(lO+) ST(5-10) NW(IO+)
8 ishunpur Fakira P M« 5) H« HPTWW CM (5· ACS(IO+) CV(IO+) 8S(IO+)
46 (00297400)
71.0 669 160 qlO+) 5) MCW«5) SS-
PO« 5) 10) NCS(IO+) SP(5-IO) RS(lO+) PHC(5-10) PH(IO+)
CP(IO+) OCS(IO+) ST(5-1~) 'NW(IO-t'r'
Bishunpur P« H« ACS« 5) CV(IO+) BS(IO+) 47 Dhamnand 68.0 756 141 5) M« 5) MCW( 10+) HP W SS- PO« 5) CM(5-10)
NCS(IO+) SP(5-10) RS(IO+) (00297500) 5) C(lO+) PHC(S-IO) PH(IO+) CP(IO+)
OCSlIO+) ST(S-\O) NW(tQ+\
48 Aura
4,428 P(2) M S C(5- PHS H« 5)
HPW SS-PO
CM«5) ACS(IO+) CV(IO+1 BS(lO+)
(00297600) 472.0 935 MCW«5) SP(5-IO) RS(lO+)
10) PHC« 5) PH(IO+) CP(IO+)
NCS(IO+) OCS(IO+) ST(5-JO) NW(IO+)
49 Lalpur
8.0 --Uninhabited ----(00297700)
Bislnlnp\l! Bindi P« H« H'I'TWW ACS(IO+) C\,(IO~ \ BS{IQ+)
50 119.0 307 66 5) M« 5) MCW«5) PO« 5) CM«5) (00297800) 5)'C(l0+) PHC(5-IO)
SS-PHI 100l
NCS(IO+) SP(5-IO) RS(IO+) CPt ~ )--o{;S( 10+) ST(5·IO) NW(JO+)
120 _---

VILLAGE DIRECTORY
VilJaee Directory Land Use (As on 1999)
14
PRMR FP
PRMR FP
PRMR FP
PRMR FP
PRMR FP
PRMR FP
PRMR FP
..
MRFP
PRMR FP
'" 1:! '" ., z 15
Sheohar ( 12)
Sheohar(l)
Sheohar(l)
Sheohar 12l
Shcohar (10)
Sheohar (5)
Sheoimr(O_l
Sileohar (0)
Sheohal (I)
16 17
ED
EIT
ED NM
•• _ •••• UnInhabIted _._ •••• _
PRMR Sheobar(O) FP
18
Land use (I e area under different types ofland use In
hectare)
19 20
TW(709) 0(395) T(1104)
TW(337) 0(21 0) T(54 7)
TW(285) T(285)
TW(519)
0(21 3) T(73 2)
GC(1050) TW(123 I) 0(205) T(2485)
TW(IOO3) 0(407) T(l410)
TW(219) 0(173) T(39 3)
TW(328) 0(6 S) T(39 7)
TW(1I1 I) 0(799) T(1910)
TW(21)O{O I) T(22)
TW(458) O(26)T(483{
121-
21
500
65
84
215
2006
5136
30 I
25&
2606
52
696
bI) c:
-i5 :::r -;:; 5~ - " " > - 0
~~ " c: - .. e ~ "..c ~ g :::r '" Uoo 22
353
77
48
108
624
108
49
23 2
Az Rakbe 14 8 AthkaunJ Urf
Bempur
9 2 Az Rakbe Raja D.1l Barah.
96 Basanl Param
667 Bmdraban
177 Chhalaum
20 BIshunpur Faklra
'5 BIshunpur - Dharanand
157 Aura
03 Lalpur
IS BIshunpur Bmdl
40
41
42
43
44
45
46
47
48
49
50
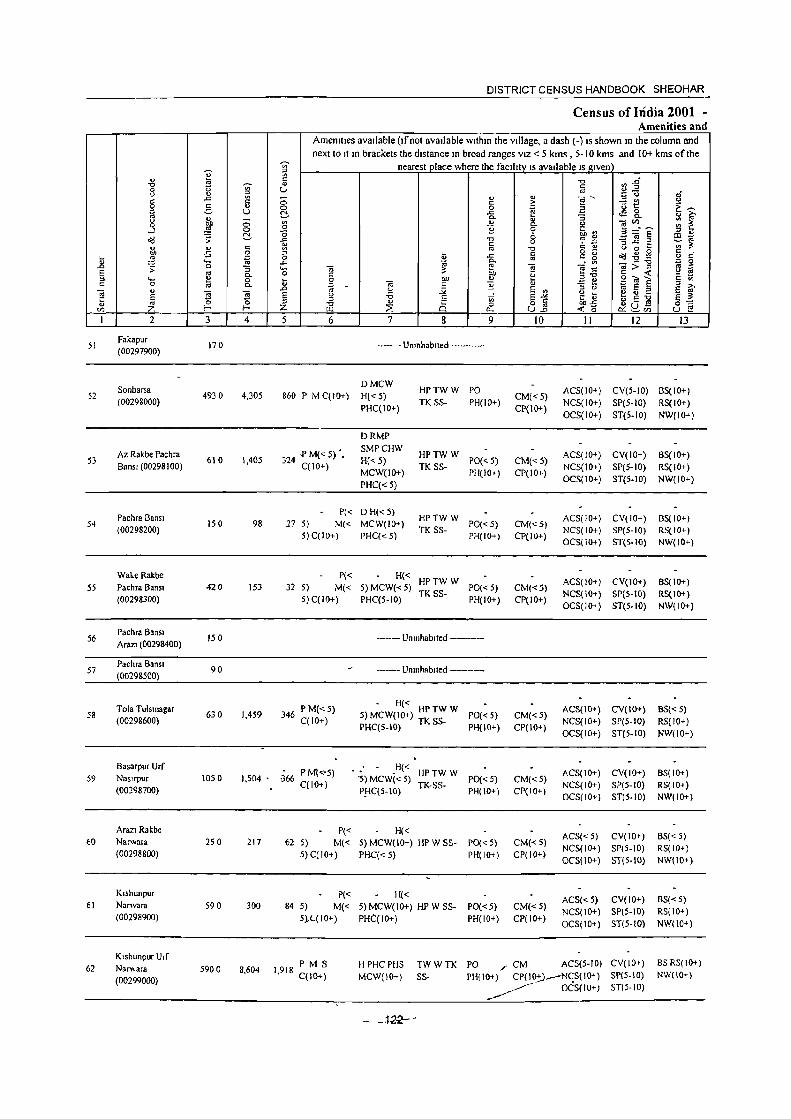
51
52
53
54
5S
56
S7
58
59
60
61
62
~ ;;: 'o
" E " Z 2
Fakapur (00297900)
Sonbarsa (00298000)
Az Rakbe Pachra Bansl (00298 100)
Pachra Bansl (00298200)
Wale Rakbe Pachra Bansl (00298300)
Pachra Bansl Arazl (00298400)
Pachra Bansl (0029&500)
Tola Tulsmagar (00298600)
Basarpur Urf Nampur (001Q8700)
Arazl Rakbe Na ...... ara (00298800)
Klshunpur Nanvara (002989OO)
K Ishunpur Urf
(00299000)
3
170
4930
610
IS 0
420
150
90
630
1050
250
590
5900
~ t:
'" U
4
4,305
1,405
98
153
1,459
DISTRICT CENSUS HANDBOOK SHEOHAR
Census of India 2001 -Amenities and
Amemtles available (Ifnot avaIlable withIn the Village, a dash (.) IS shown In the column and next to It In brackets the distance In broad ranges VIZ < 5 kms , 5·10 kms and 10+ kms of the
nearest place where the facIlI.!Y_ls available Is~ven
6 7 8 9
.•••...• Umnhablted ..•• _. __
DMCW 860 P MC(IO+) H{<5)
PHCC IO+)
'24 -PM«S)', J C(IO+)
DRMP SMPCHW H«5) MCW(IO+) PHC« S)
P« DH« 5)
27 5) M« MCW(IO+) 5) C(IO+) PHC« 5)
HPTWW PO TK SS· PH(IO+)
~~ ~~ W PO« 5) PH(IO+)
HPTWW TK SS. PO« S)
PH{IO+)
PC< H« HP TW W 32 5) M« S) MCW« S) TK SS. PO« 5)
5) C(lO+) PHC(5.10) PH(IO+)
346 P M« 5) C(IO+)
• __ .- Unmhabltcd •. _ •• _._
•••• - •• UninhabIted ••••.. _-_
• H« 5)MCW(10+) HPTWW PO«S) PHC(5.10) TK SS· PH(IO+)
10
CM«5) CP(IO+)
CM{<5) CP(IO+)
CM("5) CP{IO+)
CM{<5) CP(IO+)
CM«S) CP(IO+)
II 12 13
ACS(IO+) CY(S·IO) BS(IO+) NCS(IO+) SP(S·IO) RS(IO+) OCS(IO+) ST(5.10) NW(IO+)
ACS(IO+) CY(IO+) BS(IO+) NCS(IO+) SP(S·IO) RS(IO+) OCS(IO+) ST(5·10) NW(IO+)
ACS(IO+) CY(IO+) BS(IO+) NCS(IO+} SP(S·IO) RS(IO+) OCS{IO+} ST{S.IO) NW(IO+}
ACS(IO+} CY(IO+) BS(IO+) NCS(IO+) SP(5·10) RS(IO+) OC5(10+) ST(S.IO) NW(IO+)
ACS(tO+) CV(tO+) BS« 5) NCS(lO+) SP(S·IO) RS(IO+) OCS(IO+) ST(5.10) NW(IO+)
P M'(<-5) 1,504' 366 C(lO+) • ~) MCW·(~(S<) HP TW W rv 5)
TK-SS· P",< P_!-{C(S·IO) PH(IO+}
CM«5) CP(tO+)
ACS(IO+) CY(lO+) BS(IO+) NCS( 10+) SP(S·to) RS( 10+) OCS(IO+) ST{S·IO) NW(IO+)
217
300
8,604
P« H« 62 5) M« S)MCW(lO+) HPWSS· PO«S}
5)C(IO+) PHC« 5) PH(IO+}
P« H« 84 5) M« 5) MCW(IO+) HP W SS· PO« 5)
5)..(.(10+) PHC(IO+) PH(IO+)
CM«5) CP(IO+)
CM«5) CP(IO+)
ACS« 5) CV(IO+) BS(" 5) NCS(IO+) SP(S·IO) RS( 10+) OC5(10+) 5T(5·10) NW(IO+)
ACS«5) CY(IO+) BS«5) NCS(IO+) SP(S·IO) RS(IO+) OCS(JO+} ST(5·1O) NW(IO+)
1 918 P M S , C(1O+)
H PHCPHS MCW(IO+}
TWWTK PO / CM ACS(S·IO) CY(lO+)
SP(S·IO) ST{5·JO)
BS RS(IO+}
NW(lO+) SS· PH(IO+) CP(IOj;) ____ N<;S(lO+) ~ OCS(IO+)
- -12-2--

VILLAGE DIRECTORY
Villal!e Directory Land Use (As on 1999)
Land use (I e area under different types of land use III hectare)
]: r:::
~ g £ ~ > ;::
8 ." -a :; 0 ;:I " ! " S "0 ... r::: S I 5-r;;- ..E
~ ~ 0 ~., ., u
~ e J5
~ c!3 ~-g 0 ... ;:
~ >, ~ '" .. : a ] B Ii
" - o s € -g .2 § 1; ;: § .r::: B §- ~ 0._ 1;1 .... :;! to §.M "tl
1~ g 0 r::: ~ 0. " E e ~ ~ - ;:I ~ ~ @ " <I
0.
~ ~ ~ S 13 ;:I ~ 5 0. ~ 0 § < I'l. "" ::J u gj, < til
14 15 16 17 18 19 20 21 22 23 2 I
-------- UnInhabited -----------TW(130)
25 01 Fakapur 51 0(14) T(14 4)
PRMR TW(1668)
FP Sheohar (2) ED 0(10 8) 2576 122 452 Sonbarsa 52
T(177 5)
PRMR Sheohar(O) ED
TW(69) 73 4 2 Az Rakbe Pachra 53
FP 0(428) T(49 7) Banst
PRMR Sheohar(O) ED TW(81)T(8 I) 53 18 Pachra Bansl 54
FP
PRMR Sheohar (0)
TW(157) 252 1 2 Wake Rakbc 55 FP T(157) Pachra Banst
------- UninhabIted -----------TW(I 3) 0(8 7)
26 27 Pachra Bansl Arazt 56 T(100)
--- UninhabIted ------ TW(I 7)T(1 7) 70 Pachra Banst 57
PRMR Sheohar(O)
TW(211) 320 05 54 Tola Tulsmagar 58
FP 0(44) T(25 5)
PRMR Sheohar(O)
TW(515) 40 I 06 3 5 Basarpur Urf 59
FP 0(95) T(61 0) Nas'rpur
MRFP Sheohar(l) TW(114)
122 04 o 6 Arazt Rakbc 60 T(114) Narwara
PRMR Sheohar (I)
TW(180) 117 03 17 5 Ktshunpur
FP 0(11 9) T(29 9) Narwara 61
PRMR TW(1394)
12 7 Klshunpur Urf FP
Sheobar(l) EA 0(699) 3349 33 I 62 T(2093)
Narwara
123

DISTRICT CENSUS HANDBOOK SHEOHAR
Census of India 2001 -Amenities and
Amenities available (If not available within the village, a dash (-) IS shown In the column and
next to It In brackets the distance In broad ranges VIZ < 5 kms , 5-10 kms and 10+ kms of the -;;;- nearest place where the facility IS available IS given)
I :l
" 5 "" ~~ "" W ~ 0 u tl " " , g " '-e to u
" ..<: a .:.: t! " ~ E~ 0 -5 ... a .a E ;a J;j 8. ~ u c:!- O) 10' j
Q., <> "3 0 a Ul ] Q., " ]~- '" ~
....l a "" ~ ~'" !:l " all ;;: c:!- "0
] .. !l _g=a§ ~l 1 u ~ 'S :l .c _
" <> C § o -u 0 ... c •
~ ..s 0
t .<: c g Od~g o " ... ~ 0
" ""' .<: ~ -a~ OJ;>:] p 0
.0 ;;: 0 "3 .... OJ "§ § j ~
.. Q., 0 t: ~ j] §~< ""' ~ 0 !:i 9 00 <>
~ s E t: '" 0 OJ ~ 11 .. e ~ Q.,
.0 OJ u S '" :l U
5 <> ] ] s u -6 -' :! ki ~ u :! S ~
<II S'" ~~ ~G]
E_ ~ ~ ~
:::J ~ c§ 0 82 8 §
'" Z p.. ~'" I 2 3 4 5 6 7 8 9 10 11 12 13
P« H(S-
Strstan 10) ACS(S-1O) CV(1O+) BS{< 5) 63
(00299100) 1170 300 67 5) M« MCW(IO+)
WSS- PO« S) CM(5-10) NCS(10+) SP(5-10) RS(lo+)
5) C(lO+) PHC(5-1O)
PH(tO+) CP(IO+) OCS(IO+) ST(5-1O) NW(IO+)
H(S-
64 Banarpur
lIS 0 1,255 201 PM(S-IO) to)
W TK C SS- PO(5-IO) CM ACS(S-to) CV(IO+) BS(IO+)
(00299200) C(IO+) MCW(10+) PH(IO+)
CP(10+) NCS(10+) SP(S-IO) RS(IO+) PHC(5-10) OCS(10+) ST(S-IO) NW(IO+)
Tomahl Chak P« H(5-
65 Bhagwall 630 700 168 5) M(5-10)
TWWSS- PO(5-10) CM«5) ACS(S-IO) CV(IO+) BS(IO+)
(00299300) 10) C(IO+) MCW(IO+)
PH(IO+) CP(IO+) NCS(IO+) SP(5-10) RS(IO+)
PHC(S-IO) OCS(IO+) ST(S-IO) NW(IO+)
Shanfnagar Urf 486 P M(5-IO)
H« ACS(5-IO) CV(IO+) BS(IO+) 66 Ghauspur 1220 2,104 5) MCW(IO+) HP SS- PO«5) CM(lO+)
(00299400) C(IO+)
PHC(10+) PH(IO+) CP(IO+) NCS(10+) SP(S-IO) RS(IO+) OCS(IO+) ST(S-IO) NW(IO+)
Jafarpur Urf H(5-
67 Shanfnagar 930 1,370 246 PM« 5) 10) HPWSS- PO(S-IO) CM(S-IO)
ACS(5-10) CV(IO+) BS(5-IO)
(00299500) C(10+) MCW(IO+)
PH(IO+) CP(IO+) NCS(5-10) SP(S-IO) RS(IO+)
PHC(S-IO) OCS(S-IO) ST(S-IO) NW(IO+)
Kishunpur P«
H(5-
68 Narwara
1150 1,011 170 5) M« 10)
HP WSS- PO«5) CM(5-10) ACS« 5) CV(IO+) BS(5-10)
Tolaramnagar 5) C(1O+)
MCW(IO+) PH(IO+) CP(IO+)
NCS« 5) SP(S-to) RS(IO+) (00299600) PHC(5-10) OCS(5-10) ST(5-10) NW(IO+)
H(5-
69 Mangurah.
930 1,273 - 321 P MC(IO+) 10)
HPSS- PO(5-10) CM ACS« 5) CV(IO+) BS(S-IO)
(00299700) MCW(lO+) PH(lO+)
CP(lO+) NCS« 5) SP(5-IO) RS(IO+) PHC(_!O+) OCS(5-10) ST(5-IO) NW(IO+)
H(5-
70 Paharpur
1710 1,450 287 P M« 5) 10) WSS- PO(5-IO) CM(5-10)
ACS« 5) CV(IO+) BS(lO+) (00299800) C(10+) MCW(IO+)
PH(JO+) CP(lO+) NCS«5) SP(5-10) RS(IO+)
PHC(S-IO) OCS(S-IO) ST(S-IO) NW(IO+)
Jagdlshpur P« H« ACS« 5) CV(IO+) BS« 5)
71 (00299900)
780 535 145 5) M« 5) MCW(I 0+) HP W SS- PO«5) CM(5-10) NCS«5) SP(5-10) RS(IO+)
5) C(IO+) PHC(5-10) PH(10+) CP(IO+) OCS(5-IO) ST(5-10) NW(IO+)
Lohsurka Urf PM«5) H« ACS«5) CV(lO+) BS« 5)
72 Hamldpur 1530 1,587 331 C(10+)
5) MCW(10+) HP W SS- PO« 5) CM(5-10) NCS«5) SP(S-IO) RS(IO+)
(00300000) PHC(IO+)
" PH(IO+) CP(IO+)
OCS(5-10) ST(5-10) NW(IO+)
.12~
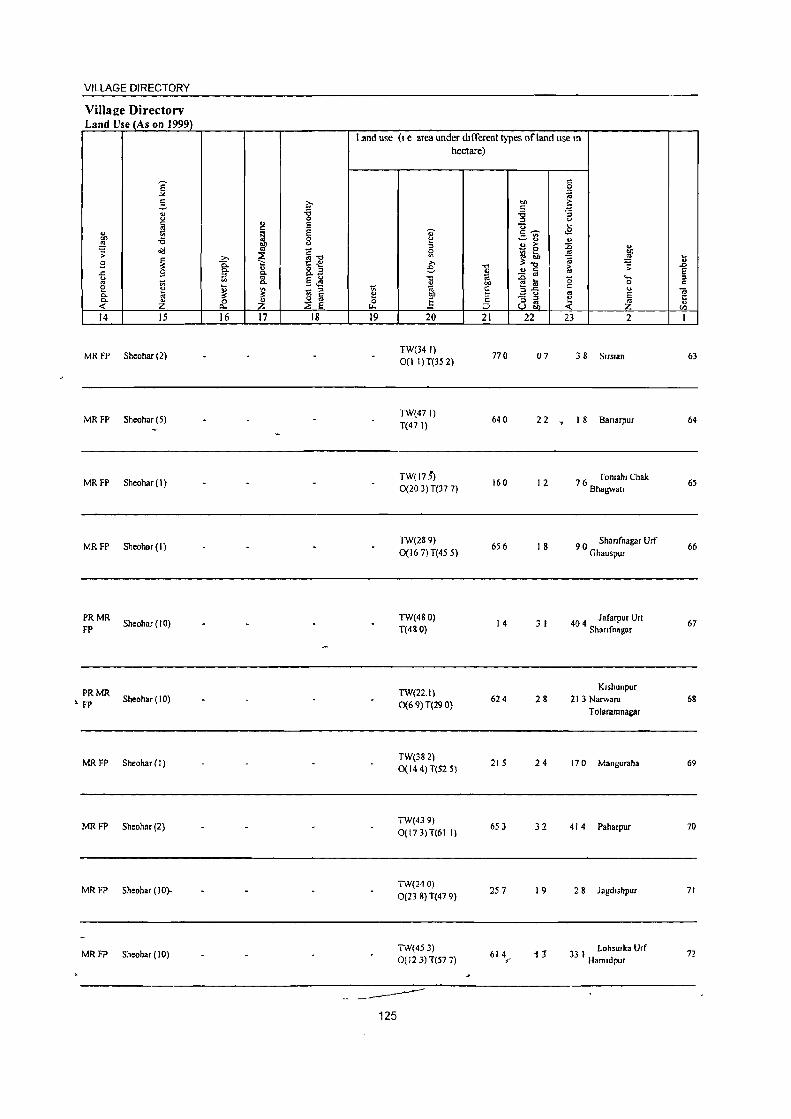
VILLAGE DIRECTORY
Villaee Directory Land Use (As on 1999)
.r:: <.> "' e 0. 0.. 4;
14
i ;z 15
MR FP Sheohar (2l
MR FP Sheohar (5)
MRFP
MRFP
PRMR FP
PRMR ~ FP
MRFP
Sheohar(l)
Sheohar(l)
Sheohar ( 10)
Sheohar ( I 0)
Sheohar (I)
MR FP Sheohar (2)
MR FP Sheohar (10)-
MR FP Sheohar (10)
16 17 18
Land use (I e area under different types of land use In
hectare)
19
125
20
TW(34I)
0(1 t) T(35 2)
TW(47I) T(47 I)
TW(175) 0(203) T(37 7)
TW(289)
0(16 7)T(45 5)
TW(480) T{48 0)
TW(22.1) 0(69) T(29 0)
TW(382) 0(144)T(525)
TW(439)
O{t73)T(6t I)
TW(240)
0(23 8) T(47 9)
TW(453) O( 123) T(57 7)
21
770
640
160
656
14
624
215
653
257
614 ...
22 23
j ;;: 'o
" E '" ;z 2
o 7 3 8 Sns.an
2 2 • I 8 Banarpur
12
I g
31
28
24
32
19
76 Tomah. Chak Bhab'Wal'
9 0 Shanfnagar Urf Ghauspur
40 4 J afarpur Urt Sh."fnagar
K,shunpur 213 Narwara
Tolaramnagar
170 Manguraha
41 4 Paharpur
2 g Jagd,sbpur
33 1 Lohsurka Urf Ham.dpur
63
64
65
66
67
68
69
70
71
72

I ]' .,
"0 0 (.) (.) ... c: -'" 0 E ~ <> (.)
0 bO ...J ~ Od ;;: ., ... bO .s
U ~ <-..0 ;;: 0 E ., ::s "- !:! e 0 .,
""§ " "5 E U ., ?: '" Z I 2 3
Ganga Dharampur 73 1410
(00300100)
74 Kumhrar
2190 (00300200)
Nandna 75
(00300300) 570
76 Ladaura
1570 (00300400)
77 Chhapra
8570 (00300500)
78 TaJpur
2420 (00300600)
Block Total 13680.0
DISTRICT CENSUS HANDBOOK SHEOHAR
Census of India 2001 -Amenities and
Amemlles avaIlable (Ifnot avaIlable wlthm the vIllage, a dash (-) IS shown In the column and nexlla :1 In brackels Ihe dlslance In broad ranges VIZ < 5 kms , 5-10 kms and 10+ kms of Ihe
'" 1il C
~ ... '" u ::s '" -c <:>
" 0 u c:!-;; '" 0 "0
C!- o -'" ... c: '" 2 ::s 0 to -'" :; "- 'iii
0.. 0 c: 0 ... 0 ., 0..
..0 ~ "5 E " ::s 0 ::s ""0 f- Z WJ
4 5 6
M P(<5)q5-1,161 217
10)
P« 2,572 409 S) M«
S)qIO+)
P« 282 62 5) M«
5)C(IO+)
2,279 559 PM« 5) C(IO+)
10,032 2,566 P(3) M(2) S C(lO+)
2,390 504 P1VJ«5} C(JO+)
155053 33130 P(6lf M(ll) S(3) 0(2)
nearest place where the faclhty IS avaIlable IS I1.lven
... c 0 -'" 0-., S "0 c
" ... -'"
~ 0-
?: e OIJ
bO " 'iii c: ~ U .;; -i3 e
V>
" C§ 0 . ::;: "-7 8 9
H PHS PO
MCW(IO+) HPWSS-PHqIO+)
PH(IO+)
RMP H(S-IO)
HPWSS- PO« 5) MCW(IO+)
PH(IO+) PHC(IO+)
H« 5) MCW(IO+) HP W SS- PO«S) PHC(IO+) PH(IO+)
H(5-10)
HPWSS- PO« 5) MCW(lO+)
PH(IO+) PHC(IO+)
H(2) MCW(2) HP TW W PO HCPHC RMP(4) TK SS- PH(IO+)
H(S-10)
HPWSS- PO« 5) MCW(IO+)
PH(IO+) PHC(IO+)
H(5) D(J)
DA MCW(3) T(4) W(63) HC PHq3) TK(12)
PHS(S) HP(66) PO(IS) NU(2) TW(16) RMP(7) R(2) C SMP(6) CHW
... :: ~ 0-
6 u
"0 c: os
(ij
~ ... E ., E-'" o c ull
10
CM(IO+) CP(IO+)
CM(IO+) CP(IO+)
CM(IO+) CP(IO+)
CM(IO+) CP(IO+)
CM(IO+) CP(IO+)
CM(IO+) CP(IO+)
CM(4)
~~ "0 e ., ::: (.) e ~t! a ~ &. :;
~~E (J
~~ 6 ~ ~~2 0 <3
(.) 0 ... c: ~~g 0
...!'''' C6;;"g ., ~ :;-0 g..,<
:::. f: ~EE ::s u
~ t IV 4) ::! ~C] ou.t:
...: <5 0:: ~'" II 12
ACS« 5) CV(IO+) NCS«5) SP(S-IO) OCS(S-IO) ST(S-IO)
ACS« 5) CV(IO+) NCS(S-IO) SP(S-IO) OCS(5-10) ST(5-10)
ACS«5) CV(IO+) NCS(5-1O) SP(S-IO) OCS« 5) ST(5-IO)
ACS NCS« CV(IO+) 5)OCS«5) SP(S-IO)
ACS«5) NCS«5) OCS« 5)
ACS« 5} NCS«5) OCS«5)
ACS(4) NCS(4)
ST(5-IO)
CV(IO+) SP(S-IO) ST(5-10)
CV(IO+) SP(S-IO) ST(S-IO)
oJ' (.)
~~
~ ~ ~ " co ~ ~~ c: " c: 2
'" 0
<> ~ " ::s E ~ E ?: 0-;:: u E
13
6S«5) RS(JO+) NW(IO+)
BSRS(IO+) NW(IO+)
6S(<( 5) RS(IO+) NW(IO+)
6S«5) RS(IO+) NW(IO+)
6S(10+) RS( 10+) NWlIO+)
6S«5} RS(IO+) NW(IO+)
8S(5) NW(2)

VILLAGE DIRECTORY
Villaee Directorv Land Use (As on 1999)
14 15
MR FP Sheohar ( 1 0)
PRMR FP
FP
PRMR FP
PRMR FP
PRMR FP
FR(ll) MR(69)
FF(68) NR NW(2)
S~eohar (10)
Sheohar (10)
Sheohar(5)
Sheohar ( 10)
Sheohar (I 0)
16
ED
ED(7) EA
17 18
NM
Land use (i.e. area under different types of land use in hectare)
19 20
TW(583)
T(SS.3)
TW(63.2) 0(55.0) T(IIS.2)
TW(17.0)
0(120) T(29 0)
W(9.7)
TW(540)
T(63.7)
TW(1032)
0{242.1) T(345.3)
TW(59.9)
0(17.9)T{77 8)
GC( 1200.59) W(46.71)
TW(2440.09)
2954 TWE(172.85) •• TK(34.07)
127
R(7S_~I)
O{1087.74) T(SOS7.S8)
21
53.0
50.6
23.6
38.9
269.6
115.8
5152.3
22
4.1
1.4
0.4
II
30.1
1.0
23
~ ;;
.... o III
~ Z 2
20 2 Ganga Dharampur
48.6 Kumhrar
4.1 Nandna
53.4 ladaura
212.5 Chhapra
47.0 Tajpur
626.0 2548.5
.8 E '" " ~ III
VJ
74
75
76
77
78
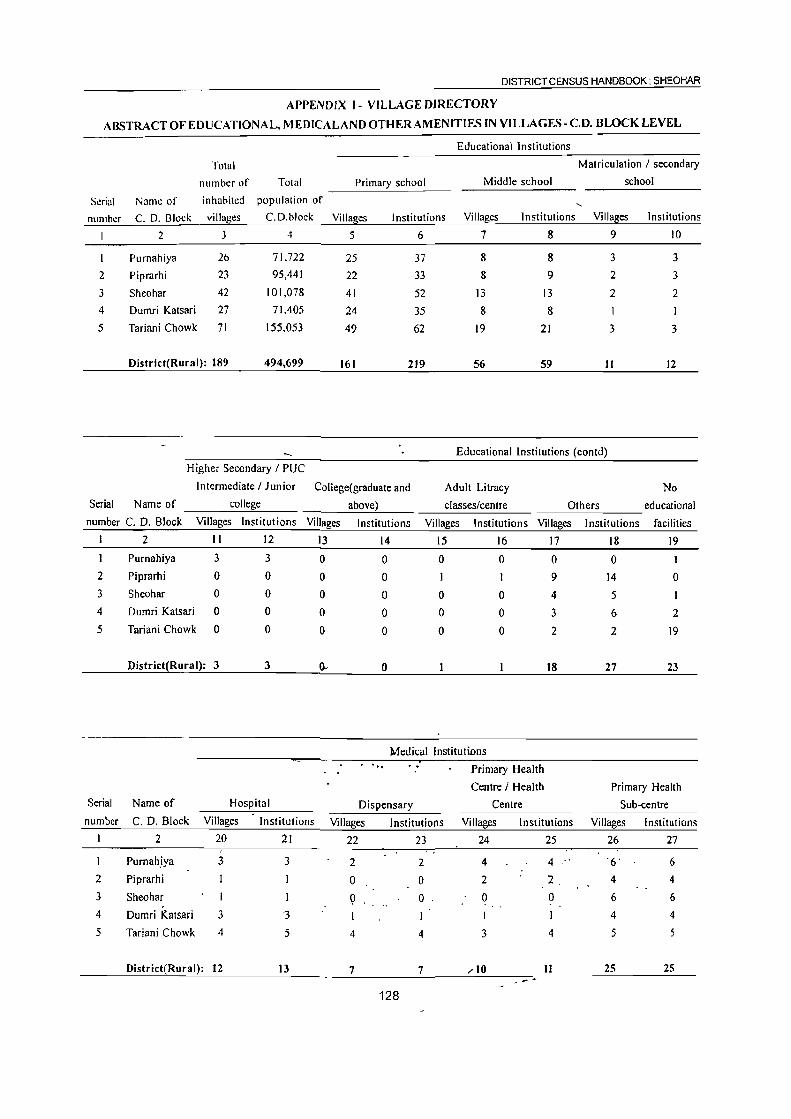
DISTRICT CENSUS HANDBOOK: SHEOHAR
APPENDIX 1- VILLAGE DIRECTORY
ABSTRACT OF EDUCATIONAL., MEDICALANDOTHERAMENITIES IN VILLAGE S-C.D.BLOCKLEVEL
Educational Institutions
Total Matriculation / secondary
number of Total Primary school Middle school school
St:rial Name of inhabited population of "-
nllmher C. D. Block villa/;lcs C.D.block Villa~es Institutions Villages Institutions Villa~es Institutions
2 J 4 5 6 7 8 9 10
Purnahiya 26 71.722 25 37 8 8 3 3
2 Piprarhi 23 95,441 22 33 8 9 2 3
3 Sheohar 42 101,078 41 52 13 13 2 2
4 Dumri Katsari 27 71,405 24 35 8 8 I
5 Tariani Chowk 71 155.053 49 62 19 21 3 3
District(Rural): 189 494,699 161 219 56 59 II 12
Educational Institutions (contd)
Higher Secondary I PUC
Intermediate / Junior College(graduate and Adult Litracy No
Serial Name of college above) classes/centre Others educational
number C. D. Block Villages Institutions Villages Institutions Villages Institutions Villages Institutions facilities
I 2 II 12 13 14 15 16 17 18 19
I Purnahiya 3 3 0 0 0 0 0 0 I
2 Piprarhi 0 0 0 0 9 14 0
3 Sheohar 0 0 0 0 0 0 4 5 I 4 Dumri Katsari 0 0 0 0 0 0 3 6 2
5 Tariani Chowk 0 0 0 0 0 0 2 2 19
District(Rural): 3 3 0- 0 18 27 23
Medical Institutions . -. Primary Health
Centre I Health Primary Health
Serial Name of Hospital Dispensary Centre Sub-centre
number C. D. Block Villages Institutions Villages Institutions Villages Institutions Villages Institutions
2 20 21 22 23 24 25 26 27
Purnah.iya 3 3 2 2 4 4 .. ·6· 6
2 Piprarhi 0 0 2 2 4 4
3 Sheohar I I 9 0 0 0 6 6
4 Dumri Katsari 3 3 I I 4 4
5 Tariani Chowk 4 5 4 4 3 4 5
District(Rural): ]2 13 7 7 ,,10 II 25 2S -~
128

VILLAGE DIRECTORY
APPENDIX 1- VILLAGE DIRECTORY (Conttl.)
ABSTRACT OF EDUCATIONAL, MEDICALAND OTHER AMENITIES IN VILLAGES - CD. BLOCK LEVEL
Serial
number
1
2
3
4
5
Serial
number
I
2
3
4
5
Serial
number
2
3
4
5
Maternity and Child
Welfare centre i
Maternity Home f Child
Name of Welfare Centre
Medical Institutions
Family Welfare Centre
Community Health
Workers Others
C. D. Block Villages Institutions Villages Institutions Villages Institutions Villages Institutions
2 28 29 30 31 32 33 34 35
Purnahiya 0 0 0 0 9 9 1 2
Piprarhi 0 0 0 0 2 9 16 Sheohar 0 0 I I I 2 2 5
Dumri Katsari 0 0 0 0 0 0 I
Tariani Chowk 2 3 0 0 9 15
District(Rural): 2 3 12 14 22 39
Medical -
institutions
(Concld.) Drinking water Source
Name of No medical More than No drinking
C. D. Block' facilities Ta~ Well Tank Tubewell River Fountain Canal Others one source water facil ities
2 36 37 38 39 40 41 42 43 44 45 46
Purnahiya 14 0 26 0 0 I 0 0 26 26 0 Piprarhi 10 3 22 6 18 9 0 0 20 22 0
Sheohar 35 0 38 0 0 0 0 0 41 37 0 Dumri Katsari 20 0 16 5 3 4 0 0 24 13 0
Tariani Chowk 53 4 63 12 16 2 0 66 65 0
District(Rural): 132 7 165 23 37 16 0 177 163 0
Post, Telegraph & Telephone Transport communications
Post.
Post & Telegraph telegraph
Name of Post Telegraph telegraph Post office office & office & Bus Railway Navigable
C. D. Block office office office & phone phone phone phone service station waterway
2 47 48 .49 50 ~1 52 53 54 55 56
Purnahiya II 0 0 2' 0 0 4 9 0
Piprarhi .& .0 0 0 O· .' 0 0 1 0 9
Sheohar 12 0 6 2 0 0 7 0 0 0
Dumri Katsari 8· 0 0 0 0 0 0 0 0 4
Tariani Chowk 15 0 0 0 0 0 0 5 0 2
District(Rural): 54 0 0 4 o ? 0_- 11 IS 0 16 ...-
1~_

DISTRICT CENSUS HANDBOOK' SHEOHAR
APPENDIX I - VILLAGE DIRECTORY (Concld.)
ABSTRACT OF EDUCATIONAL. MEDICALAND OTHER AMENITIES IN VILLAGES - CD. BLOCK LEVEL
Banks Power supply Credit societies
Number of
commercial and Number of Number of
Serial Name of co-operative Not agncultural non-agricultural number C. 0 Block Villages banks Available available Villages credit societies Villages credit societies
2 57 58 59 60 61 62 63 64
I Purnahlya 5 5 I 25 10 10 0 0
2 Piprarhl 2 3 8 15 I I 0 0
3 Sheohar 23 19 5 5 I 1
4 Dumn Katsan 1 3 24 4 4 0 0
5 Tariani Chowk 4 4 8 63 4 4 4 4
District(Rural): 13 14 43 146 24 24 5 5
Credit societies (concld.) Recreational facility . .... • : New~paper I Magazine
Stadium I
Number of Auditorium I
Serial Name of other credit Cinema I Community Newspaper number C. D. Block Villages societies Video hall Sports club hall Newspaper Magazine & Magazine
2 65 66 67 68 69 70 71 72
1 Purnahlya 0 0 0 0 0 1
2 Piprarhi 0 0 0 0 3 14 14 14
3 Sheohar 0 0 0 0 0 22 2t 21
4 Dumri Katsari 0 0 0 0 0 11 JO 10
5 Tariani Chowk 0 0 0 0 0
District(Rural): 0 0 0 0 3 '" 49 47 47
130

VILLAGE DIRECTORY
APPENDIX I A- VILLAGE D1RECfORY
VILLAGES BY NUMBER OF PRIMARY SCHOOLS
Total number of
Serial inhabited Number of primary school
Number Name of C. D. Block villages None One Two Three Four +
2 3 4 5 6 7 8
I Purnahiya 26 17 6 0 2
2 Piprarhi 23 17 3 0 2
3 Sheohar 42 I 32 7 2 0
4 Dumri Katsari 27 3 21 0 2
5 Tariani Chowk 71 22 40 5 4 0
District Total: 189 28 127 2] 7 6
APPENDIX I B- VILLAGE DlRECfORY
VILLAGE BY PRIMARY, MIDDLE AND SECONDARY SCHOOLS
Type of educational institutions available
Total
number of At least one primary At least one primary At least one middle
Serial inhabited school and no middle school and one middle school and one
Number Name of C. D. Block villages No School school school secondary school 'J. 2 3 4 5 6 7 I Purnahiya 26 1 17 8 3
2 . Piprarhi 23 0 15 7 2 3 Sheohar 42 I 28 13 I
4 Dumri Katsari 27 2 17 7 I
5 Tariani Chowk 71 19 33 16 3
Total: 189 23 110 51 10
131

DISTRICT CENSUS HANDBOOK SHEOHAR
APPENDIX I C -VILLAGE DIRECTORY
VILLAGES WITH DIFFERENT SOURCES OF DRINKING WATER FACILITIES AVAILABLE
Number of villages wIth different sources of dnnklng water
More than one source
Serral
number Name of C D Block Only lap Only well
Only tube
well Only handpump
only from tap. well,
tube well, handpump
2
I PurnahlYd 2 Plprarhl
3 Sheohar
4 Dumn Katsan
5 Tananr Chowk
District Total:
3
o o o o o
o
4
o
3
2
7
5
o o o o o
o
6
o o 4
II 4
19
1
26
21
37
13
63
160
APPENDIX 11- VILLAGE DIRECTORY
VILLAGESWJTH 5,000 AND ABOVE POPULATION WHICH DO NOT HAVE ONE OR MOREA MENITIES
Amenrtles not available
Senror Pnmary
Second- Health Tap Approach Commer-
Serral
Location
code
number
Name of ary Sub dnnklng Bus by Pucca clal
Bank number Name of village C 0 Block PopulatIOn School COllege Centre water facllrty mad
2 3 4 5 6 7 8 9 10 II 12
Barahl Mohan 00280600 Purnahlya 5,019
2 Bakhar
3
4
5
6
7
8
9
10
II
12
13'
Chandlha 00280900 Purnahlya
Khana Pahan 00282800 Purnahlya
Masaura
Amwa Kalan
00283600 Plprarhl
00284200 Plprarhl
Basahla Shekh 00284300
Mmapur Balha 00284700
Dhankaul 00284800
Kursahar 00285500
Chamanpur 00286800
SugJ8 Karesn 00288300
TaJpur' 00288~00 ....
Plprarhl
Plprarhl
Plprarhl
Sheohar
Sheohar
Sheohar
Sheohar
6,856
6,311
5.593
20,475
10,326
8,289
7,470
9,114
7,387
6,857
5,087
Jahanglrpur 00290000 Dumn Katsan 5,574
14 Naya Gaon 00290700 Dumn Katsan 10,465
15 Shampur
\6 Maksudpur
17
18
19
20
Karana
Khurpatll
Hlrauta Duma
Bmdraban
Chhataunr
21 KlslJunpur
Urf Narwara
22 Chhapra
00291000 Dumn Katsarl 5,311
00291400
00294000
00296000
00297200
Dumn Katsan 9,928
Tarrant ChowK 5,354
Tarranl Chowk 8,60 I
Tananr Chowk 6.592
00297300 Tananl Chowk 6,638
00299000
00300500
Tarrant Chowk 8.604
Tananl ChowklO 032
NA NA NA NA NA NA NA
NAN A AvaIlable NAN A N A
NAN A NAN A Available N A
NA
NA
NA
NA
NA
NA
NA
NA
NA
NA
NA
NA
NAN A Available N A
N A Avarlable NAN A
NAN A Avarlable N A
NA NA NA NA
N A Available NAN A
NA
NA
NA
Available N A
Available N A
NA NA
NA NA NA
NA NA NA
NAN A Available N A
NA NA NA NA
NA
NA
NA
NA
NA
NA
NA
NA
NA
NA
NA
N A Available NAN A
NA NA NA NA
NA NA NA NA
N A A\allable Avarlable N A
N A Available
AvaIlable N A
Avatlable N A
NA NA
Available Available
Available Available
Available N A
Available N A
Available N A
NA NA
N A Available
NA NA
Available N A
NA NA
Available N A
Available Available
NA NA NA NA N A Available N A
NA
NA
132
N A Avatlable N A
NA "NA NA
Available Available Available
N A Available N A

VILLAGE DIRECTORY
APPENDIX II A- VILLAGE DlRECfORY
CENSUS TOWNS WHICH DO NOT HAVE ONE OR MORE AMENITIES
Amenities not available
Location
Senior
Second-
Primary
Health
Serial Name of code Name of ary Sub
number census town number C. D. Block Population School College Centre
2 3 4 5 678
There is no Census Town in Sheohar district.
APPENDIX IIl- VILLAGE DIRECTORY
Tap
drinking
water
9
Approach Commer-
Bus by Pucca cial
facility road Bank
10 II 12
LAND UTILISATION DATA IN RESPECf OF CENSUS TOWNS I NON MUNICIPAL TOWNS
Name of Census
Serial town and C. D. Block
Land use ( i.e., area under different types of land use in hectare)
Irrigated by Culturable waste (including Area not available
number within brackets Total area Forest source Un irrigated gauchar & groves) for cultivation
2 3 4 5 6 7 8
There .!_s no Census Town / non-municipal town in Sheohar district
APPENDIX IV - VILLAGE DIRECTORY
C. D. BLOCK WISE LIST OF INHABITED VILLAGES WHERE NO AMENITY OTHER THAN DRINKING WATER FACILITY ISAVAILABLE
Serial number
Name of CD Block: Purnahiya
1 . Name of CD Block: Piprarhi
Name of CD Block: Sheohar
Name of CD Block: Dumri Katsari
2
Name of CD Block: Tariani Chowk
3
4
5
6
7
8
9
10 II
Location code number
2
00282400
Nil
Nil
00291800
00293300 00293500 00294400
00295300 00295400
00296300 00297000
00297500 00297809'
133
Name ofvilJage
3
Bakatpur Chaki
Jhitkahi Bazidpur Daulat
Ghorha
Kothia
Hurraha
Bochhan Urf Az Rakbe Pojhian
Fatehpur Ghauspur
Arazi Nankar
Az Rakbe Raja Dih Barahi
Bishunpur Dharanand
Bishunpur Bindi
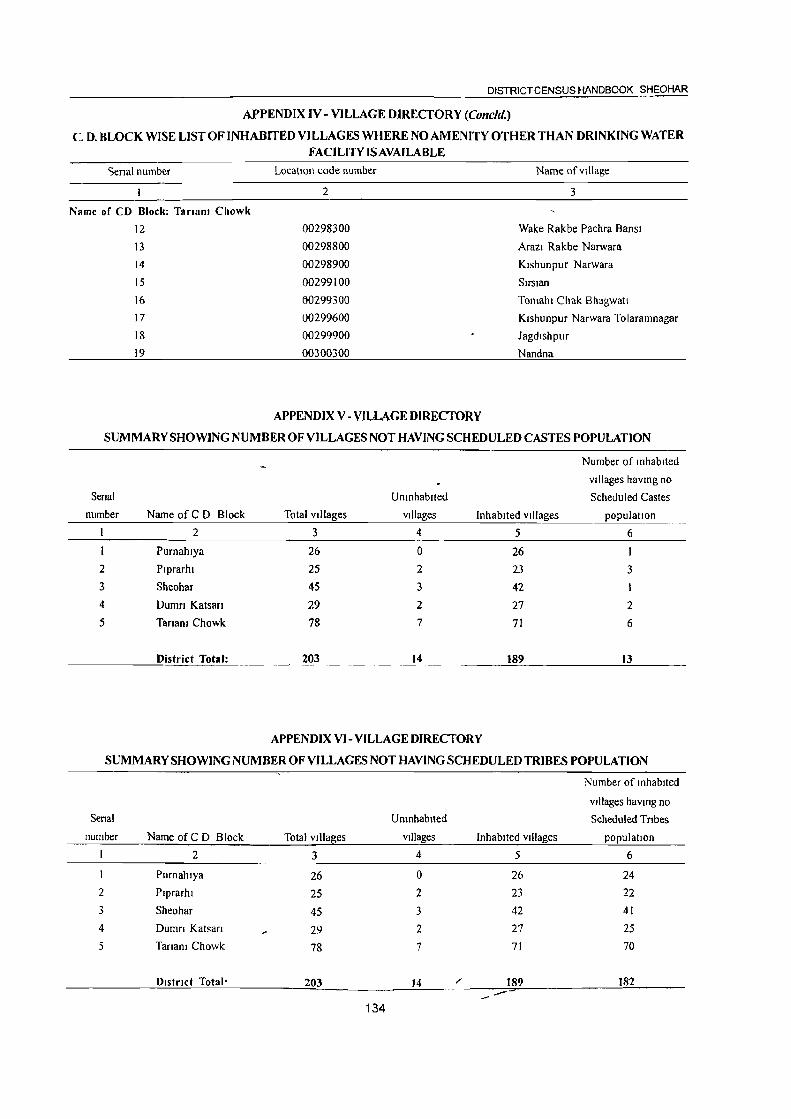
DISTRICT CENSUS HANDBOOK SHEOHAR
APPENDIX IV - VILLAGE DIRECTORY (Cone/d.)
C D. BLOCK WISE LIST OF INHABITED VILLAGES WHERE NO AMENITY OTHER THAN DRINKING WATER FACILITY IS AVAILABLE
':;enal number LocatIOn code number Name of village
2 3
Name of CD Block: Tanan! Chowk
12 00298300 Wake Rakbe Pachra Bansl
13 00298800 Arazi Rakbe Narwara
14 00298900 Kishunpur Narwara
15 00299100 Sirsian
16 00299300 Tomahl Chak Bhagwatl
17 00299600 Klshunpur Narwara Tolaramnagar
18 00299900 Jagdlshpur
19 00300300 Nandna
APPENDIX V - VILLAGE DIRECfORY
SUMMARY SHOWING NUMBER OF VILLAGES NOT HAVING SCHEDULED CASTES POPULATION
Serial
number
2
3
4
5
Name of C D Block
2
Purnahlya
Plprarhl
Sheohar
Dumn Katsan
Tananl Chowk
District Total:
Number of inhabited
Villages havmg no
Umnhablted Scheduled Castes
Total Villages Villages Inhabited villages populatIOn
3 4 5 6
26 0 26 25 2 23 3 45 3 42 29 2 27 2 78 7 71 6
203 14 189 13
APPENDIX VI- VILLAGE DlRECfORY
SUMMARY SHOWING NUMBER OF VILLAGES NOT HAVING SCHEDULED TRIBES POPULATION
Number of mhablted
Villages haVing no
Senal Umnhablted Scheduled Tnbes
number Name of C D Block Total Villages villages Inhabited Villages populatIOn
2 3 4 5 6
I Purnahlya 26 0 26 24
2 Plprarhl 25 2 23 22
3 Sheohar 45 3 42 41
4 Dumn Katsan 29 2 27 25 5 Tanam Chowk 78 7 71 70
District Total· 203 14 / 189 182 .-
134

VILLAGE DIRECTORY
APPENDIX VilA - VILLAGE DIRECTORY
LIST OF VILLAGES ACCORDING TO THE PROPORTION OFTHE SCHEDULED CASTE STOTHETOTAL POPULATION BY RANGES
Range of Scheduled Castes
populatIon (percentages) Location code number Name of village
I 2 3' Name of CD Block: Purnahiya
Less than 5
00281100 ChakSonaul
00282000 Kolhua Thikaha
5-10
00280600 Barahi Mohan
00281600 Basan! Patti
00281500 Basan! Jagjiwan
11-20
00280800 Chiraiya
00281700 Purnahia Chandandih
00281000 Asogi Chhapra Dhani 00281300 Madan Chhapra
00282600 Asopur
00281900 Hathsar
00280900 Bakhar Chandiha
00282800 Khaira Pahari
00280400 Adauri
00281200 Bedaul Baz
00282400 Bakatpur Chaki
21-30
00281800 Sonaul Sultan
00280500 Barahi )agdish
00281400 BedaulAdam
00282900 Dosti Mahamadpur
00282200 Kashipur
00282300 Balria
00282700 Kataiya
31-40
00282100 Pursaun i Gope
00280700 Chhapra Jurawan
41-50 Nil Nil
51-75 Nil Nil
76 and above Nil Nil
Name of CD Block: Piprarhi
Less than 5
00283300 Chatauna Urf Gopinathpur
00284400 Bakatpur Banbira
00284100 Belwa Narkatia Bandobasti
5-10
00284900 Harpur
00284000 Belwa Narkatia Nizamat
00284300 Ba~hia Shekh _-135

DISTRICT CENSUS HANDBOOK SHEOHAR
APPENDIX VilA - VILLAGE DIRECTORY (COllld.)
LIST OF VILLAGES ACCORDING TO THE PROPORTION OFTHE SCHEDULED CASTES TO THE TOTAL POPULATION BY RANGES
R.lOge of Scheduled Castes
pllpulalJon (percentages)
11-20
21-30
31-40
41-50
51-75
76 and above Name of CD Block: Sheohar
Less than_S
5-10
11-20
LocatIOn code number
2
00284800 00283600 00283200 00284200 00284700 00285100 00285300
00283100
00284500
00285000 00283400
00283000
00283800
00283900
Nil
Nil
Nil
00289900 00285800
00288200 00289400
00288300
00287200
00286300
00288600
00289000
00286800 00289800
00286200
00288400
00289600
00289700
00289200
00286000
00289300 ;"
136
Name of village
3
Dhankaul
Masaura Shankarpur Bmdl
Amwa Kalan Mmapur Balha Parsaufll
Kamrauli Jangah
Mohanpur
Kuanwan
Dharampur Dekuh
Narayanpur
Chak Fateh
Sengahi Indarwa
Indarwa Khurd
Nil
Nil
Nil
Parrahi
Garahm
Sugla Katesri Jagir
Chhapragobindpururfgopinathpur
SugJa Karesri
Chiknauta
Garhwa
Shahpur
Mathurapur Kahtarwa
Chamanpur
Rampur Jadu
Parsaunl Talyab
PardesJa Urf Madhubam
Gopam
Bhaluahl
Kanuam Kalyanpur
Malt Pokhar Bhmda
Bishunpur Maman _- -

VILLAGE DIRECTORY
APPENDIX VilA - VILLAGE DIRECfORY (Contd.)
LIST OF VfLLAGES ACCORDING TO THE PROPORTION OFTHE SCHEDULED CASTES TO THE TOTAL POPULATION BY RANGES
Range of Scheduled Castes
populatIOn (percentages)
21-30
31-40
41-50
51-75
76 and above
Name of CD Block: Dumri Katsari
Less than 5
5-10
11-20
Location code number
2
00289100
00288500
00287700
00286600
00285700
00287300 00287900
00286900
00285900
00286700
00288100 00286400
00287100
00287500
00287600
00285500
00287000
00287400 00288800
00288000
00287800
00288700
00286500
Nil
00290200
00292100. 00290800
00292600
00290600
0029Z400
00290900
00292200 00291700
00291900
00290500
~
,
Name of village
3
Mirzapur Dhobahi
Tajpur
Fatehpur
Kothia Dharampur Dharamaghat
Mohari
Harnahi Bishunpur Kishundeo
Chak Bishunpur
Bisahi
Sisauia
Madhopur Anant Dharampur Rajwan Bandobasti
Sundarpur Kharauna
Pota
Basahia Ram
Kursahar
Mahuaria
Azrakbe Pota Daud Chhapra
Bhagwanpur Bheli
Khairwa Darap
Jafarpur
Dharampur RaJwan Mal
Nil
GQsainpur Nilami
Gazipur Jaismghpur
Bhorha Mohanpur
Rohua
Shahbazpur
Rampur Kesho
Bira Chhapra
Masha
Jhltkahi
Dumri
...--l)hanhara Urf Dharampur

DISTRICT CENSUS HANDBOOK SHEOHAR
APPENDIX VIlA - VILLAGE DIRECTORY (Contd.)
LIST OF VILLAGES ACCORDING TO THE PROPORTION OFTHE SCHEDULED CASTES TO THE TOTAL POPULATION BY RANGES
Range of Scheduled Castes
population (percentages)
21-30
31-4Q 41-50
51-75
76 and above
Name of CD Block: Tariani Chowk
Less than 5
5-10
Location code number
2
00290700
00291200
00292000
00291400
00290400
00291500
00291300
00290000
00292800
00292500
00291000
00292300
Nil Nil
00291800
00290300
00297400 00296900
00293500
00298600
00294700
00296200
00297100
00299500
00293200
00295900
00294400
00294500
~131.~,)~\:\~ ~
\)\)?5)4\)\')\)
()()193'l,()()
13~1.~"'~~~
00299100
0029520()
1}a,..·
Name of village
3
Naya Gaon
Bhatha
Mahamadpur Katesn
Maksudpur Kararia
Paharpur
Mahamadpur Katesri
Umed Chhapra
Jahangirpur
Bahuara
Phulkaha
Shampur
Madhopur SUndar
Nil Nil
Jhitkahi Bazidpur Daulat
Gosainpur Mal
Bish.unpur Fakira Az Rakbe Athkauni Urf Benipur
Kothia
Tola Tuisinagar
Bisambharpur
Hiramma
Basant Param
Jafarpur Urf Sharifnagar
Salempur
Rupwara
Hurraha
Sultanpur Bhim
~\m-M\\
¥..'r\\\tpa\\\
\(o\s()\\ Ka\an
\\\'ta\l\'3. \)\l\\\a
Slrsian ,- _____ -PoJhlan
./"
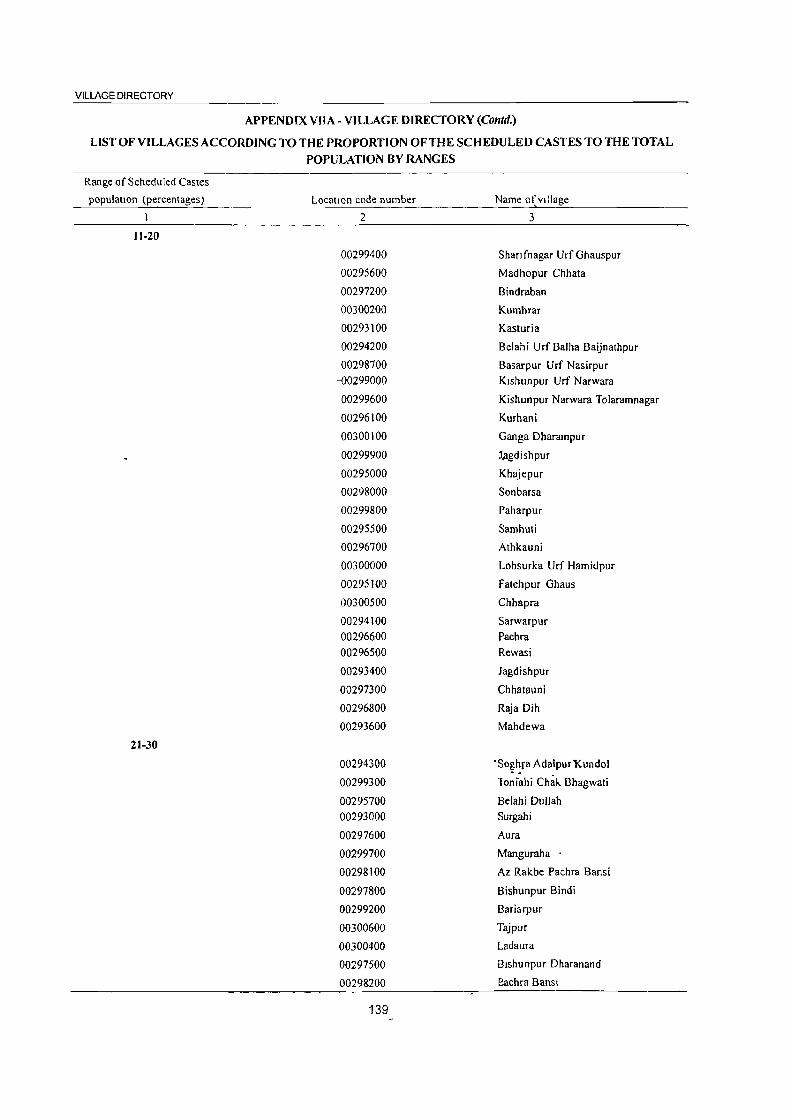
VILLAGE DIRECTORY
APPENDIX VilA - VILLAGE DIRECTORY (Contd.)
LIST OFVILLAGES ACCORDING TO THE PROPORTION OFTHE SCHEDULED CASTES TO THE TOTAL POPULATION BY RANGES
Range of Scheduled Castes
population (percentages)
11-20
21-30
Location code number
2
00299400
00295600
00297200
00300200
00293100
00294200
00298700 -00299000
00299600
00296100
00300100
00299900
00295000
00298000
00299800
00295500
00296700
00300000
00295100
00300500
00294100 00296600 00296500
00293400
00297300
00296800
00293600
00294300
00299300
00295700 00293000
00297600
00299700
00298100
00297800
00299200
00300600
00300400
00297500
00298200
139
Name of village
3
Shanfnagar UrfGhauspur
Madhopur Chhata
Bindraban
Kumhrar
Kasturia
Belahi Urf Balha Baijnathpur
Basarpur Urf Nasirpur Kishunpur Urf Narwara
Kishunpur Narwara Tolaramnagar
Kurhani
Ganga Dharampur
1.agdish pur
Khajepur
Sonbarsa
Paharpur
Samhuti
Athkauni
Lohsurka Urf Hamidpur
Fatehpur Ghaus
Chhapra
Sarwarpur Pachra Rewasi
Jagdishpur
Chhatauni
Raja Dih
Mahdewa
'So~~ra AdalpurKundol
loniahi Cha!. Bhagwati
Belahi Dullah Surgahi
Aura
Manguraha
Az Rakbe Pachra Bansi
Bishunpur Bindi
BariarpuT
Tajpur
Ladaura
Bishunpur Dharanand
eachra Bansl
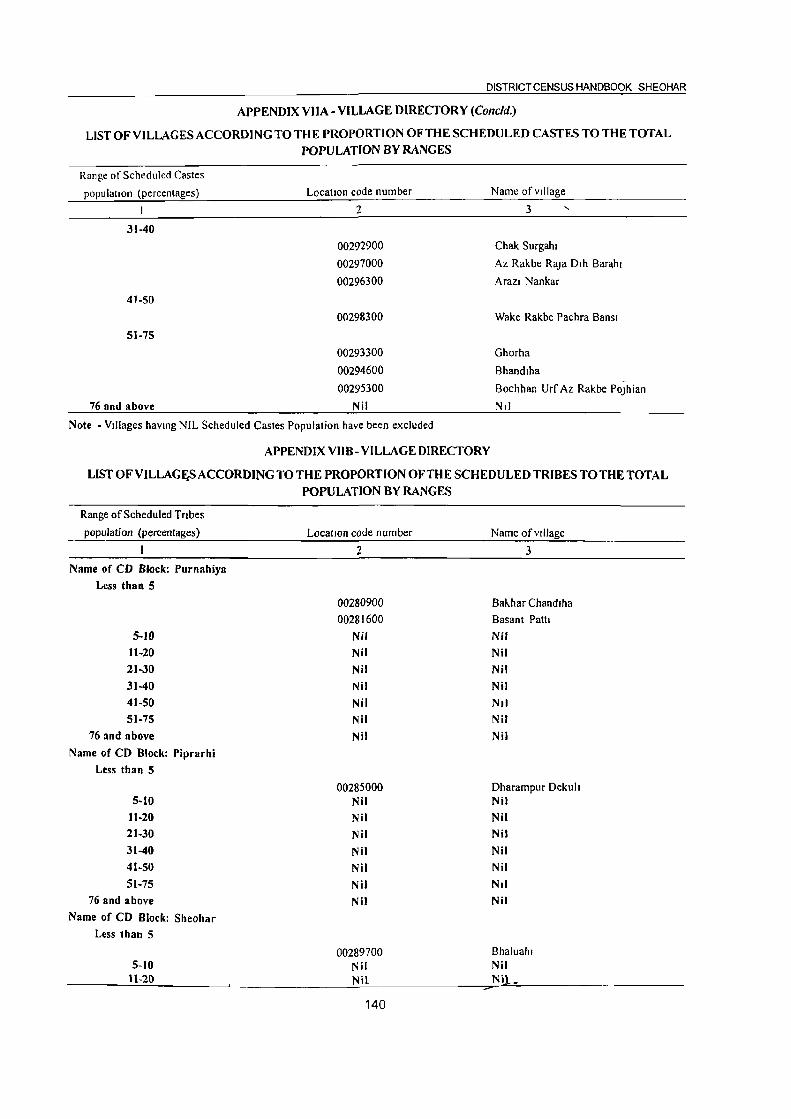
DISTRICT CENSUS HANDBOOK SHEOHAR
APPENDIX VIlA - VILLAGE D1RECfORY (Cone/d.)
LIST OFVILLAGES ACCORDING TO THE PROPORTION OFTHE SCHEDULED CASTES TO THE TOTAL POPULATION BY RANGES
Range of Scheduled Castes
populallon (percentages)
31-40
41-50
51-75
76 and above
LocatIOn code number
2
00292900
00297000
00296300
00298300
00293300
00294600
00295300
Nil
Note - Villages havmg NIL Scheduled Castes Population have been excluded
APPENDIX VIIB- VILLAGE D1RECfORY
Name of village
3
Chak Surgahl
Az Rakbe Raja Dlh Barahl
Arazi Nankar
Wake Rakbe Pachra Bansl
Ghorha
Bhandlha
Bochhan Urf Az Rakbe POJhian
Nil
LIST OFVILLAG~S ACCORDING TO THE PROPORTION OFTHE SCHEDULED TRIBES TO THE TOTAL POPULATION BY RANGES
Range of Scheduled Tribes
population (percentages) LocatIOn code number Name of village
I 2 3
Name of CD Block: Purnahiya
Less than 5
00280900 Bakhar Chandlha
00281600 Basant Patti
5-10 Nil Nil
11-20 Nil Nil
21-30 Nil Nil
31-40 Nil Nil
41-50 Nil Nil
51-75 Nil Nil
76 and above Nil Nil
Name of CD Block: Piprarhi
Less than 5
00285000 Dharampur Dekull 5-10 Nil Nil
11-20 Nil Nil
21-30 Nil Nil
31-40 Nil Nil
41-50 Nil Nil
51-75 Nil Nil
76 and above Nil Nil
Name of CD Block: Sheohar
Less than 5
00289700 Bhaluahl 5-10 Nil Nil
11-20 Nil Nil _
140

VILLAGE DIRECTORY
APPENDIX VIIB- VILLAGE DIRECTORY (Cone/d.)
LIST OF VILLAGES ACCORDING TO THE PROPORTION OFTHE SCHEDULED TRIBES TO THE TOTAL
POPULATION BY RANGES
Range of Scheduled Tribes
population (percentages)
21-30
31-40
41-50
51-75
76 and above
Name of CD Block: Dumri Katsari
Less than 5
5-10
U-20
21-30
31-40
41-50
51-7S
76 and above
Name of CD Block: Tariani Chowk
Less than 5
5-10
11-20
21-30
31-40
41-50
51-75
76 and above
Location code number
2
Nil
Nil
Nil
Nil
Nil
00291400
00292800 Nil
Nil
Nil
Nil
Nil
Nil
Nil
00292900
Nil
Nil
Nil
Nil
Nil
Nil
Nil
Note: Villages having NIL Scheduled Tribes Population have been excluded
APPENDIX VIIl- VILLAGE DIRECfORY
Name of village
Nil
Nil
Nil
Nil
Nil
3
Maksudpur Kararia
Bahuara Nil
Nil
Nil
Nil
Nil
Nil
Nil
Chak Surgahi
Nil
Nil
Nil
Nil
Nil
Nil
Nil
NUMBER OF VILLAGES UNDER EACH GRAM PANCHAYAT (c. D. BWCK WISE)
Number of villages with
Name of Gram Area of location code numbers
Panchayat and Gram
Serial location code Panchayat
Location
code
number number in hectare Number numbers
2 3 4 5
Note: N.A. stands for information not available.
Number of Total
households population
6 7
N.A.
141
Total Total
Scheduled Scheduled
Castes Tribes
popUlation population
8 9
Income and
expenditure of
Panchayat I Gram
Panchayat
( in Rs. '000 )
Total Total
income expenditure
]0 ] I

';enal
number
DISTRICT CENSUS HANDBOOK: SHEOHAR
APPENDIX IX - VILLAGE DIRECTORY
STATEMENT SHOWING NUMBER OF GIRLS SCHOOLS IN THE VILLAGES
Name of
C D. Block
2
Village
location code Name of
number village
3 4
Primary
School
5
N.A.
Number of girls school
Higher Secondary I PUC I
Middle Matriculation I Intermediate I Junior
School Secondary School college
6 7 8
Note: N.A. stands for information not available
142
TOWN DIRECTORY •


TOWN DIRECTORY
Section-II: Town Directory
Note explaining the abbreviations used in the Town Directory
Statement I : Status and Growth History
Column (2) : Class, name and civic administration status of town :
Class has been introduced to facilitate analysis of town directory data at the state and all India levels. It is presented according to 2001 Census Population of the town as follows :
Population Class
IOO,OOQ-and above '. I
50,000 - 99,999 11
20,000 - 49,999 III
10,000 - 19,999 IV
5,000 - 9,999 V
Below 5,000 VI
Town with a popUlation of one hundred thousand (1,00,000) and above is treated as a city.
The civic administration status of the towns is indicated within bracket against the name of tile town. The follOWing abbreviations are used to gellote civic status of town.
(i) Municipal Corporation M. Corp.
(ii) Municipal Committee MC
(iii) Municipal Council J\:1 CI
(iv) City Municipal Council: '''CMC:
(v) Town Municipal Council TMC
(vi) Municipal Board MB
(vii) Municipality M
(viii) Cantonment 'Board! Cantonment CB
(ix) ,Notified Area NA
(x) Notified TOWri .NT
(xi) Notified Area Committee! Notified Area Council NAC
(xii) Notified Town Area NTA
(xiii) Industrial Notified Area INA
(xiv) Industrial Township ITS
(xv) Township TS
(xvi) Town Panchayat TP
(xvii) Nagar Panchayat NP
(xviii) Town CommitteelTown Area Committee TC
(xix) Small Town Committee ST
(xx) Estate office EO
(xxi) Gram Panchayat GP
(xxii) Census Town CT
Others columns need no comments.
Statement II : Physical Aspects and Location of towns, 1999.
Column 3 to 5 : Physical Aspects
[n these columns the Rainfall and Maximum and Minimum Temperature of the town are recorded.
Column 6, 7 and 8
Name of the State headquarters, District headquarters and Sub-Divisional headquarters with distance from the referent town in kilometers, is to be recorded respectively. If the names mentioned in these columns are the same as the referent town itself, the distance is recorded as (0) zero.
Column 9 & 10
Name of the nearest city with one lakh and more and five lakh and more population are recorded.
Column 11, 12 and 13
If referent town enjoys the facility of railway . station, bus route faciUty or navigable river/canal. Its
name is to· be mentioned. If not available, then the name of i-iea~est p~age with ~~stance, where such faci,lity exists i~ mentioned.
Statement III : Municipal Finance 1998-1999
Item-wise amount of receipt and expenditure in thousand rljpees, relating to municipal finance of the town for the Xear-1"'99'8-99 is recorded.

Statement IV : Civic and Other amenities, 1999
Column (1 to 5) : selr explanatory.
Column (6) : Road length (in kms.)
Information about kutcha I pucca road is recorded separately for the roads within the limits of the referent town.
(i) Pucca Road
(ii) Kutcha Road
Column (7) : System~ of Sewerage
PR
KR
Generally, by sewerage system is implied the network of mains and branches of underground conduits for the conveyance of sewerage to the point of disposal. Sewers that carry only household and industrial wastes are called separate sewers, those that carry storm water from roofs, streets and other surface are known as storm water drains, while those carrying both _sewage and storm water are called combined sewers.
The codes used for different types of drainage system are as follows :
(i) Sewer S
(ii) Open Surface Drains OSD
(iii) Box Surface Drains BSD
(iv) Sylk Drains SD
(v) Cesspool method CP
(vi) Pit System Pt
(vii) Others D
Column 8 to 11 : Number of latrines
Number of various types of latrines both Public
and Private are given in these columns.
Column 12 : Method of disposal of night soil
The various prevalent methods of disposal of night
soil are given below with codes:
(i) Head Loads HL
(ii) Basket B
(iii) Wheel Barrows WB
(iv) Septic Tank ST
(v) Pit System Pt
(vi) Sewerage S·
(vii) Others 0
146
DISTRICT CENSUS HANDBOOK SHEOHAR
Column 13 and 14 : Water supply
Source and capacity of storage system. The following codes are used in these columns:
Column 13 :
(i) Tap water T
(ii) Tube-well water TW
(iii) Tank Water TK
(iv) Well water W
Column 14 :
(v) Over Head Tank OHT
(vi) Service Reservoir SR
(vii) River Infiltration Gallery RIG
(viii) Bore Well Pumping System BWP
(ix) Pressure Tank PT
The information on major source of water supply are given in column 13 and the storage capacity against each in kilo-litres (in bracket) are presented in column 14.
Column 15 : Fire Fighting Service
In case the fire fighting service is available in the referent town 'yes' is recorded. If the facility is not available within the town. The name of the nearest place having this facility with its distance from the referent town has been recorded.
Column 16 to 20 : Electrification (Number of connections)
Different types of electric connections have been shown in these columns, i.e. Domestic, Industrial, Commercial, Road lighting (points) & others.
Statement V : Medical, Educational, Recreational and Cultural Facilities, 1999
Column 1 to 3 : Self explanatory.
Column 4 & 5 :
The data covers all such medical institutions run by or aided by Government/Semi GovernmentILocal bodies and Charitable institutions or Social agencies like the Missionaries. Where the family planning c~ntres are attached to hospitals or maternity and child welfare centres or Primary Health Centres, may be treated as independent units and counted separately using following codes.
(i) Hospital
(ii) DIspensary _---H
D

TOWN DIRECTORY
(iii) Health Centre HC
(iv) Family Welfare Centre FWC
(v) T.8. Clinic TB
(vi) Nursing Home NH
(vii) Others 0
1n case of more than one institutions of any type, it is indicated within brackets the number of such institution (s) e.g. 0(3), NH(8), etc. The institutions have further been distinguished by providing additional codes within the bracket as given below:
(i) Ayurvedic
(ii) Unani
(iii) Homoeopathic
Column 6 to 9
A
U
Hom.
The codes used for these columns are as follows:
(i) Arts only A
Oi) Science only S
(iii) Commerce on Iy C
(iv) Arts & Science only AS
(v) Arts & Commerce only AC
(vi) Combined for all categories-Arts, Science and Commerce ASC
(vii) Law L
Column 10 Recognized shorthand, typewriting and vocational training institutes
"Recognised" should mean recognised by some statutory authority, like education department, commerce department, labour department etc. of the government or semi government or autonomous bodies, public sector undertakings etc.
The following codes are used:
(i) Shorthand SH
(ii) Typewriting Type
(iii) Shorthand & Typewriting SHType
(iv) Others 0
The vocational institutions like - Applied Art! Painting college, Pharmacy college, B. Ed. College, Teacher's Training Institute, Music/Dance School, Nursing Sc~ool etc. are covered under 'Others'.
Column 11 to14
Higher Secondary/Intermediate/Senior Secondaryl PUC/Junior College level, Secondary/Matriculation,
147
Middle Schools/junior Secondary and Primary
Schools.
School up to class V are treated as Primary or
elementary schools. These include Nursery schools,
Kindergarten schools, Pre-Primary schools, junior
Basic schools upto class V and Primary schools upto
class IV.
Schools upto VIII are considered as Middle
school or Junior Secondary.
Schools upto class X are considered as Matriculation or Secondary schools.
Schools upto XI or XII classes are considered as
Higher Secondary/Intermediate/Pre University/Junior
College etc. This would cover 10+2 classes whether
held in schools or college.
If there are composite schools like middle schools
with primary classes or Sec;ondary schools with Middle
classes, these are also included in the number of
Primary and Middle schools, respectively. For
example, if in a town, there are two Primary Schools
and one Middle school with Primary classes, the
number of Primary schools in the town is given as
three and that of Middle schools as one though there
are only three educational institutions.
If there are more institutions of a type in the town,
the number is indicated within bracket along with the
abbreviation, e.g. P(4), M(3).
Column 15 : Adult literacy class/centres
This column has been introduced keeping in view
the Minimum Needs Programme of the Planning
Commission. There are number of Adult Education
Centres which are included in these columns.
If an edu.c~tional·facilit§ is not available in the
town, the name of the nearest place and its distance
in kilometres from the town where the facility is
available is mentioned.
Column 16.: Working Women's hostels with number of seats
The number of working women's bostel jf
available in the referent town is mentioned with
number of seats. If the facility is not available in the
town the name of nearest place with distance where
the facility is available is recorded.

Column 17 to 19 : Recreational and Cultural
Facilities
Stadium, Cinema, Auditorium/Drama/Community Hall are covered under recreational & cultural facilities. The particulars of permanent recreational facilities are considered for these columns.
Column 20 : Public Libraries, Reading Rooms
Number of public libraries and reading rooms
available in the referent town are recorded in codes
as follows:
(i) Public Library
(ii) Reading room
PL
RR
Statement VI : Trade, Commerce, Industry and Banking, 1999
Column 3 to 8
Name of three most important commodities exported and names of three J!lost important
. 148
DISTRICT CENSUS HANDBOOK SHEOHAR
commodities manufactured in the town are recorded.
Column 9 : Number of Banks
Number of Banks available in the referent town
both Commercial and Co-operative banks are
recorded against this column. '
Column 10 & 11 : Number of Agricultural Credit
Societies and NOll Agricultural Credit Societies
The total number of Agricultural Credit Societies
and Non Agricultural Credit Societies in the referent
town are recorded against these columns.
Statement VII : Civic and other Amenities in
Slums, 1999
This is the statement on civic and other amenities
in all slums whether notified or not and for all towns
having statutory bodies, like municipality, Municipal
Corporation, Town area committee etc .

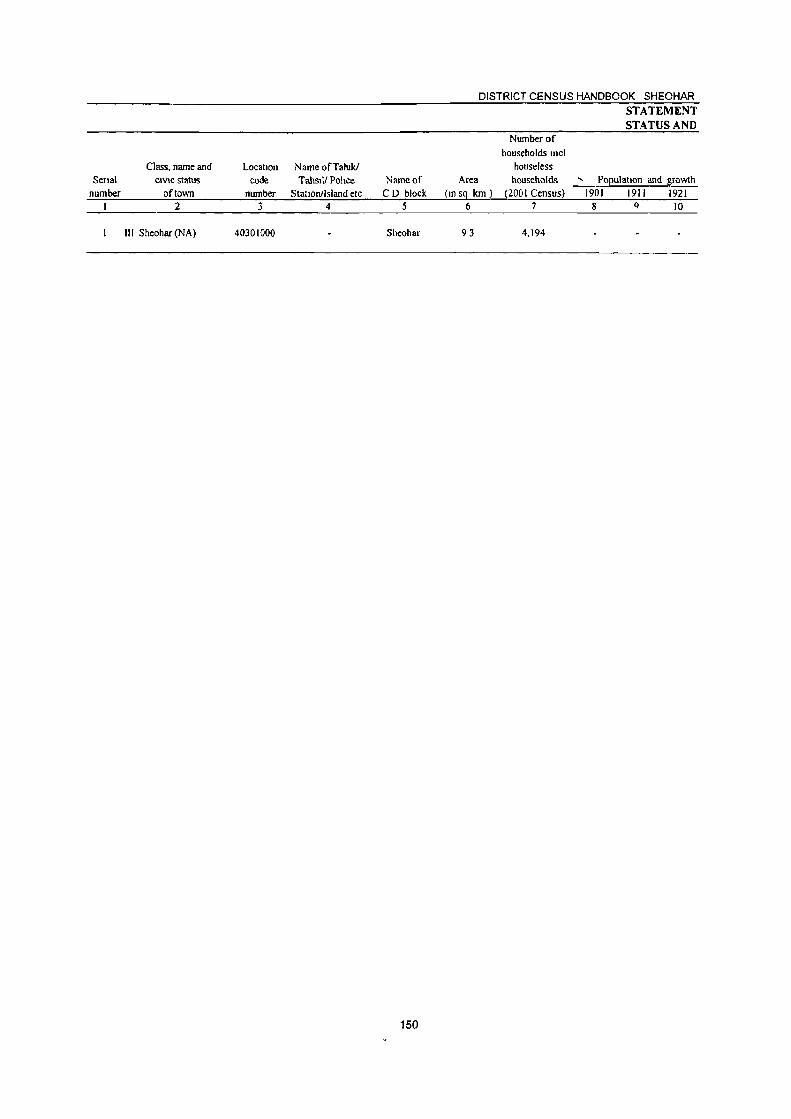
Class, name and LocatIOn Name ofTaluki Senal CIVIC status code Tahsllf Police Name of
number of town number StatIOn/Island etc CD block I 2 3 4 5
III Sheohar (NA) 40301000 Sheohar
150
DISTRICT CENSUS HANDBOOK SHEOHAR
Number of households mel
houseless Area households
(10 s9 km 1 (200 I Census.) 6 7
93 4,194
...
STATEMENT STATUS AND
POj1ulatlOn and ~rowth 1901 1911 1921
8 Q 10
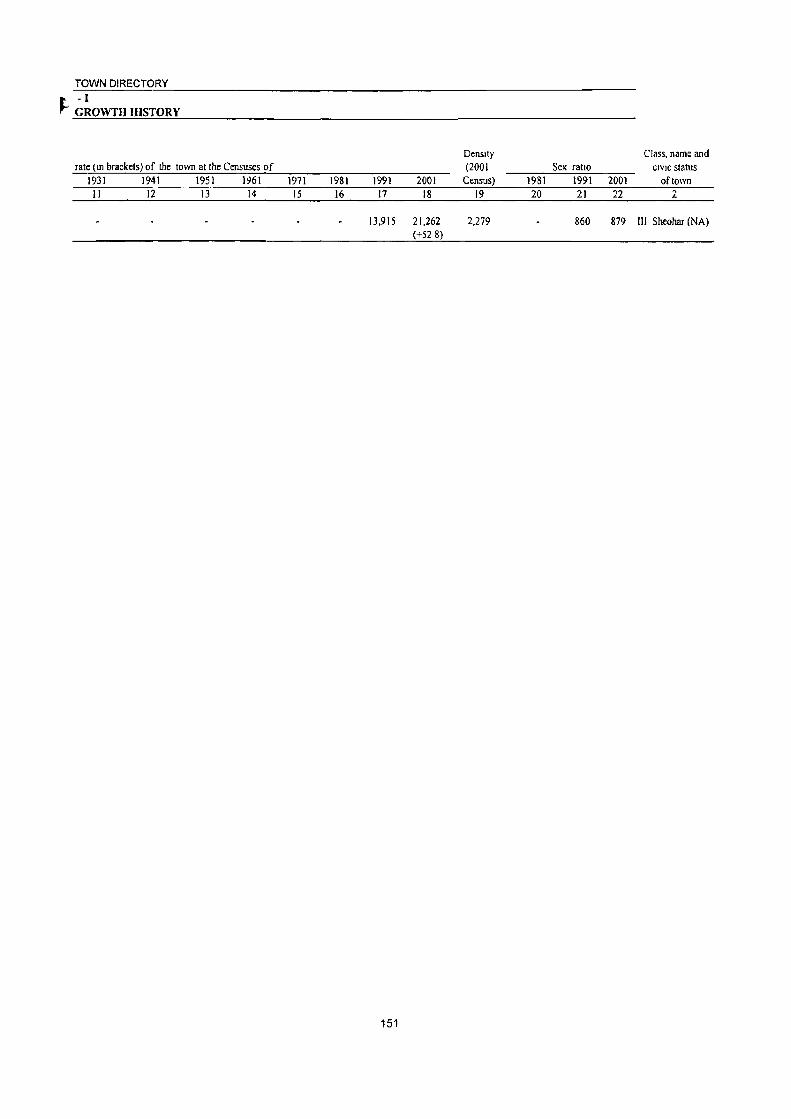
TOWN DIRECTORY
t -I ,., GROWTH H1STORY
DensIty Class, name and rate (In brackets) of the town at the Censuses of (2001 Sex ratIo CIVIC status
1931 1941 1951 ly61 1971 1981 1991 2001 Census) 1981 1991 2001 of town II 12 13 14 15 16 17 18 19 20 21 22 ~
L
13,915 21,262 2,279 860 879 III Sheohar (NA) (+528)
151

Class. name and
Senal CIVIC status Ramfall number of town (mmm)
2 3
III SheoharlNA) 369
DISTRICT CENSUS HANDBOOK SHEOHAR
PhysIcal as2el..\S Temperature (m cenllgrade) MaxImum MinImum
4 5
40 6
152
STATEMENT PHYSICAL ASPECTS AND
Name of and road dIstance m kllometer(s) from
State HQ DIstriCt HQ 6 7
Patna Sheohar (152) (0)

TOWN DIRECTORY -II LOCA TlON OF TOWNS 1999
Name of and road dIstance In ktlometer(s) from Sub-dIvISIOn lTaluk!
TahsIl! Pohee station! Development Block!
IslandHQ 8
Sheohar (0)
Nearest cIty WIth populallon of one
lakh and more 9
MuzafTarpur (19)
Nearest city With populatIon of five
lakh and more 10
Patna (152)
Railway station Bus facility II 12
Sitamarhl (20)
153
Sheohar (0)
Navigable river! canal (lfwl!hm ten kIlometers)
13
NA
Class name and CIVIC status
of town 2
III Sheohar (NA)
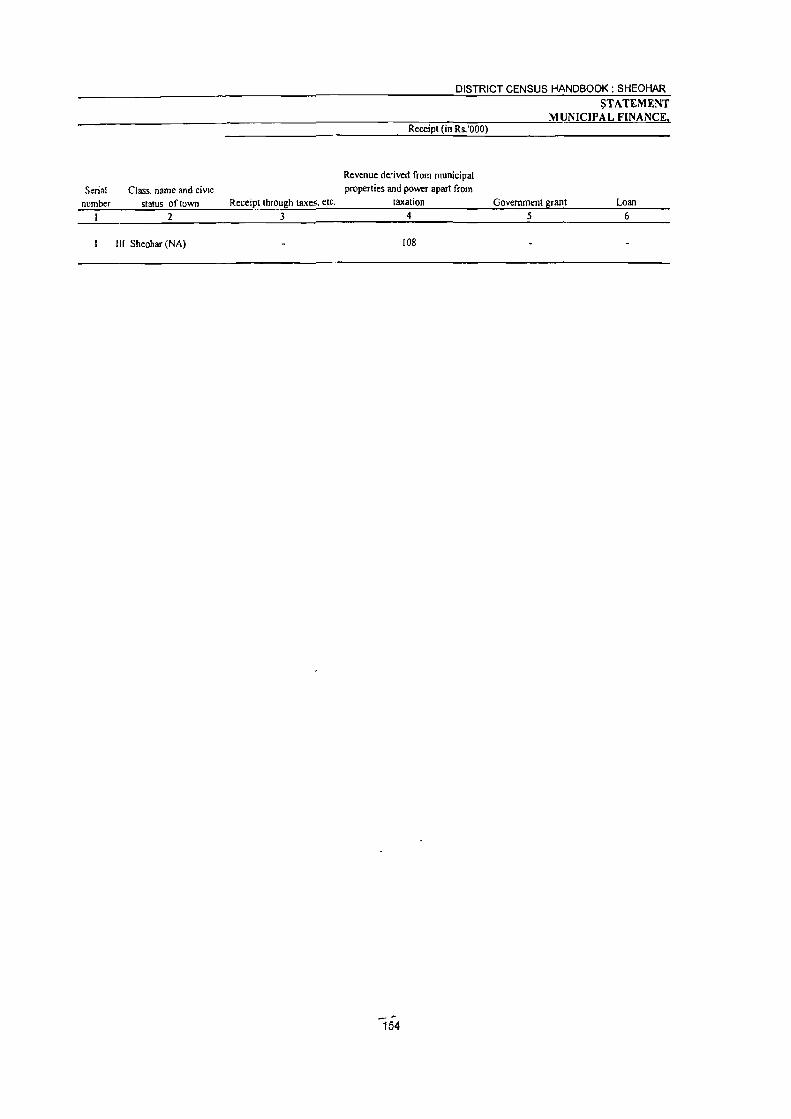
Serial number
Class. name and civIc status of town
2
III Sheohar (NA)
Receipt through taxes. etc.
3
DISTRICT CENSUS HANDBOOK: SHEOHAR
Receipt (in Rs.'OOO)
Revenue derived from municipal properties and power apart from
taxation 4
108
154
~TATEMENT MUNICIPAL FINANCE
Government grant Loan 5 6

TOWN DIRECTORY
-III ~ 1998-99
ReceIpt (Contd ) (m Rs '000) ExpendIture (m Rs '000)
Other General Public health sources TOlal admmlst- PublJc and Public Others TOlal Class, name and CIVIC
Advance (specIfy) receIpt ration safety convemences Publ,cworks mstltutlons (specIfy) expendIture status oftown 7 8 9 10 11 12 13 14 15 16 2
108 17 44 61 1lI Sheohar (NA)
155
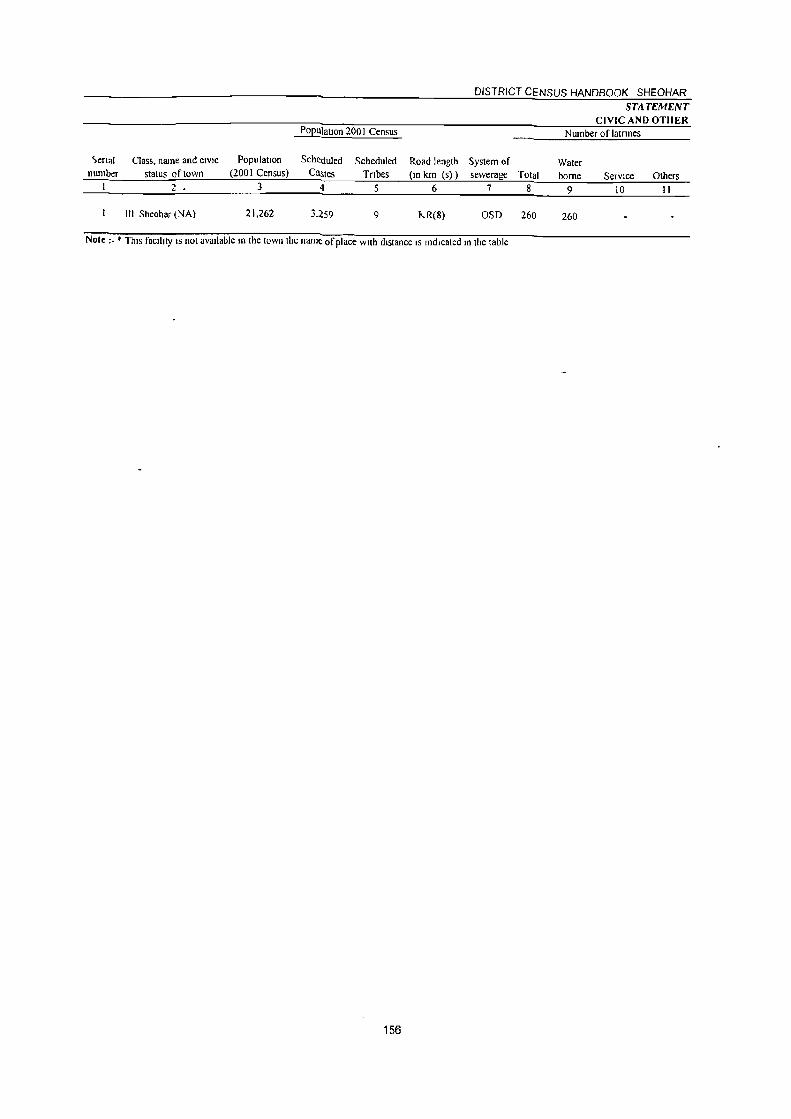
'>enal number
Class. name and CIVIC
status of town 2 •
III Sheohar (NA)
Population (200 I Census)
3
21.262
POpUlation 200 I Census
Scheduled Castes
4
Scheduled Tnbes
5
9
DISTRICT CENSUS HANDBOOK SHEOHAR
Road length System of (m Ian (s) sewerage Total
6 7 8
KR(8) OSD 260
STATEMeNT CIVIC AND OTHER
Number oflatnnes
Water borne
9
260
Service Others 10 II
Note :- • ThIs faclhty IS not available m the town the name of place wIlh dIstance 15 mdlcated m the table
156

TOWN DIRECTORY -IV
~ AMENITIES, 1999
Method of dIsposal of night sOIl
12
ST
Source of supply
13
TW.T
Water supply
System of storage wIth capacity to krlohtres (m
brackets)
14
OHT (50)
FIre fightmg servIce'
15
Snamarhl (20Km)
Electnficallon (number of connechons)
Domestrc Industnal CommercIal
16 17 18
728 32 160
157
Road hghttOg (pomts)
19
3
Others
20
25
Class, name and CIVIC
status of town
2
III Sheohar (NA)
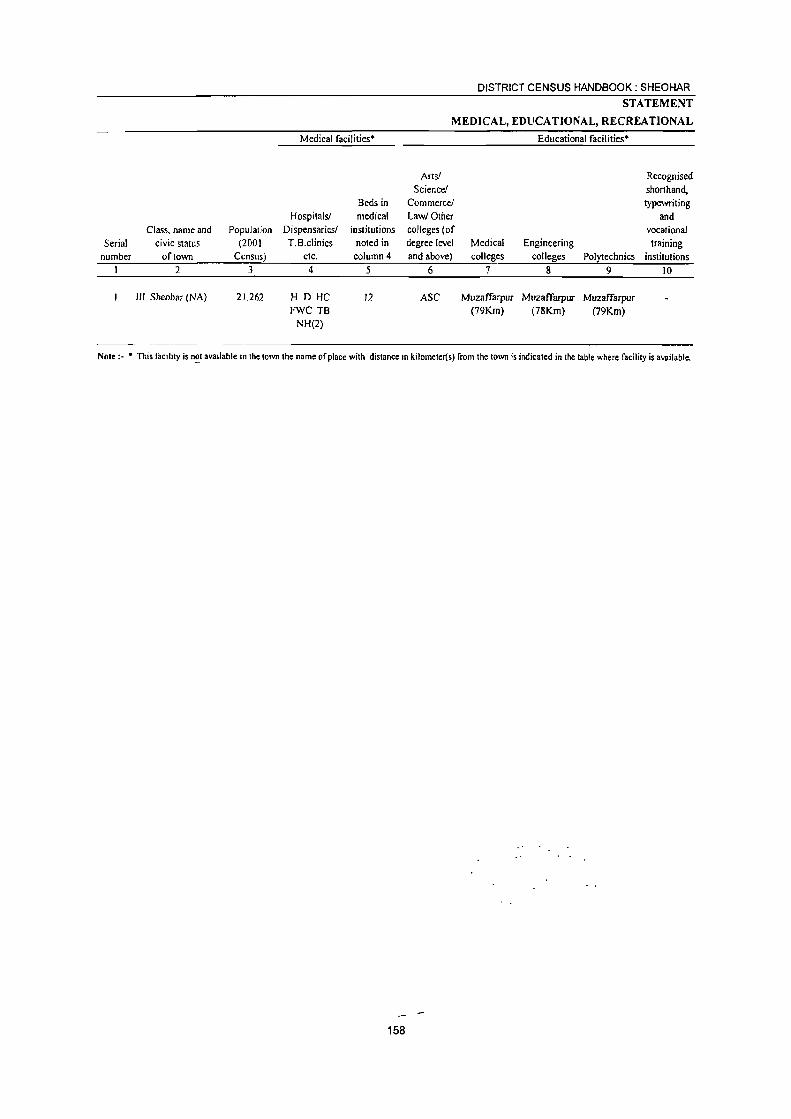
Medical facilities·
Beds in Hospitals! medical
Class. name and Population Dispensariesl institutions Serial civic status (2001 T.B.c1inics noted in
number of town Census) etc. column 4 I 2 3 4 5
I1J Sheohar (NA) 21.262 H D HC 12 FWC TB
NH(2)
DISTRICT CENSUS HANDBOOK: SHEOHAR
STATEMENT
MEDICAL, EDUCATIONAL, RECREATIONAL
Educational facilities·
Arts! Recognised Science! shorthand,
Commerce! typewriting Law/Other and colleges (of vocational degree level Medical Engineering training and above) colleges colleges Pol~echnics institutions
6 7 8 9 10
ASC Muzaffarpur Muzaffarpur Muzaffarpur (79Km) (78Krn) (79Km)
Note:- • This facility is n~t available in the town the name of place with distance In kilometer(s) from the town is indicated in the table where facility is available.
158
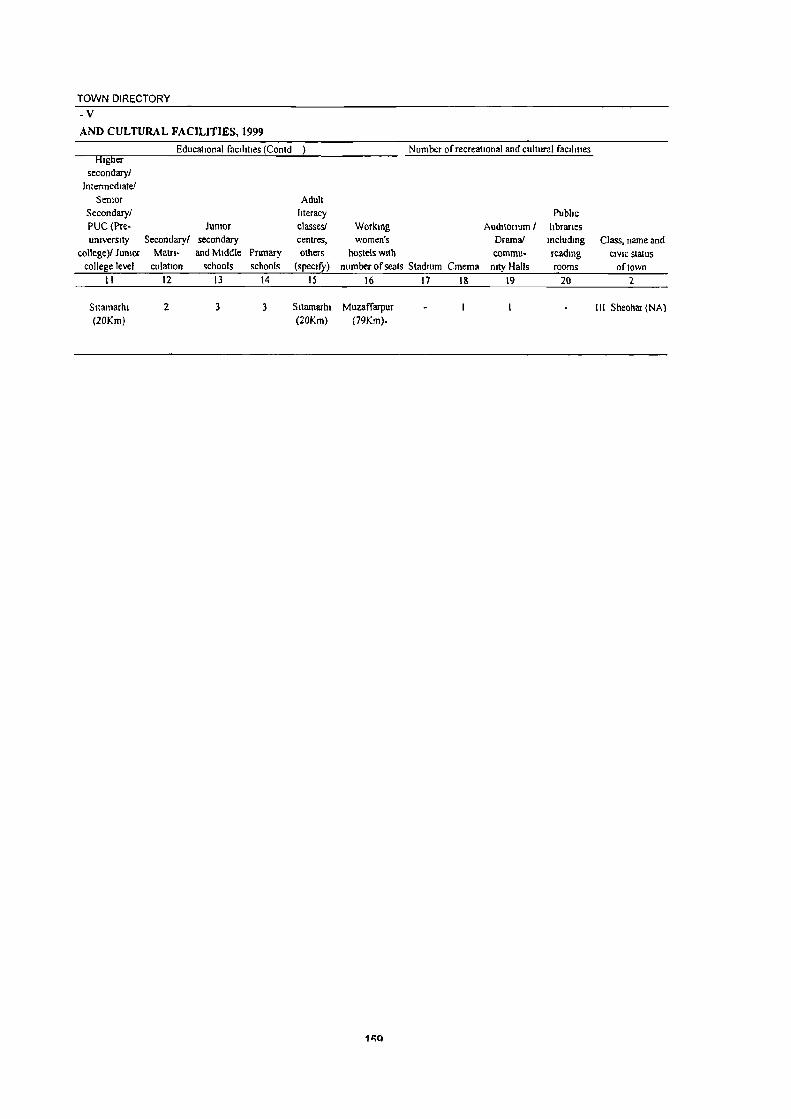
TOWN DIRECTORY
-v AND CULTURAL FACILITIES, 1999
HIgher secondary!
IntennedJatei Senior
Secondaryl PUC (Preumverslty
college)/ JUnior college level
If
Sitamarhi (20Km)
Educahonal faelhlles (Contd
JUnior Secondary! secondary
Matn- and Middle culallon schools
12 13
2 3
Primary schools
14
3
Adult hteracy classes! centres, others
(specIfy) 15
Sitamarhi (20Km)
Number ofrecreallonal and cultural faclhues
Pubhc Working Auditorium I hbrarles women's Drama! mcludmg Class, name and
hostels WIth commu- readmg CIVIC stalus number of seats Stadmm Cmema OIly Halls rooms oflown
16 17 18 19 20 2
Muzaffa!]Jur III Sheohar (NA) (79Km).
11;Q

~t:nal
number
Class. name and CIVIC status
of town " k
JJI Sheohar (NA)
DISTRICT CENSUS HANDBOOK. SHEOHAR
STATEMENT TRADE, COMMERCE, INDUSTRY
Name of three most Important commodities exported
1st 2nd 3rd
3 4 5
Milk Grams Sugarcane
160

TOWN DIRECTORY . VI AND BANKING, 1999
Name ofthree most Important commodilies manufactured 15t 2nd 3rd 6 7 S
Gur Bangle
Number of banks
9
4
161
Number of agTiLUltural
credit societieS 10
Number of non- Class. name and agricultural CIVIC status
credit SOClelles of town II 2
IIJ Sheohar (NA)

Serial Class and name number of town Name of the slum
2 3
III Sheohar
DISTRICT CENSUS HANDBOOK: SHEOHAR
No. of Is it households
notified (approximate) 4 5
STATEMENTCIVIC AND OTHER AMENITIES
Population of Paved roads "-
the Slum (in System of (approximate) kilometers) sewerage
6 7 8
There is no Slum in Sheohar town.
. 162
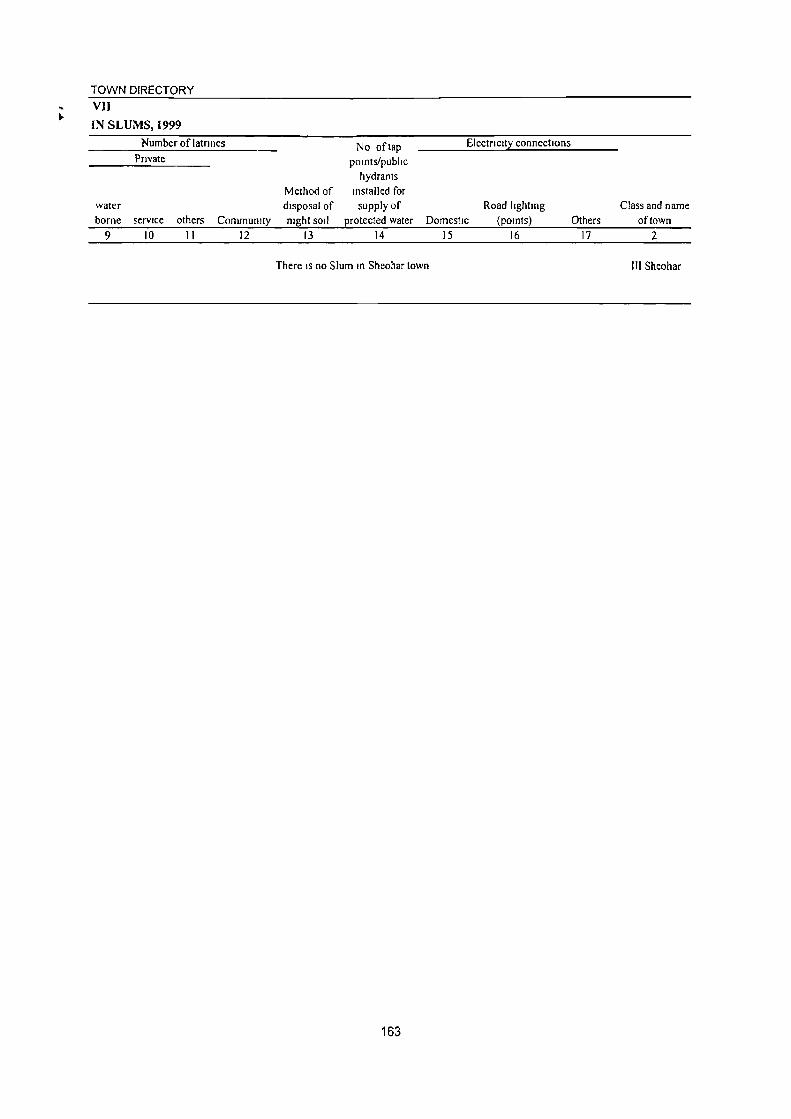
TOWN DIRECTORY VII IN SLUMS, 1999
water borne
9
Number of latnnes PTlvate
service others Community 10 II 12
Method of disposal of mght soli
13
No of tap pOints/public
hydrants Installed for supply of
protected water 14
ElectriCity connections
Road lighting Domestic (pomts)
15 16
There IS no Slum In Sheohar town
163
Others 17
Class and name of town
2
III Sheohar
DISTRICT CENSUS HANDBOOK SHEOHAR
APPENDIX TO TOWN DIRECTORY
TOWNS SHOWING THEIR OUTGROWTHS WITH POPULATION
SerIal
number Name of the town with location code PopulatIOn of core town Name of outgrowth
2 3 4 '-
There IS no outgrowth In any of the towns of Sheohar dlstnct
-~--
Populallon of
outgrowth
5

Part-B : Primary Census Abstract

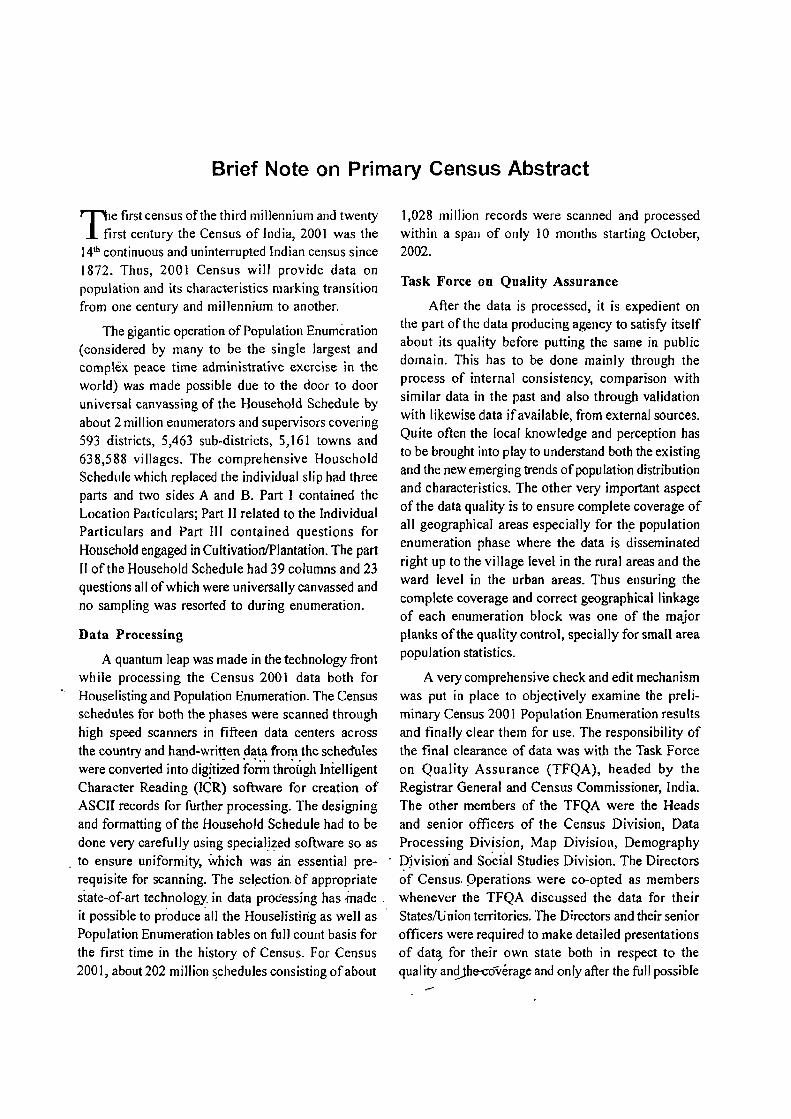
Brief Note on Primary Census Abstract
r-r'he first census of the third millennium and twenty j_ fi rst century the Census of Ind ia, 200 I was the
14th continuous and uninterrupted Indian census since 1872. Thus, 200 I Census will provide data on population and its characteristics marking transition from one century and millennium to another.
The gigantic operation of Population Enumeration (considered by many to be the single largest and complex peace time administrative exercise in the world) was made possible due to the door to door universal canvassing of the Household Schedule by about 2 million enumerators and supervisors covering 593 districts, 5,463 sub-districts, 5,161 towns and 638,588 villages. The comprehensive Household Schedule which replaced the individual slip had three parts and two sides A and B. Part I contained the Location Particulars; Part II related to the Individual Particulars and Part III contained questions for Household engaged in CultivationIPlantation. The part II of the Household Schedule had 39 columns and 23 questions all of which were universally canvassed and no sampling was resorted to during enumeration.
Data Processing
A quantum leap was made in the technology front while processing the Census 2001 data both for
~ Houselisting and Population Enumeration. The Census schedules for both the phases were scanned through high speed scanners in fifteen data centers across the country and hand-written data from the schedUles were converted into dig~ti~d fo~ thr;~gh Intelligent Character Reading (ICR) software for creation of ASCII records for further processing. The designing and formatting of the Household Schedule had to be done very carefully using special!~ed software so as
. to ensure uniformity, which was an essential prerequisite for scanning. The sel~ction. of appropriate state-of-art technology. in data processing has ·made . it possible to produce all the Houselisting as well as Population Enumeration tables on full count basis for the first time in the history of Census. For Census 200 I, about 202 million ~chedules consisting of about
1,028 million records were scanned and processed within a span of only 10 months starting October, 2002.
Task Force on Quality Assurance
After the data is processed, it is expedient on the part of the data producing agency to satisfy itself about its quality before putting the same in public domain. This has to be done mainly through the process of internal consistency, comparison with similar data in the past and also through validation with likewise data ifavailable, from external sources. Qu ite often the local knowledge and perception has to be brought into play to understand both the existing and the new emerging trends of population distribution and characteristics. The other very important aspect of the data quality is to ensure complete coverage of all geographical areas especially for th~ population enumeration phase where the data is disseminated right up to the village level in the rural areas and the ward level in the urban areas. Thus ensuring the complete coverage and correct geographical linkage of each enumeration block was one of the major planks of the quality control, specially for small area population statistics.
A very comprehensive check and edit mechanism was put in place to objectively examine the preliminary Census 2001 Population Enumeration results and finally clear them for use. The responsibility of the final clearance of data was with the Task Force on Quality Assurance (TFQA), headed by the Registrar General and Census Commissioner, India. The other members of the TFQA were the Heads and sen ior officers of the Census Division, Data Processing Division, Map Division, Demography D:ivisioti and Social Studies Division. The Directors of Census. Operations. were co-opted as members whenever the TFQA discussed the data for their StateslUnion territories. The Directors and their senior officers were required to make detailed presentations of dat; for their own state both in respect to the quality ang_the-cOverage and only after the full possible
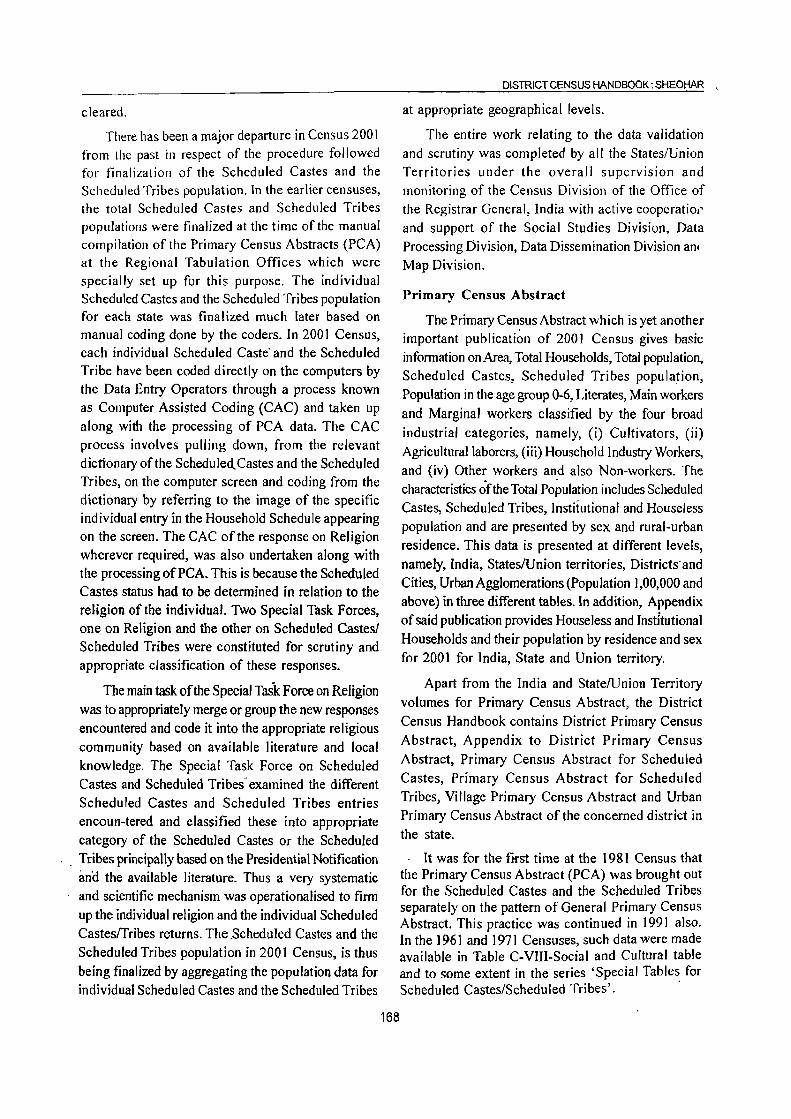
cleared.
There has been a major departure in Census 200 I from the past in respect of the procedure followed for finalization of the Scheduled Castes and the Scheduled Tribes population. In the earlier censuses, the total Scheduled Castes and Scheduled Tribes populations were finalized at the time of the manual compilation of the Primary Census Abstracts (PCA) at the Regional Tabulation Offices which were specially set up for this purpose. The individual Scheduled Castes and the Scheduled Tribes population for each state was finalized much later based on manual coding done by the coders. In 2001 Census, each individual Scheduled Caste' and the Scheduled Tribe have been coded directly on the computers by the Data Entry Operators through a process known as Computer Assisted Coding (CAC) and taken up
along with the processing of PCA data. The CAC process involves pulling down, from the relevant dictionary of the Scheduled Castes and the Scheduled Tribes, on the computer screen and coding from the dictionary by referring to the image of the specific individual entry in the Household Schedule appearing on the screen. The CAC of the response on Religion
wherever required, was also undertaken along with the processing ofPCA. This is because the Scheduled Castes status had to be determined in relation to the religion of the individual. Two Special Task Forces, one on Religion and the other on Scheduled Castes! Scheduled Tribes were constituted for scrutiny and appropriate classification of these responses.
The main task of the Special Task Force on Religion
was to appropriately merge or group the new responses encountered and code it into the appropriate religious community based on available literature and local
knowledge. The Special Task Force on Scheduled Castes and Scheduled Tribes- examined the different
Scheduled Castes and Scheduled Tribes entries encoun-tered and classified these into appropriate
category of the Scheduled Castes or the Scheduled
. Tribes principally based on the Presidential Notification and the available literature. Thus a very systematic and scientific mechanism was operationalised to firm
up the individual religion and the individual Scheduled
CasteslTribes returns. The .Scheduled Castes and the
Scheduled Tribes population in 2001 Census, is thus
being finalized by aggregating the population data for individual Scheduled Castes and the Scheduled Tribes
168
DISTRICT CENSUS HANDBOOK: SHEOHAR ,
at appropriate geographical levels.
The entire work relating to the data validation and scrutiny was completed by all the StateslUnion Territories under the overall supervision and
monitoring of the Census Division of the Office of the Registrar General, India with active cooperatiol'
and support of the Social Studies Division, Data
Processing Division, Data Dissemination Division an! Map Division.
Primary Census Abstract
The Primary Cen.susAbstract which is yet another important publication of 2001 Census gives basic
information on Area, Total Households, Total population, Scheduled Castes, Scheduled Tribes population,
Population in the age group 0-6, Literates, Main workers
and Marginal workers classified by the four broad
industrial categories, namely, (i) Cultivators, (ii)
Agricultural laborers, (iii) Household Industry Workers,
and (iv) Other workers and also Non-workers. The characteristics of the Total Population includes Scheduled
Castes, Scheduled Tribes, Institutional and Houseless population and are presented by sex and rural-urban
residence. This data is presented at different levels,
namely, India, StateslUnion territories, Districts'and
Cities, Urban Agglomerations (Population 1,00,000 and above) in three different tables. In addition, Appendix of said publication provides Houseless and Institutional
Households and their population by residence and sex
for 2001 for India, State and Union territory.
Apart from the India and State!Union Territory
volumes for Primary Census Abstract, the District
Census Handbook contains District Primary Census
Abstract, Appendix to District Primary Census
Abstract, Primary Census Abstract for Scheduled
Castes, Primary Census Abstract for Scheduled
Tribes, Village Primary Census Abstract and Urban Primary Census Abstract of the concerned district in
the state.
. It was for the ftrst time at the 1981 Census that the Primary Census Abstract (PCA) was brought out for the Scheduled Castes and the Scheduled Tribes separately on the pattern of General Primary Census Abstract. This practice was continued in 1991 also. In the 1961 and 1971 Censuses, such data were made available in Table C-VIII-Social and Cultural table and to some extent in the series 'Special Tables for Scheduled Castes/Scheduled Tribes'. .

PRIMARY CENSUS ABSTRACT
The format of Primary Census Abstract has been restructured slightly in the 200 I Census as compared to that of 1991 Census. The nine-fold industrial classification of main workers given in the Primary Census Abstract of 199 I Census has been discontinued and its place, four-fold industrial classification of both 'main workers' and 'marginal workers' are included. In 1981 census only main workers were presented in to
Name of the Primary Census Abstract
I. District Primary Census Abstract
four categories. One of the novel features of the primary census abstract of 1991 census was the presentation of data of the population of age group 0-6 is continued in 2001 Census also. This will help the data users in better analysis and understanding of this literacy data.
Level of presentation in District Census Handbooks:
The Primary Census Abstract data in different
Level of presentation
2. . Primary Census Abstract for Scheduled Castes
District/CD Block/UA/City/Town
District/CD Block/Town
District/CD Block/Town 3. Primary Census Abstract for Scheduled Tribes
4. Village Primary Census Abstract
5. Urban Primary Census Abstract
PCAs are presented at different levels. The level of presentation of Primary Census Abstracts are as under:
The PCA Data for villages was presented CD Block wise for the first time in 1991 Census. This practice is continued in 2001 Census also. The data
for each CD Block is presented both for rural and
urban areas separately. All the villages within the CD Block constitute the rural portion and the Census
Towns and Outgrowths are shown under the urban portion of the CD Block. In case a CD· Block is
spread over two or more districts, than portion which falls within the district is presented, the data pertaining to remaining portion of the CD Block is presented in
the concerned District Census Handbook. The data in the Urban Primary Census Abstract for each town as well as for town with outgrowths in the district are presented. The data for all the wards and the
outgrowths of the town(s) are also presented
separately below the concerned ·town(s).
The District Primary Census Abstract is
presented in 59 columns. The Primary Census
Abstract for Scheduled Castes and Primary Census
Abstract for Scheduled Tribes are presented in 52
columns. Tbe Village Primary Census Abstract and
Urban Primary Census Abstract are presented in 58
columns.
The concepts and definitions used in the column
heading are explained under the sub heading 'Census
Concepts' in the Analytical Note. The term 'Total
Population' includes the Scheduled Castes, the
169
CD Block/Village wise
Town/Ward level
Scheduled Tribes, the Institutional and the Houseless
populations. The explanation regarding area figures
presented at various level in the Primary Census
Abstracts are as follows:
Area Figures
The area figures supplied by local revenue authorities of the district in respect of tehsils, Police Stations and by the local bodies in respect oLtowns are given in square kilometers. The area figures of the villages supplied by the Tahsildars in acres have been converted and shown in hectares. The area figures of the CD Block is the total of the village areas coming under each CD Block. The area figures for the district are the same as adopted by the Surveyor General of India to maintain uniformity at the national level. The total area figures of all the tahsils/CD Blocks within the district may not tally with area figures of the district because former represents land use area only. Similarly, the total of all the villages may not tally with the entire rural of Police Station/ Tahsil. The difference may be due to the fact that while the area covered by hills, forests and rivers etc, have been accounted in the Tahsils and P.S. level the same may not be covered under the area of the villages. Apart from this it may also differ due to varying methods of computation adopted at different levels.
An appendix to District Primary Census Abstract has also been furnished showing urban enumeration block-wise particulars on Total Population, the Scheduled Castes Population and the Scheduled Tribes Population for each town.
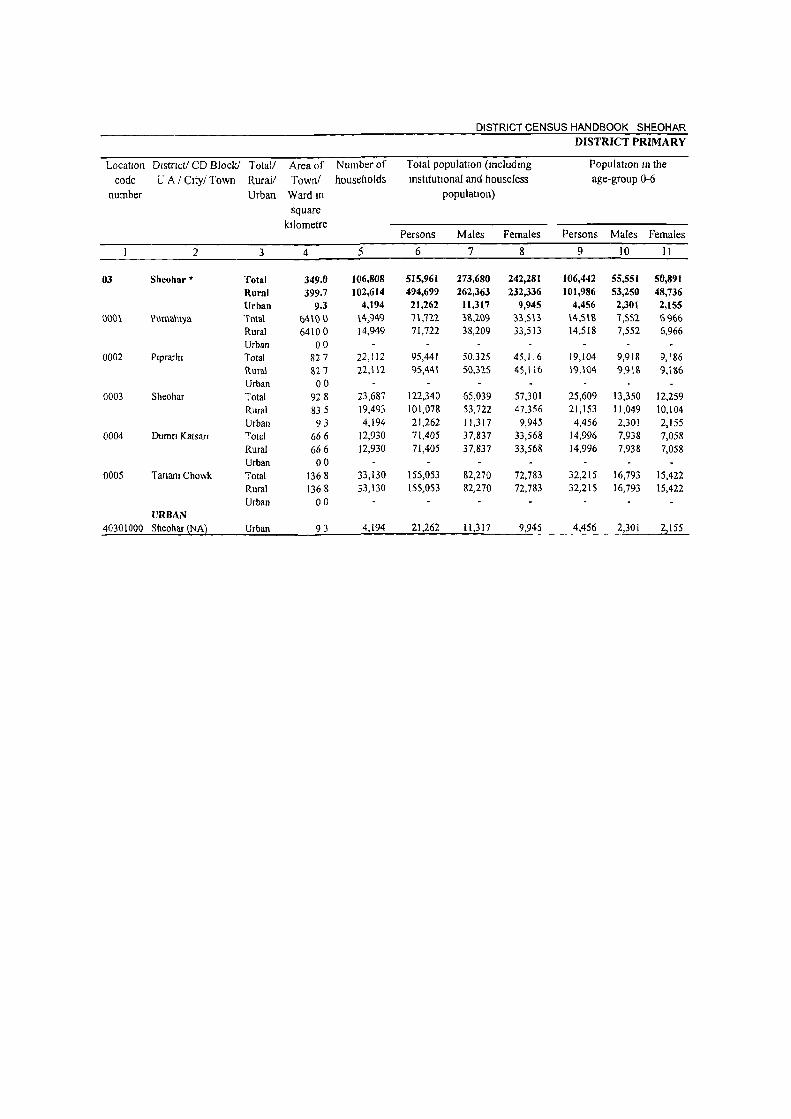
DISTRICT CENSUS HANDBOOK SHEOHAR
DISTRICT PRIMARY
LocatIOn DIstrICt! CD Block! Total! Area of Number of Total populatIon (mcludmg PopulatIon In the
code U A! CIty! Town Ruralf Town! households IDstltutlOnal and houseless age-group 0-6 number Urban Wardm populatIOn)
square kIlometre
Persons Males Females Persons Males Females
2 3 4 5 6 7 8 9 10 11
03 Sheohar * Total 349.0 106,808 515,961 273,680 242,281 106,442 55,551 50,891
Rural 399.7 102,614 494,699 262,363 232,336 101,986 53,250 48,736
Urban 9.3 4,194 21,262 H,317 9,945 4,456 2,301 2,155 OOC\ Pumanlya lotal 64100 14,949 11,122 3\',,209 33,513 14,5\\\ 1,552 6%6
Rural 64100 14,949 71,722 38,209 33,513 14,518 7,552 6.966 Urban 00
0002 Plprarhl Total 827 22,112 95,441 50,325 45,116 19,104 9,918 9,186 Rural 1127 22,112 95,441 SO,325 45,116 19.104 9,91& 9,IS6 Urban 00
0003 Sheohar Total 928 23,687 122,340 65,039 57,301 25,609 13,350 12,259 Rural 835 19,493 101,078 53,722 47,356 21,153 11,049 10,104
Urban 93 4,194 21,262 11,317 9,945 4,456 2,301 2,155 0004 Dumn Katsan Total 666 12,930 71,405 37,837 33,568 14.996 7.938 7,058
Rural 666 12,930 71,405 37,837 33,568 14,996 7,938 7,058 Urban 00
0005 Tanam Chowk Total 1368 33,130 155,053 82,270 72,783 32,215 16,793 15,422 Rural 1368 33,130 155,053 82,270 72,783 32,215 16,793 15,422
Urban 00 URBAN
40301000 Sheohar (NA) Urban 93 4,194 21,262 11,317 9,945 4,456 2,301 2,155

PRIMARY CENSUS ABSTRACT
CENSUS ABSTRACT
Total/ DIstnct! CD Block! Rural/ U A / City/ Town
Scheduled Castes populatIon Scheduled Tnbes populatIOn Literates Urban
Persons Males Females Persons Males Females Persons Males Females
12 13 14 15 16 17 18 19 20 3 2
74,391 39,405 34,986 64 35 29 144,444 98,775 45,669 Total Sheohar • 71,132 37,703 33,429 55 27 28 137,105 93,865 43,240 Ruml
3,259 1,702 1,557 9 8 7,339 4,910 2,429 llrban 11,361 6,048 5,313 8 2 6 23,152 15,655 7,497 Total Purnahlya 11,361 6,048 5,313 8 2 6 23152 15,65~ 7,497 Rural
Urban 12,357 6,478 5,879 3 2 26,730 18,129 8,601 Total Plprarhl 12,357 6,478 5,879 3 2 26,730 18,129 8,601 Rural
Urban 18,992 10,106 8,886 17 n 4 36,006 24,441 11,565 Total Sheohar 15,733 8,404 7,329 8 3 28,667 19,531 9,136 Rural 3,259 1,702 \,557 9 8 7,339 4,910 2,429 Urban 9,399 4,980 4,419 18 10 8 21,248 14,402 6,846 Total Dumn Katsan 9,399 4,980 4,419 18 10 8 21,248 14,402 6,846 Rural
Urban 22,282 11,793 10,489 18 9 9 37,308 26,148 11,160 Total Tanam Chowk 22,282 11,793 10,489 18 9 9 37,308 26,148 11,160 Rural
Urban URBAN
3,259 1,702 1,557 9 8 7,339 4,910 2,429 Urban Sheohar (NA)
171

DISTRICT CENSUS HANDBOOK: SHEOHAR
DISTRICT PRIMARY
Location District! CD Block! Total! code U.A.I City/ Town Rural!
number Urban Illiterates Total workers Main workers
Persons Males Females Persons Males Females Persons Males Females
2 3 21 22 23 24 25 26 27 28 29
03 SlJeohar • Total 371,517 174,905 196,612 161,218 137,542 23,676 133,348 123,)58 )0,190 Rural 357,594 168,498 189,096 154,759 131,992 22,767 128,369 118,459 9,910 Urban 13,923 6,407 7,516 6,459 S,550 909 4,979 4,699 280
0001 Pumahiya Total 48,570 22,554 26,016 22,745 19,265 3,480 18,996 17,400 1,596 Rural 48,570 22,554 26,016 22,745 19,265 3,480 18,996 11,400 1,590 Urban
0002 Piprarhi Total 68,711 32,196 36,515 29,349 26,046 3,303 24,674 22,873 1,801 Rural 68,711 32,196 36,515 29,349 26,046 3,303 24,674 22,873 1,801 Urban
0003 Sheohar Total 86,334 40,598 45,736 37,218 32,162 5,056 31,554 29,238 2,316 Rural 72,4 \ \ 34,191 38,220 30,759 26,612 4,147 26,575 24,539 2,036 Urban 13,923 6,407 7,516 6,459 5,550 909 4,979 4,699 280
0004 Dumri Katsari Total 50,157 23,435 26,722 22,684 19,106 3,578 19,455 18,133 1,322 Rural 50,157 23,435 26,722 22,684 19,106 3,578 19,455 18,133 1,322 Urban
0005 Tariani Chowk Total 117,745' 56,122 61,623 49,222 40,963 8,259 38,669 35,514 3,155 Rural 117,745 56,122 61,623 49,222 40,963 8,259 38,669 35,514 3,155 Urban
URBAN 40301000 Sheohar~Al Urban 13,923 6,407 7,516 6,459 5,550 909 4,979 4,699 280
172

PRIMARY CENSUS ABSTRACT
CENSUS ABSTRACT
Industnal categor~ of main workers Total! DIstrict! CD Block! Rural! U A / Clty/ Town
CultIvators Agnculturallabourers Household mdustry
Other workers Urban workers
Persons Males Females Persons Males Females Persons Males Females Persons Males Females
30 31 32 33 34 35 36 37 38 39 40 41 3 2
37,393 36,004 1,389 78,792 71,716 7,076 2,741 2,280 461 14,422 13,158 1,264 Total Sheohar * 36,838 35,473 1,365 76,891 69,919 6,972 2,511 2,078 433 12,129 10,989 1,140 Rural
555 531 24 1,901 1,797 104 230 202 28 2,293 2,169 124 Urban 5407 5,252 ISS 10,594 9,453 1,141 559 416 143 2,436 2,279 157 Total Purnahlya 5,407 5,252 155 10,594 9,453 1,141 559 416 143 2,436 2,279 157 Rural
Urban 6,206 5,959 247 \5,240 14,128 \,112 528 424 104 2.700 2.362 338 Total Plprarhl 6,206 5,959 247 15,240 14,128 1,112 528 424 104 2,700 2,362 338 Rural
Urban 8,482 8,163 319 17,823 16.156 1,667 703 622 81 4,546 4,297 249 Total Sheohar 7,927 7,632 295 15,922 14,359 1563 473 420 53 2,253 2,128 125 Rural
555 531 24 1,901 1,797 104 230 202 28 2,293 2,169 124 Urban 6,528 6,385 143 10,943 10,023 920 351 315 36 1,633 1,410 223 Total Dumn Katsarl 6,528 6,385 143 10,943 10,023 920 351 315 36 1,633 1,410 223 Rural
Urban 10,770 10,245 525 24192 21,956 2.236 600 503 97 3,107 2,810 297 Total TanamChowk 10,770 10,245 525 24,192 21,956 2,236 600 503 97 3,107 2,810 297 Rural
Urban URBAN
555 531 24 1,901 1,797 104 230 202 28 2,293 2,169 124 Urban Sheohar~A2
173

DISTRICT CENSUS HANDBOOK SHEOHAR DISTRICT PRIMARY
Location District! CD Block! Total/ Industrial cate~0!l
code U A ! City! Town Rural! number Urban Marginal workers Cultivators Agricultural labourers
Persons Males Females Persons Males Females Persons Males Females
2 3 42 43 44 45 46 47 48 49 50
03 Sheobar • Total 27,870 14,384 13,486 3,881 1,707 2,174 20,115 10,611 9,504 Rural 26,390 13,533 12,857 3,757 1,678 2,079 19,364 10,190 9,174 Urban 1,480 851 629 124 29 95 751 421 330
0001 Purnahlya Total 3,749 1,865 1,884 582 248 334 2,585 1,308 1,277 Rural 3,749 1,865 1,884 582 248 334 2,585 1,308 1,277 Urban
0002 Plprarhl Total 4,675 3,173 1,502 476 303 173 3,091 2,257 834 Rural 4,675 3,173 1,502 476 303 173 3,091 2,257 834 Urban
0003 Sheohar Total 5,664 2,924 2,740 873 325 548 3,796 ],957 ],839 Rural 4,184 2,073 2,111 749 296 453 3,045 1,536 1,509 Urban 1,480 851 629 124 29 95 751 421 330
0004 Dumn Katsan Total 3,229 973 2,256 943 353 590 ],792 473 1,319 Rural 3,229 973 2,256 943 353 590 1,792 473 1,319 Urban
0005 Tanan. Chowk Total 10,553 5,449 5,104 1,007 478 529 8,851 4,616 4,235 Rural 10,553 5,449 5,104 1,007 478 529 8,851 4,616 4,235 Urban
URBAN 40301000 Sheohar (NA) Urban 1,480 851 629 124 29 95 751 421 330
174
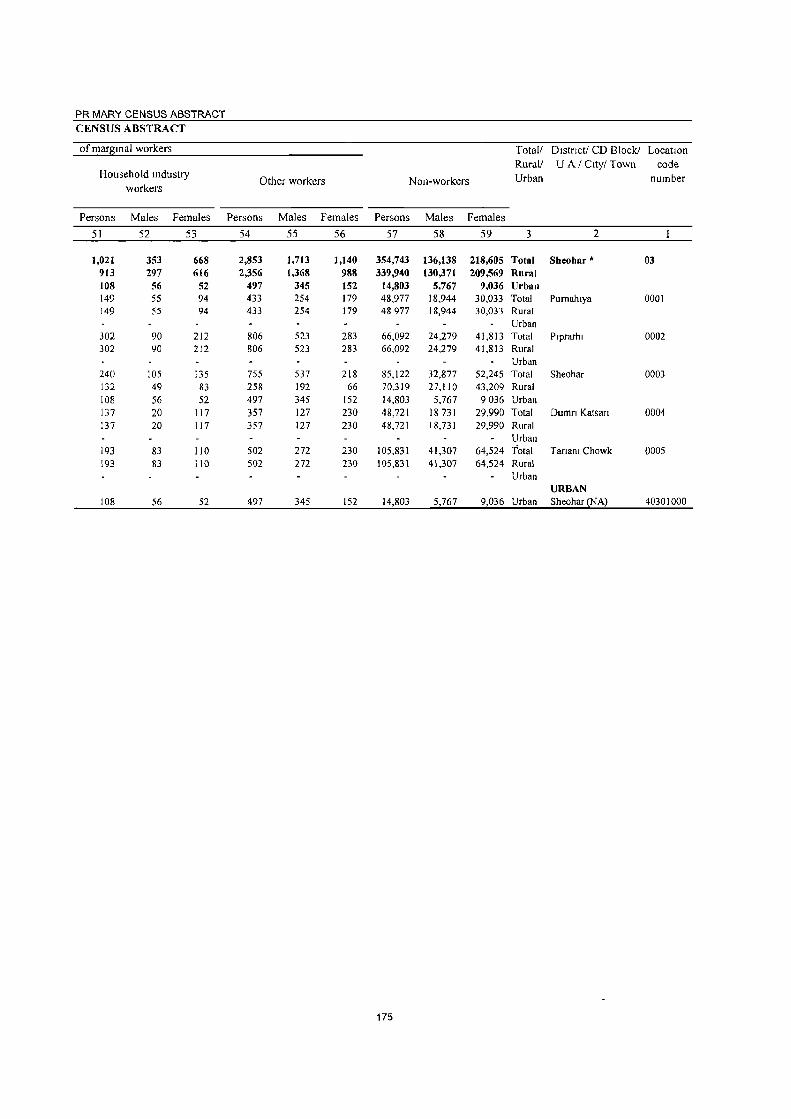
PRIMARY CENSUS ABSTRACT CENSUS ABSTRACT
ofmafj:lmal workers Total! Dlstnct/ CD Block! LocatIOn Rurall U A I City! Town code
Household mdustry Other workers Non-workers Urban number
workers
Persons Males Females Persons Males Females Persons Males Females
51 52 53 54 55 56 57 58 59 3 2
1,021 353 668 2,853 1,713 1,140 354,743 136,138 218,605 Total Sheohar * 03 913 297 616 2,356 1,368 988 339,940 130,371 209,569 Rural 108 56 52 497 345 152 14,803 5.767 9,036 llrban 149 55 94 433 254 179 48,977 18,944 30,033 Total Purnahlya 0001 149 55 94 433 254 179 48977 18,944 30,033 Rural
Urban 302 90 212 806 523 283 66,092 24,279 41,813 Total Plprarhl 0002 302 90 212 806 523 283 66,092 24,279 41,813 Rural
Urban 240 IDS 135 755 537 218 85,122 32,877 52,245 Total Sheohar 0003 132 49 83 258 192 66 70,319 27,110 43,209 Rural 108 56 52 497 345 152 14,803 5,767 9036 Urban 137 20 117 357 127 230 48,721 18731 29,990 Total Dumn Katsan 0004 137 20 117 357 127 230 48,721 18,731 29,990 Rural
Urban 193 83 110 502 272 230 105,831 41,307 64,524 Total Tarlanl Chowk 0005 193 83 110 502 272 230 105,831 41,307 64,524 Rural
Urban URBAN
108 56 52 497 345 152 14,803 5,767 9,036 Urban Sheohar Q::!A) 40301000
175

DISTRICT CENSUS HANDBOOK: SHEOHAR
APPENDIX TO DISTRICT PRIMARY CENSUS ABSTRACT
TOTAL, SCHEDULED CASTES AND SCHEDULED TRIBES POPULATION - URBAN BLOCK WISE
Boundaries of Scheduled Scheduled
Location urban block I EB Total Castes Tribes
Code Name of town Name of ward number population population population
I 2 3 4 5 6 7
40301000 Sheohar (NA) Ward No. I EB No. I 628 66
40301000 Sheohar (NA) Ward No.1 EB No.2 583 29
40301000 Sheohar (NA) Ward No. I EB No.3 553 75 9
40301000 Sheohar (NA) Ward No.1 EB No.4 689 41
40301000 Sheohar (NA) Ward No.1 EB No.5 665 88
40301000 Sheohar (NA) Ward No.1 EB No.6 493 2
40301000 Sheohar (NA) Ward No.1 EB No.7 684 63
40301000 Sheohar (NA) Ward No.1 EB No.8 491 4
40301000 Sheohar (NA) Ward No.1 EB No.9 558
40301000 Sheohar lNA) Ward No.2 EB No. 10 619 31
40301000 Shcohar (NA) Ward No.2 EB No. II 369 76
40301000 Sheohar (NA) Ward No.2 EB No. 12 550 95
40301000 Sheohar (NA) Ward No.2 EB No. 13 559 5
40301000 Sheohar (NA) Ward No.2 EB No. 14 452 33
40301000 Sheohar (NA) Ward No.2 EB No. 15 518 233
40301000 Sheohar (NA) Ward No.2 EB No. 16 640 307
40301000 Sheohar (NA) Ward No.2 EB No. 17 575 367
40301000 Sheohar (NA) Ward No.2 EB No. 18 209 100
40301000 Sheohar (NA) Ward No.2 EB No. 19 295 86
40301000 Sheohar (NA) Ward No.2 EB No. 20 321
40301000 Sheohar (NA) Ward No.2 EB No. 21 209
40301000 Sheohar (NA) Ward No.2 EB No. 22 594 178
40301000 Sheohar (NA) Ward NO.3 EB No. 23 418 14
40301000 Sheohar (NA) Ward No.3 EB No. 24 634 4
40301000 Sheohar (NA) Ward No.3 EB No. 25 507
40301000 Sheohar (NA) Ward NO.3 EB No. 26 185
40301000 Sheohar (NA) Ward NO.3 EB No. 27 614
40301000 Sheohar (NA) Ward NO.3 EB No. 28 607
40301000 Sheohar (NA) Ward No.3 EB No. 29 80
40301000 Sheohar (NA) Ward NO.3 EB No. 30 519
40301000 Sheohar (NA) Ward No.3 EB No. 31 488
40301000 Sheohar (NA) Ward No.3 EB No. 32 629
40301000 Sheohar (NA) Ward No.4 BB No. 33 532 20
40301000 Sheohar (NA) Ward NO.4 BB No. 34 540
40301000 Sheohar (NA) Ward No.4 EB No. 35 795 41
40301000 Sheohar (NA) Ward NO.4 EB No. 36 528
40301000 Sheohar (NA) Ward No.4 EB No. 37 528
40301000 Sheohar (NA) Ward No.4 BB No. 38 888 33
40301000 Sheohar (NA) Ward No.4 EB No. 39 539 539
40301000 Sheohar (NA) Ward No.4 EB No. 40 109 86
40301000 Sheohar (NA) Ward No.4 EB No. 41 384 370
40301000 Sheohar (NA) Ward No.4 EB No. 42 484 272
176

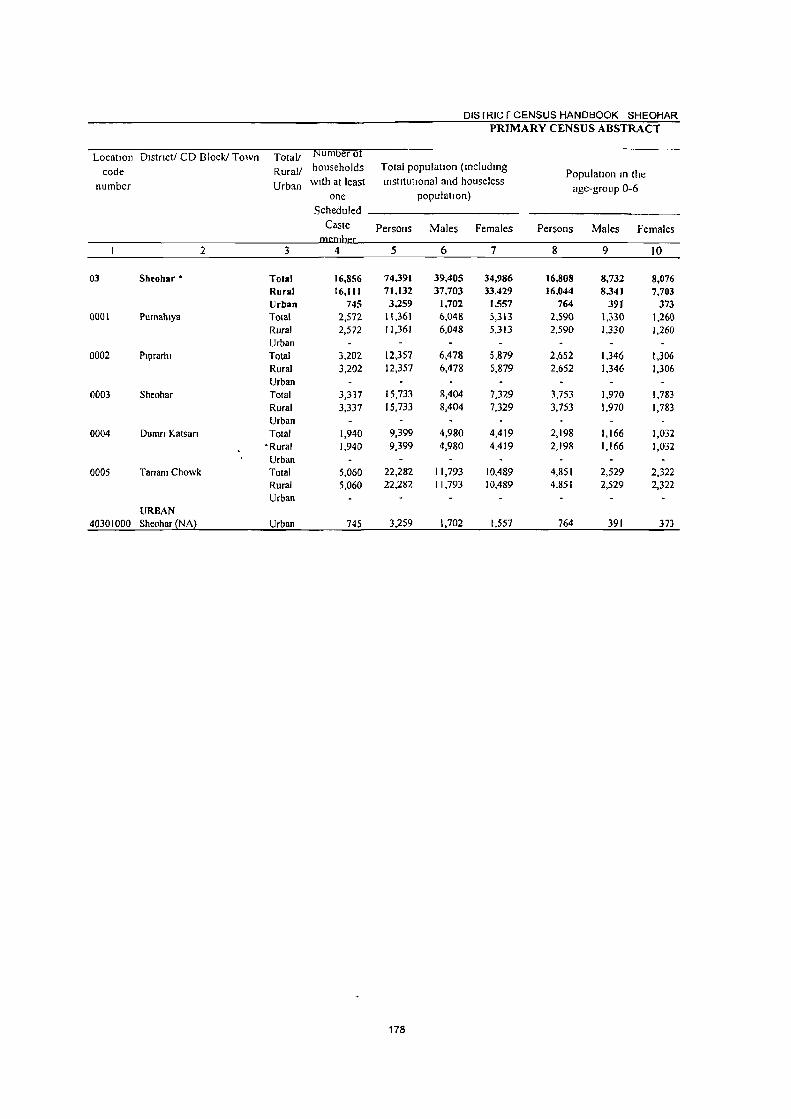
178

PRIMARY CENSUS ABSTRACT FOR SCHEDULED CASTES
Total! Dlstnctl CD Block! Town Rurall
Literates Illiterates Total workers Urban
Persons Males Females Persons Males Females Persons Males Females
II 12 13 t4 15 16 17 18 19 3 2
9,705 7,478 2,227 64,686 31,927 32,759 26,035 20,380 5,655 Total Shtohar • 9,316 7,179 2.137 61,816 30,524 31,292 24.890 19.518 5,372 Rural
389 299 90 2,870 1,403 1,467 1,145 862 283 Urban 1,1142 1.412 430 9,519 4,636 4,&&3 4,119 3,147 972 Total Pumahl:fll. 1,842 1,412 • 430 9,519 4,636 4,883 4,119 3,147 972 Rural
Urban 1,581 1,235 346 10,776 5,243 5,533 4,141 3,532 609 Total Plprarhl 1,581 1,235 346 10,776 5,243 5,533 4,141 3,532 609 Rural
Urban 2,074 1,586 488 13,659 6,818 6,841 5,433 4,245 1,188 Total Sheohnr 2,074 1,586 488 13,659 6,818 6,841 5,433 4,245 1,188 Rural
Urban 1,412 1,069 343 7,987 3,911 4,076 3,266 2,545 721 Total Dumn Kalsan IAI2 1.069 343 7,987 3,911 4,076 3,266 2,545 721 Rural
,.._ Urban 2,407 1,877 530 19,875 9,916 9,959 7,931 6,049 1,882 Total TariaOl Chowk 2,407 "1,877 530 19,875 9,916 9,959 7,931 6,049 1,882 Rural
Urban URBAN
389 299 90 2,870 1,403 1,467 1,145 862 283 Urban Sheohar (NA)
179

DISTRICT CENSUS HANDBOOK SHEOHAR PRIMARY CENSUS ABSTRACT
Locallon DI!>tnct/ CD Block! Town Totall Industnal c<ltcgory
code Rural!
number Urban Mam workers
Culuvators Agricultural labourers
"-
Pelson~ Mak., Females Persons Males Femalc~ Persons Male~ Fell13le~
2 3 20 21 22 23 24 25 26 27 28
03 Sheohar * Total 20,326 17,662 2,664 626 582 44 18,290 15,987 2,303 Rural 19,508 16,914 2,594 616 572 44 17,661 15,409 2,252 Urban 818 748 70 10 10 629 578 51
0001 Pumahlya Total ),361 2,774 587 77 72 5 3,009 2,539 470 Rural ),361 2,774 587 77 72 5 3,009 2,539 470 Urban
0002 Plprarhl Total ),337 2,972 365 99 96 3 2,986 2,680 306 Rural ),337 2,972 365 99 96 3 2,986 2,680 306 Urban
0003 Sheohar TOlal 4,378 3,845 533 153 143 10 3,996 3,512 484 Rural 4,378 3,845 533 153 143 10 3,996 3,512 484 Urban
0004· Dumn Katsan Total J,843 2,456 387 109 104 5 2,563 2,215 348 Rural J,843 2,456 387 109 104 5 2,563 2,215 348 Urban..
0005 Ianam Chowk Total 5,589 4,867 722 178 157 21 5,107 4,463 644 Rural 5,589 4,867 722 178 157 21 5,107 4,463 644 Urban
URBAN 40301000 Sheohar (NA2 Urban 818 748 70 10 10 629 578 51
180

PRIMARY CENSUS ABSTRACT FOR SCHEDULED CASTES
ofmam workers Total! Dlstnct/ CD Block! Town Rural!
Household Industry workers Other worJcers Margmal workers Urban
Persons Males Females Persons Males Females Persons Males Females
29 3D 31 32 33 34 35 36 37 3 2
510 332 178 900 761 13? 5,709 2,718 2,991 Total Sheohar* 449 Z81 167 781 651 131 5,382 2,604 2,778 Rural
61 SO II 118 110 8 327 114 213 Urban 141 55 86 134 108 26 758 373 385 Total Pumahl)'a 141 55 86 134 108 26 758 373 385 Rural
IJo;'MD.
73 50 23 179 146 33 804 560 244 Total Plprarhr 73 SO 23 179 146 33 804 560 244 Rural
Urban 91 72 19 13& 11& 20 t,OS5 400 655 Total Sheohar 91 72 19 138 lIS 20 1,055 400 655 Rural
Urban 36 24 12 135 1 LJ 22 423 89 334 Total Dumn Katsan 36 24 12 135 Jlj 22 423 89 334 Rural
Urban 108 81 27 196 166 30 2,342 1,182 1,160 Total Tananl Cbowk 108 81 27 196 166 3D 2,342 1,182 1,160 Rural
Urban URBAN
61 50 11 118 110 8 327 114 213 Urban Sheohar iliA~
181
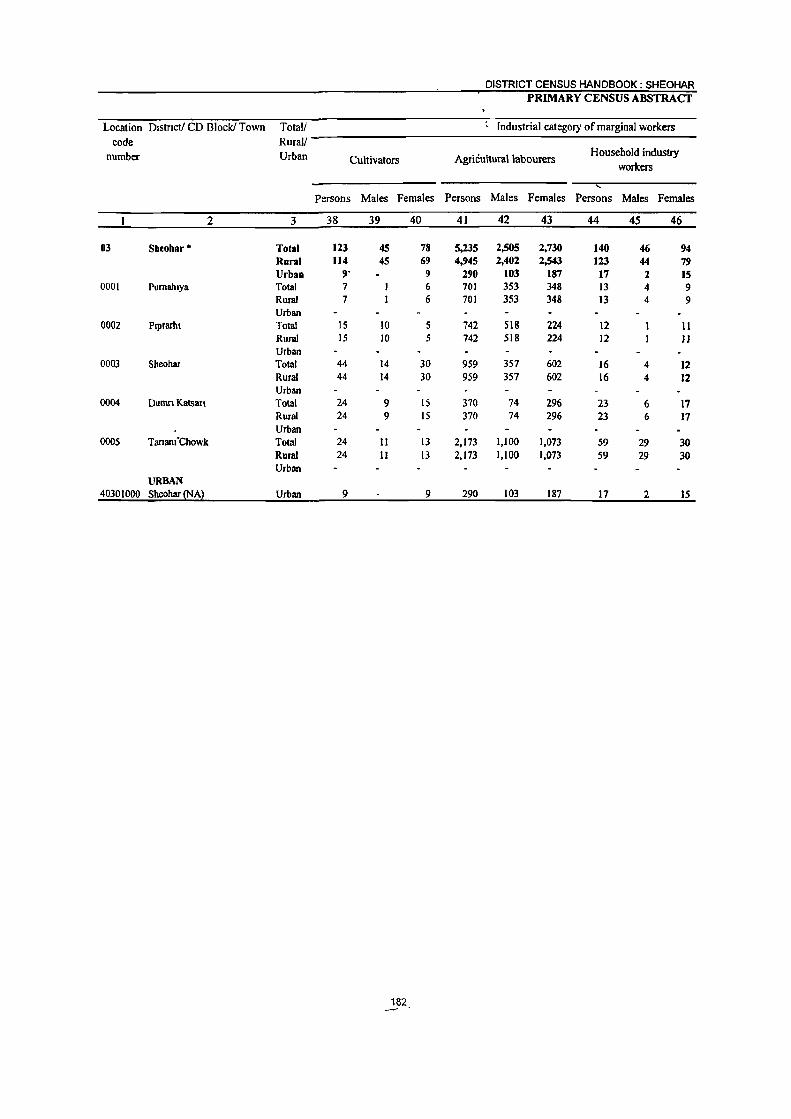
DISTRICT CENSUS HANDBOOK: SHEOHAR PRIMARY CENSUS ABSTRACT
Location DistrIct! CD Block! Town Total! Industrial category of marginal workers code Rurall
number Urban Cultivators Agricultural labourers Household industry
workers
Persons Males Females Persons Males Females Persons Males Females
2 3 38 39 40 41 42 43 44 45 46
03 Sheohar • Total 123 45 78 5,235 2,505 2,730 140 46 94 Rural 114 45 69 4,945 2,402 2,543 123 44 79 Urban 9- 9 290 103 187 17 2 15
0001 Pumahlya Total 7 6 701 353 348 13 4 9 Rural 7 6 701 353 348 13 4 9 Urban
0002 Plprarhl Total IS 10 S 742 SIS 224 12 11 Rural 15 JO 5 742 518 224 12 JI Urban
0003 Sheohar Total 44 14 30 959 357 602 16 4 12 Rural 44 14 30 959 357 602 16 4 12 Urban
0004 Dumn Katsarl Total 24 9 IS 370 74 296 23 6 17 Rural 24 9 15 370 74 296 23 6 17 Urban
0005 Tarlanl'Chowk Total 24 11 13 2,173 1,100 1,073 59 29 30 Rural 24 II 13 2,173 1,100 1,073 59 29 30 Urban
URBAN 40301000 Sheohar iliA! Urban 9 9 290 103 187 17 2 IS
182.

PRIMARY CENSUS ABSTRACT FOR SCHEDULED CASTES
Total! District! CD Block! Town Location Rural! code
Other workers Non-workers Urban . number
Persons Males Females Persons Males Females
47 48 49 50 51 52 3 2
211 122 89 48,356 19,025 29,331 Total Sheobar" 03 200 113 87 46,242 18,185 28,057 Rural II 9 2 2,114 840 1,274 Urban 37 IS 22 7,242 2,901 4,341 Total Pumahiya 0001 37 IS 22 7,242 2,901 4,341 Rural
Urban 35 31 4 8,216 2,946 5,270 Total Piprarhi 0002 35 31 4 8,216 2,946 5,270 Rural
Urban 36 25 II 10,300 4,159 6,141 Total Sheohar 0003 36· 25 11 10,300 4,159 6,141 Rural
Urban 6 6 6,133 2,435 3,698 Total Dumri Katsari 0004 6 6 6,133 2,435 3,698 Rural
Urban 86. 42 44 14,3S1 5,744 8,607 Total Tariani Chowk OOOS 86 42 44 14,351 5,744 8,607 Rural
Urban URBAN
II 9 2 21114 840 1,274 Urban Sheohar~Al 40301000
1B3

DISTRICT CENSUS HANDBOOK: SHEOHAR PRIMARY CENSUS ~BSTRACT
Location District! CD Block! Town Totall Number 01
code Rurall households Total population (including Population in the
number Urban with at least institutional and hguseless age-group 0-6
one population) Scheduled
Tribe Persons Males Females Persons Males Females
2 3 5 6 7 8 9 to
03 Sheohar * Total 16 64 35 19 15 10 5 Rural 12 55 27 28 15 10 5 Urban 4 9 8 1
0001 Pumahiya Total 2 8 2 6 2 2 Rural 2 8 2 6 2 2 Urban
0002 Piprarhi Total 2 3 2 2 Rural 2 3 2 2 Urban
0003 Sheohar Total 8 5 3 2 2 Rural 8 5 3 2 2 Urban
0004 Dumri Katsari Total 4 18 10 8 4 4 Rural 4 18 10 8 4 4 Urban
0005 - Tariani Chowk Total 3 18 9 9 5 3 2 Rural 3 18 9 9 5 3 2 Urban
URBAN 40301000 Sheohar Q:!A~ Urban 4 9 8
.18A---"'0

PRIMARY CENSUS ABSTRACT FOR SCHEDULED TRIBES
Totall District! CD Block/Town Rural/
Literates Illiterates Total workers Urban
Persons Males Females Persons Males Females Persons Males Females
11 12 13 14 15 16 17 18 19 3 2
19 15 4 45 20 25 15 14 Total Sheohar * 10 7 3 45 20 25 8 8 Rural 9 8 1 7 6 Urban
7 6 Total Pumahiya 7 6 Rural
Urban 3 2 Total Piprarhi 3 2 Rural
Urban 6 3 3 2 2 Total Sheohar 6 3 3 2 2 Rural
Urban 3 3 15 7 8 4 4 Total Dumri Katsari 3 3 IS 7 g 4 4 Rural
Urban - 18 9 9 3 3 Total Tarlani Chowk - 18 g 9 3 3 Rural
Urban URBAN
9 8 7 6 Urban Sheohar~A2

DISTRICT CENSUS HANDBOOK: SHEOHAR PRIMARY CENSUS ABSTRACT
Location District! CD Block! Town TotaU Industrial category code Rurall
number Urban Main workers Cultivators Agricultural labourers
Persons Males Females Persons Males Females Persons Males Females
2 3 20 21 22 23 24 25 26 27 28
03 Sheohar * Total 15 14 5 5 Rural 8 8 5 5 Urban 7 6
0001 Pumahiya Total Rural Urban
0002 Piprarhi Total Rural Urban
0003 Sheohar Total Rural Urban
0004 Dumri Katsari Total 4 4 3 3 Rural 4 4 3 3 Urban
0005 lariani Chowk _Total 3 3 2 2 Rural 3 3 2 2 Urban
URBAN 40301000 Sheohar illA~ Urban 7 6

PRIMARY CENSUS ABSTRACT FOR SCHEDULED TRIBES
of mam workers
Household industry workers Other workers
Persons Males Females Persons Males Females
29 30 31 32 33 34
9 8 Z 2 7 6 1
7 6
Marginal workers
Persons Males females
35 36 37
Totall District! CD Block! Town RuraV
Urban
3 2
Total Sheohar * Rural Urban Total Pumahiya Rural Urban Total Piprarhi Rural Urban Total Sheohar Rural Urban Total Dumri Katsari Rural Urban Total Tariani Chowk Rural Urban -
URBAN Urban Sheoh8I'(NA)

DISTRICT CENSUS HANDBOOK: SHEOHAR PRIMARY CENSUS ABSTRACT
Location Districtl CD Block! Town Total/ ~ Industrial category of marginal workers code Rural! ------------------___;;___;;---:-___;;;._-----
number Urban
2 3
OJ Sheohar * Total Rural Urban
0001 Purnahiya Total Rural Urban
0002 Piprarhi Total Rural Urban
0003 Sheohar Total Rural Urban
0004 Dumri Katsari Total Rural Urban
OOOs. Tariani Chowk • Total Rural Urban
URBAN 40301000 Sheohar (NA) Urban
Cultivators Agricultural labourers Household industry
workers
Persons Males Females Persons Males Females Persons Males Females
38 39 40 41 42 43 44 45 46

PRIMARY CENSUS ABSTRACT
FOR SCHEDULED TRIBES
Total! 0istrictJ CD Block! Town Location Rural! code
Other workers Non-workers Urban. number
Persons Males Females Persons Males Females
47 48 49 50 51 52 3 2
49 21 28 Total Sheohar * OJ 47 19 28 Rural 2 2 Urban 8 2 6 Total Pumahiya 0001 g 2 6 Rural
Urban J 2 Total Piprarhi 0002 3 2 Rural
Urban 7 4 3 Total Sheohar 0003 7 4 3 Rllral
Urban 14 6 8 Total Dumri Katsari 0004 14 6 8 Rural
Urban 15 6 9 Total Tariani Chowk 0005 IS 6 9 Rural
Urban URBAN
2 2 Urban Sheohar iliA} 40301000
·1~ __

DISTRICT CENSUS HANDBOOK SHEOHAR
VILLAGE PRIMARY CDBlock-
Total populalton (mcludmg
LocatIOn Area of instItutIOnal and houseless Population In the
code VIllage In Number of ~0I!ulatlonl a~e-l[ouI! 0-6 number Name ofVtllage hectares households Persons Males Females Persons Males Females
1 2 3 4 5 6 7 8 9 10
0001 PurBBbiya (Total) 6,410.0 14,949 71,722 38,209 33,513 14,518 7,552 6,966 0001 Purnahiya (Rural) 6,410.0 14,949 71,722 38,209 33,513 14,518 7,552 6,966 0001 Purnabiya (Urban)
Purnabiya (Rural) 00280400 Adaun 6310 1,126 4,809 2,565 2,244 849 438 4)) 00280500 Barahl Jagdlsh 2290 804 4,029 2,115 1,914 832 457 375 00280600 Barahl Mohan 2790 960 5,019 2,622 2,397 1,017 467 550 00280700 Chhapra Jurawan 390 240 957 531 426 143 83 60 00280800 Chmuya 3240 604 3,283 1,731 1,552 620 314 306 00280900 Bakhar Chandlha 5210 1,420 6,856 3,697 3,159 1,281 703 578 00281000 Asogi Chhapra Dhan! 1640 621 2,968 1,593 1,375 646 341 305 002SHOO Chak Sonau1 550 123 605 318 287 150 73 77 00281200 BedaulBaz 2160 316 1,605 871 734 292 151 141 00281300 Madan Chhapra 280 212 727 385 342 134 66 68 00281400 BcdaulAdam 1820 344 1,712 908 804 339 167 172 00281500 Basant JagJlwan 3610 822 4,273 2,324 1,949 851 460 391 00281600 Basant Patti 3320 671 3,306 1,742 1,564 725 369 356 00281700 Pumahla Chandandlh 1390 379 2,178 1,165 1,013 478 237 241 00281800 Sonaul Sultan 2820 294 1,514 800 714 285 141 144 00281900 Hathsar 3570 536 2,757 1,501 1,256 581 303 278 00282000 Kolhua Thlkaha 2910 796 3,692 1,935 1,757 761 395 366 00282100 PursauRi Gope 2400 370 2,045 1,107 938 377 207 170 00282200 Kashtpur 1800 255 1,483 768 715 350 184 166 00282300 Bama 3470 826 3,396 1,784 1,612 703 352 351 00282400 Bakatpur Chakt SOO 100 544 292 252 J20 64 56 00282500 Pakn 1000 275 1,335 740 595 280 156 124 00282600 Asopur 1360 348 1,719 926 793 342 171 171 00282700 Katalya 2750 324 1,573 837 736 306 165 141 00282800 Khalra Paharl 2340 1,444 6,311 3,359 2,952 1,369 736 633 00282900 Dostl Mahamad~ur 4180 739 3.026 1,593 1,433 687 352 335
190
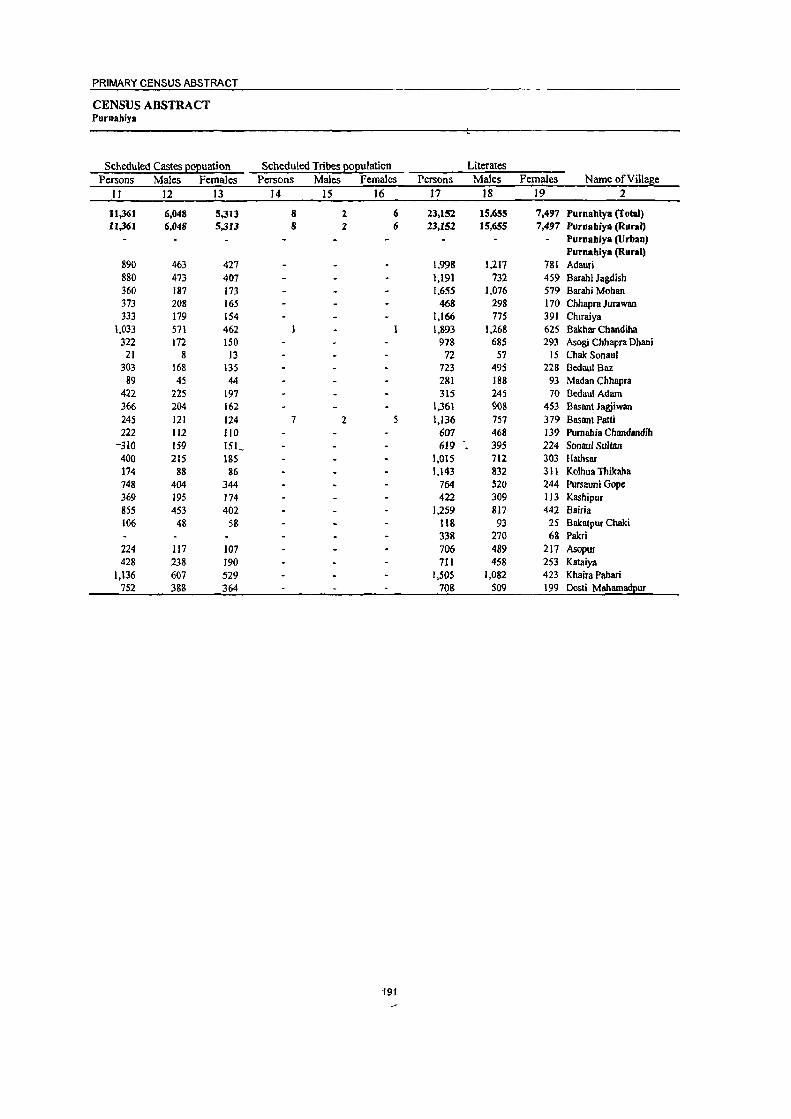
PRIMARY CENSUS ABSTRACT
CENSUS ABSTRACT Purnahiya
Scheduled Castes eOEuation Scheduled Tribes eOEulation Literates Persons Males Females Persons Males Females Persons Males Females Name of Village
11 12 13 14 15 16 17 18 19 2
11,361 6,048 5,313 8 2 6 23,152 15,655 7,497 Purnabiya (Total) U,361 6,048 5,313 8 2 6 23,152 15,655 7,497 Purnahiya (Rural)
Purnahiya (Urban) Purnabiya (Rural)
890 463 427 1,998 1,217 781 Adauri 880 473 407 1,191 732 459 Barahi Jagdish 360 187 173 1,655 1,076 579 Barahi Mohan 373 208 165 468 298 170 Chhapra Jurawan 333 179 154 1,166 775 391 Chlraiya
1,033 571 462 1,893 1,268 625 Bakhar Cbandiha 322 172 150 978 685 293 Asogi Chhapra Dhan;
21 8 13 72 57 15 Chak Sonaul 303 168 135 723 495 228 Bedaul Bu
89 45 44 281 188 93 Madan Chhapra 422 225 191 315 245 70 Bedaul AdllIll 366 204 162 1,361 908 453 Basant J agjiwan 245 121 124 7 2 5 1,136 757 379 Basant Patti 222 112 110 607 468 139 Pumahia Chandandih
-310 159 151_ 619 395 224 Sonau/ Sultan 400 215 185 1,015 712 303 Hathsar 174 88 86 1,143 832 311 Kolhua Tbikaha 748 404 344 764 520 244 Pursauni Gope 369 195 174 422 309 113 Kashipur 855 453 402 1,259 817 442 Bairia 106 48 58 lIS 93 2S Bakatpur Chaki
338 270 68 Pakri 224 117 107 706 489 217 Asopur 428 238 190 711 458 253 Kataiya
1,136 607 529 1,505 1,082 423 Khaira Pahari 752 388 364 708 509 199 Dosti MahllIlladpur
191

DISTRICT CENSUS HANDBOOK: SHEOHAR
VILLAGE PRIMARY CDBlock-
Location
code III iterates Total workers Main workers
number Name ofVilIase Persons Males Females Persons Males Females Persons Males Females
2 20 21 22 23 24 25 26 27 28
0001 Purnahiya (Total) 48,570 22,554 26,016 22,745 19,265 3,480 18,996 17,400 ],596
0001 Purnahiya (Rural) 48,570 22,554 26,016 22,745 19,265 3,480 18,996 17,400 1,596 0001 Purnahiya (Urban)
Pumahiya (Rural) 00280400 Adauri 2,811 1,348 1,463 1,445 1,332 113 1,417 1,307 110 00280500 Bambi Jagdish 2,838 1,383 1,455 1,451 1,127 324 1,225 99S 230 00280600 Barahi Mohan 3,364 1,546 1,818 1,249 1,206 43 1,204 1,167 37 00280700 Chhapm Jurawan 489 233 256 283 244 39 270 237 33 00280800 Chiraiya 2,1l7 956 1,161 1,084 934 150 944 865 79 00280900 Bakhar Chandiha 4,963 2,429 2,534 2,494 2,032 462 2,194 1,955 239 00281000 Asogi Chhapra Dhani 1,990 908 1.082 843 733 110 80S 711 94 00281100 Chak Sonaul 533 261 272 154 149 5 129 124 5 00281200 Bedaul Baz 882 376 506 593 442 151 472 401 71 00281300 Madan Chbapra 446 197 249 199 189 10 38 35 3 00281400 BedaulAdam 1,397 663 734 483 437 46 261 258 3 00281500 Basant Jagjiwan 2,912 1,416 1,496 1,584 1,221 363 1,148 1,065 83 00281600 Basant Patti 2,170 985 1,185 974 870 104 822 796 26 00281700 Purnahia Chandandib 1,571 697 874 569 555 14 549 536 13 00281800 Sonaul Sultan 895 405 490 419 397 22 286 273 13 QQ2&\900 Hathsar \,742 7&9 953 74& it? 3\ 629 603 26 00282000 Kolhua Thikliha 2,549 1,103 1,446 1,205 1,001 204 975 940 35 00282100 Pursauni Gope 1,281 587 694 659 500 159 581 436 145 00282200 Kashipur 1,061 459 602 610 444 166 495 429 66 00282300 Bairia 2,137 967 1,170 997 919 78 916 876 40 00282400 Bakatpur Cbaki 426 199 227 251 129 122 210 108 102 00282500 Pakri 997 470 527 320 298 22 311 290 21 00282600 Asopur 1,013 437 576 659 443 216 470 431 39 00282700 Kataiya 862 • 379 483 427 413 14 353 341 12 00282800 Khaim Pabari 4,806 2,277 2,529 2,137 1,711 426 1,493 1,453 40 00282900 Dosti Mahamad~ur 2~18 1,084 11234 908 822 86 799 768 31
192

PRIMARY CENSUS ABSTRACT
CENSUS ABSTRACT Purnahiya
Industrial categ0!X of main workers Household industry
Cultivators AEEiculturallabourers workers Other workers Persons Males Females Persons Males Females Persons Males Females Persons Males Females Name ofVilJage
29 30 31 32 33 34 35 36 37 38 39 40 '- 2
5,407 5,252 155 10,594 9,453 1,141 559 416 143 2,436 2,279 157 Purnahiya (Total) 5,407 5,252 155 10,594 9,453 1,141 559 416 143 2,436 2,279 157 Purnahiya (Rural)
Purnahiya (Urban) Purnabiya (Rural)
512 506 6 745 651 94 3 3 157 147 10 Adauri 241 231 10 863 649 214 12 10 2 109 105 4 Barahi Jagdisb 318 312 6 715 692 23 16 15 I 155 148 7 Barahi Mohan
S4 47 7 154 145 9 23 14 9 39 31 8 Chhapra ]urawan 315 303 12 506 448 58 5 5 118 109 9 Chiraiya 475 462 13 1,499 1,284 215 20 18 2 200 191 9 Bakhar Chandiha 316 309 7 343 260 83 18 18 128 124 4 Asogi Chhapra Dhani
7 5 2 115 113 2 I 6 5 I Chak Sonaul 142 138 4 188 127 61 5 3 2 137 133 4 Bedaul Baz 24 22 2 14 13 I Madan Chhapra 45 44 1 189 189 1 1 26 24 2 BedaulAdam
388 384 4 536 483 S3 37 24 13 187 174 13 Basant Jagjiwan 276 275 I 404 392 12 27 25 2 115 104 II BasantPatti 116 113 3 365 361 4 6 6 62 56 6 Pumahia Chandandih 202 -196 6 30 27 3 14 12 2 40 38 2 Sonaul Sultan 162 160 2 357 345 12 27 24 3 83 74 9 Hathsar 448 432 16 441 429 .12 39 38 I 47 41 6 Kolhua Thikaha 120 110 10 311 276 35 102 10 92 48 40 8 Pursauni Gape 75 60 15 318 276 42 7 5 2 95 88 7 Kashipur
317 314 3 478 447 31 5 5 116 110 6 Bairia 6 6 173 72 101 26 26 5 4 1 Bakatpur Chaki
74 73 I 180 164 16 27 25 2 30 28 2 Pakri 163 162 6 240 211 29 7 7 5S SI 4 Asopur 138 134 4 liS 117 I 4 3 1 93 87 6 Kataiya 293 293 5 963 940 23 77 74 3 155 146 9 Khaira Pahari 170 161 9 363 355 8 50 44 6 216 208 8 Dosti Mahamadpur
193
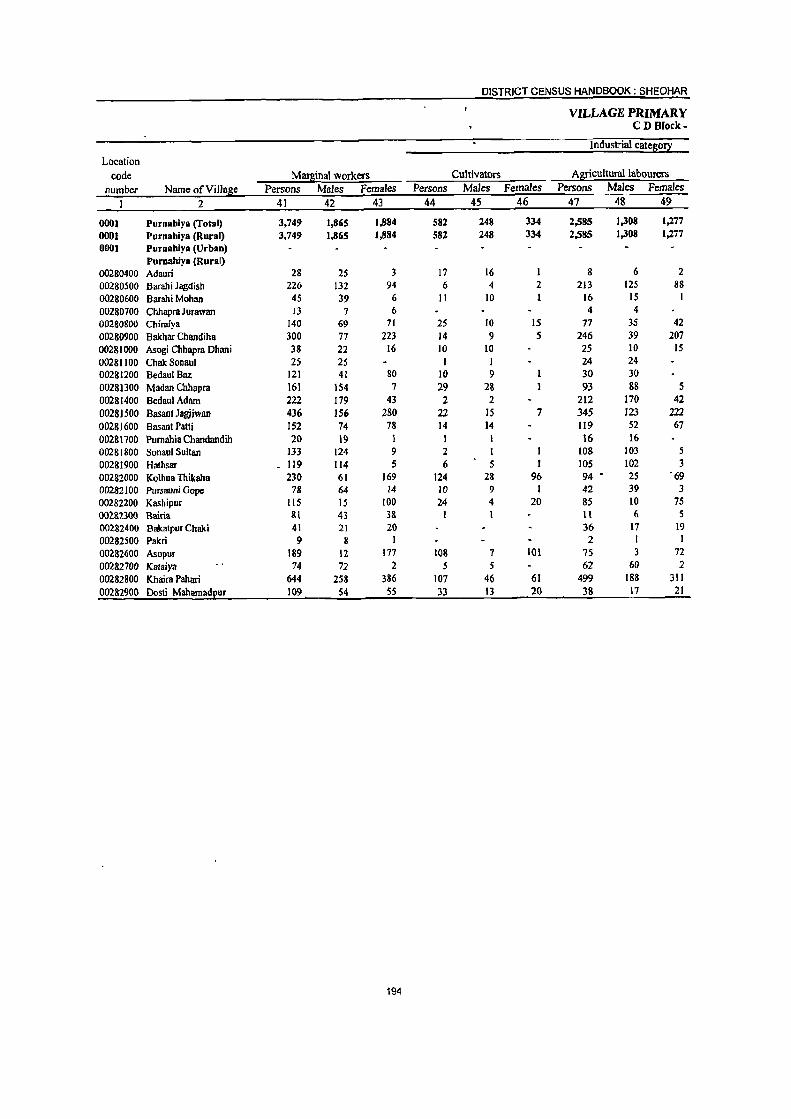
DISTRICT CENSUS HANDBOOK: SHEOHAR
VILLAGE PRIMARY CD Block-
Industrial cateS0!1
Location code Marginal workers Cultivators A~iculturallabourers
number Name ofViJla&e Persons Males Females Persons Males Females Persons Males Females
2 41 42 43 44 45 46 47 48 49
0001 Purnabiya (Total) 3,749 1,86S 1,884 582 248 334 2,585 1,308 1,277 0001 Purnabiya (Rural) 3,749 1,865 1,884 582 248 334 2,585 1,308 1,277 0001 Purnabiya (Urban)
Purnabiya (Rural) 00280400 Adauri 28 25 3 17 16 8 6 2 00280500 Barahi Jagdish 226 132 94 6 4 2 213 125 88
00280600 Barabi Mohan 45 39 6 II 10 16 15 I 00280700 Chhapra Jurawan 13 7 6 4 4 00280800 Chiraiya 140 69 71 25 10 15 71 35 42 00280900 Bakhar Chandiha 300 77 223 14 9 S 246 39 207 00281000 Asogi Chhapra Dhani 38 22 16 10 10 25 10 IS 00281100 Chak Sonaul 2S 25 I I 24 24 00281200 BedaulBru: 121 41 80 10 9 30 30 00281300 Madan Chhapra 161 154 7 29 28 93 SS 5 00281400 BedaulAdam 222 179 43 2 2 212 170 42 00281500 Basant Jagjiwan 436 156 280 22 15 7 345 123 222 00281600 Basant Patti 152 74 78 14 14 119 52 67 00281700 Pumahia Chandandih 20 19 I 1 16 16 00281800 Sonaul Sultan 133 124 9 2 I I 108 103 5 00281900 Hathsar 119 114 5 6 5 ) 105 102 3 00282000 Kolhua Thikaha 230 61 169 124 28 96 94 • 2S ·69 00282100 Pursauni Gope 78 64 14 10 9 1 42 39 3 00282200 Kashipur 115 IS 100 24 4 20 85 10 75 002&2300 Baina &1 43 3& 1 II 6 5
00282400 Bakatpur Cbaki 41 21 20 36 17 19 00282500 Pakri 9 8 1 2 1 I
002&2600 Asopur 189 12 177 108 7 101 75 3 72 00282700 Kafaiya 74 72 2 5 5 62 60 2 00282800 Khaira Pahari 644 258 386 107 46 61 499 188 311 00282900 Dosli Mahamad£ur 109 54 5S 33 13 20 38 17 21
194

195

DISTRICT CENSUS HANDBOOK: SHEOHAR
VILLAGE PRIMARY CD Block-
Total population (including
Location Area of institutional and houseless Population in the code Village in Number of EOEulation} a~e-l[ouE 0-6
number Name ofVilJa&e hectares households Persons Males Females Persons Males Females
I 2 3 4 5 6 7 8' 9 10
0002 Piprarbi (Total) 8,268.0 22,))1 95,441 50,325 45,116 19,104 9,913 9,136 0002 Piprarbi (Rural) 8,268.0 22,111 95,441 50,325 45,116 19,104 9,918 9,136 0001 Piprarhi (Urban)
Piprarhl (Rural) 00283000 Chak Fateh 88.0 18 97 50 47 18 9 9 00283100 Mohanpur 302.0 563 2,697 1,458 1,239 480 244 236 00283200 Shankarpur Bindi 180.0 452 2,001 1,076 925 384 192 192 00283300 Chatauna urf Gopinathpur 211.0 490 2,542 1,367 1,175 486 260 226 00283400 Narayanpur 180.0 534 2,452 1,339 1,113 504 295 209 00283500 Ratanpur Bishunpur
246.0 ---------Un-inhabited-------
Jagamath 00283600 Masaura 255.0 1,205 5,593 2,904 2,689 1,182 625 557 00283700 Piprarhi 443.0 447 1,946 - 1,020 926 398 214 184 00283800 Sengalli Indarwa 469.0 634 2,403 1,287 1,116 391 218 179 00283900 Indarwa Khurd 42.0 482 1,732 888 844 328 164 164 00284000 Be1wa Narkatia Nizamat 287.0 821 2,954 1,567 1,381 638 365 273 00284100 Belwa Narkatia Bandobasti 107.0 403 1.056 563 493 lOS 62 46 00284200 AmwaKaJan 1,353.0 4,879 20,475 10,713 9,762 4,111. 2,129 1,982' 00284300 Basallia Shekh 433.0 2,497 10,326 5,345 4,981 2,093· 1,099 994 00284400 Bakatpur Banbira 2Il.0 246 1,258 672 586 239 124 liS 00284500 Kuanwan 277.0 807 3,711 2,023 1,688 665 353 312 00284600 Majhaura 166.0 ----Un-inhabited 00284700 Minapur Balha 610.0 1,664 8,289 4,422 3,861 1,740 864 876 00284800 Dhankau\ 557.0 1,732 7,470 3,904 3,566 \,278 632 646 00284900 Harpur 266.0 522 2,445 1,306 1,139 491 239 252 00285000 Dharampur Dekuli 558.0 1,131 4,756 2,534 2,222 1,044 557 487 00285100 Parsauni 405,0 1,139 4,872 2,524 2,348 \,089 536 553 00285200 Parihara 112.0 39 187 III 76 47 32 15 00285300 Kamrauli Jangali 332,0 1,058 4,617 2,431 2,186 1,024 522 502 00285400 Harkarwa 178.0 349 1,562 821 741 360 183 177
196

PRIMARY CENSUS ABSTRACT
CENSUS ABSTRACT Piprarhi
Scheduled Castes EOEuation Scheduled Tribes EOEulation Literates Persons Males Females Persons . Males Females Persons Males Females Name ofViIla8e
II 12 13 14 15 16 17 18 19 2
12,357 6,478 5,879 3 1 2 26,730 18,129 8,601 Piprarbi (Total) 12,357 6,478 5,879 3 1 2 26,730 18,129 8,601 Plprarhi (Rural)
Piprarhi (Urban) Piprarbi (Runl)
25 14 II 38 23 15 Chak Fateh 532 286 246 886 621 265 Mohanpur 209 106 103 448 327 121 Shankarpur Bindi 101 58 43 674 503 171 Chatauna urfGopinathpur 623 33S 288 739 523 216 Narayanpur
--------Un-inhabited----------- Ratanpur Bishunpur Jagamath
573 313 260 1,672 1,088 584 Masaura 715 462 253 Plprarhi
632 335 297 646 419 227 Sengahi Indarwa 600 307 293 300 206 94 Indarwa Khurd 218 117 101 857 593 264 Belwa Narkatia Nizamat 47 22 25 249 163 86 BeJwa Narlcatia Bandobasti
2,505 1,302 1,203 5,642 3,581 2,061 AmwaKalan 1,018 526 492 3,074 1,969 1,105 Basahia Shekh
52 2S 27 353 232 121 Bakatpur Banbira 743 386 357 876 653 223 Kuanwan
--------Un-inhabited----- Majhaura 1,021 548 473 2,051 1,539 512 Minapur Balba
747 383 364 2,164 1,474 690 Dhankaul 125 62 63 712 531 181 Harpur
1,138 600 538 3 2 1,249 874 375 Dharampur Dekuli 692 342 350 1,590 1,082 508 Parsauni
58 SO 8 Parihara 756 411 345 1,452 1,002 450 Kamrauli Jangali
285 214 71 Harkarwa
197

DISTRICT CENSUS HANDBOOK: SHEOHAR
VILLAGE PRIMARY CDBlock-
Location code Illiterates Total workers Main workers
number Name ofViIlase Persons Males Females Persons Males Females Persons Males Females 2 20 21 22 23 24 25 26 27 28
0002 Piprarhl (Total) 68,711 32,196 36,515 29,349 26,046 3,303 24,674 22,873 1,801 0002 Piprarhi (Rural) 68,711 32,196 36,515 29,349 26,046 3,303 24,674 22,873 1,801 0002 Piprarhl (Urban)
Piprarhl (Rural) 00283000 ChakFateh 59 27 32 26 24 2 26 24 2 00283100 Mohanpur [,811 837 974 815 782 33 772 747 25 00283200 Shankarpur Bindi 1,553 749 804 667 583 84 648 575 73 1)0283300 Chatauna urf Gopinafupur 1,868 1164 1,004 7119 769 21> 787 769 III 00283400 Narayanpur [,713 816 897 855 689 166 630 591 39 00283500 Ratanpur Bishunpur -----Un-inhabited-----
Jagarnath 00283600 Masaura 3,921 1,816 2,105 1,460 1,356 104 1,359 1,301 58 00283700 Piprarhi 1,231 558 673 556 521 35 523 496 27 00283800 Sengahi Indarwa [,757 868 889 757 725 32 738 716 22 00283900 Indarwa Khurd 1,432 682 750 642 531 III 635 529 106 00284000 Belwa Narkatia Nizamat 2,097 974 1,123 921 870 51 898 864 34 00284100 Belwa Narkatia Bandobasti 807 400 407 427 415 12 372 362 10 00284200 AmwaKalan 14,833 7,132 7,701 6,023 5,498 525 5,104 4,881 223 00284300 BasahiaShekh 7,252 3,376 3,876 3,430 2,704 726 2,760 2,456 304 00284400 Bakatpur Banbira 90S- 440 465 410 351 53 410 357 53 00284500 Kuanwan 2,835 1,310 1,465 1,256 1,097 159 1,180 1,027 153 00284600 Majhaura -------Un-inhabited----00284100 Minapur Balha 6,238 2,883 3,355 2,438 2,228 210 1,907 1,827 80 00284800 Dhankaul 5,306 2,430 2,876 2,394 1,991 403 1,655 1,323 332 00284900 Harpur 1,733 775 958 708 657 51 595 561 34 00285000 Dharamlluf Dekuli 3,507 1,660 1,847 1,438 1,325 1J3 1,053 978 75 00285100 Parsauni 3,282 1,442 1,840 1,376 1,250 126 1,109 1,027 82 00285200 Parihara 129 61 68 54 48 6 41 40 1 00285300 Kamrauli Jangali 3,165 1,429 1,736 1,400 1,232 168 1,083 1,Q42 41 00285400 Harkarwa 1,277 607 670 507 394 113 389 380 9
198

PRIMARY CENSUS ABSTRACT
CENSUS ABSTRACT Piprarhi
Industrial cate~0!1 of main workers Household industry
Cultivators Asricultura11abourers workers Other workers Persons Males Females Persons Males Females Persons Males Females Persons Males Females Name of Village
29 30 31 32 33 34 35 36 37 38 39 40 ,
2
6,206 5,959 247 15,240 14,128 1,112 528 424 104 2,700 2,362 338 Piprarhi (Total) 6,206 5,959 247 15,240 14,128 1,112 528 424 104 2,700 2,362 338 Piprarhi (Rural)
Piprarhi (Urban) Piprarhi (Rural)
14 13 I 9 8 I 3 3 ChakFateh 192 187 5 497 484 13 25 23 2 58 53 5 Mohanpur 214 211 3 348 303 45 3 3 83 58 25 Shankarpur Bindi 286 282 4 461 449 12 20 19 20 19 I Chatauna urf Gopinathpur 212 209 3 347 314 33 70 67 3 Narayanpur
·-----Un·inhabited---·---· Ratanpur Bishunpur Jagamatb
270 268 2 848 834 14 113 79 34 128 120 8 Masaura 202 195 7 209 200 9 8 7 104 94 10 Piprarhi 206 205 I 489 47) 18 43 40 3 Sengahi Indarwa III 106 5 503 405 98 3 2 18 16 2 lndarwa Khurd 328 320 8 475 452 23 2 2 93 90 3 Bclwa Narkatia Nizamat
42 42 322 312 10 8 8 Belwa Narkatia Bandobasti 1,251 1,222 29 3,457 3,289 168 63 57 6 333 313 20 AmwaKalan
596 543 53 1,777 1,560 217 46 3.7 9 341 316 25 Basahia Shekh 62 S9 3 296 249 47 r 51 48 3 Bakatpur Banbira
453 392 61 647 571 76 19 9 10 61 ss 6 Kuanwan ····----·-·Un·jnhabited---··- Majhaura
561 550 II 1,074 1,025 49 98 93 5 174 159 15 Minapur Balha 203 189 14 1,088 917 171 II 9 2 353 208 145 Dhankaul 192 18S 7 328 316 12 4 4 71 56 15 Harpur 239 226 13 633 612 21 60 34 26 121 106 15 Dhararnpur Dekuli 236 228 8 604 551 53 19 15 4 250 233 17 Parsauni 28 27 I 8 8 5 5 Parihara
220 212 8 611 593 18 28 28 224 -209 15 Karnrauli Jangaii 88 88 209 205 4 4 t' 3 88 86 2 Harkarwa
199

DISTRICT CENSUS HANDBOOK: SHEOHAR
VILLAGE PRIMARY CD Block-
Location Industrial cate~0!1
code Maf!~inal workers Ctiltivators Agricultural labourers number Name ofVilIase Persons Males Females Persons Males Females Persons Males Females
1 2 41 42 43 44 45 46 47 48 49 0002 Piprarhi (Total) 4,675 3,173 1,502 476 303 173 3,091 2,257 834 0002 Piprarhi (Rural) 4,675 3,173 1,502 476 303 )73 3,09) 2,257 834 0002 Piprarhl (Urban)
Piprarhi (Rural) 00283000 ellak Fateh 00283100 Mohanpur 43 35 8 6 5 12 9 3 00283200 Shankarpur Bindi 19 8 11 2 1 2 1 00283300 Chatauna urfGopinathpur 2 2 1 1 I 1 00283400 Narayanpur 225 98 127 25 13 12 188 81 107 00283500 Ratanpur Bishunpur -----Un-inhabited------
Jagarnath 00283600 Masaura 101 55 46 7 4 3 21 12 9 00283700 Piprarhi 33 25 8 I 1 6 6 00283800 Sengahi Indarwa 19 9 10 18 8 10 00283900 Indarwa Khurd 7 2 5 2 I 1 5 4 00284000 Belwa Narkatia Nizamat 23 6 17 9 4 S 7 7 00284100 Belwa Narkatia Bandobasti 55 53 2 29 29 26 24 2 00284200 AmwaKalan 919 617 302 102 90 12 727 467 260 00284300 Basahiii Shekh 67l) 248 422 107 15 92 363 206 157 00284400 Bakatpur Banbira 00284500 Kuanwan 76 70 6 3 2 65 63 2 00284600 Majhaura ---Un-jnhabited-----00284700 Minapur Balha 531 401 130 35 26 9 376 275 101 00284800 Dhankaul 739 668 71 73 64 9 498 453 45 00284900 Harpur 113 96 17 1 1 106 91 15 00285000 Dharampur Dekuli 385 347 38 14 6 8 302 283 19 00285100 Parsauni 267 223 44 26 22 4 172 139 33 00285200 Parihara 13 g S 9 7 2 2 1 1 00285300 Kamrauli Jangali 317 190 127 19 13 6 181 134 47 00285400 Harkarwa 118 14 104 5 3 2 13 3 10
200

PRIMARY CENSUS ABSTRACT
CENSUS ABSTRACT Piprarhi
of marginal workers Location
Household indusl!i: workers Other workers Non-workers code
Persons Males Females Persons Males Females Persons Maies Females Name ofVillase number
50 51 52 53 54 55 56 57 58 2 I
302 90 212 806 523 283 66,092 24,279 41,813 Piprarhi (Total) 0002 302 90 212 806 523 283 66,092 24,279 41,813 Piprarhi (Rural) 0002
Piprarbi (Urban) 0002 Pipnrhi (Rural)
71 26 45 Cbak Fateh 00283000 18 18 7 7 1,882 676 1,206 MohanpuJ 00283100 4 4 II 6 5 1,334 493 841 Shankarpur Bindi 00283200
1,753 598 1,155 Chalauna urf Gopinatbpur 00283300 12 4 8 1,597 650 947 Narayanpur 00283400
-------Un-inhabited----- Ratanpur Bishunpur 00283500 Jagamatb
52 22 30 21 17 4 4,133 1,548 2,585 Masaurs 00283600 2 1 24 11 7 1,390 499 891 Piprarhi 00283700 I 1,646 562 1,084 Sengahi lndarwa 00283800
1,090 357 733 Indarwa Khurd 00283900 5 5 2 2 2,033 697 1,336 Belwa Narkatia Nizamat 00284000
629 148 481 Bclwa Narkatia Bandobasti 00284100 21 6 15 69 54 15 14,452 5,215 9,237 AmwaKalan 00284200 II 3 8 189 24 165 6,896 2,641 '.4,255 Basahia Shckh 00284300 - 848 315 533 Bakatpur Banbira 00284400 3 2 5 4 2,455 926 1,529 Kuanwan 00284500
-----Un-inhabited---- Majhaura 00284600 17 4 13 103 96 7 5,851 2,194 3,657 Minapur Balha 00284700 10 9 I 158 142 16 5,076 1,913 3,163 Dhankaul 00284800 3 3 3 1 2 1,737 649 1,088 Harpur 00284900
22 16 6 47 42 5 3,318 1,209 2,109 Dharampur Dekuli 00285000 5 2 3 64 60 4 3,496 1,274 2,222 Parsauni 00285100 2 2 133 63 70 Parihara 00285200
35 2 33 82 41 41 3,217 1,199 2,018 Kamrauli Jangali 00285300 91 2 89 9 6 3 1,055 427 628 Harkarwa 00285400
201

DISTRICT CENSUS HANDBOOK: SHEOHAR
VILLAGE PRIMARY CD Block-
Total population (illcluding Location Area of institutional and houseless Population in the
code Village in Number of 2°2ulation) age-grou{! 0-6 number Name ofVi\lage hectares households Persons Males Females Persons Males Females
I 2 3 4 S 6 7 8 9 10
0003 Sbeohar (Total) 9,278.0 19,493 101,078 53,711 47,356 21,153 11,049 10,104
0003 Sbeohar (Rural) 8,345.0 19,493 101,078 53,722 47,356 21,153 11,049 10,104
0003 Sheohar (Urban) Sheobar (Rural)
00285500 Kursahar 689,0 [,763 9,[ [4 4,783 4,33 [ 2,[20 [,086 1,034 00285600 Az Rakba Kursllhar 11,0 ----------Un-inhabited----------00285700 MohaJi 419,0 [,031 4,755 2,546 2,209 946 503 443 002&5800 <larah!a 2\&.0 764 3,743 1,909 1,834 774 389 385 00285900 Bisahi 195.0 594 2,484 1,314 1,170 566 292 274 00286000 Mali Pokhar Bhinda 410.0 833 4,165 2,240 1,925 896 455 441 00286100 Bhagwanpur Bheli Nankar 38.0 ------------Un-inhabited------00286200 Parsauni Taiyab 119.0 264 1.116 584 532 267 142 125 00286300 Garhwa 133.0 298 1,476 732 744 322 IS4 16& 00286400 Dharampur Rajwan
109.0 205 1,005 552 453 219 122 97
Bandobasti 00286500 Dharampur Rajwan Mal 83.0 173 750 430 320 192 110 82 00286600 Kothia Dharampur
127.0 362 1,606 855 751 365 180 185
Dhararnaghat 00286700 Sis~la 190.0 574 3,084 1,673 1,411 672 346 326 00286800 Charnanpur 533.0 1,663 7,387 3,937 3,450 1,549 810 739 00286900 Chak Bishunpur 120.0 308 1,300 692 608 169 84 8S 00287000 Mahuaria 154.0 380 1,525 822 703 319 173 146 00287100 Sundarpur Kharauna 160.0 357 1,853 937 916 432 2-14 218 00287200 Chiknauta 185.0 360 1,722 915 807 397 203 194 00287300 Harnahi 286.0 706 4,026 2,105 1,921 S77 448 429 00287400 Azrakbe Pota 59.0 86 492 264 228 109 64 45 00287500 Pota 146.0 229 1,412 752 660 300 158 142 00287600 Basahia Ram 183.0 258 1,223 661 562 186 99 87 00287700 Fatehpur ·295,0 527 3,096 1,662 1,434 470 240 230 00287800 Khairwa Darap 181.0 310 1;090 876 814 332 186 146 00287900 Bishunpur Kishundeo 152.0 314 1,944 1,044 900 392 216 176 00288000 Bhagwanpur Bhcli 37.0 llO 546 292 254 125 69 56 00288100 Madhopur Anant 321.0 458 2,503 1,377 1,126 600 323 277 00288200 Sugia Katesri Jagir 89.0 365 2,122 1,126 996 3&7 203 184 00288300 Sugia Karesri 531.0 1,301 6,&57 3,634 3,223 1,407 768 639 00288400 Pardesia urf Madhubani 175.0 339 2,281 1,232 J,049 401 201 200 OO2SS500 Tajpur 463.0 847 5,087 2,758 2,329 1,116 622 554 00288600 Shahpur 223.0 326 1,780 957 823 378 182 196 00288700 Jafarpur 89.0 327 1,356 741 615 316 180 136 00288800 Daud Chhapra 66.0 241 1,384 754 630 308 155 153 00288900 Hanumannagar 44.0 232 1,203 626 577 221 116 105 00289000 Mathurapur Kabtarwa 335.0 726 3,948 2,085 J,863 85J 432 419 00289100 Mirzapur Dhobl)hi • '" .1.25.0 347 2,018 1,077 941 390 21)5 lll5 00289200 Kanuani Kalyanpur -90;() 249 1,212 632 580 259 129 130 00289300 Bishunpur fVlaniari 168.0 415 2,608 1,394 1,214 551 295 256 00289400 ChbapraGobindpururfGopi
50.0 75 380 197 183 54 25 29
nathpur 00289500 Bhaluahi urf Pharuaha 15.0 ------------Un-inhabited-----------00289600 Gopaia 65.0 120 76J 379 382 147 67 80 00289700 Bhaluahi 910 220 1,297 675 622 226 140 86 00289800 Rampur Jadu 97.0 269. 1,576 843 733 299 161 138 00289900 Parrahi 76.0 167 1,191 658 533 1&6 102 84
202

PRIMARY CENSUS ABSTRACT
CENSUS ABSTRACT Sheohar
Scheduled Castes ~o~uation Scheduled Tribes ~o~ulation Literates Persons Males Females Persons Males Females Persons Males Females Name ofVilla~e
11 12 13 14 15 16 17 18 19' 2
15,733 8,404 7,329 8 5 3 28,667 19,531 9,136 Sheohar (Total) 15,733 8,404 7,329 8 5 3 28,667 19,531 9,136 Sheohar (RUral)
Sheohar (Urban) Sheohar (Rural)
2,432 1,293 1,139 2,200 1,520 680 KUTsahar -------------Un-inhabited------------- Az Rakba Kursahar
823 428 395 1,434 1,044 390 Mohari 168 90 78 1,057 657 400 Garahia 467 254 213 567 433 134 Bisahi 542 282 260 1,070 751 319 Mali Pokhar Bhinda
-------------Un-inhabited-------------- Bhagwanpur Bheli Nankar 104 S6 48 257 188 69 Parsauni Taiyab 95 54 41 454 283 171 Garhwa
211 112 99 281 204 77 Dharampur Rajwan Bandobasti
424 250 174 240 161 79 Dharampur Rajwan Mal 273 143 130 489 339 150 Kothia Dharampur
Dharamaghat 583 319 264 900 649 251 Sisaula 635 336 299 1,541 1,078 463 Chamanpur 244 129 115 495 322 173 Chak Bishunpur 438 239 199 323 261 62 MahuarTa 427 215 212 462 331 131 Sundarpur Kharauna 108 56 52 489 319 170 Chiknauta 697 373 324 1,016 738 278 Hamahi 149 82 67 137 87 50 Azrakbe Pota 350 184 166 579 382 197 Pota 312 172 140 426 319 107 Basahia Ram 443 236 207 1,341 898 443 Fatehpur 626 345 281 755 423 332 Khairwa Darap 364 197 167 604 409 195 Bishunpur Kishundeo 185 98 87 111 79 32 Bhagwanpur Bheli 515 275 240 864 553 311 Madhopur Anant 100 59 41 777 478 299 Sugia Katesri Jagir 398 225 173 1,498 1,006 492 Sugia Karesri 215 125 90 707 523 184 Pardesia urf Madhubani 724 390 334 1,155 855 300 Tajpur 150 81 69 532 392 140 Shahpl.lr 576 311 265 241 171 70 Jafarpur 423 230 193 282 203 79 Daud Chhapra
470 267 203 Hanumannagar 337 163 174 1,204 854 350 Mathurapur Kahtarwa 285 145 140 694 470 224 Mirzapur Dhobahi 141 70 71 156 123 33 Kanuani Kalyanpur 350 179 17l 938 585 353 Bishunpur Maniari
18 10 8 242 133 109 ChhapraGobindpururfGopi nathpur
-------------Un-inhabited-------------- Bhaluahi uli Pharuaha 78 35 43 246 145 101 Gopaia
145 70 75 8 5 684 376 308 Bhaluahi 145 73 72 480 340 140 Rampur Jadu 33 20 13 269 182 87 Parrahi

DISTRICT CENSUS HANDBOOK: SHEOHAR
VILLAGE PRIMARY CD Block-
Location code Illiterates Total workers Main workers
number Name ofVill~e Persons Males Females Persons Males Females Persons Males Females I 2 20 21 22 23 24 25 26 27 28
0003 Sheohar (Total) 72,411 34,191 38,220 30,759 26,612 4,147 26,575 24,539 2,036 0003 Sheohar (Rural) 72,411 34,191 38,220 30,759 26,612 4,147 26,575 24,539 2,036 0003 Sheohar (Urban)
Sheohar (Rural) 00285500 Kursahar 6,914 3,263 3,651 2,657 2,400 257 2,278 2,234 44 00285600 Az Rakba Kursahar -------------Un-inhabited--------------00285700 Mohari 3,321 1,502 1,819 1,481 1,294 187 1,460 1,288 172 00285800 Garahia 2,686 1,252 1,434 861 834 27 714 699 15 00285900 Bisahi 1,917 881 1,036 685 663 22 603 594 9 00286000 Mali Pokhar Bhinda 3,095 1,489 1,606 1,171 1,086 85 1,121 1,067 54 00286100 Bhagwanpur Bheli Nankar -------------Un-inhabited--------------00286200 Parsauni Taiyab 859 396 463 436 294 142 249 216 33 00286300 Garhwa 1,022 449 573 351 342 9 346 337 9 00286400 Dharampur Rajwan 724 348 376 332 297 35 305 293 12
Bandobasti 00286500 Dharampur Rajwan Mal 510 269 241 260 212 48 176 170 6 00286600 Kothia Dharampur 1,117 516 601 492 431 61 482 430 52
Dharamaghat 00286700 Sisaula 2:184 1,024 1,160 973 784 189 886 737 149 00286800 Chamanpur 5,846 2,859 2,987 2,411 2,050 361 2,105 1,812 293 00286900 Chak Bishunpur 805 370 435 451 326 125 448 323 125 00287000 Mahuaria 1,202 561 641 450 403 47 387 364 23 00287100 Sundarpur Kharauna 1,391 606 785 518 439 79 428 425 3 00287200 Chiknauta 1,233 596 637 416 391 25 388 383 5 00287300 Harnahi 3,010 1,367 1,643 1,277 1,062 215 1,128 964 164 00287400 Azrakbe Pota 355 177 178 151 127 24 124 121 3 00287500 Pota 833 370 463 390 341 49 380 339 41 00287600 BasahiaRam 797 342 455 337 326 II 327 319 8 00287700 Fatehpur 1,755 764 991 889 867 22 852 837 15 00287800 Khairwa Darap 935 453 482 609 472 137 563 443 120 00287900 Bishunpur Kishundeo 1,340 635 705 902 597 305 594 552 42 00288000 Bhagwanpur Bheli 435 213 222 281 156 ]25 159 155 4 00288100 Madhopur Anant 1,639 824 815 1,076 697 379 595 458 137 00288200 SUgia Katesri Jagir 1,345 648 697 697 554 143 557 490 67 00288300 Sugia Karesri 5,359 2,628 2,731 1,767 1,709 58 1,671 1,622 49 00288400 Pardesia urfMadhubani 1,574 709 865 786 623 163 53& 50& 30 00288500 Tajpur 3,932 1,903 2,029 1,363 1,309 54 1,035 1,021 14 002&8600 Shahpur 1,248 565 683 546 490 56 508 482 26 00288700 Jafarpur I,IIS 570 545 516 390 126 381 370 II 0028&800 Daud Chhapra 1,102 551 551 396 385 II 384 381 3 00288900 Hanumannagar 733 359 374 327 318 9 323 316 7 00289000 Mathurapur Kahtarwa 2,744 1,231 1,513 1,256 1,083 173 1,136 1,061 75 00289100 Mirzapur Dhobahi 1,324 607 717 697 548 ]49 617 529 88 00289200 Kanuani KalyanpuT 1,056 509 547 375 341 34 321 307 14 00289300 Bishunpuf Maniari 1,670 809 861 663 609 54 588 570 18 00289400 ChhapraGobindpufurtGopi 138 64 74 133 III 22 133 III 22
nathpur 00289500 Bhaluahi urf Pharuaha -------------Un-inhabited--------------00289600 Gopaia 515 234 281 240 222 18 226 218 8 00289700 Bhaluahi 613 299 314 301 285 16 295 282 13 00289800 RampurJadu 1,096 503 593 491 432 59 443 399 44 00289900 Parrahi 922 476 446 348 312 36 321 312 9

PRIMARY CENSUS ABSTRACT
CENSUS ABSTRACT Sheohar
Industrial cate!l<0!2: of main workers Household industry
Cultivators Asriculturallabourers workers Other workers Persons Males Females Persons Males Females Persons Males Females Persons Males Females Name ofVilIa!l<e
29 30 31 32 33 34 35 36 37 38 39 40 2
7,927 7,632 295 15,922 14,359 1,563 473 420 53 2,253 2,128 125 Sheohar (Total) 7,927 7,632 295 15,922 14,359 1,563 473 420 53 2,253 2,128 125 Sheohar (Rural)
Sheohar (Urban) Sheohar (Rural)
610 600 10 1,305 1,280 25 74 72 2 289 282 7 Kursahar ------------Un-inhabited------------- Az Rakba Kursahar
509 495 14 iSS 658 12/ 26 21 5 140 114 26 Mohari 163 159 4 469 458 11 32 32 50 50 Garahia 242 240 2 296 290 6 65 64 Bisahi 345 338 7 714 673 41 21 15 6 41 41 Mali Pokhar Bhinda
------------Un-inhabited-------------- Bhagwanpur Bheli Nankar 11 9 2 165 162 3 I I 72 44 28 Parsauni Taiyab 42 40 2 276 269 7 13 13 15 15 Garhwa
161 160 I 127 120 7 16 13 3 Dharampur Rajwan Bandobasti
27 27 132 127 5 3 3 14 13 Dharampur Rajwan Mal 181 163 18 211 17S 33 90 89 Kothia Dharampur
Dharamaghat 207 190 17 532 402 130 2 2 145 143 2 Sisaula 419 406 13 1,535 1,265 270 79 71 8 72 70 2 Chamanpur 123 liS 8 309 193 116 2 2 14 13 I Chak Bishunpur 171 156 15 lSI 173 8 II 1I 24 24 Mahuaria 191 189 2 228 227 I 9 9 Sundarpur Kharauna 106 106 209 206 3 12 12 61 59 2 Chiknauta 383 330 53 687 578 109 15 15 43 41 2 Hamahi
47 45 2 71 70 I 6 6 Azrakbe Pola 152 148 4 207 173 34 2 2 19 16 3 Pota 84 80 4 232 228 4 II II BasahiaRam
363 361 2 376 369 7 I 112 106 6 Fatehpur 120 117 3 375 271 104 2 66 54 12 Khairwa Darap 129 127 2 422 384 38 6 6 37 35 2 Bishunpur Kishundeo 38 37 I 120 117 3 I I Bhagwanpur Bheli
295 229 66 254 184 70 7 7 39 38 I Madhopur Anant 165 158 7 285 227 58 6 6 101 99 2 Sugia Katesri Jagir 420 416 4 1,043 1,004 39 41 40 167 162 5 Sugia Karesri 345 342 3 166 140 26 27 26 I Pardesia urfMadhubani 439 437 2 526 516 10 8 7 62 61 Tajpur 179 175 4 279 257 22 7 7 43 43 Shahpur 67 67 298 2B7 11 16 16 Jafarpur 85 85 282 279 3 6 6 II II Daud Chhapra 39 38 274 269 5 2 2 8 7 I Hanumannagar
436 427 9 661 598 63 5 3 2 34 33 I Mathurapur Kahtarwa 13l 130 I 320 262 58 76 50 26 90 87 3 Mirzapur Dhobahi 59 58 I 259 247 12 3 2 I Kanuani Kalyanpur
109 105 4 377 365 12 5 5 97 95 2 Bishunpur Maniari 65 63 2 37 20 17 31 28 3 ChhapraGobindpururfGopi
nathpur -------------Un-inhabited--·----------- Bhaluahi urf Pharuaha
21 21 172 165 7 33 32 1 Gopaia 80 79 I 177 167 10 38 36 2 Bhaluahi 89 88 1 336 293 43 6 6 12 12 RampurJadu 79 76 3 212 20B 4 29 27 2 Parrahi

DISTRICT CENSUS HANDBOOK: SHEOHAR
VILLAGE PRIMARY CD Block-
Industrial cate~0!I Location
code Marginal workers Cultivators A~iculturallabourers number Name ofVillaj;le Persons Males Females Persons Males Females Persons Males Females
2 41 42 43 44 45 46 47 48 49
0003 Sheohar (Total) 4,184 2,073 2,111 749 296 453 3,045 1,536 1,509 0003 Sheohar (Rural) 4,184 2,073 2,111 749 296 453 3,045 1,536 1,509 0003 Sheohar (Urban)
Sheohar (Rural) 00285500 Kursahar 379 166 213 66 26 40 260 116 144 00285600 Az Rakba Kursahar -------------Un-inhabited--------------00285700 Mohari 21 6 15 1 I 7 2 5 00285800 Garahia 147 135 12 II 10 1 131 120 II 00285900 Bisahi 82 69 13 18 16 2 51 40 11 00286000 Mali Pokhar Bhinda 50 19 31 5 3 2 34 7 27 00286100 Bhagwanpur Bheli Nankar ------------Un-inhabited-----------00286200 Parsauni Taiyab 187 78 109 22 12 10 147 54 93 00286300 Garhwa 5 5 2 2 00286400 Dharampur Rajwan 27 4 23 IS 2 13 8 8
Bandobasti 00286500 Dharampur Rajwan Mal 84 42 42 9 3 6 39 8 31 00286600 Kothia Dharampur 10 9 8 7 2 2
Dharamaghat 00286700 Sisaula 87 47 40 28 18 10 46 19 27 00286800 Chamanpur 306 238 68 3S 22 13 248 198 50 00286900 Chak Bishunpur 3 3 2 2 00287000 Mahuaria 63 39 24 3S 24 II 20 7 13 00287100 Sundarpur Kharauna 90 14 76 3 3 82 9 73 00287200 Chiknauta 28 8 20 8 3 5 17 4 13 00287300 Harnahi 149 98 51 47 35 12 90 59 31 00287400 Azrakbe Pota 27 6 21 7 2 5 20 4 16 00287500 Pota 10 2 8 4 1 3 4 1 3 00287600 Basahia Ram 10 7 3 I 9 7 2 00287700 Fatehpur 37 30 7 II 10 5 I 4 00287800 Khairwa Darap 46 29 17 II 10 28 14 14 00287900 Bishunpur Kishundeo 308 45 263 178 22 156 115 16 99 00288000 Bhagwanpur Bheli 122 121 22 1 21 99 99 00288100 Madhopur Anant 481 239 242 72 19 S3 408 220 188 00288200 Sugia Katesri J agir 140 64 76 16 11 5 78 35 43 00288300 Sugia Karesri 96 87 9 6 4 2 82 80 2 00288400 Pardesia urf Madhubani 248 115 133 9 2 7 236 113 123 00288500 Tajpur 328 288 40 21 12 9 305 274 31 00288600 Shahpur 38 8 30 23 2 21 13 4 9 00288700 Jafarpur 135 20 115 7 6 126 13 II3 00288800 Daud Chhapra 12 4 8 2 5 2 3 00288900 Hanumannagar 4 2 2 3 1 2 00289000 Mathurapur Kahtarwa 120 22 98 16 15 102 20 82 00289100 Mirzapur Dhohahi 80 19 61 53 S3 00289200 Kanuani Kalyanpur 54 34 20 54 34 20 00289300 Bishunpur Maniari 75 39 36 10 7 3 41 19 22 00289400 ChhapraGobindpururillopi
nathpur 00289500 Bhaluahi urfPharuaha -------------Un-inhabited-------------00289600 Gopaia 14 4 10 13 3 10 00289700 Bhaluahi 6 3 3 6 3 3 00289800 RampurJadu 48 33 15 8 8 40 2S 15 00289900 Parrahi 27 27 13 13 14 14
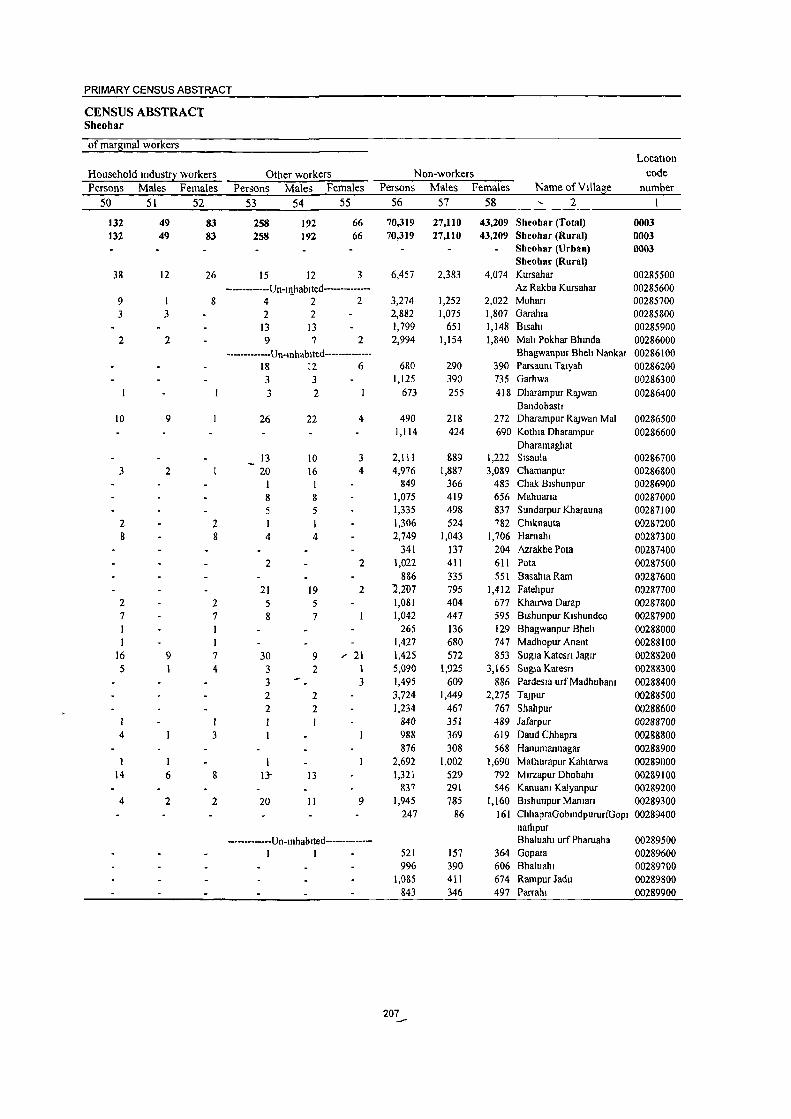
PRIMARY CENSUS ABSTRACT
CENSUS ABSTRACT Sheohar
of marsmal workers Location
Household mdust!2: workers Other workers Non-workers code
Persons Males Females Persons Males Females Persons Males Females Name ofVllIase number
50 51 52 53 54 55 56 57 58 2
132 49 83 258 192 66 70,319 27,110 43,209 Sheohar (Total) 0003 132 49 83 258 192 66 70,319 27,110 43,209 Sheobar (Rural) 0003
Sbeohar (Urhan) 0003 Sheobar (Rural)
38 12 26 15 12 3 6,457 2,383 4,074 Kursahar 00285500 -------------Un-Illhablted------------- Az Rakba Kursahar 00285600
9 I 8 4 2 2 3,274 1,252 2,022 Moharl 00285700 3 3 2 2 2,882 1,075 1,807 Garahla 00285800
13 13 1,799 651 1,148 Blsahl 00285900 2 2 9 7 2 2,994 1,154 1,840 Mall Pokhar Bhmda 00286000
-------------Un-mhablted-------------- Bhagwanpur Bhell Nankar 00286100 18 12 6 680 290 390 Parsaum Talyab 00286200 3 3 1,125 390 735 Garhwa 00286300 3 2 673 255 418 Dharampur R!\Jwan 00286400
Bandobasll 10 9 26 22 4 490 218 272 Dharampur RaJwan Mal 00286500
1,114 424 690 Kothla Dharampur 00286600 Dharamaghat
13 10 3 2,111 889 1,222 Slsaula 00286700 3 2 20 16 4 4,976 1,887 3,089 Chamanpur 00286800
I I 849 366 483 Chak Bishunpur 00286900 8 8 1,075 419 656 Mahuarla 00287000 5 5 1,335 498 837 Sundarpur Kharauna 00287100
2 2 1,306 524 782 Chlknauta 00287200 8 8 4 4 2,749 1,043 1,706 Hamahl 00287300
341 137 204 Azrakbe Pota 00287400 2 2 1,022 411 611 Pota 00287500
886 335 551 BasalllaRam 00287600 21 19 2 '2,2lJ7 795 1,412 Fatehpur 00287700
2 2 5 5 1,081 404 677 Khalrwa Darap 00287800 7 7 8 7 1,042 447 595 Blshunpur Klshundeo 00287900 I 265 136 129 Bhagwanpur Bheil 00288000 I 1 1,427 680 747 Madhopur Anant 00288100
16 9 7 30 9 " 21 1,425 572 853 Sugla Katesn Jaglr 00288200 5 4 3 2 1 5,090 1,925 3,165 Sugla Karesn 00288300
3 3 1,495 609 886 Pardesla urf Madhubant 00288400 2 2 3,724 1,449 2,275 TaJpur 00288500 2 2 1,234 467 767 Shahpur 00288600
I 840 351 489 Jafarpur 00288700 4 3 988 369 619 Daud Chhapra 00288800
876 308 568 Hanumannagar 00288900 I I 2,692 1,002 1,690 Mathurapur Kahtarwa 00289000
14 6 8 n- 13 1,321 529 792 Mlrzapur Dhobahl 00289100 837 291 546 KanuaDl KaJyanpur 00289200
4 2 2 20 II 9 1,945 785 1,160 Blshunpur Maman 00289300 247 86 161 ChhapraGobmdpururfDopl 00289400
nathpur ·------------Un-lnhablted-----------_·- Bhaluahl urf Pharuaha 00289500
I I 521 157 364 Gopal3 00289600 996 390 606 Bhaluahl 00289700
1,085 411 674 Rampur Jadu 00289800 843 346 497 Parrahl 00289900
207 --
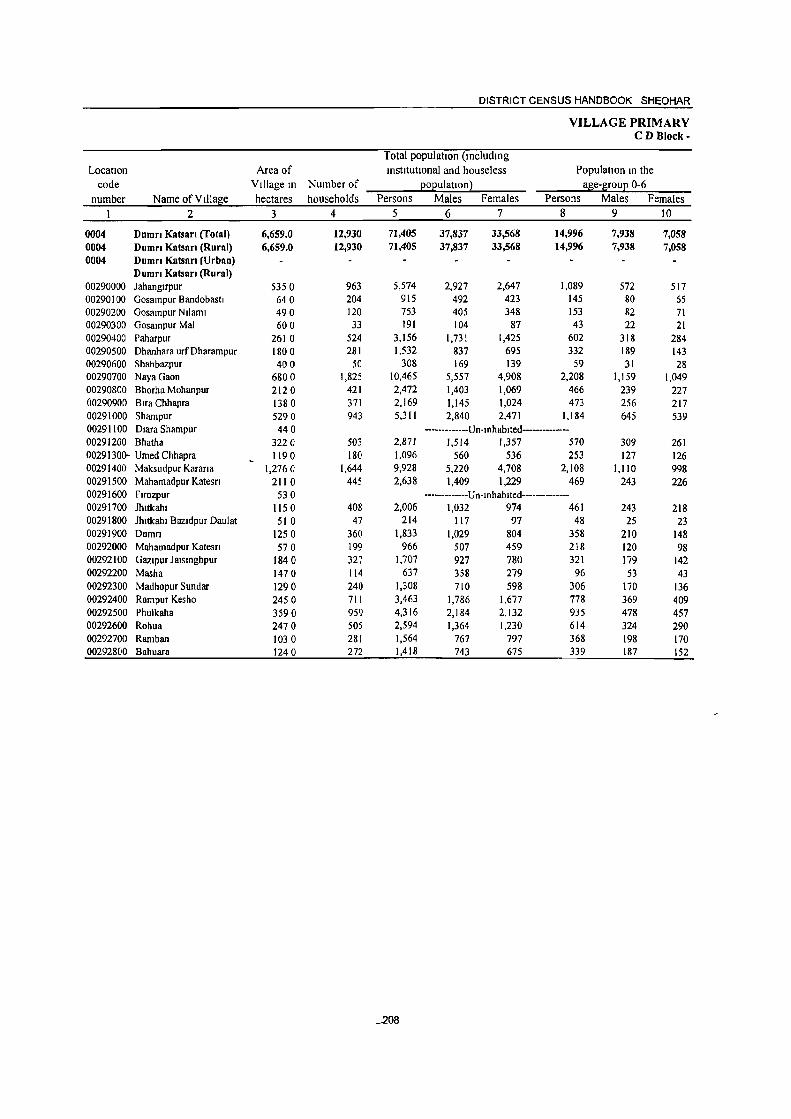
DISTRICT CENSUS HANDBOOK SHEOHAR
VILLAGE PRIMARY CD Block-
Total population (mcludmg LocatIOn Area of institutIOnal and houseless Population In the
code Village In Number of 2°2ulatlOn ~ al:\e-l:\rouE 0-6 number Name ofVlllase hectares households Persons Males Females Persons Males Females
1 2 3 4 5 6 7 8 9 10
0004 Dumn Katsan (Total) 6,659.0 12,930 71,405 37.837 33,568 14,996 7,938 7,058 0004 Dumn Katsan (Rural) 6,659.0 12,930 71,405 37,837 33,568 14,996 7,938 7,058 0004 Dumn Katsan (Urban)
Dumn KatsRn (Rural) 00290000 Jahanglrpur 5350 963 5,574 2,927 2,647 1,089 572 517 00290100 Gosampur Bandobastl 640 204 915 492 423 145 80 65 00290200 Gosampur N Ilaml 490 120 753 405 348 153 82 71 00290300 Gosampur Mal 600 33 191 104 87 43 22 21 00290400 Paharpur 2610 524 3,156 1,731 1,425 602 318 284 00290500 Dhanhara urfDharampur 1800 281 1,532 837 695 332 189 143 00290600 Shahbazpur 400 50 308 169 139 59 31 28 00290700 NayaGaon 6800 1,825 10,465 5,557 4,908 2,208 1,159 1,049 00290800 Bhorha Mohanpur 2120 421 2,472 1,403 1,069 466 239 227 00290900 Blra Chhapra 1380 371 2,169 1,145 1,024 473 256 217 00291000 Sharnpur 5290 943 5,311 2,840 2,471 1,184 645 539 00291100 Dlara Shampur 440 ······_·_····Un·lnhablted-·-.... _ .. _ .. • 00291200 Bhatha 3220 503 2,871 1,514 1,357 570 309 261 0029130()- Umed Chhapra 1190 180 1,096 560 536 253 127 126 00291400 Maksudpur Karana 1,2760 1,644 9,928 5,220 4,708 2,108 1,110 998 00291500 Mahamadpur Katesn 2110 445 2,638 1,409 1,229 469 243 226 00291600 Flrozpur 530 ·_·-.. _ ...... Un·lnhablted-........ ·_·_· 00291700 Jhltkahl 1150 408 2,006 1,032 974 461 243 218 00291800 Jhltkahl Bazldpur Daulat 510 47 214 117 97 48 25 23 00291900 Dumn 1250 360 1,833 1,029 804 358 210 148 00292000 Mahamadpur Katesn 570 199 966 507 459 218 120 98 00292100 Gazlpur Jalsmghpur 1840 327 1,707 927 780 321 179 142 00292200 Masha 1470 114 637 358 279 96 53 43 00292300 Madhopur Sundar 1290 240 1,308 710 598 306 170 136 00292400 Rampur Kesho 2450 711 3,463 1,786 1,677 778 369 409 00292500 Phulkaha 3590 959 4,316 2,184 2,132 935 478 457 00292600 Rohua 2470 505 2,594 1,364 1,230 614 324 290 00292700 Rarnban 1030 281 1,564 767 797 368 198 170 00292800 Bahuara 1240 272 1,418 743 675 339 187 152
...208
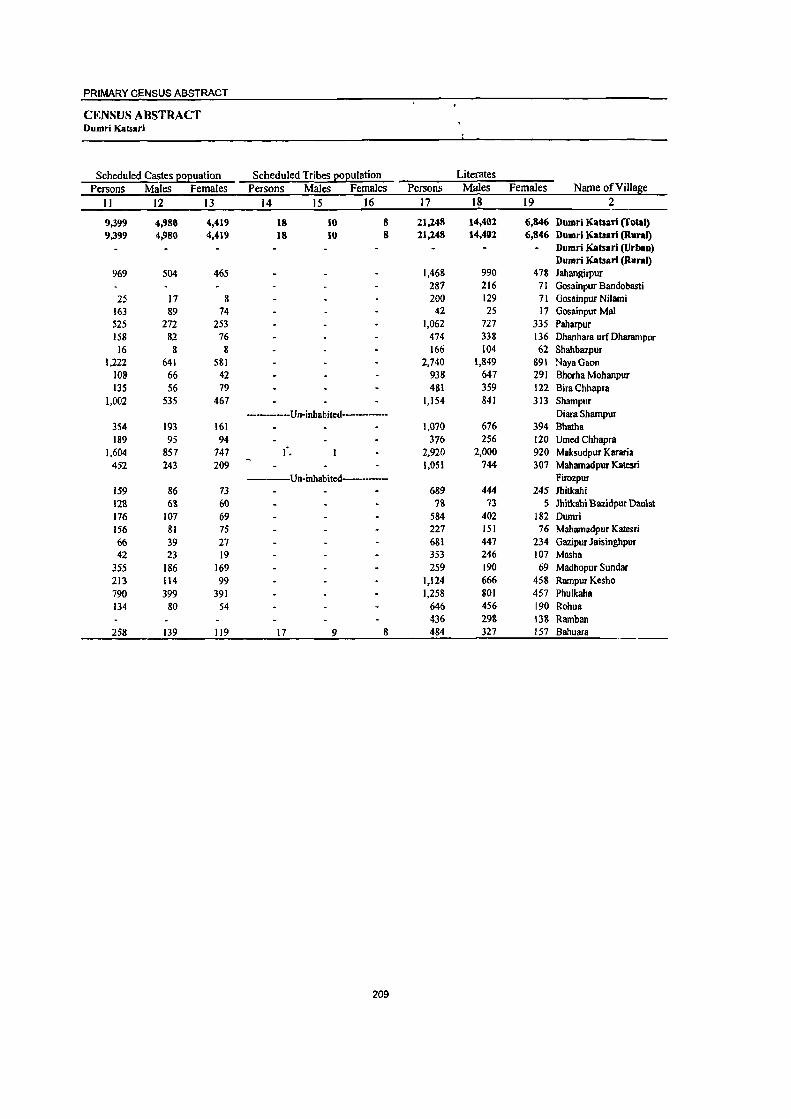
PRIMARY CENSUS ABSTRACT
CENSUS ABSTRACT Dumri Katsari
Scheduled Castes l!o2uation Scheduled Tribes 202ulation Literates Persons Males Females Persons Males Females Persons Males Females Name of Village
II 12 13 14 15 16 17 18 19 2
9,399 4,980 4,419 18 10 8 21,148 14,402 6,846 Dumri Katsari (Total) 9,399 4,980 4,419 18 10 8 21,248 14,402 6,846 Dumri Katsari (Rural)
Dumri Katsari (Urban) Dumri Katsarl (Rural)
969 504 465 1,468 990 478 Jahangirpur 287 216 71 Gosainpur Bandobasti
25 17 8 200 129 71 Gosainpur NiJami 163 89 74 42 25 17 Gosainpur Mal 525 272 253 1,062 727 335 Paharpur 158 82 76 474 338 136 Dhanhata ur{ Dharampur
16 8 8 166 104 62 Shahbazpur 1,222 641 581 2,740 1,849 &91 NayaGaon
IDS- 66 42 938 647 291 Bhorha Mohanpur 135 56 79 481 359 122 Bira Chhapra
1,002 535 467 1,154 841 313 Shampur ------Un-inhabited----- Diara Shampur
354 193 161 1,070 676 394 Bhatha 189 95 94 376 256 120 Umed Chhapra
1,604 857 747 (. 2,920 2,000 920 Maksudpur Karana 452 243 209 1,051 744 307 Mahamadpur Katesri
-----Un-inhabited---- Firozpur 159 86 13 689 444 245 Ihitkahi 128 6& 60 78 73 5 Jhitkabi BazidpuT Daulat 176 107 69 584 402 182 Dwnri 156 81 75 227 151 76 Mabamadpur Katesri 66 39 21 681 441 234 Gazipur Jaisinghpur 42 23 19 353 246 107 Masha
355 186 169 259 190 69 Madhopur Sundar 213 114 99 1,124 666 458 Rampur Kesho 790 399 391 1,258 801 457 Phulkaha 134 80 54 646 456 190 ROOua
436 298 138 Ramban 258 139 119 17 9 8 484 327 IS7 Bahuara
209

DISTRICT CENSUS HANDBOOK: SHEOHAR
VILLAGE PRIMARY CD Block-
Location code Illiterates Total workers Main workers
number Name ofVilla8e Persons Males Females , Persons Males Females Persons Males Females 1 2 20 21 22 23 24 25 26 27 28
0004 Dumri Katsari (Total) 50,157 23,435 26,722 22,684 19,106 3,578 19,455 18,133 1,322 0004 Dumri Katsarl (Rural) 50,157 23,435 26,722 22,684 19,106 3,578 19,455 18,133 1,322 0004 Dumri Katsarl (Urban)
Dumri Katsari (Rural) 00290000 J ahangirput' 4,106 1,937 2,169 1,763 1,561 202 1,525 1,485 40 00290100 Gosainpur Bandobasti 628 276 352 280 270 10 206 197 9 00290200 Gosainpur Nilami 553 276 277 210 209 I 209 209 00290300 Gosainpur Mal 149 79 70 49 47 2 39 39 00290400 Paharpur 2,094 1,004 1,090 1,146 960 186 880 804 76 00290500 Dhanhara urfDharampur 1,058 499 559 398 391 7 391 388 3 00290600 Shahbazput' 142 65 77 71 71 70 70 00290700 NayaGaon 7,725 3,708 4,017 3,470 2,728 742 2,878 2,660 218 00290800 Bhorha Mohanpur 1,534 756 178 759 726 33 728 696 32 00290900 Bira Chhapra 1,688 786 902 624 598 26 612 586 26 00291000 Shampur 4,157 1,999 2,158 1,853 1,421 432 1,465 1,391 74 00291100 Diara Shampur -----Un-inhabited-----00291200. Bhatha 1,801 838 963 935 797 138 755 724 31 00291300 Umed Chhapra 720 304 416 289 278 II 276 271 5 00291400 MaksudpurKJrraria 1,008 3,220 3,188 2,841 2,645 202· 2,584 2,500 84 00291500 Mahamadput' Katesri 1,587 665 922 737 706 31 • 686 662 24 00291600 Firozpur ----Un-inhabited----00291700 Jhitkahi 1,317 588 729 655 540 115 589 531 58 00291800 Jhitkahi Bazidpur Daulat 136 44 92 63 62 I 63 62 I 00291900 Dumri 1,249 627 622 479 453 26 477 452 25 00292000 Mahamadput' Katcsri 739 356 383 322 239 83 320 238 82 00292100 Gazipur Jaisingbpur 1,026 480 546 557 482 75 484 477 7 00292200 Masha 284 112 172 197 195 2 197 195 2 00292300 Madhopur Sundar 1,049 520_ 529 695 371 324 529 371 158 00292400 RampuT Kesho 2,339 1,120 1,219 1,011 887 124 933 847 86 00292500 Phulkaha 3,058 1,383 1,675 1,182 1,031 151 1,081 975 106 00292600 Rohua 1,948 908 1,040 1,107 758 349 687 655 32 00292700 Ramban 1,128 469 659 613 329 284 451 317 140 00292800 Bahuara 934 416 518 372 351 21 334 331 3
210

PRIMARY CENSUS ABSTRACT
CENSUS ABSTRACT Dumri Katsari
Industrial categ0!i: of main workers Household industry
Cultivators Agricultural labourers workers Other workers Persons Males Females Persons Males Females Persons Males Females Persons Males Females Name ofVilJase
29 30 31 32 33 34 35 36 37 38 39 40 2
6,528 6,385 143 10,943 10,023 920 351 315 36 1,633 1,410 223 Dumri Katsari (Total) 6,528 6,385 143 10,943 10,023 920 351 31S 36 1,633 1,410 223 Dumrl Kat!ari (Rural)
Dumri Kat!ari (UrbaD) Dumri Kat!arl (Rural)
585 584 839 806 33 23 21 2 78 74 4 Jahangirpur 46 46 156 147 9 4 4 Gosainpur Bandobasti 62 62 144 144 3 3 Gosainpur Ni1ami
3 3 35 35 I I Gosainpur Mal 332 326 6 476 408 68 16 15 56 55 PlIbarpur 124 123 1 227 -225 2 7 7 33 33 Dhanhara urfDharampur 31 31 29 29 10 10 Shahbazpur
721> 7{)2 18 1,8'39 1,656 18'3 41 3& 5 21S 266 )2 NayaQaon 375 364 11 293 277 16 2 2 58 53 5 Bhoma Mohanpur 210 207 3 396 373 23 6 6 Bira Chhapra 404 401 3 965 898 67 18 18 78 74 4 Shampur
----Un-inhabited Diara Shampur 327 323 4 325 304 21 103 97 6 Bhatha 96 95 1 134 132 2 10 8 2 36 36 Umed Chhapra
990 970 20 1,347 1,299 48 SO 40 10 197 191 6 Maksudpur Kararia 412 409 3 245 .225 20 2 2 27 26 Mahamadpur Katesri
----Un-inhabited Firozpur 192 192 313 264 49 46 39 7 38 36 2 Jhitkahi
7 7 55 55 1 I Jhitkahi Bazidpur Daulat 47 47 366 342 24 51 51 13 12 I Dumri 34 31 3 171 163 8 2 1 113 43 70 Maharnadpur Katesri
185 182 3 245 241 4 20 20 34 34 Gazipur Jaisinghpur 154 154 32 31 I 4 4 7 6 Masha 173 138 35 337 214 123 19 19 Madhopur Sundar 158 151 7 631 560 71 9 6 3 135 130 5 Rampur Kcsho 339 334 5 639 544 95 9 8 1 94 89 5 Phulkaha 260 245 15 336 331 5 19 17 2 72 62 10 Rohua 103 99 4 231 184 47 '2 I 121 33 88 Ramban 159 159 137 136 I 20 19 18 17 1 Bahuara
211
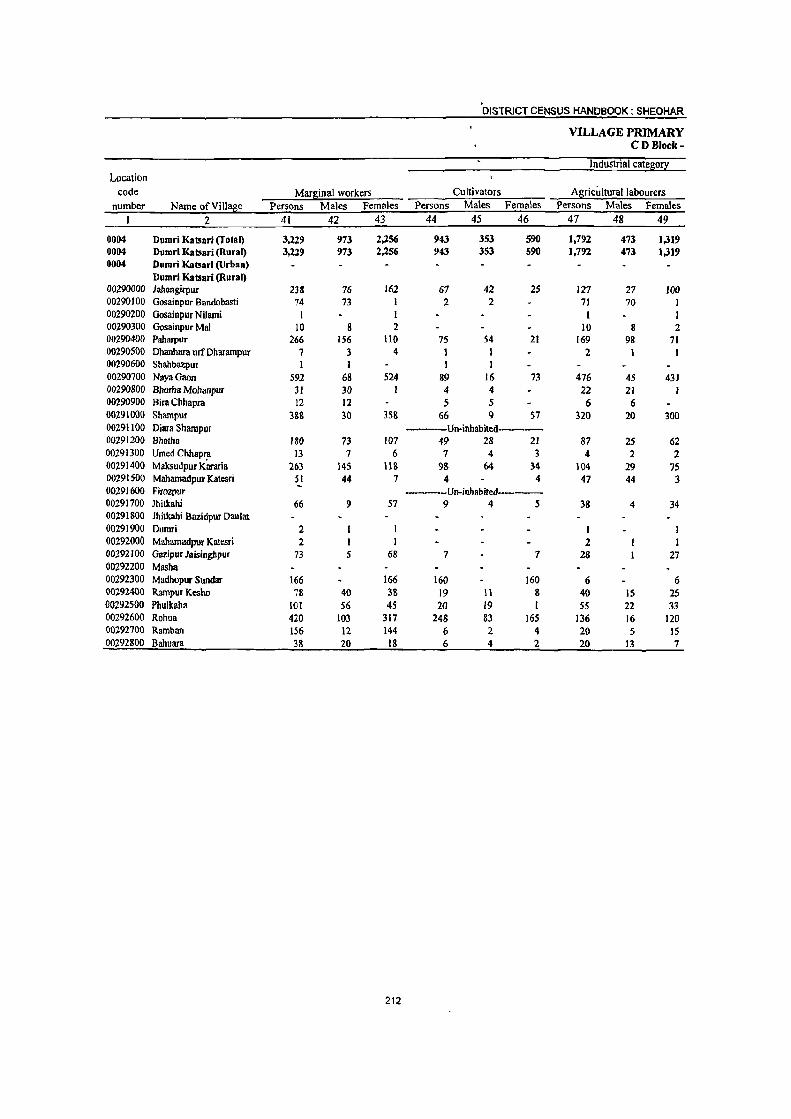
DISTRICT CENSUS HANDBOOK: SHEOHAR
VILLAGE PRIMARY CD Block-
Industrial catego!i: Location
code Marginal workers Cultivators Agricultural labourers number Name of Village PersOns Males Females Persons Males Females Persons Males Females
2 41 42 43 44 45 46 47 48 49
0004 Dumri Katsari (TOlal) 3,219 973 2,256 943 353 590 1,792 473 1,319 0004 Dumri Katsari (Rural) 3,229 973 2,256 943 353 590 1,792 473 1,319 0004 Dumri Katsarl (Urban)
Dumri Katsari (Rural) 00290000 Jahangirpur 238 76 162 61 42 2S 127 27 100 00290100 Gosainpur Sandobasti 74 73 1 2 2 71 70 1 00290200 Gosainpur Nilami I I 1 1 00290300 Gosainpur Mal 10 8 2 10 8 2 00290400 Paharpur 266 156 110 75 54 21 169 98 71 00290500 Dhanhara urfOharampur 7 3 4 1 1 2 1 I 00290600 Shahbazpur 1 1 1 1 00290700 NayaGaon 592 68 524 89 16 73 476 4S 431 00290800 BOOrha Mohanpur 31 30 1 4 4 22 21 1 00290900 Sira Chhapra 12 12 5 5 6 6 00291000 Shampur 3&8 30 3Sg 66 9 57 320 20 300 00291100 Oiara Shampur Un-inhabited---00291200 Bhalha 180 73 107 49 28 21 87 25 62 00291300 Umed Chhapr,B 13 7 6 1 4 3 4 2 2 00291400 Maksudpur Kararia 263 145 liS 98 64 34 104 29 75 00291500 Mahamadpur Katesri 51 44 7 4 4 47 44 3 00291600 Firozpur ---_Un_inhabited ___ 00291700 Jhitkahi 66 9 57 9 4 S 38 4 34 00291800 Jhitkahi Bazidpur Dau1at 00291900 Dumri 2 1 I 00292000 Mahamadpuf Katesri 2 I 2 00292100 Gazipur Jaisinghpur 73 5 68 7 7 28 27 00292200 Masha 00292300 Madhopur Sundar 166 166 160 160 6 6 00292400 Rampur Kesho 78 40 38 19 II 8 40 15 25 00292500 Phulkaha 101 56 45 20 19 [ 55 22 33 00292600 Rohua 420 103 317 248 83 165 136 16 120 00292700 Ramban 156 12 144 6 2 4 20 5 15 00292800 Bahuara 38 20 18 6 4 2 20 13 1
212

PRIMARY CENSUS ABSTRACT
CENSUS ABSTRACT Dumri Katsari
of marginal workers Location
Household indu~ workers Other workers Non-workers code Persons Males Females Persons Males Females Persons Males Females Name ofVillaae number
50 51 52 53 54 55 56 57 58 2 I
137 20 117 357 127 230 48,72] 18,73] 29,990 Dumri Katsari (Total) 0004 137 20 117 357 127 230 48,721 18,731 29,990 Dumri Katsari (Rural) 0004
Dumri Katsarl (Urban) 0004 Dumri Katsari (Rural)
43 6 37 3,811 1,366 2,445 Jahangirpur 00290000 635 222 413 Gosainpur Bandobasti 00290100
-- 543 196 347 Gosainpur Nilami 00290200 142 57 8S Gosainpur Mal 00290300
10 9 12 3 9 2,010 771 ),239 Pah!ypur 00290400 2 2 2 ) ) 1,134 446 688 Dhanhara un Dharampur 00290500
237 98 139 Shahbazpur 00290600 14 13 13 6 7 6,995 2,829 4,166 NayaGaon 00290700 I 4 4 1,713 677 1,036 Bhoma Mohanpur 00290800
I 1,545 547 998 Bira Cbbapra 00290900 2 3,458 1,419 2,039 Shampur 00291000
------Un-inhabited--- Diara Shampur 00291100 43 19 24 1,936 717 1,219 Bhatha 00291200
I 807 282 525 Umed Chhapra 00291300 11 4 7 50 48 2 7,081 2,575 4,506 Maksudpur Kararia 00291400
1,901 703 1,198 Mahamadpur Katesri 00291500 -----Un-inhabited---- Firozpur 00291600
15 14 4 4 1,351 492 859 Jhitkahi 00291700 lSI 55 96 Jhitkahi Bazidpur Daulat 00291800
1,354 576 778 Dumri 00191900 644 268 376 Mahamadpur Katesri 002920QO
38 4 34 1,150 445 705 Gazipur Jaisinghpur 00292100 440 163 277 Masha 00292200 613 339 274 Madhopur Sundar 00292300
2 2 17 14 3 2,45.2 899 1,553 Rampur Kesho 00292400 II 2 9 15 13 2 3.134 1,153 1.981 Phulkaha 00292500 20 20 16 4 12 1,487 606 881 Robua 00292600
130 5 125 951 438 513 Ramban 00292700 5 4 7 2 5 1,046 392 654 Bahuara 00292800
213

DISTRICT CENSUS HANDBOOK: SHEOHAR
VILLAGE PRIMARY CD Block-
Area of Total population (including
Location ViJIage institutional and houseless Population in the
code in Number of ~o~ulation} age-S!0u~ 0-6
number Name ofVilJage hectares households Persons Males Females Persons Males Females
I 2 3 4 5 6 7 8 9 10
0005 Tariani Cbowk (Total) 13,680.0 33,130 155,053 82,270 72,783 32,215 16,793 15,422
00fl5 Tariani Chowk (Rural) 13,680.0 33,130 155,053 82,270 72,783 32,215 16,793 15,422
0005 Tariani Chowk (Urban) Tariani Chowk (Rural)
00292900 Chak Surgahi 91.0 821 3,507 1,853 1,654 588 297 291 00293000 Surgahi 309.0 424 2,133 1,105 1,028 441 217 224
00293100 Kasturia 95.0 412 2,077 1,039 1,038 473 230 243 00293200 Salempur 481.0 820 4,026 2,125 1,901 801 399 402 00293300 Ghorha 124.0 312 1,436 749 687 242 124 118 00293400 Jagdishpur 106.0 478 1,958 1,055 903 328 182 146 00293500 Kothia 190.0 109 450 252 198 52 30 22 00293600 Mahdewa 121.0 216 1,044 572 472 177 102 75 00293700 Gularia 49.0 Un-inhabited---00293800 Kolson Kalan 315.0 406 1,847 974 873 292 141 151 00293900 KopGarh 199.0 -----Un-inhabited-----00294000 Khurpatti 382.0 1,250 5,354 2,801 2,553 1,059 564 495 00294100 Sarwarpur 304.0 823 3,612 1,883 1,729 807 406 401 00294200 8elJ!hi urf Balha 156.0 S59 2,593 1,370 1,223 522 276 246
Baijnathpur 00294300 Soghra Adalpur Kundol 200.0 500 2,184 1,180 1,004 492 273 219 00294400 Hurraha 66.0 124 646 345 30] 150 84 66 00294500 Su1tanpur Shim 90.0 336 1,694 888 806 378 190 188 00294600 Bhandiha 59.0 74 440 240 200 98 53 45 00294700 Bisambharpur 380.0 943 4,586 2,451 2.135 937 481 456 00294800 Baijnathpur 109.0 251 1,342 723 619 322 162 160 00294900 Baijnathpur 11.0 ----------Un-inhabiled----·-----00295000 Khajcpur 144.0 328 1,430 752 678 301 153 148 00295100 Fatehpur Ghaus 63.0 232 922 486 436 189 91 98 00295200 Pojhian 197.0 595 2,515 1,386 1,129 512 293 219
00295300 Bochhan urf Az Rakbe 35.0 65 289 152 137 85 45 40
Pojhian 00295400 Fatehpur Ghauspur 27.0 I ] 1 00295500 Samhuti 245.0 782 2,693 1,413 1,280 562 275 287 00295600 Madhopur Chhala 336.0 984 4,570 2,425 2,145 1,003 531 472 00295700 Belahi Dul1ah 155.0 399 1,714 857 857 426 206 220
00295800 Nimahi 149.0 308 1,771 941 830 371 188 183 00295900 Rupwara 167.0 270 1,349 707 642 292 156 136 00296000 Hirauta Duma 639.0 1,548 8,60] 4,596 4,005 1,721 900 821
00296100 Kurhani 35.0 93 500 257 243 128 78 50 00296200 Hiramma 159.0 555 2,784 1,454 1,330 670 345 325
00296300 Arazi Nankar 6.0 40 214 118 96 67 36 31 00296400 R'!mpurKhas 65.0 327 1,927 993 934 497 266 231
0.0296500 .• Rewasj : 122.0 351 1,848 985 863 422 222 200 60296600 Pachra' 216.0 542 2,243 1,181 1,062 471 247 224 00296700 Athkauni 310.0 839 4,173 2,227 1,946 939 499 440 00296800 Raja Dih 237.0 651 3,413 1,790 1,623 829 428 401 00296900 Az Rakbe Athkauni urf 84.0
188 1,116 572 544 256 131 125 Benipur
00297000 Az Rakbc Raja Dih Barahi 51.0 220 783 405 378 175 89 86 00297100 Basant Param 115.0 267 1,432 795 637 336 182 154 00297200 Bindraban 578.0 1,192 6,592 3,520 3,072 1,306 657 649 00297300 Chhatauni 683.0 1,435 6,638 3,615 3,023 1,245 669 576 00297400 Bishunpur Fakira 71.0 160 669 357 312 158 89 69
00297500 Bishunpur Dharanand 68.0 141 756 423 333 61 30 31 00297600 Aura 472.0 935 4,428 2,364 2,064 791 409 382
00297700 Lalpur 8.0 ------·-·-Un-inhabited-----------00297800 Bishunpur Bindi 119.0 66 307 164 143 64 29 35 00297900 Fakapur 17.0 -----Un-inhabited--------------00298000 Sonbarsa 493.0 860 4,305 2,289 2,016 916 479 437
" 214 .-...--

PRIMARY CENSUS ABSTRACT
CENSUS ABSTRACT Tarianl Chowk
Scheduled Castes 202uation Scheduled Tribes 202ulation . Literates
Persons Males Females Persons Males Females Persons Males Females Name ofVilla&e
11 12 13 14 15 16 17 18 19 2
22,282 11,793 10,489 18 9 9 37,308 26,148 11,160 Tarianl Cbowk (TOIal) 22,282 11,793 10,489 18 9 9 37,308 26,148 11,160 Tarianf Cbowk (Rural)
Tarianf Cbowk (Urban) Tariaoi Cbowk (Rural)
1,060 573 487 18 9 9 449 338 III Chak Surgahi 481 234 247 281 213 68 Surgahi 233 111 122 563 418 145 Kasturia 28& 14'1 141 842 614 228 Salcm\lur 180 418 362 137 113 24 Ghorha 339 182 157 844 555 289 Jagdishpur
17 10 7 225 148 77 Kothia 203 107 96 341 245 96 Mahckwa
Un-illbabited---- Gularia 166 92 74 642 494 148 Kolson Kalan
---Un-inbabited---- KopOarh 474 245 229 1,167 821 346 Khutpatti 579 305 274 970 650 320 Sarwarpur 295 145 150 752 524 228 Belahi urfBalha
Baijnathpur 437 244 193 420 326 94 Soghra Adalpur Kundol
SI 29 22 . 118 85 33 Hurraha 138 72 66 283 203 80 SultanplU'Bhim 255 135 120 82 47 3S Bhandiha 246 137 109 933 652 281 Bisambharpur
440 306 134 Baijnathpur -----Un-inllabited------- Baijnathpur
192 102 90 489 322 167 Khajepur 145 69 76 263 192 71 Fatehpur Ghaus 235 126 109 685 505 180 Pojhian 178 93 85 - Bochhan urf Az Ralcbe
Pojhian Fatehpur Ghauspur
379 204 17S 6S6 477 179 Samhuti 476 260 216 1,155 820 335 Madhopur Chhata 384 199 185 - ,- 334 235 99 Belah! Dullah 156 76 80 421 311 110 Nimahi 103 56 47 232 171 61 Rupwara 797 423 374 2,025 1,456 569 Hirauta Duma
63 29 34 131 103 28 Kurhani 180 104 76 493 304 189 Hirarnma 68 37 31 43 35 8 Arazi Nankar
228 134 94 RampurKhas 311 170 141 285 202 83 Rc:wasi 374 197 177 805 542 263 Paclu"a 605 304 301 991 707 284 Athkauni 611 317 294 948 703 245 RajaDih
33 19 14 204 156 48 Az Ralcbe Athkauni urr Benipur
240 129 III 206 145 61 Az Rakbe Raja Dih Barahi 98 55 43 123 100 23 Basant Param
711 379 332 1,271 908 363 Bindraban 1,185 645 540 1,811 1,235 576 ehhatauni
10 5 5 258 160 98 Bishunpur Faleira 218 122 96 149 89 60 Bishunpur Dharanand
1,032 549 483 1,057 728 329 Aura ______ Un_inbabited---- Lalpur
75 36 39 72 53 19 Bishunpur Bindi --------\}n-iTl'mkim:6------ 'i'lk.wpt.~
597 310 287 1,270 863 407 Sonbarsa
,-215

DISTRICT CENSUS HANDBOOK: SHEOHAR
VILLAGE PRIMARY CDBlock-
Location code IllIterates Total workers Main workers
number Name of Village Persons Males Females Persons Males Females Persons Males Females
J 2 20 21 22 23 24 25 26 27 28
0005 Tariani Cbowk (Total) 117,745 56,122 61,623 49,222 40,963 8,259 38,669 35,514 3,155 0005 Tllrianl Cbowk (Rural) 117,74S 56,122 61,623 49,222 40,963 8,259 38,669 35,514 3,155 OOOS Tarilni Cbowk (Urban)
Tarillni Chowk (Rural) 00292900 Chak Surgahi 3,05& 1,515 1,543 1,070 974 96 898 &44 54 00293000 Surgahi 1,852 892 960 564 528 36 350 330 20 00293100 Kasturia 1,514 621 893 562 504 58 537 500 37 00293200 Salempur 3,184 1,511 1,673 1,199 1,047 152 984 867 117 00293300 Ghorha 1,299 636 663 383 369 14 370 367 3 00293400 Jagdishpur 1,114 500 614 587 552 35 492 486 6 00293500 Kothia 225 104 121 153 142 II 153 142 11 00293600 Mahdewa 703 327 376 393 315 78 199 146 53 00293700 Gularia -----Un-inhablted-----00293800 Kolson Kalan 1,205 480 725 548 475 73 548 475 73 00293900 KopGarh ----Un-inhabited-------00294000 Khurpatti 4,187 1,980 2,207 1,613 1,298 315 946 902 44 00294100 Sarwarpur 2,642 1,233 1,409 1,350 1,011 339 1,003 907 96 00294200 Belahi urfBa1ha 1,841 846 995 751 724 27 708 698 10
Baijnathpur 00294300 Soghra Adalpur Kundol 1,764.. 854 9\0 SS6 S12 74 524 4&9 35 00294400 Hurraha 528 260 268 178 161 17 155 1~8 7 00294500 Sultanpur Bhim 1,411 685 726 569 422 147 567 420 147 00294600 Bhandiha 358 193 165 114 110 4 114 110 4 00294700 B lSambbarpur 3,653 1,799 1,854 1,201 1,156 45 1,185 1,143 42 00294800 Baijnathpur 902 417 485 366 317 49 301 288 J3 00294900 Batjnathpur ---Un-inhabited----00295000 Khajepur 941 430 511 419 373 46 367 335 32 00295100 Fatehpur Ghaus 659 294 365 281 26\ 16 267 1S4 n 00295200 l'ojhian 1,830 881 949 922 707 215 750 594 156 00295300 Bochhan urf Az Rakbe 288 151 137 117 78 39 117 78 39
POJhian 00295400 Fatehpur Ghauspur I I I I I 00295500 Sambuti 2,037 936 1,101 1,062 820 242 826 799 27 00295600 Madhopur Chhata 3,415 1,605 1,810 1,548 1,266 282 1,196 1,155 41 00295700 Selahi Dullah 1,380 622 758 598 442 156 301 266 35 00295800 Ntmahf 1,350 630 720 474 463 II 463 456 7
00295900 Rupwara 1.117 536 581 412 338 74 353 285 68 00296000 Hirauta Duma 6,576 3,J40 3,436 2,437 2,264 173 2,256 2,202 S4 00296100 Kurhani 369 154 215 122 120 2 122 120 2
00296200 Hiramma 2,291 1,150 1,141 682 656 26 650 632 13 00296300 Arazi Nankar 171 83 88 62 51 11 47 46 I
00296400 RampurKhas 1,699 859 840 499 442 57 395 344 51 '00296500 Rewasi 1,563 783 780 475 455 20 475 455 20 00296600 l'achra 1,438 639 799 696 600 96 621 594 27 00296700 Atbkauni 3,182 1,520 1,662 1,192 1,050 142 856 808 48 00296800 RajaDih 2,465 1,087 1,378 1,171 920 251 982 888 94 00296900 Az Rakbe Athkauni urf 912 416 496 370 293 77 292 267 25
Benipur 00297000 Az Rakbe Raja Dih Barahi 577 260 317 233 204 29 233 204 29 00297100 Basant l'ararn 1,309 695 614 607 427 180 451 366 85 00297200 Sindraban 5,321 2,612 2,709 1,969 1,756 213 1,655 1,599 56 00297300 Chhatauni 4,827 2,380 2,447 2,583 1,804 779 1,026 897 129 00297400 Bishunpur Faklra 411 197 214 163 161 2 152 152
00297500 Bishunpur Dharanand 607 334 273 489 321 168 489 32J 168
00297600 Aura 3,371 1,636 ),735 1,110 1,033 77 1,062 1,001 61 00297700 Lalpur ----------Un-inhabited------------· 00297800 Bishunpur Bindi 235 III 124 88 87 1 84 83 00297900 Fakapur -----·-----Un-inhabited·----------··
-{)0298000 Sonbarsa 3,035 1,426 1,609 1,338 1,079 259 979 932 47
?1<:
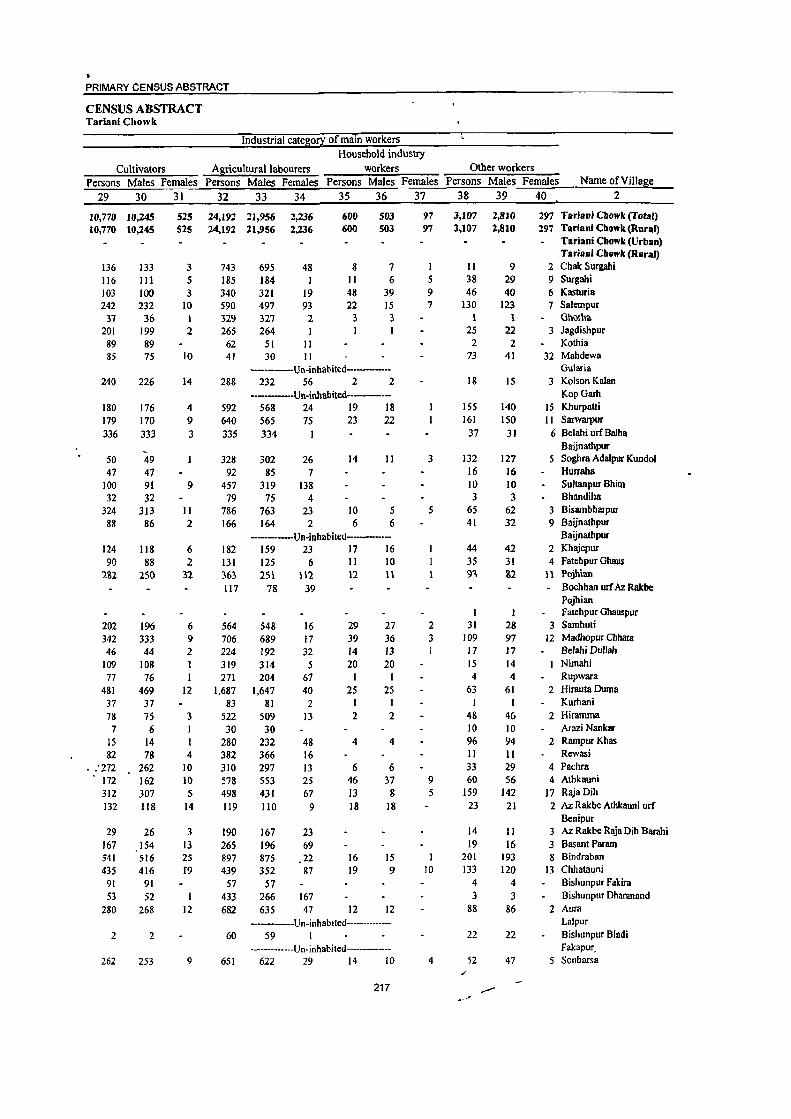
PRIMARY CENSUS ABSTRACT
CENSUS ABSTRACT TariaRi Chowk
Industrial category of main workers Household industry
Cultivators Agricultural labourers workers Other workers Persons Males Females Persons Males Females Persons Males Females Persons Males Females Nwne of Village
29 30 31 32 33 34 35 36 37 38 39 40 2
10,770 10,245 10,770 10,245
136 133 116 111 103 100 242 232
31 36 201 199
89 89 85 75
240
180 179 336
50 47
100 32
324 88
124 90
282
202 342 46
109 77
481 37 78 7
15 82
. :272 172 312 132
29 167 541 435
91 53
280
2
262
226
176 170 333
-49 47 91 32
313 86
lIS 88
251)
196 333 44
108 76
469 37 75 6
14 78
262 162 307 liS
26 154 516 416
91 52
268
2
253
525 S25
3 5 3
10 1 2
10
24,1'2 21,956 24,192 21,956
743 695 185 184 340 321 590 497 329 327 265 264
62 51 41 30
2,236 2,236
48 I
19 93
2
II II
600 600
8 11 48 22
3 I
503 503
7 6
39 15 3 I
-------Un-inhabited-------14 288 232 56 2 2
-----Un-inbabited------4 9 3
592 568 24 19 18 640 565 75 23 22
9
11 2
335 334
328 92
457 79
786 166
302 85
319 75
763 164
26 7
138 4
23 2
14
10 6
11
5 6
--------Un-inhabited-------6 2
32
182 131 363 117
159 23 17 16 125 6 11 10 251 112 12 11
78 39
6 564 548 9 706 689 2 224 192 1 319 314 I 271 204
12 1,687 1,647 83 81
3 522 509 I 30 30 1 280 232 4 382 366
10 310 297 10 5i8 553 5 498 431
14 119 110
16 17 32
5 67 40
2 13
48 16 13 25 67
9
3 13 25 f9
190 265 897 439
167 23
12
57 433 682
196 69 875 352
57 266 635
22 87
167 47
29 39 14 20
I 25
I 2
4
6 46 13 18
16 19
12
27 36 13 20
I 25
I 2
4
6 37 8
18
15 9
12 -------··Un·inhablted···-·······
60 59 I -· .. -----···-Un·inhabited--·-··--·-
9 651 622 29 14 10
217
97 97
I 5 9 7
3
5
2 3
9 5
I 10
4
3,107 3,107
11 38 46
130 1
25 2
73
18
155 161
37
132 16 10 3
65 41
44 35 93
I 31
109 17 IS 4
63
48 10 96 II 33 60
159 23
14 19
201 133
4 3
88
22
52
2,810 2,810
9 29 40
123 I
22 2
41
15
140 150
31
127 16 10 3
62 32
42 31 82
I 28 97 17 14 4
61 1
46 10 94 II 29 56
142 21
II 16
193 120
4 3
&6
22
47
297 Tariani ClJowk (Total) 297 Tariani Chowk (Rural)
Tariani Chowk (Urban) Tarianl Chowk (Rural)
2 Chak Surgahi 9 Surgahi 6 Kasturia 7 Salempur
Ghorha 3 Jagdishpur
Kothia 32 Mabdewa
Gularia 3 KolsoR Kalan
KopGarh I 5 Khurpatti I I Sarwarpur
6 Belahi un Balha Baijnathpur
5 Soghra Adalpur Kundo! Hurraha Sultanpur Bhim Bhandiha
3 Bisambbarpur 9 Baijnathpur
Baijnathpur 2 Khajepur 4 Fatehpur Gbaus
11 Pojhian - Bocbban un Az Rakhe
Pojhian Fatehpur Ghauspur
3 Samhuti 12 Madhopur Chhata
Belahi Dullah Nimahi Rupwara
2 Hirauta Duma Kumani
2 Hiramma Arazi Nankar
2 Rampur Khas Rewasi
4 Pachra 4 Athkauni
17 RajaDih 2 Az Rakbe Athkauni urf
Benipur 3 Az Rakbe Raja Dih Barahi 3 Basant Param 8 Bindraban
I3 Chhatauni Bishunpur Fakira Bishunpur Dharanand
2 Aura Lalpur Bishunpur Bindi Fakapur.
5 Sonbarsa
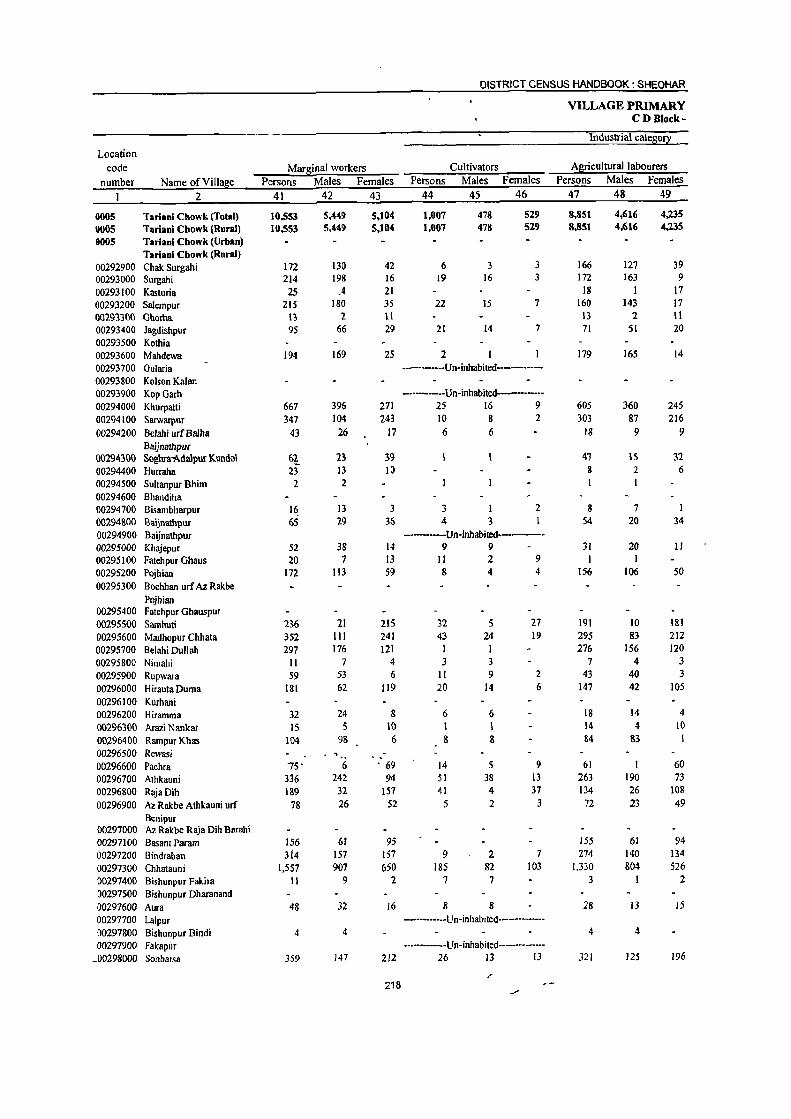
DISTRICT CENSUS HANDBOOK: SHEOHAR
VILLAGE PRIMARY CD Block·
Industrial catego!J:
Location code Mar~inal workers Cultivators A~riculturallabourers
number Name ofVilla~e Persons Males Females Persons Males Females Persons Males Females
1 2 41 42 43 44 45 46 47 48 49
OOoS Tariani Chowk (Total) 10,sS3 5,441) 5,104 1,007 478 529 8,851 4,616 4,235 OOOS Tanani Cbowk (Rural) H),553 5,441) 5,104 1,007 478 529 8,851 4,616 4,235 0005 Tariani Chowk (Urban)
Tanani Chowk (Rural) 00292900 Chak Surgahi 172 I3() 42 6 3 3 166 127 39 00293000 Surgahi 214 198 16 19 16 3 172 163 9
00293100 Kasturia 25 _4 21 18 I 17 00293200 Salempur 215 ISO 35 22 15 7 160 143 17 00293100 Ghoma n 2 11 13 1 11 00293400 Jagdishpur 9S 66 29 21 14 1 71 SI 20 00293500 Kothia 00293600 Mahdewa 194 169 25 2 179 165 14 00293700 Gularia -----.--Un-inhabited---.--00293800 Kolson Kalan 00293900 KopGarh ----·----Un-inhabited--------00294000 Khurpatti 667 396 271 25 16 9 605 360 245 00294100 Sarwarpur 347 104 243 10 8 2 303 87 216 00294200 Belahi urf Bruha 43 26 17 6 6 18 9 9
Baijnalhpur 00294300 Soghra-Adalpur Kundol &2 2~ 39 41 \5 31 00294400 Hurraha 23 I3 I() 8 2 6 00294500 Sultanpur Bhim 2 2 I 00294600 Bhandiha 00294700 Bisambharpur 16 13 3 3 1 2 8 7 00294800 Baijnathpur 65 29 36 4 3 54 20 34
00294900 Baijnathpur ------Un-inhabited-------00295000 Khajepur 52 3S 14 9 9 31 20 II 00295100 Fatehpur Ghaus 20 7 13 11 2 9 I I 00295200 Pojhian 172 113 59 8 4 4 156 106 50 00295300 Bochhan urf Az Rakbe
Pojhian 00295400 Fatehpur Ghauspur 00295500 Sarnhuti 236 21 215 32 5 27 191 10 181 00295600 Madhopur Chhata 352 111 241 43 24 19 295 83 212 00295700 Belahi Dullah 297 176 121 I 1 276 156 120 00295800 Nimahi 11 7 4 3 3 7 4 3 00295900 Rupwara 59 53 6 11 9 2 43 40 3
00296000 Hirauta Duma 181 62 119 20 14 6 147 42 lOS 00296100 Kurhani 00296200 Hiramma 32 24 8 6 6 18 14 4 00296300 Arazi Nankar 15 5 10 1 1 14 4 10
00296400 RampurKhas 104 98 6 8 8 84 83 1 00296500 Rewasi 00296600 Pachra 75' 6 ' 69 14 5 9 61 I 60 00296700 Alhkauni 336 242 94 51 38 13 263 190 73 00296800 RajaDih 189 32 157 41 4 37 134 26 108 00296900 A2. Rakbe Athkauni urf 78 26 52 5 2 3 72 23 49
Benipur 00297000 Az Rakbe Raja Dih Barahi 00297100 Basan! Param 156 6t 95 155 61 94 00297200 Bindraban 3(4 157 157 9 2 7 274 140 134 00297300 Chhatauni 1,557 907 650 185 &2 103 1,330 804 526 00297400 Bishunpur Fakira II 9 2 7 7 3 1 2 00297500 Bishunpur Dharanand 00297600 Aura 48 32 16 8 8 28 13 15 00297700 Lalpur ------------Un-inhablted----·---------00297800 Bishunpur Bindi 4 4 4 4 00297900 Fakapur ----------Un-inhabited---·------
_00298000 Sonbarsa 359 147 212 26 13 13 321 125 196
r 218 _,.,.

PRIMARY CENSUS ABSTRACT
CENSUS ABSTRACT Tarianl Chowk
ofmarg!naJ workers Location
Household indus!!1 workers Other workers Non-workers code Persons Males Females Persons Males Females Persons Males Females Name ofVilla~e number
50 51 52 53 54 55 56 57 58 2 I
193 83 110 502 272 230 105,831 41,307 64,524 Tariani Chowk (Total) 0005 193 83 110 502 272 230 105.831 41,307 64,524 Tarianj Chowk (Rural) OOOS
Tariani Chowk (Urban) 0005 Tariani Chowk (Rural)
2,437 879 1,558 Chak Surgahi 00292900 17 IS 2 6 4 2 1,569 577 992 Surgahi 00293000 7 3 4 1,515 535 980 Kasturia 00293100 7 6 26 21 5 2,827 1,078 1.749 Salempur 00293200
1,053 380 673 Ghorha 00293300 2 1,371 503 868 Jagdishpur 00293400
297 tIO 187 Kothia 00293500 13 3 10 651 257 394 Mahdewa 00293600
---------Un-inhabited----- Gularia 00293700 1,299 499 800 Kolson Kalan 00293800
-------Un-inhabited------ KopGarh 00293900 6 5 31 19 12 3,741 1,503 2,238 Khurpatti 00294000
18 2 16 16 7 9 2,262 872 1,390 Sarwarpur 00294100 19 II 8 1,842 646 1.196 Belahi urfBalha 00294200
Baijnathpur 4 2 2 Hl 5 5 1,598 668 930 Soghra Adalpur Kundo! 00294300
IS 11 4 468 184 284 Hurraha 00294400 1,125 466 659 Sultanpur Bhim 00294500
326 130 196 Bhandiha 00294600 5 5 3,385 1,295 2,090 Bisambharpur 00294700
2 2 5 4 976 406 570 Baijnathpur 00294800 ---·------Un-inhabited--------- Baijnathpur 00294900
2 1 10 8 2 1,011 379 632 Khajepur 00295000 3 3 5 1 4 635 225 410 Fatehpur Ghaus 00295100
7 3 4 1,593 679 914 Pojhian 00295200 172 74 98 Bochhan urf Az Rakbe 00295300
Pojhian Fatehpur Ghauspur 00295400
12 5 7 1,631 593 1,038 Sarnhuti 00295500 12 3 9 2 3,022 1,159 1,863 Madhopur Chhata 00295600 3 2 17 17 1,116 415 701 Belahi Oullah 00295700
1,297 478 819 Nimahi 00295800 5 4 937 369 568 Rupwara 00295900 5 3 2 9 3 6 6,164 2,332 3,832 Hirauta Duma 00296000
378 137 241 Kurhani 00296100 8 4 4 2,102 798 1,304 Hirarnma 00296200
152 67 85 Arazi Nankar 00296300 12 7 5 1.428 551 877 RampurKhas 00296400
1,373 530 843 Rewasi 00296500 1,547 581 966 ?achra 00296600
21 14 7 2,981 1,177 1,804 Athkauni 00296700 2 12 II 2,242 870 1,372 RajaDlh 00296800
746 279 467 Az Rakbe Athkaum urf 00296900 Bentpur
550 201 349 Az Rakbe Raja Olh Barahi 00297000 I I 825 368 457 Basant Param 00297100
12 3 9 19. 12 7 4,623 1,764 2,859 Bindraban 00297200 13 3 10 29 18 II 4,055 1,811 2,244 Chhatauni 00297300
I I 506 196 310 Bishunpur Fakira 00297400 267 102 165 Blshunpur Dharanand 00297500
2 10 10 3,318 1,331 1,987 Aur.a 00297600 -·--·-----Un-inhablted------------- Lalpur 00297700
219 77 142 Bishunpur Bmdi 00297800 ---------Un-inhabited---------- Fakapur 00297900
2 2 10 9 I 2,967 1,210 1,757 Sonbarsa 00298000 ?
219
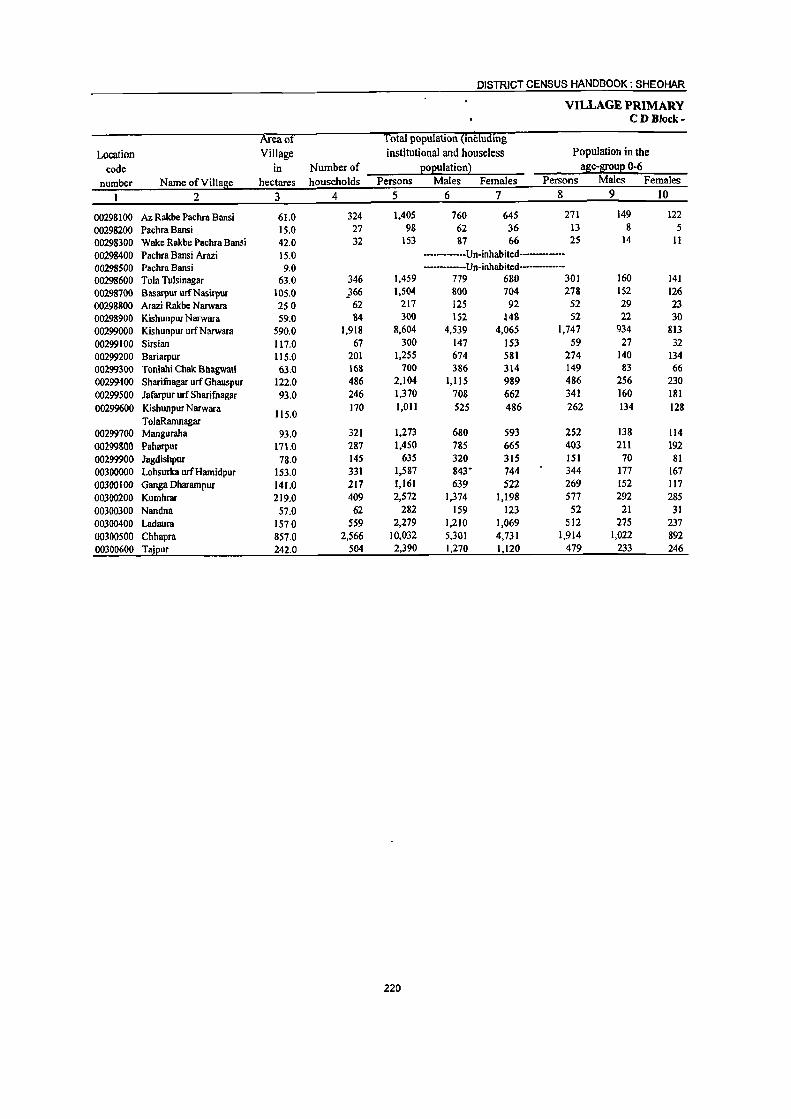
DISTRICT CENSUS HANDBOOK: SHEOHAR
VILLAGE PRIMARY CDBloc:k-
keaof Total population (including
Location Village institutional and house less Population in the
code in Number of EOEulatiorQ a~e-S!0uE 0-6
number Name of ViIla!!e hectares households Persons Males Females Persons Males Females
2 3 4 5 6 7 8 9 10
00298100 Az Rakbe Pachra Bansi 61.0 324 1,405 760 645 271 149 122
00298200 Pachra Bansi 15.0 27 98 62 36 13 8 5
00298300 Wake Rakbe Pachra Bansi 42.0 32 153 87 66 25 14 11
00298400 Pachra Bansi Arazi 15.0 -------Un-inhabited-------00298500 Pachra Bansi 9.0 --------Un-inhabited-------00298600 Tola Tulsinagar 63.0 346 1,459 779 680 301 160 141 00298700 Basarpur urfNasirpur 105.0 ..366 1,504 800 704 278 152 126 00298800 Arazi Rakbe Narwara 250 62 217 125 92 52 29 23 00298900 Kishunpur Narwara 59.0 84 300 IS2 l4S 52 22 30 00299000 Kishunpur urfNarwara 590.0 1,918 8,604 4,539 4,065 1,747 934 813 00299100 Sirsian 117.0 67 300 147 153 59 27 32 00299200 Bariarpur 115.0 201 1,255 674 581 274 140 134 00299300 Toniahi Chak Bhagwati 63.0 168 700 386 314 149 83 66 00299400 Sharifuagar urf Ghauspur 122.0 486 2,104 1,115 989 486 256 230 00299500 Jafarpur urf Sharif nagar 93.0 246 1,370 708 662 341 160 181 00299600 Kishunpur Narwara
115.0 170 1,011 525 486 262 134 128
To1aRamnagar 00299700 Manguraba 93.0 321 1,273 680 593 252 138 114 00299800 Paharpur 171.0 287 1,450 785 665 403 211 192 00299900 Jagdishpur 78.0 145 635 320 315 151 70 81 00300000 Lohsurka urfHamidpur 153.0 331 1,587 843- 744 344 177 167 00300100 Ganga Dharampur 141.0 217 1,161 639 522 269 152 117 00300200 Kumhrar 219.0 409 2,572 1,374 1,198 577 292 285 00300300 Nandna 57.0 62 282 159 123 52 21 31 00300400 Ladaura 1570 559 2,279 1,210 1,069 512 275 237 00300500 Chhapra 857.0 2,566 10,032 5,301 4,731 1,914 1,022 892 00300600 Tajl!ur 242.0 504 2,390 1,270 1,120 479 233 246
220

PRIMARY CENSUS ABSTRACT
CENSUS ABSTRACT Tariani Chowk
Scheduled Castes E0I!uation Scheduled Tribes I!0I!ulation Literates Persons Males Females Persons Males Females Persons Males Females Name ofVill~e
11 12 13 14 15 16 17 18 19 2
339 194 145 358 229 129 AI Rakbe Pachra Bansi 29 18 11 35 26 9 Pachra Bansi 67 38 29 10 8 2 Wake Ralcbe Pachra Bansi
----Un-Inhablted------- Pachra Bansi Arazi ------Un-Inhablted----------- Pachra Bansi
60 29 31 379 296 83 Tola Tulsinag81 172 92 80 343 235 108 Basarpur wfNasirpur
21 18 3 AlIlZI Rakbc N8IW8Ia 117 78 39 Kishunpur Narw8la
1,020 538 482 3,063 2,024 1,039 Kishunpur urfNarw8la 28 IS 13 139 91 48 Sirsian
323 177 146 267 220 47 Bariarpur 155 87 68 72 43 29 Toniahi Chalc Bhagwati 219 liS 101 SS2 402 150 Sh8l1fnagar wfGhauspur
97 43 54 148 120 28 lafarpur urfSharifnag81 123 64 59 180 137 43 Kishunpur N8IW8Ia
TolaRarnnagar 306 155 1St 323 207 116 Manguraha 202 102 tOO 347 283 64 Paharpur
83 37 46 170 108 62 Jagdishpur 245 124 121 291 252 39 Lohsurka wfHarnidpur 150 9S 55 251 174 77 Ganga Oharampur 283 137 146 434 286 148 Kumhrar
12 9 3 Nandna 644 340 304 382 299 83 Ladaura
1,599 843 756 2,843 1,838 1,005 Chhapra 640 346 294 476 356 120 Taj~ur
221

DISTRICT CENSUS HANDBOOK: SHEOHAR
VILLAGE PRIMARY CD Block-
Location code Illiterates Total workers Main workers
number Name of Village Persons Males Females Persons Males Females Persons Males Females 2 20 21 22 23 24 25 26 27 28
00298100 Az Rakbe Pachra Bansi 1,047 531 516 472 386 86 367 338 29 00298200 Paehra Bansi 63 36 27 37 29 8 21 19 2 00298300 Wake Rakbe Pachra Bansi 143 79 64 30 27 3 9 9 00298400 Paehra Bansi Arazi -----Un-inhabiled-------00298500 Pachra Bansi ------Un-inhabiled------00298600 Tola Tulsinagar 1,080 483 597 448 390 58 276 267 9 00298700 Basarpur urfNasirpur 1,161 565 596 429 386 43 391 373 18 00298800 Arazi Rakbe Narwara 196 107 89 68 60 8 3 I 2 00298900 Kishunpur Narwara 183 74 109 89 83 6 82 76 6 00299000 Kishunpur urfNarwara 5,541 2,515 3,026 2,624 2,111 513 2,112 1,905 207 00299100 Sirsian 161 56 105 81 71 10 77 69 8 00299200 Bariarpur 988 454 534 447 350 97 435 344 91 00299300 Toniahi Chak Bhagwati 628 343 285 465 254 211 281 205 76 00299400 Sharifnagar urfGhauspur 1,552 713 839 729 585 144 571 527 44 00299500 Jafarpur urf Sharif nagar 1,222 588 634 511 374 137 368 362 6 00299600 Kishunpur Narwara 831 388 443 482 296 186 343 229 114
TolaRamnagar 00299700 Manguraha 950 473 477 350 319 .31 243 227 16 00299800 Paharpur 1,103 502 601 384 373 . II 337 327 10 00299900 Jagdishpur - 465 212 253 171 168 3 169 166 3 00300000 Lohsurka urfHamidpur 1,296 - 591 705 591 461 130 461 44S 16 00300100 Ganga Dharnmpur 910 465 445 416 312 104 339 296 43 00300200 Kumhrar 2,138 1,088 1,050 964 734 230 672 628 44 00300300 Nandna 270 150 120 102 75 27 87 71 16 00300400 Ladaura 1,897 911 986 655 602 53 585 54S 40 00300500 Chhapra 7,189 3,463 3,726 3,322 2,695 627 2,251 2,063 188 00300600 Taj~ur 1,914 914 1,000 1,042 733 309 687 626 61
222

PRIMARY CENSUS ABSTRACT
CENSUS ABSTRACT Tariani Chowk
Industrial categoQ: of main workers
Household industry
Cultivators A~iculturallabourers workers Other workers Persons Males Females Persons Males Females Persons Males Females Persons Males Females Name ofVillase
29 30 31 32 33 34 35 36 37 38 39 40 2
78 76 2 253 238 15 36 24 12 Az Rakbe Pachra Bansi 8 8 8 7 ) 5 4 1 Pachra Bansl 7 7 ) I I I Wake Rakbe Pachra Bansi
-----Un-inhabited----- Pachra Bansi Arazi --------Un-inhabited--- Pachra Bansi
227 222 5 35 32 3 14 I3 Tola Tulsinagar 64 62 2 317 302 IS 9 8 Basarpur urfNasirpur I I 2 1 1 Arazi Rakhe Narwara
22 20 2 56 53 3 4 3 1 Kishunpur Narwara 623 589 34 ' 1,134 1,000 134 36 23 13 319 293 26 Kishunpur urfNarwara
54 53 I 20 13 7 3 3 Sirsian 221 195 26 212 147 65 .2 2 Barlarpur
34 20 14 247 185 62 Toniahi Chak Bhagwati 334 313 21 219 203 16 8 5 3 10 6 4 Sharif nagar urf Ohauspur 165 165 175 17I 4 II II 17 15 2 Jafarpur urf Sharif nagar 135 83 52 164 118 46 8 8 36 20 16 Kishunpur Narwara
TolaRamnagar 74 68 6 153 144 9 3 3 13 12 Manguraha 32 31 I 303 294 9 I I I Paharpur 73 72 I 94 92 2 2 2 Jagdishpur 93 91 2 339 -326 13 _3 3 26 25 I Lohsurka urfHarnidpur
139 121 18 176 IS2 24 I I 23 22 I Ganga Dhararnpur 166 163 3 480 445 35 2 1 24 19 5 Kumhrar 63 49 14 24 22 2 Nandna
214 209 5 345 312 33 5 5 21 19 2 Ladaura 598 571 27 1,438 1,299 139 34 24 10 181 169 12 Chhapra 40 40 639 578 61 I 7 7 Taj~ur
223

DISTRICT CENSUS HANDBOOK: SHEOHAR
VILLAGE PRIMARY CD Block-
Industrial cateB0!I
Location code Marginal workers Cultivators Agricultural labourers
number Name ofVilla~e Persons Males Females Persons Males Females Persons Males Females
2 41 42 43 44 45 46 47 48 49
00298100 Az Rakbe Pachra Bansi 105 48 57 15 5 10 88 42 46
00298200 PachraB~si 16 10 6 I I IS 10 5 00298300 Wake Rakbe Pachra Bansi 21 18 3 4 3 -17 17
00298400 Pachra Bansi Arazi -----Un-inhabited----00298500 Pachra Bansi ------Un-inhabited----00298600 Tola Tulsinagar 172 123 49 17 IS 2 154 108 46 00293700 Basarpur uIfNasirpur 38 I3 25 I I 36 II 25
00298800 Arazi Rakbe Narwara 65 59 6 3 3 62 56 6 00298900 Kishunpur Narwara 7 7 7 7
00299000 Kishunpur urfNarwara 512 206 306 24 8 16 428 162 266 00299100 Sirsian 4 2 2 4 2 2
00299200 ~ariarpur q 6 6 8 4 4 00299300 Toniahi Cbak Bhagwati 134 49 135 5 5 179 49 130 00299400 Sharifuagar urf Ghauspur 153 58 100 41 10 31 III 45 66 00299500 Jafarpur urfSbarifnagar 143 12 131 SO .3 77 6\ ., S4
00299600 Kishunpur Narwara 139 67 72 69 34 3S 46 23 23
TolaRamnagar 00299700 Manguraha 107 92 15 21 19 2 77 66 II
00299800 Paharpur - 47 46 I 5 5 42 4\ I 00299900 Jagdishpur 2 2 2 2 00300000 Lohsurka urfHarnidpur 130 16 114 49 49 00300100 Ganga Dharampur 77 16 61 6 2 4 71 14 57 00300200 Kumhrar 292 106 186 38 5 33 240 100 140 00300.300 Nandna 15 4 II J3 4 9 2 2
00300400 Ladaura 70 57 13 24 21 3 45 35 10 00300500 Chhapra 1,071 632 439 21 10 11 1,029 606 423 00300600 TajEur 3SS 107 248 347 105 242
224

PRIMARY CENSUS ABSTRACT
CENSUS ABSTRACT Tariani Chowk
of marl:linal workers Location
Household industry workers Other workers Non-workers code Persons Males Females Persons Males Females Persons Males Females Name ofVilIase number
50 51 52 53 54 55 56 57 58 2
933' 374 559 A2: Rakbe Pachra Bansi 00298100 61 33 28 Pllchra Bansi 00298200
123 60 63 Wake Rakbe Pachra Bansi 00298300 ---Un-inhabited---- Pachra Bansi Nazi 002984.00 ----Un-inhabited----- Pachra Bansi 00298500
1 ] 1,011 389 622 Tola Tulsinagar 00298600 1 "1 1,()7S 414 661 Basarpur urfNasirpur 00298700
149 65 84 Arazi Rakbe Narwara 00298800 211 69 142 Kishunpur Narwara 00298900
11 6 5 49 30 19 5,980 2,428 3,552 Kishunpur urfNarwara 00299000 219 76 143 Sirsian 00299100
4 . 2 2 808 324 484 Bariarpur 00299200 235 132 103 Toniahi Chak Bhagwati 00299300
2 2 4 3 1,375 530 845 Sbarifnagar urf Gbauspur 00299400 I I 1 859 334 525 Jafarpur urfSharifnagar 00299500
24 10 14 529 229 300 Kishunpur Narwara 00299600 TolaRamnagar
3 2 6 6 923 361 562 Manguraha 00299700 1,066 412 654 faharpur 00299800
464 152 312 Jagdishpur 00299900 81 16 - 65 ·996 382 614 Lohsurka urfHamidpur 00300000
745 327 418 Ganga Dharampur 00300100 2 2 12 11 1,608 640 968 Kumhrar 00300200
180 84 96 Nandna 00300300 I 1,624 608 1,016 Ladaura 00300400
7 2 5 14 14 6,710 2,606 4,104 Chhapra 00300500 8 2 6 1!348 537 811 TajEur 00300600
225

DISTRICT CENSUS HANDBOOK SHEOHAR
URBAN PRIMARY
Area of Total populatIon (mcludmg LocatIOn Name ofTownl Ward TownlWarci Number of PopulatIon m the
code In square households lllstltutlOnal and hauseless age-group 0-6
number KIlometre populatIon)
Persons Males Females Persons Males Females
2 3 4 5 6 7 8 9 10
40301000 Sheohar (NA) 9.33 4.194 21,262 11,317 9,945 4,456 2,301 2,155
0001 WardNo 1 964 5,344 2,871 2,473 1,094 558 536 0002 WardNo 2 1,268 5,910 3,098 2,812 1,215 629 586 0003 Ward No 3 934 4,681 2,470 2,211 987 504 483 0004 Ward No 4 1,028 5,327 2,878 2449 1,160 610 550
226

PRIMARY CENSUS ABSTRACT CENSUS ABSTRACT
Name of Townl Ward Scheduled Castes population Scheduled Tribes population Literates
Persons Males Females Persons Males Females Persons Males Females
II 12 13 14 15 16 17 18 19 2
3,259 1,702 1,557 9 8 7,339 4,910 2,429 Sheohar (NA) 368 201 167 9 8 2,179 1,471 708 Ward No. I
1,511 785 726 1,818 1,229 589 Ward No.2 18 10 8 1,894 1,211 683 Ward No.3
1,362 706 656 1,448 999 449 Ward No.4
___ :;'27-
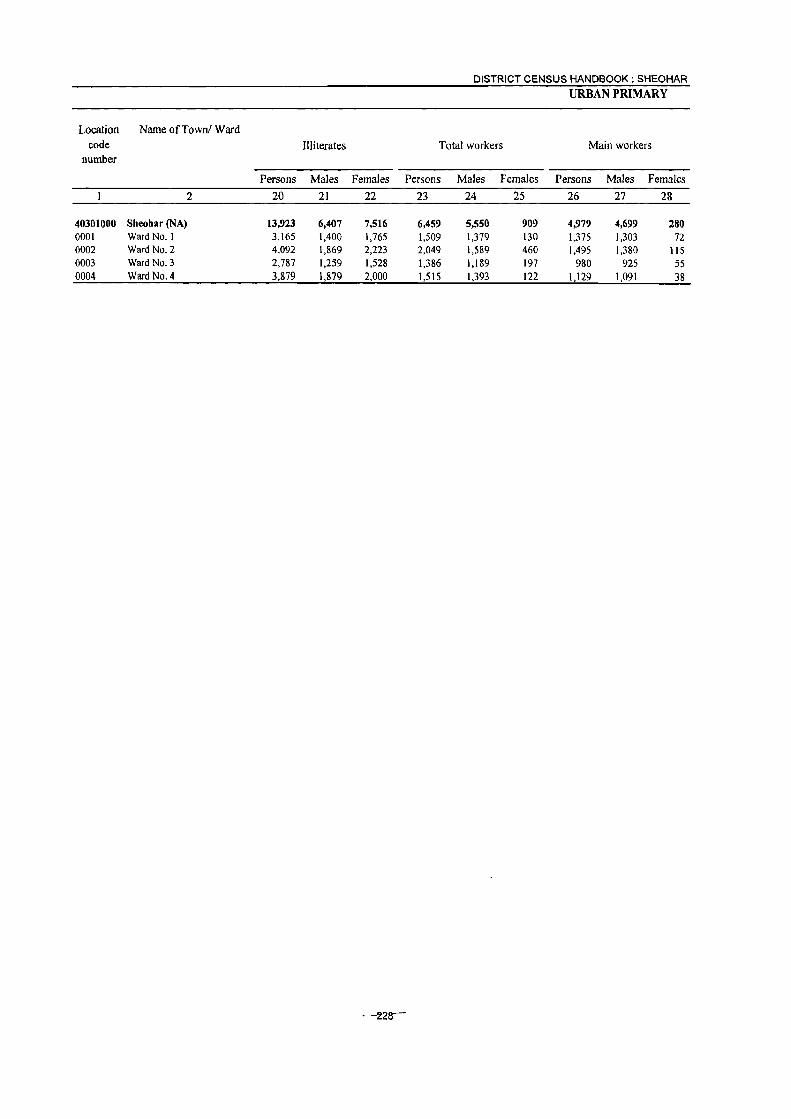
DISTRICT CENSUS HANDBOOK: SHEOHAR
URBAN PRIMARY
Location Name of Townl Ward
code Illiterates Total workers Main workers number
Persons Males Females Persons Males Females Persons Males Females
2 20 21 22 23 24 25 26 27 28
40301000 Sheohar (NA) 13,923 6,407 7,516 6,459 5,550 909 4,979 4,699 280 0001 Ward No. 1 3,165 1,400 1,765 1,509 1,379 130 1,375 1,303 72 0002 Ward No.2 4,092 1,869 2,223 2,049 1,589 460 1,495 1,380 115 0003 Ward No.3 2,787 1,259 1,528 1,386 1,189 197 980 925 55 0004 Ward No. 4 3,879 1,879 2,000 1,51S 1,393 122 1,129 1,091 38

PRIMARY CENSUS ABSTRACT
CENSUS ABSTRACT
IndustrIal category ofmam workers
Household mdustry Name of Town( Ward
Cultivators Agricultural labourers workers
Other workers
Persons Males Females Persons Males Females Persons Males Females Persons Males Females....
29 30 31 32 33 34 35 36 37 38 39 40 2
555 531 24 1,901 1,797 104 230 202 28 2,293 2,169 124 Sheohar (NA) 114 110 4 317 313 4 65 62 3 879 818 61 WardNo I 263 247 16 741 682 59 86 64 22 405 387 18 Ward No 2 70 69 I 263 246 17 30 29 1 617 581 36 Ward No 3
108 105 3 580 556 24 49 47 2 392 383 9 Ward No 4

DISTRICT CENSUS HANDBOOK: SHEOHAR
URBAN PRIMARY
Industrial categ0Q: Location Name ofTowni Ward
code Marginal workers Cultivators Agricultural labourers number
Persons Males Females Persons Males Females Persons Males Females 2 41 42 43 44 45 46 47 48 49
40301000 Sheohar (NA) 1,480 851 629 124 29 95 751 421 330 0001 Ward No. I 134 76 58 4 3 39 20 19 0002 Ward No. 2 554 209 345 115 22 93 317 94 223 0003 Ward No. 3 406 264 142 5 4 69 52 17 0004 Ward No. 4 386 302 84 326 255 71
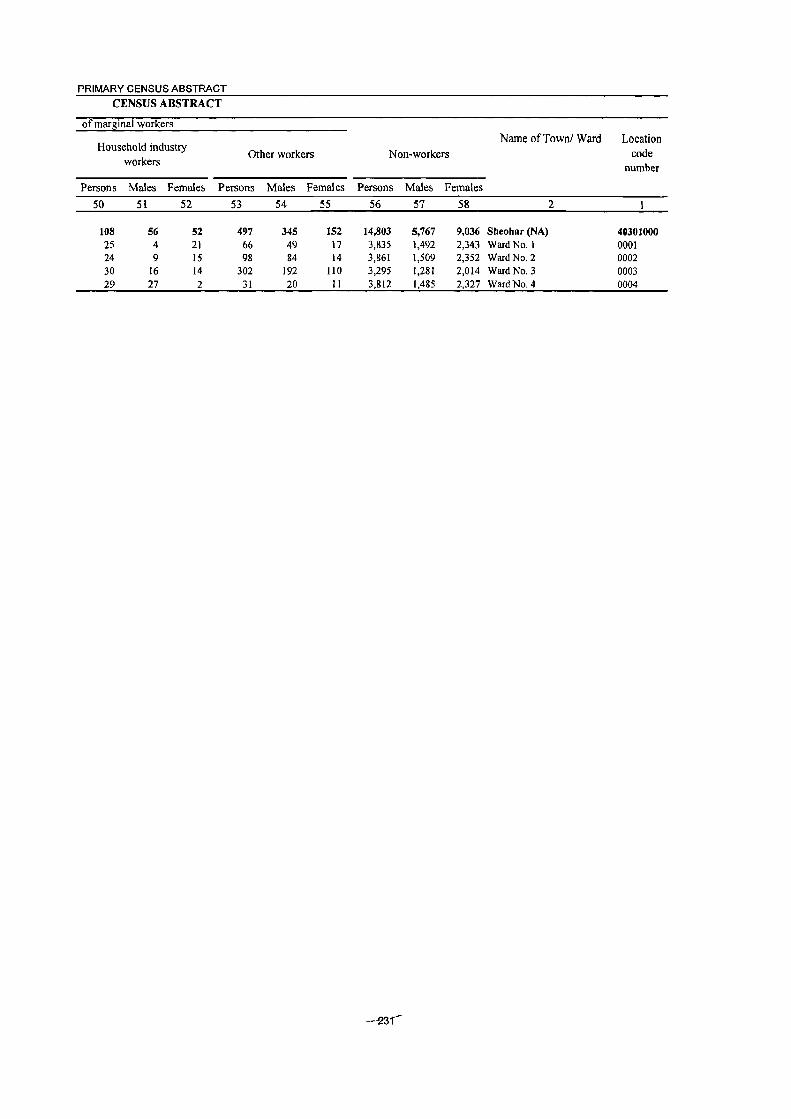
PRIMARY CENSUS ABSTRACT
CENSUS ABSTRACT
of mafji;inal workers
Name ofrown/ Ward Location Household industry
Other workers Non-workers code workers
number
Persons Males Females Persons Males Females Persons Males Females
50 51 52 53 54 55 56 57 58 2
108 56 52 497 345 152 14,803 5,767 9,036 Sheohar (NA) 40301000 25 4 21 66 49 17 3,835 1,492 2,343 Ward No. 1 0001 24 9 15 98 84 14 3,861 1,509 2,352 Ward No.2 0002 30 16 14 302 192 llO 3,295 1,281 2,014 Ward No.3 0003 29 27 2 31 20 11 3,812 1,485 2,327 Ward No. 4 0004


ANNEXURES

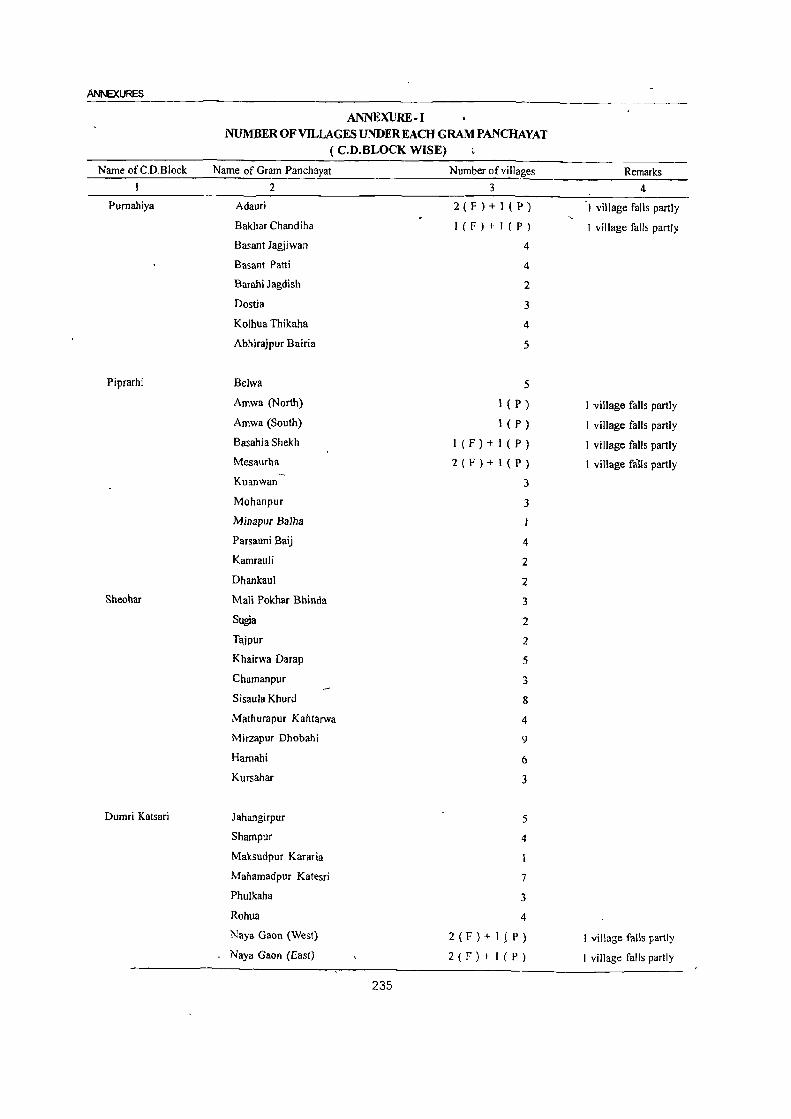
ANNEXURES
ANNEXURE-I NUMBER OF VILLAGES UNDER EACH GRAM PANCHAYAT
( CD. BLOCK WISE)
Name of C.D.Block Name of Gram Panchayat Number of villages Remarks
1 2 3 4
Purnahiya Adauri 2(F)+1(P) 1 village falls partly
Bakhar Chandiha I(F)+I(P) I village falls partly
Basant Jagjiwan 4
Basant Patti 4
Barahi Jagdish 2
Dostia 3
Kolhua Thikaha 4
Abhirajpur Bairia 5
Piprarhi Belwa 5
Amwa (North) I ( P ) 1 village falls partly
Amwa (South) I ( P ) 1 village falls partly
Basahia Shekh I(F)+I(P) I village falls partly
Mesaurha 2(F)+I(P) 1 village fills partly -Kuanwan 3
Mohanpur 3
Minapur Balha
Parsauni Baij 4
Kamraufi 2
Dhankaul 2
Sheohar Mali Pokhar Bhinda 3
Sugia 2
Tajpur 2
Khairwa DaTap 5
Chamanpur 3
Sisaula Khurd 8
Mathurapur Kahtarwa 4
Mirzapur Dhobahl 9
Harnahi 6
Kursahar 3
Dumr; Katsari Jahangirpur 5
Shampur 4
Maksudpur Kararia
Mahamadpur Katesri 7
Phulkaha 3
Rohua 4
Naya Gaon (West) 2(F)+I(P) I village falls partly
Naya Gaon (East) 2(F)+I(P) I village falls partly
235

DISTRICT CENSUS HANDBOOK SHEOHAR
Name of C D Block
I
Tanam Chowk
Distrtct Total
ANNEXURE - I (Concld.)·
NUMBER OF VILLAGES UNDER EACH GRAM PANCHAYAT ( c.n.BLOCK WISE) ..
Name of Gram Panchayat Number of villages
2 3
Hlrauta Duma 2
Madhopur Chhata 4
Po,hlan 8
Surgahl 5
Salempur 4
Khortha urf Khurpattl 4
Belahl 7
AthkaunJ 4
Bmdraban 3
Chhatauni 6
Btsambharpur 4
Tanyani Chhapra I
Sonbarsa 8
Narwara 3
Shanfnagar urf Ghauspur 9
Kumhrar 6
53 Panchayats 203
Note: 'F' denotes whole village and 'P' denotes part Village
ANNEXURE-n
ESTIMATE OFCH1LD MORTALITY, 1981 AND 1991
Persons
State/DIstnct Year q (I) q (2) q (3)
Bihar 1991 75 84 86 1981 94 112 125
Sitamarhi 1991 100 121 131 1981 100 128 147
Remarks
4
q (5)
89 141
145 163
Here q(l), q(2), q(3) and q(S) denote estimates of child mortality for the different ages I, 2, 3 and 5 respectively for the children of the district and the state. ]t is evident that child
mortality for the district (from which the dlstnct of Sheohar was carved out) for both censuses (1981 & 1991) IS in higher-side than the state average.
ANNEXURE-III
VARIOUS MEASURES OF FERTILITY AND MEAN AGE AT MARRIAGE, 1991 CEl"JSUS
Vanous fertility measures for all the dlstncts and the state(1991-Census)
No of Children ever
Child Woman born per Woman In Mean age at
State / District CBR TFR TMFR GFR GMFR RatIO age group 45-49 mamage
2 3 4 5 6 7 8 9
Bihar 36.2 5.3 5.9 163.0 186.0 66.6 4.] 16.5
Patna 353 52 60 1610 1890 635 4 I 168
Nalanda 35 I 5 I 55 1580 1770 630 40 157
236
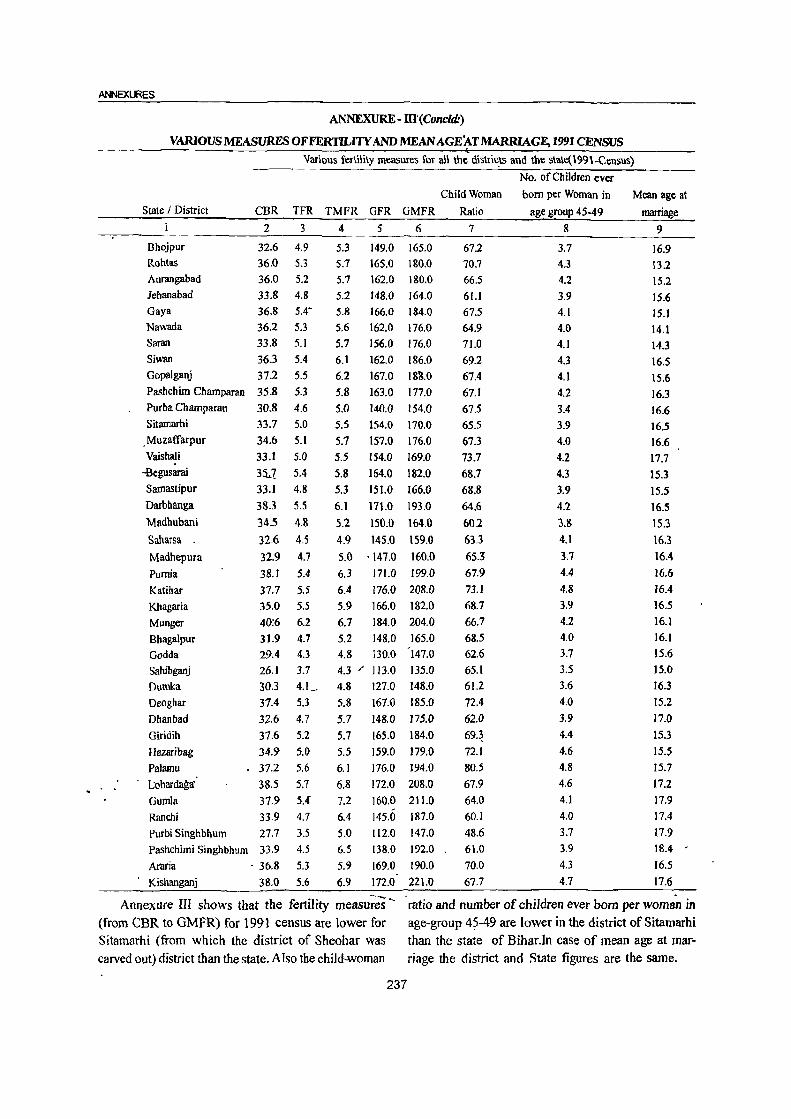
ANNEXURES
ANNEXURE - ill'( COrlett!')
VARIOUS MEASURES OFFER'fH,ITY AND MEAN AGE~T MARRIAGE, 1991 CENSUS
Various fertility measures fOT an the distTic~ and the state(\991-Census)
State / District
Bhojpur
Rohtas Aurangabad lehanabad
Gaya Nawada Saran
Siwan
Gopalganj
Child Woman CBR TFR TMFR GFR GMFR Ratio
2 3 4 5 6 7
32.6 4.9 5.3 149.0 165.0 67.2 36.0 5.3 5.7 \65.0 180.0 70.'7 36.0 5.2
33.8 4.8 36.8 36.2 33.8
36.3 37.2
5.7 \62.0 180.0
5.2 148.0 164.0
Pashchim Champaran 35.8
5.4-
5.3
5.1
5.4
5.5
5.3
5.8
5.6
5.7 6.1
6.2
5.8
166.0 184.0 162.0 176.0 156.0 176.0 162.0 186.0
167.0 18S.0
163.0 177.0
66.5
61.1
67.5
64.9
71.0
69.2 67.4
67.1
67.5 65.5
67.3 73.7
68.7
68.8
64.6
60.2 63.3
653 67.9
73.1
68.7
66.7
68.5 62.6
65.1 61.2 72.4
62.0
69.~
72.1 80.5
67.9
64.0 60.1
48.6
61.0
70.0
67.7
Purba Champaran
Sitarnarhi
. Muzaffarpur VaishaJi
-Begusarai Samastipur Darbhanga
Madhubani
Saharsa .
Madhepura
Pumia Katihar
Kbagaria Munger
Bbagalpur Godda Sahibganj
Dumka Deoghar
Dllanbad Giridih
Hazaribag Palamu L;ohardagl{ .
Gumla Ranchi purbi Singhbhum
30.8 4.6 33.7 5.0
34.6 5.1
33.1 5.0
35.,_1 5.4
33.1 4.8
38.3 5.5
34.5 4.8
32.6 4.5 32.9 4.7 38.1 5.4
37.7 5.5 35.0 5.5 40:6 6.2 31.9 4.7 29.4 4.3 26.1 3.7
30.3 4.1..-37.4 5.3
32.6 4.7
37.6 5.2
34.9 5.()
37.2 5.6
38.5 5.7
37.9 5.4"
33.9 4.7
27.7 3.5
5.0 140.0 154.0
5.5
5.7
154.0
157.0 170.0
176.0 5.5 154.0 169.0
5.8 164.0 182.0
5.3 151.0 166.0
6.1 171.0 \93.0
5.2 150.0 164.0 4.9 145.0 159.0
5.0 • 147.0 160.0
6.3 171.0 199.0
6.4 176.0 208.0
5.9 166.0 182.0
6.7 184.0 204.0
5.2 148.0 165.0 4.8 130.0 '147.0
4.3 / 113.0 135.0
4.8 127.0 148.0
5.8 167.0 185.0
5.7 148.0 175.0
5.7 165.0 184.0
.5.5 159.0 179.0 6.1 176.0 ]94.0
6.8 172.0 208.0
7.2 160.0 211.0
6.4 145.0 187.0
5.0 112.0 147.0
Pashchimi Singhbhum 33.9 4.5 6.5 138.0 192.0
190.0
221.0
Araria . 36.8 5.3 5.9 169.0
Kishanganj 38.0 5.6 6.9 172.0
No. of Children ever
bom per Woman in
age group 45-49
8
3.7 4.3
4.2 3.9 4.1 4.0 4.1
4.3
4.1 4.2
3.4 3.9
4.0
4.2 4.3
3.9
4.2
3.8
4.1
3.7
4.4
4.8
3.9 4.2 4.0
3.7 3.5 3.6
4.0
3.9
4.4
4.6 4.8
4.6
4.1
4.0
3.7
3.9
4.3
4.7
Mean age at
marriage
9
16.9 13.2
15.2
15.6 IS.l 14.1
14.3
16.5
15.6
16.3
16.6 16.5 16.6
17.7
15.3
15.5
16.5
15.3
16.3
16.4
16.6
16.4 16.5
16.1 16.1 15.6
15.0 ]6.3
15.2
17.0
15.3
15.5
15.7
17.2 17.9
17.4
17.9 18.4
16.5
17.6
Annexure III shows that the fertility measu~s(from CBR to GMFR) for 1991 census are lower for Sitamarhi (from which the district of Sheohar was carved out) district than the state. Also the chil(}..woman
ratio and number of children ever born per woman in age-group 4?-49 are lower in the district of Sitamarhi than the state of Bihar.In case of mean age at marriage the district and State figures are the same.
237

DISTRICT CENSUS HANDBOOK: SHEOHAR
ANNEXURE - IV (A) . PERCENTAGE DISTRIBUTION OF MIGRANTS BY PLACE OF BIRTH, 2001 CENSUS
Born elsewhere in the district of
enumeration Born in other district of Bihar Born in Bihar
StatelDistrict P M F P M F P M F
2 3 4 5 6 7 8 9 10
Bihar 13,662,859 1.303,785 12,359,074 4,532,117 585,005 3,947,112 18,194,976 1,888,790 16,306,186 (68.4) (62.0) (69.1) (22.7) (27.8) (22.1) (91.0) (89.8) . (91.2)
Sheohar 50,036 3,485 46,551 65,737 2,080 63,657 115,773 5,565 110,208
(42.1) (61.5) (41.1) (55.3) (36.7) (56.2) (97.3) (98.1) (97.3)
Born in other states Born in other countries Total migrants
StatelDistrict P M F P M F P M F
11 12 13 14 15 16 17 18 19
Bihar 1,58?,339 195,360 1,386,979 211,880 18,501 193,379 19,989,195 2,102,651 17,886,544 (7.9) (9.3) (7.8)
Sheohar 1,333 55 1,278
(1.1) (1.0) (1.1)
The growth of population for any area (be it any
district or stat~ is influenced by the pattern of migration (in-migration as well as out-migration). However, for want of data on out-migration from district or state to other districts or other states of the country and to other countries it might not be possible to correctly
assess the net impact of migration on growth of
population,although such impact may not be much in most of the cases.
It is apparent from Annexure IV(A) that out of 19,989,195 migrants in the State as per place of birth
the share ofSheohar distriCt is 118,965, i.e., 0.6 percent of state total.Female migrants out number the male
(1.1) (.9) (1.1) (100.0) (100.0) (100.0) 1,859 50 1,809 118,965 5,670 113,295 (1.6) (.9) (1.6) (100.0) (100.0) (100.0)
migrants both in the district and the state. In case of '. migrants born in Bihar there is wide gap between male
and female population in absolute number. With respect
to percentage figures of born elsewhere in the district of enumeration the district percentage (42.1) is less
than the state percentage of (~8.4).
When we compare the percentage figures of
migrants born in other districts of Bihar it is crystal clear that the district percentage (55.3) is higher than the state
percentage (22.7). The percentage figure for born in other
states is lower for the district than the state while the percentage figure for born in other countries is higher in the district than the state as per 2001 Census.
ANNEXURE - IV (B) INTERSTATE MIGRANTS, 2001 CENSUS
Bihar Sheohar
Percentage to total Percentage to total
Place of Birth Migrants Mi_gran!s. Place of Birth Migrants Migrants
J 2 . 3 2 3
Uttar Pradesh 434,051 27.4 Jharkhand 456 34.2
Jharkhand 339.297 21.4 Uttar Pradesh 278 20.9
Assam 133,758 8.5 West Bengal 198 14.9
West Bengal 126,499 8.0 Assam l60 12.0
Nagaland 101,267 6.4 Madhya Pradesh 77 5.8
.Chhatisgargh 90,469 5.7 Maharashtra 23 1.7
Gujarat 65,996 4.2. Delhi 20 1.5
Uttranchal 63,527 4.0 Arunachal Pradesh 19 1.4
Jammu & Kashmir 43,737 2.8 Gujarat 19 1.4
Qril!~a 42,215 2,1 Karnataka 16 1.2
238

ANNEXURES
ANNEXURE - IV (B) (Conl:/d.) INTERSTATE MIGRANTS, 1991 €ENSUS
Bihar
Percentage to total
Place of Birth MIgrants Migrants
2 3
Maharashtra 38,244 24
Rajasthan 20,542 13
Hruyana 20,505 13
Andhra Pradesh 18,371 12
Total for fourteen states 1,538,47& 972
Other states 43,861 28
Total 1,582,339 100.0
Annexure-IV(B) deals with interstate migrants
to the district of Sheohar and the state of Bihar. The
district received only 0.1 per cent of the migrants
from outside the state in comparison to total migrants
coming to the state. The State of Uttar Pardesh and
Jharkhand-have been the major cbntributor as regards
immigration, both to the district and the state. In case
of Bihar 14 states, namely Uttar Pardesh, Jharkhand.
Assam,West Bengal, Nagaland, Chhatisgarh, Gujarat,
Uttranchal, J&k, Orissa, Maharashtra, Rajasthan,
Sheohar
Percentage to total
Place of Birth Migrants Migrants
2 3
Punjab 15 I 1
Total for eleven states 1,281 961
Other states 52 39
Total 1,333 100.0
Haryana and Andhra Pradesh together account for
15.4lakh (97.2%) of the 15.81akh interstate migrants,
Uttar Pradesh and lharkhand states are prominent
in contributing 27.4 and 21.4 percent of migrants
respectively to the state in 200 I. In respect Of
Sheohar, of the total of 1,333 interstate migrants,
Jharkhand and Uttar Pradesh states contributed 34.2
and 20.9 percent respectively to the district altogather
11 major states contributed 96.1 percent of the total
inter state migrants to Sheohar district in 2001.
ANNEXURE-V(A) MAIN RELIGION AS PER 2001 CENSUS
PI MI Total
StatelDIstnct F Population Hmdus Muslims
2 3 4 5
Bihar P 82,998,509 69,076,919 13,722,048
(832) (165)
M 43,243,795 36,077,374 7,061,908
(834) (163)
F 39,754,714 32,999,545 6,660,140
(830) (168)
Sheohar P 515,961 435,121 80,076
(843) (155)
M 273,680 231,935 41,321
(847) (15 I)
F 242,281 203,186 38,755
(839) (160)
It is evident from the above Annexure V(A) that Hindus form the bulk of the society both with regard to the district (84.3%) and the state (83.2%) foHowed
Other RelIgIOns Rehglon
Chnstlons Sikhs Jams Buddhists & Persuasions not Stated
6 7 & 9 10 11
53,137 20,780 18,818 16,085 52,905 37,817
(01) (00) (00) (00) (0 I) (00)
26,913 11,057 10,220 8,446 27,336 20,541
(0 I) (00) (00) (00) (0 I) (00)
26,224 9,723 8,59& 7,639 25,569 17,276
(0 I) (00) (00) (00) (01) (0,0)
123 91 11& 6 8 41&
(00) (00) (00) (00) (00) (01)
74 47 62 3 5 233
(00) (00) (00) (00) (00) (0 I)
49 44 56 3 3 185
(00) (00) (00) (00) (00) (01)
by Muslims (16.5% for state and 15.5% for dIstrict). Followers of other religions e g , ChristIans, SIkhs, lains, Buddhists, etc., form very small chunk of the society.
239

DISTRICT CENSUS HANDBOOK: SHEOHAR
ANNEXURE - V( B) . MAIN RELIGION IN DISTRICf AND ITS C.D. BLOCKS AS PER 2001 CENSUS
PI Other
SeriaL District! MI Total Religions & Religion Number C. D. Block F Population Hindus Muslims Christions Sikhs Jains Buddhists Persuasions not Stated
2 3 4 5 6 7 8 9 10 II 12
Sheohar P 515,961 435,121 80,076 123 91 118 6 8 418
(84.3) (15.5) (0.0) (0.0) (0.0) (0.0) to.O) (0.1)
M 273,680 231,935 41,321 74 47 62 3 5 233 (84.7) (15.1) (0.0) (0.0) (0.0) (0.0) (0.0) (0.1)
F 242,281 203,186 38,755 49 44 56 3 3 185 (83.9) (16.0) (0.0) (0.0) (0.0) (0.0) (O.O) (0.1)
Purnahiya P 71,722 67,375 4,230 64 15 16 3 2 17 (93.9) (5.9) (0.1) (0.0) (0.0) (0.0) (0.0) (0.0)
M 38,209 35,916 2,225 34 9 10 2 2 11" (94.0) (5.8) (0.1) (0.0) (0.0) (0.0) (0.0) (0.0)
F '33,513 31,459 2,005 30 6 6 I 0 6 (93.9) (6.0) (0.1) (0.0) (0.0) (0.0) (0.0) (0.0)
2 Piprarhi P 95,441 74,063 21,199 1 21 13 3 0 141 (77.6) (22.2) (0.0) (0.0) (0.0) (0.0) (0.0) (0.1)
M 50,325 39,347 10,884 1 11 6 I 0 75 (78.2) (21.6) (0.0) (0.0) (0.0) (0.0) (0.0) (0.1)
F 45,116 34,716 10,315 0 10 7 2 0 66
- (76.9) (22.9) (0.0) (0.0) (0.0) (0.0) (0.0) (0.1) 3 Sheohar P 122,340 JOO,331 21,885 52 27 33 0 1 11
(82.0) (17.9) (0.0) (0.0) (0.0) (0.0) (0.0) (0.0) M 65,039 53,653 11,316 34 8 20 0 1 7
(82.5) (17.4) ,(0.1) (0.0) (0.0) (0.0) (O.O) (0.0) F 57,301 46,678 10,569 18 19 13 0 0 4
(81.5) (18.4) (O.O) (0.0) (0.0) (O.o) (0.0) (0.0) 4 Dumri Katsari P 71,405 . 59,079 12,247 5 2 18 0 0 54
(82.7) (17.2) (0.0) (0.0) (0.0) (0.0) (0.0) (0.1) M 37,837 31,515 6,278 4 2 6 0 0 32
(83.3) (16.6) (0.0) (0.0) (0.0) (0.0) (O.O) (0.1)
F 33,568 27,564 5,969 I 0 12 0 0 22 (82.1) (17.8) (0.0) (0.0) (0.0) (0.0) (0.0) (0.1)
5 Tariani Chowk P 155,053 134,273 20,515 1 26 38 0 5 195 (86.6) (13.2) (0.0) (0.0) (0.0) (0.0) (0.0) (0.1)
M 82,270 71,504 10,618 I 17 20 0 2 108 (86.9) (12.9) (0.0) (0.0) (0.0) (0.0) (0.0) (O.I)
F 72,783 62,769 9,897 0 9 18 0 3 87 (86.2) (13.6) (0.0) (0.0) (0.0) (0.0) (0.0) (0.1)
Annexure V(B) above shows religion-wise as in case of the district. Purnahiya C.D. Block has distribution of population of2001 census. Both, for the highest proportion of Hindus (93.9%) whereas Sheohar district of Bihar and its C.D. Blocks, Piprarhi C.D. Block has the maximum proportion of Hindus form great chunk of society with 84.3 Muslims (22.2%). Followers of other religions e.g., percent. In various C.D.Blocks. of the district, the Christians, Sikhs, Jains, Buddhists, etc., form very Hindus and Muslims ar~ the two major religious small chunk of the society in all the C.D. Blocks of communities and trends are more or less the same the district.
240
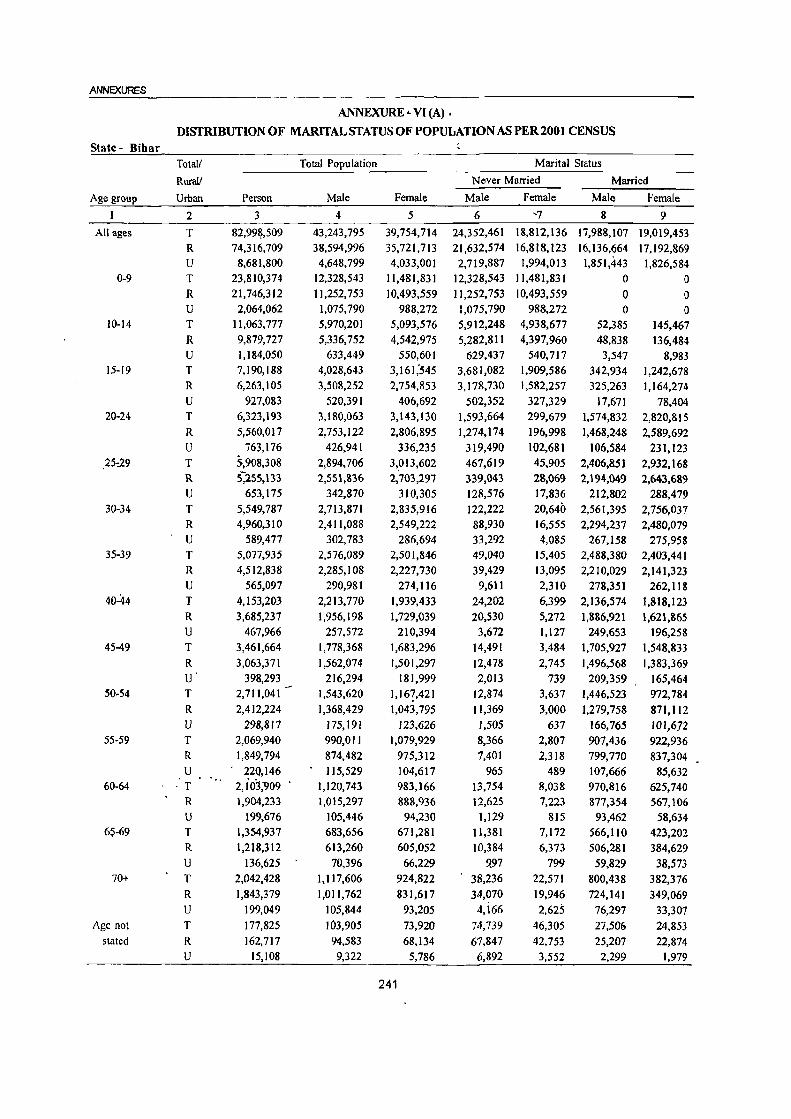
ANNEXURES
ANNEXURE.:. VI (A) •
DISTRIBUTION OF MARITAL STATUS OF POPULATION AS PER 2001 CENSUS
State - Bihar Total! Total Population Marital Status
Rural! Never Married Married
Age group Urban Person Male Female Male Female Male Female
I 2 3 4 5 6 '7 8 9 All ages T 82,99~,509 43,243,795 39,754,714 24,352,461 18,812,136 17,988,107 19,019,453
R 74,316,709 38,594,996 35,721,713 21,632,574 16,818,123 16,136,664 17,192,869 U 8,681,800 4,648,799 4,033,001 2,719,887 1,994,013 1,851,443 1,826,584
0-9 T 23,810,374 12,328,543 11,481,831 12,328,543 11,481,831 0 0 R 21,746,312 11,252,753 10,493,559 11,252,753 10,493,559 0 0 U 2,064,062 1,075,790 988,272 1,075,790 988,272 0 0
10-14 T 11,063,777 5,970,201 5,093,576 5,912,248 4,938,677 52,385 145,467 R 9,879,727 5,336,752 4,542,975 5,282,81 I 4,397,960 48,838 136,484 U 1,184,050 633,449 550,601 629,437 540,717 3,547 8,983
15-[9 T 7,190,188 4,028,643 3, 16J,'545 3,681,082 1,909,586 342,934 1,242,678 R 6,263,105 3,508,252 2,754,853 3,178,730 1,582,257 325,263 1,164,274 U 927,083 520,391 406,692 502,352 327,329 17,671 78,404
20-24 T 6,323,193 3,180,063 3,143,130 1,593,664 299,679 1,574,832 2,820,815 R 5,560,017 2,753,122 2,806,895 1,274,174 196,998 1,468,248 2,589,692 U 763,176 426,941 336,235 319,490 102,681 106,584 231,123
25-:29 T 5,908,308 2,894,706 3,013,602 467,619 45,905 2,406,851 2,932,168 R 5")55,133 2,551,836 2,703,297 339,043 2S,Q69 2,194,049 2,643,689 U 653,175 342,870 310,305 128,576 17,836 212,802 288,479
30-34 T 5,549,787 2,713,871 2,835,916 122,222 20,640 2,561,395 2,756,037 R 4,960,310 2,411,088 2,549,222 88,930 16,555 2,294,237 2,480,079 U 589,477 302,783 286,694 33,292 4,085 267,158 275,958
35-39 T 5,077,935 2,576,089 2,501,846 49,040 15,405 2,488,380 2,403,441 R 4,512,838 2,285,108 2,227,730 39,429 13,095 2,210,029 2,141,323 U 565,097 290,981 274,116 9,611 2,310 278,351 262,118
40-44 T 4,153,203 2,213,770 1,939,433 24,202 6,399 2,136,574 1,818,123 R 3,685,237 1,956,198 1,729,039 20,530 5,272 1,886,921 1,621,865 U 467,966 257,572 210,394 3,672 1,127 249,653 196,258
45-49 T 3,461,664 1,778,368 1,683,296 14,491 3,484 1,705,927 1,548,833 R 3,063,371 1,562,074 1,501,297 12,478 2,745 1,496,568 [,383,369 U 398,293 216,294 181,999 2,013 739 209,359 165,464
50-54 T 2,711,041 1,543,620 1,16?,421 12,874 3,637 1,446,523 972,784 R 2,412,224 1,368,429 1,043,795 11,369 3,000 1,279,758 871,112 V 298,817 175,191 123,626 1,505 637 166,765 101,672
55-59 T 2,069,940 990,011 1,079,929 8,366 2,807 907,436 922,936 R 1,849,794 874,482 975,312 7,401 2,318 799,770 837,304 U 220,146 115,529 104,617 965 489 107,666 85,632
60-64 ·T 2,ioT,909 1,120,743 983,166 13,754 8,038 970,816 625,740 R 1,904,233 1,015,297 888,936 12,625 7,223 877,354 567,106 U 199,676 105,446 94,230 1,129 815 93,462 58,634
65-69 T 1,354,937 683,656 671,281 11,381 7,172 566,110 423,202 R 1,218,312 613,260 605,052 10,384 6,373 506,281 384,629 U 136,625 70,396 66,229 9.97 799 59,829 38,573
70+ T 2,042,428 1,117,606 924,822 38,236 22,571 800,438 382,376 R 1,843,379 1,011,762 831,617 34,070 19,946 724,141 349,069 V 199,049 105,844 93,205 4,i66 2,625 76,297 33,307
Age not T 177,825 103,905 73,920 74,739 46,305 27,506 24,853 stated R 162,717 94,583 68,134 61,847 42,753 25,207 22,874
U 15,108 9,322 5,786 6,892 3,552 2,299 1,979
241

• DISTRICT CENSUS HANDBOOK: SHEOHAR
ANNEXURE - VI (A) (Concld.)
DISTRIBUTION OF MARITAL STATUS OF POPULATION AS PER 2001 CENSUS
State - Bihar Total/ Marital Status
Rural/ Widowed Divorced or Separated Unspecified
Age group Urban Male Female Male Female Male Female
I 2 10 II 12 13 14 15
All ages T. 882,505 1,887,575 20,722 35,550 0 0 R 807,078 1,680,053 18,680 30,668 0 0 U 75,427 207,522 2,042 4,882 0 0
0-9 T 0 0 0 0 0 0 R 0 0 0 0 0 0 U 0 0 6 0 0 0
10-14 T 3,364 7,6J8 2,204 1,814 0 Q
R 3,079 6,904 2,024 1,627 0 0 U 285 714 180 187 0 0
15-19 T 3,196 6,905 1,431 2,376 0 0 R 2,941 6,219 1,318 2,103 0 0 U 255 686 113 273 0 0
20-24 T 9,295 17,257 2,272 5,379 0 0 R 8,632 15,498 2,068 4,707 0 0 U 663 1,759 204 . 672 0 0
25-29 T 17,551 29,985 2,685 5,544 0 0 R 16,290 26,783 2,454 4,756 0 0 U 1,261 3,202 231 788 0 0
30-34 T 27,536 53,845 2,718 5,394 0 0 R 25,463 47,976 2,458 4,612 0 0 U 2,073 5,869 260 782 0 0
35-39 T 36,369 78,553 2,300 4,447 0 0 R 33,586 69,566 2,064 3,746 0 0 U 2,783 8,987 236 701 0 0
40-44 T 51,037 I I 1,347 1,957 3,564 0 0 R 47,005 98,903 1,742 2,999 0 .0 U 4,032 12,444 215 565 0 0
45-49 T 56,675 128,789 1,275 2,190 0 0 R 51,892 113,309 1,136 1,874 0 0 U 4,783 1.5,480 139 316 0 0
50-54 T 83,128 189,469 1,095 1,531 0 0 R 76,322 168,363 980 1,320 0 0 U 6,806 21,106 115 211 0 0
55-59 T 73,568 153,323 641 863 0 0 R 66,746 134,939 565 751 0 0 U 6,822 18,384 76. J.J2 0 0
60-64 T 135,474 348,345 699 1,043 0 0
R 124,701 313,674 617 933 0 0 U 10,773 34,671 82 110 0 0
65-69 T 105,757 240,422 408 485 0 0 R 96,234 213,622 3JlI 428 0 0 U 9,523 26,800 47 57 0 0
70+ T 278,026 519,077 906 798 0 0 R 252,776 461,904 775 698 0 0 U 25,250 57,173 131 100 0 0
Age not T 1,529 2,640 131 122 0 0 stated R 1,411"" 2,393 118 114 0 0
U 118 247 13 8 0 0
242

ANNEXURES
ANNEXURE - VI (B) PERCENTAGE DISTRIBUTION OF MARITAL STATUS OF POPULATION AS PER 2001 CENSUS
State - Bihar
Total!
Age Rural!
group Urban
I 2
All ages T
R
Total Population
Person Male Female
3 4 5
82,998,509 43,243,795 39,754,714 74,316,709 38,594,996 35,721,713
0-9 T 8,681,800 4,648,799 4,033,001
23,810,374 12,328,543 11,481,831 R 21,746,312 11,252,753 10,493,559
U
U 2,064,062 1,075,790 988,272 10-14 T
R
U 15-19 T
R U
20-24 T R U
25-29 T R U
30-34 T R U
35-39 T R U
40-44 T R U
45-49 T R U
50-54 T R U
55-59 T R U
60-64 T R U
65-69 T R U
70+ T
R u
Age not T stated R
U
11,063,777 5,970,201 5,093,576 9,879,727 5,336,752 4,542,975 1,184,050 633,449 550,601 7,190,188 4,028,643 3,161,545 6,263,105 3,508,252 2,754,853
927,083 520,391 406,692 6,323,193 3,180,063 3,143,130 5,560,017 2,753,122 2,806,895
763,176 426,941 _ 336,235 5,908,308 2,894,706 3,013,602 5,255,133 2,551,836 2,703,297
653,175 342,870 310,305 5,549,787 2,713,871 2,835,916 4,960,310 2,411,088 2,549,222
589,477 302,783 286,694 5,077,935 2,576,089 2,501,846 4,512,838 2,285,108 2,227,730
565,097 290,9~1 274,116 4,153,203 2,213,770 1,939,433 3,685,237 1,956,198 1,729,039
467,966 257,572 210,394 3,461,664 1,778,368 1,683,296 3,063,371 1,562,074 1,501,297
398,293 216,294 181,999 2,711,041 1,543,620 1,167,421 2,412,224 1,368,429 1,043,795
298,817 175,191 123,626 2,069,940 990,011 1,079,929 1,849,794 874,482 _975,312
220,146 115,529 104,617 2,103,909 1,120,743 983,166 1,904,233 1,015,297 888,936
199,676 105,446 94,230 1,354,937 683,656 671,281 1,218,312 613,260 605,052
136,625 70,396 66,229 2,042,428 1,117,606 924,822 1,843.379 1,011,762 831,617
199,049 105,844 93,205 177,825 103,905 73,920 162,717 94,583 68,134
15,108 9,322 5,786
% of Marital Status on total population
Never Married Married
Male Female Male Female
6 7
56.3 47.3 56.1 47.1 58.5 49.4
100.0 100.0 100.0 100.0 100.0 100.0
8 9
41.6 47.8 41.8 48.1 39.8 45.3
0.0 0.0 0.0 0.0 0.0 0.0
99.0 97.0 0.9 2.9 99.0 96.8 0.9 3.0 99.4 98.2 0.6 1.6 91.4 60.4 8.5 39.3 90.6 57.4 9.3 42.3 96.5 80.5 3.4 19.3 50.1 9.5 49.5 89.7 46.3 7.0 53.3 92.3 74.8 30.5 25.0 68.7 16.2 1.5 83.1 97.3 13.3 1.0 86.0 97.8 37.5 5.7 62.1 93.0
4.5 0.7 94.4 97.2 3.7 0.6 95.2 97.3
11.0 1.4 88.2 96.3 1.9 0.6 96.6 96.1 1.7 0.6 96.7 96.1 3.3 0.8 95.7 95.6 I.l OJ 96.5 93.7 1.0 0.3 96.5 93.8 1.4 0.5 96.9 93.3 0.8 0.2 95.9 92.0 0.8 0.2 95.8 92.1 0.9 0.4 96.8 90.9 0.8 0.3 93.7 83.3 0.8 0.3 93.5 83.S 0.9 0.5 95.2 82.2 0.8 0.3 91. 7 85.S 0.8 0.2 91.5 85.8 0.8 O.S 93.2 81.9 1.2 0.8 86.6 63.6 1.2 0.8 86.4 63.8 1.1 0.9 88.6 62.2 1.7 l.! 82.8 63.0 1.7 l.! 82.6 63.6 1.4 1.2 85.0 58.2 3.4 Z.4 71.6 41.3 3.4 2.4 71.6 42.0 3.9 2.8 72.1 35.7
71.9 62.6 26.5 33.6 71.7 62.7 26.7 33.6 73.9 61.4 24.7 34.2
243
Divorced or
Widowed Separated Unspecified
Male Female Male Female Male Female
10 11 12 13 14 15
2.0· 4.7 0.0 0.1 0.0 0.0 2.1 4.7 1.6 5.1 0.0 0.0 0.0 0.0 0.0 0.0 0.1 0.1 0.1 0.2 0.0 0.1 0.1 0.2 0.1 0.2 0.0 0.2 0.3 0.5 0.3 0.6 0.2 0.5 0.6 1.0 0.6 1.0 0.4 1.0 1.0 1.9 1.1 1.9 0.7 2.0 1.4 3.1 1.5 3.1 1.0 3.3 2.3 5.7 2.4 5.7 1.6 5.9 3.2 7.7 3.3 7.5 2.2 8.5 5.4 16.2 5.6 16.1 3.9 17.1 7.4 14.2 7.6 13.8 5.9 17.6
12.1 35.4 12.3 35.3 10.2 36.8 15.5 35.8 15.7 35.3 13.5 40.5 24.9 56.1 25.0 55.5 23.9 61.3
1.5 3.6 1.5 3.5 1.3 4.3 _-
0.0 0.1 0.0 0.0 0.0 0.1 0.0 0.0 0.0 0.0 0.0 0.0 0.0 0.0 0.0 0.0 0.0 0.0 0.0 0.0 0.0 0.0 0.0 0.0 0.0 0.0 0.0 0.0 0.0 0.0 0.0 0.0 0.0 0.1 0.0 0.0 0.0 0.1 0.0 0.0 0.0 0.1 0.0 0.0 0.1 0.2 0.0 0.0 0.1 0.2 0.0 0.0 0.0 0.2 0.0 0.0 0.1 0.2 0.0 0.0 0.1 0.2 0.0 0.0 0.1 0.3 0.0 0.0 0.1 0.2 0.0 0.0 0.1 0.2 0.0 0.0 0.1 0.3 0.0 0.0 0.1 0.2 0.0 0.0 0.1 0.2 0.0 0.0 0.1 0.3 0.0 0.0 0.1 0.2 0.0 0.0 0.1 0.2 0.0 0.0 0.1 0.3 0.0 0.0 0.1 0.1 0.0 0.0 0.1 0.1 0.0 0.0 0.1 0.2 0.0 0.0 0.1 0.1 0.0 0.0 0.1 0.1 0.0 0.0 0.1 0.2 0.0 0.0 0.1 0.1 0.0 0.0 0.1 0.1 0.0 0.0 0.1 0.1 0.0 0.0 0.1 0.1 0.0 0.0 0.1 0.1 0.0 0.0 0.1 0.1 0.0 0.0 0.1 0.1 0.0 0.0 0.1 0.1 0.0 0.0 0.1 0.1 0.0 0.0 0.1 0.1 0.0 0.0 0.1 0.1 0.0 0.0 0.1 0.1 0.0 0.0 0.1 0.2 0.0 0.0 0.1 0.2 0.0 0.0 0.1 0.1 0.0 0.0

DISTRICT CENSUS HANDBOOK: SHEOHAR
ANNEXURE - VI (C)
DISTRIBUTION OF MARITAL STATUS OF POPULATION AS PER 2001 CENSUS District - Sheohar
Total!
Age Rural!
group Urban
1 2
All ages T R U
0-9 T R U
10·14 T R U
15·19 T R U
20·24 T R U
25·29 T R U
30·34 T R U
35·39 T R U
40·44 T R
U 45·49 T
R U
50·54 T R U
55·59 T R U
60·64 T R U
65·69 T R U
70+ T
R U
Age not T stated R
U
Person
3
515,961 494,699
21,262 149,634 143,401
6,233 65,826 62,984 2,842
40,056 38,258
1,798 38,687
37,081. 1,603
36,674 35,143
1,531 35,335 33,869
1,466 31,962
30,633 1,329
26,634 25,561
1,073 22,130 21,235
895 17,235 16,510
n5 13,107 12,588
519 14,091 13,604
487 8,457 8,153
304 12,862 12,425
437 3,271 3,251
20
Total Population
Male
4
273,680 262,363
11,317 78,760 75,523
3,237 36,525 34,940
1,585 23,437 22,350
1,087 19,584 18,755
829 18,349 17,573
776 17,476 16,752
724 16,619
15,925 694
14,373 13,769
604 11,491 11,022
469 10,036 9,624
412 6,047 5,790
257 7,726 7,464
262 4,164 4,019
145 6,935 6,710
225 2,158 2,147
11
Female
5
242,281 232,336
9,945 70,874 67,878
2,996 29,301 28,044
1,257 16,619 15,908
711 19,103 18,329
774 18,325 17,570
755 17,859 17,117
742 15,343
14,708 635
12,261 11,792
469 10,639 10,213
426 7,199 6,886
313 7,060 6,798
262 6,365 6,140
225 4,293 4,134
159
)
5,927 5,715
212, 1,113 1,104
9,
Marital Status
Never Married Marrie~ Widowed
Male Female Male Female Male Female
6 7 8 9 10 11
150,660 111,206116,784118,945 6,102 11,999 144,235 106,468 112,107 114,311 5,887 11,436
6,425 4,738 4,677 4,634 215 563 78,760 10,874 0 0 0 0 75,523 67,878 0 0 0 0
3,237 2,996 0 0 0 0 36,168 28,551 304 671 29 65 34,593 27,315 296 654 27 62
1,575 1,236 8 17 2 3 21,227 9,229 2,177 7,339 25 46 20,211 8,803 2,106 7,057 25 43
1,016 426 71 282 0 3 8,264 1,055 1l,224 17,916 79 115 7,854 1,001 10,806 17,203 78 109
- 410 54 418 713 I 6 2,181 173 16,025 17,997 130 142 2,062 164 15,371 17,257 127 137
119 9 654 740 3 5 742 161 16,501 17,413 219 262 714 156 15,810 16,691 214 251 28 5 691 722 5 11
412 101 15,917 14,826 276 398 403 96 15,238 14,216 270 379
9 5 679 610 6 19 219 34 13,753 11,601 391 612 212 32 13,173 11,163 374 584
7 2 580 438 17 2& 154 15 10,914 9,938 417 676 151~ 15 10,464 9,545 401 644
3 0 450 393 16 32 11& 22 9,269 5,976 644 1,196 118 22 8,883 5,126 618 1,133
o 0 386 250 26 63 98 29 5,472 6,071 473 955
- 95 29 5,237 5,872 454 892 3 0 235 199 19 63
134 61 6,600 3,861 984 2,441 133 60 6,374 3,754 949 2,324
1 1 226 107 35 117 116 113
3 322 319
3 1,745 1,734
11
35 3,346 35 3,231
o 115 154 4,901 153 4,737
164 712 381 709 381
3 0
244
2,641 2,553
88
700 1,617 673 1,546 27 71
2,329 1,706 2,259 1,648
70 58
3,439 3,298
141 366 29 35 361 29 34
5 0
Divorced or
Separated Unspecified
Male Female Male Female
12 13 14 15
134 131 0 0 134 121 0 0
o 10 0 0
o 0 ° 0 o 0 0 0 o 0 0 0
24 14 0 0 24 13 0 0 010 0 8 5 0 0 8 5 0 0 o 0 0 0
17 17 0 0 17 16 0 0 o 0 0
13 13 0 0 13 12 0 0 o o o
14 23 0 0 14 19 0 0 o 4 0 0
14 18 0 0 14 17 0 0
o 0 0 10 14 0 0 10 13 0 0 010 0 6 10 0 0
6 9 0 0 o 0 0 5 5 0 0 5 5 0 0 o 0 0 0 4 5 0 0 4 5 0 0 o 0 0 0 8 2 0 0 8 2 0 0 o 0 0 0 2 0 0 0 2 0 0 0 o 0 0 0 6 5 0 0 6 5 0 0 o 0 0 0 3 0 0 0 3 0 0 0 o 0 0 0

ANNEXURES
ANNEXURE ~ VI (D) •
. PERCENTAGE DISTRIBUTION OF MARITAL STATUS OF POPULATION AS PER 2001 CENSUS District - Sheohar
Totall
Age Rural!
group Urban
I 2
All ages T
R U
0-9 T R U
10-14 T R U
15-19 T R U
20-24 T R U
25-29 T R U
30-34 T R U
35-39 T R U
40-44 T R U
45-49 T R U
50-54 T R U
• 55-59 T R U
60-64 T R U
65-69 T R U
70+ T R U
Age not T stated R
U
Person
3
515,961 494,699
21,262 149,634 143,401
6,233 65,826 62,984
2,842 40,056 38,258
1,798 38,687 37,084
1,603 36,674 35,143
1,531 35,335 33,869
1,466 31,962 30,633
1,329 26,634 25,561
1,073 22,130 21,235
895 17,235
; 16,510 725
13,107 12,588
519 14,091 13,604
487 8,457 8,153
304 12,862 12,425 . 437 3,271 3,251
20
Total Population
Male
4
273,680 262,363
1I,31} 78,760 75,523 3,237
36,525 34,940
1,585 23,437 22,350
1,087 19,584 18,755
829 18,349 17,573
'776 17,476 16,752
724 16,619 15,925
694 14,373 13,769
604 11,491 11,022
469 10,036 9,624
412 6,047 5,790
257 7,726 7,464
262 4,164 4,019
145 6,935
1 6,710
225 2,158 2,147
11
% of Marital Status on total population
Divorced or
Never Married Married Widowed Separated Unspecified
Female Male Female Male Female Male Female Male Female Male Female
5
242,281 232,336
9,945 70,874 67,878 2,996
29,301 28,044
1,257 16,619 15,908
711 19,103 18,329
774 18,325 17,570
755 17,859 17,117
742 15,343 14,708
635 12;261 11,792
469 10,639 10,213
426 7,199 6,886
313 7,060 6,798
262
6 7 8 9
55.0 45.9 42.7 49.1 55.0 45.8 42.7 49.2 56.8 47.6 41.3 46.6
100.0 100.0 0.0 0.0 100.0 100.0 0.0 0.0 100.0 ~OO.O 0.0 0.0 99.0 97.4 0.8 2.3 99.0 97.4 0.8 2.3 99.4 98.3 0.5 1.4 90.6 55.5 9.3 44.2 90.4 55.3 9.4 44.4 93.5 59.9 6.5 39.7 42.2 5.5 57.3 93.8 41.9 5.5 -57.6 93.9
49.5 7.0 50.~ 92.1 11.9 0.9 87.3 98.2 11.7 0.9 87.5 98.2 15.3 1.2 84.3 98.0 4.2 0.9 94.4 97.5 4.3 0.9 94.4 97.5 3.9 0.7 95.4 97.3 2.5 0.7 95.8 96.6 2.5 0.7 95.7 96.7 1.3 0.8 97.8 96.1 1.5 0.3 95.7 94.6 1.5 0.3 95.7 94.7 1.2 0.4 96.0 93.4 1.3 0.1 95.0 93.4 1.4 0.1 94.9 93.5 0.6 0.0 95.9 92.3 1.2 0.3 92 .. 4 83.0 I.2 0.3 92.3 83.2 0.0 0.0 93.7 79.9 1.6 0.4 90.5 86.0 1.6 0.4 90.4 86.4 1.2 0.0 91.4 76.0
10 II 12 13 14 15
2.2 5.0 0.0 0.1 0.0 0.0 2.2 4.9 0.1 0.1 0.0 0.0 1.9 5.7 0.0 0.1 0.0 0.0 0.0 0.0 0.0 0.0 0.0 0.0 0.0 0.0 0.0 0.0 0.0 0.0 0.0 0.0 0.0 0.0 0.0 0.0 0.1 0.2 0.1 0.0 0.0 0.0 0.1 0.2 0.1 0.0 0.0 0.0 0.1 0.2 0.0 0.1 0.0 0.0 0.1 0.3 0.0 0.0 0.0 0.0 0.1 0.3 0.0 0.0 0.0 0.0 0.0 0.4 0.0 0.0 0.0 0.0 0.4 0.6 0.1 0.1 0.0 0.0 0.4 0.6- 0.1 0.1 0.0 0.0 0.1 0.8 0.0 0.1 . 0.0 0.0 0.7 0.8 0.1 0.1 0.0 0.0 0.7 0.8 0.1 0.1 0.0 0.0 0.4 0.7 0.0 0.1 0.0 0.0 1.3 1.5 0.1 0.1 0.0 0.0 1.3 1.5 . 0.1 0.1 0.0 0.0
0.7 1.5 0.0 0.5 0.0 0.0 1.7 2.6 1.7 2.6 0.9 '3.0 2.7 5.0 2.7 5.0 2.8 6.0 3.6 6.4 3.6 6.3 3.4 7.5 6.4 16.6 6.4 16.5 6.3 20.1 7.8 13.5 7.8 13.1 7.4 24.0
0.1 0.1 0.0 0.0 0:1 0.1 0.0 0.0 0.0 0.2 0.0 0.0 0.1 0.1 0.0 0.0 0.1 0.1 0.0 0.0 0.0 0.2'/ 0.0 0.0 O.l 0.1 0.0 0.0 0.1 0.1 0.0 0.0 0.0 0.2 0.0 0.0 0.0 0.1 0.0 0.0 0.1 0.1 0.0 0.0 0.0 0.0 0.0 0.0 0.1 0.1 0.0 0.0 0.1 0.1· 0.0 0.0 .0.0 t}.O 0.0' 0.0-
6,365 6,140
225
1.7 1.0 85.4 60.7 12.7 38.4 0.1 0.0 0.0 0.0 1.8 1.0 85.4 61.1 12.7 37.9 0.4 0.4 86.3 47.6 13.4 52.0
4,293 2.8 4,134 2.8
159 2.1 5,927 4.6
.5,715 4.8 212 1.3
1,113 80.9 1,104 - 80.8
9 100.0
0.8 0.8 0.0 2.6 2.7 0.5
64.0 64.2 33.3
245
80.4 61.5 80.4 61.a 79.3 55.3 70.7 39.3 70.6 39.5 72.9 33.0 17.7 32.9 17.7 32.7 0.0 55.6
16.8 37.7 16.7 37.4 18.6 44.7 24.6 58.0 24.6 57.7 25.8 66.5
1.3 3.1 1.4 3.1 0.0 ll.l
0.1 0.0 0.0 0.0 0.0 0.0 0.0 0.0 0.0 0.0 0.0 0.0 0.0 0.0 0.1 0.1 0.1 0.1 0.0- . 0.0. 0.1 0.0 0.1 O.i> 0.0 0.0
0.0 0.0 O;{)
O.t> 0.0 0.0 0.0 0.0 0.0
0.0 0.0 . 0.0 0.0 0.0 0.0 0.0 0.0 0.0

• It is quite evident from above annexures that
Sheohar district as well as the state have a relatively higher proportion of never married males and married females. This may be attributed to the fact that women
enter into marital knot at comparatively younger ages than males. As against 56.3 and 55.0 percentages of never married males in Bihar state and Sheohar district respectively, the corresponding percentages. among married females are 47.8 and 49.1.
While analyzing marital status by broad age groups one finds that married females outnumber married males in the age group 10-14 suggesting that child
DISTRICT CENSUS HANDBOOK: SHEOHAR
marriage among females is more prevalent than males.
However, it is interesting to note that the proportion of
married mal~s and females in the age group 10-14 or 0-14 is comparatively less in Sheohar district. It is also
found that child marriage is more prevalent in rural areas of the state and the district than urban areas.
It is also significant to note that the proportion of never married females in Sheohar district and state as a whole in the age group 15-19 and above is much lower than the never married males. The proportion of
divorced or separated males and females is significantly low in Sheohar district as also in Bihar state.
ANNEXURE -vn (A)
AGE, SEX AND EDUCATION IN THE STATE, 2001 CENSUS
State - Bihar Literate without Below
Total Population Illiterate educational level Primary -
Agegroue Person Male Female Male Female Male Female Male Female
I 2 3 4 5 6 7 8 9 10
All ages 82,998,50943,243,795 39,754,714· 22,599,419 29,289,513 1, I 09,731 605,318 4,754,137 3,136,192
0-6 16,806,063 8,652,705 8,153,358 8,652,705 8,153,358 0 0 0 0
7-14 18,068,088 9,646,039 8,422,049 3,726,031 4,482,669 155,813 108,779 3,432,307 2,360,457
15-19 7,190,188 4,028,643 3,161,545 1,230,814 1,620,461 119,187 77,752 258,974 162,054
20-24 6,3~,193 3,180,063 3,143,130 1,008,021 1,984,439 116,049 77,583 146,223 111,029
25-29 5,908,308 2,894,706 3,013,602 1,044,780 2,050,645 110,162 70,259 132,771 101,505
30-44 14,780,925 7,503,730 7,277,195 3,283,034 5,463;712 289,216 146,787 359,822 225,043
45-59 8,242,645 4,311,999 3,930,646 1,996,002 3,206,666 171,406 69,431 222,485 107,543
60+ 5,501,274 2,922,005 2,579,269 1,607,825 2,275,150 116,746 44,007 195,609 64,824
Age not stated 177,825 103,905 73,920 50,207 52,413 31,152 10,720 5,946 3,737
Matriculation
Primary Middle and above Unclassified
Age group Male Female Male Female Male Female Male Female
1 11 12 13 14 15 16 17 18
All ages 5,130,917 3,203,792 3,012,151 1,378,075 6,623,397 2,137,192 14,043 4,632
0-6 0 0 0 0 0 0 0 0
7-14, 1,748,790 1,114,575 581,492 354,390 0 0 1,606 1,179
15-19 684,881 436,177 742,937 357,417 990,809 506,981 1,041 703
20-24 411,640 314,679 349,150 172,368 " 147,169 482,370 1,811 662
25-29 354,771 277,177 253,017 128,337 997,276 385,079 1,929 600
30-44 230,051 628,277 590,380 239,142 2,046,840 573,199 4,387 1,035
45-59 574,565 302,391 323,834 93,987 1,021,321 150,281 2,386 347
60+ 420,299 127,222 168,110 31,060 412,554 36,908 862 98
Age not stated 5,920 3,294 3,231 1,374 7,428 2,374 21 8
246 __ .

ANNEXURES
ANNEXURE-.vn (B) •
AGE, SEX AND EDUCATION IN THE STA,TE, 2001 CENSUS
District - Sbeobar t
Literate without Below
Total Population Illiterate educational level Primary
A~e group Person Male Female Male Female Male Female Male Female
I 2 3 4 5 6 7 8 9 10
All ages 515,961 273,680 242,281 174,905 196,612 9,008 4,305 24,445 14,261
0-6 106,442 55,551 50,891 55,551 50,891 0 0 0 0
7-14 109,018 59,734 49,284 30,364 31,5i7 1,366 888 17,591 10,840
15-19 40,056 23.,437 16,619 10,629 10,385 787 456 1,509 641
20-24 38,687 19,584 19,103 9,491 14,259 788 486 866 572
25-29 36,674 18,349 18,325 9,565 14,348 802 466 770 437
30-44 93,931 48,468 45,463 28,802 37,758 2,159 973 1,858 966
45-59 52,472 27,574 24,898 16,766 21,482 1,166 502 993 503
60+ 35,410 18,825 16,585 12,827 15,126 882 365 789 260
Age not stated 3,271 2,158 1,113 --910 836 1,058 169 69 42
Matriculation
Primary Middle and above Unclassified
Age group Male Female Male Female Male Female Male Female
I 11 12 13 14 15 16- 17 18
All ages 26,079 15,370 13,017 5,308 26,221 6,409 5 16
0-6 0 0 0 0 0 0 0 0
7-14 8,272 4,829 2,140 1,195 0 0 5'
15-19 3,845 2,179 3,109 1,37f 3,558 1,584 0 3
20-24 2,458 1,716 1,685 658 4,296 1,410 0 2
25-29 2,098 1,429 1,203 549 3,911 1,093 \l 3
30-44 4,690 3,068 2,648 990 8,311 1,705 0 3
45-59 ~,742 1,523 1,425 388 4,481~ 500 0
60+ 1,915 584 792 148 1,617 102 3 0 ,
Age not stated 59 42 15 9 47 15 0 0
247
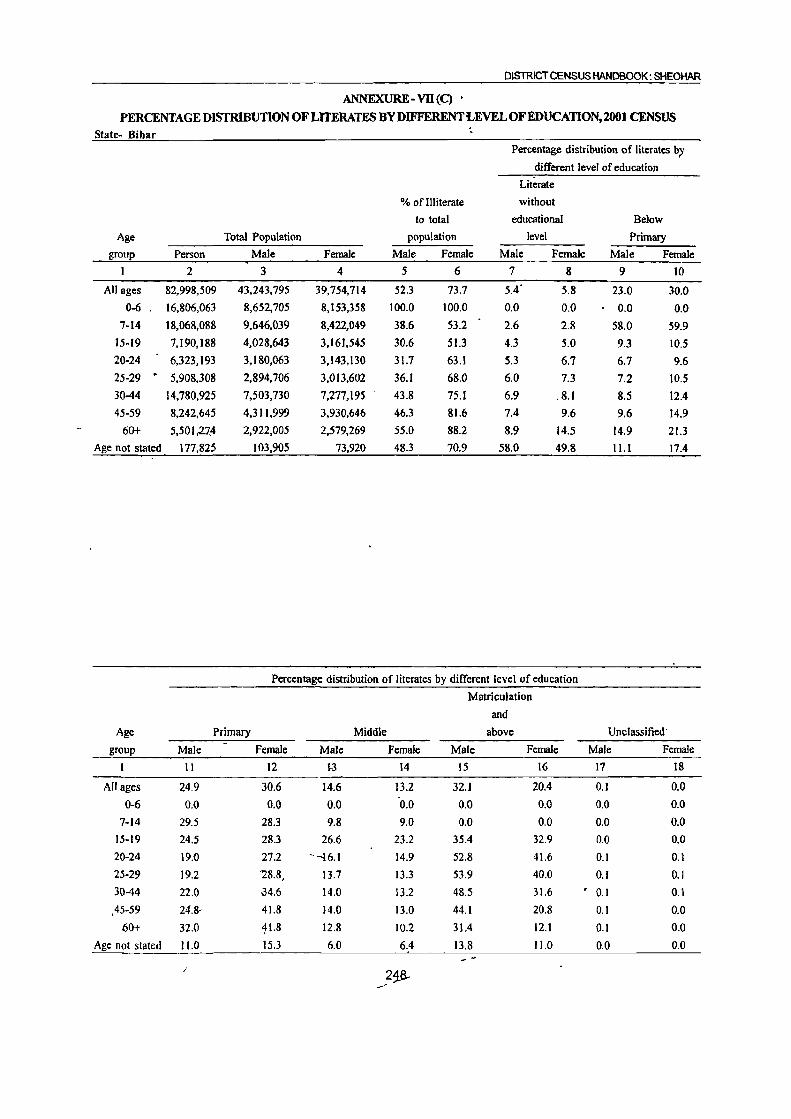
DISTRICT CENSUS HANDBOOK: SHEOHAR
ANNEXURE- vn (q .
PERCENTAGE DISTRIBUTION OF LITERATES BY DIFFERENT LEVEL OF EDUCATION, 2001 CENSUS State- Bihar
Percentage distribution of literates b'y
different level of education
Literate
% of lJIiterate without
to total educational Below
Age Total Population population level Primary
group Person Male Female Male Female Male Female Male Female
I 2 3 4 5 6 7 8 9 10
All ages 82,998,509 43,243,795 39,754,714 52.3 73.7 5.4' 5.8 23.0 30.0
0-6 16,806,063 8,652,705 8,153,358 100.0 100.0 0.0 0.0 0.0 0.0
7·14 18,068,088 9,646,039 8,422,049 38.6 53.2 2.6 2.8 58.0 59.9
15·19 7,190,188 4,028,643 3,161,545 30.6 51.3 4.3 5.0 9.3 10.5 20-24 6,323,193 3,180,063 3,143,130 31.7 63.1 5.3 6.7 6.7 9.6
25-29 - 5,908,308 2,894,706 3,013,602 36.1 68.0 6.0 7.3 7.2 10.5
30-44 14,780,925 7,503,730 7,277,195 43.8 75.1 6.9 ,8.1 8.5 12.4
45·59 8,242,645 4,311,999 3,930,646 46.3 81.6 7.4 9.6 9.6 14.9
60+ 5,501,27.4 2,922,005 2,579,269 55.0 88.2 8.9 14.5 14.9 21.3 Age not stated 177,825 103,905 73,920 48.3 70.9 58.0 49.8 11.1 17.4
Percentage distr~bution of literates by different level of education
Matriculation
and
Age Primary Middle above Unclassified'
group Male Female Male Female Male Female Male Female
I 11 12 1-3 14 15 16 17 18
All ages 24.9 30.6 14.6 13.2 32.1 20.4 0.1 0.0
0-6 0.0 0.0 0.0 '0.0 0.0 0.0 0.0 0.0
7-14 29.5 28.3 9.8 9.0 0.0 0.0 0.0 0.0
15-19 24.S 28.3 26.6 23.2 35.4 32.9 0.0 0.0
20-24 19.0 27.2 --16.1 14.9 52.8 41.6 0.1 0.1
25-29 19.2 18.8, 13.7 13.3 53.9 40.0 0.1 0.1
30-44 22.0 34.6 14.0 13.2 48.5 31.6 . 0.1 0.1
,45-59 24.8-' 41.8 14.0 13.0 44.1 20.8 0.1 0.0
60+ 32.0 ~1.8 12.8 10.2 31.4 12.1 0.1 0.0
Age not stated 11.0 15.3 6.0 6.4 13.8 11.0 0.0 0.0
.-21,8-_'

ANNEXORES
ANNEXURE· vn (0).
PERCENTAGE DISTRIBUTION OF LITERATES BY DIFFERENT LEVEL OF EDUCATION, 2001 CENSUS District - Sheohar
Percentage distribution of literates by
different level of education
Literate
% of Illiterate without
to total educational Below
Age Total Population population level Primary
group Person Male Female Male Female Male Female Male FemMe
I 2 3 4 5 6 7 8 9 10
All ages 515,961 273,680 242,281 63.9 81.2 9.1 9.4 24.7 31.2
0-6 106,442 ·55,551 50,891 100.0 100.0 0.0 0.0 0.0 0.0
7-14 109,018 59,734 49,284 50.8 64.0 4.7 5.0 59.9 61.0
15-19 40,056 23.437 16,619 45.4 62.S 6.1 7.3 11.8 10.3
20-24 38,687 19,584 19,103 48.5 74.6 7.8 10.0 8.6 11.8
25-29 36,674 18,349 18,325 52.1 78.3 9.1 11.7 8.8 11.0
30-44 93,931 ~8,468 45,463 59.4 83.1 11.0 12.6 9.4 12.5
45-59 52,472 27,574 24,898 60.8 86.3 10.8 14.7 9.2 14.7
60+ 35,410 18,825 16,585 68.1 91.2 - 14.7 25.0 13,2 17.8
Age 'not stated 3,271 2,158 1,113 42.2 75.1 84.S 61.0 5.5 15.2 .
Pefcentage distribution of literates by different level of education
Age Primary Middle
group Male Female Male
I 11 12 13
All ages 26.4 33.7 13.2
0-6 0.0 0.0 0.0
7-14 28.2 27.2 7.3
15-19 30.0 35.0 24.3
20-24 24.4 35.4 16.7
25-29 23.9 35.9 13.7
30-44 23.8 39.8 13.5
45-59 25.4 44.6 13.2
60+ 31.9 40.0 13.2
Age not stated ~.7 15.2 1.2
. " Lite~acy is one of the i~portant demographic characteristics. Apart from.collecting data on number of literate, the level, nature and type of education attained by the literates are also ascertained. The concept of literacy adopted in the c~nsus h~ already been expfained in the beginning of this publication.
A proper index for measuring literacy is propoition of literate and educated persons to the total population. The literacy rate for Bihar (excluding the population in the age-group 0-6 years) at the time of
Female
14
11.6
0.0
6.7
22.0
13.6
13.8
12.8
11.4
10.1
Matriculation
and
above
Male Female
15
26.5
0.0
0.0
27.8
42.6
44.5
42.3
41.5
27.0
16
14.0
0.0
0.0
25.4
29.1
27.5
22.1
14.6
7.0
Unclassified
Male Female
17 18
0.0 0.0
0.0 0.0 /' 09 0.0
0.0 0.0
0.0 0.0
0.0 0.1
0.0 0.0
0.0 0.0
0.1 0.0
3.2 3.8 5.4 0.0 0.0
2001census was 47.0. Male literates greatly out numbered female literates as ~he literacy rate for males, according to 2001 census, was 59.7 while for females the literacy rate was only to the extent of 33.1 pergent.
The overalllitetacy rate for the district of Sheohar, according to 2001 census was only 35.3 percent, about 12 percentage points less than the state average. Male literates in the distri,ct accounted for 45.3 percent whereas ferrlale literates constituted only 23.9 percent ..
249

of the total population. The literacy rates for males and females in Sheohar district are lower than the corresponding figures for Bihar state.
Annexures VII(A),VII(B),VIICC) and VII(D) furnish informations regarding absolute number of illiterates in Bihar state and Sheohar district as also percentage distribution of literates by different level of education by different age-groups are also provided.
A breakup of literate p'opulation by various educational levels of 200 1 census shows that 28.4 percent males and 35.8 percent females in the state were literate including below primary but had not attained any specific level of education. 24.9 percent males and 30.6 percent females in the state
DISTRICT CENSUS HANDBOOK: SHEOHAR
had crossed the primary standard, 14.6 percent males and 13.2 percent females had passed the middle exahlination while 32.1 percent males and 20.4 percent females in the State were matriculates and above. The contrast between males and females was significant among matriculates and above as the percentage of female literates who had passed the matriculation and above examination were about 12 percentage points less than literate males population.
According to 2001 census the proportion of
literates by different levels of education in Sheohar district remained higher in lower levels upto Primary standard and remained lower in higher standards
from Middle to Matriculation and above.
ANNEXURE-vm PERCENTAGE DISTRIBUTION OF MAJOR MOTHER TONGUES AS RETURNED IN
CENSUS-2001 FOR STATE & DISTRICT
Bihar
Mother Tongue Population Percentage
1 2 3
Bhojpuri 20,372,983 24.5
Hindi 14,524,035 17.5
MagadhiIMagahi 12,1)2,383 14.6
MaithHi 11,830,684 14.3
Urdu 9,457,544 11.4
Surjapuri 928,458 1.1
Bengali 442,352 0.5
Santali 382,866/ 0.5
Kurukh/Oraon - 57,952 0.1
Marwari 27,152 0.0
Total of other mother tongues 12,842,100 15.5
Total Population 82,998,509 100.0
Mother tongue, which is medium of expression, is an important attribute of population. The Census Ofindia has been the richest source of language data collected and published during the successive decennial censuses over a century. During 2001 census, as in the previol)s censuses, the mother tongue as returned by each individua) was collected.
~
Annexure VIII presents distribution of different {llother tongues as returned during the 2001 Census both for Sheoh'ar district and Bihar state.
250
Sheohar
Mother Tongue Population Percentage
I 2 3
Hindi 226,830 44.0
Urdu 64,035 12.4
MaithiJi 1,472 0.3
Bhojpuri 626 0.1
Mundari 367 0.1
Persian 231 0.0
Ho 47 0.0
Arabic/Arbi 19 0.0
Bengali 17 0.0
Santali 9 0.0
Total of other mother tongues 222,308 43.1
Total Population 515,961 100.0
It can be seen from the above annexure that Hindi language as mother tongue constitutes the majoI proportion of the population in Sheohar district where as Bhojpuri has been the mother tongue in the state of Bihar. Hindi, the main mother tongue of the district was returned by 44.0 percent of the population. The corresponding percentage for the Urdu, the second most prominent mother tongue in Sheohar district, is12.4. Hindi has got the seconq place in the state with J 7.5 percent.

DATA SOURCE FOR ANNEXURES - I TO VIII
ANNEXURE - I: CHARGE REGISTER & COVERAGE FILE OF 2001 CENSUS
ANNEXURE - II: OCCASIONAL PAPER - 1 OF 1997
ANNEXURE - III : OCCASIONAL PAPER - 1 OF 1997
ANNEXURE - IV : D - SERIES TABLES OF 2001 CENSUS
ANNEXURE - V: C - SERIES TABLES OF 2001 CENSUS
ANNEXURE - VI : C - SERIES TABLES OF 2001 CENSUS
ANNEXURE - VII : C - SERIES TABLES OF 2001 CENSUS
ANNEXURE - VIII : C - SERIES TABLES OF 2001 CENSUS