21359_1961_REG.pdf - Linguistic Survey Of India
387
CENSUS ,OF INDIA 1961 VOLtJME I PART I-A (i) TEXT IN;DIA LEVELs' OF REGIONAL DEVEl.()PMENT IN INDIA Being Part I of General Report on India A. MITRA of the Indian Civil Service 'Regis(fdY Generdz' and ex-officio Census ,.commissioner for India
-
Upload
khangminh22 -
Category
Documents
-
view
0 -
download
0
Transcript of 21359_1961_REG.pdf - Linguistic Survey Of India
CENSUS ,OF INDIA 1961
VOLtJME I PART I-A (i)
TEXT
IN;DIA
LEVELs' OF REGIONAL DEVEl.()PMENT IN INDIA Being Part I of General Report on India
A. MITRA
of the Indian Civil Service 'Regis(fdY Generdz' and ex-officio Census ,.commissioner for India
CENSUS OF INDIA 1961-UNION piJBtICA110N~
PART I General keporf.:'on the Census, Sub-divided into three subparts, viz.;
PART I-A General Report ,PART I-A(i)-TEXT Levels of Regional Development in India PART I-A(ii);-TABLES Levels of Reg!onal Development in 'India
PART I-B
PARTI-C
PART II PART II-A(i) PI\.RT II-ACii) FA~T II-B(i) P'A-R'" II -B(ii) PA~l. II-B(iii) PMi' II-CCi) PART IJ-C(ii) lJART II-C(iii) PART II-CCiv)
PART III
PART IlI-(j) PART III-(ji)
PART IV
PART IV-A(i) PART IV-A(ii) PART IV-A(iii) . PART IV-B
PART V .
PART V-!\. PART V-B
PART VI
PART VII
PART VII-A P~:r VII-B
~ART VIII
PART VIIl-A PART VIU-B
PART IX
PART X
Vital Statistics of the decade
Subsidiary Tables
Census Tables on Population, sub-divided into: General,Population Tables Union Primary Census Abstracts General Economic Tables (B-1 to B-IV) General Economic Tables (B-V) General Economic Tables (B-VT to B-IX) Social and Cultural Tables Language Tables Migration Tables (D-I to D-llI and D-V) Migration Tables (D.IV and D-VI)
Household Economic Tables (14 States) Household Economic Tablcs (India, Uttar Pradesh an~ Union
, Territories)
Housing Report Report on Industriaf Establishments House Types and Villages layouts Housing and Establishment Tables
Special Tables for Scheuled Castes and Scheduled Tribes and Ethnographic notes sub-divided into two Sub-parts viz.,
Special Tables for Scheduled Castes and Scheduled Tribes
Ethnographic Notes
Village S~rvey Monographs
Monographs on Rural Crafts Survey and list of Fairs and Festivals
Handicraft Survey Monograph Fairs and Festivals
Administration Report
Administration Report (Enumeration) AdministratIon Report (Tabulation)
Census Atlas VoJutr.:
}NotJor sale
Special Reports on cities with Population of 1 million and over
-Introductory Note
CHAPTER I
CONTEN'f"S
Natural Regions, Subr~ions and Divisions
CHAPTER 1I
The Ranking Device
CHAPTER III
Delineation of Natural RegioUl and levelsrof development
CHAPTER IV
Association of Characteristics
CHAPTER V
Relationship between patterns of shift from agriculture to non-agriculture 1951-61 and the levels of development
CHAPTER VI
Distribution of Industrial Licences among districts arranged by levels of development •
CHAPTER VII
Cases of hire purchase under the National Small Industries Corporation among districts arranged by levels of development
CHAPTER VIII
The Fourth Estate and the levels of development •
CHAPTER IX
ThC'General EI~iQns of 1957 and 1962 and the levels of development.
1-7
9-49
51-187
265-285
~87-314
315-346
347-351
353~357
MAPS
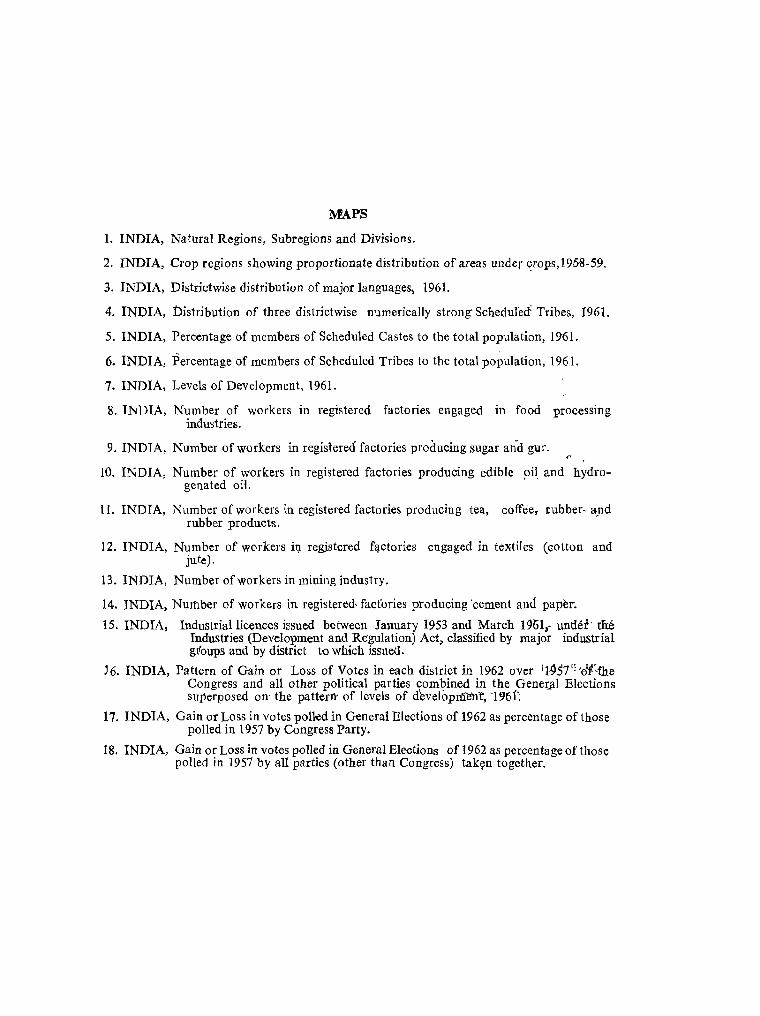
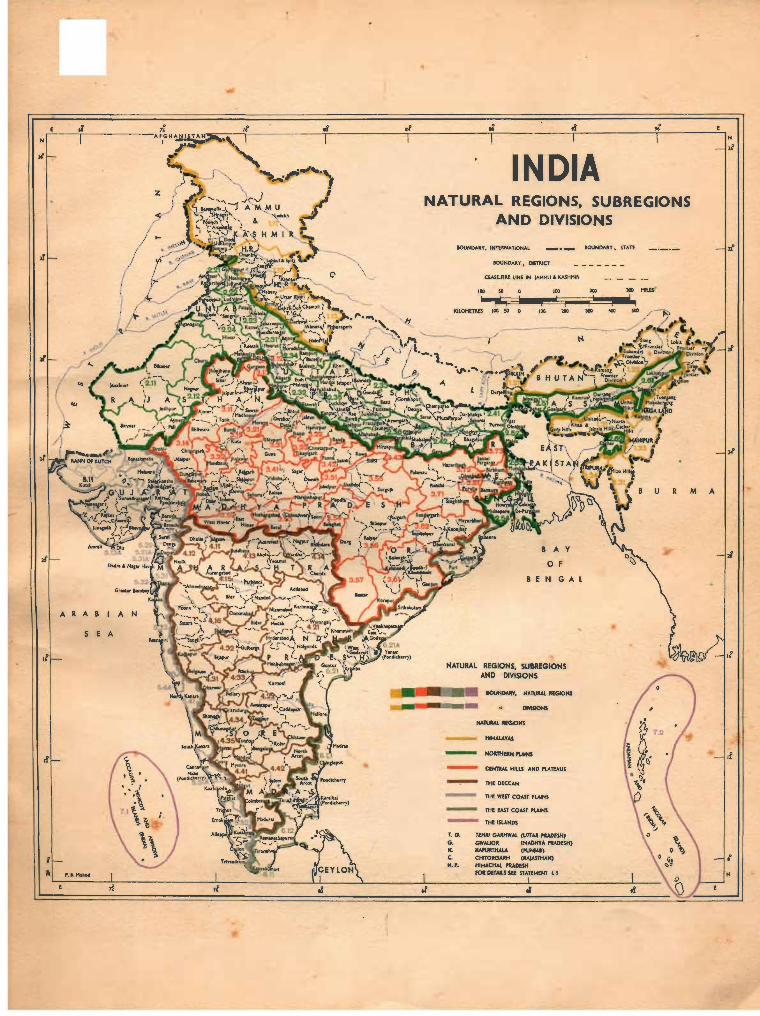
1. INDIA, Natural Regions, Subregions and Divisions.
2. INDIA, Crop regions showing proportionate distribution of areas under crops, 19&8-59.
3. INDIA, Districtwise distribution of major languages, 1961.
4. INDIA, Distrlbution of three districtwise numerically strong'Schedufed Tribes, 1961.
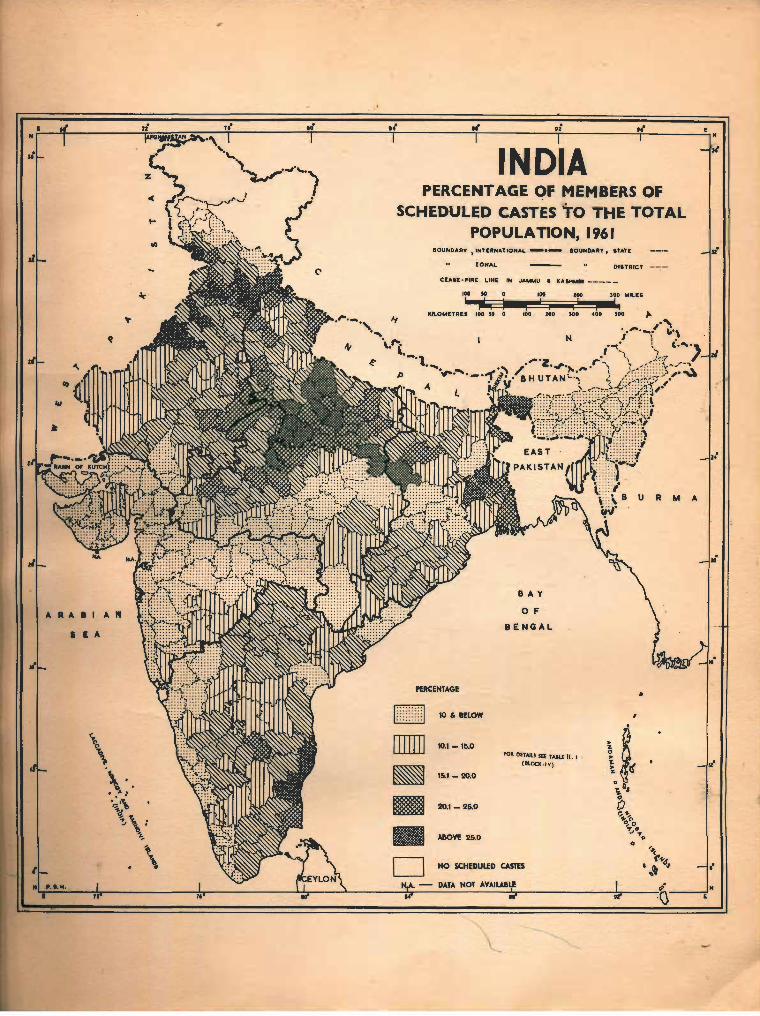
5. INDIA, Percentage of members of Scheduled Castes to the total population, 19'61.
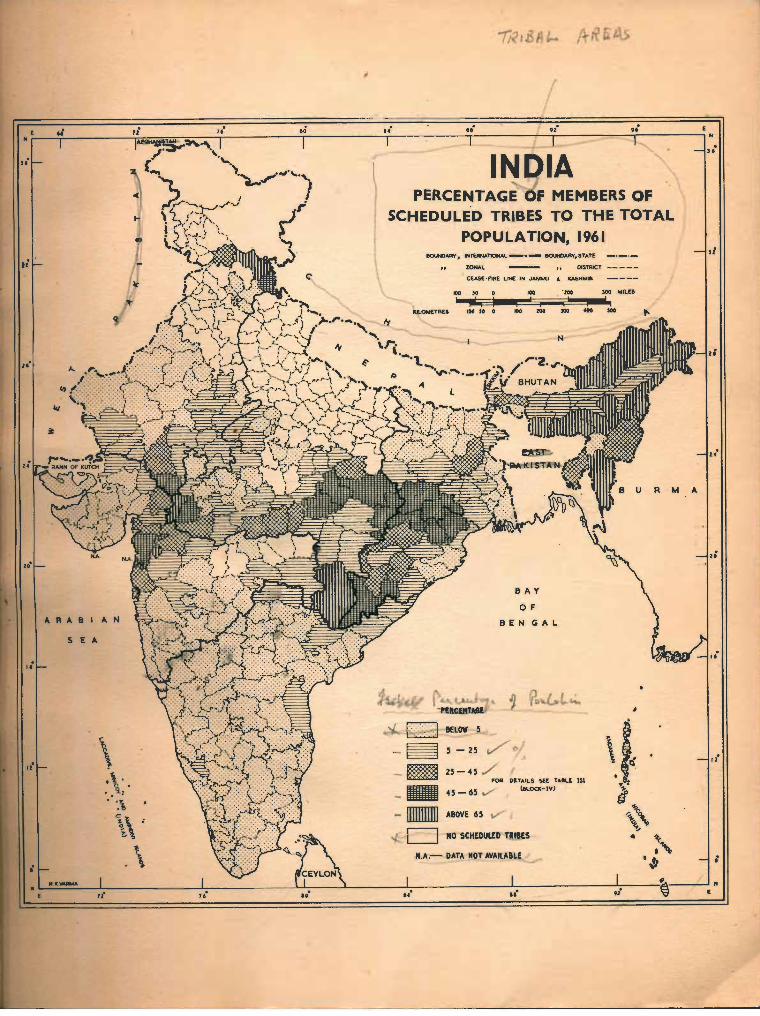
6. INDIA, Percentage of members of Scheduled Tribes to the total population, 1961.
7. INDIA, Levels of Development, 1961.
8. INDIA, Number of workers in registered factories engaged in food processing industries.
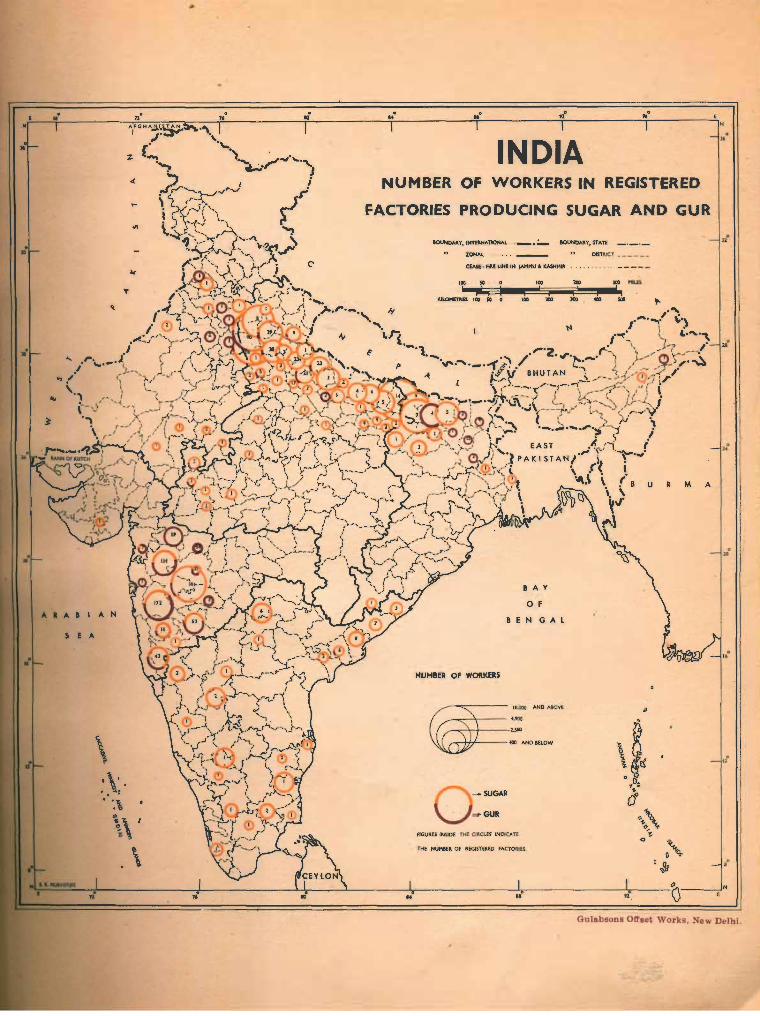
9. INDT A, Number of workers in registered factories producing sugar and gUL
10. INDIA, Number of workers in registered factories producing edible pil, and hydrogenated oil.
II. INDTA, Number of workers in registered factories producing tea, coffee. :rubber. apd rubber products.
12. INDIA, Number of workers iI). regjstered f~ctories engaged in tex.tiles (cotton and jute).
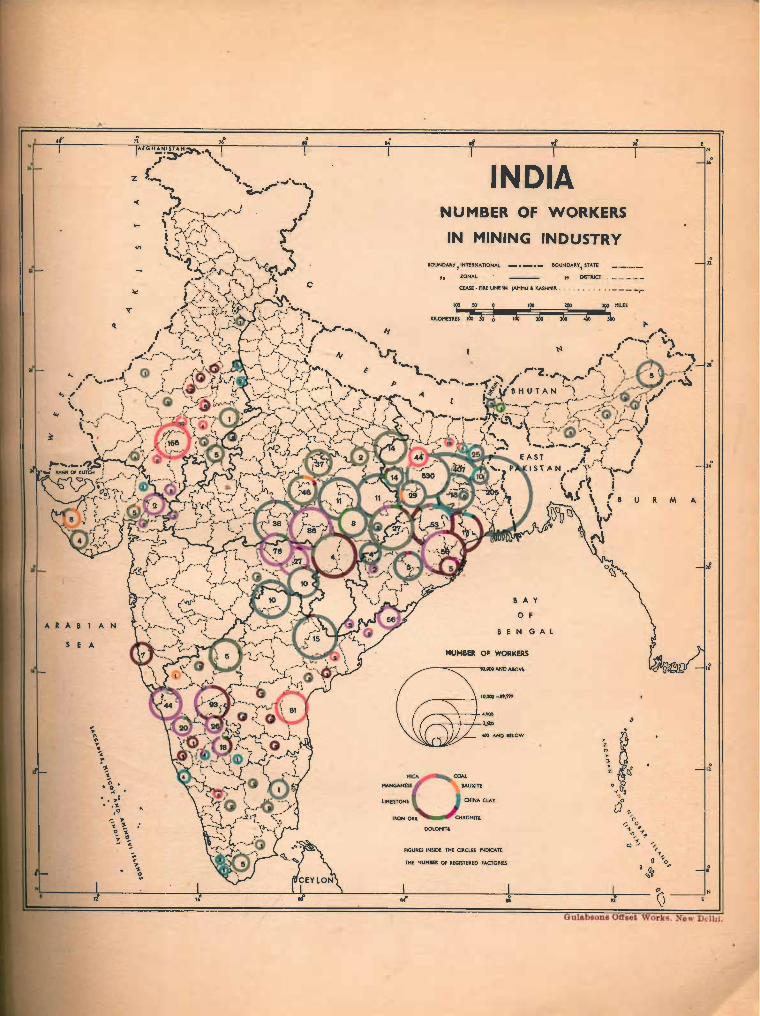
13. INDIA, Number of workers in mining industry.
14. INDIA, Number of workers in registered, factories producing 'cement and paper.
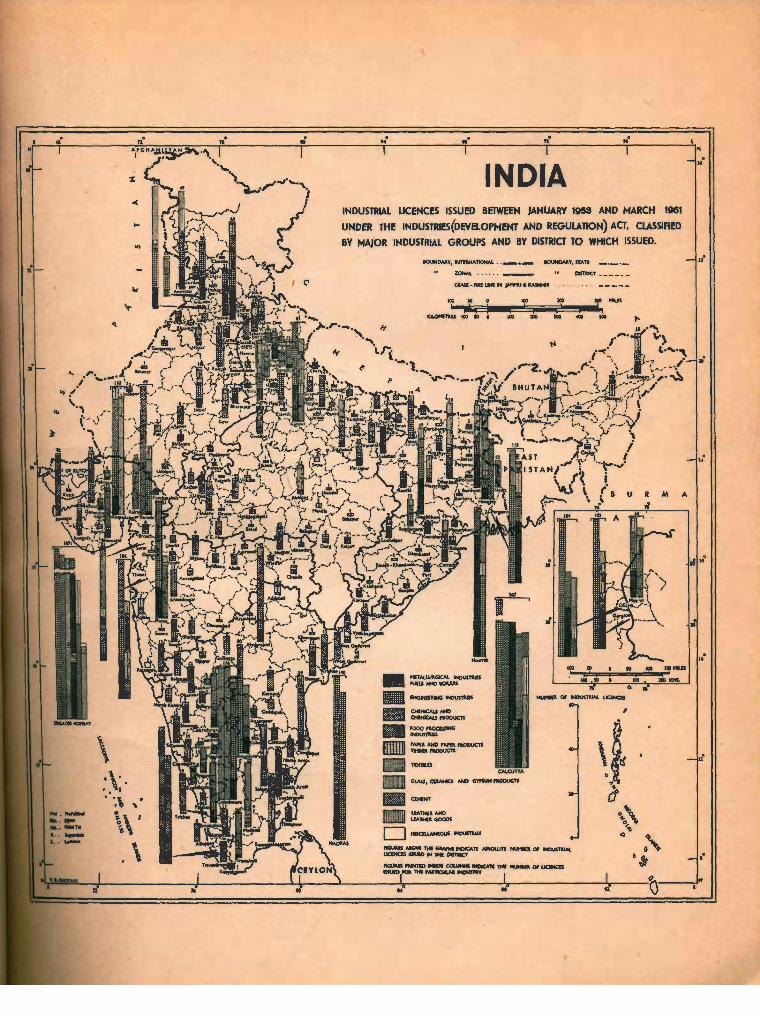
15. INDIA, Industrial licences ie.sued between January 1953 and March 1951,. unde:t' tIre Industries (Development and Regulation) Act, classified by major industrial groups and by district t'() which issued.
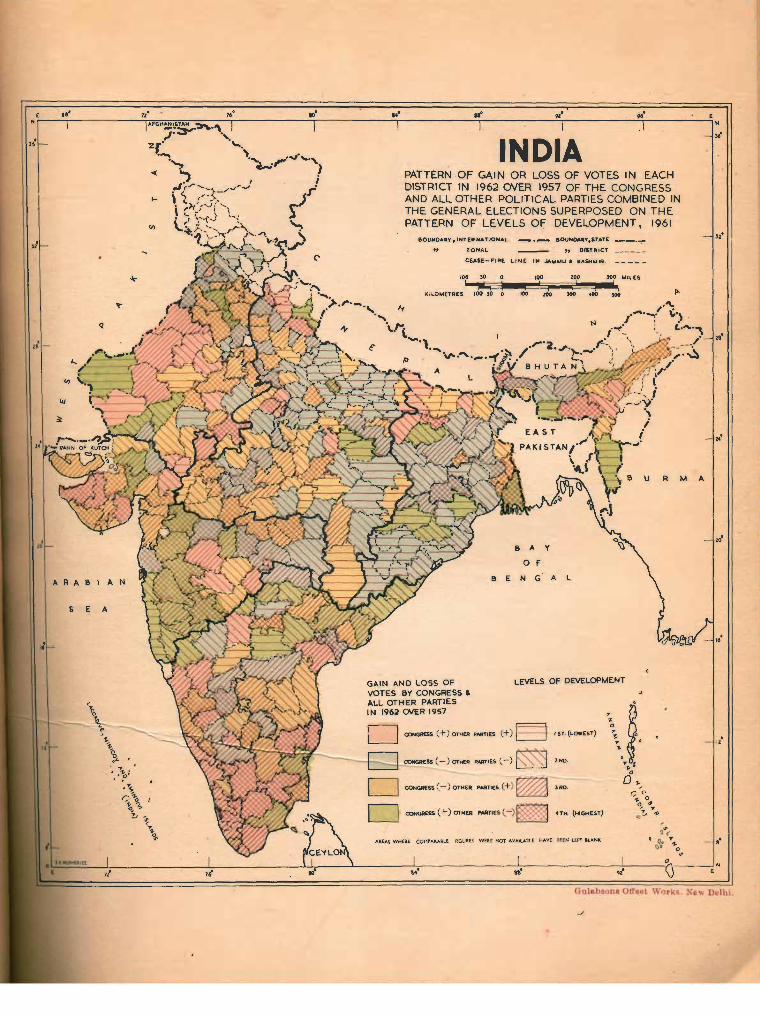
'6. INDIA, Pattern of Gain or Loss of Votes in each district in 1962 over 11-957':'o'{-the Congress and all other political parties coml?ined in the Generjil Elections superposed on- the patteni' of levels of d'evelopI1iell'f, '1961:
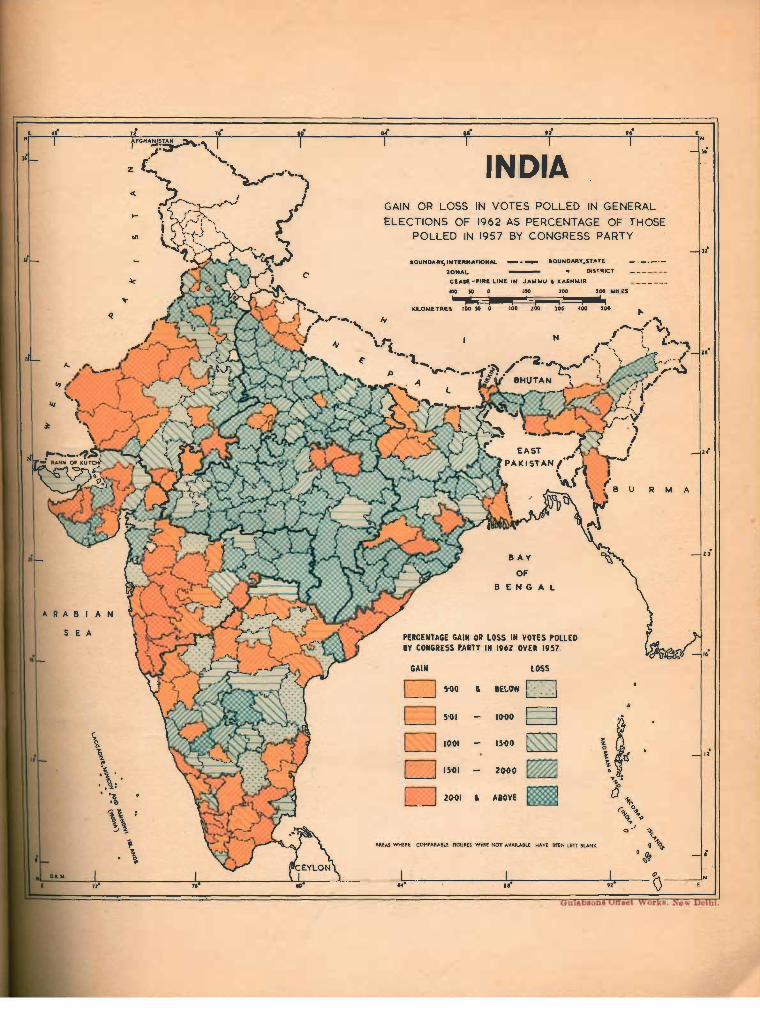
17. INDIA, Gain or Loss in votes polled in General Elections of 1962 as percentage of those polled in 1957 by Congress Party.
18. INDIA, Gain or Loss in votes polled in General Elections of 1962 as percentage of those polled in 1957 by all parties (other than Congress) takyn together.

PREFACE
This part of. tHe: Gentral Report orr the 1961 Census of India, was designed, ptbcessed an<:J. written- Oub almost entirely between the second half of May. and tlre.) end' of July tl1is ~eal'. T~ critical reader will naturally find in it many blemishes and. areas of irr'-'tlmplete- anal~si8' which a. more leisurely and careful treatment miglit have avoided. The pressures in the conduct of the Indian Census Programme liardty permit desira11le periods of gestatioll. This Report is therefore presented' more out of' regard! forllie: data:.it contains than any pretensions to other claims, for admitfedly the presentation: he];e' attempted is tentative and needs further calibration by means of principal components anal;ysisl The data are published in a separate volutnt' [Part·-I~1}.
This book started out with. two aims. First to dissolve the political and administrative outlines and let the natural regions, subregions and divisions emerge in their complex associations of natural features, social, cultural and general ecological characteristics. Secondly, to apply to the picture that emerged a .ranking device based on about three dozen, what appeared to the writer to be, significant indicators. This ranking device was based on a simple hypothesis. Given a certain amount of agricultural. general and economic infrastructure and a potential of human resources one is entitled to expect economic growth in the modern sense- of the word, particularly in organised industry, in direct relation to them. This process of delineation should be able to bring out zones of backwash and spread effect" and also those which a further instalment of economic growth might be able to retrieve from areas of backwash into those of spread. It was assumed that these areas of backwash and spread would set in motion forces of polarisation. It was therefore decided to apply several validity tests to verify this polarisation.
Of the fact of economic and even social and cultural polarisation there is little room for doubt. The main aim has been to let the facts speak for themselves. The abstract statements at the end of Chapter II bring out some of the salient ones. Fortunately for the country this polarisation has been far from regional, nothing like the north-south polarisation that one finds in Europe or the Americas, The picture that emerges is one of pockets and zones of backwardness invariably enclosed by areas of prosperity or spread effect. In very many areas except in the north and north east, the areas of prosperity and spread effect join hands across areas of backwash. Such a situation is particularly heartening for the logistics of development. It is no longer so mnch Ii matter of invasion of one region by another by organising and injecting all the prerequisites of economic growth, but of encircling and mopping up of pockets. How the sights should be set for this operation is of course outside the scope of this work.

In the chClipter on Delineation I have quoted very frequently from O.H.K. Spate's India &. Pakistan (1954) and S. P. Chatterjee's Regional Patterns of the Density and Distribution of Population in India published in The Geographical Review of India, June 1962. Dr. Spate's book has served as a constant companion during my travels as well as Dr. Chatterjee's short piece and it is' quite likely that some of their own words have crept into my writing unnoticed despite every wish to acknowledge each observation to its author. I am indebted to Dr. B. S. Minhas of the Planning Unit of the Indian Statistical Institute for a very useful discussion on Chapter II and particularly on the tasks that lie unaccomplished. Dr. Miss P. Sengupta, Map Officer and her staff kindly undertook to design the physiographic table and ex~cute the-maps.
My warmest personal thanks must go to my colleagues who processed and reprocessed, checked and rechecked all the statistics that 'were planned and designed and who enriched the final copy with useful suggestions, and to Shri-Prem Nariani, my Secretary, and Shri S. RRlagoplan who typed out a long and difficult manuscript. The brunt of the work fell on Shri O. P. Sharma and his team for whom Illothing seemed to be too biB a job. This book owes the most to their zeal and devotion. There is no greater pleasure for me than to acknowledge my debt particularly to :
Shri O. P. Sharma Shrl Mahal Singh Shri V. P. Kataria Shri D. N. Dixit Shri N. S. Bhatnagar Smt. Tripta Sarin Shri P. S. Sharma Shri D. S. Mehra Shri R.. P. Bhatnagal' Shri B. R. Kalra Shri.P. N. Baweja Shri N. S. Soam Shri V. A. Deshmukh Shri Hal' Gopal Saini
Nnw DELHI September 30, 1964
ASOK MITRA Registrar General India

INTRODuCTORY NOTE INDIA'S FIVE YEAR PLANS aim to level the local features which divide the country into natural regions and subregions that have so long sheltered an immense variety of cultural and economic organisation. Natural regions and subregions have in the past created much diversity and even exclusiveness in many spheres of India's life, thought and activity, to which the Plans now seek to give unity and cohesion.
India""'tsLbus at a most interesting stage of a dialectical process: the unity of social and economic planning at grips with a many-splendoured diversity of natural regj,Clns and subregions, economic situations, cultures, and to'ngues. The latter, enjoying a truly continental range, leaves room for more than one kind of classification.
What is attempted below is, first, a fresh classification of natural regions, subregions and divisions of India. This classification stClPS at the level of the administrative district even when a district like Dehra Dun, Madurai, Ganjam or Burdwan is composed of distin9t, mutually exclusive features, for it is''''both important and expedient to realize that at this level its diversity' is- s'ub-
ordinate to the compulsions of economic and administrative unity.
Second, to which the first provides a frame, a set of ad hoc indicators has been applied with the object of ranking the natural regions, subregions, divisions and districts by certain broad stages of social, cultural and economic achievement. This ranking will incidentally indicate which indicators generally constitute the strong and weak features of districts, divisions, natural subregions and regions.
Finally, on the strength of this ranking, a regrouping of districts has been made to bring into relief those areas which show greater affinity to each other in terms of social and economic development and in doing so are either isolated from their immediate neighbours or, ignoring the barriers of natural regions and subregions, form tracts of their own astride them. These tracts which form either small islands or continuous belts acmss natural regions and subregions will show the extent to which the twin process of economic development and cultural change is at work in any part of the country.


CHAPTERl
NATURAL REGIONS, SUBREGIONS AND DIVISIONS
Tins CLASSIFICATION differs in certain features from the one adopted in the Census of 1951. It gerierally agrees with the classification adopted in the National Atlas and tlie 'fortlicomlng India Gazetteer, although tlfele' are minor departures. As explained above, the· classification goes down to the level bf all administrative district, and no further; even' when a district betrays distiItet and mutually exclusive natural featur~, e~g., Midnapore or Dehra Dun.
The classification is laid down in Statement 1.1. In any classilication a balance has to be struck between too many and too few. The components should be numerous enough to throw real diversity into relief and yet not so prolix as to miss the wood for . 'the trees. For example, while in the details of discussion it 'has been mentioned how Jammu and Kashmir falls into four convenient parcels-Ladakh; the valley composed of Srinagar, Baramulla and Anantnag; the mountain districts of Doda, Poonch and Udhampur; and the foothill districts of Jammu and Kathua,-in the classification itself they have been combined into only one Division, Jammu and Kashmir. At the other extreme, however, single districts like Bastar or Q.angs have been given th~ distin¥uon of divisions by themselves, because it was felt lhat they stood. apart from their neighbours much too prominently to be ignored.
" The following are some of the areas.. in which the present classification has depaited from other classifications:
1. The Northern Plains have been considered as one Region right from Bikaner in
16S R.G.I.-~.
the West to the Brahmaputra and Surma Valleys in the East.
2. Uttar pradiesh-,The Jamun~-Ganga Doab of Uttar Pradesh has been split into two parts, the Upper and the Lower. Thd country north of the Ganga has been di~ded into four Divisions: Tarai or foothills; Rohilkhand; Oudh; and the Eastern Districts which are crisscrossed by the Gomati, the Tons, the Gha~a and the Rapti.
3. Separate divisions for North Bihar and South Bihar Plains.
4. Separate divisions for Darjeellng; J al· paiguri and Cooch Behar; Wes..t Dinajpur and Malda; Murshidabad, Nadia, Calcutta and 24-Parganas.
5. Hooghly, Howrah and MidnapotC have been placed under the Damodar Delta.
6. The Brahmaputra and Surma Valleys have been associated with the Northern Plains.
7. The Central Hills and Plateaus bve been considered to stretch from Sirohi in the West to the RajmahalHills (Santal Parganas) and Rarh (Birbhum, Burdwan and Bankura) in the Ea&t. Separate division~ within the same Subregions have been al· lotted for example to Delhi and Gurgaon obviously in deference to their political jurisdictions but it was considered desirable to divide Bundelkhand Subregion into Chambal Ravines (N. W. Madhya Pradesh), Trans Jamuna Alluvial Veneer and North Central Madhya Pradesh; Malwa into North Malwa Uplands and Malwa Plateau. Similarly the Vindhya Ranges and Plateaus have been divided into the

Vindhyas proper, Rewa Plateau (VindhyanScarp Lands) and Kaimur Vindhyachal (Mirzapur of U.P.). The Central Madhya Pradesh Plateau has been divided into Narmada Valley (Jabalpur, Narsimhapur and Hoshangabad), Western, Central and Eastern Satpuras, Baghelkhand Plateau, Chha:tiisgarh and Dandakaranya. The Orissa Hills and Upland districts have been diY1~rg ~to two divisions west and east of Mahanadi, while Dhanbad, Santal .. (j J
~~r~anas, Purulia and Rarh (Birbhum, ~urdwan and Bankura) have been c1assi-. )
fieq a~ ~eparate divisions.
''8. The Deccan has been divided -into four Subregions; Maharashtra Deccan, Andhra Deccan, Mysore Deccan and Tamilnad Hills and Uplands.. It is usual to re~d the fourth as a separate and independefitl.fdaibr~. J' Maharashtra Deccan has been splfiHnt<i the Divisions of Khandesh, Nasik Itdsil'l, ~idarbha, Mahakoshal, Marathawada, Western Ghats (Desb); Andhra D,ec,cm into Telengana and Rayalaseema;
2
Mysore Deccan into Inland Karnataka, Northern Maidan, Central Maidan, Malnad and Southern Maidan; Tamilnad Hills and Uplands into Nilgiri and Coimbatore Plateau.
9. Kathiawar has been split into two, Kanthadesh consisting of Banaskantha aJ'I9 Sabarkantha composed of the Aravalli put~ liets and the alluvial shelf and KathiawaE Dangs has been named as a separate division and so has Greater Bombay as QlhJl~ Basin. I have borrowed the :J{onkm'l Kerala Transition from O.H.K. ,Spate ~()
define a Subregion consisting of the Qo~ and the Karnataka Coast (North ~~ South Kanara). I have als.o s~arate~ ~~ Malabar districts from the former Travancore-Cochin ones.
10. In the Eastern Coastal Plain I have, broken the continuity of the coastIine"bYI incorporating Ganjam in the Northr Western Orissan' Hills and Plateaus.
• I {l
The districts of India, Sikkim and Bhutan stand classified as follows:
STATEMENT 1.1
Natural Regions, Subregions and Divisions of India
No. of Subregion Division districts District
2 3 4 5
1.l West Himalayas 1. t 1 Jammu and Kashmir 9 Ladakh. Srinagar, BarampJlcl' Anantnag, Doda, Poon. Udhampur, Jammu, Kathua: ".
Himalayas
,I
1.12 Himachal Pradesh 9 Chamba, Mandi, BilaSpui,' and Himalayan Sirmur. Kinnaur, Mahasu. Punjab Lahaul and Spiti .. Kangra.
Simla.
1.13 Himalayan Uttar S Uttar Kashi, Chamoli. Tekt Pradesh (Highland Garhwal. Garhwa1; DehIa Districts) Dun, Pithoragarh, Almora,.,
Naini Tal. ,.
1.2 East Himalayas 1 .21 Darjeeling-Sikkim 2 Darjeeling, Sikkim.
t .22 Bhutan-Assam 2 Bhutan, North-East Frontier Hitnalayas Agency.

3 STATEMENT 1.1
Natural Regions, Subregions and Divisions o/India-contd.
Region Subregion 1 2
1 Himalayas-concld. 1.3 North-Eastern Ranges
Division 3
1. 31 Assam Hills (Meghalaya)
No. of districts
4
Distri~
5 4 Vnited Khasi and Jaintia Hills,
United Mikir and North • GachJ»' Hills, Garo Hills, Mizo Hills.
1.32 North-Eastern Border 3 Nagaland (Kohima, Tuensang, Hills Mokokchung).
1.33
1.34
2 Northern Plains 2.1 Rajasthan Plain 2.11 Rajasthan Desert (Thar : Marwar)
2.12 Rajasthan Dry Area
2.2 Punjab Plains' 2.21 North Punjab Plain
2.22 Beas-Sutlej Doab (Bisht Doab)
2.23 East Punjab Plain
2.24 South Western Punjab (Hariana)
2.3 Uttar Pradesh 2.31 Upper Jamuna-Plains Ganga Doab
2.4 Bihar Plains
2.5 West Bengal Plains
2. '6 Assam Valleys
2.32 Lower Ganga-Jamuna Doab
2.33 Uttar Pradesh Tarai (Koshala)
2.34 Rohilkhand
2.350udh
2.36 East Uttar Pradesh
2.41 NorthBihar Plain' (Tirhut)
2.42 South Bihar Plain (Magadha)
2.51 North Bengal Plain (Duars)
2.52 Northern para Delta (Barind)
2.53 Ganga Delta
2.54 Damodar Delta
2.61 Brahmaputra Valley
2.62 Surma Valley
Manipur.
Tripura.
3 Bikaner, Jaisalmer, Jodhpur.
6 Ganganagar, Churn, Nagaur, Pali, Jalor, Barmer.
4 Gurdaspur, Amritsar, Kapurthala, Ferozepur.
3 Hoshiarpur, Jullundur, Ludhiana.
3 Ambala, Patiala, Kamal.
5 Bhatinda, Sangrur, Rohtak , Hissar, Mahendragarh.
5 Saharanpur, Muzaffarnagar, Meerut, Bulandshahr, Aligarh.
9 Mathura, Agra, Mainpuri, Btah, Farrukhabad, Etawah, Kanpur, Fatehpur, Allahabad.
8 pilibhit, Kheri, Sitapur. Bahraich, Gonda, Basti, Gorakhpur, Deoria.
6 ]3ijnor, Moradabad, Rampur, Bareilly, Budann, Shahjahanpur.
7 I:iardoi. Lucknow, Bara Banki, Unnao, Rae Bareli, Sultanp1!lr, Faizabad.
6 pratapgarh, Varanasi, Jaunpur, Ghazipur, Ballia, Azamgarh.
6 Saran, Champaran, Muzaffarpur, Darbhanga, Saharsa, Purnea.
5 shahabad, Gaya, Patna, Monghyr, Bhagalpur.
2 Jalpaiguri, Cooch Behar.
2 West Dinajpur, MaIda.
4 Murshidabad, Nadia, Calcutta. 1A--P?!ga~as.
3 I{oogbly, Howrah, Midnapore.
6 Ooalpara, Kamrup, Darrang, Nowgong, Sibsagar, Lakhimpur.
Cachar.

Region
1
4 STATEMENT 'VI
Natural Regions, Stloregions and Dipisions of India-contd.
Subregion Division
2 3
No .. of districts
4
District
5
3 Cotltral Hills and 3.1 Rajasthan Hills 3·11 Aravallis and Uplands 9 Jaipur, Tonk, Sawai Madbopur. Plateaus and Plateaus Bharatpur, Alwar, Sikar.
3.2 Bundelkhand
3.3 Malwa
3.4 Vindhya Ranges and Plateaus
3' 12 Delhi Ridges
3'13 Aravalli Outlier
3. 14 Rajasthan Hills (Mewar, Bagar)
3 .15 ~ast Rajasthan Hills
3·21 Chambal Ravines (North Western Madhya Pradesh)
3.22 Trans Jamuna Alluvial Veneer
3.23 North Central Madhya Pradesh
3.31 North Malwa Uplands
3·32 Malwa Plateau
3.41 Vindhyas
3.42 Rewa Plateau: Vin-dhyan ScarP Lands
3.43 Kaimur (Vindhyachal)
Bhilwara, Jbunjhunu. Ajmer.
Delhi.
Gurgaon.
4 Udaipur, Sirohi. Banswara. Dungarpur.
4 Chitorgarh, Ihalawar.
Kota, Bundi, ('
4 Morena, Bhind, Gwalior. Datia.
4 Jhansi, Banda.
Jalaun, Hamirpur,
2 Tikamgarh, Chhatarpur.
2 Shivpuri, Guna.
9 Rajgarh, Mandsaur, Shajapur, Ratlam, Ujjain, Dewas, Indore, Jhabua, Dhar.
5 Vidisha, Raisen, Sehore, Sagar, Damoh.
Panna, Satna, Rewa.
Mirzapur.
3.5 Central Madhya 3.51 Narmada Valley 3 Jabalpur, Narsimhapur. Hoshangabad. Pradesh Plateau
3.52 Western Satpuras 2 West Nimar, East Nimar. (SatPura-GawiIgarh Hills)
3· 53 Central Satpuras 3 Betul, Chhindwara, Seoni. (Gawilgarh-Mahadeo Hills)
3.54 Eastern Satpuras 2 Balaghat, Mandla. (Maikala Range)
3.55 Baghelkhand Plateau 3 Shahdol, Sidhi, Surguja.
3.56 Chhattisgarh 4 Durg, Raipur, Bilaspur, Raigarh.
3.57 Dandakaranya Bastar.
3' 6 Oris sa Hills and 3.61 North Western Hills 5 K\oraput, Kalahandl. Baudh· PIMeaus Khondmals, Bolangir, Ganjam.
3.62 North Eastern Hills 5 SambaJpur, Sundargarh. Keonjhat. Dhenkanal. Mayurbhanj.

~ S'Th.TENIENT '11 t
NatlU'al Regions, Subreg10fis and Divisioris 61 lndia-contd.
Subregion',
2
Divisiol1-No. of
districts District
5
3 Central Hills and 3.7 South BiharIDns 3.71 Chhota Nagpur Plateaus-conc/d. and Plateaus Plateau
3.72 Gondwana Trough
3.73 Rajmahal Hills
3.8 West Bengal 3.S1 Rancb1 Peneplains Uplands
4.1 Maharashtra Deccan
3.62 Rarh
4.11 Khandesh
4.12 NasikBaain
4.13 Vidarbha
4.14 Mahakoshal
4.15 Marathawada
4.16 Western Obats (DDsh)
.... 1 ADdhra Deccan 4.21 Telengana (Southern Deccan)
4.22 Rayalaseed1a
4.3 Mysore Deccan 4.31 Inland Karnataka
4.32 Southern Deccan Plateau (North Maidan)
4.33 Raichur-Bellary (Central Maidan)
4.34 S,?uth Maidan
us Ma1iJad
4.4 1'IIb&ad Hilk 4.41\ ~Igiri and Uplands
4.42 CoimliSatote Plateau (Kongunad)
5 The WestCoaat 5.1 Kutch and 5.11 Kutch PIaIIiB Kathiawar
5.12 Kanthadesh
5.13 Kathia'Yar
5.13A Diu
.5.2 Gujarat Plain 5.21 Oujarat Plain and Dangs
4 4 Palamau, Hazaribagb, Rancbi)
Singhbhum. '
1 Dhanbad.
Santal Parganas.
Purulia.
3 Birbhum, Burdwan, Bankura.
2 ];Ihulia, Jalgaon.
Nasik.
4 :Ouldllima~ Akola, Amravati, Yeotmal.
4 Nagp'ur, Wardha, BhandarI, qfanda.
5 Aurangabad, Parbhani, Bbir, . Nanded, Osmanabilll.
6 Poona, Satara, Sholapur, Sangli, Kolhapur, Ahmadnagar.
9 Adilabad, Nizamabad, Medale, Hyderabad, Mahbubnagar, Karimnagar, WarangaI, Khammam, NaIgonda.
4 Kurnool, Cuddapah,Anantapur, Chittoor.
2 Belgaum, Dharwar.
3 Bidar, Gulbarga, Bijapur.
2 Raiclrur, Bellary.
5 Chitradurp, 1'umkur, Ma1f4y.q I Bafigalore, Kolar.
5 Shimoga, Chikmagalur, Hassan, Coorg, Mysore.
NiIgiri.
4 North Arcot, Salem, Coimbatore. • Ml}durai.
1 Kutch.
2 l!anas~antha, Sabarkantha,
7 Mehsana, Surendranapr, Rajkot, Amreli, Jufiaga(fh, Bbavnagar, J~asar. ~
Diu.
'6 panc11malials, Atimlld4>ad • Kair.a. Ba{o~, BN~ Stprat.
STATEMENT. 1.1
Natural Regio~"'S, Subregions 'and Div~siohs bf1ndia.!...condd.
Region Subreii9.n._ 'Division No. of districts,
2
5' The _ W()st, Coast 5.2 Gujarat Plain 5,21A Daman . plains-concld. and Dangs-
6 '!ftii! East, COast i Plains" '
7 The Islands
concld. 5; 3 Konkan Coastal
Lowland
5.4 Konkan Kerala Transition
~.~»" tJca 5. 5 KeraIa COllstal
Plains ..... Western and Southern Ghats (South Sahyadri)
6. i Tamilnad Coas--tal Plain
6.2 Andjrra Coast
5.22 Dangs 5.31 NorthKonk4n
31A Dadra: and Nagar Haveli
5.32 Ulhas Basin 5.33 Kolaba·Ratnagiri 5.41 Coastal Karnataka
<;':!"h~
5.51 Malabar
5.51A Mahe
S . 52 Kerala Coastal Plain
6.11 Nagareoil Valle-y
6.1~ DrX South E~t. 6.13 Coromandel Coast
6.21 Andhra-Coastal Plain
6.21A yanam . 6.3 Orissa Coast 6. 31 Orissa cOastal
Plain
7.1 The Western i.1 The Western Islands Islaltds
7.2 The Ea\tern '1.:2 The Eastern Islands Islands
4
1 1
1 2 2
'> 3
6
2 7
7
3
D~an.
Dangs. Thana.
District:
5
Dadra and Nagar Haveli.
Greater ~ombay. Kolaba, Ratnagiri.
N~~th Ka~ara, So~~h_ !Calla[~y ~
'Car",_
Cannanore, Kozhikode, Paighat.
Mahe.
Trichur, -Ernakulam, Kottayam, Alleppey, Quilon, Trivandrum.
Kanyakumari.
Ramanathapuram, Tirunelveli. Thanjavur, Tiruchirapalli, South
Areot, Chingleput, Madras, Yondichbtry, Karaika!.
Nellore, Guntur, Krishna. West Godavari, East Godavari, Visakhapatnam, Srikakulam.
Yanam. Puri, Cuttack, Baiasore .
Laccadive, Minicoy Amindivi Islands.
and
Andaman and Nicobar Islands.
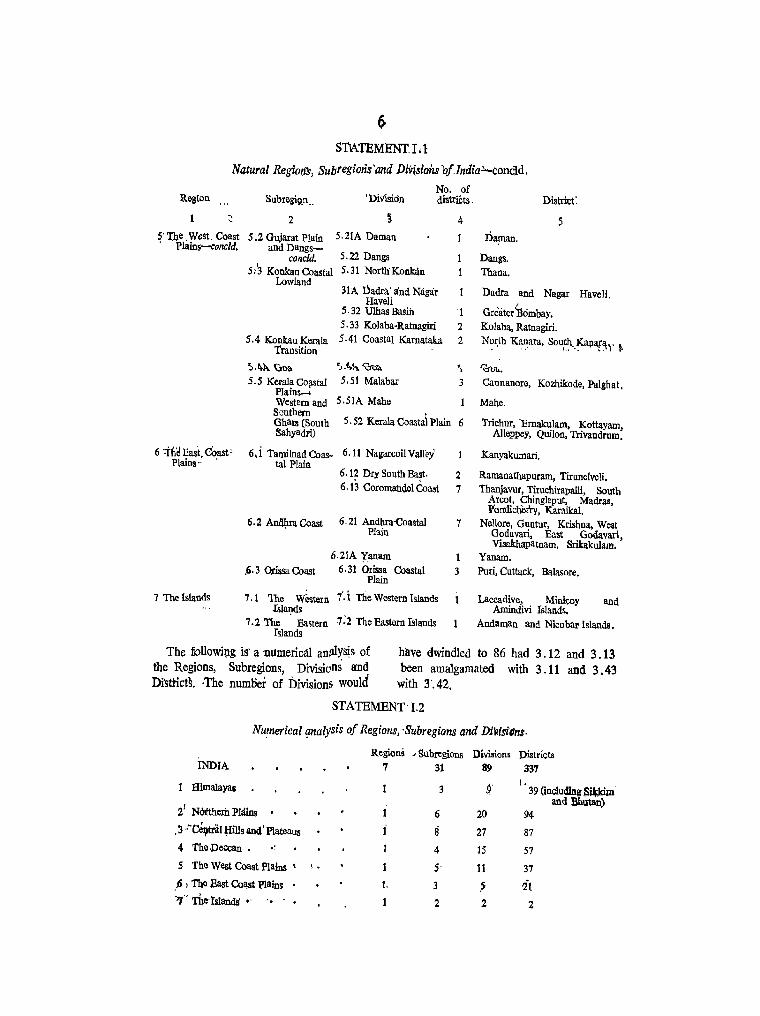
The fullowi{lg is' a 'numerical an!1lysis of the Regions, Subregions, Divisions and Di'Stticts. ·The numBer of Division5 would
h'ave dwindled to 86 had 3.12 and 3.13 been amalgamated with 3. 11 and 3.43
with 3'.42.
STATEMENT'I.2
Numerical analysis of Regions, 'Subregions and Dl\1.isiQ'ns. . -'
INDIA
Himalayas
21 N6tthern Plains
. 3 '~~triil lIills and I Plateaus
4 The.Deccan. .~
5 The West Coast Plains < ,.
,fJ , The East Coast, Plains ~" rbe-tslands' • - .•
Regions ... Subregions Divisions Districts 7 31 89 337
3
6
i 8 4
5'
3
2
9'
20
27
15
11
? 2
r. 39 (including Sikkim
and Bhutan) 94
87
57
37
il 2
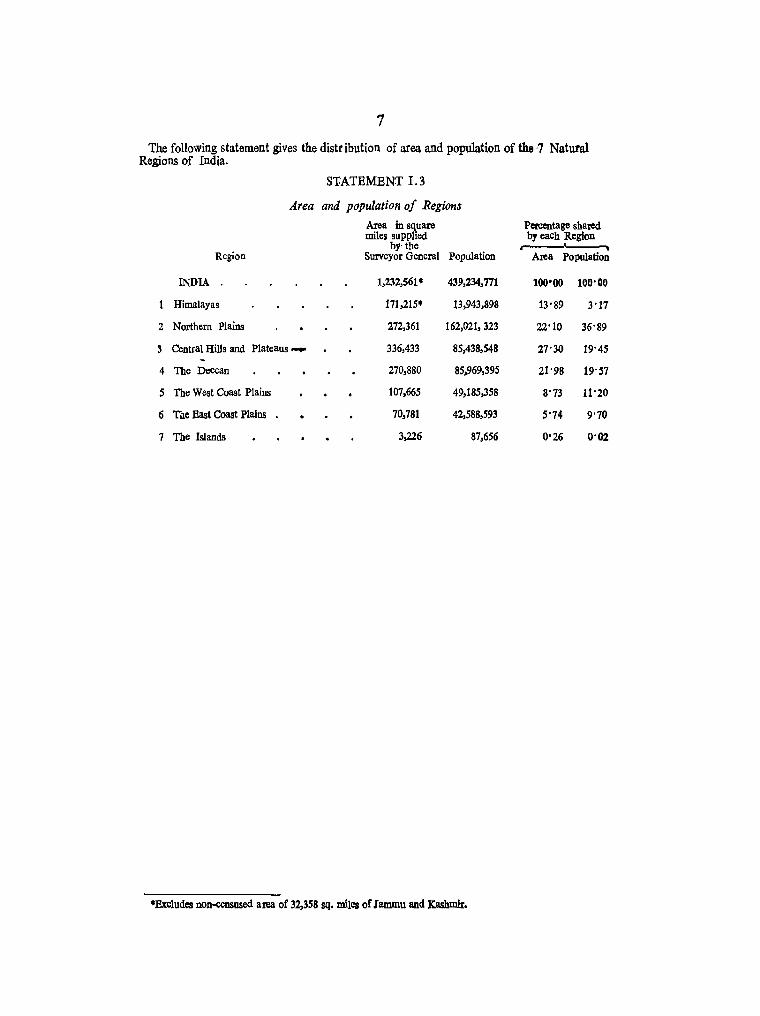
7
The following statement gives the distr ibution of area and population of the·7 Natural Regions of India,
STATEMENT 1.3
Area and population 0/ Regions
Area in square Percentage shared miles supplied
by' the by each Region
Region Surveyor General Population Area Population
INDIA 1,232,561· 439,234,771 100·00 100'00
Himalayas 171,215· 13,943,898 13'89 3'17
2 Northern Plains 272,361 162,021,323 22'10 36'89
3 Central Hills and Plateaus_ 336,433 85,438,548 27'30 19'45
4 The Deccan 270,880 85,969,395 21'98 19'57
5 The West Coast Plains 107,665 49,185,358 S'73 11'20
6 The Bast Coast Plains 70,781 42,588,593 5·74 9'70
7 The Islands 3,226 87,656 0·26 0'02
·Excludes non-censused area of 32,358 sq, miles of lammu and Kashmir.
A R A A N
II'
, 11 •. L ......
n ... ~~~~ ____________ ~~~ ____________ ~~~ ____________ ~J~ ____________ ~d~ ____________ ~Kr· __________ ~ ."GH~., I I I ~
G, INDIA NATURAL REGIONS, SUBREGIONS
AND DIVISIONS
IOUNOAAY. INlUNATIOtUo.L _. _ IOUHDAkY. STATE
IOUNOM, Y, DISTPJCT
ClASUIU UHE IN JAMMU l KASHHlk
"" 50 '01 ,. lOO
BAY
o F
BENGAL
NATURAL REGIONS, SUIIREGIONS AND DIVISIONS
-----CfNTIAL HIUS AND I"C.ATfAUS
~ THfDfCCAN
T .... G-o. C. It • .
THf WI!ST COAST I"LAINS
THf WT COAST I"LAINS
THE ISlAHDS
TfH~ GARHWAL CU1T.tI1fUDUH) GWAUOR (MADHYA P'aAOfSH) 1W'tMTtW.,A (I't.IHIAi)
CHrrQRGMtt (l4JA$THAH) HIMACHAl "'DfSH POI DlTAIU sa STATtMfHT L '
lOO
'"
U M A
n'

AIAIIAN
SEA
\ ,l. . ~.-
• • M . .. · • 'Ii
_0
1. \, : ~\
.\
INDIA CROP REGIONS SHOWING PROPORTIONATE DISTRIBUTION OF AREAS UNDER CROPS, 1958-59
1.0MAl. . .... . _
C£Asf-RIlE LINE IN jAI1HU. KASHr-u1l. . .•
Ie. 50 0
Kll"""",~ .. l '110
! : , '110 ...
BAY
OF
liEN GAL
'O·IUt ISaA80vt • • ••
... ! , ...
t:lISTI.ICT _____ _
lOll I1IUS
: , ....
U R M A
_ 5·1.\." ~ ...... SO,MOVE
COTTON 0 TlAANOCOfJ'EE D
GII.OUNOt<lUT 0 fOOOCIOtS
z
" o
H

,..
A R " A N
A
\ -\-1110 ·
_..s.~ _ .... " .... ..... ~ ,\. "_' Jo..t:)
_ '
.... ..sor
o .. n°
INDIA DISTRICT WISE DISTRIBUTION OF MAJOR
o
LANGUAGES
I I
i =~
"';;;f-. ' _ -'f.:
1961 tOVNOAAY. STA.TI _ o_o _
DIST1IJCT _____ _
lO'l~
ICO- I(QH't'AIC
"',""""" AH._
U R M A
....
_DEAU
~~~i ~+-+--+-I CHAHtAU
QIV ......
."""'/ """"'*"
• IHADMWMC ~ .... ~ v-r ...... CrMo ..._. ~I~ ... .........
o
priDwd b y Gu l .. bsoDIOlhet Works , New Delhi,
".
. "
,..

. u
,t
A R A
<
....
, A N
E A
.\, . '. ~l
0,\
\
INDIA DISTRIBUTION OF THREE DISTRICTWISE
NUMERICALLY STRONG SCHEDULED TRIBES,.I961
IOUNOA~Y J IHTtlNATIONAl _._ SOUNOA~Y,STATE
ZONAl. " OISTNCT ______ _
CEASl.ftU lINf ~ JAMMU • KASHHik
BAY
o F
BENGAL
AI\ST kANKING UIIlS
GOND
I Hl l
OMDN
MINA
"'UNO"
IlHONO
10"0.&0" 0 IVr.CHAII.I
KOl
c:J HO
r-I CONCENTM TlON Of L--J lklaeS OTHU , THAN "lOvt
MEANS Taite lISTto 41 WITH SUENGTH ABOyt 1,011,000
HEANS n.laE umo 74 WlTHSTUNGTH SO,OOO-I ,OO,OOO
MEANS n.11E USTtO" WITH SnENGTH lo,ollO ."','"
""CENTAGE flGUUS aENU TH nu AISOlUTl AGU~.EP.S INDICAn
nit DtSUICTW,SE P'E"CfNTAGE OF TAteM. POP'ULATlON TO 11-u, TOTAL POf'VlATtoN
U R M A
· II
· ,.
· 11
:
It
ARAI. Alii
• I A
,.
l\
IN.OIA PERCENT AGE OF MEMBERS OF
SCHEDULED CASTES to THE TOTAL POPULATION, 1961
BOUNDARY, INTERNATIONAL -.- aOUHDAAY, STATE.
IONAi. D'STRICT
'00 50
KILOMETRES 100 SO 0 100 100 SOO 400 SOO
BAY
o F
N
- 8 E NGAL
PERCfMTAGf
F"0l Ed
OTIIIJ ~ III
• D
10 " BELOW
1O.1-1!i.O
1!1.1- "'.0
fOl DfTAIlt sa: TMLI n. I . (IlOCk_IV)
NO SCHEDULED CAS1!S
• ,
i
JO'
tl'
10'
ARABIAN
SEA
,,'
II' \ '\ '. .. : . . .,. .e \\ : ~
t .\
!
INDIA PERCENTAGE F MEMBERS OF
SCHEDULED TRIBES TO THE TOTAL POPULATION, 1961
OtSTRJCT -- - --
M..OM£TREI 100 so 0 100 zoo 300 400 SOO
~ -~ - iii -.. - !IIIIlIlIII CJ
BAY
OF
BEN GAL
BELOW 5
5-2S ~C>
25- 4S ./ FOR Dl.TAILS $U T4&.1 lU
(aLoca- lV) 45-65 ..,/
ABOVE 65 v"
110 SCHEOULEO TIII£S
II.A .- OATA IIOT AVAilABLE
•
. ..
,;
oz·
;

z
' . \ ,... . . l .
A I A •
5 E A
\ .\ ..
• 4, .. ~
INDIA LEVELS OF DEVELO PMENT
1961 IOUNOA~Y • INTEP.NATlOHAl. _ _ ._ IOVNoAJl.Y,STA.TI ..... . •••• _ . _ __ o_._
ZONAL. O~ICT •••• • •••• _ __________ _
CEASE-flUlJNE IN JAMMU l !{ASH"," .. . _ ... ... .. _________ _
1001l.. .... "i=~-1III!!!~' .. ~-~""~~~.1OO~ HILES
KlLOHETUS 100 50 0 100 "" lOO .,. ...
-·1 .... . .,.. ....... _.
BAY
OF
N GAL
lEV£LS O f DEVELOPMENT
c=J fiRST OR l OWEST LEVEL
D $KONO LfVlL
D THlAD U VEL
• fOURTH Of. rnr UVll
D DATA HOT AVMMlf
fOA D£TAU SEE AI'PfNOIX XXI
BUM A
•
Gule.bsons Oflset Works, :-lew Delhi

"
II
A A A
SEA
IOUTH KANAAA
c
INDIA NUMBER OF WORKERS IN REGISTERED
FACTORIES ENGAGED IN FOODPROCESSING INDUSRIES
" ZONAL ' II DISTRICT _ _ __ _
CEASE-FIRE LINE IN J ... .,. .. u a KASHWIA. · · · ----
100 so 100 200 JOO MILII ....... ~~~~~ KILOWlTRE$ 100 SO 0 100 100 )00 .. soo
NUH8E R OF WOIIKERS
FIGUReS fNSfO£ THE C,RCl£J aHOW NuUH.R 0' RlGISTIAE.D FACTOR'"
V R M "
,,'
, "
,,'
...
,.
.'
....
A I I A N
$ A
\ '\', '. : , ',\
to
\\ t
,\
INDIA NUMBER OF WORKERS IN REGISTERED
FACTORIES PRODUCING SUGAR AND GUR
IOUNOMY, IN1UJ'.ATlONAl • . _.~ 1OUN000Y,STATE _ . __ . _
ClAS( . RlU UNE IH ~HU .. KASHHI~
HUMBfR OF WORKERS
BAY
o F
8ENGAL
10,000 AND """'.
4.900
1,'"
<400 ANO&El.OW
AGUltfS INSIDE THE CllI.ClfS 1N0fCA T£
THE NUHlEk Of P.fGISTEP.1O FACTcmfS
otSTPJC.T • _ ___ _
U R M A
Gul&bsons Offset Works, New Delhi.

"
· "
· "
· ..
· "
A R A
\ :\
." • 0
\. • 'J,
." '" ',-, ..
') . ..... . oJ'" .... '\ __ .r )
j
.. II' ,
91
INDIA OF WORKERS
, "
IN NUMBER
REGISTERED FACTORIES PRODUCING
AND HYDROGENATED OIL EDIBLE OIL IOUNDAkY, INTEP.NATlONAL .. _._ IOUNDAAY, STATE _._ . _
ZONAL MTIOCT _____ _
CEASE • AI\£ LINE IN JAMMU a !(ASHHI!'
U R M A
BAY
o BEN G A
NUMBER OF WORKERS
10,'" ANO ABOVE
..... "'" 400 ANDBE\.OW.
Ef,lIBLE Oil ·0 HYf,lROGENATED Oil
f IGU"ES II'mOE THE CI"ClES INOICATe
~t. ~f.'" Of J.ECts,TO.EO f"OOMES
..
'5 ~ \~~
• O. T' ... ct
"'"" o <I-o 0, ...
, "
l2
,.'
, ,.
,,'
s'

-....
,; . .' . ,.' .. ' .. " ,
" .. INDIA :z
< ; NUMBER OF WORKERS IN REGISTERED FACTORIES PRODUCING TEA, COFFEE, RUBBER AND RUBBER PRODUCTS
iCJU'U)MY, INTE.~NA1lONAl .. _._ IOUNDMY, \T ... TE Jl _._"_ . " ZONAL OIST~ICT _ ___ _ _
C' ClASE • fl~E UHE IN JAMMU a KASHH.L"
so '0> .. "" HllES
""-0.,,, ... '0> so 0 ,0> .. lOll ... "" .. ~
.." . It
• ~ ... ~
.. ~ ,
i i ..: \..". . ..,.
i \ lB U M A ". , ~"
~.l
",-•
a A Y
0 A I A a E N GA
A
. NUMIER Of WORKERS .. @--------- ,O.~O AND Ar.oV£
-------- .... 900
-------- 2.,500
----- ---- "'00 AND IILOW 4
TOA
\~< \ 0 ,,' RuellR CO'FEE
'\" • Os ~ ... .. : 0° ',\
,.,GURU INSIDE THE CIRCLES INDICATE ~~ \\' NUMBER 0' REGISTERED ,ACTORIU "'0, "!C
0
~ \ o q, ,< ... (} "
" • ..

° "
. Jl
..
..
.. 0
...
.. ~
z
~
,.. "I.
\ ,\ . "~: . . ~
.0
° .. .. 0
INDIA NUMBER OF WORKERS
FACTORIES ENGAGED (COTTON AND
IN REGISTERED
IN TEXTILES JUTE )
IOUNDMY,IHTtaNA'TK>HAL •. _._ IOUNDAP.Y. STATE _,_o_ ZONAL
DlSTAM:1' _____ _
CEASf • FIRE UNf IN JAHHU .. KASHHlfl
T I . .
J2
,.0
. "
BUR M A
GINNING It f'IlESSlNG .
conONMllLS
BAY
o BENGAL
HUMt.£I\ Of WORKEI\S
~_~=-_____ I60.000 AND ABOVE
~_~=--",.--___ 'lQ,OOO -IS9,'"
JUTE MilLS
o A.H. N-IH'C.O"''''D H. HOOGHlY
HOW liOWRAH
"
FIGUP.ES INSloe THE CUKlES INDICATE THE NUM&ei OF P.eGtmREO fACTORIE~
Gul .. bsODS Offset Works. New Delhi.
" c
•
A" A I A ", .
A
INDIA NUMBER OF WORKERS
IN MINING INDUSTRY
8OUNO",,,,'(,INTEII.NATlONAL _ . _ . _ BOUND""'Y,STATr:
't ZONAL 0tSTJJCT
C£ASf • FI"E UN! IN JAMMU' KASHM111. .
100 50 i KllOHma~ 0 "" ,t >t
B AY
o B EN G A
MUMIIBt OF WORKERS
DOlCH'"
FlGUkES INSIDE. THE OkCLlS INDICAn:
THE ...uMBO. OF P.EGISUP.ED FACTOfJU
, •
U M A
,;
, n
D'

.1 I. T
z
Ii
A R A B
SEA
"
r
~
II' \ , .. \ . " '9.: '
,,' II' ,,' ,.'
INDIA NUMBER OF WORKERS IN REGISTERED
FACTORIES PRODUCING CEMENT AND PAPER
BOUNDARY, INTERNATIONAL _._ BOUNDAPY,STATE
ZONAL
KILOMETRES 100 50 0
NUMBER OF WORKERS
o
BAV
OF
BEN GAL
FIGURES INSIDE THE CIRCLES INDIC.aTE
NUMBER OF A£GtSnllllD fACTORIES
DISTRICT ____ _
U R M A
,;
zo'
,.
'0
\ '\'. ' .. ,
• '.\ '\ • \\ I
.\
INDIA INDUSTRIAL LICENCES ISSUED BETWEEN JANUARY 1953 AND MARCH KIe1
UNDER THE INDUSTRlES(DEVElOPMENT AND REGULATION) ACT. CLASSiRED
BY MAJOR INDUSTRIAL GROUPS AND BY DISTRICT TO WHICH ISSUED.
If
"'. \'1. -·t ......
p • .,.. ......
M A
-----_ 0tlHICAU_ # CHII1ICAU IOOCUC'rS
\~d -~ m 'APIa AHO 'APIl fII.ODUCT$ _POODUCTS
R mm.r.
• GI.AU. c::DNCS ,,_, Gl'f'IIMP9IOOUCTf " ... _CIMINT » cf
~ ... ~ • LlATHOAND UATHI«. GOOPS
D tIOCIUAMC>UI ---
~." 0
~ 0.31
E
• . "
"
. lI-
, 10
.. ' ,,' .
«
....
(J)
~
'1"
ARA81AN
,.' IIJ' .. '
Iy
II' ,,' ;/
INDIA PATTERN OF GAl N OR LOSS OF VOTES IN EACH DISTRICT IN 1962 OVER 1957 OF THE CONGRESS AND ALL OTHER POLITICAL PARTIES COMBINED IN THE GENERAL ELECTIONS SUPERPOSED ON THE PATTERN OF LEVELS OF DEVELOPMENT, 1961
aOUNOAAY, INTER NAT IONAL _._ IOUHOARY,STATE
" ZONAL " OrSnUCT
CEASE-FIRE LIN E 'N ...IAli4""U & KAS .. n,U~ ..
'00 SO 100 ZOO 100 MILES
KILOMrTAES ,00 SO 0 ,00 ZOO SIlO 400 SIlO '" ..... ~ ...... ....,. ".) N .1 1 •
U R M A
8 A Y
o F
8 ENG· A L
GAIN AND LOSS OF VOTES 8Y CONGRESS ,
LEVELS OF DEVELOPMENT
ALL OTHER PARTIES IN 1962 OVER 1957
CJ cx:>NGIIGS (+) "'HER ....,.'E. (+) ~ 'ST. (LOWEST)
~Z_~----i~ ,..,.
"""'GRESS ( -) OTHER .... TI .. (+) ~ lRO.
CONGAE" (+) "'"ER .... TlES (-)~ 4TH. (HIGHEST)
AAEAS WHEM COHf'AII.A&lE FIGtJHS WE~E NOT AVAILABLE HAVE BEE~ lEfT tLANK
• ~
,,'
,.'
.,.'
",'
, 12
s'
Gula.bsODB Otfset Works. Ne" Delhi.
III
~. ,i . ... .. ,. ..... _.J.
/ "'~ '.
RABIAN
SEA
~ " \ .. :\ '.~:' . "\ \\ t
!I\ ~ 11. ~
,. /
INDIA GAIN OR LOSS IN VOTES POLLED IN GENERAL
ELECTIONS OF 1962 AS PERCENTAGE OF THOSE POLLED IN 1957 BY CONGRESS PARTY
&OUNOAttY,INTI.".TtONAL _. _ IOUNDAAY .. STATE
tONAL Ot$TA.1C. T
CIA. -".! LINE IN JA ..... U • KASHMIR
100 50 0 100 ZOO JOO "LEi
(LONE TRES 100)0 0 100 ZOO lOO 400 )00
N
U R M A
BAY
OF
BENGAL
PERCENTAGE GAIN OR LOSS IN VOTES POLLED BY CONGRESS PARTY IN 1962 OVER 1957.
GAIN LOSS
c=J CJ toO .. .ELOW .
LJ 5"01 10-00 ~ D 10"01 15"00 ~ CJ 15"01 2000 ~ D 20"01 .. ABOVE lim
AlEAS WHEltE COHPAAA8l£ AGU"ES WEltE NOT "~"ILA"-E H"VE MEN LEfT BLANK
D
.~ \ c! ~
°"T""Ci:
6 '-0
t;.."'q. ~it .. ",..J
"\ 0"'4
• a. ".

c
ARABIAN
SEA
INDIA GAIN OR LOSS IN VOTES POLL ED IN GENERAL ELECTIONS OF 1962 AS PERCENTAGE OF THOSE
POLLED IN 1957 BY ALL PARTIES (OTHER THAN CONGRESS) TAKEN TOGETHER
BOUNDARY, INTERNATIONAL.. . . _._ BOUNOARY. StATE _ . _ . _
ZONAL · " DISTRICT ____ _
CEA.SE"FIRE LINE. IN JAMMU ' KASHMIR ,
100 50
KIL.OM£TR E S laoSO 0
100 zoo JOO MILE S
lOa lOa JOO .fOO 500
BAY
o F
BENGAL
U R loA A
PEI\CENTAGE GAIN OR LOSS IN VOTES POLLED BY ALL PARTIES OTHER THAN CONGRESS
IN IP02 OVER IP57
GAIN LOSS
em S. OO & BELOW CJ .
§ 5. 01 10.00 ~ ~ 10· 01 15.00 ~ ~ 15.01 20. 00 ~
.~ 20.01 & ABOVE IWJ "REM WHEP.E COHPAAA&.E F1GUMS WE1\£ NOT AVAl\AeLE HAVE BEEN lEFT BlANK ,
GulabsonlOl1tet Works. ~e\\· Delhi.

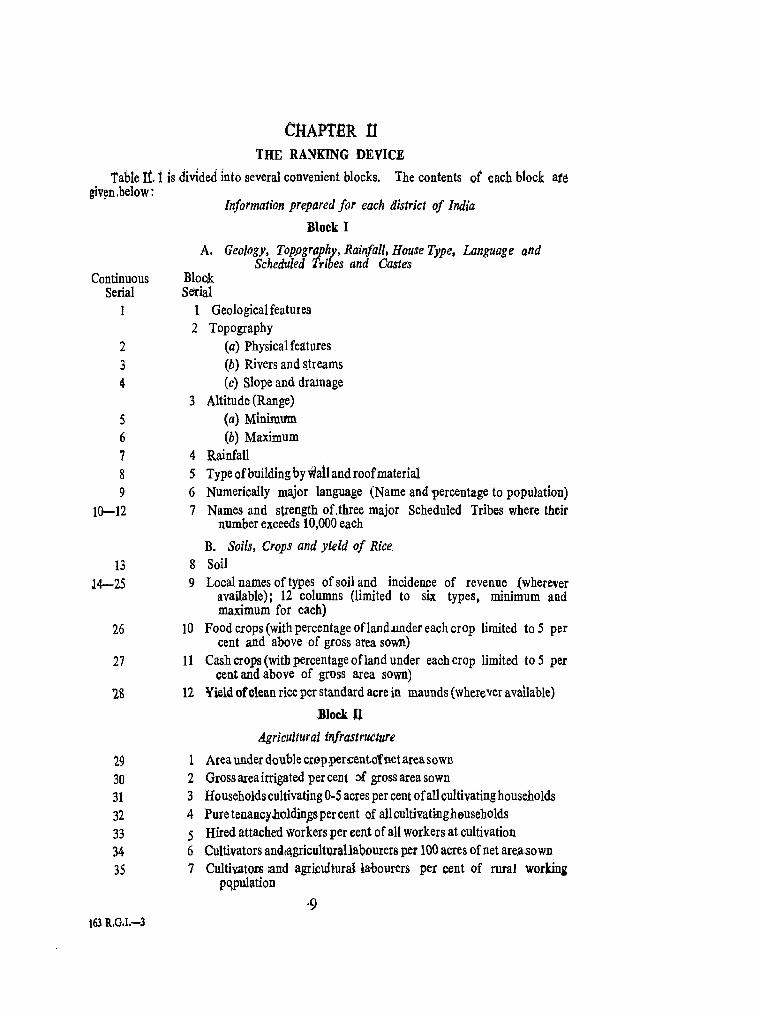
CHAPTER n THE RANKING DEVICE
Table it 1 is divicied into several convenient blocks. The contents of each block ate giv~n.below:
Continuous Serial
1
2 3 4
5 6 7 8 9
10-12
13 14-25
26
27
28
Information prepared for each district of India
Block I
A. Geology, Toppgraphy, Rainfall, House Type, Language and Scheduled 'tribes and Oaste's
Blocik Serial
1 <Jeologicalfeatures 2 Topography
(a) Physical features (b) Rivers and streams (c) Slope and drainage
3 Altitude (Range) (a) Minimum (b) Maximum
4 Rainfall 5 Type of building by wail and roofmaterial 6 Numerically major language (Name and 'Percentage to population) 7 Names and strength of.three major Scheduled Tribes where their
number exceeds 10,000 each
B. Soils, Crops and yield of Rice. 8 Soil 9 Local names of tylpes of soil and incidem:e of revenue (wherever
available); 12 columns (limited to siJr types, minimum and maximum for each)
10 Food crops (with percentage ofland.under each crop limited to 5 per cent and above of gross area sown)
11 Cash crops (with percentage ofland under each crop limited to 5 per cent and above of ~ss area sown)
12 Vield of clean rice per standard acre in maunds (where ver available)
,Block lJ Agricultural infrastructure
29 1 Area under doubJecr@p~r~nto'fnetareasown 30 2 Gross area irrigated percent :>f gross area sown 31 3 Households cultivating 0-5 acres per cent of all cultivating households 32 4 Pure tenanc;}' l101din~s,per cent of all cultivating households 33 5 Hired attached workers per eent of all workers at cultivation 34 6 Cultivators and~gricult\Jlallabourers per 100 acres of net are.asown 35 7 Cultiv.atQrs and agricu.hurallabourers per cent of rural workina
pqpuhltion
163 R.G.I.-3
10
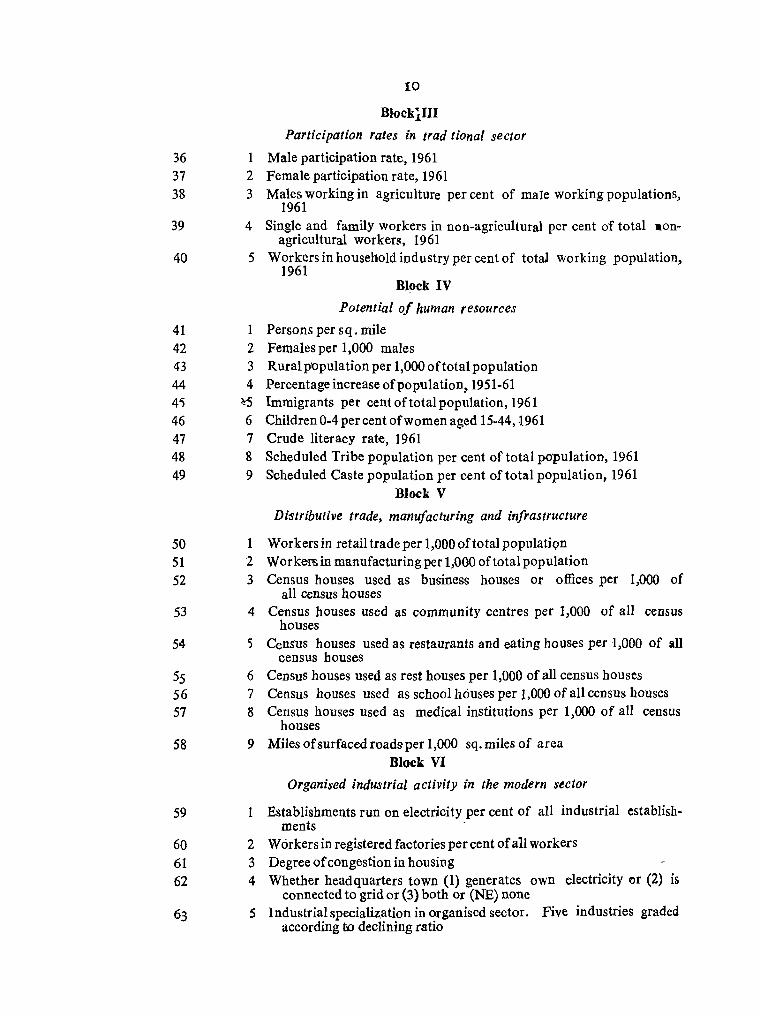
BlockllII
Participation rates in trad tionai sector
36 1 Male participation rate, 1961 37 2 Female participation rate, 1961 38 3 Males working in agriculture per cent of male working populations,
1961 39 4 Single and familY workers in non-agricultural per cent of total aon-
agricultural workers, 1961 40 5 Workers in housebold industry per cent of total working population,
1961 Block IV
Potential of human resources
41 1 Persons per sq. mile 42 2 Females per 1,000 males 43 3 Rural p'Opulation per 1,000 of total population 44 4 Percentage increase of population, 1951-61 4'5 ~5 Immigrants per cent of total population, 1961 46 6 Children 0-4 percent of women aged 15-44,-1961 47 7 Crude literacy rate, 1961 48 8 Scheduled Tribe population per cent of total papulation, 1961 49 9 Scheduled Caste population per cent of total population, 1961
Block V
Distributive trade, manufacturing and infrastructure
50 1 Workers in retail trade per 1,000 of total populatiQn 51 2 Wor kern in manufacturing per 1,000 of total population 52 3 Census houses used as business houses or offices per 1,000 of
all census houses 53 4 Census houses used as community centres per 1,000 of all census
houses 54 5 Census houses used as restaurants and eating houses per '1,000 of all
census houses 55 6 Census houses used as rest houses per 1,000 of all census houses 56 7 Census houses used as school houses per 1,000 of all census houses 57 8 Census houses used as medical institutions per 1,000 of all census
houses 58 9 Miles of surfaced roads per 1,000 sq. miles of area
59
60 61 62
Block VI
Organised industrial activity in the modern sector
1 Establishments run on electricity per cent of all industrial establish-ments
2 Workers in registered factories per cent of all workers 3 Degree of congestion in housing 4 Whether headquarters town (1) generates own electricity or (2) is
connected to grid or (3) both or (NE) none S Industrial specialization in organised sector. Five industries graded
according tp declining ratio

II
Briefly. therefore, the blocks bring out the following broad features
Block I • General ecology
Block II . Agricultural infrastructure
Block III
Block IV
. Participation rates with sp~cial reference to traditional economy
Potential of human resources
Block V
Block VI . Distributive trade manufacturing and infrastructure
Organised industry in the modern sector
The table thus seeks to bring into focus not only the dominant natural features but the essential .demographic picture in its relation both to the local social frame and th.e l~vel of economic activity.
The assumption behind this presentation is ,simple enough. I have proceeded on the premise that given a certain degree of agricultural and general infrastructure along wi~h a potential of human and other resources, there is bound to be a certain level of economic development and of organised ingustrial activity in the modern sector.
'At the outset it is important to point out that I do not pretend 'that' all the indices are either essential or the best that c::ould be chosen. On the contrary I was compelled to abandon certain more obvious and significant indices merely because they were difficult to collect with reference to a particular point of time. Not having yet devised a system of statistical weights I chose safety. in. a large number of indices. I believe it will.be :gossible in later exercises to weed out a number of indices by means of C9mponent analysis and replace some of the present ones by more significant ones. I consider this a' purely preliminary exercise which is going to print not so much for its own' worth but for the value of 'the data.
Block I. General ecology.
It.is now necessary briefly to explain the reason why each index was cho'sen. r The first 12 columns very obviously <bring together the composite ecological picture of each region! subregion and division: the
geological and topographical features, the rainfall, water supply, drainage, the type of building associated with each type of rainfall, terrain and crop, and the linguistic and ethnic composition. The next 16 columns (13-28) describe the nature of the soil mid the incidence of tevenue depending on the nature of the soil and an account of human endeavour and skill in qualitatively and quantitatively variegating the agricultural produce. Column 28 (yield of clean rice per standard acre in maunds wherever available) affords some measure of the qQ.ality of tillage and the efficiency of agricultural practices,. of inputs of various kinds and the maintained level of soil nutrients.
Block II. Agricultural infrastructure.
Col. 29. Area under double crop ppr cent of net area sown was regarded as a composite end-expression of effort in three directions: area, yield and cropping pattern and an. urge for cash crops.
Col. 30. Gross area irrigated per cent of gross area SOlVn was regarcted as on inpirect measure of total of inputs that go with irrigation, ,viz., better techniqu~, manures and fertilizers, seed and a higher level of farming activity 'and . the urge for cash crops.
Col. 31. Households cultivating 0-5 acres per cent of all cultivatir~g houseilOlds. This waS' expected ro provide an estimate of agriculture carried on primarjly by subsistence-oriented peasant households
and a measure of the built·in depressor in Indian agriculture.
Col. 32. Pure tenancy holdings per cent of all cultivating households was expected to provide a measure of the built-in depressor in Indian agriculture, the concentration of ownership and of control.
Col. 33. Hired attached workers per cent of all work{!rs at cultivation was intended to provide a measure of crop production for the market and of regional labour supply.
Col. 34. Cultivators and agricultural labourers per 100 acres of net area sown was intended as an index of pressure of family, free and unfree agricultural labour on the crop bearing soil.
Co1. 35. Cultivators and agricultural labourers per cent of rural working population was intended as a general index of the two major sectors, agriculture and non-agriculture.
Block III. Participation rates in traditional sector.
All the indices in this block were intend· ed as indices of the strength of traditional enterprise.
Block IV. Potential of human resources.
Col. 41. Persons per sq. mile. This is a generally recognised index.
Col. 42. Females per 1,000 males. A general index of migration.
Col. 43. Rural population per 1,000 of total population. An index or urbanization.
Col. 44. Perct!ntage increase of population 1951-61 intended as a composite index.
Col. 45. Immigrants per cent of total population 1961. A measure of the pull fal;tor operating in ccrtaiu art;as,
12
Col. 46. Children 0-4 per cent oft women aged 15-44. A rough index of the ability of the population to multiply.
Col. 47. Crude literacy rate, 1961. A r general index of cultural and techno. logical advance.
Col. 48-49. Scheduled tribe and scheduled caste population. An index of yet largely untapped human reserves.
Block V. Distributive trade, manufacturing and infrastructure.
Cols. 50-58. These are self-explanatory. It is possible that in later exercises I shall like to weed out some columns or replace them.
Block VI. Organised industrial activity in the modem sector.
Col. 59. Establishments run. on electricity per cent of all industrial es.tablishments. I have included all manufacturing, reo. pairing and servicing establishments that are run on electricity inclusive of sin~le person establishments on the groun_d that the use of electrieity itself means a clean break with the past, technological and industrial advance including adoption of new tools and scales of production.
Col. 60. Workers in registered factories per cent of all workers may be regarded' as a good index of modez:nization.
Col. 61. Degree of congestion in 1lopsing. A good general index of ecoI)omic activity in India.
Col. 62: Whether headquarters town (1) generates own electricit.y or (2). is con~ neeted to grid or (3} both, or (NE)
none. Connexion to grid is an important consideration and a firm qualitative index of future growth.
Co]. 63. Industrial specialization in orgallised sector. Five industries graded according to declining ratio. This i~ a qu®tative \UQ¥x.

The degree of reliability of the data varieS! not only from one item to an0ther but from one geographical area to another fOf any particular item. It is important to bear this in mind before one proceeds to apply refined calibrations which the traffic may not bear. FQr obvious reasons, therefore, it is wholesome and expedient to keep the ranking technique as simple as possible. The method is briefly described below.
I3
It was decided. to leave out of statistical use the data of block I as being largely descriptive and, qualitative. Thereafter for each column in blocks II to VI, ex~~t.. {~'>. t~~.,,~ {~'>. ~~~"'\'Wb <:R>~'!,~."ti<::>~ ~~<i
industrial pettem, the districts were arranged in~artiles in order of their observoo values. Each quartile was thereafter split as much as jlossible in two equal halves of values. (In some cases the marks (1 to 8 or 1 to 4) were directly related to the ascending values of a cell on the assumption that a high value reflected credit on a district while a low value sigrimed the reverse. In some others the eighths or fourths were inve~sely related to the value of a cell, a high eightli or fourth value being associated with a low actuai value of the cell concerned. This too was a matter of simple rules; e.g., eighth values and actual values were inversely related in the column devoted to household's cultivating 0-5 acres per 100 of cultivating households, but were directly related in the column devoted to gross area irrigated as percentage of gross area sown.· I have retained a positive grading of proportions of members of scheduled tribes and· castes according to their strength-high eighths for high ratio and vice versa-although there may be more than one opinion on the subject because there is nothing to dispute the long-term v~lue of this asset. Greater Bombay, Calcutta and Madras Corporation, which have no rural areas, have been placed as I
a matter of course in the highest level of development.
The' next step was.. to pool the < eighth. values obtained for all' the columns to-~ether by thIs process of ranking and ()btain their: total> score for leach, district. MlJ the districts, thereafter, were freshl),! tuTanged in quartiles in ascending order of their totar- scores. This rearrangemenli and: the position of each, district in terms ofits total score formed the basis of the final ianking_ in the fQUr levels of development I,resented in the next chapters.
I must. hasten. at this point to mention the obvioas shortcomings fiom. which this fechnique suffers. First" it oversimplifi~s {he scoring_ and loads the dice In . favour of those indicators which are positively ass()oo dated against those- others which are pegatively associated. Secondl:y, the assigning. of integer rank values to quantitative data split up into quartiles or ootiles and then adding up integer rank values. again for a large number of characteristics introduces an element of arbitrary. and SUbjective weighting, This may easily result in the accumulation "f small differences around the margins of qmp:tile. cla'Sses~ partieulatly in. the twilight zone.S. of octiles 2 and 3 and octiles. 6 and 7 ana distort' the true pictur-e of var.iability. Ideally, therefore, such an array of quantitative data should be subjected to analysis in search of principal components, first, to derive the implicit weiglUs, which one cannot really do without and, secondly, to reduce the number of effective characteristics. It is pFoposed to undertake sucn analyses in the near future and present the modified rankings in a later part of the General Report for 1961.
But the present device, too, has its points. While it possibly distorts tll~ scores at either end, the middle zones should be fairly dependable. Even in the terminal regions, as has been observed above, the distortions on account of marginal accumulations will be largecy limited to two sections: the ones oetween
octiles 2 and 3 and octiles 6 and 7. In the following chapters we shall examine whether thii technique seems to talk practical politics and helps demarcate areas and districts where human effort has or has not got the better of nature. It should also be able to put the finger on the strong and weak points in the life of each district.
In the chapters that follow I propose to apply several validity tests: (1) Whether values in agriculture (block II) and distributive trade, manufacturing and social and economic infrastructure (block V) are positively associated with values in organised industrial activity in the modem sector (block vn. Also the nature of association of participation rates in the traditional sector (block III) and that of potential of human resources (block IV) with blocks II, V and VI. The nature of this association is sought to be brought out by arranging the total score for each of the first four blocks into three groups: (i) Low or A in which the total score for the block is l~s than 20; (ii) Medium or B in which the total score for the block lies between 20 and 30; and (iii) High or C in which',the total score for the block exceeds 30. The fifth block is similarly arranged iIi .th~ee groups:
14
score for the block exceeds 10 .. Where aggregates of like ranks in one block are matched by aggregates of like ranks in another, the association is taken to be positive.
(2) Whether the pattern of shift of male participation rate from agriculture to non· agriculture is generally positively associat· ed with the levels of development as worked out by this ranking device.
(3) Whether the concentration of registered factories and organised industrial activity in the modern sector occurs in districts rank~ in the higher levels of development.
(4) Whether the districts ranked in the higher levels of development have been able to attract the bulk of new industrial licenses issued under the Industries (Development and Regulation) Act between 1953 and 1961.
None of these tests appears to have been applied before which offers itself as a reason for presenting this analysis, although I am only too mindful of the inadequacy of my treatment. As I have ex· plained above. I do not regard ·the methodology as anything but tentative, despite the fact that the results look encouraging. At the same time I think the data are too valuable and exciting to be denied to other research workers in this
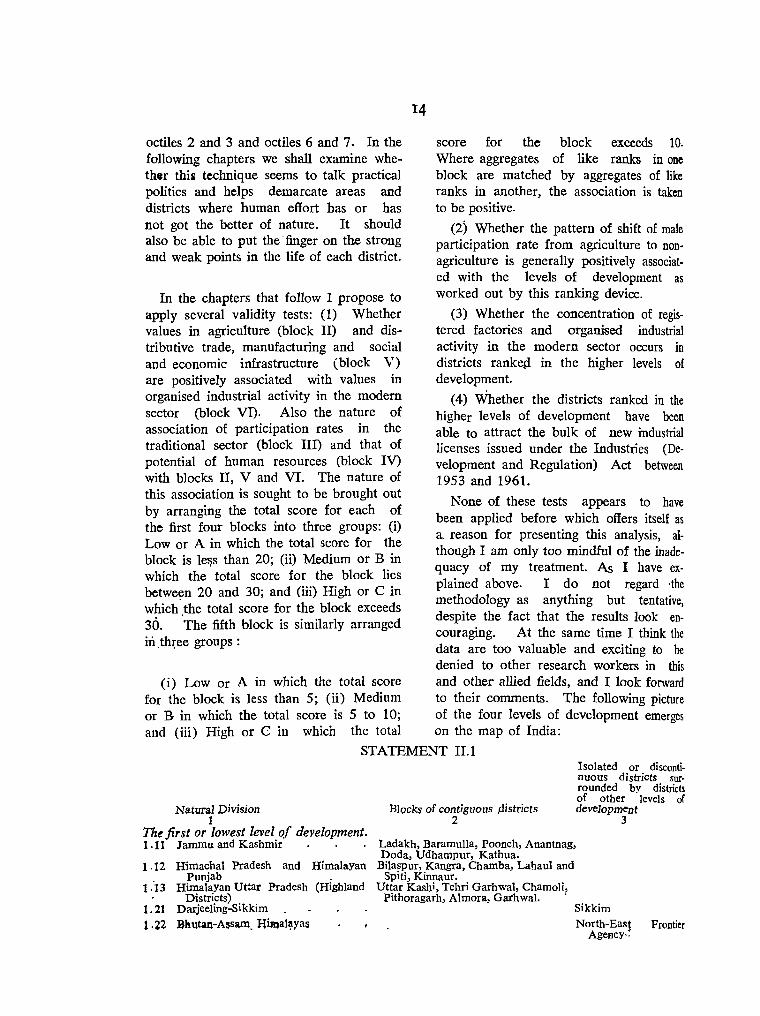
(i) Low or A in which the total score and other allied fields, and I look forward for the block is less than 5; (ii) Medium to their comments. The following picture or B- in which the total score is 5 to 10; of the four levels of development emerges and (iii) High or C in which the total on the map of India:
STATEMENT 11.1
Natural Division 1
The first or lowest level of development. 1.11 Jammu and Kashmir . . .
1.12
1 :13
1.21
1·22
Himachal Pradesh and HimalaYan Punjab .
Himalayan Uttar Pradesh (Highland Districts)
Darjeeling-Sikkim
Bkutan-ASsalll. HiJ\1ala:tyas
Blocks of contiguous pistricts 2
Isolated or disconti· nuous districts sur· rounded by districts of other . levels of development
3
Ladakh, Baramulla, Poonch, Anantnag, Doda, Udhampur, Kathua.
Bilaspur, Kangra, Chamba, Labaul and Spiti, Kinnaur.
Uttar Kashi , Tehri Garhwal, Chamoli, Pithoragarh, Almora, Garhwal. .
Sikkim North-Eas!
Age»cy·. Frontier
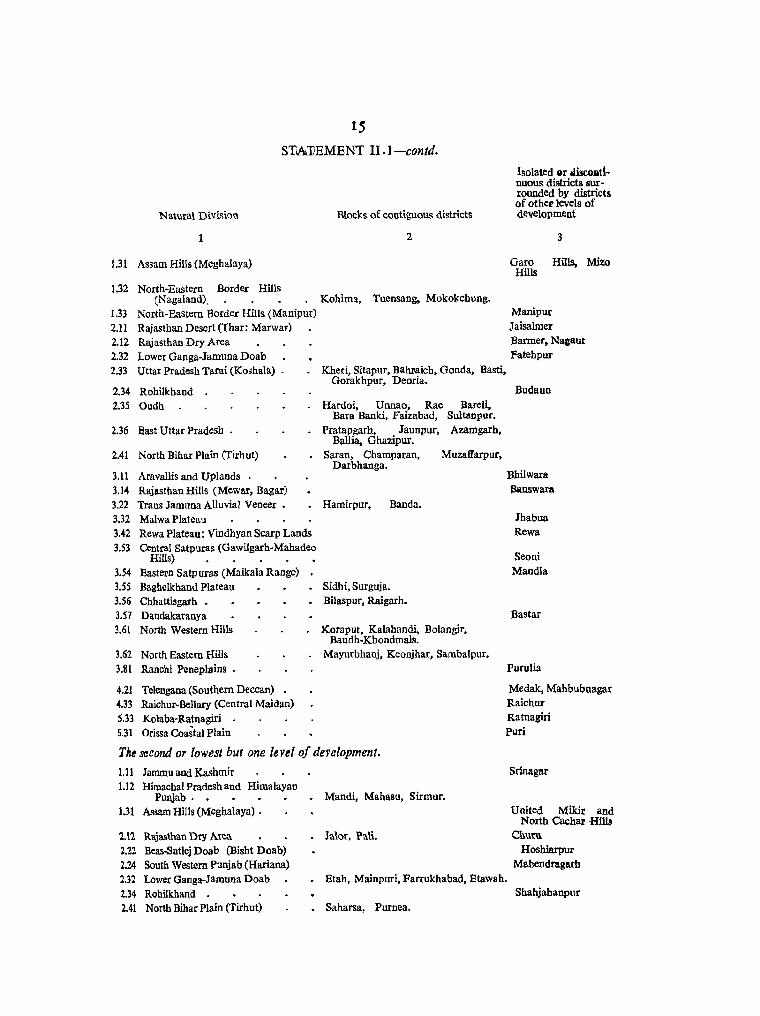
IS
STlA1mMENT II .I-contd.
Natutal Division Blocks of contiguous districts
1 2
1.31 Assam Hills (Meghalaya)
1.32 North-Eastern Border Hills (Nagaland). Kohima, Tuensang, Mokokchung.
1.33 2.11 2.12 2.32 2.33
North-Eastern Border Hills (Manipur) Rajasthan Desert (Thar: Marwar) Rajasthan Dry Area Lower Ganga-Jamuna Doab Uttar Pradesh Tarai (KoBhala) .
2.34 Rohilkhand 2.35 Oudh
2.36 East Uttar Pradesh
2.41 North Bihar Plain (Tirhut)
Aravallis and Uplands . Rajasthan Hills (Mewar, Bagar) Trans Jamuna Alluvial Veneer • Malwa Plateau
Kheri, Sitapur, Bahraich, Gonda, Basti, Gorakhpur, Deoria.
Hardoi, Unnao, Rae BareH, Bara Banki, Faizabad, Sultanpur.
Pratapgarh, Jaunpur, Azamgarh. Ballis, Ghazipur.
• Saran, Champaran, Darbhanga.
• Hamirpur, Banda.
Muzaffarpur,
3.11 3.14 3.22 3.32 3.42 3.53
Rewa Plateau: Vindhyan Scarp Lands Centra! Satpuras (Gawilgarb-Mabadeo
3.54 3.SS 3.S6 3.57 3.6!
Hills) Eastern Satpums (Maikala Range) Baghelkhand Plateau Chhattisgarh • Dandakaranya North Western Hills
3.62 North Eastern Hills 3.81 Ranchi Peneplains .
4.21 Telengana (Southern Deccan) 4.33 Raichur-Bellary (Central Maidan) 5.33 Kolaba-Ratnagiri .
Sidhi, Surguja. • Bilaspur, Raigarh.
Koraput, KaIahandi, Bolangir, Baudh-Khondmals.
Mayurbhanj, Keonjhar, Sambalpur.
Isolated er lliiscollttnuous districts surrounded by districts of other levels of development
3
Garo Hills, Mizo Hills
Manipur Jaisalmer Barmer, Nasaur fatehpur
Budaun
Bhilwara BanSWaIll
Jhabua Rewa
Seoni Mandla
aastar
Purulia
Medak,Mahbubnagar Raichur Ratnagiri
6.31 Orissa Coastal Plain Puri
The second or lowest but one level of development. 1.11 Jammu and Kashmir 1.12 Himachal Pradesh and Himalayan
Punjab. • 1.31 Assam Hills (Meghalaya) .
Mandi, Mahasu, Sirmur.
Srinagar
United Mikir and North Cachar -Hills
2. \l Rajasthan Dry Area lalor, Pan. Churu 1.22 Beas-Sutlej Doab (Bisht Doab) 2.24 South Western Punjab (Hariana) 2.32 Lower Ganga-Jamuna Doab 2.34 Rohilkhand • 2.41 North Bihar Plain (Tirhut)
• Etah, Mainpuri, Farrukhabad, Etawah.
• Saharsa, Purnea.
Hoshiarpur Mahendragarh
Shahjahanpur

16 STA;rE~T U .i-contd.
·Natural ::Division Blocks of oontiguous districts
I 2
2.42 South Bihar Wain (Magadha) Shahabad. Gaya. 2.51 North Bengal Plain (Duars) 1:62 Nottliern ParaJ)elta (Barind) Wl'St Dinajpur, Malda. 2.53 GangaD~1ta
2.54 Damodar Delta . 1. Wdnapore •. Baokura. 3;.82 Rarh ·f 2.61 Brahmaputra Valley 2.62 Surma Valley 3.11 ru"avdllis and 'Uplands . lliunjhunu. Sikar,
~awai Madhopur. Tonk,
3.14 Rajasthan Hills (Mewar, Bagar) U(ialpur. .Dungarpur.
3.15 East Rajasthan Hills
3.21 Chambal Ravines (North Western Madhya Pradesh) Morena, Bhind, Datia.
3.22 Trans .Tamuna Alluvial Veneer 3.23 North Central MaBhya Pradesh Titcamgarh. Chhatarpur. 3.31 North MaiwaUplands _ Sbivpuri. Guna. 3.32 Malwa:Plateau R~garh. Shajapur. 3.41 Vindhyas 3.42 Rewa Plateau:Windhyan Scarp Lands pgnna,8atna. 3.51 Narmada Nalley 3.52 Western Satpuras (Satpura-Gawilgarh
Hills) • . • • . 3.53 Central Satpuras (Gawilgarh·
Mahadeo Hills) . Betul. Chhindwara.
3.54 Eastern SatpUfas (Maikala Range) 3.55 BaghelkhandPlateau 3.56 Chhattisgarh . 3.61 North Western Hills 3.62 North Eastern Hills . 3.71 Chhota Nagpur Plateau 3.73 R.ajmahalHiHs 4.14 Mahakoshal . 4.15 Marathawada 4.16 Western Ghats.~J)esh) 4.21 Telengana (Southern Deccan)
4.22 Rayalaseema. 4.31 Inland Karnataka
4.32 Southern Deccan ,,(Nortlt Maidan)
4:34 !South Maitian ~ 5.12 Kanthadesh -S.21 GujaratPlain. 5.22 Da.qgs • 5.33 Kolaba-Ratnagiri 5.51 Malabar . 6.21 Andhra Coastal Plain 6.31 Orissa Coastal Plain
Plateau
• Pa1amau, Ranchi.
• B~andara. Chanda. pal'bhani, Bhir, Osmanabad.
Cllddapah. Chittoor.
• Bidar, Gulbarga, .Bijapur.
• sllilcakulam.'1Visakhapatnam. Balasore, Cuttack.
Isolated or discontinuous districts surrounded by districts of other levels of development
3 ·Monghyr CoochBehar
Murshidabacl
Goalpl\ra, Nowgonll Cachar
Chitorgarh. JhaJawar
Jalaun
Dhar Damoh
Narsimhapur
West Nimar
Balaghat Shahdol Raipur Ganjam Dhenkanal
Santal Parganas
Kolhapur Karimnagar, Nalgonda
Tumkur Banaskantha Panchmahals Dangs . Kolaba Palghat Nellore
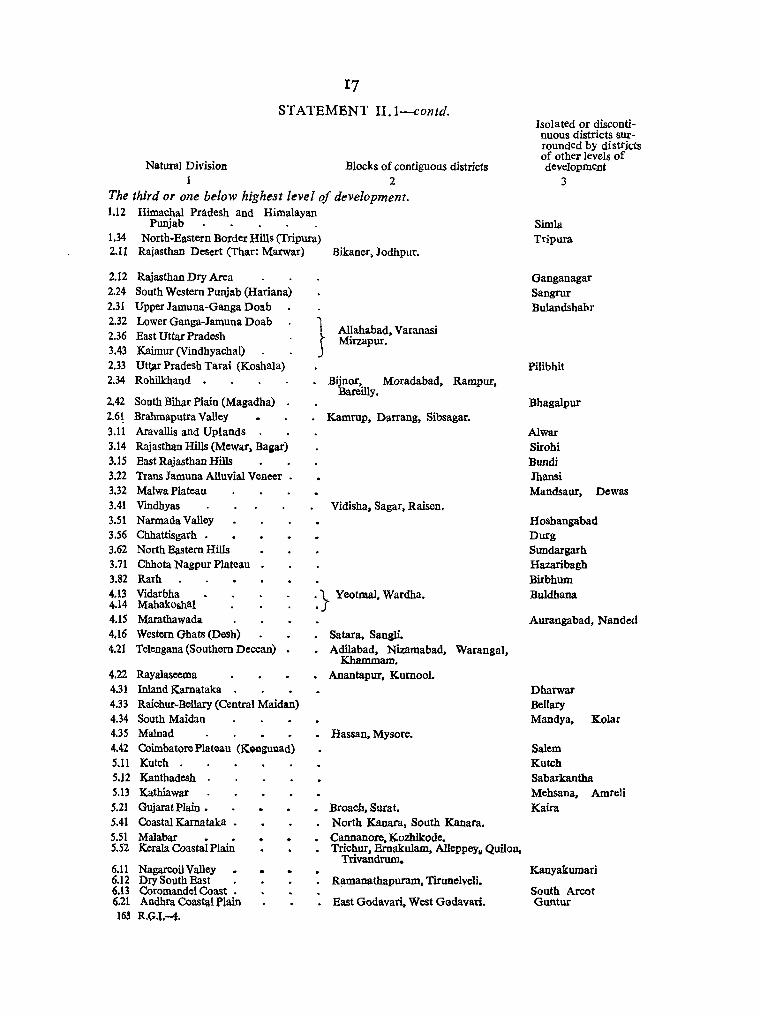
1.7
STATEMENT II.l-contd.
Natura] Division 1
Blocks of contiguous districts 2
The third or one below highest level of development. 1.12 Himachal Pradesh and Himalayan
Punjab 1.34 North-Eastern Border Hills (Tripura) 2.11 Rajasthan Desert (Thar: Marwar) Bikaner, Jodhpur.
2.12 2.24 2.31 2.32 2.36 3.43 2.33 2.34
2.42 2.61 3.11 3.14 3.15 3.22 3.32 3.41 3.S1 3.56 3.62 3.71 3.82 4.13 4.14 4.15 4.16 4.21
Rajasthan Dry Area South Western Punjab (Hariana) Upper Jamuna-Ganga Doab Lower Ganga-Jamuna Doab East Uttar Pradesh Kaimur (Vindhyachal) Ut~r Pradesh Tarai (Koshala) Rohilkhand . South Bihar Plain (Magadha) Brahmaputra Valley Aravallis and Uplands Rajasthan Hills (Mewar, Basar) East Rajasthan Hills Trans Jamuna Alluvial Veneer . Malwa Plateau Vmdhyas Narmada Valley Chhattisgarh • North Eastern Hills Chhota Nagpur Plateau Rarh Vidarbha Mahakoshal Marathawada Western Ghats (Desh) Telengana (Southern Deccan) .
1 Allahabad, Varanasi J Mirzapur.
Bijnor, Moradabad, Rampur, Bareilly.
Kamrup, Darrang, Sibsagar.
Vidisha. Sagar. Raisen.
'.} Yeot1lllal, Wardha.
• Satara, Sangli. • Adilabad, Nizamabad, Waranga),
Khammam. 4.22 Rayalaseema • Anantapur. Kumool. 4.31 Inland Karnataka 4.33 Raichur-Bellary (Central Maidan) 4.34 South Maidan 4.35 Malnad • Hassan, Mysore. 4.42 Coimbatore Plateau (KOllgUUad) S.11 Kutch . 5.12 Kanthadesh . 5.13 Kathiawar S.21 Gujarat Plain • SAl Coastal Karnataka • 5.51 Malabar • • 5.52 Kerala Coastal Plain
6.11 Nagarcoil Valley 6.12 Dry South East • 6.13 Coromandel Coast • 6.21 Andhra Coastal Plain 163 R.O.J.-f.
• Broach, Surat. North Kanara, South Kanara.
• Cannanore. Kozhikode. Trichur. Ernakulam, Alleppey. Quilon.
Trivandrum.
RiUDanathapuram, Tirunelveli.
East Godavari, West Godavari.
Isolated or discontinuous districts surrounded by districts of other levels of development
3
Simla Tripura
Ganganagar Sangrur Bulandshabr
Pilibhit
Bhagalpur
Alwar Sirohi Bundi Jhansi Mandsaur, Dewas
Hoshangabad Durg Sundargarb Hazaribagb Birbhum Buldhana
Aurangabad, Nanded
Dharwar BeIlary Mandya. Kolar
Salem Kutch Sabarkantha Mehsana, Kaira
Amreli
Kanyakumari
South Areot Guntur

18 STATEMENT II. I-concld.
Natural Division 1
Blocks of contiguous districts 2
Isolated or discontinuous districts surrounded by district of other levels o( development
3
The fourth or highest level of development. 1.11 Jammu and Kashmir Jammu 1.13 Himalayan Uttar Pradesh (Highland
Districts) . 1.21 Darjeeling-Sikkim • 1.31 Assam Hills (Meghalaya)
2.21 Nor.th Punjab Plain
2.22 Beas-Sutlej Doab (Bisht Doab). 2.23 East Punjab Plain . 2.24 South Western Punjab (Hariana) 2.31 Upper Jamuna-Ganga Doab
2.32 Lower Ganga-Jamuna Doab 2.35 Oudh 2.42 South Bihar Plain (Magadlia) 2.51 North Bengal Plain (Duars) 2.53 Ganga Delta. 2.54 Damodar Delta 2.61 Brahmaputra Valley 3.11 Aravallis and Uplands 3.12 DelhiRidges . 3.13 Aravalli Outlier 3.15 East Rajasthan Hills 3.21 Chambal Ravines (N.W. Madhya
Pradesh) 3.32 Malwa Plateau 3.41 Vindhyas 3.51 Narmada Valley
Gurdaspur, Amritsar, Kapurthala, Ferozepur.
Jullunduf, Ludhiana. Ambala~ Patiala, Kamal. Bhatinda, Hissar, Rohtak.
Debra DUl1, Naai Tal Darjeeling United Khasi and
Jaintia H!lls
Saharanpur, Muzaffarnagar, Aligarh Meerut.
Mathura, Agra. Kanpur
Nadia, 24-Parganas. Hooghly, Howrah.
JaipUF. Ajmer.
} Delhi, Gurgaon. -
Ratlam, Ujjain. Indore.·
Lucknow Patna -Jalpaisuri
Lakhirpp]lT oBharatpur
'K_ota
Gwalior
Sehore Jabalpur
3.52 Western Satpuras (Satpura-Gawilgarh Hills)
3.71 Chhota Nagpur Plateau "
3.72 Gondwana Trough. 3.82 Rarh 4.11 Khandesh 4.12 NasikBasin 4.13 Vidarbha 4.14 Mahakoshal 4.16 Western Ghats (Desh) 4.21 Telengana (Southern Deccan) 4.34 South Maidaii
4:35 Malriad. 4.41 Nilgiri 4.42 Coimbatore Plateau (Konguriad) 5.13 Kathiawar . • . .
5.21 Gujarat Plain 5.31 North Konkan . 5.52 Kerala C6asfa1 Plain 6.13 Coromandel Coast . (j.2t Aiidllra tOl\_stal Plliin 0'.
Dhulia, Jalgaon.
Akola,. Amrayati.
Ahmadnagar, Poona, Sh~lapur.
East-Nimar Singhbhum Dhanbad Bui-dwan
Nasik
Nagpur
-Hyderabad -Chitradurga"
Bangalore-S\1i!l1og~,. Cl}ikrnagalur. • .coorg .
Nilgiri (;:oimbatore, Madurai. North Arcof Bha,vnagar, Surendranagar,. Rajk'Ot, •
Jam~agar;,Junagadh. •
Tiiuchlrapalli, Th~njavur.
Ahmedabad, Baroda Thana Kottayam Chingleput KrfshnJl.

The clusters in -each level of development are extremely interesting, particularly in the third and fourth levels where they are more agglomerated than in the first and second and testify to the unmistakable spread effects which will be evident later on in this chapter. Of particular significance are the isolated districts. These isolated districts amount to a total of 127, of which 23 are in the first level, 36 in the second level, 34 each in the third and fourth levels. A phenomenon of the greatest importance is the isolated districts in the third level with the exception of Tripura and Bhagalpur, which are all either on the fringe of the districts of the fourth or top level or are new active centres of industry themselves like Durg and Sundargarh. Of the isolated districts in the fourth level, Jammu, Naini Tal, United Khasi and Jaintia Hills, Kanpur, Lucknow, Kota, Jabalpur, Patna, Lakhimpur, Singhbhum, Hyderabad, Coorg and Bangalore derive their importance either for very strategic or historic or geographi-
19 cal reasons while Kottayam and Krishna are each on the fringe of districts of the third level, apart from what they have developed themselves-
The districts in the 4 levels of development are arranged State by State in Appendjx X.XII at the end of this Chapter.
Despite the fact that all indices have been given equal weight, the association between the different blocks are so high that several features stand out hard and clear.
Let us, for instance, consider urbarl population. The two statements below give (1) percentage distribution of total population and (2) percentage distribution of urban population in the sum of all districts placed in each level of development. The statement on urban population yields a clear picture of concentration of urban population in the upper levels of development.
STATEMENT II.2
Fercentage distribution of total popUlation among levels of development zn each State
Level of development
State .,...
Total Bottom Second Third Top 1 2 3 4 5 6
INDIA - 100-00 19'66 25'02 24·60 30'72 Andhra Pradesh. 100-00 7'83 36'46 44'21 11'50 Assam 100·00 4'83 37-17 40-94 17·06 Bihar 100'00 32'55 45·35 8'84 13'26 Gujarat. . _ 100-00 12'30 45·04 42'66 J aIllll1u and Kashmir_ 100-00 67'50 17'98 14'52 Kerala 100-00 10-51 79'24 10-25 Madhya Pradesh 100'00 25'77 41'27 16'68 16'28 Madras 100'00 38'59 61·41 Maharashtra 100·00 4'62 22'37 20'39 52·62 Mysore 100'00 4'67 29'99 41-87 23·47 Orissa 100·00 53'64 42-04 4'32 Punjab 100·00 5'33 8'77 7-57 78·jS Rajasthan 100-00 15'21 40'01 20'58 24'20 Uttar Pradesh 100'00 50'12 9'16 1.0'11- 20-60 West Bengal . . 100-00 3·90 33'96 4'14 58·00 Andaman and Nicobar Islands 100_00 100_00 Delhi - _ 100-00 10d·oo Himachal Pradesh 100·00 30'37 69'63 Manipur 100-00 100'00 Tripura - _ _ _ 100'00 100'00 North-East Frontier Agency 100-00 100·00 Nagaland. . . . 100'00 100·00 SlICKlM . ·100'00 100'00

~
ST ATEMENT 11.3
Percentage distribution of urban population arranged for each State by the development of the districts
Level of development
State Total Bottom Second Third
1 2 3 4 5
INDIA. 100'00 5·86 13'79 23'29 Andhra Pradesh 100·00 4·06 23·89 43·83 Assam 100·00 2'54 31·04 37·95 Bihar 100'00 17'24 39·01 9-91 Gujarat. . . 100-00 4'24 31·95 Jammu and Kashmir. 100·00 28'73 49-73 Kerala 100-00 6'73 86·79 Madhya Pradesh 100-00 9'64 28-18 18-34 Madras 100-00 29·00 Maharashtra 100'00 1'32 9'57 10·64 Mysore 100·00 3'05 21'22 38-89 Orissa 100·00 42'40 45· 37· 12·23 Punjab 100·00 1-06 4·87 7-22 Rajasthan 100'00 7'99 31·59 24-40 Uttar Pradesh 100·00 18'55 t 7' 44 29·64 West Bengal 100-00 1-08 10·22 1-18 Andaman and Nicobar fslands 100.00 Delhi 100'00 --Himachal Pradesh 100-00 25-59 74'41 Manipur . 100'00 100'00 Trjpura . 100'00
100'00 100·00
Nagaland. 100,00 SIKKIM . 100,00 100'00
The following statement underlines the Class I Cities and Town Groups feature brought out above in respect of tion above 100,000).
STATEMENT 11.4
Percentage distribution of population in Class I Cities, and Town Groups arranged for each State by the level of development of the districts to
which they respectively belong
State
INDIA •
Andhra Pradesh Assam Bihar - . _ Gujarat, _ _ Jammu and Kashmir. Kerala . . Mahdhya Pradesh Madras . MaharashtraJ Mysore Orissa Punjab Rajasthan Uttar Prader h West Bengal Delhi
Level of development
Total Bottom
2 3
100'00
100,00 100,00 100,00 100·00 100-00 100·00 100-00 100·00 100'00 100-00 100-00 100-00 100-00 100-00 100,00 100,00
1'03
12'57
3'49
Second
4
5'30
10'79 ..
25·97
74'17
7-74
2,67 6'75
100,00
8'95 2·28 3·05
Third
5
16·67
30-08 49-58 8'52
12'46
100-00 13-16 18-10 1-75
37-71
30-24 34'70
level oJ
Top
6
57'06 28'22 28'47 33-84 63'SI 21· 54'1 6-48/
43084 71·00 78-47 36'S4
86- S5 36·02 44-37 87-52
100_00 100'00
(popula-
Top
6
77'00
59'13 50'42 52-94 87'54 25-83
79'10 81-90 95'58 55'54
100'00 60'S1 59'53 96'95
100'00
Even more eloquent is the following ~tatement of the distribution of registered
factories and persolls employed in registered factories by States in 1961.

~l
STATEMENT II.S
Di:ttribution of registered factories for each State by the level of deV'elopment of the districts to which they respectively belong
Level of development
,..------Total Bottom Second Third Top
~ ---. .... -~ Stat. No. Work.,.. No. Workers No. Worketl No. workers No· Worker.
2 3 4 5 6 7 8 9 10 11
INDIA 49,960 3,915,131 2,284 116,787 7,249 278,578 11,947 844,524 28,480 2,675,242 Andhra Pradesh 4,918 223,371 140 2,142 1,210 35,517 2,645 145,253 923 40,459 Assam 1,241 80,047 2 34 299 13.825 557 32,591 383 33,597 Bibar 6,133 209,290 961 27,871 2,667 55,641 744 26,669 1,761 99,109 <luiarat 3,840 360,528 i·· 84 5,731 1,526 95,133 2,230 259,664 lalllmQ and Kashmir 139 10,964 21 1,317 80 7,178 38 2.469 Kerala 2,412 252,961 215 11.551 1,968 224,569 229 16.841 Mldllya Pradesh 1,928 155.564 222 10,387 612 29,550 328 23.749 766 91.878 Madras 5,587 300,387 1,617 70,804 3,970 229,583 Maharashtra 8,233 787,379 36 1,779 70S 25,768 . 450 40,514 7,042 719,318 Mysorc 2,406 219,298 152 6.244 464 25,768 982 85,114 808 102,172 Orissa 488 47,739 227 ll,241 241 16,800 20 19,698 PllIliab 3,468 127,018 14 396 86 6,347 62 3.286 3.306 116.989 Rajastban 914 57,507 99 4,316 159 8.992 308 14,859 348 29,340 Uttar Pradesh • 2,751 298,174 312 47,933 173 10,536 604 55,348 1,662 184,357 West Beneal • Andaman lind Nirobar
4,307 719,793 60 2,812 230 23,507 74 s.o40 3,943 688.434
Island! II 1,882 11 1.882 Deihl 1.060 59,150 1,060 59.150 Himachal_Pradosh • 28 2,063 4 196 24 1,867 Manipur 34 119 34 119 TrIpOlI 62 1,897 62 1,897
The following two statements give the factories into four levels of development percentage distribution of registered in each State.
STATEMENT U.6 Percentage distribution of registered factories into four levels of
development in each State.
Level of development '""\
State Total Bottom Second Third Top
1 2 3 4 5 6
INDIA • 100'00 4'57 14'51 23'92 57'00 Andhra Pradesh 100·00 2'85 24'60 53'78 18·77 Assam 100·00 0·16 24'10 44·88 30'86 Bihar 100·00 15·67 43'49 12'13 28'71 Gujarat 100'00
15:i1 2'19 39·74 58·07
Jammu and Ka~hmir. 100·00 57'55 27'34 Kerala 100·00
11:52 8'91 81'59 9'50
Madhya Pradesh 100·00 31'74 17·01 39'73 Madras 100'00 28'94 71·06 Maharashtra 100'00 0'44 8·56 5'47 85'53 Mysore 100'00 6'32 19'29 40·81 33'58 Orissa 100·00 46'52 49'38 4'10 Punjab 100'00 0'40 2'48 1·79 95'33 Rajasthan 100·00 10'83 17'40 33'70 38'07 Uttar Pradesh 100'00 11'34 6·29 21'96 60'41 West Bengal . 100-00 1'39 5'34 1·72 91'55 Andaman and Nicobar Islands . 100.00 100.00 Delhi 100·00 100·00 Himachal Pradesh 100'00 14'29 85,71 Manipur 100·00 100'00 Tripura 100·00 100·00

22
STATEMENT II. 7
Percentage distribution o/workers in registered/actories/or eat;h 8.«(lte by the level of development 0/ the districts to which they respectively belong
Level of development
State r-'------------------~~--------------------. Total Bottom Second Third Top
INDIA
Andhra Pradesh
Assam.
Bihar
Gujarat
Jammu and Kashmir
Kerala
Madhya Pradesh
Madras
Maharashtra
Mysore
Orissa
Punjab
Rajasthan
Uttar Pradesh
West Bengal _
Andaman and Nieobar Islands
Delhi
Himachal Pradesh.,
2
100'00
100'0:1
100'00
100'00
100'00
100'00
100 '00
100'00
100'00
100'00
100'00
100'00
100-00
100'00
100'00
100'00
100.00
100'00
100'00
Manipur 100 '00
Tripura 100 '00
Even in the mattef of industrial est~blishments, run on electricity, which includes even single person establishments,
3 4
2'98 7'12
0'96 15-90
0'04 17'27
26'59
I-59
12'01 65'47
4,57
6'68 18-99
0'23 3'27
11'75
23'55 35'19
0-31 5'00
7'50 15'64
16'08 3'53
0'39 3'27
9'50 90'50
100-00
5
21-58
65'03
40-72
12-74
26'39
88'77
15'27
23'57
5'14
38'81
41'26
2'59
25,84
0'70
100-00
6
68'32
18'11
41'97
47'35
72'02
22'52
6'66
59-Of
76'43
91'36
46'59
92-10
51'02
61'83
95-64
100'00
100'00
the concentration in the top levels is remarkable as will appear from the two statements given on pages 23 and 24.
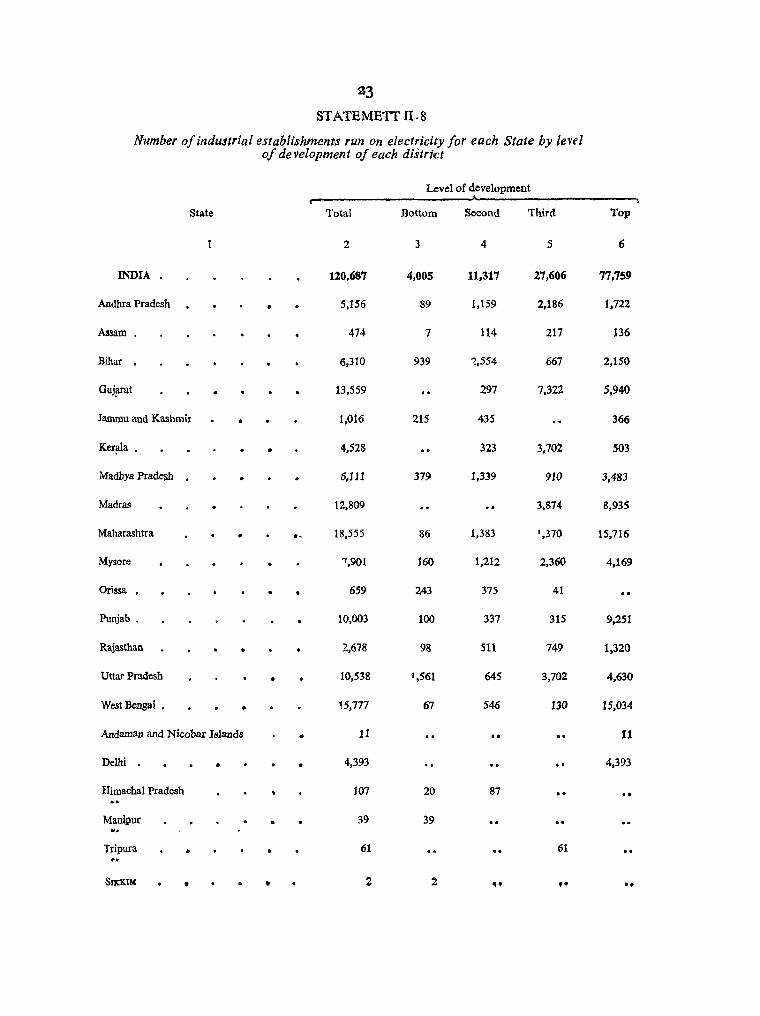
23 ST ATEMETT II. 8
Number of industrial establishment-s run on electricity for each State by levtl of development of each district
Level of development
State Total Bottom Second Third Top
2 3 4 5 6
INDIA. 120,687 4,005 11,317 27,606 77,759
Andhra Pradesh 5,156 89 1,159 2,186 1,722
Assam 474 7 114 217 136
Bihar 6,310 939 ~,554 667 2,150
Guj!U'at 13,559 297 7,322 5,940
Jammu and Kashmir 1,016 215 435 366
Ker~a • • 4,528 323 3,702 503
Madhya Prade~ 6,111 379 1,339 910 3,483
Madras 12,809 3,874 8,935
Maharashtra e·, 18,555 86 1,383 ',370 15,116
Mysore 7,901 160 1,212 2,360 4,169
Orissa • 659 243 375 41
Punjab. 10,003 100 337 315 9,251
Rajasthan • 2,678 98 511 749 1,320
Uttar Pradesh 10,538 1,561 64S 3,702 4,630
West Bengal • 15,777 67 546 130 15,034
Andaman and Nicobar Islands • 11 11
Delhi . 4,393 4,393
Himachal Pradesh 107 20 87 .. . . Manipur 39 39
w.
Tripura • 61 61
Srp:tN • • 2 2 •• • • 00

·:24 ST ATEMENT II. 9
Percentage distribution for each State of industrial establishments run Qn electricity by level of development of each district
Level of development
_State Total Bottom Second Third .....
Top
2 3 4 5 6
INDIA . 101)'00 3'32 9'38 22'87 64'43
Andhra Pradesh 100'00 1'72 22'48 42'40 33'49
Assam. 100'00 1'48 24'05 45'78 28'69
Bihar 100'()() 14'88' 40'48 10'57 34'07
Gujarat 100'00 2'19 54'00 43'81
Jammu and Kashmir 100'00 21'16 42'82 36'02
Kerala JOO-OO 7-13 81'76 11'11
Madhya Pradesh 100'00 6'20 21'91 14'89 57'00
Madras 100'00 30-24 69'76
Maharashtra . 100'00 1:)'46 7'46 7'38 84'70
Mysore 100'00 2'02 15'34 29'87 52'77
Orissa 100'00 36'87 56'91 6'22-
Punjab. 100'00 1'0(1 3~37 3-15- 92'48
Rajasthan 100'00 3'66 19~O8 27'97 49'29
Uttar Pradesh 100'00 14'81 6'12 35'13 43'94
west Bengal 100'00 0'43 3'46 0'82 95'2'
Andaman and NiCobar Islands' 100'00 100'00
Delhi . 100'00 '100'00
Himachal PradesIi • 100'00 18·651 81"31
Manipur 100'00 100'00' -Tripura 100'00 WO- 00 .. SlK~IM 100-0Q 10Q'OO •• .. ..
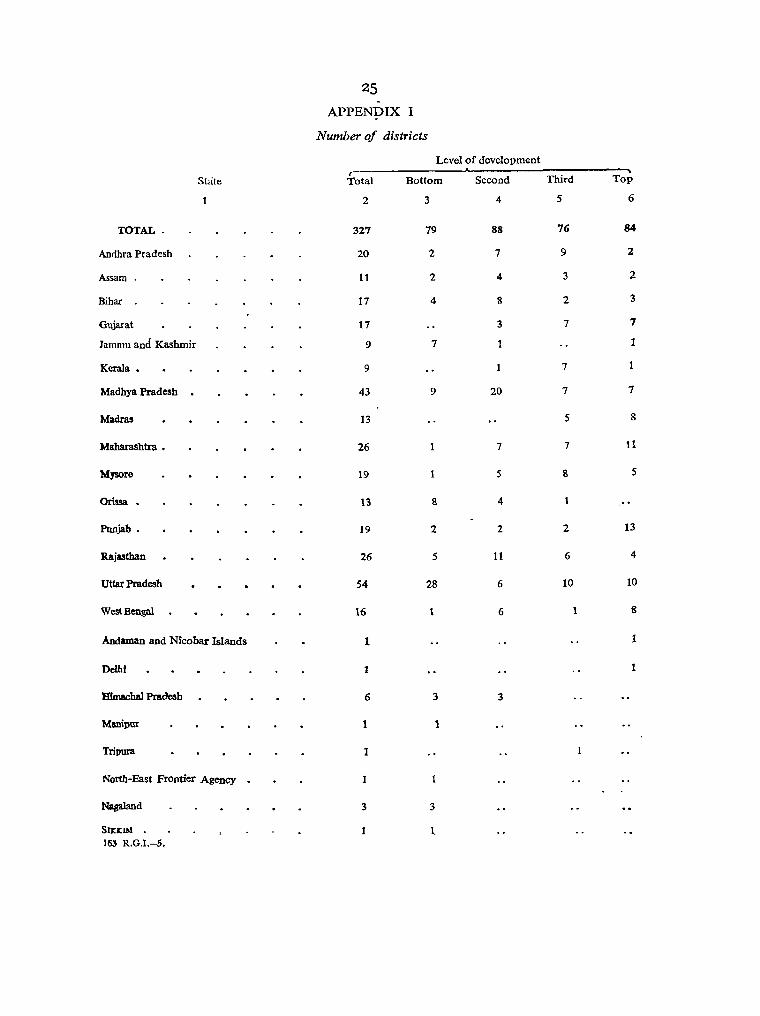
25 APPENpIX I
Number of districts
Level of development ,-
State Total Bottom Second Third Top
2 3 4 5 6
TOTAL. 327 79 88 76 84
Andhra Pradesh 20 2 7 9 2
Assam 11 2 4 3 2
Bihar 17 4 8 2 3
Gujarat 17 3 7 7
Iammu and Kashmir 9 7
Kerala • 9 7 1
Madhya Pradesh . 43 9 20 7 7
Madras 13 5 8
Mabarashtra • 26 1 7 7 11
Mysore 19 1 5 8 5
Orissa • 13 8 4 1 .'
Punjab. 19 2 2 2 13
Rajasthan 26 5 11 6 4
Uttar Pradesh 54 28 6 10 10
West Benga! 16 1 6 8
Andaman and Nicobar Islands 1 1
Delhi 1 1
Hfmachal Pradesh 6 3 3
Manipur 1 1
Tripura 1
North-East Frontier Agency 1
Nagalaod 3 3
SIXICIM 1. 163 R.G.I.-5,

26 APPENDIX II
Total populiz't{on
Level of development
Statc Total Bottom Second Third Top
2 3 4 5 6
TOTAL 438,156,951 86,131,875 109,610,928 107.772,980 134,641,168
Andhra Pradesh 35,983,447 2,818,047 13,118,431 15,907,018 4,139,951
A8sa~ . 11,872,772 573,291 4,412,855 4,860,632 2,025,994
Bihar . 46,455,610 15,122,554 21,067,242 4,107,547 6,158,261
Gujarat 20,633,350 2,536,657 9,293,946 8,802,741
Jammu and Kashmir 3,560,976 2,403,633 640,411 516,932
Kerala • 16,903,715 1,776,566 13,394,269 1,732,880
Madhya Pradesh 32,372,408 8,342,617 13,359,720 5,399,701 5,270,310
Madras 33,686,953 13,001,063 20,685,890
Maharashtra 39,553,718 1,827,203 8,847,062 8,065,281 20,814,172
Mysore 23,586,772 1,100,895 7,074,020 9,875,609 5,536,248
Orissa . 17,548,846 9,412,521 7,377,708 758,617
Punjab. 20,306,812 1,082,971 1,781,343 1,537,341 15,905,151
Rajasthan 20,155,602 3,066,122 8,064,965 4,147,940 4,876,57 5
Uttllr Pradesh 73,746,401 36,963,659 6,751,265 14,835,853 15,195,624
West Bengal . 34,926,279 1,360,016 11,861,904 1,446,158 20,258,201
Andaman and Nicobar Islands 63,548 6M4S
Delhi 2,658,612 2,658,612
Hbnachal Pradesh . 1,351,144 410,365 940,779
Manipur 780,034 780,034
Tripura 1,142,005 1,142,005
Nagaland 369,200 369,200
North-East Frontier Agency 336,558 336,558
SIKKIM 162,189 162,189

2~
AJ>P'ENDIX 1,11
total number 01 Cities~ Iown Groups and Towns (all classes) arranged for each Stale by lhe level of deyelopment of the distric,ls to which they respectiveip belong
Level of development
State Total Bottom Second Tkird T&p
2 3 4 5 6
TOTAL 2,444 289 574 726 855
Andbra Pradesh 212 22 70 103 17
Assam • 56 2 li 24 10
Bihar 126 24 66 12 24
GqjMat 175 12 ,76 .. 87
JaJAAlJ.!.811d KaslJtnir 41 33 7
Kc;t~ • 79 7 65 7
M~I!radesh . 210 33 9S .48 34
M~as 287 113 174
MD-llfl.1"l\Stl.tta • 241 12 63 57 J09
MYJlPre 214 10 54 93 57
O;(~ • 62 32 26 4
Plffiiab • 177 7 1c! 22 132
R~.i~tp.an 145 17 64 32 ,32
Uttar ,Pradesa 244 84 29 65 66
west Bengal 149 S 41 6 97
Andaman..and Nicobar_Islands 1 1
Dpjhi . 1 1
Himachal Pradesh • 13 3 10
Manipur 1 1
Tripura 6 , Nagaland 3 3
SlU.IM 1

2~
APPENDIX IV
Total urban population
Level of development
State r-------------J...-__
Total Bottom Second Third Top
2 3 4 5 6
TOTAL 78,746,942 4,615,329 10,856,147 18,~36,348 44,939,118
AndlD.ra Pradesh 6,274,508 254,571 1,499,156 2,749,879 1,770,902
Assam 913,028 23,145 283,438 346,498 259,947
Bihar 3,913,920 • 674,941 1,526,616 387,903 1,324,460
Gujarat 5,316,624 225,513 1,698,373 3,392,538
Jalnmu and Kashfl:lir 593,315 170,455 295,084 pr.rt6
Kerala • 2,554,141 171,850 2,216,822 165,469
M~dhya Pradesh: • 4,627,234 446,243 1,304,019 848,510 2,028,462
Madras .. 8,990,528 2,607,112 6,383,416
Maharashtra • 11,162,561 147,858 1,068,024 1,187,414 8,759,265
Mysore 5,266,493 160,622 1,117,506 2,048;233 ~1,940,132
Orissa 1,109,650 470,456 503,434 135,760
Punjab. 4,038,595 43,321 199,272 295,179 3,550,823 .
Rajasthan 3,281,478 ,262,276 1,036,666 800,566 1,181,970
Uttar Pradesh 9,479,895 1,758,880 704,895 2,810,133 4,205,987
West Bongal 8,540,842 92,478 873,107 100,769 7,474,488
Andaman and Nicobar Islands 14,075 14,075 .
Delhi 2,359,408 2,359,408
Himachal Pradesh • 63,928 16,361 47,567
Manipur 67,717 67,717
Tripura 102,997 102,997
Nagaland 19,157 19,157
SUClCIM 6,848 6,848

29 APPENDIX V
Number of Clfilss I Cities and Town Groups arrangedjor efilch S)tMte lq1},e le,vlII of delleiopment of the districts to which tncy respectively fJelong
Level of development
State Total Bottom Second Third
2 3 4 5
TOTAL • • 113 3 13 33 r (
Andhra Pradesh • • 11 2 (;
Assam 2 1
Bihar 9 2 3 1
Gujarat 6 1
Jammu and Kashmir 2
I<ierala 4 4
Madhya Pradesh 8 2
Madras 11 4
Maharashtra 13 1 1
Mysore 6 1 4
otissa 1 1
Punjab 5
Rajasthan 6 1 2
Uttar Pradesh 17 7
West Bengal 11 1
Andaman and Nicobar Islands .
Delhi 1
Himachal Pradesh •
Manipur
Tripura
Nagaland
StulM .1
Top
6
64
3
1
-3
5
1,
S
1
11
1
.-.. '5
'3
g
10
1
I~···
d ·!A
.....

PtJp.utaticm ... .jn .£J.ass.'lIGi(ies .ol1d/Fow/l /)rq_ups. -arra1)ged·!.Qr ~qch ..slate, by tbe.. level .of 4e'l'el()pment~ofrthe t/.i&tricts. to:whi®. tbe.y,r(!~pe.ctixe.IJl.Q.elOJlg
Level of development r-
State Total Bottom Second Third Top
1 2 3 4 5 6
TOTAL . 38,176,907 392.319 2,024,199 6,363,563 _a9J3.9q,816
Andhra Pradesh 2,676,944 .288,180 805,231 t-p82,933'
Assam 203,105 lQO,707 lQ~,398
Bihar 1,687,335 212,064 438,165 143,850 893,2.56
G~arat 2,311,615 288,026 2,QZ~S89
Jammu and Kashmir 397,822 .295,084 ,11)2;m
Kerala 1,002,626 l,OQ2,626 ",
Nadhya Pradesh 1,807,349 139,792 237,91)6 ,"1'.4~,651;
Madras 3,716,114 672,756 3,D.4~,~?a
Maharashtra 7,250,924 193,186 127,183 6,93.0,555
~ysore 2,173,169 146,790 819,418 1,2D.6,961
Orissa . 146,308 146,308 . . ~unjab 1,214,090 1,2~4,090.
Rajasthan 1,241,562 111,139 375,394 7~5,O29
Uttar Pradesh 5,159,667 180,255 117,702 1,790,466 3.071,244
West Bengal • 4,828,869 147,253 4,681,616
Andaman and Nicobar Islands
Delhi. 2,359.408 A35~.4IlI
Himachal Pradesh .. Manipur .. ~
Tripura ','
Nagaland
SIKKIM "
For r:rcentage distribution of urban population in Class I four leve s of development in each State see text above.
Cit!es and Town Groups among distri~.In.~
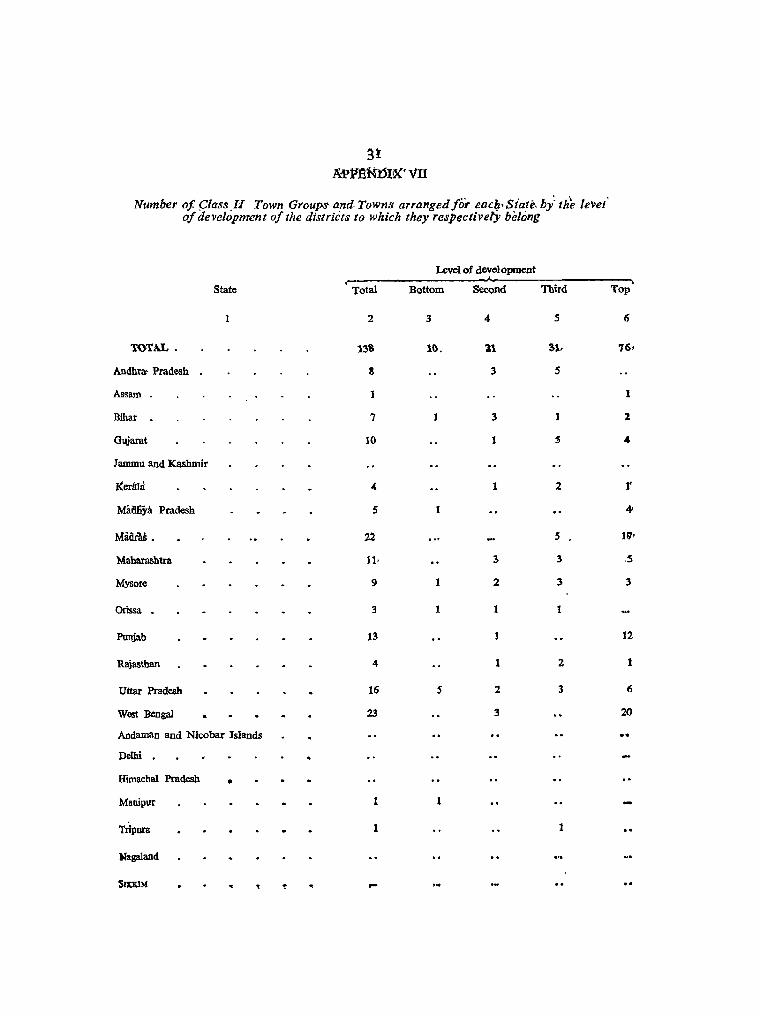
~~
Ai>VSNDI~' VII
Number of 9lass.Ii Town Groups and. Towns arranged jor eac{l' state, by: th~ level of development of the districts to which they respectively belong
Level of deve10pment r-
State Total Bottom Second Third Top
2 3 4 5 6
TOTAL. 1311 10. 11 31, 76.
Andbra- Pradesh 8 3 5
Assam 1
Bihar 7 1 3 2
Gujarat 10 1 S 4
Jammu and Kashmir
Kerf.!Ia 4 1 2 I'
Miatiya Pradesh 5 4-
MlidiM • 22 5 11;"
Maharashtra 11· 3 3 5
Mysore 9 1 2 3 3
Orissa 3 1 1
Punjab 13 1 12
Rajasthan 4 1 2 1
Uttar Pradesh 16 5 2 3 6
West Bengal 23 3 20
Andaman and Nicobar Islands
Delhi
Himachal Pradesh • Manipur 1 1
Trlpura 1 1
)lagaland
SIan.1 ~ ,..
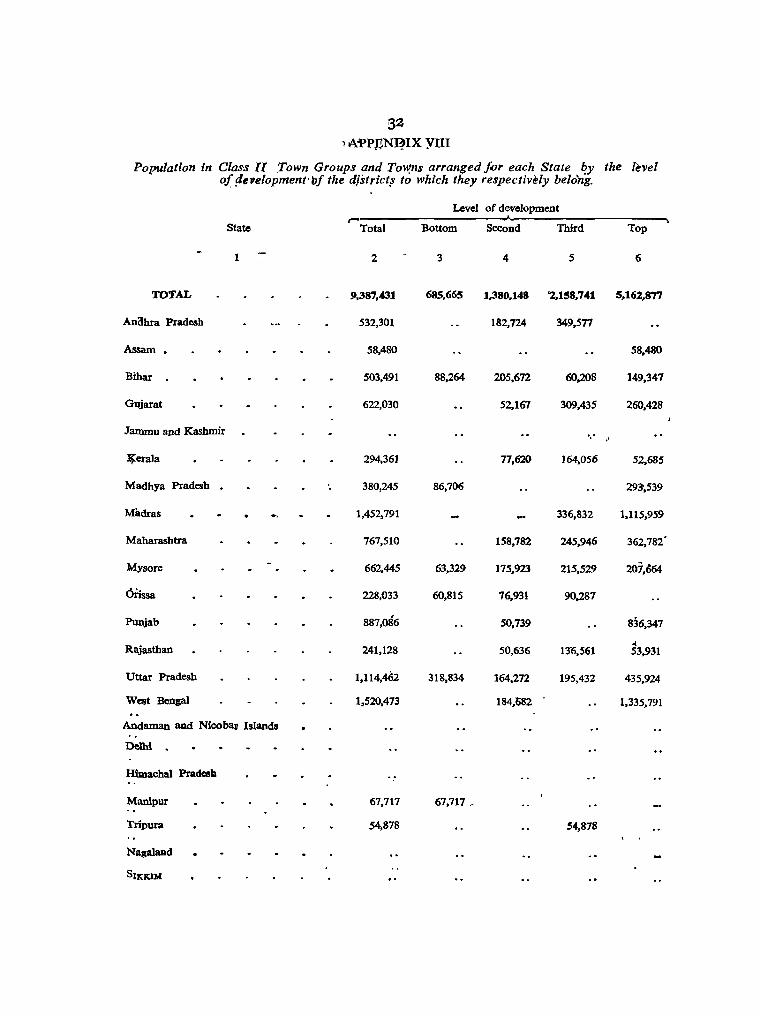
32 1 A:PPRN~IX YIn
Population in ClaS's II .Town Groups and To~s arranged for each State i?y the level of [Ie:velopment· 'of the djstrict1 to which they respectively belong.
Level of development r-
State Total Bottom Second Third Top
1 2 3 4 5 6
TOTAL 9,387,431 685,665 1,380,148 '2,158,'41 5,162,877
AniJhra Pradesh 532,301 182,724 349,577
Assam • 58,480 58,480
Bihar 503,491 88,264 205,672 60,208 149,347
Gujarat 622,030 52,167 309,435 260,428
Jammu and Kashmir '.'
~erala 294,361 77,620 164,056 52,685
Madhya Pradesh 380,245 86,706 293',539
Madras 1,452,791 336,832 1,115,959
Maharasbtra 767,510 158,782 245,946 362,782'
Mysore 662,445 63,329 175,923 215,529 207,664
6iissa 228,033 60,815 76,931 90.287
Punjab 887,086 50.739 836,347
Rajasthan 241,128 50,636 .;
130,561 53,931
Uttar Pradesh 1,114,462 318,834 164,272 19S,432 435,924
West Bengal 1,520,473 184,682 1,335,791
Andaman aDd Nicobal! Islands
Delhi . Himachal Pradesb
Manipur 67,717 67,717 _
Tripura 54,878 54,878
NagalaDd
SUramoi
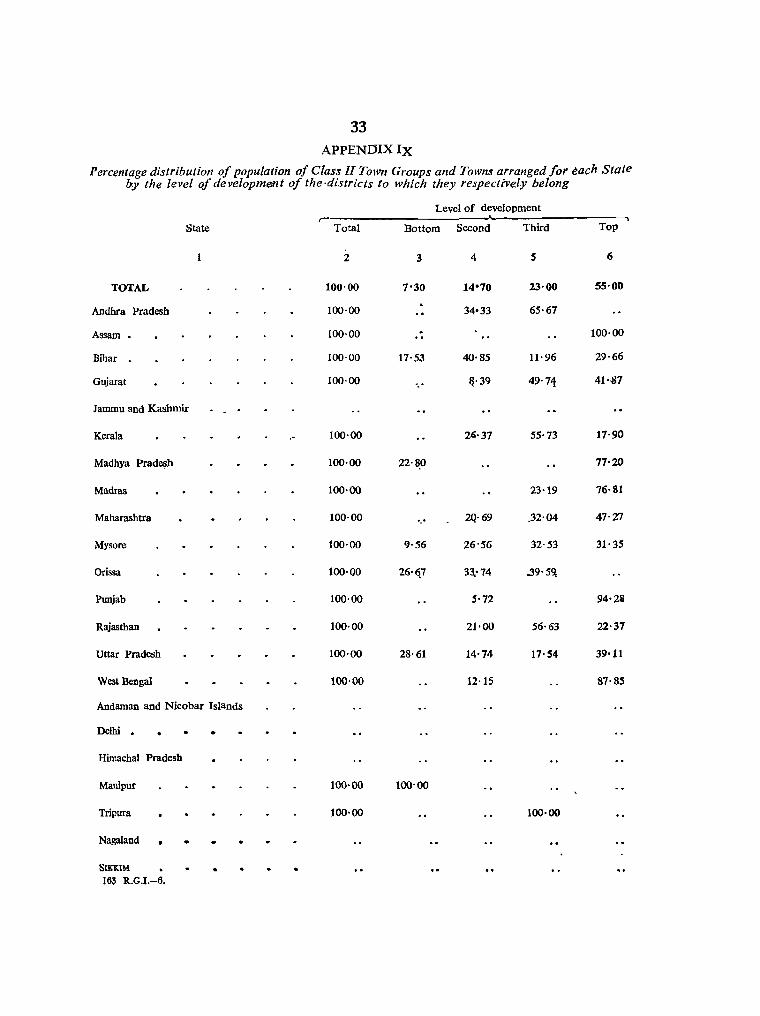
33 APPENDIX IX
Percentage distribution of population 0/ Class II Town Groups and Towns arranged for each State by the level of development 0/ the-districts to which they respectively belong
Level of development r-
State Total Bottom Second Third Top
2 3 4 5 6
TOTAL 100-00 7'30 14·70 23'00 55-00
Andhra Pradesh 100-00 34·33 65·67
Assam 100-00 . 100-00 -. Bihar 100-00 17·53 40-85 11'96 29-66
Gujarat 100-00 &-39 49-71 41-1117
Jammu aDd Kashmir
Kerala 100·00 26'37 55-73 17-90
Madhya Pradesh 100·00 22'~0 77-20
Madras 100-00 23'19 76·81
Maharashtra 100-00 -,' 2Q-69 .32-04 47·27
Mysore 100-00 C)-56 26-56 32-53 31-35
Orissa 100-00 26-<\7 33,'74 .39' 59.
Punjab 100·00 5·72 94'28
Rajasthan 100'00 21·00 56-63 22'37
Uttar Pradesh 100-00 28'61 14'74 17-54 39·11
West Bengal 100-00 12'15 87-85
Aodaman and Nicobar Islands
Delhi . Himachal Pradesh
Manipur 100·00 100'00
Tripura 100'00 100-00
Nagaland
SlKKIM
163 R_GJ.-6.
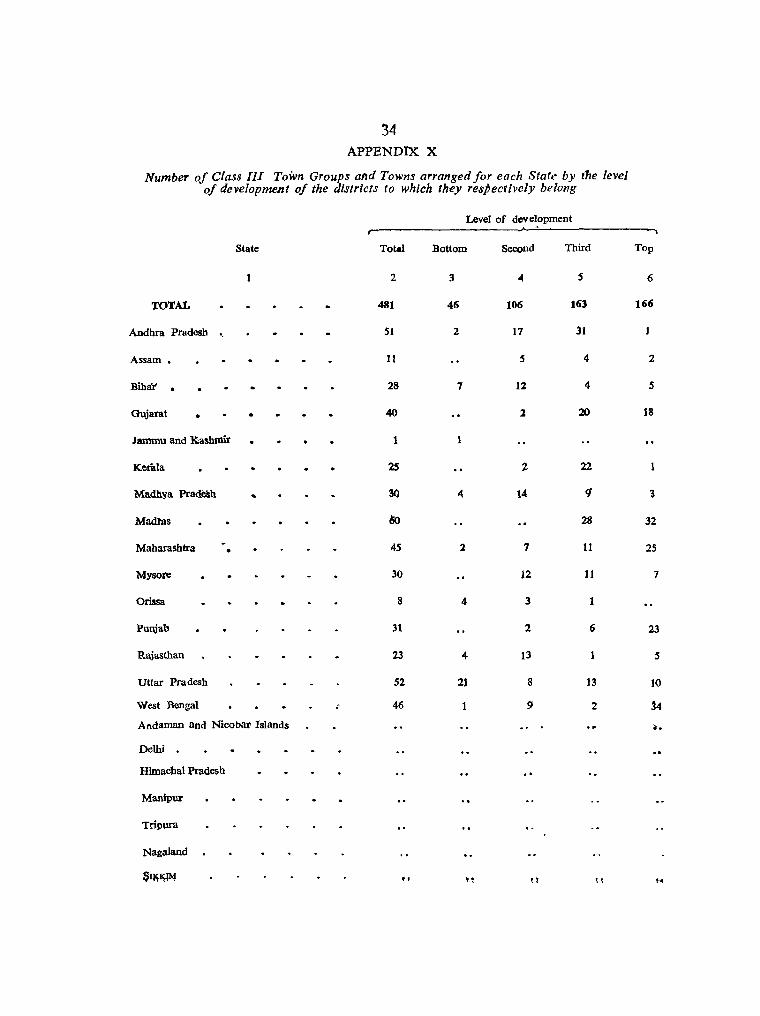
34 APPENDIX X
Number of Class III Town Groups alld Towns arranged for each Statl' by tne level of development of the districts to which they respectively belong
Level of development r-
State Total Bottom Second Third Top
2 3 04 5 6
TOTAL 481 46 106 163 166
Andhra Pradesh '. 51 2 17 31
Assam. 11 5 4 2
Bihai' • 28 7 12 4 5
Oujarat • 40 1 20 18
Jammu and Kashn1ir 1 1
Kerala 2S 2 22
Madhya PradeSh 3(l 4 14 cJ 1
Madtas 60 28 32
Maharashtra • 4S 1 7 11 2S
Mysore 30 12 11 7
Orissa 8 4 3
Punjab 31 2 6 23
Rajasthan 23 4 13 5
Uttar Pradesh 52 21 8 13 10
West Bengal ~ 46 9 2 j4
Andaman and Nicobar Islands ~,
Delhi ,
Himachal Pradesh
Manipur
Tripura
Nagaland
$~~ " , 1 n II I ...
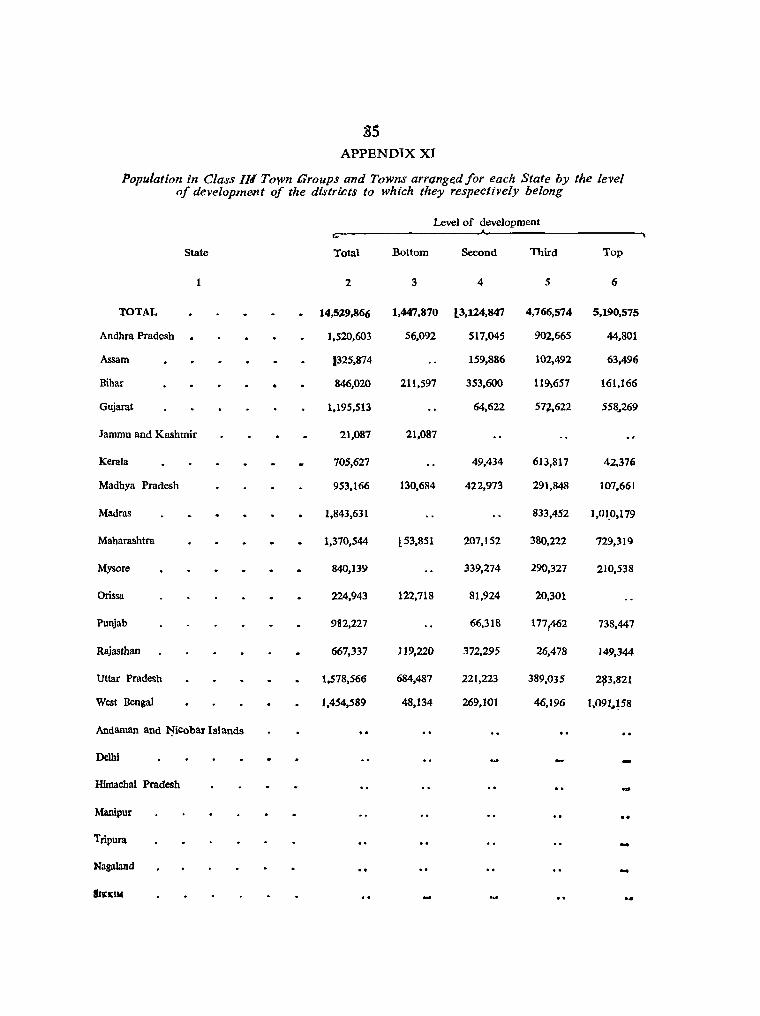
~5 APPENDIX XI
Population in Class IlL Town Groups and Towns arranged for each State by the level of development of the districts to which they respectively belong
Level of development e-
State Total Bottom Second Third Top
2 3 4 5 6
TOTAL 14,529,866 1,447,870 l3,124,847 4,766,574 5,190,575
Andhra Pradesh 1,520,603 56,092 517,045 902,665 44,801
Assam 1325,874 159,886 102,492 63,496
Bihar 846,020 211,597 353,600 119-,657 161,166
Gujarat 1,195,513 64,622 577,622 558~269
Jammu and Kashmir 21,087 21,087
KeraJa 705.627 49.434 613.817 42.376
Madhya Pradesh 953.166 130,684 422,973 291,848 107,661
Madras 1.843,631 833,452 1,01,0,179
Maharashtra 1,370,544 l53,8S1 207,152 380,222 729,319
Mysore 840.139 339.274 290.327 210.538
Orissa 224.943 122,718 81,924 20,301
Punjab 982.227 66,318 177,462 738,447
Rajasthan 667,337 119,220 372,295 26,478 149,344
Uttar Pradesh 1,578,566 684,487 221,223 389,035 2~3,821
West Bengal 1,454,589 48,134 269,101 46,196 I,091~158
Andarnan and ~icobar Islands
Delhi
Himachal Pradesh
Manipur
Tripura
Nagaland
SlltlUM .. ,

36. APPENDIX XII
Percentage distribution 0/ population in Class III Town Groups'and Towns arrangea/or each State by the level 0/ development of the districts to which they respecti..,ely belong
Level of development ,--
_State Total Bottom Second Third Top
1 2 3 4 5 6
TOTAL. 100-00 9'96 21'51 32'81 35'72
Andhra Pradesh 100'03 3'69 34'00 59'36 2'95
Assam. 100'0) 49'06 31'45 19'49
Bihar ~ 100·00 25-01 41'80 14'14 19'05 . Gujarat 100'00 5'40 47'90 46'70
Jammu and Kashmir 100'00 100'00
Kerala: • 100'00 7'01 86'99 6'00
Madhya Pradesh 100'00 13'71 44'38 30'62 n'29
Madras 100'00 ., 45'21 54-79
Maharashtra • 100'00 3-93< 15'12 21'74 53'21
Mysore 100-00 • 40'38 34'56 25 '0"6
Orissa. 100-00 54'56- • 36'42 9'02
Punjab. 100'00 6-75 18'07 75'18
Rajasthan 100'00 17'86' 55'79 3'97 22'38
Uttar Pradesh 100'00 43'36' 14-01 24'65 17'98
West Bengal. 100,00 3'31" 18'50 3 -18 75'01
Aodaman and Nicobar Islands .. DeUti . . ... Himacbal'Pradesh ,
Manipur .. . Tripura
Napland .. 11111:11"" II II .. ..
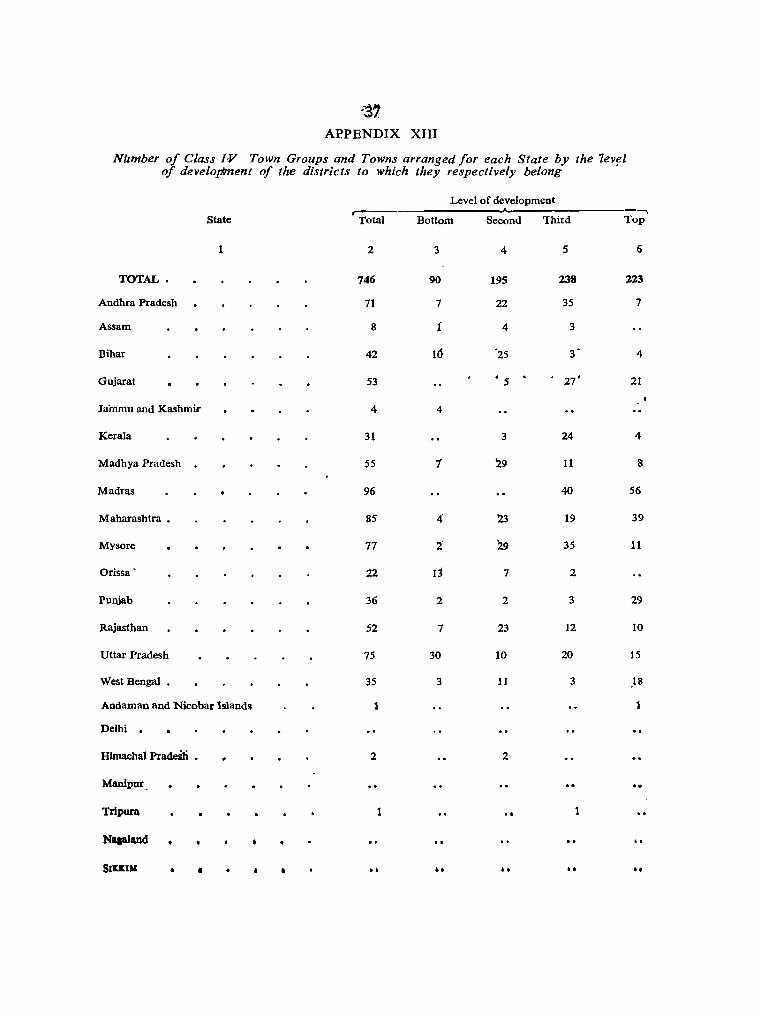
:j1. APPENDIX XIII
Nllmber of Class I;V Town Groups and Towns arranged for each State' by the 7evrl of development of the districts to which they respectively belong
Level of development ~
State Total Bottom Second Third Top
1 2 3 4 5 6
TOTAL • 746 90 195 238 223
Andhra Pradesh 71 7 22 35 7
Assam 8 [ 4 3
Bihar 42 16 25 3' 4
Gujarat 53 ' 5 27' 21
Jainmu and Kashmir 4 4
Kerala 31 3 24 4
Madhya Pradesh 55 1 '29 11 8
Madras 96 40 56
Maharashtca • 85 « '23 19 39
Mysore 77 2 29 35 11
Orissa - 22 13 7 2
Punjab 36 2 2 3 29
Rajasthan 52 7 23 12 10
Uttar Pradesh 75 30 10 20 15
West Bengal. 35 3 11 3 ,18
Andaman and Nicobar Islands 1 1
Delhi . Himachal Pradesh • 2 2
Manipuc,
Tripura 1 1
Napland .. .. SIO:l" • • • • •• .. •• ..
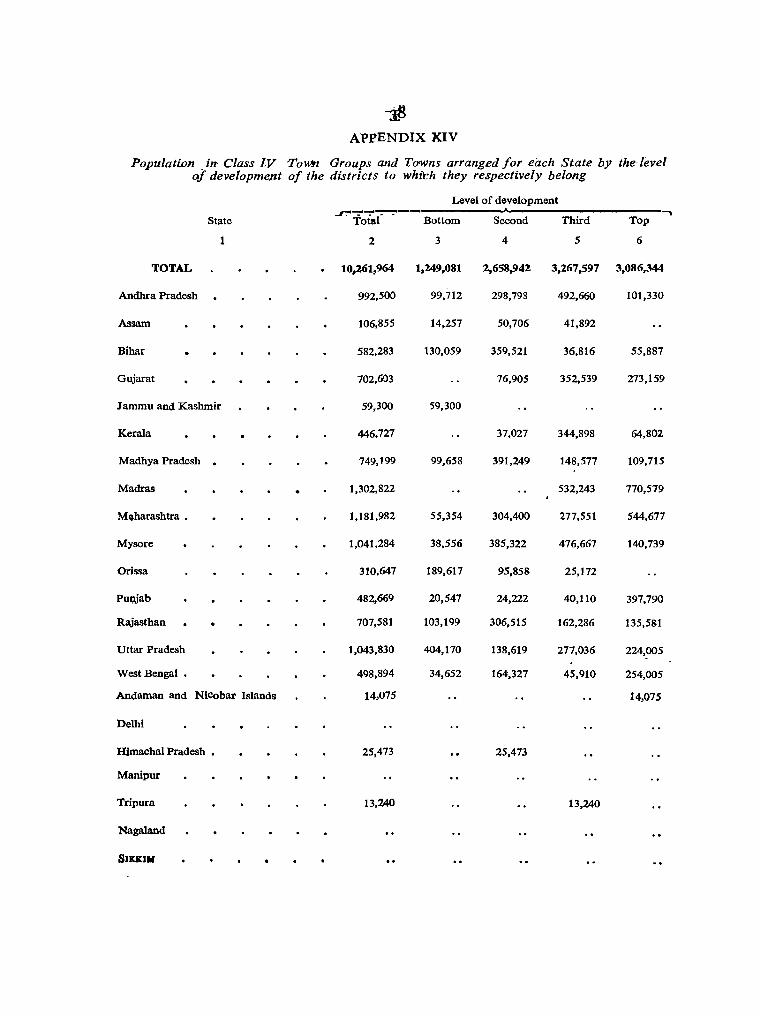
APPENDIX KIV
Population _ in Class IV Town Groups and To'wns arranged for each State by the-level of development of the districts to whi'ch they respectively belong
Stllte
1
TOTAL
Andhra Pradesh
Assam
Bihar
Gujarat
Jammu and Kashmir
Kerala
Madhya Pradesh •
Madras
M~harashtra •
Mysore
Orissa
PUl}jab
Rajasthan
Uttar Pradesh
West Bengal •
Andaman and Nicobar Islands
Delhi
ltUnachalPradesh.
Manipur
Tripura
Nagaland
SIUIIf
Level of development .....I"':"-:.-~-:--:"--'------.._---------- .......
Total Bottom Second Third Top
2 3
10,261,964 1,249,081
992,500 99,712
106,855
582,283
702,603
59,300
446,727
749,199
1,302,822
1,181,982
1,041,284
310,647
482,669
707,581
1,043,830
498,894
14,075
25,473
13,240
14,257
130,059
59,300
99,658
55,354
38,556
189,617
20,547
103,199
404,170
34,652
4
2,658,942
298,798
50,706
359,521
76,905
37,027
391,249
304,400
385,322
95,858
24,222
306,515
138,619
164.327
25,473
5 6
3,267,597 3,086,344
492,660 101,330
41,892
36,816
352,539
344,898
148,577
532,243
277,551
476,667
25,172
40,110
162,286
277,036
45,910
13,240
55,887
273,159
64,802
109,715
770,579
544,677
140,739
397,790
135,581
224,?O5
254,005
14,075
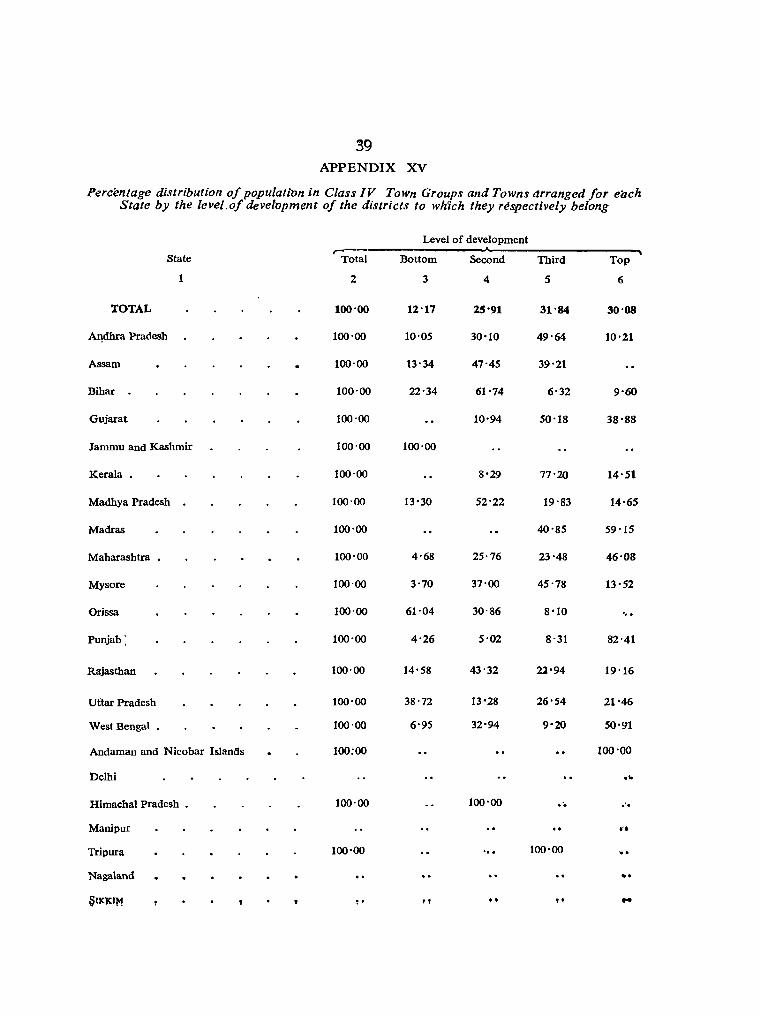
39 A"PPENDIX XV
Percentage distribution of populatirm in Class IV Town Groups and Towns arranged for ellch State by the level_of development of the districts to wh'ich they respectively belong
Level of development r-
State Total Bottom Second Third Top
2 3 4 S 6
TOTAL 100-00 12-17 25'91 31'84 30'08
A~dhra Pradesh 100'00 10-05 30'10 49-64 10'21
Assam 100'00 13'34 47'45 39'21
Bihar 100-00 22'34 61'74 6'32 9'60
Gujarat 100'00 10'94 50'18 38'88
Jammu and Kashmir 100-00 100-00
Kerala , 100-00 8'29 77'20 14'51
Madhya Pradesh 100-00 13'30 52'22 19'83 14'65
Madras 100'00 40'85 59'15
Maharashtra , 100'00 4'68 25,76 23'48 46'08
Mysore 100-00 3'70 37'00 45'78 13'52
Orissa 100-00 61'04 30-86 8'10 ',.
Punjab: 100'00 4'26 5'02 S'31 82'41
Rajasthan 100'00 14'58 43'32 2]'94 19 '16
Uftar Pradesh 100'00 38'72 13'28 26'54 21'46
West Bengal, 100-00 6'95 32'94 9'20 50'91
Andaman and Nicobar IslanBs 100:00 100'00
Delhi ... Himachal Pradesh , 100'00 100'00 . -. ,'.
Manipur .-,
Tripura 100'00 100'00 ". Nagaland
_.
~IKKIM ,. " to " ..

4«? APPENDIX XVI
Number of Class V Town Groups and Towns arranged for each State by the level of develop11Jent of the districts to -which they respectively belong
Level of development ';- ..,
'State Total Bottom Second Third Top
2 3 4 5 6
TOTAL 755 100 200 215 240
Andhra Pradesh 70 13 26 26 5
Assam 23 f 8 10 4
Bihar 35 4 21 3 7
Gujarat 58 4 21 33
Jammu and Kashmir 5 4
Kerala . 15 1 13
Madhya Pradesh! 96 17 46 22 11
Madras 81 28 53
Maharashtra 74 6 24 20 24
Mysore 57 7 7 26 17
Orissa 25 13 12
Punjab] 52 2 5 8 37
Rajasthan 51 6 ·23 11 11
Uttar Pradesh 74 20 8 22 24
West Bengal 27 13 12
Andambn and Nicobar Islands
Dellii . Himachal Pradesh ' ,.; .. 4 2 2
1\1!lnipur
Tripura 4 4
Nagaland 3 3
SliCKIM
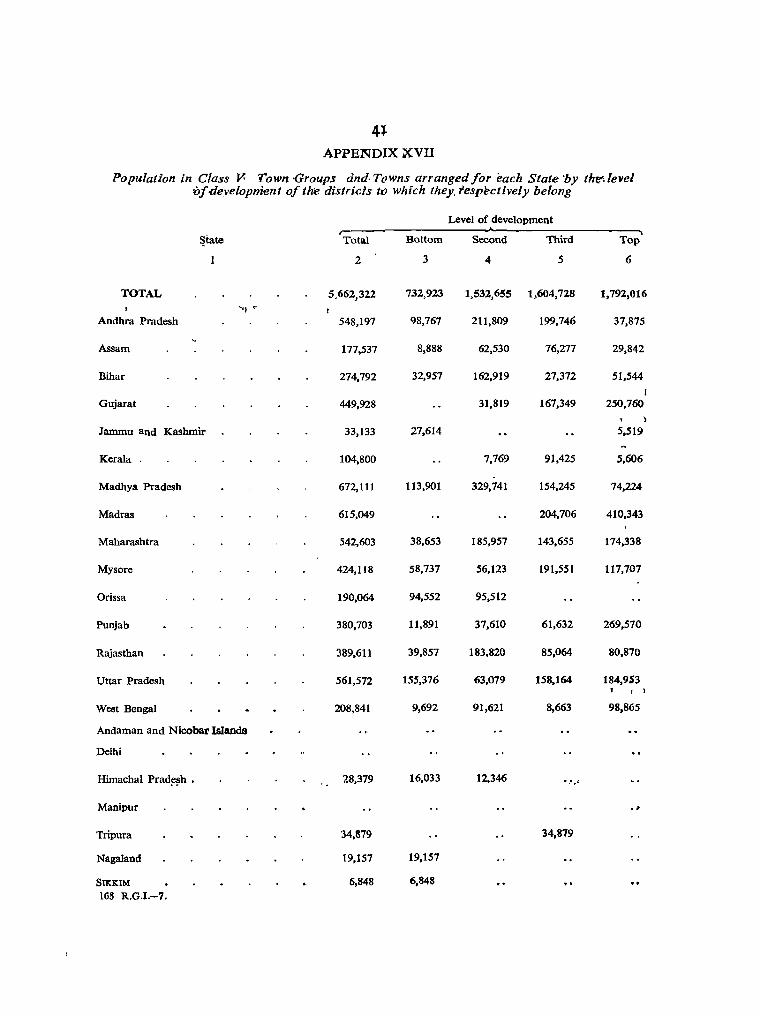
4J APPENDIX XVII
Po pufation in Class Y. Town -Groups and, Towns arranged for each State 'by thft': fellel vfdevelopment oftke distriels tl(} which they. respectively belong
Level of development
*ate r-Total Bottom Second Third Top
2 3 4 5 6
TOTAL 5>662)322 732,923 1,532,655 1,604.728 1,792,016 "'.J \'"
Andhra Pradesh 548,197 98,767 211,809 199,746 37,875
Assam 177,537 8,888 62,530 76,277 29,842
Bihar 274,792 32,957 162,919 27,372 51,544
I Gujarat 449,928 31,819 167,349 250,760
)
Jammu and Kashmir 33,133 27,614 5,519
Kerala . 104,800 7,769 91,425 5,606
Madhya Pradesh 672,111 113,901 329,741 154,245 74,224
Madras 615,049 204,706 410,343
Maharashtra 542,603 38,653 185,957 143,655 174,338
Mysore 424,118 58,737 56,123 191,551 117,707
Orissa 190,064 94,552 95,512
Punjab 380,703 11,891 37,610 61,632 269,570
Rajasthan 389,611 39,857 183,820 85,064 80,870
Uttar Pradesh 561,572 155,376 63,079 158,164 184,9S3 t I
West Bengal 208,841 9,692 91,621 8,663 98,865
Andaman and Nicobar Islands
Delhi
Himachal Prad~~h . 28,379 16,033 12,346 . ~. " Manipur . ~
Tripura 34,879 34,879
Nagaland t9,157 19,157
SIKKIM 6,848 6,848 168 R.G.I.-7.

~
APP'ENDl'X X-YJII
Pe"cemagt!:',d~i'rihJt[lon of po.ptdation- ilt ClasS' JY l'oWft'-Grou!"s and IOW11S' arranged-jer ~ach State by the lell~J. of Mfelopmem of the diS(ri'C($ t(J! which Ihey' respectively belong
Level of development ,-
State Total Bottom Second Third Top
2 3 4 5 6
TOTAL 100·00 12'94 27'07 28·34 31-65
Andhra Pradesh 100-00 18-01 38-64 36-44 6·91
Assam 100-00 5'01 35-22 42-96 16'81
Bihar 100-00 11·99 59·29 9-96 18·76
Gujarat 100·00 7-07 37·20 55-73
Jammu and Kashmir 100-00 83'34 16-66
Kerala _ 100-00 7-41 87-24 5-35
Madhya Pradesh 100-00 16-95 49·06 22-95 11-04
Madras 100-00 33-28 66-72
Maharashtra _ 100-00 7-12 34'27 26-48 32-13
Mysore 100-00 13-85 13-23 45·17 27'75
Orissa 100·00 49·75 50·25
Punjab _ 100·00 3'12 9'88 16'19 70-81
Rajasthan 100·00 10·23 47-18 21-83 20-76
Uttar Pradesh 100·00 27·67 11-23 28-16 32-94
West Bengal - 100·00 4-64 43-87 4·15 47- 34-
Andaman and Nicobar Islands
Delhi . Himachal Pradesh . 100·00 56-50 43-50
Manipur
Tripura 100 -olt 100-00
Nagaland 100·00 100-00
SIKICIM tOO, 00 100-00
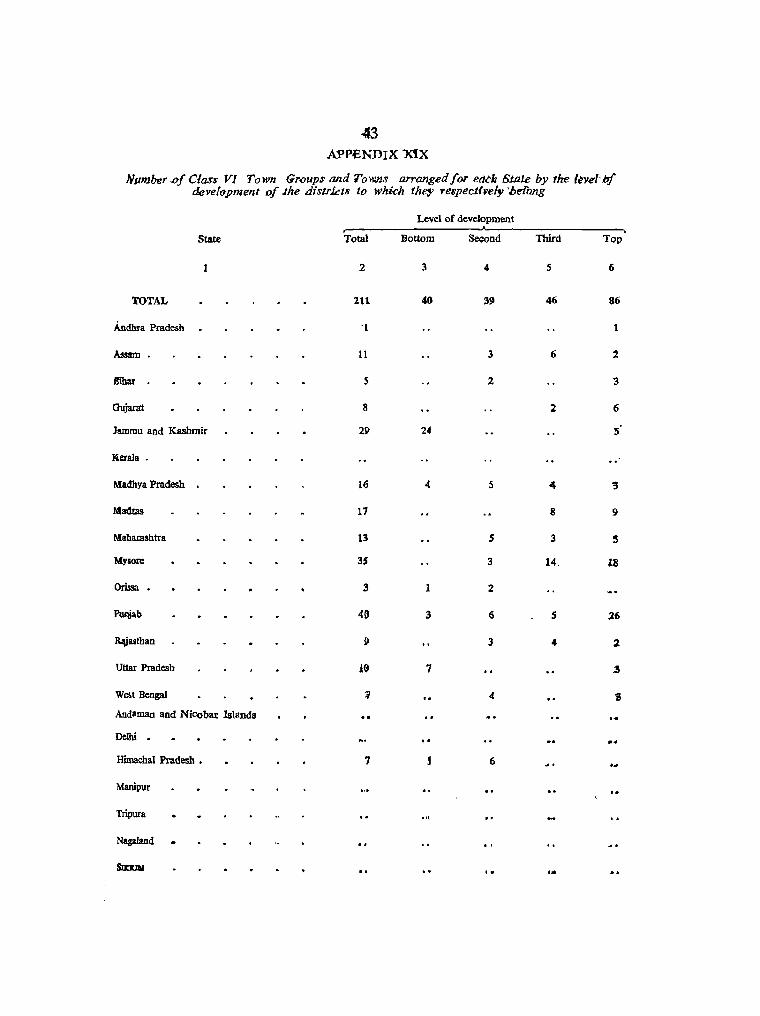
43 APPENDIX XIX
Number ,0'/ Class VI Town Groups and Towns arranged /01' each Stnte by the leve-I<b/ development of Jhe districts to which they respecti;pely'belong
Level of development
State Total Bottom Second Third Top
2 3 4 5 6
TOTAL 211 40 39 46 86
Andbra Pradesh . 'l 1
Assam II 3 6 2
8ibar S 2 3
Gujanrt 8 2 6
Jammu and Kashmir 21> 24 5
[(erala .
M&dhya Pradesh 16 4 5 -4 '3
Madras 17 8 9
Maharashtra 13 5 3 !5
MYlore 3S 3 14. 18
Orissa • 3 1 2
PoIUab 40 3 6 5 26
~aslban 9 3 4 2
Uttar Pradesh 1@ 7 S
We&t Bengal i 4 'S
Andaman and Nicobar Islands
Delhi . . .. Himachal Pradesh • 7 1 6
Manipur .. Tripara
Napland
Sttxw

44 APPENDIX XX
'Population in. Class VI Town Groups and'Towns arranged for each Stale by the level of development of the districts to which they respectively belong
Level of development
"""" State r Total· Bottom Second Third Top
1 2 3 4 5 6
TOTAL 728.452 107,471 135,356 175,145 31j),480
Andhra Pradesh 3,9~ 3,963
Assam 41,177 10,316 25,130 5,731
Bihar 19,999 6,739 13,260
Qujarat 34,935 8,602 26,333
Jammu and K;uhmir 81,973 62,454 19,51g
~~ala •
Madhya Pradesh 65,164 15,294 20,264 15,934 13,672
Madras 60,121 27,123 32,'998
Maharashtra 48,998 18,547 12,857 17,594
~sore 125,338 14,074 54,741 56,523
Orissa . 9,655 2,754 6,901
Punjab. 141,820 10,883 20,383 15,975 94,579
Rajasthan 34,259 12,261 14,7113 7,215
Uttar Pradesh 21,798 15,768 6;040
West Bengal • 29,176 16,123 13;053
Andaman and Nicobar Islands
Delhi . Hiinachal Pradesh • 10,076 328 9.748
Manipur
Tripura
Nagaland
SncKIM
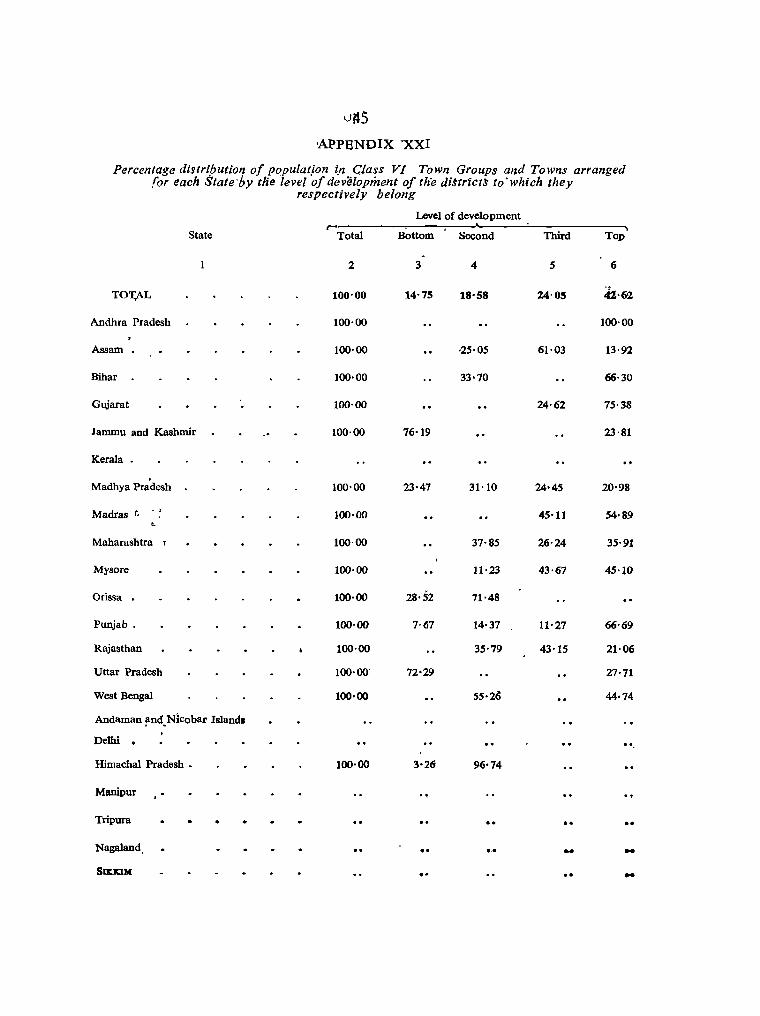
'-'tiS
-APPENDIX "XXI
Percentage distri_butio/J of population ~n Class VI Town Groups and Towns arranged (or each State'by tlie level of development of tHe dWr1ctS to'which they
respectively belong
Level of development r-
State Total Bottom Second Third Top
2 3 4 5 6
TOT,AL 100'00 14·75 18'58 24'05 42·61
Andhca Pradesh 100·00 100-00
Assam 100·00 '25·05 61·03 13-92
Bihar 100·00 33·70 66-30
Gqjarat 100·00 24·62 75·38
Jammu and Kashmir 100·00 76'19 23,81
Kerala .
Madhya Pra'desh 100·00 23'47 31'10 24'45 20'98
Madras r. . ,
100·00 45·11 54·89 .. Maharashtra 1 100·00 37·85 26'24 35'91
Mysore 100·00 11·23 43·67 45'10
Orissa . 100·00 28·52 71·48
Punjab. 100·00 7·67 14-37 11·27 66·69
Rajasthan 100·00 35'79 43'15 21·06
Uttar Pradesh 100'00' 72'29 27·71
West Bengal 100·00 55-2e) 44'74
Andaman !1DC{_ Nlcobar Islands
Delhi . .. Himachal Pradesh • 100·00 3'26 96·74
Manipur . , Tripura .. Naga}and, .. .. .. -S~1OM .. -
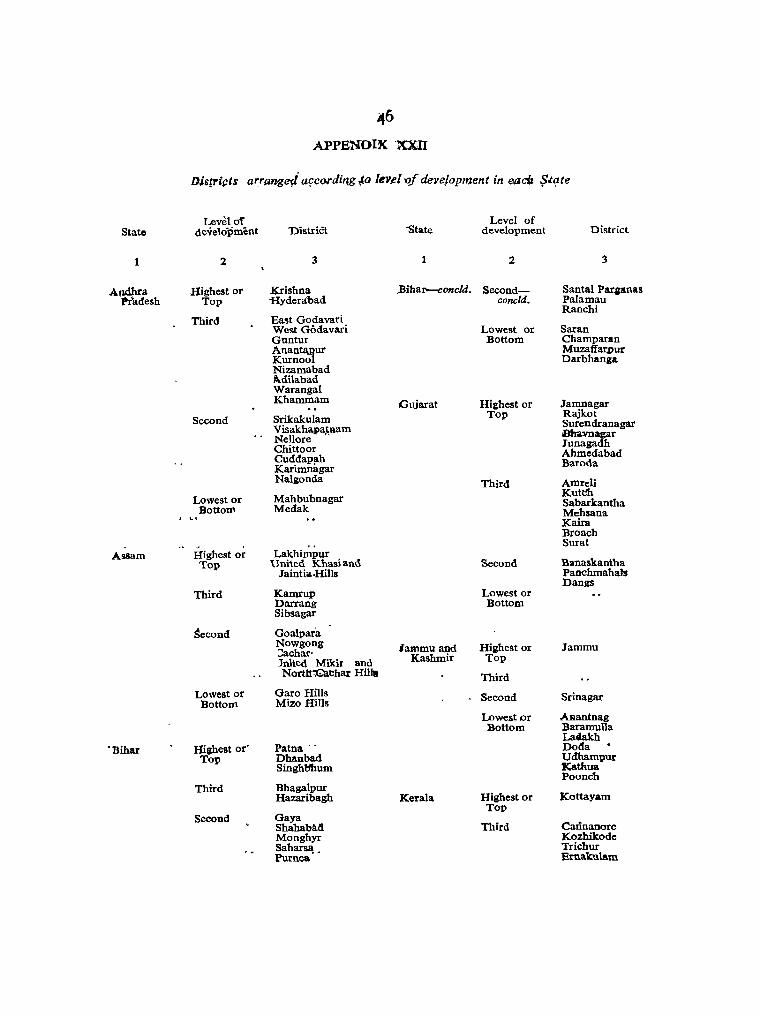
Jt6
APPENDIX XXII
[Jjqri~ts ar,ranger!' a<;cordifl:g ~o le'~l of development in eacil $.tq.te
Level of Level of State development "DistriCt "State development District
2 3 1 2 3
.Andhra Highest or Krishna .Bihar--concld. Second- Santal Parganas Pr'adesh Top Hydera'bad coneld. Palamau
Ranchi Third East Godavari
West Godavari Lowest or Saran Guntur Bottom Champaran Anant~ur Kurnoo
Muzaffarpur Darbhanga
Nizamabad ~dilabad Warangal Khammam iGujarat Highest or Jamnagar
Second Srikakulam Top Rajkot
Visakha.pa~nam Surendranagar
Nellore iBbavnagar
Chittoor Junagadh
CuddaplLh Ahmedabad
Karimnagar Baroda
Nalgonda Third Amreli
Lowest or Mahbubnagar Kutt:h Sabarkantha
Bottom Medak Mehsana . ~. Kaira Broach
.. . . Surat Assam Highest or Lakhimpur
Top United Khasi and Second Banaskantba Jaintia-Hills Panchmahals
Dangs Third Kamrup Lowest or
Darrang Bottom Sibsagar
Second Goalpaia Nowgong lammu and Highest or Jammu ~achar· Jnited Mikir and Kashmir Top
North'Qchar HUitt Third
Lowest or Garo Hills Second Srinagar Bottom Mizo Hills
Lowest or Mantnag Bottom Baramulla
Ladakh 'Bihar Highest or' Patna .. Doc1a
Top Dhanbad Udhampur Singh11hum Xathua
Poonch Third Bhagalpur
Hazaribagh Kerala Highest or Kottayam Top
Second Gaya Shahaba.d nlird Cannanore Monghyr Kozhikode Sahar~. Trichur Purnea Ernakulam
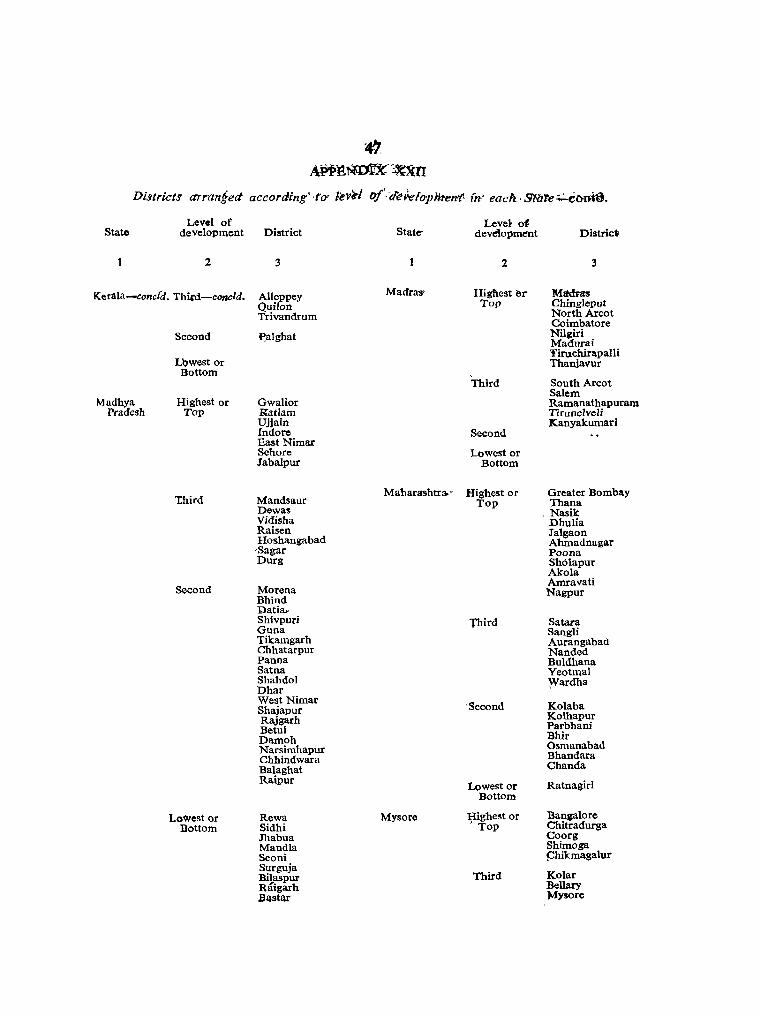
~ AppJ!~¥JC~xn
Districts arrrmi'ed according' -fO' I'ev'el of.(fe~rop}he11't {yt' eac:h -SMre~coni"d.
Level of Level of State development District State- development District
2 3 2 3
Kerala-conctd. Third-conald. Alleppey Mad'ra~ Highest 6r MIidP3S Quilon Top Chingleput Trivandrum North Aroot
Coimbatore Second ~alghat Nilgiri
Madurai Tiruchirapalli
L'Qwest or Thanjavur Bottom
Third South Arcot Salem
Madhya Highest or Gwalior Ramanathapuram Pradesh Top Katlam Tirunelveli
Ujjain Kanyakumari Indore Second East Nimar Sehore Lowest or Jabalpur Bottom
'third Maharashtra. . Highest or Greater BombllY
Mandsaur Top Thana Dewas , Nasik Vidisha Dhulia Raisen Jalgaon Hoshangabad Ahmadnagar 'Sagar Poona Durg Sh61apur
Akola Amravati
Second Morena Nagpur Bhind Datia.. Shivpuri Third Satara Guna Sangli Tikamgarh Aurangabad Chhatarpur Nanded Panna Buldhana Satna Yeotmal Shah dol }Vardha Dhar West Nimar . Second Kolaba Shajapur Kolhapur Rajgarh Parbhani Betul Bhir Damoh Osmanabad Narsimhapur Bhandara Chhindwara Chanda Balaghat Raipur
Lowest or Ratnagiri Bottom
Lowest or Rewa Mysore Highest or Bangalore Bottom Sidhi ' ToP Chitradurga
Jhabua Coorg Mandla Shimoga Seoni f:hikmagalur Surguja
Third Kolar Bilaspur Raigarh BeIlarY Bastar )I1ysore

.~ APfENDl~ XJijJ.
Djstr~ts qrranged according to lev!!l of development in each State-contd.
Level of Level, of Sta~ development District State development Distric!
2 3 2 3
M ysore-concld. "Third-conc1d. South Kanara Rajasthan Highel\t or Bharatpur Hassan Top Jaipur Mandya Ajmer North Kanara Kota Dharwar
Third Ganganagar
Second Tumkur Bikaner Belgaum Alwar Bijapur Jodhpur Gulbarga Sirohi
Bidar Bundi
Lowest or Raichur Second Chum
Bottom Jhunjhunu Sawai Madhqpur Sikar Tonk
Orissa Highest or Pali
Top JaIor Udaipur
Third Sundargarh Chitorgarh Dungarpur Jhalawar
Second Ganjam Dhenkanal Cuttack Lowest or Jaisalmer Balasore Bottom Nagaur
Barmer Lowest or Kalahandi Bhilwara Bottom Koraput Banswara
Sambalpur Bolangir
Highest or Baudh-Khondmals Uttar Pradesh Naini Tal P_uri Top DehraDun Keonjhar Saharanpur MayurbhanJ Muzaffarnagar
Meerut !\ligarh Mathura
Punja.b Highest or Hissar Agra Top Rohtak Kanpur
Gurgaon Lucknow Karnal AmbaIa Ifhird Bijnor Jullundur Ludhiana Moradabad
Ferozepur RamJ?ur Amritsar Bareilly
Gurdas£ur Pilibhit
Kapurt ala Bulandshabr
Bhatinda Allahabad
Patiala Jhansi Varanasi
Third Simla Mitzapur
Sangrur
Second Hoshiarpur Second Shahjahanpur
Btah Mahendragarh Mampuri
Farrukhabad Lowest or Kangra Etawah Bottom Lahaul and Spitt .Jalaun
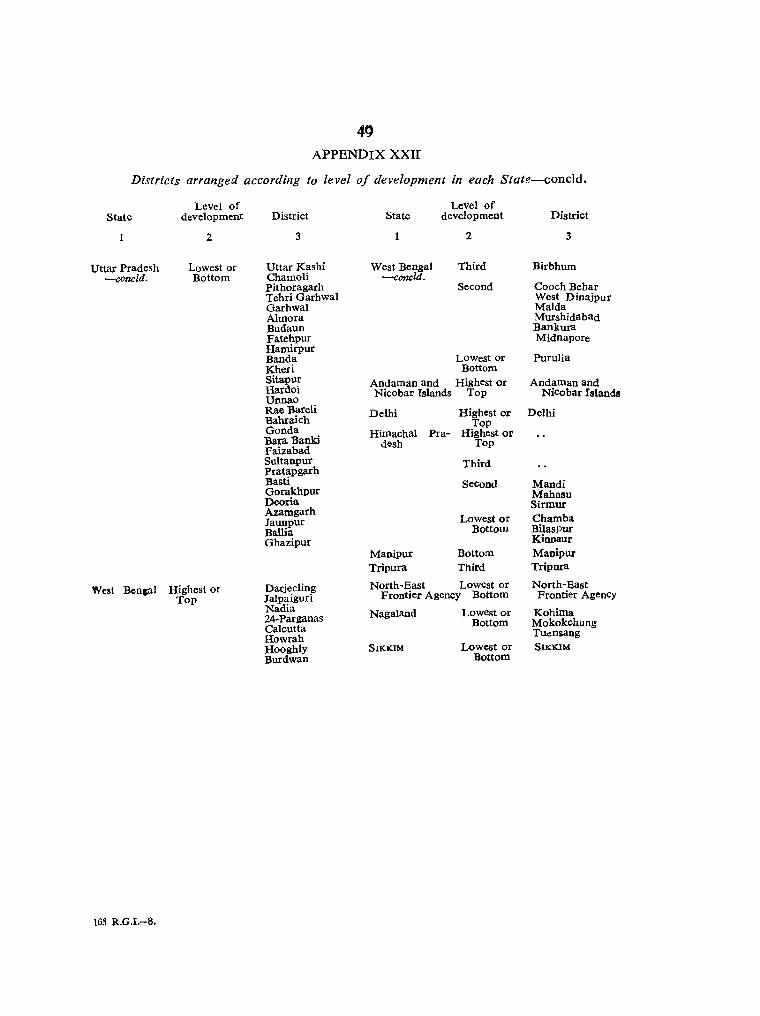
4t}
APPENDIX XXII
Districts arranged according to level of development in each State-concld.
Level of Level of State development District State development District
2 3 2 3
Uttar Pradesh Lowest or Uttar Kashi West Bengal Third Birbhum -concld. Bottom Chamoli -concld.
Pithoragarh Second CoochBehar Tehri Garhwal West Dinajpur Garhwal Maida Almora Murshidabad Budaun Bankura Fatehpur Midnapore Hamirpur Banda Lowest or Purulia Kheri Bottom Sitapur Andaman and Highest or Andamanand Hardoi Nicobar Islands Top Nicobar Islands Unnao Rae Bareu Delhi Highest or Delhi Bahraich Top Gonda Himachal Pra- Highest or Bara Banki desh Top Faizabad Sultanpur Third Pratapgarh Basti Second Mandi Gorakhpur Mahasu Deoria Sirmur Azamgarh
Lowest or Chamba Jaunpur Ballia Bottom Bilaspur Ghazipur Kinnaur
Manipur Bottom Manipur Tripura Third Tripura
West Benea! Highest or Darjee1ing North-East Lowest or North-East Top Jalpaiguri Frontier Agency Bottom Frontier Agency
Nadia Nagaland Lowest or Kohima 24-Parganas Bottom Mokokchung Calcutta Howrah
TUensang
Hooghly SIKKIM Lowest or SIKKIM Burdwan Bottom
163 R.G.I.-8.

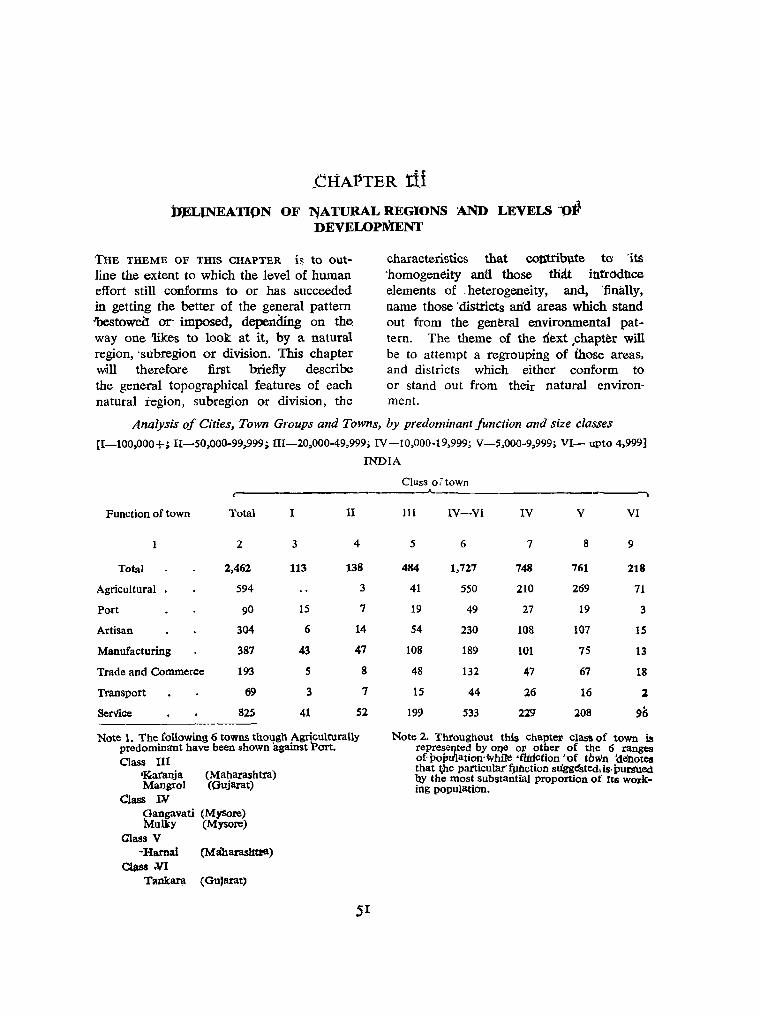
~CHAPTER tii :bJ£LJNEATl()N OF ~ATURAL REGlONS AND LEVELS "0'
DEVEWPlVlENT
THE THEME OF THIS CHAPTER is to outline the extent to which the level of human effort still conforms to or has succeeded in getting the better of the general pattern "bestowed or- imposed, depending on th~ way one 1ikes to look at it, by a natural region, 'subregion or division. This chapter will therefore first briefly describe the general topographical features of each natural region, subregion or division, the
characteristics that contribllte to' 'its 'homogeneity ana those tliat intrMtlce elements of . heterogeneity, and, 'finally, name those' districts atid areas which stand out 1irom the general environmental pattern. The theme of the riext ,chapter will be to attempt a regrouping of those areas, and districts which either conform to or stand out from their natural environment.
Analysis of Cities, Town Groups and Towns, by predominant function and size classes
[1-100,000+; II-SO,000-99,999; 1II-20,000-49,999; IV-10,OOO-19,999; V-5,OOO-9,999; VI- upto 4,999]
INDIA
Function of town Total I II
2 3 4
Total 2,462 113 138
Agricultural 594 3
Port 90 15 7
Artisan 304 6 14
Manufacturing 387 43 47
Trade and Commerce 193 5 8
Transport 69 3 7
SerVice 825 41 52 ._---
Note 1. The following 6 towns though AgqcUlturally predominant have been shown against Port. Class III
.garanja (Maharashtra) Mangrol (Gujarat)
Class l¥ Gangavati (Mysore) Mulky (Mysore)
Class V ·Harnai (MabarasJma)
Class .VI TaPk:~ (Gu,arat)
5I
Class 0 i town
111 IV-VI IV V VI
5 6 7 8 9
484 1,727 748 761 218
41 550 210 269 71
19 49 27 19 3
54 230 108 107 15
108 189 101 75 13
48 132 47 67 18
15 44 26 16 l
199 533 229 208 9~
Note 2. Throughout this chapter class of town ils represeqted by one or other of the 6 ranges of. poim'lation'~hire <fUrlc(ion ''Of tbWn 'denotes that ~he particular' fpbction stiggi!stedds' PliDtUCd by the most substantial proportion of It Ii working population.

s~
REGION 1 HIMALAYAS
This Region contains the entire Himalayan girdle in the north and northeast with the ~o.uritain..or. hiY,liand., districts, States and Union Territories embedded in valleys or encrusted on ridges and footll.\lls. The districts which are more in the plains ~ in the;,: foothills have been excludecf. This regton is treated in three subregions (West Himalayas, East Himalayas" and North-E~stern Ranges), and nine divisions (Jammu and Kashmir, iIimaohal Pradesh and HimalaYllll Punjab,
1.11 1 Himalayas 1.1 West Himalayas 1.11 Jammu and Kashmir.
Jiunmu' and Kasb.mitl may be divided mio. :four distinct s~bdivisiotrs. The first, Ladakh has the I{arakor-am massif and K :.I in the far north, the Great Himalayas and Zaskar Range in the South, and the Indus in between.. The greater part of the Ladakh Plateau has a series of eastwest river valleys and alluvial cones south af the Dtepsang, Soda and Lingzi-Tang
Himalayan Uttar Pradesh of Highland Districts, Darjeeling-5ikkim, BhutanNEFA, the hill districts of Assam, I
Nagaland, Manipur and Tripura). It is significant that in each Division the district at the base of the hill and mountain tracts shows a higher level of development than the tract it serves because it provides the funnelneck of all economic activity in the upper reaches and the contact - mart with the -plains. The entire region can be rqughly described· as a Rice Tract.
Plains in the east and the Paltistan Kara~ koram Range in the west; from north' t~ south the Shyock-Nubra valleys and the Shyock dam; the Chang-Chemmo valley, the Harong va~ley, _ the Pangong rift, the Ladakh range, the -Indus furrow.- Then follow the Zaskar Range and the Greater Himalayas, Rupshu and the Tibetan Plains. Alluvial cones ~e much sought after tor human settlement,. of which there Me several along the Indus between Skardu and Leh. Apart frdrri- the fact tliat tho

work partICIpation rates in the traditional sector of cultivation and household indus
. try (Block ill) as well as distributive trade manufacturing and infrastructure (Block V) enjoy medium values, all the other sectors have low values in Ladakh, serving to put this tract on the lowest level of allround development. The principal language is Ladakhi.
The second subdivision in Jammu and Kashmir begins from the southem flanks of the Greater Himalayas and encloses the valley of Kashmir, walled in on the west, south and part of the east by the Pir Panjal which joins the Siwailik ranges. The districts included in the falllollS vale are Baramulla, Srinagar and Anantnag, all three distinguished by rice cultivation (40, 47 and 51 per cent respectively of all cultivated land under rice). This naturally is an area of dense population: 238 persons per sq. mile in Baramulla, 531 in Srinagar and 312 in Anantnag. The surrounding mountains inoluding the ~ir
Panjal are practically uninhabited. The valley is full of furrows, the Jhelum pro·· viding the main water supply for irriga·· tion and navigation. Above the alluvial flats rise extensive terraces locally known as 'Karewas' which are level surfaces between the incised streams dissecting the terraces, the flanks of which are generally steep. These Karewas, wherever irrigated by channels (Kuls) produce rice, maize and the much prized saffron. The Jhelum marshes and lakes, including the great Wular, harbour floating gardens and encourage formation of new land on the shallow lake-ID.aJrgins with the help of boatloads of lake-mud and weeds. These are called demb lands, used not only for raising 'fruits and vegetables, but even forage, maize and tobacco' (Spate). In the west, Baramulla houses the neck of the Jhelum gorge. It is mainly the high value of block V which lifts Srinagar up
from the general setting of the mediuib. values for all blocks for this zone to the second level of development, Baralllulla and Anantnag being still relegated to the first or lowest level. All the three districts have medium values for each of the five Blocks, except that Srinagar has 'high' value for Block V ( distributive trade, manufacturing and infrastructure). Crait industries ar~ more important in all the three districts, factories being confined largely to Srinagar as State enterprises. The regilitered factories are concerned with weaving of silk, wool and miscellaneous fabrics, forestry and logging, leather and livestock, processing of food and some amount of non-metallic' ininerals, that is, processing of material locally grown. All tlle three districts are connected by electricity grid. The principal language is Kashmiri.
The third subdivision in J anunu and Kashmir begins with the high flanks of the Pir Panjal (average height :4,000 m., Pir Panjal Pass 3,494 m., Banihal Pass 2,832 ill.) which breaks down into the lower but highly dissected Tertiary hills of the Punjab border. This zone contains tmee districts in an arc from west to east: Poonch, U dhampur and Doda. The density of population is the least in Doda (61 persons per sq. mile) and highest in Poonch (193). Udhampur has 147. The staple cultivation is maize followed by wheat and only small quantities of rice in Poonch and Udhampur. Dada commands a portion of the Upper Chenab valley although Poonch and Udhalllpur take the benefit of it and its tributaries for rice cultivation. Values for all blocks in all three districts are either low or medium. Doda has no electricity while Poonch and Udhampur generate their own. All the three districts are graded the first or. lowest level of development. There are no organiacd industries except

lor lorestry and logging in Doda and mining and.quarrying in Poonch .and Udhampur. The princip,al language in Poonch is .Pahari, in Udhampur Punjabi and in Doda Kashmiri.
The fourth- subdivision in Jammu and KasJ,unir consists of the footl;lills and Siwalik terrain and a narrow strip 5-15 miles wi.d~ pf the Punjab plains at altitude of 1,100--1,200 ft. The country is badly ravined which accoUnts for the second place for rice for both Jammu and Kathua, the principal crop being wheat. The density of population in Jammu is 414 persons per sq. mile, that for Kathua being only 203.
The values for blocks IV, V and VI are high for Jammu, those for blocks II and III being medium. 'They place Jammu on the fourth or top level of de~lopment·.
But Kathua is still on the fiJ;,st level, the value for block IV (potential of human resources) alone being high, that for block III (participation rates ihl\he traditional sector of economy, agricu\trlre and household industcy) being low, the remaining blocks being medium. Jammu generates
54 its own electricity and is also connected to. a grid from J ogindemagar at Pathankot while Kathua is connected .to &tid. Organised industry is diversified: food, silk weaving, transport equipment, printing and publishing and miscellaneous industries. But in Kathua it is limited to wood products alone. The .principal language in both districts is Punjabi with which apparently Dogri [has been identified.
This Division, therefore, puts the strong imprint of its natural features on seven out of -nine districts in its four zones. All seven districts <are in the first or lowest
-level of ·development, while Sriilagar is in ,the second and Jammu iIi the 'fourth or 'top. 'It may be-borne in mind that Srinagar drains Ladakh and 'the high settlements while Jammu ,funnels all activity ·between \Jammu and Kashmir !ll1d the plains. The populati9n increase in the Lentire '<livision is' Jow, btU <immigration is -heavy in 1J ammu and Kathua. The proportion of children
-0-4 to women of 15-44 is high in all districts except Ladakh and the Valley which possibly augurs rapid population increaSe in the current decade. Most areas, except goda and Jammu, grow oilseeds.
"Analysis of Cities, Town Groups and I['cwns by predominant function and size classes
l'U JAMMU AND KASHMIR
Funcdon ot town 'total
'total
Agricultural •
Atti~an
Manufacturing
Service •
Class I cities with their function : Scrvicc-Srlna&ar .. _Jammu.
41
14
2S
r
2
.Class of·town
III IV--VI IV VI
4 s 6 7
1 38 4 19
14
1 22 4 2 16
11.12 1 Himalayas 1.1 West Himalayas 1.12 Himacbal Pradesb and ffimalayan Punjab.
The eastern continuation. of the Pir Panjal beyond the Chandrabhaga and upper Chenab Valley, the Siwaliks, the intermediate spurs, and the lesser Himalaya which here forms a definite range, the Dhaola Dhar, girdling the soutl1ern edge of the Chamba Valley, form a typical 10ngi~ tudinal arrangement_ The Siwaliks, 'here with a remarkably even crest at 2.000'---3,000 fect. but fargely deforested and savagely eroded, form the chos (should be cho) torrents which bring ruin to the plains below' (Spate). The Dhaola Dhar separates the longitudinal sections of Beas and Ravi. Chamba district takes the upper reaches of the Chenab in the north, while the Ravl flows past Chamba and Dalhousie. The Beas takes its rise 1n Lahaul and Spiti and runs east-west through Kulu, Mandi and Kangra. The Sutlej flows through Kinnaur and Bilaspur. Mahasu, Simla and Sirmur art> on the Siwalik range. The Kulu'Valley alone (north-south) is nearly transverse to the main trends (east-west).
Lahau! and Spiti has the sparsest pnpulation (6 persons to the square mile), although it Ihas experienced hio-h rates of increase and immigration in the last decade. The proportion of children 0-4 to women of'15-44 is· however low. The other districts in this division in ascending order of population density are Kinnaur (16), Chamba (79), Mahasu (159). Kanl!1"a (169), Sirmur (173), Mandi (237). Bilaspur (354) and Simla (507).
The division may be divided into five well defined subdivisions. The first, Labaul and Spiti. is reminiscent of Ladakh on account of its low popUlation density and the rivers it gives rise to. Lahau! and Sniti is in the first level of development: the v:'llnes of block& III (participation rates in the
55 traditional sector of economy: agriculture and household' industry) and IV (potential of human resources) are high, for block V medium while those for blocks II and VI' are low. It generates its own electricity but has no registered factory.
The second subdivision is Chamba. a valley enclosed between the outliers of the Pir Panjal alid the Dhaola Dhar. S. P. Chatterjee calls the pattern of popul.ation distribution in these valleys dendritictreelike, which is apt, as settlements follow the course of rivers and their tributaries. Chamb:r has high value for block IV (potential of huthafi resources and high tribal population), low value for block VI (organised industrtal activity) and medium values for the remaining blocks. It genera~ tes electricity locally but is also connected to Uhi River Power Supply Grid., It enjoys the first Or lowest level of development. Cbamba is the only district in the Division which grows oilseeds.
TIle third subdivision is comprised of the districts on the Beas valley, Mandi and Kangra. Kangra is in tWo' parts, IGingra proper and Kulu valley intersected bv the wedge of MandL Kangra valley is featured by the J aswan Dun, a piedmont plain or flat-floored valley. All values for Kanpra are either low or medium. while block IV (potential of human resources) alone is high for Mandi. Both Kangra and Mandi are connected to electricity grid. Kangra is placed in the first level of development, while Mandi is placed in the second.
The fourth subdivision as formed by the single district of Kinnaur which enjoys high values for block IV but low value for block IT (agricultural infrastructure) and medium values for the remaining blocks. ft has no electricity. A peculiar feature is the high Bhotiya valleys and dominant tribal population. It is in the first leve1 'of development.
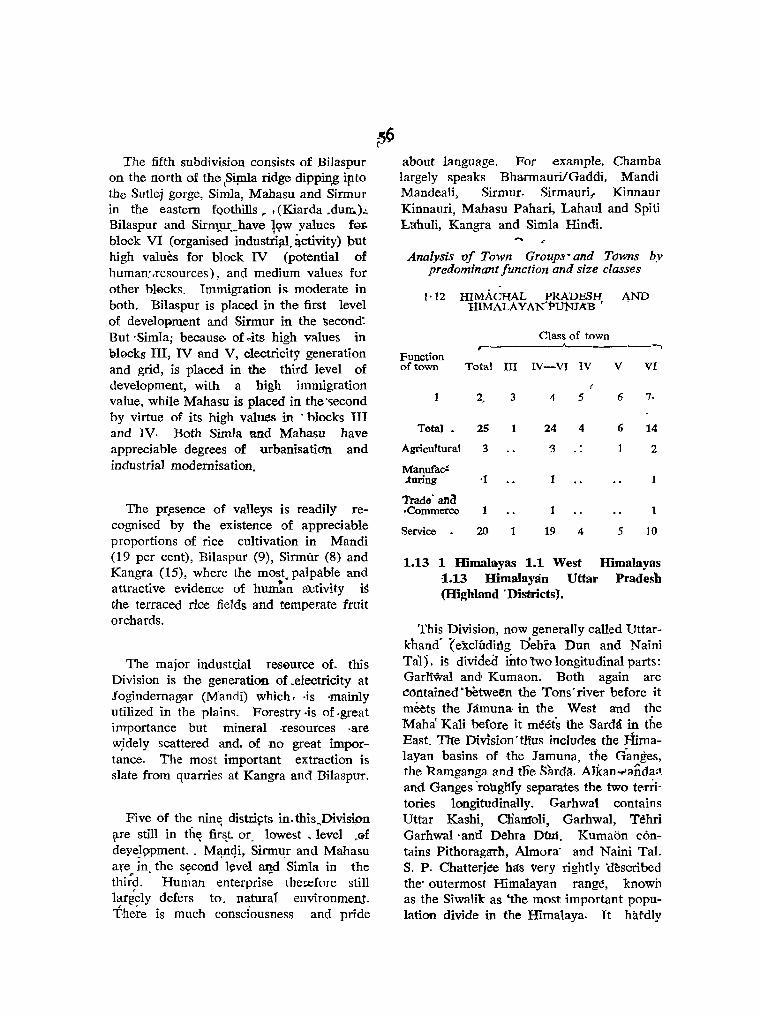
The fifth subdivision consists of Bilaspur on the north of the ,S4nla ridge dippin,g ipto the Sutlej gorge, Simla, Mahasu and Sirmur in the eastern fQoiliills ... r (Kiarda .dun:.).:. Bilaspur and SirmJ.U:_have 1.9w yalues fat:. block VI (organised industrijll. ~ctivity) put high values for block IV (potential of human',resources), and medium values for other blacks. Immigration is. moderate in both. Bilaspur is placed in the first level of development and Sirmur in the "Second: But -Simla; because of cits high values in blocks III, IV and V, electricity generation and grid, is placed in the third level of development, with a high immigration value, while Mahasu is placed in the ''iecond by virtue of its high values in 'blocks III and IV. Both Simla Md Mahasu have appreciable degrees of urbanisatidh and industrial modernisation.
The pr,esence of valleys is readily recognised by the existence of appreciable proportions of rice cultivation in Mandi (19 per cent), Bilaspur (9), Sirmtir (8) and Kangra (15), where the most. palpable and attractive evidence of huni~n a'ctivity IS
the terraced rice fields and temperate fruit orchards.
The major industtial resource of. this Division is the generation of ,electricity at Jogindernagar (Mandi) which r ·is 'mainly utilized in the plaim. Forestry ·is of .great importance but mineral ·resources ·are wjdely scattered and. of -no great importance. The most important extraction is slate from quarries at Kangra and Bilaspur.
Five of the nin~ distriyts in. thisJ)iviston ~re still in thE( fin~t or. lowest, level ,@f deye)wment. . M~n(#~ Sirmur and Mahasu are in the second l~vel and Simla in the thi;d. ' Hu~an enterpris~ therefore still largely defers to, natural environment. f,here is much consciousness and pride
about language. For example, Chamba largely speaks BharmaurilGaddi, Mandi MandeaIi, Sirmur. Sirmauri,. Kinnaur Kinnauri, Mahasu Pahari, Lahaul and Spiti l,nhuli, Kangra and Simla Hindi,
Analysis 'Of Town Groups- and Towns by predominant function and size classes
1·12 HIMACHAL PRADESH A.ND HIMALA YAN'PUNJAB '
Class of town ~ ~-------~
Function of town Total III IV-VI IV V VI
2,
Total 25
Agricultural 3
Manufac! .turing '1
Trade' ana .Commerce 1
Service 20
3
1
1
4
24
'3
19
5 6
4 6
4 5
7·
14
2
10
1.13 1 Himalayas 1.1 West Himalayas 1.13 Himalayan Uttar Pradesh (Highland 'Districts).
This Division, now generally called Uttarkhand' (excluding Dehra Dun and Naini Tal), is divided into "two longitudinal parts: Garliwal and Kumaon. Both again are ~dntained 'between the Tons'river before it me~ts the Jamuna· in the West and the "Maha' Kali before it mMts the Sarda in the East. TIre Division'tlius includes the Himalayan basins of the Jamuna, the G'anges, the 'Ramganga and tne Sarda-. Alkan-e>anda;t. and Ganges 'rottgl1l'y separates the two teoorrltories longitudinally. Garhwat contains Uttar Kashi, Cliamoli, Garhwal, Tehri Garhwal 'and Dehra DUIi. Kumaon contains Pithoragarh, Almora' and Naini Tal. S. P. Chatterjee hllS Very rightly 'described the' outermost Himalayan range, known as the Siwalik as 'the most important population divide in the Himalaya. It hardly

rises above 1,000 m., but its much dissectep sJ}rface, steep southern scarp, thin soil covering and fairly dense jungle, discourage agricultural activities, and it remains almost uninhabited. There is a sudden bursting of life where the Siwalik ends and the piedmont plains or flat-floored interior valleys, locally known as duns begin.' The Jaswan Dun has already been mentioned. In this Division Dehra Dun 'is a typical example of these valley oases in the out€r Himalayas.'
The northernmost extremity of this Division is composed of a garland of glaciers and peaks: the Kedamath--Badrinath group which gives rise to the Bhagirathi and Alakan~nda; Kamet across the Alakananda and farther East Trisul, Nanda Kat and Nanda Devi. Apart from Dehra Dun the country is heavily dissected almost throughout at heights of hOOO-3,gOO m. The climate show,s the usual montane variations. Run-off is extremely rapid, particularly' where the surface is -bare of forests. Clin'lbing up the tarat or bhabar land and Siwalik one proceeds from the sal forests, to evergreen uak and rhododendron around 1',000 m. and up, with ash, yew, Hex and bamboo, and further up the coniferous belt between 3-4,000 m., and finally alpine scrub., There are grass patches up to 5,400 m· The forests naturally play an important part in the life of the people. Mineral deposits are patchy and not of much economic significance.
Spate observes that 'the' basis of life in "Kumaon is an elaborateJy organised agriculture.' He quotes S. D. Pant to describe the Kumaon cultivation types: katU on'the forest edge, upraon on hillsides and taiaon, valley. The terracing is often most elaborate. Equally elaborate and ingenious are rotations. On the upraon the village lands are divided into two compact bIocks, the rice and the madua sars, 163 R.G.J.-9.
and these have an. alternating rotation. In talaon land the three very different systems of paddy cultivation enable the same area to grow kharif rice for years, rotating the type of tillage and introducing different rabi crops· Soils are generally poor, shallow and stony and manuring is very important. The range of crops is described in block II. It will be seen that rice is sedulously cultivated in all districts, being to some extent a prestige food. Marketgardening and potato cultivation are fast ~aining ground while sheep rearing is widespread.
On the Garhwal side Hardwar at the Southeastern tip of Dehra Dun district, where the Ganges breaks the Siwaliks, is
a typical contact mart, with the added ::lttractions of the holy river' (Spate). The Dun drains evenly into J amuna and Ganges, the town lying on the low swelling interfluve. The towns are essentially petty marts: 'contact points of hill and plain in the bhabar. or nodes of valley-on ridgeways the importance of sunShine is emphasised by the distinction between culti"9"ated taila slopes-the sunny or adret side of the valleys-and the wrested saylo: a t the highest level live the' Bhotiyas, among whom pastoralism and trading are more important than agriculture. Villages are u mally along spurs low enough to avoid the bleakness of the ridgetops, but well above the sultry valleys; the village lands often extend in strip-parish fashion, from irrigated valley floor to forested or grassy ridge top' (Spate).
There are thus, broadly, three natural sllbdivisions: The first is comprised of Uttar Kashi, Chamoli, Tehri Garhwal and Garhwal. Of these Tehri Garhwal is connected to electricity grid. Garhwal generates its own while Uttar Kashi and ChamoH have no electricity.
All the four districts have places in the first or lowest level of development, the
values for Tehri Garhwal' particularly being row for all blocks except III (participation' rates in traditional economy) where it i!'l medium. All the four districts have low values in block iI (agricultural infrastructure) and block V (distributive trade, manufacturing and infrastructure) . In block III Uttar Kashi alone enjoys high value, the other three commanding only medium· In block IV (potential of human resources) Uttar Kashi and Chahloli have rlletlium and Tehri GarhwaI and Garhwal low ""-'talues. I'n block VI (organised industrial activity) Uttar Kashi and Tehri Galnwal na"Ve low ami Cham.o'L\ anu (j~rhwal medium values. There are no . . registered' faotories in Uttar Kashl and Chambli. Tehri Garhwal has very few engaged in miscellaneous manufactures but Garhwal has a few factories engaged in miscellaneous manufactures,,' machinery 6thet than electrical and transport.
. b'he principal language in Uttar Kashi, C.hamoli and Tehri Garhwal is Garhwali, In "Garhwal it is Hindi.
i The second subdivision is formed by dne district alone: Dehra Dun, which itself is' sharply dividea in two: the Dun cmnpnsetl of porous bhabar soil and patches of badlands' and Mussoorie Hills which rise abruptly' to' a peak of 2,005 m. (Camel's' Back). l:.ahdaur is 7,534', and Vari Tibba 6,749' .. Dehra Dun is ilOtea for iJ1:s fbrestiy; timber, sawyards, charcoal, furniture-.. The principal language is Hindi.
In resp)ect of economic development' Dehra Dun ranks in the fourth or top level 'ffith ,high, values for all blocks except III ~participation.irates in, traditional economy) "Iqer~, the value is. medium, which itself is IIIag~ificent. Dehra I)un generates its own y}ectricity and is also c"nnected to grid, S;:u.,riously and significantly enough in the matter of registered.jactories food industries and not fore~try take the pride of place, t?1).o,we!=l by textiles, miscellaneous indus(~ies; printing and publishing and non-
metallic minerals. The population density' of Dehra Dun in 1961 was 452 persons' per square mile.
The third subdivision is oomposed of Pithoragarh of the high valleys, Almora (usuall'y between 2.000-2,500 m.) and Naini Tal. Pithoragarh has no town and no electricity. In the valleys and recesses it grows rice but the staple is wheat, ragi and barley. Almora has two beautiful towns: Ranikhet with its cantonment and Almora, both important as educational centres and renowned for their wood C'iCi"vlwg and w'Ucl\~n g~",. A.~1::a t'1. connected to electricity grid. Naini Tal, like D~hr:;t Dun, stands apart in development. 1t generates its 'Own electricity and is also oonnected to grid. The principal language of Pithoragarh and Almor~ is Kumauni and qf Naini Tal Hindi.
The pattern of values for both Pithoragarh and Almora is identical, low in blocks II, V and VI and m.edium in III (traditional economy) and IV (human resources) . BOoth are in the 'first or lowest rank of development. Pithoragarh has no' registered factories but Almora has a few engaged itr textiles, miscellaneous industries and chemicals.
Naini Tal occupies a place in the fOlmh or top rank of development. It enjoys high varues in II (agricultural infrastructure), IV (potential .of human resources), V (distributive tra.:Ie and infrastructure) and VI (organised industrial activity) and medium value in III (traditional sector). lis pooled total Score is much liigher tlian even Dehra Dun's. The population density in 1961, was 237 per sq. mile.
Six out of eight districts in the Division therefore are in the lowest level of development. They constitute the six highland districts of Uttar Pradesh. Dehra Dun descends to the- duns and Naini Tal to the tar'li (bhabar land in Haldwani) and are
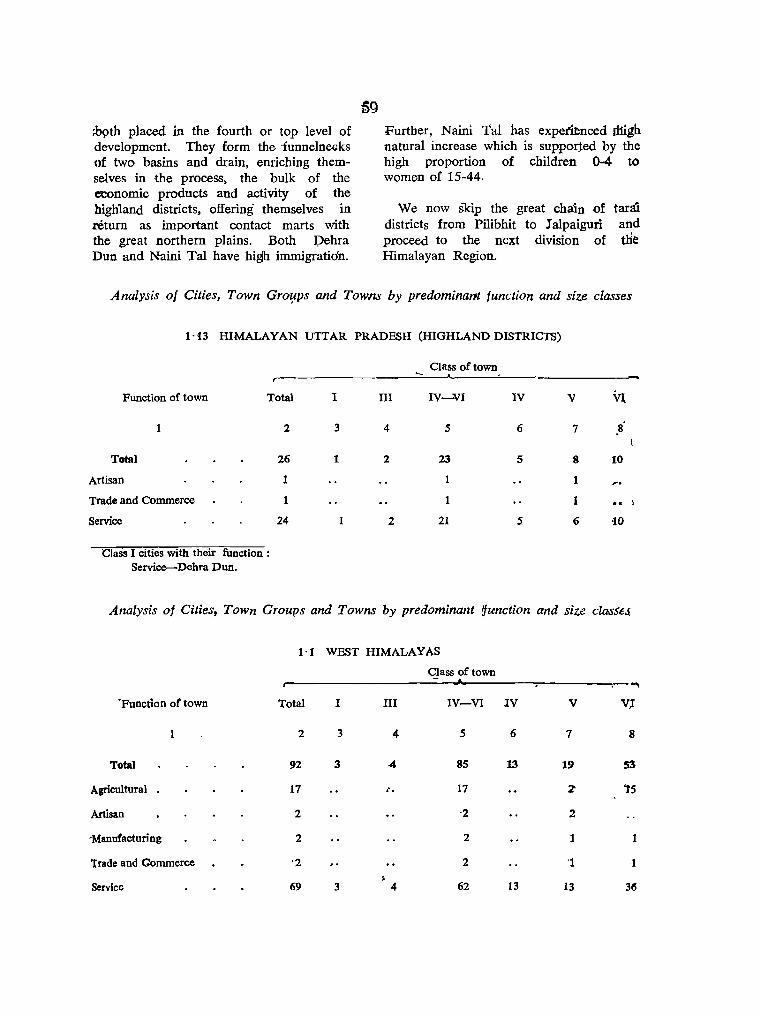
~th placed in the fourth or top level of development. They form the -funnelnecks of two basins and drain, enriching themselves in the process, the bulk of the economic products and activity of the highland districts, offering themselves in return as important contact marts with the great northern plains. Both pehra Dun and Naini Tal have higJh immigration.
Further, N aini Tal has experl.enced dtigh natural increase which is supported by the high proportion of children 0-4 to women of 15-44.
We now Skip the great chain of farm districts from Pilibhit to J alpaiguri and proceed to the next division of tlie Himalayan Region.
Analysis of Cities, Town GrolfPs and Towns by predominant function and size classes
1'13 HIMALAYAN UTTAR PRADESH (HIGHLAND DISTRICTS)
Class of town r-
Function of town Total I iII IV-VI IV V Vl
1 2 3 4 5 6 7 .8'
Total 26 1 2 23 5 8 10
Artisan 1
Trade and Commerce 1 1 .. j
Service 24 2 21 5 ~ 10
ClaSs I cities with their function: Service-Debra Dun.
Analysis of Cities, Town Groups and Towns by predominant 1unction and size clasSes,
1·1 WEST HIMALAYAS
Class of town
"'" 'Function of town Total I III IV-VI lV V V..I
2 3 4- S 6 7 8
Total 92 3 -4 85 13 19 53
Agricultural 17 t. 17 2' '15
Artisan 2 '2 2
'Manufacturing 2 2 1 1
Trade and Commerce '2 , . 2 'I 1
Service 69 3 4 62 13 13 315
1.21 1 Himalayas 1.2 East Himalayas 1.21 Darjeeling-Sikkint.
The foothills of Darjeeling slowly .descend into the tarai (locally called Morang) .o~ Siliguri Subdivision which is a nar;ow strip of the No~th Bengal plain, crisscrossed by many fast flowing streams, producing coarse porous bhabar soH excellent for growing tea. Darjeeling district is longitudinally cut into two unequal halves by the Tista gorge with Darjeeling and Kurse-ong in the West and Kalimpong in the East. The central knot of spurs is at Gboom and Tiger Hill from which one spur travels to Senchal and another to Darjeeling. A third £orms the high spine of the Kurseong spur, while a fourth of the Mirik spur. Beyond Sukhiapokri starts the Singalila range which has four high points: Sandakphu, Sabarkum, Phalut and Singalila. On the east is thrown the PeshOk-Tl'lkdah spur which descends to the Tista gorge. The population density is high being 497 per sq. mile in 1961.
60
Sikkim is a mass of deeply dissected highland. The high west waH of the Himalaya proceeds up the J ongri glacier to Kang La (La=pass), on to Kabru (24,015') leaving Pandim (22,020') on the East to meet Kanchanjangha (28,466') in Nepal. The ~ighest peak in
Sikkim proper, PowhUliri (13",180') Southeast of Dongkya La, and the next Siniolchu (22,570') north-east of Pandim. Almost 'on the northern border adjoining Tibet but well inside Sikkim is the second 'highest peak Chomiomo (22,430'). The two northern pas~es are Serpuba La (16,400') and Kongralama La (16,900'). The pass on the North-east is Dongkya La (18,131') south of Cholamo La_ke (17,000'). The two most important trade
'passes until recent times were Nathu La and Jelep La both leading into the Chumbi
Valley. The population density was 58 per ·sq. mile in 1961.
While tea is the most important manufacture of DarjeeIing, agriculture inCludes terraced wet paddy (pani-khet) in· the valleys in both Darjeeling and Sikkim. Orange is extensively grown and cardllmom is an important cash crop. Bamboo is the staple building and piping material. Settlement is essentially dendritic and in Sikkim often dispersed in hamlets of two to four homesteads. The large villages and small towns are important staging points in the great trade routes with Nepal and Tibet.
The most important crop in Darjeeling is rice, in Sikkim maize and also rice. Siliguri grows much jute and the district as a whole some oilseeds.
In ranking DarjeeIing and Sikkim are at opposite poles. Darjeeling takes its place in the fourth or top level with high values for all blocks except III (participation rates in traditional economy) in which it rates medium, which itself is significant as in Dehra Dun. It generates its own electricity at several points and has a grid network. Siliguri, the base subdivision of Darjeeling, acts as the funnelneck of all activity in Darjeeling and Sikkim, part of IIam (Nepal), the North Bengal Plains and Assam. By contrast, Sikkim is in the first or lowest grade with low value in block II, medium values in blocks IV, V and VI an~. high value only in block III (participation rates in traditional sector)
The: principal industries in Darjeeling are tea, transport and transport equipment, wood industries, basic chemicals' and furniture and fixtures.
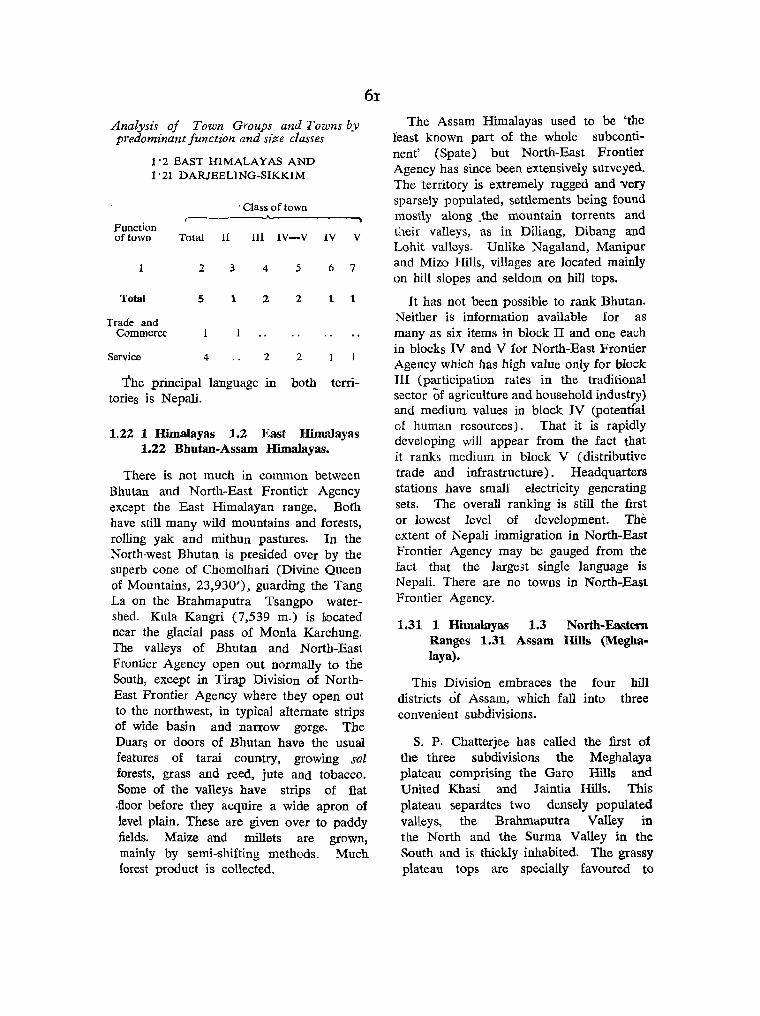
Analysis of Town Groups and 'J.'owns by pl'edominanlfuncllon and size classes
1 . 2 EAST HIMALAYAS AND l' 21 DARJEELING-SIKKIM
. Class of town
Function of town Total II III IV-V IV V
Total
Trade and Commerce
Service
2 3
5 1
4
4 5 6 7
2 2 1 1
2 2
The principal language in both territories is Nepali.
1.22 1 Hirrutlayas 1.2 East Himalayas 1.22 Bhutan-Assam Himalayas.
61
There is not much in common between Bhutan and North-East Frontier Agency except the East Himalayan range. Both have still many wild mountains and forests, rolling yak and mithun pastures. In the North-west Bhutan is presided over by the superb cone of Chomolhari (Divine Queen of Mountains, 23,930'), guarding the Tang La on the Brahmaputra Tsangpo watershed. Kula Kangri (7,539 m.) is Located near the glacial pass of Monla Karchung. The valleys of Bhutan and North-East Frontier Agency open out normally to the South, except in Tirap Division of NorthEast Frontier Agency where they open out to the northwest, in typical alternate strips of wide basin and narrow gorge. The Duars or doors of Bhutan have the usual features of tarai country, growing sal forests, grass and reed, jute and tobacco. Some of the valleys have strips of fiat .fioor before they acquire a wide apron of level plain. These are given over to paddy fields. Maize and millets are grown, mainly by semi-shifting methods. Much forest product is conected.
The Assam Himalayas used to be 'the least known part of the whole subcontinent' (Spate) but North-East Frontier Agency has since been extensively surveyed. The territory is extremely rugged and very sparsely populated, settlements being found most~y along _the mountain torrents and their valleys, as in Diliang, Dibang and Lohit valleys. Unlike Nagaland, Manipur and Mi:ro Hills, villages are located mainly on hill slopes and seldom on hill tops.
It has not been possible to rank Bhutan. Neither is information available for as many as six items in block II and one each in blocks IV and V for North-East Frontier Agency which has high value only for block III (participation rates in the traditional sector of agriculture and household industry) and medium values in block IV (potentIal of human resources). That it is rapidly developing will appear from the fact that it ranks medium in block V (distributive trade and infrastructure) . Headquarters stations have small electricity generating sets. The overall ranking is still the first or lowest level of development. The extent of Nepali immigration in North-East Frontier Agency may be gauged from the fact that the large3t single language is Nepali. There are no towns in North-East Frontier Agency.
1.31 1 I-limala~as 1.3 North-Eastern Ranges 1.31 Assam Hills (Meghalaya).
This Division embraces the four hill districts of Assam, which fall into three convenient subdivisions.
S. P. Chatterjee has called the first of the three subdivisions the Meghalaya plateau comprising the Garo Hills and United Khasi and J aintia Hills. This plateau separates two densely populated valleys, the Brahmaputra Valley in the North and the Surma Valley in the South and is thickly inhabited. The grassy plateau tops are specially favoured to
which the pine forests and waterfalls lend great charm. The lava soils in the plateau scarps 'are extremely fertile and suitable for growing oranges. South of the Tura range there is some concentration of population in the Someswari and other river valleys.' (Chatterjee) . Rice is the major crop in all districts claiming more than 50 per cent acreage in all except United Mikir and North Cachar Hills (Mizo Hills 93 per cent), followed by maize· Sugarcane, cotton and oil seeds are grown in United Mikir and North Cachar Hills and cotton, jute and oilseeds in Garo Hills.
The United Mikir and North Cachar Hills, East of the United Khasi and Jaintia Hills, forming the second subdivision, are mostly inhabited by Mikirs and Kacharis who do much jhum or shifting cultivation. Mikir villages hug the hill slopes. The population being mobile, most villages are small, as all villagers of the &arne clan still prefer to live in the same house. The Kacharis also praqtise jhum aultivation and live either on the lower hill slopes or in the river valleys. Diphu is the district headquarters. Lumding is the largest railway centre.
The Mizo Hms is the third subdivision in the South 'wedged in between Tripura and Chittagong Hill Tracts in the West -and Manipur in the East. The mountain ridges and valleys run North-south commanding some of the most charming and haunting landscapes made picturesque by a highly cultured and enterprising population, the Lushais. Most villages of the Lushais are on tops of hills or ridges. small, neat and highly organised. The silted Champhai lake lends itself to concentration of population. Aijal is the only town and district headquarters.
Garo Hills had the highest population density in 1961 of 97 persons per sq. mile, United Khasi ana J aintia Hills of 83, United
Mikir and North Cachar Hills of 48 and Mizo Hills the lowest of 33. The principal languages are respectively Garo, Khasi, Mikir and Mi.w. The populations are overwhelmingly tribal.
Garo Hills has low value in block 11 (agricultural infrastructure), high value in block IV (potential of human resources) and medium values in blocks III, V and VI. It generates a small quantity of electricity in Tura. It is placed in the first level of development. So is Mizo Hills which has no electricity and enjoys medium values in all blocks except in block IV where the value is high.
United Mikir and North Cachar Hills is placed in the second level of development having medium values in all .blocks except in bloc~ IV where the value is high. The distrIct is, therefore, treading the same line of development as Mizo Hills; only it is ahead of the latter. It generates electricity in the headquarters.
United Khasi and Jaintia Hills is way ahead of the other three districts, enjoying a high total score. It has high values in blocks II, III and IV and medium values in blocks V and VI. The dishict contains the capital of Assam State and has a wide range of organised industry in registered factories: printing and publishing, transport equipment, electricity generation, wood products, machinery other than electrical.
Garo Hills has some cotton and jUle ginning and pressing. Mizo Hills has no registered factories. United Mikir and North Cachar Hills has registered factories 'devoted to food processing, wood 'and cork products and generation of electricity.
The Division as a whole is, therefore, very much awake and, although development is still patchy, the ferment is evident everywhere. The rates of natural increase and immigration are high but the proportion of children 0-4 to women of 15-44 is
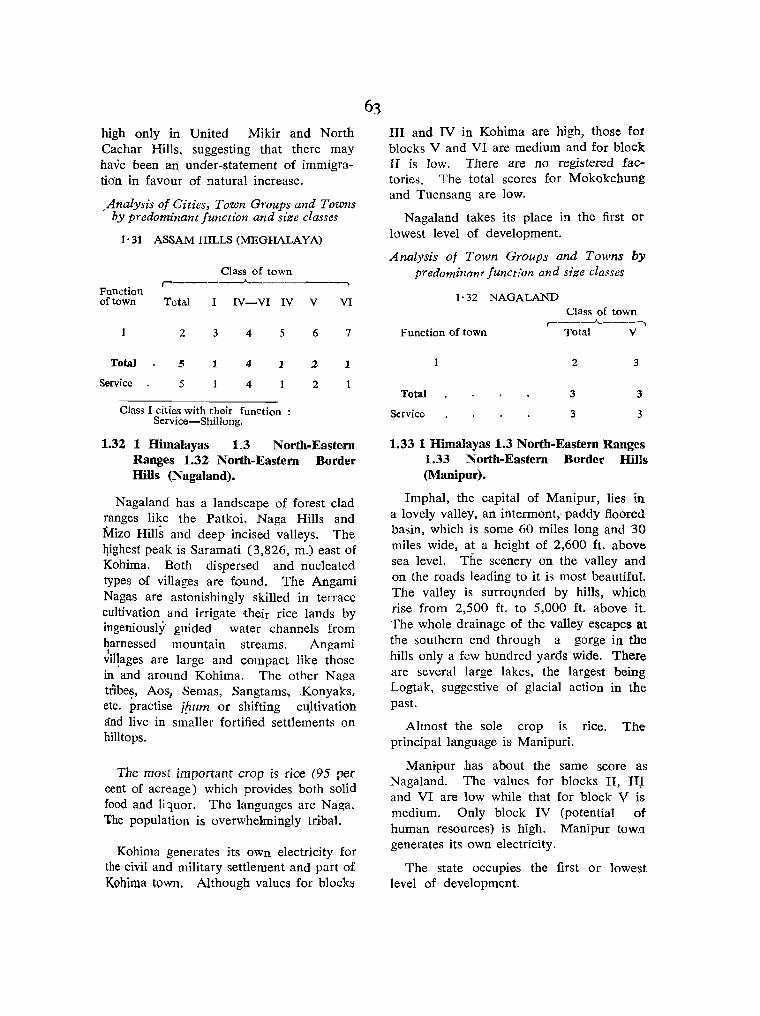
high only in United Mikir and North Cachar Hills, suggesting that there may have been an under-statement of immigration in favour of natural increase.
. Analysis oj Cities, Town Groups and Towns by predominant Junction and size classes
1'31 ASSAM HILLS (MEGHALAYA)
Class of town r------..A..----------,
Function of town
TotAl
Service
Total
2
5
5
I IV-VI IV V
3 4 5 6
1 4 1 2
4 2
Class I cities with their function : Service-ShiIIong.
VI
7
.1
1.32 1 Himalayals 1.3 North-Eastern Ranges 1.32 North-Eastern Border HiDs (Nagaland).
Nagaland has a landscape of forest clad ranges like the Patkoi, Naga Hills and Mizo Hills and deep incised valleys. The 4ighest peak is Saramati (3,826, m.) east of Kohima. Both dispersed and nucleated types of villages are f,ound. The Angami Nagas are astonishingly skilled in terrace cultivation and irrigate -their rice lands by ingeniously' guided water channels from ~amessed mountain streams. Angami vi1!ages are large and compact like those in and around Kohima. The other N aga tnbe~, Aos1 Semas, Sangtams., Konyak's, etc. practise jEzum or shifting c{\ltivation and live in smaller fortified settlements on hilltops.
The most important crop is rice (95 per cent of acreage) which provides both solid food and kluor. The languages are Naga. The population is overwhelmingly tdbal.
Kohima generates its own electricity for the civil and military settlement and part of Kohima town. Although values for blocks
III and IV in Kohima are high, those for blocks V and VI are medium and for block II is low. There are no registered factories. The total scores for Mokokchung and Tuensang are low .
Nagaland takes its place in the first or lowest level of development.
Analysis of Town Groups and TOlvns by predomz'nant Junction and st'ze classes
l' 32 NAGALAND
Function of town
Total
Service
Class of town r-----"----- .,
Total V
2
3
3
3
3
3
1.33 1 Himalayas 1.3 NOI1th-Eastern Ranges 1.33 North-Eastern Border Hills (Manipur).
Imphal, the capital of Manipur, lies in a lovely valley, an intermont,. paddy floored basin, which is some 60 miles long and 30 miles wide, at a height of 2,600 ft. above sea level. The scenery on the valley and on the roads leading to it is most beautiful. The valley is surrovnded by hills, which rise from 2,500 ft. to 5,000 ft. above it. The whole drainage of the valley escapes at the southern end through a g.arge in the hills only a few hundred yards wide. There are several large lakes. the largest being Logtak, suggestive of glacial action in the past.
Almost the sale crop is rice. The principal language is Manipuri.
Manipur .has about the same score as Nagaland. The values for blocks II, IlJ and VI are low while that for block V is medium. Only block IV (potential of human resources) is high. Manipur town generates its own electricity.
The state occupies the first or lowest level of development.

1.34 1 Himalayas 1.3 North-Eastern Ranges 1.34 North-Eastern Border Hills (Tripura~.
T.ripura suggests 'a boxing glove to the Southwest of Cachar and West of Mizo Hills. It borders Comilla district in the east and Chittagong and Chittagong Hill Tra~ts of East Pakistan in the South. It is mostly a plain and plateau country ribbed with north-south hill ranges which divides Tripura into long narnow longitudinal strips of plateau with incised valleys. The slopes and valleys are filled with dense mixed forest, mainly bamboo, which from the (:lir looks like elaborate, luminous green coral and sea anomenc .t,n crear, ocean floors. To the extreme west on the Haora river is Agartala, the State headquarters, which is barely four miles from Akhaura, the most important railway junction of Comilla in East Pakistan. In the South-west Sonamura on the Gumti river faces Comilla to\\'ll. The Selonia-Muhari doab in Belonia (Southwestern subdivision) contains very thickly settled villages, but Sabrum, the Southernmost subdivision, is mostly wooded. The first North-south range of low hills starts due east of Belonia town and passes through the western regions of Sabrum. The Muhari river drains this ridge in the West. The second longitudinal ridge, Deota mura, starts east of Mohanpur Tea Estate in Agartala subdivision (Bar Mura peak 570 m.) runs down almost due south, its ,spine serving as the dividing line between Udaipur and Amarpur subdivisions, the eastern reaches of Belonia, until it partiaIJy subsides near Ajodhya Bazar and Sabrum where the Fenny river flowing: down the valley between the second and third ridges acquires a respectable width. Khowai subdivision in the north straddles the th1rd, longitudinal Athara mura ridge (counting f110m Belonia in the West), a high pojnt on the range being Athara mura 1 ,463 ft. Amarpur subdivision, south of Khowai and north of Sabrum, also straddles the same third ridge (the highest point on tMs tract
being Jari Mura 1,355'). The Chitlgri river flows down the valley between the third and the fourth longitudinal ridge. This fourth, Langtarai-Sardengmura ridge (Langtarai Peak, 1,539') which divides Kamalpur (West) from Kailasahar (East) in the North is a thick, fat spine with many high points down the line. Dharmanagar subdivision, the easternmost, stands west of the fifth longitudinal Sakkan_!dang ridge (highest peak Sakkan) which rlivides it from Kailasahar. Dharmanagar itself is on the Silua river in the valley of which nestle many villages. The sixth and e(;\.stemmost ridge is marked by the J ampai Tlang. The eastern boundary, which separates Tripura from Mizo Hills and the Chittagong HilI Tracts, is formed by fhe Lungai river between the Hachhek and J ampui ranl?es to its source in the Betling Sib Peak (939 m.). The boundary next runs in an irregular line to the Dolajari Peak, and then along the Sardeng range and the Fenny river, till the latter enters the district of Noakbali (East Pakistan). Each successive hill range towards the East is a little higher than the previous one. These ranges ~lso increase in height southwards from the plains of Sylhet and northwards from Chittagong District, till they reach their highest points near the watershed lhle of the. rivers running North and South. The northern portions of the valleys between these ranges are for the most part flat, swampy and covered with rank vegetation; while, to the south, they are of a wild and broken character, intersected by an infinity of deepcut ravines and low, intricate narrowtopped ridges.
The chief crop is rice but Tripura also grows much jute, some cotton and oilseed. It is also a fairly important tea growing area. The texture of the population ha~ been greatly changed by the influx of a large population of displaced persons which has settled in the western alluvial"
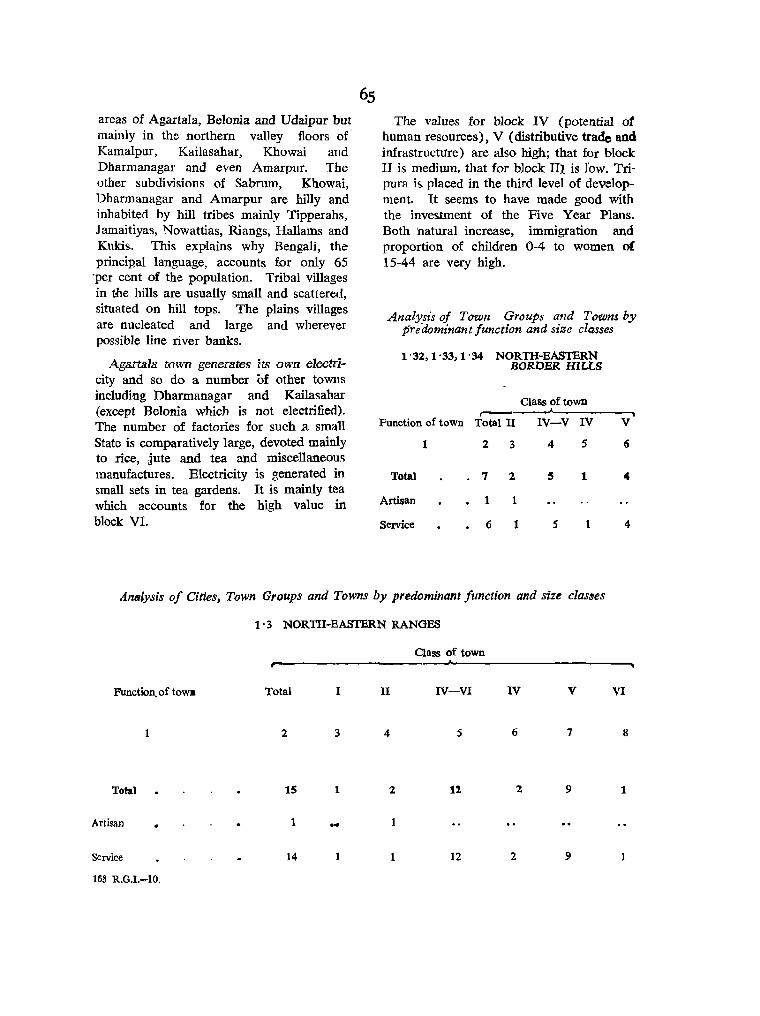
areas of Agartala, Belonia and Udaipur but mainly in the northern valley floors of Kamalpur, Kailasahar, Khowai and Dharmanagar and even Amarpur. The other subdivisions of Sabrum, Khowai, Dharmanagar and Amarpur are hilly and inhabited by hill tribes mainly Tipperahs, J amaitiyas, Nowattias, Riangs, Hallams and Kukis. This explains why Bengali, the principal language, accounts £or only 65
·per cent of the population. Tribal villages in the hills are usually small and scattered, situated on hill tops. The plains villages are nucleated and large and wherever possible line river banks.
Aga.rtala town generates its own electricity and so do a number of other towns including Dharmanagar and Kailasahar (except Belonia which is not electrified). The number of factories for such .a small State is comparatively large, devoted mainly to rice, jute and tea and miscellaneous manufactures. Electricity is generated in small sets in tea gardens. It is mainly tea which accounts for the high value in block VI.
The values for block IV (potential of human resources), V (distributive trade and infrastructure) are also high; that for block II is medium, that for block III is Jow. Tripura is placed in the third level of de\~lopment. It seems to have made good with the inves.tment of the Five Year Plans. Both natural increase, immigration and proportion of children 0-4 to women of 15-44 are very high.
Analysis of Town Groups and Towns by preaominant function and size classes
1 ·32, 1 ·33,1·34 NORTH-EASTERN BORDER HILLS
Class of town r---,----~---------,
Function of town Total II
1
Total
Artisan
Service
2 3
7 2
1
6
1
1
IV-V IV
4 5
5 1
5 1
V
6
4
Analysis of Cities, Town Groups and Towns by predominant function and size classes
1·3 NORTH-EASTERN RANGES
Class of town
Function.. of towa Total I II IV-VI IV v VI
1 2 3 4 5 6 7 8
Total 15 1 2 2 9 1
Artisan 1 ... 1
Service 14 1 1 12 2 9
163 R.O.I.-tO.
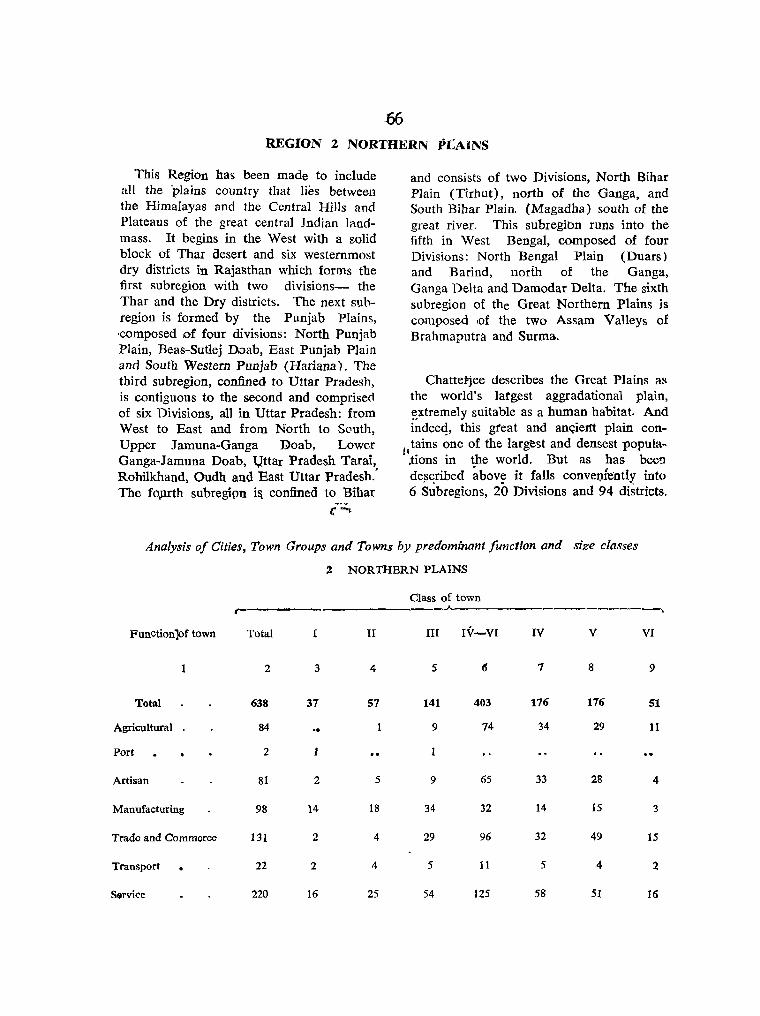
REGION 2 NORTHERN PLAiNS
This Region has been made to include all the plains country that lies between the Himalayas and the Central Hills and Plateaus of the great central Indian landmass. It begins in the West with a solid block of Thar desert and six westernmost dry districts in Rajasthan which forms the first subregion with two divisions- the Thar and the Dry districts. The next suhregion is formed by the Punjab Plains, ·composed IOf four divisions: North Punjab Plain, Beas-Sutlej Doab, East Punjab Plain and South Western Punjab (Hariana). The third subregion, confined to Uttar Pradesh, is contiguous to the second and comprisecl of six Divisions, all in Uttar Pradesh: from West to East and from North to South, Upper Jamuna-Ganga l}oab, Lower Ganga-J amuna Doab, l,lttar Pradesh Tarai, Rohilkhand, Oudh and East Uttar Pradesh: The fOJlrth subregipn i&, confined to Bihar
(""'-
and consists of two Divisions, North Bihar Plain (Tirhut), north of the Ganga, and South Bihar Plain. (Magadha) south of the great river. This subregibn runs into the fifth in West Bengal, composed of four Division;;: North Bengal Plain (Duars) and Barind, north of the Ganga, Ganga Delta and Damodar Delta. The sixth subregion of the Great Northern Plains is composed .of the two Assam Valleys of Brahmaputra and Surma..
Chattei'jee describes the Great Plains ,u, the world's largest aggradational plain, ~xtremely suitable as a human habitat. And indeeq, this great and anqiertt plain con-
l,tains one of the largest and densest popula.lions in the world. But as has bee!! described ~bove it falls conveI).iently into 6 S~bregions, 20 Divisions and 94 districts.
Analysis of Cities, Town Groups and Towns by predominant function and size classes
2 NORTHERN PLAINS
Class of town r------ ---.
Functionpf town Total I II III IV-VI IV V VI
1 2 3 4 5 IS 7 8 9
Total 638 37 57 141 403 176 176 51
Agricultural 84 9 74 34 29 11
Port 2
Artisan 81 2 5 9 65 33 28 4
Manufacturing 98 14 18 34 32 14 15 3
Trade and Commerce 131 2 4 29 96 32 49 15
Transport 22 2 4 5 11 5 4 2
Service 220 16 25 54 125 58 51 16

2.1 Rajasthan Plain. This Subregion is mainly desert and
desert fringe. The homogeneous features are desert, a common crop bajra and a common culture represented by the predominance of Rajasthani except in Ganganagar where although it is the largest single tongue, its proportion is only 44%. The very fact that more than six million people live in this Division is a testimony to man's
67,.
SUbjugation of the desert· 'The northern parts are being redeemed by canal irrigation, leading to !airly dense ,.pabitation., Elsewhere, the typical desert landsc~~ with shifting sand dunes and interior drainage basins still preVlail~ and settrements generally run along the short dry valleys (wadis) or are located in blowouts or pediplains and shallow basins near deep wells.' (Chatterjee).
Analysis of Cities, Town Groups and Towns by predominant function and size classes
2· J RAJASTHAN PLAIN
r--
Function of town Total I II
2 3
Total 50 2
Agricultural 20
Artisan 5
Manufacturing 6
Trade and Commerce 5
Transport 3
Service 11 2
2.11 2 Northern Plains 2.1 Rajasthan Plain 2.11 Rajasthan Desert (Thar: Marwar).
In India, the Thar desert proper is contained mostly in Bikaner and J aisalmer on the West Pakistan border and Jodhpur just inside them. Spate thinks that 'the numerous hills of old rock protruding through the aeolian veneer indicate that the Thar is part of the Peninsular mass; but most of it is covered with superficial deposits, and the boundaries are hence illdefined except where the desert is banked against the Aravalli Range. The desert is particularly evident in Jaisalmer where the density of population is still 9 persons per
4
1
Class of town ---"-------------.--.
III IV-VI IV V VI
5 6 7 8 9
8 39 21 14 4
3 17 11 4 2
2 3 3 ... 2 3 2 .. ,
4 2
3 2
9 3 6
sq. mile. In Bikaner, particularly in the old Ghag!?l'lr bed canal irrigation h~s . attracted population since 1931. 'Bikaner has a density of 42 persons per sq. mile. The demest is Jodhpur with 102.
The three districts form a compact Division, united by_ the desert and precarious dry cultivation. Bajra is the most important crop followed by small quantities of jowar. Canal irrigation. in Bikaner and the depressions between the sandhills in. Jodhpur favour some sesamum: Nevertheless, except for Jaisalmer, both Bikaner and Jodhpur show hi~ values lor urpan growth. All three districts exhibit high. values for decadal population increase as
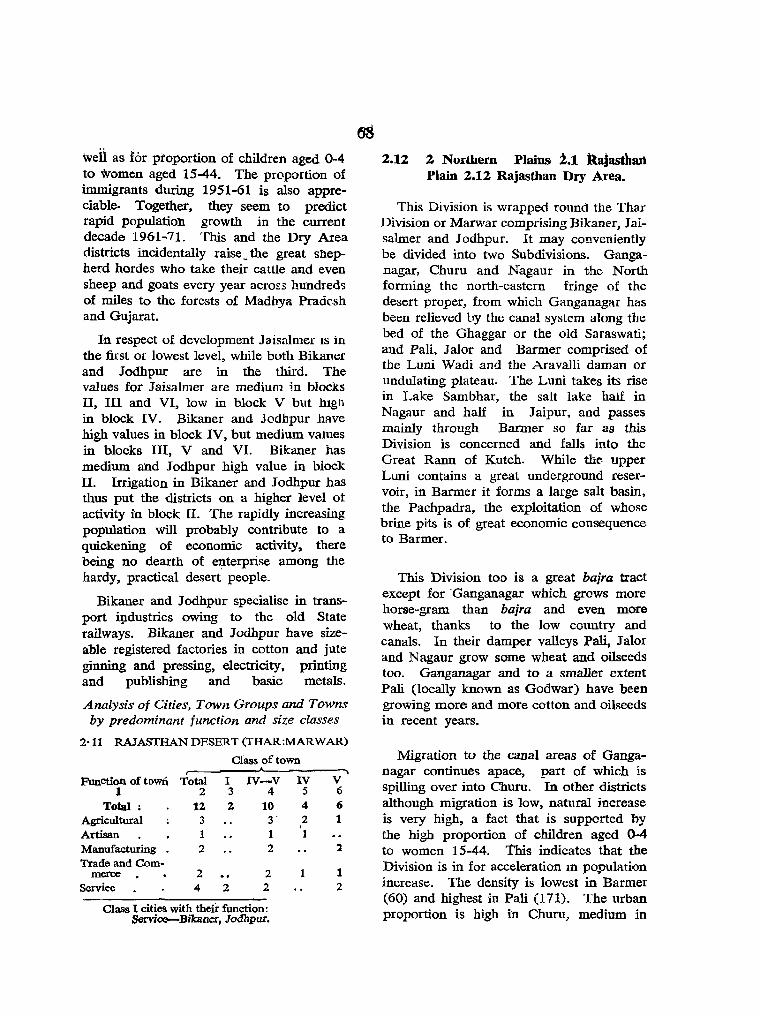
well as for proportion of children aged 0-4 to women aged 15-44. The proportion of immigrants during 1951-61 is also appreciable. Together, they seem to predict rapid population growth in the current decade 1961-71. This and the Dry Area districts incidentally raise _ the great shepherd hordes who take their cattle and even sheep and goats every year acrOS3 hundreds of miles to the forests of Madhya Pradesh and Gujarat.
In respect of development Jaisalmer IS in the first or lowest level, while both BikaIler and Jodhpur are in the third. The values for Jaisalmer are medium in blocks II, III and VI, low in block V but high in block IV. Bikaner and Jodhpur hHve high values in block IV, but medium values in blocks III, V and VI. Bikaner has medium and Jodhpur high value in block II. Irrigation in Bikaner and Jodhpur has thus put the districts on a higher level ot activity in block U. The rapidly increasing population will probably contribute to a quickening of economic activity, there being no dearth of e:.;tterprise among the hardy, practical desert people.
Bikaner and Jodhpur specialise in transport ipdustries owing to the old State railways. Bikaner and Jodhpur have sizeable registered factories in cotton and jute ginning and pressing, electricity, printing and publishing and basic metals.
Analysis of Cities, Town Groups and Towns by predominant function and size classes
2·11 RAJASTHAN DESERT (THAR:MARWAR)
Ciass of town I "-
Function of tDwn Total I IV-V IV V 1 2 3 4 5 6
Total: 12 2 10 4 6 Agricultural 3 3· 2 1
I
Artisan 1 1 Manufacturing 2 2 l Trade and Com-
merce . 2 2 1 1 Service 4 2 2 2
Class I cities with theii- function: Service-Bikancr, Jodhpur.
2.12 2 Northern Plains 2.1 Rajasthan Plain 2.12 Rajasthan Dry Area.
This Division is wrapped round the ThaI" Division or Marwar comprising Bikaner, Jaisalmer and Jodhpur. It may conveniently be divided into two Subdivisions. Ganganagar, ChufU and Nagaur in the North forming the north-eastern fringe of the desert proper, from which Ganganagar has been relieved by the canal .system along the bed of the Ghaggar or the old Saraswati; and Pali, Jalor and Barmer comprised of the Luni Wadi and the Aravalli daman or undulating plateau. The Luni takes its rise in Lake Sambhar, the salt lake hali in Nagaur and half in Jaipur, and passes mainly through Barmer so far as this Division is concerned and falls into the Great Rann of Kutch. While the< upper Luni contains a great underground reservoir, in Barmer it forms a large salt basin, the Pachpadra, the exploitation of whose brine pits is of great economic consequence to Barmer.
This Division ·too is a great bajra tract except for ·Ganganagar which grows more horse-gram than bajra and even more wheat, thanks to the low country and canals. In their damper valleys Pall, J alor and Nagaur grow some wheat and oilseeds too. Ganganagar and to a smaller extent Pali (locally known as Godwar) have been growing more and more cotton and oilseeds in recent years.
Migration to the canal areas of Ganganagar continues apace, part of which is spilling over into Churn. In other districts although migration is low, natural increase is very high, a fact that is supported by the high proportion of children aged 0-4 to women 15-44. 1'his indicates that the Division is in for acceleration In population increase. The density is lowest in Barmer (60) and highest :in Pali (171). The urban proportion is high in Chunl, medium in
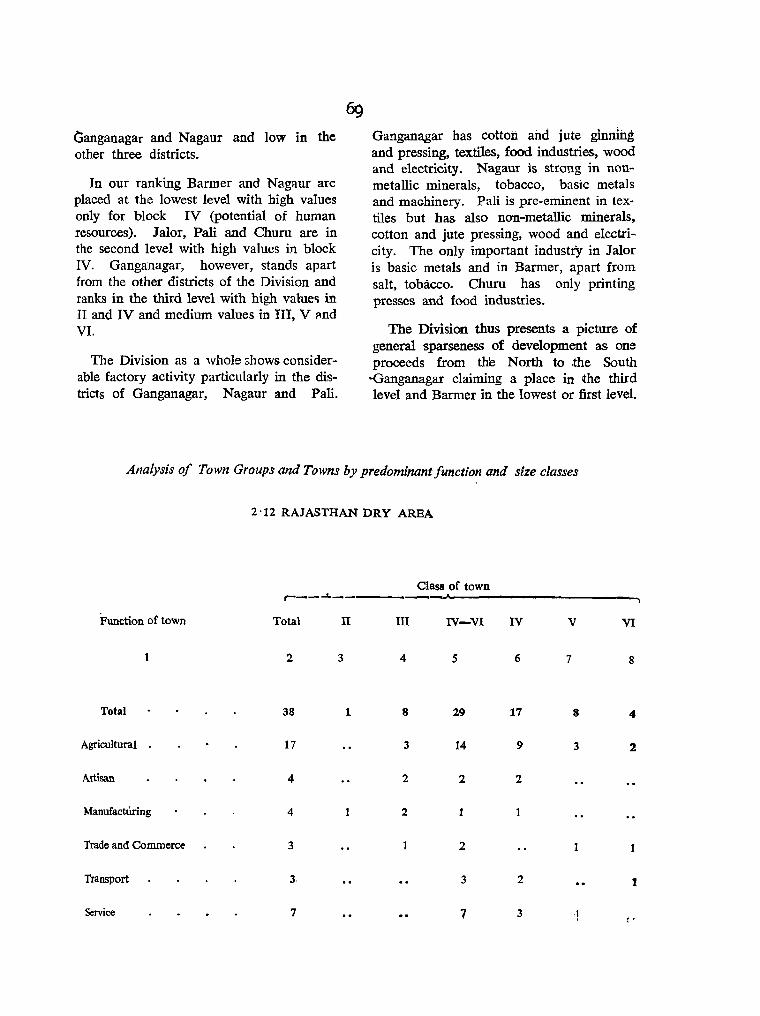
Oanganagar and Nagaur and low in the other three districts.
In our ranking Barmer and Nagaur are placed at the lowest level with high values only for block IV (potential of human resources). Jalor, Pall and Chum are in the second level with high values in block IV. Ganganagar, however, stands apart from the other districts of the Division and ranks in the third level with high value .. in II and IV and medium values in III, V flnd VI.
The Division as a whole shows considerable factory activity particularly in the districts of Ganganagar, Nagaur and Pali.
Gangana,gar has cotton and jute ginnilig and pressing, textiles, food industries, wood and electricity. Nagaur is strong in nonmetallic minerals, tobacco, basic metals and machinery. Pali is pre-eminent in textiles but has also non-metallic minerals. cotton and jute pressing, wood and electricity. The only important industry in JaIor is basic metals and in Barmer, apart from salt, tobacco. Chum has only printing presses and food industries.
The Division thus presents a picture of general sparseness of development as one proceeds from the North to the South
-Ganganagar claiming a place in the third level and Barmer in the lowest or first level.
AnalYSis of Town Groups and Towns by predominant function and size classes
2'12 RAJASTHAN DRY AREA
Class of town r--_"'£'-
Function of town Total II III IV-VI IV V VI
2 3 4 5 6 7 8
Total 38 1 8 29 17 8 4
Agricultural 17 3 14 9 3 2
Artisan 4 2 2 2
ManufactUring 4 2 1
Trade and Commerce 3 2
Transport 3 3 2 !
Service 7 7 3 '1 !'

2.2 Punjab Plains.
This Subregion naturally falls into four Divisions: the North Punjab Plain; the Beas-Sutlej Doab; the East Punjab or Trans Iamuna Plain; and South Western Punjab (Hariana) or -Sutlej/Jamuna or Delhi Doab. The first three DivisionsNorth Punjab, the Doab and East Punjab-are wheat tracts; the fourth, adjoining the Rajasthan Desert, is more gram and bajra country. But wheat and gram are common everywh~re except in Ma\l~ndragarh which gro\1{s only bajra and graql,
All PIe four Divisions grow cotton and oilseeds which aJre pervading even the irrigated Rajasthan Dry districts. Sugarcane is grown in Kapurthala and Ferozepur. The principal mother tongue i:; Punjabi in Gurdaspur, Amritsar, Kapurthala and Ferozepur (North Punjab Plam) . Iullundur and Ludhiana (Bisht Doab) , Patiala (East Punjab Plain) and Bhatinda and Sangrur (in Hariana). Hindi is dominant in Hoshiarpur (Bisht Doab). Ambala and Karnal (East Punjab Prain) and Rohtak, Hissar and Mahendragarh (in Hariana).
Analysis of Cities, Town Groups and Towns by predominant function and size classes
2'2 PUNJAB PLAINS
-----
Function of town Total I II
2 3 4
Total 152 5 12
Agricultural 26
Artisan 14
Manufacturing 23 2
Trade and Commerce 46
Transport 2
Service 41 3
2.21 2 Northern Plams 2.2 Punjab Plains 2.21 North Punjab Plain.
This Division is comprised of the districts of Gurdaspur, Amritsar, Kapurthala and Ferozepur all of which lie between Ravi and Beas, that is, the Northeastern part of the Bad Doab of which Amritsar is the high point. The Iowlying flood plains of the Ravi-Beas Doab create vex-: ing problems of annual flooding, waterlogging, drainage and alkalinity in the
1
4
5
Class of town ~
III IV-VI IV V VI
5 6 7 8 9
27 108 33 46 29
26 5 13 &
13 4 6 3
7 10 4 5
q 32 11 13 8
1 -7 26 8 9 9
western reaches of Amritsar, Kapurthala and particularly Ferozepur. This explains the comparatively low density of Kapurthala and Ferozepur where the villages are small and widely spac;ed. Elsewhere the villages are large and nucleated, density is high, Amritsar reaching as much as 782 p~rsons per sq. mile .. Urbanisation is high in all the districts and so are the v~lues for immigration and proportion of children of age 0-4 to women of 15-44. There is evidence of internal shifts and rearrangement of population t,etweeu
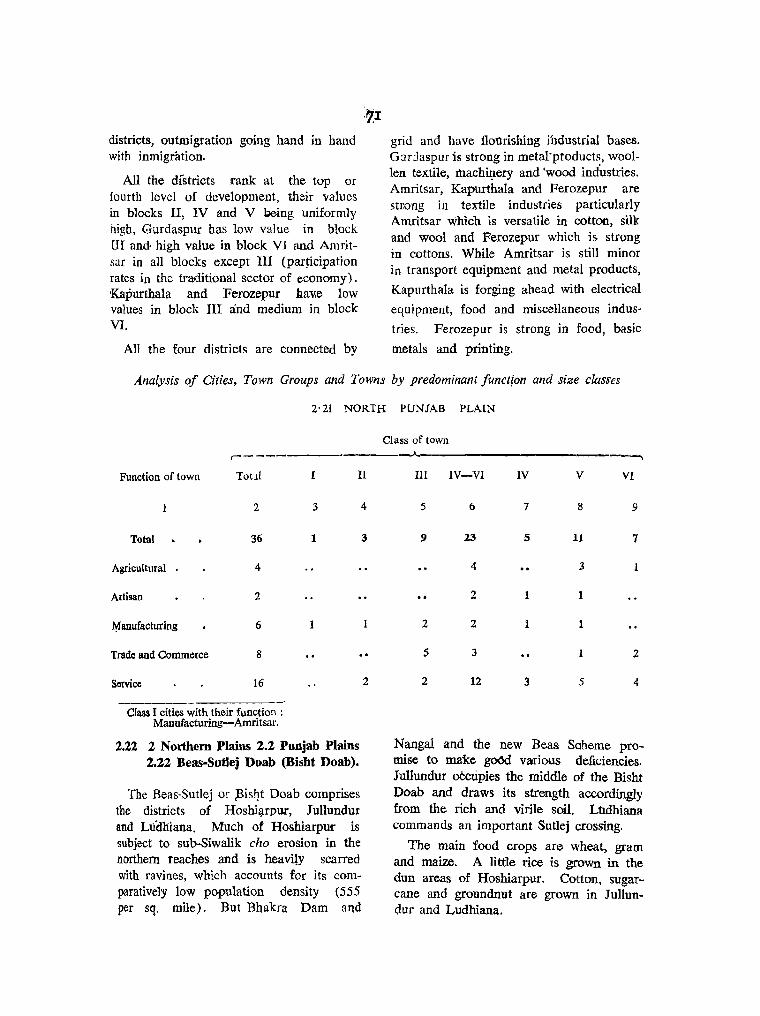
districts, outmigration going hand in hand with inmigration.
All the dfstricts <rank at the top or fourth level of development, their values in blocks II, IV and V being uniformly high, Gurdaspur has low value in block £II amJ. high value in block VI and Amritsar in aU blocks except III (participation rates in the traditional sector of economy). Kapurthala and Ferozepur DaVie low values in block III and medium in block VI.
All the four districts are connected by
grid and have flourishing industrial bases. G:.Jr:Jaspur is strong in metal-products, woollen textile, rtlachi~ery and 'wood industries. Amritsar, Kapurthala and Ferozepur are stn::mg in textile industries particularly Amritsar which is versatile in cotton, silk and wool and Ferozepur which is strong in cottons. While Amritsar is still minor in transport equipment and metal products,
Kapurthala is forging ahead with electrical
equipment, food and miscellaneous indus
tries. Ferozepur is strong in food, basic
metals and printing.
Analysis of Cities, Town Groups and Towns by predominant functfon and size classes
2'21 NORTH PUNJAB PLAIN
Class of town ,---
, ______ . __ A---___________________ , _________ ~
Function of town ToU[ II
2 3 4
Total 36 1 3
Agricultural 4
Artisan 2
¥anufacturing 6
Trade and Commerce 8
Service 16
Class I cities with their function : Manufacturiug-Amritsar.
2.22 2 Northern Plains 2.2 Punjab Plains 2.22 Beas-Sutlej Doab (Bisht Doab).
The Beas-SutIej or ,Bisl}t Doab comprises the districts of Hoshil}rpur, Jullundnr and L1.idhiana. Much of Hoshiarpur is subject to sub-Siwalik cho erosion in the northern reaches and is heavily scarred with ravines, which accounts for its comparatively low population density (555 per sq. mile). But Bhakra Dam and
2
UI IV-VI IV V VI
5 6 7 8 9
9 23 5 11 7
4 3
2
2 2 1
5 3 2
2 12 3 5 4
Nanga! a:nd the new Beas Scheme promise to make gOOd various deficiencies. Jullundur occupies the middle of the Bisht Doab and draws its strength accordingly from the rich and virile soil. Llldhiana commands an important Sutlej crossing.
The main food crops are wheat, gram and maize. A little rice is grown in the dun areas of Hoshiarpur. Cotton, sugarcane and groundnut are grown in lullundur and Ludhiana.

Urbanisation is strong in this Division. Natural increase is high in Ludhiana but immigration is still higher in all three districts thus suggesting internal shifts and movements of population. The proportion of children aged 0-4 ·to women of 15-44 is o.f moderate order. Literacy is among the highest in India.
Hosbiarpur is in the second level of the development score, with high values for blocks II and IV but low value for block III and medium values for blocks V and VI. The presence of Bhakra and the expansion of the great industrial complex of N angal will no doubt shortly raise its level· At the prerent moment it seems to
mak,e a subdivision within the Division. Jullundur and Ludhiana are at the top level, Ludhiana commanding an appreciably higher score, with high values for all blocks except, significantly enough, III in which its value is low. lullundur has high values for blocks II, IV and VI and medium value for block V and low value for tn.
The entire Division enjoys great industrial as well as agricultural importance and is an example of a high' degree of balanced economic growth and enterprise. It is particularly strong in metal products, maahinery and engineering and transport equipment, wood and food industries. All districts are connected by grid.
Analysis of Cities, Town Groups and Towns by predominant function and size classes
Class] cities with their. function: Manufacturing __;'LuOhiana. Service-JUllundur •
2.23 2 Northern Plains 2.2 Punjab Plains 2.23 East fujab Plain:
The three. districts of this natural Division; Patiala, Amba!_a and Kamal rnerge in the east with the .J amuna-Ganga Doah of the densely populated Ganga plain.
The population densities are: Patiala 545, AmJ>ala 597 and Kamal 485. All thre<? districts have been responsible. for the rehabilitation of a large displaced population from West Pakistan. An important effect has been the establishment of brand new towns like Nilokheri, Rajpura

ToWnShip and Chandigarh and the rejuvenation of old towns like PatiaIa, Ambala and Karnal. Kalka in Am.bala is the funnelneck of economic and demographic activity between the Punjab and Himachal Pradesh Hills and the Plain, a pronounced economic border.
All the four important factors of high. population growth have high values in thc(§Y three districts: urban proportion, natural inorease.. immigration ratio and proportion of children 0-4 to women 'of 15-44.
All the three districts are important wheat growing areas. They also grow small quantities of rice. Gram is important in Patiala and Ambala which form an intermediate section of the diagonal gram belt which extends fram Gurdaspur in the North-west as far as Murshidabad in the South-east. The northern reaches of
73' ~' ~ , , ..
Ambala have a belt of bhabar soU but .ilie rest is thick loam and alluvium, b_eing in the Sutlej-J amuna Doab. The entire 'area is longitudinally served by the West J amuna Canal.
All the three districts are in the top or fourth level of development with high values in blocks II and IV and close to bigh values in block VI. ,Block V (distributive trade and infrastructure) still holds high places for Ambala and Patiala and medium for Kamal. The pooled scores are high.
As for industries and electrification all these districts are now connected by grid. Their strongest line is basic metal industries but paper products, food, textiles? transport equipment, machinery and electrical equipment are also considerable..
Analysis of Cities, Town Groups and Towns by predominant function and size classes
2'23 EAST PUNJAB PLAIN
Class of town r--
Function of town Total I II III IV-VI IV V VI
1 2· 3 4 5 6 7 8 9
Total 36 2 4 3 27 7 13 7
A&ricultural . 4 4 :2- 2-
Artisa1l1 s 1 4 2- a Manufacturing (i 1 1 4 4 .. Trade and CollUllcrce 7 1 6 1 3 ~
Transport 1 1 1 -ServIce 13 2 2 1 8 4 2 2,
Class I cities with their function: Serv!cc-Ambala, PatiaIa.
165 R.G.I.-ll.

l.U Z Northern Plains 2.2 Punjab Plains 2.24 South Western Punjab ~Bariaua).
This is part of the Sutlej-Jamuna or Delhi Doab; "a great wedge of light loam and sand which Rajputana pushes northwards almost to the Sutlej" (quoted by Spat~). Well irrigation is important in the light fertile loarns of the North in this Division, but in the South-west, still loosely referred to as the fungal Desh or jungle country ... the sandy loam has much less water but is drought resistant. The chief crops are gram, wheat and bajra, in that order, in Bhatinda, Sangrur and Rohtak, but gram and bajra in Hissar and Mahendragarh. Wheat is mainly irrigated. Gram and barley are the chief rabi and millets the chief kharif dry crops. Cotton is of great importance in Bhatinda and Sangrur, so mucQ. so that the cotton stock exchange at Bhatinda is one of the busiest centres in North India. Hissar and Rohtak have belts of good land and irrigation in the Sutlej and J amuna riverains and the Ghaggar bed. The density of population is the lowest in Hissar, although the district has seen both heavy natural increase and immigration in the last decade. Owing to the paucity of waterpoints villages aTht> are definitely large and rely on tanks for their domestic supply; which is rare in the north. Stock rearing is of great importance, the Hissar or Hariana bullock belng one of the most nobly built animals. Hissar and Mahendnigarh have an abimdance of kikar, an acacia bark, an in:tportant tanning substance which is complementary to the large supplies of hides and: skins and the large populat!on of Chamars and members of other Scheduled Castes in these five districts. But the. rapid .extensbon of cotton a~~ groundnut now seriously threatens the existence of the Hariana breed. Mahendragarh
suffers from alkalinity and the fringes of the Rajasthan desert.
Population density is lowest in Bissar (287), but steadily increases to 397 in Bhatinda, 408 in Mahendragarh, 470 in Sangrur and 609 in, Rohtak. Except for Mahendragarh where natural increase in 1951-61 has been only moderately high, in all the districts including Mahendragarh, both natural increase, immigration and the proportion of children 0-4 to women 15-44 are very high, indicating the possibility of a heavy inorease in the current decade. The new highways have become the areas of heavy concentration of population and investment on education and other infrastructure.
Mahendragarh is placed in the second level of development and has, high values for blocks II and IV, low value for block TIl and medium values for blocks V and VI. At the other geographical end. Bhatinda, Rohtak and Bissar are placed in the wurth level of development, with high values for II and IV, medium values for V and VI, and low value for ~hatinda and Rohtak and medium for Bissar in III. SWlgrur is_placed in third level of development with high values in II and IV medium values in V and VI and low value for III.
A whole range of industries is rapidly growing up in Hariana. Bhatinda .an.~ Bissar are important for cotton" ginning, -pressing and baImg. Rohtak is. impoftant... for transport equipment. MaheI1.:dragarh is important for stOne quarrying ana stone ' cutting. Food industries are- ~portattt. in. the whole Division. But basic metal industries, machinery, forestry and logging' also are rapidly gaining ground.
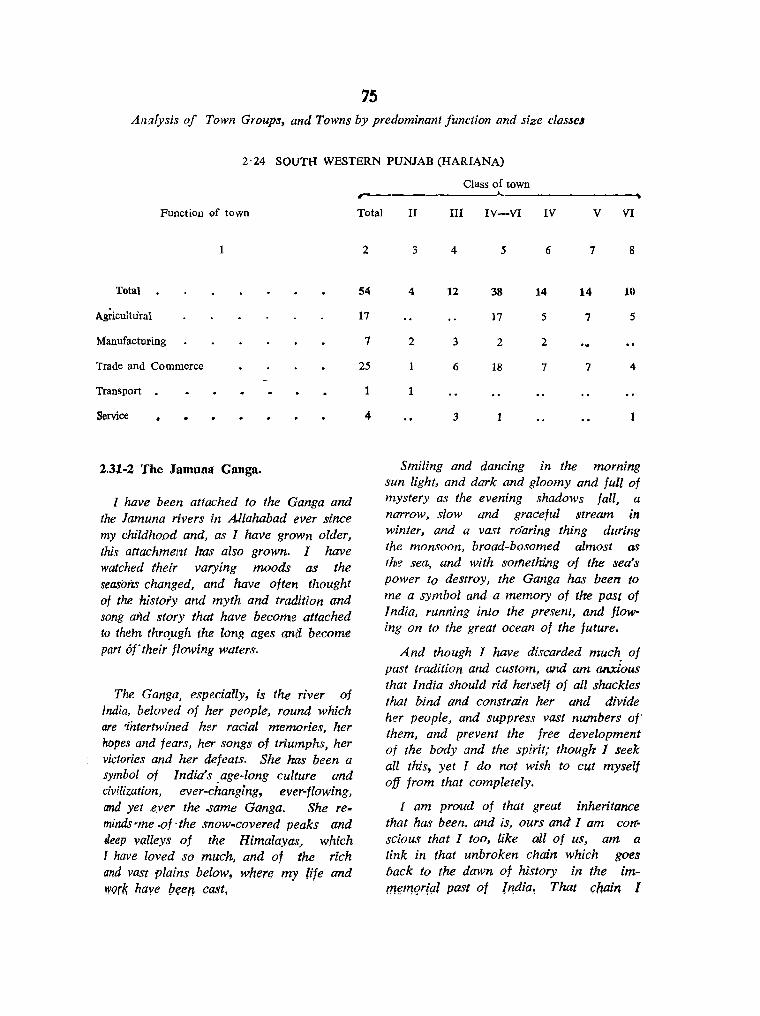
~5 An!lfysis oj Town Groups, and Towns by predominant function and size classe4
2'24 SOUTH WESTERN PUNJAB (HARIANA)
Function Qf town
Total
Ag;.icultural
Manufacturing
Trade and Commerce
Transport . Service
2.31-2 The Jamuml Ganga.
I have been attached to the Ganga and the Jamuna rivers in A.llahabad ever since my childhood and, as I have grown older, this attachmel7t has also grown. I have watched their varying moods as the seasons changed, and have often thought of the history and myth and tradition and song and story that have become attached to the In thro_ugh the long ages ana become part 61' their flowing waters.
The Ganga, especially, is the river of India, beloved of her people, round which are 'intertwined her racial memories, her hopes and fears, her songs of triumphs, her victories and her defeats. She has been a symbol of India's age-long culture and civilization, ever-changing, ever-flowing, and yet ·.eyer the ..same Ganga. She re. minds-me .of-the snow.covered peaks and deep valleys of the Himalayas, which 1 have loved so much, and of the rich and vast plains below, where my life and wQrk have Peen cast,
Class of town ------___._ ~
Total
2
54
17
7
25
1
4
II III IV-VI IV V VI
3 4 5 6 7 8
4 12 38 14 14 10
17 5 7 5
2 3 2 2
6 18 7 7 4
1
3 1
Smiling and dancing in the morning sun light, and dark and gloomy and full of mystery as the evening shadows fall, a narrow, slow and graceful stream in winter, and a vast rdaring thing during the monsoon, broad-bosomed almost as
the sea, and with sOrflethilzg of the sea's power to destroy, the Ganga has been to me a symbol and a memory of the past of India, running into the present, and flowing on to the great ocean of the future.
And though I have discarded much of past tradition and custom, and am anxious that India should rid herself of all shackles that bind and constrain her and divide her people, and suppress vast numbers of them, and prevent the free development of the body and the spirit; though I seek all this, yet I do not wish to cut myself off from that completely.
f am proud of that great inheritance that has been, and is, ours and I am colfscious that I too, like all of us, am a link in that unbroken chain which goes back to the dawn of history in the imm?111qrM past of In,dia, That l;hain 1

would not break, for I treasure it and seek inspiration from it. And as witness of this desire of mine and as my last homage to Irtdia's cultural inheritance, I am making this request that a handful of my ashes be thrown into the Ganga at Allahabad to be carried to. the great ocean that washes India's shore.
LAST WILL AND TESTAMENT OF
JAWAHARLAL NEHRU
Mainly fo:r convenience of treatment along political boundaries the great Gan_ga Plain:, included in the second Region of the Northern Plains is divided into the following Subregions and Divisions:
Subregions Divisions
2· 3 Uttar Pradesh 2· 31 Upper Jamuna-Ganga Plains Doab
2' 4 Bihar Plains
2' 5 West Bengal Plains
2' 32 Lower Ganga-Jamuna Doab
2' 33 Uttar Pradesh Tarai (Koshala)
2.34 Rohilkhand 2'350udh Z· 36 East Uttar Pradesh
2·41 North Bihar Plain (Tirhut)
2·42 South Bihar Plain (Magadha)
2· 51 North Bengal Plain (Duars)
2· 52 Northern Para Delta (Barind)
2· 53 Ganga Delta 2· 54 Damodar Delta
In the great Ganga Plain, the eastern part is more densely populated than the western, the land being almost entirely alluvial and full of rich silt, the bhabar, bhangar, tarai and bhur lands having been left hehind. Thus districts like Saharanpur, Pilibhit, Kheri, Bijnor, Hardoi imq Bahraich ill the lI1'ortq-west and NQrth
have comparatively low population densities compared to the central and eastern districts. Rainfall, too, in the eastern tracts is normally enough to dispense with irrigation. The river courses swing less violently than in the west and there is much less of alkalinity or saline efilorescence. In the tract below the Siwalik and in the bhabaT the inhospitable, rocky and coarse, porous soil does not permit a dense population but once the GangaJamuna Doab proper is reached habitation .is dense. In the Doah again the lands farthest from the river, that is, in the middle, usually have the least density while those neare~ the river have higher densities. The flood plains of the Ganga are on the whole -more densely populated than those of the Jamuna which seems to carry more rocky detritus and thick, heavy sand than the Ganga. Population density seems to be intimately associated with local relief and depth of water table. The central and western portions of the Ganga Plain are highly urbanised. The smaller towns throughout this great tract developed as market centres in the heart of densely populated rural areas.
The Uttar Pradesh Plain may be divided into 2 broad tracts: (1) the JamunaGanga Doab which has been classified into two divisions: Upper Doab aM Lower Doah. and (2) the Ganga Plain which has been divided into 4 Divisions, the Tarai, Rohillchand, Oudh and East Uttar Pradesh.
We shall first the water regime Doab.
briefly deliheate of the Jarnuna-Ganga
Upper Jamuna-Ganga Doab
This tract or country begins with Saharanpur and Dehra Dun in the North, between the Jamuna in the West and Ganga in the East and travels in an arc of varying width down to Allahabad, the ~on:ijUYJl:~ of tlje !!\lnyna and Qang!\,
Apart from the fact that this tract is subdivided into a number of smaller Doabs between the two great rivers, formed by rivers which are mostly tributaries to the
-Ganga, the upper and middle tracts are well served by a series of longitudinal ,canals.
The more important of the smaller Doabs are from West to East:
(1).Saharanpur- (a) Jamuna-Krishni Muzaffarnagar: (b) Krishni-Hindan
(2) Meerut- (a) Jamuna-Hindan Bulandshahr: (b) Kali-Ganga
(3) Aligarh-Agra- (a) Kali-Sengar Etah-Mainpuri: (b) Sengar-Rind
(c) Rind-Isan
(4) Etawah-Kanpur-Fatehpur:
(5) Allahabad:
(a) Jamuna-Sengar (b) Sengar-Rind (c) Rind-Ganga
(a) Jamuna-Sasur-Khaderi (b) Sasur-Khaderi-Ganga
The more important canals from West to East are:
(1) The Eastern lamuna Canal: Headworks at Faizabad, northwestern corner of Saharanpur. Serves western areas of Saliaranpur, Muzaffarnagar, Meerut. Bulandshahr and Shahdara of Delhi. It irrigates the Jamuna-Hindan Doab.
(2) The Upper Ganga Canal: Headworks at Hardwar, threads through Saharanpur, Muzafiarnagar, branches at J auli. The main Upper Ganga Canal passes through the heart of Meerut, becomes the Ganga Canal in Bulandshahr, leaves Aligarh on its west, is called Lower Ganga Canal before it branches near Akrabad ihto two: the Kanpur Branch and the Etawah Branch. The two branches run 'almost 'Parallel to each other until the Eraw~k' Branch veers south and peters out fi'ear~ Kiraon in Ghatampur (Kanpur district). The Kanpur Branch disintegrates into small branches South West of Kanpur. The Kanpur and Etawah Branches of the Lower Ganga Canal irrigate the Sengar-Isan 1>9aO·
7lJ. (3) The eastern branch of the Upper
Ganga Canal which takes. off at Jauli called Anupshahr Branch. and attenuates near Rajghat (Bulandshahr). This irrigates the traJCt between the Kali in the west and the Ganga in the east.
(4) The Lower Ganga Canal: Headworks at Naraura (Bulandshahr), branches about 12 miles North-northwest of Etah. The western or Bhognipur branch goes down to Shikohabad (Mainpuri) and Etawah and then runs midway between J amuna and Sengar up to Sikandra and Bhognipur (Kanpur). The easterp. or Bewar Branch ends below Bewar (Mainpuri). The Bhognipur branch irrigates the middle of the Jamuna-Sengar Doah while the Bewar Branch irrigates the middle 'of the Isan-Kali Doab mainly in Etah and Mainpurl.
(5) The Agra Canal: Headworks at OkhIa. South Delhi, irrigates Gurgaon. Mathura and Agra.
Over and above all this extensive water supply the Upper Ganga-J amuna Doab enjoys an expanding network of deep tuoewells. But the entire Doab tract suffers {110m varying degrees of saline efflorescence (reh).
The entire tract is Hindi-speaking. The proportion of members of scheduled castes is between one-sitth and onequarter of the total population in every district of this subregion.
We shall now briefly describe the Ganga Plain.
The Ganga Plain 2.33 Uttar Pradesh Tarai (Koshala)
2.34 Rohilkhand
2.35 Oudh
2.36 East Uttar pradesh
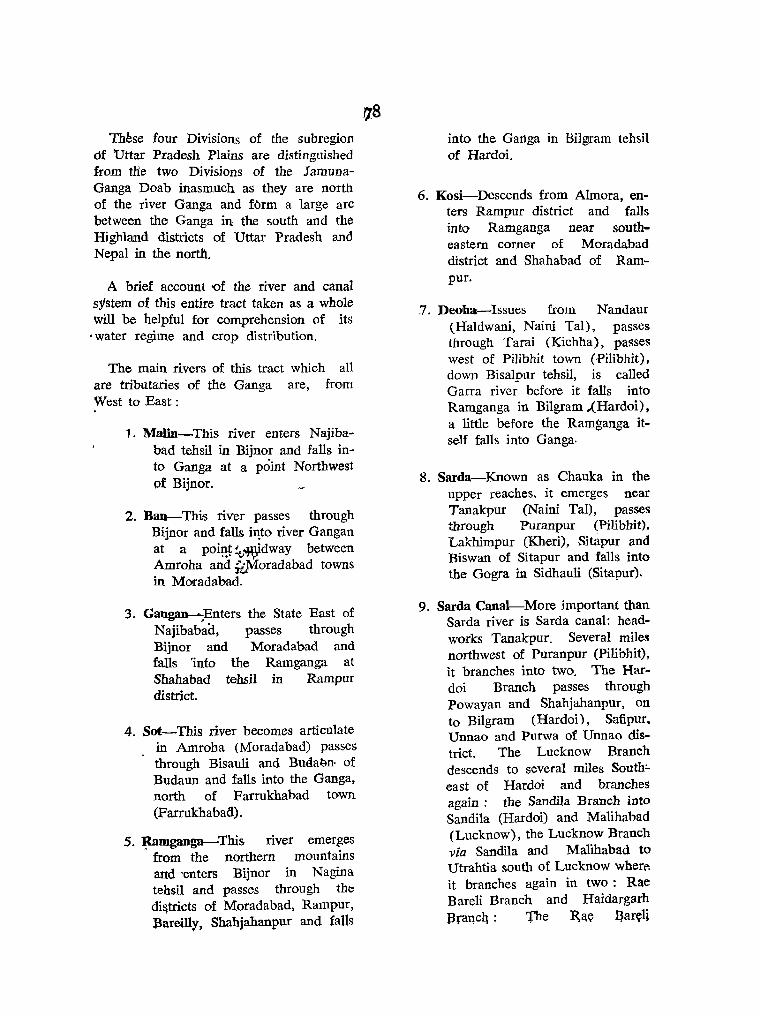
TMse four Divisions of the subregion of Uttar Pradesh Plains are distinguished from tne two Divisions of the JarnunaGanga Doab inasmuch as they are north of the river Ganga and form a large arc between the Ganga in the south and the Highland districts of Uttar Pradesh and Nepal in the north.
A brief account 'Of the river and canal system of this entire tract taken as a whole will be helpful for comprehension of its
. water regime and crop distribution.
The main rivers of this tract which all are tributaries of the Ganga are, from West to East:
1. Malin-This river enters Najibabad tehsil in Bijnor and falls into Ganga at a point Northwest pf Bijnor.
2. Ban~ This river passes through Bijnor and falls in,to river Gangan at a poi~ ;,~dway between Amroha and iZMoradabad towns in Moradabad.
3. Gangan---finters the State East of Najibabaa, passes through Bijnor and Moradabad and falls 'info the Ramganga at Shahabad tehsil in Rampur district.
4. Sot-This river becomes articulate in Amroha (Moradabad) passes through Bisauli and Budal:}ll> of Budaun and falls into the Ganga, north of Farrukhabad town (Farrukhabad) .
5. ~mganga-This river emerges from the northern mountains and 'enters Bijnor in Nagina t,ehsil and passes through the:: di!'jtricts of Moradabad, Rampur, Bareilly, Shahjahanpur and falls
qS into the Gartga in Bilgram tehsil of Hardoi.
6. Kosi-Descends from Almora, enters Rampur district and falls into Ramganga near southeastern corner of Moradabad district and Shahabad of Rampur.
.7. Deoha~Issues from Nandaur (Haldwani, Naini Tal), passes through Tarai (Kichha), passes west of Pilibhit town (Pilibhit), down Bisalpur tehsiI, is called Garra river before it falls into Ramganga in Bilgram .(Hardoi), a little before the Ramganga itself falls into Ganga.
8. Sarda-Known as Chauka in the upper reaches. it emerges near Tanakpur (Nairn Tal), passes through Puranpur (Pilibhit). Lakhimpur (Kheri) , Sitapur and Riswan of Sitapur and falls into the Gogra ill Sidhauli (Sitapur).
9. Sarda Canal-More important than Sarda river is Sarda canal: headworks Tanakpur. Several miles northwest of Puranpur (Pilibhit), it branches into two. The Hardoi Branch passes through Powayan and Shahjahanpur, on to Bilgram (Hardoi), Safipur. Unnao and Purwa of Unnao district. The Lucknow Branch descends to several miles South:. east of Hardoi and branches again: the Sandila Branch into Sandila (Hardoi) and Malihabad (Lucknow), the Lucknow Branch via Sandila and Malihabad to Utrahtia SoOuth of Lucknow wher~ it branches again in two: Rae Bareli Branch and Haidargarh 13rancq : The R~Y nar<fli

Branch passes through Mohanlalganj (Lucknow) and Maharajganj (Rae Bareli), exhausts itself near the Sai river above and below Rae Baa:eli town. The Haidargarh Branch passes through Mohanlalganj (Lucknow) and exhausts itself beyond Haidargarh (Bara Banki) around the Gomati river.
10. Gomati-Gomati is formed by the streams Bhainsi and J oknai in Powayan (Shahjahanpur district). It passes through Mbhamdi tehsil (Kheri) and divides Hardoi district from Sitapur, enters Malihabad (Lucknow) and passes through Lucknow city, travels through Bara Banki, Sultanpur, .T aunpUJr, and falls into Ganga at Saidpur, North-east of Varanasi, The Sai river loms Gomati between Jaunpur and Kerakat (Jaunpur).
11. Ghagra-Enters through Nighasan (Kheri) in three main streams, Kauriala, Girwa and Babai (Sarju) and proceeds to form the boundary between the districts of Sitapur and Bara Banki on the right bank and Bahraich and Gonda on the left bank, between Faizabad and Basti, Azamgarh and Gorakhpur, Ballia and Deoria falling at the eastern tip of Ballia into the Ganga.
12. Rapti-Enters at the junction of Nanpara and Bahraich tehsils of Bahraich. Travels through Bahraich, Gonda, Basti, Gorakhpur and falls into the Ghagra near Barbaj between Ghosi (Azamgarh) and Salempur (Deona).
The entire territory is thus arranged in longitudinal and transverse ribbons of minor Doabs. These are some of the minor Doabs in the general direction of West to East
1. Bijnor-district (a) Ganga-Malin
(b) Malin-Gangan
(c) Gangan-Ramganga
2. Moradabad. (a) Ganga-Ban (b) Ban-Ramganga
3. Budaun (a) Gang~-Mahawa
(b) Mahawa-Sot
4. Bijnor-Naini Tal
(c) Sot-Gangan-Ramganga
Ramganga-Dhela
5. Bareilly-Pilibhit Ramganga-Deoha
6. Unnao-Allaha- Ganga-Sai bad-Pratap-garh
7. SultanpurFaizabad
8. Basti
9. Faizabad
10. Ghazipur
Gomati-Ghagra
Ghagra-Kuwana
Gomati-Marha Marha-Ghagra
(a) Gomati-Besu-Mangai
(b) Mangai-Chhoti Sarju
We may now return to a bare mention of several other features.
The entire tract is Hindi·speaking. There is another fact of sociological importance. The heart of Uttar Pradesh has a solid and continuous region containing high proportions of members of scheduled castes, surrounded by a girdle in the East and South-east by a group of districts of sligbtly lower proportions. The districts are as follows with the percentages of members of scheduled castes mentioned against them.
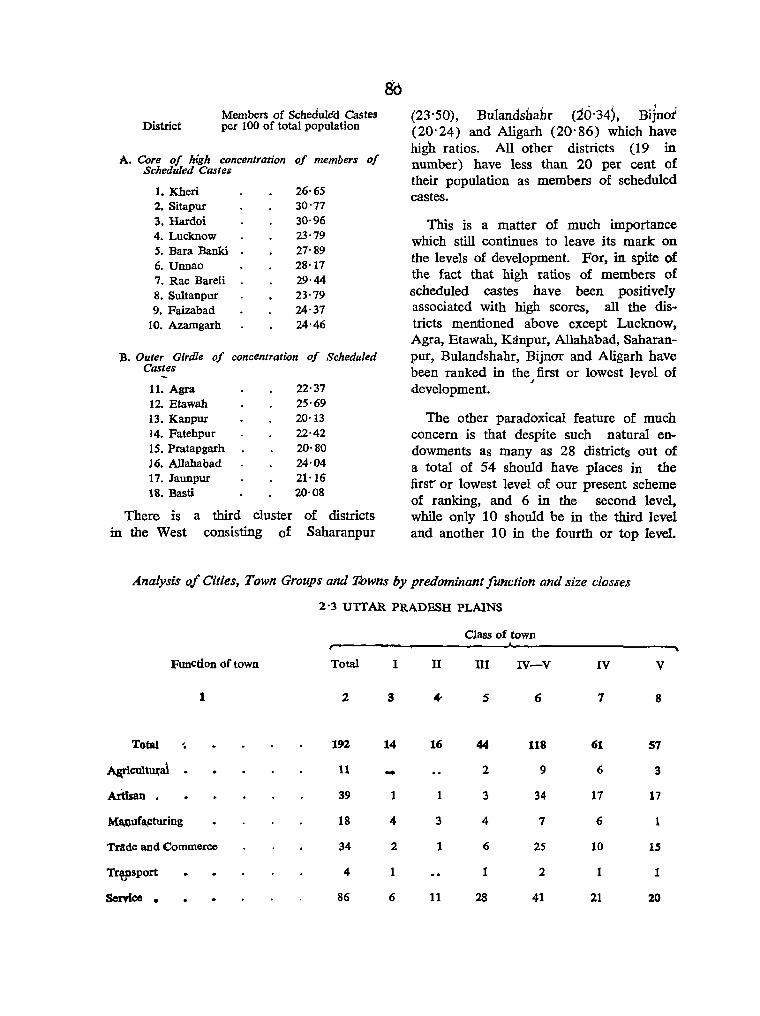
District Members of Schedule'd Castes per 100 of total population
A. Core of high concentration of members of Scheduled Castes
1. Kheri 26·65 2. Sitapur 30'77 3. Hardoi 30·96 4. Lucknow 23'79 5. Bara Banki 27'89 6. Unnao 28'17 7. Rae BareH 29·44 8. Sultanpur 23'79 9. Faizabad 24·37
10. Azamgarh 24'46
B. Outer Girdle of concentration of Scheduled Castes
11. Agra 12. Etawah 13. Kanpur 14. Fatehpur 15. Pratapgarh 16. Allahabad 17. Jaunpur 18. Basti
22·37 25'69 20'13 22'42 20'80 24·04 21'16 20·08
There is a third cluster of districts in the West consisting of Saharanpur
80 (23'50), Bulandshahr (20'34), Bijnoi (20' 24) and Aligarh (20' 86) which have high ratios. All other districts (19 in number) have less than 20 per cent of their population as members of scheduled castes.
This is a matter of much importance which still continues to leave its mark on the levels of development. For, in spite of the fact that high ratios of members of scheduled castes have been positively associated with high scores, all the districts mentioned above except Lucknow, Agra, Etawah, Kanpur, Allahabad, Saharanpur, Bulandshahr, Bijnor and Aligarh have been ranked in the first or lowest level of
J
development.
The other paradoxical feature of much ,concern is that despite such natural endowments as many as 28 districts out of a total of 54 should have places in the first or lowest level of our present scheme of ranking, and 6 in the second level, while only 10 should be in the third level and another lOin the fourth or top level.
Analysis 0/ Cities, Town Groups and T.owns by predominant function and size classes
2'3 UTTAR PRADESH PLAINS
Class of town
FWlction of town Total I IT m IV-V IV V
1 2 3 4- 5 6 7 8
Total ~ 192 14 16 44 118 61 57
~cul~a1 . 11 - 2 9 6 3
Artisan • 39 1 1 3 34 17 17
Ma,t).ufa~Iing 18 4 3 4 7 6 1
Trade and Commerce 34 2 1 6 25 10 15
Trwsport 4 1 1 2 1 1
Scryloe • 86 6 11 28 41 21 20
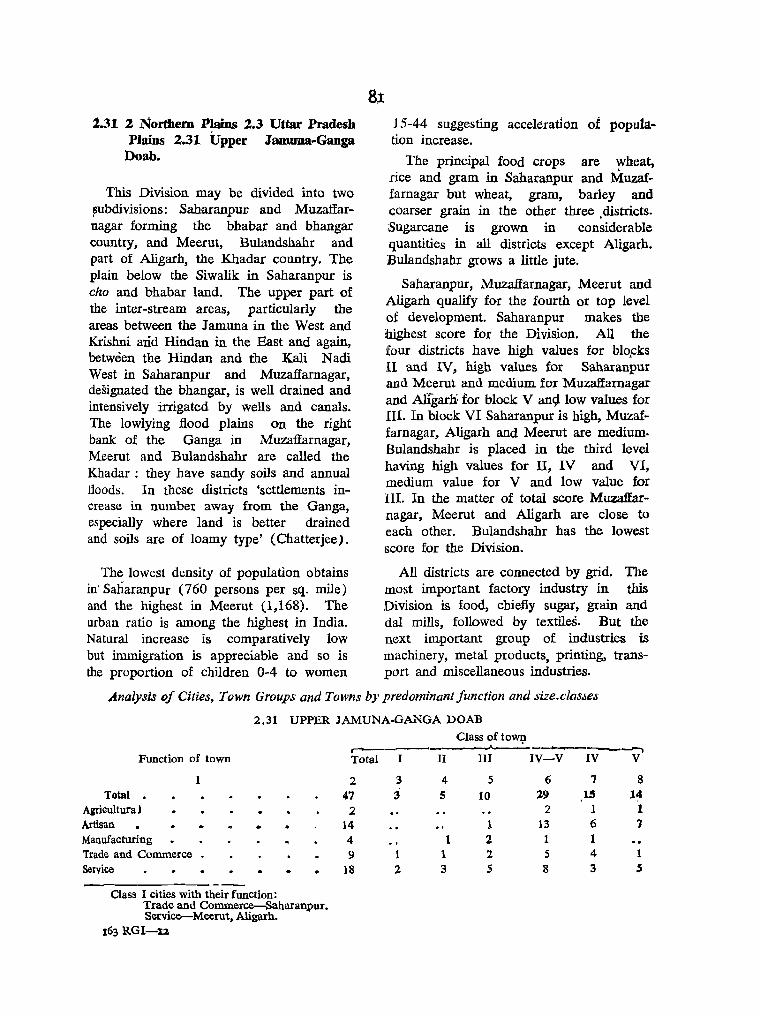
2.31 2 Northern Plains 2.3 Uttar Pradesh Plains 2.31 Upper lamUila-Ganga
Doab.
This Division may be divided into two ~ubdivisions: Saharanpur. and Muzaffarnagar forming the bhabar and bhangar country, and Meerut, Bulandshahr and part of Aligarh, the Khadar country. The plain below the Siwalik in Saharanpur is cho and bhabar land. The upper part of the inter-stream areas, particulady the areas between the J amuna in the West and Krishni a:nd Rindan in the East and again, between the Hindan and the Kali N adi West in Saharanpur and Muzafiarnagar, designated the bhangar, is well drained and intensively irrigated by wells and canals. The lowlying flood plains on the right bank of the Ganga in Muzaffarnagar, Meerut and Bulandshahr are called the Khadar : they have sandy soils and annual floods. In these districts 'settlements increase in number away from the Ganga, especially where land is better drained and soils are of loamy type' (Chatterjee).
The lowest density of population obtains in'Saharanpur (760 persons per sq. mile) and the highest in Meerut (1,168). The urban ratio is among the highest in India. Natural increase is comparatively low but immigration is appreciable and so is the proportion of children 0-4 to women
8.1 15-44 suggesting acceleration of popula.tion increase.
The principal food crops are y;heat, rice and gram in Saharanpur and Muzaffamagar but wheat, gram, barley and coarser grain in the other three. districts. Sugarcane is grown in considerable quantities in all districts except Aligarh. Bulandshahr grows a little jute.
Saharanpur, Muzaffarnagar, Meerut and Aligarh qualify for the fourth or top level of development. Saharanpur makes the ihighest score for the Division. All the four districts have high values for blo,cks 11 and IV, high values for Saharanpur and Meerut and medium for Muzaffarnagar and Aligarbi for block V anc;llow values for III. In block VI Saharanpur is high, Muzaffarnagar, Aligarh and Meerut are medium. .Bulandshahr is placed in the third level having high values for II, IV and VI, medium value for V and low value for III. In the matter of total score Muzaffarnagar, Meerut and Aligarh are close to each other. Bulandshahr has the lowest score for the Division.
All districts are connected by grid. The most important factory industry in this Division is food, chiefly sugar, grain and dal mills, followed by textiles. But the next important group of industries is machinery, metal products, printing, transport and miscellaneous industries.
Analysis of Cities, Town Groups and Towns by predominant function and size.clas.ses
2.31 UPPER JAMUNA-GANGA DOAB
Function of town
Total • Aaricultura) Artisan Manufacturing
1
Trade and Commerce . Service
Class I cities with their function: Trade and Commerce-Saharanpur. Service-Meerut, Aligarh.
163 RGI-u
Class of town r, ------~-__....._-----___. Total I II III IV-V IV V
2 47
2 14 4 9
18 1 2
4 5
1 1 3
5 10
1 2 2 5
6 7 8 19 15 14
2 1 1 13 6 1 1 1 5 4 1 8 3 S

~.3'Z t Northern flains 2.3 Uttar Pradesh Plains 2· 32 Lower Ganga-Jamuna Doab.
'this' DiViSiOn is made of rune districts ~hich tn~6 a continuous graDl ttact. ~11t' oompetes with gram ib. seven districts down "'to. KC:tn'pur. But in Fatehpiir and Allahabad, while wheat ipractically disapPl(ars, rice com~s into its C?WI1 but gram Ihblds sway'. J owar and ~ajr.a are grown in all districts. Very little of cash cropS is ,grown.
Th~ den~ity of population _ varies \yithin tULrrow limits, the lowest being Fatehptlr (64'4J and fue'high~t ~gra (997); Urban ptoportiol1s ate nigh- in Agra and :Kanput ahd appreciable in Matihtita arid Allahabad;- Natural ittcrease has been modest. Irtnnigration has been high in Mathura, Agra, Mainpuri atid Kanpur suggesting ittterhal-shifts and transfers. Immigration into Allahabad has been comparatively l~w. The pr9portion of children 0-4 to \yomen,1.)-44 is .high only in Agra, but app'~eyiaqle in Mathura, Mainpuri, Etawah and Fatehp1lI.
Fatebpur ranks in the loweSt level. The total ~core is low - Although the values in blocks II and IV are high, low in block III and medium in V and VI. The district is conn~ted to grid.
.; Mainpuri, Btab, Farrukhabad and Et!wah form a solid ge6~aphically cestrtu block of moderate or second· level of d~velopment~ They have. almost identical t'?tal scores with very similar values in el!ch block: high for blocks II and IV, low
for tIl, medium for V and VI. All are connected by grid. Farrukhabad also generates electricity.
Allahttbad alone is placed in the thitd level with high values for blocks II and IV and medium va!ues for III, V asd vi. It generates its own electricity.
Matliura and Agra, contiguous districts, and Kanpur are placed in the top level. Agra and Kanpur bave ide~tical scores and distribution, high values in n. IV and V ·and medium values in III and VI. ~athura is much low~r than either but enjoys high values ill II ana. N. medium values in V and VI and low value in III. Agra and Kanpur generate their own electricity but Mathura is connected to grid.
This Division also presents a rich texture of organised industry in whicb the chief components are basic metals (Mathtita), f60d industries (Etah, Etawah and Fatehpur), texiiles (Kanput), printing and publiShing (Allahabad). Agra and Mainpuri are important in glas.s, pottery, stone, in short, non-metallic minerai products. Wherever food is not of primary importance it invariably takes the_ ~cond most important place. The other important industries are machinery, textiles, transport equipment, footwear and readymade garments (Kanpur) , leather and leather products, wood. cotton and jute 'ginning and pressiBg: a very pr6miSing mixture of primary and secondary products. Agra is at the eastern" and hide and skin receiVing end of the livestock' tra'tts of R~jasthan.
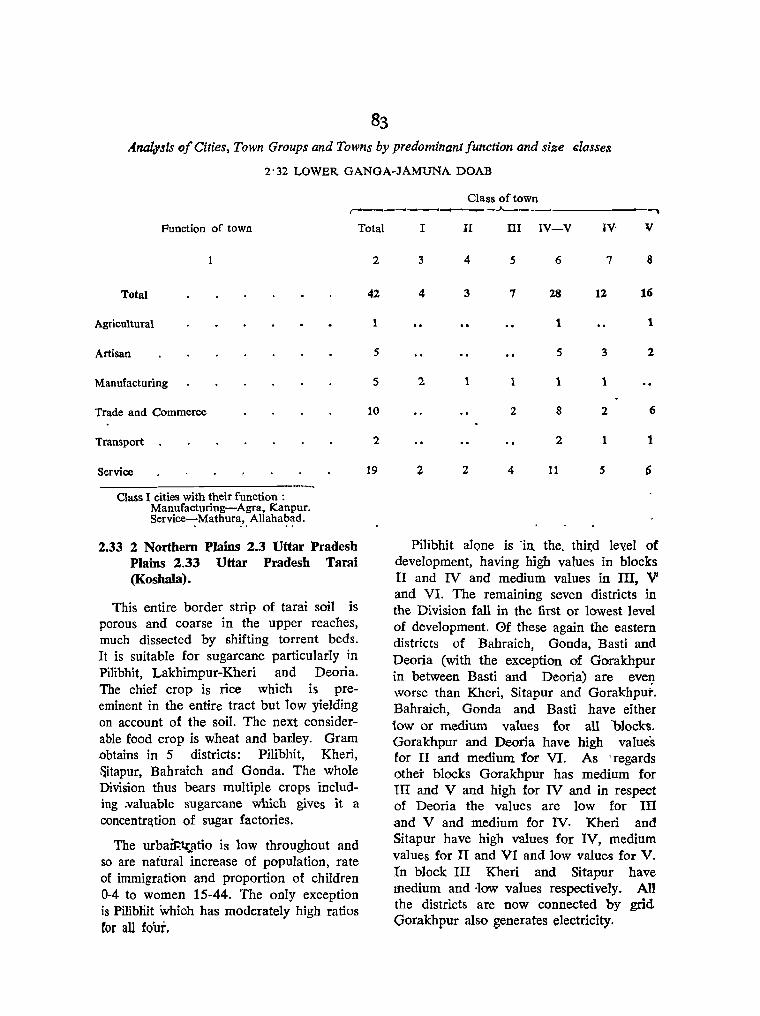
Anazysls of Cities, Town Groups and Towns by predominant function and size ~lasses
2'32 LOWER GANGA~JAMUNA DOAB
Function of town Total
Total
Agricultural
Artisan
Manufacturing
Trade and Commerce
Transport
Service
Class I cities with their function : Manufacturing-Agra, Kanpur. Service-Mathur~ •. Allaha~~d.
2.33 2 Northern Plains 2.3 Uttar Pradesh Plains 2.33 Uttar Pradesh Tarai (Koshala).
This entire border strip of tarai soil is porous and coarse in the upper reaches, much dissected by shifting torrent beds. It is suitable for sugarcane particularly in Pilibhit, Lakhimpur-Kheri and Deoria. The chief crop is rice which is preeminent in the entire tract but low yielding on account of the soil. The next considerable food crop is wheat and batley. Gram .obtains in 5 districts: Pilibhit, Kheri, ~itapur, Bahraich and Gonda. The whole Division thus bears multiple crops including .:valuable sugarcane which gives it a concentr!!,tion of sugar factories.
The urbaif.;l(,.,atio is low throughout and so are natural increase of population, rate of immigration and proportion of children 0-4 to women 15-44. The only exception is Pilibliit whioh has moderately high ratios tor all four.
2
42
1
5
5
10
2
19
Class of town ._-....--..A---_, ______ ......... I II III IV-V IV' v
3 4 5 6 7 8
4 3 7 28 12 16
1 1
5 3 2
2 1 1 1 1
2 8 2 6
2 1 1
2 4 11 5 6
Pilibhit alone is -in. the. thh:d le'v-el of development, having high values in blocks II and IV and medium values in III, V and VI. The remaining seven districts in the Division fall in the first or lowest level of development. Gf these again the eastern districts of Bahraich, Gonda, Basti and Deoria (with the exception. of Gorakhpur in between Basti and Dearia) are evet;t worse than Kheri, Sitapur and Gorakhpur. Bahraich, Gonda and Basti have either 1.ow or medium values for all ·blocks. Gorakhpur and Deoria have high values for II and medium for VI. As 'regards other blocks Gorakbpur has medium for TIl and V and high for IV and in respect of Deoria the values are low for III and V and medium for IV. Kheri and Sitapur have high values for IV, medium values for II and VI and low values for V. In block III Kheri and Sitapur have medium and -low values respectively. All the districts are now connected by grid Gorakhpur also generates electricity.
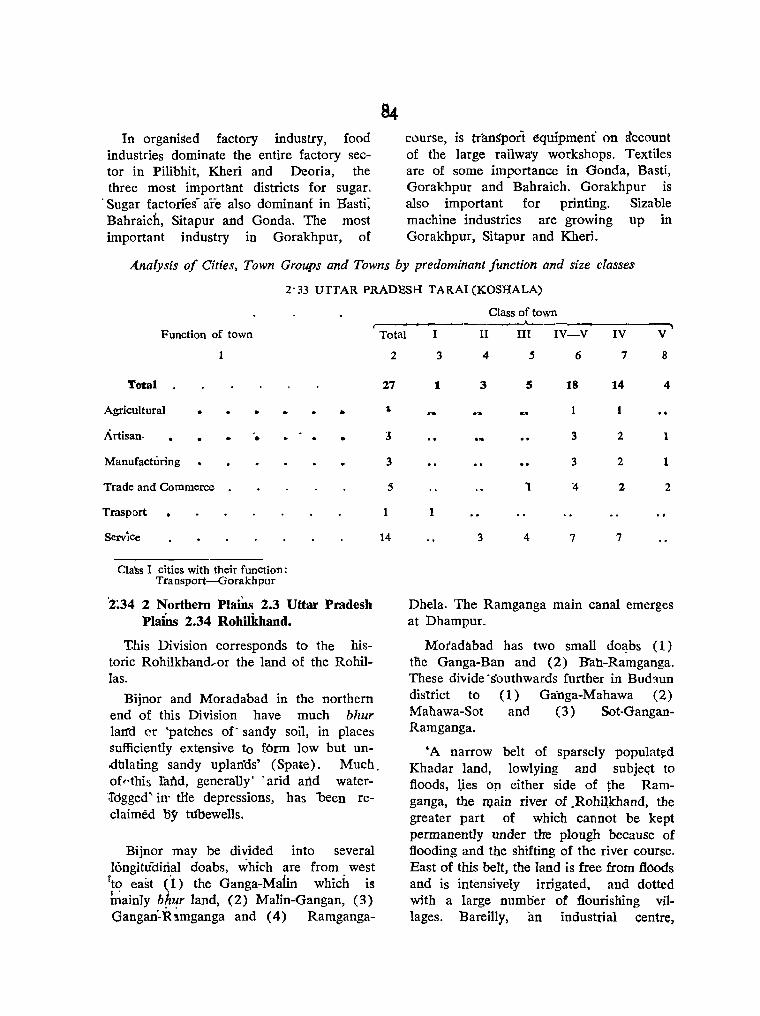
In organised factory industry, food industries dominate the entire factory sector in Pilibhit, Kheri and Deoria, the three most important districts for sugar.
. Sugar factorfes- are also dominant in Basti: Bahraich, Sitapur and Gonda. The most important industry in GorakhpuT, of
course, is trllD~pOri equipment on ~ccount of the large railway workshops. Textiles are of some importance in Gonda, Basti, Gorakhpur and Bahraich. Gorakhpur is also important for printing. Sizable machine industries are growing up in Gorakhpur, Sitapur and Kheri.
Analysis of Cities, Town Groups and Towns by predominant function and size classes
2'33 UTTAR PRADESH TARAI (KOSHALA)
r-Function of town
Total
Agricultural .. • Artisan. '. Manufacturing
Trade and Commerce
Trasport
Service
Cla'ss I cities with their function: Transport-Gorakhpur
'2:34 2 Northern PlaiDs 2.3 Uttar Pradesh PlaiDs 2.34 Rohilk.hand.
T.his Division corresponds to the historic Rohilkhand .... or the land of the Rohillas.
Bijnor and Moradabad in the northern end of this Division have much bhur laIfd er 'patches of' sandy soil, in places sufficiently extensive to fOrm low but un.dulating sandy uplan'ds' (Spate) . Much of,·this lill'1d, generally' . arid and water.Tdgged'in· die depressions, has been reclaimed 155' tUbewells.
Bijnor may be divided into several I6ngituoinal doabs, which are from west
l to east (1) the Ganga-Mafin which is fuainIy bhllr land, (2) Malin-Gangan, (3) Gangan-R;mganga and (4) Ramganga-
Total
2
27
1,
J
3
5
1
14
Class of town ..A--
I II III IV-V
3 4 5 6
1 3 5 18
. .. 1
3
3
1 '4
1
3 4 7
IV
7
14
1
2
2
2
7
V
8
4
1
2
Dhela. The Ramganga main canal emerges at Dhampur.
Motadabad has two small dO::J.bs ( 1 ) tne Ganga-Ban and (2) B"ah-Ramganga. These divide . southwards further in Bud:lUn district to (1) Ganga-Mahawa (2) Mahawa-Sot and (3) Sot-Gang anRamganga.
'A narrow belt of sparsely populat~d
Khadar land, lowlying and subj~Gt to floods, lies on either side of the Ramganga, the main river of _Rohilkhand, the greater part of which cannot be kept permanently under tIre plough because of flooding and the shifting of the river course, East of this belt, the land is free from floods and is intensively irrigated, and dotted with a large number of flourishing villages. Bareilly, an industrial centre,

'stands on the edge of an old river terrace overlooking the eastern bank of the Ramga'nga, which also ·skirts the western fringes'. (Chat,terjee) The RamgangaDeoha doab runs through much of Shahjahimpur. the main city standing on the East bank of the Deoha river.
In contrast to the Tarai Division (2.33). Rohllkhand is a predominantly wheat tract; with rice following as a tlose second. The third important foodcrop is gram. Bajra is grown in the. usar tracts of Moradabad. Budaun and Shahjahanpur. The ~o~t important cash crop is sugarcane which' is grown extensively in Bijnor, Moradabad, - Rampur and BareilIy and feed their .sugar mills. Groundnut is grown in Budaun which has oil and dal mills i1] addition to rice and flour factories.
The urban ratio is high in Moradabad. Rampur and Bareilly all of which have flourishing industrial cities. It· is moderately high in Shaltjahanpur and Biinor but low in Budaun. Natural increase and immigration are low to moderate except in Rampur bnt the proportion of children 0-4 to women 15-44 is high in Bijnor. Moradabad and RaIl).pur, moderately high in Barei1Iy and Budaun, hut low in Shahiahanpur which suggests a high rate of increase in the current decade.
Budaun is placed at tbe first or lowest level of development with low values for blocks III and V. medium in VI but high
values in II and IV. Shahjahanpu.r is placed at the second level With low value for block III, medium values for block V and VI and high values for II and IV, the total scores of the two districts being quite close to each other.
Moradabad, Bijnor, Rampur alld Bareil1y are placed on the third level, although characteristically 'enough Bijnor has low value for block III, medium for blocks V and VI and high values for II and IV .. Moraqabad, Rampur and BareiUy have identical rankings in the various blOCkS, except that in blocks III and VI, Morada:bad and Rampur have high and Bareilly medium values in block VI whereas low for Moradabad and medium for, Rampur and Bareilly in block III. All districts are connected by grid but Rampur and BareilIy generate eiectricity locally in addition.
The foremost organised industry in the Division is food, but the textiles industry is stronger in Budaun and Rampur. Bareilly is a large railway repair centre. Non-metallic minerals are prominent in Bijnor and Moradabad. Basic metals are considerable is Moradabad. The manufacture of m<\chIn,e,ry }pd ~etal products is gaining Ilround in Moradabad, Rampur. BareilI'Y and Shahjahanpur.
This as a whole is one of the advanced Divisions in ·the Uttar Pradesh· Plains.
Analysis of Cities, Town Groups and Towns by predominant function and' size" classes
2'34 ROHILKHAND Class of town
,- ------Function of town Total I II 'III IV-V IV V
2 3 4 5 6 7 8 Total 36 4. 3 8 21 10 11
1 1 1 Agricultural 2 4 2 2 5 1 At;tisan . '. ,
5 2 1 2 2 .. Manufactunbg 5 1 . i 3 1 2 Trade and Commerce
Service 19 1 6 11 4 7
Class I cities with their' function : Mallufacturing;-Moradabad., Rampur. Trade and Corilmerce-Baretlly. Service-Shahjahanpur .

2.35 2 Northern Plains ~.3 Uttar Pradesh
Plains 2.35 Oudh.
Except for Hardoi and Unnao which
have densities of 675 and 680 persons per
sq: mile respectively, the density is uni
formly high, Lucknow having 1,382 per
sons per sq. mile. Bu~ it is strange that
this heartland of Uttar Pradesh should
suff~r fr:om the lowest level of develop
ments .except for the capit.al district of
Lucknow.
Hardoi and Lucknow because of their
river and water regitnes are, almost a con
tinuation of the previous 'Division (2.34)
and are predominantly wheat and barley
districts. The tice districts are Bara Banki,
Unnao, Rae Bareli, S'!lltanpur and
Faizabad. In all seven districts,- however,
wheat, barley, and rice go close together,
the third and almost equally important
fooctcrop 'Qeing gram, this "~ing as extensive
a gram tract as Rp,hilkhiqld. Groundnut
has extended to Hardoi:
Except for Lucknow which has a high
urban and immigration ratio, the entire
division has low or moderate values for
nrbanization, natural increase, immigra
tion and proportion of children 0-4 to
women 15-44. Thus even demographically,
the area shows sluggishness and relative
lack of vitality.
Except for Lucknow all six districts are placed in the first or lowest rank of
86 development. Their block values are clos.e
to one another, the range of total scores
being low. All six districts have low values
for blocks III and V. Sul!anpur and Faiz
abad have low values' for VI but medium
values for the other' four districts. Hardoi,
Bara Banki and Urmao have high values
for block V, while Rae Bareli, Sultanpur
and Faizabad have medibm values.
All have high values in block n, except
Bara Banki and Faizabad wbich pave
medium scores. Lucknow alone, very obvi
ously because of its great city, is in the
fourth or top level with high scores for
blocks II, IVana V and ;uedium s<;ores for blocks III and VI.
All the districts are connected by elec
tricity grid but Hardoi and Lucknow
generate electricity locally also. The
moslt important factory industry in this
region is food: flour. rice and dal mills.
T.ransport industries are imP.Qrtant in
Lucknow and R-ae Bareli. Basic metals
are important in Sultanpur. Unnao has a
variety of miscellaneous industries. Tex
tiles are important i.n Faizabad but minor
in Lucknow and Bara Banki. Printing is
important in Luckflow, and Ie'atber pro
ducts (except footweai) in Unnao. There
is some machinery industry in Lucknow.
Bara Banki and Faizabad.
It. is obvious that
Rohilkhand and Tarai
this Division like
hall not yet been
able to take full advantage of its natural
endowments Ilnd geographical p,osition.
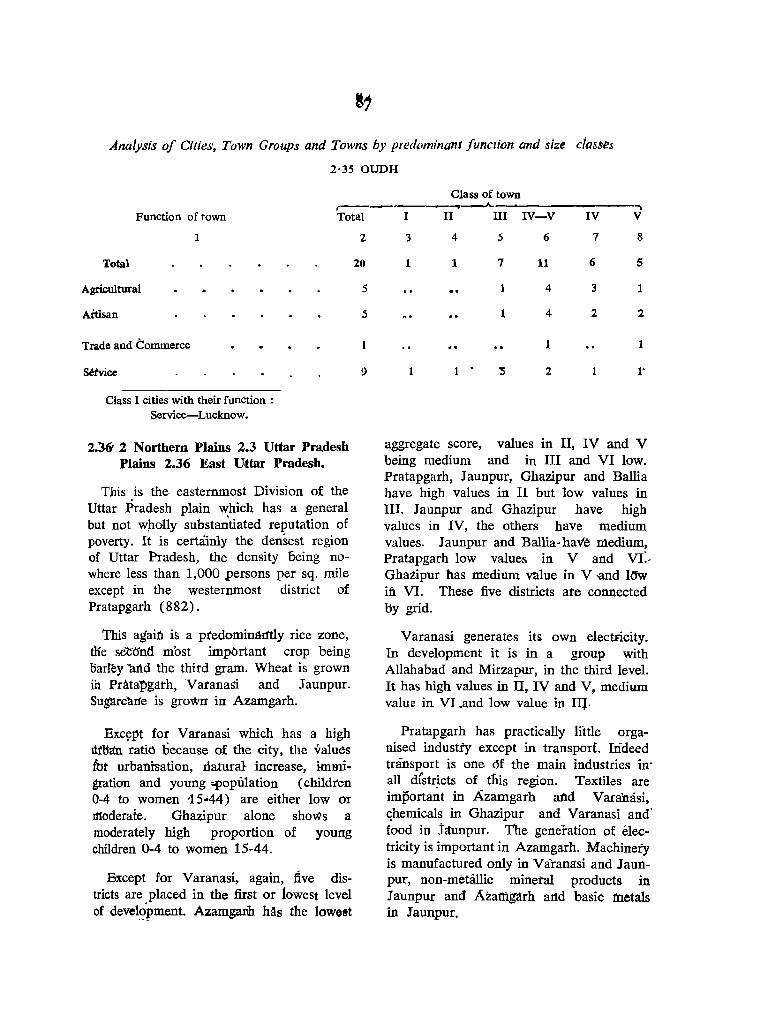
Analysis of Cities, Town Groups and Towns by predl1minant function and size ciass(1s
2'350UDH
Class of town r-----'----"- - .....
Function of town Total I II III IV-V IV V
1
Total
Agricultural
Artisan
Trade and Commerce
setvice
Class I cities with their function : Service-Lucknow.
236' 2 Northern Plains 2.3 Uttar Pradesh Plains 2.36 East Uttar Pradesh.
This is the easternmost Division of the Uttar Pradesh plain which has a general but not w!:lOlly substantiated reputation of poverty. It is certainly the denSest region of Uttar Pradesh, the density being nowhere less than 1,000 persons per sq. mile except in the westernmost district of Pratapgarh (882).
This again is a pl'edominaI1t1y rice zone, tlie set!O"ntl most important crop being barley ~artd the third gram. Wheat is grown ih Pratapgath, VaranaSi and Jaunpur. Sug'a.rdul'e is grown in Azamgarh.
Exc~pt for Varanasi which has a high l1tfutn ratio because of the city, the values fut urbanisation, rlatural increase, immigration and young -population (children 0-4 to women -15"44) are either low or moderate. Ghazipur alone shows a moderately high proportion of young children 0-4 to women 15-44.
Except for Varanasi, again, five districts are placed in the first or iowcst level of devel~pment. Azamgruili has the lowest
2
20
5
5
3 4 5 6 7 8
1 1 7 11 6 5
1 4 3 1
1 4 2 2
1 1
1 • 2 r
aggregate score, values in II, IV and V being medium and in III and VI low. Pratapgarh, J aunpur, Ghazipur and BaHia have high values in II but low values in III. Jaunpur and Ghazipur have high values in IV, the others have medium values. Jaunpur and Ballia-have n1edium, Pratapgarh low values in V and VI:, Ghazipur has medium wlue in V -and lOW ifi. VI. These five districts are connected by grid.
Varanasi generates its own electricity. In development it is in a group with Allahabad and Mirzapur, in the third level. It has high values in II, IV and V, medium ",alue in VI .and low value in lIT.
Pratapgarh has practically little organised industry except in transport. Indeed transport is one ~f the main industries in' all d[stq.cts of this region. Textiles are important in Azamgarh al'ld Varahasi, <:hemicals in Ghazipur and Varanasi and' food in j~unpur. The generation of electricity is important in Azamgarh. Machinery is manufactured only in Val-anasi and J aunpur, non-metallic mineral products in J aunpur and Azamgarh add basic metals in Jaunpur ..
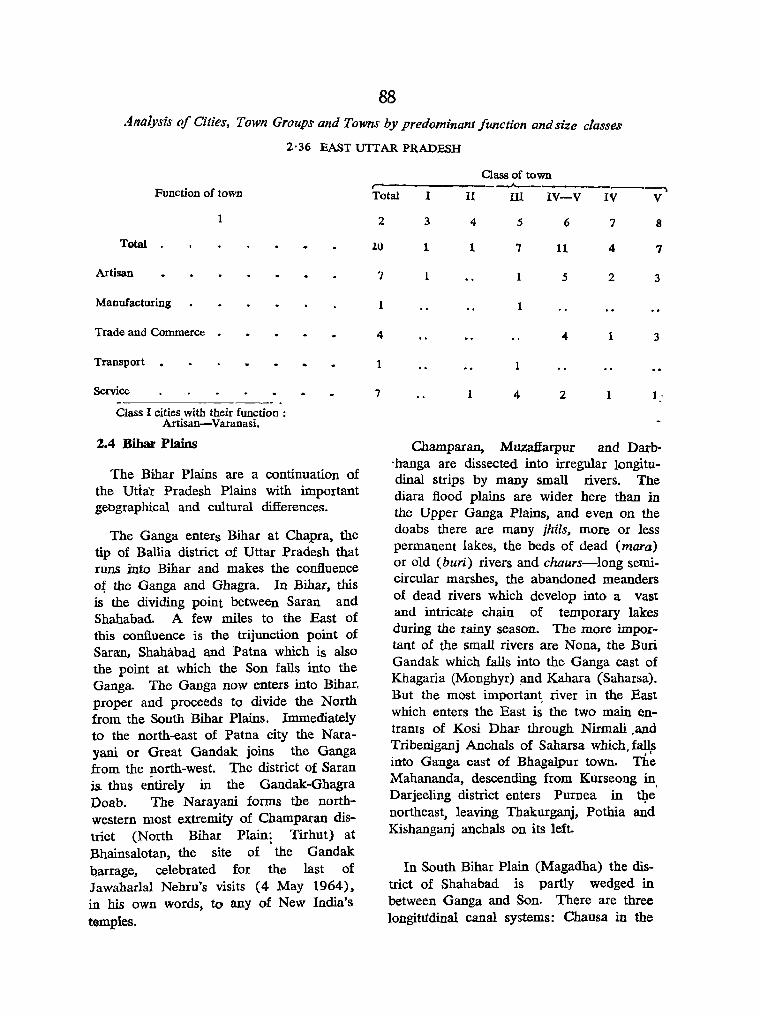
88 Analysis of Cities, Town Groups and Towns by predominant function and size classes
2'36 EAST UTTAR PRADESH
Function of town
1
Total
Artisan
Manufacturing
Trade and Commerce •
Transport •
Service
Class I cities with their function' Artisan-Varanasi. .
2.4 Bihar Plains
The Bihar Plains are a continuation of the Uttar Pradesh Plains with important geographical and cultural difIerences.
The Ganga enters Bihar at Chapra. the tip of Ballia district of Uttar Pradesh that runs into Bihar and makes the confluence at the Ganga and Ghagra. In Bihar. this is the dividing point between Saran and Shahabad. A few miles to the East of this confluence is the trijunction point of Saran, Shahabad and Patna which is also the point at which the Son falls into the Ganga. The Ganga now enters into Bihar. proper and proceeds to divide the North from the South Bihar Plains. Immediately to the north-east of Patna city the Narayani or Great Gandak joins the Ganga from the !l0rth-west. The district of Saran is. thus entirely in the Gandak-Ghagra Doab. The Narayani forms the northwestern most extremity of Champaran district (North Bihar Plain~ Tirhut) at Bhainsalotan, the site of the Gandak Qarrage, celebrated for the last of lawaharlal Nehru's visits (4 May 1964). in his own words, to any of New India's temples.
Class of town r-- -....J.-- --. Total I II III IV-V IV V
2
1.1)
7
1
4
1
7
3 4 5 6 7 8
1 1 7 11 4 7
1 5 2 3
1
1 3
1
4 2 1 1:
Champaran, Muzaffarpur and Darb-'hanga are dissected into irregular longitudinal strips by many small rivers. The diara flood plains are wider here than in the Upper Ganga Plains. and even on the doabs there are many jhils, more or less permanent lakes, the beds of dead (mara) or old (buri) rivers and chaurs-long semicircular marshes, the abandoned meanders of dead rivers which develop into a vast and intricate chain of temporary lakes during the rainy season. The more important of the small rivers are Nona, the Burl Gandak which falls into the Ganga east of Kbagaria (Monghyr) llOd Kahara (Suharsa). But the most important river in the East which enters the East i~ the two main entrants of Kosi Dhar through Nirmali .and Tribeniganj Anchals of Saharsa which falls into Ga:nga east of Bhagalpur town. 'Th~ Mahananda, descending from Kurseong in Darjeeling district enters Purnea in the' northeast, leaving Thakurganj, Pothia ~d Kisbanganj anchals on its left.
In South Bihar Plain (Magadha) the district of Shahabad is partly wedged in between Ganga and Son. There are three longitu'dinal canal systems: Chausa in the

extfeme West, Buxar in the middle and Arrah in the East. The Phalgu river travels almost due North from Hazaribagh where it is named Mohana through the middle of Gaya district where it is called Phalgu on to Fatna district. The Sakri meanders in Patna and Gaya districts. The
Kiul river travels across Monghyr district and falls into the Ganga at Lakhisarai.
A string of hill ranges travels diagonally across the South Bihar Plain from Shahabad to Barabar and Rajgir Hills in Gaya on to the Monghyr Hills in Monghyr and Rajmahal Hills in Santa! Parganas.
Analysis of Cities, Town Groups and Towns by predominant function and size classes
2'4 BIHAR PLAINS
F,lQ:!tion of t:>wn
1
Total
Agricultural
Artisan
Manufacturing
Trade and Commerce
Transport
Service
r-Total
2
81
20
12
6
5
5
33
2.41 2 Northern Plains 2.4 Bihar Plains 2.41 North Bihar Plain (Tirhut).
Champaran is full of sand and in the tarai contains sal and tall reedy grasses. Darbhanga and Saharsa have patches of peat soil. The density of population of Champaran is comparatively low (851 per sq. mile). Saharsa ( 819 per sq. mile) has so long been greatl)' disturbed by' the ravages of the Kosi, and Pumea (731) ha& tarai areas of sal and grass. Saran (1,337), Muzaffarpur (1,364) and Darbhanga (1,314) have high densities. Chatterjee speaks of 'two distinct demographic regions' which is a little of an overstatement. It will of course be correct to state that the tract lying West of the Kosi is better drained and has rich loamy soils 163 R.G.I.-13.
I
3
6
1
1
4
II
4
6
1
1
2
2
Class of town
III IV-VI IV
5 6 7
17 52 32
3 16 10
1 9 6
3 2 1
5 3
2 1 1
8 19 11
V
8
19
6
3
1
2
7
VI
9
1
1
and consequently dense population. The country East of Kosi is often laden with sand. But even within each region population distribution is not uniform. The doab between the Gandak and Ghagra (Champaran) is less densely populated than the doab between the Ghagra and Ganga (Saran). Motihari is very thickly populated and so is the tract along the Gandak: near Gopalganj~Gobindpur.
The entire area is known as Tirhut. Rice is the predominant crop followed by maize and some wheat. Champaran grows much sugarcane. Saharsa and Purnea grow jute. Spate notes '(i) the remarkable concentiation of maize on the wedge of light roams between Ganga and Burhl Gandak and on the sandy Koshi soils, and its corresponding absence on

the heavy mat/yar with its tendency to waterlogging; (ii) the somewhat similar distribution of barley in Eastern Uttar Pradesh and Westem Bihar, but more restricted towards the East than in maize owing to the increasing rainfall, and the increasing dominance of rice, barley being essentially a "rabi after bhadai" crop. Sugar refining including industrial alcohol is the biggest industry in North Bihar. The petroleum oil refinery at Barauni, opposite Mokameh in the northern half of Monghyr district, is going to be the most important industrial complex in North Bihar.
The urban ratio is low and except in Saharsa and Purnea where population increase is high, natural increase is generally low in the Division. There is enough internal evidence to show that some population migrated from Saharsa and Purnea to East Pakistan before 1951 but returned before 1961. Migration, too, is thus low except in Saharsa and Pllmea. The proportion of children 0-4 to women 15-44 is low in all other districts but high in Saharsa and Purnea. The language is Hindi. The proportion of members of scheduled castes is low.
Saran, Champaran, Muzaffarpur and Darbhanga are close tQ one another in total scores. The values are either low or medium for every block, except that Saran, situated in the Ghagra-Ganga Doab removed from the tarai waters, enjoys high value for agricultural infrastructure. Each district generated its own electricity in 1961. Saharsa and Purnea are not much better in their block values except that in block IV (potential of human resources) both Saharsa and Purnea have high values. They too generate their own electricity.
The important organised industries are food stuffs in all districts; metal products in Saran, Muzaffarpur; wood industries in Champaran, Darbhanga and Purnea; printing and publishing in Saran, Champaran, Saharsa and Pum~a; machinery in Muzaffarpur and Saharsa; generation of electricity in all districts except Saran and Darbhanga.
This Division thus is still a homogeneous area with a high population density but relatively low level of development throughout.
Analysis of Cities, Town Groups and Towns by predominant function and size classes
2·H NORTH BIHAR PLAIN (TIRHUT)
Class of town r-
__.__.__ Function of town Total I II III IV-V IV V
1 2 3 4 5 6 7 8
Total 38 2. 2. 9 25 16 9
Agricultural 10 10 7 3
Artisan 4 1 3 2 1
Manufacturing 2 1
Trade and Commerce 3 3 1 2
Transport 2 1
Service 17 2 6 8 6 2
Class I cities with their function: Service-Muzaifal'pur, Darbhanga.
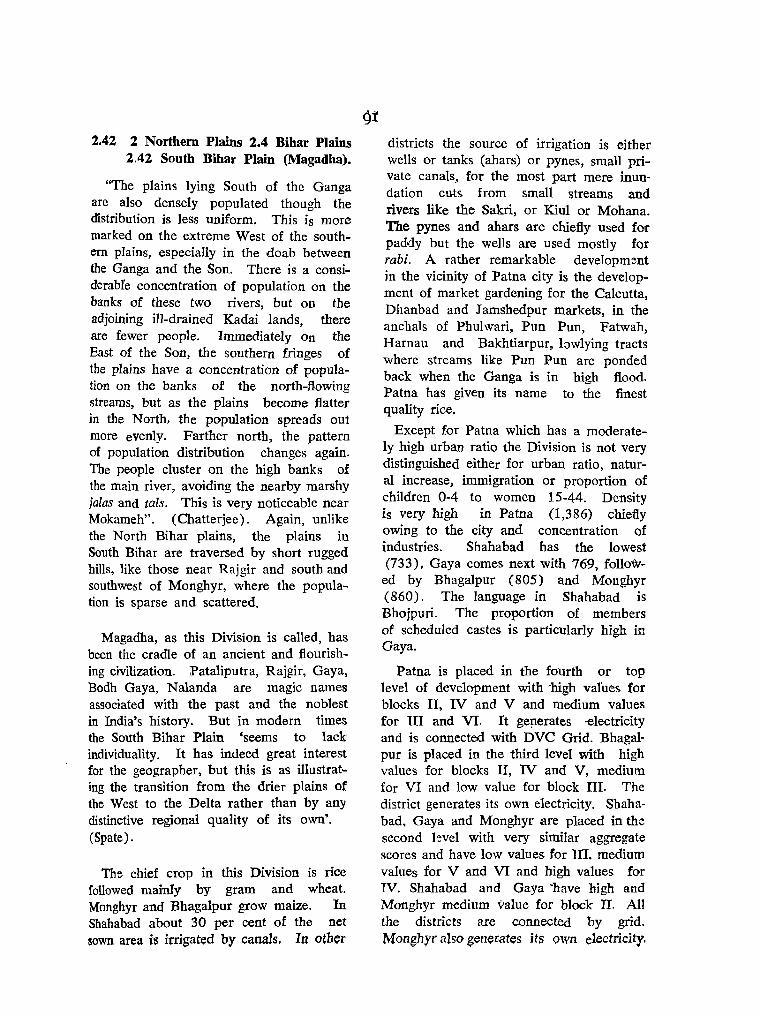
2.42 2 Northern Plains 2.4 Bihar Plains 2.42 South Bihar Plain (Magadha).
"The plains lying South of the Ganga are also densely populated though the distribution is less uniform. This is more marked on the extreme West of the southern plains, especially in the doab between the Ganga and the Son. There is a considerabfe concentration of population on the banks of these two rivers, but on the adjoining ill-drained Kadai lands, there are fewer people. Immediately on the East of the Son, the southern fringes of the plains have a concentration of population on the banks of the north-flowing streams, but as the plains become flatter in the North, the population spreads out more evenly. Farther north, the pattern of population distribution changes again. The people cluster on the high banks of the main river, avoiding the nearby marshy jalas and tals. This is very noticeable near Mokameh". (Chatterjee) . Again, unlike the North Bihar plains, the plains in South Bihar are traversed by short rugged hills, like those near Rajgir and south and southwest of Monghyr, where the population is sparse and scattered.
Magadha, as this Division is called, has been the cradle of an ancient and flourishing civilization. Pataliputra, Rajgir, Gaya, Bodh Gaya, N alanda are magic names associated with the past and the noblest in India's history. But in modern times the South Bihar Plain 'seems to lack individuality. It has indeed great interest for the geographer, but this is as illustrating the transition from the drier plains of the West to the Delta rather than by any distinctive regional quality of its own'. (Spate).
The chief crop in this Division is rice followed mainly by gram and wheat. Monghyr and Bhagalpur grow maize. In Shahabad about 30 per cent of the net sown area is irrigated by canals. In other
districts the source of irrigation is either wells or tanks (abars) or pynes, small private canals, for the most part mere inundation cuts from small streams and rivers like the Sakri, or Kiul or Mohana. The pynes and ahars are chiefly used for paddy but the wells are used mostly for rabi. A rather remarkable development in the vicinity of Patna city is the development of market gardening for the Calcutta, Dhanbad and J amshedpur markets, in the anchals of Phulwari, Pun Pun, Fatwah, Harnau and Bakhtiarpur, lowlying tracts where streams like Pun Pun are ponded back when the Ganga is in high flood. Patna has given its name to the finest quality rice.
Except for Patna which has a moderately high urban ratio the Division is not very distinguished either for urban ratio, natural increase, immigration or proportion of children 0-4 to women 15-44. Density is very high in Patna (1,386) chiefly owing to the city and concentration of industries. Shahabad has the lowest (733), Gaya comes next with 769, folloW
ed by Bhagalpur (805) and Monghyr (860) . The language in Shahabad is Bhojpuri. The proportion of members of scheduled castes is particularly high in Gaya.
Patna is placed in the fourth or top level of development with ·high varues for blocks II, IV and V and medium values for III and VI. It geperates -electricity and is connected with DVC Grid. Bhagalpur is placed in the third level with high values for blocks II, IV and V, medium for VI and low value for block III. The district generates its own electricity. Shahabad, Gaya and Monghyr are placed in the second level with very similar aggregate scores and have low values for III. medium values fo1." V and VI and high values for IV. Shahabad and Gaya -have high and Monghyr medium value for block II. All the districts are connected by grid. Monghyr also generates its own electricity.
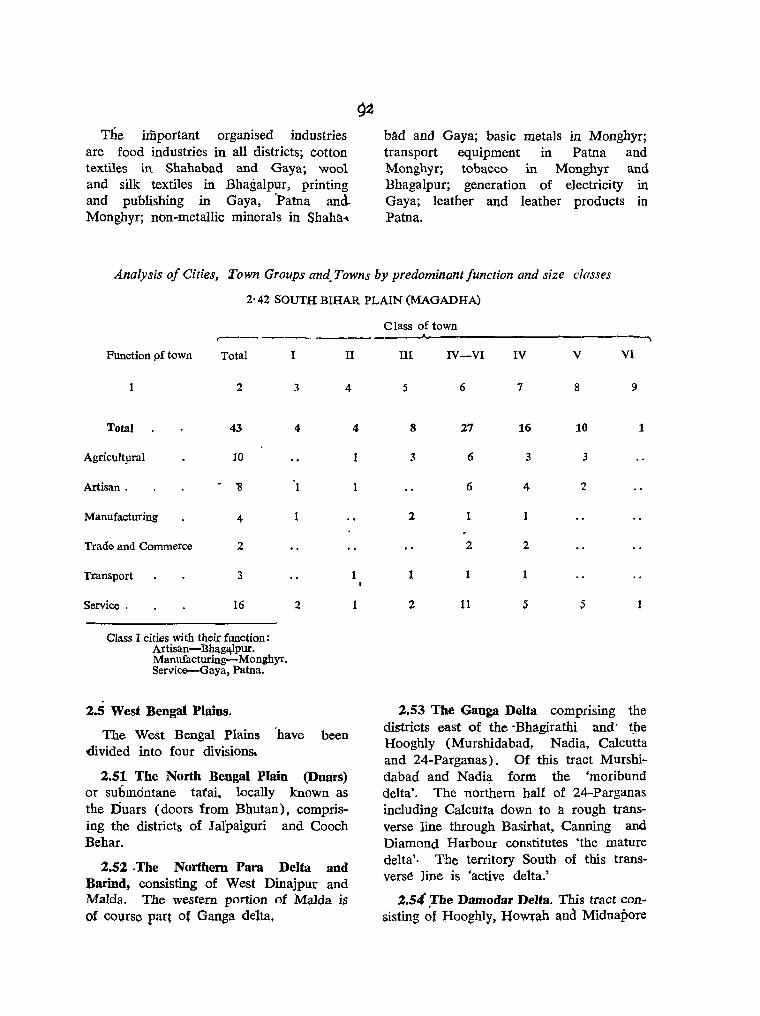
The important organised industries are food industries in all districts; cotton textiles in Shahabad and Gaya; wool and silk textiles in Bhagalpur, printing and publishing in Gaya, 'Patna andMonghyr; non-metallic minerals in ShaM---
bAd and Gaya; basic metals in Monghyr; transport equipment in Patna and Monghyr; tobacco in Monghyr and Bhagalpur; generation of electricity in Gaya; leather and leather products in Patna.
Analysis of Cities, Town Groups and. Towns by predominant function and size classes
2' 42 SOUTH BIHAR PLAIN (MAGADHA)
r----Function pf town Total I II
1 2
Total 43
Agricultprai 10
Artisan. . '8
Manufacturing 4
Trade and Commerce 2
Transport 3
Service . 16
Class I cities with their function: Artisan-Bhag(\lpur. Manufacturing-Monghyr. Service-Gaya, Patna.
2.5 West Bengal Plains.
3 4
4
'1
2
The West Bengal Plains 'have been divided into four divisions.
2.51 The North Bengal Plain (Duars) or submdntane tatai, locally known as the Duars (doors from Bhutan), comprising the districts of J alpaiguri and Coach Behar.
2.52·The Northern Para Delta and Barind, consisting of West Dinajpur and Malda. The western portion of Malda is of course part o{ Ganga delta.
4
1
1
1
C lass of town ----.... III IV-VI IV V VI
5 6 7 8 9
8 27 16 10 1
3 6 3 3
6 4 2
2 1
2 2
1 1
2 11 S S
2.53 The Ganga Delta compnsmg the districts east of the 'Bhagirathi and' t,he Hooghly (Murshidabad, Nadia, Calcutta and 24-Parganas). Of this tract Murshidabacf and Nadia form the 'moribund delta'. The northern half of 24-Parganas including Calcutta down to :t rough transverse line through Basirhat, Canning and Diamond Harbour constitutes 'the mature delta'. The territory South of this transverse line is 'active delta.'
2.54 The Damodar Delta. This tract consisting ~f Hooghly, Ramah and. Midnapore
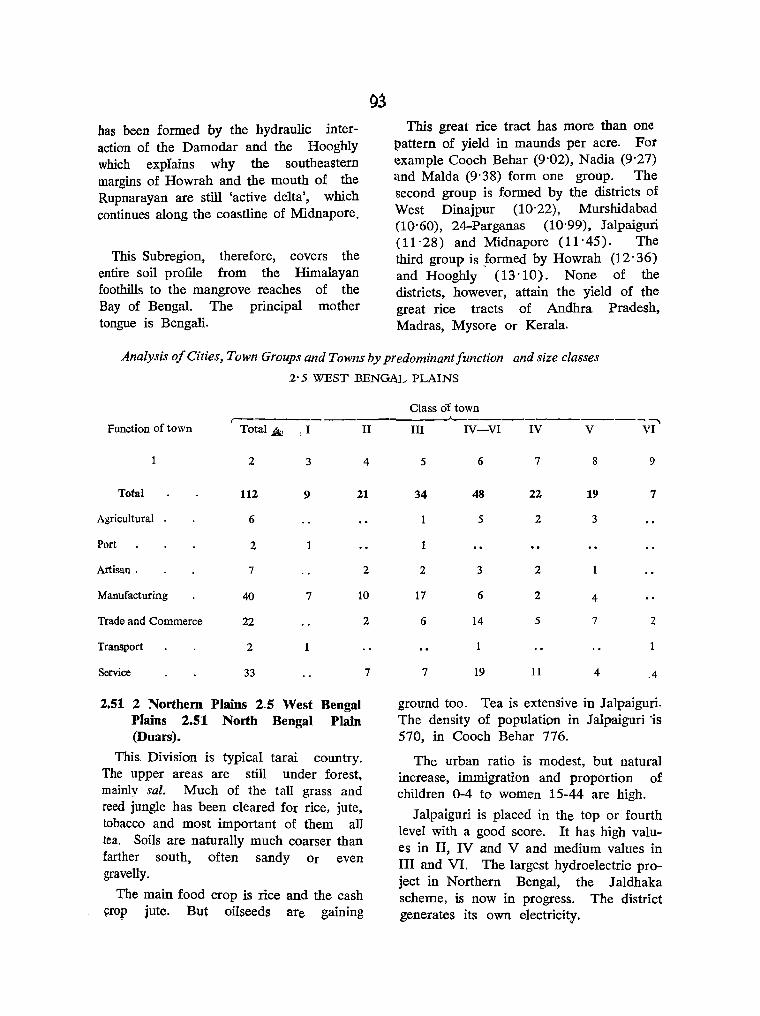
has been formed by the hydraulic interaction of the Damodar and the Hooghly which expIains why the southeastern margins of Howrah and the mouth of the Rupnarayan are still 'active delta', which continues along the coastline of Midnapore.
This Subregion, therefore, covers the entire soil profile from the Himalayan foothills to the mangrove reaches of the Bay of Bengal. The principal mother tongue is Bengali.
9S This great rice tract has more than one
pattern of yield in maunds per acre. For example Coach Behar (9'02), Nadia (9'27) and MaIda (9'38) form one group. The second group is formed by the districts of West Dinajpur (10'22), Murshidabad (10'60), 24-Parganas (10'99), Jalpaiguri (11'28) and Midnapore (11'45). The third group is formed by Howrah (12'36) and Hooghly (13'10). None of the districts, however, attain the yield of the great rice tracts of Andhra Pradesh, Madras, Mysore Or Kerala.
Analysis of Cities, Town Groups and Towns by predominant function and size classes
2' 5 WEST BENGAL PLAINS
r-Function of town Total ~ II II
2 3 4
Total 112 9 21
Agricultural 6
Port 2 1
Artisan. 7 2
Manufacturing 40 7 10
Trade and Commerce 22 2
Transport 2
Service 33
2.51 2 Northern Plains 2.5 West Bengal Plains 2.51 North Bengal Plain (Duars).
This. Division is typical tarai country. The upper areas are still under forest, mainly sal. Much of the tall grass and reed jungle has been cleared for rice, jute, tobacco and most important of them all tea. Soils are naturally much coarser than farther south, often sandy Or even gravelly.
The main food crop is rice and the cash ~rop jute. But oilseeds are gaining
7
Class or town ----"-------------. III IV-VI IV V VI
5 6 7 8 9
34 48 22 19 7
1 5 2 3
2 3 2
17 6 2 4
6 14 5 7 2
7 19 11 4 .4
ground too. Tea is extensive in J alpaiguri. The density of population in J alpaiguri 'is 570, in Coach Behar 776.
The urban ratio is modest, but natural increase, immigration and proportion of children 0-4 to women 15-44 are high.
J alpaiguri is placed in the top or fourth level with a good score. It has high values in II, IV a:nd V and medium values in III and VI. The largest hydroelectric project in Northern Bengal, the Jaldhaka scheme, is now in progress. The district generates its own electricity.
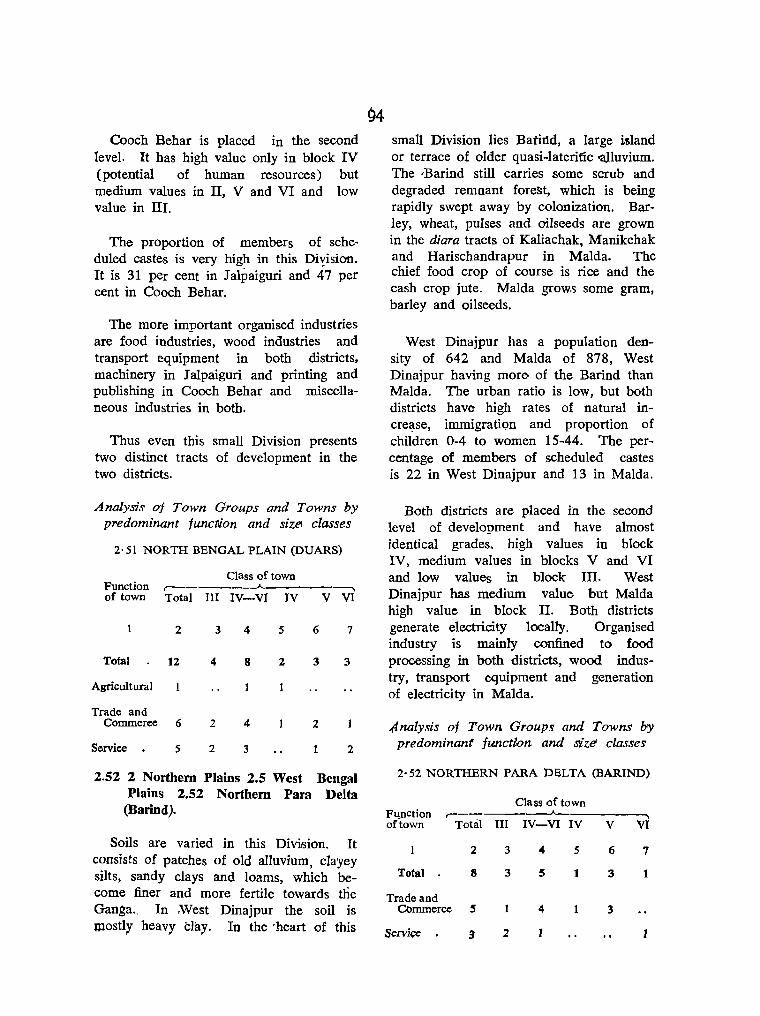
Coach Behar is placed in the second level. It has high value only in block IV (potential of human resources) but medium values in II, V and VI and low value in In.
The proportion of members of scheduled castes is very high in this Diyision. It is 31 per cent in Jalpaiguri and 47 per cent in Coach Behar.
The more important organised industries are food industries, wood industries and transport equipment in both districts. machinery in J alpaiguri and printing and publishing in Cooch Behar and miscellaneous industries in both.
Thus even this small Division presents two distinct tracts of development in the two districts.
Analysis oj Town Groups and Towns by predominant func~ion and size'> classes
2· 51 NORTH BENGAL PLAIN (DUARS)
Class of town Function ,--_____ --A.. _---.,
of town Total III IV-VI IV V VI
2
Total 12
Agricultural
Trade and Commerce 6
Service 5
3
4
2
2
4 5 6 7
8 2 3 3
4 2
3 2
2.52 2 Northern Plains 2.5 West Bengal Plains 2.52 Northern Para Delta
(Barind).
Soils are varied in this Division. It consists of patches of old alluvium, clayey silts, sandy clays and loams, which become finer and more fertile towards the Ganga.. In ,West Dinajpur the soil is mostly heavy clay. In the 'heart of this
small Division lies BatiI1d, a large island or terrace of older quasi-lateritic .a,J.luvium. The 'Barind still carries .some scrub and degraded remnant forest, which is being rapidly swept away by colonization. Barley, wheat, pulses and oilseeds are grown in the diara tracts of Kaliachak, Manikchak and Harischandrapur in Malda. The chief food crop of course is rice and the cash crop jute. MaIda grows some gram, barley and oilseeds.
West Dinajpur has a popUlation density of 642 and MaIda of 878, West Dinajpur having more- of the Barind than Maida. The urban ratio is low, but both districts have high rates of natural increase, immigration and proportion of children 0-4 to women 15-44. The percentage of members of scheduled castes is 22 in West Dinajpur and 13 in MaIda.
Both districts are placed in the second level of development and have almost identical grades. high values in block IV, medium values in blocks V and VI and low values in block III. West Dinajpur has medium value but MaIda high value in block II. Both districts generate electricity locally. Organised industry is mainly confined to food processing in both districts, wood industry, transport equipment and generation of electricity in MaIda.
4nalysis of Town Groups and Towns by predominant function and s,ize classes
2·52 NORTHERN PARA DELTA (BARIND)
Class of town Fquction r- ------"--------.. of town Total III IV-VI IV V VI
2
Total 8
Trade and Commerce S
SeTVj~. 3
3
3
2
4
5
4
5
1
6
3
3
7
1
l53 2 Northern Plains 2.5 West Bengal Plains 2.53 Ganga Delta.
The Division is composed of 4 districts; Murshidabad, Nadia, Calcutta and 24-Parganas.
Murshidabad is stretched across the Bhagirathi as it enters the districts beyond the Rajmahal Hills. On the right bank of Bhagirathi the land is the new alluvial apron of the Rarh, old alluvium and red soil. The western tract of the district is thus dissected by streams which descend from the uplands: the more important ones being the Mayurakshi and Dwaraka. The eastern tract is crisscrossed by the meanders of the Jalangi.
A little of Nadia (Nabadwip) also falls on the right bank: of the Bhagirathi. Murshidabad and Nadia on the east bank of the Bhagirathi are a true example of the Moribund delta, in which all the rivers, Jaiangi, Churni, Bhairab, Ichhamati and Mathabhanga form a network of drainage but are also liable to be ponded back when the flood level in the Bhagirathi is high. Calcutta is an enclave of 24-Parganas whose low level and salt lakes cause grave problems of run-off during early monsoon storms. The northern and eastern parts of 24-Parganas are mature delta but in the Sundarbans the delta is still very much active.
The soil is thus entirely alluvium in the stable and active delta but presents problems of drainage. It is mainly sandy loam, with patches of stiff clays in the moribund delta. TIle Sundarbans including the reclaimed Sonarpur-Arrapanch areas are clays, with fresh sands along the sea-face, and of course strongly saline. In Murshidabad and Nadia 'the oiltakes of the old distributaries have been' silted up, and the rivers themselves flow on old levees. Even in flood the country in general is
not inundated; on the other hand the interfluves are ill drained owing to their saucer section, so typical of the innumerable bils.
The chief food crop is rice and the cash crop jute, which in this Division have struck a complicated three-cornered balance for many decades between man-days of labour on the one side, jute forecasts on the second and wholesale prices on the third, so much so that even statistical forecasts, based on scientific samples came to acquire a vested interest and bias. Nadia grows more rabi crops than kharif and therefore pulses and oilseeds. Sugarcane is extensively grown in north-western Nadia. and Southern Murshidabad which feeds the large sugar mill at Plassey. Gram is grown in both the northern districts.
The densities of Murshidabad (1,105) and Nadia (1,135) are high. But "the largest concentration of population is to be found in ".od around Calcutta on the floodplain of the Ganga and its tributaries. Long meandering belts of contiguous villages with their surrounding orchards, separated by extensive rice fields, characterise the cultural landscape here. The deltaic relief, fertile soils and easy communications have rendered this spot most attractive for human settlement" (Chatterjee). The 'long meandering belts of contiguous villages' are mostly due to their having been established on the bank(s) of rivets or streams which have either moved away or been reduced to levees or to bils or old river beds. That is why they sometimes exhibit thick dendritic patterns.
The urban ratio is high in 24-Parganas and of course 100 per cent ill Calcutta. It is moderately high also in Nadia but low in Mursbidabad. The rate of natural increase has been high in all districts except Calcutta, that of imrnigration high in all districts except Murshidabad. The
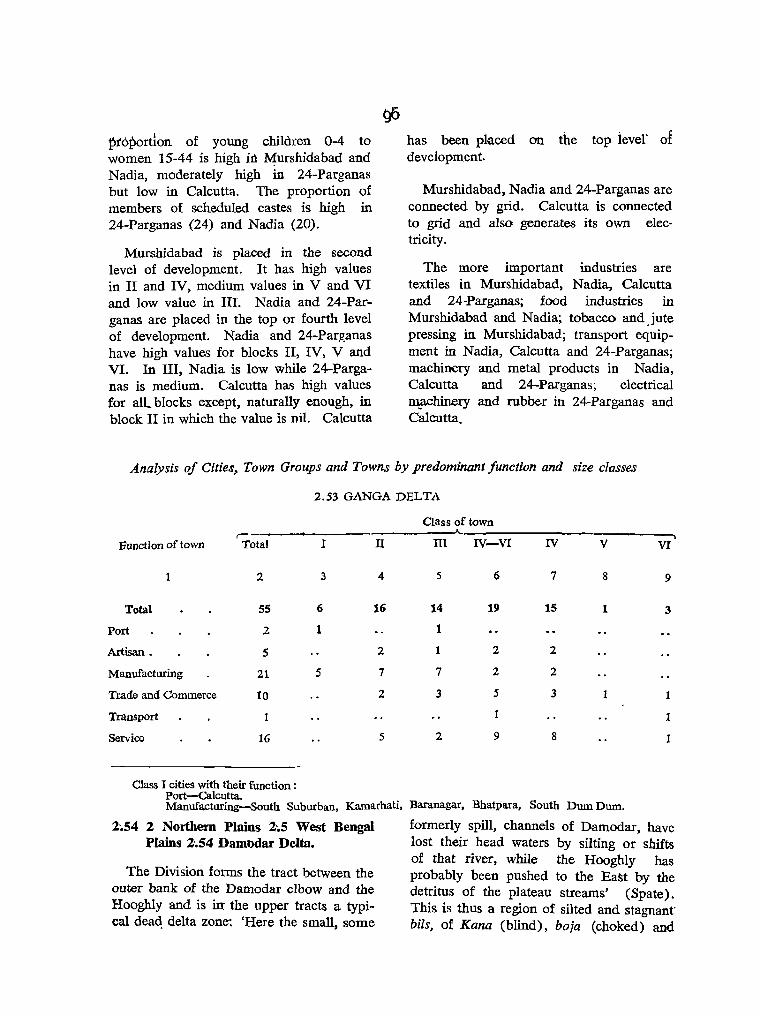
~t6pordon of young children 0-4 to women 15-44 is high in ~urshidabad and Nadia, moderately high in 24-Parganas but low in Calcutta. The proportion of members of scheduled castes is high in 24-Parganas (24) and Nadia (20).
Murshidabad is placed in the second level of development. It has high values in II and IV, medium values in V and VI and low value in III. Nadia and 24-Parganas are placed in the top or fourth level of development. Nadia and 24-Parganas have high values for blocks II, IV, V and VI. In III, Nadia is low while 24-Parganas is medium. Calcutta has high values for all blocks except, naturally enough, in block II in which the value is nil. Calcutta
has been placed on the top ievel' of development.
Murshidabad, Nadia and 24-Parganas are connected by grid. Calcutta is connected to grid and also generates its own electricity.
The more important industries are textiles in Murshidabad, Nadia, Calcutta and 24-Parganas; food industries in Murshidabad and Nadia; tobacco and. jute pressing in Murshidabad; transport equipment in Nadia, Calcutta and 24-Parganas; machinery and metal products in Nadia, Calcutta and 24-Parganas; electrical lll:.achinery and rubber in 24-Parganas and Calcutta.
Analysis of Cities;, Town Groups and Towns by predominant function and size classes
2.53 GANGA DELTA
Class of town ,-
Ii'unction of town Total I II III IV-VI IV V VI
1 2 3 4 5 6 7 8 9
Total S5 6 16 14 19 15 1 3
Port 2 1 1
Artisan • 5 2 1 2 2
Manufacturing 21 5 7 7 2 2
Trade and Commerce to 2 3 5 3
Transport 1 1 1
Service 16 5 2 9 8 1
Class I cities with their function: Port-caIcutta. Manufacturing-South Suburban. Kamarhati. Baranagar. Bhatpara, South Durn Durn.
2~54 2 Northern Plains 2-.5 West Bengal Plains 2'.54 Damt>dar Delta.
The Division forms the tract between the outer bank of the Damodar elbow and the Hooghly and is irr the upper tracts a typical deaq delta zone: 'Here the small, some
formerly spill, channels of Damodar, have lost their head waters by silting or shifts of that river, while the Hooghly has probably been pushed to the East by the detritus of the plateau streams' (Spate). This is thus a region of silted and stagnant" bUs, of Kana (blind), boja (choked) and

mara (dead) nadis, which have been recently resuscited by a network of Damodar canals. The dead and dying rivers have led to extensive market gardening and potato growing in Hooghly and Howrah districts. 'In the South lowland Midnapore is only partly deltaic, has saline soil with a prograding coastal plain marked by lines of old beachridges, which give rise to linear settlement patterns around Contai' (Spate). The western half of Midnapore is a firm shelf containing the last surface outcrops of the solid rocks of the Central Hills and Plateaus and contains red and skeletal soils.
The chief and almost the only crop in tbis Division is rice. Hooghly and Howrah grow jute.
The flood plains of Hooghly (1,841), Rowrah (3,639) and Midnapore (826) are more densely populated than those on the east bank of the Hooghly river, because of better drainage facilities and availability of water in this tract.
The urban ratio is high in Hooghly and Howrah, but 'modest in Midnapore.
Natural increase is high in all thiee districts. Immigration is high in Hooghly and Howrah but low in Midnapore. The proportion of young children 0-4 to women 15-44 is moderately high in Hooghly but modest in Howrah and Midnapore.
Hooghly and Howrah are placed in the fourth or top level of development with high values for blocks II, IV and V and medium values for block III. Hooghly has medium value and Howrah high value for block VI. Midnapore is .placed in the second level of development, with high values only for blocks II and IV, medium values for blocks V and VI and low value for block III.
All the districts are connected by grid.
The important organised industries are textiles and transport equipment in Hooghly and Howrah; chemicals in Hooghly and Midnapore; basic metals and metal products in Howrah; foodstuffs in all tbree districts; and wood industries in Midnapore.
Analysis of Cities, Town Groups and Towns by predominant function and size classes
2'54 DAMODAR DELTA
Class of town
Function of town r- ~ -"'\ Total I n III] IV-V IV V
t 2 3 4 5 6 7 8
Total 37 3 5 13 16 4 12
Agricultural 5 1- 4 3
Artisan 2 1 1
Manufacturing 19 2 3 10 4 4-
Trade and Commerce 1 .. Transport 1 1 .. Service 9 2 1 6 3 3
Class I cities with their function : Manufacturing-Howrah, Baiy. Transport-Kharagpur.
163 R.~.l.-H.
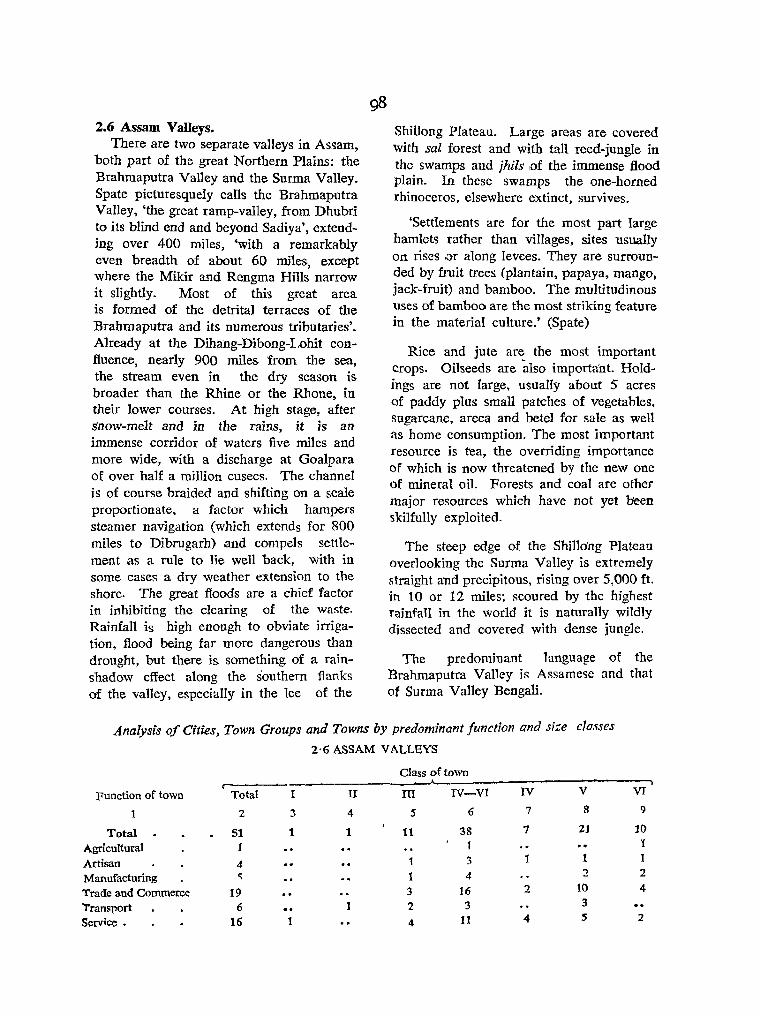
2.6 Assam Valleys. There are two separate valleys in Assam,
both part of the great Northern Plains: the Brahmaputra Valley and the Surma Valley. Spate picturesquely calls the Brahmaputra Valley, 'the great ramp-valley, from Dhubri to its blind end and beyond Sadiya', extending over 400 miles, 'with a remarkably even breadth of about 60 miles, except where the Mikir and Rengma Hills narrow it slightly. Most of this great area is formed of the detrital terraces of the Brahmaputra and its numerous tributaries'. Already at the Dihang-Dibong-Lohit confluence, nearly 900 miles from the sea, the stream even in the dry season is broader than the Rhine or the Rhone, in their lower courses. At high stage, after snow-melt and in the rains, it is an immense corridor of waters five miles and more wide, with a discharge at Goalpara of over half a million cusecs. The channel is of course braided and shifting on a scale proportionate, a factor which hampers steamer navigation (which extends for 800 miles to Dibrugarh) and compels settlement as a rule to lie well back, with in some cases a dry weather extension to the shore. The great floods are a chief factor in inhibiting the clearing of the waste. Rainfall is high enough to obviate irrigation, flood being far more dangerous than drought, but there is something of a rainshadow effect along the s'outhem flanks of the vaHey, especially in the lee of the
Shillong Plateau. Large areas are covered with sal forest and with tall reed-jungle in the swamps and jhils IOf the immense flood plain. In these swamps the one-horned rhinoceros, elsewhere extinct, survives.
'Settlements are for the most part large hamlets rather than villages, sites usually on rises .or along levees. They are surrounded by fruit trees (plantain, papaya, mango, jack-fruit) and bamboo. The multitudinous uses of bamboo are the most striking feature in the material culture.' (Spate)
Rice and jute are the most important crops. Oilseeds are also importa'nt. Holdings are not large, usually about 5 acres of paddy plus small patches of vegetables, sugarcane, areca and betel for sale as wen as home consumption. The most important resource is tea, the overriding importance of which is now threatened by the new one of mineral oil. Forests and coal are other major resources which have not yet b'een skilfully exploited.
The steep edge of the Shillo'ng Plateau overlooking the Surma Valley is extremely straight and precipitous, rising over 5,000 ft. in 10 or 12 miles; scoured by the highest rainfall in the world it is naturally wildly dissected and covered with dense jungle.
The predominant language of the Brahmaputra Valley is Assame<ic and that of Surma Valley Bengali.
Analysis of Cities, Town Groups and Towns by predominant function and size classes
2' 6 ASSAM VALLEYS
Function of town
1
Total Agricultural Artisan Manufacturing Trade and Commerce Transport Service •
Total
2
51 1
4
" 19 6
16
I
3
1
1
II
4
1
Class of town
m IV-VI IV V VI
5 6 7 8 9
11 38 7 21 10 '1
1 3 1
1 4 2 2
3 16 2 10 4
2 3 3
4 11 4 S 2
~.61 .2 Northern :Plains 2.6 Assam Valleys 2.61 Brahmaputra Valley.
This Valley, proceeding up the Brahmaputra ramp from South-west to North-east consists of 6 districts: Goalpara, Kamrup, Darrang, Nowgong, Sibsagar and Lakhimpur. Goalpara, Kamrup, Sibsagar and Lakhimpur are transversely. dissected by the Brahmaputra but Darrang is almost wholly on its right bank and Nowgong on its left.
Goalpara and Kamrup form the lower Brahmaputra Valley bordered by the Bhutan Hills in the North and Shillong Plateau in the South. There are many small tributaries both in the North and South. The northern tributaries are Manas, Champamati, Saralbhanga, Gadadhar, Gangadhar in Goalpara and Mara Manas, Pagladiya and Puthimari in Kamrup. The southern tributaries are Krishnai and Dudhani in Goalpara and Umtru, Kalang and Kalsi in Kamrup.
Darrang is girdled by the Dafla Hills in the North and Mildr Hills in the East. Nowgong is a valley defined by the Kopili reentrant girdled by the Mikir Hills in the east and Shillong Plateau in the South. Together they form an irregular ellipse with the Brahmaputra passing through the middle. Darrang presents a number of northern tributaries, of which the chief is Dhansiri, to the great river: Kameng, Barnadi, Nanai, Bardi, Dhansiri etc. Nowgong contributes the course of the Kopili and its tributaries Barapani and Umtru. Sibsagar and Lakhimpur form the Upper Brahmaputra Valley. Sibsagar is I£irdled by the Naga Hills in the Southeast and the Mildr Hills in the East, while Lakhimpur is girdled by the Abor Hills in the North, Mishmi Hills in the Northeast, Patkoi Hills in the Southeast and the Mikir Hills in the Southwest. In Sibsagar Dhansiti is the main rivet and tributary to the
Brahmaputra, the minor ones being the Jhansi, Dikhu, Disai and Disang from the south. In Lakhimpur the tributaries are Subansiri, Dihang and Dibang from the North, Lohit from the East and Dibru, Bud Dihing and Disang from the South.
Spate has observed that 'Assam is now India's lebensraum, the last frontier of settlement of any significance'. For the best part of a century it has been East Bengal's lebensraum, a steady stream of landhungry colonisers having migrated from areas like Rangpur, Mymensingh, Dacca, Sylhet and Comilla to colonise the Brahmaputra_llhars and braided banks. The density is still modest, the lowest being 312 persons per sq. mile in Lakhimpur and the highest 550 in N owgong. The proportion of members of scheduled tribes is lowest in Sibsagar (6'36 per cent) and highest in Goalpara (14' 7) ; that of members of scheduled castes is low, too, the highest proportion being reached in Nowgong (8',4).
The urban ratio is modest. There is reason to suspect that information about migration was tardily given in the Census of 1961. Nevertheless, both natural increase and immigration ate high in the Valley. The proportion of children 0-4 to women 15-44 is uniformly and extremely high, suggesting a fresh burst of population increase in the current decade.
The chief crops are rice, jute and oilseeds. The land does not need irrigation. On the contrary the problem is to keep out or drain superfluous water and rain.
With the exception of Lakhimpur which is placed in the fourth or top level of development on account of its agriculture and industries, Kamrup, Darrang and Sibs agar are placed in the third level of achievement while Goalpara and Now .. gong are in the second with total scores

very close to one another's. For example, Goalpara and Nowgong have identical total scores with medium values in blocks II, V and VI, high values in block IV and low in block III. Kamrup and Sibsagar have higher and identical total scores, with high values for IV and medium values for V and VI. Kamrup has high value for II and low value for HI while Sibsagar has. medium values for both. Darrang has a higher score than all four and has high value. for IV and medium values for the rest.
Lakhimpur stands out in development. It has high values in III, IV and V and medium values in II and VI.
100
All districts except Kamrup have their own electricity. Only Kamrup is connected to grid.
The most important organised industry everywhere is food except in Goalpara where it is transport. Transport is important in all districts. WO()d too is important in the entire subdivision. Chemicals and cotton and jute ginning and pressing are important in Goalpara. Textiles ~d printing and publishing are important in Kamrup. Machinery (tea machinery) is undertaken in Darrang, Nowgong and Lakhimpur. Lakhimpur enjoys the monopoly of petroleum and coal.
Analysis of Cities" Town Groups and Towns by predominant function and size classes 2 ·61 BRAHMAPUTRA VALLEY
Qass of town
Function of town 1
,-----_;_---~--_,._~-------.------. Total
2 45
4 5
16
I 3 1 Total
Artisan • Manufacturing • Trade and Commerce Transport Sorvico
5 15
Class J cities with their function : Service-Gauhati
II 4 1
1
2.62 2 Northem Plains 2.6 Assam Valleys 2.62 Surma Valley.
This valley floor has been carved by the Kopili-Surma-Kusiyara rivers from the northeast and the Barak-Jiri rivers from the Barail Range in the north and northeast. Cachar may thu§ also be called the Barak va)ley, and is girdled by the Lushai Hills in the south, the Barail Range in the north and northeast and the Manipur Hills _ in the east.
Cachar has patches of red soil and old alluvium at the foot of the hills. The main crops are rice, jute and tea.
The density of population is moderately high (514). The percentage of members of scheduled castes is 14. The urban ratio is modest but both natural increase and immigration are moderately high. So is the percentage of children 0-4 to women 15-44.
III IV-VI IV V VI 5 6 789 9 34 6 20 8 1 3 111 1 4 2 2 1 15 2 10 3 222 4 10 3 5 2
The district is placed in the second level of development with medium values in II, III, V and VI and high value in IV. It generates electricity locally. The main organised industries are food, wood, jute ginning and pressing, transport equipment and· generation of electricity. There are many tea estates.
Analysis of Town Groups and Towns by predominant function and size classes
2·62 SURMA VALLEY
Class of town
Function of town Total III
2 3
Total 6 Agricultural 'J'radeand
Commerce 3 Transport 1 Service
2
2
IV-VI IV
4 5
4 1 1
1 1 I 1
V VI
6 7
1 2 1
J
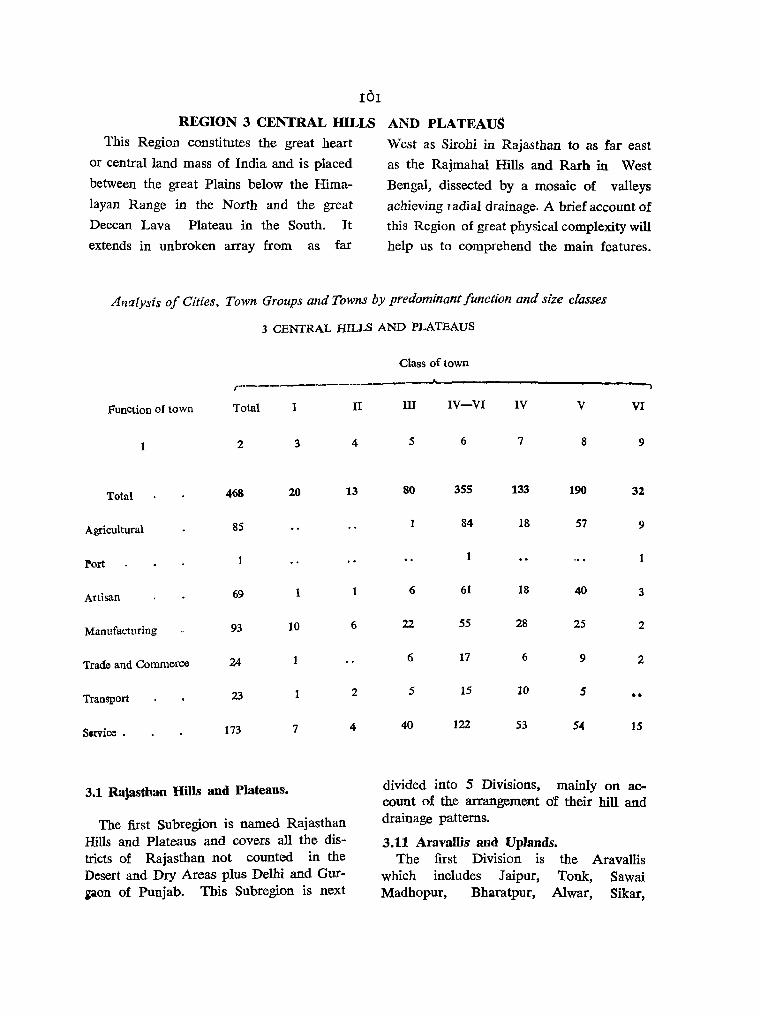
101
REGION 3 CENTRAL HILLS AND PLATEAUS
This Region constitutes the great heart
or central land mass of India and is placed
between the great Plains below the Hima
layan Range in the North and the great
Deccan Lava Plateau in the South_ It
extends in unbroken array from as far
West as Sirohi in Rajasthan to as far east
as the Rajmahal Hills and Rarh in West
Bengal, dissected by a mosaic of valleys
achieving radial drainage- A brief account of
this Region of great physical complexity will
help us to comprehend the main features_
Analysis 0/ Cities, Town Groups and Towns by predominant [unction and size classes
3 CENTRAL HILLS AND PLATEAUS
r----'----Function of town Total I
2 3
Total 468 20
Agricultural 85
Port 1
Artisan 69 1
Manufacturing 93 10
Trade and Commerce 24
Transport 23 1
S.rvice • 173 7
3.1 Rajasthan Hills and Plateaus.
The first Subregion is named Rajasthan Hills and Plateaus and covers all the districts of Rajasthan not counted in the Dosert and Dry Areas plus Delhi and GUfiion of Punjab. This Subregion is next
II
4
13
1
6
2
4
Class of town
llJ IV-VI IV V VI
5 6 7 8 9
80 355 133 190 32
1 84 18 57 9
1
6 61 18 40 3
22 55 28 25 2
6 17 6 9 2
5 15 10 s 00
40 122 53 15
divided into 5 Divisions, mainly on account of the arrangement of their hill and drainage patterns.
3.11 Aravallis' and UpJands. The first Division is the
which includes Jaipur, Tonk, Madhopur, Bharatpur, Alwar,
Aravallis Sawai Sikar,
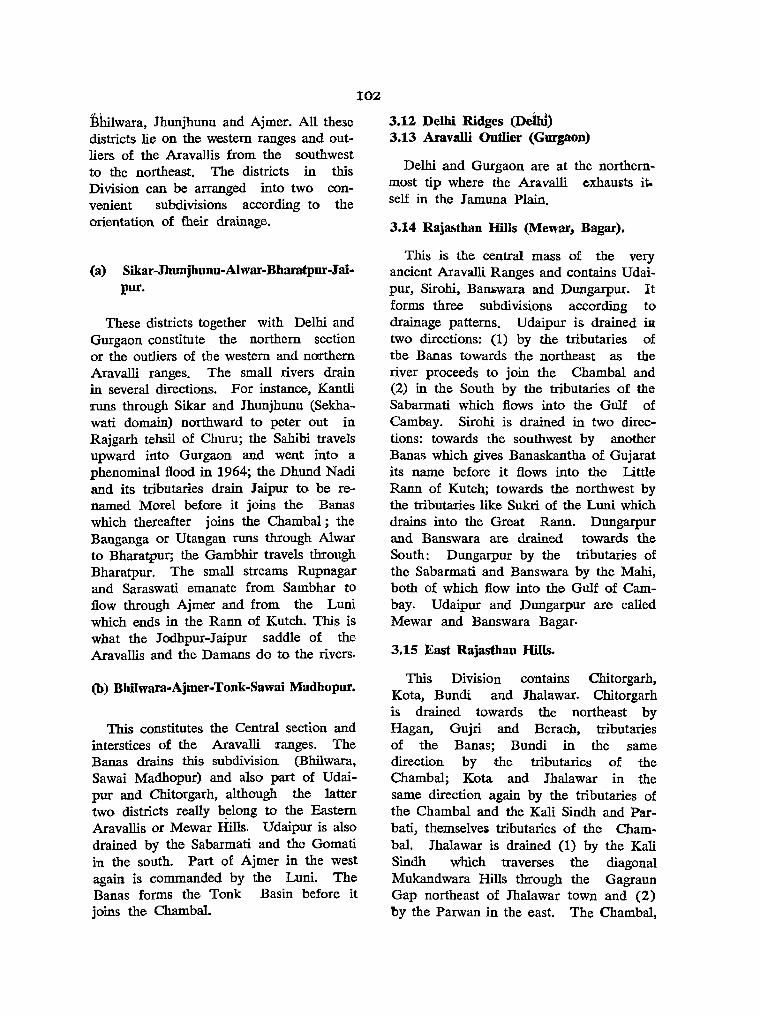
:J3hilwara, Jhunjhunu and Ajmer. All these districts lie on the western ranges and outliers of the Axavallis from the southwest to the northeast. The districts in this Division can be arranged into two convenient subdivisions according to the orientation of their drainage.
(a) Sikar-Jhunjhunu-Alwar-Bharatpur-Jai-pur.
These districts together with Delhi and Gurgaon constitute the northern section or the outliers of the western and northern Aravalli ranges. The small rivers drain in several directions. For instance, Kantli runs through Sikar and Jhunjhunu (Sekhawati domain) northward to peter out in Rajgarh tchsil of Churu; the Sahibi travels upward into Gurgaon and went into a phenominal flood in 1964; the Dhund Nadi and its tributaries drain Jaipur to be renamed Morel befoxe it joins the Banas which thereafter joins the Chambal; the Banganga or Utangan runs through Alwar to Bharatpur; the Gambhir travels through Bharatpur. The small streams Rupnagar and Saraswati emanate from Sambhar to flow through Ajmer and from the Luni which ends in the Rann of Kutch. This is what the J odhpur-J aipur saddle of the Aravallis and the Damans do to the rivers.
(b) Bhilwara-Ajmer-Tonk-Sawai Madhopur.
102
This constitutes the Central section and interstices of the Aravalli :ranges. The Banas drains this subdivision (Bhilwara, Sawai Madhopur) and also part of Udaipur and Chitorgarh, although the latter two districts really b~long to the Eastern Aravallis or Mewar Hills. Udaipur is also drained by the Sabarmati and the Gomati in the south. Part of Ajmer in the west again is commanded by the Luni. The Banas forms the Tonk Basin before it joins the Chambal.
3.12 Delhi Ridges (Deihl) 3.13 Aravalli Outlier (Gurgaon)
Delhi and Gurgaon are at the northernmost tip where the Ara.valli exbauiits it. self in the J amuna Plain.
3.14 Raj~than Hills (Mewar, Bagar).
This is the central mass of the very ancient Aravalli Ranges and contains Udaipur, Sirohi, Bamwara and Dungarpur. It forms three subdivisions according to drainage patterns. Udaipur is drained i.a two directions: (1) by the tributaries of the Banas towards the northeast as the river proceeds to join the Chambal and (2) in the South by the tributaries of the Sabarmati which flows into the Gulf of Cambay. Sirohi is drained in two directions: towards the southwest by another Banas which gives Banaskantha of Gujarat its name before it flows into the Little Rann of Kutch; towards the northwest by the tributaries like Sukri of the Luni which drains into the Great Rann. Dungarpur and Banswara are drained towards the South: Dungarpur by the tributaries of the Sabarmati and Banswara by the Mahi, both of which flow into the Gulf of Cambay. Udaipur and Dungarpur are called Mewar and Banswara Bagar.
3.1S East Rajasthan Hills.
This Division contains Chitorgarh, Kota, Bundi and Jhalawar. Chitorgarh is drained towards the northeast by Hagan, Gujri and Berach, tributaries of the Banas; Bundi in the same direction by the tributaries of the Chambal; Kota and Jhalawar in the same direction again by the tributaries of the Chambal and the Kali Sindh and Parbati, themselvei tributaries of the Chambal. Jhalawar is drained (1) by the Kali Sindh which traverses the diagonal Mukandwara Hills through the Gagraun Gap northeast of Jhalawar town and (2) 'by the Parwan in the east. The Chambal,
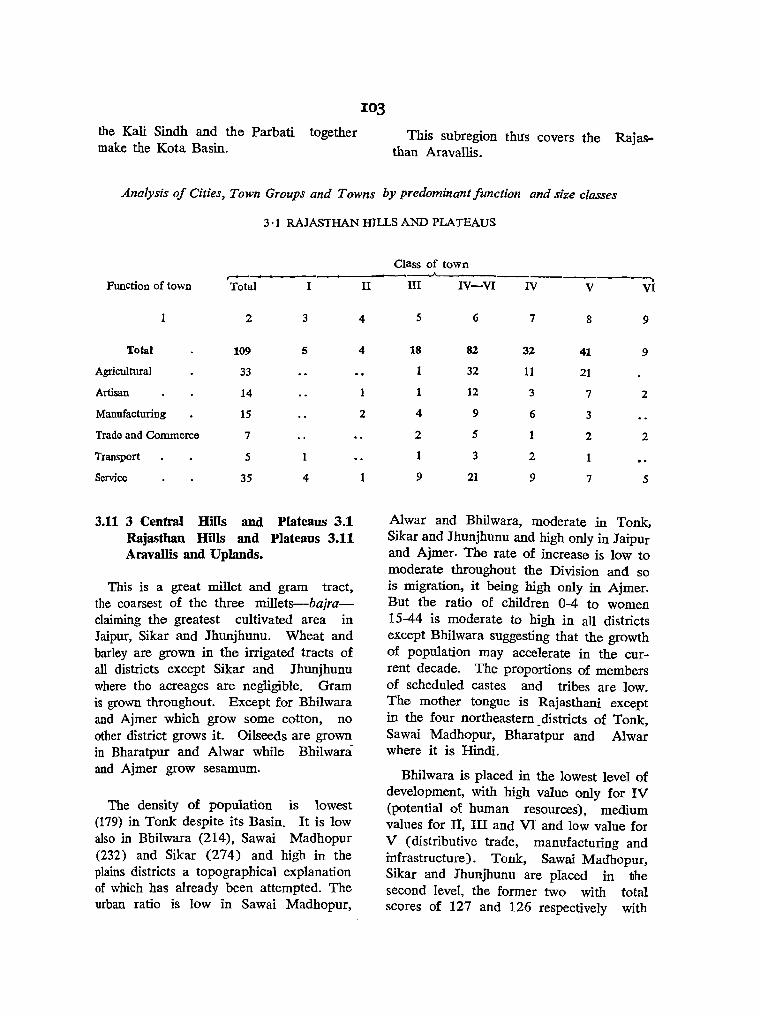
the Kali Sindh and the Parbati together make the Kota Basin.
103
This subregion thus covers the Rajasthan Aravallis.
Analysis of Cities, Town Groups and Towns by predominant function and size classes
3·1 RAJASTHAN HILLS AND PLATEAUS
r---Function of town Total I
1 2 3
Total 109 5
Agricultural 33
Artisan 14
Manufacturing 15
Trade and Commerce 7
Transport 5 1
Service 35 4
3.11 3 Central Hills and Plateaus 3.1 Rajasthan Hills and Plateaus 3.11 Aravallis and Uplands.
This is a great millet and gram tract, the coarsest of the three millets-bajraclaiming the greatest cultivated area in Jaipur, Sikar and Jhunjhunu. Wheat and barley are grown in the irrigated tracts of all districts except Sikar and Jhunjhunu where the acreages are negligible. Gram is grown throughout. Except for Bhilwara and Ajmer which grow some cotton, no other district grows it. Oilseeds are grown in Bharatpur and Alwar while Bhilwara and Ajmer grow sesamum.
The density of population is lowest (179) iu Tonk despite its Basin. It is low also in Bhilwara (214), Sawai Madhopur (232) and Sikar (274) and high in the plains districts a topographical explanation of which has already been attempted. The urban ratio is low in Sawai Madhopur,
II
4
4
1
2
1
Class of town ___.._____ ~
III IV-VI N V VI
5 6 7 8 9
18 82 32 41 9
1 32 11 21
1 12 3 7 2
4 9 6 3
2 5 1 2 2
1 3 2
9 21 9 7 5
Alwar and Bhilwara, moderate in Tonk, Sikar and Jhunjhunu and high only in Jaipur and Ajmer. Th,e rate of increase is low to moderate throughout the Division and so is migration, it being high only in Ajmer. But the ratio of children 0-4 to women 15-44 is moderate to high in all districts except Bhilwara suggesting that the growth of population may accelerate in the current decade. The proportions of members of scheduled castes and tribes are low. The mother tongue is Rajasthani except in the four northeastern _ districts of Tonk, Sawai Madhopur, Bharatpur and Alwar where it is Hindi.
Bhilwara is placed in the lowest level of development, with high value only for IV (potential of human resources), medium values for II, III and VI and low value for V (distributive trade, manufacturing and infrastructure). Tonk, Sawai Madhopur, Sikar and Jhunjhunu are pIaced in the second level, the former two with total scores of 127 and 126 respectively with

identical rankings in all the five blocks. Sikar has low values in III and VI, medium value in V and high values in II and IV, while Jhunjhunu has medium values in III, V and VI and high values in II and IV. Bharatpur and Alwar are placed in the fourth and ,third levels with medium values in V and VI, and high in II and IV, Bharatpur being medium and Alwar low in III. Jaipur and Ajmer are placed in the top level, Ajmer being much ahead even of Jaipur. Ajmer has high values in II, IV, V and VI and medium in III, whereas J aipur has high value in II, IV and V and medium in III and VI.
None of the districts except Sikar and Jhunjhunu were connected to grid. In the organised sector food industries are important in Alwar, Sawai Madhopur,
I04
Bharatpur and Bhilwara; textiles in Sikar, Bhi1w~a, Ajmer and J aipur; cotton and fibre ginning and pressing in Tonk, Bhilwara and Ajmer; metals and basic metals in J aipur and Bharatpur; transport equipment in Bharatpur, Ajmer and Sawai Madhopur; printing and publishing in Alwar, Sikar, Sawai Madhopur and Ajmer.
This Division displays great diversity in the levels of development, from the lowest through the highest level. Bhilwara in the hilly tract is at one end. Tonk and Sawai Madhopur which are a mixture of ranges and basins are in the second level with Sikar and Jhunjhunu. Alwar close to the J amuna alluvials is in the third level while Bharatpur and industrialized J aipur and Ajmer are at the top.
Analysis of Cities, Town Groups and Towns by predominant function and size classes
3 ·11 ARA VALLIS AND UPLANDS
Class oftown r- ---------.,
Function of town Total I II III IV-VI IV V VI
1 2 3 4 5 6 7 8 9
Total 61 2 3 13 43 20 20 3
Agricultural 24 23 10 13
Artisan , 8 1 6 3 2· 1
Manufacturing 9 4 4 3
Trade and Commerce 2 2
Transport 4 2
Service 14 6 6 .2 3 1
Class I cities with their function : Transport-Ajmer. Service-Jaipur.

3.12 3 Central Hilis and Plateaus 3.1 Rajasthan Hills and Plateaus 3.12 Delhi Ridges.
Delhi is at the meeting point between the Delhi Doab in the north, Hariana in the west, the Aravallis in the southwest and the J amuna alluvials in the south and has all the characteristics of the four regions in its several parts. It is thus singularly blessed in the variety of its soils, water regimes and locally bred peasant communities apart from the complexities bestowed on it by the fact of its having become the Union Capital. Down the corridors of time it has had radial communications with all parts of India. Anyone who held Delhi held in fee the routes to the northwest, the great Ganga Plains to the southeast, to the West, and to the strategic sea coast of Cambay through Malwa in the :south-west. This explains why no Government felt really secure and supreme until it was established in Delhi.
Since the Partition and Independence, Delhi has rapidly grown to be the most important centre in continental India for· Government activity, transport, communication, banking, warehousing, clearance of goods and, chiefest of all, concentration of talent. It has acquired a truly mixed and cosmopolitan population. Delhi is also rapidly shedding its character as the seat of Government dominated by official and bureaucratic values and acquiring for its citizens the priceless gift of anonymity. With each year that passes Delhi becomes a better place to live in and for following one's pursuit and to cultivate the company of one's own choice.
The chief crop is gram followed by'wheat and some way behind by the two northern millets. Thus while it betrays the predominance of the Aravalli characteristics in its crop pattern, the influence of the Delhi
, Doab (the West Jamuna Canal) is refiected in the second and important place IS &.G.I.-15.
occupied by wheat. Deihl is now rich 1rt Dlarket gardening. The principal language is Hindi. The density is 4,640 per sq. Dlile.
High values, as might be expected, are exhibited in urban ratio and inmigration and a slightly lower ranking in natural increase. But in the proportion of children 0-4 to women 15-44, Delhi has a medium value, which is possibly due to the high inmigration ratio even of women of working age.
DeIhl has about the highest score (173) in India for the aggregate of all blocks, v~ues being high for all blocks except III (participation rates in traditional sector) where it is medium·
In organised industry, textiles, and associated chemicals hold the pride of place, followed by machinery, transport equipment, printing and publishing and metal products. Delhi generates its OWn electricity and is connected to grid.
Analysis of City by predominant function and size class
3'12 DELHI RIDGES
function of town
1
Total
Service
,Class of town .--..A.~
Total I
2
1
1
3
1
1
Class I cities with their function: Service-Delhi.
3.13 3 Central Hills and Plateaus 3.1 Rajasthan Hills and Plateaus 3.13 Aravalli Outlier.
Gurgaon, south-west of Delhi, share Delhi's privileges in location, both in agri~ulture and industry. Urban, colonies are developing in Gurgaon almost as rapidly as in Delhi, while around Gurgaon and Faridapad whole industrial complexes
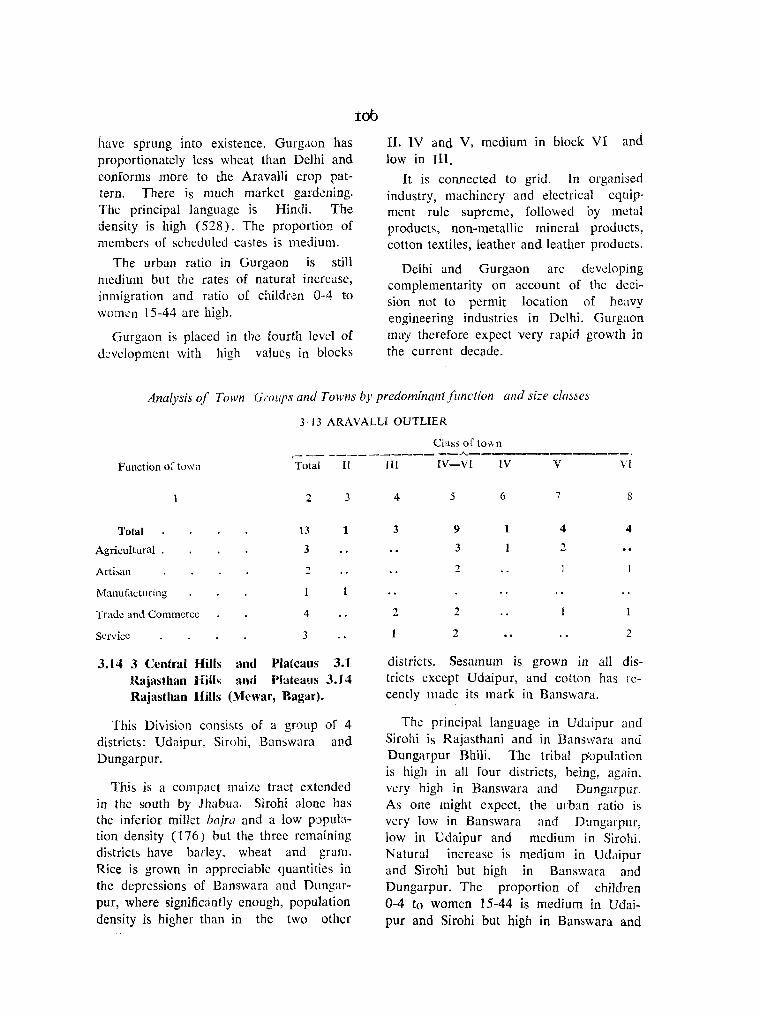
have sprung into existence. Gurgaon has proportionately less wheat than Delhi and conforms more to the Aravalli crop pattern. There is much market gard~ning.
The principal language is Hindi. The density is high (528). The proportion of members of scheduled castes is medium.
The urban ratio in Gurgaon is still medium but the rates of natural increase, in migration and ratio of children 0-4 to women 15-44 are high.
Gurgaon is placed in the fourth level of J~velopment with high values in blocks
tob
II, IV and V, medium in block VI and low in III.
It is connected to grid. In organised industry, machinery and electrical equip· ment rule supreme, followed by metal products, non-metallic mineral products, cotton textiles, leather and leather products.
Delhi and Gurgaon are d\:veloping complementarity on account of the decision not to permit location of heavy engineering industries in Delhi. Gurgaon may therefore expect very rapid growth in the current decade.
Analysis of Town (J(()UPS and Towns by predominant function alld size classes
3·13 ARAVALU OUTLIER
Class of to\\n r- -- ----------- ---"'----------------.
Function 0; (OWOl Total It 1Il IV-VI IV V VI
2 3
Total 13 1
Agricultural . 3
Arti~an 2
Manufacturing
I·rade and Commerce 4
Service 3
3.14 3 Central Hills and Plateaus 3.] Rajasthan Hills and Plateaus 3.14 Rajasthan Hills (Mewar, Bagar).
This Division consists of a group of 4 districts: Udaipur, Sirohi, Banswara and Dungarpur.
This is a compact maize tract extended in the south by Jhabua. Sirohi alone has the inferior millet bajra and a low population density (176) but the three remaining districts have barley, wheat and gram. Rice is grown in appreciable quantities in the depressions of Banswara and Dungarpur, where significantly enough, population density is higher than in the two other
4
3
5
9
3
2
2 2
2
6
1
7
4
2
8
4
2
districts. Sesamum is grown in all districts except Udaipur, and cotton has recently made its mark in Banswara.
The principal language in Udaipur and Sirohi is Rajasthani and in Banswara and Dungarpur Bhili. The tribal p:opul::ttion is high in all four districts, being, again, very high in Banswara and Dungarpur. As one might expect, the urban ratio is vcry low in Banswara and Dungarpur, low in Udaipur and medium in Sirohi. Natural increase is medium in Udaipur and Sirohi but high in Banswara and Dungarpur. The proportion of children 0-4 to women 15-44 is medium in Udaipur and Sirohi but high in Banswara and

Dungarpur. Sirohi has seen much inmigration compared to Udaipur, Banswara and Dungarpur where the value of inmigration is low.
Saw mills arc important in Sirohi and Banswara. Food industries are important in Udaipur alone: Cotton and jute ginning and pressing are important in Udaipur and Banswara, textiles in Udaipur, which has also a large locomotive workshop and garages. Printing and publishing are growing in Udaipur and Banswara. All districts generate their own power.
This Division exhibits varying degrees of development. Banswara is at the lowest level of development with high value only for block IV, medium values for II, ITI and VI and low for V. Udaipur and Dungarpur are in the second level with identical ranking, in each group except block V, where Udaipur has medium and Dungarpur low value and the total score of Udaipur is higher than that of DlIrgapur. Sirohi is placed in the third level mainly owing to its high values in II, IV a'nd VI, medium value in V and low in III. This district is an instance of acceleration of deVelopment through industrial locationing.
Analysis of Cities, Town Groups and Towns by predominant function and size classes
3·14 RAJASTHAN HILLS (MEWAR, BAGAR)
Class of town ,. ____ _.A..._ ___ ~
Function of town Total I JV-V IV V
Total
Agricultural Artisan Manufacturing Trade and
Commerce Transport. Service
2
15
2 2 2
7
3
1
4
14
2 2 2
6
Class 1 cities with their function: Service-Udaipur.
5
6
..
4
6
8
2 2
2
IfYJ 3.15 3 c.·ntral Hills and Plateaus 3.1
Rajasthan Hills and Plateaus 3.15 East Rajasthan Hills,
This Division again consists of 4 districts: Chitorgarh, Kota, BlIndi and lhalawar. The least densely populated districts are picturesque Bundi (156) and impressive Kota (176) but Bundi is growing rapidly and Kota will now see rapid industrial expansion. Chitorgarh has low density (184) mainly on account of its gaunt ridges, the fort being even more evocative and Gibraltar-like than Gwalior and exquisite in its functional layout. lhalawar is the densest (208) d:strict.
Chitorgarh and Kota constitute a wheat tract followed by jowar and gram whil:! Bundi and lhalawar make a jowar tract followed by wheat and gram. The Division thus makes a transverse cross geographically. Chitorgarh grows cotton and groundnut and Kota and Bundi linseed.
The urban ratio is 1110d~rately high only in Kota and BundL being medium in Chitorgarh and lhalawar. The rate of natural increase is moderate in Bundi and lhalawar but moderately high in Chitorgarh and Kota. Inmigration is moderately high in all four districts and so is the proportion of children 0-4 to women 15-44 in Kota. The latter is high in Buncli and moderate in Chitorgarh and lhalawar.
Chitorgarh and Ihalawar are placed in the second level of development. Chitorgarh has high value only in block IV, low value in block V and medium values in the rest while lhalawar has high values in II and IV, medium values in III, V and VI. Bundi is placed in the third level while Kota in fourth level with identical values, high in II, IV and V[ and medium in III and V. Kota and Ihalawar are connected to grid but Chitorgarh and Bundi generated their own electricity in 1961.
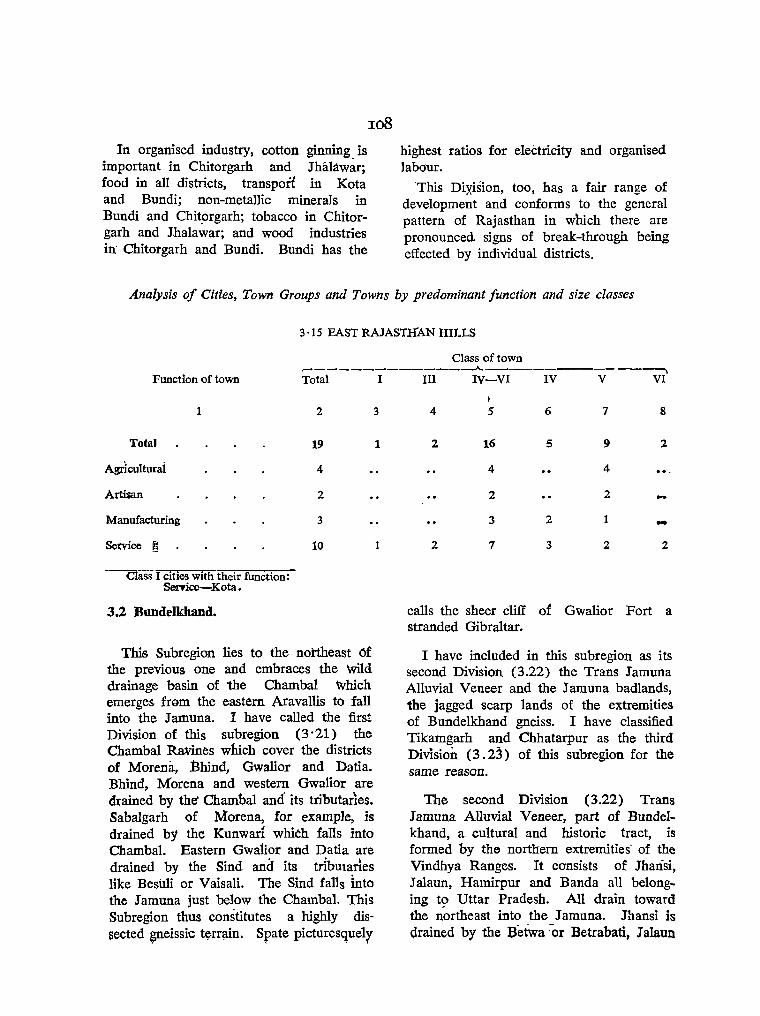
In organised industry, cotton ginning_is important in Chitorgarh and Jhalawar; food in all districts, transpoit in Kota and Bundi; non-metallic minerals in Bundi and Chit.orgarh; tobacco in Chitorgarh and lhalawar; and wood industries in' Chitorgarh and Bundi. Bundi has the
loB highest ratios for electricity and organised labour.
'This Dixision, too, has a fair range of development and conforms to the general pattern of Rajasthan in which there are pronounced signs of break-through being effected by individual districts.
Analysis of Cities, Town Groups and Towns by predominant function and size classes
3 ·15 EAST RAJASTHAN HILLS
Class of town r----------------A. -------, Function of town Total I III IV-VI IV V VI
1 2 3
Total
Agrlculturai
Artisan
Manufacturing
Service ~
Class I cities with their function: Seryice-Kota •
3.2 Bundelkhand.
19
4
2
3
10
This Subregion lies to the nottheast of the previous one and embraces the Wild drainage basin of the Chambal which emerges frem the eastern A.ravallis to fall into the Jrununa. I have called the first Division of this subregion (3'21) the Chambal Ra\7ines which cover the districts of Morena, Bhind, Gwalior and Datia. Bhind, Morena and western Gwalior are drained by the Chambal and its tributarles. Sabalgarh of Morena, for example, is drained by the Kunwarl which falls into Chambal. Eastern GwaHor and Datia are drained by the Sind and its tributaries like Besuli or Vaisali. The Sind falls into the J amuna just below the Chambal. This Subregion thus constitutes a highly dissected ~eissic t~rrain. Spate picturesquely
1
1
4
2
2
r 5
16
4
2
3
7
6
5
2
3
7 8
9 2
4
2 -1 -2 2
calls the sheer cliff of Gwalior Fort a stranded Gibraltar.
I have included in this subregion as its second Division (3.22) the Trans ramuna Alluvial Veneer and the J amuna badlands, the jagged scarp lands of the extremities of Bundelkhand gneiss. I have classified Tikamgarh and Chhatarpur as the third DiVIsion (3.23) of this subregion for the same reason.
The second Division (3.22) Trans J amuna Alluvial Veneer, part of Bundelkhand, a cultural and historic tract, is formed by the northern extremities' of the Vindhya Ranges. It consists of Jhansi, Jalaun, Hamirpur and Banda aU belonging to Uttar Pradesh. All drain toward the u'ortheast into the J amuna. .Thansi is drained by the BetWa '-or Betrabati, J alaun
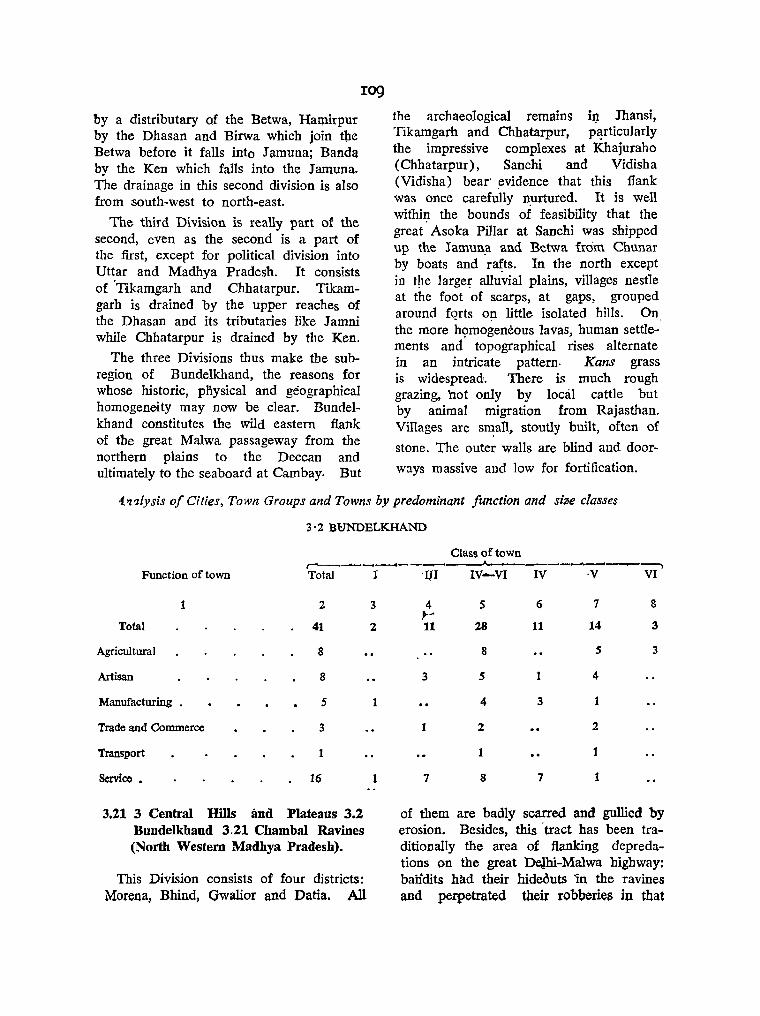
r09
by a distributary of the Betwa, Han:lirpur by the Dhasan and Birwa which join the Betwa before it falls into Jamuna; Banda by the Ken which falls into the J amuna. The drainage in this second division is also from south-west to north-east.
The third Division is really part of the second, even as the second is a part of the first, except for political division into Uttar and Madhya Pradesh. It consists of 'Y,ikamgarh and Chhatarpur. Tikamgarh is drained by the upper reaches of the Dhasan and its tributaries like Jamni while Chhatarpur is drained by the Ken.
The three Divisions thus make the subregion of Bundelkhand, the reasons for whose historic, pfiysical and geographical homogeneity may now be clear. Bundelkhand constitutes the wild eastern flank of the great Malwa passageway from the northern plains to the Deccan and ultimately to the seaboard at Cambay. But
the archaeological remains i~ Jhansi, Tikamgarh and Chhatarpur, p~rticularIy the impressive complexes at Khajuraho (Chhatarpur) , Sanchi and Vidisha (Vidisha) bear' ~vidence that this flank was once carefully n~rtured. It is weIl witbit:t the bounds of feasibility that the great Asoka Pillar at Sanehi was shipped up the J amun!\ and Betwa from Chunar by boats and ra~ts. In the north except in tIle large~ alluvial plains, villages nestle at the foot of scarps, at gaps, grouped around fQrts o~ little isolated hills. On the more h9mogeneous lavas, human settlements and topographical rises alternate in an intricate pattern. Kans grass is widespread. There is much rough grazing, hot only by local cattle but by animal migration from Rajasthan. Villages are s~all, stoutly built, often of
stone. The outer walls are blind and door
ways massive and low for fortification.
4.."l<Jlysis of Cities, Town Groups and Towns by predominant function and size classes
3'2 Bl:1NDELKHAND
r-Function of town Total
1 2
Total 41
Agricultural 8
Artisan 8
Manufacturing • 5
Trade and Commerce 3
Transport 1
Service • 16
3.21 3 Central Hills lind Plateaus 3.2 Bundelkhand 3.21 Chambal Ravines (North Western Madhya Pradesh).
This Division consists of four districts: Morena, Bhind, Gwalior and Datia. All
Class of town --....- ___ ______.A.. _____ .............,_----.------...
J 'J]! IV-VI IV 'V VI
3
2
1
1
3
1
7
5
28
8
5
4
2
1
8
6
11
1
3
7
7
14
5
4
2
1
1
S
3
3
of them are badly scarred and gullied by erosion. Besides, this 'tract has been traditionally the area of flanking depredations on the great Delhi-Malwa highway: bandits had their hideouts 'in the ravines and perpetrated their robberies in that
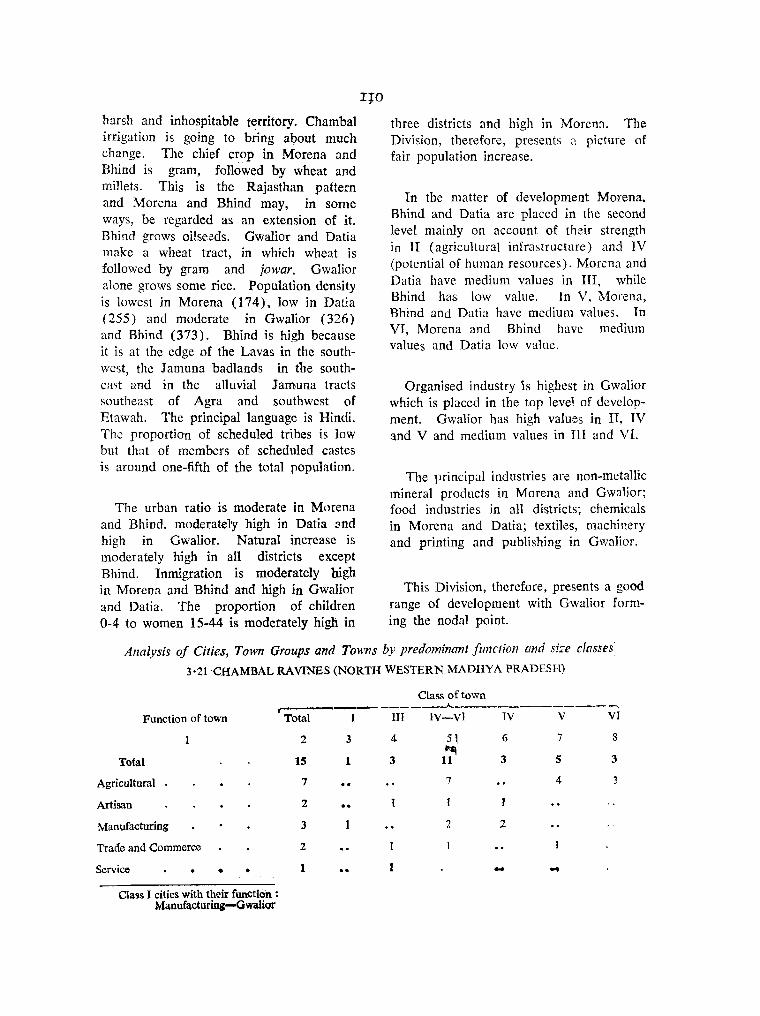
harsh and inhospitable territory. Chambal irrigation is going to bring about much change. The chief crop in Morena and Bhind is gram, followed by wheat and millets. This is the Rajasthan pattern and Morena and Bhind may, in some ways, be regarded as an extension of it. Bhind grows oilseeds. Gwalior and Datia make a wheat tract, in which wheat is followed by gram and jowar. Gwalior alone grows some rice. Population density is lowest in Morena (174), low in Datia (255) and moderate in Gwalior (326) and Bhind (373). Bhind is high because it is at the edge of the Lavas in the southwest, the Jamuna badlands in the southeast and in the alluvial Jamuna tracts southeast of Agra and southwest of Etawah. The principal language is Hindi. The proportion of scheduled tribes is low but that of members of scheduled castes is around one-fifth of the total population.
The urban ratio is moderate in Morena and Bhind. moderately high in Datia ~nd high in Gwalior. Natural increase is moderately high in all districts except Bhind. Inmigration is moderately high in Morena and Bhind and high in Gwalior and Datia. The proportion of children 0-4 to women 15-44 is modetately high in
l]:O
three districts and high in MOrCD:1. The Division, therefore, presents ;t picture of fair population increase.
In the matter of development Morena. Bhind and Datia are placed in the second level mainly on account of their strength in II (agricultural infrastructure) and IV (potential of human resources). Morena and Datia have medium values in III, while Bhind has low value. In V, Morena, Bhind and Datia have medium values. In VI, Morena and Bhind have medium values and Datia low value.
Organised industry 'is highest in Gwalior which is placed in the top level of development. Gwalior has high values in II, IV and V and medium values in III and VI.
The principal industries are non-metallic mineral products in Morena and Gwalior; food industries in all districts; chemicals in Morena and Datia; textiles, machinery and printing and publishing in Gwalior.
This Division, therefore, presents a good range of development with Gwalior forming the nodal point.
Analysis of Cities, Town Groups and Towns by predominant fimction and size cfasses'
3·21 CHAMBAL RAVINES (NORTH WESTERN MADHYA PRADESH)
Class of town r- --------~--------------~
Function of town Total I lIT IV-VI IV V VI
2 3 4 51 6 7 8
Total 15 1 3 ~
11 3 5 3
Agricultural 7 7 4 3
Artisan 2
Manufacturing 3 1 2 2
Trade and Commerce 2
Service • • 1 .. J - .... Cia'ls I cities with their function!
Manufacturing-Gwali<n"

3.22 3 Ccntl'3i Hills and Plateaus 3.2 Bundclkhand 3.22 Trans Jamuna Alluvial Veneer.
This Division consists of the edge~ of the Vindhyan Lavas, the Jamuna badlands and the Trans Jamuna Alluvial Veneer. It comprises ::Jf 4 districts all in Uttar Pradesh: Jhansi, Jalaun, Hamirpur and Banda. All are drained by rivers flowing from the Vindhya Hills and Plateaus into the Jamunu. Agriculturally, the division is of a piece with the rest of Bundelkhand inasmuch as the chief crops are gram and iowar ami the other inf.;rior millets bujra and til!". But the Uttar Pradesh strain is ljuite strong, too, wheat being the second most important crop, running close to gram. Rice is grown only in B.1l1da which is more alluvial than scarpland. J alaun alone grows appreciable quantities of oilseeds.
Population density is lowest in Jhansi (274), low in Hamirpur (286) and high in Banda (308) and lalaun (374). The proportion of members of scheduled castes is about a quarter of the total population. Hindi IS the principal languagc.
The urban ratio is high in Jhansi, moderately high in J alaun ':1l1d moderate in Hamirpur and Banda. The rate of natural increase is moderate in all districts except in Jhansi where it is moderately high. Inmigration is moderately high in lhansi and J alaun, moderate in Hamirpur but low in Banda. The proportion of children 0-4 to women 15-44 is moderately high in all districts suggesting prospects of acceleration of population increase.
Hamirpur and Banda arc placcd in the lowest level of development with identical ranks in Ii and IV (high), VI (medium) and V (low). In Ill, Hamirpur has a low and Banda a medium rank. 1 alaun is
ITl
placed in the second level with low value:> in III and VI but compensating high valu~s in II and IV and medium for V. lhansi is placed in the third level with high values in II and IV but medium values in lll, V and VI. Jhansi and Banda generate their own electricity but J alaun and Hamirpur are connected to grid.
In organised industry, transport and machinery are important in J1Jansi and Hamirpur; paper and paper products in Jalaun (the paper mill is the only industry); textiles in Hamirpur; T!OIl-Jl1et:1llic minerals in Banda and Jhansi; food industries in Banda.
Thus, this Division, too, hu<; a wide range of development and is breaking through the limitations imposed by nature.
Analysis of Cities, Towll Groups and Towns by pndominant function and size classes
3'22 TRANS JAMUNA ALLUVIAL VENEER
Class of to\\'n FUnction
,-____ .A. ., of town Total I III IV-V IV V
2 3 4 5 6 7
Total 20 1 6 13 7 6
Agricultural
Artisan 5 2 3 3
Trade and Commerce 1
Transport
Service 12 4 7 7
Class I cities with their function: Service-Jhansi.

3.23 j Central Bills and Plateaus 3.2 Bundelkhand 3.23 North Central Madhya Pradesh.
This Division consists of two districts
Tikamgarh and -Chhatarpur-both in
Madhya Pradesh.. They have been sepa
rated from the Trans Jamuna Alluvial
Veneer Division for two not very convjnc
ing reasons : (a) they are more embedded
in the J amuna badlands and have less of
the alluvial veneer and (b) politically they
belong to Madhya Pradesh. This however
gives a slightly different crop pattern:
Jowar, wheat, rice and barley in Tikam
garh; wheat, jowar, gram and barley in
Chhatarpur. Sesamum is grown in both.
Population density is low: 176 in Chhatar-, .
pur and 232 in T.ikamgarh. AI\hough, the
proportion of scheduled tribes is low,
that of scheduled castes is fair-about a
fifth of the total popuhition. Hindi is
almost the only language.
The urban ratio is low in Tikamgarh
but moderate in Chhatarpur. Natural
increase is moderately high in both but
inmigration is moderate. The proportion
of children 0-4 to women 15-44 however
is high suggesting acceleration of popula
tion increase in the current decade.
Both districts are placed in the second
level of develOJilment mainly by virtue of
their high ranks in blocks II and IV and
medium rank in III. Ranking is low and
medium in V and VI for Tikamgarh and
Chhatarpur respectively. Both districts
generate their own electricity. There is no
registered factory in Tikamgarh and the
sole registered factory in Chhatarpur
manufactures beverages;-
Analysis of Town Groups and Towns by predominant function and size classes
3' 23 NORTH CENTRAL MADHYA PRADESH
Class of town Function c------"- .. of town Total III IV-V IV V
1 2 3 4 5 6
Total 6 2 4 1 3
Artisan
Manufacturing 2 2 1
Service 3 2 1
The Bundelkhand subregion is thus largely homogeneous with the majority of districts in the second level of development. Hamirpur and Banda alone are at the lowest level, while Jhansi is in the third and Gwalior in the top.
3.3 Malwa.
The third subregion of Malwa lies east of the Eastern Aravall~s from which it is marked off by a great boundary fault, advantage of which has been taken to site the Gandhi Sagar of the Chambal Dam. I have brought within the name of Malwa the historic passageway between the J amuna-Chambal Doab in the Northeast and the Gulf of Cambay in the southwest and made it consist of two Divisions (1) the _North Malwa Uplands and (2) the Malwa Plateau proper, consisting of the outlying northern slopes of the Deccan Lava proper of the Vindhya Hills range:!.
The first Division (3.31) consists of Guna and Shivpuri, the long slope of Deccan Lavas in the Chambal basin of which the river Sind (passing through Guna and Shivpuri) forms the eastern flank. Shivpuri itself is traversed by the Parbati which has been dammed up in two places, Kaketa Dam and Harsi Dam. The Parbati later joins Sind. Guna is drained by Parbati in the west and Sind in the 'east. The second Division, Malwa Plateau (3.32) consists of 9 districts
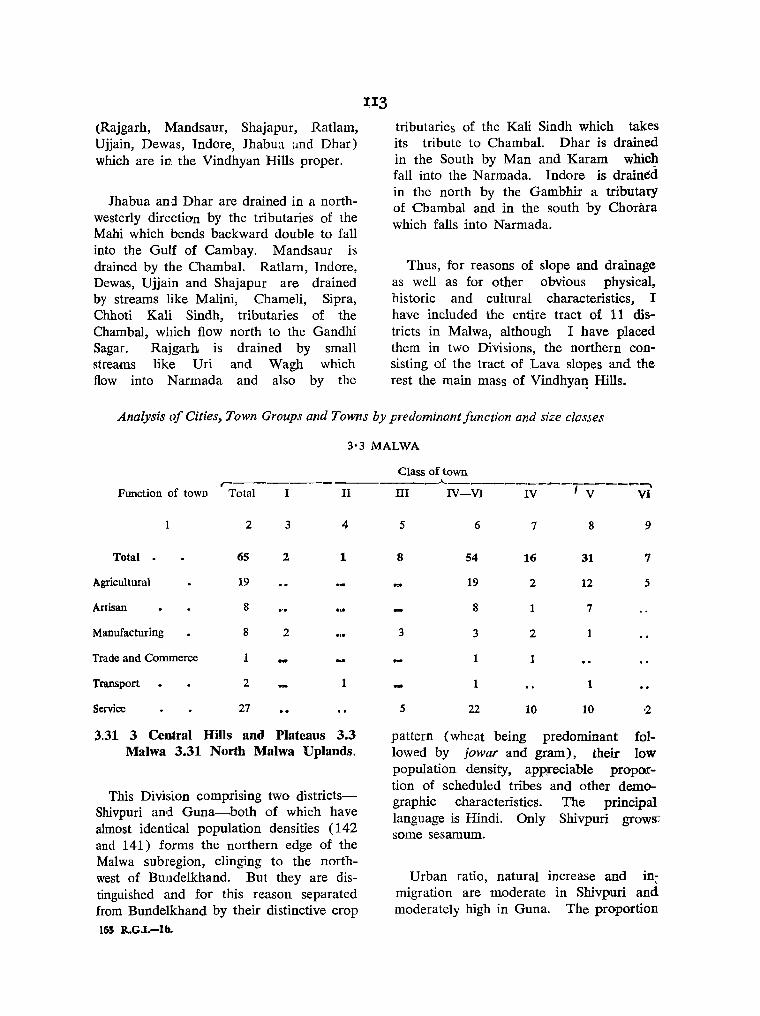
(Rajgarh, Mandsaur, Shajapur, Ratlam, Ujjain, Dewas, Indore, Jhabua und Dhar) which are in the Vindhyan Hills proper.
Jhabua and Dhar are drained in a northwesterly direction by the tributaries of the Mahi which bends backward double to fall into the Gulf of Cambay. Mandsaur is drained by the Chambal. Ratlam, Indore, Dewas, Ujjain and Shajapur are drained by streams like Malini, Chameli, Sipra, Chhoti Kali Sindh, tributaries of the Chambal, which flow north to the Gandhi Sagar. Rajgarh is drained by small streams like Uri and Wagh which flow into N armada and also by the
1I3
tributaries of the Kali Sindh which takes its tribute to Chambal. Dhar is drained in the South by Man and Karam whicll fall into the Narmada. Indore is drained in the north by the Gambhir a tributary of Cbambal and in the south by Chonira which falls into Narmada.
Thus, for reasons of slope and drainage as well as for other obvious physical, historic and cultural characteristics, I have included the entire tract of 11 districts in Malwa, although I have placed them in two Divisions, the northern consisting of the tract of Lava slopes and the rest the main mass of Vindhya~ Hills.
Analysis of Cities, Town Groups and Towns by predominant function and size classes
3'3 MALWA
r-------Function of town Total I II
2 3 4
Total . 65 2 1
Agricultural 19
Artisan 8
Manufacturing 8 2
Trade and Commerce 1
Transport 2 1
Service 27
3.31 3 Central Hills and Plateaus 3.3 Malwa 3.31 North Malwa Uplands.
This Division comprising two districtsShivpuri and Guna~both of which have almost identical population densities (142 and 141) forms the northern edge of the Malwa subregion, clinging to the northwest of BUlldelkhand. But they are distinguished and for this reason separated from Bundelkhand by their distinctive crop 165 R.G.I.-lb.
Class of town -----~ ------
III IV-VI
5 6 7 8 9
8 54 16 31 7
19 2 12 5
8 1 7
3 3 2
1 1
1 1
5 22 10 10
pattern (wheat being predominant followed by jowar and gram), their low population density, appreciable proportion of scheduled tribes and other demographic characteristics. The principal language is Hindi. Only Shivpuri grows·; some sesamum.
Urban ratio, natural increase and in~
migration are moderate in Shivpuri and moderately high in Guna. The proportion
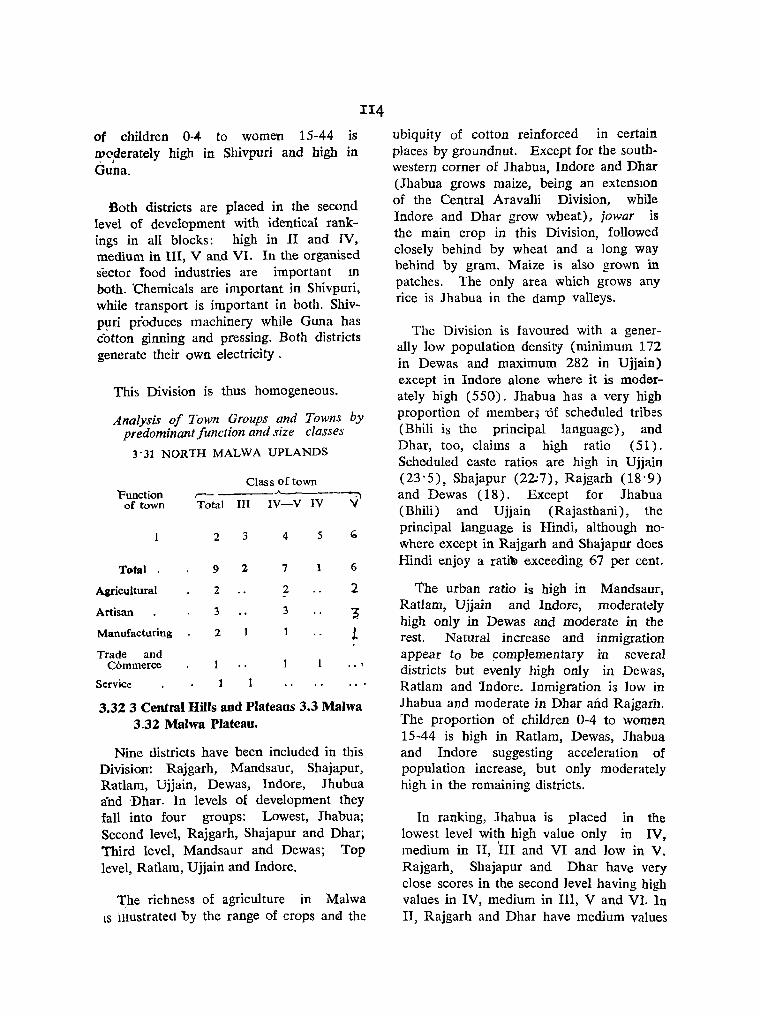
114
of children 0-4 to women 15-44 is nwderately high in Shivpuri and high in . , Guna.
Both districts are placed in the second level of development with identical rankings in all blocks: high in II and IV. medium in III, V and VI. In the organised sector food industries are important 10
both. 'Chemicals are important in Shivpuri, while transport is important in both. ShivP!lri prOduces machinery while Guna has cotton ginning and pressing. Both districts generate their own electricity.
This Division is thus homogeneous.
Analysis of Town Groups and Towns by predominant function and size classes
3'31 NORTH MALWA UPLANDS
'Function of town
Total
Agricultural
Artisan
Manufacturing
Trade and Commerce
Service
Class of town r-- -"-------:") Total III IV-V IV Y
2 3 4 5 10
9 2 7 1 6
2 2 2
3 3 ~ 2 L
.. , 1
3.32 3 Central Hills and Plateaus 3.3 Malwa 3.32 Malwa Plateau.
Nine districts have been included in this Division: Rajgarh, Mandsaur, Shajapur, Ratlam, Ujjain, Dewas, Indore, Jhubua and -Dhar. In levels of development they fall into four groups: Lowest, Jhabua; Second level, Rajgarh, Shajapur and Dhar; Third level, Mandsaur and Dewas; Top level, Ratlam, Ujjain and Indore.
The richness of agriculture in Malwa IS illustrated by the range of crops ana the
ubiquity of cotton reinforced in certain places by groundnut. Except for the southwestern corner of Jhabua, Indore and Dhar (Jhabua grows maize, being an extenSIOn of the Central Aravalli Division, while Indore and Dhar grow wheat), jowar is the main crop in this Division, followed closely behind by wheat and a long way behind by gram. Maize is also grown in patches. The only area which grows any rice is Jhabua in the damp valleys.
The Division is favoured with a generally low population density (minimum 172 in Dewas and maximum 282 in Ujjain) except in Indore alone where it is moderately high (550). Jhabua has a very high proportion of member~ tif scheduled tribes (Bhili is the principal language), and Dhar, too, claims a high ratio (51). Scheduled caste ratios are high in Ujjain (23' 5), Shajapur (22:7), Rajgarh (18'9) and Dewas (18). Except for Jhabua (Bhili) and Ujjain (Rajasthani), the principal language is Hindi, although nowhere except in Rajgarh and Shajapur does Hindi enjoy a rati\) exceeding 67 per cent.
The urban ratio is high in Mandsaur, Ratlam, Ujjain and Indore, moderatt!Iy high only in Dewas and moderate in the rest. Natural increase and inmigration appear to be complementary in several districts but evenly high only in Dewas, Ratlam and lndore. Inmigration is low in Jhabua and moderate in Dhar and Rajgarh. The proportion of children 0-4 to women 15-44 is high in Ratlam, Dewas, Jhabua and Indore suggesting acceleration of population increase, but only moderately high in the remaining districts.
In ranking, Jhabua is placed in the lowest level with high value only in IV, medium in II, 'III and VI and low in V. Rajgarh, Shajapur and Dhar have very close scores in the second level having high values in IV, medium in III, V and VI. In II, Rajgarh and Dhar have medium values

and Shajapur high. Mandsaur and Dewas are placed in the third level with identical total scores and values in all blocks e.lt~
cept that in II Mandsaur has a high value and Dewas a medium one. Ratlam, Ujjain and Indore are placed in the top level: of them again, Ratlam and Ujjain have identical ranks in all blocks but Indore is ahead of them, having high values in all blocks except medium for III.
All districts except Rajgarh and Jhabua art! connected by grid. In addition Indore generates its own electricity as do Rajgarh
115
and Jhabua. Cotton ginning and presslt!~ is either the principal or an important organised industry in all districts. Textiles is important in Mandsaur, Ratlam, Ujjain, Dewas, Indore; food industries in Mandsaur Ratlam, Ujjain, Dewas and Indore; machinery in Mandsaur, Dewas and Indore; metal products in Indore; paper and paper products in Ratlam; electricity generation in Mandsaur, Shajapur, Jhabua and Dhar; tubacco in Ratlam and Dewas.
This Division is thus fairly heterogeneous in levels of development.
Analysis of Cities, Town i Groups and Towns by predominant function 'and size classes
3'32 MALWA PLATEAU
" Function of town Total II
2 3 4-
Total 56 2 I
Agricultural 17
Artisan 5
Manufacturing 6 2
Transport 2
Service 26
Class [ cities with their function : Manufacturing-Ujjain, Indore.
3.4 Vin~hya Ranges and 'Plateaus.
[ have separated Vindhya Ranges and Plateaus from Malwa which also are part of the Vindhya system. The districts in th!s fourth subre!1;ion fall into three Divisions.
3.41 Vindhyas.
The first (3.41), formed of 5 districts. forms the ,heart of Madhya Pradesh: Vidisha, Raisen, Sehore, Sagar and Darnoh. Oamoh is hound ed in the southeast by the Bhanrer Range. Vidisha, Raisen, Sehore
Class of town
III IV-VI IV V VI
5 6 7 S 9
6 47 IS 25 7
17 2 10 5
5 4
2 2 2
1
4 22 10 10 2
(Bhopal) and Sagar are drained mainly by the Betwa and the Dhasan and their small tributaries before they join into the Jamuna in the nnrtheast. Sehore is drained by Parbati in the west and Betwa in the east. Vidisha is drained by Betwa. Sagar is drained by the Dhasan in the west and the Bewas in the eazt. Damoh is drained by the Ken which falls into the Jarnuna in Banda district (Uttar Pradesh). These districts form the main easterly mass of the Vindhya Hills and Plateaus.
II6
3.42 Rewa Plateau: Vindbyan Scarp Lands.
The second Division is composed of the Vindhyan Scarp Lands and Vindhya Rocks to form the Rewa Plateau. It consists of the districts of Panna, Satna and I~ewa.
This Division, tjlerefore, logically lies to the northeast of the first and contains the northeastern extremity of the Bhanrer Range, the Panna Hills and the Kaimur Hills. Panna is drained by the Ken, Satna by the Tons or Tamasa of which Satlla is a tributary and Rewa by the HeIan which joins the Tons. There is some tank irngation, but valleys are often dammed up and sowing is done in the moist wi} after the rains. Much of the alluvium is a fertile black loamy soil well adapted to wheat.
3.43 Kaimur (Vindbyacbal).
The third Division consisting of Mirzapur (Uttar Pradesh) is more a political Division and should properly beiong to the second or Rewa Plateau or Vindhvan Scarp Lands. It is commonly known as Vindhyachal. But it ha3 also its separate drainage identity, because northern Mirzapur drains northwestwards through the Tons. into the Ganga, while Southern Mirzapur is drained transversely from west to east by the Son and its tributarit~\;,
mainly the Rihand and Kanhar which !low from the southnorthward to join the Son. There is another river Karmanasa at the eastern corner of Mirzapur which travels through Chunar into the Ganga near Buxar (Shahabad).
Analysis of Cities, Town Groups and Towns by predominant function and size classes
3·4 VINDHYA RANGES AND PLATEAUS
r-
Function of town Total
2
Total 33
Agricultural
Artisan 15
Manufacturing 5
Trade and Commerce 2
Transport
Service 9
3.41 3 Central Hills and Plateaus 3.4 Vindhya Ranges and Plateaus 3.41 Vindhyas.
This Division consists of 5 districts·'Vidisha, Raisen, Sehore, Sagar and Damoh -·:md forms the heartland of \I1.adhya Pilldesh.
Class of town --A- --. III IV-V IV V
3 4 5 6 7
3 6 24 9 15
13 6 7
2 2
8 2 6
The main crop is wheat followed a long way behind hy jowar and gram or gram and jawar. Only Damoh grows appreciable quantities of rice. Damoh alone grows sesamum.
Population density IS generally low. being lowest in Raisen (126) and highest
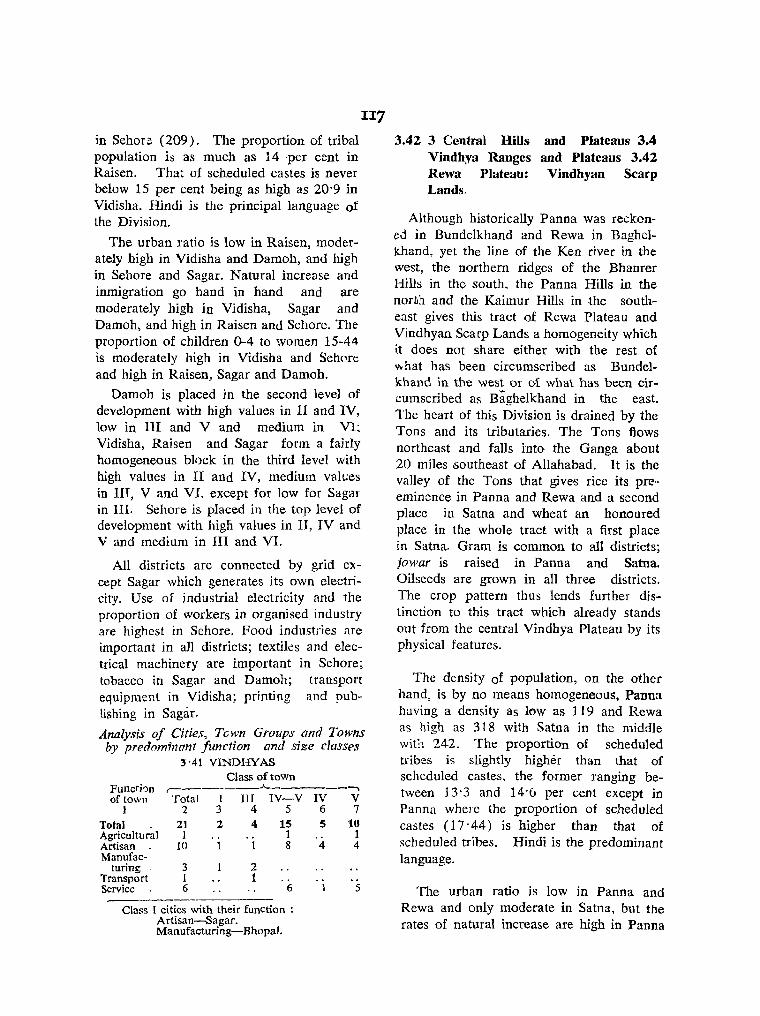
in Sehor e (209). The proportion of tribal popUlation is as much as 14 'per cent in Raisen. That of scheduled castes is never below 15 per cent being as high as 20'9 in Vidisha. Hindi is the principal language of the Division.
The urban ratio is low in Raisen, moderately high in Vidisha and Damoh, and high in Sehore and Sagar. Natural increase and inmigration go hand in hand and are moderately high in Vidisha, Sagar and Damoh, and high in Raisen and Sehore. The proportion of children 0-4 to women 15-44 is moderately high in Vidisha and Sehore and high in Raisen, Sagar and Damoh.
Damoh is placed in the second level of development with high values in II and IV, low in III and V and medium in Vl; Vidisha, Raisen and Sagar form a fairly homogeneous block in the third level with high values in II and IV, medium values in III, V and VI. except for low for Sagar in III. Sehore is placed in the top level of development with high values in II, IV and V and medium in III and VI.
II7
All districts are connected by grid except Sagar which generates its own electricity. Use of industrial electricity and the proportion of workers in organised industry are highest in Sehore. Food industries are important in all districts; textiles and electrical machinery are important in Sehore; tobacco in Sagar and Damoh; transport equipment in Vidisha; printing and publishing in Sagar.
Analysis of Cities, Tcwn Groups and Towns by predominant function and size classes
3'41 VINDHYAS Class of town
Functhn of town
,--_____ .A-.-__ _
Total [ IH IV-V IV ) 2 3 456
Total . Agricultural Artisan . Manufac-
turing . Transport Service
21 1
10
3 1 6
2
1
4
1
2 1
_--------------
15 1 8
6
Class I cities with their function : Artisan-Sagar. Manufacturing-Bhopal.
5
4
--. V 7
10 1 4
5
3.42 3 Central Hills and Plateaus 3.4 Vindbya Ranges and Plateaus 3.42 Rewa Plateau: Vindbyan Scarp Lands.
Although historically Panna was reckoned in Bundelkhand and Rewa in BaghcIkhand, yet the line of the Ken river in the west, the northern ridges of the Bhanrer Hills in the south, the Panna Hills in the nor~h and the Kaimur Hills in the southeast gives this tract of Rewa Plateau and Vindhyan Scarp Lands a homogeneity which It does not share either with the rest of ""hat has been circumscribed as Bundelkhano in the west or of what has been circumscribed as Baghelkhand in the east. The heart of this Division is drained by the Tons and its tributaries. The Tons flows northeast and falls into the Ganga about 20 miles .southeast of Allahabad. It is the valley of the Tons that give-s rice its pre·· eminence in Panna and Rewa and a second place in Satna and wheat an honoured place in the whole tract with a first place in Satna. Gram is common to all districts; jowar is raised in Panna and Satna. Oilseeds are grown in all three districts. The crop pattern thus lends further distinction to this tract which already stands out from the central Vindhya Plateau by its physical features.
The density of population, on the other hand, is by no means homogeneous, Panna having a density as low as 119 and Rewa as high as 318 with Satna in the middle with 242. The proportion of scheduled tribes is slightly higher than that of scheduled castes, the former ranging between 13'3 and 14'6 per cent except in Panna where the proportion of scheduled castes (17' 44) is higher than that of scheduled tribes. Hindi is the predominant language.
The urban ratio is low in Panna and Rewa and only moderate in Satna, but the rates of natural increase are high in Panna

and moderately high in Satna and Rewa. Inmigration is moderately high in Panna and Satna but moderate in Rewa. The proportion of children 0-4 to women 15-44 is high in Panna, moderately high in Satna and moderate in Rewa. The demographic situation is, therefore, in a state of change.
In respect of development Rewa is in the lowest level with high value only in IV, medium values in II, III and VI and low value in V. Panna and Satna have been placed in second level and are very close to each other in total score and lnelT rankings in different blocks (high in II and IV, medium in III and VI, but Panna is low and Satna medium in V).
Rewa is connected to grid while Panna and Satna generate their own electricity.
Except for the Diamond mines, Panna has little organised industry. Satnu's important industry is cement and lime 10llowed by chemical products and food industries. Rewa is acquiring distinction for machinery, printing and publh;hing and transport equipment. Both districts have tobacco factories; The Division, therefore, enjoys a certain homogeneity in respect of levels of development.
Analysis. of Town Groups and Towns by predominant function and size class('s:'
3·42 REWA PLATEAU: VINDHYAN SCARP LA""lDS
Class of town Function
,.. _____ ..A.. ___ ---.,
of town Total III rv-v IV V
1 2 3 4 5 6
Total 6 2 4 2 2
Artisan 3 3 2
Trade and CommeJre 1
Service 2
II8
3.43 3 Central Hills and Plateaus 3.4 Vindbya Ranges and Plateaus 3.43 Kaimur (Vindbyachal).
For political as well as geographical purposes the only district, Mirzapur, in this Division has a distinction all its own. It hils the Kaimur Range (here called Vindhyachal) as the central transverse spme nursing the Son, which is longitudinally fed from the South by the Rihand and Kanhar. The principal I,;rop is rice followed some way behind by gram, barley and wheat.
The urban ratio as well as the rate of natural increase is moderately high. But inmigration is only moderate (even this was mainly due to the Rihand Dam and the Indian Aluminium Pro jects). The proportion of children 0-4 to women 15-44 is moderately high. The density is 293 per sq. mile. The principal language is Hindi. Mirzapur generates its own electricity.
Mirzapur is placed in the third level of development mainly because of high value~ in II and IV and medium values in IIf. V and VI.
The chief industry is still carpets (textiles), but the more important are lime and cement (factory at Churk), machinery, electricity (Rihand hydro-electric) and chemical products.
AnalysiS of Cities, To"»n GrOVES ar.d ~h"»r.s by predominant funclicn and size classes
3·43 KAIMUR (VlNL'HYACHAI) Class of town
Function r-of town Total I IV-V IV
2 3 4 5
Total ' 6 1 5 2
Artisan 2 2
Manufacturing 2 Trade and
Commerce
Service
Class I cities with their function :
.... V
6
3
Manufacturing-Mirzapur-cum-Vindhvacha
IIg
3.S Central Madhya Pradesh Plateau.
1 have called the tract situated in Madhya Pradesh, between the Vindhya Ranges and Plateaus in the north and the Deccan and the Coastal Plain in the south, the Central Madhya Pradesh Plateau. This is the fifth subregion but is confined entIrely to Madhya Pradesh. It has seven distinct physiographic divisions each of which happens to have its cultural personality also. The drainage is mainly bipolar in this subregion, the point of divide being the bended girdle of the Bhanrer and Maika! Ranges: for, to the northeast of this girdle the Son, taking its rise from the offside scarps of 1 he outer Maikal flows northeastwards along the line of the Kaimur Range, while to the southeast of this bend the Narmada, taking its rise inside the stows of the Maikal Range flows northwestwards to the Jabalpur gap and then flow.; southwest. For the Subregion as a whole the drainage may also be described as radial because south of the MahadeoGawilgarh, the Tapti, emerging in Betul, flows westwards while the Pench in Chhindwar a and Wainganga in Seoni and Balaghat flow southeastwards.
3.51 Narmada Valley.
The first Division is made by the upper section of the Son-Narmada furrow which runs almost in a straight, northeast-southwest diagonal line down the southern slopes of Kaimur Hills, Bhanrer Hills and then enters the furrow between the Vindbya Hills in the north (Southwest to Northeast) and the Mahadeo-Gawilgarh-Satpura Hills in the south (Southwest to Northeast). The Narmada drawing its tributaries from the northwestern slopes of the Maikal Range the stows of the Upper Narmada Valley, makes its entry through the J abalpur gap at Bheraghat of the Bhanrer Hills in the north and the Mahakal Hills in the south into the J abalpur gorge and passes through Jabalpur and Narsimhapur and along the
northern border of Hoshangabad which constitute this Division. The Narmada has several important tributaries in this Division which take their rise from the Mahadeo and Gawilgarh Hills: Tawa which falls into Narmada northwest of Hoshangabad town; Dudhi which forms the boundary between Hoshangabad and N arsimhapur; and farther east in Narsimhapur, the Shakkar; the Sher which drains Narsimhapur. The river Narmada historically was the boundary between Madhvadesa and Dakshinapath, the middle and the South land, and it .still remains an effective internal frontier.
3.52 Western Satpnras (Satpwa-Gawilgarh Hills).
This Division constitutes the lower section of the Narmada furrow which continues the last Division in a line further southwest towards the Gulf of Cambay and comprises the two districts of East and West Nimar which lie in the lower Narmada V'aUey between the Vindhyas in the North and the Gawilgarh-Satpura Ranges in the South. East Nimar is drained by the Chhota Tawa which flows through the gap between the Satpura Hills, the Gawilgarh Hills and the Mahadeo Hills and flows northward into the Narmada. The Chhota Tawa takes its rise close to the Burhanpur gap in the Gawilgarh Hills. West Nimar is drained by the Kundi which takes its rise in the Satpura Hills and falls in to the Narmada.
3.53 Central Satpuras (Gawilgarb-Mabadeo Hills).
This Division comprises the southern intermont basins of the Mahadeo Range and the Upper Tapti VaIfey between the Mahadeo Hills and the Gawilgarh Hills. It consists of the districts of Betul (the Upper Tapti Valley, the Gawilgarh scarps and part of the intermont basin of the Mahadeo Hills), Chhindwara which forms the Mahadeo intermont basin of the Pench and the source of the Wainganga, and Seoni
which forms the basin of the Wainganga and contains the Mahakal Plateau a~~ it escalates in the southeast. Betul is drained by the Tapti, Chhindwara is drained by the Pench, Seoni by the Wainganga.
3.54 Eastern Satpuras (Maikaia Range).
This Div.ision is further east of the previous one (3.53) and consists of Balaghat and Mandla. Balaghat and Mandla constitute the stows of the Upper Narmada Valley of the dissected plateau of the Mmkala on its northeastern face. Mandla collects the Narmada tributaries while Balaghat feeds the Wain ganga by such tributaries as Chandan, Bagh, etc.
3.55 Baghelkband Plateau.
Traditionally called Baghelkhand, this Division, further east of the previous one (3.54) consists of the Districts of Sidhi, Shahdol and Surguja. The peak of Amarkantak is at the southernmost point of Shahdol. Shahdol is full of Maikal scarp lands and is drained by the upper reaches of the Son near its source and its tributaries. Sidhi is lined in the· north by the Kaimur Hills with the line of the Son closely hugging their base and is drained by the river Gopad and its branches. The Rihand falls into the Son. Sidhi is the valley of the upper Son. Although Surguja is at the meeting point of Baghelkhand and Chhattisgarh and may be claimed with almost equal force and cogency by either on cultural, social and economic grounds, I have placed Surguja under Baghelkhand because of the slope of drainage and the arrangement of the Hill Ranges. For, this is the third district in the company of Sidhi and Shahdol which drains through Rehar and Moran tributaries of the Riband, northward into the Son. Surguja marks the very irregular Son-Mahanadi watershed, which starts from Deogarh (3,370') north of Sonhat and travels in a southern arc around Mainpat, Ranijala Peak, Upar Ghat, and then up to Mailan.Hill. Surguja is formed
mainly of Gondwana rocks with the last outposts of Archaean and Deccan Lavas. It contains very important coalfields.
3.56 Chhattisgarh.
Apart from being a culturally homogeneous area, th'e Chhattisgarh, consisting of the districts of Durg, Raipur, Bilaspur and Raigarh has a physiographic compactness and unity. It is separated from the Wainganga Valley by a narrow divide formed partly by the Maikala Range of the Satpuras and partly by the isolated hills of Bhandara and Chanda. 'Within a short distance three contrasting demographic regions are seen between Gondia and Dongargarh. First the linear settlements of the Wainganga Valley, then scattered habitations and finally a compact mass in the Chhattisgarh basin' (Chatterjee). Bordered by the Maikala Range in the northwest and north, the Cbbota Nagpur and Hazaribagh Plateau and Ranges in the east, and the Wainganga-Mahanadi watershed in the East and Southeast, Chhattisgarh contains two contiguous ~basins of the Mahanadi: (1) the Seonath-Mahanadi Doab in the districts of Durg and Raipur, and (2) the Hasdo-Mahanadi Doab or the Raigarh Basin in Bilaspur and Raigarh. The Seonath, travels in a north-easterly direction across Durg. At Sanjari Balod Taluk in Durg, a tributary of Seonath, Tandula, has a large reservoir at Balod.
The Mahanadi forms in Kanker of Bastar, travels across Raipur in a northeasterly direction to Bilaspur. The Pairi takes its rise in the southeast of Raipur and travels north to join the Mahanadi. The Seonath forms the boundary between Bilaspur and Raipur districts and meets the Mahanadi in Baloda·Bazar tehsil of Raipur to be henceforth called the Mahanadi. The Arna travels south from Bilaspur and joins the Seonath in Mungeli tehsil (Bilaspur). The other river of Bilaspur, Hasda, travels due south and falls into Mahanadi at Raipur. ·Raigarh is drained by the Mand,

,,Kurket and Kelo rivers which travel into 'the Mahanadi.
'Villages are definitely at waterpoints, closepacked, mud-built with mud or tiled .roof; they have' a pueblo aspect enhanced by mud' walls joining up farmstead buildings and separating the field.' (Spate).
Th~ heart of the plain is· occupied by a great qasin of Cuddapah rocks. The rivers are .mature, occasionally incised in gullied banks. Th~, basin is girdled by more or less broken forest country .. Before the Marathas H· used ,to, be a Gond Kingdom.
'3.57 ~anda~anya. This comprising a single district Bastar
has been made a Division because of its
I~l
cultural, social and physiographic uniqueness as well as size. The chief river is Indravati which travels across the middle of Bastar from east to west and receives tributaries from east to west like Bhaske1. Narangi, Baordigh and Gudra, each of. which runs north to south dissecting Bastar into longitudinal strips. The district headquarters, Jagdalpur, is on the Indravati which travels westward to fall into the Godavari near Mahadeopur at the corner of Karimnagar district of Andhra Pradesh. The Saban, the southernmost river of Bastar which flows along the boundary of Madhya Pradesh, Orissa, joins the Sileru at Konta the trijunction of Madhya Pradesh, Andhra Prade'>.h .and Oris-sa before it faUs into the Ooda~ari in. Andhra Pradesh.
·Analysis of Cities, Town Groups and<Towns by predomindnt funclion and size classes
3: 5' CENTRAL MADRY A PRADESH PLATEAU
Class of town r------------"- ------,
Function of town Total I
1 2 3
Total 97 3
Agricultural 16
Artisan • 16
Manufacturing 26 2
Trade and Commerce 6
Transport 6
Service 27
3.51 3 Central Hills and Plateaus 3.5 Central Madhya Pradesh Plateau 3.51 Narmada Valley.
The three districts in this Division are Jabalpur, Narsimhapur and. Hoshangabad. Wheat is the main food crop in Jabalpur and Hoshangabad but the second crop in Narsimhapur. Rice is important in JabaIpur but minor in Narsimhapur and unimportant in Hoshangabad. Gram is common to all districts and more important in Narsimhapur. Hoshangabad alone ~rQWS 1;0tto11 163 R.G.I.-17.
II
4
4
2
1
III IV-VI] IV V VI
5 6 7 8 9
11 79 28 45 6
16 3 12
16 5 10
5 17 7 9
4 I 3
4 3 1
4 22 9 10 3
and oilseeds. Population density is lowest in Hosbangabad (160), low ih Nlirsimh2l.pur (208) and high in Jabalpur (326). The proportion of scheduled tribes is around 12 per cent in Jabalpur and Narsimbapur but 7'5 in HoshanglJ.bad. The proportion of scheduled castes is around 10 .per cent in the Division. The Principal language is Hindi.
The urban ratio is moderately high in Na:rsimh~:pur anq I1o&qangaba4 hgt hi~q
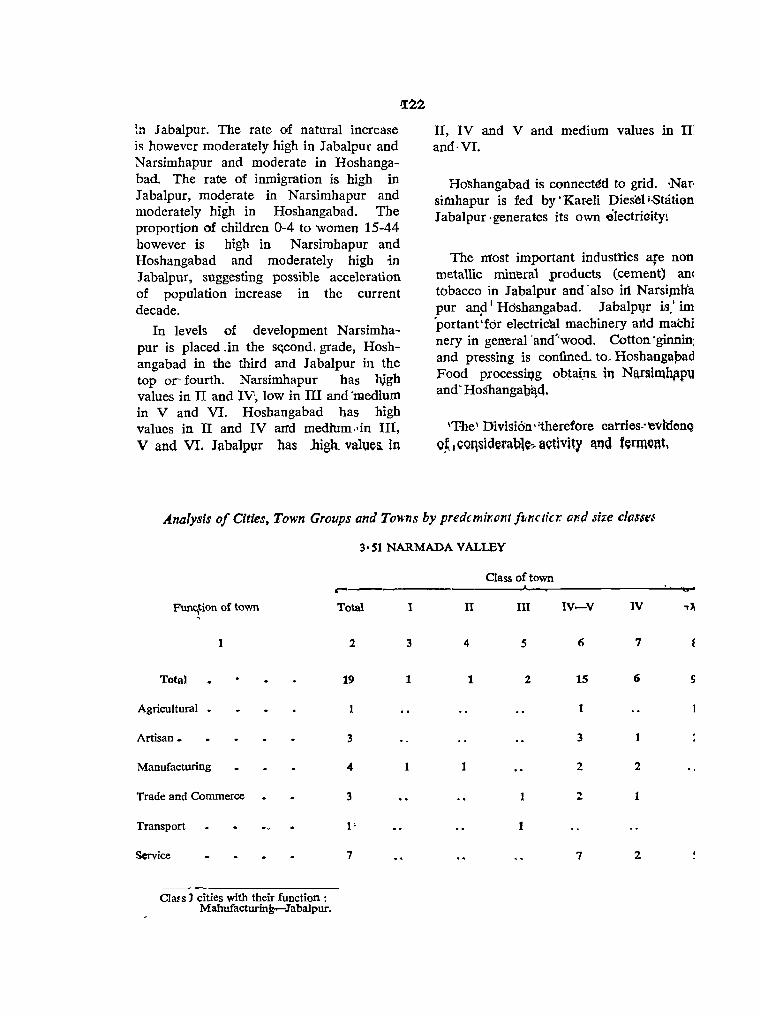
~n Jabalpur. The rate of natural increase is however moderately high in Jabalpur and Narsimhapur and moderate in Hoshangabad. The rare of inmigration is high in Jabalpur, mod~rate in Narsimhapur and moderately high in Hoshangabad. The proportion of children 0-4 to women 15-44 however is high in Narsirnhapur and Hoshangabad and moderately high in Jabalpur, suggesting possible acceleration of population increase in the current decade.
In levels of development Narsimhapur is placed.in the s~cond. grade, Hoshan gab ad in the third and Jabalpur in the top or fourth. Narsimhapur has hjgh values in II and IV, low in III and -medium in V and VI. Hoshangabad has high values in II and IV rutd medrum"in III, V and VI. J abalpur has .bigh_ values. in
II, IV and V and medium values in II and· VI.
H~hangabad is C()nnect~d to grid. <Nar, simhapur is fed by'Kareli Diesel iStatien Jabalpur 'generates its own .electrioity!
The most important industties are non metallic mineral products (cement) an( tobacco in Jabalpur and 'also iIi Narsiplh'a pur an? I Hdshangabad. Jabalpvr is.' im 'portant 'for electricl:tl machinery arld machi nery in general 'and"wood. Cotton 'ginnini and pressing is confined. to, Hoshangapad Food p.rocess~g ob~ai.ns. in Nar~iIllbf\p\1 and' Hosbangab~d.
\The' Division dtherefore carries"'evltionQI IJ~ ,cQq~id~fabl~", activity l'lnd ft;rm~nt.
A.nalysis o[ Cities. Town Groups and Towns by predcmir.ol1t ["nelia and si;e c/(lS5f.(
3'51 NARMADA VALLEY
Class of town r------------------------~~--------------~~
Func,tion of town Total I II III IV-V IV ,
1 2 3 4 5 6 7
Total 19 1 1 2 15 6
Agricultural •
Artisan _ 3 3 1
Manufacturing 4 1 2 2
Trade and Commerce 3 2 1
Transport 1
Service 7 7 2
Cla~s J cities with their function: Mailufacturing..-Jabalpur.

'3.52·1,3. C~tral Hills and ,Plateaus 3.5 Central ,Ma1dIiya Pradesh Plateau ~~S2 Western Satpuras (SatpuraGawilgarb mils)!
This Division. mnsists of the twin districts of W.est (fOl:merly Khargone) and East (formerly Khandwa) Nimar and is bounded by the Narmada in the north and the ~ncave curve of the Satpuras in the south. This is a preeminently jowar tract with -small quantities· of wheat and rice Q~ly rin the river valleys of East Nimar. The main cash crops are cotton and groundnut. Population density is low in East Nimar (166) but moderate in West Nimar (264). In the latter the proportion of scheduled tribes .is as high as 40 per cent, but in East Nimar it is only about 8 per cent. The proportion of scheduled castes is low (9 to 10',7 per cent}. In West Nim,ar the principal language is Rajasthani, in . .East'l Nimar. it~ is Hindi.
This diversity in cultural characteristics is however subdued in the demograpp.ic
features which present a certain uniformity. The urban ratio is.moderat~ly high' in West and high in East Nimar. The rate of natural increase is high.4n both. Inmigration is modesi"in West Nimar but high in East Nimar. The proportion of children 0:4 to women 15-44 is high in both.
In levels of, development however the districts present .great differences. West Nimar is in the l5econd level with high values only for IV and medium values in II"III, ~ and VI, but .East Nimar is in the top or fourth level with high values for IV and VI and medium values in II, III and V
West' Nimar' generates its own electricity while. East Nimar is connected to grid. Cotton ginning and pressing is important in both districts as are tobacco, food and textiles. Beverages are important in West Nimar and paper and paper products in East Nimar.
Analysis of Town Groups and Towns by predominant function and size classes
3· 52 WESTERN SA.TPURAS (SATPURA-GAWILGARH HILLS)
r----~
FlJnction of tQwn Total II
2 3
'Tolal-.
Agricultural
Artisan.
¥.anufac~riDg
16
5
2
,3
6
3,53 3 Central;~Hills and JPlateans 3.5 Central Madhya Pradesh' Plateau 3.53 Central Satpuras (GawilgarbM:~lmdeO' Hills).
This DiVision contains three districts: Be'tulr Chhindwara> 9nd 'Seoni. Its physical
2
configuration has already' been described to bring out why it deserves to be considered as a sep~rate tract. In crop production, too, it has a certain homogeneity, the principal crop being jowar (except in Seoni where it is rice), followed by wheat and
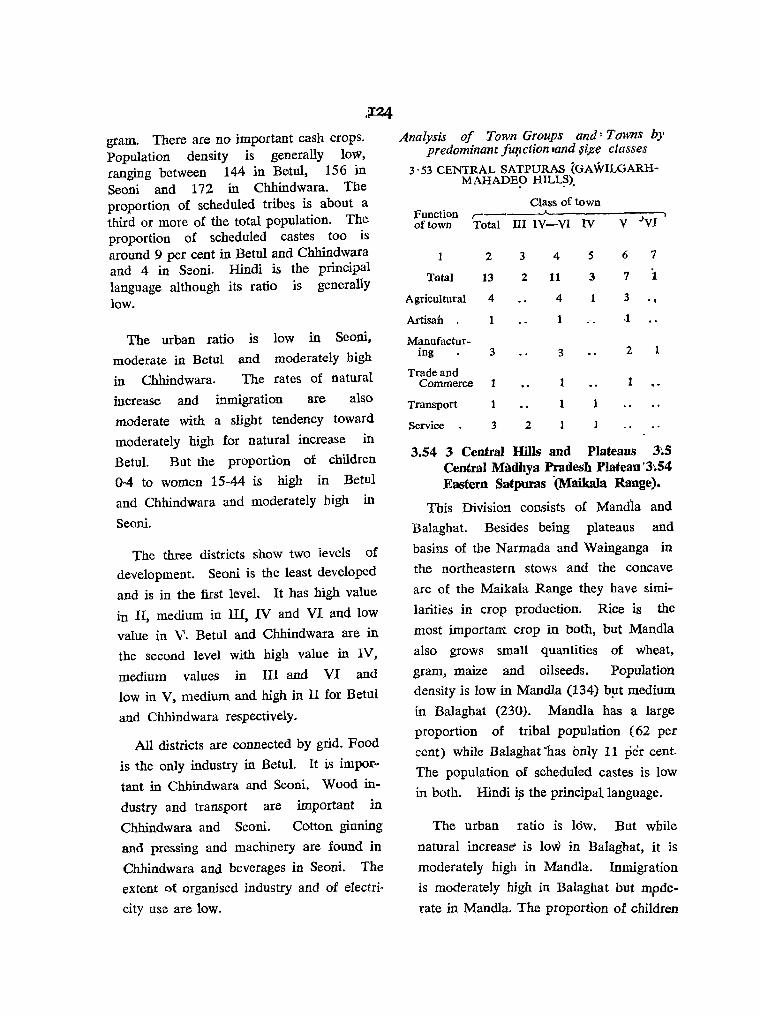
gram. There are no important cash crops. Population density is generally low, ranging between 144 in Betul, 156 in Seoni and 172 in Chhindwara. The proportion of scheduled tribes is about a third or more of the tota} population. The proportion of scheduled castes too is around 9 per cent in Betul and Chhindwara and 4 in Seoni. Hindi is the principal language although its ratio is generally low.
The urban ratio
moderate in Betul
in Chhindwara.
is low in Seoni,
and moderately high
The rates of natural
increase and inmigration are alsO
moderate with a slight tendency toward
moderately high for natural increase in
Betul. But the proportion of children
0-4 to women 15-44 is high in Betul
and Chhindwara and moderately high in
Seoui.
The three districts show two ievels of development. Seoni is the least developed
and is in the first level. It has high value
in II, medium in Ill, IV and VI and low
value in V. Betul and Chhindwara are in
the second level with high value in IV,
medium values ill III and VI and
low in V. medium and high in II for Betul
and Chhindwara respectively.
All districts are connected by grid. Food
is the only industry in Betul. It is imporp
tant in Chhlndwara and Seoni. Wood in
dustry and transport are important in
Chhindwara and Seoni. Cotton ginning
and pressing and machinery are found in
Chhindwara and beverages in Seoni. The
extent of organised industry and of electri
city use are low.
Analysis of Town Groups and; T(JWns by predominant jU!lction land ~i.JZe classes
3'53 CENTRAL SATPURAS (GAWILGARHMAHADE9 HILL~).
Class of town Function ,-----"-'-------.. of town Total III IV-VI IV V )VI
2
Total 13
Agricultural 4
Artisan .
Manufacturing
Trade and Commerce
Transport
Service .
3
1
1
3
3
2
2
4
11
4
3
1
1
5 6 7
3 7 1
1 3 ., .-. ·1
2 1
1
3.54 3 Central Hills and Plateaus 3~5 Central Madhya Pradesh Plateau' 3 .. 54 Eastern Satpuras '(Maikala Range).
This Division consists of Mandla and
Balaghat. Besides being plateaus and
basins of the Narmada and Wainganga in
the northeastern stows and the concave
arc of the Maikala Range they have simi
larities in crop production. Rice is the
most importam crop in both, but Mandla
also grows small quantities of wheat,
gram, maize and oilseeds. Population
density is low in Mandla (134) b!lt medium
in Balaghat (230). Mandla has a large
proportion of tribal popUlation (62 per
cent) while Balaghat 'has only 11 per cent.
The population of scheduled castes is low
in both. Hindi i,s the principal language.
The urban ratio is low. But while
natural increase' is low in Balaghat, it is
moderately high in Mandla. Inmigration
is moderately high in Balaghat but mode-I
tate in Mandla. The proportion of children
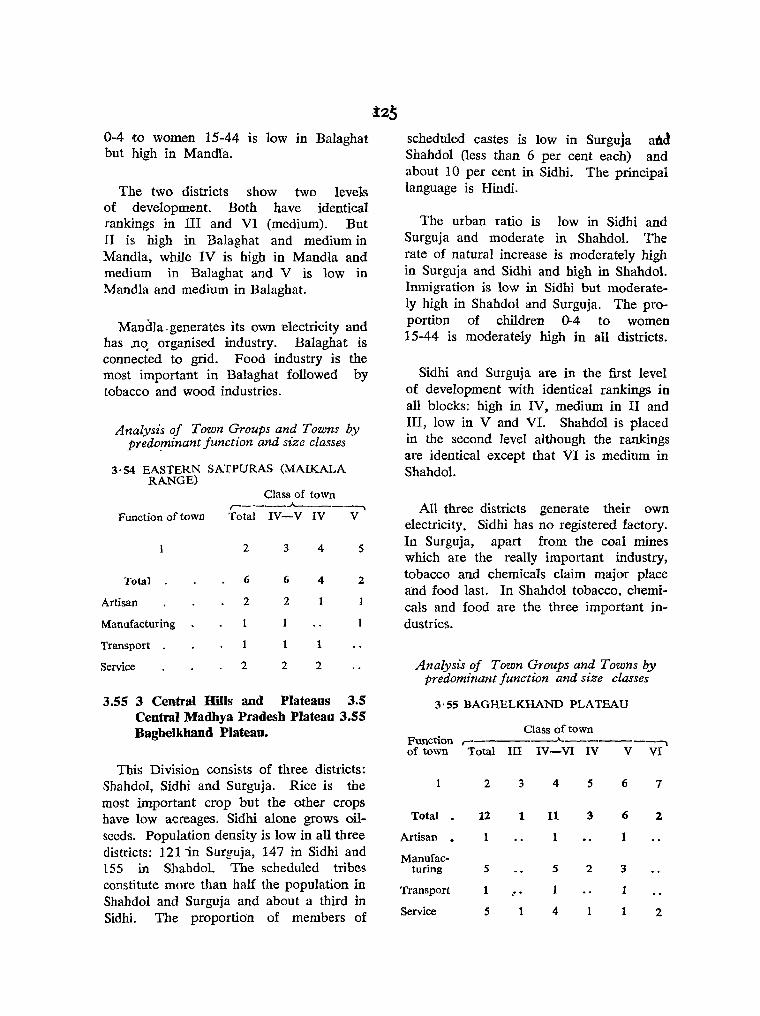
0-4 01:0 women 15-44 is low in Balaghat but high in Manilla.
The two districts show two levels of development. Both have identical rankings in III and VI (medium). But II is high in Balaghat and medium in Mandla, while IV is high in Mandla and medium in Balaghat and V is low in Mandla and medium in Balaghat.
MancHa,generates its own 'electricity and has nq organised industry. Balaghat is connected to grid. Food industry is the most important in Balaghat followed by tobacco and wood industries.
Analysis of Town Groups and Towns by predo!,!inant junction and size classes
3·54 EASTERN SATPURAS (MAIKALA RANGE)
Class of town ,-____ ..A..----.,
Function of town Total IV-V IV V
2 3 4 5
Total 6 6 4 2
Artisan 2 2
Manufacturing
Transport 1
Service 2 2 2
3.55 3 Central Hills and Plateaus 3.5 Central Madhya Pradesh Plateau 3.55 Baghelkband Plateau.
This Division consists of three districts: Shahdol, Sidhi and Surguja. Rice is the most important crop but the other crops have low acreages. Sidhi alone grows oil-seeds. Population density is low in all three districts: 121 in Surguja, 147 in Sidhi and 155 in Shahdol. The scheduled tribes constitute more than half the popUlation in Shahdol and Surguja and about a third in Sidhi. The proportion of members of
scheduled castes is low in Surguja add Shahdol (less than 6 per cent each) and about 10 per cent in Sidhi. The principal language is Hindi.
The urban ratio is low in Sidhi and Surguja and moderate in Shahdol. The rate of natural increase is moderately high in Surguja and Sidhi and high in Shahdol. Inmigration is low in Sidhi but moderately high in Shahdol and Surguja. The proportion of children 0-4 to women 15-44 is moderately high in all districts.
Sidhi and Surguja are in the first level of development with identical rankings in all blocks: high in IV, medium in II and III, low in V and VI. Shahdol is placed in the second level although the rankings are identical except that VI is medium in Shahdol.
All three districts generate their own electricity. Sidhi has no registered factory. In Surguja, apart from the coal mines which are the really important industry, tobacco and chemicals claim major place and food last. In Shahdol tobacco. chemicals and food are the three important industries.
Analysis of Town Groups and Towns by predominant function and size classes
3' 55 BAGHELKHAND PLATEAU
Class of town Function r-------'-------~ of town Total III IV-VI IV V VI
2 3 4 5 6 7
Total . 12 1 11 3 6 2
Artisan . 1 1
Manufac-turing 5 5 2 3
Transport 1 ? • 1
Service 5 4 1 1 2
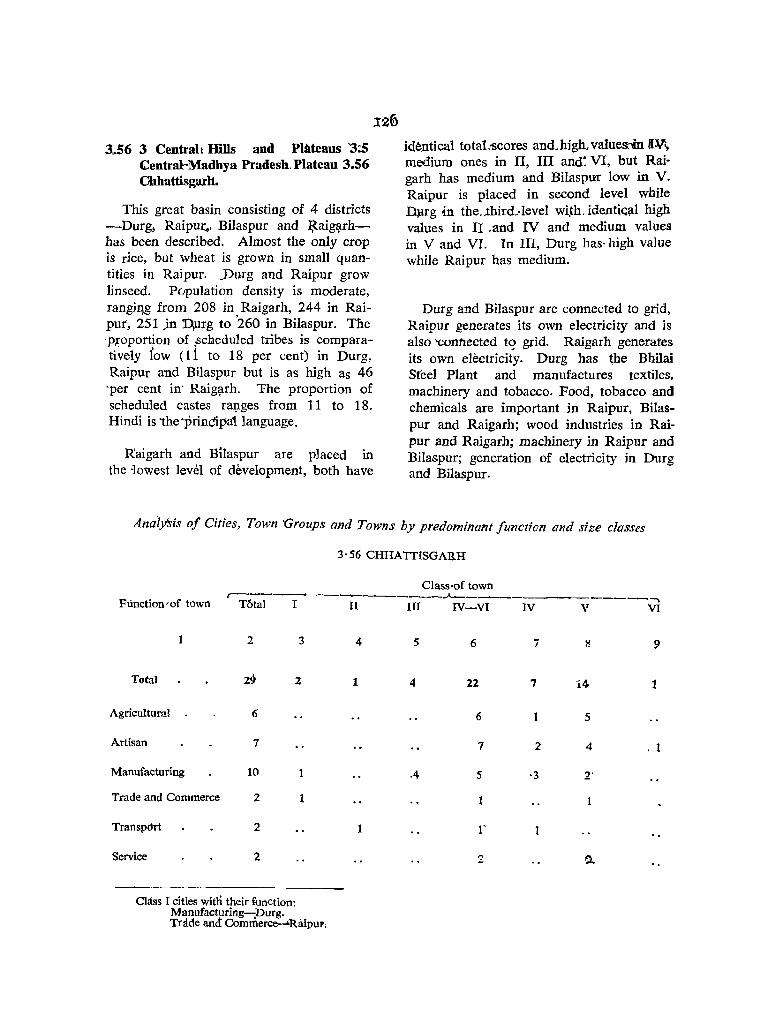
3~56 3 Central! Hills and Plateaus '3:5 Central-Madhya Pradesh, Plateau 3.56 Chhattisgarl1.
This great basin consisting of 4 districts -Durgl RaipUl:., Bilaspur and ~aiglitrhhas been described. Almost the only crop is rice, but wheat is grown in small quantities in Raj pur. _Durg and Raipur grow linseed. PCipulation density is moderate, ranging from 208 in Raigarh, 244 in Raiput, 251 jn D.ur~ to '260 in Bilaspur. The ·p1.oportion of scheduled tribes is compara-tively low (1 i to 18 per cent) in Durg, Raipur and Bilaspur but is as high as 46
'per cent in' Raig~rh. The proportion of scheduled castes rat1ges from 11 to 18. Hindi is the 'prinCipal language.
Raigarh and Bilaspur are placed in the 'lowest level of development, both have
ideJltical total;scores and. high. values-m IV., medium ones in II, III and: VI, but Raigarh has medium and Bilaspur low in V. Raipur is placed in second level while DJIrg in the . .third.·level w~th. identiGal high values in II .and IV and medium values in V and VI. In III, Durg has· high value while Raipur has medium.
Durg and Bilaspur are connected to grid, Raipur generates its own electricity and is also 'Contlected t9 grid. Raigarh generates its own electricity. Durg has ~he Bhilai Steel Plant and manufactures textiles, machinery and tobacco. Food, tobacco and chemicals are important in Raipur, Bilaspur and Raigarh; wood industries in Raipur and Raigarh; machinery in Raipur and BjJaspur; generation of electricity in Durg and Bilaspur.
Ana/y'sis of Cities, Town 'Groups and Towns by predominant function and size classes
3'56 CHHATTISGARH
Class·of town r------------_.A.-_~
Function'of town Total I II III IV-VI - ....... VI IV V
2 3 4 5 6 7 8 9
Total 29 2 1 4 22 7 14- 1
Agricultural 6 6 1 5
Artisan 7 7 2 4 . 1
Manufacturing 10 .4 5 '3 2'
Trade and Commerce 2
Transpdrt 2 1 l'
Service 2
Chiss I cities witli their f{mction: Manufacturing-Durg, Trade and Comrherce---<Rilipul'.
127
'3:57 3 'C'.entral Hills and Plateaus 3.5 Central Malfhya Pradesh Platean 3.57 Dandakaranya.
The principal crop in Bastar is rice. T.here is no cash crop worth the mention. Population density is low being only 77 per sq. mile. The proportion of scheduled tribes is. very high (72 per cent), that of scheduled castes is low (5'5 per cent). Gondi is the principal language but does not cover more than 41 per cent. The urban ratio is low but the rate of natural increase high. Inmigration is low but the proportion of children 0-4 to women 15-44 is high, .suggestive of acceleration in population inct;ease in the current decade ..
Bastar is placed in the lowest level. of , development with high value only in IV, medium in II and III, arid low in V and VI. The district generates its own electricity. Tobacco is the important industry fQIlowed by chemicals, food and wood in-
dustries. J .'~" :Analysis of Town Groups and Towns by
predominant junction and size classes
3'57 DANDAKARANYA
Function of town
Class of town r-----A--___
Total III V
Total
Serf{ice
2
2
2
3.61()rissa Hills and Plateaus.
3
1
1
4
1
The. Subtegion follows the easterly course of the Central Hills and Plateaus beyond Eastern Madhya Pradesh and consists of two Divisions in Orissa: (1) the North Western Hills of Orissa east of Bastar and Raipur and (2) the North Eastern Hills which are a continuation of the Chhattisgarh Plateau and S~onath
Mahanadi basin.
The North Western Orissa Hills consist of the districts of Koraput. Kalahandi,
Bolangir, Baudh-Khondmals and Ganjam. Koraput is a high and rugged plateau compared to Durg and JRaipur and is frequently dotted with high stretches and peaks. The Bhaskel takes its rise in North"Koraput but the Indravati flows east to west across the district. The Sabari winds through South Koraput as the Kalab. South of the impressive Machkund Dam, the Machkund becomes the Sileru. to mark the boundarv between Sileru and East Godavari. In East Koraput the Nagavali and Vansaohara flow into the sea in Srikakulam.
The Koraput Hills escalate down somewhat in Kalahandi forming a watershed but the 'district is still full of high points and plateaus. The Indravati takes its rise in South Kalahandi. The middle of Kalahandi is traversed by the Tel river which is joined by Udanti from the nor~
them section. Kalahandi forms a tra'tlsverse watershed. The south slopes westward towards Koraput while the north slopes 'eact-
ward towards the Mahanadi.
The Kalahandi Plateau escalates shawly in Bolangir. Bolangir still remains .a moderately raised plateau with high points but none above 2,422 ft. (Siker in Titlagarh). The district is drained in a southeasterly direction by transverse streams like the Indra. Lani. Singada. Suktal into the Tel. which forms the boqndarv between Bolancir in the northwest and Kalahandi and Baudh-Khondmal.s in the southeast. The Tel joins the Mahanadi at Sooepur. from which -point Mahanadi becomes the bourtdflry of -Bblangir and Baudh-KhondmaYs.
The s10pe of Baudh-Khondma1s~ continuation 'of the Bastar .. Komput mass further east, is towards the northwest and northeast. While escalating rapjdlyr towards the Seonath-Mahanadi iJ)oab' in the -north throu!!h Kalahandi and Bolangir. the KOFanut high plateau descentIs more slowlv in Baudh-Khondmals. but more steeply down
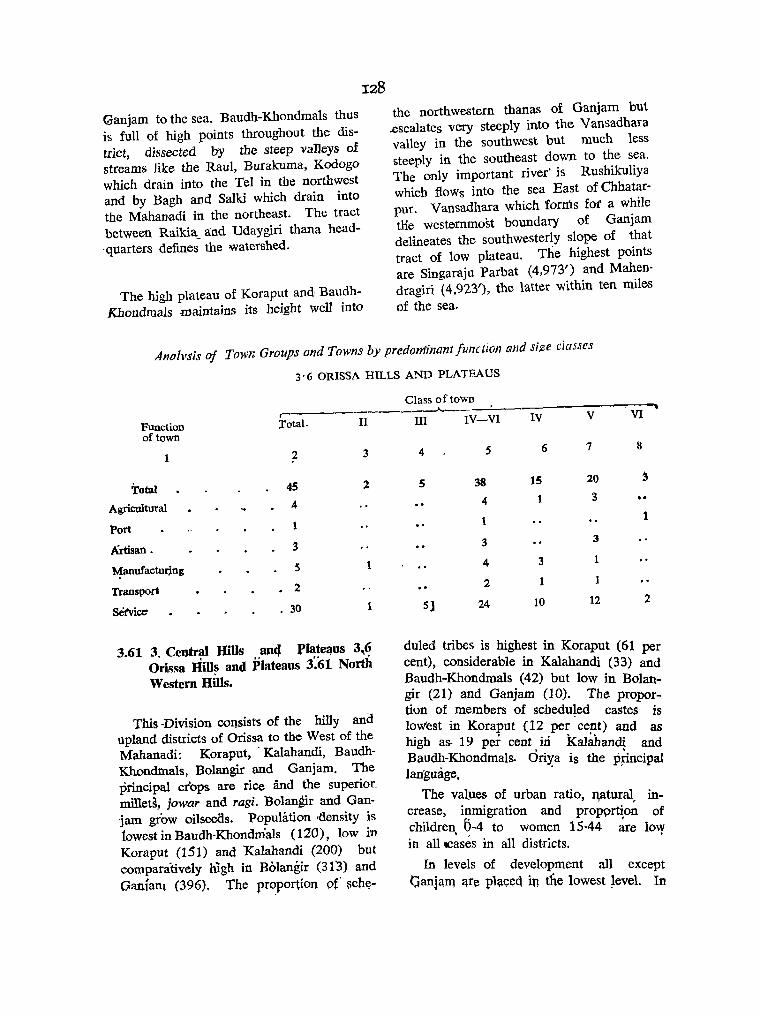
Ganjam to the sea. Baudh-Khondmals thus is full of high points throughout the district, dissected by the steep valleys of streams like the Raul, Burakuma, Kodogo which drain into the Tel in the northwest and by Bagh and Salki which drain into the Mahanadi in the northeast. The tract between Raikia_ and Udaygiri thana head'quarters defines the watershed.
128
The high plateau of Koraput and BaudhKhondmals maintains its height well into
the northwestern thanas of Ganjam but ..escalates very steeply into the Vansadhara valley in the southwest but much less steeply in the southeast down to the sea. The only important river' is Rushikuliya which flows into the sea East of Chhatarpur. Vansadhara which fonns for a while tHe westernmost boundary of Ganjam delineates the southwesterly slope of that tract of low plateau. The highest points are Singaraju Parbat (4,973') and Mahendragiri (4,923'), the latter within ten miles of the sea.
Anolvsis of Town Groups and Towns by predominant function and size ciasses
3'6 ORISSA HILLS AND PLATEAUS
,--------Function rotal. II of town
2 3
Total 45 1
Agricultural 4
Port 1
Artisan . 3
l'1anufacturjng S 1
Transport 2
Setvice 30 1
3.61 3. Central Hills an4 platel)us 3 .. 6 Orissa IiiU~ and Plateaus 3~61 North Western Hills.
This -Division consists of the hilly ana upland districts of Orissa to the West of the Mahanadi: Koraput,' Kalahandi, BaudhKhondrnals, Bolangir and Ganjam. The principal crops are rice and the superior_ millets, jowar and ragi. Bolangir and Ganjam grow ()ilseeas. Population ·density is lowest in Baudh-Khondmals (110), low i'n Koraput (151) and Kalahandi (200) but comparatively high in Bolangir (31'3) and Oanfam (396). The proportion 9f ~chc<-
Class of town
III IV-VI
4 5
5 38
4
1
3
4
2
5] 24
IV
6
15
V
7
20
3
3
3 1
10 12
VI
8
1
2
duled tribes is highest in Koraput (61 per cent), considerable in Kalahandi (33) and ~audh-Khondmals (42) but low in Bolan~r (21) and Ganjam (10). The proportion of members of schedu~ed castes is l~w'est in Koraput (12 per cent) and as hIgh as- 19 per cent in ka1~handi and Ba_ud~-Khondmals. dri~a is the p~ncipaI language,
The values of urban ratio, n,atural increase, inmigration and propprti~ of children. ~-4 to women 15-44 ~re low in all cases in all districts. .
In levels of development all except Ganj3,ll1 3,fe placed in the lowest ~evel. In

1.I Koraput al)..d Ganjam have medium values and Kalahandl, Baudn-Khondmals and Bolangir have high values; in III Kalahandi and Bolangir havc low values and Koraput, Baudh-KhondmaLs and Ganjam have medium values; in IV all districts have medium values except Ganjam which has a- high value; 'in V Koraput, Kalahandi and Bolangir have .low values and BaudhKhondmals and Ganjam have medium values; in VI all districts have medium values except Bolangir which has a low va~ue.
Koraput and Ganjam are connected by
129
grid from the Machkund. Other districts generate their own electricity. Food is the most important industry in all districts except Baudh-Khondmals where leather and leather products is the only organised industry. Wood industries are important in Koraput, Kalabandi, Bolangir and Ganjam. Machinery is important only in Koraput. Transport equipment is important in Koraput, Bolangir and Ganjam. Textiles is important in Bolangir and printing and publishing in Bolangir and Ganjam; basic metals in Koraput, metal products in Kalahandi and chemicals in Ganjam.
Analysis of Town Groups and Towns by predominant function and size classes
3-61 NORTH WESTERN HILLS
r-----Function of town Total II
2. 13
Total 26 1
Agricultural 2
Port
Artisan . 3
Transport 1
,Service '. •. 19 1
3.62 3 Central Hills and Plateaus 3.6
Orissa Hills an(l Plateaus 3.62 North
Eastern Hills.
In the northeastern Hills of Orissa one sees the terminals of the southerly continuation of the Chhota Nagpur Plateau and the easterly continuation of the BastarKoraput mass in the process of which is created the great Mahanadi-Koel-Brahmani basin.
The districts in this Division are Sambalpur, Dhenkanaf, Sundargarh, Keonjhar and Mayurbhanj. J63 R.G.I.-JS.
Class of town ~
III IV-VI IV V VI
4 5 6 7 8
2 23 5 15 3
2 e •• 2
3 3
1
2 16 5 9 2
Sambalpur is dissected in two by nle. longitudinal flow 6f the Mah~adi and the placing of the great Hirakud' Dam in the north central_ region- The'tributary streams to the west of the Mahanadi have a southeasterly slope: e.g. the Tira. Those to the east of the Mahanadi are divided between the slope to the west for the Mahanadi and the slope to the east for the Brahmani which flows longitudinally actoss the eastern thanas of Sambalpur. These features are continued into Dhenkana!, southwest of Sambalpur and east of Baudh-Khondmats, where the strike 'of the isolated
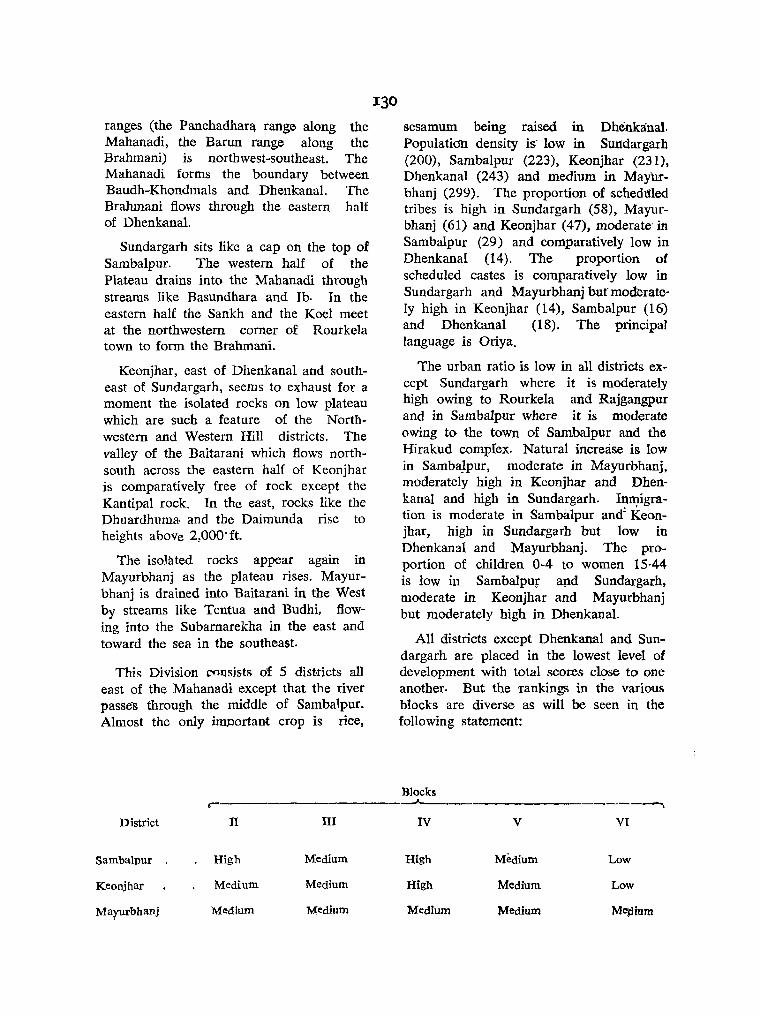
ranges (the Panchadhara range along the Mahanadi, the Baron range alollg the Brahmani) is northwest-southeast. The Mahanadi forms the boundary between Baudh-Khondmals and Dhenkanal. The Brahmani flows through the eastern half of Dhenkanal.
Sundargarh sits like a cap on the top of Sambalpur. The western half of the Plateau drains into the Mahanadi through streams like Basundhara and lb· In the eastern half the Sankh and the Koel meet at the northwestern corner of Rourkela town to form the Brahmani.
Keonjhar, east of Dhenkanal and southeast of Sundargarh, seems to exhaust for a moment the isolated rocks on low plateau which are such a feature of the Northwestern and Western Hill districts. The valley of the Baitarani which flows northsouth across the eastern half of Keonjhar is comparatively free of rock except the Kantipal rock. In the east, rocks like the Dhuardhuma· and the Daimunda rise to heights above 2,OOO·ft.
The isolated rocks appear again in Mayurbhanj as the plateau rises. Mayurbhanj is drained into Baitarani in the West by streams like Tentua and Budhi, flowing into the Subarnarekha in the east and toward the sea in the southeast.
This Division consists of 5 districts all east of the Mahanadi except that the river passe's through the middle of Sambalpur. Almost the only important crop is rice,
I30
sesamwn being raised in Dhenkanal. Populatidll density is' low in SUIldargarh (200), Sambalpur (223), Keonjhar (231), Dhenkanal (243) and medium in MayUr"bhanj (299). The proportion of schedliled tribes is high in Sundargarh (58), Mayurbhanj (61) and Keonjhar (47), moderate'in Sambalpur (29) and comparatively low in Dhenkanal (14). The proportion of scheduled castes is comparatively low in Sundargarh and Mayurbhanj but'moderately high in Keonjhar (14), Sambalpur (16) and Dhenkanal (18). The principal language is Oriya.
The urban ratio is low in all districts except Sundargarh where it is moderately high owing to Rourkela and Rajgangpur and in SambaIpur where it is moderate owing to the town of Sambalpur and the Hirakud complex. Natural increase is low in Samba.lpur, moderate in Mayurbhanj, moderately high in Keonjhar and Dhenkanal and high in Sundargarh. Inmigration is moderate in Sambillpur and! Keonjhar, high in Sundargarh but low in Dhenkanal and Mayurbhanj. The proportion of children 0-4 to women 15-44 is low in Sambalpur a!1d Sundargarh, moderate in Keonjhar and Mayurbhanj but moderately high in Dhenkanal.
All districts except Dhenkanal and Sundargarh are placed in the lowest level of development with total scores c1,?se to one another. But the rankings in the various blocks are diverse as will be seen in the following statement:
Blocks ~---------------~ --~
District 11 III IV V VI
Sambalpur High Medium High Medium Low
Keonjhar Medium Medium High Medium Low
Marurbhanj Mediqm Medium Medium Medium Me:dium
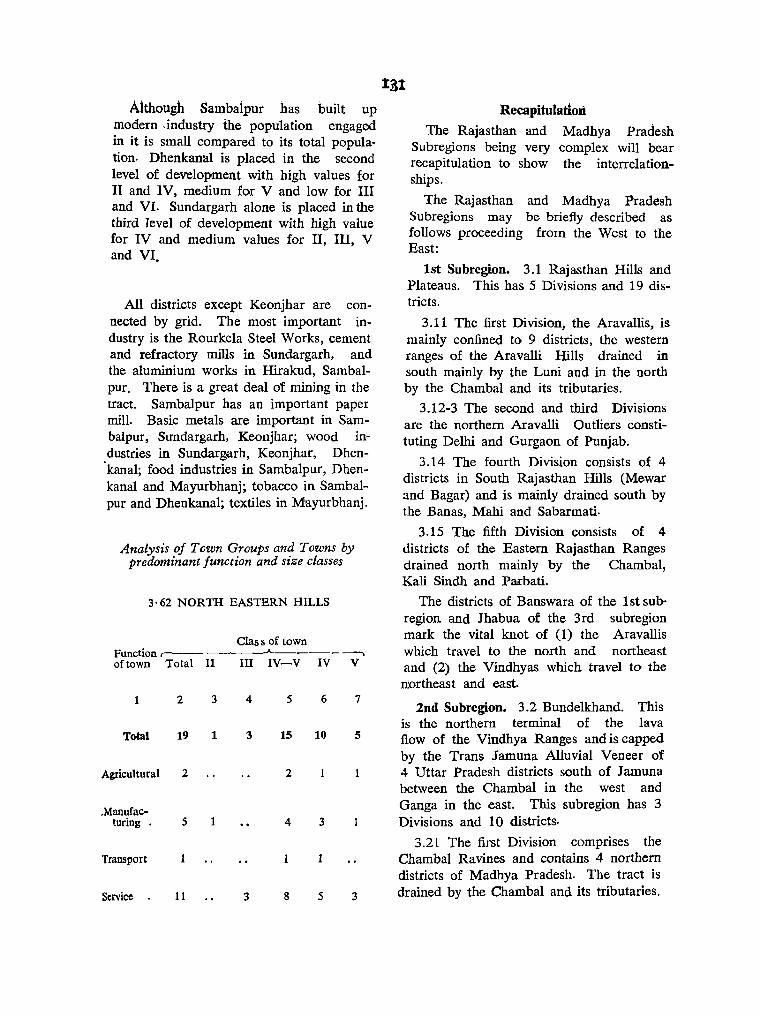
Aithough Sambaipur has built up modern ,industry the population engaged in it is small compared to its total population. Dhenkanal is placed in the second level of development with high values for II and IV, medium for V and low for III and VI. Sundargarh alone is placed in the third level of development with high value for IV and medium values for II, III, V and VI.
All districts except Keonjhar are connected by grid. The most important industry is the Rourkela Steel Works, cement and refractory mills in Sundargarh, and the aluminium works in Hirakud, Sambalpur. There is a great deal of mining in the tract. Sambalpur has an important paper mill. Basic metals are important in Sambalpur, Sundargarh, Keonjhar; wood industries in Sundargarh, Keonjhar, Dhen·kanal; food industries in Sambalpur, Dhenkanal and Mayurbhanj; tobacco in Sambalpur and Dhenkanal; textiles in Mayurbhanj.
Analysis oj Town Groups and Towns by predominant Junction and size classes
3·62 NORTH EASTERN HILLS
Clas s of town Function ,----------"----- ------, of town Total II III IV-V IV V
1 2 3 4 5 6 7
Total 19 1 3 15 10 5
Agricultural 2 2
.Manufac-turing. 5 4 3
Transport 1 1
Service 11 3 8 5 3
1.3t
Recapitulation
The Rajasthan and Madhya Pradesh Subregions being very complex will bear recapitulation to show the interrelation~ ships.
The Rajasthan and Madhya Pradesh Subregions may be briefly described as follows proceeding from the West to the East:
1st Subregion. 3.1 Rajasthan Hills and Plateaus. This has 5 Divisions and 19 districts.
3.11 The first Division, the Aravallis, is mainly confined to 9 districts, the western ranges of the Aravalli Hills drained in south mainly by the Luni and in the north by the Chambal and its tributaries.
3.12-3 The second and third Divisions are the northern Aravalli Outliers constituting Delhi and Gurgaon of Punjab.
3.14 The fourth Division consists of 4 districts in South Rajasthan Hills (Mewar and Bagar) and is mainly drained south by the Banas, Mahi and Sabarmati.
3.15 The fifth Division consists of 4 districts of the Eastern Rajasthan Ranges drained north mainly by the Chambal, Kali Sindh and Parbati.
The districts of Banswara of the 1st subregion and Jhabua of the 3rd subregion mark the vital knot of (1) the Aravallis which travel to the north and northeast and (2) the Vindhyas which travel to the rrortheast and east.
2nd Subregion. 3.2 Bundelkhand. This is the northern terminal of th'e lava flow of the Vindhya Ranges and is capped by the Trans ramuna Alluvial Veneer of 4 Uttar Pradesh districts south of J amuna between the Chambal in the west and Ganga in the east. This subregion has 3 Divisions and 10 districts.
3.21 The first Division comprises the Chambal Ravines and contains 4 northern districts of Madhya Pradesh. The tract is drained by the Chambal and its tributaries.

3.22 The second Division comprises the Trans Jamuna Alluvial Veneer described above and consists of 4 Uttar Pradesh districts drained mainly by the Betwa, Dhasan and Ken.
3.23 The third Division comprises 2 districts of North Central Madhya Pradesh continuation of the badlands and scarps. The entire subregion is historically known as Bundelkhand.
3rd Subregion. 3.3 The third Subregion, Malwa, east of the 1st subregion and south of the 2nd is the historic passageway between the Ganga-Jamuna Doab and the Gulf of Cambay. It comprises the western mass ot the Vindhya Ranges and consists of 2 Divisions and 11 districts.
3.31 The first Division, North Malwa Uplands, consists of 2 districts and is arained by the Parbati and Sindh.
3.32 The second Division, Malwa Plateau, consists of 9 districts and is drained in the south by the Mahi and in the north by the tributaries of the Chambal and by Kali Sindh, Parbati and Sindh.
4th Subregion. 3.4 The fourth Subregion, Vindhya Ranges and Plateaus, contains the main central mass of the Vindhya Ranges and is composed of 3 Divisions and 9 districts.
3.41 Tpe first Division, the Vindhyas, consists of 5 districts forming the heart of Madhya Pradesh and is drained by the _ Betwa, Dhasan and Ken.
3.42 The second Division, the Rewa Plateau, consists of the Vindhyan Scarp Lands and Rocks and contains the Rewa and Panna Hills and is drained by the Tons (Tamasa) into the Ganga.
3.43 The third Division, -Kaimur (Vindhyachal), the -easternmost outlier of the Vindhyas consists of the district Mirza-
pur which is transve~sely Qrai:Qed by.. the Son and Iongitudinaily by the· ··Rili~9'.
5th Subregion. 3.5 The fifth Subregion, the Central Madhya Pradesh Plateau, con!lists of the entire country· contained in Madhya Pradesh to the south, southeast and east of the Vindhya Ranges. It is divided into 7 Divisions and 18 districts.
3.51 The first Division, Narmada Valley, consists of 3 districts Jabalpur, Narsimhapur and Hoshangabad and comprises the Mahadeo and Gawilgarh Hills.
3.52 The second Division, Western Satpuras, consists of 2 districts West and East Nimar in the Satpura-GawiIgarh ffills. It forms the lower and southern section of the Narmada furrow which marks the southern boundary of the Vindhya Ranges. Both districts are drained into Narmada (Kundi and Chhota Tawa).
3.53 The third Division, Central Satpuras, consists of 3 districts in the Plateau and Valley formed by the outer scarps of the Gawilgarh and Mahadeo Hills which descend steeply in the south and southeast and the three districts form three important basins: Betul that of Tapti, Chhfndwara of Pench and Seoni of Wainganga.
3.54 The fourth Division, Eastern Satpuras (Maikala Range), comprising 2 districts is a continuation of the basins formed by the third Division and is enclosed in the east by the western stows of the girdle of the Maikala Range. Mandla forms the Narmada and Balaghat the Wainganga.
3.55 The fifth Division, Baghelkhand Plateau, compnsmg 3 districts~idhi, Shahdol and Surguja-is hIstorically calfed Baghelkhand. Bf;1ghelkhand is a high Plateau enclosed by the Kaimnr Range in the northwest, the Bhanrer Range in the west, the Maikala Range in the southwest and the Hazaribagh-Chhota Nagpur Ranges in the East. The lohilla tributary of the Son in Shah dol -has' . -a curious course, being separated from the broader parallel valley of the upper SOJ;l by

a nl1rroW ridge of Deccan Lava flung by the Amarkantak. The Son issues from the eastern flank of Amarkantak (the Narmada issues from the western flank) and drains Shahdol and Sidhi which form the upper Son Valley. Surguja is drained by the Rihand and is mainly trough land of Gondwana origin.
3.56 The sixth Division, comprising 4 districts, is historically called Chhattisgarh. It consists of the great Seonath-Mahanadi Doab which drains the entire country enclosed by the Surguja high plateau constituting the Son-Mahanadi watershed in the north, the Maikala in the northwest and east, the isolated hills of Bhandara and Chanda, the eastern rim of the Nagpur Maidan, the high ridge of the Western Bastar HiIIs and the Bastar-KoraputKalahandi-Bolangir girdle in the south and southeast.
3.57 The seventh Division, comprising a single district, Bastar, is named Dandakaranya.
In contrast to the densely populated Ganga Plains the Central Hills and Plateaus have sparse populations. Further, a substantial proportion of India's tribes inhabit this Region. All except the arid west was originally forested. Even the semi-desert often carries a very open acacia shrub (Kikar). Considerable areas of deciduous forest (largely Sal) remain, especially in Chhota Nagpur, and on the higher country. Thorn forests prevail in the west. The first two Subregions in Rajasthan delineated above have high rugged ranges and sharp ridges and much hard quartzite rocks which do not favour water, which accounts for the great distances between villages. In many cases villages are no more than a few homesteads erected either in forest clearings or depressions. There arc exceptional areas of concentration where for example an extensive flat surface comes between rugged ridges, as in the Bhorat plateau between Kumbalgarh and Gogunda in western Udaipur. 'The Aravallis which
splay out in fanlike form both to the northeast and southwest, are densely wooded and spar,sely populated. The eastern uplands in Tonk, Sawai Madhopur, Bharatpur, Alwar have a thicker mantle of fertile soils, higher rainfall in summer months, better perennial irrigation, a fairly even distribution of population and high land utilization.' (Chatterjee). The densest habitations are to be found along the river courses and around irrigation tanks. 'The plains near Jaipur are formed of riverborne alluvium and sand drifts, and are characterised by sparsely populated zones'.
The Chambal Ravines are not particularly hospitable to human habitation. They are inaccessible and heavily eroded. A thick mantle of alluvium in the North Malwa Upland (Shivpuri and Guna) has, however, been able to attract population.
The fertility and density of population in the Malwa Plateau are due to the rich black soils and fairly regular rainfall. 'The topography is characterised by rolling plains, separated by flat topped forested bill ranges, and drained by a number of north flowing rivers', Betwa, Parbati, Kali Sindh and Chambal. Most of the villages are located on the interfluves.
At the very base of the Malwa Plateau is the Vindhyan mountain range, 270 miles long. There are very few permanent settlements in the mountains except in forest clearings and around some ancient forts and rock caves like Mandhata, Bagh or Mandu. 'Small and scattered villages, however, appear in larger numbers on the southern slopes which are well drained and not too steep' (Chatterjee).
The Narmada Valley is narrow and confined to a rocky bed because of the high ranges on either bank, the tract between Hoshangabad and Nemawar (below Indore) alone attaining any width at all. It is only at the estuary below Broach that the Narmada attains a real expanse.
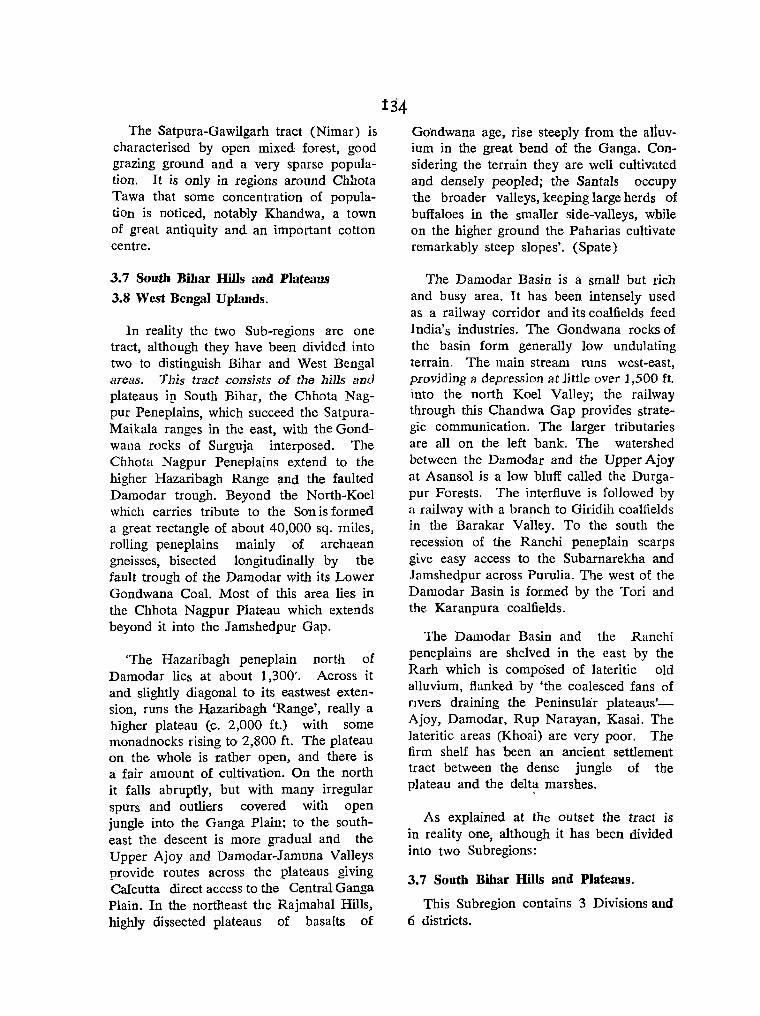
The Satpura-Gawilgarh tract (Nimar) is characterised by open mixed forest, good grazing ground and a very sparse population. It is only in regions around Chhota Tawa that some concentration of population is noticed, notably Khandwa, a town of great antiquity and an important cotton centre.
3.7 South Bihar Hills and Plateaus
3.8 west Bengal Uplands.
in reality the two Sub-regions are one tract, although they have been divided into two to distinguish Bihar and West Bengal areas. This tract consists of the hills lind plateaus i!1 South Bihar, the Chhota Nagpur Peneplains, which succeed the SatpuraMaikala ranges in the east, with the Gondwana rocks of Surguja interposed. The Chhota Nagpur Peneplains extend to the higher Hazaribagh Range and the faulted Damodar trough. Beyond the North-Koel which carries tribute to the Son is formed a great rectangle of about 40,000 sq. miles, rolling peneplains mainly of archaean gneisses, bisected longitudinally by the fault trough of the Damodar with its Lower Gondwana Coal. Most of this area lies in the Chhota Nagpur Plateau which extends beyond it into the J arnshedpur Gap.
'The Hazaribagh peneplain north of Damodar lies at about 1,300'. Across it and slightly diagonal to its eastwest extension, runs the Hazaribagh 'Range', really a higher plateau (c. 2,000 ft.) with some monadnocks rising to 2,800 ft. The plateau on the whole is rather open, and there is a fair amount of cultivation. On the north it falls abruptly, but with many irregular spurs and outliers covered with open jungle into the Ganga Plain: to the southeast the descent is more gradual and the Upper Ajoy and Damodar-Jamuna Valleys provide routes across the plateaus giving Calcutta direct access to the Central Ganga Plain. In the northeast the Rajmahal Hills, highly dissected plateaus of basalts of
t34 Gondwana age, rise steeply from the aliuvium in the great bend of the Ganga. Considering the terrain they are well cultivated and densely peopled; the Santals occupy the broader valleys, keeping large herds of buffaloes in the smaller side-valleys, while on the higher ground the Paharias cultivate remarkably steep slopes'. (Spate)
The Damodar Basin is a small but rich and busy area. It has been intensely used as a railway corridor and its coalfields feed India's industries. The Gondwana rocks of the basin form generally low undulating terrain. The main stream runs west-east, provjdjng a depressjon at jjttle over 1,500 it. into the north Koel Valley; the railway through this Chandwa Gap provides strategic communication. The larger tributa'ries are all on the left bank. The watershed between the Damodar and the Upper Ajoy at Asansol is a low bluff called the Durgapur Forests. The interfluve is followed by a railway with a branch to Giridih coalfields in the Barakar Vailey. To the south the recession of the Ranchi peneplain scarps give easy access to the Subarnarekha and J amshedpur across Purulia. The west of the Damodar Basin is formed by the Tori and the Karanpura coalfields.
The Damodar Basin and the Ranchi peneplains are shelved in the east by the Rarh which is composed of lateritic old alluvium, flanked by 'the coalesced fans of fivers draining the Peninsular plateaus'Ajoy, Damodar, Rup Narayan, Kasai. The lateritic areas (Khoai) are very poor. The firm shelf has been an ancient settlement tract between the dense jungle of the plateau and the delt~ marshes.
As explained at the outset the tract is in reality one, although it has been divided into two Subregions:
3.7 South Bihar Hills and Plateaas.
This Subregion contains 3 Divisions and 6 districts.

3.71 Chhota Nagpur Plateau c,onsists of Palamau, Hazaribagh, Ranchi and Singhbhum. It really consists of three su bdivisions: the Hazaribagh Plateau containing Palamau and Hazaribagh; the Ranchi Peneplains which should include Purulia and Singhbhum which extends to Mayurbhanj and Keonjhar. Palamau is dotted with pats and drained by the Kanhar and North Koel. North Hazaribagh is drained to the north by the Morhar, Lilajan and Mohana which travel to Gaya. The Damodar rises at Chandwa in Palamau and travels east across Ramgarh, Gola, Bokaro, Bermo to Panchet. Its main tributaries are Bokaro, Konar, Tilaiya and Barakar.
The area around Gumla-Ghagra in Ranchi is a ~harp wedge which serves -as a versatile watershed. It sends North Koel to the northwest, the Sankh south down its southwestern flank, the South Koel south aJso do~ hs southeastern flank. Not far from where the South Koel takes its rise, the Subarnarekha issues from around Semo Peak (2 t475') southwest of Ranchi and travels east parallel to but south of Damodar. The Ranchi Plateau slopes east to the Purulia peneplains. The Sankh travels due south down Western Ranchi through Simdega. The South Koel joins the
135 Karo and forms the Koel. Ranchi is thickly studded with peaks. 'Western Ranchi is generally about 2,000, 2,500 ft. It is open, broadly rolling country with mature valleys bordered however with low gullied terraces. They are broken by monadnocks, "fantastic cones and domes of gneiss, looking as if they had been exuded from the earth as gigantic bubbles that had become solid instead of bursting" (Spate)'. The Subarnarekha travels southeast after Muri and descends to J arnshedpur where it is joined by Kharkai, after whic11 it travels to Midnapore at Gopiballavpur, later to form for a while the boundary between West Bengal and Orissa. Soils are mostly thin and poor-sandy Or clayey red soils on the gneisses, badly leached and deficient in humus and minerals.
3.72 Gondwana Trough. This Division is made of the single district of Dhanbad which is drained through the middle transversely by Dam:odar.
3.73 Rajmahal Hills. The Rajmahal hills are drained west to east, proceeding from north to south, by the Gumani, Bansloi, Pagla, Brahmani, Dwarka and Mayurakshi: which also drain Birbhum district of West Bengal before they fall into the Bhagirathi.
Analysis oj Cities, Town Groups and Towns by predominant Junction and size classes
3·7 SOUTH BIHAR HILLS AND PLATEAUS
Class of town
~------------------~----------~-------Function of town Total I II III IV-VI IV V V 1
2 3 4 5 6 7 8 9
Total. 45 3 1 11 30 10 16 4
Agricultural 4 4 3
Artisan . 2 2 1 1
Manufacturing 15 2 1 4 8 6
Transport 4 2 2 2
Service. 20 J to ~ 14 5 Q J

3.713 Central Hills and Plateaus 3.7 Soutb Bihar Hills and Plateaus 3.71 Cbhota Nagpur Plateau.
This Division consists of the districts of Palamau, Hazaribagh, Ranchi and Singhbhum. It is only in the upland and hilly district of Palamau that gram, maize and tur are important. Maize and ragi are also grown in Hazaribagh and ragi in Ranchi. But a11 things considered the Djyjsion is a rice tract with the highest percentage of acreage under rice in Singhbhum. Papulation density is low in Palamau (242) and mediumin Singhbhum (398). The population of scheduled tribes is about a fifth of the total in Palamau and about an eleventh in Hazaribagh but is more than 3j5ths in Ranchi and a little less than half in Singbbhum. The proportion of scheduled castes is a little more than a quarter in Palamau but low in the other districts. The principal language is Hindi in Palamau and Hazaribagh. But Ranchi is very mixed, and Hindi, although the strongest single language, is only 25'5 per cent. In Singhbhum the strongest single language is Ho with only 21·6 per cent. Ranchi and Singhbhum are two of the most polyglot districts in India.
The urban ratio is low in Palamau, moderate in Hazaribagh and Ranchi and high in Singhbhum. Natural increase i,s low in Ranchi, moderate in Palamau and Singhbhurn, and moderately high. in Hazaribagh. Inmigration is low in two districts and moderate in Hazaribagh and moderately high in Singhbhum. The proportion of
children 0-4 to women 15-44 is low in Singhbhum, moderately high in Hazaribagh and Ranchi and high in Palamau.
Palamau and Ranehi are placed in the second level of development, Hazaribagh in the third and Singhbhum in the top. Palamau and Ranchi have identical ,scores and identical values in III (medium, IV (high) and VI (medium). Palamau has high value in II and medium value in V and Ranchi has medium value in both. Hazaribagh has high values in both II and rv and medium values in III, V and VI. Singhbhum has high values in II, III, IV and medium values in V and VI.
Ranchi is rapidly assuming importance as a great industrial centre on account of the headquarters of th~ ""jf ational Coal Development Corporation, Hindustan Steel and the great Heavy Engineering Works and other projects. Hazaribagh will be very important for Bokaro Steel Works, power, coal mines and washeries, Singhbhum is of course very important for the Tata Steel Works. TELCO, TMB Motor works and ancillaries and many important basic metal and engineering projects. All districts are connected by grid.
The important organised industri'es are wood industry in Palamau and Ranchi; non-meta1lic minerals in Palamau, Hazaribagh and Ranchi; foodstuffs in Palamau, Hazaribagh and Ranchi: basic metals in Singhbhum; metal products in Ranchi and Singhbhum; tra'nsport equipment in Singhbhum; tobacco in Palamau and Singhbhum.
Analysis of Cities, Town Groups and Towns by predominant function and size classes 3·71 CHHOTA NAGPUR PLATEAU
Class of town ~---------__ A-. __ _
Function of town 1
Total Agricultural . Artisan. . Manufacturing Transport Service .
Total I IT m 234 5
31 2 1 7 3 2
12 1 2 1 1
13 + Class I cities with their function:
Manufacturing-Jamshedpur. S~co--RlPlchi.
IV-VI 6
'Z1 3 2 8
~
IV 7 6 1 1 1
3
V 8
12 2 t 6
~
--. VI
9 3
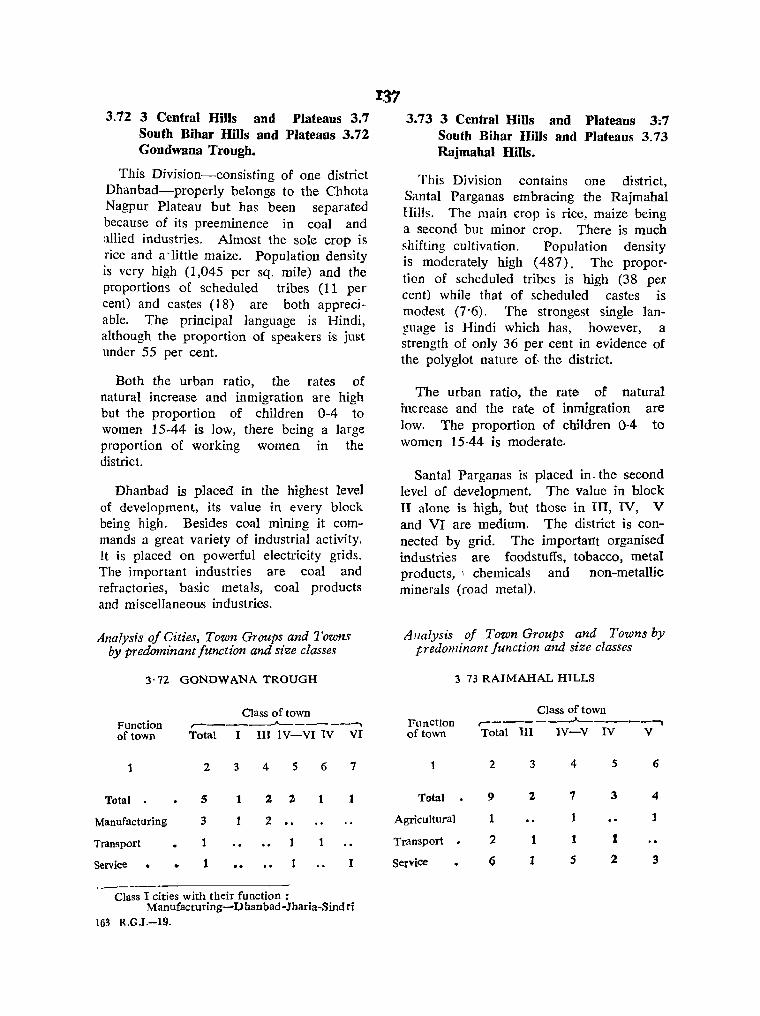
3.72 3 Central Hills and Plateaus 3.7 South Bihar Hills and Plateaus 3.72 Gondwana Trough.
This Division-consisting of one district Dhanbad-propedy belongs to the Chhota Nagpur Plateau but has been separated because of its preeminence in coal and allied industries. Almost the sole crop is rice and a . little maize. Population density is very high (1,045 per sq. mile) and the proportions of scheduled tribes (11 per cent) and castes (18) are both appreci .. able. The principal language is Hindi, although the proportion of speakers i.s just under 55 per cent.
Both the urban ratio, the rates of natural increase and inmigration are high but the proportion of children 0-4 to women 15-44 is low, there being a large proportion of working women in the district.
Dhanbad is placed in the highest level of development, its value in every block being high. Besides coal mining it commands a great variety of industrial activity. It is placed on powerful electricity grids. The important industries are coal and refractories, basic metals, coal products and miscellaneous industries.
Analysis of Cities, Town Groups and Towns by predominant Junction and size classes
3'72 GONDWANA TROUGH
Class of town Function of town
r-----~------..
Total I III lV-VI IV VI
2 3 4 5 6 7
Total 5 1 :z 2 1 1
Manufacturing 3 2
Transport 1
Service 1 I
------,-------------------Class I cities with their function:
Manufacturing-D banbad -Jharia-Sind ri 163 R.G.J.-19.
137 3.73 3 Central Hills nnd Plateaus 3;7
South Bihar Hills and Plateaus 3.73 Rajmahal Hills.
This Division contains one district, Santal Parganas embracing the Rajmahal Hills. The main crop is rice, maize being a second but minor crop. There is much shifting cultivation. Population density is moderately high (487). The proportion of scheduled tribes is high (38 pcr cent) while that of scheduled castes is modest (7'6). The strongest single language is Hindi which has, however, a strength of only 36 per cent in evidence of the polyglot nature of the district.
The urban ratio, the rate of natural increase and the rate of inmigration are low. The proportion of children 0-4 to women 15-44 is moderate.
Santal Parganas is placed in. the second level of development. The value in block II alone is high, but those in III, IV, V and VI are medium. The district is connected by grid. The importa'l1t organised industries are foodstuffs, tobacco, metal products, \ chemicals and non-metallic minerals (road metal).
Allalysis oj Town Groups and Towns by predominant Junction and size classes
FunctIon of town
Total
3 73 RAJMAHAL HILLS
Class of town ~-----~-----~ Total III IV-V IV V
2 3 4 5 6
9 2 7 3 4
Agricultural 1 1
Transport . 2 1 1 I
Service 6 1 5 2 3
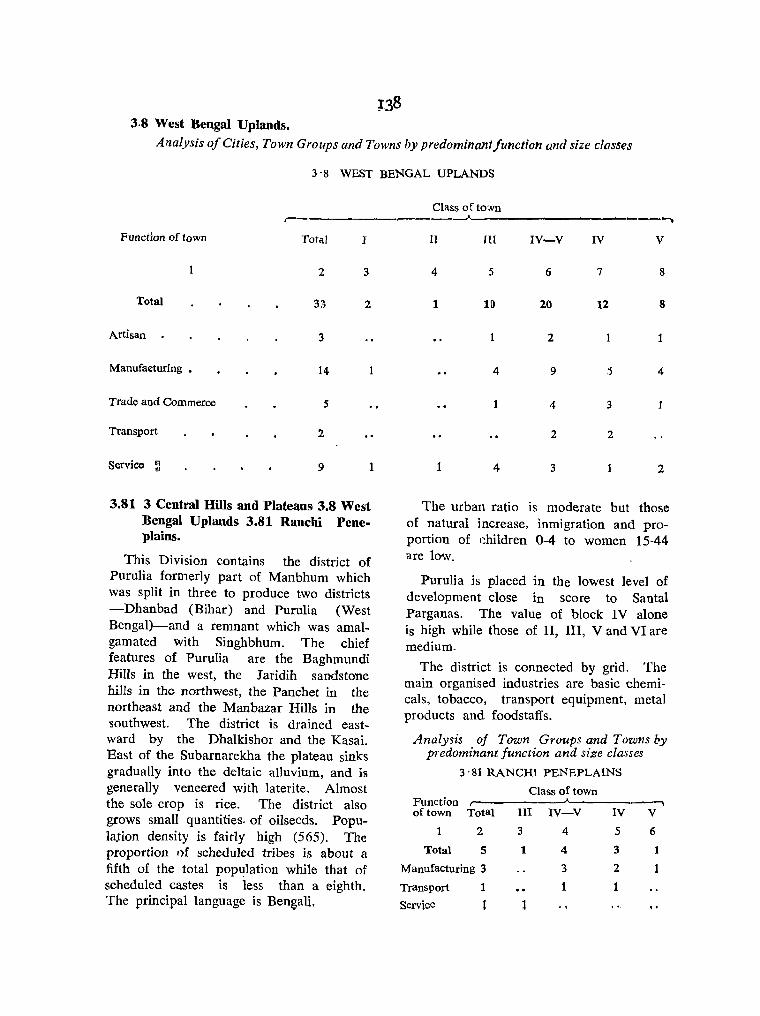
J38 3.8 West Bengal Uplands.
Analysis of Cities, Town Groups and Towns by predominant function and size classes
3'8 WEST BENGAL UPLANDS
r-
Funcdon of town Total I
2 3
Total 3;l 2
Artisan 3
Manufaeturing • 14
Trade and Commerce 5
Transport 2
Service ~ 9 1 '"
3.81 3 Central Hills and Plateaus 3.8 West Bengal Uplands 3.81 Ranchi Peneplains.
This Division contains the district of Purulia formerly part of Manbhum which was split in three to produce two districts -Dhanbad (Bihar) and Purulia (West Bengal)-and a remnant which was amalgamated with Singhbhum. The chief features of Purulia are the Baghmundi Hills in the west, the J aridih sandstone hills in the northwest, the Panchet in the northeast and the Manbazar Hills in the southwest. The district is drained eastward by the Dhalkishor and the Kasai. East of the Subarnarekha the plateau sinks gradually into the deltaic alluvium, and j,s
generally veneered with laterite. Almost the sale crop is rice. The district also grows small quantities. of oilseeds. Popula.tion density is fairly high (565). The proportion of scheduled tribes is about a fifth of the total population while that of scheduled castes is less than a eighth. The principal language is Bengali.
Class of to-.vn ~ ___ ____J..._ -----...
II HI IV-V IV V
4 5 6 7 8
1 11) 20 12 8
2
4 9 :5 4
1 4 3
2 2
1 4 3 2
The urban ratio is moderate but tbose of natural increase, inmigration and proportion of ehildren 0-4 to women 15-44 are low.
Purulia is placed in the lowest level of development close in score to Santal Parganas. The value of block IV alone is high while those of II, III, V and VI are medium.
The district is connected by grid. The main organised industries are basic chemicals, tobacco, transport equipment, metal products and foodstaffs.
Analysis oj Town Groups and Towns by predominant Junction and size classes
3 '81 RANCHI PENEPLAINS
Class of town Function r- --"----., of town Total III IV-V IV V
1 2 3 4 5 6
Total 5 1 4 3 1
Manufacturing 3 3 2
Transport 1 1 1
Service 1 1
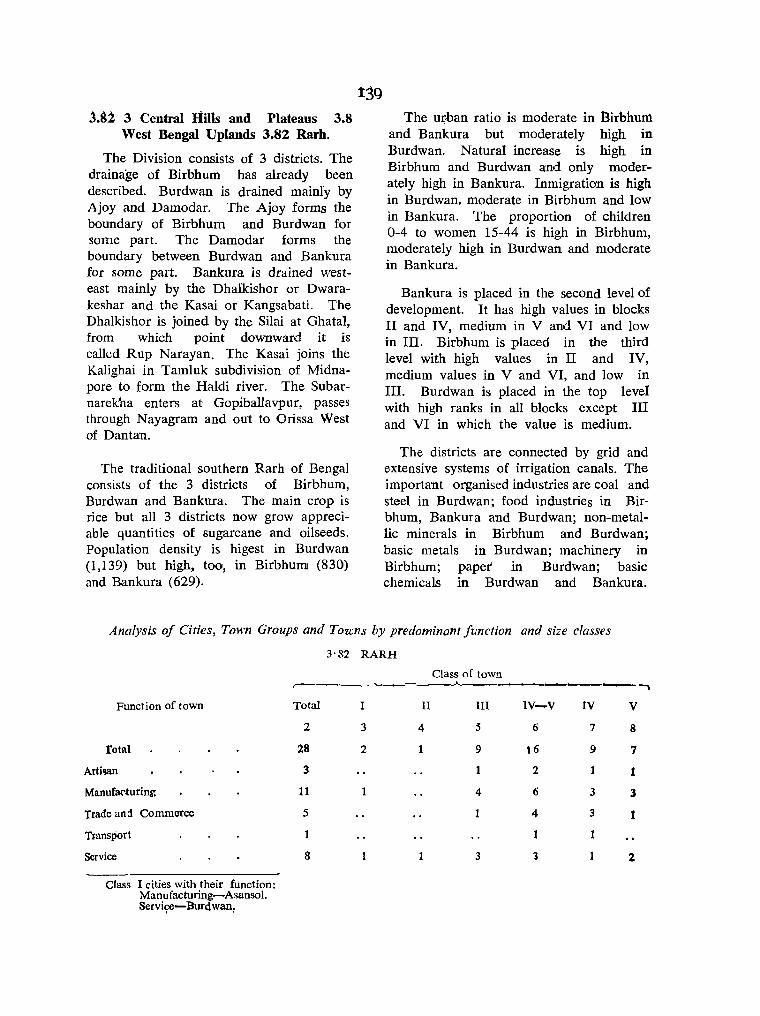
j.82 3 Central Iiilis and Plateaus 3.8 West Bengal Uplands 3~82 Rarh.
The Division consists of 3 districts. The drainage of Birbhum has already been described. Burdwan is drained mainly by Ajoy and Damodar. The Ajoy forms the boundary of Birbhum and Burdwan for some part. The Damodar forms the boundary between Burdwan and Bankura for some part. Bankura is drained westeast mainly by the Dhalkishor or Dwarakeshar and the Kasai or Kangsabati. The Dhalkishor is joined by the Sliai at Ghatal, from which point downward it is call1!d Rup Narayan. The Kasai joins the Kalighai in Tamluk subdivision of Midnapore to form the Haldi river. The Subarnarek"na enters at- Gopiballavpur, passes through Nayagram and out to Orissa West of Dantan.
The traditional southern Rarh of Bengal consists of the 3 districts of Birbhum, Burdwan and Bankura. The main crop is rice but all 3 districts now grow appreciable quantities of .sugarcane and oilseeds. Population density is higest in Burdwan (1,139) but high, too, in Birbhum (830) and Bankura (629).
139 The ut,:ban ratio is moderate in BirbhuIIl
and Bankura but moderately high in Burdwan. Natural increase is high in Birbhum and Burdwan and only moderately high in Bankura. Inmigration is high in Burdwan, moderate in Birbhum and low in Bankura. The proportion of children 0-4 to women 15-44 is high in Birbhum, moderately high in Burdwan and moderate in Bankura.
Bankura is placed in the second level of development. It has high values in blocks II and IV, medium in V and VI and low in III. Birbhum is placed in the third level with high values in II and IV, medium values in V and VI, and low in III. Burdwan is placed in the top level with high ranks in all blocks except III and VI in which the value is medium.
The districts are connected by grid and extensive systems of irrigation canals. The important organised industries are coal and steel in Burdwan; food industries in Birbhum, Bankura and Burdwan; non-metallic minerals in Birbhum and Burdwan; basic metals in Burdwan; machinery in Birbhum; paper in Burdwan; basic chemicals in Burdwan and Bankura.
Analysis of Cities, Town Groups and Towns by predominant function and size classes
3·82 RARH
Class of town r----.~ --.
Function of town Total I II III IV-V IV V
2 3 4 5 6 7 8
rotal 28 2 1 9 16 9 7
Arti'lall 3 2 1 1
Manufa .. turinr. 11 4 6 3 J
Trade and Commerce 5 4 3 1
Transport 1
Service 8 3 3 2
Class I cities with their function: Manufacturing-Asansol. Servj~-Burdwanr

140
itEGION 4 THE DECCAN
in the Deccan has been included all that tract of land between the Central Hills and Plateaus above and the Western and Eastern Coastal Plains encircling it below. The Deccan has been divided into 4 Subregions corresponding to four political territories: Maharashtra Deccan, Andhra Deccan, Mysore Deccan and Tamilnad Hills and Uplands. Maharashtra Deccan contains 22 districts comprising 6 Divisions: Khandesh, Nasik Basin, Vidarbha, Mahakoshal,
Marathawada and Western Ghats (Desh). Andhra Deccan has 13 districts in 2 Divisions: Telengana (Southern Deccan) and Rayalaseema. Mysore Deccan has 17 districts comprising 5 Divisions: Inland Karnataka, Southern Deccan Plateau (North Maidan), Central Maidan (RaichurBellary), South Maidan and Malnad. Tamilnad Hills and Uplands has 5 districts in 2 Divisions: Nilgiri and Coimbatore Plateau (Kongunad) .
Analysis of Cities, Town Groups and Towns by predominant function and size classes
4 THEDECCAN
Class of town r---------------"-------------""""\
Function of town
Total
Agricultural
Port
Artisan
Manufacturing
Trade and Commerce
Transport
Service
Total
2
631
264
4
89
97
16
14
147
I
3
23
1
14
8
II
4
36
2
5
15
12
III
5
121
]6
24
27
6
4
43
IV-VI IV
6 7
451 212
246 109
3 3
59 32
41 24
9 6
9 6
84 32
V
8
191
112
21
15
3
3
37
VI
9
48
25
6
2
15
NOTE: The following 2 towns though as:riculturally predominant have been shown agalOst Port: -Class III
Karanja (Maharashtra) Class IV
Gangavati (MYSORE)
4.1 Maharashtra Deccan.
Spate observes that 'Maharashtra, the Maratha country par excellence, may be taken as roughly conterminous with the main mass of the Deccan Lavas above the Ghats. To the North the Tapti Valley, flanked by typical lava plateaus but floored by alluvium, forms a transition to the Central Indian Scarp Lands; in the South, along the Malaprabha, there is another belt
where Archaeans and lavas interdigitate and where cultural allegiance is divided between 'the Marathi and Kannada languages. But to the East the boundary of Marathi speech shows a striking accordance with the edge of the Lavas'. Hence
. the division of the original Hyderabad State into Marathawada and Telengana. The whole Subregion bears the imprint of the Marathas, has 'a strong historic personality, a distinctive agriculture, power
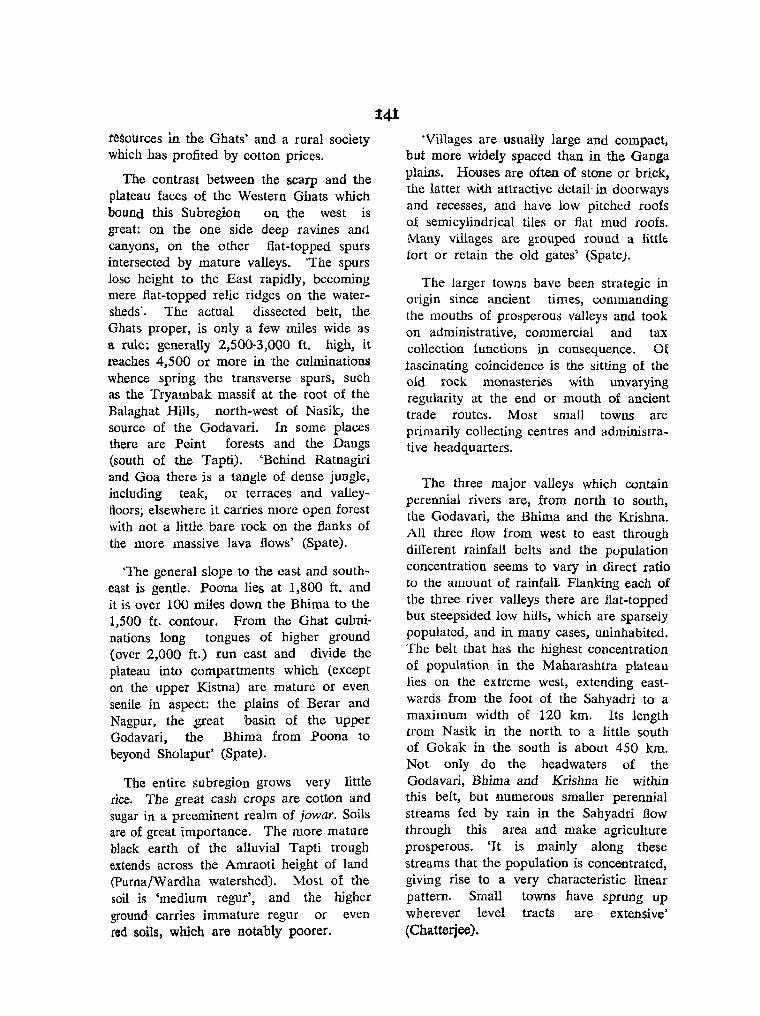
resources in the Ghats' and a rural society which bas profited by cotton prices.
The contrast between the scarp and the plateau faces of the Western Ghats which bound this Subregion on the west is great: on the one side deep ravines and canyons, on the other flat-topped spurs intersected by mature valleys. "The spurs lose height to the East rapidly, becoming mere flat-topped relic ridges on the watersheds'. The actual dissected belt, the Ghats proper, is only a few miles wide as a rule; generally 2,500-3,000 ft. high, it reaches 4,500 or more in the culminations whence spring the transverse spurs, such as the Tryambak massif at the root of the Balaghat Hills, north-west of Nasik, the source of the Godavari. In some pla~s there are Peint forests and the Dangs (south of the Tapti). 'Behind Ratnagiri and Goa there is a tangle of dense jungle. including teak, or terraces and valley!loars; elsewhere it carries more open forest with not a little bare rock on the flanks of the more massive lava flows' (Spate).
'The general slope to the east and southeast is gentle. Poona lies at 1,800 it. and it is over 100 miles down the Bhima to the 1,500 ft. contour. From the Ghat culminations long tongues of higher ground (over 2,000 ft.) run east and divide the plateau into compartments which (except on the upper Kistna) are mature or even senile in aspect: the plains of Berar and Nagpur, the ,great 'basin of the upper Godavari, the Bhima from .Poona to beyond Sholapur' (Spate).
The entire subregion grows very little rice. The great cash crops are cotton and sugar in a preeminent realm of jowar. Soils are of great importance. The more mature black earth of the alluvial Tapti trough extends across the Amraoti height of land (Purna/Wardha watershed). Most of the soil is 'medium regur', and the higher ground carries immature regur or even red soils, which are notably poorer.
'Villages are usually large and compact, but more widely spaced than in the Ganga plains. Houses are often of stone or brick, the latter with attractive detail· in doorways and recesses, and have low pitched roofs of semi cylindrical tiles or flat mud roofs. Many villages are grouped round a littlt. fort or retain the old gates' (Spate).
The larger towns have been strategic ill origin since ancient times, commanding the mouths of prosperous valleys and took on administrative, commercial and tax collection functions in consequence. Of fascinating coincidence is the sitting of the old rock monasteries with unvarying regularity at the end or mouth of anoient trade routes. Most small towns are primarily collecting centres and administrative headquarters.
The three major valleys which contain perennial rivers are, from north to south, the Godavari, the Bhima and the Krishna. All three flow from west to east through different rainfall belts and the popUlation concentration seems to vary in direct ratio to the amount of rainfall. Flanking each of the three river valleys there are flat-topped but steepsided low hiils, which are sparsely populated, and in many cases, uninhabited. The belt that has the highest concentration of population in the Maharashtra plateau lies on the extreme west, extending eastwards from the foot of the Sahyadri to a maximum width of 120 km. Its length trom Nasik in the north to a little south of Gokak in the south is about 450 km. Not only do the headwaters of the Godavari, Bhima and Krishna lie within this belt, but numerous smaller perennial streams fed by rain in the Sahyadri flow through this area and make agriculture prosperous. 'It is mainly along these streams that the population is concentrated, giving rise to a very characteristic linear pattern. Small towns have sprung up wherever level tracts are extensive' (Cha.tterjee).
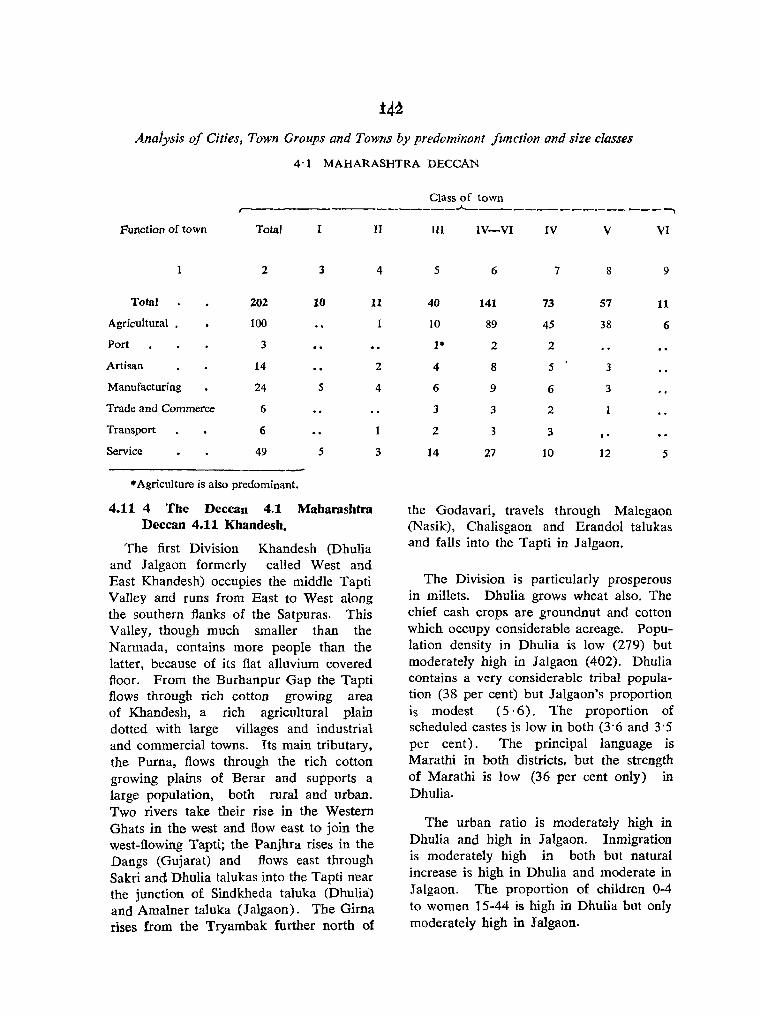
i4~
Analysis of Cities, Town Groups and Towns by predominant function and size classes
4'1 MAHARASHTRA DECCAN
Class of town r------------------""-----------.--- ---~
Function of town Total I II
2 3 4
Total 202 10 11
Agricultural . 100
Port 3
Artisan 14
Manufacturing 24 5
Trade and Commerce 6
Transport 6
Service 49 5
* Agriculture is also predominant,
4.11 4 The Deccan 4.1 Maharashtra Deccan 4.11 Khandesh.
The first Division Khandesh (Dhulia and J algaon formerly called West and East Khandesh) occupies the middle Tapti Valley and runs from East to West along the southern flanks of the Satpuras. This Valley, though much smaller than the Narmada, contains more people than the latter, because of its flat alluvium covered floor. From the Burhanpur Gap the Tapti flows through rich cotton growing area of Khandesh, a rich agricultural plain dotted with large villages and industrial and commercial towns. Its main tributary, the Purna, flows through the rich cotton growing plains of Berar and supports a large population, both rural and urban. Two rivers take their rise in the Western Ghats in the west and flow east to join the west-flowing Tapti; the Panjhra rises in the Dangs (Gujarat) and flows east through Sakri and Dhulia talukas into the Tapti near the junction of Sindkheda taluka (Dhulia) and Amalner taluka (J alga on ) . The Girna rises from the Tryambak further north of
2
4
1
3
TIl IV-VI IV V VI
5 6 7 8 9
40 141 73 57 11
]0 89 45 38 6
1· 2 2
4 8 5 3
6 9 6 3
3 3 2
2 3 3 "
14 '2.7 10 12 5
the Godavari, travels through Malegaon (Nasik), Chalisgaon and Erandol talukas and falls into the Tapti in Jalgaon.
The Division is particularly prosperous in millets. Dhulia grows wheat also. The chief cash crops are groundnut and cotton which occupy considerable acreage. Population density in Dhulia is low (279) but moderately high in Jalgaon (402). Dhulia contains a very considerable tribal population (38 per cent) but Jalgaon's proportion is modest ( 5 . 6) . The proportion of scheduled castes is low in both (3'6 and 3'5 per cent) . The principal language is Marathi in both districts, but the strength of Marathi is low (36 per cent only) in Dhulia.
The urban ratio is moderately high in Dhulia and high in Jalgaon. Inmigration is moderately high in both but natural increase is high in Dhulia and moderate in Jalgaon. The proportion of children 0-4 to women 15-44 is high in Dhulia but only moderately high in J algaon.
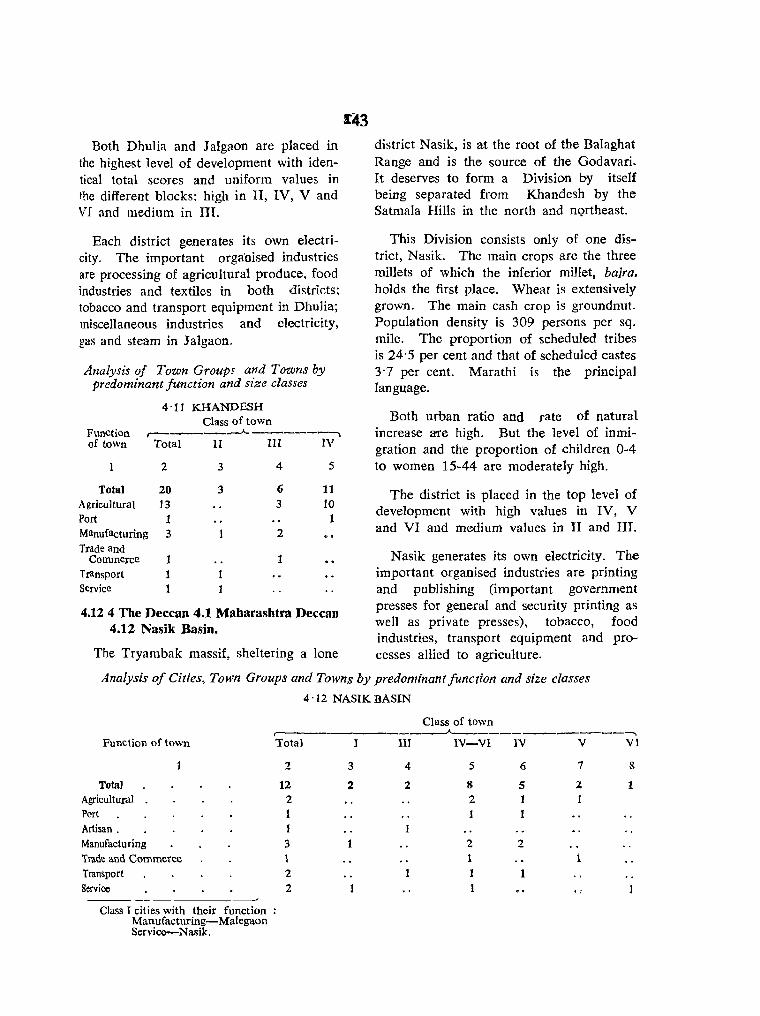
Both Dhulia and J algaon are placed in the highest level of development with identical total scores and uniform values in the different blocks: high in II, IV, V and VI and medium in III.
Each district generates its own electricity. The important orga'nised industries are processing of agricultural produce, food industries and textiles in both distrkts; tobacco and transport equipment in Dhulia; miscellaneous industries and electricity, gas and steam in Jalgaon.
Analysis oj Town Groups and Towns by predominant Junction and size classes
4'11 KHANDESH Class of town
Function r-------'- ---------.. of town Total II III IV
2 3 4 5
Total 20 3 6 11 A gricultura I 13 3 10 Port 1 1 Manufacturing 3 2 .. Trade and
Commerce 1 1 Transport 1 Service 1
4.12 4 The Deccan 4.1 Maharasbtra Deccan 4.12 Nasik Basin.
The Tryambak massif, sheltering a lone
district Nasik, is at the root of the Balaghat Range and is the source of the Godavari. It deserves to form a Division by itself being separated from Khandesh by the Satmala Hills in the north and nQrtheast.
This Division consists only of one district, Nasik. The main crops are the three millets of which the inferior millet, haira. holds the first place. Wheat is extensively grown. The main cash crop is groundnut. Population density is 309 persons per sq. mile. The proportion of scheduled tribes is 24'5 per cent and that of scheduled castes 3'7 per cent. Marathi is the principal language.
Both urban ratio and rate of natural increase a-re high. But the level of inmigration and the proportion of children 0-4 to women 15-44 are moderately high.
The district is placed in the top level of development with high values in IV, V and VI and medium values in II and III.
Nasik generates its own electricity. The important organised industries are printing and publishing (important government presses for general and security printing as well as private presses), tobacco, food industries, transport equipment and processes allied to agriculture.
Analysis of Cities, Town Groups and Towns by predominant function and size classes
4 '12 NASIK BASIN
Function of town
Total Agricultural Port Artisan.
Manufacturing
1
Trade and Commerce Transport
Service
Class I cities with their function Manufacturing-Malegaon Service-Nasik.
.-Total
2
12 2 1 I 3
2 2
3
2
1
Class of town -----"---------------~
1lI IV-VI IV V VI
4
2
5
8 2
2 1 1
1
6
5 1 1
2
1
7
2 1
1
8
1
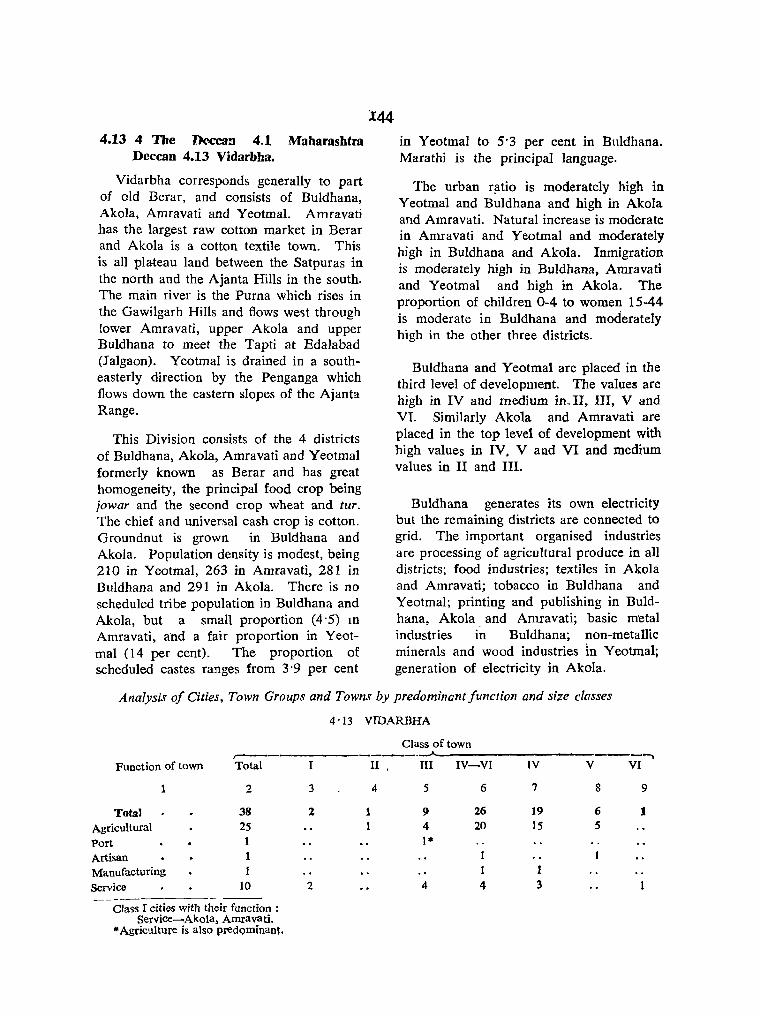
4.13 4 The Deccan 4.1 Maharashtra Deccan 4.13 Vidarbba.
Vidarbha corresponds generally to part of old Berar, and consists of Buldhana, Akola, Amravati and Yeotmal. Amravati has the largest raw cotton market in Berar and Akola is a cotton textile town. This is all plateau land between the Satpuras in the north and the Ajanta Hills in the south. The main river is the Puma which rises in the Gawilgarh Hills and flows weISt through lower Amravati, upper Akola and upper Buldhana to meet the Tapti at Edalabad (Jalgaon). Yeotmal is drained in a southeasterly direction by the Penganga which flows down the eastern slopes of the Ajanta Range.
This Division consists of the 4 districts of Buldhana, Akola, Amravati and Yeotmal formerly known as Berar and has great homogeneity, the principal food crop being jowar and the second crop wheat and fur.
The chief and universal cash crop is cotton. Groundnut is grown in Buldhana and Akola. Population density is modest, being 210 in Yeotmal, 263 in Amravati, 281 in Buldhana and 291 in Akola. There is no scheduled tribe population in Buldhana and Akola, but a small proportion (4·5) m Amravati, and a fair proportion in Yeotmal (14 per cent). The proportion of scheduled castes ranges from 3·9 per cent
)"44
in Yeotmal to 5·3 per cent in Bnldhana. Marathi is the principal language.
The urban riltio is moderately high in Yeotmal and Buldhana and high in Akola and Amravati. Natural increase is moderate in Amravati and Yeotmal and moderately high in Buldhana and Akola. Inmigration is moderately high in Buldhana, Amravati and Yeotmal and high in Akola. The proportion of children 0-4 to women 15-44 is moderate in Buldhana and moderatelY high in the other three districts.
Buldhana and Yeotmal are placed in the third level of development. The values are high in IV and medium in_ II, III, V and VI. Similarly Akola and Amravati are placed in the top level of development with high values in IV. V and VI and medium values in II and III.
Buldhana generates its own electricity but the remaining districts are connected to grid. The important organised industries are processing of agricultural produce in all districts; food industries; textiles in Akola and Amravati; tobacco in Buldhana and Yeotmal; printing and publishing in Buldhana, Akola. and Amravati; basic metal industries in Buldhana; non-metallic minerals and wood industries In Yeotmal; generation of electricity in Akola.
Analysis of Cities. Town Groups and Towns by predominant function and size classes
4 ·13 VTDARBHA
Class of town r-------~-----. .-J..- -.
Function of town Total I II III IV-VI IV V VI
1 2 3 4 5 6 7 8 9
Total 38 2 1 9 26 19 6 1 Agricultural 25 1 4 20 15 5
Port 1 1*
Artisan 1 1 Manufacturing 1 1 1
Service 10 2 4 4 3
Class I cities with their function : Service-Akola, Amravati.
* Agriculture is also predQminant.
4.14 4 The Deccan 4.1 Maharashtra Deccan 4.14 Mahakoshal.
This area may be roughly called the Nagpur Maidan or the Wardha-Wainganga Valley bounded on the north by the Gawilgarh-Mahadeo Hill ranges and uplands, on the east by the watershed of the Wainganga-Seonath-Mahanadi basins and the Indravati river, on the south by the eastern extension of the NirmaJ Range and on the west by the Wardha river.
The Wardha river serves as tIlt: oounaary line between Vidarbha on the west and MahakoshaI on the east. In the north, Nagpur and Bhandara are a continuation of the Pench and Wainganga valleys below the Mahadeo Hills. Nagpur district is drained through the middle by the Konher which passes through between Nagpur and Kamptee. It is joined by the Pench near the junction of Nagpur and Umrer talukas. The Wainganga flows down Gondia and Bhandara talukas (Bhandara) and joins the Pench at the junction of Nagpur and Bhandara districts. The augmented Wainganga then flows down through Brahmapuri. Chanda and Gadh chiroli (Chanda) to be ioined again by the Wardha. The river from now on is caned Pranhita until it meets the Godavari west of Sironcha at the boundary of Sironcha (Chanda) and Chinnur (Adilabad, Andhra). The river, called Godavari hereafter, fo.rms the southern boundary of Chanda and at the south-eastern point is met by Tndravati from Bastar. The two branches of the Penganga, the Western flowing through Parbhani (Ringoli and Kalamnuri tal uk as) into Nanded. a'nd the eastern down Larhwa and Pusad (Yeotman join at the north of Adilabad and flow to meet the Wardha at Rajura (Chanda).
The Deccan Lavas give place to generally Archaean terrain, irregularlv undulating country at about 900-1,100 ft. broken by small, apparently disconnected hills. A considerable portion of the VaHey itself.
163 R G.I.-20.
as well as the hills to north and east is heavily forested. This is the great domain of sal. Minor products-bamboo. charcoal, myrobalans, lac, bidi wrapping leaves. fodder-are important. Rice accounts for nearly half of the total sown area in Bhandara followed by wheat and oilseeds (1ins-eed). 'The Wainganga marks the transition from the agriculture of Maharashtra, with its uncertain rain but moisture-retentive regur, its wide plains and commercial bias, to the realm of paddy in the better-watered but more broken northeastern peninsula' (Spate). The more important minerals are ma!lganese and haematite. The great Gondwana trou~h
extending to the Lower Godavari Valley contains coal. "Small coalfields extend from the Pench Valley to Singareni and Tandur, and includes the Warora and Bellarpur mines in Chanda.
This Division consists of 4 districts, Nagpur, Wardha, Bhandara and Chanda which comprised the former Nagpur Division of Madhya Pradesh and went to Maharashtra. From many point" of view it is a homogeneous and internally balanced tract. ]owar is the principal crop in Nagpur and Wardha and rice in Bhandara and Chanda (river valleys of Waingamm and tributaries). Wheat is an important second crop. Cotton is the principal ca<;h crop in NalSPur and Wardha and oilseeds that of Rhandara and Chanda.
Population density is low in Chanda (123). It is moderate in Wardha (261) and moderately high in Bhandara (350)
and Nagpur (395). There is no scheduled tribe population in Nagpur, Wardha and Bhandara but the proportion in Chanda is fair (15 per cent). The proportion of scheduled castes is low. The principal hn!wage is Marathi.
The urban ratio is moderate in Bhandara and Chanda, but high in Nagpur and

Wardha. Natural increase is moderate in Wardha, Bhandara and Chanda and moderately high in Nagpur. Inmigration is high in Nagpur and Wardha and moderate in Bhandara and Chanda. The proportion of children 0-4 to women 15-44 is low in Bhandara, moderate in Nagpur and Chand,l and moderately high in Wardha.
Bhandara and Chanda are placed in the second level of development with high values in II, medium in III, IV, V and VI. Wardha is placed in the third level with high values in II, IV and V and medium in III and VI. Nagpur is placed
in the highest level with high values in II, IV and V and medium in III and VI.
All districts are connected by grid. The more important organised industries are tobacco in all districts; textiles in Nagpur and Wardha; printing and publishing in N agpur and Bhandara; food industries in Wardha, Bhandara and Chanda; transport equipment in Nagpur; machinery in Wardha; basic metals and chemicals in Bhandara; paper and non-metallic minerals in Chanda; processing of agricultural produce in Wardha; electricity, gas and steam in Chanda.
Analysis of Cities, Town Groups and Towns by predominant function and size classes
4 '14 MAHAKOSHAL
Class of town ,-----------' ~--~-------------------~
Function of town Total I
2 3
Total 25 1
Agricultural to •• Artisan 8
Manufacturing 4
Service 3
-----Class T cities with their function:
Manufacturing.-Nagpur.
4.15 4 The Deccan 4.1 Maharashtra Deccan 4.15 Marathawada.
It has been mentioned above how the boundary of Maratha speech accords with the edge of the Lavas. Marathawada includes districts taken from former Hyderabad State and allotted to Maharashtra in October 1956 and consists of: Auranga· bad. Parbhani, Bhir, Nanded and Osmana-
bad.
II III ,IV-V IV V
4 5 6 7 8
2 8 14 7 7
.. t 9 3 6
2 3 3 2 1
2 1
2
This Division is encircled by the Sahyadri or Ajanta Range in the north (A urangabad) , the Nirmal Range in the east (Parbhani and Nanded) and the Balaghat Range in Bhir and Osmanabad. It is drained mainly by the Godavari which flows west-east across the middle. The Sindphana rising in the Balaghat Hills pours into the Godavari at the northem corner of Bhir. The Puma descending from the Ajanta Hills through Parbhani

is joined east of Parbhani town by the Dudna flowing from the west and then falls into the Godavari midway between Parbhani and Nanded towns. Thereafter the Godavari flows in a southeasterly direction through the middle of Nanded district into Andhra Pradesh.
The principal food crop is jowar followed by wheat and the principal cash crop cotton which claims considerable acreage.
Thi.s Division consists of 5 districts which were formerly in the old Hyderabad State in which it constituted a Marathawada region as opposed to the Telengana Region. The districts are Aurangabad, Parbhani, Bhir, Nanded and Osmanabad. The principal crop is jowar in all districts but the variety of subsidiary crops is great, ranging to wheat, bajra, tur and gram. Cotton is grown in all districts except Osmanabad and groundnut in Aurangabad and Bhir. Population density is fairly even in all districts ranging from 237 in Aurangabad and Bhir, through 249 in Parbhani and 268 in Osmanabad to 271 in N anded. The proportion of scheduled tribes is low but that of scheduled castes is appreciable in Bhir U 3·5 per cent) and Osmanabad (13·4 per cent). The principal language is Marathi.
The urban ratio is moderate in Bhir and Osmanabad, but moderately high in Aurangabad, Parbhani and Nanded. Natural increase is moderate in Parbhani and Bhir, moderate in Nanded and Osmanabad and high in Aurangabad; inmigratiol1 is moderate in Aurangabad, Parbhani, Bhir and Osmanabad and moderately high in Nanded. The proportion of children 0-4 to women 15-44 is moderate in all districts except Bhir Where it is moderately high.
Parbhani, Bhir and Osmanabad are placed in the ,second level of development with high values in II and IV and medium values... in III, V and VI. N anded and Aurangabad are placed in the third level with high values in II and IV and medium values in III, V and VI. The pattern of development is therefore homogeneous.
All districts generate their own electricity except Nanded which is connected to grid. The more important organised i:ndustries are processing of agricultural produce and food industries in all districts; textiles in Aurangabad and Nanded; tobacco in Aurangabad and Bhir; generation of electricity in Parbhani and Osmanabad; transport equipment in Parbhani and Nanded; electrical maohinery in Parbhani; and non-metallic minerals in Aurangabad.
Analysis of Town Groups and Towns by predominant function and size classes
4'15 MARATHAWADA
Class of town r-~---_____ ..A.
Function of town Total II III IV-VI IV V VI
1 2 3 4 5 6 7 8
Total 52 3 4 4S 13 27 5
Agricultural 31 31 7 20 4
Artisan 2 •• 2 2
Manufacturing 1 1 .. frade and Commerce 2 2
Transport 1
Service IS ,2 2 11 3 7
4.16 4 The Deccan 4.1 Maharashtra Deccan 4.16 Western Ghats (Desh).
This is the sixth Division of the Maharashtra Deccan and throughout the tract the ghat Lavas look like an assembly of large layered cakes. The Division consists of the districts of Poona, Satara, Sholapur, Sangli, Kolhapur and Ahmadnagar. The Pravara and the Mula issuing from the Western Ghats flow eastward across Ahmadnagar (Harischandrapur Range) join in Nevasa taluka before falling into the Godavari at the boundary of Aurangabad and Ahmadnagar districts.
The drainage of the central area is done by the Bhima which issues from the Ghats northeast of Matheran and flows southeast across Poona district. The Nira ftows below Rajgarh transver.sely west to east and joins the Bhima in Sholapur (Bhima valley). The Nira forms the bound,ar}, of Poona and Sholapur, the Bhima of Poona, Ahmadnagar and Sholapur; the Ghod which joins the Bhima above Dhond town divides Poona from Ahmadnagar. The Sina which flows southeast dividmg. Ahmadnagar from Osmanabad joinS'"' the Bhima in Akalkot (Sholapur). The Bhima and its tributaries thus drain the district: Poona, Sholapur and Ahmadnagal' ..
The Krishna drains the lower half of Maharashtra Western Ghats. It issues from north of Mahabaleswar (4,558') and the Koyna from south of the peak. They flow southeast and join off Karad in Satara district. The river Krishna is again joined in quick succession, first by the Yell a flowing south and draining eastern Satara, and next by the Warna which fomis the boundary between Satara in the north and Kolhapur in the south: The Krishna is again considerably augmented by streams which flow northeast draining the lower half of Kolhapur. Thereafter the Krishna flows southeast across the
middle of Sangli (Krishna Gap) into Bijapur (Mysore).
The extreme South of Kolhapur is drained by the Ghataprabha and its tributary which unite in Belgaum outside ot the Division.
The chief food crop is jowar except for a certain amount of rice in the Ghataprabha Valley in Kolhapur. The chief cash crop is groundnut as against cotton in Marathawada.
This Division is principally a millet tract in which rice is grown only in Kolhapur. The chief cash crop is groundnut but sugarcane is grown in Kolhapur. Population density is lowest in Ahmadnagar (274). It is 320 in Sholapur, 355 in Sa tara, 371 in Sangli, 410 in Poona and 501 in Kolhapl}!; -.:rhe proportion of scheduled tribes is negligible except in Poona (3' 6 per cent) and Ahmadnagar (6 per cent). The proportion of scheduled castes is comparatively low or moderate in all districts except Kolhapur (11'4 per cent) and Sholapur (12'8 per cent). The principal language is Marathi.
The urban ratio is moderate in Satara and Ahmaduagar, moderately high in Sangli and Kolhapur and high in Poona and Sholapur. Natural increase is moderate in Sa tara and moderately high in all other districts. lnmigration is moderately high in all districts ex~pt Poona where it is high. The proportion of children 0-4 to women 15-44 1S moderate in Kolhapur and moderately high in all other districts,
Kolhapur is placed in the second level of development with high values in IV and Y, medium values in III and VI and low value in II. Satara and SangH are placed in the third level with high values in IV and V, medium values in III and VI , high value for Satara and medium value
. for Sangli in II. Poona, Sholapur and
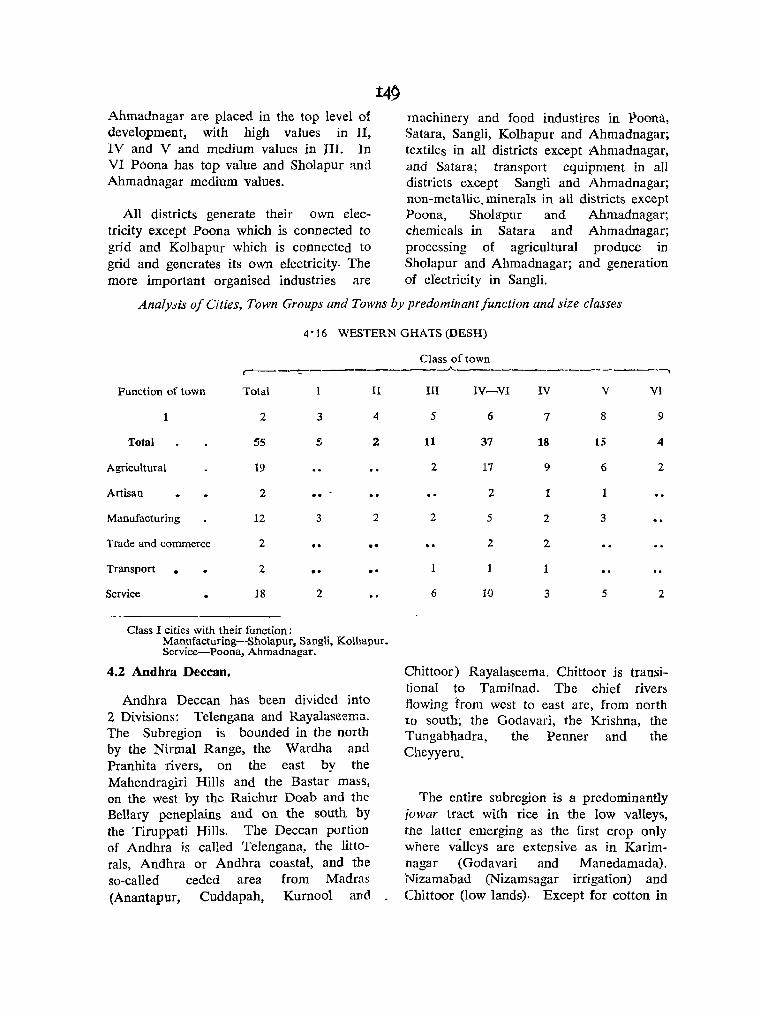
Ahmadnagar are placed in the top level of development, with high values in 11, I V and V and medium values in JI1. 1n VI Poona has top value and Sholapur and Ahmadnagar medium values.
All districts generate their own electricity except Poona which is connected to grid and Kolhapur which is connected to grid and generates its own electricity. The more important organised industries are
macmnery and food industires in Poona, Satara, Sangli, Kolhapur and Ahmadnagar; textiles in all districts except Ahmadnagar, and Satara; transport equipment in all districts except Sangli and Ahmadnagar; non-metallic_ minerals in all districts except Poona, Shola:pur and Ahmadnagar; chemicals in Satara and Ahmadnagar; processing of agricultural produce in Sholapur and Ahmadnagar; and generation of electricity in Sangli.
AnalY.>'is of Cities, Town Groups and Towns by predominant function and size classes
4· 16 WESTERN G HATS (DESH)
Class of town .. __ ~ __________ .A-_______ ~ ________ ~
Function of town TOlal II
2 3 4
Total 55 s 2
Agricultural 19
Artisan 2
Manufacturing 12 3 2
Trade and commerce 2 .. Transport • 2 .. Service 18 2
Class I cities with their function: Manufacturing--Sholapur, Sangli, Kolhapur. Service-Poona, Ahmadnagar.
4.2 Andhra Deccan.
Andhra Deccan has been divided into 2 Divisions: Telengana and Rayalaseema. The Subregion is bounded in the north by the Nirmal Range, the Wardha and Pranhita rivers, on the east by the Mahendragiri Hills and the Bastar mass, on the west by the Raichur Doab and the Bellary peneplains and on the south by the Tiruppati Hills. The Deccan portion of Andhra is called Telengana, the littorals, Andhra or Andhra coastal, and the so-called ceded area from Madras (Anantapur, Cuddapah, Kurnool and
III lV-VI IV V VI
5 6 7 8 9
11 37 18 4
2 17 9 6 2
2 1 1
2 5 2 3
2 2
1
6 10 3 5 2
Chittoor) Rayalaseema. Chittoor is transitional to Tamilnad. The chief rivers Hawing from west to east are, from north to south; the Godavari, the Krishna, the Tungabhadra, the Penner and the Cheyyeru.
The entire subregion is a predominantly jowar tract with rice in the low valleys, the latter emerging as the first crop only where valleys are extensive as in Karimnagar (Godavari and Manedamada). 'Nizamabad (Nizamsagar irrigation) and Chittoor (low lands). Except for cotton in
Adilabad, the principal cash crops in Telengana are oilseeds. In Rayalaseema they are groundnut and cotton. The language is mainly Telugu.
The bulk of the Telengana Division consists of peneplains developed on the Archaean gneisses. In the north, particularly in Khammam (Singareni), faulting has preserved a belt of Gondwanas (with some coal) along the lower Godavari trough. The levels are usually between 1,600 and 2,000 ft. The Tungabhadra and Krishna Valleys lie at 1,000-1,500 ft. The Bhima-Godavari doab further north consists of great swelling upland reaching 2,400 ft. in places. "But the general aspect nearly everywhere is that of practically senile peneplains, intersected by broad, open, almost completely graded valleys, and littered with monadnocks which range from considerable hill groups to innumerable fantastic tors which look like dumps of gigantic road-metal.
Bare hilLs, reddish-khaki plains with scattered thorny scrub, rivers merely ribbons of sand for half the year. or more, tanks bunded into the little valleys, all combine to produce a landscape with a desolate and brooding charm" (Spate).· This landscape, such as Spate speaks of, is seen at its best and most haunting in Ammtapur and Cuddapah districts of Rayalaseema.
The contrast between Marathawada and Telengana is striking.
The northern boundary of Adilabad district is formed by the Penganga running west to east to join the Wardha in Rajura taluka (Chanda, Maharashtra). Sirpur taluk of Adilabad is bounded on the east by the Pranhita which joins the Godavari west of Sironcha (Chanda). The Manjra drains west Medak and Nizamabad and falls into the Godavari as it enters Telengana to divide Adilabad from Medak. The Kadam issues north of Nirmal Hills and flows into the Godavari. Further south-
east, the Godavari is joinea OJ the Indra"ati and forms the eastern boundary of Khammam (Telengana). The Maner forms the boundary between Nizamabad and Karimnagar, while another stream, the Manedamada, drains Karimnagar before it falls into the Maner.
In the east of the Division, the Godavari runs down the south east of I\.i1ammam. leaving Bhadrachalam taluk on the left bank. Before it pierces the Papikonda Range across the north of West and East Godavari, lining the southeast of Khammam, the Godavari is joined at Kunavaram by the Kanta which is made of two rivers the Sabari and Sileru.
Hyderabad is drained through the mid~ dJe, west to east, by the Musi river which passes through the city. The Musi travels through Ramannapet taluk of Nalgonda and is joined by the Aleru which travels down from the northwest. The Musi thereafter travels along the Western boundary of Huzurnagar (Nalgonda eastern border) to join the Krishna. Further east, tirst the Paleru and then the Muneru, travel south through Nalgonda and Khammam respectively to fall into the Krishna, the first near the trijunction point of Nalgonda, Krishna and Guntur districts, the second well into Krishna. The Krishna forms the boundary between Guntur and Krishna districts.
The Raichur Doab is formed by the conwrgence of the Krishna flowing d0wn from Mahabaleswar in the north and the Tungabhadra from Sringeri (Kudremukh 6,215') in Chikmagalur in the southwest, at Nandikotkur taluk of Kurnool to form the boundary line between Mahbubnagar in the north and Kurnoo! in the south. Between this confluence and the point at which it is augmented by the Musi, it is joined first by Dindi which drains East Mahbubnagar and then by Peddavagu which forms NaIgonda's eastern boundary. BefoIe the Tungabhadra unites with the Krishna it is

joined by the Hagari which cuts through the Western margin of Anantarur and
l:SI
forms the Western boundary of Kurnool along Alur and Adoni taluks.
Analysis of Cities, Town Groups and Towns by predominant function and size classes
4·2 ANDHRA DECCAN
Class of toWn
~--------------- -"""I
Function of town Total I
2 3
Total 123 3
Agricultural 49
Artisan 22
Manufacturing 17 2
Trade and Commerce 4
Transport 4
Service '11
4.21 4 The Deccan 4.2 Andhra De~can 4.21 Telengana (Southern Deccan).
This Division consists of the 9 districts of Telengana: Adilabad, Nizamabad, Medak, Hyderabad, Mahbubnagar, Karimnagar, Warangal, Khammam and Nalgonda. 'Iihis is preeminently a jowar tract, in which rice takes the lead in irrigated districts like Nizamabad and Karimnagar, but becomes secondary in other districts. Maize is common. Sugarcane is grown in Nizamabad in which is situated the biggest sugar mill of Hyderabad State, Cotton is grown in Adilabad. In all other districts oiIseeds are extensive while ground nut is grown in Mahbubnagar, Karimnagar, Warangal, Khammam and Nalgonda.
Population density is low in Adilahad (161), Khammam (173) and Mahbubnagar (223 j, moderate in Nalgoncla (287), Warangal (312), Nizamabad (328), Meoak (334) and Karimnagar (353) and high in Hyderabad (688). The proportion
II
4
6
4
1
III IV-V IV V
5 6 7 8
23 91 39 52
48 16 32
7 14 8 6
3 8 5 3
1 3 2
3 2
10 15 7 8
of scheduled tribes is negligible in all other districts except Adilabad (13 per cent) and Khammam (16 per cent); but the proportion of scheduled castes varies from 13·5 per cent in Khammam to 19-4 per cent in Karimnagar. The principal language is Telugu.
The urban ratio is, as might be expected. highest in Hyderabad, only moderately high in Adilabad. Nizamabad, Waranga! and Khammam and moderate in Medak, Mahbubnagar, Karimnagar and Nalgonda. The rate of natural increase is high in Khammam, moderately high in Nizamabad 'and Nalgonda, moderate in Adilabad but low everywhere else. The level of inmigration is high in Nizamabad. Hyderabad and Khammam, moderately high in Adilabad, moderate in Waranga! and Nalgonda and low in Medak, Mahbubnagar and Karimnagar. The proportion of children 0-4 to women 15:'44 is low in Nizamabad, Medak and Hyderabad and only moderate everywhere else.
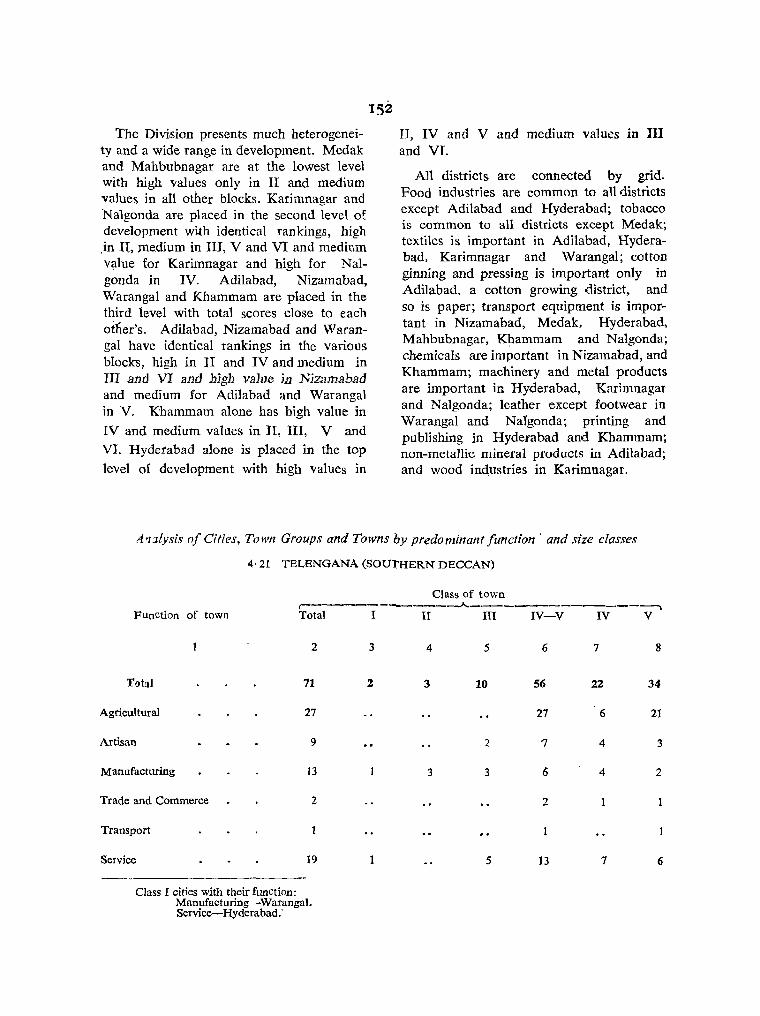
The Division presents much heterogeneity and a wide range in development. Medak and Mahbubnagar are at the lowest level with high values only in II and medium values in all other blocks. Karimnagar and Nalgonda are placed in the second level of ?evelopment with identical rankings, high In II, medium in Ill, V and Vl and medium v~lue for Karimnagar and high for Nalgonda in IV. Adilabad, Nizamabad, Warangal and Khammam are placed in the third level with total scores close to each oirier's. Adilabad, Nizamabad and Warangal have identical rankings in the various blocks, high in II and IV and medium in 111 and VI and high value in Niz.!mabad and medium for Adilabad and Warangal in V. Khammam alone has high value in
IV and medium values in II, III, V and VI. Hyderabad alone is placed in the top level of development with high values in
152
II, IV and V and medium values in 111 and VI.
All districts are connected by grid. Food industries are common to an districts except Adilabad and Hyderabad; tobacco is common to all districts except Medak; textiles is important in Adilabad, Hyderabad, Karimnagar and Warangal; cotton ginning and pressing is important only in Adilabad. a cotton growing district, and so is paper; transport equipment is important in Nizamabad, Medak, Hyderabad, Mahbubnagar, Khammam and Nalgonda; chemicals are important in Nizamabad and Khammam; machinery and metal products are important in Hyderabad, Karimnagar and Nalgonda; leather except footwear in Warangal and Natgonda; printing and publishing in Hyderabad and Khammam; non_'metallic mineral products in AdiIabad; and wood industries in Karimnagar.
A'l21ysis of Cities, Town Groups and Towns by predominant function' and size classes
4· 2l TELBNGANA (SOUTHERN DECCAN)
Class of town
Function of town ,--------------"'.-----Total I II III IV V--- IY---y-'
4.22 4 The Deccan 4.2 Andhra Deccan 4.22 Rayalaseema.
Except for Guntur and Nellore districts the country south of the Krishna in Andhra Pradesh constitutes Rayalaseema. Kurnool i~ lined in the north by the Gajjelakonda and Cumbum Hills. Guntur and Nellore are separated from Rayalaseema in the West by the great arch of the N allamalais Range, extended to the Southeast by the parallel Vellikonda Range which meets the Nagari Hills at the Southeastern corner of Chittoor. The Palkonda Range with the Errakonda Range to its west is placed northwest to southeast in the South of Cuddapah, its southeastern tip being Tirupati.
The western arcs consist of the Erramalai-Yellamalai-Seshachalam-Palkonda Hills. The Papagni and Cheyyeru descend through gorges from the Palkonda scarps to flow northeast to join the Pennar.
Anantapur is drained by the Pennar which takes its rise around M uddagiri and Nandi Drug in Tumkur (Mysore), travels northeast and flows east through Tadpatri, skirting the southern slopes of the Yellamalai along Proddatur and Cuddapah across Nellore to the sea. The Chitravati rises from the northeast of Nandi Drug and flows northeast into Penner at the foot of the Yellamalai. The Papagni has its source within a few miles to the east of that of the Chitravati, passes through the Seshachalam gorges and falls into Penner north of Cuddapah town. The Cheyyeru is joined by the Punchu at the remarkable confluence-gorge in the Palkondas and flows up the Razampetta corridor, northeast to join the Penner between Sidhout (Cuddapah) and Atmakur (Nellore).
The large Anantapur-Chittoor basin is thus subdivided into severa! interior longitudinal basins-the Penner-Chitravati, the Chitravati-Papagni, the Papagni-Cheyyem-in' each of which the slope is from southwest to northeast. This basin gives in the east on the transitional zone of thc< 163 R.G.I.-21.
l53 Swarnamukhi Valley below Tirupati with its intermont basins under the stows of the N agari Hills.
To the north of the Anantapur-Chittoor basin is the central Kunderu basin in Cuddapah consisting of the IQngitudinal Kurnool-Cuddapah plain (Kunderu river) and the central longitudinal Sagileru Valley (Sagileru·Gundlakamma river) down the eastern border of Cuddapah in the Nallamalais. These basins are thus made by the rivers which flow from the north to the south to join the Penner. They are from West to East the Kunderu and the Sagileru. Both drain Kurnool and Cuddapah. The Kunderu basin forms a great crescent, with its middle in the wide Nandyal Valley (700-800'). The Western limits are marked off from the Deccan Plateaus by the outfacing scarps of the Erramalais, Seshachalam and Palkonda Ranges. In the South, the Palkondas form a very fine scarp overlooking the Anantapur-Chittoor basins. The eastern limit of the central Kunderu basin is formed by the parallel Nallamalais and Vellikondas ('outside hills') with a beautifully regular development of longitudinal valleys, chiefly the Sagileru. The hill's are wooded and are peopled by scheduled tribes, chiefly the Chenchus.
The crops are mostly jowar, other millets, groundnut and some irrigated paddy. 'The topography in the longitudinal valleys favours the construction of large tanks by bunding -a transverse tributary gorge. The generally arid aspect is mitigated by groves of mangoes around the tanks; houses are stone or mud-walled, and round beehive huts, striped vertically in white and rust, attest the Telugu country' (Spate).
Spate excels himself in describing what one' identifies as the country between Tirupati and Kalahasti and Tirupati and Madras. The valley between Tirupati, Chandragiri !1Ild Nagari Hills upto

Kalahasti in the northeast is the Swarna
mukhi Valley, made by the Swarnamukhi
river, while the one to the southeast 'of
Tirupati created by the Nagari river to
wards Tiruvallur is the Nagaq Valley.
'The Nagari basins are better cultivated
than those of the plateau, but even they
are not very impressive agriculturally:
their flattish floors are broken by patches
of sandy soil, almost bare but for a thin
grass/acacia cover, and. by naked wck
exfoliation surfaces, looking like roches
moritonnees and often used as threshing
floors. Around the plain a lateritic pied
mont slope fringes the' craggy hiUs, with
boulders as big as a small house on the
talus slopes. Below the lateritic apron is
a better-watered and more fertile piedmont
strip, which is in places a solid belt of
paddy, the zone of bush and trees along
the laterite margin being a favoured settle
ment-line. It is a strange landscape: f:m
tastic hills, stacked and pinnac1ed, long
ridges capped by massive quartzites,
reflected in the stiI1 waters of the big tanks
with their borders of toddy palms; an
eerily attractive picture under iron-blue or
grey skiesj
This Division is also a large jowar tract
with rice as a subsidiary crop, but the
three millets dominate. The cash crops
are groundnut in alr districts and cotton in
Kurnool and Anantapur.
Population density is low in Kurnool
(207), Cuddapah (226) and Anantapur
(239) but comparatively high in Chittoor
(328). The proportion of scheduled
tribes is small in all four districts but that
Of scheduled castes i~ moc!erat\' in Kumool
154
and Cuddapah and fair in Anantapur
and Chittoor. The principal language is
Telugu.
The urban ratio is moderately high in
all districts but the rate of natural increase
is low in Cuddapah and Chittoor and only
moderate in Kurnool and Anantapur.
Inmigration is low in Kumool and Cud
dapah and very moderate in Anantapur
and Chittoor. The proportion of children
0-4 to women 15-44 is low in Cuddapah
and Chitto or and moderate in Kurnool and
Anantapur.
Cuddapah and Chittoor are placed in
the second level of development. Cudda
pah has high values in II, IV and V and
medium values in III and VI. Chittoor
has high values in IV and VI and medium
values in II, IIi and V. Kurnool and
Anantapur are placed in the thir\f level of
development with high values in II and IV
and medium values in III. Kumool has
higlh values while Anantapur has medium
values in V and VI
All districts are connected by grid.
Food industries and te,xtiles are common
to aU districts. Cotton ginning and press
ing is common to Kurnool, Cuddapah and
Anantapur. Non-metallic mineral pro-
ducts are common to all districts except
Cuddapah. Printing and publishing is
important in Kurnool; chemicals and
transport industries in Cuddapah; tobacco
and metal products in Chittoor.
This Division is thus more or less homo
geneous, develop~nt in Kumool and
Anantapuf being a matter more of degree
than kinq.
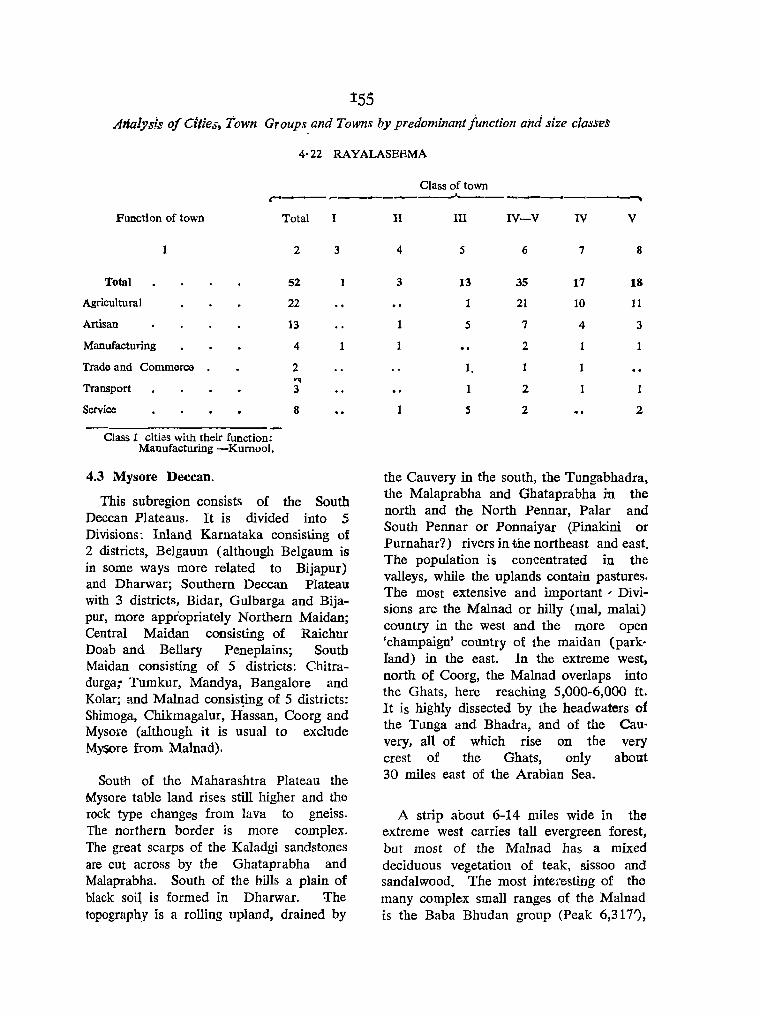
:tss Analysis of Citiea, Town Groups and Towns by predominant junction aild size classes
4· 22 RAYALASEEMA
r-'---
Function of town
Total
Agricultural
Artisan
Manufacturing
Trade and Commerce
Transport
Service
Class I cities with their function: Manufacturing -Kurnool.
4.3 Mysore Deccan.
Total
2
52
22
13
4
2
I
3
1
This subregion consists of the South Deccan Plateaus. It is divided into 5 Divisions: Inland Karnataka consisting of 2 districts, Belgaum (although Belgaum is in some ways more related to Bijapur) and Dharwar; Southern Decca'll Plateau with 3 districts, Bidar, Gulbarga and Bijapur, more appropriately Northern Maidan; Central Maidan consisting of Raichur Doab and Bellary Peneplains; South Maidan consisting of 5 districts: Chitradurga; Tumkur, Mandya, Bangalore and Kolar; and Malnad consis~ing of 5 districts: Shimoga, Chikmagalur, Hassan, Coorg and Mysore (although it is usual to exclude Mysore from Malnad).
South of the Maharashtra Plateau the Mysore table land rises still higher and the rock type changes from lava to gneiss. The northern border is more complex. The great scarps of the Kaladgi sandstones are cut across by the Ghataprabha and Malaprabha. South of the hills a plain of black soi~ is formed in Dharwar. ':fhe topography is a rolling upland, drained by
---'_ v
8
18
11
3
1
2
the Cauvery in the south, the Tungabhadra, the Malaprabha and Ghataprabha in the north and the North Pennar, Palar and South Pennar or Ponnaiyar (Pinakini or Purnahar?) rivers in the northeast and east. The population is concentrated in the valleys, while the uplands contain pastures. The most extensive and important" Divisions are the Malnad or hilly (mal, maIai) country in the west and the more open 'champaign' country of the maidan (parkland) in the east. In the extreme west, north of Coorg, the Malnad overlaps into the Ghats, here reaching 5,000-6,000 ft. It is highly dissected by the headwaters of the Tunga and Bhadra, and of the Cauvery, all of which rise on the very crest of the Ghats, only about 30 miles east of the Arabian Sea.
A strip about 6-14 miles wide in the extreme west carries tall evergreen forest, but most of the MaIn ad has a mixed deciduous vegetation of teak, sissoo and sandalwood. The most interesting of the many complex small ranges of the Malnad is the Baba Bhudan group (Peak 6,317,),

iile first home of coffee in India. The Maidan consists of rolling plateaus nsmg in the east (Tumkur and Kolar) into disjointed granitic hills of famastically irregular plan and elevation. There is however a great deal of local diversity.
The most important crops in Inland Karnataka, Southern Deccan Plateau, Raichur and Bellary are jowar and millets; groundnut and cotton· 1n the Malnad the most important crop is rice followed by ragi and jowar. In the Maidan again the important crops are jowar and ragi, followed by rice and groundnut. Tankirrigation is important and made possible by the bunding of narrow streams. There are nearly 40,000 tanks, large and small, over half the irrigated area depending on tanks.
Villages are larger, more compact and widely spaced in the northern part of the plateau than in the Maidan. In the Malnad tiny hamlets abound. Houses are generally mudwalled or of stone, usually low built. around a courtyard, which may be surrounded by carved and painted verandahs; Thatch roofing is the rule and tile is a sign of prosperity. In the east fiat roofs are common.
The Central Sahyadris or Western Ghats form the western flank of Belgaum and Dharwar. The slope of Dharwar is from southwest to northeast while that of Belgaum is from ~est to east. The Krishna enters Belgaum between Athani and Raibag taluks and fio,ws into Bagalkot (Bijapur) where it is joined from the southwest by the Ghataprabha passing through Gokak and Mudhol taluks of Belgaum. Further east the Malaprabha passing through Badami and Hungund taluks of Bijapur joins the Krishna at Hungund. The Dhone flows down southeast and joins tmc. Krishna at near Lingsugur
(boundary of Gulbarga and Raichur). The Bhima flows down from the northwest and joins the Krishna as it leaves Gul~rga at Yadgir taluk. Further north th~ Manjra crosses the Bidar transversely in Bhalki.
The Tunga and the Bhadra taKe their rise from the north and south of Sringeri (Kudremukh peak 1,892m-Chikmagalur) respectively and travel northeast to meet north of Bhadravati (Shimoga). Thereafter the Tungabhadra flows first as the boundary between Shimoga and Chitradurga and then between Dharwar and Bellary and thereafter between Raichur and Bellary. The Varada divides North Kanara and Dharwar from Shimoga but traverses Dharwar to fall into Tungabhadra between Harpanahalli and Hadagalli (Bellacy)._ The Hagari flowing out northeast from Chikmagalur, through Vani Vilasa Sagar in Hariyur (ChitradurgaTumkur), travels up Chitradurga and passing through Anantapur enters Bellary and faUs into the Tungabhadra north of Sim' guppa (Bellary). Tumkur is drained in the northeast by the North Pennar, and Kolar also in the northeast by the Chitravati and Papagni. Southeastern Kolar is drained by the upper reaches of the Palnr while eastern Bangalore (Hoskote) is drained by the South Pennar or Ponnaiyar. The Cauvery takes its rise south of Mercara in Coorg and flowing east is joined from the northwest through Hassan (Belur, Alur and Arkalgud taluks) by the Hemavati at Krishnarajasagar. Further south the Kabbani joined 'by the Nugu travels from southwest to northeast through southwest ,Mysore and joins the Cauvery near Srirangapatnam followed by the Cauvery Falls and Sivasnffiudram (MysoreMandya). The Shimsa flows in a southeasterly direction forming the boundary in places of Mandya and Bangalore to fall into the Cauvery east of Sivasamudranl. The Arkavati descending from Nandi Drug is entirely confined to the State flowing longitudinally to Cauvery. The Cauvery
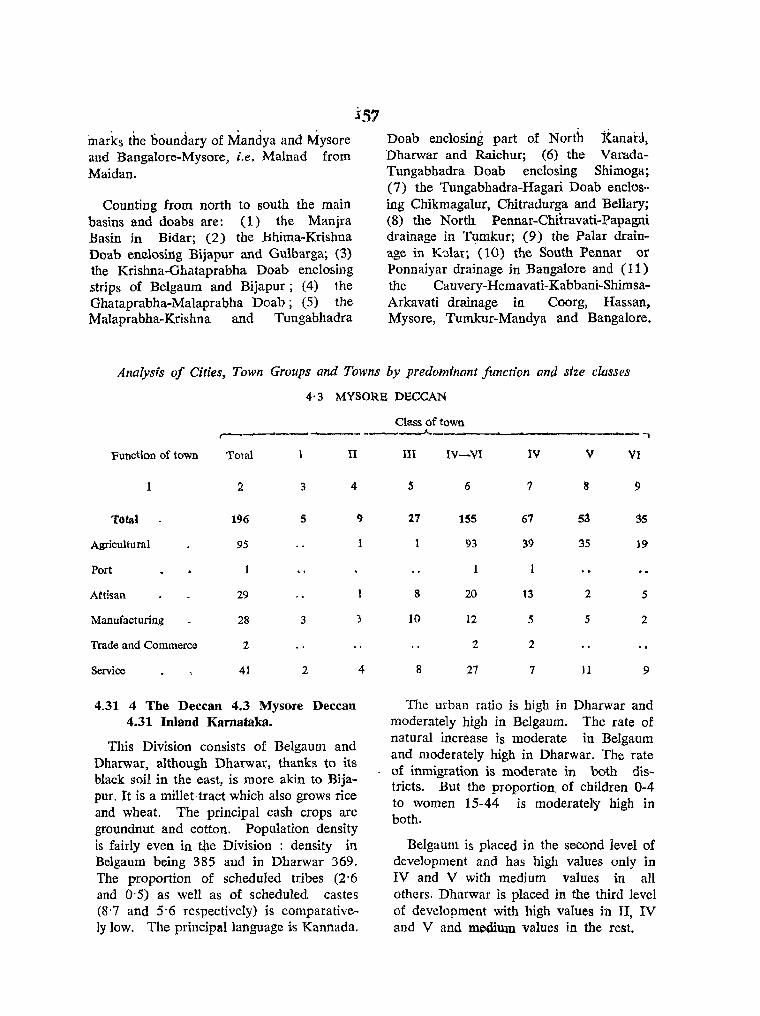
marks the boundary of Mandya and Mysore and Bangalore-Mysore, i.e, Malnad from Maidan.
Counting from north to south the main basins and doabs are: (1) the Manjra Basin in Bidar; (2) the l:ihima-Krishna Doab enclosing Bijapur and Gulbarga; (3) the Krishna-Ghataprabha Doab enclosing strips of Belgaum and Bijapur; (4) the Ghataprabha-Malaprabha Doab; (5) the Malaprabha-Krishna and Tungabhadra
Doab enclosing part of North l{anabi, Dharwar and Raichur; (6) the VaradaTungabhadra Doab enclosing Shimoga; (7) the Tungabhadra-Hagari Doab eneIos·· ing Chikmagalur, Chitradurga and Bellary; (8) the North Pennar-Chitravati-Papagni drainage in Tumkur; (9) the Palar drainage in K';)lar; (10) the South Pennar or Ponnaiyar drainage in Bangalore and (11) the Cauvery-Hemavati-Kabbani-ShimsaArkavati drainage in Coorg, Hassan, Mysore, Tumkur-Mandya and Bangalore.
AnalysIs of Cities, Town Groups and Towns by predominant function and size classes
4'3 MYSORE DECCAN
Class of town ,--__,__....--_. -- ---____,._ '--------------------~----1
Function of town Total I II
2 3 4
Total 196 5 I)
Agricultural 9S
Port
Attisan 29
Manufacturing 28 3 J
Trade and Commerce 2
Service 41 2 4
4.31 4 The Deccan 4.3 Mysore Deccan 4.31 Inland Kamataka.
This Division consists of Belgaum and Dharwar, although Dharwar, thanks to its black soil in the east, is more akin to Bijapur. It is a millet tract which also grows rice and wheat. The principal cash crops are groundnut and cotton. Population density is fairly even in the Division : density in Belgaum being 385 and in Dharwar 369. The proportion of scheduled tribes (2·6 and 0'5) as well as of scheduled castes (S·7 and 5'6 respectively) is comparatively low. The principal language is Kannada.
III IV-VI IV VI
S 6 1 8 9
27 155 67 53 3S
93 3<) 35 19
1
8 20 2 5
10 12 5 5 2
2 2
8 27 7 11 9
The urban ratio is high in Dharwar and moderately high in Belgaum. The rate of natural increase is moderate in Belgaum and moderately high in Dharwar. The rate of inmigration is moderate in both districts. But the proportion of children 0-4 to women 15-44 is moderately high in both.
Belgaum is placed in the second level of development and has high values only in IV and V with medium values in all others. Dharwar is placed in the third level of development with high values in II, IV and V and medium values in the rest.
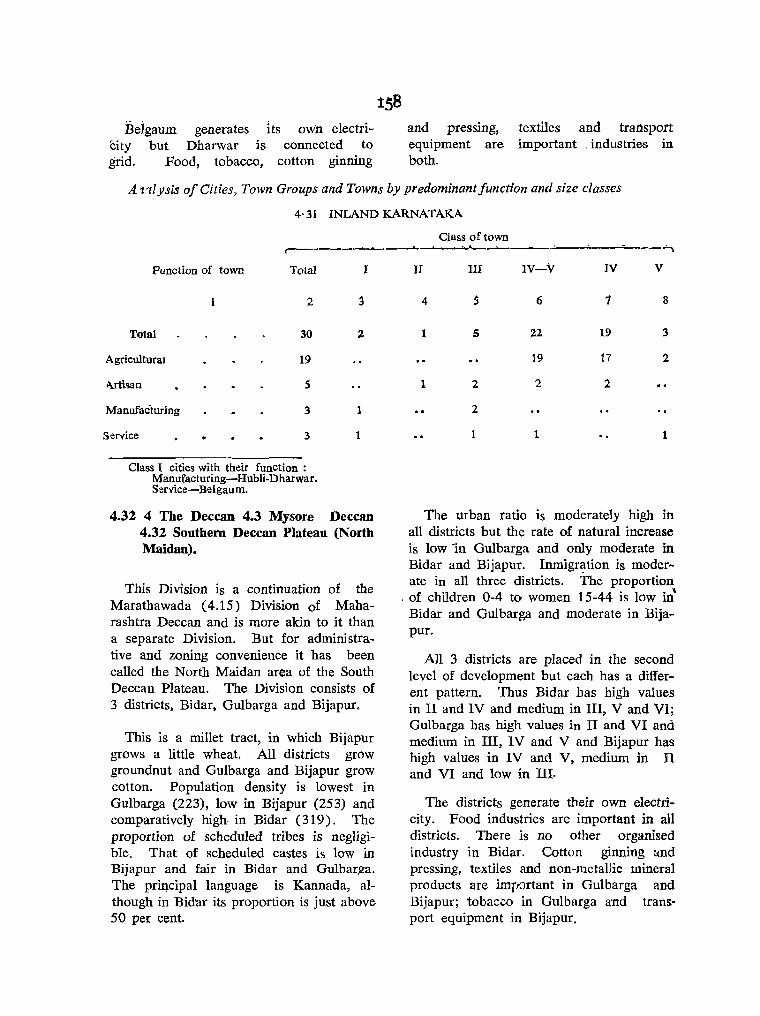
Beigaum generates its own electricity but Dharwar is connected to grid. Food, tobacco, cotton ginning
and pressing, equipment are both.
textiles and transport important . industries in
A 1'11ysis of Cities, Town Groups and Towns by predominant function and size classes
4·31 INLAND KARNATAKA
Class of toWIi ~---........_.__,.,--__._-~~ --...,
Function of town Total
'2
Total 30
Agricultural 19
i\rtisan 5
Manufacturing .3
Service .3
Class I cities with their function : Manufacturing-Hubli-Dharwar. Service-Belgaum.
I
3
2
1
1
4.32 4 The Deccan 4.3 Mysore Deccan 4.32 Southern Deccan Plateau (North Maidan).
This Division is a continuation of the Marathawada (4.15) Division of Maharashtra Deccan and is more akin to it than a separate Division. But for administrative and zoning convenience it has been called the North Maidan area of the South Deccan Plateau. The Division consists of 3 districts, Bidar, Gulbarga and Bijapur.
This is a millet tract, in which Bijapur grows a little wheat. All districts grow groundnut and Gulbarga and Bijapur grow cotton. Population density is lowes't in Gulbarga (223), low in Bijapur (253) and comparatively high- in Bidar (319). The proportion of scheduled tribes is negligible. That of scheduled castes is low in Bijapur and fair in Bidar and Gulbar,l!a. The priqcipal language is Kannada, although in Bid'ar its proportion is just above 50 per cent.
n III IV-V IV V
4 5 6 1 8
1 5 22 19 3
19 17 2
1 2 2 2
2
1 1
The urban ratio is moderately high in all districts but the rate of natural increase is low In Gulbarga and only moderate in Bidar and Bijapur. Inmigr~tion is moderate in all three districts. The proportion
- of children 0-4 to women 15-44 is low in" Bidar and Gulbarga and moderate in Bijapur.
All 3 districts are placed in the second level of development but each has a different pattern. 'Thus Bidar has high values in II and IV and medium in III, V and VI; Gulbarga has high values in II and VI and medium in III, IV and V and Bijapur has high values in IV and V, medium in n and VI and low in Ill.
The districts generate their own electticity. Food industries are important in all districts. There is no other organised industry in Bidar. Cotton ginning and pressing, textiles and non-metallic mineral products are imp~.Jrtant in Gulbarga and Bijapur; tobac.::o in Gulbarga and transport equipment in Bijapur.

159 A nalysis of Town Groups and TO'lI.'ns by [)redominant function- and size~clas5es
4'32 SOUTHERN DECCAN PLATEAU (NORTH MALDAN)
Class of town Function c-------.A..------~ of town Total II III IV-V IV V
2 3 4 5 6 7
Total 29 2 8 19 15 " Agricultural 12 12 8 4
Artisan 8 3 5 5 .. Manufac-
turing 5 1 4
Service 4 2 2
4.33 4 The Deccan 4.3 Mysore Deccan 4.33 Raichur-BeUary (Central Maidan).
This Division consists of 2 districts: Raichur and Bellary. Raichur is coritained in the Doab of Bhima-Krishna and Tungabhadra. It is entirely a millet tract and grows cotton and groundnut. Population density is low (203), scheduled tribes are negligible while the ratio of scheduled castes is only 10 per cent. The principal language is Kannada.
The urban ratio is moderately high but natural increase is low and inmigration and proportion of children 0-4 to women 15-44 are moderate.
Raichur is placed in the lowest level of development with mediu:m values in all the blocks.
The district is connected to grid. The m?in industries are cotton ginning and pressing, food, tobacco, transport equipment and printing and publishing.
Bellary fs jowar country which grows cotton and groungnl,lt. The density Of
population is low (240). The proportion of scheduled tribes is negligible. The .ratio of scheduled castes is 13'6 per cent. The prjncipal language is Kannada.
The urban ratio is high, but the rate of natural increase is moderate, that of inmigration 'moderately high and of children 0-4 to women 15-44 low.
The district is placed in the third level of development with high v811ues for IT, IV, V and VI and medium in III.
Bcllary is connected to grid and the important industries are' food industries • ~otton ginning and pressing, machinery, transport equipment and printing and publishing.
Analysis oj Town Groups and Towns by predominant Junction and size classes
4'33 RAICHUR-BELLARY (CENTRAL MAIDAN)
Class of town Function of town
r------"------,._, Total II IV-V IV V
2 3 4
Total 17 3 14
Agricultural 12 11
Port 1 1
Manufacturing
Service 3 2
Agriculture is also predominant.
5
6
5
6
8
6
4.34 4 The Deccap. 4.3 Mysore Deccan 4.34 South Maidan.
This Division consists of the 5 'Mysore districts of Chitradurga, Tumkur, Mandya, Bangalore and Kolar, and is an extensive PliIIet tract, the chief millet being ragi. Rice is grown as a second crop. Groundnut is grown in Chitradurga, Tumkur and Kolar and cotton only in Chitradurga.
Population density is moderate in Chitradurga (262), fair in Tumkur (336), Plo<;!erately hi~h in Kol&r (406)· &nd

Mandya (480) and high in Bangalore (802). The proportion of scheduled tribes is negligible in all districts but that of scheduled castes is appreciable ranging from 13 per cent in Mandya to as much as 25 per cent in Kolar. The principal language is Kannada although its strength is only 51 per cent in Bangalore and 53 per cent in Kolar.
The urban ratio is moderate in Tumkur and Mandya, moderately high in Chitradurga and high in Kolar and Bangalore. The rate 'of natural increase is low in Kolar, moderate in Tumkur and Bangalore and moderately high in Chitradurga "Ino Mandya. The level of inmigration is moderate in Chitradurga and Tumkur, moderately high in Mandya and Kolar and high in Bangalore. The proportion of children 0-4 to women 15-44 is low in Bangalore and Kolar, moderate in Tumkur and Mandya and moderately high in Chitradurga.
The Division enjoys a wide range of development. Tumkur is placed in the second level, Mandya and Kolar in the third
160 and Chitradurga and Bangalore in the fOUlth. Tumkur has high values in II and IV and medium values in III, V and VI. Mandya and Kolar 'have high values in IV and medium values in III and VI. In II, Mandya has high while Kolar has medium values and in V, Mandya has medium while Kolar has high values. Ohitradurga and Bangalore are in the top level of development, Chitradurga has high values in II, IV and V and medium values in III and VI, while Bangalore has high values in IV and V and medium values in II, III and VI.
All districts are connected by grid. Food industries are important in all districts except Bangalore. Textiles are important in Chitradurga, Bangalore and Kolar; machinery in Chitradurga, Mandya and Bangalore; tobacco in Chitradurga, Tumkur and Kolar; chemicals in Tumkur, Mandya and Kolar; non-metallic minerals in Tumkur and ~olar; cotton ginning and pressing L"l Chitradurga; furniture and fixtures in Tum· kur; wood industries, in Mandya; transport equipment in Bangalofe-.
AWllysis of Cities, Town Groups and Towns by predominant function-and size classes
4,34 SOUTH MAIDAN
Class of town ~---.-- .. ------------"- ---_._----,
Function of town Total I .j.[ III TV-VI IV V VI
1 2 3 4 5 6 7 8 9
Total 59 2 1 8 48 17 17 14
Agricultural 27 21 4 13 10
Artisan 13 2 11 6 1 4
Manufacturing 10 2 l' 3 4 3 1 ••
'frade and Commerce 2 ~ ,., '" '" .. . ..
Servicel 7 3 4 2. /. ---.i--.., ..
Class I cities with their function: Manufacturin~-Bangalore, Kolar G old Fields.

4.35 4 The Deccan 4.3 Mysore Deccan 4.35 Malnad.
This Division consists of 5 upland dislricts: Shimoga, Chikmagalur, Hassan, toorg and Mysore. The principal crop is fiee in Shimoga, Chikmagalur and Coorg arid ragi in Hassart and Mysore but millets are important in all districts. Groundnut is grown in Shimoga and Mysore. The Division has moderate population density. Density is low in Coorg (203), Chikmagalur (212) and Shimoga (251), but comparatively high in Hassan (334) and Mysore (369). The proportion of schedul. ed tribes is either negligible or low in aU districts except Coorg where it is 8'4 per cent. The proportion of scheduled castes is moderate only in Coorg (9'5 per cent) but appreciable in -the remaining districts varying from 14'3 per cent in Shimoga to 17' 5 per cent in Mysore. The principal language is Kannada.
The urban ratio is moderately high in Chikmagalur, Hassan and Coorg, and high in Shimoga and Mysore. Both natural increase and inmigration are moderate in Mysore, moderately high in Hassan and high in Shimoga, Chikmagalur and Coorg. The proportion of children 0-4 to women 15-44 is moderate in Mysore, moderately
161
high in Hassan, Chikmagalur and Coorg and high in Shimoga.
Hassan and Mysore are placed in the third level of development with high values in II and IV and medium values in III and VI. Hassan has medium value ill V while Mysore has high value. Shimoga, Chikmagalur and Coorg are placed in the fourth level of development. Coorg has high values in III, IV and V and medium values in II and VI; Shimoga has high values in II, IV ~md V and medium values in III and VI; Chikmagalur has high values in II, III, IV and V and medium value in VI.
All districts are connected by grid. BasIc metals are important in Shimoga-Bhadravati. Food industries are important in all districts except Hassan; paper and paper products in Shimoga and Coorg; chemicals in Shimoga, Chikmagalur, Hassan and Mysore; wood industries in Shimoga, Chikmagalur and Coorg; transport equipment in Chikmagalur and Mysore; nonmetallic minerals in Chikmagalur; machinery in Hassan and Coorg; cotton ginning and pressing in Hassan; rubber and rubber products in Coorg; textiles and tobacco in Mysore.
Analysis of Cities, Town Groups and Towns by predominant function and size classes
4'35 MALNAD
Class of town ,------ - .....
Function of town Total I II III IV-VI IV V VI
1 2 3 4 5 6 7 8 9
Total 61 1 2 6 52 10 21 :u Agricultural 25 1 24 S 10 9
Artisan 3 1 2 1 1
Manufacturing 9 1 7 2 3 2
Service 24 1 3 19 3 7 9
Class 1 cities wIth their function: Serrlce-Mysore.
163 R.C.l.-2''!.
4.4 Tamilnad Hills and Uplands.
This Subregion consists of 2 DivisiJos: Nilgiri and Coimbatore Plateau.
4.41 Nilgiri.
'The Nilgifis (Blue Mountains) form a compact plateau of about 1,000 sq. m. with a summit-level of 6,000-8,000 ft. rising with extreme abruptness on all sides; on the eastern slopes there is a fall of 6,000 ft. in 1 i-2 miles,. the face of the Coimbatore plateau is hardly less steep, and on the north the Nilgiris are cut off from the 3,000-4000 ft. Mysore plateaus by the deep straight gash of the Moyar Trench (the Mysore Ditch), the narrow floor of which lies at 1,000'-2,000'. The massif is as it were islanded between the Moyar and the Bhavani to the south.' (Spate). The Kallar tlows down Ootacamund and Coonoor.
The Nilgiri is virtually the trijunction point of the Western and Eastern Ghats and the Tamilnad Hills and Plateaus. Life in the Nilgiri is centred on Ootacamund (lying under the highest point of the plateau, Dada Betta, 8,760'), and its satellites Wellington and Coonoor. The Pykara rising southwest of Ootacamund is harnessed at Pykara Falls before it descends into the Moyar. The Bhavani flows southwest to northeast hugging the foothills.
4.42 Coimbatore Plateau (Kongunad).
The Coimbatore Plateau is studded with a series of ranges which make a great arc with its outer side towards the Bay of Bengal. From the north to the south they consist of (1) the lavadi Hills in the north and Tiruvannamalai in the south of North Arcot; (2) the Melagiri Hills in north .. west Salem and the Shevaroy Hills and Kalrayan Hills in southeast Salem, the Kollaimalai Hills in South Salem and South Arcot; (3) the Pachaimalai Hills in north Tiruchirapa11i; (4) the Sirumalai Hills in Melur (Madurai); and the Anaimalai,
Palni and Andipatti Hills in West Madurai; (5) the Madurai Hills in Central Madurai; (6) the Sheneottah in West Tirunelveli and (7) the Mahendragiri in Kanyakumari.
The highest peaks are Dada Betta (2,637m), Kodai Kanal (2,506m) and Anai Mudi (2,695m) which is however in Devjcolam (Kerala).
The front to the Palghat gap is steep and in the east remarkably straight. The southeastern flanks of the Palnis overlooking the upper Vaigai reentrant, such as Nilakottai and Tirumangalam taluks, are also remarkably abrupt as also the Varushanad Valley (SriviIliputtur taluk, Ramanathapuram) containing the upper reaches of the Vaigai below the Cardamom and Andippati Hills. Below the Shencottah gap in Tenkasi (Tirunelveli) 'the change from the jungleclad mountain to the tankpitted Tamilnad Plain is very sudden'. (Spate)
Proceeding from the north to the south the Subregion may be divided into four sections according to their river regions: ( 1 ) Palar-Cheyyar through North Areot and Chingleput; (2) The Cauvery and its tributaries across Nilgiri, Coimbatore, Tiruchirapalli and Thanjavur; (3) the Vaigai across Ramanathapuram and (4) the Tambraparni across Tirunelveli. All flow naturally from the western hills and plateaus into the Bay of Bengal on the Coromandel Coast.
The Palar or Paleru drains Kolar and flows by the northern slopes of the Javadi Hills and is joined midway between Kanchipuram and Chingleput by the Cheyyar flowing in a northeasterly direction from the south of the 1 avadis. The Penner or Ponnaiyar flows diagonally (northwestsouth-east) across Salem along the 'northern edges of the Shevaroys to Fort S1. DavidCuddalore in South Areat. The Vellar is fed by two main branches, one from the

Shevaroys in the north and the other from the Pachaimalais in the SQuth across South Areot to Porto Novo.
In the central stretches of Madras the Cauvery enters the State from Kollegal taluk of Mysore through the valley between the Southern slopes of the Melagiris in the north, is harnessed at the Hogenakal Falls, before it flows into the Stanley Reservoir in Salem. 'the Biligiri (white mountain) Rangan Hills and the smaller ranges like Attimalai and Madheswarmalai intervene between the Cauvery and Moyar. The Moyar rising west of Dada Betta skirts the north of Nilgiri and is joined by the Bhavani which descends from the Coonoor side where_it is dammed up in transit at Bhavani Sagar (Lower Bhavani Project). The Noyil rises from a 1,998m. peak west of Coimbatore, traverses the district to faU into the Cauvery at the junction of Coimbatore and Tiruchirapalli districts. The Amaravati with its tributaries rises from the Anaimalai and Paloi Hills to flow northeast into the Cauvery at Karur (Tiruchirapalli). These three rivers drain very mature valleys into the Cauvery. The Bhavani and the Amara' vati are perennial, but the Noyil is dry for most of the year, with practically no water in its lower course and little in the middle.
At Tiruchirapalli the Cauvery creates a genuine mesopotamia in Srirangam Island and splits into two. The left or northern arm, the Coleroon, travels northeast to fall into the sea south of Chidambaram, marking the boundary first between Tiruchirapalli and Thanjavur and next between South Arcot and Thanjavur. The right or southern arm, the Cauvery makes an enormous delta with the Vellar.
The Vaigai rises in the Varushanad valley formed by the Palnis in the north, the Cardamoms in the west and the Periyar Hills in the south. Its tributary, SurulL is formed in the Kambam Valley west ~)f
Varushanad. At first the Vaigai flows northeast and then in a great sweeping
curve due southeast across Madurai and Ramanathapuram down to Pamban Channel. The Vaigai is perennial only in the high Varushanad Valley, in contrast to its tributary the Suruli, which has feeders direct from the Cardamoms, as well as an artificial supply of Periyar water. Rice and millets are the staple crops with considerable cotton and tobacco.
Western Ramanathapuram and northern TirunelveH is drained by the Vaipur. Southern Tirunelveli is drained by the Chittar flowing from the northwest and the Tambraparni from the southwest through the Papanasham Reservoir to fall into the Gulf of Mannar.
West of the middle Palar the Mysore Ghat descends in a series of steps from a general level of 3,000 ft. and more through a broad shelf at about 2,250 ft. Both the ghat scarps and the line of the J avadis have in general straight trends, and the Tamilnad Hills have flattish surfaces at heights comparable to those of the plateau. The Tamilnad summits are generally higher than the oppos.ite heights of the Mysore Plateau; 3,600-3,800 ft. in tl~e Javadis, 5-5,400 in the Shevaroys. The steep flank of the hills are usually forested, but within this girdle of jungle the plateaus carry a surprisingly large agricultural population. On the shelf below the main :Mysore Ghat much land is still under forest, mostly rather open and used mainly for grazing, This is geographically, and perhaps histori~lly, an off-shoot of the famons cattle breeding centres 'of Mysore (the famous Amrit mahal breed which used to be raised in Channarayapatna for drawing guncarriages in Tipu Sultan's time IS now almost extinct, but tqe finelimbed iron grey HilJik.ars with their tuning fork horns are the counterpart of the noble Harianas of trye Punjab); 'the Dharmapuri/Krishna!Iiri cattle markets are fhe main source of heavy draught animals for an area stretching from Malabar to Chittoor, while the best animals are sold
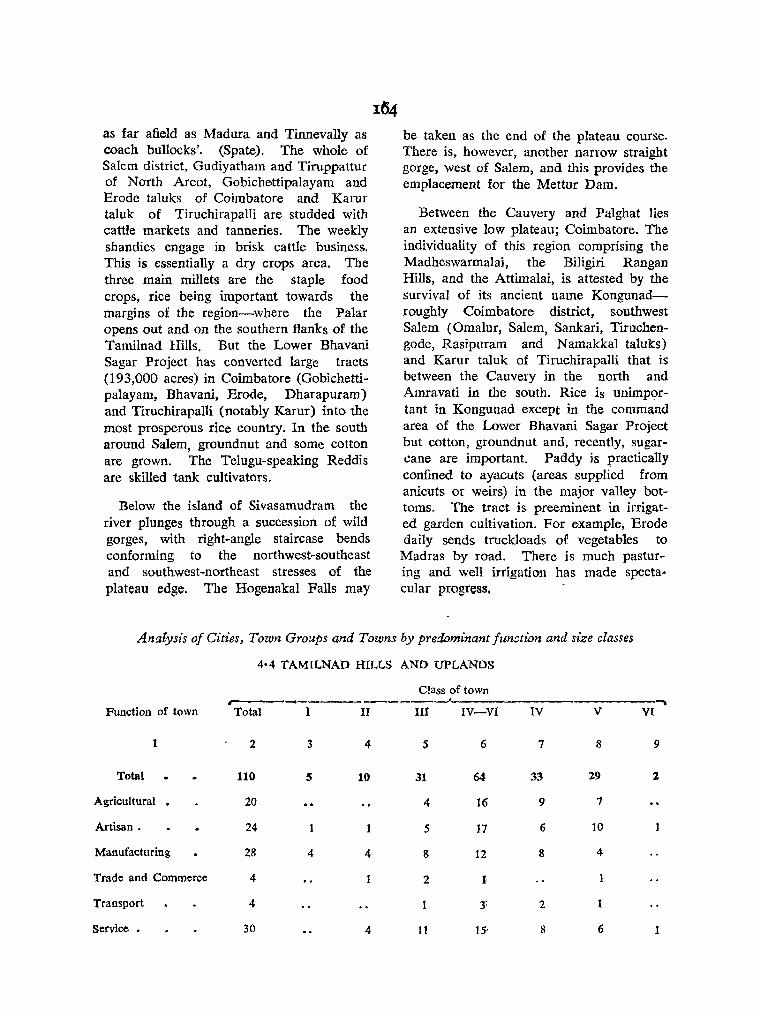
as far afield as Madura and Tinnevally as coach bullocks'. (Spate). The whole of Salem district, Gudiyatham and Tiruppattur of North Areot, Gobichettipalayam and Erode taluks of Coimbatore and Karur taluk of Tiruchirapalli are studded with cattle markets and tanneries. The weekly shandies engage in brisk cattle business. This is essentially a dry crops area. The three main millets are the staple food crops, rice being important towards the margins of the region-where the Palar opens out and on the southern flanks of the Tamilnad Hills. But the Lower Bhavani Sagar Project has converted large tracts (193,000 acres) in Coimbatore (Gobichettipalayam, Bhavani, Erode, Dharapuram) and Tiruchirapalli (notably Karur) into the most prosperous rice country. In the south around Salem, groundnut and some cotton are grown. The Telugu-speaking Reddis are skilled tank cultivators.
Below the island of Sivasamudram the river plunges through a succession of wild gorges, with right-angle staircase bends conforming to the northwest-southeast and southwest-northeast stresses of the plateau edge. The Hogenakal Falls may
be taken as the end of the plateau course. There is, however, another narrow straight gorge, west of Salem, and this provides the emplacement for the Mettur Dam.
Between the Cauvery and Pal ghat lies an extensive low plateau; Coimbatore. The individuality of this region comprising the Madheswarmalai, the Biligiri Rangan Hills, and the Attimalai, is attested by the survival of its ancient name Kongunadroughly Coimbatore district, southwest Salem (OmaIur, Salem, Sankari, Tiruchengode, Rasipuram and Namakkal taluks) and Karur taluk of Tiruchirapalli that is between the Cauvery in the north and Amravati in the south. Rice is unimpC?rtant in Kongunad except in the command area of the Lower Bhavani Sagar Project but cotton, groundnut and, recently, sugarcane are important. Paddy is practically confined to ayacuts (areas supplied from anicuts or weirs) in the major valley bottoms. The tract is preeminent in irrigated garden cultivation. For example, Erode daily sends truckloads of vegetables to Madras by road. There is much pasturing and well irrigation has made spectacular progress,
AnCllysis of Cities, Town Groups and Towns by predominant function and size classes
Function of town
1
Total
Agricultural . Artisan.
Manufacturing
Trade and Commerce
Transport
Service •
4'4 TAMILNAD HILLS AND UPLANDS
Total I
2 3
110 5
20
24
28 4
4
4
30
Class of town , ___ ____ -J-. ______________ """'
II III IV-VI IV V VI
4
10
4
4
5
31
4
5
8
6
64
16
17
12
2 1,
It 15'
7
33
9
6
8
8
8 9
29 2
7
10
4
6
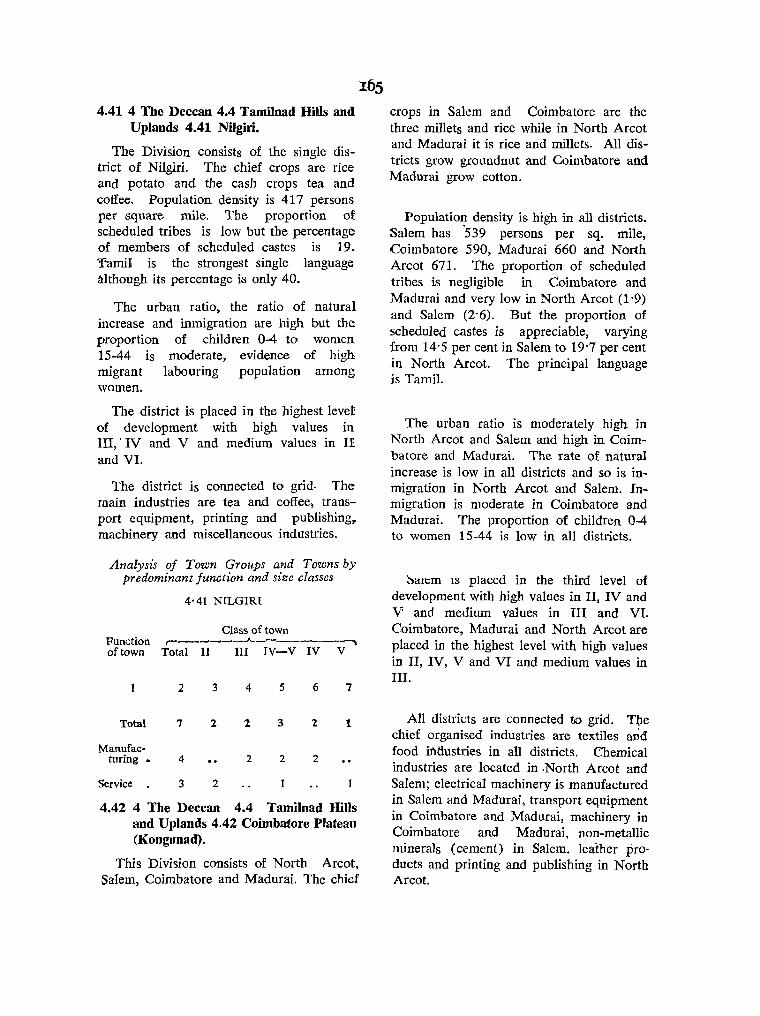
4.41 4 The Deccan 4.4 Tamilnad Hills and Uplands 4.41 Nilgiri.
The Division consists of the single district of Nilgiri. The chief crops are rice and potato and the cash crops tea and coffee. Population density is 417 persons per square mile. The proportion of scheduled tribes is low but the percentage of members of scheduled castes is 19. 'Tamil is the strongest single language although its percentage i,s only 40.
The urban ratio, the ratio of natural increase and inmigration are high but the proportion of children 0-4 to women 15-44 is moderate, evidence of high migrant labouring population among women.
The district is placed in the highest levet of development with high values in III, . IV and V and medium values in II and VI.
The district is connected to grid. The' main industries are tea and coffee l transport cquipment, printing and publishing~ machinery and miscellaneous industries.
Analysis of Town Groups and Towns by predominant function and size classes
4'41 NILGIRI
Class of town Function ,-___ . ___ .A. ~
of town Total II III IV-V IV V
2 3 4 5 6 7
Total 7 2 2 3 2 1
Manufac-turing. 4 2 2 2
Service 3 2
4.42 4 The Deccan 4.4 Tamilnad HiUs and Uplands 4.42 Coimbatore Plateau (Kongunad).
This Division consists of North Arcot, Salem, Coimbatore and Madurai. The chief
165 crops in Salem and Coimbatore are the three millets and rice while in North Arcot and Madura i it is rice and millets. All districts grow groundnut and Coimbatore and Madurai grow cotton.
Population density is high in all districts. Salem has 539 persons per sq. mile, Coimbatore 590, Madurai 660 and North Arcot 671. The proportion of scheduled tribes is negligible in Coimbatore and Madurai and very low in North Arcot (1'9) and Salem (2'6). But the proportion of scheduled castes is appreciable, varying from 14'5 per cent in Salem to 19'7 per cent in North Arcot. The principal language is Tamil.
The urban ratio is moderately high in North Arcot and Salem and high in Coimbatore and Madurai. The rate of natural increase is low in all districts and so is inmigration in North Arcot and Salem. 1nmigration is moderate in Coimbatore and Madurai. The proportion of children 0-4 to women 15-44 is low in all districts.
~alt:m IS placed in the third level of development with high values in II, IV and V and medium values in III and VI. Coimbatore, Madurai and North Areot are placed in the highest level with high values in II, IV, V and VI and medium values in III.
All districts are connected to grid. Tbe chief organised industries are textiles aDd food iMustries in all districts. Chemical industries are located in .North Areot and Salem; electrical machinery is manufactured in Salem and Madurai, transport equipment in Coimbatore and Madurai, machinery in Coimbatore and Madurai, non-metallic minerals (cement) in Salem. leather pro· ducts and printing and publishing in North Arcot.
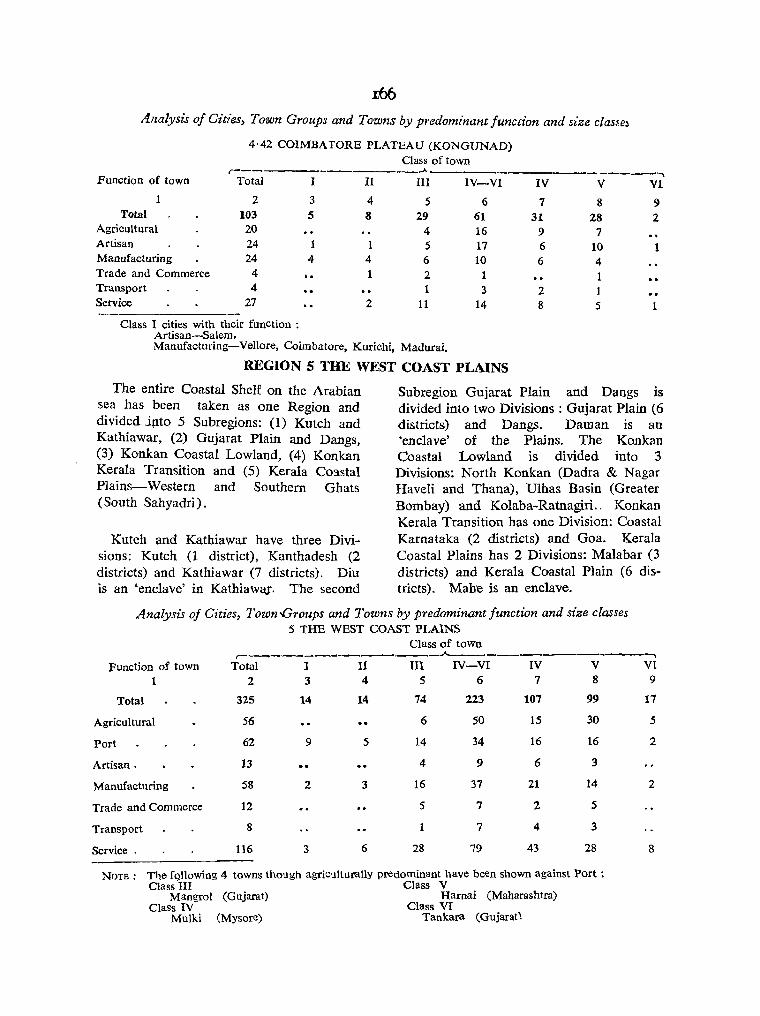
Analysis 0/ Cities, Town Groups and Towns by predominant function and size classe~
4'42 COIMBATORE PLATEAU (KONGUNAD) Class of town r-------- .A ____ •
----_ ........ Function of town Total I II III IV-VI IV V VI.
1 2 3 4 5 6 7 8 9 Total 103 5 8 29 61 31 28 2
Agricultural 20 4 16 9 7 Artisan 24 1 1 5 17 6 10 1 Manufacturing 24 4 4 6 10 6 4 Trade and Commerce 4 .. 1 2 1 1 Transport 4 1 3 2 Ser .... ice 27 2 11 14 8 5 1
Class I cities with their function : Artisan-Salem. Manufacturing-Venore, Coimbatore, Kurichi, Madurai.
REGION 5 THE WEST COAST PLAINS
The entire Coastal Shelf on the Arabian sea has been taken as one Region and divided jpto 5 Subregions: (1) Kutch and Kathiawar, (2) Gujarat Plain and Dangs, (3) Konkan Coastal Lowland, (4) Konkan Kerala Transition and (5) Kerala Coastal Plains-Western and Southern Ghats (South Sahyadri).
Kutch and Kathiawar have three Divisions: Kutch (1 district), Kanthadesh (2 districts) and Kathiawar (7 districts). Diu is an 'enclave' in Kathiawa,.r. The second
Subregion Gujarat Plain and Dangs is divided into two Divisions: Gujarat Plain (6 districts) and Dangs. Daman is an 'enclave' of the Plains. The Konkan Coastal Lowland is divided into 3 Divisions: North Konkan (Dadra & Nagar Haveli and Thana), Ulhas Basin (Greater Bombay) and Kolaba-Ratnagiri.. Konkan Kerala Transition has one Division: Coastal Karnataka (2 districts) and Goa. Kerala Coastal Plains has 2 Divisions: Malabar (3 districts) and Kerala Coastal Plain (6 districts). Mahe is an enclave.
Analysis 0/ Cities, Town..(Jroups and Towns by predominant/unction and size classes 5 THE WEST COAST PLAINS
Class of town ,--______________ .A.._
------.--------------~ Function of town Total I II III IV-VI IV V
1 2 3 4 5 6 7 8
Total 325 14 14 74 223 107 99
Agricultural 56 6 50 15 30
Port 62 9 5 14 34 16 16
Artisan. 13 4 9 6 3
Manufacturing 58 2 3 16 37 21 14
Trade and Commerce 12 5 7 2 5
Transport 8 7 4 3
Service. 116 3 6 28 79 43 28
NOTE: Tl)e fQllowing 4 towns though agriculturally predominant have been shown against Port: Class III Class V
Mangrol (Gujarat) Harnai (Ma!1arashtra) Class IV Class VI
Mulki CMysore) Tankara (Gujarat)
VI 9
17
5
2
2
8
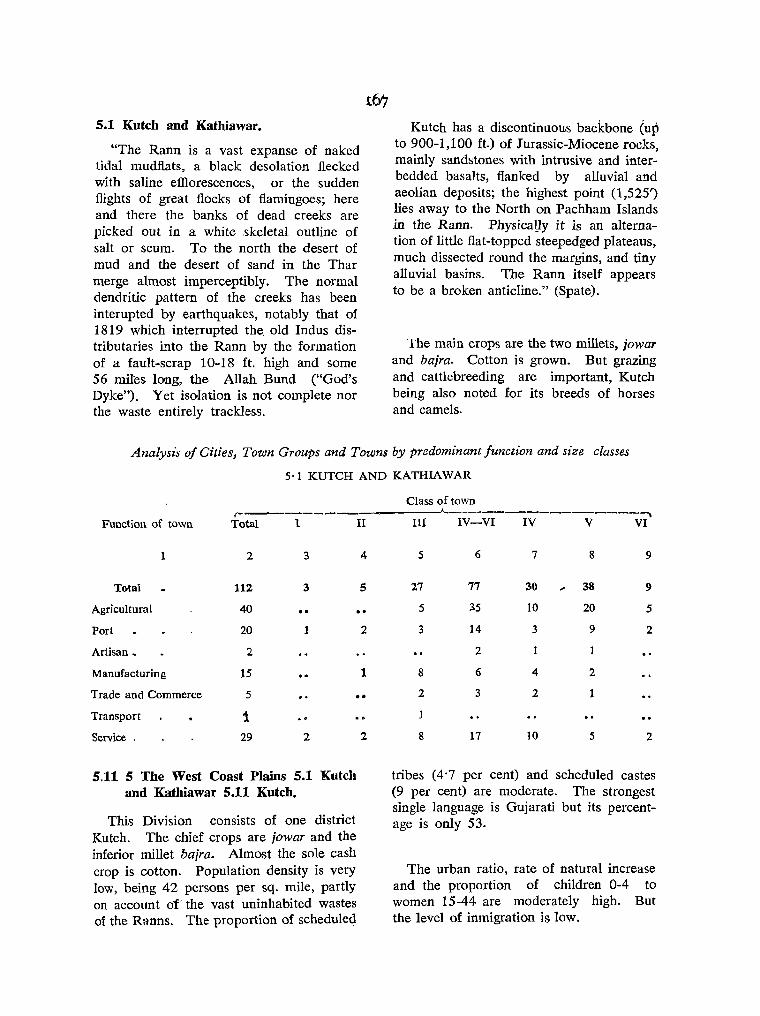
5.1 Kutch and Kathiawar.
"The Rann is a vast expanse of naked tidal nludflats, a black desolation flecked with saline efflorescences, or the sudden flights of great flocks of flamingoes; here and there the banks of dead creeks are picked out in a white skeletal outline of salt or scum. To the north the desert of mud and the desert of sand in the Thar merge almost imperceptibly. The normal dendritic pattern of the creeks has been interupted by earthquakes, notably that of 1819 which interrupted the. old Indus distributaries into the Rann by the formation of a fault-scrap 10-18 ft. high and some 56 miles long, the Allah Bund ("God's Dyke"). Yet isoJation is not complete nor the waste entirely trackless.
Kutch has a discontinuous backbone (up to 900-1,100 ft.) of Jurassic-Miocene rocks. mainly sandstones with intrusive and inter~ bedded basalts, flanked by alluvial and aeolian deposits; the highest point (1,525,) lies away to the North on Pachham Islands in the Rann. Physically it is an alternation of little flat-topped steepedged plateaus, much dissected round the margins, and tiny alluvial basins. The Rann itself appears to be a broken anticline." (Spate).
The main crops are the two millets, jowar and ba;ra. Cotton is grown. But grazing and cattlebreeding are important, Kutch being also noted for its breeds of horses and camels.
Analysis of Cities, Town Groups and Towns by predominant junction and size classes
5·1 KUTCH AND KATHlAWAR
Class of town r---------------"'-----------------""'\
Function of town Total I II III IV-VI IV V VI
Totai
Agricultural
Port
1
Arlisan.
Manufacturing
2
112
40
20
2
15
3 4
3 5
1 2
1
Trade and Commerce 5 .. Transport 1 Service , 29 2
5.11 5 The West Coast Plains 5.1 Kutch and Kathiawar 5.11 Kutch.
This Division consists of one district Kutch. The chief crops are ;owar and the inferior millet bajra. Almost the sole cash crop is cotton. Population density is very low, being 42 persons per sq. mile, partly on account of' the vast uninhabited wastes of the Ranns. The proportion of scheduled
2
5 6
27 77
5 35
3 14
2
8 6
2 3
8 17
7
30
10
3
4
2
10
8
38
20
9
2
5
9
9
5
2
2
tribes (4.'7 per cent) and scheduled castes (9 per cent) are moderate. The strongest single language is Gujarati but its percentage is only 53.
The urban ratio, rate of natural increase and the proportion of children 0-4 to women 15-44 are moderately high. But the level of inmigration is. low.
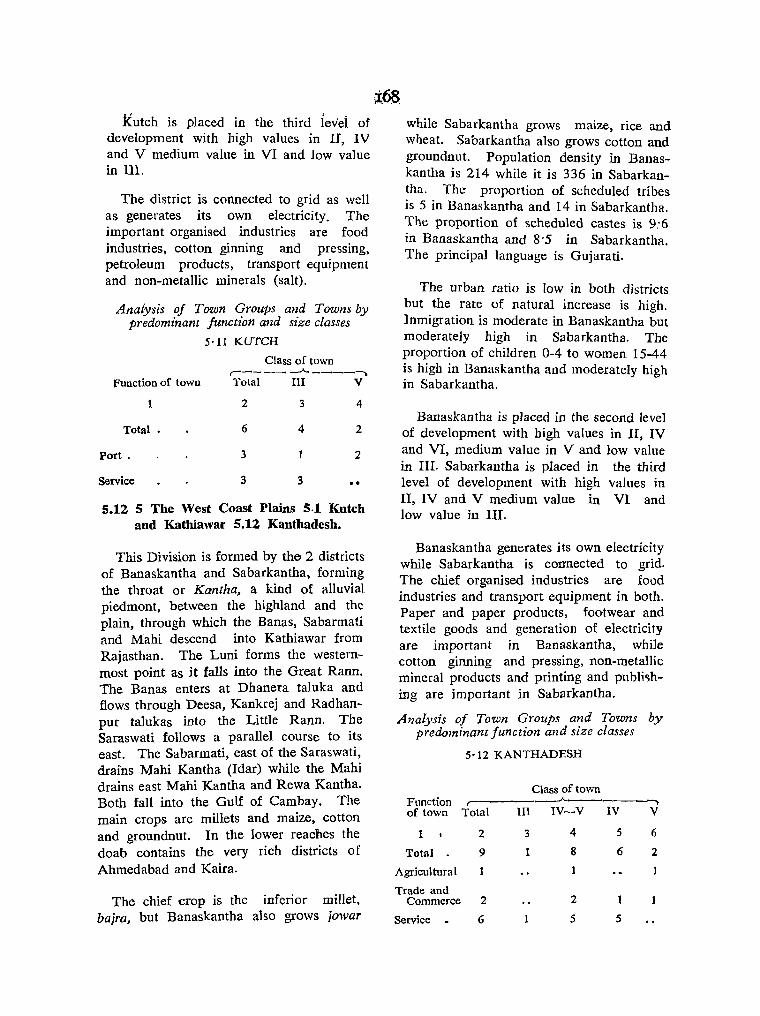
Kutch is placed in the third iev'ei of development with high values in II, IV and V medium value in VI and low value in Ill.
The district is connected to grid as well as generates its own electricity. The important organised industries are food industries, cotton ginning and pressing, petroleum products, tran.sport equipment and non-metallic minerals (salt).
AnaLysis oj Town qroups an_d Towns by predominant junctwn and Slze classes
5·11 KUTCH
Class of town ,..--- - --"- ------..
!:,unction of town Total III V
1 2 3 4
Total. 6 4 2
Port. 3 2
Service 3 3
S.12 5 The West Coast Plains 5.1 Kutch aud Kathiawar 5.12 Kanthadesh.
This Division is formed by the 2 districts of Banaskantha and Sabarkantha, forming the throat or Kantha, a kind of alluvial piedmont, between the highland and the plain, through which the Banas, Sabarmati and Mahi descend into Kathiawar from Rajasthan. The Luni forms the westernmost point as it falls into the Great Rann. The Banas enters at Dhanera taluka and flows through Deesa, Kankrej and Radhanpur talukas into the Little Rann. T~e Saraswati follows a parallel course to lts east. The Sabarmati, east of the Saraswati, drains Mahi Kantha (Idar) while the Mahi drains east Mahi Kantha and Rewa Kantha. Both fall into the Gulf of Cambay. The main crops are millets and maize, cotton and groundnut. In the lower reaches the doab contains the very rich districts of Ahmedabad and Kaira.
The chief crop is the inferior millet, bajra, but Banaskantha also grows jowar
while Sabarkantha grows maize, rice and wheat. Sabarkantha also grows cotton and groundnut. Population density in Banaskantha is 214 while it is 336 in Sabarkantha. The proportion of scheduled tribes is 5 in Banaskantha and 14 in Sabarkantha. The proportion of scheduled castes is 9.'6 in Banaskantha and 8'5 in Sabarkantha. The principal language is Gujarati.
The urban ratio is low in both districts but the rate of natural increase is high. Jnmigration is moderate in Banaskantha but moderately high in Sabarkantha. The proportion of children 0-4 to women 15-44 is high in Banaskantha and moderately high in Sabarkantha.
Banaskantha is placed in the second level of development with high values in II, IV and VI, medium value in V and low value in III. Sabarkantha is placed in the third level of development with high values in II, IV and V medium value in VI and low value in III.
Banaskantha generates its own electricity while Sabarkantha is connected to grid. The chief organised industries are food industries and transport equipment in both. Paper and paper products, footwear and textile goods and generation of electricity are important in Banaskantha, while cotton ginning and pressing, non-metallic mineral products and printing and pUbll<;hing are important in Sabarkantha.
Analysis of Town G_roups a1}d Towns by predominant junctxon and Slze classes
5'12 KANTHADESH
Class of town Function -"--------. of town Total Ul IV-V IV V
1 2 3 4 5 6
Total 9 1 8 6 2
Agricultural
Trade and Commerce 2 2
Service - 6 5 5

5.U S The West Coast Plains 5.1 Kutch and Kathiawar 5.13 Kathiawar.
The great mass of Kathiawar is formed of sheets <;If Deccan Lava, intersected by swarms of trap dykes. The actu~l edge of the lavas is marked by a discontinuous strip of laterite with much alluvium. Most of Kathiawar lies below 600 it., Iwt there are two hills masses: the longitudinal arc of Manday Hills east of Rajkot across ~ajkot, Amreli and Bhavnagar and the higher and bolder Girnar and Gir Ranges (up to 2,100/) in Junagadh and Amreli These two dissected plateaus have a radial drainage pattern. 'They are linked by a narrow and sinuous neck over 600' separating the two major rivers of Kathiawar, the Bhada'r (110 miles long) flowing west across Junagadh, and the Shetrunji east across Amreli .md Bhavnagar. A few miles west of this watershed rises the remarkable circular group of the Girnar Hills culminating in Gorakhnath, the highest point of Kathiawar (1,117m)'. (Spate).
Jamnagar has the Okha Rann in the western tip. The Barda Hills lie across the boundary of J unagadh and J amnagar in the west, the Alech Hills in southwest Rajkot. Gimar Hills are in J unagadh taluk of J unagadh. The rivers except for Bhadar and Shetrunji are engaged mostly in local drainage. The Bambha and the Kankavati drain north Surendranagar into the Little Rann; in the west from west to east the Vartu, the Bhadar and the OJ at drain southwest Junagadh while the Singavada and Machundri drain the southern end of Amreli. The Shetrunji drains Bhavnagar flowing southeasterly while the Bhogawa drains southern Surendranagar and Ahmedabad and falls into the Sabarmati in an easterly direction.
The banks of the streams are often badly gullied. 'The larger blocks of cultivation are, therefore, often located at the foot of the ridges or low plateaus or on
163 R.G.I.-23.
:r6g
the broader interfluves.' In the east the alluvial Gohilwad lowland along the Nal depression is well cultivated. Wheat is the main crop, followed by millets. Grourld water is brackish and the soil sandy along the Cambay coast. Large areas inland however are devoted to hajra,. wheat, cotton and jowar. Cotton is preeminent in the north in Surendranagar (Dhrangadhra-Wadhwan plateau), but the southern Sorath coast (Junagadh-Amreli) is unequal. The Bhadar and Ojat basins towaros the sea are dominated by salt marshes, but above them the 'gher' or sweet water lands in upper Junagadh and Rajkot raise rich crops of jowar, hajra, cotton, oilseeds and rice. Dwarka (Okha MandaI) and the Halar coast in J amnagar in the north again are agriculturally poor, the Halar being marshy creekland. Millets and oilseeds are grown but the chief wealth lies in the magnificient cattle of the Rabbaris. .
Villages over much of Kathiawar are strongly nucleated and large, 'sited on rises, bluffs along the valleys, hill-foot fans or river crossings'. In Halar and Kutch, however, they are often mere hamlets and great -stock corrals are prominent features of material culture. The village skyline has a peculiar Spanish flavour owing to the straight, angular roofs of crowded, stone houses.
This Division consists of 7 distrjcts all in Kathiawar: Mehsana, Surendranagar, Rajkot, Amreli, Junagadh, Bhavnagar and J amnagar. The whole of Kathiawar is a mille:t tract growing almost nothing else by way of food crops but bqjra and jowar. The principal cash crops are groundnut, which is extensive, and cotton. Population density is lowest in Surendranagar(169), low in J amnagar (206), Amreli(269), and Rajkot (283), but moderately high in J unagadh (304), Bhavnagar (313) and Mehsana (469). The proportion of scheduled tribes is negligible while that of
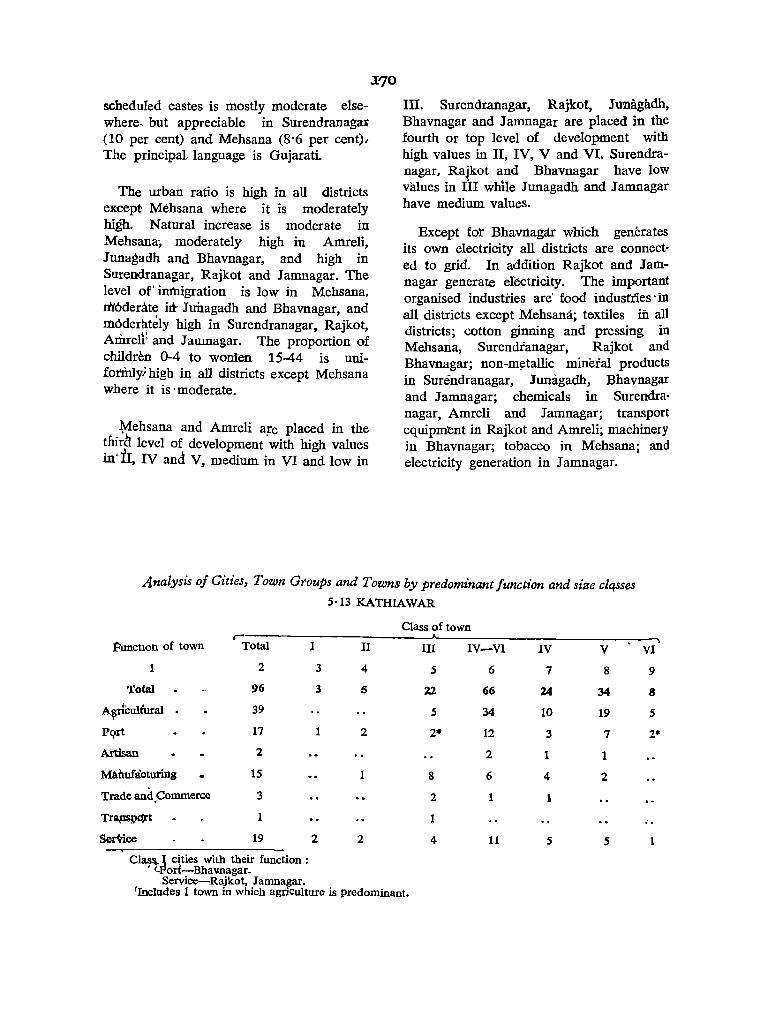
scheduled castes is mostly moderate elsewhere, but appreciable in Surendranagat (10 per cent) and Mehsana (8'6 per cent), The principal language is Gujarati.
The urban ratio is high in all districts except Mehsana where It IS moderately hig'h. Natural increase is moderate in Mehsana; moderately high in Amreli, Junagadh and Bhavnagar, and high in Surendranagar, Rajkot and Jamnagar. The level of' imnigration is low in Mehsana, :dt6derate iIi- Junagadh and Bhavnagar, and moderately high in Surendranagar, Rajkot, Ariuell: and J amnagar. The proportion of children 0-4 to women 15-44 is uniformly; high in all districts except Mehsana where it is' moderate.
~ehsana and Amreli are placed in the tI1irB level of development with high values in'iI, IV and V, medium in VI and low in
III. Surendranagar, Rajkot, Junagildh, Bhavnagar and J amnagar are placed in the fourth or top level of development with high values in II, IV, V and VI. Surendranagar, RaJkot and Bhavnagar have low values in III while Junagadh and Jamnagar have medium values.
Except for BhaVl1agar which generates its own electricity all districts are connected to grid. In addition Rajkot and Jamnagar generate electricity. The important organised industries are' food indusfties'in all districts except Mehsana; textiles iii all districts; cotton ginning and pressing in Mehsana, Surendianagar, Rajkot and Bhavnagar; non-m~tallic mineral products in Surendranagar, Jumigadh, Bhavnagar and J amnagar; chemicals in Surendranagar, Amreli and Jamnagar; transport equipment in Rajkot and Amreli; machinery in Bhavnagar; tobacco in Mehsana; and electricity generation in Jamnagar.
Analysis of Cities, Town Groups and Towns by predominant Junction and st'ze clqsses
5·13 KATHIAWAR
Class of town r-
Function of town Total I II III IV-VI IV V VI 1 2 3 4 5 6 7 8 9
Total 96 3 5 22 66 24 34 8
A~Culiural 39 5 34 10 19 5
pqrt 17 1 2 2· 12 3 7 2-
Artisan 2 2 1 1
Ma.nufacturing 15 1 8 6 4 2
Trade and,Commerce 3 2 1 1
Tr~!lqn 1 1 ; . Sem.ce 19 2 2 4 11 5 5
Clas~ J cities with their function : • t: ort-Bhavnagar.
Service-Rajkot, J amnagar. (Includes 1 town in which agriCulture is predominant.

Analysis of Town Groups and Towns by predominant function and 'size classes
S'13A DIU Class of town
Function of town
·1
Total
Service
r--- -A.-_----. Total VI
2
1
3
1
1
5.2 Gnjarat Plain and Dangs.
-Spate observes that 'Gujarat might almost be described as an intrusion of Indo-Gangetic conditions into the Peninsula: a great tract of alluvium formed by the Sabarmati, 'Mahi and minor parallel streams, .actively prograding into the 'Gulf of E:ambay'. This great shelf of firm alluvium is found in four sections, the first contaitied between Sabarmati in the west
I7I
and Mahi in the east (Ahmedabad and Kaira), the second between' the Mahi in the northeast and the Narmada (Panch-;mahals, Baroda and part of Broach), the third between the Narmada and the Tilpti· enclosing the southern half of Broach and the northern half of Surat, the fourth between the Tapti in the North and Damanganga in the South enclosing Surat and Dangs. The richest lands are in Kaira and· Baroda.
Villages are particularly large in Kaira, village sites in Gujarat Plains being mainly determined by fresh water poiilts. The village plans of Gujarat, published in th'e' Housing Report and Village Surveys show interesting zoning of the Kaliparaj or 'ies's favoured castes and the Upaliparaj or the higher castes. Poorer houses are generally of mud and grass with thatched roofs. Tiles and tin are a sign of prosperity.
Analysis of Cities, Town Groups and Towns by predominant function and size classes 5' 2 OUJARAT PLAIN AND DANOS
Class of town ----------___ --"-Function of town Total I
1 2 3
Total 6S 3
Agricultural . 9
Port 6 1
Artisan 4
Manufacturing 11 2
Trade and Commerce 4
Transport, 3
Service 28
5.~1 5 The West Coast Plains 5.2 Gujarat Plain and Dangs 5.21 Gujarat Plain.
This Division consists of 6 districts in the continental alluvium and shelf east of the Gulf of Cambay: Panchmahals, Ahmedabad. Kaira, Baroda, Broach and Surat. Rice is the principal crop in Panchmahals, Baroda and Surat, but millets are the prevailing crop of the division and whUe maize is important in Panchmahals,
II III IV-V IV V
4 5 6 7 8
5 13 44 23 21
1 8 1 7
2 2 1 1
1 3 3
2 2 5 2 3
3 1 1
3 2 1
1 4 23 15 8
wheat is a considerable crop in Ahmedabad and Broach. Cotton is important in every district while groundnut obtains m. . Panchmahals, Ahmedabad, Kaita and. Baroda.
Population density is fair in Broach. (299) but high in Panchmahals (426), Surat (503), Baroda (507), Ahmedab~d (642) and Kaira (740). The proportion of scheduled tribe!r is negligible in.·Ahmedabad and Kaira, moderatel" ·hig11,in'Baroda
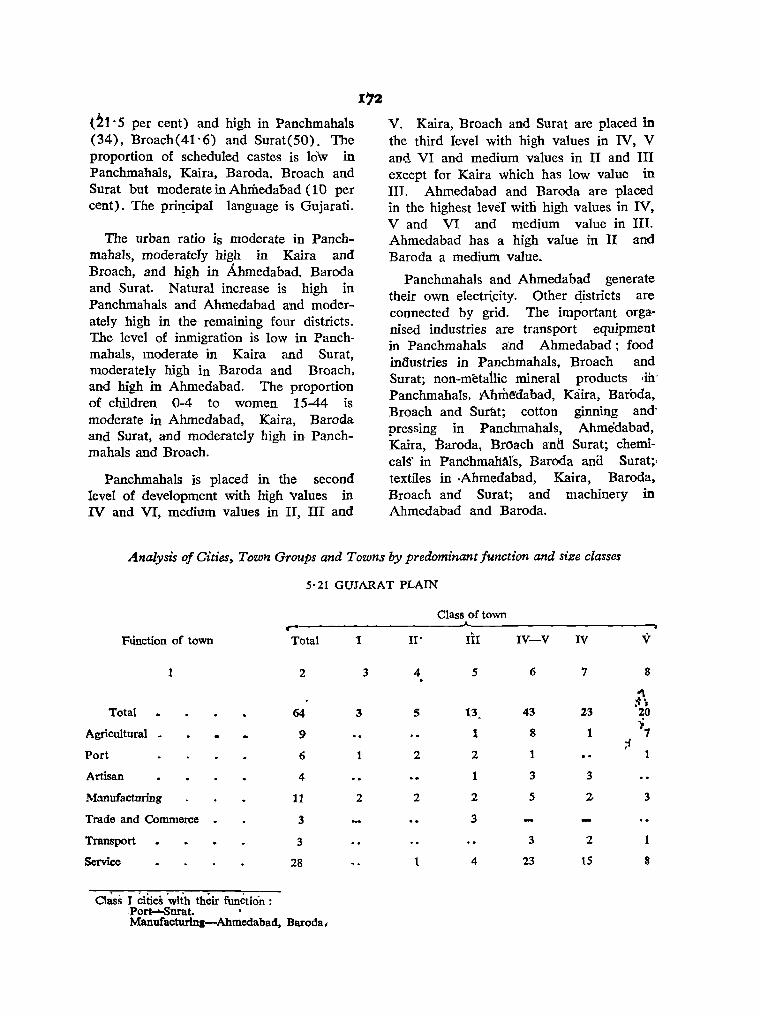
(~1' 5 per cent) and high in Panchmahals (34), Broach(41'6) and Surat(50). The proportion of scheduled castes is low in Panchmahals, Kaira, Baroda. Broach and Surat but moderate in Ahmedabad (10 per cent). The priJ!cipal language is Gujarati.
The urban ratio is moderate in PanchmahaIs, moderately high in Kaira and Broach, and high in Ahmedabad. Baroda and Surat. Natural increase is high in Panchmahals and Ahmedabad and moderately high in the remaining four districts. The level of inmigration is low in Panchmahals, moderate in Kaira and Surat, moderately high in Baroda and Broach, and high in Ahmedabad. The proportion of children 0-4 to women 15-44 is moderate in Ahmedabad, Kaira, Baroda and Surat, and moderately high in Panchmahals and Broach.
Pancbmahals is placed in the second level of development with high 'values in IV and VI, medium values in II, III and
V. Kaira, Broach and Surat are placed in the third revel with high values in IV, V am! VI and medium values in II and III except for Kaira which has low value in III. Ahmedabad and Baroda are placed in the highest lever with high values in IV, V and VI and medium value in III. Ahmedabad has a high value in II and Baroda a medium value.
Panchmahals and Ahmedabad generate their own electr~city. Other qistricts are connected by grid. The important organised industries are transport equipment in Panchmahals ahd Ahmedabad; food inoustries in Panchmahals, Broach and Surat; non-meta1lic mineral products ,ih' Panchmahals, Ahmedabad, Kaira, Baroda, Broach and Surat; cotton ginning and' pressing in Panchmahals, Ahmedabad, Kaira, Baroda, Broach anil Surat; chemicals' in PanchmahAfs, Baroda ana Surat;, textiles in -Ahmedabad, Kaira, Baroda, Broach and Surat; and machinery in Ahmedabad and Baroda.
Analysis of Cities, Town Groups and Towns by predominant function and size classes
5'21 GUJARAT PLAIN
r-Fdnction or town Total
1 2
Total 64
Agricultural - 9
Port 6
Artisan 4
Monufacturing 11
Trade and Commerce - 3
Transport 3
Service 28
Cl~ss I citieS 'with their funCtion : ,Po~urat. • Manuracturlna-Ahmcdabad, Baroda.
1 II"
3 4 . 3 5
1 2
2 2
1
Class of town
IV-V
5 6
13_ 43
1 8
2 1
1 3
2
3
4
5
3
23
IV V
7 8
4 :t~
Z3 ZO
1 )7 ;i
3
2 3
2 1
1.5 8
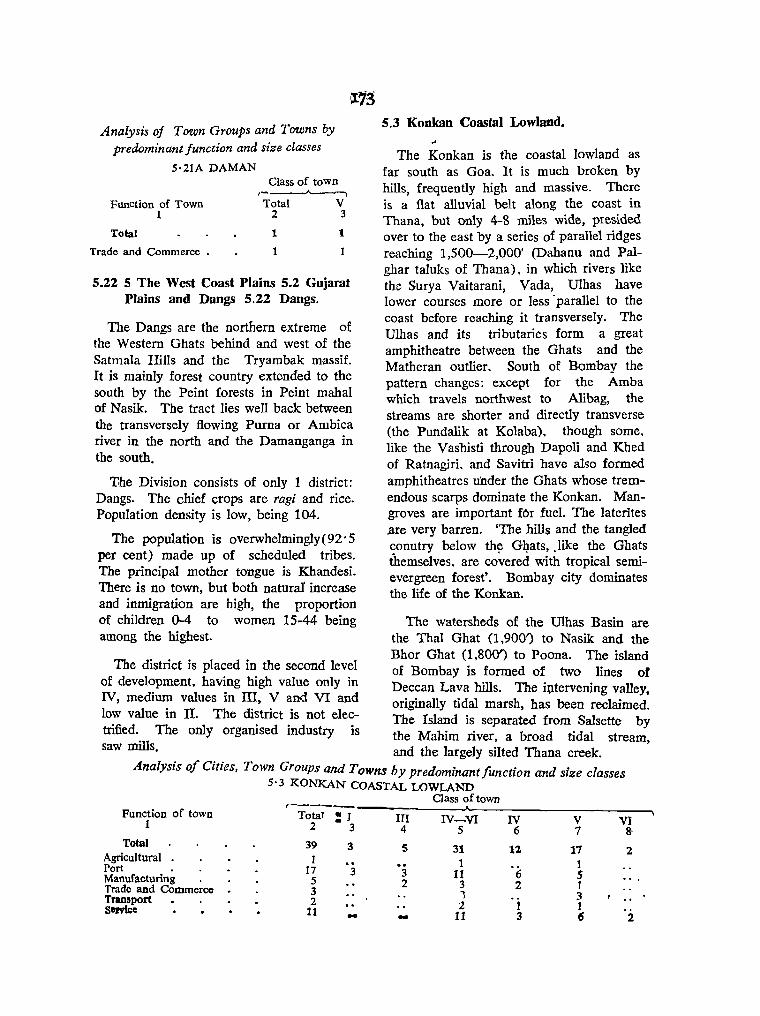
Analysis of Town Groups and Towns by predominant function and size classes
5·21A DAMAN
Function of Town 1
Total
Trade and Commerce .
Class of town ,-----'---, Total V
2 3
1
1
1
5.22 5 The West Coast Plains 5.2 Gujarat Plains and Dangs 5.22 Dangs.
The Dangs are the northern extreme of the Western Ghats behind and west of the Satmala Hills and the Tryambak massif. It is mainly forest country extended to the south by the Peint forests in Peint mahal of Nasik. The tract lies well back between the transversely flowing Puma or Ambica river in the north and the Damanganga in the south.
1ihe Division consists of only 1 district: Dangs. The chief crops are ragi and rice. Population density is low, being 104.
The population is overwhelmingly (92' 5 per cent) made up of scheduled tribes. The principal mother tongue is Khandesi. There is no town, but both natural' increase and inmigration are high, the proportion of children ()..4 to women 15-44 being among the highest.
5.3 Konkan Coastal Lowland. ..
The Konkan is the coastal lowland as far south as Goa. It is much broken by hills, frequently high and massive. The~e is a flat alluvial belt along the coast In
Thana, but only 4-8 miles wide, presided over to the east by a series of parallel ridges reaching 1,500-2,000' (Dahanu and Palghar taluks of Thana), in which rivers like the Surya Vaitarani, Vada, UIhas have lower courses more or less' parallel to the coast before reaching it transversely. The Ulhas and its tributaries form a great amphitheatre between the Ghats and the Matheran outlier. South of Bombay the pattern changes: except for the Amba which travels northwest to Alibag, the streams are shorter and directly transverse (the Pundalik at Kolaba), though some, like the Vashisti through Dapoli and Khed of Ratnagiri. and Savitri have also formed amphitheatres under the Ghats whose tremendous scarps dominate the Konkan. Mangroves are important fOr fuel. The laterites .are very barren. 'The hills and the tangled conutry below th~ GlJats, .like the Ghats themselves. are covered with tropical semievergreen forest'. Bombay city dominates the life of the Konkan.
The watersheds of the UIhas Basin are the ThaI Ghat (1,900') to Nasik and the Bhor Ghat (1,800') to Poona. The island
The district is placed in the second level of Bombay is formed of two lines of of development. having high value only in Deccan Lava hills. The iQtervening valley, IV, medium values in III, V and VI and originally tidal marsh, has been reclaimed. low value in n. The district is not elec- The Island is separated from Sal sette by trifled. The only organised industry is the Mahim river, a broad tidal stream, saw mills. and the largely silted Thana creek.
Analysis 0/ Cities, Town Groups and Towns by predominant/unction and size classes 5'3 KONKAN COASTAL LOWLAND
,-----Function of town Total : J III 1 2 3 4 Total 39 3 5
Agricultural 1 Port 17 3 3 Manufacturing . 5 2 Trade and Commerce . 3 Transport 2 servkC 11 - -
Class of town
IV-VI IV 5 6
31 12 1
11 '(; 3 2 1 :2 t
11 3
V 7
17 1 S 1 3 t 6
VI 8'
2
2
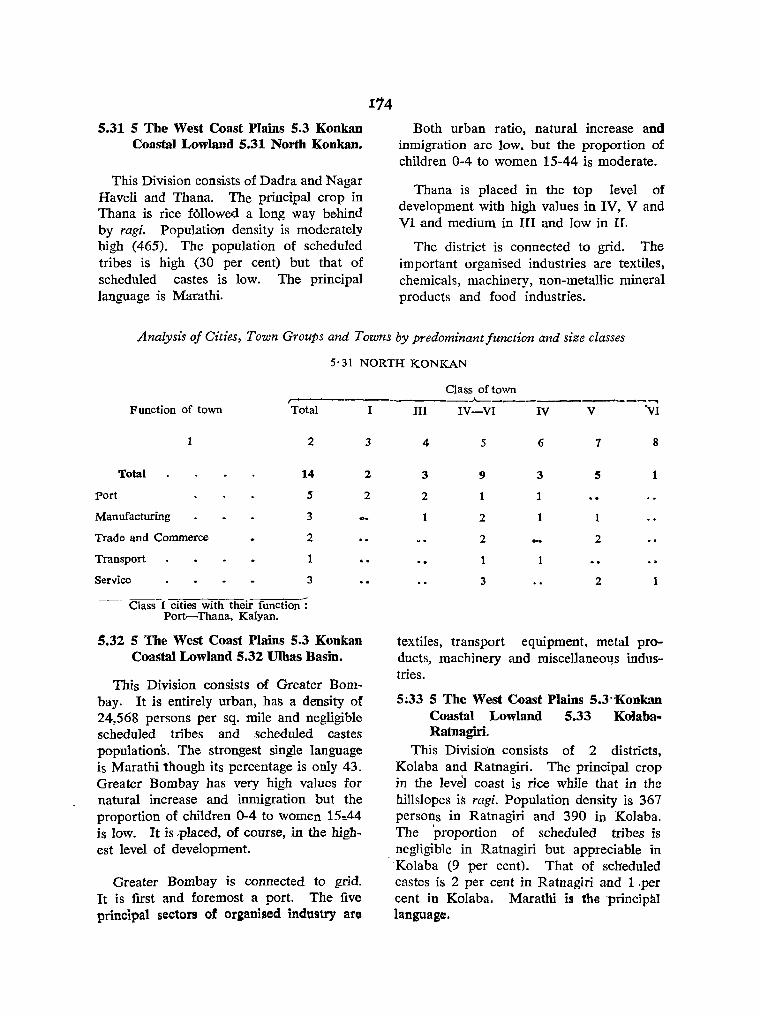
114 5.31 5 The West Coast Plains 5.3 Konkan
Coastal Lowland 5.31 North Kookan.
This Division consic;ts of Dadra and Nagar Haveli and Thana. The principal crop in Thana is rice f6110wed a long way be·hind by ragi. Population density is moderately high (465). The population of scheduled tribes is high (30 per cent) but that of scheduled castes is low. The principal language is Marathi.
Both urban ratio, natural increase and inmigration are low, but the proportion of children 0-4 to women 15-44 is moderate.
Thana is placed in the top level of development with high values in IV, V and VI and medium in III and low in U.
The district is connected to grid. The important organised industries are textiles, chemicals, machinery, non-metallic mineral products and food industries.
Analysis of Cities, Town Groups and Towns by predominant function and size classes
5·31 NORTH KONKAN
Class of town r-------------"--
Function of town Total I
2 3
Total 14 2
5 2 :Port
Manufacturing 3 ... Trade and Commerce
Transport
Service
2
1
3
Class I cities with their function: Port-Thana. Kalyan.
5.32 5 The West Coast Plains 5.3 Konkan Coastn} Lowland 5.32 Ulhas Basin.
This Division consists of Greater Bombay. It is entirely urban, has a density of 24,568 persons per sq. mile and negligible scheduled tribes and scheduled castes populations. The strongest single language is Marathi though its percentage is only 43. Greater Bombay has very high values for natural increase and inmigration but the proportion of children 0-4 to women 15:44 is low. It is ,placed, of course, in the highest level of development.
Greater Bombay is connected to grid. It is first and foremost a port. The five principal sectors of organised industry are
III IV-VI IV V
4 5 6 7 8
3 9 3 5 1
2 1 1
1 2 1
2 2
1
3 2 1
textiles, transport equipment, metal products, machinery and miscellaneo"Qs industries.
5:33 5 The West Coast Plains 5.3··Konkan Coastal Lowland 5.33 Kolaba-Ratnagiri.
This Division consists of 2 districts, Kolaba and Ratnagiri. The principal crop in the level coast is rice while that in the hlllsiopes is ragi. Population density is 367 persons in Ratnagiri and 390 in Kolaba. The proportion of scheduled tribes is
. negHgible in Ratnagiri but appreciable in Kolaba (9 per cent). That of scheduled castes is 2 per cent in Ratnagiri and 1 .per cent in Kolaba. Marathi is the 'principal language.
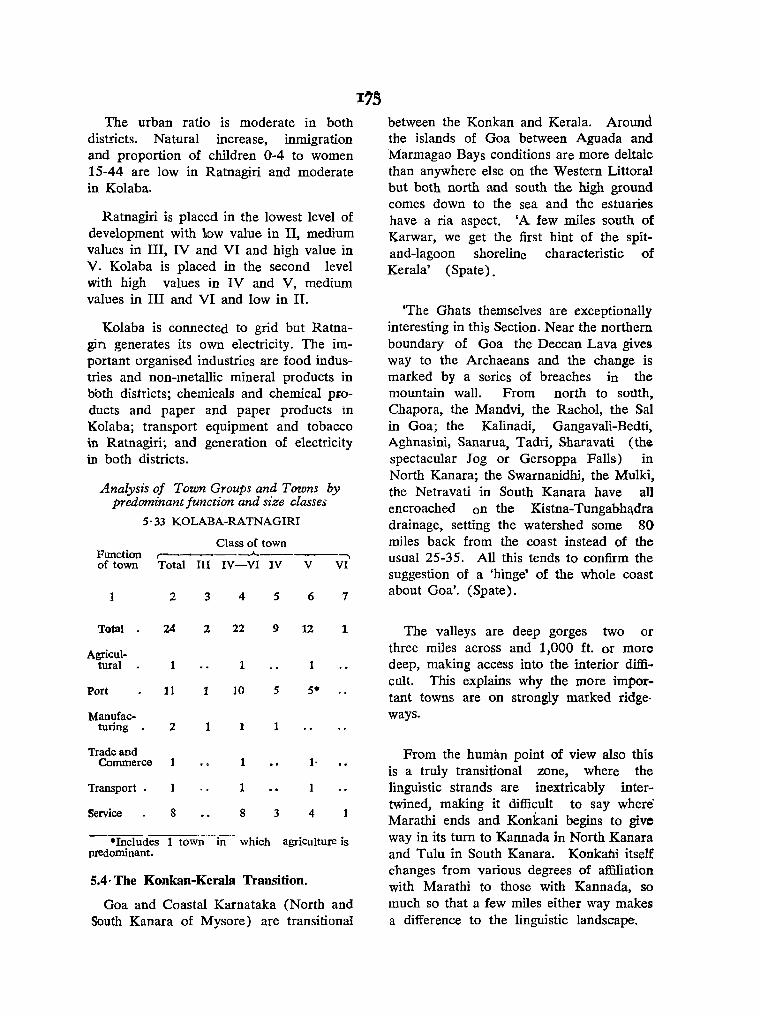
The urban ratio is moderate in both districts. Natural increase, inmigration and proportion of children O~4 to women 15-44 are low in Ratnagiri and moderate in Kolaba.
Ratnagiri is placed in the lowest level of development with low value in II, medium values in III, IV and VI and high value in V. Kolaba is placed in the second level with high values in IV and V, medium values in III and VI and low in II.
Kolaba is connected to grid but Ratnagin generates its own electricity. The important organised industries are food industries and non-metallic mineral products in both districts; chemicals and chemical products and paper and paper products in Kolaba; transport equipment and tobacco in Ratnagiri; and generation of electricity in both districts.
Analysis oj Town Groups and Towns by predominant junction and size classe~
5'33 KOLABA-RATNAGIRI
Class of town Function --A. ---........
of town Total III IV-VI IV V VI
2
Total 24
Agricul-tural 1
Port 11
Manufac-turing. 2
Trade and Commerce 1
Transport.
Service 8
3 4
2 22
1
1 10
1
1
1
8
5 6 7
9 12 1
1
5
1
1·
3 4 1
*Inc1udes 1 town '-in" which agriculture is predominant.
5.4- The Konkan-Kerala Transition.
Goa and Coastal Karnataka (North and South Kanara of Mysore) are transitional
between the Konkan and Kerala. Around. the islands of Goa between Aguada and Marmagao Bays conditions are more deltaic than anywhere else on the Western Littoral but both north and south the high ground comes down to the sea and the estuaries have a ria aspect. 'A few miles south of Karwar, we get the first hint of the spitand-lagoon shoreline characteristic of Kerala' (Spate) .
'The Ghats themselves are exceptionally interesting in this Section. Near the northern boundary of Goa the Deccan Lava gives way to the Archaeans and the change is marked by a series of breaches in the mountain wall. From north to south, Chapora, the Mandvi, the Rachol, the Sal in Goa; the Kalinadi, Gangavali-Bedti, Aghnasini, Sanarua, Tadri, Sharavati (the spectacular Jog or Gersoppa FallSl) in North Kanara; the Swamanidhi, the Mulki, the Netravati in South Kanara have all encroached on the Kistna-Tungabh~dra drainage, setting the watershed some 80 miles back from the coast instead of the usual 25-35. All this tends to confirm the suggestion of a 'hinge' of the whole coast about Goa'. (Spate).
The valleys are deep gorges two or three miles across and 1,000 ft. or morc deep, making access into the interior difficult. This explains why the more important towns are on strongly marked ridgeways.
From the human point of view also this is a truly transitional zone, where the linguistic strands are inextricably intertwined, making it difficult to say where Marathi ends and Konkani begins to give way in its turn to Kannada in North Kanara and Tulu in South Kanara. Konkabi itself changes from various degrees of affiliation with Marathi to those with Kannada, so much so that a few miles either way makes a difference to the linguistic landscape.
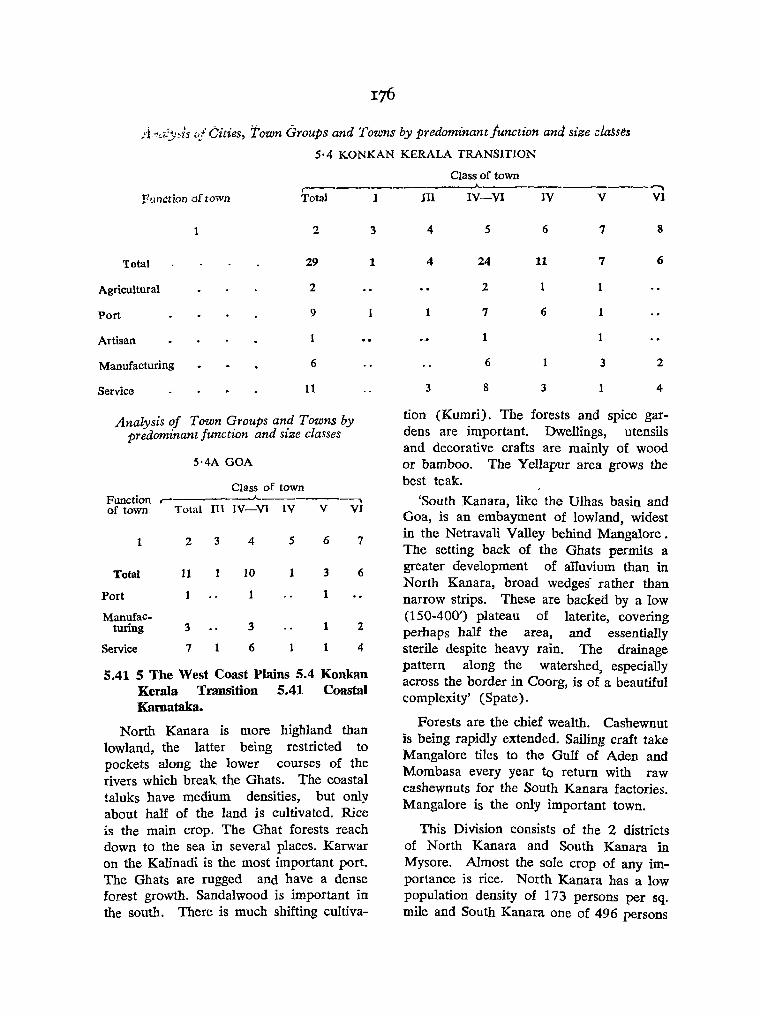
A'1c!:jl~-i5 (I/Cities, Town Groups and Towns by predominant Junction and size claSses
5·4 KONKAN KERALA TRANSITION
Class of town r-------------~-------------~
Function of town Total ] III IV-VI IV V VI
lotal
Agricultural
Port
Artisan
Manufacturing
Service
1 2
29
2
9
1
6
11
Analysis of Town Groups and Towns by predominant function and size classes
5·4A GOA
Class of town Function ,- -.A. _____ __.....,
of town Total III IV-VI IV V VI
1
Total
Port
Manufacturing
Service
2
11
3
7
3
1
4
10
3
6
5 6
3
1
1
1
7
6
2
4
5.41 5 The West Coast Plains 5.4 Konkan Kerala Transition 5.41 Coastal Karnataka.
North Kanara is more highland than lowland, the latter being restricted to pockets along the lower courses of the rivers which break the Ghats. The coastal taluks have medium densities, but only about half of the land is cultivated. Rice is the main crop. The Ghat forests reach down to the sea in several places. Karwar on the Kalinadi is the most important port. The Ghats are rugged and have a dense forest growth. Sandalwood is important in the sout.t,.. There is much shifting cultiva-
3
1
4
4
1
3
5
24
2
7
1
6
8
6
11
1
6
3
7 8
7 6
1
1
3 2
1 4
tion (Kumri). The forests and spice gardens are important. Dwellings, utensils and decorative crafts are mainly of wood or bamboo. The YeUapur area grows the best teak.
'South Kanara, like the UIhas basin and Goa, is an embayment of lowland, widest in the Netravali Valley behind Mangalore. The setting back of the Ghats permits a greater development of alluvium than in North Kanara, broad wedges' rather than narrow strips. These are backed. by a low (150-400') plateau of laterite, covering perhaps half the area, and essentially sterile despite heavy rain. The drainage pattern along the watershed, especially across the border in Coorg, is of a beautiful complexity' (Spate).
Forests are the chief wealth. Cashewnut is being rapidly extended. Sailinl~ craft take Mangalore tiles to the Gulf of Aden and Mombasa every year to return with raw cashewnuts for the South Kanara factories. Mangalore is the only important town.
This Division consists of the 2 districts of North Kanara and South Kanara in Mysore. Almost the sole crop of any importance is rice. North Kanara has a low population density of 173 persons per sq. mile and South Kanara one of 496 persons

per sq. mile. North Kanara has a negligible and South Kanara a small (3 per cent) scheduled tribe population. The proportion of scheduled castes in both is arouhd ~ per cent. The principal lan~uage !n North Kanara is Kannada and in South Kanara Tulu although in either place the strength of the principal language is only nioderate: 54 per cent Kannada' in North Kanara and 47 per cent Tulu in South Kanara.
The urban ratio is moderately high in both districts but while botli natural increase and in migration are high and moderately high in North Kanara, they a{e respectively moderate and loyrin Sout!} Kanara. The proportion of children 0-4 to women 15-44 is moderately high in North Kanara and moderate in South Kanara.
Both districts are placed in the thini level of development with identical rankings in the blocks: high in IV and V and medium in n. III and VI.
North Kanara generates its own electri· city while South Kanara is connected to grid. T.he important organised industries are: food industries and non-metallic mineral products (tiles) in both districts; paper mills, wood and transport equipment indnstry in North Kanara; textiles, printing and publishing and tobacco in South Kanara.
Analysis of Cities. Town Groups and T9wns by predominant function and size classes
5·41 COASTALKARNATAKA Class of town
Function ,-___ --A-______ _,....,,
of town Total T ITI IV-V IV V f 2 3 4 5 6 7
Total 18 1 3 14 10 4 Agricu1t'lral 2 2 1 1 Port 8 1 6 6* Artisan 1 Manufa( .
tur}ng 3 3 2 Service 4 2 2 2 -.--- _,---------
Class I cities with their function: Port-Mangalore.
-"'Includes 1 town in which agriculture is predomillant.
163 R.G.I.-24.
5.5 Kerala Coastal Plains--Western and Southern Ghats (South Sabyadri).
The Kerala Coastal Plains have been
divided into_ 2 Divisions; Malabar and
Kerala Coas.tal Plain.
In every respect Kerala is one of the
most distinctive tracts of India, the Kashmi r
of the south, but even more pleasing than
the Vale of Kashmir in certain ways. The
geI).eral tripartite longitudinal division runs
through the entire Subregion: alluvial
coastland including the lagoons and lakes.
the low lateritic plate(\us apd foothills ('th~
midlands') and the gneissic highlands. The
northern lowlands are more complex than
the southern. The great development of
lagoons and backwaters, saline or fresh,
with some artificial cuts, form splendid
waterways for about 150 miles from the
Ponnani mouth to Trivandrum. The largest
of these widens out south of Cochin and
east of Alleppey into Vembanad Lake,
where a very efficient feat of pumping.
draining and bunding has formed thf.
astonishing Kuttnad, a stupendous checker
board of the largest and best tended paddy
plots in India. The laterites form plateaus
at 200-600 ft. with much. grass and scrub
into which project spurs of the Anaimalai
Caroamom Hills which, south of Palghat,
have a strong southeast-northwest trend:
e.g. the Periyar Valley.
The more important rivers from north
to south are Valapattanam and Mahe
(Cannanore); Murat, Korappula, Chaliyar
and Chaliyam (Kozhikode); Ponnani (.PaI
ghat), Periyar (Kottayam-Ernakulam;
Pambiyar (Quiton and Alleppey).

17fi Analysis 0/ Cities, Town Groups and Towns by predominant/unction and size classes
5' 5 KERALA COASTAL PLAINS-WESTERN AND SOUTHERN GHATS (SOUTH SAHYADRI)
r-Function of i:own Total 1
2 3
Total 80 4
Agncultural 4
Port. 10 3
Artisan 6
Mal1ufactpring 21
11rausport 2
Service 37
5:51 ~~ The West Co'ast Plains 5.5 Kerala .Coastal Plains-Western and Southern Ghats ,(South Sahl,'adri) 5..51 Malabar 5.~lA MaJte.
·t!IThe .4 -districts in this Division are Capnal\ote" Kozqikode, Pall?Jhat and Mahe (rp!1,~i{;h~rry)., The 1110st il:Dportant crop 'is rice' in all three districts, a common feature of th"b coastal' plains. Palghat grows some groundnut.
Population density abruptly assumes larg~ proportions in 'this Division: 812 in £annanore, '897 in Pa1ghat, 1,018 in Kohzikode and 6,089 in Mllhe. The proportion of scheduled tribes is low in each district ,aqdpso ,is thllt of scheduled castes jn. rpl~aL wqere, it is 12 ,.per cent. . ~rinc~pal 1anguage. is Malayalam.
except The
It'-he, w:ban ratio is moderate in Palghat, ll)opetatel:r high in Cannanore and Kozhikude and high in Mahe. Natural increase is low (n Mahe ana Pa]ghat, moderately
high in Kozhikode and high in Cannanor~.
Class of town --,
II III IV-V IV V
4 5 6 7 8
4 25 47 31 16
4 3 1·
1 S t 1
3 3 2 1
4 17 12 S
2 1 1
3 13 20 12 8
Inmigration is high in Mah@, low in .PaIghat and moderate in Cannanore and Kozhikode. The proportion of children 0-4 to women 15-44 is low in Mahe am! Palghat anri moderate in Cannanore and Kozhikode.
Palghat is placed at the second level of development with high values in IV and V and medium values in II. III and VI. Cannanore and Kozhikode are placed in the third level with high values in IV and V and medium values in II and VI and medium value for Cannanore and low for Kozhilwde in III. Cannanore and Kozhi~ kode have similar trends in their development.
All districts are connected by grid. Tlle important organised industries are: timbering and saw milling in Kozhikode; pressed wood and h~rdboard in Cannan ore; steel rerolling in Kozhikode (Tellicherry); paper and wood pulp in Kozhikode (Mavur); textiles in Kozhikode and Cannanore; spinning and textiles in Palghat.
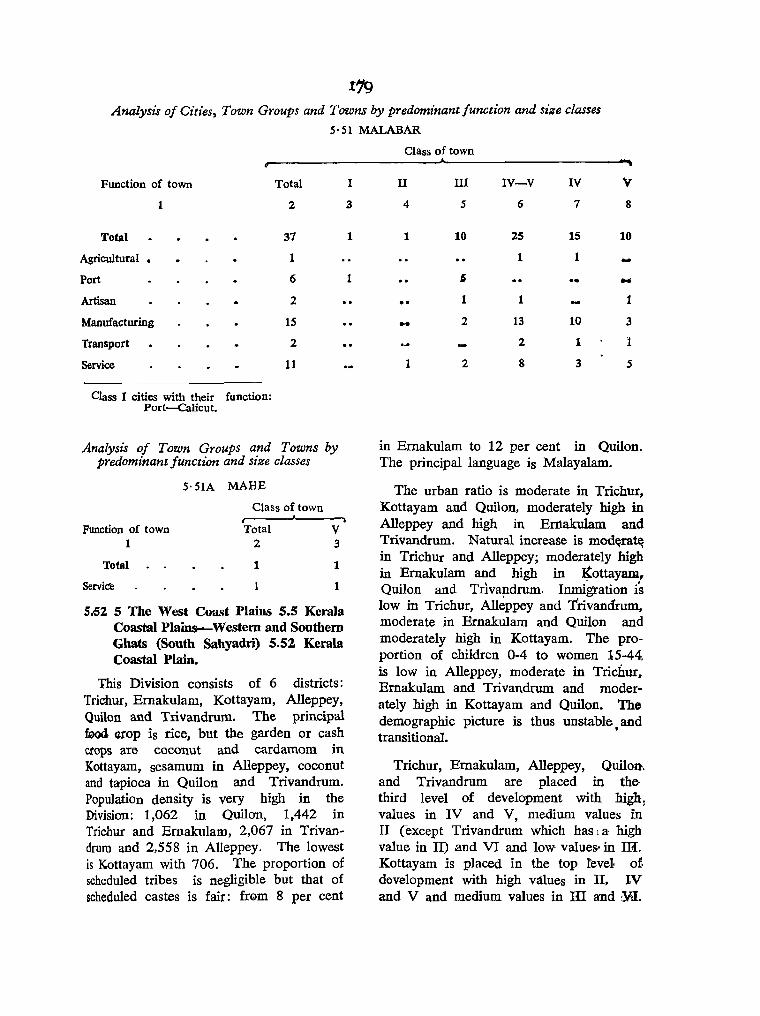
Analysis of Cities, Town Groups and Towns by predominant function and size classes
5·51 MALABAR
Function of town
Total
Agricultural •
Port
Artisan
Manufacturing
Transport
Service
1
Class I cities with their function: Port--<:alicut.
Total
2
37
1
6
2
15
2
11
Analysis of Town Groups and Towns by predominant function and size classes
Function of town 1
Total
Service
5·51A MAHE
Class of town
Total 2
1
V 3
1
1
5.62 5 The West Coast Plains 5.5 Kerala Coastal Plain&--Western and Sonthern Ghats (South Sahyadri) 5.52 Kerala Coastal Plain.
This Division consists of 6 districts: Trichur, Emakulam, Kottayam, Alleppey, Quilon and Trivandrutn. The principal food arop is rice, but the garden or cash crops are coconut and cardamom in Kottayam, sesamum in Alleppey, coconut and tapioca in Quilon and Trivandrum. Population density is very high in the Division: 1,062 in Quilon, 1,442 in Trichur and Ernakulam, 2,067 in Trivandrum and 2,558 in Alleppey. The lowest is Kottayam with 706. The proportion of scheduled tribes is negligible but that of scheduled castes is fair : fn~m 8 per cent
I
3
1
1
Class of town
II III N-V IV Y
4 5 6 7 8
1 10 25 15 10
1 1 -, .. ... .. 1 1 1
•• 2 13 10 3
2 1 1
2 8 3 5
in Ernakulam to 12 per cent in Quilon. The principal language is Malayalam.
The urban ratio is moderate in Trichur, Kottayam and Quilon, moderately high in AUeppey and high in Emakulam and Trivandrum. Natural increase is mod~t~ in Trichur and AUeppey; moderately high in Ernakulam and high in ~ottayamF Quilon and Trivap.drum. Inmigration is low in Trichur, AUeppey and Trivandrum, moderate in Ernakulam and Quilon and moderately high in Kottayam. The proportion of children 0-4 to women 15-44, is low in Alleppey, moderate in TricIiur. Ernakulam and Trivandrum and moderately high in Kottayam and Quilon. The demographic picture is thus unstable and • transitional.
Trichur, Ernakulam, AUeppey, Quilon. and Trivandrum are placed in thethird level of development with high: values in IV and V, medium values in II (except Trivandrum which has; a· high value in II) and VI and low values· in Ill. Kottayam is placed in the top revel. ot development with high vl1lues in II. IV and V and medium values in In and :W.
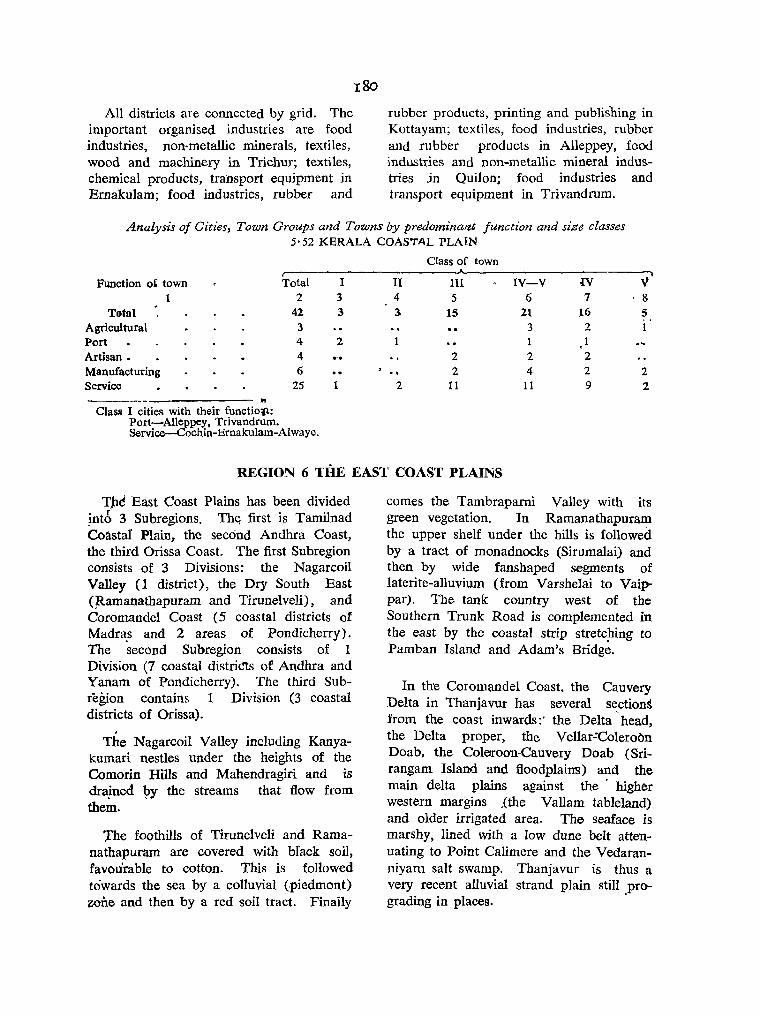
All districts are connected by grid. The important organised industries are food industries, non-metallic minerals, textiles, wood and machinery in Trichur; textiles, chemical products, trahsport equipment in Ernakulam; food industries, rubber and
180
rubber products, printing and publisning in Kottayam; textiles, food industries, rubber and rubber products in Alleppey, food industries and non-metallic mineral industries jn Quilon; food industries and transport equipment in Trivandrum.
Analysis of Cities, Town Groups and Towns by predominant function and size classes 5'52 KERALA COASTAL PLAIN
r-Function of town Total
1 2 Total 42
Agricultural 3 Port 4 Artisan. 4 Manufacturing 6 Service 25 ___ ~ __ ~.. li
elas$! I cities with their functiolt: Port-Alleppey, Trivandrum. Service-Cochin-Ernakulam-Alwaye.
I II 3 4 3 3-
2
2
Class of town
III IV-V 5 6
15 21 3 1
2 2 2 4
11 11
IV 7
16 2 1 2 2 9
" .8 5
2 2
REGION 6 THE EAST COAST PLAINS
TJl(~ East Coast Plains has been divided Jntb 3 Subregions. Th~ first is Tamilnad Coastal Plain, the second Andhra Coast, the third Orissa Coast. The first Subregion consists of 3 Divisions: the Nagarcoil Valley (1 district), the Dry South East (Ramanathapuram and Tirunelveli), and Coromande1 Coast (5 coastal districts of Madra,s and 2 areas of Pondicherry) . The second Subregion consists of 1 Division (7 coastal distri~s of Andhra and Yanam of Pondicherry). The third Subregton contains 1 Division (3 coastal districts of OriSlSa).
The Nagarcoil Valley including Kanyakumari nestles under the heights of the Comorin Hills and Mahendragiri and is draJned ?y the streams that flow from them.
'l'he foothills of Tirunelveli and Ramanathapuram are covered with bl'ack soil, favourable to cotton. This is followed towards the sea by a colluvial (piedmont) roue and then by a red soil tract. Finaily
comes the Tambraparni Valley with its green vegetation. In Ramll'nathapuram the upper shelf under the hills is followed by a tract of monadnocks (Sirumalai) and then by wide fanshaped segments of laterite-alluvium (from Varshelai to Vaippar). The tank country west of the Southern Trunk Road is complemented in the east by the coastal strip stretching to Pamban Island and Adam's Bridg~.
In tIre Coromandel Coast. the Cauvery Delta in Thanjavur has several sections from the coast inwards:' the Delta -head, the Delta proper, the Vellar:Coleroon Doab, the Coleroon-Cauvery Doab (Srirangam Island and floodplaim) and the main delta plains against the higher westem margins Jthe Vallam tableland) and older irrigated area. The seaface is marshy, lined with a low dune belt attenuating to Point Cali mere and the Vedaranniyam salt swamp. Thanjavur is thus a very recent alluvial strand plain still pro-grading in places. .

'181
The country north of Thanjavur from west to east proceeds from peneplained gneisses below the Tamilnad Hills through .rJ!Qln_ants of _marj.ne ~eposits to the Cud.d~lore sandstone faterite shelf. To the north, south of the Pulicat Lagoon, are embayments in the young alluvial plains (in Korteliyar-Cooum-Palar Valleys) and P.ondicherry (Ponnaiyar) . The Vellar basin serves as a transition to the Cauvery ~elta.
In the Andhra Coastal Plain the Nellore Ibwlands descend from the Archaean low peneplains to the coastal alluvium. Vijaywada is located at the heart of the Krishna Canal System and is important as an eh'trepot. The Krishna Delta is intensively iI:rigated and intersected by roads, rail,S and waterways, leading to heavy concentration of population. East of the Krishna
villages are small and scattered. West Godavari is placed in the Krishna-Godavari breach while East Godavari is formed by the Vashist and G~utami, the two mouths of the great Godavari. -The <lelta subsides to the subdeltaic margins, the delta proper, the sea face and the Ka11eru Lake. Visakhapatnam falls at the end of the Khondalite Zone dissected into peneplains. The main feature of Srikakulam is the Sileru trough, the Ganjam .1owlapqs overlooked by the lateritic foothills and the Waltair highlands.
In the Orissa Coastal Plain, apart from the great Chilka Lake, Puri is made by the Baitarani Valley while Cuttack is the gift of the • >Mahanadi-Brahmani basin. Balasore is formed by the deltas of. th~ Salandi, Barabalang and Subarnarekha rivers.
Analysis 0/ Cities, Town Groups "and Towns by predominant/unction and st'ze classes
6 THE EAST COAST PLAINS
Class of town
Function of town Total I II III IV-VI IV V -----...
ICVI
2 3 4 5 6 7 8 9
Total 287 15 15 62 195 103 76 16
Agricultural • 88 9 79 34 ,39. 6
Port 20 5 2 3 10 '1 3
Artisan 49 2 2 11 34 19 13 2
Manufacturing 39 3 5 9 22 14 5 3
Trade and Commerce 7 2 2 2 . Transport 2 2 1 1
Service 82 3 4 28 47 27 15 5

182
Analysis of Cities, Town Groups and Towns by predominant function and size classes
6'1 TAMILNAD COASTAL PLAIN
Class of town r----------------Jo-_ _________________ -, Function: of town "Total I II
2 3 4
TOOl' 180 6 12
Agricultural 51
Port 1~ 2 2
Artisan 33 2 2
Manufacturing 29 1 5
'fr!lde and C9mmerce 3 " Service . 51 2
6.11 6 The' East Coast Plains 6.1 Tamilnad Coastal Plain 6.11 Nagarcoil Valley.
This Division consists of 1 district, Kanyakumari. The sole crop is rice. Population density is very high, being 1,544 p~r sq. mile. Th'e proportion of scheduled tribes is negligible while that of sch~duled castes is low (4 per cent). The principal language is f Tamil.
The utifan ratio is moderately high. Natural increase is moderate, inmigration is low and so is the proportion of children 0-4 tlO women 15-44.
Kanyakumari is placed in the third level af development with high values in II, IV and V, medium value in VI and low value in m.
The district is connected to grid. The important organised industries are food,
III IV-VI IV
5 6 7
31 131 6:&
2 49 17
2 7 6
7 22 9
7 16 9
1 1
12 36 22
textiles, non-metallic transport equipment products.
V VI
8 9
52 is
26 6
1
11 2
5 2
.. 9 5
mineral products, and miscellaneous
Analysis of Cities, Town Groups and Towns by predominant function and size classes
6' 11 NAGARCOIL VALLEY
Class of town r---~
Function of town Total I IV
1 2 3 4
Total 4 1 3
Port 1 I
Artisan 1
Service 2 •• 2
Class I cities with their function: Artisan-Nagercoil.
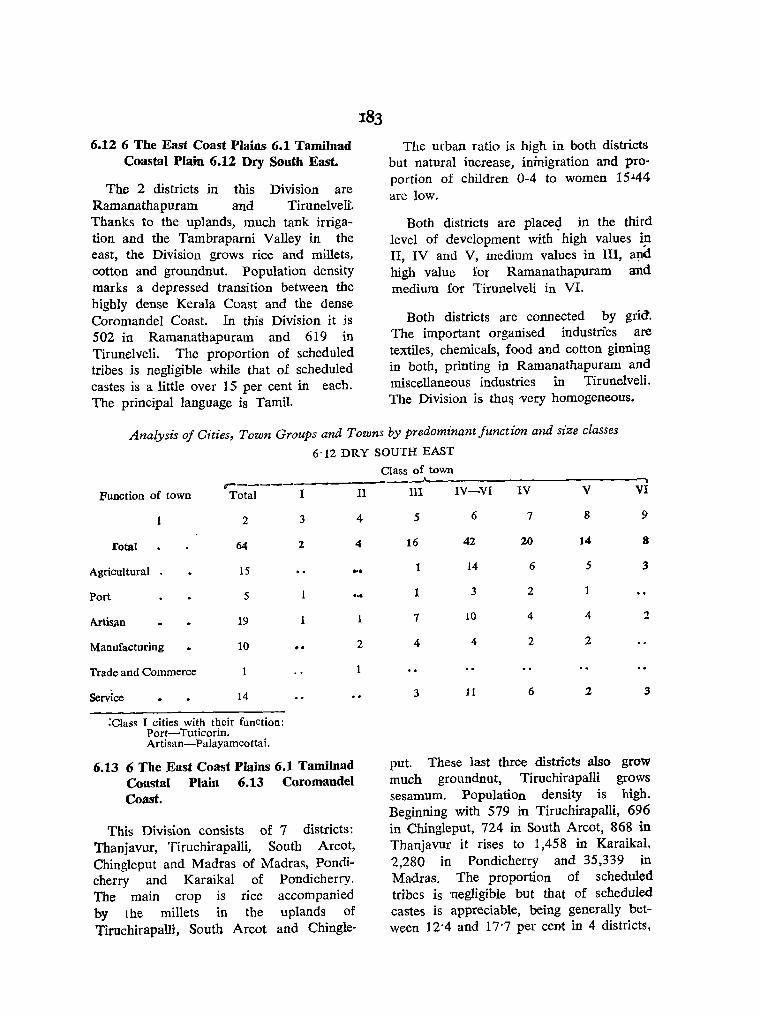
6.12 6 The East Coast Plains 6.1 Tamilnad Coastal Plain 6.12 Dry South East.
The 2 districts in this Division are Ramanathapuram and Tiruneivell. Thanks to the uplands, much tank irrigation and the Tambraparni Valley in the east, the Division grows rice and millets, cotton and groundnut. Population density marks a depressed transition between the highly dense Kerala Coast and the dense Coromandel Coast. In this Division it is 502 in Ramanathapuram and 619 in Tirunelveli. The proportion of scheduled tribes is negligible whiIe that of scheduled castes is a little over 15 per cent in each. The principal language is Tamil.
The urban ratio is high in both districts but natural increase, ininigration and proportion of children 0-4 to women 15"44 are low.
Both districts are place<J in the third level of development with high values in II, IV and V, medium values in Ill, apd high value for Ramanathapuram and medium for Tirunelveli in VI.
Both districts are connected by grid. The important organised industries are textiles, chemicals, food and cotton ginning in both, printing in Ramanathapuram and miscellaneous industries in Tirunelveli. The Division is thu~ 'Very homogeneous.
Analysis of Cities, Town Groups and Towns by predominant function and size classes
6·12 DRY SOUTH EAST
r Function of town Total I II
2 3 4
rotal 64 2 4
Agricultural 15
Port 5
Artisan 19
Manufacturing 10
Trade and Commerce
Service 14
:Class J cities with their function: Port-Tuticorin. Artisan-Palayamcottai.
6.13 6 The East Coast Plains 6.1 Tamilnad Coastal Plain 6.13 CoromandeI Coast.
This Division consists of 7 districts: Thanjavur, Tiruchirapalli, South Arcot, Chingleput and Madras of Madras, Pond icherry and Karaikal of Pondicherry. The main crop is rice accompanied by the millets in the uplands of TiruchirapalU, South Arcot and Chingle-
2
Class of town
III IV-VI IV V VI
5 6 7 8 9
16 42 20 14 8
1 14 6 5 3
1 3 2
7 10 4 4 2
4 4 2 2
3 11 6 2 3
put. These last three districts also grow much groundnut, Tiruchirapalli grows sesamum. Population density is high. Beginning with 579 in TiruchirapaIIi, 696 in Chingleput, 724 in South Arcot, 868 in Thanjavur it rises to 1,458 in Karaikal. 2,280 in Pondicherry and 35,339 in Madras. The proportion of scheduled tribes is negligible but that of scheduled castes is appreciable, being generally between 12·4 and 17'7 per cent in 4 districts.

2,3 per cent in Thanjavur, 26' 3 per cent in South,Areot and 28 per cent in Chingleput.. The principal language is Tamil.
The urban ratio is moderately high in Thanjavur, South Arcat, Chingleput, Pondicherry and Karaikal. Natural increase is' low in all districts except Karaikal where it is moderate and Madras where it is high. Inmigration is low in South Areat, moderate in Thanjavur and Tiruchirapalli, moderately high in Chingleput and high in Madras, Pondicherry and Km;aikaI. The proportion of children 0-4 to women 15-44 is low everywhere.
South Arcot is placed in the third level of development with high values in II and IV, medium values in III, V and VI. Madras is of course placed in the top level by rights. Thanjavur, Tiruehirapalli and Chingleput are placed in the highest level
a1'so, with high values for II, IV, V and VI and medium values in III.
All districts are connected by grid._ The important organised industries are food industries in Thanjavur, Tiruchirapalli and South Arcot; transport equipment in Thanjavur, Tiruchirapalli and Chingleput; textiles in Tiruchirapalli, South Arcat and Madras; printing. and publishing in Than"': javur, Tiruchirapalli and Madras; chemicals in Tbanjavur and Chingleput; electrical machinery in South Arcot a{ld machinery in South Areot, Chingleput and Madras; non-metallic mineral prodpcts it}
Tiruchirapalli and South Arcot; tobacco in Thanjavur; leather products in Chingleput and metal products in Madras. The new heavy electrical machinery project in Tiruchirapalli is going to give a great fillip to industrial activity in this Division.
Analysis oj Cities, Town Groups and Towns by predominant Junction and size classes
6·13 COROMANDEL COAST
Class of town ~---------------~ V
. Function of town Total I n III IV-VI TV VI
2 3 4 5 6 7 8 9
Total 112 3 8 15 86 41 3~ 7
Agricultural 36 35 11 21 3
p~:r 7 2 3 3 C
Artis<ln 13 12. 5 1
Manufacturing 19 3 3 12 7 3 2
Trade and Commerce 2
S~ryice 35 2 9 23 14 7 2
Class T cities with their fU'-1ction : Port-Madras. Manufacturing-Tiruct!irapalli. Service-Thanjavur.
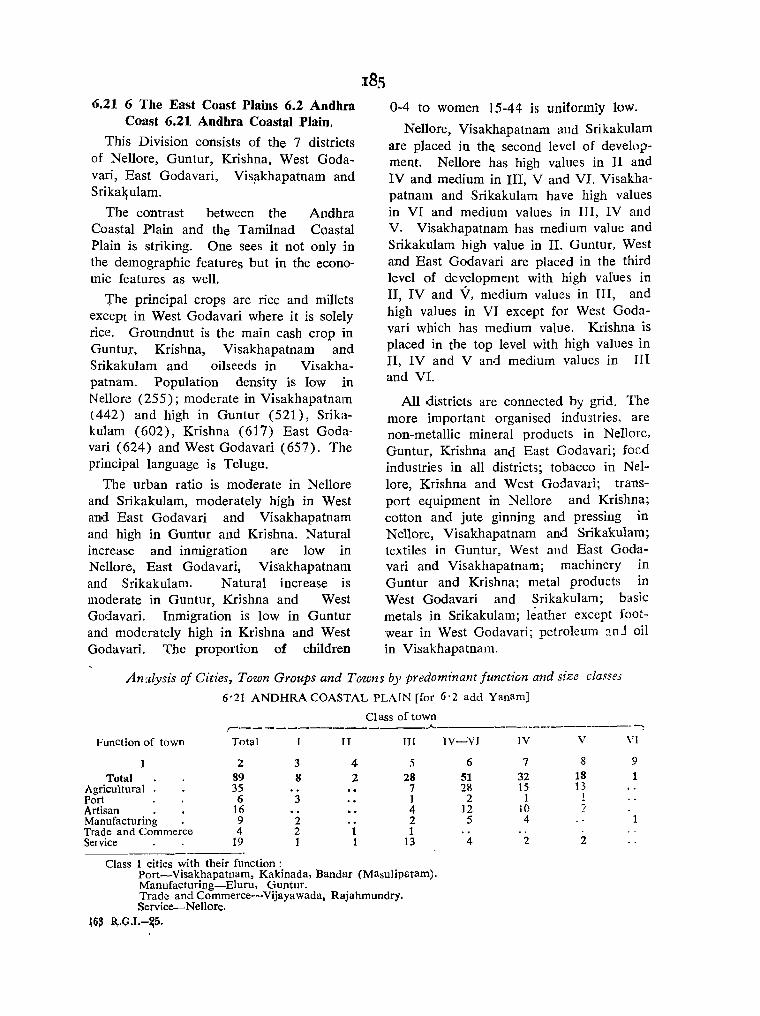
6.21 6 The East Coast Plains 6.2 Andhra Coast 6.21 Andhra Coastal Plain.
This Division consists of the 7 districts of Nellore, Guntur, Krishna, West Godavari, East Godavari, Visllkhapatnam and Srikal)ulam.
The contrast between the Andhra Coastal Plain and the Tamilnad Coastal Plain is striking. One sees it not only in the demographic features but in the economic features as well.
The principal crops are rice and millets except in West Godavari where it is solely rice. Groundnut is the main cash crop in Guntu,r, Krishna, Visakhapatnam and Srikakulam and oilseeds in Visakhapatnam. Population density is low in Nellore (255); moderate in Visakhapatnam (442) and high in Guntur (521), Srikakulam (602), Krishna (617) East Goda· vari (624) and West Godavari (657). The principal language is Telugu.
The urban ratio is moderate in Nellore and Srikakulam, moderately high in West and East Godavari and Visakhapatnam and high in Guntur and Krishna. Natural increase and inmigration are low in Nellore, East Godavari, Visakhapatnam and Srikakulam. Natural increase is moderate in Guntur, Krishna and West Godavari. Inmigration is low in Guntur and moderately high in Krishna and West Goda.vari. The proportion of children
0-4 to women 15-44 is unifonniy low.
Nellore, Visakhapatnam and Srikakulam are placed in th~ second level of development. Nellore has high values in II and IV and medium in III, V and VI. Visakhapatnam and Srikakulam have high values in VI and medium values in Ill, IV and V. Visakhapatnam has medium value and Srikakulam high value in II. Guntur, West and East Godavari are placed in the third level of development with high varues in II, IV and V, medium values in III, and high values in VI except for West Godavari which has medium value. Krishna is placed in the top level with high values in II, IV and V and medium values in III and VI.
All districts are connected by grid. The more important organised indmtries, are non-metallic mineral products in Nellore, Guntur, Krishna and East Godavari; food industries in all districts; tobacco in Nellore, Krishna and West Godavari; transport equipment in Nel10re and Krishna; cotton and jute ginning and pressing in Nellore, Visakhapatnam and Srikakulam; textiles in Guntur, West and East Godavari and Visakhapatnam; machinery in Guntur and Krishna; metal products in West Godavari and Srikakulam; basic metals in Srikakulam; leather except footwear in West Godavari; petroleum anJ oil in Visakhapatnam.
Analysis oj Cities, Town Groups and Towns by predominant Junction and size cla..~se,
6'21 ANDHRA COASTAL PLAIN [for 6'2 add Yanam]
Class of town ,---- .A.
Function of town Total II m
1 Z 3 4 ;'i
Total 89 8 2 28 Agricultural 35 7 Port 6 3 1 Artisan 16 4 Manufacturing 9 2 2 Trade and Commerce 4 2 1 1 Service 19 1 1 13
Class I cities with their function: Port-Visakhapatnam, Kakinada, Bandar (Masulipatam). Manufacturing-Blum, Guntur. Trade and Commerce-Vijayawada. Rajahmundry. Service-Nellore.
t6~ R.G.l.-~5.
--_._------, IV-VI IV V VI
6 7 8 9
51 32 18 1 28 15 13
2 1 12 10 ? 5 4
4 2 2

Analysis oj Town Groups and Towns by predominant junction and st'ze classes
6·21A YANAM
Class of town r----A--.--,
Function of town Total V
1 2 3
Total. 1 1
Service 1 1
6.31 6 The East Coast Plains 6.3 Orissa Coast 6.31 Orissa Coastal Plain.
The 3 districts in this Division are Puri, Cuttack and Balasore. Almost the sole crop is rice, but oilseeds are also grown in small quantities.
Population density is moderately high: 461 in Puri, 565 in Balasore, 727 in Cuttack. The proportion of scheduled tribes is low in Purl and Cuttack but moderate in Balasore (6'8 per cent); that of scheduled castes is appreciable in
186
all districts (14 per cent in Puri, 18 in Cuttack and 19 in Balasore). The principal language is Oriya.
The ur1;>an ratio is low in Barasore and moderate in Puri and Cuttack. Natural increase ii? moderate in Puri and Cuttack and high in Balasore. Inmigration and proportion of children 0-4 to women 15-44 are low everywhere, the latter being moderate in Balasore.
Puri is placed 'in the lowest level of development with high values only in II and IV, medium value in V and low values in III and VI. Cuttack and Balasore are placed in the second level with high values in II and IV, low values in III and VI, and medium value in V.
All districts are connected to grid. The important organised industries are basic metals in Puri and Cuttack; food industries in Puri and Balasore; textiles in all three districts; wood industries in Puri and Balas-ore; paper in Cuttack; machinery in Balasore; printing and publishing in Cuttack; tobacco in Puri.
Analysis of Cities, Town Groups and Towns by predominant junction and size classes
6'3 ORISSA COAST AND 6'31 ORISSA COASTAL PLAIN
Class of town .. __________________ ~A _________________________ ~
Function of town Total I
2 3
Total 17 1
Agril;ultural 2 -Port 1
Manufacturing
Transport 2
Service 11 1
------------Class I cities with their function - :
ServiQe-CUttack. -
II IIIJ~1 PV-V
4 6
1 3 12
2
- 2
1 3 6
IV..J
7
2
1
;I
V
8
5
1
3
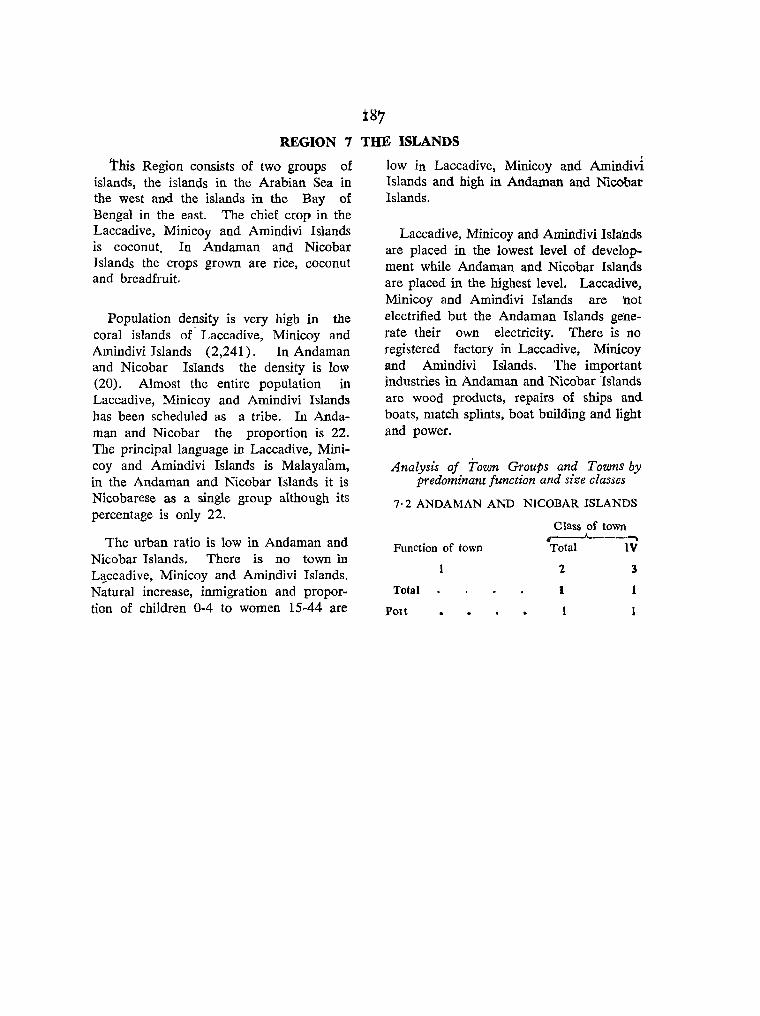
187 REGION 7 THE ISLANDS
'this Region consists of two groups of islands, the islands in the Arabian Sea in the west and the islands in the Bay of Bengal in the east. The chief crop in the Laccadive, Minicoy and Amindivi Islands is coconut. In Andaman and Nicobar lslands the crops grown are rice, coconut and breadfruit.
Population density is very high in the coral islands of Laccadive, Minicoy and Amindivi Islands (2,241). In Andaman and Nicobar Islands the density is low (20). Almost the entire population in Laccadive, Minicoy and Amindivi Islands has been scheduled as a tribe. In Andaman and Nicobar the proportion is 22. The principal language in Laccadive, Minicoy and Amindivi Islands is Malayaiam, in the Andaman and Nicobar Islands it is Nicobarese as a single group although its percentage is only 22.
The urban ratio is low in Andaman and Nicobar Islands. There is no town In L~ccadive, Minicoy and Amindivi Islands. Natural increase, illmigration and proportion of children 0-4 to women 15-44 are
low in Laccadive, Minicoy and Amindivi Islands and high in Andaman and Nicobar Islands.
Laccadive, Minicoy and Arnindivi Islands are placed in the lowest level of development while Andaman and Nicobar Islands are placed in the highest level. Laccadive, Minicoy and Amindivi Islands are not electrified but the Andaman Islands generate their own electricity. There is no registered factory in Laccadive, Minicoy and Amindivi Islands. The important industries in Andaman and Nicobar Islands are wood products, repairs of ships and boats, match splints, boat building and light and power.
Analysis of Town Groups and Towns by predominant function and size classes
7·2 ANDAMAN AND NICOBAR ISLANDS
Function of town
Total
POlt
1
C lass of town
~----Total IV
2
1
3
1

CHAPTER tv ASSOCIATION OF CHARACTERISTICS
TABLE IV·} ARRANGES THE districts of India according to the four levels of development under their respective natural regions, subregions and divisions and gives for each (a) the total number of registered factories, (b) the total number of workers in registered factories, (c) the number of factories employing (i) 20-99 workers and (ii) 100 or more workers in (1) rice mills, (2) atta mills, (3) dal mills, (4) sugarcane mills, (5) edible oil mills, (6) hydrogenated oil mills, (7) jute and cotton gins and presses and (8) tobacco factories. Table IV.1 is thus mainly devoted to agro industries which process food and cash crops grown in the locality or environs.
Table IV.2 arranges. the districts of India according to the four levels of development under their respective natural regions, subregions and divisions and gives for each (1) whether the district town generates its own electricity or is connected to grid or both or none, (2) urban population per 1,000 of total population (3) urban workers per 1,000 of total population, (4) number of class I Cities/ Town Groups, (5) number of Cities, Town Groups and Towns by function. (6) total number of registered factories, (7) total number of workers in registered factories, (8) number of workers in registered factories per 100 of total workers and (9) the number of factories in 20 selected non-agricultural industries classified according to employment by 100+, 1,000+ and 2,000+.
Table IV.3 gives for each district arranged by level of development under each State the percentage of area under cash crops relative to magnitude of workers
189
in registered factories engaged in processing the respective crop.
We may now examine whether there is any noticeable association between values in each of the five blocks (II, III, IV, V and VI) on the one hand and the four levels of development determined by the combinded scores on the other.
Broadly speaking, the five index blocks stand for the following universes: Block II: Agricultural Infrastructure Block III : Participation rates in traditional sector Block IV : Potential of human resources Block V : Distributive trade, manufacturing and
infrastructure Block VI : Organised indUstrial activity in the
modern sector
The values under each block were graded as follows : Value A = Where the total sCore is less than 20 for
the blocks I I, i II, IV and V and less than 5, for block VI
Value B = Where the tctal score is between 20 and 30 for the blocks II, HI, IV and V and between 5 and 10 for block VI
Value C = Where the total score is more than 30 for the blocks II, III,I V and V and more than 10 for. block VI
It has already been seen in Table IV.2 how organised industrial activity is concentrated in precisely those districts which have attained a hig4 level of development in other blocks also. Table IV.2 gives statistical proof for the first time on the national scale' of the positive association between industrial growth on the one hand and improvements in agricultural infrastructure, potential of human resources, distributive trade, manufacturing and infrastructure on the other.
The following statement illustrates the distribution of districts in each block by (a) low, medium and high values in (b) each of the four levels of development.
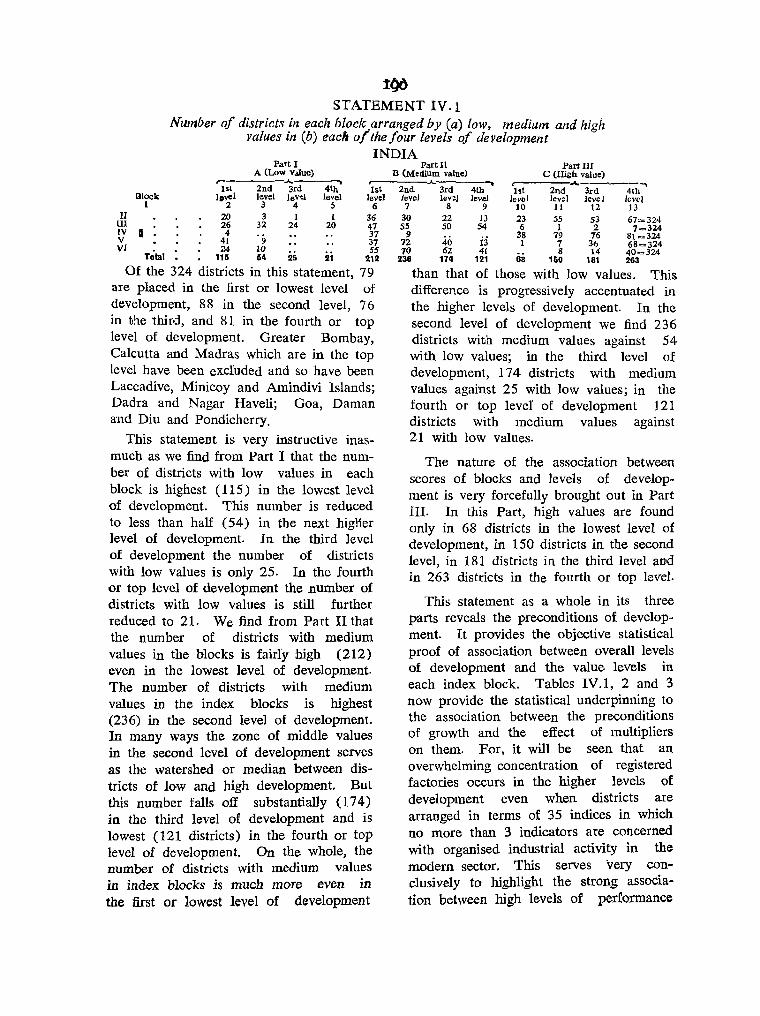
STATEMENT IV.l Number of districts .in each block arranged by (a) low, medium and high
values m (b) each o/the four levels of development INDIA
Block 1
II m IV I : v
Part I A (Low V,due)
~ ~----~ 1st 2nd Srd 4th 1st
lovel level lev'>l level level 2 3 4 5 6
20 3 1 1 36 2: 32 24 20 47 41 9 37
VI 24 10 37 Total 115 64 25 21 2~i
Of the 324 districts in this statement, 79 are placed in the first or lowest level of development, 88 in the second level, 76 in the third, and 81 in the fourth or top level of development. Greater Bombay, Calcutta and Madras which are in the top level have been excluded and so ha veo been Laccadive, Minicoy and Amindivi Islands; Dadra and Nagar Haveli; Goa, Daman and Diu and Pondicherry.
This statement is very instructive inasmuch as we find from Part I that the number of districts with low values in each block is highest (115) in the lowest level of development. This number is reduced to less than half (54) in the next hi_gll1er level of development. In the third level of development the number of districts with low values is only 25. In the fourth or top level of development the number of districts with low values is still further reduced to 21. We find from Part II that the number of districts with medium values in the blocks is fairly high (212) even in the lowest level of development. The number of districts with medium values in the index blocks is highest (236) in the second level of development. In many ways the zone of middle values in the second level of development serves as the watershed or median between districts of low and high development. But this number falls off substantially (174) in the third level of development and is lowest (121 districts) in the fourth or top level of development. On the whole, the number of districts with medium values in index blocks is much more even in the first or lowest level of development
Part n Part III B (Medium value) C (High value)
A , r 4--------2nd 3rd 4th lot 2nd 3rd 4,h -. level level level levol lev~l level level 7 8 9 10 11 12 13
30 22 13 23 S5 53 67= 32<1-55 50 S4 6 1 2 7=324 7~ 4·0· 1'3' 38 79 76 81 =324
1 7 36 68=324 70 62 41 ., 8 14 40=324
236 174 121 68 150 181 263
than that of those with low values. This difference is progressively accentuated in the higher levels of development. In the second level of development we find 236 districts with medium values against 54 with low values; in the third level of development, 174 districts with medium values against 25 with low values; in the fourth or top leveI of development 121 districts with medium values against 21 with low values.
The nature of the association between scores of blocks and levels of development is very forcefully brought out in Part III. In this Part, high values are found only in 68 districts in the lowest level of development, in 150 districts in the second level, in 181 districts in the third level and in 263 districts in the fourth or top level.
This statement as a whole in its three parts reveals the preconditions of development. It provides the objective statistical proof of association between overall levels of development and the value levels in each index block. Tables IV.1, 2 and 3 now provide the statistical underpinning to the association between the preconditions of growth and the effect of multipliers on them. For, it will be seen that an overwhelming concentration of registered factories occurs in the higher levels of development even when districts are arranged in terms of 35 indices in which no more than 3 indicators are concerned with organised industrial activity in the modem sector. This serves very conclusively to highlight the strong association between high levels of performance
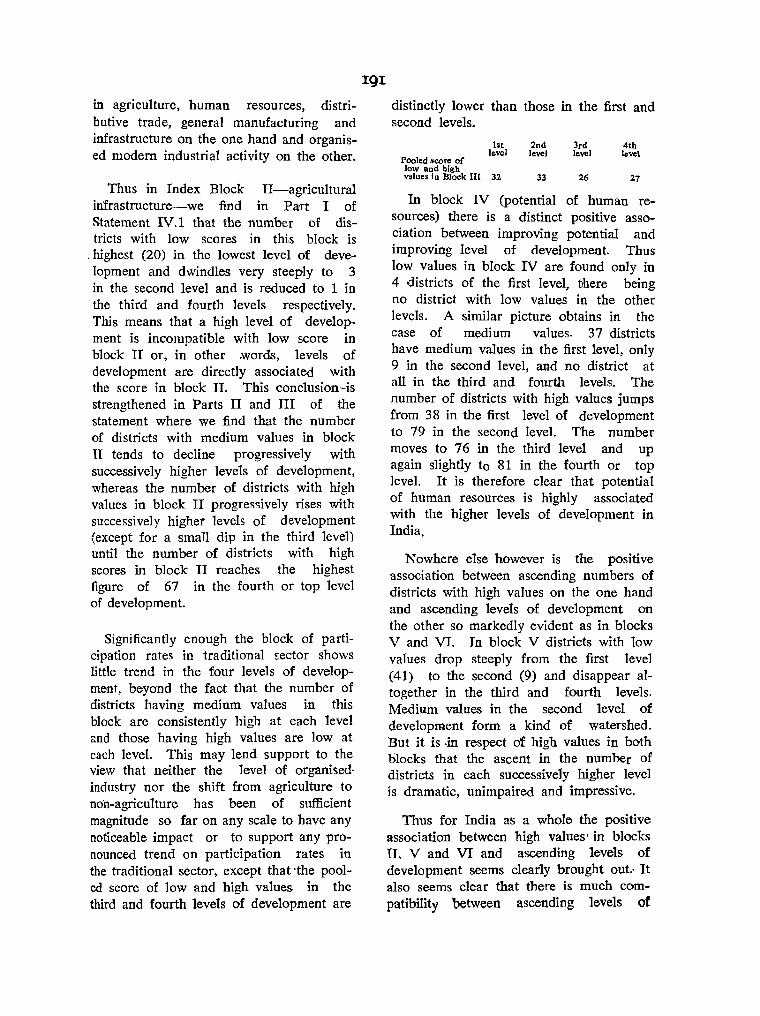
in agriculture, human resources, distributive trade, general manufacturing and infrastructure on the one hand and organised modem industrial activity on the other.
Thus in Index Block II-agricultural infrastructure-we find in Part I of Statement IV.l that the number of districts with low scores in this block is
,highest (20) in the lowest level of development and dwindles very steeply to 3 in the second level and is rednced to 1 in the third and fourth levels respectively. This means that a high level of development is incompatible with low score in block II or, in other ;words, levels of development are directly associated with the score in block II. This conclusion -is strengthened in Parts II and III of the statement where we find that the number of districts with medium values in block II tends to decline progressively with successively higher levels of development, whereas the number of districts with high values in block II progressively rises with successively higher levels of development (except for a small dip in the third level) until the number of districts with high scores in block II reaches the highest figure of 67 in the fourth or top level of development.
Significantly enough the block of participation rates in traditional Eector shows little trend in the four levels of development, beyond the fact that the number of districts having medinm values in this block are consistently high at each level and those having high values are low at each level. This may lend support to the view that neither the level of organised· industry nor the shift from agriculture to non-agriculture has been of sufficient magnitude so far on any scale to have any noticeable impact or to support any pronounced trend on participation rates in the traditional sector, except that ·the pooled score of low and high values in the third and fourth levels of development are
191
distinctly lower than those in the first and second levels.
Pooled Bcore of low and bigh
1st level
vdues in Block fit 32
2nd level
33
3ed level
26
4th level
27
In block IV (potential of human resources) there is a distinct positive association between improving potential and improving level of development. Thus low values in block IV are found only in 4 districts of the first level, there being no district with low values in the other levels. A similar picture obtains in the case of medium values. 37 districts have medium values in the first level, only 9 in the second level, and no district at all in the third and fourth levels. The number of districts with high values jumps from 38 in the first level of development to 79 in the second level. The number moves to 76 in the third level and up again slightly to 81 in the fourth or top level. It is therefore clear that potential of human resources is highly associated with the higher levels of development in India.
Nowhere else however is the positive association between ascending numbers of districts with high values on the one hand and ascending levels of development on the other so markedly evident as in blocks V and VI. In block V districts with low values drop steeply from the first level (41) to the second (9) and disappear altogether in the third and fourth levels. Medium values in the second level of development form a kind of watershed. But it is·in respect of high values in both blocks that the ascent in the number of districts in each successively higher level is dramatic, unimpaired and impressive.
Thus for India as a whole the positive association between high values'in blocks II, V and VI and ascending levels of development seems clearly brought out.- It also seems clear that there is much compatibility between ascending lc>vels of
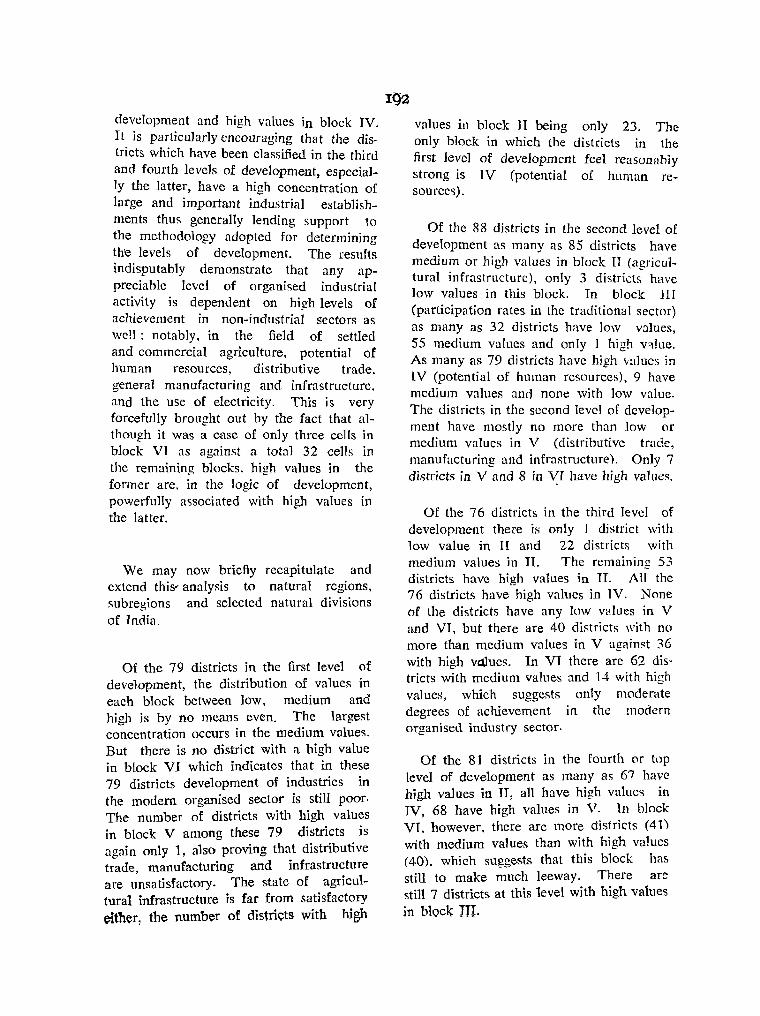
development and high values in block IV It. is pa~ticularly encouraging that the dis~ tnets whIch have been classified in the third and fourth levels of development, especially the latter, have a high concentration of large and important industrial establishments thus generally lending support 10
the mcthodology adopted for determining ~h'e. levels of development. The resuIts mdl~putably demonstrate that any apprecIable level of organised industrial activity is dependent on high levels of achievement in non-industrial sectors as well: notably, in the field of settled and commercial agriculture, potential of human resources, distributive trade. general manufacturing and infrastructure. and the use of electricity. This is very forceful1y brought out by the fact that although it was a case of only three cens in block VI as against a total 32 cells in the remaining blocks. high values in the former are. in the logic of development, powerfully associated with high values in the latter.
We may now briefly recapitulate and extend this-- analysis to natural regions. subregions and selected natural divisions of India.
Of the 79 districts in the first level of development, the distribution of values in each block between low, medium and high is by no means even. The largest concentration occurs in the medium values. But there is no district with a high value in block VI which indicates that in these 79 districts development of industries in the modem organised sector is still poor. The number of districts with high values in block V among these 79 districts is again only 1, also proving that distributive trade, manufacturing and infrastructure are unsatisfactory. The state of agricultural infrastructure is far from satisfactory either, the number of districts with high
values ill block II being only 23. The only block in which the districts in the first level of development feel reasonahly strong is IV (potential of human resource.;;).
Of the 88 districts in the second level of development as many as 85 districts have mediu~ or high values in block n (agricultural mfrastructure), only 3 districts have low values in this block. In block HI (participation rates in the traditional sector) as many as 32 districts have low values 55 medium values and only 1 high v~Iue: As many as 79 districts have high values in IV (potential of human resources). 9 have medium values and none with low value. The districts in the second level of development have mostly no more than low or medium values in V (distributive trade, manufacturing and infrastructure). Only 7 districts in V and 8 in ~I have high values.
Of the 76 districts in the third level of development there is only ] district with low value in II and 22 districts with medium values in II. The remaining 53 districts have high values in n. All the 76 districts have high values in IV. None of the districts have any low values in V and VI. but there are 40 districts with no more than medium values in V against 36 with high vc11ues. In VT there are 62 districts with medium values and 14 with hiah values, which suggests only modera~e degrees of achievement in the modern organised industry sector.
Of the 81 districts in the fourth (If top level of development as many as 67 have high values in II, all have high valucs in IV, 68 have high values in V. In block VI. however. there are more districts (41) with medium values than with high values (40), which suggests that this block has still to make much leeway. There are stm 7 districts at this level with high values
in block Hr.

:193 STATEMENT IV 2
Number of ditsricts in each bl'ock arranged By (a) low, medium values in (b) each 0/ the Jour levels 0/ development
and high
NATURAL REGION
Part 1 A (Low value) r----A.----....
1st 2nd 3rd 4th Block level level level level
l 3 4 5
il 19 1
III 4 1
IV .. V 9
V: 10 3
Total 46 3 2
As will appear from Statement IV.2 this is a natural region of much unevenness in development, the majority (26 districts) of the 38 computed districts being in the first or lowest level of development. But it is significant that of the 5 districts placed in the highest level of development as many as 4 have high values in II, V and VI and 5 in IV but only one has a high value in III (participation rates in traditional sector). Of the 2 districts placed in the third level of development, high values obtain in both cases in IV and V.
Among registered factories engaged in the processing of agricultural produce (agro industries limited to the milling of rice, atta, dal, sugarcane, edible oils, hydrogenated oils, jute and cotton ginning and pressing and making of tobacco products), the statistical an~lysis supports the general picture. There are no registered rice or atta mills in the first three levels of development. All the rice (9) and atta (1) mills are concentrated in the districts of top development. There is only one Khandsari mill in the second level of development but two in the fourth level, but as many as 3 large sugar mills in districts of the fourth level. By contrast all the four mills concerned with edible oJ! are
163 R.C.I.-26.
I-HIMALAYAS
,-1st
level
6
1.7 16
l13 17
16
69
Part II Part III B (Medium value) Q (Hig~ value)
-,J ... 2nd 3rd 4th 1st 2nd 3rd 4tb
level level level level level level level
7 8 9 10 11 12 13
S 1 . 4-=38
.. 4 6 1-38
1 9 4 2 5-38
4 2 4- 38
2 4-38
16 2 7 15 6 6 18
in the first (1) and second (3) levels of development. There is 1 jute press and 3 tobacco factories in the districts of third level of development.
Among the Hnes devoted to the processing and manufacturing of non-agricultural products analysis was limited to steel; industrial machinery; electrical machinery; cloth; jute; cement: tea and coffee; paper and paper products; petroleum and oil; aluminium; artificial yam and fabrics like rayon etc.;' fertilizers; heavy electricals; machine tools; railway wagons, locomotives and coaches; fine chemicals; heavy chemicals; generation of electricity, gas and steam; coat limestone and nonmetallic industries. This Region has only one medium-sized steel works in (Nahan Foundry) Sirmur which is placed in the second level. There are four medium and one large cotton mills in districts of the second level and only one medium cotton mill in the fourth level. All the 15 tea factories are placed in districts of the top level of development. Similarly, the only fine chemicals factory in the Region is in a district of the top level. There is 1 mine devoted to coal, limestone and nonmetallic mineral in a district placed in the first level.

Industry
Tolal 01 all Industries
Rice
Atta
Sugarcane
Editlle Oils
Jute and cotton ginning and pressing
Tobacco
lndmtry
Steel
Cloth
Tea
Fine chemicals
1<)4
STATEMENT IV.2.1 Agricultural Processing Industries
I HfMALAYAS
lst level 2nd level 3rd level Size of employ
ment
2
20-99 100+ 20-99 lOa ....
20-99 100+ 20-99 100;-
20-99 100;-
20 -99 100+
r- _..A._~..--....-_..A.. _ _" .--.A.__'
No. Workers No. Workers No. Workers
3 4 6 7 8
84 3,t36 121 9,428 67 2.862
S'J
40 3 70
22
99
STATE~ENT IV. 2.11
4th level r---....._~
No. Workers
9 10
321 18.383
9 263
45
2 48 3 1.890
Selected Industries Outside Agricultural Processing
1 HIMALAYAS
Size of employ· ment
2 100 t 1000~ 2000+
100+ 1000 t 2000t
100 ~ 1000 2000 t
lOOt 1000-1-2000+
1st level r-~,
No. Workers
3 4
2nd level 3rd level 4th level ~,
,--____ ..A-.-~ r---- -'-----.
No. Workers No. Worker. No. Workers 5 6 7 8 9 10
490
4 ~,975 514 I 1,770
15 2,149
229
Total ,--J.---~
No. Wo:kers
11 12
593 33,809
9 263
45
3 98 3 1.890 4 110
22
3 99
Total r--A----"1
No.
11
5 1
15
Workers
12
490
3,489 1,770
2,149
229
Coal,limestone and non-metallic mineral products • •
1001- 146 146 '000 '-20001'
STATEMENT IV,3
Number of distru;frs in each block arranged by (a) low, medium values in (b) each of the fJ)u'r levels of development
and high
NATURAL REGION: 2 NORTHERN PLAINS Part I Part II Part III
A (Low value) B (Mediom value) C (High value) ,.... r-- - - ~ _-J..... ---.. -....A. __ ~
1st 2nd 3ru 4th I<t Block level level level level level
1 2' 3 4 5 6 TJ 14 III 18 21 7 16 9 IV 14 V 17 10 VI 7 20
Total 4~ 22 7 16 67
This natural region as a whole is also distinguished by much uneV(~nness of development. Calcutta is excluded. Of a total of 93 computed districts as many as 27 are in the first level of development, 23 in the second level, another 16 in the third level and 27 in the fourth or top
2nd level
7
9 2
22
23
56
3rd 4th 1st 2nd 3Td 4th level level level level level level
8 9 10 11 12 13 3 1 13 14 13 26 =93 9 10 r-.. =93
13 23 16 27 =93 14 8 2 19 =93 13 18 3 9 =93 39 37 26 37 34 82
level. The Region enjoys medium to high values in agricultural infrastrncture (block II) and potential of human resources (block IV) in all districts, But values for distributive trade, manufacturing and infrastructure and organised industrial activity are mostly medium for the maiority

of districts in the third level of development· It is significant that the majority of the 27 districts in the fourth level of development enjoy high v'llues in settled agriculture (block II), potential of htlman resources (IV) and medium to high values in blockS V and VI. But 26 out of these 27 districts have only low (16) to medium (10) values, in block III (participation rates in traditional sector).
IQ5
factories and 2 out of a total of 88 coal, limestone etc. factories employing 111 personS" each, are in districts of the first and second levels of development. It is evident that the Iocational pull was too strong in these cases to be ignored. But it is important to note that all the other factories concerned with agro industries are in the third and fourth levels.
The situation is even more accentuated in the selected non-agro industries. Only a total of 6 factories out of which as many as 5 employ less than 800 persons each and 1 more than 1,000 persons are in districts of the first level. They maIiufacture industrial machinery (1), cloth (2), jute (1). Districts in the second level of development have no more than a total of 43 factories in the selected groups. 1 is concerned with electrical machinery, 3 with cloth, 2 with jute, 4 with cement, 24 with tea, 2 with paper and paper products, 1 with fertilizers (employment 2,671), 2 with generation of electricity and 4 with the coal, limestone and non-metallic industry. ,
It is encouraging that in this Region sli~t1y more than half of all rice mills and rice mill workers in the 20-99 bracket are in districts of the first and second levels o~ deve!opment. Similarly 53 out of 161 khandsari sugar mills occur in districts of the first (25) and second (28) levels of development. The most outstanding feature is the occurrence of as many as 68 Ou~ of a total of'108 sugar mills employing more than 100 persons in districts of the first (61) and second (7) levels, out of which as many as 20 sugar mills empJoy more than 1,000 persons each. The position is not so heartening in respect of districts in the first and second levels over dal, edible oils, jute and cotton 'ginning and pressing and tobacco factories. Thus, only 7 out bI; a total of 50 dal factories. 23 out of The overwhelming bulk of agro and non~ a total of 91 oil factories, 20 out of a agro registered factories are located in total of 155 jute and cotton gins and districts of th~ third and top levels of
16 out of a total of 25 tobacco development In the Northern Plains. presses,
Size of Industry employ-
ment 2
Total of all Industries Rice 20-99
100+
Alta 20-99 100+
Oat 20-99 100+
Sugarcane 20-99 100+
Edible oils. 2POO? Hydrogenated 20-99
oils 100+ Jute and 20-99
cotton.. 100+ ginning and pressing
TOba~ 20-99 100+
STATEMENT IV. 3.1 Agricultural Processing Industries
2 NORTHERN PLAINS lst level 2nd level 3rd level
No.
3
1,270
56 3 3
25 61 It
4 1
Workers
4
75,017
2,385 341 72
21
1,005 39,475
422
120 125
~ No. Workers
5 6
2,616 96,370
184 8,274 13 1,693 5 235 1 100
6 184
28 1,073 7 4,685
12 392 2 284
44
20 739 3 411
12 607 2 2,595
-----. No. Workers
7 8
1,736 99,335
14 418 1 100
7 285
20
40 1,545 16 11,743
22 l,g~~ 2
35 1,886 5 890
6 283 3 360
4th level Total r-----A----.
No. Workers No. Workers
9 10' 1t 12
7,883 803,028 13,505 1,073,750
394 i7,396 1.1 2,HZ
140 6,3i9 4 4'Til
36 1,656 14 2,461
21 1,064 13 2,361
42 1.179 50 1,404
68 2,606 161 6,229 24 21,349 108 77,252
46 2,022 91 3,868 15 2,8~6 19 3,334 2 177 3 ,221 9 2,266 9 2,266
100 5,124 155 7749 23 3,107 31 ~.408
3 134 25 1,144 7 3,887 13 6,967

196 STATEMENT IV.3.Il
Selected Industries Outsidq Agricultural Processing
2 NORTHERN PLAINS
Size of Istlevel 2nd level 3rdlevel 4th level Tolal employ- r- r-----" • ~ r r-A-"~
In:1llStry ment No. Workers No. Workers No. Workers No. Workers No. Workers
Z 3 4 S ( 7 8 9 10 11 12
Steel 100+ 170 31 10?29 32 10,899 1000+ 2 2,65 :2 2,765 2000+
Machinery 100+ 751 ( In:lustrial) 1000+
2000+
3 579 8 6,251 12 7,581
J\{ achinery 100+ 100 196 4 1,720 6 2,016 (Blcetrieal) 1000+
2000+
Cloth 100+ 2 716 3 1,673 7 3,974 84 112,382 96 118,745 1000+ 1 2,235 32 90,899 33 93,134 2000+ 1 2,23! 21 74,913 22 77,148
Jute 100+ 1 1,047 2 4,608 80 201,988 83 207,643 10004- 1 1,047 2 4,608 73 198,443 76 204,098 2000+ 1 3,500 49 162,984 50 166,484
COll1ellt 100+ 4 I,RSI 1 1,028 5 2,909 1000+ 1 1,028 I 1,028 2000+
Tea 100+ 24 3,823 116 1000+
18,466 198 35,461 338 57,750
2000+
Paper and 100+ 2 3,097 14 13,674 16 16,771 pap .. r 1000+ 2 3,097 5 10,998 7 14,095 Pto<iucts 2000+ 3 8,723 3 8,723
Petroleum 100+ I 1,228 1,228 1000+ 1 1,228 1.228 2000+
Aluminium 100+ 3 2,549 3 2,549 1000+ I 1,249 I 1,249 2000+
t\.rtificlal fibre 100+ 4 2,299 4 2,299 rayou etc. 100()+
2000+
Fertilizers 100+ 2.671 6 1,124 7 3,795 1000+ 2,671 1 2,671 2000+ 2,671 1 2,671
Railway 100+ 3 4,107 J 4,107 wagol15 1000+ 2 4,005 2 4,005 locomotives 2000+ 1 2,061 1 2,061 coaches
Leather and 100+ 16 6,348 16 6,348 leather 1000+ I 2,482 1 2,482 products 2000+ 1 2,482 1 2,482
f'ino cl'Iemicall 100+ 12 1000+
3,144 12 3,144
2000+'
Heavy 100+ 5 2,718 5 2,718 chemlcals 1000+
2000+ ,0
O"neration of 100+ 2 495 2 657 a 3,595 12 4,747 el~trlci~1 1000+
2000+ .. Coal, lime-I 100+ -12 222 4 1,871 8 2,558 74 20,941 88 25,592
stone lind 1000+ 2 3,835 2 3,835 non-metallic 2000+ 1 2,707 1 2.707 mineral products

1.97. STATEMENT IVA
Num!Jer of districts in eJch block arranged by (a) low, medium and high values in (b) each a/the/our level.<; 0/ development
NATURAL REGION: 3 CENTRAL HILLS AND PLATEAUS Part I
A (Low value) r-
Block 1st 2nd. 3rd 4th lst level level level level level
2 3 4 5 6
11 14 II[ 3 7 18 IV 6 .v l~ 8 6
Vi 6 5 15 Total 24 20 4 159
Of a total of 87 computed districts in this Natural Region 21 are in the first or lowest level of development. 35 in the second level, 15 are in the third level and 16 in the fourth or top level. Development is therefore uneven. But it is encouraging that the values of blocks II and IV are medium or high in all districts. The values for block V are either low or medium in the majority of districts which are placed in the first and second levels of development. The values for block VI are mostly medium for the majority of districts in the four levels of development indicating medium, and in 11 districts low industrial activity. Of the 16 districts placed in the top level of development only 6 have high values and 10 medium values in block VI. The majority of these 16 districts have high values for blocks II and IV also. As many as 13 districts have medium values in block III (parti(;ipation rateSi lin Ithe traditional sector) indicating that the majority of the districts at the top level are still at some transitional stage. This Region displays a distinctive pattern. While the agricultural processing industries are fairly distributed among the four levels of development (although the predominence of numbers in the first and second levels plainly testify to the concentration of even agro industries in the third and fourth levels), the non-agricultural manufacturing
Part II Part III B (Medium value) C (High value)
r-2nd 3rd 4th 1st 2nd 3rd 4th level level level level level level level
7 8 9 10 II 12 13
10 2 3 7 2S 13 13 = 87 28 10 13 2 = 87 2 IS 33 15 16 - 87
21 IS 4 12 - 87 28 13 10 2 2 6 - 87 9S 40 30 22 60 31 49
industries have a strong bias in favour of districts of the th!rd and, most of all, the fourth levels.
Thus the 21 districts in the first level have 101 rice mills of the employment size 20-99 each and only 6 large ones employing more than 100 persons; 1 small dal mill, 2 khandsari sugar mills, 6 oil mills, 19 cotton gins and presses of which 5 employ more than 100 persons each and 90 tobacco factories of which 5 employ more than 100 persons each. On the other hand these 21 districts in the lowest level have 3 steel mills employing more than 100 persons each, 1 jute factory employing 756 workers, 1 large paper mill employing 2,540 persons, 2 aluminium factories employing a total of 465, 2 factories engaged in generation of electricity and 3 factories engaged in coal, limestone etc. of which 1 employs 1,] 12 persons.
The 35 districts in the second level have a much larger number (140) of rice mills (of which 1 is really big employing as many as 3,089 persons), 6 atta mills, 14 dal mills, 3 khandsari sugar mills, 46 oil mills, 137 cotton and jute gins and presses and 108 tobacco factories of which 21 employ more than 100 persons each. But the number and range of non-agro industries are not much greater than those in districts of the first level: 1 factory of industrial
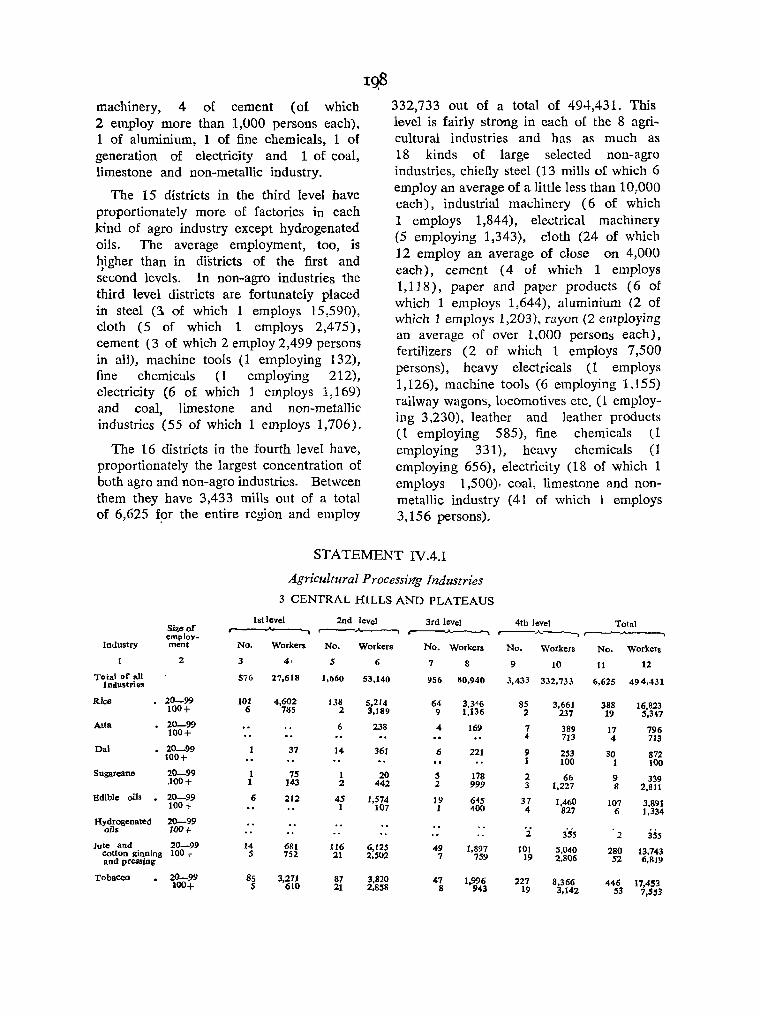
machinery, 4 of cement (of which 2 emp10y more than 1,000 persons each), 1 of aluminium, 1 of fine chemicals, 1 of generation of electricity and 1 of coal, limestone and non-metallic industry.
The 15 districts in the third level have proportionately more of factories in each kind of agro industry except hydrogenated oils. The average employment, too, is higher than in districts of the first and
}
second levels. In non-agro industries the third level districts are fortunately placed in steel (3. of which 1 emp~oys 15,590), cloth (5 of which 1 employs 2,475), cement (3 of which 2 employ 2,499 persons in all), machine tools (1 employing 132), fine chemicals (I employing 212), electricity (6 of which 1 cmploys 1,169) and coal, limestone and non-metaIIk industries (55 of which 1 employs 1,706).
The 16 districts in the fourth level have, proportionately the largest concentration of both agro and non-agro industries. Between them they have 3,433 mills out of a total of 6,625 f~r the entire region and employ
1<).8 332,733 out of a total of 494,431. This level is fairly strong in each of the 8 agricultural industries and has as much as 18 kinds of large selected non-agro industries, chiefly steel (13 mills of which 6 employ an average of a little less than 10,000 each), industrial machinery (6 of which 1 employs 1,844), electrical machinery (5 employing 1,343), cloth (24 of which 12 employ an average of close on 4,000 each), cement (4 of which 1 employs 1,118), paper and paper products (6 of which 1 employs 1,644), aluminium (2 of which 1 employs 1,203), rayon (2 employing an average of over 1,000 persons each), fertilizers (2 of which 1 employs 7,500 persons), heavy electricals (1 employs 1,126), machine tools (6 employing 1.155) railway wagons, locomotives etc. (1 employing 3,230), leather and leather products (1 employing 585), fine chemicals 11 employing 331), heavy chemicals (1 employing 656), electricity (18 of which 1 employs 1,500), coal, limestone and nonmetallic industry (41 of which 1 employs 3,156 persons).
STATEMENT IVA.I
Agricultural Processiltg Industries
3 CENTRAL HILLS AND PLATEAUS
1st level 2nd level 3rd level 4th level Total Size of r-- ...... ....----~ ~..A..-----. "'----""--_, ,----.A..-~ employ-Industry men! No. Workers No. Workers No. Worken No. Workers No. Workers
2 3 4' S 6 7 8 9 10 11 12 Toial of all
Industries Si6 17,618 1,660 53.140 956 80,940 3,433 332,733 6,625 494,431
Rice 20-99 101 4,602 138 5,214 64 i:f;~ 85 3,661 388 100+ 6 785 2 3,189 16,823
9 2 237 19 5,3.l7 Atfa 20-99 6 238 4 169 7 389 100+ 17 796
4 713 4 713 Oat 20-99 37 14- 361 6 221 9 253 30 100+ 872
t 100 1 100 Sugarcane 20-99 1 75 1 20 5 178 2 66 .100+ 1 143 9 339 2 442 2 999 3 1,227 8 2,811 Edible oils 20-99 6 212 45 1,574 19 645 37 1,460 100 + 1 107 1 400 4
107 3,891 827 6 1,334
Hydrogenated 20-99 oils lOO+- 2 3'S5 2 3SS
Jute and 20-99 14 681 116 6,125 49 1,897 101 5,040 cotton ginning 100 I- 5 752 280 13,743 and pressing
21 2,502 7 759 19 2,806 52 {i.RI9
Tobacco . 20-99 85 3,271 87 3,820 47 1~96 227 8,366 100+ S 610 21 2,8:58 446 17,453 8 943 19 3,142 53 7",3

Yt)9
STATEMENT IVA.II
Selected Industries Outside Agricultural Processing
3 CENTRAL HILLS AND PLATEAUS
Size of 1st level 2nd level 3rd level 4th level Total \):nr)loy r-------.A.---, r--A.-__..., r--
-A. __ , ,----.A.- _.-, r----...........____-1 Inlustry ment No. Workers No. Workers No. Workers No. ' Workers No. Workers
2 4 5 '6 ~7 '8 ; 9 10 11 12
Steel 100+ 657 3 17,741 13 57,150 19 75,548 1000+ 2 17,052 6 55,233 8 72,285 2000+ 1 15,590 5 53,421 6 69,011
Machinery 100+ 120 6 3,101 , 3,221 ( Industrial) 1000+ 1 1,844 1 1,844
2000+
Machinery 100+ 5 1,343 5 1,34 3 (Electrical) 1000+
2000+
Cloth 100+ 5 U65 24 56,773 29 61,038 lOOOj- 1 2,475 17 ' 54,348 18 56,823 2000+ 1 2,475 12 47,567 13 50,042
Jute 100+ 756 756 1000 j-2000+
Cement 100 t- 4 5.325 1 3.379 4 2,818 11 11,522 1000 ~ 2 3,948 2 2,499 1 1.118 5 7.~5 2000 I· 1 2,592 1 2:592
Paper and 100 ~ 2.540 6 3.574 7 6.114 paper 1000+ 2.540 1 1.644 2 4,184 products 2000 I- 2.540 1 2,540
Petroleum 100+ 2 230 2 230 1000 ~ ZOOO t-
Aluminium 100 ~ 2 465 427 2 1.305 5 2.197 1000 l- I 2000 I-
1.203 1 1,203
Artificial fihre 100,- 2 2,072 2 2,072 rayon etc. 1000+ 1 1.149 1 1,149
2000 I-
Fertilizers 100+ 2 7.600 2 7.600 1000+ 1 7.500 I 7.500 2000+ 1 7.500 I 7.500
Heavyele.::trica1s 100+ 1.126 1,126 1000+ 1,126 1.126 2000+
Machine tools 1001- 132 6 1.155 7 1,287 1000+ 2000+
Railway wagons 100+ locomotives 1000+ 3.230 3.230 coaches 2000+ 3,230 3.230
3.230 3.230
Leather and 100+ 585 585 leather products 1000+
2000+
Fine chemicals 100+ 144 212 331 687 10001-2000+
Heavy chemicals 100+ 656 656 1000+ 2000+
Generation 100+ 2 576 100 6 2.622 18 ~.632 27 8.930 eJ..:ctricity 1000+ 1 1.169 1 1.500 2 2.669
2000+
Coal, limestone 100+ 3 1,393 120 55 12.766 41 16.765 100 31,044 and non·metallic 1000+ 1 1.112 1 1.706 2 . 4,856 4 7,674 mineral products 2000+ 1 3,156 1 3.156
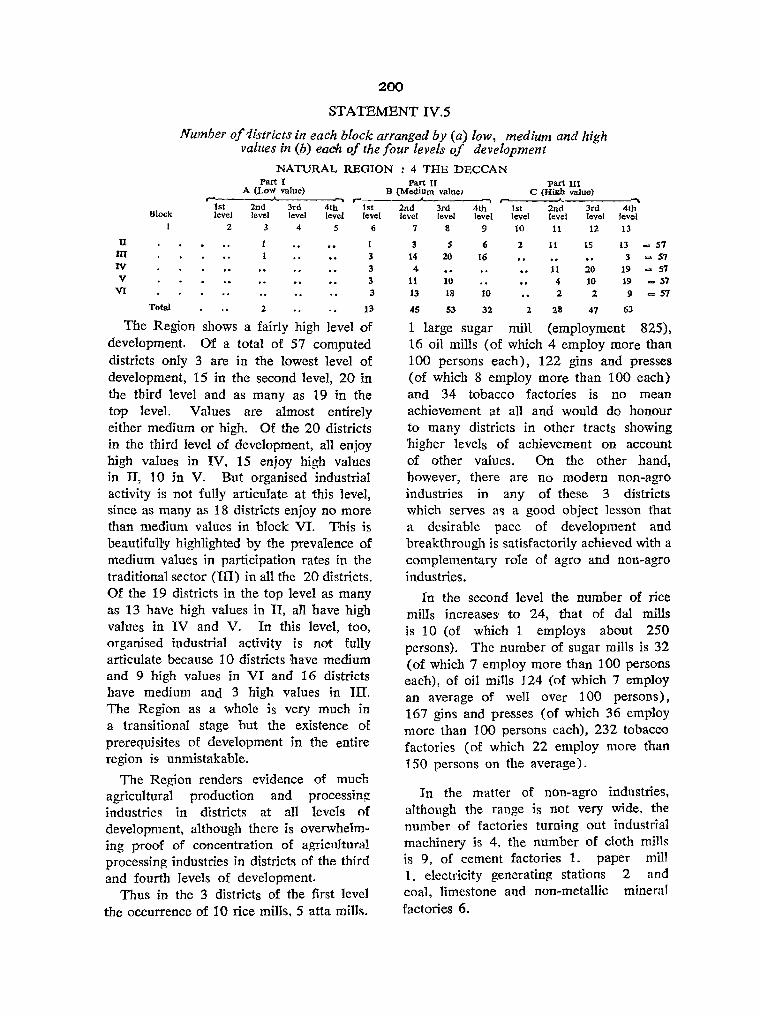
200
STATEMENT IV.5
Number o/1istricts in each block arranged by (a) low, medium and high values in (b) ead/z of the four levels oj development
NATURAL REGION : 4 THE DECCAN Part I Part I[ part II[
A (Low value) B (Medium valuel C (High value)
1st 2nd 3ed 4th 1st Block level level level level level
1 2 3 4 5 6
U 1 1 nr t 3 IV 3 V 3
VI 3
Total 2 13
The Region shows a fairly high level of development. Of a total of 57 computed districts only 3 are in the lowest level of development, 15 in the second level, 20 in the third level and as many as 19 in the top level. Values are almost entirely either medium or high. Of the 20 districts in the third level of development, all enjoy high values in IV, 15 enjoy high values in II, lOin V. But organised industrial activity is not fully articulate at this level, since as many as 18 districts enjoy no more than medium values in block VI. This is beautifully highlighted by the prevalence of medium values in participation rates in the traditional sector (III) in all the 20 districts. Of the 19 districts in the top level as many as 13 have high values in II, all have high values in IV and V. In this level, too, organised industrial activity is not fully articulate because 10 districts have medium and 9 high values in VI and 16 districts have medium and 3 high values in III. The Region as a whole is very much in a transitional stage but the existence of prerequisites of development in the entire region is unmistakable.
The Region renders evidence of much agricultural production and processing industries in districts at all levels of development, although there is overwhelming proof of concentration of agricnltural processing industries in districts of the third and fourth levels of development.
Thus in the 3 districts of the first level the occurrence of 10 rice mills. 5 atta mills.
,.... 2nd 3rd 4th 1st 2nd 3rd 4th level level level level level level level
7 8 9 10 11 12 13
3 5 6 2 11 15 13 _ 57
14 20 16 3 - 57 4 11 20 19 - 57
11 10 4 10 19 = 57 13 18 10 :2 :2 9 = 57
45 53 32 2 28 47 63
1 large sugar mill (employment 825), 16 oil mills (of which 4 employ more than 100 persons each), 122 gins and presses (of which 8 employ more than 100 each) and 34 tobacco factories is no mean achievement at all and would do honour to many districts in other tracts showing higher levels of achievement on account of other values. On the other hand, however, there are no modern non-agro industries in any of these 3 districts which serves a<; a good object lesson that a desirable pace of development and breakthrough is satisfactorily achieved with a complementary role of agro and nou-agro industries.
In the second level the number of rice mills increaseS! to 24, that of dal mills is 10 (of which 1 employs about 250 persons). The number of sugar mills is 32 (of which 7 employ more than 100 persons each), of oil mills 124 (of which 7 employ an average of well over 100 persons) , 167 gins and presses (of which 36 employ more than 100 persons each), 232 tobacco factories (of which 22 employ more than 150 persons on the average).
In the matter of non-agro industries, although the range is not very wide, the number of factories turning out industrial machinery is 4, the number of cloth mill!': is 9, of cement factories 1. paper mm 1, electricity generating stations 2 and coal, limestone and non-metallic mineral factories 6.

The 20 districts in the third level of development have 76 rice mills, 10 atta mills, 9 dal mills, 18 sugar mills ( of which 3 employ more than 1.000 persons each including 1 employing 2,000), 124 oil mills (of which 7 employ an average of over 200 persons each), 3 hydrogenated oil mills (of which 1 employs more than 200 persons), 367 gins and presses (of which 125 employ more than 100 persons) and as many as 345 tobacco (bidi) factories (of which 27 employ an average of more than 150 each). In the non-agro sector there are 38 cloth mills (of which 12 employ more than 1,000 persons each of which again 3 employ an average of more than 3,600 workers each); 2 cement factories (the position in 1961), 2 paper mills (of which 1 employs ] ,57 t), 3 fine chemicals mills, 1 Iheavy chemicals mill employing 915 persons, 2 electricity generating stations and 5 coal, limestone and non-metallic mineral establishments (of which 1 employs 1,695 persons).
261
than 500 workers each), 105 oil mills of which 11 employ -a total of 2,129 workers, 7 hydrogenated oil mills (of which 2 employ on average more than 250 workers), 385 gins and presses (of which 99 employ more than 100 workers each and at least 1 employs 2,000) I and 306 tobacco factories (of which 91 employ more tllan 100 persons each including 3 employing more than 1,000 persons each of which again 1 employs 2,000 persons). Between them they have 1 steel mill (Bhadravati) employing 5,136, 12 factories of industrial machinery (of which 1 employs 3,433), 2 factories of electrical machinery, 150 cloth mills (of which 38 employ more than 1,000 persons each, of which again 13 employ more than 4,000 each on the average), 1 cement factory (in 1961), 17 tea factories, 4 paper mills (of which 1 employs 2,000), 1 petroleum installation, 3 machine tools (of which 2 employ 4,478 of which again 1 employs 3,000), 7 leather factories, 8 fine chemicals factories, 3 heavy chemicals factories (of
The 19 districts in the top level of deve- which 1 employs 1,444), 5 electricity lopment have 118 rice mills (ot which 3 generating stations and 19 coal, limestone employ more than 100 eac-q), 21 atta mills and non-metallic mineral establishments. (of which 3 employ an average of 100 Thus the non-agro industries are distin-persons each), 16 dal mills, 103 sugar mills guished both by size of establishment and (25 employing on an average a little less versatility of products.
Industry
Total of all Industriet4
Rice
Alta
Oal
Sugarcane
Edible on.
Size of employ
ment 2
20-99 JOO+ 20-99 100+ 20--99 100+ 20-99 100+ 20-99 100+
Hydrosenated oil. 20--99 100+
Jnto and Cotton liDDing and preasina
TobaCCO •
20-99 100+
i0-99 100+
163 R.GJ.-27.
STATEMENT IV. 5. I Agricultural Processing Industries
4 THE DECCAN 1st level 2nd level 3rdlcvcl
r- . • ,.. . -,
No. Workers No. Workers No. WOTken 3 4 5 6 7 8
191 8,386 1.628 60.527 2.595 154.913 10 210 24 634 75 2.3~6
1 100 S 100 10 297
9 275 9 264 1 250
. i 825 2S 645 7 13.761
9 251 9 7.766
12 390 117 3.752
" 5S0 7 889 117 4.459
7 1,659 2- 96 1 201
114 2.679 131 •• 338 8 1,400 36 4.789
242 r9,890 125 21.644
34 1.093 210 8.293 22 3.SSS
318 12.628 27 4.431
4th tevet r-
No. Workers 9 10
5.843 439.237 115 3,688
3 331 18 541
3 300 16 462
78 2.0« 25 12,316 94 3.682 11 2,129 S ltO 2 50S
286 13.913 99 '9.230
215 r11,657 'I 21.402
Total r- . ..
No. Workerl 11 12
10.358 663.0(>3 224 6,888
4 -431 33 938
3 300 34 1,001 I 250
112 2.940 42 24.668
340 12,283 29 5,227 7 2.06' 3 706
773 30,820 268 47.063
777 33.57& 140 2.9.391

-~62
STATEMENT IV.S.H
Selected Industries Outside Agricultural Processing 4 THE DECCAN
lst level 2nd level 3rd level 4th level Total Size of ~----~--~~--~--~ r--..A...---""""'\ r--=..:,..A...---"" r __ .A-__ .....
lndustry employ-
Workers ment No. No. Workers No. Workers No.~ Workers No. Workers
2 3 4 S 6 7 8 9 10 11 12
Steel 100f- 5,136 5,136 1000+ 5,136 5,136 2000'+ 5,136 5,136
Mlchinery 100f- 4 762 12 7,803 16 8,565 ([ndustrial) 1000+ 2 4,604 2 4,604
200;)+ I 3,433 I 3.433
Machinery 100+ 2 850 2. 850 (Blectrical) 1000+
2000+
Cloth IOJ 1- 9 3,807 33 \ \ ,034 ISO 134,379 197 171,220 10)0+ 1 1,265 II~ 2 ~,061 39 93,349 51 118,675 2000+ 11,003 13 58,089 16 69,092
Cenent] lao I- 500 2 786 834 4 2,120 1000+ 2000+
Tea 10lJ+ 17 4,363 17 4,363 1Il00+ 2000+
Paper and paper 100+ 962 2 1,821 4 2,529 7 5,312 products • 1 OOJ + I 1,571 1 2,000 2 3,571
2000+ I 2,000 1 2,000
Petroleum 100+ 115 115 1000T 2000+
Machine t09]s 100+ 3 4,585 3 4,585 1000+ 2 4,478 2 4,478 2000+ t 3,000 I 3,000
Leather and 100+- 7 1,008 7 1008 leather 1000+ products 2000+
Fine Chemicals 100+ 3 501 8 2,106 II 2,607 1000+ 2000+
Heavy chemicals 1001- 915 3 1,662 4 2,5n 1000+ I 1,444 I 1,444
2000+
Generation of 100+ 2 342 2 200 5 1,746 9 2,288 electricity 1000+
2000+
Coal, Lime- 100+ 6 907 5 2,809 19 5,836 30 9,552 stone and nOn- 1000+ ! 1,695 1 1,695 metallic mineral 2000+ .. products
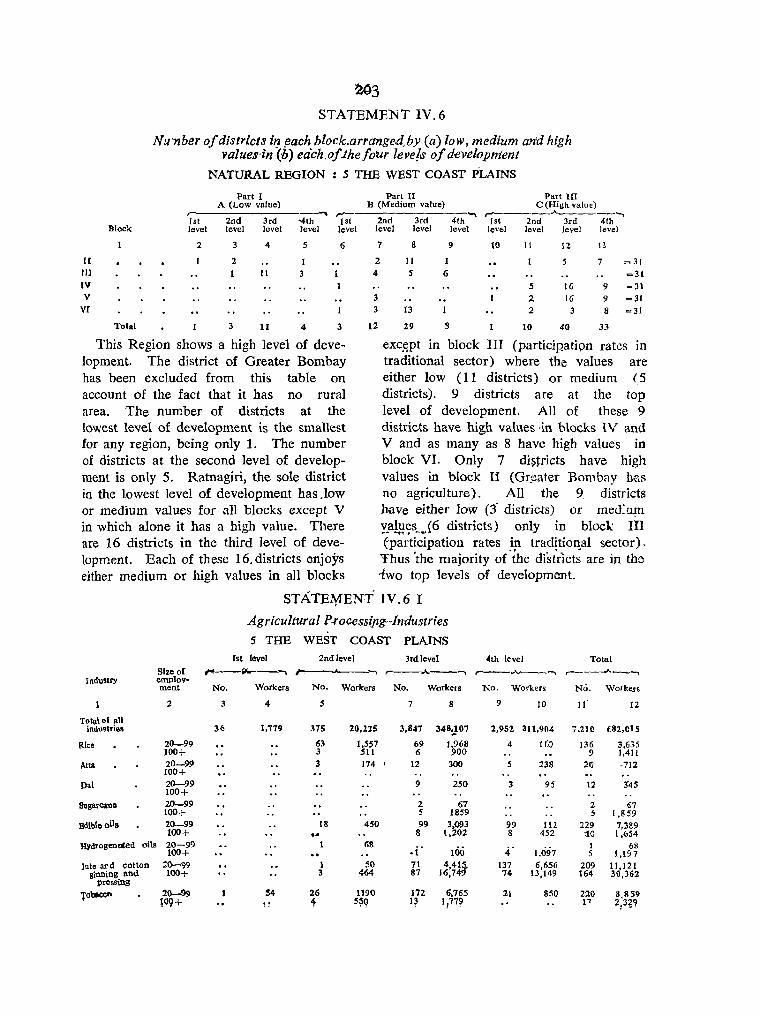
~~3
STATEMENT IV.6
Nu-nber o/districts iIJ !!ach block.arranged,by (a) low, medium arid high values'in (b) each,o/Jhe/our levels 0/ de'velopm'ent
NATURAL REGION 5 THE WEST COAST PLAINS
Part I A (Low value)
r- -"'" 1st 2nd 3rd -<lth 1st
Block level level level level level
2 4 5 6
If 2 1 III 11 3 IV V
vr Total 3 11 4 3
This Region shows a high level of development. The district of Greater Bombay has been excluded from this table on account of the fact that it has no rural area. The number of districts at the lowest level of development is the smallest for any region, being only 1. The number of districts at the second level of development is only 5. Ratnagiri, the sole district in the lowest level of development has .low or medium values for all blocks except V in which alone it has a high value. There are 16 districts in the third level of development. Each of these 16, districts enjoys either medium or high values in all blocks
Part II Part III B (Medium value) C (High value) -. r'----...... ------,
2nd 3rd 4th 1st 2nd 3rd 4th level level level level level level level
7 8 9 10 11 12 B
2 11 I 5 7 =31 4
3 3
12
S 6 =31 5 16 9 =31 2 16 9 =31
13 2 8 =31
29 S 10 40 33
exc~pt in block III (participatipn rates in traditional sector) where the values are either low (11 districts) or medium (5 districts). 9 districts are at the top level of development. All of these 9 districts have high values -in blocks IV and V and as many as 8 have high values in block VI. Only 7 di~tricts have high values in block II (Gr.eater Bombay h:as no agriculture). All the 9. districts have either low (3" districts) or med~u!D y.aL'Jl?s . ..{ 6 districts) only in block III (participation rates in traditional sector).
Thus 'the majority of -the dist~-lct~ are in the -two top levels of development.
STATE¥ENT IV.6 I
Agricultural P.rocessipg--Industries
5 THE WEST COAST PLAINS 1st level 2nd level 3rdlevel 4th level Total
Size of ,..--0lI0---.. ,...., ,--.A...-~ r--..Jv--___ ,-___ .A_,....,
Indu!lry employ-ment No. Workers No. Workers No. Workers No. Workers No. Workers
2 3 4 5 7 8 9 10 11 12
Totatol aU indu.tries 36 1,779 375 20,21.5 3,347 348~07 2,952 311,904 7.211l (82,015
Rice 20-99 63 1,557 69 1,968 4 lfO 136 3.635 100+ 3 511 6 .900 9 1,411
Alta 20-99 3 174 I 12 300 5 238 20 -712 100+
Dal 20--99 9 250 3 9S 12 145 100+
Sugar<:anc 20-99 2 67 2 67 100+ 5 1859 5 1,859
Bdible oils 20--99 18 450 99 3,093 99 111 229 7,389 100+ .. 8 1,202 8 452 '10 1,654
lIydrogenClCed oils 20-99 68 .i· 106 4' 1.097 I 68
100+ 5 1,1"7 Jute ar d cotton :20-99 1 SO 71 441? 137 6,656 209 11,121
ginning and 100+ 3 464 87 16;74 74 13,149 164 30,362 pressing
'fo\laCC" 20-99 S4 26 1190 172 6,765 21 850 220 8.859 109+ t ~ 'f 5~Q I? 1,779 17 2,32.'1
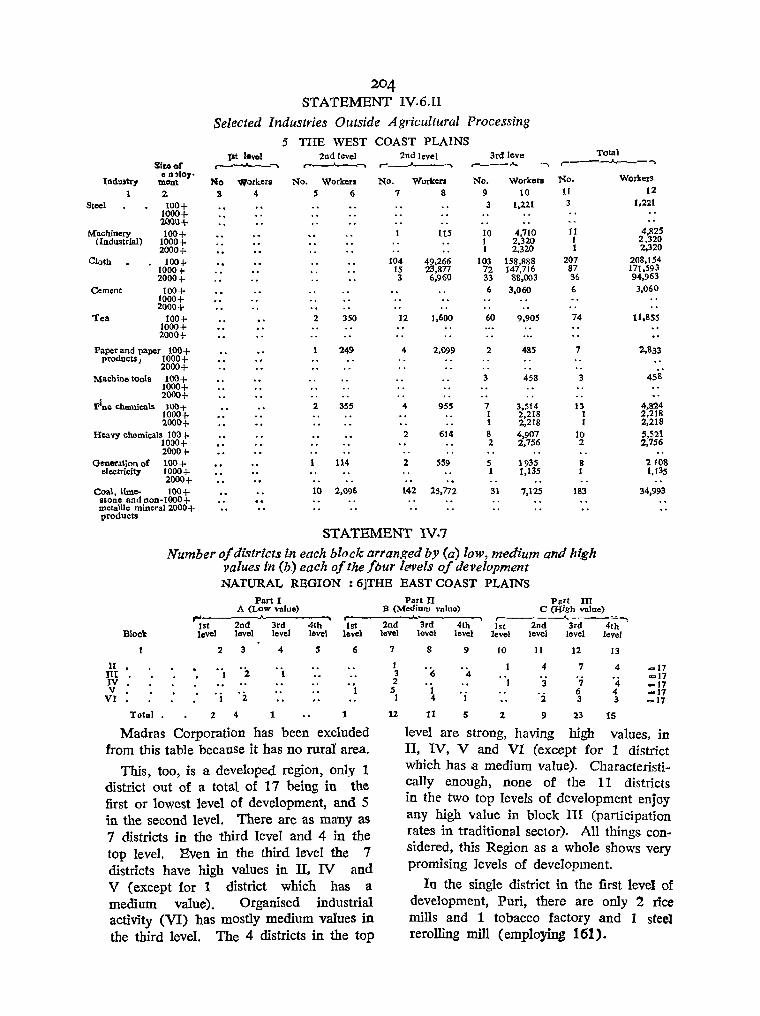
204 STATEMENT IV.6.II
Selected Industries Outside Agricultural Processing
5 THE WEST COAST PLAINS l.t 1evo1 2nd level 2nd level 3rd leve Total
Slze .. r ....---.'----.. , ,..... r __ ""'___-. r-_--.A... ....., I----.A...--- ..... Indu,tr,
cn~loy· No No. Workers mont Workers No. Workers No. Worken No. Workers
1 2 3 4 5 (; 7 8 9 10 11 12
Steel 100+ 3 1,221 3 1.221 1000+ 'lOO'l+
Machioery 100+ 115 10 4,710 11 4,825 (IndllStriaI) 1000+ I 2,320 I 2,320
2000+ 1 2,320 1 2,320
Cloth 100+ 104 49,266 103 158,888 207 208,154 1000+ 15 23,sn 72 147,716 87 171,593 2000+ 3 6,960 33. 88,003 36 94.963
Cement 100+ 6 3,060 6 3,060 1000+ 2QOO+
'Tea 100+ 2 350 12 1,600 60 9,905 74 11.855 1000+ 2000+
Paper and paper 100+ 249 4 2,099 2 485 7 2,833 products J 1000 +
2000+ Machine toola 100+
1000+ 2000+
3 458 3 458
Fine chemicals lOOT 2 3SS 4 9SS 7 3,514 13 4,824 1000+ I 2,218 I 2,218 2000+ 1 2,218 1 2,218
Heavy chemicals 10:1+ 2 614 8 4,907 10 5,521 1000+ 2 2,756 2 2,756 2000+
Generation or 100+ 114 2 S59 5 1935 S :2 f08 electricity 1000+ 1 1,135 1 1,13S
2000+ Coal, lime- 100+ 10 2,096 142
stone and 000-1000+ 25,772 31 7,125 183 34,993
metallic mineral 2000+ products
STATEMENT IV.7 Number of districts in each block arranged by (a) low, medium and high
values in (b) each of the four lervels of development NATURAL REGION ; 6jTHE EAST COAST PLAINS
Part I A (Low value)
Part II B (Medium value)
Part III C (Ii;gh value) .,.. ~------~~-------~ ,.-------'. =...,
2nd 1st 3rd 4th lst Block level level level level level
2 3 4 S 6
II '2 'i III 1 IV V . i '2 1
VI Total 2 4 1 1
Madras Corporation has been excluded from this table because it has no rural area.
This, too, is a developed region, only 1 district out of a total of 17 being in the first or lowest level of development, and 5 in the second level. There are as many as 7 districts in the third level and 4 in the top level. Even in the third level the 7 districts have high values in II. IV and V (except {or 1 district which has a medium value). Organised industrial activity (VI) has mostly medium values in the third level. The 4 districts in the top
2nd 3td 4th 1st level
2nd 3td 4th level level level level level level
7 8 9 10 II 12 13
13 • is '4 4 7 4 -17 .. =17 2 1 3 7 '4 5 1 . i '2 6 4
-17 -17
1 4 3 3 =17
12 11 5 2 9 23 15
level are strong, having high values, in II, lV, V and VI (except for 1 district which has a medium value). Characteristically enough, none of the 11 districts in the two top levels of development enjoy any high value in block III (participation rates in traditional sector). All things considered, this Region as a whole shows very promising levels of development.
In the single district in the first level of development, Puri, there are only 2 rice mills and 1 tobacco factory and 1 steel rerolling mill (employing 161).
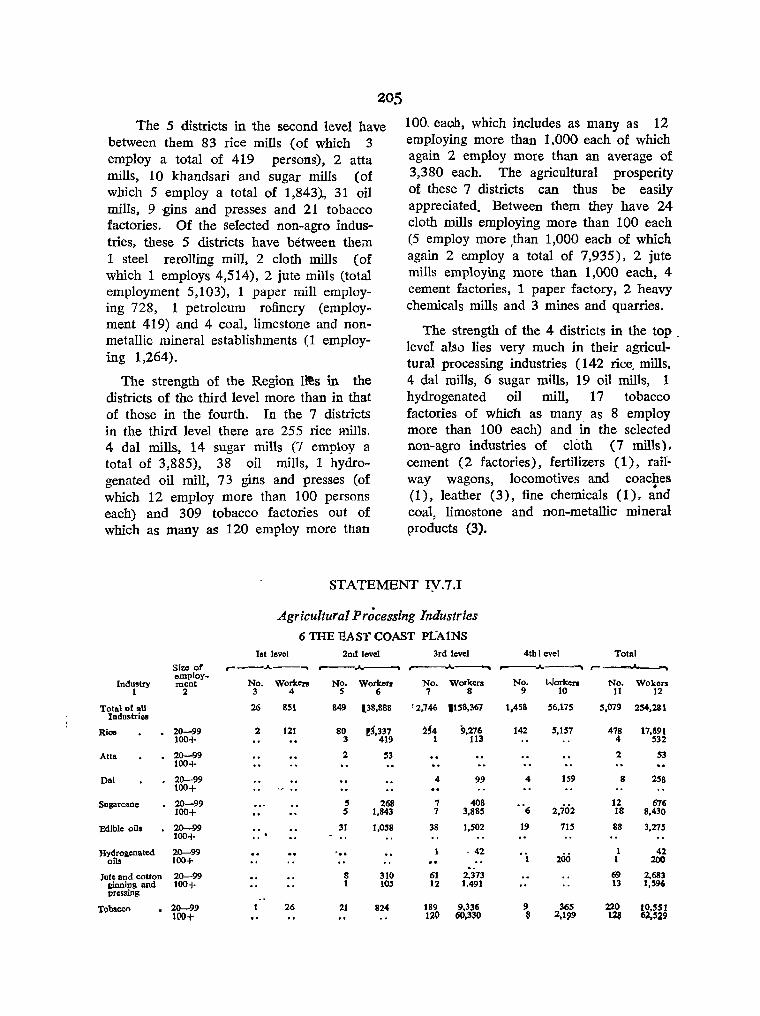
205
The 5 districts in the second level have between them 83 rice mills (of which 3 employ a total of 419 persons), 2 atta mills, 10 khandsari and sugar mills (of which 5 employ a total of 1,843)., 31 oil mills, 9 .gins and presses and 21 tobacco factories. Of the selected non-agro industries, these 5 districts have between thea) 1 steel reroiling mill, 2 cloth mills (of which 1 employs 4,514), 2 jute mills (total employment 5,103), 1 paper mill employing 728, 1 petroleum refinery (employment 419) and 4 coal, limestone and nonmetallic mineral establishments (1 employing 1,264).
The strength of the Region l~s in the districts of the third level more than in that of those in the fourth. In the 7 districts in the third level there are 255 rice .nills. 4 dal mills, 14 sugar mills (7 employ a total of 3,885), 38 oil mills, 1 hydrogenated oil mill, 73 gins and presses (of which 12 employ more than 100 persons each) and 309 tobacco factories out of which as many as 120 employ more than
100" eaoh, which includes as many as 12 employing more than 1,000 each of which again 2 employ more than an average of 3,380 each. The agricultural prosperity of these 7 districts can thus be easily appreciated. Between them they have 24 cloth mills employing more than 100 each (5 employ more ,than 1,000 each of which again 2 employ a total of 7,935), 2 jute mills employing more than 1,000 each, 4 cement factories, 1 paper factory, 2 heavy chemicals mills and 3 mines and quarries.
The strength of the 4 districts in the top . level also lies very much in their agricultural processing industries (142 rice. mills, 4 dal mills, 6 sugar mills, 19 oil mills, 1 hydrogenated oil mill, 17 tobacco factories of which as many as 8 employ more than 100 each) and in the selected non-agro industries of cloth (7 mills), cement (2 factories), fertilizers (1), railway wagons, locomotives and coaches • (1), leather (3), fine chemicals (1), and coal, limestone and non-metallic mineral products (3).
STATEMENT IY.7.1
Agricultural Processing Industries
6 THE EAST COAST PLAINS 1st level 2nd level 3rd level 4tbl evel Total
Size or r--.A.--.... ....---...A.----.. ..._
,---.A.--~ r- =sA ~ employ-
Industry ment No. Workers No. Worker. No. Workers No. Worken No. Wokers 1 2 3 4 5 6 7 8 9 10 11 12
Total ot all 26 851 849 [38,888 Industries
'2,746 1158,367 1,458 56,175 5,079 254,281
Rice 20-99 2 121 80 !3,337 2~4 9,276 142 5,157 478 17,891 100+ 3 419 1 Il3 4 532
Atta 20-99 2 53 2 53 lQO+
Oal 20-99 4 99 4 159 8 258 100+
Sugarcane 20-99 5 268 7 408 ., 2.ici2
12 676 100+ 5 1,843 7 3,885 6 18 8,430
Edible oils 20-99 31 1,058 38 1,502 19 715 88 3,275 100+
Hydrogenated 20-99 - 42 'i 200 1 42
oils 100+ I 200
Jute and cotton 20-99 8 310 61 2,373 69 2,683 ginni!,g and 100+ 1 105 12 1.491 13 1,596 pressmg
'l'llbacco . 20-99 26 21 824 189 9.336 9 365 220 10.551 100+ 1~0 60,330 , 2,199 1~ 62,529

Industry
Steel
Cloth
Jute
Cement
Size of employment
2
100+ 1000+ 2000+
100+ 1000+ 2000+
100+ 1000+ 2000+
100+ 1000+ 2000+
Paper and paper 100+ products 1000+
2000+
Petroleum 100+
Fertilizers
Railway wagons locomotives coaches
Leather and leather products
1000+ 2000+
100+ 1000+ 2000+
100+ 1000+ 2000+
100+ 1000+ 2000+
Finc chemicals 100+ 1000+ 2000+
Heavy chemicals 100+ 1000+ 2000+
Coal. lime- 100+ stone and non- 1000+ metallic mineral 2000 + products
STATEMENT IV.7.II
Selec Industries Outside Agricultural Processing
6 THE BAST COAST PLAINS
1st level 2nd level 3rd level r------.~ ..----.A----..... r-
No. Workers No. Workers No. Workers
3 4
161
5
2 1 1
2 2 2
4 1
6
365
4.840 4,514 4,514
5,103 5,103 5,103
728
419
2,296 • 1.264
7
24 5 2
2 2
4
2
3
8
17,817 11,703 7.935
2,469 2.469
2.022
585
703
450
STATEMENT "IV. 8
4th lev.I Total ..... r-....... ---.
No. Workers 'No. Workers
9 10
7 3.880 2 2,570
2 2.186 I 1,650
364
380
3 1,261
156
3 518
11 12
2 526
33 26.537 8 18,787 3 12,449
4 7.572 4 7,572 2 '.103 6 4,2011 1 1.650
2
2
JO 1
1,313
419
364
380
1,261
156
703
3.264 1.264
Nlumber 0/ distriCts in each block arranged by (a) low, medium and high values in (b) each 0/ the/our levels of development
11
III
IV
V
VI
Block
SUBREGION: 1'1 WEST HIMALAYAS
Part I A (Low value)
Part II B (Medium value)
Part III C (High value)
~--------~.~------~ r----~~--~------..... 1st 2nd 3rd 4th 1st 2nd 3td 4th 1st 2nd 3rd 4th level level level level level' level - level level level level level level
2.
12
3
3
7
II
3~
3
3
4 5 6
6
13
10
11
,10
$9
7
4
3
3
8
1
9
3
4
10
2
5
7
11
3
12 13
2
3
3
S
n
=26
~26
=26
=26
-26

Of the 26 districts as many as 18 are in the first level of development, 4 in the second, 1 in the third and 3 in the top level. All the 18 districts in the lowest level have either low or medium values in all blocks, except for high values for 2 districts in block III (participation rates in traditional sector) and 5 in block IV (potential of human res'ources). Simla. the ~(lle district in the third level of development has characteristically enough, high' alues in blocks III, IV, and V, low in H (agricultural infrastructure) and medium in VI (industrial activity in the modern sector). All the 3 districts in the top level have high values in blocks IV, V and VI, and except for 1 distriet also in block II. Significantly enough none of them have high values in block HI.
Of a total of 9 rice and 1 atta mill in the Himalayan Region, this Subregion claims I each. All the 3 khandsari sugar
2fYJ
mills in the Region are in this Subregiota and the 3 large sugar mills of the Region are also in this Subregion, in districts 01 the top level. All the 4 edible oil miIls of the Region are in this Subregion too in districts of the first ~ 1) and second (3) levels.
Among all the non-agro registered factories in the Himalayan Region all but 12 tea factories employing 1,676 persons are in this Subregion. The steel and cloth mills (except 1) are placed in districts of the second level, the coal, limestone and non-metallic factories in the first level. 1 cloth and 3 tea factories in districts of the fourth level.
In the aggregate, however, this Subregion claims a little less than half of an registered factories, but nearly two-thirds of all workers in registered factories in the Region.
STATEMENT IV.8.J
Size of In:!illtry e:np\-)y-
nl=nl
2
Total of all Iodustries
Rice . 20-99 100+
Alta 20-99 100+
SUllarcane 20-99 100+
Bdible olls 0 20-99 JOOi'
1st [evel
Agricultural Processing Industries
1'1 WEST HIM ALA VAS
2r.d Lev"l 3rdLevd 4thl.eue{ ---~ --~~--~-~ ,---..... ___, ~ __ .J._-~
No, WJrkers No, Workers No, Workers No, Workers
3 4 S 6 7 8 9 10
48 2.983 101 9.045 5 965 124 8,658
20
4S
:50 2 48 3 1,890
40 3 70
Total r---""'------\
No. Workers
11 12
281 21,651
20
45
3 9R 3 1,890
4 UO ..

Industry
208
STATEMENT IV.8.Il
Selected Industries Outside Agricultural Processing
1'1 WEST HIMALAYAS
1st level 2nd level 3rd level 4th level ,..._.___,,__...., .-.-'--. ~ . Total Size of employ. ",ent No. Workers No. Workers No. Workers No. Workers No. Workers
2
Steel • . 100+ 1000+ 2000+
Cloth 100 l-1000+ 2000-r
'lea 100+ 1000+ 2000+
Coal, Limestone loo-r a'1d n()n·metallic 000+ mineral products2000+
3 4
146
s 6 7 8 9
490
4 2,975 1 1,770
10
514
473
11
S 1
3
12
490
3,489 1,770
473
146
STATEMENT IV. 9
Number of districts in each block arranged by (a) low, mediu'tn and high values in (b) each of the four levels of developmen t
SUB REGION: 1'2 EASTERN HIMALAYAS Part I Part n Part III
A (Low value) B (Medium value) C (High value) ,.. r---.
Dlock 1st 2nd 3rd 4th 1st 2nd 3rd 4th 1st 2nd Jed 4th
level level level, level level level level level level level level level
2 3 4 S 6 7 8 9 10 11 12 13
II
III
IV
V
VI
2
Total. 3
2
2
5
There are only 3 districts in the Subregion of which 2 are in the first or lowest level and 1 in the highest level. The disparities in development are therefore high. Even in the 2 districts oi first level intersectoral development is uneven, their values being low in block II, medium in IV and V, and high in block III. One has low value and another medium value in block VI. The only district in the top level enjoys uniformly high vaIues in each block except III where the value is medium.
All the rice mills in this Subregion are
2
-)
2 4
concentrated in Darjeeling the sole district of the top level of development. The range of non-agricultural industry in the organised sector is limited to tea and fine chemicals. The 12 tea, factories and the single fine chemicals factory (cinohona factory in Darjeeling) are confined to the sale district (Darjeeling) in the top level of development.
This Subregion claims only 171 out of a total of 593 factories in the Region and no more than 8,877 workers out of a total of 3~,809.
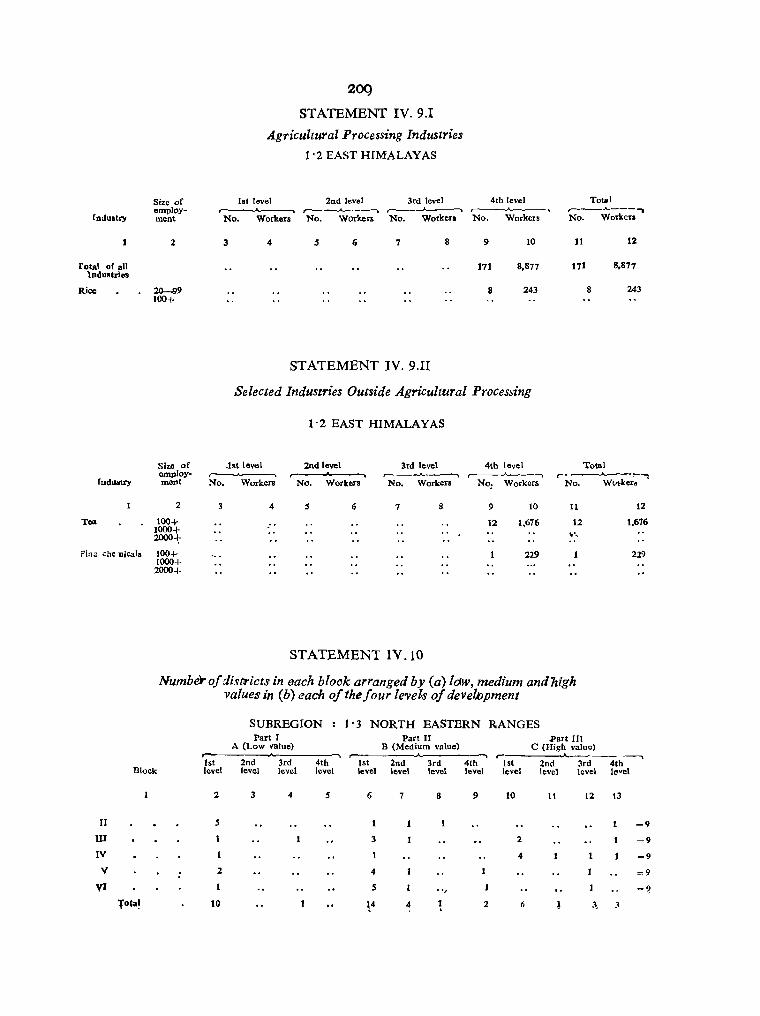
Industry
fotal of all lndu.tries
Rice
IndllStry
Tea
Size of employ-ment
2
20-99 100+
209
STATEMENT IV. 9.1
Agricultural Processing Industries
1'2 EAST HIMALAYAS
lst level 2nd level 3rd level -----.
No. Workers No. Workers No. Workers
3 4 S 6 7 8
STATEMENT IV. 9.II
4th level ,..----A.-.-- , No. Workers
9 10
171 8,877
8 243
Selected Industries Outside Agricultural Proces~ing
1'2 EAST HIMALAYAS
Tot. I ,..---........ ----., No. Worken
J1 12
171 8,877
8 243
Size of .1st level 2nd level lrd level 4th level Total employ· mertt No. Workers
2
100+ 1000+ 2000-1;
3 4
No. Workers
s 6
,.---.-...A..-~ r-----"--~ '-" --J.... __ .. :--_
No. Workers No: Workers No. Wv~ker.·
7 8 9
12
10
1.676
11
12
12
1,676
Pin~ che nical. 100+ 229 229
II
III
IV
V
VI
1000+ 2000+
STATEMENT IV.I0
Number of distlricts in aach blook arranged by (a) low, medium and "high values in (b) each of the four [e'VellS of development
SUBREGION : l' 3 NORTH EASTERN RANGES Part J Part II Part III
A (Low value) B (Medium value) C (High value)
1st 2nd 3rd 4th 1st 2nd 3rd 4th Ist 2nd 3rd Block level level level level level level level level level level level
2 3 4 5 6 7 8 9 10 lL 12
5
3 2
4
2 4
S , .,
Tota! 10 \4 4 1 2 6 l ;\_
4th l".el
13
1 =9
1 =9
1 =9
=9
=9,
;l

210
This is a Subregion of low development. Of the total of 9 districts as many as 6 are in the first level, and one each in the second, third and fourth levels. It is significant that while the district in the
ihdisputably in the top level of development although the total score places it as such nor can it be regarded as enjoying the prerequisites of such classification.
third level has high values in V and VI. The only cotton ginning and bailing the district in the fourth level has but factory and 3 tobacco factories of the medium values in these blocks. The dis- Region are in this Subregion, in the distnct ttict in the top level has high values in of third level. This Su bregion has no blocks II, III and IV only. The analysis registered factory in any of the non-agro shows that no district can be regarded as industries selected for this analysis.
STATEMENT IV.IO.I
Agricultural Processing Industries 1· 3 NORTH EASTERN RANGES
1st level 2nd level 3rd level 4th level Total Siz.eo! -'-"--....... ----, employ-
Indu."" ment No. Workers No. Workers No. Workers No. Workers No. Worlten
2 3 4 S 6 7 8 9 10 11 12
Total of all IS3 383 61 1,897 26 848 141 3.181 Industrie. 36 17
Jute and cotton ginning and
22 22 pressin& 20-99 100+
Tohacco 20-99 .' 99 3 99 100+
STATEMENT IV.11
Number 0/ districtlS in each block arranged by (a) low, medium and High values in (b) each of the four levels of development
SUBREGION: 2·1 RAJASTHAN PLAINS
Part I A (Low value)
,...... r-1st 2nd 3rd 4th 1st
Block level level level level level
:1 4 6
II 3
III • l 3
tv •
V 3
VI . 2
Total 4 3 S
This Subregion is marked by an even distribution of 3 districts in each of the first three levels. There is no district in the top level. Each district. irrespective of level of development. has high values in block IV (potential of human resources). 4 districts (2 each in the second and third levels of development) have high values in block II (settled agriculture).
Thv dis¥il;_;ts iI1 the first level havy only
Part II Part III B (Medium value) C (High value)
2nd level
7
2
3
7
...., r------A--____ __.., 3rd 4th 1st 2nd 3rd 4th level level level level level level
8 9 10 11 12 13
2 2 =9
3 ~9
3 3 3 =9
3 =9
=9
10 3 5 5
3 medium tobacco factories and 1 coal, limestone and non-metallic factory. There i.s only 1 medium jute and cotton gin and press in a second level district. But the great bulk of all registered fact6ries (264 out of a total of 313 in the Subregion) employing no less than 13,076 out of a total of 16,355 persons deCur in 3 districts placed in the third or highest ever Ie·vel of development, for this St1bre~o:q.

In~,!stry
Total 01 all Industries
'- . Alta
Sugarcane
Edible Oils
j,ne and cotton gintling and Ilreosinll
Tobacco
Ind'JStry
Generation of electricity
Coal, limestone and -non-meta-llicmiitc£ai products
Block
II
m IV
V
VI
Total
21l
S1' ATEMENT IV.l1.1
Agricultural Processing Industries
2·1 RAJASTHAN PLAINS
Size of 1st level 2nd level lrd level 4th Icyel Total employ-ment
-. ,-___s..: _ _, ~---. r-----.A.---, ~---. No. Workers No. Workers No. Workers No. Workers No. Workers
2 3 4 6 7 8 9 10 11 12
14 716 15 1.553 164 13.016 313 16.355
20-99 43 3 100+ 20-99
100+ 1 598 1 598 20-99 100+
I 40 40 ~.
20-99 47 12 649 13 691 100+' 4 751 4 751
20-99 3 100 2 74 5 174 100+
STATEMENT IV.II.II
Selected Industries Outside Agricultural Processing
2·1 RAJASTHAN PLAINS
Size of 1st level 2nd level lrd level 4th level Total employ- r--->"----.......... ,---.A..~ r--J....-- "'\ ,-----.A--_...., ,..--A. __ ~
ment No. Workers No. Workers ~o. W?rkers No. Workers ~o. Workers
2 3 4 5 6 7 8 9 to
100+ 2 657 1000+ 2000+
100+ III 187 1000+ 2000+
STATEMENT IV.12
Nlumber of districtlS in each block arranged by (a) low, medium and high values in (b) each of the four levels of development
SUBREGION : 2'2 PUNJAB PLAINS
Part I Part II Part III A. (Low value) B (Medium value) C (Ri!!h value)
II
2
2
.... r-------.A.-----. 2nd 2nd 3rd 4th 1st 3rd 4th 1st 1st 2nd 3rd 4th
level level level level level level level level level level level level
:2 3 4 5 6 7 8 9 10 11 12 13
1 12
2 10 2
:2 12
2 1 , 7 .. .. 2 1 7 5
2 10 4 2 14 4 2 36
12
6'1
298
IS
IS
IS
15
l'

By contrast to the Rajasthan Plains this Subregion is marked by a high degre; of development, among the hi ohest in India. 12 out of 15 districts ar~ in the highest level of development, 1 in the third and 2 in the second. There are none in the first or lowest level. AJI of them have high values for blocks II and IV; out of 12 districts of highest level 7 have high and 5 medium values in block V, while 5 have high and 7 medium values in block VI. This prov~s that although the sectors of distributive trade, manufacturing, infrastructure and modern organised industrial activity are still some way from attaining a uniformly high level, the base of human potential and agricultural development is sound.
212
In districts of the second levei there are only 4 small rice mills, 1 medium sized cement factory (employing 686) but 1 large fertilizer 'factory (Fertilizer Corporation of India, Naya Nangal, employment 2.671). In the sole district in the third level there are 1 rice mill, 1 sugarcane factory, 2 oil mills, 18 jute and cotton gins and presses (employing a total of 1,036 persons) and l' steel factory employing 170 persons. All the remaining 3,170 registered factories out of a total of 3,313 occur in districts placed in the fourth or highest level of development, in which the agro industries are in as strong a muster as the non-agro factories.
STATEMENT IV.12.1
Agricultural Processing Industries
2·2 PUNJAB PLAINS
SiSe of 1st level 2nd level 3rd level 4th level Total
Industry employ- , ...., ~ ~--. ~-----. r---"---.
ment No. Workers No. Workers No. Workers No. Workers No. Workers
2 3 4 5 6 7 8 9 10 II 12
Total of all 86 6,347 57 2,311 3,170 107.363 3,313 116,031
Industries
Rice 20-99 4 107 20 7 193 12 320
100+
Attn 20-99 12 675 12 675
100+ 3 445 3 445
Dal 20--99 2- 44 2- 44
100+
Suprcanc 20-99 4 147 4 147
100+ . i 29i 4 2,696 5 2,987
Ediblo on. 20--99 2 111 16 693 18 804 1(10+ I 108 J lOB
Hydrollenaled 20-99 1 91 1 91 oils 11)0+ 1 140 1 140
J ute and cotton 20-99 18 1,036 92 4,123 HO ginning and 100+
5,759
pressing 22 3,007 22 3,007
Tobacco 20-99 25 25 100+
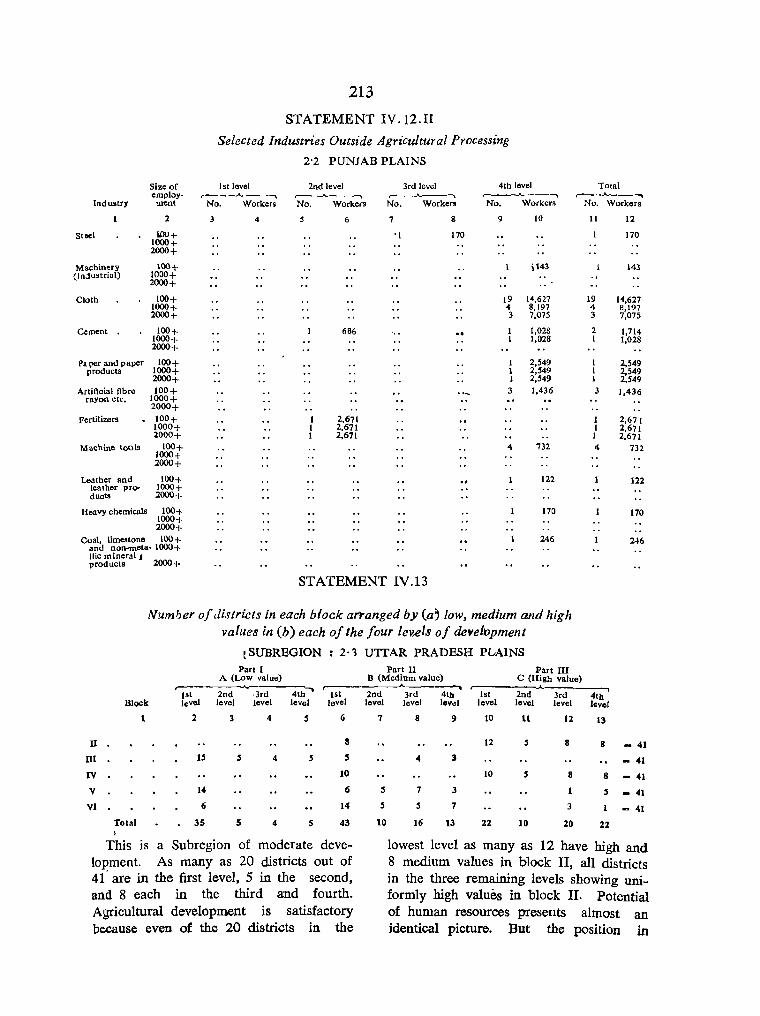
Size of employ.
Industry ment
2
Stllel tro+ 1000+ 2000+
Machinery 100+ (I nju.trial) 1000+
2000+
Cloth 100+ 1000+ 2000+
~Itlent 100+ 1000+ 2000+
Pa per and paper products
tOOT 1000+ 2000+
Artitlcial IIbre 100+ rayon etc. 1000+
2000+ Fertilizers 100+
1000+ 2000+
Machine tools 100+ 1000+ 2000+
Leather and 100+ lea ther pro- 1000+ ducts 2000+
Heavy chemicals 100+ 1000+ 2000+ tOOT
213
STATEMENT IV. 12.II
Selected Industries Outside Agricultural Processing
2'2 PUNJAB PLAINS
1st level 20d level 3rd level 4th level r----.A..- -, r---A.---, .----A-...... ..---J.----,
No. Workers No. Workers No. Workers No. Workers
3 4 6 7 8 9 10
'I 170
\.143
19 14,627 4 8,197 3 7,075
686 1,028 1,028
1 2,549 1 2,549 I 2,549 3 1,436
1 2,671 I 2,671 1 2,671
4 732
122
170
246 Cual. limestone anel non-meta· 1000+ Hic mineral ~ products 2000+
STATEMENT IV.13
Number of districts in each block arranged by (a; low, medium and high values in (b) each of the four lev,els of de~elvpment
[SUBREGION: 2·1 UTTAR PRADESH PG-AINS Part 1 Part II Part III
Totai r---...... --......
No. Workers
11 t2
170
143
19 14,627 4 8,197 3 7,075
2 1,714 1 1,028
2,549 2,549 2,549
3 1,436
I 2,671 I 2,671 I 2,671 4 732
122
170
246
A (Low value) B (Medium value) C (High value)
4th ......
---A ___ --. r- ---.
1st 2nd ·3rd 1st 20d 3rd 4tb 1st 2nd 3td 4th Block levol level level level level level level lov~1 level level level level
2 3 4 5 6 7 8 9 10 II 12 13
U II 12 , 8 8 - 41 III IS j 4 j :s 4 3 - 41
IV 10 10 5 8 8 - 41
V 14 6 , 7 3 j - 41
VI 6 14 5 , 7 3 - 41 Total 3S 5 4 S 43 10 16 13 22 10 20 22 I
This is a Subregion of moderate deve- lowest level as many as 12 have high and lopment. As many as 20 districts out of 8 medium values in block II, all districts 4t' are in the first level,S in the second, in the three remaining levels showing uni-and 8 each in the third and fourth. formly high values in block II. Potential Agricultural development is satisfactory of human resources presents almost an because even of the 20 districts in the identical picture. But the position in
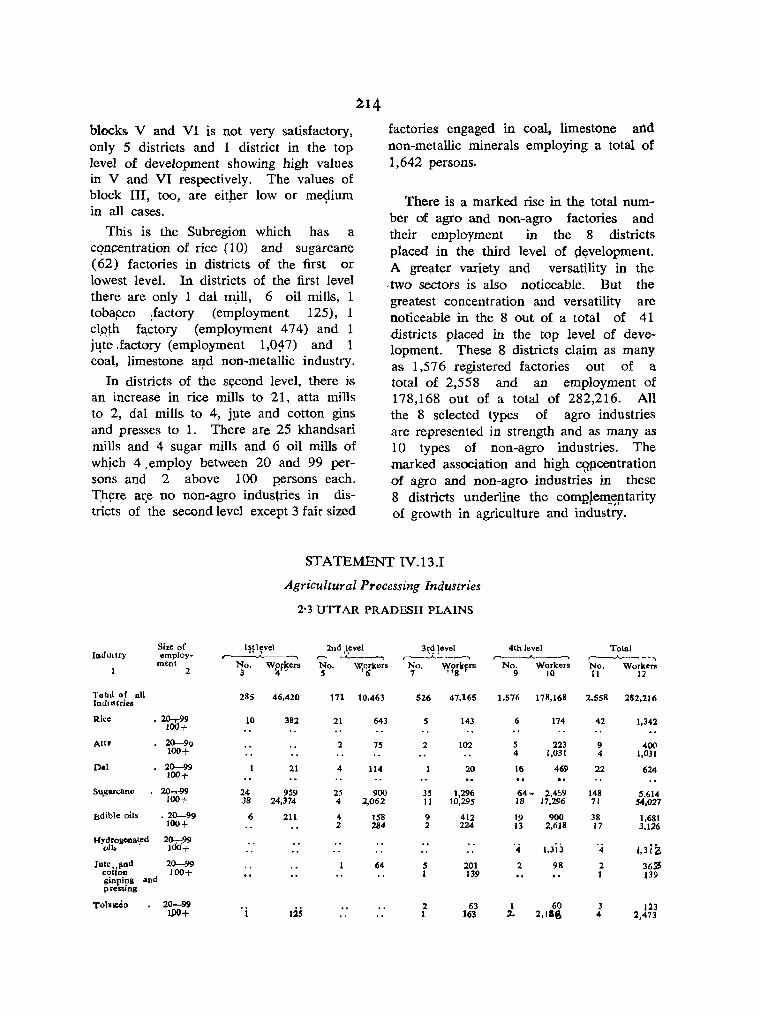
blocks V and VI is not very satisfactory, only 5 districts and 1 district in the top level of development showing high values in V and VI respectively. The values of block III, too, are eit~er low or me<;lium in all cases.
This is the Subregion which has a cqnpentration of rice (10) and sugarcane (62) factories in districts of the first or lowest level. In districts of the first level there are only 1 dal II1:ill, 6 oil mills, 1 tobaFeo :factory (employment 125), 1 c1qth factory (employment 474) and 1 jqte .factory (employment 1,0~7) and 1 coal, limestone aJ?d non-metallic industry.
In districts of the sl(Cond level, there is an increase in rice mills to 21, atta mills to 2, dal mills to 4, jpte and cotton gins and presses to 1. There are 25 khandsari mills and 4 sugar mills and 6 oil mills of wh~ch 4. employ between 20 and 99 persons and 2 above 100 persons each. T,hyre ar:e no non-agro industries in districts of the second level except 3 fair sized
factories engaged in coal, limestone and non-metallic minerals employing a total of 1,642 persons.
There is a marked rise in the total number of agro and non-agro factories and their employment in the 8 districts placed in the third level of ~~velopment. A greater variety and versatility in the
·two sectors is also noticeable. But the greatest concentration and versatility are noticeable in the 8 out of a total of 41 districts placed in the top level of development. These 8 districts claim as many as 1,576 registered factories out of a total of 2,558 and an employment of 178,168 out of a total of 282,216. All the 8 selected types of agro industries are represented in strength and as many as 10 types of non-agro industries. The marked association and high q?pcentration of agro and non-agro industries in these 8 districts underline the comp.1elI!~p.tarity of growth in agriculture and industry.
STATEMENT IV.13.I
Agricultural Processing Industries
2'3 UTTAR PRADESH PLAINS
Size of Inl~vel 2nd,I,evel 3~~ !evel 4th level Total IlldUltry employ- ,------..A. __ -, ,-. -'-------, r--A----~ r------.A..---, ~----,
ment No. W~rl_ters No. W.orkers No. "Y?~\<frs No. Workers No. Worken; 2 3 , '6 7 9 10 II 12
To till of all 285 46,420 171 10,463 526 47,165 1,576 178,168 2,558 282,216 Ind,"'tries
Rice • 2O-r99 100+
10 382 21 643 5 143 6 174 42 1,342
Attl 20-99 2 7S 2 102 5 223 9 400 100+ 4 1,031 4 1,031
011 20-99 21 4 114 20 16 469 22 624 100+ ..
Su_garcane 20...,..99 24 959 25 900 35 1,296 64- 2,4~9 148 5.614 100+ JS 24,374 4 2,062 11 10,295 18 17,296 71 S4,027
Bdible oils .20-99 6 211 4 1511 9 412 19 900 38 1,681 100+ 2 284 2 224 13 2,618 17 3,126
HYj~~8COa~ed 20-;--;99 '4 1.3ij 1,3iZ 100+ 4
Jute, I'nd 20-99 64 S 201 2 98 2 3655 coUon 100+ 1 139 1 139 ginJ'il)8 and pressIng
'l"ohICC" 20-99 2 63 1 60 3 123 IPD+ . i 125 1 163 ,. 2, taS 4 2,473

215
S'FATEMENT IV.13.II
Selected Ina us tries Outside Agricultural Processing
2' 3 UTT A:R PRADESH PLAINS
Size of 1st level 2Dd leve'l 3rd level 4tI1levei Total oM'ploy- r---"'______' ---___... -. .- -., r----.A. - --"'""'\ ~__._).._---~
Indus.,." menl No. Work:.ers No. Workers No. Wo"er. No. Workers No. W orkl:lS
2 4 5 6 7 9 10 11 12
Steel 100 I- 9 3,237 9 3,237 1000 t- I 1,090 I 1,090 2000+
Machinery 100+ 579 ISO 4 729 ( Indu.trial) 1000+
Machinery 2000+
Eloretrical) 100+ 196 196 lQOO+ 2000+
Cloth Idb+ 474 S 3,254 19 50,945 25 54,673 1000+ I 2,235 13 48,146 14 ,0,381 2000+ I 2,235 II 44,720 12 46,955
Jute '100+ 1,047 2 4,Ssa 3 5,597 1000+ 1,047 2 4,550 3 5,597 2000+ 1 3,489 1 3,489
Tea i. 100+ 112 1 112 1000+ 2000+ -Paper and 100+ 4 2,246 4 2,246
paJ;>er Iggg+ 1 1,052 1 1,052 prOducts 2 +
Artificial fi6rc (00+ 863 863 rayon etc. 1000+
2000+ Leather tU'ld 100+ 12 4,921 12 4,921
lealher 1000+ 1 24,82 I 2482 products 2000+ 1 2,482 1 2,482
Fine chentl::als ~+ 3 -458 3 458 I + 2000+
Heavy chemicah 100+ 508 508 1000+ 2000+
Coal lime- 100+ 111 3 1,642 7 2,371 39 6.832 50 10,956 stone and 1000+ non-metallic 2000+ mineral produCts
STATEMENT IV. 14
Number of distri.v.ts in each block arranged by (a) low, medium and high values in (b) each of thll four r~els of dev.elopment
SUBREGION : 2' 4 BIHAR PLAINS
Part I Part n Part lIT
A (LoW value) B (Medium value) C (High value) ___,_, ,-Block 1st 2nd 3rd 4th 1st 2nd
level level level level level
2 3 4 5 6 II 3 1II 3 S I
IV 4 V 4
VI 4 Total 3 5 1 16
Of the 11 districts in this SIIbregion, 4 are in tlie first level, 5 are in the second and "1 eaah in the third and fourth revels. This Subregion is, therefore, characterised by tardy development. The only district in the top level does not <;l?!ll! qi~h v~lues in 1:?loc~s lIJ ~qd VI.
level
7 3
5 5
13
-., ,-3rd 4th l,t 2nd 3rd 4th level level level level level level
8 9 10 It 12 13 2 1 =11
=ll 5 I =11
1 =11 1 1 =11 1 2 7 3 3
In the non-agro sector, districts in the second level have the widest variety, altliough the number of registered factories employing more than 100 persorls is small and is confined to electrical machinery (1), cloth (1), jute (2 of which 1 employs 3,590 persons), cement \3), paper <lnq
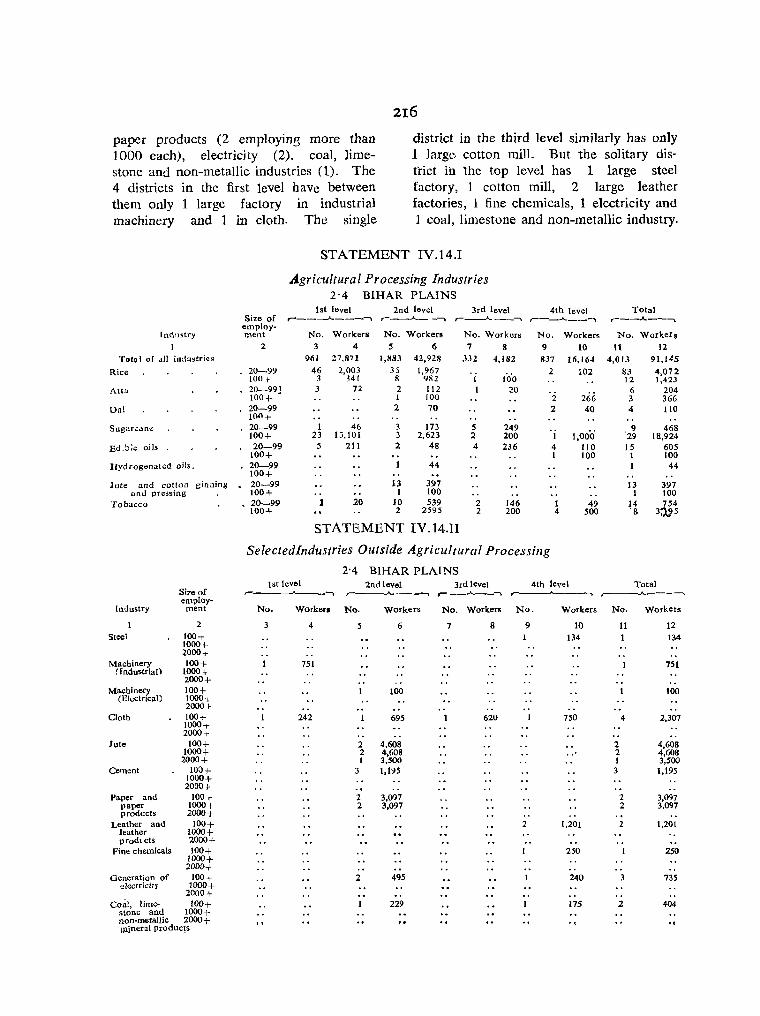
216
paper products (2 employing more than 1000 each), electricity (2). coal, limestone and non-metallic industries (1). The 4 districts in the first level have between them only 1 large factory in industrial machinery and 1 in cloth. Tht: single
district in the third level similarly has only 1 large cotton mill. But the solitary district in the top level has 1 large steel factory, 1 cotton mill, 2 large leather factories, 1 fine chemicals, 1 electricity and 1 coal, limestone and non-metallic industry.
Indu:stry
Total of all industries
Rice
Atta
Dal
Sug~r"ane
Ed,b:e oils
Hydrogenated oils.
Jute and cotton ginning anu pressing
Tobacco
Industry
Steel
Machinery !Industrial)
Machinery (Electrical)
Cloth
Jute
Cement
Paper and paper products
Leather and leather prod' cts
Fine chemicals
Generation of electricity
Si7e of employ
ment
2
100 ..... 1000+ 2000-r 100+
1000 + 2000+ 100+ 1000 ..... 2000+ 100+ 1000-r 2000,-
100+ 1000+ 2000+
100+ 1000+ 20001-
100,-1000+ 2000+
100+ 1000+ 2000+ 100+
1000+ 2000+
100+ 1000+
2000+ Coal, lime- 100+
stone and 1000+ non-metallic 2000 + wineral produq&
STATEMENT IV.14.1
Agricultural Processing Industries 2'4 BIHAR PLAINS
lst level 2nd level 3rd level 4th level Size of r-----"----l r_-.A._-_l r---..A.. __ -.. ,,---_...A... __ ~
employ-ment No. Workers No. Workers No. Workers No.
2 3 4 5 6 7 8 9 961 27,871 I,SS3 42,928 332 4,182 837
20-99 46 2,003 35 1,967 2 100 t- 3 341 8 'l81 I 10'0 20-991 3 72 2 112 I 20 100+ • 1 100 2 20-99 2 70 2 100+ 20-99 I 46 3 173 5 249 100+ 23 D,IOI 3 2,623 2 200 1 20--99 5 211 2 48 4 236 4
100+ I 20-99 44 100+ 20-99 13 397 100+ I 100
• 20--99 1 20 10 539 2 146 1 100+ 2 2595 2 200 4
STATEMENT IV.14.U
Selectedlndustries Outside Agricu! lural Processing
2'4 BIHAR PLAINS 1st level 2nd level
r-~
3rd level r-----"---.
Workers 10
16,164 102
266 40
1,000 110 100
49 500
No. Workers No. Workers No. Workers No. Workers
3 4 5 6
751
100
242 695
2 4.6OS 2 4,60S I 3,SOO
3 1,195
2 3,097 2 3,097
2 495
229
7 8 9
620
2
10 134
750
1,201
250
240
175
Total ,.-__ A __ -....
No. Workers
tt 12 4,013 91,1 45
83 4,072 12 1,423
6 204 3 366 4 110
9 468 29 18,924 15 605
I 100 44
13 397 I 100
14 754 'S 3o.?5
Total ,---.A._-----,
No. Workers
11
2 2 1 3
4
2 2
2
3
2
12 134
751
100
2,307
4,608 4,608 3,500
1,195
3,097 3.097
1.201
250
735
404 ..
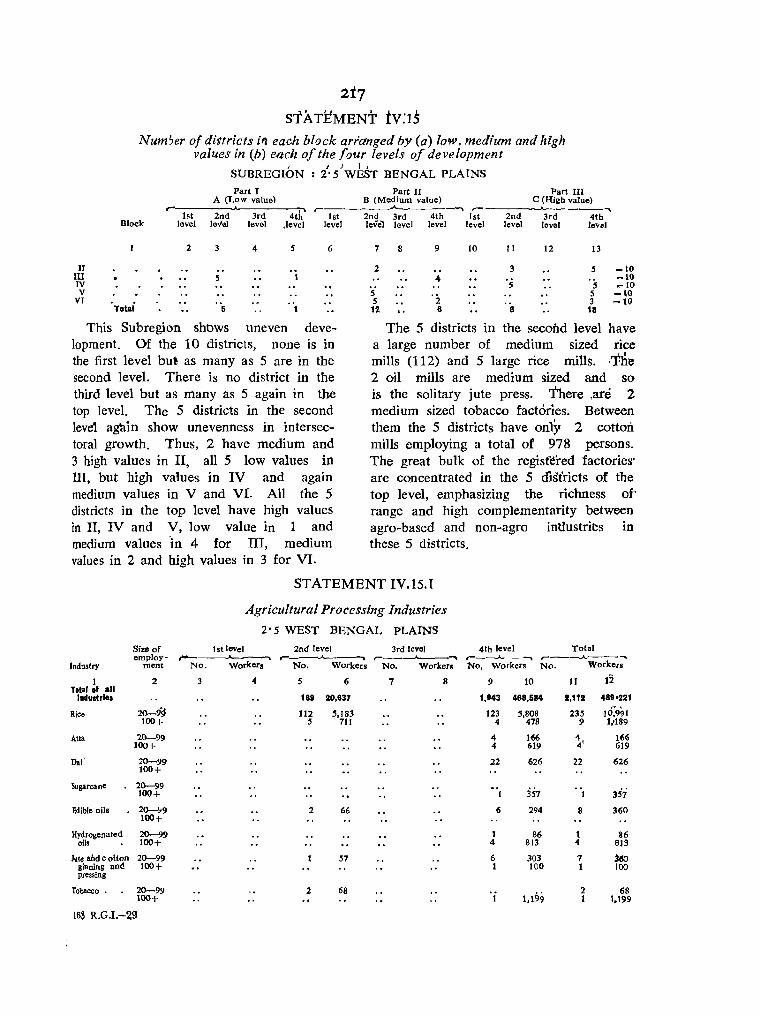
217 STATEMENT tV:1.5
Num;er of di1tricts if! each block arr'anged by (a) low, medium and high values in (b) each of the four levels of development
J ) i i
SUBREGION: 2' 5 WEST BENGAL PLAINS Part J
A (Low value) .-
4th r-
1st 2nd 3rd lst Block level level level ,level level
2 3 4 5 6
If .. III S 1 IV V
vr "6 Total 1
This Subregion shows uneven development. Of the 10 districts, none is in the first level but as many as 5 are in the second level. There is no district in the third level but as many as 5 again in the top level. The 5 districts in the second leve1 agnin show unevenness in intersectoral growth. Thus, 2 have medium and 3 high values in II, all 5 low values in III, but high values in IV and again medium values in V and VI. All the 5 districts in the top level have high values in II, IV and V, low value in 1 and medium values 'in 4 for III, medium values in 2 and high values in 3 for VI.
Part II Part III B (Medium value) C (High value) ___... r- --___,____ ----, 2nd 3rd 4th 1st 2nd 3rd 4th leveJ level level level level level lenl
7 8 9 10 11 12 13
2 .. 3 5 =10 4 '5 's =10
~10 5 '2 5 -10 S 3 =10
12 6 8 11
The 5 districts in the second level have a large number of medium sized rice mills (112) and 5 large rice mills. ,The 2 oil mills are medium sized and so is the solitary jute press. There ,are 2 medium sized tobacco factories. Between them the 5 districts have only 2 cotton mills employing a total of 978 persons. The great bulk of the regist"ered factories' arc concentrated in the 5 districts of the top level, emphasizing the richness of' range and high complementarity between agro-based and non-agro intlustries in these 5 districts.
STATEMENT IV.15.I
Size of employ-
Industry ment
1 2 Total of an
Industries
Rice 20-99 100+
Alta 20--99 100+
Dar 20-99 100+
Sugarcane 2()-99 100+
Edible oils 20-~9 100+
Hydrogenated 20-99 oils 100+
Jute aM colton 20-99 ginning and 100+ pressing
Tobaoco • 20-99 100+
163 R.G.1.-29
lst level
Agricultural Processing Industries
2' 5 WEST BENGAL PLAINS
2nd level 3rd level ... ---.... ______ r---..A...---, r- -. No. Worker. No. Workers No. Workers
3 4 5 6 7 8
189 20,837
112 5,183 5 711
2 66
57
2 68
4th level Total r---.A---, ,---.,.A..---_ No. Workers No. Workers
9 10 II 12 1,943 488,&84 2.112 489'221
123 5,808 235 10;991 4 478 9 1,'189
4 166 ~, 166 4 619 619
22 626 22 626
" 357 "I 1 357
6 294 8 360
1 86 1 86 4 813 4 813
6 303 7 jt!O 1 100 1 100
1.199 2 68
1 1 1,199
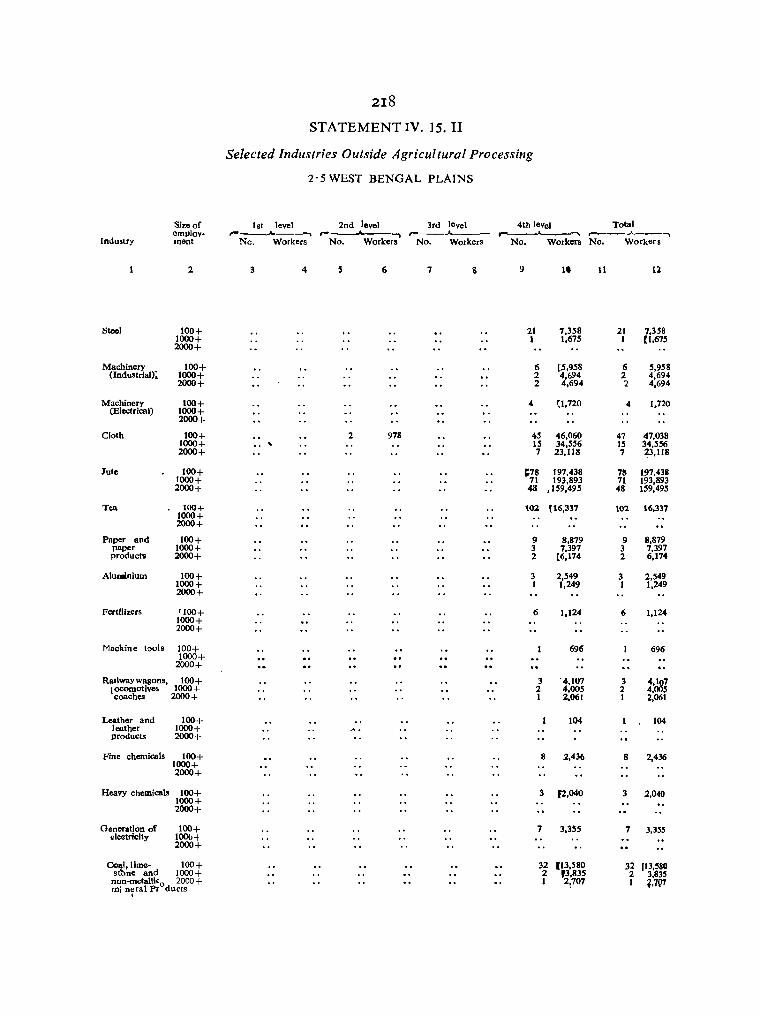
Industry
Steel
Machinery (Indu.trlal)~
Machinery (Electrical)
Cloth
lute
Tea
Paper and paper product.
Alunoinium
Fertilizers
Mackine tools
Radwaywagons, locomotives coaches
Leather and leather products
Fine chemicals
Heavy chemicals
Generation of electricity
CclaI,lime-stbne and
Size of employmont
2
100+ 1000+ 2000+
100+ 1000+ 2000+
100+ 1000+ 2000+
100+ 1000+ 2000+
100+ 1000+ 2000+
100+ 1000+ 2000+
100+ 1000+ 2000+
100+ 1000+ 2000+
'100+ 1000+ 2000+
100+ 1000+
2000+
100+ 1000+
2000+
100+ 1000+ 2000+
100+ 1000+ 2000+
100+ 1000+ 2000+
100+ lOO(J-I 2000+
100+ 1000+
non-metallic 0 2000 + mj neral Pr dUcts
I
218
STATEMENT IV. ]5. II
Selected Industries Outside Agricultural Processing
2' 5 WEST BENGAL PLAINS
1st level 2nd level 3rd level 4th level Total .--_-,-__ ."",\ ,.. ...., ,-._-...... - r- J.~ r----.A __ ......
Nc. Workers No. Workers No. Workers No. Workers No. Workers
3 4 s 6 7 s 9 11 12
21 1,358 21 1,358 1 1,675 1 (1,673
(I r.5,958 (I 5,958 2 4,694 2 4,694 2 4,694 2 4,694
" r.I,720 4 1,720
2 978 45 46,060 47 47,038 , 13 34,556 15 34,556 7 23,118 7 ~3,118
1:78 197,438 711 197,438 71 193,893 71 193,893 48 ,159,495 48 159,495
102 £16,337 102 16,337
9 8,879 9 8,879 3 7,397 3 7,397 2 [6,174 2 6,174
3 2,549 3 2,549 1 1,249 1 1,249
6 1,124 6 1,124
696 696
3 '4,107 3 4'M7 2 4,005 2 4, 5 1 2,061 1 2,061
104 104
8 2,436 8 2,436
3 rz,040 3 2,040
7 3,355 7 3,355
32 113,580 32 113,380 2 fJ,835 2 3.835 1 2,707 1 Pl!7

219
STATEMENT IV.16
Numbef of districts in each block arranged by (a) low, medium and high values in (b) each of the four levels of development
SUBREGION 2' 6 ASSAM VALLEYS
Part I Part II Part III A (Low value) B (Medium value) C (High value)
~-----~------~ ,.----__ --.A.
_."._ -;:-> 1st 2nd 3rd 4th lst 2nd 3rd 4th IiI 2nd 3rd 4th
Block level level -level level level level level level level level level level , 2 4 5 6 7 8 9 10 11 12 13
II 3 2 =7
III 2 1 2 =7 IV 3 3 ~7
V 3 3 ~7
VI 3 3 =7
Total 2 to 10 2 3 4 3
The 7 districts in this Subregion progressively taper off in the three upper levels of development, there being none in the first level. There are 3 districts in the second level, 3 in the third and 1 in the fourth. But intersectoral development again is uneven and no district can be regarded as having indisputably "arrived".
It is the districts in the second level of development which have the largest number of small rice (12), oil (4) mills and
jute presses (4). There is 1 atta mill. There are, besides, 24 tea factories in these ?J districts in the second level. In the 3 districts of the third level there are 8 rice mills, 3 atta mills and 6 oil mills but 1 large sugarcane factory employing 359 persons. There is 1 cloth mill employing 100 persons but there are 115 tea factories and the Digboi Oil Factory employing 1,228 persons. The only district in the fourth level bas only 2 rice and 1 oil mill but as many as 96 tea factories and 1 factory of coal, limestone and nonmetallic industry.
STATEMENT IV. 16.1
Agricultural Processing Industries
2' 6 ASSAM VALLEYS
s~or lit level 2nd level 3td level 4th level Total employ-
Induat!')' m.~' ,---_,,_--....... r---..A.----"" No. Worltora No. Workon No. Worken )10. Wotken No: Workers
2 3 4 5 6 7 8 _9 10 11 12
Total of all illdustriM
282 13.442 557 32.591 357 32,749 1.196 78.782
Rlec .20-99 12 374 8 255 2 42 22 671 .100+ ..
Atta 2()......99 48 3 120 4 Usa 100+
Sugarcane _ 20-99 • ·1 3S9 . i :i59 100+
Bdibleoils 20-99 100+
4 120 6 233 2$ 11 378
Jute and cotton 4 174 Sinninll and 20-99 4 174
proninll 100+ 2 311 :2 311

220
STATEMENIf IV.16.II
Selected Industries Outside Agricultur.al Processing
2' 6 ASSAM VALLEYS
1st level 2nd level 3rd level 4th level Tola I Size of employ
ment r----A-~ r-----v---~ ~ ...---------A.----. r------J..---,
tndustry
Cloth
Tea
2
100+ 1000+ 2000+
100+ 1000+ 2000+
Petroleum and oil 100+ 1000+ 2000+
Coal,limestone 100+ an..! non-meta- 1000+
lIie mineral 2000 tproduct.
No. Workers No. Workers
3 4 6
24 3,823
No. Workers No. Workers No. Workers
7
115
1 I
8
100
18,354
1,228 1,228
9
96
10 11
19,124 235
108
12
100
41,301
1,228 1,228
108
STATEMENT IV. 17
NU'nber of dlstricts in each block arranged by (a) low, medium and high values in (b) each of the four levellS ofdevel(lpment
SUBREGION 3'1 RAJASTHAN HILLS AND PLATEAUS
Part I A (Low value)
r------.A. 1st 2nd lrd 4th 1st
Block level level level level level
2 3 4 5 6
n 2
III 2 2
IV
V 2 2
VI 2
Total 2 4 2 1 6
This Subregion presents a promlSlOg picture. Of the total of 19 distriC't$ only 2 are in the lowest level, 8 in the second level, 3 in the third and as many as 6 in the top. These 6 districts again enjoy high values in II and IV, and either high or medium values in V and VI. Of the 3 districts in the third level 2 have mostly low value in block III.
Among the 2 districts (Bhilwara and B.answara) in the lowest level Bhilwara has 1 dal and 1 khandsari sugar mill, 10 cotton gins and presses (of which 4 employ more than 100 persons each) and 3
Part II Part III B (Medium value) C (High value)
r--2nd 3rd 4th 1st 2nd 3rd 4th
level level level level level level level
7 8 9 10 11 12 13
3 5 3 6 =19
7 5 _19
2 8 3 6 -19
6 3 2 4 -19
S 3 2 2 3 =19
21 5 10 2 15 8 19
tobacco factories. Banswara has only 1 factory devoted to .jute ginning and pressing. Banswara has no large non-agro industrial factory whereas Bhilwara again has 2 devoted to coal, limestone and nonmetallic minerals.
The 8 districts in the second h~vel have 2 rice mills, 1 dal mill, 1 sugar mill, 2 oil 'mills, 12 gins and presses (of which 2 employ 339 persons) and 2 tobacco factories. Sawai Madhopur has a large cement factory (employment 2,592). There is 1 fine chemicals factory and 1 factory
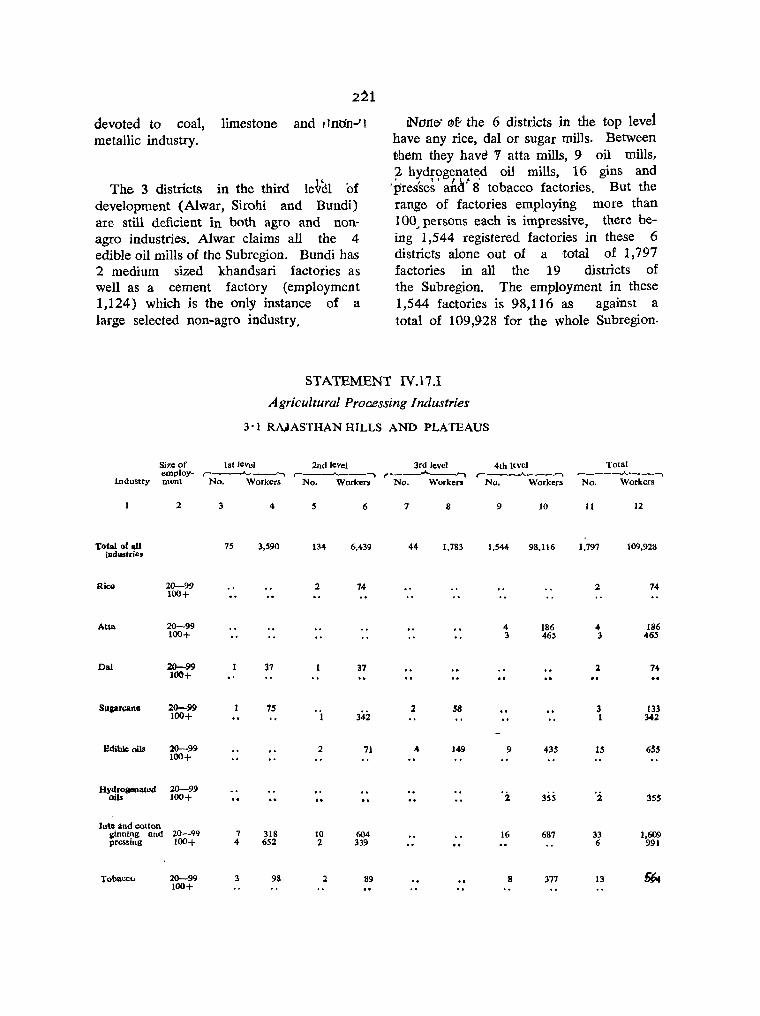
2~1
devoted to coal, limestone and rlntln-'j metallic industry.
The 3 districts in the third le~~l of development (Alwar, Sirohi and Bundi) are still deficient in both agro and nonagro industries. Alwar claims all the 4 edible oil mills of the Subregion. Bundi ha,s 2 medium sized khandsari factories as well as a cement factory (employment 1,124) which is the only instance of a large selected non-agro industry.
INOrte' <!lP the 6 districts in the top level bave any rice, dal or sugar mills. Between them they have '1 atta mills, 9 oil mills, 2 hydrogenated oil mills, 16 gins and '~res'se~' ah~' 8 tobacco factories. But the range of factories employing more than 100, persons each is impressive, there being 1,544 registered factories in these 6 districts alone out of a total of 1,797 factories in all the 19 districts of the Subregion. The employment in these 1,544 factories is 98,116 as against a total of 109,928 for the whole Subregion.
STATEMENT IV.17.1
Agricultural Prooessing Industries
3'1 RNASTHAN HILLS AND PLATEAUS
Sil!e of 1st leVel 2nd level 3rd level 4th lEvel Total employ- ,.--.A. __ -, r-----"----, t--__.I..-~ r -__ .A __ ""\ ~ ___ --.A... ___ ,""",
industry ment No. Workers No. Workers No. Workers No. Workers No. Workers
2 3 4 S 6 7 8 9 10 11 12
Total of all 75 3,590 134 6,439 44 1,783 1,544 98.116 1,797 109,928 i.IIdustries
Rice 20-99 2 74 2 74 100+
Atta 20-99 4 186 4 186 100+ 3 465 3 465
Dal 20-99 37 100+
37 .2 74
Suprcane 20-99 75 , i .2 58 3 133 100+ 342 1 342
Edible oils 20-99 2 71 4 100+
149 9 435 15 65$
Hydroll'"llaled 20~99 oils 100+ '2 355 'i 3sS
Jute and ¢Olton &inni!,!!: and 20-99 7 318 10 604 16 687 33 1,609 pressing 100+ 4 652 2 339 6 991
Tobaccu 20-99 100+
3 98 2 89 8 377 13 ~
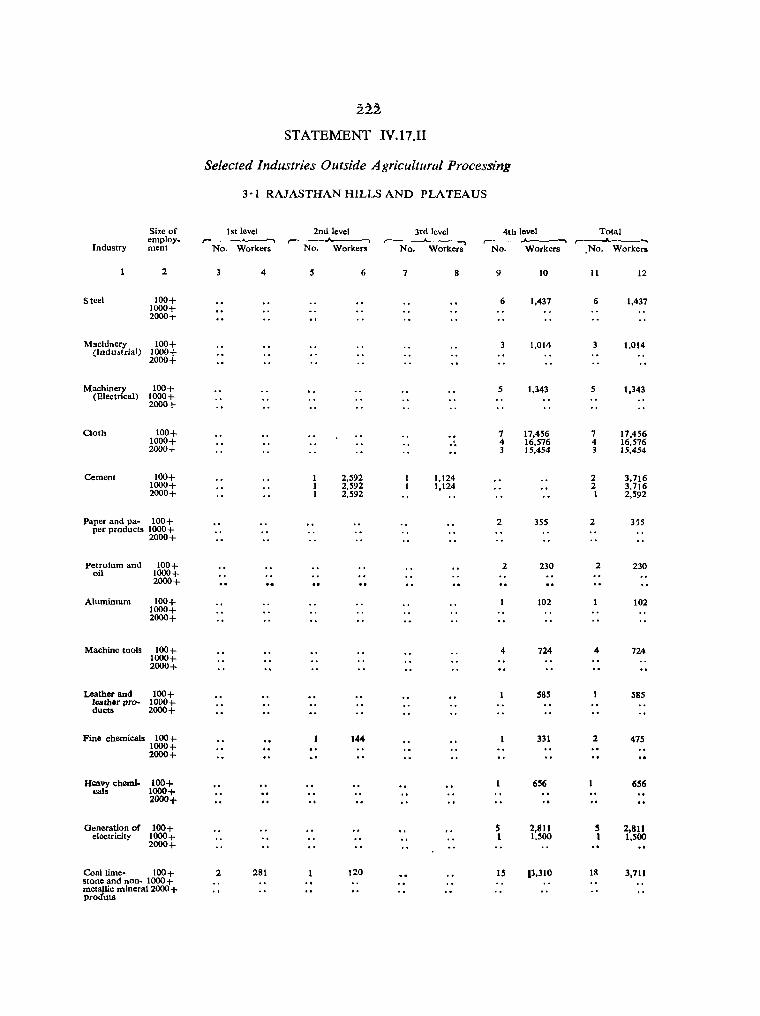
22.1
STATEMENT IV.17.rr
Selected Industries Outside Agricultural Processing
3'1 RAJASTHAN HILLS AND PLATEAUS
Size of 1st level 2nd level 3rd level 4th level Total employ. r___"_-----' r- ,- ,-----...A..------. ,---A __ ....
Industry ment No. Workers No. Workers No. Workers No. Workers .No. Workers
2 3 4 5 6 7 8 9 10 11 12
Steel 100+ 6 1,437 6 1,437 1000+ 20001-
Machinery 100+ 3 1,014 3 1.014 (Industrial) 1000+
2000+
Machinery 1001- S 1,343 5 1,343 (Electrical) 1000+
2000+
Cloth 100+ 7 17,456 7 17,456 1000+ .. 4 16,576 4 16,576 2000+ 3 15,454 3 15,454
Cement 100+ 2,592 1,124 2 3,716 1000+ 2,592 1,124 2 3.716 2000+ 2,592 1 2,592
Paper and pa· 100+ per products 1000+
2000+
2 355 2 335
Petrolum and 100+ 2 230 2 230 oil 1000+
2000+
Alumimum 100+ 102 102 1000+ 2000+
Machine tools 100+ 4 724 4 724 1000+ 2000+
Leather and 100+ 58S 585 leather pro- 1000+ ducts 2000+
Fine chemicals 100+ 144 331 2 475 1000+ 2000+
Heavy chemi· 100+ 656 656 cats 1000+
2000+
Generation of 100+ 5 2,811 5 2.811 electricity 10001- 1 I,SOO 1 1,500
2000+
Coal lime· 100+ 2 281 120 15 13,310 18 3,711 stone and non· 1000+ met~lic mineral 2000 + pro uts
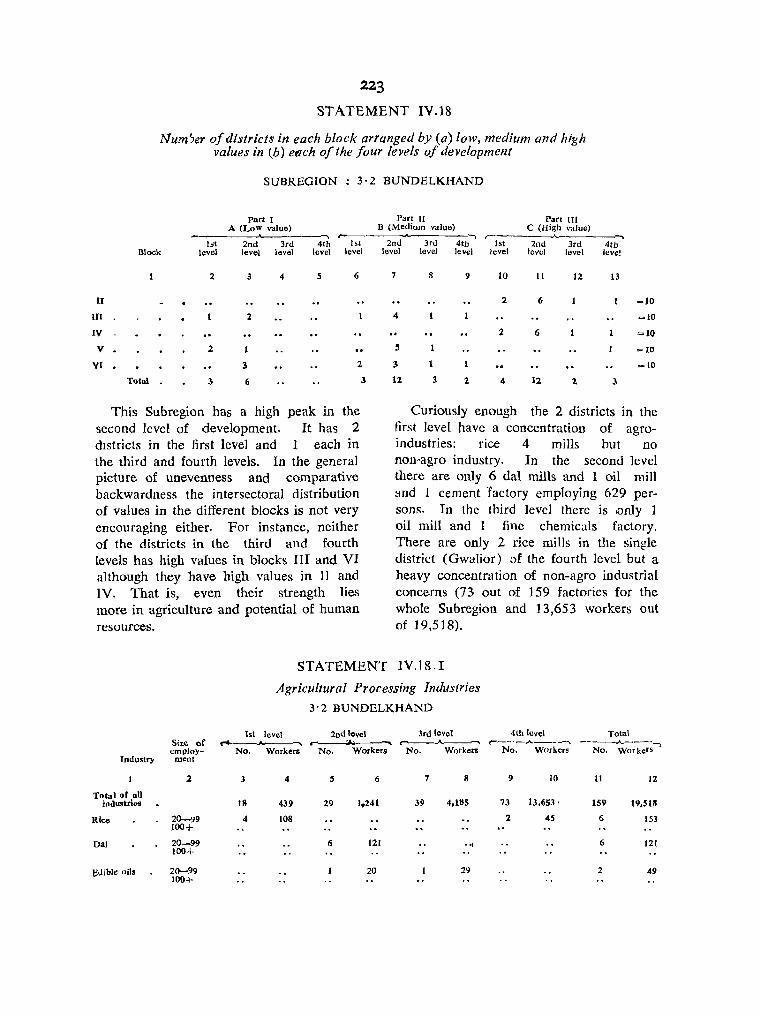
223
STATEMENT IV.18
Num'Jer of districts in each block arranged by (a) low, medium and high values in (b) eflch of the four levels of development
SUBREGION : 3'2 BUNDELKHAND
Part II Part I Part III A (Low value) B (Medium value) C (High value)
~ I"------..A. -. ,- -. 1st 2nd 3rd 4th 1st 2nd 3rd 4th 1st 2nd 3rd 4th
Block level level level level level level level level level level level ]eve!
2 4 5 6
II
III 2
IV
V 2
VI 3 2
Total 3 6
This Subregion has a high peak in the second level of development. It has 2 dIstricts in the first level and 1 each in the third and fourth levels. In the general picture of unevenness and comparative backwardness the intersectoral distribution of values in the different blocks is not very encouraging either. For instance, neither of the districts in the third and fourth levels has high values in blocks III and VI although they have high values in If and IV. That is, even their strength lies more in agriculture and potential of human resources.
3
7 8 9 10 11 12 13
2 6 =10
4 =10
2 6 =10
S =10
3 =10
12 3 2 4 12 2 3
Curiously enough the 2 districts in the first level have a concentration of agro-industries: rice 4 mills but no non-agro industry. In the second level there are only 6 dal mills and 1 oil mill and 1 cement 1actory employing 629 persons. In the third level there is only 1 oil mill and 1 fine chemicals factory. There are only 2 rice mills in the single district (Gwalior) of the fourth level but a heavy concentration of non-agro industrial concerns (73 out of 159 factories for the whole Subregion and 13,653 workers out of 19,518).
STATEMENT IV.I8.r
Agricultural Processing Industries
3'2 BUNDELKHAND
1st level 2nd level 3rd level 4th level Total Size of r4 . -... r c------A--""' ~--'-,.A.. ___ ~
---..A...---~~
employ- No. Workers No. Workers No. Workers No. Workers No. Workers Industry ment
2 3 4 S 6 7 8 9 10 11 12
Total of all indUlltricS 18 439 29 1.241 39 4,185 73 13.653 . 159 19.518
Rice 20-~9 100+
4 108 2 4S 6 153
Dal 20-99 100+
6 121 .. , 6 121
edible oils 20-99 20 29 2 49 100+
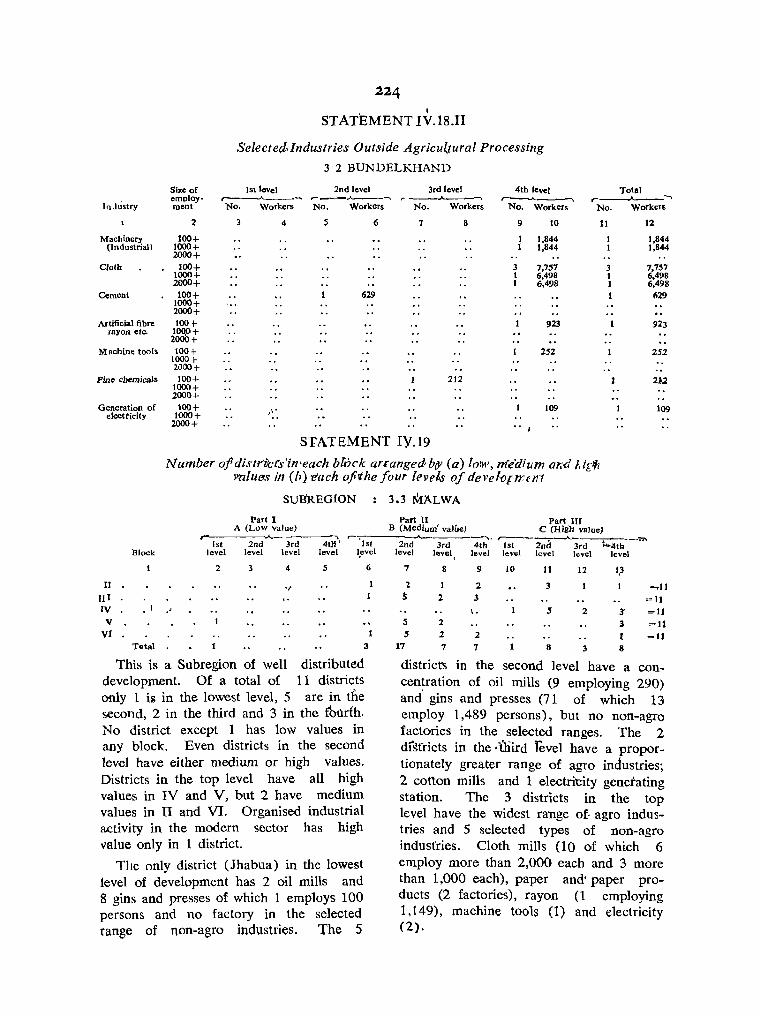
224 , i
STATEMENT IV.IS.II
Selected. Industries Outside Agricu(tural Processing
3 2 BUNDELKHAND
Si7.e of 1st level 2nd level 3rd level 4th level Total
(nJustry employ· ment
___ .A--. r __ A---, ,...----..,A--. r -.
No. Workers No. Workers No. Workers No. Workers No. Workers
'2 3 4 S 6 7 8 9 10 11 12
Machinery 100+ (Industrial) 1000+
2000+
1,844 1,844 1,844 1,844
Cloth 100+ 1000+ 2000+
3 7,757 3 7,7S7 1 6,498 1 6,498 1 6,498 1 6,498
Cement 100+ 629 629 1000+ 2000+
Artificial fibre 100+ rayon etc. I~+
:1 +
923 923
Machine tools 100+ 252 252 1000+ 2000+
Fine chemicals 100+ 1000+
212 2)2
2000+ Generation of 100+
e1e<:tticity 1000+ 2000+
,\ . 109 109
... !
STATEMENT IY.19
Number ofdistr'itc(s'in'each bliJck ar.angedbty (a) 10 1H', mea;um ar.d /.i[i/t vtzluers il1 (b) -each ofithe four levels of del'ef.Ol'n7cnJ
SUBREGION 3.3 MALWA
Part I A (Low value)
.- , 1st 2nd lrd 4tll' Is,
lIIock level level level level I,evel
:1 3 4 S 6
II ., 1
nI I
IV , V
VI Total 3
This is a Subregion of well distributed development. Of a total of 11 districts only 1 iil in the lowest level, 5 are in the second, 2 in the third and 3 in the fOurth. No district except 1 has low values in any block. Even districts in the second level have either medium or high values. Districts in the top level have all high values in IV and V, but 2 have medium values in II and VI. Organised industrial activity in the modem sector has high value only in 1 district.
The only district (Jhabua) in the lowest level of development has 2 oil mills and 8 gins and presses of which 1 employs 100 persons and no factory in the selected range of non-agro industries. The 5
Part II Part III B (Medium' value) C {High value)
......_-----. . 2nd ~~4t"
.,.,.. 2nd 3rd 4th 1st 3rd
le"el level level level level level level I
7 8 9 10 11 12 1,3
2 2 3 -=.11 ~ 2 3 =11 , . 5 2 3' =11 S 2 3 =11 5 2 2 t =IJ
17 7 7 8 3 8
districts in the second level have a concentration of oil mills (9 employing 290) and gins and presses (71 of which 13 employ 1,489 persons), but no non-agro factories in the selected ranges. The 2 dfsfricts in the ·Ulird revel have a proportionately greater range of agro industries; 2 cotton mills and 1 electri'City generating station. The 3 districts in the top level have the widest range of· agro industries and 5 selected types of non-agro indust'ries. Cloth mills (10 of which 6 employ more than 2,000 each and 3 more than 1,000 each), paper and' paper products (2 factories), rayon (1 employing 1,149), machine tools (1) and electricity (2).

Industry
Total of all industries
Rice
AUa
Dal
Sugarcane
Bdible pils
J uto and cotton Ilionina and pressina
Tobacco
Industry
Cloth
Paper and paper productS
Artificial fibre rayon et".
Macblne tools
Oeneratioo of electricity
sao of
~c::!~r
2
20-99 100+
20-.99 100+
20-99 100+
20-99 100+
20-99 100+
20-99 100+
20-99 IClOT'
225
STATEMENT IV.19. I
Agricultural Processing Industries
3'3 MALWA
1st level 2ndlcve I 3rdlcvel 4th level r--~ r---"""___' ,-.-----,--,"",,\ r--...A.-~ No: Workers No. Workers No. Worken Np. Workers
3 4 5 6 7 8 9 10
H 556 liO S.3SS 121 6,l4l 375 41,006
~ 64
24 69
20 3 92 1 100
'i 100 3 120 2 66 I 712 2 616
2 41 9 290 8 274 11 424 3 699
7 363 H 2.848 42 1,500 57 2,774 1 Ii)'] 13 l,4g9 5 SSI II 1,520
8 237 8 190 , . I 100
STATEMENT IV. 19.11
Selected Industries Outside Agricultural Processing
3'3 MALWA
lit level 2nd level
Total , No. Workers
11 12
620 59,062
3 64
2 ~ 1111
4 100 I
5 186 4 1,428
32 I,~~ 3
164 74~ 30 3,6
16 427 I 100
3rd level 4th level Tot.1 Size of .-----'-----. .--_-.A----, ,._--.A"o-_..... r·---.A---. r-A-..... emptoy' No. Workers No. Workers No. Workers No. Work;H No. Workeq
ment
2 3 4 5 6 7 8 9 10 tI 12
100+ 2 1,120 10 25,613 12 26,733 1000+ 9 15,478 9 15,478 2000+ 6 21,160 6 21,160
100+ :2 1,141 :2 1,141 1000+ 2000+
100+ I 1,149 1 1,149 1000+ 1 1,149 1 1,149 2000+
100+ 179 179 1000+ 2000+
100+ 100 2 434 . g. 534 1000+ 2000+
l63' R.G.I.-30.

226
STATEMENT IV.20
Number of districts in each block arranged by (a) low, mexlium and high val{Ue~ in (b) each of the four levels of development
SUBREGION : 3·4 VINDHYA RANGES AND PLATEAUS Part I Part II Part III
A (Low value) B (Medium value) C (High vahle) ~ r-- , r- '"""' 1st 2nd 3rd
Block 4th 1st 2nd 3rd 4th 1st 2nd 3rd 4th level level level level level level level level level level level level
2 4 5 6 7 8 9 10 11 12 13
il 3 4 =9 In 2 3 =9 IV V 2 VI
Total 3 3
This Subregion of 9 districts has 1 district in the first level of development, 3 in the second, 4 in the third and 1 again in the fourth level of development. The intersectoral distribution of medium and high values even in the third and top levels is so uneven that no district can be regarded as having registered all round development. But it is significant that all the 4 districts in the third level have high values in II and IV and medium values in blocks V and VI.
The only district (Rewa) in the lowest level of development has only 1 tobacco. factory and no non-agro industry in the selected ranges. The 3 districts in the second grade however have between them 1 rice mill, 3 oil mills and 14 tobacco fac;, tories but only 1 factory generating e1ec-
3 4 =9 4 =9
3 4 1 -9 6 11 2 1 6 S 3
tricity. There is slightly more of industrial variety in the 4 districts of the third grade with 2 atta mills, 2 dal mills, 22 tobacco factories, 2 cloth factories, 1 cement factory (employment 1,375), and 1 machine tools factory. In the single district (Sehore of Bhopal) of the top level there is a proportionate concentration of both agro and non-agro industries, Bhopal claiming a large cloth mill (employment 2,104) and the very important heavy electrical industry (employment 1,126). There is 1 paper mill and 1 electricity generating station. Se_hore alone claims 42 out of a total of
~. 213 mills and factories in the entire Subregion, and employs 7,777 out of a total factory employment of 18,330 in the Subregion.
STATEMENT IV. 20.1
Agricultural Processing Industries
3.4 VINDHYA RANGES AND PLATEAUS 1st level 2nd level 3rd level 4th level Total
Size of ___....., r-----A-....... ,..---.-A--....... r-r- ___ ..A.... __ .....
empl"y-No. Workers No. Workers No. Workers !,!". WorlrerJ. rndustry ment No. Workers
1 2 3 4 5 6 7 8 9 10 11 12
Total of all 811 6~ 3,670 9S 6.012 42 7.777 213 18.~30 industries {O
Rice 20-99 100+
SO so
20-99 2 106 . i 248 2 IO~ Alta
100+ ! 248
m.1 20-99 100+
2 40 2 40
SDgarcane 20-99 . i 611 I it'r 100+ Bcllble oils 20-99 118 1 76 4 194
100+ J ute and cotton 20-99 2 5S 2 55
ginning and 100+ pres.ing
20 888 5 210 40 1:681 TQb'lccq 20-99 SO 14 533 1<lO+ 2 212 :I m
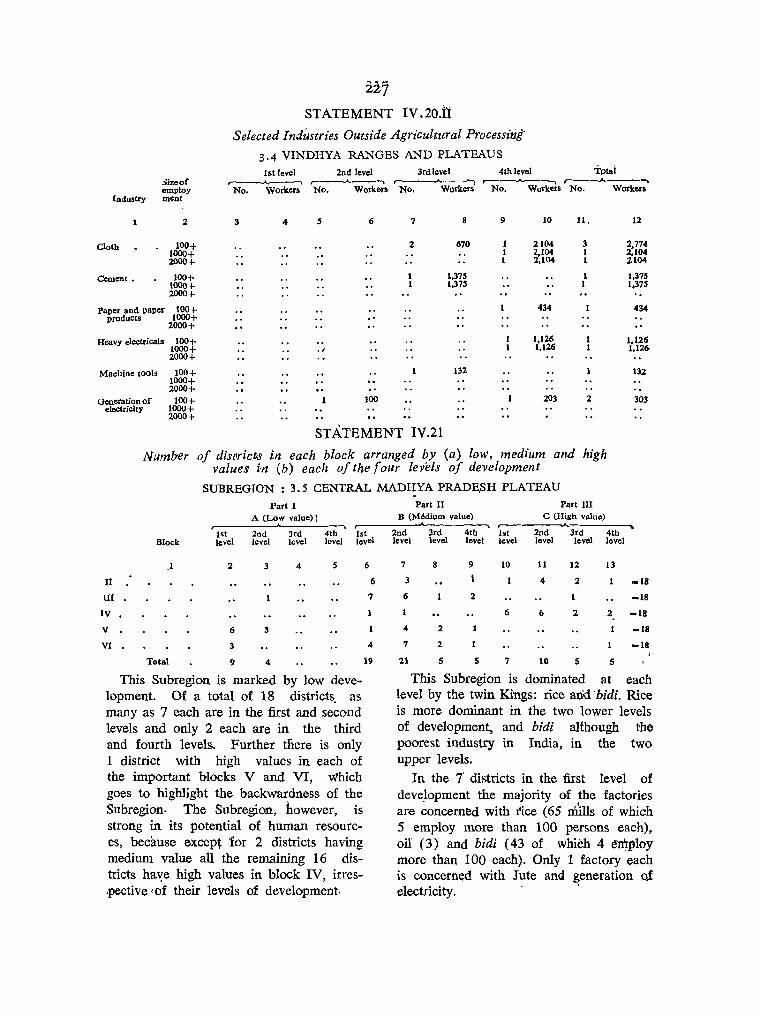
227 STATEMENT IV. 20.:h:
Selected Industries Outside Agricultural Processitig-
3.4 VINDHYA RANGES AND PLATEAUS
1st level 2nd levcl 3rdlevel 4th level 3izeof employ
Industry ment
r---~ ~~---~ r~~ ~~ ,-_-A ____ ~ No. Workers No. Workcrs No. Workers' No. Workers No. Workers
Cloth
Cement.
100+ 1000+ 2000+
100+ 1000+ 2000+
Paper and paper 100+ product. 1000+
2000+
Heavy electricals 100+ 1000+ 2000+
Machine tOOls
Generation of electricity
100+ 1000+ 2000+
100+ 1000+ 2000+
3 .. S 6 7 8
2 670
1 1,375 1 1,375
. , 132
100
9 10 11, 12
1 2104 3 2,774 1 2,104 1 2,104 1 2,104 1 2104
1 1,375 1 1,375
434 434
1,126 1,126 1,126 1,126-
132
203 2 303
STATEMENT IV.21
Number of dis()ricts in each block arranged by (a) low, medium and high values i'n Cb) each of the four levels of development
SUBREGION: 3.5 CENTRAL MADHYA PRADE,SH PLATEAU
Part I A (Low value) J
...... ~ 1st 2nd lrd 4th 1st
Block level level level level level
J 2 3 4 5
II
UI
IV
V 6 3
VI
Total 9 " This Subregion is marked by low development. Of a total of 18 districts. as many as 7 each are in the first and second levels and only 2 each are in the third and fourth levels. Further tliere is only 1 district with high values in each of the important blocks V and VI, which goes to highlight the backwardness of the Subregion. The Subregion, however, is strong in its potential of human resources, because except for 2 districts having medium value all the remaining 16 districts ha"{e high values in block IV, irres.pective 'of their levels of development.
6
6
7
4
19
Part II Part III B (Mtldium value) C (High valuo)
"'"' ~ 2nd 3rd 4th lst 2nd lrd 4th level level level level level level level
7 8 9 10 11 12 13
1 I 4 .l -18
6 2 -18
6 6 2 2 -18
4 2 -18
7 2 -1&
21 5 5 7 10 5 5
This Subregion is dominated at each level by the twin Kings: rice atid ·bidi. Rice is more dominant in the two lower levels of development, and bidi although the poorest industry in India, in the two upper lev·els,
In the T districts in the first level of development the majority of the factories are ~oncemed with tice (65 mills of which 5 employ more than 100 persol\s each). oil (3) and bidi (43 of whieh 4 en)ploy more than 100 each). Only 1 factory each is concerned with Jute and generation of electricity. .
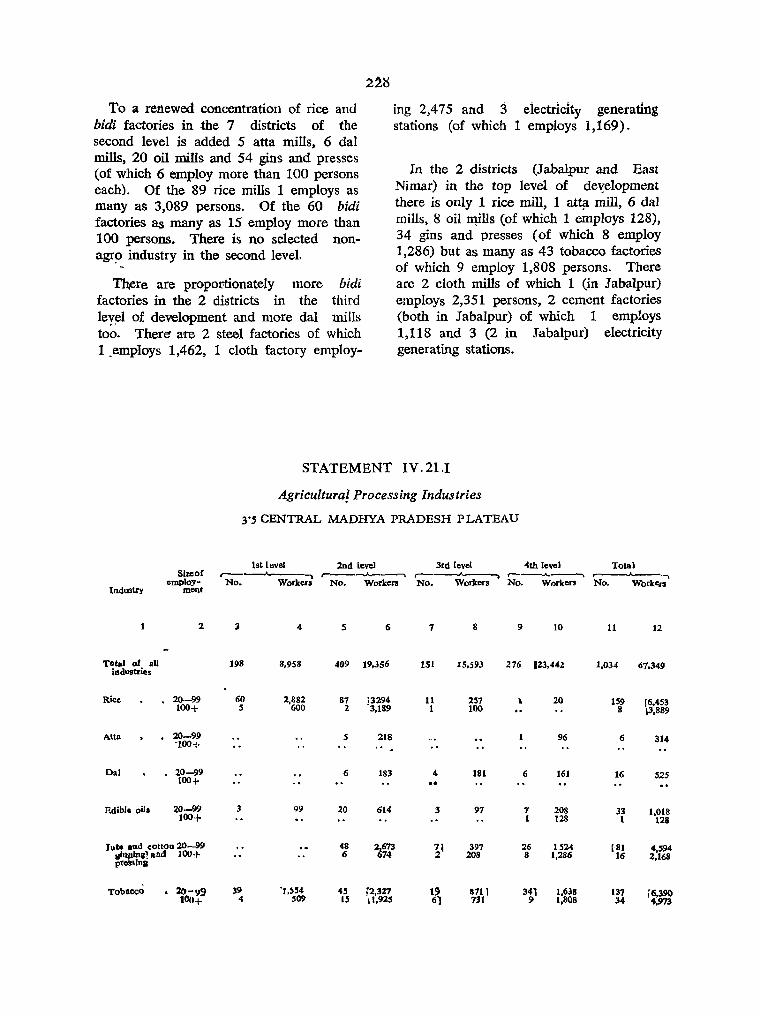
To a renewed concentration of rice and bidi factories in the 7 districts of the second level is added 5 atta mills, 6 dal mills, 20 oil mills and 54 gins and presses (of which 6 employ more than 100 persons each). Of the 89 rice mills 1 employs as many as 3,089 persons. Of the 60 bidi factories as many as 15 employ more than 100 persons. There is no selected nonagr~ industry in the second level.
Tliere are proportionately more bidi factories in the 2 districts in the third leyel of development and more dal mills too. There- are 2 steel factories of which 1.employs 1,462, 1 cloth factory employ-
STATEMENT
ing 2,475 and ::3 eiectridty generating stations (of which 1 employs 1,169).
In the 2 districts (Jabalpur and East Nimar) in the top level of de~elopment
there is only 1 rice mill, 1 attll mill, 6 da1 mills, 8 oil n¥lls (of which 1 employs 128), 34 gins and presses (of which 8 employ 1,286) but as many as 43 tobacco factories of which 9 employ 1,808 persons. There arc 2 cloth mills of which 1 (in J abalpur) employs 2,351 persons, 2 cement factories (both in J abalpur) of which 1 employs 1,118 and 3 (2 in Jabalpur) electricity generating stations.
IV. 21.1
Agricultura! Processing Industries
3'5 CENTRAL MADHYA PRADESH PLATEAU
1st level 2nd level 3rd level 4th level Total Sheof r-- -. r--- r----~ r----J>..--...... .......
employ- No. Workers No. Workers No. Workers No. Workers No. Worken Industry ment
2 3 4 S 6 7 8 9 10 11 12
Total of aU 198 8,958 409 19,356 lSI 15,593 276 123,442 1,034 67,349 industries
Rice 20--99 60 2,882 87 I~~~~ 11 257 \ 20 159 [6,453 100+ 5 600 2 1 100 8 l-l,889
Atta . 20-99 S -100+
218 96 6 314
Da) 20-99 6 183 4 181 6 161 16 525 100+ ..
Edibr. oils 20-99 3 99 20 614 3 97 7 208 33 1,018 100+ 1 128 1 128
Jute and cotton 20-99 48 2,673 ~l 397 26 1524 [81 4,594 "'1IrU!J8~ and 100+ 6 674 208 8 1,286 16 2,168 pfesnlna
Tobacco . 20-99 39 <r,~54 45 f2,327 19 8711 341 1,638 137 ,6,390 100+ 4 509 15 11,925 61 731 9 1,808 34 4,973
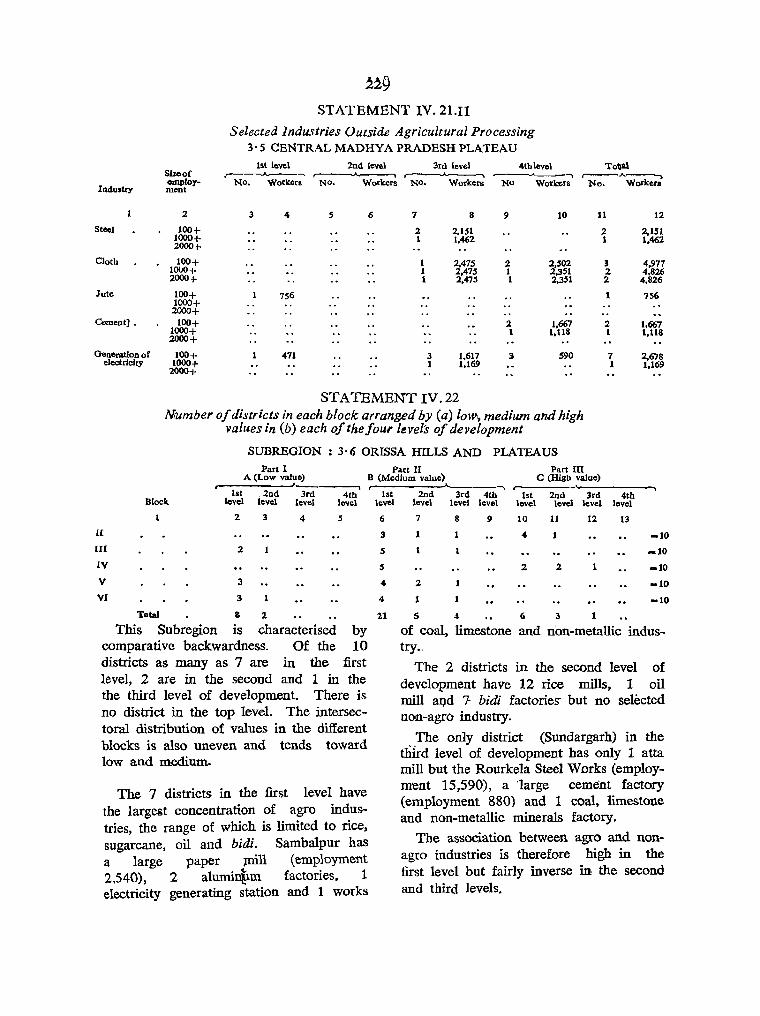
STATEMENT IV.21.U
Selected Industries Outside Agricultural Processing 3' 5 CENTRAL MADHYA PRADESH PLATEAU
1st lovel 2nd level 3rd level 4th level Total Size of
Industry employ-
-'-~"__-~ ~ r----..A __ ....... ---"--~ r---A-_, • No. Workers NO. Workers NO. Wo~ke~s No Wo~kers No. Workus
ment
2
Steel 100+ 1000+ 2000+
Cloth 100+ 1000+ 2000+
lute 100+ 1000+ 2000+
Cement] • 100+ 1000+ 2000+
Generation of 100+ electricity 1000+
2000+
3 4 5 6
756
471
7
2 1
1 1 1
3 1
8
2,151 1,462
2,475 2,475 2,475
1.617 1,169
9 10
2 2,502 1 2,351 1 2,351
:1 1,667 1 l,118
3 590
11 12
2 2,151 1 1.462
3 4,977 2 4.826 2 4,826
1 756
2 1,667 1 1.118
7 2,678 1 1.169
STATEMENT IV. 22 Nrumber of districts in each block arranged by (a) loWi, medium and high
values in (b) each ofthefour levels of development
SUBREGION : 3· 6 ORISSA HILLS AND PLATEAUS Part I Part n Part nl
A (Low value) B (Medium value) C (High value)
lst Block. level
2
II
III 2
IV
V 3
VI 3
-.2nd 3rd level level
3 4
4th level
5
4
4
Total 8 1 21
This Subregion is characterised by comparative backwardness. Of the 10 districts as many as 7 are in the first level, 2 are in the second and 1 in the the third level of development. There is no district in the top level. The intersectoral distribution of values in the different blocks is also uneven and tends toward low and medium.
The 7 districts in the first level have the largest concentration of agro indus.tries, the range of which is limited to rice, sugarcane, oil and bidi. Sambalpur has a large paper pli1l (employment 2.540), 2 alumin!Im factories. 1 electricity generating station and 1 works
2
1
3rd level
8
-. 4th
level
9
r-------.~--------._. 1st 2nd 3rd 4th
level level level level
10 11 12 13
" 2 2
-10
-10
5 4 6 3 1
of coal, limestone and non-metallic industry ..
The 2 districts in the second level of development have 12 rice mills, 1 oil mill aI}.d 7· bidi factories- but no selected non-agro industry.
The only district (Sundargarh) in the third level of development has only 1 atta mill but the Rourkela Steel Works (employment 15,590), a 'large cement factory (employment 880) and 1 coal, limestone and non-metallic minerals factory.
The association between agro and nonagro industries is therefore high in the first level but fairly inverse in the second and third levels.
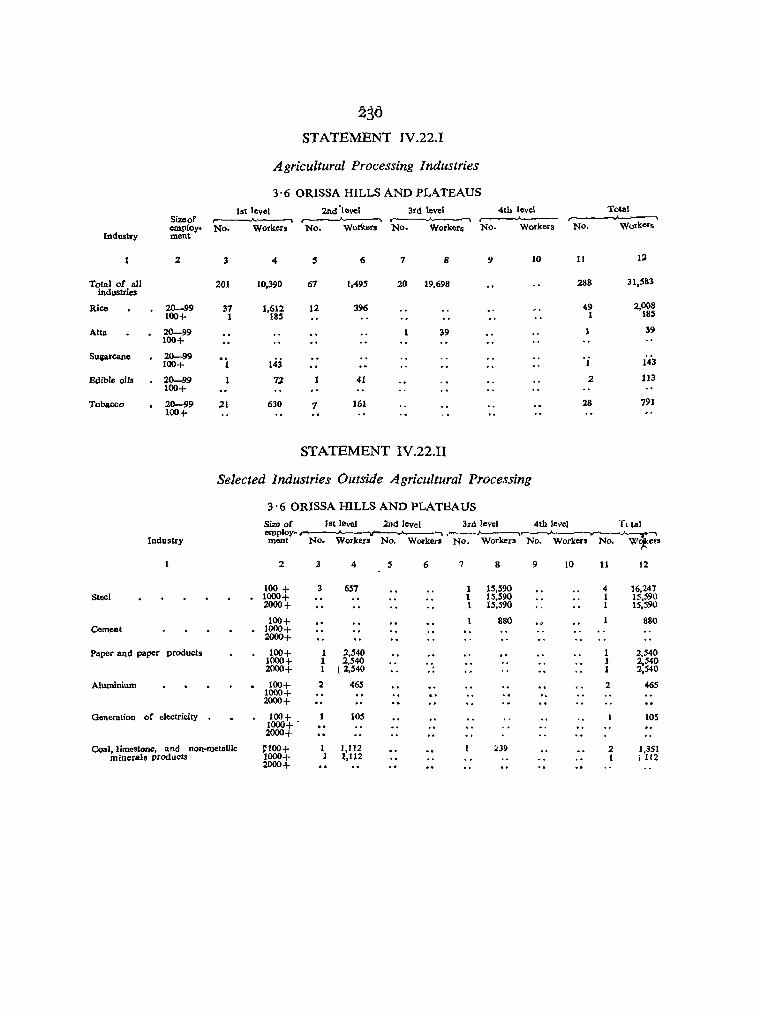
~3(}
STATEMENT IV.22.I
Agricultural Processing Industries
3·6 ORISSA HILLS AND PLATEAUS
1st level 2nd'level 3rd level 4th level Total S~of r·----~----~ r---~""'__~
Workers ,..-----..A--.......
lndusky
Tolal of all industries
Rico
Atta
Suprcane
Edible oils
Tobacco
employ' No. ment
.2 3
201
20-99 37 100+ 1
20-99 100+
20-99 'i 100+
20-99 100+
20-99 .21 100+
Workers No. Workers No. Workers No. Workers NO.
4 S 6 7 8 9 10 11 12
10,390 67 1,495 20 19,698 288 :U,S83
1,612 12 396 49 2,008 185 1 185
1 39 39
143 'j i43
72 41 2 113
630 7 161 28 791
STATEMENT IV.22.II
Selected Industries Outside Agricultural Processing
Industry
Steel
Cement
Paper and paper products
Aluminium
Goneration of electricity
Coal,limestone. and non-metallic minerals products
3' 6 ORISSA HILLS AND PLATEAUS S~ of 1st level 2nd level 3rd level 4th level T l tal employ-,-..--.A--~-. .---Jo .,....____.,_--___ -__,___,.. ....... ment No. Workers No. Workers No. Workers No. Workers No. W~ers
.2
100 + 1000+ 2000+
100+ 1000+ 2000+
100+ 1000+ 2000+
100+ 1000+ 2000+
100+ 1000+ . 2000+
1:100+ 1000+ 2000+
3
3
1 1 1
2
1 1
4
657
2,540 2,540
[2,540
465
105
1,112 1,112
5 6 7
.
8
1 15,590 1 15,590 1 15,590
880
~J9
9 10 11
4 1 1
2
2 I
12
16,247 15,590 15,S90
880
2,540 2,540 2,540
465
lOS
1,351 I tt2
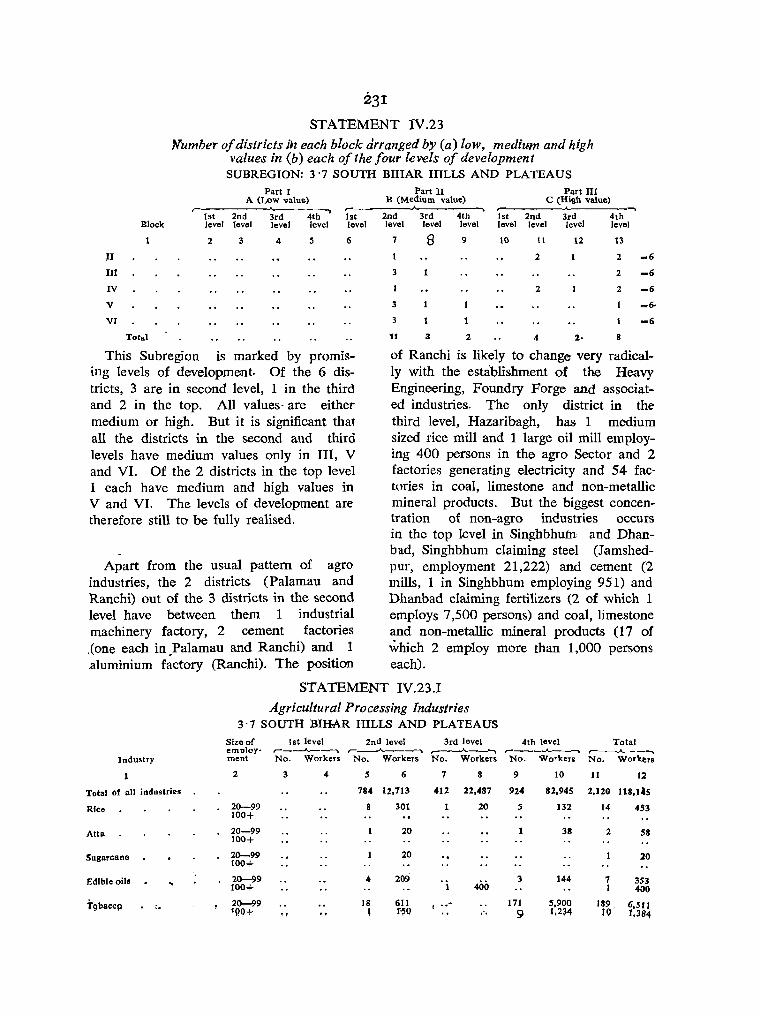
231 STATEMENT IV.23
Number o/districts in each block arranged b'y (a) low, medium and high valueiS in (b) each o/the /our levels 0/ development
SUBREGION: 3'7 SOUTH BIHAR HILLS AND PLATEAUS
Part I Part II Part III A (Low value)
~--------~------~ B (Medium value)
~_____.._~
C (High value) ~-------~ ~
1st 2nd 3rd 4th 1st 2nd 3rd 4th 1st 2nd 3rd 4th Block lev .. l level level level level level level level level level level level
II
III
IV
V
VI
Total
2 3 4 5 6
This Subregion is marked by promifting levels of development. Of the 6 districts, 3 are in second level, 1 in the third and 2 in the top. All values· are either medium or high. But it is significant that all the districts in the second and third levels have medium values only in III, V and VI. Of the 2 districts in the top level 1 each have medium and high values in V and VI. The levels of development are therefore still to be fully realised.
Apart from the usual pattern of agro industries, the 2 districts (Palamau and Ranchi) out of the 3 districts in the second level have between them 1 industrial machinery factory, 2 cement factories .(one each in .Palamau and Ranchi) and I aluminium factory (Ranchi). The position
7 8 9 10
3
3
11 3 2
11
2
2
4
12
2·
13
2 -6
2 -6
2 _6
8
_6·
-6
of Ranchi is likely to change very radically with the establishment of the Heavy Engineering, Foundry Forge and associated industries. The only district in the third level, Hazaribagh, has 1 medium sized rice mill and 1 large oil mill employing 400 persons in the agro Sector and 2 factories generating electricity and 54 factories in coal, limestone and non-metallic mineral products. But the biggest concentration of non-agro industries occurs in the top level in Singhbhum and Dhanbad, Singhbhum claiming steel (Jamshedpur, employment 21,222) and cement (2 mills, 1 in Singhbhum employing 951) and Dhanbad claiming fertilizers (2 of which 1 employs 7,500 persons) and coal, limestone and non-metallic mineral products (17 of which 2 employ more than 1,000 persons each).
STATEMENT IV.23.1
Agricultural Processing Industries 3'7 SOUTH BIHAR HILLS AND PLATEAUS
Size of 1st level 2nd level 3rd level 4th level Total emoloy- r-_--A.-_--.... r-_ ___.A.... ___ -""'\ .-_--A. __ "'""'\ r----........ --~ r--..A...---..,
Industry men! No. Workers No. Workers No. Workers No. Workers No. Work"r.
2 3 4 S 6 7 8 9 10 1l 12
Total ilf all industr;<!. 784 12,713 412 22,487 924 82,945 2,]20 118,1"5
Rice 20-99 8 301 100+
20 S 132 14 453
Alta 20-99 20 100+
38 2 58
Sugarcane 20-99 20 20 100+
Edible oils ~ 20-99 4 209 . i 400
3 144 7 3S3 100+ I 400
Tgb;lCCIl .. 20-99 18 611 t •• "'" 171 S,900 189 6,SIl 190+ t f~O .-. 9 1,234 to" 1,384
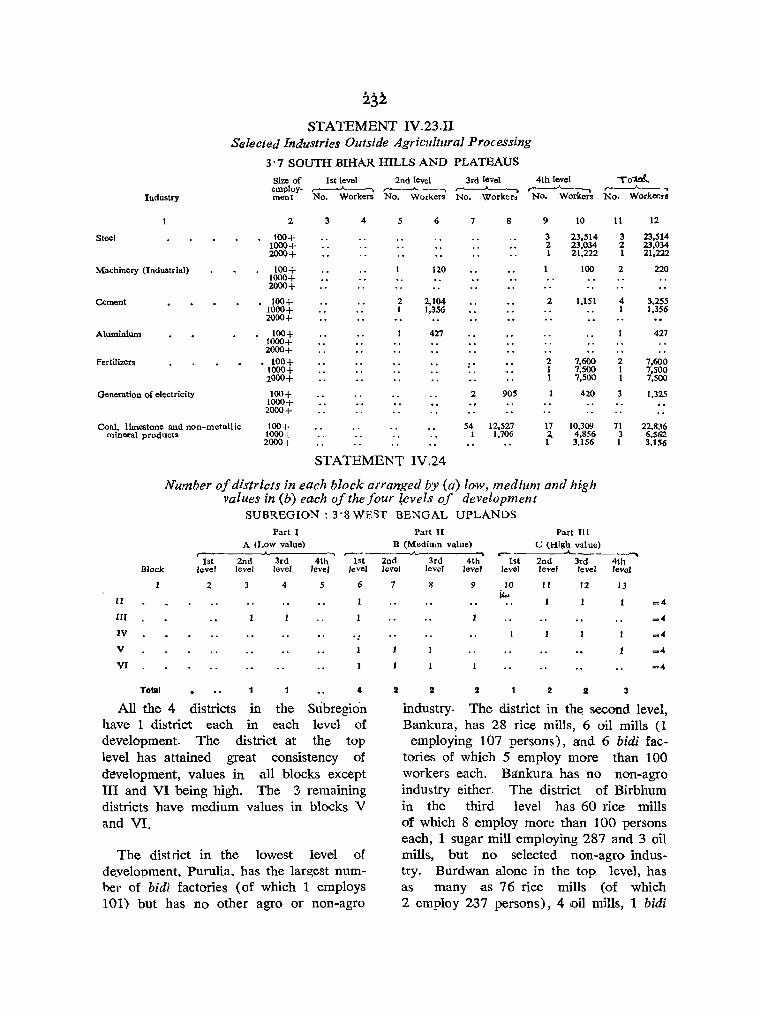
232 STATEMENT lV.23.II
Selected Industries Outside Agricultural Processing
3'7 SOUTH BIHAR HILLS AND PLATEAUS
Size of lst level 2nd level 3rd level 4th level ..---"---, No. Workers
To~ .-~ No. Worker.rs
employ. ~ ,---A_----, ment No. Workers No. Workers No. Workers Industry
2 3 4 5 6
Steel 100+ 1000+ 2000+
Machinery (Industrial) 100+ 120 1000+ 2000+
Cement 100+ 2 2,104 1000+ 1 1,356 2000+
Aluminium 100+ 427 1000+ 2000+
Fertilizers . 100+ 1000+ 2000+
Generation of electricity 100+ 1000+ 2000+
Coal, limestone and non-metallic 100+ mineral products 1000+
2000+
7 8
"
2 905
54 12,527 1 1,706
9
3 2 1
2
2 1 1
10 11
23,514 3 23,034 2 21,222 1
100
1,151
7,600 7,500 7,500
420
2
4 I
2 1 I
3
12
23,514 23,034 21,222
220
3,255 1,356
427
7,600 7,500 7,500
1,325
17 10,309 71 22,836 7. 4,856 3 6,562 1 3,156 I 3,156
STATEMENT IV.24
Number of districts in each block arranged by (a) low, medium and high values in (b) each of the four (evels of development
SUBRBGIO~: 3'8 WEST BENGAL UPLANDS
n nr IV
V
VI
Block
Total
1st level
2
Part I A (Low value)
2nd 3rd level level
4
,--4th 1st
level level
5 6
4
All the 4 districts in the Subregion have 1 district each in each level of development. The district at the top level has a ttained great consistency of development, values in all blocks except ITl and VI being high. The 3 remaining districts have medium values in blocks V and VI.
The dist nct in the lowest level of deyelopment. Purulia. has the lar~est numher of bidi factories (of which I employs 101) but has no other agro or non-agro
Part II Part III B (Medium value) C (High value)
2nd level
7
2
..... 3rd 4th
r- ________.___-----. 1st 2nd 3rd 4th
level level level level level level
8 9 10 II 12 IJ iw
=4
=4
_4
-4
-4
2 2 2 2 3
industry. The district in the second level, Bankura, has 28 rice mills, 6 oil mills (1
employing 107 persons), a:nd 6 bidi factories of which 5 employ more than 100 workers ea(:h. Ba-nkura has no non-agro industry either. The district of Birbhum in the third level has 60 rice mills of which 8 employ more than 100 persons each, 1 sugar mill employing 287 and 3 oil mills, but no selected non-agro industry. Burdwan alone in the top level, has as many as 76 rice mills (of which 2 employ 237 persons), 4 oil mills, 1 bidi
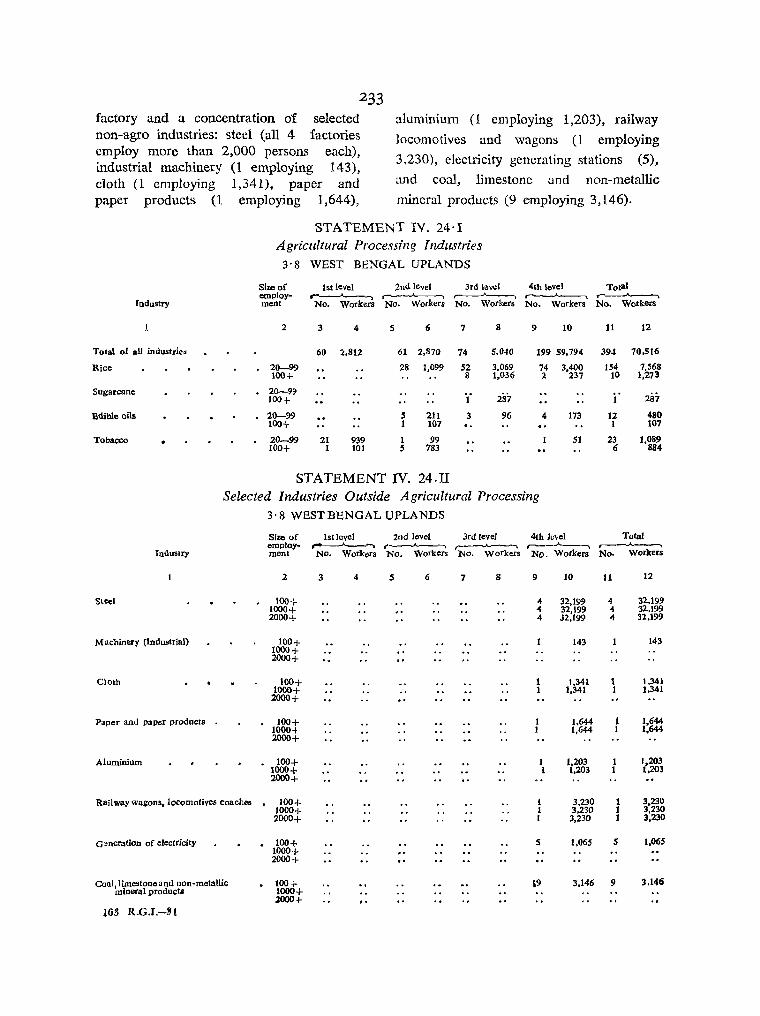
233 factory and a concentration of selected non-agro industries: steel (all 4 factories employ more than 2,000 persons each), industrial machinery (1 employing 14~),
cloth (1 employing 1,341), paper and paper products (1 employing 1,644),
aluminium (1 employing 1,203), railway
locomotives and wagons (1 employing
3,230), electricity generating stations (5),
and coal, limestone .and non-metallic
mineral products (9 employing 3,146).
Industry
Total of all industrie.
Rice
Sugarcane
Edible oUs
Tobacco
STATEMENT N. 24·1 Agricultural Processing Industries
3·8 WEST BENGAL UPLANDS
1st level 2nd level 3rd level 4th level Total Sizeaf employment ~ ~ r-----A-. ~ ~ No. Workers No. Workers No. Workers No. Workers No. Workers
2 3 4 S 6 7 8 9 10 11 12
60 ~.812 61 2,870 74 5.040 199 59.794 394 70.516
20-99 loo-t-
28 1,099 52 3,069 74 3,400 154 7.568 8 1,036 2 237 10 1,273
20-99 loo-t-
.{ 287 1 287
20-99 s 211 3 96 4 173 12 480 100+ 1 107 1 107
20-99 21 939 100+ 1 101
1 99 51 23 1.~~ 5 783 6
STATEMENT IV. 24.II Selected Industries Outside Agricultural Processing
3·8 WEST BENGAL UPLANDS
Industry
Steel
Machinery (Industrial)
Cloth
Paper anJ paper products
Aluminium
Railwaywagons,locomotives coaches
G .neration of electricity .
Co~I. limestone anti non-metallic . mineral products
165 R.G.I.-$l
Size of employment
2
100+ 1000+ 2000+
100+ 1000+ 2000+
100+ 1000+ 2000+
100+ 1000-+ 2000+
100+ 1000+ 2000+
100+ 1000+ 2000+
100+ 1000+ 2000+
100-t-1000+ 2000+
lst level 2nd level 3rd level 4th Ie,eI Total ~ ('-~ ,- r---"'___' NO. Workers No. Workers No. Workers NO. Workers No. Workers
3 4 5 6 7 8 9 10 11 12
4 32,199 4 32.199 4 32,199 4 32.199 4 J2.199 4 32.199
143 143
1,341 1 1,341 1,341 I 1,341
1.644 1 1,644 1,644 1 1,644
I 1,203 1 1,203 1 1.203 1 1,203
1 3.230 1 3,230 1 3.230 1 3.230 1 3,230 1 3,230
5 1,065 5 1.065
,9 3,146 9 ],146

234 STATEMENT IV.2S
Number of disQrects in each block arranged by (a) low, medium and high values in (b) each of the four l'<!vels of development
SUBREGION: 4'1 MAHARASHfRA DECCAN
Part II Part III B (Medium value) C (High value)
Part I A (Low value)
----. ,-___ -..A. ___ -----. .---------'---------2nd 3rd 4th r-
4th 1st 2nd 3rd 4th 1st level level level level
1st 2nd 3rd Block level level level level level
2 3 4 5 6
II
III
IV
v
VI
Total 1
This is a Subregion of promising development, there being no district in the first or lowest level. There are 6 districts in the second. 7 in the third and 9 in the top level. Of the 6 districts in the second level only 1 district has low values in block II, all other values being either medium or high. All the 7 districts in the third level have either medium or high values in each block. All 9 districts in the top level have high values in blocks IV and V; 6 each have high values and 3 each medium values in blocks II and VI. Thus all districts, and particularly, the top 9, enjoy very favourable positions in blocks IV and V.
The most remarkable thing to notice among agro industries in this Subregion is the preeminence of processing of cash crops: sugarcane, cotton, tobacco and to some extent edible oils. This applies to districts at all the three levels of development. The other remarkable thing i,g the large number of factories concerned with these commodities even in districts placed in the second and third levels, not to speak of those in the fourth. thus indicating that
level level level
7 8 9 10 11 12 13
3 3 S 4 6 =22
Ci 7 9 -22
2 4 7 9 -21
S 4 3 9 -22
~ 7 3 6 ~22
19 :Z1 15 10 14 30
the Subregion is on the way to harmonious and synchronised development with a progressive and inevitable increase in number and employment in the districts of the upper levels. And although the range and concentration of large non-agro industries is still none too remarkable in this tract of 22 districts they show a fair enough distribution at all three levels, suggesting a strong climate of savings. inner logic of growth, and of multipliers at work throughout the tract and not of alien implantation due to fortuitous circumstances favouring location of individual units. The next important thing to notice is the remarkable increase in the size of establishments in districts of the third and fourth levels as opposed to those in districts in the second level, thus proving that enterprises improve in scale in districts of higher levels of aohievement. These, seem to be the outstanding and distinguishing features of industrial activity and development in Maharashtra Deccan. The wealth has plainly come from cotton, sugarcane, groundnut and tobacco and is paying for an increasingly versatile range of industrial production.

235 STATEMENT IV.25.
Agricultural Processing Industries
4'1 MAHARASHTRA DECCAN
Sao of 1st level 2nd level 3rd level 4th level Total em ploy· ,- . ...... ~ r----'----. -. ....----"-......
Industry ment No. Workers No. Workers No. Workers NO. Workers No. Workors
t 2 3 4 5 6 7 8 9 10 11 12
Total of ail industries 629 22,825 450 40,514 2,485 178,529 3,564 241,868
Rice • 20-99 3 60 2 51 5 111 100+
Atta • 20-99 27 48 2 75 100+
DaI . 20-99 1 2S 6 174 12 329 19 5:28 100+
Suaarcane 20-99 24 595 3 101 77 2,024 104 2,720 100+ 5 2,261 5 2,050 21 10,714 31 15,025
Edible oils 20-99 25 1,216 17 878 64 2,689 106 4,783 100+ 3 489 1 100 7 890 11 1,479
Hydregenated oils 20-99 201 1. 50 2 so 100+ 1 2 50S 3 706
lute and cotton ginning and pressing 20-99 22 1,02S 63 3,320 178 9,081 263 13,426 100+ 8 1,239 56 9,960 68 12,267 132 23,466
Tobacco 20-99 60 2,680 22 1,218 186 10,400 268 14,298 100+ 8 1,408 :3 535 79 IS,508 90 17,451
STATEMENT IV.25.Il
Selected Industries Outside Agricultural Processing
4'1 MAHARASHTRA DECCAN
Size of 1st level lndlevel 3rdlevel 4th level Total employ- , . ...... r---A----. ~ r-
Industry ment No. Workers No. Workers No. Workers No. Workers No. Workers
2 3 4 S 6 7 8 I} 10 11 12
Machinery (Industrial) 100+ 3 455 S 2,970 8 3,425 1000+ 1 1,171 1 1,171 2000+
Cloth lOOt 126S II 11,950 22 48'542 34 61,757 1000+ 1,265 5 10,255 14 44,918 20 56,438 2000+ 1 4,164- 9 38,284- 10 41,448
Tea . 100+ 1000+
524 Sl4
2000+
Paper and paper product. 100+ 1000+
962 2 424 3 1,386
2000+
Petrolcrum . 100+ 1000+
1 115 1 115
2000+
'Machine tools 100+ 1000+
107 107
2000+
Fine chemicals 100+ 1000+ 2000+
101 S 1,653 6 1,754
Heavy chemicals 100+ 1000+ 2000+
118 1 118
Generation of eJ ectricit)' 100 f- 242 5 1,746 6 1,1188 1000+ 2000+
Coal, Lime.tone and non· metallic 100+ 3 557 1 1,695 9 1,886 13 4,13S mineral products 1000+ 1 1,695 1 l,69S
2000+
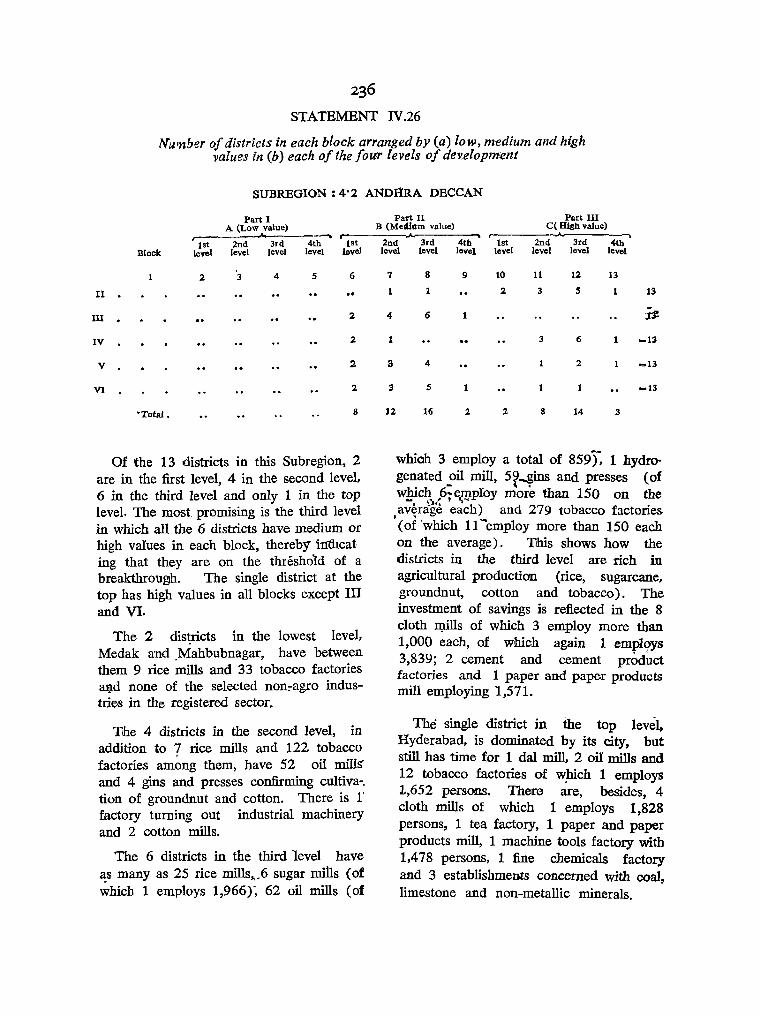
236
STATEMENT IV .26
NU'I1ber of districts in each block arranged by (a) low, medium and high values in (b) each of the four levels of dev.elopment
SUBREGION: 4'2 AND:aRA DECCAN
Part I A (Low value)
r- ---. 1st 2nd 3rd 4th 1st
Block level level level level level
2 3 4 5 6
II . III . 2
IV 2
V 2
VI 2
"Total. 8
Of the 13 districts in this Subregion, 2 are in the first level, 4 in the second level. 6 in the third level and only 1 in the top level. The most promising is the third level in which all the 6 districts have medium or high varues in each block, thereby in111cat ing that they are on the threshold of a breakthrough. The single district at the top has high values in all blocks except III and VI.
The 2 districts in the lowest level, Medak and .Mahbubnagar, have between them 9 rice mills and 33 tobacco factories aJJ.d none of the selected non::-agro industries in the registered sector.
Tihe 4 districts in the second level, in addition to 7 rice mills and 122 tobacco factories among them, have 52 oil millS" and 4 gins and presses confirming cultiva-. tion of groundnut and cotton. There is l' factory turning out industrial machinery and 2 cotton mills.
The 6 districts in the third level have ~s many as 25 rice mills".6 sugar mills (of which 1 employs 1,966)~ 62 oil mills (of
Part II Part III B (MedIum value) C( High value)
r- ...... 2nd 3rd 4th 1st 2nd 3rd 4th level level level level level level level
7 8 9 10 11 12 13
1 2 3 5 13
4 6 ~
1 3 6 _13
S 4 2 -13
3 5 .. 13
J2 16 2 2 8 14 3
whiCih 3 employ a total of 859), 1 hydrogenated _oil mill, 5?_gins and presses (of wEic~,,6;e~pIoy more than 150 on the average each) and 279 tobacco factories
• (of 'which If"'employ more than 150 each on the average). Tms shows how the districts in the third level are rich in agricultural production (rice, sugarcane, groundnut, cotton and tobacco). The investment of savings is reflected in the 8 cloth IQills of which 3 employ more than 1,000 each, of which again 1 employs 3,839; 2 cement and cement prod~ct factories and 1 paper and paper products mill employing 1,571.
The single district in the top level, Hyderabad, is dominated by its city, but still has time for 1 dal mill, 2 oil mills and 12 tobacco factories of ~hich 1 employs 1,652 persQtlS. There are, besides, 4 cloth mills of which 1 employs 1,828 persons, 1 tea factory, 1 paper and paper products mill, 1 machine tools factory with 1.478 persons, 1 fine chemicals factory and 3 establishments concerned with coal, limestone and non-metallic minerals.
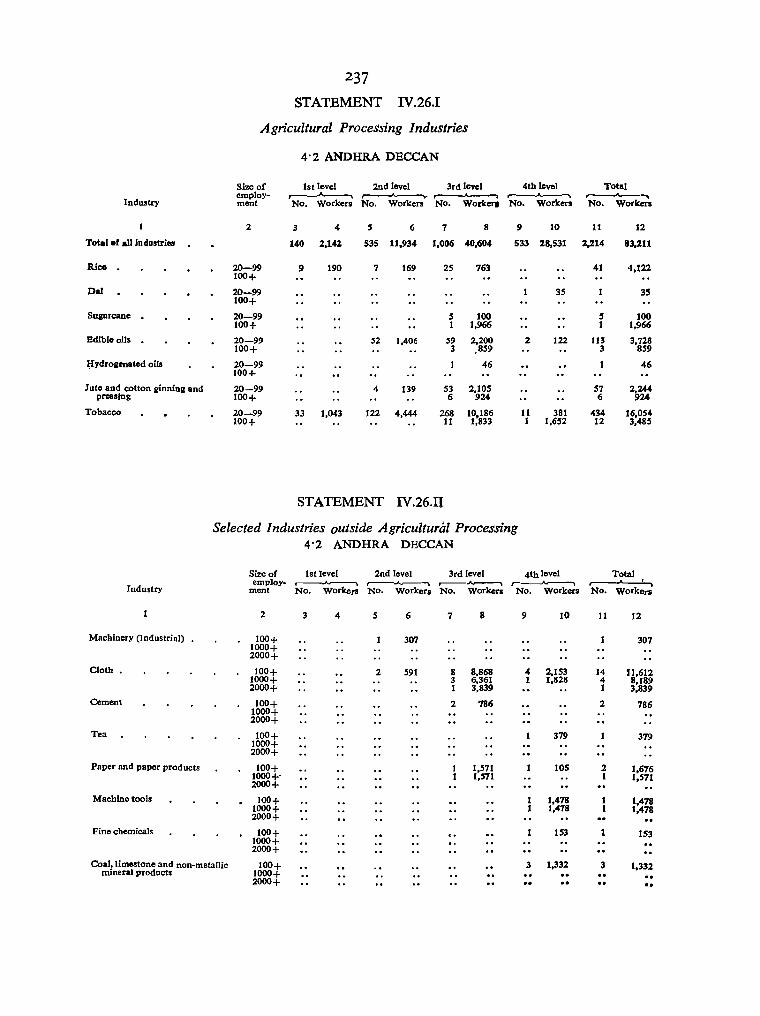
237 STATEMENT 1V.26.1
Agricultural Processing Industries
4'2 ANDHRA DECCAN
Size of 1st level 2nd level 3rd level 4th level Total employ- ,__......___..,
~ -.. Industry ment No. Workers No. Workers No. WorketY No. Workers No. Workers
2 3 4 5 6 7 8 9 10 11 12
Total 01 aU Industries 140 2,142. 535 11,934 1,006 40,604 533 28,531 2.214 83,211
Rice 20-99 9 190 7 169 25 763 41 -1,122 100+
Dal 20-99 35 35 100+
Suprcane 20-99 5 100 5 100 100+ 1 1,966 1 1,966
Edible oils 20-99 52 1,406 59 2,200 2 122 tl3 3,728 100+ 3 .859 3 859
¥ydrollienated oils 20-99 46 46 100+
Jute and cotton ginning and 20-99 4 139 53 2,105 57 2,244 pressing 100+ 6 924 6 924
Tobacco 20-99 33 1,043 122 4,444 268 10,186 11 381 434 16,054 100+ 11 1,833 1 1,652 12 3,485
STATEMENT IV.26.U
Selected Industries outside Agricultural Processing 4'2 ANDHRA DECCAN
Size of lst level 2nd level 3rd level 4th level Total
Industry employ- ~ r--_'_____" r-
ment No. workers No. Workers No. Workers No. Workers No. Workers
2 3 4 5 6 7 8 9 10 11 12
Machinery (Industrial) 100+ 1000+
307 307
2000+
Cloth. 100+ 2 591 8 8,868 4 2,153 14 11,612 1000+ 3 6,361 1 1,828 4 8.189 2000+ 1 3,839 1 3.839
Cement 100+ 1000+ 2000+
2 786 2 786
Tea 100+ 1000+ 2000+
379 379
Paper and paper products 100+ 1,571 105 2 1,676 1000+· 1.571 1 1,571 2000+
Machine tools 100+ 1.478 1.478 1000+ 1,478 1,478 2000+
Fine chemicals 100+ 1000+
153 1S3
2000+
Coal, limestone and non-metallic mineral products
100+ 1000+
3 1.332 3 1.332
2000+

238
STATEMENT IV.27
Number of districts in each block arranged by (a) low, medium and high values in (b) each of the four levels of development
SUBREGION: Part I
A (Low value) "...
1st 2nd 3rd 4th 1st Block level level level level level
2 3 4 S 6
II 1 III 1 IV V 1
VI 1
Total 5
This Subregion of 17 districts also presents a very favourable picture of deve· lopment. There is only 1 district in the first level, 5 in the second level, 6 in the third and 5 in tlhe top. None of the districts, except only 1, enjoys low values in any block. All 16 districts enjoy either medium or high values. The prerequisites of development are fairly evenly available in all districts although the values for block VI (organised industrial activity in the modern sector) are still medium in most districts.
This Subregion is fairly Ihomogeneous in its wealth of agro industries. The agri-
4·3 MYSORE DECCAN Part II Part III
B (Medium value) C (High value)
2nd level
7
2 4 1 3 4
14
,-3rd 4th ht 2nd 3rd 4th level level level level level lovel
8 9 10 11 12 13
2 3 S 3 -1'7 6 3 2 _17
4 6 S _17 2 2 4 S _17
5 5 _17
14 10 10 16 15
cultural processing industries are more or .... less evenly distributed both in number and scale of establishments in terms of food industries, sugar, oil, cotton ginning and pressing and tobacco. But the location of selected non-agro industries is confined both in number and scale of operation mainly to districts in the third and fourth levels of development, there being no selected non-agro industry i,!! tlbe first level and only 6 cloth mills, 1- cement fattory, 1 electricity generating station and 3 coal, limestone and non-metallic mineral pr~
ducts faotories in the 5 districts of the second level.
STATEMENT IV .27.1
Agricultural Processing Industries
4· 3 MYSORE DECCAN
Si~~of 1st level 2nd level 3rd level 4th level Total employ- ,...-.---A.~ r- ..-----"--.... r-
Industry ment No. Workers No workers No. WO'kers No. workers No. Workcn
2 3 4 5 6 7 8 9 10 11 12
Total of all industries 152 6,144 464 15,768 619 56,709 808102,172 1,053 190,893
Rice 20-99 1 20 14 405 30 942 13 290 58 1,657 100+ 1 100 2 200 3 300
Atta 20-99 S 100 9 270 15 410 29 780 100+ 3 300 3 300
Dal 20-99 8, 250 3 90 50 12 390 100+ 1 250 1 250
Sugarcane 20-99 8is 1 50 1 50 . i 100 2 100
100+ 1 2 1,500 3 3,750 7 6,175
Edible oils 20--99 12 390 40 1,f30 33 1,144 10 360 95 3,024 100+ 4 550 4 400 3 700 2 700 13 2,350
f(ydrogenated oils 20-99 50 3 60 4 UO 1(}0+
Iute and cotton ginninll and pressing 20- 99 114 2:679 105 3,174 121 4,305 6 217 346 to,37S 100+ 8 1,400 28 3,550 63 10,760 15 4,500 114 20,210
tobacco 20-99 1 50 28 1,169 26 1,160 9 453 64 2,832 100+ 14 2,IS0 13 2,070 8 3.816 35 8,036
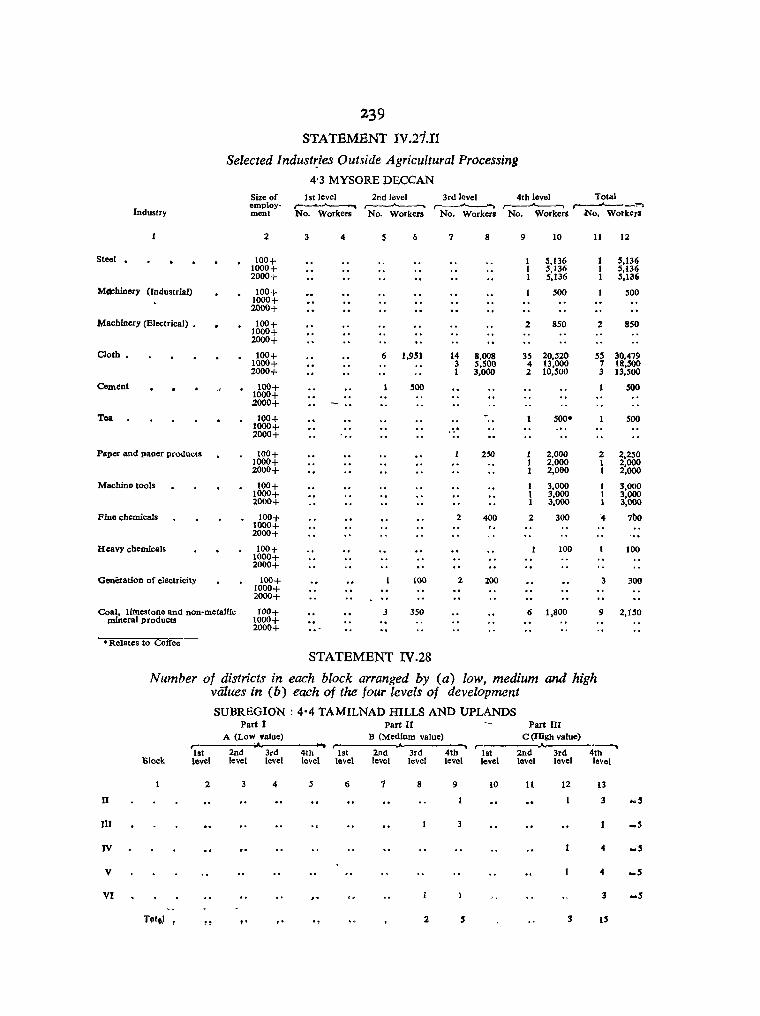
Industry
Steel •
MCk:hinery (Industrial)
Machinery (Electrical) •
Cloth.
Cement
Tea
Paper and paoer products
Machine .tools
Fine chemicals
Heavy chemicals
Generation of electricity
239
STATEMENT IV.21.n
Selected Indust~ies Outside Agricultural Processing
4'3 MYSORE DECCAN Size of employment
2
100+ 1000+ 2000+
100+ 1000+ 2000+
100+ 1000+ 2000+
100+ 1000+ 2000+
100+ 1000+ :2000+
100+ 1000+ 2000+
100+ 1000+ 2000+
100+ 1000+ 2000+
100+ 1000+ 2000+
100+ 1000+ 2000+
100+ 1000+ 2000+
1st level 2nd level 3rd level 4th level Total r-~""'____ ~ ,___.,.__-, ,...~ ,.-----'----.,-, No. Workers No. Workers No. Workers No. Workers No, WorkerS
3 4 s 6 7 8
6 1,951 14 8,008 3 5,SOO 1 3,000
500
- ..
250
2 400
100 2 200
9
2
10
5,136 5,136 5,136
500
850
3S 20,520 4 13,000 2 10,500
1 2,000 1 2,000 1 2,000
1 3,000 1 3,000 1 3,000
2 300
100
11
2
12
5,136 5,'136 S,1a6
500
850
SS 30,479 7 18,500 3 13,500
1 500
500
2 2,250 1 2,000 1 2,000
3
3,000 3,000 3,000
7bo
100
300
Coal, limestone and non-metallic mineral products
100+ 1000+ 2000+
3 350 6 1,800 9 2,UO
• Relates to Cotree
n
III
IV
v
VI
STATEMENT IV.28
Number of districts in each block arranged by (a) low, medium and high values in (b) each of the four levels of development
Block
r-1st level
2
SUBREGION: 4'4 TAMILNAD HILLS AND UPLANDS Part I Part II Part III
A (LoW "alue) B (Medium value) C (High value) r-'--------~--------_, r---------~-------.-~
2nd level
'0
W ~ W ~ W ~ W ~ W ~ level level level level level level level level level level
4 5 6 1 8 9
3
to 2 5
10 11 12
3
13
3
4
4
3
15
_5
_5
_5
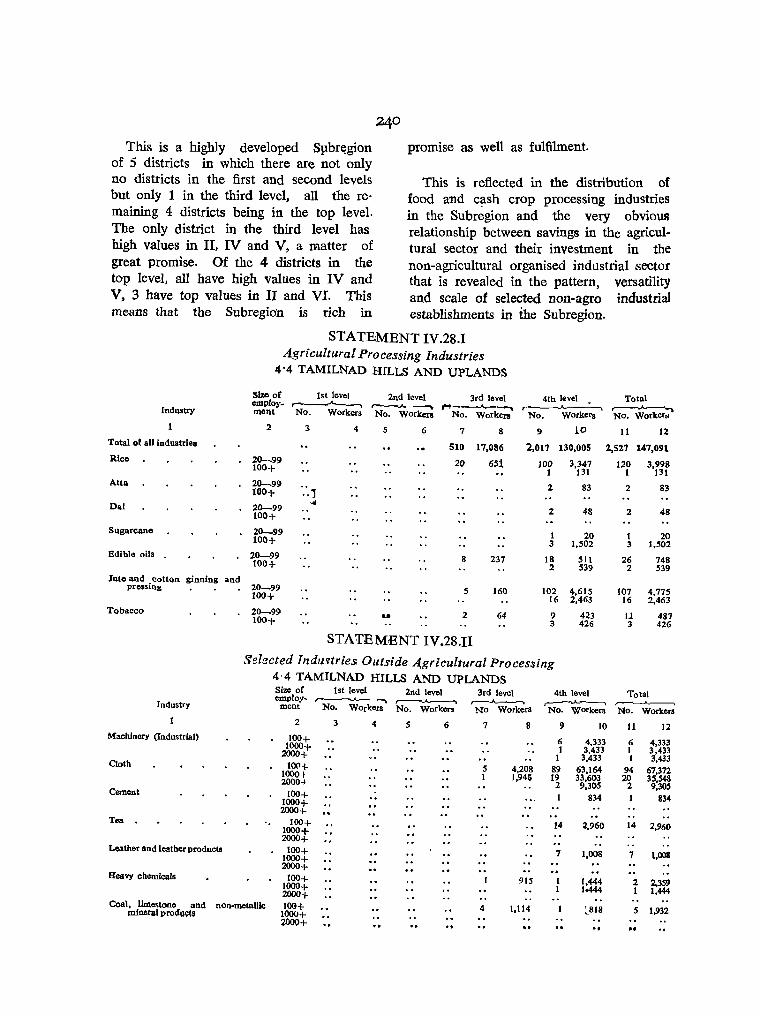
This is a highly developed Spbrt(gion of 5 districts in which there are not only no districts in the first and second levels but only 1 in the third level, all the remaining 4 districts being in the top level. The only district in the third level has high values in II, IV and V, a matter of great promise. Of the 4 districts in the top level, all have high values in IV and V, 3 have top values in II and VI. This means that the Subregion is rich in
promise as well as fulfilment.
This is reflected in the distribution of food and cash crop processing industries in the Subr~gion and the very obvious relationship between savings in the agricultural sector and their investment in the non-agricultural organised industrial sector that is revealed in the pattern, versatility and scale of selected non-agro in<fustrial establishments in the Subregion.
STATEMENT IV.28.1 Agricultural Processing Industries
4'4 TAMILNAD HILLS AND UPLANDS
Size of 1st level 2nd level 3rd level 4th level Total employ-~ . • ~ ,...-._A.--.. ,.----......~ Industry ment No. Workers No. Workers No. Workers No. Workers No. Worker~ 2 3 4 S 6 7 8 9 10 11 12
Total of all industries 510 17,086 2,017 130,005 2,527 147,091 Rice 20--99 20 651 100 3,347 120 3,998 100+ 1 131 1 131 Atta 20--99 ':., 2 83 2 83 100+
Oal 20--99 « 48 48 2 2 100+
Sugarcane 20-99 1 20 1 20 100+ 3 1,502 3 1,502 Edible oils 20-99 8 237 18 511 26 748 100+ 2 539 2 539 Jute and (lotton ginning and
prcasillg 20--99 5 160 102 4,615 107 4,775 100+ 16 2,463 16 2,463 Tobacco 20--99 ... 2 64 9 423 I.l 487 100+ 3 426 3 426
STATEMENT IV.28.I1
Selected Indu'ltries Outside A,gricultural Processing 4· 4 TAMILNAO HILLS AND uPLANDS Size of 1st level 2nd level 3rd level 4th level Total employ- ,....._...--...----. ,---_"________' ,-----...'-__, Industry ment No. Workers No. Workers No Workers No. Workers No. Workers
2 3 4 5 6 7 8 9 10 11 12 Machinery (Industrial) 100+ 6 4,333 6 4,333 1000+ 1 3,433 1 3,433 2000+ 1 3,433 I 3,433 Cloth 1()(1+ 5 4,208 89 63,164 94 67,372 1000-1 I 1,945 19 33,603 20 35,548 2000-1 2 9,305 2 9,305 Cement 100+ 834 834 1000+
2000+ Tea . 100+ 14 2,960 14 2,960 1000+
2000+ Leather and leather products 100+ 7 1,008 7 1,008 1000+
2000+ Keavy cbemicals 100+ 915 hm 2 2,359 1000+ I 1,444 2000+ Coal, limestono and non-metallic 100+ 4 1,114 :"818 5 1,932 mineral prollucts 1000+
2000+ ••

II
III
IV
V
VI
Ulock
Total
241
STATEMENT IV.29 Numher oj districts in each block arranged by (a) [ow, medium and high
values in (b) each of the jOl)r levels oj development
SUBREGION: 5·1 KUTCH AND KATHlAWAR
Part I Part II Part III A (Low value) B (Medium value) C (High value) ,..-------..A..-------1 r-----_..:,.-_A,,----___ ~ .---
1st 2nd 3rd 4th 1st 2nd 3rd 4th 1st 2nd 3rd level level level level level level level level level level level
2 4 5 8 9 10 11 12
4
4 2
4
4
4
4 :.\ 4 2 3 12
4th level
13
5 _10
~IO
5 =10
5 ~lO
5 -10
20
This is a Subregion of much achievement. Of a total of 10 districts, no district is in the first or lowest level. Only 1 is in the second level. 4 districts are in the third level and as many as 5 or half of the districts are in the top level. All the 4 districts in the thirp level have high values in each block except III and VI. In the latter block the values are medium, indicating the need for greater industrial
activity in the modern organised sector. Again eacb of these 5 districts in the top level have hlgnvalues in each of the blocks except III.
Size of
The pattern of concentration ·of ;agro and non·agro industries in distriots of the higher levels of development is too patent in the following statement to need verbal elaboration.
STATEMENT IV.29.I
Agricultural Processing Industries S·l KUTCH AND KA THIA WAR
f 1st level 2nd level 3rd level 4th level Total em[)loy-r~ r_,.,A__""""'I ~ ,-~ ,.... . .
Industry ment No. Workers No. Workers No. Workers No. Workers -, No: Workert 1 2 3 4 S 6 7 8 9 10 11 12
Tolal 01 all Industries 22 524 252 25.208 960 I: 56.970 1,2.34 82,702
Rice 20-99 1 100+
60 1 60
Atta 20-99 100+
28 28
Dal 20--99 2 100+
47 2 47
Sugarcane 20-99 . i sii . i s7i 100+
Edible oil~ 20-99 32 21 871 102 3,S14 124 4;417 100+ 1 200 2 452 3 .652
Hydrogebaied oils. 20-99 68 '3 972 1 6S 100+ 3 , . ~972
Jute ani cotton ginning and 20-99 31 1.762 79 3.751 110 ,5;513 pressing 100+ .. 30 S;846 20 l 3.446 30 ?292
Tobacco 20--99 10 S86 "2 81 12 667 100+ 1 370 1 370
(63 R.G.I.-32.
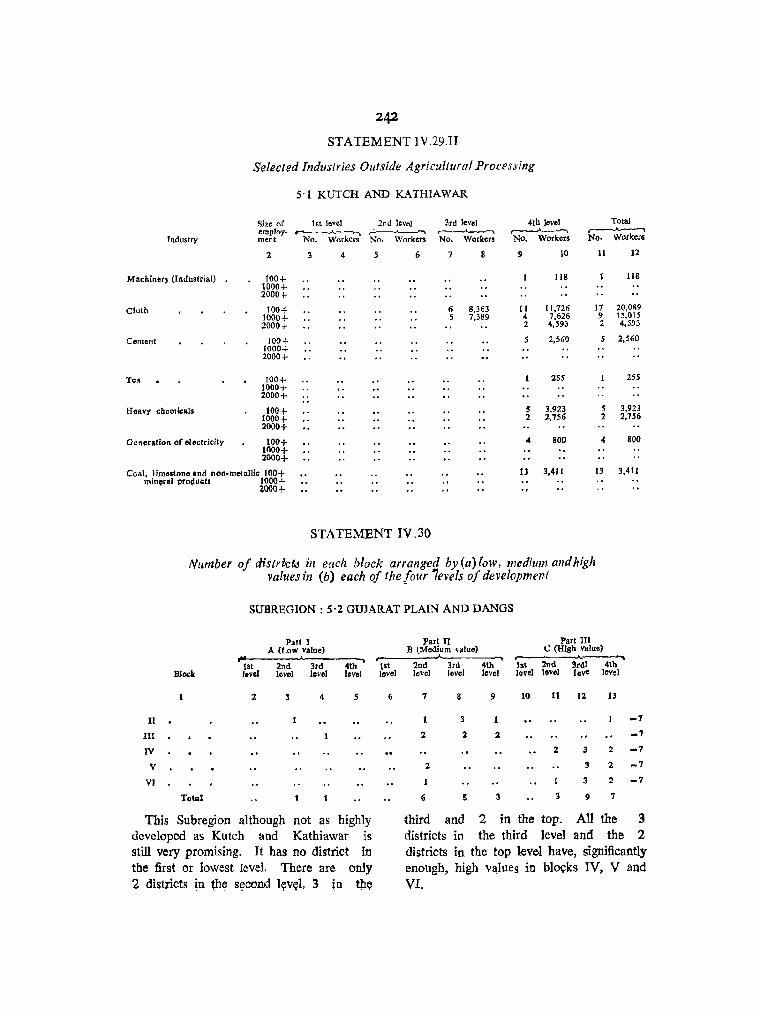
242
STATEMENT IV.29.I1
Selected Industries Outside Agricultural Processing
5'1 KUTCH AND KATHIAWAR
Industry
Machinery (Industrial)
Cloth
Cement
Tea
Heavy chemicals
Generation of electricity
Size of 1st level 2nd level employ .. '__A-, r--..A..--~ ment No. Workers No. Workers
2 4 5 6
100+ 1000+ 2000+
100+ 1000+ 2000+
100+ 1000+ 2000+
100+ 1000+ 2000+ ..
100+ 1000+ 2000+
100+ 1000+ 2000+
Coal, limed one .nd non-metallic 100+ mln,ral l'folldcts 1000+
2000+
STATEMENT IV. 30
3rd leVel , A ~
No. Workers
7 8
6 8.363 5 7,389
4th level r • -.....
No. Workers
9 10
118
11 11.726 4 7,626 2 4,593
5 2,560
255
S 3,923 2 2,756
.c 800
13 3,411
Total r--"-'""' No. Worker~
11 12
118
17 20.089 9 15,015 2 4,593
2,560
155
5 3,923 2 2,756
4 800
13 3,411
Number of distrilctJ ill each block arranged by (a) {ow, medium and high values in (b) each of the four 7evels of development
SUBREGION: 5'2 GUJARAT PLAIN AND DANOS
Pall I Part II Part III A (Low value) B lMedium •• Ioe) C (High value)
4ih' r-1st 2nd lrd 1st 2nd 3td 4th 1st 2nd 3rd! 4th
Block level level level level level level lovel level level lovel levo level
2 4 5 6 7 9 10 11 12 13
II 3 -7
III 2 2 2 _7
IV 2 3 2 -7
V 2 3 2 _7
VI 1 1 :3 2 _7
Total 6 5 3 9 7
This Subregion although not as highly third and 2 in the top. All the 3 developed as Kutch and Kathiawar is districts in the third level and the 2 still very promising, Jt has no district in districts in the top level have, significantly the first or lowest level. There are only enough, high Values in blocks IV, V and 2 districts in Qle s~cond l~v~l, 3 in tll~ VI,

Z43
STATEMENT IV. 30.t
Agricultural Processing Industries
5'2 OUJARAT PLAIN AND DANOS
Site of 1st level 2nd level ltd level 4th level Total
tnijustry ernploy .. ,---"------, r---A--~r-~~--Ir-~--_, r--".A.--~ m.:!nt NO. Workers NO. Workers NO. Workers No. Workers NO. Workers
2 3 4 5 6 7 8 9 10 11 12 Total of all Irtdustrie. 62 5,207 1,274 69,925 1,270 '202,694 2,606 277.826
Rice 20--99 1 48 2 Sa 4 110 7 216 100+ 1 161 1 161
Alta 20-99 3 174 100+
4 210 7 384
Dal 20-99 7 203 100+
3 9S 10 298
Sugarcane 20-99 2 67 2 67 100+ 3 388 3 388
Edible oils 20-99 13 338 24 932 9 312 46 1,582 100+ 1 102 1 102
Hydrogenated oils 20-99 . i lis lis 100+ 1 Jute and cotton ginning and
2,653 pressing 20 ..... 99 1 50 40 58 2,905 99 5,608 100+ 3 464 57 10,903 54 9,703 114 21,07{)
Tobacco 20-99 104 3,814 17 725 121 4,539 100+ 4 459 4 459
STATEMENT IV. 30.II
Selected Industries Outside Agricultural Processing
5'2 GUJARAT PLAIN AND DANGS
Size of 1st level 2nd level 3rd level 4th level Total employ- ,----A.-----. r-.~ ,.-----"-----.. r---.A.--> ,--___'_"_---.
Industry ment No· Workers No. Workers No. Workers No. Workers No. WorketS
2 3 4 5 6 7 8 9 10 11 12
Steel 100+ 2 1000+
757 2 757
20(10+
Machinery (Industrial) . 100+ 115 1000+
7 1,860 8 l,97S
2000+
Cloth 100+ 35 2-3,503 81 143,230 Ji6 1'6,733 1000+ 10 16,488 67 138,022. 77 154,510 2000+ 3 6,960 30 81,342 33 88,302
Paper and paper products 100+ 2 599 2 599 1000+ 2000+
Machine tools 100+ 1000+
2 261 2 261
2000+
Fine chemicals 100+ 255 3 2,699 4 2,954 1000+ 1 2,218 1 2,218 2000+ 1 2,218 1 2,218
Heavy chemicals 100+ 114 114 1000+ 2000+
Generation of electricity 100+ 2 559 2 559 1000+ 2000+
Coal, limestone and non-metal-100+ 2 305 14 1,922 IS 3,002 3l 5,229 lie mineral products
1000+ 2000+

244
STATEMENT rv.31
Number of districts in each b/'Ock arranged by (a) low, medium and high values in (b) each of the four levels of development
SUBREGION: 5'3 KONKAN COASTAL LOWLAND
Part II Part III Part I A (Low value) B (Medium value) C (High value)
1st 2nd 3rd 4th 1st Black level level level level level
2 4 5 6
tI
III
IV
v
VI
Total 1 1
Greater Bombay has been excluded from consideration because the district has no rural area·
This Subregion of 3 districts has 1 district each in the first, second and top levels of development. The district placed in the top level of development has high values in IV, V and VI.
Ratnagiri, in the first level, has only 1 tobacco factory but none of the selected non-agro industries.
Kolaba has 3 rice mills and 2 tobacco factories, 1 paper and paper products mill, 2 nne 'chemicals factories, 1 electricity
2nd lew:l
7
2
~ ,-__t...----"-----~
3rd 4th 1st 2nd 3rd 4th level level level level level level
8 9 10 II 12 13
-3
1 2 3
generating station and 1 coal, limestone etc., establishment.
Thana has a heavy concentration of 493 registered factorks with 35,399 workers (i n 1961). It has 2 small tobacco factories but 1 large steel reroIling mill; 2 industrial machinery workshops of which 1 employs 2,320; 11 cloth mills of Which 1 employs 2,068; 2 paper and paper products mills; 1 machine tools mill; 4 fine chemicals factories, 3 heavy ohemicals factories; 1 electricity generating station employing 1,135 and 3 limestone a:nd nonmetallic mineral establishments. The district constitutes the first stage of the great overflow from Greater Bombay.
STATEMENT IV.31.I
Industry
Total:of all iOdustri ••
Rico •
Tobacco
Agricultural Processing Industries
5'3 KONKAN COASTAL LOWLA.\,D
Size of 1st 'evel employ- ,.--.A.------. ment No. Workers
2 3 4
36 1,779
20-99 100+
20-99 54 100+
2nd level r---"-- ..... No. workers
6
76 2,943
3 89
2 140
3rd level 4th level r----"--..... ,----'---. No. workers NO. Workers
7 8 9 10
493 35,399
2 44
Total ,.-----'---..... No. Workers
II 12
605 40,121
3 89
5 238
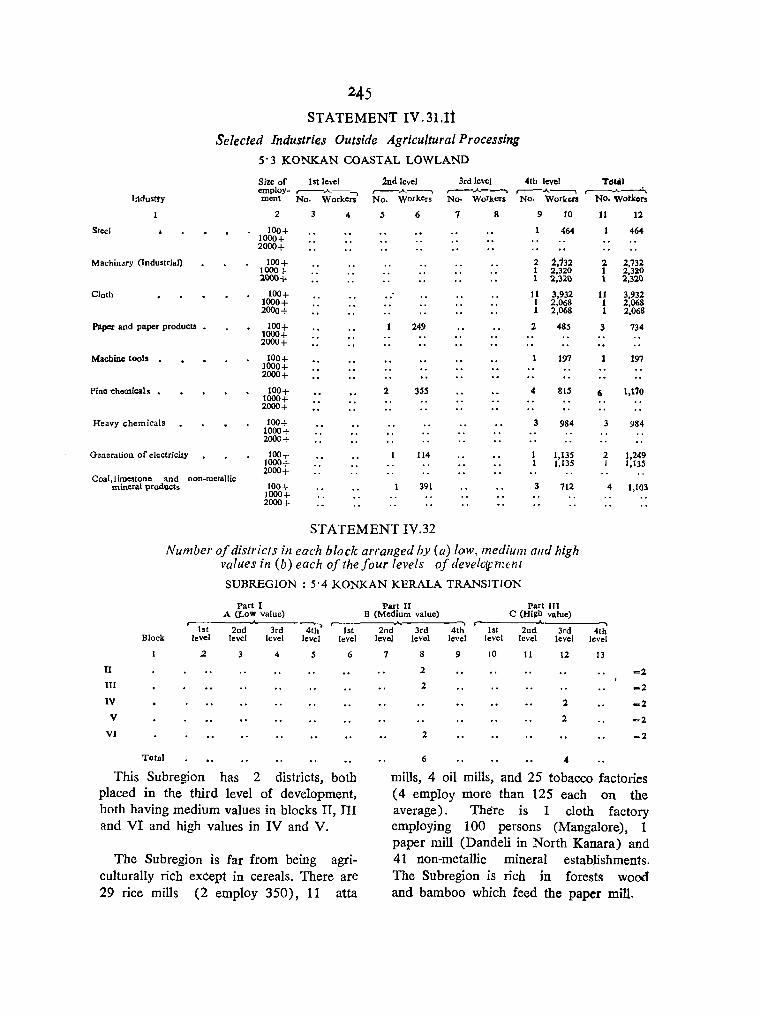
245
STATEMENT IV.31.It
Selected Industries Outside Agricultural Processing
5'3 KONKAN COASTAL LOWLAND
Size of 1st level ~dlevel 3rd level 4th level Total employ- r-.A..--, ,---.A..-----, ,..----'--..... ,...---.... ______
,---~__.;;:;..,,_
[rldustty ment No. Workers No. workers No. Workers No. Workers No. wo~kers
2 3 4 S 6 7 8 9 10 11 12
Sleel 100+ 1000+ 2000+
464 464
Macbin"y (Industrial) 100+ 2 :1;732 2 2,732 1000+ 1 2,320 1 2,320 2000+ 1 2,320 1 2,320
Cloth 100+ 11 3,932 11 3,932 1000+ 1 2,068 1 2,068 2000+ 1 2,068 1 2,068
Paper and paper products 100+ 1000+ 2000+
249 2 485 3 734
Machine tools 100+ 197 197 1000+ 2000+
Pine chemical. 100+ 1000+
2 3SS 4 815 6 1,110
2000+
Heavy chemicals 100+ 3 984 3 984 1000+ 2000+
Oeneration of electricity lOO-t- 114 1,135 2 1,249 1000+ 1,135 1 1,135 2000+
Coa[,limestone and non-metallic mineral products 100+ 391 3 712 4 1,103
1000+ 2000+
STATEMENT IV.32
Number of districts in each block arranged by (a) low, medium Gild high values in (b) each of the four levels of develclj:nu:n 1
SUBREGION: 5'4 KONKAN KERALA TRANSITION
Part I A (LoW value)
1st 2nd 3rd 4th' 1st Block [evel level level leve[ level
.2 3 4 5 6
II
III
IV
V
VI
Total
This Subregion has 2 districts, both placed in the third level of development, both having medium values in blocks II, III and VI and high values in IV and V.
The Subregion is far from being agriculturally rich except in cereals. There are 29 rice mills (2 employ 350), 11 atta
Part II Part lIT B (Medium value) C (Hiib value)
2nd 3rd 4th 1st 2nd 3rd 4th level level leve[ level level level level
7 8 9 10 11 12 [3
2 -2 2 -2
2 -2 2 -2
2 -2
6 4
mills, 4 oil mills, and 25 tobacco factories (4 employ more than 125 each on the average) . There is 1 cloth factory employing 100 persons (Mangalore), 1 paper mill (Dandeli in North Kanara) and 41 non-metallic mineral establishments. The Subregion is rich in forests wood and bamboo which feed the paper mill.
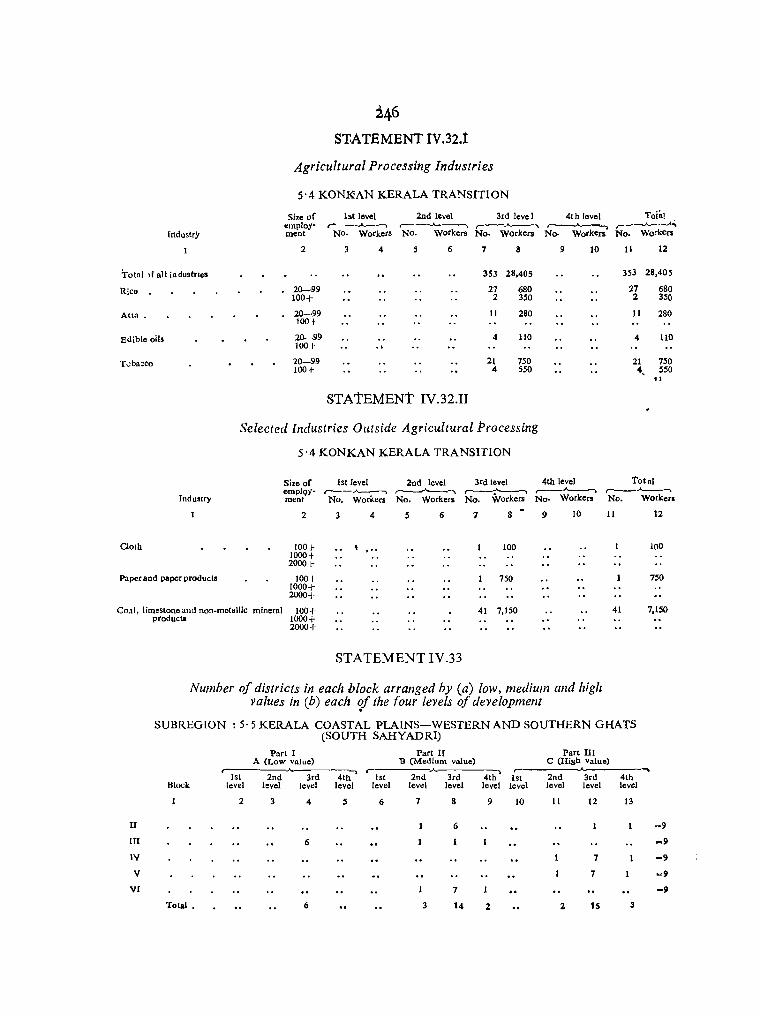
i46
S'f.ATEMENT IV.32.t
Agricultural Processing Industries
5'4 KONI{,AN KERALA TRANSITION
Size of lst level 2nd level 3rd level 4th level To!al employ- '-"'-_..A-_~
,-----..A... __ ...... r---.A.--...... r----'----, ~_--.A.._.__...-\
workers Workers [lldustry
Total )f all industries
Rico •
Attn.
Edible oils
T"bacco
fndustry
Cloth
Paper and paper products
ment NO. Workers No. No. Workers No. Workers
2 4 6 7 8 9 10
353 28,405
20-99 27 680 100-!- 2 350
20-99 II 280 100 t
20- ·99 4 110 100 1-
20-99 21 750 100 1- 4 550
STAtEMENT IV.32.II
Selected Industries Otttside Agricultural Processing
5'4 KONKAN KERALA TRANSITION
Size of emplQYmeaf
2
100-!-lOoof 2000-!-
100 l-1000-!-2oo0-!-
1st level 2nd level 3rd level 4th level r---.A...----. ,--.-..--'---...... r---:"------, ~ No. Workers No. Workers No. Workers No. Workers
3 4 5 6 7 8 9 10
100
750
Co.!I, limestone and non· metallic mineral 100+ 41 7,150 producta 1000+
2000+
STATEMENT IV.33
Number of districts in each block arranged by (a) low, medium and hig/z values in (b) each ~f the four levels of development
No.
11 12
353 28,405
1.7 680 2 350
11 280
4 110
21 750 4 550
.1
1'ot .1 r----"-----. No. Workers
11 12
100
750
41 7,150
SUBREGION: 5· 5 KERALA COASTAL PLAINS-WESTERN AND SOUTHERN GHATS (SOUTH SAHYADRI)
Block
II
1fI
IV
V
VI
Total • 6 3
7
14 2
r-1st level
10
Part III C (High value)
....... 2nd 3rd 4th level level level
11 12 13
-9
=9
7 -9
7 -9
-9
2 1S 3

247
This Subregion has 9 districts of which none is placed in the first level, 1 is placed in the second, 7 in the third and 1 in the top. This betokens a fairly high level of achievement, short of the highest, particularly as an the 7 districts in the third level have high values in IV and V and medium values in VI. Again, of these 7 districts 6 have medium values and 1 has high value in block II. The single district in the top level has high values in blocks II, Nand V and medium value in III and VI. The Subregion, as a whole, therefore, has yet to make its mark in organised industry in the modern sector.
The single district in the second level of development, Palghat, has as many as 61
rice mills (of which 2 employ a total of 350), 4 oil mills and 28 tobacco factories (of which 4 employ a total of 550).
By contrast the 7 districts in the third level have only 43 rice mills (of which 4
employ a total of 550), 1 small atta mill. 1 large sugar mill (employment 900), 56 oil mills (of which 6 employ a total of 900), 1 hydrogenated oil mill employing 100, and 41 tobacco factories (of which 4 employ 100 persons each).
The single district in the fop level has only 1 small oil mill by way of agro industries.
STATEMENT rV.33.1
Agricultural Processing Industries
5' 5 KERALA COASTAL PLAINS-WESTERN AND SOUTHERN GHATS (SOUTH SAHYADRT)
Si.e lst level 2nd level 3rd level 4th level Total Industry employ· ,... , -, r-.A._-. ,..----,A--. r---""____' ,..--.-A---..
ment No. Workers NO. Workers No. Workm No. Workers No. Worker"
2 3 4 5 6 7 8 9 10 11 12
Total of all indusl ries • 215 11,551 1,9(>8 224,569 229 16.841 2,412 252,961
Rico. 20-99 59 1,420 39 I,m 98 2.590 100+ 2 350 4 6 900
Atla • 20--99 20 20 100+
Sugarcano 20-99 'i 900 . i 900 100+
Edibledll 20-99 " 80 SO 1,180 20 55 1,280 100+ 6 900 6 900
Hydrollenatcd eUs 20-99 '1 100 100 100+
roba~p 20--99 24 1,050 37 1.1"1.5 61 2,665 100+ 4 ~5Q 4 4O'J 8 950

248
STATEMENT IV.33.U
Selected Industries Outside Agricultural Processing
5' 5 KERALA COASTAL PLAINS-WESTERN AND SOUTHERN GHATS (SOUTH SAHYADRI)
Size 1st level 2nd level 3rd level 4th level Total Industry employ' r-----'--- - ..... r-__ A-, ,---'----, ,-----"--.. r~---,
ment No. Workers No. Workers No. Workers No. Workers No Workers
2 ) 4 S 6 7 8 9 10 11 12
Machinery (Electrical) 100 t- 100 100 1000+ 2000+
Cloth 100 t- 62 17,300 62 1-. 17,300 1000+ 2000 .~
'j:~ Cement. 100-!- 500 500
1000+ "'I~ '.)(. 2000+
Tea 100+ 2 350 12 1000+
1,600 59 9,650 73 11,600
2000+
Paper and paper products 100+ 10001-
750 750
2000+
Aluminium 100+ 2 1000 t-
1,250 2 1,250
2000+
Artificial fibre rayon etc. 100+ 750 750 1000+ 2000+
Fertilizers 100+ 1,600 1,6')0 1000+ 1,600 1,600 2000 ...
Machine tools 100+ 250 2 200 3 450 1000+ 2000,
Fine chemlcals 100+ 3 700 700 1000+ 2000+
Hea vy chemicals 100+ 500 500 1000+ 2000+
Coal, limestone and non .. me- 100+ 7 1,400 87 16,700 94 18,100 tallic mineral products 1000+
2000+
STATEMENT IV.3'4
Number of distric.ts in each block arranged by (a) l.ow, medium and high values in (b) each of the four levels of development
SUBREGION: 6'1 TAMILNAD COASTAL PLAIN
Part I Part II Part III A (Low value)
r--------"--------. B (Medium value) r---------A.-------. C (Higb value) r-----..... ---,·- ~
1st 2nd 3rd 4th 1st 2nd 3rd 4th 1st 2nd lrd 41 h Block
1 jevel level level level
2 3 4 S level level level level 678 9
level level level Ie" e I 10 II 12 J3
II 4 3 -7
III 3 3 =7
IV 4 3 =7
V =7
VI 3 =7
Tllt,,1 7 3 12 12
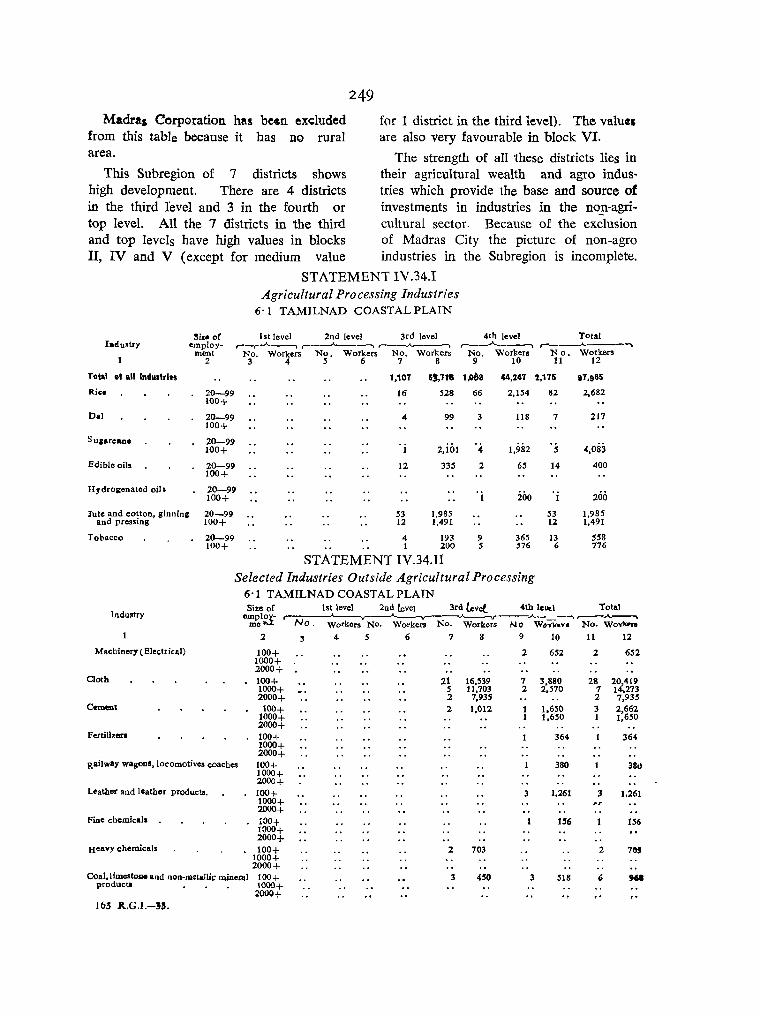
249
Madras Corporation has belln excluded from this table because it has no rural
for 1 district in the third level). The valu(tl are also very favourable in block VI.
area. The strength of all these districts lies in This Subregion of 7 districts shows their agricultural wealth and agro indus-
high development. There are 4 districts tries which provide the base and source of in the third level and 3 in the fourth or investments in industries in the nO_!l-agri-top level. All the 7 districts in the third cultural sector. Because of the exclusion and top levels have high values in blocks of Madras City the picture of non-agro II, IV and V (except for medium value industries in the Subregion is incomplete.
STATEMENT IV.34.1 Agricultural Processing Industries
6'1 TAMILNAD COASTAL PLAIN
!'Iize of 1st level 2nd level 3rd level 4th level Total radustry employ- r--rA-~ r~-____"'__-~ ,-----"-----.
r-__ A __ --"'\ r--""-----,
TIII&I 01 all Industries
Ric.
nal
Suaarean.
Edible oils
Hydrogenated oil.
Jute and cotton, ginning and pressing
Tobacco
ment No. Workers No. Workers No. Workers No. Workers 2 3 4 5 6 7 8 9 10
1,107 5),71. 1,oe8 44,247
20-99 16 ~28 66 2,154 100+
20-99 4 99 3 118 100+
20-99 2,iol 1,982 100+ 1 4
20-99 12 335 2 65 100+
20-99 200 100+ I
20-99 53 1,985 100+ 12 1,491
20-99 4 193 9 365 100+ 1 200 5 576
STATEMENT IV.34.II Selected Industries Outside Agricultural Processing
6'1 TAMILNAD COASTAL PLAIN
No. 11
2,175
82
7
's 14
. i
S3 12
13 6
Size of lst level 2nd level 3rd (evel. 4th l~uel
Workers 12
97,9115
2,682
217
4,083
400
200
1,985 1,491
558 776
Total Industry employ- -A._--v . .r----:.A..-_--"\,--........ ~
mel\.:t No. No. workers No. Workers Workers No WD-V\ccV4 No. Wo"(ken
2 3 4 S 6 1 8 9 10 11 12
Machinery (Electrical) 100+ 2 652 2 652 1000+ 2000+
Cloth 100+ 21 16,539 7 3,880 28 20,419 1000+ 5 11,703 2 2,570 7 14,273 2000+ 2 7,93' 2 7,93S
Cement 100+ 2 1,012 1,650 3 2,662 1000+ 1,650 I 1,650 2000+
Fertilizer. 100+ 364 364 1000+
RaiJway wagons, locomotive. coaches 2000+ 100+ 380 3811 1000+ 2000+
Leather and leather products. 100+ 3 1,261 3 1,261 1000+ 2000+
Fine chemicals ;:00+ 1'6 156 1000+ 2000+
Heavy chemicals 100+ 2 703 2 705 1000+ 2000+
Coal, limestoDe and non-metallic mineral 100+ 3 4'0 3 518 6 ". products 1000+ 2000+
165 R..G.L-311.
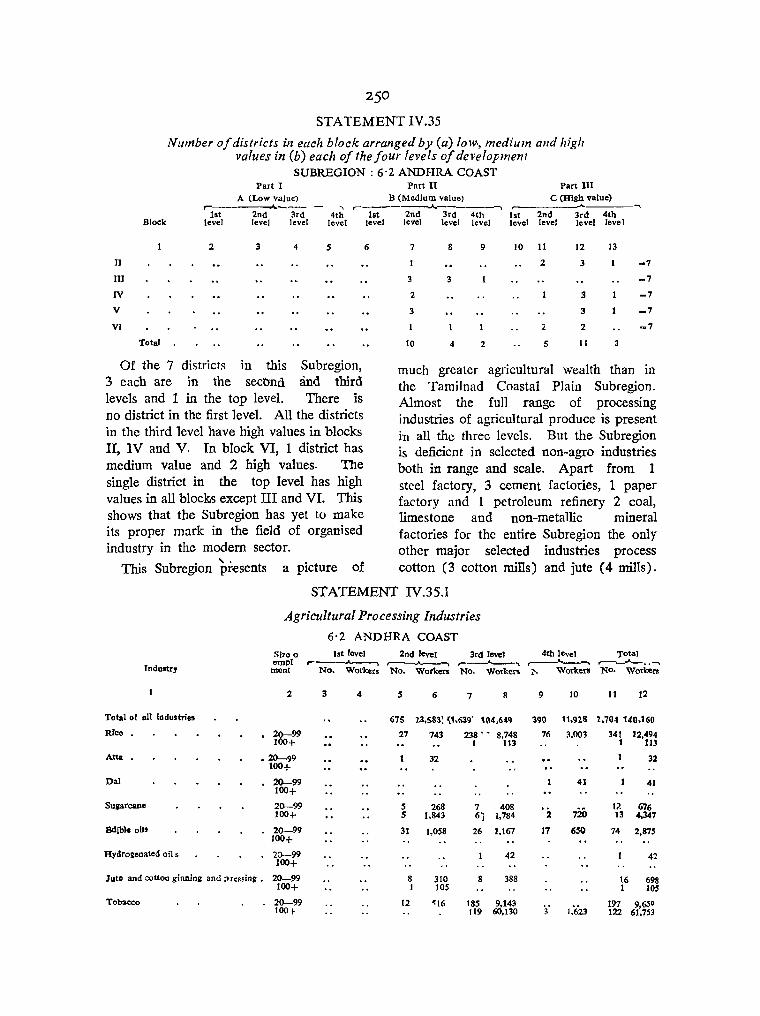
250
STATEMENT IV.35
Number of districts in each block arranged by (a) low" medium alld high values in (b) each of the four levels of development
SUBREGION: 6'2 ANDHRA COAST Part I Part II Part III
A (Low value) B (Medium value) C (High value) r--- -. r------'--------.
1st 2nd 3rd 4th 1st 2nd 3rd 4th 1st 2nd 3rd 4th Block level level level level
2 3 4 5
II
m IV
V
VI
Total
Of the 7 districts in this Subregion, 3 each are in the secOnd and third levels and 1 in the top level. There is no district in the first level. All the districts in the third level have high values in blocks II, IV and V. In block VI, 1 district has medium value and 2 high values. The single district in the top level has high values in all blocks except III and VI. This shows that the Subregion has yet to make its proper mark in the field of organised industry in the modem sector.
This Subregion presents a picture of
level
6
level level level level level level level
7 8 9 10 II 12 13
2 3 -7
3 3 -7
2 3 -7
3 3 _7
2 2 -7
10 4 2 5 11
much greater agricultural wealth than in the Tamilnad Coastal Plain Subregion. Almost the full range of processing industries of agricultural produce is present in all the three levels. But the Subregion is deficient in selected non-agro industries both in range and scale. Apart from 1 steel factory, 3 cement factories, 1 paper factory and 1 petroleum refinery 2 coal, limestone and non-metallic mineral factories for the entire Subregion the only other major selected industries process cotton (3 cotton mills) and jute (4 mills).
STATEMENT IV.35.1
Agricultural Processing Industries
6'2 ANDHRA COAST
JndlUtry
Total of all industri ...
RIce
Alta
Dal
SUiDrcane
Bdibl. oil'
Hydroienated oil s
Sixo 0 empl ment
2
20-99 100+
.20-99 100+
20-99 100+
20-99 100+
20-99 100+
2c}-99 100+
lute and cotton ginning and pressing. 20-99 100+
Tobacco 20-99 100 t
1st level .... No. Workers
3 4
2nd level 3rd level . \ ,....
No. Workers No. Workers
5 6 7 8
675 23.583; ~1,639' 104.649
27 743 238' - 8.748 I 113
32
S 268 7 408 5 1,843 61 1,784
31 1,058 26 1.167
42
8 310 8 388 1 105
12 ~16 185 9.143 119 60,130
4th level Total , . \ ,.----"--.. ~
!'. Worker!! NO. Workers
9 10 II 12
390 11.928 2,70.$ 140,160
76 3,003 341 12.494 1 113
32
41 41
I? 676 13 4.347 ·2 720
17 650 74 2.875
42
16 698 1 lOS
197 9,650 122 61.753
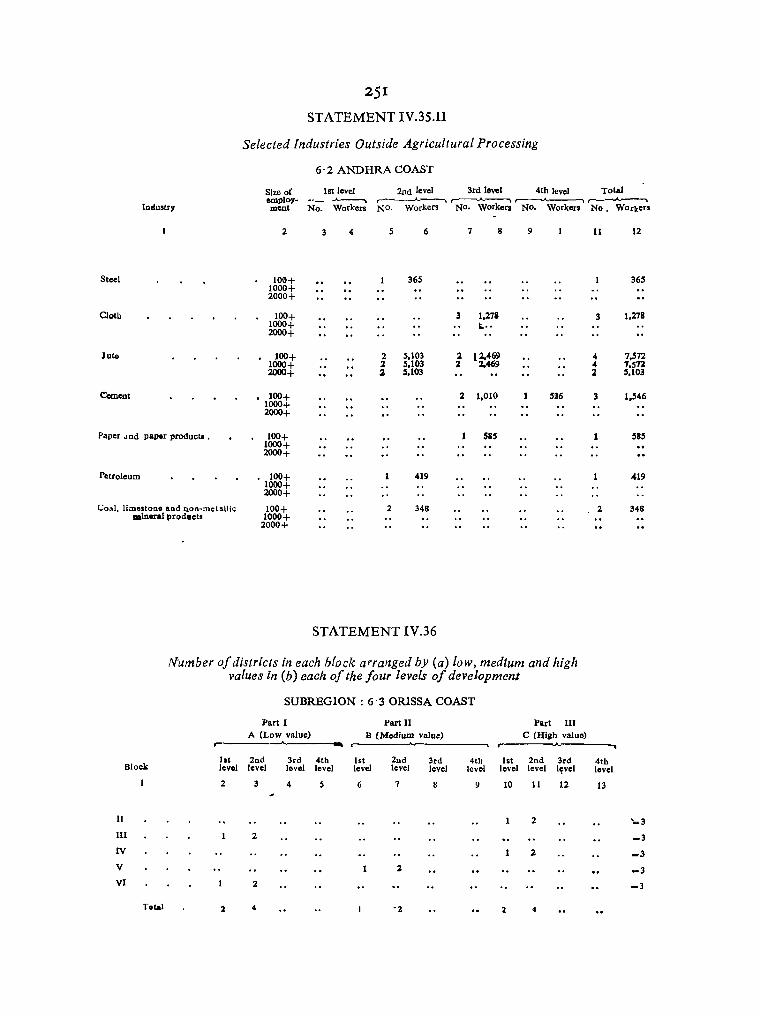
251
STATEMENT IV.35.II
Selected Industries Outside Agricultural Processing
6' 2 ANDHRA COAST
Size of lst level 2nd level 3rd level 4th level Total employ- .A.--, ,.-----..A...~ r-.A..~ ,------...____...... r-
Inelustry ment No. Workers NO. Workers NO. Workers NO. Workers No.
2 3 4 5 6 7 8 9 11
Steel 10(j+ 365 1000+ 2000+
Cloth 100+ 3 1,27& 3 1000+ 1;. .. 2000+
Jute 100+ 2 5,103 2 [2,469 4 1000+ 2 5,103 2 2,469 4 2000+ 2 !I,103 2
Cement • 100+ 1000+ 2000+
2 1,010 536 3
Paper and pap.r product •. 100+ sas 1000+ 2000+
Petroleum • 100+ 419 1000+ 2000+
Coal. limestone a.nd non.·mctal!ic 100+ 2 348 2 mlnoral products 1000+
2000+
STATEMENT IV.36
Number of districts in each block arranged by (a) low, medIum and high values in (b) each of the four levels of development
Block
II
III
IV
V
VI
Total
,.. lot level
2
SUBREGION: 6'3 ORISSA COAST
Part I Part II A (Low value) B (Medium value) --"---_ r--2nd 3rd 4th lst 2nd 3rd 4th level level level level level level level
4 5 6 7 8 9
2
2
2
4 '2
Pllrt III C (High value)
r
lst 2nd 3rd 4th level level Iyvel lovel
10 11 12 13
2
2
1
. \
Workers
12
365
1,278
7,572 7,571. 5,103
1,546
SIS
.419
348
.... 3
_3
-3
-3
-3
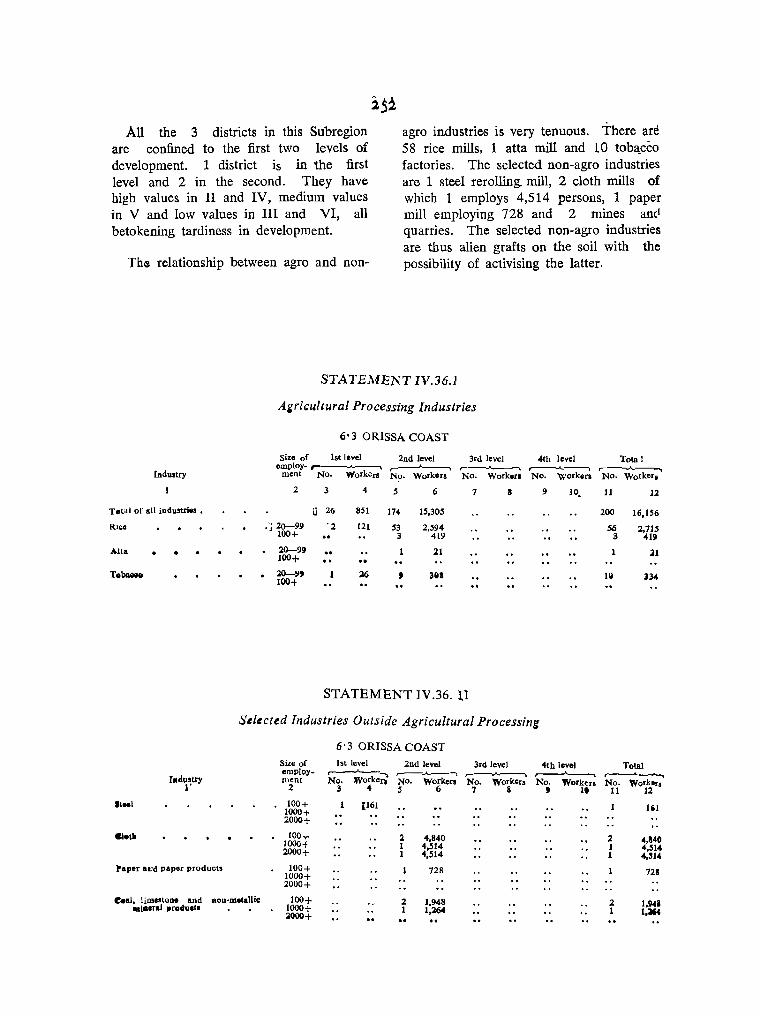
All the 3 districts in this Subregion are confined to the first two levels of development. 1 district is in the first level and 2 in the second. They have high values in II and IV, medium values in V and low values in III and VI, all betokening tardiness in development.
Th= relationship between agro and non-
agro industries is very tenuous. There are 58 rice mills, 1 atta mill and 10 tob&.cco factories. The selected non-agro industries are 1 steel rerolling. mill, 2 cloth mills of which 1 employs 4,514 persons, 1 paper mill employing 728 and 2 mines ami quarries. The selected non-agro industries are thus alien grafts on the soil with the possibility of activising the latter.
STATEMENT IV.36.1
A~ricullural Processing Industries
(joJ ORISSA COAST
Size of 1st level 2nd level 3rd level 4th level Total employ- ,..--"'-----. r- ,..._____'__"'" _...---"-------, ,..----......---..
ment No. Workers No. Workers No. Work ... No. Workers No. Worker. [ndllStry
2 3 4 5 6 7 a 9 10. 11 12
Total 01" all industries. U 26 851 174 15.305 200 16.156
.J 20-99 ·2 121 S3 2.594 56 2.715 100+ 3 419 3 419
Atta 20-99 100+
21 :u
. :l0-1I' l6 , 3&S 1& 134 100+
STATEMENT IV.36. 11
S~lected Industries Outside Agricultural Processing
6·3 ORISSA COAST
It .. 1
•• 1lI
Paper al>'d paper products
e.al. limestone and Ron-metallic .. l •• ra' ,r.duet.
Size of employment
2
100+ 1000+ 2000+
100 .... 1000+ 2000+
100+ 1000+ 2000+
100+ 1000+ :1000+
1st level 2nd level .------'----., ,...-"'---. No. worken NO. Workers 345 6
[161
2 4.840 1 4.514 1 4.514
728
2 1.948 1 1.264
3rd level ,...----.A.~
No. Workers 7 8
4th level Total r-"---. No. Workers No. Worker.
, It 11 12
2 1 1
2 1
1'1
4,840 4.514 4.314
72&
1,94' 1~
i53 CONCLUDING REMARKS
'the foregoing analysis supports several conclusions.
Firstly, it demonstrates strong and positive association between agricultural infrastructure, potential of human resources, distributive !trade, manufacturing activity, social and economic infrastructure and organised industrial activity in the modern sector. Secondly, it demonstrates that however high the participation rates in the traditional sector of the economy, viz., agriculture, household industry~ single and family worker categories, they seem to have no great positive association w.ith, or causal organic contribution to, levels of develqpment. It seems t6 follow that any labour intensive or employment oriented programmes in the household industries sector or rural works sector which do not contribute to or aim at strengthening the ecOnomic infrastructure will not have much self-generating .fIect on the levels of development. Thirdly,
the tables establish the association between irnprovements in agriculture, diversification of crops, savings on account of such improvement, their investment in social and economic infrastructure and their further iI1Vestment in modern organised industry and mutually fertilising effect of the circuit they eventually establish, in the circuit's ability to' achieve within i,tself the locationijlg of new industties and to attract new 1I1dustrial licences. Fourthly, the tables establish the fact tha't wherever industries have been located in a district or tract on the logic of availability of raw materials, economy of transport and proximity of ultimate market or export point alone, without the agricultural and human base together with its social and economic infrastructure cOhtributing to a sufficient degree to its investment, nourishment and growth, such industries, as in Singhbhum, nave behaved like alien growths and failed to demonstrate fully their multiplier effects OB the surroundings.

2.54 NON-AGRO INDUSTRIES IN CASH CROP GROWING DISTRICfS
Brief comments may be in order of the association between the significant acreage and employment of factory labour in the growing and processing of cotton, oilseeds, sugarcane and jute on the one hand and the presence of capital goods and nonagricultural tertiary manufacture on the other in the same district. It must however be borne in mind that the search for
I a too literal association -between the two wings within the same district is not always either feasible or proper, because very
often agricultural raw materials are transported outside the district for final processing and conversion, and equally often are capital and tertiary goods manufactured in nodal points for marketing in surrounding districts. A too facile cause-and-effect
relationship may suggest itself from the following presentation, which IS not cer-
tainly intended. The following statement therefore should be read always keeping in mind the above cautionary remarks.
STATEMENT IV.37 Association between cash crops and certatn industries
[manufactures in italic are first in order of employment in the district]
More than C value
State 1
District 2
in both area and workers
3 Non-agro industries
4 Allflhra Pradesh Srikakulam .
Visakhapatnam
Chittoor Cuddapah
Oilseeds Basic metal industries, metal products
Transport equipment, textiles_
Bihar
Gujarat .
Anantapur Kuroool Nizamabad Khammam
Hyderabad
Saran . Champaran
Muzaffarpur .
Darbhanga Purnea
Panchmahals .
Amreli
Sabarkantha
Mehsana
Oilseeds and sugarcane
Oilseeds Oilseeds
Oilseeds Cotton and oilseeds Sugarcane Oilseeds
Oilseeds
Sugarcane Sugarcane
Sugarcane
Sugarcane Jute
Oilseeds
Oilseeds
Cotton and oilseeds
Cotton
Textiles, metal products. Chemicals and chemical products,
transport equipment, textiles. Textiles, miscellaneous industries. Textiles, printing and publishing. Chemicals and Chemical products. Transport equipment, Chemicals
and chemical products, printing and publishing.
Transport equipme,lt, metal products, machinery except electrical machinery.
Metal products, printing and publishing. Miscellaneous industries, wood and
cork except furniture. Machinery except electrical machinery,
printing and publishing. Textiles, transport equipment. Textiles.
Transport equipment, chemicals and chemical products.
Textiles, chemicals and chemical products, transport equipment.
Transport equipment, printing and publishing.
Textiles, wood and cork except furniture, miscellaneous, industries.
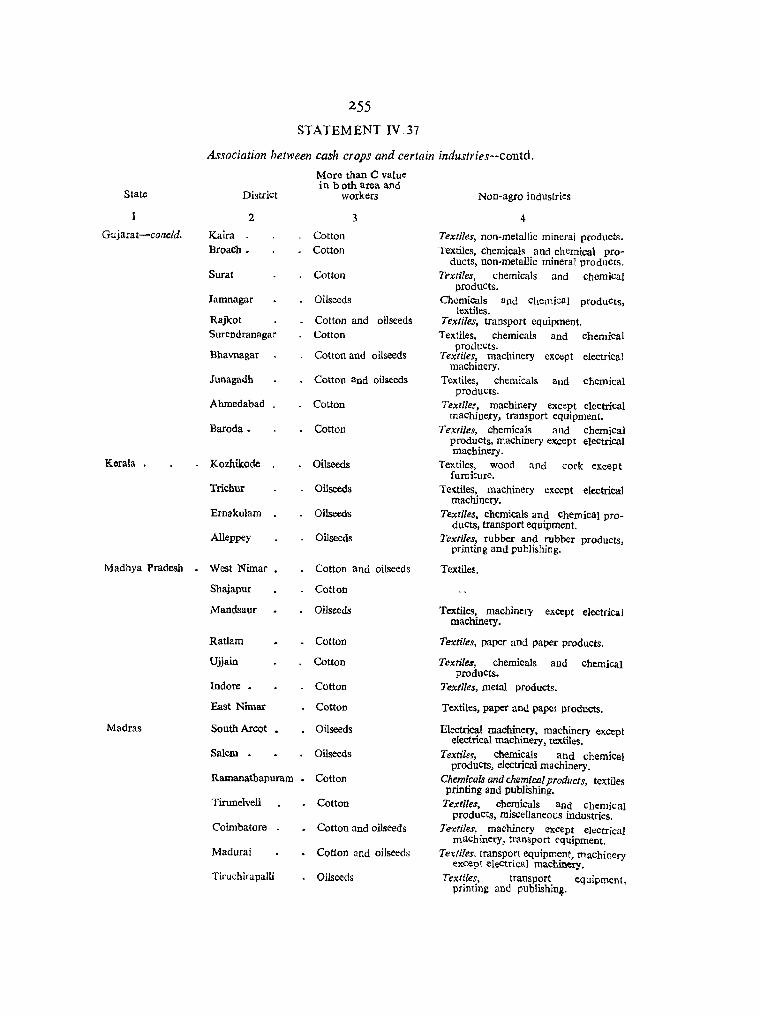
State
Gujarat-concld.
Korula .
Madhya Pradesh
Madras
255
STATEMENT IV.37
Association between cash crops and certain industries--colltd.
More than C value in both area and
District workers
2 3
Kaira Cotton Broach. Cotton
Surat Cotton
Jamnagar Oilseeds
Rajkot Cotton and oil seeds Surendranagar Cotton
Bhavnagar Cotton and oilseeds
Junagadh Cotton and oilsecds
Ahmedabad Cotton
Baroda. Cotton
Kozhikode Oilseeds
Trichur Oilseeds
Ernakulam Oilseeds
Alleppey Oilseeds
West Nimar • Cotton and oilseeds
Shajapur Cotton
Mandsaur Oil seeds
Ratlam . Cotton
Ujjain Cotton
Indore • Cotton
East Nimar Cotton
South Areet • Oilseeds
Salem Oilseeds
Ramanathapuram. Cotton
Tirunelveli Cotton
Coimbatore • Cotton and oilseeds
Madurai Cotton and oilseech;
Tiruchirapalli Oilseeds
Non-agro industries
4
Textiles, non-metallic mineral products. Textiles, chemicals and chemical pro
ducts, non-metallic mineral produces. Tf'xtiles, chemicals and chemical
products. Chemicals and Chemical products,
textiles. Textiles, transport equipment. Textiles, chemicals and chemical
products. Textiles, machinery except electrical
machinery. Textiles, chemicals and chemical
products. Textiles, machinery except electrical
machine:ry, transport equipment. Textiles, chemicals and chemical
products, machinery except electrical machinery.
Textiles, wood and cork except furniture.
Te(tiles. machinery except electrical machinery.
Textiles, chemicals and chemical products, transport equipment.
Textiles, rubber and rubber products, printing and publishing.
Textiles.
Textiles, machinery except electrical machinery.
Textiles, paper and paper products.
Textiles, chemicals and chemical produCts.
Textiles, metal products.
Textiles, paper and paper products.
Electrical machinery, machinery except electrical machinery, textiles.
Textiles, chemicals and chemical products, electrical machinery.
Chemicals and chemical products, textiles printing and publishing.
Textiles, chemicals and chemical products, miscellaneous industries.
Te1Ctiles, machinery except electrical maChinery, transport equipment.
Te1Cfi/es, transport equipment, machinery except electrical machinery.
Textiles, transport equipment, printini and publishin~.
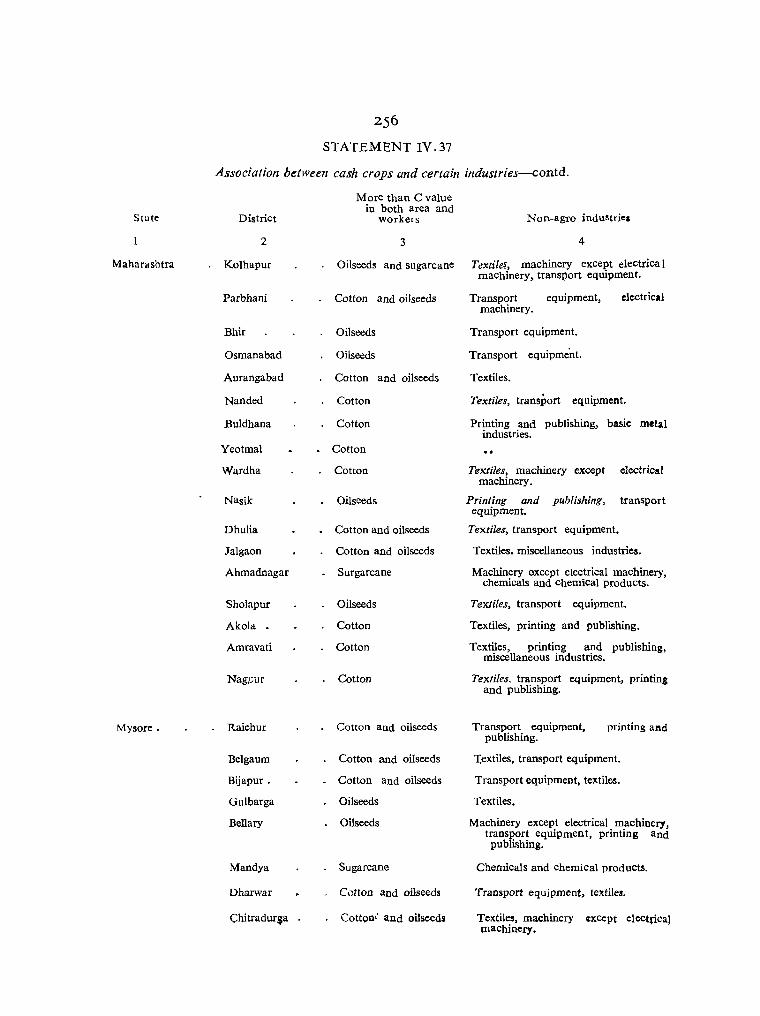
State
Mahar~shtra
Mysore.
256
STATEMENT IV.37
Associatien between cash crops and certain industries-contd.
District
2
Kolhapur
Parbhani
Bhir
Osmanabad
Aurangabad
Nanded
Buldhaua
Yeotmal
Wardha
Nasik
Dhulia
Jalgaon
Ahmadnagar
Sholapur
Akola •
Amravati
Nam;ur
Raichur
Belgaum
Bijapur.
Gulbarga
Bellary
Mandya
Dharwar
Chitradur~a
More than C value in both area and
workers
3
Oilseeds and sugarcane
Cotton and oil seeds
Oilseeds
Oilseeds
Cotton and oilseeds
Cotton
Cotton
Cotton
Cotton
Oilseeds
Cotton and oilseeds
Cotton and oilseeds
Surgarcane
Oilseeds
Cotton
Cotton
Cotton
Cotton and oilseeds
Cotton and oilseeds
Cotton and oilseeds
Oilseeds
Oilseeds
Sugarcane
Cotton and oilseeds
Cottoo' and oilseeds
Non-ageo industries
4
Textile~, machinery except electrica 1 machinery, transport equipment.
Transport equipment, electrical machinery.
Transport equipment.
Transport equipment.
Textiles.
Textiles, transport equipment.
Printing and publishing, basic metal industries.
Textiles, machinery except electrical machinery.
Printing and publishing, transport equipment.
Textiles, transport equipment.
Textiles. miscellaneous industries.
Machinery except electrical machinery, chemicals and chemical products.
Textiles, transport equipment.
Textiles, printing and publishing.
Textiles, printing and publishing, miscellaneous industries.
Textiles, transport equipment, printing and publishing.
Transport equipment, publishing.
printing aad
T,extiles, transport equipment.
Transport equipment, textiles.
Textiles.
Machinery except electrical machinery, transport equipment, printing and
publishing.
Chemicals and chemical products.
Transport equipment, textiles.
Textiles, machinery except electpcal maChinery.
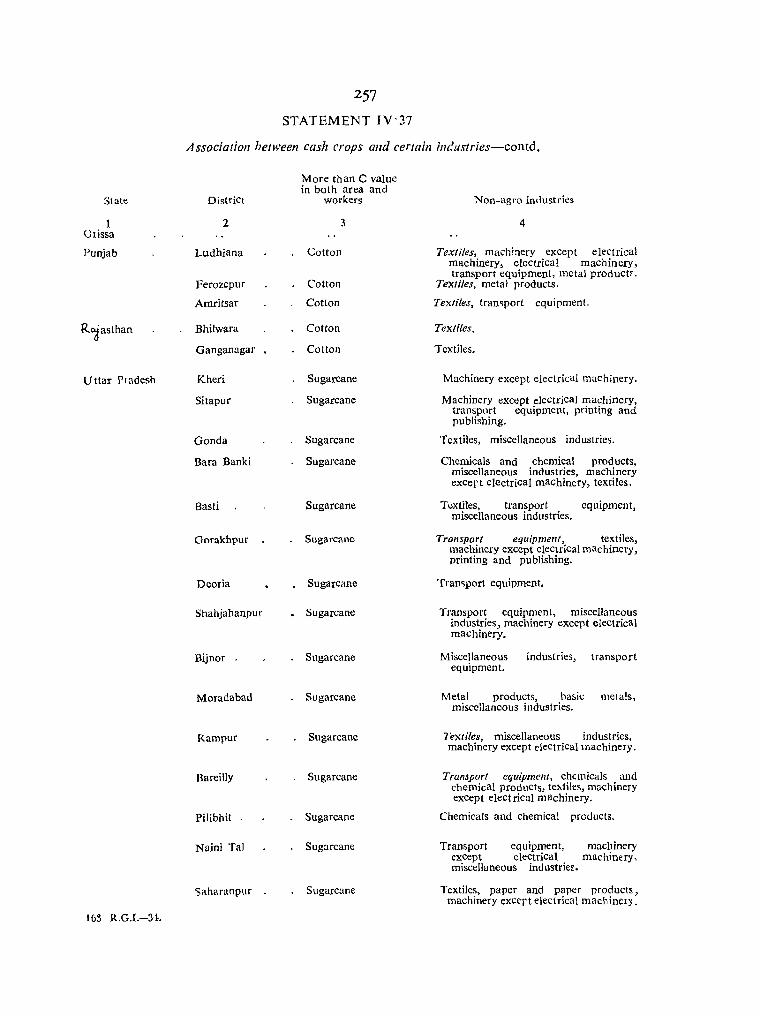
State
1 Crissa
Punjab
Uttar Pradesh
163 R,G,I.-34.
257
STATEMENT IV'37
Association between cash crops alld certain illctlstries-contd.
More than C value in both area and
District workers
2 3
Ludhiana Cotton
Ferozepur Cotton
Amritsar Cotton
Bhilwara Cotton
Ganganagar Cotton
Kheri Sugarcane
Sitapur Sugarcane
Gonda Sugarcane
Bara Banki Sugarcane
Basti Sugarcane
Gorakhpur Sugarcane
Deoria Sugarcane
Shahjahanpur Sugarcane
Bijnor Sugarcane
Moradabad Sugarcane
Rampur Sugarcane
BareiUy Sugarcane
Pi lib hit Sugarcane
Naini Tal Sugarcane
'Saharanpur Sugarcane
Non-agro industri.:s
4
Textiles, machbery except electrical machinery, electrical machinery, transport equipment, metal productf.
Textiles, metal products.
Textiles, tramport equipment
Textiles.
Textiles.
Machinery except electrical machinery.
Machinery except electrical machinery, transport equipment, printing and publishing.
Textiles, miscellaneous industries.
Chemicals and chemical products, miscellaneous industries, machinery excert electrical machinery, textiles.
Textiles, transport equipment, miscellaneous industries.
Transport equipment, textiles, machinery except electrical machinery, printing and publishing.
'fran~port equipment.
Transport equipment, miscellaneous industries, machinery Ilxcept electrical machinery.
Miscellaneous equipment.
industries, transport
Metal products, basic metals, miscellaneous industries.
Textiles, miscellaneous industries, machinery except electrical machinery.
Transport equipment, chemicals and chemical products, textiles, machinery except electrical machinery.
Chemicals and chemical products.
Transport equipment, machinery except electrical machinery, miscellaneous industrief.
Textiles, paper and paper products, machinery excert electrical machincIY.
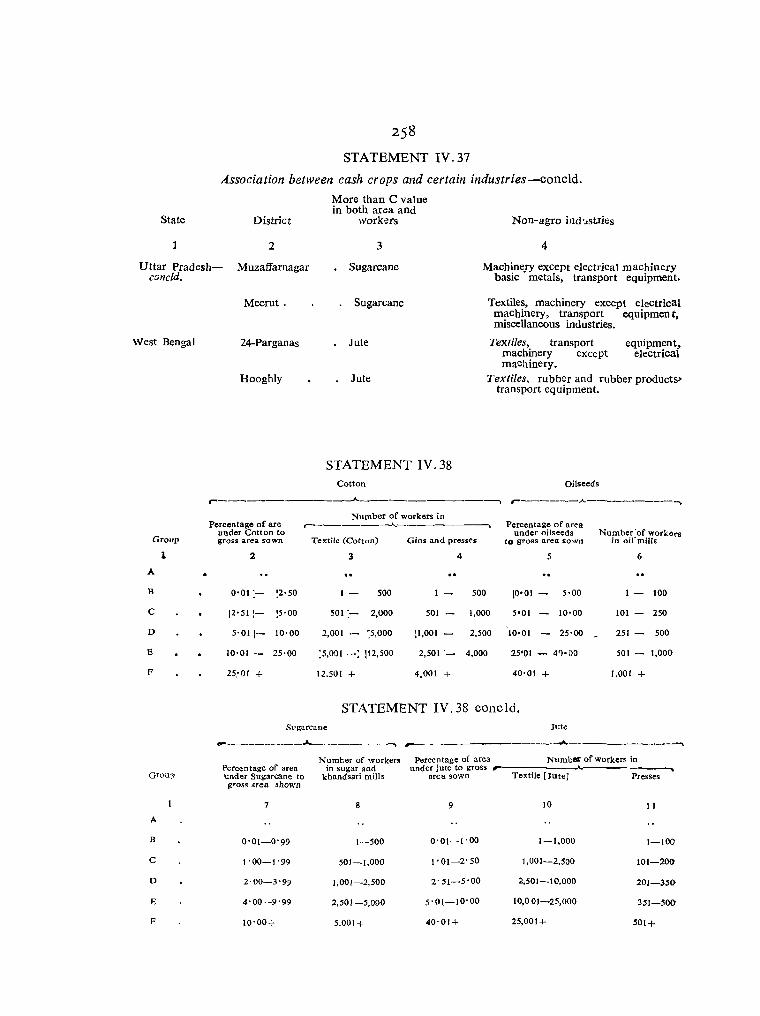
State
258
STATEMENT IV.37
A.ssociation between cash crops and certain industries-concld.
More than C value in both area and
District workers Non-agro ind ~Isuies
2 3 4
Uttar Pradesh- Muzaffarnagar Sugarcane Machinery except electrical machinery basic metals, transport equipment. candd.
West Bengal
Group
1
A
B
C
D
E
F
GrOUf:J
A
B
C
0
E
F
Meerut.
24-Parganas
Hooghly
Sugarcane
Jute
Jute
STATEMENT IV.38
Textiles, machinery except electrical machinery, transport equipmen t, miscellaneous industries.
Textiles, transport machinery except machinery.
equipment, electrical
Textiles, rubber and rubber products> transport equipment.
Cotton Oilseeds
r-----------------'"---------------.. r-------A ---------.
Percentage of are under Cotton to gross area sown
2
0'01 :- ~2'SO
12'5[1- !S'OO
S·O[ 1- 10·00
10'01 - 2S'00
25:01 +
Number of workers in r---------..A..-----------. Textile (Cotton) Gins and presses
3 4
1- SOO SOO
50[ :- 2,000 SOl - 1,000
2,001 - :5,000 :1,001 - 2.S00
:S.OOI -; 112.500 2,501 '- 4.000
12.501 + 4,001 +
Percentage of area under oilseeds
to gross area sown
S
10- 01 5'00
S-O[ 10'00
10-01 2S'00
2S'OI - 41)-00
40'01 +
Number 'of workers in oirmills
6
100
101 2S0
2S1 - SOO
501 - I,OO()
1,001 +
STATEMENT IV,38 coneld_ Sugarcane Jute
~--------~------~ ,..._. - -_" ---'-------------. Number of workers Percentage of area Numbc« of workers in
Percentage of area in sugar and under jute to gross ---.A. -~
I!nder Sugarcane to khandsari miIls area sown Textile [Jute] Presses I!ros~ Jrea shown
7 8 9 10 II
0'01-0'99 1-500 0'01· -1'00 1-1,000 I-lOa
1'00-1'99 501-1,000 1'01-2'50 1,001-2.500 101-200
2'00-3'99 1,001-2,500 2'51-5'00 2,501-10,000 201-3S0
4'00-9'99 2,501 -5,000 5'01-10'00 10,001-25,000 3S1-500
10'00+ 5.001 + 40'01+ 25,001 + 501+
259
DISTRIBUTION OF PUBLIC SECTOR VNDERTAKINGS BY LEVELS OF DEVELOPMENT
Table IV.4 gives a list in two parts of all public sector undertakings engaged in industrial production, processing and repairs under the Government of India and the State Governments. Statement IV:39 below gives an analysis of a total of 54 Central Government undertakings in the States arranged according to levels of development. It brings out very c100rly that despite the Government's declared aim to disperse government undertakings in the
iJ1terest of regional growth the compulsions of raw materials, production and managerial costs and markets still exert a strong pull in favour of location _in districts ill the higher levels of development. This pull is so strong that as many as 32 undertakings are concentrated in 18 districts in the top level of development; 10 undertakings in the 5 districts in the third level; 8 in 6 districts in the second level; and none in any district of the lowest level.
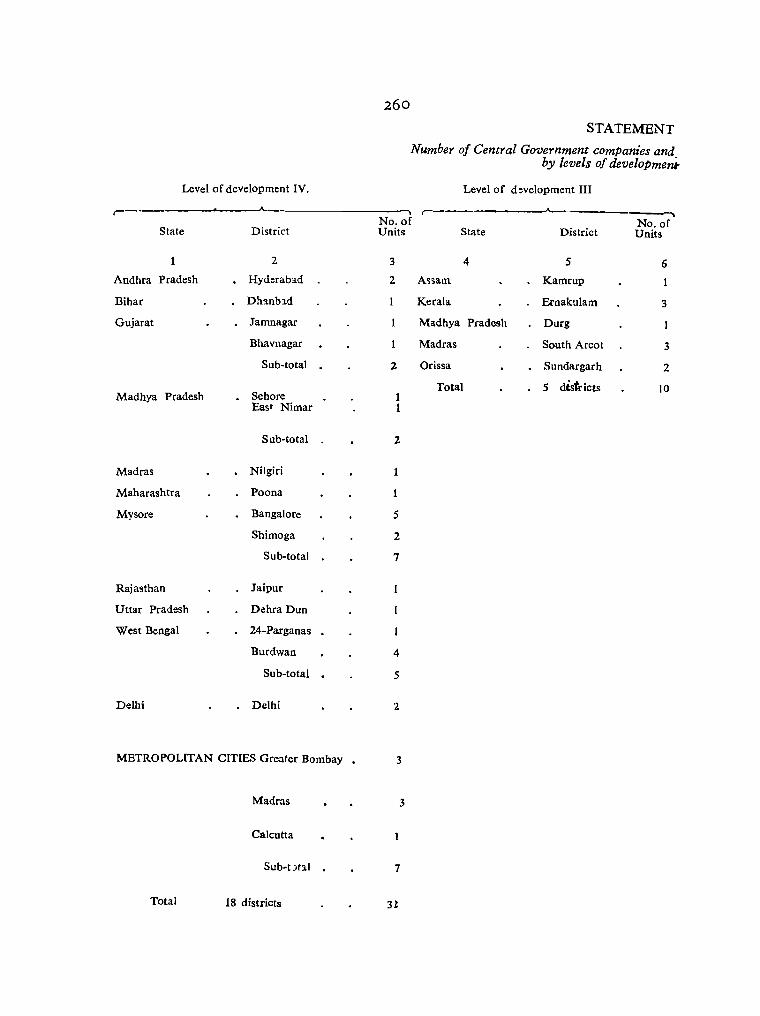
260
Level of development IV.
----------~-----~
STATEMENT
Ntember of Central Government comPanies and by levels of developrnen,.
Level of d:velopment III
r--------.----------~-----------State District
No. of Units State
-~
District No. of Units
Andhra Pradesh
Bihar
Gujarat
Madhya Pradesh
Madras
Maharashtra
Mysore
Rajasthan
Uttar Pradesh
West Bengal
Delhi
2
• Hyderabad
D!l'l.nbld
Jamnagar
Bhavnagar
Sub-total •
Sehore EasT Nimar
Sub-total
Nilgiri
Poona
Bangalore
Shimoga
Sub-total
Jaipur
DehraDun
24-Parganas
Burdwan
Sub-total •
Delhi
3
2
2
1 1
2
5
2
7
4
5
METROPOLITAN CITIES Greater Bombay • 3
Madras 3
Calcutta
Sub·Utal 7
Total 18 districts 3l
4
A'5sam
Kerala
Madhya Pradesh
Madras
Orissa
Total
5 6
Kamrup
Ernakulam 3
Durg
South Areot 3
Sllndargarh 2
5 districts 10

IY·39
d~partmmtal u'td~rtakings (industrial (JIlly) as in March, 1961
201
Level of development II All levels of development
r----------_..A..--------_&"\ r---.A. _______ --.
No. of State District Units State
7
Andhra Pradesh
Bihar
Maharashtra
Punjab
Himachal Pradesh
Total 6
8
Visakhapatnam
Ranchi
Kolaba
Hoshiarpur
Sirmur
Mandi
Sub-total
districts
9 10
Andhra Pradesh
Assam
Bihar
Gtljarat
3 Kerala z
Madhya Pradesh
4 Madras district
8 Madras (including Madras district)
Greater Bombay
Maharashtra . (including Greater Bombay)
Mysore
Orissa
Punjab
Rajasthan
Uttar Pradesh
Calcutta
%
West Bengal (including Calcutta)
Delhi
Himachal Pradesh
Sub-total . - .
UNSPECIFIED CASES
Assam
Bihar
Kerala
Sub-total
rotal including unspecified cases :
No. of No. of districts Units
11
2
2
2
3
3
3
2
3
2
29
12-
3
2
2
3
3
3
7
3
5
7
2
6
2
4
SO
2
;!,
S4
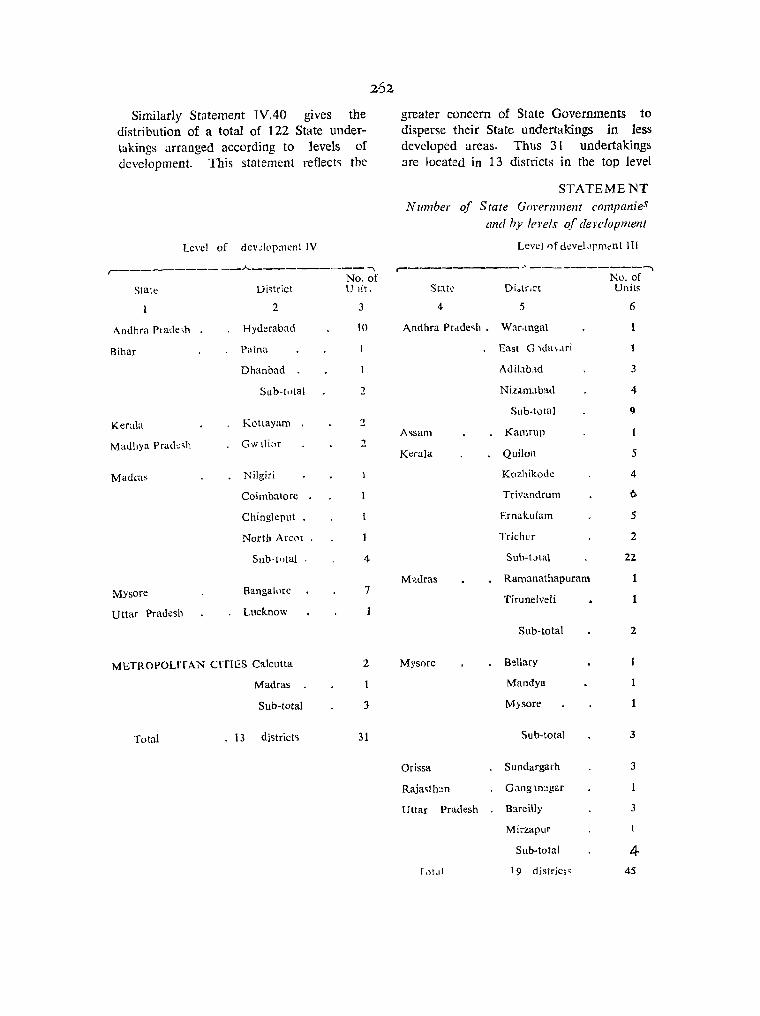
Similarly Statement IV.40 gives the distribution of a total of 122 State undertakings arranged according to levels of development. This statement reflect'> the
Level of dev~lt>p;nent IV
r-------------...A-.---------- ........ No. of
State Di~trict U lit,
Andhra Pradc',h
Bihar
Kerala
Mauhya Prade,h
Madras
Mysore
Uttar Pradesh
2
Hyderabad
Patna
Dhanbad
Sub-t"tal
Kottayam
Gw\lior
Nilgiri
Coimbatore .
Chingleput .
Bangalorc
Lucknow
METROPOLITAN CITIES Calcutta
Madras
Sub-total
Total . 13 districts
3
10
2
4
7
2
3
31
greater concern of State Governments to disperse their State undertakings in less developed areas. Thus 31 undertakings 3re located in 13 districts in the top level
STATEMENT N umber of State Government companieS
and hy lerels 0/ deJ'e/upment
Level 0f develormt'nt 111
r-----------'~ ----------~
StJ.t~
4 5
Andhra Prdde~h. War,mgal
A~sam
KeraJa
Mysore
Orissa
Raja~tlun
Uttar Pradesh
[,)t.Ji
AdiLlb_ld
Niunubad
Sub-total
Kamrup
Quilon
Kozhikode
Trivandrum
Ernakulam
Trichtor
Suh-tJt<ll
Ramanathapuram
Tirunelveli
Sub-total
B~llary
Mandya
Mysore
Sub-total
Sundargarh
Gang,n:tgar
B:.treilly
Mirzapur
Sub-total
19 district,
No. of Unit~
6
3
4
9
5
4
6.
5
2
22
1
1
2
3
3
3
4 45

of development. 45 undertakings are located in 19 districts of the third level of development. 33 undertakings' are
IVAO departmental undertakings (industrial only) as in March 1961
located in 7 districts of the second leve\, and 8 units in 4 districts of the first or lowest level.
Level of develoi)ment Il Level of development I All levels of development .-_______ ..A..
State District
7 8
Andhra Pradesh Cuddapah
Nellore
Sub-total
Assam Nowgong
Orissa . Ganjam
Balasore
Dhenkanal
Cuttack
Sub-total
Total 7 diS'riels
No. of Units
9
2
3
5
_, 22
29
33
,----------'- '-----, State District
10
Bihar
Orissa
Total
11
Darbhanga
Mayurbhanj
Sambalpur
Puri
Sub-total
4 districts
No. of Units
12
2
2
3
7
8
.-______ . ....A-____ "'I
No. of No. of State districts Units
13
Andhra Pradesh
Assam
Bihar
Kerala
Madhya Pradesh
Madras district .
Madras (inCluding Madras district)
Mysore
Orissa
Rajasthan
Uttar Pradesh •
Calcutta
14
7
2
3
6
15
22
2
3
24
2
7 7
4 10
8 39
3 5
2
West Bengal . 2 (including Calcutta)
Sub-total 43 117
UNSPECIFfED CASES
Bihar
KeraJa 3
West Bengal
Sub-total 5
Total inCluding un specified cases 122


CHAPTER V
RELATIONSHIP BETWEEN PATTERNS OF SHIFT FROM AGRICULTURE TO NON-AGRICULTURE ]951-61 AND THE LEVELS OF DEVELOPMENT
IT MAY BE ASSUMED THAT the male participation rate gives a more stable and reliable index of economic activity than the overall crude activity rate, although even here it should be remembered that the participation of boys below the age of 15 is likely to vary sharply with the school enrolment age which must, since 1951, sharply and progressively rise. All the same, the following statements leave little room for doubt, first, that the 1951 and 1961 male activity rates are closely comparable, and, secondly, that the 1951 and 1961 rates in the majority of States follow the trend since 1901.
STATEME~T V.l
Participation rates in India and three Southern States, 1911-61
All India minus Andhra Pradesh,
Madras and
Mysore r---A.---,
Males Females
Andhra Pradesh Madras and
Mysore combined
r----"---, Males Females
Ca) Ratio of workers to total population 1911 62'63 33·04 59'52 35·88 1921 62'02 32'93 55'70 31·87 1931 58'86 27'73 56'40 31,75 1951 55'58 25'33 48'97 17'01 1961 56'22 25'66 60,57 36'25
(b) Ratio of agricultural wor!! ers to total population 1911 43'74 24'71 38'08 25,63 1921 44'42 25'62 35'44 21,83 1931 42'49 21'45 32'23 19'96 1951 37'75 19'65 30'79 12,47 1961 36'99 20'76 37'35 27,62
(c) Ratio of nOli-agricultural workers to total popUlation
1911 18'89 8'33 21'44 10'25 1921 17'60 7'31 20'26 10 04 1931 16'37 6'28 24'17 11,79 1951 17'83 5'68 18 '18 4,54 1961 19'23 4 9Q 23'2~ 8,63
163 R,G,I,-35.
The closeness of the 1951 and 1961 participation rates in other States of India is well brought out in the following state-ment.
STATEME~T V.:?
Participation rates in other States, 1951 and 1961
1951 1961 ,---"---, , __ ..A.._-
1
M F M F
Assam 53' (';0 30,18 54'le '30' 91
Bihar 49,18 20-69 55'W 27'12
Gujarat and Maharashtra 55,08 31'(;0 55'72 34'59
Kerala 46,67 18'40 47'20 19'71
Madhya Pradesh 60,37 37'95 60-21 43'99
Orissa 56,34 18·80 CO'75 26,58
Punjab 55·52 17,44 52'92 14'20
Rajasthan 59,60 38'37 58' ]4 35'89
Utt:tr Pradesh 58'25 23·66 58'19 18 '14
West Bengal 54,24 11'64 53'98 9'43
Besides, the purpose of this chapter being an appraisal of sectoral shifts, any excess in the agricultural sector would tend to show off marginal Increments in the non-agricultural sector more convincingly. The concept of family worker, by its very nature, is likely to swell the agricultural sector to a greater degree than the non-agricultural, particularly the wage sector.
These average crude participation rates were tested by a two-way process: building up from below from the level of the dis:' tricts in terms of its nine industrial ca!egory components; breaking down from the State down to the level of the districts in term~
of the same nine components. This building up and breaking down faced a variety of difficulties posed by the different eConomic classifications at different censuses arid by the jurisdictional changes of territorial units. The problems of reconciliation are niggling and various and call for a large mass of patient, if mechanical, shifting.
The nine census industrial categories of workers of 1961 mentioned in the last paragraph are (1) I Cultivators, (2) II Agricultural labourers, (3) III Workers engaged in Livestock, Forestry, Fishing, Hunting, etc., Plantations, Mining and Quarrying, (4) IV Workers engaged in Household Industry, (5) V Manufacturing other than in Household Industry, (6) VI Construction, (7) VII Trade and Commerce (8) VIII Transport, Storage and Com .. munications and (9) IX Other Services. They correspond to the Divisions of the standard Industrial Classification as follows:
Division of the Census Indu~tri'll Category Standard Industrial
1961 Category
Cultivator.
Agricultural labourer
Mining. Quarrying. Livestock, Forestry, Fishing, Hunting and Plantations, Orchards
I
II
o o
and Allied acttvities III Part of 0 and t
Household Industry. TV Part ofO, 2 and 3
Manufacturing other than Household Industry V Part of 0,-2 and 3
Construction VI
Trade and Commerce • • VII
Transport. Storage and Communications • VIII
Other Service~ IX
4
6
7
5. 8 and 9
Having thus worked out two sets of figures for 1951 and 1961, the next question that may pertinently, tother, will inevitably, arise is, has there been any s'hift from agriculture to non-agriculture in the last decade, 1951-61? In the next place.
if there has been a shift at all, in favour of which industria! categories has this shift occurred and what are the regions most affected by these shifts? For it must be remembered that the decade 1951-61 has seen the most massive investment ever in this country in non-agriculture as well as agriculture, that this investment must show objective measurable results by way of shifts, however small, in the different branches of industry, and if the shifts fail to show up, then either there must be something wrong in the measurement itself or the unit of measurement itself is not sensitive enough, for not even the uniqueness of India can defy the universal behaviour of production, savings and in.,. vestment.
Before we go into the details of the shifts that mayor may not have occurred in the various regions of India, we may remind ourselves once again of the truism that India is such a vast and populous country with ~uch a wide range of nondevelopment as well as development, that a general average rate is apt to conceal real and wide differences often between contiguous, not to speak of geographically remote territories. Secondly, the shifts themselves may be of two kinds: (1) those that are primarily a function of population growth and (2) those that are primarily due to economic growth. The first kind of shift which is primariI~ a function of population growth may reflect itself more in a strengthening of the Cultivators (1), a falling off in Agricultural labour (II) and a corresponding strengthening of unspecified general labour and Services in catel?ory IX, in ~...:>trengthenin!! of Forestrv. Fishing, Orchardrv. Livestock. etc. (1m. of Household Industry (IV), Trade (VIn and of Other Services (IX). In other words. popUlation growth alone creates its own increases of employment in these traditional sectors by increasing the pressures on them. The second kind of shift, which is primarily a function of economic
glowth, wlli reflect ltseif in a strengthening of Plantations, Mining and Quarrying (111), Household Industry (IV), Manufacturing (V), Construction (VI), Transport, Storage and Communications (VIII) and of Services (IX). In regions where shifts are noticed in favour of I, III and IV, VII and IX to a greater extent than in favour of IV & V, VI and VIII, such shifts may be regarded as comparatively unstable, the growth in the tertiary sector being induced more by population growth than by solid economic achievement. In regions where positive shifts are noticed generally more in favour of IV, V, VI and VIII and speclfied sectors of IX than 1, Ill, IV, V 11 and the unspecified sectors of IX such shifts may be regarded as comparatively stable, the growth in the secondary and tertiary sectors being supported. by solid economic achievement.
II
But before one proceeds tu observ..:; the shifts that have occurred from one industrial category to another, a brief look at the changes in the average crude male participation rates at the level of districts may itself be rewarding.
Brief comments on the contents of Table V.I will be pertinent. In Andhra Pradesh, the coastal Andhra and Rayalaseema districts have increased at a faster rate than the Telengana ones, although the rate of population growth in several Telengana districts .like Nizamabad (22' 36), Adilabad (21'37), Khammam (30'88) and Nalgonda (22'36) is higher than in the remaining districts of Andhra Pradesh. The rate of population growth read with the direction and magnitude of shift will be another criterion of whether the shift is merely due to demographic growth or to the growth of the economy as well. A very general and preliminary reflection seems in order in respect of Andhra Pradesh: that the rise in the male participation rates of the coastal Andhra and Rayalaseema districts appears to be due not only to demographic but economic growth also,
26,
whereas the increase in the Telengana districts seems more immediately due to demographic growth. An exception even in the Telengana districts seems to be Kham.; mam, Adilabad, Nizamabad, Karimnagar and Nalgonc}a where economic forces are at work, mainly irrigation and extention of ~ultivation and growth of industries. In Assam the decline in Goalpara. Darrang, Lakhimpur and Sibsagar was partly due to the slump in the tea industry. Economic activity did not attain much momentum in Assam during the decade as will appear from a study of the Plan investments. and demographic growth appears to have been me chief contributing factor to the slow increases in participat!?n rates. The Garo and United Mikir and North Cachar Hills experienced a comparatively high margin of economic activity in Assam because of their erstwhile backwardness. In Bihar participation rates have risen in almost every district, there being a general association between the rate of population growth and that of participation rate, although in Saran and Ranchi lihe participation rate seems to have kept comparatively ahead of the rate of population growth than in other districts. In Gujarat there has been an actual decline in the participation rates in several economically progressive districts like Rajkot. Kutch, Ahmedabad and Baroda. At th~
same time it is well to remember that a high proporlion of urban popUlation tends to depress the general participation rate. Gujarat has a high urban-ratio, Ahmedabad and Rajkot enjoying two of the highest ratios in India. KeraIa shows decline in the former Travancore-Cochin districts but some increase in the Malabar districts. Kerala and West Bengal are a class by themselves and present complexities which do not admit of simple explanations. In Madras, Madras Corporation alone bas registered a smalI decrease, Nilgiri and Kanyakumari which have shown high rates of popUlation growth (31'30 and 20'64 respectively) have shown small increases in participation rate. Kanyakumari accords
268
more' ~ith the general picture of Southern Kerala to- which it ha.::! belonged. All other districts 'of Madras have shown hig:1 increases in participation rates exceeding the decadal rates of population growth suggestlI1g accelerated economic activity. The Maharashtra districts are divided between low decline in some and row increase in others and call for closer investigation. The general pattern in Mysore districts seems to be that the districts Qf high populat\on growth have shown comparatively low increases in participation rates whereas it is mostly districts of comparatively low population growth that have shown high increases in participation rates. It is curious that Sambalpur, J,n Orissa, with its growth of large. indu.stries and the establishment of the I:lir~kud Dam should show a small decrease in participation rates, an explanation for which will perhaps be fater available. It is also significant that many districts of comparatively high increase in participation rates should also be districts where the ra.e of population growth has been below the State average. The districts of Utt'ar Pradesh again, with the solitary exception of Fatehpur, like those of Maharashtra, are neatly divided into two unequal blocks: 28 districts of low decrease in male participation rates and 25 districts of low increase. It is a point of Interest that. as many as 13 of the 28 districts which have shown decreases in participation rates pave shown rates of popula,tion growth below the State average. AS lI).any as 8 OUt of 16 districts of WtS\
Bengal htlve shown declines in participation rates; while 5 have shown small increases and. oQly 3 moderate increases.
III
To proceed, now with the question of lfiter-tca~egOfy shifts. A uniform test has been applied for India as a whole and for each State. This test consists if! observing
I,a) the perceQ.tage of a certain category of male workers to total male workers in 1951,:' (b) the percentage of that category of male workers to total male workers in 1961 and (c) increase (or decrease) in male workers in that category 1951-61 expressed as percentage of total increase in male workers 1951-61. While (a) and (b) may be referred to as averages for each category for 1951 and 1961, (c) may be referred to as marginal changes for that category during 1951-61.
This (C) was an attempt at measurement of the intensity of the marginal change by expressing the difference between 1951-61' in a particular industrial' category as a perc-entage 1)f- the total change in male workers during 1951-61. This index, which may be called the marginal index, was intended to bring out the share of change in a particular industrial category against the decadal increase in total male workers. It may be assumed that a positive sign of the marginal index reflects a strong and favourable structural shift in employment particularly where the sign of marginal change is also positive. whereas a negative sign reflects decline particularly where the popUlation of workers in the category is marked by an absolute -decline also.
IV
We shall first consider those districts in each of the four levels of development which show decreases in marginal ind~x
tV & V, VI, VII, VIII and IX.
The following statement (V. 3). gives the decreases in marginal index in industrial categories IV & V, VI, VII, VIII and IX in individual districts classified by levels of development. Concomitant marginal decrease in other categories is indicated simultaneously together with the extent of the decrease in each such category.

209 STATEMENT V . .3
Decreases in marginal index in industrial categories IV & V, VI, VII, VIII and IX in individl.fal 4istric(s classified by levels of 'development
IV & V-Decreases
Level I
Level II
Assam
Madhya Pradesh
Manipur
SIKKIM
Assam
Guiaral
Madhya Pradesh
Maharashtra
Raiasthan
Level Ill. Kerala.
Garo Hills
Jhabua. • Seoni (includin g Chhindwara)
Manipur
SIKKIM
--0'02
-')'55
-4·81 -14·11
-0·55
Cachar. -3'53 United Mikir and North Cachar Hills -0· 83
Dangs
Rajgarh Shajapur
Bhandara (,handa
Dungarpur
Quilon (including Alleppey)
Trichur (including
-2'62
-0,30 -5·80
-13·94 -13'96
-0'37
·-5·01
Ernakulam) -I, 89
Trivandrum -2·45
VI -0·20
VI --0'92
Madhya Pradesh Hoshangabad (includ-ing Narsimhapur) -7·39
Madras
Rajasthan
Level IV Rajasthan
West Bengal •
VI Decreases
Level r
Level II
Andhra Pradesh
Mysore
Orissa oil
Rajasthan
U tlar Pradesh
Andhra Pradesh
Bihar
Maharashtra
Orissa
Rajaslh~n
Uttar Pradesh
West Bengal
Vidisha -2'45
Kanyakurnari
Alwar
Bharatpur
lalpaiguri
Mahbubnagar Medak
Raichur
Bolangir . Baudh -Khondmals Kalahandi Mayurbhanj Puri
Banswara Nagaur
Ballia . Ghazipur Rae Bareli Unnao
Cuddapah Karimnagar
Monghyr Saharsa . Santal Parganas
Bhir Osmanabad
Balasore Ganjam
Ihalawar
Shahjahanpur
Murshidabad
-1·31
-1I'04
-13·88
-2·33 VI
-1·05 -0'28
-12·61
-0'30 -2·49 -0'66 -0·52 -2'92
-0·10 -1'45
-2·07 -3·28 -25·55 -3·29
-1·03 -0·31
-0·52 -0·25 -2·43
-1'51 -0·52
-0·26 --0·54
-3·46
-0·04
-0·87
_0·48
COncomitant decrease in other categorie.
VII -0·88 VII -2·56
VIII -12·58
VII
VII
VIT
VIT
VII VII VII VII VII
VII
VII VII
VII
VII
VII
VII VIT
VII
Vll
-0·11
-5'99
VIII.
VIIl
VIII
VIII
-7·47 VIII
-4·13
VIII
VIJ)
-1'67 -7·90 VII1 --1·71 VIII -1·45 -4·31
-4'92
-0·84 -1·59 VIII
-0·74
-1·22
--0·24
-1·81 -10·01
-0·67
-1·2~
-3·26
-5·68 -0'11
-0,37
-0'78
-0·23
-0·16
-0·18 -0·03
- 1·51
IX -O'I~
IX -10·28
IX 'I. -2,77 IX --8'09
IX -4·85
IX -5·59
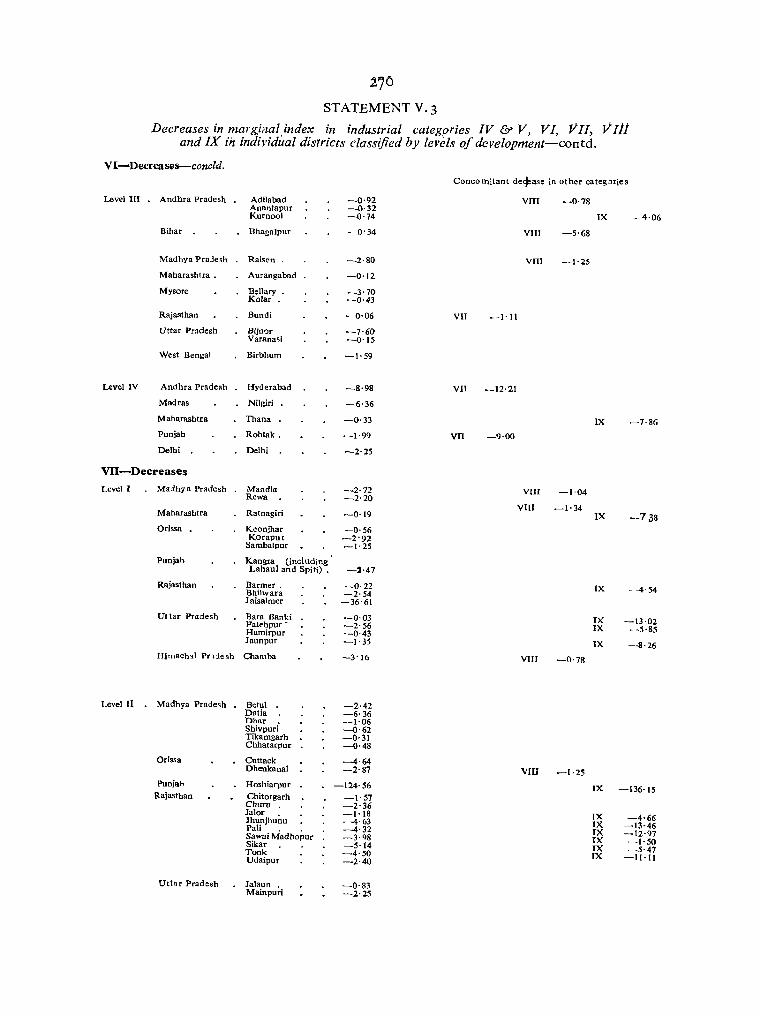
270
STATEMENT V. 3
Decreases in marg,illaI,index in industrial categpries. IV & V, VI, VII, VIIi and IX in individual districts classified by levels oj development-contd.
VI-Decreases--concld. Concomitant de~ase in other categ~ries
Level III Andhra Pradesh Adilabad -0,92 VIII -0·78 Anantapur -0·32 Kurnool -0'74 IX -4·06
Bihar Bhagalpur - 0'34 VIIl -5'68
Madhya Praje.h Raisen . -2·80 VIIl -1·25
Maharashtra . Aurangahad -0·)2
Mysore Bellary . --3·70 Kolar -0-43
Rajasthan Bundi - 0·06 VII --1-11
Uttar Pradesh Bijnor -7-60 Varanao;;i -0-15
West Bengal Birbhurn -1'59
Level IV Andhra Pradesh Hyderabad -8-98 VIT -12·21
Madras Nilgiri -6,36
M aharashtra Thana -0,33 IX -7·86 Punjab Rohtak. -1·99 VII -9-00
Delhi Delhi -2-25
VII-Decreases
Level I Madhya Pradesh Mandla --2- 72 VIII -1'04 Rewa -2-20 VIlT -1-34 Maharashtra Ratnagiri -0-19 IX --738
Orissa Keonjhar -0-56 Koraput -2-92
Sambalpur -1-25
Punjah Kangra (including Lahaul and Spiti) • -2-47
Rajasthan Barrner. --0- 22 IX --4-54 Bhilwara -2-54 laisalmer -36-61
UI tar Pradesh Bara Banki ·-0·03 IX -13·02 Fatehpur' -2-56 IX --5-85 Hamirp-ur -0·43 Jaunpur -1-35 IX -8-26
Him.ch~1 Pn:iesh Chamba -3'16 VIII --0-78
Level II Madhya Pradesh Betul -2-42 Datia -6-36 Dhar -1-06 Shivpur;' -0-62 Tikamgarh -0-31 Chhatarpur -0·48
Orissa Cuttack -4·64 Dhenkanal -2-87 VIII -1·25
Punjah Hoshiarpur -124-56 IX -136-15 Rajasthan Chitorgarh -1·57
Churu -2-36 Jalor -1·18 IX -4·66 Jhunjhu~u - A- 63 IX -13'46 Pali . -4-32 IX -12-97 Sawai Madhopur -3·Q8 IX -I-50 Sikar -5·14 IX -5·47 Tonk -4-50 IX -II-II Udaipur -2·40
Uttar Pradesh lalaun -0,83 Mainpu~i -2-25
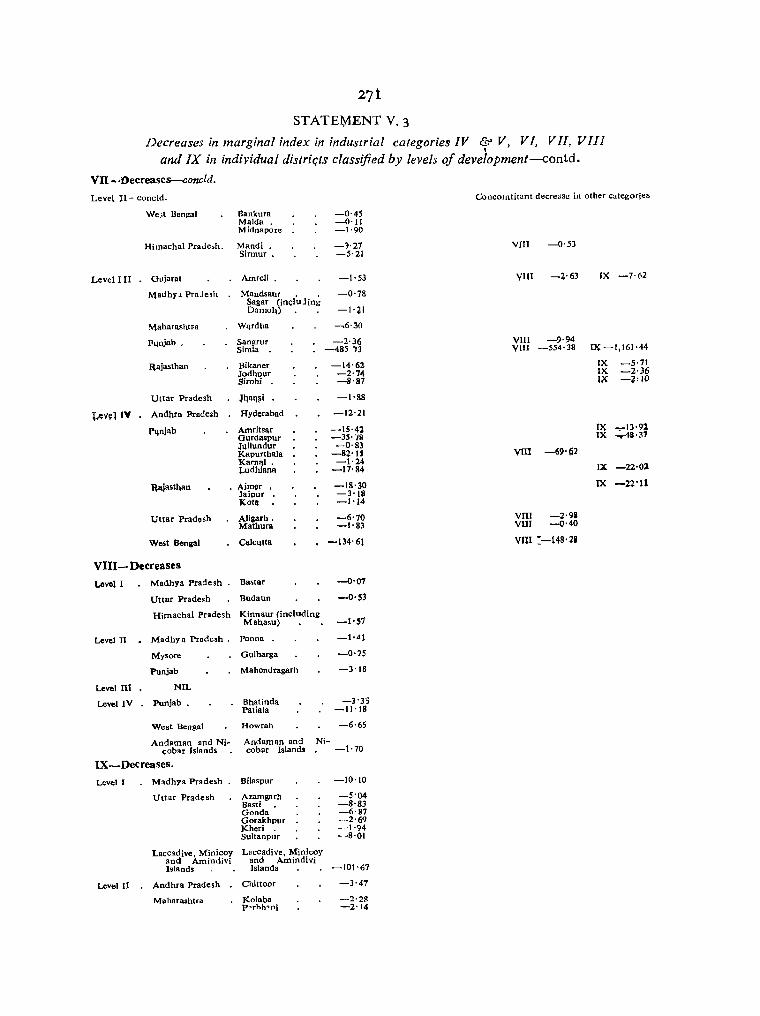
271
ST ATE1';v1ENT V. 3
Decreases in marginal index in industrial categories IV & V, VI, VII, VIIi and IX in individual distril;ts classified by levels oj deve;opment-contd.
VII-·Oecreases-concld.
Level II - concld.
West Bengal Bankura Maida. Midnapore
-0'45 -0·11 -1'90
Himachal PraJe.h. Mandi. -)'27
Level In. Gujarat
Madhy, Pr.Jesh
M~luIrl\ShtFa
F"njab .
~aiasthan
Uttar Pradesh
1..~v9l IV . Andqr. Prade'h
p"ni~b
~lIjast"~n
Uttar Pradesh
West Benll'll
VIII-Decreases
Lovel I Madhya Prade sh
Uttar Pradesh
Himachal Pradesh
Level n Madhya Pradesh .
Mysore
Punjab
Level III NIL
Level IV Punjab.
West Bengal
Andaman and Ni-cobar Islands
IX-Decreases,
Level I Madhya Pradesh
Uttar Pradesh
Laccadive, Minicoy and Amindivi Islands
Level II Andhra Pradesh
Mabaraahtra
Sirmur . -5'21
Amreli . -1'53
Mandsaur . . -0'78 Sagar (incluling Damo4) -l<al
W'Irdh. ~6'30
S'Inllrur -2·36 Simla . ~485 73
Bik.ner -14'62-Jodhpur -2'14 Sirohi -8'87
~qal'\~i -1'88
Hyder.bad -12'21
Amrits'lr -15'41 Qurdaspur -3~'78 ~qllundur -0'83 J{apurthala -82' IS J{arn~1 . -1·24 Ludhianll -17'84
Ajmor -18'30 Jaipur -3'IS Kotll -1'14
Aligarh. -6'70 M~thura -1'S3
Calcutta . -134-61
Bastar --0'07
Budaun -0'53
Kinnaur (including -1'57 Mahasu)
Panna -1·Al
Gulbarga -0'15
Mahendragarh -3'18
Bhatinda -3'35 Patiala -11'18
Howrah -6,65
Andaman and Ni-cobar Islands -1'70
Bilaspur -10'10
Azamgarh -5'04 Basti -8'83 Gonda -6'87 Gorakhpur -2'69 Kheri -1'94 Sultanpllr --8'01
Laccadive, Minicoy and Amindivi Islands -101'67
Chittoor -3'47
Kalaba -2'28 P"Thh"oi -2'14
Concomtitant decrease in other categories
VIII -0,53
VUI -2-63 IX -7,62
VIIl -9·94 VJII -554·38 IX -1,161'44
IX -5·71 IX -2·36 IX -'j.,ID
IX ..,-1J09t IX ....,.48·3
VllI -69'!i2
IX -22'02
lX -22'U
VIII -2·9& VIII -0·40
vru :-148'28
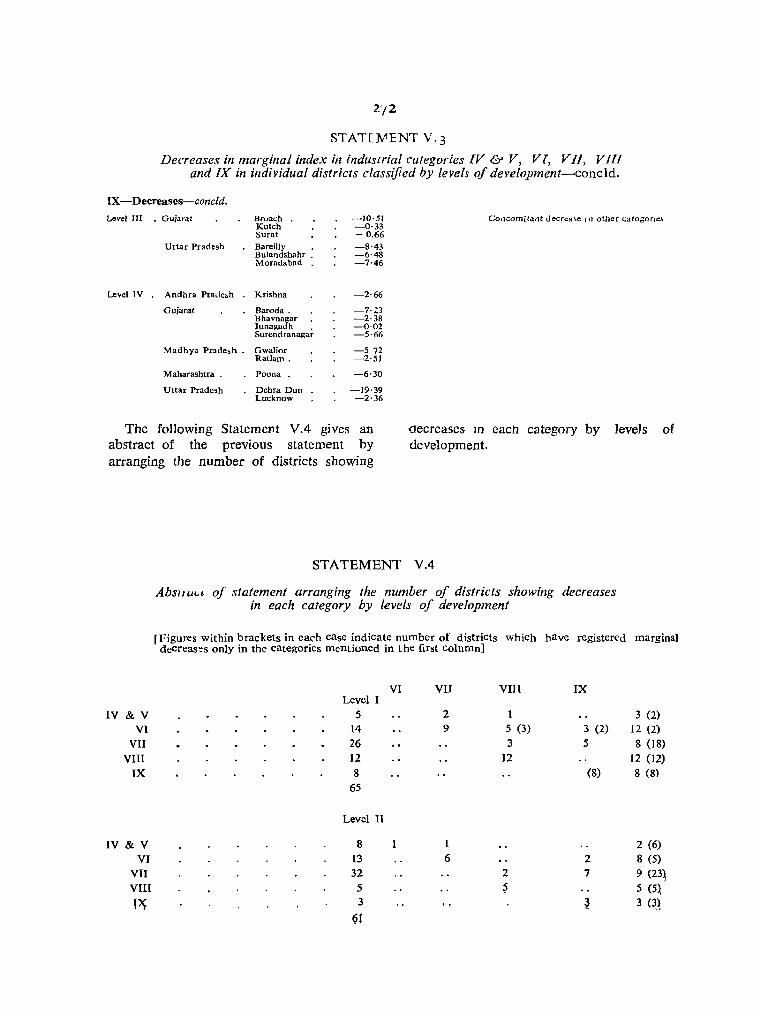
2'/2
STATIN'ENT V'3
Decreases in marginal index in industrial categories IV & V, VI, VII, VIII and IX in individual districts classified by levels of development-conc1d.
IX - Decreascs-concld .
Level III • Oujarat Bcuach -IO'SI Concomitant uecrea~e J n oHler catogone.s Kutch -0,33 Sural -0.66
Uttar Pradesh BaTeilly . -8'43 Bulandshahr . -6'48 Moradabad -7'46
Level IV Andhra Pradesh Krishna -2'66
GujaTa! Baroda. -7·;:3 Bhavnagar -2·38 Junagadh -0·02 Surendranagar -5,66
Madhya Pr3dc,h • Gwalior -572 Ratlam. -2'51
Maharashtra . Poona -6'30
Uttar Pradesh Dehra Dun -19·39 Lucknow -2·36
The following Statement VA gives an abstract of the previous statement by arranging the number of districts showing
(leCreases m each category by levels of development.
IV & V VI
VII VIII
IX
IV & V VI
VlI VIII p~
STATEMENT V.4
AbslfuLt of statement arranging the number of districts showing decreases in each category by levels of development
fFigures Within brackets in each case indicate number of districts which have registered marginal decreas<es only in the categories mentioned in the first column]
Level I 5
14 26 12 8
65
Level n
8 13 32
5 3
~t
VI VII
2
9
1 6
VIII
t 5 (3)
3 12
2
~
IX
3 (2)
5
(8)
2 7
3 (2) 12 (2)
8 (18) 12 (12) 8 (8)
2 (6)
8 (5)
9 (23~ 5 (5).
3 q~
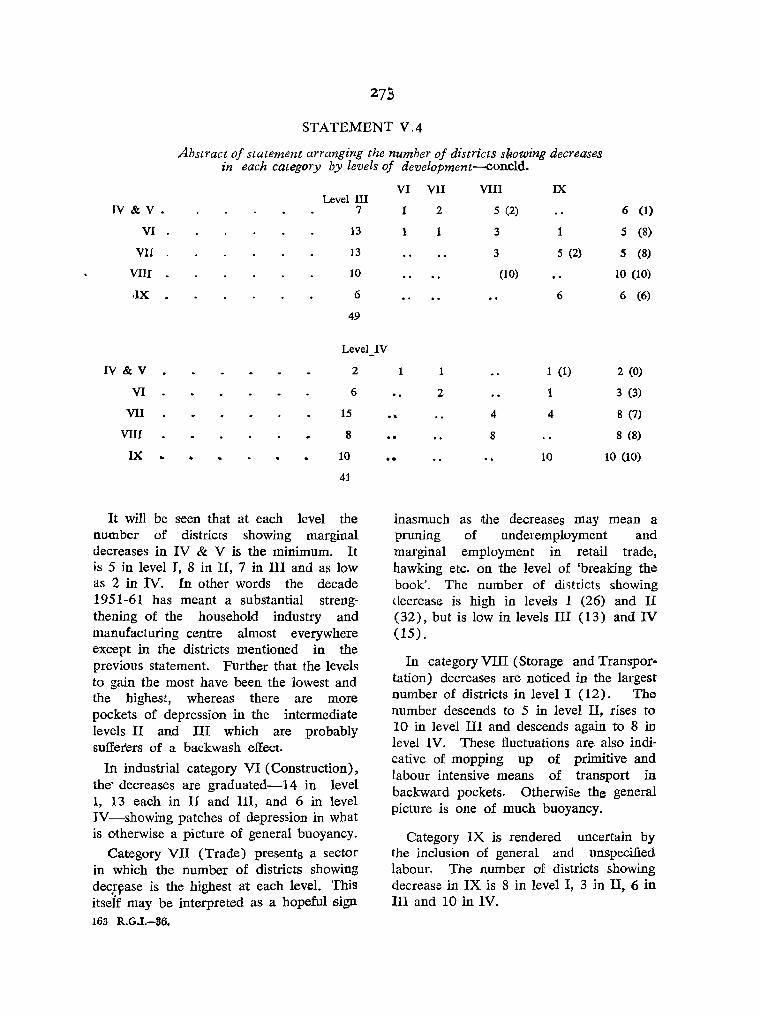
273
STATEMENT V.4
Abstract of statement arranging the number of districts showing decreases in each category by levels of development-conc1d.
IV & V.
VI
VII
VIII •
.IX.
IV & V
VI
VII
VIII
IX ..
Level III 7
13
13
10
6
49
Level_IV
2
6
15
8
10
41
It will be seen that at each level the number of districts showing marginal decreases in IV & V is the minimum. It is 5 in level I, 8 in II, 7 in III and as low as 2 in IV. In other words the decade 1951-61 has meant a substantial strengthening of the household industry and manufacturing centre almost everywhere except in the districts mentioned in the previous statement. Further that the levels to gain the most have been the lowest and the highest, whereas there are more pockets of depression in the intermediate levels II and III which are probably sufferers of a backwash effect.
In industrial category VI (Construction), the' decreases are graduated-14 in level 1, 13 each in II and III, and 6 in level IV-showing patches of depression in what is otherwise a picture of general buoyancy.
Category VII (Trade) presents a sector in which the number of districts showing deqrfase is the highest at each level. This itseif may be interpreted as a hopeful sign 163 R.G.I.-86.
VI VlI VIII IX
1 2 5 (2) 6 (1)
1 1 3 1 5 (8)
3 5 (2) 5 (8)
(10) 10 (10)
6 6 (6)
1 1 1 (1) 2 (0)
2 1 3 (3) .. 4 4 8 (7)
8 8 (8)
10 10 (10)
inasmuch as the decreases may mean a pruning of underemployment and marginal employment in retail trade, hawking etc. on the level of 'breaking the hook'. The numher of districts showing decrease is high in levels I (26) and II (32), but is low in levels III (13) and IV (15).
In category VIII (Storage and Transpor~ tation) decreases are noticed in the largest number of districts in level I (12). The number descends to 5 in level II, rises to lOin level III and descends again to 8 in level IV. These fluctuations are also indicative of mopping up of primitive and labour intensive means of transport in backward pockets. Otherwise the general picture is one of much buoyancy.
Category IX is rendered uncertain by the inclusion of general and unspecified labour. The number of districts showing decrease in IX is 8 in level I, 3 jn II, 6 in III and 10 in IV.
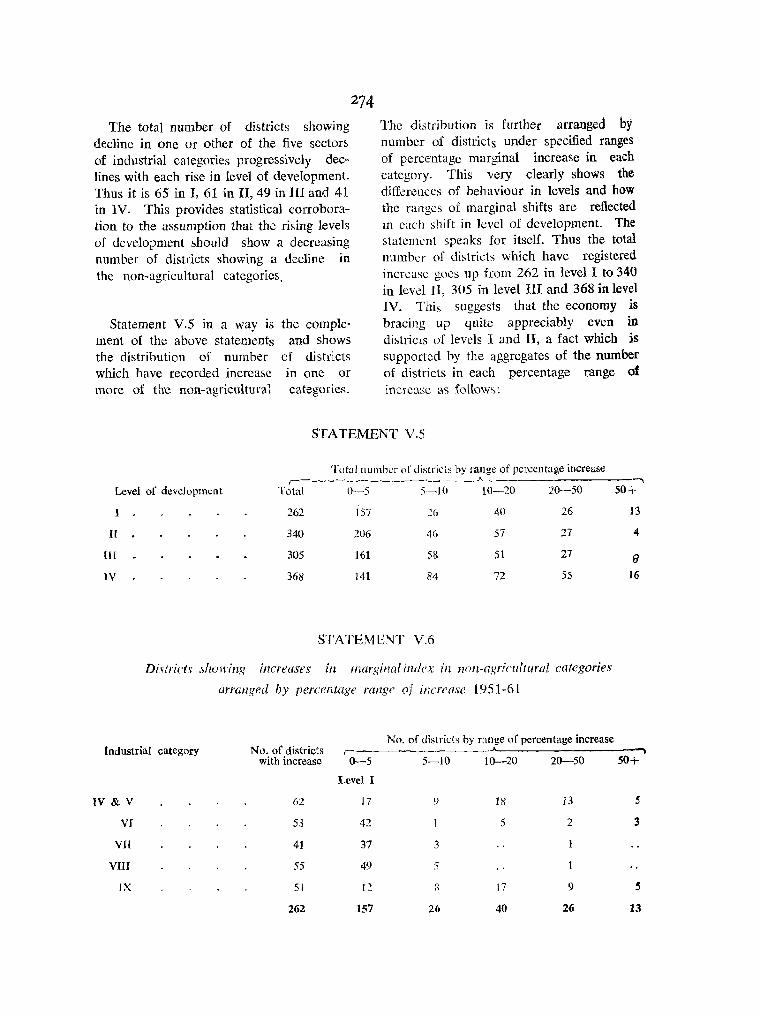
The total number of districts showing decline in one or other of the five sectors of industrial categories progressively declines with each rise in level of development. Thus it is 65 in 1, 61 in II, 49 in III and 41 in IV. This provides statistical corroboration to the assumption that the rising levels of development should show a decreasing number of districts showing a decline in the non-agricultural categories.
Statement V.5 in a way is the complement of the above statements and shows the distribution of number of districts which have recorded increase in one or more of the non-agricultural categories.
274 The distribution is further arranged by number of districts under specified ranges of percentage marginal increase in each category. This very clearly shows the differences of behaviour in levels and how the ranges of marginal shifts are reflected III cach shift in level of development. The statement speaks for itself. Thus the total number of districts which have registered increase goes up from 262 in level I to 340 in level II, 305 in level III and 368 in level IV. This suggests that the economy is bracing up quite appreciably even in districts of levels I and II, a fact which is supported by the aggregates of the number of districts in each percentage range of increase as follows:
STATEMENT V.5
Total number of districts by range of percentage increase ,-__ -_-____ --_-__ _A_
Level of development Total 0-5 5-10 10-20 10-50
1 262 157 26 40 26
II 340 206 46 57 27
HI 305 161 58 51 27
tV 368 141 84 72 55
STATEMENT V.6
Districts showing increases in marginal index ill nOll-agricultural categories
arranged by percentage range of increase 1951-61
No. of districts by range of percentage increase Industrial category No. of districts ,
with increase 0-5 5-10 10-20 20-50
Level I
IV & V 62 17 l) 18 13
VI 53 42 5 2
VII 41 37 3
VIII 55 49 :'1
IX 51 12 R 17 9
262 157 26 40 26
"""""I
50+
13
4
fJ 16
'"""\ 50+
5
3
5
13

275
STATEMRNT v.o Districts showillg ill creases ill l1l(/r~~illal index ill lion-agricultural categories arranged by
percentage range of illcrease, J95I-6I-conc1d.
No. of districts by range of percentlge increa,e -,
Industrial category No. of districts with in~rc~ls~
r 0-5 5-10 10-20 20-50 50+
Level J(
IV & V 74 18 15 25 14 2
VI 69 53 6 3
VII 50 45 5
VIII 77 70 7
IX 70 15 13 29 12
340 206 46 <;7 27 4
Level In
IV & V 65 6 17 24 16 2
VI 59 45 9 4
VII 59 49 10
vm 62 51 7 3
IX 60 10 15 20 10 5
305 161 58 51 27 9
Level IV
IV & V 81 6 8 26 32 9
VI 77 45 20 9 2 1
VII 68 49 15 4
VIII 75 34 26 12 3
IX 67 7 15 21 18 6
368 141 84 72 55 16

Andhra Pradesh
The first thing to notice about Andhra Pradesh is the absolute decline in the number of workers in the categories and districts noted below:
Category District
II-Agricultural labour . Mahbubnagar, Medak, Nizamabad. Adilabad, Karimuagar, Waraugal (inCluding Khammam).
HI-Forestry, Plantations, Chittoor, Mahbubnagar, Mining, Quarrying, etc. Hyderabad, Karirnnagar.
VI -Construction Cuddapah, Anantapur, Kurnool, Mahbubnagar, Hyderabac. Medak. Adilabad, Karimnagar.
VII-Trade and Commerce Hyderabad.
VIII-Transport, Storage Medak, Adilabad. and Communications
["'-Other Services Krishna, Chittoor, Cuddapah, Kurnoo!.
These absolute declines have necessarily been attended by declines in the marginal indices also
Positive values for marginal indices of cultivation are observed in all the districts of the State, whether they are on the west or in Rayalaseema or in Telengana thus reflecting the general extension of cultivation through colonisation, reclamation and irrigation that has occurred in these districts. Chiefly responsible for continued and fresh improvement in agriculture has been not only the existing productive irrigation systems in the Godavari and Krishna deltas, the Tungabhadra and Manjira hasins and the Nellore delta area to the number of as many as 15, but the hew irrigation projects in the three Plans notable among which are the projects in the districts of Srikakulam (Narayanpuram), Nalgonda (Musi and Nagarjunasagar), East Oodavar.i (Thorri~edda), Hyderabad (Tutpa ..
ill), Visakhapatnam (Thandava and Varaha), Nellore (Kanupur), Kumool (Zurreru), Anantapur (TBPHLC, and Mid Pennar) , Nizamabad (Swarna, Pochampadu, Kaddam and Godavari). It is interesting that the absolute and marginal declines in II-Agricultural labour in Mahbubnagar, Medak, Nizamabad, Adilabad, Karimnagar, Warangal and Khammam is complemented to a certain extent by marginal increase in IX-Other Services in them which suggests the possibility" of interchangeability between a type of agricultural labour in 1951 and unspecified general labour in rural areas (Major Groups of I.S.I.C. 89 and 90) in 1961. Category III-Mining, Quarrying, Forestry, Orchardry, Plantations shows increments in marginal index in all but five districts. Chittoor, Mahbubnagar, Hyderabad, Karimnagax and Khammam alone show marginal declines. This reflects the striking growth in tobacco and coconut plantations, fruit orchards and mining and quarrying particularly in the coal'.tal Andhra and Rayalaseema districts. IV & V Household Industry and Manufacture have shown encouraging growth in all districts. This category (IV & V) and VIn (Transport, Storage and Communications) are the crux of the marginal structural shifts reflecting economic growth that have occurred in Andhra Pradesh in the last decade. The low positive index observed for VIII in Nizamabad, Karimnagar and Nalgonda and the low negative indices for VIII in Medak and Adilabad are the oilly exceptions to a strong positive shift which underlines the role played by investment and ec0-
nomic growth in shifts in employment. This is evident in the increases in marginal indices for lII, IV & V, VI and VITI for Andhra Pradesh as a whole.
Assam
The fonowing districts have experienced llbsolute declines j'n WQrker~ in the

categories noted against them:
Category District
II United Khasi and Jaintia Hills.
III GOl!-lpara, Darrang, Lakhimpur, Slbsagar, Cachar, United Mikir and North Cachar Hills.
IV & V . Cachar, Garo Hills, United Mikir and North Cachar Hills.
Category I shows increases in Goalpara, Kamrup, Nowgong, Garo Hills; United Khasi and J aintia Hills, United Mikir and North Cachar Hills and Mizo Hills. There have been numerous irrigation schemes in Goalpara, Darrang, Cachar and Kamrup districts. It is possib~e that operationally there was some interchange in certain districts between plantation labour in 1951 and agricultural labour and unspecified labour in 1961 because negative indices in III are matched by positive indices in both II and IX in the districts of Goalpara, Darrang, Sibsagar, Cachar and United Mikir and North Cachar Hills. IV & V register only marginal increases but, marginal decline in as many as 3 districts Cachar, Garo and United Mikir and North Cachar Hills. The real structural shifts, although they involve very small absolute populations and are therefore marginal, have occurred in VI Construction and VIn Transport, Storage and Communications, the marginal indices being positive everywhere in VI and VIII. In VII, the increases during 1951-61 are positive in each district. The general picture seems to be that the effect of econ0'mic growth in Assam on structural shifts has been weak, but there has been notioeable strengthening of the infrastructure in construction, transport, storage and communication. Population growth seems to have played a more positive role than economic growth in augmenting employment in Ag;riculture and Services. This is evident in increases in marginal indices for Ass~m a~ a whole in VI, VI~I and IX.
277 Bihar
The foIIowing districts have experienced absolute declines in workers in the categories noted against th'em:
II Singhbhum.
VI • Monghyr, Bhagalpur. Santa] Parganas.
Saharsa.
VII Santal Parganas.
Bihar presents a picture of structural shift from agriculture to non-agriculture. This is evident from the fact that although there have been substantial absolute increases in cultivation and agricultural labour the marginal indices in these two categories are mostly positive. The First Plan saw 20 irrigation schemes none of which except. the commenoement of Kosi were of great importance. The Second Plan saw 18 schemes the more important of which were the three Sane and the Khajia and Sikri schemes. The' Third Plan has taken up 12 schemes of which the major ones are the Kosi Project (Western Kosi Canal) and irrigation,of area between Kosi Eastern Embankment and Bhenga Dhar. On the contrary the marginal indices in III, IV & V, VIII and IX are high and positive in all districts, suggesting shifts in the economy. Even in VI the indices are high and positive in all districts except Monghyr, Bhagalpur, Saharsa and Santal Parganas districts which have also experienced abso~ute declines· In VII the marginal indices are positive, though low, in all districts except Santal Parganas.
This buoyancy of economic growth and structural shift is evident almost everywhere even to the naked eye. Plantations (chiefly sugarcane, tobacco, etc.). mining, quarrying, livestock, forestry, orchardry, have grown along with small and large industries. New constructiop_s are visible in most places and transport and communication have improved. The Government have expanded Services through th~ ~llchalsl development l;llor;k.!l

and a close network of school and medical services. This is evident in the positive marginal indices in all categories for the State as a whole, particularly in I, II, III, IV & V and IX.
Gujara.t
The following districts have experienced absolute declines in workers in the cate. gories noted against them:
IT Jamnagar, Panchmahals.
III Jamnagar, Rajkot, Surendranagar, Bhavnagar, Amreli, Junagadh, KutCh Banaskantha, Sabarkantha, Mehsana, Ahmedabad, Kaira, Baroda.
IV & V Dangs.
VIC Amreli.
VIII Amreli.
IX • Surendranagar. Amreli. Bbavnagar, Junagadh, Kutch, Baroda, Broach, Surat.
The growth of popUlation undoubtedly has contributed to increases in marginal indices in I Cultivation which in Gujarat has assumed a decisive share in economic growth. There were,as many as 33 irrigation schemes in the first Plan, 26 in the Second Plan, some of them continuing in the Third, distrihuted all over the State but none of them tof sufficient magnitude to claim a major share in the marginal increase in I. Gujarat now has some of the richest agricultural tracts in India where inputs have joined hands with careful husbanding, diversification and multiplicity of crops, irrigation and better storage and marketing. This inorease has been accompanied by a rise in the marginal index in TT in Rajkot, Surendranagar, Bhavnagar, Kutch, Banaskantha, Mehsana, Ahmedabad and Kaira. There has been universal decline in the marginal index in HI except in Panchmahals, Broach, Surat and Dangs. An adequate explanation for this is being sought in the sectors of Jivestock, fishing, animal husbandry etc., wmch may not hav~ beetl '!:>rought out to
the fullest extent from under the cover of cultivation. The structural shifts are noticeable in IV & V, VI and VIII. The marginal indices are positive in IV & V in all districts except Dangs. VI shows positive indices in all districts although the values are weak in Mehsana, Panchmahals and Surat. VII shows positive indices in all districts except Amreli, although the marginal accretiuns are weak. VIlT shows positive indices in all districts except Amreli, suggesting the same conclusion for these districts as in the case of VII. IX shows negative indices in the districts of Surendranagar, Bhavnagar, Amreli, Junagadh, Kutch, Baroda and Broach. The conclusion is that economic growth has made a far more positive co·ntribution than population growth in Gujarat's structural shifts in employment. This is evident in the high positive marginal indices in I, IV & V, VI and VIn for Gujarat as a whole.
Kerala
The following areas have experienced absolute declines in workers in the categories noted against each:
I
II
IV&V
VI
VIII
Kottayam.
All areas.
Trichur (including EmakulaI!l)' Quilon (including Alleppey), Trivandrum.
Trichur (including Ernakulam).
Trichur (including Ernakulam), Quilon (including AlIcppey), Trivandrum.
Kerala has had substantial accretions to category I but seems to have weaned away masses of agricultural labour from H to Major Groups 89 and 90 in IX (unspecified general labour). The distrkts which have benefited most from major irrigation scnemes in the last ten years (8 in the First Plan and 5 in the Second) are Palghat, Trichur, Ernakulam, Alleppey and Trivandmm. There has been marked improvement in III (Forestry, Fishing, Plantations, Mining and Quarrying) in all districts. In IV & V the mar~nm

Index is negative in Trichur (including Ernalrulam), Quilon (including Alleppey). and Trivandrum. Even VI has low'positive indices in most districts and has declined in absolute terms in Trichur (includ-, ing Emakulam). There has been a spectacular build up of industries in Trichur and Ernakulam in the last decade. The marginal indices for VII are positive for all districts. In VIII the marginal indices are positive but quite weak in Cannanore, Kozhikode, Palghat and Kottayam; being negative in the rest. There have been large accretions in IX. The conclusion seems to be that population growth has multiplied pressure on traditional avenues of employment, being unable to induce large shifts, economic growth having strengthened the existing pattern of employment.
Madhya Pradesh
There have been absolute declines in, the following districts in respect of the categories noted against them:
1 . Raigarh.
11. Bhind, Gwalior, Datia, Shivpuri, Guna, Tikarngarh, Chhatarpur, Satna, Mandsaur, Ujjain, Jhabua, Dewas, East Nirnar, Rajgarh, Raisen, Hoshangabad-Narsirnhapur, Betul, SagarDarnoh, Jabalpur, Mandla, Chhindwara-Seoni, Balaghat, Surguja, Bilaspur, Raigarh, Durg, Raipur, Bastar.
III • Morena.
IV & V. Jhabua, Shajapur, Rajgarh, Vidisha, Hoshangabad-Narsimhapur, Chhind wara-Seoni.
VI Raisen.
VII Datia, Shivpuri, 1'ikarngarh, Chhatar-
VIII
IX
pur, Rewa, Mandsaur, Dhar, Hoshangabad-Narsimhapur, Betui, Sagar-Darnoh, Mandla, ChhindwaraSeoni.
Panna, Rewa, Raisen, Mandla, Bastar.
Gwalior, Ratlam, BiIaspur.
Madhya Pradesh as a whole presents a picture of buoyancy as well as increasing pressure on land. The factor of buoyancy
2l/9 has been contributed by extension of cultivation, by reclamation of land and by a number of major irrigation projects in the Five Year Plans. The 22 irrigation projects of the First Plan mainly concerned resuscitation of tanks, which also saw the beginning of the first phase of the Chambal Project. TIre Second Plan saw 32 schemes and the Third 2 more major schemes. The schemes are geographically well distributed throughout the State. It is possibly extension of cultivation which has been responsible in part for the negative index in II Agricultural labour for Madhya Pradesh as a whole. Forestry, plantations and mining have greatly increased particularly -in the eastern, central and 'northeastern districts while Raipur, Bhopal, Indore and J abalpur Divisions have seen not only rapid expansion in manufacturing industries but household industries as well. Construction (VI) and Transport, Storage and Communications (VHI) have enormously improved. The increase in services merely reflects the gains made in the primary and secondary sectors. Madhya Pradesh thus present~
a picture of real structural shift in employment in the growth sectors, indicative of economic growth.
Madras
The following districts have experienced absolute declines in workers in the categories noted against each:
I • Madras Corporation.
II Madras Corporation, Nortb Arcot, NiIgiri, Kanyakumari.
III • Madras Corporation.
IV & V • Kanyakumari.
VI
VIII
Nilgiri.
Kanyakumari.
Category I has made substantial advance in the State. It is possible that workers returned in category II in 1951 have to a certain extent been returned in Major
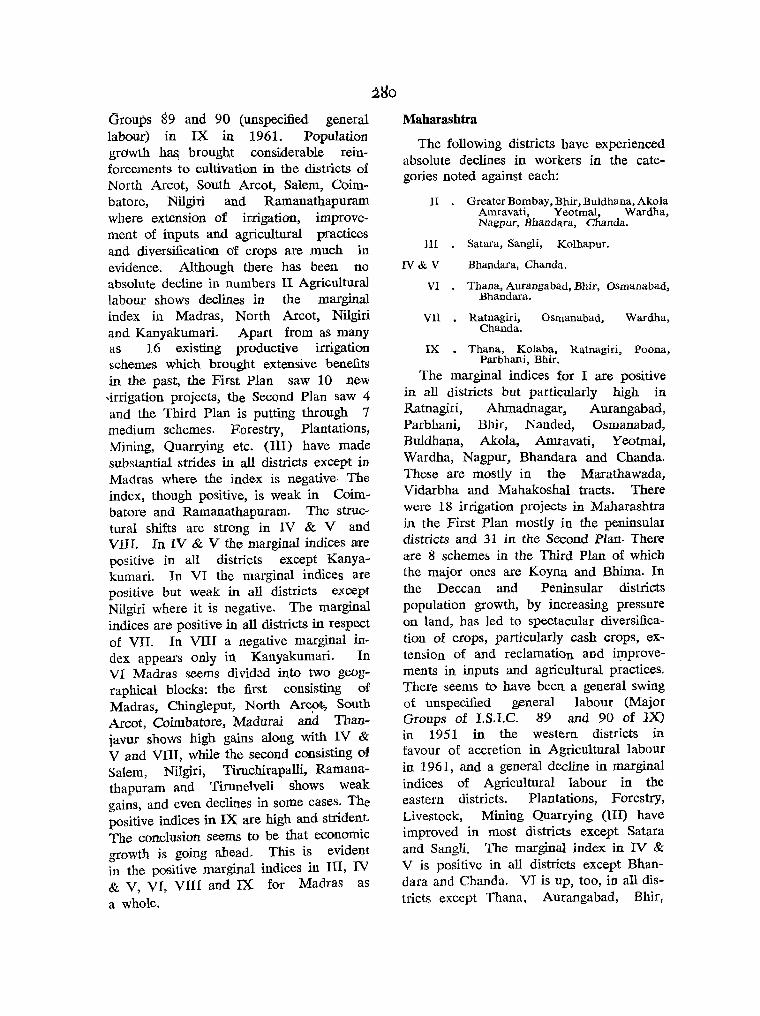
Groups 89 and 90 (unspecified general labour) in IX in 1961. Population grOWth hasl brought considerable reinforcements to cultivation in the districts of North Areot, South Areot, Salem, Coimbatore, Nilgiri and Ramanathapuram where extension of irrigation, improvement of inputs and agricultural pmctices and diversification of crops are much in evidence. Although there has been no absolute decline in numbers II Agricultural labour shows declines in the marginal index in Madras, North Arcot, Nilgiri and Kanyakumari. Apart from as many as 16 existing productive irrigation schemes which brought extensive benefits in the past, the First Plan saw 10 new ,irrigation projects, the Second Plan saw 4 and the Third Plan is putting through 7 medium schemes. F.orestry, Plantations, Mining, Quarrying etc. (III) have made substantial strides in all districts except in Madras where the index is negative. The index, though positive, is weak in Coimbatore and Ramanathapuram. The structural shifts are strong in IV & V and VII r. In IV & V the marginal indices are positive in all districts except Kanyakumari. In VI the marginal indices are pOSItive but weak in all districts except Nilgiri where it is negative. The marginal indices are positive in all districts in respect of VII. In VIII a negative marginal index appears only in Kanyakumari. In VI Madras seems divid;)d into two geographical blocks: the first consisting of Madras, Chingleput, North Ar~, South Areot, Coimbatore, Madurai and Thaniavur shows high gains along with IV & V and VIII, while the second consisting ot Salem, Nilgiri, Tiruchirapalli, Ramanathapuram and Tirunelveli shows weak gains, and even declines in some cases. The positive indices in IX are high and strident. The conclusion seems to be that economic growth is going ahead. This is evident in the positive marginal indices in HI, IV & V, VI, VIn and IX for Madras as a whole.
Maharashtra
The following districts have experienced absolute declines in workers in the categories noted against each:
II . Greater Bombay, Bhir, Buldhana, Akola Amravati, Yeotmal, Wardha, Nagpur, Bhandara, Chanda.
III Satara, Sangli, Kolhapur.
IV& V
VI
Bhandara, Chanda.
Thana, Aurangabad, Rhir, Osmanabad, Bhandara.
VIi Ratnagiri, Osrnanabad, Wardha, Chanda.
IX • Thana, Kolaba, Ratnagiri Poona Parbhani, Bhir. ' ,
The marginal indices for I are positive in all districts but particularly high in Ratnagiri, Ahmadnagar, Aurangabad, Parbhani, Bhir, Nanded, Osmanabad, Buldhana, Akola, Amravati, Yeotmal, Wardha, Nagpur, Bhandara and Chanda. These are mostly in the Maxathawada, Vidarbha and Mahakoshal tracts. There were 18 irrigation projects in Maharashtra in the First Plan mostly in the peninsular districts and 31 in the Second Plan· There <lIre 8 schemei> in the Third Plan of which the major ones are Koyna and Bhima. In the Deccan and Peninsular districts population growth, by increasing pressure on land, has led to spectacular diversification of crops, particularly cash crops, ex:~
tension of and reclamation and ilf1provements in inputs and agricultural practices. There seems to have been a general swing of unspecified general labour (Major Groups of I.S.I.C. 89 and 90 of IX) in 1951 in the western districts in favour of accretion in Agricultural labour in 1961, and a general decline in marginal indices of Agricultural labour in the' eastern districts. Plantations, Forestry, Livestock, Mining Quarrying (III) have improved in most districts except Satara and Sangli. The marginal index in IV & V is positive in all districts except Bhandara and Chanda. VI is up, too, in all districts except Thana, Aurangabad, Bhir,

Osmanabad and Bbandara. VIII shows a strident positive marginal index in all districts. VII shows negative in the districts of. Ratnagiri, Osmanabad, Wardha and 8handa, and so does IX in the districts 00£ Thana, Kolaba, Ratnagiri, Poona, Parbhani and Bhir. The general conclusion seems to be a marked marginal structural shift in employment in favour of IV & V, VI and VIII and a strengthening of I denoting sound overall improvement in the economy. This is evident in the positive indices for all categories for Maharashtra as a whole.
Mysore
The following districts have experienced ~bsolute decline in workers in the categories noted against each :
II • HasS:J.n, Chikmagalur, Gulbarga, Bidar.
III • Bangalore, Kolar, Gulbarga, Bidar, Raichur.
VI Kolar, BeUary, Raichur.
VIn Gulbarga, Raichur.
PopUlation growth has contributed to a strengthening of I particularly in Tumkur, Kolar, Hassan, Mandya, Belgaum, Gulbarga, Bidar and Raichur, indicating that the pressure on land has intensified in these districts and is comparatively less in the remammg districts. There have been notable irrigation and drainage achievements during 1951-61 as fonows:
Raichur
Bijapur
Chikmagalur
Belgaum Shimoga
Mysore
165 R.G.l.-37.
Tungabhadra-Left and Right Bank Rajolibunda Division Kanakanala
• Ghataprabha II Ramanahalli Tank Areshankar Tank Kalascope Tank Nagathana Bb-adra JambadhaUa Kolchi Weir Tunga AnicuU Ambligola Nugu Reservoir Chik Hole Kabini Hebbattalla
28r
Bellary
Gulbarga
Tungabhadra Hagaribommanhalli
Hathi Koni
North Kanara • Dharma
Coorg • Laxamanathirta
Tumkur Mangala
Bangaiore Arkavathi
Negative marginal indices in II appear in Hassan, Chikmagalur, Gulbarga and Bidar. Fore~try, Plantation, Mining and Quarrying etc. (III) show negative marginaJ indices in Bangalore, Kolar, Gulbarga, Bidar and Raichur in all of which there have been absolute declines also. IV &: V .show positive marginal indices in all districts. VI Construction shows positive marginal indices in all districts except Kolar, Bellary and Raichur where the indices are negative. The .indices though positive are weak in Hassan, Mandya and Belgaum. VIn shows positive marginal indices in all districts except Gulbarga and Raichur, where they are negative. VII shows a positive but generally weak marginal index in all districts. IX shows positive indices in all districts. The overall picture is one of' economic growth and structural shift in employment. This appears in the positive marginal indices in all c.ategories for }\fysore as a whole.
Orissa
The following districts have experienced absolute declines in wor~rs in the categories noted against each:
II
lIT.
VI •
VII
VIIT •
• Baudh-Khondmals.
• Kalahandi, Sambalpur, Bolangir, Baudh-Khondmals, Dhenkanal. Cuttack, Balasore.
Kalahandi, Bolangir, BaudhKhondmals, Ganjam, Puri, Mayurbhanj, Balasore.
All districts except Sundargarh.
Kalahandi, Baudh-Khondmals Dhenkanal.
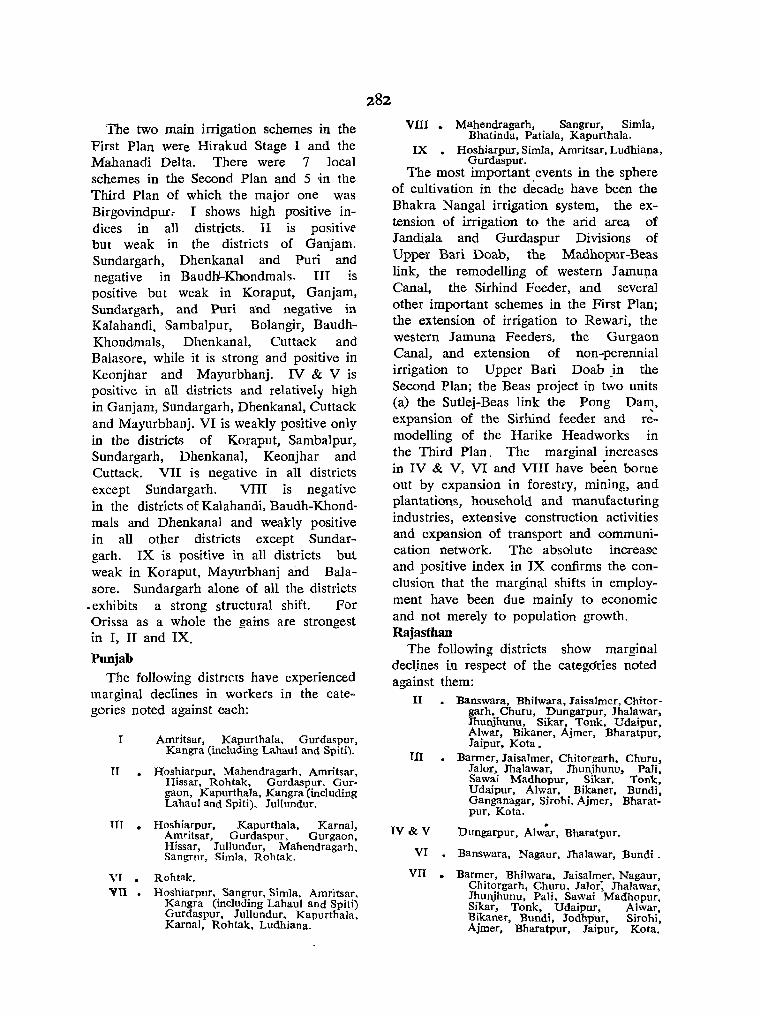
The two main irrigation schemes in the First Plan were Hirakud Stage I and the Mahanadi Delta. There were 7 local schemes in the Second Plan and 5 >in the Third Plan of which the major one was Birgovindpur: I shows high positive indices in all districts. II is POS!tlVI'
but weak in the districts of Ganjam. Sundargarh, Dhenkanal and Puri and negative in Baudll-Khondmals. III is positive but weak in Koraput, Ganjam, Sundargarh, and Puri and negative in Kalahandi. Sambalpur, Bolangir, BaudhKhondrnals, Dhenkanal, Cuttack and Balasore, while it is strong and positive in Keonjhar and Mayurbhanj. IV & V is positive in all districts and relatively high in Ganjam, Sundargarh, Dhenkanal, Cuttack and Mayurbhanj. VI is weakly positive only in the districts of Koraput, Sambalpur, Sundargarh, Dhenkanal, Keonjhar and Cuttack. VII is negative in all districts except SU'ndargarh. VIII is negative in the districts of Kalahandi, Baudh-Khondmals and Dhenkanal and weakly positive in all other districts except Sundargarh. IX is positive in all districts bul weak in Koraput, Mayurbhanj and Balasore. Sundargarh alone of all the districts
-exhibits a strong structural shift. For Orissa as a whole the gains are strongest in 1, II and IX.
Punjab The following distncts have experienced
marginal declines in workers in the categories noted against each:
I Amritsar, . KaP!lrthala, Gurdaspur, Kangra (mcludmg Lahaul and Spiti).
IT • Hos~iarpur. Mahendragarh. Amritsar, Hlssar, Rohtak, GurdaspuT. Gurgaon. Kapurthala. Kangra (including Lahaul and Spiti), Jullundur.
TTT • Hoshiarpur. Kapurthala. Karnal Amritsar, Gurdaspur, Gurgaon' Hissar. Jullundur. Mahendragarh' Sangrur, Simla, Rohtak. '
VI • Rohtak. Y11 • Hoshiarpur, Sangrur, Simla, Amritsar
Kangra (including Lahaul and Spiti) Gurdaspur, Jullundur, Kapurthala Kamal, Rohtak, Ludhiana. '
282
VIII • Mahendragarh, Sangrur, Simla, Bhatinda, Patiala, Kapurthala.
IX • Hoshiarpur, Simla, Amritsar, Ludhiana, Gurdaspur.
The most important .events in the sphere of cultivation in the decade have been the Bhakra Nangal irrigation system, the extension of irrigation to the arid area of Jandiala and Gurdaspur Divisions of Upper Bari Doab, the Madhopur-Beas link, the remodelling of western J amuna Canal, the Sirhind Feeder, and seve~al other important schemes in the First Plan' the extension of irrigation to Rewari, th~ western Jamuna Feeders, the Gurgaon Canal, and extension of non-perennial ungation to Upper Bari Doab in the Second Plan; the Beas project in t~o units (a) the Sutlej-Beas link the Pong Dam, expansion of the Sirhind feeder and r~modelling of the Harike Headworks in the Third Plan, The marginal increases in IV & V, VI and VIII have be"en borne out by expansion in forestry, mining, and plantations, household and manufacturing industries, extensive construction activities and expansion of transport and communication network. The absolute increaSie and positive index in IX confirms the conclusion that the marginal shifts in employment have been due mainly to economic and not merely to population growth. Rajasthan
The following districts decUnes in respect of the against them:
show marginal categories noted
II • Banswara, Bhilwara, Jaisalmer, Chitorgarh,. Churu, .Dungarpur, Jhalawar, JhunJhunu, Slkar, Tonk, Udaipur A1:war, Bikaner, Ajmer, Bharatpur: Jalpur, Kota.
III • Barmer, Jaisalmer, ChitoTgarh, Churu, Jalor,. Jhalawar, Thun.ihunu, PaJi, Saw:;1.1 Madhopur, Sikar, Tonk, Udatpur, Alwar, Bikaner, Bundi Ganganagar, Sirohi, Ajmer, Bharat: pur, Kota.
IV & V DungarpuT, Alw~r, 'Bharatpur.
VI Banswara, Nagaur, Jhalawar, Bundi.
VII • Darmer, Bhilwara, Jaisalmer, Nagaur Chit<?rgarh. Ch~ru. Jalor~ Jhalawar: JI.mnJhunu, Pall, Sawai Madhopur. Slkar, Tonk, Udaipur, Alwar B~kaner, Bundi, Jodhpur, Sirohi: AJmer. Bharatpur. Jaipur, Kota.

VIlt Alwar.
LX Barmer, Nagaur, Jalor, Jhunjhunu, Paii, Sawai Madhopur, Sikar, Tonk, Bikaner, Jodhpur, Sirohi, Ajmer, Bharatpur.
Rajasthan as a whO'le shO'WS increase lD
emplO'yment in cultivatiO'n, to' which the decade's irrigatiO'n projects have contributed in nO' mean measure. In the First Plan there were as many as 30 schemes, in the SecDnd as many as 19, the pride O'f place gDing to' Chambal Stage II (Rana Pratap· sagar Dam) and Rajasthan Canal; in Ilhe Third as many as 10, the pride of place gDing to' the Beas Project (PDng Dam) extension. The extension in irrigation and cultivatiDn chiefly in the eastern, central and sDuthern districts led to' a rise in I and a decline in II, III and VII (Agriculturallabour, LivestO'ck, etc., and Trade and Commerce and Industry). The rise in IV & V has been substantial but the marginal inareases in VI and VIII have been of a lDwer Drder, and there has been some marginal increase in IX.
Uttar Pradesh
The follDwing distrlcts have experienced absDlute declines in wDrkers in the categDries nDted against each:
I Faizabad, Sultanpur, Varana&i.
II Saharanpur, Muzaifarnagar, Agra,
III
VI
VII
VIII
IX
Etah.
All districts, except the six highland districts-Tehri Garhwal, Uttar Kashi, Garhwal,. ~hamoIi, AllRora, Pitboragarh-Narlll Ta1, BIJnor, Rampur, Pilibhit, Kheri, Jaunpur Mi~ai)Ur.
Bijnor, Shahjahanpur, Unn!1o, R~e Bareli, Ghazipur, Varanasl, Balha.
Aligarh Mathura, Mainpuri, Fatehpur, 'Jhansi, Jalaun, Hamirpur, Bara Banki, Jaunpur, Ballia, Ghazipur, Unnao.
Budaun, Aligarh, Mathura, G~azipur.
Moradabad, Bareilly, Debra Dun. Bulandshahr, Fatehpllr, Kheri, Unnao, Lucknow, Rae Bareli, Gonda, Bara Banki, SultanpuT, Basti, Gorakhpur, Azamgarh, Jaunpur.
The marginal index in I is negative tOt the districts Df Faizabad, Sultanpur and Varanasi Dnly. Similarly, II has negative marginal indices only in the districts men· tioned above. This unmistakably denDtes increasing pressure Dn cultivation and swelling Df the ranks of agricultural labourers, a sign Df the strain pDpulation growth exerts in Uttar Pradesh. The decline in 111 shows regional geographical variatIOns, the marginal index being positive in the hignland districts of the northwest, Bijnor, Pilibhit, Kheri, Jaunpur and Mirzapur. IV & V ShDW positive indices. in all districts which indeed is very encDuraging although the values are small in districts like Btah, Btawah, Jalaun, Kheri, Sitapur and Unnao. There has been tardy grDwth and in sO'mt' districts actual decline in VI, although the highland districts of the northwest, Debra Dun, Lucl9low, Mirzapur and even Meerut ShDW fairly high values. In VIII the eastern districts, the nDrthern highlands and the western districts adjoining Punjab generally bear appreciable positive indices while the central land mass generally bears low values. In Vln the indices are negative in the 4 districts mentiDned abDve and positive but lDW in all districts except Bareilly, Dehra Dun, Sahal!_"anpur, Agra, Jhansi, LucknDW and Varanasi where they are comparatively high. A very welcome sign of hope is in Eastern Uttar Pradesh where the entire group of 12 districts CFaizabad, Sultanpur, Pratapgarh, Basti, Gorakhpur, DeDria, Azamgarh, Jaunpur, BaHia, Ghazipur, Varanasi and Mirzapur) has shown much welcome shift in favour of IV & V although the pressure on land in these districts has simultaneously mtensi.., fled, particularly aggravating the problem of agricultural labDurers ..
Uttar Pradesh as a whDle presents II
picture of high marginal increase in I. Tn the First Plan there were a~ many as 25 irrigation projects in Uttar Pradesh, the mDre important Df them being the extension of the Sarda Canal, the Saprar

and N angarh Dams, the remodelling of Upper Ganga, Agra, Banganga, Eastern Jamuna and Tanda Canals. Tn the Second Plan there were 10 schemes the more important of which were the Matatilla Dam and Sarda Sagar Stage II. In the Third Plan there are as many as 23 schemes, the major ones being Sarju and Gandak Canals. There has been a marked marginal rise in II and it is possible that there has been some transfer from general unspecified labour (Major Groups of I.S.l.c. 89 and 90 of 1951) to II in 1961. HI has shown an absolute as well as marginal decline whib IV & V shows an appreciable marginal increase. VI, VII and VIII show positive but low indice~ bur a fair positive index in IX. The overall conclusion seems to be that economic growth has played a positive although limited, role in diversifying and increasing employment in the growth sectors.
West Bengal
The following districts have experienced absolute declines in workers in the categories noted against each:
I
11
III
IV & V
VI
VIl
VIlf
Calcutta.
Darjeeling, Calcutta.
Jalpaigun, Maida, Calcutta.
Jalpaiguri.
Jalpaiguri, Murshldabad, Birbhum.
Mallia, Murshidabad, Calcutta, Bankura, Midnapore.
C.llcutta, Howrah.
Population growth has intensified pressure on the land and cultivation. The indices in I and IL have appreciably risen. A proportion of workers returned in plantation labour in 1951 in Jalpaiguri seems to have been returned in II Agricultural labour in 196]. Forestry, Plantations, Mining, Quarrying etc. (Ill) have registered increase~ in all districts except Jaipaiguri, MaIda, and Calcutta, but the: values for Cooch Behar, West Dinajpur
and Midnapure, although posItive, are very low. IV & V have registered declines in marginal index in J ulpaiguri, and weak though positive indices in Darjeeling, Cool.:h Behar, West Dinajpur and Bankura. V 1 shows negative marginal index in J alpaiguri, Murshidabad, Birbhum and positive but weak value~ in Darjeeling. Vll shows negative indices in Malda, Murshldabad, Calcutta, Bankura and Midnapore and weak positive indices in West Dinajpur, Nadia, 24-Pargana~, and Howrah. Vin shows negatlve marginal indices in Calcutta and Howrah and weak POSItlYe indices in J alpaiguri, Cooch Behar, West Dinajpur, MaIda, Murshidabad, Nadia, 24-Parganas, Birbhum, Bankura and Midnapore. All districts have positive indices in IX. Economic growth is ~trongly reflected in marked increases in the marginal index in 24-Parganas, Calcutta, Darjeciing, Howrah, Hooghly and Burdwan. There have been extensive and major irrigation projects in the districts of Birbhum (Mayurakshi), Burdwan, Hooghly, Bankura (D.V.C. and Suvankar Dams) and Midnapore (Kansavati) and drainage schemes in 24-Parganas (Sonarpur-Arapanch) in the last decade the etIect of which is evident not only on the primary but also on the secondary and tertiary sectors. In the remaining districts popUlation growth more than economic growth seems to have been responsible for augmenting existing pressures on employment. This is evident in the strong positive marginal indices which are observed only in I, II, Ill, IV & V and IX for West Bengal as a whole.
The Union Territories and Other Areas
The Andaman and Nicobar Islands and Sikkim have experienced high rises in I owing to colonisation, reclamation and extension of cultivation. Andaman and Nicobar IslanJ", Manipur and Tripura have !.hown increa<;es in II but all other territories havc shown abs.olute as well as marginal decreases. III shows absolute as well as marginal decreases in
Sikkim,. but absolute marginal increases in Delhi and Himachal Pradesh. There have been absolute as well as marginal decreases in Laccadive, Minicoy and Amindivi Islands and Manipur. IV & V hav{'\ increased in all other Union Territories but show negative marginaf indices in Manipur and Sikkim. VI Construction shows high indices evefYW'here except in Delhi where there has been distinct falling off in construction activity in 1961 from 1951. VII shows high marginal increases only in Delhi, Laccadive, Minicoy and Amindivi Islands and Sikkim. VIII shows high positive indices in Delhi, Manipur and Tripura. Delhi, Himachal Pradesh and Manipur show high positive indices in IX.
On the whole the picture in the Unio11 Territories is one of rapid build up of the infrastructure of growth.
All India
Taking India as a whole we .tind there have been marked marginal shifts in employment indicated by positive marginal indices, in favour of III, IV & V, VI and VIII, reflecting the effects of economic growth on employment in these growth sectors, together with a small marginal growth in the Service sector. There i~
comparatively less pressure on land than what might have been if the 1951 structural pattern had persisted in 1961.

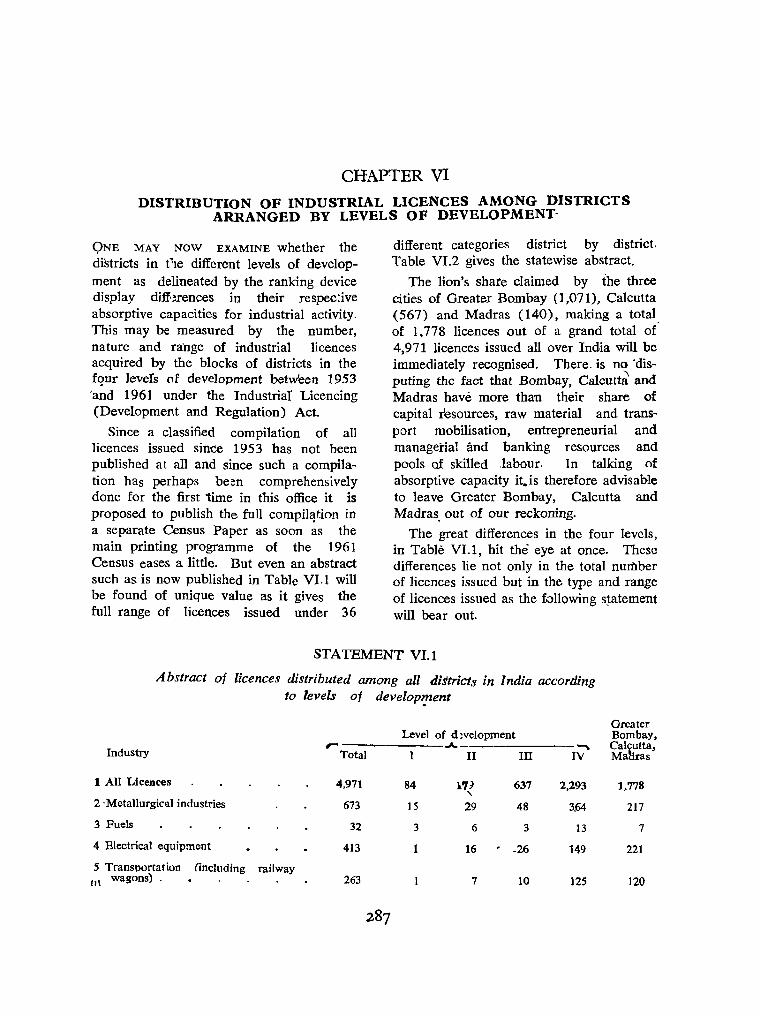
CHAPTER VI DISTRIBUTION OF INDUSTRIAL LICENCES AMONG DISTRICTS
ARRANGED BY LEVELS OF DEVELOPMENT-
QNE MAY NOW EXAMINE whether the districts in t'le different levels of development as delineated by the ranking device display di:ff'~rences in their respec:ive absorptive capacities for industrial activity. This may be measured by the number, nature and ra·nge of industrial licences acquired by the blocks of districts in the fqur levers (1f development betWeen 1953 'and 1961 under the Industria! Licencing (Development and Regulation) Act.
Since a classified compilation of all licences issued sinCe 1953 has not been published at all and since such a compilation has perhaps be~n comprehensively done for the first time in this office it is proposed to publish the full compil~t.ion in a separate Census Paper as soon as the main printing programme of the 1961 Census eases a little. But even an abstract such as is now published in Table VI.1 will be found of unique value as it gives the full range of licences issued under 36
different categories district by district. Table VI.2 gives the statewise abstract.
The lion's share claimed by the three cities of Greater Bombay (1,071), Calcutta (567) and Madras (140), making a total of 1,77 8 licences out of a grand total at" 4,971 licences issued all over India will be immediately recognised. There. is no ·disputing the fact that Bombay, Calcutt~ and Madras have more than their share of capital resources, raw material and transport mobilisation, entrepreneurial and managerial and banking resources and pools of skilled .labour. In talking of absorptive capacity it.is therefore advisable to leave Greater Bombay, Calcutta and Madras. out of our reckoning.
The great differences in the four levels, in Table VI. 1 , hit the" eye at once. These differences lie not only in the total number of licences issued but in the type and range of licences issued as the £ollowing s~atement will bear out.
STA TEMENT VI.1
Abstract of licences distributed among all diStricts in India according to levels of develop'!1ent
Level of d !velopment --- .A. -. Industry Total I II III IV
1 All Licences 4,971 84 i7} 637 2,293 , 2 ·Metallurgical industries 673 15 29 48 3.64
3 Fuels 32 3 6 3 13
4 Electrical equipment 413 1 16 . .26 149
5 TransDortation (including railway (1\
wagons) . 263 7 10 125
287
Greater Bombay, Cal~utta • Ma ras
1,778
217
7
221
120
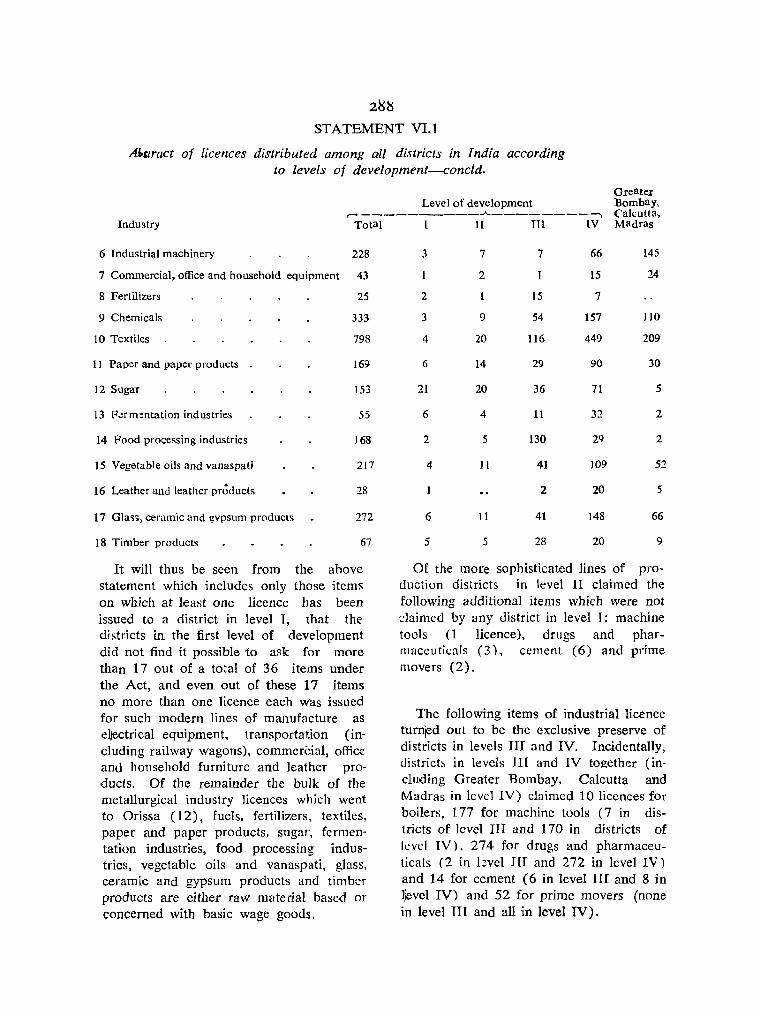
2~~
STATEMENT VI.1
AI.stract of licences distributed among all districts in India according to levels of development--concld.
Greater Level of development Bombay, r- __________ ..A.. ________ -.. Calcutta,
Industry Total I ][ III IV Madras
6 Industrial machinery 228
7 Commercial, office and household equipment 43
8 Fertilizers 25
9 Chemicals
10 Textiles
11 Paper and paper products
12 Sugar
13 F~rm!ntation industries
14 Food processing industries
15 Vegetable oils and vanaspati
16 Leather and leather products
17 Glas'>, ceramic and I?:vpsum products
18 Timber products
333
798
169
153
55
168
217
28
272
67
It will thus be seen from the above statement which includes only those items on which at 1east one licence has been issued to a district in level I, that the districts in the first level of development did not find it possible to ask for more than 17 out of a total of 36 items under the Act, and even out of these 17 items no more than one licence each was issued for such modern lines of manufacture as e])ectrical equipment, transportation (including railway wagons), commercial, office and household furniture and leather products. Of the remainder the bulk of the metallurgical industry licences which went to Orissa (12), fuels, fertilizers, textiles, paper and paper products, sugar, fermentation industries, food processing industries, vegetable oils and vanaspati, glass, ceramic and gypsum products and timber products are either raw mate rial based or concerned with basic wage goods,
3
2
3
4
6
21
6
2
4
6
5
7
2
9
20
14
20
4
5
11
11
5
7
15
54
116
29
36
11
130
41
2
41
28
66 145
15 24
7
157 110
449 209
90 30
71 5
32 2
29 2
109 52
20 5
148 66
20 9
Of the more sophisticated lines of production districts in level II claimed the following additional items which were not chimed by any district in level T: machine tools (1 licence), drugs and pharmaceuticals (3), cement (6) and prime movers (2).
The following items of industrial licence turnjed out to be the exclusive preserve of districts in levels III and IV. Incidentally, district:" in levels HI and IV together (including Greater Bombay, Calcutta a'nd Madras in level IV) claimed 10 licences for boilers, 177 for machine tools (7 in districts of level III and 170 in districts of level TV), 274 for drugs and pharmaceuticals (2 in bvel III and 272 in level IV) and 14 for cement (6 in level HI and 8 in Ijevel IV) and 52 for prime movers (none in level ITI and all in level IV).
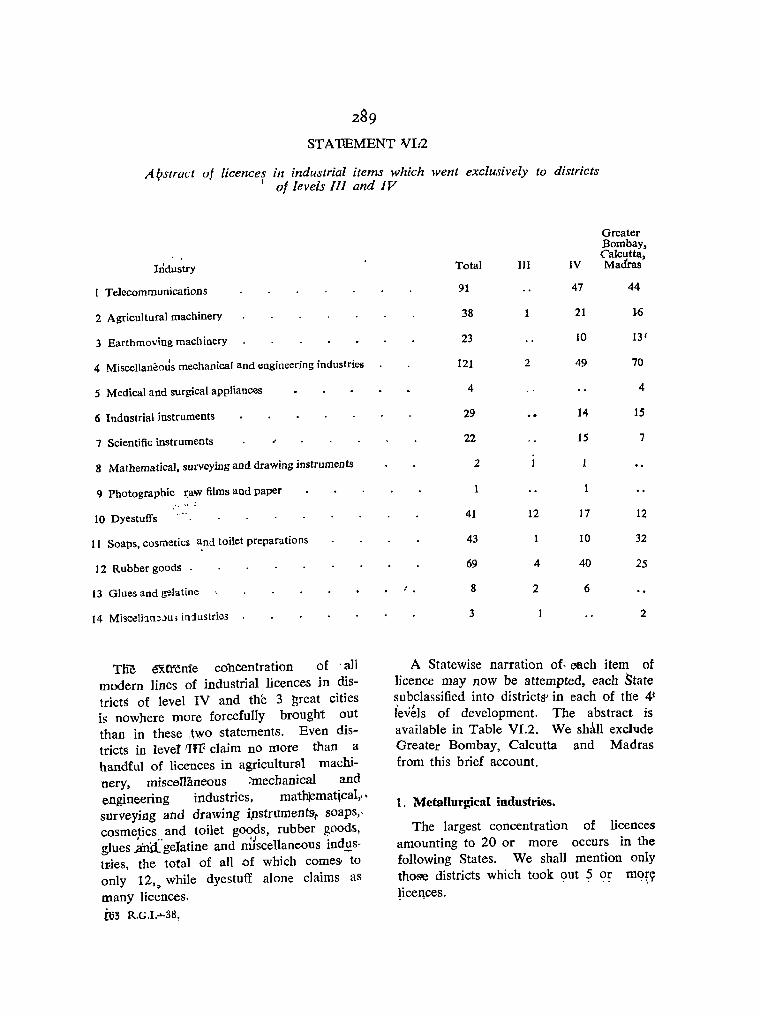
A~stract of licences in industrial items which went exclusively to districts I of levels III and IV
Industry
Telecommunications
2 Agricultural machinery
3 Earthmoving machinery
4 Miscellaneotis mechanical and engineering industrictl
5 Medical and surgical appliances
6 Industrial instruments
7 Scientific instruments
8 Mathematical, surveying and drawing instruments
9 Photographic t:aw films and paper
10 Dyestuffs
11 Soaps, cosmetics ~n'i toilet preparations
12 Rubber goods .
13 Glues and g~latine
14 Mis~llln~Ju) iniustries
The extreme collcentration of' all modern lines of industrial licences in districtS of level IV and the 3 ~reat cities is nowhere more forcefully brought out than in these ,two statements. Even districts in level !Iff< claim nO more than a handful of licences in agricultural machinery, miscemmeous :-mechanical and engineering industries, mathlematica1f' surveying and drawing jpstrumentsr soaps,cosmetics and toilet goods, rubber goods, glues ~'ni{geIatine and nltscellaneous ind!!stFies, the total of all ,of which comes- to only 12'Q while dyestuff alone claims as many licences. [63 R.G.I ..... 38,
Greater Bombay, Calcutta,
Total III IV Madras
91 47 44
38 21 16
23 10 13'
121 2 49 70
4 4
29 14 15
22 15 7
2
41 12 17 12
43 10 32
69 4 40 25
8 2 6
3 2
A Statewise narration of· each item of licence may nOW be attempted, each State subclassified into districts, in each of the 41 " .i levels of development. The abstract is available in Table VI.2. We slulll excllJde Greater Bombay, Calcutta and Madras from this brief account.
1. Metallurgical industries.
The largest concentration of licences amounting to 20 or more occurs in the following States. We shall mention only those districts which took out 5 or m9{Y Fceqces.

~~ STATEMENT VI 3
Distribution of licences of metallurgical industries by States and districts
Level I Level II Level III Level IV
State Total , __ -J. ,-,,-----> ,-------..A--., number District No. District No. District No. District No.
Bihar Gujarat Madras
35 • 21
24
Maharashtra • 38
Mysore • 20
Orissa • 20
Punjab • 84
Uttar Pradesh 52
West Bengal 94
Delhi . 22
2. Fuels.
Shahabad 11
Cuttack 5
Moradabad 5
We shall take those States which hav.e.taken more than 5 licences.
STATEMENT VIA
Singhbhum 16 Ahmedabad 8 Chingleput 7 Coimbatore 9 Poona 11 Thana 17 Shllnoga 5 Bangalore 7
Patiala 15 Jullundur 9 Ambala 14 Amritsar 10 Ludhiana 9 Gurgaon 17
Agra 5 Meerut 12 Kanpur 16
Burdwan 9 Hooghly 5 24-Parganas 26 Howcah 54
Delhi 22
Distribution of licences of fuels industries by Stales and districts
Level I Total
State number District No.
Bihar 8
West Bengal 7
3. Boilers.
Level II ...... _-..,
District No.
Monghyr 1 Ranchi 3
Level III
District No.
Hazaribagh
Level IV ~-.
District No.
Dhanbad 3
Darjeelin~ 1 Jalpaigufl 1 Burdwan 5
We shall take only those States which have taken 3 licences or more.
STATEMENT VI.S Distribution of licences of boilers by States and districts
Level I Level II Level III Level IV Total
State number District Ng, District Ng, Pistrict No. District No.
.Maharashtra 3 Poona 3
W~t Ben~al ~ Hurdwan 1 ~4-Parganf}S ~
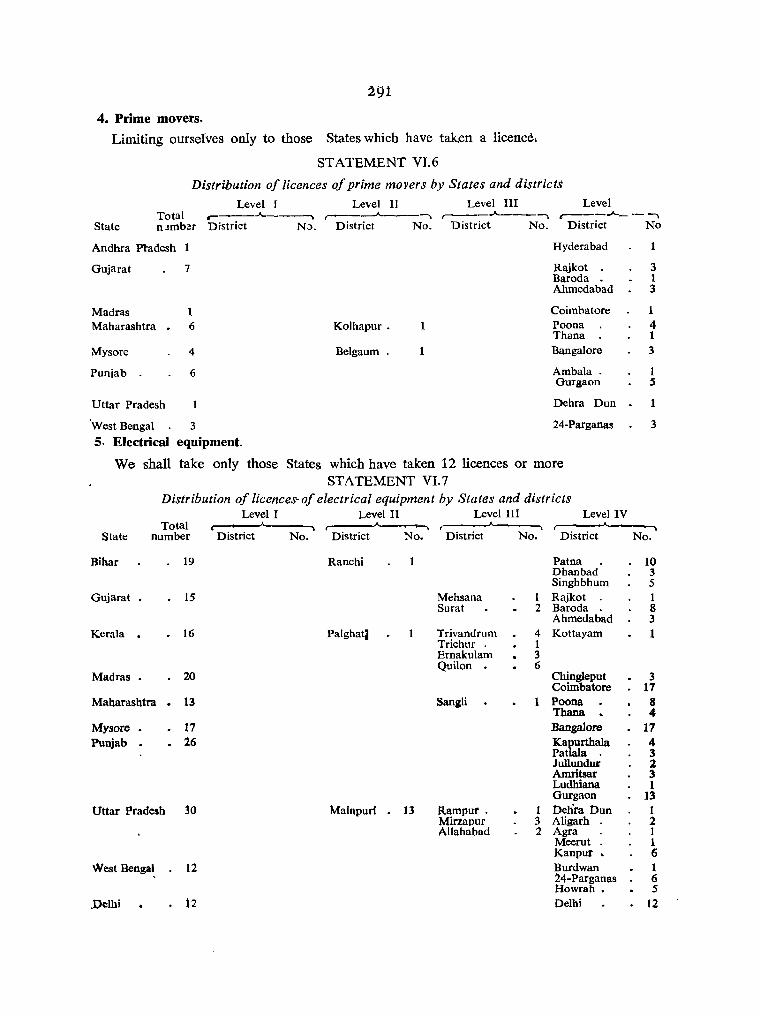
291
4. Prime movers.
Limiting ourselves only to those States which have taken a licence.
ST ATEMENT VI.6
Distribution of licences of prime movers by States and districts
Level J Level II Level III Level Total ,--___ .A.. ___ -, ,------'-___ --. ,--__ .A. ___ -, .-----"-_ -- -,
State n:.tmber District No. District No. District No. District No
Andhra Pl:adesh
Gujarat 7
~adras 1 Maharashtra. 6
Mysore
Puniab
Uttar Pradesh
4
6
'West Bengal 3
5. Electrical equipment.
Kolhapur. 1
Belgaum .
Hyderabad
Rajkot . Baroda . Ahmedabad
Coimbatore Poona Thana Bangalore
Ambala . Gurgaon
Dehra Dun
24-Parganas
We shall take only those States which have taken 12 licences or more STATEMENT VI.7
Distribution of licences-of electrical equipment by States and districts Level I Level II Level III Level IV
Total State number District No. District No. District No. District
Bihar 19 Ranchi Patna Dhanbad Singhbhum
Gujarat IS Mehsana I Rajkot Surat 2 Baroda
Ahmedabad Kerala . 16 Palghatl Trivandrum 4 Kottayam
Trichur . 1 Ernakulam 3 Quilon 6
~adras • 20 Chingleput Coimbatore
~aharashtra . 13 Sangli 1 Poona Thana
Mysore • 17 Bangalore Punjab . - 26 Kapurthala
Patiala . JullundUl" Amrltsar Ludhiana Gurgaon
Uttar Pradesh 30 Mainpuri . 13 Rampur. 1 Delira Dun Mirzapur 3 Aligarh Allahabad 2 Agra
Meerut Kanpur •
West Bengal 12 Burdwan 24-Parganas Howrah •
.Delbi 12 Delhi
3 1 3
4 1 3
1 S
. 1
3
No.
10 3 5 1 S 3 1
3 17
8 4
17 4 3 2 3 1
13 1 2 1 1 6 1 6 5
12
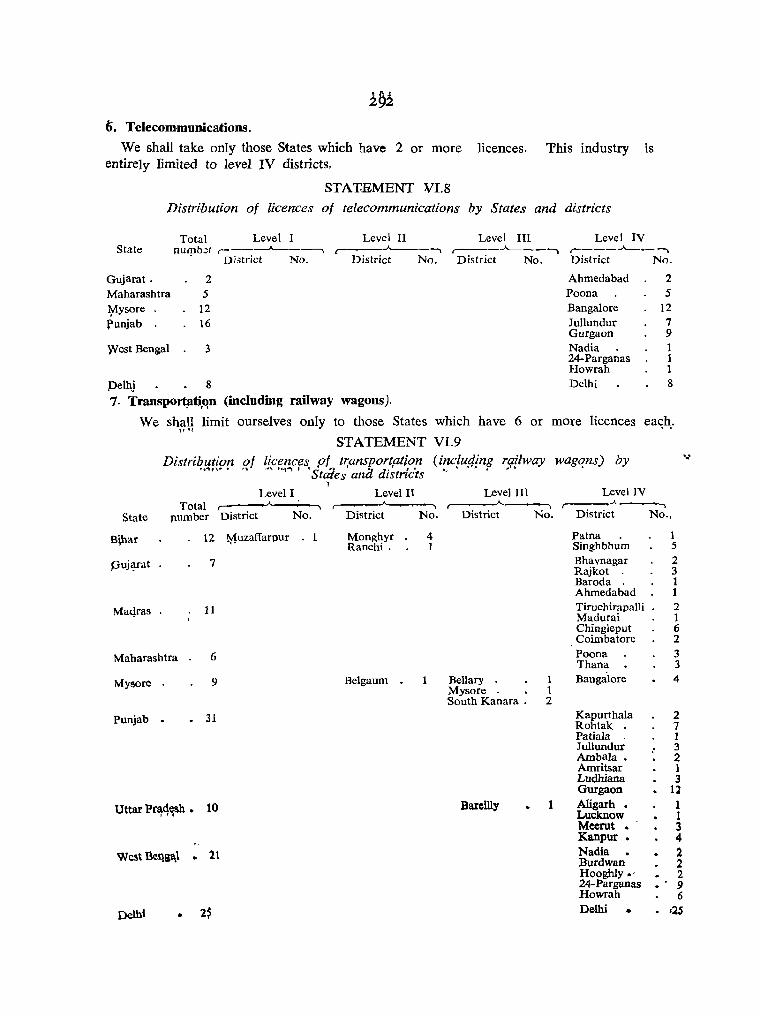
6. Telecommunications.
We shall take only those States which have 2 or more licences. This industry is entirely limited to level IV districts.
STATEMENT \11.8
Distribution of licences of telecommunications by States and districts
Total Level I Level II Level III Level IV State numb.:r ,------'------. ...----'------. ,-----"----, r-----"----,
- Di3trict No. District No. District No. District No.
Gujarat. 2 Maharashtra 5 ¥ysore . 12 punjab. 16
West Bengal 3
pel~ 8 7. Transpol'tflti,qn (including railway wagons).
Ahmedabad Poona Bangalore Jullundur Gurgaon Nadia . 24-Parganas Howrah Delhi
2 5
12 7 9 1 1 1 8
We sh,~U limit ourselves only to those States which have 6 or more licences eac:h,.
STATEMENT VI.9
Distribution Rf licences .of transport,ation (inc!url!ng r_qflway wagqns) by .... "'" .... " h,"" 'States' ana districts '.. - ...
! Level I Level II Level III Level IV
Total ..A
State Jlumber District No. District No. District No. District No.,
Bihar 12 ¥.uzafl'arpur 1 Monghyr 4 Patna 1 Ranchi. 1 Singhbhum 5
puj~rat 7 Bhavnagar 2 Rajkot 3 Baroda 1 Ahmedabad 1
Maqras 11 Tiruchirapalli 2 Madurai 1 ChingJeput 6 Coimbatore 2
Maharashtra 6 Poona 3 Thana 3
My!ore 9 Belgaum . Bellary 1 Bangalore 4 Mysore . 1 South Kanara . 2
Punjab . . 31 Kapurthala 2 Rohtak 7 Patiala 1 Jullundur 3 Arnbala • 2 Amritsar 1 Ludhiana 3 Gurgaon 12
Uttar Pr~4~sh • 10 Bareilly Aligarh • 1 Lucknow 1 Meerut . 3 Kanpur • 4
West Beq8l\_1 21 Nadia 2 Burdwan 2 Hooghly.' 2 24-Parganas 9 Howrah 6
Delhi • 2$ Delhi • . ,25
'-l
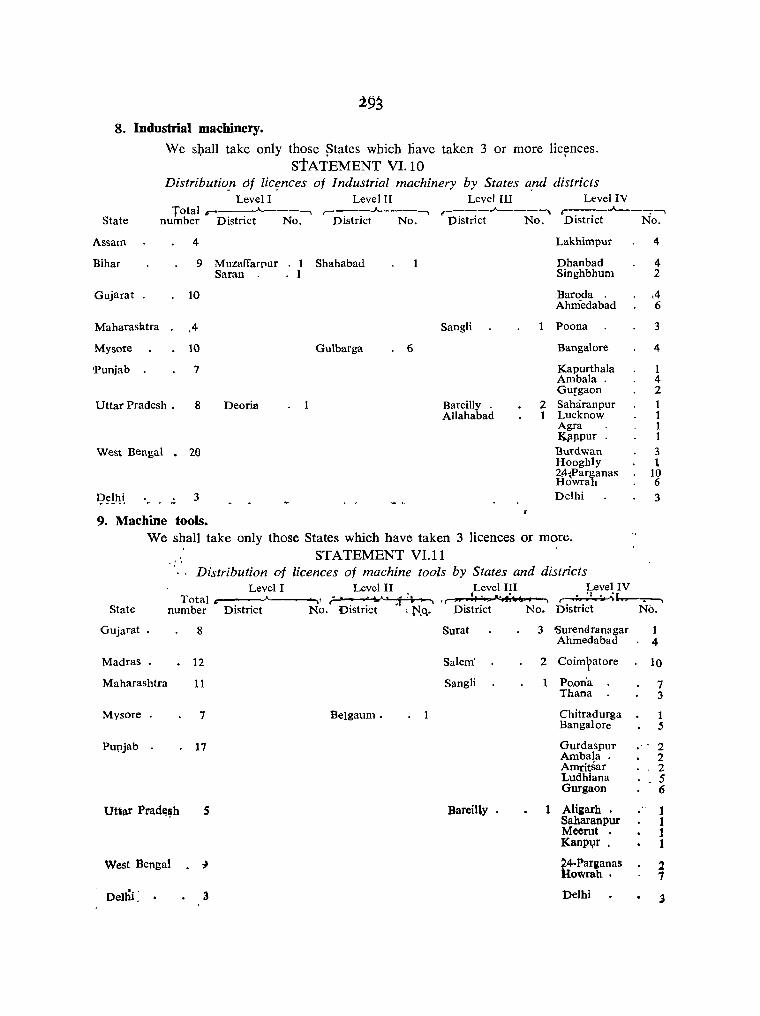
8. Industrial maebinery.
We sl,lall take only those ~tates which nave taken 3 or more lic~nces. STATEMENT VI. 10
Distributio!, of [ic~nces of Industrial machinery by States a.nd districts Level I Level II Level III Level IV
State Total c----A.----, ,-___ .A. ___ -, ,,-___ ..A. ___ --. .---"""__--;--,
number District No. District No. District No. District No.
Assam
Bihar
Gujarat
Maharashtra
Mysore
'Punjab
UUar Pradesh •
4
9
10
,4
10
7
8
West Bengal • 20
3
9. Machine tools.
Muzaffarflur 1 Shahabad Saran 1
Gulbarga
Deoria
6
Sangli
Bareilly . Allahabad
1
2 1
Lakhimpur
Dhanbad Singhbhum
Baroda Ahmedabad
Poona
Bangalore
Kapurthala Ambala . GUIgaon Saharan pur Lucknow Agra I{flPpur Burdwan Hooghly 24,(Parganas Howrah Delhi
We shall take only those States which have taken 3 licences or more. STATEMENT VI.11
_': I
Distribution of licences of machine tools by States and districts Level I Level II Level III Level IV
4
4 2
,4 6
3
4
1 4 2
3 1
10 6
3
State
Gujarat
Total e----./'.---__ , (!-J tV' "'; '1.1 .. , 'r)!J !: 9$1 ""'''::''''. \ (. ~'. "~Q J .--\ .... 10 .... , --. • ...,_, number District No. District ; 1'\0.. District No. DIstnct No.
Madras.
Maharashtra
Mysore
PUJ;ljab
Uttar Pradl;~h
West Bengal
Delbi,
8
12
11
7
17
5
Belgaum.
Surat
Salem'
Sangli
Bareilly
3 'Surenclranagar Ahmedabad
2 Coimratore
Po.on'a Thana
Chitradurga Bangalore
Gurdaspur Ambala . Amritsar Ludhiana Gurgaon
1 Aligarh Saharanpur Meerut • I{anpl,lr .
Z4-Paraanas lIowrah •
Delhi
1 4
10
7 3
1 5
2 2 2 5 6
.. 1 1 1 1
2 7
~

io. Agricultural machinery. STATEMENT VI.12
Di.~tribution of licences of agricultural machinery by States and districts Total Level I Level II Level III LevellY
State number r----.A..----, r---.A..------, r-----A..------, ,..-__ A ___ -,
Dsitrict No. District No. District No. District No GUjaral Ahmedabad 1
Madras. Chingleput 1
Maharashtra 3 Poona. 3
Mysore 1 Hassan . Punjab 8 Gurdaspur 1
Jullundur 1 Ambala . 2 Gurgaon 4
Rajasthan Kota
Uttar Pradesh 4 Agra 1 Kanpur 3
West Bengal 2 Howrah 2
Delhi Delhi
11. Earthmoving machinery. STATEMENT VI.13
Distribution of licences of earthmoving machinery by States and districts Level I Level II Level III LevellY
Total number
r---'---. -"--. ....-----.., State
Bihar Gujarat West Bengal
District No. District No. District No. District No. 2 Singhbhum 2 1 4
Delhi 3
Baroda • Hooghly 24-Parganas Delhi
12. Miscellaueous mechanical and engineering industries. STATEMENT VI.14
Distribution of licences of miscellaneous mechanical alld engineering industries by States and districts
Level I Level II Level III LevellY Total .A. ..A
State number District No. District No. District No. District Andhra Pradesh 3 Hyderabad Gujarat • 2 Rajkot . Kcrala 1 Ernakularn Madras 6~ Madurai
Coimbatore Maharashtra 8 Poona
Thana MySore 2 Bangalore Puniab 6 Rohtak
Amritsal": Ludhiatla Gurgaon
Uttar Pradesh 6 Jhansi Meerut Kanpur •
West Bengal !6 24-Parganas Howrah .
Delhi 1 Delhi
1 3 3
No. 3 2
1 5 1 7 2 1 1 2 2 3 2
9 7
1

13. Commercia], office and household equipment. STATEMENT VI.15
Distribution of licences of commercial, office and household equipment by States and districts
Total State number Andhra Pradesh 2 Maharashtra 1 Orissa 3
Punjab 10
Delhi 3
Level I Level II Level III Level IV r---.A..---___ -- .A.. ___ ...... ,-___ ..A.-_ ...... r----"-
Il:3trict No. District No. District NO: District
Puri Balasore Cuttack
1 1
Sangli . . 1 Hyderabad
Amritsar Ludhiana Gurgaon Delhi
14. Industrial instruments.
STATEMENT VI.16
Distribution of licences of industrial instruments by States and districTs
Total State number
Madras 1 Mabarashtra 2 Mysore • 1
Punjab 3
Rajasthan 3
Uttar Pradesh • 2 West Bengal 2
Level I Level II Level II I Level IV
District No. District No. District No. District Chingleput Poona
Bangalore Jullundur Ambala. Gurgaon
Ajmee laipur Lucknow 24-Parganas Howrah .
15. Scientific instruments.
STATEMENT VI.17
Distribution of licences 0/ scientific instruments by States and districts Level I Level II Level III Level IV
Total State number District No. District No. District No. District
Andhra Pradesh 1 Krishna Maharashtra 4 Poona
Thana Mysore Bangalore Punjab 4 Ambala.
Gurgaon Rajasthan 1 Ajmer Uttar Pradesh. 2 Lucknow West Bengal I Howrah . Delhi 1 Delhi
16. Mathematical, surveying and drawing instruments. STATEMENT VI.IS
Distribution of licences of mathematical, surveying and drawing instruments by States and districts
Level I Level II Level II I Level IV
...... No.
2
1 6 3 3
No. t 2
1 2 2 1 1
No. 1 3 1
3 I I 2
Total ~, .-_A __ _._ Stale number Distric~ ~9. Qistric~ No. District No. District No.
Uttar Pradesh. 1 yaranl\si l "Qj:1hi ,

17. Fertilizers. ST A TE~ENT VI.19
Distribution oj licences oj fertilizers by Slates and districts
State Total
number
Andhra Pradesh 5
BIhar
Gujarat . 3
Kerala
Madhya Pradesh 2
Madras 3
Maharashtra
Mysore 2
Rajasthan
Uttar Pradesh. 6
18. Chemicals.
Total State nUIl'ber
Andhra Pradesh 9
As~am 4
BiharJ
!l
Gujllrat 50
Kerala 10·
Madhya Pradesh 7
Madras . . 23
Level T Level U Level III Lc\clIV ,..-_-.A.. ___ ..., ,..- __ -.A.-__ --, ,-___ ..A..-__ --., ,--___ .A - - - -.,
District N.). Di'Strict No. Di.,trict No. District No.
Vis.lkh.lpatnam Khamu.lm West Godavari
Surat
Ernakulam
Hoshangabad Durg
South Areot
Mysore
Ganganagar
Unnao Allahabad Jaunpur
ST A TEMENT VI. 20
1 3
2
2
2
Dhanbad
Baroda Ahmedabad
Coimbalore .
Than<l
Kanpur 2
Distribution oj licences oj chemicals by States and dis:ricts Level I Level IT Level TIl Le.vel IV
,---~ ,-----A--~ Di~trict No. District No. District No. District No.
Adilabad Krishna. East Godavari 2 Hyderabad West Godavari 2 Guntur. 2
Kamrup. 4
Hazaribagh 4 Singhbhum 4
Surat 6 Surendranagar 1 lutmgadh 4 Bhavnagar 3 Jamnagar , , 16 Baroda 9 Ahmedabad' 11
Trivandrum 1 Kottayam Trichur 1 Ernakula~ 6 Quilon 1
Betu! 1 East Nimar 1 Shahdol . I Ujiain 2
Gwalior . I Indore 1
South Areot I Thanjavur 1 Tirunelvel i 3 North Areot 4 Salem 5 Chingleput 2 ~ama natbapuram 6 Coirpbatore I

297
STATEMENT VI.fO
Distribution of licenc~s oj chemicals by 'states and districts-concld.
'BeVel 'I Lev.el If bev~) III Total r---.-A.---"",,\ r--~ r --~---......
State
Mab.arashtra
number Distnct No District No. District
33 kolaba ~ I 2 Kolhapur 1
Mysore • 8
'Orissa ~ 4 Sambalpur
PIlDjab 12
Uttar Pradesh 20 Faizabad 1 Bara Banki 1
. West Bengal 24
Delhi 8
1
19. Photographic raw fi~m~ and paper.
Dhenkanal Ganjam Cuttack •
Hoshiarpur
1 1 1
1
Mandya. • North Kanara Mysore Dharwar
Varanasi Barelliy • Moradabad •
STATEMENT VI.21
No.
2 1 1 1
2 1 1
Level IV r---'--~ D\strict No.
JalgaoD • 1 Nagpur. . 4 Ahmadn,agar., ,1 Poona. • 5 ThaDa ~9 Shithoga 1 Chitradurga 1 Bangalore 1
Katnal '. J 1 · Hissar 'U~f"
,I PatiaIa" ~ -I Amritsar 2 ,Ludhiana 1 Gutgaon 's Ajmer 1 Kota 2 DehraDun 2 Lucknow 1 Meerut . 6 Kanpur • 5
Nadia. 1 Burdwan;'lJ • ..2 Hobghly· . - '12 24-Parganas • 7 Rowrah. 2 Delhi 8
Distribution of licences of photographic raw films and paper by States and districts Level I Level II Level III Level IV
Total r----"'-----, State number District No. District No. District No.
West Bengal 1
20. Dyestuffs. STATEM~NT VI.22
Distribution of licences of dyestuffs by States and districts Level I Level II Level III
State Total~ .....
number District No. Distrtct No. District No.
Gujarat 17 Kaira . . 11 Surat 1
Maharashtra • 9
Punjab 1 Delhi 2 165 R.GJ.-39,
District Nadia •
LevelI.J
No. I
DistrIct No.
JaqlnagaJ: 1 Baroda: • 3 Ahmedabad 1
Poona · 5 Thana · 4 Amriisai 1 Delhi • • 2
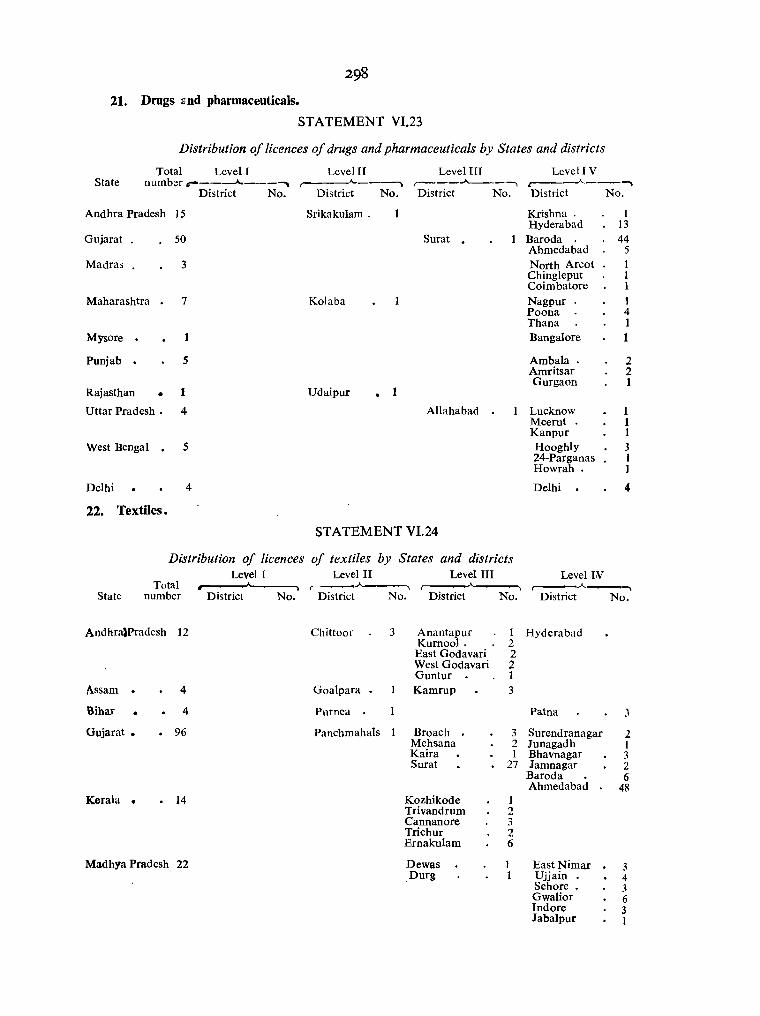
21. Drugs :md pharmaceuticals.
STATEMENT VI.23
Distribution of licences of drugs and pharmaceuticals by States and districts
Total Level I Level II Level III Level I V State numb~r r-----"----""'\ .--~--__. ,--_--A-----, -"----""'\
District No. District No. District No. District No.
Andhra Pradesh 15 Srikakulam . Krishna. 1 Hyderabad 13
Gujarat 50 Surat . Baroda 44 Ahmedabad 5
Madras 3 North Arcot 1 Chingleput 1 Coimbatore 1
Maharashtra 7 Kolaba Nagpur . 1 Poona 4 Thana 1
Mysore Banga10re 1
Punjab 5 Ambala . 2 Amritsar 2 Gurgaon 1
Rajasthan • 1 Udaipur 1
Uttar Pradesh • 4 Allahabad . Lucknow 1 Meerut 1 Kanpur 1
West Bengal . 5 Hooghly 3 24-Parganas I Howrah . I
Delhi 4 Delhi 4
22. Textiles.
STATEMENT VI.24
Distribution of licences of textiles by States and districts Level I Level II Level III Level W
Total ..A--., -"----State number District No. District No. District No. District No.
AndhralPradesh 12 Chittoor 3 Anantapur 1 Hyderabad Kurnool. 2
East Godavari 2 West Godavari 2 Guntur 1
t\ssam . 4 Goalpara • Kamrup 3
Bihar • 4 Purnca Patna J
Gujarat • . 96 Panchmahals Broach 3 Surendranagar 2 Mehsana 2 Junagadh 1 Kaira I Bhavnagar J Surat 27 Jamnagar 2
Baroda . 6 Ahmedabad 48
Kerala • 14 Kozhikode 1 Trivandrum 2 Cannanore 3 Trichur 2 Ernakulam 6
Madhya Pradesh 22 Dewas 1 East Nimar 3 Durg 1 Ujjain 4
Sehore . :I Gwalior 6 Indore 3 Jabalpur 1

State
299,
S1\t\TEMENT 'VIJ24
Ji)istribution of licences of textifes by States and distfics-concld.
Level I -';-evel 1\ Level lIt Level IV Total ' . . A!. .. • number District No. District No. District No. District
Maaras' • • 188 Kanyakumari 1 North Areot· • South Arcot 2 Tiruehira paIli Tirunelveli 15 Madurai Salem 5 Chingleput Ramanathapuram12 Coimbatore
Ma"barashtra · 22 Kolhapur 1 Aurangabad ' . Nasik 1 Akola
Nagpur Thana .
My~ore " 33 Bijapur 1 Mysore 4 Chitradurga ' Belgaum 3 Dharwar 5 Bangalore '
Orissa 6 Sambalpllr Cjlttack 3 Sundargarh 2
Punjab' • · 67 Ferozepur Karnal • Hissar . Kdpurthala Ambala • Amritsar Ludhiana Gurgaon
Rajasthan 18 Bhilwara 2 Jhalawar. 1 Jodhpur. Ajmer Pall 3 Kota
Jaipur
Uttar Pradesh ' 38 Etawah 1 Rampur 1 DehraDun Varanasi 3 Aligarh' Mirzapur 1 Saharanpur Moradabad 1 Agra Allahabad 2 Meerut
Kanpur
West Bengal · 54 Bankura. Nadia Burdwan Hooghly 24-Parganas Howrah.
Delhi 10 Delhi
Himachal Pradesh 1 Chamba
23. Paper and papef.t products.
S:r~TEM~NT Vl.25
Distribution of licences of paper ana paper products by States and districts
Level I Level II LeVi'll III Lev\)l IV Total ,,-___...___. . ~ .,A_.. ,
N,o.
Ii 6
24 2
120
1 1 1
17
It 9
1 :.! S ~ 1
24 24 6'
4 3' 4
3 2' 2 2
',7' 13
3 1
19 16 14
10
. • State number District No. District No. District No. District No
Andhra Pradesh 5 Chittoo~. 1 Adilabad . 3 t:ast Godavari 1
Assam 5 Npw~ong J Sibsagar. 1 Kammp:. 3

300
STATEMENT VI.25 Distribution of licences of paper and paper products by States and districts-concld.
Levell Levell! Level III Level IV Total ,-_____'___---, ,-__ --A. ___ -, r-----.A..----., .... ___ .A._ - ---,
State number District No. District No. District No. District No.
Biliar 2 Darbhanga Patna
Gujarat 13 Dangs 1 Broach 1 Rajkot 3 Kaira 1 Ahmedabad 4 Surat 3
Kerala 1 Trichur 1
Madhya Pradesh 7 Bilaspur . Balaghat Vidisha Ratlam 1 Ujjain 1 Sehore 2
Madras • 10 Tirunelveli 1 Thanjavur 1 Salem 4 Madurai 1
Chingleput 1 Coimbatore 2
Maharashtra 19 Bhandara 1 Nagpur 1 Chanda. 1 Thana 12 Kolaba 4
Mysore . 10 Belgaum Mandya 1 Shimoga • 2 North Kanara 2 Chitradurga )
Mysore 2 Bangalore 1
Orissa 5 Kalahandi Cuttack 2 Sambalpur 2
Punjab 14 Kangra Ambala . 5 Ludhiana 2 Gurgaon 6
Rajasthan 4 Kota 2 Jaipur 2
Uttar'Pradesh • 20 Varanasi 2 Muzaii'arnagar 1 Allahabad 2 Saharanpur 4
Meerut 6 Kanpur 5
West Bengal 19 Jalpaiguri I Nadia 2 Burdwan 3 Hooghly 2 24-Parganas 7 Howrah 4
Delhi 4 Delhi 4
Himachal Pradesh Sirmur
24 Sugar.
STATEMENT VI.26
Distribution oj licences of sugar by States alld (/;stricts
State Total
number
Andhra Pradesh 19
Assam 2
Level I
District No.
Level II --"'\
District No.
Chittoor 1 Srikakulam .. ' 2 Visakhapatnam 3
Level III Level IV ,- ,-----..A. ...
District No. District No.
Anantapur 1 Krishna . 4 East Godavari 4 West Godavari 3 Guntur 1
Sibsngar. 2

jOl
ST A'TEMENf 'Vi.'26
1J"iffributibn of licences 'of sugar by'States and districts-cofield.
Level I I:evel II LeveJ'III Level IV Total r-~-~.A.."--"""""70 r----..A.--____, r----..A..~-~- ........ • ('T---..?~.A..----...
number 'Dhtrict No .. District No. 'District State No Dfstrict No.
Bihar 7 Champaran 2 Gaya . 1 Muzaffarpur 1 Purnea . 1 Saran • 2
Gujarat 3 Amreli 1 Surat • 2
Madhya Pradesh 3 Rajgarh • 1 Ratlam 1 Gwalior. 1
Madras 13 South Arcot 1 Thanjavur 3 Salem 1 Tiruchirapalli 5
Chinglepqt 1 H-
Coimbafore :f
Maharashtra 31 Osmanabad 1 Satara 1 Nasik 2 Kolhapur ,,' 6 Aurangabad 2 ,Sholapur 6
Sangli .' 'a Ahinadnagar 7 Poona 3
Mysore~:- 9- Raichur . 1 Belgaum -3 Mandya-. 1- ·Shimoga 1 Bellary 3
Orissa 2 Koraput. 1 Ganjam 1
Punjab 13 Sangrur • 1 Kamal 1 Gurdaspur t Kapurthala 3 Rohtak 2 lullundur 2 Ambala 3
Rajasthan Ganganagar 1
Uttar Pradesh • 43 Bahraicb • 1 Bulandshahr . 1 Naini Tal 3 Hardoi 1 Bijnor 2 Aligarh 1 Bara Banki 1 Bareilly - 2 Muzaffamagar 5 Gonda 2 Moradabad 2 Saharanpur 4 Kheri 2 Meerut 8 Dearia 2 Kanpur - 1 Gorakh~ur 3 Sitapur . 2
West Bengal •• 2 Birbhum 1 Nadia
-'2:5 25. Fermentation industric3. STATEMENT VI.27
" Distribution of licences offermentation industries by States and districts
Level I Total
State n.umber District
Andhra Pradesh
Bihar
Gujarat .
Madhya·Pradesh
Maharashtra . Mysore
4
4
2
9
2
1
Saran
Level II
No. District
Srikakulam Yisakhapatnam
1
Kolhapur
Level III
No. District No.
1 Nizamabad 1 West Godavari
1 Sangli
LevellY
District N o.
Baroda . 3 Ahmedabad 1
Ratlam Sehore
Nasik • Ahmadnagar Poona . Bangalore Rohta~
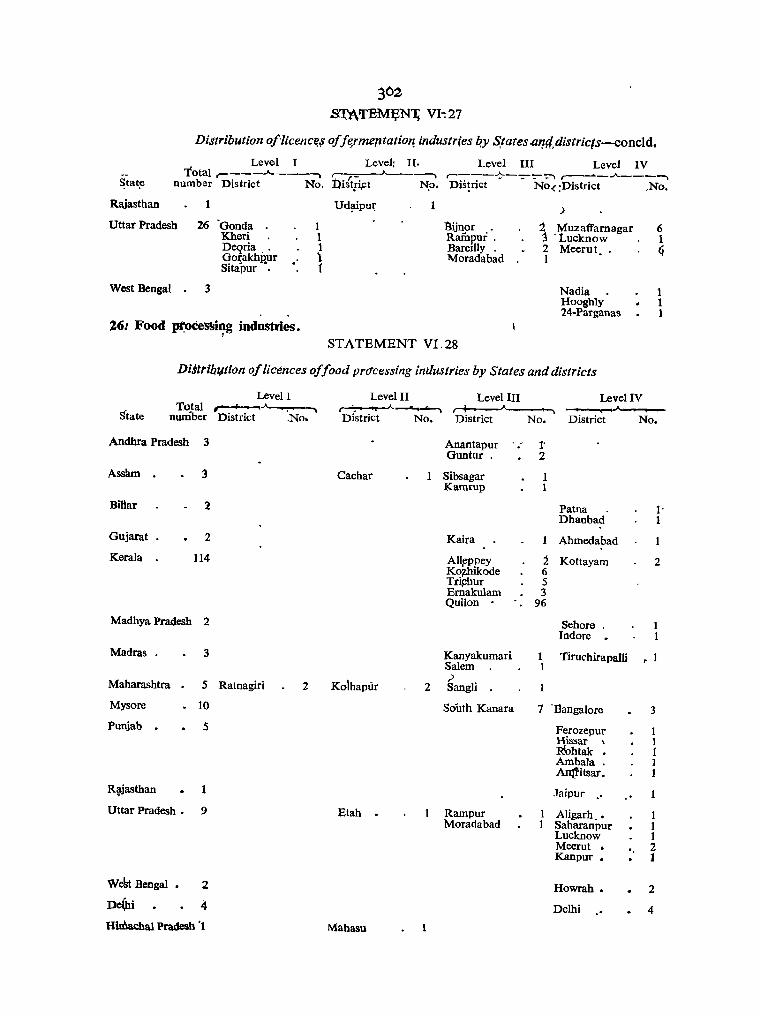
302
S'1;l\TEMem VI"": 27
Distribution oflicellcE:~ offe,rmefltation, industries qy s.tates<41J4.distric{s-concld.
Level I Level; II, Level III Level IV Total,-----"-----. r--::-_.... I r----~--::-_:_'::'""I r--~-..A----__.
~ta~ number District No, Ois"t;i,ct N;o, Dis!rict No< ;District ,No.
Rajasthan
Uttar Pradesh 26 -Gonda Kheri , Deqria , ' Gorakhp.ur Sitapur "
West Bengal • 3
e'
Z6J Food pt:oCe:ssi~g industries.
1 1 1 \ r
1
llijnor . Rampui, Bareilly . fvIoradabad
STATEMENT VI, 28
)
t Muz affam agar :3 'Lucknow 2 Meerut 1 •
Nadia Hooghly 24-Parganas
6 1 li
1 1 1
Disltibtltion of licences offood prdcessing industries by States and districts
Levell Level II Level III Level IV Total . I (,..A ~ . ... , "\ I
Dfstrici State numoer District ,No. No. District No. District No.
Andhra Pradesh 3 Anantapur . t Guntur ' 2
Asshm 3 Cachar Sibsagar 1 Karnrup 1
Biliar 2 Patna I' Dhanbad 1
Gujarat 2 Kaira Ahmedabad
Kerala 114 AI~eppey 2 Kottayam 2 Ko~bikode 6 Tri$:hur 5 Brnakulam 3 Quilon 96
Madhya Pradesh 2 Sehore . 1 Indore . 1
Madras. 3 Kanyakumari 1 Tiruchirapalli • 1 Salem 1
Ko\hapiir .> Maharashtra 5 Ratnagiri 2 2 Sangli
Mysore . 10 South Kanara 7 '_gangalore 3
Punjab . 5 Ferozepur 1 Hissar \ 1 R'obtak 1 Amhala . 1 Anti'itsar. 1
R1!-jasthan .Taipur
Uttar Pradesh • 9 Btah Rampur 1 Aligach .• 1 Moradabad 1 Saharanpur 1
Lucknow 1 Meerut • " 2 Kanpur • 1
weSt Bengal • 2 Howrah • 2 oe(hl 4 Delhi 4
Hin\achal Pradesh 'I Mahasu
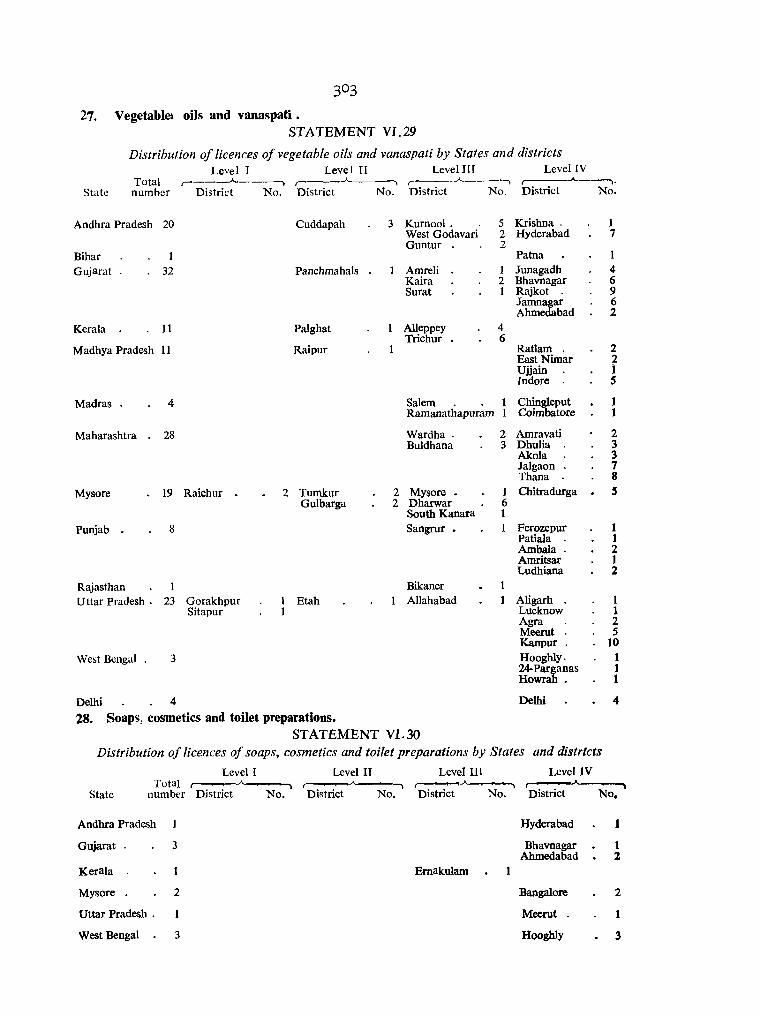
27. Vegetable.! oils and vanaspati. STATEMENT VI. 29
Distribution of licences of vegetable oils and vanaspati by States and districts Level I Level II Level III Level IV
State Total ,-__ --A. __ ---, ,-----"------, r---"-number District No. District No. District
......, ,----_..A.. __ -,. No. District No.
Andhra Pradesh 20 Cuddapah 3 Kuroool. 5 Krishna. 1 West Godavari 2 Hyderabad 7 Guotur 2
Bihar Patna
Gujarat 32 PanchmahaIs Amreli 1 Junagadh 4 Kaira 2 Bhavnagar 6 Surat 1 Rajkot 9
Jamnagar 6 Ahmedabad 2
Kerala 11 Palghat AlIeppey 4 Trichur • 6
Madhya Pradesh 11 Raipur 1 Ratlam 2 East Nimar 2 Ujjain i Indore S
Madras. 4 Salem Chingleput 1 Ramanathapuram Coimbatore 1
Maharashtra 28 Wardha. 2 Amravati 2 Buldhana 3 Dhulia 3
Akola 3 Jalgaon . 7 Thana . 8
Mysore 19 Raichur . 2 Tumkur 2 Mysore • 1 Chitradurga S Gulbarga 2 Dharwar 6
South Kanara 1
Punjab . 8 Sangrer • Ferozepur J Patiala 1 Ambala . 2 Amritsar J Ludhiana 2
Rajasthan Bikaner Uttar Pradesh . 23 Gorakhpur Etah Allahabad Aligarh 1
Sitapur Lucknow 1 Agra 2 Meerut 5 Kanpur . 10
West Bengal . 3 Hooghly. 1 24-par~anas 1 Howra . 1
Delhi 4 Delhi 4
28. Soaps, cosmetics and toilet preparations. STATEMENT VI. 30
Distribution of licences of soaps, cosmetics and toilet preparations by States and districts
Level I Level II Level III Level IV Total
State number District No. District No. District No. District No.
Andhra Pradesh Hyderabad 1
Gujarat 3 Bhavnagar 1 Ahmedabad 2
Kerala Emakulam 1
Mysore 2 Bangalore 2
Uttar Pradesh. Meerut 1
West Bengal 3 Hooghly 3

29. Rubber goods. ~TArE¥ENT VJ.31"
, DistriQution of licences of. rubber goods by States and districts Level I Level II Level III Level IV
State Total r------'----"" ~~. ,---...A----, r----_,.__--...... -number District No. Bistrict N?-. District No. District No.
Gujarat
~erala
Madras
Maharashtra .
-Mysore
Punjab
Uttar PradeslY
\Vest Bengal
Delhi
4
7
5
4
l'
3
3
16
AIIeppey Trivandrum Emakulam
30. Leather and leather products. STATEMENT VI. 32
Bhavnagar Baroda
2 Kottayam 1 1
Madurai IChingleput
Coimbatore II>
IPoona Thana
Bangalore
Rohtak Gurgaon.
Meerut Kanpur •
Hooghly 24-Parganas Howrab
Delhi
Distrlb1f,tion of licences of leather and leather products by States and districts
Level I Level II Total number
r--__ A,-____ ,.. .. .......,__.A __ --.. State District No. District No.
Oujarat 3
Madhya Pradesh 2 . '.' I.
Madras S
Orissa r Baudh-T{bondmals 1 c
Uttar Pradesh 7
West Ben'~hl • 2
31, Glues and gelatine.
Level III
District
Kaira
STATEMENT VI.33
Level IV
No. District
2 Ahmedabad . Sehore Gwalior .
North Areat TiruchirapalH ' ChingIeput .
Agra Kanpur
24-Parganas 0'
Howrah .
Distribution oj licences of glues and gelatine by States and districts Level I Level II Level III Level IV
1 -3
2 1 2
3 1
1
2 1
1 2
9 2 5
1
No;
1
1 1
1 2 5
6
1 1
Total " '\._~, .... ----, State numger District No. District No. District
,.--....... -J-_-.... -T
-, .... ,
No. District 1 .... 0. Gujarat : 11 Kaira • Kerala. • 1 Cannanore Madhya Pradesh 1 Madras. 1 Maharashtra 1 Uttar Pradesh~ 1 West Bengal 1 Delhi 1
1 1
Jabalpur • 'Chingleput Poona • Kanpur .,., 24-Parganas Delhi .;
1 1 1 1 1 .J
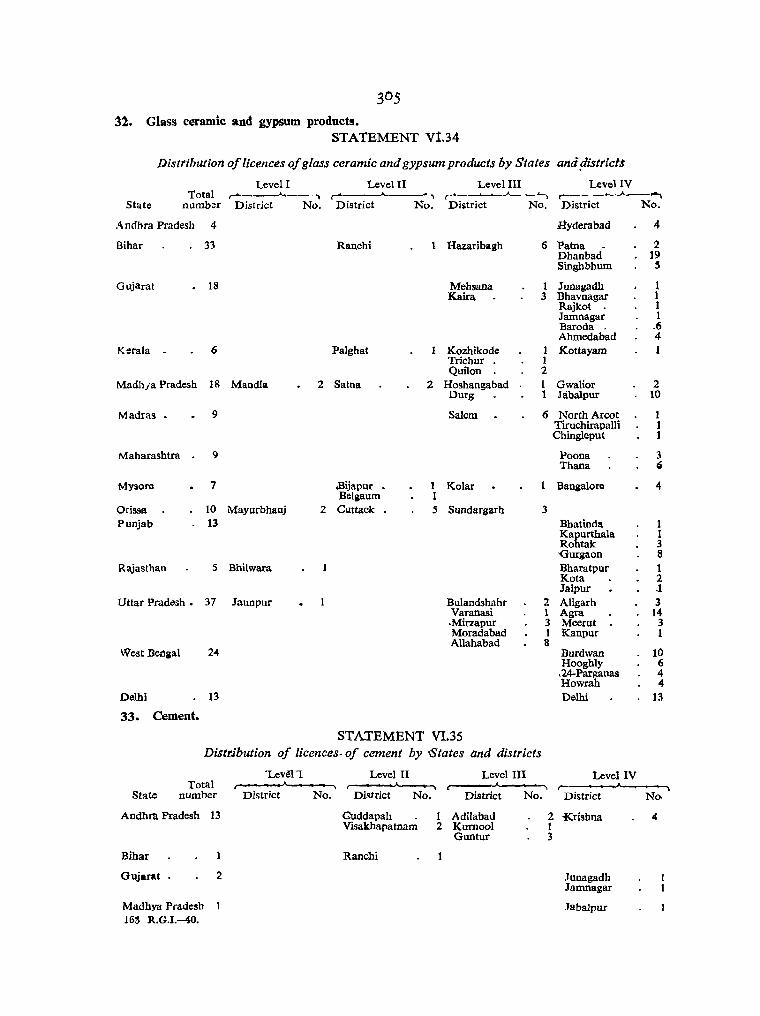
31. Glass ceramic and gypsum products. STA 1'EMENT Vl.34
Disttibution of licences of glass ceramic and gypsum products by States
Level I Level II Level III Total ,-...--~--. ,...------A. r-__"__4-.-..A..-_""__
State numb~r District No. District No. DiI;trict No.
A ndhTa Pradesh 4
Bihar 33 Raochi 1 Hazaribaah 6
Gujarat 18 Mehsana 1 Kaira 3
Kerala . 6 Palghat Kozhikode I Trichur 1 Quilon 2
Madhja Pradesh 18 Manella 2 Satna 2 Hoshangabad 1 Durg 1
Madras. 9 Salem 6
Maharashtra 9
Mysora 7 cBijapur . 1 Kolar Belaaum 1
Orissa 10 Mayurbhanj 2 Cuttack 5 Sundargarh 3 Punjab 13
Rajasthan 5 Bhilwara
Uttar Pradesh. 37 Jaunpur Bulandshahr 2 Varanasi 1 .Mirzapur 3 Moradabad 1 Allahabad 8
West Bellaal 24
Delhi 13
33. Cement.
STATEMENT VI.35 Distribution of licences. of cement by <States and districts
State Total
number
'Lev!l"1 Level II ,,____.._______.. ~ District No. District No.
Level III
District No.
ana ,disttiets
Level IV , ___ ~...A-_"'"" District No.
Hyderabad 4
Patna 2 Dhanbad 19 Singhbhum S
Junagadh 1 Bhavnagar 1 Rajkot I Jamnagar 1 Baroda . .6 Ahmedabad 4 Kottayam
Gwalior 2 Jabalpur 10
North Arcot 1 Tiruchirapalli 1 Chingleput 1
Poooa 3 Thana (i
Bangalora 4
Bhatinda 1 Kapurthala 1 Rohtak 3 'Gurgaon 8 Bharatpur 1 Kota 2 Jaipur .1 Aligarh 3 Agra 14 Meerut 3 Kanpur 1
Burdwan 10 Hooghly 6 ,24-Parganas 4 Howrah 4 Delhi 13
Level IV r-------~--~--~ District No.
A ndhra Pradesh 13 Cuddapah 1 Adilabad 2 Krishna " Vi~akhapatnam 2 Kurnool 1 Guntur 3
Bihar Ranchi
Gujarat 2 Junagadh Jamnagar
Madhya Pradesb Jabalpur I6S R.G.I.-40.

306
STATEMENT VI.35
Distribution of licences of Level I
cement Level II
by States and districts-conc1d. Level III Level IV
Total .------"-------. r---_____;"_---~ r----'----. District No.
r---__..A..----. District No. State number District No. District No.
Madras Maharashtra -t Mysore 1
Chanda Bijapur
Coimbatore . 1
34. Timber products. STATEMENT VI.36
Distribution of licences of timber products by States and districts
Level I Total ~---Stale number District No.
Andhra Pradesh 2 Assam 14 Bihar 1 Muzalfarpur Gujarat 2 Kerala 10
Madras 9 Maharashtra 2
Mysore . -2
Orissa 3 Koraput Uttar Pradesh 9 Deoria I
Sitapur 2 West Bengal . 4
35. Miscellaneous industries.
Level II -"-
District No.
Visakhapatnam Cacha!" .
Palghat
Balasore 2
Level III
District
Sibsagar
Surat Trivandrum Cannanore
Level IV
No. District
Rrishnfi 5 Lakhimpur
1 Ahmedabad 1 Kottayam 6
Ramanathapuram 9 Poona Thana
North Kanara 1 South Kanara 1
Bijnor Bareilly
2 DehraDun 2
No.
8
2
1 1
2
24-Parganas 2 Howrah 2
STATEMENT VI.37 Distribution oj licences of miscellaneous~ indztstries by States and districts
Level I Level II Level III Level IV Total
State number District No. District Andhra Pradesh 1
In conclusion it may' be worthwhile to have a look at the licences taken out by each State as a tentative index of their absorptive capacities.
It is a matt6f.:af much interest that none of the districts in the first level of development in the States of Andhra Pradesh, Assam and West Bengal has taken out any' licence of any sort. This is of particular significance for the State of West Be~gfll which is generally held to be industrialized. Of those States which have taken out licences for districts in level I, Bihar has ,taken out 11 (districts of Darbhanga 1, Champaran 2, Muzaffarpur 4, Saran 4), Madhya Pradesh 3 (districts of
r---.A.~---. -"--~~
No. District No. District No. Guntur 1
Bilaspur 1, Mandla 2), Maharashtra 2 (district of Ratnagiri), Mysore 3 (district of Raichur), Orissa 27 (districts of BaudhKhondmaIs L Kalahandi 1, Mayurbhanj 3, Koraput 4, Puri 4, Keonjhar 5, Samoa1p_ur 9, Punjab 1 (district Kangra), Raj'a~ihan 3 (district of Bhilwara), and Uttar pJt des}f_33 (1 each in Bahrai9h. Ballia, Faiza-. bad, Hardoi, Unnao, B¥"$, Banki and' Jaunpur 2, Gonda 3, Kheil 3, Deoria 5, Gorakhpur 6 and Sitapur 7) and Himachal Pradesh 1 (district of Chamba). This makes a total of only 84 licences in only 30 out of a total of 79 districts in the
. lowest level of development throughout India.
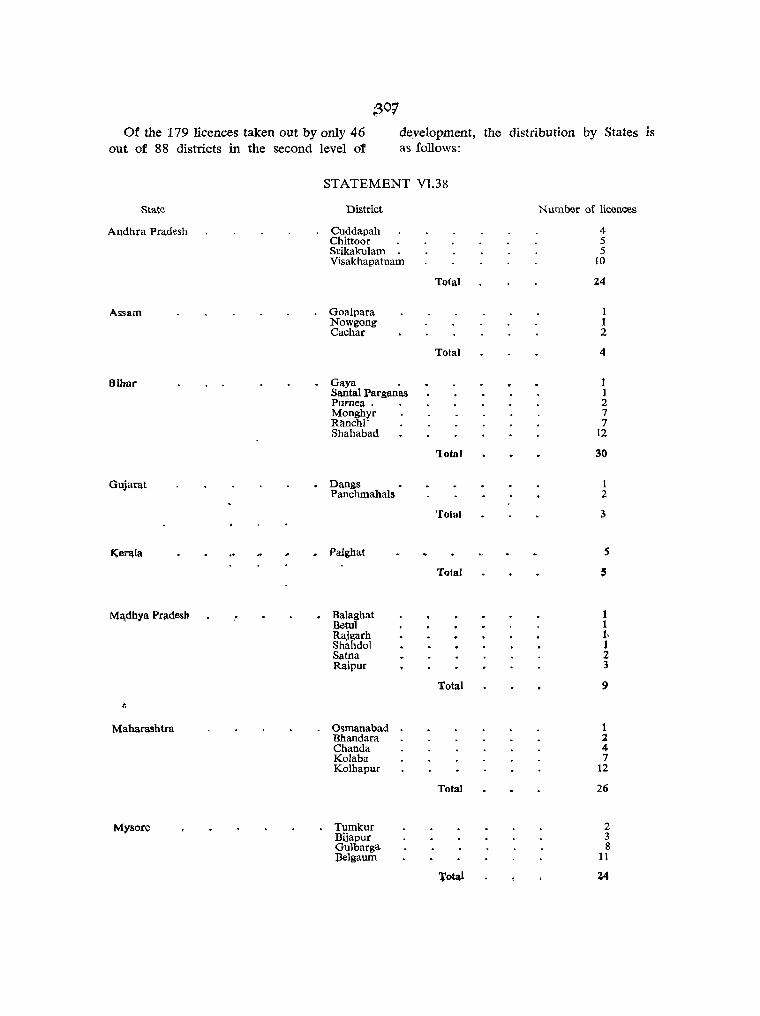
~O'i
Of the 179 licences taken out by only 46 development, the distribution by States is out of 88 districts in the second level of as follows:
STATEMENT VI.38
State District Number of licences
Andhra Pradesh Cuddapah 4 Chittoor 5 Srikakulam 5 Visakhapatnam 10
To(al 24
Assam Goalpara 1 Nowgong I Cachar 2
Total 4
Bihar . Gaya 1 Santal Parganas 1 Pumea. 2 Monghyr 7 Rlmchi" 7 Shahabad 12
lotal 30
Gujarat . Dangs 1 Panchmahals 2
Total 3
£<e~la ~ Palghat 5
Tolal S
M~dhya Pradesh . Balaghat 1 Betul 1 Rajgarh 1, Shahdol 1 Satna 2 Raipur 3
Total 9
t
Maharashtra Osmanabad 1 Bhandara 2 Chanda 4 Kolaba 7 Kolhapur 12
Total 26
M)"sorc Tumkur 2 Bijapur 3 Gulbarga 8 l3eJgaum 11
ToW Z4

State
Orissa
Punjab
Rttjasthan
Qtti\r prilQeSn
West Beng!\l
Himachal Pradesh •
~o8
STATEMENT VI.38-concld.
District
Dhenkanal Ganjam Balasore Cuttack
. Hoshiarpur
Ihalawar . Sawai Madhopur Udaipur "Pali
Etawah • Etah lYfainpqri
Mahasu Sirmur
Total
Total
TotlJl
Total
Total
'.
Total
Number of licences
1 2 4
19
26
1
1 2 2 ~
It
1 2
13
Hi
1
1 1
2
Of the 637 licences taken out by 62 out of a total of 76 districts in the third level
of development, the distribution by States is as follows:
State
Andhra Pradesh
STATEMENT VI. 39
District
Khammam Nizamabad Anantapur Adilabad Kurnool . East Godavari West Godavari Guntur
Sibsagar Kilmrup
Total
Total
Number of licence.
1 1 4 6 9
1.Z 12 14
59
9 17
26
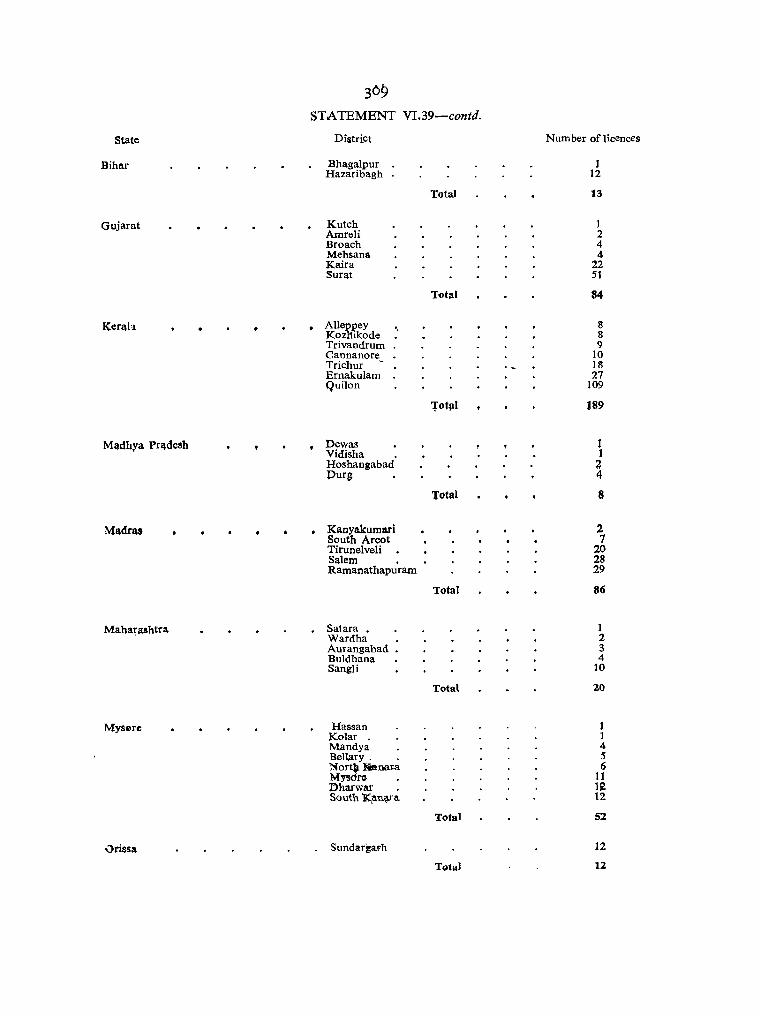
309 ST.A TEMENT VI.39-contd.
State District Number of licences
Bihar Bhagalpur 1 Hazaribagh 12
Total 13
Gujarat Kutch 1 Amreli 2 Broach 4 Mehsana 4 Kaira 22 Surat 51
l10tal 84
I{.er~h • AUeppey '. S Kozl1ikode 8 Trivandrum 9 Cannanore 10 Trichur 18 Ernakulam 27 Quilon 109
l'otlll 189
M~dbra Pr~desh • Dewas 1 Vidisha 1 Hoshangabad 2 purt; 4
Total 8
Madras · Kanyakumari 2 South Arcot 7 Tirunelveli 20 Salem 28 Ramanathapuram 29
Total 86
Mahat;ashtra Satara • 1 Wardha 2 Aurangabad • 3 Buldhana 4 SangIi 10
Total 20
Mysere Hassan 1 Kolar J Mandya 4 BelIary . 5 NortlJ.*oora 6 MysdFo 11 l'>harwar 1£ South K~n~ta. 12
Total 52
Orissa Sundargal'h 12
Total 12

310
'STATEMENT
State District
Punjab. Sangn r
Rajasthan Bikaner Ganganagar Jodhpur
Uttar Pradesh Jhansi Bulandshahr Bijnor Rampur Varanasi Mirzapur Bareilly Moradabad Allahabad
West Bengal . Birbhum
Of the 2,293 licences taken out by 75 out of a total of 81 (excluding districts of Greater Bombay, Madras and Calcutta of
V1.39·-concld.
Number ef licollcea
2
Total 2
1 2 2
Total 5
1 3 6 6 9
10 12 12 21
Totol 80
1
Total
this level) districts in the fourth or top level of development, the distribution by States is as follows;
ST A TEMENT VI.40
State District Number of licences
Andhra Pradesh Krishna 15 Hyderabad 43
Total 58
Assam • Lakhimpur 18
Total 18
Bihar . Patna Dhanbad
19 34
Singhbhum 39
Total 92
Gujar~ Suren&anagar 5 Junagadh 13 Bhavnag:'lr 22 Rajkot . 23 Jam nagar 28 Baroda 89 Ahmedabad 110
Totlll 290
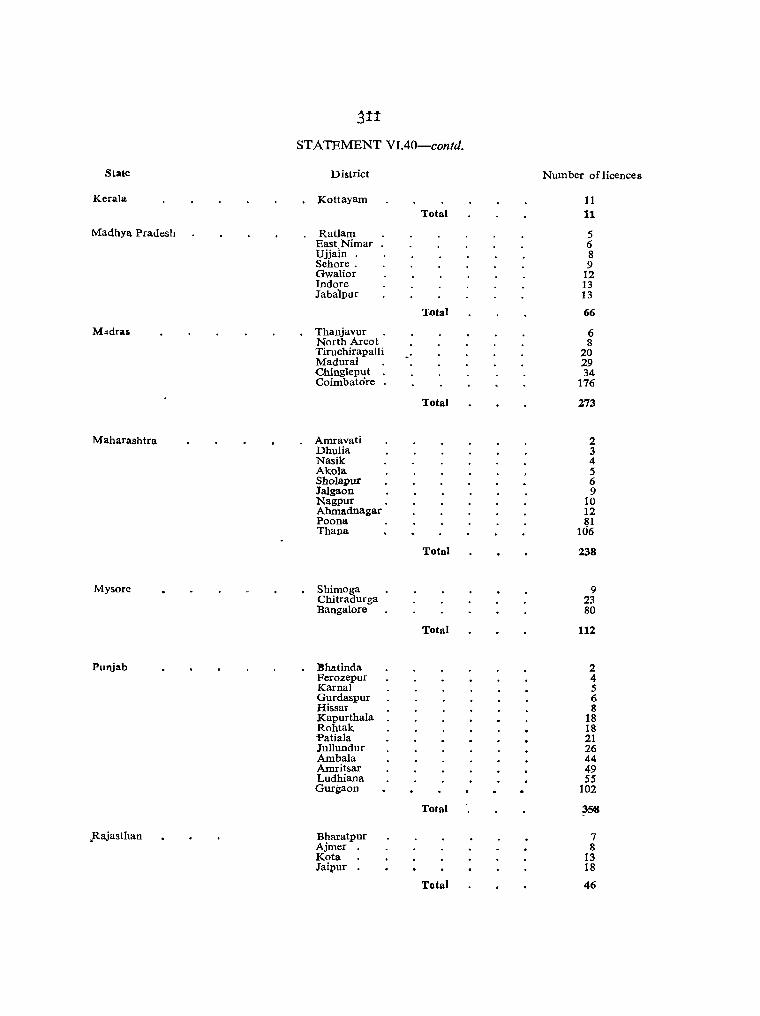
~!t
STATEMENT VI.40-contd.
State District Number of licences
Kerala Kottayam 11 Total 11
Madhya Pradesh Ratlam 5 East.Nimar 6 Ujjain . 8 Sehore. 9 Gwalior 12 Indore 13 Jabalpur 13
Total 66
M~dras Thanjavur 6 North Arcot 8 Tiruchirapalli 20 Madurai 29 Chingleput . 34 Coimbatore . 176
Total 273
Maharashtra Amravati 2 Dhulia 3 Nasik 4 Akola 5 Sholapur 6 Jalgaon 9 Nagpur 10 Ahmadnagar 12 Poona 81 Thana 166
Total 238
Mysore Shimoga 9 Chitradurga 23 Bangalore 80
Total 112
Punjab Bhatinda 2 Ferozepur 4 Karnal 5 Gurdaspur 6 Hissar 8 Kapurthala 18 Rohtak 18 "Patiala 21 Jullundur 26 Ambala 44 Amritsar 49 Ludhiana 55 Gurgaon 102
Total 358
.Rajasthan Bharatpur 7 Ajrner 8 Kota 13 Jaipur 18
Total 46
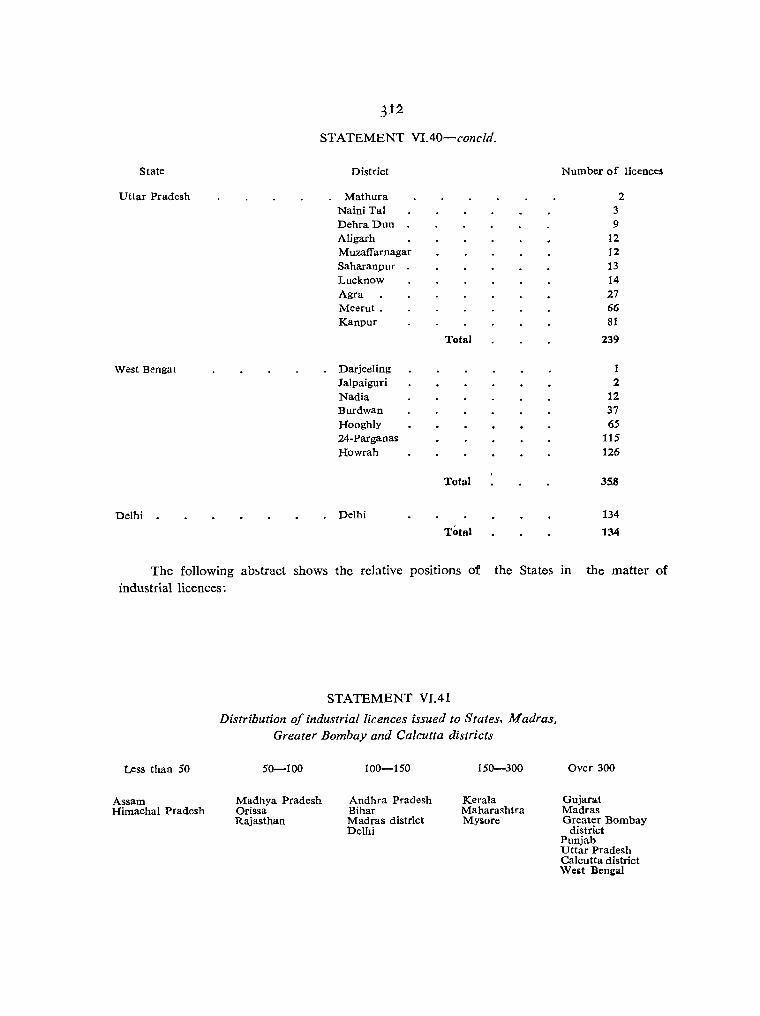
State
Uttar Pradesh
West Bengal
Delhi
STATEMENT VIAO-concld.
District
Mathura Naini Tal Dehra Dun Aligarh M uzaffarnagar Saharanpur Lucknow Agra Meerut. Kanpur
Darjeeling Jalpaiguri Nadia Burdwan Hooghly 24-Parganas Howrah
. Delhi
Total
Total
Number of licences
2 3 9
12 12 13 14 27 66 81
239
2 12 37 65
115 126
358
134
134
The following ab~tract shows the relative positions of the States in the matter of industrial licences:
Less than 50
Assam Himachal Pradesh
STATEMENT VIAl
Distribution of industrial licences issued to States. Madras, Greater Bombay and Calcutta districts
5(}-100
Madhya Pradesh Orissa Rajasthan
100-150
Andhra Pradesh Bihar Madras district Delhi
150-300
Kerala Maharashtra Mysore
Over 300
Gujarat Madras Greater Bombay
district Punjab Uttar Pradesh Calcutta district Weat Bengal

No licences have been taken out in respect of the following industries in the States noted against eaph:
STATEMENT VJ.42
States which have taken out no industrial licences
Metallurgical industries
Fuels 1 •
Boilers.
Prime m.overs
Electrical equipment
Telecommunications
Transportation (including railway wagon)
Industrial machinery
Machine tools
~gricultural machinery
Earthmoving machinery
Miscellaneous mechanical engineering industries
Commercial, office and household equipments
Medical and surgical appliances
Industrial instruments
Scientific instruments
Mathematical surveying and drawing instruments
1611 R.C.I.-4l.
Himachal Pradesh
Gujarat, Kerala, Madhya Pradesh, Mysore, Rajasthan, Uttar Pradesh, Delhi and Himachal Pradesh
No licences in any State except Maharashtra, Punjab and West Bengal
Assam, Bihar, Kerala, Madhya Pradesh, Orissa, Rajasthan-, Delhi and Himachal Pradesh
Assam and Himachal Pradesh
Andhra Pradesh, Assam, Bihar, Kerala, Orissa, Rajasthan, Uttar Pradesh and Himachal Pradesh
Kerala, Madhya Pradesh and Himachal Pradesh
Himachal Pradesh
Assam, Bihar, Kerala, Madhya Pradesh, Orissa~ Rajasthan and Himachal Pradesh
Andhra Pradesh, Assam, Bihar, Kerala, Madhya Pradesh, Orissa, and Himachal Pradesh.
Andhra Pradesh, Assam, Kerala, Madhya Pradesh, Mysore, Orissa Punjab, Rajasthan, Uttar Pradesh and Himachal Pradesh
Assam, Bihar, Madhya Pradesh, Orissa, Rajasthan and Himachal Pradesh·
Assam, Bihar, Gujarat, Kerala, Madhya Pradesh, Mysore, Rajasthan! Uttar Pradesb and Himachal Pradesh
No licences in any State except Maharashtra and West Bengal
Andhra Pradesh, Assam, Bihar, Gujarat, Kerala, Madbya Pradesh, Orissa, Delhi and Himachal Pradesh
Assam, Bihar, Gujarat, Kerala, Madhya Pradesh, Madras, Orissa and Himachal Pradesh-
No licences in any State except Uttar Pradesh and Delhi,

3I4 STATEMENT'VI.42
States which have taken out no industrial licences-concld.
Fertilizers
Chemicals
• •
Photographic raw films and paper
Dyestuffs
Drugs and pharmaceuticals
Sugar
Flfflli.entation .industries •
Food processing industries
Vegetable oils and vanaspati . Soap3, cosmetics and toilet preparations
Rubber goods
Leather and leather 1),roi1u'Cts .
Glues and gelatine
Glass, .ceramics and gypsum products
Cement
timber products
Miscellaneous industries
Assam, Olissa, Punjab, West Bengal, Delhi and Himachal Pradesh
Himachal Pradesn
No licences in any State except West Bengal
Andhra Pradesh, Assam, Bihar, Kerala, Madhya Pradesh, Madras, Mysore, .Orissa, .Rajasthan, Uttar Pradesh and Himachal Pradesh
Assam, Bihar, Kerala, Madhya Pradesh, Orissa and Himachal Pradesh
Kerala, Delhi and Himachal Pradesh
l'\.ssam, Kerala, ~J;i!$a, Delhi.and Himachal Pradesh
Orissa
Assam, Orissa and .}Iim\lchal"Prad((.sh Assam, Bihar, Madhya Pradesh, Orissa, Punjab, Rajasthan, Delhi
and. Himachal Pradesh
AnlIhra ~adesh, Assam, Bihar, Madhya Pradesh, Orissa, Rajasthan and Himachal Pradesh
Alldhra I'l'attl!sh, A'SSUm, Bihar, ;Keulla;.iMysote;:Pullja-b, Attjas~ Delhi and Himachal Pradesh
Andhra Pradesh, Assam, Bihar, Mysore, Orissa, 'p.j}~b, B.ajasthan and Himachal Pradesh .
Assam and Himachal Pradesh
Assam, Kerala, Orissa, Punjab, Rajasthan, Uttar PradeSh, West Bengal, Delhi and Himachal Pradesh
Madhya Pradesh, Punj<tb, Rajasthan, DelhI anti HlmaChtti 'Prade~
No licences in any State except Andhra pradesh and Maharashtra

CHAPTER vn CASES OF HIRE PURCHASE UNDER THE NATIONAL SMALL INDUSTRIES CORPORATION AMONG DISTRICTS ARRANGED BY LEVELS OF DEVELOPMENT
'FPlFl PRECEDING CHAPTER was concerned with· th.e 4i~i~ution of industrial licences pe~ing te, l'~a'ge facteries among districts arranged by levels of development. A Directory of machines supplied on Hire. Purchase iSSlUed by' the National Small Industries Corporation in August, 1964 provided the occasien for investigating how much of the hire purchas~ benefits has been claimed by districts in the various l'cvels of development. The Statistics presented in this Chapter hav.e been based on this authoritative Directory alone.
The Directory giJles us oll' the whole a picture of more equable distribution of hire
purchase cases in the various levels of development than of industrial licences. This accords with the aims and ob.jects of the National Small Industries Corporation, which are mainly designed to stimulate. small industrial enterprise over as large an area as possible. But despite this effort there is a noticeabl'e concentratiolll 0:& hi.re purcbas~ cases in districts of the tQP or highes.t ~vyl of development and mainly in the three cities of Bombay, Calcutta and- Madras, which provides prOOf. of their aosoq>tivif capacities. Statement VII.I gives an abstract of cases of hire purchase distributed among all districts, according tOr levels of development.
STATEMENT VII.!
Abstract of cases of hire purchase distributed among all districts in India according to levels of development'
Greater Bombay,
Industry Total of, CaJ~\l.ttJi,
Total I IJ, III IV I to IV Madrl!s
1fotab . 3,71ii 105 301 651' l',($lo(i 'Zr,679 l~
F .Atgricultural implements 42 4 5 11 18* 38' 4
Z l\.uto serviclllg . 127 2 11 43 55 I1t 16
'30 B u.il4.ia" lflawia~ " 67 1-7 17. 18 53 It
..,_ €eramiCs· a ::t 4- ~ 4
5 Chemicals 126 3 6 22 41 72 54
6 ~ontai.nm5' 38 2 7 7 16. 22
/. Erect'ricaf good's 1'43 8 14* 73 9S 48
8. 'S'oocl products 1.16. 17 lO. 32 4-5. 104 1:l 9; F~nclry. 92 4 10 16 36 66. 26
tOJ IAlthcr . 30' 7 4 11 ~ , Jill LigHt. engiil('ering 1,546 19 119 222:1:' 'ZU@:. 1,.071 475
*1qcludes r unit for which hire purchase value is not avana1:S1e. t{nC~s 41 uni~ fOI) wll.ktlU1ire purc'hase value is not a,vailable.
@IIlBludes 9 units for which hire purchase value is not avaUable.
31-5·
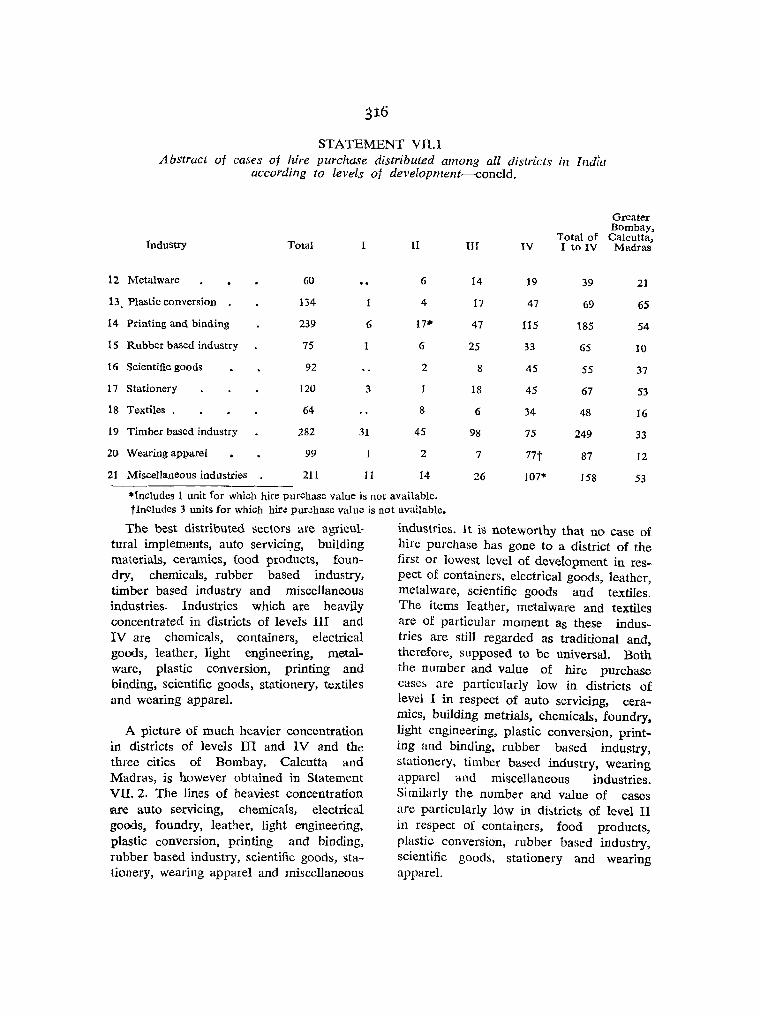
316
STATEMENT VII.l Abstract of cases of hire purchase distributed among all districts in India
according to levels of development-coneld.
Industry Total
12 Metalware 60
13, Plastic conversion 134
14 Printing and binding 239
15 Rubber based industry 75
16 Scientific goods 92
17 Stationery 120
18 Textiles. 64
19 Timber based industry 282
20 Wearing apparel 99
21 Miscellaneous industries 211
I
6
1
3
31
11
II
6
4
17·
6
2
8
45
2
14
Greater Bombay,
Total of Calcutta, IH IV I to IV Madras
14 19 39 21
17 47 69 65
47 115 185 54
25 33 65 10
8 45 55 37
18 45 67 53
6 34 48 16
98 75 249 33
7 77t 87 12
26 107'" 158 53
"'Includes 1 unit for which hire purchase value is not available. tlncludes 3 units for which hiN pur.::hase value is not available.
The best distributed sectors are agricul- industries. It is noteworthy that no Case of tural implements, auto serviciIJ.g, building hire purchase has gone to a district of the materials, ceramics, food products, foun- first or lowest level of development in res-dry, chemicals, rubber based industry. pect of containers, electrical goods, leather, timber based industry and miscellaneous metalware, scientific goods and textiles. industries. Industries which are heavily The items leather, metalware and textiles concentrated in districts of levels III and are of particular moment as these indus-IV are chemicals, containers, electrical tries are still regarded as traditional and, goods, leather, light engineering, metal- therefore, supposed to be universal. Both ware, plastic conversion, printing and the number and value of hire purchase binding, scientific goods, stationery, textiles casc~ are particularly low in districts of and wearing apparel. level I in respect of auto servicing, cera
A picture of much heavier concentration in districts of levels III and IV and the three cities of Bombay, Calcutta and Madras, is however obtained in Statement VII. 2. The lines of heaviest concentration Ial'e auto serVlcmg, chemicals. electrical goods, foundry, leather, light engineering, plastic conversion, printing and binding, rubber based industry, scientific goods, stationery, wearing apparel and miscellaneous
mics, building metrials, chemicals, foundry, light engineering, plastic conversion, printing and binding, rubber based industry, stationery, timber based industry, wearing apparel and miscellaneous industries. Similarly the number and value of cases are particularly low in dbtricts of level II in respect of containers, food products, plastic conversion, rubber based industry, scientific goods, stationery and wearing apparel.
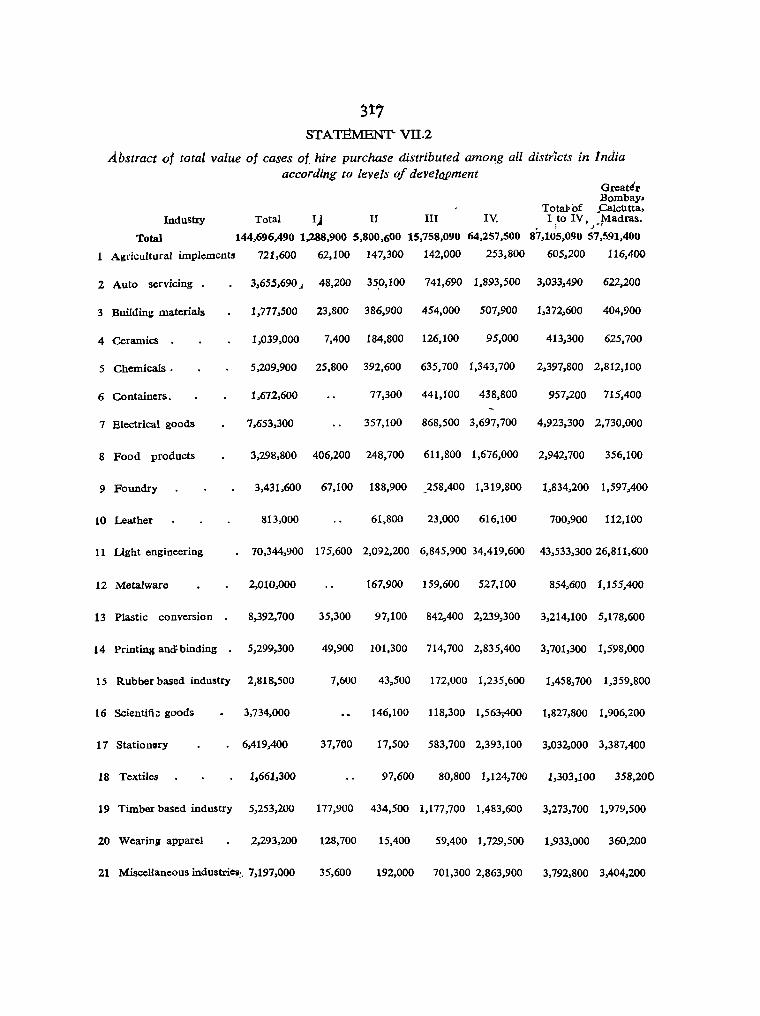
317 STATEMENT" VII.2
A.bstract of total value of cases of. hire purchase distributed amon,g all districts in India according to levels of development
Greattr Bombay.
Total> of .Calcb tta, Industry Total I~ II III IV. I .to IV , ~. fv.ladras.
Total 144,696,490 1,288,900 5,800,600 15,758,090 64,257,500 87,105,090 57,591,400
1 Agricultural implements 721,600 62,100 147,300 142,000 253,800 605,200 116,400
2 Auto servicing . 3,655,690 J 48,200 359,100 741,690 1,893,500 3,033,490 622,200
3 Building materials 1,777,500 23,800 386,900 454,000 507,900 1,372,600 404,900
4 Ceramics 1,039,000 7,400 184,800 126,100 95,000 413,300 625,700
5 Chemicals. 5,209,900 25,800 392,600 635,700 1,343,700 2,397,800 2,812,100
6 Containers. 1,672,600 77,300 441,100 438,800 957,200 715,400
7 Electrical goods 7,653,300 357,100 868,500 3,697,700 4,923,300 2,730,000
8 Food products 3,298,800 406,200 248,700 611,800 1,676,000 2,942,700 356,100
9 Foundry 3,431,600 67,100 188,900 _258,400 1,319,800 1,834,200 1,597,400
10 Leather 813,000 61,800 23,000 616,100 700,900 112,100
11 Light engineering 70,344,900 175,600 2,092,200 6,845,900 34,419,600 43,533,300 26,811,600
12 Metalware 2,010,000 167,900 159,600 527,100 854,600 1,155,400
13 Plastic conversion 8,392,700 35,300 97,100 842,400 2,239,300 3,214,100 5,178,600
14 Printing ancf binding 5,299,300 49,900 101,300 714,700 2,835,400 3,701,300 1,598,000
15 Rubber based industry 2,818,500 7,600 43,500 172,000 1,235,600 1,458,700 1,359,800
16 Scientifi;: goods 3,734,000 146,100 118,300 1,563;400 1,827,800 1,906,200
17 Stationory 6,419,400 37,700 17,500 583,700 2,393,100 3,032,000 3,387,400
18 Textiles 1,661,300 97,600 80,800 1,124,700 1,303,100 358,200
19 Timber based industry 5,253,200 177,900 434,500 1,177,700 1,483,600 3,273,700 1,979,500
20 WearinlJ apparel 2,293,200 128,700 15,400 59,400 1,729,500 1,933,000 360,200
21 MisceHaneous industriell:. 7,197,000 35,600 192,000 701,300 2,863,900 3,792,800 3,404,200

This shows that not only moderJr lin~ of small industry but even the, traditional on:es which lean on modem tools .are concentrated in districts of levers Il'f ana rv.
./4;. s'llatevrise' marration of each item of hire' purchase may now De attempted, each
State subclassified into districts in each of tho four levels of development. We shall exclude' Grea.ter Bombay, Calcutta and Madtas from this brief account. The first figure gives the number of cases of hire purchase and the second figure the total value (in rupees).
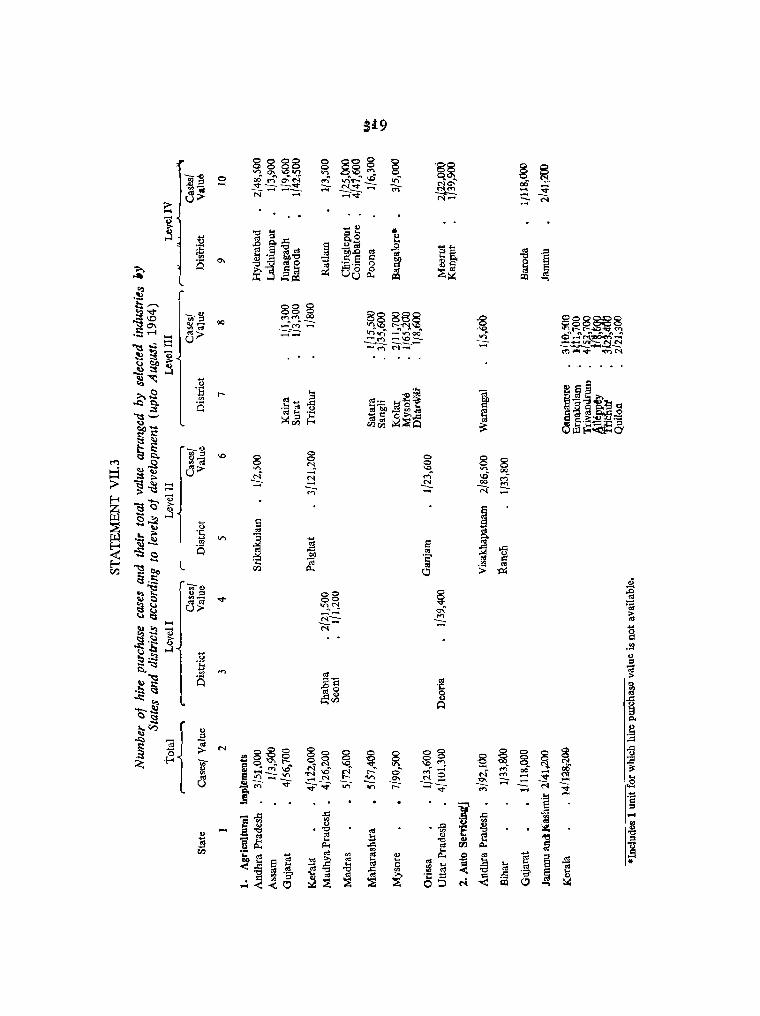
:> ....
!
o .....
00 00 "1..C"'i ..... -<'1---<'I
o '0 '<to r-~
It">
s .. ~
0 0 0 0 \0 r<1. M" O <'I ..... ---""
]
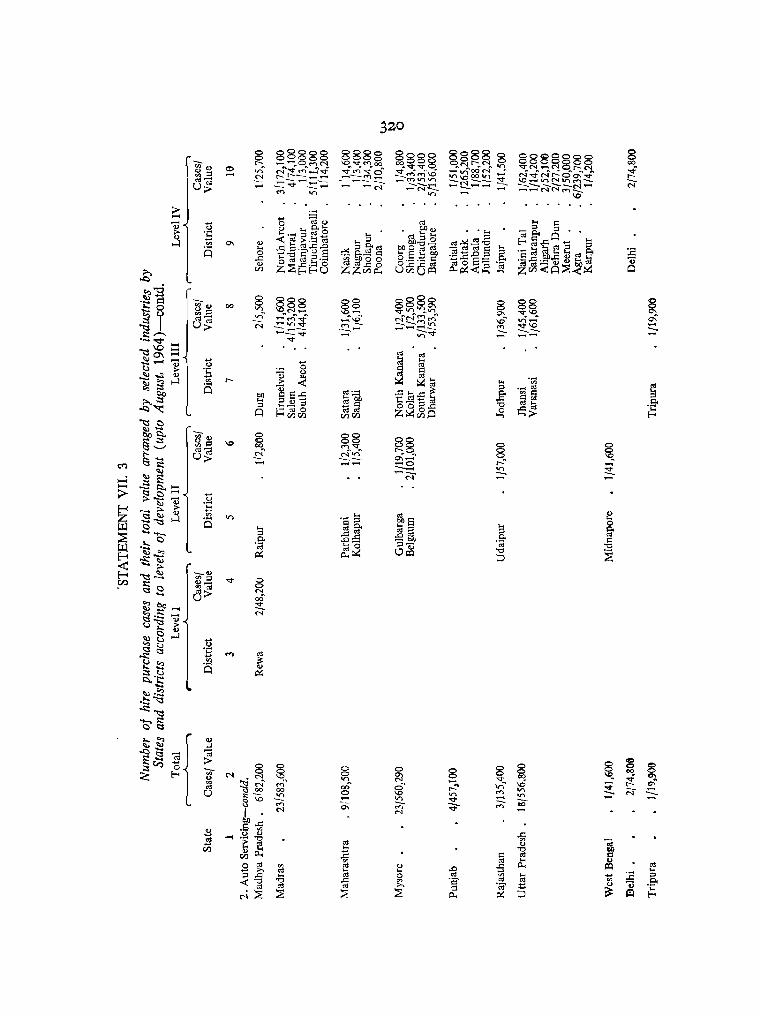
1:! o .c OJ
VJ
~ 00-o -
g 00
~ N

32I
88 00_
m ('i' -----. . . . .
~ o --.....
. .
...
I
8 --00 -:;;;-
~ ..... -.....
•
•
§~ ..... - -... o ~ .... .-. -.-.
8 00
'£ ----
.8 ~ ---
8 .... .... t::. ...
8 ~ --
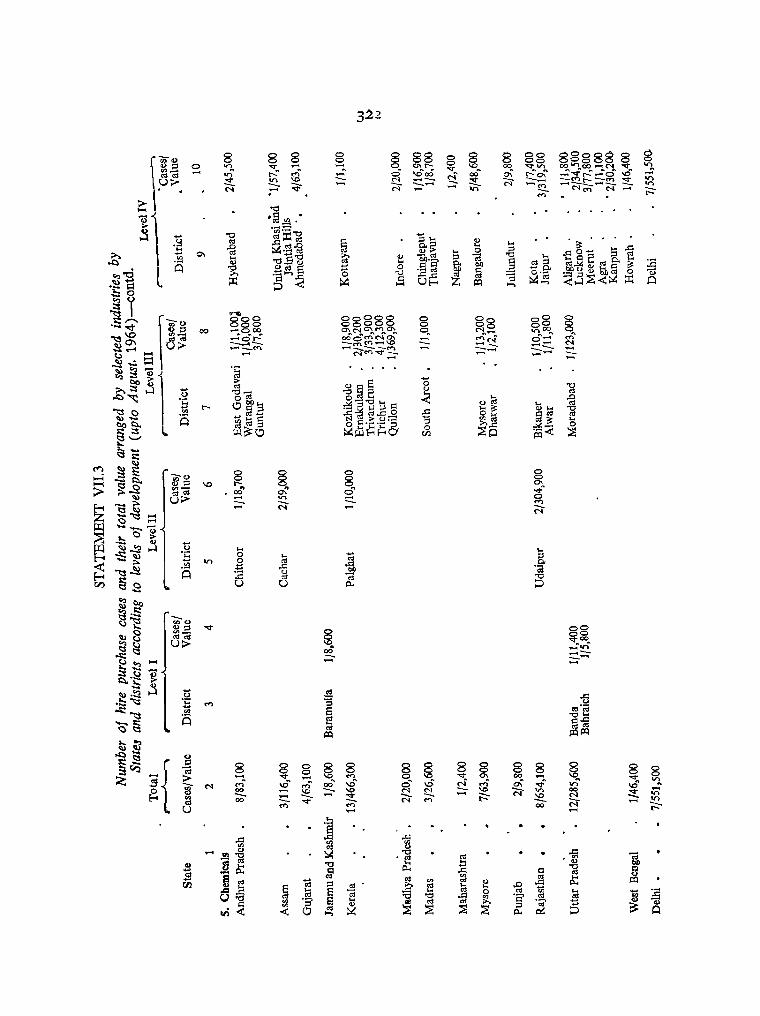
o -
8 ~ --.... .... o o
~
8 ..,. r-: V') -.... .
~
§ 00" -....
.... -....
o
~ ....
3.22
o o o . .::::.. ....
8 00
~ i ....

,.. 0 0 8 8 0 8 r- O'I~ II">
S t...:' 0:: .,.; '" .... - ~ ;:;:; ---
.::l ~ '" t ! .9
~ ~ e ~ ~. ~
d 8' ~ m .0 -< ~
o:s § o
fl:<
8- 0
~ 0 <'l 00
S' ~ ~--<'l --_. N"
.' ,-
~ -= s ~ a· i ~ -0 (3):
00 00 _00
ci::i---
0
8 f-.. ... V .... -....
-- '" -e 0 0
.::l Ill)
II ] "0
~ .. 1S
G>
;i. ~ ~,
, t:'
. . . •
j
0 8 ~: 0>
~ ..., ~ vS r-!'"' \O~
II"> N \0- 0'1 ~
<'l -~ --- ~
.' ... ]-~ -= ~- , . <U ~ "0. e ,.. l Po.:
0$ ~ ::I '" :§~ ... _. [ <a Oil
<-~.E?
p : ~: ~
o· -0
CO
~
~§ .,..--_--
~ '<O~, -M'
1 "" ~ ~J
~ i -
-8 0'1.
-I=: N
i:r
[3 .g ::a
~ ~ ---
,~ O'I~
'" -~ '<U .:::
1 ,~ .::a
~ -
8 ~ .~ ~
I 0
'g,
j
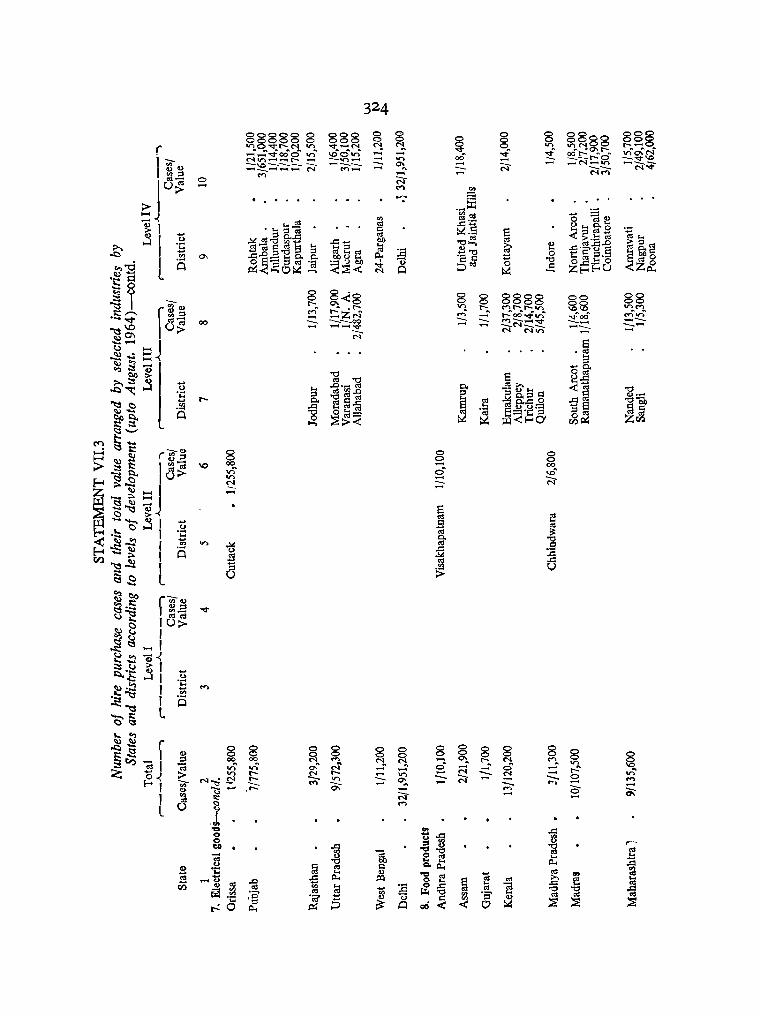
r , Ql tU
1~::s
1
«1-U'; > ..... J
ii ~I
l
fU;-Q Q:S
, ~<; u> ,
..... 1 o-{ >1 ~I
I I t
r 0:1 1 o-{ 1-<,
I L
..... . ~ ... ."E Q
o -
00
8 .... 8' -....
§ 8' -....
~ 00· .... --
o o on
~
1 .9
6
8 M.
--... 8 on to:' o .... 0-....

•
~ ·13 o
, , . 8 ..., o ----
g
~-
gg ('I ('I
.or-!' ""I" 00 ------«>
8 0 0\0
, -'" .. ;:;-\2;
';;)-
-::;,
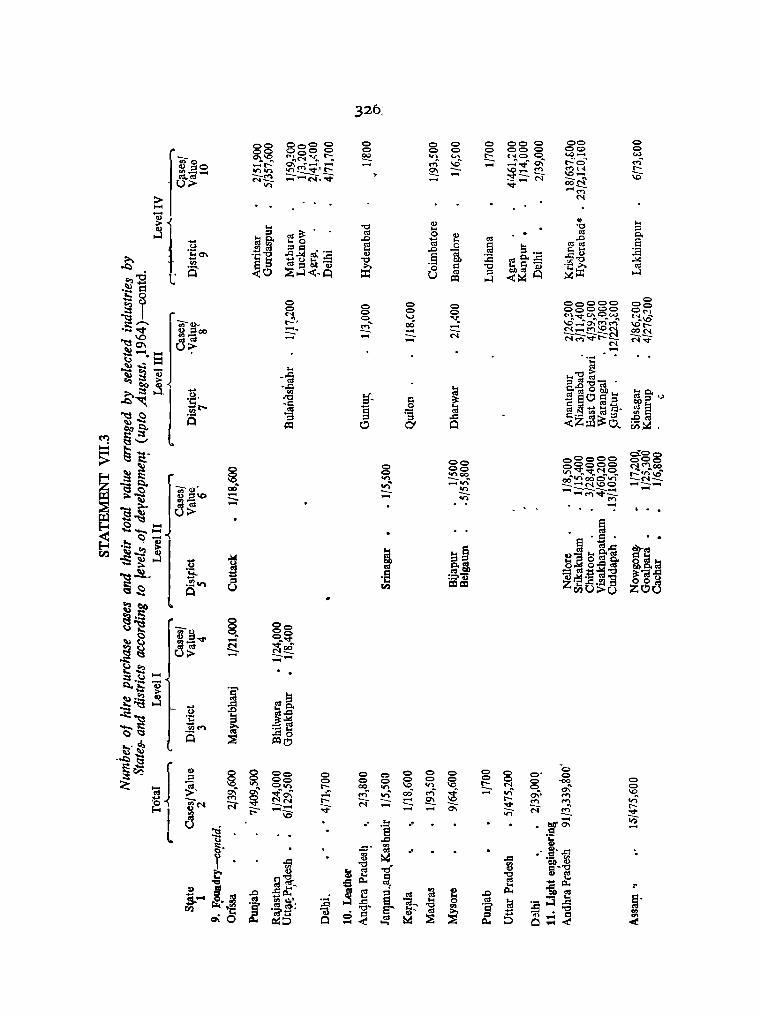
326;
8§ gog g 0 0 0 0 000 00 0 0 0 0 0 000 O~ 0
f~~o ~~~~~ ~ ..... ,-, t: ,,,,Q 0 <.0 ..... W O).~ M \D~ ~.q"" 0\ 0;-:'0- M~ ..... I- 0\ ............... ..... .....
~~ ..... 11'>11'> V)("f'1v·t t'-- ~ --- \0 ..... M Ml ~ I----M ;::;-~.:;; ..... ~;:.- N ~~ \C N ___ ....
II'> "<I" eo~ -M
> N ....
!l ., * .... .... "0 .... "0 ;::I
t;j~ ..s~ ..s 0 0 til 0. ... .... 0 .r::. ~ .... ..s .0 e .~ ='~ til 0 ~ .... til til :l'" .... .0 ca .~
::s ._ "' ... :E .b0\
]~ .o~ cU,'_ .,
.9 .0 0
oS <0 ~gt1.:t "0 CIi .0 os 0..0 ~~~ ~
Q >. 0 Q "0 th ~ A> til
..,-0 r ~....l<'Q ::z:: u til j <~ Q ~::z:: ....l
.~ i:l ~
.t:: o og
rL ro 0 0 0 0 ggggg ~ 0 0 0 0", ~. 0 '-' ~ ~~~~~~ (!~
• _ '<f" 0 :;I eo S: "," 00 .... N""""",('f')~N \DI-- ~ N eo N
~ \0 aca .... ..... N~~r---~ N~ ~O\ > ~ t;~. == . .;:: ~ . ....
!B! ....
.... ""d ~ "~ ... -.0
~ ='2~ca
<0 ~tII8~"" ""0. ..Q~
.S:!. .."'C:l ~ . Q '" ::s • .>
~'" .~ d ~ ",E j~ -a § 0 ~ os - r.:1'
~~ i5 :s .0 ~. l3~:::S Co§- ~ 0 CI 0 <Zr;a o~ i::i3~
(f) §._, ~
'"'" :;;
:lJ 0 0 0 00 0.00
00 000
§ I:) 01:) ~~~~~ C":t<'loo
I 0 "'00 r-tn\C)' VI --- . _N ___
l~ "f.e~ 00 ~ .... '" ",_"""'N\OQ .... --.,.. ...... ------..... ..... ..... ..... --- ..... ('f")~ __ -- '" '" l~ t:3~ .... .... . . .
c .... 8
fS ::·=-1 ..s . . ~ . . .
~~! ii ~~ o~ .... l~ Cl>-os til
~ g;
:2 .. 0 0. til ~J o O~tII CliO-;
~~ Jt ·8 ~~~ :g ~ca.d
a :::;"0 oOa a~ 011\ == z· .~:;I til til >u ZO
~Co ~.s
~ (,,)~ ";;;-0 00
j~ 01:)
o :;I...,. ~"<I"
a~ s ~00 _-..... "'"
~~ .... ~.~ i .~ .... ~.~ ~
.... .~'1::S - :§ ",='
~l 0 ;,g. ·c ~ ~~
O'I:S .~M :-::Ie Q :g .00
.... &, ~o 'U~
. ..Q ~
r =: ... 0 8 <:;>
;:s~ ::s 8 1:)1:) <:) <:) <=> <:) 0 I:) 0 0 o· 0 00 0 0 0 ~ 0 0 0 0 0
~ ~: ID VI l- I:) -00
~~ a\ a\ 0"., I- 00 II'> 'n \D - N 0 0\ 0 ..,f~ ~ "," ~ 00 M i ..... v\ ",,"\ \0
'" ~ !::!~ l- N ..... ~ I- '" '" ~N N- - ..._ - ~ '" <? ~ I - ..... ~ ~ ..... - 0\ N- I-., t- "., ~ ~ t:3 .' .!:: .' eq"C;::
~ 8 = ..... I. ..0
.;:
f ..::I' ., G>
'" '" • G> • ..c: ' . ..0 3 ~ ..0 . . ~ ~ '" ""d ""do ~ =~""d <I) liS til ... o""d ~ = ""d G> ..s ..,
~~~ i3 til, e -~ D i·a ib", ,..
5.- .0 _il-< ! ~ ::I '" ~ e .0 il-< os ~ o!.' ~ 8 ].- .. 0 '" t; ;S ~;§ ~'
til 0\5 I ·(;'2~ ""dO 8"' ""d '" 'i:j' 0 r:! o· til >. =' ::: .... = '" 0 ~ ~ ::s :::a "' '" ~::> .... ~ il-< ::> 0 .... ~ <
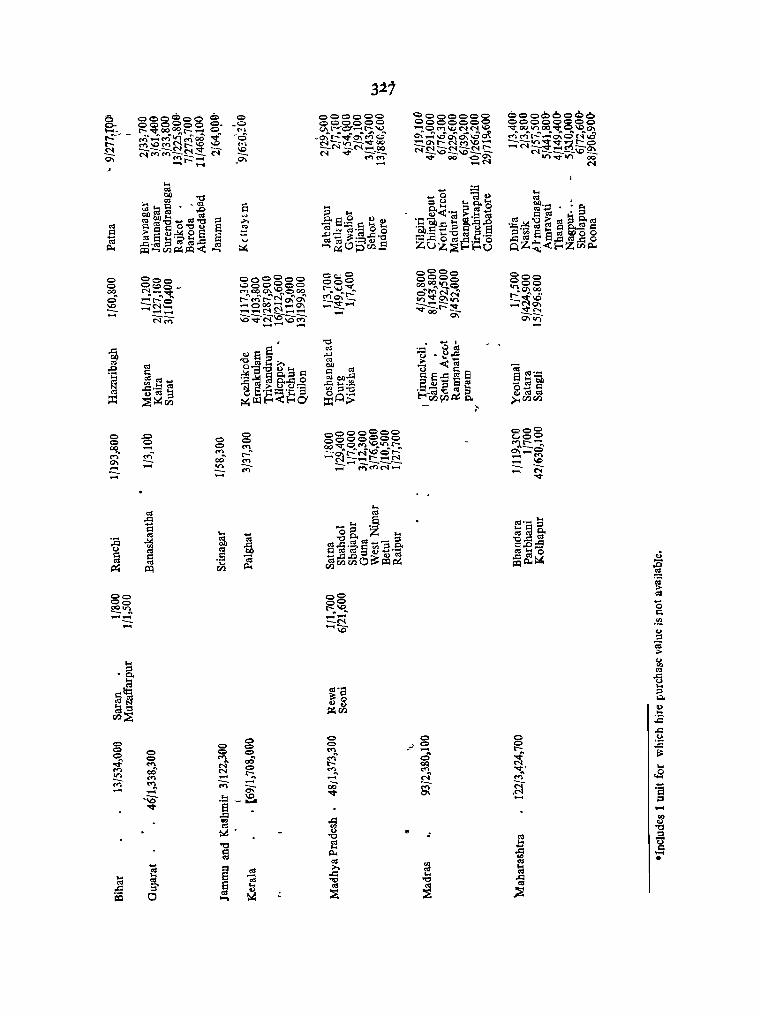
<::> <::> 00
o ~ .....
o <::> 00
~ ~ .....
:
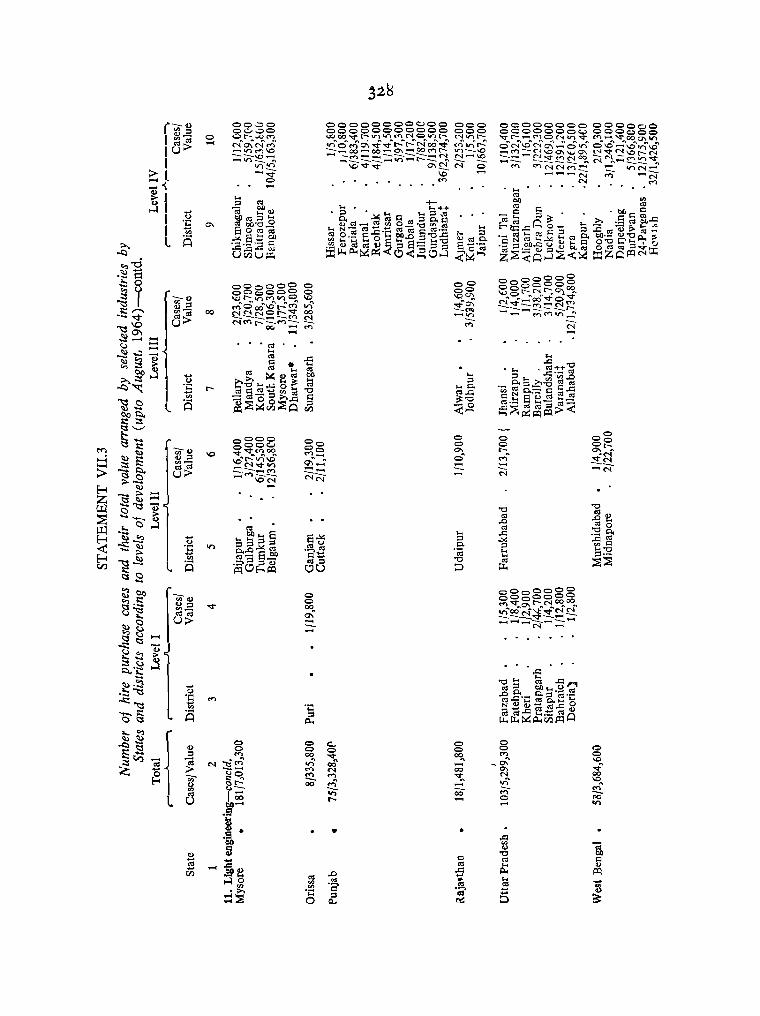
<=> <=> 00 0\"
::::: ...
•
. .
<=> <=> 0\ g .....
<=> <=> 09-.... 00 '<I;, .... 00 ....

32 9
0 g- CC C OQ.. 00 0 0 C 0
0 o~ 0 QC- 00 C 0 0 C
"'t 0\ '<I" ." -- orar-..., ..., r- M
00- ~~. - a\_..Q r-.!'r-: r-: ..,.: ..,.: ei :;
.... ID
~ N ..... o- N -- - ~
ID ---- --- N-.... N-
o:-!' .... ..., .... <":>- - N ....
\0 N - '0 0)
'0-~ ......
<IS -~ ::1 0 <l)
++ .0 >- ... ..... J;:I
:E ('(j ('(j'o 0) ('(jd 0 0
tt '00) ... ,..,..0 ;:I", 'Ca cu ... 0' oS 0 §',§ As::l co co ::I ~ 0 '0 ... ,.c:: '0- bOo ~ ... A
>. ~< s::l ,.c::0 ('(jO '" ::I 'til :r: ..... E-<U Zi:!. Il:l ~ ..... 0
0- 00 0 00 0 0 0 0 0
0 00 <:) ~<:). C 0 0 0 0 00 .... ora ~ ~
..... r-:~ ID -:. lDora "'!. . ~ r-- _
!i r-" - -- . .... M .... ~ -1'1 ~S N - .... M --- - -- -. -- NN N -- .... ,...,
,.c:: .... "@ >. ~
cu' bO ... A 0) . bQ
..... J;:I ::I ::I Ad :.:l Ce .... 1:1 ('(j ... .... AO_ ~
A .... = S ~:a bQ ,r;I) ~£ '0
~::I .... = =
E5 «S ::I ->.
~~ ~ <0- ~ ~~ ::I 0 til til
..... 8g
0 0 0
~ C
-0 0\
" ~ ...; -C ..... --M N N
.... - --N
8 '0 cu '" = ,c d..d «I A('(j E ~ ~A ..dCU '8 e ,.!.O'o «1'0
... .~ ~ ~
«I
:>U ~
• ttl a).. .2-Zt ,c~.~
0 ~~ ,_ ~
0 «t-> '>. - ~~~
! ..... 00 0J;:l= - t:1 Ul 0')' CI.)._-_ -; V 0)
::12 ,s . ...-4 d cd'
CU
cu-... > ... -.0
G)"~ ~t
8 "'-"'" '"
('(j <IS,.c::.a
..<:l ~~~
U .... ::l::l S,AA 0)0)0
0 0 0 0 0 0 0 0 0" ,,~:.E:a
~ 0 0 0 0 0 0 0
0 0 0 0 Q 0 0 0 0 0 Q 0 <:) C Q .a _
$: .... on .0\ ~~ 0 0 ID
~ M M r- 0\ M ..d.t§ 13
0\" !i :00 . ..;- ..;- 00 .,.;- ~ "'!. -:f. ...; ...; r::S u·_·_ 0\ - '-;.c::.a
~ 0\ ~ - M ~ '<I" N \0' M - .£:! %- ~~ ~
" - ,..... - -- ~ £! - - -. ~ - - ~. en .M ..... N .... \0 co
..., .. k·~ J-t
N-s.e..s
... c:~~ .. . . • 'Q§'Q
::I :::I ,.c:: '" ..d
..d _NM Q) '" '0 '" Q) "' .. ", o<i cu f
0) '0 ..d .... !'O '" • 0) 'oJ 0 1: i:!. ~ 't<S
<IS .... '" ]:g-g .... ... Q)
0; .... i:!. ..d = '0 "1
i i:!. 0 ..........
<IS '" '" ('(j .El.E.E ~
g '" '" d '" '" ....
.... 8 .<IS >. ~ ... Q) .g ..cI i:!. ~ '2f. ;:I ~
.... .... <a ..<:l ... ,('(j (S • oS ... * +-++ ..d '" "', '" '" .... :E
of" El .9- '0 '" 'S' :;os '0 "t:l ..c:: '" '" 'g '" ('(j
'" <IS .~
'(i ., ~ 0 ttl .... ~ ~ '" .~ ~ i' ';:: 5 E-< ... < ~ fit:: 0 i:!. ~ Q .....

L
... u ';:: ~
is
o -
0\
0:> o 00 --. ...
o o ..... ~ .....
0:> <:> -N .t!. .....
•
000 000 NO"" .o:;f'r-"N' """d'M ..... -- ..... -- ..... -..........
. . 8 0\ vS .,.. ..... \0
C> o -c!l --N
' .
00 00 ..... 0 N"'m-M_ ------
:a 13 Q

o o .... ". .... --.. N
o o ~ --..
8 .., ~ -....
o o 00 ~ ..,
o ~. --..
33 1
00 00 ","0 00·'15 -.--.. ........
8 <')_
N .... --.. -
o o N
t::: N
0000 0000 1.000Noo 0 .. -. ... \0 ... "," ~--O\-_ __ --...... .... N
o o "'"~ QO
.... --.. V)

00 00 I'- 0'\ r-r...: ------
o o QO
~ .....
332
o ~ ..... -.....
o
:?: ..... ::::. QO
e o
:8 .§ 8
0000 8 0 00
..... 1'-10 tri'..;r-:o\' -_--.....~_N
"
<I)' ..... o
~
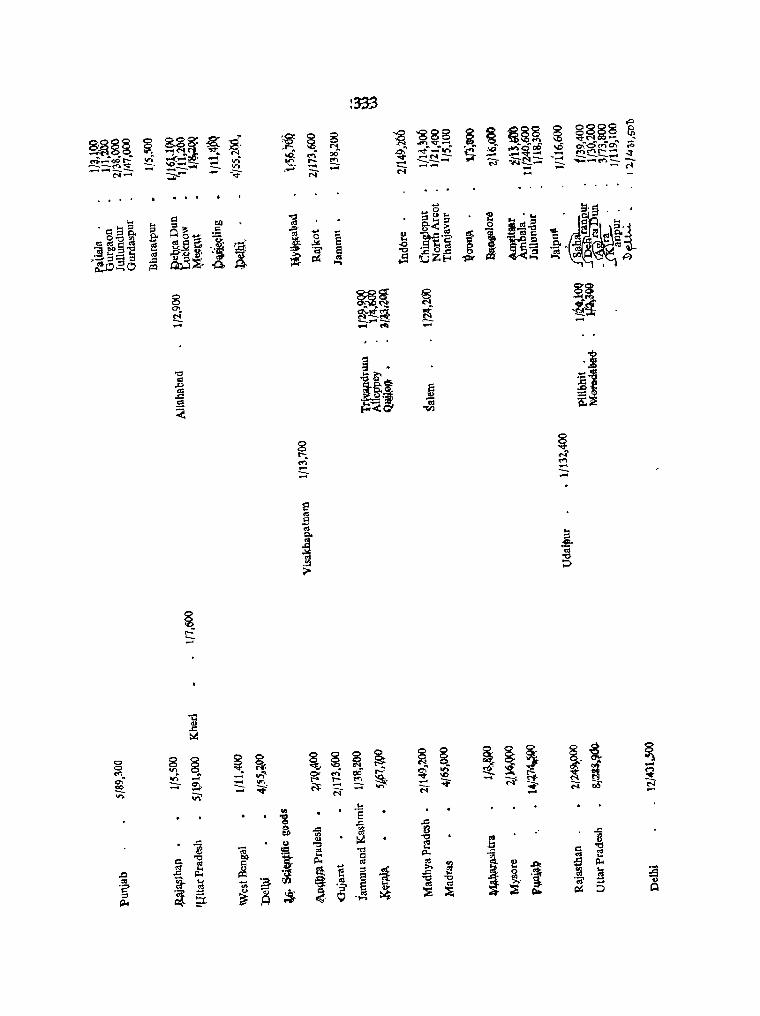
'"0 ~
c:I .tit' .P a: l&f .~ .:C
'" -~~ ~ ~<
'iii "VI
8 ...... .., S
~ .s <IS ;r ~ _:!l ...
~ t:: .....
-c:
~ 0 :3 8 ~. ~ ~ ~ ~ ~ ~ 8. §; § 8- 0
1 8 0 ~ ..., ." o_ 1 ~
C\" ~ - - W 0< ...... ® ~ on ~ :!: -00 ~
..... ."., l'"" t- ~ ~, ~ ....... ~ ~
"V> --- ~ No ... .... -". Sf. ;;:;-. ..... M - ..... M
~ N -'"
.1:::
"8 E ~ ..d i .c
..0 '" ~ ::t:
.g os ..c::
.., OJ
'0 <'is ~ "" !!S «I "d ..
1 ! '0 0/)
i ...
~ ~ a
<IS c:: p.. c:<I
.,
~ '" ... <II G) ..s ..
~ j:C ilc ..: :::!
~ » S ... .a. p..
O<S ~ >or ~ ~ rn ~ .. 8 :g 0 -~ gj w ;s
-2' ~ <A os '0 ~ ~
~ ., -:;- e ..: -Oij'
::I ~ ~
0> .$ d- ~ ); ~ ~' 5 '" p.- I=! 0(. 0 .~
QO, ~ Q
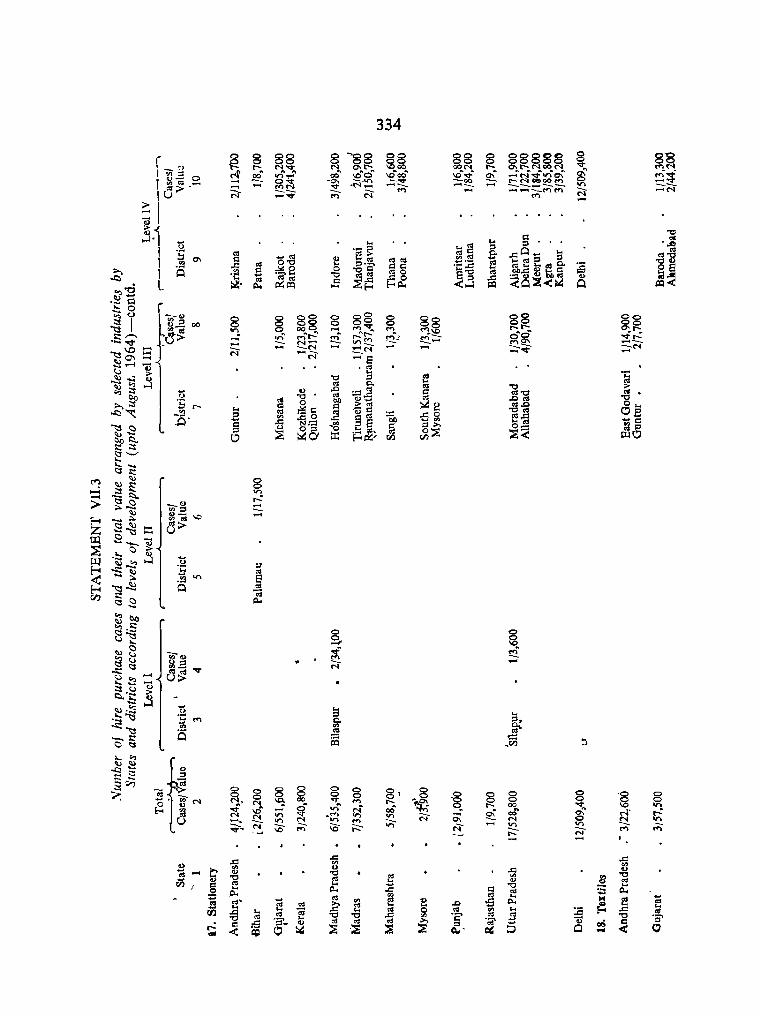
r..
~ --. -
334
e o 'g ....
88 ooN 1C~.q-~
-00 ---. -
8 00 <»' N II')
--..... -
00 00 "'. r-: "<1" ..... _----'N
_
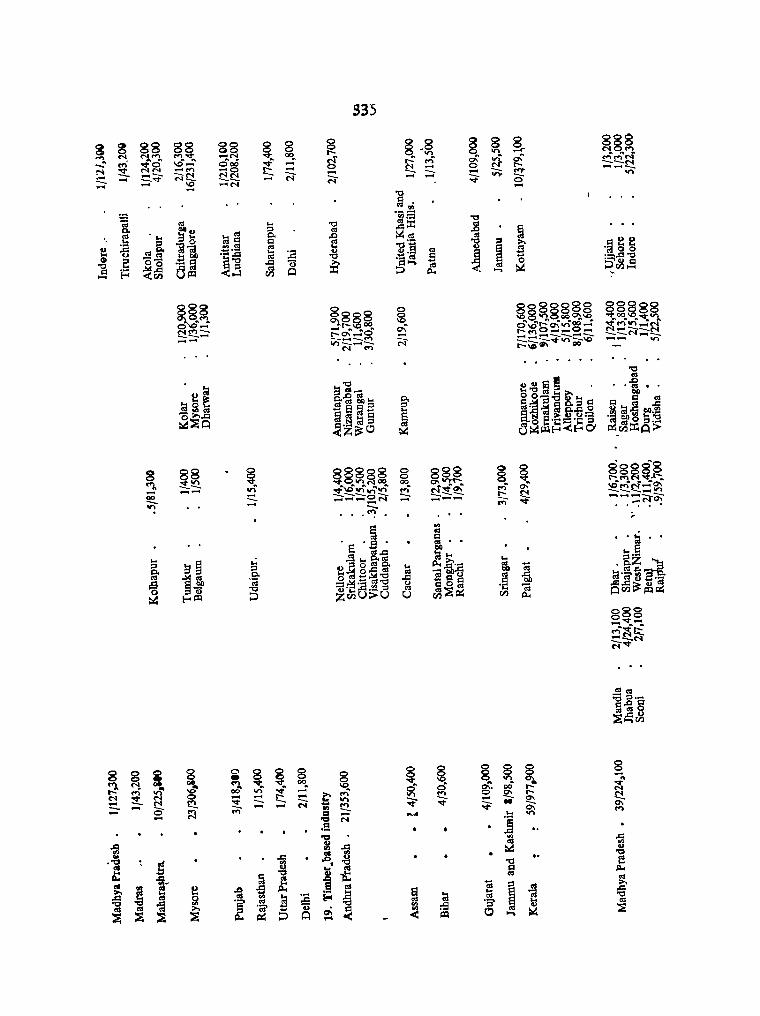
88 N ......
~~ ..... -_v -
88 v.,., ------ ~ .,., ----
335
:-
8 00
!i -
.. _4 ....
J ]
,.
j
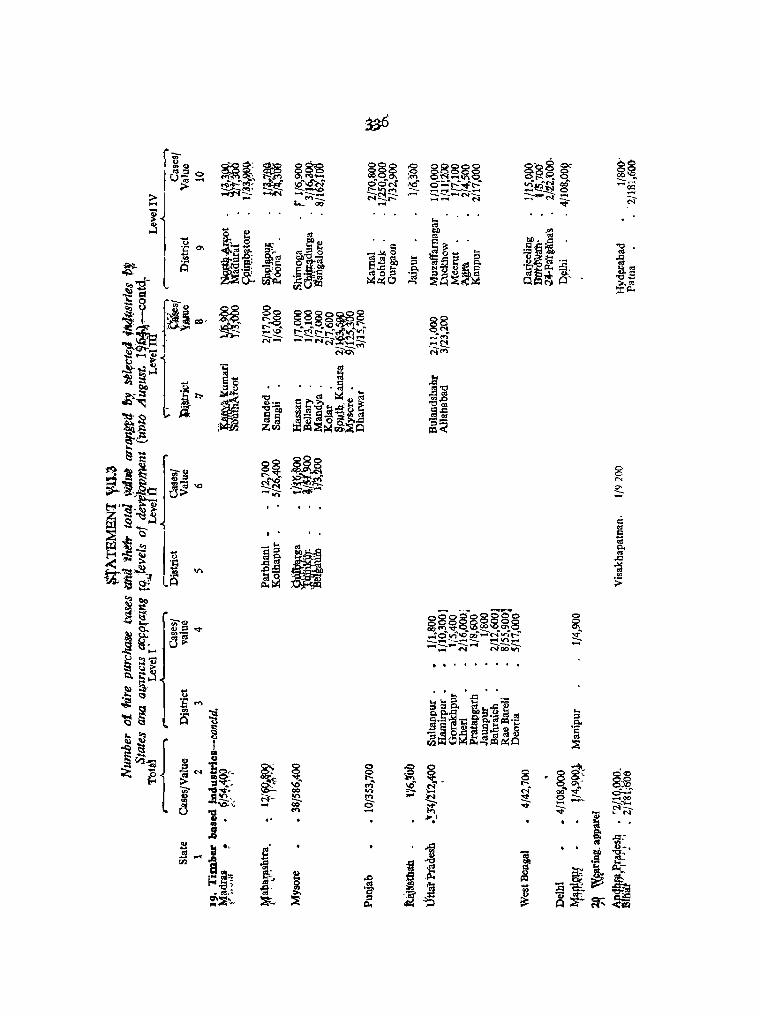
· .
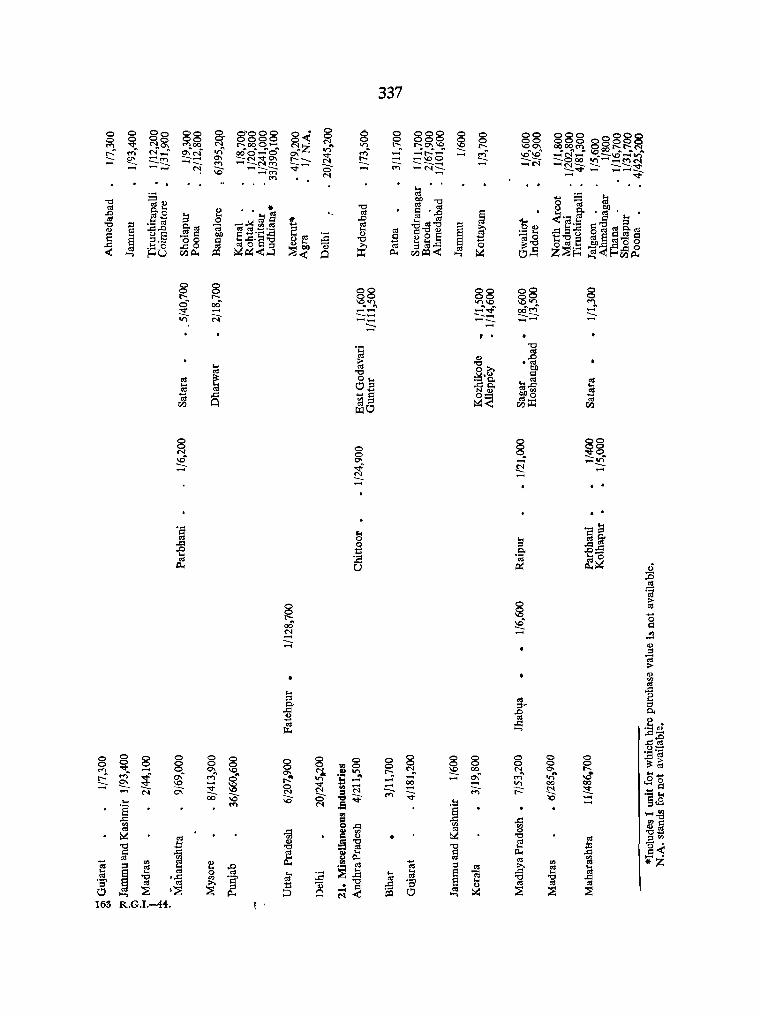
~ 6 163
o
~ r<> 0\ -_ .....
. .
g ocr -M
r '
o g 00 N ..... --. -
00 00 ~~ -----.... ,....
o o a<
~ ,....
:::::.
337
•
o
~ 00 .... ~
J
§_ -
, .
o o 00 0\"
~ r<>
g :J. -----
. .
..
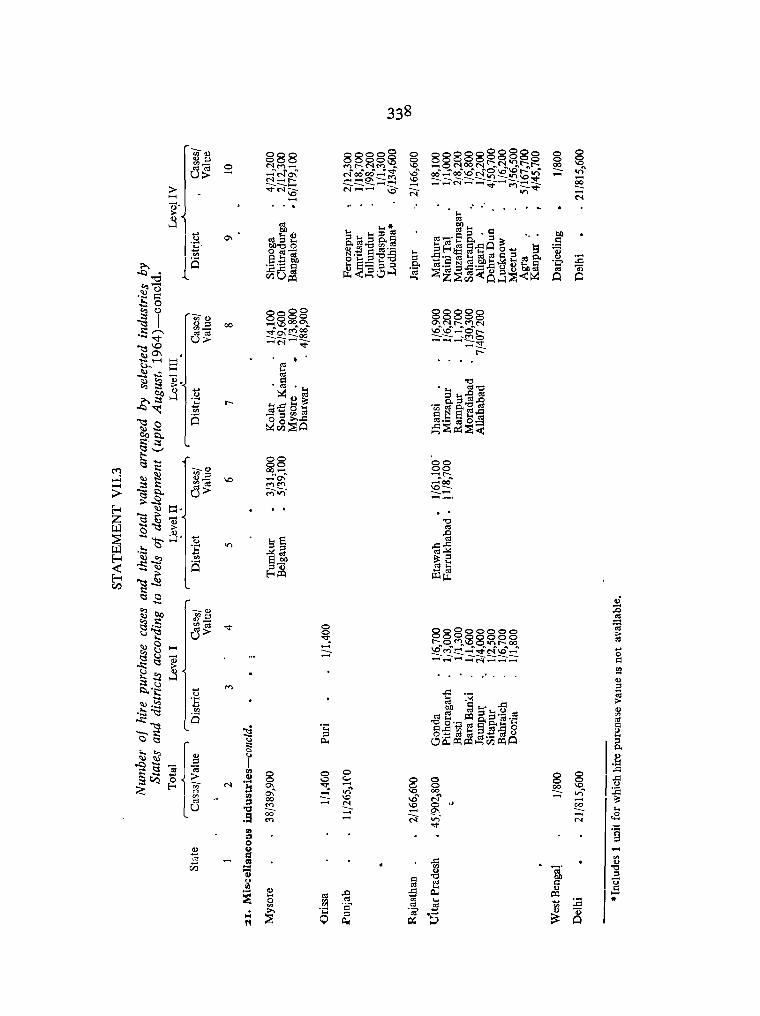
o ,....,
00
\0
o o '" "'~ 00
~ 00 <"l
o
3 -,....,
.-... ::I
Po.
o c ~ -,....,
o ~ v:S \0 .... N
..
.S "8 .;::;>
'" A
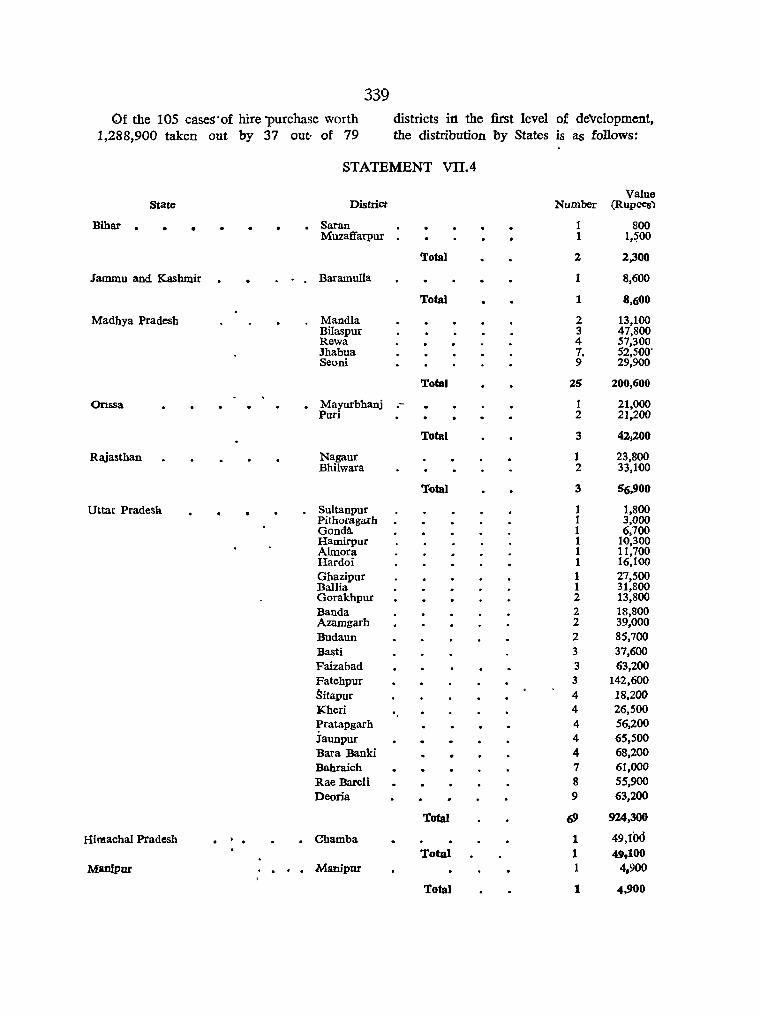
339
Of the 105 cases' of hire 'Purchase worth districts in the first level of development, 1,288,900 taken out by 37 out· of 79 the distribution by States is as follows:
STATEMENT VIlA
Value State District Number (Rupees)
Bihar . • . Saran 1 800 Muzaifarpur . 1 1,~00
Total 2 2,300
Jammu and Kashmir Baramulla 1 8,600
Total 1 8,600
Madhya Pradesh Mandla 2 13,100 Bilaspur 3 47,800 Rewa 4 57,300 Jhabua 7. 52,500' Seoni 9 29,900
Total 25 200,600
Onssa Mayurbhanj .- 1 21,000 Puri 2 21,200
Total 3 42-;200
Rajasthan Nagaur 1 23,800 Bhilwara 2 33,100
T~tal 3 56,900
Uttar Pradesh Sultanpur 1 1,800 Pithoragarh 1 3,000 Gonda. 1 6,700 Hamirpur 1 10,300 Almora 1 11,700 Hardoi 1 16,100 Ghazipur 1 27,500 Ballia 1 31,800 Gorakhpur 2 13,800 Banda 2 18,800 Azamgarh 2 39,000 Budaun 2 85,700 Basti 3 37,600 Faizabad 3 63,200 Fatebpur 3 142,600 Sitapur 4 18,200 Kheri . 4 26,500 Pratapgarb 4 56,200 iaunpur 4 65,500 Bara Banki 4 68,200 Bahraich 7 61,000 Rae Bareli 8 55,900 Deoria 9 63,200
Total 69 924,300
Himachal Pradesh . Chamba 1 49,IOd Total 1 49,100
Manfpur . . Manipur 1 4,900
Total 1 4,900

Of the 301 cases of hire purchase worth 5,800,600 taken out by 45 districts out of 88 districts in the second level of
development, the distribution by States is as follows:
Stat"
Andhra Pradesh
Assam
Bihar
Gujarat
Jammu and Kashmir
Kerala
Madhya Pradesh
Mabarashtra
STATEMENT VII.5
District
Nellore Srikakulam Chittoor Visakhapatnam Cuddapah
Nowgong Goalpara Cachar
Santa1 Parganas Monghyr Palamau Ranchi
• Bana.;kantha
• Srinagar
• Palghat
Satna Morena Dhar ShahdoI Shajapur Guna Chhindwara Betul West Nimar Raipur
• Bhandara Chanda Parbhani Kolhapur
Total
Total
Total
Total
Total
Total
•
Total
Total
•
•
Number (RUpees)
3 4 8
15 18
48
1 1 4
6
2 2 4
9
1
8
8
17
17
1 1 1 1 2 3 4 4 4
14
35
1 2 5
66
13,900 39,000
130,600 308,800 256,400
748,700
7,200 25,300 69,600
102,100
2,900 19,500 24,400
259,400
306,200
3,100
3,100
199,000
199,000
280,500
280,500
800 5,700 6,700
29,400 10,300 12,300 9,300
21,900 78,800
142,100
317,300
119,300 20,600 12,300
1,005,500
74 1,157,700

341
STATEMENT VII.5-concld.
Value State District Number (Rupees)
Mysore Bijapur 4 47,800 Gulbarga 5 63,900 Tumkur* 23 262,900 Belgaum 29 603,300
Total 61 977,900
Orissa · Ganjam 4 45,500 Cuttack 11 604,600
Total 15 650,100
Punjab • Mahendragarb 2 109,100
Total 2 109,100
Rajasthan • • Chitorgarh 1 10,500 Udaipur • 6 520,600
Tot'al 7 531,100
Uttar Pradesh . Etawah 1 61,100 Shahjahanpur • 2 68,400 Mainpuri 2 128,400 Farrukhabad 8 86,300
Total 13 144,200
W~t gengal . West Dim1jpur 1 4,400 MurshidAbad 1 4,900 Midnapore 3 64,300
Total . 5 73,600
*Includes 1 unit for whicb hire purchase value is not available.
Of the 657 cases of hire purchase worth 15,758,090 taken out by 58 but bf 76
districts in the third level of development, the distribution by States is as follows:
STATEMENT VII. 6 value
State • District Number (Rupees)
Atldhra Pradesh Kurnool 1 16,400 Nizamabad 8 66,600 Anantapur 8 100,800 East Godavari 9 82,300 Warangal 13 99,800 Guntur 28 435,300
Total . 67 801,200
. Sibs agar 3 97,000 Kamrup 9 315,900 . '.
Total 12 412.900
Bihar • • • . Hazaribagb 1 60,800
Total 1 oo.soO

342 STATEMENT VII,6-contd.
Value State District Number (Rupees)
Gujarat Broach 1 9,000 Mehsana 2 6,200 Kaira 4 130,100 Surat 7 618,000
Total . 14 763.,300
Kerala • · Cannanore 16 382,000 Kozhikode 23 600,900 Ernakulam 24 365,500 Trivandrum 28 464,500 Alleppey 34 336,200 Trichur 35 593,200 Quilon 40 995,100
Total 200 3,737,400
Madhya Pradesh Mandsaur 1 4,200 Raisen 2 26,000 Sagar 3 23,500 Hoshangabad 5 15,900 Vidisha 8 48,300 Durg 8 112,700
Total 27 230,600
Madras · Kanyakumari 2 10,300 Tirunelveli 10 300,200 Salem 14 326,300 South Arcot 16 160,000 Ramanathapuram 17 536,400
Total 59 1,333,200
Maharashtra • . Yeotmal 1 7,500 Nanded 4 39,600 Satara 18 520,000 Sangli 28 473,300
Total 51 1.040.400
Mysore · North Kanara 2 9,700 Hassan 2 14,100 Bellary 5 32,300 Mandya 7 32,900 Kolar 17 79,800 South Kanara 21 456,800 Mysore 24 446,800 Dharwar * 35 628,290
Total 113 1,700,690
Orissa · Sundargarh 4 317,400
Total 4 317.400
Punjab . Simla 1 10,500
Total 1 10,500
Includes 1 unit for which hire purchase value is not available.
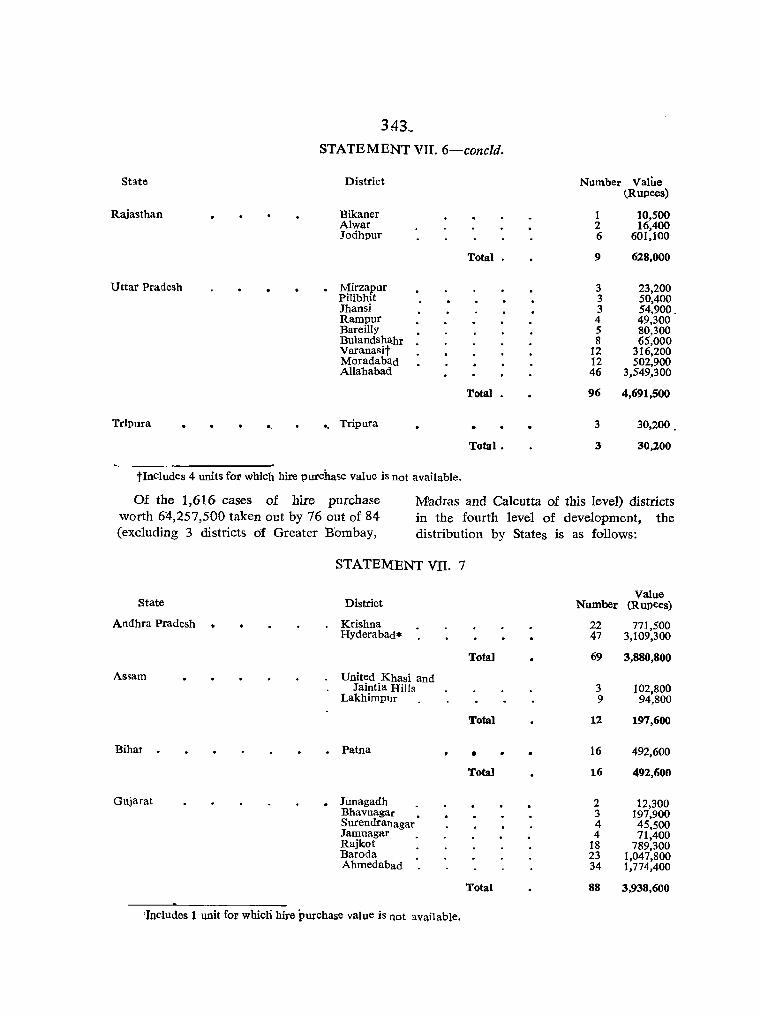
3:43_
STATEMENT VII. 6-conc1d.
State District Number Value (,Rupees)
Bikaner 1 10,500 Alwar 2 16,400 Jodhpur 6 601,100
Rajasthan
Total. 9 628,000
. Mirzapur 3 23,200 Pilibhit 3 50,400 Jhansi 3 54,900.
Uttar Pradesh
Rampur 4 49,300 Bareilly 5 80,300 Bulandshahr 8 65,000 Varanasit 12 316,200 Moradaban 12 502,900 Allahabad 46 3,549,300
Total 96 4,691,500
.. o. Tripura • 3 30,200.
Total. 3 30,100
tlncludes 4 units for which hire purcha~e value is not available.
Of the 1,616 cases of hire purchase worth 6:4-,257,500 taken out by 76 out of 84 (excluding 3 districts df Greater Bombay,
Madras and Calcutta of this level) districts in the fourth level of development, the distribution by States is as follows:
State
Andhra Pradesh
Assam
Bihar
Gujarat
------~--------------
STATEMENT VII. 7
District
Krishna Hyderabad*
United Khasi and Jaintia Hills
LakhimplJr
• Patna
• Junagadh Bhavnagar • Surendrallagar Jamnagar . Rajkot Baroda Ahmedabad
'Includes 1 unit for whicli hire purchase value is not available.
Total
Total
• Total
Total
Value Number (Rupees)
22 47
69
3 9
12
16
16
2 3 4 4
18 23 34
88
771,500 3,109,300
3,880,800
102,800 94,800
197,600
492,600
492,600
12,300 197,900 45,500 71,400
789,300 1,047,800 1,774,400
3,938,600
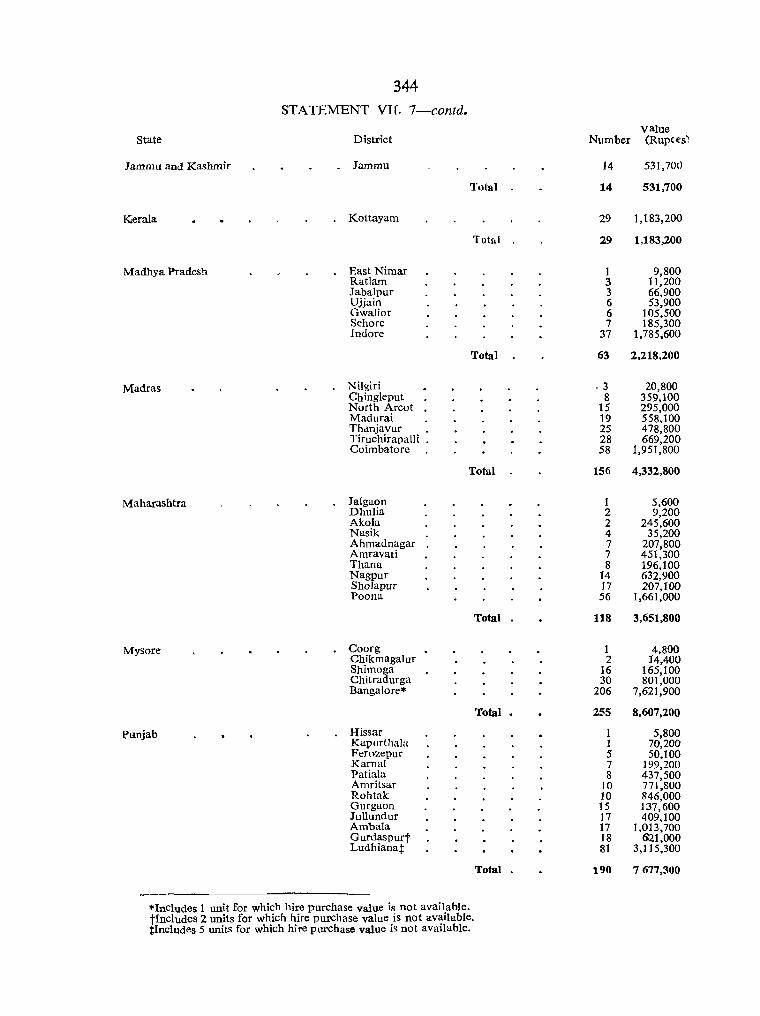
State
Jammu and Kashmir
Kierala
Madhya Pradesh
Madras
Maharashtra
Mysore
Panjab
344
STATEMENT VII. 7--contd.
District
Jammu
Kottayam
East Nimar Ratlam Jabalpur Ujjain Gwalior Sehore Indore
Nilgiri Chingleput North Arcot Madurai Thdnjavur . Tiruchirapalli . Coimbatore
Jalgaon Dhulia Akola Nasik Ahmadnagar Amravati Thana Nagpur Sholapur Poona
Coorg Chikmagalur Shimoga Chitradurga Bangalore*
Hissar Kapurt11ala Ferozepur Kamal Patiala Amritsar Rohtak Gurgaon Jullundur Ambala Gurdaspurt Ludhianat
Total
Total
Total
Total
Total
Total.
Total
*Includes 1 unit for which hire purchase value is not available. tlncludes 2 units for which hire purchase value is not available. tIncludes 5 units for which hire purchase value is not available.
value Number (Rupees)
14 531,70t)
14
29
29
1 3 3 6 6 7
37
63
.3 8
15 19 25 28 58
156
1 2 2 4 7 7 8
14 17 56
118
1 2
16 30
206
255
1 1 5 7 8
10 10 15 17 17 18 81
190
531,700
1,183,200
1,183,200
9,800 11,200 66,900 53,900
105,500 185,300
1,785,600
2,218,200
20,800 359,100 295,000 558,100 478,800 669,200
1,951,800
4,332,800
5,600 9,200
245,600 35,200
207,800 451,300 196,100 632,900 207,100
1,661,000
3,651,800
4.800 14,400
165,100 801,000
7,621,900
8,607,200
5,800 70,200 50,100
199,200 437,500 771,800 846,000 137,600 409,100
1,013,700 621,000
3,115,300
7677,300

345 STATEMENT VH.f-concliJ.
Value State District Number (Rupees )
Rajasth3.D Bharatpur 2 15,200 Ajmer 2 253,200 Kota 3 22,800 Jaipur 23 1,365,400
Total 30 1,656,600
Uttar Pradesh . Naini Tal S 80,900 Mathura 5 194,600 Muza,ffarnagar 7 161,700 Saharanpur 7 247,800 Aiigarh 9 186,000 DehraDun 14 533,200 Lucknow 27 1,175,200 Meerut * 40 1,008,500 Agra* 52 1,820,400 Kanpur 54 2,630,000
Total • 220 8,038,300
West Bengal Hooghly 2 20,300 Nadia 3 1,246,100 Darjeeling 4 48,600 Burdwan 6 372,500 24-parganas 16 614.5~ Howrah 33 1,472,9
Total 64 3,774,900
Delhi . Delhit 292 14;075;900
Total 292 14,075,900,
*rncludes 1 unit for which hire purchase value is not available. tlncludes 3 units for which hire purchase value is not available.
The following abstract shows the relative positions of the States in the matter of cases of hire purchases:
Less than 25
.TJ.mmu and Kashmir Orissa Himachal Pradesh Manipur Tripura
Less than 1,000,000
Assam Bihar Jammu and Kashmir Himachal Pradesh Manipur Tripura
1(}3 R.G.l.-45.
26-100
Assam Bihar Rajasthan West Bengal
STATEMENT VII.8 Total cases of hire purchases
101-200
Andhra Pradesh Gujarat Madhya Pradesh Punjab
201-300
Kerala Madras Madras District Maharashtra Delhi
STATEMENT VU.9
Total value of cases of hire purchases
0'1-0'5 Crores
Gujarat Madhya Pradesh Orissa Rajasthan West Bengal
0'6-1'0 Crores
Andhra Pradesh Kerala Madras Maharashtra Punjab
1'1-1' 5 Crares
Madras District Mysore Uttar Pradesh Delhi
Over 300
Greater Bombay District
Mysore Uttar Pradesh Calcutta. District
Over l' 5 Crore!.
Greater Bombay District
Calcutta District"

The following statement gIves an abstract of those industries for which there has been
no contract for any hire purchase case in respect of the States noted against them.
Agricultural implements .
Auto servicing
Building material
Ceramics
Chemicals
Containers
Electrical goods
Food products
Foundry
Leather
Light engineering
Metalwares
Plastic conversion
Printing amI binding
Rubber based industry
Scientific goods
Stationery
Textiles
Timber. based industry
Wearing apparel
Miscellaneous ind\.lstrie~
STATEMENT VII. 1 0 No cases of hire purchase
Bihar, Jammu and Kashmir. Punjab, Rajasthan, Delhi, Himachal Pradesh, Manipur and Tripura
Assam, Orissa, Himachal Pradesh and Manipur
Assam, Bihar, Gujarat, Jammu and Kashmir, Uttar Pradesb, Delhi, Himachal Pradesh, Manipur and Tripura
Andhra Praue:,h, Assam, Bihar, Gujarat,Madhya Pradesh,Madras, Mysore, Rajasthan, Delhi, Himachal Pradesh, Manipur and Tripura
Bihar, Punjab, Himachal Pradesh, Manipur and Tripura
Assam, Bihar~ Jammu and Kashmir, Madhya Pradesh, Punjab, Rajasthan, Delhi, Himachal Pradesh. Manipur and Tripura
Assam, Bihar, Himachal Pradesh, Manipur and Tripura
Bihar, Jammu and Kashmir, Himachal Pradesh, Manipur and Tripura
Assam, Bihar, Jammu and Kashmir, Himachal Pradesh, Manipur and Tripura
Assam, Bihar, Gujarat, Madhya Pradesh, Orissa, Rajasthan, Himachal Pradesh, Manipur and Tripura
Manipur
Bihar, Jammu and Kashmir, Himachal Pradesh, Manipur and Tripura
Assam, Jammu and Kashmir, Ori,sa, Rajasthan, Himachal Pradesh, Manipur and 1 ripura
Rajasthan. Himachal Pradesh and Manipur
Assam, Jammu and Kashmir, Orissa, Himachal Pradesh, Manipur and Tripura
Assam, Bihar, Orissa, Himachal Pradesh, Manipur and Tripura
Assam, Kerala, Orissa, Himachal Pradesh, Manipur and Tripura
Assam, Bihar, Jallllllu and Kashmir, KeraJa, Orissa, Himachal Pradesh, Manipur and Tripi Tn
Orissa. Himachal Pradesh and Tripura
Assam, Kerala, Madhya Pradesh, Orissa, Rajasthan, HimaChal Pradesh, Manipur and Tripura
Assam, Himachal Pradesh, Manipur an.;! Tri,pura

QHAl?TER vIr! THE FOURTH ESTATE AND THE LEVELS OF DEVELOPMENT
IT WOULD BE iNTERESTING to find out whether there is any association between the aClivity of the opinion forming press (newspapers and journals) and districts in the various levels of development, whether newspaper publication increases in range and circulation with improving levels_ of d~velopment. All of us are generally agreed on the likelihood of positiye assodation belween the two, but no statistical analysis of association has yet beeti made to, the writer'~ knowledge, The following brief analysis prepared from the 'Annual Report of the Registrar of Newspapers for India 1961' (tables appearing on pages 66-75 and 139-152) on which it is based might therefore be of -'interest.
Disltricts, in the lowest level of development
The ranking device has placed 79 districts in the first or lowest level of development. Only 3 districts (Rewa, Faizabad and Manipur) produce 7 daily newspapers in all, none of which sell anything like 50,000 cop~es each. In fact, the circulation of 5 of 'them is small" and unknown. of ' these again, 4 are puoli'shed f;bm Manipur, 1 of w,hich is bilingua1. Gorakhpur p~oduces 1 monthly journal in Hindi with a circulation of more than 50,000.
Districts in th"e second (lowest but one) level of development
A total of 88" districts have been placed in the second level of development. Out
347
of these 88 only 6 districts publish a total of 18 daily newspapers. . Of these! '18 again, 14 have circulations less than 50;OQO, each. The circulation of the remaining 4 is small and unknown, The districts publishing daily newspapers are Chittodr 'ila. Andhra Pradesh (English 1, Tamil 1~
Telugu 1), Shajar:lUr in M~dhy~ Pradesh, (Hindi 1) Raipur in Madhya Pradellh (Hindi "4), Kolhapur in Maharash:tta (Marathi 3), Cuttack in Orissa (Englisli 1, Oriya 5) and Etawah in Uttar Prade~hl (Hindi 1). Etawah also publishes 1 monthly journal in Hindi with a circulation below 50,000.
: Districts in the third level of development
A total of 76' districts have .been ,placed in the third level of development. Of these only 32 districts produce any newspapel or journal at all. Only 1 daily newspaper claims a circulation of more than 50,000 in Kozhikode (Kerala). Only 1 weekly, again from Kozhikode, claims a circulation exceeding 50,000. There are 2 monthly journals from Al1ahabaa'~(Uttar Pradesh) with a circulation exceeding 50,000. Detailed information about the languages in which the papers and joutIlals are published will be found in thle tabl~.
The following is an abstract of dally newspapers published from distriots ill' tD.ethird level of development of eadl State;
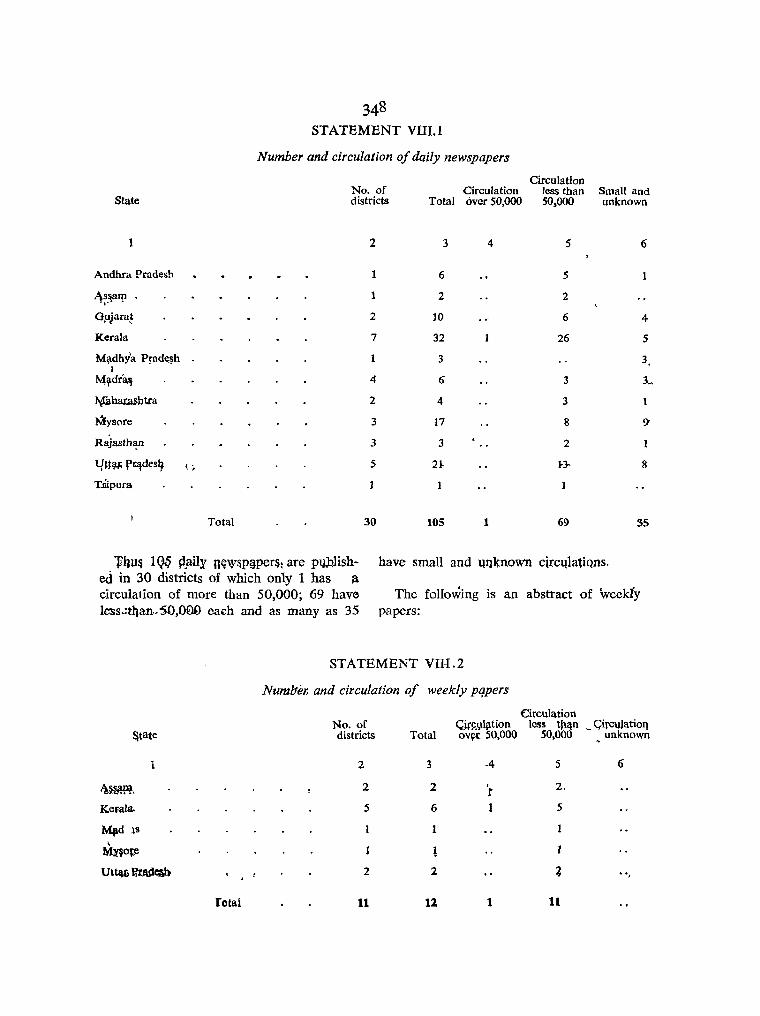
flW~ 1 ~ {I,aily n~\y~p!iper~i are p1Jh1ish- have small and Ullknown cV:clllatiQns. ed. in 30 districts of which only 1 has a circulation of more than 50,000; 69 have The following is an abstract of weekly le"Ss~tl}an .. 50,000 each and as many as 35 papers:
STATEMENT VIH.2
Numlier. and ciccu/ation of weekly pqpers
Circulation No. of C;in;'1}llltion less ttu~n _ Girc\lJatioq districts Total ov~r. 50,000 50,000 unknown
i 2 3 -4 5 6
2 2 'r 2.
Kemla. 5 6 1 5
Mpd 15 , rmr,ote
Ut~[o IlWtcM 2 2 ",
fOlal 11 11 1 11
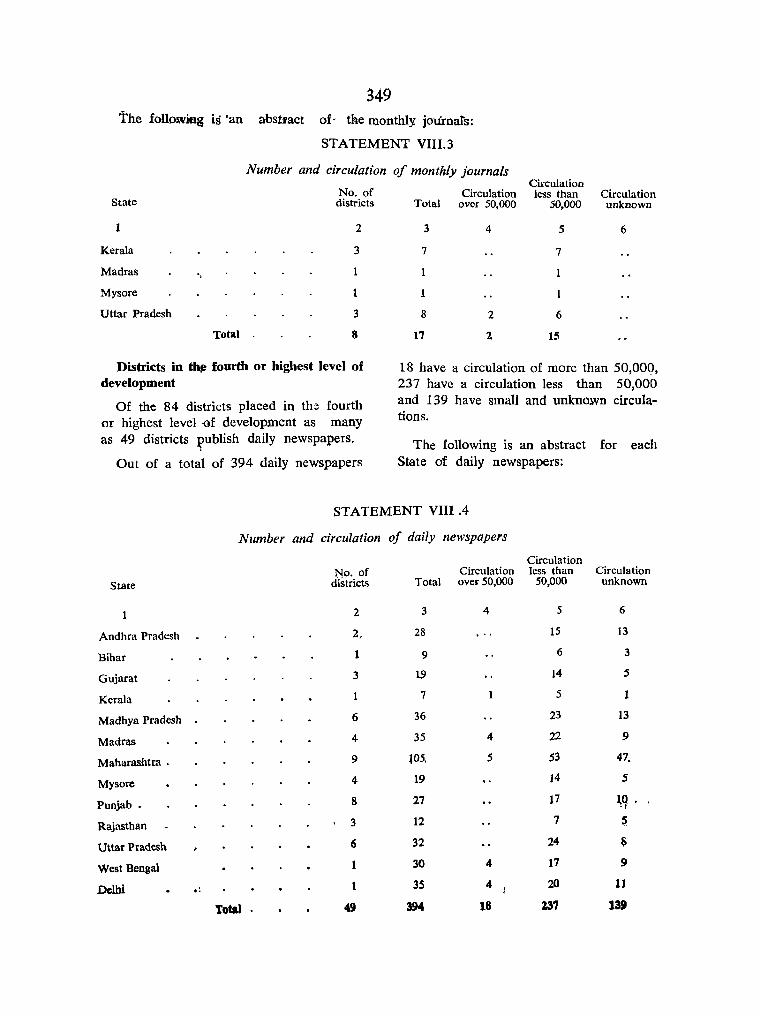
349 the followiflg is 'an abstJact of- the monthly jomnats:
STATEMENT VIII. 3
Number and circulation of monthly journals
State
1
Kerala
Madras
Mysore
Uttar Pradesh
Total
No. of districts
2
3
1
1
3
S
Districts in t~ fourth or highest level of development
Of the 84 districts placed in the fourth or highest level -of development as many as 49 districts J?ubIish daily newspapers.
Out of a total of 394 daily newspapers
Circulation Circulation less than Circulation
Total over 50,000 50,000 unknown
3 4 5 6
7
8
17
2
2
7
6
15
18 have a circulation of more than 50,009, 237 have a circulation less than 50,000 and 139 have smaU and unknown circulations.
The following is an abstract for each State of daily newspapers:
STATEMENT VIII .4
Stare
Andhra Pradt:sh
Bihar
Gujarat
Kerala
Madhya Pradesh
Madras
Maharashtra .
Mysore
Punjab.
Rajasthan
Uttar Pradesh
West Bengal
Delhi
Number and circulation of daily newspapers
Total
No. of districts
2
2,
1
3
1
6
4
9
4
8
3
6
1
49
Circulation Circulation less than Circulation
Total oveI 50,000 50,000 unknown
3
28
9
~
7
36
35
lOS-
19
27
12
32
30
3S
394
4
4
5
4
4
18
5
15
6
14
5
23
22
53
14
17
7
24
17
20
'1.37
6
13
3
5
13
9
47.
5
1,q . ~
~
9
11
135»
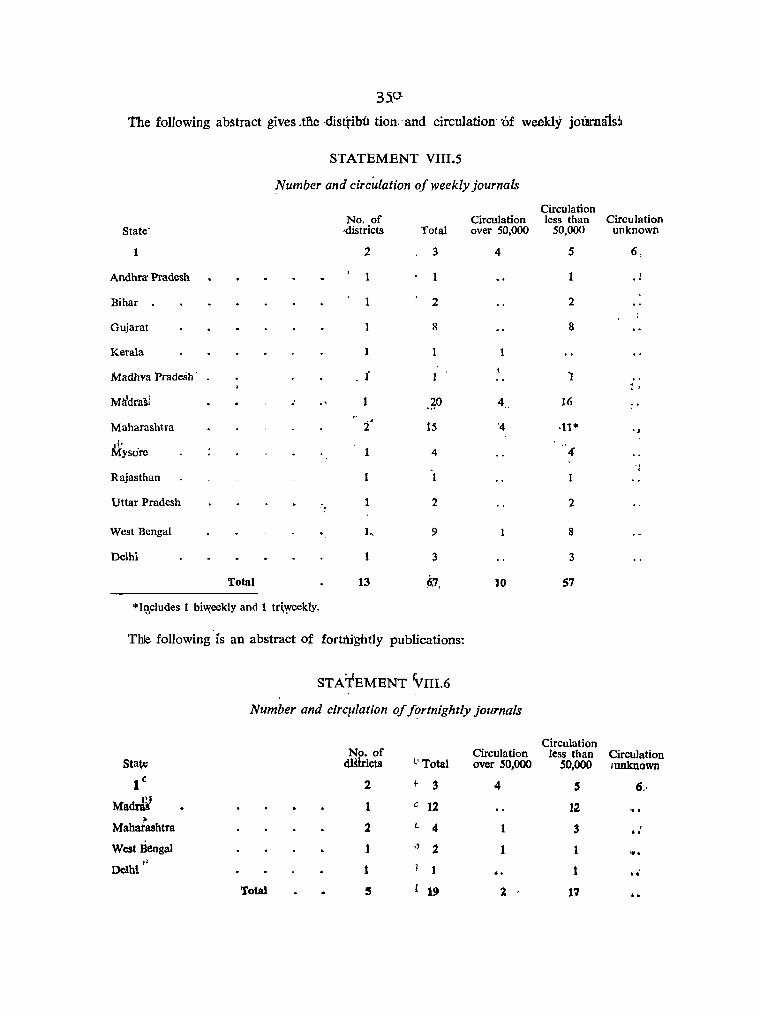
35.°' The following abstract gives .tIie ,distribtJ tion.' and circulation' 'of weekly jOUma1s~
STATEMENT VIII.5
!'lumber and circulation oj weekly journals
State'
1
Andhra: Pradesh
Bihar .
Gujarat
Kerala
Madhya Pradesh'
Ma'dras;
Maharashtra
Ji: Myso're
Rajasthan
Uttar Pradesh
West Bengal
Delhi
Total
*1t:l,c1udes 1 bi'Xeekly and 1 tr\'(Veekly.
No. of ,districts
2
1
1
, f
1
1
l~
1
13
Total
3
1
2
8
1
20 '.'
15
4
2
9
3
~7.
Thle following is an abstract of fortI'lightly publications:
STATEMENT VIII.6
Circulation Circulation less than Circulation over 50,000 50,000 unknown
4
1
4
'4
10
Number and circplation oj jortnightly journals
l' Maharashtta
West Bengal
" DeIhl
Total
No. of diStricts
2
1
2
1
t
S
l'Total
l- 3
c 12 I.. 4 ,j 2 I 1
19
Circulation Circulation less than Circulation over 50,000 50,000 I unknown
4 5 6.·
12
3 , .. 1 '<I-. . 1 ••
1 11 ..

351
The following is an absract of monthly journals:
STATEMENT VIII.?
Number and circulation of monthly journals
Circulation No. of Circulation less than CirculatioD
State districts Total over 50,000 50,000 unknown
2 3 4 5 6
Andhra Pradesh 2 2
Gujarat 3 5 5
Kerala 1 2 2
Madras 3 25 2 23
Maharashtra 4 17 2 15·
Punjab 2 3 3
Rajasthan 1
Uttar Pradesh 3 4 4
West Bengal 1 12 12
Delhi 19 2 17
Total 20 90 6 84
·Includes 1 published yearly and 1 for which period is not stated.
The above brief analysis testifies to the concentration of opinion forming organs in districts of the two top levels of de~lopment, particularly in the highest level. This leadership in news distribution and opinion formation may be used bo~h for aftruistic and other purposes. In any case it is indicative of the heavy dependence of districts
in the lower levels of economic deV1elopment on geographically concentrated sources of news and opinion dissemination. Such a situation, again. sometimes makes it difficult for the case of economically backwald areas to be presented and press
ed in the correct perspective.


CHAPTER IX THE GENERAL ELECTIONS OF 1957 AND 1962 AND THE LEVELS OF
DEVELOPMENT
THIS SMALL CHAPTER IS a digression in which the intention is to examine whether there is any noticeable association on the one hand between the strength, range and consistency of poHtkal parties, their voting performance and changes in the strength of votes polled in 1957 and 1962 and the levels of economic development on the other. Various tests of possible associations were carried out by relating the voting pattern in each of the four levels of development with ( 1 ) natural regions, subregions and divisions; (2) strength of organised labour in registered factories and establishments; (3) ratio of urban population to total population; (4) number of class I towns; (5) number of class II towns; and (6) by the numerical strength of agricultural processing industries viz., rice, atta, dal mills, sugar factories, oil mills, jute and cotton gins and presses, tobacco and bidi factories. But none of the associations proved either significant or consistent to any appreciable degree for either any of the levels of development or for any particular party or for any natural or cultural tract. But the examinations were little more than exploratory and there is need for a whole series of systematic exercise in an effort to detect the sensitive and significant spots of association. The main excuse for introducing this chapter
J63 R.G.I.-46. 353
is the presentation of election statistics district by district grouped under the four levels of development. It is perhaps for the first time that such a systematic compilation was attempted and Table IX.1 in four parts gives the results of the General Elections of 1957 and 1962.
The following statement gives an abstract of the Table IX.I. I would prefer to reserve comments at this stage as it is felt that no conun.ent would be valid as a general observation on the strength of the limited analysis that has been carried out and that one ought to return to more detailed and systematic analysis when time permits. A very interesting field of analysis that I have in mind is the intrablock and inter-block variances in the indicators adopted in this volume and their association, if any, with the voting patterns of different parties. I feel it is neces.sary to investigate whether the results of the proposed principle components analysis that has been referred to elsewhere in this book would have any bearing on the voting pattern. In the meantime it was felt that the data were too valuable to be denied to research workers and they are now presented in the hope that researchers would like to discuss with the writer the findings of their analytical work or about possible lines of further enquiry.

354
STATEMENT IX.1 Distribution of districts ill each of the four levels of development by (a) number of districts where no votes were polled by a party; (b) number of districts showing increases in percentage of votes polled 1957-62 ; (c) number of districts showing decreases in percentage of votes polled 1957-62
No. of districts having nil value both
Level of in 1957 and 2·00- 5·00- 7·00- 10,00-development 1962 Total 1·99 4,99 6·99 9·99 19·99 2O-r
1 2 3 4 5 6 7 8 9
(a) Districts with no return and increases Congress
I 27 4 8 4 7 3
II 33 9 12 4 4 3
III 29 7 10 4 2 3 3
JV 25 9 2 4 5 5
C,mmunist Part)' of Inaia
21 27 10 10 4 :-
I I 24 34 12 7 3 7 4
III 16 37 16 8 .) J 3 2
IV 11 39 14 12 4 3 6
Praja Socialist Party
8 21 11 6 2
II 21 24 6 10 3 4
III IJ 24 9 6 J 4 2
IV 11 23 10 4 4 2 3
Socialist
1 26 36 7 13 3 4 8
n 48 35 9 14 2. 4 4 2
llf 52 22 8 7 3 2
IV 41 37 15 5 3 7 5 2
Jan Sangh
I 18 35 4 10 6 3 9 3
If 24 42 12 11 8 3 6 2
III 18 49 22 12 4 5 4 2
IV 12 51 20 12 11 3 5
Swatantra
1 33 29 9 7 3 2 5 3
II 35 48 12 6 3 12 14
III 31 43 13 10 2 6 5 7
IV 25 53 15 15 7 4 6 6
~ The SW'ltantra Party did not put uD any candidatc in 1957, The Socialist Party was included in Other Pa ?e~ i.~ 1957. Tile scores of these two parties in this statement. theref,?re, indicat.e n?t 'inc~ease over 1957' but th:~umber of districts which polled a certain percentage of total votes In 1962 as mdlcated In the class range.

355 STATEMENT IX.I
Distribution of districts in each of the four levels of development by (a) number of districts where no votes were polled by a party ; (b) number of districts showing increases in percentage of votes .polled 1957-62 ; (c) number of districts showing decreases in percentage of ~otes polled 1957-62-contd.
Noo of districts having nil value both
Level of in 1957 and 2°00- 5 °00-development 1962 Total <1°99 4°99 6°99
2 3 4 5 6
(a) Districts with no return and increases-concld.
I •
II
111
IV
I
II
III
IV
13
12
11
8
(b) Districts with decreases
I
II
III
IV
II
III
IV
I
II
III
IV
I
II
III
IV
26
26
34
45
18
25
27
21
35
50
45
53
14
25
21
28
33
38
40
44
9
17
7
15
Other parties 9
4
12
6
Independents
3
3
5
4
Congress
7
7
5
7
5
5
5
13
3
5
6
5
6
4
7
12
6
3
2
3
4
3
12
10
4
C07lmunist Parry 0/ India
5 7
10 7
5 7
9 8
Praja Socialist Party
6 10
10 8
12 10
14 1'5
Jan Sangh
2 7
8 6
6 1
9 4
3
3
3
5
7
5
3
2
2
7°00-9°99
7
3
3
4
1
2
6
7
7
9
8
2
5
6
5
6
5
10°00-i909'
8
4
6
7
7
7
7
7
6
4
14
11
21
3
4
3
5
7
7
7
1
20+
.0
9
7
2
4
14
2
5
2
8
6
3
1
1

356
STATEMENT IX.l
Di:,tribution of districts in each of the four levels of development bJ (a) number of districts wher no votes were polled by a party (b) number of districts showing increases in percentage of voteS polled 1957-62 : (c) number of districts showing decreases in percentage of votes polled 1957-62-concld.
No. of districts ha"ing nil value both
Level of in 1957 lind 2'00- 5'00- 7'00- 10'00-develop'nent 1962 Total <1'99 4.99 6.99 ~.!)9 11).99 20+
r 2 3 4 5 6 7 8 9 Ollrer Parties
23 5
II 45 9
III 28 4
lV 25 5
44 2
II 58 6
III 47 5
IV 57 4 ----~~-- -
~OTE: Swatantra d;d not contest the 1957 electlon.
Another type of exercise was attempted in which the increase or decrease in votes polled between 1957 and 1962 by the Congress party on the one hand and all other parties including Other Parties and Independents on the other was expressed in terms of percentage of the votcs polled in 1957. This suggesteu that the results might be classified into four groups as follows:
A. Districts in which both Congress and Other Parties have pollcJ a large number of votes from 1957 to 1.962. This might be , I.. ~
ta~eq to signify an intensification of. polItical contest.
B. Districts in which Congress has experienced an increase from 1957 to 1962 but all other parties together have poned a decrease. This would signify that the Congress was gaining at the cost of other parties.
C. Districts in which Congress has experienced a decrease from
6 5 3 3
9 4 10 6 7
7 3 8 6
4 6 3 7
illd<pl'lldL"lt.,
3 3 6 12 18
10 3 7 17 15
6 7 6 6 17
6 6 3 19 19
1957 to 1962 but all other parties together h:::ve polled an increase. This would signify the emerging strength of other political parties at the cost of the Congress.
D. Districts jn which both Congress and all other parties combined have each experienced a decrease, This would signify growing apathy all round to\\ ards the elections.
The four groups of results were in the next place arranged in two ways. First, where any of the four characteristics CA, B, C and D) mentioned above are observed in medium and large clusters of contiguous districts, thus forming large patches of territory. Secondly, where any of the four characteristics are observed only in isulated districts or very small clusters of districts.
The four groups of results classified again into clusters of contiguous districts or spots of isolated districts are prest::nted in Table IX.2. The following is an abstract of the results obtained in Table IX.2.
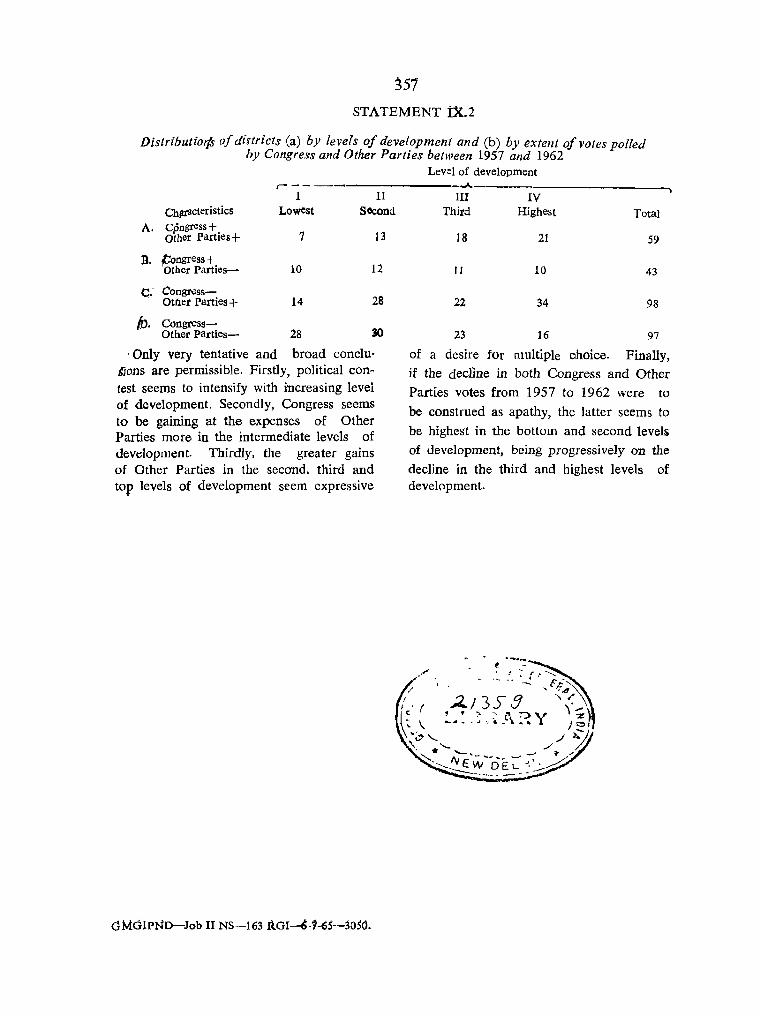
357
STATEMENT 1X.2
Distributioifs 0/ districts (a) by levels of development and (b) by extent o/rotes polled by Congress and Other Parties between 1957 and 1962
r--I II
Chlltacteristics Lowest Second
A. Cpngress+ Other Parties+ 7 13
B. jCongress + Other Parties- 10 12
C.- COngr<lss-28 OUlet Parties+ 14
(D. Congtess-SO Other parties- 28
c Only very tentative and broad concIuGions are permissible. Firstly, political contest seems to intensify with increasing levei of development. Secondly, Congress seems to be gaining at the expenses of Other Parties more in the intermediate levels of development. Thirdly, the greater gains of Other Parties in the second. third and top levels of development seem expressive
dMOIPND-Job II NS-163 RGI~-1-6S-joSO.
Level of development -.A
III IV Third Highest Total
18 21 59
II 10 43
22 34 98
23 16 97
of a aeme for nlultiple ohoice. Finally, jf the decline in both Congress and Other
Parties votes from 1957 to 1962 were to
be construed as apathy, the latter seems to
be highest in the bottom and second levels
of development, being progressively on the
decline in the third and highest levels of devel()pment.
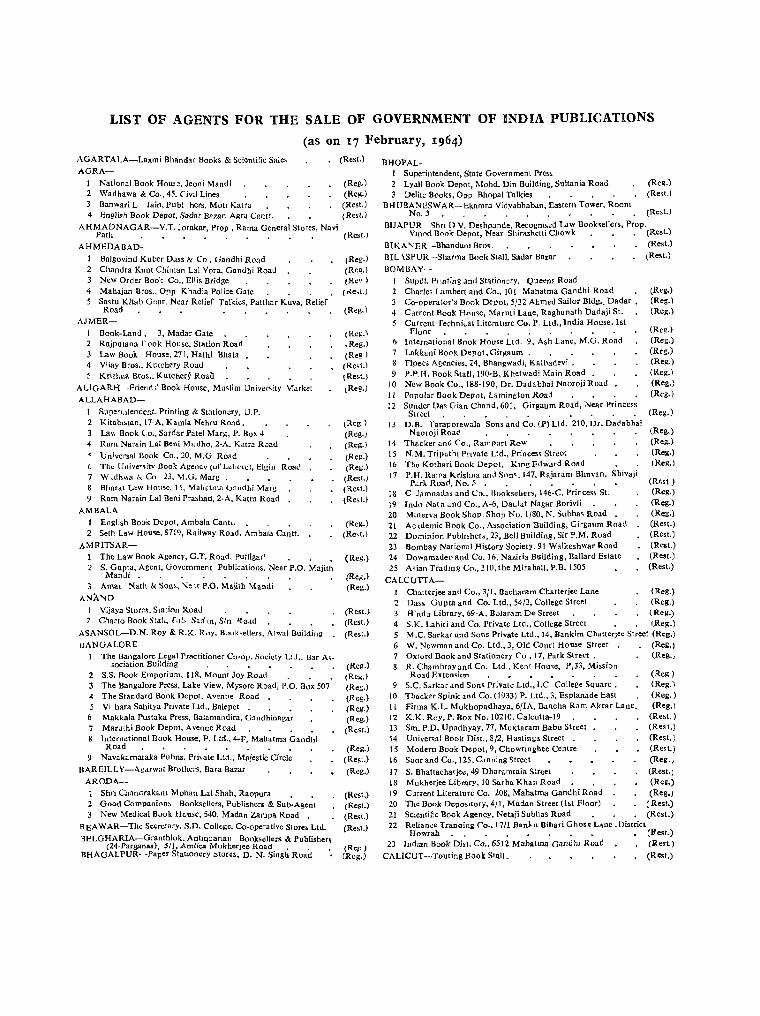
LIST OF AGENTS FOR THE SALE OF GOVERNMENT OF INDIA PUBLICATIONS
(as on 17 February, 1964) AGARTALA_Laxmi Bhandar Books & Scientific Sale, (Rest.) AGRA-
I National Book Hom '. Jeoni Mandi (Reg.) 2 Wadhawa & Co., 45. Civil Lines (Reg.) 3 Bnnwari L Jain. Publ hers. Mot! Katra (Rest.) 4 English Book Depot. Sadar Bazar, Agr. Cantt. tRest.)
AHMADNAGAR-V.T. Jorakar, Prop, Rama General Stores, Navi Path . • • • . . . • . (R<>;I.)
AHMEDABAD·
Balgovind Kuber Dass &: Co. Gandhi Road 2 Chandra Kant Chiman Lal Vora. Gandhi Rand
:-lew Order Boo', Co., Ellis Bridge 4 Mahajan Bros., Orp Khadia Police Gate • 5 S .. tu Kit.), Gnar. Near Relief Talkies, Patthar Kuva, Relief
Road . " ..•.. AJMER-
Book·Land. 3. Madar Gate 2 Rajputana l' oak House. Station Road 3 Law Book House. 271. Hathi Bhata 4 Viiay Bros., Kutchery Road
Kri;hna Bros .. Kutchery Roa(!
ALlGARH: -Friend;' Book House, Mu,lim Unive"ity \,farket ALLAHABAD-
I Supe'I.llendent. Printing & Stationery. U.P. 2 l<itabl!lotan, t7-A, Kamla Nehru Road. 3 La" Book Co., Sardar Patel Marg, P. Box 4 4 Rum Narain Lal Beni Madho, 2-A. Kmru R.:md
Universal [look Co., 20, M.G Rood 6 Thl.! Univc"''iitv Sook Agencv (uf Luh(.llei, Elgin Rca(' 7 v.,' ... dhv.u II ... CO 23, 'l\I.U. Marg . 8 Bharat Law House, 15, Mahatma uandhi Marg 9 Ram Narain Lal Beni Prashad, 2·A, Katra Road
AMBALA-I English Book Depot, Ambal. Cante. 2 Seth Law Hou,., 8719, Railway Road, Amb.Ja Cantt.
AMRITSAR-The Law Book Agency, G.T. Road. PutIigar' S. Gupta, Agent, Government Publkations. Near P.O. Majith ManJi. . . . . . " .
Amar Nath & Son;, '\(elf P.O. Majith Mandi
ANA";D I V;jaya <;tore" Station RoaJ ? Charto Book Stol" [.11., Sad 1II, Stn ROdd
ASANSOL-D.N. Roy & R.K. Roy. B,)C,k'ellers. Atwal Building
IJANGALORE The Bangalorc Legal Practitioner Co-op. Society Ltd. Bar A~-
5ociation Building .. . . .'. . S.S. Book Emporium, 118, Mount Joy Road. . The Bangalore Press. Lake View. Mysore Road, P.O. Box 507
4 The Standard Book Depot, Avenue Road . 5 Vi hara Sahity. Pnv'te Ltd., Balepet .
6 Makkala Pustaka Press, Balamandira, Gandhinagar 7 Maruthi Book Depot, Avenue Road
International Book House, P. Ltd., 4-F, Mahatma Gandhi Road
9 Navakarnataka Pubns. Pri,ate Ltd., Majestic Circle IlAREILLY-l<garwul Brothers. Bara Bazar
ARODA--I Shn Chanorakant Mohan Lal Shah. Raopura . . 2 Good COtf1panlom, Booksellers, Publishers & Sub-Agent 3 New Medical Book House, 540, Madan Zampa Road .
B EA W AR-The Secretary, S. n. College, Co-operative Store~ Ltd.
BELGHARIA-Granthiok. An.tlquanan Booksellers & Publishers (24-Parganas), 511, AmLIca Mukherjee Road . . .
BHAGALPUR- -Paper Stationery More" D. N. Singh Road
(Reg.) (Re~.)
(Reo) (<{e,t.)
(Reg.)
(Reg.) ,Reg.) (Reg) (Rest.) (Rest.,
tReg.)
tReg) (Reg.) (Reg.) (Reg.) (Reg.) (Rest., (Rest.) (Rest.)
(Reg.) (Re,t.)
(Reg.)
(Re,:.) (Reg.)
(Rest.) (Rest.) (Rest.)
(Reg.) (Reg.) (Rog.) (Reg.) (Reg.) (Reg.) (Rest.)
(Reg.) (Rest.) (Reg.)
(Rest.) (Rest.) (Res!.) (Res!.)
(Re~ ) (Reg.)
BHOPAL-Superintendent, State Government Press
2 Lyall Book Depot, Mohd. Din Building, Sultania Road 3 Delite B('oks. Opp Bhopal Talkies
BHUBANESWAR- Ekamra Vidyabhaban, Eastern Tower, Room No.3
(Reg.) (Rest.)
(Rest.)
BlJAPUR 5hn [) V. Deshpande. Recogn"ed Law Booksellers, Prop. Vmc'd Book Depot, Near Shirashetti Chowk . . . (Rest.)
BIKANER -BhandantBros. (Rest.) BIl \SPUR -Sharma Book Stall, Sadar Ba .. r
BOMIlAY-Supdt. Pnnt:ng and Stationery, Queem Road Charles Lambert and Co., to I Mahatma Gandhi Road Co-operator's Book Depot, 5/32 Ahmed Sailor Bldg •• Dadar •
<\ CJrrent Rook House, Maruti Lane, Raghunath Dadaji St. Current fechnical Literature Co. P. Ltd., India House, 1st
Floor 6 International Book House Ltd. 9, A;h Lane, M.G. Road 7 Lakkani Bo('k Depot. Girgaum . 8 Flpees Agencies, 24, Bhangwadi, Kalbadevi . 9 P.P.H. Rook Stall. 190,B, Khetwadi Main Road
10 New Book Co .• 188-190, Dr. Dadabhai Naoroji Road I J Popular Book Depot, Lamington Road :2 Sunder Das Gian Chand, 601. Girgaum Road, Near Prince;s
Street . , 13 D.B. Taraporewula Sons and Co. (P) Ltd. 210, Dr. Dadabhai
Naoroji Road 14 Thacker anC: Co., Rampart Row 15 N.M. Tripathl Pnvate Ltd., Princess Street 16 The Kothari Book Depot. KIng Edward Road 17 P.ll. RafT'a Krishna an,1 Son'. 147. Rajaram Bhuvan. Shivaji
Pdrk Road. No.5. 18 C Jamnada'S and <':0., Hooksehers, 146-C, Princes~ St. 19 Int!o Nath and Co., A-b, Daulat Nagar Borivl; 20 Minerva Book Shop, Shop No. I{SO, N. Subha, Road 21 Ac .uemic Book Co., Association Building, Girgaum Road 22 Dominion Pubh,hers, 23, Bell Building, Sir P.M. Road 23 Bombay National History Society, 91 Walkeshwar Road 24 Dowamadeo and Co. 16, Naziria Building, Ballard Estate 25 A'ian Tradmg Co., 310, the MirahaH. P.B. 1505
CALCUTTA-
(Rest.)
(Reg.) (Reg.) (Reg.)
(Reg.) (Reg.) (Reg.) (Reg.) (Reg.) (Reg.) (Reg.)
(Reg.)
(Reg,) (Reg.) (Reg.) tReg.)
(Rest) (Reg.) (Reg.) (Reg.) (Rest.) (Rest.) (Rest.) (Rest.) (Rest.)
Chatterjee and Co., 3/1, Bacharam Chatterjee Lane (Reg.) Z Dass Gupta and Co. Ltd .• 54/3, College Str .. t (Reg.) 3 H'ndu Library, 69-A, Bolaram De Street tReg.) 4 S.K. Lahiri and Co. Private Ltd., College Street (Rel':.) 5 M.e. Sarkar and Sons Private Ltd., 14, Bankim Chatterjee Street (Reg.) 6 W. Newman and Co. Ltd., 3, Old Court House Street . (Reg.) 7 Oxford Book and Stationery ("0 • 17, Park Street. (Reg., 8 R. Chambray and Co. Ltd., Kent Hou,e, P,33, Mission
Road Extension (Reg) 9 S.c. Sarkar and Son' Private Ltd .• I.C College Square. (Reg.)
10 Thack<r Spink and Co. (1933) P. Ltd., 3, Esplanade East (Reg.) II Firma K.L. Mukhopadhaya, 6/IA, Bancha Ram Akrar Lane. (Reg.) 12 K.K. Roy, P. Rox No. 10210. Calcutta-19 (Rest.) i3 Sm. P.D. Upadhyay, 77, Mul<taram Babu Street (Rest.) 14 Universal Book Dist., 8/2, Hastings Street . (Rest.) IS Modern Book Depot, 9, Chowringhee Centre (Rest.) 16 Soar and Co., 125. Canning Street (Reg.;
17 S. Bhattacharjee, 49 Dharamtaia Street (Rest.; 18 Mukherjee Library, 10 Sarba Khan Road (Rei.) 19 Current Literature Co. 108. Mahatma Gandhi Road (Reg.) 20 The Book DepOSitory, 4/1. Madan Street (Ibt Floor) (Rest.) 21 Scienticc Book Agency, Netaji Subhas Road (Rest.) 22 Relian..:e Tranding Co., 17/1 Banl.u Bihari Ghose Lane, District
Howrah " • . • . .• • (R est.) 23 Indian Book Dist. Co .. 6512 Mahatma GandhI Road (Rest.)
CALlCUT-.. Touring Book Stall. (Rest.)

CHANDIGARH-Supdt. Govt. Printing and Stationery, Punjab
2 hin Law AgencY, Plat No.8, Sector No. 22 3 Rama News Agency, Bookseller, Sector No. 22
4 LJniverlal Book Store, Booth 25. Sector 22D 5 English Book Shop, 34, Sector 22D , Mehta Bros, IS-Z, Sector 22B 7 Tandan Book Depot, Shopping Centre, Sector 16 .
Kailash Law Publishers, Seclor 22B
CHHINDWARA-The Verma Book Depot
COCHIN-Saraswat Corporalion Ltd. ,Palliarakav Road CUITACK-
1 Press Officer, Oris.a Sectt. 2 Cuttack Law Times 3 Prabhat K. Mohapatr., Mangalabag, P.B. 3S 4 D. P. Sur & Sons, Ma, galabag 5 Utkal Stores, Balu Ba:zar
DBHRADUN-
1 Jugal Kishore &. Co., Rajpur Road 2 National News Agency, Paltan Bazar 3 Bishan Singh and Mahendra Pal Singh, 318, Chukhuwala 4 Utam Pustak Rhandar, Pallan Bazar
DI!LHf-1 J .M. Jaina & Brothers, Mori Gate. 2 Atma Ram & Sons, Kashrnere Gate 3 Federal Law Book Depot, Kashmere Cate 4 Bahri Bros., 188, Lajpat Rai Market .
Bawa Harkishan Dass Bedi (Vij.y. General Ageneie.) 2027, Ahata Kedar., Chamalian Road
6 Book-Well, 4, Sant Narankari Colony, P.B. 1565 • 7 Imperial Publishlng Co., 3, Faiz Bazar, Daryaganj 8 Metropolitan Book Co., I, Paiz Bazar 9 Public ation Centre, Subzimandi .
10 Youngman & Co., Nai Sarak II Indian Army Book Depot, 3, Daryaganj
P.B.
12 All India Educational Supply Co., Shri Ram Buildings, Nagar
Jawahar
13 Dhanwant Medical & Law Book House, 1522, Lajpat Market.
Rai
14 University Book House, IS, U.B., Bangalore Road, Jawahar Nagar
15 Law Literature House 2646, llalimaran 16 Summer Brothers, P.O. Bir!a Lines 17 Universal Book & Stationery Co., 16 Netaji Subhash Marg 18 B. Nath & Br08., 3808, Charkhawalan (Chowri Bazar) 19 Raikarnal Prakashan P. Ltd., 8, Poiz Bazar. 20 Premier Book Co., Prlflters, Pubhshers & Booksellers, Nai
Sarak 21 Universal Book Traders, 80, Gokhale Market 22 Tech. &. Commercial Book Coy., 75, Gokhale Market 23 Saini Law Publishing Co., 1416, Chabiganj, Kashmere Gate 24 G.M. Ahuja, Booksellers & Stationers, 309, Nehru Bazar 25 Sat Narain &. Sons, 3141, Mohd. Ali Bazar, Mori Gate. 26 Kitab Mahal (Wholesale Div.) P. Ltd., 28, Paiz Bazar • 27 Hindu Sahltya Sansar, Nai Sarak 2& Munshl Ram Manohar Lal Oriental Booksellers & Publishers,
P. B. 1165, Nai Sarak • 29 K. L. Seth, Suppliers of Law, Commercial Tech. Books, Shanti
Nager, Gan~hpura • 30 Adarsh Publishing Service, SA/lO, Ansari Road
DHANBAD-1 I.mag Co-operative Stores Ltd., P.O. Indian School of Mines
2 New Sketch Press, Post Bolt 26 •
DHARWAR-The Agricultural College Consumers Co-op. Society
2 Ram~hraya Book Depot, Subash Road 3 Kamatakaya Sahltya Mandir of Publishers and Booksellers
ERNAKULAM-Pai & Co., Cloth Bazar Road
2 South India Trader. C/o, Constitutional Journal
(Reg.) [Reg.)
(Reg.) (Rest.) (Rest.) (Rest.) Rest.)
(Rest.)
(Reg.)
(Reg.) (Reg.)
(Rest.) (Rest.)
(Reg.)
(Reg.) (Reg.) (Rest.)
(Reg.) (Reg.) (Reg.) (Reg.)
(Reg.) (Reg.) (Reg.) (Reg.) (Reg.) (Reg.) (Reg.)
(Rest.)
(Rest.)
(Rest.) (Rest.) (Rest.) (Reg.) (Rest.) (Reg.)
(Rest.) (Reg.) (Rest.)
(Rest.) (Rest.) (Rest.) (Reg.) (Rest.)
(Rest.)
(Rest.) (Rest.)
(Reg.)
(Rest.)
(Rest.) (Rest.)
(Rest.) (Reg.)
(ii)
FEROZEPUR-English Book Depot, 78, Jhoke Road GAUHA U-Mokshada Pustakalay.
GA YA-Sahitya Sadan, Gautam Budha Marg GHAZIABAD-Jayana Book Agency
GORAKHPUR-Visbwa Vidyalaya Prakashan, Nakhes Road
GUDUR-The General Manager, The N.D.C. Publishini & Ptg. Society Ltd. . .
GUNTUR-Book Lovers Private Ltd., Kadriguda, Chowra,t.
GWALIOR-1 Supdt., Printing & Stationery, M.B. 2 Loyal Book Depot, Patankar Bazar, Lashkar
M. C. Daftari, Prop. M.B. Jain & Bros., BOOksellers, Sarafa Lashkar •
HUBLl-Pervaje's Book House, Koppik¥ Road
HYDERABAD-
1 Director,. Govt.. Press 2 The Swaraj Book Depot, Lakdikapul 3 Book Lovers Private Ltd. . 4 Labour Law Publications, 873, Sultan Bazar
IMPHAL-Tikendra &. Sons Booksellers
INDORE-
1 Wadbawa &: Co., 56, M.G. Road 2 SWarup Brothers, Khajuri Bazar .
Madhya Pradesh Book Centre, 14, Ahilya Pura 4 Modern Book House, Shlv Vilas Palace •
Navyug Sahitya Sadan ,Publishers & Booksellers, 10, Khajuri Bazar
JABALPUR-
Modem Book House, 286, Jawaharganj 2 National Book House, 135, Jai Parkash Narain Marg
JAIPUR-
Government Printing and Stationery Department, Rajasthan 2 Bharat Law House, Booksellers & PubIIShe .. , Opp. Prem Pra
kash Cinema • Garg Book Co., Tripolia Bazar •
4 Vam Mandir, Sawai Manslngh Highway 5 Kalyan Mal & Sons, Tripolia Bazar 6 Popular !look Depot, Chaura Rasta 7 Krishna Book Depot, Chaura Rasta 8 Dominion Law Depot, Shah Building, P.Il. No. 23
lAMNAGAR-Swadeshi Vastu Bhandar
JAMSHEDPUR-I Amar Kitah Ghar, Diagonal Road, P.B. 78 2 Gupta Stores, Dhatkidih 3 Sanya! Bros, Booksellers & News Agents, Bislapur Market
lA WALAPUR-Sahyog Book Depot
1 HUNJHUNU-
(Reg.) (Reg.)
(Reg.) (Rest.)
(Reg.)
(~t.)
(Reg.)
(Reg.)
(Res!.)
(Reg.)
(Reg.) (Root.) (Rest.)
(Rest.)
(Reg.) (Rest.) (Rest.) (Rest.)
(Rest.)
(Reg.) (Rest.)
(Reg.) (Reg.) (Reg.) (Rest.) (Reg.)
(Rest.) (Rest.)
(Reg.)
(Reg.) (H.eg.) (Rest.)
(Rest.)
Shashi Kumar Sarat Chand . (Re;t.) 2 Kapram Prakashan Prasaran, 1/90, Namdha Niwas Azad Marg (Reg. I
JODHPUR-1 Dwarka Das Rath., Wholesale Books and News Agents 2 Kitab-Ghar, Sojati Gate 3 Cboppr. Brothers, Tripolia Bazar
llJLLUNDUR-Hazooria Bros., Mai Hiran Gate
2 Jain General House, Bazar Bansallwala 3 University Publishers, Railway Road
KANPUR-I Advani & Co., P. Box. 100, The Mall 2 Sahltya Niketan, Shradhanand Park 3 The Universal Book Stall, The MaU 4 Raj Corporation, Raj House, P.B. 200, Chowk
(Reg.) (Rell.) (Reg.)
(Rest.) (Reg., (Rest.)
(Reg.) (Reg.) (Reg.) (Rest.)
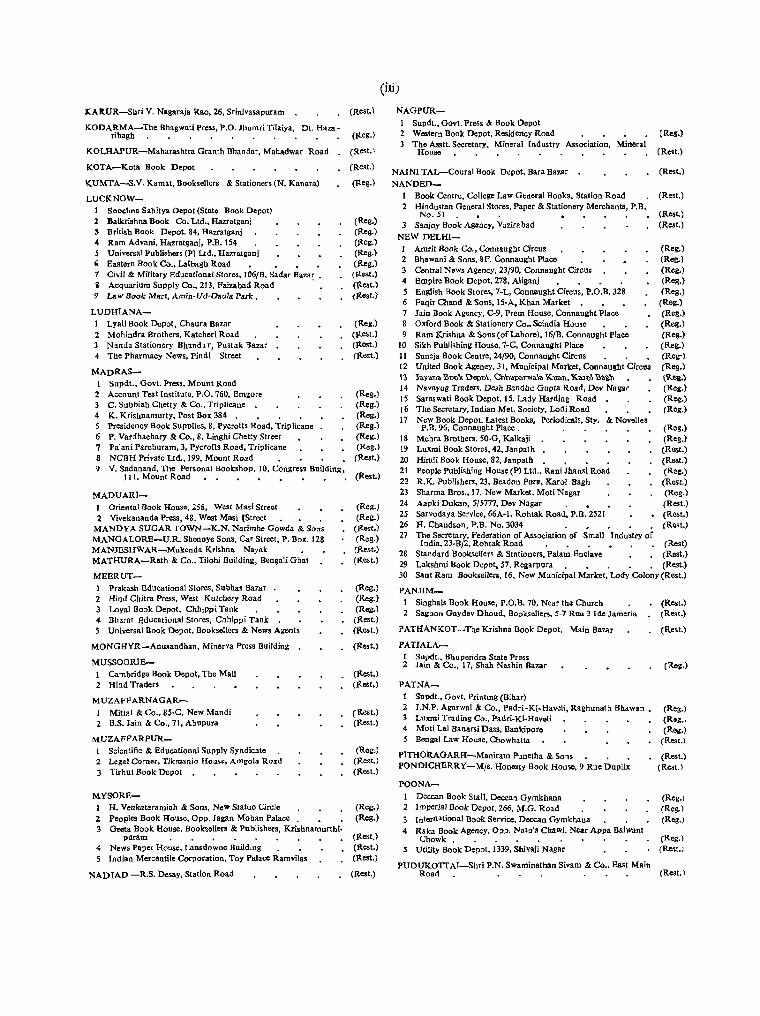
Jt:AIIlUR-Sbri V. Nagar.ja Rao, 26, Srinivas.pur.m (Rest.)
KODARMA-The Bh.gwati Press, P.O. Jhumri TiI.iya, Dt. Haza-ribagh (Iteg.)
KOLHAPUR-Maharashtra Granth Bhandar, Mah.dwar Road (Rest. \
KOTA-Kota Book Depot (Rest.)
lCUMTA-S.V. Kam.t, Booksellers & Stationers (N. Kanar.) (Iteg.)
LUCKNOW-1 Soochna Sahitya Depot (State Book Depot) 1 Balkrishna Book Co. Ltd., Hazratgani 3 British Book Depot, 84, Hazratgani " Ram Advani, Hazratgani, P.B. 154 5 Universal Publishers (P) Ltd., Haze"tgani , Eastern Book Co., Lalbagh Road 7 Civil & Military Educational Stores, 106{B, Sadar Bazar. a Acquarium Supply Co., 213, Palz.bad Road ' 9 Law Book Mart, Amin-Vd-Danla Park,
LUDHlANA-1 Lyall Book Depot, Chaura Bazar 2 Mohindra Brothers, Katcheri Road 3 Nanda Stationery Bhanda r, Pustak Bazar 4 The Pharmacy News, Pindi Street
MADRAS-Supdt., Govt. Pres., Mount Road
2 Account Test Institute, P.O. 760, Emgore C. Subbiah Chetty & Co., Triplicane .
4 K. Krishnamurty, Post Box 384 • 5 Presidency Book Supplies, S, Pycrofts Road, Triplicane 6 P. Vardhacltary & Co., 8, Linghi Chetty Street 7 Palani Parchuram, 3, pycrofts Road, Triplicane 8 NCBH Private Ltd., 199, Mount Road 9 V. Sadanand, The Personal Bookshop, 10, Congress Building,
I II, Mount Road
MADUARl-1 Oriental Book House, 258, West Masi Street 2 Vivekananda Press, 48, West Masi IStreet
MANDYA SUGAR TOWN-K.N. Narimhe Gowda & SOilS
MANGALORE-U.R. Shenoye Sons, Car Street, P. Box. [28 MANJESHWAR-Mukenda Krishna Nayak MATHURA-Rath & Co .. Tilohi Building, Bengali Ghat
MEERUT-I Prakash Educational Stores, Subhas Bazar 2 Hind Chitra Press, West Kutcbery Road 3 Loyal Book Depot, Chh,Ppi Tank 4 Bharat Educational Stores, Chhippi Tank 5 Universal Book Depot, Bookse!lers & News Agents
MONGHYR-Anusandhan, Minerva Pres. Building
MUSSOOR[E-Cambridge Book Depot, The Mall
2 Hind Traders
MUZAFFARNAGAR-
I Mittal & Co., 85-C, New Maodi 2 B.S. Jain & Co .. 71, Abupura
MVZAFFARPUR-Scientific & Bducational Supply Syndicate
2 Legal Corner~ Tikrnanio Haase, Amgola Road 3 Tirhut Book Depot
MYSORE-H. Venkataramiah & Sons, New Statue Circle
1 Peoples Book House, Opp. Jagan Mohan Palace 3 Geeta Book House, Booksellers & Publi.hers, Krishnamurtbi
puram 4 News Paper Rouse, Lansdowne Buildmg 5 Indian Mercantile Corporation, Toy Palace Ramvilas
NADIAD -R.S. Desay, Station Road
(Reg.) (Reg.) (Reg.) (Reg.)
(Reg.) (Itest.) (Rest.) (1{est.)
(Reg.) (Itest.) (Itest.) (Rest.)
(Reg.) (Reg.) (Reg.) (Reg.) (Reg.) (Reg.) (Rest.)
(Rest.)
(Reg.) (Reg.)
(Rest.) (Reg.) (Rest.) (Itest.)
(Reg.) (Reg.) (Reg.) CRest.) (Itost.)
(]test.)
(It .. t.) (Itest,)
(Rest.) (Rest.)
(Reg.) (Rest.) (Rest.)
(Reg.) (Reg.)
(Rest,) CRest.) (Itest.)
(Rest.)
(iii)
NAGPUR-
I Supdt., Govt. Press & Book Depot 2 Western Book Depot, Residency Road (ROl:.)
The Asstt. Secretary. Mineral Industry Association, Mineral House (Re.t.)
NAINI TAL-Coural Book Depot, Bara Bazar (Rest.)
NANDED-Book Centre, College Law General Books, Station Road
2 Hindu,tan General Stores, Paper & Stationery Merchants, P.B. No. 51
3 Sanioy Book Ag.ncy, Vazirabad
NEW DELHI-I Amrit Book Co., Connaught Circus 2 Bhawani & Sons, SF, Connaught Place 3 Central News Agency. 23/90, Connaugbt Circus 4 Empire Book Depot, 278, Aligani 5 English Book Stores, 7-L, Connaught Circus, P.O.B. 328 6 Faqir Chand & Sons, [5-A, Khan Market
Jain Book Agency, C-9, Prem House, Connaught Place Oxford Book & Stationery Co .. Scindia Rouse
9 Ram Krishna & Sons (of Labore) , 16{B, Connaught Place 10 Sikh Publi.hing House.7-C, Connaught Place I [ Suneja Book Centre, 24{90, Conoaught Circus 12 United Book Agency, 31, MUnicipal Market, Connaught Cire ... n }"'flI.1>." '300'0< DtpcA, C'nm.'P"l_\a KU'Oll, K",,,\ '3 .. ~'n 14 Navayug Traders. Dosh Bandhu Gupta Road, Dov Nagar 15 Saraswati Book Depot, 15. Lady Harding Road 16 The Secretary, Indian Met. Society. Lod; Road 17 New Book Depot. Latest Books, Periodicals, Sty. & Nov.lles
P. B. 96, Connaught Place . 18 Mehra Brothers, 50-G, Kalkaji 19 Luxmi Book Stores, 42, Janpath 20 Hindi Book House, 82, Janpath 21 People Publi,hing House (P) Ltd., Rani Jhans; Road 22 R.K. Publishers, 23, Beadon Pura, Karol Bagh 23 Sharma Bros., 17, New Market, Moti Nagar 24 Aapki Dukan, 5/5777, Dev Nagar 25 Sarvodaya Service, 66A-I, Rohtak Road, P.B. 2521 26 H. Chand,on, P.B. No. 3034 • 27 The Secretary, Federation of Association of Small Industry of
(Rest.)
(Res!.) (Res!.)
(Reg.) (Reg.) (Reg.) (Reg.) (Reg.)
(Reg.) (Reg.) (Reg.) (Reg.) (Reg.) (Reg·) (Reg.) {Rtt.) (Reg.) (Reg.) (Reg.)
(Reg.) (Reg.) (Rest.) (Rest.) (Res.) (Rest.) (Reg.) (Rest.) (Rest.) (Rest.)
India, 23-B/2, Rohtak Road (Rest) 28 Standard Booksellers & Stationers, Palam EnClave (Rest.) 29 Lakshmi Book Depot, 57, Regarpura . (Rest.) 30 Sant Ram Book.ellers. 16, New Municipal Marlcet, Lody Colony (Rest.)
PANJIM-
1 Singhals Book House, P.O.B. 70, Near tho Churcb 2 Sagoon Gaydev Dhoud, Booksellers, 5-7 Rna 3 Ide Jamoria
PATHANKOT-The Krishna Book Depot, Main Bazar
PATIALA-1 Supdt., Bhupendra State Press 2 Jain & Co., 17, Shah Nashin Bazar
PATNA-Supdt .• Govt. Printing (Bihar)
2 J.N.P. Agarwal & Co., Padri-Ki-Haveli, Raghunath Bhawan • 3 Luxmi Trading Co., Padri-Ki-Haveli 4 Moti Lal Banarsi Dass, Bankipore 5 Bengal Law House, Chowhatta
PITHORAGARH-Maniram Punetha & Sons PONDICHERRY-M/s. Honesty Book Hou.e, 9 Rue Duplix
POONA-
1 Deccan Book Stan, Deccan Gymkhana 2 Imperial Book Depot, 266, M.G. Road 3 International Book Service. Deccan Gymkhana 4 Raka Book Agency, Opp. Natu's Chawl, Near Appa Balwant
Chowk . Utility Book Depot, 1339, Shivaii Nagar
PUDUKOITAI-Shri P.N. Swaminathan Sivam & Co .. East Main
(Rest.) (Rest.)
(Rest.)
(Reg.)
(Reg.) (Rog •• (Reg.)
(Rest.)
(Rest.) (Re.,t.l
(Reg. I (Reg.) (Reg.)
(Reg.) (Rest. I
Road (Rest. I

R ... JKOr -Mohan Lal Do'sabhal Shah. B()o""eller, and Sub-Agents (Reg)
RANCHI-
1 Ctown Ilook Depot. Upper Ba7.ar 2 Pus,ak Mahal. Upper Bazar
REWA- Supd, .• Covt. State Emporium V.P. ROURKELA -The RourkeJa Review SAHARANPUR -Chandra Bharata Pu\tak Bhand.r. Court Road SBCUNDERABAD-Hindustan Diary Publishers. '>1arket ~treet
SILCHAR-Snri Nisnitto Sen Nazirpatti
SIMLA- -I Supdt.. Himachal Pradesl> Cnvt. 2 Minerva Book Shop. The Mall . 3 The New Book Depot. 79. The Ma I
SINNAR -Shri "I.N. Jakhadl, Agent, Time< Jfln1ia, Sinnar(", .. ik)
SHlLLONG-1 The Offh:er~in~CI-]<1rge. A~sam Govt. B.D. 2 Chapla Bookstall, P.B. No. I
SONEPAT-Uruted Book Age~cy
SRINAGAR-The Kashmir Book,h~p. Residency R,,,d
",'SRJI.' - 'i>n,) (',"i~n .. n ?UW1>' .. .,M'Y ... '\ """t\ R,,'il~
IlRUCHlRAPALLf -Kalpana Puoli~her'i. Wosiur
2 S Krishnaswami & Co., 35, Subha,h Ch.Gder Il,,,e Road 3 Palamiaopa Bf os.
TRIVA"IDRlIM-
I Tnternatlona, Book Depot, Ma;n Road 2 Reddear Press & Book Depot. P.B. No.4
TUTICORIN -Shri K. Thiagarajan, to-C, French Chapal Road
UDAIPUR-
(Reg.) (Re.t )
(R.;!.) (Re,t.) (Reg.) (Rei!.)
(Reg,) (R~gl
IRe;' )
(Reg·) (Reg.)
(R~st.\
(R~g.J
(Rest.) (Rest.)
1 Jagdish & Co., Tnside Surajapole. .• • (Rest.) 2 Book Centre. Maharana. Bhopal Consumers' Co-op. ,>ocietv Ltd. (Rest)
UJJAIN - 'I.1anak Cn.md 3"ok Depot. ')ati Gate
VARANA";' -
"tude'lfs, FrieI1d~ & Co LantCa . 2 Chowkhamba 'San~kClt Ser;.!" OJ1 __ e. Gn1>.1.r ~tnJi" RO<l(l. P.ll.S
Globe Book Centre • 4 KohinvorStores, t.:niver.ity Road,Lanka 5 B.H.U. BOOK Dopot
(Rest.)
(Re,t.) (R~g·)
(Rest.) (Reg.) (Rest.)
VELLORF....--A. Vcnkata~ubhan, La>" B":>olo".'"leUe('> (Reg,) VIJAYAWAD,,--The Book &. Revidw Centre. E,uru Road ,UJvern-
pet (Re.t.)
VISAKHAPATNAM -
Gupta Brothen, Viz;' 13uilding Book Centre, 11/97, Mai~ Rvld. [he Se.cy., AnJhra Unive,.c;;ity. G~nt!r.a: CO-lIp. gt''''eo; Ltd.
VIZIANAGARAM -Sardo &. Co.
(Re~.) (Reg.)
(R~<tJ
(R~st.1
(iv)
WARDHA- -Swar.ieya Bnanuar. Bnor)i Market (Reg.)
For Loca Sa:c
Govt. offndia, Kitab Mahal, Janpath, Opp. Ind'a Coffee !-fv~e. New Delhi
2 Govt. ('f India Book Dftl)ot, 8, lia,tillgs ~treet, Calcutta 3 High CO'1lmission"'er for India in London, lndia' Ht)u<;~, Ll)nuon,
W.e. 2.
Railway Books!a:l HoldeT8
t 2
SIS. A.R Wheeler & Co., 15, Elgin Road, Allahabad Gahlot Bros., K. E. M. Road, Bikanet Higgmoothams & C;,. Ltd., Mount Road. Madras
... M. Gulab Singh & Sons Private Ltd .. Mamura Road, New Delhi
Foreign
1 SIS flUlication Enter'Jris(" Private Ltd., Kathumandu (Nepal) 2 SIS. Aktie Bologat, C.E Frize, Kungl, Hovobokhandel. Fred\gation-2
Box 1650. Stocknolm-16 (Sweden), . Rei.sc-und Verkehraverlag Stuttgart, Post 730. Gutenbergstra 21~ Stuttgart
No. 11245, Stuttgart den (Germany West) 4 Shri [gwa" Subramanyam 452, Reversite Driv Apt. 6, New York, 27 NWY 5 The Proprietor, B,JOk Ce~tre, Lakshmi Mansons, 4~. The Mall, Lahore
(Pakistan) On S. and R. Basi.
I The Head Clerk, Gi'lV(. B.,.,k Depot, Ahmedabad 2 The Asstt. Olc.;ct..1r, E ;;:teuSl..J11 Centre, Kapileswar !toad, Belgaurtt 3 The Em~k'yment Offker, Emfll"ym~nt Exchange, Dhar 4 Th.~ Ao;stt. O're("tor. ~ootwear E"{tension. Centre, Polo Ground No. I,
JoJhpur 5 TI:le O,T/C .. Exten.ion Centre, Club Road, M"zalTarpur. 6 The O.ref'tnr. r I1J;an Bureau of M;ne~, Govt. of India. 1\'[inic;try of Mines
aau Fuel. Nagpur 7 The"' A.,~tt Oircctor, I~1d<.lstf·.al R'(te LSlnn Centre, Nadiau (Gujarat) !i. "I'm. Ht.w. ~1i"..r..Ih, f!'mJ/~LtW';J;!<g...1..rp.'J,,: Pt'!.~'t.. $. F~t;'Ia..W"~ RQ..m. ~'Wn.R. 9 Govt. P'tntillg & Stationery. Rajkot
10 The 0 I IC. E~t~'1"it.,n C,::nUI!, Indu5trial E<;tate. Kokar. R<ln~hi 11 The DL"~Ct.)f. S.£.'5.1nJustria: Extenl;lOn Centre~ Utlhna, Surat. 12 Th~ Reg;strar of CompanIes, ~arayani Budding, 27, Erabonrne Roau
Cakutta-l 1.3 Thi! R.eJistrar of ComjJa.me~. Kerala, 350, Feet Road, Ernakulam. 14 The Re~istr.r of CJmllanies. [J, No 3-5-81, Hyde(guda, Hyder.bad 15 The R~glstrar of GJm"lame::>, Assam. Manipur and Tripura. ShiUong 16 The Registrar of Companies. Sunlight Insurance Budding, Ajmeri Gate
Extension, New Delhi. 17 The Registrar of Companies Punjab and Himachal Pradesh, Link .'toad,
Iullundur City. 18 The Registrar ofCompanre<;, Bihar, Jamdl R.Jad. Patna-l 19 The Registrar ur Cumpanies, Raj & Al'ner; Sri Kamta Prasad House, Is
Floo- 'c' Scheme, Ashok Ma'g. Jaipur 20 fhe R~Jt<;tr.lr of C,)'mp.anies, Andhra Bank BUIlding. 6. Linghi Chetty
Street, P R. 1530, M.dra. 11 The R~~hrr,r· :>f C.>mpanie,. Mahatma. Gandhi Road. \V~jt Cotto Bldr.
P.B No. 334, Kanpur 22 Ine Registrar of Companies. Everest 100. Marine Drive~ Bombay 13 fn:;. R.~~:,t.-.r· o~ ~.,)mi'<blie<:j. 162. Brigade Road, Bangalore :!4 The Re~i"itrar ofCompames, Gwalior 25 The Asstt. Dlfectm. Edension Centre, Bhuli Road, Dhanbad 16 The Reghtrar of Companies, Orissa, Cuttack Chandj, Cuttack 27 fhe Registrar ot Complmes, Gujarat State, Gujarat Sam3ehar BuiIJI.Ig.
Ah nedab.d 28 P,JbllCalion Diw5iun, '3a re Depot, North Block. 1'.,,:ew Delhi 29 fh" D<vtlopment CommlS,io ler. Small ~oa)e J~du,tries. New Delhi 30 fhe 0 [JC .• lJnj'{~(<;ity E.mp1oyme It Bureau. LUCKnow
3 J O. I/C. S 1.S.1. E>.ten"o.l C.n'''. V!alJa 12 O.I/C. S.1.S./ E'te~"on Contre. Hlora. Tabaluria, 24-Parganas 33 0 fjC .. ~.r."') r. Mc)Je1 Cd,rpeOltry Work'lOop, Piyali Nagar, P.O. Burni
pur 3~ 0, I'C . '> I S.I. ChrontarnlClg Extension Centre 1an!!ra 33. North
Top,ia Road, Calcutta-46. 35 0 l/C. S I. ~.L EX'knsion Ce.,_tre (Footwear). ("~Jcutta 36 A5,tt. Oire~tor. E"{tensioil Centre, Hyderabad 37 A«tt. Dire",;>r, Exten.ion. Centre, Krishna Distt. (A.P.) 38 Employment Officer~ Employment Exchange. Jhabua 39 Dy Director lnoharge, S.I.S.1. C/o ChIef Civil Admn. Goa, Panjim 40 The ReJlstrdf otYrade Unions, Kanpur . ..j. t The Employment Officer, Employment Exc.hange, Gopal Bhavan, Morma 42 The O. IIC. ~tate Information Centre, Hyderabad 4 3 T~Je Registrar of Companies, Pondicherry. 44 The Ac;,stt. Director cfPublicity and Information Vidhana Saubh a
(P.B. 271 ) B~ng,tor.