Palamau, 13, Bihar - Linguistic Survey Of India
544
'0 . ... CD '0 ... .. CD '0 ..... ... . ... • a.. « 1: >- ... 0 in Z w a . - , • ::::J c( l: « ...J « Q.. ....... .... - E .. ... J + x .. ,. .... ·---1 : , " Q to '0 • ... '", - .- 0 ... CD I CD ! O. Q 0 __________ ____________ ____________ ____________ __________ ____ ______
-
Upload
khangminh22 -
Category
Documents
-
view
0 -
download
0
Transcript of Palamau, 13, Bihar - Linguistic Survey Of India

' 0
~ .... CD
' 0 ...
.. CD
' 0
..... ...
.... •
a.. « 1:
>-... 0 in Z w a
. - , •
::::J c( l: « ...J « Q..
....... .... -
E ..
... J + x
.. ,.
.... ·---1 : ,
" Q to
' 0
• ...
'", -.-0 ...
CD
I CD
~.
! O. Q 0 -~
~ ~~~-L--.~ __________ ~~~~~ ____________ ~~~~~ ____________ ;~~ ____________ ~~~ __________ ~~~ ____ ~ ______ ~~~v

CENSUS 1961
BIHAR
DISTRICT CENSUS HANDBOOK
13
PALAMAU
s. D. PRASAD 01' THB INDIAN ADMINISTRATIVE SERVICE
SuperintenJent of Censu,)" Operations, Bihar

~-A
PART I-B
P~I-C PART II-A
PART II-B{i)
PART II-B(ii)
PART II-C
PART II-D
PART III(i)
PART III(ii)
PART IV-A
PART IV-B
PART V-A
PART V-B
PART VI
PART VII-A
PART VII-B
PART VIII-A
PART VIII-B
PART IX
1961 CENSUS PUBLICATIONS, BIHAR
CBll the Census Publications of this State will bear Vol. No. JV)
Central Government Publicati.ons
General Report
Report on Vital Statistics of Bihar, 1951-60
Subsidiary Tables -of 1961 '"
General Population Tables·
Economic Tables (B-1 to B-IV and B-VII).
Economic Tables (B-V, B-VI, B-VIII and B-IX).
Social and Cultural Tables·
Migration Tables*
Household Economic Tables (B-X to B-XIV) *
Household Economic Tables (B-XV to B-XVII)'"
Report on Housing and Establishments'"
Housing and Establishment Tables*
Special Tables for Scheduled Castes and Scheduled Tribes·
Ethnographic Notes on Scheduled Castes and Scheduled TribeI'
Village Surveys*· (Monographs on 37 selected villages)
Selected Crafts of Bihar
Fairs and Festivals of Bihar
Administration Report on Enumeration* } (N ot for sale)
Administration Report on Tabulation
Census A das of Bihar
State Government Publications
17 volumes of District Census Handbookst
-Already printed , •• Nos. 1-4 of the series already printed l' The Handbooks of Patna, Gaya, .Shahabad, Saran, Champaran, Muzaf£arpur, Monghyr.
Bhagalpur, Saharsa, Santal Parganas, Palamau (present volume) and Dhanbad already printed and those of Darbhanga, Haza:tibagh and Singhbhum under print.

CONTEN"TS
PAR.T I-CENSUS TABLBS, OFFICIAL STATISTICS' AND VILLAGB D1RE9';l'OR. Y
-P~G'E;'f-i PREFAOE ~.
INTRODUCINQ THE DlSTRlCT
Census Tables-Note
A·SERlEs-GENERAL POPULATION T ABLES
Explanatory Note
Table A-I-Area, Houses and Population
Appendix I to Table A·I ..
Annexure I to Appendix I to Table A·I
Annexure II to Appendix I to Table A·I "----
Appendix II to Table A-I
• I
... List A,-Places with a population under 5,000 treated as towns fdr the
first time in 1961
Table A-IV-Towns (and Town.groups) classified ,by Population in 1961 with variation since 1941.
Appendix to Table A·IV
Explanatory Note A to Appendix to Table A-IV
Special Appendix to Table A·IV-
Part A I
Part B B-SERIES-GENERAL AND HOUSEHOLD' ECONOMIC TABLES-
' ..
Explanatory Note _
Table B-I-Workers and Non.workers classified by Sex and Broad Age-groups
Table B-IlI Part A-Industrial. Classification of Workers and Nonworkers by Educational Levels in Urban Areas only.
Table B·III Part B-Industrial Classification of Workers and Non-workers by Educational Levels in Rural Are~ only.
Table B-VIll Part A-Persons unemployed aged 15 and above by Sex Broad Age·groups and Educational.Levels in Urban Areas only.
Table B-VIll Part B-Persons unemployed aged 15 and above by Sex and Educational Levels in Rural Areas only.
Table B-IX-Persons not at work classified by Sex, Broad Age-groups and Type of Activity.
Table B-X-Sample Households (z) Engaged neither in Cultivation nor in Household Industry, (ii) Engaged either in Cultivation or Household Industry but not in both and (iii) Engaged both in Cultivation and Household Industry for All Areas. '
Table B.XI-Sample Households engaged in Cultivation classified by interest in land and size of land cultivated in Rural and Urban Areas separately. .
Table B-XVII-Sample Households classified by (i) Number of male and female members by size of Households and (ii) Engagement (a) neither in Cultivatlon nor in Industry, (b) in Household Industry only and (c) in Cultivation sub-classified by size of land cultivated.
i
3
5
7
9
10
12
13
13
14
]5
15
16 17
18
22
22
24
82
33
34
42
43
46

C-SERIES-SOCIAL AND CULTURAL TABLES
Explanatory Note
li
Table C-I-Composition of Sample Households by relationship to Head of family classified by size of land cultivated. -
Table C-II-Age and Marital Status ,Table C-III Part B-Age, S~x and Education in Urban Areas only Table C-Ill Part' C-Age, Sex and Education in Rural Areas only Table C-V-Mother-tongue w ..
Table C-VII-Religion Table C-VIII Part A-Clas~ification by Literacy and Industrial
Category of Wo_rkers and Non-workers among Scheduled Castes.
Table C-VIII Part B-Classification by Literacy and Industrial Category of Workers and Non-workers among Scheduled Tribes.
SCr-SERIES-SPECIAL TABLES FOR SOftEDULED C<\,TEi AND SOIlEDULED TRIBES
Explanatory Note Table SCT-I Part A-Industrial Classification of Persons at Work and
N on-workers by Sex for Scheduled Castes.
PAGE
47 49
50 54 55 56 60 64
66
68 70
Table Sar-I Part B-Industrial Classification of Persons at Work and 72 N oQ-workers by Sex for Scheduled Tribes.
Appendix to Table SCT-I 74
Table SC-I-Persons not at Work classified by Sex, Type of Activity 75 and Educational Levels for Scheduled Castes.
Table ST-I-Mother-tongue and Bilingualism for Scheduled Tribes 17 Table Sr-II-Perso 1S not at Work classified by Sex and Type of 84
Activity for Scheduled Tribes.
TABLES B<\SED ON DATA OBTAINED FROM THE HOUSELIST-
Explanatory Note Annexure-Standard Industrial Classification Classification of Rural Population living in villages of various sizes ViIlagewise Industrial Data
..official Statistics
Explanatory Note
VrrAL STA1ISTICS-
88 89 91 92
101
Table VS·I-Re6istered Births and Deaths with mid-year rates 105 Table VS-II-D~aths and D~ath rates dlle to selected causes 106 Supplement to Table VS-II-Deaths and D~ath rates due to, suicide, 107
wounds or accidents, snake bite and wild animals and rabies.
AGRICULTURAL STATISTJCS-
vfable' AS-I-Rainfall 108 Table AS-II-Highest and Lowest Temperatures .. 111 Tal)le AS-HI-Land Utilisation and Area under different crops 112 Ta.ble AS-IV -Gross Area. irrigated by crops 112
J Table AS-V-Gross Area irrigated by sources 113 Ta!Jle AS-VI-Yield rates of principal crops 113 Table AS-VII -Statistics of skilled and un ;killed Agricultural labourers 114 Tab1e AS-VHI-Monthly ruling wholesale prices of staple foodgrains .• 115

iii
rAG. Table AS-UI.I-Land Utilisation 116 Table A3-In.2-Pro5r"ess of CLlltivation during the last three decades.. 116 Table. AS-III.3-CClmponents of Land Area, Cultivable {and Cultivated 117
Area per hundred persons during the last three decades. Table AS-III.4-Cropping Pattern 117 Table -\~-IIr.5-D.!n~ity of Total/Rural Population per hundred acres 118
of Area under foodgrains and net Area sown, Table A~·III.6 -D.!nsity of Cultivators and Agricultural labourers per 118
hundred acres of net Area sown in 1951 and '1961. Table AS-III.7-Rainfall, Area sown and irrigated, Density, etc.
LI\'ESTocK-
Table LVT-I -Government Veterinary Facilities Table L VT-II-Livestock and Poultry
INDUSTRIES-
119
120 121
Table I~D-I-Employment in Textile and Non-textile Industries 122 Table r~D·II-~a.ne of Industry with number of Households and 123
persons employed in Rural Areas only. Supplement to Table IND· II 126
ADMINISTRATION-
Table AD\{-I-General results of trial of Criminal Cases 126 Table AD~-II-Punishments inflicted in Criminal Cases 127 Table ADM-III-Strength of police 127 Table AD~·rV -Places of confinement and distribution of convicts 128
by Age-groups and Literacy.
Table ADM-V-Co-operative Societies 129 Table A.D~-Vr-Reccipts of Ex:cise Revenue, Sales Tax, Entertainment 130
Tax, Motor-Spirit Tax, Stamps, et~. Table ADMNII-Land Revenue/Rent 130
Table AD~·VnI-~umber ,of registered documents and value of 131 properties transferred
Table \D v.[·IX-3.lle and discharge under Small Savings Scheme 131 Table ADM-X:"""List oCBanks 132 Table AD~-XI-Progress''Of Life Insurance 132 Table ADM-XlI-Number of Motor Vohicles 132
EDucATION-
Table ED~-I-Educational Institutions and Pupils Table ED~-II-List of Educational Institutions
Table ED~-III-Press and Journals Table EDN-IV-List of Cinema Houses
PUBLIC HEALTH-
Table PH-I-Medical Facilities COMMUNICATIONS-
133 134
135 135
135
Table a v:[ {or - \tlleage of extra municipal roads maintained by 136 Public Authorities.
Table C~.,{-II-List of Inspection/Dak Bungalows 137 Table C.\{.'{-III-Polymetric Table of distances (in miles) 141

IV
"'Village Directory-- PAGE
Explanatory Note 142
ANCHALS-
Daltonganj 0.. 143
Chainpur 145
Leslieganj ... .. ... 149
Panld 152
Chhatarpur 156
Hariharganj .'. 161
Patan 165
Bishrampur 169
Manatu 174
Hussainabad ... 178
Meral 184
Carhwa -.I 87
Untari 190
Dhurki 193 . ~Ran~a ·195
Bhandari a 198
Majhiaon 200
Bhawanathpur .. 204
Balumath ... 206
Chana.wa 210
Latehar 212
Manika 216
Barwadih 218
Mahuadanr . ,. 220
Garu 223

v
PART II-VIt:LA.GB AND TOWN SrATI~rICS
Village Stati.tiel-rAGE
Explanatory Note •• ""2
ANCHALS-
Daltonganj 4
Chainpur 8
Leslieganj . . ... 18
Panki 26
Chhatarpur 36
Hariharganj. • .r ... 48
Patan . . ... - 56
Bishrampur 66
Manatu 78
Hussainabad .~ 86
~
Meral .. 98
Garhwa ... 104
Untari 110
Dhurki 118
Ranka 122
- 128 Bhandaria .. Majhiaon ..• 132
Bhawanathpur 146
Balumath 150
Chandwa - 158
Latehar .-. . .. 162
Manika ... 170
Barwadih 176
Mahuadanr .. 180
186 Garu

Town Statiltica-
Explanatory Note •.
TOWN8-
Daltonganj
H ussainabad
Garhwa
Latehar
Netarhat
vi
. .. ...
..
.'0
MAPS AND DIAGRAMS
~. Map ofPalamau showing density
2. Map of Palamau showing administrative divisions
PAGB
191'
192
192
192
192
192
... Facing Inner Title
Facing page i
3. Map of Palamau showing-percentage variation in population xv
4. Diagram showing literacy and educational levels
5. Map of Palamau showing percentage of literacy
6. Diagram showing Anchalwise distribution of workers
1. Aachal Map. (At the end of the VoluDle)
ANCHALS-
Daltonganj
Chainpur
Leslieganj
Panki
Chhatarpur
Hariharg¥lj
Patan
Bi~hrampur
Manatu
-
00
xxvii
xxviii
xlii
S
5
7
9
11
13
15
17
19

vii
PAGE Russainabad 21
Meral 23
G.arhwa 25
Untari 27
Dhurki , . .. 29
Ranka 31
Bh and aria 33
Majhiaon 35
Bhawanath pur ... 37
Balumath 39
Chandwa .-. 41
Latehar 43
Manika ~ . 45
"Barwadih . . .. 47
Mahuadanr .. ....... 49
Garu ... 51 P-II

I wish to l'lace on record my grateful appreciation on the useful services renderect by the following members of my staff in the preparation of this volume:
I. Shri R. N. Misra
2. Shri U. P. Shrivastava
'3. Shri K. K. Chakravorty
4. Shri R. B. Singh
5. Shri R. B. Pandey
6. Shri Maheshwar -Prasad
7. Shri M. Abbas
8. Shri S. P. Verma
9. Shri Sheo Prasad
10. Shri Md. Noor·Khan
11. Shri Safi Ahmad
12. Shri A. K. Mathur
13. Shri "R. K. Sinha
. .
" .
} Ooputy Sup"intondont of Oem", OpO'ation.
1 Tabulation Officer
Statistical Assistant
Senior Cartographer
Tabulation Assistant
Proof -Reader
Supervisor, Anchal Map Section
Draughtsman
Artist
Investigator

PREFACE
Though compiled in the Census Office, District Census Hal}dbooks are actually State Government publicatiops. They were published for the first time in the 1951 Census.
So varied have been their uses and so great their value that there ~an be little doubt that the Handbooks have come to stay as a regular feature of every census. In 1961, while the tradition has .been continued, efforts have been made to enlarge 'the scope and enrich the contents of the Handbook in several ways. Much of it is, of co.urse, <;lue to the able guidance and inspiration from Sri Asok Mitra, the Registrar General of India, to whom ,no words of gratitude can really do full justice.
The main attraction of the District Census Handbook lies in the portion relating to village Statistics which presents primary census data for each village in the district. To facilitate reference, this table has been supplemented by a village Directory which apart from cataloguing some additional information, gives an alphabetical list of villages in each Anchal. The arrangement of villages in the village Statistics portion is according to the jurisdiction of Panchayats and Anchals. No authentic list of villages com prised in each Panchayat or Anchal was readily available before the Census of 196}. Much i)ioneering effort had, therefore, to be made - in the preparation of these lists. It is possible that some errors, particularly in the delineation of Panchayat jurisdiction, might have crept in because of these limitations or subsequent modifications in boundaries. It may be noted also that the statistics reproduced here are generally related to March, 1961 unless otherwise indicated.
The Anchal maps are a speci~l feature of the Handbook this time. They have been 'Prepared from 1"-1 mile Anchal maps which were traced from the old Revenue Thana maps. Though revenue thanas had long ceased to be of much significance in day-to-day administration, no attempt appears to have been made in the past to prepare police station or anchal maps delineating the village boundaries. The CenSus of 1961 in Bihar can
r justly claim the preparation of these anchal maps, both on 1"-1 mile scale as well as on the reduced scale in which they are presented in this book, among its major achievements. Of course, this wa!il made possible mainly because of the keen interest and helpful attitude of the State Government which not only placed the relevant materials at my disposal but also agreed to meet the entire cost of the scheme. For all this, I am greatly indebted to Sri S. J ~ Majumdar, the then Chief Secretary, Sri S. K. Chakravorty, the then Revenue Secretary, and Sri J. P. Shrivastava, the then Director of Land Records, Bihar. lowe a special debt of gratitude to Sri M. P. Singh, Deputy Director of Surveys, Bihar, who not only helped with some of his experienced staff but also provided valuable technical supervision from time to time.
The Village Statistics and the Village Directory, together with the Anchal maps, should provide a complete index and statistical guide to each vill~ge ,in the district. Among other items of interest, mention may be made of the note introducing the district, brief gazetteer of places, glossary of ancient mOnuments and official statistics. These are, of course, in adgition to the census tables for the district. It is regretted that paucity of space stood in the way of reproducing a good many of the other census tables in the Handbook. For instance, Migration and Housing Tables have been excluded completely. These may be looked for, if necessary, in the relevant State volumes.
ii
This Handbook is the product of hard toil and patient labour of several persons and agencies. No list can really be comprehensive enough to include them all. An acknowledgement appears elsewhere mentioning some of those who were associated with this work in the CenSuS Office. Outside sources and agencies have been ment_ioned, as far, as. practicable, at appropriate places in the book itself.
My thanks are also due to Job Printers, Allahabad for the care and interest taken in. printing this volume.
PATNA:
September, I 7, 1966 S. D. PRASAD
Superintendent -of Census Operations,. Bihar.


c . U
" d
r .;;
"..
~
':;;
:> <{
E « _J
<{ n..
I-u cr: I-Vl
0
z ~ ~~ :;; Ci
'" ~ >. ,::
'" '" ~ ~ Z f 0 < 0
" Z
~ -0 :;
;:
H
,.
_ . .i n
d
S :1 (] .. ~ }Jd
).
Z
r":" '., " 1/
~ 1>'.1.
r'
'-( ~
\ t.v
1. f)
0 .... N 0
'>
Q
'" ~
t--I.
-?- (
\
.. <
, J:
..,
~
I I : I ! I i . : ! I I
~ .. . : .: ; ~ .! , . ~
.... ..
'. 0:.-'"

INTRODUClNG THE DISTRICT
I. GENERAL
~ituated between the north latitude '3 00IQ'
and 24040' and east longitude 83°20' and84° 50',
the district of Pal am au lies in the south-western
part of the State. Comprised within the Chotanag
pur Division, Palamau is bounded on the north
by Shahabad and Gaya distric;:ts, on the east by
Hazaribagh, on the south by Ranchi and on the
west by Madhya Pradesh. It contains three sub
divisions, viz., Daltonganj, Garhwa and Latehar,
the headquarters of which are located in towns
bearing the names of respective subdivisions.
Daltonganj town situated on 24°2' north and 84°4-1
east is also the headquarte'rs and pr,incipal town
of the district. There are 25 anchal-cum-deve-
lopmen t blocks and 21 police stations in the dis
trict. They are distributed in tne three sub
divisions as indicated alongside:
Number of anchals and police Stations in Palamau di stri ct, 1961
Subdivision
Daltonganj Garhwa Latehar
Anchals Police stations
10 8 7 ~
9 6 6
The following police stations comprise two anc!Ials each
Police Stations Anchals
1. Daltonganj 1. Dp.ltonganj 2. Chainpur
2. Garhwa 1. Garhwa 2. Meral
3. Untari 1. Untari 2. Dhurki
4. Latehar 1. Latehal' 2. Manika
Of the total number of 3,602 mauzas or
revenue villages in the district, 3 ,194 mauzas are
inhabited, 28 mauzas are wholly included in .towns
and I mauza partly so. The number of towns
in the district is, rather ~small, only Hussainabad
and Netarhat being towns in addition to the dis
trict and sub divisional headquartes at Daltonganj,
Garhwa and Latehar.
2. BRIEF HISTORY
The district of Palamau was constituted on
the I st January, 1892. Just after the movement
of 1857, Palamau had been formed into a separate
subdivision with headquarters at Da·ltonganj. In
1871 parganas Japla and Belaunja, covering 650 sq. miles, were transferred from Gaya to Palamau.
Tori Pargana was also added to it in 1891.
Palamau is one of the' few districts having
its he~dqu~rters in a town whose name is different
from that of the district. Various hypotheses have
been uut forward a'bout the origin of the name,
Palamau. Thus, it has been suggested in the
Settlement Report of I 872 that the name is deri-
ved from the Hindi word, palana, or 'to flee,'
and hence a 'place of refuge'. In the Settlement
Report of 1898, however, a different theory ha!
been put fprward according to which the name i:
a combination of 'pala' meaning frost and '11100'
the root for 'dead' so that Palamau signifies'deac from frost' ..
Ear ly Period
. The early history of Pal am au , like the rest 0
Chotanagpu r, is largely shrouded in mystery Comprising uncleared forest tracts, the territor; seldom engaged the attention of invading armies
and the area remained outside the palt" 0

lnfiuecne of empires which were established in
::>ther parts of modern Bihar. The area was pro
Jably inhabited by autochthonou s tribes in the
past.
For accounts of its early history, therefore, ::>ne must fall back upon the legendary accounts of the tribal population of Pal am au. The Kharwars, the Oraons and the Cheros are the three main
tribes of the district, all presently scheduled under
the Constitution. The Kharwars, according to
their legends, were once the rulers ofRohtasgarh,
a great fort on the ban-k of the Sone (in south Shahabad). They migrated to Palamau from there. Similarly, Oraon lore refers to Rohtasg_arh
as their stronghold in the past. According to their
traditional belief, the Oraons settled on the banks
::>f the Sone after leaving their original homes in
the Carnatic and built a fort at Rohtasgarh. They
;vere, however, ou sted from their fort by the
::::heros. One section migrated. to the Rajmahal
~i1ls and the other to Palamau and the western.
parts of the Chotahagpur plateau. The Cheros llso aver that they-are migrants to Pala'mau from
Shahabad where they held the position of the
ruling class. The Cheros overran Palamau in
:he beginning of the seventeenth century and there
lfe quite a few accounts of the conquest. The
)ne generally accepted relates that the fifth ruler
:n the li!1e of Chero kings who ruled in Shaha)ad was Sahabal Rai. ;He was defeated and taken Jrisoner by Emperor Jehangir .. His son Bhagwat ~ai tried to extend his sway, but on being pur
med by the Emperor's forces, took refuge with
)eo Sahi a Rajput Chief of Dhanudanr near Sasaram. Bhagwat Rai left this place with Puranm!ll,
Deo Sahi' s ~on and took service under Man
Singh, the Rakshel Rajput Chief of Palamau.
[n 1613, when Man Singh was absent (having ~one to Surguja), Bha~wat Rai murdered his
ramily and made himself lord of the country.and
tppointed puranmal as his De",an. Bhagwat
ii
Rai was the first of the Chero chiefs who ruled
OVer Palamau for nearly two hundred years.
Prior to the domination Qf Palamau by the
Cheros, Rakshel Rajputs held sway over the district. They, in turn, had supplanted early
Marhatta settlers of whom , however, no traces are
to be found now. They have' probably been
a.ssimilated in the indigenous population.
A factual history of Palamau, therefore, commences with the 16th century. In 1538 Sher Shah had sent one of his officers to control
the turbulent chiefs and free the Grand Trunk Road from their explo'its against travellers.
The influence of the Mughals reached Palamau during the reign of Emperor Akbar when it was invaded by Raja Man Singh in 1574.
The troops left by him were, however, driven out
m 1605 when Akbar <.died.
In 1629, Emperor Shahjehan appointed Ahmad
Khan as the Subedar of Paina, and Palamau was
given to hifi? as his Jagir. Ahmad Khan imposed an annual tribute ofRs. 136,000. The avoidance
of the Chero rulers of Palamau in paying this tribute led to three successive invasions by -the
Muhammadans, which have been detaHed by Muhammadan chroniclers. The first invasion took
place in the reign ofPratap Rai. The Muhamma
dan army was headed by Shaista Khan, Governor
of Bihar. The army reached the fort of Pal am au,
defeated Pratap Rai and extracted a tribute of
Rs. 80,000 after which Shaista Khan left in 1642.
The second invasion was caused by internal
bickerings. Tcj Rai, uncle of the ruling chief
Pratap ,Rai, induced Itikad Khan, successor of Shaista Khan, to agree to the deposition of Pratap
provided he was sent to Patna as a prisoner. Tej Rai succeeded in imprisohing Pratap and usurped the throne, -bu t he did- not send the> deposed

nephew to Patna a s,agreed earlier. Hence Za6arda st Khan headed a Mu}lammadan force which was aided by. Baria Rai, another uncle of Pratap. Tej Rai's forces were tIefeated ,~t Deogan. 'MearlwhiJe
Pratap haq been s,et fr~~lby his' followers ana had re-occupied Palamau fort. When Zabardast Khan was only six miles from Palamau, Pratap Rai
began negotiations with him \.vhich were conclpded at Patna: P.ratap Rai agreed to pay annual tribute
of one lak}l of rupees. an the 'recommendation ofltaikad Khan, Emperor -Sha-hjehan gave Pala,mau to him as a military fief on a jama of Ai lakhs of rupees.
In spite of the Success ,of these invasions, the payment of tribute by the 'Chero Chiefs was never regular. As "a last :resort, '1)aud Khan, Governor
of Bihar, left Patna, with a strong force in 1660
and in ,spite' of heavy dJ'awbacks and qifficult terrain, reach.ed within two mile-s 'of Palamau.
I
There was an engagement. and fighting which las,ted three days, after which the fort was captured. Palamau was now, placed in charge 'of a
Muhammadan Faqjdar. But this- system was done
away with soon and P4lamau was placed under direct control 6fViceroy of Bihar in' 1660.
In . 1720 'Palamau was again, invaded by Subedar Sar1?alIand Khan. But actual fighting
was warded off by the payment of one lakh of rupees in cash and in the shape of diamonds.
/
During the rule·' of Jai ·Kri shn a Rai (1722-
1770 ) th~re were some· events of consequence. In 1730 the GoveInor of Bihar, 'Fakhr-uddmylah, marche,d to Kunda. He sent ap :;tdvance force to Palamau which, however,. could
not meet with any SUCcess. The Governor, there
fore, had td be remained satisfied wi'th a shortlived agreement for payment of an annual tribute pf Rs. ~,00C). In 1734 Alivardi Khan, the new Subedar, again marched to Kun da an d forced .. the Palamau Ghatwals (as the chiefs were then called)
p-ur
iii
to enter i!lto engagements. Palamau was reI: ted to 'the Raja of Tikari. Nawab Alivardi Khan 'again undertook an expedition in 1740 to curb the Raja
of Ramgarh. He was aided by Jai Krishna Rai of. Palamau and wa s able to capture the fortress of' Ramgarh. But s_9on afterwards it was learnt ,that
a large {lrmy of Maratha~ was on its ~ay to
Bengal. So. rather than come' to an ellgagement ~with them., Alivardi retreated ffom Palamau. The
Maratha passage: through Palamau left little of the usual depreda,tion practised 'by them.
. Internal feuds led to the.killing of Jai Krishna'
Rai in 1770, aftt;l' which his family tied. to Sherghati and took" shelter with Udayant Rai.
Chatnipati Rai was placed on the' gaddi and Jainath Singh became· Diwan. Meanwhile
Udayant Rai went to Patna to Captain Camac,
the Government Agent, artd presented Gopal Rai
as the rightful heir of 1>al;mau gadai. .simultaneously, re'presentativ,e~ of Chatrapati Raj were also ,in negptiat~ns with the Council a~ Patna. The
.Council proposed that the fort should be made
oyer to the British if Chatrapati Rai were to be
recognised 'as Raja and he should pay a fixed . revenue of Rs. 5,000 for ten years. These terms.
were not accepta1j>le to represen tatives of Chatrapati
Rai and hence the Council took up the cause of ~ .
Gopal Rai. Captain Camac marched to Palamau
fort in January r 7,71. After many diffic,ulties the
fort was captured in February. 1771 and Gopal Rai was installed to ~he gaddi on his agreeing
to pay an 'annual tribute of Rs. 12,000. Gopal Rai was removed after: trial in 1776. J:'b ~re followed a 'scramble for power. Bishwanatn J lai,
his minor brother~ succeeded him while Gajra j Rai became the manager. But 'their position was aS1lailed by Sugandh Rai and, Sheo Prasad Singh. However, Gajraj .Rai could continue due to the
support of the Coilector of Ramgarh. Meanwhile
in' 1780 Daljit Rai, brother ~f Chatrap'ati Rai, -attempted to re-establish the fortune of the

house of Medni Rai. The Governor ordered th;t Bishwanath Rai, the third brother of Gopal
Rai, was the successor to the gaddi and not
Gajaraj or Spgandh. Since this order was resisted I
Maj. Crawford was Sent to Palamau with mili
tary force to restore peace. Major Crawford
managed to capture Gajaraj and Sugandh.
Raj'a Bishwanath Rai died in 17S3. He was followed by Churaman Rai who came of age in
1793· Churaman Rai succeeded in resuming the
estate of his weaker tenants. His action provoked
th~ tenantry, and led to the Chero insurrection
in I Soo. The leader was Bhukhan Singh, a Chero.
The British came with a force and suppressed the
insurrection but by that time the Raja and the
administration had been reduced to bankruptcy.
Another factor in Chero insurrection was that
up to 1779 the British followed a system of ~ollect~ ing revenue through a Sajawal. Accordmg to this Raja granted an Imdad to a Sajawal appointed
by the Government. The revenues of specified
estates and villages in liquidation were assigned
but the Sajawals extracted as much as they could.
This led to discontent and hence the insurrection. An Assistant Collector of Bihar waS appointed
to look after the revenue collection on western
part of the province. Parry, Assistant Collector,
in ISII made the first settlement of re.venue in
I SI2. He annulled the Sanad granted by Churaman
Rai and took over direct collection. TJl,e
Palamau estate was attacked. In IS I2, 'the sale of
Palamau estate was au thorised and it was accord
ingly sold for Rs. 51,000 against arrears amounting
to Rs. 65,000. The assessment of the estate was
;reduced to Rs. 9,000 in I S14 when it was granted to Ghanashyam Singh of Deo as a re~ard for his help to the British in suppressing Cheros
and Kharwars.
In 1813 there was a rising organised by great
Jagirdars. This led to the attachment of estates
fo Chainpur, Ranka, Lokaya,BisrampurandOhra.
IV
The Kol rebe1liort of IS32 bad its impact in
Palamau also. The Cheros and Kharwars rose
against the administtation, and non-tribal Hindus
and Muslirri.s. The insurgents were, however,
defeated in an engagement with-the British forces
near Latehar.
1857 Movement
In the 1857 Movement, Palamau was the most
severely affected district of the Chotanagpur
plateau.
The brothers Nilambar and Pitambar were
chiefs of the Bhogta clan of the Kharwar tribe,
who held ancestral jagirs. Hearing of the
movement against British rule they' made up
their minds to declare independence. They were
joinedby many Cherojagirdars. On October 21,
1857 a force of 500 persons was led by Nilambar
and Pitambar. They attacked Raghubar Dayal at
Chainpur since he sided with the British. From
there they proceeded to leslieganj and caused
heavy destruction. Lt. Graham, with only
50 persons at his disposal, could not do much to
thwart the insurgents. The entire countryside
appeared to be; up.in arms. Lt. Graham was beseiged
in the house of Raghubar Dayal. In December,
two companies arrived tinder Maior Cotter. He
was able to ·capture Devi Baksh Rai, one of the
principal leaders of the movement. In January Col. Dalton, Commissioner of Ranchi himself
came to Palamau and captured Palamau fort.
Uftimately the insurgents were captured and peace
was restored Soon afterwards. It is noteworthy
that the movement in Palamau was no mere
Sepoy mutiny' but an uprising of the indigenous
population of the district.
Palimau played its part in the freedom
movement of the country in this century. The
Bihar Students' Conferen.ce was held at Dalton
ganj in 1920 under the presidentsbip of Rev. C. F. Andrews. The participants included

Mazharul Haque. Mahatma Gandhi· and
Dr. Rajendra Prasad visited Daltonganj in 1927.
v
The August disturbances
echoes in Palamau.
1D .I942 had their
3. PHYSICAL FEATURES
Natural Divisions
The district h~s length of II9 miles from
north-west to south-east, breadth of 1 01 miles from west to east and in shape like a
parallelogram. The average elevation of Palamau
is about 1,200 feet above mean sea level, the highest point being Netarhat 3,900 feet. The district comprises three natural divisions the
first 'constitute the erstwhile Parganas of Palamau and Tori which have the characteristics of Chotanagpur Plateau proper. The erstwhile ~elaunja Pargana forms a long strip of broken hill occasionally forming 10 to 12 miles in _
breadth on the southern bank! of the Sone, touch-
ing from Mirzapur. district of U. P. on the west and Koil to the east. As noted earlier this
Pargana was added to Palamau district in 1871.
The third natural division comprises the erstwhile Pargana of Japla which was tran sferre4 from Gay.a district to Palamau in 1871. This division
is almost devoid of hills lying along the bank of the Sone and north-east comer of tne district and
similar in characteristics to the adjoining parts
of Gaya.
Topography and Hills
The hills in the district are widely sea ttered. Many of the ranges consist of crystalline and metamorphic rocks and rise up to 3,000 feet. Another class consists of hills formed of sandstones o~ coglomerates constit~te the long ranges
east of the Koil some 200 to 300 feet high but some rise higher such a s the La tehar peak near the
subdivision'al town (2,051 feet above mean sea
level), which i~ 9.10 feet high from surrounding
area. The third class of hills comprise of the pats or plateaus on the south which ar~ formed of
crystalHne rocks with their summits capped with
sandstone trap or la teri teo
Some of the important hills are Kotam (2,71 9 feet) south of Garu police station and Kumandih (2,530 feet) between Garu and Latehar.
Rivers The drainage in the distriGt is generally
from ,south to north towards the Sone which forms a part of the northern boundary
of the district. The principal rivers are the Sone, Koil, Auranga and the Amanat. The Koil,
also known as North Koil rises in Ranchi district and enters Palamau in Netarhat. It flows westerly direction for about 20 miles
when it takes a 90° turn to north and fll()wing through the middle of the district faps into the Sone north-west of Haidernagar. It is
joined by the Auranga from the east at Kachki 10 miles south of Daltonganj and by the Amanat also from the east and 5 miles north of Daltonganj. The upper ridges of the Koil are characterised by high banks. The bed of the Koil is rocky up to a short distan ce north of its confluence with Aurang~ after which it is sandy. The Koil flows for a total distance of 160 miles from its source to its confluence with
the Sone. It is geher-ally dry in the summer
when boat traffic is not possible up to Daltonganj. The Auranga· rises near Sohida and flow s north-we sterly direction for about 5-0 miles till .it joins the Koil. The Amanat rises in Hazaribagh and flows in westerly direction to join the Koil.
The Sone reaches Palamau at its north-west
corner and then flows east below the Taimur hills till it is joined by the Kotl. It then flows north-easterly direction leaving the district opposite Akbarpur in Shahabad.
\ Among other rivers of note in the district are Kanhar which forms a part of south-western boundary of the district for about 50 miles, separating it, from Surguja in Madhya Prade~h. The

~adabah, which literally means ever flowing,
flows some 17 miles north of Daltonganj and is
noted chiefly because of an irrigation scheme
completed tliere. Among the minor rivers and
rivulets are Jinjoi, Maila and Piri which are
tributaries of the Amanat. Sadabah, Tahleh
and Banki drain the country near Un tari,
Danro flows past Garhwa and Karabar
drains Japla area.
Geology and Minerals
There are many minera 1 deposits in the dis
trict. Coal is worked near Rajhara and Pandua.
Bauxite ore aluminium IS found in the
plateaus of Netarhat, Joradumar "and Garitanr
Pahars and Jamira Pat. Geological surveys are likely to yield location of further deposits
in the high plateau areas. Iron ore occurs at Gore in the form of magnetite and also at Datum and Sua. Dolomite and dolomitic limestone occur in many places such as Kothila near
Latehar Railway station, Balumath, Pandwa and Majhaulia. Deposits .of graphite and mica occur but they are not fit for commercial exploitation.
The soil is more or less uniform throughout ~he district being clayee. Stretches of red and black clay soil are also found. Ranka and Bhandaria
police stations have laterite soil while that in Panki and Leslieganj is light black clay. The soil
formation in the district is the result of the action
of rivers like the Koil, Amanat and Sone. The
first fertile tract consists of the valleys of these
three rivers where rice is chiefly grown. The
second type comprises hilly tract where the soil is loose and full of gravel. This area is mostly covered with jungle and cultivation is restricted
in valleys and narrow basins on either side of the
hills, rivulets and rivers. The entire hilly' tract
in the south comprises the soil of this kind in which maize and similar crops are chiefl y grown.
vi
Flora and Fauna
Forests playa dominant part in the economy of the district. In tot~l area of 4,916 sq. miles
as much as 2,I46 sq. miles arc under forests. Many
of the villages lie in thick forest areas. In such a large area vegetation is very varied. Among
important trees are sal (Shorearobusta), Buchnania,
Semecarpus, Terminalia, Cedrela Cassia Batea ~, ' ,
Bauhinia, Acacia, Adina, Cochlospermum, Srymida,
Bosweilia, Hardwickia, and Bassia. The exten
sive forests still harbour tigers, leopards, bears
hyaenas, wild dogs,jackal and wild cat. Among
the carnivora and other wild animals are bison,
sambar and various other kinds of deer, nilgai,
wild pig and monkeys. Elephants are sometimes found in the forests and hills 'of Garn. The
follOWing species of birds observed in the district
are mentioned in the District Gazetteer:
1. Green pigeon 2. Blue rock pigeon
3· Painted sand grouse
4· Common sand grouse
5· Common peacock
6. Red jungJe fowl
7· Black! p;rtridge
8. Painted partridge
9· Crey partridge 10. Jungle bush quail II. large grey quail 12. Larger button quail
13· Black-breasted quail
14· Button quail
IS· L~sser Borikin
16. Common snipe
17· Painted snipe 18. Common wild goose
19· Cotton teal 20. Brahminy duck 21. P"mtail duck 22. Blue-wingee teal
23. Red-crested pochard

Climate and Rainfall
The district has a dry climate. The mean
daily mjnimum temperature at Daltonganj falls to
8.20 in December while the mean daily maximum
rises to 41.3 0 C.G. in May. The lowest minimum
ever recorded in Daltonganj was in 1923 when
vii
the temperature in January, 1923 fell to freezing point (0.00).
Average annual rainfall is 133.5 roms. The northern parts of the district are'relatively drier
than the southern. Rainfall is generally steady and wide variations from year to year are rtot met with.
4. COMMUNICATIONS
Roads
Although no National Highway runs through
th e district it ha s a good numb er of State roads. Among the main roads arc the following: (i) Daltonganj-Ranchi Road which run s from Daltonganj through Latehar and Chandwa for 66 miles
in ·the district. N etarha t is reached through this
route vi a Kuru ansi Ghaghra in Ran chi q.istrict,
(ii) Daltonganj-Aurangabad Road runs through
Chhatarpur and Hariharganj for 44 miles within
the district from where Aurangabad on the Grand
Trunk Road is only r6 miles away,(iii)Chandwa
Balumath'-Chatra Road runs through Balumath
for 24 mil-es in the district and joins Dobhi on
the G. T. Road. Rehla-Godarmana Road passes
through Garhwa and R anb and run s 36 miles in the district up to the Madhya Pradesh border.
Besides these important roads there are many
District Board roads, the most important of which
is Daltongan j-Garhwa Road, 18 miles long.
Various roads maintained by the Forest Depart
ment help in facile transport of forest produce. There are 16 miles of roads maintained b'y the
Daltonganj municipality.
Railways
A branch of the Eastern Railway runs from
Dehri-on-Sone to Gomoh. It runs for ISO miles in the district from Japla through Garhwa Road,
Daltonganj, Latehar to Mahua Milan. Recently a branch line has been started from Garhwa Road to Mirzapur in Uttar Pradesh.
Rivers'
There IS hardly any traffic by boat.
Airways
'rhere IS a small landing groul}.d at Chianki
3 miles from Daltonganj.
5. DISTRICT ADMINISTRATION
General Administra tion
The Deputy Commissioner is in charge of ,the civil, revenue and criminal administration of the district. He is also the chief pilot of all develop
ment and welfare activities in the district. The
Commissioner, Ranchi Division, having his head
quarters at Ranchi, exercises general superv{sion
and control over him. The Deputy Commis
sioner is assisted by an additional Collector and a District Development Officer both of Additional
District Magistrate's rank. A number of Deputy
Collectors, Sub-Deputy Collectors and other officers are posted at the district headquarters to
assist the Collector.
For general administra tion purposes, Palamau is divided in three subdivisions eacl:,l. in charge of a subdivisional officer who is drawn from the Indian
Administrative Service or the Bihar Civil
S,ervice. The subdivisional officer works under
the direct control of the Deputy Commissioner. He is assisted by a number of Deputy and Sub
Deputy Cellectors.
Each subdivision is divided into anutnber of
Anchal-cum-Development Blocks. The ~istrict
has 25 such blocks, each in charge of an Anchal
Adhikari, who is also the Block Development Officer. These officers belong "either to the

viii
Bihar ·Civil Service or the' Biha r Junior Civil
Service. The Anchal Adhikari-cum-BI6ck Deve
lopment Officer is in' charge of all revenue, deve
lo~ment and welfare activities in the area and
works tmder the direct Con trol of the sUbdivisional
officer. His services as a magistrate are utilised
only when a law and order situation arises. He
has a team of workers drawn from different
dep_artments of Government to assist him in
development work. As Anchal Adhikari, he is also the chief officer at the anchallevel and col
lects rent, cess and other miscellaneous dues of
Government.
Judicial Administration
There is complete separation of executive and'
judiciary in the district. The District Judge,
who is also the Sessions, Judge for the Se~sions
Divisi,on of Pal am au, heads the judiciary. Besides the District and Session s Judge, there are subdivi
sional headquarters for the administration of
civil justice. The subordinate judges are also
vested with powers of an Assistan t Sessions Judge.
Additional Judges, subordinatejudges and munsifs
ate posted when cases accllmulate.
Poli ce Ad ministration
The Superintendent of Police is the head of the police force in the district. He has his head
quarters at Daltonganj and works under the Deputy
Inspector-General of Police, Southern Range,
Ranchi. He is assisted by a numb"er .of Deputy or
Assistant Superintendents of Police, Police Ins
pectors, Sergeants-Major, Police Sub-Inspectors
and Prosecuting Inspectors. In every subdivision
there is a Depu ty or Assistant Superintendent of
Police and below him, Inspectors an~ Sub
Insp ectors of Police incha rge of circles and police
stations respectively. The total number of the
police stations in the District is 21. The officer
incharge of a police station is assisted in hi s work
by a team of a Sub-Inspectors, Assistant Sub
Inspectors, literate constables and ordinary
constables. 869 Chowkidars constitute the rural
police force. Their duties consist of night patrol,
watch over the movement of strangers and sus
pects, and reporting of crimes.
6. AR&'\, VILLAGES AND TOWNS
Area
Palamau district has an area of 4,914 sq. miles
(or 12,727 sq. kms.) according to the State Survey
and 4.925 sq. miles (or 12,756 sq. kms.) accord
ing to the Survey of India. The small difference
of II sq. miles may be attributed to the different
methods of corpputation adopted by the two
agencies. The area of Palamau is much higher thim the average area of a district in the State (3,937 sq.
miles) and accounts for 7.34 per cent of the State's
total area. It ranks 5tJ;1 among the seventeen districts of Bihar in area, coming after Ranchi,
Hazaribagh, San tal Parganas and Singhbhum. Among the 328 districts of the country, it holds
the 64th position in area. Its area is larger than
the area of the Union Territory of Tripura (10,660
sq. kms.) and more than one and a half times
thearea ofSikkim (7,299 sq. kms.). Compared to some a'ther countries of the world, its area, is more
than one-third the area of Netherlands (33,612 sq.
kms.) and nearly one-fifth the area of Ceylon
(65,610 sq. kms.)
Villages
The term 'village' has the same meaning as I
revenue mauza which was defined in the Code of
Census Procedure, 1961 as follows: "A mauza means a parcel of land which as a
rule is partly built over but mostly cultivated
and waste with a definite position and area,
the boundaries of which were defined either
at the time of the cadastral surveyor at the

time of the revenue s.urvey. It may contain no houses at all or, on the other hand, several hamMt~ 'each bearing a differen't name."
Accordi_!lg to the I9()J, Census', there a:t~ 3,6IO
villages, in, the dis'trl.ct , of which 3,I94' are: • I'
inhabited and 3 88 uninh~bited,_ 2-8 vill~ges are
wliolly and I partly irl.Clu~ea in towns ,:whicb
number,5 in the distri~t. The total of inhabited: uninhabited and mauzas wholly included in towns exceeds tp;e.:.tot~f -number of m.auzas as
;.
per Thana Jurisdiction Lists by 8. This excess
of 8 fnauzas f is ~xplained by the jnclusio~ of 8 unsurveyed fores't villages in ... the Village Statistics of the district. 'ln the number of villages,
Palamau ranks 12th amon? the districts ·of· the State.
The average area of a-.m"uza In the district ~ .
is 1.36 sq. mile which is much above the average area df mauza in the State (0.8S sq ..
mile): Except Ranchi (1.80 sq._ mile) an,d
Saharsa ,(1'·55 sq. 'miler, tIle average are~ per
villa&e in Palamau is higher thary any other district of the State. The avet'ag.e, population per
village in the district (3,30 .pers~ms) is much
below the Sta te average -of S 88 persons. In fact,
it is lowest ~mong the disttfct~ of t,he State,
except San t,a I Parganas (~,,~-persons). The average area and PQPulatfon'-per·vnlage have been
worked oUt by taking int? acioJlnt all the vil1ages
,inhabiJ;ed, un.inh'abi~ed ana. those included - , wholly in _towns. The eight unsurv.eYSa forest
villages included in the Village Statjs1ics have 'not, however, been taken into accoun!.
The statement alpl1gside shows for the district and the State the distribution ofr 000 inhabited , villages by different' size classes of population and
proportion of population in. each size .class per 1',900 of rural pop,ulation.
ix
vmalf~clas sifted by. population rallge, 1961
_PROP0RTIeN pER 1,000
------~ ........ Villages containing ,.PaIRma'U district
r-----('------.
Villages Population
Bihar State .---~-~
Village'S Population 4 5
627 216 1 2 3
_ Less .than 500 p~r~ons 779 446 , 500-999 persons 165 316 204 228
ll3 247 49 22R
6- 68 1 13
1,000-1,999 persons 48 175 2,000-4,999 persons B 58 5,000-;-9,999 persons:N 5 10,OOO'persons and above 0 0
O-denotes nil N--denotes negligible figures
(Detailed :qgures up to anehal lev~l are given ~n Table A-IU*.):
It is to be noted that more than three fourths (76 .2 per cent) o£ the rural population of Palamau
"district live in small villiges with less than 1,000
inhabitants in e~ch. The corresponding propor
tion for the 'State is much lower t44.4 'per cent).
This is so not only in respect of population but the proportion of villages in this sjze class is
also higher in the district (94.4 pe~ ~~nt) than t,he St~te (83~.I per cent)_ HoY/ever, the proportion of ~,edium sjze ~ villages (with I ,oo~_' t ,999
inhabitants in each) ~nd population contaip.ed in '
them are lower in Palamau than in Bihar. This
is al~o true in r,egard to large villages with 2,000
w persons or more. This size class contain..s 0.8 per'
cent of villages and 6.3 per cent of p~pulation in the district as against 5.6 per cent of
Villages and 30 .9 per -cent of population in the Sta.te. It is 'n9te~orthy that there IS not a single
village with a population of more' than 10,000
in the district of Palamau~ There is, however,
one vIllage,_ Haidar, Nagar (Thana no. 3b 3)- in
Huss~il1,abad anchal ;with a 1'0puiatiQl1. of more than' 5,800 (5,052 persons).
, , .(
Towns
According to the definition adopted af the 19.61 Census, 'a 'town' includes· • ,f •
'... (i)-every ,municipality or notified' a.rea ;
, * Census ofIndia~ 1961; Bihar, Vol. 'IV, Part II-A, Ge~eral Population Tables.

" (Ii) an civil lines not included within
municipal limits ;
(iii) every calltonn1ent ; and
( iv) such other places which have (a) a population of not less than 5,000, (h),
density not less than I ,000 p~rsons per
squa re mile, (C) at least three fourths of
the adult male population e'ngaged in non-agricultural livelihood, arid (d) which have peen declared to be towns
for census purposes by the Superintendent of Censu s Operations.
Towns are cla ssified in to six clas ses according
to their population sizes. Palamau district has 5
x
towns which are classified in different population sizes as given below
Class Population range Town Popt1lati~n
I 100,000 or more Nil Nil
II 50,000-99,999 Nil Nil III 20,000-49,999 1. Da}tonganj 25,270
IV 10,000-19,999 2. Garhwa l1,i56
V 5,000-9,999 3. Hussainabad 9,464 4. Latehar 7,689
VI Below 5,000 5. Netarhat 2,085
Daltonganj has municipality and Garhwa
Notified Area Committee. Hussainabad, Latehar and Netarhat have no statutory local body. The
latter two have been treated as towns for the first time in I961.
7. POPULATION
General
Palamau district contained I,187.789 persons
~t sunrise on the 1st March, 1961. The population of this district is less than half the average district population in Bihar (2,732,683). Its contribution to the State's total population is
only 2.56 per cent though it covers 7.34 per cent of its total area. Except for Dhanbad,
Palamau is' the least populous among the districts of the State. In the Indian Union,
its position in order of population is 169th out of 328 districts in a 11.
As compared to some other countries of the
_ world. the population of the district is more than
two times the population of Cyprus (0.58 million, 1960), about half the population of New Zealand'
(2.4 million, 1961) and more than two thirds of the population of Albania (1.6 million,I960).
The population of the district and each anchalJ
town is given in Table A-I at page 7 of Part 1. The diagram alongside compares the percentage
ofl: rea and population of differen t districts in Bihar.
PERCENTAGE OF POPULATION AND AREA OF DISTRICTS
Distribution of Population
Among the three s\lbdivisions, Sadar (S84,IlI
persons) is the most populo.s with 49.18 per ceot.

of the total district popu'lation. Its posltlon, however, is 40th in order of population among the
58 subdivisions of the State. The other two sub
divisions, Garhwa (358,877 persons) and Latehar
(244.~01 persons) contain 30.21 per cent and 20.61 per cent respectively of the total district population. It may be noted that after the Patna
City subdivision, Latehar is the least populous
among the subdivisions of Bihar.
Signiflcantly, no anchal in this district has
population exceeding one lak<h. The Hussaina
bad ancha! having the highest population amor.g anchals of the district, misses the one lakh mark
by 1,797 only. Garu anchal is the least populous
(II ,781). Its population is the smallest among the 575 anchals of Bihar. Only the following anchals have populations exceeding 50,000 in each case:
Name of anchal Population Name of anchal Population
1. Hussainabad 98,203 7. Chhatarpur 58,238' 2. Bishrampur 78,822 8. Bat'umath 55,702 3. Chainpur 63,489 9. Majhiaon 55,426 4. Daltonganj 63,061 10. Untari 54,603 5. Garhwa -_ 60,571 11. Meral 51,340
6. Patan 60,176 12. Panld 50,326
The average population of an anchal in the district is 47,512. Nearly 56 percent of the anchals (14 out of 25) have higher population than the
average indicated above and they contain as much
as 71.32 per cent of the district population.
Density of Population
The average density of population in Palamau distri-ct is only 242 persons per sq~are mile which
is about one third of the State average of 694 persons per sq. mile and about two thirds of
the all India average of 358 persons per sq. mile. Palamau, it may be noted, has the lowest
density of population among the seventeen districts in the State. This is so because over three fourths
of the land area of the district is comprised of
forests and hills and other' types of uncultivable
or unculturable land. The Sadar subdivision in . "
the north-eastern portion of the district and bor-P-IV
de ring mainly on the Shahabad and Gaya districts
on the north is, however, better populated, the
average density being 351 persons per square mile.
The Daltonganj anchal has the highest density
(806J in the district. Hussainabad (521) and Leslieganj (471) are also among the comparatively more densely populated anchals. In the Garhwa subdivision,_ the average density drops to 230 persons per square mile. Th-e northern part of the subdivision' comprising Garhwa,
Untari, Majhiaon and Meral anchals has more than
250 persons per square mile; while the southern part consisting of Dhurki, Ranb and Bhandaria
anchals has density below 250. In Bhandaria anchal,
the density (77 persons per sq. mile) is
the second lowest in the State, the lowest being
in Adhaura anchal of Shahab~d district (48 persons
per square mile). This block of low denSity
anchals extends over the Latehar subdivision also where Barwadih, Garu and Mahuadanr anchals on
the west and Chandwa and Balumath anGhals on
the east have all equally low densities (less th;t.n 250 persons per square mile). The overall density of Latehat subdivision is also very low (I73 persons per square !llile).
Growth of Population
The statement below gives the growth of population in the district since 1872. Per cent
variations in the State population have also been indicated alongside for comparison:
Growth of population in Palamau district, 1872-1961
Year' Population Valliation Per cent variation
Palamau district Bihar S~ 2 S. 4' 5
1872 424,055 1881 551,413 +127,358 +30.03 +15.56'" 1891 597,272 +45,859 +8.32 +5.94* 1901 620,092 +22,820 +3.82 +0.22"', 1911 687,710 +67,618 +10.90 +3.67 1921 733,394 +45,684 +6.64 -0.66 1931 818,736 - +85,342 +11.64 +11.45 1941 912,734 +93,998 +11.48 +12.20 1951 985,767 +73,033 +8.00 +10.27 J961 1,187)789 +202,022 +20.49 +19.77
"'Unadjusted for changes in territory after 1951.

The diagram below depicts the growth of total,
rural and urban population of the district since
1901 :
POPULATION, 1901-1961 DISTRICT PALAMAU
12~--~----'-----,----,----~---,
.. iJ
III----+--~:--:-_---_---_---__._-_!_~_~~_~-.--'f---____JI-I t:-,-/' .. ~.II-_ f!!iI!/;I!/;!ii!,'!lJ URBAN • II--
: IO>---+-----+---I---+-~---tl/1
: 9 f----+------+--+--v----,d .. . ;'iJiJ .:;;. ~
8 ,/f'" A!)/
7 f-v--, -+>;''7JPG,:,'~ 6L_ __ ~ ____ ~· ____ ~ __ ~ ____ ~ __ ~
o
1901 I~II 11121 1931 1941 1951 1961
During a period of 90 years, the population of the district has grown by more than 2l times.
The district has registered a consistent increase
in its population at each successive census, the
growth rate being most prominent in the decades
J872-81 and 19$1--6I. The following excerpt
from the Bihar Cesnus Report of 1951 ?:ives a
:succinct account of the growth of population
during thee ntire period 1872-1951 :
"Palamau was separated from Lohardaga (now
Ranchi district) and formed into a separate
district in 1872. Separate statistics of birth~, -dea ths and migration are therefore not available
for this district till i 892 and it is difficult to
d~termine with precision the rate of growth
<luring this period. The 1872 enumeration was
very deficient in this district, but there is little
doubt that the population increased between 1872
and 1880. In the next dec,ade, 'the population
increased by 8.3 per cent. A part of this seems to
xii
have been due to better enumeration in 1891;
immigration (principally from Gaya district) alio.
contributed to the increase. During the 1891-
1900 period, the district suffered like others from
failure of crops in 1895, 1896 and 1899, and there were famines in 1897 and 1899. III
1897, the famine was accompanied by cholera,
and a large·number of deaths was caused. At;. the 1901 census, Latehar and Balumath showed
decreases in population. In the district as a whole, however, the population had increased
by 3.8 per cent. The next decade (1901 - 10)
was a period of development in this district.
The Daltonganj Railway was 'opened in 1902
and this induced a boom in the lac market and
stimulated trade and commerce also in 'other ways. Crops were satisfactory in the first six
years of the decade and though there was
scarcity during 1906-09, and an epidemic of
cholera during 1907-08, the population registered
an increase of 10·9 per cent at the 191I census. The district suffered from acute scarcity in 1912
and 191 8 and there were epidemics of cholera on
both occasions. The influenza epidemic also
came in 1918 and the death rate from influenza
i'n Palamau was probably higher than anywhere
else in this State. In 1919 also, there were a
large number of deaths from influenza. The
other years of the decade had however been
fairly healthy and prosperous and emigration was
on the decrease. The 1921 census showed all. increase of 6.6 per cent, but· there was fall of population in Mahuadanr, Balumath and Ranh
thanas, and only a nominal increase in Latehar.
The first year of the 1921-30 d.ecad.e was very
unhealthy. There were a large number of deaths , from fever alone. Cholera and small-pox were
.also present that year in epidemic form, and th~ death rate exceeded the b~rth rate by 9.5 per
cent. From 1922 onwards, however, public
health improved very considerably though fairly
severe outbreaks of cholera occurred in 1924.

xiii
1927 and 1929 and smallpox was also fairly
active from 1927 to 1929. After 1921 economic
conditions also improved very considerably. Harvests were plentiful in most years and there
was a good market for lac of which the price had risen very high. The 1931 census showed 'm increase in the population of 11.6 per cent.
In the following decade (1931-4°), public health situation was better than during 1921-3 o· Cholera appeared in epidemic form in 1934, but did not trouble the district seriously in other years. Therewas also a sharp fall in death rate
from smallpox. The number of deaths from fever was still quite h:\gh, but there was a fall aGo in
the fever death rate as compared with the preceding decade. Crop conditions appear to have
been generally satisfactory throughout, though
many were hit hard h¥ the fall in the price of
lac due to world-wide trade depression. The
1941 census showed an increase of 11.5 per cent. The registration figures show that the
~rowth of population was due mostly to natural
increase. In the last decade (1941-50), the population
of Pal am au has increased by 8 per cent only. As in other districts, there was a flare up of cho
lera in this period; the 1943 outbreak being
yery sever~. On the other hand, there was a substantial reduction in the death rate from
fever and smallpox. Crop conditions were fairly satisfactory in all years except 1950 when, as in other districts, the winter rice crop suffere9 due to absence of rains after August. In spite of these favourable circumstances, the 1951 census
has shown an increase of op.]y 8 per cen t. The registered figures of births and deaths show that
the natural increase was 7'7 per cent which is exactly the same as the decennial growth rate
c:llculated on the mean popu]a tion of 19$1 and
1941. As mentioned already, there was a large reduction in the death rate in this decade al compared with 1931-'40. The fall in the
growth rate during the last decade would seem
to be due to decrease in the birth rate. The
ratio of males to females has increased in 195I
and there is no indication of any increase in the flow of emigration. Compared with 1931
there has been an increase of approximately
I I,OOO in the number of immigrants presumably attracted by the development of the cement
industry. Some part of this influx, probably as much as 50 per cent, may have occurred in
1931-40."
During the last decade (1951-61), the population of the district has increased by 20.49 per
cent. This rate of growth of population is higher than in: any other decade except 1872-.81. Even the State rate o.f growth (19.77 per cent)' during
-the last decade is slightly lower than that of this district.
The main cause behind the big spurt in the rate of growth of population in Palamau as
elsewhere in the country during the last decade i~ the rapid fall in the death rates. This is the
outcome of improved public health conditions
better arrangements for medical treatment, and
utilisation of modern techniques in surgery and
wonder drugs which have gone a long way towards lowering of the death rates in general and -infant
mortality rates in particular. That there has
been no corresponding lowering of birth rate is an acknowledged fact and so a higher rate of increase of population is only' natural. Unfortunately
because of thewell acc:?ted deficiency in the registra tion of vital statistics of birth s and deaths, there
is not much scope for testing the correctness of the
above postulates with reference to the registered
figures of births and deaths. However, the statistics in Table VS-II at page 106 of Part I will indicate that the epidemics were largely controlled during the later years ofth-e decade. Thus, against
a total of 2,271 deaths due to cholera in 19Sr-60
there were I ,8o~ deaths in the year 1952 alone.

xiv
Smallpox took a toll of 2,287 lives in the last decade of whom 1,974 related to the years 195 I-52
only.
Migration too has a great impact on population growth. It is dependent upon the gen€tal economic condition prevailing in the district. Thus, from an economically backward district, people move outside to earn their bread.
This trend is reversed when there is affluence at home. Unfortunately, there is no complete picture of migration trends at· the district level, as data relating to inter-State migrants by district of
origin are not available for any census except 1921. However, figures relating to inter-district migrants within the State may throw some light on the general trend of migratiefi. In 1951, the
numb"er of immigrants in Palamau from other districts of the State exceeded the number of emigrants from Palamau to other districts of the State, by 6,796. In 1961' the balance of migration has been adverse, the emigrants from Pa]amau to other districts of the_State outnumbered immig
rants from other districts to Palamau by II ,063.
Had this factor not 'been operative, the increase in population would have, perhaps, been still higher.
'"'the following statement shows the increase In population during the last decade for the di 5-
trict subdivisions and anchals : ,
Per cent variation in population in Palamau, 1951-1961
District/Subdivision} Population Decade Percentage variation decade Anchal variation .....
1951 1961
2 3 4 5
PALAMAU 9B5,767 1,187,789 +202,022 +20.49
Sadar Subdivision 490,037 584,111 +94,074 +19.20
Da1tonganj 52,796 63,061 ~10,265 +19.44
Chainpuf 56,404 63,489 +7,085 +12.56
Leslieganj 37,301 42,563 +5,262 +14.11
Panki 41,715 50,326 +8,611 +20'.64
·Per cent veriation in population in Palatnau, 19~1-19i1-concld .
District/Su bdivision"J Ancha1
Popufation D~(:ade Percentage variation decade
,---....._ ____ variation 1951 1961
2 3 4 5
Chhatarpur 49,199 58,238 +9,039 +18.37
Hariharganj 25,523 30,647, +5,124 +20.08 Patan 51,373 60,176 +8,803 +17.14 Bishrampur 61,962 78,822 +16,860 +27.21
Manatu 32,626 38,586 +5,960 +18.27 JI'ussainabad 81,138 98,203 +17,065 +21.03
Garhwa Subdivision 294,170 358,877 +64,707 +22,00
Mera1 41,925 51,340 +9,415 +22.46 Garhwa 49,412 60,571 +11,159 +22,58
Untari 44,426 54,603 +10,177 +22.91 Dhurki 17,742 21,807 +4,065 +22,91
Ranka 37,791 45,990 +8,199 +21,70
_ Bhandaria 16,431 19,541 +3,110 +18.93
Majhiaon 45,620 55,426 +9,806 +21.49
Bhawanathpur 40,823 49,599 +8,776 +21.50
Latehar Subdivision 201,560 244,801 +43,241 +21.45
Balumath 47,995 55,702 +7,707 +16.06
Chandwa 29,989 35,755 +5,766 +19.23
Latehar 38,480 47,518 +9,038 +.23.49
Manika 24,850 30,687 +5,837 +23.49
Barwadih 23,397 30,969 +7,572 +32.36
Mahuadanr 27,383 32,389 +5,006 +18.28
Garu 9,466 11,781 +2,315 +24.46
NOTE: 1951 populations of anchals have been taken from E-Summary Tables of 1951 census. Where a police station of 1951 has been split into two or more: anchals, the 1951 population of the police station has been distributed among the -anchals in
the same proportion as in 1961.
The map at the facing page shows the p ercen tl
age variation of population, 1951-61 in different anchals of the district. Among the three subdivi
sions, Garhwa has shown the highest growth rate (22.00 per cent) of population during the las~ decade followed closely by Latehar (2I.4S per cent). The growth rate in the Sadar subdivision has been of the order of 19.20 pe'r cent, a rate
lower than the district average of 20.49 per cent.
Among the anchals, Barwadih has shown the
highest increase rate (32.36 per cent) follow~d by

'0
0.., III
'0 1'1
o~ CD
0 .... ...
o ..,
z
::> « ~ « _J <{ a_
t--U -a: -t-If) -0
z 0
~ _J
::> 0-0 0-
z -Z 0 I-« c::: « > w l? « I-Z W· U c::: W 0..
--.0 ~ -I -L.I"l ~ -
VI J
::i: o
o 0
o iii ..J ::i:
2 vi ::i: :.:
-L._.
~ 'f _.
. '.
.
xv
.-.l , " ".~
q.. " <
~
.. rr 'J
\l u
r- 0.., .'
:z~ ~. <<>-
~ J: .. U
,. '\.
\I"
~ ,... \
. ... ,' li
~ j
1-,.. "' .... Z';' « -
, :l ..........
.. .., '0 z ~ .... .., 1&1
li « j
li: £h ~ Z a: ::s:
> « ;:) « I-ct: 0 o 0 « « Z CD Z ~ 0 j Z 0 J ;:) ~ ;;:. CD « 0 oCt 0 Z CD cD 2 to-
~ en ..J J :> « « a: a J: z .... u '0 0 !!? CD z ;;) N 0 en «
I ! , i .1Il
I I I OIl ',_ I I I
I ! ~ I I I ! ..
I I i - ) I A'
~ .....
~ (., J
'0 \,) ..,
"~ CD
• .",
~ A.
.1+\ . " ct:
z <£ 01(
OCD .... ~
'" . ::lOll .. J: -< '0
-IS ::i:
0..-II)
·~II~ 0 0 0 0 0 0 q 0 on ci III .,; - N N N
I I '0 .., , UJ ..
0 .., - ;;. CD -..J 0 0 0' IU .n ci CD - N
C ill
• 1&1
.. .., '0 z
~~~ln III L_------~~~--------------------~_r.~---------------------_o~~~----~--~ 0. '0 0'<t '0 # z
N '" N .... ..,

IHshrampur (27.21 per cent). As many as 13 out
of 25 anchal s have registered growth rates varying between 20-25 per cent and 8 anchals between 15-20. Only two anchals, viz., leslieganj (I4·II
per cent) and Chainpur (12.56 per cent) grew
by less than 15 per cent each.
The Rural Population
95.27 per cent of the population of the district live in villages as against 9I.57 per cent in the State as a whole. The following statement
shows the percentage decade variation of rural population and the proportion of rural population to total population in Palamau district and Eihar State, 1901-61 :
Variation. in and proportions oerural population in Palamau district and Bihar State, 1901-1961
Year Palamau district - Bihar State ~.------~--------~
Percent decade Percentof Per cent decade Percent of variation rural popul- variation ruralpopu-
,...,..-~.II---~ alion to total ,..---.....___.... lation to Rural Total population Rural Total total popu-
popula- popula. popula. popula- lation tion tion tion tion
2 3 1901 , JgIl + ]0.76 + 10.90
19%1 + 5.56 + 6.64
4 98.48 98.35 97.35
5 6
+ 3.90 + 3.67 1.04 - 0.66
? 96.01 96.22 95.86
1931 + 11.31 + 11.64 97.07 + 10.99 + 11.45 95.46 1941 + 12.00 + 11:'48 97.52 + 11.21 + 12.20 94.62 1951 + 6.59 + 8.00 96.25 + 8.75 + 10.27 93.31 1961 + 19.27 +20.49 95.27 + 17.54 + 19.77 91.57
It follows that the growth of rural population in Palamau has always been tardier than that of total population except in 1931-41. It is
also noteworth y that the proportion of rural population to the total population has been on the
decline since 1901 .(except during 1931-41), though the pace of urbanisation during the six decades
after 1901 has not been as fast as in the State.
xvi
The Urban Population
Palamau has an urban population of 56,164-
comprising 4.73 per cen-t of the district population. This is considerably lower than the corres-ponding proportions for the State (8.43 per cent). and the country (17.97 per cent). Thus, Palamau
is comparatively backward in the race for urban-· isation. The statement below gives the propor
tions and rates of growth of urban population irrPalamau district and Bihar State during the pel'iod
190 1-61. Trend of urban growth in Palamau district and Bihar
I State, 1901-1961 Ce1lllus Palamau district Bihar State
Number Per cent 'Per cent Number Percent Percent of towns varia.tion of urban of towns variation of urban
inurban to total in urban to total population population population population.
I 2 3 4- 5 6 7 1901 2 1.52 55 3.99-
1911 2 +20.43 1.65 57 -1.92 3.7S.
1921 2 +70.90 2.65 63 +9.03 ~.14
1931 2 +23.57 2.93 66 +22.00 4.54·
1941 2 - 5.70 2.48 82 +32.99 5.38-
1951 3 +63.35 3.75 103 +37.07 6.69
1961 5 +51.77 4.73 153 +50.94 8.43.
Note: Only tbose towns of previous censuses have been considered which were towns in 1961 aho.
It is evident that the urban pop'ulation of the
district has always been increasing except for a
slight decrease in the decade 1931-41. The growth rate has however been particularly striking during the decades I9II-21, 1941-51 and 1951-61. As 2g2inst 251\.97 per cent increase in the State's urban pO~llIlation durng the last 60 years, there has been ~n increase of 494.52 per cep.t .in the urban
population of Pdlamau. The statement below -traces the growth of population in each toWn of
the di5trict since 1 ~OI :
Growth of popUlation in inclividual town. oCPalamall district, 1901-1961 Name of towns 1961 1951 1941 1931 1921 1911 1901
2 .S 4 5 6 7 8
25,270 19,223 13,943 12,040 9,817 (+31.46) ( +37.87) (+15.81) ( +22.64) (+36.75)
DaltOll.ganj (M) 7,179 5,837 (+22.99)
11,656 9,467 8,712 11,985 9,626 ( +23.12) (+8.67) (-27.31) (+24.51) ~+129.30)
Garhwa (N) 4,198 3,610 ( +16.29)
X_aiaabad towa 9,464 (+13.79)
8,317
Latebar tow. 7,689
:Netarhat towa 2,085 \

XYii
Two of the :five towns in the district, viz. ,
Daltonganj and Garhwa are continuing as towni.
~ince I901 or before. Hus~ainabad was treated
...1S town for the first time in 1951 while latehar and Netarhat are the new entrarlts of I90I. In 1901 the district had an urban population of
"9,447 which increased to :;6,164 in 1961. Thus, in the last sixty years, the urban population has
become nearly sixfold. Nonetheless Palamau
had the lowest urban population in Bihar in I196r. Its contribution to the State urban total was a mere 1.43 per cent.
Daltonganj, the district headql1art~rs, is the most populous town of the district. It had a population of 25,270 in 1961 as agaInst 5,837 in 1901. It has always had a progressive population,
the rates of increase being around 23 per cent
in the first and third decades, and around 37
per cent in the secDnd and fifth decades. Only
in the fourth decade 193 1-4r), the growth rate
was somewhat low (15,.81 pe~ cent). In the last decade the rate of increase was 31.46 per cent.
The main importance of DaltonganJ lies in its being the district headquarters and much of
its increase is attributable to the expansion of
'Goyernment offices and other allied activities.
Nearly 47 per cent of its working population is
engaged in 'Other Services'. There has been no
change in the area of the town since- 1'95I.
Garhwa, a subdivisional headquarters. is the
next important town of the district. In 1961 it
had a pop ula tion of II,6.>6 a s again st 3,6 I() only in
1901 and 4,I98 in 191 I. The subsequent decade,
however, witnessed the most spectacular growth
(I 29.30 per cent). The Increase was, however.
not maintained during the subsequent decades.
Instead of growth, there was actually a decline
of over 27 per cent in the decade I931-4I. In the last decade also the ,increase has been' of the order of 23 per cent which callnot be said to be much, particularly in view of Garh-W3 haVing
become a sub divisional headquarters and its
area having increased by 0.30 square mile. .29. I O
per cent of its working population is engaged in. 'Otller Services'.
Hussainabad has been a town since li95 I . Its present population (9,464) reveals an increase of
13·79 per cent which is cons'iderably lower than
the,district: average. 23.87 per cene of its working
population is engaged in 'Other Services' while
household industries and manufacturng together claim 30.66 per ceui.
tatehar, another subdivisional headquarters,
h\:td a population of 7,689 in 1961. Situated in the
midst of heavily forested and scanti1}' populated
area, this town has no special claim toimportance
save that of being the seat of the subdivisional
administration. 37.61 _per cent of its workers are engaged in 'Ot1i~r services'.
Netarhat with a population of 2,085 is the smallest town of Bihar. Perhaps, it can be said that it is a town by courtesy. It conr:ains the
only public school run by the State Government,
a dairy farm, and a few minor offices of the Forest
Department. Situated at a height of 3,900 ft., the place has much scenic beauty and can be
developed into a great_tourist centre. It is also
a hill resort. 'Other Services' claim 43.44- per Cent of its working population. '
8. MIGRATION
111 Indian census, migration is determined 'solely by the concept of p lace of birth. Thus, a
persop born at a place other t.han the village or town of enumeration is treated as an immigrant. Immigrants can Suitably be classed according to
their place of birth as intra-district immigrants
(those born elsewhere in the district of enumera
tion), inter-district but intra-State immigrants
{those born in other districts of the State;, inter
State immigrants (those born in other States of

xviii
India). and international immigrants (those born outside India). Similarly, emigrants from the district are those who were born in the district but enumerated outside it. They may also be clas
sified into intra-State emigrants and inter-State
emigrants. Information is not available for the
very few persons born in the district who rna have migrated outside- the country. ~
-The distribution of population enumerated i
Palamau district in 1961 by place 'of birth i
given in the following statement
Distribution of popUlation in Palamau district by piace of birth, 1961
Total Rural Urban .,.___: ,...
Birth place Persons Males Females Persons Males Females Persons Males Fern
1 . 2 3 4 5 '6 7 8 9 10
Total Population 1,187,789 598,600 589,189 1,131,625 567,913 563,712 56,164 30,687 25" (100.00) (100.00) (100.00) (100.00) (100.00) (100.00) (100.00) (100.00) (lCO. Born-
At tIte place of enumeration 818,184 5-13,759 304,425 787,712 495,772 291,940' 30,472 17,987 12. (68.8B) (85.83) (51.67) (69.61) (B7.30) (51.79) (54.25) (58.61 ) (49
Elsewhere in the district of enumeration 311,417 63,418 247,999 298,114 57,361 240,753 13,303 6,057 7, (26.22) (10.59) (42.09) (26.34) (10.10) (42.71) (23.69) (19.74) (28
In other districts of 13ihar 43,167 15,585 27,582 33,463 10,385 23,078 9,704 5,200 4, (53.63) (2.60) (4.68) (2.96) (1.83) (4.09) (17.28) (16.94) (17 .
• 1n other States of India 14,238 5,305 8,933 11,971 4,134 7,837 2,267 1,171 1, (1.20) (0.89) (1.52) (1.06) (0.73) (1.39) (4.04) (3.82) (4,
Outside India 783 533 250 365 261 104 418 272 (0.07) (0.09) (0.04) (0.03) (0.04) (0.02) (0.74) (0.89) (0 .
• Includes birth,place "Unclassifiable'. Note: Figures'within brackets indicate percentages.
In Palamau, 68.88 per cent o( the total popu
lation of the' district was enumerated at the place of birt4, a proportion very similar to that for
Bihar (69.3 1; p~r cent). Those born elsewhere in the district accounted for 26.22 per cent or a little
over one fou~th of the district population. In:-• migrants frbm other districts of Bihar comprised
3.6 3 per cent, while those from other Sta tes of lndia accounted for 1.20 per cent only. Immigrants
from outside India were 783 persons in all. Pala
mau has got common bb~ders with two of the
States, viz., Uttar Pradesh and Madhya Pradesh, but still the number of inter-State immigrants is not very large.
The picture of immigr~tion v:nies r~ther
significantly between the two seXeS. The bulk of
n.1igratiQn among females is caused by move
Dl,en,t~ co:p,sequent \lFon 11;larriage which is generally contracted outside the place of their
birth. Thus, while 85.83 per cent of males i Palamau were enumerated at the place of thei birth, the corresp.onding proportion among female was Si .67 per cent of which no doubt a cons] derabl~ portion comprised unmarried girls. Th bulk of marriage migration is conflned mostTy t
placcswithin the district. Thisi~however,obviot
from thc fact that as against 96.42 per cent mah born md enumcrated in the district, the proportio
of such females was as high:is 93.76 per celli
Among the total female immigrants from othe States of India, nearly 85 per cent were from tn bordering States of Uttar Pradesh and Madhy Pradesh.
It may be of interest to ascertain the exten
of il)1migration to, and emigration from, Palama
in relation to other districts of Bihar. The state
ment C!n the next page gives the distribution pe 1,000 of each separately for males and females.

xix
Diltribution of migrant. to and from Palamau in relation to other districts of the -State, 1981
Immigrants to PaJamau from- Emigrant. from Palamau to-,.--
District Males Females District Males Females
Tatat 1,000 1.000 Total 1.000 1,000' Patn_ 73 21 Patna 22 11 Gay_ 155 444 Gaya 162 380 Shahabad 233 163 Shahabad 313 ·308 Saran 39 7 Satan I 1 Champaran 7 I Champaran 2 I Muzaffarpur 28 6 Muzaffarpur 2 1 Darbhanga 24- 3 Darbhanga I I Monghyr 22 5 Monghyr 5 3 Bhagalpur 13 2 Bhagalpur 3 1 Sahar!a 3 N Sah drs a I N Purnea 5 2 Purnea 3 N Santal Parganas 6 1 Santa] Parganas :i I Hazaribagh 117 151 Hazaribagh 185 142 Ranchi 259 186 Ranchi 171 124 Dhanbad 6 3 Dhanbad 82 17 Singhbhum 10 5 Singhbhum 44- 9
" N-denotes negligihle figures.
Palamau adjoins the districts of Shahabad,
Gaya, Hazaribagh and, Ran chi. The bulk of im
migration to Palamau is from the adjacent districts
only. Thus, these districts account for 94.4 per
cent of females and 76.4 per cent of males among
inter~district immigrants to Palamau. There is
no other district which contributes even 8 per cent
of such immigrants. The emigration from this
district is also confined mainly to the adjoining districts. The adjacent districts have absorbed
as much as 95.4 per cent of emigrant females and 13.0 per cent of emigrant maJes from this district.
of India are concerned the two a..djacent States of
Uttar Prade3h and Madhya Pradesh have sent 77.7
per cent or more than .three fourths of such im-
So far as immigrants
_ migrants. Uttar Pradesh has sent the largest num
ber (M-I ,83 7, F-4,i(9) followed by Madhya Pradesh
(M-I,6SS, F-3,40 3), West Bengal (M-S78, F-42 3),
Punjab (M-380, F-221), Assam (M-236, F-2IS),
Rajasthan (M-r 88, F-: r~9), Madras (M-u8, F-78)
and Gujarat (M-r 08, F-6o). Figures relating to im
migrants fro mother States are very small. Similar
information from Palamau to other States of
India is not available for any census after 1921.
In that year as many as 24,017 persons had from other States emigrated from Pa.,lamau to other States of India.
9· AGE, SEX AN'D MARITAL STATUS
\.ge Single year age returns have been presented
in Table C-IV of 1961.* This table has not leen reproduced in the present volume for want
)f space. Among the census tables published in
:his volume, however, is Table C-II which classiies the pgpulation of either sex in quinquennial
Lge groups and also by marital status. Broad
Lge groups are also shown in TablesB-I and C-III
nc1uded in this volume. Heapings into quinquennial age group s result
• CeIllUI of India, 1961 Bihar, Volume IV, Part II·C, Social and Cult\lral T_blea.
in better apprecIation of data relating to age" structure as inconsistencies apparent in single year
age returns are 1~:ge1y eliminated in the heaped age groups. While the five-year age groups have
their own importance, particularly in regard to
evaluation, of sex ratios for the purpose of assessing
economic characteristics, four broad age groups
indicative of children (0-14), young persons (IS-34),
middle aged'persons (3S-S9) and elderly persons (60 +) are more revealing .

xx
Dist!ibution of 1,000 person~, males and females in palamau district a,,!d Bihar State by broad age groups, 1961
Age gr.oups PaIamau district ,Bihar St'lte
Persons Males Females Persons Males Females
1 2 3 4 5 6 7
All ages 1,187,789 598,600 589,189 46,455,610 23,301,449 23,154,16f (1,0.00) (1,000) (1,000) (1,000) (1,000) (1,000)
0-14 5201'i-83 265,962 254,521 19,653;328 10,112,846 9,54-0,482 (438) (444) (432) (423) (434) (412)
15-34 362,241 178,889 183,352 14,335,615 6,976,349 7,359,26b (305) (299) (3U) (309) (299) (318)
35-59 248,132 127,779 120,353 9,845,764 5,OQ6,949 4,838,815 (209) (214) (204) (212) ( 215) (209)
60+ 56,654 25,814 30,840 2,608,218 1~197,596 1,410,622 (48) (43) (53) (56) (52) (61)
Age not stated 279 156 123 12,685 7,709 4,976 (N) (N) (N) eN) (N) (N)
N-denotes negligible figures
NGTR : Figures within brackets give the- distribution per 1,000 persons, males and females.
The diagram below shows the per cent dis- by the fout broad age groups: tribution of male and female population separately
DISTRIBUTION BY SEX AND' AGE - GROUPS
MALE 1961 DISTRICT PALAMAU
f r .
~L
AGE-GROUPS
" 0-14 35 - 59
15 -.34 liiiiiiiiiiiiil 60 +

I
xxi
The statement shows the distribution of population by sex and four broad age groups in Palamau district and Bihar State.
It is evident that a little -more ~han one half I
(51.4 per cent) of the total population is in the
working age group :I: 5-59 years. The corresponding proportions among males (sr.3 per cent) and females (51.5 per cent) are almostidentica1. The pro
portion of children is, however, hi~her in Palal1lau than in the State. This is presumably attributable to the higher rate of increase of population in the district (20.4'9 per cent) in the decade 1951-6I.
The proportion of elderly persons is also lower in Palamau (4.8 per cent) than in the State (5.6 per cent).
According to Sundburg, "half of the total population is always made up of persons betyveen 15 and 50 y~ars of age, while the fluctuations in the lower and higher categories respectively indicate whether the population is progressive,stationary, or retrogressive".· Thus a proportion of 40 per cent or more in the age group 0-14 is indicative of the population being progressive, 33 per cent of its being stationary and 20 per cent of its
being retrogressive. By these criteria it would seem that P<tlamau district and Bihar State have highly progressive populations and speaking comparatively, the former is more so than the latter.
Another intere,sting feature i~ the higher pro
portion, as well as number, of elderly females,
both in Palamau and Bihar, whi"ch would seem to indicate greater longeyity amo1).g them. Sex Ratio
Sex ratio is determined by the number of females per 1 ,000 males. The district of Palamau has a sex ratio of 984 as against 994 in the State of Bihar. Eight district in the State have higher
sex ratios than this district. These are-Saran
(1,137), Darbhanga (1,059), Muzaffarpur (1,047),
Gaya (1,010), Hazaripagh (991), .Shahabad (990),
Monghyr (989), and Ranchi (987).
~densusorlndia, 1931, Vol. VII, BIhar and Orissa, l'art I. Report by W.G. Lacey. page 12 :to
The following statement tra~~ the changing pattern of sex ratio, in the district and the
State, 1901-6I.
Variations in sa ratio in Palamau district and Bihar State separately for totai, rural and urban, 1901-61 '
Number of females per 1,000 males
Census ' Pa1amau district Bihar State ~-------------~ ~,----~------~ Total Rural Urban Total Rural Urban
1901 1,023 1,026 850 1.054 1,057 997 1911 1,012 1,017 756 1,044 1,048 936'
1921 996 1,~01 846 1,016 1,023 86S 1931 998 1,001 915 994 1,003 813 1941 996 997 924 996 1,006 828 1951 977 9~82 853 990 1,001 841 1961 984 993 830 994 1,012 811
The diagram below depicts the above statistics for the district by means of a graph separately for total, rural and urban populations.
1.150
~ 1.050 ~ ::::I
~I,OOO t-
IX
~ 950
III
~ ~ 900 :l: UJ u.
650
800
750
SEX RATIO, 1901-1961
DISTRICT PALAMAU
TOTAL ------_. RURAL ....................... URBAN
~ ~ E__Q_UALITV "- --~ :1 ~
, ).--.~
) r\ , \
// \ \
/ "'" '.
j\\ ... ............. ( , . / \ _..' .,
... ... '0\
... ' \ .'.' \ ")
1901 1911 1921 1931 1941 1951 1961
The over all sex ratio in tne district was tavourable up to 19II, after which-it became adverse and has continued so till 1961. During the period 1901-$1, the'trend has been towards a falling

sex ratio but for a break in 1931. The same is
true of the State except in I94I. In the district
as well as the State, there has been some
improvement in sex ratio in 1961 as compared to
I9SI. As favourable sex ratio is mainly attribut
ahle to emigration ot males, it can be
reasonably inferred that the extent of emigration
,from the district has recorded decline during the
five decades following I9II. This is also under
standable in view of certain developments such
as general improvement in \ public health and
agriculture, better scope of employment due to
expansion of economic activities, etc.
- I It is natural that rural areas, which send out
bulk of the emigrants, should invariably have
higher sex ratios than urban areas. This is true
as much of Palamau as of the State.
The sex ratio in the urban areas of the district \ .
has always been adverse. The urban areas, in fact,
suffer from a chronic shortage of females. This
-is a feature common to most towns in northern
lildia. Evidently, the towns serve only a limited
l'urpose, the population being mainly agricultural
~ith its moorings in villages. People take to towns
only for purposes, such as employment, education,
trade, business, professions, etc. Most of these
avocations concern men only who come to or
live in towns as sort of makeshift arrangement.
They continue to keep contact with their village
homes where they Jeave behind their families and
ma~e frequent visits to look after cultivation,
observe festivals and for various other purposes.
Of course, definite signs of change in this pattern
of living are perceptible now and more people
xxii
are making towns their permanent abode. Even
so, the old order takes long to change.
Sex ratios by the broad age groups give a
more ill uminating ~icture 0 f the factors at work.
The following statement does so for Palamau
district and Bihar State.
Sel: ratio by broad age groups in Palaman <listrict and Bihar State,1961
Age group Number offemleas per I,OOUmales
Palamau district Bihar State
2 3
0-14 957 943
15-34 1,025 1,055
35-59 942 966
60+ 1,195 1,178
As in'the State so in Palamau, sex ratid among children (age group 0-14) is advecse. Migration is not likely to have much influence in determining the sex ratio in this age group. ~t follows, therefore, that deficit of females among children.is mainly the outcome of biological and natural causes In the 'age group 15-34, the sex ratio in the dis~ trict is favourable. At least a portion of the high sex ratio among young persons (15-34) is due t(J educational migration which affects mostly males. Sex ratio in the age 'group 35-59 is, however, adverse. The trend in the age groups 1;5-3.01-
and 35-59 is shnilar to that in the State. Highet longevity among females seems to explain the high sex ratio among elderly persons (60+) both in the district and the State.
Marital Status
Table C-II at page so of Part r furnishe!
relevant statistics on this topic. The statemen1
on the next page gives the distribution of I,OOC
persons, males and females ?y marital Status,

Dbtrlblltioll of' poplliation in Palamall <listrict and Bihar State by marital atata.,1981
Palamau district Bihar State
PersoDS Males Femalea Pen ODS Male. )'emal.
Total 1,000 1,000 1,000 1,000 1,000 1,001
Never married 441 480 402 oH7 498 191 Married 487 477 497 476 4-59 49! Widowed 68 38 98 7. 39 lOi Divorced or separated of. 5 :3 :3 5 !I Unspecified Status N N N N I 1
-N-denotes negiigible figures.
Non: All persons in the age group 0-9 -have 1leen treated as 'never married' irre.pectiye of the aetna I return'.
The diagram below gives for Palamau the
_per cent distribution of never m:lrried, married an.d widowed persons separately for males and
females. The figures for divorced or- separated persons and those of unspecified status are too small for diagrammatic representation:
DISTRIBUTION BY MARITAL STATUS
MALE 1961
DISTRICT PALAMAU
47.99"10
MARRIED
WI DOWED
Like other districts of Bihar, Palamau has.a relatively more 'never married' males than females. and more married females than males. This is explained by the fact that girls get married at much younger age than boys. As against 48.0
'pcr cent of never married males in Palamau, the corresponding proportion among females is
DIVORCED OR &EPARATED
N"EVER MARRIED
40.2 per cent only. The corresponding proportions in the State are 49.8 per cent and 139.6 pe. cent. The proportion of married females in Palamau (49.7 per cent) is higher than that. in the State (49.2 per cent) Palamau has, however, lower proportion of widows (9.8 per cent) than the State (10.9 per cent).

xxiv
A better a?lneciation of'marital status can
be had from an analysis of marital status by
broad age groups as in the following statement::
Distribution of 1,000 persons of either sell: in 'broad age groups by marital statuI, Palamau,1961
Marital status Males Female~
,---
0-14 15-34 35-59 60+ 0-14 15-34 35-59 60+
Total
Never married Married Widowed Divorced or separate Unspecified status
1,000
950 49 1
N N
1,000
178 790 21 11 N
1,000 1,000
19 11 ·885 706
90 280 6 3 N N
1,000 1,000 1,000 1,000.
905 34 1 11 95 937 739 261· N 24. 254 736. N 4 5 ~: N 1 1 N
N-denotes negligible figures.
Notwithstanding the fact that all persons
aged o-9were treated as 'nevermarried'irrespec
tive of the actual returns in this regard, as
much as 4.9 per cent of males and 9.5 per cent
of females in the age group 0-14 .have been returned as married. The corresponding pro
portions for the State are 3.5 and 8.2 per cent
respectively. This shows that child marriage
is in vogue in this district also and is more prevalent among females. Three districts,
viz., Gaya (6.1 per cent), Darbhanga (5.9 per cent) and Saharsa. (5.3 per cent) have higher
proportions of married males in this age group.
Monghyr (11.4 per cent), Saharsa (II.3 per cent),
Darbhanga (II.2 per cent), Bhagalpur (n.o per cent), Gaya (10.7 per cent), and Hazaribagh
(lo.4 per cent) have higher proportions of marrie&
f~males in ths age group.
The universality of marriage, particularly among females is established by the fact that only
O.r per cent of females in the age group 604" belong to the category 'never married'. It is also significant to note that only 3.4percent of females. in the age group 15-34 are 'never married'. The corresponding proportions among males are un
derstandably higher particularly in the age group
15-34·
In regard to widowed perwns it is onlynatural that with the restrictions imposed on the Hindus
on widow remarriage, the proportion of widows
should be appreciably higher than that of widowers.
in each age group.
10. LIT1;!RACY AND EDUCATION
161,227 persons forming 13.57 per cent of the
total popuiation of the district of Palamau are
able to read and write or have attained higper
eduqtionallevel. The corresponding percentage
for Bihar State is 18.40. The district is, therefore,
lagging behind the State as a whoie in li,teracy.
Children up to 4 years of age are, by _defini-
, tioD, treated :1. s illiterate. The effective litera«y is,
therefore, measured by the proportion of literate and educ~ted persons' to persons aged 5 years
or more. The table on the next page shows the effective literacy rate per 10,000 of population in
Palamau district and Bihar State" separately for
persons, males and females! and for total, rural
and urban pop ulation.

Effective literacy rates for Palamau district an4 Bihar State, 1961
xxv
<lategory of P ersons/MalesJ population Females
Number of literates per 10,000
almost one out of every tw enty six. Among the males, it is seen that nearly 65 per cent of males
in urban areas are literate and educated, the
corresponding proportion in rural areas being little less than M per cent. It is also noteworthy that though in rural as well as urban areas ofPalamau. the literacy rates are lower than those in the
State, the gap in rural areas is strikingly wide
and this is responsible for pulling down the district in the overall ranking in the State.
Palamau district Bihar State Total P 1,641 2,175
M 2,754- 3,519 F 500 817
'Rural P 1,472 1,909 M 2,545 3,219 F 384- 613
·Urban P 4,936 5,021 M 6,474- 6,363 F 3,026 3,310
In regard to total population, the effective Qiteracy rate in Palamau (r6.4I per cent) is lower
than that in the State (21.75 per cent). Cham.paran with a literacy rate Of1S.46 per cent is the
<mly district having lower literacy rate than ·Palamau. The literacy rat~ in urban areas of Palamau is nearly three and a half times that of rural areas. The difference is quite apparent. in case of females. While almost one out of every -three urban females in )?aiamau is literate, the ,corresponding proportion among rural females is
A break up of the literate population by ~arious educational levels shows that among'" literates, as much as 73.8 per cent can. merely' read and write; 21.1 per cent have crossed the
primary or junior basic standard; and only 5.1
per cent have passed matriculation or higher examinations. The classification of literate and
educated persons by broad ed~cational levels,
separately for total, rural and urban areas is
given below ; \
Classification ot literate and educated persons in Palatnau distriet by broad educational levels, '1961'
Educational levels Total Rural Urban
Number of literates Proportion per 1,000 of total Proportion per 1,000 or all population literates
Persons Males Females Persons Males Females Persons Males Females
2 3 4- 5 6 7 8 9 10 11
Literate {without educational T 118,980 98,802 20,178 121 199 42 738 721 832 89,901 113 191 33 766 750 870 level} R 105,370 15,469
336 22'l 576 519 729 U 13,610 8,901 4,709 284
IPrimary Or Junior Basic T 33,969 30,285 3,684 35 '61 8 211 221 152 R 27,577 25,354 2,223 30 54- 5 200 212 125 U 6,392 4,931 1,461 134 186 68 271 287 226
Matriculatioll or above T 8,278 7,889 389 8 16 1 51 58 16 R 4,655 4,557 98 5 10 N 34- 38 5 U 3,623 3332 291 76 126 14 153 194 45
Note: , N-Negligible
Total population excludes population in the age group 0-4.
The contrast between rural and urban areas as al~9 between males and females is most apparent
in the educational level, matriculation or above.
,. While 12.6 per cent of urban males in Palalllau district are at least matriculate, the c~rrespon~ing percentages among urban females, rural males and rural females are 1.4, 1.0 and negligible resp.ecti-:
ve1y.
The diagram at page XXVIl indicates the literacy and educational level for males and
females sq>arately for rural and urban areas.
The statement on the next page compares
the grow.th of literacy in Palamau district and.
.Bihar State during the period 1901 to 1961,

(!Jrrtrtla or literacy in Palamau diatric:t and Bihar State, 1901-1961
Literacy J'ate per 10,000 ohotal population- in
Palamau district Bihar State
XXVl
Per.onJ Males Females Persona Males Females
! S 4 5 6 7
1901 226 0438 16 .394 7'17 29
1911 207 378 35 443 854 45
1921 324 609 34- 494 926 ~6
1931 297 546 45 489 893 77
1941 731 1,SO! 152 1,072 1,873 261
1951 776 1,21' 323 1,345 2,194- 4H
1961 1.641 2,75. 500 2,175 8,519 817
A ,graph illustrating the above statistics for
Palamau Clistrict is alsO' given below
LITERACY, 19().1-1961 DISTRICT PALAf1AU
PERSONS -H~LES ----f£MALa
-
/ I , , -
II ,/' // V
~~ ,...,....-' )---~ V ~.~ __ '..c
v-' .~
II
o ,Nt .911 19'2' 19Jt I9SI "'. Since 1901. the literacy rate in the district
hal always been lower than that in the State as a whole. 'It is to be noted, however that Palamau haa ta~en big strides to improye its literacy
.!xcIllliiq penons in the ace p'0up 0-+
posltlon during the last six decades. In 196r, the
rate has been found to be more than two time,s.
~ the rate in 1951. The disp.arity between male:
and female literacy rates in this di.strict, however,
"is too glaring to escape attention. It is, therefore,. evident that more concerted efforts have to be:
made to i?1pove female literacy.
The extent of li'teracy an;lOng different cate
gories of wod"ers (vide economic classification
given later) also throws interesting 'light on thesubject. Relevant statistics will be found ~n Tables B-III Part A and B-III Part B printed elsewhere in tHs book. III Palamau, the literacy is highest among workers eng2ged in Trade and Commerce (60.99 per cent) followed by those in Transport, Storage and Communications (58.85
per cent). As is natural to lxpect, the literacy rate is lowest among Agricultural labourers (2..300-
per cent) .. Considering all workers together, the bulk of li!erates among them is made up of
Cultivators (60.86 per cent) because of their large share in the total working population.
An roea of the di stributi on of literacy in different parts c.f the district cm be had from the
literacy map on page XXV.III
The table below gives the rates for each
subdivision, anchal and town individually. Effective literacyr atel in lubdivt.iob., abchall anel
town. of Palamaa district, 1961,
Su bdivision-, AnchaJ/Town
Sadar Subdivision
1. Daltonganj Daltonganj .(M)
2. Chainpur
3. Leslieganj 4. panki
5. Chhatarpu. 6. Hariharganj
7. Patan
8. Bishrampur
.. 9.: Mimatu
10 ... HU8sainllbap -H~lSainabad Town
Literacy per 10,000
2
1,_ S,8lf 6,275
1,375
1,795
1.59.
1,06. 1,73%
1,486
1,680
1,564 1.969
3,370

xxvii
LITERACY AND EDUCATIONAL LEVELS 1961
DISTRICT PALAMAU
MALE FEMALE
URBAN
35.26 0t..
P-VI
74.55 %
I. LITE RAT E S WITHOUT EDUCATIONAL LEVELS
2. PRIMARY 0 R JUNIOR BASIC
69.75 '10
RURAL
96.16 %
3. MAT RIC U LA T ION fI'MM AND A BOV~
-4.IL.LITERATES


Eflective literacy ratet In lubdhision ancbaIs and town. o (Palamau district. 1961-concld.
Subdivision} AnchalJToWD Literacy per 10,000
Garh_a Subdivision
fJ. Meral 12. Garhwa
Garhwa (N)
13. Untari
14. Dhurkl
15. Ranka 16. Bhandaria
17. Majhiaon 18. Bhawanathpur
I.atehar Subdivision
2 1,438
1,289 2,017
4,063
1,419
920 1,045 1,257
1,630
1,356
1,446
J9. Balumath 1,066 20. Chandwa 1,415
21. Latehar 1,716 Latehar Town 3,922
22. Manika 1,138 23. Barwadih 1,636 24. Mahuadanr 1,852
Netarhat Towll 4,096
15. Garu 1,371
The literacy rate is highest in Daltonganj
anchal (38.14 per cent). The large urban population of Daltonganj town with literacy rate as high as 62.73 per cent has helped this anchal to gain such distinction. Garhwa comes next with literacy rate of 20.17 per cent. In this caSe
too, the urban population of Garhwa town is a great contributory factor in increasing the literacy rate of the anchal. The literacy rate is lowest
in Dhurki anchal (9.20 per cent) of Garhwa sub
division The remaining 22 anchals of the district have literacy rates between 10-20 per cent.
Educational institutions and the number . of pupils
Table EDN-I at page 133 of Part I gives the number of educational institutions of various types in the distric~ and the numbe! of pupils in them in 1960-61. It will be seen that there has been an appreciable increase in both th~ enrolment and the number of educational institutions
of all types during the last decade. The number of primary and junior basic schools rose from
482 to 999 in 196r, of which 323 were for girls. There were 50,338 boys and 15,776 girls on the rolls in 196I. The number of middle and senior basic schools rose from 41 to 139 (in,eluding II for girls), having 27,674 pupils on the rolls.
of whom 5,079 were girls.
There are 26 high schools and 3 higher secondary schools (including one fN girls) in the district. The n.umber of high schools in
195I was only II. The district has only one
college.
Table Et'N-II at page 134 of Part I gives the loca tion of all educational institutions of and
above tbe level of middle schools·
II. LANGUAGE
Table C-V at page 56 of Part I gives the number of speakers of differentlanguages and dialects in the district and its anchals. The statement tiven alongside gives the distribution of rna jor mother-tongues (having more than 1,000 speakers) in the district separately for total. rural and urban areas. The mother-tongues have been arranged in dt!scending order of their numerical importan~e.
Distribution of major mother-tongues in Palaman district, 1961
Percentage· of speakers of
Mother-tongue Number of speakers each language ill ,..----".. ..-----"-
Total Rural Urban Rural Urbau
2 S 4 5 6
All Languages 1,187,789 1,131,625 56.164 (100.00) (tOO.OO) (100.00)
Hindi 901.235 858,315 42.920 95.2+ ".76 (75.88) (75.85) (76.42)

xxx
Distribution of major mother-tongues in Palamau district, 1961-concld.
Mother-tongue
1
Magahf/Magadhl
Kurukh/OraoD
Urdu
Bhojpuri
Sadan/Sadri
Korwa
Number of speakers
Percentage of speakers of
each language in
Total
2
74,873 (6.30)
68,331 (5.75)
68.211 (5.74)
50,575 (4.26)
8,428 (0.71)
3.653 (0.31)
Rural
3
74,721 (6.60)
67,511 (5.97)
Urban Rural Urban
4 5
152 99.80 (0.27)
820 98.80 (1.46)
6'
90.20
1.20
60,056 8,155 88.04 11.96 (5.31) (14.52)
50,140 435 99.14 0.86 (4.43) (0.77)
8,177 (0.72)
3,653 (0.32)
251 97.02 2.98 (0.45)
100.00
Hindi has been returned as mother-tongue by 75.88 per cent of the total population of the district. Similarly Magahi/Magadhi has been
returned as the mother-tongue by 6.10 per cent and Kurukh/Oraon by $.7$ per cent of the district population. These three languages taken together account for 87.93 per cent of the population 'of the district. Urdu and Bhojpuri have also been
returned as mother-tongues by 5.74 per cent and 4.26 per cent respectively of the district population. No definite conclusion can ,be drawn from these proportions as mother-tongue returni are, by and large, indicative mainly of individual preferences rather than o'f any precise lingUIstic divisions.
Mundari t,905 (0.24)
2,778 (0.24)
127 95.63 4.37_ (0.23)
Among other important languages in the
district Sadan/Sadri was returned by 0.71 per cent, Korwa by 0.31 per cent. Mundari by 0.24 per c~nt, Bengali by 0.20 per cent, Birjia/Brijia/Binjhia 9Y 0.13 per cent and Punjabi by 0.12 per cent of the district population. It is pertiqent to note that
64.43 per cent of sp~akers of Punjabi were enumerated in urban a~eas.
Bengali
Birjia/Brijia/Binjhia
Punjabi
Others
2,331 (0.20)
1,506 (0.13)
1,448 (0.12)
4,293 (0.36)
1,247 (0.11)
1,462 (0.13)
515 (0.05)
3,050 «(1.27)
1,084 53.50 46.50 (1.93)
44 97.08 2.92 (0.08)
933 35.57 64.4:3 (1.~6)
1,243 71.05 28.95 (2.21)
12. RELIGION
1he distdbution ofpopuh,ltion by religion is
~iven up W anchals in Table C-VIl at page 60 of ;Part r. The following statement shows the
number and per cent distribution of populatio.p. by
religion in tofa!, rural and urban areas of the
district :
Distributioll of population by religion in Palaml!~ district, 1961
Distribution of population by religion in Palamau, district, 1961-concld.
Religion
Muslims
Christians
Number offo!lowers Per cent of eaeh
religion in
Total Rural Urban Rural Urb~
2 3 4 5 6
115,078 105,534 9,544 91.71 8.29 (9.69) (9.33) (16.99)
19.853 (1.67)
19,177 676 96.59 3.41 (1.69) (1.20)
Religion Number of followers Per cent of each Sikhs reli~ion in
856 (0.07)
124 732 14.409 85.51 (0.01) (1.30)
All religions
Hindus
Total Rural Urban
2 3 4
1,187,789 1,131,625 56,164 (100.00) (100.00) (100.00)
fural U~ban
5 6
1,051,823 1,006,759 45,064 95.72 4.28 (88.56) (88.97) (80.24)
Jains
Buddhists
Others \
152 (0.01)
26 (N)
1 (N)
12 (N)
140 (0.25)
7.8 929.11
18 8 69.23 30.77 (N) (0.02)
1 (N)
100.00 , -N-denotes negligible figures.
Note: Figures within brackets indicate percentages.

XX:lCi
The Hindus comprise 88.56 per cent and the
Muslims 9.69 per cent of the district population.
lQther religious groups together constitute a mere
I.75 per cent.
The rural-urban break up indicates that the
'Sikhs and. the Jatns aourisn mlinlv in the urban
'areas of the district. Also, it is signific~nt to note
that 96.$9 per cent of the Ghristians live in the
rural areas. The existence of Christian missionaries
in rural areas and the conversion of large numbers
-of scheduled trib,es into Christianity perhaps -accouht for this. Both the Hindus and the Mus-iims are mlinly rural but of the two, the Mus
lims are comparatively more urban.
The table b e10w shows the growth, of each
"religious group in the district during the last sixty years. The figures f()r Cqristians,' Sikhs, Jains,
~nd Buddhists are small and have been given
separately in the footnote below the table:
Variation ill pop:d .. tion of each religiou! group 1901-61
.census
1
1901
1911
1921
1931
1941
'1951
1961
.--
iN"umber
2
533,182
586,918
617,690
669,961
503,746
871,261
1,051,823
HiM-a! Muslims
-""" ....., --
Percent de- Per ceilt de-cl¥ie variation Number cade variation
I •
3 4- 5
52,353
+ 10.08 57,669 + 10.15
+ 5.24 65,002 + 12.72
+ 8.46 74,501 + 14.61-
- 24.81 85,272 + 14.46
+ 72.96 97,403 + 14:23
+ 20.72 115,078 + 18.15
:'{OTE : Absolute figure_s for Crrristians, Sikhs, Jains, and Buddhists are given below :
Religion 1901 1911 1921 1931 1941 1951 1961
I ,
Christians 7,91)8 7,7B3 7,2B3 8,607 11,250 13,666 19,853
Sikhs 74 11 74 483 856
Jains . 46 14 24- 9 72 197 152
Buddhists 16 26
The Hindus comprised 85.05 per cent and the Muslims 8.45 per cent of the district population
in 1901. The corresponding proportions at 1961 I \
census were 88.55 per cent and 9.69 per cent
respectively. It is evident, therefore, that both these communities have registered increases in
their J_jroportions in the last six decades at the
cost of other religious communities.
\
The Hindus have always been the most domi-nant religious group in the district. In the last six
decades, their population has grown by 97.27 per cent as against 9I.55 per cent increase in the
overall population of the district. Except in 1941,
the Hindu population has always been on the
increase.
The Muslim population, on the other hand,
has increased by II9.8r per cent during the same
perioo. The rate of growth has been much faster
than that of the district population (91.55 per
cent), or even the Hindn population (97.27 per
cent). At every- census since 1901, the Muslim
population has registered steady increase in its
numbers.
Among the minor religious groups, the Chris
tians have sh;wn very high increase in their popu
. lation at thet'961 CenSUsi The Sikhs, who appear
ed for the first ti11.le in 1921, and the Bud4hists,
who have been returned for the fust time only in
the year 1951, have also increas~d their numbers
at the 1961 Census. The Jains have been returned
at each ~ensus but in small numbers always. The
growth of population among the Jains has defied
Note; Figures have not been adJusted for territorial changes in ~ny set trend. the prevIOUS cenOOses. "\

xxxii
The sex ratios for different religious groups
in the district are-Hindus-986; MuslimS0-986;
Christians-88S; Sikhs-726; Jains-I,I41; and
Buddhists 238. The Buddhist population is com
posed mostly of mendicants and monks, who are
generally males. It is, therefore, natural that
sex ratio among them should be so adverse. The low sex ratio among the Sikhs is explained.
by the fact that they are mo~t1y the erstwhiledisplaced persons who have taken to trade and
business leaving behind their families at home.
I3. SCHEDULED CASTES AND SCHEDUlED TRIEES
The total population of scheduled castes in
'Palamau district was 308,051 in 1961. They com
prised 25.93 p'er cent or a little over one fourth
'ef the district population. The corresponding
percentages in previous cenSUses were 22.28 in
1951 ; 23·72 in I941 ; and 26.04 in 1931. Th\ls, the 196r proportion is higher than previous
censuses except 1931. In the State as a whole, the
scheduled castes comprise 14.00 per cent of the
total population.-
Among the districts of the State, Palamau is
at the top ie, relative proportions of scheduled
"Castes to total population in each aistr.ict are
taken into account. Its position, however, drops to tenth if the population of scheduled castes
in the different districts of the State is considered.
The greatest concen tration of scheduled castes
in Palamau is in Balurnath anchal of Latehar sub
division where they comprise 38.1 per cent of its
total population. Chandwa anchal of the same
subdivision follows next where the proportion
is 33.3 per cent. The proportion is, however,
lowest in Mahuadanr anchal (2.6 per cent). In 13
anchals, the proportions are between 25 and 33
and there are 9 anchalswhere the proportions vary
between 10-24.
It may now be useful to find out which are the more numerous among the scheduled castes in
Palamau district. 'The statement given alongside
sho"Wl the individual scheduled castes having
.ere than 1,000 persons in the district.
PopUlation of ICbeduled cutes having more than 1,000 persons in Palamau, 1961
Number per 1,000 of
Total Total popula_ Scheduled tion of the
Name of Scbeduled Castes
Population 1961
Castes Tt'spt'c!ive populationin Scheduled
the district Castes in the State
2 3 4
Total 3'5,683 992 50 I. Bhuiya 118,636 385 329-2. Cbamar or Mochi 72,458 235 38 3. Dusadh including 5(1,918
Dhari or Dharhi 165 29,
t. Bhogta 22,875 7+ 261 5 Rajwar ]3,887 +5 9o. 6. Dhobi 12,693 41 sa 7. Turi 3,487 12 gg. 8. Dom or Dhangad 3,431 11 22-9. Pasi 2.828 9 II
10. Ghasi 2,647 9 4ft 11. Musahar 1,826 6
The above eleven castes comprise 99.2 per cent
of the total population of sched~led castes in the
district and S.O per cent of their total population
in the State. Among individual castes, the Bhuiyas
as most numer9us,and account for 38.5 per Cent
of the total scheduled caste popula,tion in the
district. The Chamars or Mochis come next
with 23.5 per cent. These two castes taken
together account for 62. per cent of the scheduled
caste population in Palamau. The Dusadhs (includ
ing Dhari or Dharhi) and the Bhogtas contribute
16·5 and 7.4 per cent respectively. The district
of Palamau, it may be mentioned, contains ~.~6 per cent of the total population of Bihar. II
follows, therefore, that on a pro ratll basis, it has
more than its fair share of the Bhuiyas, Bhogtas~
2'

xxxiii
:Rajwars, Ghasis, Chamars, Dhobis. Dusadhs and
"'Turis. Other scheduled castes are under represented.
Am6ng the remaining scheduled_ castes
{see Table SCT-I Part A at 'plge 70) 1,030
_persons have been returned under the category
·Unclassified'. It relates to cases in which
vague entries such as H,lr(jan, Achoot, etc. were
'made without specifying the exact n~me of the
-scheduled caste to which the person belonged. , Palamau lies in the tribal belt of Bihar, and has
-228,589 persons belonging to the scheduled
tribes who comprise 19.24 per cent of the dis ..
"trict pJpulation. The corresponding percentages
in previous censuses were-I7.45 in 1951 ;
. .20.06 in 1941 and 20.94 in 193I.
Among the districts in Bihar, Palamati ranks
-£fth in the population of scheduled tribes. Its
-position is, however. fourth if the relative propor-
rion of the scheduled tribes to the total popula-.
tion in each district is taken into account. The
three districts havin~ higher proportions of scheduled tribes in their population are-Ranchi
(6I.61 per cent), Singhbhum (47.31 per cent) IW.d
Santal Parganas(38.24 per cent).
The Mahuadanr anchal has the highest concentration of the scheduled tribe population in the district. 84 per cent of its population is tribal. It
is followed by the Garu anchal where the porpor
tion is 81 per cent. There are 6 anchals in Pala
mau with the tribal proportions varying betweea
42 and 66 per cent.
Among individual tribes the Oraons are easily
the most numerous comprising 36.5 per cent of
the tribal population of the district. The Kharwarl follow next with 28.7 per cent. The Cheros,
the Korwas, the Parhaiyas, the Mundas and the
Kisans are among the other numerically important tribes .
14. HOUSING
Tables E-I, E-II, E-IV, and E-V, published
:in Part IV-B of the 196r Census Publications
relating to Bihar, contain information on various
-characteristics of housing in rural and urban areas
'-Of the district and anchals.
'Use of Houses
The total numher of houses in Palamau dis
trict according to the houselistirig operation con
Jucted in September-October, 1960 was 230,994·
Itis of interest to note that this district has the
smalbst number of houses in the whole State.
"Even so, 4.4 per cent of these houses were found vacant, that is, they were not put to any specific
'Use. -The corresponding proportion for the State
was 3 per cent. It follows that 95.6 per cent
of the houses in Palamau were occupied.
rn comparison to other districts of the State, the
ptoportion of occupied houses in this district is
higher than the districts of Hazaribagh (94.4 per
cent) ; Ranchi (93.8 per cent) ~d Saharsa (9I.7
per cent) only. 87.S per cent of the houses in Palamau were used solely for the purpose of
dwelling or shop-cum-dwelling or workshop
cum-dwell.ihg. The cOJ'responding proportion for
the State is 79.8 per cent.
An idea of the differentk:inds of uses to which
Census houses are put in Palamau district can be
had from the table given on the next page which also gives proportional figures of Bihar State for comparison.

xxxiv
Number and distribution of 1,000 census house. in Palamau dis(ric:f by kinds oriJie., 1860
Kinds of uses
Total cen.us houses
A. Vacant during houseli$ting
B. Occupied Census houses used 35-
Number
2
230,994
10,207
Proportion per 1,()00 censJ, houses •
Palamau district Bihar State
3
1,000
44-
4
',000
SO·
(i) Dwellings (including shop-cu,m-dwl:llirigs'or workshop-cum. dwellings).
(a.) Dwellings (b) Shop-cum-dwelling.
202,069
187,531 2,819
11,719
875 798·
812 765
(c) W6rkshop-cum-dwellings 12 13 51 2()O
(ii) Hotels, Sarais, Dharamshalas, toullis! houses and inspection houses (iii) Shops excluding eating houses
224 2,066
937 1,182
1 9
1 15-
(iv) Business houses and offices 4 + 5 (v) Factories, workshops and work sheds
(IIi) Schools and other educational institutions including training classes, coaching and shop <'lasses. 1,246
117
a. 5 5-
N (vii) Restaurants, sweetmeat shops and eating places (viii) Places of entertainment and communily gathering (Pancbayat Ghllr)
(ix) Public health and medical.institutions,hospitals, health centres, doctOI'S clinics, dispensaries, etc. - _
1,745
217
10,984
1 8 1()O
1
( .. ) Other. 48 127
N-denotes negligible figures.
The category • others' is a residuary group and
includes uses which could not be fitted into any of
the prescribed categories and includes entries such
as goshala, baithka. bhoosa-ghar, cemetety,
lavatory, kitchen, garage. pigeon house, pig
house, etc.
Density of Houses
There ate only 45 houses _per square mile in rural areas and 530 hotlses p'er square mile in urban areas of the disttitt. The tural density islow
because of the large area's covered by agricultural
fields, orchards, etc. -which in rural areas con-prise the bulk of the land mass. If th'e areas of village
settlements_ only were taken into account, the
density of houses in rural areas would be equally high. Such a study is, however, handicapped
because relevant figures are not available. How
ever, compared to the State (I20 in rural and 1,016 in urban), the density of census houses in
Palamau is lower. l>alamau occupies the lowest
position in the State so far as the denSity of
census houses in rural 'areas is concerned. If urban
areas are taken into account, onlv one district . ,..
namely, Saharsa has a lower density (SoB'houses.
per square mile).
Status of Occup~cy
96.S per cent of households in rural areas and
62.3 per cent in urban areas of Palamau live in
owned houses. It follows that the proportion of households living in rented houses in rural areas is 3.5 per cent only. In urban areas, however, it js more than one third of the total households.
The corre~'Ponding proportions for the State as
a whole are 2.5 per cent_in rural and 43.S per
cent in urban areas.
Material of Wall
To facilitate study of the type of materials that
provide the structure of houses. a statement has

"been given' b~low whith compares the distribution_ of 1,000 households living in census houses used
wholly or partly as dwellings by predominant
material ofwall separately for rural and-urban areas
in _Palamau district and Bihar State:
Distribution of 1,000 households living. in census houses used wholly or partly al dwellings by pt:edominant wall
snaterial in Palamau district and Bihar State, 1960
Number per 1,000 households
p'aJamau district Bihar State Material of wall ,---_..._--~ ~__,_- ......
Rural Urban Rural Urban
1
Grass, leavcs,reeds or bamboo
Timber
Mud
Unburnt bricks
Burnt bricks
C. I. sheets or other metalsheets
Stone
Cement concrete
All other mater,ials
2
23
16
941
2
18
N
N
o
N
3
11
1
554
105
317
4
8
o
o
N-denotes negligible figures
Q-denotes nil
4
225
3
663
7
99
2
N
N
5
88
6
289
30
579
3
3
As in the State so in Palamal1, mud is
the most common material of waH in rurai areas.
Comparatively speaking it is more popular in Palamau. It is of interest to note that mud is
equally popular in the urban areas of the district
also. More than one OU! of very two households live in mud walled house. The usc ofhurnt bricks is confined maJnly to urban areas. The
use of unbumt bricks as wall material is found
generally in the urban areas or the district. At least one out of every 10 households in ~lrban
areas of the district lives in a house having walls
mad~ of unburnt bricks. Compared. to the State
as a-whole, the use of grass, leaves, reeds or
bamboo as wall material is insignificar_t in the
district. P-VII
:Material of Roof
Considering next the material of roof, the
table below shows the distr~b.ution' of 1,000
households living in census houses used wholly
or partly as dwellings by predominant roof material in rural and urban areas of Pal am au
district as well as Bihar State:
Distribution of 1,000 households living in census houses used wholly or partly as dwellings by predominant roof
materials in .Palal1'lau district' and Bihar Stare, 1960
Number per 1,000 households
Palamau di~trict Bihar State Material of roof r--------. .---""---....
Rtlraj Urban Rural Urban
2 3 4 5
Grass. l~aves, reeds, thatch, wood 80 24 446 125 or bamboo
Tiles, slate, shingle 909 878, 522 524-
Corrugated j ron, zinc, or other metal sheets 3 9 8 41
Asbestos cement sheets 12 21
Brick and lime 7 72 22 283
Concrete anel stone slabs N 5 6
All other materials N N N N
N-denotes negligible figures
As in the State, a much higher proportion of households in rural as well as urban areas of the
district have tiled roofs in preference to tha tched
roofs. The use of brick and lime _as roof
materials is mainly confined to urban areas of the
district as in the State. Besides these materials, others do not count.
Living Accommodation
For obvious reasons, the enquiry conducted by
the census at the time of houselisting did not
concern itself with exact area of accommodation
available to each household. Information relati;g
to. the number of rooms occupiod by each house
hold was, however, collected.
A room was defined as follows
"A room should usually have four walls
with a doorway with a roof overhead· an:d

xxxvi
should be wide and long enough for a
person to sleep in, i.e., it should. be
at least 6 feet long. Unenclosed verandah,
kitchen, store, garage, cattle shed
and latrine which are not ordinarily
used for living and sleeping should not
be treated as rooms. An enclosed room,
however, which is used for living,
dining, storing and cooking should be
regarded as a room."
The statement alongside gives the distribut
ion of households by number of rooms occupied,
separately for total, rural ~nd urban areas in
Palamau district and J3ihar State.
Distribution of 1,000 cellSUI hou.ehol4. by numberofl'OOllH occupied in Palama', district and Bihar State, 1960
Number per 1,000 households in
Palamau district Bihar State Number of rooms _---.A--- ---.
Total
2
Noregular room 1
1 room 500
2 rooms 258
S rooms 113
.. rooms 62
5 rooms or more 66
Rural Urban Total Rural Urb_
3
503
259
112
61
64
... 3
441
223
127
88
118
5
2
S63
293
155
83
104
6
2
356
296
157
84
105
, •
44l
264
127
7J
91
A comparison of columns 2 and 5 of the above table would indicate that the general trend in the
district is towards small sized dwellings. The proportions of 'households living In houses
having two rooms or more are lower than those
in the State.
IS. HOUSE HOLDS THEIR SIZE AND COMPOSITION
Size of Households
A household means 'the entire graup of per~ sons who comnlonly live together in the same census house and take their meals from a com
JIlon mess unless the 'exigencies of work prevent
them from doif1g so'. A census house is a structure or- part of a structure, a dwelling, a shop,
a workshop, factory or place of business, or a shop-cum-dwelling giving on the road or a common staircase or a common courtyard leading to a
main gate or enjoying a separate entrance.' It
follows that while the concept of census house relates to a physical unit, that of census household
extends to a social unit.
In Palamau district, the average size of a
household is 5.14 persons. It is lower than the
State average of 5.49 persons per household.
Strangely enough the size of households in Pala
mau is some what larger in urban areas than in
rural areas. As the following figures will indicate, the trend is just the reverse in the State .as a whole :
Number ofpcrsons pet' houschold
Total
Rural Urban
Palamau district
5.14
5.14-5.19
Bihar State
5.49
5.51 5.33
Further light on the distribution of houso-
holds by different sizes is thrown by the following table:
Distribution of1,O()O households in Patamaa district and Bihar State by their size, 1961
Palamau disrtict Bihar Statc Size or household
Total Rural Urban Total Rural Urblll:l 2 3 4- 5 6 7
AU aize 1,O{l0 1,000 1,000 1,000 1,000 1,001
Single member 60 58 111 57 53 99
2-3 members 233 239 238 211 209 23:1
4:-6 members 453 456 3'73 436 442 876
7-9 members 187 188 179 202 203 191
10 members and 67 65 99 94- 93 10 I above

xxxvii
The most common size of bouse holds compri
sing 45.3 per cent or more than two fifths of the
total households in Palamau district consists of 4.6
members. l:age households (having 7-9 members) comprise 18.7 per cent while small households
(having 2-3 members) account for 23.3 per cent
of the total households. These two taken together
account for 42 per cent or more than two fifths of the total households in the di strict. A compari
son of the district proportion~ with the corresronding proportions for the State shows a marked tendency towards households of smaller
• sizes in the Palamau district.
Composition of Households
The statement presented below gives th"
composition of households by relationship to
the head of household:
Composition of households in Palamau district, 1961
Rrlationship to Total Rural Urban head or households r-
Males Females Males Females Males Females
J 2 3 4 5 6 'J
Total 100.00 100.00 100.00 100.00 100.00 100.00
Head. of Households 35.64 3. II 35.71 3.13 34.18 2.89
Spouses ofheads 0.06 30.1i 0.07 30.20 0.05 28.84 of households ).{arried sons 11.42 11.55 8.79
Other married 4.40 19.13 4.36 J9.16 5.15 18.30 .relations
Never married. 47.40 47.41 47.39 47.36 47.58 48.43 lIridowed and di-"orced or separa-ted relations Unrelated persons 1.08 0.21 0.92 0.15 4.25 1.54
35.64- per cent or more than one third of the
males in l?alamau district are heads of households.
The corresponding proportion among females is
3·ll per cent only. The small proportion offemale
heads of households should cause no surprise
because the patriarchal system of family is almost
universal throughout- the State. Even the small
proportion of female heads of households presum
ably relates to the elderly widows, mothers of
mInor sons or such other females. In some cases , continued absence of husbands for long period
on work e1s'ewhere may also have resulted in their
wives having been treated as heads of households.
The category 'never married, widowed and
divorced or separated relations' has the highest
proportion both in rural and urban areas of the district' as well as in the State.
- The category 'other married relations' has almost the same proportion both in rural and
urban areas of the district. The proportion of
'unrelated persons' of both sexes is higher in urban areas, because of the more prevalent practice
of engaging domestic helpers, private tutors, pro
fessional clerks, etc., in urban areas on salary-cum
food basis.
16. ECONCMIC CHARAC1ERISTICS
The economic classification of 1961 census envisages a broad division of the entire population
into two ca tegories, viz., workers and non-workers.
A 'worker' is a person who is engaged in some
kind of economic activity. For exan'plc, he may
be working as a cultivator, or as an lIgricultural
labourer, or at household industries or doing any
other work of productive- and/or gainful nature.
Work includes not only actua 1 work, but effective lupervision or direction of work. Persons en
~aged in season~l work like C'lltivatioll, livestocl!!
dairying, household industry, etc., were deemed to be workers if they had regular work for more
than an hour every day for the greater part of the
last working season. Persons engaged in trade.
profession, business or service, were treated as
workers if they were employed during any of the fifteen days preceding the date of enumeration. A person who is not working is a non-worker. Nonworkers may be full time students or children
doing no other work, housewives or other persons
engaged in hou sehold duties only. ipfants or disabled

-xxxviii
person s .incapable of doing any work, retired per
sons (not re-employed), rentiers, beggars, vagrants,
convicts in jails, inmates of penal, mental or chari
'table institutions and unemployed persons. For
:a fuller understanding of these concepts, reference
may be made to the flyleaf to Primary Census
Abstract in Part II-A (General Population Tables)
or to the Introductory Note in Part Il-B (i) (General Economic Tables) of the 1961 Census Publications
relating to Bihar. The Primary Census Abstract gives the dis
tribution of workers by nine categories of economic activity.
Participation Rales
The participation rate (also called labour parti
cipation ra.te) is expressed as the number' of wor
kers perI ,00) I:D21bti,:> 1. Ti\:: st1te_n~1t below'
gives the participation rates separately for per
son s ,1n1les and females in the total, rural and urban
areasof Palamau d.istrict and Bihar State according
to the censu,~ of 1961. Workers have also been
classified by the three broad sectors of economy,
viz., primary, secondary and tertiary:
Participation_rate or workers in Palamau district and Bihar State by broad sector. or econOMY. 1961
District/State
I
Palamau
Bihar
Palamau
;:Bihar
Palamau
Bihar
Persons Males
Female*
2
P M F
P M F
P M P
P M F
P M F
P M F
Total population
1,000 1,000 1,000
1,000 1,000 1,000
1,000 1,000 1,000
1,000 1,000 1,00l}
1,000 1,000 1,000
1,000 1,000 1,000
Total
..
478 571 382
414 556 271
485 575 394
422 560 285
329 497 -126
332 517 104
In Palamau district, 478 persons out of every
1,000 are workers. This is a proportion much
above the ~tate average of 41 4. Though the par
ticipation rate in Palamau is the lowest among the
districts of Chotanagpur Division, it is higher
than that of other districts in-the State exc-ept the
S:mtal Parganas. Considering the participation
rates for both sexes separately. it is seen that the
Primary sector
5
TOTAL
415 476 353
926 421 231
RURAL
432 497 367
352 458 248
URBAN
67 84 47
Workers
Secondary lector
6
2! 33 12
41 57 24
20 29 12
M 45 23
72 117 17
Tertiary I Noo.. .ector lrorkell
7
40 62 17
47 78 16
3~ 49 15
36 51 14
190 296 62
• 522 .429 6111
s8& 44f 7%8
515 425 600
578 '44f 715
671 503 8n
46 114 112 668 59 180 278 48S 29 32 43 896
male rate 15 higher than the ·State average by
2.7 per cent while the female rate is higher by as
much as 41 per tent. As is quite natural, males
have higher participation rate than females. The
margin of difference between the male and female
rates in Palamau is, however, much lower .than
in the State.

xxxix .. ·The rural areas in Palamau, however, llave
~gher participation ote {48S) than the urban :arcas (329). This is true also f~r the State
'. though the difference-between the rural and urban
r.ates in the Sta.te is lower than in the district.
~Considering both the sexes separately , the rate
in rural areas is higher tha.n in urban areas. Thus
the male and female participation rates in rural
-areas of the district are 575 and 394 respectively,
'while the corresponding. rates in urban areas are
497 and 126. A considerable portiop. of males in
urban areas consists of students, job seekers and
retired persons who are all non-workers. The ,females in urban areas also have very little scope
-of work in household industry and -agricultural
labour (in which they are mostly engaged).
"These factors depress the participation rates in
urban areas considerably.
A better idt:a of the participation rate caft
DC had by the distribution of workers into the
three broad sectors of economy, viz, primary,
sccondaryand tertiary. The primary sector includes 'workers in cultivation, agricultural labour, live
stock, forestry, fishing, hunting, plantations, or
chards and allied activities. The secondary sector
comprises workers eng~ged in mining and quarrying, household industry, manufacturing, construc
.. tion and gas and electricity. The tertiary sector
relates to workers in trade and commerce, transp.ort.
~torage and communications and oth~r services. As compared to the State, Palamau has a
~igher proportion of workers in the primary
sector. Thus, against 32.6 persons per 1,000
engaged in primary sector in Bihar, the proportion in Palamau is 415. Participation rates in the
secondary and tertiary sectors are, however, lower
in the district than in the State. This ~learly
indicates the comparative backwardness of ,the district. The trend is similar both in rural and
urban areas; except in the tertiary sector in urban -areas.
As in the State so in the district, the primary sector claims the largest proportion of workers in rural arelS, while the tertiary sector does so in urban areas;-
Industrial Categories of Workers
Workers have been classified into the nine industrial' categories depending on the Sector of
economic activity in which they are engaged. In the case of a peson doing more than one kind of work, such classification has been done on the basis of principal work determined as the one which consumed the greater part of his working
time. 'The statement below shows the distribu .. tion of 1,000 workers in Palamau district and
Bihar State by the nine industrial categories, separately for persons, males and females .
Distribution of1~OOO workers in Pa1arnau district and Bihar State by industrial categories, 1961
Proportion per 1,000 workers
Working Palaman district Rihar State -.
Persons Malo!$ Females PerSOllJ Males Females
·1 2 S 4 5 6 7
I As (lultivator 593 592 595 539 534- 547 II As Agriculturallabourer 243 195 317 230 199 294
iII In Mining, Quarrying, Livtstock, Forestry, Fishing 35 51 13 34 42 18 Hunting and Plantations, Orchards and Allied activities
32 34- 28 IV A Household Ind\ustry 55 46 '13 V In Manufacturing otherthanHousehoid Industry 9 13 2 22 30 6
VI In Construction 3 5 N 5 8 1 VlI In Trade and Commerce . 16 23 5 27 35 12
'VIII In Transport, Storage and Communications 8 13 N 12 17 N IX In Other Services 61 74- 40 76 99 ft
N-denotes negligi ble ligures.

CultivatoIl! and ag,riculturallabourers account
for 83.6 per cent of the workers in Palamau dis
trict. The corresponding proportion for the State
is 76.~ per cent. The extent of agricultural em
p~oyment in Palamau is, therefore, much above
the State average. Considering cultivators and
agricultural labourers separately, the proportions
of workers in both the categorie~ are higher in the di strict than in the State, though the order of
<.Iif1'erence in the ca~egory 'agricultural labourers'
is smaller. Agricultural l~bourers are persons who work in other persons' land for wages in
cash, kind or share without having any kind of
right, title or interest in such land. It is seen that
the proportion of agricultural labourers is rela
tively high among females. -More than half
(57.45 per cent) of agricultural labourers among females belong to the scheduled castes.
. Employment in category III (tnlnmg and
quarrying, etc.) is more or less of the same - .
xl
order in the district as in the State. Employment:
in category IV (household industry) is, however,
lower in the district for both males and females.
The details of household industries will be found'
later. In other categories viz., manu fa ctu rillg.
other than household industry, construction, trade
and commerce, transport, storage and communica
tions, and other services, the proportions of
workers in p~ br ~u district are comparativelr
lower t:bm t}_ose in the State.
F nnale Participation
An idea of the extent of femaJe participation
in economic activities can be had from a consi
deration of sex ratio among. wqrkers in each in-- dustrial category. The following statement gives,.
the relevant figures for Palamau district and
Bihar State, separately for t9tal, rural and urban
areas as well as for each industrial category. total
workers and total population:
NumbetoCCemales per 1,0(0 lIlaleS .IIlOllg ",orLen in different il1dustrial Ca1tf,Clries ill Palamau district and Bihar StiLle, 19&1
Category of workers
Total population Total workers
I Cultivators II Agriculturallabourers
III Workers in Mining Quarrying, etc. IV Workers at Houst"hold Industry.
V Workers in Manufacturing other than Household Irc'vshy VI Work"rs in Construnion
VII Worker!' in Trade and Commerce VITI Workt"rs in Transport, Storage and COmIDuJlicaticns
I_X Work,," in Other Service!
It is seen that the females are emp loycd largely
in cultivation, agricultural labour and household
industry in the distircts as well as the State. For
every 1,000 males working in categories I, II and
IV in Palamau, there are 661, 1,067 and 538
:females respectively workiLg in them. Th,e first
~o ratios are higher than the State while the
Pal amau district Bibar State .....
Total Rural Urban Total Rural Urban
2 S 4: 5 6 7'
984 993 830 991- 1,012 811 659 680 210 485 515 163
528 496 497 S8!} 661 662 1,067 1,070 697 716 717 650
166 168 101 204 210 169 538 576 221 755 801 407 H) 1]9 (9 105 162 59 55 37 B8 91 88 9$
145 177 73 166 218 77 3 7 12 II 13 5
360. 390 250 267 302 181
last one is kwer. Aln:ost 52 per cent of the
workers amo:r:g ;;gricnlturallabourers are females, the corresponding proportion engaged in house
hold indt1~try beirg 35 per cent. Female partici
pation in transport, storage and communications
is almost insignificant (5 per 1,000 males). This
proportion is much lower than that for the

·State. It may, however, be noted that Palamau
lhas better female 'participation rates in cate-
gories I, II and IX than the S~ate. It is noteworthy that the participation of females in rural
-areas is lower than that in urban areas In cate
gories VI and VIIL
Participation Rates in Anchals
The pa~ticipation rates at lower, units, viz~
-subdivisions and. anchals give a better idea 9f the :regional differences within the d;strict. The
'statement below gives the relevant information !
• Number of W'orkerl p&r1.000 m~de! and fem-del iu lubdivision. and aachall oC Pala.m1u district, 1961
.Diltrict/Subdivillion/Anchal
1
"!PALAMAU
Sadar Subdiyilion
Daltonganj Chainpur Leslieganj Panki ChhAtarpur
Hariharganj Patan Bishrampur
Manatu H ussai nab ad
<Garhwa SubdiTisioll
Meral
Garhwa
Untari Dhurki Ranka
Bhandaria Majhiaon Bhawand.thpur
-!Latehar Subdlyision
Balumath
Chandwa
Latehar
Manika
8arwarlih
Mahuadanr -,Garo
Number of workers pel' 1,000 population
--. Mai(8 Females
2 S
671 382
560 325
518 210
597 373 557 36. 569 334-588 380 566 318 568 316 564- 426 573 412 530 212
580 408
587 481 551 30a .569 333 610 475 631 528 614- 530 552 323 574- 446
683 478 575 479
621 514 569 406 594- 532 60D 383 573 553 583 548
Male participation rate varies from 560 in the
Sadar subdivision to 586 in the Latehar Subdivi
sion. Among the anchals, ~he variations arc
greater still. Ranka anchal has the highest parti
cipation rate (631) and Daltonganj the lowest
!SI8). Five anchals in the district have male pal'
ticipation rates exceeding 600. These aro--:
Ranka, Chandwa, Bhandaria, Dhurki and Barwadih. As many as 18 anchals have male rates varying between 5$0 and 600, and only two have rates between 500-550. lt is significant to note
that no anchal in this district has male participation rate below 500 •
Among females, the participation rates fluc
tuate considerably. The Mahuadanr anchal has
a female 'participation rate as hign as 553. Other anchals which have rates above 500 are Gara,
Manika, Bhandaria, Rank.a and Chandwa. S~ven
anchals have rates varying between 400-500
while IO others havoe rates varying between
30 0-400. The rem1mmg two anchals, viz,. Hussain_abad and Daltonganj, have rateS of .21.3.
and 210 respectively.
Workers by Age groups
The following statement shows the percentage
of workers in each broad age group in Palama1l district and Bihar State separately for persons. males and females.
Percentage')f Norkel'!J in bro:lC! age gronps in Palama. district and Bihar Stat"t 1901
Percentage of worken
Age groups Palamau disttrict Bihar State -- -. ...---~-_,. PersOIl5 Modes Females PersollS l\-Iales Female.
1 2 3 4 5 6 7
All age' 47.78 57.14 38.24 41.40 55.60 27.12
0-14 9.82 11.27 8.31 7.84- 9.64- 5.9. 15-34 17.57 92.17 63.32 63.90 87.65 41.39
35-59 "=
82.84 98.59 66.13 73.29 97.40 ~.U
60+ 52.20 8l.8£} 27.35 50.26 82.26 2,.09: 4
Age Q:ltstate:l 37.211 53.85 15.26 42.84- 56.13 11.25

OISTRICT PALAMAU
DA~TONG
CNA.N>PUA
LESI..t!GANJ
P -'. N
C:HHA'AAPUR
HAAlIHAFtG'A
A N
a J S H II A
.. II
"USIAINASA
.. • A A
U fill T • A
o H " R
R A .. A
&HANOARJP.
MAJHIAON
8HAWANATH
8ALUMATtt
CHANO.A
LA' " A R
MANaKA
8 A It W A.D I H
.... HUADANIj
Q A R U
PERCENTAGES_ 0
xlii '
DISTRICT ·PALAMAU
ANCHALWISE DISTRIBUTION OF WORKER5 1961
10 20 >0 40 50 60 80
REFERENCES_ ErZJ WN;:l ~ a _ III III 0 ~ II jII IV V VI VB VlII IX
A It ...... THUR
90 100

The pJ"oportion of workers among children {age group 0-14) of both sexes is appreciably higher in' Palamau district than in the State. Since
the' overall participation rate is higher in Palamau
than in the State, ie is reflected in the age group
0-14 also. The proportions of workers among
the y~)Ung (age group 15-34) and the mid"dle aged
(age Igroup 35-59) are also higher in Palamau.
Except in the age group 60+ r~la.ting to males, the proportions of workers in all the age group sand for both sexes are higher in the district than in the State. It may be noted that in Palamau as in
the State, the _proportion of workers in the age
group 35-59 is the highest. This phenomenon is easily exp lained by the fact that the age gro1,lp 15-34 includes a considerable proportion of
students as well as job seekers who have been
treated as non-workers.
Workers by Literacy and Educational
levels
The following statement show s the distri
bution of workers by literacy and educational levels for Plamau district and Bihar State:
Workers by literacy and educationallevels ill Palamau district and Bihar State, 1961
Educational level Percentage of workers in
""Palamau district Bihar State
2 3
Total 'Workers 100.00 100.00
Illiterate 86.13 78.45
Literate 13.87 21.55
(i) Literate (without educational 9.76 15.84 level)
(ii) Primary or Junior Basic 3.07 3.86
(iii) Matriculation and above 1.04 1.85
It has been discussed earlier that Palamau has
much'lower.literacy rate than Bih~r. This is also
reflected among the workers. Thus, the propor
tion of literates among the workers in Palama u is much lower than that in the State. This is so not
P-VII
xliii
only in respect of mere literates (without educational level) but also for those who have
,attained the primary or junior basic standard and those who are matriculates and above.
Status of. Empl~yment
Workers in industrial categ.ories III and V to IX have been classified further by four kinds of
employment status, viz, employer, employee,. single worker and family worker. An employer is
a person who has to employ other persons in order to perform the work in which he is engaged. An employee is a person who usually work~ under some other person for salary or wages in cash or kind. A single worker is a .person who work.s
by himself, i.e., he is not employed. by anyone nor does he employ anyone, not even members
of his household except casually. A Jam; 11 wor4
ker is a member who works without receiving
wages in cash or kind in some industry, 'business or trade conducted mainly by members of the family, and ordinarily does atleast one hour of work every day during the working season. For further elucidation of these terms a reference rna y be made to the flyleaf Tto able B-lV Part B.*
The statement below shows the distribution
of 1,000 workers (eategories III and V to IX)
in Pilamau district ana Bihar State by status of
employment:
Distribution oft ,000 'Workers (other than th.os\',in agric~lture and household industry) in Palamau dlStnct and Blhar
State by employment status, 1961
Number per 1,800 workers
Palamau district Bihar State
Total Rural Urban Total Rural Urban I 2 3 4- ~ 6 7
Tota~ workers 1,000 1,000 1,000 1,000 1,000 1,000
Employers 39 32 69 ,41 30 61
Employees 392 370 488 463 407 590
Single workers 437 452 373 377 419 ~80
Family workers 1~2 146 70 119 144 63
• Census of India, 19151, Bihar, Vol. IV, Part II-B (i). General Economic Tables.

xliv
The comparative backwardness of Palamau
district in regard to employment in large industrial
establishments or, other business concerns is reflee
ted in the lower proportions of both the categories, 'employers' and C employees'. Single workers
and family workers comprise nearly 57 out of I
every 100 workers (other than in agriculture and
household industry) in this district, underlining
its essentially rural economy. This is explained
by the large number of workers returned in rural
areas under Minor Groups 040 (dairying) 640
(retail trading in cereal~, pulses, etc.) as well as
Major Groups 88 (personal services) and 89 (ser
vices not elsewhere classified),
Household alld th~ir Economic Activities
It is well known that the main economic
activities of households, in Palamau as in th;
State are cultivation and household industry. The
information collected on the basis of individual
slips has, therefore, been supplemented in 1961
by further data in Household" Schedules on the
aforesaid two econo'mic activities of the household
as a unit. T'tbles B-X, B-XI, B-XVII and C-I
_given in this volume are based on 20 per
<cent sarrple of Household Schedules. Other
Household Economic Tables have been published
:in Parts III (i) and III (ii) of the 196r Census
Publications relating to Bihar. The following statement gives the distribu
tion of sample households according to their par
ticipation in cultivation and household industry.
Distribution of households in Palarnau distrIct and Bihar State by their economi< .. activlty. 1961.
palamau district Bihar State
Kind or activity 'Total Rural Urban Total Rural Urban
All Households
2
100
Households engaged-
(i) Neither in 20 cultivation nor in household industry
3
100
18
4
100
74
5
100
28
6
100
7
100
Distribution of households in Pabroau district and Bihar State by their economic activity, 19G1-&oncld.
Palamau district Bihar State Kind oCattivity ~---...... ,------..-...-~
Total Rural Urban Total Rural Urban
2 3 4 5 6 7
(ii) Incuitivation 69 71 20 64 68 13 only
(iii) In household 2 2 4- 2 2 industry only
(iv) Both in euI- 9 9 2 . 6 7 tivation and household bdustty
Cultivating households with orwithout house
hold industry comprise as much as 78 per cent of
the households, a proportion higher than the
State average of 70 per cent. These figures,
however, do not rake intQ account households
whose members work merely as agricultural
labourers. In rural areas the proportion of culti
vating households is naturally higher (8oper cent). 20 per cent of the households in the district
are engaged neither in cultivation nor in household
industry. 'this proportion is lower than the State
average of 28 per cent. Only 2 per cent is en
gaged exclusively in household industry. This
tallies with the proportion in the State. I( house-holds engaged in household industry with or
without cultivation are considered together the
participation of households is slightly higher in
the rural areas as well as the district as a
whole. Nature and Size of Land Holdings
5
1
81.64 per cent of the cultivating households in
Palamau district cultivate lands owned by them. Only 3.75 per ccnt'ofthem cultivate unoWlled lands held from private persons .or institutions for pay
ment in money, kind or share. This category
evidently includes households of lease holders
and share croppers. The remaining 14·61 per"cent
have mixed tenancies in the sense that they cul
tivate lands partly owned by them and partly held from others. The possibility of concealment

in furnishing information relating to the extent
of share cropping cannot be ruled out completely.
In the State as a whole, 68 per cent of the house
holds cultivate owned land while 7 per cent cul
tivate lands held from private persons.
The following statement shows the distribution
of sample cultivating households irl rural areas by
the size of land cultivated by them.
Distribution of cultivating honseholds in rural areas of Palamau district and Bihar State by the size of their
holdings, 1961
Size ofland (in acres)
1
All Sizes
I.ess than I 1.0-2:4-2.5-4.9 5.0-7.4-7.5-9.9 10.0-12.4 12.5-14.9 15.0-29.9 30.0-49:9
50+ Unspecified
Percentage of cultivating households to total cultivating house
holds in rural areas
Palamau district Bihar State
2 3
100.00 100.00
15.34- 21.51
24.41 26.65 25.26 23.34-
N.42 12.20 6.26 5.10 4.93 3.70 1.84- 1.80 5.36 4.21 1.44- 1.01 0.69 0.42 0.05 0.06
XlV
It is significap.t that 65.01 per cent of the
households in rural areas of the district have.
holdings below 5 acres of land each. This is
lower than the corresponding proportion for the
State (71.50 per cent). Less than one sixth (15.34·
per cent) of the cultivating households of the
district have below one acre of land each and
nearly two fifths (39.75 per cent) have less than
2.5 acres each. 14.26 per cent or approximately
one o~t of every 7 cultivating households have
holdings of 10 acres or more. Holdings over 50.
acres are owned by a mere 0.69 per cent.
Non-workers
Table BI-X at page 34 of Part I gives the
classification of non-workers by diffe,rent kinds
of activity. It is to be noted that 52.2 per cent of
the population in Palamau district consists of
non-workers. This poportion is below the State
average of 58.6 per cent. For obvious reasons
the proportion of non-workers among males (42.9
per cent) is much lower than among females (61.8
per cent). An _idea of the different categories of
non-workers can be had from the following statistics.
Distribution of 1,000 non-workers in Palamau district and Bihar State by the kind of their activity, 1961
Kind or activity Number per 1,000 non-workers
""" Palamau district Bihar State ,..-- ..... ;::-Persons Males ' Females Persons Males Females
2 3 4- 5 6 7
1 Full eime students 124 255 32 126 273 36 2 Engaged in household duties 193 1 328 270 3 435 1I Dependants, infants and disabled persons 678 736 637 596 IG9 526 4 Retired, rentier or independent means '1 Z; 1 2 3 1 5 Beggars, va~a~ts, ~tc. 2 2 2 - 2 3 2 6 Tnmates ofmstltutJons N 1 N 1 2 N 7 Persons seeking employment for the first time 1 2 N 2 4- N 8 Persons employed before but now' out of employment and 1 1 N 1 3 N
leelcing work N-denotes negligible figures.
Dependants, infants and disabled persons
account for the largest 'Pro'Portion (67.8 per cent)
of non-workers. This c~tegory accounts for 73.6
per' cent of non-workers aILor.!?; males and 63.7
per cent among females. 'Full time students'
constitute the next important category among the
non-working males. They comprise 2S.S per cent
in Palamau. This proportion is, however. lower

xlvi
than the State average of 27.3 per cent. Among
females, 32.8 per cent of the non-workers are
engaO'ed. in household duties in this district. This ::>
proportion is also lower than the corresponding
proportion for the State (43.5 per cent). While beggars, vagrants, etc., are of the same oFder as in
the State, the proportion of retired .persons, rentiers etc., is lower in the district. , ~
The ,figures relating to unemployed persons
give an impres'Sion of well nigh full employment
in the district as well as the State. An explanation
for this unusual featurewillbecome obvious if the basis of economic classifiql.tion at the t 961 Census
is taken into account. Much of the unemployment
in this country,'particuhrly in tutal'Sector, is in the nature of unner e'mployment. A referen(;e to
fhe concep t~ and 'defmhiohs discussed earlier would
show that most of the under emp loyed persons would have been returned in the Census as workers. Even students and other categories ordinarily listed among non-workers would have
figured a s workers if engaged in some kind of
work Or other. Non-workers, by..Jefinitiofi, ate only those who are not engaged in any kind of
economic activity. The number of such p.er .. sons is naturally very small and limited.
17. VITAL STATISTICS ,
System of Regi'stratiorl
As in other districts of the State, vital
statistics in Palam-au also are collected under the
Bengal 'Birth ahd Death Registration Act, 1873,
which makes -the registration of births and deaths
compulsory. This Act extends over the whole
of Palamau district. In the past, village Chowki
dars were the primaty rep6rting agency in rural
areas. Their teports were routed to the State
level through the officers intharge of pdlice stations
,and Civil Surgeons. The system worked fairly
..well in the past but started deteriorating steadily
:$ince-I93 t. It nearly broke down in several ar~as
in the last decade. The year I9$9-60, therefore,
5aW ,a far reaching change in the system as the
Gram :Pafichayats were brought into the pic
ture. The Panchayat Sewak is now the primary
registering authority, though he still continues to get the returns from villageChowkidars. lIe passes
on tb e information to the Junior S tati'stical Sup er
visor at the Block level who sarutinises and ~om
piles the data for the block as a whole. At the district level, the District Statistical Officer does
the necessary processing. In munic>ipal areas,
the municipal bQdy is supposed to maintain the
necessary record and transmit the information
to higher authorities., Finally, these data arc pro
cessed at the State level by the Directorate of
Statistics at Patna. Since the beginning of
I965, however, compilation of data at the distriGt
level has been given. up and Junior Statistical
Supervisors now send reports direct ~o the S~ate
headquarters for further processing.
The Decade, 1951-60
There were 120,3 84 male and II4,437 female births registered in the district ofPala.mau during the decade 1951-60. During the same period
63,922 male and SS,85S female deaths were reported. Thus there wa~ a natural increase of h5 ,044
persons (S6,462 j.l1ales and 58,582 females) in the de facto population, of t~e district as against the observed increase of 202,022 persons during tlie
d.ecade. Though ihfotmatioh abolit emigrahts from Palamau to other States or places outside
India is not available, the district lost by as many
as II ,063 persons in I96I as a result of the gap between emigrants froll). and immigrants to it.
In 195 1 , however, the immigrants to Palamau from
other districts of the St~te outnumbered the emi-. . grants from Palamau to other districts of the

'State by 6,796. It is -eviJent~ th-erefore, that .the
actual increa'St in Palamau'-s populatiQn in the last
,decade was not less thafi 202,022 plus II ,o6J, i.e.,
.21'3,08 5. A. comparisun of this with the regis-
tered .figure of r!~ ;0421- would give a measure of
large'dificienc.Y in the registration of birth's and
deaths .
18. NATURAL CALAMITiES
The following is a chronol< 10. list of severe natural calamities in the district:
11859.6.0-F-amine 'lS69.Famine 1873.14-Fainine .n896-97 -Famine
~ 899,l9004amine 1918-19-Famine ..f923-Flood i932~33--Droqght
19.4Z·48-Dr ought 1950-51-Drought {95J-52~Drought 1952-53-Drought
1953-Flood 1954-55-Scarci ty 1955.56-Scarcity 1956-Flood
1957-Flood
19. AGRICUL:ruRB AND IRRIGATION
Table AS-ItI at page II2 of Part I gives the
-statistics on land utilisation. Out of a total
:area of 31.45 lakh 'acres: the cultivated area
{ consisting of net area sown and current fallows)
is only 8.481akh atres or!tbout ~6'96 percent of
the total area. 'As tdtnpared to 1951, there has
b-een a decrease of 0.78lakb: acres in the cultivated
.atea. The area under forest, on the other hand,
bas increased by about I.7$ lakh acres during
the same period. I
The per capita availability of land in the dis-
trict has declined from 3119 acres in I~sr to 2.65
.acres in 1961. This figure is, however, higher than the correspondihg State average of 0.92 acre
in 1961. A better idea of the pressure of popu
lation on land can be had by considering the
proportion of net area sown to the total popula
tion. This is termed as agricultural holding per
capita. The agricultural holding p_er capita in
'1>alamau district in 196r is 0.46 acre as against
-0.43 acre for the State. In 1951, the agricultural
holding. ,per capita in the distri€t was 0.62 acre.
"The average size of agricultural holding per'cultivating household is 5.82 acres in Palamau as
-again'st 4.85 acres in the State. Thus Palamau
.is bett,er placed in regard to availability of agri
cultural land. The intensity of cropping (assum
rug net area sowtJ. to b'e 106) in Palman Ci:22.9)
''is naturally lower than ~hat of the State (13 8.3).
Only ~6 dist:-i<:ts., viz., Saharsa (117.9) and Ranc!li (II.4.7) have lowerint"ensjties of cropping
. thah Palaniau. These ratios are oased ~n the
figures of gross and net area. soWn in I 960-6r, as printed in the Bihar Statistical Hand B1>ok. 1960.
Rice is the main crop of the dis~rict accounting for 30.4 per cent of the gross area sown.
Wheat covers only 2.7 percent of the gross area sown. Non-food crops account for 10.1 per cent o,ut of which 9.6 per cent is covered by oil seeds. The cropping pattern in detail is given in Table
AS-III at page II2 and its sub.sidiary table at
J?age 117 of Part I.
The gross irrigated area in the district has
increase<l from O.62lakh acres In 19$1 to 1.43 lakh
acres in 1961. It would appear from Table AS-V
at page, ri3 that-in the pre-plan 'period the area
irrigaged by Government ,canals or tube-wells was nil. During 1951-61 the area untl~r irtigation. througb these sources was 3,165 acres.

xlviii
Notwithstanding the expansion of irrigational
facilities and provisionof other facilities, such as
improved seeds, more fertilisers and better agri
cultural practices, the yield rates of principal
crops (Table AS-VI at page Il3) do not show
commensurate increase. Wide variations are noticed from ye!lr to year. These may be due to
,several gaps in the available data and it will be
hardly safe to draw any firm "Conclusion.
Every 100 acres of net area sown in the
district provide employment to 61 cultivators and
2$ agricultural labourers. The latter consist mainly of field workers whose daily wages during
khaTi! season appear to have decreased froni.
Rs. 1.37 in 1951 to Re. 0.75 in 1960 for males,
and from ·Rs. 1.12 to Re. 0.47 for females~
Children got Re. 0.64 in 1951 and Re. 0.25 in 19,60 per day. Table A S-VII at ,page II4 gives..
the data relating to average daily wages. It needs
to be stated h hat some of the trends revealed
by these statistics arc prima Jacie unacceptable.
Judging by common experience, one is inclined to
think that the daily wages of labourers, including
those in agriculture, have been going up steadily.
:But the above mentioned figures tell a different: story.
20. LIVESTOCK
The term livestock includes cattle (cows, bulls
and bullocks), buffaloes, sheep. goats and pigs,
whi1e ~poultry' refers to fowls and ducks. Table
LVT-II at page 121 shows the population of
these categories with their variations from 1920,
as revealed by quinquennial censuses conduct
ed by the Animal Husbandry Department of the
State Government.
The total livestock population ofPalamau dis
trictin 196Iwasll.215,296. Only Bhagalpur, Patna andDhanbad had lower figures than that of Pala-
mau iu 1961. It will be seen that during the last
quinquennium (! 956-61), there has been an in
crease of nearly 0.83 lakhin the cattle population
of the district. This is more than one fourth o£ the net accretion during the last 40 years. This figure
is, however, much below the increa se during
I~M-51 (3.o9Iakh). A high rate of increase in
cattl e population is obviously an indication of
genera~ prosperity among the agricultural classes
in the ··district. There were 72 cowS per 100
bulls or bullocks (excluding young stock ) in the
district. It_may be noted that for almost every
six heads of cattle in the district, there was one
buffalo.
Coming to poultry, the available data relate
to the period 1945 and onwards. It is atonce
evident that their population ha~ always been increasing. The poultry populztion of 416,417,.
consisting almost entirely of fowls, marked an
increase of 58,320 or more than 16 per cent during the period 1956-61.
Table LVT-I at page 120 of Part I gives the
number of veterinary hospitals, dispensaries and
veterinarians in eac,h year of the last decade. The
district has one hospital and 2S dispensaries.
These arc mar:ned by 22 veterinary surgeons.
Though number of veterinary dispensaries has
risen -from 4 to 25 in the last decade, even the
pr'esent number seems to be small fo~ the large
livestock population of the district. On an
average, one veterinary hospital/dispensary is
available for almost every 189 so,. miles of the
district 2nd one veterinary surgeon for every
SS ,241 heads of livestock.

xlix
21. INDUSl'RInS
:Registered Factori~s
According to the records maintained by the -Chief In~pector of Fac "'ries, Bihar, there were 97 registered factories. in 'Palamau in the year, 1960.
"They provided employment on an average to
-2,476 workers daily. As many as 58 registered factories were located in towns and the remaining
39 ill villages There were 21 floilr tilills in urban .areas and 11 in rural areas. As regards rice
_mills, there were 2 in urban area s while none in
rural areas. Industries manufacturing lac and
shellac were more common ( 19) in rural areas. Among- large industrial establishments in the distrlct, mention may be made of the Sane VaTley "Portland Cement Co. Ltd. at Japla, Sri DaHi RaIl). Bansidhar Shellac Factory at Ga{'hW:l, and
. Shellac factories at Tandwa, Shabpur, Rajchainpur
and Baralota.
Houselist figures of Industri~l Establi.h-
ments
During the houselisting operations preceding
the 1961 Census, an attempt was made to assess the number and nature of industrial establishments,
registered or otherwise, engaged 'in any kind of production, processing, repair or serviting ot
where goods or articles were JUade and sold'. The
enquiries revealed that Palamau had in all, 12.901
industrial establishments-12,I'71 ill rural area,
and 730 in twons. The manufacture of sundry hardwares accounted for the largest number
(1,844),' followed by manufacture of shoes (1,827), manufacture of earthenware and earthen pottery (1,769) and production of edible fats
and oils (1,615). The following statement gives
the subdivisionwise break up of five major indus
trIes in the di strict :
Majorindl1$trial est,bIish!l1&!Jts ill P.lla"llll1 district by sl1bdivisions, according to hoaselisting in 1960
:51. Industrial Particulars of Industry Number of industrial establishments DO. code no.
District Sadar Garhwa Latehar total subdivision subdivision su bdi vision
2 3 4- 5 6 7
369 Manufacture of sundry hardwares 1,844- 792 596 456
2 311 Manufacture of shoes and other leather r ootwear 1,827 812 831 184-
'"3 350 Manufacture of earthenware and earthen pottery 1,769 907 491 371
-4 207 Production of edible fats and oils (other than hydrogenated oil) 1,615 858 586 171 -5 288 Manufacture ofmaterials from cork, bamboo, cane, leaves
allied products and other 909 352 230 327
Household IndJstries
In view of the importance of household indus-tries to the economy of this country, the number
·-of perSons engaged in household industries was -separatel y recorded and tab ua ted in the Census of
:196r. A household industry W<tS defined thus :
"An industry conducted by th~ head of the
household himself anll o~ mainly by members of tue hOUSe,l-.l/rl, at hOlne or
within the village in rural areas and only at home. in urban areas. The' industry should not be on the scale of a registered
factory. A household i:ldustry would
relate to production, processing. servicing
and repairing and includes maker$. and sellers of goods."
In the district of Palamau 18,~20 persons were found engaged in l1.ousehold industries.
Their break up industrywise can be found"

in Table B-lV Part C.* They comprised 3.19
per cent of the total working poputatioJ.]: of the distri,ct. The number of persons engageq itl five
numerically important household industries is given below:
SI. nO.
1
1
Industrial code nO.
2
288
Particulars of Industry
3 I
Manufacture ofmaterials from cork bamboo, cane,leaves and other alJied products
No. of persons at work
4
2.812
1
Sl. no.
1
3
4
5
No.of Industrial persons at: code no. Particulars and Industry work
234
207 Production of edible fats and oils (other 1,658 than' h~drogenated oil}
206 Production of butter, ghee, cheese and 1,376. ·other dairy products
369 Manufacture of sundry hard wares 1,37&
It is at once clear that from the employment
point of view establishments relating to manufacture of mater\als from cork, bamboo, cane, leaves, etc., have great importance. The number
2 350 Manufacture of earthen ware and earthen 1,932 of units engaged in the manufacture of earthen pottery
works and oi,l-crushing is also quite considerable. 22. TR...I\DE AND COMMERCE
Trade in l?alamau district consists mainly Class of workers Males Females
of exporting coal, cement, lac, katha timber , bamboo, ghee, bones and hides, bi,; patta,
honey, vegetables. goats, etc., and of importing
of rice, gram, wheat, arhaT, yarn; salt,
piece goods, tobacco, medicines, spices,
kerosene oil, etc.
cotton
sugar,
According to the 1961 Census, 8,838 persons
or I.S6 per cent of the total working population
of the district were found engaged in trade
and commerce. Their distribution by sex and
class of worker is given below :
Total persons at work in trade &commerce 7,722 1.116-As employer 1.214 4~
As employee 1,090 85> As single worker 3.473 67& As family worker 1.945 31)
(For elucidation of the concepts, a reference may be made to para 4 at page xl ii).
According to the houselists prepared on the
eve of 1961 Census, Palamau had 5,822 shop s. business houses, etc. excluding cating houses.
Their break up and procortion have earlier been discussed in Section 14 on housing.
A list of banking offices will be found in Table ADM-X at p~ge 132 of Part I. It will be seen that only Daltonganj, the district head
quarters, has banking facility. 23· POWER
The district receives most of its power suppJy by the Bih If State Electricity Board in Palamau
from theState Electricity Board. It has a power district during I960-6I was 35.9 lakh K.W.H. house at Netarhat operated by the Board. Its break-up is given below:
All the 5 towns of Palamau have electricity now, In rural areas, however, the pace of electrification is comparatively slow. Out of 3,194
inhabited villages in the. district, only 2S villages were electrified upto 31st March, 1961. Upro 1964-65, however, 21 more villages were
electrified. The total sale of electric energy
.Census ofIndia, 1961, Bihar, Volume IV, Part II-B(i)General .Economic,Tables.
Nature of consumption KWH
1. Domestic or residential 3.6
2. Commercial 7.4-
3. Industrial Power (a) Low and medium voltage 1.75 (b) High voltage 1.2
4. Public lighting 0.8 5. Irrigation 2.4 6. ~ublic water work and sewage pumping 3.0
Source: Bihar State Electricity Board •

Ii
24. LAND REFORMS'AND REvENuE ADMiNISTRATION
According to the settlement operations of 0[1,894-97. the total demand was Rs. 74.433 in t:be district. ':The next settlement In 1913-20
disclosea that the total. number of revenue
estates was ,637-258 permanent revenue paying estates. one Govt. estate and 378
revenue free estates .. The total demand in the
district as a result of this settlement increased to
Rs. 590,126. When the Land Reforms Act carne into operation. the number of revenue estates in the district was 1,320. It included 885 rev.enuefree estates and one Govt. estate.
With the enactment of the Bihar Land Reforms Act, 1950 and its subsequent amend
ments, all the estates vested in the State
Goven n:mt. In the bfgir.nirg, ttc estates and
tenures of big proforietors with an mceme of
Rs. 50,000 or above were taken over by Sta'te
Government. later. in pursuance of Goverr.ment
notification no. 631-1R, dated. 26th January, 1955 all intermediary interests also vested in the State.
With the abolition ofZamindari in the district,
a vast machinery had to be built up for the col
lection of rent and management of land. It com
pIises at present of an AdditionalCollector, 3 Land Reforms Deputy Collectors (one in e!lch subdivision) and 25 Anchal Adhikaris and Circle Ins-
pectors (one for each of the anchals). The Collec
tor and the Subdivisional Cfficer head. the revenue 2dministration at the district and subdivisional
levels respectively. At the village lever. there ,at
Karmacharis for each of the halkas. Th Karmachari is required to collect rent fror tenants. looks 'after Govenrment propertie
such as Government hats. bazars, tank: trees, etc., makes enquiries in !nutation an
other cases, .reports encroachment on Goverr
ment lands or illegal cutting of trees, etc
and such other duties connected with th
land revenue administratiQn. His work is supe] vised by the Circle Inspector. Anchal Adh: kari and other superior officers. In suitable case:
the work of rent collection has been entruste to Gram Panchayats also.
The following table shows the revenuedeman of the district in a, chronological order
Period
After vt'Sti ng 0 f E.~tates with income of Rs. 50,000 and ab£?ve-
1952-53 1953-54 1954-55
Arter total vesting-
1955-56 1956-57 1957-58 1958-59 1959-60
Demand in Rupees
220,594-432,24{)
w 511,981
1,373.1i60 •• 1,572,338 •• 1,573,170 •• 2;037,135
2,275,217
The figures relating to 19$2-53 and onwar include cess and miscellaneous demands, beside
rent.
25. PlJBLIC HEALTH AND MEDICAL FACILITIES
Publi~ Health The preventive and curative sections were
combined in the early fifties to er alIt' 1 ttter co
ordination :tnd control. T1.e Ci"j} Surg{cn of the district was, therefore, re-designatcd is .the Senior Executive Medical C f[ CCI of L<c:ltL '\\1:.0
is now ind::u.ge of the entire n.(dical QLd ptblic P-VIlI
health progtarnme in tILe district. He i,s assiste
by a District Medical Officer of Health an
Assistant H~alth Officers on the preventive sid and Deputy Superintendents of Hospitals an Civil Assistant Surgeons attached to Governmen
hospitals on the curative side.

Cholera and smallpox often break out in the
district in epidemic form. Table VS-II at page 106
of Part Iwould, however, indicate that deaths from
these diseases were comparatively low in the later
years of the decade 1951-60. 2,271 persons died of cholera during the decade 1951-60. Of them, as many as 1,809 deaths were reported in the yeu
1952 alone. S.nallpox took a toll of 2,287
lives in the last decade of which 1,914- occurred
in the years 1951 and 1952. Smallpox has been largely cOltrolled by the mBS vaccination
programme launched by the Governmentand after
1952, casualties from this disease have never
exceeqed 1 29.
Plague was almost extinct in the last decade.
Pever accounted for a large number of deaths
but much of it may be attributed to -the tendency
on the part of the reporting agency to put all deaths which Calmot be classified otherwise under this head. Even- so, the mortality rate from fever
was comparatively low during the later years of
the decade. The number of deaths from malaria
has almost come down t~ nil as a result of the
anti-malaria campaign launched by the; Govern~ ment.
_Medical Facilities
'There are four full-fledged hospitals in the
clistdct, including the district and subdivi
sional hospitals. Besides these, there are 23 dis
pensaries of which 17 are S tate managed and 6
belong to District Board. In addition to these,.
there are IS Primary Health Centres. Only the
Sadar hospital at Daltonganj has a family planning
centre. Maternity and Child Welfare Centres are
located at Latehar and Garhwa. T.B. Centres
Wards are located at Daltonganj and Garhwa,
The district has no leprosy centrc.
Iii
Only 1,73 !reds are4 provided in the hospital.
and dispensaries of the district. This gives a ratio
of I bed for every 6,866 persons in the district.
Sirhilarly there is on an average only one hospital
or dispensary to serve an area of 182 square miles.
The 15 Primary Health Centres have not.
howev~L, been taken into account for those calcula ti on s.
The district has 47 allopaths and 114 homeo
paths in rural areas besides 93 Vaidyas and 10
H 1kims. Thus there is oJ.e medical practitioner
for every 4,286 perso:lS in the district.
Table PH-I at page 135 of Part I gives the:
details of medical facilities. In Part A of the table
is shown the number of degree or diploma holding
medical practitioners registered in the district at
each year during 1951-60.
The number of persons engaged in medical
and public health work, as returned in the 1961
Census, is given below :
Family of National
Classifica- Category of Persona Males Femll. lion of Dc- worker cupation
1 2 3 f 5
030 Physicians and Surgeons, Allopathic 60 54 6 031 Physicians, Ayurvedic 50 49 032 Physici ans, Homeopathic 73 73 033 Physici ... ns, Other 21 21 039 Physicians, Surgeons and Dentists, 16 15
n. e. c. ()40 Nurses 35 6 29 041 Midwives and Health Visitors 28 1 21 042 Nursing Attendants and Related 168 55 115
Workers ()43 Pliarmaclsts and Pha maceutical 80 80
Techmcians ·C)44 Vaccinators 41 40 1
046 Sanitation Technicians 200 199 1 049 Medical and Health Technitians 8 7 1
n.e. c. (e'l:cluding Laboratory Assistants)
Details of th.eir employment by industrial categories are giv~n in fable B-V of Part lI-B (ii) 1961 of this State. '

BRIEF GAZETTER OF PLACES IN pALAMAU DISTRICT [ Compiled Crom yillaie DOte. prepaJed l)'~ enumerators durilJt llie 1 !l61 Censul; a'Ccuracy of tbein{ormation has not been
checked in enry case]
Anijharia
Situated- seven miles off Chandwa, on the
road from :Barsidar to Ranchi. A rh:ce of great
Icenic beauty which attracts more tourists. It
'has a Forest Rest House sItuated on tie st-rrmit
(If a hill, ccrr012r:dhg a pictUle~qt:e vitw of the
area. (Pop. 1I9). :Balumath
Situated on the Chandwa.Chatra State high
way, 14 miles north of Chandwa; the head
quarters of an anchal. It has a high schoo!,
'District Board dispensary, Forest R~r.ge office.
inspection Bungalow and a grair:-gola n:n by
the Welfare Department. (Pop. 1,9S6 ).
:Bargarh 10 miles south of Bhandaria, the vil1~ge is
noted for its weekly hat. It h:;LS a library.
(Pop. 1,006).
13ariatu Situated four miles off :Balumath, it is the
junction of liJ:k roads cornectirg rray of 'the
'Yillages ill the area. It has a Christian mission
cJispensary, a lower primary school, a library and
:l' grain-gola run by the Welfare Department.
(Pop. I,I03).
Earwadih
HeadquaTters of an anchal, and a railway
station on the Dehri-Gorr.oh s(cticr. cf fl.e Eastern
Railway. It hasa high school, library, Fost effee,
and dispensary run by the railw~ys for their
staff residir.g in the railway colony. (Pop. 2,832).
Dhandaria
Headq ua.rters of an ancha 1, 1 oca ted 7S miles
from Daltorg~nj ad 36 n:ilc5 f)(-rr :F:n hrc'a
throtlgh forest road. It has a District Eo~rd di~
pen Jary, a forest impection hrgakw, a n:iddle
school and a branch of the British churches of
Christ Mission. A weekly hat is held here every
Saturday. (Pop. 769).
Bhawnathpur Headqua ters of an anchal, situated 10 mi les
from Untari. It has a high school, Forest Range
office and rest house. The vill2ge contains rich
deposits of flux-grade limestone. (Pop. 869). Doda
About 8 miles from Chandwa on way to
Seuha. River Damodar _ originates here (Pop.
58!) .
Chainpur Situated 2 miles south-west of Daltorganj,
it is the headquarters of an anchal. Durries (coarse carpets} and brass utensils are manu
factured here. A market is also h~ld on Sunday.
The village contains the ruins of an old fort. It is the residence of an idluential bnmch of the
Thakurais who are the descendants of the Diwans of Chero kings. The village has a 'dispensary es
tabJished by the Thakurais. it has several lac
factories. (Pop. 3,349).
Chandwa , Situated 57 miles from Daltonganj and 47
miles from Rallch, on the Daltonganj-Ranchi
highway, it is the headquarters of an anchal. It: is a rail-head on the Dehri-Gomoh section. 1here'
is a r02d from Cha11dwa to Dolhi via Chatra:
(42 miles). The vilhge contain s an imp cction
bllngalow, a dispensary ar.d a grajn gDla. (Pop.
2,875 ). Chhattarpur
Situated 29 miles north of Daltong:mj on the
Hariganj Road, it is the headquarters of an anchal.
A hat is held on every Tuesday. The village
has an inspection bung:alow. a middle school,and
a dispensary. (Pcp. 1,063).

Chipadohar
Situated on the Da:lts>ng_anj-MahuadanF fair,:-
weather road, it is growing into importance as a
centre for export of forest products. A iarge
quantity of bamboos are exported to Dalmianagar
paper factory. It is an important timber sawing
centre. The village is a rail-head on the Dehri
Gomah section of the Eastern Railway. (Pop. 106).
'-Daltonganj
liv
Headquarters of the district and subdivision,
situated on tlie Koel at 24°3' north Lat. and
84° 4' east Long. The town was founded in 186z
by Colon~l Dalton, Comtp.issioner of Chotanagpur~ after whom it has been named. It is well
connected by road as well as' rail and contail!s the
usual public officers, hospital, schools- and the
District Jai~. It -has also a large market. A large hat is held every Wednesday. The town
had a population of 25,270 in I961 as against
S,837 in I90I, the increase being consistently steady in every ~ecade.
Demu
The ~il1age contains waterfall known :JS
Saptavahini,where the river Pandhi falls from f1
_height ofI2 to IS feet. There are several temples
.of goddess Durga and Lord Mahavir and the plac~
j,s considered to be sacred. (Pop. 993).
'f>eori The Japta Cement Factory is locatea in this
village on the Sone river, at a distance of about 3 miles from Japla Railway Station. The output
of cement is about I ,oo~ tonnes per day. (Pop.
3,846).
Dhurki Situated 14 miles from Nagar Untad, k is the
headquarters of an anchal. A small mar"k-et is
held every Friday. A centre for export of forest
pIoduce.
D'Undu
Laying 1~ miles "[tom.. :the a1].chal headquarters
at Malp.tLl, the {iUage is n.oted. for its mahua tree
under w:lich the villagers dan.ce on the occasion ~
[email protected] festival and Jitia (jiwitputrikavra!). The
tree is b ~lieved to have special powers. (Pop.
239)'
Darua
Well-connected by both rail and road, and situatd 4 mUes from Latehar ; the 'village is
noted f;)r its timber·and lac mar~et (Pop. 123).
Garhwa
Situa~ed at the confluence of the rivers Dauro
and Saraswad, six: miles off Glrhwa ,Road railway
statio::!, the town is a subdivisiona.l headquarters.
It is c01nected br a 19-mile District Board ro~d
with Daltonganj. A weeIdy hat is held every
Thursday. Lac', cattle, ghee, hides and .oilseeds
~re the chief items of export. The town hat" two
high schools, a dak bungalow, an inspection bun
galow, a pub lie Ubrary known as Shri Krishna
PllstakalaYJ, and a. dispensary besides usuar Government officers. (Pop. 11,656).
Garu
Sitllated.::-on the southern bank of the river K.oel, 16 miles south of Kerh, the village is the
headquarters of an ancha!. The area is renowned
for wild game hLlnting. Elephants are found in
'large number in the forests. They sometimes
cause heavy damage to crops in the area. (Pop.
1,331).
Godarmana
Situated on a metalled road 16 miles from
Ranka, noted for its weekly market held on every
Sunday. "fhe vilhge has two inspection bunga
lows. (Pop. 1,239).

'Gulgulpat
Situated at an altitude of 3,900 ft. ah'ove
mean sea level.it is now named as Jawaharpat in memory oflate Prime Minister Shri Jawahar Lal
'Nehru. It contains dense forests. There are
many peacocks in the area. The scenery is very
',good particularl,y between July and September.
Gursendhu A small water-fall in the south-west corner of
IIrillage Champakali 3 miles from Ranka anchal
lheadquar~en: It is scenically situated amid
forests.
"HaidarJ1agar ;
A large village situated five miles south-west
-of Japla railway station. It was founded in the
I 1:8th century by Sliyld Nlbi Ali Khan, the son of
"Nawlb H:hyat Ali Khan, w.ho was the founder
. of Hussainabad. It is a rail-head. It has a dis
:pensary, an inspection bungalow, a-library, a post
office and schools. A weekly hat is held every
Tuesday. An important centre for export' of red
. chillies. (Pop. 5,OS2}.
Hariharganj Situated 43 miles north of Daltonganj, the
headquarters of an an~ha-l. It' is a flourishing
-centre for weavhg of handloom cloth and for
trade in lac and kendu leaves. It has an inspection bungalow, a dispensary, a library and a high school. A bi-weekly hat is held every Monday
and Friday. (Pop. 3,527).
Hussainabad
A tonn in the north-eastern part of the
~is,trict. near the bmki of the river ,Sone and
opposite the fort of Rohtas 1n Shahabad. It is
the headquarters of an anch11. It has a Union
BQld 1 d 1 R.!~i~trttio:1 Odicc. It is important
for brBs ,n::tll a:1d bbckslUithy industries. The
.old III no! f.)c d 1551'1.111;>13 wa~ J apIa. It is a town
.:Since 1951. (Pop. 9,464).
Iv
Kailan
_ .situated seven miles from th~ anchaHiea-cl
quarters at Bhawanathpur the village lie-s 'aniidst
forests. Formerly it was a renowned place for
big game hunting, but noW its importance is decreasing due to the thinning of the forests. It
has Forest rest house. (Pop. 821).
Kanjia -
Lying five miles from Bhandaria, the village
is noted for its Catholic Ashram which was started
in 1937. It has a middle school and a dispensary.
(Pol': 285).
Kauri
Situated ~even miles off Mohammadganj
railway station, the village contains a police
slzivir, a dispen~ary and a middle school. A
weekly market is held. (Pop. 855) •
Kanti-fall Situated on the Chandwa-Kuri P. W._ 0'"
Road, 4 miles from village Senha, it is a lovely
spot for l'icnic as it lies amidst forests .
Kechki
A village close to the Auranga bridge. with a
forest bungalow. It is an important Gentre foil' .
'export ~f forest produce, particularly bamboos. It is an attractive pla-ce for picnic and well worth
a visit by tourists. (Pop. 92 5).
Kerh
The village, 10 Iniles off the Auranga bridge,
contains q forest bungalow and provides a good resting place for game hunters. It was previously' the headquarters of a police station. which has
since been tran~ferred to Barwadih (Pop. 840).
Ketar
Sitgated seven miles north-west of Bhawana
thpur, it is an ~portant village on the bank of
river Panda. There is a temple ef Bhagwati
around which a month-Iorig fair'is held on -the

eYe of Ramnawami. Ie has a middle school.
(pep. I~'293)·
n.i~a. Pa,lt.f , 14 miles away: (rom the ancbal headquarters
at JHshrampur, it is the highest hill (4,000 ft.) in the locality;lt is named after.a hermit known
as Khaira Baba who is believed to have resided
on the hill in ancient tinies. It is a sacred
Flace for Hindu ••
Kishanpur Situated in the south-ea'St corner of the Patna
Inchal, the village is noted as the seat of learned
men and landlords who are immigrants from
Mithila. It has a market, a dispensary and
schools. (Pop. I,Q28).
ltotang Situated in scenic grandeur some 10 mlfes
(rom the subdivisional headquarters at Garhwa, the village contains a hillock about 1,000 ft. in
height. There is ~n image of a goddess riding
on horse-back on the hill-top. People worship
the image during the winter months.
Kumardih Situated :lmid forests about I~ miles from
Latehar and on the Gomoh section of the
Ea stern Railway the village is a good place for
shooting. It contains a rest house.
Kutku . Situated on the codluence of the rivers Koel
and'Haraya, it is a place of scenic beauty. It has
a forest bungalow which commands a -.fine view
Hp :md down the river. It is the proposed site
for the Koel Dam to be built at an estimated
cost of Rs. 10 Crores. (Pop. 506).
Ladi Situated 4 miles south-west of Daltonganj,
it con tains a garh of Kumar Ambika Pra sad Singh,
of Birnren Rajput f::.mily of GoraHpur district
"Which settled at Palamau as early as the second
Ivi
hal( of the 18th century.
Latehar
HeadquarterS of a subdivision, the town is; situated- 40 miles east of Oaltonganj 0l\. the Oal
tonganj-RanchiRoad. It contains usual Govern-·
ment offic~s. a hNpital. and in~pd:tion burgaJows. It also has high schools for boys and girls~
It is electrified and has piped water-supply~
(Pop. 7,689).
Lesliganj
Founded by alid n:lfl1ed after Mr. Mathew Leslie, Collector ofR amgarh. head<]u:lrters of an.
anchal. It has a dak bungalow, a tallsil kutcherry" and a high: school. A beautiful tar.k with a PUCltk
ghat has been constructed ill the village. A market is -held here thrice a week. A large
fair is also l1eld annual1y in the month of Magh~ (pop. I,323)
Loda fall. -
Situated in the interior of the district ~ miles from Mahuad:lnr. it is also known as "Burha Ghagh", The water falls from a height
of 450 feet. It is said to be the highest fall in Bihar. It lies on the Burha river which forms the-
border between Bihar and Madhya Pradesh for some distance.
Mahuadanr
'64 miles south of Daltong:mj in the Chhech
hari valley and connected to it by a fair-wea
ther road, it is the headqu:lCters of an anchaI. It
is also the headquarters of the Roman Catholic 'Mission under the care of the Australian Fathers
o{the Society of Jesus. It has a post office, a dak bungalow, one senior ba sic trainir g school,
one residen tial high school and two middle schools
maintained by the Christian Mission, a provin
cialised difpcnsary, a vctenr.21Y hmpital, and
library. A big hat is held on Mor.days. (Pop.
I ,662).

Majhiaon Situated I2 Jl!i1es off Garhwa on the ba~k
,of river Koe1, it is the headquarters of an anr.hal It contains an inspectiol'l bungalow, a dispensary
'and a beat house. (Pop. 1,6IS).
Manatu
Situated 36 miles north-east of Daltongan]. :it is the .headquarters of an anchal. It contains a
.dak bungalow and a dispensary. (Pop. 383).
:Manika
Situated 26 'miles east of Daltonganj and 14
~i1es west ofLatehar, it is the headquarters of an anchal. It has a police shillir and a Forester's -office. A weekly hat is held every Friday. (Pop. '934).
Meral
Headquarters of an anchal, it is an important trading centre on the road from Garhwa to Nagar. A weekly hat is held every S~nday. (Pop. 3,001).
Muhammadganj
Sttuated 12 miles south of Japla; it is a rail-head. An annual flir is held on. the occasion -of M:zkar Sankranti in the grounds near the railway tunnel. The tunnel is called Bhimchulha (the oven from which Bhima had cooked food). A weekly market is held every Sunday. Nawa
Lying 20 miles north of Dlltonganj and 7
miles from the Block headquarters at Patan, the village was fo.rmetly a seat of the Chero kings. It has a dd.k bungalow. (Pop. 1,113).
Nawagarh
A, village of some historical importance. It crotains the dilapidated ruins of a .garh of the
!vii
proprietors of die erstwhile Deogan estate an~ decendants of the Chero kings. Located amidst ~ dense forest in the foot-hills, it commands a grand scenic view. (Pop. 1,748).
Netarhat 96 miles from Ranchi by a good metalled road.
the town is accessible from Daltonganj as well. The plateau is four miles long and two and a ~half miies wide and has -an average altitude of 3,800 feet above the mean sea level. Netarhat to',vn has an agriculture farm, inspec~ion ,bun,galows and rest houses, and the Netar]1at Residential Public School established in 19H·. The town is also connected by a .:I.7-mile fair-weather rOld with Mahuadanr, an anchal headquarters. It is electrified and has piped water-supply_
- It is being developed as a tourist centre. (Pop_ .:1.,08,5). -
Orsapat
Situated on the highest plateau on thewestern bO'lndary of Mahuadanr, the village lies on the border of Bihar and Madhya Pradesh. Though situated at a greater altitude than Netarhat. and :having more extensive table lands, it is rather
;-.... neglected as it is inaccessible by ve4ic1es.
Palamau fort
3 miles from .th-e National Park,. Betla and 12 miles from Barwadih, the fort is situated on a hill in a dense forest by the side of river Oranga. The fort is ascribed to the CheroRaja, Medni Rai. An almual AJivasi fair is held h~re in the month of November.
Pandwa
Situated 8 miles north of Patan, it is an jindustrial place for mining. It is famous for the

l~ill
production of smoi;eless coal whtdr fs exported to'
foreign countries. '(Pop'. 1,326).
PanJd
Situated at the confluence of river Amanat and
Sondya 30 miles east of Daltonganj, it is the
he~quarters of an anchaI. It has a dispensary arid dak bungalow besides a high school and
library. Sal logs, bamboos, lac, (aT leaves and
kath are exported. A weekly hat is held. Two'
mica rr.ines pave reeen tly been excavated here and '
the State Government has constructed two ill'por
tant irrigation canals called Chako and Sonrey. (pop: 2,673).
Paraspani
Situated 16 miles south of Nagar,· it is noted
for a beautiful fall in the t'iver'Kanhar bordering the village. -
Patan
S~tuated lj miles rrortB-east of Daltonganj,
i.t is the headquarters of an anchal. A bi-weekly
hat is held. It has dispensary, a high schMI
and a middle schooL (i>op: ~ ,39,$).
Rabda
the Ranka-Raj the founder of which had given. support to a l:rrg('! nun.ber of b~ggars (rankl,
Therds still a garh afRanka estate in dilapidated
condition. It has a d2k burp-alo", BlJd a high
school. A bi-we-ekly bat is held every Tuesday
and Saturday. It is an important trCldir:g centre for lac ~nd In(lhua. (}:>op. 2,5 16).
Rella
Situated on the river Koel. it has a railwaystation on the Dd:rj-Grn-d lire of Iasterr Railway known as G<lILwa R oad ~tatiOIl. It is also.
an important tradjrg centre for bid leaves an.i bam boos. (P op. I, 767)
Richuguti
A railway station on Dehri-Gcmoh line or Eastern R'ailway. It is noted for its e>:port
of timber-and lime stone .. (Pop. 132).
Satbarwa
lying 17 miles offDaltorg~nj on the Dalton
ganj-R:mchi Road, it cont~ins old llJines an4 is important trade centre, particularly [or lac. A weekly market is held eVery Wednesday.
Sukhadari
An ancient village situated at a distance of one
mile from Satbarwa on the Ran chi-Daltonganj
Road. It was a seat of the Chero Kings.
(Pop. 669).
Situated on the river Kanhar, 2-2 miles south from -N~gar Untari, it is noted for a beautiful
waterfall. A fair is held annually on the eve of - Makar Sankranti.
Rajhara
A -village and railway station situated 10
miles north of Daltonganj. The Bang::!l Coal
Company is working here. It has a middle
~chool. A weekly .,hat is held every Sunday. (Pop. I, 72I).
Rank a
Headquarters of an anchal and Forest Range.
The village is said to have derived its names after
Tatha
Situated at 32 miles from Daltonganj and connected by a 12 mile fair-weather road with
Barwadih, it is bown for a hot sprir.g, wbch draws a large number ~of visitors in the winter.
(Pop. 175)-
Untari Road
A railway station on Dehri-Gcmoh line of
Eastern Railway, noted for export of biri leaves.

A GLOSSARY OF THE BETTER KNOWN ANCIENT MONUMENTS IN THE DISTRICT OF P ALAMAU
NOt'13
Along with the house1isting operati'()n COll
ducted in October, J960, a village note was also
prepared by en tlmerators for each maUza or enu
merator's block. 'the- en umer:rtors Were required
to record information on ancieht monuments
according to the fo1l0wi"~g instructions
"Part 13(3) Ancient M-onul11ents-::--
A monument means 'anything that preserves
the memory of a person or an event,
a building, pillar, tomb, tablet, statue',
mound, etc.'. The idea here is to conect
information about moll uments which are
of 'some importance and an tiquity. By antiquity, the idea is that the pet#od to
which ilie monument relates should not be less thin ! 50 years old. Re1igiou s
shrines of Some antiquity will be noted
under this head as well a s item II of
P.ut A."
Admittedly, the e~tm t of details c;ollected in
this survey is rafher meagre and. perhaps, not very
authentic. This could not have been otherwise,
handicaps of the enumeration agency. Even so,
the comprehensive coverage has yielded some
significant data which are presented below for
further investigation and research by interested persons.
The list is presented in the same order of s.ub
divisions and anchals as in the Village Directory
and Village Statistics. Within an {InG:hal, the villages are arranged in alphabetical order.
SADAR SUBDIVISION
Anchal-C'hainpur
Shahpur (Thana no. II2l-The ruins ta( a
250-year old fort made ofb ricks, stone and wood,
said to belong to Raja Mec1ni Rai and Churaman
Rai !\re found 'here. The fort is famotls by the
name of Paiamau fort.
Anchal-Pa'llld
Panki (Thana no. 468)-Jt cont~ins a hun
dred-year old terrace made of stone, n ow ill a
dilapidated condition.
Anchal--Chhatarpur
Deogan (Thana no. 223)--11: has the remains of an interestmg old Chero fort. It is said that
it wa s once a Bourishing town with 52 streets and
5) bazant It al~o contains.a 30D-year ola statllt
of Visbn u and Laxmi in black stone, now the
possession of Churaman Rai.
Anchal-l?atan
Huri urf Barsato (Thana no. 209)-It con
tain s a Iso-year old tank.
Sirma (Thana no. 232)-There is a 4oo-year
old pucca 'Well of Rak~hel period.
Sale (Thana no. 22C!)--It contains an old Sati
smar.ak which is worShipped on the occasion of marriages in the village.
Anchal--Bishramp'ur
Bishrampur (Thana no. 28)--There is a 300-
year old temple-shaped debris.
Mnffnakaltl (Thana no. 594)-lt Contains a 406-
year old stone slab 6 feet high, upon which two men and a horse are figured.
Ancnal-Manatu
Chilho (Thana "no. 423)-:-T.here is a place
known as Burhiadai.on the hill-top. A weil and

an old tree are a1so located there. bricks have also been found.
Some d1d
MaJhgawan (Thana no. 464)--It contains an idol of Jharkhandi Devi which was found about
250 years ago while cultivating the land.
Nagad (Thana no. 397)-There
old kutcha tank.
An chal--Hussainabad
IS a very
Aalinagar (Thana no. 448)-It contains the ruins of a 'soo-year old 'garh of Muslim period on
a hillock. There is also a well which has been filled in.
Bahera {Thana no. 300)-Tpere are the re
mains 'of an old garh where _burnt rice and
potsherd have been found. .
Baniadih (Thana no. 362)-It contains a
Nilha-Kothi about ISO years old.
Chok'adi (Thana no. 329)-It contains the remains of a 300-year old garh of Kolhraj. After
excavation, bricks, tiles and other t~ings are found.
Ix
Kabra Kala (Thana no. 266)-It contains the
ruins of a garh, said to be contemporary to the
fort of Rohtasgarh. After excavation, a well,
wall~ of rooms and a square foot "bricks we~e found.
Mahuary (Thana no. 381 )-It has the remains of a thousand yeat old garh of Kolhraj. It is 50 feet high. Some times old coins are found by
the side of the rnin s. There are a few wells in
good condition. Old bricks and potsherds are
also met with. MJkharkala(Thana no. 306)--It contains a
400 vears old memorial of Satbahani dai which
is encarved on a stone slab.
Pansa(Thana no. 26z)-There is a 17s-year
old garh by the side of a peepal tree where
Johardevi is worshipped. Samano (Thana no. 404)-It contains an old
temple of Devi, the inscriptions in which are
undecipherable.
Uprikala(Thanano. 342)-There is believed to be Ashoka pillar buried beneath a peepal tree.
GARHWA SUBDIVISION
Anchal--Untari 'Ashta-Dhatu' and is one of the beautiful idols of
Nagar Untari (Thana no. 31 )-There is a its kind in Northc'rn' India. The image is 41 feet
temple containing the idbl of Shri BansidhaA'jee, hign and weighs about 30 maunds.
Rani Saheba Shrimati Sheomani Kuar of Nagar Anchal--Bhaunathpur
Estate is said to have brought this idol from vil- Gorganwan (Thana no. B)-It contains a
!age Man uli, P. S. Untari. The idol is ma~e of cave and a Shiva-temple.
LATEHAR SUBDIVISICN
Anchal-Chandwa Nagar Mandir (Thana 'no. 240)-It is a
flmous and old temple in the locality. An cIial-Manika
Piprakala (Thana no. J 26 )-It contains the remains of a 400 years old Garh where saints are believed to have resided. An chal-Barwadih
Betla(Thana no. I5)-It contains a 450-year old fon said to have been built by the Chero Raja Shri Medni Rai.
Atlchal--Garoo
Simakhash (Thana no. 20 )--It contains the remains of a 150 years old garh of Raja Narhar Singh. .
No ancient monuments were' reported from the following anchals:
Daltonganj Leslieganj Harihargan j Meral
Garhwa Dhurki Ranka Bhandaria
Majhiaon Balumath Mahuadanr

PART I
CENSUS TABLES, OFFICIAL STATISTICS
AND VILLAGE DIRECTORY


NOTE
The Census tables have been published in Parts II to V (with their various sub-parts) of the ]961 Census Publications for Bihar. However, many of the important Census tables are also being reproduced in the District Census Handbooks, and some of these give information for units upto the Anchal.
The Census tables are classified into different series according to the nature of information presented in them. These are :
A-Series-General Population Tables; B-Series-Economic Tables, comprising:
(i) General Economic Tables, and (ii) Household Economic Tables;
C-Series-Social and Cultural Tables;
D-Series-Migration Tables;
E-Series-Housing Tables; and
SCT .Series-Special . Tables for Scheduled Castes and Scheduled Tribes.
Selected tables from all the above Series except D and E are being reproduced in this Handbook. Each series of tables is preceded by a brief explanatory note indicating the contents of the tables and the concepts used.


EXPLANATOR Y NOTE
A-Series comprises 4 General Population Tables, viz.:
A-I-A1ea, houses and population;
A-II-Variation in population during 60 years;
A-III-Villages classified by population; and A-lV-Towns (and Town-groups) cla~si
fied by population in 1961 WIth variation since 1901.
Only Tables A-I '(together with Appendices and Annexures) and A-IV (with Appendices) are being reproduced in this Han.dbook, and for the latter the variation of populatlOn has been shown from '1941 instead offrom 1901.
The particlliars of these tables are given beloW :
Table A-I-Area, Houses and Population fhis table furnishes for each subdivision, anchal,
town-group and town, the area (in sq. miles .and sq. km.), density (number of persons per sq. ml~e), number of occupied residential houses and populatlon cl.assified by sex. It also gives the number of villages (inhabited or uninhabited) and towns upto anchals. The terms and concepts used in this table are defin.ed below: Town
A town includes every municipality, notified area, civil lines or cantonment. Certain other selected places were also treated as towns for the 1961 Census provided that they ordinarily fulfilled the following criteria, viz., (i) having a population of not less than 5,000 persons, (ii) density of not less than I 000 persons per sq. mile, and (iii) at least 3/4th ~f the adult male population were engaged in non-agricultural activities.
Town-group If two or more towns are contiguous and so
constituted that they form together a compact block, each part having separate civic bodies, the entire area is treated as a town-group. There is, however, no town-group in the district of Palamau.
Village A village means a revenue mauza which is.
defined as follows:
House
"A mauza means a parcel of land which, as a rule, is partly built over but mostly cultivated and waste with a definite position and area, the boundaries of which were defined either at the time of cadastral surveyor at the time of revenue survey,., I t may contain no houses at all, or on the other hand, sev~ral hamlets each bearing a different name."
A house is a structure or part of a structure inhabited or vacant, a dwelling, a shop, a workshop, factory or place of worship or shop-cum-dwelling giving on the road or a common staircase or a
common courtyard leading to a main gate or enjoying a separate entrance. The term "occupied residential houses" refers only to such houses as are used for dw~lling purp~ses or where any other purpose of use IS accompan~ed by the element' of dwelling, e.g., ~hop-cum-dwelhng. workshop-cum-dwelling, etc.
Appendix I to Table A-I shows the 1951 _territorial units constituting the district of Palamau and indicates the changes in their jurisdiction after the 1951 Census. For details of villages affected in these changes a reference may be made to Annexure II to this Appendix.
Annexure I to Appendix I to Table A-l shows the inter-relationship among reVenue "thanas, policestations and anchals.
Annexure II to Appendix I to Table A-I not published elsewhere gives the list of villages affected in the territorial changes mentioned in Appendix I to Table A-I. The numerical symbols given within brackets in columns 3 and 6 of Appendix I to Table A-I are elaborated in this Annexure. For example 80 .vi!lage~ were ~r~nsferre~ from. Bhawanathpu; pollee station to MaJhlaon polIce statIon as mentioned in columns :3 and 6 of Appendix I The numerical symbol is prefixed to this entry and the affected village are enumerated in Annexure II against the same symbol in column 1 of the Annexure.
Appendix II to Table A-I gives the number of villages with a population 5,000 and above and of towns with a population under 5,000 upto the level of Anchal. It is seen that in Palamau only one village has a popluation of more than 5,000, while only one toWn has a population under 5,000.
Table A-IV-Towns (and Town-groups) classified by population in 1961 with variations since 1941 This table traces the growth of towns since 1941
The area of each town is given in sq. miles as well as sq. kms. The towns are divided into 6 classes according to their population-sizes as under.
Class I 100,000 and above Class II 50,000-99,999 Class III 20,000-49,999 Class IV lD,000-19,999 Class V 5,000- 9,999 Class VI Less than 5,000
The class totals have been.. worked out bv considering the population of towns falling in different classes on the basis of their actual popufation and class in previous censuses.
Two n~w towns namely, Latehar and Netarhat have been added to the list of towns in 1961, the details of which are given in the Appendix to Table A-IV. No town of 1951 was declassified in 1961.
Explanatory Note A to Appendix to Table A-IV gives the names and areas of the villages constituting the new towns.
Special, Appendix to Table A-IV prepared in two parts, gives details of the units constituting the towns together with their status and boundaries.


District/Subdivisionl Total AnchalfTowll Rural
1
PALAMAU
Sadar Subdivision
1 Daltonganj
Daltonganj (M)
2 Chainpur
3 Leslieganj
4 Panki
5 phhata~ur
6 Hariharganj
7 patan
8 Bishrampur
9 Manatu
10 Hussainabad
Urban
2
T R U
T R U
T R U
U
R
R
R
R
R
R
R
R
T R U
.Hussainabad Town U
Garhwa Subdivision T R U
11 M_eral
12 Garhwa
Garhwa (N)
13 Untari
14 Dhurki
15 Ranka
16 Bhandaria
17 Majhiaon
18 Bhawanathpur
R
T
R
U
R
R
R
R
R
R
7
TABLE A-I-ARFA, HOUSES AND POPULATION
Area ,---_ .... -------, Sq. miles Sq.kmt
3(a)
4,914.0 4,888.7
25.3
1,665.2 1,656.8
8.4
78.2 74.7 3.5
3.50
246.1
90.3
163.7
2~3.0
87.7
152.2
226.1
179.4
188.5 .l83.6
4.9
4.85
1,561.3 1,556.6
4.7
155.3
177.8
113.1
4.7
4.70
140.8
145.9
360.8
255.3
160.7
224.7
3(b)
12,727.2 12,661.7
65.5
4,312.8 4,291.2
21.6
202.5 193.5
9.0
9.07
637,4-
233'9
424.0
655.3
227.1
394.2
585.6
464.6
488.2 475.6
12.6
12.56
4,043.8 4,031.6
12.2
402.2
305.1
292.9
12.2
12.17
364.7
377.9
934.5
661.2
416.2
582.0
Population per Sq.
milet
'4
242 231
2,222
351 332
4,160
806 506
7,220
7,220
258
471
307
230
349
395
349
215
521 483
1,951
1,951
230 223
2,480,
331
514
432
2,480
2,480
388
149
127
77
345
221
Number of villages
,---_....._-.... In- Unin-
habited habited
5
3,194 3,194
1,624 1,264
71 71
157
134
171
205
120
169
202
162
233 233
827 827
97
121
121
124
52
135
71
150
77
6
388 388
270 270
7 7
25
8
29
35
58
17
22
28
41 41
80 80
8
8
8
11
4
10
7
30
2
Number Nuinber of occupied
of residential towns houses Population
1
I I
I
,..---. -----.. Persons Males Females
8 9 11
197,606 1,187,789 188,043 1,131,625'
10
598,GDO 567,913 30,687
589,11.9 563,712 25,477 9,563 56,164
94,393 88,630
5,763
10,484 6,219 4,265
4,265
10,481
7,453
8,031
9,785
4,524
9,998
12,300
7,005
14,332 12,834 1,498
1,498
61,153 59,114
2,039
584,111 549,377 34,734
63,061 37,791 25,270
25,270
63,489
42,563
50,326
58;238
30,647
60,176
78,822
38,586
98,203 88,739 9,464
9,464
358,877 347,221
11,656
294,765 275,852
18,913
32,946 18,902 14,OH
14,OH
32,013
21,181
25,346
28,978
15,530
30,233
39,432
19,365
49,741 44,872 4,869
4,869
180,711 174,512
6,199
289,346 273,525
15,821
30,115 18,889 11,226
11,226
31,476
21,382
24,980
29,260
15,117
29,943
39,390
19,221
48,462 43,867
4,595
4,595
178,166 172,709
5,457
8,597. 51,340 . 25,522 25,818
30,492
25,035
10,423 60,571 30,079
8,384
2,039
~,039
9,354
4,118
8,947
3,502
8,003
8,209
48,915
11,656
I1,656
23,880
6,199
6,199
5,457
5,457
54,603 27,740 26,863
21,807 1l,062 10,745
45,990 23,327 22,663
19,541 10,079 9,462
55,426 27,625 27,801
49,599 25,277 24,322

District/Subdivision/ Anchal/Town
8
TABLE A-I-AREA, HOUSES AND POPULATION'-concld.
Total Rural Urpan Area in
r---.A----,
Population Number of per Sq. villages
mBet ~ __ ,A. __ ~
In- Unin-
Number Number of occupied
of res'irlential towns houses Population
Sq.miles Sq.kmt habited habited Persons Males Females
2
Latehar Subdivision T R U
19 Balumath
20 Chal1dwa
21 Latehar
LatehaT Town
22 Manika
23 Barwadih
24 Mahuadanr
Netarhat Town
25 Garu
R
R
T R U
U
R
R
T R U
U
R
3(a)
1,413.4 1,401.2
12.2
363.3
227.0
177.2 172.0
5'2
,'5.18
145.5
168.1
246'2 239.2
7.0
7.05
86.1
3(b)
3,660.7 3,629.0
31.7
941.0
587.9
458.9 445.5 13.4
13.42
376.8
435.4
637.7 619.4
• -18.3
18.26
223.0
4
173 168 799
153
158
268 232
1,484
1,484
211
184
132 -127 296
296
137
5
743 743
171
84
154 154
93
76
97 97
68
6
38 38
3
12 12
3
7
7 7
5
7
2
2
8
42,060 40,299 '1,761
9,212
6,186
7,947 6,595 1,352
1,352
5,003
6,155
5,495 5,086
409
409
2,062
9
244,801 235,027
9,774
55,702
35,755
47,518 39,829 7,689
7,689
30,687
30,969
32,389 30,304 2,085
2,085
11,781
10
123,124 117,549
5,575
27,086
17,929
24,095 19,895 4,200
4,200
15,446
16,100
16,525 15,150 1,375
1,375
5,943
II
121,677 117,478
4,199
28,616
17,826
23,423 19,934 3,489
3,489
15,241
14,869
15,864 15,154
710
710
5,838
NOTES: 1. tThe Sq. km. and density figures of Urban areas of Anchal/Subdivision/District are worked out by using the area figures corrected up to 2 places of decimals obtained by adding the area's of the towns in the respective units and not using the area figures given in the table. In addition to this the area figures relating to Sq. km. are further adjusted to make the Anchal/Su bdivision/District totals tally.
2. Town trelLted as such for the first time in 1951 Census which continues as town in 1961 Census is shown with asterisk (*) on its left.
3. Towns treated as such for the first time in 1961 are printed in italics.
4. The following abbreviations have M-Municipality
Where no symbol occuts but the purposes.
been used for the Status of town,e. g.: N-Notified Area
place 1's shown as Urba:t, it means that the place has been treated as town for census
5. The rural areas of units smaller than the district do not add up to th e total rural areas of the district, because the rural areas of units smaller than the district have been computed from thana jurisdiction lists, while the total rural area of the district has been arrived at by subtracting the total urban area of the district as supplied by the District Officer, from the total area Q1f the district as supplied by the State Survey Office.

F-I-2
.. . ~ ... . ~ tl ....
.... l!') 0\
9
Appendix I to Table A-J

Annexure I to Appendix I to Table A-I
" g .~.~ r..o "O,fS ~1Zl
.: .9 ':;j "3 on g. ~
ll"l co co co' co
c<'l 0'>
10
-C<>CXl N-c<> c-<t.:,d, on "" ..... -""-
-C<>CXl ""-c<> NtOo) on"" ..... -"" ....
0'> c<'l N
on ~
cO co
C<'l o
"" co' 0'>
.... ~
O'l c<'l
""
COCXl ........ .....
0'>ll"l0C<>"" N('.I"'--COO'l u-ir..:.q;ciu-i lti- ~~ _ ....
<0 ....
.... C<'l
<0 .....
or-....
<0 o ""
on on ""
<0
"" g on
"" ""
<D .....
U') o cO ~" ....

11 Annexure I to Appendix I to Table A.I
0"Ilt'} ...... ~~ "0 a) a) a) I'! CtlO" .gS '" NN'-"
Ctl .... ., S " (,) .=I'! 0 vi
" • of) ... ., .b :;) ... .=~
., E ... ., ., ~ ... .;i ... ... ,g .~ '" :1lC\la) "0 -B :1l (0 " ., 0 .... " "0 .~ o g ;:I
to" <3 ~ I'! ... lJ :1lof) .... .~~ 0 "'0 .... c::.~ E-< ~...:g :;)"0 c:: 0 ., 0 '" '"
(,) ... ., c:: -'" ..0 ..
~~ 0
~ ., ~
ti " ~ ... 111'= . -;. ...... "'0 .= ., c:: '" 0 ... 0 ... 01'= ... \) ..... ., <: ]~ ln Oi 0
"0 ;:l t) ;:l :U~; ~ " '@Z; 0 <::: ... .= .... ... :;s tl 8:: ~ .S
(5 " OJ ~ W _; > >.
:1l - ... ... on '" :0 a) .~ I'! cd s:: s::l ... . :<'l ". cd .
N .... • ~ ;:I ~ Po ~ :<'l .... ., .... OJ
"0 ~8o " tii ['0 of) .!So .... -g Po :::.~ .;:?
<3 'u ~U:a .9 ';:j 08.=
" :::I
~ bO· .... " vi ~ g; a) ,,<::: >Q to 'iii (0 ..0 ~ S v:>" .... -e '" ::1-:5 ...... '> s:: .~ s:: 0 • <: l)-IooIo ... .....
.;i go:> ;:l v .~
:n '" '" .... >Q .= cd ~ !D ., . ... .;< a) N:g(l; S s:: bO
'" 0", ~a'J ~ I'! =g'"t)-:' " ~ .;i ::g ~. ... "
0 (,) .,
~ (,) ... i~fr s:: '" 0 .; ...
cd O""~ bO cd '0 '" 0 cd I'! "0 <: § ~ ;:l ;:I ..... d I s:: 0 ~ ... "'cd .... ;l: ..0 .... 01 s:: .... 0 8 :g C!) Ole<') ... .= '5
~a~ ..
's:: ... cd ::> "sP-. " ~
., ... " ;:1;:1 .... ..0 u ...
s:: .... 0 ., ., ~" 0 uO .... " 0
';J :>" • ~ .;i "s::<: bO
:-I ~.~ ., .= ., cd -< '= .. - iJ . -g "0
(')"..0 ;l:§ "'iJ u
01 ... cd § ., SbE-< o·~ .S .... t;; 'j ... ~<::: 0 c:: 0
'~_g'a .~ Po
:£ 2~ 'iii S "S .... ;:>
;l: 8 '5 0 .... >'0 s:: u c8:::...., >. ... <: u
!'l e':; ... ., ..0 "0'= .... .. u ... u .= .... .. '" 1j 0-;l:.=
0 .cI 0 l'lZ~ ';j 0 ...
].::- bD N ..c,.;" '" ~ :<'l .9= oS "00 C<l :::1.= s:: E-< .;Js::o ]d ~ ... .... 0 ..... 0 ~ • .;:l u .~ u ~
t1~~ nll .. g bD ... " ... '" s ., d ... r- Sb';:: ==' ~ ...". C<l ~";J:l .~ 0 6 " :>(,) fi; ..... ..... ... ...; c-i ..; ~ § ~
fIl ;:I
~ 1<1 i-
::g 0 z

12
ANNEXURE II TO APPENDIX I TO TABLE A-I
Statemel1t showing the names, thana numbers and area of villages affected j 11 territorial changes (vide Appendix 1 to Table A-I) during 1951-61
PALAMAU DISTRICT
Area Area Symbol Seria I Revenue in Symbol Serial Revenue in
no. no. Name of vLIlage Thana no. acres no. no. Name of village Thana no. acres
1 2 3 4 5 2 3 4 5
(1) 1 Gorgawan 53 564.26 41 Ratamgara 93 1,198.98.. 2 Bhaunathpur 54 675.17 42 Wolam 94 495.16 3 Buka 55 1,425.93 43 Jatro 95 893.27 4 Arsali 56 9,005.41 44 Lamari Khurd 96 1,02060
5 Sinduria 57 539.07 45 Chatnian 97 4,319.44 /
6 Ghaghra 58 2,970.51 46 Pipra Dih 98 338 .. 22
7 Kailan 59 10,304.28 47 LarnariKalan 99 525.56 8 Phulwar ..... 60 1,731.75 48 Jainath Alias Gbordag 100 1,50B.08
9 Konmandra 61 4,553.91 49 Bardiha 101 1,178.74 10 Parsodih 62 1,307.64 50 Jika Bukcham 102 3,287.89
11 Kadh",an 63 1,8!9.61 51 Lebhri 103 448.85
12 Bansdih Khurd 64 64962 52 Khardiha 104 65's.55
13 Bansdih Kalan G5 1,208.36 53 Sukhriadi 105 2,226'17 , . 14 Chaunt 66 1,549.53 54 Kolhua 106 540.12
15 Kosdchra '67 1,229.98 55 Parchha Bandh 107 688.95
16 Gurur 68 165.58 56 Lawa Chan.pa 108 769.8T
17 Merauni Chherhat 69 1,505.23 57 Adar 109. 2,13361
18 Lohargara 70 580.i 1 58 Semri 110 1,431.84
19 Hariharpur 71 2,509.20 59 Nawadih III 1,504.49
20 Hurka 72 1,970.76 60 Jatro Banjari 112 1,203.37
21 Rapura 73 1,542.06 61 DawanKara 113 1,292.81
22 Manjh Gawan 74- 6,532.04 , 62 Purhe 114- 979.65
23 Bato 75 383.57 63 Tanrhe 115 949.11
24 Dagar 76 746.80 64 Karui 116 1,027.33
25 Sri Nagar 77 224.15 65 Bali Garh 117 855.19
26 Daridah 78 1,635.55 66 Jahar Sarai 118 4,516.36
27 Kusahi 79 20.44 67 Rani Tali 119 1,486.79
28 Dumar Sota 80 1,124.17 68 Bhalodih J alima 120 1,488.70
29 Sheikhpura Ali Sohab Sarki 81 487.96 69 Koin Bar 121 876.64
30 KishuDpur 82 113.98 70 Son:purwa 122 686.01
31 pindraha 83 160.75 71 Chaukhandi 123 119.55
32 Sarki 84 347.50 72 Gogea 124 54.63
33 Chaukhari 85 55.33 73 Bhataulia 125 46.38
34 Siuri 86 414.56 74 Accho :qih 126 354.55
35 Kachar 87 177.44 75 C.bandrapura 127 319.07
36 Kanri 88 277.41 76 ('..opalp\Jr 128 75.88
37 Dhabria 89 432.48 77 Kamat 129 110.15
38 Saleya 90 196.65 78 Pirthipur 130 79.43
39 Naiha Bar 91 424.26 79 Hari Ganwan 131 157.29
40 Baherwa 92 176.06 80 Majh Gawan Dube Bhataulia 132 296.00

13
APP~ND IX II TO TABL"E A-I
Number of villages with a population of 5,000 and over and towns with a population under 5,000
(Units of territory which have nothing to show for this itatement have been excluded.)
Villages with a population of5,000 and over Towns with a population under 5,000
District/Subdivision/ Anchal ,_ ~ .... Percentage of Percentage of Total
totalruralpopu. • urban population Number Population !ationof the district Number Population of the district
2 3 4 5 6 7
PALAMAU -1 5,052 D.45 ',0&5 3.71
Sadar Subdivision 5,052 0.45
. Hussainabad 5,052 0A5
Latehar Subdivision 1 2,085 3.71
Mahuadanr 2,085 3.71
LIST-A-PLACES WITH A POPULATION UNDER 5,000 TREATED AS TOWNS FOR THE FIRST TIME IN 1961
Name of Town District
2
Netarhat palamau
Area in Sq. miles
3
7.05
Population in 1961
4
~,085

TABLE A-IV-TO"'NS (AND TOWN.GFOUFS) CIASSIFlf.D BY POPULATION IN 1961 WITH VARIATION S]KCE 1941
Decade Percentage
decade Status Area Person! variation variation
District Name of town o,[town Year - ~--~ Males Females: Sq. miles Sq. Km.
2 3 4 5 6 7 8 9 10 I I
PALAMAU All Classes-5 Towru
1941 22,655 II,774 10,881
1951 13.20 34.20 37,007 +14,352 +63.35 19,975 17,032: 1961 25.28 65.48 56,164 +19,157 +51.77 30,687 25,477
Class III (20,000-49,999)-1 Town
1961 3.50 9.07 25,270 14,044- II,2260
Daltonganj M 1941 13,943 7,522 6,421 1951 3.50 9.07 19,223 +5,280 +37.87 10,849 8,374-1961 3.5G 9.07 25,270 +6,047 +31.46 14,044- 11,22&
Class IV (10,000-19,999)-1 T~n
1941 13,943 7,522 6,421 1951 3.50 9.07 19,223 +5,280 +37.87 10,849 8,374 1961 4.70 12.17 11,656 -7,567 -39.36 6,199 5,457
Garhwa N 1941 8,712 4,252 4,460 1951 4.40 11.40 9,467 +755 +8.67 4,940 4,527 1961 4.70 12.17 Il,656 +2,189 +23.12 6,199 5,457
Class V (5,000-9,999)-2 Towns
1941' 8,712 4,252 4,460 1951 9.70 25.13 17,784 +9,072 +104.13 9,126 8,658 1961 10.03 25.98 17,153 -631 -3.55 9,069 8,084
·Hussainabad 1951 5.30 13.73 8,317 4,186 4,131 1961 4.85 12.56 9,464 +1,147 +13.79 4,869 4,595
Lauhar 1961 5.15 13.42 7,689 4,200 3,489
Class VI (Less than 5,000)-1 Town
1961 7.05 )8.26 :Z,085 1,375 710
Nttarhat 1961 7.05 18.26 2,085 1,375 710
NOTES: J. Town treated as such for the first time in 1951 Census which continuea as town in 1961 census is shown with asterisk (*) on its left.
2. Towns treated as such for the fil'3t time in 1961 are printed in italics.
3. The following abbreviations- ba~e been used for' the status of towns, e. g., : M-MuniciRality ,N-Notified Area
Where no symbol occurs but the place is shown as urban, it means that the place has been treated as town for cenSllS purpose~.

15
TABLE A-IV -TOWNS (AND TOWN':GROUPS) CLASSIFIED BY POPULATION IN 1961 WITH VARIAT~ON SINCE 1941
District
PALAMAU
APPENDIX
New towns added iu 1961' and towns in I95 I declassified itz 1961
NEW TOWNS ADDED IN 1961 T@WNS IN 1951 HAS BEEN DECLASSIFIED AS RURAL IN 1961
,....-------:;-----".__----------~ r---
Area Population Area Population
Name of town r------ ..... _- .... "'---"'---., Name of town
Sq. miles Sq. Km. 1961 1951 Sq. miles Sq. Km. 1961 1951
2 3 4 5 6 7 8 9 10 11
Late~a, 5.18 13.42 7,689 NA
Netarhat 7.05 18.26 2,085 894
NOTE: Towns treated as such for the first time in 1961 are printed in italics.
EXPLANATORY NOTE A TO APPENDIX TO TABLE A-IV
Consti tuent villages
-- ~
1951 District Name of new town
Name Thana no. Area in acres Population
2 3 4 5 6
PALAMAU Latehar Mako 185 243.59 98
Karkat 184 450.89 392
Rajahar 186 324.71 210
Durua 187 664.69 1;179
Dharampur 247 46.12 Uninhabited
Chandandih 248 238.92 599
Tappakhas 249 257.·74 917
Latehar 250 275.46 2,089
Banpur 251 352.08 280
Amwatikar (Part) 255 461.00 NA
Total 3,315.20 NA
Netarhat Netarhat 81 2,327.80 850
Birjiatoli 82 2,187.07 44-
Total 4,514.87 894

Dhtrict/Town Constitu~nt villages
2
PALAMAU
16
SPECIAL APPENDIX TO TABLE A-IV
PART A
Statement showing the COi1Stiwtiol1 of Towns
Thana no. Area in District/Town acres
3 4
Con~tituent villages
2
Thanann.· Area in acres
-3 4-
HUSSAINABAD REvENUE THANA'-concld.
Mohamadabad 34~ 360.83 Daltonganj (Mlt DALTONGANJ REvENVE THANA Japia Dharhara 346 875.75
Rampur MehendiNagar 349 193.53
qarhwa (N)
·Hussainabad
NOTES
Rerma (Part) 188 Da\tonganj 189 Kund 190
250.00 , 206.61l 323.56
T0TAL 780.24 LalthaT
GARH"'A REvENUE THANA
Ucrr'i Sonpurwa Tanrwa' Garhwa Nagwa Dipwa Pipra Kalan Sahijna
TOTAL
241 462.48 242 1,044.18 338 664.22 339 145.00 340 94.46 341 116.16 342 247.98 345 301.16
3,075.64
HUSSAINABAD REVE~UE THANA
japla Chaube 336 Gamharia 344
627.46 310.25
Neta,hat
Saidabad 355 739.42 TOTAL 3,107.24-
LATEHAR R.EvENUE THANA
Karkat Mako Rajahar Durua Dharampur Chandandih Tappa khas Latehar Banpur Amwatikar (Part)
TOTAL
~AHUADANR REVENUE THANA
Netarhat Btrjia Toli
TOTAL
184 450.B!} 185 243.59 186 324.71 187 "664.69 247 46.12 248 238.92 249 257.74 250 275.46 251 352.08 255 461.0(}
3,315.20
81 2,327.80 82 2,187.07
4,514.87
I. Town treated as such for the first time in 1951 Cengus which continues as town in 196! Census is shown with asterisk (*) on its left.
2. Towns t.reated as such for the first time in 1961 are printed in italics.
3.t Area figures shown in col. 4 of the above table differ from the area figures as given in Table A-IV. This discrepancy has arisen because t~e area figure of Table A-IV was obtained initially from local officers, while that for the above table has been worked out in the Census Office from available records.

PALAMAU
1'_1_3
17
SPECIAL APPENDIX TO TABLE A-rv-concld.
PART B
Statement showing the boundaries of towns with status'
Revenue Thana Town with status Boundaries
2 3
Daltonganj Daltonganj (M)
Carhwa Garhwa (N)
4
North-Villages Kund (Thana no. 190) and Sudna (Thana no. 191)
South-Village Shahpur ~Thana no. 112).
East-Villages Bara10ta (Thana no. 198) and Rerma (Thana no. 188).
West-ViJIage Shahpur (Thana no. 112)
North-Villages Sukhbana (Thana ho. ~43) and Ursugi (Thana no. 281).
South-River Dunru lind Villages Pipra Khurd (Thana DO. 343) Tenar (Thana no. 34'6) and Narayanpur (Thana no. 348).
East-Villages Chetna (Thana no. 335) Bharatiya (Thana no. 336) Garhuta (Thana DO. 337) and Nawadih (Thana no. 331).
West-ViII ages Sukhbana (Thana no. 243) Jobraya (Thana no. 240), Nawada (Thana no. 239) and Bishunpur (Thana no. 234).

EXPLANATORY NOTE
1. GENERAL Eco'Nbwc TABLES
There are 9 Economic Tables (excluding subparts) compiled from information collected in the Individual Slips. Termed con~ctively as the. Gener.::,\l Economic Tables, these ate :
B-I-WorkF-rs and non-workers classified by sex and broad age-groups.
B-I1-Workers and non-workers_ in cities, town-groups and towns arranged ,territorially classified by sex and broad agegroups.
B-IlI Part A-Industrial classification of workers and non-workers by eduoational leve!s in urban areas onljl.
B-llI Part B-Industrial "classification of workers and 1 non-workers" by edhcation a! levels in rural areas only.
B-IV part A-Industrial claSSification, by sex., a~d class of wor~er~. of persons ~t
work at household-industry.
B-IV' Part B-Industria1 classification by sex and class of workers of persons at work in non-household industry, trade, business, profession or service.
B·IV Part C-Industria! classification by sex and divisions, major groups and minor group~ of persons at work other than cultivation.
B-V -Occupational cla'lSification by sex of p::rsons at work other than cultivation.
B-VI-Occupational divisions of persons at work other than cultivation classified by sex, broad age-groups and educational levels in urban areas only.
B-VII Part A-Persons working principally (i) as cultivators, (ii) as agricultural labourers or (iii) at household industry classified by sex and by secondary work (i) at household industry, (ii) as cultivator or (iii) as agricUltural labourer.
B-VII Part B-Industrial classification by sex of persons working in non-household industry, trade, business, prof~ssion or service who are also engaged in house-hold industry. ' ~
B-VIII part A-Persons unemployed aged 15 and above by sex, broad age-groups and educational levels in urban areas orrLy.
B-VIll Part B-Persons unemployed aged 15 and above by sex and edu(;ational levels i.n rural areas DlIry.
B-IX-Persons not at work classified by sex, broad age-groups and type of activity.
Oftltese, the following tables have been repro~ duced in this book
B-I Up to district.
B-llI part A Up to district.
B-III Part B Up to anchals.
B-VIII Part A Up to district.
B-VIII Part B Up to anchals.
B-IX Up to anchals.
The economic classification adopted in 1 ~61 is based on the division of the entire population in
,two basic groups, namely, workers and non-w?rkers. Workers are persons engaged in the productIon of goods and/or exchangeable services. T~e concept of work is not tied to the securing of ,;n mcome,,,hen~e even family workers who do not receIve .anr wages lfl
cash or kind (but ~upplement the falmly lllCome by engaging in any kind of productive work) have been treated as workers. On the other hand, persons who have earnings, but do not work (e. g., b~ggars, rentiers and pensioners) are classed as non-workers. The workers have been further classified into nine in'Clustrial categories according to the sector of economic activity in which the~ are . enga~d. This classification, therefore, is entIrely mdustn:=tl, and based upon the Indian Standard IndUstrIal Classification Scheme adopted by the Go:,ernment ~f India. I t may be noted that occupatIonal classlfication has also been done, in Tables B-V and,B-VI [printed 'in Part II-B (ii) of this State] whic~, h0:-vever, are not reproduced in. this volume. The nme Industrial categories are :
I \v orking as Cultivator
II Working as Agricultural labourer
III
IV
V
VI
VII
VIII
IX
Working in Mining, Quarrying, Livestoc:[{, Forestry, Fishing, Hunting a?d Plantations, Orchards and AllIed activities I
Working at Household Industry
Working in Manufacturing other than HOllsehold Industry
Working in Construction
Working in Trade and Commerce
Working in Transport, Storage and Communications
Working in Other Services

19
In previous cef!suses, the non-working or nonearning section of the population was tagged on to each livelihood class so that the total number of dependants of each livelihood class was easily determinable. In 1961, all non-workers have been pooled together into one category and it is no longer possible to 'Say what is the extent of dependancy among -persons, say, engaged in cultivation. However, in accordance with the recommendations of the United Nations, the non-workers have for the first time in the Indian Census been further classified into. the following 8 groups :
1. Full time students,
2. Housewive~ and persons engaged in un- / paid home duties,
3. Infants and other dependants including permanently disabled or old persons,
4. Retired persons, rentiers and others who are in receipt of income without any work,
5. Beggars? vagrants or independent women and others of unspecified source of existence,
6. Convicts in jail, inmates of a penal, mental or charitable institution,
7. Persons not employed before but now seeking employmen t for the first time, and
8. Persons employed before but now out of employment and seeking work.
The particulars of the tables, beillg reproduced berein, are given be low :
Table B-I-Workers and NOH-workers classified by Sex and' Br oad Age-groups
This table gives for each census industrial category of workers and also non-workers the classification by sex and broad age-groups 0-14 15-34 35-59 and 60 +, besides the rubric "~ge not'stated":
Cultivation in volves production of crGps like cereals and vegetables on land owned or held on lease. T~us, tenant cultivators are included, but not plantation growers.
An agricultural labourer is a person who works on another. person's .land for wages in cash, kind or share Without havmg any right on the land. He has also no right to take a decision as to which crop will be sown and when. .
Household industry means an industry not on the scale of a registered factory, conducted b; th,e head of the household himself and/or members 'Of the household at home or within the village in rural areas and only at ho~e it;! urban areas.
Table B-IU Part A-Industrial Classification of Workers and Non-workers by Educational Levels in Urban Areas only
Table B-II J Part B-Indnstrial Classlfi cation of Workers and Non. workers by Educational Levels in Rural Areas (mly
These tables give the classification of workers and non-workers by sex, literacy and educational leve~s separately for urban and rural areas. All persons In the age-group 0-4 are, by definition, illiterate. The classification of persons with some educational stan· dard is COmmon upto the stage of Matriculation or Higher Secondary for both rural and 'urban areas. H.owever, in urban areas, persons with qualifications above Matriculation or HigJ:ler Secondary have b.een further classified into persons holding (i) techrucal diplom~ not equal to degree, (ii) non-technical dip-" 10IT_a llot equal to degree, (iii) University degree and (iv) technical degree or diploma equal to degree or post-graduate degree in ,Engineering, Medicine, Agriculture, VeterinalY and Dairying, Technology, Teaching and others.
Illiterate means a person who' can neither read nor write or can merely read but not write in any language.
Literate means a person who ran bQth read and write a simple letter.
For a literate person wh_o haa also pam'd a written examination or examinatior,s a5 ploof oj the educational siandaJd attained, the highest examination was noted in the Individual Slip. This f01med the baslS for grouping under the different educational Jevels. Table B-VIII Part A-Persons Unemployed Age<l
15 and above by Sex, Broad Age-groups and Educational Levels in Urban Areas onlY
Table B-VIII Part B-Persons Unemployed Aged .... 15 and above by Sex and Educational Levels in Rural Areas OTily
These tables give figures of unemployeq. persoIJs aged 15 and above by sex and the same educatio.nal standards as ih Table- B-III. The unemployed persons given in these tables are th05e (i) se~kirjg
employment for the first time or (ii) having been
employed before, but now out of .employment and seeking work. Table B-VIll Part A also shows classification by age-groups.
Table B-IX-Persons not at Work classified by Sex, Broad Age-groups and Type of Activity.
This table gives the figures of the non-working population classified by sex and broaq. age-groups (0-14, 15-34, 35-59 and 60+) into the 8 different categories of non-workers, vi;;,
1. Full time students or children attending school who do no other / work, such as make articles at home for sale, nor even help part-time their own family cultivation,/inaustry, trade or business.

2. Persons engaged in unpaid home dutjes (like housewives or other adult females) but doing no other work, such !Is make articles at 'home for sale or wages, nor helping regularly even'part-time in family cultivation" industry, trade or busmess.
3. Dependants, including infants or children ,not attend~ng school, persons permanently disabled from work because of illness or old age.
4. Retired persons 110t employed again, rentiers, pe'rsons living on agricultural or non-agricultural royal ty, rent or dividend or other persons of independent means fo.r securing which they do not have to work and who do no other work.
20
5. Beggars, vagrants or independent women without indication of source of income and others of unspecified 'source of existence.
6. Convicts in jails (undertrial prisoners were treated as wo'rkers if they used to work before being 'apprehended) or inmates of penal, mental or charitable institutions.
7. Persons who had not been employed before but were seeking employment for the first time during enumeration.
8. P~rsons employed before but out of employment and seeking employment< at the time of enumeration.
II. HOUSEl}.OLD ECONOMIC TABLES
The Household E'conomic Tables have been prepared from the data collected in the Household Schedule canvassed for each and every hQusehold in the State. In preparing the tables, 'however, a 20 per cent systematic sample was drawn separately for rural and urban areas. ThuS, all the tables in this series are based on a 20 per cent sample. The tables are :
B-X
B-XI
B-XII, " ";,'
B-XIII
B·XIV
B-XV
Sample Households (i) engaged neither'in cultivation nor in household industry, (ii) engaged either in cultivation or household indl,lStry Bu t ~ot in both and (iii) engaged bo'th in cultivation and hou~ehold industry for all areas.
Sample Households engaged in cultivation classified hy interest in land and size of land cultivated in 'rural and urban areas separately.
Sample Households engaged in cultivation only classified by size of land cultivated and number' of family workers and hired w6tkers in rural and urban areas 'separately.
Sample Households engaged both in cultivatio.n' 'and household i!ldustry showing size of land cultIvated classified by principal household industry ,in rural -and urban a'reas separ-ately.
~ample Households engaged only m Household, Industry classified by PrinCipal Househdld Industry'in alL(JreG.3~ - -, : -- , -, '
t
~ample. I:t?useholds ,~ngaged both, III eultlVatlOn, and hOlisenold indus
, try cl'assified. by size! 'of'lar'ld 'in r:ur~l and urba~'are~s sel?arat~ry.'
-< -I • -:- , :.: I .. < ~ '. ",~:
B·XVI
B-XVII
Sample Principal Household industry classified by period of working and total number ~f worke.rs. engaged in household mdustry m all areas
Sample Households classified by (i) number of male and female members by size of househ?lds a~d (ii) Engagement (a) neither In cultivation nor in industry, (b) in household industry only and (c) in cultivation sub-classified by size of land cultivated. •
The Household Economic Tables being reproduced in this Handbook art: :
Table B.X-Sample Households (i) Engaged neither , in Cultivation nor in Household Industry(ii)
Engaged either in Cultivation or Household Industry but not in both and (iii) Engaged both in Cultivation and Household Industry for all areas
This taole gives the classification of sample households' by the following four types of economic activity :
(i) households engaged neither in cultivation nor in household industry ;
(ii) households engaged in cultivation only;
(iii) households engaged in household industry' only ; and
(iv) households engaged both in cultivation and household industry.
, . Cultivation involves. '~ploughing, sowing and har~esttQ.g and does nl,)t mclude fru~t-growing or keep .. l~g orchar~ or, ,groves or workmg for plantations ltke tea, coffee,' rubber, cinchona and other medicinal plantations".
'~ ,i:h~se~~~~' l(laustry .. !TIcins l"indust;~, (not on the scale 'of regJ.ster~d factory) ,copducted: 'by the head

21
of the household himself and/or mainly members of the household at home or within the village in rural areas and only at home in urban areas".
Table B-XI-Sample Households engaged in CultilVation classified by Interest in Land and Size of Land Cultivated in Rural and Urban Areas separately.
This table t:!ives the classification of sample cultivating households by the following 10 size-range's of land cultivated in acres :
Less than 1; 1.0 to 2.4; 2.5· to 4.9 ; 5.0 to 7.4; 7.5 to 9.9; 10.0 to 12.4; 12.5 to 14.9; 15.0 to 29.9; 30.0 to 49.9 ; 50+and 'unspecified'.
The information is cross-tabulated with reference to the following 3 kinds of interest in land ;
(i) owned or held from Government;
(ii) held from private persuns Or institutions for payment in money, kind Or share; 'and
(iii) partly held from Government and partly from private persons Or institutions for payment in money, kind Or share.
Table B-XVII-Sample Households classified by (i) Number of male and female members by Size I
of Households and (ii) Engagement (a) neither iIi Cultivation. nor in Industry, (b) in Household Industry only and (c) in, Cultivation subclassified by size of land cultivated.
This table gives the distribution of sample households by the following size-classes: (i) 1 member (ii) 2-3 members, (iii) 4-6 members, (iv) 7-9 members and (v) 10 members or more. For urban areas the figures are for total sample households. FOr rural ,areas, however, the size-class· of household is cross-tabulated with reference to the economic activity of the household, vi;;:;.,
(a) households engaged neither in cultivation nor in household industry ;
(b) hous'eholds engaged in household industry only ; and
(c) households engaged iII cultivation only. I
These are further categorised 'into 10 size-classes by the extent of holdings. '

22
TABLE B-I-WORKERS AND NON-WORKERS
WORKERS
.--------I II
Rural Age- Total workers As ·Agricultural Di~trict Urban group Total Population (I-IX) As Cultivator labourer
,- .... ----- ..... --- ,,--_ ..... _- .... ...._---Persons Males Females Males Female; Males Females Males Females
2 3 4 5 6 7 8 9 10 II 12
PALAMAU R Total 1,131,625 567,913 563,712 326,787 222,094 201,184 133,224 66,312 70,942 0-14 497,616 253,819 243,797 29,547 20,976 11,954 9,955 7,475 8,278
15-34 343,097 168,042 175,055 157,087 114,679 97,930 68,759 35,193 ,37,917 35-59 236,832 121,465 .115,367 119,904 78,224 80,741 49,325 21,249 22,570 60+ 53,817 24,440 29,377 20,170 8,197 15,510 5,175 2,381 2,170
Age not stated 263 147 116 79 18 49 10 14 7
U Total 56,164 30,687 25,477 15,260 3,204 1,404 741 547 381 0-14 22,867 12,143 10,724 421 180 56 28 35 31
15-34 19,144 10,847 8,297 '7,793 1,421 576 342 296 175 35-59 11 ,300 6,314 4,986 6,071 1,363 561 322 182 156 60 + 2,837 1,374 1,463 970 238 211 49 34 19
;Age not stated 16 9 7 5 2
TABLE B-III PART A-INDUSTRIAL CLASSIFICATION OF {V"ORKERS AND
Total
Educational Levels Population of workers
\ and Non-workers
~-----Persons Males Females
2 3 4
TOTAL 56,164 30,687 25,477
Illiterate 32,539 13,523 19,016 Literate (without educational level) 13,610 8,901 4,709 Primary Of Junior Basic .. 6,392 '4,931 1,461 Matriculation or Higher Secondary .• 2,923 2,687 236 Technical diploma not edqualtodegree 67 62 5 Non-technical diploma not equal to degree 3 3 University degree or post-graduate degree 516 485 31
other than technicaidegree 19 Technicaldegree or diploma equal 114 95
to degree or post-graduate degree Engiveering 16 16 Medicine 27 23 4 Agriculture 13 13 Veterinary and dairying 6 6 Technology Teaching 52 37 15 Others
I
As Cultivator ..... _-....
Males Females
5 6
1,404 741
83D 706 340 25 170 8 56 2
1
6
WORKERS ..,
II III In'Mining,Quarrying
Li vestock, Forestry, Fishing, Hunting and
As Agricultural Plantations,Orchatds labourer and Allied activities
~--.,.___ ..... ---_ ..... _--.., Males Females Males Females
7 8 9 10
547 381 655 66
494 378 345 65 48 3 118 1 5 87
79 1
20
5
3 2

23
CLAsSJ'I1IED BY SEX AND BROAD AGE-GROUPS
WORKERS \ , .A-
III IV V VI VII VIn IX In Mining, Quar-rying, Livestock,
In In Forestry, Fish-ing,Hunting and Manufactur. Transport, Plantations, Or. At ing other than In Storage and chards & Allied ,. ·Household Household In Trade and . Communi- In ,
activities Industry Industry C onstructi on Commerce cations Other Services Non-workers ,---"'_---~ ,--_A.._-.....
.-__ .A. __ ~ ---;..--~
,_.-.J!o., __ ........ __ -.A.._-..... ,---A._ ,..... Males Females Males Females Males Females Males' Females Males Females Males Females M!\les Females Males Females
13 14 15 16 17 18 19 20 21 22 23 24 25 26 27 28
16,628 2,798 10,542 6,067 2,855 340 999 37 ,5,292 938 3,158 11 19,817 7,737 241,126 341,618. 8,012 1,447 537 442 76 '31 14 8 118 31 29 1,332 784 224.272: 222,821 5,823 746 4834 2,864 1,427 , 153 627 '20 2,653 355 1,950 4 11,650 3,861 10,955 60,376 2,441 515 '1,345 2,441 1,288 135 323 9 2,166 444 1,133 6 6,218 2779 1,561 37,143
351 89 &13 320 64 21 34 354 108 44 1 609 313 4,270 21,180 1 1 3 I 1 2 8 68 98
655 66 1,238 273 1,649 114 546 48 2,430 178 1,216 9 5,575 1,394 15,427 22,273 59 7 42 16 29 4 5 6 19 3 10 .. 166 85 11,722 10,544,
346 34, 630 110 864 37 312 29' 1,139 45 '673 3 2,957 646 3,054 6,876 228 18 478 124 673 57 201 13 1,054 103 504 6 2,190 ' 564 243 3,623 22 '7 88 23 83 16 28 217 27 29 258 97 404 1,225
1 4 2 " '4 5' " :. -
NON-WORKERS BY EDUCATIONAL LEVELS IN· 'URBAN ARE.(1S ONLY ,
WORKERS ,...
JV V VI VII VIII IX X
In Manufacturing other thari In In Transport
At Household Household Trade and Storage, and Indm'try Industfy 14 Construc;tion Commerce Communications 'Ib Other'Strvices N op-workers
...... --.......5--- .... _--..........c.--...., ..-L.___,_~"""" -~--;..~~ -----"---'_ .---'~-""_ Males Females Males Females Males Fem'ales Males Females' Males Females Males Females Milles Females'
,11 12 13 14 15 16 17 18 19 20 21 22 23 24
1,238 273 1';1349 114 <546' 48 2,430 178 1,216 9 5,575 1,394 15,427 22,27~,1
601 2(/4 ' 590 1101 292 48 457 . 163 465 8 2,{)6~ ,"'-'\ I ,25~ .7,387 16,030' , 519 8 720 12 141 •• ' I 1,069 11 377 ,. 1,287 36 . '1-,28"2 4,613 . 106 266 1 > 51 631 3, 220 ' 745 4~' •. 2;650 1,404"-
10 68 .. \ 49 243 128 996 35 1,058 197 "" I 7 2 I 44 5 5
,'6' 3 ", 2 3 .', 26 19 359 2 44 29
]' ',' 2' 6 79 19 '') - , ... , .~\ .. . ~' 3 11 t
2 3 17 4 10
4 ., . ..-: .' . > ", r • ,
"c" -'I " ' . 37 15
'., ... _,I.,

Table B-I1I 'Part B 24
TABLE B-III PART B-INDUSTR TAL CLASSIFICATION OF WORKERS AND
WORKERS
I II III In Mining, Quarrying Livestock, Forestry, Fishinl5, Hunting and
Educational Levels Total Population of Workers As Agricultural Plantations Orchard.,
and non-workers As Cultivator labourer and Allied activities ~
,--_ ..... _ Persons Males Females Mall!S Females Males Females Males Females
2 3 4 5 6 7 8 9 10
PALAMAU
TOTAL 1,131,625. 5~7,913 563,712 201,184 133,224 66,312 70,942 16,628 2,798 Illiterate 994,023 448,101 545,922 155,388 131,750 63,310 70,820 14,809 2,788 Literate (without educational level) 105,370 89,901 15,469 35,985 1,254 2,774 113 1,123 8 Primary or Junior Basic 27,577 25,354 2,223 9,125 218 224 9 502 2 Matriculation and above 4,1)55 4,557 98 686 2 4 194
SADAa
TOTAL 549,377 275,852 273,525 91,398 48,292 35,544 37,071 7,452 1,416 Illiterate 476,144 212,456 263,688 68,009 47,713 33,936 37,023 6,692 1,412 Literate (without educational level) 55,955 47,233 8,722 18,054 504 1,496 48 533 3 Primary or Junior Basic 14,738 13,675 1,063 4,904 73 112 162 I Matriculation and above 2,§40 2,488 52 431 2 65
Daltonganj
Total ,37,791 18,902 18,889 5,453 2,444 2,525 2,215 369 114 Illiterate 31,005 13,000 18,005 . 3,540 2,402 2,296 2,206 271 114 Literate (without educational level) 5,903 5,061 842 1,746 39 222 9 84 Primary or Junior Basic 604 563 41 139 3 7 7 Matriculation and above 279 278 1 28 7
Chaiapur
Total 63,489 32,013 31,476 11,683 6,341 3,300 4,032 979 294 Illiterate 56,150 25,658 30,492 9,320 6,277 3,165 4,029 916 292 Literate (without educational level) 5,203 4,388 815 1,651 54 118 3 34 1 Primary or Junior Basic 1915 1,750 165 673 10 17 21 1 Matriculation and above 221 217 4 42 8
Leslieganj
Total 42,563 21,181 21,382 7,374 4,096 3,194 3,318 249 29 Illiterate 36,173 15,631 20,542 5,029 4,029 3,023 3,313 205 29 Literate (without educational level) 4,514 3,766 748 1,638 56 152 5 19 Primary or Junior Basic 1,709 1,619 90 661 11 19 18 Matriculation aad above 167 165 2 46 7
Panki
Total 50,326 25,346 24,980 8,538 4,109 3,643 3,738 638 79 Illiterate 43,698 19,790 23,90B 6,459 4,043 3,498 3,733 567 79 Literate (without educational level) 5,630 4,609 1,021 1,785 64 133 5 60 Primary or Junior Basic 813 766 47 274 2 12 10 Matriculation and above 185 181 4 29 1
Chhatarpur
Total 58,238 28,978 29,260 10,748 6,654 3,634 3,668 1,293 209 Illiterate 53.162 24,537 28,625 8,702 6,612 3,534 3,666 1,231 209 Literate (without educational level) 3,697 3,158 539 1,508 36 93 2 44 Primary or Junior Basic 1,227 1,133 94 505 6 7 10 Matriculation and above 152 150 2 33 B
Harihargaaj
Total 30,647 15,530 15,117 4,893 2,526 1,545 1,390 711 206 Illiterate 26,264, 11,808 14,456 3,795 2,513 1,496 1,388 678 206 Li terate (»:~~P"d't eaikllfi1n!aUeve!) 2,842 2,309 533 683 10 47 2 23 Prim~.f..oqul'!i~I''l3~l:t • ., • ~, •. " 1,414 1,289 125 397 3 2 7 M~l~.~JJ>n-attti lIbave- .1!1' • .' •• 127 124 3 18 3 ··.i~' .......... ~

25 Table B-IU Part B
-NON-WORKERS BY EDUCATIONAL LEVELS IN RURAL AREAS ONLY
WORKERS ~ -IV V VI VII VIII IX X ,
In Manufacturing In transport. At Household other than House In Trade and Storage and Industry hold Industry In Construction Commerce Commqnications In Other Services Non-workers ...... --..... -- .... ~ ---- ...... ...---......__
Ao-_ ..... Males Females Males Females Males Females Males Females Males Females Males Females Males Females 11 12 13 14 15 16 17 18 19 20 21 22 23 24
DISTRICT
10,542 6,067 2,855 340 999 37 5,292 938 3,158 11 19,817 7,737 241,126 341,61B 8,032 5,980 1,683 336 648 37 1,905 923 1,325 10 12,249 7,564 188,752 325,714 2,066 70 790 2 231 2,363 15 997 1 2,806 59 40,766 13,947 437 17 261 2 70 937 .. 555 2,584 97 10,659 1,878 7 121 ' .. 50 87 281 2,178 17 949 79 SUBDIVISION
5,351 2,736 2,262 223 573 18 2,910 506 1,338 6 9,244 3,139 119,780 180,118 3,867 2,693 1,354 222 424 18 I, I 34 499 619 6 5,392 3,064 91,029 171,018 1,205 38 621 I 1I3 1,261 7 438 1,610 32 21,907 8,089 277 5 180 19 473 189 1,217 19 6,142 965 2 107 17 42 97 1,;025 4 702 46 Anchal
286 119 203 114 83 8 245 52 194 1,154 428 8,390 13,395 185 117 155 114 54 8 77 50 105 600 424 5,717 12,570 98 2 42 26 139 2 77 380 4 2,247 786 3 2 3 26 9 84 283 38 4 3 3 90 143 1 Anchal
673 336 157 9 33 501 75 9,2 1,677 650 12,915 19,739 458 336 10J 9 26 198 74 46 1,223 644 10,205 18,831 166 42 5 206 I 26 204 2 1,936 754 48 13 I 91 18 164 4 704 150 I I 1 6 2 86 70 4 Anchal
304 161 33 2 8 165 32 38 437 71 9,379 13,613 191 159 13 2 6 80 32 15 192 70 6,877 12,908 68 2 17 2 61 14 60 1 1,735 6B4 45 3 2l' 6 116 73D 79 3 3 69 37 2 Anchal
492 214 74 8 27 255 14 29 729 177 10,921 16,641 415 211 15 8 12 103 14 8 350 170 8,363 15,650 69 3 41 12 132 11 i43 3 2,223 946 7 11 1 18 10 114 3 309 42 I 7 , 2 2 122 1 26 3 Anchal
481 344 50 12 12 204 32 39 573 192 11,944 18,14J 396 340 35 12 7 82 32 17 298 190 10,235 17,564 58 4 10 2 79 10 84 1 1,270 496 27 3 1 42 8 104 1 426 87 2 2 1 4 87 13 2 Anchal
551 402 70 6 33 337 55 58 595 229 6,737 319 384 48 6' 13 87 54 31 353 228 4,988 171 15 12 16 116 1 12 83 61 3 9 3 129 13 85 I 1 5 2 74 P-I-4

26 Table B-III Part B
TABLE B-III PART B-INDUSTRIAL CLASSIFICATION OF WORKERS AND
WORKERS
I II III In MiningQuarrying, L\vestock, Forestry
Total Population of Workers Fishing, Hunting and
As Agricl tural Plantations, Orchards Educational Levels and Non-workers As Cultivator labourer and Allied activ,ities.
~ ,... ,... -. ,... ... Persons Males Females Males Females Males Females Males Females-
2 3 4 5 6 7 8 9 10
Patan
Total 6!l,176 30,233 29,943 10,395 4,442 4,818 4,526 640 75 Illiterate 52,726 23,475 29,251 7,564 4,395 4,632 4,520 524 75-Literate (without educational level) 6,072 5,439 633 2,386 38 176 6 82 Primary or Junior Basic 1,184 1,128 56 412 -B 10 21 Matricuation and above 194 191 3 33 1 13
Bishrampur
Total 78,822 39,432 39,390 12,651 9,589 5,035 6,051 !l5t 118, Illiterate 67,884 29,793 38,091 9,228 9,453 4,766 6,043 827 117 Literate (without educational level ) 7,252 6,230 1,022 2,446 108 248 8 83 1· Primary or Junior Basic 3,133 2,866 267 897 27 21 38 Matriculation and above 553 543 10 80 1 3
Manatu
Total 38,586 19,365 19,221 6,956 4,544 2,667 2,858 382 31 Illiterate 33,683 15,057 18,626 5,028 4,509 2,576 2,855 330 31 Literate (without educational level) 3,469 2,946 523 1,382 32 83 3 24 Primary or Junior Basic 1,300 1,228 72 524 3 8 18 Matriculation and above 134 134 22 10
Hussainabad
Total 88,139 44,872 43,8~1 12,704 3,547 5,183 5,275 1,240 255 Illiterate 75,399 33,707 41,692 9,344 3,480 4,950 5,270 1,143 254-Literate (without educational level) 11,373 9,327 2,046 2,829 67 224 5 80 1
.Primary or Junior Basic 1,439 1,333 106 422 9 12 Matriculation and above 528 505 23 109 5
GARJIWA
TOTAL 341,221 174,512 172,709 63,613 42,920 21,620 22,938 4,127 554 Illiterate 308,601 140,029 163,572 49,272 42,620 20,572 22,909 4,308 550 Literate(without educational level) 30,066 26,430 3,586 n,373 269 959 26 272 3 Primary or Junior Basic .. ' 7,552 7,018 534 2,731 31 87 3 113 1 Matriculation and above 1,002 985 17 182 2 34
Meral
Total 51,340 25,522 25,818 '10,081 8,693 2,514 2,793 919 SO Illiterate 45,901 20,593 25,308 7,835 8,652 2,402 2,790 847 60 Literate (without educational level) 4,286 3,852 434 1,784 41 103 2 65' Primary or Junior Basic 1,067 992 75 397 3 9 1 7 Matriculation and abo\ e 86 85 1 15
Garhwa
Total 48,915 23,880 25,035 7,812 3,913 2,760 3,143 48~ 88 Illiterate 42,800 18,336 24,464 5,504 3,878 2,583 3,141 433 88 Literate (WIthout educationa level) 4,543 4,047 496' 1,745 33 159 2 32 .. Primary or Junior Basic 1,446 1,374 72 529 2 17 19 Matriculation and above 126 123 3 34 1 2
Untari
Total 94,603 27,740 26,863 8,608 4,174 3,936 3,609 365 17 Illiterate 48153 22,005 26,148 6,497 4,133 3,697 3,604 333 17 Literate (without educational level) 5,337 4,673 664 1,791 41 230 5 23 Primary or Junior Basic f 904 856 48 292 9 6 Matriculation and above 209 206 3 28 .. 3


28 Table B·I1I Part B
TABLE B-IlI PART B -INDUSI:RIAI; CLASSIFICATION OF WORKERS AND
WORKERS
I II III In Mning, Quarrying, Li vestock, Forestry, Fishing, Hunting and
Total Population of Workers As Agricultural Pantations,' Orchards Educational Levels and N on·worker~ As Cultivator labourer and Allied activities
""'-.... _____ "'"--...., .... Persons Males Females Males Females Males Females Males Females
2 3 4 5 6 7 8 9 1~
Dhurki
Total 21,807 11,082 10,745 4,102 2,752 1,855 1,984 347 21 Illiterate 20,150 9,545 10,605 3,354 2,741 1,792 1,983 325 21 Literate (without educational level) 1,466 1,337 129 646 11 62 1 20 Primary or Junior Basic 155 144 11 86 1 1 Matriculation and above 36 36 6
Ranka
Total 45,990 23,327 22,663 9,5s7 8,175 3,248 3,192 843 226 Illiterate 42,008 19,756 22,252 7,954 8,133 3,168 3,191 754 224 Literate (without educational level) 3,142 2,795 347 1,390 35 74 1 45 1 Primary or Junior Basic 701 641 60 .223 7 6 '33 1 Matriculation and above - l~ 135 4 .20 II
Bhandaria
Total 19,541 10,079 9,462 4,299 3,828 856 965 369 24 Illiterate 17,499 8,295 9,204- 3,534 3,777 808 950 311 24 Literate (without educational level) 1,467 1,284 183 637 39 42 3 25 Primary or Junior Basic 489 418 71 120 12 6 2 !6 Matriculation and above 86 82 4 8 7
Majhiaon
Total 55,426 27,625 27,801 9,512, 4,250 3,756 4,175 590 71 Illiterate 48,002 21,136 26,866 7,124 4,226 3,555 4,166 556 71 Literate (without educational level) 5,121 4,354 767 1,511 20 165 9 17 Primary or Junior Basic 2,126 1,960 166 846 4 35 9
'Matriculation and ~bove 177 175 2 31 1 8
Bhawanathpur
Total 49,599 25,277 24,322 9,612 7,132 2,695 3,077 808 47 Illiterate 44,088 20,363 23,725 7'MO 7,080 2,567 3,074 748 45 Literate (without educational level) 4,704 4,138 566 1,84 49' 124 3 45 2 Primary or Junior Basic 664 633 31 .288 3 4 12 Matriculation and above 143 143 40 3
LATEIlAR
TOTAL 235,027 117,549 117,478 46,173 42,012 9,148 10,933 4,449 828 Illiterate 209,278 95,616 113,662 38,107 41,417 8,802 10,888 3,809 826 Literate (without educationllevel) 19,349 16,188. 3,161 6,553 481 319 39 318 2 Primary or Junior Basic 5,287 4,661. 626 1,440 1I4 25 6 227 Matriculation and aLove 1,113 1,084 29 73 2 95
Balulllath
Total 55,702 27,086 28,616 10,446 9,453 2,617 3,229 970 257 Illiterate 50,858 22,986 27,872 8,832 9,364 2,522 3,229 911 257 Literate (without educational level) 3,781 3,116 665 1,286 85 91 27 Primary or Junior Basic . 895 817 78 303 4 4 20 Matriculaton and above 168 167 1 25 ... 12
Chandwa
Total 35,755 17,929 -17,826 7,331 6,678 800 1,367 815 241 Illiterate 31,615 14,530 17,085 6,172 6,578 777 1,364 720 240 Literate (without educataonal level) 2,915 2,335 580 .917 70 21 1 54 1_ Primary or Junior Basic 1,003 849 154 231 30 2 2 26 Matriculation and above 222 215 '1 11 15

29 Table B-III Part B
NON-WORKERS BY EDUCATIONAL LEBVELS IN RURAL AREAS ONLY-contd.
WORKERS .....
IV V VI VII VIII IX X
In Manufacturing In Transport, At Household other than House- In Trade and Storage and
Industry hold Industry In Construction Commerce Communications In Other Ser',ices Non-workers r- ,-----" . ~-....._____, ,.- ,.--.A.---- --_,.,._----, ~--!'---- .......... Males Females Males Females Males Females Males Femat'es Males Females Males Femal~s Males Females
11 12 13 14 15 16 17. 18 19 20 21 22 23 24
Anchal
186 183 13 2 15 4 10 3 221 158 4,311 5,64t1 154 183 8 4 4 5 3 155 - 158 3,737 5,512 30 3 11 4 21 539 117 2 2 19 32 11
26 ~ Anchal
13 5' 19 194 46 34 458 129 8,602 . 329 195 10,695 209 191 8 5 5 62 45 ' 15 181 122 7.400 10,34£ 93 4 1 9 .. 89 1 10 63 3 1;021 302 26 3 4 41 9 124 4 172 48 1 1 1 2- 90 9 4--
Anchal
125 53 7 1 11 1 79 14 5 1 442 130 3,886 4,445 108 52 5 8 1 26 12 1 1 244 121 3,250 4,256 11 1 2 31 2 2 42 .. 492 13B 6 . 2 1 1 21 2 97 7 137 49 1 59 2 7 2
Anchal
375 224 119 10 27 255 41 66 559 219 12,366 18,811 285 220 70 10 8 89 40 37 278 216 9,134 17,917 I 67 4 41 7 92 1 17 81 2,356 733 o. 23 7 9 71 10 109 3 841 159 1 3 3 2 91 35 2
Anchal
4!l2 3f>0 15 6 21 57 26 56 746 169 10,775 13,485 424- 372 8 5 19 27 26 40 546 168 8,574 12,955 62 6 7 1 2 22 12 76 1 1,914 504-5 2 8 2 67 247 26 1 2 57 40 SUBDIVISION
1,877 1,112 273 45 195 10 1,172 202 1,309' 4,709 1,922 48,244 60,414 1,563 1,107 138 45 91 10 343 200 431 2,843 1,838 39,489 57,331 242 5 79 63 514 2 420 551 19 '7,129 2,613 69 <46 27 282 304 674 55 1,567 451 3 10 14 33 154 641 10 59 19 Anchal
422 316 38 19 44 3 214 20 20 812 4l)9 11,503 14,910 361 314 22 19 33 3 53 19 8 465 397 9,779 14,270 44 2 11 6 91 1 3 88 1 1,469 576 17 5 4 70 8 139 10 247 64 .. \ 1 1 120 I 8 Anchal
344 239 57 4 44 3 231 27 255 1,258 606' 6,794 8,661 264 239 25 4 19 3 42 27 114- 860 586 5,537 8,044-56 14 18 94- 60 138 4 963 504 24 14 5 79 52 135 13 281 109 4- 2 16 29 125 3 13 4

30 Table B-III Part B
TABLE B-I1I PART B-INDUSTRIAL CLASSIFICATION OF WORKERS AND
WORKERS --.
I II III
In Mining, Quarrying, Livestock, Forestry,
Total As Fishing, Hunting and population of workers As Agricultural Planta tio!l5, Orchards
Educational levels and non-workers Cultivator labourer and Allied activities --"-------. r--- --, r--- ----.
Presons Males Females l\1ales Females Males Females Males Females
2 3 4 5 6 7 8 9 10
Latehar
Total 39,829 19;895 19,934 7,605 5,889 2.333 2,449 514 103 Illiterate 35,617 16,215 19,402 5,988 5,801 2,230 2,424 524 102 Literate (without educationalle"el) 3,550 3,058 492 1,421 82 98 25 71 1 Primary or Junior Basic 590 550 40 186 6 3 14 Matriculation and above 72 72 10 2 5
Manika
Total 30,587 15,446 15,241 6,065 6,031 1,708 1,768 461 50 Iliterate 27,870 12,957 14,913 5,081 5,991 1,662 1,764 401 50 Literate (without educational level) 2",044 1,752 292... 817 34 42 4 22 Primary or Junior Basic 528 492 36 162 6 4 26 Matrculation and above 245 245 5 12
Barwadih
Total 30,989 16,100 14,869 5,615 4,153 778 876 .785 56 Illiterate 26,764 12,426 14,338 4,555 4,108 733 870 544 56 Literate (without educational level) 3,012 2,611 401 913 35 38 3 83 Primary or Junior Basic 934 818 116 135 10 7 3 95 Matriculation and above 259 245 14 12 38
Mlhuadanr
Total 30,304 15,150 15,154 7,056 7,514 427 511 169 44 miterate 26,060 11,705 14,355 5,755 7,298 406 504 126 44-Li terate (without educational level) 3,017 2,413 604 927 159 16 6 21 Primary or Junior Basic 1,108 919 189 364 57 5 I 17 Matriculation and above 119 113 6 10 5
Gara
Total 11,781 5,943 5,838 2,055 2,29' 485 733 655 77 Illiterate 10,494 4,797 5,697 1,72.4 2,277 472 733 583 77 .Li terate (wi thout educational level) 1,030 903 ·127 272 16 13 35 primary or Junior Basic 229 216 13 59 1 29 Matriculation and above 28 27 1 8

31 Table B.IlI Part B
NON-WORKERS BY EDlJCATIONAL LEVELS IN . RURAL :hREAS ONLY-conc1d.
WORKERS
.---IV V VI VII V-III IX X
In Manufacturing /'
At other than In In Household Household In Trade and Transport, Storage In
Industry Industry Construction Commerce and Communications Other Services Non·workers
,...---------' ..... r---.___'___'" r----"------..!, ~ .. - _--.A.-_~
Males Females Males Females Males Females Males Females Males Females Males Females Males Females
11 12 13 14 15 16 17 18 19 20 21 22 23 ' 24
Anchal
210 132 29 1 . 14 138 22 125 483 162 8,344 11,176 165 130 13 I 9 46 22 58 298 155 6,884 10,767 40 2 12 3 75 40 74 2 1,224 380 5 3 1 16 14 79 5 229 29
1 1 I 13 32 7
Anchal
121 76 30 12 20 123 53 84 563 122 6,266 7,129 91 76 1"6 12 9 64 53 41 238 121 5,354 6,846 21 7 7 46 20 38 .. 732 • 254 6 4 2- 16 17 ; 79 1 176 29 3 3 2 2 6 1 208 4
,
Anchal !
245 100 80 1 '0 2 249 40 806 1,088 467 6,434 9,174 208 99 33 1 13 2 66 40 205 844 4.63 5,225 8,69g
30 1 26 12 107 292 1I8 1 987 361 7 19 9 63 205 74 3 204 100
2 6 13 104 52 18 14
Anchal
480 225 28 8 32 2 135 21 8 389 101 6,426 6,728 428 225 19 8 8 2 52 21 3 109 66 4,799 ,6,187 44 9 16 59 3 62 10 1,256 429 8 6 23 2 130' 20 364 111
.. . . 2 I 88 5 7 I
Anchal
!i5 24 11 77 19 11 116 55 2,477 2,636 46 24 10 20 18 2 29' 50 1,911 2,513-
7 42 I 2 33 1 498 . 109 2 I IS 6 38 3 66 9
I 16 1 2

Table B-VIIl Part A
[ I
L l rll:. •
co
,e-t
...
... '"
too ...
32
" .
r
~t l
-C<)
o e-t
. .
co -C,O_

r
I
~ I ~I
~I ~I ~.I g I ~l ~I ~I il ~I Z I ~I Pil ~I
I I I I I I I I I
P-I-5
_ _
o
...
It) It)
33
~ ~ t<)c<)~(.O~r--C',f~~~ ......
~ t! 'll'C'l"'tt'l('o('oC'lr--_~ ...
It) ...
It) ... c co ....
.... ...
.. .r. .I-t' . "
...
'" '" ...
: :: t.O .'11' .0'11' ._
Table B. VIn Part B
C .'II'tl') ..
It) • ." ...
It) ...
.... C'-I.~ ... _
...
.tl')

34 TableB.IX
TABLE B.:IX-PERSONS NUT AT WOR K CLASSIFIED BY SEX,.
Total 51. District{5ub. Rural Age. Total non.working Dependants, infants no. division/Anchal Urban group population Full time students Household duties and dis~bled
~ ,- ,..---..A..____. r-- ~
Persons Males Females Males Females Males Females Males Females
1 2 3 4 5 6 7 8 9 10 11 12 13
PALAMAU T TOTAL, 620,444 256,553 363,891 65,420 11,622 111 119,349 188,844 231,818 0-14 469,359 235,994 233,365 55,296 11,045 7 16,676 180,589 ·205,548
15 ••• 34 81,261 14,009 67,252 10,112 574 48 62,974 2,723 3,509 35-59 42,570 1,804 40,766 6 3 40 34,090 1,378 6,394 60+ 27,079 4,674 22,405 16 5,601 4,089 16,272 - Age not stated 175 72 103 6 8 65 95
R. TOTAL 582,744 241,126 341,618 57,951 8,944 77 108,830 181,651 222,954 0.·14 447,093 224,272 222,821 50,215 8,705 7 16,l-J5 173,965 197,978
15-34 71,331 10,955 60,376 7,728 ·239 32 56,747 2,509. 3,271 35-59 38,704 1,561 37,143 4 27 30,855 1,273 6,040 60+ 25,450 4,270 21,180 .. 11 5,107 3,841 15,583 Age notstated 166 68 98 4 6 63 92
U TOTAL 37,700 15,427 22,273 7,469 2,678 34 10,519 7,193 8,854 0':"'14 22,266 11,722 10,544 5,081 2,340 561 6,624 7,570
15-34 9,930 3,054 6,876 2,384 335 16 6,227 214 238 35-59 - 3,866 243 3,623 2 3 13 3,235 lOS 354-60+ 1,629 404 _1,225 .. 5 '494 248 / 689 Age notstatQd 9 4 5 2 2 2 3
Sa<1ar Subdivision R. 'rotal 299,898 119,780 18!l,118 32,527 4,458 34 66,224 86,309 108,978 0-14 218,686 109,803 108,883 27,606 4,372 3 8,804 82,145 95,693
15-34 ,
43,673 6,707 36,966 4,917 86 16 34,898 1,385 1,93;. 35-59 23,364 847 22,517 3 13 19,548 686 2,842 60+ 14,084 2,404 11,680 2 2,969 2,076 8,445 Age not stated 91 19 72 1 5 17 67
1 Daltonganj R Total 21,785 8,390 13,395 2,531 384 13 5,307 5,802 . 7,660 Q.....-14 14,922 7,476 7,446 2,003 373 491 5,470 6,576
15-34 4,000 )10 3,290 528 11 8 2,969 157 303 35-59 1,804: 68 1,736 5 1,4:98 48 223 60+ 1,058 136 922 349 127 557 Age not stated 1 1
2 Chainpur R Total 32,654 12,915 19,739 2,763 459 5 7,129 10,114 '12,135 0-14- 23,546 11,930 11,616 2,329 4:51 .. 638 9,597 10,527
15-34 4,967 676 4,291 434 8 5 3,997 223 285 35-59 2,622 95 2,527 2,170 88 351 60+ 1,485 205 1,280 324 198 947 Age not stated 34 9 25 8 25
3 Lcslieganj R Total 23,052 9,379 13,673 2,336 335 4,901 6,982 8,421 0-14 16,877 8,539 8,338 1,929 ·325 539 6,602 7,473
15-34 3,346 604 2,742 405 10 2,603 158 126 35-59 1,805 62 1,743 2 1,506 51 233 60+ 1,024 174: 850 253 171 589 Age not stated
4- Panki R Total 27,562 10,921 16,641 3,231 849 6,445 7,652 9,324 0-14 20,206 10,209 9,997 2,905 844 929 7,300 8,224
15-34 3,855 426 3,429 326 5 3,312 80 III 35-59 2,239 54 2,185 1,909 47 268 60+ 1,261 231 1,030 295 224 721 Age notsta~d 1 1 1
5 Chhatarpur R Total 30,093 11,944 18,149 1,942 259 5,776 9,944 12,091 0-14 23,287 11,330 11,957 1,715 256 907 9,613 10,793
15-34 3,509 360 3,149 227 3 3,046 93 96 35-59 2,032 63 1,969 1,587 55 375 60+ 1,262 191 1,071 234 183 826 Age not ~tated 3 3 2 I

3"5 Table B-IX!
BROAD AGE-GROUPS AND TYi?E OF ACTIVITY .
Inmat'.'.sofpenal, Persons seeking Persons employed
Total Retired, rentier before but now out or Independent Beggars, vag. mental and charit· employment for of employment Age- Rurl;ll - District/Sub. ~I!
means rants etc. able institutions the first time and seeking work gr0!lP Urban division/Anchal no. ,.....--.,,__--~ ,....--~ .-
.Males Females M'lles Fem'lles Males Females Males Females Males, Females
14 15 16 17 18 19 20 21 22 23 4 3 2
478 337 578 733 235 10 588 21 299 TOTAL T PALAMAU 1 69 96 25 7 0-14 4 6 200 176 176 505 12 241 15-34
73 79 175 191 40 3 49 6 43 35-59 -400 252 133 270 19 7 9 3 8 60+
I Age not stated
358 325 438 530 18 8 431 16 202 TOTAL It 1 52 23 25 7 0-14 4 5 144 106 T 360 7 171 15-34
47 79 142 162 6 1 38 6 24 35-59 306 241 99 239' 5 7 8 3 60+
I " Age not stated
120 12 140 203 217 2 151 5 97 TOTAL U 17 73 0-14 56 70 169 145 5 70 15-34
26 33 29 34 2 11 19 35-59 94 11 34 31 14 1 8 60+
" ,. Age nots_!ated
.300 192 235 257 17 8 231 127 Total R Sadar Subdivision 26 14 19 4 0-14
1 3 81 47 6 192 109 15-34 34 44 76 82 6 I IS 14 .. 35-59
265 145 51 114 5 7 5 .. 60+ 1
" Age not stated
4 24' 36 4 8 8 4 Total R Daltonganj 3 6
" 0-14 6 7 1 8 2 15-34
1 11 14 1 1 2 35-59 :3 4 9 2 7 60+
Age not stated
15 14 12 6 Total R Chainpur 2 4 0-14
1 8 5 15-34 6 5 " 1 35-59 7 9
" 60+ 1 Age notstated "-
. " 3 21 13 29 10 Total R Les,lieganj S 7 1 . 1 0-14 5 3 27 9 15-34 7 4 , i 1 1 35-59
3- 2 5 60+ Age not stated
2 9 23 18 8 Total R Pankj 3 1 0-14
5 1 8 6 15-34 3 8 3 1 35-59
2 1 14 4 60+ Age not ~tated
10 10 15 13 28 5 Total R Chhatarpur 5 1 1 1 0-14 8 4 28 4 "- " 15~34
4 3 4 4 35-59 6 '7 2 4 60+'
" Age not stated

36 TBbleB_IX
TABLE B-IX-PERSONS NOT AT WORK CLASSIFIED BY SEX,
Total 51. District/Sub- Rural Age- Total non-working Dependants, infanti!-DO. division! Anchal Urban group population Full time students Household duties and'disabled
,--- ...... ,..------'--...... ~.A. __ ...... r---...._ .... Persons Males Females Mides Females Males Females Males Females
1 2 3 4 5 6 7 8 9 10 II 12 13
6 Haciharganj R Total 17,040 6,737 10,303 • 1,975 278 3,806 4,679 6,191 0-14 12,254 6,127 6,127 1,713 272 5S8 4,404 5,264
15-34 2,583 373 2,210 262 6 1,889 70 313 35-59 1,390 72 1,318 1,190 52 1I4 60+ 813 165 648 139 153 50(} Age not stated
7, Patan R Total 33,544 13,061 20,483 2,831 213 8,336 10,200 1l,91I 0-14 23,783 11,982 11,801 2,267 207 1,069 9,714 10,525
15-34 5,174 709 4,465 563 6 4,245 131 209-35-59 2,988 72 2,916 1 2,623 64 288 60+ 1,582 290 1,292 397 283 882 Age not stated 17 8 9 2 8 7
8 Bishrampur R Total 39,797 17,200 22,597 4,316 485 II 6,279 12,710 15,625 0-14 31,105 15,739 15,366 3,471 480 3 '1,040 12,254 13,845
15-34 4-,447 1,019 3,428 844 5 3 3,224 108 175 35-59 2,287 103 2,184 5 1,720 61 410 60+ 1,957 338 1,619 295 287 1,195 Age not stated 1 1 1 .. .. ..
9 Manatu R Total 19,561 8,268 1l,293 1,940 289 3,278 6,293 7,678-0-14 15,316 7,766- 7,550 1,705 287 539 6,059 6,724
15-34 I 2,214 307 1,907 235 2 1,809 53 94 35-59 1,151 45 1,106 836 45 263 60+ 8BO 150 730 94 136 597 Age not stated
10 Hussainabad R Total 54,810 20,965 33,845 8,662 907 • 5 1 ~,967 11,933 17,942 0-14 37,390 18,705 18,685 7,569 877 2,064 11,132 15,742
15-34 9,578 1,'123 8,055 1,093 30 i,804 312 219 35-59 5,046 213 4,833 3 4,509 175 317 60+ 2,762 524 2,238 2 589 314 1,631 Age not stated 34 34 1 33
Garhwa Subdivision R Total 174,188 73,102 101,086 15,196 2,132 40 30,118 57,540 6&,580 0-14 136,658 68,548 68,1I0 13,363 2,081 4 5,135 55,155 60,888
15-34 18,877 2,773 '16,104 1,831 51 13 15,146 747 872 35-59 10,774 442 10,332 14 8,211 367 2,053 60+ 7,825 1,302 6,523 .. 9 1,626 1,236 4,750 Age not stated 54 37 17 ·2 35 17
11 Meral R Total 23,946 10,547 13,399 1,998 385 10 2,916 8,518 10,085 0-14 20,180 10,016 10,164 1,793 384 4 739 8,217 9,041
15-34 1,670 263 1,407 205 1 4- 1,340 45 66 35-59 988 62 926 2 678 55 248 60+ 1,099 197 902 159 192 730 Age not stated 9 9 9
12 Garhwa R Total 27,340 10,660 16,680 2,483 195 9 6,106 8,108 10,336 0-14 20,021 9,860 10,161 2,098 19O 851 7,762 9,118
f5-34 3,790 514 3,276 385 5 3,072 87 194 35-59 2,150 63 2,087 4 1,808 51 266 60+ 1,374 223 1,151 5 375 208 753 Age not stated 5 5 5
IS Untari R Total 29,886 11,955 17,931 2,440 274- .11 6,563 9,477 1I,069 0-14 22,061 1I,121 10,940 2,017 266 877 9,102 9,795
15-34 4,Ofii7 569 3,498 421 8 5 3,296 126 193 35-59 2,380 59 2,321 5 2,021 52 293 60+ 1,367 195 1,172 1 369 188 788 Age not stated II 11 2 9

31 B.I:X! Tabl~
BROAD AGE-GROUPS ANn TYPE o~ ACTIVITY - c.ontd.
Persons employed Retired, rentier Beggars, vag. Ipmates of penal , P,ersonsseeking before but now out Total or Independent rants etc. mental andcharit. emplovnent for of employment Age- Rural District/Sub· SI.
means able institutions the firsttime and seeking work group Urban division/Anchal no. ,.----....... ~.-.--. Males Females Males Females Males Females Males Females Males Females
14 15 16 17 18 19 20 21 22 23 4 3 2
13 10 23 18 2 36 9 Total R Hariharganj 6 3 10 " 0-14
1 6 2 26 7 15-34 7 6 10 8 2 35-59 5 4 7 5 60-t-
Age not stated
3 15 '22 12 Total R Patan 7 I 0-14 3 5 12
#
1-34 2 5 5 35-59 1 6 12 ' 60+
Age not stated
49 132 73 76 23 18 Total R Bishrampur 8 11 1 .. 90-14
3 27 21 22 15 15-34 12 31 21 23 1 3 35-59 37 98 14 31 60+
Age nofstat.ed
14 34' 6 14 11 4 Total R Manatu 9 1 I 0-14 5 2 10 4 15-34
3 4 " 35-59 14 31 8 60+
" Age not stated
205 34 28 9 .. 54 63 Total R Hussainabad 10 2 2 • 2 0-14
15 2 3 43 57' 15-34 8 9 7 4- 10 4 .. 35-59
197 8' 17 2 1 .. 60+ Age not stated
29 59 140 196 109 1 48 Total R. Garhwa Subdivision 18 6 6 2 0-14
1 1 41 33 101 39 15-34 8 16 44 52 2 7 35-59
20 42 37 105 60+ Age not stated
17 13 4 .. Total R Meral 11 2 0-14 5 4 15-34 5 35-59 5 13 60+-.. Age not stated
3 19 43 27 11 Total R Garhwa 12 2 90-14
6 5 26 10 15-34 6 13 1 1 35-59
3 7 23 60+ Age not stated
2 8 24 11 6 Total R Vntari 13 2 1 1 0-14
3 1 9 5 15-34 .. 1 7 1 35,59 2 4 1·1-' 60+
Age not stated

38 Table B-IX
TABLE B-IX:-PERSONS NOT AT WORK CLASSIFIED BY SEX:,
Total 81. District/Sub. Rural Age- Total non-working Dependants, infants no. divisioiJ./~nchal Urban group population Full time students Household duties and disabled
~
Femal~s Females Persons Males Males Males Females Males Females
2 3 4 5 6 7 8 9 10 11 12 13
14 Dhurki R Total 9,951 4,311 5,640 685 93 1,373 3,616 4,142 0-14 8,215 4,164 4,051 644 90 297 3,518 3,662
15-34 772 59 71'3 41 3 687 IS 22 35-59 522 20 502 321 18 171 60+ 442 68 374 68 65 287
Age not stated
15 Ranka ,_R Total 19,297 8,602 10,695 1,429 244 2,384 7,109 8,009 0-14 16,3,53 8,250 8,103 1,326 243 531 6,919 7,329
15-34 1,403 170 1,233 103 I 1,178 44 51 35-59 829 66 763 5{8 46 195 60+ 711 116 595 t27 100 433 Age not ~tated 1 I 1
16 Bhandaria R Total 8,331 3,886 4,445 804 189 719 3,051 3,509 0-14 7,109 '3,665 3,444 739 168 84, 2,922 3;192
15-34 613 !~4 489 65 21 421 40 - 34 35-59 312 34 278 192 29 80 60+ i297 63 234 22 60 203 Age not stated
17 Majhiaon R Total 31,177 12,366 18,811 3,187 468 1O 6,796 9,083 11,503 0-14 22,815 11,351 11,464 2,674 459 .. 1,057 8;666 9,948
15-34 4,436 680 3,756_ 513 9 4 3,502 109 234 35-59 2,366 75 2,291 3 1,906 59 377 60 t 1,534 243 1,291 3 331 232 935 Age not stated 26 17 9 17 9
18 Bhawanathpur R Total 24,260 10,775 13,485 2,170 284 3,261 8,578 9,927 , 0-14. 19,904 10,121 • 9,783 2,072 281 699 8,049 8,803 15-34 2,126 394 1,732 98 3 1,650 281 78 35-59 1,127 63 1,164" 737 57 423 601- 1,001 197 804 175 191 621 Age not sta ted 2 2 2
Latehar Subdivision R Total 10S,SS3 48,244 60,414 10,228 2,354 3 12,488 37,802 45,406 0-14 91,749 45,921 45,828 9,246 2,252 2,176 36,665 41,397
15-34 8,781 1,475 7,306 980 102 3 6,703 377 468 35-59 4,566 272 4,294 I 3,096 220 1,145 60+ 3,541 564 2,977 .. 512 529 2,388 Age not stated 21 12 9 -1 1 11 8
19 Balumath R Total 26,413 11,503 14,910 2,262 466 3,097 9,215 11,324 0-14 22,464 11,101 I1,363 2,126 462,. 632 8,973 10,267
15-34 1,978 232 1,746 135 4 1,603 84 138 35-59 1,159 58 1,101 1 739 49 351 60+ 806 106 700 123 103 568 Age not stated 6 6 6
20 Chandwa R Total 15,455 6,794 8,661 1,334 344 1,728 5,460 6,578 0-14 13,071 6,480 6,591 1,175 332 287 5,305 5,972
15-34 1,261 206 1,055 159 -12 994 47 47 35-59 672 39 633 447 39 177 60+ 448 66 382 66 382 Age not stated 3 3 3
21 Latehar R Total 19,520 8,344 1I,176 1,435 218 2,739 6,876 8,198 0-14 16,015 7,958 8,057 1,323 213 477 6,633 7,367
15-34 _1,786 222 1,564 1I2 5 1,408 89 142 35-59 1,032 45 981 722 40 260 60+ 687 119 568 132 114 429 Age not stated

39 TableB-IX
BROAD AGE .. GROUPS AND TYPE OF ACTIVITY-contd,
Persons employed Retired, rentier Inmates of penal Persons seeking before but now out Total or Independent Beggars, vag. mental and charit. employment for of employment Age- Rural DIstrict/Sub. Sl.
means rants etc, able institutions the first time and seeking work group ~ Urban divisionjAncha! no. r-----"-----I ....----'------~ ~ .-----'----.
Males Females Males Females Males Females Males Females Males Females
14 15 16 17 18 19 20 21 22 23 4 3 2
2 7 8 25 Total R Dhurki 14 2 2 0-14 ,I 2 I 15-34
2 10 35-59 7 2 12 60+
Age not stated
15 35 26 23 22 Total R Ranka 15 2 3 0-14 4 3 19 ·15-34
6 13 13 7 35-59 9 22 7 13 60+
Age not stated
3 9 20 18 3 5 Total R Bhandaria f6 4 0-14 12 12 3 4. 15-34
3 4 3 I 35-59 3 6 3 60+
Age not stated
2 7 30 37 34 20 Total R Majhiaon 17 8 2 1 0-14 ,'. 7 IO 32 15 15-34
8 8 4 35-59 6 7 19 60+
Age not stated
2' 12 13 8 5 Total R Bhawanathpur 18 ,. ,', 0-14 2 1 8 5 15-34 5 4 35-59 5 8 60+
Age no1: stated
29 74 63 77 1 91 15 27 Total R Latehar Subc}ivilion I 8 3 1 0-14 2 I 22 26 67 6 23 15-34 5 19 22 28 21 6 3 35-59
21 54 11 20 3 3 60+ Age not. stated
7 13 16 8 4 Total R Balumath 19 2 2 0-14 2 I 8 3 15-34
5 7 6 1 35-59 2 2 7 60+
- Age not stated
11 Total R Chandwa 20 " 0-14
2 15-34 9 35-59
60+. Age not stated
19 21 14 Total 21
R Latehar 2 0-14 7 9 14 15-34 5 5 35-59 5 7 .60+
Age n.otstated

40 Table B.IX
TABLE B-lXi-PERSONS NOT AT WORK CLASSIFIED BY SEX.
Total 81. District/Sub. Rural Age. Total non.working" Dependants,infantl no. division/Anchal Urban group population Full time students Household duties and disabled
Persons Males Females Males Females Males Females Males Females
2 3 4- 5 6 7 8 9 10 11 12 13
22 Manika R Total 13,395 6,266 7,129 1,201 24-4 772 5,056 6,101 0-14- 12,105 6,057 6,048 1,108 243 182 4,948 5,623
15-34- 568 118 4-50 92 1 407 22 37 35-59 312 27 285 ,155 25 129 60+ 406 61 345· .. 28 59 311 Age not stated 4 3 I 1 2 1
23 Barwadih R Total 15,608 6,434 9,174 1,310 307 3,052 5,077 5,751 0-14- 12,032 6,076 5,956 1,217 304 376 4,859 5,276
15-34- 2,050 215 1,835 93 3· 1,755 102 70 35-59 975 4-3 932 798 34 119 60+ 5431 100 443 122 82 279 Age not stated 8 8 1 7
24 Mahuadanr R Total 13,154 6,4-26 6,728 2,104 674 751 4,287 5,282 0-14 11,478 5,903 fl,575 1,737 597 126 4,162 4,851
15-34 891 413 478 367 77 366 25 27 35-59 271 21 250 162 15 81 60-+- 514 89 425 97 85 323 Age not stated
25 Garu R Total 5,113 2,477 2,636 582 101 2 349 1,831 2,172 0-14 4,584 2,346 2,238 560 101 96 1,785 2,041
15-34 247 69 178 22 2 170 8 7 35-59 145 39 106 73 18 28 60-+ 137 23 114 10 20 96 Age not stated

41 Table B·D!
BROAD AGB-GROUPS AND TYPE O~ ACTIVITY-concld.
Persons employed Retired, rentier ~eggars, vag. Inmates o(penal, Persons seeking before but now out Total
<or Independent rants etC. mental andcharit. emplcgment for of employment Age- Rural District/Sub- S1. means able institutions the rst time and seeking work group Urban di vision! Anchal no. .~ ~ ,..-------- ,..---'-0------. ~
Males Females Males Females Males Females Males Females Males Females
·14 15 16 17 18 19 20 21 22 23 4 3 2 1
3 7 9 Total l{ Manika 22 1 0-14 3 5 15-34 2 1 ".:15-59
3 I 3 60+ Age not stated
·17 44 8 5 19 15 2 Total :f{ Barwadih 25 0-14
2 I 16 6 15-34 4 8 3 1 1 6 35-.59
J3 36 3 3 2 3 60+ Age not stated
8 7 13 14 7 7 Total R Mahuadanr t4 1. 2 1 1 0-14 2 1 7 7 7 5 15-34 1 1 4 6 1 35-59 -4 5 60+
Age not stated
2 13 3 57 Total R Garu 25 1 0-14 1 36 15-34
5 1 20 35-59 Z S 1 60+
Age not stated
1'-1-6

42 '\
TABLE B-X-SAMPLE HOUSEHOLDS (i) ENGAGED ~EITHER IN CULTIVATION NOR IN HOUSEHOLD INDUSTRY (ii) ENGAGED EITHER IN CULTIVATION OR HOUSE-HOLD IN'DUSTRY BUT NOT IN BOTH AND (iii) ENGAGED BOTH IN CULTI. VATION AND HOUSEHOLD IN'DUSTRY FOR ALL AREAS
(Based on 20 %. sample)
Households Households engaged Households engaged in Households engage<
Total Total neither in Cultivation engag~d in Household both in Cultivatio District! Anchal Rural no. of nor in Household Cultivation Industry and PIousehold
Urban Houseliolds Industry only only Industry
2 3 4 5 6 7
PALAMAU T 4G,OS7 9,406 31,892 849 3,910 R 43,9B5 7,B76 31,474 765 3,870 U 2,072 1,530 418 84 40
Daltonganj R 1,492 259 1,160 21 52 Chainpur R 2,585 565 1,778 54 18B. Leslieganj R 1,701 230 1,358 9 104 Panki R 1,988 352 1,391 20 225 Chhatarpur R 2,327 456 1,655 51 165
Harihargailj R 1,107 326 442 64 2i5 Piltan R 2,416 542 1,704 33 137 Bishrampur R 2,9.76 482 2,202 47 245. Manatu R 1,593 218 1,223 II 141 Hnssainabad R 2,997 885 1,740 142 230
Meral R 1,992 247 1,400 31 314 Garhwa R 1,916 393 1,263 54 206 Untari R 2,117 372 1,538 39 168 Dhurki R 910 142 676 3 89· Ranka R 1,934 284 1,502 30 118
Bhan<laria R 758 9\ 612 10 45. Majhiaon R 2,156 352 1,517 23 264 Bhawanathpur R 1,841 207 1,287 17 330 Balumath R 2,172 289 1,664 19 200 Cbandwa R 1,356 202 1,043 21 90
Latehar R 1,557 248 1,229 8 72 Manika R 1,199 199 926 9 65 Barwa:lih R 1,336 363 899 20 54 Mahuadanr R 1,096 97 900 24 75-varu R 463 75 365 5 18.

43
TABLE B-XI_':SAMPLE HOUSEHOLDS ENGAGED IN CULTIVATION CIASSIFIEQ BY INTEREST IN LAN'D AND SIZE OF LAND CULTIVATED IN' RURAL AND URBAN AREAS SEPARATELY
(Based on 20 % sample)
Households engaged in cultivation bysize ofland in acres
No. of Interest inland cultivating Less than 10.0- 12.5- 15.0- 30.0- Un-
cultivated households 1 1.0-2.4 2.5-4'9 5.0-7.4 7.5-9.9 12.4 14.9 29.9 49.9 50+ specified
2, 3 4 5 6 7 8 9 10 11 12 13
PALAMAU DISTRICT-ALL RURAL AREAS
'TOTAL 35,344 5,421 8,629 8,926 5,098 2,214 1,742 650 1,894 507 245 18 (a) 28,822 4,648 7,200 7,014 3,997 1,725 1,473 503 1,589 440 219 14 ('b) 1,328 556 438 220 70 17 11 3 10 1 1 1 .(c) 5,194 217 991 1,692 1,031 472 ' 258 144 295 66 25 3
Daltonganj Anchal-Rural
"'Total 1,212 274 334 293 157 37 56 14 38 6 2 '1 (a) 1,068 265 296 245 129 32 51 11 34 4 1 (b) 23 5 10 4 2 1 " 1 (c) 121 4 28 44 26 4 5 3 3 2
Chainpur Anchal-Rural
Total 1,966 304 536 473 244 111 103 34 96 36 25 4 (a) 1,689 287 458 389 205 90 92 '27 83 32 22 4 (b) 62 14 31 10 4 2 I «() 215 3 47 74 35 19 10 7 13 4 3
Leslieganj Anchal-Rural
Total 1,462. 456 344 315 149 66 41 10 60 17 4 (a) 1,278 425 307 253 126 55 34 8 50 16 4 (b) 34 16 9 4 4 1 (c) 150 15 28 58 19 10 7 2 10
Panki Anchal-Rural
Total 1,616 404 467 342 185 60 69 16 54 13 6 (a) 1,220 329 371 227 135 35 52 12 42 11 6 (b) 86 54 20 7 2 1 2 (c) 310 21 76 108 48 24 17 4 10 2·
Chhatarpur Anchal-Rural
Total 1,S2D 2D9 398 501 285 167 105 24 97 23 9 1 (a) 1,474 186 322 388 216 139 86 20 85 22 9 1
~b) 63 14 27 14 6 2 c) 283 9 49 99 64 26 19 4 12
Hariharganj Anchal-Rural
Total 717 81 147 176 111 64 47 14 57 12 6 2 (a~
539 71 117 126 64 46 35 9 51 12 6 2 30 9 8 8 5 ..
~~) 148 1 22 42 42 18 12 5 6
Patan Anchal-Rural
Total 1,841 305 516 431 257 86 85 19 98 32 12 (a) 1,654 298 452 371 226 79 77 18 92 30 11 (b) 24 3 12 8 1 .. (c) 163 4 52 52 30 7 8 6 2
Bishrampur Anchal-Rural
Total 2,447 513 489 589 345 154 109 45 135 38 29 (a) 1,900 352 386 461 272 130 93 34 116 30 26 (b) 159 124 17 12 4 1 , 1 (c) 388 37 86 116 69 24 16 11 19 7 3
N0TES: (<I)-Owned or held from Government. (b)-Held from lrivate persons or institutions for payment in money, kind or share. (c)-Partly hel from Government and partly from private persons or institutions for p~}ment in money, kind or share.

44
TABLE B-XI..--SAMPLE HOUSEIfdLDS ENGAGED IN CULTIVATON ClASSIFIED BY INTEREST IN LAND AND' SIZE OF LAND CULTIVATED IN RURAL AND. URBAN AREAS sEPARATELY-contd.
Interest in land cultivated
Total (a) (b) (c)
Total (a) (b) (c)
Total (a) (~) (c)
Total (a) (b) (c)
Total (a) (6) (cl
Total (a) (b) (c)
Total (a) (b) (c)
Total (a) (b) (c)
Total (a) (b) (c)
(Based on 20 % sample) Households engaged in cuJtivation by size of land in acres
No. of cultivating Less than 10.0- 12.5- J5.0- 30.0- Un-households 1 1.0-2.4- 2.5-4.95.0-7.4 7.5-9.9 '12.4 14.9 29.9 4-9.9 50+ specified
2
1,3&4 J,040
JIg 205
1,970 1,524
109 337
1,714 1,364-
4-0 3JO
1,4.69 1,337
16 116
1,706 1.361
46 299
765 528 45
192
1,620 1,3.57
56 207
657 511 40
106
1,781 1,297
58 4-26
389 283
91 15
252 23B
6 8
233 ZOI
18 14
163 152
7 4
336 286
24-26
83 69 9 5
159 140
14 5
53 38 10 5
266 239
20 7
4
381 306
16 59
5 6 7
Manatu Anchal-ltural
289 228
6 55
135 94-
3 '38
054 41
I 12
8
39 32
7
Hussainabad Anchal-Rural
436 326 53 57
402 341
11 50
381 364
3 14
503 395
18 90
221 161 27 33
366 303
28 35
178 140 20 18
357 279
17 61
487 342 27
lIB
288 204-
15 69
120 87
2 31
Mer:al Anchal-Rur:al
480 371
6 -103
255 191 \
2 63
114 79 1
34
Garhwa Anchal-Rural
386 '333
4 49
203 173
2 28
91 • 83
8
Untari Ancltal-Rural
357 £21 267 J68
3 97 53
83 67 .. 16
Dhurki Anchal-Rural
189 117
8 64-
115 70
1 H
45 24
21
Ranka Anchal-Rural
464 386
11 67
292 245
1 46
119 94
2'5
98 82
2 14
76 64 2
10
84 82 .. 2
74 71
3
34 25
9
81 67
2 12
Bhandaria Anchaf-Ru;al
189 '118 148 100
9 I 32 17
43 28
15
Majhiaon Anchal-Rural
443 298
13 132
273 182
4 87
131 81
3 47
32 26
6
99 72
27
9
19 12
1 6
53 4D
13
33 22 .. Jl
22 20
2
26 20
6
13 10
:3
32 29
3
13 10
3
38 22 .. 16
10
40 29
1 10
167 143
3 21
75 58
17
82 77
5
&8 51
7
42 ·37 ..
5
86 74
12
26 18
8
125 90
1 34
11
12 II
49 4-6
3
!I1 24
7
33 31
2
19 19
16 10
6
10 9
I.
3 . 3
38 27
11
12
6 4
2
19 15 1 3
14 13
1
22 22
18 17
"
1
7. 5
2
11 10
1
2
11 7
4
13-
, .
1 r
" 2
NOTES: (a)-Owned or held (rom Government. (h)-Held from private persons or institutions for paymentin money, kind or share. (c)-Partly held from Government and partly from pri .... ate persons Of institutions for payment in money, kind or share.

i5
TABLE B.XI-SAMPl,'E HOUSEHoInS ~NGAGED IN CULTIVATION' CLASSIFIED P - :By INTEREST IN LAND AND SIZE OF LAND CULTIV.A:TED IN RURAL AND
URBAN AREAS SEPARATELY -concld. (Based on 20 % sample)
Households engaged in cultivation i?Y size ofland in acres
No.of Interest in land cultivating Less than 10.0- 12.5- 15.0 30.0- Un.
cultivated households I 1.0--2.4 2.5-4.9 5.0-7.4 7.5-9.9 12.4 14.9 29.9 49.9 50 +- specified
, 2 3 4 5 6 7 8 9 10 II 12 13
Bhawanathpur Anchal-Rural
Total 1,617 272 390 387 212 91 88 15 109 32 20 1 (a) 1,353 231 337 320 161 72 74 12 95 30 20 1 (b) 56 32 15 3 5 I
" (c) 208 9 38 64 46 18 14 3 14 2
Balumath Anchal-Rural
Total 1,864 205 469 525 260 130 100 46 92 . 27 8 2 (a) 1,548 171 413 435 209 103 78 37 73 20 7 2 (b) 52 29 15 6 2 ..
"
(c) 264 5 41 84 51 27 20 9 19 7 '1
Chandwa Anchal-Rural
Total 1,133 71 241 319 227, 95 57 27 71t 15 3 (al 965 62 205 270 196 81 49 23 62 14 3 (b) 21 5 II 5 ..
147 4 25 !. 44 31 14 8 ..
(c) 4 16 1
Latehar Anchal-Rural
Total 1,301 93 370 395 208 78 68 20 58 7 3 1 (a) 1,156 84 33.') 345 182 70 64 17 49 6 3 1 (bl 20 6 11 3 ..
" "
Cc) 125 3 24 47 26 B 4- 3 9 1
Manika Anchal-Rural
Total 991 131 273 270 155 62 37 13 42 7 (al BIO 99 226 218 133 51 34 9 33 6 (b) 50 24 16 7 1 I .. J (cl 131 8 31 45 . 21 10 3 4 8 1
,. Barwadih Anchal-Rural
Total 953 118 230 277 165 65 32 19 39 5 2 (al BOI 103 193 235 133 52 27 16 35 4 2 (bl 55 13 21 16 3 1 1 .. (cl 97 2 16 26 29 12 4 3 .4
Mahuadanr Anchal-Rural
Total 975 18 105 207 182 127 114 69 122 25 6 (al 736 13 87 135 140 88 93 51 101 22 6 ~b) 43 3 13. 20 4 I 2 c) 196 2 5 52 38 39 20 _ 16 21 3
Garu Anchal-Rural "-
Total 383 33 95 132 54 21 14 16 17 1 (al 312 26 80 106 43 18 13 14 II 1 (b) 21 6 9 ·6 .. (cl 50 I 6 20 11 3 I 2 6
PA1;.AMAU DISTRICT=--ALL URBAN AREAS
Total 458 81 116 69 68 1ft 28 9 40 21 8 (a) 405 76 92 58 66 15 24 7 40 19 8 (b) 16 3 8 3 1 1 (,) 37 2 16 8 1 3 4 1 2
NOTES: (a)-Owned or held from Governmer:t. (bl-H~ld from private persons or institutions for payment in money, kind or share. (c)-Partly held from Government and partly from private persons or institutions for payment in money, kind or share.

46
TABLE B-XVII-SAMPLE HOUSEHOLDS CLASSIFIED BY (i) NUMBER OF MALE AND FEMALE MEMBERS BY SIZE OF HOUSEHOLDS AND (ii) ENGAGEMENT (a) NEITHER IN CULTIVATION NOR IN INDUSTRY (b) IN HOUSEHOLD INDUSTRY ONLY AND (c) IN CULTIVATION SUB-clASSIFIED BY SIZE OF LAND CULTIVATED
Total/Rural/Urban
Total no. of sample
households
2
TOTAL 46,057
All Rural 43,985
(i) Householdsengagedneither 7,876 in Cultivationnar inHousehold Industry
(ii) Households engaged in Household Industry onl y
(iF) Hausehol d$ engaged in Cultivation Size of holding groupLess than 1 acre 1.0-2.4 acres 2.5-4.9 acres 5.0-7.4 acres 7.5-9.9 acres
10.0-12.4 acres 12 .. 5-14.9 acres 15.0-29.9 acres 30.0-49.9 acres
50+ acres Unspecified
All Urban
Tolal/Rural/Urban
765
3.5,344
5,421 8,629 8,926 5,098 2,214 1,742
650 1,894
507 245
18 2,072
(Based on 20 % sample)
PALAMAU DISTRICT
SIZE OF SAMPLE HOUSEHOLDS Total Sample Household
Population ~.----------------~----------------~ Single member Households 2·3 members
,----.,._....,._ .. - ---.... r---------'------.. Persons Males Females Households Males Females Households Males Femal es
3
236,891
226,141
31;102
3,893
191,146
23,867 40,653 16,837 29,589 13,769 11,477 4,606
14,215 4,113 1,932
83 10,750
4
118,910
113,281
15,488
2,022
9.5,770
11,859 20,296 23,510 14,871 6,962 5,757 2,289 7,145 2,065
977 39
5,629
4-6 members
5
117,981
112,860
15,613
1,871
95,376
12,008 20,362 23,327 14,718 6,807 5,720 2,317 7,070 2,048
955 44-
5,121
6
2,781
2,551
1,175
44
1,332
350 393 266 116 50 60 18 45 16 15 3
230
7
1,550
1,369
590
31
748
156 228 157 66 28 38 13 36 14 12 ..
181
8
1,231
1,182
585
13
584-
194 165 109 50 22 22
5 9 2 3 3
49
SIZE OF SAMPLE HaUSEHOLDS
7-9 members
9
10,732
10,238
2,499
182
7,557
1,589 2,291 1,878
869 340 233
68 197 57 32
3 494
10
14,040
13,323
3,226
234
9,863
2,002 2,965 2,466 1.175 '465 30B 90
264 78 45
5 7fT
11
13,495
12,99[»
3,132
216
9,642
2,033 2,953 2,395 1,103
423 294-
91 240
72 35
3 505
10 members and over ~-----~.----~----~ ~---------.~,--------- r------~~------~ Households Males Females Households Males Females Households Males Females
TOTAL
All Rural
(i) Households engaged neither in Cultivation norin Household Industrv
(ii) Households engaged in Household Industry only
(iii) Households engaged in Cultivation
Size of holding groupLess than 1 acre 1.0-2.4 acres 2.5-4,9 acres 5,0-7.4 acres 7.5-9.9 acres
10.0-12.4 acres 12.5-14.9 acres . 15.0-29.9 acres 30.0-49.9 acres
50+ acres Unspecified
All Urban
12
20,837
20,064
3,223
346 16,495
'2\691 4,372 4,450 2,356
927 661 246 595 136 54
7
773
13
51,405
49,447
7,678
870 40,899
6,474 10,650 11 ,079 5,941 2,400 l,,679
641 1,533
352 133
17
1,958
14
51,469
49,596
7,888
826 40,832
6,660 10,799 10,944 5,916 2,286 1,677
623 1,484
342 135
16
1,813
15
8,622
8,252
850
144 7,258
686 1,321 I,B64 1,320
611 494 185 574 133 65 5
370
16
33,312
31,864
3,258
590 28,016
2,641 5,024 7,155 5,131 2,356 1,950
702 2,268
518 254
17
1,448
17
33,012
31,59D
3,214
523 27,853
2,553 5,001 7,153 5,032 2,380 1,896
750 2,271
536 254 22
,1,422
18
3,085
2,880
129
49 2,702
105 252 468 437 286 294 133 483 '165
79
205
19
18,603
11,278
737
297 16,244
536 1,429 2,653 2,558 1,713 1,782
843 3,044 1,103
533
1,325
20
18,774
11,502
794
293 16,415
563 1,444 2,726 2,617 1,696 1,831
848 3,066 1,096
528
1,272
EXPLANATORY NOTE
The following tables constitute the C·series :
C-I-Composition of sample househOlds by relationship to head of family classified by size of land cultivated.
CoIl-Age and Marital Status.
C-IlI part A-Age, Sex and Education in All Areas.
C-III Part B-Age, Sex and Educati on in Urban Areas on{y.
C-III Part C-Age, Sex and Education in Rural -1rcas on{y.
C-lV-Single year age returns.
C_V-Mother-tongue.
C· VI-Bilingualism.
C-VII-Religion.
C-VIII part A-Classification by Literacy and Industrial Category of Workers and Nonworkyrs among Scheduled Castes.
C-VIII Part B-Classification by Literacy and Industrial Category of Workers and NonVvorkers among Scheduled Tribes.
Table C:I has been prepared from the data collected in the Household Schedules on the basis of a 20 per cent sample. The remaining tables of this series have been prepared from information gathered in the Individual Slips.
The tables reproduced in this Handbook are given below, alang with the unit up to which they have been furnished:
Table C-I-For district classified by total, rural and urban. .
Table C-II-Upto SUbdivisions classified by rural and urban.
Table C-III Part B-For district only.
Table c-tn Part C-For district only.
Table C-V-Upto anchals fOr total o'nly.
Table C-VII-Upto anchals ..
Table C-VIII part A-Upto anchals.
Table C-VIII Part B-Upto anchals.
Relevant particulars of the above tableF are given below :
Table C-I:-Co~position of Sample Households by relatIonship to head of family classified by size of land cultivllted
The table gives separately fOr total rural and urban areas, the COmposition of sample ho~eholds by heads
of households, their spouses, relations (separately for married and never marrifd widowed and divorced or separated), and unrelated persons. The information relating to rural areas is crosS,:tabulated with reference to (i) househO'lds engaged neither in cultivation ~or in household industry, (ii) househOlds engaged In household industry only, and (iii) househOlds engaged in cultivation, the last named category being further classified by the size of holding into 10 size-classes.
Table C-I1-A.ge and Marital Status
This table gives, separately for rural and urban population, ,the marital status of males and females for the entire population and also for quinquennial agegroups beginning from 10-14 years. All persons up to 9 years of age have been treated as 'unmarried"
'Married' implies a living. spouse, whether of the first or a subsequent marriage and includes any husband-wife relationship customarily rec{)gnized by SOCiety as well as de facto unj'on.
'iWidowed' means married but spouse dead, no reo marriage having taken place.
'Divorced' means a person divorced in a lawful manner either by a decree of a law court or by a regular, social or religiOUS custom, but not remarried and 'Separated' means a person separated from wife or husband and living apart with no apparent intention of living together again.
'Age' means number of completed years on the 1st March 1961, the reference day for the 1961 Census. I'nfants below one year have 0 year as their age.
Table CIII Part B-Age, Sex and Education in Urban Areas only.
Table C-III Part C-Age, Sex and Education in Rural Areas on{y.
1'0 both the tables, educational standards of the population (classified by sex) are given for all ages and quinquennial age-groups commencing from 5-9 years to 30-34 and broader age-groups thereafter. Those within 0-4 years of age were, by definition, treated as illiterate.
Table C-V-Mother-tongue
This table gives the number of speakers of each mother-tongue returned in the Census. The mothertongues have been given in alphabetical order and are classified by the Linguist in the Office of the Registrar General, India, on the basis of Griersc:'m's Linguistic Survey. They have been marked approprIately to indicate-
(i) mother-tongues Of countries outside the Indian sub-continent printed in italics);

(ii) mother-tongues unclassified in the Linguistic Survey of Inqia (with asterisk);
(iii) mother-tongues though classified in the Linguistic Survey of India, either tentatively reclassified by the Linguist or considered by him to be unclassifiable (with dagger);
(iv) mother-tongues unclassified by the Linguistic Survey of I ndia but tentatively clas,sified by the Linguist (with asterisk and dagger).
In 'Nagpuri.Eastern Magahi', .the hyphenated words have been inserted by the Linguist to indicate the affiliations of the mother-tongue 'Nagpuri'.
Mother-tongue is the language 'spoken'in childhood by the person's mother to the person or mainly spoken in the household'.
Table C-VII-Religion
48
This table gives figures for the following six main -religious groups, arranged in alphabetical order :
(i) Buddhists,
(ii) Christians,
(iii) Hindus,
eiv) J ains,
C v) Muslims,
(vi) Sikhs
and
There is a residuary group 'other religions and persuasions' as also a group comprising of persons who did not state their religion.
Table C-VIII-Scheduled Castes and Scheduled Tribes, classified by Literacy and Industrial Categories of Workers and Non-workers
Part A of the table furnishes data for the combined population of all Scheduled Castes and P~rt B for the combined population of all Scheduled Tnbes.
The popUlation is categorised by sex into C&) illiterate, and (ii) literate a~d educated, and also by the nine industrial categones of workers and nonworkers.

--o
P-I-:7
49
... co to = It'l _=. ... '" ... .... ....
.. CCI -'" ..... ....
<.o(»~""on,,", er;)C'f')t,OC1lf':)N 000:>000;) _"'C'-iN'N_"
o <.o""on tJ'lN _ ...... _o ...... ~ 010)~Q:l-~ ~ ... ~eo"'~c-i'-..
NOl'lCOCC,,", C'\I'ct:I(j)C'J.-..4 c.o~~C".( -
Table C·I
.... ~ ... '
.. '" o
< == '" ,.c ..
;:J
~

rable c-n
.. ... [; z
r '" , ...
11 l~
..... .....
0:>
50
~ ~~ ~N ~~ ~~ ~_ ~ ~_ N~ -
(j)
"" I U") t<'l
CON <00> ON ~ " co_
N
..... N -
"""" 0:>"" ~i;Q (,ON
- to-c-r I:'t'"
It")~ ""'''''' O')c::r'l C\I ...... c.o ... U"") ~ ... IC.O N ,...-.....
~-
+ ~
N •
.......
..... .
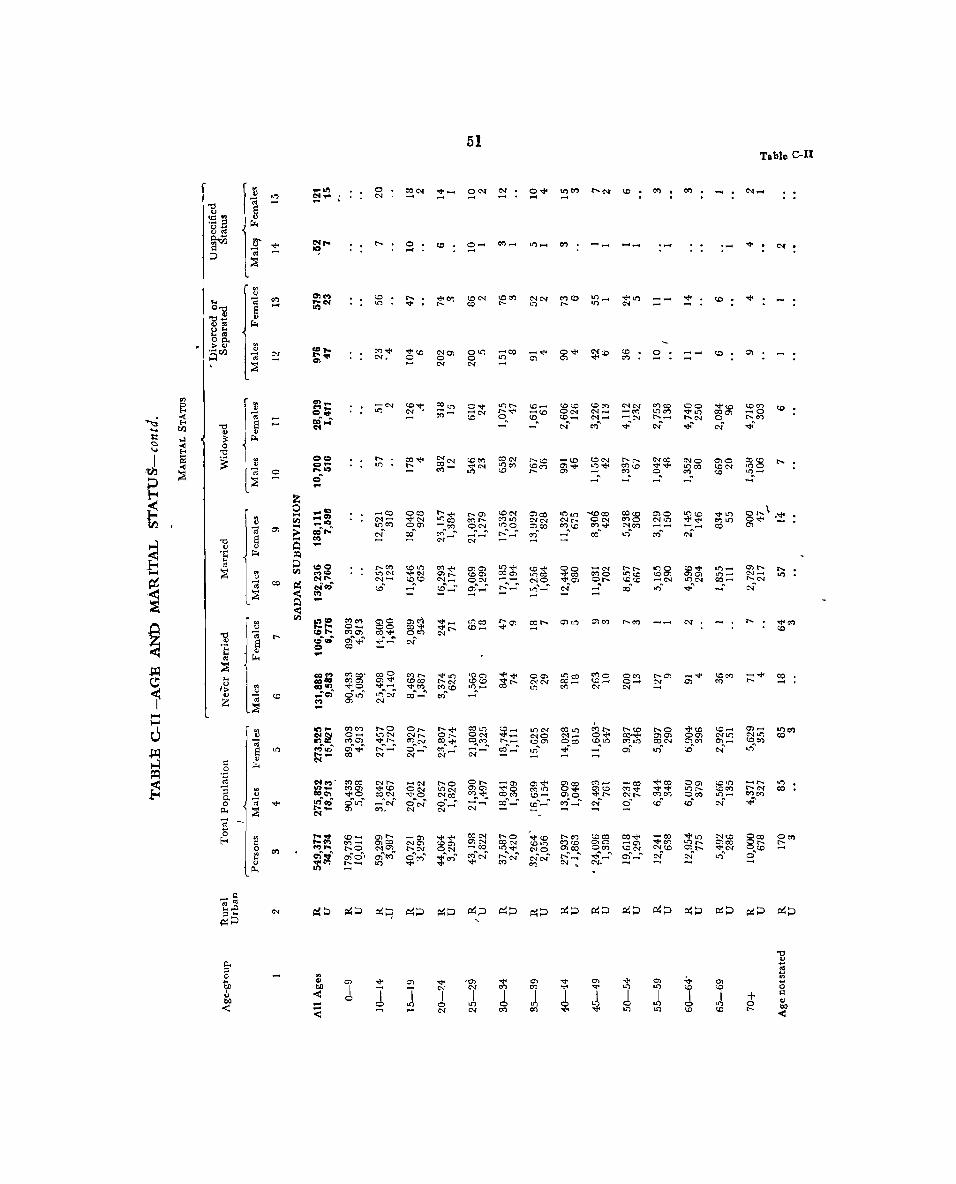
f
... I~ .., Z
p.. ::> o ~ u CO <
c:t') .....
o .....
-<1
o N
o .....
51
""_ ON N ..... .....
<oN CO
0"1 o "'I
a> a> <0 a> ON ~ .. ,-.. ; ..
on." --<0 CO C'l ....... Oc-.l c<') ... (.C ('t')~ ..... CO'
o
Table C-II
"" .
0 .... \ ."" ~"" .....
+ o .....
CO .....
0<:<1 .... .....

Table C-II
r r n I"; I 8
H
'" <= o t
p..,
o -
:0
IOU') ...
52
.""
11')_ --C'llt') <.,)(", co
-0 co ..... ....
Ol C<')
I to C<')
....
..... <.0
.... -o
.....
co
...
--t'I
+ o r--
01_ ..,

on .....
o
co
l
It)
tl
1 ~ I
I ! l p..
co
o N
U")
'"
co
CON
53
COO> o c<'l
""0 <00> 00<')
0"
co
OC'-l .... ..... co co
0<0 c<'l
N .....
on. :
t1')
'"
0>0>
-'" COc<'l 0>"
o N
eoC') co~ -.... c<'l" \
o c<'l
eo
eo'" ~"<O .....
on~ oeo o e-7
-on cor--
- Tablle ColI
• co
oon ....
0 .... ~O> e-7
~p ~o ~o ~o ~o ~o ~o ~o ~o ~o ~o ~o ~o ¢o ~o ~o
.. " lo.I)
< ..... '<
"
0>
1 U')
0>
I' tt"l N
0> U')
I U') on
0>
1 <0
t o r--

54 Table C·III Part B
_ u
t~ <0
{i :~ g ~ - r C'l t<'l
s:l .'" ..
..<lOS", ....
al 8 0 '" "'0 ...
..<l rz.
~o.-lJ") Cf) ·N
... 00'" C':S -; - 0 ;3 -
til Z'" 50 ~ -; t<'l
..:l ~ I'l '" > I'l ,-
r ..:I 0.. os '<!< .., .C'I' ..... -
.., .~ ;l l~
0 :tOtt)et')_
..:l '" 0' u ~ t<'l
..: _ u U bO
Z os ... to rz. -s:l ~
::>-t 0 .~ 0 Q) :.a
Z ~ s:ls:l", tl ..., C'f :CC')::lt')r-..~CX)~
u u rz.
c3 ..<l...,o -; ID '" os
I~. 0> t; ·N<OOOl-O
al S ... .... '"
::> ~ bO E-< N
. .....
0 0 E-<.£ " ~ '" L~
'" C;;) s:l r ~ co .0>0>(0 "NOt<'l
.....
~ o - N Cf) co (.Oet'l-C'l
os
r 01""4 I-t >- ~ C'f ;l ~
1 co
~-!~ t 0 "0 bO N
~
os .3
l B'~ Q rz.
...
~ .;:::::Il 8 II ! g rz.
..... .COOeoCOVtN-l'_ ..<l
...... " ~ u ~ Z CUocn C; '"
.NCOc<lNlJ")"<!'lJ")<D U " ~ ~
co L(')('o"d"C'\ICt)C"{ • 0.. E-< N
~ N ... ~ 0
lXl f ~ " ~
... .N0lJ")C:OCOc:Jl ..... coo ~ " 1l r tl ~.~ 0 ID .,<!<<DC<'l,<!<lJ")C:O"'<!<-
... <D
l~ .... , .q..C\"}N- I>l bO os
{i
N
Ogj > '" e-~
... I'l "0 >- ~o
Z ..:I 0 ..... ~
os .. ... ~e-'r"'I 8·8 .0 NC<'lC:O'<!<'<!<"OOC<'l
..:l ... ..: -; 0;: 0; co .NC'>!
.;::: = Cf) .000N_CCL(')t,OO'l ....... Ct') lJ") ...... -
Z p...:l 01 0'1 c<')-I.()~CC1"'1d'4ct)-Z :l 2"0 N
,_, 'iii ..; , " g 0' '" 0 ~
.......... E- '" >-Joot
c3 os
~ ::> 8
l~ ~ 0 0 '" '<!<
E-t ;; 'B 0'1 ...... ~t.Ocn_oCt')of"o.C"-l ~ 0.. .. '" 0 oCOO.q.ct.ONc<")"'f"O)- .a
U 0_ 'iii c:o ..... N",O')~~~c<'i~N- :a ....... ... ..<lOS 8 ..; S ~ p; .::: g-;;- u
.. .~
fil 0
E-< ;!:.~ <3 '" .. Cf) .et')U")~_
(I) '" bO 'iii e<'l
';;'~> '" ...
... '" < ~ c:::l
... u '" ...
~ <II ;:l- n .. :;;;;§~~~;~g~ bO
... '" Oi " ° OJ
!:) 2 " 0> co ['.t-...t"'-ot--...(.C-cnoo:;t4 "0
< ~ ::g ",' ' ' I~ ..... '- - -; ....
< ~ N :-~-
u OJ '" 'a =
~ ..l
[~ ..<l 'u ,!
< CD C()oo_co<.OL(")C\ll!')O'>t.Ol!")
u :.;:; " P-t
,.. NO"lOC()<.OCC1-CO~c<') E-< " l~ tf) <0 0 _~.q._1!)Lt":lc<'i-0")Ct') ::g ..... .., :-~~"'l""'("O-
0' n "' n "' "' "' "' n "' n '" C'f
"
t~ .q.N __ --·-N--
~ ~ ....
c.!J~ 2
1 2..- M tnOlC") ..... N-Ct')~CO~..q. r II 0
.... N ....:r--..c.D_-Ntr.l- ...... - bO
11 '" lJ") In __ t-...cococoO:!et'lC\l" s:l
c<i' '" '" ... '" ·C· ~N -_
~ .. " " =
l~ . ~ 'M 01 co : ...... ..q.co ...... _ ......
I~ " Ct"),,~..l._~-N~Ct') ...... =
..... ~~J::o~~~~~~ ~
~ '<I'
.,.
I! .". ~~er') ... N ... N~c-.i-... N~-... " r .. s:l
N OJ " -$-!....,~~ /.!:: c:o .. :U1~t.CN_CC")
1-4 0
bIlC<S",u I C<S ..,.
1-4 ;;: III
~~£'a 0 ~~ ..... S ,.. lJ") "<!'"<!'o '<1'<0 " '<!<o '<1'0> t·~O~~
I '" !:::!:~~~~~~;;~ U c. c<l <:> .~ bO '" " bO
0
1: e' ~"'~Ct'")"'er')"'"ic;~"'et)"e-.l-'" ~ ~ GJ. U l~ tn
P-< OJ'o En c::'" " co • "'<D'<!< "'''U'')C:O ....
~ M
'_l(');::!0)0')"'"
5 .2: ~"ll
....
J-l t= .... "'- l~
~ 0
;:'0
E-< .... co ...... co_Ll")OCO("C~['C"O
fS ID
0") ['.O')co Nl!")CO,QOlCf)-
It N ... NO')L()O~r.....O')--CO
rD' o::rr---... tO ... l.!"j't") ... ~ ... Ct'") ... tO ... l!") ... N LP-< ..,
'" "C
'" " c. ~ c. 5
;:l ;:l
0 0 .. ..
... ... '<1'0> "<!'OI.,..''<I' ....
bIl .. '<I'0>"<!'0>'<I'~0I g bO " 0:-
., 0 1>1) jiTil1l i 1 +~ ~
1>1) ~O'l __ NC"rC'C') L(') bO <
< / I I IJ I I I I +~ < .... lJ")OlJ")OlJ") U")U")O bO
.... .... ..... _"'IC'{c:<'le<'l'<!<<D<
" .. OlJ")s~C'{~g~~g< -<

55
TABLE C-III PART C-AGE, SEX AND EDUCATION IN RURAL AREA S ONLY
PALAMAU DISTRICT
EDUCATIONAL LE"VELS Literate (without ,:.... --.
Age.group Total Population IllIterate Educationallevels) Primary or Matr~culation Junior Basic and above ,...
,.....~ ,..----..A.. __ '""""' ~........__'""""'
,_.--_.,.A.a __ ..... PersOt'ls Males Females Males' ,Females Males Fen.ales Males Females Males Females
2 3 4- 5 6 7 8 9 10 11 12
All Ages 1,131,625 567,913 563,712 448,101 545,922 89,901 15,4d9 25,354 2,223 4,557 98
0-4- 197,094 97,055 100,039 97,055 100,039 '1 ••
5-9 179,089 !)1,627 87,462 72,818 82,740 18,542 4,669 267 53 10-14 121,433 55,137 56,295 38,624- 51,441 20,743 4,141 5,754 713 16 15-1.9 83,024 41,584 41,440 27,659 39,081 7,531 1,775 5,838 559 556 24 20-24 9), 153 41,499 48,654 29,279 46,813 6,957 1,454 3,846 356 1,4"17 31
25-29 91,375 45,312 46,063 34,005 44,705 7,534 1,120 2,676 217 1,097 21
30-34- 78,545 39,647 38,898 30,718 38,050 6,455 710 1,939 12], 535 11 35-44 123,169 62,901 60,268 50,017 59,309 9,745 826 2,646 125 493 8 45-59 _113,66S 58,564 55,099 47,733 54,4S1 8,666 559 1,821 58 344 1 60+ 53,817 24,440 -29,377 20,074 29,147 3,710 214 5(i2 15 94 1 Age not stated 263 147 116 119 116 18 5 5

"I:able C·V
'.
.0> N
·to .0 .r-. ltl ...: ""
.co .0> . !::;
r-.'
"" .0'> .:::: -""
., .f"ooo. ."" N O· N
.0
.U"l 0'> co' N
56
.0'>
.c<')
.0'>
.e<')
.0'>
.e<')
tJ:)ir-...COO')O - ___ C\I
oN
-co ""
§
• C\I
. ..,
.r-. ·CO
.0 ·N
:~
• CI"I •
.0U"l
.CO "j< e<')N
.U"lN
.CO~ c<')N
.0 • to
0'>
. .,., CO

1'-1-8
.f"
.:t'-l<0
... .,
N .~ co ~" t<l
N ..... ."'l co ""," t<l
.N .en 0 ,,"
.N • a.
0 ,," N~
N .c<l
.... n
c<l
"CQ ·N '<l' .c<l
to <J:)n
c<)
.N • 00 .~
CJ)"
N
.~ .0 ..... 0 0)" N
.0)
. " N
._ 0) ,.... "'"
157
."" .",
.to
.'<1'
.co ·N
• It') .0")
.If'l00 <J:)
.If'l- a. Nlt')~
.C<'l a.lf'l • to "'" co NC()q
O)~N......t ~ «> to ,....
I!f')"
8~Rr--.et) ~ «')
"","
"'" ."'" 0 ·00 t<l
~ ."", .....
..... CO""'O") t<l 00 co 00 "",' .,.)
~~ot:;;;e<') co "1 "",' on
e<') .N" .", co 0<)"
co' ;:;g co
'" <:::)"
'" .a. "",
Ii') : ...... c-.&'-f"
""' r.o • Ii')
r-.
"" :- co Cf')
"
co .. '0') 0\ '-""
Ii') , " <.0 'N c<'l
N 'ON ~ e<') '0
N ",,"
- ''''''' IN 'e<)_ on ",,"
._-'N
.(0 'N
.(0 'IN
."" .0")
.t<l e<')
·""N .-eo
.on .<A .C'>f
: ~ to<)
t<l
t<l
.<1'
.~
. ."
C'l .0 .0\
N
"" ._c<l .,.,
.0
.t-
"" .f" ·0
e<'l
er)0-")_0')
t<l "
;<c
."",
.""
.r-:. e, .~
._: .. : ...
" :
.- :"!
._
Table C-V
.o.r--.
.t::-J • .['000.,
~
-:
-
• C'I .<c t--
.N
.0
N
.....
.e<') ....
.-.tt) ,....
.00
.e<) If)
,t-."",
""

TabJe C-V
'-"" . ""
: It') 00
.~
'0')"" . -" .""
.0')
.",
• It')
.0')
.~
.....
:-
.0>
.~ ..... "
.It') .0 ·co . '"
• 0 ...... 01
.co
.~
to
00 .", 00 .0
CO
N
.0
.01
• C'I
• It')
'\0
• r.o 'N ....
.0').
.", -.'<1'·0
C<) -._It')
00
""~

on on
o on
·on • 0'> on . ",,'
. " '0
CJ')
-
59
• 0 ·on
.0
(0" CO CJ')'O _ .......... _C'I
on (0 on
._
.-.0;)
....
: to •
....
.on
.on
.on
.CO • '<to
on
Table C-'

60 Table C-VlI
TABLE C-VII
NAMES OF RELIGIONS Total
DistrjctJSubdivisonJ Rural Anchal Urban- Totalo Buddhists Christians Hindus
_, -"---_, ,..---Persons Males Females Males Females Males Females Males Females
2 3 4 5 6 7 8 9 1O 11
PALAMAU T 1,187,769 598,600 589,1'89 21 5 10,530 9,323 529,545 522,278 R 1,131,625 567,913 563,712 18 10,108 9,069 504,684" 502,075 u 56,164 30,687 25,477 3 5 422 254 24,861 20,203
Sadar Subdivision . T 684,111 294,765 289,346 • 15 5 3t'O 291 264,507 258,526 R 549,377 275,852 '273,525 12 97 135 249,647 246,532 U 34,734 18,913 15,821 3 5 243 156 14,860 11,994
Daltonganj T 63,061 32,946 30,115 3 5 247 155 28,872 26,458 OR 37,791 18,902 18,889 5 17,436 17,567 U 25,270 14,044- 11,226 3 5 242 155 11,436 - 8,891
Chainpur R 63,489 32,013 31,476 46 86 28,640 28,092
Leslieganj R 42,563 21,181 21,382 19,523 19,824
Panki R -50,326 25,346 24,~80 5 5 21,543 21,026
Chhatarpur R 58,238 28,978 29,260 3 27,236 27,309
Hariharganj R 30,647 15,530 15,117 14,648 14,343
Patan R 60,176 30,233 29,943 27,808 .27,425
Bishrampur R 78,822 39,432 39,390 6 4 36,016 36,074
Manatu R 38,586 19,365 19,221 17,298 16,953
Hussainabad T 98,203 49,741 48,462 12 31 40 42,923 41,022. R 88,739 44,872 43,867 12 30 39 39,499 37,919 U 9,464 4,869 4,595 1 1 3,424 3,103
Garhwa Subdivision T 358,877 180,711 178,166 6 971 909 159,359 158,110 R 347,221 174,512 172,109 6 960 902 154,123 153,470 U 11,656 6,199 5,457 11 7 5,236 4,640.
Meral R 51,340 25,522 25,818 4 22,346 23,114-
Garhwa T 60,571 30,079 30,492 12 8 23,601 24,105 R 48,915 23,880 25,035 1 I 18,365 19,465 U 11,656 6,199 5,457 11 7 5,236 4,640
Untari R 54,663 27,740 26,863 5 24,182 23,498
Dhurki R 21,807 1l,062 10,745 .10,030 9,795
Ranka R 45,990 23,327 22,663 21,426 21,03&
Bhandaria 10,079 9,462 ,
R 19,541 .. 954 901 8,740 8,229
Majhiaon R 55,426 "27,625- 27,801 25,031 25,122
Bhawanathpur R 49,599 25,277 24,322 24,003 23,211
Latehar Subdivirion T 244,801 123,124 121,671 9,219 8,123 105,679 105,642-R 235,027 117,549 117,478 9,051 8,032 100,91)1 102,073 U 9,774 5,575 4,199 168 !\1 4,765 3,559-
Balumath R 55,702 27,086 28,616 .. 98 92 24,772 26,236
Chandwa R 35,755 17,929 17,826 527 325 16~621 16,769-

61 Table C-VII
RELIGION
ARRANGED'IN ALPHABETICAL ORDER Total - __ ' .. .,.ce .
Other religions Religion not Rural District/Su bdivisiortt -Jains Muslims Sikhs ann persuasions stated Urban Anchal
4a mt 'SAt "'" , ,......~~~ , ""A .. - . .;::~ Males Females Males Females Males Females Males Females M.tles Females
12 13 14 15 16 17 18 19 20 21 2
71 81 57,937 57,141 496 360 1 ·To PALAMAU 7 5 53,012 52,522 84: 40 1 R
64 76 4,925 4,619 412 320 u
69 80 29,470 30,143 364 300 1 T Sadar Subdivision 6 4 26,047 26;842 43 11 .. 1 1 R
163 76 3,423 " 3,301 321 289 .. U
64 76 3,439 3,132 321 289 T Daltonganj ~ 1 1,460 1,322 R
63 76 1,979 1,810 321 289 U
3,327 3,298 R Chainpur
1,658 1,558 R Leslieganj
3,798 3,949 R Panki
1,736 1,951 3 R Chhatarpur
' .. 1379 774 3 R Hariharganj
2,424 2,518 R Patan
3,377 3,306 33 6 R Bishrampur
2,066 2,267 R Manatu
5 4 6,766 7,390 4 5 1 T Hussainabad 5 of 5,322 5,899 4 5 1 R
1,444 1,491 U
1 20,327 19,110 48 36 T Garhwa Subdivision 1 19,405 18,312 18 24 R
922 798 30 12 U
3,172 2,704- R Meral
6,431 6,360 35 19 T Garhwa 5,509 5,562 5 7 R
922 798 30 12 U
3,543 3,354- 10 11 R Untari
1,032 950 R Dhurki
1,900 1,620 6 R Ranka
383 332 2 R Bhandaria
2,592 2,679 R Majhiaon
1,274 1, III R Bhawanathpur
2 8,140 1,888 84 24 T Latehar Subdivision 1 7,.560 7,368 23 5 .i R. 1 580 520 61 19 U
2,216 2,288 R Balumath
778 732 3 R Chandwa

Table c.vu 62
TABLE C-VII
Total NAME OF RELIGION
District/Subdivision! Rural Anchal Urban Total Budhists Christians Hindus
,- ... ..... Persons Maies Females Males Females Males Females Males Fem~les
1 2 3 4 5 6 7 8 9 10 11
Latehar T 47,518 24,095 23,423 172 14-0 21,603 21,013 R 39,829 19,895 19,934 96 76 18,044 18,089 U 7,689 4,200 3,489 76 64 3,559 2,924
Manika R 30,687 15,446 15,241 14,762 14:,598
Barwadih R 30,969 16,100 14,869 397 448 14,214 13,127
Mahuadanr T 32,389 16,525 15,864 8,025 7,115 7,912 8,217 R 30,3M 15,150 15,154 7,933 7,088 6,706 7,572 U 2,085 1,375 710 92 27 1,206 645
Garu R 11,781 5,943 5,838 2 5,79.5 ·'),682

Table c..VII
RELIGION-ccncld.
ARRANGED IN ALPHABETICAL ORDER Total
Jains Other religions Religion not Rural District/Subdivision/
Muslims Sikhs and persuasions stated Urban Anchal r----"--- .----"--.
Males Females Males Females Males Females Males Females Males Females
12 13 14 15 16 17 18 19 20 21 2
2,289 2,251 30 19 T Latehar 1,755 1,769 R
5'34 482 30 19 U
680 642 4 R Manika
1,472 1,289 16 5 R Bar,wadih
557 532 31 T Mahuadanr 511 494 R
46 38 31 U
148 154 R Garu

Table C. VIII Part A
I
l
..... ..... .....
..... .....
.....
64
0'> on 00 '" to ~ ....... coC\(o O-"_N _.,. ¢r')"'Cf')'" N"'Ct':I'"
o Ct')-(!(")O') -.::f'!OL()_"". It') Ct') - 01 ef'}
t<)' t<)' ~. t<)'
tOt<)OontO N "N-<O r-... 0') 0'> ... O'l 0':1 -
onoo", ° -t'.lf'.U")tn li)C'.! ....... _!n ",' 0'>' 0' to' .,.," - -
..... OOon ..... O'> _tOCC")o~
","'tOO'>", ... ...... .... ....... -- -~r::~g~ C<')C'I ..... O'>C<') .. , " " - --
L()C'lt,O_O o",ooO'>to 0""0'> 00 on to" <t";" to" ~ Il")"
N~_c<')N tOC'lon",to 00_01""-to" on' ...... t<)" ","
'" "'l'" on C'I r-.. 0""" co-"'lC<')"'-to
c-.;_"C\J'"
~~~~~ C\l 0 .. ~ to: ~ "'l--
;;~~~~ 0 .... ""':.,CC") - -
-N('oO')CO C(")'Ct') "" (.0 N c.ocoee -
",C<')t<)C"ltO _tnO")-O
"' ... " .. ~ C"l Ct') - --
o",O'>tOC<') C'I 0'" 00 on ",,,,C'lC<') on c<"t Ct') .... Ct)'"
to""to",'" l!) 11) C'-.I CI'l ..q. CO_COl' r..o" .......... tt:J ...

1'-1-9
.... ..... ..... :>
:> . ....
- I "" - eoI'" CO" -
O')-("O.r-....CJ') Ct')-~"C\I CO""'l"--l(')O e-.i' "I:f'I" r.;<')1\r:t')"'tt')1\
10 .... _ C') :00
. -• C')
65
...
'''''''It')lt')'''' -NI!Nl!')"'d't (,0-0')_",
N~C'\I"'_O\N
000>10 ........
.It')
Table C-VIII Part A
-.,.,

Table C-VIlI Part B
r
..... ...... ......
......
......
......
t
.... o ~
'" > ~;:: • ::I
o
CD -
--° -
ll'l
L
COCIOO co..,.., ",coo fIIl!t ... ro;.,.. ... ----"'..,CO 0..,'<1' en",'" MCtf~" ....... ... ,_
66
",,<.o""""ll'l <.oooco"" 0') I!') co C'.IO ~1t")"'_"'C\{~'"
.......... 0""'" __ NO")C,O
..... ...,""""''''' ...,"<c"~~",,"
0 ..... <.0<.0 N -O'>IOt!jCO ~o ... o ... ----
""""ll'l""N Nll'lCOCD"" <.0<.0 ..... ..., N-_ C'lCO NO ll'l I1")CO-U")CO
""...,,,,,CD ll')"""',,,,'
"",<.OCt)""", -~O'>-O') <.0""""<')<.0 c-;-.. c-.i'~"0')'"
"'O ..... COCO ","COCflCOo) "",""NO<')'" C\l"'_ .... c-;et) ... o,l"
""""""COO ---C<'le,o O""OCOll'l C<')~ _"c:iet')'"
....... ONO'lc<'l """"lI')C<')co "I:f'ICf')Ct')CO_ et")" _ ... e<")"~"
0<')0<.0<.00 ~O")"-O> U"lll'l0'lll'lCt) c,o.... "'c.c;'f'.,. ..
c.o--_o ",C(')-C<")CO co-COCOOO C'\f"'-"It)"er)"~""
__
_01:'--- ..... (.0 C'f)- ...... C::Ol'_""""O<')ll'l
_" ""~..., '" co ..... 0"" ..... ""<.0 O';<N"""" -C:OO""O<')ll'l tOf"'oo._ ...... C'O r--..o_coo """",,"';'"<c"~
Netlet")['-..r--.. 0'l-lf")'1"~ 0"",,,,Ct) <.0 ~"","~r-:'~

I-< ..... :;
..... ..... :>
..... :>
:> .....
l
l
~ l
o C<')
O'l C'I
co C'I
<0 C'I
ll') C'I
0'l0'l
ll')
67
~<OO'lCOO _UjNOlt')
O .... CO ...... _ -
.. '
.ll') .C<')
.ll')
.10
Table C-VIII Part B
(,O_et)c'o ..... If''')_CO''''''''O COC'lC'l'<t'C<') 1:'1 _r,C<") ... t!<') ....
.<.0 ._ .C<')
.e--.r ....... ....,

EXPLANATORY NOTE
Special tables for the Scheduled Castes a~d Scheduled Tribes, separately Jor each caste or tnbe ~re a?innovation of the 1961 Census. The tables In thIs aeries are the following :
SC'f-I part A-Industrial classification of persons at work and non-workers by sex for Scheduled Casles.
SCT-I Part B-Industrial classification of persons at work and non-workers by sex for Scheduled Tribes.
SCT-II part A-Age and marital status for Scheduled Castes.
SCT-II part B-Age and marital status for Scheduled Tribes.
SCT-III part A (i)-Education in urban areas only for Scheduled Castes.
SCT-III Part A (ii)-Education in urban areas only for Scheduled Tribes.
SCT-III part B(i)-Education in rural areas only for Scheduled Castes.
SCT-III Part B(ii)-Education in rural areas only for Scheduled Tribes.
SCT-IV part A-Religion for Scheduled Castes.
SCT-IV Part B-Religion for Scheduled Tribes.
SCT-V Part A-:,Sample households engaged in cultivation classified by interest in land and size of land cultivated in rural areas only for Scheduled Castes.
SCT-V Part B-Sample households engaged in cultivation classified by interest in land and size ofland cultivated in rural areas only for members of Scheduled Tribes.
SO-I-persons not at work classified by sex, type of activitv and education al levels for Scheduled CMtes.
ST-I-Mother-tbngue and Bilingualism for Scheduled Tribes.
ST-II-Persons not at work classified by sex and type of activity for Scheduled Tribes.
The tables being reproduced in this Handbook and the levels up to which they are reproduced, are indicated below :
SOT-I-Industrial classification of persons atwork and ricin-workers by sex for Scheduled Castes (Part A) and Scheduled Tribes (Part B) -For the district as a whole.
Sa-I-Persons not at work classified by sex, type of activity and educational level for Scheduled Castes-For the district 'as a
whole and rural areas -of such anchals in which the combined Scheduled Caste population is higher than the average Scheduled Caste population per ancha I in the district.
ST-I-Mother-tongue and Bilingualism for Scheduled Tribes-For the district and selected anchals in which the combined strength of Scheduled Tribes is higher than the average population of Scheduled Tribes in an anchal.
SToll-Persons not at work classified by sex and type'" of activity for Sche"'duled TribesIi or the district and selected anchals in which the Scheduled Tribe population is higher than the average Scheduled Tribe population per ancha1.
The Scheduled Castes and Scheduled Tribes have been notified as such under Notification no. SRO-2477-A. dated the 29th October, 1956, issued by the Government of India, Ministry of Home Affairs in accordance with the provisions contained in Articles 341 (1) and 342 (1) of the Constitution of India. The list of Scheduled Castes and Scheduled Tribes, thus notified, fOr the district of Singhbhumis given below
A. Scheduled Castes
1. Bantar
2. Bauri 3. Bhogta 4. Bhumij
5. Bhuinya
6. Chamar' or Mochi 7. Ohaupal 8. Dabgar 9. Dhobi
10. Dom or Dhangad 11. Dusadh inlcuding Dhari or Dharhi
12. Ghasi
13. Hafalkhor
14. Hari, Mehtar or Bhangi 15. Kanjar 16. Kurariar 17. Lalbegi 18. Musahar 19. Nat 20. Pan or Sawasi
21. Pasi 22. Rajwar 23. Turi

B. Scheduled Tribes
1. Asur 2. Baiga 3. Banjari' 0
4. Bathudi 5. Bedia
6. Binjhia
7. Birhor"
8. Birjia'_
9. Chero' 10. Chik Baraik
11. Gond
12. Gorait v
13. Ho'
14. Karmali
15. Kharia
16. Kharwar
17. Khond 18. Kisan 19. Kora
20. KOrwa
21. Lohara or Lohra'
22. Mahli"
23. Mal Paharia " 24. Munda' 25. Oraon
26. parhaiya
27. Santal
28. Sauria paharia
29. Savar
Table SCT~I-Indltstrial classification of persons at work and non-workers by sex for Scheduled Castes (Part A) and Scheduled Tribes (Part B) for the district at a whole
Part A gives the same information for each of the Scheduled Castes as given in Table B-1, i. e., industrial classification of workers and non-workers. However, the data are not classified by broad agegroups. Information is also given of the number of males asd females of each caste engaged in the
69
unwholesome occupations of (i) tanning and currying of hides and skins, and (ii) Scavenging.
Part B of this table give,s the industrial classification by sex of each Scheduled Tribe into nine categories of workers and non-workers.
Appendix to Table SGT-I shows the total popUlation, of Sch~duled Castes and Scheduled Tribes in each anchal of Palamau district.
Table SC-I-Persons not at work claSsified by Sex Type of Activity and Educational Leve~! fo: Scheduled Castes
This table gives for the Scheduled Castes as a whole, the classification of nO!n-workns by sex, type of activity and also educational levels. instead of 8 detailed groups of activIhes relatmg to non-workers vide Explanatory Note to General Economic Tables at page 18, the grOups are restricted to four, namely' (i) full-time students, (ii) persons seeking emplOy: ment for the. first time, (iii) persons employed before but now out of employment and seeking work and (iv) others: '
'Others' include persons engaged in unpaid home duties (such as housewives), dependants, retired persons, beggars, and inmates of penal and mental institutions.
The classification by educational levels is by illiterate, literate without educational level, primary Or Junior Basic, Matriculation or Higher Secondary and above Matriculation or Higher Secondary. '
Table ST-I-Mother-tongue and Bilingualism for Scheduled Tribes
This table gives the extent of prevalence of tribal languages spoken as mother-tongue by each of the SchedUled Tribes and the number of speakers of subsidiary language in each tribe.
Table ST-II-Persons not at work claSsified by Sex and Type of Activity for Scheduled Tribes
This table gives information similar to that in Table SC-I, in respect of the· Scheduled Tribes. However, information about the four types of activities of non-workers, though given separately for each Scheduled Tribe, ,is not, as in the case of Scheduled Castes, eIassified by educational levels.

Table SCT-I Part A
r
..... .....
l
~'" ... " .,;:; '" ..... .::: ;:; ....;:;0
u..c ,~ til
~-
o
CX)
... :co _CQ eo .. o· o:l'
,C<") ,I!)
• I!) ......
...... . co ....
.co ..... o
N ...... • -.to
C'I I!)"
o 'to ._ ..... to"
70
.r--.. .e-.rCt":l_CI")N .0<.0- .-.::t' .(.0 '0""""1 ...... • ~_e<i
.e<')_{,Oe<')O-.::tcO')-r--.~Ol!')to • .q.t ~ :: I,.., _ ...... ~ ...... <.0 Ct') _ .
:~~~~co~~C\l~ N ,.... N"
... o
1a S t;I
o
I
.""
·co
.""
:0:: .-.to ·tOc-.r .... ....... ...
.cr) 0,..... :0;
.....
.co
.~
.0_
.I!)
• I!) ....... 0> ......
,..: cO ......
""
ai ...
.0>
.to . ....

Col"" eM """" " " ...... co
"' ... ......
-:(
.on . ...,
"0 " .....
71
.0 .""
·0 c..o ['.. C\l ...... ",co C\f0') "'_ ~ ~ ('0.
'at~~O:> ~NC<')on~-CO -
'0:> 'N
:~~~~~~g~~~~~~8~e<":I=~ NC'-l_ - er') C'-f-N _.... ...
: .....
: to- • \ •
......
...... -
·co ..............
..... .....
: .....
.""
Tabl. SCT-I Part A
:;G :~""g:;2Rg-§5"" :fci ~ CO ..... CO f',. C(')
C<')
-C\I .0') .Ct")..- CC"j U') co e<":I ....... .0) 'N .<.0...,(0 0:> ·on tr,I-'" (.0 C\I
""
.",,-
r.: cO .....
'0:> . on

72 Tabfe SeT-I Part B"
TABLE SCT-I PART B-INDUSTRIAL CLASSIFICATION OF PERSON~
Name of Scheduled Rural Tribes Urban
All Scheduled Tribes
I. Asur
2. Baiga
3. Bathudi
4. Bedia
5. Birhor
6. Birjia
7. Chero
8. Chik Baraik
9. Gond
10. Gorait
11. Ho
12. Karmali
13. Kharia
14. Kharwar
15. Kisan
16. Korwa
17. Lohara or Lohra
18. Mahli
19. Munda
20. Oraon
21.· Parhaiya
22. Santal
23. Unclassified
2
R U
R U R U R U R U R U R U R U R U R U R U R U R U R U R U R U
R U R U R U R U R U R U R U R U
PALAMAU
WORKERS ._---__,___.:..
Total Total
workers (I-IX)
~.--------~--------~ ~ Persons Males Females M F
7 3 4 5 6
I
As Cultivator
B 8
II III In Mining, Qu: rying, Livestocl
Forestry, fishir As Hunting and PI
Agricultural talions, Orcha labourer and Allied
10
activities ,.....--.A..o_ ..
M
12
226,191 112,553 113,638 68,164 58,493 51,289 45,456 9,342 10,546 3,820 2,398 1,348 1,050 736 403 194 159 31 23 55
804
634
.. 2 2
1,575 153
27,238 71
822 12
1,187 85 37
1 6
8
7 11
65,370 212
7,540 566
'13,050 6
5,207 54
435 23
9,074 161
82,430 960
10,586 19
180 • 2
3 55
422
379
726 70
13,572 50
429 9
567 15 12
1 6
2
5 10
382
255
1
2
849 83
13,666 21
393 3
620 70 25
6
269
275
405 36
7,919 30
250 7
354 14 10
1 2
2
2 4-1 4
236
103
2
495 46
5,153 5
235 2
298 3
23
150
152
266 22
5,971 1
103
297 9
2
134
57
311 27
3,638
124
265 3 2
32,925 120
32,445 20,639 17,002 16,959 14,633 92 67 26 17 11
3,775 292
6,619 6
3,765 2,411 274 173
6,431 4,493 6
2,237 139
3,889
2,535 2,672 1,461 1,321 30 24 21 6
217 218 130 116 9 14 6 3
1,978 106
2,305
665
87
1,932 80
2,147
735
68
4,316 4,758 2,654 2,709 '2,275 2,398 108 53 55 13 1
40,508 41,922 23,409 22,064 18,27fi. 17,694 557 403 295 155 38 36
5,365 5,221 3,316 2,609 1,736 1,318 19
175 5 159 67 1 1 1 1 3
45 10 3
18 3 2
89
92
95 3
1,103 i
33
27
10
1,762 2
263 7
1,636 5
322
11
90
36
173 4
1,330
36
22
13
1,846 5
254 4
1,596
468
18
116 219
2,584 3,391 13 10
1,115 1,054
84
18
7
24 5
354 1 2
26
1,320 12 83 5
349
89 2 4-
135 2
1,172 28
233

73 Table SCT-I Part B
AT WORK AND NON-WORKERS-BY SEX FOR '~CHEDUIED TRmES
DISTR.ICT
WORKERS ...... X .....
V VI VII VIn IX IV
In In At Manufac- In Transport,
House- turing other Trade Storage and In hold than House- In and Communi- Other Rural Name of Scheduled
In:iuHry hold Industry Construct.ion Commerce cations Services Non-workers Urban Tribes
• ~
..... -.....,___, r--_"_'_-' r---..A..-- __ .. -~ ,_---_.A",.,_____..." ,_.-__,.,.__~
M F M F M F M F M F M F
14 15 16 17 18 19 20 21 22 23 24- 25 26 27 2
699 434 66 40 1C4 9 28 34 228 2,588 1,133 44,389 55,145 R. All Scheduled Tribes 3 11 114 37 7 29 292 183 612 647 U
3 7 8 153 146 R 1. Asur U
13 11 4 104 152 R 2. Baigd U
.. R 3. Bathudi 1 1 U 2 R 4. Bedia
U
R 5. Birbor U
15 6 " " .. 4 3 321 354 R 6 . Birjia 1 1 5 14 34 37 U 28 11 4 4 6 5 14 51 397 1'02 5,653 8,513 R 7. Chero 1 1 1 1 23 5 20 16 U
100 63 .. 10 9 179 158 R 8. ChikBaraik 2 1 '4 1 2 1 U 4 .. 2 4 213 322 R 9. Gond 5 1 67 U 3 4 2 2 R 10, Gorait
U .. R 11. rIo 2 4 U
6 R U
12. Karmali
4 1 1 R 13, Kharia 4 1 6 lJ 43 58 2 6 16 2 2 14 60 475 220 12,286 15,443 R 14. Kharwar 1 1 2 33 9 53. 66 U
5 3 81 36 1,364 1,528 R 15. Kisan 7 48 54 119 135 U 83 24 2 117 66
1 2,126 2,542 {} 16. Korwa
263 39 21 3 6 1 6 9 SO 52 1,074 1,351 ·R 17. Lohara or Lohra 3 3 9 5 3 1 1 9 18 U 21 26 7 1 87 102 R 18. Mahli 6 3 3 11 U
13 6 5 9 107 37 1,662 2,049 R 19. Munda 16 7 2 34 6 53 40 U 34 96 29 25 71 5 12 5 96 1,135 500 17,099 19,858 R 20. Oraou 7 69 22 2 23 115 '87 262 248 U 89 80 142 91 2,049 2,612 R 21. Parhaiya 19 U .
4 16 5 ..
R 22 • Santal I U 3 R 23. Unclassified 17 27 7 U P-I-IO

74
APPENDIX TO TABLE SCT-I
Statement showing the oj Scheauled Castes and Scheduled Tribes total population the ,fistrict o( Palamau
in each anchal c
TOTAL POPULATION
Name of the Anchal Scheduled Castes Scheduled Tribes
.A. ... Persons Males Females Persons Males Fern. ,
.2 3 4 5 6
Daltonganj 11,743 5,796 5,947 7,786 3,941 3,
Chainpur 15,365 7,537 7,828 12,522 6,205 6,
Leslieganj 13,918 6,854 7,064 4,455 2,235 2,
PanE 14,161 7,066 7,095 5,200 2,608 2
Chhatarpur 18,875 9,190 9,685 8,983 4,514 4,
Hariharganj 9,266 4,515 4,751 59 24
Patan 18,430 9,228 9,202 5,388 2,653 2,
Bishrarnpur 21,727 10,774 10,953 3,312 1,685 1,
Manatu 12,169 6,151 6,018 3,450 1,764 1,
Hussainabad 28,394 14.398 13,996 696 340
Meral 12,067 6,062 6,005 5,093 2,479 2,
Garhwa 1I,695 5,807 5,888 2,776 1,350 I,
Untari 14,137 7,151 6,986 4,530 2,237 '1,
Dhurki 5,934 3,043 2,891 6,700 3,388 3,
Ranka 11,322 5,762 5,560 19,697 9,998 9,
Bhandaria 2,361 1,211 1,150 12,826 6,543 6,
Majhiaon 15,973 7,941 8,032 1,131 590
jlhawanathpur 12,684 6,604 6,080 5,611 2,976 2,
'Balurnath 21,229 ]0,304 10,925 13,831 6,516 7,
Chandwa 11,904 5,899 6,005 14,880 7,390 7,
Latehar 8,729 4,352 4,377 21,484 10,682 10,
Manika 7,152 3,742 3,410 15,178 7,340 7,
Barwadih 6,826 3,526 3,300 16,405 8,252 8,
Mahuadanr 846 +36 410 27,096 13,499 13,
Garu 1,144 584 560 9,500 4,692 4,

75
TABLE SC·I-PERSONS NOT AT WORK CLASSIFIED BY SEX, TYPE OF ACTIVITY AND EDUCATIONAL LEVELS FOR SCHEDULED CASTES
Persons em-ployed before but
Persons seeking now out oJem-Total Full-time employment for ployment and
Education,,1 Levels non-working population students the first time seeking work Others ,..--- -. ,...---A----. r- ~ .... Persons Males Females Males Females Males Females Males Females Males Females
2 3 4 5 6 7 8 9 10 11 ' ]2
PALAMAU DlSTRICT-TOTAL
TOTAL 142,260 63,439 78,821 7,105 344 48 2 33 55,253 78,475
Illiterate 134,821 56,457 78,364 .1,542 56 22 2 21 54,872 78,306 Literate (without educational level) 6,118 5,720 398 4,497 265 7 3 1,213 133 Primary or Junior Basic 1,235 1,178 57 994 23 16 7 16] 34 Matriculation or Higher Secondary 84 82 2 71 2 2 7 2 Above M~triculation or Higher Secondary 2 2 1 1
PALAMAU DISTIUCT-RURAL
TOTAL 137,894 61,702 76,192 6,704 305 44 2 24 54,930 75,885 Illiterate 130,992 55,195 75,797 1,523 50 20 2 16 53,636 75,745 Literate (without educational level) 5,831 5,478 353 4,333 233 5 2 1,133 115 Primary or Junior Basic 1,028 986 42 812 17 16 4 154 25 Matriculation or Higher Secondary 42 42 31 2 2 7 Above Matriculation or Higher SecQndary I 1 I
PALAMAU DI&,TRICT-URBAN TOTAL 4,366 1,737 2,629 401 39 4 9 1,323 2,590 Illiterate 3,829 1,262 2,567 19 6 2 5 1,236 2,561 Literate (without educ~tional level) 287 242 45 159 27 2 I 80 18 Primary or Junior Basic 207 192 15 182 6 3 7 9 Matriculation or Higher Secondary 42 40 2, 40 2 Above Matriculation or Higher Secondary ] I I
Chain pur Ancha1-Rural Total 6,757 2,64J 4,111 299 13 2,347 4,098 Illiterate 6,422 2,330 4,092 7 2,323 4,09:.! Literate (without educationallevel) 257 240 17 218 12 22 5 Primary or Junior Basic 77 75 2 73 I 2 1 Matriculation or Higher Secondary I 1 I Above M:1triculation or Higher Secondary
LesJieganj Ancha1-Rurai Total 6,490 2,774 3,716 300 2 2,471 3,716 Illiterate 6,129 2,441 3,688 23 2,418 3,688 Literate (without educational level) 280 259 21 214 1 44 21 Primary or Junior Basic 80 73 7 63 1 9 7 Matriculation or Higher Secondary 1 1 Above Matriculation or Higher Secondary
Panki Anchal-Rural Total 6,456 2,879 3,577 437 46 2,44:2 3,m Illiterate 6,127 2,602 3,525 180 2,422 3,5Z5 Literate (without educational level) 319 268 51 248 46 20 5 Primary or Junior Basic 9 8 1 8 1 Matriculation or Higher Secondary • , 1 I 1 Above Matriculation or Higher Secondary
Chhatarpur Anchal-Rural Total 8,684 3,655 5,029 261 5 4 2 3,388 5,023' Illiterate 8,453 3,436 5,017 5:4- 3 2 3,377 5,017 Literate (without eduationallevel) 192 180 12 169 6 II 6-Primary or Junior Basic •• 39 39 38 Matriculation or Higher Sec.ondary ., Above Matticulation or Higher Secondary


77
TABLE ST-I-MOTHER-TONGUE AND BILINGUALISM FOR SCHEDULED TRIBES
:81. Name of Scheduled mo. Tribes
Asur
1 Chero :2 Kharwar
1 Birjia
1 Asur "2 Baiga 3 Bathudi 4 Bedia 5 Birhur 6 Birjia 7 Chero 8 Chik Baraik 9 Gond
10 Gorait 11 Ho 12 Karmali 13 Kharia 14 Kharwar
15 Kisan 16 Korwa
17 Lohara or Lohra
18 Mahli 19 Munda
"20 Oraon
"21 Parhaiya 22 Santal "23 Unclassified
I Kharia
Lohara or Lohr:.
Korwa
1 Korwa 2 Oraon
Total speakers
Mother-tongue and total number of persons returned
as speaking a language subsidiary to the mother-tongue Subsidia~y Language
Males Females Males Females
2
13
1,050 1,414
715
409 298
1
80 12,572
212 423
12 7 2 5
30,545
3 4 5 6
PALAMAU DISTRICT-TOTAL
Mother-Tongue-1. Asuri
25 Hindi (M-I)
Mother-Tongue-2. Bhojpuri
890 1,195 58 Magahi[Magadhi(M-57,FI), Urdu (M-I).
Mother-Tongue-3. Birjia[Brijia/Binjhia
791 332 342 English (F-13), Hindi (M--331, F-32B), Kurukh{Oraon (M-I, F-1).
Mother-Tongue-4. Hindi
357 255
I 2 1
141 12,797
194 558 25
6 2
30,374
17 14
394-
English (M-I)
29 Birji~/Brijia/Binjhia (M-6), KurukhjOraon (M-ll). EnglIsh (M-14, F-I), Kurukh/Orao'n (F-IB), Mundari (F-10) •
Mundari (M-I)
67 English (M-21), ~harwari (M-3~2, F.j), Kurukh/Oraon (M.50 F-59), Mundan (M-l, F-5). '
2,391 2,285 13 5 Engl!sh (M-6), Kurukh/Oraon (M-7, F-5). Enghsh (M-I), Korwa (M-61, F-61), Magahi/Magadhi (M-37 2,886 4,311 102 91
F-16), Kurukh/Oraon (M-3, F-14). • 2,164 2,389 26 40 Bengali (M-I), English (M-3), Kurukh/Oraon (M-I3 F-29)
M~gahi/Magadhi (M-B, F-7), Mundari (M-I, F-4).' , 132 133
2,463 3,139 9 13 Kurukh/Oraon (M-9, F-13).
145 B4 English (M-I), KurukhjOraon (M-43 F-9) Mundarl (M-IOI f-75). ' , ,
10,772 9,369 1,441 1,526 English (M-21, F-lD), Kurukh/Oraon (M-l,412, F-l,513) Magahi/Magadhi (M-8, F-3). '
5,015 4,845 7 4 Kurukh/Oraon (M-7, F-4). 164 48 10
Mother-Tougue-S. Kharia
10 10 English (M-6), Hindi (M-4, F-1).
Mother-Tongue-S. Koda/Kora
281 214 .193 104 Hindi (M-193, F-I04).
Mother-Tougue-7. Xorwa
2,258 1.395 1,204= 829 Hindi (M-l.204, F-829),
920 30,171
Mother-Tongu~8. Kurukh/Oraon
466 . 599. '246 Hindi (M-599, F-246). 3?,826 16,473 16,493 EngliSh (~-69, F-IO), Hincli (M-16,094 F-16,389), Mll.,.ahi/
Magadhl (M-310, F-94), ....

78
TABLE ST-t-MOTHER-TONGUE AND BILINGUALISM FOR SCHEDULED TRIBES-contd.
SI. Name of Scheduled no. Tribes
1 Baiga 2 Gond 3 Kharwar 4 Korwa 5 Oraon 6 Parhaiya
1 Korwa 2 Munda 3 Oraon
1 parhaiya
1 Birjia 2 Chik Baraik 3 Kharwar 4 Kisan 5 Lohara or Lohra 6 Mahli 7 Munda
8 parhaiya
1 Santal
1 Baiga 2 Birhor 3 Birjia 4 Chero 5 Gond 6 Kharwar 7 Korwa 8 Lohara or Lohra 9 Mahli
10 Munda 11 Oraon 12 Parhaiya
1 Korwa
1 Korwa 2 Oraon
] parhaiya
Total speakers
Mother-tongue and total number of persons returned
asspeaking a language subsidiary to the
mother-tongue Subsidiary Language
Males Females
2
81 159
1,036 556 82
199
5 1,395
40
152
I 226 50
1,676 120 94
566
18
12
23
1,953 I
1,584 251
14 7
31 60
826
139
422 679
3
132 913 259 130 220
981
156
202 55
1,754 93 99
691
6
39 1 5
2,079 2
1,527 772
38
115 422 758
39
394
Males Females
4 5 6
Mother_ Tongue-9. Magahi/Magadhi
234 I
13 Hindi (M-233, F-13), Korwa (M-l). KurukhjOraon (M-I).
Mother-Tongue-10. Mundari
548 272 English (M-2), Hindi (M-546, F-272).
Moth~r-Tongue-11.*t Parhaiya ,
123 118 Hindi (M-123, F-118).
Mother-Tongue-12. Sadan/Sadri
I 12
4 18 45
6
English (M-I). Hindi (M-9, F-I), Kurukh/Oraon (M-3). KurukhJOraon (M-4).
II Kurukh/Oraon (M-18, F-Il). 52 English (M-2, F-I), Hindi (M-24, F-30), Kurukh/Oraon(M_19
F-21). 7
Hindi (M-6).
Mother-Tongue-13. Santali
8 2 Eng[ish (M-I), Hindi (M-6, F-2) , Kurukh/Oraon (M-I).
CHAIN PUR ANCHAL-RURAL
Mother-Tongue-1. Hindi
321 Kharwari (M-321). 40 48 Korwa (M-40, F-48).
4 I Mundari (M-4, F-I). 36 48 Kurukh/Oraon (M-S6, F-48).
Mother-Tongue-2. Korwa
Mother-Tonguc-3. KurukhjOraon
345 Hindi (M-345). 62 122 Hindi (M-62, F-122).
Mother-Tongue- 4. Parhaiya

79
'TABLE-STI-MOTHER-TONGUES AND BILINGUALISM FOR SCHEDULED TRIBES-contd.
.81. Name of Scheduled no. . Tribes
1 Munda
1 Chero 2 Gond 3 Kharwar 4 Kisan 5 Korwa
-6 Munda 7 Oraon 8 Parhaiya 9 Santali
1 Lohara or Lohra
1 Korwa
I Korwa :2 Oraon
Korwa
1 Munda
1 Birjia 2 Chero 3 Chik Baraik 4 Gond 5 Ho 6 Kharia 7 Kharwar 8 Kisan 9 Korwa
10 Lohara or Lohra 11 Munda 12 Oraon 13 Parhaiya l4 Santali
1 Karwa
1 Korwa 2 Oraon
Total Speakers
Mother-tongue and total number of persons returned
as speaking a language subsidiary to the mother-tongue Subsidiary Language
r---..A...~ ,---__ ..A..-__ -""'
Males Females Males Females
2 3 4- 5 6
Mother-Tongue-5. Mundari
214 126 8 10 Hindi (M-8, F_I0).
RANKA ANCHAL-RURAL
Moth:er-Tongne-1. Hindi
9 7 100 119
5,179 5,104 9 13
680 1,627 19 22 Korwa (M-6, F-7), Magahi/Magadhi (M-13, F-15,. 87 93 86 70 Mundari (M-86, F-70).
4-44- 414' 61 52 Kurukh/Oraon (M-61, F-52), 676 653 154
Mother-Tongue-2, Koda/Kora
127 129 127 104 Hindi (M-127, F-I04).
Mother-Tongue-3. Korwa
1,327 725 962 579 Hindi (M-962, F-579).
Mother-Tongue-4. Kurukh/Oraon
486 298 254 169 Hind; (M-254, F-169). 446 465 301 337 Hindi (M-I09, F-337), Magahi/Magadhi (M-192).
Mother-Tongue-5. Magahi/Magadhi
237 29 229 13 Hindi (M-229, F-13).
Mother-Tongue-6. Mundari
37 23 26 17 Hindi (M-26, F-17).
BHANDARIA ANCHAL-RURAL
Mother-Tongue-1. Hindi
27 23 33 10 65 67 21 24 1
I 2,457 2,409 6 English (M-6).
772 715 4 English (M-4). 437 457 7 Korwa (M-6), Magahi/Magadhi (M-I). 80 149
4 6 1,756 1,645 II 6 Kurukh/Oraon (M-5, F-6), English (M-6).
8 5 1
Mother-Tongue-2. Korwa
170 95 64 81 Hin~i (M-64, F-al).
Mother-Tongue-3. Xurukh/Oraon
11 680 649 156 280 Hindi (M-143, F.280), Magahi/Magadhi (M.la).

8.0
TABLE ST-I-MOTHER-TONGUE AND BILINGUALISM FPR SCHEDULED TRffiES.l.-contd.
SI. no.
Name of Scheduled Tribes
Mund~
1 Asur 2 Kharwar 3 Lohara or Lohra 4- Mahli 5 Munda 6 Oraon 7 Parhaiya
Lohara 'or Lohra
Oraon
Munda
1 P:irhaiya
1 Asur 2 Baiga 3 Chero 4- Kharia 5 Kha:cwar 6 Lohara or Lohra
17 Mahli 8 Munda 9 Oraon
10 Parhaiya
1 Oraon
1 Oraon
Munda
1 Parhaiya
1 Munda 2 Parhaiya
-".
Total speakers
Males Females
2 3
20 28
2 568 571 364 434 12 10
189 233 1,949 34
149 142
154 85
3,087 5,802
44-
2
66 36 5 7 8 1 3
470 492 463 408 42 48
1,228 1,257 569 144 170 190
3,648 4,210
10
548 436
33 33
119 218 18
Mother-tongue and total number of personsretumed'
as speaking a language su bsidiary to the mother-tongue Subsidiary Language
Males Females
4 5 6
Mother-Tongue-4. Mundari
• 7 9 Hindi (M-7, F.9)
BALUMATH ANCHAL-RURAL
Mother-Tongue-1. Hindi
12 Kurukh/Oraon (M-12)
I KurukhjOraon (M-l). 60 English (M-6), Kurukh/Oraon (M-54, F-l).
Mother-Tongue-2. Koda/Kora
66 Hindi (M-66).
Mother-Tongue-3. Kurukh/Oraon
1,209 1,437 English (M-15, F-l), Hindi (M-I,IM, F-I,436),
Mother-Tongue-4. Mundari 22 Hindi (M-22)
Motlier-Tongue-5. Parhaiya
CHANDWA ANCHAL-RURAL
Mother- Tongue-1. Hindi
llengali (M-I). .. 9 5 Kurukh/Oraon (F-I), Mundari (M-9, F-4).
16 26 ~urukh/oraon (M-16, F-26).
Mother-Tongue-2. K uruk h/Oraon
2,350 2,480 English (M.3), Hinc\.i (M-2,!!47, F-2,480).
Mother-Tongue -3. Magahi/Magadhi
Mother-Tongue-4. Mundari
253 121 Hindi (M-253, F.121).
Mother-Tongue-5. Parhaiya
30 21 Hindi (M-30, F-21).
Mother:Tongue-6. SadanjSadri
10 4 Hindi (M-IO, F-4). 6 Hindi (M-6).

81
TABLE ST-I-MOTHER-TONGUE AND BILINGUALISM FOR SCHEDULED TRmES -contd.
81. -Name of SCheduled no. Tribes
1 Asur 2 Bedia 3 Chero 4 Goo.d 5 Kharia 6 Kharwar 7 Lohara or Lohra 8 Mahli 9 Munda
10 Oraan 11 parhaiya 12 Santal 13 Unclassified
Oraan
Khar.war
1 Munda
I parhaiya
1 Chera 2 Gond 3 Kharwar 4 Lohara ar Lohra 5 Munda 6 Oraon 7 Parhaiya
1 Oraon
1 Chero 2 Chik Baraik 3 Gond 4 Kharwar 5 Kisan 6 Korwa 7 Lohara or Lohra 8 Mahli 9 Munda
10 Oraon 11 l'arpaiya
P-I-ll
Total Speakers
Mather-tongue,and total number of persons returned
as speaking a language subsidiary to the
mother-tongue Subsidiary lan'gUage r---..A .... ~
Males Females Males Females
2 3 4 5
LATEHAR ANCHAL-RURAL
Mother-Tongue-l. Hindi
324 309 2
.~
1,046 1,075 I
1 2,660 2,711
330 368 48 48 I 18
602 59! 3281 287
4 English (M-2), Kharwari (M-I), Kurukh/Oraon (M-I). I 5 KurukhlOraon (M-I, F-5). 9 'II Kurukh{Oraon (M-9, F-Il). I I Mundari (M-I) Kurukh/Oraon (F-I).
350 339 English (M-6, F-7), Kurukh/Oraon (M-344, F-332).
I 3
Mother-Tongue-2. KUfukh/Oraon
4,810 4,942 3,289 3,676 Hindi (M.3,289, F-3,676)
Mother-Tongue-J. Magahi!Magadhi
Mother-Tongue-4. Mundari
106 117 74 .
84 Hindi (M-74, F-84)
Mother-Tongue-5. 'Parhaiya
44 66 3) 52 Hin:li (M-39, F-52).
MANIKA ANCHAL-RURAL
Mother-Tongue-l. Hindi
759 762 2 English (M-2), 2 4
3,262 3,200 English (M-I). 197 ~~l' 18 Mun:iari (M-I)
1,420 1,744 288 302
Mother-Tongue-2. K urukh/Oraon
1,394 1,104 902 963 English"(M-I), Hindi (M-901, F.963).
BARWADIH ANCHAL-RURAL
Mother-Tongue-l. Hindi
1,782 1,810 29 English (F-l) , Kurukh/Oraon (F-18), Mundari (F.IO). 2 2 4 5
Kharwari (F-3), Kurukh/Oraon (F-46), Mundari (F-5). 3,831 3,552 54 6 9 2 Kurukh/Oraon (M-2).
332 389 4 16 Korwa (M-4. F-2), Kurukh/Oraon (F-14). 289 335 1 4 Mundari (M-I, F-4).
6 2 Kurukh/Oraon (F-2). 2 '44 I Kurukh/Oraon (F-1).
139 597 58 93, Kurukh/Oraon (M-50, F-go), Magahi/Magadhi (M-S, F-3); 721 692 2 KurukhjOraon (F-2).

82
TABLE ST-I-MOTHER-TONGUE AND BILINGUALISM FOR SCHEDULED TRIBES-contI
81. Name of Scheduled no. Tribes
1 Korwa
1 Oraon
1 Munda
1 Parhaiya
Asur
I Birjia
1 Asur 2 Birjia g Chero '4 Chik Baraik '5 Gond ~ Kharia 7 Kharwar "'8 Kisan ~ Korwa
10 Lohara or Lohra II Mahli 12 Munda 13 Oraon
I Korwa
1 Korwa 2 Oraon
1 Gond 2 Rorwa
1 Munda
1 Bix:jia 2 Chik Baraik 3 Kharwar
Total speakers ~
Males
2
43
798
263
40
13
374
18 13 3
135 1 1
J17 1,137
104 122 14
857 2
91
7,081
1 102
52
1 226
50
Females
3
10
466
181
55
25
358
10 15 1
119 2 1
119 1,095
127 135 . 7
804 1
50
131 7,332
14
202 55
Mother-tongue and total number of persons returned
as speaking a language subsidiary to the mother-tongu e
Males Females
4 5
Mother-Tongue-2. Karwa
41 5 Hindi (M-41, F-5).
Mother-Tongue-3. Kurukh{Oraon
SubS'idiary Lal,guage
6
577 237 Hindi (M-576, F-237), Magahi{Magadhi (M-I).
Mother-Tongue-4. Mundari
56 14 Hindi (M-56, F-14).
Mother-Tongue-5. Parhaiya
36 45 Hindi ~-36, F-45).
MAHUADANR ANCHAL-RURAL
Mother-Tongue-1. Asuri
Hindi (M-l).
Mother-Tongue-2. Birjia/Brijia/Binjhia
129 106 Hindi (M-128, F-I06), Kurukh/Oraon (M-l).
Mother-Tongue-'3. Hindi
2 7 2 2
42
Mundari (M-l).
5 English (M-l), Kurukh/Oraon (F-5), Mundari (M-l). 4 English (M-2), KurukhfOraon (M-5, F-4). 4 Kurukh/Oraon (M-2, F-4).
24 English (M-2), Kurukh/Oraon (F-24).
6 Kurukh/Oraon' (M-4I, F-6), Mundari (M-I).
Mather-Tongue-4. Karwa
68 Hindi (M-68).
Mather-Tongue-5. Kurukh/Oraon
4,nij 43
3,738 Hindi (F-43). English (M-32, F-l), Hindi (M-4 089 F-3,669), Magah if
Magadhi (M-40, F-68). "
Mother-Tongue-G. Magahi/Magadhi
Mother-Tongue-7. Munc1ari
38 Hindi (M-38).
Mother-Tongue-B. Sadan/Sadri
English '(M-I).

/
83
TABLE ST-I--MOTHER-TONGUE AND BILINGUALISM FOR SCHEDULED TRmES-concld.
S1. Name of Scheduled no. Tribes
4 Kisan 5 Lohara or LohIa 6 Mahli 7 Munda
1 Santal
,Birjia
1 Asur 2 Biljia 3 Chero 4 Chik Baraik 5 Kharwar 6 Kisan 7 Korwa 8 Lohara or Lohra 9 Munda
10 Oraon 11 Parhaiya
1 Oraon
1 Santal
Total speakers
Mother-tongue and total number of persons returned
as speaking a language subsidiary to the
mother-tongue ~---."._,---~
Subsidiary language
Males Females Males Females
2
1,676 120 94
447
297
I 14 4 I
1,727 105 64
164 17
481 III
1,701
5
3 4 5
Mother-Tongue-8.
1,754 12 93 4 99 18 II
473 35 48
6
Sadan/ Sadri--condd.
Kurukh/Oraon (M-3), Hindi (M-9, F-I). Kurukh/Oraon (M-4). _ Kurukh/Oraon (M-I8, F-II). English (M-2, F-I), Hindi (M-H, F.26),
(M-19, F-2I).
Mother_ Tongue-9. San tali
3 Kurukh/Oraon (M-I).
GARU ANCHAL·-RURAL
Mother-Tongue -1. Birj'aJ Brijia/Binjhia
KurukhjOraon
433 167 197 EnJlish (F.13), Hindi (M·167, F.183), Kurukh/Oraon (F.I).
Mother· Tongue-2. Hindi
15 14-Kurukh/Or.lon (F.II), Birjia (F.3).
2 3
1,733 44 B Kurukh/Oraon (M.H, F.B). 105 I KurukhjOraon (F.I). 62 Kurukh/Oraon (M·I).
187 22
651 252 288 Kurukh/Oraon (M-252, F-288). 122 7 2 KurukhJOraon (M-7, F-2).
Mother-Tongue-3.K urukh/Oraon
1,471 994 731 English (M·B), Hin~1i (M.9a6, F.73J '.
Mother-Tongue-4. Santali
2 4 2 Hindi (M-4, F·2).

84
TABLE ST-II-PERSONS NOT AT WORK CLASSIFIED BY SEX ANT.) TYPE OF ACTIVITY FOR SCHEDULED TRIBES
Pers~ns employed before, but now
Tolal non-working Persons seeking out of employ.
Full-time employment for ment and seek. Name of Scheduled Tribes population students the first time ing work Others
~ -. Males Females
r---,.,A..,-........
Persons Males Females Males Females Males Females Mairs Females
2 3 4 5 6 7 8 9 10 11 12
PALAMAU DISTRICT-TOTAL
ALL SCHEDULED TR.IBES 100,793 45,001 55,792 7,429 1,510 129 13 27 1 I
37,416 54,238
1 Asur 299 153 146 3 150 145 2 Baiga 256 104 152 6 98 152 3 Bathudi 1 1 .. 1 4 Birhor 1 1 1 5 Bi~jia 746 355 391 37 36 318 355 6 Chero 14,202 5,673 8,529 1,242 153 89 11 4,331 8,376 7 Chik Baraik 340 181 159 52 II 129 148 8 Gond 603 214 389 38 8 176 331 9 Gorait 4 2 2 2 2
]{) Ho 4 4 4 11 Karmali 6 6 6 12 Kharia 8 7 1 7 1 .. " 13 Kharwar 27,848 12,339 15,509 1,500 202 10 2 1 10,828 15,305 14 Kisan 3,146 1,483 1,663 238 74 1 .. 3 1,241 1,589 15 Korwa 4,668 2,126 2,542 167 10 3 1,959 2,529 16 Lohara or Lohra 2,452 1,083 1,369 101 21 2 5 980 1,343 17 Mahli 203 90 113 29 6 1 60 107 18 Munda 3,804 1,715 2,089 386 102 1 2 1 1,327 1,985 !9 Oraon 37,467 17,361 20,106 3,428 861 26 1 10 13,897 19,244 20 Parhaiya 4,680 2,068 2,612 159 16 1,909 2,596 21 Santal 21 16 5 7 3 9 2 22 Unclassified 34 27 7 25 5 2 2
PALAMAU DISTR.ICT-RURAL
ALL SCHEDULED TR.IBES 99,534 44,389 55,145 7,143 1,427 128 12 25 37,093 53,705
1 Asur 299 153 146 3 150 145 2 Baiga 256 104 152 6 98 15Z 3 Birhor 1 I I "4 Birjia 675 321 354 30 35 291 319 !5 Chero 14,166 5,653 8,513 1,234 153 89 9 4,321 8,360
Chik Baraik - 337 179 158 51 1·1 128 147 '6 ., Gond 535 213 322 38 8 175 314
8 Gorait 4 2 2 2 2 9 Karmali 6 6 .. 6
to Kharia 2 I I I 1 .. 10,797 11 Kharwar t"
2 7,729 12,286 15,443 1,478 202 10 2 1 15,239 12 Kisan 2,892 1,364 1,528 235 74 1 1'3 1,125 1,454 13 Korwa 4,668 2,126 2,542 167 10 3 1,959 2,529 14 Lohara or Lohra 2,425 1,074 1,351 97 20 I 5 ., 976 1,326 15 Mahli 189 87 102 28 6 1 58 96 16 Munda 3,711 1,662 .2,049 346 88 1 I 1 1,314 1,960 17 Oraon 36,957 17,099 19,858 3,264 799 26 I 10 " 13,799 19,058 18 Parhaiya 4,661 2,049 2,612 158 16 . 1,891 2,596 19 Santal 21 16 5 7 3 9' 2

85
TABLE ST-II-PERSONS NOT AT WORK CLASSIFIED BY SE:x! AND TYPE· OF ACTIVITY FOR SCHEDULED TRIBES-contd.
Persons employed before, but now
Total non-working Full-time Pet,~ons seeking out of employ-employment for ment and seek-
Name of Scheduled Tribes population students the first time ing work Others r- ,--.A.--,
____ ...... ___ Persons Males Females Males Females Males Female~ Males Females Males F
1 2 S 4 5 6 7 8 9 10 II 12 PALAMAU DISTRICT-URBAN
ALL SCHEDULED TRIBES M59 612 647 285 83 2 313 5i13
I Bathudi 1 I 1 2 Birjia 71 34- 37 7 27 36 :3 Chero 36 20 16 8 2 10 16 4 Chik Baraik 3 2 I I 1 1 5 Gond 68 1 67 1 67 6 Ho 4 4 4 7 Kharia 6 6 6 8 Kharwar 119 53 66 ,22 31 66 9 Kisan 254- 119 135 3 116 135
10 Lohara or Lohra 27 9 18 4- 4- 17 11 Mahli 14- 3 11 1 " 2 II
12 Munda 93 53 40 40 14 1 13 25 13 Orson 510 262 248 164 62 98 186 14- Parhaiya 19 19 ::, I 18 15 Unclassified 34 27 25 5 2 2
Chainpur Anchal-Rutal
All Scheduled Tribes 5,440 2,115 3,325 385 45 1,730 3,279 1 Baiga 40 10 30 3 7 30 2 Birhor I 1 3 Birjia 5 5 ,. 5 4 Chero 1,974 707 1,267 153 26 554 1,241 5 Gond 1 1 1 6 Kh'll.rwar 1,098 456 64-2 83 7 373 635 7 Korwa 627 263 364 22 1 241 363 8 Lohara or Lohra 13 13 13 9 Mahli 7 7 2 '0,
5 10 Munda 233 79 154 26 7 53 147 11 Oraon 693 293 400 61 " 232 400 12 Parhaiya 748 300 448 35 4- 265 444
Ranka Anchal-Rural
:All Scheduled Tribes 7,134 3,250 3,894 140 411 3,110 3,836
1 Chero 3 3 3 2 Gond 99 33 6l 7 31 61 3 Kharwar 3,877 1,752 2,125 39 32 1,713 2,093 4 Kisan 8 4 4 1- 4 5 Korwa 1,745 794 951 45 749 951 6 Lohara or Lohra 85 50 35 4 46 35 7 Munda 99 53 4-6 3 50 4-6 8 Oraon 771 352 419 36 9 316 410 9 Parhaiya 447 207 240 6 7 201 233

86
TAB IE ST-II-llERSCNS KaT AT ~-ORK CLASSIFJID BY SEX MD TYFE OF ACTIVITY FOR SCHEDULE,D TRIBES- con td.
Persons employed
Persons &eeking before, but now
Total non-working out of employ-
Name of Scheduled Tribes Full-tin!e emplo~ment for mentand seek_ population students the first time ing ""ork Q.thers
r-- ____ ..A--____ ~ ,..-__ .,.A... __ -...
r--- A --. ~--"A-.--..." ,-__ .A.. __ ~
Person~ Males Females Males Females Males Females Males Females Males Females
2 3 4 5 6 7 8 9 IQ 11 12
Bhandaria Anchal-Rural
All Schedcled Tribes 5,393 2,537 2,856 545 173 2 4 1,986 2,682
I Birjia 19 9 10 9 10 2 Chero 7 3 4 3 4 3 Chik Baraik 52 24 28 3 21 28: 4 Gond 16 7 9 2 5 9 5 Kharia 1 1 I 6 Kharwar 1,985 890 1,095 147 27 I 742 1,06B: 7 Kisan 541 274 267 25 .5 1 248 262 8 Korwa 416 194 222 14 4 180 2 lit-9 Lohara or Lo1,ra 89 26 63 1 25 63=
10 Munda 19 .) 14 5 14 11 O:caon 2,247 1,105 1,142 353 136 2 2 748 1,005-12 Parhaiya I 1 .. 1
Balumath Anchal-Rural
All Scheduled Tribes .6,455 2,979 3,4713 ~31 48 6 2 2,740 3,428-
1 Asur 2 2 .. 2 2 Kharwar 487 237 250 20 217 25~ 3 Lonara or Lobra 517 248 269 19 229 269-4 Mah1i 4 3 I 3 I 5 Munda 198 99 99 22 . , 77 99-6 Ol'aon 5,119 2,323 2,796 152 48 6 2 /2,163 2,748 7 Parhaiya 128 69 59 15 54 59-
Ch andwa Anchal-R ural All Scheduled Tribes 6,1178 2,171 3,307 475 79 2,296 3,228
1 Asur 25 25 24 2 Baiga 4 I 3 I 3 3 Chero 3 2 1 I I 4 Kharia 1 1 1 5 Kharwar 400 163 237 35 128 237 6 Lohara or Lohra 336 163 173 13 150 173-7 Mahli 41 17 24 4 1 13 23-8 Munda 1,609 656 953 115 17 541 936 9 Oraon 3,488 1,664 1,824 301 60 1,363 1,764
10 Parhaiya 171 79 92 4 75 92
Latehar Anchal-Rural
All Scheduled Tribes 9,704 4,213 5,491 516 53 3,697 5,438
1 Asur 237 114 123 I 113 123 2 Chero 1,162 451 711 91 2 360 709 3 Kharwar 2,315 1,018 1,297 129 18 889 1,279 4 Lohara or Lohra 419 189 230 20 I 169 229-5 Mah1i 43 21 22 2 19 22 6 Munda 183 65 118 16 8 49 II(} 7 Oraon 4,993 2,198 2,795 252 23 1,946 2,772 8 Parhaiya 352 157 195 5 1 152 194
Manika Anchal-Rural All Scheduled Tribes 6,173 2,927 3,246 460 6 2,467 3,240
1 Chero 701 335 366 79 256 366 2 Gond 5 2 3 2 3 3 Kharwar 2,630 1;~63 1,367 165 4 1,098 1,363 4 Lohara or Lohra 182 71 111 6 65 III 5 Munda 16 13 3 13 3 6 Oraon 2,366 1,126 1,240 204 2, 922 1,238 7 Parhaiya 273 117 156 6 111 156

87
TABLE ST-II-PERSONS NOT AT WORK CLASSIFIED BY SE:X: AND TYPE OF ACTIVITY FOR SCHEDULED TRIBES-concld.
Persons employed before, but now
Persons seeking out of employ. 'Name of Scheduled Tribes Total non.'Nork ing Full-time employment for ment lind seek.
popUlation students the first time ing work Others
--Persons Males Females Males Females Males Females Males Females Males Females
2 3 4 5 6 7 B 9 10 11 12
Barwadih Anchal-Rural
All S ched uled Tribe s 7,8]8 :3,299 4,539 438- 7} 4 11 2,856 4,446
I Chero 1,973 785 1,IBB 159 39 625 1,149 2 Chik Baraik 3 1 2 1 2 3 Gond 6 I 5 1 5 4 Kharwar 3,438 1,474 1,964 224 14 2 2 1,248 1,948 5 Kisan 5 5 5 6 Korwa 276 118 158 7 3 11] ]55 7 Lohara or Lohra 310 118 192 5 2 5 113 185 8 Munda 217 115 102 12 12 1 r- 101 89 9 Oraon 849 387 462 22 12 365 450
10 Parhaiya 761 300 461 9 291 461
Mahuadanr Anchal-ltural
All Schedule<l Tribes 11,039 5,506 5,533 __ 1,811 590 7 5 3,683 4,943
1 Asur 35 14 21 1 1 13 20 2 Birjia 292 150 142 23 2 127 140 3 Chero 2 2 2 ' r 4 Chik Baraik 279 154 12~ 48 11 106 114 5 Kharwar 129 67 62 21 4 45 58 6 Kisan 2,216 1,033 1,183 208 60 2 822 1,123 7 Korwa 223 118 105 24 2 94 103' 8 Lohara or Lohra 217 98 119 23 2 74 117 9 Mah1i 94 39 55 17 5 21 50
10 Munda 1,083 558 525 141 32 417 493 J 1 Oraon 6,466 3,275 3,191 1,305 468 4 2 1,964 2,723 12 Santa 1 3 3 3
Garu Anchal-Rural
All Scheduled Tribes 4,137 2,055 2,082 80 100 19 1,956 1,942
1 Birjia 359 162 197 7 155 197 2 Chero 3 1 2 J 2 ::s Chik Baraik 3 3 3 4 Kharwar 1,493 717 776 20 42 7 690 734 5 Kisan 79 37 42 2 9 35 33 6 Korwa 42 24 18 3 3 21 15 7 Lohara or Lohra 155 72 83 5 11 67 72 8 Munda 20 8 12 8 12 9 Oraon 1,899 999 900 28· 20 12 959 880
10 Parhaiya 79 32 47 4 3 28 44 11 Santal 5 3 2 3 2

EXPLANATORY NOTE
Information relating to the nature and number of houses was collected during the period of houselisting in September-October, 1960 in the Houselist Form. The data processed from these lists were compiled un~er the E-Series tables. Although none of the E-Senes tables is reproduced in the Handbook, the informatio;n collected in the houselists is given in two tables: (I) Classification of rural population by size-class of villages determined by the number of houses in them, and (ii) Villagewise industrial data.
Classification of rural population living in villages of various sizes
The villages are classified into SeVen categories by the size-class of number of houses contained in each. These are:
(i) 5 and below (ii) 6-15
(iii) 16-25
(iv) 26-35
(vii) Above 100
Villagewisc Industrial data
(v) 36-50
(vi) 51-100
This table gives information about the number 0: industrial establishments in each village. The name of the village is followed by the three-digit code number of-the industrial establishment indicating the Divi. sion, Major Group and Minor Group of the Indiar Standard Industrial Classification. A list of th( DiviSions, Major Groups and Minor Groups togethel with their code numbers occurring in the tablf is reproduced in the Annexure to this note. Figurel within brackets indicate the number of establishment: relating to the industry concerned in the village. Datll relating 10 towns have been given separately.

89
ANNEXURE
STANDARD INDUSTRIAL CLASSIFICATION
Major Minor Group Description Group (Code) (Code)
2 3
Division 2 & 3-Manufacturing
20 FoodstufJs-
Production 0 r rice, atta, flour etc. by milling, dehusking 200 and processing of crops and food grains'
Production ofindigenous sugar, gur from sugarcane or 202 palm juice and production of candy
Slaughtering, Preservation of meat and fish and 204 canning of fish
Production of bread, biscuits, cake and other bakery 205 products
Production of butter, ghee, cheese and diary products 206 Production of edible fats and oils (other than hydro- 207
genated oil) Production of other food product!! such as sweetmeat 209
and condiments, muri, murki, chira, kllOi, coca, chocolate, toffee, lozenge
21 Beverages-
Production of country liquor 211 Production of indigenous liquor such as toddy, liquor 212
from Mahua, Palm juice Production of aerated and mineral water 214 Production of ice 215 Production ofice cream 216
22 Tobacco Products-
Manufacture of bidi Manufacture df hookah tobacco
220 223
23 Textile-Cotion
24
25
26
Cotton ginning, cleaning. pressing and baling Cotton spining (other than in mills) Cotton weaving in haml looms Manufacturing ofKhadi textile inhandlooID8 Printing of cotton textile ManufactUl'ing of cotton, cordage rope and h~ine
Te xtil1!-Jute-
Manufacture of other products like rope, cordage from jute and similar fibre such as hemp, mesta.
Textile-Wool-
Wool spinning other than in mills Wool weaving in power 100m Wool weaving in handloom
Textile-Silk-
Spinning of silk other than in mills.
230 231 235 236 237 239
244
253 254 255
262
27 Tlxlile-Misullaneous
Manufacture of carpet and all other similar type of 270 textile products • .,
Manuf:!.cture of hO'lery and other kill tted fabnc and 271 garments ."
Making of textile garments mcludmg ramcoats and 273 head gears
Manufacture of umbrellas 278 1'-1-12
Major Grou}' (Code)
Description
2
MinOT Group (Code)
3
n-,vision 2 & 3-Manufacturing-confd.
28 Manufacture oj wood and 1900den products ,
Sawing and Planning of wood 280 Manufacture of wooden furniture and fixtures 281 Manufacture of structural wooden goods (including 282
treated timber) such as beams, posts,doors, windows Manufacture of wooden industrial goods other than 283
transport equipment such as bobbin and similar equipment and fixtures
Manufacture ofother wooden products such as utensils, 284 toys artwares
Manufacture 0 f materi als from cork, bam boo, cane, 288 leaves and other allied products
Manufacture of other wood and allied products nat 289 covered above
30 Printing and Publishing
printing and fublishing of books 301
31 Leather and Leather Products
Currying, tanning an.d finishing of hides and skins and 310 preparation of fiDlshed le~ther
Manufacture of shoes and other leather footwear 311 Repair of shoes and other leather footwear 314 Repair of all other leather products except footweAr 315
32 Rubber, Petroleum and coal Products
Manufacture of tyres and tubes
33 Chemicals and ch'mical Produrts l\1anufacture of ammunition, explosives and fire works
Manufacture o,fmedicines, pharmaceutical preparations, perfumes, cosmetics and other toilet prepara-tions ex.ecpt soap .
Manufacture of soap and other washing and cleaning compounds
34-35 Non-meta/lic mineral Products other than Petro/tum and OJal-
Manufacture of structural clay products such aa bricks, tiles
Manufacture of cement and cement products Manufacture of strtictualstone goods, stone dreSSing
and stone crushjng. Manufacture 0 f stonewares, other than images Manufacture ofearthenware and earthen pottery Manufacture of chinaware and crockery Manu facture of glass bangles and beads
36 Basic Metals and other products except Machinery and Transport Equipment
Manufactllre of armament Manufa~ture of brass and bell metal products Man';_facutre ofmetalproducts other than of iron,
brass, bell metal and aluminium such as tin can Enamelling, galvanising, plating (induding electro
plating), poli~hing and welding of metal products
320
333
33!
33t
S4C 341 ~4~
34-35( 35J 352
36~ 36! 36,

90
ANNEXURE-coneld.
STANDARD INDUSTRIAL CLASSIFICATION
Major Group (Code)
Description
2
Division 2 & 3--Manufacturing-conld.
Minor Group (Code)
3
Manufacture of Supdry hardwares such as G. I. pipe, !l69 wirenet, bolt, screw, bucket, cutlery (This will also include th e manufacture 0 f sundry f en:ous engineering products done by jobbing engineering concerns which can not be classified in major groups 36, 37, 38 and 39).
37 Machinery (All kinds other than 7ransport) and Electrical Equipment
Manufarture and assembling of machinery (other 370 than t1ectrical except textile machinery.
Manufacture of electronic equipment such as radio, microphone 378
38 TT~r.s,~ort Equipment
Manufacture, assembl y and repairing oflocomoti ves 380 Manufacture and assembling ofmotorvchiclcs of all 382
types (excepting motor engineS)
Major Group (Code)
Description
2
Division 2 & 3-Manufacturing-eoncld.
Minor Group tCode)
3
Repairing and servicing ofmotor vehicles 384-Manufacture of bicycles and tricycles and accessories 385
such as saddle, seat, framr-, gear Repairing of bicycles and tricycles 388
39 Miscellaneous MamlfactuTing Industries I
Manufacture of opticalinstrumentll and lenses, 390 opthalmic goods and photographic equipment and supplies.
Assembling and repairing of watches and clocks 392 Manufacture of jew !llery, silverware and wares using 393
gold and other precious metals . Manufacture and tuning of musical instruments 394-Manufacture of stationery articles not covered else- 395
where such as pencil, penholder, fountainpen Manufacture and repair work of goods not assignable 399
to any other group

91
CLASSIFICATION OF RURAL POPULATION LIVING IN VILLAGES OF VARTOUS SIZES
District/Anchal
PALAMAU
Daltong;anj
2 Chainpur
3 Leslieganj
4 panki
5 Chh.atarpur
6 Hariharganj
7 Patan
8 Bishrampur
9 Manatu ,
10 Hussainabad
11 Meral
12 Garhwa
13 Untari
14 Dhurki
15 Ranka
16 Bhandaria
17 Majhiaon
18 Bhawanathpur
19 Balumath
20 Chandwa
21 Latehar
22 Manika
23 Barwadih
24 Mahuadanr
25 Garu
Total Rural
Population
2
1,131,625
37,791
63,489
42,563
50,326
58,238
30,647
60,176
78,822
38,586
88,739
51,340
48,915
54,603
21,807
45,990
19,541
55,426
49,599
55,702
35,755
39,829
30,687
30,969
30,304
11,781
Population living in villages containing house,S
r-------------------------__ N--------------------------~ ~ and below
3
6-15
4
3,392 26,558
69 261
77 • 1,298
215. 1,165
109 1,963
213 2,735
237 1,718
208 1,646
297 1,174
249 1,324
326 ),035
54 303
126 438
113 947
51 262
67 590
124 408
272 1,113
89 296
80 1,497
55 394
199 1,492
36 699
35
91
211
865
724
16-25
5
59,109
889
2,702
2,573
3,704
3,659
3,479
2,464
3,480
2,308
4,942,
943
1,664
1,811
748
1,437
1,713
3,039
900
3,fi06
1,390
3,792
2,727
1,359
1,168
2,612
2_6-35
6
36-50
7
51-100
8
Above 100
9
68,852 120,539 345,073 508,102
1,838 3,542 3,069 28,123
2,768 6,285 18,365 31,994
1,697 3,813 18,032 15,068
5,617 6,843 14,885 17,205
4,809 6,525 21,756 18,541
3,826 4,203 7,734 9,450
3,210 5,897 18,398 28,353
4,754 6,789 27,661 34,667
3,687 7,571 12,109 1I,338
5,357 8,637 27,230 39,212
789 4,467 9,150 35,634
1,705 4,003 16,247 24,732
2,043 4,781 15,073 29,835
624 1,028 4,503 14,591
2,966 4,141 16,932 19,857
1,017 2,560· 8,159 5,560
2,899 6,511 22,118 19,474
478 2,913 6,831 38,092
3,796 8,530 17,254 20,939
2,222 2,129 11,599 17,966
4,603 - 5,290 14,851 9,602
1,371 4,080 9,748 12,026
2,044
2,327
2,405
1,522
6,777
1,702
9,285
10,379
3,705,
16,54&
8,751
542

92
VILLAGEWISE INDpSTRJAL DAT.4-
PALAMAU DISTRICT
TOTAL .• 200(108), 202(2), 204(3), 205(2), 206(61), 207 (1,615),209(524),211(18), 212,(7), 214(2), 215(1), 216(1), 220(103), 223(1), 230(1 f), 231 (183),235(628), 236(8),237(9),239(13),244(588),253(238), 254(161), 255(94),262(1), 270(20), 271(7), 273(757), 278(2), 280(37), 281(63),' 282(274), 783(153), 284(16), 288(909),289(159),301 (6). 310(29),311 (I ,827),314(36), 315(6), 320(3), 333(7), 335(3),336(4), S40(8), 341 (I), 343(4), 344(3), 350(1,769), 351(1), 353(1), 362(1), 365(34), 367(1),368(2), 369(1,844),370(1), 378(3), 380(1), 382(9), 384(21), 385(1), 388(48), 390(2) 392(12), 393(378), 394(43), 395(2), 399(11).
RURAL .. 200(57), 202(2), 204(2), 2C6(60), 207(1,606), 2G9(383), 211(17), 212(7), 220(70), 230(4),231(183),235(622), 236(8), 237(5),239(13),244(588),253(238),254(161),
255(78), 262(1), 270(19), 271(7). 273(674),278(1), 280(27), 281 (61), 282(264), 283(152), 284(14), 288(898),289(153), 310(28), 311(1,781).314(~!l),315(6), 333(6), 336(1), 340(8), 341(1), 344(3), 3~0(t,729), 351(1), 365(17),367(1),368(2), 3ES(J.fC5). ?l:0(1), 382(9),384(1), 388(15), 392(1), 393(301), 394(42), 399(8).
URBAN.. 200(51\ 204(1), 205(2). 2C6(1), 207(9), 209(141), 211(1),214(2),215(1),216(1),220(33),223(1),230(7), 235(6), 237(4), 255(16), 270(1); 273(83), 278(1), 280(10),281(2), 282(10), 283(1), 284(2), 288(11), 289(6),301 (6), 310( I), 311 (46),314 (7), 320(3), 333(1), 335(3),336(3), 343(4), 3~0(40), 353(1), 362(1), 365(17), 369(39), 370(1), 378(3), 384(2(;). 385(1), 388(33), 390(2),392(11), 393(77), 394(1), 395(2), 399(3).
SADAR SUBDIVISION
Total •. 200(83), 202(1), 204(3), 205(2), 2(6(53), 207(858) 209(321), 211(1), 212(6),214(2). 215(1), 216(1), 220(75), 230(11), 231(5), 235(388), 236(3), 237(6), 244(7), 254(161),255(27), 270(1), 271(5), 273(405), 278(1), 280(3), 281(55), 282(251),283(127), 284(7), 288(352), 289(93), 301(6),310(9), 311(812), 314(8), 320(1), 333(7),336(3),340(4),341(1),343(4), 344(2), 350(907), 362(1), 365(31), 368(2), 369(792), 370(1), 378(3), 384(19), 385(1),388(29), 390(1), 392(8), 393(215), 394(9), 395(2), 399(6).
Rural .. 200(43) 202(1), 204(2), 2(6(53),207(856),209(220), 212(6), 220(57), 230(4), 231(5) 235(382), 236(3),
~
237(4), 244(7) 254(161), 255(27), 271(5), 273(350) 278(1),280(1), 281(;,4), 2~2(241), 2E3(J.:26), 284(6/ 288(341),289(88),310(8), 311(772), 314(1), 333(6)' 340(4), 341(1), 344(2) 3~0(873), 365(14), .31:8(2/
- 369(774), 3£4(1), 388(8), 3~ 3(173), 394(8),399(3):
Urban .. 200(40), 204(1) 205(2), 207(2), 209(101), 211(1) 214(2),215(1),216(1),220(18),230(7); 235(6),237(2/ 270(1),273(55),280(2), 281(1j,:Z82(10), 283(1), 284(1) -288(11), 289(5),301(6), 310(1), 311 (40), 314(7) 320(1), 333(1), 336(3), 343(4), 350(34), 362(1)' 365(17),369(18), 370(1), 378(3), 384(18), 385(1)' 388(21),390(1),392(8),393(42),394 (l). 395(2), 3S9(3)'
Daltonganj Anchal
Total .. 200(34), 205(2), 206(37), 207(29), 209(112), 214(2), 216(1), 220(16), 231(1), 235(3), 237(2), 254(3), 270(1), 271(5), 273(64), 280(2), 282(11),. 284(1), 288(5), 28~(2), 301(6), 311(37), 320(1), 333(3), 336(3), 343(4), 350(33), 362(1), 365(9), 369(37), 378(3), 384(18), 385(1), 388(19), 390(1), 392(7), 393(36), 394(1), 395(2), 399(~).
,Rur.!ll .. 200(1), 206(37), 207(27), 209(31), 220(6), 231(1), 235(1),254(3),271(5),273(28),282(1),280(4),311(33), ~33(2), 350(31), 365(1), 369(31), 388(1),393(9),399(3).
Urban .• 200(33), 205(2), 207(2), 209(81), 214(2),' 216(1), 220(10),235(2),237(2),270(1),273(36),288(2),282(10), 284(1),288(1),289(2),301(6),311(4),320(1),333(1), 336(3), 343(4), 350(2), 362(1), 365(8), 369(6) 378(3), 384(18), 385(1), 388(18), 390(1), 392(7), 393(27), 394( I), 395(2), 399(2). •
Mauzas •.
DALT0NGANJ T0WN
Town .,
Total ..
Mauzas ••
Daltonganj 200(33), 205(2),207(2),209(81), 214(2), 216(1), 220(10), 235(2), 237(2), 270(1), 273(36), 280(2), 282(10), 284(1), 288(1), 289(2),
Chainpur Anchal
200(1), 207(64), 209(23), 235(39), 255(10), 273(29), 282(2), 28~(3), 288(54), 311(64), 350(106), 368(2), 369(55), 393(16), 394(1).
'Alagdiha 350(3), Ausane 207(2), 311(4), Babhandih 207(2), 235(2), 273(3), 311(6), 369(1), Bahera 207(1), 369(1), Bankheta 235(3)"Banua 350(4) 369(5), Basaria Kalan 311(3), 350(2), 369(3), Basariya Khurd 207(1), 350(6), Bdri 207(2), 394(1), Burhibir 207(8), 273(1), 311(3), 350(1), 369(2), Chainpur 200(1),207(1), 209(6), 273(17), 282(2), 288(15), 368(2), Chando 207(10), 209(5),
Aru 207(3), 273(1), 369(3), Baralota 200(1) 207(4) 209(1), 350(2), 369(2), 3S9(2), Bari 206(5): 207(5): 311~3), 369(4), Chakbarewa 311(1), 369(4) Chatti 350(8), Chatti Sitbarwa 207(5),209(26),220(5) 231 (I) 271(5),273(20),288(4),311(18),333(2).350(4) 369(5)' 388(1),393(7) Chianki 311(6),350(4).365(1),' 369( I): Du1sulma 206(6), 311(5), 350(1), 369(1), Halumanr 207(3), 350(4), 369(1), Hurmur 369(2), Jamune 399(1), Jhl/-bar 273(3), Jora Hunhe Alias Jora 350(4) Kathautia 206(1), Kewatwar 206(1O),Khamdih 369(4) Kundelwa 206(8), Manasoti 206(1), 369(1), Mukt~ 206(2), 369(1), Naudhonrha 206(3), Nawadih 207(1) Pol Pol Kalan 207(5), 209(4), 393(1), Ponchi 207(1): 350(2), 369(2), Rerma 220(1), 393(1), Sarja 273(3) 350(2), Sudna 235(1), 254(3), 273(1), 282(1), Taba: 206(1).
301 (6), 311 (4),320(1), 333(1), 336(3), 343(4), 350(2) 362(1),365(8),369(6), 378(3), 384(18),385(1),388(18) , 390(1),392(7), 393(27), 394(1), 395(2), 3S9(2). '
273(3), 311 (6), 350(18), 369(3), Dulsulma 311 (2) Gurha 369(4), Hansa 311(1), Hisra 288(2), Horand~ Alias Ramgalh 207(1),209(1),311(1), Hutar 207(1) 311(1), 350(1), 369(1), Jainagra 311(1), Kakatu; 350(9), Kankari 207(10), Kars 207(2), 235(1) 369(1), 393(1), Khiribar 369(1), Kosiara 207(1); 311(2), 369(3), Kudaga Khurd 369(1), Kurkutta 207(1), Ladi 369(1), Lidki 235(16),273(1), 369(1), Lokeya 235(14), Mahugawa, 207(1),255(9), 283(2) 350(5), 369(1), Majhagawa 207(3), Matauli311(1): Nagwa 31 I (2), 369(5), Naudiha 283(1), Nawadih 209(3), 288(21), 311(5), Neura 288(10), 350(47)'

93
VILLAGEWISE INDUSTRIAL DATA,-conti.
Chainpur Anchal-concld.
Nimian 311(7), Paneri Bandh 235(3),255(1), Patarhia Kalan 369t4), Patarhia Klturd 311(6), Pathra Alias Narsinhapur 207(5), 209(7),273(3), 350(2), 369(7), 393(5), Rajhara 207(1), Rampuf 207(1), 369(1), Salatua 207(3), 311(6), 35()(6), 369(2), 393(1),
Lcslieganj Anvhal
Total .• 200(5), 206(15),207(97),209(8).220(4) ,231 (3), 235(26), 254(16\, 273(47), 281(8), 283(14) 288(10), 311(23), 350(53), 3b5(3), 369(62), 388(1), 393(25).
.. Akhauripatra 369(1), Akhouri Didri 369(1), Bairia 207(7), Banua 207(11,235(4),369(1), Bhakasi 369(4), Bahita f07(3), 273(2),' 311(2), Chandalgir 3."'0(3), 369(2), Chaukhara 207(2), 369(2), Cheri 207(2), Dabi'a 369(2), Darudih 207(1), 283(1), 311(3), 369(1), Dhabaih 207(3), Dhanganw 209(1), 273(1), 350(6), Dhobdiha 200(1), 209(1), 273(1), Dugila 350(5), 369(1), Gentha 350(10). Gopalganj 207(2), 231(3),281(8\, 369(3), Goradih Khas 207(8), 283(11), 350(4), Hal\sangra 311(1), 350(1), Jhagarpur 207(2), Juru 207(1), 209(1), 369(2), Kamalpur 207(3), 350(2), Karma 235(14),273(19), Khairant
. Total .,
Mauzas .,
Panki Anchal
200(4), 207(88), 209(19), 220(5), 235(36), 254(1), 273(28), 282(74), 288(61), 289(2), 311(128), 350(92) 365(3), 369(88), 393(7).
Abun 311(1), 350(1), 369(2), Ambabar 235(8), 311(1), Angara 288(3), Aparmanri 200(3), 311(4), Aseahar 207(6), 273(1), 282(31, 289(2), 311(10), 350(lB), 369(8), Auka 311 (1), Bah era 235(1) Baherwatanr 311(1), 369(1), Balndih 350(3), Balmuwan 369(1), Banai 350(2), Bandvbar 273(1), 311(1), Baniadih 282(2), Banki Kalan 207(4), Banki Khurd 207(1), 3II(1), Barwadih 207(3), Basariya 273 (I), 369(.5), Basdiha 288(5), 311(6). Bhanwardah 207(1), 282(1), 288(2), 311(5), 369(1), Bhari 220(2), 369(1), Bidra 207(1),235(8),282(4), Borodiri 311(16), BlIrhabar 350(4), 365(l). 369(1), Chandarpur (Thana No. 454) 207(2). 282(3), 350(5), 369(3), Chandamur (Thanit No. 4621 350(2),369(1), Chanpi Kalan 282(2), Chanpi Khurd 311(1),369(2), Chhapar 311(2), Chorea 311(4), Dandar Kalan 207(2), 235(,2), 350(1l), 36~(2), Du,ndar Khurd 207(5), Duwanka 207(4),350(1), 369(1), Ganeshpur 311(4), Garhganw 273(1), .Gongo 311 (3), 369(1), Gopaldih 369(3), Harkhuwa 369(4), Hahlallng 207(1), 209(2),273(1) 282(1), SH(l), 350(1), 359(2), Harna 369(1), Hesatll 207 (2), 254(1), 282 (.5), 31 I (3), 369( I), Hotwar 235(3), 273(1), 350(2), 369(1),
Chhatarpur AnchaI
Total ., 207(100), 209(26), 220 (5), 235(12), 273(56), 282(10), 283(1), 288(46), 310(1), 311(47),340(1), 350(84), 369(45), 388(1), 393(12), 394(1).
Mallzas .. Amwa 207(1), 273(2),. Arar 207(1), 311 (3), Bagai}:'a 311(1),369(3),340(1), Balra 207(1), 369(2), Bamhandlh 207(9), 311(2), 350(1), Bansdiha Alias Latea 209(1), 282(1),311(1),350(1),369(7), Bara (Thana No. 192) 207(1), Bara (Thana No. 208) 209(4), 273(1),311(5), 350(38), Bardiha 311(4), 359(3), Barwadih alias 'Ko,iara 207(2),209(2), 273(5),282(3), 311(1), 350(3) Charai 207(5), 311(9),350(8), Chhatarpur 209(7), 220(1) 273(9), 288(17), 388(1), 393(4), Chiru'273(1), 369(3), Choukhara Bandhudih 311(1), 369(1),Dagra • 350(2), Dal i 207(1), 220(1), Dumri 207(1), 369(1), Gamharia 283(1), Gulab Jhari 207,(3), 209(1),273(2),350(5),369(1), Gurdi 207(1), 350(1), 369(3), Harna 20'7(1), Jharha 369(2), Jobna Alias Ramgarh 350(1), Kala Pahar 207(4), 288(1), 311(3),
Sarhauwa 288(4), Shabpur 207(1), 209(1), 350(2), 393(9), Sokra 207(1), Tal.eya Khas 311 (4-), Tenia 207(1), Turuk Taleya Alias purub Diba 207(4) 273(1),311(2),369(7), Uldanda 311(1), Ulman 288(2),
207(1),. Kotkhas 207(4), 220(2), 273(9), 369(5), Kundn 207(9), 254(16), 273(3), 369(2), Kurai Patra 207(4), 350(2), 365(3), 369(1), Leslieganj 207(2) 209(4), 220(1), 273(10), 288(10), 350(5),' 369(3)' 388(1), 393(25), Lohra Pokhri 207(12), 369(1)' Maharja 207(6), 369(2), Mangat Gorea 235(1) 311(1)' MuruJtar 235(4), Naudiha 369(l), Nauranga' 207(1/ 311(6), 369(13), Nawagarh 350(4), 369(1) Pat: k~auliya 311(11, 350(1) Pinrra 207(1), 311(1),369(2), Plpra Khurd 207(13),311(1),369(1), Rajpl1r 369(2) Ramsagar 235(3), 273(l), Rcbaratu 220(1),273(1): 3lJ(5), 369(3), Sang bar 207(J), 283(2), Sehra 200(4) 206(15), 207(2), 31I(1), Shonsh 350(9), Sobri 207(2), Sonbarsa 207(1), Tenaraliasnawadih 207(1) 209(1),311 (I), 350(1), 369(2), Thakuraididri (Chakal didri) 369(1), Turkadih 369(2), Urhu1ia 207(2).
HuseI,ligurha Alias Misirgl1rha 207(1), 273(1), 311 (5), Hutal 207(2), 311(3), 350(1), 369(3), Jiro 288(22) Kakargarh 369(1), Karar 207(1) 273(2), 288(2)' 311 (2), Kaseri 311(3), Kolwa 207(1) 235(3) 273(2), 282(1), 350(7), Koteya 2B2(2), Kllnwai' 207(4)' 209(1), 220(1), 311(6), 350(3), 365(2), 369(2/ Loharsi 207(9), 209(3), 273(2), 288(6), 3J I (10)' 350(12), 369(4), 393(3), Lukuwa 311(6), 369(1)' Mahugain (Thana No. 412) 282(2), 311 (2), 350(7)' ~69(2), Mahugain (Thana No. 484) 311(2), 369f2): Mangarpur 207(8), 311(1), Manran 273(1), Maran 282(5), 350(4).. 369(4), Nandiha 282(7), 369(3), Nandiha 209(12, 235(7), 282(4), 369(5), Nawadih 207(3), 369(1), Nuru 207(7), 235(1), Pagar Khurd 207(4), 282(5), Panki 200(1), 209(6), 220(1j, 273(7) 282(14), 311t1), 369(4), 393(3), Parasia 273(2); Parsawan 282(2), Pundru 288(1), Rabhadih 207(5), Ratanpur 207(1), 209(4), Sagalim 207(2), 209(1), 282(1), 311(12), 350(3), 369(2), Sangaldipa 273 (1) Saraidih 207(3), 350(5), Sarjamatu 207(1), 273(3): 282(6), 311.(1), 369(1), Sorath 207(1), 273(1), 369(1), Sunn 220(1),. 311 (3), 369(7), Surajaun (Thana No. 455) 288 (20), Surjaun (Thana No. 480) 207(3), 282(1), 311 (I), Taiya 311 (3), 369(2), Tarwadih 209(1), 393(1), Titlangi 282(3), 311 (2), Tunudag 235(3), Ulgara 369(1).
369(5), Karma 273(2), Kauwal (Thana No. 205) 369(3), Kauwal (Thana: No. 268) 207(3), Khaira Dohar
'207(2), 350(5), Khajuri 282(2), 288(3), 311(1) 369(2), Khatdiha 311(1), Khatin- 207(8), Khonrhi 207(5), 311(7), Kui ali~s Shushiganj 207(1), 209(1), Lawadag 350(1), Madanpur 207(5), 310(1), Madheya 3'50(3), Mahipta 207(1), Manuh 207(6), Marwa 207(2), 273(30), 350(3), Masihani 311 (3), 369(1) Mednipur 350(1), Munkeri 207(1), 220(1), 235(12)', Murumdag 207(4), Namudag 273(1), Naso 282(2), Nawatanr 207(10), 209(10), 220(2),273(3), 288(14) 311 (2), 393(8), Nawdiha 207(2), 369(1), Nima 369(1); Palwa 394(1), Pokhraha 207(7), Rabda 207(1) 369(1), Rangnia 350(2), Rudwa 207(1), 288(5/ Sahaedih 288(1), Sarma 288(1), 369(2), Shabpu; 207(4),282(2),288(4),311(3),350(4),369(3), Shild.ag 207(1), Singhna 350(3), Telari 207(2), Telia Dih 207(3), Tilharwa 350(2).

94
VILLAGEWISE INDUSTRJAL DATA-contd
Total
Mauzas
Total ••
Mauzas .,
Hariharganj Anehal
200(8), 202(1), 207(32), 209(31), 220(11), 231 (I), 235(64), 236(3), 237(3), 254(1), 273(36), 281 (I), 282(12), 283(38), 288(21), 311 (51), 350(58), 365(5), 369(66), 388(4), 393(14), 394(2).
Amba 283(5), 350(1), Ambajharna 350(3), 369(1), Andharibag Kalan 207(7), Ararua Kalan 369(4), Ararua Khurd 200(1), 209(5), 235(3), 237(1), 273(3), 288(2), 31 1 (8), 350(2),. 369(2), 393(1), BabhanJih 200(1), 207(2), 231(1), 236(1), 273(1), 282(1), 288(2), 31 I (3), 350(14),369(1), Banahi 369(3), Bardag 282(2), 311(1), 369(1), Barwadih 311(1), Baso 369(1), Belodar Alias Pirtichak 200(1), 235(25), Bhagat Tendua 283(3), 311(2), 350(2), 369(4),' Bhanwar 369(5), Bhojua 283(1), Blshrampur 283(2), Chaitubigha 283(1), Chapar Bar 369(1), Dalpatpur 283(4), 311 (2), 369(2), Damwa 369(1), Dhabkalan. 209(2), 369(2), Diharia 311(1), Dubridih 350(2), Gahora 207(2), 282(2), 369(2), Halka 350(2), Holea 283(2), Jagdishpur Alias Rampur 283(1),
Patan, AD ehal
206(1), 207(116), 209(10), 220(1) 235(20),254(2), 255(17), 273(25),281(12),282(1), 283(35), 288(33), 289(5),310(7), 311(89), 314(1), 333(4), 350(89), 369(95),. 393(14).
Amwa 207(3), Angra 311(7), Aredana 369(3), Barahmoriya 207(3), Bardiha 207(12),235(5), Basu 369(3), Buchilami 311(2), Chakrudarpur 207(1), Chetma 235(4),310(1), 311(1), Churadohar 207(3), 350(3) 36.9(1), Dhangardiha 207(2), 310(2), 369(2~' Dlpana 207(2), Dulhi 207(2), 289(2 , 3lJ(3), Gahhrpathra 207(4), 281(1), 369(1, Gareriadih 283(3),369(8), Gari Khas207(4), 283(2), (311)1, 369(1), Golhana 207(1), 369(2), Haraiya Kalan 350(11), 393(1), Haraiya Khurd Alias Doamba 350(1), Hesla Alias Kaswakhar 28~(3), 369(3), Homia 288(14), Huri Alias Barsaita 311(4), Huruhansa 235(1), 369(2), Imli Khas 207(2), 289(1), Jaimaran Pathra 311 (2) Jaipur 207(3), 311(2), 350(5), Janghasi 207(7),281(3),282(1),283(7), 3U(2), 350(15) 369(1), Kajarma 350(6), Kajri 207(3), 289(2),369(2), Kanke Kalan 207(1), 283(6), 3II(8), 369(2), Kararkalan 207(2), 369(1), Kariahar 207(1), 281(1), 311(8), 369(2)
Bishrampur Anchal
To~al •• 200(15), 207(159), 209(39), 212(1), 220(5), 235(52), 244(7), 254(70), 273(43), 279(1), 280(1), 281(13), 282(1), 283(32),28,8(45), 289(76), 311(153),340(2), 350(158),369(125), 384(1), 388(1),393(24).
Mauzas .• Asnaulia 235(2), Baghmandwa 254(1),350(1),369(2), Bankheta 281(1), Barah Moria Kalan 311(2),350(1), 393(2), Bariganwan 207(3), 311(1),369(2), Basauna 273(1),369(1), Basna 207(7), 235(1), 254(2), 281(4), 3Il (.5), 350(2), 369(2), Belhara 207(1), 254(13).288(1), 289(11), 311(2), 369(3), Bhaluhi 311(1), Bhandar 207(7),283(3), 311(3), 350(4), 369(2), Bhatwalia 235(3), 311(3), Bhitihara 311(1), Binhua 350(3), Bishunpur 350(1), Bisrampur 207(6), 209(7), 254(4),273(8), 288(14), 369(2), 393(3), Burhkhaira 209(1), 350(1), 369(1), Chanaukhar 207(2), 311(1), Checharia 3Il(2), Dalakalan 283(2), 311(.5), 350(8), 369(4), Damaro 207(1), 350(1), Dandila Khurd 3ll(I), Darua 207(1), 235(3), 350(8), 369(5), Dhachabad 311(5), 350(1), Dhanudih 207(2), 369(2), Diharia 369(3), Ghaghua 273(1), Gharatia 207(5), 369(2), Ghasidag 311(1), Ghordiha 207(2), 254(2), 273(4), Godarma Kalan 207(5), 244(6), 281 (5), 311 (1),350(25), Guasarai
311(1), 369(1), Kataia283(1), 369(3), Rrap Kalaia. 311(4) Kharagpur 207(1), 282(5), 283(1), 288(4), 311(3), 350(5), Kokro 283(2), Kolhwara 350(2), Kothila 369(2), Kurhat Alias Tf'ndua Khurd 288(1), Labhra 311 (1), Langurahi 283(1), 350(2),. Mahugain AliasJadudih 311(1), Majhganwan Kalan 207(1), 283(1), 311(3), Pacbmo 283(4). 350(1), 369(4), Paraia 254(1). Pipra (Thana no. 45) 207(5), 209(5), 273(2), 311(1), 350(15), 369(2), Pipra (Thana No. 114) 311(2), Pilhaura 283(1)1 350(2), 369(1), Salaia 207(3), 369(2), Saraia 207(1), 235(3), 273(2), 283(2),369(2), Sarsot 282(2), 283(2), 311(5), 350(1),369(1), Satganwan Alias Hariharganj 200(5), 202(1), 207(41, 209(19), 220(11), 235(33), 236(2), 237(2), 273(28). 281(1), 288(12), 311(J2), 350(3), 365(5) 369(8),388(4),393(11), 394(2), Sbakaldipa 207(5), 350(]), 369(2), Shikarpur 283(1), Sultani 207(1), 283(3), 369(2), 393(2), Tendua KaHan 369(2), 1 endua Pipra 369(1), Tendudih 369(1) Tendui 369(2)
Kathautia 207(7), Kelhar 209(1), Khairdohar 235(6), 273(1), Khajuri 220(1),369(1) Khamhi 311 (4), 369(2), Kisaini 281 (I), Kishunpur 207(7), 209(2), 273(1), 350(4),393(5). Kokarsa 369(1), Kolhua 3Il (3) 369(4', Kumhwa 207(2),311 (2), 350(13), Lami 207(3),369(4) Lohandi 283(3), 369(1), 393(1), Lohanra 283(5), 311(1), Loinga 207(2), 273(1), 281(1), 350(10), Mahuliya 207(5), 273(5), 311(2), 369(2), Majhiganw 207(2), 281(2), 369(3), Manahar 207(7), 273(2),. 369(5), Manika 310(4) 350(2),369(11), Meral 311(2) 369(2),Murma 206(1), 207(6), 254(1), 283(3)' 311 (7), 369(5), Naudiha 283(2), 311 (1), Nawakhas· 209(1),273(1),369(1), Nawada 207(1), Nimiya 207(6), Pachkeria 311(1),369(1), Pakri 273(1), Palhe Khurd 369(J}, Pandwa 207(5), 209(1) 254(1), 255(1), 281(1), 283(1),333(4),369(3), Patra 207(2), 288(8),311(4), 369(2),Pokharia 369(1), Rabdi 235(1), Rudidih 209(1), 235(2), 288(4) Sadhpur 369(1), Sakaldipa 281(2), Sakhua 273(3),311(1),369(1), Sanda 350(6), Sataua 207(2), 255(16), Sathe 311(17), 369(1), Semri 207(1), 209(3), 273(3), 314(1), 369(6), Sika 311(1), 350(6), 369(2), Sirma 207(2),209(1),273(6), 350(7), 393(7), Sole 235(1), 273(1), 311(3), Tisirbar 288(7).
207(2),311(1),350(4), Gurha Kalan 311(1), 369(3), Guri 283(.5),393(1), Harhepa 283(1), 369(1), Holga 254(5), ltko 207(4), 273(2), 311(1),350(1), 369(1), Jarka 207(1),.Jbagarua 311(2), 36Q(3),]hani 393(1), Jharandih 283(3),jharha Kalan 311(1), Jharhakhurd 207(~), Jllarna Kalan 311(1), Jharma Khurd 207(3), 311 (I), Soga 207(4), 254(3),Kadhwan 311 (1), Kairu Kalan 207(3), 235(18), 273(3), 288(2), 289(4), 311(3), 350(10), 369(1), Kajru Khurd 207(6),254(2), 288(1), 289(3), 3U(5), 350(3), 369(2), Kalinpur 350(1), Kamta 273(1), Kanda Khas 207(1), 209(1), 235(2), 254(1), 273(1),283(3), 311(5), 350(3), 369(2), Karamdih 207(1), 350(6), Karkata 281(1), 311(8), 369(4), Kauria 369(1), Ketal Kalan 207(1), Ketal Khurd 311(I),Khura 311(2), Kulhi 289(1), Kulia 207(1), Kunrwa K~lan 235(1l), Kunrwa Khurd 235(2),Kushha Kajru 235(1), Kutmu 200(ll), 207(7), 209(4), 254(12), 283(1), 288(2), 311(9), 350(4), 369(4), Lalgara 207(7). 212(1), 254(4), 273(1), 283(1), 289(1), 311(10), 350(1), 369(5), 393(1), Lawarpanru 207(2),350(6). 369(4), Lumasatbahini 207(1), 311(1), 350(2), Mahu. ganwan 207(12), 235(5), 273(2), 288(2.), 289(10), 311(4), 340(2), 350(2), 393(9), Malhatoli 207(1),

95.
VILLAGEWISE INDUSTRIAL DATA-contd.
Bishrampur Anchal--concld.
369(1), Mallah Toli 311(1), 369(1), Ma1waria 207(2), 281(1), Mayapur 207(5),369(3), Murma Kalan (Thana No. 57) 254(3), 311(2), Murma Kalan (Thana No. 551) 350(1),369(4), Murma Khurd (Thana No. 56) 207(4), 254(7), 3110), Murma Khurd (Thana No. 552),207(1),209(2),289(3).311 (2), 369(1), Murumalu or Mururatu 254(6), 311(2), Musikhap 207(4), 235(1), 273(1), 289(14), 311(6), 350(2), 369(1), Naugarha 207(2), 289(7), 311 (3), 369(3), 393(1) Nawa 207(3), 209(3), 350(10), 369(1), Nawgarh 311(1), 350(5), 369(1), :"fimia 207(1), 369(1), Obra 289(2), 311(4), 350(1), 369(1), Pahargerua 283(1),350 (2), Panjri Kalan 207(4),209(1),311(1), 350(3), 369(2), Panjri Khurd 207(1), 393(1), Panrepura (Thana No. 24) 283(3), Panrepura (Thana No. 547) 200(2),207(6), 273(1), 311(3), 350(3),369(2), Panru 209(1), 220(2), 288(4), 311(4), 369(3), Phulia 207(1), 254(3),288(4),311(3),350(6), Pipra 273(1), 350(4), 393(1), Pipri 311(1), pokhn 369(1), Rabrla 207(1), 350(2), Rabra 207(1), 289(3),
Manatu Anchal
Total .. 207(83), 209(8), 220(1),23.5(53), 273(18), 281(1), I
283(17),288(49),311(61), 344(2), 350(68), 31)9(74), 393(12), 394(3).
Mauzas .• Arka 207(3), 220 (1), 235(8), 273(2), 369(2), Baja1pur 207(12), 282(3),350(2), Banasam Alias Murdhoi 288(2), Rara 273(1), Bedani Kalan 250(1), 393(2), Bedani Khurd 350(2), Bhalugari 207(2), 311(2), Bhanrra 311(2), Chak 207(2),209(4),273(3), 350(14),369(11), Chhaknadih 235(3),273(1), Chhatar. pur 207(2), Dhuma 207(4), 311(2), Dumri 288(21),
. Ghanghri 369(1), Ghirsiri 369(1), Gogda 350(1), Goindi 207(5), 350(3), 369(2), Gurha 350(5),369(1), Gurturi 350(3), 369(2), J aidu 393(4), J aleya 311 (2), Jamuniadih 311(1), Jaspur 369(1), Karaila 394(3), Kasmar 369(3), Lalgara 207(1), 350(6), 369(3), Madheya 288(1), Mahari· 369(10), Mahuari 207(2), 350(1) ,369(2), Mahudanr 235(5), 273(2), Majhganwan
Hussainabad Anchal
.. 200(16), 204(3), 207(90), 209(45),211(1), 212(5), 215(1), 220(27), 230(11), 235(83),237(1), 254(68), 273(59),281 (20), 282(123),283(4),284(6), 288(28) 289(8), 310(1), 311(159), 314(7), 340(1), 341(1), 350(166), 365(11), 369(145), 370(1), 388(3),392(1), 393(55), 394(1), 399(1).
Rural .. 200(9), 204(2), 207(90), 209(25), 212(5),220(19), 230(4), 235(79), 237(1), 254(68),273(40),281(19), 282(123), 283(3), 284(6),288(18),289(5),311(123), 340(1), 341(1),350(134),365(2),369(133),393(40), 394(1).
Urban •• 200(7),204-(1),209(20),211(1),215(1),220(8),230(7), 235(4), 273(19), 281(1), 283(1), 288(10), 289(3), !310(1),311(36), 314(7), 350(32), 365(9), 369(12), 370(1) 388(3),392(1),393(15),399(1).
Mauzas .• Arajikusumhara 282(1), 311(1" 369(1), Babhandih 207(1), Bahera (Thana No. 300) 282(2), 311 (1),369(1), Bahera (Thana No. 379)282(1),Bairaon207(3) Bajardih 369(3), Baldihri 369(2), Baniadih 350(2): 369(2), Bardanda 207(1), Barwadi~235(1), 254(2), 289(2), 311(1),350(1),369(1), Basana 207(1), Batauwa 311 (1), Belaspur 200(1), 282(4), 369(3), Belbigha 235(8) 311(2), 369(1}, Beni Kalan 220(1),254(5), 282(6); 311(1), 350(1), 369(1), Bhajania 207(5), 212(1) 273(2), 282(5), 350(4), 36~(2), B~ali 235(1), 254(2): 284(2), 289(1), 369(1), Bhltarpantl 311(1), Birdhaur 207(1), ~11(2), Birgain 350(3), Bishunpur 282(3), Bulandblgha 350(7), Cllahkargopal 207(2), 254(9),
369(1), Ragda 281(1), Rajdiria 369(1), Rajhara 209(3), 273(2), 350(7), Rajkhar 311(1), Ram jani Bigha 2.')4(2), Ratnag 207(2), 288(1),289(2),311(3), 350(2),369(4), Reh1aKalan 200(2), 209(14), 220(2), 273(5), 384(1), 388(1), Rehla Khurd 280(1),282(1), Salhana 311(1), SAnkha 207(6), 283(6), 369(4) Semri 289(3),350(1), Semri Kalan 289(5), 311(1): 350(5), 369(2), Semri Khurd 209(1), 350(~), 369(1), Seora 207(2), 369(2), 393(1), 8'liankardlh 283(1), 311 (1), 369(1), Sigsigi 207(3), 273(2), 288(3), 3?9(6), 393(3), Sildili 288(1), 350(1), 369(2), Strha 209(1),220(1) 273(1), Sohdag Kalan 311(1) Sordiha 283(1), 288(7), Supwa Alias Amw~ 311(1), 369(1),' Tisibar Kalan 207(3), 235(2), 244(1), 273(5), 2·78(1), 288(3), 289(4), 311(6) 350(1), 369(2), Titahi 273(1), Tolra 207(1), 289(3): 311 (6), 3M(I), Tona 235(1), 311(1),350(1),369(2) Tukbera 207(1), 311(2), 369(4), Ulipahari 207(4), ' 311(2), 369(3), Wasula 207(1),283(1), 311(2).
207(1), Majhouli 369(2), Manatu 207(2), 209(2) 311(2), Mitar 288(1), 311(2), l'\agad 369(1), Naw~ (Thana No. 369) 350(2), 369(1), Nawa (Thana No.491) 393(1), Nawadih 207(10), 311(5), Paduma • 207(2), 350(6), 369(4), Pakri 207(1), 235(3), 273(3), Parsalll 207(8), 282(1), parsawan 207(2), 350(2), 369(7),l'ashar 207(2), Pathak Pagar 235(20), 273(2) 311(1), Patila 207(3), 350(6),369(5), Rabda 288(5)' Saraidih.2g7(1), Senoti 282(10), 31!(2), 369(3): 393(4), Slkm (Thana No. 457) 350(4), Stldiliya Kalan 207(2), 288(1), 311(1), 344(2), 350(2), 369(5) Sildiliya Khurd 311 (2): Sonpura 207(1),273(1), "282(2) 350(3), 369(3), Sugl 207(3), 311(1), Surguja 288(6), Tanrwa 273(1), Tarhasi 209(2) 235(6) 288(3), 31!(28), 350(3), Tariya 207(7),' 235(8), 273(1), Tehyadohar 207(2), Tetar 393(1), Tiraundha 207(1): 369(2), Udaipur 207(2), 273(1), 281(1) 282(1), 350(2), 369(2), Udaipura 311 (8), Urur 288(9):
281(3), 350(1), Chankarkasturi 273(1) 350(7) Chankari 207(3), 235(21), 311(2), 369(2), 393(1): Chankhanda 207(3), 282(4), 288(1) 369(1), Checharia Kalan 281(1), Cheladih 3lId) 350(5), G:hha!akund 311(1), Dali 207(3), 282(2),' 350(1), Dandtla 207(1), Dangwar 220(1), 235(1), 273(2) 282(2), 311(14). 350(6), 369(5), 393(3') Daru~ 235(7), 369(2), Deori Kalan 200(2), 209(8{ 220(5) 2~5(~),. 273(5),282(2),289(2),341(1),350(1),369(1)' DlhnbISfampur 282(1), 369(2), Ekauni 282(1)' Gajitehra 207(1), 282(3), 350(6), 369(1), Ghaghr: 207(1), 3ll(I), ~69(2), Ghurwa 282(1), 350(3), 369(3), Gonradlh 207(4), 369(1),. Haidarnagar 200(6), 204(2), 207(13), 209(11), 212(2), 220(5)
~~~m: ~3~JW,' ~~mk), 2itdU), ~lgg2?' ~~;m: 36~(7), 393(16), Hirasikni 311(1), 350(3), h~amnaga; AlIaS Barewa 369(1), It wan 350(1), Jamua 282(1) Jhargara 207(1), 282(1), 311(4), 369(3) Jharh~ 369(1), Jhari 369(1), Jhari Khurd 282(2), Kabra Kalan 235(7), 254(7}, 273(1), 282(3), 31[(2),350(1) 369(1), Kachra 207(~), 282(5), 288(1),311(5),350(2): 369(6), Ka_dalkurm1 207(3), 3ll (4), Kajimnagar 369(1), KaJrat 350(3), Kamat 369(3), Kamgarpur 273(1), 281(4), 311(1), Karimandih 350(2) Kathoundha Kalan 235(1), 282(1), 369(1) Khalilpu; Alias Tikri 369(1), Khardiha 282(3), 288(3), 311(2), 350(3), 369(1), Khargara 369(6), Koiriadih 273(3) Kolhuasonbarsa 207(1), Koshiara 369(1), Kosi 207(1)' 254(2), 273~1), 288(3),311(2),350(1), Kukuhi282(7) 288(2),311(5),350(5), Kunrwa Kalan 282(1),369(1),

96
'VILLAGEWISE INDUSTRJAL DATA-contd.
Hussainabad Anchal-concld.
Kunrwa Khurd 220(1), 282(1), 283(3), 350(1),369(2), Kurmipur 207(5), 282(4), 288(1), 311(3), 369(6), Kusbanaraenpur 282(1),311(1),369(2), Kuswa 369(1), Lan~arkot 282(6), Lapea 311(3), Loharpurwa 207(1), 350(2),369(1), Lotania 212(2),273(1), 282(8),394(1), Mahuari (Thana No. 341) 288~1), 311(2), 369(2), Mallllari (Thana No. 387) 350(5),369(1), Mahudand 282(1), 311(3), 369(2), Majhouli 350(1), Majhiaon 359(1), Mali 369(1), Mankhap 207(3), 369(2), Marha 220(3), Mirheiadih 369(1), Mobarakpur 350(3), 369(1), Mohsin Nagar Alias Mahammadganj 209(4), 220(2), 311(5), 369(1), Mukharkalan 207(1), 282(2),31[(11, 3'69(2), Nadiain 369(1), Naudiha 207(2), 288(1), Nawadih (Thana No. 366) 207(6), Nawadih (Thana No. 376) 273(2), 350(6), Nokhila 281(2), 282(2), Obra 311(2), Pansa 207(2" 254(5), 311(2), 350(11), Panti 207(2), parta 207(1),281(2), 311(1),369(2), Pataria 207(2), 282(1), 311(4), 369(1),
HUSSAINABAD TOWN
Town .• 200(7),204(1),209(20),211(1),215(1),220(8),230(7), 235(4), 273(19), 281(1), 283(1), 288(10), 289(3),
GAlUIWA SUBDIVISION
Total .• 200(17), 202(1), 206(8), 207(586), 209(106),211(5), 212(1), 220(26), 223(1).- 231(17), 235(59), 237(3), 244(581),253(238),255(67),262(1),270(15),273(235) 280(10), 281 (5), 282(22), 283(24), 284(6), 288(230), 289(58), 310(15), 311(831), 314(28), 315(6), 320(2), 335(3), 340(4), 344(1), 350(491), 353(1), 365(2), Urban .. 369(596), 384(1), 388(12), 390(1), 392(4), 393(127), 394(18).
Rural •. 200(9), 202(1), 206(7), 207(584), 209(86). 211(5), 212(1),220(11), 231(17), 2~5(59), 237(1),244(581),
. Meral Anchal
Total .• 200(1), 207(101), 209(9), 23'1(12), 255(7),244(437), 253(23), 273(43), 28!(2), 284(4), 288(7),311(141), 350(110), 369(117), 388(1), 393(9), 394(1).
Mauzas , .• Adhaura (Thana No. 202) 207(4) 284(1), 311(5) 350(4), 369(1) Adhauri (Thana No. 212) 369(2), Akalbani 231(12), 311(2), Arangi 350(4), 311(2), Bajudih 207(4), 253(11), 311(2), 350(3),369(1), BaIekhariauas Balekhar207(1l, 311(8), 369(1),393(1), Bana 207(2), 273(3), 350(9),369(4), Banajang 273(1), Banka 207(3), 253(12), 350(1), 369(4), 393(1), Bardari Alias Jarhi207(17), 209(1), 244(75), 273(3), 350(1), 369(6), Bauraha 207(1), 311(2), 369(3), Bhandar 369(1), Biklam 311(1),369(1)1 Chama 207(4), 273(1),281(1),311(4),369(4),394(1), Danrai 235(1), 273(3), 311(8), 350(3), 369(1), Dewgapa 207(4), 244(22), 350(1, Duldulwa 369(3), Garua 244(57), 273(1), 311(8), 369(5,. Garusoti 27_3(2), 288(1), Gobardaha 369(1), Gonda 207(3), 350(8). 369(7), Harandube 207(1), Hasan Dag 235(1), 244(116),
Garhwa Anchal
Total .•
Rural .•
200(8), 206(1), 207(56), 209(22), 220(15), 223(1), 231(5), 235(42),237(2), 2H(144),253(2), 255(35), 273(72), 280(10), 281(1), 282(6), 288(86), 289(1), 311(78), 320(2), 335(3), 350(124), 353(1), 369(94), 384(1), 388(9), 390(1), 392(3), 393(31 ).
207(54),20)(2), 231(5), ,235(42),244(144),253(2), 255(19), 273(60),280(10), 282(7), 288(86), 311(74), 350(124), 369(81), 393(4).
Urban •• 200(8),206(1), 207(2), 209(20), 220(15), 2i3(1). 237(2), 255(16), 273(12), 281(1), 2B9(1), 311(4),
Mauzas ..
Pathra 282(2), Patra Kalan 207(4), 235(2), 350(1) .. Patra Khurd 282(3), 350(7), pokhra 369(1), Pokhrahj, 207(1),311(1),369(5), Poldih 254(5),282(4), 3J 1(6), 350(2), 369(1), Randaih 369(1), Ranidewa 207(4), 235(1), 311 (2), 393(19), Ratanbigha 235(1), 369(1), Repura 311(2), Reriya207(2), Rupnaraenpur 282(3), 350(3), 369(7), Sabano 393(1), Sabanwa 235(9), Sadajal 207(.1), 254(2), Sfljwan Salempur 209(1), 254(7), 281(3), 311(1), 369(3), Sarea 207(1), 254(4), 273(1),282(3) 350(4), 369(3), Sarhu(Thana No. 321) 282(1),350(1),369(1), Sarhu (Thana No. 467) 282(2) 369(1), Semarsot 220(1), 282(1), 369(1), Sewar alia;;' Mangaldih 282(7), Sinduria 350(3), 369(1), Sonpurwa 273(1), 288(1), 311(2), 350(1), 369(1), Supha 311(4), Takea 288(1), Tongra 207(2), 209(1),281(4) 311(1), 369(2), UpriKalan 282(4), 369(1), Urdwa;· 254(7), 311(4).
310(1), 31l (36), 314(7), 350(32) 365(9), 369(12),. 370(1), 388(3), 392(1), 393(15), 399(1).
253(238),255(51),262(1), 270(15), 273(223), 2£0(10) 281(4), 282(22), 283(24), 284(6),288(230), 289(57/ 310(15), 311(827), 314(28), 315(6), 340(4), 344(1( 350(491), 365(2), 369(593), 388(3),392(1), 393(100)' 394(18). ,.. 200(8), 206(1), 207(2), 209(20), 220(15), 223(1) 237(2),255(16),273(12),281(1),289(1),311(4),320(2/ 335(3),353(1),369(13),384(1), 388(9),390(1) 392(3/ 393(27). '
311(3), 369(5), Kadailia 244(5), Kajrat 244(53) 3€9(2), Kaprat 288(4), Karkoma 244(74), 273(3( 311(10), 369(1), 388(1), Kolodohar 311(1), Lakhect' 244(19) Latdag 207(2), 369(5), Lawadohar Alia~ Phulwar 273(1),369(1), Lawahi Kalan207(8) 235(1) 311 (12), 350(3), 369(10), Lawah; KhuI'd' 207(3); 311(3), 369(1), Loadag 273(2),311(4),369(2), Meral 200(1), 207(13), "235(1), 273(6), 284(1), 311(15) 350(1), 369(7), 393(3), Naudiha Alias Suarj angh~ 350(2), 369(1), Okhargara 207(3), 209(1), 235(3), 273(6), 281(1), 311(7), 369(1), Panduhan 369(2) Patara 207(4), 311(11), Pendli 311(3), 369(1), Pesk; 207(6), 209(7), 273(6), 284(1), 288(2), 350(24) 369(6), 393(4), Rajbandha 350(11), 369(1), Rajha~ 273(2), 369(1), 311(1), Raro 207(7), 273(2), 311(9), 350(5), 369(8), Rejo 207(1), 244(16),281(1),311(1), 369(1), Sangbaria 311(3),369(1), Sohbaria 31](9) 359(2), Sonhe AliasSonehara 207(4), 369(]), Tasra: 273(1),350,2), Tena 207(6),311(6),350(28),369(6) Tisartetuka 311 (1), 369(2), Tori Kalan 369(4). '
320(2), 335('3), 353(1), 369(13), 384(1), 388(9), 390(1),392(3), 393(27).
Aseya 288(23), 311(4), B~ligarh 369(1), Bana 207(1). Baneya 207(1), Bardaga 273(1), BauIiya 282(1), 31 I (1), Belchampa 207(1), 209(2), 350(4), IIhikhaM 207(9), 244(144),280(3), 369(2), Bishunpur 207(1), Chhaparda,ga235(1), 255(6),311 (3), 369(2), Chhatar. pur 311 (4), Chiraunjiya 207(7), 273(1), 311(31 369(9), Danda 273(5), 288(17), 311(6) 369(2), 393(2 ' Datrna 288(20), Dhonti 369(2),Dumro350(13), 369(1 : Garnaha 311(3), 369(1), Gorheya 273(1), 282(1 , Jala 369(2), Jata 207(1), 311(10),' 350(21),369(10.

97
VILLAGEWISE INDUSTRIAL DATA-contd.
Garhwa Anchal-concld.,
Jhaluwa 273(4),311(1),369(2), Juti 273(1),369(1), Nawadih (Thana No. 275) 207(1), 311(1), 369(2). Kalyanpur 207(1), 273(3), 280(7), 350(6), 369(3), Nawadih (Thana No. 318) 350(7), Parihara 207(1», Kamta 311(2), Karmahi 369(3), Karuakalan 207(2), 253(2), 311(2), Patsa 207(1), 273(4),350(2) 309(5), 369(4), Karua Khurd 273(1), Khajuri 231(2),311(4), Phara Tiya 369(1), Pipra 273(1), 311(1), 369(2), Kitasotikhurd 350(9), Korta 207(2), 288(6), 311(5), Potma207(1),231(1),Pratappur207(1),Ranka207(1). 369(1), Korwadih 273(1), 311(2), Kundi 350(10), 282(3), 311(5), 350(4), 369(1), Salgara 235(3), 369(1), Lagma 231(2),235(1),311(2),369(1), 393(2) Sangarhe Kalan 207(1), 273(1), 350(5), 369(2), Lapo 207(1), 369(1), Madheya 273(1), 311(2), Sangrahe Khurd 207(2), 311(1),369(2), Sidekhurd 369(1), Mahupi 369(7), Merhna Kalan 255(4), 207(0,235(31), 273(2); Soh 288(3), 369(1), Teenar 288(17), 311(1), 369(2), Kotihara 207(5), 282(1), 207(6),350(43), Terhiharaiya 235(6),273(2), Ursuagi 311(2), Nawada 255(9), 273(31),282(1), 311(1), 207(6),311(1). 350(2),369(6), Nawadih (Thana No. 231) 311(7),
GARHWA TOWN
200(8), 206(1), 207(2), 209(20), 220(15), 223(1), 237(2), 255(16), 273(12», 281 (I), 289(1), 311 (4),
Untari Anchal
320(2) 335(3), 353(1), 369(13), 384(1), 388(9), 390(1), 392(3), 393(27).
)tal .• 200(1), 207(125), 209(19), 220(5), 235(2), 253(121), 273(48), 283(9), 288(7), 289(39), 310(15), 311(140), 314(28), 315(3), 340(4), 344(1),350(68). 36.5(2), 369(102), 388(2), 292(1), 393(44), 394(14).
369(3), Korga 369(2), Kumba Khurd 311 (I): Mahuli 369(1), Mahuli Kalan 273(2), 311 (2~ Majhganwan 253(9), Mandohar 209(1); 311(2), Mangar Dah 207(1),289(1),311(10),369(4), Mangra 273(1), 288(3), Manpur 311(4), Marchwar 253(1), 273(1), Marwanian 253(19), 273(4), 289(4),311 (5), 350(9), 369(3), Nagarutari 200(1), 207(5), 209(11), 220(1), 273(7), 311(16), 344(1), 365(1), 369(6), 388(2), 393(8), Narhi 273(2),283(1), 350(4),393(4), NarkhoriaKhurd 369(4), Nasa AliasJasa 253(1), 369(3) 393(4), Palhe Kalan 207(1),311(2),369(2), Parswan 273(2),283(1),314(4), Patagara Kalan 207(2),209(2), 253(6),314(1),393(3), Patagara Khurd 353(3), 369(1), Patariya Kalan 311(1), Patihari 273(2),311 (3), 369(1~, Pipardih 311 (8), 369(3), Pipri Kalan 253(8),273(1 , 314(8), 350(2), 369(2), Pipri Khurd 207(2), 289(2 , 350(3), Puraini 207(11), 253(26), 3U(6), Rohilil 273(1), 369(2), Sahrastal Khurd 350(2), 1369(2), Salsaladi 311(1) , Sandhea 289(1), Sapahi 273(1), 369(3), Sarang 207(3), 369(1), Saro 253(6), 311(1), 350(1).369(1), Siddhi 207(3), 369(4), Silidag 207(14), 235(1), 273(2), 283(1), 289(6), 311(2), 315(3), 350(2), 369(5), 393(3), Singhpur 311 (3), Siriatongar 235(1), Tandwa207(4),273(1), 311(3),350(9),369(8), 393(1), Tharka 207(2), 369(1), Tharkia 207(2),
auzas .,
otal
[auzas
otal .•
Adhaura 253(19), 289(7), 311(3), Amhar Khas 207(4), 220(3), 273(1), 311(5), 392(1), Baghaundha Alias Ranna 207(18), 209(3), 273(2), 311 (6), 314(7), 350(4), 365(1), 369(4), 393(3), Bahiarkalan 273(1), 314(3), 369(1), Bahiar Khurd 207(3),273(1),311(2),369(2), Barorlih 207(2), 311(9), Bha~odih 311(2), Bhojpur 207(5), 283(4), 311(6), 369(1), Bilaspur 207(5), 273(1), 369(5), Bishunpur 369(1), Bishunpura 207(3), 2'53(9), 288(4), 289(8), 311(7), 314(5), 350(2),369(3), 393(3), Checharia 207(3), 209(3), 220(1), 273(11), 289(6), 310(15); 350(7),369(2),393(1), 394(14), Chit Bisraon 207(4), 311(8), 369(2), 393(14), Chitri 369(3), Gangti 369(1), Garbandh 207(3), 283(2), 289(4), 311(8), 369(2), Halwanta Kalan 207(3), 311(1), 369(3), Halwanta Khurd 311(1), Hara Dag Khurd 207(3), Hulhula Kalan 311(2), Hurhi 207(2), 369(1), Jatpura 311(1), 350(10), Kabisa 311(1), Kadhwan 207(4), 273(1), 350(7), Karanpura 207(8), Kochea 207(2), 350(5), 369(1), Koindi 273(3), 369(1), Kolhua 207(3), 369(2), Ko!jhiki 311(8),340(4), ,350(1),
Dhurkl Anchal
207(29),253(6), 273(5), 288(25), 311 (45), 350(27), 369(36), 394(1).
Amba Khorea 311(5),350(2), 369(2), Baliari Alias Siuri 350(1), Bhandra Alias Bhandar 311 (I), 369(2), Birb:il 369(2), Bishunia 369(1), Bulka 207(1), 350(3), 369(1), Chana Kalan 207(1), 311(1), Chundi 207(1), 253(3), 311(4), 350(7), 369(2), Dhamdll.amia Alias Atiari 288(8), Dhobni 369(1), Dusaia 369(1), Gamharia 207(1), Ganiari Kalan Alias Phatpani 273(4), 288(9),311(6),369(2), Ganiari Khurd 369(1), Henhe
Ranka Anchal
200(6), 206(7), 207(62), 209(25), 211(5), 212(1), 220(3), 237(1), 262(1), 273(32), 281(2), 283(1), 288(39), 311 (125), 315(3), 350(22), 369(97), 393(15) 394(1).
[auza~ •• Anhar 369(1), Baghokundar 369(1), Baha Hara 283(!), Bali Garh 369(1), Bandu 273(1), 311 (5), Baradih 369(1), Bardari 207(2), 288(3), 311(9), 369(2), Barwa 315~2)' 369(1), Barwadih 207(4), 288(2), 311 (3), 350 1), 369(2), Belari Alias Chinia 209(1), 211(1), 28 (7), 369(1), Besri Knari Alias Besri 273(1), Bhaluani 207(1), 369(1), Bhaunri 288(8),
P-I-13
369(2), Uska 253(14), 369(3). '
Alias Baraiha 369(2}; Jirua 288(1}, Kadwa 207(8) 369(1), Kadwa Alias Likhnidhama 207(2), 311(2)' 350(1), 369(2),394(1), Ketma 369(1), Khala 273(1); 311 (2), 369(1), Khutia 207(2), 311 (3),369(2), Kumba Kalan 288(2), Libra Alias Paras Pant Kalan 288(2) 369(2), Mandohar Alias Karua 311(4),350(2),369(2)' Marc~aiya207(1), 369(1) Panghatwa 311(1), 350(1); Raksl 311(6), 350(2), 369(1), Sagma 207(7), 253(3)
• 288(3), 311(2), 350(6), 369(4). Tatidiri 207(5), 3U(8), 350(2),. 369(2). ,.
311 (3), Bilaiti Khar 209(1), 311 (I), 369(1) Bir~pur 311 (1), Birbandha Alias Birbandh 288(10): 369~~J 393(1), ChapkaJi Alias Chamkali 311 (1), 369 1 ' Chapla Alias Chaphra 311 (1), Chapri 311(2) 369 1 ' Chatak Man 369(1), Cheta Alias Beta 369(1) Chet~ 369(1), Qhutia 209(5), 273(1), 369(4),393(1), Chutru 207(1), 273(1), 311(2), 369(1), Dudhwal 207(1) 273(3), 311 (2), Duduhara Alias Raj bans 369(2)' Durjan 315(1), Gangdih 394(1), Gasedag 2072)' 369(1),Gaurgara350(8), 369(1), 393(2), GObardih~ 369(1), Harhe 207(4), 369(2), Helri Anas Chhatailia 288(2), 369{1), Hetar Kalan 288(3), 369(1), Hetar

98
YILLAGEWISE INDUSTRIAL DATA-contd.
Ranka Anchal-e,ncla'.
Khurd 369(1), Homia 369(1), Honhe Khurd 369(1), Jhagrahe 369(1), Jogi Khura 207(2), Jolanga 207(1), 31I(2), Kachanpur 369(1), Karma Alias Khuri 207(1); 311(2), 369(1),393(1), Karri 311(1), Kasmar (Thana No. 107) 369(2), Kathautia 311(1), 369(1), Katta 369(1), Kerwa 369(1), Khapro 207(1), 311(1), 369(2), Khardiha 369(1), Kudrum 311(2), 369(3), Kundil Alias Dol 207(5), 311 (2), 350(6), 369(2), Kurumdari 369(1), Kuswar 311(1),369(1), Mangrahi 311 (6),369(2), Manpur 311(2), 369(2),Murkhur 369(1), Murli311(2), 369(1), Nagari 369(1), Palhe (Thana No. 21) 311(1), 369(1), Pargawal 288(2), 311(7),369(2), Patsar 207(2), Pindra 207(1), 311(8), 369(2), Dundaga 311(3), Puregara 211(1), Raksi 206(7), 207(4), 311(6), 369(3), Ramkanda 207(4),
Bhandaria Anchal
Total .• 207(2),209(4),21 I (2),235(4),273(2),284(1),288(14), 311(19), 350(16), 369(27), 39~(2), 394(1).
Mauzas •• Bark 01 Kalan 288(4), BarkolKhurd 369(2), Bhandaria 20~(2), 284(1), 350(3), 369(2), Bijka 369(1), Bijpur AliaS Barhni 207(2),209(1),273(1), 369(1), 393(2), Borri 23.5(2), 288(10), 369(3), Gathani 311(1), 350(1), Jamauti 311(4), Janewa 311(1), 369(2),
Majhiaon Anchal
Total •• 200(1), 202(1), 207 (88), 209(16), 220(3), 235(4), 253(35), 255(32),270(15),273(11),282(15), 288(7) 289(6), 311(63), 350(56), 369(49), 393(16).
Mauzas " Adar 311(6), Akhauri Tahle 207(8), Amarchhecharia 3ll(I), 350(2), 369(1), Amdiha 311(1), BaburaaIias Bhandua 393(2), Bakoia 255(3), Baliari 350(2), B"lrchhabandh 207(2), 311(2), 350(1), 369(1), Bardiha 207(2),253(1), Belhath 288(3), 311(2), Bhilma 235(2), 253(10), 350(2), 369(2), Bhusua 253(1), 31l(1), Birbandha 270(15), Bodra 207(2), Burhikhar 369(1), Chandna 207(5), 273(1), 311(6), Chaukhari 253(1), 311(2), Choka 207(1), 350(2), Dalko 207(2), Dawankara 311(7), 369(6), Dhabria 350(1), Hariganwan 207(2), Jainagra 207(1), 273(1) Jaunglpur 207(2), Kachar 202(1), Kanri 200(1),207(2), 209(8),220(1), 273(5),369(3),393-(2), Karkata 207(1),350(1), Karui
Total
Bhawanathpur Anchal
.. 207(123), 209(11), 253(51), 273(22), 283(14), 284(1), 288(45),289(12),311(220),350(68),369(74),393(10),
Mauzas ., Amrora 207(2),311(4),369(3), Arangi 207(3) 288(5), 311(22),350(1), 369(5), 393(1),Arsali207(1l), 209(1), 273(3), 288(2), 289(11), SII(7), 350(4), 369(4), Aunra~a Alias Chauria 207(1), 311(3), 369(1), Biligarh 207(2), 253(2), 273(1), 289(1), 369(1), Bansani 207(2), 311(8),350(3), 369(3), Bansdih Kalan 311(2), Bansdih Khurd 207(2), Barwari 288(9), 311(1), Bata 311(1).369(3), Bato Kalan 273(1), Belahar 273(1), 369(1), 393(1), Bhaluhi Alias Kariwadih 3lI(2), 369(2), Bhaunathpur 207(6), 209(2), 288(5), 311(6),369(1), 393(1) Bijdih 209(1),311(4), 350(2), 369(1), Raka 311(4), 369(2), Chandni 253(10), 288(5), 3Il(1), 350(16) Chapri 207(5) 288(3), 311(6) Checharia 207(1), 311(IS), 369(3), Chhatakund 207(2) 3Il(2), Dagar 31l(1), 350(1}, 369(1), 393(1), Daridah 253(14), 283(4 311(1), Dumarsata 207(5), 253(5), 283(7), 288(1, 3Il (7), 350(1), 369(4), Gorganwan 369(1), Hariharpur 207(11) 209(1), 273(1), 283(3), 284(1),
209(3),211 (1),273(2),311 (4), 350(6), 369(4),393(1) Ranka Kalan 200(3), 207(12), 209(15),212(1),220(3) 237(1), 262(1), 273(22), 281(2), 311(7), 350(1). 369(2), 393(8), Ratanpura Alias Ranpur'! 207(1). 311(1), Serasam 369(1), Sewadih 207(1), Singsinga Kalan 311(1), SingsingaKhurd207(1), 311(2),369(2), Siroi Al ias ReI wadamar 311 (3), 369(1), Siroi Kalan 207(2), 288(1), 369(1),393(1), Siroi Khurd 288(1), 311(4), 369(1) Siswa 369(3), Sondag 311(7}. 369(1), Sonpurwa 207(3), 311(1), 369(2), Tahle 369(3), Tamge Kalan 200(1), 311(5),369(2), Tamge Khurd 200(2), 207(1), 311(2), 369(2),Tendudill 369(1), Tetardih 207(1), Tuni Alias Turimunda 31 I (I) 369(1), Udaipur 207(4.), 273(1), 369(1), Vlka 369(1).
Kanjia 2IJ (1), Karchali 369(2), Khajuri 350(3), Kurun 369(1), Kutku 211(1), 311(1), 369(2), Adgaro 273(1), 311(2), 350(9), 369(1), Maggar 369(2), Mail Alias Phakiradih 369(1), Nauka 369(1), Paraswar 235(2)' 311(2), 369(1), parro 209(1),369(1), Path 394( 1 \, R~mar 311 (3), Saneya 369( I), Sarai Dih 369(1), Totki 369(1), Ugra 311(5), 369(1).
207(2), 311(3), 350(9), 369(9), Kasnap 235(2), Kauakhoh 282(1), 311(5), KhajuriNawadih 255(29), 282(2),311 (6),350(6),369(3), Khardiha 207(1),393(1) Kharaundha 207(3), 273(2), Kolhua 311(3), 350(11), Kuari 207(2), Lamar Kalan 207(6), 282(1), 288(3). 350(4),369(2), Lamari Khurd 207(2), Lebhri 207(2), Madra Nisf Nijamat 369(1), Majhganwan 31I(14), Maihiaon Kalan 207(6), 209(3), 273(1), 282(8), 311(1), 350(5), 369(6),393(1), Misarbigha 350(4): Morwe 207(11), 282(3), 289(2), 350(3), 369(2): 393(4), Nawadih 207(1), 350(3), Patila 207(2),220(1), 273(1), Purhe 207(2), 369(1), RampJ.ll' 369(6), Sarki 207(4), 220(1), 253(14), 288(1), 311(1), 369(1), Sarkoni 369(1), Semri 207(2), 311(1), 369(1). Semaura 209(4), Siuri 207(1), 253(8), 289(4), 393(6), Sohgara 207(3), Sonpura 209(1), 311(1), 369(1), Sonpurawa 207(1), Sukhnadi 369(1), Tanrhe 207(7).
288(4),311(2), 350(5),369(3), Hurka 207(1) Husru 311(5), 369(1), Kadhwan 288(1), 311(1) 369(1), Ketar 207(5),209(1), 253(6),273(1),288(1),311(22) 350(2), 369(4), Ketari 207(3), Kharaundhi 207(5), 209(5) 273(5),311(4), 350(3),369(1), Khondar 207(4), Konmandra 207(1), 311(2), 369(1), Kupa 207(5), 3Il (5), 350(1), 369(4), Lohargara 207(4), 311 (5), Majhganwa (Thana No. 13) 207(1), 288(8), 3Il(I), 350(5) Majh.ganwan (Thana No. 74) 207(6), 350(1), Makri 207(5), 253(6), 273(3) 31 J (10), 350(1) 369(6), Makundpur 207(1), 350(3), 369(1), Merauni Chherhat 311(3), Nawadih 273(2), 350(2),369(1), 393(1), Pachadumar 207(4), 311 (B), 350(1), Pandaria 207(2), 273(2) Parsodih 207(1), 311(1), 350(4), 369(2), Partikuswani 207(3), 311 (10), 350(3), Pipri 369(1), Raji 207(4), 273(1), 311(10), 350(2), 369(1), 393(3), Rapura 311(2), 350(2), Rohiniar 273(1), 311(4), Saraia 369(1), Sindura. 311(1), Singhitali 207(6), 311(7), 369(4), 393(2), Slnghpur 288(1), 3II(3), 369(1), Sisri 207(3), 3Il(5), 350(5), 369(2), Sundi 207(4), 253(8), 311 (6) 369(;), Tali 207(1), 311(3), 369(2), Torelawa 207(1).

99
VILLAGEWISE INDUSTRIAL DATA -contd.
LATEHAR. SUBDIVISION
231 (16[, 235(181), 236(5), 239(13), 270(4), 271 (2), 273(101),280(16), 281(3), 282(1), 283(2), 284(2), 288(327),289(8),310(5),3[1(182),336(1), 350(365), 351(1),365(1), 367(1), 369(448), 380(1), 382(9), 388(4), 393(28), 394(16), 399(5).
Total .• 200(8), 207(171) 209(97), 2Il ([2), 220(2), 23[ ([61), 235(181), 236(5), 239(13), 270(4), 271 (2), 273(117), 278(1), 280(24), 281(3), 282(1), 283(2), 284(3), 288(327), 289(8), 310(5), 311(184), 336(1), 350(371), 351(1), 365(1), 367(1), 369(456), 380(1), 382(9), 384(1), 388(7), 393(36), 394(16), 399(5).
Rural .. 200(5), 207(166), 209(77), 2[1(12), 220(2), Urban .. 200(3),207(5),209(20),273(16),278(1),280(8),284([),
3Il (2), 350(6), 369(8), 384(1), 388(3), 393(8).
Balumath Anchal
Total .• 200(1), 207(31), 209(10), 2Il(8), 335(32),236 (1), 271 (I), 273(39), 281(2~, 283(1),284(1),288(95),289(1), 311(63), 350(140), 369(96), 388(1), 393(1).
Mauzas .. Ara 369(2), Bachra 350(26). Ba[baI269(1), Balu 350(4), 369(3), Balubhang 207([), 2Il(I), 3Il(I), Balumath 200(1), 207(1), 209(5), 273(4), 288(1), 350(14), 369(3), 388(1), Bandua369(1), Bara 273(1), Bariatu 209(1),211(1),273(2),289(1),369(2), Bathet 369(1), Besra 288(3), 369(1), Bhaisadon 31l(1), 369(2), Bhargaon 288(3), Bhatchatra 288(13), 311(2), 369(1), Bijra 369(2), Birbir 369(1), Bi~hunpur 273(1), 281 (2), 369(1), Bukru 369(1), Chamate 369(2), Charra 369(1), Chetag 288(7), Chitarpur 369(1), Chuku 369(1), Darha 235(9), 236(1),273(1), 288(2),369(3), Dembu 3Il(I), 369(1), Dhadhu 271(1),273(1), 350(9), Dori 31l(1), Ganeshpur 207(12), 235(8), 311(4),350(2), 369(1), Gargoma 369(1), Geenaj 369(1), Hathdih 211(1), 273(2), 369(1), Hempur 207(1), 369(1), Beranhopa 311(1), Huri 288(2), 350(19), 369(3), Holong 369(1), Humbu 369(1), Itke 369(1), Jabra 350(6), 369(1), Jala 369(1), Jaubar 288(3),
Chand wa An chal
Total .. 200(2), 207(3), 209(14), 220(2), 231(1), 239(12), 273(16), 280(2), 284(1), 288(112), 311(9), 350(71), 35.1(1), 369(86), 382(2), 388(2), 393(3).
Mauzas .. Alaudia 207(10), 209(4), 280(2), 288(14), 369(3), 382(1), An 369(1), Ara 369(1), Banhardi 369(4), Barwadih 311(1), Barwatoli 350(21), 369(1), Belenga 369(1), Belgara 369(2), Bctar 369(1), Bhusar 369(1), Boda 288(5), 369(3), Borsidag 369(1}, Bulhu 369(1), Chula 288(6),311 (1),369(5), Chandwa 200(2), 209(10), 220(2), '273(9'), 311 (2), 350(2), 369(2), 382(1), 388(2), 393(2), Chatuang 288(13), 369(1), Chetar 369(5), Chiro 288(6),
Latehar Anchal
Total •• 200(3), 207(41), 209(35), 273(31), 278(1), 280(8), 284(1),288(42), 311(26),350(66), 369(49), 382(1), 384(1), 388(3), 393(15).
Rural
Urban
Mauza!
207(36), 209(15), 273(15),288(42),311(24), 350(60), 369(41),382(1), 393('7).
.• 200(3), 207(5), 209(20), 273(16), 778(1), 280(8), 284(1),311(2), 350(6),369(8), 384(1),388(3), 393(8).
.• Baridih 350(1), 369(1), Batal Khurd 369(2), Bendi 369(1}' Beraini 369(1), Chope 273(1), Demu 207(3), 369(1 , Dhankara 207(1), 273(3), 369(4), Dihi 273(3), 350(1, 369(3), Darangi Khurd 369(1), Ghutua 369(1), Gire 273(1), Goa 393(2), Godna 369(1), Hetaloto 350(7), Heth Pochra 273(1), 369(1), Hesla 350(2), Hotwag 350(1), Hundru 207(6), 369(1),Icbak
Jhabar 273(1),350(29), 369(2),393(1),]hirmatkuma 350(2), 369(4), Jilanga 235(7), 273(3), 311 (2), 369(2), Jipua 369(2), Karandag 369(1), Karma 288(1) Kenru 273(1), 369(1), Keri 207(3), 284(1), 311(2): 369(1), Khairatann 369(1), Khapia 31l(1), Kuriam Kalan311(4),369(3),Lawagara (Thana No. 91)369(2), Lawagara (Thana No. 128) 369(2), Lejang 273(2) Mailam 369(1), Makra 288(3),311(7), 369(2), Manat~ 211(1),288(5),369(1), Marangloiya 235(4), 273(1) Masiatu 207(1), 273(4), 311(1), 350(1), 369(1): Matkoma 369(2), Mukki273(1), 311(4), Murpa 207(5) 211(1),. 235(3), 273(6), 3Il(17), 350(7), Nawadlh (Thana No. 36) 311(3), 369(13), Nawadih Thana No.211) 273(1), Olhepat 288(8),369(2), Pakri 288(32), Phulbasia Alias Amarwadih 350(3), 369(1), Phulsu 201(3), 209(3), 211(1), 273(4), 350(10" 369(2), Pindarkom 283(1), 31l(5), 369(1), Pukchu 369(1), Rahea 369(1), Rajbar 311(4), Salaiya 288(lj, 369(1), Salwe 273(1), Serandag 350(1), 369(1), Seregara 207(4), 209(1), 211(1), 235(1), 273(1) 288(8), 311(1), 350(4), 369(8), Sibla 211(1), 273(1) Skid 311(1), Siram 369(1), Toti 288(3), 350(3): 369(3), Tunqahutu 369(1).
Deonadia 288(4), Dhoti 288(6), 369(1), Dudhimati 351 (I), Dumaro 311 (5),350(7),369(1), Ganiari 369(3), 393(1), Gardag 288(11), 369(1), Hutap 369(5), Kali 369(2), Kamta "288(14), 369(1), Kita 369(1), Ladhup 369(1), Latdag 288(16), 369(1), Loharsi 369(3), Lukuia 369(1), Mahua Milan 369(4), Mahua Tan; 239(10), Malhan 273(1), 369(2), Marmar 350(1) 369(6), Nawadih 369(1), Nindra 369(2), RoI350(6): 369(2), Rud (Thana No. 266)273(1),288(1), 350(1), 369(2), Rud (Thana No. 304) 288(6), 369(1), Sasang 207(2), 273(5), 284(1), 369(2), Seuba 231(1)~ Sikni369(1), 80S 369(1), Torar 207(1), 369(1) Turisot 239(2), Zamira 350(33), 369(7), ~
311(2),Kaima 369(1), Keru 311(13), Kura 207(21 311(2), 350(J6), Ledhpa 369(1), Lundi 369(1' Manachotag 207(1), 350(1), 382(1), Mangra 273(1 ' Matnag 288(2),Muka 369(1), Mungar 207(8),311 (4 ' 350(6), 369(2), Murgidih 288(7), Murup 207(9)' 209(8), Narayanpur 369(1), Nawadih (Thana No' 233) 288(3), Nawadih (Thana No. 254) 350(1)· Nawagarh 207(3), 209(5), 273(3), 350(14), 369(2) 393(2), Nindir 369(2), Odan 369(1), Pandepur 311 (3)' 369(3), Parsahi 369(1), Patratu (Thana No. 318)' 207(2),350(2). 369(2),393(1), Patratu (Thana No 341) 393 P) Salaia 288(6), Sasang 288(20), 369(1)' Semaria 369(1), Sotam 288(4), 369(1), Tarwedih 207(1), 369(1), 393(1), Temki 273(2), Tupu Kalan 369(1), Upartoto 350(7), Zalim Khurd 209(2) 350(1). '

lO()
VILLAGEWJSE INDUSTRIAL DATA-concld.
LATEHAR TOWN
Town .• 200(3), 207(5), 209(20), 273(16), 278(1), 280(8),
Manika Anchal
Total .. 207( 40),209(2),239(1),270(3),273(5),282(1),288(34), 311(31), 350(11), 369(47); 393(4).
Mauzas •. Agardih Mandhania 311(4), Ara 207(1), 369(2), Bakoria 207(18),273(3),288(1), 311(8), 369(14), 393(3), Bandua: 207(.'l), 369(1), Barai Tola 273(1), Bariatu 311(3), 369(1), Barwaia Kalan 207(7), 369(2), Beang 311(3),369(1), Bichlidag359(1),BishunBandh 288(7), Chama 350(2), 369(1), Doki 288(5), Janho
Barwadih Anchal
Total .• 200(2). 207(23), 209(25), 235(12), 273(9), 280(14), 28g(16), 289(3), 310(3), 311(46), 350(37), 365(1), 36~(73), 380(1), 382(6), 388(1), 393(7).
Mauzas .. Babhandih 280(3),289(1), 369(1), 382(1), Barichatan 369(1), Barkheta 369(4), Barwadih 200(2), 209(11), 273(5),289(1),311(1),350(8), 369(3),380(1),388(1), 393(02), Bere 369(2), Betla 288(7), Chamardiha 207(2), Chapei31! (2), Chatam 288(!),Cllhencha 207(2), 273(1), Chhipadohar 207(2), 209(4),273(2), 280(11), 289(1), 350(1), 369(1),.382(5), Chungru 369(1), Ganeshpur 369(2), Gan 369(1), Haratu 369(2), Rarhe 209(3), 350(1), Hari Namar 369(1), Harparwa Alias Biratpurwa 369(1), He Hegara 311 (1) 369(1), Hosir 311(1), Juruhar 369(3), Kachanpur' 311 (2), Kechki 311(1), 369(1), Khamhi Khas
Total ..
Mauzas ..
Mahuadanr Anchal
207(22), 209(7), 2II(2), 231(160), 235(136), 236(4), 270(1), 271(1), 273(15), 281(1), 283(1), 288(23), 289(4) 310(2), 311(7), 336(1), 350(45), 367(1), 369(92), 393(6), 394(16), 399(5).
Ahirpurwa 369(1), Aksi 211(1), 235(4), 369(1), Amboatoli 271(1), 273(2), 281(1), 367(1), Ara Hans 369(1), Amari 207(2); 235(6),369(7), Aunratoli Alias Kliapartala 231(77), 369(2), Bahebatoli236(2), 369(2), Bandua 273(1), 369(1), Banskarcha 235(11), Barahi 211(1),235(1),369(2), Bardauni Kalan 369(2), Bartoli 235(2), 369(1), BeltoH 235(2),369(1), Bhenrital Alias Sarnadih 231(21),235(7),273(1),283 (1) 369(1), Bisrampur 235(4), .369(2), Chainpur 235(1), Champa 235(2), Chatakpur 207(6), 235(20), 369(2), 3~4(2), Chetma 235(1), 288(3), 369(1), Chiro 369(1), Chopmanrwa 369(1), Dankapur 350(7), 369(2), Dauna 310(2), 350(2), 369(1), Dipatoli 270(1), 369(1)" 393 (1), Dumardih 231 (34), 235(1), 369(2), Durup 207(2), Gansa 235(2), 369(1), 391(1), Garhburhni 207(1), 350(4), 369(2), G~th Gaon 207(2), 235(1), 273(1), 350(18), 369(2), 393(4),
NETARHAT TOWN
,Town .. There is no industry in this town.
Tota.l
Mauzas
GarLl Anchal
207(1),209(4) 211(2),235(1),273(2), 28B(5), 311(2), 350(1), 369l13). ,
Baherwa Tola369(2), Bandua 207(1),369(2), Baresanr 209(2) 273(1), Chorha 311(2), 369(1), Dabri 369(1),
284(1), 311(2),350(6),369(8),384(1),388(3),393(8).
369(2),Jungur 350(2), 369{3), 393(1), Kamaru 311 (2), 350(1), Kasiadih 207(2), Manika 209(2) 273(1), Matlaung 207(5), 3ll (3), 350(1), 369(3), Matang 369(1), Nai Rara 288(4), Pipra Kalan 288(1), 311(4), 369(1), Purnipalhea 207(1), 350(4), 369(2), Rabda 288(6), R.tniKalan31 1 (4),369(5), Ranki Khurd282(21) 369(2), Rewad Kalan 369(2), Salaia 288(10), Sewdhara 369(1), Sinjo 239(1), 369(1), Siris 369(1), Thema 270(3), Uraon Toli 207(1), 350(1).
369(1), Khura 310(3), 369(2), Kuchila 311 (1), t 369(3), Kuku 207(1), 369(2), Kutmu 311(1),365(1),
369(5), 393(1), Ladi 369(1), Lanka 207(1), 1.at 311(2), 369(4), Leadgain 369(1), Luhur 311(5), 369(1), Manatu 369(1), Morwai Khurd 311(1), Morwai Kalan 369(3), Munru 369(1), Murgidih 207(1), 3Il(2), 350(3), 369(2), Muru 207(1), Nawadih 207(1),350(8), Nawarnag() 369(1), PokhariKalan207(9), 209(1) 235(12),288(3), 3 II.(S) , 350(10), 369(6), 393(4), Pokhari Khurd 207(31, 311 (9), Protected Forest 209(5) • 273(1), 369\1), Saidup 3Il(I), 369(2), Saraidih 209(1), 288(2), 3Il(5), 350(6), Salaitanr 288(3), 369(3), Serengdag 311 (1), 369(2), Tongari 369(4), Ukamar 311(2), 369(2), Wopag '369(1).
Hamikhas 207(1), 235(6), 289(1)/350(12), 369(3), Harinaghura Alias Bijgatoli 231(15), 273(1), 369(1) Haptua 235(1), 369(2), Hurmudatoli 369(1), JaipU: 235(9),]amdih Alias Raramgara 3Il(6), 369(3), 393(1) Jangsi 235(2), Jori 235(1), 369(1), Karkat 369(3), Katho' 288(3), Kewarki 235(3), 369(1), Khajurtala 235(1), 369(1), Kukud 369(2), Kurokalan 235(1), Kuro .Khurd 235(1),369(1), Kurund 235(6),273(2), 288(1), 369(3), Kutudiri 235(3), 369(1), Lodh 235(1), 369(2), 394(3), Lurgumi Kalan 273(3}, 369(2),394(1), Lurgumi Khurd 273(1), 28B(9), 369(1), Mahuadanr 209(7), 336(1), Maunadih 235(3), Merhani 289(3), Mirgi 231(9), 235(1), 369(3), Orsa 23.'i(1~. 311(1), 369(1), Parhapkapu 207(1), 235(2),273(3, 369(1), Parewa 369(1), Parhatoli 236(2, 369EI), Parmi 235(6), 369(1), Rajdanda 207(2), 235(3),359(2), Rampur 207(3), 350(1), Semarburhni 235(7),369(1),394(7),399(4), Shahpur 231(4), 369(1), Sidra 207(1), 235(1), 369(2), 394(2), Sugi 235(2), 369(1), S ..!rkain 369(1), TamoJi235(4), 288(7), 350(1) 369(5), Tewahi207(1), 235(4), 369(2), 399(1), Urwnbi 235(2), 369(1). •
Dhangar Tola 209(2), 211(1); 273(1). 350(1), Goendi 369(1), Hesag 369(2) , Heth Tola 369(1), Hurdag 288(3), Kotam 369(1), Kui 288(2), Lai 369(1), Lohargara 369(1), patratu 235(1), Simarkhas 211(1)

EXPLANATORY NOTE
Besides giving the Census tables, the District -CensUs Handbook of 1951 contained information on vital statistics, rainfall, agriculture, livestock, industries and wholesale prices. The present Hand{look seeks not only to continue the tradition but also to enlarge its scope by furnishing official statistics on several other topics. The data contained in rthe following pages are complementary to the Census tables, and attempt to give a complete statistical picture of the district.
The materials in this section have been obtained from various sources indicated in the tables. They -can be broadly divided into eight groups, namely, Vital Statistics, Agricultural Statistics, Livestock, Industry, Administration, Education, rublic Health .and Communications.
The salient features of the tables under each group are briefly summarised below:
VITAL STATISTICS
Table VS-I-Registered Births and Deaths with Mid-year Rates ,
This table gives for th'e district as a whole the number of births and deaths registered during the years 1951-1960. The birth and death rates have been calculated both on the 1951 CenSus and the estimated mid-year popUlation, i.e., the population on the 30th June of each year.
Table VS-Il-Deaths and Death rates due to selected causes
This table furnishes the figures of death by selected causes for 1951-1960. The death rates have been calculated for 1951 on .the figures for the Census of that year, and In other cases on the estimated mid-year POpuhltion. Data in respect of four causes of death coula. be had only fo~ the year 1960 only and, tlierefore, they h~ve been presented separately in the supplement to thls table.
AGRICULTURAL STATISTICS
Table AS. I-Rainfall
Monthly rainfall data for the years 1951-60 are presented for the fine selected rainfall recording stations at Pal am au "observatory", Latehar, Garhwa, Balumath and Mahuadanr. The district average has also been given.
Table AS.I1-Highest and Lowest Temperatures
This is a table on temperature. The mean maximum, highest, mean minimum .and .lowest temperatures recorded at DaltonganJ durmg all the twelve months of the decade 1951·1960 have been given.
Table AS-Ill-Land Utilisation and Area under different crops
This table presents land utilisation statistics for the district as a whole. The figures relate to the six Census years beginning from 1911. The manner in which the figures have been worked out is indicated in a note appended to the table.
The terms ~nd c~ncepts used in the table are defined below:
Geographical area: It represents the total land area of the district. The 1951 and 1961 area figure! tally with the area worked-out by the Bihar Survey. In other Cases there a:r:e differences \Jhich may be due to computational errors.
Forests: All actu~lly forested areas on the lands classed or administered as forest under any legal enactment dealing with forests, whether State-owned or private.
Barren and tlnculturable land: All barren and unculturable land like mountains, deserts, etc. Land which cannot be brO'lght under cultivation unless at a high cost is classed as unculturable, whether such land is in isolated blocks, or within cultivated holdings.
Land put to n7n-agricultural usc: All lands occupied by buildings, roads and railways or under water, e.g., rivers and canals and other lands put to uses other than agricultural.
Culturable waste: All lands available for cultivation, whether or not taken up for cultivation or abondoned after five years for one reason or the other. Such lands may be either fallow or_ covered with shrubs and jungles which are not put to any use. They may lie in isolated blocks or within cultivated holdings.
. Permanent pasturrs and other grazing lands: All grazing lands, whether they are permanent pastures
• and meadows or not. Village common and grazing lands within forested areas are included' under this head.
Miscellaneoustree crops and groves: All.cultivable lands, which are not included under net area sown, but are put to Some agricultural use. Lands under casuarina trees, thatching grass, bamboo bushes and other groves for fuel, etc., which are not incll!ded under 'orchards' are classed under this category.
Other fallow land: All lands which were taken up for cultivation but are temporarily out of cultivation for a period of not less than one year and not more than ijve years.

Current fallowl: Lands which are left fallow .curing the current year only.
Net ar~a sown: The net area sown represents the area Sown to crops, counting areas so~n more than once in the same year only once.
Cultivattd area: The sum of net areas soWn and area under current fallows gives the cultivated area.
Section B of the table Iurnishes details of the area covered by differen t crops. The total area lawn under all crop! is in fact the gross cropped area, which term means "the sum of areas under all crops and represents the sum of net sown area and area sown more than once in the year".
The cropped area is divided into three main groups, viz., under food crops, non-food crops and miscellaneous crops. The food crops have been further subdivided into basic food crops and other food crops. The former includes rice, wheat, pulses, fruit and vegetables, and the latter, sugarcane condiments, and other food crop. Non-food crops have also been likewise subdivided into oilseeds, fibres (which term includes cotton, jute and other fibres) and tobacco. Miscellaneous crops cover fodder and other non· food crops. -
Table AS-IV-Gross Area Irrigated by crops
This table gives the gross cropped and irrigated areas for the district as a whole. The break-up of the irrigated area by crops (food and non-food) has also been indicated.
Table AS-V-Gross Area Irrigated by sources
This table shows the gross area irrigated in the district by different sourCes for the six: censuS years biginning from 1911.
Table AS-VI-Yield rates of principal crops
This table furnishes the average yield in maunds per acre in respect of the principal crops of the district for the period 1951-52 to 1959-60.
• Table AS-VII-Statistics of skilled and unskilled Agricnltnral labourers
This table indicates the average daily wages paid to skilled and unskilled agricultural labourers during the rabi and klzarij seasons.
Skilled labourers include carpenters, blacksmiths and mochis (cobblers). Among the unskilled are the field labourers, herdsmen and other agricultural labourers. Separate figures have been given for men, women and children so far as the unskilled labourers are concerned.
Tables AS·VIII-Monthly ruling wholesaI~ prices of staple foodgraina
The wholesale prices of staple foodgrains, namely,
102
rice (medium), wheat (red) and gram for all thetwelve months during the years 1952-60 are presented: in this table for the district. Figures for the year 1951 could not be had.
Subsidiary Tables
Seven subsidiary tables have been prepared. TheY' are all subsidiary to Table AS-III
Subsidiary table AS-III.I-Land utilisation.-I t gives; the breakup of 1,000 acres of the land area in the district by area under forests, etc., and total cultivablearea_ The net area Sown per 1,000 acres of the land. area has also been indicated. The distribution of every' 1,000 acres of the total cultivable area in the district by the net area sown and area of falloW and other uncultivated land has also been given. The propor- . tion of the cultivable area, net area . sown, net area irrigated etc., in the district to every 1,000 acres in the State has also been worked out to facilitate comparative study.
Subsidiary Ttfble AS-III.2-Progress of culti,oli,n during Ihe last three decades.-This table traces the progress of cultivation since 1931 in terms of area under foodgrains and other crops, net area shown and area sown more than once.
Subsidiary Table AS·III.3-Components of land area cultIvable and 'Clltivated area per hundred ptrsonJ during liz, last thru decades.-It shows the incidence of land area area cultivable. net area sown, etc., per 100 persons i~ the district. The figures relate to the last three decades.
Subsidiary Table AS-IlIA-Cropping patttrn.-The table indicates the cropping pattern as in 1951 and 1961. The crops have been grouped under two heads, namely, food and non-food. The area covered by different crops per 1,000 acres of the gross area Sown in the district as also their proportion to every 1,000 acres in the State as a whole, ~as been shown.
Subsidiary Tab[, AS- III.5-DmJiIJ of total/rural population per hundred acru oj area und" f006t,rains ar.d net area ,sown.-This table furnishes the density of total and rural population per 100 acres of area under foodgrains, other crops, net area spwn and area sown m::>re than once for the last three decades.
Subsidiary Table AS-III.6-Density of CultivatorJ and Agricultural labourers per hundred acres of net arta Sown in 1951 ami J961.-This table gives the density of cult ivators and agricultural labourers per 100 acres of net area sown in 1951 and 1961. Separate figures have been furnished for the total and rural population.
Subsidiar:.y Table AS-III.7-RainJall, area Jown and Irrigated, densiry, etc.-The table furnishes data on rainfall and gross area sown and irrigated (by different crops) together with yield rates. The density per 100 acres of the cropped area and the area under foodgrains has also been given.

103
LIVESTOCK
Table LVT-I-Government Veterinary Facilities
Veterinary facilities existing in the district <luring the years 1951-52 to 1960-61 are indicated in this table. The number of hospitals, dispen"Saries and veterinary doctors has been given year by year. "Table LVI-If-Livestock and Poultry
This table presents the population of livestock .and paul try for eight livestock censuses beginning from 1920. The variation in the numbers from census to census has also been indicated. Figures preceded by a plus (+) sign denote increase, and those by minus (-) sign denote decrease Aom previous figures.
Livestock' means all domesticated animals of economic importance and includes cattle, buffaloes, sheep, goats and pigs.
Poultry means domestic avian such as fowls and ducks.
INDUSTRIES
Table IND-I-Employment in Textile and NonTextile Industries (as on 31st December 1960)-The number of industrial establishments in the
district with daily average employment in each has been furnished in this table. The industries have been divided into two broad groups-textile and nontextile. While the former category has no indmtry at all the htler e nbraces 15 industries detailed in the table. The rural and urban breakup of the industrial establishments has also been given. Table IND· II-Name of Industry with number
of Households and persons employed in R'lra[ Areas only. This table furnishes anchalwise industrial data
for all the rural areas of the district. These have been extracted from the Houselists prepared during September-October, 1960, as a preliminary step to the 1961 Census. Here also the industrial establisments have been grouped into two broad divisions -textile and non-textile'. The textile establishments include weaving only. Non-textile establisments cover leather works, blacksmithy, carpentry and furniture making, pottery, gold and silver ornaments making, laundry, tailoring, bidi making, bamboo products making, preperation of oil, rice & flour mills preparation of sweetmeats, etc. The number of' villages where the particular type of industrial establishment is found, along with the number of households and number of penons engaged in it, has been indicated anchal~ise. The industries which are not common m many of the Anchals. have been shown in the supp1ement to this table to save space.
ADMINISTRATION
Table ADM_I-General results of trial of Criminal eales General results of trial of criminal cases in
the district for the period 1951~60 have been shown
in thi~ ~able. Sec~ion A gives the manner of disposal of cnmtnal cases In terms of persons affected in the lower courts, while section B deals with the results of appeals and revisions.
Table ADM-II-Punishments Inflicted in Crimina] Cases
This table gives for the district data on punishments inflicted in criminal cases during the period 1951·60.
Table ADM-Ill-Strength of PoJice
The strength of the Police force in the district during the years 1951-60 has been shown in this table for every category of policemen.
Table ADM-lV-Places of confinement and distribution of convicts by Age-groups and Literacy
This table gives the average daily number of pris~n.ers in the district jail of Daltonganj and other sub-:Jluls. The number of convicts and their distribution by age-groups and literacy has also been indicated. The figures relate to the years 1951-60.
Table ADM-V-Co-operative Societies
The data regarding Co-operative Societies are presented in this table for the years 1950-51 to 1959-60. The Societies have been grouped into three broad categories, namely, Primary Agricultural Societies Non-agricultural Societiesand Central Co-operativ~ Banks and Unions. The first has been further subdivided into Nan-credit and Credit Societies. For each type of Co-operative Society information is given about the number of soci~ties, number of members, working capital (in rupees), and profit or loss (in rupees). Figures preceded by plus (+) sign denote profit, and those by minus (-) sign indicate loss.
Table ADM-VI-Receipts of Excise Revenue, Sales Tax, Entertain ment Tax, Motor-Spirit Tax, Stamps, etc.
This table gives for the district details of collections made under various heads such as excise sales tax, entertainment tax, motor-spirit tax, etc.; during the years 1951-52 to 1960-61. Figures for registration fee relate to the calendar years 1951-60.
Table ADM-VII-Land Revenue/Rent
Figures relating to the demand and ,collection of land revenue/rent for the district, along with the percentage of collection to the demand, have been given in this table. The State Government started taking over the zamindari interests und~r the Bihar Land Reforms Act, 1950 in 1954-55. prior to this, the zamindars paid land revenue to Government and the raiyats generally paid rent to the zamindars~ The collection of rent by Government started in 1954-55 consequent upon the vesting of the zamin4ari fnterests in the State. The demand and -collection for the years 1951~52 are not available.

Table ADM·VIII-Number of registered doc!1. ments and value of properties transferred
Registration statistics are presented in this table for the decade 1951-60. The number ofinstruments registered and the value of property transferred art given in this table along with gross receipts and expenditure for the district as a whole.
Table .A:DM-lX-Sale and discharge under Small Savings Scheme
This table furnishes data relating to the sale and discharge of certificates under the Small Savings Schemes. Figures have been given separately for the Treasury Savings Deposit, Post-Office Savings Bank 15-Year Annuity Certificate and National Plan' Savings Certificate for the period, 1951-52 to 1960-61.
Table ADM-X-List of Banks
It contains a list of Banks in the district. Column 1 gives the names of pla~es where banking facilities exist, while column 2- mdlcates the names of Banks.
Table ADM-XI-Progress of Life Ins!1rance
This table traces the progress of Life Insurance in the district from the year 1957 onwards.
Table ADM-XU-Number of Motor Vehicles
The number of motor vehicles in the district during the period 1950-51 to 1960-61 is shown in this table. Separate figures have been given for different types of automobiles. State figures have also been given to facilitate comparison.
EDUCATION
Table EDN-I-Educational Institutions and Pupils
This table gives the number of various types of educational institutions with pupils therein. Cohimn 10 of the table shows the population in the relevant age-group the pupils of which generally receive schooling in the institutions noted against it in column 1. Column 7 furnishes figures of enrolment in 1960·61. The percentage of the pupils enrolled to the total population in the relevant agegroup has l:.eeri given in . column 13. Si~ce enrol
-"Oent in schools for profeSSIOnal and specIal edllca-
104
tion is open to pupils belonging to a very wideage-group, no figures similar to column 8 onwards. have been furnished for such institutions.
Table EDN-Il-List of Educational Institutions
T~e tab~e ~ive.s a list of 'middle and' higher educatIOnal InstltutlOns. Column 1 shows the tYQeof institution and column 2 the location in alphabetIcal order. Where two or more educational jnst~tutions exist, the names of such institutions have been indicated within brackets immediately afterthe name of the locality.
Table BDN-I1I-Press and Journals
This table shows the number of printing presses in the district, and the publications brought. out by them ,during the period 1951.61.
Table EDN-IV-List of Cinema HO!1.ses
I t gives a list of cinema houses in the district.
PUBLIC HEALTH
Table PH-I-Medical Facilities
This is a table on medical facilities. Part A of the table gives the ,number of degree or diploma holding medical practitioners registerefi in the district at each year during 1951-60. Part B indicates the number of hospitals and dispensaries. Part C is a list of other health institutions, viz., Family Planning Centre, and T. B. Clinic/Ward.
COMMUNICATIONS
Table CMN-I-Mileage of extra municipal roadsmaintained by Public AUthorities
The mileage of various types of roads in the district maintained by the Public Works Department is indicated in this table.
Table CMN-Il-List of Inspection/Dak Bungalows
_ This is a list of Inspection/Dak Bungalows with details of amenities existing in each. Table CMN-I1I-Polymetric Table of distances
(in miles)
This is a polymetrie table of distances in milesThe district, subdivisional arid anehal headquarters numbering 2.5 find p1 ace in. t~e table. Each place i~ connected with the remammg, ones by a verticar line. The road distance between any two places on the table can be read along the vertical line connecting the two places. Rail distances "are given within brackets for places connected by rail as well.

105
VITAL STATISTICS TABLE VS.I REGISTERED BIRTHS AND DEATHS WITH MID-YEAR RATES
Births and Deaths 1951':"60 1951 1952 1953 1954 1955 1956 1957 1958 1959 1960
2 3 4 5 6 7 8 9 10 11 12
1. Births
Male 120,384 10,553 10,279 10,944 12,594 15,559 14,423 11,707 13,530 '10,699 10,096 Female 114,437 10,118 9,694. 10,282 12,161 14,845 14,007 11,331 13,053 10,022 8,924
2. Birth rate (a)
Male 12.21 10.71 10.43 11.10 12.76 ·15.78 14.63 11.88 13.73 10.85 10.24 Female 11.61 10.26 9.83 10,43 1,2.34 15.06 14.21 11.49 13.24 10.17 9.05
3. Birth rate (b)
Male II.l5 10.64 10.17 10.63 (2.01 14.56 13.!?5 10.56 11.97 9.29 8.61 Female 10.60 10.20 9 .. ')9 9.99 11.60 13.89 12.87 10.22 11.55 8.71 7.61
4. Female births-965.62 Reported per 1,000 male births .. 950.60 958.78 943.09 939.51 954.11 971.16 967.88 964.75 936.72 ast91
• 5. Deaths
Male 63,922 7,893 8,543 7,192 7,270 5,902 5,590 5,625 7,124 4,497 4,285 Female 55,855 6,754- 7,189- 6,479 6,384 5,17!. 5,044 5,292 6,440 3,657 3,443
6. Death rate (c)
Male 12.82 15.8.3 16.95 14.43 14.58 11.84 11.21 11.28 14.29 9.02 8.60 Female; 11.46 13.86 14.76 13.30 13.10 10.62 10.35 10.86 13.22 7.51 7.07
7. Death rate (d)
Male 11.72 15.74 16.72 13.83 13,72 10.94 10.17 10.05 12.50 7.75 7.25 Female 10.44- 13.78 14.39 12.72 12.30 9.7A 9.36 9.63 11.50 6.41 5.92
8. Females deaths~ Reported per 1,000 male deaths 873.80 8.55.69 841.51 900.86 878.13 876.48 902.33 940.80 903.99 813.21 803.31
NOTES: (a) Numbt"r of births. per 1,000 of the tot(ll population calculated on the population ofl951. _ (b) Number of births .per 1,000 .of the total population calculate(! on the estimated popUlation on the 30th June of each yeal'. (c) Number of deaths per 1,000 of the same sex calculated on the ,population of 1951. (d) Number of deaths per 1,000 of the same sex calculated on the estimated population on the 30th iJune of each year.
SOURCE : Directorllte of StatistiCs, Bihar.
1'-1-14

106
TABLE VS-II-DEATHS AND DEATH RATES DUE TO SELECTED CAUSES
Cau~e of death 1951 1952 1953 1954- 1955 1956 1957 1958 1959 196()O>
2 3 4 5 6 7 8 9 10 11
1. Cholera
Actual deaths 19 1,809 61 16 26 280 26 18 16 Male 7 919 28 11 15 144 13 11 11 Female 12 -890 33 5 11 136 13 7 5
Death rate (per 1,000 of total population)
Total 0.02 1.79 0.06 0.02 0.02 0.25 0.02 0.02 0.01 Male 0.01 1.80 0.05 0.D2 003 0.26 0.02 0.02 0.02 Female 0.02 1.78 0.07 0,01 0.02 0.25 0.02 0.01 0.01
2. Small·pox
Actual deaths 1,582 392 44: 8 12 6 129 48 61) Male 751 198 25 5 4- 5 71 211 41 Female 831 194- 19 3 8 I 53 20 25
Death rate (per 1,000 of total population)
Total 1.60 0.3:3 0.04: 0.01 0.01 0.01 0.11 0.04- 0.06 Male 1.50 0.39 a.05 0.01 0.01 0.01 0.12 0.05 0.07' Female 1.69 0.39 0.04- 0.01 0.02 ... 0.10 0.04 0.04
3. Fever
Actual deaths 11,493 12,146 12,126 11,394 9,371 8,89'~ 9,'111 11,677 6,820 6,031 Male NA NA 6,351 6,297 4,985 4,579 NA NA NA NA Femall" ,NA NA 5,775 3,597 4,386 4,315 NA NA NA NA
Death rate (per 1,000 of total population)
Total 11.59 12.02 11.78 11.34 8.77 8.17 8.40 10.33 5.92 5.14 Male NA NA r 2.'21 11.89 9.24 8.33 NA NA NA NA Female NA NA 11.31· 10.78 8.29 8.00 NA NA NA NA
4:. Hague
Actual deaths NA NA 2 Male NA NA Female NA NA 2
Death rate (per 1,000 of total population)
Total NA NA ... Male NA NA Female NA NA ...
5. Dysentery and Diarrhoea NA NA 53 45 26 11 70 54 52 Actual deaths 14R
Male NA NA 38 28 16 8 52 27 33 74-Female NA NA 15 17 10 3 18 27 19 74
Death rate (per 1,000 of total population)
NA NA 0.05 0.04 0.02 0.01 0.06 0.05 0.05 0.13 Total Male NA NA 0.07 0.05 0.03 0.01 0.09 0.05 0.06 0.13 Female NA NA 0.03 0.03 0.02 0.01 0.03 O.Ob 0.03 0.13
6. Respiratory diJ60ses NA 21 32 11 22 50 49 43 67 Actual deaths NA
Male NA NA 14- 24- 4.- 15 22 26 25 42
Female NA NA 7 8 7 7 28 23 18 25
Death rate (per 1,000 of total population)
NA NA 0.02 0.03 0.01 0.02 0.05 0.04- 0.04- 0.06 Total Male NA NA 0.03 0.05 0.01 0.03 0.04.- 0.05 0.04 0,0]
Female NA NA 0.01 0.02 0.01 0.01 0.05 0.04- 0.03 0.04-
NA-Not available ·-Negligible SauRcE : Directorate of Statistics, Bihar.

107
SUPPLEMENT TO TABLE VS-I1-DEATHS AND DEATH R.ATES DUE TO SUICIDE, WOUNDS OR ACCIDENTS, SNAKE-BITE AND WILD ANIMALS AND RABIES
G~use of death
1
Suicide
Wound" or accidents
S we-bite and wild aniIX¥lla
.Rabiu
r-.
Actual death! ... Total Male
2 3
26 15
43 33
38 17
12 8
1960 ._--Death rate (per 1,000 of total
pOIJulation) ,.- -Female Total Male Female
4 5 6 7
11 0.02 0.03 0.02
10 0.04 0.06 0.02
21 0.03 0.03 0.04
4 0.01 0.01 0.01
SeuRcE : Directorate of Statistics, Bihar. /

108
AGRICULTURAL TABLE' AS-I-'
January February March April May June Station/Year r--""'__'_"
_____ --------. r---.,.A..~
____ .A.--_, __ -.A.--, r------- .... Rainy Rain- Rainy Rain- Rainy Rain- Rainy Rain- Rainy Rain- Rainy Rliin-
days fall days fall days faU days fall days fall days fall
2 3 4 5 6 7 '8 9 10 11 12 11
D1STRICT AVERAGE
1951 1.4 13.2 0.3 2.3 3.fi 45.7 2.7 30.2 1.2 9.7 7.3 153.9 1952 1.0 7.4 1.4 20.1 2.4 23.1 0.7 S.8 2.4 23;6 9.5 248.7 19!i3 1.9 23.1 0.8 7.9 " 1.1 8.6 0.7 6.6 6.9 114.5-1954 1.4 9.9 1.6 15.7 0.9 8,4 0.2 1.3 0,4 2.5 7.7 121.9 1955 6.4 87.1 2.0 .13.5 1.0 5.1 ·0:8 11.4 7.6 65.0 1956 1.5 19.1 1.6 16.8 2.2 22.1 0.1 0.8 2.3 31.7 9.9 252.0 1957 2.8 37.3 1.4 34.3 3.5 33.5 0.4 2.3 0.5 2.8 5.4 64.8 1958 1.4 13.8 2.9 33.1 1.6 15.1 1.2 20.7 0.3 2.8 4.9 80,4 1"959 4.9 63.1 0.3 2.9 0.2 0.9 0.3 2.7 1.3 16.1 6.3 96.4 1960 0.3 3.2 0.1 0.4 3.1 34.4 0.4 3.5 0.9 5.7 80.6
PALAMAU "Observatory"
1951 1 10.9 1 4.6 '5 56.4 4 33.3 1.8 7 108.5 1952 2 14.0 2 12.5 4 39.9 1 4.6 I 5.1 9 223.0 1953 I 7.4 I 5.6 1.0 4 98.3 1954 I 6.3 2 27.2 - 2.0 I 5.6 8 123.9 1955 8 111.0 3 15.5 0.8 5 36.8 1956 2 24.4 2 20.8 2. 7,4 4 59.4- II 264.9 1957 1 27.9 * * 2 47.0 1.5 6 1.0 4 51.1 1958 1 13.2 3.8 1 5.1 1.3 5 56.1 1959 7 66.6 2.9 1 10.1 2 20.8 1960 2.6 4 52.0 1 10.7 6 92.2
LATEHAR
1951 2 11.7 3 39.4 2 29.0 1 14.0 7 167,4 1952 1 9.1 1 7.6 2 36.6 " 2 23.4 8 138.7 1953 2 29.7 2 16.5 2 16.5 2.8 12 177.8 1954 1 11.7 1 4.6 '" '" 0.3 10 153.9 1955 6 77.0 1 10.2 1 6.6 0.5 7 51.8 1956 1 10.4 2 32.0 2 31.0 2 17.3 14- 236.0 1957 2 17.5 1 6.1 5 55.1 1 5.3 6 78,7 1958 2 10.1 4- 32.3 1 10.7 2 29.0 3 23.1 1959 5 72.8 '" '" 1 18.0 6 62.8 1960 0.5 * * 4 33.6 1 6.0 3 30.0
(;ARHWA
1951 1 38.1 4 48.3 7 117.9 1952 2 9.9 3 26.4 3 54.6 1 3.3 1 3.6 10 307.6 1953 ? 21.8 1 5.3 1.5 3.6 4 74.9 1954 3 15.7 2. 9.4 1 2.5 4 38.9 1955 7 102.6 2 23.1 2 9.1 1 7.6 5 45.0 1956 1 27.9 I 10.2 1 5.1 7 159.0 1957 4 47.7 2 13.7 3 24.9 0.8 2 12.7 1958 1 7.1 3 19.2 1 14.2 1 3.6 5 113.6 1959 4 44.0 1 12.0 2.4 7 90.8 1960 3.6 3 17.0 1 5.7 5 . 89.0
BALUMATH
1951 2 9.9 76.7 3 47.2 1 22.9 2 9.9 10 230.6 1952 1 9.9 3 ;29.2 1 2.5 6 56.6 9 189.5 1953 3 54.6 1 4.6 2 36.8 13 217.9 1954 1 15.5 1 15.0 2 35.6 0.8 1 11.7 14 256.5 1955 7 86.6 3 37.9 1 6.9 1 6.9 9 68.1 1956 1 ID.4 * * 1 24.9 0.5 , 4 84.6 12 313.9 1957 3 53.6 3 15.7 5 25.7 1 2.5 * * 9 148.1 1958 2 14.5 3 36.8 2 37.6 1 35.6 1 8.9 7 128.0 1959 6 71.3 1 6.0 2.0 1 10.2 9 145.6 1960 2.4 3 26.4 1.6 6 89.4

109
STATISTICS RAINFALL
(Raitifall ill millimetm)
July August September October Novemher Dece~ber _-,.A...--""" ,..--..,.A---_. ,--'"'---- ,--...A...-_~ ,--...... ----, '_-...A..---~
Rainy Rain- Rainv Rain- Rainy Rain- Rainy Rain- Rainy Rain- Rainy Rain- Station/Year -days fall "days fall days fall days fall days fall tlays fall
14 15 16 17 18 19 20 21 22 23 24 25
DISTRICT AVERAGE
10.9 206.3 16.8 345.9 9.5 205.2 2.9 38.6 1951 12.1 232.4 19.5 345.7 9.7 189.5 2.2 50.0 O.S 5.8 .J.952 8.5 440.4 19.0 405.9 13.3 25B.3 0.9 7.6 1953
13.1 227.6 13.5 250,4 14.0 261.9 1.7 16.8 0.3 2.3 1954 19.0 270.5 1.3 19B.6 9.2 119.4 4.6 85.3 0.'3 7.6 1955 15.4 264.9 17.9 34'0.9 15 .. 1 384.1 7.2 117.6 0.9 9.7 1.7 22. I 1956 17.6 517.4 15.4 301.0 7.5 186.2 0.4 2.5 1957 18.0 446.7 15.7 273.3 13.0 "220.5 5.8 124.7 1958 13.8 317.9 16.5 308.1 12.4 20G.5 7.6 146.13 1959
- 18.2 331.6 21.2 457.0 1.0.4 231.5 2.6 40.6 1960
PALAMAU "Obser~'atoryl'
Il 186.9 16 273.3 10 230.9 3 54.9 1951 6 71.4 22 227.8 13 238.8 2 36.3 1 4.1 1952
20 ~66.3 - 20'-' 392.2 13 249.7 1 2.8 * * 1953 9 103.6 . 1'5 263.1 15 246.1- 12 16."3 0.8 1954 .
18 257.1 11 '130.6 8 77.5 3 78.7 0.8 - 1955 17 295.4 21 404.1 16 455.7 6 43.2 1 3.3 1 8.6 1956 16 491.3 15 238.3 . 10 165.9 .. .. 1957 16 500.8 15 210.6 14 271.1 NA NA 1958 14 369.6 17 257.8 4 60.1 6 128.4 1959 19 363.4 20 418.5 10 150.1 4 38.0 1960
LATEHAR
14 183.6 17 367.8 9 223.8 2 39.6 '" 1951 13 262.6 21 393.5 . 15 J48.3 2 35.8 1 3.8 1952 21 369.8 19 3.06.S 13 250.7 2 10.7 1953 10 153.9 16 261.4 7 ,130.8 2 15.7 1 12.9 195·4 20 316.5 11 147.8 6 59.2 5 88.7 .. 1.3 1955 1.5 '2:77.1 , . 17 -407.9 13 :319.5 8 109.2 1 27.2 1 3.8 19.'i6 14 641.6 10 2~4.5 .' 7 .176.5 1 18.5 1957 19 452.9 19 226.6 '14 "215.5 7 Il6.2 1958 15 278.2 16 ~3.7 ·r • • 8 200.4 6 114.4 ,. 1959 19 264.3 20 "386.6 . 12 .274.4 3 39.6 ( . 1960
GARHWA
9 205.2 14- 323.9 14 298.2 24.1 1951 11 168.4 19 285.7 12 290.3 49.0 1 5.6 1952 23 548.1 24 440.4 16 2.57.6 2.5 1953
11 299.2 13 268.5 16 342.9 1954-
17 167.6 S 223.0 12 212.3 4 80.0 .. 1955
18 258.6 15 279.4 13 348.2 11 170.4 1 6.9 3 27.9 1956
19 412.5 19 153.2 9 220.2 1957
20 388.0 14- 344.0 10 220.2 5 170.0 1958
12 251.8 16 376.0 12 218.2 8 173.0 1959
20 317.8 22 363:6 10 178.2 3 50.6 1960
BALUMATH
10 204.0 3 18.0 0.8 \ 1951 14 367.0 20 313.2 1~ 358.1 23 452.9 8 154.7 4 84.0 1 3.3 1952
21 557.8 22 433.6 11 174.2 1 5.1 1953
15 245.1 14 211.3 15 275.1 2 11.2 2.0 1954
20 301.2 17 184.9 9 106.9 6 103.4 1.~ 1955
19 272.0 18 264.7· 16 291.6 7 137.7 5.1 1 10.2 1956
18 541.3 13 223.8 8 230.1 1 7.1 1957
16 4R3.6 16 217.2 14 273.8 5 118.8 195R
17 274.6 17 241.8 14 252.13 10 217.8 1959
17 314.7 ... * 11 315.4 2 22.1 1960
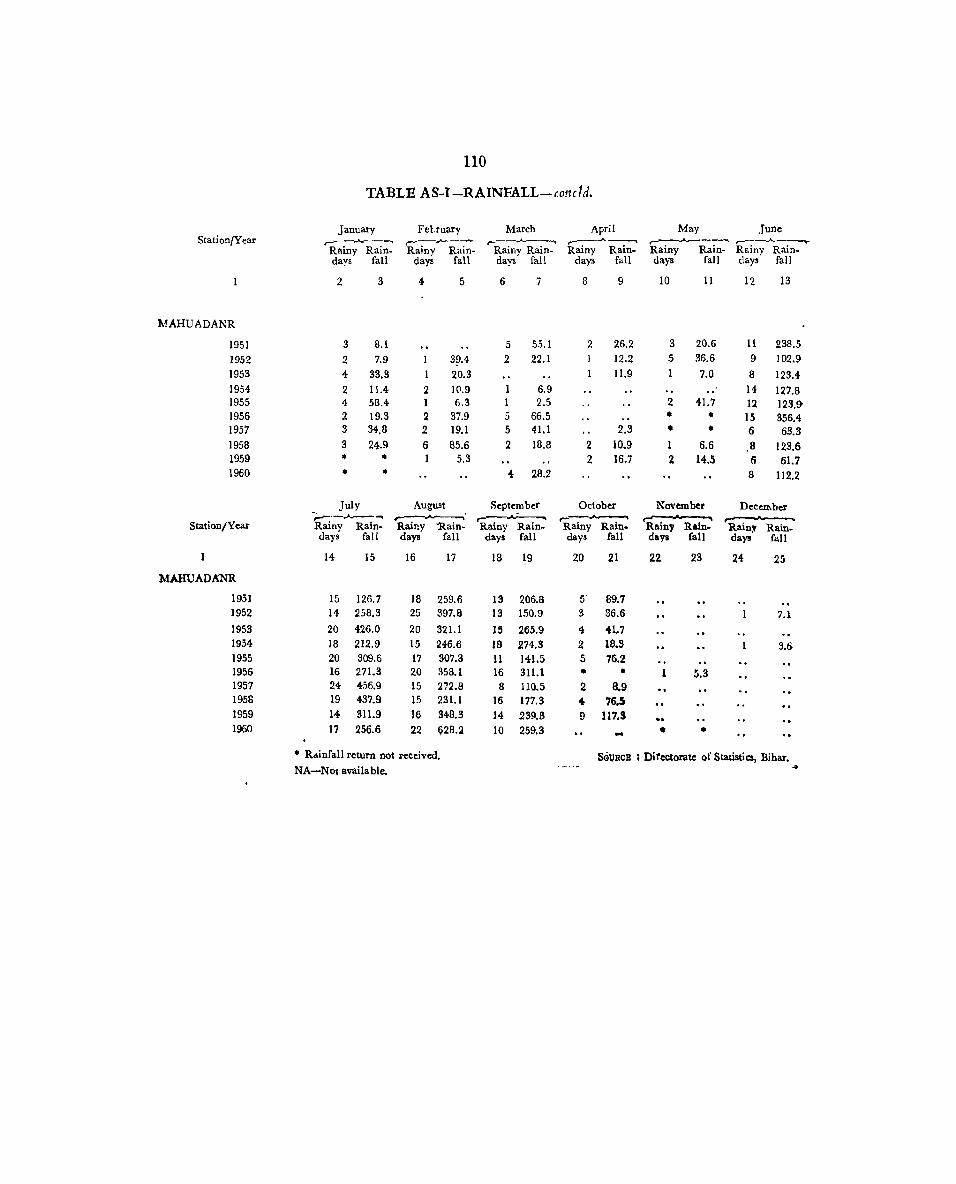
110
TABLE AS-I-RAINFALL-col1cld.
January Febuary March April May June Station/Year ,-----....A---_.., r-----_"____ r--~ r---...A...----, ,......-..A---...... r----,..A..----...
Rainy Rain- Rainy Rain- Rainy Rain- Rainy Rain- Rainy Rain- Rainy Rain. days fall days fall days fall days fall days fall days fall
2 3 4 5 6 7 8 9 10 11 12 13
MAHUADANR
1951 3 8.1 5 S5.1 2 26.2 3 20.6 11 238.5
1952 2 7.9 1 3~.4 2 22.1 12.2 5 36.6 9 102.9
1953 4- 33.3 1 20.3 11.9 7.0 8 123.4 1954 2 11.4 2 1(1.9 6.9 14- 127.8 1955 4 53.4 1 6.3 2.5 2 41.7 12 123.!} 1956 2 19.3 2 37.9 5 66.5 • • 15 356.4 1957 3 34.8 2 19.1 5 41.1 2.3 • • 6 63.3 1958 :3 24.9 6 85.6 2 18.8 2 10.9 1 6.6 8 123.6 1959 .. .. 1 5.3 2 16.7 2 14.5 6 61.7 1960 .. .. 4- 28.2 8 112.2
July August September October November December -;.....-.-..A-- ... '-. ,.....-Jo,..~ ,... r .... ., r .... . .
Station/Year Rainy Rain- Ramy 'Rain- Rainy Rain- Rainy Rain- Rainy Rain- Rainy Rain. days fall days fall days fall days fall days fall days fall
14- 15 16 17 18 ~9 20 21 22 23 24 25
MAHUADANR
1951 15 126.7 18 259.6 13 206.8 5' 89.7 1952 11- 258.3 25 397.8 13 150.9 3 36.6 7.1 1953 20 426.0 20 321.1 15 265.9 4 41..7 1954 18 212.9 15 246.6 18 274.3 2 lS.S 3.6 1955 20 309.6 17 307.3 11 141.5 5 76.2 1956 16 271.3 20 353.1 16 311.1 • • 1 5.3 1957 24 4,')6.9 15 272.8 8 110.5 2 8.9 1958 19 437.9 15 231.1 16 177.3 4 76.5 1959 14 311.9 16 348.3 14 239.3 9 117.3 1960 17 256.6 22 (;\28.2 10 259.3 - • •
.. Rainfall return not received. Set,lRCE ~ Directorate of Statistics, Bihar • NA-Not available. ....

IiI
TABLE AS-II-HIGHEST ,AND LOWEST TEMPERATURES
(Figures in Fanrmheit)
Year/Temperature January F~brllary March April May June July August Septem. Octo. NOl'em· Decem· ber ber ber bel'
2 3 4 5 6 7 !l 9 10 11 12 13
DALTONCANJ
1951 Mean Maximum 74.4 82.5 90.6 97.0 106.8 102.0 90.6 89.8 91.4 92.2 85.8 76.9 Highest 84.0 92.0 98.0 107.0 114.0 111.0 98.0 93.0 95.0 97.0 92.0 81.0 Mean Minimum 4,s.8 49.3 60.7 69.0 77.7 81.7 73.0 78.0 75.9 72.0 56.1 46.2 Lowest 39.0 4:2.0 ,s1.0 6J.0 72.0 72.0 72.0 74.0 72.0 64.0 47.0 41.0
1952 Mean Maximum 79.4 84.9 89.8 103.0 108.3 101.4 92.1 88.1 88.9 89.9 84.1 78.1 Highest 84.0 93.0 99.0 110.0 114.0 114.0 99.0 92.0 93.0 95.0 89.0 82.0 Mean Minimum 48.1 5.1.4 60.5 72.3 82.1 81.5 79.1 77.7 76.2 67.7 54.1 47.6 Lowest 42.0 49.0 52.0 62.0 75.0 74.0 75.0 75.0 73.0 55.0 42.0 40.0
1953 Mean Ma"imum 75.1 85.3 98.8 103.5 108.3 103.1 89.0 88.8 88.6 88.7 82.1 79.3 Highest 82.0 93.0 105.0 109.0 114.0 115.0 91.0 94.0 95.0 94.0 87.0 85.0 Mean Minimum 50.4- 54.8 64-.2 71.3 81.7 83.1 77.9 76.5 76.0 67.4- 5.1.3 49.5 Lowest 40.0 43.0 57.0 61.0 72.0 75.0 74.0 73.0 72.0 57.0 45.0 H.O
195·4 Mean Maximum 75.5 85.S 92.2 104.2 lOB.8 100.1 93.0 90.0 88.9 86.5 82.3 77.2 Highest 84.0 94.0 102.0 110.0 114.0 107.0 104.0 99.0 93.0 92.0 85.0- 84.0 Mean Minimum 45.7 56.0 60.0 72.6 80.9 81.5 78.8 77.4: 76.3 64.2 50.2 47.5 Lowest 36.0 46.0 47.0 63.0 no 71.0 74.0 74.0 74.0 53.0 46.0 40.0
;1955 Mean Maximum 74.9 80.3 95.2 100.5 106.8 103.0 90.2 90.'1 9l.1 88.1 82.7 77.3 Highest 85.0 89.0 105.0 108.0 112.0 115.0 95.0- 94.0 96.0 92.0 86.0 83.0 Mean Minimum 50.3 52.5 63.0 67.6 81.1 83.9 77.5 77.3 76.1 71.0 54.5 48.1 Lowest 37.0 45.0 50.0 59.0 no 79.0 74.0 73.0 7,1-.0 58.0 49.0 38.0
>1956 Mean Maximum 77.9 81.7 94.5 105.2 106.0 92.9 91.2 88.1 * 82.6 77.6' 79.3 Highest 86.0 94.0 100.0 112.0 116.0 100.0 97.0 93.0 ... 91.0 83.0' 88.0 Mean Minimum 48.9 50.8 63.! 72.0 82.3 7B.7 77.2 - 76.8 75.3 70.7 55.7 51.0 Lowest 39.0 43.0 54.0 63.0 72.0 75.0 68.0 75.0 73.0 65.0 48.0 43.0
i957 Mean Maximum 75.7 79.7 87.5 100.6 107.6 101.0 90.1 91.0 90.9 92.5 85.5 79.5 Highest 84.0 87.2 100.9 109.9 113.2 Il1.6 96.1 94.6 95.7 96.6 91.6 87.6 Mean Minimum 54.0 50A 60.8 70.9 79.5 83.5 78.4 78,4 75.0 66.7 54.0 49.5 Lowest 46.0 43.0 49.5 62.6 71.0 73.6 73.2 75.6 70.0 55.0' 49.6 12.4 1958 Me=Maximum ·79.5 82.B 94.8 104.5 109.2 110.3 93.6 91.4- 90.3 88.9 84.7 79.3 Highest 88.9 !l0.9 102.4 110.7 113.5 115.0 106.0 97.3 102.0 93.7 90.0 83.5 Mean Minimum 50.0 54.3 64.2 74.1 78.4 83.8 79.3 77.7 76.6 71.6 58.6 50.4-Lowest 42.2 45.1 52.5 66.0 69.3 70.5 75.0 73.0 73.9 60.4- 49.8 42.8
1959 Mean MaximUm 75:9 79.7 91-.5 102.9 108.1 101.5 92.1 9"0.0 NA 8S.3 33.3 77.5 Highest 81.0 89.4 104.0 109.6 11'2.3 109.0 97.0 93.9, NA 93.9 89.1 84.0 Mean Minimum 52.9 52.0 59.4 71.4 79.0 82.0 78.4 77.5 NA 71.I 55.0 46.0 Lowest 38.5 40.8 51.3 57.9 72.3 76.6 74-.3 74.8 NA 65.1 47.8 39A 1960 Mean Maximum 75.2 NA 89.2 102.2 107.2 103.8 91.4 90.7 90.7 90.3 NA NA Hlghest 81.0 NA 102.4- 108.9 1I3.S 113.7 97.7 94.6 96.8 95.2 NA NA Mean Minimum 48.0 NA 61.2 69.6 77.0 83.1 77.5 77.9 76.5 63.4 NA NA Lowest 37.8 NA 52.2 62.1 64.9 75.6 70.7 75.6 73.2 57.6 NA NA
NA : Notavailable
*-Not received SOURCE: Director, Regional Meteorological Centre, Calcutta.

112
TABL'E AS-Ill-LAND- UTILISATION AND AREA UNDER DIFFERENT CROPS
(Area figures in Acres)
Classification of area 1911 1921 1931 1941 1951 1961
2 3 4 5 6 7
(A) Total geographical area 3,144,981 3,137.322 3,138,550 3,138,040 3,149,440 3,144,960' Forests 176,244 1,492,669 1,327,832 1,394,970 1565,583 1,740,296-Area not available for cultivation 1,534,812 264,923 265,040 265,040 254,788 237,884 Land put to non-agricultural uses .. 1 1,534,812 264,923 265,040 265,040 } 76,334 71,538-Barren and uncultivableland ., ) 178,454 166,346-
Area cultivable 687,155 422,133 499,959 499,954 403,180 318,286-Culturable wastes
.. ~ } 249,538 135,198
Miscellaneous tree crops and groves .. 687,155 422,133 499,959 499,954 30,894 Pastures and grazing land· 1!1,984
Other fallows 122,748 163,104 Area cultivated 74-6,750 957,597 1,045,729 978,076 925,884 848,494 Current fallo .... s 205,450 395,617 391,669 491,336 313,185 297,774
'Net area sown 541,300 561,980 6.54,060 486,740 612,699 550,72(}
(B) Total arEa sown under all crops 58il,350 669,280 7S(),840 618,160 767,231 812,219 Area under food crops 524,650 .565,380 657,180 540,680 699,600 730,466 Basic food Crops 512,250 556,100 647,880 529,460 690,827 722,437
Rice 320,450 174,580 175,380 177,220 243,852 247,241 Wheat 11,0.50 11,360 16,000 8,100 17;115 22,286 Pulses NA NA NA NA NA NA Fruits and vegetables 2,500 2,300 4,600 4,600 4,084 4.307
Other food crops 12,400 9,280 9,300 1l,220 8,773 8;029 Sugarcane 3,450 4,900 4,900 5, '!-OO 5,964- 5,335 Condiments 2,540 3300 3,300 1,311 1,72(} Others 8,950 1,840 1,100 2,520 1,498 973
Area. under non.food crops 51,750 103,900 122,463 74,760 65,316 81,575 Oil seeds 51,250 101,780 120,300 73,800 62,042 '77,663-
Fibres 500 2,120 2,160 960 3263 3,906 Cotton SOD 1,000 1,200 960 1,941 1,197 Jute Other fibres 1,120 960 1,322 2,709
Tobacco 11 6 Area under miscellaneous crops 9,950 1,200 2,720 2,315 17a
Fodder 9,950 2,720
1,000 27 Other non· food crops 1,2(10 1,3!5 151
NaTE: 1911 figures r.epresent the average for 1911.12 and 1912·13. Mgures for the census years 1921 to 1951 give the average of five crop years WIth the relevant census year as the mid·year in everv case. 1961 data are the average oCthe five crop years including and preceding 1960.61. '
NA-Not available SOURCE: Directorate of Statistics, 1,Iihar.
TABLE AS-IV -GROSS AREA IRRIGATED BY CROl>S
(Area in acrtls)
Crops Irrigated 1911 1921 1931 1941 1951 1961
2 3 4 5 6 7
GR.OSS CltOPfED AREA 586,"350 669,280 7S0,840 618,160 767,231 812,219
Gross Irrigated Area 61,000 90,041 90,536 90,536 61,757 142,735
Irrigated area under food cYops 59,000 88,741 89,236 89,236 61,484 142,601
Rice NA 81,629 81,629 81,629 51,931 53,216 Wheat 2,700 974 974 974 2,943 3,042 Other Cereals NA NA NA NA 2,929 79,797 Pulses NA NA NA NA 465 1,350 Sugarcane . NA 4,002 4,003 1,601 3,216 5,196
lmgated area under no'!·jood crops 2,000 1,300 1.,300 1,300 273 134
Cotton Other non· food crops 2,000 1,300 1,300 1,300 273 134
NOTE: 1911 figures reJ:reser.t tIle average for 1911.12 ~nd 1912 13. Figtres for tile census years 1921 to 1951 give tbe average , of five crop years wilIl the rekvant C{nlUS Har astl-e mid·year in every C2se. 1£61 data a.re the average of the five crop
years incl uding and preceding 1960.61. '
NA-Not available. SOURCE: Directorate of Statistics, Bihar.

113
TABLE AS-V -GROSS AREA IRRIGATED BY SOURCES
(Area in Acres)
Sourc~ 1911 1921 1931 1941 1951 1961
2 3 4 5 6 7
Total Irrigated area by all lources 61,000 90,0(1 90,536 90,536 61,757 142,735
Government Canah . .,. 3,153
Private Canah 41 27
Tanks 200 80,378 81,176 8'1,1'6 40,426 89,155
Tube.wells 12
Other welh 5,000 7,4B6 7,486 7,486 8,672 '19,600
Other source! such as river, water.faIl, etc. 55,BOO 2,177 1,874 1,874 12,618 30,788
N0TE • 1911 figure! represent the average for 1911-12 and 1912·13. Figures for the census years 1921 to 1951 give the average of five • crop ye_ars with the re~evant census year as the mid.year in every case. 1961' data are the average of the five crop years
includmg and preceedmg 1960-61. SeuRcE : Directorate of Statistics, Bihar.
TABLE AS-VJ-YIELD_RATES OF PRINCIPAL CROPS
(rield in maunris pe r acre)
Princi.pal Crops 1951·52 1952·53 1953-54 1954.55 1955.56 1956·57 1957.58 1958·59 1959-60
2 3 4 5 6 7 8 9 10
Rice 2.29 4.71 4.67 3.84- NA NA NA NA NA
Jawar NA NA NA 6.45 5.64- 7.97 2.00 4.15 NA
Bajra NA 4.95 NA 4.31 3.46 4.71 4,12 4,98 NA
MlIi:ze 7.77 9.30 NA 1.60 7.45 ],1.55 7.12 3.93 NA
Ragi 4.53 3.52 NA 4.25 5.10 3.99 3.58 3.77 NA
Wheat 3.05 4.36 5.51 2.66 6.28 l.J6 5.79 6.18 $.13
Barley 4.25 5.37 3.50 1:82 6.32 4.31 3.50 8.90 3.93,
Gram 4.10 3.20 3.49 3.42 2.12 2.19 2.41 4.92 3.5a
Tur 2.94- NA NA 3.60 3.14 4.46 2.36 4.76 NA
Potato NA NA NA 38.63 31.40 22.84. 41.27 66.17 NA
SugliIcaoe 167.01 130.00 NA 147.20 505.09 162.56 295.00 368.59 333.47
Chillies (Dry) 7.51 7.41 NA 18.05 3.07 8.49 4.33 6.92 NA
TobacCO NA NA NA 4.61 4.40 4.81 5.30 4.42' NA
Castor Seed 0.93 0.98 NA 1.60 6.'1·8 4.83 5.55 2.01 NA
Sesame 2.09 NA NA 3.46 2.23 1.44 2.85 2.04- NA
Rape and Mu,tard 2.21 NA NA ~.75 3.44 2.41 2.13 2.20 NA
Linseed ~_. 1.84- NA Nz\, 2.50 2.58 1.63 1.54 2.76. ·NA
NA : Not available. S pURcEs-(i) Estimate of atea and production of principal crops in India, Vol. II. (ii) Annual Season Crop Rf"port, Directorate of Statistics, Bibar.
1'-1-15

114
* • • • • • • • ~ ~ ~ ~ ~ ~ ~ ~ ~ ~ ~ ~ o 0 0 0 Z 0 ci 0 0 0 0 !
II .. c· * • .. * • ~ ~ ~ ~ < ~ ~ ~ + o 0 0 0 Zoo 0
•
0; • d
•
•
l ~ ~ ~ ~ ~ ~ ~ ~ ~ $0' ~o~ ~ ~ ~ ~o~ ; ~ ~o~ ~ ~ mo' : ~ ~ ~ _ _ _ dod 0 0 _ 0 ci 0 d
~ ~ ~ ~ ~ ~ ~ ~ ; ~ g ~ ~ ~ g ~ ~ $ ~ ~ g ~ ~ ~ ~ 0 0 0 0 0 0 0 0 0 0 ci 000
-B .~ ~ j ~ ~ ~ ~ : ~ ~ ~ ~ ~ ~ ~ ~ ~ = ~ ~ ~ ~ ~ ~ ~ ~ ~ ~ N " N N ~ ~ N ~ ~ ~
13
~ N ~ ~ ~ ~ ~ ~ : ~ ~ ~ 5 ~ ~ ~ ~ ~ ~ ~ ~ ~ ~ os
C.l
ill
g ::> a>
<II

115
TABLE AS-VIII-MONTHLY RULING WHOLESALE PRICES OF STAPLE FOODGRAJ,NS ~
Year
1
1952
1953
1954
1955
1956
1957
1958
1959
1960
Foodgrains
2
Rice
Wheat
Gram
Rice
Wheat
Gram
Rice
Wheat
Gram
Rice
Wheat
Gram
Rice
Wheat
Gram
Rice
Wheat
Gram
Rice
Wheat
Gram
Rke
Wheat
Gram
Rice
Wheat
Gram
Price per maund during
Sen- Octo- N ovem- De-J:muary February March Appil May June July August temher ber ber cember
4- 5 3
NA
NA
NA
30.00 27.80
22.67 22.75
21.00 18.80
21.20 20.87
20.00 26.00
22.00 22.50
21.00
24.00
18.83
6
28.25
24.00
18.50
2I.I2
18.88
15.75
7
27.00
23.00
15.75
23.60
18.80
17.55
8
28.00
NA
18.17
25.62
19.67
18.50
10 11 12 13 14 9
30.66
27.00
18.75
32.00 29.33" 28.25 23.75. 20.37
NA NA 21.4(}' ~9.75
NA 21.00 31.00
21.00 20.25 23.25
25.16 25.80
18.67 19:13
18.00 ' 18.13
24.75
19.00
17.88
22.40. H1.62
19.00 18.50
18.2.') 16.25
17.25
1-8.00
14.38
18.20 16.67 16.94 17.33 16.50 16.00 15.25 15.50 15.38 15.25 15.62 14.00
18.20 17.33 17.00 16.17 1,4.62 15.00 13.67 13.75 14.25 15,75 17.38 17.75
14.70 14.17 12.75 13.33 12.25 10.88 11.00 11.00 10.75 11.50 10.63 8.67
13.30
NA 8.40
15.87
14.62
10.75
18.00
NA
15.00
23.00
15.00
NA
9.25
15.87
15.50
11.62
19.37
NA
15.50
23.67
14.00
14.00
9.13 16.40
15.00
12.12
21.10
NA
15.60
22.50
14.60
13.25
8.25
17.50
NA 12.50
21.00
NA 14,37
25.00
14.67
12.00
7.67
18.~1)
NA 12.00
22.40
NA
13.70
25.90
15.13
11.00
8.38
19.00
15.00
12.19
22.25
~A 13.38
26.66
15.67
12.17
9.67
19.00
15.00
12.25
23.00
NA
13.37
27.50
17.42
13.17
9.42
19.30
NA
12.70
23.10
NA 13.60
28.60
16.69 17.00
12.12 13'.25
9.00 9.25
19.50 19.00
NA NA
13.00 13.25
25.17 25.50
NA NA
13.87 13.75
28.33 28.00
16.37'
14.00
9.37
18.00
18.00
14.19
25.70
NA
14.00
23.50
15.60
13.60
9.70
17.25
NA
15.00
'26.00
NA
13.69
22.00
NA NA NA 16.00 19.00 19.00 20.00 21.00 21.00 21.50 31.00 NA
13.12 12.75 12.63 13.12 13.60 15.00 15.44 17.00 19.17 19.83 19.87 19.13
20.00
NA 20.20
22.00
NA
23·09
2UO
22.00
22.75
23.50
20.00
17.88
21.40
19.20
15.00
25.00
19.00
15.00
25.25
19.00
15.00
25.25
19.00
14.75
23.00
NA
14.50
24.20 23.00 17.25
NA 18.00 18.00
15.00 19.13 20.20
21.00 22.00 22.25 23.80 24.75 25.00 25.20 25.00 25.00 24.31 23.25 22.50-
17.70 17.80 18.00 NA NA NA NA NA NA NA NA NA
14.70 15.00 15.00 14.60 15.00 15.50 16.00 16.50 16.88 17.13 17.50 17.00
NaTE: (i) IUce refers to medium rice and wheat to red wheat. (Ii) Figures for 1951 are not available.
SOURCE; Directorate of Statistics, Bihar.
NA-No~ available.

1M
TABLE AS-III.l-LAND UTRISATION
(Subsidiary Table I)
(Area ,It acres)
Serial no, Classification of land
2
\ Total land Rl;ea according to the Surveyor General 2 Total area for which villa(ie papers are available 3 ~er 1,000 acres of the land area in the district-
(i) Area under forests or otherwise not available for cultivation (ii) Total cultivable area, , , (iii) Net area sown "
4 Per 1,000 acres of total cultivable area in the district (1) Net area sown (ii Area under fallow lands (iii) Area under other uncultivated land excluding fallow land
5 Proportions per 1,000 acres of the State-(i) Total cultivable area (ii) Net area sown (Iii) Net area irrigated (iv) Area sown more than once (v) Area,irrigated mort: than once
r 1961
3
3,152,000 3,144,960
629 371 175
472 395 133
45 29
NA 38
NA
Year
..... 19,51
4-
.':j, I 33,440 3,149,440
578 422 195
4-111 328 211
50 29
NA 28
NA
NOTE: Figures for the Census year 1951 give the average of five srop years with the Census year 1951 as the n:id-year. The 1961 data are the average of the five crop years including hlld proceeding 1960-61.
NA-Not available.
SOURCE : Diroctol'at.: of Statistics, Rihar.
TABLE AS-III.]-'-PROGRESS OF CULTIVATION DURING THE LAST THREE DECADES
(Subsidiary Tabl~' II)
(Area ill ams)
Particulars 1961 1951 1941 1931
2 3 4 S
Area under foodgrams 718,130 686,743 524,860 643,280 Area under crops other than foodgrains 94,089 80,488 93,300 137,560 Net area sown 550,720 612,699 486,7-1:0 654,060 Area sown mar,e than once 261,499 154,'532 1 31,-!20 126,780
NOTES' (1) Figure.~ for the Census years 1931 to 1951 give the average of five crop years with the relevan1:census year as the mid-year • in every case. 1961 data are the average of the fi Ie crop yea.rs including and preceding 1961.
(2) Figures relating to the net irrigated area and the area irrigated more than once are not available.
S0URCE: Directorate of Statistics, Blh!U'.

117
TABLE AS-In'3-COMPONENq,'S OF LAND AREA, CuLTIVAB):.E AND CULTIVATED AREA PER HUNDRED PERSONS DURING THE LAST TItREn DECADES
(Subsidiary Table III)
(Arra in acres)
Particulars 1961 1951 1941 1931
2 3 4 5
Land area 265 319 344- 383 Area cultivable 98 135 162 189 Net area sown 46 62 53 80 Net irrigated area .. NA NA NA NA Area ROwn more than once 11 13 17 32 Area irrigated more than once NA NA NA NA Area under foodgrains 60 70 58 79 Area under crops other than fuodgrains 8 8 10 17
Land area-Total Geographical area according to the village papers.
Arta culli~able-Tncludes (i) Nt:t area sown, (ii) Current fallows, (iii) Culturable wastes, (iv) Fallows other than curren t (v) Pastures and grazing land, (vi) Miscellaneous tree crops and groves not included under net area sown .'
Net area sown-Represents the area sown counting area sown more than once in the same year only once.
Net irrigated area-Rf'presents the area irrigated different 6ources, counting area irrigated more than once, in the same year only once. .
Area irrigated more thlm o~cf-Represents area wEch receh~e irrigation more than once in raising the same crop again or other crops 10 the same year.
NOTE' Figures for the census years .\931-19.51 give the avera:ge of five crop years with the relevant census year as the mid-year in every . case. 1961 data are the average of the five crop years includincs and preceding 1961. ,
NA-Not available.
Crops
kll Crop.
(i) Food ero ps
Ric ,
Whea'
Other £oodgrains
Sugarcane
Other foodcrops'
(ii) NOII.jooJ crops
Oilaeeds
Cotton
SOURCE: Directorate of St1l.tistics, Bihar.
''TABLE AS-I1I.4-CROPPING PATTERN (Subsidiary Table IV)
Total, Arca (1,000 acres)
1961 1951
2 3
812 767
730 700
247 244-
22 17
,(,53 430
5 6
S 3
82 67
78 62
2
Area per 1,000 acres of grossareasownin the
district
1961 1951
4 5
1,000 1,000
899 913,
304 318
27 22
558 561
6 8
4 4
101 87
96 80
3
Areaper 1,000 acres in the State
---- 1961 1951
6 7
31 29
30 28
20 19
14 12
45 42
12 16
23 13
56 41
112 62
146 91
J ute and other fibres other than cotton 3 4 5 2
Other non-food crops • 2 • 3 • 12
• -N egligi ble. SeuRcE : Directorate of Statistics, Bihar •

118
TA~LE AS~III. 5-DENSITY OF TOTAL/RURAL POPULATION PER HUNDRED ACRES . O~ AREA UNDER FOODGRAINS AND NET AREA se~
(Subsidiary Table V)
1961 1951 194,1 1!l31
"------ ~ __ -.A. ___ ~ Classification of land
Total Rural Total Rural Total Rural Total Rural:
2 3 4- 5 6 7 8 9
Area under foodgrains 165.4 157.6 143.5 133.2 173.9 169.6 i27.3 123.5-
Area under crops other than roodgrain, 1,262.4- 1,202.7 1,224.7 1,178.8 978.3 954.0 595.2 \ 577,7
Net area sown 215.7 205.5 160.9 154.8 187.5 182.9 125.2 121.5·
Area sown more than once 454.2 432.7 637.9 614.0 694.5 677.3 645.8 626.8-
NOTE: Figures for the Census years 1931 to 1951 give the average of five crop years with the relevant Census year as themid-year in every case. 1961 data are the average of the five crop years including and preceding 1961.
SOURCE: Directorate of Statistics, Bihar.
TABLE AS-III'6-DENSITY OF CULTIVATORS AND AGRICULTURAL LABOURERS PER HUNDRED ACRES OF NET A REA SOWN IN 1951 AND 1961
Population
1
Total
Rural
(Subsidiary Table Vi)
Crude density per 100 acres
,.- ...... 1961 1951
2 3
38 31
36 30
Density per 100 acres or net area sown for
~.----------------~-----------------~
Cultivators ,.-
1961 1951
4 5
61 39
61 39
Agricultural labourers
r- 1961 1951
6 7
25 11
25 10
r
Agricul tural workers
..., 1961 1951
a 9
86 50
86 49
S(')URCE : Directorate of Statistics, Bihar. I

119
.TABLE AS-III.7-RAINFALL, AREA. SOWN AND IRRIGATED, DEN~IT.Y; 'ETC~
(Sub)jdiarrTabl~ VII)
(Area in '000 acres)
Particulars 1951-52 1952-53 1953-54- 1954--55 1955-56 1956-57 1957-58 1958-59 1959-60 1960-61
1 2 S .. 5 6 7 8 9 10 11
.Average annual rainfall 39.26 58.12 (in inches) 1-4.04- 50.09 S9.11 34.48 45.57 48.47 44.01 49.15
.Annual num ber of rainy days 54.8 58.5 63.1 59.6 60.1 77.1 53.7 64,4 61.4 66.0
A. gross area lown under
(i) Karif Main crop
Rice 271 265 Zl1 218 154- 214- 235 259 260 268 Secondary crops
l\faize 73 87 68 68 68 80 87 85 97 90 Marva 19 13 11 11 10 9 10 10 12 11 Bajra .. Other Cereals 65 85 64 61 58 56 . 63 68 92 84 Pulses 66 66 55 54- 51 4-9 58 74 74 Vegetables 1 .. • • • * • I 1 1 Sugarcane 6 10 4- 4 5 4 4 5 7 7 Sunhemp 1 1 • 1 1 1 1 1 1 1 Other fibres • • • 1 1 1 1 1 1 9
(ii) Rabi
Main crop Gram 64- 44- 49 39 82 81- 26 107 103 93
Secondary crops ' , . Wheat a 14 14 10 15 25 9 24 '26 27 Barley 23 27 21 15 29 35 15 54 54 44-Other oilseeds 40 48 26 37 34 46 31 50 64 54 Arhar 51 47 45 36 43 51 25 51 71 56 Other Pulses 15 17 25 16 11 29 22 41 48 50 Sweet Potato 1 • • * • • • • I 1 Other foodcrops • • • ,1 1. 1 1 1 1 1 Chillies, 1 1 I 1 1 1 1 I I 2 Potato 1 ~ 1 1 I I 1 1"2 2 2 2 Other vegetables 1 1 I 1 1 1 1 2 1 1. Linseed 6 j 7 7 4 10 15 2 23 21 21 Rape and mustard 14 15 11 10 10 16 1 14- 15 14 Mango 1 1 1 • * • • * .' • Cotton 1 1 1 • • • • .. •
B. Gross area irrigated under
(i) Kharif Main crop
Rice • 137 lOB 117 99 151 148 159 149 • Secondary trops Sugarcane 4, 6 2 4 5 4 4- 5 6 •
(ii) Rabi Main crop
Gram 3 2 • " Secondary crops
Wheat 2 • 2 2 5 3 2 3 • Barley 1 1 1 2 • '" 4 1 .. • Other Cereals • • • 1 • • • • • • Pulses * .' • • • • • • • .-Rape and mustard * • * • 1 • * • • • Fruit, • • • • 2 3 3 3 3 -/ *

120
TABLE AS-III· 7-RA INFALL , AREA SOWN:ANlJ .IRRIGATED, DENSITY, ETC-concld.
(Subsi diary Table VII) (Arta in '000 acres).
Particulars 1951·52 1952-53 1953-54- 1954-55 1955·56 1956-57 1957-58 1958.59 1959·60 1960·61
2 3 4 5 6 7 8 9 10 11
C. Estimated yield rate of main 246 392 549 121 crops (Lbs. per acre) 289 697 266 808 5H 792:
D. Density
Crude density per 100 acres 31 31 31 31 31 38 38 38 38 38 Densi ty per 100 acres of 1<:J3 131 }'58 166 168 159 201 138 124 130
gross cropped area 148 148 173 186 189 218 Density per 100 acres of 218 156 142 148.
area under foocl.-gr<iim
*-Negligible. SOURCE: Directorate of Statistica, Bihar.
LIVESTOCK TABLE LVT .I-GOVERNMENT VETERINARY FACILITIES'
No. of No. of No. of Year hospitals dispenoaries Total doctors
2 3 4 5
1951-52 4- 4- 4-
i952-53 4 4 4
1953·54- 5 5 5 . 1954--55 5 !:i 4
1955-56 8 9 9
1956-57 11 1 ~ 9
1957-58 16 17 16
1958-59 16 17 16
1 959 .. fO 20 21 20
1960-61 25 26 22
SOURCE: Deputy Superintendent, Livestock Cen~us, Bibllr.

Cat egory 0 fliv eatock /p01al try
1
rotlll ' Livestock
Cattle
Male
Female
Young,tock
Buffaloes
Male
Female
Young stock
Sheep
Goats
Pigs
Poultry
Fouls
Ducks
Category oflivCltock /poultry
Total Livestock
Cattle
Male
Female
Young .tock
BuJfaloes
Male
Female
Yotmg atock
Sheep
Goats
l'igs
Poalu,
Fouls
Ducks
121
TABLE LVT-I1-LIVESTOCKAND POULTRY
1920 1925 1930 1940 194-5 _-..1' __ --. ...------. ~~""'-_---.
Population Population Variation Population Variation Population Variation Population Variation
2
687,506
441,84~
186,957
144,721
110,169
90,486
6,389
53,265
30,832
30,306
104,867
NA
NA
NA NA --
3 4
686,335 :.:_ 1,171
4S~;9~() +11,073
188,221 + 1,264
156,787 +12,066
107,912 - 2,257
101,375 +10,889
8,813 + 2,424
59,825 + 6,560
32,737 + 1,905
50,707 +20,401
61,333 -43,534
NA N.t\
NA NA
NA NA
NA NA
1951 ,...------~
5 6
592,457 - 73,878
408,897 - 44,023
181,626 - 6,595
146,612 ~10,175
80,659 -27,253
90,431 - 10,944
8,747 - 66
56,2.58 - 3,567
25",426 - 7,311
39;346 - 11,361
5~ 783 - 7,550
NA NA
NA NA
NA NA
NA NA
1956
7 8
581,149 -11,308
407,680 -1,217
185,756 +4,130
126,731l -19,874-
95,186 +14,527
77,978 -12,453
5,644 - 3,103
41,893 -11,365
9 10
491,978 ---ai,171
352,430 -55,250
149,730 -36,026
114,353 -12,385
88,347 - 6,839
68,569 .......... 9,409
7,882 + 2,238
40,,725 4,168
27,441 + 2,015 19,962 7,479
42,035 + 2,689 32,433 ...... !}-,602
45,538
7,918
NA
NA
NA
8,245 32,850
NA 5,696
NA 154,038-
NA 153,603
NA 4115-
1961 ~-------~----~
12,688
2,222
NA
NA
NA
Population Variation Population Variation Population
Net Variation
Variation
11 12
995,881 +503,903
661,024 +308,594
277,319 +127,589
249,262 +131,909
134,443 + 46,096
124,845
17,616
74,300
32,929
57,509
127,703
24,800
243,304
241,409
1,89.5
+ 56,276
+ 9,734
+ 33,575
+ 12,967
+ 25,076
+ 94,853
+ 19,104
+ 89,266
+ 87,806
+ 1,460
13 14
1,037,054 + 41673
648,702 - 12,322
265,368 - 11,951
215,036 - 34,226
168,298 + 33,855
11 1,352
8,102
63,685
39,565
56,165
184,619
36,216
358,097
357,376
721
13,493
9,514
10,615,
+ 6,636
1,344
+ 56,916
+ 11,416
+ '114,793
+ 115,967
- 1,174
15
1,215,296
731,657
305,468
220,037
206,152
123,914-
8,326
64,857
50,731
74,508
253,951
31,266
416,417
415,574
843
16 17
+178,242 + 547,790
+ 82,955 + 289,810
+ 40,100
+ 5,001
+ 37,854
+ 12,562
+ 224
+ 1,172
+ 11,166
+ 18,343
+69,332
- 4,950
+ 58,320
+ 58,198
+ 122
+ 118,511
+ 75,316
+ 95,983
+ 33,428
+ 1,937
+ 11,592
+ 19,899
+ 44,202
+ 149,084-
+ 23,348
+ 282,37S
+ 261,971
+ 408
NA-Not availlible. SOURCE : Deputy Superintendent, Livestock Census, Bihar.

122
INDUSTRIES "A~LE IND-f-EMPLOYMENT IN T.EXTILE,·AND NON-TEXlTILE INDU-STRI ES
'(As on 3 1. I~.6o)
Seria, Number of Establishment Daily Average Employment ilb. Name of Industries
,.... ~
Total Rural Urban Total Rural Urhan
2 3 of 5 6 7
Total Industries 97 39 58 2,476 2,031 446
.4. Textile
B. Non-textile 97 39 58 2,.(.76 2,031 H5
Electric light and Power .(. 4 23 !IS
2· Water Supply Stations 1+ 104
3 Oil·Mills •• > 3 2 20 16 4
4 Saw Mills 12 3 9 57 12 45 ~1
5 Flour Mills ,. 32 11 21 55 16 39 . ;_
6 Rice Mills 2 2 7 7 .. 7 Manuftlcture oflac and Shellac .. 25 19 i 836 672 16~
8 N[anufacture of Cement 1. 2 1,287 1,287
9 Stone Pressing and Crussing 12 12
10 General and Jobbing Engineering 2 19 16
11 Repairi~g orMotor Vehicles 7
Tobacco Manufacturing ..
12 3 3 95 9~
13 Printing Press 6 6 25 %!
14- Tube Making and Wire Dral\oi~g 9
15 Manufacturing of Ice 2 2 10 Ie
SOURCE: Chief Inspector of Factories, ruhar

l
123
C»l.{)I1')<:n-CO .... 0 011')11') • .... ....
...... . _
'eN . .....
• Cf)
" .
'" ' ....
: .

124:
Q ~ ~ 0 ...:l
~ til
(
rOi ... 0 • "" ~ a.l . ..., "" '0 : .... ,. ... f ~.[ N ..., .".
• '" N ..... "" "" ... I
I OJ) P.S = , U
~ U" .... ~ "" : "Of< .". ... : _.. to 1 t.a ..... ,IQ < ~:s "" ..... ~ ~ I 8 0<:1
) :g :=.<: ~ ... ll - : "" .., "Of< o bO 0 c:i : ..... It) • CO') ..... !'" o,.;g ""
lZ:;
Z 0 til
~ p.,
Q Z < til
s· o"E ~ § ~ u fill ,........ :;J~ 0
o~ '0 0\ ...
ttl 0 .: loltfJ'.) '" ...s::. O~ Q ....
~~ ..,
Q ... ~~ '" ..Q
IQ E O~ ~
Z~ e-. ::J t.?
=r!~ .:: ~Z ....
~ ~~ .__
~
r C'> In 1'00"""" "i<"Oto N g:j* ""'" .... .., ... ~f,!) <:"flO ... .". "" 0 u_~Cf) _, _ c-.I ... lt") ..,. .., ... ..,
... -of' e~ bO ~~ I:
~-t1 .. .".00+.,.,
'i" ... oo:> ;:~~tn~ .., Oleo ~..,
';:: (I()
~ ~U')C'l 0 0 ON N "fC'( ._ 1'"1 N N
.... :; 1"'0 E-< ~.<:
,'- fJ ... - "' .... ot') ..,
"'"" ~.~N °bO N CI)
"'0 0<:1) l.'" 0"'" C"II ~ .., .... ~ .... ""oo • .s ... ..... .... .... -... 0-
Uz::; ~
fa] .". ...... r"I
<0 lOCI .. ~r c.o "" ~"" : r- "" .... ."fO =- I 0 >-. N ...
ill I !!:,g U>
" 0.. :3 1 P< S
~I >. . " " " ... ..... «J .., .... C"~ e<"l "" ... : r--. 0 :- ;,('IC "0 '" " of)
'" I:: ~ ;:;-0 "" ;:J -j~] I<l{ .s o-l ...l
1'" ~" t:: ~
.,. ' .... - "" ""C'le<"lN'OjO : _'''N ..... '''''
r:l 0 • .:1 C'4 fo- 0:;: C'( . z lZ :>-0 Z
ro
,
0 .., ... co of) CO) .... CO.O "" 1tl0l ""'''''0.0'("" a~ ~ c:n · .... -.., ..,10 '" -0"4,*, ....... N .". • C'C ....... ... Ill) 0(
C.S I'!-a ;..>1 ~e -'" . ., a "
~ ~ co' ........... < ~-t! ..,0 .... 0 ""' '" "",,-1o ... N cr.-.!<.., • of)
"""''''u> 't] ,!I- N t;:; ... - ..... 0') ............ .., · .... ~5 ;:J- N
o ~ 'tlS ::z:: ..... .... ",
'-~ o E Obi) ... """"",,«1 N--I<,,*,to"" """"co : .... - .. ..,.."'""''''"' ~ ...... ('I(Qt) 1.:)0 . ", N ....
0-(z:;:
:;... p:: ~ en ;:J
~ ~
p.. 0 j:Q
r al COl c.oll"')_.eC'lo:) -ooOC',,~ -C\C~ ............ 0<) .... "' .... .,., N()1_U")_ 0 ... ..,oeo O .... CO"""" .... ", <0001''-'"" C"f C:Q f.;TJ..,. N Q)-'U')I/) <:> :> .,.. ... N -_ -~ -- .... 1:"<1 t'fN 1:- cf ..,P.. . >. r .., e-.lot")O')_CO ~C'-fe-.t~_ 0""'""''''' .... 0(.0:;;_1:' ...... 0)11":1_
... !l (J'tl c:n ... NOl<'>OI'O 1.lj000)c.o~ --_(''Ct)C'C':I INC<) ~I'- Ie .... .". ~ ....... Q :lo ... p.. ~..c l ~ ~ ...... r..o-:: co 0"", "''''''i<CX)C'> ICN(QOCQ ""'001 ""'I'- ~lL')tQ~_ Otll) 0:> 0lI ""- - - - - 'C'l
- -. _ ..... - .... I . '" ... I 0-
l z'S
~
~ . :
'1
I .... .... I
~ ~ ...:I ~
~

-o \0 0\ H
.!:
f
I I
l
-·0 .... o §
1 o P:
125
<:'1
· .., . ..,
• IN
· ...,
:10
:'"

126
SUPPLEMENT TO TABLE IND-II-NAME OF INDUSTRY 1 WITH NUMBER OF HOUSEHOLDS AND PERSbNS EMPLOYED IN .:RrjR:AL .AREAS ONLY
(As in September/October 1960)
Number of Industry! Anchal No. of Housc- persons' Number of
villages holds ~mployed No. of House:::, pe1'l'ons Industry / Am'hal villages holds' employed
2 ::I 1 2 3 4
I. Spinning 7 22 33 (1) Garh\\a 2 b 5 7. Motor reparir.g 5 82 108 ~2) Chandwa I 2 12 {I) Latl!har 3 70 70 3) Mahuadanr 4 15 16 2) Farv.adih 1 5 28
2. Manufacture of rope, twine, string "(3) Mahuarlanr" 1 7 10 and olh er related goods .') 36 86 6. Comb making 2 4 5
(I) Chainpur 1 21 47 (1) Mahuadanr 2 ... 5 (2) Garhwa I 2 2 9. Soap making 1 II (3), Chandwa 2 12 25 ., (4) Manika 1 1 12 (1) Mahuadant. 1 1 8
3. Metal works of. 9 18 10. Distillation of wine 3 3 8
(I) Mahuadanr 1 1 3 (I) Daltonganj I 1 I (2) Gant 2 2 5 (2~ Chainpur 2 5 14 (I. Prt:paration of Bhunja I 1 (3 Cl-.andwa I .3 3
(I) Mel'al 1 1 ~. Bricks making 1 50 12. Extraction of palm juice 2 5 6
(1) Chainpur I 50 (1) Panki 1 2 5. Stone chips 2· 30- (2) Hussainabad -4 4
(I) Daltonganj 2 30 13. Production of sugar and I'~r 5 5 (I) Chainpur 1 5 .'i 6. Sealed stamp mlolkinf.! 3 3 14. Medicines I 1 1
(1) Mapaht 3 3 (I) Chainpur I ~
SOUltC£: ·HollSe List!, 1961 Census, Bihar.
ADMINISTRATION TABLE ADM-I-GENERAL RESULTS OF TRIAL OF CRIMINAL CASES
Description 1951 ~
1952 1953 1954 1955 1956 1957 1958 1959 1960
2 3 0{ 5 6 7 8 9 10 11
A. Persolls brought to trial 1,765 1,768 4,774 1,848 t,91I'" .2,207- 2,074 2,201 2,176 2,442 Discharged or acquitted 636 567 595 636 718 944- 1,042 803 662 621 Convicted 290 296 301 305 280 305 300 438 312 24-3 Committed or referred to higher court 56 63 66 69 63 n 67 73 62 49 Died,"elIfaped or tra1lsferrtd io another State' 3 2 3 4 4 3 3 3 Under trial 780 838 309 1m 853 88+ 662 884 1,140 1,529
B. Appellants and ApJ?licants for revision (per.o •• ) 19 24 21 17 20 23 19 27 26 45 Rejected 8 8 14 5 10 9 7 13 1,1 19 Sentence or order confirmed 6 7 6 5 S 7 ]2 10 20 Sentence al tered 3 5 7 6 4- 3 .5 2 .5 ~ Sentence reversed Otherwise di8p08cd of 2 4 3 . i Died,escaped or tr~sferrcd tg anotber State
' .. Pendini tri • .sI
SOllftCE : Inspector_General of Police, Bihar.

127
TABLE ADM-II-PUNISHMENTS INFLICTED IN CRIMINAL CASES
Nature of punishment 1951 19.52 1953 1954- 1955 1956 1957 1958 1959 1960
2 3 4 5 6 7 8 9 [0 '11
1\. Sentenced to (Numbe~ of per.onl)-
I:' Death 3 3
2:: Transportation or penal servitude 9 7 4 j{ 5 7 III 16 11
3; Imprisonment 270 268 274 290 250 282 280 400 280 220
(a) of 15 days or under
(b) Above 15 days t? 6 months 162 180 [00 171 127 164- 162 201 166 ,128 -.,
(c) Above 6 months to 2 years 98 76 160 106 109 98 104- 17'3 99 82
(d) Above 2 years io 12 14 13 [4 20 14 26 15 ;' 10
4. Fine or forfeiture 18 16 20 13 17 19 16 23 16 12
(a) Rs. 10 or under .. (b) Over Rs. 10 18 16 20 13 17 19 16 23 [6 12
5. Give Security
S. Total Amount of fine (ia Rs.)-
1. Imposed 270 192" 300 260 340 380 192 460 320 240
2. Reali.ed 270 192 500 2fiO 34() 380 192 460 320 1%"0
3. p&id as compensatioR ., SOURCE Inspector.General of Police, Bihar. -
TABLE ADM-III -STRENGTH OF POLtCE
Category 1951 1952 1953 1954- 1955 1956 1957 ·1958 1959 ~6()
2 3 4 5 6 , 8 9 10 ,1 11
Tot!!1 Staff 1,389 1,381 1,390 1,3H 1,398 1,398 1,398 1,455 1,455 11455 - I
Sup~tintendent: ASsistant ·Superintendent ani ) Deputy Superintendents _ •• 1 1 1 [ 1 1 1 I- I 1
Insp~tors, Sub-Inspectoril and Sergeants-Major H H H H 44 "H H H H 44
Sergeants, Head constables, A.S.;Is. and fiavaldars .6 ., 47 .. i' 4-9 .9 .9 51 51, 51
Foot' Constables 409 4-09 409 .O~ 409 409 409 Hfi 446 'Hi
Chowkidars ~nd Dafadars 889 589 889 895 895- 895 895 913 913 t 913 "
,/
SOURCE: Inspector-General of Police, );\ihar.·

«< OCl)< ZZZ ..... Z
«<' ZZZ
«< ZZZ
«< ZZZ
00< _ .... Z
128
.< 'Z
- .<.0 c.o ._
C .0> ..,
'0 ·co
It") :0:>
-""t-- ..to"''''' Nlt")'Oi' t--N N_ C"-I N,.....
0> .It") ..,
oeo -CCI
• U") . ...,
......... It")

o
d: on Cl -
co ll"l ~ ll"l Cl
N 00 ,
-on o (;l ....
o
co
1:'1
'" .. .. 'il o
rill
; .. :; II 'C be -< i>-. :<l a
'C Il.o , ...
P-I-17
129
.! .. ,! II o
If.)
1 :; u ·c DO
~ ~ ot
COCO N -L!')
00 00 00 0" <D"
fi5 +
couo,ll"lO C'{e<'l ..... '""
e<,,) 0 C'J 0" _
~ +
............ .......... -:.=...

<.0 '? It") ll') Ol ....
ll')
~ 0> -
co
co CO oft M .-s:; CO c-i
o o ci ~
a
000 000 u-io:i<6 0l0 ...... C'l<CLt"l on"1/3 -to" OlC<lo:> ll""~_~ .... 000 0<='0 u-i1Ci~ OO'C'l Oc:-tOl cr)'-"'~'" C<>c:<'l<O ~",-~
coo COO ~a;o ..... <.Oc<") O<'o-to " .... e-.,"'Cf}'" 0 ...... on - ... -Ct':l ......
CO o
~ coi ... CO ..::
/
o o ci ~ ID CO ...
III .g u .. :a u
s:: o
s:: o
] "0 u

"" -
8ai~~~f2;ggs~8 '""0000 .... ""' .... <0""<0 r-..""I' "'(D'" t!)"'l.r;'c.o'" tl') "'00 "'C'!"co'"
131
C'\fN~(j)c<'Jl'-tO.-II1")O c<'Jc.o~["-o.O""",,,~ONCO ,. ... aJNCC')U")lf')t.CCOCC')CJ)
..... ffi·~·:=r<o·g:f gg.~"~.~.;1;. C"f ....... NC(")tl')f,OC'{CC'jO .. O .... .........
««« Z·ZZZZZ

Place
DALTONGANJ
Description
No. of policies Sum assured ~in RS.) Income from premium
(in Rs.)
Year
1950·51 1951·52 1952·53 1953.54 1954.55 1955.56 1956·57 1957.58 1953-59 1959.60 1960.61
1950·51 1960.61
132
TABLE ADM-X-LIST OF BANKS
places ill the district where hanking jacilities exist
Name of the Bank
2
(I) Bank of Behar
(2) Central Co·operative Bank
Place
DALTONGAN]
Name of the Bank
2
(3) Punjab National Bank
(4) State Bank of India
SOURCE: The Reserve Bank of India, Bombay.
TABLE ADM-XI- PROGRE.SS OF LIFE INSURANCE
1957 1958 1959 1960 Staff/Offices 1957 1958
2 3 4 5 - 2 3
Number of-
132 149 327 744 Field Staff 2 2 663,000 815,500 1,652,750 4,438,000 Agents 35 40
18,500 20,009 38,500 182,000 Br"nch offices Sub·offices Development Centres
1959 1960
4 5
2 3 50 60
SOURCE : Senior Divisional Manager, Life Insurance Corporation ofTndia, Patna.
TABLE ADM-XII-NUMBER OF MOTOR VEHICLES
Motor cycles Trucks Motor cabs Buses CaI'l! and Jeeps Others Total
2 3 4- 5 6 7 8
PALAMAU DISTRICT
8 217 22 98 345 16 i39 26 102 6 • 389 23 229 25 91 6 374 17 204 26 95 7 349 14 237 28 100 7 386 24 222 28 131 22 4-27 28 258 30 '132 12 4-60 29 300 34 167 25 555 45 390 36 151 13 635 37 314 39 144- II 545 45 370 5 44 166 13 643
BIHAR STATE
1,450 3,530 197 1,225 6;685 - 63 13,150 3,386 7,766 708 1,881 10,395 984 25,120
SOURCE: State Transport Commissioner, Biha;.

_ '" d ~ _ .5 15 ('
S
l
.. g
:~ i9 ..... .... o I:l ,a
§ Z
r~ · I
I~ <.:: c:t)
jC
II ~
'" co ... ...
Of" M CCI
WI
'0 o
.tI u
I:Il
U") o <0 _
_ eo.:
Of" ... ci
"" '" co
eN ... It)
M co ...
" c.: t S S o U "'0 c ~
" u 5
·u en
'" r::
1 ... b,)
" "0 u
C'f ,... o
133
... co M
• C<' .0;
·0 .c:c
._ ·0
0'1
,
+++++++

Educational I nsti tution
Primary Institutionll-'
MIDDLE SCHOOLS
Higher Institutions-
HIGH SCH00LS-
(i) For Boys
(ii) For Girls
134
TABLE EDN-II--LIST OF EDUCATIONAL INSTITUTIONS
Locations
2
Akalbani, Amboatoli, Amrora, Ararua Khurd, Arju, Arsali, Ascahar, Bahera, Balumath, Banahi, Bar Bansdih, Baranw, Bardauni Kalan, Bari, Bariat, Barwadih, Barwaia Kalan, Betar, Bhandar, Bhanoaria, C Chando, Chandwa, Chankari, Chatakaur, Chha'tarpllr, Chicharia, Chiru, Chithisraon, Dali, Damodar, Dan~ Dewgana, Dhanganw, Dhangartola, Dihri Bi~rampur, Dipaua, Gulabjhari, Gurha, Hariharpur, Harmi H ethpothra,jilanga,jour, Kanda Khas, Kanjia, Kauri, Kasiadih, Ketar, Ketar Kalan, Kharaundha,Kharam Khundra, Kisunp~r, Kochea, Korhas, Lalgara, Lami, Latu, Leslieganj, Lohaura, I,uti, Madheya, Mahul Majhganwan, Majhiaon Kalan, Mana,n Chotag, Manatu, Mandohar, Manika, Marangloiya, Ma,iatu, M Muhammadganj, Murpa, Murwa, Nagesar, l'i'amudag, Naudiha, Naugarha, Nawagarh, Nenua, Neara, C Oria Kalan, Pachadumar, Pachperwa, Pakariya,Panru, Panti, Pllraswar, Patagara Khurd, Patra, P, Pokhari Kalan, Polrlih, Putur, Rabda, Rajhara, Rajwadih, Ramkanda, Ratanpur elias Rampur, Raj Salatua, Saraidih, Sasang, Satganwan alias Hariharganj, Semri, Singraha Kalan, Siki Kalan, S Sonpura, TMge Kala~, Tarllasi, Tetibar, Tisibar Kalan, Turule Te10ya alias Purubdiha, Vdaipur.
Ralumath, Bisrampur, Chandawa, Chhatarpur, Daltonganj (Brahman Vidyalaya, Ganesh Lal, Giriwar, Sansl Hariharganj, Hussainabad, Hyderna~ar, japala, Kandi, Lesliganj Lobanda, Mahuadanr, Nagaruntri, P~ Patan, Ranka, Rehala, Tarahasi, Vntari. Nil
HIGHER SEC0NDARY SCHGOLS--'(i) For Boys Garhwa, Netarhat. (ii) For Girh Nil
MULTIPURPGSe HIGHER SECONDARY SCHOOL-
(i) For Boys (ii) For Girls
P0ST BASIC SCHOOL(i) For Boys (ii) For Girls
COLLAGE-(i) For Boys (ii) For Girls
UNIVERSITY
Daltonganj. Dal tonganj.
Nil Nil
Daltonganj Nil Nil
Professional InltitutioDs-
TEACHER'S TRAINING SCH00LS~
(i) For Bovs (ii) For Girls
COLLAGE-(i) For Boys (ii) For Girls _
Technical Institution_
Latehar, Rehala, Saltbarwa Daltonganj
Nil Nil
(i) For Boys (ii) For Girls
Daltonganj (Agriculture School, Nandlal Commercial Institute) Daltonganj
NOTE: Institutions have been named within brackets in all casell where the number is more than one.
S9UJ~C!: ! Director o. Public Instruction,Bih~

135
TABLE END-III-PRESS AND JOURt'fAI,S
Numbers of Books Published / ,-------..A.---
Persons Newspapers
,-- ..A_-_____ -:-.....
In English and In Hindi at and other European and other
Year work periodicals langua,~es Indian languages
2 3 5
1951-.52 3" 2 1952-53 • 3 1953-54 4- 3 3 1954-55 4- 2 1955·56 4- 2 1956-57 6 1957·58 7 3 1958-59 7 1 1959-60 8 2 1960-61 8 2
SOURCE : Political Department, ~ihar.
TABLE EDN-IV -LIST OF CINEMA HOUSES Plac(" Cinem ... Houst:'
2
DALTONGANJ Mohan Picture Palace
SGUIWE : Deputy Commissioner (Headquarters), Commercial Taxes, Bihar.
PUBLIC HEALTH TABLE PH-I-MEDJCAL FAC1LITJES
A. MEDICAL PRACTITIONERS B. HOSPITALS AND DISPENSARIES C. HEALTH INSTITUTIONS
Year
1951
1952
195:i
19504, 195.'>
1956 1957
1958 1959 1968
Degree holders
2
.. , 3
1 5 3
2 6 6
Diploroa holders
3
!
Name Number Family Plannin; Centre-
2 Sadar Hospital Dalton~anj
Maternity and Child Welfare Centrel-
HOSPITALS 4- Latehar District Garhwa
Su'bdi visional 2 T. B. Clinic/Ward-Daltonganj
Other~ 1 G:uhwa (1 <l-Bedded) DISPENSARliIs 23
State 17 j District Board 6
OTHER HOSPITALS AND DISPENSARIES PRIMARY HEALTH CENTRES IS BEDS 173
SOURCE Director of Health Services, ]'Iihar.

136
COMMUNICATIONS
TABLE CMN-I-MILEAGE OF EXTRA. MUNICIPAL ROADS MAINTAIN ED BY PUBLIC AUTHORITIES
Nature of Road/Maintained by
All roads
P. W. D. or M. E. S.
Bituminous
Natural soil motorab1e in fair weather
Mileage
2
343.25
343.25
201.25
142.00
NOTES: Figures under the following heads are either nil or not a"ailable :
(a) Bituminous (Local Bodies). (b) Concrete (P. W. D. & M. E. S. and Local Bodies) (c) Water Bound macadam (P. W. D. & M. E. S. and Local Bodies) (d) Artificially admixed granular materials. etc. on natural soil (P. W. D. & M. E. S. and Local Bodies), (e) Natural soil motorable in fair weather (Local Bodies) (j) Natural soil unmotorable (P. W. D. & M. E. S. and Local Ilodies).
M. E. S.-Military Engineering Service.
P. W. D.-Public Works Department.
SOURCE: Chief El'lgineer, Public Works Department, Bihar.

F-I-! 8
<: i
137
~ o ....
""
o -~ tl ·E " is
£ ... is
00 ...... ... ... 150
e o e ""
o ... ... is
< i

13M .... = a.~ ~.?;- .... Itnv ... >o,
.; tda~~cB t = a e·!~ II> 1l§gt.E-a C) 0011> >l ~
C) o~~·tlSo. II> '-'000 ... Q:l= "'''<:: tIS .. tE >:I 0 g~ Ei' !§=E~,,§' S tE=~~ .?;- t~"'.E "0 0
0" 0. .0 ""' ~ .... s...~uo~ to.. ~ .~, 0 o.,-,~o. P(j c£ IU.~S ~
.. ]t2 o'~~B 0 "O.EB Lf}E
'> ]cB o'i::'~ ~ ~ ;!:1~%. 0. B (Ij "'!j ~ .,j ..w +-'b CIS
~ ~t)~~ u_ :> ~ ...... ::s "0 ... > ... =~ AJ0-4 ~ ~o ~ 0 It) :> U a..> N ..... _ ro fI!
~ ~-·;::cB ro ., N ..... _I.!") C!l ~-'c'U 0 ~ (Ij • ~UP-f ~
o:l ,.0 gb • p.. II> 0 ~ g tIS.:l, "0 ... ... bO O' ... Lf}~ bOt,} ~o £ '" bO~ ... zj>:l 00 0
~ ~ .... "0"0 t:
is ,£ • 0
0 "'~1l.ELf} ~ "5 ""CI till ('Ij '.._a +-' 0. ~ ""0 0 ; d·· .... ""0'- "0 .... § .;< >- ~ .~ .'.:: o ~.... ro 'e.Q 1A .... ~d "O~ ,£ ro "0;::: • <> ... ;lQQ ~ 0 t.,. >. ~.-4 5 • ... d i:l .s. ~ 00 . ; ~ • (Ij- ~ • ,,$"0 • ro"O .e-] .!::.-::..t:1 "0 ~;j13 0 ~~..ct ~ C"'d U ~ ~ u
~;lB~ '" i:;';l b!)~Q)U~~ ~ ~='::: to ~~ ... .... "O~~· .. O"'" 0 a"O ~ ~.~ ro .; 0
t'j t)U)tj~C'l Lf} ~"C'I.w ~go ;"d ~ fn tl ~C'.l 0. 0 ro 0 tno>< ..... ..d
"5c~.EE~g ..<:: d "'2..<:: ....... ..g d ~ E ~ o§ ~ ..<:: = ~2" <:l,<!< :i C) 0 bO 0..~.E.E 0 :;, "0 0.. ..... fI} t,;:;.
~ (,,) 0 be ~.;:: ~N 0 0 t:l/) c.. ........ ..Q 0
~ z :@ z ~ Z 4 $
.~ ~
:::. .;::: ..... ..... to ,.; .: .. 0 .~ u~
" " I ..c; • !l " .se; ;; " " " "'5 ~ bOA = bOQ ro = c:: 'l < .b'n g ~ ·M;:l ~ ·13 .b'n g °bb
c:: ~ .... = . 00 ~og ~'S g 0 ~ol = i5 ~~ ~g ~ ... :::: ~~
bO ~ ...
~ro"; :> oS ~ 13 iSoa o..c; ... ... ro 0 ~ ... ;;::~ ti 13 > 'C~ • t: 0 u ... -... • .. os ..:j ... ... os ~ QJ,,",:,,) .- ro ...... r:: ... ~ ro qz ~P-. u~::: ~c; tiro :J .~~
is ~~b'o iS~ ·a~ ,
~ Q !l.. '-'
~ 0 ... '" J "
I:l ...
~ ~ .;::
00 00 00 00 ~ 00 00 00 " (0 ~. ~. ~. >4' 00 00 t:I s 00'
:c: < ::l :::
8 '" 8 e s El '8 '8 0
E! 13 S a -- .~ ~ 0 0 0 0 0 0 0
0 0 0 8 0 8 0 e 0 0 0 "0 0 0 .. ., 0 ., ., 0 :) 0 ... ... ... ...
13 ... ... s s ... "0 "0 "0 ... S Lf} "0 "0 "0 "T.l 0 "0 II> 0 "0 "0 0 0 1l ., .,
13 " " " II> ,.0 ,.0 ,.0 0 II> " 0 0 ... ,.0 ,.0 ,.0 ,.0 ,.0 .... ,.0 ,.0 ... ... ,.0 J 0
eN eN eN eN eN eN eN eN U eN "" eN eN ~ C)
< i:l 5 l; OJ
f.l >- r:; 'E E "0 E "0 i!'; ..c "0 II> os .. ~ ... .. ... E! '" ro tIS "0 ro 0 0. 0 0.. 0 ...
!Xl ~ II> 0 g ~ g <U g " g P=l 'c 'd '<!< !Xl g "0 g g Cl .. Cl ~ . 0; g- o C) 0 i5 .~ ::J a .... q is 'E 0 is = ·c § u
0 ... Of a ti .~ ~ .... .~
~ ~ .~ :..c '" '" Q
Q ·a " .~ bO I'J ... .;:: II> .... "'"
.... ... ,~ .. .... ...... -4 I ~-g S "0 "0 " u
I I I ... a .... ... • ; ('j c.§ ro ro ·s .... o !:l 0 ~ II> -g e 1 I 0 -I ~dll> ~ .~.,.~ '~!:l
.! I 0"
~:-;: ~~~] be:-:=! 0 c:::::: So os oS tIS
~ z; ir~ § c<'I ~a ~ § SIrs g 13 ~ a eel ~ li.!:l 1., ~ ... " "'-~ .......... ..c;'<!< ..c:: "00 ro.~ ..c;
~·8 ;]t: i5 =·8 (l;!r:n.~ ~I ... ;='CO":::N,!:;_ -a 0; l..c .. ro ro eN ol '<!< ol eN ::r: °bO oS
C!l 8 ;;J ;; Z "0 C!l C!l o Cl Q ro ~ C!) C!l ......,
~ ~ ;s: ~ ;,: ~ 0 ;,: 0
~ 0 0 "a ..;j 0 Cil 'l\i 0; bO
~ 'ia bO II> bO
"0 bO "0 b/)
"0 = bO § !!l = OJ = " § ~
II> .8 ;:l = g ~ ;:l ..c:: ;:l ..<:: ..c; P=l ;:l p:) S 0 P=l 00 P=! 00 P=l 00 .':! III ::r: = 0 0 = CN = is is Cl .§ ~
d
~ .... .9 ... o~ ... . g o£ .. rl " t> 0 ti U p:: p:: ti p:: u p:: u ., II> " " " 0. 0. 0. 0. ~ 0.. ... >- '" '" .,
E Eo< :::. = = ::: ...... .... .... .....
I:r ~
I 0
t. ~ 0; ;: ';
=1 ..<:: .~ oS! I u ro ..
I·~ ..c;1I> ..c = .. bO .~ I "iC: "bO u
Cil~ = .. ol '" < gb "0 :aca d ..c,..., :::ro
<8. ca~ ro " '-' oS ..c;'" <::: "tl ro 8 s::; oS 0;:; u d ]> ::.::: =;:l :a ro = .c..c; >-<'l = ;:l ~ ~ ..c .... 8 Jl g.Oj <~ oS<~ ro ol ~ 0i! <~ o...c S "0 os ol "0 ro
os < ~ ro..c; .8 0:!1 ~.~ 2E!§ = ... ..<:: ;s: ... .... "3 ·c W ...
~ ~ 0 = > ~ ~~
ro .~ ~ ~ l!:'" ;l ..coS is ..<:: < .sz :; lip=! ::.::: 00
;l""'" ..c::1.'l< :;C!l ~ = ..c '" .. " .~ ~ ::r: ~~ 0 ;;J ;:l P=l 00

00 ,
B ·S .,
, .~ !:J '" ~
... '" 0.
00
s o 8
1l ..0
N
.... " ·S ., is
139
<: i
.J~~ o 8Z
1-<0
00
c: .g " '" j
, 8 o 8
13 ..0
""
e o o ...
"0
'" ..0
""

Js '"t:I o 8 d 8·g 0 .... u u <:
.... o ., ~
.:0
s o o .. 1l .0
""
s o [; '"t:I ., .0 N
, o ~ .~
8 8 .. 1l .0
""
8 o e 1l .0
""
... ., :.::
o ... .... .~
8 o o .. '"t:I
" .0 N
.... u "5 .~ o
8 o o ... 1l .0 ~
140
8 o ·0 <: ..
i1l .0 N
I~ rJJ
i:: '" 8 e '" > o
e"
o .... .... is
8 o o .. '"t:I ILl
.0 N
...
~ ... '" "l
o ~
is
~ o .. '"t:I
OJ .0
N
... '" .~ '" ~,
E o o ... ~ ~

141
'(FIGURES
N01E:-
CMN III
DAL TONGANj /_ POLYMETRIC TABLE OF CHAINPUA.l~
DISTANCES LESLIEGANJ J. 3 '0
(IN MILES)
PANKI Z 8 3: 'WITHIN BRACKETS INDICATE RA1L DISTANCES) 18
CHHATARPUR 17 13 1. 92S
I -
HARIHARGANJ ! 4 5 1 THE DISTANCE BETWEEN ANY TWO PLACES IS
INDICATED AT THE INTERSECTION OF THE VERTICAL 374 239
AND HORIZONTAL LINES CONNEplNG .THEM.
PATAN ~6 I 1 2S I t I 16 13
OAL TONGANJ
CHAIN PUR
lESLIEGANj
FANKI
CHHATARPUR
HARIHARGANJ
PATAN
BISHRAI1PUA ! 4 ) 9 24 Iv 10 2 3 210
M .. N:1U ! 0 116 36 30 1. ~ 7 30 17
t\uSSAINAS .. D ! 6 11 30 l I I 7 S s 410 " !S 0
MHAL!
-o S 1 I a i S 5 6 ~ 1 5 13 3 S 27 1S
GARHWA l!J- 3 J 45 I I l 5 q 9 3 5 ~ 1'6 2 a 20 18
UNTARI / I I ~ 4 J 6 6 J 2 52 70 ?~67 ~ 9 4 I 3 9
61SHRAMPUR
MANATU
HUSSAINASAO
HEM\,
GARHWA
UNTARI
OHURKI f, l2 2 5 64 7 7 413 63 e I 6 7 7 B 6 0 5 2 5 5 DHURKI
RANKA /..:. 14 I 1 20 416 4 B 2. 31 62 4 6 49 1 I I 8 21
BHANDARIA / e 61 S 1 1 I 3 a 7 I 56 42 42 6 S 5" 5 7 3 9 26 29
RANKA
BHANDARIA
MAIHI;ON Is 4 36 3 9 1 8 2 1 3 I) 20 6 I 1 4 4 9 S I 37 62 443 7 J 4
SHAWANATHPUR ~ 8 62 44 2 I I o 1 I 21 33 7 9 4 2 6 1 64 SO 7 7 6 2 S 1 <19
MAjHIAON
BHAWANATHPUP.
t1AHUADA
BAR
BAlUMA TH ~ 9 89 8 ... 7 6 lOS 9 47) 80 82 5 I 7 S. 5 2 7 8 64 7 .... 5 5 8 55
! \ 6 53
CHi'lNDWA 12 lOS 87 96 74 103 92 7 I 78 94 6 3 73 5 6 90 7 6 39 " 5 5
LATEHAR ~ 6 i 8 89 7 I 8 2 5 8 85 74 55 62 7 o 46 57 "0 66 5 2 " 7 2 9 o 37
MANIKA /,
(6 Q)
3 29 '" 7 6 5 8 5 345 72' 6 I "2 " 9 6 7 3 3 ~" 2 7 5 1 3 9 3 " 16 27 24
WAOIH 10 " J 60 727 2 5 " 4 S 1 7 7 o 59 39 '4 5 6 lO 40 3 3 5 9 4 5 4 8 30 I 9 20
! (4 I)
(27)
NR _)5 47 4 4 60 72 107' 8 9 3 8 S ~ 105 9", 6 9 716 9 a 82 71 68 94 80 B 2 64 54 5 5
~4 24 313 2
,
10 36 48 8 64 6 2 "
a 80 69 "3 5 5 '7 3 )7 50 4) 69 ~ 5 5 a 40 13 30 GARU
BALUMATH
CHANDWA
lATEHAR
MANIKA
BARWADIH
MAHUADANR
GAP-U
EXPLANATORY NOTE
Tht! Village Directory is primarily an Anchalwise list of villages arranged in alphabetical order. While serving this purpos'O:, it also gives certain information about ~ross crop;.>ed and irrigated areas (cols. 5 and 6), irrigation facilities (cols. 7-11), drinking water-supply (cols.12-14) and availability of transport (cols. 15 and 16) for each village. The 1951 Census population of each village has also been shown in col. 4 for comparative purposes. All such information should: have been actually gone into the Village Statistics portion (see part II), but this could not be done for want of space. However, the Village Directory read with the Village Statistics should give detailed information for each and' every village. Cols. 2 and 3 of the Village Directory give the cross reference to the Village Statistics.
The data relating to irrigation facilities, drinking water-supply and transport have been compiled' from the Village Note prepared for every village at the time of the Houselisting (September-October, 1960) for the 1961 Census. The gross cropped and irrigated areas noted in cols. 5 and 6 respectively have be.en obtained from the District Statistical Officer, Palamau.
\
The term 'mauza' (col. i) has the same meaning as a 'Revenue village' (see page 2 of Part II).
The different abbreviations used in this Table are explained below
Cols. 7 to 14 :
B-Bandh (including Ahar, Pyne and Nala)
C-Canal
K-Kacha well 'Ors-Others, such as river, Tube-well, etc.
P-Pukka well
Riv-River T-Tank (including Garha)
Tw-Tube-well W-Well
Cols. 15 and 16 : B-Bullock-cart C-Cycle
Figures under cols. 7, 9, 10, 12, 13,15 and 16 indicate numbers, while figures under col. 8 give the distances in miles. The figures precedirrg the ab?reviations in cols. 11 and 14 denote the number relatIllg to them. N.A. means not available and U denotes uninhabited.

14ii PALAMAU BIHAR
VILLAGE DIRECTORY
SUBDIVISION SADAR
ANCHAL DAL TONGAN]
Reference to Village
Irrigation facilities Drinking
Statistic:; Population Area in acres water-supply Transpcrt Mauza 1951 ,...-----'--- . ._ r-----...__-----.. r---.",.._-----. ,...._.,A.. _ _.._
Page Serial no. no. Cropped Irrigated B C T W' Ors. P K Ors. B a 2 3 4 5 6 7 8 9 10 11 12 13 14 15 16
Aru 4 35 213 133.17 128.48' 2 2 3 2 3 Riv 3 3 Babunebhi 6 47 U 73.75 5.75 5' Bairia 4 16 341 227.71 0.10 4 9 4 Bairia 6 48 U 132.30 2.27 2 Bajraha 4 12 U 61.77 3.85 I Riv
Bakhari 4 I 194 298.56 0.80 1 3 Riv Bakoia 4 42 80 64.36 7.43 4 3 Banua alias Sal a 4 41 130 126.62 10.05 7 I 5 Baralota 4 17 1,601 532·39 247.70 12 13 12 14 Riv 50 Bari 6 58 1,190 1,151.60 305.65 9 3, 35 5 2 7 Barkinebhi 4 26 256 155.63 44.71 4 2 4 1 Bhogu 6 55 245 311.55 129.27 1 5 3 6 2 4 Chak Barewa 6 46 244 22.42 4.40 2 5 5 4 Chama 6 52 122 103.76 9.02 5 2 I 2 Chatti 4 33 296 93.42 21.41 3 - 2 5 Riv 3 3
Chatti Satbarwa 6 74 2,129 261.51 0.42 2 I 50 14 Riv 13 36 Chianki 4 8 1540 275.43 108.26 8 24 15 35 5 36 Chukru 4 2 190 311.48 41.65 9 1 6 Dhangardih alias Khanwan 4 19 553 .360.56 151.41 7 9 6 3 2 Duba 6 54 U 122.72 46.30 2 1 5
Dulsulma 6 76 660 572.07 75.72 10 4 5 Riv' 3 Dulsulmi 6 75 U 86.31 14.23 3 Riv Ganke 4 9 34 111.21 25.95 2 7 }.. Gaura 6 70 90 124.41 44.26 3 Gorho 4 6 U 84·91
Gurha 6 66 15 79.35 22.07 1 Halumanr 6 65 335 269.39 61.89 3 1 11 1 Hisra alias Pokhraha 4 ~O 313 285.Q5 31.67 4 7 9 3 Hurmur 6 72 224 137.56 52.70 6 3 4 1 Hutar 4 27 8 61.58 22.12 I .. o • 1
Jamune 4 22 971 500.67 41.37 12 11 Riv 3 10' jhabar 4 31 780 627.42 81.33 12 1 J 16 Riv 2 7 Jonr 4 18 750 350.79 156.12 9 3 11 20 Riv 15 7 Jora Hunhe alias Jora 6 73 180 84.31 14.23 3 Riv 3 4 Riv 1 Jorkat 4 5 147 242.56 56.99 2 3 2
Karma 6 53 140 192.15 2.71 6 2 3 4 1 Ka;ia 4 37 95 70.82 40.19 3 4 1 T,Riv 3 3 Kathautia 6 78 58 125.05 0.48 1 I Riv Kauria 4 3 1,016 806.32 7.76 28 10 25 Riv 4 Kewatbar 4 .25 UO 172.70 54,15 7 9
Khamdih 6 56 553 250.81 19.79 2 2 8 40 Riv 10 4 Kishunpur 4 38 194 55.59 10.09 1 I 3 Kumar alias Barkagaon 4 20 903 581.53 58'22 3 7 8 Riv 3 24 Kundel",a 4 30 680 489.23 53.83 1 2 2 18 Riv 1 Kusi 6 49 122 61.42 7.33 3 1
Lahiahe 4 39 451 195.06 38.94 5 2 7 8 Riv 4 5 Ledwakhar 6 64 47 53.63 2 Riv Madhunebhi 4 36 54 NA NA 2 1 2 2 2 Mana 50ti 6 63 273 183.79 55.98 8 2 5 Mukta 6 67 130 127.20 42.20 2 G 2

144: PALAMAU BIHAR
VILLAGE DIRECTORY
SUBDIVISION SADAR
ANCHAL DALTONGAN]
Reference to Village Drinking Statistics Population Area in acres Irrigation facilities water-supply Transport ___ ......._....., 1951 ,----,.,._-----. .-----~_,.___-----. r----.,..,.---. ,..-_.A-__
Mauza Page Serial no. no. Cropped Irrigated B C T W Ors. P K Ors. B C
2 3 4 5 6 7 8 9 10 11 12 13 14 15 16
Munna 6 77 127 119.17 42.32 3 1 4 Riv Nauadbonrha 4 29 151 98.60 23.16 2 3 5 1 Nawadih 6 59 237 112.22 15.13 3 6 3 6
. 7
Nawadih ~ 6 45 ::'9 66.42 9.60 1 1 2
Nawatoli 4 32' 15 151.09 26.16 ..
Nimia 4 11 141 132.60 2 !:I. 06 2 23 10 14 2 Pirhia 4 28 95 NA NA 5 5 pokhraha Kalan 4 23 615 420.18 141. 45 7 I 2 5 Riv 2 1 pokhraha Khurd t 24 1,171 622.82 18t:l.09 13 3 5 20 Rill' 8 10 Polpo Kalan 51 897 312.25 46.49 8 1 18 22 11 6
Pol pol Khurd 6 50 29 NA NA 3 3
Ponchi 6 71 540 356.87 62.35 4 10 10 12 Purnadih 6 61 U 135.99 2.93 3 . 1 Rajderwa 6 62 236 153.34 18.79 2 10 Riv 5 7
Raj,vadih 4 21 834 675.63 105.64 7 15 20' T 6 34
Rerma 4 7 1,913 476.90 104.26 4 58 18 6 44
Rupaundha 6 60 U 146.85 44'.65 Sarja 4 44 596 248.23 32.89 10 8 33 6 1 Sembhuchak 6 57 28.5 27.74 16.09 ,7 10 4 5
Shahganj 6 68 U 35.92 Riv
Sinduria 4 34 217 23.;;8 15.62 2 2 7 Riv 10 4 Singraha Kalan 4- 14 345 239.15 31.65 3 4 7 4 R1V 14 18
Singraha Khurd 4 13 94·6 319.80 33.20 4 107 23 101 2 32
Sonpurwa 4- 43 144 82.49 13.17 5 2 4 5 3 5
Sua 4 4 2,053 977.89 258.51 21 29 25 67 Riv 6
Sucina 4 10 1,231 266.31 67.38 8 46 35 12 11 30
Tabar 6 69 246 93.24 35.93 4 2 20 Riv 3 4 Tikuliya 4- 15 U 251.12 63.94 1 2
ANCHAL TOTAL 31,910 18.355.50 3,189.71 338 11 304 489 727 180 457

145 PALAMAU BIHAR.
VILLAGE DIREOTORY
SUBDIVISION SADAR
ANCHAL .CHAIN PU R.
Reference' to Village Statistics Population Area in acres Irrigation facilities
Drinking water-supply Transport
Mauza Page Serial
1951 r-----""--------, r------_,.,_--------- .-----.",...--'--~ ,--"""'-~
no. no. Cropped Irrigated B C T W Ors. P K Ors. B C
2 3 4- 5 6 7 8 9 10 11 12 13 14- 15 16
Adar 14- 153 104- 61.74-Ajlatua 14- 146 22 26.18 16.69 2 1
T,'Riv Ajodhaya Kolhua .8 38 186 169.38 39.79 2 2 5 Alagdiha 14 136 141 117.84 18.22 3 1 4- Riv Aragara 12 Ill· 85 * 58.11 Riv
Ausane 14 139 U 425.72 171.09 :3 . 4- 8 Riv 1 Babhandih 8 40 579 436.17 11841- 9 16 4- 2T 2 8 Babhandih 12 88 545 314.92 17.02 2 2 2 Riv Baghi 12 96 396 302.47 11.61 5 2 6 Bahera 12 86 216 488.82 26.63 5 3 2 1 Riv.
B;;thera Khurd 10 74 406 250.55 32.36 4- 2 Baigadih 14 138 U 287.98 78.03 .. Bairiya 12 117 612 62.34 -Banalat 12 105 . 140 197.83 2~.45 3 ~ 1 1 Riv Banjari 8 39 91 318.43 151.21 7 5 3
Bankhcta 8 23 154 131.40 41.84 3 3 1 ., Bansdih 10 51 402 408.43 102.17 9 4- a 4 Bansdih Khurd 12 116 375 249.69 5 4 Riv Banus 10 53 808 374.27 lSI. 75 I 8 10 3 Baranw 10 61 1,397 788'68 122.52 27 40 2 54 I
Barhariian 12 122 U 4.18 Bariman 1.4 145 34 7.77 Barkat jO 75 66 127.30 2.07 1 I Basaria Kalan 14 126 24R 457.96 47.66 6 3 14 Riv Basariya Khurd 14 134 '320 226.34 56.55 4 5 Riv
Benidih i2 '89 110 110.75 0.58 1 2 Riv Herrna 12 90 232 32599 11.53 1 2 2 T,'Riv Bhnirwa 8 24 129 369.47 80.12 20 1 3 1 T,Riv Bhaonadin 8 34 U 1I2.07 51.08 .• Not available Bharganwan 16 178 703 128.92 26.44 2 2 Riv .•
Bhat Ko1hua 8 27 U 134.63 79.76 B;wabdthan 14 154 61 22.38 1 Bokeya Kalan 8 4 165 90.22 4 2 Bok<"ya Khurd 8 5 58 169.16 3 Riv Bori '12 81 668 579.04- 41.78 8 2 16 Riv
Burhibir '10 68 8til 628.35 294.08 10 12 4- Riv 2 3 Chainpur 16 177 2,394 87.74 _ 33.13 1 3 4 1 Riv 7 77 Chak Harbhonga 10 44 95 169.96 4.21 4 4 5 Chakwa 8 14 U 365.27 10.28 10 .. Chando 14 137 1,395 2,015.25 18.08 19 11 25 Riv
Chando alias Mayapur 12 107 513 266.57 92.53 6 10 Riv Charka 16 166 U NA NA Chauparia 12 87 300 240.95 5.43 3 2 3 Riv Chenrabar 8 37 347 4-76.23 8.36 Riv 1 3 Riv ." Chhatwa 10 78 U 45.73 0.60
Chhitra alias Sonar Khap " 12 109 409 176.15 24.:12 Riv Cllltabar alias Dinabai 12 99 143 102.40 2.29 .. 2 3 Ch"rhat 12 104 444 124.79 24.48 5 2 5 Riv 1 Chothas4 10 63 276 370.03 28.38 7 1 4 5 Riv 2 Chunga B:.nsdib 12 115 U 219.62 3 2
P-I-19

146 PALAMAU BIHAR
VILLAGE nffiECTORY
SUBDIVISION SADAR
ANCHAL CHAINPUR
Reference to Village
Area in acres Drinking
Statistics Population Irrigation facili ties water-supply Transport Mauza ,.--""'___' 1951 ~----'-"""'----- ,..-----."._-----...... ,...---.,...--- ,..--~--.
Page Serial Cropped Irrigated a no. no. B C T W Ora. P K ors. B
2 3 4 5 6 7 8 9 10 II t2 13 14: 15 16
Datam 14 152 155 77.35 0.25 2 Dhawa J2 91 51 171.43 2.38 2 Riv Dhelua 12 95 142 72.57 2.30 2 Dhurhubar 10 59 U 69.95 11.38 2 Doki 10 77 U 102.65 3.80
Doha 14 135 279 233.3;; 31.45 .. 3 4 Riv Duba 14 140 325 327.51 ?2.30 3 22 Riv Dulhi 8 '6 172 94.27 4 4-Dulsulma 14- 132 157 122.58 9.7.2 3 5 Dumri 16 180 184 211.87 39.87 6 4 7 Riv 4-
/
Gangdhara 10 70 U 81.80 Gangi 8 7 202 125.75 2 Riv Garda 16 172 451 215.13 80.85 9 11 Riv 2 Gardu 16 171 U 41.44 5.15 .. Golpa 10 66 U 77.58 41'90 .. Gore 14 156 186 77.62 .2.00 2 2 Riv Gurha 16 173 134 204.18 106.68 3 3 Riv 3 Haminpur 14 150 U 9.57 0.10 1 Hansa 16 176 300 133.52 70.6B 3 2 Hansgara 14 144- U 43.46 17.16 4 1 , .. Harbhonga 16 ~74 239 149.08 91.13 1 1 3 Harnamar 10 62 713 .588.40 98.76 19 1 10 22 Riv 24-Hisra 14 155 159 171.89 5.20 1 2 3 Riv Horanda alias Ramgarh 12 94 477 242.35 20.44 7 6 4 T.Riv Hukwa , 14 147 100 58.83 37.19 2 1
Hutar 12 108 578 759.89 30.56 2 2 2 Riv 2 Itko 10 67 U 101.77 46.07 .. Jagarnalhpur B 35 U 106.67 27.77 ..
"3 Jainagra 10 65 244- 78.92 25.87 7 Riv Jhalar 14 159 U NA NA
Jharha 14 149 U 70.38 12.32 2 Jhariwa 10 54 331 "239.23 85.23 4 3 12. 3 Kachan 12 98 558 405.31 21.12 I 7 Kakatua 8 10 73 160.78
13.25 3 4
Kaleyanpur 14- 141 260 41.64 2
Kankari 14 143 1,181 269.56 102.26 10 8 8 Riv 2 Kara Kath 10 46 291 2.71.26 102.40 12 6 2 Karamdih 8 26 107 564.37 115.11 4 I Karma 14 160 ISO 161.41 8.50 I 2 Riv Karso 12 79 714 643.75 61.73 4 6 24 Riv 7
'Katuwal Kalan 8 12 459 333.84 88.90 6 3 6 Katuwal Khurd 8 13 74 207.32 58.70 4 I Khambhi 14 165 99 76.34 10.23 I 2 T Khapia 12 121 163 230.41 Khauraha I4 129 241 29.90
Khiribar 8 31 95 317.65 21.03 3 3 2 Khohri .. 16 167 53 57-30 26.94 3 I 1 Khura 14 127 U 203.28 15.97 1 5 .. 5 Khura Kalan 10 73 694 509.68 102.71 9 5 12 I Khura Khurd 14 164 178 I I I.IO 42.70 .. 2 Riv

147 PALAMAU BIHAR,
VILLAGE DIRECTORY
SUBDIvISION -SADAR
ANCHAL CHAINPUR
Reference to Village
Irrigation facilities Drinking
Sitatistica Population Area in acres water.supply Transport Mauza ,.----A--- 1951 ,...._~-"---~ r- -- .....-~-----. ,--""_~
Page Sorial ho. !lo. Cropped Irrigated B C T W OrB. p K Ors. B C
2 3 4 5 6 7 8 9 10 II 12 13 14 15 16
Khutar Kalan 10 48 124 181.60 66.74 3 2 3 }(hutar Khurd 10 49 158 106.38 49.04 6 2 2 Kilhar 12 82 76 291.30 14.15 5 4 2 Kini 10 50 175 571.80 103.71 5 2 3 1 Kokaru 12 114 869 185.10 I oS I
Kolhua 'Khurd 8 28 48 189.40 27.72 2 3 2 Kosiara 8 2 423 NA NA 4 3 3 Kudaga Kalan 16 169 264 293.53 90.98 5 .. 2 2 Riv 3 Kurlaga Khurd 16 168 +45 297.92 136.45 4 1 3 1 Kui 14 128 77 141.87 13.45 2 1 1 Riv
Kumni 12 83 185 395.25 66.40 14 4 4- T 2 • 5 Kunrlpani 12 100 15 88.57 Ul3 2 1 2 Riv 1 - , 1 Kurka 14 148 245 198.55 5.5.66 8 4 J Kurkulta 14 131 88 153.23 30.50 1 3 Riv Kutti 14 161 130 37.27 4.1l7 1 Riv
Ladi 16 181 469 261.75 59.79 7 10 13 2 Lali '10, 76 128 172.78 3.24 J 1 5 Riv Lidki 8 9 351 182.15 7 ~. ~. 2 Ldki 8 16 302 739.60 100:70, 2
Loharsimi 14 163 47 105.49 47.41 2 2
Lokeya 8 42 393 298.28 84.76 4 5 2 2 Mabawat Muria 12 118 9 20.94 Mahawat Mmia Sani .12 119 14- 10.85
ii Mahugawan JO 47 727 440.86 100.74 8 1 14- 5 13 , Mahuliya 8 30 41 235.61 194.20 2 1
Maira 8 19 128 259.20 27.93 2 ~ajpg~wan 8 '18 720 202:09 54.64 5 Manke 12 113 40 26.95 Mantuwa 8 29 U 211.30 42.52 3 Margara 12 120 82- 28.93
Matauli 12 80 131 426.35 21.88 3 _1 5 Rlv Mathura Doh;r 8 22 U 53,32 20.50 2 Muru 12 224 150 352.42 2.03 2 4 Musurmu 12 101 226 155.66 58'95 1 1 5 Nagwa 8 43 438 266.06 123.11 6 5
N&udihf> 8 21 U 188.e2 37.02 Nawa 14- 151 130 88.93 1 Nawadih 12 93 644- 361.80 11.41 1 8 Riv 5 Nawadih 12 106 04,01 381.4-0 61.36. 2 1 -4- Riv 1 Nenua 10 71 303 339.59 62.76 4 1 4 8 T,Riv 1 1
Neura 16 170 1,230 366'1-1 135.20 7 2 11- 6 .. 10 5 Nimian 16 175 214 254.59 52.39 2 1 T 3 Pachlewa 12 81- 188 339.71 11.88 1 '" 1 3 Riv Paneri Bandb .• 10 55 354 185.19 39.52 5 1- 6 3 parsakhar alj'a3 !larwakhar 12 125 139 147.64- 0.18 2-
Parsiya 8 32 U 219.33 3.20 2 7 12 5 Patarhia Kalan 8 11 480 1,101.92 1- 3 3 Patarhia Khurd 8 8 231 199.07 1.09 2 2 Pataria • ,. 8 25 193 275.83 48.64 5 I 3 Pathra aliaJ Nanmhapur ." 8 20 1,503 263.35 81.25 11 3 13 5 3 9

148 PALAMAU BIHAR
VILLAGE- DIRBCTORY
SUBDIVISION SADAR
ANCHAL CHAINPUR
Reference to Village
Area in acres Drinking
Statistics Population Irrigation facilities water-supply Transport Mauza ,--"'-"'_-""I 1951 r--- -.. ,.---""---- ,.....-----..
Page Serial Cropped I.rrigated B C no. no. T W Ors. P K 01"1. B C
2 3 4- 5 6 7 8 9 10 11 12 13 14- 15 16
Pinrhe 12 123 519 214.66 3 Pinrra 14 142 209 3828 24-..l3 5 3 Purna Majbgawan 8 15 212 206.74 57.04 4 4-Rabda 10 69 670 1,342.15 46.13 4- 3 16 R1V I Rajhara 14 133 66 125.68 17.86 2 .. 5
Rampur 8 1 513 151.46 7 3 8 2 Riv 4 Ranital 16 182 U 127.43 6.·78 I Rp,nki 16 179 4 138.36 37.20 4-Salalua 12 85 1,134 785.96 99.27 10 14 4 Riv Saram 10 72·' U 78.65 19.67 "
Sarhauwa 12 92 192 .97.22 2.31 5 Riv 2 Sarja 12 97 198 125.99 5.29 6 7 Semaria 14 157 112 55.4'4 10.25 4 2 I 1 Semra 14 162 790 677.20 209.82 8 1 13 4- 14- 8 Serka 12 i03 190 213.49 29.05 6 2 4
Shahpur 10 56 1,907 409.55 126.20 4- 21 1 Riv 5 30 Sheopur 10 4-5 U 227.40 31.41 6 3 Sokra 14- 130 387 285.53 62.57 3 3 10 Sonpurwa 8 41 269 118.32 47.40 2 .. 2 2 T 2 Sukri 10 52 81 375.04 53.94 3 1 2
Talapara 10 60 178 233.65 39:39 5 3 3 Talavara Jhaibar 10 58 U 26.28 14.92 2 2 Taleya Khas ·8 36 593 697.68 257.74 5 1 10 4- I 7 Tali 8 17 162 87.98 I I 5 7 1 4-Temrain 14 158 35 322.09 106.78 6 1 1 Riv I
Tenia 8 3 75 80.36 10.4(}- 2 1 Turuk Taleya alias Purubdiha 8 33 1,342 254.41 36.12 2 7 12 5 Uldanda 12 102 215 254.41 57.44 2 1 7 Riv Ulman 10 57 15 78.92 25.87 2 1 1 Ulman 12 IlO 417 279.49 51.95 2 1 3 Riv
Uter 12 112 85 141.06 6.50 1 Riv Wornar 10 64 954 758.95 109,21' 12 3 22 5
ANCHAL TOTAL 52,851 44,588.38 7,540.96 590 47 63 453 612 133 281

149 BIHAR PALAMAU
VILLAGE. DIRECTORY I
SUBDIVISION SADAR
ANCHAL SAUR LESLIEGANJ
Reference to Village
Drinkin,
Statistics Population Area in acre! Irrigation facilities water.supply Tramport
Mauza r""' . , 1951
r--_:___"'_--~ ,-____ -J--...-----Jo,.--__
r--""""__-'"
Page Serial no. no. Cropped Irrigated B C T W Or •. P K Orl. B C
2 3 ~ 5 6 1 8 9 10 11 12 IS 14 15 16
Akhautl Dumi 18 45 28 147.41 42.82 1
Akhauri Patra 18 49 IH 14513 69.B4 .. 'Z 3 4
Akhaurididri 20 89 273 100.74 65.17 5 3
Alan,pur 20 ;7 U 53,56 5Al Not available
Alaula 22 121 15 103.94 39.4·8 7
Amwa 20 74 32 157.9B 35.85 3 2 2 Riv
Amwa Khurd 2? 114 178 328.62 +1.D3 1 1 3 Riv
Asalpahari 22 120 U 43.24 +3.13 7
Babhandih 22 117 142 62.22 27.42 2 1
Babu Dumi 18 46 234 222.91 61.78 3.00 3 1
BaiTia 20 75 100 63.50 33.22 2 Riv 2
Baka~khap 20 72 31 100:26 49.08
Baksidabra 20 73 22 142.06 17.42 1 1 Kiv
Bansdih 22 128 365 131.47 71.98 4 1 - 4 10
Bansdohar 22 126 160 113.03 67.13 4 2 3 T 2
Banua 20 81 300 312.42 64.05 4 3
Barganw alias Tetariadih ., 22 116 164 148.01 54.53 4 7
Bariatu 22 136 15 212.67 65.83 5 1 1 1
Basaura 20 n 325 213.15 124.34 4 4 2 2 3 7
Baura Khar 22 113 83 80.39 8.22 4 7 4 Riv I 3
Bhakasi 18 29 685 NA NA :f 2 5 20 2
Bha\roanda 18 26 344 234.23 52.80 3 3 4 5 3 1
Bohita 18 24 665 642.33 3:i.63 5 2 3 12 Riv 1
Cha!< 18 37 166 146.4R 62.'52 5 3 1 15 3
Chak Maribhang 18 32 26 59.34 19.65 ., I I
Chak Nawadih 20 76 U 54.28 32.46 1 .. Chandaigir 24 142 245 2,)5.90 87.77 5 2 20 1
Chanpi 18 11 346 NA NA 9 5 3 1
Chaparna 18 12 217 157.87 11.61 2 3 Riv
Chaukhara 22 118 392 264.64 129.38 9 10 1 8
Chaura 22 129 W9 360.41 JlB.10 10 1 9
Cheri 22 130 114 255.06 50.05 7 1 3 I Riv
Dabra 22 131 504 868.45 119,84 23 8 9 9 Riv 4
Darua 18 5 117 NA NA 3 I Riv
Darudih 20 84- 815 791.63 229.36 8 21 6 Riv 12 3 '
Dhabadih 18 15 834 542.62 122.27 8 6 25
Dhanganw 18 36 224 150.52 51.46 3 3 2 10 3
Dhela 20 51 366 9O[).OO 75.49 .. 7 3 Riv 3 2
Dhobdiha 18 42 53 150.36 45.85 2 2
Dodang 18 1 47 NA NA .. I I I
Dugila 24 13B 259 107.01) 33.34 2 2 4Tw 2
Ekta 18 3 280 NA NA 1- 2
Erua 22 132 142 NA. NA 4 3 q
Gentha 24 139 385 341.99 14289 10 1 3 9 20 4: 4
Ghutua 18 8 425 188.90 22.51 3 3 Riv
Gopalganj 20 55 490 150.75 52.80 2 10 2 Riv Z 4
Goradi J agatpurwa 20 l:l2 85 81.44 3{\40 6 Riv 3
Goradi Khas 20 90 435 350.84 108.61 IO 3 7 I Riv
Goradih Koth.ilwa 22 97 19 36.18 15.20 1 ~
Goradlh Piprahat 20 96 124 55.21 30.29 3 4

150 PALAMAU BIHAR
VILLAGE DIRECTORY
SUBDIVISION SADAR
ANCHAL LESLlEGAN]
Reference to Village Drinking StatisticlI Population Area in acres Irrigation facilities water-aupply Tran:
Mauza r .. I 1951 r-----A.--.......... - ''''\ r------"""-----....,. ...., ~-'
Page Serial no. no. Cropped Irrigated B C T W Drs. P K Drs. B
2 3 4 5 6 7 8 9 10 11 12 13 14 15
Goradih Tali 20 91 63 92.40 26.27 4- 6 3 8 Riv Gurua 22 107 8Z 175.71 63.97 1 2 2 Riv Haratua 20 80 474- 38559 65.59 3 2 3 T Harsangra 24 140 136 115.20 94.42 4 6 13 Itahe 20 67 557 327.72 68.10 2 25 Riv
Jainagra 22 122 44 135.14 53.18 1 .J ai tukhanr 20 65 305 399.79 56.1') 2 4 Riv Jamudih 22 110 604 215.55 65.89 3 10 17 2 Jhagarpur 20 58 282 127.11 64.54 1 1 !l ! 3 Jharha 22 115 28 92.51 27.3'3 5 'J 3 I Riv I
Jharkatia 20 78 366 88.19 3R.91 2 5 3 Jharna 20 63 33 200.15 35.75 Jogia Sohri 22 134 163 233.19 101\.24 5 2 Jogiyapokhri 18 21 116 101.8Q 77.89 2 1 4 4 Riv Julanga 20 66 47 214.11 16.30 3 Riv
.J uru 20 64 634 '251.42 115.37 3 6 4 44- 2 Kamal Keria 20 94 181 159.95 45.24 1 5 T,Riv 3 KamaljJur 18 35 244- 119.1)5 33.82 2 3 10 Kapaud.l 20 59 U 91.97 28.40 2 T Kan"uda ali as Nirpat Chatti 20 54 48 238.11 48.16 3
Karma 18 16 487 156.88 40.64 5 5 15 Kasmar 18 6 36 57.48 4.92 I Kathaundha 20 52 436 10.5.44- 72.(12 3 2 28 Khiiirant 22 102 1!!3 176.32 13.29 5 3 5 9 2 Kirto 24 141 60 50.70 30.16 I 2 2 2
Koiriplttra IS 48 40S 236.36 142.96 4 1 5 21 2 Kotkhas 18 43 823 362.77 116.24- 2 2 14 5 Kubua 22 . 133 129 313.02 99.35 'I 1 I Riv Kulia 18 20 1I5 19S.86 67.08 2 1 2 Riv Kumrahi 18 4 17 NA • NA I
Kundri 22 104 1,211 2l.73 16.50 40 I 9 11 300 Riv 25 K urainpatra 20 50 '717 NA NA 5 I 6 18 S Kusha 22 101 U NA NA Not available Lesliganj 18 4I 1,141 168.50 7679 2 1 16 5 Lohra 20 86 142 250.20 126.S3 22 1 6
Lohra Pokhri IS 18 244- 104.06 19.01 4 .. 3 Riv Lonhri IS 19 192 lIS.00 12.55 3 2' 16 Riv LotWll 20 93 338 121.08 15.47 ~ 1 Madhodidri (Thakurdi3ri) ., 20 88 lOS 123.52 38.46 2 4 1 Maharja 22 123 115 226.71 79.59 7 3 7 2 4
Man!f"tgorea IS 22 68 63.40 13.84 1 1 I Riv MaribhangiJara IS 31 S5 156.37 56.14 6 3 3 Maribhangjagir I8 30 26 75.22 15.61 Not available Mukrum 18 13 U 91.27 21.10 2 Munaria 20 60 418 375.65 51.09 1 2 3 8 Riv
Murmusi 20, 83 398 285,44 105.23 3 ~ ... Riv Murubar 22 99 347 172 05 99.54 7 10 10 1 T 4 Muswa Khap 22 100 28 fi9.27 45.50 4- , 1 ~akti 20 70 45 6808 36.87 1 1 NiolUdiha 18 38 600 371.92 190.57 IS II 50 17

151 PALAMAU BIHAR
VILLAGE DIRECfORY
SUBDIVISION SADAR
ANCHAL LESLIEGANJ
Reference to Village Drinking Statistics Population Area in acres Irrigation facilities water-lupply Trllillsport .--.A...--, 1951 r----_,,_---~ ,-----_....._ """--....., r---"'--""'_
Mauza Page Serial no. no. Cropped Irrigated B C T W Ors. P K On. B C
2 3 4- 5 6 7 8 9 '10 11 ~ 12 IS 14- 15 16
Naurang8 18 17 222 124-.65 42.12 4- S 1 2 Nawgarh 18 33 138 19392 • 62.60 7 2 4- 5 2 Oria Kalan 22 103 1,064 276.33 104.57 3 5 20
.~ Riv 1.5 17
Oria Khurd 22 106 U 122.08 50.20 If'
Pachmo 20 82 455 NA NA 8 7 Riv
Pahari Ka an 18 28 226 149.76 46.57 7 2 5 12 .. Pahari Khurd 18 27 127 55.62 26.Z0 3 1 1 5 I 2 Patllr:thi 18 39 334 97.02 76.02 'I 6 4 15 Patlch"ulia 22 127 93 17058 91.01 5 2 Phudla 20 68 17 256.26 31.60 3 I Riv
Phulang 22 III 264 355.69 92.23. .. 6 5 2 Phutharna 20 95 48 33.87 15.25 I 2 2 I Pinrra 18 9 226 126.92 13·31 4 2 Riv Pipra J<,hurd 22 125 564 239.53 144.59 II ;c 23 17 3 3 Pumadih 20 57 757 821.54 160.42 5 1 • 2 12 10 Riv 4
Pursuram Khap 22 124 284 98.67 58.72 5 7 7 2 Rajbaria .. 22 135 65 97.79 41.26 3 . 1 1 1 Rajhara 18 34 728 1,149.44- 102.61 8 5 5 25 Riv I Rajogari 22 98 4-43 NA NA 5 2 12 6 /' ..• 2 8 RlO:ipur 22 112 249 128.24 39'77 2 1 3 15 1
Ramanand Dabr. 20 79 316 315.98 66.37 '3 Riv 1 4 Ram Sagar 22 109 517 573.99 2.')1.81 8 3 6 6 2 7 Rebaratu 18 14 571 409.84 81.52 7 4 4 Riv 4 Sahad 22 108 457 219.57 76.0B 8 4 5 3 2 6 Sangbar 2U 85 567 551.32 129.70 n 5 8 20 Riv 4
Se-hra 18 23 484 453.30 38.02 15 2 3 13 Riv 4 Serandag 18 2 186 NA NA 1. Riv ),. -Riv Sewai 22 105 22 1-57.08 45'15 2 2 2 'Riv Shonsh 20 53 318 235.10 92.04 21 3 2,5 Sirrampur 18 40 78 40.21 17.55 1 1
Sitadih 18 44 362 327.93 94.80 2 4 6 Riv Siuri 18 7 89 54.35 16.57 2 1 I Sohgara 18 25 90 110.32 14.84 . 7 1 Riv Sohri 18 10 193 504.55 29.27 1 2 Riv Sonbarsa 22 119 236 395.49 76.75 3 8 3
Sonhi Sarai 20 69 200 875.35 400.11 3 2 6 4 3 Sotamdabra alias Panredabra 18 47 176 257.58 69.68 2 2 1 Riv Tenar alias(Nawadih) 24 137 567 995.35 101.12 4 2 9 20 Tengri •• 20 56 U 327.86 52.75 3 I 1 5 1 Thakuraididrl (Chakaididri) 20 87 14B 695.33 331.11 4 3 2
Turka,Hh 20 62 340 45.70 0.24 3 6 6 ' Urhulia 20 61 105 192.35 10.00 1 2
ANCHAL TOTAL 37,504 30,582.31 8,614.41 576 3.00 43 138 569 1,030 173 270

152 PALAMAU BIHAR
VILLAGE DIRECTORY
SUBDIVISION SADAR
ANCHAL PANKI
Reference to Village Drinking Statistics Population Area in acres Irrigation facilitie~ water-supply Transport
Mauza .---~-.... 1951 ,..--__ .A.o-_ .. ~ ,,-_____ ;... _____ ~
r----""...---~ ,---~-Page Serial no. no. Cropped Irrigated B C T W ore. P K On. B C
2 3 4- 5 6 7 8 9 10 11 12 13 14- 15 16
Abun 34 194 261 178.Q7 1 2 Ahirgurha 23 52 205 143.49 23.23 I .. 2 Riv Ambabar 30 131 377 273.36 2.76 -4 0.25 + .5 Riv 2 Ambalori 30 138 U 32.31 11.11 Andag 34 197 22 27.88 2.54
Angara 26 41 7 16.",8 1 Riv Aparmanri 30 137 232 106.21 48.13 2 I 3 Ara 28 89 134 142.30 101.70 5 3 II Riv I Asarhia 28 56 89 41:67 6.73 2 2 Aseahar 26 12 1,447 677.99 289.06 40 25 20 +0 7 10
Auka 32 185 131 NA \ NA 2 1 Riv Ba(.Ldohur 28 68 146 96.55 32.57 2 0 .. 50 2 Bahera 28- 90 208 NA_ NA 6 .'i 12 7 Baherwalanr 30 109 62 16.59 4.50 I 5 2 Baina 28 76 190 21fl.94 73.81 7 1.00 4 9 7 Riv 4
Balmuwan 30 141 260 99.49 10.52 3 2 I 8 Riv .. Balu(lih 32 157 83 54.4&. 28.23 3 I- 3 Eanai 26 13 366 285.62 77.93 15 I 14 14 23 Riv I Bannubar 26 16 172 160.69 50.74 2 3 3 2 Riv 2 Baniadih 30 lIO 73 17.68 5.77 .. I 4
Banki Kalan 26 24 173 201).73 55.64 3 0.25 2 3 3 Riv 3 Banki Khurd 26 23 2H 195.46 62.62 9 2 6 3 Riv Banri Pakria 28 79 67 128.61 55.90 1 I 1 I T Bara 32 180 99 118.61 I 1 1 Riv Barahmoria 32 156 U 14.12 I
Bardaga 26 32 U 4.').31 36.37 10 Barkadaha 32 143 U 30.44 9.11 I Barwadih .30 114 238 406.10 107.70 2 4 5 4 Riv 4 3 Barwaiva 28 73 119 120.91 78.70 1 3 3 4- Riv 1 Basari)'a 26 25 334 383.03 96.98 15 1.50 .. 6 4- Riv 1 3
Bas<1iha ~8 75 208 284.54- 205.97 1 6 5 2 Riv 5 Beia 28 85 32 90.03 43.49 1 1 Bhang 26 7 63 157.72 3.55 1 1 1 Riv Bhanwardah 26 28 240 224.93 40.61 12 3 3 1 Riv Bhari 26 3 467 254.12 87.31 4 5 16 7
Bhulnya KUlha 32 163 189 160.38 51.09 5 3 RIV I I Bidra 30 136 156 129.60 82.32 8 1 3 5 2 I Bidra 28 91 149 NA NA 3 1 1 BILari Khap 30 134 81 132.93 0.13 2 0.01 4- 2 Bihra 26 34 358 338.83 47.12 2 1 4-
Birbii 34 192 59 190.29 7.91 1 Riv Birtia 30 111 U NA NA 4 Biritiya Dandar 26 22 55 176.87 73.87 7 0.13 1 3 Riv Biru 28 87 104 163.57 49 .. 'il 3 1.00 3 4 1 Borodiri 32 144 294 200.62 32.63 3 1 5 2 8 2
Jlurhabar 26 18 333 109.46 37.42 2 2 6 Riv 4 Burhi 29- 64 39 NA NA I 1.00 1 3 T,Riv Chakaminan 32 189 U 9.34 Chandarpur 28 70 255 268.64 12Ir.18 3 1.00 2 8 10 2 Chanciarpur 32 159 491 318.64 128.18 1 2 3 35 Riv

153 PALAMAU BIHAR
VILLAGE DIRECTORY
SUBDIVISION SADAR
ANCHAL ~ANKI
Reference to Village Drinking S tatistics'Population Area in acreS ' Irrigation facili ti e£ water-supply Transport
Mauza r---""_~ 1951 ,..-___ -"w __ ~
,- ..... ,_..---.".._---- ,---"---_ Page Serial no. no. cropped Irrigated B C T W Ors. P K 01'S. B C
2 3 4 5 6 7 8 9 10 11 12 13 14 15 16
Chand war 26 44 73 21().45 15.39 1 Riv Chanpi Kalan 26 39 114 83.91 52.45 2 2 1 Chanpi Khurd 26 40 173 '146.09 52.59 4 3 ] 3 Chauphal 26 20 203 71.28 30.02 2 0.25 1 5 Chhapar , . 34 199 85 68.30 0.20 2 2 2 1 Riv
Chorea 32 153 81 147.41 48.52 7 Churra 34 195 U NA NA Dandar Kal:.n 7. 28 72 1,073 765.13 403.29 19 1.00 20 11 40 Riv 7 3 Daryapur 28 60 88 169.80 90.11 2.00 1 Dema 26 31 46 91. 76 40.85 3 2
Dhub 28 74 - 482 339.32 171.36 3 6 ... 5 Riv 2 6 Dumarkhar 32 176 U NA NA Dundar Khurd 28 80 263 266.71 bO.63 3 _3 1-0 3 4, Duriatu 32 147 85 1,116.33 29.68 4 2 2 2 1 Duwarika 32 174 304 485.47 13.59 3 ·3 4 Riv 5
Ganeshyur 30 112 180 183.61 64.82 6 . " 5 T
Gareriadih 30 132 U 37.03 25.13 ' .. Garhganw 30 142 237 236.51 1:-5.24 2 5 2 12 Riv Gariiiara 32 168 124 157.51 20.41 3 3 Riv Giri 30 123 32 ]23.71 0.24 1 2 Riv
Gogar .. 26 10 157 322.33 43.66 4 1 2 Gongo 30 94 336 401.69 6.94 2 2 2 14 Riv 8 Gopaldih 32 181 202 65.94 1 Riv Gurlipahari .. 30 105 25 67.64 0.05 0.57 2 H"ldi 30 128 U 47.65 11.83
Halrliminhai 30 96 U 145.13 58.73 2 Harkhuwa 30 106 260 143.10 102.48 3. 0.57 2 1 10 2 Harlaung 26 9 700 435.01 202.62 .. 16 26 Riv 5 Harna 32 164 492 182.1.5 26.65 2 6 Herum 32 171 230 74.61 19.17 1 1 Riv
Hesatu 36 124 179 86.93 5.09 2 1 7 Hiringbar 34 193 48 33.35 7.26 .. 1 Riv Hoiyo 26 +5 159 159.87 4.11 1 Hotwar 32 146 281 159.87 4.11 2 1 3 1 Husenigurha alias I. isirgurha 28 53 148 145.90 26.97 2 3 4 Riv 5 ·2
Hutai 26 29 609 345.02 95.32 16 4 4 4 Irgu 26 +3 244 216.87 17.79 .. 1 1 Riv Janjo 32 177 140 133.47 . ,- I 2 Riv Jaspur 30 125 -180 89.36 4.58 3 1 1 1 1 Jaspur alias Cheribar 32 169 56 39.11 Riv
Jhagrudih 32 188 U 4.94 Jiro 26 42 278 167.89 5 .. ~6 Riv Jobla 34 190 100 43.90 7.49 1 Riv jolah Bigha 32 173 100 165.02 101.90 2 4 Riv Jotang 32 167 89 93.25 1 Riv
Kakargarh 32 175 271 219.06 13.59 2 4 Riv Kakrigarh 28 65 U 74.08 Kamal 32 184 37 40.78 1 Riv Kamat 28 88 285 214.28 108.50 12 6 T Kamatola 28 69 98 18.45 1.52 1 0.50 3 1
P-I-20

154 PALAMAU BIHAR
VILLAGE DIRECTORY
SUBDIVISION SA DAR
ANCHAL PANKI
Reference to Village Drinking Statistics population Area in acres Irrigation facilities water-suppl>' Transport
Mauza ,..----...... 1951 ,-___ .A. ___ -... ,-------"--------. ,---___ """ __ 10.---... ,---.;....-~
Page Serial no. no. Cropped Irrigated B C T W Ors, P K o I'll. B C
2 3 0{- 5 6 7 8 9 10 11 12 13 14 15 16
~aparphuta 30 95 U 14.52 0.99 arar 29 67 866 914.28 U3.47 23 10 8 20{- Riv
Karma 30 129' 20 56.39 1 0.02 1 1 Riv Kasmar 32 182 4 78.fll I 1 1 Riv KeIwa 30 140 339 151.29 37.18 0{- 8 2 10 Riv 3
Kerki 28 51 116 158.50 6.35 3 2 4-Khaira 28 93 U 119.41 34.08 3- 1 Khajuri 32 186 206 188.97 1 3 2 Riv Khamdih 34 198 U 16.39 Khankhar 32 145 U 14.60 2.70
Khap 28 84 186 212.65 111.62 2 10 5 2 Khapar Manda 26 47 120{- 82.00 31.83 ~ 1 Riv Kolhua 30 U6 36 145.~1 9.43 1 1 Korwatanr 32 154 U 17.98 - 1.50 ' .. Koseri 28 59 35 129.24-, 65.07 1 Riv
Koteya 28 92 69 97.3-4: +1.92 6 2 1 Kunwai 26 19 1,548 652.34 221.25 7 6 19 26 Riv 24- 12 Kusri 26 14 266 165.64 20.27 6 1 2 8 Lawabar 28 49 78 129.97 4.98 1 Riv Loharsi 30 127 1,338 554.42 66.85 17 1.00 18 13 16 2 3
Lukuwa 30 130 222 237.03 29.14 2 0.13 4- 2 14- Riv 2 Maduli 26 17 U 134.32 23.36 1 Mahe 26 30 U 9.75 3 Mahllgain 26 8 407 232.79 32.45 7 2 2 5 2 Mahugain 28 62 21.') 163.97 H.94 3 1 1 Riv
Majhauli 30 121 189 221.88 93.25 3 7 3 2 10 Manatu 28 48 U 52.33 28.64 1 Mangarpur 32 lSI 333 270.15 96.03 5 1 4 7 9 2 Manhepipra. 28 50 U 29.37 Manran 28 82 154 96.55 32.57 2 5
Maran 28 54 522 542.82 77.36 12 0.43 7 5 Riv Matnag 32 172 76 65.06 2.85 1 2 Riv Matuli 32 187 217 165.50 1 2 2 Riv Maulaganj 26 27 U 41.09 4.84 1 Mukta 32 178 68 50.22 1 Riv
Nagri 26 33 130 86.70 15.89 1 3 1 Riv Naudiha 32 149 562 325.47 103.79 5 3 13 ' 1 Riv 18 Naudiha 30 lOB 639 '216.63 101.41 2 10 35 7 2 2 Nawadih 32 152 231 99.04 42.51 '3 1 1 2 Nawagarh 28 55 272 79.06 3.25 2 6 1 Riv
Nima Chak 30 120 -294 253.23 57.40 4 6 6 9 Riv 5 3 Nuru 32 160 699 377.72 142.06 8 2 8 1 Riv 4 6 Pachamba 30 102 103 NA NA 3 2 1 3 Pagar Kalan 30 99 478 184.21 4 0.06 1 Pagar Khurd 30 100 U 153.65 6.29 3 0.28 8 10 8 -7
Pakanya 28 78 498 246.911 1ll.O3 .. 0.50 2 5 6 Riv 4-Panki 30 117 1,9-10 1,450.43 416.39 17 51 49 20 26 Parasia 26 I 664 383.36 139.50 6 6 7 20 4 Parcloher 30 107 51 10.06 6.68 2 1 1 4 1 Parhiya Tola 32 183 U 182.74 74.02

155 PALAMAU BIHAR
VILLA.GE DIRECTORY
SUBDIVISION SADAR
ANCHAL PANlrI
lteCelence to Village Drinking Statistics Population Area in aCl'e! Irrigation facilities water-supply Transport
Mauza .....---"'-~ 1951 r----~----'\ ,,-----__,.,__---~ ,.--__.._----:-o r-_"__""'_
Page Serial no. no. Cropped Irrigated B C T W ors. P K Orl. B C
2 3 4 5 fl 7 8 9 10 11 12 13 14 15 16
Panawan 32 148 135 236'59 74.04 3 3 Parsotirnpur 28 66 271 ~OI. 78 4.87 6 0.50 4 Riv 1 Pathra Kala!! 30 119 95 230.96 57.06 5 5 3 4 Pathra Khurd 30 118 6 65.5~ 35.73 Phulwaria 26 38 105 134.32 23.36 :I 2 1 .. Pipra Kllla. 26 21 114, 267.17 75.22 10 5 2 3 Pipratanr 30 122 79 88.82 1.65 1 3 2 2 Pokhraha .. 32 150 159 232.84- !l2.83 3 2 .2 Riv Ponam 32 165 113 132.94 1 1 Pundru 34 196 95 73.68 .. 1 1
Puraini 26 5 37 60.88 31.88 .. Riv Radhadilo 28 57 133 37.87 11.01 .. Riv Randah 32 170 II 3).38 Riv Ranne 26 4 169 187.67 65.61 3 4 2 Ratanpur 26 37 402 405.19 104.41 4- 1'w 4 1
Rengai 26 46 67 65.80 0.84 Riv SagalilJl 26 !l 766 579.21 .218.19 16 11 Tw 15 20 10 5 Salamdiri • 26 35 221 .216.59 22.04 6 3 8 Riv Sal gas 26 11 223 ~96.16 72.43 3 3 8 2 Sangaldipa 28 61 351 259.59 83.57 ~ 3 5 Riv 2 1
Saraidih 32 162 ~77 263.75 95.25 5 3 4 5 Riv 3 Saraiyll. 26 15 105 138.55 50.20 4- 2 2 3 Riv Saraun:4 28 86 276 118.04- 57.60 3 0.28 4 10 6 ~
Sarjamatu 30 133 239 120.70 1.04- .2 0.25 .2 6 5 Sirma 30 104 293 263.0G 0.85 6 0.50 1 2 4 1 4 2
Sons 26 36 16 80.30 Sorath 32 158 79 205.25 16.95 3 3 2 2 3 Sunri 26 6 ~8 594.96 152.90 .'i 1 2 7 T,Riv Surjaun 28 71 84 137.00 71.05 3 2 4 Surjaull 28 58 202 175.95 47.78 1 2 Riv
Taiya 26 26 ~2 519.80 165.85 19 1.50 2 4 Riv 5 .2 Tal 34 200 225 133.76 25.20 .. 3 - 6 T,Riv Taledih 34 191 56 49.60 .. 1 Riv Tar wadi. '28 63 161 104.54 26.82 2 6 3 S 3 4 Tatidiri 32 161 113 192.62 34.18 5 1 2 2 Rlv 2 1
Teldiha 30 139 U 23.07 5.31 Tetariadih 32 179 3 49.30 7.92 1 1 1 1 Riv Tetrain 28 77 370 309.H 107.88 11 1.00 8 15 2 7 7 Thekhi 32 166 U Nt. Nt. Tilamba 30 126 U Nt. NA
Tilra 30 103 U 60.12 3 0.40 Tilangi 30 135 270 137.51 89.42 1 1 6 Tola Chatti 28 81 333 Nt. NA 3 5 3 Tola Mmrall 28 83 78 28.57 11.18 3 0.50 4 2 3 Tunud .. , 30 113 199 48.15 12.38 3 1 5 4 1
Uchahra Kalan 30 97 31 103.09 35.98 3 1 Uchahra J(hurd 30 98 66 161.35 73.56 3 1 1 1 Udib 30 101 :l48 46.93 l.51 .... 6 5
, 3 5 4
Uksu 30 115 183 180 • .55 10.80 2 3 2 5 Riv 2 1 Ulgara 32 155 127 134.71 34.44 4 1 2 1 1
ANCHAL TOTAL 4,1,527 35,133.77 1,898.06 637 18.88 18 381 1147 734 .. 214 212

156 PALAMAU BIHAR
VILLAGE DIRECTORY
SUBDIVISION SA DAR
ANCHAL CHHA TARPUR
Reference to Village Drinking Statistics Population Area in aCres Irrigation t'acilities water-supply Transport
Maun ,.....--...... ---. 1951 ,.- - ,--------------. ,..--------- ,---.A.._ ...... Page Serial n,?, no. Cropped Irrigated B C T W Ora. P K Ors. B C
2 3 4 5 6 J 8 9 10 11 12 13 14 IS 16
Adar 44 196 U 20.:33 4.41 Not available Akabasa 38 60 161 64.25 22.88 7 3 Amola 44 193 U 33.P2 Not available Amwa 42 135 55 157.53 14.54 0.50 3 3 Anata Kalan 44 214 131 241.07 49.67 2 2
Anata Khurd 44 215 19 17.81 4.66 1 1 Arar 38 53 433 257.83 61.48 4 5 5 Riv 1 Arjm,dih 40 110 274 182.12 84.99 3 5 6 2 Bachkoma 42 136 92 163.03 1.02 3 Bagaiya 40 115 551 2PS.II 69.54 8 { 20 4
Baghamara 36 49 165 135.P.6 10.30 .. 3 Riv BaiJna . 36 27 65 29.51 Balra 42 1"56 248 211.03 10.16 4 3 5 Riv 3 1 Bamhandih 36 13 171 384.32 -23.45 1 3 ') 1 1 Bamhandlh 38 82 54 99.58 8.80 1
Bandhudih 42 133 296 358.08 28.93 3 ..... 2 6 45 II Bansdiha alias Latea 36 12 334 243.44 22.45 2 10 21 Riv 11 .'l Bara 46 222 397 384.25 212.77 1 9 21 1 2 Bara 40 100 489 357.24 70.76 5 6 6 8 1 - 7 Bara Khanr alias Kahua Khanr 4~ 169 95 104.83 8.31 4 1 2
Bardiha 38 77 261 97.48 16.29 6 Barwadib alios Kosbiar" 44 200 62 88.73 1~.44 Flasantpur 42 163 15 22.49 0.07 2 Basrliha 38 72 67 91.90 0.53 2 Belwanr 38 63 U 58.90 21.38 2
Bergain 36 41 44 104.74 3:7'1
Not available Bhadwa 36 45 23 68.46 2 Riv Br.alubar 36 5 48 180.55 0.75 Not available Bhandardih .. 42 130 .203 226,45 61.99 15 6 7 20 12 Bhikhi 40 90 234 158.86 61.21 5 1 1 2
Birhordih 44 178 82 54.30 14.20 4 1 Riv Birwadohar 36 20 U 173.12
3l.20 .. 1 Riv
Bisaipur 40 88 172 111.34 6 4 1 3 Biwa-lohar 42 171 U 88.92 12.12 2 Bogna alias Ahr1 36 26 69 NA NA 1 Riv
Champa 42 165 U NA NA 1 Charai 38 81 515 294.61 64.41 5 3 8 5 Charain 46 238 256 213<).33 119:44 7 1 6 7 Chatarchati 36 38 U 27.69 1.30 .. Chan Khara 44 217 24 18.55 ' 1
Chengwana 38 65 221 NA NA 2 1 3 Chhatarpur 40 107 764 336.76 96.28 4 31 8 Riv 9 37 Chhuchhia 36 9 U 51.79 Not available Chi1ho Kalan 40 89 235 107.68
3').9f; 3
Chilho Khurd 40 93 164- 101.44 4 2
Chipo 42 166 41· 66.03 0.41 3 . ( 2 Chiru 42 140 1,246 572.39 26478 .. 1 13 8 4-Cborar alias lIdaigarh 42 131 384 431.40 132.05 18 3 6 20 7 Chordanda 42 149 91 43.78 10.80 1 1 1 Riv Choukhara BandhuJih 38 73 266 307.74 1.71 3 . 3 12

157 PALAMAU BIHAR.
VILLAGE nm.ECTORY
SUBDIVISION SADAR
ANCHALCHHATARPUR
Reference to Village Drinking Statistics Population Area in aCrel Irrigation facilities water-supply Transport
Maullft 1951 ,.- - ,,-.----__,,_------ ,.---_.,....----.._ "..-_riA.._-"""\
Page Serial no. no. Oropped Jnigated B C T W On. P K On. B C
2 3 4 5 6 7 8 9 10 11 12 13 14 15 IS
Chuchru' 40 122 112 112.25 18.23 2 5 2 3 2 Chuchrumanr 40 77 150 101.16 0.60 1 1 4 Chunautwa 36 31 U 10.51 .. Dagra 44 201 330 532.52 130.2.5 I 5 5 3 1 1 Dali 38 66 1,012 573.87 0.29 6 7 17 25 7 5
Dantuta 42 138 256 275.75 14'.87 I 16 Dt"hnitr 44 189 66 72.22 15.49 1 1 Deogan 36 37 144 128.92 27.68 1 2 1 Dhobiclih 40 1I9 40 151.68 1.20 1 .. Dinadag 40 1I2 315 232.11 27.03 4 '3 3 6
Dumaria 36 39 57 141.06 32.70 2 2 Dumri 42 154 380 300.80 104.32 5 3 4 5 Riv 5 5 Dun·iur 36 23 152 107.43 1.03 1 1 2 2 Riv Gamharia 36 14 285 321.95 (j4.38 -A:. 4 4 Gamhari"dih 44 194 276 12~. 78 26.45 2 3 7 Riv 1
Gangoari 38 56 U NA NA Gansa 44 213 102 127.26 16.62 3 Ghujv. a H 181 U 33.85 V,g .. .. Gontha 36 15 180 416.80 16.14 1 2 4 5 GopaJpur 40 103 67 145.2~ 23.58 .. 5
Gorealhan 42 176 83 166.83 19.11 12 6 2 Gorho 44 186 81 R3.91 1 Gosaindih 40 120 377 435.78 50.77 2 1 19 7 Guadag 42 170 61 73.45 3.97 2 2 Gulahjhari 40 121 582 508.25 235.31 21 1.'i 2 16 6 4
Gundri 38 69 139 NA NA 1 2 2 2 Gurdi 38 58 262 176.64 39.44 7 3 2 7 Riv Guruain 46 226 U 147.60 1?2.50 3 Harai)'a 44 188 48 13.88 '4 H&.rna 46 228 161 142.57 85.76 7
Rami 44 191 158 115.20 24.26 2 Hathgara 36 17 U 90.12 Not available Risag 36 24 U 99.33 Not available Hulsam 40 95 399 151.39 20.05 4 5 6 Hufsi'Kalan 44 183 U 2.75
Hulsi Khurd 44 182 87 77. oS .. I 1 Hutukdag 40 98 340 144.68 1.39 6 2 3 10 ltakrlag 40 99 132 89.19 0.32 2 .. .. 3 3 Jamalpur 46 224 203 229.10 71.18 3 2 - ::l Jamuna 44 202 llB 159.68 31.29 7 1 1 Riv
Jamua alias Bishunpur 46 230 137 292.69 1'22.36 7 3 6 Riv Jaura 38 85 172 97.28 25.08 5 1 4 Ja"ar 42 172 166 214.11 30.48 5 1 7 Riv Jhard"g 46 220 90 158.3.2 10.99 .. I J :3 J Jharha 42 155 339 220.42 90.88 5 G 2 !
.I ObM alias Ramprll 40 113 3R4 358.03 135.62 9 .. 4- 2 6 4 Jolahkhap 40 129 146 167.97 62.73 6 (}'23 . , 2 2 .2 1 1{a('hanpur 40 102 682 468.41 61.05 I !J 8 24 4-Kalapaha;r 36 19 371 219.68 12.54 1 3 2 Riv K«ng"lid,h 40 109 313 1,56.05 18.81 1 1

15S PALAMAU :8IHAR
VILLAGE DIRECTORY
~UBDIVISION SADAR
ANCHAL CHHATAltPUR
Reference to Village: Drinking Statistics population Area in ac~r> frrigation facilities water-~upply Transport ...---'--- 1951 .- ..., ,.....--"--.....
Manzs Page Serial . no. no . Cropped Irrigated B C T W On. P K Ors. B C
2 3 4- 5 6 7 8 9 10 II 12 13 H- 15 16
KaIkat .. 4+. 190 31-4: 186.71 94.12 2 1 4- 4- 2 Karma -4:0 96 147 137.19 37.31 3 3. 5 3 -I Kanna -4,4. 184- 28 31.28 I Karma Kabn 40 104 221 444.01 80.22 8 2 5 9 4 Karnima H 198 22 NA NA I 1 Riv
Karupa 36 29 U 71.77 Kathuautia +6 221 211 160.72 107.3.'1 2 17 I Kauwal 40 III 551 396.99 186.21 8 II 4 10 Riv II 4 Kauwal 38 57 366 20568 98.33 10 2 4 3 1 Kauwal 1-4 208 169 NA NA 4- 2 2
Kerki Kabn 38 79 149 92.72 23.25 2 Kerki Khurd 38 80 12+ 96.80 0.11 1 2 1 2 1 Khiradohar -4:2 174 509 278.55 13.39 ~ 15 12 3 4 Khajuri 38 59 398 275.65 75.86 5 3 6 8 Riv 2 Khajuri« 38 86 U NA NA
Kharar 4+ 199 137 165.80 34.03 2 3 Riv Khardih:t -4:0 92 10 12.20 Kharrlih .. -4:2 158 523 536.39 119.91 24 5 8 6 Riv 8 7 Kharwardih +2 132 82 -4:38.27 18.05 13 1 16 Khatin -4:0 106 726 29-4:.92 21H8 7 26 6 18
Khendhra Kalan 36 H 279 20'3.05 3.76 5 2 Kh~ndhra Khur. 36 -4:2 341 2'08.82 15 .. '13 3 Khonrhi 38 5-4: -4:59 3(15.0-4: 42.38 8 1 4 7 6 Kodwaria 36 8 32 81.53 8.60 1 2 Koilkha 36 36 11 27.97 12.404-
Kokro 38 78 H6 86.68 18.64 1 2 2 Korltmi 42 162 262 294.21 89.67 5 3 10 2 Kui uif Shushiganj 36 3 U 218.29 4.95 I 1 3 6 Riv 1 Kuku K:I.lan 44 205 177 308.45 67.45 4 6 12 Kuku Khurd lllias B<1rhania H 206 7 59.4+ 8.20
Kulhia 46 219 11 113.48 2 Kundil 46 218 U 23+.85 Kurauli 38 70 207 N .... NA 1 1 4 Kurkuta 38 51 48 54.34 17.06 3 1 Kushmah .. 36 22 17 ,~6.9g 1.17 Riv
Lachhmipur 40 125 333 137.+1 73.14 7 0.11 2 15 Lahanga 36 21 69 102.08 0.50 I 1 1 Lakrahi 42 173 1+1 189.54 2.32 5 3 Lalgara 44 209 435 331.66 69.15 2 5 3 5 Riv Lamba 36 28 17 13.52
Larmi 36 7 35 103.80 3 3 Riv Latrlag 42 164 76 61.42 0.17 3 1 1 La",adag 36 16 332 194.55 2R97 3 6 Lehar 38 62 168 188.26 3.34 2 6 7 Lohrai, 40 105 429 398.46 134.17 5 4 7 10 2
Loto 38 52 46 39.10 2.81 1 Madanl'ur 40 101 517 540.10 91.90 5 2 3 34 5 Madheya -4:6 235 37 128.55 52.41 3 3 2 Maheshra 36 18 12 NA • NA Not available Mahipt .. -4:6 225 76 59.15 16.45 1 3 2 Riv

159 PALAMAU BIHAR
VILLAGE DIRECTORY
SUBDIVISION SADAR
ANCHALCHHATARPUR
Reference to Village
Area in acres Drinkin~
Statistics Population Irrigation facilities water-supJily Transport .--~ 1951 ,--_-..A. ___ -...
,.------_,._----~ r----.A.-.--- ,--...,.._.- .. Mauza Page Serial
no. no. cropped Irrigated B C T W Or!. P K On. B C
2 3 4- 5 6 7 8 9 10 11 12 13 It 15 16
Mahuari 40 117 342 366.13 196.13 ~ 7 2 4 MahugaiD 36 33 179 70.71 21.85 2 7 2 Mahugain 42 151 9 6B.67 30.94 4- 1 2 Mahurawl\ 42 153 40 ~·5. 77 8.68 2 1 1 2 Majhauli 38 84 3!J2 143.65 42.22 7 3 3 3
Ma,ihganWilIl 36 30 20 28.71 Majurahi 46 233 U I16.06 22.05 8 Manandohar 46 229 41 66.50 18.28 2 1 Riv Mangara 40 !I6 U 42.82 6.98 Manhu 42 142 350 463.96 ~20.13 6 I 6 12 3
l\1aradag 36 11 69 192.37 5.~6 Z .. 1 Maradag 44 203 146 205.73 48.46 1 1 1 Riv Marar 40 118 31 1-41.16 62.86 4 1 1 Marwa 42 134 611 497.81 124.12 7 1.00 5 6 17 3 3 Masihani 40 114 HB 584.67 !16.32 10 3 6 21 Riv 3 2
Matnag « 187 34 26.01 3.39 Mavaur 46 223 283 80.46 9.14- 8 4 3 4-Mednipur 40 124 54 48.49 8.<!9 2 1.00 7 Mahadih 46 240 U 92.96 22.52 3 .. Munkeri 42 146 822 77'1.03 252.69 4 2 15 8 10 5
Murumdag 38 68 260 193.71 0.82 j ~ 6 Mururnda~ 42 137 278 276.23 25.82 I 6 3 3 Namuda~ 42 160 553 611.32 297.54 13 .. 3 9 8 Riv 6 1 Nasa 40 126 286 162.59 70.46 3 0.11 .. - 1 5 15 6 4 Naudiha 46 227 251 182.39 133.42 5 7 7
Nawadih 40 127 4,7 52.17 17.01 2 2 2 2 Na\'iadih 44 195 159 123.83 6.42 2 1 11 2 Nawadih 46 232 171 227.73 94.91 1 1 3 1 Na\'iatanr 46 236 1,013 197.53 27.65 .(. 40 7 Riv 2 7 Nawdiha 36 46 1,039 197.04 0.74 18 19 15 4
Nirna 46 234 169 42.49 25.70 3 6 2 2 Okraha 38 61 193 219.06 19.91l 7 4 6 Pahari 36 43 128 176.29 52.10 2 3 3 1 Riv Pakha .. 36 48 U 137.80 5.60 Palwa 40 91 III 128.16 9.15 I 3 Riv
Pathra alias Palhe 44 185 32 27.11 Patsara 36 1 100 187.50 41.47 2 1 Riv Pichhulia 44 197 78 NA NA 3 4 3 Pidrahi 36 25 302 144.10 26.06 "2 2 3 Piprahat 36 4 82 61.15 1 Riv
Pipra Kalan 36 2 U 119.22 3.70 Not available Pokhraha 40 123 363 176.50 78.89 5 9 5 5 Rabda 42 152 496 261.19 92.81 3 1 6 Riv 2 Raebar 44 211 19 51.15 8.72 1 1 Rajbandh 38 83 30 57.13
Rajderwa 42 167 3'6 3026 2 2 Rajha -iO 128 141 59.59 22.77 3 3 5 4 1 Rajmanclih 42 141 28 119.93 13.69 1 2 Rakoi 42 150 U NA NA 6
, Ramsadeya 44 204 46 27.20 3.24 2 Riv

160 PALAMAU lJIHAJ
VILLAGE nmEcroRY
SUBDIVISION SADAR
ANCHAL CHHA TARPUR
Reference to Village Drinking Stat.istics Population Area in acreS Irrigation facilities water-supply Transpc
Mauza ,--~__, 1951 ,.-- ,._~ ,,------"-- r- -. ~""-Page Serial
Cropped no. no. Irrigated B C T W On. P K On. B
2 3 4 5 6 7 Il 9 10 11 12 IS 14 15
Rangnia 36 34 L9,~ 81.08 16.91 .. 4 2 I Rasida 42 157 241 177.49 93.14 7 7 2 Riv Ratnag alias Sirha 44 210 241 NA Nt\. .. 4 Rehra 38 64 U 36.24 1.79 .. Ri5yapd 44 207 245 NA NA 1 5 2 5 Riv
Rue! 36 50 163 165.32 25.57 3 4 2 6 Riv Rudwd 38 71 474 NA NA 2 2 4 Riv Sah ... dih 38 87 U 76.98 20.11 9 2 Saharsawa 42 143 117 198.64 87.40 8 2 9 Sahi 38 67 156 NA NA 2 1 3
Sahiyar 44 212 240 NA NA 1 Salaia 38 76 141 89.73 16.18 2 3 SaJaia Khurd - 42 168 135 21_4.71 18.60 4 2 3 SaJaiya 46 231 53 59.49 16.48 5 1 4 Riv Salaiya 44 192 U NA NA .. Not available
Salwe 44 216 U 12.50 1 Riv Saraidih 44 179 1,055 401.22 186.44 12 .5 21 3 Sarma 40 108 370 NA. NA 16 8 8 1 Sabpur 44 180 1,200 NA NA .. 12 Riv 4 Sbildag 38 74 443 322.8'1 2,65 .. 3 9 1
Shiupur 42 159 158 203.44 72,51 7 4 2 Shivrlavaldih 36 47 65 85.21 2.32 2 1 Riv Silrla Kalan 42 175 75 143.78 29.80 :i 1 3 Silda Khurd 42 177 466 226.98 3.82 4 4- 7 Singhna 46 239 217 218.10 3'1.89 5 1 12
Solanga 36 10 5 81.11 O.5!i 1 SUJlgrj 42 139 326 40').89 7.47 8 Taktllka alias Kartuka 38 75 100 152.33 0.14 . , 4 Riv Tardih 36 6 17 158.!)7 .. 1 3 Riv Taridih 42 148 398 139.9::! 68.87 5 .. 7 4 6
Tarudag alias Diocil 40 94 i62 1()~.55 11.24 I 1 2 T!'lari 38 55 3.';9 144.96 28.66 9 5 3 1 Teliul,h . 42 161 409 223.88 38.22 10 1 9 Tendudih 36 40 U 32.73 Tendurlih 42 145 221 366.12 28478 9 5 6 1
TeJema 42 144- 145 318.08 104.88 7 1 4 Thekahi 36 35 18 31.00 15.G8 2 1 2 Thekha 42 147 2 61.45 4.63 3 0.50 1 Riv Till'at,va 36 32 268 64.4-2 H,48- 1 1 Z 2 Turkadh 46 237 79 118.05 :;1.87 2 2 2 2
ANCHAL TOTAL 48,102 39,075.76 9,044.69 708 3,45 27 236 679 1,046 272 11

161 PALAMAU BIHAR.
VILLAGE DIRECTORY
SUBDIVISION SADAR
ANCHAL HARIHARGANJ
Reference to Village Drinking Sta tis tics Population Area in acres Irrigation facilities water-supply Tr3JIlBp ort ~....._ ..... 1951 _-__ ..A. ____
r------""-- ..., ,----""---. r---"---Mauza Page Serial
no. n9· Cropped Trrigated B C T W On. P K Ors. B C
2 3 4- 5 6 7 8 9 10 11 12 IS 14- 15 16
Ajania 50 57 9 85.54 19.75 4 2 Amba 54 154 374 240.36 10?55 1 5 2 5 Ambajharna 48 27 191 224.1)4 67.29 3 3 1 3 5 1 Andharibag KillIan 48 51 320 140.73 55.4.'i 3 .. 6 5 6 8 1 Andharibaq; Khurd 48 52 90 70.86 39.75 '2 4: 2 4 1
Ararua Kalan 54 155 4:04 312.71 153.09 0.13 4 5 3 4- 2 Ararua Khurd 54 152 813 222.16 133.21 5 2 4- 45 5 5 19 Bahhandib 50 96 802 194.89 121.54 2 1 2 14- !! Riv 5 4 B~hhan Sarhu 48 14- U 236.15 0.75 .. Baghi 50 84 U 47.27 1655 ., 0.28 3 Riv
Bagl,na 54 173 66 176.06 17.82 4 Bagsara 50 60 U NA NA .. Baiiua 50 91 U 84.48 33.60 Balha 50 55 99 132.07 .~8.91 "2 Riv 2 Balra 50 73 10 113.32 31.58 2 4
Banadih 48 11 72 84.93 42.35 4 1 3 Banahi 48 1 165 30.63 17.19 1 2 I Bansapti 52 134 85 142.00 85.69 0.75 2 3 2 2 Ba!l~doi:Jar 48 29 U NA NA Bardag- 48 42 434 253.25 135.~8 5 12 8 16 5 2
Barwadih 4:8 4 100 456.69 167.19 10 3 2 4-Raso 52 124 131 88.31 82.70 0.32 2 4 3 2 Bataua 52 106 U 58.26 30.95 .~ Belodar alias l'irthichak 52 143 305 139.52 110.93 3 3 5 5 3 4-Bhagat Tendua 52 142 406 2311.37 195.37 4- 1 6 3 6 2
Rhandar 52 116 U 84.8~ 11.90 1 2 2 Bhanga 48 23 60 204.13 35.12 2 1 1 Bban\\ar 54 160 356 502.52 131.08 3 2 3 1 2 Bhaurha 54 177 177 NA NA 4 1 1 Bhitiha 50 62 108 <;j05.28 8.S1 1 1 2
Bhojua j 54 174 154 141.03 69.37 2 7 3 2 Bijbar 52 121 35 51.14 50.':16 1 1 Bijnibar alias Lakhni 50 80 144 66.1+ 37.79 2. 2 4 2. 2 Bishrarnpur 48 3 255 125.5~ 66.55 1 3 2 Bisbunpur 50 56 78 90.42 30.86 .. 1 1 2
Bishunpur 54 151 209 118.82 71.17 4 5 2 2 Burhronga 48 15 39 106.06 16.35 2 1 Chaitu Bigha 48 9 H 104.15 50.34 3 4 2 Chanda 50 79 18 85.72 49.44 2. 1 Cha);Jarbar 50 65 182 335.47 31.09 1 2 2 3
Chaukhra 50 95 5 165.21 39.79 2 Chingua 50 76 11 NA NA Chiraili alias Gidhi 54 159 118 195.17 38.34 4 1 2 DaJpalpnr 50 61 448 400.63 91.77 2 7 4 Damwa 48 44 155 355.32 81.7.7 2. 7 1 2 3 2.
Dema 52 148 818 21.'i.03 161.60 5 7 6 2 Riv 10 2 Dhab Kalan 50 8.2 355 54.09 38.01 0.28 1 3 1 2 2. Dhab Khurd . 50 83 44 58.19 13.92 1 1 Dhekcha 54 170 372 811.86 124,96 SO 3 15 5 6 Dhusarua 50 66 203 82.75 20.44- 1 1 1 1
1'-1-21

162 PALAMAU BIHAR
VILLAGE DIRECTORY
SUBDIVISION SADAR
ANCHAL HARIHARGANJ
Reference to Village Drinking Statisticll Population Area in acres Irrigation facilities water-suppl~. Transport
IVIauza ,..... . . 1951 ~--~-'''''IIr- r-_""_____' ,.--~....,
Page Serial no. no. Cropped Irrigated B C T W OrB. P K On. n C
2 3 1.- 5 6 7 8 9 10 11 12 13 14, 15 16
Digla 52 107 3 50.88 28.61 Dihria 48 49 329 145.89 22.37 .. 2 5 3 2 Duara 52 136 U 49.86 Dubridih 54 166 137 201.21 59.97 3 2 3 2 Dura 52 144 U NA NA
Cohora 50 89 327 294.14 127.2CJ 2 4 11 5 3 Cajna 48 40 U 60.37 10.05 6 3 1 Ghaghra 52 137 U 16.12 Ghansi Khap 50 64 U 205.32 26.39 Guriauta 48 39 U ],')1.78 86.76 .. Halka 52 H2 62 181.55 i05,49 2 (l,45 4- 2 2 Harinia Khurd / 52 110 U 19.11 15.01 HarsiKhap 52 109 U 32.09 1.80 1 Hasanpur 48 34 58 312.61 16.98 4 2 Holea 48 20 34 241.91 16.34, 2 1
Jagdishpur 52 105 U 77.59 48.80 7 1 Jagdishpur alias R;!mpur .. 52 127 225 22.68 0.26 7 10 2 Jahna 52 108 34 132.13 27.65 Jarka 50 59 U NA NA Jharna 48 19 c U 104.35 6.87 Not available
Jharna' 48 48 23 97.45 27.75 4 :Jharna 54 149 U 44.37 0.35 Jhumri 48 50 U 135.99 38.61 Jitpur 4B 41 109 155.49 41.99 2 4 7 Jolrahi alias Jolha Khap 50 77 U 27.811 9,46
Kajru Kalan 52 135 ;U 224.96 Kajru'Khurd 52 128 45 157.26 1.79 1 Rh Kalipur 4B 31 171 331.04 Bl.76 3 4- 2 .... Karilebra .. ~ 50 97 5 204.03 411.55 Karma 50 94 U 102.30 58.35.
Katctia 52 131 352 275.33 2,03.60 2 7 8 2 <{ 3 Kathkoma 54 162 94 150.15 90.51 2 5 1 3 KauwaKhoh 52 118 U 16.15 1.33 0.18 1 1 Kauwakhoh 54 164 U 30.21 5.87 .. Khajuria .50 54 100 331.21 83.28 3 2
Khapkat~ia 52 141 413 106.11 70.20 <i- S 7 10 2 3 Kharagpur 54 161 932 326.19 183.90 4 11 5 10 2 Kodwaria 48 38 63 164-.41 (l.9S 1 1 Kokro 54 171 246 320.16 72.54 3 <i-Kolhwara 52 III 77 365.81 235.35 0.18 1 2 5
Koshdihra 52 140 21 99.16 54.90 2 1 1 Kothila 52 100 237 269.60 44.13 12 1 3 2 Kuarbanrlh 50 70 U 259.01 16.37 Kulhaia 52 101 213 127.74 46.29 5 2 4-Kumhaia 50 92 U _62.80 30.54
Kumhara 48 28 19 230.13 89.21 2 2 Kunrwa 48 IB 50 47.64 23.95 2 R!v Kurhath alias TendudKhu;c:i 52 130 249 43.98 38.01 0.25 2 3 3 7 Kushdih 52 .126 246 64.58 62.90 1 8 2 16 5 Labhra 50 69 222 259.01 16.37 1 2 1 1 1

PALAMAU )~~
:BIHAR
VILLAGE nmECTORY
SUBDIVISION SADAR
ANCHAL HARIHARGAN]
Reference to Village Drinking Statistics Popula tion Area in acres Irrigation faCilities water-tupply Transport
Mauza ,. .. ~ 1951 ,_-____ ..A.--___ r-- _,..._---_-. ,....---.,..----.. ,--....__,
Page Serial no. no. Cropped Irrigated B C T W On. .P K. Or8. B C
2 3 4 5 6 ? 8 9 10 11 12 13 It 15 16
Ladihadi 52 102 77 236.21 50.28 11 2 4 Lalbara 52 122 TJ 138.92 7.89 I.aIgara 54 157 2 53.69 Langurahi 52 139 158 174.83 58.58 0.17 3 2 Larbari ' 52 119 U 65.48 30.00 .. Largahi 52 145 U 12.60 .. Lebabar 50 99 U NA NA .. Lodia 50 74 U 197.94 8.34 Lukuwa 54 163 U ll6.91 35.09 Madhubana 48 32 465 453.60 120.75 4 4 19 6 3
Mahgugdn IIlias Jadudih 50 86 114 343.63 4l'.53 2 3 4-Mahugain 48 21 U 119.15 Majhgarwan 52 II7 U '34.09 7,:,00 Majhganwan Kalan 54 176 163 NA NA 2 ::1 4 3 Majhganw.tn Khurd 54 168 U NA NA
Majuraha 50 81 U 132.31 12.57 Mali 48 46 U 13(:;.4-9 45.00 4 MamarKha 52 132 123 78.14 75.57 I 0.25 2 2 3 1 MarW4 50 63 U 136.58 Masuria 50 75 312 101.89 45.40 2 3 3 2 2
Naktibar 50 85 U 309.86 15;10 Nath 52 115 U 53.74 18.23 Naudiha ... 48 35 U 81.93 13.04· .. Naurliha Kalan 52 103 20 80.13 49.56 Naudiha Khurd 52 104 U 64.98 35.45
Nawadih 48 2 163 52.91 29.11 10 2 2 Ordana 48 22 U 72.06 Pachmo 54 175 289 529.61 179.75 10 3 2 3 Pahaldewa 48 30 U 156.1.5 66.58 Paharpur 43 7 U 131.52 63.08 2
Paraia 54 172 307 321.06 8.1.49 3 6 1 Parsachuan . 50 72 340 78.73 46.16 1 3 7 8 Pathakbigha 54 153 30 37.96 9.15 2 3 Pathra 54 167 54 172.42 62.90 4 1 1 Riv Patrenga 48 6 33 105.20 64.94 3 2
Pipra 48 45 614 350.32 186.80 5 9 20' 2 12 7 Pipra 52 138 169 205.26 114.93 5 1 3 1 Piroji 52 114 U 72.96 40.96 1.00 2 Pithari 48 13 56 205.90 50.57 2 Pithoura 48 10 229 62.18 31.10 2 14 2 9 4-
Polda alias Majhauli 48 53 86 146.20 74.89 4 4 3 3 Rabdi 54 178 203 NA NA 2 3 1 2 Rahria 50 87 17 1.'i7.60 51.58 2 4 1 ]
Rajhar 52 120 107 55.03 5.32 1 1 Rajokhar alias Rooga 48 5 4 137.25 50.19
Rampur 50 71 U IB8.18 47.67 Ranjitpur 48 47 U 25.35 6.34 Rengania /llill' Goia 50 68 U 43.51 28.35 Rongha alias Belaudar 48 14 U 91.93 0.22 Saguna 50 93 U 100.B3 30.62

164 PALAMAU BIHAR
VILLAGE DIRECTORY
SUBDIVISION SADAR
ANCHAL HARIHARGAN]
Reference to Village Drinking Statistics Population Area in acres Irrigation facilities water-eupply Transport
Maus8 ..----"---- 1951 r-t--~_,.__~ ,-------"-----._.. ~__,.__-~--., r-""'--. PageSorial
no. no. Cropped Irrigated B C T W Ors. P K Ors. B C
2 3 .f. 5 6 7 8 9 10 11 12 13 14 15 16
Salaia 54 169 287 4,42.45 99.94 4 5 4 Sotmail 48 16 U 78.72 3·L40 1 Riv Saraia 48 8 283 69.43 7 13 5 2 Sarsot 54 165 53 192.11 108.51 7 5 5 2 .') 1 Satganwan alias Hariharganj 52 147 2,694 ~04.4·3 225.13 10 0.25 5 139 12 4Tw 10 68
Semarbar 50 78 366 126.74- 38.06 5 5 8 3 Semaria 48 17 U NA NA .. , (
Shakaldipa 48 33 248 334.16 70.06 4- 1 1 8 5 Shikarpur 50 98 106 145.86 56.65 4 3 3 2 Shiripalpur 48 43 38 192.45 . 38.34 2 3 1 1
Sirnia 50 58 U 41.55 26.70 .. Sobhichak 48 12 56 NA NA 1 5 1 7 Sobhnath Chak 52 125 38 NA - NA 3 2 Sonbe 50 90 105 91.45 49.53 5 2 1 Sultani 50 67 510 43.72 35.81 2 17 2 17 8
Tarachak 52 113 57 58.41 46.23 1 1 Tarwa alias Akouni 54 158 III Na NA 2 2 2 Tatrwa aliaf Ja~ispur 48 25 U NA NA Tarwan 52 123 U NA NA Tarwan Kalan 50 88 129 88.20 57:91 3 3 3 2
Tarwan Khurd 52 146 42 137.73 23.86 2 Riv Tendua Kalan 52 129 291 190.82 176.93 6 8 5 1l 5 Tendua Pipra 48 36 30 87.07 0.55 1 1 I Tendudih 48 37 86 279.70 0.43 1 1 4 Tendui 48 26 267 357.12 132.37 3 4 2 3 6
Tetaria 54 150 123 183.62 8.14 2 3 Riv Tharghdt 52 133 U 136.57 56.25 Turi 54 156 274 632.13 6.13 4 5 Riv 2
ANCHAL TOTAL 24,697 26,753.01 8,631.44 275 4,49 20 242 544 286 311 2.)8

PALAMAU
Ahori Amwa Angra
Mauza
Anjan Mayapur Arerlana
Bagaia .. Baghmari alias Pakbalmar .. Raida Kalan Baida Khurd Balgara Kalan
Balgara Khurd Bandua Banjari Barahmoriya Bardiha
Barwadih Rasabar Basdah Basu Batsara
Bhonga Bhusra • Bijra Bikua Rjsunl'ura
Boradah Buchi Lami Buka Burhi Chakrudarpur
Chandeya Chetma Chetma Chhechhauri Chilhi
Chougain Churadohar Dandai Darha Derwa
Dhangain Dhangardiha Dhangardiha Diharia Dipaua
Dulhi Dumri Durhi Gahar Pathra Gamhetha
Reference to Village Statistics Population .- ... ...... 1951
165
VILLAGE DIRECTORY
SUBDIVISION SADAR
ANCHAL PATAN
Area in acres Irrigation facilities ------- r------.",._-----~
Drinkin~ water.supply
,..----".,..._---....
,BIHAR
Transport ,....-oA--.
Page Serial DO. no. Cropped Irrigated B C
8
T
9
WOre. p K
13
1 3 8
On. B C
16 2 3
56 2 60 94 60 119 56 43 60 118
62 153 64 184 56 30 56 29 62 163
62 62 62 58 60
56 62 58 56 58
164 139 131 87
103
4 144
61 20 73
58 76 56 27 58 67 62 128 60 125
64 181 56 13 64 177 64 179 56 9
60 100 60 121 64 176 56 3 56 I
60 95 62 145 60 ll3 60 102 56 5
60 58 64 60 62
II I 56
180 104 150
56 8 56 11 62 142 58 82 56 37
U 17fl.64 242 125.50 266 306.88
U 123.08 377 322.71
219 159 562
U 82
U 9
63 397 388
170.55 83.19
192.85 79.00
187.45
90.23 131.30 188.91 444.94 114.25
258 302.18 45 165.91 19 925.73
376 273.80 257 1,037.18
104 314 90 70 83
133 322 46 U 54
U 489
43 712 162
l]
51i1-132
97 U
322 84
454 75 .
425
497 96
168 656 256
195.34-244.75 83.17
194.29 71.94
287.97 179.94 76.73
100.71 183.20
31.77 484.74-
76.62 446.78 398.8<1:
43.82 463.75 136.91 132.11 115.50
100.48 67.47 357.97 131.76 237.09
445.70 242.89 198.71 518.03 194.53
6 7
113.118 57.36 4 87.72 4 57.64 97.37 I-+
85.76 5 38.96 1
102.27 3 25.65 2 74.28 8
15.12 7.02 3.1-5
44.611 70.33
139.11 95.23
127.21 40.26
139.38
2 1 5 .. 4 0.09 3
2 3 3 2.00 1 6
32.59 4 91.84 15 0.25 9.17 3 0.25
42.00 10 0.13 23.72 2
80.64 5 .. 9·U6 3 0.25
23.07 155.33 0.50
26.48 4-300.43 24-
33.44 I 197.68 8 182.60 2
21.01 3 0.11 220.4Q 9 70.81 66.53 4-28.27 5
50.88 20.02
152.07 49.31
116.44
7 1 7
378.05 3 0.50 137.10 2 0.25 76.30 3
139.17 10 0.09 41.89 4
2
3
10
7
1 1
I
5 3-I
3 I I 3
I 5
of.
5
3
I 1
'6 2
I 8
II
7 •
12
7
10
5
3
2
I 2 4-
2 I
I 2
I 6 I 1 I
2 4
2
12
3 6
35
I 4-2 5
5
3 IS
·13
10 30
2 I
5 7
5 16 I 5 10 3 5
7 1 1
4-1 4-
14-
7 1 I
13 I
8 4 3
8 5 4-2
5 4 5 5 5
14
Riv
Riv Riv
Riv Riv Riv
Riv
Riv
Riv
Riv
15
4-
2
9 11
2
2
.. 5
Riv 2
Riv 2
Riv Riv
Riv
5
1
1 3
10
2
15
.. , 5 3
4
2 3
I 3
2
·2
4-
I I
2 3
I I
7 2

166 PALAMAU BIHAR.
VILLAGE DIRECTORY
SUBDIVISION SADAR
AN~HAL PATAN
Reference to Village Drinking Statistics Population Area in acres Irrigation facilities \\'ater.supply Transport
Maus. r--- ........ _--"'\ 1951 ,.--- ..... ,.-- -. r---".__--..... ,..---.A----, Page Serial
Irrigated B no. no. Cropped C T W Orl. P K Ot'S. B C
2 3 ~ 5 6 7 8 9 10 I] 12 13 14- 15 16
Gangatua 1 56 28 292 193.16 82.24 6 1 16 1 2 Gareriadih 56 19 716 653.82 58.38 4 1 3 25 3 3 Gari KhdS 56 24 675 5511.86 88.05 4 21 8 10 Riv 1 20 Garo 60 99 U 28.32 ]5.71 I 0.11 .I. GhurJewa 58 86 U 267.97 53.25
Gulhana 58 66 495 487.28 4R.53 8 7 7 Riv 9 Haraiya 58 90 lJ 117.88 42.]0 .. ~ Har<liya Kalan ., 64 183 176 92.80 28.24 2 4 2 6 Riv 1 3 Har.uya Khurd alias Doamba 64 186 :m 145.66 55.62 4 1 2 8 1 ] Hesla alias Kaswa Khar 64 173 230 376.63 18406 8 2 4- Riv
Hisra alias Barwadih 58 79 7'i5 ~50.27 89.28 7 4- 8 15 Ri~
3 9 HonJia 64 174 103 262.03 6075 5 2 2 Hurda~a 62 140 113 153.H 35.03 3 3 4
.Huri alias Barsaitai 58 83 125 1,1-82.72 1-1-012 8 0.63 3 10 6 2 6 Huruhama 58 65 191 202.33 62.42 4 1 3 1
lmli Khas 62 1134 7If! 740.35 262.85 6 6 5 10 8 9 Jagodih 60 120 U 66.64 4.44 2 1 1 Riv Jaimaran Pathra 60 92 '178 407.62 197.18 3 I 3 4-Jaipur 62 155 318 7.19.41 59.57 5 I 4-Janghasi 62 133 853 824.71 273.28 10 1.00 2 10 41 Riv 8 1
Thad 56 15 300 351. 53 262.90 5 3 10 Riv ]hari Nimia 58 74 102 292.53 5.1 i 1 4 4 4- Riv Jitadih 62 143 U 10664 14.41 2 1 Jonra Kaian 58 48 78 216.87 70.10 1 2 4 Jonra Khurd 56 '45 71 83.28 36.30 6 I 1 Rw 1
Rajarma 56 7 203 204.93 90.4') 3 2 3 2 2 3 Kajri 56 25 453 52435 67.45 2 13 8 16 30 Kala Pahar 60 115 Hl7 175.65 43.38 8 2 3 4 Kanaudi 62 135 !8 149.91 6.48 1 1 3 Kanchanpur 62 148 109 162.07 ?8.73 3 I 5 6 .. 3
Kanke Kalan 58 85 840 643.52 145.49 3 3 4 3 Riv 11 Kanke Khurd 58 84 U 262.39 58.84 .. Karar Kalan 60 122 395 363.78 157:51 5 3 13 40 Riv 1 3 Karar Khurd 60 116 174- 233.03 53.44 2 1 2 3 1 1 Kariahar 58 80 498 57526 162.38 4 6 7 8 2
Kathauha 58 72 298 298.24 42.15 8 3 2 3 3 Katri 64 172 47 219.29 57.12 5 3 Riv Kelhar 58 50 749 491.58 191.87 3 5 13 4- 5 Khairdohar 60 124 170 289.46 87.63 7 1 1 8 Khajuri 62 149 510 367.12 134.67 6 2 6 7 2 4
Khamhi 60 110 414 489.16 263.71 4 1.00 2 6 8 Riv 4-Khapar Manda 64 178 112 16.10 KharaunJha 62 127 254 320.fi9 70.76 8 0.38 3 5 4 3 Kisaini 62 165 142 237.97 15.20 1 3 I 1 Kisunpur 60 98 970 416.15 21871 4 0.25 11 14 10 15
Koiriadih Kalan 60 106 183 117.22 61.25 4 5 Riv 2 KoiriadiI, Khurd 60 107 43 57.99 24.41 .. 3 Riv I Kokarsa 56 18 551 521.66 196.45 7 0.50 <15 9 19 6 16 Kolhua 62 166 438 319.24 109.90, 1 2 Riv 1 1 Ko.~iara 62 138 160 198.35 29.32 I 2 4

l()7 PALAMAU BIHAR
VILLAGE DIRECTORY
SUBDIVISION SADAR
ANCHAL PATAN
Reference to Village Drinking Statistics Population Area in acres Irrigation facilities water-1upply. 1_ranspoIt
Mauza ~ 1951 ,..------"------... r------."..._.-----., ,..----.".._----.. ,.--""....--Page Serial no. no. Cropp ed Irrigated B C T W Ors. P K Ors. B C
2 3 ~ 5 6 7 8 9 10 ,11 12 13 14 15 16
Kumhwa 62 132 332 273.06 130.14 5 4 -6 10 Riv 4 3 Kunarbandlt. 56 31 11 158.04 32.10 2 1 I 1 Kunclri 56 40 3 1 \5.04 ·55.91 5 1 Kurwa 60 96 173 144.10 52.98 3 0.17 1 Lamba 58 60 U 167.20 84.44
Lami 56 12 384 233.38 13130 7 0.25 ? 7 18 11 Larbandhwa 62 169 !l8 59.11 1.03 I 2 Riv Lede:ani 62 167 55 102.13 35.67 4 2 3 3 Riv 1 3 Lohancii 56 21 260 366.97 81.20 '3 1 1 10 9 3 Lohanra 56 23 512 302.71 57.04 9 11 6 16 Riv 3 20
Loing.! 60 117 706 617.62 191.111 12 4- 4 40 Riv 3 Mahuhya 56 39 3(\0 192.73 3.89 2 2 Riv' .. Mahuliya '62 158 251 270.77 159.79 I 2 10 2 2 Mahuliya 62 156 694 191.14 112.f;9 7 7 5 3 6 Majhau1i 56 32 168 181.51 74.22 3 2 4 7
Majhiganw 56 10 533 266.22 159.77 4 1.00 5 7 Riv 6 4-Majhauli 62 147 334 145.35 32.64 1 1 14 2 Manahar 56 16 239 176.77 66.21 4 0.25 5 4 3 2 Manika 60 126 299 186.16 109.34 4 1.00 3 20 3 1 Maranya' 58 58 33 35.21 23.76 2 3 3
Mayap1.lr Kalan 56 34 159 216.26 73.29 3 I 3 2 Mayapur Khurd 56 33 174 174.58 37.33 5 3 Meral 58 75 1,003 925.82 146.22 7 5 10 17 Ri\· 7 3 Moreya 60 101 U 121.56 71.10 2 0.17 ., Murma 56 17 914- 269.31 152.01 10 4.00 2 9 25 3 5
Nagesar 56 44 202 136.55 57.71 3 1.00 2 i Riv 2 2 Naudiha 58 64 550 484.17 71.25 3 3 4 1 2 2 Nau~iha 62 168 64 106.96 23.87 J 2 Riv Nawada 62 130 322 247.46 85.51 4 4 3 Riv Nawadih 64 185 73 63.74 21.19 1 4 Riv
Nav.adih Bhurwa 58 88 570 494.64 8841 8 2 7 38 Riv 4 5
Nawa Khas 62 141 987 953.28 397.23 7 1 14 16 )0 10
Nimiya 60 91 121 83.05 35.90 4 3 4 "6
4-Nimiya 58 47 292 116.42 37.97 3 2 3 9 3
Pachkeria 64 182 378 489.13 175.57 .) 2 3 14 Riv 4-
Pahartarlami alias Nawadih 56 26 165 . 264.27 126.74 3 1 8 5 3
Pakaria 62 154 224 67.59 17.66 '3 I 3
Pakri 60 105 ~80 347.44- 132.67 8 20 3 Riv 1 8
Palhe Kalan 55 38 790 452.49 105.71 6 2 21 20 Riv 3 19
Paihe Khurd 58 70 281 730.86 50.86 9 1.00 4 10 Riv
PandejJura 60 109 265 223.65 75.97 4 2 7 6 2 4
Pandwa 56 22 8'24 503.52 101.89 4 2 10 22 Riv 15 35
Patan 58 59 324 209.28 30.99 2 1 8 5 3
Patra 55 14 859 35.1.21 228.95 7 0.25 2 10 15 6 12
Phusna Pathril 58 81 58 273.55 91.51 2 3 3 2
pokha.ia 62 137 131 346.24 17.26 1 1 4
Rabdi 56 6 197 368.85 II 7.60 10 2 4- Riv 5 1
Rabi 60 123 165 133.41 74.99 2 4 9 1 3
RaJhara 60 1I2 449 527.27 183.85 4- 7 2 Riv
Rol 64 171 159 166.09 47.25 3 1 4 Riv 1

168 PALAMAU BIHAR
VILLAGE DlRECTORY
SUBDIVISION SADAR
ANCHAL PATAN
Reference to Village Drinking
Statistics Population Area in aCreS Irrigation facilities water.supply Transport Mauza ~-"--. 1951 ,-----_,.._-----.. r-------".,..___-----.. r----~--- ,.--_,._--
Page Serial no. no. Cropped Irrigated B C T W Ors. P K Ors. B C
2 3 4 5 6 7 8 9 10 11 _ 12 13 14 15 16
Ruddih 62 146 352 32'i.70 77.24 3 ~ 8 :3 J Sadbpur 58 62 316 351.44. 53.79 2 2.00 2 2 3 Riv Saguna 58 51 554 452.90 2()4.S9 4- 36 3 Saguni 56 42 !?S2 158.61 79.1 I 2 2 Sabdewa 60 108 297 247.76 97.92 3 8 6 2 2
Sakaldipa 62 159 56 21,82 6.64 2 3 4 Sakaldipi 62 160 14 41.61 18.60 1 2 Sakanpirhi 58 52 223 282.37 68.1i2 1 .. 14 Sakhua 58 68 382 406.39 52.50 6 0.25 2 9 2 Sakhui 58 69 181 120.09 27.80 6 3 2
Sakhui 58 49 81 113.33 70.02 .. .. 3 4 Sanda 58 63 159 637.27 151.27 7 1.00 3 4 Riv Saraiva 56 36 300 242.70 86.83 4 15 2 13 SarlYJ~ 56 35 U 125.lis 17.45 2 Satantoia 62 162 36 42.37
Sataua 62 157 326 264.92 74.08 4 4 10 Riv 4 1 Sathe 62 161 245 176.87 40.17 2 4 10 Riv 10 4-Semri 58 57 917 420.71 181.40 5 5 12 25 9 10 Sika 58 71 583 \ 46320 37.18 8 1 6 30 Riv 2 4-SikiKalan 58 77 656 623.16 75.60 7 1 2 15 Riv 2 6
Siki Kburd 58 78 433 336.44 32.45 1 3 3 .5 1 Sirma 60 97 843 324.89 138.49 3 0.25 3 7 14 2Tw 8 19 Sale 58 89 618 739.08 138.41 20 1 11 22 Riv 2 3 Somarlih 62 151 5 175.07 80.16 2 Sonpurwa 62 136 13 79.39 0.15 3
Suntha 60 114- 673 336.28 145.14 .. 2 10 20 4 10 Tancwa 58 53 208 201.52 76.13 2 1 25 I Tdaria 60 93 U 131.38 59.01 4 Tilaia 64 175 18 34.72 1 1 Tilkudih 58 55 72 47.26 19.14 2 3 12 Riv
Tisibar 64 170 160 219.45 77.94 8 1 3 Riv Tola Nawada 62 129 23 24.13 1.37 1 Tola Tandwa 58 54 U 81.74 25.27 1 Tu a 62 152 233 157.13 50.09 6 2 8 Tusra 58 46 208 113.40 44.16 2 1 5 :2
Utaki 56 41 521 445.81 184.12 8 10 4 26 Riv 10 4-
ANCHAL TOTAL 51,648 51,235.85 15,923.33 725 20.81 25 305 661 1,361 327 514

169 PALAMAU BIHAR
VILLAGE DIRECTORY
SUBDIVISION SA DAR
ANCHAL BISHRAMPUR
Rererence to Village Drinking Statistics Population Area in acres Irrigation facilities water-supply Transport
Mauza ,.--""""---.... 1951 ,....----..Jtro..-----. .. r------"-- r--,_--.A. __
Page Seriaf r
no. no. Cropped Irrigated B C T W Ors. P K Ors. II C
2 3 ' of. 5 6 7 8 9 10 11 12 IS 1.f. 15 16
Achanga alias Barb 74 175 U NA NA 7 2 Riv Arapur 66 30 61 158:85 26.04 4 4 2 Arhi 68 57 U 98.55 26.03 Not a;~i1abl~' Asnauli 74' 200 240 255.7.1 162.14 12 1 4 6 Riv Ataria 68 66 251 178.35 36.49 5 6
Baghamndwa 70 127 403 NA NA 11 9 25 3 Bairia 68 68 U 52.26 32.02 Not available Balar 74 193 U NA NA Not available Eana " .. 66 32 105 160.21 12.44 2 2' 3 Riv Banaudha 66' Il 66 NI\ NA I I 2
Banaua '66 14- 37 26.34 1 Bankheta 68 52 113 31.07 O.RO 3 3 5 2 Barahmoria Kalan 66 44 285 191.95 31.29 2 4 3 4: Barahmoria Khurd 66 47 83 87.87 19~86 3 .~ 2 Bariganwan 68 67 280 310.57 94.84 17 2 6
B3!launa 66 35 U 158.79 48.64 Not available Basdiha 74 182 292 NA NA I I -7 Basna 66 5l 770 NA NA 9 2 23 36 2 4 Belhara 76 208 491 274.48 34.89 4 8 6 8 Riv 5 3 Bhaduma 72 159 523 NA NA I 11 7
Bhaluani Kalan 70 102 86 324.98 IR.OI 2 2 2 Bhal uani Khurd 70 131 54 127.30 15.89 I . 3- 4: Bhaluhi 70 118 191 172. I 0 13.fl4 2 9 6 2 Bhanrlar 68 73 887 1,07.ll- 136.89 .9 22 22 1 8 Bhatwalia 74 196 441 NA NA 3 8 2 14 2 2
IIhitihara 72 147 312 219.56 72.08 3 3 5 Binhua 70 139 398 315.16 51.80 4- 2 5 12 Birja 72 148 180 414.65 3:'1.94 5 1 5 Bishunpur 70 112 21 23.65 5.75 3 1 1 Bisrampur 70 126 1,96.f. NA NA 6 2 6Tw 33 63 Riv 13 35
Burh Khaira 74 17l 190 NA NA 1 1 2 2 Cbanau Khar 74 186 259 NA NA 3 5 3 2 Chanea 68 53 285 126.94 5 5 12 2 Chapia 74 184 116 NA NA I 1 3 Chaura 74 174 U NA NA
Chechanha 66 49 400 480.46 41.41 1 15 Riv 2 6 Checharia 66 -i3 124 221.33 4-8.46 2 1 3 Checharia 72 163 307 NA NA 8 6 2 Chhatarpur 72 156 '140 NA NA 2 1 4 Riv Chhipadohar Kalan - 70 135 76 '152.34- 29.97 3 2 1 7 ',' .. Chhipadohar Khurd 70 136 75 67.29 41.99 •• I 2 2 Choratia 66 19 160 327.97 56.58 4- _ 2 4 10 Riv 3 Dala Kalan 74 172 611 NA NA 7 4 9 5 4- 1 Dala Khurd 74- 178 109 NA NA 3 2 3 5 .'i Damaro 66 42 300 NA NA 1 I 7 14 Riv
Dandila Kalan 70 105 403 150.41 25.94- 5 9 4- 5. 3 Dandila Khurd 70 106 199 123.84- 7.27 7 5 6 1 4-Daru. 72 145 179 155.93 10.79 4 1 4 Darua 74 176 4-37 NA NA 6 2 11 Riv 1 Deodanr 70 138 415 573.27 305.58 3 3
, 5 20 Riv 2
P-I-22

170 PALAMAU BIHAR
VILLAGE DIRECTORY
SUBDIVISION SADAR
ANCHAL BISHRAMPUR
Reference to Village Drinking Statistics Population Area in aCres Irrigation facilities water-8upply Transport
Mauza 1951 ,- ,------_......__--~- ,- ,_--..A-_--.. Page Serial no.' no. Cropped 11'rigated B C T W Ors. P K Ors. B C
2 3 4- 5, 6 7 8 9 10 11 12 13 14- 15 16
Dhachabar 74- 170 299 NA NA g 2 2 2 Dhanudlh 74- 185 211 NA NA 10 5 1 4-Diharia 70 120 516 307.10 8n.34 5 20 6' 14 3 4 Dindi 66 12 U NA NA Not avaiIable Dulsulma 70 101 44 99.84 36.50 4 3 5
Gltura 66 17 149 552.81 5.43 4 2 3 Riv Gaurletwa 72 155 13n NA Ni\ 2 2 4-Gerua 68 76 30 NA NA 3 1 1 Gbaghua 68 90 151 218.42 48.41 4 2 3 Riv Charatia 66 18 291 305.72 1 15 Riv
Ghasidag _ 66 24 278 492.11 fi.29 2 5 Riv Ghordiha 70 110 433 328.36 86.30 4 3 6 2 2 2 Godarma Kalan 70 107 775 232.00 9.06 10 5 18 16 2 13 Godarma Khurd alias Barwadih 70 121 85 NA NA 3 4- 1 3 Riv Golpa 76 219 129 NA NA 10 3 3 Riv
Guasarai 76 221 150 139.69 62.35 4 1 14 Riv 1 Gurha Kalan 70 117 556 455.88 !84.89 6 10 4 Riv ~ 7 Gurha Khurd 70 116 U 151.82 41.32 N ot a~~ilable Guri 68 77 440 4R4.90 11 2.95 9 ! 17 12 2 3 Hansdaga 68 70 ,H H8.53 206.88 12 2 2 1 •
Harhepa 70 ISO 41 322.30 107.54 8 1 Jl Hatai 66 13 61 122.41 2 1 1 Riv Hisra 76 213 44 136.24- 80.05 4 1 Holga 72 149 66 90.32 21.00 2 1 2 Itko 66 8 713 408.50 83.32 .. 6 7 4 4
Jamari 66 22 215 314.01 41.76 1 6 " Jamdiha 70 137 419 246.76 38.09 3 10 3 25 2 Jarka 68 75 167 82.40 4·3.52 4 1 2 3 4-Jhagarua 70 119 508 478.73 76.01 3 14 1 13 I Jhani 68 80 2 35.68 15.67 1
Jhantinatb 66 25 U 2.89 Jharapdih 68 78 38 11.67 2.02 1 2 Jhllrgara 74 201 U NA NA Not a~~ilable Jharha Kalan 68 84 lI1 122.87 1!l.J9 7 4- 2 I Jharha Khurd 68 83 277 180.76 56.00 7 8 1 2
Jharna Kalan 74 180 326 122.87 19.19 2 5 7 7 2 Jharna Khurd 74 179 150 NA NA 3 3 5 3 Jinjira 68 92 35 42.25 13.24 4 3 1 Riv
" Joga 72 143 720 83.71 2.75 7 2 8 10 Riv 5 2 Kadhwan 70 98 451 929.09 384.57 93 2 14 4 11 9
Kajru Kalan 76 216 896 583.06 313.49 3 2 .. II 6 5 5 Kajru Khurd 76 215 869 337.02 194.63 6 2 14 12 Riv 17 6 Kalianupr 72 146 24 180.72 45.30 1 3 Riv " Kamta 68, 87 175 77.24- 30.09 4- 2 3 I 4-Kanda Khas 66 38 856 NA NA 5 4 42 6 7
Kanti 74 203 53 204.48 108.78 3 3 I 3 " Karamdih 74 197 582 NA NA 3 18 2 13 2 Karcha 68 56 110 348.13 4.36 .. 1 10 Riv Karkata 72 142 618 365.58 .53.19 4- 1 25 1 Kauria 66 20 196 560.58 84.54 I
1 10 ..

171 PALAMAU BIHAR
VILLAGE DIRECTORY
SUBDIVISION SADAR
ANCHAL BISHRAMPUR
Reference to Village
Irrigation facili ties Drinking
Statistics Population Area in acreS water-supply Transport Mauza ,.--~-...., 1951 .----~ r-------"- ,------"'---~ ,__,.A.._ .......
Page Serial no._ no. cropped Irrigated B C T W Ors. P K 01'8. B C
2 3 4 5 6 7 8 9 10 11 12 13 14 15 16
Retat Kalan 68 88 1,035 565.59 484.50 14- 5 16 18 10 Ketat Khurd 68 89 2-1:6 171.63 112.92 3 I 2 ". Khaira 74 181 68 265.94 39.21 I I. 2 Riv Khamdiha 66 34 U 173.90 4.26 Not a~~i1abi~ Khokhma 66 40 40 53.87 3 Riv
Khura 74 204 190 565.67 211.21 3 I 4- Riv Korta 66 27 99 169.90 24.75 2 I 3 Kosiar 70 132 106 267.79 78.81 2 4 1 Kulhi 72 141 86 NA NA 6 2 10 Kulia 74 205 231 436.98 65.98 2 1 5 Riv
Kumbhi Kalan 66 3 233 NA NA 2 2 12 Riv Kumbbi Khurd 66 2 357 498.84 26.87 3 1 2 12 Riv Kundi 70 97 144 348.23 85.66 6 2 5 Kunrwa Kalan 74 191 22'1 NA -NA 3 4- Riv Kunrwa Khurd 74 192 85 NA NA 3
Kusa alias Hengabar 74- 194- U NA NA Not available Kushha Kajru 76 212 82 267.01 175.67 10 1 2 1 Kutmu 74- 183 1,462' 224.72 62.30 4-4 10 44- 23 Riv 23 8 Kutmu 72 154- 358 NA NA 3 9 1 Ladi 66 4-5 U 113.87 1.10 Not available
Lahar Banjari 72 160 986 NA NA 3 2 9 7 Lalgara 68 60 1,450 NA NA 4-2 2 31 6 6 2 Lathea 68 54 U 187.81 Not available I.awar Panru 74 199 986 203.98 162.46 1 1 3 10 Riv Lohardaga 72 153 160 217.26 46.84 5 4- 1
Lotar 68 82 42 252.15 87.51 12 3 2 Lotra 74- 195 103 NA NA 1 2 6 I 3 Lumasat Bahini 72 158 682 NA NA 4 4- 10 8 Riv 1 3 Lumba 68 72 1 1~4.22 20.21 Not available Lurikhuri 70 125 5 40.65 5.10 2 1
Madhuririih alias Tenv.ahi 70 123 106 NA NA 2 2 3 Mahugain 66 26 118 197.28 14.06 2 1 10 1 Mahuganwan 74 202 1,166 645.87 279.84 6 2 18 42 Riv 9 7 MahuH 76 214- U 82.53 63.42 Not available Makai .. 68 85 21 201.64 120.59 7 T
Malhatoli 66 5 180 181.58 3.17 3 1 6 Mallahtoli 68 91 446 230.39 32.49 10 6 10 Riv Malwaria 72 166 355 NA NA 1 5 8 4 Mayapur 70 104 264 NA NA 3 3 2 Murma Kalan 72 168 365 459.05 76.79 8 3 4-
Murma Kalan 68 95 777 NA NA 20 4 7 2 2 2 Munna Khurd 72 169 630 320.89 196.89 5 3 10 ,2 2 Murma Khurd 68 -94 311 340.50 62.25 5 3 3 Riv Murumatuor Maruratu 76 218 370 NA NA 6 4 1 Riv 1 Musikhap 76 211 667 274.79 153.09 g 2 7 8 illv 8 1
Naudiha 68 69 45 194-.86 23.28 5 1 1 1 Naugarha 68 63 566 308.99 74.91 10 2 5 4 Riv 5 Nawa 66 7 573 335.45 181.32 14- 2 8 5 10 10 Nawadih Kalan 70 128 161 433.51 202.57 3 1 5 Riv 1 Nawadih Rhurd 70 103 U 75.30 37.40 Not available

17~ PALAMAU BIHAR
VILLAGE DIRECTORY
SUBD lVIS ION SADAR
ANCHAL BISHRAMPUR
Reference to Village
Irrigati~n racilities Drinking
Statistics Population Area in aCrl'!s water-supply 'transport Mauza
,....---...... ___ 1951 r----.A.----~ ,..------"-------, ,.--------- ,....-_..A.._-.,.
Page Serial Irrigated no. no. Cropped B C T W Ors. P K Ors. B C
2 3 4- 5 6 7 8 9 10 11 12 13 14- 15 16
Nawgarh 72. 157 258 NA NA 1 6 Nenua 66 39 46 111.77 15.46 2 1 4- I Ncori .. , 76 220 111 96.89 48.84 2 2 1 Riv 1
- Nimia 70 100 180 154.00 40.21 .. 1 2 Obra 74 207 491 334.10 50.15 3 7 4 8 Riv 4- 4
Odh Kanda 66 37 U 131.90 41.97 2 1 Riv Ordiha - 74 188 168 NA NA 3 3 2 Oria 72 152 28 198.89 14.76 2 1 Pach~hara Kalan 70 134 20 95.37 12.00 1 Riv Pachghara Khurd 70 113 120 225.38 21.52 .. 1 4- Riv
P~har Gerua 68 71 qO 143.02 30.06 2 2 10 Panjri Kalal] 68 61 600 67.87 22 1 3 10 Riv 1 Panjri Khurd 68 - 62 364' 63.21 0.35 10 2 7 3 3 2 Panrepura 70 122 345 170:82 48.91 1 3 18 2 1 Panrt'pura 72 164 672 NA NA 2 5 3 8 8
Panru 74 198 1,080 817.38 523.17 9 2 15 19 Riv 7 13 Partappur 72 161 U NA NA 2 I Pataria - 66 33 275 295.54 25.26 3 2 10 Pathe 70 115 U 192.M 56.97 Not available Phulia 74 187 421 NA 'NA 3 1 3 4 Riv
Pipra 68 58 161 232:80 81.18 7 3 Pipra 66 28 29 77.61 l.Q4. 1 4 Riv Pippri 76 217 167 140.85 60.50 4- 4 2 r 2 Pokhri 76 210 80 NA NA Not availahle . Rabda 66 46 U 139.09 17.51'\ Not available
Rabda 66 36 439 239.24 97.08 4- 7 20 Riv 2 Rabra 76 222 2117 NA NA 2 8 4- Riv I Rabri 76 223 99 NA NA 6 1 3 Ragda 72 150 19 186.27 29.90 7 2 Rajdiria 66 4 358 6~9.<)6 21.38 -4. .. 18
Rajhara • 66 50 1,152 900.88 30.48 28 10 Riv 13 23 Raj Khar 66 23 u- 538.13 16.04 I Riv Raksa 70 108 240 74.59 0.34 Not available Ramjani Bigha 70 113 37 1)7.07 20.63 4- 2 Ratnag 76 224 600 488.40 140.81 20 2 11 5 Riv 3
Rehla Kalan 70 111 864 183.39 16.70 48 2 Riv 17 78 Rehla Khurd 70 114 366 197.79 18.70 2 16 Riv 1 Sabauna 70 109 399 191.22 26.19 6 2 20 2 Sabaspura 72 144 U NA NA -Not available
. Salhana 74 190 263 NA 1\'A 3 3 4- 2
Sankba 70 96 578 < 326.29 116.02 5 12 .. I 2 Sarauna 66 41 7[r NA NA 3 2 14 Riv 2 Semri 72 167 474 NA NA 7 4 12 7 7 Semeri Kalan 68 65 181 150.86 44.90 6 2 1 Semri Khurd 68 64 184 130.00 35.98 4 5 2 2
Seora 68 59 320 319.61 92.99 7 5 2 Shankardih 68 74 90 34.51 7.63 I I 2 " Sigsigi 72 151 966 491.47 294,77 12 3 II 30 ,9 Sibaldco 74 189 21 NA NA: " 2 Riv Sikni 76 209 U 263.06 34.71 Not available

173 PALAMAU BIHAR
VILLAGE DIRECTORY
SUBDIVISION SADAR
ANCHAL BISHRAMPUR
Reference to Village Drinkin~ Statistics population Area in acres Irripation facilities water-supJlly Tran8port ..-~ 1951 ,.-- _J.. ___ ........
~--- ----""""-------. r-----.,.__--- ,---..,..___ Mauza Page Serial
no. no. Cropped Irrigatl"d B C T W OrB. P K Ou. B C
2 3 4 oS 6 7 8 9 10 II 12 13 14 15 16
Silrlil i 74 206 484 1,18.1.86 293.41 5 5 5 12 Riv 6 Siejo 66 9 151 NA NA 4-Sirha 72 162 510 NA NA 8 2 16 6 12 4 Sobdag Kalan 66 21 204 361.83 18.38 4 1 9 5 Sohdag Khurd 66 6 354 ;359.13 76.70 6 12 - S
Sordiha 70 129 61 NA NA <I- 2 6 2 Riv 4 Sulumdag 72 140 228 912.110 63.47 12 2 5 SU)Jwa alias Amwa 66 48 340 473.07 73.08 15 5 2 4 Tali 66 31 120 181.42 17.85 2 2 8 Riv Tamrlaga 66 15 156 32.5.69 O.IlO 1 2
Tati Pathal 66 16 U 2.78 Nut available Tendua 68 79 U 16.57 8.80 Not avai Id bk Thekhi 66 I 64 G54.:Z~. 2 .. 1 .. Tisibar Kalan 74 173' 894 KA :;\!A 5 [) 7 14 R:, i 5 Ti~ihar Khurd 74 177 364 Nt\ NA 3 3 8 Riv
Titan! 72 16.'i U NA ,"it\ 2 2 TaIra 68 93 819 601.67 254.37 10 1 10 30 1 5 Tona 61l 81 558 598.89 172.78 13 2 7 16 3 3 Tukbera 68 55 529 1127.55 25 .. 'i7 2 20 20 Tlilbull'l 66 29 110 177.32 20.54 2 1 5
Turirlaq 66 10 II NA 1\;A Not availabl .. Ulipahari 70 99 161 163.'::;1 '22.37 2 ! Urdwaf 68 86 100 113.70 72.54 3 .. 1 3 War sulll 70 124 580 IOU.40 1 3 17
ANCHA.L TOTAL 63,824 C2,605.92 10,700.61 1,020 22 231 995 1,380 362 387

174: PALAMA'tJ
BIHAR
VILLAG E DIRECTORY
SUBDIVISION SADAR
ANCHAL MANATU
Reference to Village
Drinking Mauza
Stalistics Population Area in acres Irrigation racilities water..suppl}' Transport ___ ""'--..., 1951 r---"""""---~ ,_-----..... ----, r--_ ..... _--..., ~...__-Page Serial
no, no. Cropped Irrigated B C T W Ors. P K Ortl. B C 2 3 4 5 6 7 8 9 10 P 12 13 14 15 16
Abduldih 80 56 34- 32.06 3.06 2 A-iauriya 78 12 85 157.64- 1. S Apti 84 178 37 12.80 1 Arakanda 82 100 19 111.81 45.20 2 1 Atka 82 96 577 171.11 66.59 2 2 2 9 5 8 Bagahi 82 94 135 23003 0.13 2 6 3 Bagla 84 152 40 378.02 49.56 3 I 1
, Bahorna 82 135 L' 42.15 Not available BajaJpur 82 124 574 408.71 124.58 4 I 30 2 BaJiari 82 140 230 181.17 17.32 2 I 6 TW,Riv 3 L . dl .
78 42 Banasam alIas Mur 101 48 38.78 ., Riv Bansi Khurd 82 125 253 114.64 6.40 1 1 2 7 2 1 Sara 80 84 34 74.83 3.00 " 2 .3 1 Barah Kurwa 30 38 U 31.77 19.00 2 Bariatu 82 97 7 286.74 70.96 4 I 3 2
Barkoma 30 71 203 202.64 9·UR 5 2 Ba.<dewa 80 92 U 58.60 18.06 2 ll ... skatia 34 180 U 3.21-Bedani Kalan 80 85 352 21.92 1..'54 "
. i II 11 11 Badani Khurci 80 77 215 108.29 76.40 2 .3 4 I Bhainsa Sur 80 57 176 86.03 32.06 2 I 2 5 Bh .. l Manda 82 118 U 19.26 21.00 2 I Bheiugari 30 64 482 NA NA 6 I 1 2 48 2 4 Bhanrra 32 '103 113 91.97 14:09 5 3 1 Bhdrathpur 82 108 223 427.65 85.44 14 4 2 2 2
llharli 82 104- 175 115.15 25.46 3 3 6 I Riv 5 Bhitrtiha 78 44 34·5 447.29 49.92 8 4 4- 12 Riv 1 Bhitiahl 34 187 U NA NA .. Bhit Kila 80 53 112 131.17 10.72 2 I 4-Bihra 78 38 34 100.30 10.69 3 1 1
Binaika 34 168 241 143.06 33.51 2 7 Blraunclha 80 72 U 22.10 1 .. .. Birhorwa 78 2 U 20.56 Not available Bishunpur 80 78 50 161.72 67.33 2 I 2 .. Bisranw 84 186 74 38.01 4.17 1 2 2 Budhandih 78 49 180 139.42 29.05 2 2 9 R'v 3 lluclhu Chak 80 82 U 20.05 1 Chaita 84 148 53 83.54 24.37 1 I 1 Chak 78 14 I,G26 216.34 :19.77 3 18 8 Riv 38 Chanlti 78 8 135 87.05 14.74 I 1 3 1
Chaura 32 98 liD 84.11 37.83 3 2 2 1 Chhaknadih 80 69 227 251.56 123.43 5 1 2 3 ] 1 Chhatarpur 84 145 402 299.21 93.01 2 " 5 Rho· I 2 Chhechani 84 156 143 153.05 69.67 3 2 1 3 ] Chilho 80 63 65 209.35 2.66 8 1 3 3 2 2 Chiri Kalan 84 164- 63 92.69 1.75 1 ChiriKhurd 84 169 40 84.98 0.80 1 1 Riv Chopea 80 58 (J 16.21 12.95 1 Chunka 78 18 132 244.01 87.40 12 I' 2 Daldalia 84 189 35 53.02 ·4.30 " 3

175 PALAMAU BIHAR
VILLAGE DIRECTORY
SUBDIVISION S.A':DAR
ANCHAL MAN I\. TU
Reference to Village Drinking Statistics Population Area in acres Irrigation facilities water-supply Transport
Mauza ...--"---.. 1951 ,..--__ '""'-__ ---"'\ ,---___ --A--___ ---.. ".----_-'--~ ,_---.".__-, Page Serial
Irrigated no. no. Cropped . B C T W ora. P K Orl. B C
2 3 '4 5 6 7 8 9 10 11 l,2 13 14 15 16
Delha 110 68 4-21 501.31 188.33 5 II Riv Demugau 84 162 U 61.60 1 Dewdih 80 54 163 136.68 35.93 4 2 1 Dhangaon 82 116 178 17363 84.22 2 1 6 3 f Dhanibigha 78 37 U 1.14 1
Dhobdiha 82 134 U 49.83 8.36 1 .. Dhuma 82 106 260 294.68 47.01 11 2 6 11 Riv 10 2 Dhumkhar 78 9 57 23.83 3 1 1 Riv 3 Dumri 84- 190 296 216.57 17.01 1 1 f Dundu 82 132 195 17466 69.08 2 1 2 27 Riv 12
Gardu 84 159 85 101.68 2.22 .. 2 f .. Garhg,mw 78 22 93 122.10 10.8·l 2 1 Riv 2 Garhwat 78 30 57 65.18 2.87 6 1 1 3 1 Garwat 84 173 160 NA NA " 2 f Gauhi 82 128 379 254.27 84.29 4- 2 3 9 RlV 3
Gaurwiitanr 82 129 * 54.83 1.76 Ghanghri 78 26 88 137.9B 32.37 2 2 2 Gllaro 80 91 U 58.8-1: 21.55 3 1 Ghir~iri 78 17 202 168.66 11.56 2 1 4- Riv Gogda 80 60 .266 117.96 l.49 4- 3 6 2
Goindi 84- 165 594 314.20 21.11 2 2 11 Gulalpur 82 138 U 44.66 35.48 1 .. Gurha 82 105 535 525.44 155.09 18 4- 6 10 Tw,Riv 8 5 Gurturi 82 120 425 395,89 187.13 .. 3 4- 10 Riv 5 5 Hindlya 84 167 109 52.84- 0.34 2 1 3
Jagirha 80 52 88 41.50 4.23 Jagudih 80 66 U 17.12 Jaidu 84- 158 131 175.33 17.13 1 2 Jaleya 78 15 39 43.47 6.49 1 1 Riv Jamuniadih 84 160 113 28.31 0.18 .. 1 2 Riv
Jaspur 78 25 271 349.13 59.36 .. 2 Jaspur 84 170 207 138.85 0.70 .. 1 2 Riv Jhanti 84 176 94 NA NA 1 Jhumri 84 163 70 86.70 1 I Riv Jhurha 80 93 16 11.55 2
Kairarlih 80 50 58 28.07 10.74 3 1 Kamalkeriya 82 113 223 376.15 170.00 7 " 4 Riv Karaila 78 43 158 289.94 112.49 8 2 5 7 Riv 4- 1 Karma 84 150 U 44.51 3.57 3 1 Karma 84 174 132 NA NA .. 1 1 4
Kanna alias Tilha 78 32 31 43.20 1.14 1 1 Karmahi 78 II 46 124.73 7.53 1 2 2 3 Karwat 84 175 U NA NA Kasha 82 126 17 49.16 Riv " Kasiyadih 84 146 60 21.48 6.69 .. 3 3 [
Kasmar 84 151 938 510.97 291.93 R 3' 3 10 47 10 Kedal \ . 84 182 136 156.98 ·1 t.Ol .. 1 1 4 Kekrahi 78 3 U NA NA Khaira 78 40 61 86.35 10.42 2 1 Riv Khankdag 78 7 49 110.62 8.27 1 1 1 2 5
-Included in village Gauhi

176 PALAMAU BIHAR
VILLAGE DIRECTORY
SUBD IVIS ION SADAR
ANCHAL MANATU
Reference to Village Dl'inking Statistics Population Area in acers Irrigation facilities water.,upply Transport _____.._..... 1951 ~~--_, ,.- -,
Maun. Page Serial no. no. Cropped Irrigated B C T W Orl. P K Or •. B C
2 3 4 5 6 7 8 !l 10 II 12 13 14 15 16
Khichariya 82 133 200 135.64 70.18 3 2 I{) Riv Kdiriadib 82 136 J 71 80.24- ~5.63 2 2 10 .1 Korda 84 179 2Q 3.22 Kosiara 82 131 26 99.28 23.15 1 4- Riv Kumhradih 82 121 24- 121.91 16.67 Riv 3 Riv
Kllnrlil]Jur 78 5 74 61.34 1 3 Kusaldih 80 70 57 97.28 43.67 3 1 1 Kusri i8 34 41 41.42 I 3 Riv 3 Lalgara 82 117 325 615.3~ 197.89 12 12 Riv 2 Lohraya 80 62 U 10.56 Not available
Ma.1heva 78 29 88 115.75 43.99 6 .. 1 1 Mahari 89- 73 245 5'31.78 299.85 3 2 3 5 Riv 2 2 Mahuari 84 155 96 119.H 50.10 2
Iii'v 2 2 2
Mahudanr 82 119 149 111.36 80.64 4 2 Riv Majhauli 82 114 265 335.44 134.95 6 1 5 . Majhganwan 82 III 332 221.52 60.62 2 2 4 .. 2 Maihganwan 82 139 78 189.(16 31l.S8 2 1 2Tw 1 Majhouli 78 39 231 174.70 38.11 3 2 4- 7 4 2 Makundpu!' 82 101 U 78.30 34.18 2 .. Manatu 78 41 370 160.64· 5Z·99 6 I 7 6 16 20
Masuria 78 10 II4 150.31 2.36 5 2 14 2 MatjJurhi 80 74 287 9<).09 1.38 3 2 4 1 Mayapur 82 115 U 91.06 37.09 Mi~ir Patra 80 79 38 175.27 1.93 3 2 Milar 84 171 89 13.64 2 I Riv
Morainia 84 183 U NA NA .. Mukta 78 36 18 19.35 5.21 2 Nagarl B4 185 45 41. 77 292 .. T Naudiha 78 28 225 244.93 25.00 " 2 Riv Nallgar B2 141 347 263.1+ 156.62 2 2 9 Tw,Riv
Nawa 78 20 24.5 136.92 13.45 2 2 3 1 2 Nawa 82 142 280 310.49 50.15 3 1 4- 5 2 ,Nawarlih 80 76 157 166.57 76.44 I .. 2 1 Ojha Patra 80 80 22 324.14 1.34 2 2 2 Parhrukhiya 82 112 24- 51.6~ 1.03 .oj.
Paduma 80 55 251 142.79 72.32 6 8 9 5 5 Pakariadih 78 47 IH 350.89 14.B2 4- 2 5 Pakri 80 89 495 284.36 ~ 101.76 3 6 4 13 2 4" Pannadih 80 51 216 77.69 9.26 3 1 1 6 I Parpain 84 147 220 18.66 5.27 .. 1 2 4-
Parsain 82 109 Hl4 ]07.86 22.50 I 2 1 2 Riv 2 2 Parsawan 82 110 363 250.10 49.79 3 4- 3 4 ,
1 Pashar 84 143 341 286.17 127.91 .. 2 6 15 Tw 2 I Pasiy .. 78 2+ 23 :>4.36 .. 1 Pathak Pagar 82 123 529 4'29.27 145.16 4 5 13 Riv 4
Patila 82 122 305 249.37 103.96 .. 4 Riv 1 20 Riv Palra 78 19 U 20.10 Not available Purnadih 84- 177 36 30.44- I Purnahindiya 84 166 32 51.01 1 I 2 Rabrla 78 35 138 108.80 12.92 4 <1: Riv 2

177 PALAMAU BIHAR
'VII;LAGE DIRECTORY . SUBDiVISrON SA DAR
ANCHAL MANATU
Reference to Village Drinking Statistics Population Area in aCres Irrigation facilities water.supply Transport
Mauza ,- . . " 1951 r-- __._, r--- - -, ~_.".._-- ~.........._ ....
Page Serial no. no. Cropped Irrigated B C T W Ors. P K Ors. B C
2 3 4 5 6 , 8 !! ') 11 12 13 14 15 16
Rahea 78 27 249 185.04 13.15 .. 4 Ri" 5 Rajkhcta 78 4- 37 16.77
/ 1 .. .. Rangeya 78 6 '260 191.17 9.96 3 1 14- ... 12 Saingarh 84- 149 '171 234.3!) 86.71 1 3 2 Saraidih 80 59 127 129.31 0.24 5 1 4
Selari 84- 153 330 1,179.06 230.39 6 4 6 35 3 6 Se!ari 80 67 'u 196.77 24.70 Semri 78 31 220 159.11 22.27 7 1 6 4 6 Senoti 80 87 400 455.51 183.75 12 10 20 I 3 5 Seyum Bedani 80 86 38 29.65 0.10 1 3 3 1 3
Sikda 84- 184- 22 17.16 2.07 1 Sikni 84- 188 90 75.75 3.53 1 .. 1 3 .. Sikni 82 102 131 243.33 :f9.60 10 2 2 9 2 2 Sildag 84 181 26 9.23 ',' Riv Sildiliya Kalan .. 82 130 711 507.05 11 ~.77 3 8 10 27 16 . Sildillya Khurd 82 127 171 225.90 177.03 5 2 3 5 2 SiDduriya 80 83 U 22.82 1 Sinjo 84- 154- 163 121.63 41.88 1
ii~ 5 3
Siri KedaJ 82 107 117 79.55 18.42 3 .. I I Riv 2 4 Sohe 84- 172 60 14.10 I Riv
Sonpura 82 137 772 96210 159.99 7 1 9 22 T,Riv 7 !'J Sugi 82 99 403 286.38 115.22 7 3 8 4-Surguja 78 21 216 175.35 5.30 1 3 Riv Tal 84- 161 256 130.70 38.06 1 2 1 Riv Tanrwa 78 16 140 163.21 13.76 .. 2 3 - .. Tanrwa 84 144 304 133.81 52.95 1 .. 10 3 Riv 1 1 Tarhasi 80 81 1,043 267.38 16.77 7 2 6 20 1 Riv,2Tw 1 15 Tariya 80 65 622 600.09 226.43 11 1 2 4 48 4- 5 Teidiha 82 95 134 63.21 14.89 2 3 1 Te,iyadohar 78 45 78 24.92 21.24 2 1 3
Tetar .'. 78 33 143 111.37 20.16 3 .. 1 4- 8 Tetardih 78 46 119 118.73 31.76 2 3 2 Tilha " 78 13 113 122.62 6.42 I 3 6 Tilo 78 48 257 244.36 35.09' 2 12 4 Tiraundha 80' 61 316 219.6.5 1.71 7 3 6 1
Tirwa 80 90 21 74.54 34.20 4 2 Turiadih 78 1 U 22.34 Udaipur 84 157 512 527,43 101.73 6 3 s- 1.') 5 2 Udaipura 80 75 479 448,45 214.12 8 3 8 5 4- 1 Urur 78 23 186 110.32 8.34 1 2 5 4- 1
ANCHAL TOTAL 32,433 29,929'93 7,671.83 477 28 155 438 779 321 186
P-I-23

PALAMAU
NIauza
Adbaura Agheria Kalan Ahmadnagar Akbauri Khap Alinagar
Araji Bhairopur Araji Birgain Araji B;rgain alias Khonchi Araji Dangwar Araj! Kamgarpur
, Araii Ku~umhara Ar ... ]i Langarkot Araji Mojuraha Araji Sheikhpura Araji Sinduna
Araji Teta alias Pokhar Asiknagar alias Kardanda Babhandib Bahadur Bigha Babarpura
Babera BhllC'ra Bah era Baijli Baieaon
Bajardih Baldihri Banahi Baniadib Bardanc!a
Bardiha Barepur Barwadih Barwadih Barwadib
Basaria Basadiha llataua Batau Khal' Bedaulia
Begampura Belaspur Belbigha Beni Kalan Beni Khurd
Bhadua Bbagra Bhagwan Bigha Bhagv. anpur Bhainsra alias Labsera
178 BIHAR
VILLAGE DIRECTORY
SUBDIVISION SADAR
ANCHAL HUS SAINABAD
Reference to Village Statistics Popullltion Area in aCres Irrigation facUities
Drinking water.supply TranspOI1
& 1951 r-- -. r-------J...-.----._, Page Seri~1
,_--__"__-- ...... ,---.,.,.._--
no. no.
2 3
86 . 2 96 237 94 223 92 168 92 167
94 217 94 199 94 194 96 255 94 219
94 208 94 212 88 86 96 267 94 198
94 197 86 47 88 77 96 233 88 57
90 91 96 264 92 173 92 182 90 115
96 86 90 96 86
94 96 86 88 92
94 90 86 86 92
94 90 96 94 94
88 86 94 96 90
246 18 94
263 39
229 262
34 76
174
222 112 44 37
171
2S0 106 253 191 205
71 15
214 244 12~
{-
185 171 136 68
393
U U U U
62
77 U 34 U U
U 334 474
U 111
545 36
148 39
785
54 229 141 631 268
146 710 3114 150 179
97 112 319
5 153
82 574 421 698
.180
300 192
76 64 84
Cropped Irrigated B C
8 5
NA 285.90 101.14 126.52 165.41
123.94 17.11
NA 3R.17 61.71
20.53 46.83 31.71 ~1~82 14.22
1.76 NA
281.11 25.86
236.63
771.32 112.15
99.57 44.85
584.32
149.94 NA
114.25 648.49 494.08
69.65 125.71 210.23
NA 150.83
172.56 220.36 312.57
NA 41.84
95.52 599.04 149.70 650.10 277.02
188.63 NA
118.69 125.7Z 167.31
6 7
NA 97.00 6 0.25 23.69 74.22 5 95.91 3 20.00
10.31 5 -4,.75 NA
9.53 .. 8.18
14.77 19.12
0.68 7.35 5.00
0.88 NA 3
H.60 1 6.65
68.01 3
322.05 9 '55.05 88.09 30.00 23.75 0.25 .'iO.OO
20,91 NA
67.76 167.58 150.31
56.92 43.88
113.87 NA
105.52
72.52 69.38 87.19
NA 22.36
31.57 244.92
56.56 364.70 1 11.82
57.81 NA
33.96 44.27 ·t85
8 2
5
5 1.00
13 1 2 1.00
7 5
14 1.00 1
6 5 1 10.00
T
9
1 1 4,
W Ors. p K
10 11 12 13
1
Z. 2 7 2 7
Not available Not available
2
Not available Not available Not available
Not available
2
1 1 10
3
1 3 5
15 1
3
2
5 3 4 2
2
6 6
5 2
15 I 6 1 5
1 6
11 13
3 28
4 2 7
3 5
13 I 6
2 24 2
20 11
4-9
1 2
17
4-
5
2
18 4-3
1 2
3
2
2
Ors. B C
14
Riy-
15
4-2 1 1
2
16
,2 2 2
Riv Riy 1 . 2
11
6 1
Riv 7
5
4-2Tw I 7
1
2
28 .5-
10 2
1 !! 2
2
6
4-I
1 3
6 2 5 7

179 PALAMAU BIHAR
VILLAGE DIRECTORY
SUBDIVISION SADAR
ANCHAL HUSSAINABAD
Reference to Village Drinking Statistics Population Area in acres Irrigation facilities \\'ater..supply Transport
Mauza r--;"'!__'" 1951 ,...---------. --- ,.--"""---... ,---~~ Page Serial
Irrigated no. no. cropped B C T W Ors. P K Olll. B C
2 3 4 5 6 7 8 . 9 10 11 12 13 14 15 16
Bhairopur 94 215 157 ,40.71 22.80 1 6 Riv 4 1 Bhajania 86 46 1,133 423.68 85,83 2 4 7 12 Riv 12 , 5 Bhali 86 41 412 NA NA 5 1 2 20 10 Bharuhi 88 51 U j19.3S Bhi tarpanti 86 38 136 211.50 50.85 2 2
Bhainsra 90 124 U NA NA Not available Bihari Bigha 94 211 91 74.43 34.02 1 Birdhaur 86 22 437 478·75 14058 7 11 8 5 5 2 Birgain 92 156 59 58.40 26.18 4 4 Bishunpur 94- 202 95 171.76 90.16 .. 1 5 2
Bucihuiol. 96 273 855 871.89 196.38 9 3 0{. Riv 19 10 Bub 92 162 33 1l9.02 52.56 1 2 Ruland Bigha 94 206 180 NA _ NA L 5 3 Chak Bishun 92 153 61 51.94 41.32 3 -3 1 Chandrapur 90 109 91 401.38 32.92 .. 2 3
Chankar Gopal 92 157 334 0{.33.13 232.45 5 3 8 6 2 Chankar Kasturi 92 183 825 723.90 270.90 7 0.50 6 13 2Tw 7 3 Chaparclag Sikni 92 IH 29 200.75 3.90 1 1
~
Chaukari 90 96 1,286 939.79 485.09 8 3 22 17 Tw 14 3 Chaukhanda 92 160 228 120.71 1I2.03 2 1.00 4 8
Chaukhandi" 96 25'1: 56 132.52 40.57 1 4 Checharia 86 4 54 NA NA 1 1 1 Checharia Kalan 88 84 342 330.61 119.37 5 3 5 2 6 2 Cheladih 90 103 95 72.37 32.72 .. 1 3 Chorpahra 90 128 82 394.44 14.10 7
Dali 86 23 225 NA .NA 11 9 Damdami 92 141 146 103.00 21.30 ., 2 I 2 Riv Dandila 90 119 532 266.42 73.52 2 3 9 :Riv Dangwar 96 251 1,413 252.82 82.28 10 15 7 10 11 Darua 94 207 661 47.37 1.17 2 10 8 4
Deori Kalan 90 90 937 978.57- 278.18 5 2 TW,Riv 12 40 Deuri Khurd 88 87 790 315.44 62.18 8 Riv 5 2 Dewan Bigha 90 100 133' 137.74 66.63 2 6 3 Dhania 92 172 14 83.25 28.70 2 1 Dhawalpura 86 12 U NA NA Not available
Dhobni Ekaji Ki te 90 122 U NA NA Not available Dhobni Gairabad 90 123 U NA NA Not !"vailable Dibri Bisrampur 96 271 347 508.95 190.67 15 2 1 3 Duara 92 164 88 114.94- 42.11 2 3 2 Duba 86 16 190 NA NA 4 2 5
Dudhia 88 67 U NA NA Not available Dulhar 96 274 174 265.62 77.24 7 6 3 3 2 Ekauni 96 245 320 425.02 87.61 2 10.00 1 6 2 Riv Ekdari 94 189 49 18&02 97.99 3 0.50 4 3 3 FatUla Chak 94 209 171 90.70 42.12 7
• 3 Gajlbehra 86 20 427 578.76 180.87 5 2 3 Gajrahi •• 86 24 11 NA NA 5 1 1 Gangapur lllill.! Lankasur •• 86 43 U NA NA 6 1 Gaonkhap 92 180 150 244.17 108.99 3 1 1 2 Garurahi 90 111 157 86.35 31.45 1 4 0{. 1

180 PALAMAU BIHAR
VILLAGE DIRECTORY
SUBDIVISrON SA DAR
ANCHAL aus SAINABA,D
Reference to Village
Irrigation facilities 'Drinking
Statistics Population Area in acres water-suppl y Transport Mauza -- . 1951 r-- .__......._ r-----;...-----..... r---""_---~ --Page Serial
no. no. Cropped Irrigated B C T W Ors. P K Ors. B C
2 3 4 5 6 7 8 9 10 11 12 13 14 15 16 r
Ghagra 90 117 241 452.08 22.35 S 4- S Riv Ghurna Araji Nawadih 96 257 U 37.94 17.83 Ghurwa 92 176 120 127.69 97.83 230.00 4-Golhna 88 65 88 17397 60.14 1 4- S Gonradih 86 42 388 NA NA 7 5 10 16 Riv 7
Haidar Nagar 88 74 4,399 1,836.12 361.99 5 125 5 20 150 Hathidaha 88 49 U 20.69 Not available Bemja 88 56 240 194.16 114.90 8 11 2 6 2 Hira "s~kni 92' 145 275 166.26 38.55 .. :i- 3 Hussainbandh 96 239 151 14.50 13.72 .. Imamnagar alias Barewa 88 63 680 356.05 223.90
, 2 10 14 Riv 2
Itbandh 92 146 100 55.52 4.66 1 2 Itwa 88 73 130 276.48 86.55 .. 1 3 ltwan 92 184 89 178.72 91.51 5.00 2 3 Jan.ua 90 116 sSo 800.65' .158.0;4 9 Riv 2
Jamua Kalan 88 64 63 79.02 44.37 3 Jamua Khurd 88 78 11 115.62 13.85 1 1 1 Jhargara 92 161 1,152 1,256.27 298.55 11 2 8 12 Riv 16 3 Jharha 88 54 389 '355.71 141.16 Jharha 96 272 U 80.35 8.24 Not available
Jhari 86 32 317 466.72 195.67 4 13 3 Tw 5 Jhari Khurd 94- 228 201 129.93 91.40 1 5 2, 2 1 Jujhar Sikni 92 143 23 173.27 4.15 1 Riv I Juribandh 96 241 11 22.30 11.20 1 Kabra Kalan 86 7 604 NA NA 7 7 3
Kabra Khurd 88 80 408 289.23 8.32 4 4 8 1 Riv 3 3 Kachra 90 IJ4 841 375.31 172:90 1.00 16 4- Riv 6 12 Kadal Kurmi 88 55 886 458.38 149.97 2 4 5 30 6 2 Kahugarah 88 72 U 2.10 2.10 Not available Kaji Bigha 96 240 5 40.63 11.00
Kajimnagar 90 107 335 479.76 61.62 4- 4 4- Riv 2 Kajrat 96 235 155 413.19 114.82 5.00 1 7 I. Kakoria 96 248 194 273.61 109.65 5 11.00 2 ,Kamat 96 270 345 241.91 , 29.84 I 2 6 1 I Kamgarpur 92 152 475 571.99 228.63 2 I 9 4 4-
Kararia 86 33 213 305.93 146.07 11 2 5 4 2 Karimandih 94 227 87 85.46 42.38 1 1 Kathaundha Khurd alias 94 221 64 108.57 49.48 1
Hussaingar 203 342 135.50 Kathoundha Kalan 94 262.97 18 Tw 14 7
Kemo 90 131 U 23.64 0.50
Kt'swah; alias Chhakauria .. 90 137 U 401.11 133.71 Not available Keswahi alias Tenwahi 90 125 U 36.99 1 Kewalpura 86 40 88 NA NA 1 I Kl'taira 92 158 98 207.05 68.01 5 0.50 2 1 Khalilpur alias Tikri 92 150 226 377.04 187.37 3 2 9
Khardiha 88 75 202 205.96 88.80 4 4- 3 Khardiha 96 268 154 227.09 47.82 3 ., 1 I Khargara 88 81 690 612.90 142.27 5 15 9 4- 4 KharKhol 86 9 8 NA NA 1 Kishunpur 96 269 28 78.64 12.07 1

181 PALAMAU BIHAR
VILLAGE DIRECTORY
SUBDIVISION SADAR
ANCHAL HUSSAINABAD
Rcference to Village Drinking Statistics population Area in acres Irrigation racilitie. wa tcr-supply Transport ,..--......._......, 1951 r------,.",.._--..... ~------ ,---~ ...... r--"---",
Mauza Page Serial no. no. Cropped Irrigatcd B C T W Drs. P K Drs. B C
2 3 4- 5 6 7 8 9 .10 ) 1 12 13 14 15 16
Kodwaria 90 118 U 373.56 4.35 .. Riv Koiriadih 86 1 283 NA NA 2 4 Riv 2 Kolhua $onbarsa 86 28 686 589.75 39.27 6 .. 10 6 7 Konpahari • 92 175 U 170.99 .. Korma 90 93 22 75.17 0.89 .. Koshiara 86 17 478 NA NA 9 6 2 2 Kosi 92 154 391 466.13 195.34 13 0.50 1 13 5 KuarkhlLp 86 8 U NA NA Not available Kukuhi 90' 9B 1,034 270.69 139.16 3 6 21 16 Riv 15 2 Kunrwa Kalan 96 266 205 743.05 125.72 .. 1 4 2
Kunrwa Khurd 88 60 346 421.03 80.31 .. 9 2 6 Kurdag 92· 139 38 258.44- 7.37 .. 2 Riv Kurmipur 92 149 1,232 1,202.46 625,57 4 1 15 9 Riv 15 4 Kusha Naraenpur 94 190 411 100.94 2.4B 2 0.50 .. 12 2 7 5 Kusumhara 94 210 66 NA NA 2 1
Kuswa 90 89 502 566.82 109.67 1 8 10 Riv 9 4-Lamar 96 260 118 306.21 45.45 2 .. 1 Langar Kot 94 201 331 251.57 137.28 12 10 9 S' 15 Lapea 90 105 396 498.91 191.24 6' , .. 6 5 11 8 5 Latpauri 86 27 454 276.17 7.36 3 3 5 T 5 4
LOharpurwa 88 61 476 274.27 162.78 .. 6 10· G Lohbandha 90 135 186 167.08 53.48 1 1 2 Lotania 94- 225 410 474.45 10.97 1 1.00 10 1 Riv 7 Mahuari 90 113 89 NA NA .. .. 2 1 Mahuari 94 224 437 82.24- 42.30 2 18 2 T
Mahudand 92 140 245 306.92 0.50 1 12 Riv Mahur 88 52 88 86.20 1 ~ . Majhauli 92 177 231 165.87 128.14 1.00 5 3T 2
, Majhiaon 94 216 82 118.68 2.76 4 Majuraha 88 88 34- 205.25 II 7.02 1 1
Mali 86 26 219 NA NA 5 2 5 4 Riv 2 lr Malwaria 96 247 55 147.18 90.00 3 '9.00 1 T 3 3 Mandar 94 186 115 142.61 • 69.78 " 5.00 2 2 2 1 Mangardah 90 120 U 13.29 Not available Manikpur Bathani 90 136 U 10.72 Not available
Mankhap 94 192 '102 289.66 100.09 2 1 3 2 Marha 92 185 252 114.50 63.19 5.00 6 4- 2 Mirheiadih 94- 220 U 50.39 14.10 Mobarakpur 92 '151 147 116.64 67.21 3.00 1 - 7 1 5 1 Mohsinnagar alias Moha- 88 50 1,119 630.92 96.73 1 1 11 20 Riv 9 7
mmadganj Mokhar Khurd 86 36 8 NA NA 1 ., ., 1 Mukhar Kalan 88 58 693 713.42 256.41 7 1 2 14 10 T 8 3 Nadiain 96 250 363 799.77 247.20 6 '5 9 2 11 3 Naia 90 134 13 28.01 4.50 3 Nasojamalpur 88 06 U 29.60 9.53 .. 1
I
Naudiha 90 102 453 572.92 345.62 9 3 10 3 Naukainia 90 110 U 922.42 32.43 Nawadih 90 92 U 116.94 65.88 2 .. Nawadih 96 .252 166 83.68 23.26 7 1 4 Nawadih 96 236 163 303.43 56.44- .. 9.00 4' I

182 PALAMAU 1JIHAR
VILLAGE DIRECTORY
SUBD IV!S ION SADAR
ANCHAL HUSSAINABAD
Reference to Village Drinking
TrallSport Statistics Population Area in aCres Irrigation Caeili ties water ... !Upply Mauza ...--~ 1951 .,------"'----- ,.-- ,.,._------.. ,----_ .... _----. ,....----.
Page Serial On. B C no. no. Cropped Irrigated B C T W On. P K
2 3 4 5 6 ? 8 1I 10 11 12 13 It 15 16
Nemhat 92 181 74- 115.77 51.09 6 0.50 2 2 1 2 Nimiahi 90 130 U NA NA Not a;ailable Nokhila 88 59 223 180.47 61.97 ! 2 S Nonil!.dh 96- 242 8 46.65 4.01 o bra 92 170 39 97.55 {8.63 2 10.00 -4
Pachamba 90 101 270 129.88 71.53 2 5 2 Riv 3 Pachpoklid 86 14 25 NA 'NA 1 3 2 Pahtla 90 126 60 50.61 2 Pansa 86 3 1,181 1,300.58 517.66 2 25 ~9 Ri'l,2Tw 19 Panti 86 35 274 97.76 71.24 6' 2 8 -4- 7 2
Parta 88 82 616 567.'21 283.88 4 8 2 Riv 2 Partappur 90 132 103 226.38 47.10 3 1 Palaria .. 88 69 7';9 3i7.o4 102.50 4 1 9 13 5 3 Pathra 94- 187 468 1!9.55 25.57 3 ~ 5 2 Riv 4- -4 Patkhoulia 86 30 139 NA NA 2 7 2 3
Palra Kalan. 92 165 298 385.22 264.61 5 2 6 -{ Palra Khurd 92 166 745 132.70 62.71 6 5 Riv 3 Piparbar .. 94 213 57 115.55 53.15 1 Piprabandh alias Basariadohar 88 48 50 98.52 2.52 I 5 Pokhra 96 238 97 116.02 56.41 <i- 0.30{ 1 2 8 T 5
Pokhraha 92 138 U 60.80 11.47 Not available Pokhrahi 96 249 284 435.28 208.92 2 6 5 2 2 2 Poldih 92 169 636 540.75 387.72 11.00 II 3 11 Riv 8 -{ Poto 86 45 50 109.47 20.72 ~ 1 1 5 1 Raghubir Bigha 96 265 U 74.90 6.25 .. RaJwandha 86 5 195 NA NA 2 Raksahi 96 256 34 105.48 56.30 2 1 2 Rambandh 86 10 359 NA NA 6 6 6 1 Ranadih 86 13 258 NA NA 2 2 Ranidewa 86 6 .%8 NA NA 9 7 3 2
Ra5ulpur 86 25 85 NA NA tl 2 1 2 Ravmbigha 88 79 269 164.98 75.05 2 -{ 2 1 2 Repura 92 148 189 309.48 130.56 1 2 Reria 92 147 U 3!)2.39 137.98 . Not available Reriya 96 259 109 240.09 18121 4 6.00 2 2
Rup Naraenpur 94 196 50 66.34- ~1.34- 1 2 3 Sabano 94 231 455 124.56 69.54 2 7 5 Riv • Sabanwa .86 29 372 NA NA 3 9 13 8 5 Sadajal 94 204 167 147.40 63.22 1 2 4 Saharbehra 86 21 226 174.35 • 81.93 . 5 2 .. Sajwan Salempur 88 83 S04 446.59 238.16 3 5 9 6 2 Salaia TikltI' , 90 133 112 146.18 7.64 2 RiV Salima 96 258 45 102.90 36.43 2 1 1 1 Sandha 92 142 224 442.68 67.50 3 2 2 2 1 Sarea 90 108 860 466.90 104.11 6 2 12 8 -{
Sargara 90 97 391 141.23 103.89 2 1 1 10 .. I Sarhu 90 104 404 415.42 214.01 3 2 2 12 Sarhu 92 179 443 .271.58 202.57 4 8 4- Riv 8 Satbahini 90 121 U 34.91 Not available Semar Khar 88 68 U NA NA Not available

183 PALAMAU BIHAR
VILLAGE DIRECTORY
SUBDIVISION SADAR
ANCHAL HUSSAINABAD
Reference to Village Drinkinjg Statistics populatioB Area in acres Irrigation facilities water-supJlly Transport _........__._ 1951 ,-----J>. __ -. ,- "":-----. .---- ~ ,--_,__..-.
Mauza Page Serial no. no. Cropped Irrigated B C T W Ora. P K QrB. B C
2 3 4- 5 6 7 8 9 10 11 12 13 H- 15 Ii
Semarsot 90 99 81 64.10 29.95 .. 5 12 !J ~ Sewabigha 90 95 4L 48.85 37,22 Not available Sewari alias Man~aldih 96 261 285 NA NA 2 9 4 2 SheikhptU"a. 96 243 J73 258,69 59.52 3 9.00 2 Shiupur 94 18B 85 162.02 53.52 4 2 2 Riv 3
Sinduria 94 195 150 136.07 70.68 3 4- 2 4- 3 RiT 2 Singhna 88 62 374 411.17 100.28 .. 12 8 6 '3 Sitachuan 811 53 U 1.35 Not available Soba 88 70 334 194.42 154.18 5 2 9 4- 4-Sonbarsa 94 226 191 140.21 82.21, 1 13 2
Sonpurwa 88 85 646 592.05' 43.38 4 5 9 2 Riv 2 10 SUkha 92 163 174 78.77 +9.99 2 1.00 I 2 1 Ta ea 92 159 78 76.50 +9.60 2 I 1 Takea Araji Bajardih 94 232 134 22.82 14.27 " " 2 4 .. .. Tara 86 19 257 NA
, NA 7 - 6 2 2
Tendua 96 234 188 72.07 -4-2.47 .. :i 1 ! Tendua Kalan 86 11 129 NA NA I 1 Tendua Khurd 86 31 115 262.90- 104.16 2 6 3 Tenwahi alia& Hathbajhwa" 90 127 U NA NA Not available Teta 94 193 224 +29.46 235.00 5 3 6 6 2 2
Tongra 92 155 368 394.20 180.43 7 1.00 1 12 2 1 1 Upri Kalaa 94 200 429 481.43 256.15 1 1 I 10 5 T,Riv 4 6 Upri Khurd 94 218 334 154.26 60.72 .. 5 5 3 5 2 Urdwar 92 178 395 257.03 122.20 1 7 3 5
ANCHAL TOTAL 71.3~8 60,009.99 20,241.19 535 200.84 55 281 1,338 729 711 474

IM4 PALAMAU BIHAR
VII.LAGE DIRECTORY
SUBDIVISION GARHWA
ANCHAL MEltAL
Reforence to Village Drinking Statistics Population Area in acres Irrigation facilities water-supply Transport
Mauza ,..---.A--~ 1951 ~_A.-_----.. r-------"--------. ~--"------. ,-_,JIt.._ .....
PageSoriaI no. no. Cropped Irrigated B C T W Ors. F K Ors. B C
2 3 4- 5 6 7 8 9 10 11 12 13 14 15 16
Adhaura 98 3 190 283.60 10.36 4- 2 5 1 Adhauri 98 13 180 326.40 96.11 2 12 4-Akalbani 98 23 260 NA NA 18 1 12 9 Riv 12 Arnwar 100 54 11 251.89 43.04 1 1 Arangi 98 24 221 648.03 180.02 12 6 6 9 2"
Ataula 98 40 125 251.76 108.33 7 Riv Aunraiya 98 36 183 381.25 67.56 10 2 Baghauta . ~ 100 57 U NA NA 1 Baghesar 100 68 96 121.31 20.74 2 2 Baherwa 100 63 18 20.47
Bajudih 98 39 305 135.03 67.43 4- 3 5 Bale Khari "U.s Bale Khar 102 95 629 NA NA 12 1 17 Riv Bana 100 69 1,120 1,166.6(1 179.95 16 4- 36 Riv 10 Banajan~ 100 62 129 228.89 36.00 3 3 Banka 98 4- 411 144.23 41..19 2 8 16 5 4
Bankheta 98 22 86 NA NA .. 3 2 2 Banua 98 12 185 t62.74 13.73 2 7 Riv Bardari alias J arhi 100 79 1,393 631.80 114.94 12 2 4 8 Riv 1 6 Basaria • 98 30 340 266.16 53.57 7 1 4 ' .30, 5 4-Baur,aha 98 28 221 319.02 65.89 5 2 8 35 3 3
Bhandar 98 5 283 147.51 57.59 1 4 6 Bhaunraha 100 55 22 10.24 lU.15 1 1 3 Bhirnkhar 98 11 U 34.67 5.34 5 1 Riv Biktam 98 29 625 975.54 272.35 12 2 11 60 II' 12 6 Bokeya 98 38 ,226 172.54 75.05 2 1 1 2
Bulai altas BocH 102 101 410 799.96 105.00 1 3 4- Riv Bulka alias Bairia Damar 102 104 215 336.81 12.84 6 2 9 Riv Chacharia 98 41 623 220.54 0,50 5 10 18 Riv 18 12 Chakri .. 100 84 146 NA NA 1 1 Chama 98 47 882 753.97 205.10 16 6 9 1, 3
Chhaparbar Kalan 98 45 172 NA NA 2 2 7 Chhaparbar Khur4 98 42 155 190.62 93.92 2 1.00 2 7 1 Danrai 102 103 1,086 NA NA 13 1 5 20 Riv 4 9 Dewgana 100 76 675 NA NA 5 2 9 17 ,Riv 1 5 Doni alias Lowadoni 102 ~6 169 NA NA 4- l' 6 Riv
Du1dulwa 100 51 1,117 757.95 82.21 ~ 2 7 29 2 2 Gaibatwa 100 52 U 12.29 Garhauta 98 35 8 163.94- 17.84- 4 Garua 100 77 637 NA NA 1 1 22 Riv 3 Garuasoti 100 60 203 303.20 74.32 6 4 ' 1 2
Gobardaha 100 . 56 373 634.30 94.24- 11 5 22 Riv 2 Gonda 100 72 1,l'40 NA NA 10 10 52 Riv 11 Hara'ndubc: 98 43 9 362.67 130.90 7 1 2 1 Hasandag 100 73 1,061 NA NA 10 4 39 2 3 Jamua 100 67 U NA NA 2
Jarde 102 98 -i-71 92.67 14.25 1 4- 24- Riv Jhakra alias Bailajhakra 102 102 462 624.49" 36.59 1 2 13/ Riv Jhotar 100 83 797 264.50 64.00 3 2 1 4- Riv Kadailia 100 78 97 39.06 30.00 2 1 1 2 Kajrat 100 75 295 NA NA 1 2 3 7 Riv

185 PALAMAU BIHAR
VILLAGE DIRECTORY
SUBDIVISION GARHW A
ANCHAL MERAL
Reference to Village
Area in acres Irrigation facilities Drinking
S tatistic~ Population water-!uppl,y Transport Mauza ,--oA.-----, 1951 ,------~-- • ..- ,----__ .A..
,.--__ .A..-_____ ,......_.A..__...
Page Serial no. no. Cropped Irrigated B C T W Ors. P K Drs. .B C
/
2 3 4 5 6 7 8 9 10 II 12 13 14 15 16
Kamarma 98 31 277 327,45 56.00 4 1 22 4 Kaprat 100 81 120 NA NA 1 1 2 1 Karke 102 99 792 1,189.00 138.08 10 10 5 55 1 3 Karkoma 100 74 903 1,186.76 30.07 43 4 11 32 Riv 10 2'4 Karmahi 98 49 U 205.01 I I Riv
Katri 100 53 U 196.91 36.80 . 3 1 I Katritisar alias Kusmahi 98 '50 99 225.95 30.95 1 1 1 5 Riv Kholra 98 37 221 253.76 94.20 112 3 3 2 'i Khoridih 98 46 358 NA NA 3 4 3 Khundra 98 10 43. 582.72 92.00 8 3
Kolodohar 100 61 149 215.03 16.30 2 1 5 Kotam 100 59 94 NA NA 2 I 1 Kumbhi 98 21 212 NA NA 9 2 7 Riv 2 Lakhea 100 71 542 469.90 50.70 10 5 100 6 5 Latdag 98 16 795 NA NA 7 2 3 33
Lawadohar alias Phulwar .. 100 91 196 275.61 10.98 5 1 6 Riv Lawahi Kalan 102 105 1.127 598.79 91.98 3 6 15 Riv 3 Lawahi Khurd 102 94 372 278.02 136.35 8 4 17 Ri,,- 1 Loadag 98 1 459 408.23 150.75 7 3 22 Ri" Lora 100 85 112 92.41 6.47 1 I 1 T
Mahetam 98 27 U 34.63 10.15 .. Mahudar 102 97 385 NN NA 9 1 13 1 Meral 98 20 2,361 264.57 117.98 20 3 49 21 135 Riv 19 36 Naudiha alias Suarjangha •. 100 92 361 506.28 231.15 7 1 1 8 Riv Nawadih 100 88 67 NA NA 1 1 1 Riv
Okhargara 98 34 1,948 1,200.56 251.47 32 4 24 135 6 30 Panduhan 98 2 631 499.09 179.33 6 21 6 22 . Riv 2 5 Palara 98 8 534 ;i39.43 141.46 6 1 1 1 14 1 2 Pendli 100 66 386 407.04 108.10 7 1 4 4 2 Peskll 98 48 1,027 NA NA 8 2 28 13 Riv 5 14
:Pindra 98 26 142 241.36 35.64 7 ...... Pokharia 100 89 52 55.35 1 1 Riv Rajbandha 98 9 233 506.94 129 .. 'i6 9 3 2 9 Rajhara 98 14 282 195.78 66.02 2 1 2 10 2 6
tRankiadheri 98 7 U 509.56 63.82 4 Riv
Raro 100 90 2,066 NA NA 17 2 3 47 Riv 3 Rejo 100 70 7.50 569.37 114.22 12 3 10 80 2 11 Sangbaria 98 19 413 572.35 80.29 6 6 15 1 1 Serasam 98 15 U 131;19 33.08 3 ... Siho 98 33 196 34Q.42 64.49 10 4
Sikariya 100 86 63 96.90 7.57 2 .. 2 Riv Sikni 98 6 49 234.25 QO.12 6 1 Sikni 98 32 46 299.71 63,41 7 4 Sirhe 98 25 168 328.06 65.81 5 4- 12 1 Sohbaria / .. 98 18 605 365.55 152.67 4 30 4
Sonhe alias Sonehara 102 100 1,236- 1,2,53.68 • 372.33 5 .. 2 25 Riv 4 Soti 100 82 24 NA NA 1 Riv Tarke 98, 44 246 176.13 84.69 4 1 1 21 Riv Tasrar 100 80 658 235.21 158.09 4 3 8 6 Riv Telri alias Pachaur 102 93 559 567.26 201. 75 4 1 3 8 Riv
P-I-24

186 PALAMAU BIHAR
VILLAGE DIRECTORY
SUBDlYISION GARHWA
ANCHAL MERAL
Reference to Village Drinking Statistic. Population Area in acres Irrigation faeilitiel water-supply Trallsport
Mauza r A.. . 1951 .....__-----. r-- --. r-- ,---"""--
Page Serial Irrigated no. no. Cropped B C T W on. P K Ora. B C
2 3 4 5 6 7 8 9 '[0 11 12 13 14 15 16
Tenar 98 17 812 NA NA 5 40 3 5. Tetka Kalaq 100 64 82 156.57 40.90 8 1 Tetka Khurd 100 65 166 226.49 68.66 4 :. 3 1 Riv Tisartetuka 100 58 125 NA NA 5 1 3 5 Riv .. Tori Kalan 100 87 227 NA NA 4 2 4 3 Riv 1
ANCHAL TOTAL 42.233 29,559.93 6,355.44 606 1.00 25 156 365 1,586 125 281)-

187 lPA LAMA U BIHAR
VILLAGE DIRECTORY
SUBDIVISION GARHWA
ANCHAL GARHWA
Reference to Village
Irrigation facilities Drinking
Statist'ic. pOfulation Area in acers water.supply Transport ~.... 951,.-- _, .... ,...--"""'__'_
Mauza Page Serial no. no. Cropped Irrigated B C T W Or •• P K Ors. B C
2 3 4- 5 6 7 8 9 ·10 11 12 13 14 15 16
Achla 104 -17 464 643.04 21 2 3 10 2 Achli 104 27 U 42.49 1 Aseya 108 122 169 289.45 4.43 1 1 2 Riv lIaghauta 106 64 218 208.47 35.55 2 6 11 5 'Baghi 104 29 113 124.77 42.36 1 2
Baghmanwa 106 90 20 NA NA 4 1 1 Riv Baghmar 104 45 80 148.95 23.46 6 2 3 Riv 2 Baligarh 104 15 260 NA NA 5 4 8 Riv 2 Bana 106 74 U 181.80 1l.l7 Bana 108 100 361 144.38 18.77 5 Riv
Banpurwa 104 1 583 647.67 50.71 6 3 11 17 Riv 5 5 Banutikar 106 51 210 , NA NA .. 1 3 Riv Banyae 108 99 277 249.11 64.28 4 •• 2 4- Riv Bardaga 108 123 lOS 252.11 33.80 3 3 Basaha 108 95 -34 178.80 8.81 6 1 Riv
Bauliya 108 128 218 NA NA 4 11 -2 3 4-Bel champa 106 86 576 571.36 13.64 5 5 12 1 Riv 2 2 Belhara 104 14 276 _NA NA 6 3 1 10 Riv 4 Bhadua 104 46 78 202.85 28.09 2 I 1 Riv I Bhaduma 104 42 360 NA NA 2 2 7 7 Riv
Bharatiya 108 114 147 305.90 80.29 4 5 3 1 Riv Bhikhahi 108 121 916 850.98 10.60 34 3 6 Riv Birbandha 104 39 563 404.72 89.40 10 4 50 7 Bishunpur 106 89 59 NA NA 6 2 2 3 Riv 3 2 Bongasi 104- 2 69 257.96 6.40 1 1 2 2 1
Burhi Gamhar 104 44 51 161.30 16.65 2 2 Riv Chak Chhapardaga 108 120 7 104.49 1 Riv Chamrahi 106 70 412 372.40 • 31.72 2 4 9 Riv 2 Cheripokhar 104 11 13 143.07 0.26 Chetna 108 129 145 326.95 7 2 8 7 4-
Chhapardaga 108 119 585 1,340.26 59.09 14 8 9 Riv 1 4 Chhatarpur 106 66 375 620.64- 107.15 4 3 4 23 2 2 Chiraunjiya 106 68 610 702.70 91.51 7 2' 31 47 Riv 7 5 Danda 108 117 1,034- 910.32 43.58 7 3 22 30 Riv Darmi 106 78 523 257.98 89.48 '3 .. 5 2 Riv 3 ~
Datma 108 124 105 143.44- 20.93 5 3 Riv Dhangardiha 104 24 )29 43.61 17.35 2 2 2 Riv 3 Dhonti 106 6Q 268 122.06 20.52 1 2- 3 10 Riv 2 Dohopal 106 50 U 32.03 1.15 Dube Marhatia 104 33 787 751.63 237.03 15 7 11 41 2 4
Dubiahi 106 73 3 171.54 Riv Dumariya 108 101 348 856.40 117.15 1 12 Riv 3 Dumro 106 58 331 153.52 62.73 3 l~ 4 2 2 Gangi Kalan
" 108 106 248 184.30 17.44 3 2 2 Riv ~ . Gangi Khurd 108 104 122 208.81 41.97' 6 3 2 Riv
Garhauta 104 20 , 21 56:10 15.62 . Garnaha 108 107 182 160.64 8.59 3 3 2 Riv Gidha 106 75 121 18.77 4.38 1 .. 1 I Gijna 104 13 220 412.34' 196.41 13 4- 2 IO I Gorheya 108 127 88 265.88 34.56 6 1 2 2 1 2

188 PALAMAU BIHA~
VILLAGE DIRECTORY
SUED IVIS ION GARHWA
ANCHAL GARHWA
Reference to Village Statistics Population Area in aCres Irrigation facili ties
Drinking water-supply Transport
Mauza ,.---"----.. 1951 ,.- -. r---- r---"--~
Page Serial no. no. Cropped Irrigated B C T W Ors. P K On. B C
2 3 4, 5 6 7 8 9 10 11 12 13 14- 15 16
Gurdi 106 84 236 502.30 15.74 3 2 2 4 Riv 1 Haraiya 104 30 295 674.80 269.46 5 2 4 4 T 3 3 Harnathpur 104 26 U 7B.I0 .. if'
Hasker 1M 2B 448 369.14 40.00 B 15 5 2 1 Hur lOB III 143 924.91 285.86 24. 1 2 3 7 1 I
{ala 106 72 181 171.25 51.34 .. 1 ,3 _ argarh .. 104' 38 451 40.47 39.40 6 7 13 Riv 4 Jata 106 59 844 271.96 68.63 3 10, 10 12 Riv 3-Jhaluwa 106 67- 386 235.33 25.62 1 4 5 5 Jhura 104 31 280 257.00 80.16 3 2 3 5 R:v 5
'Jobraiya 106 92 289 NA l'/A 11 6 13 Riv 5 Juti 106 53 94 361.83 45.95 1 1 5 Riv I Kalyanpur 106 54 .813 1,248.26 282.70 22 1 .. 6 28 Riv 1 -Kamta 108- 125 184 212.16 32.20 6 2 3 1 1 'Karcha 108 105 175 226.04 39.05 3 2 2 Riv
Karke 104 35 224 1,070.31 106.36 3 2 4 T 3 Karmahi 106 56 223 102.57 47.39 2 7 1 6 Riv 1 Karua Kalan 104 6 583 834.50 124.12 2 1.00 1 2 6 10 Riv 5 S. Karua Khurd 104 3 "265 203.96 183.79 3 2 12 .. Khajuri 106 63 402 336.42 50.1.5 5 3 7 26 2 2
Khajuri 108 96 42 NA NA 1 .. Khonhar 104- 12 259 451.23 81.00 10 3 5 19 1 3 Kitasoti Kalan 106 49 "217 444.75 35.37 7 I 9 Riv Kitasoti Khurd 104 16 244 NA NA 2 I Riv Korta 108 116 -675 314.72 39.41 2 9 :. 2 6 Riv
Korta 104 9 12 111.27 6:85 3 Riv Korwadih 106 52 732 1,308.26 52.71 3 3 37 Riv 2 Kundi 108 115 241 561.74 80.86 Not available Lagma 106 61 384 235.73 22.39 5 1 4- 14 3 Lakhna 104 5 284 295.85 62.6? 3 3 5 3 4 ,
1 3 Riv 1 Lapo 108 .98 141- 259.29 50.81 7 Loto lQ4 41 501 NA NA I 1 4- 11 6 Madheya lOB 112 939 754.85 144.22 4 12 6 Riv 5 4 Mahadag lOB 108 9 144.24 35.41 Mahulia 104 37 609 NA NA 3 .. 2 4 5 Riv 2
Mahupi 108 113 183 335.86 15.~3 9' 1.00 4 3 Riv Majhganwan 108 109 U NA NA 1 1 Masuriya Kalan 108 102 367 163.98 2.65 1 3 Riv Masuriya Khurd 108 103 99 211.40 18.19 3 4 Merhna Kalan 106 87 437 788.60 2.94 5 3 1 Riv 2
Merhna Khurd 106 88 191 244.58 1 1 .. Riv Motihara 108 118 622 276.54- 33.85 3 .. 3 2 Riv Murka 104 19 U 90.44 31.52 6 1 Narayanpur 104 21 209 142.71 40.29 2 3 24 3 Riv .. 6 Nawada 106 91 678 263.75 41.90 7 13 20 R,iv 2 21
Nawadih 106 65 326 112.12 10.56 2 1 Riv Nawa:dih 106 79 288 '323.19 74.00 6 2 2 Riv I Nawadih 104 4 149 79.16 5.15 1 4 .. 4-Nawadih 104- 18 497 182.44 95.12 6 1 2 6 7, 3 Nawadih 104 36 224 256.90 4.40 3 3 I 3

189 PALAMAU BIHAR
VILLAGE n-IRECTORY
SUBDIVISION GARHWA
ANCHAL GARHWA
Reference to'Village Drinking Statistics Population Area in acres Irrigation racilities w_ater-Iuppl}· Transport
Mauza ,---"----. 1951 ,..----,..,...,---....._ ,.-____ """ ___ _, ,.-___ ,.I'I. ____ _..._
~"""__,
Page Serial no. no. Cropped Irrigated B C T W Ors. P K Ors. B C
2 3 4 5 6 7 8 9 10 11 12 13 14 15 16
Nawadih 106 :48 275 NA NA 6 2 2 Riv ,Nimiyadih 104 23 207 41.03 18.36 1 1 7 o bra 104 40 899 ·369.24 76.52 18 5 7 10 2 Pachkeri 104 47 U ~4.05 2.45 1 1 Pachperwa 104 25 413 119.26 3.33 6
Parihara 104 34 579 520.27 149.69 5 3 44 3 3 Patariya 108 110 143 242.45 17.56 4 11 2 3 4 Patsa 106 77 432 113.16 61.80 7 4 9 1 Patsi 106 76 U 165.32 38.65 .'. Pharatia 108 94 1,072 626.17 56.65 9 2 8 Riv 2
Pipra 108 97 484 381.52 61.43 10 3 10 5 pipra Khurd 106 55 56 205.46 40.15 10 3 2 Riv potma 106 62 347 258.31 28.00 6 1 3 16 7 Pratappur 106 82 586 878.60 81.70 15 " 4 9 Riv 2 1 R~ka 108 126 539 644.03 77.60 6 23 5 6
Salgara 104 7 59 80.00 7.50 1, l' Riv Sangrahe Kalan ." 106 69 409 786.33 37.31 4 4 10 Riv Sangrahe Khurd 106 71 583 717.17 88.16 5 8 25 3 3 Sarjama 106 83 U 110.19 Side Kalan 106 80 124 267.70 11.56 3 2 Riv
Side Khurd 106 81 367 312,65 48,08 12 10 5 Riv 3 Soh 104 22 387 272.50 203.48 5 2 7 10 Riv 5 Sukhbana 106 93 • 307 396.30 89.98 32 3 8 15 Riv 2 2 Tenar 106 57 265 lE6.S7 106.31 II 4 3 2 1 Terhiharaiya 104 8 402 357.35 55.27 4 3 5 Riv 1 4
Tewari Marhat'ia 104 32 508 683,69 373.69 22 5 11 26 Riv 1 3 Tildag 104 10 927 945.21 328.43 lL 4 10 21 8 10 Tulbula 104 43 99 188.68 115.02 4 1 7 Riv Ursugi 106 85 841 538.18 53.98 20 5 30 Riv 3
ANCHAL TOTAL 40,272 41,122.70 6, 7~5.8t 678 2.00 13 153 552 950 100 242

190 PALAMAU BIHAR
VILLAGE nffiECTORY
SUBDIVISION GARHWA
ANCHAL UNTAR.l
Reference to Village Drinking Statistics Population Area in acreS Irrigation facili ties 'I'Iater-supply Transpol
Mauza ~_JIo,o_""""", 1951 ,-___ ..A. __ ~ ,- ,..-----"-_'--. ,--_,.,..._,_
Page Serial no. no. cropped Irri!Jated B C T W ors. p K Ors. B C
2 3 4 5 6 7 8 9 10 11 12 13 14 15
Adhaura 112 69 533 614.46 201.61 7 3 3 Riv Adhauri 112 77 205 213.03 31.41 6 1 10 2 Ahirpurwa 112 57 480 96.27 23.97 2 3 4 Riv 6 Alkar 112 61 202 120.64 16.27 1 2 3 Amhar Khas 114 112 632 1,211.76 234.74 7 8 1 9 Riv
Babhni 110 26 48 300.74 100.90 4 2 Bachhikhoh 114 89 10 48.96 4.06 Baghaundha alias Ramna .. 116 130 1,798 557.61 12.72 9 2 24 69 20 2 Bahiari 112 54 26 52.59 6.95 1 1 Riv Bahiar Kalan 114 100 512 318.07 70.66 6 1 1 18 Riv
Bahiar Khurd 114 98 589 439.28 11.82 3 7 16 Riv Balua Khar 112 85 TJ 72.20 9.29 Bamba 112 50 189 378.70 54.60 2 10 Riv Bankheta 114 101 41 118.85 0.50 1 Riv Barahpati 110 48 U 55.69 27.81 Not available
Baraitanr 110 10 U 1.00 1 Bardiha 112 51 261 235.09 4.49 4 2 2 10 Riv Barodih 110 31 452 215.11 78.24 7 2 Riv 4- 18 Riv 4 Bataua 116 129 113 NA NA I 2 6 2 Bhagadih 116 133 1,331 675.97 368.63 8 3 Tw 10 18 T, Riv 5
Bhainsberhaw 112 72 136 160.75 10.75 2 5 Riv Bhojpur 112 66 678 580.92 166.86 3 5 7 30 Riv 3 Bilaspur 110 22 469 190.99 119.34 1 4 4 Riv Bishunpur 110 19 438 325.93 109.58 1 5 12 10 Bishunpura 114 105 964 627.67 116.40 8 2 7 15 Riv,T 2
Chamar Bahiari 114 9q U 145.40 2.90 Chaukhara 110 34 U 35.94 9.16 Not available Chech"ria 112 60 1,007 290.24 118.32 '5 6 Riv 3 Chi tbisraon 110 47 863 466.12 104.83 11 8 T,Riv 7 Chitri 112 81 240 322.49 54.80 4 3 6 Riv
Dahena 122 64 96 194.64 5 Riv Dar 112 83 73 197.11 11,53 5 Riv Darjia 114 118 127 110.23 21.59 Q 1 6 Deikhoh 110 17 U 17.26 Not available Deogurwa 112 80 21 223.80 5.10 3
Dhamni 112 56 U 223.72 3.00 1 2 1 Riv Gangti 110 21 178 373.74 116.15 4 1 2 3 Riv Garbandh 110 9 1,203 1,063.71 150.10 6 1 1 T Ghaghra 110 20 U NA NA Not available Giddhi 114 120 224 303.92 12.5.80 8 1 3 12
Gordih 110 49 560 213.06 15.77 Not available Halwanta Kalan 110 5 646 464.97 152.16 4 4 8 Halwanta Khurd 110 6 271 159.73 58.21 4 3 4 Haradag Kalan 116 135 838 617.93 1.90 1 25 Riv Har~dag Khurd 116 134 587 710.26 31.07 1 3 43 Riv
Henho 112 55 193 181.89 7i.39 2 3 4 Riv 2 Hulhula Kalan 110 13 105 316.19 68.30 2 2 10 1 Hulhula Khurd 110 12 256 408.17 113.50 4 20 Hurhi 112 84 202 213.43 27.89 12 2 12 Riv Jamua 110 3 413 462.55 23.43 4 1 1 Riv

191 PALAMAU BIHAR
VILLAGE DIRECTORY
SUBD IVIS ION GARHWA
ANCHAL UNTARI
Reference to Village
Area f naCres Drinking
Statistics Populatidn Irrigation facilities water-lupply Transport Mauza 1951 r- ,..--_"""'_--- r- -- ,..--~-.
Page Serial Dropped I1"rj,gated C no. no. B T W Ors. P K Ors. B C
2 3 4 5 6 7 8 9 10 II 12 13 14 15 16
Jamui no 4 380 472.02 - 53.15 7 2 6 Riv 2 2 Jangipur 112 63 796 340.86 15.01 I 4 4 25 4 Jatpura 112 70 198 250.63 36.53 I 1 3 Riv .. Jatpura 114 116 382 390.23 132.09 7 4 14 Riv 2 Jharia 110 23 118 337.83 .50.74 .. 1 2 1
Jhumri 112 65 63 177.94 l' 4 Riv Jogiral Kalan 114 93 283 260.04 97.14 , 6 8 3 Jogiral Khurd 114 92 137 94.16 19.27 2 3 2 Jorma 110 7 187 115.65 2.22 2 5 3 3 Kabisa 114 123 413 538.17 14.79 1 2 2 8 6
Kadhwan 112 73 468. 482.44 58.88 7 3 16 Riv I Kamta 114 113 72 76.97 51.21 3 2 1 1 Karanpura 114 128 429 369.03 190.46 5.00 1 2 6 10 1 Karcha 114 95 229 375.67 29.96 3 3 5 6 2 2 Karkachia lI2 79 55 47.46 1.47 .. 1
Kharatia 114 122 43 258.79 15.85 2 1 3 Kochea 114 109 320 339.81 113.33 4 3 5 12 Riv 8 3 Kodwaria 110 45 U 36.38 15.32 Not available Koindi 112 75 548 226.97 0.26 5 3 12 Riv Kolhua 110 40 287 NA NA 4 I I 5 7
Koljhiki 112 74 612 446.27 11.86 3 6 3 3 1 Korea 110 2 203 292.17 67.74 1.00 3 Riv 1 Korga 114 124 188 397.67 5.20 5 4 Kothilwa alias Shuipur 110 14 183 41.83 1 I.I 1 I 1 4 7 Riv 2 2 Kumba Khurd 110 1 413 1,121.67 45.31 I 2 2 Riv
Kusdanr 112 76 499 415.65 80.62 8 3 30 2 Mahdaia 1)0 25 60 242.32 125.16 1 1 4 Mahuli 112 78 133 155.08 46.12 2 1 1 3 Mahuli Kalan 114 III 209 89.09 .. I 1 3 1 Mahuli Khurd 114 110 156 136.13 28.62 2 I 3 Riv I 2
Majhganwan 116 132 316 346.66 29.07 1 5 5 22 Majhganwan 114 119 129 79.31 41.96 3 " 8 Mahdohar 116 131 239 89.72 23.41 1 1 3 4 1 1 Mangardah 110 37 608 138.74 45.24 1 3 1 8 22 3 Mangra 114 102 334 540.24 181.32 7 4 10 Riv
Manpur 114 127 127 78.18 27.85 1 .. 2 4 Marchwar 110 41 241 133.06 99.53 5 1 1 Riv 3 2 Marwanian 114 125 825 390.76 16.70 4 6 5 9 Riv 10 7 Nagarutari 112 53 2,360 250.78 111.20 1 21 19 Riv 10 37 Narhi 110 46 124 148.20 59.99 2 2 '4 8 2
Narkhoria Kalan 110 38 162 60.21 22.30 3 3 5 Riv 2 2 Narkhoria Khurd 110 IS 328 116.39 42.18 2 3 9 Riv 7 2 Nasa alias Jasa 110 44- 198 443.31 104.50 9 7 2 Riv 2 Nayakharh 112 58 49 132.91 0.66 I 2 Riv Orhea 114 88 84 1 ~5.37 25.16 2
Palhe Kalan 112 71 737 314.99 107.43 7, , 1 40 Palhe Khurd 112 67 110 68.75 16.14- 2 1 1 2 Parasawan 114 97 332 324.92 110.10 3 3 5 18 Riv 6 8 Patagara Kalan 114 107 603 231.06 57.05 3 3 7 3 5 Patagafol Khurd 114 108 185 199.87 73.59 2 2 12 Riv 2 '2

192 PALAMAU BIHAR
VILLAGE DIRECTORY ,
SURD IVI S ION GARHW A
ANCHAL UNTARI
Reference Drinking to Village
Statistics Population Area in aeres Irrigation facilities water-supply Transport Mauza ,----"--....._ 1951 r---.A.o---~ r----.,._----.... ,.---_."._,-----.. ,.--~-....,
Page Serial no. no. Cropped Irrigated B C T W Ors. P K Ors. B C
2 3 4 5 6 7 8 9 10 11 12 13 14 15 16
Patariya Kalan 110 8 238 302.33 93.40 3 5 12 Patari ya Khurd 110 11 304 221.73 77.80 3 1 4 10 T 3 3 Patihari 112 82 669 317.43 36.57 1 2 3 Riv Pato 114 87 U 89.10 1 1 Pindaria 110 16 213 435.00 86.52 7 1 4 5 Riv 2
Pipardih 110 32 430 400.51 145.08 3 14 11 2 2 Pipri Kalan 114 90 847 487.91 11.19 11 9 17 1 Pipri Khurd 114 114 392 408.21 155.40 6 2 6 2 1 puraini lID 39 453 221.17 95 .• 79 6 4 8 T, Riv 3 4 Purnanagar 112 59 252 280.29 107.70 4 3 5 3
Raksa 112 52 287 23.17 0.21 8 7 Riv 1 4 Rohila 114 126 425 369.23 4.90 3 2 I 7 2 1 Saharastal Kalan lID 28 U 273.18 82.03 Not available Saharastal Khurd 110 27 252 184.53 70.04 1 9 6 Riv I 2 Salsaladi 110 43 254 303.98 142.97 9 1 \ 2 6 Riv 5
Sandhea 114 106 188 371.66 55.04 2 2 4 8 Riv 5 Sangbarwa alias Chhapard';ga 114 103 64 136.72 0.56 2 3 Riv Sapahi .. 114 104 373 312.16 78.20 5 2 4 Riv Sarang 114 117 197 326.54 65.49 3 4 6 Saro 112 86 247 411.61 40.73 3 7 3 4
Siddhi 114 121 264 424.10 71.25 3 14 .. bilidag 114 94 1,762 372.79 153.54 3 3 11 125 12 17 Singhpur lID 42 26 193.20 71.21 1 1 Riv Siriatongar 114 91 273 195.61 5.86 I 4 6 Sonbarsa 110 18 15 303.17 107.19 2 2 1
Ii Sondiha 114 115 131 NA NA 3 4 Riv 2 Sonpura 110 33- 69 243.50 85.38 2 1 3 ]lulsulia 110 36 481 306.91 118.37 2 11 6 1 Tandwa 114 96 1,378 215.15 127.99 6 6 42 Riv 2 3 Tenduwa 110 35 17 80.00 64.32 1 1
Tharka 110 29 293 251.70 115.62 8 6 8 12 Tharkia 110 30 184 250.95 123.38 4 4 6 .. Torma 110 24 U 44.98 25.28 Not available Tulsidamar 112 62 18 31.35 (l.51 1 Uska 112 68 277 293.90 95.51 1 .4 Riv
ANCHAL TOTAL " 45,638 37,144.91 8,098.33 362 6.00 13 116 424 1,166 217 246

193 PALAMAU BIHAR
VILLAGE D !RECTORY
SUBD_IV'IS'ION GARHWA
ANCHAL DHURKI
Reference to Village Drinking Statiisticil Population Area in acres Irrigation facilitics water-supply Transport
Mauza ,--"'__' 1951 r---__"__-~ ,.- ""---. ,-----"---~ ,......-.......___. Page Serial no. no. Cropped Irrigated B C T W on. P K Orl. B C
2 3 4 5 6 7 8 9 10 II 12 13 14 15 16
Amba Kborea 118 26 365 48.833 61.66 5 .-. 6 15 3 1-1 BaiIia 118 8 HI NA NA 10 1 4 15 T,Riv 5 3 Baliari alias Siuri 118 27 207 26.79 23.39 3 1 3 Riv Barahsoti 118 28 92 128.76 2 .. 1 1 Ril' Bhanda alias Bhandar 118 32 505 591.49 9 1 ... 5 11 Ril' 1
Bhuinphor 118 19 84 123.80 2.17 5 1 4 Riv Birba 118 7 758 750.33 300.12 5 3 2 25 Riv Bishunia 118 34 96 211.06 4.50 2 2 1 Bulka 120 55 784- NA NA 10 5 5 22 I Chainpur 118 10 177 922.52 &7.53 15 1 4- 5 Riv 4 3
Chana Kalan 120 46 168 N.-\ NA 13 1 3 T Chana Khurd 120 H U NA NA Nat available Chundi 120 56 446 409.80 _ 1.19 8 12 1 31 1 Danrkathsar 118 2 173 188.25 114.38 .. - 1 3 10 2 Dhamdhamia "li", Atiari •. 120 51 197 186.40 '3 6
Dhobni 118 15 167 169.95 5 5 Riv Dudhi alias Paraspani Khurd 118 18 109 148.98 .. \ ... Riv Dusaia 118 13 206 281.20 58.21 4 1 2 3 2T 1 3 Gamharia 120 53 841 79.30 27.24 6 13 ... 1 Ganiari Kalan "lias Phatpani 118 38 726 986.39 I 34.94 5 1 4- 20 Riv 2
Ganiari Khurd 118 35 391 423.34- 5.08 6 2 5 2 Garda 120 50 54 44.901- 8 I 3 Riv Ghaghri 118 11 820 5,536.95 235.58 12 1 ... 6 15 5 - 3 Henhe alias Baraiha 128 49 265 232.12 0.13 .. 1 8 Riv Jaurahi 118 39 U 7.75 Not available
Jhunka 118 12 11 569.70 -54.64 3 4 Jirua 120 54 128 3.76 3.55 2 2 4 R-itl Kadwa 118 17 363 37.67 10.40 9 1 6 Riv Kad wa alias Likhnidhaura 118 30 4-67 733.70 13.00 3 1 6 1 Kalma US 5 U 817.47 292.38 Not available
Karwapahar 120 <i5 183 29'1.66 16.77 3 1 2 6 Kathhar KaliA l18 3 751 695.67 170.60 5 2 .. 26 Riv 2 1 Ketrna 118 . 31 390 410.28 2 1 5 T,Riv I Khala U8 23 549 737.33 2+.57 8 4- 1 8 Riv Khutia lIS 22 507 675.36 107,55 3 :1 1 12 R\v
KumbaKalan 118 16 137 223.H 36.90 5 5 Riv Libra alias Paras Pani Kalan 118 24 436 758.85 94.35 " 6 1 3 Riv' 2 Lolki 120 44 57 84.60 10.65 1 1 ... Riv Machhpui 118 29 15 56.70 0.03 2 I ., Makri 118 9 241 968.68 252.42 11 3 9 Riv 5 I
Mandohar lilia, Kerua 120 52 281 234.40 1.19 1 2 i Riv Mal1dre alias Phephsa 118 20 30 128.97 12.74 2 1 Marchai 118 37 <i19 398.50 13.28 2 I 5 Murhpur alias Pachphri 118 25 20 52.26 3.92 .. I Riv Panghatwa 118 33 201 402.43 6.93 .. 8
"-pokhrahil 120 <is 6 0.10 Not available
_ putur 118 1 677 5.59 1.41 21 2 16 26 Riv 3 1 Raksi 118 14 402 292.35 36.62 7 4- iO Riv 1 Sagma 118 4- 1,066 1,329.l4 77.34 21 15 45 2 Sal urn alias Sakti 1I8 <i2 94 128.63 5 Riv
P-I-25

194 PALAMAU BIHAR
Vn.LAGB DIRECTORY
SUBD IVIS ION GARHWA
ANCHAL DHURKI
Reference to Village '" Drinking Statistics Population Area in acres Irrigation racilitiel water-aupply Transport ...--......._ __
1951 ,.---,.,...--__ .- ,.,... ""'\ ""'"--.
,.---"A. __
Mauza Page Serial no. no. Cropped Irrigated B C T W Ors. P K Ors. B C
2 3 4- 5 6 7 8 9 10 II 12 13 14 15 16
Samo alias Suru 118 21 181 137.31 8.10 5 Riv " Sarda 118 41 166 243.49 2.64 .. 1 7 2 Sendha 118 40 33 98.13 .. 1 Sondiba 118 6 887 NA NA 6 1 9 16 1 1 Tatidiri 118 36 706 533.34 24.56 4 1 4 13 6 Tendra lIlias Dhurld 118 43 281 671.44 30.26 3 1 S 4 Riv 2
ANCHAL TOTAL 17,767 23,665.60 2,282.92 260 12 76 1111 463 38 Jj3

195 PALAMAU BIHAR
VILLAGE DlRECTORY
SUBDIVISION GARHWA
ANCHAL RANKA
Reference to Village Drinking Statistics Population Area in acres Irrigation! acilities water-suppl y Transport
Mauza r---"'""""'---. 1951 ,---_~---"'"\ ,..-_____ Jl.....;._ _____ ,-----,.",...---~ ~------.
Page Serial no. no. Cropped Irrigated B C T W on. P K Ors. B C , 2 3 4 5 6 7 8 9 10 11 12 13 14 15 16
Acbhukhap alias Tetardih •. 124- 83 106 154.42 5 2 Riv Ambowa 126 126 U " fi6.37 1 Antlar 122 34 152 266.22 1 1 4 Riv Baghokundar 122 35 160 213.14 1 2 1 Riv Bahahara 126 109 421 408.16 17.32 .. 6 Riv
Bairiya 126 144 147 NA NA 1 2 2 1 Baligarh 126 136 283 369.06 1 2" 2 Riv 2 1 Banrlu . 122 37 452 405.71 2 s- 10 Riv 3 Bandua 124 64 144 184.77 .. 1 5 Baradih 122 23 228 312.39 2 5 Riv
Bardari 122 40 711 406.41 0.17 6 10 Riv Barwa 126 143 201 NA ~A 1 5 Barwadih 124 63 500 503.75 0.30 2 8 8 Barwah 122 42 248 329.10
4~.93 3 3 1 3 Riv
Belri alias Chinia 122 5 781 645.22 5 2 4 2 2 . Bhadua 122 47 22 29.82 Bhaluani 124- 94 235 294.31 5.41 3 1 8 Bhaunri, 122 41 421 474.20 5 3 3- a 2 7 Bilai tikhair 122 7 283 '416.45 16.14 1 - 4- Riv Birajpur 126 138 241 455.93 0.15 6 1 4 Rh·
Birbandba alias Birbandh •. 124 53 375 164.66 5 2 Bisrampllr 122 .48 330 284.45 0.55 11 7 9 Riv 2 2 Boila 124 89 U 2*1.32
~5.i2 3
Chapkali' alias Chamkali 122 8 379 5'l3.33~ 2 2 4 Chapla lltias Chaphla 124 67 35 298.70 1 3
Chapri 126 122 291 408.45 0.75 2 2 1 Riv ChatakI1lan 126 106 292 393.50 5 7 Chaukrr 124 59 170 76.22 1 1 Riv Cheta alias Betli 122' 17 475 638.82 0.40 2 5 3 Riv Chete 126 128 281 325.21 2 2 Riv
Chi tka alias Chirka 122 6 357 425.72 21.60 3 2 Riv Cbutia .. - 122 49 445 344.78 0.03 8 4 14 Riv 6 5 Chutru 122 38 536 536.07 2 2 5 10 Riv 2 3 Daho 126 114 201 280.49 Riv Daldalia 122 39 - U 20.37
Damaran 122 45 56 102.95 2 Riv Daunadag 124 86 200 139.96 - "0.60 6 1 3 1 Dudhwal 122 22 375 270.66 3 2 1 Riv 4 Duduhara alias Rajbans 122 2 380 344.43 21.64 6 1 ~ ' .. 1 8 Durjan • 126 142 237 270.31 1 1 . 7
Gangudih. 122 25 60 94.44 3 Garhauta alias Gurgur Khari 124 72 120 218.90 7.21 2 1 Riv
alias Semar Khar GaserJa 126 107 365 8S.l7 5.10 7 Riv Gaurgara 126 105 364- 307.79 2 3 Riv Gobardaha 126 137 281 234.05 1 4 Riv 1
Harhe 126 '123 590 617.60 3 Riv Helri alias Chhatailia 122 3 345 446.14 9.97 3 2 5 . , I Hetar 122 26 14 57.22 2 Riv Hetar Kalan "124 61 549 857.47 2.90 2 2 1 6 Hetar Khurd 124 60 151 228.99 '0.45 .. < 1 3 .

196 PALAMAU BIHAR
VILLA,GE.OIRECTORY
SUBDIVISION GARHWA
ANCHAL RANKA
Reference to Village Drinking
, StatistiCs Population Area in acre. Irrigation facilities water...!upply Transport Mauza ...------ 1951 ..... --..., ,----__ --.A... r---"""--t--- ,.--_"__~
page Serial Cropped I,rrigated C no. no. B C T W Ors. P K Ors. B
2 3 4 5 6 7 8 9 10 11 12 13 14 15 16
Homia 126 141 107 115.96 2 1 1 2 Honhe..Kalan J24 77 143 253.92 .. 4 4 12 7T Honhekhurd 124- 76 81 NA NA 2 Riv 1 1 Hurdag 124- 55 348 NA NA 1 Riv Ja10bar 126 108 194 157.51 8.57 .. 3 Riv
Jhagrahe 124- 78 77 47.00 0.59 3 1 1 Jogi-Khura 124- 96 J'30 178.05 2 .. - 1 3 Jalanga 126 III 285 265.81 +.10 1 3 4 Jun 122 30 75 144.87 .. .. I Riv 'J Kachanpur 124- 80 536 223.07 54.73 8 2 4 5 Riv 4
Kanna alilll Khuri 122 10 381 477.04 3 1 5 Riv .. Karri 122 4-3 261 4.92 0.22 1 2 2 I Riv 2 Kasmar 124- 98 9 28.59 I Kasmar 126 121 412 NA NA 2 I 4- Riv 1 2 Kathautia 124.- 62 321 1I54.69 1 2 Riv
Katra 122 46 205 216.48 0.05 1 2 Riv Kedal 124 99 126 122.21 8 Riv Kerwa 126 120 138 262.49 .. Khaparmunda 122 28 38 53.79 1 .. J Riv Khapro 124- 91 633 691.77 49.57 7 1 5 1 Riv
Khardiha 124 82 16t 223.15 O.H 4 S 3· Khura 124 74 81 159.90 16.43 5 .. 5 Riv Kudrum 126 112 138 486.08 13.96 2 2 12 Riv Kundil alial Dol 122 1 866 1,204.92 70.68 9 6 16 Riv Kurumdari 126 133 III 252.99 2.67 1 2 Riv
Kuswar 126 139 254 266.0f " ~ 4 11 Kuttl 126 113 231 194.72 3 3 Laleya alias Saleya 124 85 U 68.64 1 2 Ledikanra 124 90 34- 172.18 .. 3 1 1 Lehda 122 44- U NA NA ",
Lukumbaalias Lukumbar •• 124 70 61 142.53 l6.10 2 2 1 Riv Makhatu 122 27 40 117.42 2 1 Riv Mangrahi 126 116 382 624.63 3 13 Riv 2 Manjhgawan 124 52 234 132.83 10 .. 2 5 2 Riv Manpur 124 92 683 330.33 6 2 3 7 Riv 1
Masri alias Masra .. 122 9 124 249.21 2 1 3 Mungarain alias Mugdah .. 124 97 98 139.48 1 1 2 Riv Murkhur 126 132 62 319.83 1 1 Riv Murli 126 117 159 258.65 7 Nagari 122 24- 180 199.80 2 2 2 Riv
Nagsili 122 11 136 208.62 Nagwa 122 29 U 11.41 Nawabandh 122 36 U 31.57 Nawadih 122 32 14 79.38 2 1 Riv Nawadih 126 125 115 216.42 2 2
Palhe 122 18 203 178.79 1 4 Riv Palhe 124 88 tJ 47.34 1 pargawal 122 31 U NA NA Riv Parsukh<lr 122 13 128 198.27 2 2 Riv Patsar 126 129 290 155.38 1 2

197 PALAMAU BIHAR
VILLAGE DIRECTORY
SUBDIViSION GARHWA
ANCHAL RANKA
Reference to Village
Area in acres Irrigation facil'ities Drinkin~
Statistics Population water-llupply Tran!port Ma.u 1951 ,.-- - \ ~-___,.___----. r
. .. Page Serial
no. no. Cropped Irrigated B C T W Ors. P K Orl. B C
2 ~ f. 5 6 7 8 9 10 11 12 13 14 15 16
pindra 126 1I0 331 386.82 3'.24 .. 2 7 Pundagll. 126 134 '244 381.44 7.66 .. 2 I .j
Purgara 122 20 83 36.71 .. 1 Riv Pur{'gara 126 103 274 NA NA 2 2 .5 Riv Rabda 124- 75 133 190.45 17.13 4 1 2 7
Raksi 126 115 706 1,040.63 34.43 2 3 -i Riv 2 3 Ramkanda ]26 1]8 ],702 ],083.10 20.60 9 2 ~ 9 ~1 Riv 13 Rani cheri 122 4 340 23.91 16.46 3 3 1 . .. 1 Ranka KaiaR 124 87 2,029 857.31 .51.22 10 3 3.5 10 Riv 3 37 Ranka Khurtl 124 79 112 236.7. 0,40 6 Riv I 3
Ranudih 126 130 U 119.17 .. " .. .. " Ratanpura alias Rampura :: 122 Ii- 250 377.82 0.20 3 i 4: 5 Riv I 1 Resrikhari alias Belri .. 122' 15 80 NA NA 2 .. 2 Riv " Rohl-a 126 119 193 347.04 2.15 3 - 2 3 3 .. Sabane 126 135 123 354.81 1 ;r
Salwahi 122 21 U 10.80 1 Riv SerasaIl\ 124 81 165 241.92 0,60 IS 4 ~ Sewadih 124 54 293 316.74 33.76 7 1 5 Riv 2 Bide 122 19 97 ] 06.09 % Riv Sikat 122 12 U 1.3.15
Sikat 126 102 250 152.57 2 2 6 Singa Kalan alias Sarka 124- 56 .48 183.36 4.11 1 2 2 Singa Khurd 124 57 88 102.43 1 3 Singsinga Kalall 124 69 302 637.25 30.15 5 3 ! 7 Singsinga Khutd 124 68 272 299.0i' 7 . ~ Sinjo 12<{- 71 148 181.69 6.20 % 1 Riv Sirki 126 145. 26 94.10 .. 1 Siroi alias Belwadamar 122 33 267 174.77 1 1 t Riv Siroi Kalan 122- 50 443 598.57 1 1 6 Riv Siroi Khurd 122 51 355 414.37 2 4 R,iv
Siswa 126 12-4.- ,167 34-0.88 2 lUv Sonda~ 124 95 477 ~26.34 0{- 1 5 Sonpurwa 124- 93 276 518.18 3 2 5 Suli 126 127 239 ~22.45 1 2 Riv Table 124 65 469 491.36 20.55 .. 2 7 Riv
Tale alias Dal(' 124- 73 95 292.05 114.18 0{- 2 2 Riv Tamge'Kalan 126 104 591 59.35 NA 10 2 22 Riv Tamge Khurd . 126 lOr.. 179 255.05 6 2 3 Riv Tanril 124 66 196 69.90 1 Tcndudih 124 84 108 172.47 0.31 3 l. '., 2 2 Riv
Tetardih 126 140 102 216.53 .. 1 Riv Tuni alias Turimunda 122 16 249 296.14- 3 5 R[v Uehri 124- 58 205 1'23.31 5 2 Udaipur 126 131 848 560.87 0.79 4 5 6 Riv 2 2 U1ka '124- 100 150 185.33 3.75 1 3 .... ANCHAL TOTAL 36,983 38,855.31 764.44322 9 57 248 564 30 118

198 PALAMAU BIHAR
VILLAGE DIRECTORY
SUBDIVISION GARHWA
ANCHAL BHANDARIA
ReforeDcc to Village
Irrigation facilities Drinking
Statistics Population Area in acres water-supply Transport ¥auza _____..._ ...... 1951 ,-J------Jt..----"\ ,-----_,..._----- --, r---.-..-..-----._ ,.-_.A..___..._
PageSorial Irrigated no. no. Cropped B C T W Ors. P K Ors. H C
2 3 4 5 6 7 8 9 10 11 12 IS 14 15 16
AJ:ar 128 40 U 131.86 Riv Bag}1war 128 13 587 555.72 21. 76 3 4 4 5 Riv Banjari 128 20 84 126.72 0.22 2 1 2 1 Riv 1 Barganwa 128- 24 102 118.96 0.24 1 2 1 2 T.Riv 1 Bdrgarh 130 72 965 NA NA 2 1 9 Il 5 2 20
Bari Khajuri 130 67 126 204.53 3 2 I Barko1 Kalan 130 78 518 170.16 8.14 .. 1 • f I Riv Barkol Khurd 130 77 U 377.02 55.57 2 2 9 3 Bayakhura 128 5 50 1£>1.86 5.25 I 1 2 .. Bhajna 130 54 64 102.55 0.08 .. 1
Bhandaria 128 23 537 244.58 1.64 8 3 12 5 Riv 15 Bhejariva 12-S 18 U 23.36 0.15 1 1 Riv Bijka . 128 38 406 489.99 5.24 9 Bijpur alias Barhni 130 70 19 57.24 1 Riv Binda 128 27 310 247.81 22.85 .. 2 7 Riv
·Binjpur 130 60 175 197.15 72.47 2 2 1 2 1 Borri 130 66 4II 263.23 1 6 4 Chapalsi 128 36 13 32.60 2.50
-Chapiya 128 46 162 95.42 Riv Cherno 130 58 174 155.09 3
Chhetki 128 7 97 208.97 12.18 2 1 Riv Dhasni 128 2 59 67.2,5 0.16 .. I 2 Riv Durgadih 128 19 49 51.33 2 1 1 Riv DUlhu 128 41 U NA NA Gariya 128 14 171 223.52 1.75 2 2
Gothani 130 75 195 198.35 36.64 2 2 1 ·Harta 128 35 296 538'.39 4 4- 2 Riv Hesatu 130 64 132 202.75 ., Riv Jarnauti 128 II 394 239.97 2.35 1 4- 6 5 Riv 1 Jane"a 128 I 473 536.54 7.74 5 1 4- 6 Riv 2
-;J onhikhar 128 26 73 53.35 1 1 Riv 1 KauJia 128 IO 200 196.23 2..10 1 6 2 2 b.archali 128 4 440 410.78 160.70 3 7 3 4 T 5 Khaira 130 53 U 8.96 Not available Khajuri 128 12 370 NA NA 5 5 10 4- Riv 2
Khajuri 130 68 488 441.06 4 3 13 6 K:1Ura 130 '52 125 144.85 .1 2 2 Riv Korwadih 128 37 U NA - ~A Not available Korwadih 128 47 U 16.71 0.30 Riv KOTwadih .. 130 56 U 15.00 Not available
Kudgara 130 59 U 29.27 Not available Kulhi 130 65 37 52.65 Riv KuTun 128 39 3.50 304.93 1.23 1 2 9 Kutku 130 55 318 286:27 2.90 5 5 5 4 Riv 2 I.idki 128' 31 152 123.42 Not available
Lodidih 128 21 31 57.20 0.08 2 2 1 2T, Riv Madgari 128 3 1,087 87fl.51 282.16 5 1 9 22 24 Riv 3 3 Madgarsi 128 44- 407 273.02 4 1 2 3 Riv Mallllgain 128 9 93 136.79 0.15 1 2 I Mail alias Phakiradih 128 34 104 329.38 1.00 2 .. \ 1 3

199 PALAMAU BIHAR
VILLAGE DlRECTORY
SUBDIVISION GARHWA
AN'CHAL BHANDARIA
Reference Drinlring to Village
Statistics Population Area in acres Irriga tion facil i ties water-supply Transport Mauza ,--Jl.---, 1951 r------""-----. r----------- ,----""----- ,---........__~
Page Serial no. no. Cropped Irrigated B C T W Ors. P K Ors. B C
2 3 4- 5 6 7 8 9 10 11 12 13 14- 15 16
Manjari 128 30 177 181.33 32.07 I 3 "
Marda 128 16 342 213.12 89.11 6 2 3 3 5 Mutki 130 76 IP.7 138.33 0.68 2 .. Riv I 3 2 Nauka 128 17 341 319.58 2.65 5 2 6 5 Riv 4 2 P~raswara 128 45 473 290.94 0.52 .. I 3 4 4 6
Parro ·128 42 182 155.01 26.02 4 4 1 Path 128 33 193 187.69 .. 2 I 3 Pipra 128 8 78 NA NA I 3 2 Riv Pol pol 130 51 24 72.47 0.04 .. .. ., .. Ri'l Putsora 130 69 U 73.51 Not available
Ramar 128 15 332 300.24 164.47 5 4 4 5 Riv 4 Rodo 128 29 313 349.96 21.75 I 2 5 I Rud 130 61 43 209.93 1 1 Sal0 130 71 963 74.44 0.50 1 I Riv Saneya 130 57 323 l8I.I6 2 2 .. Riv
Sangali 128 32 42 NA NA 1 Saraidih 128 6 524 44.23 11.85 3 4 3 5 Saruwat 130 63 293 240.42 1 1 Riv Sikariya 128 22 U 221.39 0.15 1 1 Sinjo 128 28 143 162.83 27.~8 1 2 Riv
Sinjo 128 50 11. 14.37 Not available Tengari 130 74 127 141.13 1 1 2 Tenhri j30 62 389 325.13 0.43 1 2 1 2 Tewali 128 25 156 171.12 1 1 2 1 Riv 4 Totki 128 43 147 10.7.59 0.10 4 1 2 Riv
Tumera 128 48 62 31.90 0.25
.. 1 Turer 128 49 92 85.03 1 ) 1 Ugra 130 73 331 214.55 19.52 2 2 2 4 2
ANCHAL TOTAL .17.121 14,308.70 1 ,10~.44 113 10 93 167 204 14 101

200 PALAMAU BU
VILLAGE DIRECTORY
SUBDivISION GARHWA
ANCHAL MAJHIAON
Reference to Village
Irrigation rachities Drinking
Statistics Population Area in acres water.supply Tran Mau2:a '---._"'__--"' 1951 .- ~ r----~-._----.... ,--_ .... _---. ,_..--
Page Serial Irrigated B W Ors. P K Ors. no. no. Cropped C T B
2 3 4- 5 6 7 8 9 10 11 12 13 14 15
Achhodih 142 157 175 312.12 145.43 2 4 6 4 Adar 138 115 524 908.68 101. 71 8 2 15. Riv Adhaura 140 138 190 304.72 35.56 2 1 2 Riv Adhaura 134 65 255 217.26 103.24 6 4 3 Akhauri Tah1~ 140 136 362 18Ul8 13.12 4 6· 4
Arnar Chhecharia 142 170 380 509.56 218.68 2 3 9 2 Arndiha 132 29 106 89.51 32.97 1 5 " Babhni 140 134 85 1,042.62 2.28 1 1 Riv b abufa alial Bhandua 134- 49 80 23.21 1 Bahera 134 62 120 232.39 42.87 .. 1 3
Bahera Kalan 140 122 U 190.78 7.89 .. " Bahera Khurd 140 123 .7 105.'76 26.43 2 I I
.Baherwa 132 - 13 265 256 .. 54 61.88 4- 2 5 3 8 Bakoia 144 172 296 452.98 193.99 3 1 12 6 2 Baliari 132 33 1,335 NA .NA .. 15 16 13
Baligarh 142 148 20 297.87 40.95 7 2 3 Barchhahandll 138 113 267 488.86 6.18 2 1 5 Riv Bardiha. .. - 138 106 698 762.57 ~2.89 1 9 15 Basu Khap 138 100 U 52.35 21.45· " 2 .. Be1hath 134 53 385 212.22 73.36 2 4 2 Riv 8
Belopati 138 99 128 73.86 27.23 oi- 7 Benipur 136 79 U NA NA 2 Bhagodih Jalima 142 151 6 601.68 Il6.10 8 2 Bhalui 136 73 151 146.31 '34.62 1 2 2 2 Bhandaria 136 83 233 193.27. 37.56 2 2 4- 3 5
Bhataulia 142 156 U 46.54 2.56 Not available Bhilma 132 20 327 152.22 37.28 2 7 'Riv 5 llhurwa 134 51 142 199.53 85.53 2 1 3 Bhu5ua 142 168 324 366.44 66.75 9 10 2 Riv 11 Birbandha 142 167 80 328.04- 29.09 8 1 1 Riv
Bodra 140 143 585 1.381.22 203.77 8 3 6 5 . .Riv 6 Burhi Khar 144 180 258 432.24 19.91 1 2 Chanchar 134 48 U 111.43 • Chandarpura 142 158 24-5 326.39 61.48 i 2 6 Riv Chandarpura 132 28 U 148.18 61.07 1 Riv "
Chandna 142 16-4:- 368 208.39 69.50 5 * 6 4 Chandri 144 179 137 80.56 36.38 1 2 1 Chatanian 136 89 397 1,259.25 122.63 a 1 .. 1 12 Riv .. Chaukhandi 142 154- U 121.96 3.90 Not available Chaukhaudi 136 76 U NA NA
Chaukhari 132 6 171 76.58 0.20 l' . 3 Checbar;. Kala. 13,6 86 U 98.21 0.67 4-Checharia Khural 136 85 362 120.45 .'19.61 3 3 7 5 Riv 3 Chheriaha . 144 171 U 69.71 1.00 1 1 R:iv 1 .. Choka 132 38 4:01 4:03.63 103.99 11 1 6 7 2 3
Dalko 140 124- 369 136.71 61.09 2 4-Dawankara 140 144- 4~5 509.29 97.47 3 3 5 Riv Dekar 132 39 U 123.20 79.34 .. Dema 134- 70 64 332.59 70.58 2 2 3 Deodih 131, 64 ~45 255.44- 90.86 i 6 2

201 PALAMAU BIHAR
VILLAGE DIRECTORY
SUBDIVISION GARHWA
ANCHAL MA]HIAON
Reference to Village Drinking Statistics Population Area in acreS" , Irrigation facilities water-supply Transport ....--~ -1951 ,-- ___ r------_,,_---..., .--- ~ ,_.-..".__ _
Mauza Page Serial no. no. Cropped Irrigated B C T W Ors. P K Ors. B C
2 3 4 5 6 7 8 9 10 11 ~ 12 13 14 15 16
Dhabria 132 10 226 447.67 2.28 9 4- 2 Dhango 140 125 U 74.72 25.37 1 Dhe1ka 136 87 U 177.42 "- 46.84 4 1 1 Riv Dhelka alias Salga 138 110 348 890.43 4.04 2 30 Riv
, Dube Tahle 140 135 299 183.19 61.85 3 1 1 5 12 , Gahiri 144 177 120 120.10 33.00 4- Riv Ganakpura alias Baghauti 136 75 U 58.56 21.31 2 Gangtaria 140 127 122 227.52 41.48 .. 1 3 Riv Gara Kalan 134 54 100 503.11 112.87 6 2 Riv Gara Khurd 132 40 1,154 383.29 43.71 4 5 24 30 24 8
Gardana 134- 6B 153 210.98 36.20 3 4 3 3 2 Ghatahua Kalan 138 103. 344 241.27 63.80 2 9 18 2 3 Ghurua 134 71 481 178.97 92.73 6 8 14 3 Ghuruakalan 138 120 12 75.00 28.02 1 1 .. Ghurua Khurd 140, 139 462 159.88 60.07 2 5 2 2 2
Ginjal 140 137 33 38.84 10.16 2 Gogea 142 155 42 62.65 18.11 1 2 2 Gopalpur 142, 159 188 NA NA 1 3 3 Riv 4 Gosang 136 92 361 671.22 122.65 10 3 3 .. '" Gujari 132 24 U 33.14 7.87 .,
Hariganwan ". 142 162 162 156.62 88.15 2 6· 1 2 2 Hariganwan 136 95 306 494.84 72.83 7 4 27 3 1 Hundraba 138 - 101 U 87.65 35.85 3 .. Jahar Sarai 142 149 471 845.53 258.18 8 5 13 3 4 Jainagra 134 50 356 266.20 101.41 4 2 2 13 10 1
Jainath alias, Gbordag .138 105 488 575.04 132.55 .. 4 20 Jamua 132 30 127 107.43 49.14 2 2 2 ·1 Jatro . . 132 16 94 608.91 20.27 10 5 1 JatrobanJarl 138. 118 400 837.87 6.75 3 2 3 2 Jaungipur 136 77 59 93.56 8.10 1 1 Riv
Jika Bukcham 138 107 230 497.04 1.65 .. 2 16 Kachar 132 8 21 137.18 4.00 1 1 Tw Kakanpura 132 32 U 66.01 .. Kamat 142 160 409 121.99 73.54 2 4- 2 3 1 Kanri 132 9 725 222.88 1 7 Tw 6 14-
Karamdih 144 173. 440 485.48 113.48 5· 4 6 9 2 Karkata 134 61 278 597.09 367.01 2 5 1 1 Karma 132 18 .11 41.65 22.35 1 ," 1 Karui 140 147 851 716.12 317.40 11 7 5 16 Riv 13 5 Kasnap 134 55 284 153.57 18.03 1 4 6 2 ,Riv 5 3
Kaua Khoh 140 133 305 704.62 501.38 5 5 16 Khajuri Nawadih 142 169 384 410.40 135.65 2 3 12 Riv Kharaundha 134 52 704 456.13 426.88 4 5 4 8 4 Khardiha 138. 109 365 496.64 0.16 2 10 Kharsota 136 72 980 538,59 71.69 12 25 10 9 3
Khutheria 136 93 839 1,023.93 211.46 14 2 5 3 Kirya 138 98 U 270.54 102.36 5- 2 KishuilpU! 132 3 U NA NA Koinbar 142 152- 26 437.64 54.53 3 Kolhua 138 112 307 498.87 3 Riv
~-I-26

202 PALA~U BIHAR
VILLAGE DIRECTORY
SUBDIVISION GARHWA
ANCHAL MAJHIAON
Reference toViUage _ Drinking Statistics Population Area in acres Irrigation facilities water-supply Transport
Mauza 1951 r- r--- r- . Page Serial
no. no. Cropped Irrigated B C T W Ors. P K Ors. B C
2 3 4- 5 6 7 8 9 10 11 12 13 14- 15 16
Korgain 134 46 320 178.29 49.36 5 2 2 3 6 Kuarni 134 44- 140 131.49 32.40 10 1 6 Kundrahe - 140 132 261 456.74 77.25 2 2 6 2 Kurkuta 134 58 ·157 299.41 31.93 2 1 2 Kusahi 132 1 U . 25.91 12.15 .. Kusha 134 69 354 379.29 47.69 4 8 3 2 Lalgara 140 131 252 566.98 25.74- 4 3 3 Lamari Kalan 136 91 844 552.67 159.19 6 8 5 16 6 Lamari Khurd 136 88 162 517.15 22.91 6 3 3 4.- Riv,Tw I Lawa Champa 138 114 231 684.49 2.92 2 5 Riv
Lebhri 138 108 345 350.29 4.37 1 _.
12 2 Ledka J,S6 81 U 23.08 1
" Ledki 136 80 U 33;81 1 1 Loka 140 129 401 500.93 82.15 .. 10 9 Riv 1 Madra Nisf Nijamat ]34 59 396 193.27 60.45 .. .. 2 5 1
Mahatwa.la 132 27 U 52.91 3.15 Mahuli 134 42 214 215.68 -{-7.40 3 6 1
'Mainput>iI 134 60 19 123.89 13.31 1 Majhganwan 140 128 191 259.72 0.73 1 1 3 Majhiganwan 136 74 105 164.05 50.45 5 2 3
Majhganwan Dube BhataJllia 142 163 273 329.29 166.23 9 2 5 I Majhiaon Kalan ., 144 175 1,201 277.33 165.40 1 24.- Riv 5 10 Majhiaon Khurd 144- 176 341 120.94- 47.74 I 5 Riv 5 J Majhganwan 134 47 U 332.53 88.92 3 2 I Marhatia 132 34 138 50.52 37.27 .. Misar Bigha 136 82 27 42.48 7.19 1 3 Misraulia 132 19 14 NA NA 1 1 1 Mlsraulia 138 102 46 114.58 24.16 2 1 Tw 1 Morwe 136 78 1,554- 797.10 41.45 4- 3 9 10 Riv 8 4-Mukhapi 134 45 350 192.32 55.15 4 3 6 2 1
Nainabar 132 12 281 51)9.46 97.57 2 2 2 3 Naubliilma 132 23 116 29.06 2.12 3 Riv· J NauSemaura 132 37 U 312.30, 21.07 3 Riv Nawadih 138 117 58 293.01 15.51 1 2 Riv ·1 Nawadih 123 25 87 166.95 91.03 1 4:
a bra 140 126 389 711.96 43.43 4 4- 4 Riv 3 Panre pura 132- 22 U 43.12 .. 1 Riv Patakpura 132 31 U 57.28 29.28 Not avai1abl~' Patariha 136 97 195 176.52 50.11. 1
.~
, 4 5 3 Patila 132 35 579 757.38 233.77 7 10 14 2
Patriya 132 17 291 458.28 49.39 2 3 3 2 Riv 3 2 Pindrat,a 132 4 U NA NA Not available Pipardih 136 90 238 416.60 39.42 5 10 ,3 4 Riv 4 2 Pirthichak 144- 178 U 425.36 30.71 4 Pirthipur 142 161 82 82.87 48.59 2 3 2
purhe 140 145 523 411.57 87.65 .. 7 ,3 12 Riv .. Raisua 144 174 86 115.88 37.29 2 1 Raja Chatahua 138 104 172 286.49 8.91 1 • .. 1 3 Rambandh 134 57 250 270.73 44.56 2 2 2 3 Rampur 142 165 471 665.81 186.65 17 2 6 17 12 1

203 PALAMAU BIHAR
VILLAGE DIRECTORY
,SUBDIVISION GARHWA
ANCIIAL MAJHIAON
Reference to Village Drinking Statistics Population Area in acreS Irrigation facilities water-supply Transport
Mauza ,---"""'__' 1951 """ ,------,.,.,_----_, ,- ~,..-_J\.._ .....
Page Serial no. no. Cropped Irrigated B C T W ors. P K Or8. B C
2 3 4 5 6 7 8 9 10 1i 12 13 14 15 16
Ranadih 134 56 -4-29 354.91 35.02 15 5 5 4 Ranitali 142 ISO 131 262.45 61.77 2 1 5 Ratamgara 132 14 242 677.87 105.00 9 2 2 10 13 Repura 140 141 97 91.96 79.86 2 .. 4 2 I Sabua 136 96 97 179.03 75.97 7 I 2 5 3
Sahrasta1 138 121 18 70.46 16.59 1 Sakarkoni 142 166 354 313.85 112.71 12 I I 12 I 3 3 Sa1eya 132 11 80 218.39 51.81 2 3 2 2 2 Sanni 136 94 126 383.05 71.92 7 3 Sarki 132 5 792 329.43 158.82 I 15 10 Tw 12 3
Sarkoni 132 21 497 512.85 146.46 4 Riv 3 3 2Tw Sarsatia 140 130 \ 194 5~2.86 10.39 3 I 1 Riv Semaura 132 36 377 101.74 52.77 1 .. Riv 7 I 6 Semrahat 138 119 13'8 Il1.16 74715 3 3 Semri 138 116 363 824.05 33.16 I - 4 2 Riv
Sheikhpura alias.Dhab Sarki 132 2 U NA NA Not available Shiupur 134- 63 532 !:195.78 133.97 11 8 3 2 3 Siuri - 132 , 301 432.09 104.62 6 3 5 3 ., I 1 Sohgara 136 84 279 49.44 18.42 1 2 3 Riv 2 Sonpura 132 26 293 NA NA 1 7
Sonpurwa 142 153 382 484.99 109.74 1 3 10 3 Sonpurwa 134- 43 I Hi5 196.09 76.42 10 f' 3 Sukhnadi 138 1Il 182 750.48 13.52 2 2 Sunripura 132 41 1,20f 177.63 38.80 I 12 16 5 Riv 12 3 Talasbaria 140 142 1tl 477.42 10.~1 2 1 I
Tanrhe 140 146 503 319:67 70.60 .. 16 Ri~ Teliabandh 134 66 23 96.98 27.34 .. 1.00 .. 1 . .. Telia Nijamat 134 67 24 93.52 24.65 1 1 1 Uchri 140 140 246 266.55 196.70 4 2 5 2 I Wolma 132 15 2 436.99 0.20 1
ANCHAL TOTAL 45,46JJ: 55,672.14 11,161.22 527 1,00 27 179 582 729 334 132

204: PALAMAU BIHAR
VILLAGE DIRECTORY
SUBDIVISION GARHWA
ANCHAL BHAWAN'A THPUR.
Reference to Village Drinking Statistics Population Area in acres Irrigation facilities wa t er-stlpply TraDsport
• Mauza ,---"""__' 1951 ,-___ .",... ____ ~---."._---IL--- ;---__ ,..A.. ___ r--~
Page Serial Cropped Irrigated B no. no. C T W Drs. P K Drs. B C
2 3 4 5 6 "I 8 9 10 11 12 13 14 15 16
Adhaura 148 51 76 276.21 130.27 3 1 3 Amrora 146 37 697 703.12 227.28 24 2 4 20 Arangi 146 21 1,373 1,115.76 50.95 25 7 5 Riv Arsali 148 45 1,988 2.217.16 305.93 10 1 20 12 5 Aunraia alias Chauria 146 22 622 919.75 33.41 .. 2 3 Riv
Baitra 146 19 39 929.98 43.15 .. Riv Baksipur 148 61 U 162.80 11.93 I Riv Bahgarh 146 26 685 251.09 39.11 13 8 10 20 Riv 1 Bansani 146 40 1,140 1.395.47 281.20 10 8 7 10 Riv 5 Bansdih Kalan 148 65 382 399.52 61.15 3 5 10 2 Riv
Bansdih Khurd 148 64 105 219.69 9.38 2 2 " 4 Riv Barwari 146 41 275 302.85 30.90 7 2 Riv Bato 148 75 297 514.00 _ 94.82 3 7 1 .. 3 1 Bato Kalan 146 14 250 270.12 71.13 3 3 2 Riv Belabar 146 32 236 270.12 6 1 3 7 10 Riv 3 3
Bhaluhi alias Kariwadib 146 5 630 793.63 68.89 9 1 4- Riv 4 Bhaunathpur 148 44 1,036 558.64 216.30 6 2 10 5 Riv 8 10 Bijdih 146 16 285 124.67 44.88 2 4 2 4 Riv 1 1 Buka 146 43 683 829.45 198.34 13 5 4 5 T 1 1 Chandih 146 17 166 202.23 41.11 3 3 2 3
Chandna 146 2 137 770.84 21.75 3 3 Riv Chandni 146 34 1,163 1,052.30 155.23 11 8 7 15 Riv 2 3 Chapri 148 54 861 415.21 110.17 2 12 6 6 Riv 1 2 Chaura 148 66 165 337.56 33.24 5 1 2 1 Riv Checharia 146 24 487 453.71 36.20 4 5 .. Chhata Kund 146 10 605 232.05 139.14 4 2 6 1 2 Dagar 148 76 247 252.77 40.86 7 3 2 3 2 Daridah ,. 148 78 531 711.35 64.43 5 '8 10 3 3 Dhanimandra 148 49 174 355.68 46.42 4 1 Dumarsota 148 79 1,230 530.48 16.59 3 12 10 20 1I 4.
Gamharia 146 15 48 73.91 24.16 2 Garda 148 50 U 307.01 47.60 7 Ghaghra 148 57 209 302.13 22.84 4 6 Riv GorGanwan 148 56 62 350.95 92.85 1 Gurur 148 68 99 139.70 23.97 2 2
Hariharpur 148 74 1,072 838.99 179.13 20 3 7 8 Riv 4 () Hendea alias Baitri 146 36 311 260.33 24.80 4 .. 2 1 Riv 1 . Hurka 148 71 500 597.92 15.06 4 2 3 2 Riv Husru 146 4 486 763.23 5.58 5 1 1 Riv Kadhwan 148 63 173 207.36 85.18 5
Kailan 148 47 790 85'3.55 58.21 .. 2 16 .. Ketar 146 27 1,040 415.18 126.05 1 8 7 8 Riv 1 2 Ketri 146 25 224 271.37 29.88 5 I 3 5 Riv 1 Khai,rwa 148 59 242 269.86 69.00 1 2 Riv Kharaundhi 146 33 1,657 1,158.00 513.79 6 3 7 10 Riv 3 3
Khokha 146 1 110 298.15 44.00 4 1 Riv Khondar 146 23 549 552.67 5.26 2 3 Riv Konmandara 148 58 368 '104.96 67.42 9 4 3 Kosdehra 148 67 141 438.36 38.51 4 .. Riv Kupa 146 18 514 928.80 73.26 2 2 6 Riv

205 PALAMAU BIHAR
VILLAGE DIRECTORY
SUBDIVISION GARHWA
ANCHAL BHAWANATHPUR
Reference to Village Drinking Statistics Population Area in acres Irrigation facilities water..supply 1ransport
:Mauza ,,------.. 1951 r-----"----......_ ,_..----__,.__---~ r----.,.,...---~ ,..--.".___-Page Serial
OfS.' no. no. Cropped Irrigated B C T W P K Ors. B C
2 3 4 5 6 7 's 9 10 II 12 13 14 15 16
Lami alias Sarahia 146 35 475 861.87 133.72 17 5 2 Riv Lohargara 148 70 449 276.02 16.35 1 8 11 4 2 Majhganwan 146 38 802 826.97 339.69 14 6 13 3 Majhganwan 148 73 1,656 2,662.18 449.02 12 1 20 10 7 6 Makri 146 42 1,624 1,657.67 "436.35 50 7 16 • 41 Riv 4 8
Makundpur 146 31 413 1,236.15 261.38 3 2 5 .. Meraunichherhat 148 69 583 529.82 35.22. 1 5 3 1 Munmun 146 12 65 336.73 1 " Nawadih 146 29 349 250.59 40.46 2 5 1 1 Pachadumar 146 13 1,254 486.90 293.65 8 10 10 12 Riv I 2
Pandaria 148 52 548 250.92 20.28 .. 4 9 Panditpura 146 28 18 57.70 3.44 1 Parsodih 148 62 613 404.78 33.32 3 .. 2 5 Riv Partikuswani 146 II 1,022 634.59 181. 74 7 4 3 2 Riv 2 Phulwar 148 48 fl5 107.20 6,38 .. 1 Riv
Pipra 146 3 131 340.28 67.13 3 Riv Pipri 146 7 197 230.37 6.86 4- Riv Raji 146 8 955 _654.62 132.61 7 2 Riv Rapura 148 72 451 666.40 18.88 4 5 Riv 2 4 Rohinian 116 39 838 774.39 159.34 10 3 20 Riv 1
Saraia 148 55 305 577.26 3.99 2 2 Sinduria 148 46 51 213.71 44.99 2 1 1 Singhitali 448 53 600 268.11 64.25 2 I 2 6 Singhpur 146 30 192 364.14 14.07 2 3 6 Sisri 146 9 976 747.27 1{)4.04 17 1 6 4 Riv 2
Srinagar 148 77 145 163.55 f.SO 1 1 ,1 Riv Sundi 146 6 627 575.26 136.26 13 2 4 1 Riv 3 Tali 148 60 525 915.73 58.02 1 3 1 Riv Torelawa 146 20 460 NA NA 2 3 Riv
ANCHAL TOTAL 41,569 44,071.82 7,236.65 425 6 168 324 388 68 95

206 PALAMAU BIHAR
VILLAGE DIRECTORY
SUBDIVISION LATEHAR
AN'CHAL BALUMA TH
Reference Ito Village.
Irrigation facilities Drinking
Statilstics Population Area in acreS water.supply Transport Mauza ,--""_""" 1951 ".-------"""--__...... ,-- -'- -~- -, ,...-..""'---'
Page Serial no. no. cropped Irrigated B C T W or •. P K or •. B C
2 3 of 5 6 7 8 9 10 11 12 13 14 15 16
Ara 154 135 334 648.61l 142.46 2 1 a 15 Arabara 152 76 290 336.88 107.30 3 3 1 1 2 Bachra 152 94 331 400.65 96.21 4 1 1 16 Riv 2 2 Bahera 156 168 62 100.45 18.51 1 " 2 <{- 2 Balbal 156 174 130 151.19 49.25 3 1 10 3 3 I
Ba1u 152 74 1,795 1,118.71- 695.92 23 15 5 10 'Riv 2 Balu Bhang 150 38 1,029 617.82 9.96 8 4- 5 6 Riv 28 4-Ba1umath 152 81 1,410 54040 23.17 2 3 14 19 27 23 47 Banalat 154 128 51 260.02 14.47 1 2 2 1 Bandarlauria 150 9 110 108.54 Riv'
Bandua 150 4 124 1l9.39 15.52 I 2 I Banio 152 85 157 295.49 29.63 4 .. 2 4 Riv 1 Bankita 150 48 118 61.45 1 I 1 1 3 1 Banwar 154 130 22.2 330.20 33.35 3 Riv Bara 154 120 115 207.73 20.37 3 2
Bara Barhallia Khas alias Bhut;ha
156 170 199 220.37 96.71 2 5 4 2
Baher 154 101 27 128.23 .. 3 I I Bariatu 154 108 1,040 527,65 0.08 3 2 10 7 26 56 17 Barikhap 154- 107 395 236.94 0.14 1 1. 16 Riv 17 1 Barni 152 83 81 215.86 10.59 4 2 I Riv
Barwadih 154 131 256 251.42 27.20 2 2 2 Riv BaSeta 150 28 U NA NA Not available Basiya 156 167 560 969.98 92.62 4 4 1 5 , Riv 2 • Bathet 154 114 199 337.84 76.40 6 4 2 4 Besra 154 127 336 583.51 57.93 5 1 1 2 )3 Riv 5 1 , Bhagea 156 153 .523 936.68 1.92 " 3 13 Riv 1 Bhjl-isadon 156 165 280 263.17 26.87 2 5 1· 6 4 3 Bhang 152 71 60 159.43 99.60 3 1 1 Riv Bhargaon 150 10 177 255.96 29.59 2 '. :i 2 Riv Bhat Ghatra 154 123 288 430.81 56.64 3 1 10 12 4
Bidir 150 29 83 60.B5 3.23 -2 2 Bijra 150 43 206 207.62 55.10 I 2 3 .. Birbir 154- 112 121 191.39 29.10 I 1 1 Riv 2 Bishunpur 156 173 387 374.16 155.26 3 15 .. 2 4 3 Bisrampur 154 119 U 195.17 29.36 3 3 1 3 3
Bukru 154 141 280 352.96 41.59 2 1 2 3 3 Ghaea 150 5 71 109.74- 13.30 '1 1 1 Chain 152 55 91 151.56 - 48.15 2 1 Chamatu 154 136 388 755.19 152.49 3 2 4- 1 20 32 Chandli 156 156 40 156.40 0.03 " I I 2
Charra 154 133 390 576.01 21.79 3 6 " Ghatuhans ISO 33 U 13.01 2 &iv Chetag 152 86 340 448.75 47.40 4 2 4 5 10 Rliv 1 3 Chetar 154 139 91 590.57 27.58 2 1 Ri1l' 3 Chetuag 152 84 l7l 306.24 22.91 5 1 Riv
-Chiru ISO 4-5 605 440.98 93.34- 4 4- 2 8 Riv 8 8 ~. Chitarpur 156 162 353 274.24 20.21 3 ." 2 !l 3 2
Chuku 150 30 206 202.14 50.10 4 I .2 2 , Chumba 154 III 223 342.40 58.90 9 2 1 1 2 Dakadiri 150 37 383 227.50 3.72 2 3

207 I?ALAMAU BIHAR
VILLA GE DIRECTORY
SUBDIVISION LATEHAR
ANCHAL BALUMA TH
Reforence to Village Drinking Statistics Population Area in acres Irrigation facilities water..supply Transport
Mauza ,.....--'--..... ]951 ~-...., ,---__ -=._.A",, ____ ..... ,--_ ..... _ ..... ,.--........-.....
pageSeriaJ no. no. Cropped Irrigated B C T W Ors. P K OrB. B C
-I 2 3 4- 5 6 7 8 9 10 11 12 13 14 15 Ii
Darha 152 92 1,370 1,1l3.89 4.23 8 2 6 10 14 37 10 Dembu 152 97 198 510.95 2.36 1 4- 2 2 Dhadhu 156 164 1,080 725.25 215.33 4 1 18 4- 8 4- 2 Diridag 152 98 120 210.90 50.86 2 2 2 3 Dori ISO 14 39 67.38
Endwa 150 35 209 58.26 0.22 2 1 1 Riv Ganeshpur 154 137 868 1,003.48 349.62 7 13 9 41 Riv 12 8 Gargoma 154 llO 271 419.35 110.03 6 7 2 5 4 ;'$ Gari 152 90 626 830.97 3.62 2 I 3 22 3 Gerenja 156 166 300 316.10 1.10 5 3 \ 5 3
Ghure 150 23 321 '321.23 60,05 12 3 4 -6 4 Ghutam ISO 46 258 263.04 3.9"9 5 .. 3 Riv 4 2 Gonea 154 117 242 446.38 41.26 5 5 1 .. Gurbe 150 39 207 249.67 1 .. 1 1 T Gurtur 152 67 125 238.21 80.31 4 1 ! 3 Riv
Guru Salwe 154 105 101 154.76 18.53 2 1 22 Hathdih 156 95 176 457.98 0.16 1 1 1 2 Hebna 156 171 252 185.35 76.97 2 6 2 4 3 Hempur 156 160 332 348.69 26.02 3 3 .. 6 Riv Heranhopa 150 36 U 229.67 0.05 2 2 3 T 1
Herhanj 150 21 601 255..33 64.45 10 3 11 Riv 4-Hesatu 150 13 231 184.78 1 1 1 H~ri 152 60 273 307.43 ,3 I 7 Riv 4 Holang 152 70 360 388.44 139.70 3 4- " 4 10 Riv 10 8 Humbu 150 42 480 465,99 100.05 4- 1 1 7 Riv,T 10 3
Hundi 152 75 U 180.58 26.46 1 2 Hundra 150 50 46 90.26 26.05 1 I Hunjar 152 51 60 85.67 I Riv Hur 150 24 230 365.49 65.63 7 1 1 3 Ichak 150 20 215 101.61 2,0.31 5 -1 3 ."
Ichak 150 40 325 414.62 101.32 4 2 2 10 10 3 Itke 154 102 300 366.66 q9.94 4 3 22 Riv 20 8 like 154 145 4 262.21 164.10 2' .. 1 Jabra 154 115 306 597.65 . ~ 8 1 6 2 6 3 Jala 154 144- 246 435.00 121.69 3 5 5 3 3
Jani 150 7 153 219.44 29.29 2 Riv Jarri 154 142 268 600.62 80.29 I .. 2 Riv 4 Jaubar 150 31 132 110.23 0.31 1 Jawar 150 6- 225 186.59 58.55 5 .'. 5 2 Riv 2 1 Jhabar 152 96 552 691.66 7.21 2 3 2 12 13 7
Jhirmat Kuma 154 124 152 308.19 32.36 7 1 2 4 Riv 4-Jilanga 156 146 251 314.18 171.77 3 ~2 3 12 21 1 Jipua 156 148 428 338.25 50.51 2 6 6 8 25 1 Jogiadih 152 88 II3 235.20 0.10 2 2 " J Kacha 150 26 121 132.23 40.30 2 1 1 3 T
Karandag 1.')0 25 270 164.26 41.24 5 2 4 Riv .. Karma 152 61 281 320.78 3 1 3 Riv 2 1 Karmatanr 150 32 64 23.22 0.02 .. Riv Kasiadih 156 158 U 91.39 +.75 Not available Kasiadih 152 77 52 115.29 18.03 ,

208 PALAMAU BIHAR
VILLAGE DIRECTORY
SUBDIVISION LATEHAR
ANCHAL BALUMATH
Reference to Village Drinking Stat!stics Population Area in acres Irrigation facilities \\ ater-supply Transport
Mauza ,---"""___ ...... 1951 ,-----_,.._____-,. ,--- ,....--"""--~ r---""__"'" Page Serial no. no. Cropped Irrigated B C T W ors. P K Ol'l'l. B C
2 3 4- 5 6 7 8 9 10 11 12 13 14 15 16
Kasmar 152 52 225 360.96 71.23 5 2 3 4 Katang. 150 19 165 176.34 18.09 7 2 2 Riv Kenru )50 II 208 213.56 25.35 2 2 2 2 30 .. Keri 156 152 535 683.39 397.77 8 3 22 7 31 5 Khairatanr 152 54 147 84.92 I 1
Khapia 150 12 132 13B.86 2 " Kolpatia 156 147 77 163.43 6.53 6 2 4 5 Kon.ar 152 82 277 479.68 6.86 3 4- 3 7 3 3 Kuriam Kalan 152 63 U 129.64 52.15 3 " 2 .. 1 Kuriam Khurd 152 65 U 178.49 66.85 3 26 2 10
Kusamha 154 126 85 303.53 28.42 2 ," 1 5 Lachhipur 152 72 304 ~31.58 60.65 1 1 1 Ldth 150 I 76 111. 22 .. 1 T,Riv Latu 152 57 539 384.16 136.15 6 3 2 13 8 11 Lav.agara ISO 41 411 436.74 83.02 4 1 6 7 12 6
La'l'lagara 150 17 195 126.26 15.12 2 2 2 Lejang 152 64 135 161.05 63.17 1 2 1 Lttndibar 152 66 20 49.51 13.95 2 1 I Mailam 152 56 15"4- 271.39 55.14 4 J 3 Riv 3 Makra 154 125 150 336.27 60.B1 4 1 2 2 8 Riv 6
Manatu 154 129 397 357.12 78.55 6 2 I 8 Riv 7 1 Mansingha 156 149 556 56.80 9.10 1 5 4 10 " 3 Mal'angloiya 156 172 545 462.52 184.68 2 2 12 6 4 5 1 Mari 150 27 200 97.97 12.40 1 2 .. Masiatu 152 69 600 414.40 225.03 8 1 8 12 a 5 5
Matkoma 152 62 416 389.94 4 2 5 Riv Meral 150 3 140 146.43 1 I Riv Mohanpur 152 78 96 151.38 44.93 I 3 4 2 Mukki 152 59 93 63.80 2 1 1 Munukdag 150 8 15 91.26 Riv
Murgaon 156 161 127 139.94 I 1 1 Murpa 156 151 912 574.16 186.49 1 11 2 12 10 6 Machna 154 109 104 162.53 22.04 2 1 3 Nagra 156 157 540 326.47 68.34 1 2 40 4 6 4 Nawada 150 49 286 290.17 50.03 3 1 1 2 6 Riv 6 1
Nawadih 154 1I6 375 649.74 83.06 5 2 2 6 Nawadih 156 163 U 89.55 0.50 .. 1 2 2 Okea 156 150 412 375.81 40.25 3 7 2 45 Riv Olhepat 154 89 180 726.04 80.83 2 t 1 5 Pakri 154 100 306 57B.13 101.64 2 2 3 5
Phulbasia alias Amarwadih 154 138 560 983.98 82.65 3 4 1 3 3 Phulsu 152 58 606 2,115.34 154.46 10 1 8 17 15 8 pindarkom 156 169 340 327.4 7 83.21 2 1 2 2 4- 3 Pipradih alias Kutse 154 103 108 133.40 35.50 2 3 4 Riv 6 l'ukchu 152 89 1.97 292.45 1.68 4 3 2 7 Riv 2
Pundurlawa 154 143 40 197.22 22.48 2 1 Rahea .. 154 132 249 572.13 31.53 6 1 3 Raj bar 152 68 249 353.94 25.87 5 2 2 1 9 Riv 2 Rajguru 154 118 383 477.57 108.09 7 1 3 3 5 6 Ratnadag 152 93 U 150.94 25.87 .. 1

209 PALAMAU BIHAR
VIlLAGE DffiECTORY
SUBDIVISION LATEHAR
ANCHAL BALUMATH
Refccence to Village Drinking Statistica population Ar ea in acres Irrigation facilities water .. upply Tramrcrt
Mauza ___....,__ ..... 1951 ,_..,.._............_..A. __ _"..,.,., r-----__"._----...._ ".---_-"--___ -., r--"""-~ Pag e SC1'ia I
no. no. Cropped Irrigated B C T W Ors. P K ors. B C
2 3 4 5 6 7 8 9 10 Ii 12 13 14 15 16
Renchi 154 104 110 147.07 21.59 2 I 2 Ronhe 154 113 96 119.88 26.10 2 2 I 2 2 Rud 152 91 125 122.03 0.01 1 1 2 2 .. 1 Salaiya 1;52 53 410 575.43 136.31 6 2 14 5 3 Salwe 154 106 8ll 529.24- !l-60.89 I 6 29 19 6
Santi 156 155 269 539.13 73.17 3 3 7 2 Sardhabar 150 2 190 188.26 .. .. 1 Sasang 150 16 126 120.87 I 1 1 Semarsot 156 159 360 489.44- I 3 1 6 Serandag 150 15 285 228.03 12.96 5 I' .. 2 3 2
Ser(lgara IS,!} 140 889 105.59 86.71 4 II 9 42 27 7 Serk'a 150 47 211 '246.56 56.35- 2 I ., I 4 Riv 3 Sibla 154 l21 510 562 •. 51 125.78 8 3 - 3 5 8 8 Sikid 150 18 119 101.52 12.78 1 2 Riv .. Siram 156 154 319 951.90 26.84 3 2- 15 5 1
Sirismadh 150 34 U 97.85 0.30 2 Riv Soparam 152 87 69 123.30 I .. J Rtiv TasatwaI' 152 80 30 248.20 12.04 4 2 1 1 Ta.,u 152 79 240 $47.42 43.27 2 2 .. Tetebar 150 44 40 140.85 15.03 3 1 3 Riv
Toti 154 122 680 918.93 129.84 5 6 2 13 Tw,Riv 12 ~ 4 TumbagaPa 152 73 84 187.68 9.90 .. 2 1 Tundahutu 154 134 259 454.22 55.77 3 I 5 1 Ud 150 22 51 19.17 T
ANCHA L 'IO'DAL 48,112 57,887.78 9,202.22 510 69 448 326 993 668 276
- P-I-27

210 PALAMAU BIHAR
VILLAGE DIRECTORY
SUBDIVISION LATEHAR
ANCHAL CHANDWA
R~rerence to Village Drinking Statistics population Area in acres Irrigation facilities water-supply Transport ..--......_...., 1951 ----_"._--~ ,..------_,___---~ r-"---""_---~ ,_.._ ...... - ........
Mauza Page Serial no. no. Cropped Irrigated B C T W Ors. P K Ors. B C
2 3 1- 5 6 7 8 9 10 II 12 13 14 15 ]6
_Alaudi~ 158 30 849 307.53 28.80 1 4 17 Il .. 21 19 Ambadohar 158. 43 83 107.30 14.46 1 5 1 1 2T Amjbaria 160 78 74 NA NA 1 1 2 1 2 An 158 15 584 610.18 0.51 2 1 5 1 5 1 1 Angara 158 45 50 109.63 2 1
Ara 160 64 83 NA NA .. .. 2 Ardhe 158 33 164 NA NA .. 1 2 Bairgara 160 79 75 NA NA I Bana 160 50 U NA NA 1 "
Banhardi 158 4 546 669.21 158.70 8 1 4 19
Bari 158 6 1,051 NA NA 16 2 12 10 17 6 .3 Barwadih 158 - 9 129 129.85 15.31 2 1 1 4 1 Barwakhar 158 17 18 44.89 - 2.Q4 .. Riv Barwato1i 160 75 300 NA NA 4 2 3 5 9 6 Belenga 160 67 98 NA NA 1 1
Belgara 160 62 314 357.49 1.11 1 5 5 3 Riv 1 Betar 160 70 221 199.17 8.57 5 1 6 1 3 3 Bhusar 158 34 434 NA NA 1 3 I 3 Riv Boda 158 25 513 581.79 59.43 5 4 2 T,Riv 1 Borsidag 158 27 238 176.51 17.21 1 I I Riv I
Bulhu 158 13 166 239.04 .. .. 1 1 .. Chak1a 160 49 1,215 NA NA 10 .. 12 7 23 T 13 13 Chandwa 158 24 1,533 NA NA 2 2 5 46 20 Riv 16 46 Chatro 158 44 289 314.24 69.50 2 5 2 5 2 2 Chatuang 158 31 433 362.38 28.18 5 2 2 5 l_{iv I
(jhetar 158 '19 686 917.86 1.47 2 3 10 Riv,T 2 oChilidri 160 74 11 NA NA Riv Chiro 158 21 484 549.54 37.27 1 2 3 Damodar 158 42 311 183.63 3.02 2 3 6 7 2 4 Darea 158 2 327 NA NA 3 2 2 5 1
Deonadia 160 56 U 137.37 14.38 1 .. 2 I Riv Dhoti 160 58 533 534.60 0.91 1 6 11 6 Riv Dudhimati 160 71 311 NA NA .. 2 2 2 Riv Dumaro 160 60 670 727.47 0.26 I 3 4
Erud 158 38 57 75.60 2 1
Ete 158 8 253 529.06 141.23 4 2 7 6
Ganiari 160 54 516 NA NA 1 4 Riv 3 4 2 Gardag 158 22 175 213.38 23.57 I 2
Goli 160 72 137 NA NA 1 7 6 Hesalong 160 65 93 NA NA .. 2
, Hesla 160 85 332 NA NA 2 2 1 1 Riv 2 Hisri 158 32 208 NA NA 2 2 1 4 R.iv 3 Hutap 158 28 1,190 857.80 22.22 2 4 6 21 . 1 4 Jamuari 160 66 188 122.69 1.64 3 1 2 1 2 3 3 Jiling 160 77 196, NA NA 9 9
Kali 160 59 315 483.39 1.71 3 6 4 1
Karota 158 35 541 277.83 23.15 1 1 2 12 5 Riv 15 8 Kita 158 12 290 266.15 34.26 5 1 4 2 Riv,T 2 1 Kita 158 39 570 559.53 0.68 1 3 13 Riv 1 Kudra 160 63 138 NA NA 2 2

211 PALAMAU BIHAR
VILLAGE DIRECTORY
SUBDIVISION LATEHAR
ANCHAL CHANDWA
Reference to Village Statistic~ Population Area in acres Irrigation facilities
Drinking water-supply Transport
Maula ..... • . 1951 ,,_..--_JIo. ___ .... .....~-""-"---..., r--""'_'--~
,-._.A._~
Page Serial Irrigated no. no. Oropped B C T W Or!. P K Ors. B 0
t 2 3 4 5 6 7 8 9 10 11 12 13 14 15 16
Kurarnubarat pur 158 37 93 102.47 .. 2 2 1 Riv Ladhup 160 81 361 NA NA 10 2 22 Riv 3 4 Latdag 158 29 308 303.36 0.10 1 2 5 1. .. Loharsi 160 55 359 NA NA 1 3 3 5 Riv 4 Lukuja lSi!. 26 433 190.07 32.36 .. 2 3 Riv 5
Mahuamilan 160 , 51 698 NA NA 2 3 5 4 Riv
Mahuatanr 160 47 U NA NA 1 1 .. .. Mal han 160 57 1,093 1,000.39 54.60 2 4 4 7 Riv 8 Manatu 160 82 250 NA NA 3 3 3 2 5 1 5 Marma 160 68 176 141.86 0.44 ., 1 -. , Marrnar 160 48 447 NA NA 2 2 Riv .. Nagar 158 36 443 308.90 7.85. .. 3 5 4 6 N~wadiq, 158 18 104 188.93 .. 1 Nmdra 158 40 179 146.01 12.11 2 2 Riv ..
" Nindra 160 61 286 356.17 1.54 3 1 7 7 3 Riv,T 2 2
Pirdag 160 80 70 NA NA 1 7 8 2 Riv 2 Rarnpur 158 7 572 428.93 9.20- 1 3 7 17 Riv .3 Renchi 158 3 475 604.10 215.45 4 6 2 11 Rohurn 160 69 182 141.75 0.60 .. 4 6 3 Riv 1 Rol 160 52 238 112.21 0.09 .. 5 2 Riv 3 7
Rud 158 20 291 439.47 4.81 2 .. 2 3 Riv 2 Rud 160 73 250 NA NA 4 4 4 11 12 2 Sasang 158 16 532 504.73 29.64 6 3 3 5 3 Senha 160 83 141 NA NA 1 6 5 1 Riv 2 2 Serak 158 1 1,137 884.55 235.17 9 7 7 32 Riv 3 2
Sikni 158 II 222 244.18 7.82 5 2 4 1 Sos 158 14 585 633.36 0.23 1 2 10 19 2 Surlj 158 5 211 225.85 41.16 1
" 4 4 Tarhasi 158 41 92 129.22 21.75 1 4 4 I 1 Tata 160 76 29 NA NA .. J . . ; " . Torar 160 84 193 NA NA 1
" .. Riv 1 Tota 158 10 60 144.13 5.21 2 2 3 1 Turharnu 158 23 116 253.36 80.67 1 6 1 2 3 Turisot 158 46 192 137.00' 0.05 .. 2 1 1 1 I Zarnira 160 53 736 930.00 1.87 2 5 15 4 2.
ANCHAL TO'! AL 29.546 19,196.11 1,472.31 160 34 194 297 444 164 183:

212 PALAMAU BIHAR
VILLA9E ntRECTORY
S~DIVISION LA'fFHAR
ANCHAL LATEHAR
Reference to Village Drinking Statistic~ Population Area in acres Irrigation facilities water-supplv Transport
Mauza-. ___ ..... ___ 1951 ...-----"----~ ,-----.-.,..___----. r----_,.__--- ...--....___ Page Serial no. no. Cropped Irrigated B C T W .Ors. P K On. B C
2 3 4 5 6 7 8 9 10 11 12 13 14 15 16
Alagdiha 166 125 28 NA NA Ambaiharan 162 34 97 NA NA .. Ambatikar 166 145 U NA NA .. Riv Aragundi 162 49 327 NA NA 4 12 Bachra 164 75 76 NA NA 3 I
Baheratanr 164 88 - 131 76.48 10.41 I Riv R.iv Bajkum 166 III 140 95.56 20.20 6 3 3 3 Bamhan Herua .. 162 142 133 NA NA 4 4 Bariatujagir . . 166 120 351 243.91 70,40 4 2 2 'J Bariatu Nisfal1as Bariatu Khalsa 166 127 L! 198.35 1{l3.40 8 1 2
Baridih 162 3 108 NA Nt\. 6 1 Batatkalan 166 141_ 244 107.64 9,33 1 I 2 Riv 3 Batatkhurd 166 142 159 59.70 .9.23 1 3 Riv I Bendi 164 66 278 ;,\,A NA 4 4- Riv' Beraini 164 99 66 138.70 59,18 3
Bhalugari 162 39 44 NA NA I 1 1 Riv BI-.usur 168 16-1 797 NA NA 2 1 7 2 Bingara 164 87 158 NA NA .. , . I Bishunpur 166 128 356 NA. NA 2 10 Riv 2 7 Bisrampur 162 30 49 NA NA 2 • .. 2 1
Chope 162 37 126 NA NA 1 3 Churia 164 74 146 56.82 27.88 3 1 Datam 162 52 U NA NA 1 2 Demu 166 129 601 368.35 70.73 • 3 I 7 20 4 Dhanlcara 166 112 705 NA NA 4 2 4 13
Dhobia Jharan 162 35 57 NA NA 1 I R,iv Dihi 162 33 543 NA NA 2 6 18 'T 8 4 .Dubiahi 164 100 42 64.57 Riv Dugila 164 53 171 118.34 . 2 ., 2 2 Vl.ltnm:ialant 164- 68 74 59.84 8.50 1 Riv
Durangi Kalan 164 71 98 4·61.86 75.85 4 .. " 3
Durang; Khurd 164 70 174- 200.18 21.15 6 2 3 1 2 6 Ghanghri 164 92 131 NA NA Riv
Ghutua 166 134 163 NA NA 3 8
Gire 166 147 41 NA NA , . 1
Goa 168 157 4-72 NA NA 6 3 13 Riv - 3 Godna 164 76 236 NA NA 5 1 1 4 ! Gulariatanr 166 115 64 NA NA I I Riv
Gurgu alias Irgu 164 102 189 NA NA 3 2 3
Harkha 166 -132 79 NA NA 3 2
Hartua 164 101 115 72.22 8.28 2 Riv
..Hesalbar 162 19 52 NA NA Riv
Hesla 164 81 202 149.76 27.92 2 1 1 Riv
Hesla 166 119 161 116.63 11.29 1 Riv
Heth Besra 162 28 330 NA NA 2 2 2 3
Hethloto 164 59 143 24Q.43 82.37 1 2 2 T Hethpochra 162 15 549 NA NA 10 3 3 [3
Hethtoli 166 144 28 12.65 4.90 1
Hosir 166 139 181 NA NA 6 .. 1 1 Riv 164 69; 250 426.31 157.40 5 - 2 2 1 3 Hotw..g

PALAMAU 213 BIHKR
VILLAGE DIRECTORY
SUBD !VIS JON LATEHAR
ANCHAL LATEHAR
Reference to Village
rrrigationr acilities Drinking Statistics Population Area in acres
water-supply Tratuport Mauza _..._""._-- 1951 ...---___ Jv-_ ___., ,_... _____ .,.. ____ -.
,,_..---....... ---~ --...... __ Page Serial Irrigated C T W no. no. Cropped E OrB. p K On. a c
2 3 4 !i 6 8 9 10 II 12 13 14: 15 16 .fIundru 166 124 228 229.74 67.10 2 4 3 Hutar 162 14 266 1'\1\ NA 7 4 5 Ichabar 166 118 64 1.56.4-0 8.65 I " Riv Ichak 164 57 400 216.36 2.75 5 4 2 5 ..
" 3 Ichak 168 162 398 H8.74 0.16 4 I 3 Riv jagal Daga ]68 165 285 246.65 105.81 5 4 2 "2 jalta 164 72 133 115.40 10.85 4 I 1 Jaram 162 2 15
, 85.75 6.35 1 Riv jareang ]62 50 236 NA NA 7 1 6 Riv Jer 164- 77 173 182.76 26.52 3 1 3
Jogiadh 166 126 U 25.22 9.75 N'ot available Kaima 162 21 344 . NA Nd. I 2 2 ~yanpur 166 122 247 232.51 80.6Q 4 1
Karhuma 168 155 332 352.07 176.35 3 2 9 5 l'-armachuan 164 62 U 17.52 0.31 Not available Kend 162 11 86 NA NA 5 2Tw Keru 166 131 533 157.16 62.00 6 .. 3 7 Khaira 164 9.6 28 60.B3 26.23 2 1 Khairajagir 164 97 141 21.23 7.29 2 ..
" 1 .. Kinamanr 164 65 U 100.37 1.18 1 1 1 Kodag 164 78 158 B9.35 17.47 2 Riv Kolheruwa 162 44 79 NA XA 1 3 .. Komo alias Kumu 16B 156 7 28.07 7.13 Riv Kane 164 90 167 78.44 30.11 .. Riv .. Korhas 162 23 U NA XA 3 • 3 4- 9 3 Kothila 164 80 40 30.63' 13.81 Riv Kudag 168 153 122 71.31 7.95 I J .. Kulgara 166 137 412 NA NA 8 4 3 Riv 30 2
Kumhar 166 135 82 NA NA 2 Riv .. Kundri 162 45 243 NA NA J I Riv 1 Kura 164 58 188 161.83 1.70 8 3 2 Labarpur 162' 13 100 NA NA 6 1 Labarpur 166. 146 102 NA NA 2 2 5 3 Largari 162 5 199 NA NA 3 .. 1 Lawagara 162 12 59 NA NA 2 ]
-j Ledhpa 164 67 276 NA MA 4- .. ' . .- 4 .. Lohsini alias ,!ulbul 162 9 84 NA NA 5 1 Riv I Lundi 104- 86 141 56.90 22.37 1 Riv 1 Luti 162 41 197 NA NA· 3 I 3 Riv 1 Mahuatoli 165 143 8 NA NA I Riv Manan~hotag 166 110 330 204.73 77.26 3 2 4 3 Mangra 162 32 352 NA NA 1 1 12 Riv Manikpura 164 56 86 44.13 24.49 3 4 4- 1 Manjar 162 17 261 239.44 53.75 2 2 5 Mankerijll$ir 164 98 66 NA NA 2 1 1 Mankeri Khas 166 104- 6B NA NA 2 Marabar 162 1 104- 112.73 5.58 6 - 2 Riv Matkhai 166 lOS U 15.62 0.04 'Not a~~lable' Matnag 162 8 78 NA NA l Muka 164 61 455 91.09 1.99 ::; 8 2 10 3

214 PALAMAU BIHAR..
VILLAGE DIRECTORY
SUBDIVISION LATEHAR
ANCHAL LATEHAR.
Reference to Village Drinking Statistics Population Area in acrt's Irrigation facilities .water-supply Transport
Mauzd ,..--..... _____
1951 F ,..,.__ ,.--.-_""'_--- ,---......._,,_
Page Serial Irrigated no. no. Cropped B C T W Ors. P K Ors. B C
2 3 4 5 6 7 8 9 10 11 12 13 14 15 16
Mungar 166 133 629 445.43 205.60 23 6 35 .. 3 3' Murgidih 164 94 105 122.34 60.24 2 1 1 T Murup 162 38 466 NA NA 5 2 12 21 3.-Narayanpur 166 116 129 528.11 216.05 3 1 4 .. Nareshgarh 164 91 396 227.16 60.41 1 3 Riv 1
Nawadih 166 I14 127 227.66 20.30 3 I 3
Nawadih 164 55 48 121.27 50.37 2 2 3 Nawadih .. 162 22 U NA NA Not available Nawadih alias Ka!yanrur .. 166 121 333 112.85 43.79 8 1 3 5 2 Nawagarh 166 107 1,563 NA NA 2 I 9 2 Riv 20 17
Nawari 162 36 600 NA NA 3 15 " 10 4-
~~gain 162 25 58 NA NA 2 1 3 2 T 1 Nmdir 16S- 152 606 317.58 80.51 3 5 ·17 5-Obar 162 29 98 NA NA 2 '3 2 I
Odan 162 10 126 NA NA I I
Orea 164 89 105 55.03 3.80 2 Riv Orwai 164 85 222 54.21 3.72 .. . N ot a~~ilabi~
Riv Pachamba 164 95 1,.562 NA NA Pakrar 162 46 200 NA NA 3 Riv
" I, Pandepur 164 63 300 81.00 1.90 1 7 8 Riv 1 3'
Panruka 162 43 45 NA NA 2 1 2 Parahi-atoli 166 117 U NA NA Not available Parsahi 164 73 485 342.86 104.61 4 2 2 3 Riv Z Patariachotag 166 109 135 147.05 25.85 3 ., 1 4,
Patratu 166 138 232 NA NA .. 4.00 1 2 Riv
Patratu 162 24 405 NA NA 3 2 5 Riv 7 6 Patratu 162 40 76 NA NA 2 4 1 Patratu 162 51 293 NA NA 3 4 patuki 162 7 50 NA NA 1 Riv .. .. peshrar 166 149 333 NA NA " 2 3 Riv 2 2
Rehal 162 26 194- NA NA 2 2 Ri;
" Re:b.ea 166 130 42 32.85 6.26 2 1 1 2 2 Reheldag 168 150 198 138.39 50.30 3 1 2 4 Rehra ,164 54 45 117.85 47.56 1 1 1 Riv Rehrahi 166 105 U 71.38 32.25 .,
Richughutu 166 140 128 NA NA .. 7 6 Sabano 168 166 438' 867.77 389.83 4 4 9 Sakwar 166 148 124- NA NA 2 .. 1 % Salaia 164 93 128 122.48 60.52 1 1 1 1 1 Salodih 164 64 41 100.06 40.22 3 3 Riv
Saraidih 168 163 U 15.91 Not available Sasang 162 20 780 NA NA 4 1 8 Riv 8 2 Semaria 162 48 105 N-K NA 3 Riv 1 Strnariatanr 164 83 170 70.98 17.78 2 Riv Sinjo 168 160 98 1'27.33 5 2 4- 2
Sisi 166 123 285 231.49 43.86 3 1 1 .. Sohdag 162 18 240 NA NA 2 1 2 Riv Sotam 162 6 194- NA NA 2 3 Riv Sukhalkatha 168 151 U NA NA Not available Sukri 162 4 319 NA NA 4- 1 5 2 Riv 1 2

215 .PALAMAU BIHAR.
VILLAGE DIRECTORY
SUBDIVISION LATEHAR
ANCHAL LATEHAn.
Reference to Village Drinking Statistics Population Area in acres Irrigation facilities. water.supply Transport
Mauza ,--....__ ...... 1951 ,----J>.. r-----.A.-.-----'" ~---.A..---~ ,---"-_ Page Serial
Cropped Irrigated no. no. B C T W On. P K On. B C
2 3 4 5 6 7 8 9 10 II 12 13 14- 15 16
'Tarwadih 166 106 550 NA NA Not available Tarwatanr 166 103 U NA NA Not available 'Temki 162 47 400 NA NA I 1 5 Riv 3 Thakurpara 166 113 106 184.24 30.25 I 1 Riv Tinia Khar 164 84 U NA NA 'Not a~;Ulable
Tubed 162 31 395 NA NA I 2 2 3 Riv TupuKalan 164 79 96 89.73 19.83 2 Riv Tupu Khurd 164 82 270 116.74 53.77 I Riv I Turidih 168 154 125 115.11 5.22 2 2 1 1 Udaipura 168 164 340 NA NA 4 2 9 2
Ulgara 166 136 124 NA NA 3 2 Riv 2 Uparbesra 162 27 III NA NA 1 3 1 Uparloto 164 60 201 NA -NA I 1 1 2 1 Uparpochra 162 16 U 70.12 27.50 -Not available Zalim Kalan 168 159 189 NA NA 5 4 Riv 2 ZalimKhurd 168 158 796 NA NA 5 , 2 8 19 Riv 18 22
A'NCHAL TOTAL 34,997 12,405.46 3,341.27 404 4.00 13 93 227 462 178 181

216 PALAMAU BIHAR
VILLAGE DIRECTORY
SUBDIVISION lATEHAR
ANCHAL MANIKA
Reference Drinking to Village
Irrigation facilities Statistics Population Area in acres water..suppl)· Transport Mauza ,...._ .... _..... 1951 ,...---""'---- ___ ---~------....,. ,_-___ ,.A.. ____ ..---_,____-
Page Serial Cropped Irrigated C T W Or8. p K no. no. p. Ors. B C
2 3 4 5 6 7 8 9 10 11 12 U 14 15 16
Agardih Mandhania 170 14 271 161.03 10.82 3 2 Riv Amwatikar 174 92 31 50.14 7 .. " 3 Antikheta 172 79 181 129.25 20.91 7 I 1 3 .. Ara 172 68 U 34.88 0.a5 .. .. 2 Riv 1 Aunraw,nr 172 76 469 392.16 15.31 2 2 1 Riv 2'
Bakoria 170 13 1,215 978.92 116.58 12 10 1:4 25 Riv 2 ~ Bandua 170 39 967 844.80 24.49 8 .5 1 10 Riv 2 g, Banri 172 73 239 237.21 24.94 4 3 3 3 6 3 Baraitola 170 23 78 48.94 0.11 1 2 2 Bariatu 170 44 299. 276.56 22.27 1 3 Riv
Barkadih 174 95 U 255.22 44.38 vi .. S Riv 5 'T Barwadih 172 85 259 73.49 14.26 2 I 1 4 1 .. Barwaia Kalan 170 31 634 537.41 83.97 9 1 6 8 .. 2" Barwaia Khurd 170 33 180 258.86 60.15 ~ 1 3 2 1 1 Beang 172 55 182 163.35 42.34 5 1 1 2-
Betla 170 .32 94 165.67 39.69 7 .. S " ..
Bhatko 172 89 257 NA NA 3 3 .. S 3-Bichlidag 172 66 195 186.91 2 Bikra 172 57 20 47.16 11.92 1 1 Bishunbandh 172 63 428 320,05 4H10 5 1
Chama 170 35 271 425.22 45.50 6 9 Riv Charwadih 170 37 432 185.96 1 Riy 1 Cheehendha 170 18 110 161.41 9.92 4 .. 1 2 Ri" Chetma 170 11 131 195.23 &5.06 4 7 6 2 Dasdih 172 88 U 111.85 37.27 Not avail1(tble
Deobar 174 94 U 135.66 3.67 2 1 Riv Doki 170 42 383 351.55 62.90 I 1 6 Riy .I>umb! 172 815 121 136.16 25.72 3 :t 2 Dumfl 170 24 103 98.16 26.39 2 :3 I .. Dunrlu 172 74 671 367.87 84.45 3 3 2 Riv
.. 2
Ejamar 170 15 87 180.27 33.89 5 2 1 . Hatta 174 91 169 164.39 4.83 .2
Hlsatu 170 , 45 278 147.71 15.33 .. '.' Riv Humamara 172 81 97 85.50 12.05 ~ Jagtu 170 21 169 NA NA
Jalima 172 62 74 102.56 13.21 2 Riv Jamuna 17:l 70 193 203,,'i5 12.13 2 1 Janho 170 29 607 624.90 47.~7 8 .. 1 4- Riv .. Jerua 170 22 271 234.39 35.79 6 1 3 7 I .2 Jobla 174 93 83 61.98 3 1 Riv
Jungur 170 41 1,117 1:144.37 127.05 .. 1 1 14 Riv '7 Kamaru 170 2 563 375.32 55.08 Jl 2 5 Riv 7 5 3 5 Kasjadib 170 3 402 393.51 47.58 5 1 Riv 4 II Riv 2 .2 Khapiadih 172 ~ U 62.88 36.75 Not available Koili 170 65 134.63 26."()9 .5 1 4-
Kope 170 25 291 133.73 18.80 .1 2 2 6 4 .2 Kuchal 172 58 U 41.16 14.74 3 ... 1 Kui 170 28 536 303.81 38.10 14 6 6 Kurid 172 53 102 302.81 38.0& I Riv Kurumkheta 172 90 23 34.19 1.25 2 2

~17 PALAMAU BIHAR
VILLAGE DIRECTORY
SuBDIVISION LATBHAR
ANCHAL MANIKA
Reference to Village Drinking Statistics Population f\l'ea in acres Irrigation facili ties \\-Bter-supply Transport
Manz. ,--~"","", 1951 ,-__ .:A.. ,----"- ... -r-------"------ ,..--.....___,
Page Serial no. no. cropped Irrrgated B C T W On. P K Ors. B C -
1 2 3 4 5 6 7 8 9 10 11 12 13 14 15 16
_Kurund 172 52 274 NA "NA 3 . 1 I Kutmu 170 19 73 169,87 40.31 5
. 2 I 1
Lali 172 77 449 335,.82 4.00 2 2 4- Riv Lanka 170 26 336 279.00 ,6, I " 1 3 Riv 1 Lawagara 174 96 59 35.03 3.13 3 I .. 2 I
Madandih 172 65 110 71.03 0.31 "2 I Riv "
Mai 172 75 730 NA NA 2 1 2 Riv 2 1 Manika 172 72 685 415.25 14.02 4 I I 5 2 9 18 Manikdih 170 17 )23 124.23 12.85 3 .. I 3 Riv .. Matlaung 172 69 726 491.45 75.40 7 '4 5 4- F I 5
Matnag 170 34 459 409.00 18.94 8 1 8 Riv Matnag 172 59 U NA NA'- Not. available Nadbelwa 172 78 79 95.11 1'7.29 I .1 I Naihara .. 172 51 120 NA NA 1 2 Riv .. Namudag 170 16 453 NA NA 6 3 10 Riv 1 'S
Nawadi 172 83 1(}2 134.05 24.52 3 3 Newar 172 56 81 80.93 IlAl 4 1 Riv Pagar 172 46 65 71.60 8.50 "i Palhea 172 54' 613 777.19 105.19 19 5 10 Riv 1 pasgam 172 48 163 121.50 25.14 Riv
patki 172 80 46 71.25 8.04 _2 Patna 170 30 238 240,46 22.10 5 3 Riv ". pipra Kalan 170 12 465 576.91 137.62 5 I 8 5 8 Riy 2 2 Pokhri 171) 20 74 136.66 10.81 2 I Purnipalhea 170 40 364- 124.16 39.92 9 5 6 Riv 2 3
Rabda 170 7 666 384.34 49.85 8 .. 1 5 3 Riv Ranki 'Kalan 170 5 520 700.10 162.98 6 4- 9 4 3 Rinki Khurd 170 4 191 342.95 79.38 4 II 1 11 3 Rewad KaIian 172 60 272 138.95 37.11 3 2 2 .. Rewad Khurd 172 ,61 136 146.53 41.37 ] .} 2 Riv 2
Sadawadib 170 ,3~ 554 579.45 23.81 4- 2 4 Salaia 170 165 146.89 24.40 4 1 I Riv Salgi 172 64 121 88,45 . 0.23' .• Riv Sansdohar 172 49 U 11.86 7.40 " . .- I Sardamdag 172 50 299 179.01' 4'1.24- 2 1 2 Riv
Seldag 172 47 172 135.66 20.10 1 Sewan 170 36 83 119.24 5.25 3 1 .. 2 •• SewdhanJ 170 1 130 169.75 7.12 2 I 2 4 Shiwacbarantola 172 82 84 101.52 10.60 4- 1 I . ~ S;imri 172. 84 182 24B.29 13.61 4 2 1 .. Sinjo 172 71 497 418.93 66.80 4 1 4 7' 3 Siris 170 ~3 123 124.14 5.42 1 1 1 1 Riv , .. Tb.ema 170 9 173 129.25 36.80 5 4- 8 2 Riv,F 2 r Themi 170 8 155 157.92 36.80 6 .. J 2 TUOlagara 170 10 85 145.70 32.74 1 1 3 1 5 Uraontoli 172 67 U 39.8t1 0.23 1 1 3 2
ANCHAL TOTAL 24,246 21,032.65 2,797.03 360 ''1 91 178 293 II 85 1\-.1-28

218 PAL~U BIHAR
VILLAG:~ .DIRECTOR Y ,
SUBDIVI"srON LATEHAR
ANCHA~ BARWADIH
Reforence to Village
Area in acres Irrigation facilities Drinking
Statistics Population water..supply Transport Mauza .-:.--..... 1951 ,,-------"'-----....._ ~--"-----. Page Serial ,.._.....A.,-_
no. no. Cropped Irrigated B C T W OrB. P K Ors. B C 2 3 4 5 6 7 8 !l 10 11 12 13 14 15 16
Aghra i76 10 U 129.42 24.67 Not available Akhra 176 12 146 241.03 24.88 3 1 Riv Amdiha 176 14 465 283'.64 1 2 Riv,5Tw Babliandih 176 31 280 157,03 55.75 2 5 2 Riv 6 7 Barichatan 176 45 118 209~ 16 3 Riv
Batrdodar 176 44 141 210.49 " 2 Barkheta 178 63 293 160:59 I 4
.. Barwadih 176 21 1,536 397.68 0.9D 1 2 23 12 Riv 9 31 Bere 178 58 280 143.09 3 1 3 Riv BetIa J76 II 430 415.28 120.21 7 2Tw 5 3 3 2
Bode J76 27 U 42.62 Not available Chainar®ha 176 24 83 100.90 40.20 3 2 .. 5 Chapri 176 26 428 24~.16 60.84 4 3 I R,iv
.. 2 Chatam 178 82 130 50.52 2 .. 1 Riv
Chhencha ._l76 28 1,066 303.16 1.10 7 1 2 5 8 T,Riv 23 5 Chhipadohar 176 42 1,132 560.51 38.91 4 14 6 Riv 24 12 Chungru 178 76 501 258.52 30.44 3 3 5 Riv Dorami '176 16 184 131. 71 7 1 2 Ganeshpur' 178 78 405 163.84 2
.. .. 3 Riv Gad 176 48 647 232.49 15.83 6 4 2
.. R,iv 2,
Gasedag 178 .~~ 154 Il3.19 \ 13. I I I .. Riv Gua '178 119 70.10 .. 3 .. 1 Riv Haratu 178 68 294 258)4 25.38 4 3 4 Harhe 178 . 62 202 105.42 1 2 Harihamar 176 46 118 172.08 5 2 1 Riv
.Harparwa alias Biratpurwa .. ·176 2 U 131.96 " 55.61 Not available Rehegara 178 71 323 168.90 8.66 1 3 Riv .Hendehas 176 1.5 110 8B:80 .. 2 .. Riv HoriIong 176 30 212 183.97 0.50 2 , . I. I Riv HO$ir 178 73 IBI 207 .. 37 41. 77 5 ~. 2 2 3
" .. 2 Husarcolliery (Protected J76 32 U NA NA .. 4
'Forest)
Jargarh 176 38 U 69.65 .. .. Jobe alias Amboatikar 178 77 171 55.40 2 1 Riv] Juruhar '176 47 304 436.38 10 2 4 " .. Riv 4 I Kachanpur 176 3 360 NA NA 2 1 2 4 Riv 1
K!\lyanpur . 176 13 339 68.35 . 1 4 3 Riv Karamdih ·178 54 79 74.56 2 .. 2 .'
Kechki ·176 I 763 ··NA NA 6 .. 3 II 6 Riv Kef. ,178 51 613 294.64 19.60 10 .. 2 8 Riv . I Ker 178 70 U NA NA Not ,available
Kfiamhi Khas 178 55 107. 76.26 " 2 1 Knura . -.176 23 524 232.81 0.88 5 3 Riv 5 Kol~urwa .. .176 9 1I6 IH.53 29.28 I " 2 K~c ila . 176 43 506 ,880.53 I 8 3 3 Riv 7 2 KI;I~u ., " 17B 83 145 7:1-.85 1.50 1 2 '.
Kushhaqathan ~ 176 6. U ;45.24 9O.3i'
Not available Kutmu 176 7 463 291.69 5 1 2 12 8 Labhar • J 178 65 46 33,00 2.38 1 1 Ladi 178 67 371 142,36 19.17 1 5 Lanka 176 25 108 63.39 1

219 PALAMAU BUU:R
VILLAGE DIREerORY ,
SUBDIVISION LATEHA~
ANCHAL BARvtA.D~H
Reference to Village
Irrigation facilities . ,. Drinking
Statistics Population Area ;n acres water-lupply Tranrrou Mausa 1951 ,.-----"'----_..._ ,....---::--"..-----........ ",.----",.,.---~ ,_.-"""'---
Page Serial no. DO. Cropped Irrigated B 0 T W Or •. P K On. B C
2 3 4 5 6 7 8 9 10 11 ~. 12 13 14' 15 16
Lat i78 €O ~28 173.63 4 .. 4 7 7 Ledgin 176 41 134 161.53 37.'50 3 5 4 2 Riv Luhur 176 20 293 139.81 .. ~ 7
" Lukumkhar 176 49 92 154.13 5.55 2 .. S Riv Manatu 178 SO 129 48.07 4 1 ."
MandaI 176 •. .35 107 78.34 Riv -.. .. . . Mansra 176 17' 611 296.38 2 2 1 Riv Meral 178 61 U NA NA .. 1 Ri .. Morwai Kalan 176 37 414 848.01 .. 11 3' 7 3 Morwai Khuld 176 36 72 69.25 3 I, I Riv
Munru 178 66 245 125.12 16.80 1 3 Riv ... Murgidih 176 22 432 245.93 8 2 9 Riv Muru 176 18 484 336.57 .. S 4 8 Riv .. 1 Nawadih 178 75 245 135.02 16.10 2 i 4 Riv 2 Nawarriage 178 53 73. 89.65 2
Paira 176 19 170 95.18 3 1 Riv .. Patradib 178 57 .J] .35.40 Not available Pokhri Kalan 176 5 1,611 776.2.7 272.31 5 11 8 21 12 pokhri Khurd 176 8. 258 312.32 26.50 4 .. 2. 6 Riv Putuagarh (" 176 29 100 113.87 6 1 2 5 Riv ,1 2
Rabdi 178 50 202 'NA NA 3 4 Riv Ramrudag 178 69 U NA NA 1 1 Riv Saidup 176 39 436 561.59. 10 i 2 Riv .. Saraldll 17(;' 4 781 281.93 82.51 7 1 13 26 7 9 Selaritanr 178' 8'1 42 47.31 1 ., 1 Riv'
Serengdag 178' 56' 162 133.95 7 t" 3 Sindharowa 176 33 11 75.72 2 Riv Sukal Katha 178 79. U 11.J8 Not available Tanwai 178 52 107 , 41.40 2 Tatha 'alias Balba1 176 34 96 161.38 ...... Riv
Tongari 178 64 308 123.34 2 3 3' 3 .. •• Ukamar 176 40. 463 307.09 48.90 6 3 4 Riv .. Wopag 178 74 107 .87.26 22.62 2 r. 2 2 '2:
ANCHAL TOTAL 23,568 14,976.£4 1,250.67 237 4 25 181' 243 129 114.1

220 .PALAMAU BlHA:
VtLtAGE'D'IRECTO!ty
SUBDIVISTON LATEHAR
ANCHAL MAHUADANR
Reference to Village Drinking Statistics roputation Area in acres Irrigation facilities water-auJ'ply Transpar
M'auz8 ' ,...----.:....... 195'1 r- -____, ,---___ ..A.. ______
,.----."..---- F ~
PageSeriaJ no. no. Cropped Irrigated B C T W On. P K On. B C
2 3 4 5 6 7 8 9 10 II 12 13 If 15 ],(5
'Adhe 182· 77 34 141.82 10.00 Ahirpurwa ,. 182 68 188 NA NA 2 I Aigu " 182 89 56 NA NA 2 1 Riv • t Aksi' lao 9 402 369.68 0.62 2 1 4 2 Riv All1boatoJi 180 46 676 NA NA '.' 4 9 6 Riv f
Arahans 184- 102 216 230.16 0.'11 Riv I 'Aunratoli alias Khapartol~' 182 66 506 560.72 0;36 I 3 2 Riv Ausari, 180 29 375 239.91 26.57 2 12 . j Baheratoli 182 67 301 424.39 0.58 .. J Bandua 180 4 197 24'3.98 6.18 2 3 4 5 .. Bans Karcha ., 180 1& 213 203.08 0.88 '1 Ear 182- 80 U 89.53 Bar~hi 182 92 303 493.29 0.89 3 5 3 T,Riv 2 Baidaimi Kalan 18Z- 85 200. 234.20 4.50 .. 4 2 8 Bardauni Khurd alias Pandey-
toli 182 84 85 87.42 5.61 2 2
Bartoli 180 47 342 NA NA 3 'lleltoli 182 70 232 432.72 I '1!elwar 184- 98 146 57.29 Riv 1 Riv . Eesrakona 184- 103 14- NA NA Riv 1 Riv Bhenril alias Sarnadih 180 8 408 413.64 57.96 2 12
"
Bisrampur 182 58 307 88.44 .. 4 3 .Chainpur 182 ,64 493 NA NA ' .. 2 5 Champa 182 53 920 NA NA 1 2 4 .Chatakpur 180 22. 729 499.08 19.53 J 17 .. ' 3 3 ,chetma 180 1 218 307.74 2.55 3 3 2 1 Riv
thiro 180 25 625 397.34 6.30 1 3 184 104' 419 330.56 I Riv 3
-, Chormanrwa Riv Chutia IS2 75 237 225.66 0.49 1 1 -.. Riv Danrkapu 182 90 292 199.02 119.63 2 4 5 2 J Dauna 182 76 214 276.32 13.00 1 Riv
Dipatoli ISO 44- 191 33.26 0.33 1 3 Duari 182 51 U 34.99 I\ot available Dumardih IS2 74- 197 634.68 0.20 1 Riv Durup 182 79 334 448.26 15.08 , .. 2 4. 4 Riv Qansa IS2 59 235 208.19 2 Riv
Garh Burhni 182 91 406 319.00 125.77 2 2 2 Gaurgara 180 3 U 5.28 Not available Goalkhar 180 40 84 1.93' 1 Gothgaon ISO 31 617 783.09 203.51 7 3 3 HamiKhas 180 30 903 1,1I0.S3 51.79 2 16 2 32
Harinaghura alias B~gatoli lsa 65 123 NA NA I "
Hartua 180 13 186 146.97 . 1.63 6 ~ Horeheng 182 88 108 NA NA .'. 2 -Hurmundatoli 184 101 160 108.31 ! .. Riv 1 Rjv Husmu 184 99 115 214.87 Riv
Jaipur 180 20 146 121.83 10.29 5 1 Jamdia 180 39 U NA NA Not available Jamdih alias Haramgarh 180 6 686 708.24 31.80 2 2 Riv Jangsi 182 63 67 NA NA 1 1 Janta 180 2 71 109.46 10.18 ,2 Riv

221 PALA~U BIHA!l-
VILLAGE DIRECTORY
SUBDIVISION LATEHAR..
ANCHAL MAHUADANR
Reference to Village
Area in acers Irrigation facili ti ~s Driaking
Statistics population water-supply Transport ____...._ __ 1951 .--~.., ,.- ,....__...___, Mauza Page ~eria1
no. no. Cropped Irrigated B C T W OrB. p K On. B C
2 3 4- 5 6 7 8 9 10 II 12 13 14- 15 16
jarhatoli 182 50 133 195.50 20.76 2 jori 180 37 156 L 79.23 0.17 2 Riv Kabrapllt 180 34 U 83,86 0.75 I Karkat 182 93 114 350.16 0.30 .. Riv Katho 180 36 91 83.21 0.60 1 1
Kewarki 184 94 234 297.32 15.40 1 Riv Khajurtala 180 18 300 226.35 4.73 2 31 Kita 180 42 U 254.93 Not availabi~ Korgi 182 78 207 226.50 12.00 .. .. 3 Riv Korwadih 182 60 U ],.16.55 0.10 Not available
Korwatoli 182 52 U 224.36 10.05 Not available Kukud 180 24 316 293.78 1 -..... 3 KuroKalan 182 56 237 274.08 0.24 1 2 " 1 Kuro Khurd 182 57 291 170.35 3 1 2 2 Kurund 182 61 463 302.41 0.83 2 I
Kutui:liri 180 14 130 119.72 11.74 3 1 4 Lakhepur 180 17 U 111.09 5.78 ., 1 1 1 Lodh 180 26 354 46.85 18.23 1 5 3 '. T Lurgumi Kalan 182 83 276 173.14 6.03 3 4 3 7 Lurgumi Khuro 182 81 157 151.25 2.64 1 1 3 I Riv
Mahuadanr 180 45 581 427.95 0.37 3 5 12 Mail 184 97 249 NA NA .. Riv 1 Riv Maunadih 180 12 87 138.39 1.34 ., 3 Meram 182 48 95 291.56 .. 2 Methari 180 35 103 295.45 119.43 1 Riv
Merhatua 180 10 101 106.04 3.12 1 Riv Mirgi 180 28 377 349.88 10.39 2 34 Na.ina 182 86 50 33.35 Riv Nawadih 180 15 U 110.55 0.40 Not available Nawatoli 184 100 121 68.29 1 -1
Orsa 180 32 1,064 NA NA 4 4 8 1 Paharkapu 184 95 220 215.74 3.25 2 4 I 3 Pakardih i82 82 58 103.87 I Parewa 180 23 182 271.11 12.63 2 2 .. 1 Parhatoli 182 71 459 348.68 Riv
Parhi 180 38 316 491.16 0.41 2 5 '3 2 1 Partab].Jur Nagar 182 72 153 476.88 1.46 2 7 3 Riv 2 Putrungi 182 49 228 256.91 1 1 Ra,jdanda 182 69 445 512.27 0.69 2 3 Riv Rampur 180 43 107 NA NA 2 2 Riv
Regain 180 41 464 865.13 206.04 3 2 Riv Sale 180 11 187 251.91 23.10 8 Semarburhni 180 - 19 460 360.91 24.71 2 I 5 7 2 Shahpur 182 73 242 571.03 0.69 2 2 Riv Sidra 182 55 418 535.33 2.79 3 3
Sirsi 182 87 '213 INA NA I Riv Sohar 184 96 422 290.65 7.86 2 Riv 3 2 Riv Sugi 182 62 339 NA NA 1 1 Surkain 180 33 453 557.62 2 'Tahil' 182 54 39 296.63 6.20 - 1

PAI.AMAU
Tamoli Tewahi Tisia Urumbi
Mauza
ANCHAL TOTAL
222
VILLAGE DIRECTORY
~UBDIVISI0N LATEHAR
ANCHAL MAHUADANR
Reference 10 Villa_ge
Area in acres Irrigation facilitirs Stalifstic, Populatioll ,_.-A. __ 1951 ,_-___ ..A.--_ ....... ,..------...... ___ r---__,_ Page Serial
Irrigated no. no. Cropped B C T W 011,
2 3 . 4 5 6 7 8 9 10 11
180 7 362 448.64 56.70 2 4-180 27 157 191.90 12.01 2 23 180 5 96 98.85 1.18 180 21 165 239,12 6.34 8
26,449 24,621.62 1,337.80 .56 17 252
BIHAR.
Drinking water.supply Transport ,..--.....__.
P K orl. B C
12 13 14 III 16
5
Riv
146 202 3 8S.

223 PALAMAU BIHAR
VILLAGE DIRECTORY
SUBDIVISION LATEHAR
ANCHAL GARU
Reference to Village Drinking Statistics Population Area in acres Irrigation facilitiel water.supply Transport
Mauza .,---""""___' 1951 r-----.... ----..... ~---"-----.. ~-~~ Page Serial no. no. Cropped Irrigated B C T W Ors. P K Or •. B C
2 3 4- 5 6 7 8 9 10 11 12 13 14 IS 16
Alagdiha 186 42 145 64.86 1.63 4 2 Armu alias Marchaia 186 1 38 95.80, Riv Baherwatola 186 17 83 145.99 3 1 Riv Baigatoli 186 22 223 NA NA 1 I 2 Bajajpur 188 71 U NA NA 2 2
Bandua 186 46 345 196.51 21.91 6 3 3 '! Baresanr 188 62 218 NA NA 3 2 2 Riv 1 Baribandh 188 59 191 110.23 I Riv Bhanwarbandh 186 9 59 65.53 Riv Bheriabathan 186 27 U NA NA Not available
Chanchu 186 41 66 NA NA 2 2 Chanpi 188 51 V 57.32 3:"88 Chipru 186 28 72 NA NA Riv Chiraiya 188 54 46 24.38 Riv Chorha 186 47 372 965.30 4.87 9 3 Riv
Dabri 186 48 182 111.63 1.47 4 1 3 Daldalia 186 18 115 228.74- 2 • 2 1 Riv Danrkocha 188 65 B9 NA NA 1 "" 1 Riv Darichhapar 188 60 56 54.05 I Derhganw 188 . 61 300 NA NA 1 2 Dhangartola 186 8 177 NA NA 3 4 Riv 2 Doram 186 36 151 NA NA 1 . '1 Garu '186 7 60 NA NA .. Riv Gasigara 186 45 8 8.17 .. 2 Ghasitola 186 34 145 NA NA
Ghuturu 188 72 U NA NA I 1 2 Goendi 186 13 124 .157.17 2 2 2 Gotag 186 39 21 4-2.27 1.26 3 1 Hanumantola 186 33 U NA NA Not available Hendehas 188 58 94 53.13 1.01 - 1 Riv
Hesag 186 3 116 91.94 4 Riv Hethtola 186 15 84 171.17 4 Hurdag 186 24 124 NA NA I Riv Kabri 188 57 156 82.02 0.09 1 2 Kante 188- 55 U NA NA .. Not available
Karihenar 188 70 U NA NA Kari Tola 186 35 33 NA NA Karwai 186 16 311 222.38 20.75 2 2 Riv Kojram 188 69 U NA NA 2 1 Korwatola 186 37 109 NA NA 1 Riv
Kotam 186 21 555 NA NA 4 1 Kui 186 14- 107 115.35 Not available Lai 186 44 186 102.42 0.13 5 1 3 Latu 188 68 U NA NA 1 Lohargara 186 19 242 '174.39 3 Riv
Lohurtanr 186 5 132 NA N,A 2 4- Riv Mahuadabar 188 56 104 50.31 Riv Makundpur 186 26 151 NA NA , .. Mangra 188 63 U NA NA Riv Maromar' 186 II 250 95.63

224 PALAMAU BIHAR..
VILLAGE 'D IRECTOR Y
SUBDIVISION LATEHAR
ANCHAL GARU
Reference to Village Drinking Statistics Population Area in acres Irrigation racilities watel.svpply T ra r.sporll
Mauza ...----"--...... f951 ,-----".,....---...... "__----.,,.__----~ ,.----."..----... r--."....-~
Page Serial no. no. Cropped Irrigated B C T W OrB. P K Orl. B C
2 3 4- 5 6 7 8 9 10 11 12 13 14- 15 16
Mayapur 188 66 421 NA NA 2 3 R1v Murpa 186 43 22 63.09 3.92 4 1 Paharkocha 188 67 111 NA NA 1 2 Riv Pailapathal 186 40 U 12.90 Not available Pandra 188 73 U NA NA 2 1 Riv
Patratu 186 30 201 NA NA 1 2 1 2 Riv 1. Piri 186 25 240 NA NA 2 1 Riv Puranki Dabri 186 49 133 NA NA 3 I 2 .. Purni Armu 186 2 44- 81.06 Riv Purnihesag 186 4 10 37.31 2
Ramseli 188 64 203 NA NA 2 1 2 Riv R<rl 186 29 117 NA NA 4 1 2 }
Rud 188 52 791 NA NA 12 3 1 Riv 1 Salwe 186 23 118' NA NA 2 Riv Samodhtola 186 6 36 NA NA 2 Riv ~
Sarju 186 38 293 80.82 1.83 5 8 2 Z SimaKhas 188 50 144 85.36 20.46 2 1 Riv Siram 186 20 125 NA NA 2 1 Riv 1 Sonwar 186 31 72 NA NA 4 2 Sirkumi .. 186 10 317 304.94 Riv
Tati 188 53 18 21.61 Not available Tolahurdag alias (Chairodih) 186 12 76 119.05 Riv Udaipur 186 32 U NA NA
ANCHAL 10TAL 9,532 4, 29?83 83.2! H9 5 64 56 22

PARTn
VLLAGE AND TOWN~ STATISTICS

EXPLANATORY NOTE
VillaO'e Statistics containing a reproduction of the Prim:ry Census Abstract were presented for the first time in 1951 in Part II of the District Census Handbooks. This innovation has been followed in 1961 with certain improvements. The main object of this ,table is to furnish for every village certain basic data such as area, number of occupied r~siden. tial houses and households, general population as well as population of Scheduled Castes and Scheduled Tribes, literate and educated persons, and workers and non-workers classified into various industrial categories separately for each sex.
Definitions
Village : The term. "village" has the Same meaning as a revenue mau,=a. A mauza means "a parcel of land which as a rule is part~y built O\~er but mostly cultivated and wast~ WIth a. defim_te position and area, the boundanes of whIch were defined either at the time of the Cadastral Survey or at the time of the, Revenue Survey. It may contain no houses at aU or, on the other hand, several hamlets each bearing a different name".
House: A "house" means Ha structure or part of a structure inhabited or vacant, a dwelling, a shop, workshop. factory, a place of worship or sho~-cumdwelling giving on the road or a common staIrcase or a common courtyard leading to a main gate or enjoying a separate entrance".
"Occupied residential house" refers only to s)lch houses as are used for dwelling purposes
,either wholly or in part.
Household: A "household" means "a group of persons who commonly live together in the same house and take their meals from a common mess unless the exigencies of work prevent them from doing so".,
Workers: Workers, are ~h?se in some kind of economIC actl':lty. classified into the followmg categories
I Cultivator.
II Agricultural labourer.
who are engaged They have been nine industrial
III Mining, Quarrying, Livesto~k, Fon:st!Y~ Fishing, Hunti~g. ~nd Plantations, Orchards and Allied actIvitIes.
IV Household Industry.
V Manufacturing other than Household Industry.
VI Construction.
VII Trade and Commerce.
VIII Transport, Storage and Communications.
IX Other Services.
Non-worker : A person who is not working is a. non-worker. The following is the list of non-workers of different kinds :
(1) Full time students or children doing noother work, such as make articles at home for sale nor even help part-time in their own family cultivation, industry, trade or' business;
(2) Housewives or such other persons engaged in unpaid home duties, doing no other work, such as make articles at home for sale 'or wages, nor help regularly even part-time in family cultivation, industry, trade or business ;
(3) Dependents such as infants or children not attending school, persons permanently dis-' abled from work beca!lse of illness or old age;
(4) Retired persons (not employed. again) .. rentiers, persons living on agricultural or non-agricultural royalty, rent or dividend or other persons of independent means for securing which they do not have to work and who do no other work ;
(5) Beggars, vagrants or independent women without indication of source of incomeand others of unspecified source of exit-ence ;
(6) Convicts in jail (undertrial prisoners were treated as workers if they used to work before being apprehended), inmates of a penal, mental or charitablr institutioIJ ;
(7) Persons not employed before but now seeking employment for the first time ; and
(8) Persops emnloyed before but now out of employment and seeking work.
Column Headings
Cal. 1 [Serial IW. (Thana no.) ): The figure within brackets immediately after the serial number under this column is intended to-indicate the revenue thana number of the village. The name of Revenue Thana has been shown in bo capital letters above the village names in column 2.
Col. 2 (Name of Dillage) ~ Within an Anchal, villages have been arranged according t the Gr~m Panchayat (where constituted at the time of cenSus arrangements for 1961) to hic h they belong; or according to their thana numbers in blocks of 5, where no Gram Panchayat was then constituted.
If the Gram Panchayat bears the name of one of its constituent villages, it has been indicated by printing the name of such village in italics. Where thi~ is not so, the name of the Gram Panchayat has been printed in leati" at the head of its consti. tuent villages:
3
It may be noted here that at the time of ~reliminary arrangement for 1961 Cens us, the juris,dictions of many Gram Panchayats were not finally ~ettled. Some were in the process of proposed changes. Great difficulty was also experienced in obtaining a complete and authentic list of Gram Panchayats with the names of their constituent villages. Efforts were no doubt made to verify the lists with those maintained in the District Gram Panchayat Offices. But it is possible that in some cases the jurisdiction as indicated herein is not in strict conformity with the actual position. However, this is the first time that such information is being made available in print and few discrepancies here and there may be excused.
S~veral symbols and abbreviations have been used under this column to the left or righ t of the village names. These indicate various kinds of amenities found in the village. For full explanation of these, a reference may be made to the relevant section below.
Col. 3 (Area'in acres): Village ~ea.s ~ave b;en reproduced f(om the Thana J unsdictlOn LIsts, Unsurveyed villages (whose area figures are not available) have been shown as such. The Anchal _ area is the arithmetical total of village areas. In following cases, however, the areas differ from "those published earlier in Part II-A, Vol. IV, Bihar, Census of India, 1961, which are presented in the Appendix to Village Statistics. The differences ,are due to copying or computational errors which have been detected subsequently:
Area published in Part II-A Correct area
SubdivisonJAnchal (in Sq. miles) (in Sq. miles)
Sadar
Manatu 179·0} 180'9
Hussainabad 183-6 HiH
Gals. 6 to 36: In these column headings, P stands for Persons, M for Males, and F for Females.
Dots under' columns 9 to 36 indicate 'nil' figures.
'N·A' in column 3 denotes 'Not available.' Sources of information
Information about village amenities, other than po~t offices and post and telegraph offices, have been compiled from the Village Notes prepared by the census agency at the time of houselisting, which operation was conducted in September-October, 1960. Locations'· of ppst offices and post and telegraph offices ha.ve been shown on the basis of,the informa'tion obtained from the office of the Postmaster General, Bihar Circle.
Figures relating to occupied residential -houses and households (columns 4 and 5) have been obtained from the Household Schedules filled in at the time of census enumeration between the 10th February and 5th March, 1961.
All other data have been processed from the Individual Slips, which wefe prepareI'} separately for each individual at the time of enumeration.
Symbols and Abbreviations
The various symbols and abbreviations used under column 2 of the table relate to the existence of certain amenities in the -village concerned. Their significance is explained below:
Symbols +Post Office. tPost and Telegraph Office. :l:Electrified villa~e. *Rest House, Inspection Bungalow, Dak Bungalow,
etc.
Abbreviations
A-Allopathic medtcal practitioner B-Senior Basic School G-80mmunity' Building GC-Cane-growers' Co-operative Society G. P.-Gram Panchayat H-Homeopath h-High School Hos-HospitalfDispensary Ie-Industrial Co-operative Society K-Makht"b L-Public Library M-Middle School m-Madersa
Me-Multipurpose Co. operative Society Oc-\) ther Co-operative Societies F.-Primary School Rhc-Rural Health Centre Rvc-Rural Vaccination Centre S-Sanskrit Pathshala U-Unani Hakim V..:....Vaidya
. Where the: '.amenities existi~g in the village exceeded one, th_elr number has -been given iIl1Jllediately after the abbreviation.

PALAMAU
Occupied residential
houses
4
,..---..... _-..... Total num her of persons No. of enumerated (including
VILLAGE
SUBDIVISION
~NCHAL
Serial no. 1banano.)
Area No. of bouse. inmates of institutions Scheduled Scheduled
Litelate and
educated persons Name of village in acres hc;>uses holds and houseless persons) castes tribes
2
REVENUE THANA-DALTONGANJ
1 (183) Bakhari 2 (184) Chukru 3 (185) Kauria 4 (186) +Sua 5 (208) J orkat
P P
Rerma Chianki G. P.
6 (187) Gorho 7 (188) Rerma 8 (206) +Chianki 9 (207) Ganke
P P2,Oc
10 (191) Suana P 11 (192) Nimia 12 (193) Bajraha 13 (194) Singraha Khurd P 14 (195) Singraha Kalan P,M 15 (195) Tikuliya 16 (197) Bairia P 17 (198) tBaralota P,K,Mc 18 (199) Jonr P,M
.. 502·21 561·62
.. 1,522'80 •• 1,626·83 •• 1,015.76
313.17 .. 1,497.14 •• 2,266.57 •• 2,319.25
.. 567.35 385.27 250.16 933.85 850.62 268.42
.. 688.74 •• 1,718.70
9.27.22
'19 (200) Dhangardih alias Khanwan P .. 529.30 '20 (201) Kumar aliM Barkagaon .• 614.98 21 (202) + Rajwadih P,M,L 750.65 22 (203) Jamune P .. 1,477.50
'23 (204) pokhraha Kalan P .. 1,263.48 :.24 (205) Pokhraha Khurd P,Cc •• 1,357.95
Sinau,ill Lahtahe G. P.
25 (209) Kewatbar 26 (217) Barkinebhi 27 (218) Hutar' 28 (219) pirhia 29 (220) Nauadhonrha 30 (221) Kundelwa 31 (222) Jhabar 32 (223) Nawatoli 33 (224) Chatti 34 (225) Sinduria
36 227) Ma~hunebhi 37 237) .Kasla
P
P K
v p V
351226) Aru
38 238) .+Kishunpur 39 (239) Lahlahe P
Polpol Kalan G. P.
40 (210~ Hisra alias Pokhraha P 41 (211) Banua alias Salo 42 (212) Bakoia 43 (213) Sonpurwa K 44 (214) Sarja P
1,691. 70 420.62 142.32 34-3.11 198.43
.. 1,717.79 •• 1,033.37
183.26 75.03 21.38
218.86 230.60
,544.81 35.69
306.64
.. 1,979.14 389.23 136.03 68.97
321.09
4
48 41
145 311 25
375 344-
8
198 32
3 171 77
81 326 124
109 175 166 172
98 235
46 50
2 19 17
1I8 179
5 43 49 29 7
16 26 70
76 27 18 27
156
5
51 47
197 479
38
P
6
250 204-
1,171 2,251
152
398 2,081 426 2,140
10 46
270 1,409 33 173 4 19
201 1,153 92 542
87 431 381 1,891 166 869
109 175 200 184 140 255
53 60 2
19 17
159 203
8 68 54 47 9
23 43 98
83 43 24 39
186
640 968 989 997 747
1,452
249 287
3 112 93
920 1,040
30 362
-276 235
64 99
216 534
425 182 105 182 916
M
7
127 100 579
1,108 79
1,058 1,096
27
699 95 II
548 266
213 992 413
315 481 513 498 378 726
122 139
2 66 52
468 517 15
173 146 J12
31 43
106 286
207 82 52 90
450
M F M F M F F
8 9 '10 11 12 13 14
123 104 592
44
103 103
44 67 63 32
1,143 73
88 104 23 190 389
66
96 17 32 122
424 259 61 19
1,023 201 205 84 102 409 1,044 75 74 102 197 335
19 1
710 268 283 78 8
605 489 492 276 203 228
23 19 8
252 22 10
263 1'04
218 132 138 6 9 43 899 454 474 76 81 320 456 35 33 67 85 206
325 43 6 III 275
487 118 476 263 499 369 59 726 127
70 139
127 148
1 46 41
452 523
15 189 130 123 33 56
110 248
56 61 106 117
1
39 41 119 129 10 11 'ti8 '81
8 7 43 56 19 14 57 48
99 263 100
90 213 234
276 105
90 222 253
12 15 14 7
I 1 66 46 26 23
345 325 64 73
.. 62 60
1'l4 281 251 133 74
160
9 13
7 61 82 2
72 29 24
6
52 100
3 1 7
14-3
71 23
57 .-
1 20 18
13 49 29
7 66 36 38
5 17
10 4-
16 3 3
218 50 61 52 55 46 2 100 21 25 34 35 19 5 53 38 31 1 6 10 '2 92 27 31 3 2 34 16
466 162 166 23 21 121 23

STATISTICS
~ADAR
~ALTONGANJ
Total workers (I-IX)
I
Cultivator
II
Agricul. tural
labourer
5
WORKERS
II I IV V VI VII VIII Manu· Transport,
facturing Storage Mining, House· other than Trade and
Quarry. hold House4old Cons. and Commu. ing, etc. Industry Industry truction Commerce nications
IX
Other Services
M
15
F
16
M F M FMFMFMFMFMF M F M F
68 60
347 664
48
578 615
18
389 55
9 287 155
127 503 205
183 249 262 268 218 391
80 73 2
33 26
241 290
10 90 80 60 15 32 53
162
114 45 31 52
273
17 18 19 20 21 22 23 24 25 26 27 28 29 30 31 32 33 34
12 8
217 432
6
53 37
213 392 29
10 3
104 182
3
7 23 56
179 7
Uninhabited 222 147 5 119 440 308 236 31
1 8 4
326 132 120 168 47 41 40 4 4 7 1 1
67 154 11 40 82 83 .'. 60
Uninhabited III 21 6 54 172 182 33 43
72 104 23 62
5 83 20 97
225 229
60 72
1 25 17
191 213
11 lli 3 2
26 10 72
19 30 20 27
145
74 4 163 11 65
168 88 .]60 163 156 '158
33 28
16 '·14 '171 208
22 14 9 4
31 76
8 11 I .. 2-
63 83
'3 1 2
1 9
28
80 +5 8
61 54 85
39 38
1 14 8
63 72 '10 62 52 28
9 32 14 37
65 4 42 40 22 4 10 2 21 25 9 27
141 110 120
2 1 .. 5 ,0 ••••••
100 23 3 6 224 30 1 11
3 5 " 4 4 4 3
8 7 " 12 " "
53 25 1 26 3 8 T I I .. 22 4 2 73 57 10 25 27 40 .. .. 5 17 I .................. ..
189 7 7 3 9 2 6 .. .. .... 6 ...... 3 ...... "I .1
1 10 .. 2 .. 4 1 1 .. 82 I " 1 ..
97 7 .. 1 30 25 4 14 43 10 1 3
I 12 " 4.. 2 1 7 94 64 9 1 21 3 1 .. .. .. .. 3 ..
.. 3.. .. ...... 72 10 .. .. .. .. .. 2 .. 2 16 " 13 .. 15 " 1 " 92 .. 1 .. 1 .. 4 ..
62 47
.. .. I. "" 10 .. 5 .. 6 .• 10 "
44 7 .• 61 1 .. 1 .... 25 3 .• 11 4 ..
126 .• .. 6 126 .. .. 4
8 .. .. .. .. 5
4 .. 2 •. 2 ..
I .. 1 .. 1 1 ..
3 ..
'0 .o ....... .
8 3 .. .. ... . 15 1 .. 1 6...... I .. •. " .. 12 1 5 " 3 .. 2 ..
25 ............ " ..... . 1 .. " ........ ..
403 .• 8 ...... 1 74
15 1 ., 8 1 .•
18 .. .. ...... .. 18 .. " .. " .• 35 ., .. 6 .•
16 25
38-- .. 12
22 1
6 1
19 7 4
2 4 7 2
8
5
6
24 20
3 13
182 155 149 63
6
44 11 3 1 1
70 5i-9
7 6 108 30
19 4
23 24
136 28
- 4 108
I 6
3 5
'3 2
8 30
6
18
24
2
BIHAR
x
Sl. Non·workers no.
M
35
59 40
232 444
31
480 481
9
310 40
2 261 III
86 489 208
132 23:2 251 230 160 335
42 66
33 ,26
227 227
5 83 66 52 16 ~1 53
124
93 37 21 38
fn
F
36
III 96
375 711 67
801 604 18
384 31
4 538 194
107 727 384
320 404 456 402 144 497
1 2 3 4 5
6 7 8 9
10 11 12 13 14 15 16 17 18
19 20 21 22 23 24
67 25 76 26
27 21 28 24' 29
261 .30 310 31
15 32 178 33 114 34 120 35 31 36 30 37
JOO 38 176 39
199 70 33 65
321
40 41 42 43 44

6
PALAMA VILLAG£
SUBDIVISION:
ANCHAL
Occupied residential
houses ,-_......___., Total number of persons Literate No. of enumerated (including and
Serial no. Area No. of house- inmates of institution. Scheduled Scheduled educated -(Thana no.) Name of village in acres houses holds and housel~ss persons) castet tribes persons
,..-----' ,..--""---> .---..... ~ P M F M F M F M F
1 2 3 4 5 6 7 8 9 10 11 12 13 14
REV ENUE THA,NA-DAL TONGA'NJ-&onld.
45 (215) Nawadih B 103.83 32 53 263 134 129 12 10 52 2" 46 (216) Chak Barewa Me 19.77 47 62 249 :27 122 36 32 '5 3 42 4-47 (228) Babunebhi 78.2.7 48 (229) Bairia 29.04 49 (230) Kusi 76.53 4 4 12 3 9 3 9 1 50 (231) Po1po1 Khurd 82.79 10 11 49 26 23 9 8 4 5 3 51 (232) +Polpol Kalan P,B •• 2,407.75 174 211 974 489 485 37 34 III 97 138 6-52 (233) Chama 249.84- 32 32 138 64 74 36 47 6 53 (234) Karma 801.80 32- 36 156 83' '73 31 38 12
54 (235) Duba 136.83 17 23 116 58 58 48 48 18 I 55 (236) Bhogu 218.37 40 57 329 159 170 67 68 66 & 56 (240) Khamdih 432.39 116 145 743 359 384 71 76 7,3 81 52 57 (241) Sembhu Chak 2585 111 115 327 165 162 27 24- 6 9 59 18 58 (242~ Bari P,M .. 1,433.73 254 284 1,412 698 714 142 157 31 38 234 20-59 (248) Nawadih 153.85 10 12 58 27 31 5 6 22 25 8 60 (249) Rupaundha .. 147,49 61 (250) Purnadih P 495.04 I 1 2 1 1 1 1 62 (251) Rajderwa 232.18 39 46 314 168 146 7 5 17 15 56 50,
63 (243) Mana Soti .. 984.34 48 53 241 120 121 53 43 48 55 24 64 (244) Ledwa Khar 120.90 II II 44- 26 18 4 65 (245) Halumanr 883.15 93 106 390 185 205 24 39 116 113 65 .,. 66 (246) Gurha 91.11 1 1 3 1 2 I 2 67 (247), Mukta 142.32 29 34 155 80 75 39 7 68 (252) Shahganj 60.89 69 (253) Tabar K 172.27 46 60 29~ 133 159 4J 38 42 ~
70 ('2.54) Gaurfi 295.57 24 28 105 57 48 57 48 3 71 (255) Ponchi V,P 674.51 123 180 652 313 339 140 160 82 21
72 (256) Hur~ur 812.76 47 52 239 118 121 38 4 68 15 17 1 73 (257) Jora Hunhe alias Jora .; 232.36 45 50 250 12S 125 70 78 "' 33 6 74 (258) Chatli Satbarwa P,h,K2,l., V2,U,H3 349.9 I ,412 544 2,367 1,199 1,168 232 231 3 ',4 646 206-75 (.259) Dulsulmi 175.60 76 (260) Dulsulma P 902.8', 127 156 761 386 '375 62 62 313 303 72 2 77 (261:) Murma 353,85 32 32 138 68 70 20 40 48 30 10 78 (262) Kathalltia 135.Q5 18 21 107 49 58 47 54 7
ANCHAL TOTAL .. 47,780.39 6,219 7,601 37,79(- 18,902 18,889 4,722 4,967 3,694 3,717 5,902 884 or
74.&6 sq. miles

7
'STATISTICS
1lAPAR
1)ALTONGAN] WORKERS
--- .;...
I II III IV V VI VII VIII IX Manu- Transport,
facturing Storage Agricul- Mining, House- other than Trade and
tural Quarry- hold Household Cons- and Commu- Other '[ot3,1 workers " (I-IX) Cultivator
,--""'__"
labourer ing, etc. Industry Industry truction Com~ree nieations Services
M
15
75 77
S 14
302 42 47
30 75
203 88
415 15
1 80
81 18
127
40
77 38
163
73 65
620 ' ..
212 38 3.2
,--A.----,. ,...-~_,,....-..A--... ~ ~ ,__....,._...., .--oA._____ ,.--~
F
16
M
17
F M FMFMF'MFMFMF M , 18 19 20 21 22 23 24 25 26 27 28 29 30 I 31
41 54 53 45
Uninhabited Elninhabited
.6 3 14 • 10
197 .230 35 31 20 36
4 19 38 48
120 .129 21 32
154 274 16 .. 9
Uninhabited 1
65 .64
19 1
'82 I
42 10 74
9 27-Uninhabited • 53 40
7 28 66 112 _
18 33
2 7
141 18 12
3 38
48 12
11 23
3 34 11 10
11 18 72 52
134 2
65 "14
5 23 5
19 4,0
4 3
36 17 8
42, 25
86 ,. 15 18 56 31 •. 30 ., 2· 14
178 261 86 'c 23 Uninhaf1ited 253 180 218 18 48 20 26" 14 37 26 31
22 2 20 ..
4 7
1 .. 2 ..
.. 44 1 17
2 14 , _. 10 1 .. 12 2
8 1
4 .... 35 2 ..
10 I •• 0.. ••
.. .. .. .. .. 3 82 1 II •• O.
21 I. I ••• 1 .. 6 .. 106 ..
4 .. .. .. .. 3
13 11 1 I. •• '0 ••• ,
52 9 4 I 2.. 3 .. 1 .. .. 3 5 •. 1 2 ......
16 7 4 I 7 1
.. 10 2 .•
52 1 16 1 23 6 3 1 . " 21 29 11 110 37 14 3
26 7 4 4 16 1 4 '.'
5 4 1 1
663 1 .. 141 6 14
F M F
32 33 34
4 8
1 10
4
3 1 1
4 3 3
,. 4
12 I,
13
,. 2
36
3 3
2 .. .-.
2 15
14
4, 2 1
BIHAR
x
81. Non-worken nv·
M
35
59 50
12 187 22 36
28 84
156 77
283 12
88
39 8
5g 1
40
56 19
150
45 60
579
174 30 17
F
!l5
88 69
3 9
288 39 53
54 132 264 141 560
IS
81
102 17
123 1
66
106 41
273
35 94
990
122 22 21
45 46 47 48 49 50 51 52 53
54 55 56 57 58 59 60 61 62
63 64 65 66 67 68 69 70 71
72 73 ;74 75 76 77 78
lO,5U 5,494 '6;453 '2,444 2,525 '2,215 369 114 285 119 203114 83 8 245 52 194 1,154 428 8,390 13,395

PALAMAU
Occupied residential
houses
8
,---"""'_____ Total Dum ber of persons No. of enumerated {including
VILLAGE
SUBDIVISION
ANCHAL
S'enalno. iThan8no.)
Area No. of house- inmates of institutions Scheduled Scheduled
Uteratc and
educated persons
,...--......___, Name of village in acres houses holds and houseless persons) castes tribes
4
REVENUE THANA-DALTONGAN]-CQntd.
Katuwal G. P.
I (1) Rampur P 2 (2) Kosiara P 3 (3) Tenia 4 (4)" Bakeya Kalan 5 (5) Bakeya Khurd 6 (6) -Dulhi 7 (7) Gangi 8 (8) Patarhia Khurd P I
9 (9) Lirlki' 10 (10) Kakatua 11 (11) Patarhia Kalan 12 (12) Katuwal Kalan P 1'3 (13) Katuwal Khurd 14 ,(14) Chakwa 15 (41) Purna Majhgawan 16 (42) Lidki
.. 2,630'57 .. 431065
175'14 .. 774.93 .. 449'17 .'. 309·06 .. 370·96 .. 454'68 .. 749.58 .. 501'57 .. 266·52 .. 244'27 " 263·47 . . 229'37
200'22 .• 1,310'69
17 18 19 20
(~7) Tali .. (40) Majpgawan ..
86·07 205'52 200'37 435·58
2 ! 22 23 24-25
(43) Maira' Rvc .. (44)+ Pathra alias Narsinhapur P, B,L,
{45) (!i6) (47) (48) (49)
Naudiha Mathura Dohari Bankheta Bltairwa Pataria
V2, H3 " 130·72
88'93 2[6·90
" '4u4'93 317·46
26 (15~ Karamdih 606'46 27 X16) Bltat Kolhua 84'40 28 (17) Kolhua Khurd .. 175'00 29 (18) Mantuwa 150'26 30 (19) Mahuliya .. 227'22 :11 (20) Khiribar >. 470'40 32 (21) parsiya .. 339·03 33 (22) Turulr. Taleya alias purubdiha P,M 230'87 34 (23) Bhaonadiri 103'09
35 36 37 38 39 40 41 42 43
(24) (25) (26) (27) (23) (29) (34) (38) (39)
Taleya Babhandih G. P.
J agarnathpur Taleya Khas Chenrabar Ajodhya Kolhua Banjari Babhandih Sonpurwa Lakeya Nagwa
H P
p
p
54-93 466'44
.. 630·-46
.. 585·04 " 384'95
455'16 93'98
219·47 239-60
75 73 12 31
9 27 3~ 47 50 11 62 59 12
36 52
42 98 18
270
27 22 3~
10
5
8 27
213
85 60 40 25 99 51 50 70
.----=--_ .... _--...... ,...-----. .-----,
5
105 125 16 52 20 34 56 70 84 13
114 87 17
44-79
40 175 23
343
33 24 50
P
6
632 646 87
269 73
203 302 344 452 69
595 456 84
254 386
206 815 113
1,652
189 163 247
17 95
13 69
10 42 31 188
282 1,500
125 84 45 31
121 58 79
102
646 400 188 176 614 275 439 505
!vI
7
329 313 46
143 33 96
146 176 226 36
279 205
44
123 201
95 407 5~
869
91 79
116
42
3;> , 23 75
739
3I1 211 102 94
330 146 228 245
F
8
M:
9
F
10
M P !vI F
303 333
41 126
35 107 156 168 226
33 316 251
40
131 185
111 408
59 783
98 84
131
70 42 20 4-4
14 .. 117 61
17 34 32
33 86
14-18
233
22
71 44 18 6 3
16
II
98 39 62 79
1 16 147 35 30
37 87
13 32
121
27
2
53 42 53
34
19 19 18
12
50 75
159
.. 2
13 14
1S5 34-SO
7 20 6
13 1
19. } 24 13 I 31 3 79 26 1
15 38 7 ,
28 66
7 305
1 6 II
..,
s
14 2
2 113 ... ~ .. 63 105 43 8
761 143 136
335 189
B6 82
284 129 211 260
76 24 80
30 124-
8
100 23 68
36 112
S
100 146
394 57
120 107 27 14-
102 22 42 61
10 5
34
1 5

STATISTICS
SADAR
CHAINPUR..
1
Total wOFk rril(I-IX) Cultivator
{
M
15
Ili7 189 29' 69 27 57 78 98
132 21
161 104 25
74 125
47 2'36
30 435
65, 47 59
26
18
lZ 38
S60
198 Jl8 62 46
185 86
126 144-
F
IS
50. 112' 22 6a 10
g. 2
B 60 12
146 9.5 8
100 ]56
45 13
49 40 54 69 S
Jl9 69 16
U ninkabiud 94 74
110 116
15 25 183 17. 32' 13
120 118
U ninhabitetl T!J ninkabit.tI 2f S2 13 40
11 53
33 6 Yninlzo1JitNI
4 12 Uninha6i1n1
9 1 25 !K
Uninha6itltl 231 184 U ninhsbi"t4
UninhabW )51 )01 74 102 41 U 44 44-
U,l4 45 37 7
107 fi9 140 152
P-lJ-2
F
18
1 6
1 I 5
4-9 3
20 SO
86 103
7 143
16 9
J
4
4
10
77
17 «i6
5 S6
S 11 80
III
9
WORKERS
~----------------------~
II III IV V VI VII VIII Manu- Transport,
facturing Storage Agricul- Mining, House- othertllan Trade and
tura) Quarry- hold Household Com- and Commu-Iabouret 109, etc. Industry Industry truction Commerce nicatiODs
M FMFMFMFMF MF M
19 20 21 22 23 24 25' 26 27 28 29 30 31
61 49 6 .. .. .. .. .. 29 106 1 .. .. " " 1 ..
29 22 .. .. .. .. . . 22 67 1 .. .. .. .. .. .. " 18 9 .. " .. .. " . . ..
6 . . .. .. .. 6 1 14 16 1 ..
13 5 17 1 .. .. .. 38 39 23 5 7 ..
6 12 9 23 125 19 1 27 65 5 .. 1 .. 7 7 2 ..
.. 8 .. . . .. 9 7 .. .. .. ..
4- " .. " .. .. 53 40 4 .. 2
3 .. 17 13 .. " 105 21 2 53 18 8 5 81 4 8
2 1 .. 6 .. .. . . .. 5 12 .. .. .. 2 1 3
16 28 4 .. .. .. "
3 .. .. . . 3 9 .. .. .. " .. ..
15 2
29 151 2 16 2 1 .. 10 5
31 68 5 6 30 .. .') .. 2 6 2 1 " .. .. .. 7 40 5 1
8 .. " .. .. .. .. 41 101 4 .. 19 2 18 1 .. 13 5
7 2 .. .. 3 .. 4- • 27 2 .. 10 .. 6 1 6 28 .. 1 2 4
F
32
IX
Other Services
M F
33 34
2 .. 1 1 2 4 2
13 2 2
2
17 8 6
107 66
25 20 2 1
3
8 2
113
19 6 12 1 37 1 2
39 28 69 i4 34
BIHAR
x
81. Non-workers no.
,---.....___, M
35
162 124
17 74 11 39 68 78 94 15
118 101
19
49 i6
48 171 24
384-
26 32 57
16
17
11 37
379
IJ3 93 40 48
145 60
102 101
F
36
253 221
19 58 25 98
154 157 166
21 170 156
32
37 75
96 225 27
663
77 71
130
20
30
10 88
530
181-115 39 38
150 42
104 120
1 2 3 4 5 6 7 8 9
10 11 12 13 14 15 16
17 18 19 20
21 22 23 24 25
26 27 28 29 30 31 32 33 34,
35 36 37 38 39 40 41 42 43

PALAMAU
Serialno. (Thana no.) N am e of village
2
10
Occupied residential
houses
No. of Area No. of house-
in.acres houses holds
3 4 S
VILL.AGE
SUBDIVISION
ANCHAL
Total number ofpersons enumenated (including inmates of institutIOns Scheduled Sch~duled
Literate and
educated persons and houseless persons) castes tribes
r---.."._----. ..---.....
P
6
...
M
7
F
8
M
9
F
10
F
12
M
13
F
14
REVENUE THANA--DALTONGANJ-colltd.
Shahpur G. P.
44 (30) Chak Harbhonga
45 (31) Sheopur 46 (32) KaraKath 47 (33) Mahug awan 48 (3.5) Khutar Kalan 49 (36) Khutar Khurd 50 (50) Kini /' 51 (51) +Bansdih 52 (52) Sukri
.53 (109) Banua
54 (11'0) Jhariwa 55 (Ill) Paned Bandh 56 (112) +Shaltpur
Burhibir G.P.
57 (53) Ulman 58 (54) Talapara Jhaibar 59 (55) Dhurhubar
60 (56) Talapara 61 (57) Baranw 62 (58) Harnamar
P
p
P p,e,H
P,K M
Burhibir G. p.-contd.
.63 (59) Chothasa
Harnamar C. p.-concld.
'64 ( 62) W ornar
65 (99) Jainagra 66 (100) Golpa 67 (1 01) Itko 68 (102) Burhibir
P
P
p
Khura.NenulJ, G. P.
69 70 71 72 73 74 75 76 71 78
(61) Rabda (63) Gangdhara
1(64} Nenua (6S) Saram (66) Khura Kalan (67) Bahera Khurd (68) Barkat (69) Lali (70) Doki (71) Chhatwa
p
p
.• 747.07
622.06 616.69 447.96 143.44 94.20
.. 1,105.20 610 .. ') 1 373.28 720.29
.• 207.01 297.23
.. 1,072.43
.. 205.80 .• 180.15
181.11
300.97 .• 3,489.27 .. 1,640.74
.. 999.89
2,133.20
499.03 .. 242.14
425.96 .. 1,364.53
.. 1,618.67 . . S12.56 .. 1,813.45
232.24 .. 3,04S.73
499.53 343.10 S91.66
.• 697.47 " 3,320.50
27
2 54
117 23 29 22 76 16
163
60 76
366
3 4
38 275 149
61
132
42
.153
179
94
134 80 13 26
32 13'!
2 3 79 354
153 857 35 169 37 181 26 156 93 523 23 85
201 1,009
75 88
418
5 4
422 368
2,296
18 15
48 227 333 1,755 195 882
77 336
162 990
52 307
204 1,088
179
94
134 80 13 26
965
478
843 552
84 173
72
3 172 437
80 88 86
264 46
505
222 183
1,092
10 9
112 897 455
167
S17
142
541
496
241
434 276
43 85
62 11 11
2 182 81 84 420 112 116
89 24 24-93 26 27 70 32 24
259 82 76 39 37 39
504 206 210
200 185
1,204
8 6
57 88
322
47 97
336
115 100 105 858 128 119 427 34 36
169 58 54
473 133 107
17 .. 32
.. 770
7
.. 11
21
. . 762
.. II
8
.. 41
133 32 25 22 94
70
52 45
371
5
5 105 128
19
59
165 4- 6 123 143. 13
547 88 96 II 16 36
469
237
409 276
41 8&
47
14
88 3
13
74-2
75
17
48 8
31 77
49
26
35 5
35 81
19
51
61 35
1 8
12 21
2 3
10 22
8
1 8
90
I 6
15
2
9
2
2
1 2
...

STATISTICS
SADAR
CHAINPUR
Total wOlken (I-IX)
]
Cultivator
F
II
Agricul. tural
labourer
11
WORKERS
III IV V VI VII VIII Manu· Transport,
facturing Storage Mining, House- other than Trade and Quarry. hold Household Cons. and Commu. ing, etc. Industry Industry truction Commerce nications
M F MFMFMFMFMF M
IX
Other Services
M
15
F
1&
M
17 18 19 20 21 22 23 24 25 26 27 28 29 30 31
F :M F
32. 33 34
3B SO 20 15 9 13 8 2
3 ·4 3 102 73 42 4 45 64 9 2 .. 3 2 220 88 118 13 1 6 11 17 8 1 2 7 69 54
43 13- 30 1 4 11 3 1 .. .. .. . . . . .. 6 50 44 33 10 9 30 .. 2 2 6 2 45 27 28 16 9 9 3 .. 2 .. .. " .. 3 2
135 115 95 82 25 29 4 .. .. .. I 10 4 30 '3 22 5 .. 3 3
290 186 113 4 II9 151 25 28 6 .. I .. 3 1 23 2
124- 93 45 36 30 51 27 3 .. 7 4 .. 2 8 3 107 88 47 22 29 58 16 1 2 1 .. 5 3 10 1 623 199 l43 19 5 12 64 50 69 36 25 3 5 73 6 17 222 73
5 5 .. .. .. ' . .. .. . . .. . . 4 3 3 3 ..
Uni71kahijttl
73 55- 1& 5 54 60 1 516 459 264 81 196 271 3 .. 29 100 2 .. 22 7 342 2g5. 2;1 246 63 49 .. .. .. .. 8
108 59 7 4-9 79 .. .' .. .. . . .. .. .. .. . .
275 180 95 174 179 4 2
79 83 62 4- 16 79 Unjnhabilli U nitJzabi'eti
295 152 210 19 73 133 10 .. .. .. .. ..
301 255 135 8 127 242 36 5 2 Uninhabited
166 161 140 130 15 27 II 3 .. U ninh.biteil
3 287 185 179 98 102 B4 4 1 .. 166 170 154 153 5 9 I .. 6 8
30 3;l 29 29 1 11 59 48 46 38 5 10 2 .. 6
U ninhabitell Uninhabited
BmAR
x
Sl. Non-workers no.
M
35
34
70 217
37 38 41
129 16
215
98 76
469
5 5
39 • 3BI 113
59
2<{'2
63
246
195
75
147 110 13 26
F
36
32
109 332
76 49 43
144 36
318
107 97
1,005
7 3
50 399 132
83
293
82
395
214-
76
224 106
9 40
44
45 46 47 48 49 50 51 52 53
54 55 56
57 58 59
60 61 62
63
64
65 66 67 68
69 70 71 72 73 74 75 76 77 79

12
PALAMAU VILLAGE
SUBDIVISION
ANCHAL
Occupied residenual
houses ,----_,,___....., Total number of penoru Literate
No. of enumerated (including and Serial no. Nea No. of bouse- inma tel of instiiutionta Scheduled Schedul-ed educated
(Thana no.) Name of village in acres houses holds and house~ess person:!) castes tribes persons
-"----~ r---..A.----, ,---~--.....
" P M F M V M oF M F
2 3 4 5 6 7 8 9 to U '12 13 14
REVENUE THANA-DALTONGANJ-contd .
79 (72), Karsa P •• 3,765.95 199 219 963 484 479 116 132 176 IF5 125 17 80 (73) 1\latauli 895.00 70 72 373 179 194 118 137 36 ?'·O 12 2 81 (74) Bori P .. 2,379.77 182 189 860 441 419 58 52 82 <;4 37 82 (75) Kilhar .. 2,091.65 26 26 ll6 59 57 5 1 22 27 6
83 ~60) Kumni V,H .. 1,068.84 36 4:l 191 99 92 39 37 6 2 22 8 84 76) Pachlewa P .. 2,315.52 37 39 192 96 96 10 7 62 64 9 85 (97) +Salatua M,L,C .. 5,144.46 184 233 1,289 669 620 133 145 117 59 2Q6 36 86 (98) Bahera 7t3.0B 54 58 310 155 155 32 33 40 74 22 1
87 (77) Chauparia .. 1,490.41 66 81 368 203 16.'1 27 21 46 72 2.0 88 (7:::, +Babhandih m .• 1,611.90 116 153 706 373 333 13 24 1 7 64 10 89 (79) Benidih .. 653.49 28 31 140 79 6 10 6 58 44 9 1 90 (80) Berma P.K '. 2,814.73 69 74 388 187 201 35 43 35 37 43 7 91 (81) Dhawa .. 1,198.69 29 31 139 74 65 22 13 52 :52 fi
92 (88) Sarhauwa .. 2,262.28 54 54 231 134 97 43 28 82 66 20 4-93 (90) Nawadih p .. 1,962.39 176 185 794 391 403 142 146 8 7 3] 9
Ramgarh G.P.
91 (82) Horanda alias Ramgarh p,OeS 1,929.91 123 156 564 302 262 211 i90 7 14
95 (83) 1)helua .. 1,090.55 22 23 171 89 82 66 64 96 (84) Baghi .. 1,354.37 96 116 196 244 252 ISS 188 44- 53 25 3 97 {a5; Sarja 701.47 55 73 328 166 162 83 87 63 67 17 98 ~a6) Kachan P .. 2,8.')6.09 III 143 579 29! 285 71 73 163. 169 6 2 99 87} Chitabar alias Dinabar 812.38 37 39 98 50 48 25 16 19 26
llutar-Mayapur G. P.
100 (148) Kundpani 949.32 17 17 74 37 37 5 2 29 27 4-
101 ( 14~) Musurmu .. 1,147.57 67 67 265 133 130 33 32 75 74 6
102 (150) Uldanda p .. .1,598.57 51 56 271 145 126 51 45 91 75 5
103 (151 ) Serka 526.81 45 48 206 102 104 4 3 92 97 18
104 (147) Chorhat .. 1,830'57 85 99 427 215 212 7 ,9 70 62 38
lOS ( 52) Banalat .. 1,705-57 20 23 126 62 64 5 9 50 ,.,5 7
:lO6 ~ 53) Nawadih .. 2,159·46 64 94 455 231 224- 24 17 58 48 4
107 (154) f- Chando alias Mayapur P .. 2,099,04 106 118 546 266 280 72 72 90 191 67
108 (15.1) -Hutar P .. 2,346·44 147 149 715 359 356 297 299 . 60
-lOg (156) Chhitra alias Sonar Khap 975·49 75 100 449 241 203 25 27 45 H3 3
'1l0 (157) Ulman 1366'60 93 101 439 218 221 18 21 80 178 17
1'1.11 (\ 53) Aragara 920·91 6 8 3'i 15 20 15 3
112 \159) Uter 8(16'32 16 18 89 52 37 52 37
113 ( 146} Manke 493·71 8 B 33 14 19 4 9 8 8
114 ( 160) Kokaru .. 1,190,74 32 44 367 183 184 103 ]04 39 :33 7
115 (161) Chunga Bansdih .. 2343·86 59 62 319 167 ].'12 100 100 20 I
116 (162) Bansdih Khurd P .. 1,575'40 65 91 475 247 228 100 61 100 140 11
117 (163) Bairiya 164·34 118 (141) Mahawat Muria 253'67 5 5 25 15 10 10 6
119 (142) Mahawat Muria Sani 18·93 2 3 12 8 4 1 4 2
120 ( 144) Margara 303'78 12 22 90 46 44 46 44
121 (164) Khapia 904·86 25 32 176 84 92 15 20 56 55 2 1
122 (165) Barhanian 25·86 123 (166) Pinrhe P .. 1,468'63 94 115 504 255 249 65 69 167 158 8 1
124 (167) Muru .. 2,489'90 25 34 172 83 89 16 20 66 67 20 7
125 (\6B) Parsakhat' alias Barwa Khar .• 502·89 19 34 139 68 71 17 15 41 54 8 3

STATISTICS
SADAR
oCHAINPUR
Total workers (I-IX) Cultivator
II
Agricultural
labourer
13
WORKERS
III IV V VI VII VIll Manu- Transport,
facturing Storage Mming, House- other than Trade and Quarry- hold Household Cons- and Commu. ing, etc. Industry Industry truction Commerce nicatlona
M F MFMFl\1FMFMF M F
IX
Other Services
M F M
15
F
16
M
17
F
18 19 20 21 22 23 24 25 26 27 28 29 30 31 32 33 34
320 107 254
39
54 ~I)
40 8S
1I~ 240
41-109 43 87
'J57
198 (;2
1 5 110
"203 34
23 92 97 71
149 41
182 199 2?') 1;2 148
11 35
13 157 1~6 222
9 1-
29 50
155 50 41
210 67
193 17
33 54
295 55
57 159 24 31 12 35
183
136 53
100 105 170
7
205 46
194 21
20 11
237 81
134 27
136 7
4
186 30
117 54 187 123 30 2 81 12 34 3 69 35
121 131
77 36
118 55
162 17
25 15 47 51
131
106 60 59 17
31 41
103 7
2 16 14 13 8
10
113 25 27 42 35 17
18 80 85 65 95 46
10 9 8 43 43 30 67 49 16 62 59 2
148 95 34 46
166 158 162 144 60
138 150
163 126 1 133 55 83 141 130 4
10 2+
14
119 123 II 10 35 24
14~ 157 142 111 126 III 204 202 189 Uninhlbited
5 8 2 2 4 2 9 25
41 44 36 Uninhabited 142 120 liS 47 38 34 34 30 23
13
.. 19
4 5
28 12 11
76 7 40 .. J7 .. 10
2Q 53 2
107 24 25 ..
3 .. 5 7
22
2 .. I ..
2 6 ..
12 7 .. 3 4 7 ..
1 ..•. o. 90 33 5 18 ..
100 I .. 5 2 .. gB •. 50 6 4~ t,. 3 3 39 I .. 4
4 ..
7 .. .. .. .. .. .• ..
8 5 I .. 35 13 .. 3 2 ..
" 2 I
" 18 ..
'0 ••••
4
I ..
2 ..
•••• 0,
1 .. 35 11 1 .. .. .. .. .. .. 2 ..
5 4 ..
7 8
.. 14 5 2 6
20 3
14
I 5
.. 1 1
15 .. ..
3 ..
9 5 1 ..
27 3 ..
I ...... .
8 2 8 1
5
3 ..
•• o •
S .. 6 .. .. ..
1 ••
13 .. .. .. 11
I I
3
3
3
19
30
5 1 3
41
1 1 3 4 1
2 1 2
18 I
21
30
3 2
9
3 2
13
BIHAR
X
51. I\ on-workers no.
M
35
164 72
187 20
45 40
259 67
84 133 35 78 31 47
134
104 27 89 56 91 16
14 4-3 48 31 66 21 49 67
134 89 70 4
17
1 26 41 25
6 4
17 34
100 33 27
F
36
269 127 226
40
59 42
325 100
79 S()
81 82
83 84 85 86
108 87 174 88 37 89
170 90 53 91 62 92
220 93
126 29
152 57
115 41
94-!J5 '::)6
97 98 99
19 100 50 101 41 102 39 103
117 104 18 105 62 106
136 107 296 108
70 109 71 110 10 III 13 112
5 113 42 ) 14 41 ll5 24 116
117 5 1I8 2 119
35 120 51 121
122 107 123 ~2 124 37 125

14
PALAMA.U VILLAGB.
SUBDIVISION
ANCHAL
Occupied r esid ential
houses ,---....._~ Total number of persons Literate
No. of enumerated (including and Scrialno. Area No. of house- inmates of institutions Scheduled Scheduled educated
(Thana no.) Name of village in acres bouses holds and houseless p~rsons) castes tribes persons -----...... ,.....-~ ~~ ...... ,..--""""-- .......
P M F M F M F M F
2 3 4 5 6 7 8 9 10 11 12 13 14-
It RVENUE THANA-DAL TONGANJ-confd.
Sokra G. P.
126 (123) Basaria Kalan P .. 917'04- 87 118 571 284- 287 150 162 33 25 37 7
Chanda G. P.
127 (169) Khura .. 383·98 13 15 75 44 31 44 31 10
128 (J "0) Kui .. 1,060'07 14 16 60 25 35 25 35 3 129 (171) Khauraha 26·54 6 6 30 14 16 " 14 16 130 (172) Sokra 1,269'05 63 75 359 180 179 78 79 100 99 54 s-131 (173) Kurkutta 152·35 16 21 88 40 48 25 26 5 6 5 132 (174) Dulsulma 121·87 32 46 216 111 105 40 90 21 15 5 133 (175,) Rajhara Ie .. 117'27 12 ]8 81 42 39 20 25 4 3 9 1 134 (176) Basariya Khurd .. 331·36 47 53 250 124 126 12 11 11 13 12 . 135 (177) Dokra 336·47 44 56 289 147 142 90 100 8 11 44 11
136 (178) Alagdiha 109-44 36 58 272 129 143 20 26 100 108 33 :2 137 (179) + Chanda P,M .. 2,117,93 287 450 2,126 1,122 1,004 250 469 239 242 185 122' 138 (180) Baigadih 262·77 139 (181) Ausane P .. 2,347'24 127 226 1.207 613 594 13 13 100 115 151 14 140 (182) Duba 401·16 43 62 345 161 184 102 121 32 2
141 (113) Kaleyanpur 328·54- 79 79 324 157 167 .. 3 H2 ( 120) Pinrra 81 ·52 55 63 255 128 127 8 6 92 92 10 Z 143 (121 ~ Kankari .. 1,075'64 276 276 1,324 654 670 71 98 50 69 34 1 144- (12? Ransgara 602·46 1 2 4 3 1 1 1 1 145 (124) Bariman 927.09 6 6 2:! 12 10 4 4 8 6 146 (125) Ajlatua 603-70 12 12 48 24 24 20 22 3 1 1 147 (126) Hukwa 202·20 23 25 106 60 46 " 1 53 44 9 H8 (127) Kurka 480·32 77 78 274 139 135 20 30 80 75 25 149 (128) Jharha 367'00 150 (130) Haminpur 403'12 151 (139) Nawa P .. 1,478'35 33 40 151 77 74 3 1 61 55 14 152 (140) Datam .. 1,935'42 43 49 187 100 87 6 7 94 79 4 153 (143) Adar " 2,819'62 19 22 72 38 34 4 2 34 32 2 15~ (as) Biwabathan .. 213·60 15 18 80 42 38 15 5 20 16
Semra G. P.
155 (89) Hillra ., 2,299-47 49 49 224 113 111 112 108 8 3 156 (91) Gore ., 1,293-15 38 39 196 103 93 65 58 10 2
Neura G. P.
]57 (133) Semaria 51·88 24 25 lIl! 56 62 50 60 10 2 158 ~13f) Tcmrain .. 1,045-63 20 21 110 55 55 27 24-159 136) Jhalar 256.69
160 (137) Karma .. 1,609·10 44 44 21B 110 108 110 108 14 2 ]61 (138) Kutti ., l,fl37'23 9 9 20 13 7 3 1 2 2 162 (92) Semra P ., 3,774048 192 216 986 492 494 162 155 12 16 88 19 163 (93) Loharsimi .. 291 ·43' 1] II 40 23 17 9 5 13 12 3 ]64 (!l4~ Khura Khurd 457-75 23 26 176 87 89 .. B7 89 7 ]65 (95 Khaiiibhi 443'29 20 20 114 56 58 15 11 39 47 1

STATISTICS
'SADAR
{;HAINPUR.
I
Total workers (I-IX) Cultivator
M
15
175
22
17 10
114 23 77 24 71 86
71 629
.370 100
91 72
350 3 6
12 41 97
46 60 24 28
71 58
32 40
72 11
281 18 59 38
F
16
IS9
3
19 8
25 26 6
30 70 70
86 463
M
17
164
22
4-3
85 14 35 20 63 57
69 478
Uninhabit,d 343 241 68 81
6 83 34 49 52 260
1 2 2 3 5 5 39
28 68 Uninhabited Uninhabited 33 42 5 57 3 21 3 22
23 40 18 28
16 4 24- 24-
Uninhabited
45 50 5 2
209 259 12 18 50 58 35 38
F
18
129
3
6 2
25 12 2
24-.'i8 36
78 376
295 55
5 18 14-
5 7
29 3 2
10 '3
5
28
183 12 50 35
II
Agricultural
labourer
15
WORKERS
III IV V VI VII VIII Manu- Transport,
facturing Storage Mining, House- other than Trade and Quarry- hold Household Cons- and Commu-ing, etc. Industry Industry truction Commerce nications
IX
Other Services
M FMF~IFMFMFM F M F M F
19 20 21 22 23 24 25 26 27 28 29 30 31 32 33 ~4
10 10 .. " .. .. .. .. .. . .
.. .. " .. .. .. .. .. 13 13 .. .. .. .. .. . . 7 6 .. .. .. .. . . 5 ., 3 21 \:I 14 .. " .. . . .. .. . . .. ., .. .. . . .. 42 4 6 .. .. .. " 6 12 2
25 34 2 .. .. ., .. .. 2
4
R 2 " .. .. .. .. .. 'i 118 59 6 26 16 " .. .. S I I 7
48 16 61 28 .. " " .. 20 4 9 9 .. 2 .. " " .. .. .. .. .. 10 2
.. 4 .. . . I 1 .. . . .. .. 2 4 1 5 .. 6 13 .. .. .. . . 6 2 1 5 7 75 15 6 \ 1 1 .. .. .. . . 1 3 4
.. 1 .. .. 1 2 3 .. .. 1
3 .. 4 3 2 .. .. .. .. . . .. .. .. "
3 .. 23 .. I 5 .. .. .. J4. 2 2
.. 4 4- .. .. " .. .. . . .. 2 2 1 .. .. " .. .. . . .. .. 2 1 I .. " " .. 6 3 .. .. .. .. " . . .. ..
22 8 3 2 6 3 .. .. .. " . . 17 11 13 4- .. .. .. .. . . ..
22 16 4 .. .. .. " " II 15 5 2 .. .. .. .. 2
1 7 19 2 2 2 6 2 2 5 1 2 2
19 26 1 .. .. .. .. " .. .. 2 \ .. .. .. . . .. ..
1 .. .. .. .. .. .. . . .. .. ..
BIHAR
x
SI. Non-workers no.
M
35
109
22
8 4
66 17 34 18 53 61
:>8 493
243 61
66 56
304
6 12 19 42
31 40 14 14-
42 45
24-15
38 2
211 5
28 18
F
36
148
28
16 8
154 22 99 9
56 72
57 541
251 116
161 93
618 1 8
21 41
107
41 82 31 35
88 75
46 31
63 2
285 5
39 23
126
127
128 129 130 l~l 132 133 134 135
136 137 138 139 140
141 142 143 144 145 146 147 148 149 15. 151 152 153 154
1.'55 156
157 1.'58 159
160 161 162 163 164 165

16
PALAMAU VILLAGE
SUBDIVISION
ANCHAl.
Occupied residential
houses ~_J.,.. __ __'" Total num ber 0 I persons Literate
No. of enumerated (including and Serial no. Area No. of house- inmates of institutions Schedukd Scheduled educated
(Thana no.) Name of village in acres houses holds and houseless persons) castes tribes persons
,...------' ..--...... ~ ,...--"---.
P M F M F M F M F
2 3 4- 5 6 7 8 9 10 11 12 13 If.
REVENUE THANA-DAL TONGANJ-contd.
Semra G·P.-concld.
166 (96) Charka 134·61
)67 (103) Khohri 122·69 12 16 61 27 31 13 22 .. 2 168 P04) Kudaga Khurd 898.87 66 94 500 256 244 37 36 103 109 16 169 105) Kudaga Kalan 531·89 49 66 292 146 146 67 69 19 170 (106) Neura K, V 368·17 229 289 1,483 742 741 70 72 230 14-171 (107~ Gardu 25·B8 172 (lOB Garda 318·35 81 100 493 245 248 55 55 52
173 (114) Gurha K,A 259·21 12 15 70 34 36 14- 1 174 (115) Harbhonga 451·53 48 48 215 109 106 84 73 15 3 175 :116) Nimian 230'22 49 54 210 101 109 91 101 19 4 176 (117) Hansa 131·66 22 22 109 45 64 34 43 9 177 (118) *Chainpur P2,B,L2,Mc,Ic, V,H .. 222·49 536 658 3,349 I,6N 1,675 244 265 6 2 750 211 178 (119) Bharganwan 200·15 163 173 666 334- 332 204 202 44- 4 179 (129) Ranki 233·83 180 (131 ) Dumri 209·22 47 47 236 115 121 59 70 29 7 ]81 (132) Ladi P,L 301·33 100 112 438 223 215 93 17] 70 10 lH2 (135) Ranital 282'76
ANCHAL TOTA.L .. 157,508'39 10,481 12,9Q9 63,489 32,013 31,476 7,537 7,82.8 6,2.05 6,317 6,355 9U or
246.11 sq. miles

STATISTICS
SADAR
CHAINPUR
I
Total workers (I-IX) Cultivator
M
15
18 12B 81
427
147
19 66 59 ~8
88% 211
65 ns
F
16
M
17
U ninhabit,t/
12 18 3 113
35 81 55 311
Uninhabited 10 77
5 8 10
12 5 , ! 126 101 187 29 Uninhabit,ti 25 29 56 68
U ninllditei
F
18
12 2
35 16
1
5 37
1 16
17
WORX'lDBS
II III IV V VI VII Manu
facturing Agricul- Mining, House- other than Trade
tuml Quarry- hold Household Cons- and labourer ing, etc.lndWitry Industry truction Commerce
,..---A-._.., ,.-'""---0 ,---'""---0 ,.-'""---o"""""'_"_ ,.-'""---0
M FMFMFMFMFM:F
19 20 21 22 23 24 25 26 27 28 29 30
.. .. . . .. .. . . .. 14 1 " .. .. " .. "
" .. .. ..... .. " 53 39 1 .. 54 4
66 8 1 .. .. .. .. .. .. 8 .. .. .. .. 25 4 11 .. 1 .. 1 . .
~ 4 1 4 1 9 .. J .. S 2 1 6 1 .. .. 1
31 1 37 1 164 24 13 .. '3 •. 245 20 12 38 72 41 11 ~ 7 .. 3 .. 12 11 2 .. 1 ..
'12 4 1 1 2 .. 2
11,118 1l,737 11,'16 ,,3413,300 ~,032 .79 294 673 338 157 I 33 •. 601 75
l'--II-S
BIHAR
VIn IX X Transport,
Storage and
Commu- Other SI. nieations Services Non-workers no.
...--.....__, ,..--.....__, M F M F M F
31 32 33 34 35 36
166
9 22 167 12B 241 16B
4. 65 III 169 4 315 686 170
171 3 98 23!l 172
6 15 36 173 18 3 43 98 174
9 18 10 42 97 175 2 8 2 17 61 176
13 275 75 792 1,549 177 3 74- 69 123 145 178
179 1 20 13 50 96 180 5 47 36 . 85 159 181
182
12 .. 1,'77 .1 12,915 18,"'9

18
PALA'MAU VILLAGE
SUBDIVISION
ANCHAL
Occupied residential
houses ,.-__ .A.-_ ....... Total number of persons Literate
No. of enumerated (including and Serial no. Area No. of house- inmates of institutions Scheduled Scbeduled educated
(Tbanano.) Name of village in"acres houses holds and houseless persons) eastes tribes persons ,.--""-'!"'_" --'""'---
P M F M F N F M F
2 3 . 4 5 6, 7 8 9 10 11 12 13 14
REVENUE THANA-DALTONGANJ-c~nld.
1 (263) Dodang .. 524.67 14 29 100 46 54 13 18 33 36 12 2 (264) Serandag .. 1,220.57 41 41 204 103 101 16 19 54 52 11 3 (265) Ekta .. 1,383.38 53 62 264 144 120 29 20 94 84 21 4 (266) Xumrahi ., 41.28 7 9 28 14 14 .. Il 10 1
5 (267) Draua .. 954.41 18 31 123 66 57 11 11 52 43 4 6 (268) Kasmar .. 305.91 7 7 36 18 18 10 13 8 5 1 7 (269~ Siuri .. 549.10 13 13 62 30 32 20 22 .. 2 8 (270 Ghutua P ., 1,924.70 88 91 482 231 251 132 128 84 106 16
9 (271) Pinrra .. 556.12 34 54 261 137 124 52 50 6 10 (272) Sohri P .. 338.84 :n 46 184 96 88 12 15 71 65 22 4
11 (273) Chanpi P .. 1,590.48 88 88 426 236 190 76 48 138 123 27 6
12 (285) Chaparana 586.20 59 59 292 151 141 112 100 39 41 6
13 (286) Mukrum .. 270.68
14 (274) Rebartu P 880.92 97 137 697 356 341 110 109 73 69 136 19
15 (275) Dhabadih P .. 1,200.06 128 206 934 470 464 119 114 III 109 126 1
16 (276) Karma K 355.06 81 119 645 331 314 73 74 2 5 143 15
17 (277) Nauranga 104.40 44 56 273 135 138 53 52 36 4
18 (278) Lohrapokhri 175.20 61 66 292 148 144 54 54 25
19 (279) Lonhri .1', V 124.69 43 45 226 114 112 25 33 .. 83 12
20 (280) Kulia .. 231·01 27 27 150 79 71 79 71 16
21 (281) J ogi yapokhri 170.90 25 30 152 76 76 25 20 34 8
22 (282) Mangatgorea 61.01 9 12 63 28 35 3 3 8
23 (283) Sehra Oe .. 620.86 130 144 726 366 360 88 110 31 28 75 7
24 (284) Bohita P .. 1,216.12 138 179 788 374 414 176 183 130 155 69 2
25 (300) Sohgara 774.04 21 22 106 44 62 17 25
26 (301~ Bhalmanda P 306.44 69 84 361 173 188 80 92 45 7
27 (302) Pahari Khurd 56.71 21 22 122 65 57 6 3 35 9
28 (303) Pahari Kalan 177.88 41 46 273 127 146 62 68 25 1
129 (307) Bhakasi 167.80 164 164 712 352 360 149 161 104 23
30 (308) Maribhang Jagir 289.37 31 (309) Maribhang Ijara P .. 400.73 13 15 97 51 46 38 30 18 4
'32 (310) Chak Maribhang 2.'\,92 5 6 27 16 11 16 11 4
'33 (311 ) Nawgarh 160.91 27 29 145 67 78 28 40 12 5
34 (312) Rajhara P .. 2,570.89 225 225 942 476 466 169 165 101 98 37 3
'35 (313) Kamalpur 227.01 53 54 235 115 120 24 23 20 35 28 1
'36 (314) Dhanganw M 210.40 53 58 234 104 130 36 49 32 7
'37 (315) Chak 146.60 38 43 188 103 85 48 33 29 6
sa l316) +Naudiha p 576.93 91 106 574 291 283 185 201 113 27
39 {325) p~thrahi 55.38 71 85 493 228 265 43 40 128 24
40 (327) Strrampur .. 37.79 20 20 83 38 45 24 2
41 (328) *tLesliganj P,M,Hos,A, H3, De .. 250.10 227 231 1,323 682 641 219 218 2 260 41
42 (329) Dhobdiha 19.82 16 16 77 40 37 17 4-
43 (330) Kotkhas Me 340.82 197 197 915 432 483 122 164 226 17
44 (331) Sitadih.. . Me 373.70 81 81 405 208 197 58 54 38 6
45 (359) Akhaurl Duml 134.92 13 16 37 19 18 19 18
46 (360) Babu Dumi P, Dc 209.55 51 62 290 143 147 123 129 21
47 (361) Sotamdabra alias Panre Dabra 242.89 36 36 189 101 88 69 56 10
Dhela G. P.
48 (317) Koiripatra Oc, Cc 534.08 64 91 442 214 228 66 78 54 7
49 (318) Akhauripatra p,e 176.00 27 33 177 85 92 37 34 14- 7

19
,STATISTICS BIHAR
SADAR
LESLIEGANJ WOBXBRb
,..--
I II III IV V VI VII VIII IX X Manu- Transport,
facturing Storage Agricul. Mining, House- other than Trade and
Total workers tural Quarry- hold Household Cons- and Commu- Other Sl. (I-IX) Cultivator labourer ing, etc. Industry Industrytruction COmmerce nicatioilil Services Non·workers no.
,...--..... ___.., ,.--~ ,...-""'""""", ,...-.-...__,...--.... ,....-.A---, ...--..... ,--.....___, ,--...___, ,---"--..... M F M F M F M F M F M F M F M F M F M F M F
15 16 17 18 19 20 21 22 23 24- 25 26 27 28 29 30 31 32 33 34 35 36
2~ 29 22 26 1 3 .. .. . . .. .. 2 .. 21 25 1 61 53 48 43 5 8 .. .. 1 1 ." 7 1 42 48 2 95 67 89 63 4 3 .. j
" " .. .. 3 48 53 3 11 10 10 9 .. .. .. " .. .. . . .. . . 1 1 3 4 4 41 42 37 38 .. .. .. .. .. " 4- 4 25 15 5 14 12 14 12 .. .. .. .. . . . . 4 6 6 19 17 12 8 7 9 .. .. .. .. 11 15 7
136 146 111 102 25 44 . :, .. .. .. 95 105 8 78 65 50 17 17 23 .. 3 25 1 59 59 9 66 50 53 40 8 10 4 .. .. .. " I 30 38 10
136 114- 102 93 31 21 .. .. .. .. " .. " 3 100 76 11 82 82 43 30 39 52 .. .. .. " 69 59 12
Uninhabited 13
192 155 127 96 46 59 5 .. 3 .. 9 . . .. 2 164 186 14 269 271 246 198 20 73 1 .. " .. I .. 1 201 193 15 173 126 119 94 - 30 29 1 .. 15 3 3 .. 2 .. 3 158 188 16
74- 69 59 48 14 21 .. .. 1 61< 69 17 88 90 62 69 26 21 .. 60 54 18 59 43 42 39 3 3 1 1 .. .. 1 .. .. .. .. 12 55 69 19 48 45 40 45 2 6 .. .. 31 26 20 44 29 31 22 4 4 2 .. 1 6 3 32 47 21 17 19 10 19 .. .. 7 .. .. .. . . 11 16 22
200 212 152 136 16 66 5 .. 13 10 2 .. 11 .. 166 148 23 237 257 167 194 32 54 33 5 .. .. .. 2 3 4 137 157 24-
29 28 11 '3 18 25 .. .. .. . . 15 34- 25 lOS 97 50 29 55 68 .. " .. 3 65 91 26
31 3 24 3 3 2 .. 1 34 54 27 66 j()' 45 .. 19 10 .. .. 2 61 136 28-
220 143 98 19 III 124 1 .. 1 .. .. 9 132 217 29 Uninhabited 30
26 22 10 10 15 12 .. .. .. . . 25 24- 31 6 7 6 6 1 .. 10 4 32
30 31 8 7 18 23 1 2 1 .. 1 .. 37 47 33 287 227 176 109 42 76 48 6 17 33 1 1 3 2 189 239 34
71 55 50 37 11 15 3 .. 6 3 1 44 65 35 67 48 24 22 29 23 1 .. 8 2 3 2 37 82 36 53 27 23 29 27 .. .. 1 50 58 37
163 144 100 80 57 64 .. .. 3 3 128 139 38
103 27 37 16 16 3 3 7 3 36 8 125 ·238 39 24 23 13 14 10 9 1 14- 22 40
345 41 46 4 11 1 1 10 137 .. 2 67 10 S 77 16 337 600 41 )9 2 6 1 1 2 7 1 .. 2 I 21 35 42
256 103 145 18 48 81 .. .. 14 6 .. 13 'I 28 3 176 380 43 94 12 43 1 51 11 .. .. .. .. 114 185 44 )0 10 10 10 .. .. .. 9 8 45 77 .. 43 4 1 .. 29 66 147 46 67 3 27 38 2 .. .. .. .. 2 34- 85 47
133 134- 113 58 19 81 .. I 81 94 48 47 34- 30 9/ 14 25 .. .. 2 38 58 49

20
?ALAMAU VILLAGE
SUBDIVISION
ANCHAL
Occupied residential
houses ,--""'----_____, Total number of persons Literate
No. of enumerated (including and Serial no. Area No. of house- inmates of institutions Scheduled Scheduled educated :Thanano.) Name of village in acres bouses holds and hou~eless persons) castes tribes persOLS
r A --. ,....------.. ,--""'----~
P M F M F M F M, F
2 \ 3 4- 5 6 7 8 9 10 11 12 13 14-
REVESUE THANA-DALTONGAN J-:onld.
50 (319) Kurainpatra Oc .. 390·39 138 159 8~2 388 444 56 69 105 7 51 (320) Dhela 231.24 93 103 488 236 252 84 77 52 30 52 (321) Kathaundha P 130.03 83 91 516 265 251 79 82 41 10 53 (322) Shonsh 726.9!J 62 69 378 207 171 13 16 21 15 40 1 54 (323) Kanallda alIas Nirpat Chatti 332.16 14 14 96 40 56 8 5 29 27 55 (32-1:) Gopalganj P3, Me 414.15 95 104- 527 255 272 103 104 1 104 25 56 (326) Tengri h 122.70 6 6 35 18 17 7 4 10 3
57 (332) Purnadih P,Mc .. 1,957.60 167 181 855 446 409 130 III 142 145 96 15 58 (333) )hagarpur H 116.21 39 45 264 136 128 14 13 5:i 13 59 (334) Kanauda 147.91 1 1 7 3 4 3 4 2 60 (335) Munaria P .. 1,193.57 96 114 544 263 281 32 31 145 161 4'l 4-61 (336) Urhulia .. 227.65 15 21 137 74 63 55 45 25 62 (337) Turkadih .. 116.27 53 69 403 202 201 4- 26 122 92 50 10 63 (338) Jharna .. 46.15 1 1 4- 2 2 2 2 1 64 (339) Juru P,Mc .. 1,022.12 138 154 747 366 381 113 107 122 134 33 5 65 (340) Jaitukhanr P .. 700.30 46 71 393 197 196 151 135 1 28 3 66 (341) Julanga " 446.90 9 9 41 18 23 18 23 67 (342) Itahe P 418.70 140 140 585 305 280 115 113 120 120 72 9 68 (343) Phudia 158.57 3 3 18 11 7 .. .. 11 7 .. 69 (344) Sonhi Sarai .. 305.38 47 47 240 110 130 73 61 7 13 30 4-70 (345) Nakti 52.13 7 7 24 14 10 10 2 1 6 2 1 71 (346) Basaura 198.61 70 70 304 156 148 54 4-I 67 73 52 5 72 (347) Bakaskhap 87.32 6 6 40 24 16 24 16 2 73 (353) Baksidabra 138.05 4 4 21 13 8 6 3 74 (354) Amwa 415.29 6 16 59 33 26 16 12 9
75 (348) Bahia 50.72 16 26 131 67 64 11 11 76 (349) Chak Nawadih 50.96 77 (350) Alampur 42.18 78 (351) Jharkatia P 68.76 67 74 395 201 194 37 36 96 13 79 (352~ Ramanand Dabra Hos 238.73 52 69 279 131 148 44 -H .. .. 26 3 80 (355 Haratua p 421.58 64 71 478 250 228 58 51 2 1 82 7 .81 (356) Banua 538.22 57 69 341 184 157 23 .82 357) pachmo .. 374.02 69 76 466 239 227 60 62 33 4 '83 (358) Murmusi p,ee 309.99 87 93 438 2" 227 37 34 89 12 .. :84 (362) Dqrudih P 797.19 145 187 994- 512 482 150 149 128 '85 (363) Sangbar P,L .. 1,489,39 87 101 589 297 292 145 131 70 28 '86 (364) Lohra P .. 579.84 25 30 165 90 75 4 I 50 17 :87 (365) Thakuraididri (C hakaididri) 184.20 18 26 115 53 62 23 23 15 8 . 88 (366) Madhodidri (Thakuridri) L 81,29 19 20 95 41 54- 6 Ie 24- 8 89 (367) Akhourididri P 163.00 69 79 321 150 171 64 69 2 2 32 90 (36B) Goradi Khas .. 588.16 78 84- 422 '194- 22& 71 76 52 16 91 (369) Goradih Toli 289.21 17 17 104 54 50 2 6 23 6 92 (377) Goradih Jagatpurwa
, 64.94- IS 19 92 39 53 9 11 14 3
Kundr; G. P.
~3 (372) Lotwa .. 225.65 91 95 449 210 239 179 20i 9 '94 (373~ Kamal Keria P,r' " 247.24- 40 48 209 97 112 31 39 !l8 3 95 (374- Phutharwa 53.18 7 8 45 !2 23 15 "96 (375. Goradih Piprahat 95.08 25 28 128 64- 64 18 16 19

STATISTICS
SADAR
~ESLIEGANJ
1
Total work en (I-IX) Cultivator
..,_--_..A.. __ _.... '-:--"'---""'
M
15
195 126 147 125 21
136 9
'228 78 1
178 37
114 2
181 98 9
187 • 8
72 7
.84 9 6
16
31
98 65
146 120 127 101
:289 158 36 27 18 82 98 25 '20
438 51 10 31
F M
16 17
104- 154-96 49
125 89 60 52 34 18 45 62 3 6
4-8 146 13 65 1 1
36 169 4 31
14 58 1
58 162 45 63 15 99 136
4- 7 57 33 4 4
62 19 7 3 5
13 16
32 7 Uninhabited Uninhabited 25 17
103 85 13 59
204-105
25 31 II 53 75 11 II
135 10 2
13
72 48
121 106 114 46
165 81 32 8
10 22 40 20 12
8 .fol
9 20
F
18
65 4I 76 12 II 10 2
15 5 1
12 3 4
40 3
84 4 3
12
13
6
3 13 79 77 4
21 112 40 24 16 3 5
12 10 2
7 S 1 4-
21
WORKERS ....... _------------------------..
n 111 IV V VI VII VIU IX Manu- Tramport,
facturing Storage Agricul- Mining, House. otb.er tb.an Trade and
tural Quarry- hold Household Cons- and Commu- Other labourer ing, etc. Industry Industry truction Commerce nications Services
" ,---""""- '"""'" r---"'----\ ,.-....... _, ,--_.A..-, ,..-.-"'---. ,--~.~ r--.... _-- ,---.....___,
M
'19
36 59 55 39 3
55
54 11 .. 7 4
50 I
13 33 7 II
32 3
58 6 6
2(
22 15 22 10 12 43
112 75 3
18 5
55 44-
1 7
130 9
11
F M
20 21
38 I 50 49 .. 40 !9 23 33 3
I
33 21 7 2
.. 22 .. 1
10
16 .. 42 1 6 7 4
1 53 5 4
47 .. 7 5 ..
26
22 .. 4 I
24 3 8 9 1
34 5 90 65 ..
I .. 15 1 8
48 61 6
I 4 8
128 .. 7 1 9
F M F
22 23 24
.. J
.. .. 5 8 " .. 5 I
.. .. .. .. ., .. I
.. 2 2 .. 3 ..
.. .. 2 .. .. .. .. " " "
" I " ..
.. .. . . .. "
..
3 .. .. I ..
5 2
"
.. 2 1 7
M F M F M F M F M F
25 26 27 28 29 30 31 32 33 34
.. .. .. " .. .. 3 .. 6 4- II I
S 4- " .. 2
.. .. .. .. " 2 .. 1 I 8
.. . . .. .. 3
J .. 6 . . . , . . .. .. .. .. ., . , .. .. 2 .. .. .. . . . . .. . .
2 I .. . , .. ..
3 2 I < .. J
.. 2 9 2 2 .. .. 30 6 I 3
.. ., . . .. 2
., ., .. . . ..
. . .. .. .. 2 5 3 .. . ,
., .. .. ..
. , .. .. , .. 4-
.. .. ., 1 .. " .. ..
.. . . .. . , .' . I
, 5 3 .. .. .. , ., ., 7 . . .. " I " .. " I
.. 3
.. " .. .. 2 I
.. .. .. . , 1 I -
.. 1
1 ..
BIHAR.
X
Non·workers .--....._~
M
35
193 110 118 82 19
119 9
218 58 2
85 37 88 '
185 99 9
118 3
38 7
72 15 7
17
36
103 66
104-64
112 110 223 139 54 25 23 68 96 29 19
72 46 1% 33
" 36
340 ]56 126 III 22
227 14
361 115
3 245
59 187
2 323 151
8 181
3 . 73
6 86 9 3
13
32
169 131 125
72 214-168 278 187 50 31 43
118 153 39 42
104 102 21 5l
51. no.
51) 51 52 53 54-55 56
57 5~ 59 60 61 62 6., 64 65 66 67 68 69 70 71 72 73 74
75 76 77 78 79 80 81 82 83 84 85 86 87 8S 89 90 91 92

22
PALA.M.lU VILLAGE
SUBDIVISION
ANCHAL
Occupied residential
houses --......_-~ Total num ber of persons Literate
No. of enumerated (including and Serial no. Area No. of house- inmates of institutions Scheduled Scheduled educated (Thana no.) Name of village in acres houses holds and houseless persons) castes tribes persons
----_,;.,.._--~ .--~ ,....-.... ---. ,.....-"""- ..... P M F M F Kf F M F
2 3 4 5 6 7 8 9 10 11 12 13 14-
REVENUE THANA-DALTONGANJ-Contd.
llundri G. P.-contd.
97 (376) Goradih Kothilwa 38.26 4 4 30 15 15 3 2 8 98 (378) Rajogari .. 144.01 67 92 432 215 217 40 40 104 100
9 (379) Murubar .. 196.21 70 75 404 194 210 11 12 53 24 100 (38!) MuswaKhap 100.81 6 6 36 21 15 21 15 101 (382) Kusha 20.14
Phulang G. P.
102 (370) Khairant L,Cc2 397.09 57 59 274 145 129 69 65 31 50 103 (371) Oria Kalan M,Me .. 629.99 248 268 1223 636 587 151 166 115 21
104 (383) +* Kundri Has, H, P, De .. 1,351.76 293 323 1570 752 818 III 120 224 51
105 (384) Sewai " 367.48 5 5 25 12 13 10 106 (385) Oria Khurd .. 275.91 107 (386) +Gurua .. 335.87 19 20 98 52 46 28 24 6 108 (387) Sahad P .. 456.76 38 84 524 277 247 62 • 13-]09 (388) Ram Sagar P .. 44v.74 78 120 589 289 300 76 152 81 6 110 (389~ Jamudih P, V 193.78 107 115 676 313 363 103 90 65 9 III (399 Phuiang 215.17 31 50 265 140 125 52 55 52 7 112 (400) Rajpur 100.50 24 74 264 139 125 127 116 12 9 113 (402) Baura Khar 93.18 6 18 III 50 61 13 3-114 (403) Amwa Khurd 551.33 31 38 184 95 89 50 42 25 115 (404) Jharha 235.23 5 5 34 16 18 5 2 9
116 (304) Barganw alias Tetariadih V .. 122.55 23 30 166 89 77 18 14 43 • 3-117 (305) Babhandih 54.35 1 1 I 1 118 (306) Chaukhara Me .. 224.24 63 82 408 194- 214 105 117 78 18 119 (380~ Sonbarsa 200.30 41 44 265 135 130 43 41 53 50 120 (390 Asalpahari 200.80 121 (391) Alaula 161.57 5 5, 1,9 10 9 10 9 122 (392) Jainagra 150.59 123 (393) Maharja 185.68 17 30 126 70 56 24 1 124 (394~ Pursuram Khap V 121.11 53 _ 68 315 152 163 69 70 42 11 125 t95 Pipra Khurd P 251.03 92 112 560 290 270 53 59 58 4-126 396) Bansdohar 112.84 24 32 199 89 110 44 6 127 397~ Patkhaulia 142.77 17 22 94 50 44 44 37 9 128 (398 Bansdih M,Me 208.76 72 86 401 189 212 74- 100 40 11 129 (401) Chaura 620.55 85 95 465 219 246 113 123 59 11
Gentha ,G. p.
139 (287~ Cheri 332.18 25 25 133 67 66 23 29 .. - II 131 (288 Dabra P, Me .. 3,166.29 112 112 539 278 261 149 150 22 15 38 IS. 132 (289) Erua 396.52 30 30 152 73 79 1 2 72 77 16 2 133 (290) Kubaa 734.08 35 35 179 81 98 16 20 65 78 9 134 (291) Jogia Sohri 845.38 39 40 171 83 88 73 82 5 135 (292) Rajbaria 160.90 13 14 52 33 19 10 3 32 }36 (293) Bariatn 237.62 3 6 29 12 17 12 17 7


PALAlUU
Serial no. (Thana no.}
137 (294-) 138 (295) 139 (296) 140 (297) HI (298) 142 (299)
Name of village
2
Area in acr.es
3
24
Occupied residential
houses r---""'----o
No. of No. of househouses holds
4 5
REVENUE THANA-DAL TONGANJ-contd.
Tenar alias Nawadih .. 4-96.60 115 136 Dugila P 63.31 53 53 Gentha P 542.03 !l8 ~8 Harsangra Il8.12 36 40 KiTto 73.02 15 15 Chandaigir 839.87 47 47
ANCHAL TOTAL •• 57,817.43 7,453 8,634 or
10.34 sq. mile.
Total number of persons enumerated (including inmates of institutions and houseless persons) ,-----...__ ____
P
6
707 247 467 160 66
234
M
7
338 109 222 78 37
110
F
8
369 138 245 82 29
124-
Scheduled castes
M
9
131 20 94 32 3
64
F
10
180 17 93 29 8
74
VILLAGB
SUBDIVISION
Scheduled tribes
r--"""____'
M
11
56
F \
12
56
ANCHAL
Literate and
educated persons
r--"""____'
M
13
63 61 52 18 31 16
F
14-
2' IS. 14 5· 2 2"
42,563 21,181 21,382 6,854 7,064 2,235 2,220 5,550 ~
"

25
STATISTICS BIHAR
SADAR
LESLIEGANJ WORKERS
I II III IV V VI VII VIII IX X Manu- Transport,
facturing Storage Agricul- Mining. House- other than Trade and
Total workers tural Quarry- hold Household Cons- and Commu- Other 81. (I-IX) Cultivator labourer ing, etc. Industry Industry truction Commerce nications Services Non-workers no •
~ ,--"-"'__' .....--....... ...--. ....----.....----. ,.-."---.
M F M F M F M F M F M F M F M F Kf ., R F M F
15 16 17 18 19 20 21 22 23 24 25 26 27 28 29.30 31 32 33 34 35 36
184 118 117 20 57 93 3 1 3 6 154 251 137 58 35 33 13 13 20 1 .. 4 2 .. 7 51 103 138
127 84 34 5 68 62 1 .. 13 16 .. 9 2 95 161 139 47 29 22 10 22 18 3 31 53 140 16 14 14 14 2 21 15 141 74 56 30 19 41 31 3 2 2 36 I 68 142
11,802 7,709 7,374 4,09& 3,1~ 3,318249 29304161 33 2 8 165 32 38 437 71 9,379 13,673
P-II-4

26
PALAMAU VILLAGE'
SUBDIVISION
ANClfAL
Occupied residential
houses ...----"----' Total number of persons Literate
No. of enumerated (including and Serial no. Area No. of house- inmates of institutions Scheduled Scheduled educated
(Thana no.) Name of village inaeres houses holds and houseless persons) castes tribes persona ,--""'_ __
r--.Ao..-_'~
p M F M' F M F M F
2 3 4 5 6 7 8 9 10 11 12 13 11-
R.EVENUE THANA-DALTONGAN]-contd.
Rann, Bhari G. P.
1 (405) Parasia P 719'96 99 138 821 393 428 113 127 109 23 2 (406) SagaIim P,V _ 1,171.01 131 180 1,007 503 504 142 140 190 32 3 (407) Bhari C,U .. 416'90 114 123 664 331 333 53 47 163 48 4 ~408) Ranne P,rn 185·51 40 55 272 135 137 69 65 32 15 5 409) Puraini 91.09 13 14- 59 28 31 26 25 .. 6 (410) Sunri P 677-06 88 120 586 281 305 88 84 7 7 12 1 7 (411) Bhang 739.91 17 20 76 40' 36 26 26 12 10 8 (412) Mahugain P .. 526·55 78 102 519 260 259 91 103 53 48 98 33 9 (418) Harlaung P,H .. 848'61 138 177 809 376 433 129 134 27 28 ll5 45
10 (419) Gogar .. 757-68 40 43 184- 95 89 57 65 8 11 (420) Sa1gas m2 .. 862-76 54 75 353 163 190 65 70 33 14
12 (413) Aseahar M.Mc .. 1,810'35 226 338 1,787 919 868 .318 281 88 22 13 (414) Bahai P .. 1,350-74 78 99 450 226 224 9 3 82 97 39 20 14 (417) Kusri .. 1,366'86 45 68 358 166 192 42 47 37 16
15 (421) Saraiya P,Oe .. 632·51 19 24 106 55 51 6 2 22 1 16 (422) Bandubar .. 712·19 34 47 227 1~6 101 35 30 30 5 17 (423) Maduli .. 145·31 18 (424) Burhabar 110.95 41 55 267 132 135 21 I 19 (425) Kunwai C,B,Hos,V,O; .. 5,224.77 294- 42ft 2,008 1,040 968 60 60 78 61 244 12 20 (429) • Chauphal .• 51.33 15 26 143 76 67 20 1 21 (433) PipraKalan L,Mc .. 414.78 28 34 152 75 77 42 46 12 3
22 (426) Biritiya Dandar Me .. 200.78 12 16 64 31 33 6 5 17 5 23 1427) Banki Khurd P .. 207.28 36 56 329 148 181 39 77 55 4-24 428) Bami Kalan .. 283.71 11 20 210 105 105 23 15 11 25 ~430~ Basariya P,Oc 617-67 60 100 484 232 252 69 74 68 35 26 431 Taiya .. 709·86 84 115 525 264 261 84 76 66 17 27 (432) Maulaganj 37-83
28 ~415) Bhanwardah 718'49 76 84 356 169 187 95 98 35 32 24 I 29 416) Hutai P,L,C 2,399'97 125 139 657 329 328 68 79 62 51 39 11 .sO (485) Mahe .. 285,10 31 (486) Dema 939.87 10 11 43 24 19 6 6 18 13 2
.s2 (487} Bardaga 795'23 :33 (488) Nagri P .. 2,111'80 31 35 166 89 77 50 50 39 27 11 1 34 (489) Bihra P .• 1,349·89 75 89 431 204 227 159 213 43 63 27 2 -35
~!~~ Salamdiri P .. 1,325'53 45 48 249 132 117 17 23 72 57 27 :3 :36 Sons .. 321·56 2 2 4 3 1 2 1 1 :37 492) Ratanpur P 782·91 75 85 429 210 219 18 16
I .. 82 84 26 4:
Chanpi G.P.
38 (493) Phulwaria 148'31 37 40 159 86 73 29 29 10 39 (494) Chanpi Kalan C,Me 172'23 24 27 116 53 63 32 40 3
768:27 36 44 199 91 108 32 35 ..
40 (495) Chanpi Khurd 2 4 11 41 (496) Angara 60·70 3 3 13 7 6 7 6 42 (497) Jiro P :: 1,042.50 60 63 292 148 144 104 108 43 36 14 43 (498) Irgu 996'25 60 68 318 163 155 101 100 60 4-9 8 1 44 ~499) Chandwar 850·74 16 16 85 44- 41 25 26 of. 45 500~ Hoiyo P 439,82 26 27 159 91 68 50 45 29 16 4 46 (501 Rengai 201·07 12 13 56 SO 26 16 16 47 (502 Khapar Randa P 485-4·2 S9 41 163 89 74 71 59 9 6

STATISTICS
SADAR
PANKI
Total work en (I-IX)
I
Cultivator
II
Agricultural
labourer
27
WOUZR8
III IV V VI VII VIII Manu- Transport,
(acturing Storage Mining, House- other than Trade and Quarry- hold Household Cons- and Commu-ing, etc. Industry Industry truction Commerce nications
IX
Other Services
M
15
F
16
M
17
F M F MFMFMFMFMF M F M F
211 292 162 71 18
161 24
142 200
53 73
~87 132 92
31 60
74 623 • 35
38
15 75 55 97
140
95 217
15
4:7 127 80 2
129
50 30 58 6
81 103 25 52 21 54
18 19 20 21 22 23 24 25 26 27 28 29 30 31 32 33 34
169 89 64 37 20
184 20
117 182 45 48
441 72 58
169 157 82 22 12
145 24 95 86 20 27
267 119 56
106 9
13 1
13 169 20
2 73 12 14
266 71 24
37 68 28 33 6
13
44-72 32 32
157 9
,23
30 10 15 10 46 24 18 19 Uninhabited 62 46 48 5
414 409 351 72 38 32 35 3 35 II 10 22
15 11 73 49 57 42 69 53 86 65 Uninhabited
72 50 41 141
Uninhabited 8
Uninhabited 1 43
88 97 51 23
2 21 106
37 32 51 I
38 79
9 45 17 42
32 21 35 4
27 62 12 31 3
22
12 44 42 15 12
32 3
1 64
8
18
27 25 36 .. 16 60 6
33 8
17
4 20
3 23 44
29 55
7
2 9 7 ..
17
10 8
14 .. 19 19 12 21 12 31
63 2 48, 5 .. 15 5 49 2 .. 6 " 31 362 .. 2 .. 1 7
15 .. 3 ..
115 1
.. 1
..
1 .. 2 .. 3 I
.. 10 ..
102 15 4 9 33
3 2 .. .. "'\ .. 5 ..
30 10 1 ..
141 12 33 29 .. 1 2 ..
'25 13 2 .. 7 ....
7 20
2 .. 9 ..
4 8 .. 3 7 ..
2 ..
14 2 .. 9.. . ... 57 8 ..
3 .. 7630 .. 11 .. 5 ..
25 1
3 27 11 51 72
1 ..
6 2 5
29 13 33 9
. . 1
2 5
" 2 2 7 4 .. 4 .... 8
2 9 5 ..
.. 9 9
...... .. .. .. 3 ..
. , 1 ..
1 16 1
...... 2 ..
13 11 2 7 21 .. 1 16 ...... . .....
1 .. 2
10 .. 7 .• .1. "
15 5 .. 4 ..
14 9 1! 20 3 ..
12 9 6
25 1
2 4 21 8 1
. ...
1 3
1
4
3 1 ..
........ 1 ....
1 .• ....
2
". 1
2 43 10 1
2 10
1 3
17 2
2 5
12 81 .. 1
2 3
10 1
1 5
1 1
28
1
7 1
1
.. 27
3
4
.. 1
20
BIHAR
X
Sl. Non-workers no.
M
35
182 211 169 64 10
]20 ]6
118· 176 42 90
432 94-74
24 66
58 417
41 37
-.16 73 50
135 124
74 112
9
42 77 52 1
81
36 23 33 1
67 60 19 39 9
35
F
36
259 415 269 100
11 121 ]6
14:1 251 44
142
427 152 134
21 55
73 554 29 42
18 108 48
183 1.75
I 2 3 4 5 6 7 8 9
10 11
12 13 14
15 16 17 18 19 2() 21
22 23' 24 25-26 27
115 28 287 29
30 19 31
32 76 33
139 34 66 35
1 36 198 37
36 31 57
5 106 76 32 23 9
32
38 39 40 41 42 43 44 45 46 47

28
PALAMAU VILIAGE
SUBDIVISION
ANCHAL
Occupied residential
houses ,..---..... ----, Total number of persons Literate
No. of enumerated (including and Serialno. Area No. of house- inmates of institutions Scheduled Scheduled educated
(Thana no.) Name of village inacres houses holds and' houseless persons) castes tribes persons
,..------'
P M F M F M F M F
2 3 4 5 6 7 8 9 10 11 12 13 14
R.EVENUE THANA-DAL TONGA!.'U -coned.
Chanpi G. P.-concld.
48 (503) Manatu 624-50 49 (504) Lawabar P .. 1,577'23 12 12 62 31 31 29 29
50 ~447~ Manhepipra 1,200'27 51 448 Kerld .. 248·36 18 30 149 77 72 17 22 20 19 30 6 52 (449) Ahh'gurha P •• 108'27 26 45 226 114 112 71 71 27 21 25 2 53 (450) H usenigurha alias Misirgurha .. 136'13 28 46 253 128 125 43 41 29 6 54 (451) Maran P,L,U .• 1,061,70 106 160 778 392 386 138 140 25 31 36 4 55 (477) Nawagarh .. 1,153·98 47 '60 318 172 146 43 27 37 38 31 56 (478) Asarhia P 66·92 15 19 85 43 42 36 30 ,. 57 (479) Radhadih 35·28 28 35 151 78 73 20 9 28 35 8 I 58 (480) Surjaun p .. 798·38 30 49 216 98 118 15 13 15 19 14 3 59 (481) Koseri 119·18 7 10 55 29 26 16 17 13 9 5 60 (482) Daryapur 123-33 14 22 96 43 53 14 14 29 39 8 6 61 (483) Sangaldipa 293'14 48 80 382 206 176 1 3 14 12 55 1 62 (484) Mahugain P .. 345'66 25 44 229 118 III 20 19 36 26 22 4
63 (473) Tarwa<#h Cc 173-40 34 43 230 113 117 39 37 34 4 64 (474) Burhi 0: 225'54 8 10 45 27 18 1 65 (475) Kakrigarh 190·95 66 ~476) Parsotimpur P 934·40 32 64 315 147 168 25 46 24 1 67 506) Karar P, L,C,Me,Oc .. 2,451·02 187 226 1,060 519 541 238 236 46 49 97 ,32
68 (442) Bachdohur 123·59 21 26 150 71 79 47 54 15 2 69 (453) Kamatola Me, Oc •• 20·30 15 18 98 54 44 25 26 .. 24 3 70 ~ 454) Chandarpur P,L, V ... 350'89 53 64 254 134 120 32 28 1 59 7 71 455~ Surjaun L •.• 138·33 35 35 134 63 71 2 1 3 72 ~456 +Dalldar Kalan Hos,V,P,Mc,le ... 1,997'03 220 265 • 1,440 754 686 183 180 159 34-73 457) Barwaiya •.• 162·28 20 25 130 73 57 6 5 11 .. 74 (458) Dhub P,Mc ... 918·17 89 106 636 317 319 90 103 72 9 J5 (472) Basdiha C, L, Rhc, Me .. 272'22 65 68 337 174 163 59 56 44 5
76 (434)- Baida C,L,H, Me 552-51 33 44- 200 100 100 16 7 39 16 77 435) • Tetrain M,L,C,Mc 338·22 110 176 679 332 347 3 2 62 33 is (436) Pakariya M 760·34 101 101 620 309 311 65 56 72 11 i9 (437) Banri Pakria 89'00 17 17 89 43 46 .. 2 :sO (43B? Dundar Khurd Oc 155'87 40 54 318 159 159 6 5 54 13 oSl (439 Tola Chatti H 10'30 25 31 185 81 104 40 22 '82 ~440~ Manran L,B 158'49 31 31 1168 88 80 43 41 .. 24 5 83 441 Tola Manran 25·26 19 23 102 50 52 8 13 9 13 11 2 84 ~443) Khap L 1BO·83 35 41 186 93 93 27 85 444~ Bela 81-66 8 1'1 47 29 18 8 4 86 (445 Sarauna 103·23 50 66 313 156 157 46 35 .. 58 8 87 (446) Biru .. 996·10 21 24 129 66 63 21 17 18 6 88 (452) Kamat Ce3 .. 897-06 70 77 323 159 164 8 9 40 2
Pogar G. P.
89 (555) Ara .. 995'51 25 30 154 72 82 4 4 21 18 10 90 (556) Baheta M 208'34 50 53 261 139 122 35 38 51 2 91 (557~ Bidra .. 180,79 33 44 200 95 105 18 16 42 44 21 2 92 (558 Koteya .. 401'50 )2 12 67 34 33 3 2 16 10 4 93 (559) Khaira .. 353-29

2,9
:STATI ST les
SADAR
.PANKI WOBKER8 r-_________________________________ J~ ______________ ~ ______________ ~
Total workers (I-IX)
I II
Agricultural
Cultivator labourer
III IV V VI VII ViII Manu- Transpott.
facturing Storage Mining. House- other than Trade and Quarry- hold Household Cons- and Commu-ing, etc. Industry Industrytruetion Commerce nicatioD.l ,..-"'__' ..----.. ___ ...A.--., ~ ....--"-_, ,..--.....__,
IX
Other Services
,..------'
M
15
F
16
M
17
F
18
M F MFMFMFMFMF M F M F
19 20 21 22 23 24 25 26 27 28 29 30 31 32 33 34
U ninhabitetl 18 15 .. 3 .. .. .. .. , i .. . . .. .. .
Uninhabited 37 9 26 7 9 2 .. 1 .. .. .. .. .. .. .. 65 65 46 49 14 16 5 .. .. .. .. .. . . 61 45 36 24 18 21 .. .. .. .. .. . . 1 ., 6
:223 32 159 2 19 9 .. 3 .. 1 32 30 84 74 56 50 24 24 1 ~ 3 .. .. .. .. 26 16 5 17 5 1 3 11 54 42 20 20 20 ,13 5 1 9 8 .. " 65 76 47 68 4 4 8 3 3 1 " .. 2 .. 1 17 9 11 7 3 2 " .. 2 .. . , .. .. . . .. .. 1 27 22 17 16 6 5 1 .. .. .. .. . . .. .. 3 1
111 71 99 65 3 5 4 .. " 1 .. 4 1 61 5'8 47 48 6 9 6 1 2 " .. .. . . .. 58 43 38 22 15 17 2 .. .. " .. 4 2 12 10 12 9 1 " .. .. ..
Uninhabited 95 43 56 29 33 14 4 .. .. .. .. " .. 2
'289 233 135 84 III 132 5 .. 16 12 .. .. .. 4 2 17 3
47 32 36 26 7 6 .. 4 35 15 14 2 18 13 .. .. .. . . 3 92 44 55 23 24 21 " 7 .. 6 34 43 25 32 4 7 3 .. 4 .. " .. .. 1 . . 1
"S98 191 280 69 97 114 2 .. 11 7 " .. .. .. 1 7 1 39 23 37 21 2 2 .. ., " " . . .. ..
161 99 '119 63 38 36 .. .. '1 .. .. . . 3 101 50 57 10 26 40 .. .. .. " .. . . .. .. 1 .. 2 15
50 24 23 5 20 18 .. .. " .. .. .. . . .. 7 .140 25 80 11 42 14 .. .. 12 .. 1 .. 3 .. 2 1)42 47 121 30 18 17 1 2 . .. " .. .. .. . . . . 31 14 31 14 .. .. " " .. .. . . .. .. 90 2~ 61 8 16 17 3 .. .. .. 10 43 19 5 3 1 1 .. .. .. .. . . 19 1 1 49 16 23 5 21 11 .. .. .. .. 1 . . 4 34 17 19 15 17 .. .. .. .. .. .. .. .. .. . . .54 29 25 1 27 28 .. .. .. .. .. .. . . .. 2 16 6 4 4 4 8 2 .. .. .. .. -89 35 67 10 19 25 2 .. .. .. . . . . .. .. 1 41 11 25 2 14 9 1 ., .. .. . , . . .. .. I '97 54 42 4 54 50 .. .. .. .. 1
44 40 21 19 16 21 5 .. .. .. .. . . .. .. .. 2 74 21 61 15 9 6 3 .. 1 .. .. .. .. .s8 40 42 27 10 13 4 .. .. . , .. .. 1 .. 1 23 1 6 1 12 5 .. -.. .. .. . . .. ..
Uninhabited
BIHAR..
X
Non-workers ,..--""'__'
M
35
13
40 49 67
169 88 17 24 33 12 16 95 57
55 15
52 230
24 19 42 29
356 34
156 73
50 192 167
12 69 38 39 16 39 13 67 25 62
28 65 37 II
F
36
31
63 47 80
354 72 26 31 42 17 31
105 53
74 8
125 308
47 29 76 28
495 34
220 113
76 322 264
32 134 97 64 35 64 12
122 52
110
42 101 65 32
Sl. DO,;
48 49
50 51 52 53 54 55 56 57 58 59 60 61 62
63 64 65 66 67
68 69 70 71 72 73 74 75
76 77 78 79 80 81 82 83 84 85 86 87 88
89 90 91 92 93
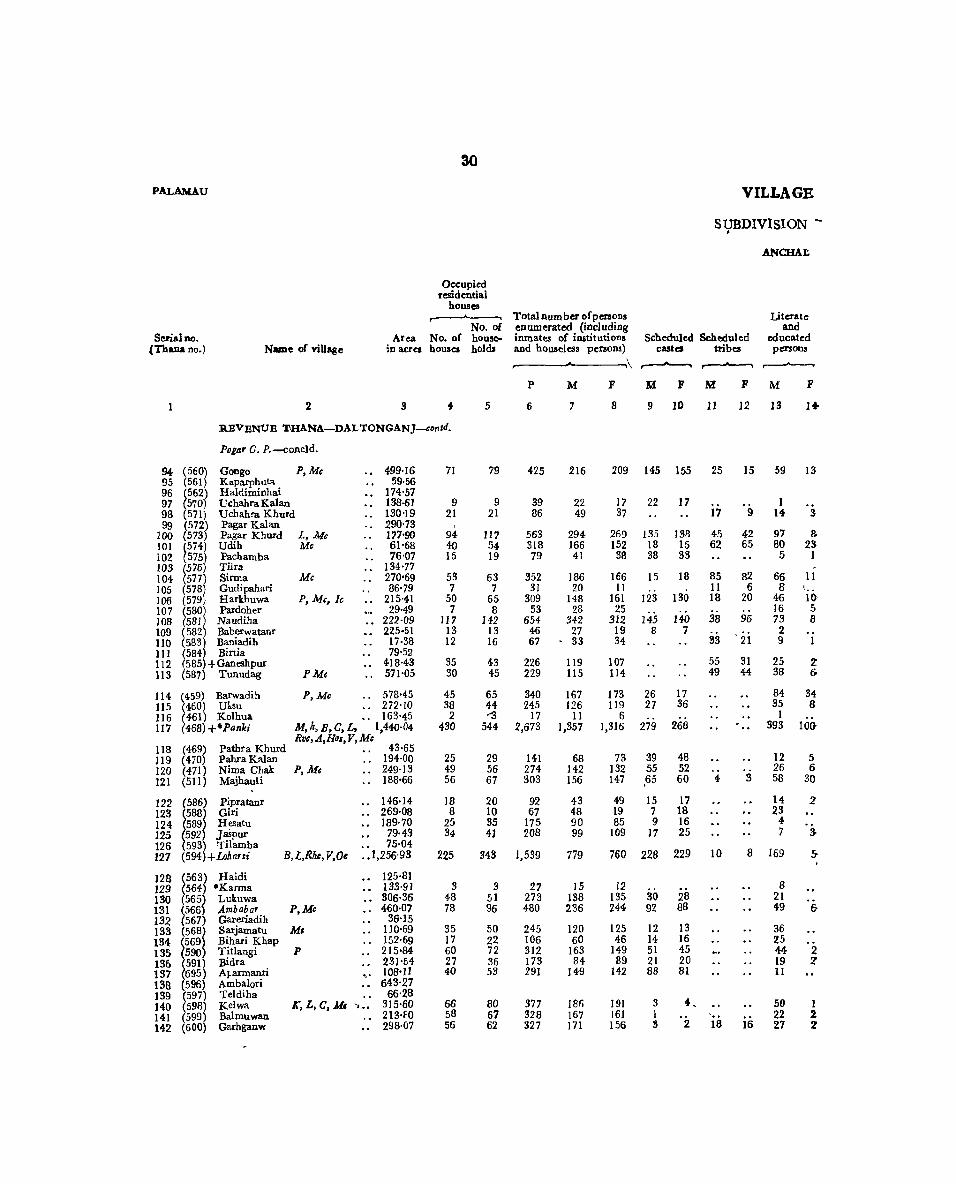
30
PALAMAU
Serial no. (Thana no.) NUDe of' village
Occupied residential
houses ~
No. of Area No. of bouse
in acres houses holds
1
94-95 96 97 98 99
100 101 102 103 104 105 106 107 108 109 no 111 112 113
114 115 116 117
118 119 120 121
122 123 124 125 126 127
128 129 130 131 132 133 134 135 136 137 138 139 140 141 142
2
REVENUE 'l'HANA-DAL TONGANJ-conld.
Pogar G. P.-concld.
( 560) Gongo P, Me (561) 1{aparphuta
•• 499·16 59·56
(562) Haldiminhai " 174-57 " 138·61 (570) Uchahra Kalan
(571) Uchahra Khurd (572) Pagar Kalan
" 130'19 " 290·73
(573) Pagar 1{hurd L,.Me (574) Udih Me
177'90 61'68 76'07 (575) Pachamba
" 134-77 (576) Tilra (577) Sirma Me (573) Gudipahari
" 270'69 86'79
.. 215-41 29-49
.• 222·09 225·51
17·38 79·52
.• 418·43
(579; Harkhuwa P, Me, Ie (580) Pardoher (581) Naudiba (582) Baberwatanr (583) Baniadih (584) Birtia (5B5)+Ganeshpur (587) Tunudag PM, .. 571'05
(459) Barwadih (460) Ulsu (461) Kolhua (468)+·Pank;
(469) Pathra Khurd (470) pahra Kalan (471) Nima Chak (511) Majhauli
(586) Pipratanr (588) Giri (589) H!!Satu (592) Jaspur
P, Me " 578'45 .. 272·10 •. 163-45
M, 11, B, C, L. 1,440·04 RVG,A,Hos,V,Mc
43-65 .. 194·00
P, Me .. 249·13 .. 188·66
146·]4 .. 269·08
189·70 79·43
(593) Tilamba (594)+Loharsi B,l,Rlle,V,O,
75·04 .. 1,256'93
(563) Haidi (564) -Karma (565) Lukuwa (566) Ambabar (567) Gar~riadih (568) SarJamatu
P,Me
125·81 .. 133·91 .• 306·36 ., 460·07
36·15 .. 110·69
(569) Bihari Khap (590) Titlangi P (591) Bidra
.. 152-69 .. 215·84
231'54 (695) A]-armanri (596) Ambalori (597) Teldiha (598) Kelwa (599) Balmuwan (600) Garhganw
" 10S·II .• 643'27
66·28 r, L, C, MI -,_. 315·60
213-80 •• 298·07
71
9 21
I
94-40 15
53 7
50 7
117 13 12
35 30
45 38
2 430
25 49 56
]8 8
25 34
225
3 48 78
35 17 60 27 40
66 58 56
5
79
9 21
117 54 19
63 7
65 8
142 13 16
43 45
65 44 ...g
544
29 56 67
:20 10 35 41
343
3 51 96
50 22 72 36 53
80 67 62
Total num ber of persons enumerated (including inmates of institutions and houseless persons) .--__ J--__ --.~
P
6
425
39 86
563 318 79
352 31
309 53
654 46 67
226 229
340 245
17 2,673
141 274 303
92 67
175 208
1,539
27 273 480
245 106 312 173 291
377 328 327
M
7
216
22 49
294-166 41
186 20
148 28
34-2 27 33
119 115
167 126
11 1,357
68 H2 156
43 48 90 99
779
15 138 236
120 60
163 84
149
186 167 171
F
8
209
17 37
269 152
38
166 II
161 25
312 19 34-
107 114-
173 119
6 1,316
73 132 147
49 19 85
109
760
12 135 244
125 46
149 89
142
191 161 156
VILLAGE
SUBDIVISION -. ANCHAJ:.
Scheduled Scheduled
Literste and
educated persons castes tribes
r= ,.,
9 10
145
22
135 18 38
15
123
145 8
26 27
279
39 55 ,65
15 7 9
17
228
30 92
12 14-51 21 88
3 I 3
155
17
138 15 33
18
130
140 7
17 36
268
48 52 60
17 18 16 25
229
28 88
13 16 45 20 81
4,
2
F
11
F M
12 13
25 15
17 9
45 42 62 65
85 82 II 6 18 20
38 96
33 'ii 55 31 49 44
4 3
10 8
18 16
59
1 14-
97 80 5
66 8
46 16 73 2 9
25 33
84 35 1
393
12 26 58
14-23
4 7
169
8 21 49
36 25 44-19 11
50 22 27
F
H·
13
3
a. 23
1
II I .. 1() 5 8
2: 6-
34-8
100-
5 6
30
2
&
2 2
1 2 2

STATISTICS
SADAR
:FANKI
I
Total workers (I-IX) Cultivator
M
15
, 127
14 37
166 99 29
103 15 82 16
.221 18 18
67 69
83 69 5
775
36 78 '85
:26 '19 59 60
-492
4 75
0124
60 ·43 98 47 75
112 104-93
F
16
53
M
17
69 Uninhabited Uninhabited 12 2 11 19
Uninhabited 93 72 40 61 22 17
Uninhabited 15 63 ·4 5 79 56
14 141 84
11 13 15 9
Uninhabited 23 45 68 56
77 72 27 63 2 5
332 408
Uninhabited 35 13 44- 43 54 22
8 19 5 8 9 25
52 25 Uninhabited 192 171
Uninhabited 4
51 45 98 64
Uninhabited 36 42 12 16 74 54 34- 26 69 41
Uninhabited Uninhabited
7 80 5 76 7 59
F
18
4
15 3
5
5
54 8 4
8 55
62 18 2
153
1 4 5
2
1 5
16
28 34
24 2
54 22 44-
5 3 1
31
WORKERS
II III IV V VI VII VUI Manu· Transport,
facturing Storage Agricul. Mining, House- otherthan Trade and
tural Quarry. hold Household Cons- and Commu· labourer ing, etc. Industry Industry truction Commerce nications ,..-....-.... ~ ....---. .....----.. ~ .....--.. ,-----' M FMFMFMFMF MF!'VI
19 20 21 22 23 24 25 26 27 28 29 30 31
36 43 17 6 .. j " .. ..
11 12 1 9 7 2 7 .. ..
73 72 5 4 6 1 .. 2 .. 2 31 37 3 .. .. .. .. . . .. .. 12 22
29 10 2 .. 2 .. 1 .. 5 4 ~ . .. .. .. ..
26 72 .. .. .. 2 .. .. ..
65 74 12 .. 'IS 9 .. .. .. .. 26 3 4 2 1 1 .. .. ..• .. .. . . 7 11 2 .. .. ..
21 15 1 .. .. .. 10 13 3 .. .. . . 6 10 3 1 .. 2 2 2 .. .. 5 9 .. .. ..
.. .. .. 136 135 5 57 3 .. 2 58 5
23 34 33 40 1 .. 38 45 2 2 2
7 6 5 5 1 .. 2 .. 3
14 8 15 35 47 -
219 160 4 41 12 9 .. 17 ..
.. .. .. .. 27 22 2 .. 54 64 2
8 8 3 .. 3 .. 9 9 1 .. .. .. 10 ..
23 18 16 1 3 1 .. 4- 12 13 .. 1 .. 1 ..
32 25 1 .. .. .. .. .. .. ..
4 9 .. S .. 10 2 .. 2
9 7 S 2 3 15
\
F
32
IX
Other Services
F
33 34
7
7 4
5 4
2
19
1
104- 40
I.
1 20 2
5
31 4
1 1 '3
4 4 7 1 2 2
11 16 1
X
Non·workers
M
35
89
8 12
128 67 12
83 5
66 12
121 9
15
52 46
84 57 6
582
32 64 71
17 29 31 39
287
• 11 63
112
60 17 65 37 74-
H 63 78
F
36
156
5 26
176 112 16
151 7
82 25
l7! 8
19
84 46
96 92 4
984
38 88 93
41 14 76 57
568
12 84
146
89 34 75 55 73
184-156 149
81. .11.0.
94 95 96 97 98 99
100 101 102 103 104-lOS 106 107 108 109 110 111 112 113
114 115 116 117
118 119 120 121
122 123 124 125 126 127
128 129 130 131 132 133 134 ISS 136 137 138 IS9 .. 0 141 142

32
PALAMAU VILLAGE
SUBDIVISION
ANCHAL
()ccupied resid ential
houses ~---.. Total number of persons Literate
No. of enumerated (including and Serial no. Area No. of howe- inmates of iIlltitutions Scheduled Scheduled educated
(Thana no.) Name of village in acres houses holds and houseless persona) cutes tribes persons .....---"--.......
p M F XI F ?VI F M F
2 3 4 5 6 7 B 9 10 11 12 IS 14-
REVENUE THANA-DAL TON GANJ-con td.
Ambabar G. P.-concld.
143 (601) Barkadaha 99.Sl 144 (602) Sorodiri P -. 610.13 .58 66 338 167 171 106 98 39 29> 145 (603) Khankhar '38.27 3 3 10 4 6 I 1 146 (604) Hotwar P 816.81 61 72 297 148 149 44- 42
.. .. 30 !),
147 (507) Duriatu 199.02 23 30 156 71 85 44 53 11 148 (SOB) parsawan 605.45 24- 29 129 63 66 5 I 52 62 9 149 (509) Naudiha 721.60 99 149 684 354 330 121 121 59 150 (510) pokhraha 150.79 28 38 177 75 102 75 102 151 (512) Mangarpur P,C,Me,Oe 202.31 71 104 478 246 232 216 170 40 .-152 (513) Nawadih Me,oc 84.21 38 53 241 114 127 43 46 16 9' 153 (514) Chorea .. 562.40 16 20 81 42 39 39 36 I 154 (515) Kor\\atanr 300.00 155 (516) Ulgara .. 1,207.29 23 38 156 84 72 34 30 50 38 12 156 (517) Barahmoria 7.15 157 (518) Baludih .. 227.03 12 19 77 44- 33 23 17 7 g..
158 (519) Soratb .. 620.89 34 39 155 82 73 5 2 41 37 17
159 (462) Chaodarpur P,Cc .. 218.69 95 119 519 238 281 .. .. 65 2 160 (463) Nur" Me,D; .. 530.68 127 275 830 421 409 170 173 86 28-161 (464) + Tatidiri P,Cc .. 358.88 22 29 172 • 83 89 22 19 12 .. 162 465) +Saraidih Ce, Dc .. 372.25 84 III 542 264 278 42 65 51 IS· 163 (466) Bhuinya Kurha " 139.21 31 50 224 113 III 21 24 I .. 34 1 164 (467) Hama " 212'20 92 119 459 233 226 17 2'
165 (538) Porsam .. 1,100'37 22 22 98 59 39 12 12 '39 25 i2 1 166 (541) Thekhi 94'50 167 (542) Jotang P .• 2,693·94 31 50 124 74 50 53 55 15 2 168 (545) Garihara P .. 1,081'00 27 35 154 75 79 22 23 28 24 12 2' 169 (546) Jaspur alias Cheribar 218'73 8 11 54 25 29 25 29 170 (547) Ranadah 188'33 5 5 29 16 13 16 13 171 (548) Herum .. 1,057·81 35 41 259 141 118 33 24- 14 1 172 ~549) Matnag Oc " 1,545'65 17 18 68 40 28 12 14 6 4 173 550) Jolah Bigha Cc .. 587-96 16 29 127 63 64 4 5 5 174 (551) ])uwarika P,L,Ce 253·77 55 73 348 180 168 53 48 27 6-175 (552) Kakargarh P ... 2,058·31 36 63 350 .176 174 61 56 46 4 176 (553) Dumarkhar 151-46 177 (554) J~jo P .. 1,705'40 26 28 146 83 63 83 63 22 1
Tal G. P.
178 ~505~ :Mukta P 378·52 12 17 88 52 36 52 36 6 179 520 Tetariadih 258·27 1 2 6 4 2 1 180 (521 +Bara 308',57 23 30 134 61 73 26 36 11 4 181 (522) Gopaldih 81'88 37 40 194 100 94 7 4 60 60 20 182 (523) Kasmar M9 8 8 43 22 21 14 14 2 183 ~24) Parhiya Tola 306'85 184 (25~ Kamal Me 152·84 7 7 41 19 22 9 9 10 13 2 2 185 (526 Auka Me 365·90 30 30 139 66 73 5 8 51 53 10 2 186 (527) Khajuri P, Dc 499.26 26 36 175 90 85 4 5 51 60 35 7
187 (528) Matuli P,L 788'78 36 48 235 110 125 63 125 20 7 188 ~529) Jbagrudih 5-12 1 1 3 2 1 2 1 189 530) Chakaminan 17'78

STATISTICS
SADAR
PANKI
I
Total workers (I-IX) Coltivator
,..--__"""____'_
F lt1
15
F
16 17 18
Uninhabited 98 48 80 5 3 1 3 1
81 34 71 19
37 28 18 . 3 36 15 17 6
207 92 110 40 47 48 3
126 78 54 32 72 56 40 25 25 12 7 4
Uninhabited 49 39 21 16
U ninhahited 26 16 4 5 50 I 30 21 10
134 118 123 109 259 169 140 51 44 11 37 7
lSI 84 99 49 67 40 53 34
147 78 125 44
37 29 29 22 Uninhabited
43 32 12 11 45 37 7 2 15 14 7 7 8 6 5 3
93 52 40 33 27 10 10 1 36 5 31 3
106 41 37 2 III 104 69 71
U n;n!zabited 52 40 -45 35
28 7 12 2 1
36 16 15 2 62 13 31 12 2 8
Uninhabited II 5 5 2 39 27 17 2 44 7 30 4 77 37 55 29 2 1 1 I
Uninhabited
P-II-5
33
WOBKlIIB8
II III IV V VI VII l'\i!anu.
Agricul. Mining. HoUIC- 0= Trade tural QUarry- hold Household CollI- and
la bourer mg, etc. IndUJtry Industry tructioo Conunerce
£ --. ,...--"---. ,....--"----. .....---.,....--"--. .....---.
M: F M F Nt F M F lVI F' M: F
19 20 21 22 23 24 25 26 27 28 29 30
8 43 7 .. .. .. .. .. .. . , .. .. .. ..
7 14 2 1
16 25 .. ..-. .. 14 9 2 .. 3 .. 64 51 2 .. 6 I .. .. 20 . . 44 48 .. .. . . .. .. .. .. 28 42 24 .. 9 4 .. .. .. . . 23 28 4 .. 5 3 .. ., .. .. " .. 11 8 3 .. 3 .. .. .. 22 23 3 .. .. .. . . .. .. .. .. 14 9 3 I 5 .. .. .. .. 23 14 2 5 2
11 8 .. 1 99 100 8 I 9 6 3 7 4- .. .. . , " .. . .
40 34 2 3 .. .. .. .. .. 1 .. 12 5 .. 1 .. . . .. .. .. .. .. . . 21 34 .. .. .. .. .. . . .. ..
5 7 3 .. .. .. .. .. .. .. 27 21 3 .. .. .. .. .. 32 35 5 .. .. " .. .. .. .. 7 7 I .. .. .. .. .. .. .. 3 3 .. .. .. ..
35 17 18 2 .. .. " .. .. .. 13 9 4 .. .. .. .. .. 3 2 1 .. .. .. .. .. . .
43 36 8 .. 4 2 6 .. 36 33 3 .. .. .. " .. .. .. 4 5 1 .. .. .. .. ..
5 3 4 .. 6 3 .. .. .. .. . . .. .. .. ..
13 14 8 .. .. .. .. .. 18 12 9 .. 1 .. I .. .. .. 1 2 2 .. 1 .. 3 _ '!3 I .. 2 .. .. .. ..
17 25 3 .. 2 .. .. .. .. .. .. 5 3 8 .. .. .~ .. .. 3 I 18 4 .. 3 I . , .. .. .. ..
BIHAR
VIII IX X Transport.
Storage and
Commu- Other SI. oicatiom Services Non-workers no.
~
M: F M: F M F
31 32 33 34 35 36
143 '3 69 123 144
1 5 145 1 67 115 146
3 34 57 141 .. 27 51 148 5 147 238 149
28 54 150 11 120 154 151
42 71 152 I 17 27 153
154 2 35 33 155
156 18 17 157
2 32 43 158
104 163 159 5 6 162 240 160
39 78 161 2 4 1 113 194 162
2 46 71 163 1 86 148 164
22 10 165 166
1 31 18 167 1 30 42 168
10 15 169 8 7 170
48 66 171 13 18 172
1 27 59 173 8 1 74 127 174 3 65 70 175
176 2 31 23 177
1 24 29 178 1 2 2 179
25 57 180 2 1 38 81 181
10 19 182 183
8 17 184 27 46 185
1 46 78 186 1 33 88 187
188 189

34
PALAMAU VILLAGI
SUBDIVISIOro;
ANCHAL
Occupied raidential
houses ,--- Total num ber of penoos Literate
No. of emolInerated (inchtding and Serial no. Area No. of house- inmates of institutiOllS Scheduled Scheduled educated
(Thanano_) Name of village in acres houses holds and houseless penons) castes tribes penon.
,..------' ,..--~
P M F 1\1: F M F M F
2 3 4- 5 6 7 8 9 10 II 12 13 14
RBVENUE THANA-DALTONGANJ-concld_
190 (531) Jobla 874-75 19 20 103 52 51 52 51 7 191 (532) Taledih 420'4-3 7 11 46 16 30 16 30 192 (533~ Birbir I •• 1,190-29 11 14 58 27 31 27 31 2 193 (534- Hiringbar _ _ 384-00 7 9 44 24- 20 24 20 1 194 (535) *Abun P " 1,638-i5 58 65 314 152 162 4 4 136 139 4 195 (536~ Churra 325'61 196 (537 Pundru P 669-30 19 22 89 46 43 10 12 36 3) 197 (539) Andag __ 1,401-31 198 (540) Khamdih 325-29 199 (543) Chhapar Me 311-29 ,17 18 91 44 47 24 25 16 21 17 2 200 (544) Tal P,Rkc _. 1,593-50 ,56 66 326 158 168 72 83 3 9 42 9
ANCHAL TOTAL 104744-94 , 8,031 10,435 50,326 25,346 24,980 7,066 7,095 2,608 2,592 5,5561,On or
163_66 sq_ miles

35
. STATISTICS BIHAR.
SADAR
PANRI WaRKERs
I II III IV V VI VII VIII IX X Manu- Tramport,
?
Agrlcul-facturing Storage
Total workers Mining, House- other than Trade and
tura! Quarry- hold Household Cons- and Commu- OthCl' SI. (I-IX) Cultivat~r labourer ing, etc. Industry Industry trnction Commerce IDeations Services Non-worken no.
,----""'"___, ,..---"""""___ ~,...-A--.~~ ~ ,..------' ,------. ,..----.... M F M F .M F M F M F M F M F M F Nt F ).I;{ F M F
15 16 17 18 19 20 2} 22 23 24 25 26 27 28 29 30 31 32 3S 34 35 36 '-
37 9 29 7 5 2 3 .. .. .. 15 42 190 14 11 10 9 2 4 .. 2 19 191 20 3 10 1 5 5 2 7 28 192 16 2 10 2 1 5 8 18 193 95 83 78 67 3 15 11 3 57 79 194
Uninhabiud 195 30 25 18 21 2 7 3 2 .. -.. 16 18 196
U nin1cabiled 197 Uninhabited 198
30 10 21 10 7 36 2 .. .. .. " .. 14 37 199
97 44 33 2 20 34 2 .. .. .. 1 6 6 61 124 200
14,425 8,339 8.538 4,109 3,643 3,738 638 79 492 214 74 8 27 .. 255 14 29 729 177 10,921 16, 641

36
P~LAMAU VILLAGE
SUBDIVISION
ANCHAL
Occupied residential
houses ,.---~ Total number of persons Literate
No. of enumerated (including and Serial no. Area No. of house. inmates of institutions Scheduled Scheduled educatetl.
(Thana no.) Name of viII age in acres houses holds and houseless persons) castes tribes persons ~~ ,..---"--.....
P M F M: F ~ F M. F \
1 2 3 4 5 6 1 8 9 10 11 12 13 14
REVENUBTHANA-CHHATARPUR
I (236) Patsara 565.14 22 25 139 14 65 2 2 60 55 2 (237) PipraKalan 619·63 3 (238) Kui IlrjShushiganj Rhc 527.85 101 III 613 314 299 99 60 38 4 (239) Piprahat 86.83 14 14 64 31 33 3 15 21 3 5 (240) Bhalubar 411.50 6 (241) Tardih .. 824.99 II 15 43 22 21 19 17 3 7 (242) Larmi 718.39 9 11 50 25 25 22 19 I 8 (244) Kodwaria 298.19 8 9 33 18 15 15 11 9 (245) Chhuchhia 436.94
10 (246) Solanga 373.14 12 15 64 29 35 24 29 11 (247) Maradag 522.79 1I 16 66 34 32 32 29 1 1 12 (248) Bansdiha alias Latea P 221.01 76 83 444 240 204 18 10 110 90 50 9 13 (249) Bambhandih 404.57 27 39 239 108 131 20 19 80 101 10 14 (250) *Gamharia 404.88 48 53 362 170 192 5 12 50 40 15 3 15 (251) Gontha 726.16 35 36 197 103 94 3 2 80 70 3 16 (252) Lawadag 175.20 85 88 458 242 216 10 12 102 90 12 17 (253) Hathgara 413.01 18 (254) Mahcshra 476.93 19 (255) Kalapahar 187.99 78 93 461 259 202 15 12 120 130 18 20 (256) Birwadohar 582.75 1 1 2 1 1 1 1 21 (257) Lahanga .• 1,145.41 11 16 70 38 32
22 (258) Kushmaha 234.18 4 4 20 10 10 1 7 7 23 (259) Dundur 211.64 46 49 206 102 104 12 14 70 68
24 (260) Hisag .. 511.99
Khendhra Rangania G. P.
25 (2 11) Pindrahi 662.38 54 68 427 210 217 50 30 50 60 25 26 (212) Bogna alias Ahri 127.98 14 14 77 47 30 40 21 27 (213) Baijna 292.40 28 (214~ Lamba 556.04 29 (215 Karupa .. 740.73 30 (216) Majhgawan 91.12 3 5 23 13 10 9 8
31 ~217) Chunautwa 385.58 32 218) Tilharwa Me 89.29 41 63 296 156 140 9 10 30 20 14
33 (219) Mahugain Me 100.G6 23 32 160 78 82 10 7 50 55 28 7
34 (220~ Rangania P,L,Me 99.75 25 35 200 107 93 7 7 35 33 20 6
35 (221j Thekahi Me 24.89 4 4 28 15 13 2 1 10 8 6 1
36 (222) Koilkha 26.55 37 (223) Deogan Me 411.19 23 34 167 85 82 30 25 50 45 12
38 (224) Chatarchati 139.26 39 (225) Dumaria Me •• 1,347.73 6 10 49 21 28 3 4 10 14
40 (226) Tendudih 712.36 41 (227) Bergain :: 1,760.85 9 10 37 19 18 5 4 12 II 42 (228) Khendhra Khurd P .. 1,339.60 51 70 285 146 139 30 31 55 49 23 2 4-3 (229) Pahari II .. 542.78 28 35 161 82 79 IS 20 S5 So 6 2
4A (234) Khendhrakalan .. 806.35 48 61 263 129 134 20 19 5 6 16 3
45 (235) Bhadwa 786.31 6 9 34 13 21 10 IS 2 1
Khajuri Nawdiha G. P.
46 (231) Nawdiha C 501.29 160 326 1,104 526 578 229 235 118 7 047 (232) Shivdayaldih 149.53 10 15 65 28 37 11 16 2 48 (233) Pakha 775.54 49 (243) Baghamara .. 1,220.08 36 46 212 109 103 40 41 20 19 6 .. 50 (261) Rud 794.34 32 44 239 127 112 36 28 27 1

37
STATISTICS BIHAR
SADAR
CHHATARPUR WOJlJ[BB8
--. •
I II III IV V VI VII VIII IX X Manu- Transport,
facturing Storage Agricul- Mining, House- other than Trade and
S1. Total workers tura1 Quarry- hold Household Cons- and Commu- Other (I-IX) Cultivator labourer ing, etc. Industry Industry truction Commerce ::nications Services Non-workers no.
,...---""'___' ,...---............ ...--"---- ,..--"---.,..--"---.,..--"---. ~ ...... ,...---"""'___"'" ,...---""'___' ~,."..__.....,.
M F M F M F M F M F M F M F M F M F M F M F.
15 16 17 18 19 20 21 22 23 24 25 26 27 28 29 30 31' 32 33 34 35 36
43 19 31 12 12 7 31 46 1 Uninhabited 2
167 96 143 65 18 30 1 .. 2 2 147 203 3 21 13 18 11 3 2 .. .. .. 10 20 4
Uninhabited 5 15 13 10 6 5 7 .. .. . . .. 7 8 6 17 4 14 1 1 1 .. 2 2 .. " .. .. 8 21 7 13 9 11 6 2 3 5 6 8
Uninhabited 9 17 16 16 14 1 2 .. .. .. . . .. . . .. .. 12 19 10 16 16 15 9 1 7 18 16 11
138 13 118 6 10 4: 1 2 7 3 102 191 12 59 13 54 5 5 8 .. .. .. .. 4:9 118 13
103 4:9 103 49 .. " .. 67 143 14 58 28 55 27 3 1 45 66 15
137 70 135 70 2 105 146 16 Uninhabited 17 Uninhabited 18
134 78 128 73 3 ~ .. .. .. 2 3 125 124 19 1 1 I 20
21 14 17 12 3 2 1 .. .. .. .. . . 17 18 21 7 3 4 2 2 1 1 .. .. .. "
3 7 22 59 37 51 31 7 6 .. .. .. 43 67 23
Uninhabited 24
124 16 112 15 11 .. .. .. 1 .. 86 201 25 23 1 9 I .. 13 I 24 29 26
Uninhabited 27 Uninhabited 28 Uninhabited 29
7 5 2 6 10 30 Uninhabited 31
90 3 59 2 27 1 3 I .. .. 66 137 32 49 20 27 10 10 6 1 .. 4 4 6 .. I 29 62 33 71 27 40 18 7 5 19 2 2 2 2 36 66 34 6 5 6 5 9 8 35
Uninhabited 36 46 43 27 25 14 16 4 .. . . .. .. 2 39 39 37
Uninhabited 38 15 15 11 7 3 4 5 .. .. .. 6 13 39
Uninhabited 40 14 11 6 5 7 6 I .. .. . . .. .. .. .. 5 7 41 89 55 68 49 !5 2 I 4 .. 'j 3 .. I 57 84 42 48 24 44 20 2 2 .. 2 " .. .. 2 34 55 43 73 43 33 17 39 26 .. 1 56 91 44-10 6 6 1 4 3 .. .. .. 2 .. . . .. .. 3 15 45
306 211 188 121 67 81 25 1 11 5 10 2 5 220 367 46 19 27 10 16 7 10 2 1 .. .. .. .. . "' 9 10 47
Uninhabited 48 62 58 40 38 3 16 9 3 1 .. 10 47 45 49 69 59 42 31 14 22 Ii I 1 5 .. .. .. .. 1 58 53 50

38
PALAMAU VILLAGE
SUBDIVISION
ANCHAL
Occupied re$idential
houses ------- Total number of persons Literate No. of enumerated (including and
Serial no. Area No. of house- inmates of institutions Scheduled Scheduled educated
(Thana no.) Name ohilJa~e in acres houlc:J holds and houseless persona) castes tribes pereoos •
~--__,__-__....., r--"""'---"' ,---.A.-~ ,..---"---
/I! M :Ii' M P N.I. F M F
2 3 4 5 6 7 8 9 10 11 12 13 14-
REVENUE THANA-CHHA T ARPUR-,contd.
51 (262) Kurkuta 568.68 9 9 90 48 42 3 2 +0 32 4- 4
52 (263) Loto ., 1,294.89 9 19 50 21 29 .. 20 27 2
53 (264) Arar P,L,Me .. 1,488.33 94 102 478 251 227 90 84 55 50 51 8
54 (265) Khonrhi Ie .. 1,150.69 103 110 556 278 278 67 66 8 6 25 1
55 (266) + Telari P,L,Me ,. 1,2 31.09 76 97 447 236 211 103 100 30 26 60 7
56 (267) Gangdari 473.13 57 (268) Kauwal P :: 2,533.27 64 72 340 173 167 59 61 15 20 54 2
Khajuri Nawdiha G._P.-eontd.
58 (2b9) Gurdi P 793.30 57 67 333 158 175 49 53 24
59 (270) +KhaJuri P,L .. 1,025.77 69 85 423 223 200 104 99 28 30 47 6
/> Telari G. P.-coneld.
60 (271) Akabasa .. 1,946.37 37 40 I 179 92 87 32 30 25 22 18 2 61 (272) Okraha ., 1,238.54 35 55 265 132 133 34 33 2 4 17
Khajuri Nawdiha G. p.-concJd.
62 (285) Lebar V 848.31 44 48 230 109 121 30 37 16 24 24 12
63 (286) Belwanr 198.42 64 (287) Rehra 683.68
Dali Shildag G. P.
65 (273) Chengwana 483.26 6 8 32 19 13 5 2
66 (274) Dali M,L, Rhc,Mc ':. 2,500.22 222 333 1,239 581 658 134 158 84 99 145 17
67 (275) Sahi .• 1,568.96 33 39 186 104 82 5 7 44 23 8
68 (276) Murumdag P ., 1,778.22 58 79 326 170 156 87 91 ;14 29 15
69 (277) Gundri .. 652.70 18 27 148 i9 69 5 6 22 14 6 1
70 (278) Kurauli .. 970.75 32 46 209 llO 99 25 26 43 56 2
71 (279) Rudwa .. 609.08 82 115 568 287 281 133 140 42 23 16
72 (280) Basdiha .. 466.46 14 15 64 35 29 II 10 3 1 1
73 (281) Choukhara Bandhudih .. 819.32 43 62 326 159 167 23 25 49 5~ 17 1
74 (283) Shildag P 916.45 83 97 532 278 254 67 73 42 22 46 3
75 (284) Taktuka alias Kartuka .. 714.33 31 39 161 88 73 22 17 32 26 16
76 (293) Salaia .. 851.43 26 36 154 76 78 32 31 23 23 1
77 (294) Bardiha 785.86 55 68 313 164 149 67 64 9 4 14
78 (295) Kokro .. 588.90 30 35 174 84 90 29 40 31 31 5 1
79 (296) Kerki Kalan .. 687.83 40 50 249 126 123 34 37 34 26 9 1
80 (297) Kerki Khurd .. 827.11 22 28 141 71 70 20 20 49 49 4- 3
81 (298). Charai p .. 960.87 97 125 624 304 320 134 155 30 27 49 8
82 (299) Bamhandih .. 170.80 6 7 32 16 16 9 7 7 9 2
83 (300) Rajbandh .. 115.09 6 7 51 26 25 26 25
Majhauli Bisaipur G. P.
84- (3~!) Majhauli P,Mc 394.77 50 66 315 145 170 48 49 6 23 14-
85 (302) Jaura 694.29 25 33 160 73 87 20 26 52 57 14
86 (303)+Khajuria .. 278.47
87 (304) Sahaerlih 1,057.13 10 13 50 26 24 14 15 12 9

39
STATISTICS BIHAR
St\DAR
CHHATARPUR WOllXlIi:&S
r-- .A-
I II III IV V VI VII VIn IX X Manu- Transport,
Cacturing Storage Agricul- Mining, Housc> other than Trade and
Total workers tural Quany- hold Household Cons- and Commu- Other SI. (I-IX) Cultivator labourer ing, etc. Industry Industry trllction Commerce nieations Services Non-workers no.
,.---.!......A...-.. .-..........__, ~ ,..-_,__, ,_..._...,_..._... ,........-..... .....--..-, r .... --, ,--~ ,.---~
M F M F M F M F M FM F M F M F M F M F M F
15 16 17 18 19 20 21 22 23 24 25 26 27 28 29 30 31 32 33. 34 35 36
34 27 16 15 15 10 3 2 .. .. .. 14 15 51 !8 16 17 14 1 2 3 13 52
157 121 1I8 87 33 34 I 2 1 .. 1 1 94 106 53 166 137 128 117 6 14 20 1 9 5 .. .. .. .. I .I ., 2 112 141 54 144 87 56 17 52 61 23 8 1 .. .. .. .. 2 3 7 92 124 55
Uninhabited 56 114 55 52 13 38 38 15 .. 3 2 I .. 5 2 59 112 57
98 97 51 58 22 24- 19 6 4 9 .. 2 60 78 58 131 85 60 23 45 58 8 " 8 3 3 7 1 92 115 59
53 13 30 8 17 4 6 1 .. .. .. " " ., .. 39 74 60 79 18 43 8 17 9 16 1 .. " .. .. 3 53 115 61
'\
I
75 56 46 32 22 22 4 2 .. .. .. " '. " .. " 3 34 65 62
Uninhabited 63 Uninhabited 64
\
9 5 9 5 .. .. ' .. " 10 8 65
345 85 230 24 74 49 17 4 5 3 5 8 I . if 236 573 66 64 32 45 22 5 6 13 4 1 40 50 67
109 80 38 34 52 36 15 7 3 - .3 .. 61 76 68 52 43 38 18 14 25 .. . . . , .. .. ., .. 27 26 69 65 56 55 41 10 15 .. .. 45 43 70
189 72 98 40 50 17 16 5 23 10 1 .. 1 98 209 71 25 5 12 I 5 4 8 " .. . . . , .. 10 24 72
103 84 57 60 24 20 19 4 .. .. 1 1 .. 1 . . 56 83 73 158· 95 106 57 36 32 10 1 1 5 1 .. 1 .. 3 120 159 74 55 43 39 27 11 13 5 2 1 .. .. .. 33 30 75
49 43 35 33 13 10 .. .. 27 35 76 98 86 65 59 23 27 7 .. 3 66 63 77 47 50 39 40 8 10 .. " .. .. 37 40 78 81 61 50 44- 20 17 6 4 .. .. .. "
45 62 79 42 35 30 24 II 11 1 "
29 35 80 185 183 91 97 67 67 .. .. 19 15 .. 1 7 4 \19 137 81
9 9 6 7 3 2 .. 7 7 82 18 14 3 1 15 J3 .. .. ., . . .. .. 8 11 83
87 91 59 75 19 15 8 1 .. " .. .. .. 58 79 84 49 45 20 19 25 22 3 2 2 .. ' .. " 1 .. 24 42 85
Uninhabited I 86 17 12 9 4 6 6 2 2 9 12 87

40 PALAMAU
VILLAGE
SUBDIVISION
ANCHAL
Occupied resid ential
hOWleJ ,---~ Total number ofpersons Literate
Serial no. No. of enumerated (including and
Area No. of house- inmates of institutions Scheduled Scheduled educated (Thana no.) Name of vilI~ge in acres hOWies balds and hOWieless persons) castes tribes persons ,.-------.. ,..------..
P M F M F M F M F
2 3 4 5 6 7 8 9 lO 11 J2 13 14
REVENUE THANA-CHHA T ARPUR.-contd.
Majhau/i Bisaipur G. P.-conc1d_
88 (305) Bisaipur p .. 1,092.64 52 64 259 145 114 50 35 45 42 9 119 (306) Chilho Kalan .• 1,350'91 36 53 205 105 100 15 18 90 82 4 90 (307) Bhikhi .. 1,237'43 40 52 240 123 117 60 41 55 59 6 91 (30B) Pah~a 640·55 22 38 169 79 90 16 25 63 65 6 9!! (309) Kharcliha .. 1,311'89 93 (310) Chilho Khurd 1,015'07 22 26 129 69 60 11 10 58 50 7 94 (311 ) Tarudag alias Dindi .. 1,191'98 28 30 150 75 75 I 3 67 55 2 95 (317) Hulsam .• 1,867'15 58 67 367 188 179 75 94- 5
Ckarai G. P.-concld.
96 (318) Karma .. 485·48 50 53 249 112 137 6 6 84 94 20 2 97 (319) Chuchrumanr 412-11 24 31 196 92 104 10 8 48 60 7 98 (325) Hutukdag P.O, .. 1,622'59 70 89 464 220 244 154 162 48 65 22 7 99 (326) Itakdag .. 465-51 31 38 1'73 85 88 33 35 4
100 (20B) . Bara 553-19 148 184 883 463 420 236 260 4 1 89 5 1'01 ~209) Mwianpur P 696.91 ltD 150 799 422 377 105 100 11 9 26 102 210) Kacbanpur Me _. 1,559-82 123 145 939 463 476 169 183 24-103 (230) Gopalpur Me 21I ·99 13 16 81 34 47 21 23 6 104 (282) Karma Kalan Me 776·92 40 51 280 148 132 25 29 27 4-105 (288) Lohrai Me 520·42 79 98 526 268 258 72 76 7 3 37 13 106 (289) Khatin Me 496'18 145 159 906 440 466 114 125 126 18 107 (290) +*Chhatarpur P,M,L,A,kk,Ie2 .. 715·50 211 222 1,063 556 507 216 219 287 22 108 (291) Sarma Me 1,230'15 78 97 467 237 230 63 67 51 44 30 2 109 (292) Kangalidih Me 931·94 15 17 71 37 34 3 1 20 18 4
110 (201) Arjundih Me 312-71 38 54 273 131 142 13 III (205) K""'vlll P,"v1.c 792'99 !:l8 129 749 371 378 201 215 35 4-112 (206) Dinadag .• 1,278'41 64 75 417 238 179 18 9 17 ll~ (207) +Jobna alias Ramgarh Me 70.0·07 67 85 479 24-9 230 195 190
34 38 5
114 (336} Masihani h,K,A,Mc .• 1,459·93 116 164 810 395 415 285 299 32 34 20 115 (337) Ilagdiy~ 561·29 86 120 609 311 298 104 1?9 14 1 116 (179) Mangara 324044
Udaigarh G. P.
117 (180) Mahuari P,L,Mc .. 1,923-45 53 72 364- 179 185 65 69 66 42 118 (181) Marar .. 757-86 8 8 48 24- 24- 24 24 1 119 (1112) Dhobidih 652'56 10 10 50 24- 26 2 120 (183) Gosaindih _. 1,496.56 69 80 445 211 234 34 24 10 121 (184) Gulabjbari M,Hos 863-90 77 106 558 267 291 88 100 48 18 12::! (185) Chuchru .. 304-80 26 26 133 68 65 23 18 7 123 (11l6~ Pokhraha 267-69 68 81 423 197 226 40 44- 22 124 (1137 Mednipur 46·89 7 8 51 27 24 B 7 17 5 125 (195) Lachhmipur 180-05 63 77 409 184 225 14 13 130 23 126 (196) NasQ .. 200·05 53 75 432 224- 208 63 61 50 32 127 (197) Nawadih P 232-87 8 9 60 36 24 4- 3 9 128 (198) Rajha 268.05 18 24 155 79 76 27 129 (199) ]olahkhap .. 303.46 25 29 172 82 90 30 40 12 6

41
STATISTICS
SADAR
CHHATAltPUlit. WOlUl:EB8
r----------------------------------~------------------------------~
I
Total workers (I-IX) Cultivator
M
15
102 70 80 48
45 56
129
68 50
134 55
253 247 269
23 87
146 247 347 162 26
71 209 ]65 156 219 172
106 14 16
130 128 35
117 13 91
116 20 45 46
F
16
82 57 86 53
M
17
60 47 30 40
U ninh a6 it,a 39 35 49 33
103 122
76 23 53 39
118 94 47 21
53 112 189 188
30 124-8 21
62 66 117 103 175 186 93 114
114 91 16 9
54 53 121 156 51 110 47 96
ll5 ]37 105 104-Uninhabited
51 45 15 2 15 14-
107 61 126 51 21 22 57 54 6 4
95 61 64 76
3 17 19 35 30 23
P-IJ-6
F
18
51 39 30 41
29 23 96
14 40 88 16
9 149
11 3
48 83
134 22 60 9
38 99 29' 25 85 60
4 2 8
70 69 13 20 2
69 42 2
16 5
II
Agricultural
labourer
III IV V VI VII VIn Manu- Transpon.
facturing Storage Mining, House- other than Trade and Quarry- hold Household Cons- and Commu-ing, etc. Industry Industry truction Commerce nications
IX
Other Services
M F MFl\1FMFNlFMF M Ji' NI F . 19 20 21 22 23 24 25 26 27 28 29 30 31 lI2 33 34
26 20 13 4- 3 6 .. .. .. .. 14 16 9 2 .. .. .. .. . . .. .. .. 43 54 5 2 .. .. .. .. . . , . .. .. 2 8 8 4 .. .. .. ..
10 10 .. , . ... .. 23 26 .. .. " ' . .. .
" .. _" .. .. 7 7 .. " " .. _ . .. ..
27 36 6 4- 5 18 .. 3 2 2 2 2 8 11 1 1 2 1 .. .. .. ..
29 30 7 4 17 16 12 3 5 11 .. .. ., , .. 43 24 3 15 .. 12 9 58 20 16 38 38 1 1 1 .. .. .. .. 1 .. 3
104- 14- 4-0 5 1 ., 1 1 1 4- ,. ., .. ,. . , .. .. .. 7 10 14 4 " " ..
37 34 1 .. 2 .. 1 2 48 39 6 .. 1 .. 2 .. 1 1 4 21 7 59 27 46 8 .. 1 " 35 5 7 75 13 30 39 33 6 .. 1 .. .. .. ., 2 .. 6 8 10 7 5 .. " ., .. .. ., .. .. .. 2
4 3 10 2· 1 10 .. .. 2 15 13 12 18 9 2 .. 6 10 4 7 6 37 12 .. .. .. 1 24 16 25 4- 5 2 1 .. " 5 11 17 18 4- 1 2 2 .. 1 " 4 1 .~ . 44 7 13 41 29 5 4 .. .. .. .. 21
37 42 14 2 1 .. 7 4 9 11 3 2 .. .. .. .. .. 2 5 1 .. .. ., .. .. .. 'S 1 7 2 56 30 3 4 .. .. "
._ .. .. 1 49 45 10 .. 12 6 " .. .. 6 6 9 8 2 "
.. .. , , ,. 2 38 32 7 ., 4 3 2 ., 12 2 4 4 1 .. .. .. .. 4-
12 16 l! I 2 7 " 1 5 1 13 19 11 .. 13 3 3 .. . , .. .. ..
1 3 .. .. .. .. .. 5 3 5 "
.. 16 22 5 2 1 I I .. ,
"
BIHAR
x
SI. Non-workers no.
M
35
43 35 43 31
24 19 59
44 42 86 30
210 175 194-11 61
122 193 209
75 11
60 162 73 93
176 139
73 10 8
81 139 33 80 14 93
108 16 34 36
F
36
32 43 31 37
21 26 76
61 51
126 41
367 188 446 39 70
141 291 414 116
18
88 257 128 183 300 193
134 9
11 127 165 44-
169 18
130 144-'21 57 60
88 89 90 91 92 93 94 95
96 97 98 99
100 101 102 103 104 105 106 107 108 109
110 ]11 112 113 114 115 1I6
117 118 119 120 121 122 123 124-125 126 127 128 129

42
PALAMAU VILLAGE
SUBDIVISION
ANCHAL
Occupied residential
houses ~ Total number of persons Literate
No. of enumerated (including and Serial no. Area No. of hoUJe- inmates of institutions Scheduled Scheduled educated
(Thana no.) Name of village in acies houses holds and houseless penons) caates tribCl penons ,_.~ ~--- ,...--.-'---.
P M F M F M F M F
2 3 4 5 6 7 8 9 10 11 12 13 14
REVENUE THANA-CHHATARPUR.-contcl.
Udaiga,h G. P.-concld.
130 (200) Bhandardih P, L, Hos, V,M c .• 904.93 37 42 250 148 102 36 32 33 12 131+(201 ) Chorar alias Udaigarh .. 847.87 68 77 394 170 224 81 89 37 22 16 1 J.32 (202) Kharwardih 498.77 14 16 97 49 48 21 24 1 133 (203) Bandhudih 916.84 52 66 369 176 193 25 25 12 134 (340) Marwa K,Oc 730.08 108 145 792 387 405 102 106 59 2 135 (355) Amwa 124.57 9 14 85 42 43 3 2 11
]36 (327) Bachkoma 1,076.38 23 29 liS 54 61 25 31 2 ] ]2 137 (328) Murumdag 1,448.17 43 56 318 152 166 15 18 63 63 31 1 138 (329) Dantuta 740.35 68 78 353 188 165 2 7 51 38 3 139 (330) Sungri 1,257.21 57 64 317 148 169 46 54 4 140 (331) Chiru P,Mc 1,141.52 234 289 1,568 708 860 80 129 123 136' 81 6 14] (332) Rajniandih 289.98 7 9 41 19 22 2 12 142 (333) Manhu 679.82 64 .85 440 223 217 93 105 31 2 143 (334) Saharsawa 343.19 32 38 194 95 99 40 39 17 4 144 (335) Tepna 624.60 26 35 173 83 90 39 52 7 145 (338) Tendudih
P,K, H,le, Me:: 538.20 41 46 263 129 134 65 61 23 5
146 (339) Munkeri 1,403.75 177 177 943 459 484 171 214 1 96 2
Dumri Namuclag G. P.
147 (354) Thekha 231.91 3 3 9 4 5 3 4 1 148 (356) Taridih 157.42 77~ 92 488 263 225 115 108 1 3 28 149 (357) ·Chordanda 515.22 13 25 131 68 63 68 63 17 150 (358) Rakoi 188.54 lSI (361) Mahugain 100.52 1 3 25 15 10 4 1 8 152 (362) Rabda 264.52 81 108 542 272 270 212 204 44- 2 153 (363) Mahurawn 92.27 10 10 64 26 38 18 154 (364) Dumri P,L 447.84 73 86 447 214 233 55 62 61 11 155 (365) Jharha 194.34 64 81 373 179 194 75 89 33 2 156 (366) Balra 850.59 38 58 250 115 135 68 77 15 157 (367) Rasida 199.80 33 38 243 124 119 16 24 .. 59 4 158 (368) Khardiha L,Me 950.54 88 112 516 255 261 84 102 2 2 19 159 (369) Shiupur .. 229.25 51 51 235 III 124 75 59 17 8 160 (370) +Namudag M,L \1,104.83 158 223 1,109 531 578 206 209 .. 113 9 161 (371) Teliadih 567.27 28 44 237 120 117 4 7 4 6 21 162 (372) Korami P 668.46 32 40 271 126 145 51 40 20 20 22
163 (312) Basantpur 1,084.10 8 B 32 17 15 3 4 7 6 i64 (313) +Latdag 420.31 6 6 19 11 8 4 4 1 2 1 165 (314) Champa 877.41 166 (315) Chipo 724.99 22 22 74 39 35 8 11 26 19 2 167 (316) Rajderwa 674.13 8 9 29 17 12 16 12 .. 168 (320) Sa1aia Khurd " 404.44 27 29 119 60 59 4 3 53 56 12 169 (321) .Bara Khanr alkis Kahua K hanr 1,600.44 14 20 88 47 41 5 4 42 37 9 170 (322) Guadag 700.29 14 12 58 26 32 12 9 11 21 7 171 (323) Biwadohar 325.51 172 (324) Jawar 464.01 34 42 182 96 B6 67 66 18 173 (381) Lakrahi 571.92 22 30 152 73 79 33 29 3 7 9 174 (382) Khiradohar P,Mc 411.03 101 138 602 285 317 128 147 69 16 175 (383) Si1da Kalan 136.i3 18 2·1 90 40 50 16 19 5 176 (384) Goreathan 485.83 12 19 98 48 50 B 8 27 24 3 177 (385) SilcaKhurd 821.11 87 lOS 514 246 268 123 129 7B 89 12

STATISTICS
SADAR
CHHATARPUR
I
Total workers (I-IX) Cultivator
F
II
Agricul. tural
labourer
43
WOBIKB.8
----_""'--III IV V VI VII VIII
Manu- Transport, facturing Storage
MIning, House- other than Trade and Quarry- hold Household Cons- and Commu-ing, etc. Industry Industry truction Commerce nications
M FMFMFMFNlFMF M P M
15
F
16
M
17 18 19 20 21 22 23 24 25 26 27 28 29 30 31 32
83 29 48 II 18 18 13 .'. .. " " .. .. .. . . . . 90 40 79 14 3 26 8 " .. .. .. .. 32 15 25 11 2 4 5 .. .. .. " .. ..
110 39 78 24 14 14 16 1 .. 2 208 175 ]58 141 25 31 2 .. 21 3 1 .. .. " .. 26 10 18 9 2 I 3 .. 2 .,..
" " 1 .. 33 3 ]6 17 3 .. .. .. .. .. .. 82 1 80 1 2 .. .. .. .. .. .. "
106 1 99 1 7 I .. .. .. .. .. .. .. .. .. 93 8 65 2 25 6 .. 3 ..
377 306 295 272 21 10 23 .. 16 10 4 .. 3 2 13 8 10 8 2 .. .. .. ..
127 83 90 66 21 16 16 .. .. .. .. .. I 60 21 33 4 14 16 13 1 .. .. ., .. .. .. 50 37 27 20 11 15 9 2 1 .. .. .. 75 55 44 35 17 20 13 1
231 103 154 60 46 34 18 6 7 2 .. 5
3 3 I 2 3 .. .. .. .. .. .. .. 150 97 105 69 25 17 8 .. 1 1 41 38 41 38 .. .. .. , ..
Uninhabit,d 5 3 ] "
154 136 47 36 93 97 4 1 .. .. .. .. 3 " 16 10 12 10 1 .. .. 1 ..
114 60 83 39 19 16 2 .. 2 I I .. 1 118 77 62 29 48 45 7 I .. 1 2 77 64 38 28 39 36 " .. .. .. .. .. .. .. . . 59 14 44- 1 10 11 3 ." 166 134 71 77 35 40 39 4 1 .. 5 .. 2 , . 64 43 17 6 34 34 9 .. 1 ..
280 208 155 139 47 41 5 6 2 9 .. 5 .. 2 66 59 7 " .. .. 74 32 43 14 28 18 1 .. 13 7 7 3 4- 2 2 1 .. 1 .. .. .. .. .. 9 6 8 5 1 1 .. .. ..• ..
Uni"habited 30 19 7 3 21 16 2 .. .. .. .. .. .. 12 9 5 2 6 6 I 1 .. .. 42 38 32 32 5 2 5 4 .. .. ., 30 25 20 18 5 7 5 .. .. .. .. 16 23 9 11 5 12 ~ .. .. .r.
Unin/uJbilld 70 55 36 33 18 22 15 .. .. .. .. ' .. 49 39 28 22 12 17 9 .. .. ..
169 157 99 79 54 62 9 7 3 3 .. 1 26 28 13 16 10 10 2 I .. 1 .. 36 30 25 24- 2 3 9 I .. .. .. .. .. ..
163 150 85 86 50 51 16 5 5 6 .. .. .. .. 2 ..
BIHAR
IX X
Other 51. Services Non-workers no.
r--"____' ,..----..... XI F M F
33 !l4 35 36
4 65 73 130 80 184 131 17 33 132 66 154 133
] 179 230 134 16 33 135
21 58 136 70 165 137 82 164 138 55 161 139
15 12 331 554 140 I 6 14 141
96 134 142 35 78 143
2 33 53 144 54 79 145
228 381 146
1 2 147 11 10 113 128 148
27 25 149 150
I 10 10 151 J 2 118 134 152 2 10 28 153 6 4 100 173 154-
61 1]7 155 38 71 156
2 2 65 105 157 13 13 89 127 158 3 3 47 81 159
51 25 251 370 160 54 117 161
2 52 113 162
4 8 163 2 2 164
165 9 16 166 5 3 167
18 21 168 17 16 169 10 9 170
171 26 31 172
.. 24 40 173 3 5 116 160 174 1 14 22 175
2 12 20 176 5 2 83 118 177

44
PALAMAU VILLAGE
SUBDIVISION
ANCHAL
Occupied residential
houses ,---"""'_____' Total number of persons Literate
No. of enumerated (including and Serialno. Area No. of house- inmates of institutions Scheduled Scheduled educated
(Thana no.) Name of village in acres houses holds a.nd houseless penons) castes tribes persons r----,A.--. _~ ,.--..A.-~ ,......~
P M F M F' M F M F
2 3 4 5 6 7 8 9 10 11 12 13 14
R.EVENUE THANA-CHHATARPUR-contd.
Saraidih ShahpuT G. P.
178 (378) Birhordih .. 638.23 3 3 8 6 2 179 (379) *Saraidih P,Oc 894.95 200 202 1,159 594 565 168 202 7 5 118 10 180 (380) Sahpur P,L,Oe .. 335.83 243 306 1,556 726 830 248 292 .53 72 81 2 181 (386) Ghujwa 533.90 \
182 (387) Hulsi Khurd Me 637.58 387 387 76 47 29 47 29 5 183 (388) Hulsi Kalan 624.94 184 (389) Karma Me •• 2,040.63 6 7 31 13 18 13 18 185 (390) Pathra alias Palhe Me 892.26 7 8 26 14 12 5 3 9 9 1 186 (391) Gorho 0, 767.61 17 17 67 37 30 30 23
187 (392~ Matnag M. 762.96 188 (393 Haraiya Me 242.07 4 4 21 10 11 2 2 8 9 189 (394) Debnar Me 335.98 14 19 89 46 43 46 43 8 190 ~395) 'Karbta Me,Dc 270.86 65 77. 370 181 189 51 73 31 31 25 191 396) Harni 807.85 46 49 204 91 113 48 68 10 192 (397) Salaiya 625.10 193 (398) Amola 244·99
194 (399) Gamhariadih 618.11 61 73 338 ]73 165 114 ]05 57 58 7 195 (400) Nawadih 896.91 38 38 185 89 96 5 4 84 92 8 196 (401) Adar .. 707.72
Kuku Lalgara G. P.
197 (348) Pichhaulia 840.98 20 31 140 58 82 41 58 5 ]98 (375~ Karnima. 526.64 8 10 47 20 27 20 27 199 (376 Kharar 492.82 33 35 148 73 75 1 3 60 62 7 200 (377) +Barwadih alias Koshiara 95337 15 16 59 32 27 18 15 14 12
201 (402) Dagra P,L,Me,Oe .. 1,745.95 47 83 379 190 189 53 52 100 101 38 8 202 (403) Jamuna .. 451.16 23 32 158 83 75 29 26 49 48 III 2 203 (404) Maradag .. 1,108.62 24 41 182 97 85 39 32 46 44 5
Kuku Lalgara G. P.-concId.
204 (405) Ramsadeya 63.47 9 _ 9 44 22 22 22 22 .. .. I 205 (406) Ruku Kalan P 992.88 54 72 342 179 163 51 62 4 5 14 206 (407) Kuku Khurd alias Barhania 351.22 207 (408) Risyapa Me 714.06 61 68 337 181 .156 64 61 36 5 208 (409) Kauwal 640.46 42 53 231 123 108 66 60 4 209 (410) Lalgara •• 2,339.99 94 113 515 273 242 104 112 51 88 12
Dagra G. P.-concld.
210 (411) Ratnag alias Sirha .,1,183:66 57 71 281 ]46 135 61 71 58 64 2
211 (412) Raebar ., 1,829.69 2 2 5 2 3 2 3
212 (413) Sahiyar •• 1,219.73 34 50 256 126 130 39 45 75 73 8
213 (414) Gansa 283.48 18 28 130 74 56 36 23 27 27 8 1
214 (415) Anata Kalan .. 428.38 27 32 130 56 74 28 35 8 9 4 1
215 (416) Anata Khud .. 929.30 4 4 16 9 7 .. 9 7 216 (417) Salwe .. 549.10 4- 4 19 10 9 10 9 217 (418) Chau Khara ., 514.44 12 12 36 19 17 I 19 16

STATISTICS
SADAR
CHHATAltPUlt
I
Total workers (I-IX) Cultivator
r----..... M
15
6 311 423
25
8 9
23
10 31
111 59
101 56
36 13 45 22
125 47 69
13 108
109 79
176
102 2
77 40 35 6 7
11
F
16
2 295 416
M
17
2 191 317
Uninhabited 21 23
Uninhabited 9 7 7 6
16 23 Uninhabited
6 6 29 21
111 85 54 32
Uninhabited Uninhabited 86 75 37 49
Uninhabited
43 19 13 8 39 17 19 5
96 68 36 27 56 45
16 7 89 64
Uninhabited 81 59 58 28
134 106
84 60 2 2
64 58 26 19 34 16 2 3 5 3
13 1
F
18
2 199 301
21
7 3
14
4 23 86 29
67 34
30 7
17 7
43 18 37
10 66
53 38 91
44-2
56 14-10 2 1 1
II
Agricultural
labourer
45
WORKERS _..A-
III IV V VI VII VIII Manu- Transport,
facturing Storage Mining, House- other than Trade and Quarry- hold Household Cons-. and Commu· ing, etc. Industry Industry truction Commerce nicatiom
IX
Other Services
M
19
FMFMFMFMFM F
20 21 22 23 24 25 26 27 28 29 30
M F M F
31 32 33 34
2 2 .. . , .. " .. 66 82 5 14 8 1 .. .. 25 2 8 4 74 110 I }9 5 1 2 9
2
2 .. .. .. .. .. " .. .. . . 3 4
2 - .. .. " ,
1 2 2 4 2 6 2 2 1 23 10 3 1 1 12 "
24 17 2 1 3 1 4
16 13 6 3 6 5 1 2 2 ..
13 13 2 2 5 6
22 20 6 2 .. 9 12 7 1
36 48 15 5 5 1 15 16 5 2 13 17 11 2
4 5 1 1 20 23 19 1 4
26 26 19 1 3 22 16 27 4 .. .. 2 45 39 23 4 1 ..
37 40 4 " .. .. .. .. ., .. .. J
16 8 2 .. .. .. 14 12 4 3 17 24 2 .. .. " .. 3 .. .. .. 4 4 " .. .. "
10 12 ..
BlHAR
X
~). Non-workers no.
M
35
283 303
22
5 5
14
.. 15 70 32
72 33
22 7
28 10
65 36 28
9 71
72 44 97
44
49 34 21
3 3 S
F
36
270 414
8
9 5
'14
5 14 78 59
79 59
39 14-36 8
93 39 29
6 74
75 50
108
51 1
66 30 40 5 4 4-
178 179 180 181 182 183 184 185 186 187 188 189 190 191 192 193 194 195 196
197 198 199 200
201 202 203
204 205 206 207 208 209
210 211 212 213 214-2]5 216 217

PALAl\IAU
46
Occupied residential
houses ,_---"-----.
Strial •• ( Th_no.) Name of village
No. of Area No. of house
in acres Ito'llSCI holds
1 3 4
REVENUE THANA-CHHATARPUR--contd.
218 219 220 221 222 223 224
(188) (189) (190) (191 ) (192) (193) (194)
Jamua Alias Bhisuupur G. P.
Kundil 81.30 46.89
.. 152.69 .. 390.78 .. 369.73
Kulhia Jhardag Kathautia Bara Mayapur Jamalpur
P,Mc 133.26 .. 160.64
Naudiha Bazar G. P.
225 (341) Mahipta 226 (342) Guruain 227 (343) Naudiha 228 (344) Harna
160·12 65.01
201.44 184.88
229 (345) Manandohar 741.09 230 (346) Jamua alias Bishunpur Mc,P •• ,501.39 231 (347) Salaiya .. 1,803.49
232 233 234 235 236 237 238 239 240
Naudiha Bazar G. P.-concld.
(349) Nawadih (350) Mujurahi (351) Nimd (352) +Madheya (353) Nawatanr (359) Turkadih (360) Charain (373) Singhna (374) Mohadih
P .• 738.02 339.61
V2, H 52.76 227.12
P2,L,Ma,H,Rhc.. 52.76 .• 166.17 .• 388.21 .. 450.73
194.32
20 57 95 40 25
20
36 30
7 94
7
34
23 3
209 13 55 48
5
20 . 57 95 40 31
23
43 34
7 113 12
45
38 6
239 17 63 58
VILLAGE
SUBDIVISION
ANCHAL
Total number ofpersons enumerated (including inmatel of institutions and houseless persons)
Scheduled Scheduled
Literate and
educated persons
p
6
118 291 475 230 165
137
256 166
M
7
58 149 221 130 73
68
127 90
37 17 556 .252 75 39
'257
195 37
1,192 89
331-278
129
96 17
581 45
157 140
castes tribes
F
8
60 142 254 100
92
9 10
33 56
130 26 44
29 37
159 25 65
69 22 21
129 57 63 76 40 30
20 304 87 86
36 22 25
128
99 20
611 H
177 188
7
16
183 U
106 74
7
27
182 22
139 70
11 12
25 31
13
8 14 41 42 6
10
32 12
1
4
10
2 2 42 102
12
36 5
177 5
17 6
21
20
ANCHAL TOTAL _161,919.71 9,785 12,102 58,238 28,978 29,260 9,190 9,685 4,514 4,469 4,4:41 635 or
253.00 Sq. nUl ••

47
STATISTICS BIHAR
SADAR
CHHATARPUR WORKERS
,------------------......__ I II III IV V VI VII VllI IX X
Manu- Transport, facturing Storage
Agricul- Mining, House- other than Trade and Total worken tural Quarry- hold Household Cons- and Commu- Other 51.
(I-IX) Cultivator labourer ing, etc. Industry Industry truction Commerce nications Services Non-work en no. ,..---.,....____, ,--~ ,..---' ~ ,...-""'__' ,.-~ ,...--....... ,........,..__. ,--",___, ,--.... ___, ,--",___,
M F M F M F M F M F M F M F M F M F M: F M F
15 16 17 18 19 20 21 22 23 24- 25 26 27 28 29 30 31 32 33 34 35 36
Uninhabited 218 Uninhabited 219
32 4- 25 7 4- .. . 26 56 220 79 34- 61 2 17 31 70 108 221
lIS 67 85 12 25 55 .. 1 . . .. .. .. 2 .. 1 106 187 222 72 20 49 1 16 18 6 .. 1 58 80 223 42 34 16 25 34 1 31 58 \ 224
39 25 31 17 7 8 29 44 225 Uninhabited 226
69 52 30 19 31 33 3 5 58 77 '227 58 34 43 24 / 15 10 .. 32 42 228
14- 6 5 B 6 3 14 229 133 157 75 30 57 127 119 147 230 22 18 8 14 18 17 18 231
67 15 57 9 9 6 62 113 232 Uninhabited 233
52 27 H 23 5 4 1 2 , 44 72 234 9 11 6 9 2 2 1 8 9 235
317 256 119 III 72 82 3 57 47 3 40 6· 21 9 264 355 236 27 7 10 16 7 1 18 37 237 88 62 33 2 55 60 .. 69 115 238 71 69 38 3 29 66 4- 69 69 239
Uninhabited 240
17,OM 11,111 10,748 6,654 3,634 3,6681,293 209481 34450 12 12 204 32 39 673 192 11,944 18,149

PALAMAU
Serial no. (Thana no.)
1 2 3 4 5 6 7 8 9
10' II 12 13 14 15 16 17 18 19 20
21 22 23 24 25 26 27 28 29 30 31 32 33 34 35 36 37 38 39
(I) :2) (3) (4) (5) (6) (7j (8) (9)
(10) (11 ) (12) (13) (14) (15) (16) ( 17) (23) (24) (25)
(21) (22) (26) (27) (28~ (29 (30 (31)
g~~ (34) (:35) (36) ~37) (38) (39) (40) ( 41) (42)
40 (18) 41 (19) 42 (20) 43 (+3) 44 (44) 45 (4:5) 46 (46) 47 (47) 48 (48) 49 (49) 50 (50) 51 (59) 52 (60) 53 (61)
Name of village
2
48
Occupied residential
houses ---.....______, , No. of
Area No. of house-in acres bouses holds
3 5
REVENUE THANA-CHHATARPUR-eontd.
Banahi M,Rhc Nawadih Bishram/lu, Barwadih RaJokhar alias Ronga
patrenga PaharpuI' Saraia Chaitu Bigha Pithoura P Banadih Sobhichak Pithari Rongha alias Be1audar Burbronga Samail Semaria Kunrwa
Jharna Holea
Mahugain Ordana Bhanga Babhan Sarhu Tarwa alias Jagdispur Tendui Ambajharna Kumhara Bansdohar pahaldewa Kalipur Madhubana Shakaldipa P *Hasanpur Naudiha Tendua-Pipra Tendudih
Kodwaria Guriauta
Gajna C,Oe Jitpur Bardag Me Shiripalpur Damwa Pipra L,Y2,Me Mali Ranjitpur Jharna Dihria Jhumri Andharibag Kalan P Andharibag Khurd Me Polda alias MaJhauli
I ••
25·00 40·50 98·93
318·99 118'4f1
93·92 80·16 49·75 67-40 46'02 60'07 63-40
166·63 81'64
161'37 463·03 924·52 346·64 461'75 364·31
459·60 119'70 374'45 701-64 209·39 326·24 182~56 260'62 338·29 18Hl 141·11 384·46 238'89 265'85
78·07 238·31 878·22 666'87 296·96
352'52 263-56 336·34 265·22 347-29 431'70 146·38 63·48
141'12 47'30
137'85 111·53 52'64
122'42
30 36 33 18
4-
48 7
33 13 10 12
22 1
8
9
12
53 26
5
33 68 49 12
6 22 8
11 23 84
4-25
116
iO 60
109 17 23
41 37 45 23
6
54 12 43 16 12 20
23 1
9
12
18
69 32 6
37 88 61 16
8 28
9
14 25
108 10 35
148
II 81
109 19 23
Total number of persons enumerated (including inmates of institutions and houseless p~rsons)
Scheduled castes
._---...., ,- .. P
6
206 217 250 127
42
309 70
257 91 85 78
83 1
56
50
76
383 203 19
225 548 318 72
30 141 59
75 157 574
48 196 766
52 420
335 120 III
,
M
7
110 110 121 67
16
152 32
130 53 46 34
38 1
28
28
42
202 94 8
106 295 167 29
15 74: 28
36 74
294 29
100 361
26 213
172 58 60
F
8
96 107 129 60
26
157 38
127 38 39 44
45
28
22
34
181 109 11
119 253 151
43
IS 67 31
39 83
280 19 96
405
26 207
163 62 51
M
9
64 1
54 33
11 32
6 7
17 34
37
3
2
44-18
58 101 75 25
30
31 39
124 29
6 163
18 87
78 32 13
F
10
60
52 29
16 38 1 3
15 44
45
4
2
49 19
64 120 71 36
24
35 26
133 )9 8
192
16 75
82 35 13
VILLAGE
SUBDIVISION
ANCHAL
Scheduled tribes
Literate and
educated persons
M
11
21
F M
12 13
3]
18 67 23 12
6
63 5
48 15 2
9
3
4
46 25
1
32 73 54
4
12 4:
2 17 45
6 13
107
38
23 12 5
F
14
8 3
5
7
3
7 13
9
6
1 1

49
STATISTICS BIHAR
SADAR
HARIHARGANJ WORKERS
.----I II III IV V VI VII VIII IX X
Manu- Transport, facturing Storage
Agricul- Mining, House- other than Trade and Total workers tural Quarry- hold Household Cons- and Commu- Other SI.
(I-IX) Cultivator labourer ing, etc. Industry Industry truction Commerce nicatio'ls Services Non-workc;rs no.
r- ,....--"""____ ,----.,.".__._. ,---..A.. .. ~ ,--~ ,..-.A....~ r--.A.--" r---'-""""'" ,....--....__. ,.--....____. ,.----......
M F )M F M F M F M F M F M F M F M F M F M F
15 16 17 18 19 20 21 22 23 24 25 26 27 28 29 30 31 32 33 34 35 36
74 34 32 6 28 25 2 .. 4 2 J .. 7 36 62 I 60 3 50 2 3 J 2 .. ., .. .. " .. .. .. 5 50 104 2 67 40 27 8 29 30 9 .. 1 .. " " .. .. 1 2 54 89 3 39 17 17 1 18 16 4 " " .. " " " 28 43 4
Uninhabited 5 12 2 8 3 1 .. .. " .. 4 24 6
,U ninhabited 7 74 48 57 40 3 7 ., 10 1 .. 3 78 109 8 17 16 12 12 4 4 1 .. .. .. " 15 22 9 75 16 49 10 5 5 13 1 5 " 1 " .. " .. " 2 55 III 10 33 4 25 2 5 2 1 " .. .. .. 2 20 34 11 26 8 21 6 3 2 2 " .. .. ., 20 31 12 23 28 3 1 20 27 ..
" " .. " .. .. 11 16 13 U ninhah fled 14
23 25 1 22 23 .. 15 20 13
U ~inhabited .. .. .. J 16
17 19 II 13 8 4 2 2 J .. .. .. . . 9 17 18
I i! ninhabitd 19 18 18 14 17 I .. .. .. ., 3 10 4 20
Uninhflbited 21 Unin!,iJhi'ed 22
30 27 21 22 9 5 .. .. .. .. .. .. . . .. 12 7 23 Uninhabited 24 U ninhaoT/ed 25
123 63 76 26 40 37 2 .. .. . . .. S 79 118 26 55 36 45 24 10 11 1 39 73 27 5 6 3 1 1 5 .. .. .. .. . . .. .. .. .. 3 5 28
Uninhabited 29 Uninhabited 30
61 33 23 3 32 30 1 '0 2 1 .. .. .. 2 45 86 31 169 77 102 13 49 57 4 .. 7 3 " .. " " J .. 6 4 126 176 32 103 40 70 8 29 29 .. .. 1 .. 3 3 64 III 33 18 15 10 6, 8 9 .. .. 11 28 34
Uninhabited 35 10 10 9 6 I 4 5 5 36 45 38 30 22 12 14 ., " 3 2 " .. 29 29 37 17 17 10 12 7 5 0, " .. .. 11 14 38
Uninhabited 39
24 25 19 24 4 1 .. .. " " .. 1 12 14 40 46 34 30 25 7 B 3 1 " ' . .. .. .. .. 6 28 49 41
169 150 114 107 13 17 35 10 2 14 ,. ' . .. 2 3 2 125 130 42 16 12 13 10 3 1 .. .. " .. .. 1 13 7 43 60 43 51 30 4 5 1 12 .. .. .. .. 40 53 44-
205 195 120 109 39 55 9 2 23 27 .. .. 13 .. 1 2 156 210 45 Uninhabited 46 Uninhabited 47
17 12 6 4 5 7 5 o. I .. .. . . .. .. . . 1 9 14 48 115 115 72 77 22 27 7 3 1 6 13 2 98 92 49
U ninhabiled 50 104 75 61 40 28 27 11 7 .. .. .. .. 1 . . 2 68 88 51 37 23 23 13 10 7 4 I . , .. .. .. 2 21 39 52 36 20 25 14 5 3 4 3' .. .. .. .. . , 2 24 31 53 P-II-7

50
I'ALAMAU VILLAGE
SUBDIVISION
ANCHAL
Occupied residential
housl:-' .--~ Total number of persons Literate
No. of enumerated (including and Serial no. Area No. of house- inmateS of institutions Scheduled Scheduled educated (Thana no.) Name of village in acres houses bolds and houseless persons) castes tribes persons
.A.----. ,-----.. ,--"'----, ,..--......_....,
P M F M F M F M F
2 3 4 5 6 7 8 9 10 11 12 13 14
R.EVENUE THANA-CHHATARPUR.-contd.
pipra G. p.-coneld.
54 (62) Khajuria .j 498·99 25 25 107 58 49 58 49 1 55 (63) Balba P 321,77 16 16 93 47 46 25 29 5 56 (64) Bishunpur 110·31 15 IS 97 49 48 5 57 (65) Ajania 217'27 1 1 4 2 2 58 (66) Sirnia " 1,126'16 59 (67) Jarka 721·81 60 (68) Bagsara 1,697·89
Labhra Sultani G. P.
61 (51) Dalpatpur 479'09 70 90 486 246 240 25 22 14 62 (52) Bhitiha 1.226'53 25 29 137 76 61 54 43 13 63 (5:1) Marwa 434-85 64 (54) Ghansi Khap 201·20 65 (55) Chaparbar P 592·91 34 40 230 124 106 38 43 24 2 "66 (56) Dhusarua 132·57 23 35 195 - 100 95 4 67 (154) Sultani P 46·34 70 98 553 283 270 78 69 77 23 68 (155) Rengania ali as Goi a 39'29 69 (157) Labhra 73'09 .26 34 188 99 89 71 60 IS 2 70 (158) Kuarbandh 939'59 71 (159) }{ampur 329'80 72 (160) Parsachuan 163.93 36 58 330 155 175 59 89 43 9 73 (161) Balra 181·32 74 (162) Lodia 1,805'67
75 (57) Masuria 126'97 40 50 368 182 186 4 3 .. 18 2
'6 (58) Chingua 82'54-
77 (79) Jolrahi alias Jolha Kbap 77·13
78 (135) Semarbar 214-83 70 89 -509 262 247 103 122 36
79 (136) Chanda 87-21 2 2 6 3 3
80 (137) BUnibar alias Lakhni 79·53 27 28 165 88 77 6 2 29 5
81 (138) Majuraha 449,86
82 ~139~ *Dhab Kalan P t36·75 59 73 383 208 175 77 78 24
83 140 Dhab Khurd 79'12 5 6 f2 24 18 2
84 (141) *Baghi 63·32 1 1 3 3 3 85 (142) Naktibar 365·08
86 <143) Mahgugan alias Jadudih 552·68 18 29 138 58 80 56 73 2
87 f44) Rahria 181·86 2 2 19 9 10 1
~ 145) . Tarwan Kalan 65'46 23 30 171 92 79 .. 9 146) Gohora A,Hos 407-71 59 73 395 204 191 59 57 26
90 (147) Sonbe 97'58 t 21 24 118 59 59 2 1 10 91 (148) Baijua 68·89
92 (149) Kumhaia 59·20
93 ? 150) Saguna 9520
94 152) Karma 134-94
95 'tI53) Chaukhra 44022 1 2 7 2 5 In 96 (156) Babhanc/ih M,L,V2,Oc 227·22 116 164 927 458 469 201 140 71
Jagdl"hpur alias RampuT-G. P.
97 ~~6~ Karilebra 1,062'61
98 Strikarpur .\ 1,450'46 26 32 144- 71 73 24 26 11 2 99 (71) Lebabar 658'16

STATISTICS
SADAR
HARIHARGANJ
Total workers (I-IX) Cultivator
M
15
33 26 31 1
160 50
76 68
173
66
86
94
139 3
38
118 .12
3
41 5
55 112 32
1 227
41
F
16
30 20 18 2
M
17
3] 19 25
]
UninhaQited Uninhabited Uninhabited
]06 106 17 28
Uninhabited Uninhabited 35 51 4B 42 31 108 Uninhabited 40 46
Uninhabited Uninhabited 67 46
Uninhabited Uninhabited
77 B5 U ninh abited Uninhabited
22 97 2 3
16 26 Uninhabited 44 77 5 10
Uninhabited 28 13 4 5
"37 54 72 72 32 30
Uninhabited Uninhabited Uninhabited Uninhabit,d
2 133 115
lJ ninhabited 12 31
Uninhabited
F
18
125 14 17 1
91 6
23 46 15
31
38
73
16 2
15
34 5
8 4
36 41 31
58
5
,
51
WOBX1I:BB
II III IV V VI VII Manu
facturin Agricul- Min4Ig, Houae- other m! Trade
twal Quarry- bold Household eoo... and labourer ing, etc, IndWitry Industry auction Commerce
-------~ ,....-"'--. ~ r-"""__" ~
M FMFMFMFMFMF
19 20 21 22 23 24 25 26 27 28 29 30
" " 1 ., " " .. 4 5 2 1 .. " " .. ,. 1 1 5 ., .. ., "
I " .. .. .. .. ..
17 13 25 10 ., .. .. 14 9 8 2 .. " ., .. ..
13 12 10 .. .. .. 2 26 .. .. .. .. .. . . ..
34 16 14 .. 6 .. .. .. .. .. 1
9 7 10 2 .. .. .. .. ..
23 27 7 .. .. . . .. .. .. .. . .
4 3 .. .. 4 .. I . .
18 5 6 .. I .. 2 . . .. .. . . .. .. .. .. .. 2 .. .. .. .. 7 . .
20 10 10 1 .. 2
.~
24 20 2 .. .. ..
J .. .. .. .. .. . . 32 29 6 2 , . .. .. .. ..
2
1 2 70 45 9 .. 10 27 8
9 6 1 .. .. 1 .. .. .. .. .~ . .
BIHAR.
VIn IX X Transport,
Storage and
Commu- Otber SI. nieations Services Non-workers no.
NI F M F M F
31 32 33 34 35 36
1 5 25 19 54 1 21 26 55
18 30 56 I 57
58 59 60
2 2 86 134 61 26 44 62
63 64
2 48 71 65 32 47 66
10 110 239 67 6B
33 49 69 70 71
8 2 69 lOB 72 73 74
88 109 75 76 77
15 123 " 225 78 1 79
2 50 61 80 81
9 90 131 82 12 13 83
3 84 , 85
17 52 86 4 6 87
J 37 42 88 2 92 119 89
1 27 27 90 91 92 93 94
1 30._ 95 2 12 2 231 336 96
97 30 61 98
99

52
PALAMAU VILLAGE
SUBDIVISION
ANCHAL
Occupied residential
houses ,--"'_____' Total number of persons Literate
No. of enumerated (including and Serial no. Area No. of house- inmates of institutions Scheduled Scheduled educated
(Thana no.) Name of village in acres houses holds and houseless persons) castes tribes persons
~------ ~ ....------P M F M F M F M F
2 S 4 5 6 7 8 9 10 11 12 13 14-
REVENUE THANA-CHHATARPUR-contd.
100 (72) Kothi1a P 996·95 48 54 297 141 156 13 101 (73) Kulhaia 675·34 44 57 252 124 128 50. 57 10 102 (74) Ladibadi 397·51 13 -i5 87 44 43 10 8 10 10"3 (75) Naudiha Kalan II!H:8 104 (76) Naudiha Khurd 102'84 105 ('"/..7) Jagdishpur 452·45 106 (78) Bataua 400'01 107 (80) Digla 247·22 IG8 (81 ) Jahna 15085 13 I"\- 66 33 33 33 33 109 (82) Harsi Khap 48·89 11.0 (83) Halinia Khurcl 19'06 111 {84) Kolhw«ra 243·57 15 17 ISO 68 62 4 4 18 112 (85) Halka 189-51 21 30 154 79 75 48 49 12 113 (86) Tar"chak 46·92 48 58 55 27 28 27 28 1 114 (87) Piroji 8904 2 3 B 5 \ 3 5 3 ll5 (B8) Nath 64.00 I I I I I 116 ~8!!) +Bhandar 10B·91 3 4 10 6 4 5 !l 117 90) Majhganwan 11661 118 (91J Kau wa Khoh 4726 3 8 27 13 14 13 14 119 (92) Larbari 90·58 120 (93) Raj bar 59·51 7 13 63 35 28 19 20 I .. 3 121 (94) Bijbar 68·37 19 24 lIB 64 54 54 54 3 122 (96) Lal bara 188'73
. 123 (97) Tarwan 62·Bl 124 (98~ Baso 84048 19 27 154 79 75 34 37 14 9 125 (99 Sobhnath Chak 75·00 12 12 63 31 32 20 23 7 126 (100) Kushdih p,ec 83·54 33 52 292 146 146 38 42 46 12 127 (101) Jagdishpur alias Rarr:pur 28·.~7 2:1 3~ 220 ll6 104 21 27 38 3
128 (95) Kajru Khurd 275·49 6 14 63 21 42 129 (102) Tendua Kalan Me 134'23 47 53 321 172 149 15 21 66 14 1"30 (103) Kurhath alias Tendua Khurd V 29·82 37 57 309 163 146 45 49 73 131 (104~ Kataia P,Mc 236·48 5G 63 336 172 164. 48 44 51 3 132 (l05 Mamar Kha .54·23 13 16 liS 56 59 32 44 27 6 133 (106) Th..rghat 113'10 134- (107~ Bansapti 176·43 16 .1 6 98 50 .48 14 15 23 135 (108 Kajru Kalan .. 509:S4 136 (lU9) Duara 388·51 137 (112) Ghaghra 3742 13B (114) Pipra 132'58 30 37 230 116 114 94 91 23 j
1~9 (lI5) Langurahi 198·78 31 36 190 99 91 35 3:4 14 140 (116) Koshdihra 61·77 6 6 32 18 14 1] 12 8 141 (117) Khapkataia 71'21 68 80 434 204 230 .71. .79 "~ 54 J, 142 (1 [8\ Bhagat Tendua 271·82 76 100 517 262 255 112 112 31 2 143 (119) Bdodar alias Pit-thichak 1"72'44 60 76 407 198 209 15 15 76 5 144 (130) Dura 366'05 145 (131) Largahi 374·64 J;46 (132) Tarwan Kh~r::d 262·,Z.7 .1.0 , 11 49 25 24 6 8
Hii,ihargan{ G. P.
147 (122) + tSatganwan alias Hariharg-anj .. 575·64 539 661 3,527 1,763 1,764 205 213 3 868 27 P3,h,S,LMc,lc,H2
445.J2 148 (123) Dema P IP4 IJj: 703 372 :331 61 68 96 7

53
STATISTICS BIHAR
SADAR
HARIHARGAN J WORKERS
,.....-
I II III \ IV V VI VII VIII IX X
Manu- Transport, facturing Storage
Agricul- Mining, House- other than Trade and Total workers tural Quany- hold Household Cons- and Commu- Other SI.
(I ....... IX). Cultivator labourer ing, etc. Industry Industry tfuction Commerce nications Services Non-workers no.
or--- ,.---~ ,...--"'-~ ,---""'--~ ,..-""""__' ...---"---. ,_....._..., ,...--.....__, .-......___, ,...---"--___,
M F M F M F M F M FM F M F ~ F M F M F M F
15 16 17 18 19 20 21 22 23 24 25 26 27 28 29 30 31 32 33 34- 35 36
81 28 60 7 16 19 2 2 .. .. .. . . 2 60 128 '100 70 31 54 3 14 26 2 .. " 2 54 97 101 27 9 17 4 7 3 1 1 .. 1 2 17 34 102
U nirihabited 103 Uninhabited 104-Uninhabited 105 Uninhabited 106 Uninhabited 107
20 15 8 6 9 9 3 .. .. .. .. 13 18 108 Uninhabited 109 Uninhabited 110
35 30 31 28- 1 ., 3 2 " .. 33 32 III 49 37 18 9 22 26 5 2 2 " ,. 2 .. 30 38 112 13 13 2 1 9 11 2 .. .. .. " .. .. .. .. 1 14 15 113
4 2 2 2 2 .. .. .. .. , . .. 1 1 114 J . , .. .. 1 115 2 I .. . ' .. .. , 4 4 116
Uninhabited 117 9 9 I 8 9 .. " .. .. .. .. .. 4 5 118
Uninhabited 11~ 20 14- JO 6 6 7 3 1 " " .. 15 14 120 42 35 20 16 14- 18 8 1 .. 22 19 121
Uninhabited 122 Uninhabited 12S
44 31 '18 10 22 21 3 " " .. 1 35 44 124 21 12 5 1 12 10 2 .. " .. .. . . 2 ., 10 20 125 82 29 49 6 4 20 7 '. 1 .. -. I 20 2 64 117 12€ 62 16. 48 13 I I 2 .. 1 ." 2 .. 1 .. , . 7 2 54 88 127
13 17 8 14 4: 3 " .. " .. 1 '3 8 25 128 89 11 66 14 2 2 .. 2 6 .. . . .. .. .. 5 83 138 12~ 93 50 56 20 23 3e 1 .. 2 3 8 70 96 l3(
105 19 66 11 27 6 8 .. 3 2 67 14:5 13J 25 21. 23 17 1 4 " .. ., .. 1 31 38 13:
Uninhabited 13! 31 12 , 25 8 4- 4- >2 19 36 13'
Uninhabited 13, Uninhabited 131 Uninhabited I . 13'
59 51 27 21 17 12 4 2 4 I I .. 2 6 13 57 63 13: 47 41 29 27 JO 10 4- 3 " .. .. J 4 .. 52 50 13! 10 5 6 I .. .. _. i 3 4- 8 9 141
115 48 74- 15 13- 3 8 2 8 10 .. .. .. .. 3 8 18 89 182 14 167 48 96 3 14 1 6 5 11 1 .. .. 40 3a 95 207 14: 104 73 33 4' 4 1 2 " 37 58 15 ., 2 .. I ., 10 10 94 136 14
Uninhabited 14 Uninhabited 14
13 14 18 14 ., ·c .. " ,., " .. " 1 " 10 14
895 262 147 50 19 22 13 5 239 102 29 6 23 .. 226 23 29 170 54 868 J,502 H
230 134 140 91 20 15 51 14 .. .. 2 .. 5 10 12 4 142 197 14

54
PALAMAU VILLAGE
SUBDIVISION
ANCHAL.
Occupied reJidential
hoUJes ---"--- Total number of persons Literate
No. of enumerated (including and Serial no. Area No. of house- inmates of institutions Scheduled Scheduled educated
(Thana no.) Name of village in acres houses holds and houseless persons) castes tribes persons
----_.".__----- ,.--"'__~ ,--""'__' ,..---""'---
P M F M F M F M F
2 3 4 5 6 7 8 9 10 II 12 13 14
REVENUE THANA-CHHATARPUR__"onc'ld.
Ararua C. P.
149 (110) Jharna 840·50 150 (Ill) Tetaria 657'71 24 31 171 92 79 12 9 3 151 (113) Bishunpm 22140 35 41 248 126 122 71 69 27 I()' 152 (120) Ararua Khurd P,M.k,Hos,A,V,Jf 238'60 208 248 1,249 652 597 153 164 285 73 153 (121) Pathakbigha .. 35'91 II II 41 22 19 17 17 6 154 (124) Amba 273·85 72 88 464 236 228 72 66 23 2 155 (125) Ararua Kalan 281·89 69 82 449 229 220 101 92 35 156 (126) Turi .. 1,500'91 50 63 352 170 182 51 67 5 157 (127) Lalgara. .. 1,232'61
158 (128) Tarwa alias Akouni .. 1,229-48 18 23 105 58 47 22 24 3 2 159 (129) Chirail i alias Gidhi 430'03 28 32 191 95 96 20 5 160 (133) Bhanwar .. 1,204'29 59 84 453 244 209 31 35 21 161 (J 34 Kharagpur P 416'75 155 218 1,126 582 544 19 16 105 II 162 (151 ) Kathkoma 257·31 10 13 118 58 60 14 163 (163) Lukuwa. 261-47 164 (164) Kauwakhoh 70·75 165 (165) Sarsot P,Rhc,Mc .. 748·58 102 131 817 413 404 176 226 82 15-166 (166) Dubridih 588·12 24 28 142 71 71 5 2 8 1 167 (167) Pathra 434'64 20 23 102 53 49 43 40 1
168 (16B) Majbganwan Khurd 34,22 169 (169) Salaia P 545'07 38 64 359 179 180 19 17 17 170 (170) Dh~kcha P,L 8B5'66 56 74 423 205 218 87 93 52 14 171 (171) Kokro P 311'78 28 36 221 103 118 74 84 23 (}
172 (172) Paraia 273'91 49 63 333 185 )48 92 72 17 173 (173)' Baghna 132·22 21 22 120 65 55 45 44 2 174 (174) Bhojua 102,86 28 33 182 104 78 15 8 19 4 175 (175) Pachmo P 33836 46 60 383 177 206 22 22 28 1 176 (176) Majhganwan Kalan 310'92 31 33 207 98 109 20 13 3 177 (177) Bhaurha P 326·27 23 32 201 98 103 25 44 11 178 (178) Rabdi 363'09 27 35 197 101 96 19 30 13
ANCHAL TOTAL 56,098'50 4,524 5,685 30,647 15,5"30 15,117 4,51"54,751 24 35 3,722 6~1 or
87.65 sq. miles
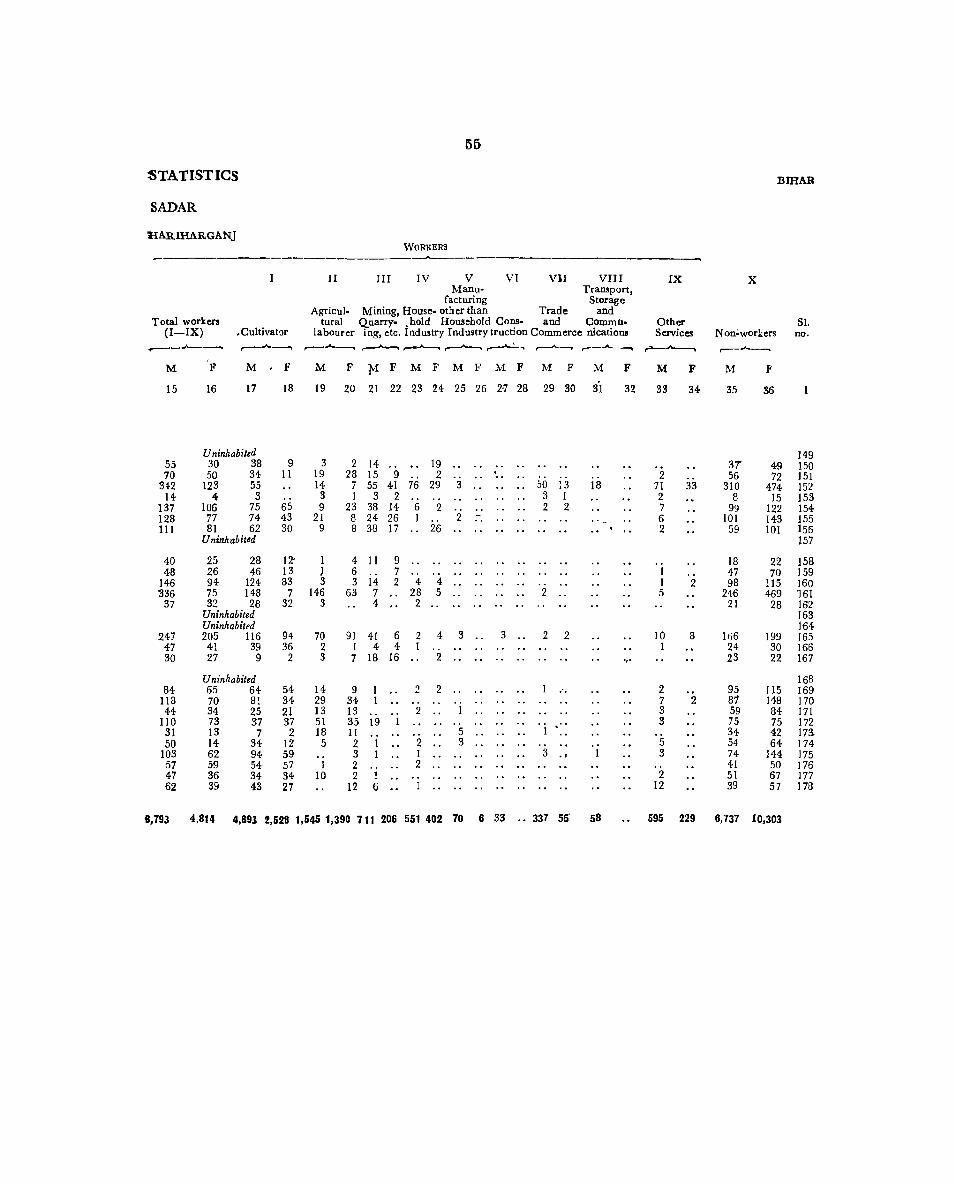
55
STATISTICS BIHAR
SADAR
IIARIHARGANJ WORKERS
---------------------"-_--------II III IV V VI VII VIII IX X
Manu- Transport, facturing Storage
Agricul- Mining, House- other than Trade and Total workers tural Quarry-. hold Household Cons- and Comm(1- Other SI.
(I-IX) .Cultivator labourer ing, etc. Industry Industry truction Commerce nications Services Non~workers no. ~_.A-----. ,..--..... ___, r---"--"'"'"""\ ,.-........... ~~~ ,..--A-~ ...--""'----. .....-----..... r---.,A..-_
, M F M F M F !'vI F M F M F M F M F M F M F M F
15 16 17 18 19 20 21 22 23 24 25 26 2·7 28 29 30 3'1 32 33 34 35 36
Uninhabited 149 55 30 38 9 3 2 14 19 .. 37 49 150 70 50 34 II 19 28 15 9 2 .. .. 2 56 72 151
342 123 55 14 7 55 41 76 29 3 .. 50 :3 18 71 33 310 474 152 14 4 3 3 1 3 2 .. 3 1 2 8 15 153
137 106 75 65 9 23 38 14 6 2 .. 2 2 7 99 122 154 128 77 74 43 21 8 24 26 I 2 - 6 101 143 155 .. 111 81 62 30 9 8 38 17 26 .. " .. ., , 2 59 101 156
Uninkabited 157
40 25 28 12- 1 4 11 9 .. .. .. .. 18 22 158 48 26 46 13 ) 6 7 .. 1 .. 47 70 159
146 94 124 83 3 3 14 2 4 4 .. .. 1 2 98 115 160 336 75 148 7 146 63 7 .. 28 5 .. 2 .. 5 246 469 161
37 32 28 32 3 4 .. 2 .. .. .. .. .. . . 21 28 162 Uninhabited 163 Uninhabited 164
247 205 116 94 70 91 41 6 2 4 3 .. 3 .. 2 2 10 8 166 199 165 47 41 39 36 2 1 4 4 1 1 24 30 166 30 27 9 2 3 7 18 16 .. 2 .. ',' 23 22 167
Uninhabited 168 84 65 64 54 14 9 1 2 2 .. 2 95 115 169
118 70 81 34 29 34 1 .. .. .. .. .. .. . . 7 2 81 148 170 44 34 25 2l 13 13 .. 2 .. 1 " 3 59 84 171
110 73 37 37 51 35 19 1 .. 3 75 75 172 31 13 7 2 18 11 .. 5 .. I .. 34 42 173-50 14 34 12 5 2 1 .. 2 .. 3 .. ., 5 54 64 174
103 62 94 59 3 1 .. 1 .. .. .. 3 • f 3 74 144 175 57 59 54 57 1 2 .. 2 .. 41 50 176 47 36 34 34 10 2 1 .. .. .. .. 2 51 67 177 62 39 43 27 12 6 1 .. 12 39 57 178
1,793 4,814 4,893 2,528 1,545 1,391) 711 206 551 402 70 6 33 .. 337 55' 58 595 229 6,737 10,303

56
PALAMAU VILLAGE .
SUBDIVISION
l\NCHAL
Occupied residential
houses ,.---.....__....., Total num ber of persons Literate
No. of enumerated (including and Serial no. Area No. of house- inmates of institutions Scheduled Scheduled educated
(Thana no.) Name ofvillage in acres houses holds and houseless persons) castes tribes persor,s
"-I ,----"'--......, ___ "'--.....
P M F M F M F M F , 2 3 4· 5 6 7 8 9 10 11 12 13 14
REVENU~THANA-PATAN
Dulhi Kojarma G. P.
I (155) Chilhi .. 576·01 50 55 225 119 106 31 39 8 2 (156) Ahori 301'52 3 (t57) Chhechhauri P ... 46526 121 196 887 434 453 5 11 39 46 101 12' 4 (158) Barwadih .. 1,005·45 39 50 262 128 134 54 63 15 5 (159) Derwa .. 1,089'75 6 (160) Rabdi .. 391'21 29 43 194 87 107 65 73 8 7 (237) Kajarma S05'28 34 35 219 119 100 18 21 24 2' 8 (238) Dulhi P,L,V,lvfc 349-46 90 127 605 297 308 II 14 60 68 78 11 9 (239) Chakrudarpur 13806 13 14 86 45 41 20 17 10
Lami Patra G. P.
10 (161) Majhiganw P .. 299·16 107 107 724 375 349 74 80 99 19-11 (163) Dumri .. 19284 to 20 106 54 52 43 40 14 12 (164) -l-Lami M,L,Rvc, V,H2 .. 207·17 86 106 516 253 263 15 18 67 11 13 ( 165) Buchi Lami .. '147-69 55 80 415 203 212
96' 70 82 34 J(}
14 (166) Patra M,S,e,L,Rvc,V,H2,Mc .. 35958 143 194 1,011 . 486 525 90 76 79 81 IS< 15 (167) Jhari 415·53 39 59 321 172 149 32 34 28 .. 16 (171 ) Manahar .. 212'21 34 44 300 138 162 55 62 43 I
\ 17 (168) Murma P 731'56 155 218 1,012 483 529 173 179 143 z-18 (169). Kokarsa 637-66 90 95 672 323 349 80 84 llo 10 19 (195) Gar'e'riadih P,Mc 757-42 126 162 891 437 454 127 121 12 11 40 I 20 (196) Basu 575'84 70 81 461 224 237 64 72 3 5 23 21 (197) Lohandi 631'1:l 34 53 287 141 146 22 24 26 22 (198) Pandwa P,L,A,Hos,Mc .. 1347-46 211 24'1 1,326 743 583 205 138 12 9 206 18' 23 (199) Lohanra M,h 427'74 il5 118 610 327 283 139 104 93 15-24 (200) Ga.i Khas P,e,Ce,Oe 825'78 141 155 790 377 413 89 99 ,53 68 152 26 25 (202) Kajri P .. 1,046· 32 102 122 641 ~32 309 84 78 114 27
26 (162) Fahartarlami alias Nawadih p,e 195:62 27 36 200 113 87 53 53 7 7 68 2 27 (170) Bhusra P 641'29 58 69 377 194 183 130 125 26 .. 28 (172) Gangatlla .. 266·47 52 70 286 144 142 65 62 18 ] 29 (173) Baida Khurd 86'72 30 (174) Ba'ida Kalan 302·40 121 128 606 311 295 250 220 66 31 (175) Kunarbandh 451·34 2 2 13 6 7 2 3 3 32 (17.6) Majhouli 203'41 40 61 '310 155 155 53 54 34 31 8 33 (177) Mayapur Khurd 232-47 4 4 23 10 13 5 34 (178) Mayapur Kalan .. 288·8f! 20 32 181 94 87 20 28 37 26 25 S 35 (179) Sarma 42377 36 (180) Saraiya 551.17 45 63 349 177 172 115 119 16 37 (181) Gamhetha 13S.8D 36 4S 293 150 143 63 63 IE 38 (182) Palhe Kalan P;Hos,Cc .. 366.20 124 138 792 426 366 222 284 191 2() 39 (183) MahuIiya 41)4,98 43 64 26fl 142 124 103 83 20 40 (233) Kundri .. 1,259.54 1 1 3 2 1 .. 41 (236) Utak.i .. 954.95 113 115 605 316 289 199 150 50 3] 67
Patan G. P.
42 (234) Saguni .. 411.57 12 l5 57, 28 29 9 8 11 43 (235) Anjan Mayapur 363.76 1 I 1 ] ,1 .. 44 (240) Nagesar 222.41 42 48 208 112 96 27 36 28 2 45 (241) Jonra Khurd .. 668.31 12 14 71 41 31 13 8 14 8 4

57
STATISTICS :8"IHAR
SADAR
PATAN WORKERS
I II III IV V VI VII VIII IX x Manu- Transport,
facturing Storage Agricul- Mining, House- other than Trade and
Total worken tural Quarry- hold Household Cons- and Commu- Other 81. (I-IX) Cultivator labourer ing, etc. Industry Industry truction Commerce nications Services Non-worken no.
~ ,...--_"____' ~...._._, ~ r.-.Ao~ ,.--"""_" ...--....., ,........,...__ ,--""'___' ,...--""'___' ,...--.....___,
M F M F M F M F M F M F 11' F M F M F M F M F
15 16 17 18 19 20 21 22 23 24- 25 26 27 28 29 30 31 32 33 34- 35 36
67 58 24 13 3a ~5 3 5 2 52 48 1 Umnl, lb:ted 2
251 271 10 I?~ ~I 17 13' 4 7 4 1 .. 9 7 9 183 182 3 77 84 'tj A .. 32 38 51 50 4
U '/Oited 5 53 fiC) ~ ?O 30 46 6 1 3 2 34 38 fi 68 ~:! 3" ?5 17 17 8 6 9 1 51 48 7
173 111 7'~ 30 71 79 7 7 1 1 .. .. 8 124 197 8 22 18 12 7 R 10 1 1 1 .. . . .. .. 23 23 9
181 0 129 8 37 3 2 I .. 9 " 191 339 10 29 Z 6 .. .. .. 25 51 II
137 26 171 6 12 17 3 .. .. .. . . 4 116 237 12 121 ~: 41 12 77 82 2 .. I 1 .. 82 117 13 250 1~6 l1j.6 38 89 95 6 2 .. 1 2 6 1 236 389 14
CJ7 57 64 35 16 17 7 .. .. 3 .. .. . . 8 2 2 75 92 15 75 CJO 64- 81 8 9 1 .. 1 .. 1 63 72 16
335 29~ 261 209 58 1113 .t 2 6 3 1 1411 236 17 183 1::10 125 76 45 54 3 .. 4 2 .. 3 ·s 140 219 18 241 7h 195 41 27 2:J 6 .. 1 2 .. .. .. .. 12 196 378 19 133 62 119 53 11 5 1 " .. .. .. 2 4 91 175 20 85 63 70 35 13 28 2 .. .. .. .. . . . . 56 83 21
423 223 163 144- 9 7 214 46 13 4 1 1 .. 1 2 19 22 320 360 22 • 158 98 73 54 30 25 33 .. .. 1 .. 2 19 19 169 185 23
207 142 U5 119 26 13 40 .. 4 4 1 3 .. .. 6 12 6 170 271 24 198 31 120 6 63 25 .. .. .. .. .. " " .. .. ., 9 6 134 278 25
54 3 40 3 6 .. .. .. 8 59 84 26 110 121 110 121 .. .. .. .. .. .. .. .. 84 62 27 82 47 56 11 26 36 ' .. 62 95 28
U ninh abited 29 162 93 96 4 64 89 2 149 202 30
2 1 2 1 .. .. .. 4- 6 81 78 57 61 3 17 54 .. 77 98 32 5 4 1 5 13 33
38 9 25 3 3 4 5 .. .. .. 2 5 56 18 34 Uninhabited 35
105 102 105 102 .. .. .. 72 70 36 75 80 63 68 11 12 .. .. .. .. .. 1 75 63 37
247 14 126 6 41 2 9 .. 1 .. 3 .. .. 48 . . 19 6 179 352 38 68 17 37 3 30 11 .. .. .. .. 1 . . .. .. 1 2 74- 107 39
1 .. 1 .. .. .. " 1 1 40 179 66 138 19 35 47 .. 6 137 223 41
19 9 9 2 10 7 .. .. .. .. 9 20 42 1 1 .. 43
73 17 49 4- 18 12 .. .. 6 1 39 79 44 22 2 6 1 16 1 .. 19 29 45
p-II-8

58
PALAMAU VILLAGE
SUBDIVISION
ANCHAL
Occupied residential
houses ~_.A..----"\ Total number of persons Literate
No. of enumerated (including and Serial no. Area No. of house- inmates of institutions Scheduled Scheduled educated
(Thana no.) Name of village in acres houses holds and houseless persons) castes tribes persons ......._ ,.------' ,.------.
P M F M F M F M F
2 3 4 5 6 7 8 9 10 11 12 13 14
REVENUE THANA-PATAN-contd.
46 (242) TlJsra 143.95 85 91 345 185 160 130 125 55 35 47 2 47 (243) Nimiya 104.90 85 91 189 90 99 60 55 30 32 19 48 (244) Jonra Kalan 225.09 18 18 81 38 43 28 33 8 10 5 49 (245) Sakhui 162.95 16 16 89 47 42 8 8 16 50 (246) Kelhar h,Hos,H,Mc 477.20 173 189 954 475 479 286 300 102 4 51 (247) Saguna 400.05 113 129 644 323 321 146 141 83 18 52 (248) Sakanpirhi P 375.42 43 52 210 116 94 64 61 16 12 24 1 53 (252) *Tandwa 195.91 38 51 263 145 118 78 88 34 3 54 (253) Tola Tandwa P 81.03 55 (254) Tilkudih P 30.68 14 14 96 52 44 .. .. 24 5 56 (255) Dhangardiha 82.11 20 76 99 51 48 18 14 8 1 57 (258) Semri M,B 670.74 198 £18 1,089 557 532 467 445 202 14 58 (259) Marariya 69.09 4 4 31 13 18
" 11 59 (260) tPatan A 546.16 80 91 395 195 200 67 73 I 45 8 60 (267) Lamba 596.30'
61 (184) Basdah 1,415.70 25 25 93 52 41 30 36 3 62 (185) Sadhpur 283.38 93 93 345 175 170 " " 10 I 63 (l86) Sanda 458.81 29 31 175 92 83 24 2(] 29 8 64 (187) Naudiha M,P,L,Me 431.53 92 116 604 332 272 107 109 118 23 65 (188) Huruhdsa 137.66 39 45 243 118 125 54 50 .. 22 66 (189) Golhana P, L 828.56 92 109 540 278 262 51 52 1 72 9 67 (190) Bijra 61.09 9 17 84 39 45 .. .. 21 I 68 (191) Sakhua Me 340.35 59 82 407 177 230 36 4I 24 27 46 5 69 (192.) Sakhui 96.71 23 35 186 101 85 8 9 46 70 (193) Palhe Khurd P 646.30 54 60 310 166 144 43 42 I 1 12 59 6 71 (194) Sika P 649.42 109 122 587 281 306 17 18 53 51 57 3 72 (201) Kathau,tia 979.44 101 III 639 317 322 43 57 29
Siki G. P.
73 (203) Batsara 1,154.08 59 59 312 162 150 52 60 13 74 (204) JhariNimia 492.55 18 25 123 66 57 49 49 3 75 (205) +Meral P 1,362.62 2'19 237 1,192 617 575 67 77 42 65 275 7 76 (206) Bhonga .. 283.07 23 23 146 63 83 15 15 48 68 18 77 (207) Siki Kalan P,M,Mc,C .. 733.42 160 165 795 388 407 59 48 69 97 127 16 78 (208) Siki Khurd 295.64 111 115 617 323 294 146 138 58 55 48
79 (215) Hisra aiias Barwadlih P 1,312.85 175 185 838 423 415 Y71 185 95 98 97 9 80 (216) Kariahar Me 768.58 79 91 626 312 314 37 41 7 9 52 2 81 (217) Phusna Pathra 228.60 11 12 91 50 41
" .. .. 27 5 82 (218) Gahar Pathra P, Me 587.25 108 .. 137 809 387 422 219 204 41 36 81 22
83 (209) Huri alias BarsaitaP, Me .. 1,664.57 58 75 460 245 215 104 95 2 48 5 84 (210) Kanke Khurd 321.22 85 (211) +Kanke Kalan P 580.70 166 214 880 446 434 100 95 76 76 91 11 86 (212) Ghurdewa 184.55 87 (213) Barahmoriya Me 391.41 83 101 496 254 242 44 50 1 5 55 7 88 (214) Nawadih Bhurwa P 882.01 119 161 832 427 405 173 155 26 23 57 5 89 (220.) Sole K 1,963.51 132 163 767 384 383 152 147 90 (221) Haraiya ... 139.49

59
STATISTICS
SADAR
PATAN Wo:u:us
r---------------------------------- __ .-----I
Total work en (I-IX) Cultivator
M
15
99 58 21 32
256 175 68 88
25 26
329 8
111
31 10+
'i3 ]B5 65
134 20 96 50 84
160 182
III 36
344 41
200 165
254 186 26
205
149
251
143 245 213
F
16
M
17
36 52 30 29 16 12
?O 52 152
137 59 10 39 18 39
Uninhabited 2 16
14 218 137 .. 8 5 49
Uninhabited
4
10 73
3 85
1 55
4 44
122 34
77 2
17 33
116 52
153 126
116
23 56 38
111 18 72
11 42 16 54
130 144
86 36
278 30
189 129
178 131 26
118
104 104 Uninh1bited 100 162 Uninhabited 91 91
239 229 197 100 Uninhabited
F
18
.J
1 2
3 40 1
111
3
.. ,I
17 J
15
20 11 116
47 1 7
23 lIS 10
67
81
49 231 104
II
Agricul. tural
labourer
III IV V VI VII VIII Man U· Transport,
facturing Storage Mining, House- other than Trade and Quarry- hold Household Cons- and Co=u-ing, etc. Industry Industry truction Commerce nications
M FMFMFMFlVIFMF M F
IX
Other Services
F
19 20 21 22 23 24 25 26 27 28 29 30 31 32_ 33 34
45 25
9 10 35 98 22 36
3 10
102
35
2 45 12 52 32 55
30 3
26 20 8
24-
20 11
33
47 55
80
31
40
33 12
91
29 29 2 .. 14 ., ..
1 2 .. 2
...... 10 3 44 39 3 .. .. .. 2 91 .. 12 6 .. •• "T. •• 2 .. 952
IG 7 .. .. 1 ..
1 .. 4 1 .. 1 ..
101 27 3 7 1 2 5 .. ••• 0 .0 ••
1 ., .. 8 ..
10 ., 54 ., ..
5 .. 67
2
2 .. .. .. .. .. 3 1 .. .. 1 .. 1 1 . . . .
3 ..
1 ..
9 .. 39 4
20 106 11
6 .. 11 •. .. •. •• .• .• .. 1 .. . . .. .. .. .. .. 16 ..
1 1 .. 9 5
27 4 3 3 .. .. .. .. .. ..
30 1 .. 1 7 19 ..
10 1
42 ., ..
44 6 .. 42 .. ..
84
37
17
37 8
90
5 •.
3 .• 3 .. 7 ••
........ 4 ..
I • . 1 •.
••• 0 ••
5 ..
18
2
4
2 .. 16 .•
4 .. 1 .. ......
2 .. 1
2
3
2 17
4
4
I 1
48
16
6 1 2
19 4 6
7 14 3
22
10 3
20
2
9
12
13 1
10
3
19 1
1
4
3
I
24
x
Non-workers
M
35
86
~j 15
219 148
48 57
27 25
228 5
84
21 71 39
147 53
144 19 81 51 82
121 135
51 30
273 22
188 158
169 126 24
182
96
195
III 182 171
F
36
124 69 27 42
• 427 184
84 100
42 48
314 18
195
37 170 73
199 122 177
44-175 81
100 184 288
73 55
558 50
291 242
262 188 41
306
III
334
151 166 186
BIHAR
Sl. no.
46 47 48 49 50 51 52 53 54 55 56 57 58 59 60
61 62 63 64 65 66 67 68 69 70 71 72.
73 74-75 76 77 78
79 80 81 82
83 84 85 86 87 88 89 90

60
PALAMAU VILLAGE
SUBDIVISION
ANCHAL
Occupied resid entia!
houses ...-----"----, Total number ofpersons Literate
No. of enumerated (including and Serial no. Area No. of house- inmates of institutions Scheduled Scheduled educated
(Tbanano.) Name of village in acres houses holds and houseless persons) castes tribes persons --"- .------. ....---"-~ ,--_..A..---.
P M F Iv.I F Iv.I F M F
2 3 4 5 6 7 8 9 10 11 12 13 14-
REVENUE THANA-PATAN-contd.
Koiriadih G. P.
91 (219) Nimiya 79.22 12 18 139 65 74 .. 15 92 (226) Jaimaran Pathra 385.15 28 30 178 98 80 69 32 20
Kishunpur G. ".
93 (227) Tetara 101.55 94 (228) Amwa . 101.50 57 -64 258 132 126 51 41 45 3 95 (229) Chougain 39.22
Koriadih G. P.-contd.
96 (231) Kurwa 130.20 35 41 21& 117 99 ::JI 44 9 97 (232) Sirma P, Me 329.80 172 184 1,003 490 513 20 15 37 35 89 18
98 (273) +Kisunpur P, M, h, L, C, 367.42 175 222 1,028 508 520 166 156 133 22
99 (274) Garo Rhe, V, Me
17.00 100 (275) Chandeya 49.46 101 (276) Moreya 141.33 102 (277) Darha 162.58 18 27 107 49 58 10 27 27 18 103 (286) Bardiha 99.55 81 97· 415 213 202 29 27 38 104 (287.) Diharia 142.94 13 15 69 26 43 9
Koiriadih G. P.-concld.
!l05 (288) Pakd P 241.56 73 92 486 227 259 46 59 81 13 106 (289) 'Koiriadih Kalan 92.80 41 51 -185 89 96 7 10 36 5 107 (290) Koiriadih Khurd 46.64 5 7 42 22 20 10
108 '(222) Sahd~a 494.20 ~~ 73 322 147 175 36 35 46 1 109 (223) Pandepura P, L 507.46 80 320 151 169 72 83 36 2 110 (224) Khamhi 891.43 63 98 400 202 198 94 87 49 3 111 (225) Dhangain V,H· 90.50 53 83 363 166 197 55 58 1 71 7 112 (291) +Rajhara P, Ce 1,140.49 85 102 510 255 255 77 75 39 39 77 4 113 (292) Dandai P 229.51 16 22 151 75 76 74 72 5 114 (293) Suntha 937.69 111 124 696- '342 354 95 117 64 13
115 (280) Kalapahar 291.31 38 49 242 107 135 33 41 18 116 (281) Karar Khurd 260.91 33 35 197 105 92 26 24 .. 10 .. 117 (294) Loinga P, C, Me 2,320.96 164 190 906 444 462 12 15 20 38 69 10 118 (295) Aredana P,L,Me 897.57 66 86 378 186 192 36 b1 43 40 38 9 119 (296) Angra P 724.42 43 63 353 178 \ 175 178 175 21 120 (297) Jagodih 393.09 1 1 7 5 2 5 2
121 (278) Chetma L,Me 1,187.23 60 81 525 260 265 110 128 .. " 67 6 122 (279) Karar Kalan P 920.35 103 125 477 219 258 22 24 30 50 23 3 123 (282) Rabdi 96.28 26 33 187 88 99 10 9 32 3 124- (283) Khairdohar 255.05 18 37 i72 95 77 26 20 13 125 (284) Bisunpura 52.66 10 17 89 40 49 .. 28 3 126 (285) Manika P 178.12 36 71 380 187 193 46 49 60 1

STATISTICS
SADAR
PATAN
Total workers (I-IX) Cultivator
M
15
37 63
69
67 282
302
32 125
6
103 49 10
90 92
115 99
134 47
l81
63 67
250 115
88 1
131 135-48 62 24 93
F
16
22 30
M
17
26 23
Uninhabited 45 32
Uninhabited
10 20 88 lOS
145 101
Uninhabited Uninhabited Uninhabited 30 3
121 72 12 5
63 66 37 29 9 8
72 64 68 33 25 68 64 48 38 98 50 12
192 102
27 45 15 57
182 178 50 68 12 56
1
88 65 131 134
13 . 43 41 38 18 21 26 54
F
18
15
II
1 12
7
I 60 12
17 14 8
52 22 11 11 16 14
118
13 2
115 27 2
25 131 II 25 17 10
II
Agricultural
labourer
61
WORKERS
III IV V VI VII VIII Manu- Transport.
facturing Storage Mining, House- other than Trade and Quarry- hold Household Cons- and Comma-ing, etc. Industry IncfustrytrueUon Cummercc nicatiohs
F
IX
Other Services
M F M F MFMFMFMFMF M
19 20 21 22 23 24 25 26 27 28 29 30 31 32 33 34
10 7 .. .. .. . . .. .. 35 30 ., .. 2 .. .. . . . . .. 3
31 31 4 .. .. 3 .. .. .. . . .. .. 2·
36 8 .. .. 3 7 112 61 1 45 5 8 8 3 1 5
176 135 8 .. .. .. 2 .. 14- 3
29 29 .. .. 34 41 2 .. 7 16 1 3 9 1
.. .. .. .. .. .. .. .. . . 1
34 46 . . " .. .. .. 3 13 10 . , .. .. . . .. .. 5 13 2 2- I .. .. .. .. .. . . .. -.
18 17 5 2 .. 2 51 44 . , 3 1 .. 1 5 46 14 .. .. . . .. .. 1 39 53 .. 2 .. .. .. . . .. 5 .. 5 29 ?2 .. .. .. .. .. 2 .. 5 30 36 .. 4 .. .. .. .. 1 68 71 .. .. 8 3 . . .. ., .. 3
15 14 1 .. .. .. .. .. .. .. 2 10 13 .. .. .. .. .. .. .. 46 64 8 " 18 3 .. . , .. 32 20 2 .. 11 3 .. .. .. .. 2 24 10 .. .. 8 .. " .. .. ..
.. . , .. .. .. .. ..
57 62 I .. 2 1 .. 5 .. "
_ . .. .. .. .. 1 2 2 1 .. .. . . .. .. 2
20 16 2 .. 2 .. .. .. ., 2 1 .. .. .. . . .. .. .. 1
25 14 1 "
11 2 .. .. .. .. .. .. 2
BIHAR.
x
Non-workers Sl. no.
M
35
2E1 35
63
50 208
206
17 88 20
124 40 12
57 59 87
. 67 121
28 161
44 38
194 71 90 4
129 84 40 33 16 94-
F
36
52 50
81
89 423
375
28 81 31
196 59 11
103 101 173 133 217
26 162
108 77
280 142 163
2
177 127 86 36 31
167
91 92
93 94 95
96 97
98
99 100 101 102 103 104
105 106 107
108 109 110 111 112 Jl3 114
115 116 117 118 119 120
121 122 123 124 125 126

62
PALAMAU VILIAG:E
SUBDIVISION
ANCHAL
Occupied residential
houses ,---~ Total number of persons Literate
No. of enumerated (including and Serialno. Area No. of house- inmates of institutions Scheduled Scheduled educated
(Thana no.) Name of village in acres houses holds and houseless persons) castes tribes persoIll
~~----~~-~ ~......_____, ,.--""""-._.
P M F M F M F M F
2 3 4 5 6 7 8 9 10 11 12 13 14
REVENUE THANA-PATAN-contd.
Imli Khas G. P.
127 (230) Kharaundha 268.83 40 57 291 144 147 61 59 14 128 (249) Bikua 257.66 14 18 94 52 42 28 17 8 129 (250) Tola Nawada 23.05 3 5 28 12 16 9 15 I .. 130 (251) Nawada P 290.55 56 66 346 177 169 40 38 53 3 131 (269) Banjari 415.93 14 14 70 45 25 22 13 18 10 4 132 (270) Kumhwa P,Me 426.10 52 79 342 173 169 19 24 36 7 133 (271) ]anghasi P, C 943.56 166 232 1,052 539 513 139 104 57 56 80 134 (272) Imli Khas Me 1,168.28 139 173 813 416 397 136 166 40 52 71 12
135 (2'98) Kanaudi 736.14 10 10 49 25 24 .. 16 17 2 136 (29~) Sonpurwa 832.31 2 3 19 14 5 5 1 2 .. 137 (300) Pokharia 960.76 45 49 254 126 1211 26 26 46 49 13 1 138 (301) Kosiara P 723.61 35 39 177 85 !12 28 24 31 48 7 139 (302) Bandua 535.06 8 15 31 15 16 4 5 5 7 " 140 (303) Hurdaga .. 488.98 31 3" 158 68 90 31 45 I " 141 (304) Nawa Khas P, C,Rhe,Me,Oe 2,185.54 229 239 1,113 563 550 177 174 8 6 138 18. 142 (333) Durhi '180.93 35 43 180 78 102 32 29 11 143 (334) .Ii tadih 119.52 3 3 21 13 8 .. 4 4 I 144 (33.5) Basabar 166.21 II 12 49 22 27 14 13 2 145 (336) Churadohar 674.71 102 127 698 346 352 17.1 177 64 72 32
Dipaua Bagaia G. P.
146 (305) Rudidih 990.22 76 89 375 191 184 52 54 16 147 (306) Majhauli 667.:'7 41 47 213 119 94 76 65 2 3 6 148 (307) Kanchanpur Me 224.02 23 27 125 5a. 67 3 10 1 149 (324) Khajuri 488.03 92 131 624 307 317 132 li5 87 98 66 8 150 (325) Dipaua M, L, Me 304.54 76 89 422 214 208 52 54 1 2 84 24 151 (326) Somadih 109.25 152 (327) Tuia 174.87 58 68 313 140 173 20 36 23 1 153 (328) Bagaia P, V 114.47 25 43 173 85 88 48 58 16 14 154 (329) Pakar.ia H 100.10 33 42 206 110 96 20 21 40 25 27 1 155 (33 1) ]aipur 23'1.96 58 68 350 173 177 71 73 7 9 18 1 156 (332) Mahuliya 196.51 96 141 758 374 384 106 125 6 6 108 22
Dho.ngardiha G. P.
157 (256) Sataua L 320.02 66 78 385 201 184 91 89 29 158 (257) Mahuliya 133.56 55 66 356 184- 172 57 54 54 5 159 (261) Sakaldipa 28.67 13 13 71 37 34 8 11 12 3 160 (262) Sakaldipi 26.03 2 2 20 13 7 .. 9 161 (263) Sathe 224.90 46 54 304 152 152 114 113 47 162 (264) Salantola 28.89 8 8 43 20 23
i~ 1
163 (265) Balgara Kalan 637.53 17 21 100 51 49 14 2 2 13 164 (266) Balgara Khurd 215.85 165 (268) Kisaini P 2,767.10 10 24 112 57 55 6 8 20 17 7 166 (312) Kolhua P 1,898.68 89 96 465 228 237 73 76 48 4-
167 (313) Ledgani 198.67 10 13 57 32 25 3 4 10 168 (314) +Naudlba 191.23 17 17 83 3~ H 1 5 8 7 16!J (315) Larbandhwa 1,668.39 9 10 47 17 30 17 30 1

STATISTICS
SADAR
PATAN
I
Total workers (I-IX) Cultivator
M
15
87 22 7
100 27 Q9
337 238
16 12 71 54 10 44
306 47 10 14
188
122 74 29
169 117
101 64 65
106 215
104 107 23 7
84 12 28
33 134
18 21 10
F
16
58 23 6
62 20 75
265 162
12 1
37 33 3
41 85 48
;I,
10 194
78 50 7
78 47
M
17
32 5 4
70 21 79
198 '175
9 5
41 31 5
12 176 16
2 6
108
58 29 28 79 63
Uninhabited 91 68 38 19 27 42 62 38 78 126
54 38 53 52
4 18 6
64 38 1 9
11 20 Uninhabited 2 28
32 91
12 11 21 13 11 10
F
18
13 I 2
31 14 45
130 103
6
18 II 3
II 32 20
3 124
21 11 2 4 1
47
14 II
9
2
35
4
1 3
4 10 9
II
Agricultural
labourer
WORKERS ---,.,._----III IV V \ I VII VIn
Man~- Transport, facturmg Storage
Mining. House- other than Trade and Quarry- hold Household Cons- and Commuing, etc. Industry Industry truction Commerce nications
M FMFMFMF~FMF M F
19 20 21 22 23 24 25 26 27 28 29 30 31 32
5~ 45 .. .. .. .. . . 16 22 .. .. " . . .. " .. 3 4 .. .. " .. ..
30 31 " .. " .. .. . . 6 6 .. .. .. . .
20 30 .. " .. .. ~ . .. . . . . .. 138 13. 1 .. .. .. ..
&3 58 .. I . . .. .. 2 I 2 3 3 ')
3 1 4 .. .. " .. .. 3 3 10 2 15 11 .. " .. .. 5 II 14 5 1 2 " 2 .. .. ..
31 3,0 .. .. 96 48 6. 9 4 4 .. I 26 27 2 I 1
4 4 .. " .. .. .. .. 4 8 h .. . .
58 6::> 14 .. ~ 4 I 1
,'12 41 2 .. 7 15 .. .. I 1 45 39 .. .. .. ..
1 4 " .. .. .. 90 7't .. " " .. .. . . .. .. 46 46 I .. " .. .. " .. .. I . . 21 43 I 8 " 2 44 37 I " .. .. " .. 15 13 2 " 4 " .. .. .. 65 51 .. 3 .. . . .. 75 67 .. .. 8 1 .. .. " ..
33 34 12 .. 10 10 47 53 2 .. " .. 3 4 2 " .. .. .. . .
.. .. . . 28 29 .. .. 16 .. .. .. 3 1 .. .. " . . .. .. 6 7 .. " .. "
2 1 3 .. .. .. .. 26 27 10 2 5 "
7 8 .. 7 10 1 1 .. .. .. . .
2 ..
BIHAR
IX X
Other 81. Services l': on-work ers no •
..--..........____, r- . ....._ .....
M .Ii' M F
33 34- 35 36
57 89 127 '30 19 128
5 10 129 71 107 130 18 5 13 74 94 13?
202 248 133 178 233 134
9 12 135 2 4 136
2 3 55 91 137 4 j 3 59 138 1 J 13 139
24 49 140 14 '1.57 465 141 1 3 54 I 2
3 4 1,3 1 8 17 144
1 i8 158 h:i
69 106 146 45 44 147 29 60 148
138 239 149 6 97 161 150
151 39 82 152
1 21 50 153 1 45 69 154
67 115 155 6 159 306 i:Jo
10 8 97 130 157 6 77 119 158
14 30 159 1 6 7 160 2 68 88 161
8 22 162 2 23 38 163
164 24 53 165
2 94 205 166
14 13 167 18 23 168
7 19 169

64
PALAMAU VILLAGE
SUBDIVISION
ANCHAL
Occupied residential
houses ,..---------. Total number of persons Literate
No. of enumerated (including and Serial no. Area No. of house- inmates of institutions Scheduled Scheduled educated
(Thana no.) Name of village in acres houses holds and houseless persons) castes tribes persons ,..-___ .A.-_
,..--~. ,....-...__ ..... ,---........ -~
P M F M F M F M F
2 3 4 5 6 7 8 9 10 II 12 13 14
REVENUE THANA-PATAN-contd.
170 (319) + Tisibar 715.46 27 34 154 71 83 18 24 23 29 6 171 (320) Rol 823.85 37 45 211 106 105 3 3 51 50 16 172 (330) Katn 1,055.93 15 16 54 2:> 29 17 22 1 173 (337 HeI, alias. Kalwa h.har 704.65 44 58 288 14:1 14J 31 36 22 2 17.4 (3bb) Homia 1,045.20 30 4 18? q'l 89 14 17 79 72 4 175 (316) Tilaia 1,444.87 7 7 28 J.t 14 1 -l3 14 176 (3 17) Cbetmd 2,642.16 9 12 39 2:1 14 2 20 10 2 177 (318) Buka 834.39 8 12 4 2 21 25 21 178 (339) Khapar l\I~anda 423.12 179 (340) Burhi 1,554.9!) 19 32 132 67 {)5 18 13 37 27
180 (308j Dhangardiha 412.6' . 89 113 507 257 2.'i() 81 80 45 22 32 1 ]81 (309) Boradah 960.69 24 33 142 7'1: ttl 35 35 16 182 (310) Pachkeria V 865.19 tJL. 9) 470 239 2:' 68 64 37 32 23 2 183 (311) Haraiya Kalan P, L,e 134.98 37 39 226 99 127 21 18 29 6 184 (321) Ba~hmari alias Pakhalmar " 94.66 23 34 175 85 9, 8 8 24 3 185 (322) Nawadih 37.00 12 20 73 30 3i 30 32 8 186 (323) Haraya Khurd alias Doamba 215.64 51 74 376 19u 18r 17 15 60 52 57 7
ANCHAL TOTAL 97,417.20 9,99':1 12,135 60,176 30,233 29,943 9,228 9,202 2,653 2,735 6,758 692 or
152.21 sq. miles
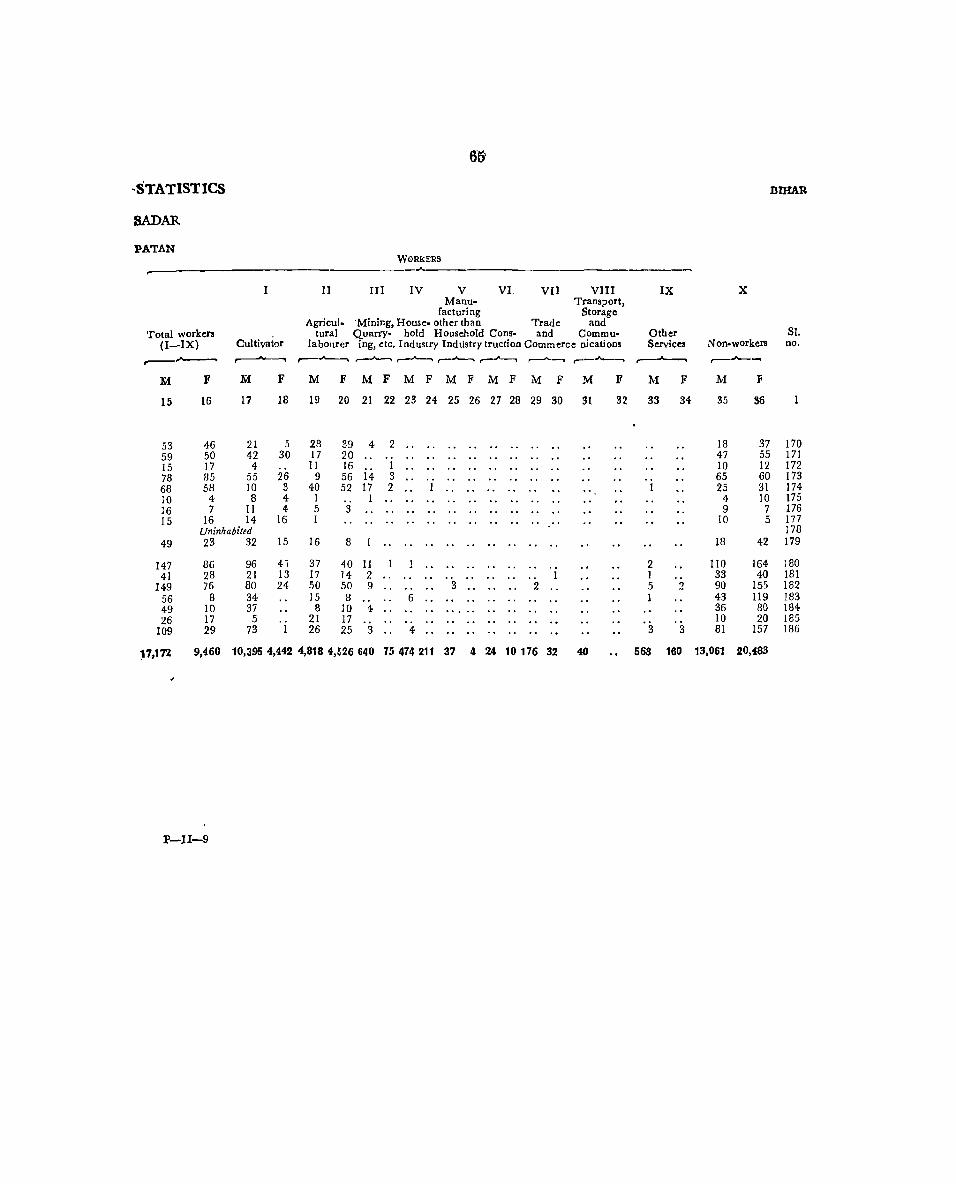
6'5'
-STATISTICS BIlJAR
SADAR
PA'l'AN WORKERS
I II III IV V VI. VII VIII IX X Manu- Transport,
facturing Storage Agricul- 'Mining, House- other than Trade and
Total worker! Cultivator
tural Quarry. hold Household Cons- and Commu- Other 81. (I-IX) labourer ing, ctc. Industry Industry truction Commerce cications Services Non-workers no.
,---"""__' ,..---"----0 ,.-.....__.,,.-.A--., ,.-.A--., ,.-.A--., r-"--, r--""___' ,.------... ,.----......
M F M F M F M F M F M F M F M F M F M F M F
15 16 17 18 19 20 21 22 23 24 25 26 27 28 29 30 31 32 33 34 35 36
53 46 21 5 28 39 4 2 ., .. .. .. . . .. 18 37 170 59 50 42 30 17 20 " 47 55 171 15 17 4 11 16 I ., .. ' . .. " .. 10 12 172 78 85 55 26 9 56 14 3 .. 65 60 173 68 5A 10 3 40 52 17 2 1 " 1 25 31 174 10 4 8 4 I 1 " .. .. " " " .. 4 10 175 16 7 II 4 5 3 .. .. .. " . . .. .. .. " ., 9 7 176 15 16 14 16 I .. .. .. . . . . .. 10 5 177
Uninhabited 178 49 23 32 15 16 8 I .. 18 42 179
147 86 96 4i 37 40 11 1 .. .. . , . . " .. 2 110 164 180 41 28 21 13 17 14 2 " .. " . . .. I I 33 40 181
149 76 80 24 50 50 9 " 3 ., 2 5 2 90 155 182 56 8 34 15 B 6 " .. .. .. ., 1 43 119 183 49 10 37 8 10 4 ., .. I·· .. .. .. .. 36 80 184 26 17 5 21 17 ., " " .. " .. 10 20 185
109 29 73 1 26 25 3 .. 4 .. 3 3 81 157 186
,7,172 9,460 10,395 4,442 4,818 4,526 640 75 474 211 37 4 24 10 176 32 40 568 160 13,061 20,483
P-II-9

66
PALAMAU VILLAGE
SUBDIVISION
ANCHAL
Occupied residential
houses _---..... Total num her of persons Literate No. of enumerated (including I and
Serial r;s; Area No. of house- inmates of institutions Scheduled Scheduled eiucated lThana n .) Name ofviUage itt acres houses holds and houseless persons) castes tribes persons
~~ ,..--...__...., ,--...__ ..... ".-_Jo.. __ ...
P M F M F M F M F
2 3 4 5 6 7 8 9 10 II 12 13 14
REVENUE THANA-PATAN-conttl.
1 (111) Thekhi Me 659.84 7 9 44 23 21 23 21 2 (1l3) Kumbhi Khurd P, Me 1,380.26 71 89 426 221 205 27 30 47 36 26 3 (1l4) Kumbhi Kalan Me 1,401.57 60 75 347 172 175 46 47 35 43 II 4 (145) Rajdiria P,Mc 1,424.32 69 100 447 223 224 47 30 159 156 33 5 (146) Malhatoli Me 337.16 32 45 199 97 102 23 32 IS 6 (147~ Sohdag Khurd Me 1,338.28 74 94 443 222 221 12 11 72 68 30 2 7 (148 Nawa M,H,U,Mc .• 1,334.94 116 151 709 346 363 37 35 136 34 8 (.149) Itko P,Me 1,703.80 144 204 9M 495 490 128 127 151 153 130 8 9 (150) Sinjo Mfi 1,407.04 30 45 215 107 108 36 33 67 72 9
10 (151) Turidag 1,123-62 1 1 6 4 2 4 2 11 (152) Banaudha Me 572.06 12 13 53 23 30 3 3 16 25 4 12 (153) Dindi 188.88
13 '92~ Hatai 3,668.00 13 20 103 50 53 27 26 8 14 (98 Bandua 439.33 8 8 35 17 IS 17 15 15 (99) Tamdaga 1,022.35 31 40 178 98 80 23 iir 25 22 18 16 (100) Tati Pathal 427.36 17 (103) Gaura Me 1,809.43 42 52 228 115 113 51 50 50 35 22 5 18 (104) Gharatia 2,575.54 50 70 337 173 164 22 26 21 10 23 19 (lOS) Choratia 310.68 40 47 235 118 117 16 19 22 18 36 . 20 (106) Kauria p 1,266.75 60 79 431 227 204 50 59 25 19 11 21 (107) Sohdag Kalan 1,447.95 52 60 296 150 146 57 43 77 76 6 ! 22 (108) Jamari 1,133.47 35 44 250 138 112 45 26 82 71 6 23 (109) Raj Khar 1,000.81 3 4- 18 II 7 11 7 .. 24 (110) Ghasidag 1,649.18 62 79 348 186 162 101 106 28 17 2
:25 (Ill) Jhaatinath 198·91 2 4 19 9 10 9 10
26 (llS) Mahugain 862.60 22 23 102 50 52 2 4 46 48 I 27 ~116) Korta 931.92 24 26 123 64 59 5 1 3 28 117) Pipra 498.81 7 8 31 10 21 9 19 1 29 (118) Ttdbula \ . 679.57 25 31 133 62 71 34 34- 2 1 30 (JI9) Arapur 1,280.87 17 21 97 50 47 33 36 13 9 6 1 31 (120) Tal~ 900.83 23 32 147 78 69 23 25 2 2 5 32 (121) Bana 290.71 20 28 137 74 63 22 23 9 33 (139) Pataria 663.63 54 83 386 204 182 lo.? 105 10 34 (140) Khamdiha 703.39 35 (111) Basauna 164.19 36 (112) Rabda .. 365.26 94 132 60.9 300 309 164 168 34 5 37 f143) Odh Kanda 213.10 3 3 7 3 4 38 144) Kanda Khas M,Rhe,Me 2,248:84 175 211 999 492 507 192 215 88 6 39 (154) Nenaa Me 219.62 10 12 60 31 29 18 20 5
40 (122), Khokhma 474.61 10 10 44 20 24 20 24 41 (123) Sarauna 1,132.81 20 23 123 57 66 12 11 12 14 '}
42 (1·24) Damaro 1,088.62 52 62 317 161 156 5 6 14 43 (125) Checharia 434.05 28 30 156 83 73 34 30 16 44- (126) Barahmoria Kalan P 147.31, 57 75 359 185 174 40 43 87 12 45 (127} Ladi 139.30 46 f128 Rabda 149.36 47 129 Barahmoria Khurd 76.06 16 24- 92 44- 48 16 16 15 I 48 (130) Sup wa alia, Amwa P 59l.a. 5. 67 372 179 193 57 57 71 B 49 f31) Chechanha
P2,M,L, Y 934.31- 93 9~ 553 200 263 55 51 124 16 50 132) Rajhara 1,346.13 258 277 1,121 834 887 151 181 3 3 209 3' 51 133) &lstI{l p,.L, V' •• 11'4.58 223 275 1,:107 605 60t 22% 221 .. l.\lg 45

07
STATISTICS .BIHAR.
SADAR
JUSHRAMPUR WOBJt1lll8
I II III IV V VI VII VIII IX X Manu· Transport,
facturing I Storage Agricul. Mining, HoUIC- other than Trade and
Total worken tural Quarry- hold Household Com- and Commu- Other SI, / (I-IX) Cultivator la hourer ing, etc. Industry Industry truction Commerce IDeations Services Non·worken no,
A _, ,..-""""_' ,...--"'--I ~ ~ ~
M F M F l\{ F M F M F M F M F ltI F 1\1 F Nt F M F
15 16' 17 18 19 20 21 22 23 24- 25 26 27 28 29 30 31 32 33 34 35 36
15 14 9 8 4- 6 2 .. .. . . .. 8 7 1 129 100 79 76 19 21 14 6 .. .. .. .. 1 10 2 92 105 2 116 102 72 78 19 19 19 2 3 2 .. 3 I 56 73 3 140 107 90 86 24- 8 18 3
. 5 13 83 117 4 .. .. .. ..
61 38 48 34 5 4- .. 1 I " .. .. . . 3 3 36 64 5 135 96 122 93 2 5 " 5 .,I .. .. .. I 2 87 125 6 188 90 99 66 13 9 1 .. 16 7 4 .. 5 .. 3 . . 5 42 8 158 273 7 277 233 189 164 51 62 I .. 7 2 " .. 13 .. 16 5 218 257 8 66 58 42 33 23 25 .. " .. .. 1 41 50 9 1 1 I 1 .. .. .. " .. , . .. .. .. .. 3 1 10
17 15 12 7 5 8 .. .. .. .. .. . . .. .. .. 6 15 11 Uninhabited 12
32 29 25 '25 .. .. .. .. .. .. .. .. . . 6 3 18 24 13 10 13 9 13 .. " .. .. .. ., .. .. . . .. J 7 5 14-65 55 58 52 7 3 .. .. .. .. " .. .. . . .. .. 33 25 IS
Uninhabited 16 76 69 60 55 16 14 .. .. .. .. . . .. .. .. .. 39 44 17
105 99 87 89 14 10 1 2 .. .. .. .. " .. .. 1 . 68 65 18 69 51 64 41 4 10 .. .. . . .. .. . . 1 49 66 19
135 110 120 99 11 10 2 1 .. .. .. .. .. .. 2 92 94 20 96 90 67 70 16 17 12 2 .. .. .. .. .. .. .. " 1 1 54 56 21 83 67 73 63 7 4 3 .. .. .. .. .. .. .. 55 45 22 5 4 3 3 I 2 .. .. .. " .. .. .. 6 3 23
III 109 69 79 24 29 15 .. .. .. " .. .. .. 3 1 75 53 24 5 5 5 5 .. " .. .. .. .. .. .. . . 4 5 25
42 39 32 35 10 4 .. .. .. .. .. . . .. .. S 13 26 49 39 38 32 2 .
9 7 15 20 27 .. . . .. .. .. .. .. 9 13 9 12 1 " .. .. .. .. "
1 8 23 41 42 30 30 8 11 3 1 .. . . .. .. .. .. .. 21 29 29 32 22 .7 4 20 17 4- 1 .. .. .. .. .. " 1 18 25 3()1 45 42 38 37 6 3 .. .. .. .. .. .. 1 2 33 27 31 33 30 28 .24 1 1 1 .. .. " .. " .. .. .. 3 5 41 33 32'
109 103 92 89 13 14- 2 1 .. .. .. .. .. .. 1 95 79 33: Uninhabited 3.fl. Uninhabited 35
177 175 III 76 ff4 97 123 134 36 3 3 3 3 .. I •
186 1 37
306 317 211 222 57 85 4 .. 17 2 1 3 6 2 11 2 190 38 22 17 7 3 14 14 .. .. .. .. .. J 9 12 39
15 20 7 10 8 10 .. 5 4 40 37 46 34 43 3 3 .. .. . . .. " .. .. .. 20 20 41 99 98 85 89 9 9 1 .. 4 .. . . .. .. 62 58 42 49 51 24 32 22 19 1 .. 1 .. .. 1 34 22 43
108 120 53 80 37 40 2 .. 6 .. .. .. .. .. 8 2 77 54 44-Uninhahit~ 45 Uninhabited 46
28 34 14 19 12 15 2 .. 16 14 47 105 75 52 41 47 27 .. .. .. 7 .. .. .. .. .. .. " .. 6 74 118 48 166 106 83 3 40 102 6 1 .. 2 32 1 2 124 157 49 430 173 96 35 36 22 186 60 31 30 2 ~ . 24 14 3 52 12 404 714- 50 362 368 219 237 102 129 15 .. 11 2 2 ., 13 241 236 51

~8
~4L.AMAU VILLAGE'
SUBDIVISION
ANCHAL..
Occupied residential
" houses
~-.....______, Total number ?-[persona Literate No. of enulJIerated (including and
Serial DO. Area No. of house- inmates of institutions Scheduled Scheduled educated (Thana a[).) Name of village in acres hou$es holds aad houseless persons) castes tribes persons
~ ,-----, ,..---....____,. ~ . P M F M F M F M F
2 3 4 5 6 7 8 9 10 11 12 13 14
R.EVENUE THANA-PATAN-contrl.
Basna G. P.-eoneld.
52 (134) Bankheta 25.83 16 24 104- 53 51 10 14 3 8 53 (135j Chanea P 468.21 53 59 309 149 160 40 38 44 11 54 (136 Lathea '206,10 55 (137) Tukbera P 1,129.35 109 122 646 316 330 140 14-7 53 49 72 4 56 138) Karcha 370.97 22 22 107 55 52 19 17 20 22 2
57 ~66) Arhi 80.46 58 67) Pipra 254.01 32 35 182 92 90 30 34 10 59 (68) Seora 543.52 48 56 295 145 150 ,27 35 30 60 (69) Lalgara M, L, H, Me 2,105.34 210 329 .1,643 775 868 257 278 185 13 61 (70) Panjri Kalan Me 951.58 79 86 525 250 275, 73 77 62 (71) Panjl!i Khurd 343.48 59 68 33,9 166 173 27 44
39 2
63 (72) Naugarha Me,M 319.23 78 H2 528 253 275 73 77 103 12
64 (73) Semri Khurd 97.36 36 49 218 101 117 45 42 123 28
51 4 65 (74) Semri Kalan 98.68 29 44 228 97 131 37 48 30 5 66 (75) Ataria 123.26 36 57 223 96 127 26 24 38 3 67 (76) Bariganwan Me, Dc 309.50 45 60 335 157 178 21 20 60 15 68 (77) Bairia 115.23 69 (79) Naudiha 172.70 9 16 43 ]5 28 4 10 (80) Hansdaga Me 364.17 1 1 8 5 3 .. 3
'71 (64) Pabargerua 182.57 21 27 127 61 66 24 20 18 4 72 (65) Lumba 322.18 73 (78) Bhanrlar P,M, L, Rna, Oc .. 616.21" 134 205 994 482 512 72 74 84 86 150 3f 7~ (81) Sbankardih 19.92 19 19 9f 46 48 13 16 3 75 (82) Jarka 79.60 25 37 182 75 107 3 4 21 76 (83) Gerua 111.04 10 II 43 ~ 22 21 22 21 1 77 (84) Guri L;V 347.43 96 120 635 300 335 33 50 126 135 7I 15 78 (85) Jbarapdih 6.31 7 8 37 18 19
79 (86) Tendua 9.18 7
80 (87) Jhani 23,79 1 1 2 1 1 1 1 81 (BB) Tona C, -¥c I,05~.01 107 133 643 291 352 131 156 82 (89) Lotar 445.19 8 8 33 . If 19 8 10
78 17 , . 3 1 83 ~90} Jharha Knurd P 239.30 49 53 260 128 132 37 40 50 5 84 91} Jharha Kalan L 292.31 ,30 .42 185 94- 91 13 12 68 65 5
85 (33) Makai 331.32 3 6 29 16 13 "7 2 4 86 (34) Urdwar 201'.00 ' 21 32 111 57 54 '45 "44 8 87 ~35) Karota 116.64 50 53 298 153 145 63 45 43 1] 88 36) Ketal Kalan M,~L, Oc 695.05 155 193 1,218 561 657 52 &1
Ketat Khurd 148,29 45 61 333 160 173 ., 298 7!L
89 (37) 21 4
KadItwan G. P •• I
90 (52) Ghaghua 244-71 33 41 231 122 109 11 9 .'. 46 91 (53) MalJabtoli 6]8..04 ,80 101 489 219 270 . :2 '9
3 17
92 (54~ Jinjira 1I3.02 ,18 , ,19 : .. 62 38 '24 ·'3 .. .', 26 5 93 (55 +Tolra- P 2,132.60 PI 2Ql ,,1,087 543 ~44 '162 137 H Ss 198 16 94- (56) Murma Khurd .. 443 .. 52 p5 63 376 166 210 19 20 18 95 (57) Mtirrma Kalan •• " 374.;!-7 .51 « J)8 t08 204., 204 12(J 109 " 4-5 ..

69
$TATISTICS
SADAR
.13 ISHRAMPUR. WORKERS
~---------------------------------~
I
Total workers (I-IX) .Cultivator:.
~.....__..., ,--""'___'
M
15
35 70
160 35
59 88
384-148 78
131 48 52 34-61)
6. 1
31
257 26 <f0 11
152 10
1 148
6 72 51
8, 37 77
259 96
61 135 24
284 110 124
F
16
M ;p
17 18
38 21 26 97 41 69
Uninhabited '125 184 E3
34- 24 23
Uninhabited 3'1- · !32 12 73 56 35
363 168 174 129 66 61
31 51 12 86 49 23 49 25 38 60 4 20 39- '16 20 59 35 14
U nillhabited 1& '3 IS S 1 3
31 25 24 Uninhabited 179 80 48 33 4 4 42' · 36 33 13
168 '65 70 12 6 10
Uninhabited
103, 68 29 9 3 2
26 '33 4 33· IS 2
'5 4 3 33' 7 10 74 · 23 .23
176' '180 .1.05 78 ' )8 13
4>4> "35 '36 171 103 150
3 13 2 i16 122 21 125 "92 119
' 128 '110 96 , ..
II III IV V VI VII VIII IX Manu- Transport,
facturing Storage Agricul- Mining, House- other than Trade and
tural Quany" bold Household Cons- and Commu- Other labour~r ing, etc. Industry Industry truction Commerce nications Services
,...--.......____, ,...--~ ~ r-""'--t ~-....., ,.---.. ,...-----....., ,-_"___' M F MFMFMFMFMF M F M F
19 20 21 22 23 24 25 26 27 28 29 30 31 32 33 34
4 12 7 .. .. .. .. .. .. . . . . 3 '24 28 5 .. .. .. .. ..
16 54 23 1 4 2 .. .. 2 2 2 11 8 3 .. .. .. .. .. ' . .. .. -,
27 21 .. .. 1 .. .. .. " 27 38 .. 5 .. . .
131 176 12 .. 26 II 4 " 1 4- 2 24- 14-61 59 .. .. 12 9 .. .. .. . . " ., 6 3 1 2 3 3 .. .. .. .. ., , . I 22 14-
3 2 .. 8 ,5 .. .. .. .. I . . I 70 55 4 2 .. 2 ' . .. .. .. I 18 7
I 17 5 .. .. . . .. .. .. I 29 35 16 18 I .. .. .. 1 I 23 42 -1 .. 5 3 .. .. " . . 2
2 3 1 .. .. .. . , .. .. .. .. .. .. . . .. 3 7 . .. .. 3
99 II6 19 .. 15 7 2 .. .. , 1 3 38 6 20 29 .. .. 2 .. .. . . 4 8 .. 1 .. .. .. ..
11 13 .. .. .. .. .. 81 98 .. .. 3 .. ' .. .. 3 1 2 .. .. 3 .. .. .. .. .. . .
.. .. .. 63 68 15 4 2 I 3 7 " .. ..
26 20 1 2 .. .. . . .. 12 ~ . 36 31 .. .. ..
4 2 .. .. .. 25 23 2 .. .. " .. .. 1 2 21 48 13 .. 2 1 .. .. 1 " 2 .. 5 1 10 1 30 71 7 .. 1 1 .. 1 '. 2 37 72 65 5 .. .. . , .. .. .. . . I ,
7 8 2 .. ,. .. .. 11 6 9 20 .. 1 " . .. .. .. 18 5 I 1 .. .. .. .. .. . . " .. 9 1
61 93 20 1 9 2 ' .. .. 17 53 1 2 6 6' . '. 1 1 .. .. 5 4 '5 30 6 .. . . , .. 2 . . 1 2
BIHAR
X
Sl. Non-workers no.
.--M
35
18 79
156 20
33 57
391 102 88
122 53 45 62 91
9 4
30
225 20 35 11
148 8
143 8
56 43
8 20 76
302, 64
61 84-14'
~59 56 80
F
36
13 63
146 18
56 77
505 146 142 189 68 7I 88
119
10
35
333 IS 65
8 167
7
1 249
10 106 53
8 21 71
481 95
65 99 21
428 84 76
52 53 54 55 56
57 58 59 60 61 62 63 64 65 66 67 68 69 70
71 72 73 74-75 76 77 78 89 80 81 82 83 84
85 86 87 88 89
90 91 92 93 94 95

70
PALAMAU VILLAGE
SUBDIVISION
ANCHAL
Occupied residential
houses ,.--.A--__, Total num ber of persons Literate No. of enumerated (including and
Serial no. Area No. of house- inmates of institutions Scheduled Scheduled educated (Thana no.) Name ofviUage in acres houses hold. and houseless persons) castes tribes PersOll.
,.....----~ ..--""___'
P M F M J1 M J1 M F 2 3 4 5 6 7 8 9 10 11 12 13 14
R.EVENUE THANA-PATAN-contd.
((etat Kalan C. P.-coneld.
96 (58) Sankha 349.84 llO 127 654 320 334 78 64 54 6-97 59) Kundi 446.63 41 47 178 92 86 31 30 4
98 (60) +Kadhwan P,E 1,846.67 97 129 619 318 301 155 121 124 32 99 (61) Ulipahari 269.97 32 36 206 98 108 38 38 12 100 (62) Nimia .. 324.45 16 20 85 40 45 9 10 7 101 (63) Dulsulma 95.94 39 41 251 135 ll6 3 102 (93) Bhaluani Kalan 643.40 21 24 115 59 56 37 41 .2
Rehla C. P.
103 (22) ~awadih Khurd 67.11 104 (38') ayapur 295.21 53 59 331 157 174 1 2 8 6 55 6-105 (39) Dandila Kalan 177.42 100 113' 614 296 318 77 80 1 1 62 1 106 (40) Dandila Khurd P 263.34 41 46 325 165 160 20 22 71 2 107 (41) Godarma Kalan P,Mc 1,368'00 196 223 1,239 593 646 7 10 177 14-108 (42) R'6ksa 159.75 109 (43) Sa'bauna .. 361.06 81 87 481 245 236 69 75 30 1I0 (1:4) Ghordiba .. 286.83 74 85 465 234 231 48 47 92 9-III (45)t*Rehla Kalan P,B,h,L,H4 .. 602.70 346 383 1,767 1,149 618 216 206 3 1 375 114 Il2 (46) Bishunpur 46.22 4 5 26 11 15 7 3 ll3 (47) Ramjani Bigha 37.95 6 8 57 32 25 7 114 (48) Rehla Khurd A 156.79 80 91 461 237 224 36 48 95 27 115 (49) Pathe 206.41 116 (50) Gurhakhurd 171.96 117 (51) Gurhakalan P 492.37 91 122 629 313 316 102 99 III 23
118 (19) Bhaluhi P 184.22 .30 36 233 113 120 75 80 26 S. 119 (20j Jhagarua 562.24 83 96 606 298 308 183 187 33 120 (21 Diharia K 290.63 83 123 621 329 292 42 50 66 a 121 (23) Godarma Khurd alias Barwadih 556.53 16 26 135 68 67 63 64 7 122 (24) Panrepura 158.34 66 72 37,6 196 180 53 3: 123 (25) Madhuridih alios Tenwahi •. 145.24 21 27 128 52 76 7 6 10 4 124 (26) Warsula P 631.93 100 115 708 344 364 221 240 53 Z 125 (27) Lurikhuri 43.00 4 4 13 6 7 6 7 126 (28) * Bisrampur P, L, Hos, A. Me .. 1,218.22 454 529 2,399 1,219 1,180 318 323 14 2 420 8,. 127 (29) Bagh Mandwa 970.37 103 107 515 265 250 86 84 43 128 (30) Nawadih Kalan 561.92 46 48 225 114 'Ill 76 65 U 6-129 (31) Sordiha A 245.39 32 32 168 106 62 22 18 5l 4 130 (32) Harhepa 580.65 35 36 167 90 77 37 33 10 131 (94) Bhaluani Khurd 382.95 19 23 107 48 59 14 18 3 132 ~.95) Kmiar 430.10 25 30 132 64 68 21 23 .. 13 133 (96) Pachghara Khurd 699.24 23 35 168 77 91 14 21 11 26 :2 134 (97) Pachghara Kalan 514.68 2 2 11 4 7_ 1 4 3 3 135 (101) +Chhipadohar Kalan 1,625.3J 49 27 106 52 54 9 10 43' 44 4 136 (102) Chhipadohar Khurd ., 378.41 15 17 76 31 45 1
Joga C. P.
137 (2) Jamdiha P 367.48 86 87 496 248 248 28 24 28 1.38 (3) Depdanr P 1,026.69 82 83 517 279 238 167 135 .. 21 l-139 (4) Binhua P 668.93 56 56 361 211 150 67 53 .. .a4

71
STATISTICS ;BIHAR
SADAR
.BI SHRAMPUlt WOBI.lI:B8
I II III IV V VI VII VIII IX X
Total worken (I-IX) Cultivator
Manu- Transport, facturing Storage
Agricul- Mining, House- other than Trade and tural Quarry- hold Household COIlS- and Commu- Other Sl.
labourer ing, etc. Industry Ind;tstry truction Commerce ',nicatioUl Services Non-workers no. r- ~ ,.........--"-___ ,..-.A...~ """"""__',...--A--. ~ ,..-~ r--""'__' ,..---.....__. ,..---""'__'
M F M F M F M F M F M F M F M F 1\{ F M 11 M F
15 16 17 18 19 20 21 22 23 24 25 26 27 28 29 30 31 32 33 34 35 36
141 45 33 113 107 18 10 1 I 186 .. .. .. .. .. 134 193 ~ 64 47 15 16 44- 31 5 .. .. .. ., 28 39
187 126 90 39 79 86 5 .. '.' 3 10 131 175 98 49 55 23 30 18 24 3 .. 2 t 3 49 53 99 19 19 6 3 10 16 .. 3 .. - .'. " .. 21 26 100 75 68 57 59 16 9 2 .. .. .. .. 60 48 101 33 35 14 15 18 20 1 .. .. .. . . .. .. .. . . .. 26 21 102
Uninhabited 91 10 33 .. .. 10 3 . , 5
103 .. 14 22 7 6 66 164 104 163 53 97 7 2 .. 3 .. 3 .. I .. 2 57 44 133 265 105 59 23 39 12' 1 1 1 .. .. .. .. 2 16 10 106 137 106
364 321 2t1 235 26 57. 33 12 18 14 5 .. 1 .. 7 63 3 229 325 107 Uninhabited 108
.137 27 54 10 16 4 .. 10 '2 3 .. .. 7 43 17 108 209 109 135 19 72 13 9 .. 16 . , .. 1 3 34 4 99 212 110 668 104 51 25- 10 11 :3 .. 16 4 59 .. 72 .. 75 4 186 196 60 481 514 In
5 2 4 I .. 1 1 6 13 nz 14 15 6 11 4: 4 .. .. .. .. .. 4 18 10 113
14:8 50 43 16 1 9 2 .. 1 .. .. .. 19 .. 9 73 25 89 174 114-Uninhabited 115 Uninhabited
175 113. 63 14- 55 89 13 .. 2 .. .. o. 1 .. 40 116
10 138 203 117
51 63 13 23 37 40 1 ,. .. .. 62 57 118 155 154 66 94- 34 53 15 . , 3 1 8 .. .. 1 2 26 6, 143 ,154 119 188 178 71 97 90 80 3 .. 7 1 10 .. 2 .. 3 2 141 114 120 46 37 2 '3} 85 3 .. .. .. . . 12 22 30 121
103 110 74 92 22 18 1 .. .. 4 .. 2 93 70 122 29 41 ~4 35 3 4 I 1 I .. 1 23 35 123
195 213 1'10 130 31 72 14 .. 3 3 29 :.; 5 .. 3 149 151 124 2 3 1 2 1 I ,.
~5 4- 4 125
697 532' 266 258 132 149 9 5 65 34- 5 1 .. 41 11 4 174 522 648 126 164 116 130 87 1 . , 1 5 I 1 .. .. . . 31 23 101 )34 127 65 ~ 51 34 1 1 .. J 11 24 49 53 121t 37 12 6 1 1 2 .. 14- 10 .. .. " .. .. .. 8 3 69 42 129 54 35 34 12 3 6 .. 1 .. .. .. 11 22 36 42 130 33 39 22 28 4 5 3 4: .. .. .. .. 4 2 15 20 131 32 30 18 15 1 13 15 32 38 132 55 52 34- 35 5 4- 15 8 1 5 22 39 133
S 3 I 2 ·s 2 1 1 4 134 41 35 91 32 3 7
, 11 19 135 .. . ,
16 28 9 23 I 2 .. 3 5 1 15 17 136
tlffi 98 102 SO 45 68 13 88 150 1~7 lee 10!} 1i17 76 105 .. .. .- 3 113 'lS3 U8 1&15 Y1 '74: :14 62 53 2 ,. .. 13 13 1S9

'72
PALAMAU YILIAGR
SUBDIVISION
A NCHAL.
Occupied residential
houses ,.--~ Total number of persons Literate
No. of enumerated (including and Serial no. Area No. of house- inmates of in~titutions Scheduled Scheduled educated
(Tbanano.) N arne of village in acres houses holds and houseless penons) castes tribes persons ...._____, ~~
P M F M P M: F M F
2 S 4 5 6 7 8 9 10 11 12 13 14-
REVENUE THANA-PATAN-contd.
Sigsigi G. P.
140 (5) Su1umdag 2,999.21 65 69 306 150 156 5 3 19 24 5
141 (6) Kulhi 510.82 24 31 121 57 64 4 5 15 1 142 (7) Karkata P 526.53 100 125 704- 355 349 99 107 'J' 44-143 (8) yoga P, Me 952.43 125 149 767 395 372 84 92 87 f~ 144 (9) Sahaspura 437.50 145 (10) Darua 288.69 36 44 213 107 106 14 146 (11) Kalianpur 253.63 5 .6 42 22, 20 u 7
Sigsigi G. P.-contd.
147 (12) Bhitihara 427,09 77 77 421 207 214 83 94 71 15-
yoga G. P.-cone1d.
148 (13) Birja P 42Ul4 34 ~2 2QI 95 106 .. 16
149 (14) Ho1ga 336.63 18 18 96 58 38 .. 5 150 ~15) Ragda 231.22 ,5 5 29 10 19 I 151 16) Sigsigi P, Oe 1,033'61 192 226 1,171 584 587 68 55 4 170 14 152 (17) Oria 256.97 33 '33 175 82 93 56 63 6 153 (1'8) Lohardaga 477.90 ' 3 '3 24 14 10 3 2
UntaTi Road" G. P.
154 (1.) +Kutmu 1,001.73 55 74 433 2~2 211 7* 76 87 6
155 (581) Gaurletwa 3,036.08 32 39 212 114 98 106 102 8 156 (582) Chhatarpur Ce 155 .. 1-3 27 ·35 • Jo96 103 93 82 73 6 ,I 157 (583) Nawgarh 468.64 41 50 321 165 156 54 '37 46 3 158 (584) Lumasatbahini .P, Cc 1,091.62 88 149 930 455 475 161 160 101 10 1?9 (585) Bhaduma 405·82 ~i 120 577 270 307 60 57 2 79 13
Untari Road G. P.-contd.
160 (586)' Lahar Banjari .. 1,370.39 153 189 1,104- 552 552 129 135, ! • 91 2
Lumasat Bakini G. P.-concld.
161 (587) Partappur 315.26 5 6 23 13 10. H
UntaTi Road G.P.-concld. o.
'4'" 1(l2' (588) Sirha P,M,h,L,H2,Me .1,073.16 121 13'l 855 477 378 59 ,. 138 ,,23 163 (589) Checharia 455.70 51 .. 51 391 194- 197 44 ,47
.~" 18 1
164 (590) Panrepura .987.n 98 127 788 373 415 185 222 89 10· 165 (591) Titahi 922.72 5 7 38 21 17 3 2 2 166 (592) MalwaTia P, Oc 141.75 56 '72 455 249 206 43 39 98 9 167 (593) Semri 368.96 103 103 587 318 269, 91 97 ~~ ... 84 ·1 168 (594J'+Munna Kalan P, Me 2;849.84: ., 180 211 1,152 585 567 2~~ 282 \~ 2- ,84 --~3 16,9 (595) Murma Khurd 496.04 HI 135 ' 789 396 393 14,9., 112;
, 74 . ' .. , ~: .. " ~ , l~ ~ .. " . . "

'STATISTICS
SADAR
BISHRAMPUR WOBltBB8
~--------------.-----------------~
Total workers (I-IX)
I
Cultivator
II
Agricul. tural
labourer
III IV V VI VII VIII Manu· Transport,
facturing Storage Mining, House- other than Trade and Quarry. hQld Household Cons. and Commu. ing, etc. Industry Industry truction Commerce nications
IX
Other ~ces
M
15
F
16
M
17
F M F M F M F M -F M F M F M F M F
18 19 20 21 22 23 24 25 26 27 28 29 30 31 32 33 !l4
101
40 243 255
95 56 61
39 26 240 193 211 125 Uninhabited
24 187 86
44 34 1 "
14 37-96
15 53
122 16 2 1 .• 2 2 1 . r- ..
61 12
68 33 13 17 3 .. 7 7 .. .. .. ' ..... 9 11 1 .•
121
63
35 8
315 53
8
117
54 53 82
232 141
294
8
255 119
108
60
24 11
280 54
3
57
53 46 51
248 57
257
199 167 12 12
130 58 181 81 332 279 204 192
B-II-IO
52 54 54 54 ............ ..
28 37 27 23 2 . . 2 ..
15 _ 6 210
17 7
91
45 32 64
126 120
15 11
205 13
3
14
58 35
1
6 ....
59 5 41
25 24 30
44 30 37
133 25
7 21 4
75 13
7 .. 16 13
108 31
9 7 .• 2 ••
6 3 .. 2
16 14 3 .. 4 ..
2 7 2
I 7 I
1 .. ..
2
1 2
1 .. 1 ..
206 198 51 39 13 " . . I .. . . . . .• 1 ••
6 3 2 ••• , ... , .•..••••••
143 86 29 18 14 101 70 8 ]0 9
190 .148 .12 12 100 52 123 32 196 113 132 117
4
1 51
118 53
13 3
3 .. 48 4
165 2 74
2
1
6
3
8.. 9 1 ..
.. 7
37 ,.
1 ]
9 6
5
12
3
11 1
14
12
8 3 5 3
I 9
3
17 1
2
2 3 3
2
2
9 19
3
19
3 IS
8
.~
1
BIHAR
x
Sl. Non-workers
,...-"""'___
no.
"- 35
49
17 112 140
46 10
86
32
23' 2
269 29 6
105
60 50 83
223 129
258
5
222 75
174 9
119 137 253 ~92
F
36
61 140
25 109 161
38 11
106
141 142 143 144 145 146
147
46 148
14 8
307 39
7
149 ISO 151 152 153
154 154
45 47
105 227 250
155 156 157 158 159
295 160
7 161
265 162 116 163
!!48 5
148 188 288 201
164 165 166 167 168 169

14
PAL~U VILLAGE
SUBDIVISION
ANCHAL
Occupied residential
houses r--""_____' Total number ofpersoll1 Literate
No. of enumerated (including and Serial no. Area No. of house- inmates of institutions Scheduled Scheduled educated
(Thana no.) Name of village in acres housea holds and houseless persons) castes tribes person.
~--" ,--~ ,--~
P M F M F M F M F
2 g 4 5 6 7 8 9 10 11 12 13 14
REVENUE THANA-PATAN-cottd.
Tisihar C. P.
170 (596) Dhachabar. P 217.05 52 iO 383 .1.96 187 121 119 56 15 171 (597) Burh Khaira 328.39 45 51 238 117, 121 51 59 24 172 ~98) Da1a Kalan. P " 3,038.61 91 115 593 306 287 89 84 51
21 173 ( 99) + Tisibar Kalan M,L,Mc~V .. 551.00 152 177 1,029 480 549 182 193 125
Malwaria C: P.-concld.
174 (600) Chaura 892:23 175 (601) Achanga alias Harka 676:03 2
Tisihar C. p.-concld.
176 (603) Darua 706:27 75 86 476 231 245 56 90 29 I 177 (60&) Tisibar Khurd P 183.38 58 89 402 209 193 112 110 .-. 52 .5 178 (605) Dala Khurd 127.49 26 28 153 74 79 17 24 7 4 21 6 179 (606) ]harna Khuz:d 90.08 27 33 187 90 97 43 47 17 180 (607) Jharna Kalan P, Me 141.60 52 62 417 204 213 79 80 .. 68 15 181 (620) Khaira 1,819.03 7 10 45 18 27 13 22 182 _(622) Basdiha 175,80 36 65 339 183 156 105 100 32
Hi3 (602) Kutmu P, C, Me 3,914.04 378 429 2,371 1,)"33 1,238 266 265 191 39 184 (608) Chapia Me 199.76 24 31 151 76 75 4 9 25 1 185 (609) Dhanudih P,Me 257.95 '36 56 259 131 128 35 38· 37 186 (610) Chanau Khar 151.59 41 47 253 132 121 90 88 25 187 (611) PhuIia P 164.70 80 82 463 222 241 54 64 60 7 -188 (612) Ordiha Me 85·99 27 34 162 69 93 11 12 24 3 189 (613) Siha1deo Me 56.23 ' 9 9 _ 35 15 20 10 12 4 6 190 (614) Salhana Me 195.44 49 54 306 151 155 36 36 54 4
Panru C. P.
191 (615~ Kunrwa KalanK, Me 108.17 33 A5 262 123 139 42 5 192 (616 Kunrwa Khurd Me 85..17 .12 • 19 III 53 58 19 2
Kutmu C. P.-concld.
-193 «(5l1l Balar 40.55 194 (618 Kusa alias Hengabar 21.4<2 195 (619) Lotra Me 169.53 17 21 109 60 49 16 11 26 2
"1-96 (621) Bliatwalia • 122.29 .. • .64 . 108 5S"3 , 286 247 103 "96 , . 100 14 .,
197 (627) ·Karamdih 404.97 95 107 599 316 283 21 19 125 5 198 (628) Panru, M, h, C, Rhe, A, H, Me 1,778.51 185 249 1,282 645 637 51 54 268 40
.199 (629) Lawar Paneu Me 213.94 54 64 303 154 149 43 41 35
200 (630) Asnauli P, Me 331-.73 43 53 297 145 152 32 37 ,
57 8 -,
201 (623) Jhargara 660,52 '202 (624~ MahugaTiwan P,Mc 654.97 195 251 . 1,330_ 669 661 '233 232 183 15
'·2Q3 (62,5 Kantj 471.20 10 10 64 39 25 .5 ~ 12 l' ·204- (626) Kh-ura 856.92 .28. 37 201 .98 103 97 101 4-
~O5 (639) Kulia P 691.63 ,- 43 .53 249 130- 119 69 69 .. 19
-206 ~640) Sildili " - 3,694.84 .90, 108 550 259 291 39 45 56 47 51 5
'·207 641) ObIa P,Mc 1,808.76 .76 • .84 .. 561 277 284 H5 130 4 68 "II

STATISTICS
SADAR
BISHRAMPUR
I
Total workers (I-IX) Cultivator
M
15
122 70
190 267
135 108
42 49
108 13 89
626 42 73 76
142 36 10 79
65 26
36
155 191 339 96 77
385 22 45 77
144-182
F
16
M F
17 18
84 36. 3 40 45 20
126 133 82 192 144 77
Uninkabitefl 1 1
115 100 73 87 82 69 17 25 3 44 28 . 13 69 83 37 9 9 7
64. 50 22
529 345 322 44 31 32 63 28 22 69 21 13
123 66 67 53 18 21 8 2 1
53 47 18
25 46 10 12 II I
Uninhabited Uninhabited 11 20
96 113 71 38 169 26
222 240 153 5] 75 38 40 43 14-
Uninhabited 285 139 60
3 ]9 ]
40 7 '3 55 35 24-
110 79 54-97 89 15
WORKERS
II III IV V VI VII VIII IX Manu- Tramport,
facturing Storage Agricu]- Mining, House- other than Trade and
tural Quarry- hold Household Cons- and Commu- Other labourer ing, etc. Industry'Industry truction Commerce nications Service!
".--._"_____' "_-..A.-_...,, ~~~ .----.. ..--......__~
M FMFMFMFMFM F 1\1 F M F
19 20 21 22 23 24 25 26 27 28 29 30 31 32 33 34
83 81 .. .. .. " .. 25 20 .. .. .. " .. 53 44 4 .. " .. .. . . 62 109 10 .. 28 6 .. .. . . .. 9 4 10
.. .. .. .. .. .. .. .. . . .. ..
25 42 3 1 .. .. .. .. .. 4- 2 14- 17 .. .. .. .. .. . . 1 .. 11 14- 14- .. .. .. " .. .. .. 3
,14 27 .. 5 4 .. .. . . . . 2 17 30 1 .. 2 2 .. " .. " .. 1 4
4 2 .. .. .. .. 35 42 .. .. .. .. .. .. . . .,
" .. 4
153 189 45 .. 31 6 ., 10 ·1 6 35 II 8 12 3 .. .. •.. ..
35 36 .. 6 3 1 .. .. .. 3 2 38 46 5 1 7 9 .. .. .. . , 2 .. 3 29 40 13 25 14- .. " .. .. 5 .. 3 2 1:J 22 .. " .. .. .. .. .. ., " .. 5 10
7 7 .. .. " .. '"'
1 26 35 I .. 3 .. .. .. 2
16 13 .. o • 3 2 10 10 .. .. 2 .. 2
14 ]0 ., I "
8 II 3 8 ] 23 13 5 6 2 5 4- 2 10
47 64 1 .. 9 5 .. 18 .. 24- ,. ]9 9 4 ., 2 30 24- " .. .. 2 4-
163 205 7 .. 45 15 ]6 2 ]4 3 2 2 1
36 37 .. < • 2 38 31 3 .. , 1 60 54 3 " 1 2 1 62 77 10 9 2 6 3 6
X
81. Non-workers no. ,.....--.....____..
F M
35 36 {I,
74 103 170 47 81 . 171
116 161 17.2 '213 357 173
174 175
96 130 176 1011 106 17i
32 62 178 41 53 179 96 144 180 5 18 181
91, 92 182
507 709 183 34 31 184 58 65 185 56 52 186 80 118 187 33 40 188 5 12 189
72 102 190
58 114 191 27 46 192
193 194
24- 38 195
131 151 196 125 245 197 306 415 198· 58 98 199 68 112 200
201 284 376 202
17 22 203 53 63 204-53 64 206
115 181 206 95 187 207

76
~~AMAU VILLAGE,
SUBDIVISION
ANCHAL
Occupied residential
houses ,..--....... ____ Tftal num her of persons Literate
No. of e . umerated (including and Serialno. Area No. of house- inmates of institutions Scheduled Scheduled educated (Than~no.) Name of village in acres houses holds and house1ess persons) castes tribes persoll1 •
....... ..------' ,--""'-...,~
P M F M F M F M F 1 2 3 4- 5 6 7 8 9 10 11 12 13 14
REVENUE THANA-PATAN-contd.
Mahuganwan G. P.-concld. ,/
208 (642) Belhara P 634.26 85 101 622 317 305 79 79 59 5 209 (644) Sikni 495.41 210 (645) Pokhri 594.57 11 12 114 51 63 16 27 6 3 9 211 (631) Musikhap L 531.67 118 14i 854 430 424 58 62 70 4 212 (632) Kushha Kajru 274.02 19 23 132 65 67 27 2 213 (633) Hisra 160.09 12 13 52 26 26 3 214 (634) Mahuli 69.52 215 (635) Kajru Khurd P,Oc 374.54 157 195 1,067 542 525 122 113 172 17 216 (636) Kajru Kalan P, O~ 1,107.84 182 201 1,119 530 5&9 163 170 2 4 181 12 217 (637) Pipri 184.32 31 33 213 102 III 45 51 48 7 218 (638) Murumatu or Maruratu 522.99 62 90 526 259 267 56 67 48 4 219 (643) Golpa 595.36 30 39 200 97 103 41 47 6 5 220 (646) Neori 108.88 20 24 154 85 69 23 16 20 1 221 (647) Guasarai 189.74 30 36 194 100 94 16 12 29 '222 (648) Rabra 335.35 50 60 373 183 190 44 2 223 (649) Rabri 138.96 11 14 94 43 51 19 5 224 (650) Ratnag M,Mc 2,564.21 119 151 764 364 400 117 121 61 11
ANCHAL TOTAL •• 144,732.35 12,300 14,983 78,822 39,432 39,390 10,774 10,9531,685 1,6279,639 1,299 or
226'14 sq."nlllea

77
STATISTICS BIHAR
SADAR
]3ISHRAMPUR WOBKEBS
--. I II III IV V VI VII VIII IX X
Manu- Tramport, facturing. Storage:
Agricul- Mining, House- other than Trade and Total workers tural Quarry- hold Household Cons- and Commu- Other 81.
(f-IX) Cultivator labourer ing, etc. Industry Industry truction Commerce nications Services Non-workers no. _.-- ,...----"'" ,...--~ ,...-~ ~ r-~ ~.....--~ ,--~ ,--~
M F M F M F M F M F M F M F M F M F M F M F
15 16 17 18 19 20 21 22 23 24- 25 26 27 28 29 30 31 32 33 34 35 36 1
181 136 122 87 41 46 4 .. 8 2 5 136 169 208 Uninhabited 209 30 24 23 18 7 6 .. .. .. .. .. .. .. 21 39 210
231 145 144 72 47 68 .. 32 4 .. .. .. 1 .. 7 199 279 21I 32 24 25 23 2 1 3 .. .. - .. 1 .. " .. I 33 43 212 15 15 7 10 6 3 2 .. .. .. .. .. .. .. " .. -; . 2 11 11 213 Uninhabited 214 289 149 202 79 50 63 15 .. 12 7 1 .. .. 2 7 253 376 215 304 253 242 192 43 56 8 5 2 1 3 2 2 1 226 336 216 50 37 17 13 19 24 4 " .. ., .. .. .. .. I . . 1 8 52 74- 217 148 153 88 97 34 51 23 5 .. .. .. .. .. .. I 2 III 114- 218 60 53 33 29 22 23 5 1 .. .. .. .. 37 50 219 /45 48 31 37 10 11 3 " .. .. .. .. 1 40 21 220 48 34 39 26 4- 7 2 .. 3 1 52 60 221 96 84- 83 73 ,7 II 4 " 1 .. .. .. 1 87 106 222 25 12 18 10 4 2 3 .. .. . . .. 18 39 223 211 151 160 108 34 39 10 .. 6 4 .. 1 153 249 224
22,232 16,793 12,651 9,589 5'.035 6,051 951 118 748 341 155 12 144 .. 351 '58 525 2 1,672 622 17,200 22,597

PALAMAU
78
Occupied "residential
houses ,----......____, No. of
Serial no. (Thana no.)
Area No. of house-Name of village in acres houses holds
2 3
~EVENUE THANA-PATAN-contd.
I (372) 2 (373) 3 (371-) 4 (375) 5 (376) 6 (377) 7 (378) 8 (379) 9 (380)
TuriacI.ih Birhorwa Kekrabti Rajkheta Kundi1pur Rangeya Kharikdag Chanpi Dhumkhar
10 (381) II (382) 12 (383) 13 (384) 14 (385) 15 (386~
Masuria M c *Karrnahi P Ada'uriya Tilha .. ChaJc P, m,L,Rhc, V,A,H,Mc Jaleya
Surguja Pasiya G. P.
16 (341) Tanrwa .17 (342) Ghirsiri 18 (367) Chunka 19 (368) Patra 20 (369), Nawa 21 (370) Surguja 22 (371) Gat>hganw 23 (387) Urur 24 (388) Pasiya
Me
P, Cc P
P
129.18 241.87
1,189.37 858.63
3,495.52 516.93
1,778.62 278.87 245.23 564.47 571.90
1,600.54 128.66 362.58
74.44
5,146.58 906.38 495.97 135.39 247.64
1,492.77 1,880.13 1,811.09 2,002.55
25 (343) Jaspur 466.36 26 (344) Ghanghri 236.71 27 (345) Rahea 418.15 28 (346) Naudiha 1,416.97 29 (347) Madheya . . 470.37 30 (354) Garhwat Cc 153.66 31 ,(360) Semri P, Cc 913.50 32 (361) Karma alias Tilha 1,382.1 I 33 (362) Tetar 700.81 34 (363) Kusri 438.89 35 (364) Rabda M 262.48 36 (365) Mukta 97.38 37 (366) Dhanibigha 50.07 38 (389) Rihra 164.59 39 (3~(J) Majhoul i 437.72 40 (391) Khaira .. 477.29 41 (392)+*Manatu M,L,RI'C,Hos,A2,Mc,Oc 2,021.69 42 (393) Banasam alia,· Murdhoi .. 53.40-
Paduma G. P.
43 (348) Karaila 44 (349) Bhitdiha 45 (350) Teliyadohar 46 (351) Tetar(lih 47 (352) Pakariadih 48 (353) Tilo 49 (355) Budhandih
P, Ct Cc Ct Ct Ct Mc,Cc P,Mc, Ct, A .•
358.97 49429 203.22 ~536.81 262.87 296.57 33562
4
9 24 71 23 19 14 39 10 26 32
249 9
37 48 37
71 48 14 50
7
5
10 24 71 25 21 16 39 11 31 36
302 19
42 54 38
72 49 14 50 11
59 , 70 22 24 37 45 46 50 20 20 10 11 44 60
8 12 32 38 15 15 40 42
36 38 62 67 16 16 85 85 12 12
30 72 22 42 30 52 46
30 80 22 51 38 61 53
Total number of persons enumerated (including inmates of institutions and houseless persons)
Scheduled castes
P
6
33 '92
304 89 97 48
170 37
134 139
1,317 32
181 Q13 171
324-220
58 237
25
329 123 288 279 87 60
261 48
183 62
__ 198
178 34:1
71 383
70
144 382 95
237 160 287 192
M
7
16 52
156 48 54 31 81 19 67 64
597 14
98 112 84
158 118
33 124 10
165 64
141 133 43 33
133 24
102 3 ..
10,)
93 175 35
2~(j 35
68 20-1: 40 _
-116 76
14U ';)7
F
a
17 40
148 41 43 17 89 J8 67 75
720 18
83
M F
9
16 51 50 18 50
8 24
5 41 37
193
10
17 38 57 IS 40
2 27
4 45 55
206
101 59 56 29 87 30
166 74' 76 31 25 59
102 35 25 33
113 . 76 15
164 59
147 146 H 27
128 24 81 28 93
85 168 36
157 35
76 178 47
121 84
139 95
43 ., 37 10 42 .. 69
2 13 7
44
50 16 20 15 16
41
33 16 43 .. 62
3 9 7
47
48 12 21 11 19
17 20 69 66 26 32 55 60 29 28 82 84 61 ,66
VILLAGE
SUBDI~ISIOl'i
Scheduled tribes
ANCHAL.
Literate \. and
educat~d persons
1\1
11
F M F
14-12 13
1 26 23
14
.. 8
98 43 30
49 76
12 10
.. 2
20 20 .. 7
10
83 38 37
62 68 " 8
15
83 80 26 24-
2 1 93 100 1 1
50 56 20 21 68 53 14 12 6 6
23 12 57 58 7 I;j
36 30
15 47
61 37 48
11 40
56 31 42
1 10
1 9
8 2 4 6
131 2
3 6
'20
39 I .. 9
22 12 13 15 2 8 13 2 7 4
33
3 23
94 1
4 17 1 1 2
20 17
" 1
3:
.,
1
7
9
1·
2 2

79
STATISTICS BlHAR
SADAR
MANATU WORKERS
,..-_________ .-.-.t-......... _
II III IV V VI VII VIII IX X Manu. Transport
facturing Storage Agricul. Minil,lg, House· other than Trade and
Total workers tural Quarry. hold, Household Cons· and Commu. Other SI. (I-IX) Cultivator labouret ing, etc. Industry Industry truction Commerce nications Services N on·workers no.
.,---~ r--~-:...., ,..........__ ~ ... _ ......... __" ,.--".A.., ,--"""-~ ~ ,-..,._____, ,...--""_____' ,..------. M F M F M F M F M F M F M F M F M F M F 1\1 F
l5 16 17 18 19 20 21 22 23 24 25 26 27 28 29 30 31 I
32 33 34- 35 36 t
Uninhabited 1 Uninhabited 2 Uninhabited 3
10 8 8 6 2 2 .. .. .. .. .. .. 6 9 4 33 23 31 22 1 .. .. . . .. .. 1 1 19 17 5 92 48 62 16 27 32 3 .. 64 100 6 30 34 12 11 10 5 7 1 .. .. .. .. .. .. 1 17 18 7 7 31 9 26 6 5 3 .. .. .. .. .. .. . . .. 23 34 B 11 8 7 10 8 .. .. .. - 14 9 9 .. . . .. .. 57 31 39 12 17 19 .. .. .. . . .. .. .. .. .. 1 24 58 10 16 3 10 1 3 2 I .. .. " .. .. .. .. 2 3 15 11 46 32 17 9 23 23 6 .. .. .. . . .. 21 35 12 35 42 28 25 7 17 .. .. .. .. 29 33 13
368 317 206 119 69 171 6 .. 32 14 10 .. 19 5
" 25 8 229 403 14
7 II 5, 7 I 4 1 .. .. .. .. " .. 7 7 15
69 31 54 20 15 11 .. .. .. " .. .. . ( .. 29 52 16 73 58 ,32 21 39 37 2 .. .. .. .. . . 39 43 17 55 50 22 31 27 19 '3 .. .. 1 2 29 37 18
Uninhab~ted " 19 99 92 38 33 56 58 3 I 1 .. 59 74 20 80 58 .. 35 27 31 22 1 1 13 8 .. .. 38 44 21 22 2'1 15 15 , 7 6 .. .. ',' 11 4 22 85 1'5 '18 '10 45 28 2 .. 16 13 .. .. .. .. 2 . . 2 39 62 23
7 (0 4 4 3 6 .. .. .. .. . . .. " .. 3 '5 24-
95 70 75 55 17 15 ,. ., .. 3 70 94 25 30 12 15 4 10 8 .. 1 " " ',' 3 34 47 26 79 46 '47 '17 27 29 1 ,. 1 " .. .. 3 62 101 27 79 77 '39 . 40 36 35 4 " ., 2 " .. " 54 69 28 29 21 7 2 20 18 1 1 .. . , ' . .. 14 23 29 22 ·9 17 8 .. 5 .. .. 1 .. .. , . 11 18 30 81 7S • 53 45 24 31 2 2 .. .. ., \ . ., 1 52 50' 31 15 1-5 .13 1-2 2 3 .. .. .. .. " .. .. 9 9 32 55 43 ·-'38 33 11 10 4 .. 1 , . .. .. .. " "
1 47 38 33 21 1-5 7 -10 6 5 3 .. , . .. .. .. 1 4 13 13 34 73 50 • ·20 27 9 13 3 1 12 9 1 28 32 43 35
Uninhabited 36 Uninhabited 37
59 49 17 20 36 26 5 2 34- 36 38 95 83- ·47 47 33 34 10 .. ',' 1 1 2 2 80 85 39 24 4- .-10 14 4 .. .. 11 32 40
161 '_', 42 · .33 13 36 24 19 " 10 3 1 .. .. .. 10 1 ' 1 51 65 115 41 22 10 11 3 6 5 5 2 13 25' 42
38 40 rt;W 28 12 12 6 .. .', ' .. 30 36 43 124 98 76 66 26 30 17 2 1 3 ., 80 80 44 34 31 ··28 27 4 4 2 , . .. .14- 16 45 82 85 .. 55 .51 25 34 1 .. ... .. " 1 34 36 46 ).
52 53 42 45 4 8 6 " .. .. ' .. 24 31 47 95 90 92 90 2 .. .. .. .. 1 53 49 48
. 58 : 512· .37 33 20 19 1 39 43 49

PALAMAU VILLAGE
SUBDIVISION
ANCHAL.
Occupied resid ential
hoUies ,.--.'-----. Total number of persons Literate
No. of enumerated (including and Serial DO. Area No. of house- iDmat~ of ilUtituti0ll9 Scheduled Scheduled educated
(Thana no.) Name of village in acres hoUies bolds and bouseless pcrsolU) castes tribes penonJ ....---"----. .......--"-~
P M F M F M 'F M F
2 3 5 6 7 8 9 10 11 12 13 14-
REVENUE T.FIANA-PATAN-rontd.
50 (356) Kairadih Cc 228.32 11 13 59 31 28 7 5 24 23 51 (357) Pannadih 115.08 36 45 212 109 103 66 73 " " 10 52 (358) Jagirha 303.60 28 30 119 71 48 44 35 8 2
" 4 Z
53 (359) Bhit Kila 478.47 26 26 132 70 62 4 3 34 39 5 1 54 (406) Dewdih 844.56 37 37 181 97 84- 43 41 7 11 24 55 (407) +Paduma L, C,Cc,Oc .. 1,369.51 72 80 359 182 177 43 25 1 3 43 2 56 (408) Abduldih 263.62 4 4 17 9 II 2 1 3 3 57 (409) Bhainsa Sur Cc 673.11 35 49 224 109 115 16 10 59 51
.. II
f Sugi G. P.
58 (411) Chopea 18.81
59 (.412) Saraidih P 149.04 38 48 169 92 77 .. 15 1 60 (416) Gogda 124.47 48 61 277 135 142 4 28 1 61 (417) Tiraundha Me 211.41 55 71 354 174 130 15 13 34 3 62 (422) Lohraya 4.98 63 (423) Chilho 210.25 15 IS 80 41 39 5 6 II 4 64 (424) Bha1ugari P,Oc 501.51 109 122 568 264 304- 94 81 55 5 65 (425) Tariya Oe 873.52 148 168 738 357 331 228 242 106 5 66 (426) Jagudih 19.40 67 (427) Selari P 1,905.35 70 89 460 252 208 29 23 71 9 68 (428) De1ha P 972.40 87 107 538 291 247 80 70 81 6 69 (429) Chhaknadih 289.54 49 59 276 140 136 50 64 57 5 70 (430) Kusaldih Oc 60.15 12 IS 51 22 29 5 4 9 2 71 (432) Barkoma 356.06 52 52 273 138 135 135 129 16 72 (#4) Biraundha 1l~78 73 (#5) Mahari P 374.27 41 58 245 126 119 60 3-74 (446) Matpurhi 78.50 54 62 309 158 151 27
75 (431) Udaipura P 399.47 120 134 646 322 324 217 194 74 2 76 (433) Nawadih 134.81 38 41 214 112 102 29 28 1 15 77 (434) Bedani Khurd P 113.21 41 48 258 120 138 90 101 39 5 78 (435) Bishunpur 276.33 7 9 42 20 22 6 7 5 1 79 (436) Misir patra 220.72 11 II 56 29 27 9 2 80 (437) Ojha Patra 340.38 6 6 24 12 12 6 10 1 81 (438 J + Tarkasi P,M,h,L,A 518.20 210 253 11263 653 610 272 263 241 47 82 (439) Budhu Chak 11.81 83 (440) Sinduriya 13.83 84 (#1) Bara 48.91 13 14 53 31 22 22 9 85 (#2) Bedani Kalan L,Oc 22.19 66 79 438 209 229 18 13 96 30 86 (443) Seyum Bedani 16.79 7 7 56 27 29 14 5
Sugi G. P.-contd.
87 (410) ·Senoti Rhc 1,272.18 85 114 495 260 235 10 12 11 9 61 13 88 ~413) Barah Kaurw 22.75 89 414) Pakri P 237.77 121 135 593 275 318 28 44- 109 16 90 (415) Tirwa 48.66 5 9 23 ~ 14 7 2 91 (418? Gharo 39.08 92 (419 Basdewa 45.38 ~3 (420) Jburha 6.30 4 4 16 9 7 8 4 <4'

81
STATISTICS BIHAR.
SADAR
MANATU WOBJI:BBB
~----------------.-------------~--------------------------~ I II III IV V VI VII VIII IX X
Manu- Transport, facturing Storage
Agricul- Mining, House- other than Trade and tural Quarry- hold Household Cons- and C'ommu- Other 81.,
labourer ing, etc. Industry Industry truction Commerce ,nicatiollS &_ctvices Non-workers no. TOtal workers '
(I-IX) Cultivator
...--------' ,..-~ ,..-"---.. ,--"-.... ,..-......__,',--"-.... ,..-......__, ,..-...... ..., ,..---"'____' ,.--~.._, ,..-...____. M F M F M F M F M F M F M }' M F M F M F M F
15 16 17 18 19 20 21 22 23 24 25 26 27 28 29 30 31 32 33 34 35 36
17 20 13 15 4 5 .. .. .. .. . . .. .. .. .14 8 50 59 55 45 40 13 15 .. .. .. .. .. .. I 50 48 51 35 28 11 7 24 20 .. .. 36 20 52 40 32 39 32 I .. 30 30 53 55 53 26 27 24 26 2 .. 3 42 31 54
III 78 57 47 26 25 6 .. 8 4- 1 .. 5 1 1 7 71 99 55 6 4 2 3 2 1 2 .. .. .. 3 4 .56
68 53 57 41 7 9 4 3 -.. .. .. .. 41 62 57
Uninhabited 58
60 49 32 8 28 41 .. .. .. .. .. .. .. 32 28 5~ 80 76 55 38 25 34 ' .. .. .. . . .. " 4 55 66 60 87 93 71 44 14- 49 1 .. .. .. .. . . .. .. 1 87 87 61
Uninhabited 62 25 13 14 2 9 11 2 .. .. .. 16 26 63
143 176 116 125 23 48 2 3 1 .. .. 1 121 128 64 209 '207 165 119 36 71 7 " " 10 " " .. .. ',' 7 1 f48 174 65
Uninhabited 66 145 71 ll6 56 11 12 11 2 3 .. .. .. .. '., 4 1 107 137 67 151 82 107 53 22 10 8 " . , " " .. .. 14 19 140 165 6~
.. 77 54 58 35 16 18 " 1 .. .. .. .. 3 63 82 69 10 12 8 10 2 2 ., .. .. .. .. .. .. .. 12 17 70 74 47 65 25 9 22 '. ., .. .. .. .. .. .. .. 64 88 71
Uninhabited 72 60 52 56 46 4 6 .. " '. .. .. .. .. 66 67 73 73 59 60 57 1 1 5 1 1 .. 1 5 85 92 74:
198 188 106 100 10 25 14 10 .. .. .. .. 58 63 124 136 75 60 63 40 38 " 3 2 3 .. .. .. .. I .. 17 19 52 39 76 62 61 40 .f4 13 15 2 2 .. .. .. .. .. .. 1 6 58 77- 77 14 9 9 5 4 4 I 6 13 78 18 11 15 8 1 1 1 ~ 11 11 16 79 10 7 8 6 1 .. .. 1 ' 1 2 5 80
323 183 121 62 61 87 1 .. 47 19 4 1 .. 54 ,. 2 32 15 330 427 81 Uninhabited 82 Uninhabited 83
16 7 5 7 1 .. .. .. 1 . . 9 15 15 8~ 111 46 6~ 31 16 7 I .. 6 4 J • 15 ,. 9 4 98 183 85 13 4 1 .. 6 .. 2 14- 29 86
165 137 99 81 46 54 II .. 2 .. .. ... .. 6 2 95 98 87 Uninhabited 88
166 155 125 120 6 10 8 2 4 3 5 3 IS 17 109 163 89 4- 1 3 1 5 13 99
Uninhabited 91 Uninhabited
4- 5 2 3 .. .. 92 .. .. 2 5 2 93 P-II-l1

82
PALAMAY VILLAGE
SUBDIVISION
ANCIlAL
Occupied rClidential
houses -""'----' Total number orpersOlU Literate
Serial no. No. of enumerated (including and
Area No. of house- inmates of institution. Scheduled Scheduled O'iucated (Thana no.) Name ofviUage in acres houses holds and homeless person,) castes tribes persons
,.....-~ ,.--.A.-~ ,.--~--.
P M F M F M F M F
2 3 4- 5 6 7 8 9 10 II 12 13 14-
REVENUE THANA-PATAN-eontd.
94- (421) Bagahi P 14.77 24 27 147 70 77 .. .. ,'13 4 95 (447) Te1diha 37.40 25 30 137 71 66 8 6 18 2 96 (448) Arka P 113.68 102 lOB 6B6 347 339 11 B 119 15 97 (449) Bariatu 220.57 2 2 • 9 3 6 2 98 (450) Chaura 55.40 26 26 133 68 65 31 99 (451) Sugi Me 194.48 '84 '99 492 259 233 34 12 4 I 39
'100 (452) Arakanda 85.92 5 5 '26 • 12 14 5 101 (453) Makundpur 129:67 102 (457) Sikni 461.50 43 46 218 91 127 32 2
103 (454) Bhanrra 83.28 21 27 121 65 56 39 34 19 104 (455) Bharri P.L, V4,Hos 169.39 25 37 191 99 92 17 15 57 105 (456) Gurha K,m,C,Mc .. 688.73 12B 128 592 275 317 67 92
19 75 25
106 (458) Dhuma 432.60 56 70 358 178 180 77 78
107 (460) Siri Kedal p,p 71.06 28 69 47 2
33 129 60 .. 29 2 108 (461) Bharathpur L, C 428.21 46 52 261 138 123 81 72 35 8 109 (462) Parsain C 127.49 36 46 223 104 119 .. 36 4 110 (463) parsawan P, C2 206.87 61 75 332 162 170 8 12 8il 12 III (464.) Majhganwan C2 239.64 66 80 372 184 188 12 8 68 4
112 (405) Pachrukhiya 924.50 4 6 28 17 11 5 3 11 8 2 113 (459) Kamal Keriya 2,378.50 55 61 283 141 142 34 26 38 3 114 (465) Majhauli 354.30 45 61 328 177 151 79 70 25
115 (466) Mayapur 102.86 116 (467) Dhangaon 102.24 30 35 206 101 105 15 15 .. 59 6
117 (468) Lalgara P, Me 950.09 58 75 362 181 181 59 68 25 29 37
11B (469) Bhal Manda 115.92 119 (470) +Mahudant K 115.08 26 .29 152 12 80 11 9 21 2
120 (471) Gurturi P 407.50 .71 88 437 223 214 70 72 35 6
121 (472) Kumhradih P 197.97 14 16 47 26 21 7 4 9
122 (473) Patila 260.53 67 76 367 177 190 43 61 38 3
123 (474) PathakP51gar P,Me 431.56 113 134 695 360 335 44- 50 96 5
124 (475) Bajalpur P 1,659.06 88 125 619 302 317 29 18 50 72 82
125 (403) Bansi Khurd P 1,974.23 61 70 274 149 125 72 64 3 1 38
126 (404) Kasha 1,304.69 • 4 4 14 8 6 .. S 6
127 (476) Sildiliya Khurd 2,136.24 38 49- 194 94 100 70 76 18 4
128 (477) Gauhi 248.50 69 86 498 254 244 196 189 20 20 55 2
129 (478) Gaurwatanr 501.86
130 (479) Sildiliya Kalan P 2,133.79 151 186 863 437 426 2.10 200 12 18 109 12
131 (481) Kosiara 337.10 9 10 38 18 20 2 4
132 (480) Dundu 208.99 33 50 239 123 116 8 4 17
133 (482) Khichariya 323.82 39 45 247 117 130 30 28 23 : 134 (483) Dhobdiha 74.09 1 I 7 3 4 3 4
'135 (484) Bahorna 32.02 31 "83
136 (485) Koiriadih 60.38 38 175 92 3 3 " 28
137 (486) Sonpura M,G .. 914.28 161 186 973 496 477 93 83 1 103 II
138 (487) Gulalpur 9M2
139 (488) Majhganwan 168.17 16 16 110 44 66 24- 1 :
140 l489) +Baliari Hos 173.44 30 38 237 114 123 47 48 33 1:
141 490) Naugar 395.26 71 ~ 83 472 237 235 .61 58 41
142 (491) Nawa. P,Me 1,454.08 57 64 367 179 188 35 42 26

83
:STATISTICS
SADAR
.MANATU WOBIEB8
------------------------~------------------~--------------~ I II III IV V VI VII
Manuf~turiDg
Agrieul- Mining, Houae- other than Trade Total workers
(I-IX) Cultivator tural Quarry- hold Household Com- and
la bouler ing, etc. Industry Industry tructiOll Commerce
M
15
40 38
185 3
32 144
7
53
34 41
136 89 31 72 65 96 99
13 74 79
54 96
36 128
11 106 202 173
91 6
64 131
247 13
64 57
1
53 262
19 59
129 106
,.....--...--- .....--"---> ,...:---. ,..---., ~ ,..---.,
F
16
F M F M F M F M F 'Nf F N{ F
17 18 19 20 21 22 23 24 25 26 27 28 29 30
12 37 25 2C 49 125
2 9 23
100 71 5 5
Uninhabited 48 46
23 20 87 64
8 37 44 55 74
12 25 63 75 25 34 53 76 79
9 14 28
3 40 5
46
7 6
35 43 7 5
35 38 56
3 9 9 I
55 2
15 9
41 4 I
29 7
13 13
5 8 4 4 43 52 26 21 50 66 38 13
Uninhabited 25 37 16 11
104 65 81 21 UninhahilFd 45 27 33 4 80 77 44 48 10 10 6 1· 78 60 29 35
160 114 104 23 98 121 60 46
49 56 14 33 3 3 6
40 34 8 21 119 102 96 28 Uninhabited
82 206 48 29 12 II 10 2
68 55 47 43
2 •• Uninhabited
19 50 91 183
Uninhabited 12 12 34 18 90 '66 66 62
59 39
19 35
4-11 47 37
8 11 1
52'
4 21 36 42
3 9
II 2, 1
II I 8 " :: :: . i' .. I .. .. 24 3
I 49
2 .. 7 5
., '0 ••••••••
.. .. .. 2 .. 4 1 .. .. .. I ..
I ..
12 3 .. •••• 0, 7
48 11
7 449 ...... 1 .. 8 ....... . I ................ ..
28 2 ...... .. 2 •. 3 .. I
II 16
3 3 2 .. .. .... 3.. I I ........
I 1 .. .. .... .. 17 .................. .. 12 ., ............ ..
8 4 .. 22 .. .. 10 I ..
10 I .. 4 2 .. .. .. .. .. .. 36 3 .. .. .. .. .. .. ..
'I- ..
43 1 .. 9 5 .. 31 II 38 23 .. 27 5 11
35
32 23
.......... 7 .. I ..
33 I .. 2 ..
9 6 2 ..
.. 49 II 2
7 1
2
1 .. 2 ..
1 ...... 7 2
22 6 .. 6
.. 5 1
1 ..
•• J'
•• '0 ••
4 2
•• " •• '0
2 30 7 .. 5 28 ..
4 1
.. .. .. 3 1 2 ..
VIn Transport,
Storage and
Communications
~
IX
Other services
F Nf F
31 32 33 34
2
2
4 8 .. 5 5
5
4 7 9 2 4 6 3 I 3
2
1 9 1
.. 2
8
2 5
2 6
12
1 5
5 6
2
3 7
10 1 4 5 4 1
2
I
1 1 8
BIHAR.
X
Sl. Non-work en
r--"----
no.
1\1
35
30 33
162
36 115
5
38
31 58
139 89 29 66 39 66 85
4-67 98
47 85
36 95 15 71
158 129
58 2
30 123
190 5
59 60
2
30 234
25 55
108 73
F
36
65 41
290 6
56 133
9
79
33 72
230 116 61 86 75
115 114
9:1-95 96 97 98 99
100 101 102
103 104 105 , 106 107 108 109 lIO III
6 112 99 113
101 114 lIS
80' 116 77 117
118 35 q9
134 120 II 121
112 122 175 123 219 124
76 125 3 126
60 127 125 128
129 344 130
8 131
48 132 83 133
2 134 ]35
73 136 386 137
]3S 54 I3g 89 14()
145 14} 122 142

84
,PALAMAU VILIAG:
SUBDIVISIOj
ANCBAl
Occupied residential
houses ,..--~ Total number ofpersons Literate
No. of enumerated. (includjng and Serialno. Area No. of house- inmates of institutions. Schedule9 Scheduled educated
(Thana no.) Name ofvillage in acres houses holds and houseless persons) castes tribes persOnt ..A.-_ ____, r---..._ ..... ,..-""____'
p M F M F M F M F
1 2 3 4 5 6 7 B 9 10 11 12 13 14
REVENUE THANA-~ATAN-conclo'.
Baliari G. P.-coneld.
143 fJ.96) Pashar 2 I 1.96 65 73 373 182 191 51 qI 3 5 42 2 144 497j Tanrwa 134.89 50 60 338 'I6B 170 13 13 73 14 145 (49B Chbatarpur P, Me 498.25 80 100 552 260 292 103 92 95 38 14-6 (499) Kasiyadih 20.55 14 18 66 29 37 5 8 6 .. 147 (500) Parpain 22.31 38 46 222 117 105 48 40 17 1
148 (492) Chaita 394.56 8 8 53 22 31 IB 29 B 1 149 (493) Samgarh 542.31 30 41 1BB 88 100 32 34 22 2 150 (494) Karma 118.24 3 3 7 3 4 .. ..
" 151 (495) Kasmar P, C, Ce 1,320.95 213 234 1,067 551 516 230 218 21 22 120 IS 152 (501) Bagla 848.42 18 20 86 47 39 40 37 2 153 (502) Selari 231.66 154 (503) Sinjo P, L, V 654:56 33 39 199 91 lOB 26 18 S3 2S 155 (504). Mahuari 250.55 25 25 122 59 63 32 34 15 3 156 (505) Chhechani 383.22 32 34 133 64 69 30 34 18 3
157 (506) Udaipur P,L,Mc .. 1,050:35 110 157 609 286 323 74 90 7 9 70 8 158 (507) Jaidu 473.B6 24 34 170 81 89 45 51 I 15 I 159 (508) Gardu P 147.24 19 29 129 69 60 57 49 10 160 (509) Janl.uniadih 60.18 20 21 I18 59 59 51 52 6 I 161 (510) Ta-l 293.89 41 55 255 136 119 45 34 7 162 (511) Demugara 680.12 163 (513) Jhumri 370.21 5 7 33 IS 18 15 14 .. '64 (514) Chiri Kalan 300.18 13 13 44 23 21 17 17 I 165 (527) Goindi P 3,189.84 ll8 125 704 339 365 IDS 112 67 67 36 3 166 (528) Purnahindiya 265.33 4 5 23 10 13 1 3 .. 167 (529) Hindiya 89.72 9 1(\ 81 39 42 4- 6 6 168 (535) Binaika 232.94- 38 55 255 133 122 26 29 17
109 (512) Chirikhurd 925.65 28 28 120 65 55 13 II
170 (515) Jaspur P 3,483.32 34 34 157 86 71 23 20 29 24 1 171 (516) Mitar 700.79 30 30 121 63 58 2 4 36 43 4 172 (517) Bohe 1,495.27 14 15 63 33 30 10 9 13 5 .. 173 (518) Garwat 541.63 32 33 153 75 78 70 76 1 174 (519) Karma P 602.64 36 36 144 67 77 67 77- II I 175 (520) Karwat 462.96 176 (521) Jhanti 760.65 21 21 \74 42 32 36 5 3 5
177 (522) Purnadih 441. 70 17 17 57 28 29 22 26
178 (523~ Apti 327.18 12 12 38 21 17 5 4 16 12
179 (524 Korda 830.91
IBO (525) Baskatia 700.05 181 (526) Sildag 1,223 .. 02. 4 4 27 16 11 16 11
IB2 "(394) Kedal 9,126.29 49 49 229 119 110 118 109
\l~~ (395) Morainia 70.23 184- (396) Sikda 296.25 3 3 19 10 9
185 (397) Nagad C 1,569.05 22 22 98 49 49 IS 14 25 27 2
l86 (398) Bisranw 2,180.72 22 22 96 51 45 14 12 14 15 1 .. 187 (399) Bhitiahi 1,262.75
27 27 llO 61 49 24 24 'l2 10 5 188 (400) Sikni ),374.45 .. 189 (401) Datdalia C 762.26 23 23 82 43 39 8 8 22 21 5 2
2,550.30 65 ~6 313 156 157 104 95 6 8 13 190 (402) Dumri P, Me
ANCHAL TOTAL 115,804.18 7,005 8,133 38,586 19,365 19,221 6,151 6,018 1,764 1,686 4,308 596 or

85
:STA'tISTICS
:SADAR
MANATU WOBltlmS
r----------------------------------'----
Total workers (I-IX)
I
Cultivator
II
Agricul. tural
I~b<?urer
III IV V VI VII VIII Manu- Transport,
facturing Storage Mining, House· otheithan Trade and Quarry. hold Household COOl· and Commu. ,jng, etc. Industry Industrytruedon Commerce nications
IX
'Other ServicCl
F M F M
15
F
16
M
17
F
18
M F MFMFMFMFMF M
19 20 21 22 23 24 25 26 27 28 29 30 31 lI2 33 34
103 91
137 18 76
12 58
2 296 30
49 38 43
166 50 33 '33 77
9 Ib
211 7
21 79
40 52 39 18 53 48
31 20 16
. 9
68
6 26 27
34 23 89
80 44'
ll2 16 51
65 S)! 68 18 70
...
49 33 35 14 47
28 8
63·
15 2 3
2
9 36 56 H 28
3 2 3 328 17,5 201 "99
29 21 .. 1 Uninhabited 29' 28 6 15 30 29 15 9
2b 38 20 12.
131 li7 76 26 26, 11 2 24 14 23 1 10 26' 14 1 17 63 56 46 19
Uninhabited 9 9
11 4 2 10 197, 121 106 75
7. .4 2 2 25 .18 17 3 12 5,6 3 21
31 9 40 16 31. 25 18 16 44 51 53 46
Uninhabited 18 19 17 7 12 II
Uninhabited' Uninhabited'
5· 5
3" 56 Uninhabited'
6 22
.. 13 ,UninJrabited •
14 2 9
15 43
10 18 19 '28 24 8 14 1 42 1 47 2
13 3 4 11 8 1
3 3
2
2
II
2 14
18 13 32
29 4.. 2 2 .. 11 76 5 1 ..
2 , ......... 4 .. .. .. .. 1
·12 28 ~2 ..
.0 ' ••• 0_
12 J 12 1 7 5 ...... 26 1 "
22 2 15 .. " .... 26 .. ,.. 2
49 24 13 25 17
9
4 .. 3 "
6 6 ..
...... 1 , I 2 ......
9 1 84 7 4 5 3
.. .. .. 1 ..
...... 10 ..
1 .. 5.. 1 ............ .. 6 2 .. 9 2 ..
16 13 5 " .. .. 17 8 4 .. ."", 6 5 .. " 4.. , .....
5
3 5 13 2 2 2 ..
2
1 ..
.0 ••• 0
2 ..
...... I ..
1 ..
8 15 ....
1
2
3
4 .1 I
3
3
4
1
9 2'
1
1 2-'
4
2
2 1 5
2
,
X
51. Non-workers 110.
M
35
79 77
123 11 41
II
36
III 126 180
21 54
143 14!-145 146 147
10 16 148 3D 44 149
1 .1 150 255 188 151
17 12 152 153
42 I 79 154 21 33 155 21 31 156
120 31 36 26 59
6 7
128 3
18 54
25 34 24 15
'22 19
II 8 5
7
51
4 23. 24
27 .20 67
192 157 63 158 46 159 33 160 56 161
162 9 163
10 164 168 165
6 166 17 167
110 168
24 169 31 170 27 171 12 172 34 173 24 174
175 14 176 12 177
5 178 179 180
6 181
107
9 49 45
49 37
142
182 183 184 185 186 187 188 189 190
11,0~7 7.928 6,956 4,544 2,667 2,858 382 37 34D 205. 43 1 2 .. 182 34 22 503 249 8,268 11,293

8~
PALAMAU VILLAGE
SUBDIVISION
ANCHAL.
Occupied residential
houses ,.---.....____.., Total number ofpersons Literate
No. of enumerated (including and Senalno. Area No. of house- inmates of institutions Schednled Scheduled educated
(Tbana no.) Name of village in acres houses holds and bouselesa persons) castes tribes penons
P M F 1tI F 1tI F M F
2 3 4 5 6 7 8 9 10 11 12 13 14--
REVENUE THANA-HUSSAINABAD·
Pansa Ranidewa G P.
I (260) Koiriadib C, Cr 117.39 47 55 297 142 155 9 5 48 4-·2 (261) Adha\Jra 766.74 36 38 220 108 112 35 25 ":"
36 12 3 (262) +Pansa P3,L,H2,Cc .. 2,147.29 180 229 1,312 p89 623 135 119 217 35 4 (263) Checbatia 301.29 8 8 34 15 19 3 3 6 5 5 (264) Rajwandha ~49.38 26 35 199 111 88 ' SO 2·0 16 2 6 (265) Ranidewa p 594.22 90 97 707 384 323 39 37 165 9 7 (2fi6) Kahra Kalan P 628.32 99 116 77,8 375 403 84 87 95 7 8 (268) Kuar Khap 105.96
9 (269) Khat Khol 196.50 2 2 12 7 5' 7 5 10 (270) Rambandh P,L,H 417.54 67 80 466 213 253 28 35
.. 64 9·
Il f271) Tendua Kalan 186.32 9 11 93 48 45 13" 6 12 272) Dhawaipura 124.00 13 (273) Ranadih 186.13 45 54 332 167 165 80 92 40 9-14 (278) Pad::pokhri 264.58 5 6 32 16 16 16 16
15 (279) Bhagra P, H 252.49 28 31 196 104 92 3,0 29 22 ..
16 (292) Duba 294.77 49 53 263 139 124 2
17 (293) Koshiara BJ L, Me 335.43 79 79 523 269 254 100 91 ". 52 11
45 13 18 (294) Baldihri 277.81 49 53 269 133 136 7 4 43 6 19 (296) Tara 432.11 45 48 306 159 147 76 74 41 12
Sonbarsa G. P.
20 f74) Gajihehra P 600.34 57 80 495 231 264 95 107 57 21 27.'» Saharbehra 414.94 23 35 251 117 134 8 10 13-
22 (276) Birdhaur 793.88 91 96 540 263 277, 36 31 62 3
23 (277) Dali 464.84 49 58 339 173 166 121 118 75 1
24 (280) Gajrahi 69.46 1 1 13 5 8 5 8 29 3
25 (281) RasuIpur 277.73 13 15 98 50 48 4 5 3 26 (523) Mali Cc5 151.47 43 46 277 138 139 67 68 "
27 (524) Latpauri Me 365.18 58 74 540 260 280 99 101 37 4
28 (525) KoIhua Sonbarsa P2 1,181.71 107 \34 '806 409 397 96 99 38 2
109 7
29 (282) Sabanwa V 241.79 62 74 391 195 196 13 7 44-30 (283) Patkhoulia 165.40 18 21 137 76 61 16 18 7
31 (284) Tend.ua Khurd 150.82 19 19 1 IS 53 60 21 20 .. 20 2 I 15
32 (291) Jhari p 329.37 52 63 335 163 -172" 40 33 38 2
33 (521) Kararia 204.49 43 54 267 121 146 .. 16 12 14 26
34 (285) Barwadih 160.99 63 80 424 203 221 74 74 5
35 (286) Panti P,M 169.07 48 51 377 187 190 86 86 35 2
36 (287) Mokhar Khurd 79.67 1 2· 7 3 4 3 4 42 a
37 (288) Batau Khap 47.94 1 1 6 3 3 I 38 (519) Bhi tarpanti 242.94 27 29 179 83 96 33 35
39 (520) Bardanda 343.16 43 56 375 184 191 44 32 5 ..
40 (522) Kewalpura 82.42 12 19 82 41 41 30 26 34 9
41 (530) Bhali P 258.81 62 85 478 236 242 30 23 ..
42 (531) Gonradih Ce3, V,H 349.20 68 93 468 227 241 110 101 47 28
43 (532) Gangapur aliaS Lankasur 255.06 34 9
44 (533) Bataua K 295.93 56 70 409 196 213 90 89 32 9
Mohammadganj G. P.
45 (526~ poto 200.05 7 8 62 33 29 33 29 1
46 (527 Bhajania 735.85 178 229 1,325 656 669 141 14! 9 5 179 .. 40
47 (528) Asiknagar alias Kardanda 334.84 49 57 319 162 157 35 33 68 88 24 6

87
'S TATISTICS
:SA DAR
HUS SAINABAD WOaltltB8 - --------------~---------~------~~-------------------------~
Total workers (I-IX) ~ .. _""--.....
I II
Agricultural
Cultivator labourer
...--~ ~ .....
III IV V VI VII VIII Manu- Transport.
racturing Storage Mining, House.. other than Trade and Quarry- hold H9useho1d Coru-o and Commu .. ing, etc. Industry Industry truction Commerce nications ~---. ,-.........__, ..---~, _'" ,.......,..._.. .----_
M-
15
F
16
K{
17
F
18
M F M. F M F M F M F l\'II F M: F
19 20· 21 22 23 24 25 26 27 28 29 30 31 32
75 51 • 45 7 38 2 6 9 11 5 63 28 22 34 28 5 2
'330 157 155 25 81 90 17 27 34 21 3 2 1 II • -3 9 2 3 64 39 32 28 39 1 1 1
168 2.4 63 2 3 28 37 2 6 9 178 99 49 3 44 94 34 22 2 4 5 . i'
Uninhabited
4 2 2 92 4 50 38 4 23 16 • 13- 10 16
Uninhabited 88 58 28 2 52 56 2
9 1 6 1 3 , ,
57 4 39 3 18 1 .. 67 6 31 1 23 5 8
138 30 37 1 76 28 5 5 3 , , 63 10 35 4 25 6 2 84 22 56 2
128 66 :~ 17 48 45 4- 4 2 62 9 1 7 8
132 33 63 1 6 2 5 8 4 6 15 ~ 6 91 61 45 10 P 51 5 4 30
3 1 1 1 14 . 12 2 61 9 26 4 4 3 3 1 1 22
122 11 75 6 13 5 1 33 194 99 118 6 64 90 2 3 1 2 96 1 53 15 4 6 1 4 2 37 1 '9 1 28 30 9 21 91 -s 34 2 46 3 3 1 58 l' 26 10 9 3 1 1 1 96 51 45 31 48 6 4 1 2 5 2 " , 99 7~ 29 8 '42 46 10 5 6 6 1
2 3 1 1 1 2 1 1
52 39 18 15 19 19 13 2 4 84- 1'4 • '47 Ii 16 3 2 13 3 2 25 8 10 2
127 40 61 4 24 20 3 7 1 I 2 126 73 ·"73 22 '16 46 8 l8 2 3 1 1
Uninhabittd .111 32 50 4 36 26 17 2 1
22 16 11 4 8 9 1 3 2 323 138 ·1-22 27 ·70 46 36 15 35 4- 3 37 22 4-
•• 96 so. .64- 4 16 29 8 42 7 3 .,
IX
Other Services
.---"""'---'
NI
33
1
25
1 25 19
4
6
5 12
I 4
4 1
23 1
5 I
7
12'
4' 8 3
11
1 15 27
7
6
31 1
F
34
2
5
17
24
8
6 16
2
8 2
X
Non-workers ...---_ M
35
67 45
359 4
47 216 197
3 121 25
79 7
47 72
131 70 75
103 55
131 82 2
36 77
138 215 99 39 23 72 63
107 88
1 2
31 100 16
109 101
85
11 833 66
F
36
104 84
466 16 49
299 304
5 249 29
107 15 88
118 224 126 147
198 125 264 1 5
8 48
130 269 298 195 60 60
169 145 170 117
1 3
57 177 33
202 168
181
13 531
77
BIHAQ
Sl. no.
1
I 2 -3 4 5 6 7 8
9 10 11 12 13 14 15 16 17 18 19
20 21 22 23 24 25 26 27 28 29 30 31 32 33 34 35 36 37 38 39 40 41 42 43 44
45 40 47

88
PALAMAU VILLAGE . . SUBDIVISION
ANCHAIJ.
Occupied residential
houses ,..--""'_ ___ Total number ofpersons Literate No. of enumerated (including and
Serial no. Area No. of house- inmates of institutions Scheduled Scheduled educate!) (Thana no.) Name of village 'in acres bouses holds and houseless persons) castes tribes persons
,----- _......._-----. ,..--.....___.. ...---.... _,_" ...---_,__ ...... P M F M F Nt F M F
2 3 4 5 6 7 8 9 10 11 12 13 14-
R.EVENUE THANA-HUSSAINABAD-contd.
Mohammadganj G. P.-concld.
.48 (529) Piprabandh alias Basariadohar 165.58 9 10 60 32 28 27 26 49 (534) Hathidaha 1,726.95 50 (535) Mohsinnagar alios Mohammad- 4,534.~9 236 283. 1,596 843 753 301 287 192 22-
ganj M, H2 51 (505,) Bharuhi 59.05 1 I 3 1 2 1 2 .. 52 (506) Mahur 1,164.67 14 30 119 64 55 38 39 2 53 (507) S'itachuan 529.45 54 (536) Jbarha 405.77 55 (537) Kadal Kurmi P 2,607.08 166 207 1,017 496 521 182 199 12 13 128 17
56 (289) Hemja P,..:! 208.03 38 45 315 150 165 38 38 62 28. 57 (305) Baharpura 192.67 In 24 134 56 78 12 15 20 3 58 (306) Mukhar Kalan P,m 512.71 123 733 360 373 93 82 134 48 59 (307) Nokhila Cc3 173.10 49 55 257 118 139 62 65 17 S-60 (308) Kunrwa Khurd Cc5 337.00 73 87 490 252 238 27 27 31 . a. 61 (309) Loharpurwa 246.75 63 73 493 235 258 28 35 70 7 62 (Ii 18) Singhna P 1,665.61 65 68 425 218 207 95 92 51 25
Pataria Soba G. P.
63 (310) Imamnagar alios Barewa .. 607.94 129 138 806 422 384 146 121 50 5 64 (314) Jamua Kala Cc 103.74 17 17 94 52 42 25 28 8 65 (316) Golhna 130.04. 14 15 III 61 50 10 13 30 2-66 (508) Nasojamalpur 471.49 12 12 47 22 25 21 24 1 67 (509) Dudhia 1,078.38 68 (510) Semar Khar 937.03 69 (514~ Pataria P 852.50 llO 116 787 397 390 239 236 95 16
·70 (515 Soba P,Cc,H 1,146.72 66 74 444 218 226 89 100 49 8' 71 (516) Bhadua 572,94 46 55 313 152 161 73 72 27 1 72 (517) Kahugarh 543.'14
73 (290,) Itwa . . 459.03 23 23 159 93 66 65 36 18 74 (303) tt"'Haidar Nagar P3,M,h,K.L,Mc, 1,432.54 749 833 5,052 2,701 2,351 458 359 22 26 900 201
ic,A,3,V2,H3;Hos 103 52 38 75 (304) Khardiha 143.09 2'7 34 178 75 22 4-
76 (311) Barwadih J34.22 30 34 214 106 108 63 60 30 77 (312) +Babhandih 200.58 -97 97 '555, 252 303 59 73 47 11 78 (313) Jamua Khurd 76.57 3 3 18 10 8 3 4 2 79 (315) Ratanbigha 114.51 47 51 349 180 169 42 42 14 a·
Parta Kharga.ra O. P.
80 (267) +Kabra KhUrd P, H 650.84 63 87 511 237 274 43 47 57 21 81 (295) Khargara P, H 749.80 117 131 797 390 407 67 75 125 14 82 (297~ parta Cc,P,H .. 2,160.56 119 126 798 391 407 60 55 131 13 83 (298) Sajwan Salempur 761.19 82 86 662 315 347 23 23 '52 84 (299) Checharia Kalan P 336.24 62 64 419 213 206 98 83 44 13
D'oria G. "P. , 85 (331)1 Sonpurwa 1,246.38 103 113 837 428 409 49 44 . 79 86 (332) Araji Majuraha 10.32 87 (333) Deod Khurd H2 1,131.48 123 170 1,107 585 522 32 30 .;. 167 7-88 (334) Majuraha 261.88 8 10 55 35 20 6 2

:TATis'fICS
ADAR
[U S SAlNABAn
I
['otal workers (I-IX) CultIvator
M
15
19
469
1 44
279
87 35
191 75
144 1I9 123
240 29 26 14
224 124 86
55 ,414
50 49
131 3
83
98 199 204 171 117
174
255 15
F
16
M
17
12 10 Uninhabited 108 261
1 31 24
Uninhabited Uninhabited 296 105
45 34 99 55 61 80
5
49 22 96 45
104 96 40
86 124 10 17 2 26
19 " Uninhabited Uninhabited 154 112 68 80 72 46
Uninhabited
403
2 5
44-
8
27 152 105 152
91
49 401
23 37 53 1
13
59 118 135 131 33
12 119 U ninhahited
5 165 2 10
F
18
31
.. 6
131
11 4
14 50
I
25 6 2
47 42
36
I 3
6 68 14
120 I
2
89
WORKERS
II. III IV V VI VII VIII IX Manu· Transport,
fac;turing . Storage Agricul. Mining, House. other than Trade and
tural Quarry. hOld Household Cons. and Cot'nmu- Other labourer ing, etc. Industry Industry truction Commerce nications Services
M F M F M F M F M F 1\1 F • M
19 20 21 22 23 24 25 26 27 28 29 30 31
4
46
.. 10
56
37 13 76 26 33 5 8
96 6
14
101 28 23
.. 165
3
11
9 52 50 21 75
9
39 3
9 4 3 "
42 60 8 21 20 3" 3 ..
•• o • I .. " .. " 13 8 5 2 6
79 87 75 8 10 .. ..
44 " 34 " 811 1 49 1 1 45 " .. 18 7 "
5 ..
6 .. 2
4 2 I 1
5 _ 3 .. 2.. 1
til 5" 2 4- 3 .. "
6"" .. 2 "
.. 19
153 17 9 26 11
.. 2 2 2 .. 1 ..
9 5
4
1 1
2
.. 2"" " 285 38 1 176 52 140 " 174 ,,205 21
< ••
8 " 2 " 2 "
9 5' .. 84 10 91 6 .. 31 2 90 5 ..
...... 2 "
9
9
1
8 10 I I ..
23
1 10 11 .. 1 " 8 "
19 2 "
1 6 I
12 I .. 4.. 41
1 2 .. 3.. 40 2 .. - " 2 .' " .. .. 2
6 21 .. 5 7
",
41
8
.. 1
.. 24
I 1
.. 1 I 1 1
F
32
M F
33 34
25
11
9 1 2 6
66
7 I
8 -6 5
4 91
IO 7
46 1
30
13 16
3
,6
2
9 4
8
2 4
12
2
BIHAR
x
51. Non·workers no.
,.---...._____ M
35
13
374
20
217
63 21
169 43
108 116 95
182 23 35 8
[73 94 66
38 1,287
53 57
121 7
97
139 191 187 144 96
254
330 20
F
36
J6
645
I 24
22'5
120 44
274 84
177 178 202
298 32 48 6
236 158 89
66 1,948
73 103 259
8 161
247 255 302 195 115
397
517 18
, 1
48 49 50
51 52 5:t 54 55
56 57 58 59 60 61 62
6l 64 65 66 67 68 69 70 71 72
73 74
75 76 77 78 79
80 81 82 83 84
85 86 87 88

90
PALAMAU VILLAGE.
SUBDIVISION
ANCHAL
Occupied residential
houses ,,----""'-----""'1 Total number of persons Literate
No. of enumerated (including and· Serial no. Area No. of bouse- inmates of institutions Scheduled Scheduled educated
(Thana no.) Name of village in acres housel holds an_d houseless persons) castes tribes persons
----. ,..--..... ____
P M F M F M -F M F
2 3 4- 5 6 7 8 9 10 11 12 13 14
~EVENUE THANA-HUSSAINA13AD"?"ontd.
Deoria C. P.-coneld.
89 (356) Kuswa 588.23 83 83 .589 309 280 98 88 95 3 90 (357) tDeori Kalan p,h,~3,A3,H5,Hos 2,297.36 765 778 3,846 2,135 1,711 432 344 " 1,117 445
91 (300) tBahera P 625.05 88 106 644 325 319 133 121 43 16 92 (301) Nawadih 107.33 93 (302) K()rma 83.34 9 10 30 15 15 4 1 15 9 94 (326) Banahi 182.72 22 30 169 81 88 71 68 10 95 (328) Sewabigha 59.59 96 (329) tChaukari M,K,V2 658.51, 184 210 1,374 690 684 124 110 229 45 97 (330) Sargara 399.92 129 135 500 246 254 143 136 36 1 98 (325) Kukuhi P, V 835.75 230 260 1,324- 669 655 108 124 138 5 99 (335) Semarsot 530.65 69 85 587 293 294 58 65 45 100 (337) Dewan Bigha 185.18 18 21 165 84- 81 15 15 IS 101 (338) Pachamba 524.03 44 51 307 156 151 31 41 32
102 (317) Naudiha P,Mc 346.39 55 86 522 237 285 84- 87 105 38 103 (318) Cheladih 48.18 17 21 127 59 68 47 53 2 104 (32 1) Sarhu 346.70 70 87 540 282 258 104 '95 30 105 (322) Lapea P 450.06 73 81 439 218 221 92 101 77 10 106 ~327) +Belaspur P,Mc 399.66 98 145 768 373 395 80 76 141 66 107 (319) Kajim Nagar P 356.12 53 67 340 168 172 129 128 30 1 108 (320) Sarea 335.86 143 151 920 455 465 229 240 59 5 109 (323) Chandrapur 417.60 19 20 101 46 55 32 40 3
110 (324) Naukainia 964.16 III (339) Garurahi 191.64 29 29 184 94 90 .. 5 1 HZ (340) Basdiha 247.18 21 27 132 66 66 5 5 24 12 1I3 (341) Mahuari 69.05 13 16 118 55 63 30 42 5 114 (483) Kachra P 292.94 126 166 1,028 506 522 142 139 171 61 115 (484) Bairaon P 763.53 133 152 981 470 511 114 109 68 3 116 (485) Jamua ,. 1,313.80 195 200 1,035 520 515 265 257 16
Mahudand C. P.
117 (486) Ghagra V 448.57 54 62 311 156 155 105 119 7 2 118 (487) Kodwaria 740.90 5 6 16 7 9 7 7 119 (488) Dandila P 1,354.62 101 116 611 310 301 175 130 18 3 120 (489) Mangardah 1,662.30 121 (490) Satbahini 191.50 122 (491) Dhobi Eraji Kite 171.82 123 (492) Dhobni Gaitibad 111.84-124 (493) Bhainsra 352.25 125 (494) Keswahi alias Tenwahi 879.32 4 6 20 12 8 1 126 (495) Pahtia .. 480.34- 4 6 27 15 12 13 11 2 127 (496) Tenwahi alias Hathbajhwa .• 177.16 . 128 (497) Chorpahra 2,195.11 25 28 173 87 86 12 13 14 9 8 129 (498) Bhainsra alias Labsera 421.60 13 18 103 56 47 47 41 4 130 (499) Nimhihi 6.41 131 (500) Kemo 428.31 132 (501) Partappur 564.36 29 29 160 76 84- 10 10 33 96 2 133 (502) Sa1aiatikar 629.54 15 16 89 46 43 13 14 .. 134 (503) Naia 137.75 6 6 32 20 12 18 11 2 I 135 (504) LohbanCIba 796.82 32 41 166 7B 88 23 17 31 31 4 136 (511) Manikpur Bathani .. 978 • .(.4
137 (512) Keswahi alias Chhakauria 634.18

STATISTICS
SADAR
BUS SAINABAD
I
Total workerl (I-IX)
M
15
154 1,002
179
9 43
344 139 336 177 42 86
136 36
164 121 189 99
270 33
54 41 32
272 245 315
102 4
191
4-12
56 27
48 30 12 56
Cultivator
F
16
M F
17 18
84 67 33 133 93 27
54 66 Uninhabited
3 .. .. 18 15 1
Uninhabited 233 93 18
11 60 2 187 203 115 10 108 3 .. 20 .. 8 61 1
1,25 76 83 32 11 12
130 86 1'5 71 78 41 68 116 14
III 62 61 171 134 53 32 15 12
Uninhabited 45 39 34 14 32 II 32 9 11
215 154 153 136 209 121 288 246 223
57 51 6 4 4
99 118 1 Uninhabited Uninhabited Uninhabited Uninhabited Uninhahited
4 1 4-9 3 5
Uninhabited 39 24 9 29 11 9
U ninhahited Uninhabited
32 23 10 8 15 7 5 4-
36 19 4-Uninhahited Uninhabited
91
WORKERS
II III IV V VI VII VIII Manu- Transport,
facturing Storage Mining, House. other than Trade and Agricul.
tural labourer
Quarry- hold Household Cons- and Commu. ing, etc. Industry Industry truction Commerce nicatioD!
M FMFMFMFMFMF M Ii'
19 20 21 22 23 24 25 26 27 28 29 30 31 32
31 50 4 " J 40 . . 2 .. 1 42 34 24 4 15 6 487 I .. 56 2 25
62 52 18 .. 4 .. 9 " . . .. 10 .. . . .. 8 3 -26 17 .. .. .. . .
172 208 8 .. 19 15 " 5 .. 13 5 57 ' 9 .. 2 15 .. .. .. . . 48 60 4 .. 28 10 34 .. 1 25 7 22 13 .. 4 .. J 12 .. . . .. .. 9 .. .. . . . . .. 1 8 7 7 . . I .. 9 ..
37 37 5 " 4 4 1 .. 5 .. 16 19 I 8 1 .. .. " .. 74 lIS 4 ... .. " .. " 25 26 9 2 .. .. 4 .. " 1 44 54 5 .. 6 .. 2 .. 5 .. 1 30 50 5 .. I .. .. . . .. 75 101 35 1 16 16 3 .. 3 " 18 20 .. . , .. .. .. .. ..
10 7 2 4 3 .. 6 3 .. 2 ..
14 16 1 I 2 2 2 3 33 35 17 " 27 7 13 .. 9 .. 3 }{) 13 9 .. .. 2 12 . . " " .. .. 63 58 .. 5 2 "
32 49 11 2 3 ., .. 4 " .. 50 97 20 1 1
.. S 6 4- 2 ., " .. ..
10 11 19 2 .. 12 10 16 4 I
15 21 9 10 8 5 .. .. .. 7 3 .. .. ..
29 31 6 .. 1 .. 1
BIHAR.
IX X
Other 51, Se!vices Non·workers no. ,...--.......___,
.--~
M F M 11
33 34 35 36
9 155 196 89 260 59 1,133 1,578 90
9 146 265 91 92
6 12 93 38 70 94
95 18 346 451 96
5 107 243 97 18 2 333 468 98 4 116 284- 99
42 81 100 70 143 101
7 101 160 102 23 36 103
.. 118 128 104 5 I 97 150 105
10 184 327 106 1 69 61 107 4 185 294- 108
13 23 109
110 40 45 111
J 25 52 112 3- .. 23 31 1I3
16 20 234 307 114-5 225 375 115-4 2 205 227 11&
4 54 98 117 3 5 118
·2 119 202 1I9 120 121 122 123 124
8 4- 125 3 3 126
127 3 5 31 47 128 2 3 29 18 129
130 131
28 52 132 16 35 133 8 5 134
1 22 52 135 136 137

92
PALAMAU VILLAGE'
SUBDIVISION
ANCHAL
Occupied resid ential
hous('s ,--"""_____'" Total number of per sam Literate
No. of enumerated (inel uding and Serial no. Area No. of boule- inmates of institutions Scheduled Scheduled educated (Thana no.) Name of village in acres houses holds and housel ess persons) castes tribes persons
....._~ .--~ ,......-"'___
p- M F M F M F M F
2 3 4 5 6 7 8 9 10 11 12 13 14
REVENUE THANA-HUSSA1NABAD-contd.
138 (513) pokhraha 873.35 139 (598)' Kurdag Ce5 593.60 8 8 45 24 21 3 I 14 16 1 140 (599) Mahudand P, Ce5 1,814.61 74 74 359 184 175 36 32 3 1
.. 33
141 (472) Damdami 282.81 15 17 115 65 50 1 2 4 142 (475) Sandha 867.34 46 48 282 144 138 65 62 12 143 (476) J ujhar Sikni 473.33 7 12 71 41 30 41 30 1 144 (477) Chapardag Sikni 843.62 1 1 9 5 4 .. 145 (478) Hira Sikni 174.49 55 69 370 179 191 64 61 13 146 (479) Itbandh P 132.15 26 28 167 78 89 30 38 10 147 (480) Reria 362.23 148 (481) Repura 102.98 26 33 222 106 116 102 113 8 149 (482) Kurmipur P 1,109.37 205 234 1,469 769 700 365 343 78 1 150 (432) Khalilpur qlias Tikri H 248.00 39 52 247 132 115 47 41 29 2 151 (433) Mobarakpur 79.54 25 2-5 151 81 70
63' 12 2 152 435) +Kamgarpur P, L, V 458.45 65 84 442 216 226 60 65 15 153 (436) Chak Bishun 34.45 7 7 58 33 25 2 1 16 .. 154 (437) Kosi 606.26 71 86 466 221 245 110 109 31 I 155 (438) Tongra P 332.25 67 79 413 196 217 34 45 55 18 156 (439) Birgain 40.53 6 8 52 23 29 2 2 3 4 157 (445) Chankar Gopal 350.67 51 68 390 182 208 24 21 38 5 158 (446) Khaira 142.84 13 18 85 41 44 13 14 6 159 (447) Takea H2 66.29 12 16 118 53 65 48 56 9
Poldih Jhargara G. P.
160 (4G6) Chaukhanda 104.98 40 54 310 170 140 69 59 14 .'. t61 (468~ Jhargara P2 2,882.39 211 238 1,421 730 691 325 314 129 11 l62 (469 Buka 115.28 5 5 21 13 8 2 163 (470) Supha 73.86 32 49 236 111 125 87 102 1 164 (471) Duara 176.97 16 23 -125 68 57 6 3 165 (473) Patra Kalan P 637.63 52 66 374 177 197 73 84 45 166 (474) Patra Khurd Ce, Dc 575.66 1I9 '159 942 458 484 209 240 19 167 (448) Alinagar P 154.76 68 90 463 232 231 127 137 60 11 168 (449) Akhauri Khap 97.71 10 17 88 42 46 9 36 II 5 169 (456) +Poldih P,M,h 469.25 90 117 724 354 370 113 120 114 31 170 (457) o bra 79.66 8 10 53 24 29 24 29 171 (458) Beda~li.a P 31.54 28 33 197 87 1I0 17 '19 38 15 172 (459) Dhama 63.50 3 4 16 • 10 6 10 6 173 (460) Bahera Ce, Dc 111.03 21 25 140 -81 59 " 20 174 (461) Barwadih 174.71 28 33 221 119 102 41 37 24 2 175 (462) Konpahari 304.00 176 (463) Ghurwa 215.02 23 24 151 80 71 32 34 5 177 (464) Majhauli P 138.14 31 46 236 134 102 70 45 14 178 (465) Urdwar 793.31 65 90 530 268 262 172 167 19 I 179 (467) Sarhu 388.92 57 72 480 258 222 147 123 18 1
Ekdari G. P.
180 (444) Gaonkhap 181.57 18 21 167 92 75 80 68 9 181 (450) Nemhat 84.10 10 11 67 39 28 18 15 13 182 (451) Baijli 35.94 10 12 61 34 27 28 14 183 (452) Chankar Kasturi 584.13 103 130 818 394 424 129 157 104 9 18:4- (453) Itwan Cc 143.63 18 22 100 53 47 38 33 2 5 185 (454) Marha 96.81 47 63 352 152 200 26 28 46- 15 ,

'STATISTICS
'SADAR
::HU S SAINABAD
Total workers (I-IX) Cultivator
,...--"""___'
l\l
15
15 ]04
36 92 25
4 120
37
69 435
79 44
109 17
121 127
13 109 22 2B
100 450
7 67 38
102 26B 12B
21 185
12 44 4
44 72
38 75
143 140
49 23 23
209 -35 • 98
F
III
M
17
Uninhabited 10 13 78 62
27 35 71 -58 8 }9 1- ·3
92 83 28 30
Uninhabited 52 43
172 314 1 50 I 28
13 35 2 14
96 47 90 70
12 18 .7.9 12 .~6 2 )6
8 .51 25 353
6 53
4- 35 9 95
75 1·90 37 f',7 10 12 18 98
5 3 15 27
4, 2 39 8 65
Uninhabited I 30 2 60 5 74
14- 123
B. 2 2.
82 17 12 ..
!tJ II • 4
13J .8 80
F
18
6 35
26 27
7 I
65 22
38 26
I I 7 I
19 42 ., 7 2
10
.. 2 9 9
33 5 3 4 2 I 2 8
, 1 1 I 6
19
I I
WORKERS ~
.----~
II III IV V VI VII VJII IX Manu- Transport,
facturing Storage Agricul- Mining, House- other than Trade and
tllral Quarry- hold Household Cons- and Commu- Other labourer ing, etc. Industry Industrytruction Commerce nications Services
,...--......___ ...--"--t....-----....--"--t,.---. ....--"---. r--~ ~
M FMFMFMFMFMF M
19 20 21 22 23 24 25 26 27 28 29 30 31
2 30
I 30
5 " 5 5
6 97 26
1 51
45 31 o'
J5 6 4
38 36 1
12 2
61 8 6
44 9 6 3
., 2
6 13 55 15
12 18 37 27 14
4 .. 40 8 I 3 1 ..
I .... 25 4 2 .. 17 ..
I 1 .... .. 1 .. ......... 2 23 6 5 19 1 1 .. 4.. 1 ..
4 15 10 2 130 1] 3 8 10 .. .. .. .. I
2.. 1 ........ .. .. I .. 10 ........ .. I 5 .. 13 5 I .. .. .. .. ..
2 I 1 ...... .. 6B 20 4 7 5 ....... . 40619 .. 8 7 .. .. .. I II 9 2 .. 10 .......... 2 5 .. .. .. .. .. .. .. 2 ••
6 .. 9 3
2 • •.• o. 10 48 3 2 4 .. ...... .• .. .. 2 .. .. .. 6 .. 54 13 " 3
2 1 ..
11 .. 1 4 3 5 .. 17
5 2.. 1 •• " .0
I 2 3
14 .. 10 11 2 ••
1 .. 1 .. 2 ..
.. 2 2 ..
1 1
1 ..
2 .......... 1 1 .. 1 2 11 2 .. .. .. .. 8 ....... , ..
. . . . . . .~. . . ., •• o'
1
5 ..
4 2
2 .. 46 12 17
7 17 8 1 4 2 .. .• .• .•
3 .. .. 1 .•
2
F M F
32 33 34
3 2
3 4
4 3
1 3
.. 4
1
2 2
I I 2
i's 7
2 4
3 2
2
3
.. 2
9
8 2
B[HAB
x
SI. Non'workers !lo.
M
35
9 30
29 52 16
1 59 41
37 334
53 37
107 16
100 69 10 73 19 25
70 280
6 44 30 75
190 104 21
169 12 43 6
37 47
42 59
125 118
43 • 16 11
185 18 54
F
36
11 97
138 139 140
23 141 67 142 22 143
3 144 99 145 61 146
147 64 148
528 149 114 150 69 151
213 152 23 153
149 154 127 155 29 156
190 157 32 158 63 159
132 160 666 161
8 162 125 163 53 164-
188 165 409 160 194 167
36 168 352 169 24 170 95 171 2 172
57 173 94 174
175 70 17
100 17 257 17 208 17
67 180 26 181 25 182 342 183
30 184 188 185

PALAMAU
Serial no. (Tha"lano.) ~ame of"village
2
Area in acres
!I
94
Occupied residential
houses ,.----.;..__--,
No. of No. of househouses holds
4 5
REVENUE THANA-HUSSAINABAD--conld.
186 (455) ~andar 187 (406) Pathra P, Cc.'> 188 (407) Sbiupur Cc5 J89 (408) Ekdari V 190 (409) +Kusha Naraenpur P,h 191 (410) Beni Kalan P, K, Me .. 192 (414) ~ankhap 193 (422) Teta P, Me 194 (423) Araji Birgain alias Khonchi 195 (424) Sinduria 196 (440) Rup Naraenpur 197 (441) Araji Teta alias Pokhar 198 (442) Araji Sinduria 199 (443) Araji Birgain
Darua Beni G. P.
200 (342) 'Upri Kalan H2 201 (343) Langar Kot 202 (347) Bishunpur 203 (348) Kathoundha Kalan P, V 204 (413) Sadaja1 205 (415) Beni Khurd P 206 (416) Buland Bigha 207 (417) Darua 208 (418) Araji Kusumhara 209 (419) Fatma Chak 210 (420) Kusumhara 211 (421) Bihari Bigba 212 (425) Araj i Langarkot 213 (426) Piparbar 214 (427) Bhagwan Bigha 215 (428) Bhairopur P 216 (429) +Majhiaon 217 (430) Araji Bhairopur 218 (431) Upri Khur-d 219 (434)- ATaji Kamgarpur
220 (350) Mirheiadih 221 (351) Kathaundba Khurd alias
Hussainagar 222 (35,2) Basaria 223 (353) Ahmadnagar 224 (387) Mahuari P 225 (398) Lotania K 226 (3S9) Sonbarsa 227 (400) -+ Karimandih 228 (401) Jhari Khurd 229 (402) Bardil:a 230 (403) Begarnpura 231 (404) Sabano P 232 (40.1',) Takea Araji Pajardih
109.16 521.94 150.74 169.01 125.83 647.55 227.47 504.25 00.73
108.07 53.46 1.01 9.78
13.59
452.74 328.26 199.85 221.09 122.64 300.93 129.74 415.00
23.15 79.90
100.94 88.30 47.02 75.66
106.19 35.00
181.59 1].36
261.66 586
73.62 78.52
131.40 91.12
650.40 481.96 238.06 128.85 246.15 173.58 311.24 931.46 56.54
19 93
8 8
64 126
24 28
25 8
70 45 15 53 26 36 23
101 18 27 8
11
7 14 25 21
56
10
16 21 78 80 30 10 33 20 18 !JI 23
32 103
8 8
83 150
26 36
27 1>
89 57 16 61 32 41 39
114 19 32 11 17
12 18 35 22
73
12
22 22 94 84 35 12 40 22 22
104 23
Total number of persor s ~Dumerated (including inmalrs of institutions Scheduled and houseless persons) casttS
VILLAGE:
SUBDIVISION
Scl)eduled' tribes
ANCHAL.
Literateand
educated' persons
,..-___ ..A ___ ..... ,:...-__ --. ,...-..Jo---. ,.--~
P
6
152 617
73 81
478 896 159 237
160 50
503 391 123 414 177 247 181 751 109 168 69
111
71 97
161 125
434
50
130 155 532 530 183 75
251 164 125 634 164
M
7
70 290 39 41
218 442
79 126
92 25
246 199 57
219 79
114 83
373 58 81 33 56
37 53 98 67
220
28
f,2 80
272 258 101 35
134 89 63
340 98
F
8
F M
9 10 11
82 17 19 327 151 157 34 40 II II
260 83 87 454 103 89 80 12 12 III 11 13
68 20 20 25
257 46 47 192 15 19 66 11 7
195 14 17 98 26 31
133 44 35 98 7 4
378 46 42 51 19 14 87 33 28 36 '17 20 55 56 55
34 25 22 '44 46 37 63 58 26 27
214 35 46
22 2~ 22
68 48 48 75 15 19
260 62 61 272 39 36 82 48 48 40
117 33 25 75 25 23 62 47 50
294 28 20 66 5 6
F M F
12 13 14
4 73 27 12 2 II 7 80 ·32
160 64 23 4 48 8-.
17 10 1
80 35 8
59 15 50 42
100 7
22 2 5
1 46
7
54
6 11 85 49 27
9 25 31 41 74 28
13 1
.. 5 1
15 12 12
2 1
2
2
15 8 1
2 1
10

95 B.IHAR
.STATISTICS
:SADAR
.:HU S SAINABAD WORKERS ._--_ .• _---------""'-
I II III IV V VI VII VIn IX X Manu· Transport,
facturing Storag~ Agricul- Mining, House- other than Trade and
Total workers tural Quarry- hold Household Cons- and Commu- Other SI. (I-IX) Cultivator labourer ing, etc. Industry Industry truction Commerce nications Services Non-workers no.
,---"""'-----' .-----' ,---""___' ___ """'--. ___ ...__, ,..-...__, ,........,..._., ,...-""'"--. ,--~ .-""'----. ,---""""-----.
M F M F M F M F M F M F M F M F M F M F M F
15 16 17 18 19 20 21 22 23 24 25 26 27 28 29 30 31 32 33 34 35 36
51 4 26 4 24 1 .. .. .. .. .. . . 19 73 IB6 143 17 95 9 12 3 1 9 .. 8 4 2 14 3 147 310 187 21 20 I . , .. . , .. . , .. ., . . .. 18 3!- 188 18 3 11 .. 5 3 .. .. . . .. .. . . .. 2 . . 23 37 189
105 64 36 5 48 52 4 4 1 ., .. . , 5 7 7 113 195 190 214 138 105 44 60 83 9 1 14 4 18 .. I 7 6 228 316 191
35 1 24 4 . , " .. .. 6 .. " .. " .. 1 1 H 79 192 63 49 6 2 .. 4 ., .. ., .. 2 63 III 193
Uninhabited 194 48 6 27 8 2 .. 8 1 " .. .. .. 2 4 44 62 195 14 13 I .. .. .. 11 25 196
Uninhabited 197 Uninhabited 198 Uninhabited 199
!22 73 .62 56 6 6 6 ., 11 5 25 ., 10 6 124 184 200 117 38 108 34 4 4 2 .. J .. . . .. .. 2 82 154 201
36 29 28 24 7 5 .. . , .. I ., " .. .. 21 37 202 119 '92 78 54 28 38 I .. 9 ., .. .. " I 2 100 103 203 44 45 I4 13 20 32 3 .. 3 .. . . ., .. 4 35 53 204 59 22 33 I 25 19 1 ., .. ., .. ., " ., 2 55 II I 205 41 24 34- 14 7 10 .. " .. .. .. . . .. .. .. 42 74 206
210 223 128 131 49 90 10 .. 13 .. 4 . . .. ., .. 2 _6 163 155 207 38 32 4 4 27 27 " .. 2 .. 3 ., " .. .. .. 2 I 20 19 208 42 39 21 24 11 15 " .. " .. 5 .. " .. " ., 5 39 48 209 21 16 3 4 8 12 4 .. " .. .. .. .. " 6 12 20 210 36 26 13 14 6 4. 5 .. 1 .. 1 .. " . . 10 8 20 29 211
U ninhahi ted 212 20 9 10 .. 8 9 .. .. .. .. 2 ., 17 25 213 34 26 11 5 23 21 .. .. .. .. 19 18 214: 74: 10 74- 10 .. .. .. .. " . . .. .. .. .. 24: 53 215 44 20 17 6 22 14 " .. 5 .. ' .. 23 38 216
Uninhabited 217 115 16 89 5 12 11 I .. 10 2 105 198 218
Uninhabited 219
Uninhabited 220 19 12 2 17 12 .. 9 10 221
30 34 5 2 21 32 .. 4 ., 32 34 222 46 24 .21 1 18 23 .. 6 ., .. J 34 51 223
135 26 69 2 43 21 3 .. 5 3 9 .. 5 1 137 234 224-140 103 95 80 II 15 4 .. 5 3 12 2 2 .. 4 3 5 2 118 169 225 65 27 30 2 31 25 " .. .. .. .. I 3 36 55 226 17 . 4- 9 4 6 1 .. .. .. .. 1 18 36 227 70 28 4:0 9 18 13 5 1 1 2 4- .. 1 1 3 64 89 228 38 12 29 4 9 8 .. " . , .. .. " .. " 51 63 229 35 1 27 1 5 .. .. .. 3 .. .. .. .. .. 28 61 230
170 46 116 l4' 30 26 2 ., 2 .. 11 ., .. .. " 6 9 170 248 231 55 54 1 .. 43 66 232

96
PALAMAU VILLAGE
SUBDIVISION
A NCHAL. "-
OccuJ:>itd residenti&1
houses ,---.....__ Total num ber of per~OI s Literate
No. ~f enumerated (including and Serial na. Area No. of house. inmates of institutions Scheduled Scheduled educated
(Thal"aoo. ) Name of village in acres houses hold~ and houseless persons) castes tribes persons ...... A ....... ..----~ ,....-""""--~
P M F M F H F M F
2 3 4 5 6 7 8 9 10 11 ·12 13 14-
REVENUE THANA-HUSSAINABAD-contd.
Mahuari G. P.-coneld.
233 (411) Bahadur Bigha 57.92 234 (412) Tendua 266.75 27 36 226 109 117 56 64 13
235 (375) Kajrat 420.99 34 38 232 1I6 116 22 21' 35 2" 236 (376) Nawadih - 269.59 30 36 218 III 107 '6 4 4 3 34 5-237 (377) Agheria Kalan 329.75 29 39 209 113 96 49 40 28 238 (378) Pokhra P 138.14 16 17 167 85 82 13 23 30 Z 239 (388) ·Husainbandh 14.38 240 (389) Kajibigha 46.93 I 1 4 2 2 241 (390) Juribar.dh 26.50 2 2 14 9 5 4 242 (391) Noniadih 48.11 243 (392) Sheikhpura 237.57 27 34 263 132 131 64 56 36 244 (393) Bhagwanpur 88.13 10 12 58 28 30 4 6 2 245 (394) Ekauni 461. 79 .56 64 399 210 189 60 53 34 246 (395) Bajardih 254.18 12 18 84 44 40 24- 23 7 247 (396) Malwaria P 167.04 16 20 120 65 55 32 26 22 4-248 (397) Kakoria K 264.82 38 41 246 114 132 3·6 1~
249 (363) pokhrahi 608.67 44 52 360 168 192 102 119 7 6 36 9-250 (364) Nadiain 1,697.13 68 77 489 254 235 96 134 64 5-251 (365) +Dangwar M,Ot 1,254.54 259 287 1,665 815 850 7I 62 .. 235 3a-252 (366) Nawadih 157.28 41 43 239 120 119 9 16 26 .. 253 (367) Belb;gha Oc 375.36 60 66 496 250 246 55 54 55 7 254 (368) Chaukhandi 101.07 5 8 65 34 31 24 IZ 255 (369) Araji Dangwar 37.28 256 (310) Raksahi 75.61 . 5 5 42 23 19 6 2 257 (371) Ghurna Araji Nawadih 22.63 258 (372) Salima 99.58 6 6 45 24 21 16 3 259 (373) Reriya 195.01 20 23 138 70 68 39 48 14 2.60 (374) Lamar 364.68 16 18 143 75 68 31 25 8
261 (360) Sewari alills Mangaldih 216.00 47 56 335 190 145 84 63 38 3 262 (361) Barepur P,L 1,363.77 121 141 938 471 467 240 220 152 25 263 (362) Baniaaih P 1,101.S6 Il7 135 873 446 427 145 161 III 10 264 (379) Bahera 86.04 8 8 53 28 25 4 265 (380) Raghubir Bigha £0.46 266 (381) Kunrwa Kalan 662.47 39 39 246 122 124 52 49 16 261 (382) Araji Sheiklpura 30.54 268 (383) Khardiha 187.76 26 31 179 87 92 8 II 9 269 (384) Kishunpur 65.14 7 7 49 26 23 7 270 (385) Kamat 238.53 57 61 456 235 221 51 "55 65 81 6~ 3 271 (386) Dihri Bisnmpur M, L, H .. 403.16 55 73 437 215 222 95 106 85 20 272 (354) Jharha 616.94 66 75 507 270 237 116 111 73 3 273 (358) Budhua P 1,817.97 135 147 1,048 532 516 67 76 218 72 274 (359) Du1har 270.38 31 39 259 121 138 15 27 33 2
ANCHAL TOTAL .. 118,131.33 12,8~4 14,979 88,7~9 114,872 43,86.-713,350 13,1l17 332 353 11.165 2,175 or
184.58 sq. miles

97
STATISTICS BIHAR.
BADAR au s SAINADAD
WOBKlIiBS
,_-----------------------------------~------------------------------~ I II III IV V VI' VII VIII IX X
Manu- TraDllport, facturing Storage
Agricul- Mining, House- other than Trade and Total workers tural Quarry. hold Household Cons- and Commu. Other 51.
(I-IX) Cultivator labourer ing, etc, Industry Industry tructioD Commerce nicatioDs ServictS N on-wC?rkers rid, ,..--- ....--~ ~~, ,.-~ ,....""""_' ~........_, .----. ,...-... ..... ,...--""'____" ,...-""'____" ,...--~
M F M F M F M F M F M F M F M F M F M F M F
15 16 17 18 19 20 21 22_ 23 24 25 26 21.· 28 29 :30 31 32 ~3S 34 35 36
Uninhabited 233 66 42 41 10 15 31 '2 " .. ., " 7 43 75 234
68 11 26 11 ~ 8 4 .. " ., .. 6 . 5 3 7 2 48 lQ5 235 65 8 40 7 " .. " 10 8 ., " .. " 6 2 46 99 236 63 26 52 26 11 .. .. . . .. .. . . .. .. 50 70 237 47 11 37 II 5 3 " . , .. " .. .. .. " .. '2 .. 38 71 23B
Uninhabited 239 2 2 .. " 2 240 5 5 5 2 3 .. .. .. " .. .. " ., 4 241
Uninhabited 242--63 50 40 33 15 17 .. 7 .. " ., .. 69 81 243 12 12 12 5 7 " " .. .. .. .. " .. ., 16 18 244
109 89 79 70 17 19 5 " S " .. " .. .. 101 100 245 28 17 18 2 10 15 .. .. .. .. 16 23 246 35 22 14- 3 17 19 2 " .. .. " " .. " 2 30 33 2t7 61 46 37 19 18 27 6 " .. " , .. 53 86 24B
96 97 62 65 12 30 15 " 6 .. I .. 2 72 95 249 134 92 87 63- 17 27 12 " 7 2 11 " .. .. .. 120 143 250 453 153 211 44 103 92 1:0 " -44 4 18 4 2 .. 33 3 16 1 16 5 362 697 251 64 29 55 2 4' 22 .. " 5 5 .. .. . . .. 56 90 252
133 119 119 91 16 28 11 " 11 . , 3 .. 1 .. 2 117 127 ...253 18 13 5 " .. 16 31 254
Uninhabited -255 14- .. 14' .. . ,
" 9 19 256 Uninhabited 257
9 9 ., .. .. . , .. 15 21 25B 40 41 29 32 9 9 .. .. 2· ., 30 27 259 47 -41 39 25 8 16 .. .. . , .. , . 28 27 26~
96 49 33 2 25 42. 17 2 9 .. 5 7 2 94 96 261 244- Ji)4 96 63 35 4 18 2 68 .. 1 25 .. ~5 227 363 262 217 131 97 1 53 117 28 " 18 9 12 1 ., 8 -4 229 296 263
11 2 9 1 1 1 1 " .. .. ., " ., ., '0, 17 23 264 Uninhabited 265"
66 30 23 23 29 5 2 2 ., .. .. n 56 94 266 Uninhabited 267
48 31 30 5 30 2 " . , ., ., .. 11 39 61 268 13 8 .. 5 .. .. 13 23 269
115 21 67 8 16 10 4 2 1 18 " 2 .......... 2 .5 J 120 200 270 106 45 41 2 29 34 12 2 3 13 ., .. " J 2 .0 7 5 109 177 271 130 52 63 2 41 50 7 " 2 15 . , .. 2 6 134 185 272 269 22 140 6 63 13 6 .. 9 ., 42 3 , 2 4 3 263 494 273 65 23 44- 11 12 12 1 " 2 ""4- .. .. " 1 1 59 115 274-
23,907 16,022 12,704 3,547 5,183 5,275 1,240255 1,002 403 1,440 55 207 .• 494 122-I
301. 4 1,336 ~361 20,9~5 33,845
P-II~13

PALAMAU
Serial no. (Thana no.) Name of village
2
98
Occupied residential
houses ,.--"""_____'
No. of Area No. of house-
in acres houses holds
5
REVENUE THANA-GARHWA
1 (200) 2 (201) 3 (202) 4- (203l 5 (204-6 (205) 7 (206) 8 (207) 9 (208)
10 (209) 11 (210) 12 .(211) 13 (212) 14 (213) 1& (214)
Loadag Panduhan Adhaura Banka Bhandar Sikni Rankiadheri Patara Rajbandha Khundra Bhimkhar Banua Adhauri Rajhara .8erasam
16 (197) +Latdag 17 (198) Tenar 18 (199) Sohbaria 19 (215) Sangbaria
20 (216) Meral 21 (217) Kumbhi 22 (218) Bankheta 23 (219) Akalbani
~4 (237) Arangi -25 (238) Sirhe ~6 (244) Pindra ~7 (245) Mahetam :!8 (246) Bauraha 29 (247) Biktam 30 (248) Basaria 31 (249) Kamarma 32 (250) Sikni 33 (251) Siho 34 (252) Okhargaf'G 35 (253)' Garhauta
36 (254) *Aunraiya 37 (255) Kholra
P
M
P
P
P, L P P
M,Rhc, V2,H2
M, V,H,Mc
P
v Cc
P3,Oc
38 (256) Bokeya 39 (257) Bajudih P 40 (258) +Ataula L, V. • • 41 (259) Chacharia P,L, V2, Hos 42 (260) Chhaparbar Khurd 43 (261) Harandube 44 (262) Tarke P 45 (263) Chhaparbar Kalan 46 (264) +Khoridih M, L
47 (227) Chama K .• 48 (379) +Peska M,L,Ruc,Rhc, V,H,Oc 49 (228) Karmahi 50 (377) KatritIsar olias Kusmahi
456.81 591.13 285.11 231.49 107.05 186.87 842.24 517.68
1,081. 7,9 700.64 815.39
1,035.99 423.80 450.14 339.42
1,903.15 1,660.13 1,540.63 1,200.68
3,155.36 1,281.85
247.87 654.33
806.39 506.80 714.6B 197.44 296.56
1,616.16 257.78 273.26 693.69
1,307.70 2,652.16 278.~2
1552.47 1,074.13
283.67 291.55 358.55 288.70 224.34 689.27 445.72 415.80 450.22
1,752.57 1,126.27 1,137.83 1,268.50
78 132
42 78 68 16
1 110 42 6
38 26 48
172 183 105
90
518 52 19
100
76 41 38
53 139 83 65 11 44
464 2
37 51 50 44 29 94 41
3 54 31 66
213 228
37
99 149 50
100 , 83
16 1
114 52 7
43 42 57
181 213 Jl2 102
587 59 19
104
85 43 48
64 170 89 66 11 45
483 2
37 51 50 57 31
105 48
3 65 33 78
239 259
37
Total number of persons enumerated (including inmates of institutions and houseless persons)
Scheduled castes
P
6
535 797 226 527 375
76 3
606 295 40
202 240 319
939 1,068
686 543
3,001 253
70 503
327 209 197
337 742 391 394
52 190
2,525 7
213 317 290 330 190 656 221
10 318 186 425
1,195 1,276
144
M
7
258 393 I J2 246 178 38
1 315 152 17
115 113 164
471 526 336 261
1,500 125
33 248
165 ll2 g2
162 373 205 197 25
106 1,246
6
116 152 148 160
90 302 III
7 138 85
202
596 606
70
F
8
277 404-114 281 197 38 2
291 143 23
87 127 155
M
9
60 87 15 41 28
60 52
2
38
Bl
F
10
59 102
8 50 29
" 56 56 3
35
69
468 91 ,84 542 126 107 350 55 59 282 104 112
1,501 128
37 255
162 97
105
175 369 186 197 27 84
1,279 1
97 165 142 170 100 354 110
3 180 101 223
599 670
74:
143 127 7' 9
50 49
43 37 35 32 75 82
69 81 156 158 125 123 96 93 11 9
101 81 216 206
29 13 38 2
26 53-
43 127
53 86
37 14 44-2
25 56
50 135
59 90
VILLAGE
SUBDIVISION
ANCHAL
Literate and
Schedul~d educated tri b es persons
M
11
F M F
12
40 51 109 122 45 56 81 89
46 50
18
.. 65
17 1
19
48 56
15
3
76
15 1
24
13 14
70 86 23 71 37 2 1
25 29
3
Ii 21 37
105 77 61 33
393 11 8
83
48 38 12
20' 75 35 39
4 225
15 15 19 23 19
129 18
43 26 62
121 232
3
3 4 t 9 8 .. t 2 7
II
12 4 1
62
14
3
3 8 .. 1
22
1 3 6
43 3
4
14
2 24

STATISTICS
GARliWA
MERAL
Total worken (I-IX)
I
Cultivator
II III IV
99
V Manu·
facturing
VI VII
Agricul. Mining, House- other than Trade tural Quarry. hold Household Cons. and
labourer ing, etc. Industry Industry truction Commerce
VIII Transport,
Storage and
CommunicatiollS
IX
Other Services
M
15
F
16
M F M FMFMFMFMFMFM F M F
14-6 213 69
]32 ]06 26
]
174 78 8
58 56 82
269 325 191 146
854 82 23
145
97 68 53
105 236 ]29 123 16 67
719 3
74 93 93 91 50
165 64
7 75 0(.3
100
372 362
52
17 18 19 20 21 22 23 24 25 26 27 28 29 30 31 32 33 34
131 135 121 204 134 87 59 61 54
120 92 67 113 47 45 14 7 9
1 173 87 86 60 57 34 14 4 9
Uninhabited 43 45 29 53 53 53 55 56 35
Uninhabited
9 10 69 117 6 4
16 50 53 67 18 5
81 19
87 26
3 .. .... 15 ..
3 .. 1
1 1 2 1 1
1 .. •••••••••• o.
1 ...... 2 1 .. .. .. 1 1 1 ....
•••• '0 •••• I" ••
•••• o. 6 ........ .. 1 ..... .
5 ..
13 14 .. .. " . , , . 1 25 20 1 ..
234 316 172 156
211 217 15 9 9 II 1 •. 188 216 65 153 1t6 17
97 94 31
796 67 17
104
555 627 60 53
5 7 37 19
84 65 44 30 50 33
Uni.nhabited 98 . 51
226 110 94 96 94 78 12 12 58 27
592 985 I
59 78 72 89 48 95 52 1
81 55
102
37 73 0(.0 60 14 96 46 5
61 31 70
64 31 25
59 126 68 62
6 26
26*
31 45 12 23
14 !H 1
62 50 86
69 12 11 ,65
32 80 10 18 4
27 120
3
11
30 34 29
8
4 1
11
348 318 336 4
75 14 .. 33 25 6 19
58 8 .. 3 ..
93 68 13' 1 '6 3 73 12
8 43 23 1 2 .. 129
11 2
5 .. •• '0 ••
1 ..
..
.. 12 ..
4 7 23 " 36 5 1 ..
.. 1 .. 2.. 1 1
.. .. .. .. .. 36 96 12 15
12 .... 29 3 15 3
2 .. 2 1 ..
9 .• 3
13 8 123 71
1
17
5 7 ..
3 5
.... 1 ...... 2
" 2 2
66.. 1 ...... 48 .. .• .. .. 65 17 .• 2 1 18 8
3 2 9
2 .• 4 7 3.. 3
9
........ 2 .... d
.1, •• e.
1 •• 1 ....
6 40'.. .. 3 1 ....
.. 6
4
12 2 3 1
5
.. 13
2
3
269 163 159 68 68 18 57 37 2 .• 25 2 6 Uninhabited t 46 33 ~7 3 5 10 ••
. "
6 2
1 4
.. 2
18 13
2 7
8
4
44 I 33 6 1 2
24 1
26 28 19
1'0
ff 15 .. 5
130
35 9
50
2 19 2
5 3
12
9 23
6
9 II 25
3
II 15
3 19
198
28 16 55
15
.. 7 3 7
3 3
4
BIHAR
X
Sl. Non-workers no.
M
35
112 180
43 114-72 12
141 74 9
57 57 82
202 201 145 115
646 43 10
103
68 44-39
57 137 76 74
9 39
527 3
42 59 55' 69 40
137 47
63 42
102
224-244-
18
F
36
146 200
55 161 84 24 2
118 83 9
44 74-
100
234 226 178 126
705 61 20
151
78 53 55
'17 143 92
103 15 26
687
38 87 70 8] 52
259 58 2
99 46
121
?
3 4 5 6 7 8 9
10 11 12 13 14 15
16 17 18 19
20 21 22 23
24-25 26 27 2B 29 30 31 32 33 34-35
36 37 38 39 40 4-1 42 43 44-45 46
251. 47 401 4,8
49 28 50

100
PA:LAMAU ,-.. ,VlLiAGE'
SUBOivtSION
ANCHAL
Occupied residential
houses' r---..A..----"\ Total number ofpersoI)s Literate
No. of enumerated" (including and Serialno. Area No. of house- inmates of institutions Scheduled Scheduled educated
(Thana no.) Name of village in acres' houses holds and houseless persons) castes tribes persons r----.,.I\.....:...-~ ,--~ ,--"""__' ,.--~
P M F 1'\4' F M F M F -2 3 4 5 6 7 ,8 9 10 11 12 13 14
REVENUE THANA-GARHWA-contd.
Peska G. P.-conc1d.
51 (378) Duldulwa P 827.52 263 276 1,309 632 677 170 179 112 13 52 t22)
Gaibatwa 465.15 53 423) Katri 451.7.1 54 ~424) Amwar 349.10 2 2 6 2 4 2 4 55 425) BhaUllraha 909.79 - 7 7 12 4 8 1 46 (426) Gobardaha 2,05).97 60 - 64 318 162 156 12 14 41 32 34 2
57 (226) Baghauta 667.82 58 (380) Tisartetuka 1,464.23 50 55 298 164 134 49 50 ~ 4 14 59 (38I) Kotam 430.46 22 2.T 1I0 55 55 10 16 5 60 (413) Garuasoti P 671.87 58 64 276 145 131 68 68 .. '" SO 3 61 (414) Kolodohar 295,15 36 36 !65 83 82 60 62 3 5 5 62 (415) Banajang 543.94 25 26 161 78 83 44- 43 3 7 '13 63 (416) Baherwa 400.73 1 3 13 10 3 .. 10 3 64 (417) Tetka Kalan 640.40 9 19 56 30 26 26 24 5 65 (418) Tetka Khurd 502.18 39 40 152 72 80 48 ·60 10 li6, (419) Pendli P,Mc 436.81 81 88 402 199 203 41 42 33 67 (420) Jamua 843.15 68 (421) Baghesar 318.55 18 24 97 46 51 41 46 2
Bana Rejo G. P.
69 ( 92) Bana P,L 1,930.62 230 262 1,425 720 705 129 141 126 137 146 17 :70 (193) Rejo P,Mc 861.29 123 177 ' 936 455 481 89 87 96 24 ~I _ (195) Lakhea 1,094.07 106 '129 765 374 391 84 84 61 6 ';2 (196) Gonda P,Mc 1,595.08 236 276 1,440 750 690 180 182 116 9
73 (i94) Hasandag P, Ie 1,849.06 177 220 1,159 570 589 ' 54 61 99 6 74 (225) Karkoma P2,Oe 2,188.61 161 201 1,119 542 '577 139 123 171 37 75 (383) Kajrat 314.47 50 64 390 194 196 57 50' 20 2 76 (384) Dewgana M,Mc 976.49 114 126 647 -507 340 53 58 104 38 77 (386) Garua 1,455.43 132 152 862 432 430 72 80 36
Jarhi G. f.
78 (385) Kildailia 301.65- 31 40 173 91 82 64 ·65 21 1 79 (403) Bardari aliasJarhi P2, L,Mc 2,074.51 259 324 1,821 925 896 242 232 29 28 163 2 80 (404) Tasrar 670.03 107 125 631 311 320 132 142 16 IS 72 6 81 (405) Kaprat 324.69 22 25 137 65 72 10 II 50 56 14 82 (406) Soti 254.75 2 4 15 11 4 11 4 83 (382) Jhotar P 2,268.72 146 164 796 396 400 99 92 18 15 30 84 (407) Chakri P 1,04}.23 22 22 98 49 49 48 49 1 85 (408) ,Lora 34 .38 23 23 120 58 62 ., 58 52 8 86 (409) Sika.riya 189.09 14 14 55 29 26 5 3 22 23 4 87 (410) Tori Kalan P 22!?21 51 51 307 149 158 77 79 .. 24 88 (411) Nawadih P 312.97 15 15 88 42 46 37 44 3 2 89 (412) Pokharia 446.43 16 16 74 33 41 33 31
90 (394) +Raro P2, Me .. 4,218.79' 211 230 2,195 1,094 1',101 126 118 444- 493 140 5 91 (395) LawadoharaliasPhu1war P •. 1,986.99 38 38 148 64 84 42 33 11 92 (396) Naudiha alias Suarjangha .• 1,522.75 77 94 412 212 . 200 73 69 98 90 It·

STATISTICS
(}ARHWA
,--------
Total workers (I-IX)
I
Cultivs'tor
M F
II
Agricul. tural
labourer
101.
WOBKB.BS ,A..
III IV V VI VII \ ,VIn Manu· Transport.
facturing Storage Mining, House- otherthan Trade and Quarry. hold Household Cons- and Commu-ing, etc. Industry Industry tructi.:;>n Commerce nications
IX
Other Srrvices
M F M F M F M F M ,F M F M F ].I;{ F ].I;{
15
F
16 17 18 19 20 21 22 23 24 25 26 27 28 29 30 31 32 33 34
356 353 189 199 138 139 9 7 5 2 .. .. 2 " 3 8 7 Uninhabited Uninhabited
2 2 .. .. 2 2 .. .. . . .. 3 7 2 I 5 1 .. . , .. .. .. .. , . . . .. 1
107 94 59 72 17 21 23 1 6 .. .. .. .. ,. .. " 2'
Uninhabited 107 80 57 46 26 32 23 1 2 " .. " .. .. . .
3,4 33- 16 16 14 16 3 1 1 .. .. .. ., .. .. 78 65 36 33 29 27 1 .. 2 3 ~ . .. . . . . 1 .. 9 2 52 42 20 3D 23 12 7 ., 2 .. . , . . .. .. .. 43 44 27 31 9 13 '6 . , .. .. . , ,. .. . . 1 3 3 3 2 1 . , .. .. .. .,
"
26 1'8 5 2' 16 16 5 .. , . .. ., .. .. . .. 49 44' 12 7 25 27 3 ., 5 10 ,. " " 4
126 lOS' 84 8f 25 24 9 .. 1 .. .. " .. 7 Uninhabited
33 29 9 5 21 24 3 " " ..
418 341 293 259 81 76 30 2 4 4 .. .. 4 . ~ .. 6 251 158 lI6 39 61 104 25 5 36 9 " .. .. . . .. 3 10 222 145 149 69 47 65 17 7 4 4 .. .. .. .. . . .. 1 4-422 280 351 264 21 16 13 .. 7 .. 1 .. 25 4
330 342 254 276 39 56 19 11 8 .. .. .. 6 322 284 200 178 68 86 29 .. 15 20 .. ., " .. 2 " 8 104 124- 96 116 3 8 2 3 .. " .. 196 174, lO'7 109 60 49 15 5 4 9 .. .. .. .. 1 9 2 256 223 204 200 5 7 39 I 2 6 14 2
44 54 39 52 2 2 1 .. .. .. '4 .. 2 523 465 403 406 72 47 25 1 9 11 3 .. .. 7 174 179 106 113 63 64 3 .. 2 1 , . .. 1 39 42 30 31 3 1 1 .. 5 9 .. .. 1 6 3 6 3 .. .. . , .. .. .. .. .. .. ..
212 138 191 120 14 7 ., .. 6 11 1 38 6 31 3 7 3 .. .. .. .. . . 32 1 32 I . , . , .. .. .. .. . , 21 2 21 2 ., .. 79 7 35 4 42 3 . , .. 1 .. I 20 15 .. 4 . , . , .. .. .. .. .. .. .. .. .. 1 21 15 14 6 7 9 . , .. / ..
684 422 572 370 72 49 22 7 2 .. .. .. " 3 8 42 46 38 41 1 5 3 .. .. .. ..
127 109 103 86 11 20 II I 3 .. .. " .. .. . ..
X
N on. workers
M
35
276
1 55
57 21 67 31 35 7 4
23 73
13
302 204 152 328
240 220
90 1\1 176
47 402 137 26 5
134 11 26 8
70 22 12
410 22 85
F
36
324
2 I
62
54 22 66 40 39
8 36 93
22
364 323 246 410
247 293 72
166 207
28 431 141 30
I 262
43 61 24
151 46 26
679 38
, 91
SI. no ..
5i 52 53 54 55 55
57 58 59 60 '61 62 63 64 65 66 67 68
69 7() 71 72
"73 74 75 76 . 77
78 79 80 81 82 83 84 85 85 87 88 89
90 91 92

102
PALAMAU VILLAGE
SUBDIVISION
ANCBAL.
Occupied residential
hoUies TOlf\1 number of persons Literate
No.of enumerated (including and Serial no. Area No.of home- inmates of irutitutioos Scheduled Scheduled educated
(Thana no.) N arne of village in acres home. holds and homeless persons) castes tribes penon!
P M F M F M F M F
2 ,3 4 6 7 8 9 10 11 12 13 14-
REVENUE THANA-GARHWA--conta.
Balekhar G. P.
93 (397) Telri alias Pachaur 846.60 109 121 752 376 376 87 70 169 188 71 94 (398) Lawahi Khurd 846.65 85 96 -4-86 260 226 100 89 14 17 25 95 -.(400) Bale Khari olios Bale Khar P 1,482.61 III 140 688 341 347 76 86 218 247 68 3 96 (401) Doni alias Lawadoni 1,508.30 40 46 208 105 103 1 1 f)7 98 6 97 (402) Mahudar P 838.85 78 95 <1-22 203 219 48 67 95 101 38 14-
Sonehara G. P.
9B (389l Jarde P .• 135.55 118 124 555 294 261 120 107 43 99 (390 Karke P, Me . . 2,874.55 190 226 1,262 614 648 200 190 23 21 87
100 (391 +Sonhe alias SoneharaP, L, V,Me 1,860.15 210 224 1,138 594 544 2]] 182 4- 4- 147 2() 101 (392) Bulai alias Boeli P 1,829.63 113 113 595 286 309 161 152 50 47 50
102 ~387} Jhakra alias Bailajhakra P .. 944.65 74 108 614 309 305 73 70 61 9 103 388) Danrai.P, L,Hos,Rhe,H,Me 2,611.00 256 28'5 1,410 708 702 225 225 86 82 1"79 16 Id4 (393) Bulka alias Bairia Damar P 794.62 48 50 270 130 140 24- 15 23 1 105 (399) Lawahi Kalan 1,441.42 207 237 1,306 673 633 179 166 90 4-
ANCHAL TOTAL 99,388.10 8,597 9,781 51,340 25,522 25,818 6,062 6,005 2,479 2,614 ",,929 51c. or
155 29 .g. mile.

'STATISTICS
-GARHWA
.MERAL
I
Total worken (I-IX) Cultivator
Nt:
15
208 165 243
75 120
180 357 346 173
179 413 70
493
F
16
138 125 229 67 76
154 264 336 133
169 294 47
259
F
17 18
174 121 'lID 105
178 182 58 61 90 57
.99 95 247 203 261 271 148 87
138 138 344- 263 61 42
231 148
103
WOltXlIB8
II III IV V VI VII Manu
facturing Agricul- Mining, House- other than Trade
tural Quarry- hold HOUIChold Coos- and la bourer iDg, etc, Industry IIldUltry truction Commerce _----. ~ .----. ......,.._., ~ .----. Nt: F Nt: F 1\IF M FMF MF
19 20 21 22 23 24 25 26 27 28 29 30
16 11 4 .. 12 6 1 .. 1 9 12 32 2 I 1 .. .. .. .. 12 5
28 43 34 4 3 .. .. .. 9 6 8 .. .. .. ..
17 19 12 -.. .. .. . . .. .. ..
14 18 11 .. 5 8 .. .. .. . . .. 52 50 23 .. 10 .. .. . . .. .. 3 .. 50 57 25 .. 2 .. 1 .. 24 46 .. .. . . .. .. .. .. .. .. .. 33 31 7 .. 1 .. .. .. . . 43 29 10 .. 2 .. .. .. .. 2 .. 3 4- .. 4 1 .. ., .. ..
96 81 1 .. 57 29 5 .. 14,975 12,419 10,081 8,696 2,514 2,793 919 '60 439 288 22 9 32 1 119 20
r _
BIHAR
VIII IX X Transport,
Storage and
Commu- .other SI. oicatiOlU Services Non-workers no. ~
.. ..----"----
M F M F M F
31 32 33 34 35 36
168 238 93 "i 95 101 94 98 lIB 95 30 36 96
I 83 143 97
51 33 114 107 98 22 11 257 384 99
1 6 8 248 208 100 1 113 176 101
.. 130 136 102 12 2 295 408 103
2 60 93 104-13 1 270 374 105
88 761 552 10,547 13,399
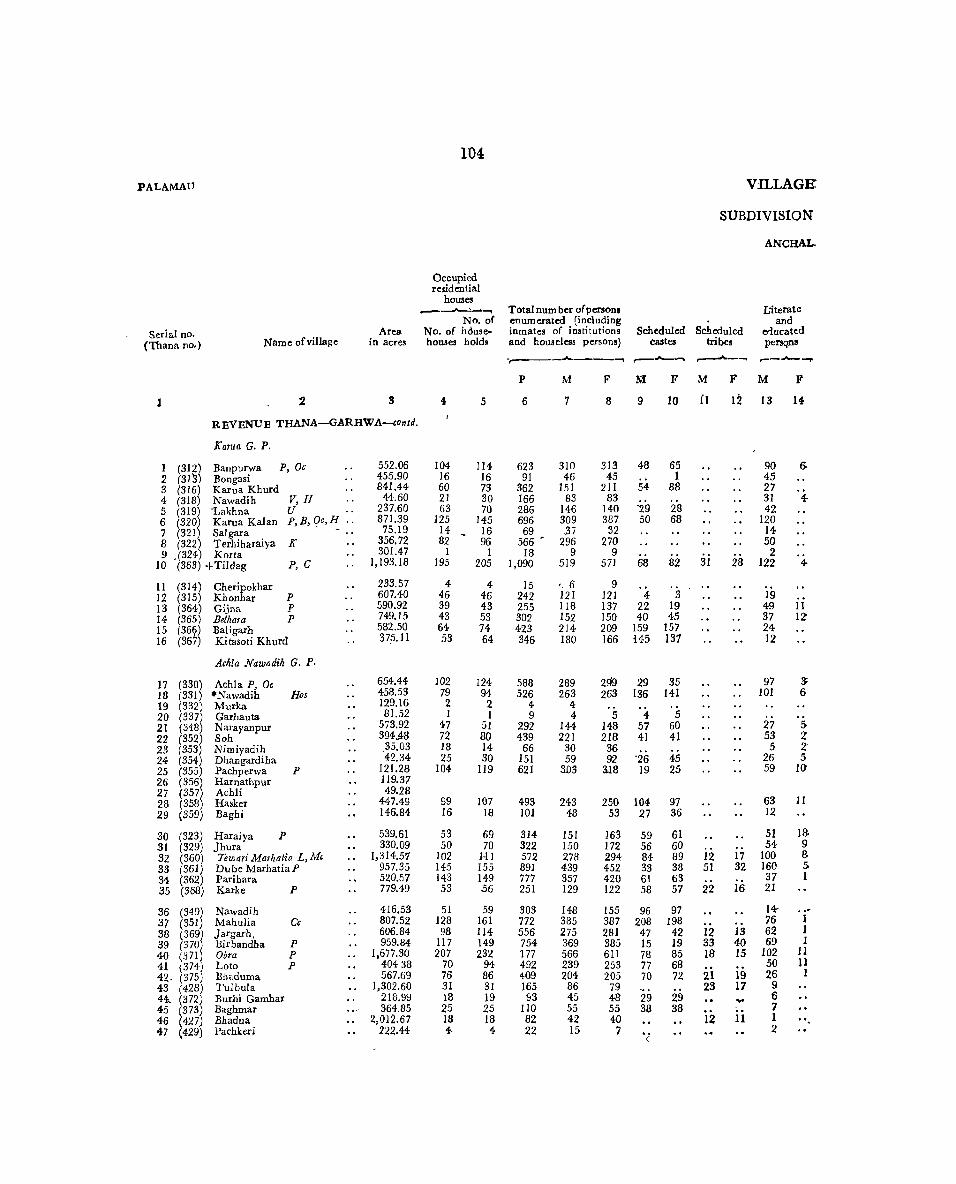
104
.PA LAMA U VILLAGE
SUBDIVIStON
ANCHAL.
Occupied reJidential
houseJ -~ Total num ber ofpersonl Literate
No. of enumerated (including and Serial no. Area No. of Muse- inmates of i nsti tutions Scheduled Scheduled etiucated
(Thana no.) Name of village in acres houseJ holds and houseless persons) castes tribes persqns
-,,----_.,__--. ,..-"'"-..... ,..--.A-...... ,.-_.J!I._--.-
P M F KI F M F M F
1 :2 g 4- 5 6 7 8 9 10 [1 12 13 14-
REVENUE THANA-GARHWA-cantd.
Karua G. P.
I (312) Banpurwa P,Oc 552.06 104 114 623 310 313 48 65 90 6 2 (313) Bongasi 455.90 16 16 91 46 45 1 45 3 (316) Karua Khurd 841.44 60 73 362 151 211 54 88 27 4- (318) Nawadih V,H 44.60 21 30 166 83 83 31 4-5 (319) -Lakhna U .. 237.60 63 70 286 146 140 '29 28 42 6 (320) Karua Kalan P,B, C}c,H .. 871.39 125 145 696 309 387 50 68 120 7 (321) Salgara 75.19 14 16 69 ,37 32 14 8 (322) Terhiharaiya K 356.72 82 96 566 • 296 270 50 9 • (324) Korta 301.47 1 1 18 9 9 2
10 (363) + Tildag P, C 1,193.18 195 205 1,090 519 571 68 82 31 28 122 4-
II (314) Cheripokhar 233.57 4- 4 15 '. 6 9 12 (315) Khonhar P 607.40 46 46 242 121 121 4 3 19 13 (364) Gijna P 590.92 39 43 255 118 137 22 19 49 11 14 (365) Bethara P 749.15 43 53 302 152 150 40 45 37 lZ 15 (36~) Baligarh 582,50 64 74 423 214 209 159 157 24 16 (36 ) Kitasoti Khurd 37:5. 11 53 64 346 180 166 !45 137 12
Achla Nawadih G. P.
17 (330) Achla P, Oc 654.44 102 124 588 289 299 29 35 97 3 18 (331) ·Nawadih Has 458.53 79 94 526 263 263 136 141 101 6 19 (332) Murka 129.16 2 2 4- 4-20 (337) Garhauta 81.52 1 1 9 4 5 4- 5 21 (348) Nal'ayanpur 573.92 47 51 292 144- 148 57 60 27 50 22 (352) Soh 39U8 72 80 439 221 218 41 41 53 Z 23 (353) Nimiyadih ,35.03 18 14 66 30 36 5 Z 24 (354) Dhangardiha 42.34 25 30 151 59 92 '26 45 26 5 25 (355) Pachperwa P 121.28 104 119 621 3.03 318 19 25 59 10' 26 (356) Harnathpur 119.37 27 (357) Achli 49.28 28 (358) Hasker 447.49 99 107 493 243 250 104 97 63 11 29 (359) Baghi 146.84 16 18 101 48 53 27 36 12
30 (323) Haraiya P 539.61 53 69 314 151 163 59 61 51 IS. 31 (329) ]hura 330.09 50 70 322 150 172 56 60 54 9 32 (360) 7i:wari Marhatia L, Me 1,314.57 102 HI 572 278 294 84 89 12 17 100 a. 33 (361) Dube Marhatia P 957.35 145 155 891 439 452 33 38 51 32 160 50 34 (362) Parihara 520.57 143 149 777 357 420 61 63 37 1 35 (368) Karke P 779.49 53 .56 251 129 122 58 57 22 16 21
36 (349) Nawadih 416.53 51 59 303 148 155 96 97 14-37 (351) Mahulia Cc 807.52 128 161 772 385 387 208 198 76 1 38 (369) ]argal'h, 606.84 98 114 556 275 281 47 42 12 13 62 1 39 (370) Birbandha P 959.84 117 149 754 369 385 IS 19 33 40 69 1 40 (::J71) Obra P 1,677.30 207 232 177 566 611 78 85 18 15 102 J 1 41 (374) Loto P 40438 70 94 492 239 253 77 68 50 11 42. (375) Bhaduma 567.69 76 86 409 204 205 70 72 21 19 26 1 43 (428) l'ulbula 1,302.60 31 31 165 86 79 23 17 9 44. (372) Burhi Gamhar 218.99 18 19 93 45 48 29 29 ... 6 45 (373) Baghmar 364.85 25 25 JlO 55 55 38 38 o. 7 46 (427) Bhadua 2,012.67 18 18 82 42 40 12 11 1 o. 47 (429) Pachkeri 222.44 4- 4 22 15 7 2
(

105
'STATISTICS
GARHWA
GARI:lWA WORKEBS
r---------------------------------""-
I
Total worker. (I-IX) Cultivator
M
15
163 17 74 29 85
146 24
127 4-
264
5 65 55 90
HI 97
145 119
4 3
82 98 19 37
159
132 28
73 76
136 224 197
72
77 210 152 207 314 162 133 54 26 37 28 9
F
16
85 13 73 22 43 77 2
34 2
213
3 63 24 78
140 87
16 16 .. 2
48 13 4
18 23
f ..
M F
17 18
100 21 13 3 16 3 II 2 23 15 74 25 10 2 83 10 4
173 51
5 3 28 22 39 19 16 10 32 25 57 39
76 8 82 9 4 I 2
23 69 5 14 2 20 5 67 3
Uninhabited Uninhabited 99 71 8 12 14 3
63 32 6 57 30 16 82 78 25
224 160 127 209 167 169 60 57 42
59 39 33 226 130 27 148 141 145 145 156 128 198 270 178 156 55 63 106 96 77 36 42 23 22 21 17 24 20 14 24 ·s 7 5 7 5
p-II-14
II III IV V VI VII VIII Manu- Tramport,
facturing Storage Agricul. ,Mining, House--other than Trade anti
tural Quarry. hold Household Cons- and Co=u-labourer ing, etc. Industry Industry truction Commerce nieations
,...........--. ___.,.__.. ~ ~ ,....-...._., .. M F M F M FM F M F M F M F
19 20 21 22 23 24 25 26 27 28 29 30 31 32
57 62 3 1 .. .. .. .. 4 10 .. .. .. .. .. . . .,
50 70 4 .. .. .. 7 IS .. 6 s- .. .. .. .. - I
53 28 I " 1 . , .. .. .. .. 50 48 2 .. 2 3 1 1
16 22 " .. 5 I 3 .. .. .. . . 2 .. .. .. o. o.
40 151 10 2 13 9 .. .. 14 o. 2 . . I
.. .. .. .. .. .. .. o •
36 40 .. .. .. .. .. .. .. " .. o •
12 5 .. .. .. .. .. .. " .. . . 45 47 3 2 .. .. .. .. .. ..
103 115 3 ., 2 ., 32 47 .. .. 3 .. .. .. I
23 I 4 3 .. .. .. .. .. 2 4 " I I .. 3 .. .. .. .. I
.. " " " I .. .. . , .. ..
53 38 3 .. . , . , .. I .. 16 8 " .. S . , 3 .. 4 2 .. . , .. ..
13 II .. ., .. .. .. 54 18 " .. 10 .. .. .. . . .. 11 2
55 91 S .. " .. . ~ .. .. 9 2 5 7 ..
14 15 23 41 .. .. .. .. 2 .. 1 .. 24 19 19 22 .. .. .. .. -. 47 54 1 .. .. .. .. .. 43 78 .. .. .. .. 15 30 3 .. 5 3 I .. .. .. 10 18 I .. .. .. . , .. .. .. .. .. 19 18 1 .. .. .. ., .. 21 125 .. .. " .. .. .. .. . , 2 3 .. .. .. .. I ..
32 17 .. .. 11 .. .. 27 17 3 .. 1 .. '1 1 .. 2 1
105 93 .. .. . , .. .. .. .. .. 33 26 .. .. .. .. . , .. .. .. 11 13 " " " .. .. .. .. .. ..
'" 5 5 .. .. .. .. 16 10 " .. .. .. .. .. .. .. .. .. 20 17 .. .. . . .. 2 .. " .. .. .. .. ..
~IHAR
IX X
Other Sl. Services Non-workers no. ,--"'"___, ,...--.....____,
M F M F
33 34 liS 36
3 .. 147 228 1 29 32 2
4 77 138 3 4 54 61 4-7 61 97 5
17 163 310 6 14 13 30 7 21 169 236 8
5 7 9 II 255 358 10
I 6 II 1 I 56 58 12 4 . . 63 1I3 13
,26 19 62 72 14 I 73 69 IS 4 1 83 79 15
41 4 144 I 283 17 29 3 144 247 18
19 I 1 3 20 2 10 62 100 21 7 123 205 22 I II 32 23 4 2 22 74 24
17 144 295 25 26
3 27
111 151 28 20 41 29
1 78 100 30 3 74 115 31
10 3 142 212 32 21 19 215 228 33 6 7 160 211 34-4 57 62 35
18 8 7I 96 36 59 74 175 161 37 8 123 133 38 8 162 240 39
11 252 413 40 2 77 97 41 4- 3 71 99 42 I 32 43 43
19 26 44-1 18 31 45
14- 16 46 6 2 47

106
PALAMAU VILLAGE
SUBDIVISION
-ANCHAL
Occupied residential
hoUBe. .----------. Total number of persool LIterate
No. or enumerated (including and Serial no. Area No. of house- inmate. of institutions Scheduled Scheduled educated
(Thana no.) Name ofvfIlage in acres boules holds and houselcu persons) cates tribes persOIl. ,....-""""____ ,...--...._ ....
P M F M F M ' F M F
2 g 4 5 6 7 8 9 10 11 12 IS 14-
REVENUE THANA-GARHWA-contd.
Ohro G. P.-conc1d.
48 (430) Nawadih P 766.8! .!l8 67 294- 148 146 11 12 35 45 37 49 (431) Kitasoti Kaian 285.86 !l9 59 293 147, 146 116 116 13 16 12 50 (432) Dohopal 128.83 51 (433) Banutikar 796.90 61 61 286 151 135 79 83 26 13 10
52 (224) Korwadih P 1,901.77 147 170 958 4-75 483 27 35 105 5 53 (229) Juti 777.67 22 - 25 123 60 63 7 54- (230) Ka{vanplir P .. 2,456.98 180 211 1,000 510 490 23 33 17 17 103 4-55 (343) Pipra Khurd 254-.03 8 12 62 30 32 7 10 9 56 (344) Karrnahi 301.12 74 75 , 344 168 176 87 94 19 57 (346) Tenar 260.79 66 72 369 183 186 28 26 38 58 (347) Dumro P 180.88 68 81 359 183 176 37 42 45 2 59 (350) Jata P 706.28 171 187 961 471 490 94 91 92 6 60 (376) Dhonti .6~4.59 70 72 301 158 143 6 3 21 1
61 (220) Lagma 75.00 80 108 529 260 269 20 15 15 20 100 9 62 (221) Potma 293.65 73 88 404- 207 197 40 4 51 40 105 15 63 (222) Khajuri 782.27 76 79 392 187 205 16 30 50 60 65 11 64 (223) Baghauta P 416.58 43 45 259 128 131 18 14 45 56 48 8 65 (231) Nowadih 87.37 55 74 316 146 170 22 23 22 15 23 1 66 (232)+Chhatarpuf 768.19 103 121 505 249 256 30 21 55 57 58 2 67 (233) Jhaluwa P 221.53 86 97 479 225 254- 15 25 102 106 83 10 68 (236) ChiraunjiYif P, Me 558.69 164 168 767 369 398 46 47 45 52 122 4
S angrahe G. P.
69 (265) Sangrahe Kalan 674.92 77 99 516 251 265 4 2 49 1 ~O (266~ Chamrahi P 298.44- 91 109 482 218 264 40 3 :71 (267 Sangrahe Khurd 974.98 120 147 676 305 371 166 167 67 25 72 (268) Jala 229.89 34- 39 1'83 90 93 8 8 24- 28 7 2 tS ~269) Dubiahi 231. 71 -74- 270) Bana 309.27 75 (271} Gidha 19827 22 24- 138 64- 74- 11 76 (272 Patsi 279.11
32 77 (273 Patsa 210.40- 82 96 512 253 259 33 53
78 (274) Darmi 322.37 9, - 114 603 307 296 44- 35 5 3 71 4-79 (275) N~wadih P 367.67 62 64- 379 199 180 '69 60 54 '80
(
276
1 Side Kalan 419.24- 25 36 178 98 80 21 21 33
81 (277 Side Khurd P, K2 440.93 78 82 467 240 227 45 '38 61 5 82 (278 Pratappur P 2,050.81 114 144 787 389 398 84 79 23 17 38 2 83 (279 Satjama 186.70 84 (280~ Gurdi 651.61 43 49 310 162 148 30 38 17 1 85 (281 lUrsugi P,Mc 1;522.46 179 209 1,092 511 581 93 108 30 28 58 11 86 (283~ ,!;Belchampa P, V, Me 826.31 122 134- 713 358 355 110 120 10 5 77 22 87 (284 Merhna Kalan P 738.39 77 92 520 254- 266 30 33 60 18 -88 (288) Merhna Khurd 256.29 44- 46 219 100 119 95 115 21 1
89
1'941 Bishunpur 202.91 10 14 68 34- 34 13 7
175.42 5 5 20 12 8 12 8 90 235 Baghmanwa 277.93 175 220 1,108 553 555 133 156 3 140 19 91 239) Naw.ada P 729.96 76 86 395 204- 191 54- 50 48 5 92 240) Jobraiya 661.31 80 95 371 ' 196 175 67 67 27 3 93 (243) Sukhbana

STATISTICS
GARHWA
GARHWA
Total workera (I-IX)
I
Cultivator
107'
WORKERS
II III IV V VI VII VIII Manu· Transport,
facturing Storage ·Agricul. Mining, House- other than Trade and
tural Quarry- hold Household Cons. and Commu. labourer ing, etc. Industry Industry truction Commerce nication.
,.--......___,....---.. ,.....-...,. ~ .---. ,.--......___,
IX
Other . Services
• 1.5
., 16
• r ),{ FMFMFMFMFM F M r.M F
75 80
83
253 36
304 15
101 100 116 291
92
149 104 101 66 85
136 128 232
130 134 153 50
35
139
177 114 49
140 219
70 308 216 168 60
20 6
290 113 128
17 18 19 20 21 22 29 ,2t 25 26 27 28 29 30 31 S2 !IS S4
60 44 9 38
Uninhabited 11 21
31 3
4-
265 22
237 259 31 22
240 17 81 20 11
208 222 9 9
83 62 87 2
104 9 139 67
203 105 75 66
125 55
103 56 92
133 133 185
54 65 61 48 22 52
102 138
113 65 133 79 134- 59 36 :12
Uninhabited Uninhabited 33 23
Uninhabited 121 70
119 6 62 6 IS
25 69 136 155 Uninhabited
2 47 307 141 32 76
117 37 60 33
7 5
168 .124 101
15 4
163 49 22
9 10 52 36 45 53
110 150
69 98 43 14
19
68
I
10 68
82 .. 6
12
6 .. 102 65 19
20 18
61
10
9 3 2
3 3
713 31 35 18 15 53 10 38
29 ]5 65 18
12
27
22 I 7
42 63
15 115 61 62 23
5 29 52
26 2 •• 6 ...... " •.
6 " ".. ..
5 3 ..
4- 24 I 3 I .. 8 ....
2 •• •. 3 .. 8.. 5
5
1 "
1 ..
9 I .. .. ., 13 17 " .. ..
.. 2 2 ........ 10 24 2 16 2 .. .. 4 3 8 1 I .. 3 " .. ..
110 3 .. 45
4- 2 .. 1
........ 48 3 20 36 30 1 '74 18 2
3 .. .0 .0 ••
.. .. .. 2 ..
5 3
.. 1
21 12 1 32 12 ..
5 .. .. 10 812 2 1 ••• 0 ••
12 ..
38 12 7 2 .. 35 ]2 .. 89 7 2 22 " •. " ••
14 ..
.')1 6.. 3 2 ..
4- .. '
.... 0 ••
2 .• 1
4-15 8 67
5 1 .. 1 8 ..
1 ..
o. o.
207 5 .. 3 3 26 11 7 94 26 1 8 5 48 1 ......
1 5
1 ..
...... 9
4- 3 3
4 .. 1 ..
3 9 .. 30 26 13 32 10 .. .. .. 15 48 11 ;. 2
5 .. 3, ....
1 ••
3 .. 14
4 18
7 24
31
3
7 3
.f ......
32
1 I 8
9 4
2 45
2 10
6 38 10
10 5 2 .. 7 2 2
27
10 1
21
2
33 50 14 9 1
8· 43 19 27 3
2 66
9 29
3
13 5 2
12
4
-3
3
3 1
2 14 6 4-
1 1
31 10 16
BIHAR-
x
Sl. Non·workers no,
M
35
73 67
68
222 24-
206 15 67 83 67
180 66
III 103 86 62 61
113 97
137
121 84
152 40
29
114
130 85 49
100 170
92 203 142 86 40
14 6
263 91 68
P
36
86 137
124-
218 41
250 15 95
166 165 351
76
144 142 102 75 78
123 121 213
152 131 237
57
41
138
296 174
74 202 262
14-6 274 323 149 . 5!J
27 3
387 67 74
48 49 50 51
52 53 54 55 56 57 58 59 60
61 62 63 64 65 66 67 68
69 70 71 n 7$ 74 75 76 77
78 79 80 81 82 83 84 85 86 87 88
8S 90 91 92 93

lOB PALAMAU VILLAGE
SUBDIVISION
ANCHAL
Occupied residential
houses ,.---.A-_---"'\ Total num ber of persons Literate
No. of enumerated (including and Serial no. Area No. of house- inmates of institutions Scheduled Scheduled educated
(Thana no:) Name of village in acres housCl holds and houseless persons) castes tribes persons ....
.---~ ,...---"----.,
P M F M F M F M F '-
2 S 4 5 6 7 8 9 10 11 12 13 14-
REVENUE THANA-GARHWA-contd.
94 (282) Pharatiya P 1,551.77 245 247 1,383 701 682 151 150 53 50 48 95 (285) Basaha 490.74 8 8 41 18 23 9 14 I 96 (286) Khajuri 441.55 5 6 -21 .g 12 3 97 (287) +Pipra K 496.54 105 131 594 286 308 100 125 150 175 45 98 (289) Lapo 433.36 28 34 181 89 92 14 12 33 I 99 (290) Banye 362.69 54 61 311 143 168 27 30 20 14 54 7
100 (291) Bana P 344.36 58 67 391 192 199 100 101 .50 65 76 22 101 (292) Dumariya P,L 726.71 62 79 445 215 230 25 20 102 25 102 (293) Masuriya Kalan 100,45 40 53 295 13-1 164 31 46 25 20 48 8 103 (294) Masuriya Khurd 182.11 15 16 124 50 74 13 20 12 30 22 I 104 (295) Gangi Khurd P,V 243.90 18 21 122 70 52 52 47 105 (296) Karcha K 181.36 32 34 204 95 109 26 1
. 106 (297) Gangi Kalan 284.57 46 67 293 141 152 21 22 20 25 15 4 107 (298~ Garnaha 192.90 36 41 253 127 126 59 51 30 108 (325 Mahadag 219.35 1 I 7 3 4 2 109 (326) Majhganwan 44.25 110 (327) Pataria 350.89 31 33 161 82 79 10 9 10 50 30 III (328) Hur 1,033.15 29 35 180 88 92 20 20 50 52 31 2 112 (333) +Madheya M 813.68 203 215 1,129 555 574 62 45 201 31 113 (334) Mahupi P 385.70 35 36 209 98 III 25 36 30 35 38 10 114 (336) Bharatiya 355,43 39 44 201 109 92 35 25 37 5
Ranka Baulia G. P.
115 (299) Kundi P,L 751.39 48 55 283 118 165 58 14
116 ~300) Korta P 605.34 143 153 759 373 386 59 50 58 2 117 301) Danda P 2,199.81 218 232 1,290 595 695 64 86 4 4 108 13 118 (302) Morihara P 597.35 80 86 il17 258 359 45 70 15 1 119 (303) Chhapardaga P,Mc 1,505.51 117 123 723 359 364 44 42 62 1 120 (304) Chak Chhapardaga '112.58 3 3 10 3 7 1 121 (305) Bhikhahi P 2,387.16 203 214- 1,215 613 602 60
Ranka Baulia G. P.-concld.
122 (306) Aseya 423.82 33 41 225 ' 103 122 10 18 6 123 (307) Bardaga 304.39 25 28 132 57 75 15 23 15 124 (308) Datma 305.76 21 27 111 49 62 4 .. 125 (309) Kamta 315.10 45 49 233 104 129 29 20 36 1 126 (310) +Ranka P,.L 701.97 110 126 617 285 332 96 102 112 7 127 (311) Gorheya 600.59 12 12 74 38 36 20 128 (317) Bauliya 505.74 49 57 244 123 121 39 26 41 6 129 (335) Chetna 525.42 31 31 197 109 88 30 28 50 40 33 G
ANCHAL TOTAL 72,354.69 8,~S4 9,534 48,915 23,88~ ·25,035 5,024 5,252 1,280 1,3465,544 571 or
113.05 sqj miles

109
'STATISTICS BIHAR
'(}ARHWA
<;ARHWA WOBXIIBS
.....
I II III IV V VI VII VIII IX X Manu- Transport.
facturing Storage Agricul- Mining, House- other than Trade and
Total workers tural Quarry- hold Household Cons- and Commu- Other SI. (I-IX) Cultivator labourer' ing, etc. Industry Industry truction Commerce nications Services Non-worken no.
~ ,..........._, ,........._. ,..........._._ ,-"__,,..........._, ~ ,..-..A--...... ,--oAo--",\ ,...--"""___'"
M F M F M F M F M F M F M F M F M F M F M F
15 16 17 18 19 20 21 22 23 2+ 25 26 27 28 29 30 31 32 '33 3t- 35 36
431 352 215 12 .. 116 225 .. . . .. .. 99 114- 270 330 94-10 13 9 12 I 1 .. .. " .. 8 10 95 2 7 2 6 1 .. .. .. " .. . . 7 5 96
152 27 98 5 38 21 7 . , 7 .. 1 " I 1 134 281 97 44 7 25 1 11 6 2 .. 3 .. .. .. .. .. .. . . 3 45 85 98 64 13 39 9 19 4- 1 .. 2 . .. 1 2 79 155 99 85 14- 50 5 10 7 .. 3 1 1 .. .. .. 12 . . 9 I 107 185 100
104 36 61 5 18 15 3 .. 10 16 1 .. 11 III 194- 101 58 21 33 12 12 9 2 .. 7 .. " .. " .. " . . 4- 73 143 102 25 4 17 2 5 2 .. .. .. .. 3 25 70 103 35 33 .. .. .. .. " I I 35 52 104-51 5 37 2 6 3 .. .. .. " .. .. .. 8 44 104- 105 82 15 30 1 11 3 2 .. 15 10 .. .. 24- 1 59 137 106 66 4- 34 2 21 .. .. .. 3 2 2 .. .. . . .. .. 6 61 122 107
2 2 .. .. .. . . .. .. .. . . .. .. . . I 4- 108 Uninhabited 109
46 17 27 6 10 11 9 .. .. .. 36 62 110 '42 24 21 6 14 17 5 .. 1 1 .. .. .. . . 1 46 68 III
302 189 135 56 48 120 40 .. 19 12 35 .. 1 . . 1 23 1 253 385 1I2 49 26 19 17 5 8 2 .. 15 1 .. 2 .. \ . 6 49 85 113 57 11 38 3 5 .. 2 1 1 .. 1 10 7 52 81 114
64 24 43 7 4 5 .. .. 14- 12 .. . . .. .. 3 54 141 115
239 70 1'82 15 55 54 .. 2 1 .. 134- 316 116 335 41 200 11 79 13 1 .. 30 10 8 5 3 .. 10 1 2 2 I 260 ,654 117 146 159 r21 130 2 .. I .. .. .. .. . . .. .. 1 21 29 112 200 118 197 168 154 157 .. .. .. 19 .. .. .. .. .. .. .. 1 23 11 162 196 119
3 3 .. .. .. .. .. .. 7 120 385 298 225 7 35 57 50 5 69229 .. 6 22B 304 121
67 63 51 18 14 27 .. 2 18 .. .. .. .. .. .. .. 36 59 122 27 33 20 19 5 14 1 .. .. .. .. .. ., I 30 42 123 31 36 14 20 8 9 .. 9 7 .. .. . . .. .. 18 26 124 56 22 31 5 18 17 1 .. 3 .. .. . . .. .. 3 48 107 125
150 78 84 17 49 60 7 1 1 .. 1 8 135 254 126 17 3 1,5 2 3 .. .. .. .. .. . . .. .. 21 33 127 73 31 43 3 '25 28 .. 1 .. .. .. .. .. . . .. 4 50 90 128 58 30 6 .. 1 .. .. .. . . 21 51 88 129
13,220 8,355 7,812 3,913 2,760 3,143 486 8S 585 654 96 37 67 5 65 58 138 .. 1,211 457 10,660 16,680

no P~,L~U VILLAGE
SUBDIVISION,
ANCHA~,
Occ!upied • residential
houses _---. Total num ber of persOIlJ Literate No.ot enumerated (including and
Serial no. Area No. of house- inmates of institutions Scheduled Scheduled educated (Thana no.) Name ofviUage in acres houses holds and housel~s persons) castes tribes pcI'5Ol1B
...-----' ,.....-....._ .... ~oJ\o_~
P D F M F M F M F
1 a s f CI 7 8 9 10 11 12 13 14
REVENUE THANA-GARHWA~ontd.
Halwanta G. P.
1 (3) Kumba Khurd .P 8,2,5~,33 liS 113 515 246 269 9 10 170 188 17 2 (4) Korea 379.00 49 ~9 269 13"2 137 55 59 4 7 34 3 3 (5) Jamua C& 1,082.56 86 86 512 271 241 214- 193 13 II 16 4 (6? Jamui P 553.98 70 70 401 201 200 90 90 40 6 ,5 (10 Halwanta Kalan P 40HI 121 145 719 379 - 340 128 Il9 68 3 6 (II) Halwanta Khurd 111.52 42 56 299 152 147 27 42 39 6 7 (12? Jorma 133.97 45 .j8 246 114 132 58 62 26 2 8 (15 pataria Kalan 336.12 50 50 305 159 146 67 65 72 17
9 m Garbandh p .. 4,915.84- 306 308 1,604 826 778 310 246 299 312 41 10 Baraitanr 339.00 II (16) Pataria Khurtl 294.01' 56 61 328 179 149 I 77 68 29 6 12
1171 Hulhula Khurd 640.24- 68 76 331 154- 177 10 14 29 30 14
13 f8
Hu1hula Kalan 227.46 24- 26 130 63 67 53 59 5 14 19 Kothilwa alias'Shiupur 39.40 43 46 253 123 130 53 2 15 25 Narkhoria Khurd 83.49 65 69 345 180 165 I 2 64 16 (26~ Pindaria p 570.06 41 43 260 126 134 60 3 17 (27 Deikhoh 122.15 18 (28 Sonbarsa 302.06 5 5 23 II 12
'4i 3
19 (39) BishunpUl' 0, 462.99 100 117 562 289 273 40 24 33 64 2 20 (40) Ghaghra J.,094.94
21 (7) Gangti 340.03 27 35 193 105 88 32 30 2 2 9 1 22 (8) Bilaspur 1,139.50 102 117 656 328 328 III 109 42 .J 23 (9) Jha1)ia 563.78 23 25 126 66 60 12 24- (13~ Torma 26.55 25 (14 Mahdaia 211.37 15 15 99- 50 49 42 42 8 26
fl?j Babhni 350.95 4 6 48 26 22 3 3 10
27 Saharastal Khurd 190.38 55 70 323- 173 150 56 48 4-7 2 28 (22 Saharasta! Kalan 262.07 29 (132. Tharka 291.79 67 71 359 190 16"1 45 30 51 2 30 (133 Tharkia 195.18 31 34 188 90 98
15] 26
31 (134) Barodih p 233.23 90 113 576 277 299 136 64 9 32 (135) Pipardih 450.16 90 105 539 258 281 131 145 37 33 (136) Sonpura .11.74 13 17 91 45 46 20 21 8 2 34- (137) Chaukhara 22.77 35 (138~ Tenduwa 43.02 4- • 24 11 13 11 13 3 36 (139 Sulsulia 599.00 87 91 498 264 234- 73 65 96
37 (23) Mangardah P 182.11 101 106 596 299 297 86 85 79 17 38 (24) Narkhoria Kalan 122.·79 30 35 189 93 96 29 2 39 (29) Puraini 146.81 105 118 568 289 279 74- 69 6Q 40 (113) Kolhua 886.90 69 77 409 198 211 98 109 23 27 24 41 (114) Marchwar 155.37 45 48 251 136 Il5 9 8 28 7 42 (liS) Singhpur 176.52 11 11 63 26 37 23 33 43 (116) Salseladi 1,067.57 48 5'8 275 138 137 77 78 30
,. 14
44 (124) Nasa alias Jasa 1,196.91 49 57 253 136 117 10 12 5 6 43 4-45 ~125f Kodwaria 38.45 46' 126 Narhi 217.39 89 99 529 268 261 9 12 51 16 47 (127 Chitbisrao71 M 1,172.35 179 1St 958 494- 464- 51 46 152 8 48 (128) Barahpati 28.80 49 (129) Gordih 345.36

STATI ST ICS
-GARHWA
"UNTARI
Total worken (I-IX)
I II
Agricultural
Cultivator labourer
_-"-___, ..-----
III
WOBEliBS
III IV V VI vU VIII IX Manu- Transport,
facturing Storage Mining, Howe- other than Trade and Quarry- hold Howehold Cons- and Commu' Other ing, etc. Indwtry Industry truction Commerce nications Services ,.---. ,...-..,,..-"""'_' ,.---. .....---. ..------ ..-----
F F
16
M
17
F
18
M F MFMFMFMFMF R
19 20 21 22. 23 24 25 26 27 28 29 30 31 32 33 34
177 176 l37 133 38 43 .. 2 .. .. .. .. .. 87 58 59 32 26 26 1 .. .. .. .. 1
143 107 87 /49 44 58 9 3 - .. .. .. .. .. 111 53 64 2{) 46 33 .. .. .. .. .. 1 245 107 140 54 94 52 " .. 5 .. 1 .. 2 .. 1 2 1 84 56 42 23 39 33 3 .. .. . . .. .. 65 56 34 16 26 40 .. .. .. .. .. .. .. 5 69 31 33 .f- 31 27 1 .. .. .. 4
523 408 424 361 88 32 7 2 14 1 .. Uninh{lbited
109 89 28 4 77 85 .. " .. .. .. .. .. .. 4-97 96 43 24- 53 72 .. .. .. .. .. .. .. .. .. 1 45 32 14 2 28 26 2 .. .. .. .. .. .. .. 1 4 82 22 58 2 21 20 .. 2 " .. .. .. .. 1
105 11 41 1 20 10 12 .. 6 .. 1. . . 7 .. 16 2 71 25 47 1 23 24 .. .. .. .. .. .. .. .. 1
Uninhabited 2 7 4 4 3 1 1 " .. " .. .. .. .. ..
182 116 55 27 73 86 .. .. 3 .. 1 .. 50 3 Uninhabited
55 38 18 2 37 36 .. .. .. 165 109 100 4 62 105 3 .. .. .. .. 30 5 24 5 6 .. .. .. .. .. .. ..
Unirzhabited 26 1 14 12 .. .. .. .. 11 1 5 6 1 .. .. .. .. .. .. .. .. .. 77 15 39 6 33 9 .f- .. .. .. .. .. .. .. 1
Uninhabited 3 105 74 79 55 22 19 . 1 .. .. .. .. ..
49 42 37 33 12 9 .. .. .. .. 138 74 62 3 59 43 4 .. 3 2 1 .. 9 26 130 103 35 71 52 6 .. 1 .. 17 51 22 15 8 2 13 12 .. .. .. " .. .. .. .. 1 1
Uninhabited 1 5 7 .. 4 7 .. .. .. .. . . ..
144- 41 81 7 62 34 .. .. .. .. 1
161 91 75 5 73 85 4. .. 5 .. .. .. .. 3 50 36 26 13 24 23 .. .. .. .. .. ..
146 128 96 73 27 32 22 23 .. 1 109 83 60 48 31 26 3 .. 3 .. .. .. 1 .. .. 30 8 79 52 30 33 17 13 3 .. 1 3 .. .. 6 2 20 3 17 16 5 7 6 8 .. .. 3 .. 3 1 71 62 43 30 26 31 2 .. .. .. .. .. '2 1 1 76 35 54 3 12 31 6 .. 2 .. .. .. .. .. .. .. 1
Uninhabited 9 27 3 155 122 53 6 46 110 2 .. 17 3 .. .. 1 .. ..
266 42 131 20 82 19 .. .. 34 1 .. .. .. .. 19 2 Uninhabited U nirzhabited
BIHAliL
X
51. Non-workerl no.
M
35
69 45
128 90
134 68 49 90
303
70 57 18 41 75 55
4-107
50 163
36
24 15 96
85 41
139 128 23
6 120
138 43
143 89 57 9
67 60
113 228
F
36
93 79
134 147 233
91 76
115
370
60 81 35
108 154 109
8 157
50 219
55
48 21
135
95 56
225 178 31
6 193
206 60
151 128 63 21 75 82
139 422
1
1 2 3 4 5 6 7 a
9 10 11 12 13 14 15 16 17 18 19 20
21 22 23 24 25 26 27 28 29 30 31 32 33 34-35 36
37 38 39 40 41 42 43 44-45 46 47 48 49

112
PALAMAU VILLAGE
SUBDIVISION
ANCHAL
Occupied residential
houses ,--...... _____, Total number of persons Literate
No. of enUlllerated (including Schedul~d
and Serialno. Area No. of house- inmates of institutions Scheduled educated
(Thana no.) Name ofvillage in acres houses holds and houseless penons) castes tribes persons r---"--...... r---"---... ...-----
p M P M F M F M F
1 2 3 4 5 6 7 8 9 10 11 12 13 14-
REVENUE THANA-GARHWA-contd.
ChitbiJraon G. P.-conc1d.
50 (130) Bamba 84-9.13 19 50 235 127 108 44 38 6 51 (131) +Bardiha 561.63 49 57 359 175 184 1 24 5-
52 (30) Ra~a A 33,04- 55 55 300 144- 156 2 4 60 29 53 (31)*+N4garutari h,C.Mc,A,H3.Hos,Rvc 258.20 544 568 2,772 1,451 1,321 209 216 1 623 151 54 (32) Bahiari 50.59 12 12 63 33 30 1 3 15 1 55 (33) Renho 115.19 46 50 264 137 127 46 47 34 s-56 (34) Dhamni 271. 75 57 (35) Ahirpurwa 271.12 107 116 565 282 283 159 159 4 4 65 2 58 (36) Naya Kharh 465.21 10 17 74 39 35 39 35 59 (37) Purnanagar. P 464.41 52 58 288 141 147 3 4 24 28 31 7 60 (38) Checharia M2,h,L, C,A,Rhc, Rvc 436.67 230 261 1,424 764 660 97 77 396 85 61 (41) Alkar 1,861.4-9 46 46 219 113 106 58 54 55 52 4 62 (42) Tulsidamar 764.09 IO 10 46 22 24 9 12 13 12 3 .. 63 (48) Jangipur 985.95 204 216 1,119 553 566 41 47 195 219 85 Z
64- (43) Daheria 1,318.74 23 23 116 62 54 2 36 37 5 65 (44~ Jhumri 1,481.67 21 21 113 67 46 4-6 32 I .. 66 (4-5 Bhojpur P, RVe, Cc 1,378.74 154 173 917 435 482 152 144 31 71 84 14-
67 (46) Palhe Khurrl 53.83 8 8 43 24 19 7 5 I .. 68 (47) Uska 231.02 57 57 301 138 163 23 30 15 13 28 I 69 (49) Adhaura P, De 832.22 121 121 559 276 283 10 12 43 & 70 (50) jatpura P 278.64 33 34 217 109 108 37 31 24- " 71 (51) Pa1he Kalab 481.25 149 176 967 476 4-91 116 131 41 45 82 &
BhojpUT G. P.-conclcl.
72 (52) Bhainsberhwa A, Cc 358.95 27 30 143 78 65 48 51 15 Z 73 (53) Kadhwan P 787.80 97 121 595 303 292 56 60 17 13 59 2 74- (55) Koljhiki P 468.96 143 1"91 783 390 393 278 118 24 75 (56) Koindi Oe 912.17 99 134- 654 343 311 lOS 97 60
Adhaura G. P.-conc1d.
76 (110) Kusdanr K 947.33 116 131 ·701 352 349 115 96 16 # 14 20 77 (1 I \) Adhauri P, L,Mc 420.58 4-1 51 244- 132 112 13 20 45 & 78 (1I2) Mahuli 157.85 26 26 162 83 79 83 79 3
Pipri G. P.
79 (57) Karkachia 497.76 12 14 51 29 2-2 29 22 80 (58) Deogurwa 345.24 8 8 38 19 19 81 (59) Chitri 964.92 44- 53 258 124 134 7 12· 50 38 I I 4-82 (60) Patihari P, Me 601.45 127 204 792 417 375 39 6 12 31 36 83 (61) Dar 244.03 15 23 98 51 47 , . 7 84 (62) Rurhi 168.97 31 42 214- 97 117 18 18 21 24 8 85 (63) Balua Khar 71.74 2 2 9 5 4 2 86 (64) Saro 3,486.70 4-8 66 340 177 163 5 4 138 128 23

us
'STATISTICS
GARHWA
UNTARI WORKERS
I II III IV V VI VII VIII IX Manu- Transport,
. facturing Storage Agricul- Mining, House- otherthan Trade and
Total workers (I-IX)
tural Quarry- hold Household Cons- and COmmu- Other Cultivator labourcl ing, etc. Industry In4ustry truction Commerce nications Services
r----..... ...-......__, ,........._., ~ r---'-...... ~ ,..-""'__' ~ ,-'-.A.--, ...-......__,
M
15
61 97
70 821
19 67
158 23 83
384 _ 76 17
321
40 43
254
14 74-
151 46
273
48 178 247 220
181 72 44
17 II 77
243 34-63
5 112
F
16
M F
17 18
M FMFMFMFMFMF M
1 16
54 76
10 16 133 124
6 23
d ~inhahited 54 51 q 18 14 38
145 58 38 45 12 15
187 170
29 24
172
10 61 63 19
225
31 13f 211 126
80 9
42
17 11 64
201 31 73
4-115
32 28
153
11 43
116 28
173
2:3 119 192 137
92 31 11
15 10 39
172 34 60 ,3 99
19 20 21 22 23 24 25 26 27 28 29 30 31
1 2
4 11
6 24 44 75
3 31
9 42 10 7 10
27 59 1 29 5 2
63 127
5 .. 26
I 28
6 140
5 85
147 99
27 4-
13 9
36
l~t 68
2 103
3 11 78
3 17 29 16 71
15 29 42
-30
70 35 32
2 I
23 39
3
13
2 .. .. 13 4.. 2 1
I .. 6 2 1 1 16 2 1 1-51 9 8 1 19 .. 156 4
2 .. 1 " '0 ••••
1 " . . . . 10
24 2 .. 19 5 1 . . 5 .. •• ., •••• '0 '0 '0 ., ••
7 .. 2 .. 6 48 8 4 106 38 2 3 4.. 73 8 26 .. 1 2 .. .. " .. ..
7 .. . ... 124 2.. 1 ..
23 5 .. I ........ 23 3 " I I ..
3 2 •• '0 0,
133 16 2 3
.... 9 7
" " 0,
.. 5 .. I .. I ..
1.0 53 35 13 63 8.. 3 ..
26 10 41 22 60 26 45
'0 o. "
4 " " .• I ..
I
•. 16 2 I " 51 5
42 1 ..
I
I ..
4 " " ., ...... 2 .. . ... 8 1 I ..
37 29 .. .. .. ....... '0 '0
.. .. 14 ..
..... '0 .0 .0 .0 '0 '0 "
5 .... " ............. . 2 2 " " " ...... ..
1.2 •• " .. .• •. •. .. ••
5 17
4
3 19
.. 2
3
P-II-15
F M F
32 33 34
1 4
17 269
7 2
34 5
24-55
. . 5
.. 2
5 1
14
8 11 8
6
14-3
','
1 57
16 I
17 10
6
22
I 4
19
]UHA~
x
S1. Non-workers no. ,....----. M
35
66 78
F
36
107 168
74 146 630 1,188
14 30 70 127
124 229 16 24 58 133
380 515 37 68
5 12 232 379
22 24
181
10 64
125 63
203
30 125 143 123
171 60 39
12 8
47 174 17 34,
65
25 22
310
9 102 220
89 266
34-16t' 182 H!5
269 103 37
5 8
70 174 16 44-
48
50 51
52 53 54 55 56 57 58 59 60 61 62 63
64 65 66
67 68 69 70 7I.
7'/ 7:r 74 75
76 77 78
79 80' 81 82 83 84" 8S-81t

114
PALAMAU VILLAGE
SUBDIVISION
ANCHAL
Occupicd rcsid cn tial hOlll'e~
Total number ofpersons ~
Literate No. of enumcrated (including and
serial no. Area No. of house- inmates of institutions Scheduled Scheduled educatM
(Thana no.) Name of village in acres houscs holds and housclcss persons) castes tribes persons ,---""__'
p M F M F M F M F
2 3 4 5 6 7 8 9 10 11 12 13 14
REVENUE THANA-GARHWA-eontd.
Pipri G. P.-conc1d.
87 (65) Pato 1,585.93 88 (66) Orhea 1,340.11 21 23 110 50 60 23 39 6 " S
89 (67) Bachhikhoh 250.11 1 2 8 4 4 4 4
90 (79) Pipri'Kalan P 596.35 194 211 1,002 504 498 136 137 4 ..
74 2:
Tandwa G. P.
91 (54) Siriatongar 382.11 62 62 334 173 161 37 33 34
92 (81) Jogiral Khurd 183.22 21 23 189 72 67 14 10 21
93 (82) Jogiral Kalan 405.&1 52 52 310 158 152 19 12 69 5
94 (9~) +Silidag P 863.12 294 352 1,755 890 865 256 264 237 6
95 (100) Karcha 328.58 61 63 299 154 145 74 67 16
96 (101) Tandwa p 2,028.67 232 307 1'520 765 755 301 384 148 168 168 1
97 (102) Prasawan 484.94 67 70 375 185 190 75 75 62 4-
Silidag G. p.-conclo.
98 (103) Bahiar Khurd P, Me, Oc .. 1,352.83 140 141 801 409 392 180 166 69 77 56 5 99 (104) Chamar Bahiari 244.06 1 1 1 I
100 (105) Bahiar Kalan 743.70 88 108 575 318 . 257 38 2\) 57 46 40
101 (106f Bankhetll 570.38 8 13 59 32 27 19 15 3 4 5
102 (107 Mangra .. 830.27 76 84 460 229 231 49 46 38 46 13
103 (108 Sangbarwa alias Chhapardaga 973.96 15 17 83 50 33 5 4 34 20 7
104' (109) Sapahi 1,390.86 75 93 516 239 277 26 31 104 107 28 1
105 ~~~~ Bishunpura 820.60 210 233 1118 580 538 230 272 52 2
106 Sandhea 643.67 36 46 232 124 108 8 15 10
107. (70) Patagara Kalan 339.25 99 121 619 293 326 71 81 104 9
108 (71) Patagara Khurd H,M 240.02 27 32 164 91 73 9 9 25 3
109 (72~ +Kochea M 580.85 60 70 388 203 185 14 22 71 17
110 (73 Mahuli Khurd 123.16 30 36 167 79 8B 25 25 22 1
1ll (74 Mahuli Kalan 190.40 36 49 237 124 113 49 47 36
112 (75) Amhar Khas 1,852.03 137 166 BOB 396 412 125 127 2 47 2
113 (76) Kamta 68.05 15 15 98 51 47 10 15
(77) Pipri Khurd H 596.0S 89 93 423 193 230 50 51 31 I
114 26 5
115 (78) Sondiha 109.95 20 23 1I0 58 52 25 5
116 (80) Jatpura p 407.11 79 97 523 255 268 106 124 38 1
117 (83) Sarang 550.15 36 38 217 108 109 78 84 4 15
118 (84) Darjia 146.08 23 25 130 71 59 53 47 12 ,3
119 (85~ Majhianwan 91.70 20 26 141 ~ 67 74 28 32 11 2
120 (86 Giddhi 397.85 29 38 243 120 123 13 9 51 8
121' (87) Siddhi 506.44 55 59 321 158 163 8 3 8
122 (88) Kharatia ' . 1,028.07 7 9 41 18 23 9
123 (89) Kabisa P,V 1,098.95 63 95 472 242 230 65 62 78 3
124 (90~ Korga 1,311.40 24 36 190 98, 92 69 69 2
125 (91 Marwanian 641.85 141 182 1,081 541 540 100 97 122 31
126
{~!~ RohiIa p 845.08 61 93 521 245 276 71 71 28 4
127 Manpur 106.52 19 35 159 90 69 54' 39 26 7
128· Karanpura 640.11 78 119 641 322 322 58 57 59 4

11i
STATISTICS
GARHWA
UNTARI ,WORKERS
~------------------------------
I II III IV V VI VII VIII IX Manu- Transport,
racturing Storage Agricul- Mining, House- other than Trade and'
'rqtal workers (I-IX) Cultivator
,-----'
tural Quarry- hold Household Cons- and Commu- Other labourer ing, etc. Industry Industry truction Commerce, IDeations Services ,-----' ,.--.A--o. "...-.-..... ~ ~ ...-"--..... ,...---.... ___, r......------.
M
15
28 3
270
100 42 93
514
81 425 112
246 I
178 16
139 29
154
346 79
187 44
113 53 68
221 26
1.12 20
136
66 43 43 61
119 13
129 61
292 134 45
169
F
16
M
17
Uninhabited 24 21 2 3
178 173
87 • 32
74
407
78 316 103
146 ..
122 12 96
4 8
305 59
111 28 70 42 46
197 8
135 2
99
68 27 28 15
109 2
12 3
II7 37 14 56
82 28 70
243
S8 377
68
226 1
119 14 40 22 75
104-67 94 40 90 23 38 74 17 50 19 76
50 8
21 51 59
9 86 29
114 50 17 80
F M FMFMFMFMFMF M F M F
18 19 20 21 22 23 24 25 26 27 28 29 30 31 32 33 34
15 I ••
2 110 10
77 23 52
2i9
SO 284:
73
116
100 12
5 .. 2
82 47 57 28 45 14 11 49
61 2
48
53 2 6 8
56 2 3 I 4
3 3
12 12 11
188
42 35 7
15
14-
13 6
68
178 12 34 1
18 29 26
139 8
43
58
13 32 22 8
53 2
41 32 15 14
7
r .. ~ . . .
8 1 .. 14 7 2 ..
2 ., 10 1 .. .. 7 .• •• o.
16 " 1 .•
180 .. .. 51
48 1 .,
5 ., 22
•••• '0 '0
30 . . I . . . . 2 .. 1 " 2 17 1 4 3 ..
28 I .. 2, 1 .. .0 '0 o'
10 14 .. 2 .. .. .. .. I . . . . ,..
7 3 .. 19 5 .. 4 ...... 4 5 ..
206 .. " 55 12 12
2 ..
3
35 7 I 12 15 " 38 I
2 .. 2 .. 22 28
2.. I 2 " .... " .. " " " .... \ .... "
35 I 148
3 " 6 "
8 .. 67 ..
'0 ••••••
.. 12 3 .. 2 .. I ••••• '0 ......... "
51 .. " 1 ..
15 3 25 .. 22 ......... .
...... ;
7 .. 50 .... 73"
I ........ " .. 9 .. .. " " 1 2 '0 e •••
. . 38 I 43 53 3 . . 1 2 " " .. .. 1 .. " .. "
3 " .... 6 ..
2
2
7
68
2 2
11
8
8 16
29 1
64 1
6
7 .. 1
2 1
2 1 5 1 1
3
2
1 1
55 69 25 75
8
53
2 6
1 24
12
79 " 2
4
1
4
59 37 11 53
BIHAR
x
51. N on-workers no.
M
35
22 1
234
73 30 65
376
73 340 73
163
140 16 90 21 85
234 45
106 47 90 26 56
175 25 8.J 38
119
42 28 24 59 39 5
113 37
249 III 45
153
F
36
36 2
320
74 35 78
458
67 439
87
246
135 15
1,35 29
269
233 49
215 45
115 46 67
215 39 95 50
169
41 32 46
108 54 21
218 89
423 239
55 266
87 88 89 90
91 92 93
94
95 96 97
98 99
100 101 102 103 104
105 lOS. 107 lOS; 109. ll() III 112 113 114 1I5 116
117 118 119 120 121 122 123 11'4 125 126 127 128

PALAMAU
Serial no. (Thana no.)
1
Name of village
2
Occupied residential
houses ,---"'____'
No. of Area ,No. of bouse
in acres houses bolds
3 4 5
REVENUE THANA-GARHWA-contd.
Mafwanian G. P.-conc1d.
129 (95) Bataua 405.27 22 26 130 (96) Bagbaundba alillS Ran\1~a H .' 761'.92 . ~99 490. 131 ~97) Mandohar M, V, C~. 125.02 35 35 132 98) +Majbganwan ( 431.88 90 92
133 (189~ Bhagadih P - 2,307.Q3 266 266 134 e90 Haradag Khurd P 1,550.92 1:'39 139 135 191) Haradag Kalan .. ' 1,357.76 197 197.
ANCHAL TOTAL 90,131.79 9,354 1(;,69~ or
140.83 sq. miles
Total num her of persons enumerated (including inmates of institutions Scheduled and houseless persons) castes
p M F M F
6 7 8 9 10
112 60 52 7 5 2~409 • 1,266 1,143 375 355
163 76 87 40 44 ,443 .230 .213 9 9
1,446 732 714 162 150 679 346 333 54 60
1,001 .537 464- 71 66
VILLAGE
SUBDIVISION
ANCHAL
Literate and
Scheduled educated tribes persons
r----"'---._,,,,~
M F M F
11 I 12 13 It
24 14- 6 12 15 327 45
21 2 27 27 17
50 46 93 9 121 118 31
40 36 16
54~6!)3 27;740 26,863 7,1516,936 2,237 2,293 5,735 715

'STATISTICS
<1ARHWA
UNTA.RI
I
Total work en (I-IX) Cultivator
M
15
S8 725
50 135
393 207 293
15,t85
F
16
22 229 28 93
87 50
135
8,932
F
17 18
11 3 199 6 29 2 62 40
287 70 180 35 274- 27
8,608 4,174
II7
WOB1I:1IB8
II III IV V V~ VII Manu.
facturing Agricul. Mining, Houle- other than Trade
tural Quarry- hold Household Cons- and. la bourer ing, etc Industry Industry tructiOQ Commerce
,..._..._... r-'--o ,.......,.._.._ ~ ~
M FMFMFMFMFMP
19 /20 21 22 23 24 25 26 27 28 29 30
.. 100 26 27 . , 87 7 1 .. 11 .. 71 2
1 3 1 I .. 3B 31 16 ., 4 7
101 17 2 .. .. .. 27 15 .. .. .. .. .. .. 19 lOB .. .. ..
3,936 3,609 365 17783242 35 4 62 2 426 21
VIII IX Transport,
Storage and
COmmu- Other nications Services
M
31
F NI P.
32 33 34
27 19 10 219 HIS .. 18 23 - . 15 15
3
114 1 1,456 Sa!
X
Non.workers ,.. ,...~
22 541 26 95
339 139 244
11,955
F
36
30 914-
59 120
627 283 329
17,931
81. no.
1
129 130 131 132
133 134 135

118
PALAMAU VILLAGE
SUBDIVISION
ANCHAL
OCcupied residential
houses ,.. ---, 1:otal number ofperllon! Literate
No.of enumerated (including and Scrialno. Area No. or house- inmates of insthutions Scheduled Scheduled educated
(Thana no.) Name of village in acres houses holds and houseless persons) castes tribes persons ,..--"'" ~
;. .&
P M F M F M F M F
1 2 3 4 5 6 7 8 9 10 11 12 13 14
REVENUE THANA-GARHWA-contd.
Sagma-Kathhar G. P.
1 (140) Putur M 1,659.47 141 141 778 405 373 115 119 21 26 109 a 2 (141) Danrkathsar 216.II 33 33 175 90 85 40 . 37 26 7 3 ~142). +Kathhar Kalan 603.58 134 161 807 400 407 .... 75 100 III 104 70 5 4 143) Sagma P, Me 2,303.31 275 291 1,341 701 640 284 221 41 47 112 50 5 (145) Kalma 1,000.41 6 (146) Sondiha P,Mc,Hos_ 1,260.81 172 172 1,017 521 496 223 210 52 9
7 (147) Birbal P,L 1,285.60 160 179 921 450 471 83 81 20 26 65 6 8 (1481 Bailia 768.66 85 97 512 256 256 9 8 23 20 51 4-9 (149 Makri P 1,031.77 59 69 345 181 164- 21 17 47 150
10 (150) +Chainpur 1,186.15 38 42 199 109 90 1 45 42 25 3 11 (151) Ghaghri P 1,259.23 232 243 1,141 566 575 235 209 3 7 65 3 12 (152) Jhunka 795.21 15 15 59 32 27 1 1 4 2 3 1 13 (153) Dusaia P 1,198.94 73 73 355 168 187 14- 15 102 107 20 6
14: (154) Raksi P 2,057.51 106 116 538 281 257 154: 141 54: 4:9 23 15 (155~ Dhobni 1,134.33 25 36 168 90 78 50 46 5 16 (156 Kumba Kalan 2,497.90 33 36 169 85 84 21 20 35 30 4 17 ~157~ Kadwa 1,773.07 81 I 86 469 253 216 116 104 8 18 158 Dudhi: alias Paraspani Khurd 2,059.38 27 27 170 86 84 51 59 13 19 (159) Bhuinphor 1,406.63 24 30 145 80 65 .. 50 46 11 20 (160) Mandre alias Phephsa 305.49 3 7 33 17 16 2 14- 16 4-21 (161) Sarno alias Suru 1,505.01 39 39 163 86 77 80 72 2 22 (162) Khutia P,L,Mc 1,506.73 123 145 696 336 360 120 100 III 125 52 2
23 (163) Khala P,Mc 3,785.66 126 138 768 398 370 70 83 102 80 52 3 24- (164) Libra alias Paras PaniKalan P 2,977.68 125 129 584- 310 274- I 300 258 50 3 25 (165) Murhpur alias Pachpheri 1,919.97 9 9 _ 36 22 14 2 2 16 12 4 26 (166) +Amba Khorea P,L,Me 1,776.61 68 70 480 246 234 36 20 170 168 43 9 27 (177) +Bali&ri alias Siuri 2,012.81 55 56 248 134 114 66 49 17 16 4
Bhandari G. P.
28 (167) Barahsoti 1,040.15 23 23 109 56 53 15 9 35 35 29 (168) Machhpani •. 2,347.33 2 2 16 7 9 7 9 30 (169) Kadwa alias Likhnidhaura P 5,213.46 127 130 593 310 283 8 17 213 174- 40 4-31 (170) Ketma 2,166.82 93 96 376 188 188 . 19 20 169 168 8 32 (171) Bhanda alias Bhandar P 2,261.66 151 162 747 385 362 120 107 157 149 38 3
33 (172) Panghatwa 1,679.42 50 62 305 158 147 53 40 51 52 26 34 (173) Bishunia 1,154.74 14 20 99 55 44 7 9 32 20 11 35 (174) Ganiari KhurdMc 1,885.19 80 105 488 235 253 13 13 213 231 29 36 (175) Tatidiri P, L, Rhc, Me,le 1,929.37 164 186 890 444 446 117 119 78 72 60 4-37 (176) Marchai P 3,300.48 112 122 523 251 272 102 101 77 100 16 38 (182) Ganiari Kalan allasPhatpaniP 2,427.19 154 193 825 ~ 413 412 104 102 196 200 30
Dhurki G. P.
39 (121) Jaurahi 668.85 40 (122) Sendha 747.82 I 1 2 1 1 .. 41 (1445 Sarda ," 1,883.34 39 40 177 93 84 44 49 49 35 3 42 (178 Sa1um alias Sakti .. 2,135.28 26 28 110 50 60 9 15 19 18 3 43 (179) + Tendra alias Dhurki..P, Me •. 1,560.35 90 90 405 215 190 19 16 54 53 48 2

119
STATISTICS 'BIHAR.
GARHWA
DHURKI WOBK.lBII
I II III IV V VI VII VIn IX X
Total worken (I-~X) Cultivator
,-- ,------'
Manu- Transport, facturing Storage
AgricuI- Mining, House- other than Trade and tural Quarry-, hold Household Co'Il.s- and Commu- Other Sl.
la bourer ing, etc. Industry Industry trllctlon Commerce nieations Services Non-workers no. ,...---"-....... ,...--A-....... ",---"-,,...-J'--. __ ....__, ,..... ...... -. ,--~ ,--~ ,-----.
M F M F M F M F M F M F M F' M F M F M F M F
15 16 17 , 18 19 20 21 22 23 24 25 26 27 28 29 30 31 32 33 34- 35 36
236 107 134 35 90 72 4 .. 8 169 266 1 55 23 24 6 28 17 1 .. " 2 35 62 2
238 211 142 109 77 94 I .. 10 3 \ 1 .. " .. 2 1 6 3 162 196 3 419 267 239 102 121 146 21 .. 26 18 1 .. " .. 1 1 10 282 373 4
Uninhabited 138 127 18 5 4- S 3
5 316 257 147 119 .. .. " .. 3 4 205 239 6
280 256 175 152 '92 96 3 .. 6 6 1 .. 1 " 1 " 2 170 215 7 140 86 III 55 29 27 4 .. " .. .. 116 170 8 105 72 75 49 19 23 11 .. .. " .. 76 92 9 67 49 37 24 20 24 5 1 . , .. .. " " .. 4 1 42 41 10
322 274 173 114 117 144 5 .. 26 16 ., " .. .. 1 244- 301 11 26 18 26 18 .. .. ., 6 9 12
103 104 29 17 74 87 65 83 13
169 143 112 90 38 47 16 5 .. .. " 112 114 14 47 33 38 20 3 13 6 .. .. .. .. 43 45 15 57 47 28 21 25 23 3 3 ., .. " 1 28 37 16
149 92 118 68 18 23 11 .. 1 ., .. .. .. J 1 104 124 17 59 37 27 18 20 19 12 .. .. " " 27 47 18 51 23 23 13 7 10 10 .. 9 .. 2 29 42 19 11 6 8 5 3. 1 .. .. .. .. .. 6 10 20 59 43 52 40 3 1 4 2 .. .. . 27 34 21 , ..
212 142 176 132 6 5 21 2 4- 3 ., .. 1 " 4 124 218 22
222 66 149 45 62 20 2 2 1 " .. 6 176 304 23 203 185 145 129 40 55 10 3 .. .. .. 1 .. .. ' 4 107 89 24
17 11 8 7 2 4 2 " 4 " 1 5 3 25 152 124 122 112 11 11 I .. 4 .. .. . , .. .. 1 13 94 110 26 93 70 77 54 6 16 3 .. 1 6 41 H 27
32 30 22 21 8 9 2 .. .. .. . . 24 23 28 4 4 3 3 1 1 . , .. .. " 3 5 29
182 133 102 66 69 62 10 5 128 150 30 131 104 99 90 26 13 6 1 " ., .. 57 84 31 237 174 118 93 77 79 34 1 3 .. .. 1 4 1 148 188 32 ,
93 28 66 21 21 7 6 .. 65 119 33 33 9 26 8 5 1 2 .. .. .. 22 35 34
153 52 96 26 44- 25 13 1 .. .. .. 82 201 35 264 173 163 79 78 90 15 2 1 2 I 6 180 273 36 134 125 84 49 28 72 19 2 4 1 117 147 37 271 263 226 210 43 53 .. 2 142 149 38
Uninhabited 39 .. .. .. .. .. .. 1 1 40 59 45 36 31 17 13 5 .. .. 34 39 41 31 30 13 10 12 17 6 3 .. . . .. .. ..
ii' 19 30 42
119 88 65 43 37 38 4 6 ., .. 1 96 102 43

120
PALAMAU VILLAGE ~
SUBDIVisION
ANC:ffAL
Occupied residential
houses ,..--.A.l __ --, Total number of persons Literate No. of enumerated ({ncluding and
Serial no. Area No. of house- inmates of institutions Scheduled Scheduled educated (Thana no.) Name of village in acres houses holds and houseless persons) c,:asus tribes persons
r-~ _..A.---__ ,.--..,,__...... ,-_..A.._ .....
P M F M ~ M F M F
2 ~ 4 5 6 7 8 9 10 11 12 13 14-
REVENUE THANA-GARHWA-concld.
Dhurki G. P.-concld.
44 (180) Lolki 1,129.66 16 16 73 3B 35 38 35 2 45 (181) Karwapahar P 2,100.90 62 70 287 147 140 33 32 101 98 12
46 ~I17) Chana Kalan Me 2,060.86 17 22 122 59 63 41 43 4 15 S. 47 118) Chana Khurd 140.18 48 (119) Pokhraha 170.70
35 ,49 (120) Henhe alias Baraiha P 1,7.94.23 51 61 273 127 146 32 90 112 25 50 50 (123) Garda 1,476.)9 14 16 68 32 36 1 2 31 34 I 51 (183j Dhamdhamia alias Atiari .. 1,773.02 42J: 48 184- 96 88 43 48 48 38 8 52 (184 Mandohar alias Kerua P .. 1,503.63 51 59 265 139 126 5 4 129 122 21 53 (185) Garnharia P 1,463'.15 165 190 968 472 496 254 272 1 1 87 a 54 (186) Jirua 1,711.63 ' 20 25 131 70 61 69 62 1 2 I I I 55 (187) Bulka P,L,Mc 2,697.20 180 210 924 455 469 177 176 128 145 54 3 56 (188) Chund; P 1,680;04 III 114 530 263 267 90 84 27 28 48 2
ANCHAL TOTAL 93,390.87 4,118 4,531 21,807 11,062 10,745 3,C43 2,1191 3,3118 3,312 1,517 140 or
145.92 sq miles

121
STATISTICS .
GARHWA
DHURRI WODEBD8
I II III IV V VI VII VIII IX
Total workers Agricul.
tural (I-IX) Cultivator labourer
Manu· Transport. facturing Storage
Mining, House. other than Trade and Quarry. hold Household Cons. and Commu· Other ing, etc. Industry Industry truction Commercenication. Services
....---.....__ ....... .---.....___, .---.... ___, ,_-.A.----,.........._.., ,...... ...... ...., ~ ~ ,.--...._____ .------.. M
15
F
16
M
17
F M FMFMFMFMFMF M F M F
18 19 20 21 22 23 24 25 26 27 28 29 30 31 32 33 34
22 16 13 10 8 6 1 .. .. 89 66 49 34 30 30 7 ", 2 ,2 .. .. .. 83 24 22 15 4 8 6 .. I .. " .
Uninhabited Uninhabited
83 61 47 32 16 27 16 1 2 1 .. " .. .. 2 24 22 6 3 12 IS 6 4 .. .. .. .
" 65 52 43 21 10 21 9 .. 1 10 .. . . .. .. .. 2 88 78 31 20 41 37 8 2 14 .. 6 7
291 285 77 18 110 144 5 .. 35 48 I .. 63 75 45 39 17 3 8 15 6 .. 3 10 .. .. II 11
294 298 205 221 40 19 7 4 7 , . 1 37 51 166 160 78 71 61 77 a .. 18 12 .. 1
8,751 5,105 4,102 2,752 1,855 1,984 347 21 186 183 13 2 15 4 10 3 221 158
BlHAR
X
Non-workers .---...... ___,
M
35
16 58
26
44 8
31 51
181 25
161 97
4,311
F
36
19 74
39
85 14 36 48
211 22
171 107
5,640
Sl. no •
44 45
46 47 48 49 50 51 52 53 54 55 56

PALAMAU
122
Occupied residential
houses ,....-----~ Total number of persons
No. of enumerated (including
VILLAGE
SUBDIVISION
ANCHAL
Serial no. -(Thana. no.)
Area No. of house- inmates of institutions Scheduled Scheduled
Literate and
educated persons Name of viJIage in acres houses holds and houseless. persons) castes tribes
1 2 3 4 5 6 7 8
2
REVENUE THANA-RANRA
(I) Kundil alias Dol P, Oe (2) Duduhara alias Rajbans P .. (3) Helri alias Chhatailia (4) + Ranieheri P (5) +Belri alias Chinia P (6) Chitka alias Chirka (7) Bilai ti Khair (8) ChapkaJi alias 9hamkali P ..
Rampur C. P.
3
2,528.19 2,193.80 2)387.00
817.74 3,464.47 4,899.-77 1,915.70 7,185.45
9 (9) Masri alias Masra 3,564.50 10 (10) Karma alias Khuri P 6,054.24 II (I I) Nagsi).i 2,182.60 12 (IS) Sikat 81.61 13 (16) Parsukhar P .. 1,177.87 14 (17) RatanpuraaliosRampuraM,L,Oel,676.60 IS (18) Resrikhari alias Besri .. 196.78 16 (19) Tuni alios Turimunda P,Oe 941.36 17 (20) Cheta alias Beta 4,504.20 18 (21) Palhe 1,181.51 19 (22) Side • 2,827.43 20 (29) Purgara 762.29 21 (30) SaIwahi 383.46
22 (12) Dudhwal Oc,P 2,308.45. 23 (13) Baradih 1,844.77 24 (14) Naga.ri 964.32 25 (23) Gangudih 1,550.10 26 (24) Hetar 193. 15 27 (25) Makhatu 277.16 28 (26) Khaparmunda 66.87 29 (27) Nagwa 17.93 30 (28) Jun 1,210.66 31 (31) Pargawal 347.08 32 (32) Nawadih .. 439.20 33 (33) Siroi alias Belwadamar P,Oe 1,666.39 34 (34) Anhar 1,452.68 35 (35) Baghokundar 1,668.51 36 (36) Nawabandh 196.91 37 (37) Bandu 2,366.24 38 (38) Chutru K.L,Rhc,Me 1,939.08 39 (39) Daldalia 993.48
40 (40) Bardari Me 3,465.22 41 (41) +Bhaunri P,L,Me 4,770.74 42 (42) Barwah 2,441.72 43 (43) Karri 3,969.42 44 (44) Lehda 916.94 45 (45) Damaran .'. 1,624.34 46 (46) Katra 3,095.84 47 (95) Bhadua 976.69 48 (134)+"'Bisrampur Me, Oe,P,S .. 6,455.49 49 (141) Chutia P, L, H, Rhe,Me, Oe 4,758.10
Sewadih C. P.
50 (47) Siroi Kalan Me 51 (48) Siroi Khurd Me, P
4,270.04 1,853.21
4
233 72 67 76
188 93 67 88
5
244 86 77 83
188 95 75 96
27 27 90 92 30 32
24 28 76 82 15 15 53 57
101 109 51 54 20 20 12 12 6 7
72 • 76 57 57 48 48 22 24 13 16 3 4 1 1
13 15
2 2 63 70 32 82 30 30
110 115 141 147
136 150 lilY'" 126 52 55 65 77
21 21 54 55 fO 10 99 102
171 186
104 70
112 80
P
6
1,081 412 369 434 870 4,11 331 436
156 432 138
lit' 358 84
·234 499 214
98 62 33
384 233 211 89 66' 22 4
86
12 285 182 185
519. 698
780 608 297 388
78 252
30 497 886
534 487
M
7
545 206 1'90 213 435 214 Itll 2b9
88 206 68
56 188 42
108 255' 106 53 35 18
208 121 107 44 31 10 2
39
8. 138 94 92
271 337
390 '311 143 196
36 132
15 251 450
268 243
F M F M F F
8
M
9 10 II 12 13 14
536 206 179 221 435 197 150 227
68 226 70
55 170 42
126 244 108 45 27 15
176 112 104 45 35 12 2
47
4 147 88 93
248' 361
390 297 154 192
42 120
15 246 436
102 96 55 43 7 6
g~ ,Il~ 16' 13 78 80
69
16 65 12 5
1-7... 5
20 2
12 II
91 147
5 29 .. 40
.. 15 .. 5
81 2
13 74 12 9
17 6
IS 5
" 10 10'
87 151
3 32 .. 37
.. 15 .. 6
229 135 174
193 141 103 105
85 75 67
33 25
96 225
73 40 35 18 73
100 66
3
4
39
8 7
46 65
II2 35
187 )05 126 137
28 120
185 165
218 141 167
194 130 88
114
65 77 68
31 19
88 216
74 33 27 15
58 83 64 2
" 4
32
4 7
43 69
109 33
173 92
101 134
16 113
178 172
49 33 20 78 93 34 17 19
4 7 6
7 45 10 12 19 8 2
35 4
11 2 2 I
5
12 6 8
45 74
35 85 12 13
II 8 .. 17 92
266 31 34 199 194 38 244 46 46 176 184 33
5
8 5 2
4
7
3 1
4 2
3 8
6 19

123
STATISTICS
GARHWA
RANKA WOBltllillS'
~.~------------,--~------------~
II III IV V VI VII VIII IX Manu. Transport,
_ facturing Storage Mining, House- other than Trade and
Total workers (I-IX) Cultivator
Agricul. tural
labourer Quarry. hold Household Cons. and Commu. Other ing, etc. Industry Industry truction Commerce nications SrrvlCtS
..-~ ,,_....... ..... .---"-~ ..---"---, ....----.,........._.... ~ ,..--'"""-...... ,..--.... _____
M
15
347 132 124 131 292 136 116 146
66 141 51
39 109
21 80
179 82 36 23 12
119 78 70 28 22 7 2
29
6 97 65 63
173 210
250 186 83
129
30 87 12
172 286
176 139
M F M FMFMFMFMF MF M F M F F
16 17 18 19 20 21 22 23 ·24 25 26 27 28 29 80 !H 32 33 34
258 118 Ill, 75
243 112 92
137
240 190 78 70 65 54 84 84 34 86 47 30
175 162 57 92 74 28 91 77 22 95 86 37
45 42 35 130 67 62 36 33 26
Uninhabited 35 21 18 94 50 39 19 13 12 94 53 78
168 125 136 65' 33 39 32 18 17 18 2 4 9 3 4
86 83 58 85 52 56 74 50 59 33 22 24 25 11 12
7 2 3 2 "
Uninhabited 31 21 22
Uninhabited 3 6 3
101 3-4 40 60 56 49 53 3.5 28
Uninhabited 175 104 129 J66 J 16 83 Uninhabited
J99 J42 85 J60 104 90 68 67 5.4
J36 98 113 Uninhabited 31 . 23 24 86 64 61 12 11 10
136 116 106 166 124 123
17 5S-
9
9 38 7
16 20 25
9 J9 8
24 20 14 6 7 3 2
3
39 6
16
52 73
80 51 2
19
4 17
31 16
66 15 .. 53 6 .. 27 5 .. 27
5 2 1
3 .. 1. ,. 2 .,
1 •. 2
'0 ••••••
64 9 ., 16 1
13 11 6 .,
,. 14 36 15 3 50 7 .. '.
10 7 60 12 10 8
.,
6
15 51
5 2 ......... . 5.. 2 ..
. . 1 7 1 1
7 15 28 26 15 14
33 3 1...... 21 ._. 2 .. 7 ........ " .. 2 ...... ..
5 1 •• .• ..
24 1 28 4 1 14 3 ,. 8 "
11 2 4 I 2
9 2 1
4
4 5 5 .. ..
.. 58 10 .. 12 3 .. 11 I 2 23 7 4 1
.. .. 46 8 73 13
3 6 .. .• .. .. 1 ..
3
.. ..
'.'
3
...
103 20 .. 57 9 .. 3 13
6 10 9 13
. . 11 6 .. 1 ..
23 11
4 3 18 5 1 I
27 10 16 38
...... 3 7 1 3
1 ....... .
7 24 5 1 : . 5 .. 36 3
154 145
129 121 ,43 30 2 3 126 137 10 7.. 1
.. 1
.. 5 9
3 1
7 23
7
4 1
4 10 .. 3 f 1 2
2
2
2
2
5 7
2 6
10 33
1 6
2 .
4
12
.BIHAI\
X
SI. N on·workers no •
R
35
198 74 66 82
143 78 65 63
22 65 17
17 79 21 28 76 24 17 12 6
89 43 37 16 9 :r
10
2 41 29 29
~ 98 127
140 125 60 67
6 4-5
3 79
164
92 104
l1'
36
278 88 68
146 192 85 58 90
23 96 34
20 76 23 '32 76 43 13 9 6
90 27 30 12 10
5
16
1 46 28 40
73 195
191 137 86 56
II 34
3 110 270
1 2 3 4-5 6 7 8
9 10 II 12 13 H 15 16 17 18 19 20 21 22 23 24 25 26 27 28 29 30 31 32 33 34 35 36 37 38 39 40 41 42 43 44-45 46 47 48 4-9
112 50 99 51

124
PALAMAU VILLAGE
SUBDIVISION
ANCHAL
Occupied residential
houses ~-""'---. Total number of per SODS Literate
No. of enumerated (includinll' and Serialno. Area No. of house- inmates of imtitutioDs Scheduled Scheduled educated (Thana no.) Name of village in acres houses hold~ and housel ess persons) castes tribes persons ..---_-.4. ___ ...... ..- ... "'"' ,--""____ ,..------.,
P M F M F M F M F 1 2 S 5 6 7 8 9 10 11 12 13 14-
REVENUE THANA-RANXA-contd.
52 (68) Manjhgawan 367.78 49 69 341 177 164- 64 58 13 17 20 53 ,(69) Birbandha olias Birbandh 1,756.62 73 87 437 220 217 62 66 129 111 19 54 (70) Sewadik P.Mc 1,019.68 55 55 299 ISO 149 38 48 83 70 33 8 55 '(71) Hurdag P 2,309.21 56 74 418 219 199 134- 133 51 61 22 56 (72) Singa Kalan alias Sarka 469.17 10 10 51 30 21 30 21 57 (73l Singa Khurd Il1.65 19 ~9 80 42 38 42 38 5 58 (74- Uchri 720.85 62 62 314 159 155 39 41 61 46 23 ]-59 (94-) Chaukri 519.75 34- 35 162 83 79 78 72 4 5 2
60 (4-9) Hetar Khurd 1,376.22 29 35 160 89 71 " 89 71 4 61 (50) Hetar Kalan 4,463.19 116 143 653 335 318 15 15 301 291 26 62 (51) Kathautia P, 2,204.03 66 66 371 172 199 8 5 100 . 100 20 3 63 (52) Barwadih P, Rhe 1,765.83 162 172 '741 381 360 22 20 215 212 62 4-64 (53) Bandua 1,,363.10 21 23 136 67 69 " 66 69 3 65 (54) Tahle 3,617.£3 115 -122 '501 '271 230 35 38 175 149 15 2 66 (55) Tanril 870.36 12 13 41 22 19 .. 22 19 67 (56) Chapla alias Chaphla 1,250.24 36 36 '232 102 130 40 40 60 80 4 68 ?57) Singsinga Khurd .. 691.77 67 71 292 162 130 10 10 147 113 18 69 58) Singsinga Kalan P, Me: L .• 2,100.22 99 ]04- 427 222 205 46 34- 91 97 21
70 (59) Lukunba alias Lukumbar 1,420.59 24 24 88 40 48 35 42 1 71 (60) Sinjo 1,973.88 40 46 177 94 83 4-5 39 4- 1 72 (61) Garhauta alias Gurgur Khari 850.49 30 33 143 77 66 77 66 28 3 alias Semar Khar P 73 {62) Tale alzas Dale p .. 775.97 21 27 121 57 64 28 30 14 19 16 6 74- (63) Khura P 249.99 27 28 165 .77 88 16 9 43 46 24 7 75 (64) Rabda 317.64 20 22 157 82 75 58 54 22 76 (65) Honhekhurd 741.12 8 9 66 33 33 14 II 19 22 77 (66) Honhe Kalan 1,057.67 53 56 261 140 121 62 55 22 32 22 78 (67) Jhagrahe 53.85 22 22 98 44 54 56 51 3 3 2 79 '(75) R;;nka KhUi-d 6$9.97 37 41 175 96 79 65 46 4- 2 11 80 (76) Kachanpur '84-7.92 108 14.3 65l 333 318 199 176 5 3 85 15 81 (77) Serasam ., dc' 2,201.75 42 48 2JO 107 103 26 11 65 80 10 82 .(78) Khardiha 1,575.40 50 60 234 125 109 96 89 6 4 12 83 (79) Achhukhap alias'retardih p 1,13'8.75 26 30 113 51 62 38 34 13 27 10 84 (80? Tendudih . 1,61'S.86 34 35 176 86 90 32 • 30 44 31 22 2 85 (81 Laeya alias Saleya 629.56' 9 9' 34 20 14 10 7 .. 3 86 (82) Daunad~g' . 545.04 31 41 187 94 93 30 30 14 14 15 4 87 (83) +* Ranka Kalan B,h,K,S,L2, H2, 1,24-7.1 [ 540 -564- 2,526 [,261 1,259 185 203 23 4 526 [28 Hos,A2 88 (84) Pa[he 275.02 89 (85) Boi1a 230.72 90 (86) Ledikanra 514.01 7 8 37 18 19 4- 3 .. 7 91 (87) Khapro P 1,296,10 165 175 865 436 429 140 127 7 8 74 5 92 (83) Manpur P 1,303.12 163 177 923 474 449 95 104 18 18 93 2 93 (89) Sonpurwa 634,01 52 62 354 187 167 11 17 46 2 94- (90) Bhaluani 7Q6.89 35 46 248 114 134 2l 22 86 104 23 I 95 (91) Scndag P 784.00 91. 97 527 259 268 187 189 30 35 26 1
Tamte Kalan C. P. 96 (92) Jogi Khura 944.88 46 55 229 119 IlO 51 48 56 44- 31 97 (93) Mungarain alias Mugdah
" 892.32 26 27 131 63 68 25 33 38 ,35 6 98 (96) Kasmar .. 1,057.05 2 2 10 6 4 6 4 3 99 (97) Kedal p. 300.16 21 22 128 62 66 10 10 52 56 16 3 100 (98) Ulka 430.75 28 35 155 80 75 69 69 23 I

125
STATISTICS
GARHWA
RANKA WORKERS
r----------------------------------~----________________________ . ____ ~
Total worker. (I-IX)
I II III IV V VI VII VIII IX Manu- Transport,
facturing Storage Agricul- Mining. House- other than Trade and tural Qu an y- bold Household Cons- and . Co=u- Other
labourer ing, etc. Industry Industry truction Co=erce nicatioDs Services Cultivator
.----' ,....-"""'___'_ ,...........--. ,..........._., ~ ...--"---. ,..---- ,..--.......__, ,..--.;..__"
M FMFMFMFMFMF M F M F M
15
F
16
M F
17 18 19 20 21 22 23 24 25 26 27 28 29 30 31 S2 SS 34
88 82 77 43 8 22 44 33
132. 103 103 72 132 119
18 15 31 28 88 74 48 51
107 36 53 30 94 80 18 15 29 26 65 52 13 16
.. 2
20 34
56 32 34 41 9 36 32 60 15 39
240 202 122 141 254 253 44 41
146 168 83 104
130 167 25 25
193 152 18 17 68 82
106 98 158 132
105 106 13 14 52 76 59 77 61 84
2 9
36 48
31 61 46
37 41 37 22 73 29 59
190 76 83 37 51 12 55
716
10 252 265 III 83
149
76 40
2 38 53
28 49 25
21 35 39
32 28 33 31 30 30 22 18 66 51 27 26 54 38
162 52 57 50 60 47 40 24 50 51 8 12
43 18
355 238 Uninhabited Uninhabited 12 9
209 165 251 203 80 107 77 79
138 121
73 43 2
37 47
76 40 2
38 51
14 14 20
10 23
6
21 8 22 9 25 5 9 4
47 11 25 2 29 16 58 100 29 16 32 6 23 9 50 8
20 36
176 77
II 1 145 74 212 38 78 74 2
109 20
70 43 2
37 45
2 28 .. II .. 62 " 3 2 2 42 2 .. .. .. 39 I "
......
••• 0 ••••
........
1 .. 2 ..
1 .. 2 ..
2 22 34
" .. .. .. 2 .. I .. .. .. .. .. .. .. .. 1
11 13 .. .. .... 25 49 4 ., .. .. ., .. " 6 1 36 6 1 .. .. ., .. .. 78 47 4 10 3 .. .• ., . . 3 I 14 3 .......... .. 39 38 3 I .. .. .. ., .. 1 "
1 1 2 6 7 ........ ..
20 11 ...... .. 30 18 1 .. " . . .. ,2 .. . . "
14 26
5 .... 3
.0 .0 .0 ••••
9
10 .............. .. II .. .. .. .. .. .. .. .. 4 .. .. .. ..
13 .................. .. 19 10 .. .. .. .. .. 2 I ............ ..
24 1 .. ......... . 97 16 .. 8 7 .. .. ., .. 28 7 .. 3.. ., .. .. .. 8 28 20 .. .. . . ..
15 2 2 .......... ..
••• 0 ••••••••••••••••• 0
20 1 .. ., .. .. .. .. ..
42 14 5 118 54 1 .. 3.. 71 23
.. 1 60 9 2 "S6 15 3
2 3 .. 31 ..
25 I 2
.. .. .. .. .. 31 .. 5.. I .. I .. 1 .... 6 2
3 ..
••• 0 ••
1 .. 1 1 ......
.0 .0 ••
1 ......
" 1 1
14
1 1 2
3 1 4 1 9 2
.. 29
.. 1
1
1
4 14 .. 2 2
180
1 3
4
.. 2 4
1 17
.. 3
55
.. 1
BIHAR
x
SI. Non-workeI'll no.
M
35
89 88 47 87 12 II 71 35
33 95 50.
127 23 78
4 34 56 64
9 33 31
20 36 45 II 67 15 37
143 31 42 14 35 8
39
551
8 184 209 76 31
110
43 23 4
24 27
F
36
82 114 77 80 6
IO 81 28
19 1i6 58
107 28 78
2 48 32 73
20 34 41
32 55 45 11 55 27 25
156 46 49 22 40 6
50
904
7 220 198 87 57
130
37 25 2
29 28
52 53 54 55 56 57 58 59
60 61 62 63 64 65 66 67 68 69
70 71 72
73 74 75 76 77 78 79 80 81 82 83 84 85 86 87 88 89 90 91 92 93 94 95
96 97 98 99
100

126
PALAMAU VILLAGE
SUBDIVISION
ANCH4L
Occupied residential
houses ...----""-----.. :rota1 number of pen OilS Literate
No. of enumerated (including and Serial no. Area No. of house- inmates of institutions Scheduled Scheduled educated
(Thana no.) Name. of village in acres houses holds and houseless persons) castes tribes persons ____ ---. r- A ~ ....... ~
P M F M F M F M F
2 3 4 5 6 7 8 9 10 11 12 13 14
REVENUE 1'HANA-RANKA-conta'.
101 (99) Tamge Khurd 445.96 38 41 201 102 99' 83 80 5 3 5 102 (100) Sikat P 663.45 49 57 289 136 153 39 38 89 112 15 1'03 (101) Puregara P 1,095.37 75 77 353 188 165 61 54 29 23 63 10 104 (102) Tamge Kalan M 1,195.70 118 142 690 338 352 70 73 244 259 53 10 105 (103) Gaurgara P 730.55 .95 '99 439 230 209 92 94 2 2 69 7 106 (104) Chatakl1}aI! 725.69 75 75 321 159 162 74 72 29 32 22 I 107 (l05) Ga$eda P 2,204.56 87 101 386 193 193 101 100 67 73 17 2 108 (129) Jasobar 364.10 ,43 43 184 94 90 82 77 7 9 7 I 109 (130) Bahahara P " 995.49 88 Y07 549 27-7 272 69 67 182 175 28 12 IlO
(I3Il Pindra 557.80 60 - 69 397 188 ,209 27 26 103 142 20 4
III (132 Jalanga 2,100.71 .71 81 358 170 188 12 10 150 166 20, 2 l12 (133) Kudrum 1,901.56 .100 .100 542 286 256 19 13 215 187 61 4
113 (106) Kutti 757.45 40 65 255 .125 130 40 40 25 20 4 114 (122) Daho 941.99 49 .51 217 116 101 49 50 20 11 4 115 (123) Raksi P, L,Me. 2,632.33 .152 .199 863 430 433 183 170 100 109 48 4 116 (124) Mangrahi P 2,512.74 107 124 599 319 280 100 100 190 150 68 3 117 (125) Murli 672.88 .35 37 183 99 84 30 30 29 30 10 1 ll8 (126) Ramkanda M,C,L2, Me, V,H2 6,025.57 .371 426 2,053 1,05~ 995 421 411 427 421 220 40 119 (127) Rohra 666.69 50 50 257 124 133 37 38 27 33 16 4 120 (128) Kerwa 1,715.96 -51 :i3 203 102 101 25 26 30 35 5
121 (107) Kasmar P 1,747.00 103 III .550 279 271 52 62 211 202 60 122 (108) Chapri 1,151.59 80 81 383 187 196 95 100 40 42 35 4 123 (109) Rarhe P 1,472.57 119 136 640 334 306 132 129 129 118 11 1 124 (110) Siswa 1,834.73 46 54 229 120 109 "
108 95 I .. 125 (1 II) Nawadih 56.1.67 32 34 149 74 75 65 67 4 3 4 2 126 (I12) AIl).bowa 115.64 127 (113) Suli P 1,894.31 ·61 64 252 135 117 7 8 11 11 128 ( 114) Chete 2,286.87 79 83 320 177 143 15 11 129 121 1 ., 129 (115) Patsar 832.66 85 86 339 183 156 86 79 59 43 9 1 130 (116) Ranudih 272.18 131 (117) + Udaipur P, Me 2,125.50 220 221 1,127 569 558 316 278 86 109 80 4 132 (JI8) Murkhur 864.76 24 24 121 65 56 23 16 14 10 6 133 (119) Kurumdari 914.66 32 32 167 87 80 .. 87 80 11 134 (120) Pundaga 690.00 63 63 278 155 123 ...:;'8 63 3 2 9 " 135 (121) Sabane 1,173.75 37 37 163 80 83 34 6 44 47 15 I
136 (135) Baligarh 5,71.4.53 78 79_ 373 177 196 60 75 101 102 15 137 (136) Gobardaha 2,112.28 61 61 349 178 171 6 7 152 148 18 2 138 (137) Birajpur 3,495.14 72 72 320 154 166 13 9 101 117 -s 139 (138) Kuswar 678.1 I 68 69 333 164 '169 79 70 66 84 32 140 (139) Tetardih 1,508.13 22 22 132 60 72 17 28 12 HI (140) Homia 1,219:90 33 33 166 79 87 .. 38 42 6 4 142 (142) Durjan. 3,167.11 49 50 293 156 137 10 6 15 11 1 2 143 (149) Barwa 1,320.56 51 51 283 150 133 14 8 132 120 8 144 (150) Bairiya 1,518.21 40 42 244 123 121 19 19 102 102 13 6 145 (151 ) Sirki 75.30 3 3 19 10 9 10 9 I
ANCHAL TOTAL .• 23D,923.10 8,947 9,785 45,990 23,327 22,663 5,762 5,560 9,998 9,699 3,511 411 or
360.82 sq. miles

STATISTICS
GARE~WA
RANKA
Total workers (I-IX)
I
Cultivator
II
Agricultural
labourer
127
WOBB:lIiB8
III IV V VI VII VIII Manu- Transpbrt,
facturing Storage Mining, House- other than Trade and Quarry- 'hold Howehold COIU- and Commu· ing, etc. Industry Industry tructi6n Commerce nications
M F MFMFMFMFMP' M F
IX
Other Services
M F
x
Non-workers
BIHAR
81. nd.
M
15
F
16
M
17
F
18 19 20 21 22 23 24 25 26 27 28 29 30 31 32 33 34
M
35
F
36
65 102 109 229 139 100 135 67
166 113 110 191
87 7'7
274 188 63
641 68 74
184 109 198 70 44
102 123 118
,337. 37 51 84 54
1I8 1I5 108 105 34 50 98 92 74 6
59 96 80
221 110 J05 124 55
158 110 115 162
59 58
202 121 45
353 36 36
58 58 102 96
59 38 199 204 89 71 80 80
120 101 58 48
147 143 113 110 80 80
174 152
39 14 39 32
155 102 129 67
31 26 327 146 27 4 38 3
142 129 100 100 89 72 155 180 143 30 69 30 30 38 25
Uninhabited 86 27 37
105 70 47 75 62 19
Uninhabited 290 199 171 35 32 32 44 51 44 63 44 29 49 37 24
107 35 50 64 35 37 80 72 66
4
108 89 92 72 34 45 70 72 56 5
101 24 42 47 35 35 70 58 58 4
7'
28 24 42 20 13
9 16 .. IS 13
47 38 94 50 29
252 41 36
41 13 6 .. 6
69 48 53
81 3
37 10
4 9 9
24 .. 2
11 4 7 1
II ••
2,!1 3 12 11 17 .' .. 38 5 I 2 25 .... 16 7 7 ........ ..
15 ........ .. II I.
22 II 10 10 1 ..
1 2 ..
•• • 0 ••
5 I
. . .:::'
2 .. ..
4 2
1 .. 45 .. 26 .. II ••••
97 14 38 .. 18 ..
3 3 .. .. .. .. 8 .. 13 7 .. .. .. 1 .. .. 2 9 23
.. .. .. .. 1 1 187 10 31 33 ....
34 10 21 5
8 4
5 ..
47 5
8 7 2
56 5 1
1 2
7
2 1 ..
52 2 2 ., 2
75 47 20 .. 20 .. 3 1 ........
.. -, 34 3 .. 25 5 •.
6 6 7 15 5 7
14 3 .. 2 2
16 .. 16
9
3 3 3 2 ....
•• 10 ••
9 .. 12 ..
5 .. .. .'.
.... 10 2
I. '0 I. O.
3 1
........ 2 I
1
5 3 1 ..
2 ..
•••••• '0
2 .... 3
. . .;~
'} ..
~.
14,725 11,968 9,587 8,175 3,248 3,192 843 226 32.9 195 13 5 19 194 46 34
•• o •
2· I 6 1
I
1
I 3
19 2
3
3 1
4
2
2
2-
2
1
.. I
37 34 79
109 91 59 58 27
III 75 60 95
38 39
156 131 36
417 56 28
95 78
136 50 30
33 54 65
232 28 36 71 26
59 63 46 59 26 29 58 58 49
4
40 101 -57 102 85 103
131 104 99 105 57 106 69 107 35 108
114 109 99 110 73 111 94 112
71 113 43 114
231 115 159 116 39 117
642 118 97 119 65 120
129 1'21 96 122
151 123 79 124 45 125
126 31 127 38 128 81 129
130 268 131
21 132 36 133 60 134 34 135
89 136 ll6 105 37 50 57 61 55 5
i36 137 138 139 140 141 142 143 144 145
458 129 8,602 10,695

128
PALAMAU VILLAGE
SUBDIVISION
ANCHAL
Occupied reddential
houses .--~~ Total num ber of persons Literate
No. of enumerated (including and Serial no, Area No. of house- Inmates of institutions Scheduled Scheduled eriuc2ltcd
(Thana no,) Name ofviUage in acres houses holds and houseless persons) castes tribes persons
~--- r---~"'" ,.--.A._ ...... ~-"""'--
P M F M F M F M F
2 11 4 5 6 7 8 9 10 II 12 13 14
REVENUE THANA-RANKA-contd.
I (l4~) Janewa P 2,634,20 99 II7 60a 312, 296 37 34 221 216 55 3 2 (144) Dhansni P 290,55 9 9 46 26 20 12 8 10 g (145) Madgari P, Rhc,Mc,Cc 2,183,92 242. 260 1,373 700 673 335 325 88 89 124 7 4 (146) Karchali P 1,262.86 ~9 97 603 319 284 3 '3 182 175 52 6 5 (147) Baya Khura 1,679.85 22 22 97 48 49 1 3 41 36 12 6 (148) +Saraidih M,Me 1,026.54 102 114, 643 320 323 74 76 23~ 247 53 4 7 (152) Chhetki 2,006.70 18 19 143 79 64 79 64 7 .. 8 (153) Pipra S 347.55 17 17 114 60 54 6 4 51 48 13 3 9 (154) Mahugain M 751. 73 13 13 89 51 38 3 I 46 35 6 2
10 (155) +Kanjia H,M 899.35 ~5 46 285 149 136 2 13 128 120 49 12 II (156) Jamauti P,S 1,020.75 71 78 471 243 228 40 46 203 182 70 3 12 (164) +Khajuri P 2,368.26 76 87 458 236 222 55 54 143 134 39 3 13 (193) Baghwar P 2,515.41 120 140 764 366 398 106 97 224 255 87 I 14 (194) Gariya 3,214.53 46 47 228 107 121 3 2 42 44 8
15 (157) Ramar P 4,173.26 90 91 448 219 229 62 61 137 145 23 4 16 (158) Marda P 3,399.85 80' 84- 356 171 185 18 25 101 120 28 2 17 (159) Nauka P,L,Oc 3,180.90 107 110 478 251 227 32 24 144 141 77 10 18 (160) Bhejariya 73.96 I I 6 -3 3 3 3 19 (161 ) Durgadih 179.36 10 10 42 24 18 9 6 5 20 (162) Banjari 251.49 20 26 124 55 69 53 65 12 21 (163) Lodidih 230.17 8 9 34 16 18 9 12 8 4 22 (165) Sikariya ., 325.19 I 1 12 5 7 5 7 2 3 23 (166)*+Bhandaria M2,h, H,A,Me 1,425.33 154 156 769 427 342 8 4 220 197 158 55 24 (192) Barganwa 1,441.52 16 16 97 48 49 48 49 5
25 (167) Tewali 3,309.71 35 40 194 95 99 17 17 74 82 26 1 26 (168) Jonhikhar Mc,P 758.57 19 19 101 49 52 3 6 41 33 7 I 27 (169) Binda P 1,518.01 69 78 357 180 177 1 .. ". 159 156 27 1 28 (170) Sinjo 2,753.58 43 43. 218 113 105 13 8 100 97 9 29 (171) Rodo P 4529.74 74 -78 373 189 184 44- 38 137 134 14-30 (172) Manjari 3,268.63 28 33 223 108 115 I 101 108 7 31 (183.) Lidki P 5,594.64 36 37 172 93 79 4 6 77 73 11 32 (185) Sangali 3,240.44 17 17 82 37 45 16 8
33 (173) Path Me 1,941.99 47 52 221 116 105 47 41 60 '55 12 34 (174) Mail alias Phakiradih 1,093.28 42 35 169 85 84 52 57 31 26 19 '. 35 (175) Harta P 4,370.58 71 76 400 207 193 17 19 135 125 45 6 36 (176) Chapalsi 1,469.00 2 2 11 8 3 8 3 1 37 (177) Korwadih 312.50 38 (178) Bijka 8,Z85.04 83 106 '576 300 276 .. 240 208 29 ,. 39 (179) K.uruD P 3,360.98 69 80 409 215 194 18 17 121 116 39 1 40 (180) Arar ., • 2,225.23 5 5 19 7 12 7 12 41 (181) Duthu 935.51 42 (182) Parro P 4,049.27 44 51 228 118 110 118 110 6
43 (184)- Totki 2,943.32 24 25 158 81 77 10 8 14 44 (186) Madgari P, Me .. 10,410.05 85 93 426 224 202 16 146 152 16 2 45 (187) Paraswara Mc,M 2,971.19 112 127 527 296 231 48 35 136 114 26 46 (215) Chapiya 2,953,91 43 47 215 117 98 4 I 99 86 16
Kutku G.P.
47 (210) Korwadih 2, 175,17 I 1 10 6 4 6 4 48 (211) Tumera 2,295,68 18 18 87 45 42 42 41 3 1 49 (212) Turer 1,698.45, 23 24 108 57 51 55 50 3 1 50 (213) Sinjo 158.03

STATISTICS
GARHWA
:BHANDARIA
Total worken (I-IX) Cultivator
129
WORKERS
II III IV V VI VII VIII Manu- Transport,
facturing , Storage Agricul- Mining, House- other than Trade and
tural Quarry- hold Household Cons- and Commu-labourer ing, etc. Industry Industry truction Commerce nications
IX
Other Services
M
15
F
16
M F FMFMFMFMFMF M.J.1 M F
17 18 19 20 21 22 23 24 25 26 27 28 29 30 31 32
191 11
404 192 29
173 38 36 27 79
139 133 f11
76
153 128 167
2 15 42 14 4
242 29
64 32
121 70
137 80 63 19
80 60
141 5
178 114
6
79
51 151 183 17
149 10
303 178 24
151 34 37 21 79
127 79
155 61
133 113
·.146 3
13 59 12 4
164 31
59 33
114 67
128 77 54 25
140 112 34 753
227 187 123 165 146 14
19 17 9 109 106 44
31 34 7 22 30 10 16 13 9 68 79
131 125 2 -1I3 75 5 183 88 19 62 24- 11
116 113 14 92 87 9
102 104 35 2 3
14 13 34 56 2 9 11 2 2 3 1
132. 120 31 27 28 2
28 21 81 48
103 61 40 10
14 19 80 18
115 72 38 19
15 7
24 10 29 15
6 5
65 55 45 36 81
2 2 44 46
108 96 3 3
Uninhabited 76 122 3 78 7 6
Uninhabited 87 66
44 122 130 65
29 74 98 41
2
2 2 7
86
44 9~ 94 64
18
55 33
9
1 10 21
2
S 3 3 3 16 32
30 24 20 43 37 29
Uninhabited
P-II-17
7 8
34 5
10 '1 2
101 10 28
1 10 5
1 ..
6 33
•• • 0 '0 .0
3 .. 2
2 .. ••• 0 .0
1 .. .3 1 I 3
.0 .0 ••••
2 1 1 .. ••• 0 ••• 0 •• '0 ••
"
7 8
2
2 __ 1 __ 1 _ . 2 _,
1 ••• 0 '0 '. ·0 ••
1 .. 4 .. ·0 ·0 ••
5 1 .... 1 2 .. 7 .. 2 .... .. 67
37 2 ...... 1 ....... ,- ..
19 19 21 4 .. 40 6 1
3 3
33 9 3 ..
44 16 14 2 .. 28 13 46 12 3 13 3 .. 5 3
12 13 3 5 2 ..
2 3 1 8
II 15 I 2
73 1
7
2 I
16 21 .. 22 8 "
12
8 3 .. 4 3
2 .. 7 2 1 ..
2
12 15
4
., .0
3 1 ••
I 2 5 I .. 1 1 ..
1 .. 4 1 I I
5 4
2 .. 1 , . 2
1 ..
.0 .0 ••• 0
2
4 1 5 .. 4- ..
2 1
2
" 2
' ..
33. 34
3 1
30 6 1
12 , i-1 5 4 7
1 12 21
I 1 3 'I
61
5 2 3
.. 2 2
8 3 7
13 40 46 17
14
1 11
3
2
1 7
6
1 1
3 5
13
12 13
BUIAR.
x
Non-worken
M
35
121 15
296 127 19
147 41 24 24 70
104-103 155
31
66 43 84
I 9
13 2 1
185 19
II'
36
147 10
370 106 25
172 30 17 17 57
101 143 243
60
96 72 81
5 10 6 3
178 18
31 40 17 19 59 "'63 43 38 52 56 28 38 30 25 18 \. 20
36 25 66
3
122 101
1
39
30 73
113 40
3 15 14
40 40 85
200 191
5
23
33 80
101 33
1 18 14
Sl. no.
1 2 3 4 5 6 7 8 9
10 11 12 13 14
15 16 17 18 19 20 21 22 23 24-
25 26 27 28 29 30 31 32
33 34-35 36 37 38 39 40 41 42
43 44 45 4-6
47 48 4~ 50

130
PALAMAU VILLAGE
SUBDIVISION
ANCBAL
Occupied residential
houses ,..-._..It..----"" Total num ber of petlOllS LIterate
No. of enumerated (including and Serial no. Area No. of house- inmates of institutions Scheduled Scheduled educated
(Thana no.) Name ofv111age in acres bouses bolds and ilouseless penons) castes tribes penons
,.....-""____' ,.....-~ ,...--......_ .....
P Nt: F Nt: F l'>i[ F M F
1 2 !J 4 5 6 7 8 9 10 11 12 13 14
REVENUE. -RANKA-concld.
51 (214) Polpol .. . 1,157.06 5 5 14 8 6 7 6 3 52 (216) Khura 1,188.60 43 44 181 96 85 90 81 8 53 (217) Khaira .. 1,969.36 54 (218) Bhajna 611.31 23 23 124 64 60 11 7 36 32 5 1 55 (219) *Kutku P2,Mc,Rhc, .. 2,989.61 91 93 506 270 236 26 IS 207 196 46 11 56 (220) Korwadih 631,45 57 (221) Saneya P 3,257.39 69 71 323 173 150 24 19 118 106 13 58 (222) Chemo .. - 1,811.56 46 40- 210 96 114 30 36 6 59 (223) Kudgara . 411.50
60 (204~ Rinjpur P 461.26 35 40 211 103 108 103 108 16 7 61 (205 Rud 3,053.98 4- 4- 26 15 11 15 '11 .. 62 (206) Tenhri P 6,B60.59 42 50 256 141 115 139 115 29 6 63 (207~ Saruwat P "
. 2,701.07 28 39 225 121 104 94 82 1 64 (208 Hesatu P 5,453.07 25 28 175 94 81 80 73 8 65 (209) Kulhi 207.97 13 14 76 45 31 45 31 3
Khajuri Kalan G. P.
66 ~188) Born 557.68 74 84 444 227 217 129 123 53 3 67 189) Bari Khajuri Me 539.78 22 22 129 68 61 59 55 7 3 68 (190) Khajuri P2, Me 2,011.99 96 108 524 265 259 191 209 51 32 69 ( 191) Putsora 681.17 70 (195) Bijpur alias Barhni 1,812.01 6 6' 41 26 15 6 4 5 71 (196) Salo 1,858.60 4 4 26 13 13 .. 13 13 2 72 (197) +Bargarh P,L,Rhc,H, Me 1,437.03 180 187 1,006 525 481 I ,. 387 364 137 37 73 (198) Ugra P . . 610.31 62 66 366 184 182 19 18 68 82 52 7 74 (199) Tengari 446.39 24 25 174 90 84 90 84 10 75 (200~ Gothani 475.01 26 28 164 86 78 86 78 25 8 76 (201 Mutki 904.41 37 43 197 99 98 .. 29 30 15 5 77 (202) Barkol Khurd P 2,194.60 100 111 511 261 250 '48 62 160 IH 39 8 78 (203) Barkol Kalan 1,084.11 11 13 60 28 32 27 27 2
ANCHAL TOTAL •• 163,384.60 3,502 3,811 19,541 10,079 9,462 1,211 1,150 6,543 6,283 1,784 258 or
255.29 sq. miles

131
STATISTICS aIHAlt I
GARHWA
..BHANDARlA WOBXRBB
,..... --I II III IV V VI VII VIII IX X
Manu- Transport, facturing Storage
Agricu)- Mining, House- other than Trade and Total workers tural Quarry- hold Household Cons- and Commu- Other SI.
(I-IX) Cultivator labQurer ing, etc. Industry Industry truction Commerce nications Services Non-workers no. ,.--~ ,...---...__, ,....--'---. ,....--'---. r-"--.. ~ ,....-...... _, ,.....--~ ,.....--~
M F M F M F M F M F M F M F M F M F M F M F
15 16 17 18 19 20 21 22 23 24 25 26 27 28 29 30 31 3:1 33 34 35 36 1 ,
5 6 3 6 I 3 51 68 60 61 56 1 4- 1 " 1 2 ., 2 28 25 52
Uninhabited 53 46 43 38 39 3 4- 3 .. .. .. .. .. 2 " 18 17 54
178 142 121 124 11 14 10 2 .. ., 11 1 23 3 92 94 55 Uninhabited 56
111 104 99 98 5 6 4 2 62 46 57 77 76 70 69 2 7 3 - 1 19 38 58 ..
Uninhabited 59
63 59 55 53 6 4 1 .. 2 ., 40 49 60 11 7 11 7 .. .. .. .. .. .. . . 4- 4 61 96 81 74 61 4 18 5 1 10 1 .. .. .. 3 45 34 62 71 61 60 60 1 9 .. .. :1 50 43 63 62 45 41 38 4 4 15 .. I 3 .. .. .. I . . 32 36 64 21 19 14 15 4 4 3 .. .. .. 24 12 65
148 112 90 76' 21 24 27 3 7 .. .. .. .. 6 4 79 105 66 40 38 31 31 1 1 5 I I 5 .. 2 28 23 67
141 148 102 126 17 14 10 3 2 3 .. 10 2 124 111 68 Uninhabited 69
13 9 7 5 6 3 13 6 70 • 8 6 4 6 3 1 5 7 71 287 172 96 102 68 38 16 3 26 4 1 ., 14- 66 25 238 309 72 95 75 65 46 15 29 9 4- .. .. .. .. 1 1 89 107 73 50 41 41 41 5 4 .. . . .. .. 40 43 74-49 39 39 25 4 12 2 .. 3 2 1 37 39 75 61 54 44 36 13 17 4 38 44- 76
149 142 135 131 7 11 .. 3 .. .. .. .. 4 112 108 77 21 17 17 16 1 3 1 ... 7 15 78
6,193 5,017 4,299 3,828 856 965369 24 125 53 7 1 11 1 79 14 5 442 130 13,886 4,445

132
PALAMAU VILLAGE
SUBDIVISION
ANCHA.L
Occupied residential
houses Total number ofpersons Literate
No.of enumerated (including and Serilllno. Area No. of house- inmates of institutions -Scheduled Scheduled educated
(Than_Do.) Name of village in·acres housts holds and houseless persons) castes tribes. persolls ,..... ,..--""'----'
p ~ F M F M F M F
2 3 4- 5 6 7 8 9 10 11 12 13 14-
REVENUE THAN~-HU S'SAINABAD-contd.
1 (79) Kusahi .'. ·20.44 2 (81) Sheikhpura alias Dhab Sarki. 487.96 3 (1:12) Kishunpur 113.98 4 (83) Pindraha .. 160.75
. 5 (84) Sarki P,Oc 347.50 146 172 949 474 475 88 96 5 3 166 2Z 6 (8~1 Chaukhari 55.33 21 24 149 65 84 13 23 11 Z 7 (86 Siuri V ., 414.56 67 77 375 178 197 53 52 42 Z 8 (87) Kachar • .. .h77.44 5 6 38 26 12 15 8 13 9 (88) Kanri M,h, L3,-Rvc, A, V •. 277.41 142 163 855 447 408 386 336 222 34
10 (89) Dhabria 432.48 ~ 51 65 327 155 172 37 .39 73 9 11 (90) Saleya t. 196.65 10 10 59 30 29 11 8 .. 6 1 12 (91) Nainabar 424.26 52 62 363 183 180 99 90 23 13 (92) Baherwa .. 1·76.06 45 46 291 150 141 73 78 35
Lamari G. P.
14- (93) Ratamgara P 1,198.98 39 46 280 154 126 12 12 33 15 (94) Wolma .. 495.16 16 (95) Jatro
_. 893.27 23 30 159 74 85 55 65 6
17 (220) Patriya P t. 399.23 58 67 423 196 227 52 92 33 17
Kanri G. p.-contd.
18 (222) Karma ._ .48.98 3 3 22 14 8, 4 19- (223) Misraulia J61.69 7 9 47 25 22 .. .. 10 3 20 (2'24) Bhilma 173.09 65 73 395 21~ 182 26 25 52 4-
PaliZa G. P.
21 (219) Sarkoni 1,166.28 67 73 569 275 294 35 79 8,0 12 22 (221) Panre Pura 36.46
Kanri G:P.-conc1d.
23 (225) Naubhilma P 17.81 13 20 119 60 59 8 8 25 5 24 (226? Gujaria 25.37 25 (227 Nawadih 880.16 6 7 106 58 48 9 5 15
26 (223) Sonpura 1,194.00 44 43 305 153 147 51 45 23 2 27 (229) Mahatwan::! 31.68 28 (230) Chandarpura 99.59 29 (231) Amdiha L 51.74 20 29 153 63 90 27 21 19 14 30 (232) Jamua H 95.01 18 22 118 58 60 28 23 16 2 31 (233) Patakpur .. 37,30 32 (234) Kakanpura 39.47 33 -(235) Baliari P2 1,829.71 155 201 1,414 743 671 110 96 245 27
34 (236) Marhatia 37.93 16 27 148 73 75 .. , .. 11 35 (237) Patila K 727.09 83 104 767 375 392 94- 99 137 10 36 (238) Semaura B, L. 103.43 67 34 465 239 226 33 39 113 18 37 (239) Nau Semaura 232.07 I I 1 1 33 (253) Choka P, L 489.07 78 85 514 243 271 48 48 55 23 39 (254) Dekar 93.06
40 (257) Gara Khurd P, L, H 1,252.92 225 264 1,510 738 772 168 157 170 10 41 (259) Sunripura P,L 1,416.5? 181 212 1,331 643 688 68 70 192 14

133
STATISTICS I1IHAB
GARHWA
MAJHIAON WORKERS
.- -.A.
I II III IV V VI VII VIII IX X Manu- Transport,
facturing Storage Agricul- Mining, House- other than Trac!'e and
Total workers , tural Quarry- hold Household Cons- and Commu- Otber 51.
(I-IX) Cultivator labourer i ng, etc. I nd ustry I nd ustry truetion Carom eree nieations Services ".N on-workers no.
,---J>o~ ,.--..... _____, ,.--""""___' ,...-.............. ,...--"--0 r--"""-....... ,...---. r--"""---. r--;"-"'""'" ,_.._.A.--.. _ _..,.._-
M F M F M F M F M F M F M F M F M F M F M F
15 16 _l7 18 19 20 21 22 23 ~4 25 26 27 28 29 30 31 32 33 34 3.'\ 36
Uninhabited 1 Uninhabited 2 Uninhabited 3 Uninhabited 4-
24-6 134 135 55 62 63 30 2 3 12 4- 14- 228 341 5 35 32 22 13 3 16, B .. .. .. 2 3 30 52 6
109 102 42 17 52 80 13 5 .. .. .. .. - 2 69 95 7 14- 8 5 3 5 1 8 .. / .. .. 12 4 8
230 79 74- 4 6::l 75 1 11 4 .. " 41 .. 36 217 329 9
75 28 37 2 23 26 4 3 8 80 144 10 17 7 II I 6 6 '., .. 13 22 11
102 63 65 36 62 1 ~. 1 81 117 12 81 68 47 24 61 5 5 6 " 1 69 73 13
89 25 66 2 6 23 9 5 3 65 101 14 Uninhabited 15
35 27 20 16 15 11 " ., .. ,. 39 58 16 98 83 68 52 29 31 98 144 17
5 3 S 3 " ... '. 9 5 18 9 9 .. ., .. .. 16 22 19
lIS 43 78 24 34 19 3 .. 98 139 20
134- 102 82 35 51 67 1 .. .. .. .. .. .. " .. .. 141 192 21 Uninhabited 22
27 12 16 5 6 7 4 33 47 23 Uninhabited 24-
28 20 20 17 2 3 5 .. 30 28 25
96 57 49 31 30 23 .. 3 2 12 1 .. 62 90 26 Uninhabited 27 Uninhahited 28
33 23 16 7 16 16 " .. .. " .. .. .. 30 67 29 35 27 . 12 6 20 21 .. I . . .. " .. .. 2 23 33 30
Uninhabited 31 • Uninhahited 32
377 230 251 113 93 108 8 .J3 6 3 3 2 I. 6 366 441 33
44 29 19 9 25 20 29 46 34 194 '164 87 56 64 95 12 5 13 9 7 '3 6 181 228 35 97 66 40 17 33 ' 42 2 9 7 1 2 10 142 160 36
1 I " .. 37 133 104 55 i9
.. 64 79 7 5' 4 .. 3 I liD 167 38
Uninhabited 39
367 203 240 78 90 118 5 3 6 4 <1- 21 I 371 569 40 .. 328 75 142 9 57 53 10 ~4 .. '33 2 18 1 7 36 10 315 613 41

134
PALAMAU VILLAGE
SUBDIVISION
ANCHAL
Occupied resid ential
houses ,..----""__ ____ Total number ofpersons Literate
No. of enumerated (including and Serial no. Area No. of house- Inmates of ill8titutions Scheduled Scheduled educated
(Thana no.) Name of village in acres houses holds and homeless persons) castes tribes persons ,...--~ .---.....___,
P M F M F M F M F
2 3 4 6 7 8 9 10 11 12 13 14
REVENU E THANA-HUSSAINABAD-contd . •
Patila C. P.-contd.
42 (240) Mahuli P 502.50 37 44 261 119 142 73 72 18 4
Kusha C. P.
43 (242) Sonpurwa 391. 72 30 37 233 116 I17 21 17 10
PaliTa C. P . ...:..concld.
44 (244) Kuari 402.09 22 31 146 75 71 27' 28 16
45 (245) Mukhapi P 638.60 56 75 379 196 183 63 161 20 6 46 (246) Korgain 447.03 61 65 432 226 206 56 41 58 4 47 (247) Majhganwan 257.30 17 19 126 63 63 4 5 11 48 (248) Chanchar II 1.56 49 (249) Babura alia.f Bhandua 23.23 15 16 74 39 35 12 13 7 50 (250) Jainagra P 397.18 69 74 452 251 201 33 25 95 28 51 (251~ Bhurwa H 293.06 21 26 157 66 91 9 20 24 6 52 (252 Kharaundha M,S,Ie3,H2 892.77 154 205 1,154 559 595 191 192 205 38 53 (255) Belhath Ie 236.24 64 78 468 234 234 92 92 45 9
Baliari C. P.
54 (256) Gara Kalan 1,084.72 10 10 40 23 17 13 3
Sunripura C. P.-concId.
55 (258) Kasnap L,le2, V,H .. 497.62 3~ 44 239 108 131 7 4 46 l()
kharaundha C. P.-contd.
56 (189) Ranadih P 1,030.16 63 67 441 223 218 9 9 95 8 57 (190) Rambandh 331;04 35 39 222 117 105 1·5 9 2J 2 58 (191) Kurkuta 306.96 26 32 168 88 80 23 16 13 1
59 (192) Madra Nisf Nijamat 258.84 52 99 458 231 227 81 68 16 17 70 60 (196~ Mainpura ,
114.25 4 4 18 9 9 61 (197 Karkata 505.30 41 70 355 173 182 109 104 14 4 62 (198 Bah era 177,56 20 23 126 57 69 16 25 11 63 (199) ShiuPU1 P 783.45 76 117 666 323 343 145 131 107 5
64 (20Q~ Deodih 235.00 25 49 279 137 142 17 18' ,'. 36 2 65 (201 Adhaura 169.25 33 80 280 138 142 60 56 40 12 66 (202) Teliabandh 82.12 1 1 12 7 5 7 5 67 (203) Te1ia Nijamat 99.63 6 6 32 14 18 3 68 (204) Gardana P 291.48 25 27 197 109 88 17 17 47 IS 69 (207) KfJsha B 363.66 39 63 382 191 191 55 59 '- 77 26 70 (241) Dema 558.15 10 17 72 34 38 4 6 2 71 (243) Ghurua 494.27 64 85 463 224 239 71 67 56 3

STATISTICS
GARHWA
MA]HIAON
I
Total workera (I-IX) Cultivator
.---.........____, ,..... a .... J\{ F lU .,
, 15 16 17 18
61 58 19 9
59 29 41 8
35 22 20 7
100 74 42 35 110 63 68 33 32 26 22 24
Uninhabited 22 19 5 5
120 76 70 45 30 '24 5 6
275 177 79 20 124 9 47
12 12
53 11 34
126 24 92 76 41 41 52 42 24
126 47 92 21 5 1 5 1
89 '67 65 45 28 "21 24 • II
185 130 84 4
85 70 42 84 -68 ··32 5 3 3 1 3
11 10 8 8 51 33 28 15
106 69 58 16 22 19 .. 13 II
108 7>1- 67 38
135
WORKERS
II III IV V VI VII VIII IX Manu- Transport,
facturing Storage Agricul- Mining, House- otherthan Trade and
tural Quarry- hold Houaehold Cons- and Co=u- Other labourer ing, etc. Industry Industry uuction Commerce Dicationl ServIces ,..-"""_' ~ ,..-.A. ....... ~ ,..-.A--o ......-"----. r-----' ,..--.A.-..,
M FMFMFMFMFMF M
19 20 21 22 23 24 25 26 27 28 29 30 31
29 21 6 1 .. .. .. .. . . .. " "
9 6 6 12 " 3 .. " .. .. 2 ..
11 3 10 3 .. 25 14 9 5 4
" .. .. I " 39 29 .. .. ., 1 I 2 8 .. .. ,. " ..
13 14 I 3 " .. .. " .; 22 26 11 .. 9 5 .. .. .. 22 18 .. .. 1 .. 1 " 161 144 2 .. 11 11 4 .. .. 10 .. I 56 2 11 .. 3 6 2 .. 1 1
.. .. .. .. " .. . . .. ., .. ..
7 2 .. .. 8 9 . . .. .. .. 1 ..
27 24 l .. 23 41 12 .. ." .. 23 42 4 ..
9 5 9 .. " .. .. .. ..
12 6 2 .. 1 I .. . . " I 4 .. ..
" 57 105 I .7 9 II .. I 1 .. 28 66 2 12 4
" 38 63 7 .. .. .. I " I 1 1 .. " .. .. .. .. .. " " 3 2 .. 5 16 3 1 2 .. .. " .,
" .. 1 37 49 3 4 1 6 8 3 .. .. .. .. " 34 36 1 2 .. . , ., J
F
32
M F
33 34
7 27
19 20 2 1 1
8 1 7 2 3 1
3
S
1
15 20
8 15 10
33 2
1 5
13 7
3
BIHAR
x
81. Non-workers no.
..--..._____, M
35
58
57
40
96 116 31
17 131 36
284 110
11
55
97 41 36
105 4
84 29
138
52 54 4 3
58 85 12
116
.
F
36
84
88
49
109 143 37
16 125 67
418 225
17
120
194 64 38
180 8
115 48
213
72 74 2 8
55 122 19
165
42
43
44-
45 46 47 48 49 50 51 52 53
54
55
56 57 58
59 60 61 62 63
64 65 66 67 68 69 70 71

136
PALAMAU VILLAGE
SUBDIVISION
ANCHAL
Occupied residential
houses r---_,.,__----'\ Total number of persons Literate
No. of enumerated (including and Serial no. Area No. of house- inmates of institutions Scheduled Scheduled educated
(Thana no.) Name of village in acres houses holds_ and houseless persons) castes tribes 'persons ,..--"""'___' ,..--........__, ,..--.....__..,
P M F M F M F M F " 2 3 4 5 6 7 8 9 10 11 12 13 14
REVENUE THANA-HUS SAINABAD-contd.
Morwe C. P.
72 (176) Kharsota P 1,073.48 164 204 1,249 620 629 5 8 55 31 78 6 73 (177) Bhalui 244.23 19 22 124 49 75 10 74 (178) Majhiganwan 384.18
ShiulJUT C. P.-contd._
75 (179) Ganakpura- alias Baghaufi 85.35 76 (180) Chaukhandi 49.98 77 (181) ]aungipur 104.59 10 16 61 38 23 4
78 (182) .Morwe P,M 1,207.87 199. 222 1,719. 848 871 21 43 57 39 241 43 79 (183) Benipur 28.64 80 (184) Ledki 20.01 .. 81 (185) Ledka 23.44 82 (186) Misar Bigha 41.25 2 4 40 21 19 8
Shiupur C. P. -contd.
83 (187) Bhandaria .'. 543.04 47 49 301 148 153 52 57 48 13
Kharaundha C. P.-coneld.
84 (188) Sohgara 228.70 50 50 380 187 193 127 127 35
Shiupur C. p.-condd.
85 (193) Checharia Khura .. 157.69 43 54 '325 154 171 58 60 68. 6 86 (194) Checharia Kalan 173.67 87 (195) Dhelka 135.96
Lamari C . .P.-contd.
88 (96) Lamari Khurd P 1,020.60 31 32 215 104 111 40 38 38 8 89 (97) Chatanian 4,319.44 74 82 445 , 229 2.16 104 93 8 90 (98) Pipardih 338.22 68 68 347 177 170 32 40 35 3 91 (99) Lamari Kalall P 525.56 151 158 937 483 454 190 190 125 7
Kusha C. P.-contd.
92 (205) Gosang V 1,159.94 65 84 452 229 223 97 108 18 1 93 (206) Khutheria 2,249.73 141 154 877 439 438 177 206 53 3 94 (208) Sanni 1,500.49 20 21 181 86 95 14 1
Lamari C. P.-contd.
95 (209) Hariganwan 684.03 61 67 432 230 202 26 20 63 6
Kusha C. P.-contd.
96 (210) Sabua ... 174.58 '20 21 127 67 60 13 8 22 2 97 (211) Patariha 126.13 39' 44 236 ll2 124 15 14 55 19

l37
STATISTICS
GARHWA
MA]HIAON WOB.ll:ERI!
-----------------------~
Total workerl (I-IX)
I
Cultivator ,..---"""___'
M F
II
Agricultural
labourer ...--'-.....
III IV V VI VII VIII IX Manu- Transport,
faeturing , Storage Mining, House- other th~ Trade .!lDd Quarry- hold Household Coru- and Commu. Other ing, etc. Industry Indultry truetion Commerce nieations Services ...-"--- ,....---.. ,-......_,,............_, ,.-......_, ,...--.....__.....---~
M FMFMFMFMF MF ~ F M F M
IS
F
16 17 18 19 20 21 22 23 24 25 26 27 28 29 30 !II !l2 33 34
350 306 '272 215 62 89 8 .. 2 .. 2 (7
·28 36 18 20 • 7 16 3 .. .. .. . . .. ., .. Uninhabited
Uninhabited U ninhahited
20 II 13 8 4 2 .. 2
482 262 289 160 63 57 36 .. 26 26 48 4 17 15 Uninhabited Uninhabited Uninhabited
12 10 8 10 4 .. .. .. .. .. .. .. . . ..
81 40 44 6 19 9 3 .. 4 .. 3 2 7 23
114 79 81 46 10 25 2 .. I .. .. .. .. ," .. II .9 7
87 4-5 58 7 14- '32 3 .. 1 ._ .. .. . , .. .. .. 11 .6 Uninhabited Uninhabited
51 8 "38 2 10 2 2 2 2 14:4- I 52 I 82 101 6 39 4 48 2 12 .. I 1 277 52 162 04- 94 '34 2 .. 13 14 ., 6
123 54 97 '20 53 3 3 1 ,. 218 72 147 68 67 I .. 5 2 47 12 23 16 II 6 .. 2
119 16 64 30 16 2 .. 3 .. 9 .. 2 .. 6 2
33 14- 14 13 ·14 4 .. I .. 1 57 II 40 2 11 9 I 2 .. . , .. .. 2 P-1I-18
BIHAR
X
Non-workers ,...--~
M
35
270 21
18
366
9
67
73
67
53 85 76
2G6
106 221
39
III
34 55
F
36
323 39
12
609
9
113
114-
126
lO3 215 104-402
169 366 83
186
46 113
Sl. no •
72 73 74-
75 76 77
78 79 60 81 82
83
8f
85 8t1 87
118 89 90 91
92 93 94-
95
96 '5)7

138
PALAMAU VILLAGE
SUBDIVISION
ANCHAL
Occupied resid ential
houses ,---_..A.---......._ Total number ofpersoDs Literate
No. of enumerated (including and Serial no. Area No. of bouse- inmates of institutions Scheduled Scheduled educated
(Thana no.) Name or village in acres housCi bolds and bouseless persons) castes tribes persons .--__ .A.-.-__ ..... ____ ......_...,
,..--""'--, ,_.-~__....
P M F M F :M F M F
2 3 4- 5 6 7 8 9 10 11 12 13 14
REVENUE THANA-HUSSAINABAD-contd.
Lamari G. P.-contd.
98 (212) Kirya 210.95
Kusha G. P.-{;ontd.
99 (213) Belopati S, V 45.59 28 32 164 75 89 44 20 100 (214) Basu Khap 38.30 , 101 (215) Hundraha 47.18
Lamari G. P.-eontd.
102 (216) Misraulia 33.85 9 4 . 5 2
Kusha G. P.-coneld.
103 (217) Ghatahua Kalan 226.14 72 74 455 215 240 84 105 70 9
Lamari G. P.-coneld.
104 (218) Raja Ghatahua 301.60 35 42 214 103 111 25 22 16 105 (lOa) Jainatha alias Ghordag 1,508.08 89 103 543 "263 280 71 74 10
J06 (101) Bardiha M, L 1,178.74 145 155 859 457 402 187 153 94 5 107 ~I02~ Jika Bukcham 3,287..89 47 53 .271 .134 137 104 115 11 1 108 103 'Lebhri 448.85 67 78 414 211 203 51 45 47 109 (104) Khardiha P 653.55 74 80 451 231 220 77 55 32 110 (172) Dhelka alias Sa1ga 1,315.61 87 98 486 231 255 29 42 9 III (105) Sukhnadi 2,226.17 62 63 301 141 160 86 46 14 14 17 112 (106) Kolhua 540.12 72 82 417 223 194 80 78 13 113 (107~ Barchhabandh 688.95 .69 73 423 207 216 21 25 19 114 (108 Lawa Champa 769.87 57 59 ~ 321 168 153 14 20 42 "; .. 115 (109) Adar K ,2,133".61 ]07 129 661' 334 330 114 ItO 41 116 (110) Semri 1,431.84 68 98 520 258 262 96 103 37 117 (Ill ) Nawadih 1,504.49 13 17 75 • 42 33 30 25 2 118 (112) Jatrobaniari 1,203.37 104 114' 564 " 281 283 175 182 40 2
Bodra G. P.
119 (156) Sernrahat 110:07 20 20 150 72 78 7
Majhiaon G. P.
120 (158) Ghuruakalan 53.95 7 4 3"
BodTa G. P.-contd.
121 (157) Sa~rastal 54:49 "2 3 14' 6 8

139
STATISTICS
GARHWA
MAJHIAON WOBKIllM ,
~------------------------~-----------------------~ I II III IV V VI VII VIII
Manu- Transport, facturing Storage
Agricul· Mining, House- other than Trade and Total workers tural Quarry. hold Housenold Cons. and Cornmu.
(I-IX) Ctlltivator labotlrer ing, etc. Industry Industrytruction Commerce' nications r:----..."....----.. r--""".__, r-_Jt-_~ ,..-.... __, ,..-....._, ,.-..Jw__, ~ ,......_.,.._.. ,..--""'".-...,
M
15-
44
2
122
58 182
249 71
108 131 153 95
134 133 82
253 151 30
167'
43
3
F M
16 ]7
Uninhabited
21 28 U nitthabited Uninhabited
2 2
81 69
53 31 160 133
146 146 65 53 89 88
127 124 122 137 107 7.5 120 134 123 109
19 78
179 247 144 • 110 19 11 77 99
32 33
2 3
F M F M F M F M F :M F M F M F
18 19 20 21 22 23 24- 25 26 27 28 29 30 31 32
3 13 18 .,
2
34 49 47.... 4.. .. .. .. .• .. .•
27 27 26 .. " .. 112 45 47 4 1 ..
20 63 122 8 14 3 6 44 6 21 11 76 17 12 ., 1 ..
122 7 5 102 14 20 2 .. .. .. 84 16 23 3
117 3 .. 102 18 20 2 .. 4 1 .. 17 4 2 " .. .. .. ..
174- 6 5 III 25 31 13 I .. 2
11 1,9 8 7 51 64 16 5 ..
18 ,4 14 2 .. .. .. .. .. I ., .. .,
2
2 ' ..
IX
Other Services
.---"""-~
M F
33 34
3
10. 1 1
3
BIHAR
X
-SI. Non·workers no.
r---"'-_-..,
M
35
31
2
93
45 Bl
2O'B 63
103 100 78 46 B9 74 86
81 107 12
114
29
2
F
36
68
I
98
99 100 101
3 102
159 103
58 104 120 105
256 106 72 107
114 108 93 109
133 110 53 III 74- 112 93 113
134 114
151 115 1I8 Il6 14 117
206 Il8
46 119
2 120
6 121

140
PALAMAU VILLAGE'
SUBDIVISION
ANCHAL
'Occupied residential
houses Total number of persons Literate
No. of enumerated (including and Serial no. Area No. of house- inmates of institutions Scheduled Scheduled educated
('thana no.) Name of village in acres houses holds and houseless persons) castes tribes persons ,--....___. ,...--~ ,...--.....____
P M F M F M F M F
z 3 4 5 6 7 8 9 10 11 12 13 14
REVENUE THANA-HUSSAINABAD-contll.
Majhiaon G. P.-contd.
122 (160) Bah era Kalan 161.91 123 (161) Bahera Khurd P, H 91.57 I 6 13 12 I 4 I 9 124 (162) Dalko 98.07 66 79 373 193 180 20 24 64 7
Bodra G.P. -contd.
125 (163) Dhango 65.76
Sarsatia G. P,
126 (164) Obra M,V,.Cc 703:19 22 77 473 237 236 40 47 97 84 38 4 127 (166) Gangtaria 285.50 21 29 133 56 77 56 77 2
Bardiha G. P.-contd.
128 (167) Majbganwan 314.47 37 50 248 130 118 114 111 2
129 (1,68) Loka 681.40 • 61 B8 500 245 255 133 149 44 130 (169) Sarsatia 613.08 39 54 269 137 1'32 '35 29 6 I 131 (170) Lalgara 542.26 34 46 285 150 135 25 21 25
Bardiha G. p.-condd.
132 (171) Kundrahe P 495.19 45 59 276 140 136 16 17 51 13
Sarsatia G. P.-concld.
133 ~173) Kaua Khoh P 1,098.02 71 83 395 219 176 134 105 78 12 134 174) Babhni 1,472.48 20 -24 110 59 51 ,47 42 3 -
Majhiaon G. P.-contd.
135 (149) Dube Tahle 280.19 67 67 412 219 193 124 125 36 11 136 (150) Akhauri Tahle V, H, Hos 185.88 71 71 403 198 205 28 34 44 11 137 (151 ) Ginjal 36.38 8 8 46 23 23 23 23 4 138 (152) Adhaura P 654;82 35 45 265 135 130 74 65 15 1 139 (I 53) Ghurua Khurd, K 107.54 96 96 533 262 271 10 12 53 8
Bodra G. P. -contd.
140 (154) Uchri 216.00 41 41 247 98 149' 28 28 31 6 141 (155) Repura 83.43 17 17 98 45 53 6 4 20 I
Majhiaon G. P.-contd.
142 (159) Talasbaria 506.24 26 26 143 79 64 64 53 4
143 (165) Bodra P 1,915.8~ 100 100 725 357 368 109 102 92 20
144 (113) Dawankara 1,292.81 87 109 559 289 270, 136 134 65 9 145 (114) purhe 979.65 114 154 709 360 349 188 199 47 146 (115) Tanrhe 949.11 102 103 618 304 314 152 159 16 147 (116) Karui P 1,02].33 ~ 137 159 1,104 542.. 562 232 2,52 21 29 .136 54

141
STATISTICS
GARHWA
MA]HIAON WORKERS
r--'--------------------------------
T.otal workers (I-IX)
.M
15
F
16
I
Cultivator ,..--~
M
17
F
18
Uninhabited 12 .. 1 ..
107 79 72 56
Uninhabited
134 102 99 77 31 32 29 25
81 64 78 62
135 121 124 114 85 54 61 30 85 78 58 55
76 56 40 29
115 68 55 25 36 22 17 9
120 64 "65 1~ 103 48 80 30
11 10 2 ., 70 51 43 4
149 8 132 . 1
54 14 29 4 20 3. 17 3
40 8 30 6
181 40 144 2
164 133 146 119 198 184 131 90 195 52 179 29 307 240 184 127
II III IV V Manu
facturing
VI VII
A.sricul- Mining, House- other than_ Trade tural Quarry- hold Household Cons- and
labourer ing, etc. Industry Industry truction Co=erce ,..------' ~ ,.......,..._., ~ ~ ,.---A--.
M F M F M. F M F M F M F
19 20 21 22 23 24 25 26 27. 28 29 30
1 .. ,. ,. , . ,. ,. . . II 22 11 ., 2 1 " ., ., , . .. .,
18 21 12 " 2 ,. .. ., 5 1 '. ,. " " .. 1
3 2
5 7 ., ,. r , . .. . , II 17 7 . , 3 .. .. " '. .. , . 7 18 19 1 1 4 ,. .. ., ,. "
.,
13 24 12 .. 6 3 I. , . .. ,. .. .,
43 43 7 " 7 ,. , . . , 2 6 3 . , 2 .. '. , . ..
46 45 5 .. :2 11 16 3 ,. 2 ,. -8 10 .. 1 .. ., ,. " ., 22 44 3 1 1 .. , . .. . , 2 2 4 1 , . .. ,.
24 ,10 ,. ., .. 2 .,
" " " , . . , " '. ,. ,. ..
9 2 ,. , . .. " ,. ,. '. 36 38- .. .. .. . .
16 14 , . .. .. .. .-~ .. 60 94 " ." ., .. 3 ,. 5 8 4 15 1 1
103 107 2 " 13 6 1 ..
BI-HAR.
VIn IX X Transport,
Storage and
Co=u- Other 81. nications Services Non-workers no.
r--_,__ ..... .--"._____ ,.---"--
M F M F M F
31 32 33 34 35 - 36
122 10 I 123
11 86 101 124
.... 125
4 2 103 134 126 2 25 45 [27
49 54 128
4 " 110 134 129 6 4 52 78 '130
65 57 131
5 64 80 132
I 3 104- 108 133 "
12 7 23 29 134 ,
4 4 99 129 135 7 95 157 136
.. ' 12 . 13 137 .. 2 1 65 79 138
11 4 1I3 263 139
44 135 140 '\ 25 50 141
3;9 56 142
176 328 143
2 125 137 144 -.. 7 162 165 145
-. 2 109 262 146 4 235 322 147
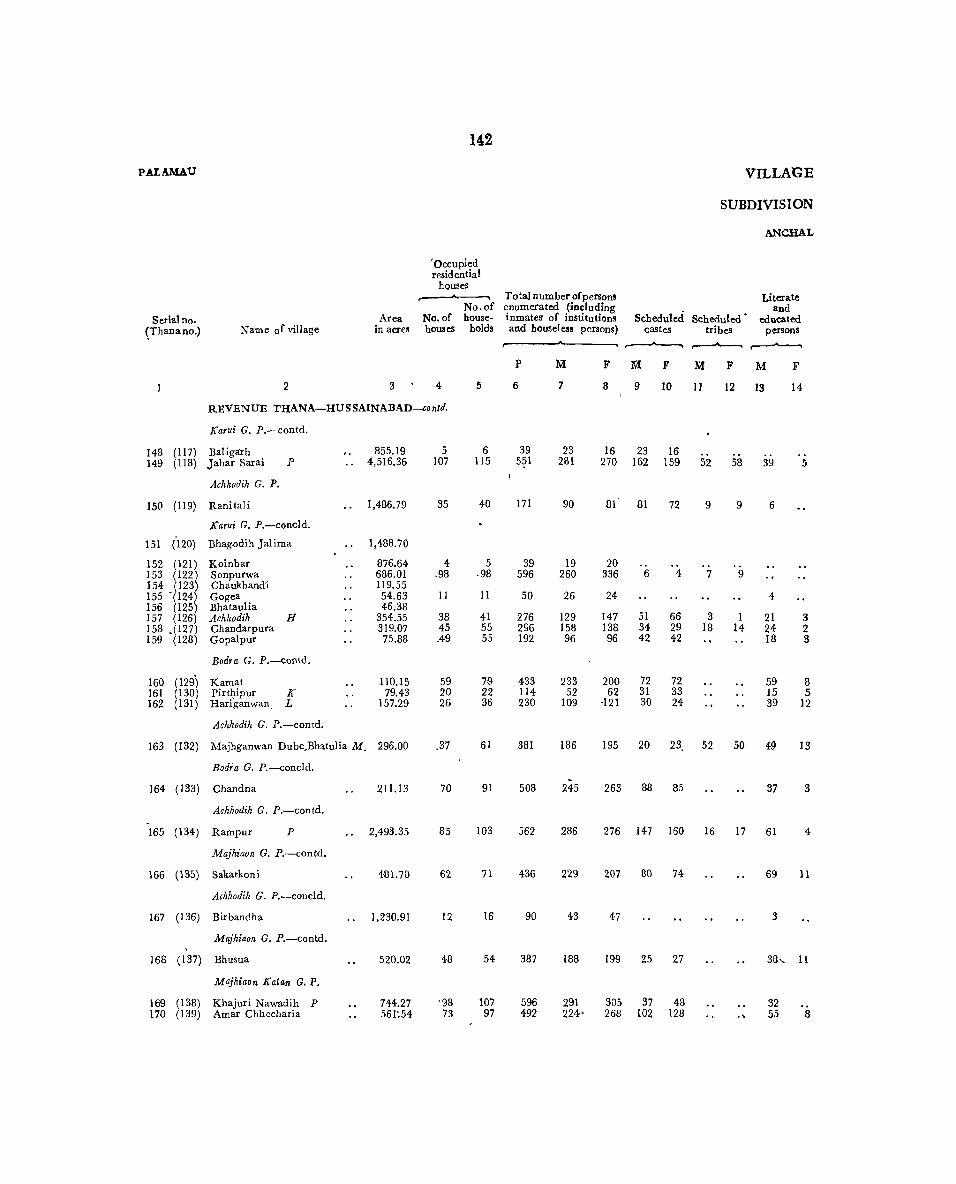
142
PALAMAU VILLl\GE
SUBDIVISION
ANCHAL
(Occupied residential
houses
No.of Total number of persons Literate enumerated (including and
Serial no. Area No. of house- inmates of institutions Scheduled Scheduled' educated (Thaoano.) Name of village in acre~ houses holds and houseless persons) castes tribes persons
r- .. ~
P 1\1 F M F 1\1 F M F
2 3 4 5 6 7 8 9 10 II 12 13 14
REVENUE THANA-HUSSAINABAD-contlf.
Karui G. p.-contd.
148 (117) Baliga'rh 855.19 5 6 39 23 16 23 16 149 (118) Jahar Sarai P 4,516.36 107 115 5~1 281 270 162 159 52 58 39 5
Achhorlih G. P.
150 (119) Ranitali 1,486.79 35 40 171 90 81 81 72 9 9 6
J(arui G. P.-coneld.
151 (120) Bhagodih Jalima 1,488.70
152 (121) Koinbar 876.64 4 5 39 19 20 153 (122) Sonpurwa 686.01 .98 .98 596 260 336 6 4 7 9 154- (123) Chaukhand'i 119.55 155 '(124) Gogea 54.63 II 11 50 26 24 4 156 (125) Bhataulia 46.38 157 (126) Achhodih H 354.55 38 41 276 129 147 51 66 3 I 21 3 158 .(127) Chandarpura 319.07 45 55 296 158 138 34 29 18 14 24 2 159 (128) Gopalpur 75.88 .49 55 192 96 96 42 42 18 3
Bodra G. P.-contd.
160 (129) Kamat 110.15 59 79 433 233 200 72 72 59 8 161 (130) Pirthipur K 79.43 20 22 114 52 62 31 33 15 5 162 (131) Hari'ganwan. L 157.29 26 36 230 109 -121 30 24 39 12
Achhodih G. P.-contd.
163 (132) Majhganwan Dube,Bhatulia M. 296.00 .37 61 381 186 195 20 23. 52 50 49 13
Bodra G. P.-coneld.
164 (133) Chandna 211.13 70 91 508 245 263 88 85 37 3
Achhodih G. P.-contd.
165 (134) Rampur P 2,493.35 85 103 562 286 276 147 160 16 17 61 4
Majhiaon C. P.-contd.
166 (135) Sakarkoni 481. 70 62 71 436 229 207 80 74 69 11
Achhodih G. P.-coneld.
167 (136) Birbandha 1,230,91 12 16 90 43 47 3
Majhiaon G. P.-cootd.
168 ([37) Bhusua 520.02 48 54 387 188 199 25 27 38, 11
Majhiaon Kalan G. P.
169 (138) Khajuri Nawadih P 744.27 -98 107 596 291 305 37 43 32 170 (139) Amar Chhecharia 561:54 73 97 492 224' 268 102 128 55 8

STATISTICS
GARHWA
MA]HIAON
I
Total workers (I-IX) Cultivator
,..-_.A._____, ...-_.....___,
M
15
II 192
56
, 12
169
15
84 86 50
120 28 61
106
129
148
114-
26
108
171 107
F
16
10 158
52
M
17
5 133
36
Uninhabited
2 12 32 156
Uninhabited 6 15
Ullinhahi'1ed 48 41 21 56 19 31
41 71 17 7 22 24
37 79
102 80
133 92
71 71
28 18
70 66
146 89 99 68
F
18
4 101
28
2 31
6
16 3 2
13 4 1
16
57
74
25
18
37
6 25
143
WORKERS
II III IV V VI VII VIn IX MaIlU- Transport,
facturing Storage Agricul- Mining, House- other than Trade and
-Other tural Quarry- hold Household Cons- and Commu-labourer ing. etc. Industry Industry truetion Commerce nieations Services
,---""'_____'_ __ ,..,..__" ~ ,--""____'...--"---.,..--J'---. ,..--.....___, ,--.....___, M
19
FMFMFMFMFMF M F M F
20 21 22.23 24 25 26 27 28 29 30 31 32 :J3 34
6 6 .. .. 59 55 2 " .. .. " .. ..
.19 24 .. .. .. .. .. .. .. ..
.. " .. ., .. .. .. .. .. .. II 1 2 .. .. .. .. .. . . . ,
.. .. .. " , . . . .. ..
43 31 ., .. " 30 18 18 17
44 28 . , .. J ., .. .. .. .. 1 . . 3 20 13 . . .. .. .. .. 1 30 15 5 2 .. .. .. . . 4- 1
16 19 2 .. 2 .. ., .. J . . .. 2 6
34 43 14 2 1 .. .. .. .. .. " .,
44 58 12 1 " .. . , .. .. " .. . ,
33 46 6 .. .. .. .. .. " .. .. .. 4-
5 10 3 " .. .. .. " .. " .. ..
24- 31 Ir 2 .. " .. .. ..
45 126 21 1 14 13 .. .. . . .. 2 .. 27 72 8 1 .. " .. 4- 1
BIHAR.
X
Non-workers ,..--"'""""--,
M
35
12 89
34
7 ~r
II
45 72 46
113 24 48
80
116
138
115
17
80
120 117
F
36
6 112
29
18 304-
18
99' 1 17
77
159 45 99
158
161
,143
136
19
129
159 169
SI. no.
148 149
ISO
151
152 153 154 155 156 157 158 159
160 161 162
163
164-
165
166
167
168
169 170
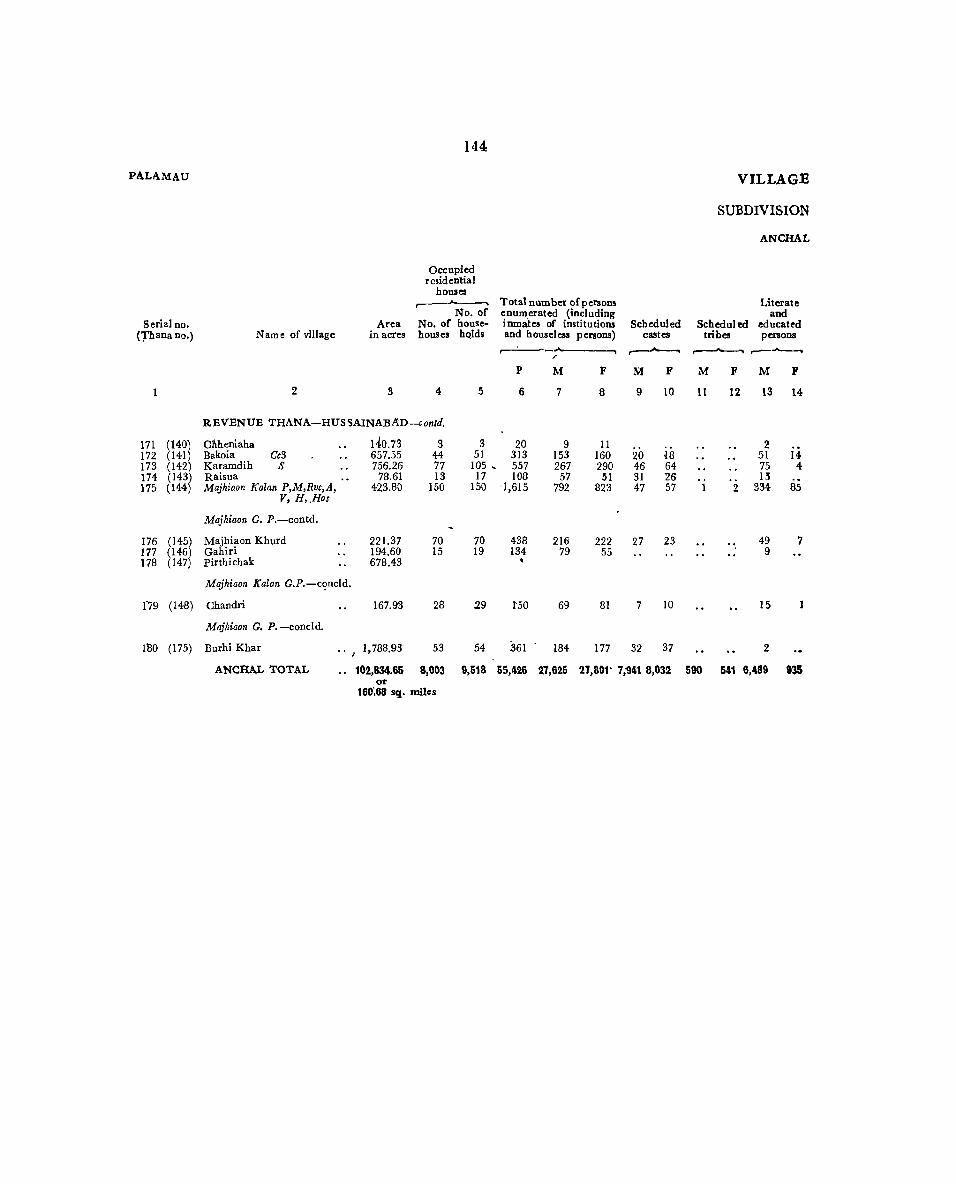
144
PALAMAU VILLAGE
SUBDIVISION
ANCHAL
Occupied r esid entia I
houses ,..---......___.. Total number of per sons Literate
No. of enumerated (including and Serial no. Area No. of house- inmates of institutions Scheduled Schedul ed educated
(Thana no.) N am e of village in acres houses hQlds and houseless persons) castes tribes persons ....._____, ;
____ ---. ,,---~ ,---oA..--.
P M F M F M F M F
1 2 3 4 5 6 7 8 9 10 11 12 13 14
R.EVENUE THANA-HUSSAINABAD-contd.
171 (140) CJ\.hel1iaha 140.73 3 3 20 9 11 2 172 (141) Bakoia Cc3 657.55 44 51 313 153 160 20 ~8 51 14 173 (142) Karamdih S 756.26 77 105 , 557 267 290 46 64 75 4 174 (143) Raisua 78.61 13 17 108 57 51 31 26 15 175 (144) Majhiaon Kalan P,M,Rvc,A, 423.80 150 150 -1,615 792 823 47 57 2 334 85
V, H,.Hos
Majhiaon G. P.-contd.
176 (145) Majhiaon Khurd 221.37 70 70 438 216 222 27 23 49 7 177 (146) Gahiri 194.60 15 19 134 79 55 9 178 (147) Pirthichak 678.43
Majhiaon Kalan G.P.-c<;mcld.
119 (148) Chandri 167.93 28 29 1'50 69 81 7 10 15
Majhiaon G. P.-coneld.
1'80 (175) Burhi Khar 1,788.93 53 54 361 184 177 32 37 2
ANCfIAL TOTAL 102,834.65 8,003 9,518 55,426 27,625 27,801' 7;941 8,032 590 541 6,439 935 or
160:68 sq. miles

145 BIHAR.
STATISTICS
GARHWA
MAJHIAON WOBXliB8
r--
I II III IV V VI VII VIn IX X Manu- Transport,
facturing Storage Agricul- Mining, House- other than I Trade and
Total workers tural QuaTlY- bold Household Cons- and Commu- Other S1. (I-IX) Cultivator labourer ing, etc. Industry Industry truction Commerce nications' Services Non-work en no.
r--"""'___' h .... ,..............~~ ,......--. ,...--.... ..------. ,.--~ ~ M F M F M F M F M F M F M F M F Nt . F NI F M F
\ 5 • 16 17 18 19 20 21 22 23 24 25 26 27 28 29 30 81 82 33 84 35 36 1
4 3 3 1 '3 " .. 5 8 171
80 26 44 11 14 13 15 4 2 .. .. 3 73 134 172 141 122 70 36 48 86 14 .. 1 1 .. 4 3 126 168 173 25 17 11 2 11 -15 .. 2 1 32 34 174-
421 62 127 16 88 29 8 34- 5 16 6 1 88 3 5 54 3 371 761 175
111 77 58 32 42 45 .. 11 105 145 176 52 32 19 9 4 8 3 18 5 .. .. .. 3 6 9 27 23 177
Uninhabited 178
40 11 7 26 5 2 1· _. .. 1 . . .. .. 2 5 2 29 70 179
180 150 174 138 5 12 " .. .. .. 4 27 180 ,
15,259 8,990 9,512 4,250 3,756 4,175 590 71 375 224 119 10 27 .. 255 41 68, 559 219 12,366 18,811
P-II-19

146
PALAMAU VILLAGE
SUBDIVISION
ANCHAL
Occupied re!idential
houses ,--...___ ...... Total num ber of persons Literate
No. of enumerated (including and Serial no. Area No. of house- inmates of institutions Scheduled Scheduled oiucated
(Thana no.) Name of village In acres houses holds and houseless persons) castes tribes persons
..--~ ,....-"..___, ,---......... _""'"
P Nt F M F M F M F
2 3 4 5 6 7 8 9 10 11 12 13 14
REVENUE THANA-HUSSAINABAD-contd.
Kariwadih G. P.
1 (I) Kh okh a 1,654.37 25 25 129 67 62 25 23 21 3 2 (2) Chan dna 1,586.61 37 37 202 94 108 .. 50 46 11 2 3 (3) Pipra 2,026.34 38 40 209 109 100 25 16 38 32 I
4 (4) Husru 2,219.90 84 90 583 295 288 54 58 74 60 32 I 5 (5) Bhaluhi alias Kariwadih P .. 1,323.46 106 132 743 375 368 110 112 7 6 127 33 6 (6) Sundi P 1,394.38 126 152 852 442 410 212 205 14 8 90 8 7 (7) Pipri 573.36 39_ 43 246 122 124 26 24 44 35 13 .. 8 (8) Raji P 1,959.91 160 197 1,166 577 589 272 273 40 40 69 2 9 (21) Sisri P 1,863.24 229 291 1,213 588 625 70 80 149 139 136 14
10 (27l Chhata Kund P,H2 1,107.41 123 123 586 299 28·7 30 28 97 85 53 3
II (28 Partikuswani P 5,209.13 359 369 1,269 688 581 60 57 398 331 102 9 12 ~29) Munmun 348.96' 13 30) Pachadumar M,Mc 4,190.00 236 267 1,356 698 658 168 140 69 67 166 21 14 (31 ) Bato Kalan 1,490.68 57 57 278 144 134 6 4 77 67 37 5 15 (37) Garnharia 4,65.61 4 4 26 12 14 5 7 16 (38) Bijdih 589.37 52 62 304 154 150 54 51 39 7 17 (39) Chandih P 1,442.58 27 31 161 87 74 47 30 3 I 32 16
18 (18) Kupa 3,290.72 103 128 590 306 284 127 120 39 55 21 19 (20) Baitra 1,196.33 7 7 39 18 21 I 8 13 20 (22) Torelawa L 1,080.47 88 103 514 282 232 22 16 63 42 63 4 21 (23) Arangi P 1,227.60 268 296 1,671 863 808 201 189 84 91 58 22 (24) Allnraia alias Chauria 1,210.98 138 163 730 390 340 72 59 18 23
.. 27 2
23 (26) Khondar 1,150.72 75 81 479 244 235 6 7 95 88 2
.24 (25) Checharia P 862.83 106 106 588 291 297 100 102 27 I 25 (32) Ketri 415.37 13 18 257 130 127 16 10 22 5 26 (33) Baligarh 2,189.83 148 148 851 446 405 103 96 56 45 74 7 27 (34) +Ketar M,L 803,47 239 239 1,293 670 623 261 218 135 16 28 (35) Panditpura 3830 4 4 22 10 12 1 29 (36) Nawadih P 811.94 85 85 507 259 248 106 79 61 6 30 ~43~ Singhpur P,L 996.52 48 49 239 133 106 37 29 56 7 31 44 Makundpur 1,190.89 102 102 575 288 287 11 6 43 32 (45) Belabar V 548.62 48 48 300 146 154 2 4 26
33 (9) Kharaundhi V,M 2,590.21 268 413 1,882 970 912 429 395 5 8 147 23 34 (10) Chandni P 1,766.79 223 239 1,420 711 709 235 136 62 77 149 12
35 (11) Lami alias Sarahia P 2,292.44 75 116 519 254 265 53 38 89 80 64 6 36 (19) Hendea alias Bliitri 1,334.13 50 54 345 179 166 17 16 56 49 9 37 (12) +Amrora M, V,Oc 2,283.17 151 151 812 416 396 214 201 6 4 123 40 38 (13) Majhganwan P 1,988.38 174 174 1,017 535 482 168 158 95 80 67 7
Jhagrakhand G. P.
39 (14) Rohinian P 2,545.24 163 187 923 438 485 158 170 26 23 82 10 40 ( 15) Bansani h 6,360.53 262 299 1,433 747 686 192 197 228 203 238 25 41 (16) Barwari Cc 2,589.65 59 65 304 160 144 35 35 74 69 17
42 (17) Makri P, 0. 6,801.37 363 404 2,233 1,126 11,07 350 287 122 101 229 20 43 (55) Buka 1,425.93 J31 17! 888 448 440 203 206 6 5 65 2

STATISTICS
GARHWA
BIIAWANATHPUR
Total workers (I-IX)
I
Cultivator .--.....___,
II
Agricultural
labourer
147
WORKERS
III IV V VI VII VIII Manu- Transport,
facturing Storage Mining, House- other than Trade and Quarry- hold Household Cons- and Commu-ing, etc. Industry Industry truction Commerce nications
IX
Other Services •
M
15
F
16
M
17
F ].I;{
18 19
FMFMFMFMFMF ]I;{
20 21 22 23 24 25 26 27 28 29 30 31
F 1\11 F
32 33 34
38 54 57
182 199 255
73 350 358
166 380
409 82 12
101 48
170 13
158 489 215 168
161 76
241 378
5 134
71 170
73
549 401
150 92
248 310
242 418 105
654 283
36 50 47
168 187 228
71 339 328
17 29 .51 92
111 208 64
261 216
21 25 42 91
110 210 65
293 2.50
67 92 14 92 102 227
Uninhabited 287 285 186 26 37 4
4 7 15 51 .. 10 31 1
144 11
112 383 180 126
133 41
158 276 .. 5
24 138
38
127 10
1I3 282 153 104
III 7
76 268 156 98
100 79 44 26
142 98 239 194
5 1I0 3 49 7
140 115 69 37
12 19
4 19 31 11 2
14 12
64 25
112 33 4
46 16
28 .. 6
41 7
25 17 45 90 .. 20
9 18
2
11 2.5
5 .. 47 47 11 5 14 69 23 .. 14 8 14 27 2 4 2 4 5 2 2
12 4.. 60 34 32 40 7 28 21
. . . . . . 1
50 3 .. 24
4 2 7 10
101 2 .. 2 .. 17 5 .. 1 ..
.. 2 ..
3 1 1 .. 14 .. 1 .. 9 " .. .. ..
33 I .. 14 .. 4 3 .. .. . .
2.5 10 5 7 41 32 .. 89 49 5 21 .. 24 19 2 24 2 10 8
1 .•
1 .• 1
9
. ' .. 3 2 ..
1 ., .. 6 6 ...... 12 2 3 .. .. ., .. 1 .. 49 .. .; 4 8 .. .. 2 .. 3 2 66 1 .. 14 4 3 .. 11 7
2 13 I .. 16
1 . . . .
.. 2 6 1 .. 4 3 2 2 ..
507 244
483 407 56 92 3 4 4 1 ..
69 4
189 292
265 371 84
583 222
345 199 19 21 8 .. 13 21 ..
100 81 82
287
lsI 266
71
24 2 5
277
19 264 67
44 10
155 15
88 95 7
42 2 2 1 ..
184 .. 13 .. 1
246 1 104 39
12 18 1 3
2 .. 2 .... 3
1 1 1 .. 6 1
435 394 149 179 29 23 7 2 148 105 66 89 47 1 3 27
1 ..
1 3 J
1 .. 6.. 1 ..
4 .....
33
.. 2
8 6 2
19 15
4
7 61
3 55
8 6
4 1
24 41
8 30
30 12 45 18 " 2 6 8
5 15
4
8 2
17 3
15 11
4
5
18
4 25
16
47
1 5
,. 3 2
,. 3
BIHAR
X
Sl. Non-workers DO •
M
35
29 40 52
113 176 187 49
227 230
133 308
289 62
53 39
136 5
124 374 175' 76
130 54
205 292
5 125 62
118 73
421 310
104 87
168 225
196 329 55
4i2 165
F
36
26 58 53
120 18r 182 53
250 297
220 479
371 108 10
135 64
140 10
120 425 160 109
164 86
247 347 12
243 82
149 116
1 2 3 4-5 6 7 8 9
10 11
/12 13 14 15 16 17
18 19 20 21 22 23
24 25 26 27 28 29 30 31 32
405 33 465 34
196 162 207 190
220 315 60
35 36 37 38
39 40 41
524 42 218 43

148
PALAMAU VILL,AGE
SUBDIVISION
ANCHAL
Occupied residential
houses ,--....... __, Total number of persons Literate
No. of enumerated (including and Serial no. Area No. of house- inmates of institutions' Scheduled Scheduled .educated
(Thana no.) Name ofviIlage in acres houses holds and houseless persons) castes tribes persons ,-- ...... ,--..-.._ ........ .---"'---- r---"'--......
F M F NI F 11;{ F 11;{ F
1 2 3 4 5 6 7 B 9 10 11 12 13 14
REVENPE THANA-HUSSAINA~AD-concld. 44 (54) +*Bhaunathpur A, Hos, Rile .. 675.17 153 176 869 460 409 176 170 89 53 192 53 45 (56) Arsali P,K,Ic, 9,p05.41 408 470' 2,597 1,305 ],292 307 2]3 168 136 270 11 46 (57) Sinduria 539.07 5 7 29 15 ]4 6 9 6 2 47 (59) *KaiIan P .. ],0304.28 ]46 149 821 426 395 148 140 45 3 48 (60) Phulwar 1,731.75 [9 19 96 53 43 35 31 5
49 (46) Dhanimandra [,708.37 34 37 [80 86 94 20 20 ]3 12 24 2 50 (47) Garda 1,474.09 51 (48) Adhaura 376.93 19- 24 119 57 62 54 53 4 52 (49) Panda ria 330~95 III 124 688 361 327 15 8 35 .I8 45 3 53 (50) Singhitali P, L 648.08 ]29 147 745 374 371 II8 ]16 23 18 131 38 54 (51) Chapri P 429.42 165 205 1,083 528 555 122 120 26 24 85 8 55 (52) Saraia 68I.I2' 62 75 384 200 184 2 2 10 56 (53) Gorganwan 564.26 24 26 106 53 53 4 2 57 (58) Ghaghra 2,978.51 54 58 248 129 119 44 34 65 6[ 9 58 (61) Konmandra P .. 4,553.91 63 85 482 231 251 130 132 27 29 45 7
Kadhwan Parsodih G. P.
59 (40) Khairwa 1,311.77 42 43 Nl 129 112 33 19 15 60 (41) Ta[i 782.59 109 109 601 320 281 54 45 31 1 61 (42) Baksipur 573.28 2 2 1'2 8 4 ," 62 (62) Parsodih 1,307.64 ]23 146 725 3t2 363 75 68 41 I 63 (63) Kadhwan 1,849.61 38' 39 271 147 ]24 28 25 8 12 8 6 64 (64) Bansdih Khurd P 649.62 20 25 138 67 7] 3 3 2 65 (65) Bansdih Kalan 1.208.36 69 77 445. 237 208 88 83 24 66 (66) Chaura 1,549.53 37 37 191 94 97 9 67 (67) Kosdehrd 1,229.98 20 24 142 63 . 79 25 28 12 3
Hariharpur G. P.
68 (68)) Gurur 165.58 29 29 137 63 74 23 24 5 69 (69) Meraunichherhat P 1,505.23 ]25 125 740 374 366 76 72 96 70 (70) Lohargara 580.11 106 109 566 294 272 40 33 51
71 (72,) Hurka P 1,970.76 90 95 569 288 281 105 88 3 1 60 2 72 (73) Rapura P 1,542.0§ 81 85 523 284 239 66 60 34 26 89 5 73 (74) Majhganwan P,L 6,532.04 344 404 2,064 1,030 1,034 479 485 29 23 188 14-
74 (71) +Hariharpur M,L,H .. 2,509.20 132 223 1,119 572 547 135 167 189 38 75 (75) Bato 383.57 49 58 361 187 174 44 41 44- 2 76 (76) Dagar V 746.80 44 52 3Q8 154 [54 39 39- 52 17 77 (77) Sri nagar 224.15 18 24 170 84 86 17 78 (78) Daridah P,C 1,635.55 64 118 692 334 358 37 53 98 25 79 (80) Dumarsota P 1,124.17 182 246 1,383 '697 686 59 65 273 35
ANCHAL TOTAL .. 143,820.66 8,209 9,442 49,599 25,277 24,822 6,6046,080 2,976 2,635 4,914 597 or
224.72 sq. mi~es

14:9
STATISTICS BIHAR
GARHWA
BHAWANATHPUR WeRKERs
II III I.V V VI VII VIII IX X Manu- Transport,
facturing Storage Agricul- Mining, House- other than Trade and
Total workers tural Quarry- hold Household Cons-. and Commu- Other 81. (I-IX) Cultivator labourer ing, etc. Industry Industry truction Commerce nications Services Non-workers no.
,.....---.....__, ,------, .-:-.....__, ~ ,.-...... _, ,_............. ...----. ____......_.. ,..-""__' ,---"""'____' .-----.,
M F M: F 1'\1: F M F M F M F M F M F M F M F M F ~
15 16 17 18 19 20 21 22 23 24 25 26 27 28 29 30 31 32 33 34 35 36
246 174 52 11 56 138 9 .. 17 14 .. .. 11 B 7 94 3 214 235 44 756 606 512 443 139 138 63 5 30 15 .. .. .. 2 10 5 549 686 45
9 2 6 2 2 .. .. 1 . , .. ., .. . . .. 6 12 46 255 154 130 75 121 79 2 .. .. .. .. 2 171 241 47
30 15 21 10 8 5 1 .. ., .. 23 28 48
48 50 35 29 Jl 21 .. .. .. .. .. .. 2 38 44 49 Uninhabited 50
36 42 21 21 14 21 I " .. .. 21 20 51 217 176 152 165 17 9 47 .. 2 1 .. 144 151 52 213 179 112 42 81 131 JO .. 5 6 5 161 192 53 308 283 224 251 35 22 33 12 9 .. 1 4 220 272 54 121 101 93 71 13 30 13 .. 1 .. .. ., .. .. 1 79 83 55 36 29 5 2 25 27 5 .. ., .. .. 1 .. 17 24 50 79 66 52 40 13 21 14 1 .. .. ., 4 50 53 57
125 112 63 47 53 I 65 7 .. .. ., .. .. .. . . 2 106 139 58
81 56 52 27 25 2·9 1 .. . . .. .. 3 48 56 59 203 123 165 121 35 2 I ., I ., 1 117 158 60
6 3 6 3 .. .. 2 1 61 232 206 216 201 8 5 I .. " .. .. 7 130 157 62 93 69 54 45 32 24 3 .. 2 .. 1 .. 1 54 55 63 31 36 27 36 I .. 3 .. .. ., .. ., 36 35 64
146 123 116 118 6 5 14 .. 2 .' .. . . .. .. 8 91 85 65 60 49 58 49 2 .. . , .. .. .. 34 48 66 40 24 21 8 13 16 3 1 .. 2 23 55 67
40 ~~ 25 16 15 16 .. .. .. .. .. 23 42 68 188 135 44 47 45 2 .. I .. .. ,. .. . . 3 186 277 69 158 76 107 9 49 65 1 2 I .. 136 196 70
153 .24 '76 9 73 11 .3 1 1 .. 3 135 257 71 168 109 III 54 32 49 19 2 4- 4 .. .. 2 116 130 72 577 476 332 252 181 192 45 6 13 26 .. 5 1 453 558 73
330 159 181 48 71 85 30 18 17 2 7 5 ...20 3 242 388 74-90 81 66 69 1 I 12 3 .. 2 .. ., .. . , 8 .. 97 93 75 95 65 71 46 11 17 .. 3 1 .. .. .. 10 1 59 89 76 52 45 43 40 5 5 1 .. .. .. " .. 2 . . 1 32 41 77
155 165 198 116 20 46 17 .. I 3 2 ~ 6 .. 179 193 73 387 274 249 172 34 77 39 2 II 15 .. 1 53 8 310 412 79
14,502 10,837 9,612 7,132 2,695 3,077 808 47 492 380 15 6 21 57 26 5& 745 169 10,775 13,485

150
PALAMAU VI~LAGE
SUBDIVISION
ANCHAL
Occupied residential
houses ,..--""'-----, Total numberofpersons Literate
No. of enumerated (including and Serial no. Area No. of bouse- inmates of institutions Scheduled Scheduled educated
(Thana no.) Name of village in acres houses holds and houseless persons) castes tribes persOIlll ---, ,--~ ,... .& ,..--.... --.
P 1\1 F 1\1 F 1\1 F M F
2 3 4 5 6 7 8 9 10 II 12 13 14
REVENUE THANA-BALUMATH
I (106) Lath 1,027.69 12 12 63 32 31 23 25 9 6 1 2 (110) Sardhabar 1,205.94 37 39 203 104 99 61 64 43 35 16 3 (llI) Meral P 1,519.08 23 25 138 71 67 62 58 9 9 1 4 (115) Bandua 1,386.27 25 26 144 73 71 8 6 58 57 5 (116) Chaea 578.24 15 16 99 50 49 50 49 2 6 (II7~ Jawar H,.Me 551.61 20 20 109 62 47 35 26 16 12 7 2 7 (118 Jani P 999.44 27 30 168 83 {l5 48 52 11 7 7 8 (119) Munukdag ., 531.1)8 6 6 25 12 13 .. 12 13 6 9 (120) Bandar1auria 379.13 17 21 124 66 58 20 14 41 40 12
10 (121) Bhargaon P 1,806.38 40 40 213 109 104 62 63 34 33 • 8 11 (122) Kenw P 1,378.78 51 51 244 124 120 75 73 33 33 11 12 (123) Khapia C 1,429.96 29 29 162 83 79 12 10 64 65 5 13 (124) Hesatu P 1,007.81 43 46 242 125 117 8 8 114 106 16 14 (125) Dari 387.44 15 15 57 26 31 10 13 7 5 1 15 (126) Serandag P 1,630.95 64 73 336 171 165 55 49 32 35 32 .. 16 (127) Sasang 784.43 19 20 1:»8 70 68 67 64 3 17 (128) Lawagara P,Me,Oc 914.49 44 50 219 104 115 29 35 38 41 16 18 (129) Sikid 1,686.14 29 29 132 72 60 13 19 58 41 1
19 (I) Katang 3,742.63 45 45 240 112 128 84 107 28 21 5 20 (2) Ichak
/ 3,340.49 29 31 161 82 79 80 77 2 2 21 (3) +Herhanj P2,L,C 3,376.25 127 136 648 319 32'9 136 136 11 14 81 16 22 (4) Ud 377.81 14 14 71 41 30 41 30 .. 23 (5) Ghure Rhc,Mc, Dc 1,230.79 74 80 331 170 161 81 76 23 28 40 10
24 (6) Hur Me 1,363.74 41 47 277 139 138 20 26 101 94 4 25 (12) Karandag P 1,787.67 58 70 366 189 177 129 120 4 7 12
26 (13) Kacha 1,135.30 26 28 139 65 74 57 62 7 12 3 1 27 (14) Mari P 2,632.17 36 44- 217 114 103 107 98 6 3 2 28 (112) Baseta 144.00 29 (113) Bidir 828.34 12 12 74 34 40 32 37 .. 30 (114) Chuku P, Mc 2,014.85 35 48 207 103 104 76 76 2 2 5
31 (15) Jaubar P 2,213.76 22 23 130 67 63 57 54 3
32 (16) Karmatanr 877.83 5 5 34 18 16 13 11 5 5
33 (17) Chatuhans 658.14 6 6 21 10 11 10 11 34 (18) Sirismadh P 1,103.49 24 25 141 70 71 70 71 5
35 (19) Endwa 2,582.22 26 29 143 72 71 51 55 1
36 (20) Heranhapa P 2,433.59 49 54 290 150 140 127 119 2
37 (21) Dakadiri P 3,097.00 27 28 163 70 93 45 46 2
38 (22) Balu Bhang P, L, H, Mc' 3,166.96 212 234 1,213 605 608 504 531 1 116 12
39 (23) Gurhe 1,200.96 33 39 197 97 100 89 95
40 (90) Ichak P 1,262.53 53 79 363 144 219 38 41 100 151 29 10
41 (91) Lawagara P, L 1,304.54 65 89 448 217 231 52 60 138 127 36 6
42 (92) Humbu 1,949.07 84 108 547 270 277 196 192 34 34 28 3
43 (93) Bijra 265.60 38 43 220 108 112 41 36 43 43 8 1
44 (94) Tetebar m 319.40 15 15 63 27 36 20 21 1 2
45 (96) Chiru P,m,Cc 1,491.92 127 138 703 346 357 153 160 .. 130 13
46 (97) Ghutam V 1,149.49 54 67 347 173 174 105 102 38 40 16 2
47 (98) Serka P 872.24 33 40 227 104 123 77 64 .. 18 3
48 (107) Bankita L, Me, 765.07 24 27 126 68 58 42 30 9 11 12 1
49 (108) Nawada P 1,550.67 38 56 306 162 144- 14 6 89 82 22 7
50 (109) Hundra 520.82 15 17 92 52 40 42 30 5 4 4

151 I
STATISTICS BIHAR
LALEHAR
BALUMATH WOBKERS
I II III IV ,V VI VII VIII IX X Manu· Transport,
facturing Storage Agricul. Mining, House- other than Trade and
Total workers tural Quarry. hold Household Cons· and Commu· Other SI. (I-IX) Cultivator labourer ing, etc. Industry Industry truction Commerce nications Services Non.workers no.
,.--~ ~--. ,..--"---, ~,..-- ...... ,...........__, ___ .............. ,..--""'_" ,..--"""___' .--~
Nr F X:I F M F M F M F M F M F M F M F M F 1\1 F
15 16 17 18 19 20 21 22 23 24 25 26 27 28 29 30 31 32 33 34 35 36
19 20 12 8 Jl 4 .. .. .. " .. 3 13 11 1 64 60 56 54 2 7 .. .. .. .. .. .. 1 4 40 39 2 49 46 27 31 8 14 8 .. .. 5 1 .. 1 22 21 3 40 41 22 16 12 23 2 .. 1 .. .. .. .. 3 33 30 4 32 31 19 17 2 5 11 3 6 .. 18 18 5 40 24 24 21 5 2 11 " 22 23 6 48 47 31 24 6 20 6 1 2 .. .. "
1 1 2 35 38 7 8 9 8 9 .. .. .. .. .. . . .. .. .. .. .. 4 4 8
33 35 29 34 2 1 2 .. .. .. .. .. .. .. 33 23 9 66 53 40 28 9 8 10 6 3 7 .. .. .. .. 4 4 43 51 10 69 74 34 38 14 5 9 3 12 28 55 46 11 46 39 31 31 12 8 2 1 .. .. .. .. 37 40 12 92 71 50 48 16 19 20 2 2 1 .. .. .. .. .. . . 4 33 46 13 17 13 7 ~ 5 5 2 3 2 .. .. .. .. 9 18 14
103 67 44 19 32 31 18 3 2 12 .. .. .. .. 5 .. 2 2 68 98 15 '36 36 29 '1.7 2 8 5 1 .. .. .. .. 34 32 16 69 58 36 37 24 19 2 .. .. 7 2 35 57 17 46 43 17 8 18 28 9 I 6 .. .. .. .. 1 26 17 18
60 43 34 37 18 3 8 3 .. .. 52 85 19 50 36 33 32 12 3 4 .. .. .. .. 1 1 .. 32 43 20 201 183 111 108 70 68 7 4 2 2 6 .. .. , 5 118 146 21 '-20 10 6 2 13 4 1 4 .. .. .. .. .. .. 21 20 22 105 104 38 45 49 50 5 7 .. 13 2 65 57 23 84 70 72 61 6 7 4 1 1 .. 1 55 68 24
123 87 69 48 43 38 8 1 2 .. .. .. 1 66 90 25 47 40 22 16 22 22 2 2 .. .. .. .. 1 18 34 26 83 63 55 46 26 17 2 .. .. .. .. . . 31 40 27
Uninhabited 28 18 27 16 26 2 1 . , .. .. .. 16 13 29 64 63 52 55 10 8 2 .. .. .. .. .. 39. 41 30
40 33 20 24 8 7 6 3 1 .. .. .. .. 3 27 30 31 10 7 5 6 3 1 .. - 2 8 9 32 4 6 4 6 .. .. .. 6 5 33 38 33 31 16 3 17 3 .. 1 32 38 34 44 42 30 13 5 29 5 .. .. .. .. .. 4 " 28 29 35 87 52 57 27 13 23 3 .. 2 .. 1 .. 11 2 63 88 "36 ,38 38 29 33 6 4 1 .. .. .. .. .. .. .. 2 1 32 55 37
369 279 104 115 133 142 38 9 17 4 .. .. .. .. 60 2 1 16 7 236 329 38 56 61 40 46 9 14 7 1 .. .. .. 41 39 39
78 68 50 32 5 1 21 13 3 .. 18 .. .. " .. 2 66 151 40 12~ 114 92 75 27 38 .. 3 1 .. .. .. 2 93 117 41 154 144 119 98 31 45 1 .. 2 1 .. 1 116 133 42 65 51 51 43 8 4 6 4 ..
" " .. 43 61 43 20 IS 11 5 9 10 .. .. . . .. .. .. 7 21 44
191 35 130 10 45 17 3 1 " 2 .. 1 7 3 7 ISS 322 45 90 66 59 46 18 15 13 4 " 1 .. .. " .. 83 108 46 63 55 59 55 4 .. .. .. " .. 41 68 47 43 38 36 34 4 3 .. " .. .. 1 .. '0- 1 1 25 20 48
101 66 75 45 15 20 4 1 3 .. 3 61 78 49 29 24 14 8 15 16 .. 23 16 50

152
PALAMAU VILLAGE
SUBDIVISION
ANCHAL
Occupied residential
houses ,---._..A.-........ Total number of persons Literate
No. of enumerated (including and Serial no. Area No. of house. inmates of institutions Scheduled Scheduled educated
(Thana no.) Name of village in acres houses holds and bouseless persons) castes tribes persons ..... ,----""--~ ,....-A.._....,. ,..--"""__'
P Nf F Nf F M F M F
2 11 4 5 6 7 8 9 10 II 12 13 14
REVENUE THANA-BALUMATH-tonld.
51 (7) Hunjar , 1,051.86 8 11 56 26 30 26 30
52 (8) Kasmar 1,474.93 42 51 246 115· lSI 65 72 41 42 28 I 53 (9) Salaiya P 2,116.46 66 88 471 221 250 17 8 195 215 13 2 54 (10) Khairatanr 386.29 16 18 96 46 50 46 50 .2 55 (11) Chain 86S.32 25 26 III 57 54 50 50 I 56 (24) Mailam
M,L, V,Mc·· 1,911.02 31 36 183. 88 95 76 86 12 9 1
57 (25) ·Latu 649.61 102 110 597 289 308 138 127 78 108 82 21 58 (26) +*Phulsu P,L, Rhe;Me 781.06 121 150 743 361 382 85 76 4 5 111 39
• 59 (27) Mukki 670.41 17 22.... 87 42 45 40 44 5 60 (28) Hisri 1,291.82 58 90 442 209 233 55 48 82 105 32 2 61 (29) Karma P 2,052.46 47 58 281 122 159 120 159 34 9 62 (95) Matkoma P 3,536.80 7l 76 449 218 231 193 2II 2 .,. 8 3
63 (190) Kuriam Kalan 345.70 21 22 1I3 56 57 27 23 22 26 64 (191) Lejang 457.88 31 34 175 86' 89 17 .12 5 65 (192) Kuriam Khurd P 388.88 35. 41 231 124 107 20 18 41 13 66 (193) Lundibar 356.60 5 5 19 9 10 7 10 2 67 (194) Curtur P 1,222.87 32 35 162 88 74 12 13 30 20 41 17 68 (195j Rajbar P 1,639.52 50 54 357 168 189 58 57 86 110 22 1 69 (196 Masiatu P,M,K,C,L, U,Me 1,323.05 157 174 861 418 443 75 76 91 100 84 34 70 (197) Ho1ang P, U2 1,443.06 96 108 553 272 281 53 55 43 47 99 44 71 (198) Bhang 1,006.05 II II 53 27 26 26 25 .. 72 (202) Lachhipur P 2,293.70 47 52 256 136 120 116 102- 28 5
73 (99) Tumbagara 390.89 10 16 93 41 52 41 52 74 (100) Balu P 6,979.24 325 419 2,136 1,046 1,090 167 160 197 237 136 1) 75 (101) Hundi 601.53 19 22 100 51 49 16 IS 76 (102) Arahara P 584.94 42 01 .311 ISO 161 12 18 92 94 15 77 (103) Kasiadih 311.71 10 10 49. 28 21 12 7 4 78 (104) Mohanpur 366.35 17 21 114 53- 61 24 28 23 28 6 79 (105) Tasu 1,721.27 50 58 295 147 143 31 42 60 78 7
80 (70) Tasatwar 803.8S 9 11 35 17 18 16 18 I ,. 81 (71) +*Balumath P, B,h, m, L3, Hos, 960.58 365 403 1,J56 999 957 322 352 52 65 342 79
Rhc,A,Mc 82 (72) Komar P 1,352.73 40 52 278 137 141 50 44 50 56 13 83 (74) Barni 485.18 II 20 95 40 55 40 55 84 (75) Ghetuag 1,439.80 29 30 - 151 84- 67 84 67 1 85 (87) Banio 644.10 22 29 186 86 100 86 100 22 1 86 (204) Chetag 1,334.11 64 84 465 218 247 50 7l 90 97 33 4 87 (205) Soparam P 329.12 10 13 61 29 32 29 32 . 5 2 88 (206) Jogiadih 704.37 IS 22 121 62 59 62 59 14 1
89 ,(73) Pukchu P 556.75 41 48 211 92 119 2 1 50 82 8 90 (81) Gari P, Mc 2,30b.60 106 136 644 276 368 100 119 116 179 f3 1 91 (32) Rud 1,157.73 25 27 152 73 79 62 61 7 15 2 92 (83) Darha P, L, Oc 4,422.54 /234 286 1,482 712 770 136 141 269 351 135 21 93 (84) Ratnadag 466.66 94 (85) Bachra P,.Me 850.67 52 69 345 160 185 4, 7. 75 84 28 6
95 (86) Hathdih 869.05 23 34 201 105 96 6 10 14 9 3 96 (88) J'hahar P,L,Me 1,203.21 98 119 578 275 303 30 49 46 57 28 5 97 (89) Dembu 1,006.05 34 42 202 98 104 10 13 18 25 3 98 (199) Dir~dag 1,288.25 23 27 138 71 67 19 17 28 30 4

ST~TISTICS
I,.ATEHAR
BALUMATH
Total workers (I-IX)
I
Cultivator
153
WOBXBB8
---------~ -------------II
Agricultural
labourer
III IV V VI VII VIn Manu- Transport,
facturing Storage Mining, House- other than Trade and Quarry. hold Household Cons· and Commu· ing, etc. Industry Industry truction Commerce nications ,.-~ ,...-.....-, ~ ...----. ~ ,....-.....___.
M F MFMFMFNlF:rv.t:J! M F
._---. IX
Other Services ,,---"--......
Ii' :rv.t:
15
F
16
:rv.t:
17
F
18 19 20 21 22 23 24 25 26 27 28' 29 30 31 32 33 34
14 60
]43 31 34 51
165 -195
24 132 78
]05
31 55 67 6
47 98
182 155 16 80
22 601
30 84 15 35 81
14 562
85 31 50 50
118 21 29
50 132
42 392
73
62 154 60 41
18 73
147 23 41 51
113 153 29
119 88
111
19 22 58 6
39 108 169 140
18 70
23 286
24 53
8 31 66
12 310
33 27 38 59 81 18 29,
10 15 4 41 51 17 98 liD 29 22 16 9 15 20 19 8 3 29
73 55 77 82 95 43
4 4 15 28 16 60 48 61 13 81 98 15
28 8 2 43 6 12 54 52 1.0
I 4 38 33 81 101 12
109 95 57 82 75 22 16 18 59 54 20
21 440
27 74 14 16 62
21 172 22 46
7 12 47
121 2 5
14 1
13 12 1 225 140 41
68 30 46 44 77 16 20
25 27 35 53 63 17 24
2 2 3
3
49 44 47 217
32
I 9
16 44-
225 120 46 26
290 335 Un;'nhabited 76 68
50 125 50 38
54 123 54 32
240
72
44 98 43 33
4
5 21
4 6
3 22 2 28 4
7 .. 21
9
47 11 .• 2
8
55 10 .. 1 3 .. 41 6 2 19 9 5 .: .. .. 15 4 25 4.. .. I .. 71 10 .. 25 27 3 .. 20 I 4 7 12 4 ................ ..
11 1 .......... .. 16 ., .. " 6 3 .... 6 6 7
9 .. '0 ••••
73 61
2 30 1
3 .. 4 4 3
....... J .• .. '0
1 3 7
••••• 0 ••••• 0 .0 .0 ••••
16 ........
2 I .• .. .. 102 21 .. 9 7 I .. 1 2
2 1 .......... .. 7 3 .. .. ........ .. 1 1 ................ ..
19 4 ................ .. 19 12 .... ..
•• • •••• 0 ••••••
25 27 5 34 26 5 00 15 00 25 I
.. 2 3 3
1 2 1 8 1
3 3
2
1 3 ....
9 4-I 2 ........
2 ..
2 .... .. 5 .... .. 2 .... .. 2 .... ..
•• '0 ••
2 8
14 47 3.. 5
...... 3 .• 2 ..
4 ..
6 25 ....
7 5
3 .. 3. 2 I .. o.
•• •• '0 •• '0 ••
3 ..
.. J
o. 6
3
1 4
25
6 12 5
.. I 5
10
'I
8 .. 2
1
2 .. 5
1
3
184 113
.. -17
I 16 2 I
1 2
3
. . 4 1 3
8
11
]3IHAR
X
SI. Non·workers no.
,.--'"""'-.....
M
35
12 55 78 15 23 37
124 166
18 77 44
113
25 31 57 3
41 70
236 117
11 56
19 445
21 66 13 18 66
3 437
52 9
34 36
100 8
33
42 IH 31
320
87
43 121 38 30
F
36
12 51 58 52
103 53 27 54 13 55 44 56
195 57 229 58
16 59 114 60 71 61
120 62
38 63 67 64 49 65 4 66
35 67 8[ 68
274 69 141 70
8 71 50 72
29 804 25
108 13 30 82
73 74 75 76 77 78 79
6 80 647 81
[08 28 29 41
166 14 30
70 143 33
480
109
46 178 54 29
82 83 84 85 86 87 88
89 90 91 92 93 94
95 96 97 98

154
P"ALAMAU VILLAGE
SUBDIVISION
ANCHAL
Occupied residential
houses ,_.--_"'_--_", Total num ber of P CUODS Literate
No. of enumerated (including and Serial no. Area No. of house- inmates of instituti~ns Scheduled Scheduled educated
(Thana no.) Name of village in acres houses holds and houseless persons) castes tribes persons ,...--....____, ,--""____' .-----...-.
P M F M F M F M F
1 2 g " 5 6 7 8 9 10 11 12 13 14
R.EVENUE THANA~BALUMATH-contJ.
Jhabar G.P.-concld.
99 (200) Olhepat 1,765.74 45 50 263 133 130 68 69 65 60 7 100 (201) Pakri 'P2,Mc .. 1,373.29 66 81 362 175 187 109 119 61 62 9 101 (203) BarhaniaKhas alias Bhutalm- '1059.64 7 9 27 16 11 15 II
baher
102 (41) ltke P,K,Mc 990.30 81 115 633 297 335 22 30 154 167 87 25 103 (62) pipradih alios Kutse 545,73 23 23 146 72 74 2 3 4 6 3 104 (63) Renchi 777.40 23 24 III 56 55 41 44 .. .. 3 105 (76) Guru Sal we 785.48 18 24 130 54 76 49 66 3 6 106 (77) Salwe P, K, Dc 1,765.09 145 162 819 387 432 26 34 102 139 96 17 107 (78) +Barikhap Dc " 1,347.411 75 88 441 207 234 70 78 118 127 24 I 108 (79) Bariatu P2,M,L,H,Mc 1,767.28 221 250 1,103 537 566 122 146 59 47 136 30 109 (80) Nachna .316.81 17 18 90 43 47 12 18 21 16 9 1
110 (30) Gargoma P,L,Mc 1,882.56. 37. 46 298 149 149 32 46 21 111 (31) Chumba 1,316.95 47 55 264 135 129 123 119 19 4 112 (32) Birbir ,323.13 22 25 154 66 88 59 78 7 2 113' (33,) Ronhe P ,470.89 12 14 102 51 51 8 13 43 38 6 2 114 (34) Bathet 752.47 42 55 267 124 143 53 65 11 3 115 (35) Jabra .P,Mc 2,839.47 52 67 362 196 166 90 85 10 8 57 9 116 (36) Nawadih P 2,267.03' 75 86 462 210 252 188 239 .. 33 9 117 (37) Gor.ea P 2,152.25 59 63. 297 146 151 141 45 5 6 10 6 118 (38) Rajguru P,S,Mc ( . 1,508.47 71 84 372 177 195 116 110 5 5 25 6 119 (39) Bisrarnpur P 604.60 23 29 124 62 62 28 27 32 33 8 7 120 (40) +Bara 898.54 19' r 25 140 65 75 16 15 49 60 11 2 121 (44) Sibla P,L,C,U,Mc 1,351.75 110 115 574 281 293 30 34 150 156 61 10
122 (42~ Toli P,L,C,Mc •• 1;680.89 120 )65 804 393 4Il 63 74 168 177 74 1 123 (43) Bhat Chatra Dc, P 1,678.13 61 80 379 179 200 87 89 18 96 20 9 124 (45) Jhirrnat Kuma' Dc 2,203.13 33 39 '209 97 112 45 71 7 125 (46) Makra 1,468.0!! 39' 43 243 122 12f 75 77 7 8 36 2 126 (47) Kusamha 503.59 20 22 130 69 61 28 28 .. 4 1 127 (48) 13esra P,Mc 2,344.11 64- 82 463 219 244 124 137 46 42 18 1 128 (49) Banalat ,. 1,426.26 16 19 106 56 50 34 30 6 5 Il 2 129 ~50) Manatu P,Mc 1,734.02 62 87 423 197 226 133 186 II 9 Il .. 130 51) BaIiwar P 1,126.03 20 29 142 73 69 65 65 4 2 6 2 131 (52) Barwadih P .. '723.67 21 32 131 66 65 40 34 8 1 132 (53) Rahea 1,323.00 50 63 283 136 147 108 116 10 14 21 3 133 (54-) Charra Me,P 2,088.29 58 73 397 186 211 65 65 70 78 2 134 (61) Tundahutu :'. 702.27 48- 53 269 124 145 64- 75 54 60 2
135 (55) Ara P,Mc 1,289.18 97 113- 647 324 323 142 140 21 25 27 136 (56) Chamatu P,Mc 3,054.10 79 85 444 201 243 85 112 15 14 15 137 (57) Ganeshpur P, L, Me 3,010.19 157 185 969 449 520 119 155 115 138 53 1 138 (58) Phul basia alias Amarwadih P 2,394.63 III 123 542 258 284 208 235 26 23 17 139 (59) Chetar ;1,150.41 35 36 157 66 91 39 36 26 55 1 140 (60) Seregara P, L,C,Mc, De 3,171.45 193. 223 1,062 501 561 145 177 47 65 132 22 141 (64) Bukru 921.33 49 52 277 131 146 105 123 4 3 4 1 142 (65) Jarri 8,62.89 41. 45 225 J09 116 70 68 3 143 (66) Pundurlawa 394.90 7 7 39 22 17 14 12 5 144 (67) Jala P,M,C 1.445.08 56 60 285 135 150 87 108 29 5
Murpa G.P.
145 (220) ltke ... 347.39' 3 2 2

STATISTICS
LATEHAR
BALUMATH
I
Total workers (I-IX) Cultivator
,--"""_____ ,..--......_____, l'VI
15
69 99 10
138 40 35 21
] 78 119 304
28
81 93 49 30 64
101 134 80
102 34 38
148
226 108 62 68 46
126 31
123 42 43 80
112 78
178 119 240 147
37 273
87 71 13 79
F
16
78 115
6
152 31 32 41
210 129 138 26
85 82 54 28 81 73
120 98
106 37 46
123
259 100 42 53 28
105 28
128 44 43 89
127 80
160 III 282 123 40
-268 69 58 5
68
M
17
52 63
9
103 33 26 18
139 91
143 20
80 75 42 30 55 69
103 76 70 17 30 44-
155 54 55 31 28 94 11 57 20 24 55 67 42
146 89
176 120 30
112 53 51
7 56
F
18
70 65
6
109 23 24 38
161 106 19 17
85 67 47 28 73 47 92 92 79 18 29 25
173 49 28 22
5 37
9 48 19 20 56 81 50
136 80
199 III 33
129 64 55 5
58
155
WORKERS -.
II III IV V VI VII VIII IX Manu· Transport,
facturing Storage Agricul. Mining. House- other than Trade and
tural Quarry. hold Household Cons. and Commu. Other labourer ing, etc. Industry Industry truction Commerce nieations Services
r--......-----,~ ,....-A--oo ..-----. ~ r- .. • .....---"----0 ,..--....___, M FM FM FM F MF 1\1: F 1\1 F 1\1 F
19 20 21 22 23 24 25 26 27 28 29 30 31 32 33 34
4 5 .. .. 13 3 .. .. .. .. .. . . 5 6 .. .. 31 44 . . .. .. ..
.. .. .. .. .. .. .. 1
33 43 1 .. 7 8 .. .. .. .. .. " .. .. .. 6 6 .. .. .. .. . . .. .. .. 3 2 2 3 .. .. . . .. .. .. 1 ..
22 24 .. .. . . .. .. " .. .. .. .. 17 25 18 19 .. .. .. .. .. 10 4
104 118 2 .. 9 .. 4 .. 9 1 4 29 2 6 .. .. .. " .. .. .. 6 3
.. .. .. .. .. .. . . 13 15 .. .. 1 .. " .. .. .. . . 4 2 7 " .. 4 .. .. .. .. .. 1
.. .. " .. " .. .. 3 8 1 .. J .. .. .. .. .. .. . . 4 ..
25 25 2 .. 5 1 14 25 10 .. 1 .. .. " .. .. 5 3 2 6 1 .. .. " .. .. .. .. I
26 27 2 .. .. " .. .. 4 12 19 3 .. " " .. .. .. " 2 6 17 2 .. .. . . .. .. .. " .. .. ..
63 95 12 .. 10 .. 1 .. 8 .. 10 3
29 69 16 7 17 9 " .. .. I 8 17 29 18 2 7 14 .. .. .. .. 2 . . 10 6 2 14 1 .. 1 .. .. .. .. . . 3 " 11 20 11 2 6 3 " .. .. 1 .. 8 6 3 9 2 .. .. . . .. .. .. .. 13 14 4 31 2 .. 6 3 .. .. .. .. . . . . 20 34
11 19 7 .. .. .. 2 31 67 12 3 6 9 7 " 4 .. 6 15 19 3 .. 2 6 . . .. .. .. 2 14 22 4 1 1 " .. .. .. .. 16 26 5 4 1 .. .. " .. .. 2 .. 1 3 18 31 18 .. 4 15 .. .. J 4 20 25 11 J 2 1 .. .. .. .. 2 3 1
17 24 11 .. 1 .. .. " .. .. .. .. 3 .. 23 25 7 5 .. .. .. " .. .. .. .. 1 19 61 27 9 14 13 .. " .. .. .. .. 1 3 3 11 18 1 4 .. .. " .. .. .. 2 3 3 3 4 .. .. 1 ..
76 107 25 12 21 18 .. " .. .. 25 .. 2 12 2 30 3 4 2 .. " .. .. .. .. 17 2 3 1 .. .. .. 3 .. 3 .. .. .. " .. .. .. 8 4 8 6 3 " .. .. .. .. 4
1 .. .. .. .. .. .. .. .. .. . .
BIHAR.
X
Non·workers ,..--........___, M
35
64 76 6
159 32 21 33
209 88
233 15
68 42 17 21 60 95 76 66 75 28 27
133
167 71 35 54 23 93 25 74 31 23 56 74 46
146 82
209 III 29
228 44 38 9
56
F
36
52 72 5
184 43 23 35
222 105 428 '21
64-47 34 23 62 93
132 53 89 25 29
170
152 100 70 68 33
139 22 98 25 22 58 84 65
163 132 238 161
51 293
77 58 12 82
81. no •
1
99 100 101
102 103 104 105 106 107 108 109
110 III 112 113 114 115 116 117 118 119 120 121
122 123 124 125 126 127 128 129 130 131 132 133 134
135 136 137 138 139 140 141 142 143 144
145

1~6
PALAMAU VILLAGE
SUBDIVISION
ANCHAL
Occupied residential
houses Total n umber of persons Literate
No.of enumerated (including and Scrialno. Area No. of house- inmates or institutions Scheduled Scheduled educated
(Thana no.) Name of village in acres houses holds and housel ess persons) castes tribes persons
p K{ F NI F M F M F
2 3 4 5 6 7 8 9 10 11 12 13 14-
REVENUE THANA-BUL UMATH-contd.
146 (221) Jilanga m 393.49 49 54 337 172 165 26 33 15 147 (225) Kolpatia 276.90 11 15 73 39 34 13 8 I 148 (226) Jipua 522.40 69 96 464 230 234 28 27 30 2 149 (227) Mansingha 71.67 60 116 549 284 265 18 12 37 2 150 (228) Okea P 515.08 78 87 483 233 " 250 18 22 16 15 40 19 151 (229) Murpa P,m,Me' 845.81 121 181 987 469 518 139 146 4 4 8a 15 152 (230) Keri P, B, Me 3,044.30 110 136 658 330 328 91 83 101 129 74 9 153 (231) Bhagea P 3,215.00 123 141 889 435 454 297 303 107 96 36 1 154 (232) Siram P 2,303.66 75 81 406 213 193 160 146 5 155 (233) Santi P 3,000.33. 37 - 38 288 142 146 52 41 6 156 (234) Chandli 1,537.62 8 9 42 21 21 16 18
Marangloi),a G. P.
157 (68) Nagra P2 735.15 104 i30 702 358 344 74 77 8 7 26 3 158 (69) Kasiadih 114:25
159 (207) Semaisot P 1,399.63 82 92 424 208 216 207 216 1 .. 40 10 160 (208) Hempur 1,015.80 59 73 426 207 219 100 128 6 10 34 8 161 (209) Murgaon 847.08 29 29 175 86 89 80 79 5 6 2' 162 (210) Chitarpur P 1,187.53 58 65 321 154 167 2 3 149 161 7 1 163 (2Jl) Nawadih 251. 70 3 3 24 12 12 9 10 2 2 164 (212) Dhadhu P 2,306.35 138 147 761 334 427 20 29 187' 259 127 45 165 (213) Bhaisadon P, Me 979.72 47 59 309 154 155 26 28 15 19 22 166 (214) Gerenja Me 1,585.92 50 62 335 149 186 60 79 76 88 4
167 (215) Basiya P 2,362.73 98 Jl2 565 255 310 102 122 130 156 22 2 168 '(216) 'Bahera 110.63 14 14 86 49 37 11 11 8 2 169 (217) Pindarkom P 1,194.20 61 69 367 181 186 68 69 6 2 170 (218) Bara 839.43 37 42 252 121 131 9 10 73 31 13 2 171 (219) Hebna 693.21 43 53 -267 1,24 143 19 15 3 2 23 1 172 (222) Marangloiya M,L,Rhc~Mc 1,141.44 90 107 524 244 280 15 17 134 167 41 1 173 (223) Bishunpur P,Mc '2,365.28 76 . 84 403 191 212 27 34 92 103 32 2 174 (224) Balbal P 1,329.72 28 29 153 75 78 II 10 64 68 14 ,..11
ANCHAL TOTAL .• 232,500.20 9,212' 10,a05 55,702 27,086 '28,81610,304 10,925 6,516 7,315 4,100 744 or
'363.2g sq. mil~s

157
STATISTICS BIHAR.
LATEHAR
llALUMATH WORKERS ..,.__
I II III IV V VI VII VIII IX X Manu· Trailliport ,
Agricul. (acturing Storage
Mining, House- other than Trade and Other Sl. Total worker. tural Quarry. hold Household Cons- and Commu·
(I-IX) Cultivator labourer ing, etc. Industr;y Industry truction Commerce nications S~rvices Non.workers no. ,-"""'__' ,..-----. ~ ....-__ ,...-~ ,...-. ........... ,....-.... ,.............. ,..----' ,...----' ,--"""___"
It! F M F :M F M F M F M F :M Ii' M F M F M F M F
15 16 17 18 19 20 21 22 23 24 25 26 27 28 29 30 31 32 33 34 35 36
96 85 80 80 6 4 3 2 " .. .. 4 .. l' 76 80 146 26 21 17 18 3 3 " .. .. " .. .. 6 13 13 147
124 125 92 108 17 15 .. 4 .. 1 . . 6 2 4 , 106 109 148 167 130 115 112 18 11 27 ., " .. .. 1 6 7 117 135 149 130 127 91 100 10 15 17 1 "
12 11 103 123 150 271 306 196 245 30 48 .. 21 11 8 .. 16 2 198 212 151 194 184 145 166 5 8 10 .. 1 4 .. .. 2 .. 31 6 136 144 152 289 273 234 211 2 34 42 25 2 ,3 .. 3 .. 6 146 181 153 121 106 107 99 3 6 2 .. 1 .. 1 .. 7 1 92 87 154 83 79 69 74 3 5 5 .. " .. .. .. . . .. 6 59 67 155 13 10 10 8 1 1 .. .. " .. " .. .. .. " 2 1 8 11 156
205 59 128 3 50 46 23 10 " " " .. 4 153 285 157 Uninhabited 158
125 132 125 122 3 7 " .. " .. 83 84 159 122 140 117 123 3 6 2 11 "
85 79 160 57 53 44 36 9 14 2 .. J I 2 1 29 36 161 85 97 74 89 3 8 4 .. .. .. .. .. .. " .. 3 1 69 70 162
7 7 7 6 .. . , .. " 1 5 5 163
180 239 131 178 4 ~4 21 19 II 5 2 11 3 154. 188 164 108 89 89 68 5 14 7 5 3 1 ., .. .. .. .. 1 4 46 66 165 85 95 71 86 3 5 6 1 .. . , .. .. 2 .. " .. 3 3 64 91 166
144 183 84 76 58 107 1 .. .. .. " .. .. " .. L III 127 167 19 11 9 1 2 1 4 4 .. .. .. . . .. " .. 4 5 30 26 168
105 67 37 19 15 19 22 3 7 1 .. .. .. .. 24 25 76 119 169 75 77 69 71 6 6 .. .. .. .. .. .. .. ." . .. 46 54 170 70 90 56 79 2 12 1 .. .. . . .. .. .. . . 2 8 54 53 171
161 179 94 156 30 19 23 3 " 4 .. .. .. I 9 1 83 101 172 114 109 87 83 3 6 11 6 5 1 .. .. 8 13 77 103 1']3 43 49 36 45 3 3 2 ., 2 1 32 29 174
15,583 13,706 10,446 9,453 2,617 3,229 li70 2~7 422 316 38 19 44 3 214 20 20 812 409 11,503 14,910

PALAMAU
158
Occupied residential
houses Total number ofpero;l1ns
No. of enumerated (including
VILLAGE
SUBDIVISION
ANCHAL
Serial no. (Thana no.)
Area No. of house- inmates of institutions Scheduled Scheduled
Literate and
educated persons Name of village in acres houses holds and houseless persons) castes tribes
2 3
REVENUE THANA-BALUMATH-eontd.
I (246) Serak 2 (247) Darea 3 (248) Renchi 4 (249) Banhardi 5 (250) Surli 6 (251) Bari 7 (252) Rampur 8 (254) Ete
9 (255) Barwadih 10 (256) Tota 1 I (257) Sikni 12 (258) Xi ta 13 (259) Bulhu 14 (260) Sos 15 (261) An 16 (262) Sasang 17 (263) Barwakhar 18 (264) Nawadih 19 (265) Chetar
Me, P p. P, Me
P, C U Me
P
Me,P De P, Me
P
2,630.41 1,026.21 1,285.82 1,746.42
422.54 2,954.21 1,298.35 1,194.22
156.99 206.58
1,885.40 1,172.10
381.26 1,670.94 1,206.31
610.56 144.14 350.55
3,688.99
20 (266) Rud 1,861.86 21 (267) Chiro Me, [e 1,963.68 22 (268) Gardag 926.18 23 (271) Turhamu P 1,406.78 24 (285) *Chandwa P,M,L2, C, Hos, Rve, 1,766.15
A,V,H,U2, Me, [e3, Oc2
25 (269) Boda 26 (270) Lukuia 27 (286) Borsidag 28 (287) Hutap
Me P Me P
29 (253) +Latdag P, De • . . 30 (272) Alaudia h, A, Hos,[e2 .. 31 (273) Chatuang 32 (274) Hisri 3'3 (282) Ardhe 34 (283) Bhusa!' 35 (284) Kamla P, C, Me
36 (240) Nagar P 37 (241) Kuramubaratpur 38 (242) Erud 39 (243) Kita P 40 (244) Nindra 41 (245) Tarhasi 42 (275) Damodar M, L, 0& •• 43 (276) Ambadohar 44 (277) Chatro 45 (278) Angara
Chakla G.P.
46 (235) Turisot
4,646.36 2,370.12
845.65 5,125.49
1,946.04 1,991.30 2,771.67
899.08 1,215.75 1,560.64 1,050.43
2,825.10 1,021. 74
894.08 2,162.81 1,417.93 1,288.30
597.59 251.65 768.83 509.53
3,412.72
4
208 63· 84 80 .42 255 ll6 57
26 14 36
112 31
J.06 95
115 4
32 153
57 99 20 34
521
94 83 39
232
71 244
71 33 36 83
1I0
95 23 10 55 23 16 55 17 39 11
12
5
233 71 88 95 44
317 132 60
27 15 38
124 33
IJ9 '109 124
5 37
169
57 119 36 42
579
P
6
1,259 377 499 608 230
1,403 644 288
161 90
228 667 159
6.76 665 708
25 141 872
311 646 177 267
2,875
115 581 90 496 48 254
258 1,352
73 272 73 42 39
-lJ2 125
95 24 10 71 29 1,7 68 18 51 16
12
415 1,154
423 221 186 484 613
437 117 44
370 160
75 378 114 310 68
79
M
7
600 196 243 307 116 650 299 137
77 44 112 319
82 327 353 356
13 67
433
157 3Il 85
167 1,514
294 250 124-688
176 651 208 108 96
239 306
221 58 22
193 87 40
202 58
154 32
45
M F M F M F F
8 9 10 11 12 13 14
659 181 256 301 114 753 345 151
84 46
116 348
77 349 312 352 12 74
439
99 54 22 40 40
326 156
26
2 6
63 137 79 91 92
162 13 66
222
154 83 335 169 '92 38 100 9
1,361 418
287 75 246 ,65 130 22 664 8
239 503 215 113 90
245 307
216 59 22
177 73 35
176 56
156 36
34
132 231 155 63 90
177 85
91 49
73 81 36 21
I 80 32
102 53 27 44 33
368 153
27
4 7
78 130
73 88 80
153 12 74
246
287 112 176 228
38 206
73 65
35 ., 22
153 3
109 130
17
95
295 107 .184 220
45 264 101
74
38
14 17l
4 134 126
15
67
96 34 24 168 124 125 44 47 48 10 51 31
419 '356 356
94 39 41 17 13 78 78 14
18 12 19 17 2
48 47 44
1 86
25 39 4
109 730
78 194 187 18 61 155 155 55 25 94 99 8 10 374 407 138
191 212 158 48 84
190 87
98 48
80 7I 30 22
1 79 36
43 83 51 41
5 55
7
112 9
16 92
5 4
150 45 12
5
48 100 55 61 6
46 16
106 7
18 89 2 5
140 51 10
9
16 223
14 13 2 3
111
38
17 1 2
53 19 23
2
6
3 2
15 21 11
5
4 6 7
5
3 14
33 286
2 12 1
22
1 65
5
36
6
6
11 4 4

159
STATISTICS
LATEHAR
CHANDWA WORKERS
----------------------------~------,-------------------
Total workers (I-IX)
I
Cultivator ,..-----'
II
Agricultural
labourer
III IV V VI VII VIn Manu- Transpon,
facturing Storage Mining, House- other than Trade and
Quarry- hold Household Cons- and Commu-ing, etc. Industry Industry truction Commerce nications
.----~ ,...._.....__, ~ ...--"----,...._.....__, ,...---..--.
IX
Other Services
M
15
F
Iii
M
17
F M FMFMFMFMFMF M F M F
352 93
150 166 68.
361 156 85
52 29 79
199 61
206 218 2Il
8 51
272
97 197 54 59
850
198 153 69
476
105 434 140 60 62
161 194
135 38 15
125 68 27
112 37 85 23
34
403 95
172 153 70
425 186 78
46 27 76
162 54
211 176 131
3 52
208
86 218 47 35
391
178 145 66
405
138 208 127 68 61
147 183
128 38 16
100 54 22
108 36 91 24
17
18 19 20 21 22 23 24 25 26 27 28 29 30 31 32 3.1 34
240 86
125 138 53
184 110 69
278 90
155 135 52
140 143 65
42 39 22 22 46 52
48 5 6 4 2
92 35 8
110 109 40 47 48
116 111 33 140 114 43 86 57 12 5 1 1
41 48 3 216 184 13
63 172 47 16
240
58 202
41 6
205
13 2 1 3
40
95 97 41
93 49 108' 28
49 12 364 365 5
82 120 58 36 40
108 82
118 IH 49 43 43
130 144
88 68 29 34 13 13 51 41 44 47 8 4
85 73 28 36 80 91 18 24
31 17
4 13 1 5
8 1
7 3 I
43
19 9
121 20 5 I ..
13 14 4 4 I ..
5 2 1 ..
...... 3 .. ••••• 0 o. 3 ..
259 8 42 7 II 5
1 8.. 2 ... I 1 .... .. 1 .. ..
1 ..
I ..
6
4 6 1 .............. .. 3 I .. .. .. .. I ..
3 20 7 .. .0 .• " •• o. 31 29 19 5 ..
13 6 I .. J .. 2 3 .. " ....
79 39 11 2 10 .. .. 34 2 " 3.. .. .. .. "
3 2 6 2 ...... .. I I I .. .. .. .. 2 5 1 .. ..
17 II .. 10 4 .. ..
2 .. 4 .. 5 .. .... 2 .. 3 ..
22 7 .. I
4
2 .. 15
3 I
80
I .. .. 2 3 .. 12 ...... .. 2 ...... ..
15 8 .. 60 25 I
.. 3 .. 2 .. 4 17 4 13 .. 130 3
50 35 19 18 16 .. .. 21 16 10 8 6 .. " ... . II 3 2 .. .. 1 .. 2 .... .. 9 44 9 6 .. 4.. 7 ..
6 4 23 22 22 30 2 9
.. 10 2 20
.. 22
35 27 3 6 I 1
39 18 I 23
18
2 15 12 .. .. .. .. 10 7 19 .. 14 .. 37 1
8 7 19 .. .. 1 1 3 .............. ..
15 .. .. .. .. 6.. 2.. 1 2 2 10 13 2.. 5 ..
5 6 18 .. .. .. .. I .......... .. 2 ..
14 I 1 .. .. 6 ....
2 ..
•• "1
2 .. 1 ..
" '0 •• ,0 •• I ••••• o.
21 7 9 2 5 .. 5 .. 4.. I ............ .. 4 ....
2 ......
I
11 I 1
13
28
5
126
1 6
38 .. 5
19 13 61
3 3
4 3
13 11
3 25 99 I
.. 6
10 7 3
26 277 •
I 4 5
46
73 43 10 12 21 66
5
10
9' 4
1
14 15 25 .. I
2 4
14
28 69 .. 1 3
.. 4
14 114
.. 4
22
33 '28 20
3 7
24
2
.. 5
BIHAR.
X
51. Non-workers no.
M
35
248 103 93
141 48
289 143 52
25 15 33
120 21
121 135 145
5 16
161
60 ll4
31 108 664
96 97 55
212
71 217 68 48 34 78
ll2
F
36
256 86 84
148 44
328 159 73
38 19 40
186 23
138 136 221
9 22
231
68 II7
45 65
970
109 101 64
259
101 295 88 45 29 98
124
86 88 20 21
7 6 68 77 19 19 13 13 90 68 21 , 20 69 65
9 12
11 17
J 2 3 4 5 6 7 8
9 IO I I 12 13 14 15 16 17 18 19
20 21 22 23 24
25 26 27 28
29 30 31 32 33 34 35
36 37 38 39 40 41 42 43 44 45
46

160
PALAMAU' VILLAGE
SUBDIVISION
ANCHAL
Occupied resid entia I
houses ,..---~ Total number ofpersons Literate
No. of enumerated (including and Serial no. Area No. of house- inmates of institutions Scheduled Scheduled educated
(Thaoano.) Name of village in acres houses holds and houseless persons) castes tribes persons r--.A-~
p M F M F M F M F
2 3 4- 5 6 7 8 9 10 11 12 13 14
REVENUE 'llHA.NA.-BAL UMATH-r,oncld.
47 (236) Mahuatanr 3,113.91 20 23 115 55 60 55 60 48 (237) Marmar P 3,037.98 46 51 284 126 158 44- 56 32 I 49 (238) +Chakla P2,m,C,Rhe .• 7,653.33 261 261 1,514 750 764 270 283 417 395 135 20 50 (239) Bana 261.50
51 (279)' *Mahuarnilan 3,226.63 144 146 815 393 422 12 '14 249 249 27 2 52 (280) Rol H 355.55 . 69 75 338 177 161 12 3 95 86 58 17 53 (281) Zatnira P 1,713.61 161 179 967 492 475 120 90 335 306 44-54 (296) Ganiari 1,878.61 108 III 573 300 273 86 71 89 68 26 10 55 ?97) Loharsi Me, Oc, P 1,411.22 86 87 416 220 196 II 16 199. 160 33 2 56 298) Deonadia 894.74 30 33 183 99 84 37 41 62 41 2 57 (299) Malhan P 5,336.73 217 262 1,192 576 6}6 375 379 189 190 45 4
58 (312) Dhoti 5,210.13 111 128 682 353 329 147 147 127 149 76 g 59 (313) Kali Rhc,Mc 2,642.26 70 74 444- 239 205 86 85 123 102 26 I 60 (314) Dumaro P 3,691.48 97 126 680 330 350 103 102 141 145 56 61 (315) Nirydra P, Me l,lI4.69 56 71 372 183 189 39 37 85 95 55 3 62 (316) Belgara C 3,320.02 52 60 356 186 170 80 73 66 54 12
63 (300) Kudra 1,459.56 28 29 162 82 80 25 22 3 64 (306) Ara Me 945.07 24 27 173 87 86 20 21 67 65 65 (307) Hesalong Oc 1,521.99 19 20 83 41 42 13 11 21 26 3 66 (310) Jamuari Me,Oc 3,296.27 28 37 194 IH 110 27 40 50 54 17 8 67 ~311) Belenga 1,069.82 23 25 135 61 74 10 14 30 39 8 5 68 317) Marma Oc 2,788.95 29 35 181 96 85 64 53 32 32 3 2 69 (318) Rohurn 878.95 30 33 145 75 70 75 70 14 I 70 (319) B~tar M,Mc 1,060.98 53 62 255 134 121 1 101 99 38 5
71 (302) Dudhimati P 1,756.86 56 56 328 160 168 3 2 157 166 37 1 72 (303) Goli 750.26 40 40 163 89 74 6 4 29 29 22 1 73 (304) Rud P, Me 2,326.23 62 63- 301 153 148 16 16 82 84 68 22 74 (305) Childiri 116.68 5 '5 30 14 16 .. 14 16 7 -2 75 (308) Barwatoli Oe 1,746.75 81 83 377 18R 189 7 5 99 91 60 41 76 (309) Tata 549.77 8 8 29 13 16 12 15 3
Ladhup Senha C. P.
77 (288) Jiling I, II 0.49 32 36 230 lI6 114 84 80 32 34 1 78 (289) II< Amjliaria P, Me 618.02 25 28 lI9 58 61 ~2 37 23 23 19 3 79 (290) Bairgara ," 398.01 15 16 84 47 37 7 6 8 5 3 80 (291) Pirdag' 641.39 25 25 122 68 54 29 31 25 2 81 (292) Ladhup Me,Oc 482.95 74- 74- 405 188 217 17 18 156 184 47 2 82 (293) Manatu P 764.48 48 48 261 131 130 78 84 33 12 83 (294) Senha S,L,C2 536.79 35 35 178 85 93 75 84 16 1 84 (295) Torar 1,313.44 39 39 213 98 1I5 97 1I4 B 85 (301) Resla P, Me 2,740.83 67 67 349 165 184 58 62 86 103 6
ANCHAL TOTAL .• 145,21j6.39 6,186 6,889 35,755 17,929 17,826 5,899 6,005 7,3907,490 3,399 741 or
226.98 sq. miles

161 BIHAR
STATISTICS I
LATEHAR.
CHANDWA WOBKBBS
I II III IV V VI VII VIII IX X Manu- Transport,
facturing Storage
Total worken Agricul- Mining, House- other than Trade and
81. tura! Quarry- hold Household ConS- and Commu- Other (I-IX) Cultivator labourer ing,. etc. Industry Industry truction Commerce nications Services Non-workers no. .-------........____. ,.--...._____,
~.....---. ,..........--. ,......--.... ~ ,.....-...._____, .. ,.--~
M F M -F M F M F M F M F M F M F M F M F M F
15 16 17 18 19 20 21 22 23 24 2'5 26 27 28 29 30 31 32 33 34 35 36
36 33 IB 14 17 19 " .. .. 19 27 47 74 91 72 54 18 1 1 16 1 2 52 67 48
464 441 285 277 44 82 33 11 13 11 1 .. 6 82 59 286 323 49 Uninhabited 50
246 57 211 B 13 31 4 .. 1 2 .. .. " .. 1 -14 18 147 365 51 109 62 72 55 .. 1 2 1 2 .. .. .. .. 3 .. 19 12 4 6B 99 52 317 260 287 255 6 I 4 I 10 2 .. .. .. .. 6 4 I 175 215 53 175 131 148 114 6 10 19 6 " .. .. .. 2 1 125 142 54 123 109 114- 104- 2 4 2 I .. .. .. .. I .. 3 I 97 87 55 65 34- 34 4 .. 3 .. 24- 30 .. .. .. .. 4 34 50 56
427 419 393 394 16 23 9 .. .. .. .. .. .. .. . . 3 8 149 197 57
243 IH 153 125 2 12 25 .. 9 7 .. .. .. .. . . 13 41 110 185 58 148 89 64 64 17 16 17 1 3 .. .. I .. 16 32 6 91 116 59 210 85 120 46 8 26 31 5 IS .. 3 .. .. .. 33 8 120 265 60 Il4 100 82 89 9 11 10 .. 3 .. .. .. 2 ., 3 5 69 89 61 II3 60 103 60 4 .. .. " .. .. 1 5 73 110 62
58 29 46 28 2 1 10 .. .. .. .. .. .. .. . . 24 -51 63 61 23 47 21 2 13 . , 1 .. .. .. .. .. .. .. 26 63 64 27 22 23- 16 I 4 3 .. 2 . . .. .. .. .. 14 20 65 54 60 39 45 3 5 7 10 .. .. .. .. 5 30 50 66 39 41 28 28 4 13 7 .. .. .. .. .. .. 22 33 67 66 44 52 24 5 9 9 II " .. " .. .. .. .. . . 30 41 68 38 47 36 43 1 2 I 2 " .. .. "_ 37 23 69 86 80 59 47 3 33 6 I .. " .. I 16 ~. 48 41 70
100 55 73 I I I 13 6 .. .. .. .. .. - 14- 13 33 60 113 71 53 40 37 29 7 10 4 .. .. 4 1 36 34 72 87 75 63 64 8 1 8 10 7 66 73 73 7 7 7 7 7 9 74-
116 119 98 107 10 8 3 3 2 .. .. .. .. . . 3 1 72 70 75 8 12 8 12 • I ., .. 5 4- 76
74 12 56 3 12 4 6 5 .. .. .. .. .. .. 42 102 77 38 25 28 3 1 21 8 1 .. .. .. .. 1 20 36 78 27 3 22 2 5 1 .. . . .. ., 20 34 79 46 24 36 21 .. .. .. .. 8 .. 1 1 1 2 22 30 80
127 124 114 110 11 14 .. .. 2 61 93 81 78 65 55 54 9 10 8 .. 1 .. 1 .. 4- 1 53 65 82 59 64 55 57 6 " .. " .. .. .. .. .. .. .. 4 I 26 29 83 70 80 65 79 .. " .. .. .. .. 5 1 28 35 84
127 134- 116 125 .. " .. 5 .. 6 9 38 50 85
11,135 9,165 ',331 6,678 800 1,367 815 241 344 239. 57 4 44 3 231 27 255 1,258 606 6,794 8,661
P-1I-21

162
PALAMAU VILLAGE
SUBDIVISION
ANCHAL
Occupied r esid ential
houseS ,,--- ..".,..__~ Total number of persons Literate
No. of enumerated (including and Serial no. Area No. of house- , inmates of institutions Scheduled Scheduled etiucated
(Thana no.) Name ofviUage in acres houses holds and houseless persons) castes tribes persons ,----__ ,JIt. ___ ~- r--:-oA.- ........ ,.--."""-~ ,--~--""
P M F M F M F M F
2 3 4 5 6 7 8 9 10 11 12 13 14
REVENUE THANA-LATEHAR
'1 (296) Mambar 2,374.89 21 23. 128 60 68 59 67 I I 4 "2 (297~ Jaram • 984:35 7 7 43 24 19 22 18 5 .. 3 (298 Baridih 687d3 26 .30 ; 156 81 75 6 4 66 65 s- 2 4 (299) Sukri P, Me 1,330:23 "5 89 454 228 226 15 12 155 '149 15 5 (300) Largari 651.41 40 50 246 123 123 6 2 117 120 2 6 (301) Sotam 1,247.77 46 51 272 )32 1"40 23 30 103 103 7 (302) Patuki 1,355: 10 '8 9 51 27 24 8 6 15 16 8 (303) Matnag -829:97 II '11 73 35 38 5 9 30 29 9 (304) Lohsini alias Tulbul 802~35 24 26 119 55 64 .. 55 64 I
10 (305) Odan 400.50 29 30 156 80 76 18 26 58 42 1 1 ·11 (306) Kend 427:62 19 19 106 56 50 15 20 23 19 11 12 (308) I,awagara 307.'!l2 13 f6 104 60 44 1 41 44 2 .. 13 (3b9) Labarpur 183:09 '25 27 151 88 63 26 23 36 131 6 Z
14 (310) -t-Hutar 698.10 53 58 338 169 169 11 13 134 132 29 1 15 (3i I) Het'hpochra P, K,V 727. I'8 108 129 674 333 341 112 103 140 143 111 24 16 (312) Uparpochra, 210.g4 17 (313) Manjar P 921.97 49 60 325 162 163 162 163 45 14
18 (294~ Sohdag "P 2,537.22 41 42 226 118 108 33 23 75 74 6
19 (295 Hesalbar 1,355.55 17 17 73 41 32 .. 41 32 .. 20 (314) Sasang K,Mc .. .1,532.00 121 159 694 340 354 ,72 79 197 191 46 8
21 (315) +Kcima P, Dc, .1,034.54 52 59 372 ,188 184 188 184 24 9
12 (316) Nawadih 106.52 23 (317) Korhas K 444.15 57 71 332 170 162 46 40
125 34 4
24 (318~ Patratu Me 990.82 99 108 537 264 273 17 14 121 83 26
25 (322 Negain 529.29 25 26 104 -55 49 15 .16 31 20 4
26 (324) Rehal 415.76 26 30 ].19 81 98 2 4 77 92 9' .. 27 (325) Upar Besra . 237.55 20 25 134 77 57 !>8 41 J4 12 7 2 28 (326) Heth Besra ".' Me ," 420.92 27 34 181 92 89 : 18 22 40 38 5 3
29' (331) Obar Me . ~ .. 1,149.93 , 24' 25 106 49 57 20 17 17 24 8 7
30 (332) BiH~mpur • Me'
' 249.75 12 1ft. 72 38 34 7 7 4 2' 6,
3J (333) Tubed .... .1,759.52 58 65 369 190 179 14 16 176 157 8
32 (33P) Marlgra V ..... 1,640.69 51 68 . 353 188 165 54 41 53 45 34 3
33 (334) Dihi P, Rhc 1,917.80 131 ~ 151 828 400 428 88 33 129 138 64 4
34 (335) Amba_iharan 484.99 21. 31 130 63 67 46 52 I
35 (336) Dhobiajharan 313.05 8 13 79 38 41 .', .. 15 16 9 1
36· (337); Nawaf'i '"'I.. · '228.01 88 119 ~ 552 291 261 88 20 9 10 63 10
37 (338) Chope .. \. · 82.12 2-2 25 143 70 73 25 20 23 .. 6
38' (339) -+ M urup P ... .. 361.12 78 105 508 258 25'0 79 .... 43 111 19
39 (340) Bhalugari ;,
~ ' .. ·260.8'1 15 15 68 35 33 35 33 ' .. ,40 (341) Patrlitu ',. · 154.56 2'1' 29. 110 62 48 13 4-
41 (342) Luti 1 M .. 448.75- 4-1, 53 . 243 128 115 120 115 33
42' (343L B2mhan Herlla ., . ·319.41· 2~ 24 123 63 60 58 60 1"1 . .. 4~ (344) Panruka , . .·177.50 8· IQ- 54 26 28 15 14 3 ' .. 44 (345) Kolh.eru-wa ·l!26.91 .- H· Hi 7·3 34 39 34 38 5
45 (346) Kundri 455.84 ~~ 58 279 133 146 12 14 ;. 78 ,. 89 ·25 I
46 (347) Pakra'r' , . ,. '217.59 40 189 ' 100' S9' {g. 49 ' 28 '1
47 (348) Temki P 363.75 54 76 430 209 221 28 27 116 118 ..... ,'43 ; I
48 (349) Semaria 655.14 22 25 140 64 76 8 29 24 15 21 2
49 (350) Aragundi 1,658.92 61 64 337 178 159 19 11 47 38 18 I
50 (351) Jareang 1,288.12 21 29 246 110 136 18 31 71 80 6
51 (352) Patratu Me 598.19 25 40. 205 89 116 89 116 3
52 (353) Datam P 161.30 18 25 128 70 58 3 I 16

163
"STATISTICS BIHAR
LATEHA.R
'"LATEHAR. WOBlt.BB8 ..---
I II III IV V V~ vu VIn IX X Manu· Transport, facturing Storage
Agricu]. Mining, Howe- other thao Trade and Total workCl8 tural Quarry. hold Household Cons- and Commu- Other SI. (I-IX) Cultivator lahourer iag, etc. Industry Industry truction Commerce nications Services Non-workers no, ~ ,--......___,
,...---"-....... ,..--A---. ~....-.-~....-~ ~ .--~ ~ ...--.....___, M F M F M F M F ¥ F M F M F M F M F M F M F 15 16 17 18 19 20 21 22 23 24 25 26 27 28' 29 30 31 32 33 34 35 36
40 34 29 33 11 .. .. .. ., 20 34 I 17 12 15 12 .. 2 . . .. " . . .. .. .. 7 7 2 49 40 41 37 2 2 .. 5 I 1 32 35 3 H7 130 93 105 52 25 .. " .. .. " " .. 2, 81 96 4-70 69 68 69 1 " .. .. 1 53 54 5 81 75 70 61 11 12 .. .. .. -L' .. " 2 51 65 6 17 14 15 14 2
10 10 7 22 20 18 19 3 " .. " " .. " 1 13 18 8 35 30 25 24 8 6 .. ..
" .. " 2 20 34- 9 52 45 46 42 5 3 .. ,. J .. .. .. .. 28 31 10 35 28 IS 14 IS 12 5 2 " " .. " 21 22 II 46 23 [8 20- 3 3 25 " .. 14 21 12 63 27 [I 7 26 20 8
" '. 3 2 .. .. .. 13 .. 25 36 13 105 76 66 6[ 27 [3 11 2 " .. .. .. .. .. 1 64 93 14 176 138 118 105 43 33 9 I ., .. .. .. 2 .. 3 157 203 15 Uninhabited 16 94 92 82 81 4: 2 6 9 .. .. .. .. .. .. 2 68 71 17
76 63 75 63 1 ., .. .. 42 45 18 2f 20 23 20 I .. .. .. 17 12 19 209 119 109 3 68 92 13 .. II ?2 1 .. 3 2 4 131 235 20 1 [1 87 110 87 " .. . , .. .. .. .. " .. 1 77 - 97 21 Uninhabited
22 111 87 98 77 [3 8 1 59 75 23 170 114 102 91 23 14 17 .. U 3 2 .. 3 ., J 11 6 94 159 24 37 15 12 8 8 6 " .. .. .. 2 .
9 7 18 34 25 53 57 43 52 1 3 7 2 1 .. .. .. .. .. -1 - 28 \ 41 26 40 30 27 20 13 10 .. . , " 37 27 27 56 53 52 48 3 5 " 1 36 36 28 34- '38 31 35 2 3 .. .. ' .. .. .. .. 1 15 19 29 21 23 19 21 2 2 .. " .. .. .. .. 17 Il 30 114- lJ8 105 106 9 12 .. . . .. .. .. .. .. .. 76 61 31
101 40 70 8 23 28 2 " 2 3 .. .. 2 ", 2 1 B7 125 32 230 205 III 68 89 133 8 1 11 1 .. .. .. .. 2 .. ,. 9 2 170 223 33 44 31 23 17 18 14 3 " .. .. .. . . .. .. 19 36 34 25 13 21 13 53 4 " .. .. .. 13 28 35 163 121 83 68 62 5 " I .. . . .. 5 .. 6 128 140 36 34- 37 [2 19 11 18 5 " 1 5 36 36 37 140 59 94 7 39 29 .. .. 22 4 .. .. " " J 3 118 191 '38 16 20 3 4 13 16 " ',' 19 IS 39 37 23 33 15 2 8 .. 2 .. .. " .. .. 25 25 40 79 84- 66 78 5 5 4- I .. " •• f .. .. .. 4 49 31 41 40 44 35 44 5
" 23 16 42 18 18 14 15 2 3 2 . , .. .. .. .. .. " ., ., 8 10 43 26 33 23 28 2 3 3 .. .{ 8 6 +4-80 89 76 87 3 1 .• I 1 .. .. .. .. 1 53 57 4-5 55 39 53 39 1 1 .. .. .. . . 45 . 50 46 127 117 106 115 I 19 .. .. .. 2 I 82 104 47 35 24 30 23 2 I 2 ......... 1 29 52 48 109 99 101 93 8 6 " .. .. .. . .-: 69 6() 49 78 92 73 78 I 14 1 .. .. .. .. .. .. .. 3 32 44 50 66 85 65 82 .'3 1 .. .. .. ,. .. . . .. 23 31 51 45 42 45 42 . . .. .. .. " .. .. 25 16 52

164
PALAMAU VILLAGE
SUBDIVISION
ANCHAL
Occupied residential
bouses r--- Total number ofpcnons Literate
No. of enumerated (including and Serial no. Area No. of house- inm ate; of institutions Scheduled Scheduled educ,ated
(Thana no.) Name of village in acres houses holds and bouseless persons) castes tribes persons ,..------' ~--. ,..--""'___'
P M F M F M F M F
2 3 .. - 5 6 7 8 9 10 II 12 13 14
REVENUE THANA-LATEHAR-contd.
53 (252) Dugila Me 373.69 37 45 200 110 90 8 9 91 71 19 54 (253) Rehra 313.59 13 1.5 69 37 32 7 8 26 19 7 55 (254) Nawadih 373.49 4 11 60 29 31 13 18 2 2 8 56 (257.) Manikpura Me 159.71 23 25 118 59 59 . 5 5 5 57 (307) Ichak Me 550.75 '56 79 435 221 214 38 37 72 74 38 58 (319) KlJra P 544.64 52 58 299 141 158 46 42 29 29 32 7 59 (320) Hethloto Me 409.98 26 37 176 91 85 35 36 11 10 28 1 60 (321) Uparloto 292.21 33 43 221 104 117 25 33 20 19 11 3 61 (323) Muka 670.42 58 81 428 205 223 3 7 162 175 38 4
Latehar C. P.
62 (246) Karmachuan 86.38 63 (256) Pandepur P 687.50 78 81 485 251 234 32 20 140 143 64 9 64 (259) Salodih 125.79 6 6 51 22 29 10 14 4 65 (260) Kinamanr 864.35 1 1 7 7 4 6
66 (178) Bendi 1,783.58 60 78 '309 162 147 35 26 III 108 14 67 (179) Ledhpa P 1,074.56 64 75 334 175 159 99 78 64 78 31 2 68 (180) Dumariatanr 488.54 12 14 60 28 32 .. 24 29 1 69 (181) Hotwag Me 889.05 50 60 301 142 159 36 42 16 24 28 2 70 (182) Durangi Khurd Me 319.94 42 46 246 109 137 10 13 77 101 14 4 71 (183) Durangi Kalan 731.19 38 40 214 116 98 27 18 85 77 3 1 72 (188) Jalta 645.98 32 34 196 98 98 7 10 91 88 2 73 (189) Parsahi 1,419.54 89 101 611 313 298 79 75 219 210 34 4. 74 (190) Churia 418.88 28 30 174 82 92 82 92 3 75 (191) Bachra 271.47 12 14 76 38 38 2 3 32 33 3 76 (192) Godna P,Me 774.69 63 66 315 159 156 16 18 135 134 17 2 77 (193) Jer 604.80 28 32 182 86 96 86 96 8 78 (194) Kodag 2,017.11 19 20 104 53 51 49 47 5 79 ~219) Tupu Kalan 426.67 18 18 96 50 46 48 46 6 80 220) Kothila 73.00 10 10 57 28 29 25 26 9 81 (221) Hesla 257.35 50 55 250 1I9 131 76 87 21 82 (222) Tupu Khurd Me 333.30 78 83 350 187 163 33 23 56 61 27 2 83 (223~ Semariatanr 101.19 33 40 197 92 105 10 17 82 88 13 84 (224 TiniaKhar 89.66
85 (195) Orwai 910.85 33 33 249 123 126 90 100 12 18 22 1 86 (196) Lundi Me 2,305.39 37 39 186 104 82 15 21 89 61 25 6 87 (197~ Bingara P,Me 1,785.62 55 61 323 163 160 115 111 21 15 15 1 88 (198 Baheratanr 419.55 6 7 30 14 16. 4 4 4 89 (199) Orea 534.04 31 38 171 89 8.2 51 57 6 4 90 (200) Kone 646.15 47 47 235 123 112 35 21 21 25 4 91 (201) Nareshgarh P 3,274.94 99 108 490 242 248 20 32 210 215 16 92 (202) Ghanghri Me 1,241.86 21 24 113 63 50 5 5 48 28 6 93 (203) Salaia P,Me 468.96 24 26 145 76 69 20 22 44 41 32 4 94 (204) Murgidih Dc 247.68 20 25 114 59 55 28 25 31 20 16 1 95 (205) Pachamba 53.86 96 (206) Khaira 450.90 8 8 38 17 21 17 21 97 (207) Khairajagir Dc 29.38 27 38 180 94 86 94 86 4 98 (208) Mankerijagir 78.08 12 15 62 31 31 8 5 .2 99 (209) Beraini 262.28 16 17 65 32 33 7 6 23 26 4
100 (210) Dubiahi 380.27 5 7 46 21 25 .. 21 25 6 101 (211) Hartua 499.28 28 29 144 71 73 2 . 3 3 102 (212) Gurgu alias Irgu 295.26 36 45 237 P2 125 59 50 6

165
.STATISTICS BIHAR
LATEHAR
LATEHAR WORKERS
~ .....
I II III IV V VI VII VIII IX X Manu- Transport,
facturing Storage Agricul- Mining. House- other than Trade and
Other Total workers tural Quarry- hold Household Cons- and ComnJU- 81. (I-IX) Cultivator labourer ing, etc. Industry Industry truction Commerce nications Services Non-workers no.
,....---......______, ,..---"-__, ,..--........___, ,...-...... __, ,...-""--0 r-""--o ,........_.., ,.....-..., ,..--..._..., ,--"---. ,--"".___....,
M F M F M F M F M FM F M F M F M F M F M F
15 16 17 18 19 20 21 22 23 24 25 26 27 28 29 30 31 32 33 34 35 36
58 43 25 12 23 30 .. .. .. .. 2 .. 8 I 52 47 53 21 17 3 3 14 7 .. .. .. 2 " 2 7 16 15 54 15 14 8 4 6 8 I .. " .. " .. " 2 14 17 55 41 21 30 12 I} 9 .. .. .. 18 38 56
112 88 58 48 42 38 2 .. 2 1 " 7 2 109 126 57 82 62 23 23 35 • 30 .. " 11 4 " .. I ., 2 10 5 59 96 58 46 42 19 14 19 9 " 7 .. .. .. " .. " " I 19 45 43 59 56 49 20 20 23 17 1 10 .. .. .. . . .. " 2 12 48 68 60
110 35 88 18 19 16 I .. .. .. 2 1 95 188 61
Uninhabited 62 132 80 69 23 44 54 6 2 1 " .. 1 .. 2 .. 9 119 154 63
12 12 8 8 2 4 .. .. .. I .. I 10 17 64 7 7 .. " .. 65
105 95 86 87 9 6 3 7 2 57 52 66 112 98 72 74 9 22 Jl 1 I .. I .. 6 12 1 63 61 67 21 20 13 10 4 9 4 I .. .. 7 12 68 87 84 56 53 12 19 17 10 2 2 .. " .. ..
" 55 75 69 67 46 42 19 19 24 6 2 .. .. .. J 42 91 70 69 43 38 22 25 19 5 2 .. .. " .. 47 55 71 53 46 30 18 22 27 I I " .. .. .. .. " .. 45 52 72
179 138 104 79 55 59 12 1 " .. .. .. .. " .. 1 6 134 160 73 51 52 25 23 18 25 8 4 .. .. .. .. .. .. 31 40 74 28 21 19 12 6 8 3 I .. " " .. 10 17 75
102 97 33 29 63 65 5 2 .. " " .. " 57 59 76 58 61 39 48 7 9 10 4 .. .. .. " .. .. .. .. 2 28 35 77 34 33 19 17 15 16 " " .. " 19 18 78 34 27 19 19 7 7 7 I I .. " " .. 16 19 79 22 19 II 13 5 4 5 2 .. . . .. .. .. .. I 6 10 80 79 72 43 46 20 23 4 " 5 3 2 4 1 40 59 81
103 88 56 57 30 28 5 1 2 1 3 " 2 1 5 5 79 75 82 54 60 35 52 5 8 7 1 " " .. " " .. 6 38 45 83
Uninhabited 84
68 44 49 35 12 9 6 .. .. .. " .. .. 1 55 82 85 63 34 45 33 13 1 2 .. 2 .. .. .. .. . . I 41 48 86 88 58 68 50 16 5 2 2 3 75 102 87
7 5 5 3 1 1 1 .. .. .. " 7 1 I 88 53 43 38 35 11 8 4 " .. .. .. .. .. .. .. 36 39 89 79 62 54 49 8 11 9 .. .. .. .. .. " .. " 8 2 44 50 90
140 134 100 99 33 34 4 1 .. " .. " 3 102 114 91 34 28 26 24 8 3 I .. " .. " .. " 29 22 92 41 27 17 19 5 4 I 9 7 .. .. .. .. . . " 6 35 42 93 34 30 18 20 4 1 I 7 9 .. .. .. 4 25 25 94
Uninhabited 95 10 10 1 7 1 2 2 I .. " .. " 6 .. 7 11 96 49 51 30 47 6 2 3 .. .. " .. " 10 2 45 35 97 19 14 9 12 3 1 .. " " .. " .. .. .. " 6 2 12 17 98 23 14 10 12 2 2 2 ., 9 9 19 99 15 I I 13 10 1 1 " .. " .. .. 1 .. 6 14 100 42 42 39 36 1 I I 4 .. .. . . .. .. 1 I 29 31 101 71 61 44 47 13 5 6 I .. .. .. .. 2 I 5 7 41 64 102

166
I?ALAMAU VILLAGE
SUBDIVISION
ANCHAL
Occupied residential
houses ,...---'""------, Total number of persons Literate
No. of enumerated (including and Serial no. Area. No. of house- inmates of institutions Scheduled Scheduled educated
(Thana no.) Name of village inacres houses holds and houseless persons) castes tribes I persons .A. ,...--~ ,...--~ ,...--~
P M F :tv.{ F M F M F
2 3 4 5 6 7 8 9 10 11 12 13 14-
REVENUE THANA-LA TEHAR-eontd.
Nar~shgarh G. P.-"concld.
103 (213) Tarwatanr 24.77 104 (214) Mankeri Khas Me 312.90 13 i9 88 '39 49 8 7 9 9 3 lOS (215) Rehrahi 52.60 [0.6 143 714 347 367 96 ll4 ,141 143 119 4 106 (218) Tarwadih 523:g_7
,~~~ (216) Nawagarh P,K,m 709.50 3'05 37:5 1,748 8,66 882 llO 106 340 347 351 71 (217) Matkhar 15.0'5
109 (225) Patariachotag Me 647.52 29 31 2ll 10-1. 110 1 1 95 105 110 (226) Mananchotag Me,M 68&.62 78 94 472 237 235 15 11 203 207 13 2 111 (227) Bajkum 581.05 48 54 280 142 138 22 20 32 41 4 112 (230 Dhankara P,Me 1,133.93 113 157 841 412 429 26 30 287 313 113 4 rI3 (232) Thakurpara 148.00 35 3.5 173 88 85 88 85 6 114 (233) Nawadih 225.92 30 33 172 84 88 25 30 12 17 8 liS (234) Gulariatanr , 100.51 H 15 72 34 38 30 24 4 116 (235) Narayanpur Me 2,205.24 '23 29 164 73 9\ I 2 13 117 (236) Parahiatoli .. , 112.00 118 (237) Ichabar. 642."25 14 14 84 :46 38 14 10 30 26 4 .. 119 (238) Hesla 870.47 25 30 i82 '89 93 89 93 2
, 120 (228)' Bariatujagir' De 744,73 61 78 380 196 184 51 53 115 106 80 121 (229) Nawadih aliar Ka[yanpurP,Oe 372.16 63 84 396 189 207 92 94 70 72 21 122 (230) Kalyanpur .. 335.71 55 65 291 140 lSI 22 25 105 106 37 2 123 (239) Sisi Me 1,126.79 52 72 378 168 210 35 52 132 147 4 124 (240) Hundru Me 808.98 ~59 69 330 164 166 11 9 5 131 [9 125 (241) Alagdiha I17.10 10 12 62 28 34 15 11 13 23 3 126 (242) Jogiadih 51.61 127 (244) Bariatu Nisf alias Bariatu '847.63 28 32 160 72 88 40 44 32 39 8 4
Khalsa 128 (245) Bishunpur P,L, Me 98.01 67 71 398 198 200 51 86 3 6 81 25 129 (288) Demu P,Me. 1,975.89 133 168 993 500 493 21 50 424 413 227 65 130 '(289) Rehea 290.65 12 14 74 29 45 2 27 42 11 6
131 (243) Keru P,Me 451.65 115 139 665 347 318 71 61 207 199 49 132 (261) Harkha Me, De 267.87 18 I 19 89 51 38 3 3 5 133 (262) Mungar P 1',319.85 130 163 765 381 384 70 63 114 114 120 10 134 (287) Ghutua 456.23 30 38 195 98 97 20 10 69 67 28
135 (269) Kumhar NA 18 21 102 47 55 22 25 10 136 (270) Uigara 274.87 20 21 121 59 62 35 38 17 18 8 I 137 (271) Kulgara P,Oe 357.11 70 83 416 219 197 25 47 87 85 53 12 138 (272) patratu 598.72 42 46 220 112 108 25 56 52 48 II 1 139 (273) Hosir 660.83 41 44 223 112 )11 23 22 77 79 7
io" 140 (274) *Richughutu P 339.07 32 43 132 72 60 19 22 21 22 33 141 (275) "Batat Kalan 1,230.20 48 49 268 - 130 138 7 5 103 112 23 8 f4.2 (276) Batat Khurd ' 306.31 28 29 125 70 55 23 42 42 10 1 143' (277) Mahuatooli 33.84' 2 2 13 5 8 1 3 4 5 144 P8) Hethtoli Hos 112.62 5 5 34 18 16 1 4 2 11 8 145 (279) Ambatikar 47.13 3 3 16 8 8 .. 8 8 2 146 (290) Labarpur P 427.59 32 32 153 76 77 I 6 39 31' 28 4 1.47 (291) Gire lli.13 10 10 52 . 23 29 23 29 8 1 148' (292) Sakwar 142.38 30 30 156 .75 81 68 71 3 .. 149 (293) Peshrar :2,535.53 )5 81 412 ~95 207 32 39 139 137 45 7

STATISTICS :.BIHAR
LATEHAR
LATEHAR WORKERS
I II III IV V VI VII VIII IX X
Total worken (I-IX) Cultivator
Manu- Transport, facturing Storage
Agricul- Mining, House- otherthan Trade and tural Quarry- hold. Household Cons- and Commu· Othcr SI.
labour~r ing, etc. Industry Industry truction Comm~rce nicatjoD~ Services l'\on·workers Dd. .---""-------. ,..--""----0
__ ........_, ,.--J--. ,..-JIo--, ,............_, ,.........._... ,........._., r-oAo-.... ,..--oAo--. ,..--oAo--.
M F M F M F M F M F M F M F M F M F :M ' F M F
15 16 17 18 19 20 21 22 23 24 25 26 27 28 29 30 31 32 33 34 35 36
U ninhabiled 103 25 17 17 17 2 3 .. 3 14 32 104-
185 174 121 113 27 36 5 .. 6 I .. .. 19 8 3 4 16 162 193 105 Uninhabited 106
453 335 251 184 106 109 21 28 16 2 .. 25 2 2 18 23 413 547 107 Un'inhabiled 108
59 63 50 60 7 3 2 .. .. . . .. . . 42 47 109 132 141 108 132 12 9 .. . . .. 4 5 3 ., 105 94 110
79 80 65 64 -14 14 'fl 2 63 '58 III
229 156 184 137 6 6 30 1 " .. 3 5 2 183 273 112 56 45 6 8 43 37 7 " " " ., .,
" ., 32 40 113
51 38 2'3 21 14 13 5 4 4 ., .. " ,. " " 5 33 50 114 20 18 4 5 14 13 2 " ,. .. ., '14 20 115 39 39 29 37 4 2 6 .. .. . , " .. .. 34 52 116
Uninhabited 117 23 22 14 15 7 7 2 " 2,3 16 JI8 .. .. ..
I' " .. ,\ . .
52 41 44 40 8 I .. .. " .. 37 52 119 '/
. . . .' 105 80 • 15 2 .. .. .. .. • :::11 5 3 91 184 120 110 I 49 53 I .. " .. .. ',' . . .• 2 .. 6 79 206 121 85 2 63 17 .. " .. .. .. , . 1 2 4 55 149 122 95 82 71 36 24 46 ,. 73 128 123 97 60 70 45 4 10 I " .. .. .. 14 8 5 67 106 124 17 JI 11 5 6 6 .. . . .. .. II 23 125
Uninhahited '126 41 13 23 3 18 10 .. 31 75 127
92 52 34 4 46 48 .. .. 1 11 .. J06 148 128 288 257 164 164 65 90 34 I " '2 .. 5 8 9 2 212 236 129 19 25 13 17 3 7 2 I 10 20 130 ,
180 82 89 7 48 75 5 .. 6 " 9 22 167 236 131' 28 7 23 3 4 4 .. . . .. 1 23 31 132
196 191 136 155 2 25 16 J 8 7 .. J .. 14 5 15 2 185 193 133 52 50 41 44 2 6 3 2 " 4 46 47 134-
32 3 28 2 3 1 I .. .. " .. .. .. " 15 52 135 39 23 18 1 21 22 .. .. .. .. . . 20' 39 136
109 31 72 5 32 26 ' . .. " .. .. " 5 lID 166 137 56 22 34 4 21 18 1 " " .. " " " 56 86 138 61 /41 50 39 9 2 I " " " " " I .. 51 70 139 51 17 19 2 5 15 5 .. .. " " " " " 6 10 6 21 43 140 78 16 64 6 12 10 1 " .. " " " J 52 122 141 45 8 23 22 7 " J 25 47 142 3 2 3 1 1 .. .. .. " " 2 6 143
11 3 2 2 2 2 J 3 7 13 144 4 1 4 J .. 4 7 145
39 14' 28 6 6 8 3 .. " .. " " 2 37 63 146 15 8 II 3 8 1 " .. " " .. 8 21 147 46 19 35 I 10 18 1 " " " " 29 62 148
110 16 78 3 32 13 95 191 149

,168
PALAMAL VILLAGE
SUBDIVISION
ANCHAL
Occupied residential
houses ,---- Total number of persons Literate
No. of enumerated (including and Serial no. Area No. of house- inmates of institutions Scheduled Schedwed educated
(Thana no.) Name ofviUage in acres houses holds and housclesa persons) castes tribes person,
~--...... ~~
P M F M F M F M F
2 S 4 5 6 7 8 9 10 11 12 13 14
REVENUE THANA-LATEHAR-contd.
150 (280) Reheldag 325.37 42 43 210 110 100 27 19 72 73 18 3 151 (281) Sukha1katha 143.61 152 ~283) Nindir P, Me 619.36 97 122 702 346 356 7 17 213 211 49 2 153 284) Kudag 444.23 29 31 154 75 79 12 18 60 59 3 154 (285) Turidih 487.90 17 22 109 53 56 26 27 11 16 2
Zalim G.P.
155 (258) Karhuma P~ Oc 781.83 - 60 62 347 176 171 29 22 26 19 43 21 156 (263) Komo alias Kumu 538.79 5 5 23 11 12 6 7 5 5 3 157 (264) Goa p.Oc 616.73 80 107 512 251 261 23 27 65 69 80 12 158 (265) ZaHm Khurd M, H, Me .. 838.01 165 189 862 434 428 34 48 47 53 133 16 159 (266) Zalim Kalan M,Me 594.7,3 34 41 221 107 114 41 72 41 42 2 160 (267) Sinjo 295.37 20 23 124 65 59 13 18 22 8 161 (268) Bhusur NA 134 162 818 418 400 43 60 219 217 23 162 (282) Ichak 850.55 72 85 407 214 193 17 25 139 135 12 163 (286) Saraidih 211.65 164 (327) Udaipura 1,349.94 37 61 330 153 177 94 99 7 I 165 (328) Jagal Daga 2,260.73 49 59 299 138 161 138 155 4 5 166 (329) Sabano Me 3,292.65 81 87 449 221 228 7 190 194 14 1
ANCHAL TOTAL 110,062.30 ... 6,595 7,843 39,829 19.895 19,934 3,426 3,430 10,30510,535 3,680 532 or
171.97 sq. mUes

169
STATISTICS Bnua
LATEHAR
LATEHAR WOBXBB8 ......__ -
I II III IV V VI VII VIII IX X Manu· Transport,
facturing Storage Agricul. Mining, House- other than Trade and
Other Total workers tural Quarry. hold Household Cons- and Commu. SI; (I-IX) Cultivator labourer ing, etc. Industry Industry truction Commerce nications Services N on·workers DO.
~------. ,..--......____ ,.... ... ,.-............. ,..--...,,......---. ,....-...., ,....-J'oo ...... ,--""""-..... ,----......_....,. .--~
:Nt: F l\l F M F M F M F M F m F M F M ~ M F M F
15 16 17 18 19 20 21 22 23 24 25 26 27 28 29 30 31 32 33 34 35 36
59 58 44 45 14 12 1 .. .. .. " .. ,. .. ' . 51 42 150 Uninhabited
f8 151 193 161 120 109 31 52 5 .. 9 ·9 153 195 152 37 31 25 22 12 9 " .. .. .. " .. .. .. " .. 38 48 153 32 27 12 13 18 J4. .. .. .. .. .. .,
" 2 21 29 154
105 61 71 42 8 19 12 .. " .. 3 2 9 71 llO 155 9 4 5 2 2 .. .. .. .. .. .. . . 3 2 8 156 ]57 131 112 93 15 32 14 6 9 .. I 6 94 130 157 :234 ~6 128 63 12 18 24 I 7 5 6 .. .. 14 3 2 : . 4f 6 200 332 158 55 58 16 24- 14 28 2 1 7 .. 1 .. .. 15 5 52 56 159 29 28 23 19 4 9 1 .. .. I .. 36 31 160 '223 232 147 137 17 84- 20 16 8 .. .. . . .. 1 22 3 195 168 161 J43 115 67 28 73 87 3 .. .. .. .. " .. .. " .. 71 78 162
Uninhabited 163 94- 89 82 74 6 15 1 .. " " 5 59 88 164 95 97 68 56 1 24- 15 15 1 .. .. " 10 2 43 64 165 135 121 103 96 16 14- 5 1 2 8 9 2 86 107 166
~1,551 8,758 7,605 5,889 2,333 2,449 614 103 210 132 29 1 14 " 138 22 125 483 162 8,344 11,176
P-II-22

170
PALAMAU VILLAGE
SUBDIVISION
ANclfAL
Occupied residential ~ouses
Total number ofpersons Uterate No.of enumerated (including and Serial no. Area No. of home- inmates of institutions Scheduled Scheduled educated (Thana no.) Name of village in acres houses bolds, and bouselelS persons) castes tribes persons
P l\l F M F M F M F
2 3 4- 5 6 7 8 9 10 11 12 13 14
REVENUE THANA-LATEHAR-contd.
1 (113) Sewdhara 371.I 7 29 32 170 87 83 10 I~ 49 41 2 2 (116) Kamaru P 1,453.91 115 135 625 314 311 116 115 77 82 77 25 3 (I 17~ Kasiadih P,M,Mc .. 631.61 86 99 546 272 274 39 31 63 72 101 12 4 (l18. Ranki Khurd 419.55 40 45 223 115 108 44 42 15 10 23 4 5 (119) Ranki Kalan P,Me 1,375.16 91 126 637 323 314 138 128 65 69- 90 18 6 (120) Salaia 565.07 36 39 190 85 104 35 32 31 47 -2 7 (121) Rabda P,Mc ~. 1,316.20 133 l40 669 336 333 71 71 254 250 59 10 8 (I22~ Themi 410.50 43 46 182 84 98 74 76 4 9 (123. Thema B 237.11 34-- 34 270 223 47 31 27 3 181 5 10 (124~ Tumagara 373.82 43 52 209 119 90 55 52 51 26 30 2 II (125 Chetma 417.15 23 33 150 65 85 14 18 3'8 49 22 4 12 (126) Pipra Kalan P 1,028.69 104 117 564 284 280 77 69 72 78 29 2. 13 (127) Bakoria P,L,H,Oc .. 2,134.31 230 306 1,447 709 738 222 216 205 201 152 29 14 (128) Agardih Mandhania Dc 482.10 21 41 216 117 99 ~1 18 96 81 9 1
15 (94) Ejamar 605.29 25 26 114 56 58 32 28 12 17 5 16 (95) Namudag K 767.38 87 106 564 271 293 101 99 33 54 40 15 17 (96) Manikdih 517.13 23 33 171 83 88 12 11 54 58 5 18 (97) Chechendha 619.73 21 23 84 43 41 22 24 3 3 2 19 (98) Kutmu 414-.12 23 23 95 48 47 27 19 14 11 7 20 (99) Pokhri 258.83 17 19 98 45 53 .. 30 35 3 I 21 (107) Jagtu 255.80 36 39 201 105 96 25 18 52 67 25 } 22 (108) Jerua 1,920.36 71 72 330 161 169 11 10 124 130 34 4 23 (109~ Baraitola 51.88 15 19 79 40 39 4 4 29 30 7 24 (110 Dumri 82.08 25 27 155 70 86 18 19 29 33 16 25 (Ill) Kope P 711.37 64 65 411 191 220 55 51 71 135 36 Z 26 (l12) Lanka 3,119.34 65 68 425 223 202 4-1 24- 131 178 15 27 (114) Koili 482.29 16 16 86 35 51 14- 15 16 22 13 1 28 (115) Kui P,Me 1,705.85 103 104- 579 284 295 71 59 129 122 38 3
Barwaia G.P.
29 (132) Janho 2,671.03 95 121 757 367 390 102 85 116 171 22 30 (133) Patna 1,365.25 45 51 302 156 146 6 4 140 135 14 I 31 (134) Barwaia Kalan P,M, H,M c 1,308.01 177 204 938 467 471 118 103 56 60 142 13 32 (135) Betla 225.75 23 26 110 58 52 42 38 6 33 (136) Barwaia Khurd 253.58 47 51 243 103 140 84 81 15 12 34 (l37) Matnag P 697.65 97 105 544 267 277 73 7{) 26 1 35 (138. Chama P 982.90 65 71 353 189 164 106 104 31 21 20 36 (139) Sewan 145.90 15 22 121 58 63 58 63 1.4- 2
37 (129~ Charwadih 389.23 22 23 151 76 75 76 75 5 38 (130' Sadawad,ih P 2,395.29 101 110 603 297 306 297 306 21 39 (131 Bandua P,Mc 2,928.93 174 196 1,288 602 686 138 101 398 460 47 17 40 (170) Purnipalhea 243.22 71 86 453 222 231 123 106 22 • 20 48 12 41· (171) 'JuncuT P 1,815.11 187 230 1,405 684 721 60 52 460 538 98 6
Palhea G. P.
42 (140~ Doki P 1,891.21 57 76 385 207 178 47 37 146 134- 48 12 43 (141 Siris 181.49 22 27 165 85 80 83 79 21 1 44 (142) Banatu P 1,151.08 61 77 416 215 201 22 16 186 185 24- 3 45 (143) Hesatu 1,193.15 35 37 159 73 86 37 35 26 32 9 3

171
STATISTICS BlHAB
LATEHAR
MANIKA WORKERS
r-- """ I II III IV V VI VII VIII IX X
Manu- Transport, facturing Storage
Agricul- Mining, House- other than Trade and 51. Total workers tural Quarry- hold Household Cons- and Commu- Other
(I-IX) Cultivator labourer ing, etc. Industry Industry truction Commerce nications Services Non-workers DO •
,--...______. ,..--~ ,..--....., ......-"---- ,_...,_..._, ,....."""___,..---" ......--. ,---..A....--., ,----.A.___" ..-----~
M F M F M F M F M F M F M F M F M F M F M F
15 16 17 18 19 20 21 22 23 24 25 26 27 28 29 30 31 32 33 34 35 36
51 47 29 33 16 14 3 3 .. .. . . .. 36 35 I 167 138 86 54 67 84 II .. .. . . 3 147 173 2 145 156 95 121 34 35 II .. .. .. .. . . . . 4 127 lIS 3 65 58 47 40 15 18 2 .. .. " "
I 50 50 4 172 129 96 94 60 35 7 .. 2 " .. .. " " .. 7 151 185 5 62 55 36 34 20 19 5 2 I 24 49 6
]91 167 134 132 23 24 7 10 4 .. .. 17 7 145 166 7 63 66 8 13 5 3 5 1 45 49 21 32 8
196 23 f) 10 13 13 I .. . , .. .. .. 3 176 27 24 9 75 52 J 30 40 .. .. .. 22 12 6 .. 9 44 38 10 38 45 23 27 12 18 I .. .. .. . . 2 27 40 II
162 174 80 97 76 77 3 .. .. .. .. .. 3 122 106 12 392 343 289 292 41 21 7 4 15 16 I .. .. .. 10 .. 29 10 317 395 13 74 63 67 61 4 2 I 1 .. .. .. .. .. .. .. 1 43 36 14
34 41 15 17 15 22 2 2 .. .. .. .. .. .. 2 22 17 IS 153 174 89 127 41 45 3 .. 4 1 " .. I .. 1 ., I 13 I 118 119 16 57 52 44 36 8 8 5 " 8 .. . . .. .. 26 36 17 28 28 19 22 7 6 1 .. 1 .. .. 15 13 18 28 24 20 19 7 5 " .. " " " .. .. J 20 23 19 28 30 24 29 I I 3 .. .. .. .. 17 23 20 63 50 49 42 8 8 3 .. I " " " .. .. 1 .. 1 42 46 21 94 95 76 83 11 11 6 1 1 .. 67 74 22 28 20 23 16 2 4 I 2 .. .. .. .. 12 19 23 39 45 35 42 3 3 .. " .. ., 1 31 41 24
107 112 95 104 9 8 " .. .. .. .. " 1 2 84 108 25 134 116 126 108 8 8 .. .. . . .. .. 89 86 26 22 26 21 25 1 1 13 25 27
170 155 153 141 14 13 .. 1 .. 3 114 140 28
226 224 134 164 45 51 38 9 4 .. 2 .. 2 141 166 29 90 81 67 69 8 9 15 3 .. 66 65 30
270 192 126 106 76 82 9 I 8 3 .. 34 6 II 197 279 31 41 31 5 3 34 28 .. .. .. .. 2 17 21 32 64 68 14 13 41 48 7 3 .. 2 4 39 72 33
175 146 101 91 48 48 24 2 1 I 1 4 92 131 34 130 96 93 78 16 12 6 " 3 .. .. .. .. .. .. .. 12 6 59 68 35
34 30 27 29 3 3 " .. .. I I 24 33 36
52 4S 48 4.1 ., " .. .. .. " 4 24 30 37
177 166 168 158 7 8 I .. I 120 140 38 344 380 282 316 60 63 .. .. I .. .. .. 2 258 306 39 119 103 42 41 64 58 3 2 2 I .. 7 2 103 128 40 385 409 290 348 43 59 18 10 6 .. I 17 2 299 312 41
119 100 85 75 21 19 2 9 6 2 88 78 42 38 49 31 42 4 7 " 1 .. 2 47 31 43
121 116 106 106 8 10 1 .. 5 .. I 94 85 44 42 39 20 15 21 24 .. .. .. .. . . 1 31 47 45

172
PALAMAU VILLAGE
SUBDIVISION
ANClJAL
Occupied r~idential
houses ~ Total number of persons Literate
Serial no. No. of enumerated (including and
Area No. of house- inmates of institutions Scheduled Scheduled educated (Thana no.) Name of village in acres houses holds and houseless penons) castes tribes persons
.......... .., ..---......__:.., ..----"---,
p M F 1\1: F 1\1: F M F
2 3 4 5 6 7 iI 9 10 11 12 13 1+
REVENUE THANA-LATEHAR.-contd.
46 (144) Pagar 403.00 13 17 69 34 35 34 35 47 (145) Sel<;lag 581.46 34 39 201 106 95 97 95 - 16 1 48 (146) Pasgam 1,139.93 30 34 180 98 82 26 22 62 52 3 49 (1.47) Sansdohar 53.71 1 1 ' 15 8 7 a 7 50 (148) Sardamdag 1,249.47 48 56 283 147 136 22 25 1I6 108 1 51 (149) Naihara P 613.56 16 18 90 45 45 12 13 18 9 6 52 (150) Kurund 1,073.74 47 63 290 138 152 70 51 32 33 7 53 ~151) Kurid P 1,736.93 24 '2·7 1I0 52 58 44 42 6 6 13 3 54 16.9) PalMa P 2, t 76.01 9,0 - 108 735 360 375 64 55 243 297 31 1
55 (152) Beang P 1,039.64 42 44 211 114 97 53 55 .. 2 19 56 (153) Newar 917.49 16 17 97 39 58 19 18 15 14 2 57 (154) Bikra 1,148.33 7 9 37 21 16 21 16 1 . 58 (155) Kuchal 1,269.41 5 5 21 10 11 10 11 59 (156) Matnag 967,00 60 (157) Rewad Kalian 639.38 36 36 231 122 109 33 36 26 46 14 4 61 (158) Rewad Khurd 1,15).22. 52 56 262 131 131 49 44 37 45 8 1 62 (159) Jalima . 958.70 14 14 77 43 34 43 34 4 63 (160) Bishunbandh H, P, Oc 1,52.1.59 86 97 478 247 231 45 40 145 166 15' 2: 64 (161) Salgi 152.51 18 19 76 35 41 10 10 25 31 1 65 (162) Madandi)) 392.87 20' 21 93 45 48 .. .. 45 48 7 66 (163) Bichlidag 951.88 43 46 235 122 113 3 2 1I6 108 4 1 67 (166) Uraontoli L, V 45.27 45 47 198 103 95 21 25 58 60 29 of 68 (167) Ara 45.37 22 22 97 45 52 14 16 10 69 (168) Matlaung Me 2,802.25 150 160 809 419 390 107 80 110 162 60 I 13
70 (90) Jamuna 2,006.99 28 37 200 104 96 3 3 101 93 6 71 (91) Sinjo • P,Ie 1,254.61 9B 126 _ 709 355 354 55 53 217 227 47 5 72 (92) +Manika P,L,H2,M,Me 2,190.43 13B 200 934 504 430 233 202 35 56 130 20 73 (93) Banri 600.84 62 80 356 176 180 89 B4 58 55 6 2: 74 (164) Dundu P,Oc 4,236.64 115 152 830 421 409 23 28 347 368 38 1 75 (165) Mai P 2,761.26 112 147 73B 379 359 72 67 253 262 30 2: 76 (172) Aunratanr Oc 1,395.83 56 88 554 264 290 64 60 100 120 24 77 (173) Lali P 1,212.83 60 llO 573 289 284 15 13 155 154 35 78 (174) Nadbeiwa P 710.68 14 19 106 56 50 10 11 15 5 8
79 (84) Antikheta 744.98 51 52 260 131 129 26 17 89 101 14 80 (87) Patki 699.57 10 11 51 27 24 5 4 19 17 3 81 (88) Humamara 407.31 24 26 125 59_ 66 6 6 51 58 4 82 (89) Shiwacharantola 612.82 18 24 95 53 42 15 10 21 19 8 1 83 (100) Nawadi 309.18 25 28 131 63 68 49 48 14 19 12 84 (101) Simri' l,259.28 39 52 263 130 133 13 16 95 105 35 6 85 102) Barwadih P, K,Mc 85.76 47 53 302 152 150 97 107 46 6 86 (103~ Dumbi 290.25 25 29 III 55 56 32 25 23 21 9 87 (104 Khapiadih k 67)16 88 (105) Dasdih 1,027.42 89 (106) Bhatko 504.71 47 53 264 133 131 2 4 43 48 35 l()
Lawagara Kumandih G. P.
90 (82) Kurumkheta 301.48 9, 9 38. IB_ 20 15 20 3

173
STATISTICS BIHAlt
LATEHAR
MANIKA WORKERS
II III IV V VI VII VIII IX X Manu· Transport,
facturing Storage Agricul. Mining, House- other than Trade and
Other Total work en tural Quarry- hold Household Com- and Commu- SI. (I-IX) Cultivator labourer ing, etc. Industry Industry truction Commerce nieations Services Non-worken no.
r--"'____' ~~ ,---_"'____" ,..-.",_-"'\ ~~~ ,.---~ ,.---..... ____
,--_,.,____"
M F M F M F M F M F M F M F M F M F M F M F
15 16 17 18 19 20 21 22 23 24 25 26 27 28 29 30 31 32 33 54 35 36
19 15 17 14 2 1 .. .. .. . . 15 20 46 57 42 42 36 5 5 10 .. .. I 49 53 47 65 45 34 27 16 17 12 1 .. ' .. 3 33 37 48 3 2 3 2 .. .. .. .. " S 5 49
98 87 69 71 17 16 12 .. .. . . .. . . 49 49 50 26 19 19 9 2 1 3 .. 2 9 .. 19 26 51 90 81 49 47 26 32 15 .. 2 " " .. .. 48 71 52 32 31 23 23 8 8 1 .. .. .. .. . . .. . . 20 27 53
216 162 137 II8 35 23 20 1 3 4 .. .. .. " J .. 20 16 144 213 54 ,
67 43 23 10 24 33 9 .. 3 .. .. .. 3 47 54 55 27 27 5 6 13 21 4 .. 12 31 56 15 10 8 7 3 3 4 .. .. .. .. 6 6 57 9 5 5 5 2 2 I 6 58
Uninhabited 59 64 66 19 27 40 38 3 2 .. .. .. ., .. .. 58 43 60 73 76 31 28 36 46 5 1 .. I 1 58 55 61 18 21 15 19 3 2 .. .. .. 25 13 62
143 128 83 88 41 36 4 .. 2 4 1 .. 7 104 103 63 23 20 13 14- 10 6 .. .. .. . . .. .. 12 21 64 25 24 10 II 14 12 I I 20 24 65 76 49 44- 34- 30 15 2 .. .. .. . . 46 64 66 63 46 13 14- 34 31 1 1 1 .. .. " .. .. 1 .. 1 7 40 49 67 28 20 12 , 2 15 18 .. .. I 17 32 68
234 174 174- 139 32 35 3 .. 13 .. .. .. 5 7 185 216 69
66 54 63 54 I " .. 1 38 42 70 215 205 200 190 " 13 2 .. 3 2 . . .. .. .. .. .. .. 10 140 149 71 278 208 182 123 52 84 20 " .. .. .. .. .. .. 2 2 20 1 226 222 72 100 106, 52· 52 42 54 2 " .. .. .. 2 .. 2 76 74 73 256 243 248 245 .. " 4 2 3 .. .. .. 2 165 161 74 239 239 ]82 182 56 57 .. .. .. .. .. .. .. I 140 120 75 163 161 148 140 11 21 4 .. " .. .. .. 101 129 76 172 162 130 137 30 25 8 .. " .. " 4- 117 122 77 33 31 26 30 5 2 I .. " " .. 23 19 78
79 69 52 67 3 9 2 .. .. .. 14 1 52 60 79 16 15 8 12 2 3 1 5 II 9 80 37 38 37 38 .. ., .. .. .. .. " .. 22 28 31 32 24 24- 24- 6 2 21 18 82 34- 37 31 36 2 1 1 .. .. . , .. .. .. .. . . .. 29 , 31 83 68 79 48 72 " 4 6 2 " .. .. .. .. 14 1 62 54 84 87 63' 64 58 7 5 13 ,
2 1 65 87 85 .. .. .. 32 28 25 23 4 5 3 .. .. 23 28 86
Uninhabited 87 Uninhahi ted 88
79 69 50 56 5 II 7 2 ., .. .. .. .. " ., 15 54 62 89
13 12 9 8 .............. .. 3 5 8 90

PALAMAU
Serial no. (Tbanano.)
91 (83) 92 (85) 93 (86) 94- (175) 95 (176) 96 (177)
Name of village
2
174
Occupied residential
bouse! ~
No. of Area No. of house
in acres .boules bolds
3 5
REVENUE TH4NA-LATEHAR.-contd.
Lawag.ra KUl1Iondih G. P.-concld.
Hatta 690.68 44 52 Amwatikar 415.80 11 12 Jabla 365.12 22 22 Deobar 1,566.42 29 32
'Barkadih P 1,273.84 139 150 Lawagara 521.67 8 13
ANCHAL TOTAL 93,i1f56 5,003 5,931 or
145.49 sq. ~Hes
Total number of penon! enumerated (includiDg inmates of institutioDs and houseless persons)
P
6
253 49
106 191 597
72
M
7
121 26 60 99
334 38
F
8
132 23 46 92
263 34
VIL~AGB
SUBDIVISION
ANCHAL
Scheduled Scheduled
literate and
educated persons castes tribes
M: F
9 10
5 2 23 19 52 58 19 19
M:
11
117 26 55 73
207 6
~
F M F
12 13 14
130 7 23 .,1
44 I 73 14- I
141 114- 21 7 2
30,687 16,446 15,241 3,742 3,410 7,340 7,838 2,489 328

»TATISTICS
,ATEHAR
dAINKA
Total workers (I-IX)
I.
Cultivator ,..-OA..-.-,
F
II III
175
WeRKERS
IV v Manu·
facturing •
VI VII
Agrieul. Mining, House- other than Trade tural Quarry- hold Household Cons- and
labourer jng, etc. Industry Industry truction Commerce ..-----. ~ ,,_............ ,..............,_....._.., ,..-A-.
VIII IX Transport,
Storage and
Commu. Otber nieations Services
,..-----.... ,...-"""___'
M FMFMFMFMFMF M F M F 1\1
15
F
16
1\1
17 18 19 20 21 22 23 24 25 26 27 28 29 30 31 32 33 34
73 72 53 58 6 4 8 2 3 9 15 12 11 9 3 " .. .. .. 4 32 28 25 24 3 4 .. .. " .. 3 63 48 34 39 4 1 12 1 2 '. .- 10 8
240 132 63 79 5 2 36 6 4 1 1 .. 19 2 48 61 45 22 20 8 10 I 4- I .. .. " 9 9
9.180 8,112 8,065 6,031 1,708 1,168461 50 121 76 30 12 20 .. 128 53 84 563 122
BIHAR
X
S1. Non·worken no . ,.--"'__'
M
35
48 11 28 36 94 16
6,266
F
36
60 11 18 44
131 14
7,129
91 92 93 94 95 96

176
PALAMAtJ VILLAGE
SUBDIVISION
ANCHAL
Occupied residential
house! ~ Total number of person! Literate
No. of enumerated. (including and Serial no. Area No. of house- inmates of institutiOn! Scheduled Scheduled educated
(Thana no.) Name oTviIlage in acres houses holds and houseless persons) castd tribes person!
,-- ,...-""""'__' ,..--""""'__' ..---.....___., P M F M F M F M F
2 3 4- 5 6 7 8 9 JO Il 12 13 14-
REVENUE THANA-LATEHAR-contd.
1 (1 ) Kechki P 1,097.44 173 202 925 491 434 59 41 382 374 173 II 2 (2) Harparwa alias Biratpurwa : .- 304.70 3 (3) Kachanpur P .. 638.09 63 85 427 217 210 9 9 201 188 55 12 4 (9) Saraidh P, M,K,m,A,H 996.44 168 174 876 436 44-0 148 150 146 48 229 13 5 (10) Pokhri Kalan Me
" 1,167.13 434 451 1,934- 97~. 961 132 128 10 17 185 21 6 (11 ) Kushhabathan 147.92 7 (8) Kutmu P 855.83 110 122 533 265 268 147 146 64 58 76 6 8 (12) Pokhri Khurd 926.57 73 93 416 211 205 143 129 40 45 11 9 ( 13) Kolpurwa 268.01 22 28 127 68 59 - 68 59 16 2
10 (14) Aghra 154.85 II (15) Betla K,Oe 778.56 107 134 570 310- 260 132 83 80 86 107 4 12 (16) Akhra 545.94 23 39 173 87 86 46 38 16
13 (4) Kalyanpur P 428.53 65 83 364 180 184 7 9 II4 !I3 60 5 14- (.5) Amdiha M 967.40 85 108 497 252 245 42 40 195 197 49 2 15 (6) Hendehas 180.08 20 25 143 72 71 1 4 70 67 4 16 (7) Dorami P 1,363.47 52 52 199 108 91 71 55 36 33 33 14 17 (24) Mangra P 1,463.99 157 157 705 360 345 67 63 229 238 35 4 18 (17) Muru P,Me 1,308.04 123 123 641 316 325 30 33 281 288 103 5 19 (20) Paira .'i57.78 38 39 192 98 94 14 13 83 79 11 1 20 (21) Luhur P3,M, h, L, Hos,Rhe, Me 1,091.27 68 68 365 196 169 83 70 95 91 23 21 (22) * BaTWadih A2, H2, 1,120.93 709 725 2,832 1,632 1,200 234 266 182 183 846 251 22 (23) Murgidih P 724.28 92 100 467 230 237 54 47 139 156 21
23 (25) Khura P,/z,.Hos,.A " 929.84 140 144- 639 332 307 189 204- 29 30 66 8 24 (26) Chamardiha 291.60 35 35 142 76 66 27 21 5 6 14- 5 25 (27) Lanka 327.59 28 30 102 50 52 38 27 9 20 4 26 (28) Chapri P2 976.9.7 138 138 632 311 321 263 275 22 21 36 3 27 (32) Bode 182.51 28 (29) Cizhencha 1,081.39 154- 188 834- 421 413 96 84- 187 188 95 16 29 (30) Putuagarh 429.95 26 ,26 88 47 41 6 4 33 28 3 3 30 (31) Horilong 1,083.83 60 60 268 143 125 21 18 117 102 12 2 31 (33) Babhandih P 1,101.61 92 95 370 196 174 25 9 94 119 89 16 32 (34 Protected Forest (Husar Colliery) NA 69 69 17,9 107 72 25 21 12 6 53 15
33 (36) Sindharowa \ 5,010.43 9 9 38 19 19 5 3 14- 16 4-\ 34 (37) Tatha ali as Bal hal 2,972.54 30 30 175 88 87 .. .. 4-35 (38) Mandai 3,053.94 19 19 118 62 56 12 15 50 41 3 36 (35) Morwai Khurd 1,600.27 13 14 67 30 37 8 12 22 25 5 37 (39) Morzeai Kal an P " 10,355.86 138 140 694 369 325 71 71 281 250 109 19 38 (52) Jargarh 514.53 7 7 32 15 17 15 17 1 39 (53) Saidup 2,135.34 98 115 629 319 310 18 23 300 286 49 4
40 f18~ Ukamar P 1,784. II III 129 613 306 307 28 26 274 281 75 4 41 19) Ledgain P 1,267.11 51 51 237 118 119 63 57 42 44 25 2 42 58) Chhipadohar P2,A,H,Hos 2,487.96 367 382 1,749 1,010 739 217 199 365 368 291 32 43 (59) Kuchila P 1,244.52 130 152 771 397 374 130 121 161 149 53 11 44 (54~ Baridodar P, Me 1{292.63 33 39 201 94 107 94 107 5 .. ... 45 (55 Barichatan 941.85 23 26 161 86 75 46 (56 Harinamar 274.14 34 47 213 100 113 10 12 89 101 13 47 (57) Juruhar P 1,082.62 80 87 481 239 242 33 26 196 209 40
Ker G. P.
48 (60) Gari P,Mc '2,032.17 147 166 760 386 374 184 160 200 188 51 9 49 (61) Lukumkhar 644.54- 25 25 144 .... 86 58 24 10 58 46 14 2

STATISTICS
LATEHAR
J3ARWADIH
r
177
WOBXIIi:&e
II III IV V VI VII' Manu
facturing Agricul- Mining, House- other than Trade
IX x
Total worken (I-IX) - Cultivator
tural Quarry- hold Household Cons- and labourer ing, etc. Industry Industry truction Commerce
VIn Transport,
Storage and
Communications
Other Services Non-workers
M F M FMFMFMFMFMF M F M F M
15
F
16 17 18 19 20 21 22 23 24 25 26 27 28 29 SO 31 32 33 34
M
35
283
120 222 538
153 124-
34-
189 51
116 156 35 70
183 182 67
101 954 144-
194-47 37
176
263 17 69
·122 75
14-62 39 22
220 11
194
203 75
716 218
68 55 63
148
94- 146 51 51 Uninhabited 46 116 34-94 74 9 23
384 325 202 100 Uninhabited 108 95 97 84 90 38 24 13 32 12
Uninhabited 54 73 27 15 2 29 2 14
17 19 35 54
180 189 51 94
134-41
116 142 33 51
126 158
18 86 87
102
140 102 37 12 29 26 18 145
Un'inhabited 216 161
6 16 13 61 45 40. 3
10 52 37 22
194 10
183
172 62
299 191 64 45 38 81
5 46 26 .18
167 10
184
160 53
215 132 61 45 36 70
17 19 33 41-
131 171 44 93 62 27
95 14-16 8
19 5
12 37
6 49 32 15
168 10
175
160-47
189 160 61 40 33 68
8 .. 19 51 2l'
8 - 1
12 10
22 5 9
16
59 o.
5 3
1 7 6 3
27
3
4 16
4-7
I 45
229 202 119 37
139 25
1 6 48 25
P-II-23
33 17 4- 4- 1 ..
9 .. 1 I 14 4 5 2
156 17 I 38 13 4 ..
38 I
21 .. .. .. 4 5 ..
2 ..
1 ..
2 .. 33 9 .. 27 7
3
1,8 67 .. 5 I .. " . . . . I . , I ............ ..
.. 1 .. 10 ........ ..
I 48 18 4
2 .. 6 ..
'. 0, '0 " " ••
.. .. I .. 9
21 27 J 27 11 8 .. )3
.. 2 I 6 13 I 10 " 75 10 1 .. .. 2.. I ..
35 2 " 12 7 .. I .. 17 1 .. .. 2 13 2 ...... 9 3.. 2 ..
2 "
184 27 3.. 2 1 .. 1 .. 2 4 1 1 2 .. .. 5 33 11. 0 3 .. 12.. 3 1
60 1 1 .. .. .. 5
4 3 4 2
8 .... 7 1 7 1
5 2 1 .0
.0 .. o.
23 18 I 5 7 I ......
5 3 .. 15 1 ..
7 89 2 14 10 ... , ..
4 .. 4- 9 .. 9 II ..
.. 18 ..
4 1 .. 1 9 5 46 .. 9 3 ....
....... 2 .. .. I .. ..
1 ..
5 .. 1 ...... 4 ., 54
2 I
3a
2 13
" 6
6
574
3 7
6 1
7
10
98
2
26
1 58 27
- 30 10
27 7
1 34
3 129
8
45 20
10
6
1 10 9
,7
2
17 2
197 58 7 6
15 18
91 4
5 208
3 97 69 214
5 435
10 --t-12 3 87
34
8 121
2
3
33 2 _
10 4
:; 4
2 2
7
96 13 3 5 I 3
63 .. ,
36
64 96 37 38
177 134
31 95
678 86
138 29 13,
135
158 30 74.-74 32
5 26 23 8
149 4
125
103 43
294-179 26 31 37 91
157 38
F
36
340
164 346 577
160 121 46
206 84
167 226 36 37
165 136 43 75
1,066 196
167 29 23
!I03
197 35
112 129 69
9 35 19 15
131 7
127
135 57
440 183 43 30 75
161
172 33
BIHAR.
81. no.
1 2 3 1-5 6 7 8 9
10 II 12
13 14 15 16 17 18 19 20 21 22
23 24 25 26 27 28 29 30 31 32
33 34 35 36, 37 38 39
40 41 42 43 44 45 46 47
48 49

178
PALAMAU VILLAGE
SUBDIVISION
ANCHAL
Occupied residential
hoWies ,..-----..... Total number of persons Literate
No"of enumerated (including and Serial no. Area No. of house- inmates of institutions Scheduled Scheduled educated (Thana no.) Name of village in acres bouses bolds and houseless persons) castes tribes penons ,.---""""'--...... ,..-",__ .... r-rA.-_'" ,--"""'-"-1
p 1\1 F M F M F M F
2 3 4 5 6 7 8 9 10. B 12 13 14
REVENUE THANA-LATEHAR-concld.
50 (62) Rabdi 772.54 47 47 220 III 109 48 48 61 54 7 51 (63) Ker p 1,888.41 14-6 160 840 435 405 163 1:1:3 211 173 25 52 (40~ Tanwai 273.24 19 19 99 46 53 45 53 I 53 (41 Nawarnago 739.18 18 18 89 4-3 46 2 3 41 43 7 54- (42) Karamdih 772.05 21 21 99 52 47 2 50 47 1 55 (43) Khamhi Khas P 900.42 30 30 158 68 90 1 67 90 10 5 56 (44) Serengdag 1,186.68 44- 48 234- 110 124 2 2 105 118 8 2 57' (45) Patradih - 326.39 .. 58 (46) Bere 888.79 74 ':i4 333 161 172 f4 21 133 139 8 59 (47) Gasedag .'. 654.87- 30 33 197 98 99 98 99 3 60 (48) Lat p 1,069.81 50 99 506 258 248 13 II 219 218 37 61 (1J) Meral NA 28 28 124- 69 55 .. 63 55 7 62 (49) Harhe 790.03 59 62 272 134 138 7 4 112 121 8 1 63 (50~ Barkheta 1,050.53 73 79 430 224 206 8 5 214 201 20, 1 64 (51 Tongari p ,847.81 82 82 442 214 228 4 7 199 217 42 3
65 (71) Labhar 1,018.54 20 20 95 53 42 8 7 40 35 4 66 (72) MUTlfU 977.95 67 75 297 155 142 61 59 87 79 34 67 (73) Ladi 627.20 57 57 276 146 130 4 3 139 127 6 68 (74) Haratu p 4,955.23 73 74 368 193 175 39 36 134 125 31 69 (2J). Ramrudag NA 26 32 179 92 87 92 87 14-
70 (64) Ker 336.08 71 (65~ Hehegara P 3,319.81 75 80 402 214 188 89 73 79 72 77 3 72 (66 Gua 792.99 27 29 171 87 84 87 84 11 -.. 73 (67) Hosir 1,267.17 54 61 274 139 135 41 39 90 88· 11 4 74 (68) Wopag 609.64 29 34 1'27 62 65 4 5 50 50 12 . i 75 (69) Nawadih p 899.18 77 78 334 170 164 10 22 116 132 35 76 (70) Ckungru P 7,807.59 85 100 546 289 ~57 16 10 265 245 37 5
77 (75) lobe alias Amboatikar 2,678.02 44- 44 196 100 96 6 5 87 85 10 78 (76j +Ganeshpur 2,058.31 63 77 412 205 207 1 1 ,]02 ]64 22 79 (77 Sukal Katha '1,270.34-80 (78) Manatu 549.84 31 33 167 85 82 48 44 32 36 4 81 (79) S elari tanr 76.35 23 23 111 53 58 9 12 42 44 2 82 ~80) Chatam 390.36 Ii l2 '74 36 38 8 II 28 27 5 83 81) Kuku 3,572.4-9 038 39 174 89 85 6 7 80 77 8
ANC;::HAL TOTAL t. 107,554.64 6,155 6,600 30,969 16;100 14,869 3,526 3,300 8,252 8,153 3,674 531 or
168.05 sq. miles

179
STATISTICS BIHAR
LATEHAR
BARWADIH WeRKERS
I II III IV V VI VII VIII IX X Manu· Transport,
facturing Storage Agricul- Mining, House- other than Trade and
Total worken tural Quarry- hold Household Cons- and Commu· Other 81. (I-IX) Cultivator labourer jng, etc. Industry Industry truction Commerce cications Services Non.workers no.
~.....____, ,..--.....__, ....---.. ,..--... ,..-."---. ~ ~ .,...._,,__, ,...----. ,..-----. M - F 1\1 F Nt F M F Nt F M F 1\1 F M F 1\1 F l\l F M F
15 16 ]7 18 19 ~O 21 22 23 24 25 26 27 28 29 30 3] 32 33- 34- 35 36 1
80 64 42 41 " 2 .. .. .. .. 3B 21 31 45 50 257 166 164 110 29 28 25 " .. ·3 .. .. .. .. .. I 39 24 178 239 51
35 31 33 31 " 2 .. .. .. .. .. . . .. .. .. 11 22 52 30 3.1 29 30 I .. I .. " .. .. . . 13 15 53 33 24- 31 22 1 1 1 1 .. .. .. .. .. .. .. .. 19 23 54 54 46 49 46 4 1 .. .. .. .. .. .. .. 14- 44' 55 ~2 61 42 52 9 8 4- 1 6 .. .. .. .. .. 1 . . 48 63 56
Uninhabited 57 99 93 77 80 9 10 5 5 .. .. .. ' .. . . 2 3 62' ~9 58 55 49 54 49 1 . , .. ,. .. .. .. .. . . .. .. 43 50 59
158 126 123 ll4 7 12 12 " 6 .. .. . . .. 6 .. 2 2 100 122 60 49 37 22 18 4 .. 23 19 .. . . .. .. .. 20 18 61 90 63 56 53 3 .. 24 6 4 4 .. I .. 2 44 75 62
139 ll6 108 112 4 .. 20 .. 6 3 .. .. .. I .. I 85 90 63 ]37 95 103 90 8 5 18 .. 3 . , .. .. , . " 1: .. , 1 77 133 64
35 2S 1.9 19 I 4 . , .. .. .. .. II 4 18 19 65 98 54 45 36 1 31 I .. J 3 1 9' 7 17 57 ~ 88 66 85 68 66 61 4- 2 10 5 3 .. 2 .. .. 6r 62 67
114 39 80 35 15 3 8 4 I 3 2 .. 2 79 136 68 53 44 49 40 2 4 2 .. .. .. .. .. 39 43 6~
Uninhabited 70 T35 87 56 35 21 28 5 2 5 4 .. .. .. .. 4- .. 19' 25 18 79 101 71 50 31 33 21 I 1 .. J .. .. .. .. . . .. 16 8 37 53 72 79 17 55 3 5 12 2 .. L .. ., ., .. .. I . . " 1-S 2 60 118 73 38 30 23 II 4 n .. .. .. .. .. " I 10 8 24- 35 74 91 47 40 34 2 ,. 33 .. 10 1-1 ., .. I S 2 7'1 117 75
1.50 98 104· 75 a 5 16 5 2 9 " .. .. .. 2 ., 23 4 139 159 76
57 47 38 39 15 7 2 .. .. .. .. .. .. 2 ., 43- 49 77 12~ 100 10? 92 4 12 7 2 I " 80 107 78
Uninhabited 79 61 38 45 36 6 I 8 .. .. .. .. .. " '. . 1 24- 44- 80 35 23 21 18 6 3 2 4- 2 .. " " .. , . 1 18 35 81 23 19 21 19 .. 2 ., ,. .. " " " .. .. .. 13 19 82 52 41 '34 35 8 4 8 2 I .. " " 1 37 44 83
9,666 5,695 5,615 4~153 778 876 765 56 245 10~ 80 40 2249 40 806 .. 1,083 467 6,434 9,171

180
PALAM,AU VILIAGE
SUBDIVISION
ANCHAL
Occupied residential
houses ,..----" • Total number ofpersoDi! Literate'
No. of enumerated (including and
Serial no. Area No. of house- inmates of institutions· Scheduled Scheduled educated
(Thana no.) Name of village inures !;louses bolds and houseles.s persons) castes tribes person! ..... ,...--J'--..... ,.--""'___"
P M F M ...
F M F M F
1 2 3 5 6 7 8 9 10 11 12 13 14
REVENUETHANA-~HUADANR
(68) P,L,C,Rhc,Mc 3,5l9.40 47 49 , 266 124 142 7 7 113 134 40 5 I Chetma
2 (69) Janta L 500.66 17 ]9 8S 40 45 40 45 12 5 3 (70) Gaurgara 377.61 4 (71 ) Bandua 3,386.61 38 38 199 97 102 92 95 23 1 5 (72) Tisia 7,349.16 23 23 115 60 55 1 1 54 49 3 6 (73)' J amdih alias Haramgarh P,L .. 3,303.79 145 153 731 371 360 21 21 331 315 43 1 7 (74) Tarnoli .. 2,297.81 79 88 431 220 211 206 196 32 2 8 (75) Bhenritalalias Sarnadih P,Me 2,287.03 86 86 442 210 232 209 229 36 1
9 (76) Aksi P 4,215.38 73 84 423 204 219 193 217 23 1 10 (77) Merhatua 411.55 14 18 97 56 41 47 31
II {9l j Sale Me 728.49 32 40 222 99 123 99 123 14 2 12 (92 Maunadih 607.42 16 17 103 50 53 50 53 13
13 (93) Hartua 830.51 24 26 178 82 96 63 77 35 8 14- (94) Kutudiri 291.00 27 27 160 80 80 80 80 22 2 15 (95) Nawadih 421.13 16 (96) Bans Karcha P, C, Me 721.99 62 64 361 176 ISS 166 179 67 B 17 (97) Lakhepur 762.30 7 9 35 19 16 17 15 6 18 (98) Khajur ta1a 751.70 47 49 316 148 168 148 168 77 30 19 (124) Semarburhni P,Me 1,427.49 74 86 497 265 '232 6 8 238 223 90 15
Hami Chatakpur C. P.
20 (99) Jaipur P 487.95 29' 3] 166 86 80 85 79 20 21 (100) Urumbi P 852.27 36 37 196 96 100 4 7 92 93 18 2 22 (101 ) Chatak'pur M, C, Cc, Rhc 1,I.19.69 138 151 726 362 364 9 11 266 296 109 38 23 (102) Parewa P 2,257.18 39 43 200 89 111
.. 87 108 ]5 1
24 (103) Kukud P 2,480.87 51 51 319 116 153 176 153 22 25 (104) Chiro P 3,981.72 113 113 6 2 321 341 321 341 7 26 (105) Lodh P2,Mc 2,622.00 62 62 315 155 160 8 9 125 128 34 5 27 (106) Tewahi P 1,142.95 26 77 193 100 93 100 93 52 20 28 (107,) Mirgi P 1,598.85 66 67 394 192 202 171 180 69 15 29 (108) Ausari P, H 2,030.62 71 81 430 207 223 7 6 185 203 69 20 30 (113) Rami Khas P,Mc 1,808.77 151 164 938 469 469 2 3 414 433 133 22 31 (123) Gotbgaon P2 1,398.42 116 123 642 324 318 8 4- 233 234 66 11
32 (109) 015.(1 P, Me 7,084.08 138 238 1,169 585 584- 4 4 505 497 65 2 33 (110) Surkain P2 ],081.45 93 93 525 255 270 240 228 49 ]6 34 (Ill) Kabrapat 1,505.94- 1 I 14 8 6 8 6 .. 35 (112) Merhari 2,789.41 41 41 188 96 92 59 58 11 2 36 (114~ Katho 3!4.92 26 26 133 71 £2 50 44 6 37 (115 Joti 951.65 44- 44- 227 107 120 102 ]13 13 1 38 (lIB) Par:bi P,Mc 1,647.74- 72 72 386 193 193 187 189 59 ]3
39 (1 ]6) Jamdia 143.75 40 ( 117) Goalkhar C 330.30 13 14 97 52 45 52 45 2 41 ( 119) Regain P 1,524.76 94 94 520 257 263 257 263 64- 19 42 (I 33) Kita 373.35 43 (134~ Rampur 935.80 40 57 181 96 85 26 27 48 39 31 9 44- (135 Dipatoli H 50.26 50 52 271 146 125 4 2 84 9'9 29 1 45 (136) Manuadan1 P 536.67 146 154 662 338 324 8 3 137 158 135 36 46 (137) AmboatoIi P2,M2,h,m, L5,C,
Ic2, A2, H, Hos 480.83 158 173 1,078 576 502 7 3 380 338 360 186 47 (138) Bartoli 236.88 67 76 415 212 203 4 3 185 191 88 40

181 BIHAR.
STATISTICS
LAl'EHAR
MAHUADANR. WOBKEBS
I II III IV V VI VII VIII IX X Manu- Transport,
facturing Storage Agricul- Mining, House- other than Trade and
Total workers tural Quarry- hold Household Cons- and Commu- Other SI. (I-IX) Culti~ator labourer ing, etc. Industry Industry truction Commerce nications Services Non-workers no. r----.""...___, ,..--............... ,..--..... ___, ,....-.J'o ...... ~ r-...... __, ,..........__,,..........._.. ,......----. ....-----.... ,..--...... ___,
M F M F M F M F M F M F M F 'M F M F M F M F
15 16 17 18 19 20 21 22 23 24 25 26 27 28 29 30 31 32 33 34- 35 36
72 83 64 77 3 1 .. 5 52 59 I 23 21 20 21 2 1 .. 17 24 2 Uninhabited 3 59 64 50 53 9 II .. .. . . .. .. .. ., 3S 33 4 39 25 27 24 1 10 1 .. I .. 21 30 5 244 233 213 215 9 13 I .. 20 4 .. " .. 1 127 127 6 133 132 94 116 19 15 " .. 14 4 1 2 37 79 7 132 145 126 138 3 6 I 1 .. .. " " .. .. 2 78 87 3 121 126 III 125 2 I .. " .. .. 1 .. 4 83 93 9 31 23 29 19 2 4- 25 13 10 56 73 54 73 " .. .. 2 .. " .. 43 50 11 27 30 25 28 .. " .. I .. I 2 23 23 12 42 51 36 50 1 1 I .. 2 .. .. . . .. .. 1 .. I 40 45 13 41 42 40 40 2 1 .. 39 33 14 U ninhahited 15 100 99 87 96 I 3 .. 3 " " I ., 7 76 86 16 13 10 6 9 4 I " .. I .. I .. 1 6 6 17 66 95 64 94 .. I .. I .. . , I 32 73 18 149 149 135 130 9 18 2 . , .. " .. 1 3 116 83 19
52 41 35 26 8 7 9 S .. .. .. .. 34 39 20 62 62 58 62 .. 3 .. .. .. " .. 1 34 38 21 205 195 126 161 13 5 .. 31 22 9 5 18 .. 8 2 157 169 22 66 67 59 62 1 2 1 .. S 3 .. .. .. -:2 23 44 23 105 83 89 79 6 1 3 4 2 " 3 I 71 70 24 192 176 181 172 2 .. 7 4 1 I 129 165 25 98 73 88 60 I 3 I 2 I 6 9 57 87 26 46 47 40 45 2 .. 2 I .. " " " 2 1 54 46 27 103 112 90 109 I 4 2 2 " 1 6 89 90 28 114 138 102 129 I 9 6 .. " .. .. 2 3 93 85 29 245 288 194 273 23 10 I 1 20 2 I 3 z_ 3 .. 224 181 30 180 127 136 98 1 .. 34 26 .. 10 2 144 191 31 -373 351 325 326 33 19 4 .. 2 4 5 1 4 212 233 32 155 170 142 158 8 5 3 2 " .. " .. " 5 2 100 100 33 4 3 4 3
" .. " 4 3 34 59 56 48 52 10 4- I 37 36 35 39 42 27 34 6 3 3 5 3 32 20 36 68 76 53 68 8 6 " .. 5 -2 " " " 2 " 39 44 37 117 108 84- 90 19 II 8 6 .. " .. " .. .. 6 I 76 85 38 Uninhabited 39 33 30 19 17 4 3 3 7 10 19 15 40 157 316 143 158 6 I .. .. 7 4 .. 1 100 100 41 Uninhabited 42 66 47 21 24 15 18 3 2 2 .. 2 22 2 30 38 43 74- 49 34 33 9 6 1 9 5 1 .. 10 3 10 1 72 76 44 198 59 63 35 14- 4 1 27 I " .. 45 I 47 18 140 265 45
224 176 92 100 30 38 13 .. 10 I 3 13 61 36 352 326 46 123 108 79 107 I 6 I 2 6 .. 23 89 95 47

182
PALAMAU
Serial no. (Thana no.) Name of village
Occupied residential
houses .-------........._____, No. of
Area No. of housein acres houses holda
2 . 3
REVENUE THANA-MAHUADANR-contd.
Mahuadanr ,G. P,--concld .
48 (139) Meram 49 (140) Putrungi 50 (141) Jarhatoli 51 (142) Duari 52 (143) Korwatoli 53 (144) Champa P2, Me 54 (145) Tahir 55 (146) Sidra Me 56 (147) Kuro Kalal\. 57 (148) Kuro Khurd 58 (149) BIsrampur P, Me 59 (151) Gansa 60 (152) Korwadih 61 (153) Kurund P, Oe
Sug,i
.. -1,104.17 296.05 536.14 530.08 474.27
2,630.78 1,017.11 1,424.18
939:27 224.9Q 100.88 941.58 901.4,0
1,807.23
62 (120) 63 (121) 64 (122) 65 (125) 66 (126) 67 (127) 68 (128)
.69 (129)
Jangsi .. 927.96 375.50 826.89 940.00
70 (130) ,71 (131) 72 (.]32) 73 (150) 74 (15q) ~75 (158)
76 (78) :n (79) 78 (80) 79 (84) 80 (85.) 8'1 (86) 82 (87) 83 (88) 84 (89) 85 (90)
Chainpur- P, Me .. Harinaghura aHas Bijgato.li .. A'-lnratoli alias KhapartolaP Baheratoli Ahirpurwa Rajdandfl Beltoli
P Me
Parhatoli P Partabput Nagar Me Shahpur Dumardih Chutia
1,886.87 681.51 455.61 647.00 490."27 365.01 777.04
2,640.02 . . .1,781.64
529.22
Dauna P 3,03{05 Adhe 1,929.65 Korgi ~,424.23 Dump P, Me 6,441.16 Bar 943.87 Lurgumi Khurd 900.87 Pakardih '334.96 Lurgumi Kalan .. 625.38 BardauniKhurd alias Pandeytoli P 188.05 Bardauni Kalan M, C, Rhc, 606.16
Oe,Mc
Neterhat G. P.
86 (83) Naina 87 (163) Sirsi
3,432.67 3,39.6.88
812.24 1,054.84
88 (164) Horeheng 89 (165) Aigu
90 (159) 91 (160) 92 (161) 93 (162)
Danrkapu Garh Burhni Barahi Karkat
P P,L,C Me
538.21 825:58
1,057.42 1,965.43
7 47 26
163 16 9C 35 43 46 44
'82
'56 13 71 15
104 47 34 64 41
,99 34 55 40 36
47 14 '32 57 2
48 12 46 14 36
7 '50 19 10
52 61 64 ·33'
5
15 50 26
171 16 93 37 44 46 • 44
86
-60 13 89 20
107 47 36 77 46
113 36 56 48_ 39
53 14 32 67 2
54 16 58 14 46
7 51 21 10
·58 £2 67 ,33
Total number ofpersons enumerated (including
VILLAGE
SUBDIVISION
ANCH4L
inmates of illBtitutions Scheduled Scheduled
Literate and
educated persons and houscless persons) castes tribes
P
6
104 296 136
968 83
566 ~ 205 289 282 270
511
358 79
529 112 574 323 221 453 271 540 205 270 259 212
301 59
229 359
13 210 ·'73 286 85
229
34 263 141 90
308 431 367 185
M
7
59 141
70
J-
454 44
267 104 153 • 152 127
252
182 40
256 '51 280 153 104 231 131 266
99 139 150 110
152 28
115 HI4
5 108 36
133 '40 131
15 126 72 45
154 218 198 '91
F
8
45 155 66
514 39
299 101 136 130 143
259
176 39
273 61
294, 170 117 222 140 274 106 131 1l>9 102
149 31
114 175
8 102
37 153 45 98
19 137 69 45
154 213 169
94
M
9
F
10
20 10
19 15
3 3
2 3
17
21 11 20
16
9
3 21
11, 2
13
23 14 25 .. 15
11
.. 3
28
17 2
2
M F M F
11 12 13 14
59 45 122 134
42 39
416 475 44 39
233 248 101 100, 153 136 141 120 124 140
250 256
i77 34
249 48
258 144 97
202 128 229 75 59
133 72
110 27 94
152 2
45 26 80 38
101
170 33
248 55
274 167 112 200 140 232 73 31
106 54
109 '30 96
152 5
39 25 87 43 7.9
15 19
,9 21 17
54 2
63 15 46 48 26
82
44 4
89 13 54 45 16 55 39 12 21
8 47
3
15 3
16 28
9 4
26 15 26
101 111 17 58 56 30 44 45 10
110 '188 166 68
119 187 146 76
45 30 52 I~
9 1
8
21 2
19 10 6
22
3 3
18
11 7
3 2
6
4
6
3 2
I
12 3 4
1 9 1
5 3
II 1

STATISTICS
LATEHAR
MAHUADANR.
r-----------------' I
Total workers (I-IX) Cultivator
r-~
M
15
35 73 41
255 26
151 64 83 72 70
136
100 23
132 32
157 '79 67
142 68
.156 64 91 87 59
93 22 79
112 3
68 22 87 21 78
10 95 42 2J
85 126 100 55
F
16
30 94 21
M
17
28 60 30
Uninhabited Uninhabited 291 237
20 22 170 120 60 57 71 63 87 60 71 60
Uninhabited 135 118
102 91 20 21
130 1I5 41 27
185 125 94 76 71 62 99 109 81 55
156 125 58 55 83 73 61 63 55 46
86 77 22 21 74 55
116 83 5 2
70 43 24- 22 92 60 23 16 66 53
9 8 70 76 39 37 24 20
80 59 125 112 86 81 55 47
F
18
3 83 19
276 12
145 57 66 80 66
128
98 18
129 35
155 92 66 82 67
125 51 82 57 43
78 19 67 93 5
54 22 66 22 42
6 60 38 24
65 1I0 75 55
183
WORXlIiBB
II III IV V VI VII VIII IX Manu- Transport,
facturing Storage Agricul- Mining. House- other than Trade and
tural Qu an y- hold Household Cons- and Commu- Other labourer ing, etc. Industry Industry truction Commerce nications Services .---~ ,..--"---. ,.--"---. ~ ,..--"-..:.... ~ .---.....__, r-"'___'
M FMFMt"MFMFMF M F M F
19 20 21 22 23 24 25 26 27 28 29 30 31 32 33 34
4 26 3 .. 9 10 .. 4 1 ,. .. .. ,. . . 8 2 I , . .. .. .. .. 1 " 1
2 6 .. 8 8 .. " .. .. 8 3 8 1 .. .. ..
12 19 3 10 3 .. .. . . .. 9 I 3 .. 2 3 .. I 6 1 5 4 I 7 I 6 .. 6 1 .. .. .. 5 1 3 2 5 2 I .. .. .. .. 1
4 4 12 3 .. .. .. 2
2 2 .. .. 4 I .. .. 3 . , 1 1 1 .. .. .. I 4 1 .. 6 .. I 1 3 I I 1 6 2 .. . , .. 2 6 16 .. . , 12 10 3 3 .. .. 7 1 4
1 .. .. 1 1 .. .. .. 2 ., 2 4 3 .. . ,
" I 4 9 .. 15 5 4 .. .. 2 1 8 2 3 5 " 1 5 8 .. ,. 3 .. ., 2 4 31 .. .. 22 1 I 1 2 4 4 .. .. .. I .. .. .. 4: I
.. .. 15 .. .. 3 1 4 4 I . . 2 .. 13 .. .. . . 2 2
.. 13 12 .. .. .. .. 2 6 3 7 2 .. 3
" 1 2 .. I 4 3 20 3 " I 4 18 20 4 .. I .. .. .. .. 4 1 .. .. 3 3 2 20 13 .. .. .. ..
1 . , I .. .. .. 15 25 5 .. 4 .. 3 1 3 1 1 .. .. .. .. .. .. I
10 19 5 3 .. .. .. .. .. I . . 6 4
2 3 .. 7 9 7 I 4 I I 2 ,. 1 1 .. I
1
2 3 I I 13 10 .. .. .. 5 .. 5 1 4 3 3 5 2 3 I 4 4 2 1 2 1 7 6 1 " .. .. 7 3
6 2 ..
BIHAR
X
81. Non-workers no.
I .---~c::;
M
35
24 68 29
199 18
116 40 70 80 57
116
82 17
124 19
123 74 37 89 63
110 35 48 63 51
59 6
36 72 2
40 14-46 19 53
5 31 30 24
69 92 98 36
F
36
15 61 45
223 19
129 41 65 43 72
124
74 19
143 20
109 76 46
123 59
118 48 48 48 47
63 9
40 59
3 32 13 61 22 32
10 67 30 21
74 88 83 39
48 49 50 51 52 53 54 55 56 57 58 59 60 61
62 63 64 65 66 67 68 69 70 71 72 73 74 75
76 77 78 79 80 81 82 83 84 85
86 87 88 89
90 91 92 93

184
PALAMAU VILJ.AGE
SUBDIVISION
ANCHAL
Occupied resid ential
houses ,.---~ Total num ber of persons Literate
No. of enumerated (including and Serial no. Arta No. of house. inmates, of institutions Scheduled Scbednl(d educated
(Tbllnano.) Name of village in acres bouses bolds and houseless persons) castes tribes persoIl, ".--_"____' ~ ..
,.--~
P M F ,~ F :M F M F
1 2 ~ <\ 6 7 I'> 9 10 11 12 13 10\
REVENUE THANA-MAHUADANR-eontd.
Barahi G, P.-concld.
94- (166) Kewarki 1,717.85 38 4-4 255 121 13,4 121 134- il- I 95 (167) Paharkapu 1,530.48 4-8 52 236 116 120 65 64 34- 9
96 (154) Sohar P, Me, V, Hos, Rve 3,085.36 99 101 518 269 249 103 86 66 63 37 4 97 (155) Mail P 2,220.45 50 54 309 158 151 153 14,5 17 98 (157) BeI"jVar 711.44 34- 38 183 '\99 84 99 84 9 99 (168) Husmu P 2,665.25 24 24 183 93 90 92 90 14 1
100 (169) Nawatoli P 575.17 22- 23 147 77 70 77 ,70 7 3 101 (170) Hurmundatoli 1,083.52 34- 34 222 122 100 122 100 II 2 102 (171) Arahans P, Me 1,764.71 41 46 244 1'23 "1'21 115 115 21 2 103 (172) Besrakona 544.92 2 2 8 4 4- I I 3 1 104- (173) Chormanrwa P 2,489.81 89 93 502 232 270 232 270 44- 13
ANCHAL TOTAL 153,111.30 5,086 5,622 30,304 15,150 15,154 405 389 12,853 13,0253,445 799 or
239.24 sq. miles

185
STATISTICS
LATEHAR
MAHUADANR. WORKERS r-___________________________________ J--. __________________ . ______________ ~
Total work en (I-IX)
M
15
73 81
151 93 61 56 37 67 70 3
144
8,724
F
16
87 73
162 81 48 52 35 55 79 1
152
8,426
P-II--24
I
Cultivator
17 18
69 87 72 64
132 152 86 80 59 46 51 47 37 36 64 54 67 73
136 150
7,056 7,614
II III IV V VI VII VIn Manu- Traruport,
Cacturing Storage Agricu)- Mining. House- other than Trade and tural Quarry- hold Household Cons- and Commu.
labourer ing, etc. Industry Industry truction Commerce nieations
IX
Other Servicea
M
19
FMFMFMFMFMF M F .M F
20 21 22 23 24 25 26 27 28 29 30 31 32 33 34
.. 4 .. 3 6 3 3 2 .. 1 .. 6 10 2 .. . . .. .. .. 2 9
1 1 .. " .. J .. 4 1 2 " " " 1 1 4- " .. 2 " " .. 2
" . , .. 1 1 .. .. " 2
5 .. .. 1 J .. .. .. . . 2 .. 2 1 1 I .. .. .. .. .. .. .. . . 8
427 511 169 44480226 28 8 32 2 135 21 8 389 101
BIHAR.
x
81. Non-worken no, ,.------. M
35
48 35
ll8 65 38 37 40 55 53 1
88
6,426
F
36
47 47
87 70 35 33 34 45 42
1 113
6,728
94 95
96 97 98 99
100 101 102 103 104

186
PALAMAU VILLAGE
SUBDIVISION
ANCHAI..
Occupied residential
houses . ,..----'-----.. Total number of persons Lit date No. of enumerated (including and
Serial no. Area No. of house- inmates of institutions Scheduled Scheduled educated (Th'ana no.) Name of village in acres houses holds and houseless persons) castes tribes persons
-. ..---....___, r---"--- .--......__, P M F M F M F M F
1 2 3 4 5 6 7 8 9 10 II 12 _ 13 14-
REVENUE THANA-MAHUADANR-colltd.
I (50) Armu alias Marchaia 1,580.46 22 26 151 71 80 I 2 69 80 5 2 (51) Purni Armu 152.27 14 17 90 49 41 49 41 4 3 (52) Hesag 121.88 22 27 170 83 87 83 87 8 2 ~ ?3) Purtii Hesag . .122.35 1 '3 10' ·5 5 " 5 5 5 54) Lohurtanr 220.93 22 34 174 83 !h 2 71 86 16 3 6 (55l Samodhtola I •• 233.66 7 17 60 30 30 .. 27 25 17 3 7 (56 Garu P, A, Hos,Rhc 707.64 10 10 31 16 15 2 2 11 10 8 3 8 (57) Dhartgartola M 334.36 65 71 305 15tT 155 44 57 62 93 69 110 9 ~58) Bhanwarbandh 1',017.56 14 18 83 42' 41 16 16 26 25 5
10 59) Surkumi P 3,380.83 84 - 94 441 232 209 6 3 2i3 198 30 3 11 60) Maromar P 3,079.77 33 39 162 85 77 3 7 74- 68 20 4-, 12 (41') Tolahurdag alias Chirodih 523.22 21 22 149 77 72 77 72' 7 13 (43) Goendi P 851. 71 21 21 110 60 50 5 5~ 48 5 14- (44) Kui 511.13 20 22 121 68 53 17 15 ,50 36 3 15 (45) Hethtola 989.83 22 24 118 53 65 49 47 'I 16 (46) irarZl.!ai P 976.66 51 60 328 169 159 167 158 17 17 ?47) Baherwatola 450.93 13 23 111 55 56 55 56 11 18 48) Daldal,ia 689.09 32 36 179 95 84 20 19 66 58 14 19 (49) Lohargara 710.07 29 33 174 85 89 10 9 73 78 8
20 (31) Siram 833.65 10 10 39 13 26 9 23 1 I ~1 (32) Kotam P 1,040.74 97 ' 106 538 265 273 32 33 147 240 69 6 :22 t) Baigatoli 634.36 40 51 226 114 112 21 28 83 73 24 2 :23 34) Salwe 1,312.38 38 39 201 98 103 13 17 84 83 9 :24 42) Hurd as 2,010.50 23 23 106 54 52 4 5 50 47 2
~!, (1) Piri P 935.02 39- 47 247 99 148 7 4- 92 144 ~ !'S' 26 (2) Makundpur 998.0~ 33 41 202 95 107 6 8 89 94 10 27 (3) Bheriabathan 46.87 28 (4) Chipru 453.16 23 23 97 49 48 49 48 4 29 (5) Rol 860.26 21 25 148 81 67 81 52 18 1 -SO (6) Patratu 457.22 44 47 242 118 124 43 48 30 3 31 (7) Sonwar 478.94 21 21 104 57 47 53 47 4 32 (8) Udaipur M 151.09 37 40 184 100 84 28 18 16 10 24 2 33 (9) Hanumantola I' 32.40 34 (15) Ghasitola 398.37 37 40 184 100' 84 78 68 10 10 24 2 35 (38~ Karitola 623.45 4 5 21 10 11 10 11 1
~~ ~39 Doram 579.83 23 35. 194 89 105 89 105 5 40 Korwatola 941.49 18 21 137 ,68 69 1 67 68 '9
38 (10) Sarju P,M, m 425.23 60 81 355 174 181 114 122 81 20 39 (11~ Gotag 561.79 14 15 80 42 38 42 38 4 40 (12 Pailapathal 1,066.75
14 15 41 (13) Chanchu 331.01 7I 38 33 1 37 33 3 42 (14) Alagdiha . 426.31 29 35 128 69 59 15 14 54 45 14 43 (16) Murpa 615.18, 6 8 43 20 23 5 6 15 17 4' 3 44 (17) Lai 65.5.21 28 39 216 105 III 105 110 20 2 45 (18) Gasigara 496.25 2 2 10 3 7 3 7 46 (19) Bandua P 1,797.01 55 69 367 199 168 191 165 34 1 47 (35) Chorha P 1,581.74 65 85 418 221 197 45 29 176 168 40 .. 48 (36) Dabri P 836.80 30 36 221 122 99 37 24 85 75 19 1 49 (37) Puranki Dabri 695.43 23 31 173 82 91 82 91 16

187
STATISTICS BIHAR.
, LATEHAR
GARU WORKERS
I II III IV V VI VII VIII IX X Manu- Transport,
facturing Storage Agricul. Mining, House- other than Trade and
Other Total workers tural Quarry- hold Household Co~- and ~mf!lu. 81. (I-IX) Cultivator labourer jng, etc. Industry Industry tructlon Commerce nlcatloDs Services Non-workers no.
,...---------. ,.---~ ,---"--......, __ .....___ ~,....-----. ....---. ~'"' ~ ..... ~ r--""'-~ ~.A. __ .....
M F M F M F M F M F M F M F M F M F M JJ M JJ
15 ]6 17 18 ]9 20 21 22 23 24 25 26 27 28 29 lIO Sl 32 33 34- 35 36
47 41 14 37 4 29 4- .. .. .. 24 39 1 .26 23 20 21 2 6 " .. .. " .. 23 18 2 51 49 30 47 16 2 .. " .. 3 2 32 S8 3
7. 4- 2 4 .. " .. .. .. . . S 1 4 52 47 27 40 1 23 6 2 31 44 5 16 15 14 13 2 .. .. 2 14 15 6 13 7 I 6 .. 7 I .. .. .. 2 3 3 8 7 77 73 17 41 I 10 29 a 4 3 1 .. .. " 16 5 9 6 73 82 8 28 22 19 18 1 I 6 .. .. .. " .. "
2 3 14 19 9 153 123 72 71 10 25 62 23 2 2 1 .. 3 1 3 1 79 86 10 52 36 28 33 .. 19 2 . . .. 3 1 2 33 4] 11
39 36 21 20 15 16 3 .. " .. 38 36 12
38 30 30 27 3 3 2 1 1 " J .. 22 20 13
39 31 25 22 9 5 1 I 3 3 .. J .. 29 22 14-35 36 24 23 4 13 3 I "
3 .. 18 29 15 100 92 74 82 7 10 16 " 2 .. 1 69 67 16 28 44- 22 38 .3 6 :3 " .. .. .. " ... .. 27 12 17 56 50 41 45 1 3 10 "
3 1 1 I 39 34 18 48 49 29 44 2 1 13 " 2 .. .. .. .. .. 1 1 1 3 37 40 19
8 16 3 2 1 13 4 " .. .. .. .. .. .. 5 10 20 160 142 103 113 23 28 25 " 1 .. .. .. 4 1 4 105 131 21: 70 63 27 51 17 12 20 .. .. " 2 .. 4 44 49 22 64 57 19 34 20 39 3 3 .. " .. .. 7. .. I 34 46 23' 37 30 18 25 1 4 15 3 1 .. .. " .. 17 22 24
64 45 46 34 8 7 " " .. .. 3 11 35 103 25 54 57 47 36 3 17 4 .. .. .. " .. .. .. 4 41 50 26
Uninhahited 27 29 30 23 16 6 11 .. .. .. " " .. 20 18 28 4'6 38 29 27 14 11 .. .. " " .. " " .. S 35 29 29 65 64 30 42 35 22 " .. .. .. " " .. .. " .. 53 60 30 34 31 19 20 J4. 11 .. .. " " .. " .. .. 1 23 16 31 51 48 18 20 25 28 4 " .. .. " " .. " 3 .. I 49 36 32
Uninhabited 33. 51 48 18 20 25 28 4 " .. .. .. .. 3 .. 49 36 34-7 7 7 7 .. .. .. . . .. .. 3 4 35
51 55 35 42 10 8 4 2 2 " .. .. 3 38 50 36. 41 40 30 28 4- 5 6 .. .. .. .. .. .. " . . " 1 7 27 29 3;
95 65 54 32 16 33 6 I .. 2 .. 14 79 116 38; 29 22 16 17 11 5 2 .. .. .. . . . , .. 13 16 39'
Uninhabited 40, 23 19 12 11 10 a 1 ., .. 15 14 41 36 35 20 27 12 7 I I ., .. .. .. . , .. 3 33 24 42-9 B 6 5 3 :3 .. .. .. " II 15 4-~ 54 52 40 37 10 15 1 .. 2 .. ., .. 1 51 59 44 2 3 1 2 2 .. .. .. ., ., .. I 4- 4S 105 101 92 96 6 4 2 .. 1 .. . , .. 2 I 2 94 67 46 125 110 103 94 12 15 3 .. S 1 .. .. .. .. 2 96 87 47 63 60 47 56 10 4- 2 .. 2 .. .. .. . , .. . . .. 2 59 39 48 41 44 39 44 2 .. " .. ., .. .. . . 41 47 49

188
PALAMAU VILLAGE
SUBDIVISION
ANCHAL
Occupied residential
houses ,---"""'____' Total number of per SOD! Literate
No. of enumerated (including and Serial no. Area No. of house- inmates of institutions Scheduled Scheduled educated
(Thana no.) Name of village in acres houses holds and houseless penoils) castes tribes persons
r---- ,.--~ ,----"-----. ,.-_.A..-""""".
P M F M F M F M F
2 3 4 5 6 7 8 9 10 11 12 13 41
REVENUE THANA-MAHUADANR-concld.
50 (20) Sima Khas 839.24 30 36 177 92 85 8 9 59 76 25 ~-51 ~21) Chanpi 1,130.25 9 9 33 17 16 17 16 52 22) Rud P 1,203.59 60 70 361 175 186 8 12 166 174 61 1 53 (23) Tati 195.,80 54 (24) Chiraiya \ 40.98 5 5 26 15 II 14 10 55 (25) Kante 380.96 56 (26) Mahuadabar 161.40 9 16 83 42 / 41 18 12 11 14 17 6 57 (27) Kabri p 178.48 32 40 196 130 66 12 13 68 53 25 2 58 (28) Hendehas 288.77 17 21 124 60 64 3 5 57 59 15 59 (29) Baribandh p 1,772.42 43 j-6 248 122 126 122 126 10 1 60 (30) Dad Chhapar 5'65.97 21 24 97 47' 50 47 50
61 (61~ Derhganw 382.69 43 43 170 93 77 25 25 55 45 17 2 62 (62 Baresanr P 2,954.96 82 83 307 163 144 14 14 89 84 25 2 63 (63 Mangra 736.83 5 5 24 11 13 11 13
64 (64) Ramseli P 1,433.15 61 61 2~5 141 144 2 85 86 31 2 65 (65) Danrkocha 405.61 21 21 93 48 45 47 45 10 I 66 (66) Mayapur P2 716.70 107 115 542 257 285 31 36 212 215 84 18 67 (67) Paharkocha 2,789.29 25 28 128 63 65 52 51 8
68 (IJ) Latu p NA 19 20 129 61 68 61 68 14 6 69 ~2J) Kojram P NA 21 24 89 37 52 37 52 15. 3 70 3J) Karihenar NA 28 30 191 101 90 101 90 1
-,71 (4J? Bajajpur P NA 27 31 171 76 ' 95 70 -95 14 3
'72 (5J Ghuturu NA 32 32 204 105 99 105 99 16 2 'J3 (6J Pandra NA 28 36 184 94- 90 94 90. 22 3
ANCHAL TOTAL 55,107.95 2,062 2,383 11,781 5,943 5,838 684 5S0 4,691 4,8081,146 141 or
86'11 sq. mile.

189
STATISTICS BIHAR
LATEHAR
~ARU WORKERS
I II III IV V VI VII VIn IX X Manu- Transport,
facturing Storage Agncul- Mining, House- other than Trade and
Total workers turaJ Quarry- hoJd Household Cons- and Commu- Other Sl. (I-IX) Cultivator labourer ing, etc. Industry Industry truction Commerce nications Services N ')n-workers no.
r--..... -~ ,..--"""_____ ~ ~,.-~ ~ ,.-""___' ~-. ..... -......_____ ,.--"""_____ ..--.....__, M F M: F M F M F M F M F M F M F M F M F M F
15 16 17 18 19 20 21 22 23 24 25 26 27 23 29 30 31 32 33 34 35 36
59 37 35 32 .. 2 12 .. J .. 6 . . b 2 33 43 50 12 10 5 2 6 7 I .. .. .. .. 1 5 6 51 95 126 63 88 15 28 13 10 3 .. .. .. . . .. 80 60 52
Uninhabited 53 9 6 5 4 4 .. .. .. .. .. .. . . 6 5 54
Uninhabited 55 21 13 8 3 1 7 10 1 1 .. ' . .. 2 21 28 56 65 37 40 18 18 17 5 2 " .. " ' . 2 .. 65 29 57 36 15 34 12 2 3 .. .. . . .. . . .. ' . .. 24 :1-9 58 79 73 33 25 II 43 35 3 .. 2 .. " ' . .. 43 53 59 30 29 11 10 4 19 15 .. " .. .. .. .. . . 17 21 60
56 49 10 20 9 24 3J .. 2 5 .. 1 1 2 .. 37 28 61 104 80 14 47 7 23 51 I 5 1 3 " .. .. 12 7 2 10 I 59 64 62
5 8 4 1 4 4 .. .. .. .. .. .. . . .. . . 6 5 63 ,
84 81 37 68 3 1 I 40 .. 2 2 .. .. .. . . I . . 57 63 64 30 28 24 23 5 5 .. .. .. .. J .. 18 17 65
143 165 97 132 27 33 12 .. .. .. . . .. .. 3 4 114 120 66 38 40 32 32 4 6 2 .. .. 1 .. .. . . . . .. 1 25 25 67
39 40 17 28 4 5 .. .. .. .. 16 8 22 28 68 13 31 5 28 .. 3 2 .. .. . . 6 24 21 69 68 57 38 1 29 56 J .. .. .. .. 33 33 70 45 59 39 49 2 10 2 1 .. J 31 36 71 62 62 59 57 4 .. J 2 .. .. .. .. .. " ' . J 43 37 72 59 58 38 45 5 3 12 9 4 1 .. .. .. .. 35 32 73
1,466 3,202 2,055 2,294 485 733655 '17 55 24 11 .. 77 f9 11 116 55 2,477 2,836


E~PLANATORY NOTE
Town Statistics give the same data as Village Statistics, but for urban areas.
According to the definitIon adopted for the 1961 Census a town included "(i) every municipality or notified area; (ii) all civil lines not included within municipal limits; (iii) every contonment, and (ilJ) such other places which have (a) a population of not less than 5,000, (b) density not less than 1,000 persons per square mile, (c) at least 314th of the adult male population engaged in non-agricultu-
ral livelihood, and Cd) which have been declared tobe a town for census purposes by the Superintendent of Census Operations because of die historical or administrative importance of the place, or such other factor."
As areas of individual wards Were not available, only the town areas have been given.
Other concepts and explanations are the same aq in the case of Village Statistics.

192
PALAMAU TOWN
Occupitd residential
houses Total number of persons Literate
No. of enumerated (including and' Area In No. of house- inmates of institutions Scheduled Sc.beduled educated
Serial no. Town/Ward no. Iq. miles houses holds and homeless persons) castes tribes persons ,--_ _';;__ __, r-.... - .... ~~--
p M F M' F II F M' F
2 6 7 8- 9 10 11 12 13 14-
SUBDIVISION
DAL TONGAN] (M) 3.50 4,265 4,828 25,270 t4,044 11,226 1,074 980 247 128 9,349 4,30f
1 Ward no. I 917 954 4,528 2,468 2,060 195 190 4 5 1,677 I 691 2 Ward no. II 582 605 3,046 1,790 1,256 ll6 105 64- 12 1,275 632' 3 Ward no. III 491 617 3,346 2,063 1,283 365 224 69 57 • 1,324 574-4 Ward no. IV 187 203 1,167 605 562 21 28 391 -237 5 Ward no. V 239 239 1,205 728 477 . 17 14 590 274 6 Ward no. VI 52 52 329 • 176 153 149 III 7 Ward no. VII 112 121 887 474 413 374 232 8 Ward no. VIII 268 331 1,767 939 828 178 233 497 188 9 Ward no. IX 209 240 1,629 845 784 27 18 10 5 482 220
10 Ward no. X 284 301 1,596 810 786 6 6 1 17 547 370 11 Ward no. XI 193 210 1,133 618 515 18 14 10 :10 429 245 12 Ward no. XII 731 955 4,637 2,528 2,109 148 162 72 8 1,614- 53G-
HUSSAINABAD TOWN U5 1,498 1,542 9,464 4,869 4,595 1,048 979 8 3 1,994 672
I Ward no. I 403 413 2,230 1,251 979 229 189 3 634 134 2 Ward no. II 229 230 1,721 879 842 130 125 4- 2 43O 176 3 Ward no. III 220 235 1,472 694 778 160 158 1 1 290 165 4 Ward no. IV 325 338 2,133 1,098 1,035 244- 243 381 ll4 5 Ward no. V 321 326 1,908 947 961 285 264 259 83
SUBDIVISION GAR.HWA (N) 4.70 2,039 2,264 11,656 6,199 5,457 783 636 70 80 3,136 887
1 Ward no. I 320 328 1,751 870 881 204 191 356 36 2 Ward no. II 298 371 1,769 940 I 829 185 164 2 2 321 70 3 Ward no III 191 204 1,015 578 437 75 57 10 1 318 90 4- Ward no. IV 500 556 2,628 1,385 1,243 37 32 5 4 851 . 242 5 Ward no. V 341 393 2,257 1,241 1,016 129 107 804 352 6 Ward no. VI 389 412 2,236 1,185 1,051 153 85 53 73 486 97
SUBDIVISION LATEHAR TOWN 5.18 1,352 1,495 7,689 4,200 3,489 926 947 377 267 1,991 54S
I Ward no. I 26 26 134 57 77 43 \ 50 2 5 17 l' 2 Ward no. II 58 70 408 218 190 118 105 49 43 81 40 3 Ward no. III 345 373 1,650 914 736 131 124 46 32 389 llS 4- Ward no. IV 354 398 2,166 1,158 1,008 172 208 50 40 643 191 5 Ward no'. V 96 103 521 259 262 70 62 23 8 91 15 6 Ward no. VI 138 139 154 473 281 52 48 103 55 256 8] 7 Ward no. VII 163 193 1,068 630- 438 161 163 42 21 370 58 8 Ward no. VIII 56 61 338 164 174 84 99 20 20 35 8 9 Ward no. IX 116 132 650 327 323 95 88 42 43 109 42
NETARHAT TOWN 7.05 409 443 2,085 1,375 710 31 21 646 572 694 4a
1 Ward no. I 115 141 730 622 108 9 I 109 88 511 40 2 Ward no. II 92 96 340 246 94 12 11 118 64 117 6 3 Ward no, III 114 116 612 303 309 10 9 264 294- 30 2 4 Ward no. IV 44- 46 262 128 1s-t 90 81 10 5 Ward no. V 44 44- 141 76. 65 45 45 26
NOTE: The following abbreviations have been used for the status of town, e. g. :
(M)_Municipa1ity (N) Notified Area
Where no Symbol occurs, it means that the place has been treated as town for Census purposes, according to the definition explained in the Explanatory Note.

STATISTICS
Total worken (I-IX)
M
15
S.ADAR.
6,555
1,183 794 891 294-375 86
208 474 393 366 294
1,197
2,436
643 442 332 534 435
GARHWA
F
16
819
122 142 154 65 16
4 8
4B 63 39 46
112
245
62 52 16 55 61
3,365 1,040
487 528 363 '.'718 1643 626
LATEHAR
176 309 121 134-122 178
2,151 755
33 95
548 562 143 203 2BO
99 18B
753
31 34
186 13B 54 23
103 49
137
345
215 9 21B 49 174 174 B4 71 62 42
.p-JI-25
193
WORKER!!
I II [II IV V VI VII Vln IX X Manu· TrlUlJpoI't,
facturing Storage Agricul. Mining, House- other than Trade and
lural Quarry. hold Household Cons. and Commu. Other 81. labourer ing, etc. Industry Industry truction Commerce nicationl Services Non_orkell DO. Cultivator ~ ~ ...-.A. ...... ..----.. ,...-....-, ,....-.A--, ,..------.
~ F
17 IB
M FMFMFMFMF MF M F M F .M
35 19 20 21 22 23 24 25 26 27 28 29 SO 31 32 33 34
154 19 36 10 145 6 292 63 95& 22 224 4 1,25l 55 625
9 8
98 2 7 1 9
1 13 6
2,
3 2
11 1
5 4
11 1
1 11 3
65 2 61 22 163 4 13 28 II 79 4
1 25 1 13 7 66 1 1 .• 19 1 48 2 4 .. 5.. 35 1 1 .. 11 .. 10 .. 4 .. 19 .. 5 3 45 10 110 5 5 .. 23 4 98 1 1 .. 6 .. 85 3
8 1 17 4- 56 • • 20 •• 64 4 187 1
37 3 200 10 24 .. 105 3 92 1 73 6
3 .. 62 3 15 .. 62 1 " 44 3 3 119 4 122 7
15 .. 89 10 3 150 5 4 87 1
24 .. 139 6
271 61 66 17 44-
4 37 36 12 18
86
313 27 162 26 62 \I 515 56 23(1 21 62 .. 342 31 190
89. 49 37 58 80
5 1 1 4-
16
31 22 12 74-23
9 13 1 4
4 13 4
3 37
.. 97
.. 108
.. 98
.. 133 4 79
14 63 2 12 34 5 6 20 2 9 66 11
15 47 1
14 .. 75 7 3 .. 110 9
34 .. 41 2 .') .. 86 7 6 .• 30 6
121 19 10 34 6
454 306 182 194 229 18 285 125 369 63 53 .. 593 72 178
83 126 40 40 67 98
63 124 47 18 28 26
36 21 14 1
109
10 81 4 67 86 8 31 28 .. 1 16 ..
8 .. 85 10 6
47 34 93 23 40 37 36 8 6
7 6 33 3 16 89 20 84 21 17 55 18 82 5 3 47 10 41 3 11
.. 75 22
.. 55 13
.. 15 2
.. 150 15
.• 244 13 " 54 7
5 18 20 36 21 78
328 253 150 133 180 37 146 29 79 3 39 " 239 20 172
14 46 41 68 25 23 60 25 26
27 23 84 11 33 5
20 6
44
7 22
5 8 1
23 46 23 15
2 4- .... 5 5 2 1 7 98 33 41 12 8 7 .. 53 12
7 .. 14 .. 2 16 8 1
66 16 4 12 2 19 11 24 16 .. 16 1
2 1 ..
41 21 1
3 1 3 8 2 1 •• 3 ..
1 1 1 .. 2 3 " 52 2 4 .. 126 2 4.. 5 6 .. 2 4- •• 43 3 1 .. 4 1
15.. 4- 12
2 4
126 18 1 1 9 2 9
165 136 17 18 39 1 .. .. 15 .. 168 44 4.. 24
88 81 64 50
3 5
5 4 8
6 .. 8
6 11 1 7 2 .. 5 12
9 1 1.. 5 3 44 44 18 1 11.. 3
2 2 .. 10 ......
7 2,1M4 633 7,4119 10,401'
6 372 472 447 141 203
19 50
151 127 107 87
668
72 124 134 57 14
1 8
23 47 31 22
100
1,285 996
1,172 311 353 90
266 465 452 444 324
1,331
1,9SB 1,110(. 1,129
497 461 149 405 780 721 747 469
1,997
560 80 2,433 4,350
190 93 76 74-
127
25 24 4
11 16
558 437 362 564-512
917 790 793 980 900
2 1,OU 260 2,834 4,417
.. 2
66 140 190 285 172 169
20 52 32 59 58 39
383 412 215 667 598 559
705 520 316
1,109 894-873
818 215 2,049 2,734
4 12
141 257
83 123 82 32 84
.. 5
48 104-
21 12 6
23 56
331 146
193 9 45 5 55 86 12 14 26 32
24 123 266 596 116 270 350 65
139
622
407 82
129 44-14-
46 156 550 870 208 258 335 125 1'86
365
99 45
135 63 2J
I 2 3 4-5 6 7 8 9
10 11 12
1 2 3 4-5
I 2 3 4.-5 6
1 2 3 4-5 6 7 8 9
1 ! S 4-5


ANCHAL MAPS

2
DALTONGANJANCHAL
INDEX TO VILLAGE NAMES
192 Nimia 193 Bajraha 213 Sonpurwa 216 Chak Barewa 220 Nauadhonrha:
223 Nawatoli
224 Chatti 225 Sinduria
227 Madhunebhi 228 Babunebh i
229 Bairia 231 Polpol Khurd
REfERENCES
Bound.a'r;- St.tt c'P District with Pll1&.1'.
do Revenue Thana.
~o Anchal. Police SU,tlon.
do P.andll),ar.
do Vnrage.
do Forese.
N<1.!1nrd Highway, •
State Higr.way, , •
ROld~l-Meialled. Un.,,¢talled ••
Railway hne Broad Gallge With StatlP" •
. -.. -.~
. ----~
NATIONAL HIGJ.fWAY
STATE HIGHWAY
, .= __ L __ .. ® ...
do Metre or Narrow Gaoge wtth station. ___ ...... '-_ ...
RIver or Strelm. • • • • • • • .. ~ C;:anal WIth distrIbutary and locic. • • • • • •• !2''.!!'~U' ~
lo~k
238 Kishunpur
241 S embhu Chak 244 Ledwa Khar 248 Nawadih
249 Rupaundha 251 Rajderwa 252 Shahganj 253 Tabar
257 Jora Hunhe alias Jora 259 Dulsulmi
262 Kathautia
REFERENCES
Anehal Headquarters, Police Station • . . Hlne. Maternity Centre. Health Sub - centre:
Camj)lng Ground, Circuit House ••
Bunplows:- Oak, Inspection, Canal & Forest"
Relt House. Ho,plcal. Olspensary. • •
Post Offl,!. Pou Z, Tele:raph Ofhce •
foresc- I\eserved, Protected • • •
Town, Bench Mark. • • • .. • •
TI'IIOPQmet~::31 Statlcn WIth hCI,~t.
Gram Panchayat, Uninlfabited 'I1l1a,,, ...
V,lIag.' below 2000 POp~'ltlon. •
do betw .. n 2000 - 1000 do 0
do .bov. 5000 do •••
o® r ... I1.C. H.S.
• C.G CoHo
• D.B. '.B. C.B. F.a.
• R.I.... HOI.. Oil.
o P.O.
.R1'
o~
.G.P.
P.T,O.
~.f.
B.M.SIJ
RAIPU'tO,llll
• • •

•
• 24 o·
\
3
84· r • .: IS' ~ .s. d MAP Of
~ DAL~ONGANJ ANORAL • 13
5S'
.............
·INSET X
• 24
• 24
o·
· 21 -'\"' lS'
/... t;{ ~
--.....--------:r----------.--.--1l4' 5' E of GRHNW<:1i IH' (D' 84° IS'

4
CHAINPUR ANCHAL
INDEX TO VILLAGE NAMES
l.2. Katuwal Kalan
13 Katuwal Khurd 16 Bhat Kolhua
17 Kolhua Kh urd
19 Mahuliya
22 Turuk Taleya alias l>urubdiha 23 Bhaonadiri
24 Jagarnathpur
34 Sonpurwa
35 Khutar Kalan
36 Khutar Khurd 37 Tali
41 Purna Majhgawan
REFERENCES
'~nln~a,,:- sutc! or DI$trl,' wit" Pillir. I • • _ •• _ • ~
~o Revenue than •• I •••••• o ____ ~
~o
do
do
do
"nc.h.I. Police StatIon •••••••• __ ••• _ •••
Panthayar •••
VIBage.
Forest ••
NaClonal HIghway. • • • •
State HIghway. • • • • • • •
Roads._ MDlalled, Unmetalled. • • •
Railway line B(oad Gauee with statIon •
NATIONAL HIG!iW"y
STATE I-IIGHwAr
. .. = __ L __
'r.i ... do Metre or Narrow Gaoge wUh stltlon. I • IjI
R.1\'!rorStrelh1 •••••••••••••• ~ Distributary Cantl
Canll WIth di$Ulb1uary and lock. • • , • • ... - -...., :: L,,'
43 Maira
44 Pathra alias Narsinhapuf 45 Naudiha
46 Mathura Dohari
54 Talapara Jhaibar 96 Charka
107 Gardu 117 Hansa
120 Pinrra
133 Semaria
175 Rajhara I78 Alagdiha
REFE~ENCES
Ancbll Hetdquarter.. Police 5tadol'l ..... • * Mine, Haternlt1 Centre, Halt" Sub .. ~nt"e , • H,C,
I.B. C.B,
Hoi
r H.S,
e.H. P.L
Db.
Camplnc Ground. ClrCUI1: t-!a1.Iie. • • • • • • e.G.
aunC,lows:- Oak, Inspection, Canal" Foresi\ .O.B.
kest House. Hosplul. Dispensary. • • • • , • A..H.
PO$t Office, Post & Telegraph Office, •••• ',0. P,T,O.
f'Orest:- P.tserved. Protected • • •
Town. aerlc" M3rk • • • • , • , •
T rlgonometr1cal Station With hel,h~. •
• RJ'.
.~
Gram 'anchar-t. UnlnlAblt"ed Village. • • • G.P.
V,II., .. btlow 2000 popuIUi.h. • • • • • • •
do between 2000 .. 5000 60. • • • • • • •
d. .bov~ 1000 do •• '.' ••••
P,F .
a.H.SI)
MlPURAII17
o
• • •

'lAP 0'::
CHAINPUR ANCHAl
"~y T"'~NA DAl TONGANJ
OISTRICT PAL"M);I)
F~' D"~' ~~..: ~:;:=:::=:;=,=' =r===i1.t11.
(/ I 11<m,
Ccnsu~ O~ Bihar
5
SEE INSET B
., 0'
. 84 5'
INSET A

6
1:BSLIEGANJ ANCHAl.
INDEX TO VILLAGE NAMES
278 Lphrapokhri
302 Pahari Khurd
304 Barganw alias Tetariadih
305 Babhandih
306 Chaukhara 3 ro Chak Maribhang
317 Koiripatra
3 I 8 Akhauripatra
319 Kurainpatra
320 Dhcla
325 Pathrahi
327 Sirrampur
329 Dhobdiha
346 Basaura
347 Dakas Khap 348 Bairia
349 Chak Nawadih
350 Alampur
REfERENCES
hundary:- State or Dlmlc:t with 'Illar •••• _ •• _1:1 ~ do Revenue Thana ............ ____ ~
do Ancha). PolrceSratron ••••••• __ ••• _ ...
do ,Pallch"yaf. • • • • • ••••• __ --=-__ do Village •••••••••••• _ ._._._._._
do Fore ............... , ..... ~ .... " Nallonal Highway ................ NATIONAL HIGHWAY'
Sfle« Highway •••• t ........ I • ... STA.TE WICHWAY
l\oadl:-MetalJed,Unmerllled ............. ~ __ L __
kallway line Broad G.U""wftn sUtlOfl • • • • • ~. do Hetre or Narrow G • .,t With statlcn • ' ~
River or Screaln ................... ::::=:::....~ Cal'ill wleh dl5tribvury and lock. • • • • • .. • ~I!lll!;b"'_ Cand
L«k _
3 5 I Jhar Katta
353 Baksidabra
359 Akhauri ,Dumi
360 Babu Dumi 361 Sotamdabral alias Panredabra
365 Thakuraididri (Chakaididri)
366 Madhodidri (Thakurdidri)
367 Akhourididri
373 Kamal Keria
374 Phutharwa
375 Goradih Piprahat
376 Goradih Kothilwa
377 Goradih Jagatpurwa
381 Muswa Kha p
394 Purs\lram Khap
396 Bansdohar
397 Patkhauliya
402 Baura Khar
~EfE~ENCES
And'lll Htadqulrtert. Police Sc.tlon. • • • • ® MII,e. Maternity Centre. Health 5\)6 - centre • ••
Camping Ground. ClrculC House. '. • • • •• e.G.
M.e. H,S,
e.H.
Buncalows:- Oak. Inspection, Canal & Foresc~ ~ 0.8. 19 C 8. F B
Rm House. Hospital, DIsJ:lensary. .. . • • • • R. H. Hos Of,-.
} .. ost Of~te, 'ost Br Telegraph Offlce_, •••• P.O.
Forett:- Reserved, Protected • • • • • I • • RI.
Town, 'ench Mar~ • • • • , • • • • • • • ~ fr1lonometrlcal Station With belchc ••••••
Gram r.no;harat, Uninhabited villa~~. • • • • • G.P.
""1I3fu btlow 2000 populadon. or =- .....
do between 2000-5000 do. • • • ~ • • •
<10 abo'le SOOO do •
P.T.O.
P.F.
8,M 51)
u'IPURA.117
• • •

, 2~
5'
" H
0'
u' 'S'
[§j , lUh'«"fll P s 1 O .. tt""c''', ps !Part)
."J,' 10 ~1I(h.ll"dOrur'CI l)ouMulu .I<PI ~et~'.r'i(f1 to Su"".t of 'Md,. lQt)C'(n,\lnl S~e.h
'I
o Bt IS'
MAP Of
LESLIEGANJ ANCHAL R.y, THANA DALTONGANJ
DISTkleT PAl.'MAU
c",,", Office, U,h.u
o 2~
5'
o 2~
O·
. 2)
,,'

'-
..L_ .; :.; cD ~ <) ..: 0 • •• :t '" '" ~
"'C u '" :i ::: I-< cD
0: .. ell ::s ~ u ! - "'C ::: ..... ell g I-< :t .,; ell ell I-<
~ ell 'ell ..., ,...c:: A 0... ~ ~
..... ..:
::i~ - ,...c:: I=: ell ::s ::s ell ell I-< 0 ::: .... ...., ..0 ell '"'
...... oj .,; :i <) 0: ..... ..... ...>:! ,...c:: ,...c:: ('j ® • ...... "'C S ..a ..... "'C ell ('j ell S ,...c:: (l) ell ell U d ri. 0: U ('j .....
0... S <11 S ~ 1-0 1-0 C':I ,..:t.: A ~ ..... 1 ~ ::s 1-0 C':I "'C C':I ell 1-0 .... .... ..a ,...c:: C'il .... .... 1-0 ~
.... E '"' <11 1-0 <11 1-0 0... 0 "'C 1-0 <11 ~ {1 OJ) <11 ~ C':I"'C (l)
'i:'> Jt A <11 <11 ..a .... "'C ::s (l) .... j. . 0-1- 1-0 1-0 .J3 OJ) \.) "'C 1-0 ..a ::: - 9 02 1
<11 ,...c:: C':I <11 \.) C1I ..... <11 <11 C1I ('j ..... <11 <11 ::s <11 <11 <11 f-l p-! ~() Cl ~ :r ~ CJ tI) tJ:l ~ ~ j::l;P-!0A Z Il:l Il:l i1i , ..
c ~ ~ ~ . ... 1i ~ S oil e . ...r 0\ 0 I-t I-t <'l ...r ['.. 00 0\ 0 I-t ....., V'I 00 0 H <"'I ....., ....., ::! ':!i i V ; 0 ~ I
<"'I <"'I ....., .,... \0 \0 \0 \0 \0 '0 ['.. ['.. ['.. t-- t-- 00 00 00 00 0\ ~ ~ J! g
~I c:t:l .~ . ] ~ V'I V'I V'I V'I V'I .,... V'I .,..., V'I V'I .,...
V'I V'I .,... V'I V'I V'> V'I V'> V'I :! % 0
5. ] :E 'S ~ ;e tl §. ~ :;; 'S
~ i ! ll. 15 '" c ~ &: ! :! £ ~ . <: ~ ~ ii ..
1 ". ~ ~ c
~ ~ ,,;, ... i ~ ~ ~ z f 5 s : 'ii ~ !( % j ~ e .I. ..c
~ c
~' : ~ Ii j ~ i .:C: " ~ ] ~
~ 0 -l .. i5 ~ ~ ol! l! ~ 'a. f
:c: ~ <: i E ii ~ ~ ~ ! E .: .: H ) ~ f U GO '" of {! J :>
H ..... ~
t:t: I>
Z~ ~ .',_
H11;11 ~
0 ·c ,_ <11 :~ c
~ 3: {1 • u z • % '"
~ ::s . I · ~ %
OJ) I I : ~ ~ ~
.... I .!! .... ; ~ Z '" ! .... . ...
~ ~ " .!!
"> ~
~ ~ w
o::s U ..c ._ ~ Ii:
" i ~ <11 g ~ a
~ ,...c:: i c = ::: 1-0 "'0 ::: a: j t: .; .. .... <11 ::s 1-0 <11. ]
..c
~ ~ ...... ell ,..ct "" ::s ..... CIS i 1-0 1-0 :::l ~ CIS 1-0
A ............
~ 1-0 ell ,...c:: ell ::s ..... ~ ~ Eo 1 ::: ell ::s ::s fr' ..¢I 1-0 1:4 1-0 0 ;f Z
ell ..a ..... 1:4 ::s ..... o...,...c:: 0 ,.c' t · ~ I ::: ~
,...c:: OJ) 0 ell ..... 1-0 j:g ~ ~ 03 ~ ~u 0 .... ...... C1I :>- ell "'0 0-1 <11 ..... 1-0 .... .. j • .=> ell .:: ...... "'C ell .... ell ~l 0... ell "'0 ;J j 1
'5 , r · t 1 ~ .-; 1-0 "'C ell .:: 1-0 ..a ~ OJ) ell .i: s " ..a (l)
E ~ a .:: of .... = i ~ ::s ell .:: ('j '" '3..g 1-0 "'C 1-0 ::s ~ ~ CIS 0... .I. ~ i i ell ..... ell ..... \.) ::s C'il 1-0 0 :c: ..c I: ! 0 ~~ CIS ellA ..a <11 '" <11 c6~ ..a ::- r .1, i ~ 8 Il:l ::r:: ~u ~ ~ <:1 ~ Cl~ u ~ Z ~C!I ~ -3 -3 0 0 ;;
~ 0 ... -3 ... ! . .;; ... -: <"'I 0\ 0 I-t <"'I 0 ....., I"l \0 0\ 00 0\ <'l ..... -.t' <"'I rf') f..- I"l i ! i·J ~ u ...., ....., ...r ":t -.t' V'I V'I'O \0 \G ['..
~ 00 Q\ 0\ I-t .... I-t <"'I • ...r -.t' -.t' -.t' -.t' -.t'''tt ...r "tt "'t -.t' ~ -.t' V) .,... ;,., V'I

--'. f. _ .... ...L
0 _(l~1l -----_j

10
/
i\~ 'f i R~ ,f i •• I j II I .: I II I
I
~ 0 0 ." ...... .i
,) ·0 •
...
.;

11
, , \ ) \
... -........ _- -.-=-~.,~- ... -.. , .... '\ ~~o ,/
\_~ \ .. - -#
-.

12
\0 I:-- 0\ 0 .... V"\ 1:--00 0\ 0 N M '<t V"I\O r--.O H '<too M '<t\O MMM~'<t'<t'<t'<t'<tV"lV"lV"lv"\V"IV"IV"\\O\o\o\o~I:--t-.... "H H H H H H H H H H H H H H H H H H H H H H
H N M V"I\O I:-- N M '<t V"I\O 1:--00 o 0 000 0 H H H H ~ H H H H H H H H H H H H H H H
..... ,...c; i:l ........ o -.
'<t\O 1:--00 0\ 0 H ~ V"IIQ 0\ 0"' N M '<tIC I:-- 00 0\ 0 H N M V"I V"I V"I V"\ V"I \0 \0 IQ I:-- I:-- I:-- 00 OC 00 00 00 00 00 00.00 0\ 0\ 0\ 0)
._ -~ ..... I-<
S ::l
A -.
L ~ ~ : 8 ~
i\Ur i i~~ ~' i • • I I II , .: , II
I ;:. i -3 .s .g i
I •
<I •
o 0 .., ..,
'"
.)0 . ~ : ~ x~ .~
ox '" ._. i :~ ... :2 ~ : ~ :i+H~: .. , . .
t

_, <: :r u z <:
. :
'{'
o
.1 E ..
r ol:
13
.. : ... :r ~
i .,
j
'" ::> ... cr ~ ~ l: v
1 g ,;
~

14
..... <11 <11 0.. ...... >.
..... 0 11)
""Cl .... ""C).;; _. l::i l::i <11 <11 <11 ~ .... ,...ct <11 <11
U IZlIZl
® .• S
r'l ...r V'\
\0 \0 r-.. tr.J r'l r'l r'l ril ;:;E
~ ~ ril
~ d < ~ ~
~ ..... ~
~ ~ ><:
~
\~\ ~r ! \ I i . 1
I I 1 1
I ! z 1-4 .
i .. a:
'" ~ § tl .ii § . . -ll 0 ~ ;f <; , . -"
>
'" .:(
1
~ 0 .., '0 c ,
.:l
v 11 ~ J:
ai =i <) o ti .;
1 · ~ • c
i · ~ ':r: .Cl
1 · i
! J 1 ·1 : ~
'{ .
f . ~ ~ ~ i:. ~ .f !.
;; . c .g 0 .g g '0
Z
..
~1' il .
~
! ,. J:
;: on
..
.;
I i'l~ r·~ ~I
i~j 61.
c a
" !l -5
c 'i a
N . 0
~ <3 .., ~ '" ~
l! u i 'D "Ii u c
~ !!>' Z :J
<3 <; I ] ~ . 0 ~ §
7i '" i i . ;;
c -"
-1 ~ I 0 '0
~ .. .J '" a:

15
!
1 , j 1
~
'"' ii
~,
l. .... :!
~i: ":; ~ f j r~ ,
U
""~ Z ~ « .
.... z
~ .. ...
~ :: z ~ " . « :; .. S 0
C
J
0.
; 1
-----p'. ------ .--r-

16
V'\ 10 ['., 000000
I
~~i :~ . I I I
I J !
.:
~ ~ J
~ . ~ ;; .l! 0 .. z u
~ c
oJ: . "'
~ i i j
I ,',. ' ~
:~ ' % ' ~ ," ;g
I : ~
· "
. . · 0 · ~ . . .~ ;e i ~ ~
; :; j f ~ 01: $
.~ :J:
3-8 .s .a I :z
o 0 ••
1:~1H ,. .. ~
II': i ! 2 J:
$ t;
· ...... . . j . . · · "!i . · "i · c e :. . ; ~ j i
.., ~ " J f ...
I ~ i c
1:-.; ~ ::> ~ :g i i A
E ~ f :; OJ, :It
~ .;;
£ ! .!' f :I: ,I, f 4 ~ ! .; r 1 .il l! " " '" .. ii

17
~
_J
<{ §' r v 2
~ 'I z : " 4 ! 0
~ : Q a . i • :J t
0.
:i: ~ 0 0
« 5 '" :t V> j a; r
.t
, .i .. /:J~.
!
:) -r ,
..I .. ",",,_...!.{} , , . ' ~ I·
~ ~.
\,- .. e~q ,
"> 1~:
i
,1~' ;'; i ' 21· I

18
<'"> "<I" \0 t--' 0 C'l <'"> "<I" 0 0\ 0 00 0\ 0 0\ "<I" '''<I" "<I" "<I" .,., .,., .,., .,., \0 \0 t-- 00 0\ 0 0 "<1""<1""<1""<1""<1""<1""<1""<1""<1""<1""<1""<1""<1".,.,.,.,
"
:~ ~ • • I II I .; I ; I
I ;:. i.a:.ai': !
:i

19
z • " ~ 8 ~ ~
0
, i " ~ ~
;
I 4 .. 'l
" iij. ~ I j 1
.... .:.
-' « ~ r
1-u ~ ~
~
~ ~ ::> ~ 0 • I- ~ 0
<l .5 a
~ r

280 Gajrahi 281 Rasulpur 282 Sabanwa 283 Patkhoulia 284 Tendua Khurd 285 Barwadih 286 Panti 287 Mokhar Khurd 288 Batau 'Khap 301 Nawadih 302 Korma 3 '04 Khardiha 305 Baharpura 309 Loharpurwa 312 Babhandih 313 Jamua Khurd 314 Jamua Kalan 315 Ratan Bigha 316 Golhna 317 Naudiha 318 cheladih 319 Kajim Nagar 328 Sewabigha 337 Dewan Bigha 341 Mahuari 345 Mahamdabad 347 Bishunpur 348 Kathoundha Kalan 349 Rampur alias Mehedinagar 350 Mirheiadih 35I Kathaundha Kliurd alias
Hussainagar 352 Basaria 353 Al{m2.dnagar 360 Sewari alias Mangaldih 368 Cha ukhandi
REFERENCES
20
HUSSAIN':A:BAD ANCHAL
INDEX TO VILLAGE NAMES
369 Araji Dangwar 370 Raksahi 37I Ghurna Araji Nawadih 372 Salima 377 Agheria Kalan 378 P.okhra 379 Bahera 380 Raghubir Bigha 382 Araji Sheikhpura 383 Khardiha 384 Kishunpur 386 Dihri Bisrampur 388 Hussainbandh 389 Kajibigha 390 Juribandh 39I Noniadih 392 Sheikhpura 393 Bhagwanpur. 397 Kakoria 399 Sonbarsa 400 Karimandih 405 Takea Araji Bajardih 409 Kusha Naraenpur 416 Buland Bigha 4d Araji Kusumhara 419 Fatma Ch'ak 420 Kusumhara 421 Bihari Bigha 423 Araji Birgain alias Khonchi 424 Sinduria 425 Araji Langarkot 426 Piparbar 427 Bhagw:ln Bi_gha 428 Bhairopur 429 Majhiaon 430 Araji Bhairopur
432 Khalilpur alias Tikri 433 Mobarakpur 434 Araji Kamgarpur 436 Chak Bishun 439 Birgaill 440 Rup Naraenpur 441 Araji Teta alias Pokhar 442 Araji Sinduria 443 Araji Birgain 445 Chankar Gopal 446 Khaira 447 Takea 448 Alinagar 449 Akhauri ~hap 450 Nemhat 451 Baijli 454 Marha 455 Mandar 457 0bra 458 Bedaulia 459 Dhania 460 Bahera 461 Barwadih 462 Konpahati 463 Ghurwa 464 Majhauli .499 Nimahi 521 Kararia 52 2 Kewalpura 523 Mali 524 tattnuri 528 Asiknagar alias Kardanda 529 Piprabandh alias Basariadohar 530 Bhali 531 Gonradih 532 Gangapur alias Lankasur 533 Bataua
Beundary:- Sute or DIHrict with Pillar •••• _ •• _.~
REFERENCES r ~------~--~-
Anc;hll He:dquarter,. Pollc:e Station. • • • • ~
do Revenue Thana ............. ____ ~
do AMehal. ~ollce SUtlon ......... ___ .,,_ ••.
d., Panchayar .............. ___ _
do Village ............... _._._._._._
do Fortst ........................ "'!. ••••••
Natlonll Hrghway. .. .. • .. • • .. .. ...... NA.TIONAL HIGHWAY'
State HltMway.. • • • .............. ='=:T'""T'=,"='C=HW=AY,= Roads - Metalled, Un metalled. • • .. " • I • • = __ L __
OS .~all¥r.!Y line Broad Gluge with station • • • • • flll----..c::-
/
do Metre or NarroW Gao:e with station .. _--'_""'_
RtverorStreatn •••••••••••••• ~ Canl.l-vlitb 61'Stflb\lur1 \fte lode ........... Ql':.!!.~~rJ' C~nll
lod!;
Hlne. Maternlt)' Ccnt~. Health Su~_centre • •• H.C. H'S,
Campln, Ground. Ctrcult House.. • .. .. .. • .. C.G. C.H.
Bungalows:- Oa~. Inspection, Can .. I. Foresb .. 0.8. '.8, C,B. f.8,
Roese House. HOSpital. Dispensary. .. • " .. • • It.H. HOI. 01&,
Post Office. Post & Telegraph Offlce ........ P.O, P.T.O.
Forest:- Reserv~d. Protected • .. • • .. • .. .. R.F. • P. F,
Town. Bench Mark ...... r ........ ~ 6.1'151)
Trl,onometrlul Station with hellhe, • • • • • 1I..(IPUR~1I11
Gram Panchayat. Uninhabited Village. • • • .. • G.It.
Villages below 2000 populatloll. • .. .. .. " .. •
d~ between 2000 .. 5000 do" .. • • ......
do .bove SOOO do ........ .
• • .;

21
II,.., a.
JroSSAINABAD AMORAL ..... T ..... N~ HVSSAINAI.\D
..... n- "'TAH

j =: r~ 0
<.i E
.® • 3
tIl, ,(r ! I\~ \r i • • I I II I
. I
II !
ai
'" a:i u .;
a:i ci
22
..: ft !: 0 • •• g 0 ..: ;;;
~ ,.,
t '" " !
, f E ci ::i~ ..:
.; .: '0;

23
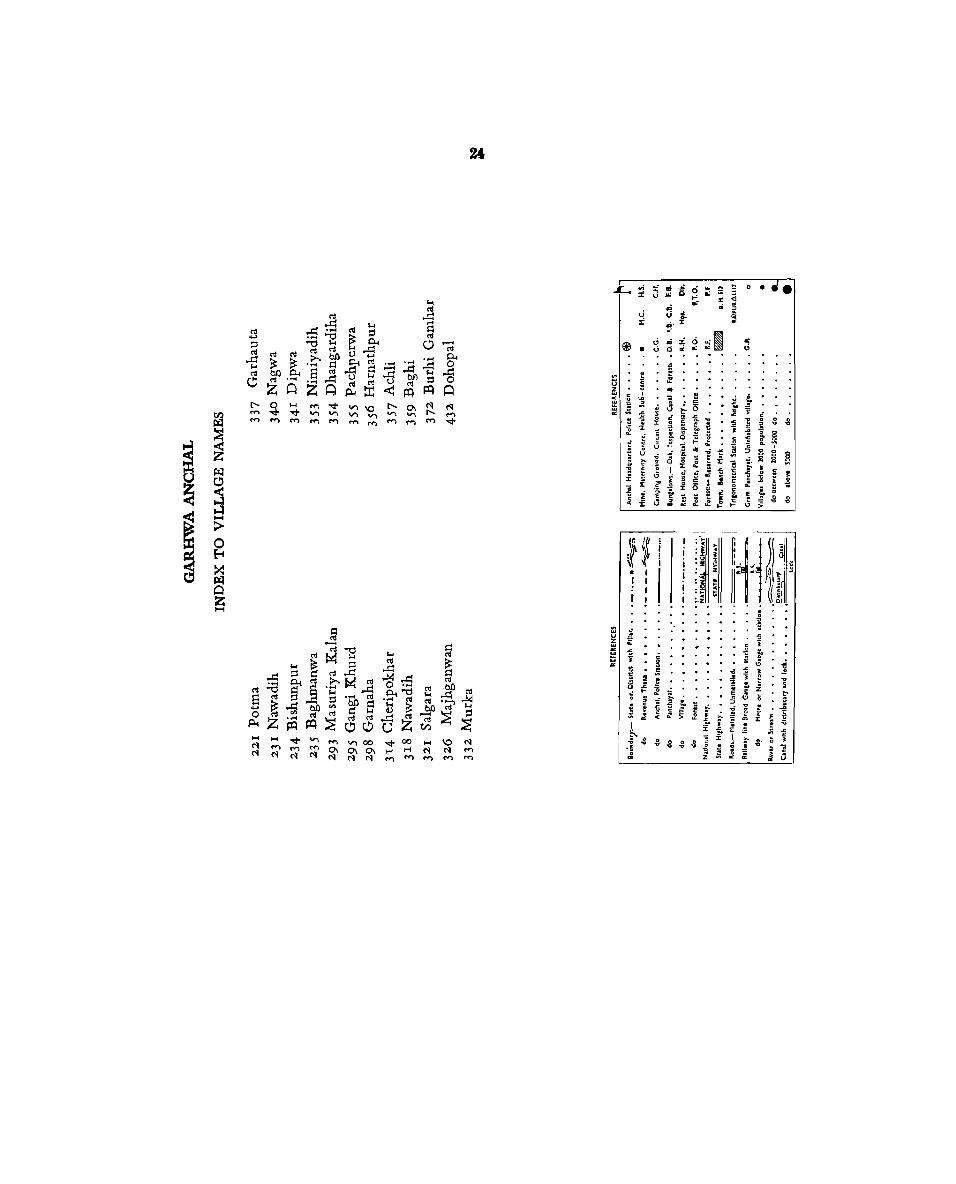
'" § o ~
24
~~ • I I I
I
I ~;) .., .., .~ .. .g. .g

25

M 1-1 M H ~ V'lV'IOO t--OC 'Ot--t--OOHH<'l<'lMM
H ..... H H H .....
26.
i ~\ j~f " 1 I~ \ • • I II I " I I J I+Hi~i
•• I •

- '$
.... CD
'II
0..,
'"
i .. .J < ; :::r:: ~ -U J:
'" :r; ... z 11 ::5 0 « .. "- < .. 4( z II :IE oc -<
c( ~ e; .. .. I- ~ (5
z .. ::>
.. ~
i
'lQ
•
-. l . ..... 1 ....... '"
"'", "'"
"
i I i. i /' "'1- ".,.,_1
,- i ~/ .. 1. '\ j i -. " 1 , .. ,,-.. _. .. _ •. _ •.
,~ ~.' ". -. ! ~.~ i
..... j .'.. ". ........ .... "
~------------------~~~-----~~.~.-------------------------~~---------------------------------." ~IS

28
DHURKI ANCHAL
I\E'E~EtlCJS ... IHfaq:_ ,n'.rftatloWwllh" 1.,. ..•
.. , St.t.t..., Otlut« With "tltr.
.. II_TMM ••• .. .. lie ...
_ ... '0 .... _ . -,.s .. VIII .....
Fo_. _IH,p"'7.· ...•
_H'''''''' ...... .
. ----~
NATIONAL HIGHWAY
"ATI HlOHW.T
• . .J;t- -~ --l1li..., !* ...... Gooz.""\ - • ','
• ...,. _ Harrow GI\lC. with ~.. '"
.tN,or .......... " ..... .. ~ ~ wttII·.,...., ................ a~'*'1 I CaMt .....
~----~~~~--IIBfERENCES r
AneW ~ 'oll(C St.dOft .. . *' HI_ .... r:rnuy Cent". Healtr. Strb- centre •• H.C H,S.
Comp'ft, G ... nd. Orcuft Houc.. • e.G. CJf.
.. ... 10W1:- Oak. 1 .. _. C-I ....... D .•• ~ •• C ••• f." l\ect HolitlC. Hospital, 01.,.-'1_ .. . I'oot omce. ,." • To'o, .. p\ 01lIo •
h;"n~- "'.,erved, 'roteUM .. .. •
Town, etncll Hat.... . .. . .. .. .. T r'lonotnetrlcal Sutton wIth ... ,IIe. Gram Plnchayac, U"Jnhlbltt4 Ylltac.. ..
VlUar" bell.,., 1000 P9pulatlon. • •
do b.twet:n 2000 - 5000 de.. .. ..
do above SOOO ... "
• R,H Hoe. Ott.
· ~.O. '.T.O .
.1\.1',
• EW2I ..f.
1.""11
.AIPU~A 1117
• G.P. 0
• • •

'"
INSET A
"-..... _. ___ -_, .• ~--- i. ...
r I
<.
I
(. r'
/5/ G"'(I,~rJ
Ijt-, jhu71ka ., .....
\
';..J -----'" .,\ 15J I
DfJJQItJ
/ , 1"1
f '.,,11.1 I .G'
29
Bl 20'
I1APOF
DHURKI ANCHAL ~h' THANA G.AI'H ........
CHSnfCT PAL",.. .... U
I
, , IS) l)4,0III".04I1" 'I _rJ j
/~ I , i
\.
• I ;
I i
"". i \ / 'r-"'- - ... .... J.._
f I I ; i i i I !
w w VI
Census Office, Bihar
,
10'

30
..L...;5~g2:::~ 0;
i\~ if I
i~ 'r Ii II I .: I II !
; .
.,;
., .. ' .

.;!:
l
... ~ i i .. u
~ ~ ; J i
..j>o
.0( i 0
~~ .x :z: ;i ~
.<Y
.0( .l/ ..;_ 4", "
I
. , ,-
sr,
i I
r' 23-
. ,r~-·_."'~
: ... ' \. .'
, ,
:J a. ~
,
, .
, i i ,,'
~"" ,. \ ~
,
\... ,.,.. ..... ----..... ~ ",
" .) I
<iii
~t -:I"

·~ ~' ,'... 1'111~ I . i ,: i ~: ~ ., , J'I! I I ~ 1\ i i: z ~ I.. ~ 1 i 1 : I : ~ I 5 II" , " I . ~ to I II! I: ~ •••• I ,. . I . . , ~,
It . .: • .,. • ••• • . • ~'f . '. I .... 'I', •.• i :Ii '.. • . • • , • • ; • • I to .. II" .' ..... » :if- . I ~. '... <3 -Ii
~II • J • . .• ~ i' .I \ i! I j '. ',',: I r j 1
hjlffii~iljil " • :r l t J Ii i i~ • 4 • ~.~ r I t r 4 : 1 1 z .... ! ~"

< ~ ~ ~
~ < ~ ~
:
..J « :r u :z 0(
~ ~ « < Oi " «
0 :z « :r (EJ
0_
~
! < z « f-J
.:::.: -::.
i
~t
~~ ~'I~ : I
l.~. 0
co !
~
V~ /"r ~/---
33
, :_ ; I;;;; t·
J ~
/ I
I
'.
':;; " 0; ~
, • • .. ,
~ 1 ,. ~
I :
.~
~'.:
' ____ .. _.; ~t-·-..-.. ,- ....
, , ; ,I
i ~ J. JI
\ , "
· .. ·f
" i 1 , ~ '.
, ~ \
, 1 l I
i 1 I
j I
9 , :r
<~ 3° • .., « " a: « 0-
'" « ....: )-
is :r 0 « :r
0:a

34
MAJHIAON' ANCHAL
INDEX TO VILLAGE NAMES
156 Semrahat 157 Sahrastal
158 Ghuruakalan
179 Gal1akpura alia5 Bhaghauti 180 Chaukhandi 183 Benipur
184 Ledki 185 Ledka
186 Misar Bigha 213 Belopati 214 Basukhap
REFERENCES
8ou'"darl:- Suta or,Oil'r1't Wltlt ,,,,.r •••• _ •• _.~
do. Revertue Tflau ........... ____ ~
do
do
do
Anthill. 'otl~ St.CJOft. ••••••• ~_ ••• _ •••
Pancht),at •••
Viltage ••
Forest. '; ••• , ••••• _ ••••••••••• ,.
Natronal Highway. • • • • • • • • • • • • N-.tIONA). M1GkW",'(
STAn HICHW,-y Srate Highway. • • • • • • • • • ... Roads.-Mofalled. Unmetalled. • • • • • • • • __ ,, __
M: Railway ',ne Broad Gauge with station ••••• -=-~ .. ~s.-=-do Metre or Narrow Gaoge With station ~ !jl
RlverOrStrel!n •••••••••••••• ~ Ctntl witb dlstrlblltuy and lock. • .. • • • ... ~1~I~ary Clnal
Look
215 Hundraha 216 Misraulia
221 Panrepnra
225 Naubhilma
226 Gujaria 229 Mahatwana
230 Chandar,pura
231 Amdiha 233 Patakpura 234 Kakanpura
249 Babura alias Bhandua
~EFERENCES
Anc:hal Headquarters. Pollee Station. I" • ® the. Maternity Centre, Health S\lb ... uflue •• II.C. H.S.
Clmplng Ground, CircUit House. • • •• • e,G. C.H.
Bunl.lows:- Oak. Inspection, C'I'IJI a fOfeSh • O. 8. I.~. C.8. 'P. B.
• R.H. Hq.. Oil.
Po .. Olllce, 'ost & Tere,raph Olliel ••••• P.O. P.T.O.
Forest:- R.eserved. Protected • • •
Town, Bench Mlrk • • • I I • • •
Trlgol'lometrleal Station with belght. •
Gram Panchay~t. Unlnhabltd Villa,s. •
Vllla,es below 2000 population. •
do between 2000 ... 5000 do. I
00 .bo ... 5000 do •••
• R.F. •• P.P
B.H.51)
~AIPUR.o.1117
• G.P. b
• • •

,.
35
~ ____________ -,-~'~fL~~' ~:::::::::::::::::::::::::::::-1 ,,' MAP 0' OISTRICT SHAHABAO ,.. ... THANA SASA.JLA.P1 :::::~~ ___ ~='J::5:"::::::::;::::::::::::::=
NAw.. ... T1"A, "/'KHAt ~ ./ __..---/ --~
"' _ .....
/
5~
(" I t
I I \
I

36
£... II! :.; .. 8 0 u: ~ 0 • •• :I; '" 0.: U ,.: q .. 0: ~ I.i v f "~ x
~
® .; .; i 0 ~~ '" • v ci .. 0: ..;
U ~ ! f w , of u ~ ..
c ~ ~
~ ~ j
.... ~ ~ ~
J 0-- ~ '" '" i -{ J! ..
1 ~ c
B i "" ." ~ 8 .g ~ : ;e J ;- i :;; ,!!
U' j ~ is ~ ~ , <>
;: c a. <>
Z if 0 o <>
ii .. ~
.. "~ oil -" ] <>
I
I: ..z I .,; g, § < ~
.,; d ! j f f
~ ~ I:- l ~ f ~ ~ l:
~ i ~ .:; 0 ~ :
l c E 1: -! ~ 1 • .1: .e ~ .,.
"li. j ::I: 0 8 i x Il.I
-5 i E ! ~ j c .
~ ~ i: " oil ~ -1:' .g .g
~ {!. l- I.:> ;;
~ ~~
,""
H1~.;~; ;i "
~ ~ ;:: ... %
• i " • I · ~ i
~ I I : ~ w
I • Q ~ ~ I ; ;
... ~
_,. ! :::: "" ~ 0: ~. i g " i ~ j c
0 ~ f.3 -" '" " § a
1 j l: 2 j .1l ~ ."
0 .- ~ z c .. ;f . :; j :; ~ ] :;-
j ::> U :; ~ j ~ .~ ,.:.
J ..,
~ :: ~ .e ;; of i ~ ~
"~
0< ... '" 1 ~ I
,.. j v -;; X c
"" t- ,.. j '" ! ~
. .g 0 • ~ x ~ .g ." .g ... ... j .5 ) ;: i "ii ~ • '" Oi

37
-' « 1:
0 U Z ~ <: ~ .. er: ~
" :J i ~
~ "- « I ~ '< f
\ 0; \
:z: ~ . <:: 1: m
,
~
,'_ -, _/
_. " ,
~l 6)
~
\ !
.~
I ~ < .z:
x "' " ~ < .., . ~ "" n
9 I
I-~- it ;
· • .... 5 0 • -! .. i II .. :
. ~ ~J " Cl i &};
" . ..... v.__

38
l~ ~ I
.~ r ~ 1) ~ i ;1 ~: 1 , I i I :i ; Ii; ; ~ i j " I
I I r ! I
i i I I I
! , · . ...... : . · . . I · . · .
. " . . :~ i · . Ii " ~i j . I t . . " ..l :It! :I ;0 · j iii ! .I · 1i e
'!! ... ~ i 00 1i • • • • 0 .. i. . .. . .3 i ~~
j · t · f. l j i ! t · 1 ~ ... s= i- 1 " .s~ < > of '" e .Ii
!!! . R ... I :I: r a '" t~ '" i 0 ~
.. I .g ~ .. ~ -3 .a !I j t i, n ! .z ;;: "

-.
. ': - - _' ~ ~~~~ ~ ~ -:~! '
39
-.
\
-.

40
.Jr- III .; '" 8 0 ..; 0 • •• :.: .: 0: ;;; U '"' t
,; 0: ,;
o..i u Ii E .. :t
..:
:i~ ,1$ .; ,; .; ci 0:
• U ci " a: ..;
e ~ ~ of
z ~ .. ~ c .
5 8 t j .n
t ~ ~ r,. Ie ::! ~ 0 c r i ~ c" l } 1 "l! .II 0 .g :t ij ii
~ ...
:t i ~ ~ ! ~ !:. Ei ~ g &
~ 0 ! t "" :3 , ~
.. I i a 0
~ ~ ~ l:- t l ~ -a t ~ '~ t!! ~ I I f ~ , Ii ] i ~ i I ! " 2: r Ie I I!
~ ~ % 0 i ; i j ! r E ~ .t: J
e • of :! '08 « f " .i .~ ~ " $ ...
"
i~~ I I ' ..
li+1~~l ; i ..
i~ I I ! 'Ii! i V ' % ~ ". I
I I : ~
I! I :z ~ I :~ i i I i ~
! :z .... 0,
J ; . ," .. . .~ " . '5 " ,;;; " ~: i
~::i " , ,
I 5-j I" .. ~ w. 03 j -51: r, ~ l ~ i • i" 2 ~ ... ,.1! I! ! ':1 l~
, I i z : !~ j
"
j ~~ ~ l t 1 ::> " ~ ~ t f J 'fi :~ : < ~,
1'. ; .. E J i . , :;; l- I: c
i .i~ = ~ .a . ~ J. ; ~ Ii i .g
j J L] j .. ~ .2

"II
r~::::::::--------~'~~r~.;---------------------·"----------~ " -~ .. ~:---::----------'~~-------------t.:.___ lI!IIi..rJ!J:az:;W • -:';1-1<
! ..J « :r ;: u :f; ~ z ~r "':-: 13
..,;
'z i « 3: p 0
o 3 ' z « i . J: V
I
:1f· '" ~~ ~ ................
• l.'lp .. d'
, .. / , "'i ;;a·
I i~ /0 o -<-I " ~T' Y/p ,,0 ~
o{>
.. II!
h : n n 1~
j~ J
:)
L--! i
j .. ~ 0
j
i .. .. -. "

42
::l S ::l ~,
....c: "" U) ::; '\j <": «I 1::$
..... ....c: ...... ....c: «I ..., ::l ..... ..... .....
'\j I-< ._
;:J ,...... «I
@ ~ ::l - ....c: ....c: 0 .... ~
<: ~~ o......c: 1::$ I-<
~ .... ...... ~ <II L,- ui :.; od zg ci u. 0 0 •• M ..... .~ ::l ~
'\j ~ ;.a «I ~ 0 .... 'C;i '\j I) .... 8 :t u '" .. 0:
«I 0 ....c: ::l ::l ..... c1l ::I l::I 0.. ...... ....,
~ ,..d ~ 0.. «I 0:
0. g 0 S. S ....c: ~ A ..0 'l) ~ 0 I-< H C'$ od <'11 ...-; U ...., <1!
..., E ...:4 ..... .... ,... .... '-i oj 3 ...c: «I <'11 0 ::l ..... <'11 :::s
'l) ::I ..... ~ ....c: <'11 ;; C'$ 1: :I:
U f-t ~ CI:l ~ ~ ~ P=l :r: <: CI:l ~ Z u ~ .A-I Q .,; ...
::i~ 0\ 0\ ...., 0\ I'- 0\ H 'D 00 H '<t" ® ..; .. i ci a:
00 I'- '<t" IQ 00 H M • U d <i 0: .; '<t" '<t" V'\ V\ IQ IQ l:- I'- I'- l:- I'- 00 0\ H M ..r '<t" V) rq rq rq rq !"l !"l !"l !"l rq !"l '" !"l !"l "" M M M M
e f E I:'I.l ~ of CI:1 ~
~ .. ~
e . '2 8 .
'" 0 "" .:;
~ l!i ·z oil .:l 5 . ] 1
~ a . t- ;
'" -5 . ~
0 c ! '&. ." . '" 1
0 ~ -8 ·x ~ ~ i ~ ~
:.i!
! B i .5 ~ ! c ~ &: ~ 5 Ii ;!. 0
~ 0 :; .. .,; '"
.~ ~ 0
~ :: .; A. ~ ~ ~ d ~ ~ ~ 0 is ~ t f ] 1 "} " ~ .I. J: l: .., ~ c
~ i " ~ 8 .:! ! i .2 i ! ~
~ l5 I l: .... :& 0 il :> '" ~ } J: " f ! i J j E J! 0 < x II Ii .s s; .g
."
d ... '" ~
~ ~ .....
S ;:J
~ 0..
:~ ~t ,',.
I'Hn ::: '4 ,.
~ C'$ ,~ < 'X ~
~ >.. .~ x ( il .-; \ ~, .:;
~ «I · I .~ .... ~ I I :~ w
:g ~
'" I : ~ ~
I-< '\j ~ .....
._ l::I
..... ...... H '"' e
OJ) 8 ..... - ~ ..... ,_' «I .2 «I C1l ..... ::l «! ~ ... Q ...... ::: ::l ~
..0 :~ l::I ...c: ..., A C'il C'il 0 <'11 ...c: 0. ::: ~
c1l ;E ..... }4 c1l ~ ....c: O-t~ ..... .... ....c: ....c: S .!! '" S ..... .... «I <'11 ..... ..... <'11 <1 ' .... U u lE •
0 ... '"t) ..... C1l z i <'11 «I ....c: .-; ..... '\j ;:J «!
..... ' .... '\j '\j ~ .. e <'11 ~ ' .... <:'J ... A § ::i
0
~ ~ '"' . ..l4 ::l ~ <1! bJl <'C H '!l ; ....c: ;:: ....c: ....c: E ....
~ ~ ~ <'11
'" <'11 ::. • g J u .... .... 0.. i::! ,...... ... «I bJl '" " 1 <'11 V <".l 0 ;:J ;:J ....... c1l ....c: ~
<".l ~
<'11 ~ ::E
<!.) .... ~ Z <'11 <: 0 oil ~ j ~ ~ f-t ~ f-t CI:l f-t Z 0 ~ 1-, ~ Q ~ ~ ! .5 ~ ~ Z F ~ E .,.. 00 ",.,
.,.. t- o '" M ...r 01 '" M ..r IQ H !"l IQ 1'-- ~ .; l;
a a 1-1 H H !"l rq rq rq
'" C"1 M C"1 M ..r '<t" '<t" ..r ~ -' i- 1 :) j · ." 1: !"l !"l !"l rq rq rq rq rq N '" r<i '" '" N N N rq N ~ j; '" '" ~ § c r:. $: i 0
i! ~ '" < r ... .;; I .~ i . J: c .;; '5 t- ".
.: ~ J: .I. i" i .;: ~ .g .g .g ~ 1 3 j ~ i1 '" .2 ;;

43

t .. :i ai g ci ..: - 0 • • a l: Ii a: ~ ,..: ,; ~
ai 0: .. ::>
c! u li ~
[$ 1: :!i :t
d ai :r: 0 ::i~ '" :I io u ci .;. 0: U
~ .. i . ~
~ .2
5 . .. .. . "2 " . l! k '" j ~ E r ::; .. ; -~ 0 . I '< 0: i ~
e
~ ! ~ 1 i ] 0 g 0 ~ -= " :? l: ~ ~ ;;; 1.
~ ~ ~ } 6 o! ~ ~ ~ x.
·f (; :l ~ U "
.. t
~ a ., g ~ ~ .,; a
~ ~ ?:- li- e ;; :C "ii f :;:
5 ~ e .I. :t
~ ~ ;: ~ c
l C> i ~ t c I j ~ ~ :t ~
:"!' 0 ~ J ., O! '2 ~ .!! l: } ii g i ~ 1 li E ; r ~ .g .g Z '" '" i: " '" :e of ~ ... .:; > -< -< ~
:~ ~~ .,..
ii+H;~l · ~ ,.
'"'" · ~ • Z • % ~
: ~ % \ \. "
~ • I · ~ x I I : ~ ~
I • Q ~ · ~ I ! : ~ ....
c
~ ~ w ~ ~ u 3 0; c Ii
~ .« 0
~ ,. c ; '"
2 ..3 1 ~ ~ i ~
~ A
8 i t .., ~ ~ . c
" ~ ~ !';' z ~ :; ~ 03 .,.. . ~ ~ ~ j :> .. c
"" g ~ j ~ " ~ j ~ . ~ i i " .;; .:;. < 0: s: of f j ~
I '" i . .;; l: c
~
~ .'" .1. j .g 0 0- 0 • c l: f 0 1! ... .., .., .. 0 . .; ... ] J i ~ ;; ~ ,;; .. >
" 0: ii

45
\
/

46
A- u; :i .. a 0 ~ 0 • • • :t U u: 0.: ;;;
~ '"' >: .: -! al
~ ~ u t .., :E:
~ :t "
@ " .,; :i 0 ~~ 0.:
• U 0 ,;, .: ..;
~ li .0.
w .e u II .. ~ c ,
1i II f 0 "'" ~ U
:: ] .
~ 0 '"
.., ; ""
;: . ~ :l! c t ,.., ~
~ ~ .g 0
£. "8 ~
:f ~ ~ 6 .>! ~ i
~ I ~ ~ ~ ~ c
I a E i 0
~ , u .. .,; '" 0 0
~ ] ~ t " ~ £ ~ ~ ~ ?> 0 ~ .g" ~ :t ~
~ ~ i e ~. ~ Ii ~ g
1 ! ~ i " ] ~ 5 ~ oll a: .§
~ c :t "- r jo 1:
~ :! E i " ! i ~ .g .g :f .:J .. 0: ,f ,? ~ 0 ;;
::c I-f
\~\ ~ .'>-
~+1~ I
Q ... . t • !: .. \ I
'z ~
~ .<:l 2 .:;: ~ l ~ . I . ~ i
If I I : ~ ~ I • Q < -< .,.. t;
~ : ~ 0' .
0
~
E ~ w -5 u
ao 0: c i ~
.., 0
j ~ c .. j ~ '"
~ ~
~ .2 ~ ~ . ;; . £
~
0 F :f ~ 11' <3 ~ f ,
~ . :::>
a ~ ,;-~ " I
~ . ~ .'i a: ;;: i 0 ~ '" ~ ~
'" j " i i ;:_ . .;;
'" ..,
." .g 0 .g 0 0 c :t ~ f-_g ~ c ~ ." .. 0 . 1i 0 Z a J ;, ~ u '" if.

47
<i: I-w V>
~ ), w
w '"
\ ~ !
.~: .. , . .' .. ~
-r. , . I , ) I : .. "
.,_ - ...... .

48
.L... ~ ~ .,; ~ ci ..: ~ 0 • • • '" '" V I-' <I .,; 0: ..
" ._; u ~ " « i ~
:I: "
® ci .,; :i 0 ~~ 0:
• U ci '" '" ..;
'" j E w & u 15 .. !
, ~ E ~ .~
i 3 t- oE """ ::! a Jl ;; -5 <
II ~ f U-a ~ ""
~ 0 ~ .g ~
J: l ~ II ~ ~ ~
g ;; I 0 ;!! ~ < ~ i ~ f 5 .. g 8-104 ~ ] ... ..; !.~ ~ ,
" .. g ~ ~ a ~ ~ 11 0 ~ of ~ I: "ii
oJ :;:: ~ E g'
~ J:
~ "" 5- ~ ~ IS ~ ~ " ~
< ~ I c I ] I ~ .I.
. ~ .. 0:
~ c .. J: 0 Z or ~ 11' i '" 1 ~ ! ~ i
'< c f u .i: " ,e ~ " :;
.g .g
~ ~\ ~~ ....
~ 1 i1tll
... .. . ~ .. • ;r ;: ." x
~ . :;; !2
f'! If . . ~ %
I : ~ w
~ : g !< :i
t; ....
::E < 0
-= ~
" :: w
u ,!! ~
t:i 0: c i g .c Q :. '.":! c g • 0 ~ .,; " ~ " 1:: 11 "i 30 1
~ ~ .1! ~ e .., . ~ < ,: .. ~ :i'! ~ E ~ t-o ~ i :5 .; ;;
~ ~ ~ -5 g 2 f ~ ~
~ .:: ~ 0: ~ & e .e ~ " ! .. I:
t """ ~ . ] :i: c -5
0 .g. c 0 1 :i: ~ f c i " .... ..g
" .• ... 3 .£ :Z ~ :2 ~
" ;;:

, , ....... \ ....... _, ..... ,
)
'I ;" 81 { ,... .... 1. ~.;.
... ~',
I -111' t
, . ,-

'" w U
~ '" ~ w
'"
riO
;5~BS~
\~ $ • I I I
I I
,.;
'>-1 . '" . ~ ~ ':r ~
: il § :..J r : ~I ~ ~ ~ I ~

51
'II 13SNt 33S
.~