District Census Handbook, 1 Jamnagar - Linguistic Survey Of ...
Upload
khangminh22Category
view
2download
0
CENSUS CENTENARY MONOGRAPH
No.3
Census of India 1971
INTERCENSAL GROWTH OF POPULATION
(Analysis of Extracts from All India Census Reports)
D. Natarajan
OFFICE OF THE REGISTRAR GENERAL. INDIA MINISTRY OF HOME AFFAIRS
NEW DELHI

, , ( i/ I . : "
_,f'
Price: Inland Its. 8' 25 Foreign £ O· 96 or $ 2' 97
FOREWORD
1972 is the Centenary year of the Indian Census. It is appropriate on this occasion that one should be helped to look back over the past hundred years to get an authentic picture of the population and its growth as revealed by each of the decennial censuses in the past. India had an unbroken chain of regular decennial censuses over these hundred years, the last one havingjust been completed in 1971, which is indeed a proud record. The dynamics of the Tndian poputation growth have been fascinating. Before 1931, the average annual growth rate of population found it difficult to reach even 1 %. in any decade. Did this mean that there was no population problem as we know of it now? But one has to only look back at the conditions prevaiiing: in the ear!y decades to realise the amount of human wastage that occurred: how thousands of lives were swept away by famines: how epidemics took a frightfully heavy toU of life: how inadequate were the health facilities resulting in very high infant and maternal mortality. But fertility had always been high. There can not be a better source than the decennial Census reports themselws to give an authentic picture of the population at each census.
D::mography in India is stiH nascent. It is only in recent years that a good number of books and articles have appeared concerning I nelia's popUlation. In the earlier decades the onl~T objective, authoritative and analytical accounts of the population were contained in the comprehensive and masterly decennial Census reports. In the present monograph, Shri Natarajan has judiciously selected excerpts from the o~d Census reports and put them together in a cogent manner to help the reader to a source which gives a first-hand account of the socio-economic conditions that affected or shaped the "growth" of population not only in India as a whole but in different parts of the country.
The author, Shri D. Natarajan, is a doyen of the Indian Censuses. He is associated with at least four Indian censusesperhaps five, from 1931 to 1971. He has already compiled a monograph entitled "Indian Census Through Hundred
(i)
(ii)
Years" which will be published as one of the Census Centenary monographs. The present monograph is a follow up and this win be yet another addition to the Monograph series of the Indian Census Centenary.
It is hoped that this monograph, published by the Censlls Organization on the occasion of the Indian Census Centenary, will serve a very useful purpose in helping the reader to relevant substance from the odd Censlls reports, most of which are out of print and the pages of the few rare copies that are available have become so briWe with age that one can hardly handle them. My appreciation and thanks to the author, Shri Natarajan, and to others in the Census Organization that have helped in the compi!atiOll of this monograph.
NEW DELHI
March 29, 1972
A. CHANDRA SEKHAR
Registrar General and Census Commissioner. India
PREFACE
In addition to the series of monographs mentioned above, a monograph entilcd 'Indian Censuses through a hundred years' has b~en prepared. This monograph deals with the organisational aspects of the I ndian Census. The Indian Census cover the largest population-China which has a largest population has not taken a regular Census so far-and is a major administrative undertaking. The success of the Census is due to the detail and proper planning and their prompt execution.
(iii)

INTROOOCTION
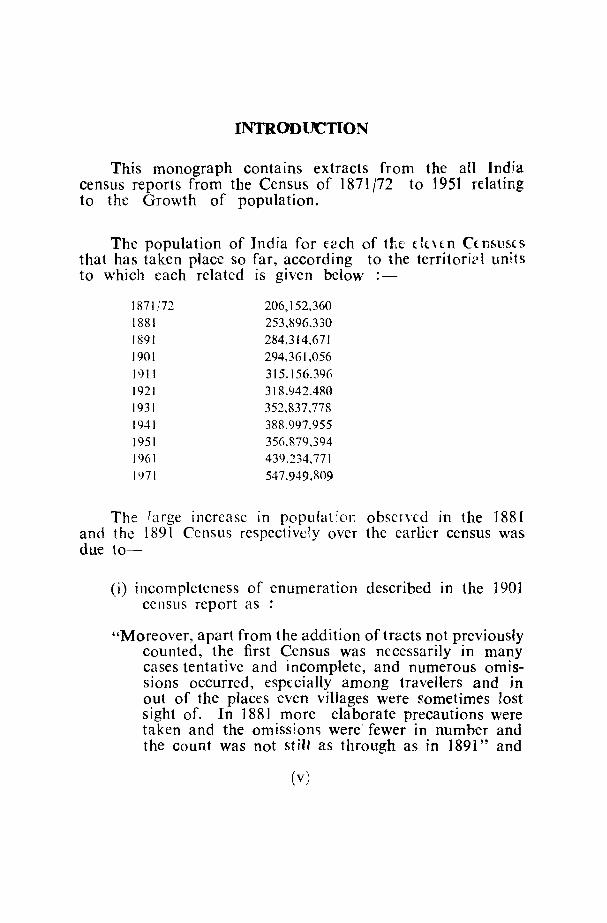
This monograph contains extracts from the aU India census reports from the Census of 1871/72 to 1951 relating to the Growth of population.
The population of India for tach of the d('Hn C(n~l!S(S that has taken place so far, according to the territoript units to which each related is given below :
1871/72 206,152,360 1881 253,896.330 1891 284,314,671 1901 294,361,056
1911 3 t 5.156.396 1921 318.942.480 1931 352.837,778 1941 388.997,955 1951 356.879,394 19G1 439.234,771 1971 547.949,809
The large increase in popu!at:on observcd in the 1881 and the 1891 Census respectively over the earlier census was due to-
(i) incompleteness of enumeration described in the 1901 cenSlLS report as :
"Moreover, apart from the addition of tracts not previously counted, the first Census was necessarily in many cases tentative and incomplete, and numerous omissions occurred, espcciaJIy among travellers and in out of the pJaces even villages were !\ometimes lost sight of. In 1881 more elaborate precautions were taken and the omissiom were fewer in number and the count was not stiU as through as in 1891" and
(v)
(vi)
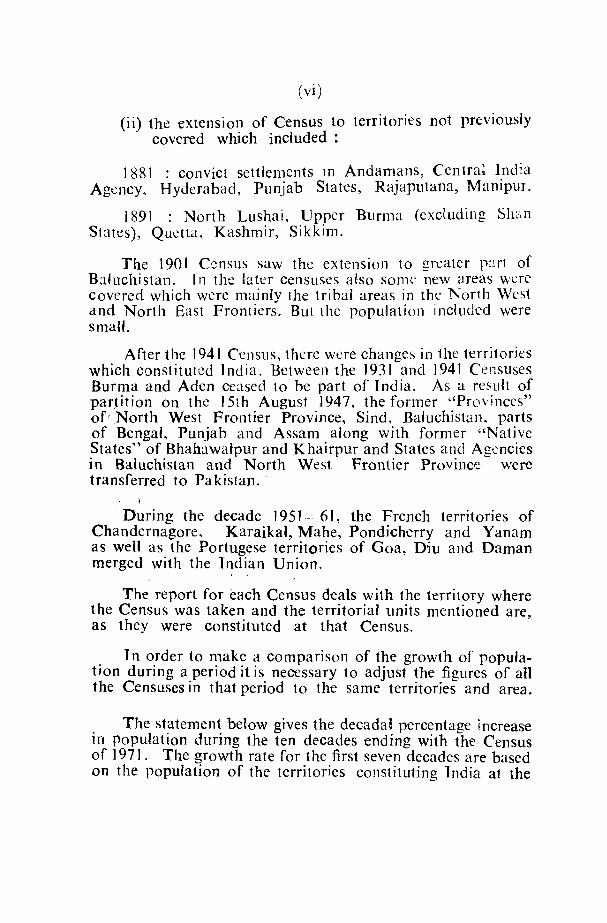
(ii) the extension of Census to territories not previousJy covered which included:
1881 : convict settlements In Andamans, Central India Agency, Hyderabad, Punjab States, Rajaputana, Manipur.
1891 : North Lushai, Upper Burma (cxduding Shan States), QuelL'], Kashmir, Sikkim.
The 190 1 O~nsus saw the extension to greater r~!rt of Rlluchistan. In the later censuses also some new areas were covered which were mainly [he tribal areas in the North West and North East Frontiers. But the population included were small.
After the 1941 Censlls, there were changes in the territories which constituted India. Between the 1931 and 1941 Censuses Burma and Aden ceased to be part of India. As a result of parJition on the 15th August 1947, the former "Provinces" of' North West Frontier Province, Sind, Baluchistan. parts of Bengal, Punjab and Assam along with former "Native States" of BhahawaJpur and Khairpur and States and Agencies in Baluchistan and North West Frontier Province were transferred to Pakistan.
\
During the decade 1951 - 61, the French territories of Chandernagore, Karaikal, Mahe, Pondicherry and Yanam as weB as the Portugese territories of Goa, Diu and Daman merged with the Indian Union.
The report for each Census deals with the territory where the Census was taken and the territorial units mentioned are, as they were constituted at that Census.
I n order to make a comparison of the growth of population during a period it is necessary to adjust the figures of all the Censuses in that period to the same territories and area.
. The st~temen~ below gives the decadal percentage increase lfI populatIOn durmg the ten decades ending with the Census of 1971. The growth rate for the first seven decades are based on the population of the territories constituting India at the
( vii)
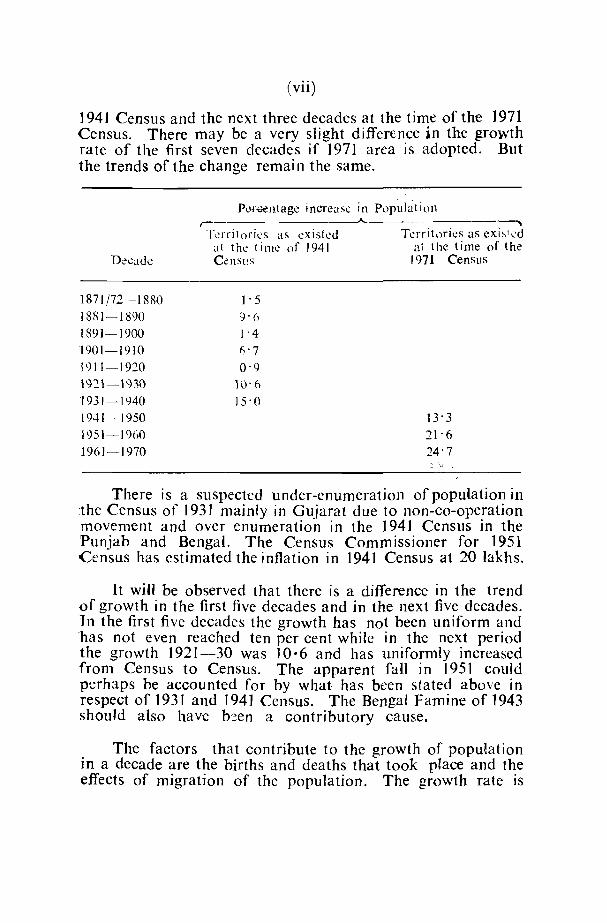
1941 Census and the next three decades at the time of the 1971 Census. There may be a very slight difference in the growth rate of the first seven decades if 1971 area is adopted. But the trends of the change remain the same.
Decade
1871172-1880 1881-1890 1891-1900 1901-1910 1911-1920 1921-1930 1931-1940 1941-1950 1951-1960 1961-1970
Pur;;entage increase in Popuhjtion ~ ~ --------~ Tcrrilnries as existed
al the timc of 1941 Cc:nsus
l' 5 9'6 ]'4
("7
0'9 11)'6 15'0
Territories as CXiS1Cd at the time of the
1971 Census
13'3 21' 6
24'7 \.\ \
There is a suspected under-enumeration of population in the Census of 1931 mainly in Gujarat due to non-co-operation movement and over enumeration in the 1941 Census in the Punjab and Bengal. The Census Commissioner for 1951 Census has estimated the inflation in 1941 Census at 2'0 lakhs.
It will be observed that there is a difference in the trend of growth in the first five decades and in the next five decades. 'Tn the first five decades the growth has not been uniform and "has not even reached ten per cent while in the next period the growth 1921-30 was 10·6 and has uniformly increased from Census to Census. The apparent falJ in 1951 could perhaps be accounted for by what has been stated above in respect of ]931 and 1941 Census. The Bengal Famine of 1943 should also have b~en a contributory cause.
The factors that contribute to the growth of population in a decade are the births and deaths that took place and the effects of migration of the population. The growth rate is
(viii)
thus Birth rate-Death rate + migration rate according as in-migration,is greater or less than out-migration. It has been stated in all reports that for India as a whole the net migration is negligible and has no effect on the growth rate. The growth rate will be reduced from the norma) rate of growth either by a steep fall in the birth rate or considerable rise in death rate by 'abnormal' mortaHty. The causes of abnormal mortality are War, Famine including the diseases consequent on Famine. Epidemics such as Plague, Malaria, Influenza etc. The cause for a very small increase in four out of the first five decades arc due to 'abnormal mortality' as explained in detail in the extracts from the census reports given in this monograph.
The decade ]911--1921 shows the smaHest increase. The main cause was the influenza epidemic of J 918 which invaded the country in two distinct waves. According to the 1921 Census report 'aH other factors in the health of the people have however been overshadowed by the influen'za epidemic of 1918-19 which has dominated the popubtion figures at the present census'.
The decade next in order is 1891-1900. The lrain causes werc (1) the two famines in the decade the first during 1896-97 and the second during 1 R99-1900 am'l. (2) the Bubonic Plague which first appeared in Bombay City in September 1896 and spread to other parts of fnella' where the mortality may possibly have been a mil!ion. The 1901 report s~:ys 'Tn a period which has witnessed the two greatest famines of the century and the appearance of a new and deadly disease, the wonder is not that the pace at wh:ch the population has grown ;s kss than what it was during the previous ten years, when the rate of progress was more rapid than usual, but that there should have been any increment at al1'.
The increment in the decade 1872--1880 was more or less the same as in the decade 1891-1900. Here also Famine was the main cause. It was prevalent in par1s of Mysore (1877), parts of Madras (1876-78), parts of Born bay (1876-77) (which was also affected by cho1era) and parts of North West Province (1879).
The decade 1901-1910 was better, in that it showed an increase of about 6.7 per cent though much less than the normal rate of increase. This was due to the prevalence of Plague
(ix)
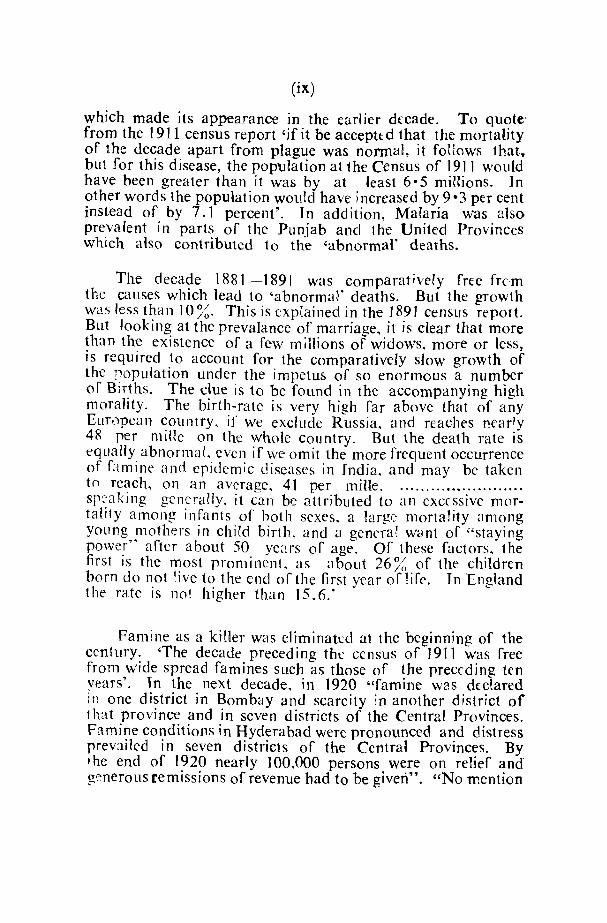
which made its appearance in the earlier decade. To quote' from the 1911 census report 'ifit be accepted that the mortality of the decade apart from plague was normal, it foHows that. .. but for this disease, the population at the Census of 1911 would have been greater than it was by at least 6·5 millions. In other words the population wou!d have increased by 9-3 per cent instead of by 7.1 percent'. In addition, Malaria was also prevalent in parts of the Punjab and the United Provinces which also contributed to the 'abnormal' deaths.
The decade 1881-1891 was comparatively free frem the causes which lead to 'abnormal' deaths. But the growth was less than 10%. This is explained in the 1891 census report. But looking at the prevalance of marriage, it is clear that more than the existence of a few millions of widows, more or i.ess, is required to account for the comparatively slow growth of the population under the impetus of so enormous a number of Births. The clue is to be found in the accompanying high morality. The birth-rate is very high far above that of any European country. if we exclude Russia. and reaches nrarly 48 per mille on the whole country. But the death ratc is equally abnormal, cven if we omit the more frequent occurrence of famine and epidemic diseases in India, and may be taken to reach, on an average, 41 per mine. .. ..................... . speaking generally, it call be attributed to an excessive mortali1y among infants of both sexes, a large lllorta]ity among young mothers in child birth, and a genera{ wClnt of "staying power" after about 50 ye2rs of age. Of these factors, the first is the most prominent, as about 26% of the children born do not live to the end of the first year oPife. Tn England the rate is not higher than 15.6:
Famine as a kiHer was eliminated at the beginning of the century. 'The decade preced ing the census of ] 91] was free from wide spread famines such as those of the preceding ten vears'. Tn the next decade, in 1920 "famine was dcctared In one district in Bombay and scarcity in another district of that province and in seven districts of the Central Provinces. Famine conditions in Hyderabad were pronounced and distress prevailed in seven districts of the Central Provinces. By the end of 1920 nearly 100,000 persons were on reHef and g~nerous remissions of revenue had to be given". "No mention
(x)
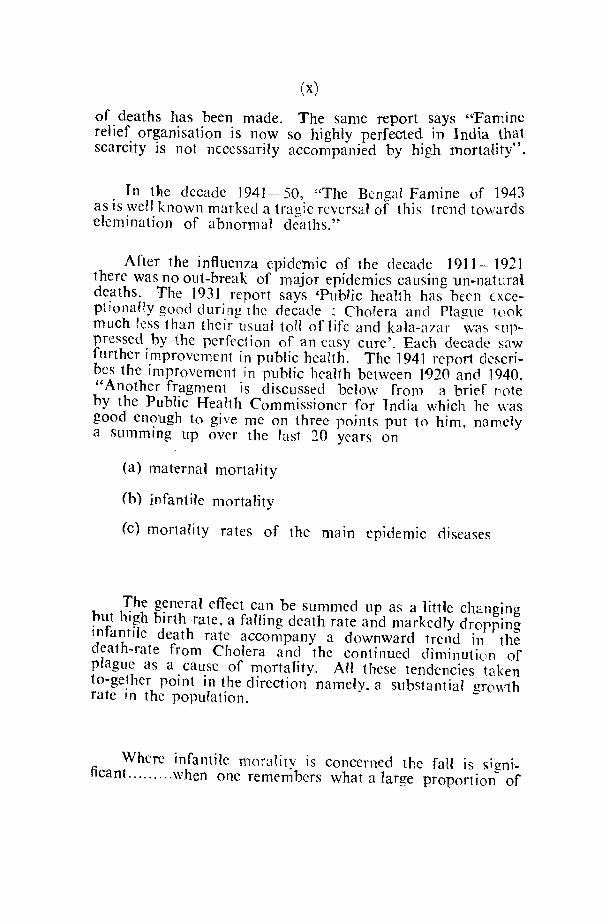
of deaths has been made. The same report says "'Famine relief organisation is now so highly perfecte~ in India .th~,t scarcity is not necessarily accompanied by h1gh mortalJty .
Tn tRc decade 1941--- 50, "The Bengal Famine of 1943 as is well known marked a tragic reversal of this trend towards clem i nation of abnormal deaths."
After the influenza epidemic of the decade ] 911- 1921 there was no out-break of major epidemics causing un-natural deaths. The 1931 report says 'Public heahh has bern (xceptionally good during the decade : Cho1era and Plague took much less than their usual toll of life and kala-azar was qlP
pressed by the perfection of an easy cure'. Each decade saw further improvement in public hea11h. The 1941 report describes the improvement in public heal1h between 1920 and 1940. "Another fragment is discussed below from a brief pote by the Public Heahh Commissioner for India which he was good enough to give me on three points put to him, namely a summing up over the last 20 years on
(a) maternal morta1ity
(b) infantile mortality
(c) mortality rates of the mam epidemic diseases
~he g~neral effect can be summed up as a little changing ~ut h1~h blflh rate, a falling death rate and markedly drorping 111fantlle death rate accompany a downward trend in the death~ra1e from Cholera and the continued diminution of plague as a cause of mortality. AH these tendencies taken to-get her point in the direction namely, a substantial growth rate in the population. ~
Where infantile moratity is cOllcerned the fan is signi .. ficant. ........ when one remembers what a large proportion~ of
(Xl)
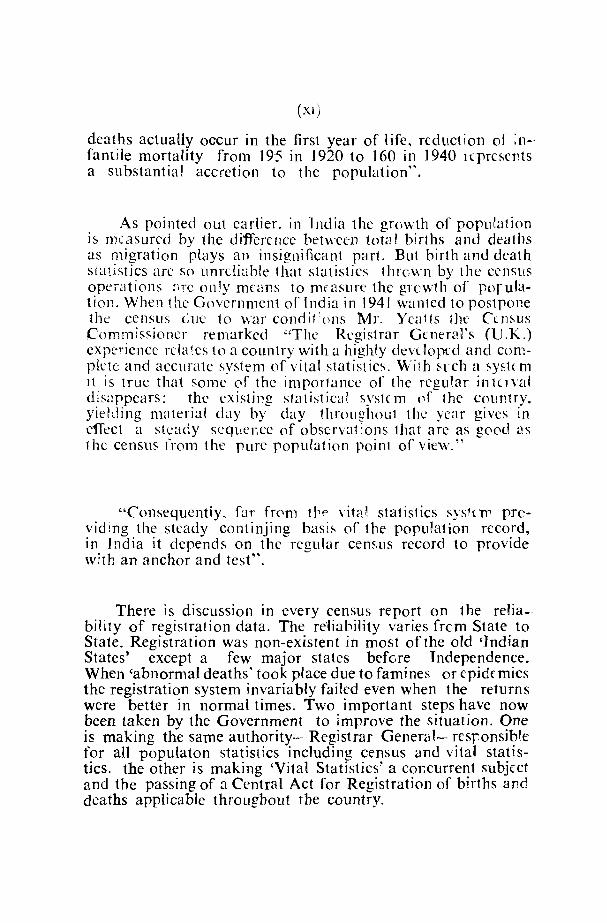
deaths actually occur in the first year of life, reduction of :n-fantiie mortality from 195 in 1920 to 160 in 1940 1 (presents a substantial accretion to the population".
As pointed out earlier. in 1 ndia the growth of population is measured by the difference hetween total births and deaths as migration plays an insignificant part. But birth and death statistics are so unreliable that statistics thrcwn by the census operations ~lrC on!y mums to mf<lS11l-C the glCwth of porulation. When the Government oflndia in 1941 wanted to postpone the census (;UC 10 war condi(ol1s Mr. Yca1ts the CU)SlIS
Commissioner remarked "The Registrar General's (U.K.) experience rcia 1.cs to a country with a highly devdopcd and complete and accurate system of vital statis1 ics. Wil h Sl ch a sysl( m It is true that some of the importance of the regular intt1\al dis~lppears; the existing stalistinJl syslc 111 of the cOlmtry, yielding material day hy day througllOut tbe year gives in effect a steady sequcr\ce of obscrvat :OI1S that are as good as 1 he censlls from the pure population point of view."
"Consequently. far from 1re \it<1t statistIcs sys1(1ll providing the steady continjing basis of the population record, in India it depends 011 the regular census record to provide with an anchor and test".
There is discussion in every census report on the reliability of registration data. The re"liahility varies frem State to State. Registration was non-existent in most of the old '.Indian States' except a few major states befGre Independence. When 'abnormal deaths' took place due to famines or epidemics the registration system invariably faited even when the returns were better in normal times. Two important steps have now been taken by the Government to improve the situation. One is making the same authority- Registrar Generat~responsib'e for all populaton statistics including census and vital statistics. the other is making 'Vital Statistics' a cor.current subject and the passing of a Central Act for Registration of births and deaths applicable throughout the country.
(xii)
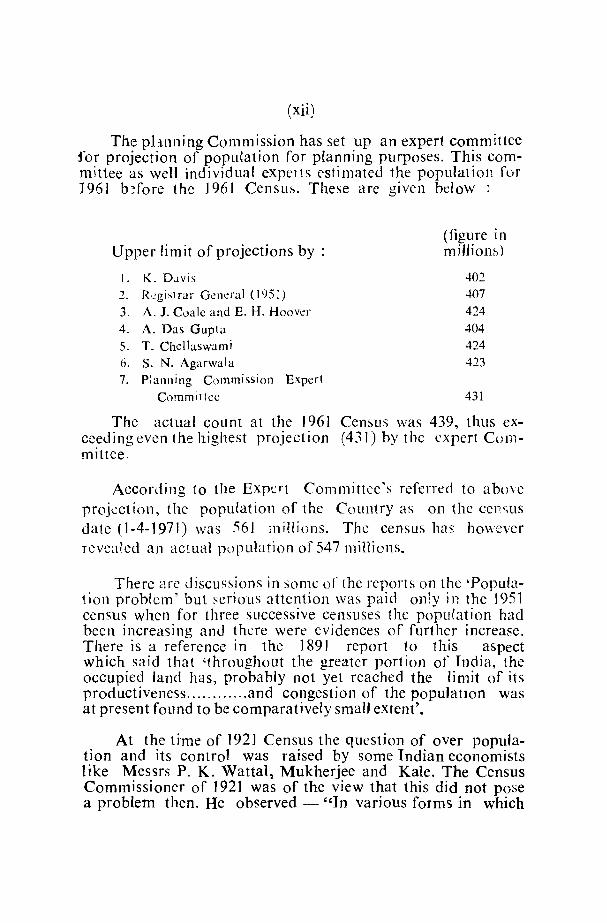
The pLu1I1ing Commission has set up an expert committee for projection of population for planning purposes. This committee as well individua{ expells estimated the population for 1961 b?forc the 1961 Census. These are given below:
Upper limit of projections by :
I. K. D.lvis 2. R':gi slrar G~neral (1951) 3. A. J. Coale and E. H. Hoover
4. A. Das Gupta 5. T. Chellaswami 6. S. N. Agarwala 7. Planning Commission Expert
Committee
(figure in miHiol1s)
402 407 424 404 424 423
431
The actual count at the 1961 Census was 439, thus cxceedingevcn the highest projection (431) by the expert Committee.
According to the Expert Committee '5 referred to abovc projection, the population of the Country as on the cell<,US date (1-4-1971) was 561 mil!ions. The census has however Tcveakd an actua~ population of 547 minions.
There arc discussions in some of the reports on the 'Populalion problem' hut seriolls attention was paid onty in the 1951 census when for three successive censuses the population had been increasing and there were evidences of further increase. There is a reference in the 189' report to this aspect which said that 'throughout the greater portion of India, the occupied land has, probably not yet reached the limit of its productiveness ............ and congestion of the populatIOn was at present found to be comparatively sman extent'.
At the time of 1921 Census the question of over population and its controf was raised by some Indian economists like Messrs P. K. Wattal~ Mukherjee and Kale. The Census Commissioner of 1921 was of the view that this did not pose a problem then. He observed - "In various forms in which
(xiii)
it occurs the situation as here described, viz, the overtaking of the ~xisting material reSOllfces by the expansion of population, provides the chief stimulus to progress. )1 forces the population to enhance the food resources by increasing the productivity of the tract alld to overcome the limitations of area by improving the facilities of the communications. The enterprise Illvolved, reacting on the mental and moral equipment of the people, widens the scope of their lives and, by raising their standards, CTrates a new economic stress and thus establishes a continuity of progress by a succession of reactions. )n the histor i -cal life of a nation or a people the moral benefits of overpopulation in this sense are probably worth the temporary Jifficulties, and sacrifices whIch resuH from the inevitable delays and imperfect ions In the adjmtment of resources to growth". In this connection among other things the Census Superintendent of Burma referred that Poland was abk to 111crease her wheat and rye crops by 250 % during the ten years ending 1921. He was therefore of the view that the 1ast word on production had not yet been said in Burma.
Tn the 1931 Census Dr. Hutton, the Cemus Commissioner considered that the point had not yet been Jeached a1 which the ability of the Country to feed the population was seriously taxed.
Shri Gopalaswami, Cemus Commissioner for ]95] Censlls after taking into consideration his estimated increase' in population and the m:):ximlJm increase in food production, came to the conclusion that it was necessary to stablise the popubtion at 45 crOTes whi:h according to him should have been reached bv 1969 and so to ~imit the number of hirths that they do not materially exceed the number of deaths and thus achieve a sustaintiaUy stationary population by 1969. The popltlation has however already exceeded 54! crores according to the 1971 Census. But 'Family P1anning' has become an important programme with top most priority. Food production in India has also increased considerab!y by change in method of cultivation, applicatIOn of fertilisers and improved seeds etc.

coNTENTS
FOUWORD
PIu:FACB •
INTRODUCTION
CENSUS OF INOlA 1871-72
Memorandum by the Secretary of StateIncrease or Decrease of the Population
CENSUS REPORT FOR THE YEAR 1881 CENSUS
The Movement of the PopulationGeneral Condition
Its significance and cause of decrea~e
Omissions in 1871 canSUB
Estimated decrease allowing for 1871 omission
Reasons for believing the population is ordinarily a progessive one
Estimated loss allowing for normal increase
Estimated Population in 1876
Check to progress not confined to famine Zone
Epidemic
ALL INDIA CENSUS REPORT FOR THE 1891 CENSUS
The Movement of the PopulationGeneral Condition
Condition in India
Marriage Customs
Birth & Death Registration
Epidemic disease
Cholera ahd Small pox
Fevers
Famine
Probable diminution of normal Mortality
Quality of AgricuitlVt'
Prospects of dispersion
Migration .
2-1 R. G Indiafn (xv)
PAGES
i-ii
iii
v-xiii
1-3
!!-13
14
14
14
14-15
15-17
17
17-28 -
28-29
31-33
33
33-35
35-36
37
37
38
38-40
40-41
41
42
43
(xvi)
Interchlnge of wives b:tween contiguous villages
Summary of conditions
General variation in population
ALL INDIA CENSUS REPORT FOR THE 1901 CENSUS
The movement of the population-
InJividual Provinces & States
Object of discussion
Assam Kala-azar
Decline ofIndigenous population
Bengal
Movement in relation to dencity
1',LlvC/TICnt by natural divisions--East Bengal
Chota Nagpur
West Bengal
Central Bengal
North Bengal
North & South Bihar
The Famine of 1896-97
Comparison of Ccmus figures with vital statistic
Bombay
Conditi()Ils afTc:cting movement b~tween 1891 & 1901
Central Provinces
Decrease in the paSt decade
Its probable Cau~e
D'~aths from starvation rare & High Infant Mortalily
Madras
Condi t ions affecting movement b~tween 1891 & 1901
United Provinces
Central India
Hydcr~,b.~d
KaShmir
Mysore
Rajputana
General Summary Eliminat ion of variations due to Census of New areas &
on account of better enumeration
Estimeted true variation in Population sinee 1872.
Brief analysis of variat ions-1891-O 1
PAOES
43-44
44
44-46
47
47-48
48
49
49-50
50-51
51
51
52
52
52
52-53
~3-54
S4
S4
55-56
56
56
56-59
59-60
60
60-61
61-63
63
63
64
64
65-66
66-67
67
68
(xvii)
, Comparison of Census results with those indicated by the returns of -bl'rths & deathS
Factors on which movement depends .
Migration.
Adverse condition of decade (1) Femine
Their effects smaller than might have expected
Conditions making for progress
The outlook for the future .
ALL INDIA CENSUS REPORT FOR THB 1911 CENSUS
Movement of Population-Introductory remarks .
Effect of Migration on the growth of population
Other factors which determines the growth of populat ion
Famine
State of Crops in decade 1901-1910
The State of the publir health
Irrigation
Progress of Trade & Industry
Improvement in communiCations by Rail
General Summary
Summary .
Variations in relat ion to density
Comparison of Census results with total statililics
ALL INDIA CBNCUS REPORT FOR THE YEAR 1921
Movement of Population
Migration
The war
Economic condition of the decade
Public health
The Influenza Epidemic of 1918-1919
Vital Statistics
The progress of population in the intcrcensal period
Comparison between enumerated and deduced population
Population and Economic Problems
Growth of the Population
Of the districts of North Bihar. Mr. Talelnts wri tes
Standard of living
PAGES
68-70
70-71
71-72
72-75 75
75-78
78-79
81-82
83
83-84
84
85
85
86
86-87
87
87
87-90
90
90-92
97
97-98
98-99
99-100
100--103
103-105
105-106
108-113
113-121
121-122
123-12G
(xviii)
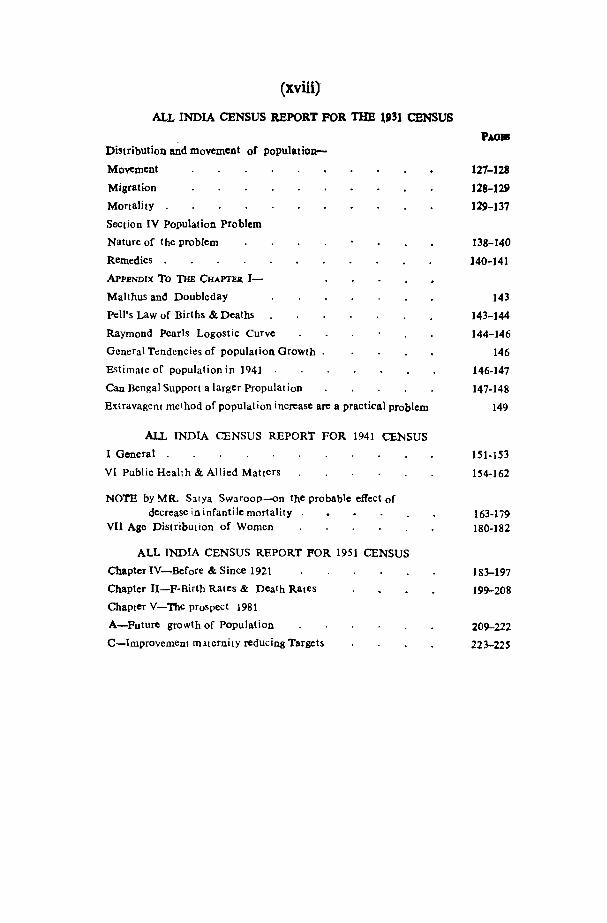
ALL INDIA CENSUS REPORT FOR THE U~31 CENSUS
DiStribution and movement of population
Movement
Migration
Mortality
Section IV Population Problem
Nature of the problem
Remedies .
APPBNDIX To THE CHAPTBR 1-
Malthus and Doubleday
Pell's Law of Births & Deaths
Raymond Pearls Logostic Curve
General Tendencies of population Growth
E5timate of population in 1941
Can Bengal Support a larger Propulation
Extravagent method of population increase are a practical problem
ALL INDIA CENSUS REPORT FOR 1941 CENSUS
I General .
VI Public Health & Allied Matters
NOTE by MR. Satya Swaroop-on the probable effect of decrease in infanti Ie mortality
VII Age Distribution of Women
ALL INDIA CENSUS REPORT FOR 1951 CENSUS
Chapter IV-Before & Since 1921
Chapter U-F-Birth Rates & Death Rates
Chapter V-Tbe prospect 1981
A-Future growth of Population
C-Improvement m.lternity reducing Targets
121-128
128-129
129-137
138-140
140-141
143
143-144
144-146
146
146-147
147-148
149
151-153
154-162
163-179 180-182
183-197
199-208
209-222
223-225
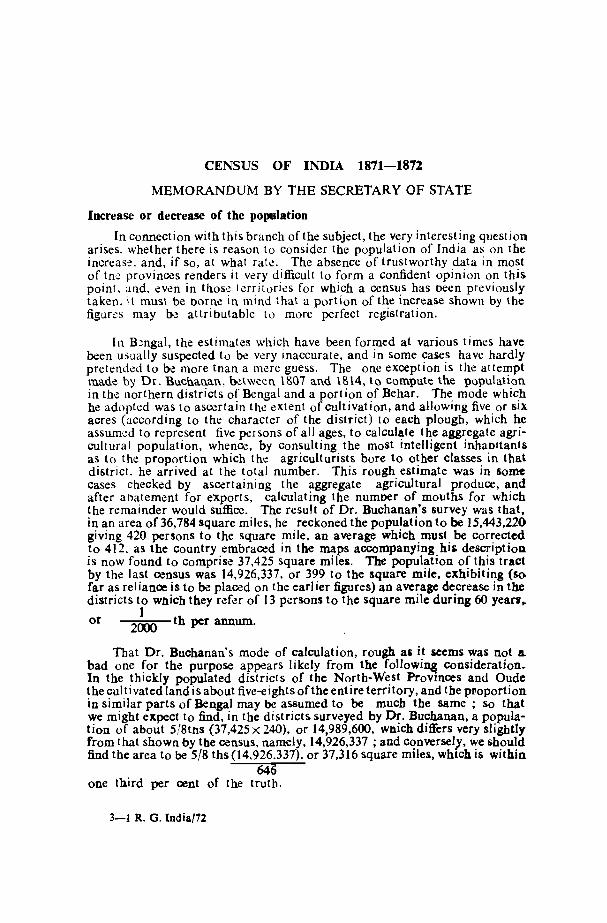
CENSUS OF INDIA 1871-1812
MEMORANDUM BY THE SECRETARY OF STATE
Increase or decrease of the population
In connection with this branch of the subject, the very interesting question arises. whether there is reason to consider the population of India as on the increas·~. and, if so, at what rate. The absence of trustworthy data in most of tne provinces renders it very difficult to form a confident opinion on this point. and. eVl!n in those taritories for which a census has Oeen previously taken. it must be oorne in mind t hat a port ion of the increase shown by the figures may be attri butable to more perfect registration.
In B~ngal, the estimates which have been formed at various times have been usually suspected to be wry inaccurate, and in some Cases have hardly pretended to be more tnan a mere guess. The one exception is the attempt made by Dr. Buchanan, between 1807 and 1814, to compute the population in thl! northern districts of Bengal and a portion of Behar. The mode which he adopted was to ascertain thl! extent of cultivation, and allowing five or six acres (according to the character of the district) to each plougb, which he assumed to represent five persons of all ages, to calculate the aggregate agricultural population, whence, by consulting the most intelligent inhaoitants as to the proportion which the agriculturists bore to other classes in that district, he arrived at the total number. This rough estimate was in some Cases checked by ascertaining the aggregate agricultural produce, and after aOateml!nt for exports, calculating the numoer of mouths for which the remainder would suffice. The result of Dr. Buchanan's survey was tbat, in an area of 36,784 square miles, he reckoned the population to be 15,443,220 giving 420 persons to the square mile, an average which must be corrected to 412. as the country embraced in the maps accompanying his descriptioD. is now found to comprise 37,425 square miles. The population of this tract by tbe last census was 14,926,337, or 399 to the square mile, exhibiting (so far as reliance is to be placed on tbe earlier figures) an average decrease in the districts to wnich they refl!r of 13 persons to the square mile during 60 yean,.
or 1 2000 th per annum.
That Dr. Buchanan's mode of calculation, rough as it seems Was not 11 bad one for the purpose appears likely from the followi~ consideration. In the thickly populated districts of the Nortb-West ProvInces and Oude the cultivated land is about five-eights of the entire territory, and tbe pl'oportion in similar parts of Bengal may be assumed to be much tbe same; So that we might expect to find, in the districts surveyed by Dr. Buchanan, a population of about 5!8tns (37,425 x 240), or 14,989,600, wnich differs very slightly from that shown by the census, namely, 14,926,337 ; and conversely, we should find the area to be 5/8 ths (14.926.337), or 37,316 square miles, which is within
646 one third per cent of the trutb.
3-1 R. G. Indial72
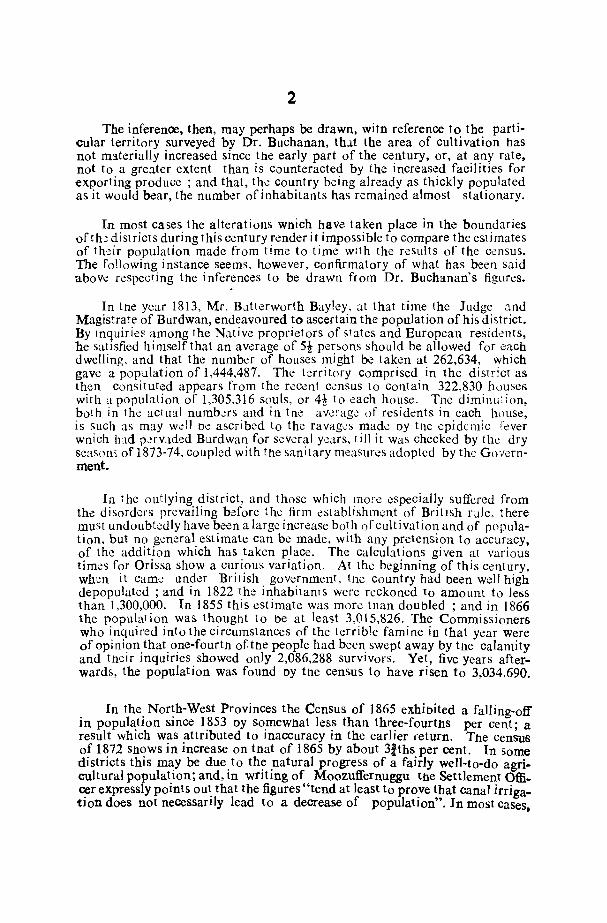
2
The inferenoe, then, may perhaps be drawn, witn reference to tbe particular territory surveyed by Dr. Buchanan, th.lt the area of cultivation has not m3.terially increased since the early part of the century, or, at any rate, not to a greater extent than is counteracted by the increased facilities for exporting produce; and that, the country b,~ing already as thickly populated as it would bear, the number of inhabitants has remained almost stationary.
In most cases the alterations wnich have taken place in the boundaries ofth:! district s during this century render it impossible to compare the esti mates of th,~ir population made from time to time w:th the results of the C'?nsus. The following instance seems, however, confirmatory of what has been said abov.:: respecting the inferences to be drawn from Dr. Buchanan's figures.
In the year 1813, Mr. Butterworth Bayley, at that time the Judge and Magistrate of Burdwan, endeavoured to ascertain the population of his district. By inquiries among the Native proprietors of states and European residents, he satisfied himself that an average of 5t persons should be allowed for each dwelling. and that the number of houses might be taken at 262,634. which gave a population of 1,444,487. The territory comprised in the district as then consituted appears from the r.::c.::nt c.::nsus to contain 322,830 houses with a population of 1,305.316 souls, or 41 to each house. Tn.:: dimillu~ion, both in the actual numbcrs and in tne average of residents in each h()use, is such as may well DC ascribed to the ravag..:s made oy tIle .::pidcmic fever wnich had pervaded Burdwan for several y,~ars. till it was checked by the dry seasons of 1873-74, coupled with the sanitary measures adopted by the GO'''ernment.
In the outlying district, and those which more especially suffered from the disorders prevailing b;!fore the firm .::stablishment of BritIsh rule, there must undoubtedly have been a large increase both of cultivation and of population. but no general estimate can be made, with any pretension to accuracy, of the addition which has taken place. The calculations given at various time') for Orissa show a curi.ous variation. At the beginning of this century, when It cam\~ under BrI1Jsh government, t11e country had been well high depopulated; and in 1822 the inhabitants were reckoned to amount to less than 1,300,000. In 1855 this estimate was more tnan doubled; and in 1866 the population was thought to be at least 3,015,826. The Commissioners who inquired into the circumstances of the terrible famine in that year were of opinion that one-fourth of the people had been swept away by the calamity and their inquiries showed only 2,086,288 survivors. Yet, five years afterwards, the population waS found oy the census to have risen to 3,034.690.
In the North-West Provinces the Census of 1865 exhibited a falling-off in population since 1853 oy someWhat less than three-fourths per cent· a result which was attributed to inaccuracy in the earlier feturn. The cen~us of 1872 ShOWS in increase on tnat of 1865 by about 3!tbs per cent. In some districts this may be due to the natural progress of a fairly well-to-do agricultural population; and, in writing of Moozuffernuggu the Settlement Officer expressly points out that the figures "tend at least to prove that canal irrigation does not necessarily lead to a decrease of population". In most cases.
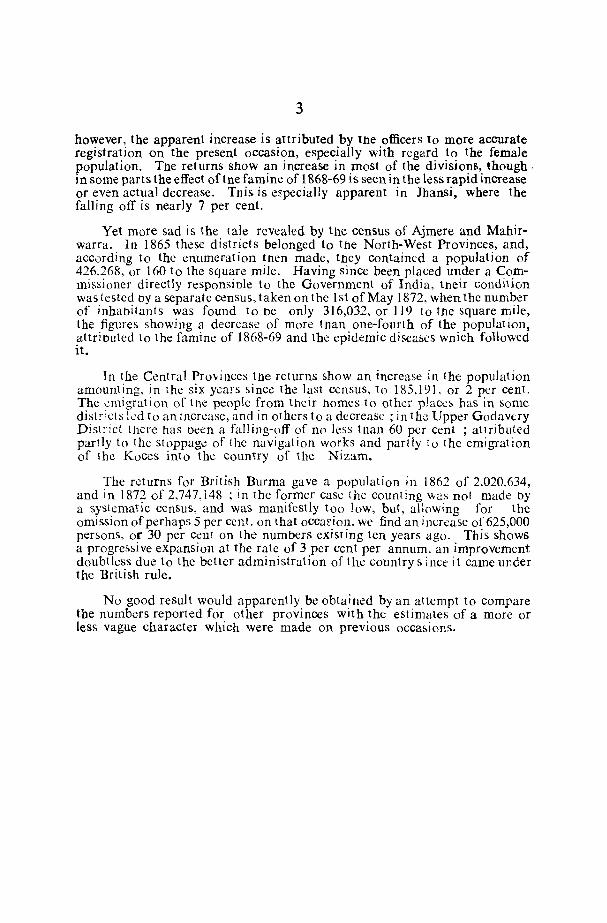
3
however, the apparent increase is attributed by the officers to more accurate registration on the present occasion, especially with regard to the female population. The returns show an increase in most of the divisions, though. in some parts the effect oftne famine of 1868-69 is seen in the less rapid increase or even actual decrease. Tnis is especially apparent in Jhansi, where the falling off is nearly 7 per cent.
Yet more sad is the (ale revealed by the census of Ajrnere and Mahirwarra. In 1865 these districts belonged to the North-West Provinces, and, according to the enumeration then made, they contained a population of 426,268, or 160 to the square mile. Having since been placed under a Commissioner directly responsible to the Government of India, tneir condition was tested by a separate census, taken on the 1 st of May 1872, when the number of inhabitants was found to be only 316,032, or 119 to the square mile, the figures showing a decrease of more tnan one-fourth of the population, attributed to tbe famine of 1868-69 and the epidemic discases wnich followed it.
Tn the Central Provinces the returns show an increase in the population amounting, in the six years since the last census, to 185,191, or 2 per cent. The c:migration of tne people from their nomes to other places has in some dist:icls kd to an increase, and in others to a decrease; in the Upper Godavcry District tl1ere llaS oecn a falling-off of no less tnan 60 per cent ; attributed partly to the stoppage of the navigation works and partly to the emigration of the Koces into tb~ country of the Nizum.
The returnS for British Burma gave a population in 1862 of 2.020.634, and in 1872 of 2,747.148 ; in the former case the counting was not made by a systematic cenSus, and waS manifestly too low, but, allowing for the omission ofpcrhaps 5 per cent. on that occafiOll. we find an increase of 625,000 persons. or 30 per cent on the numbers existing tell years ago. This shows a progressive expansion at the rate of 3 per cent per annum, an improvement doubtless due to the better administration of the country since it came under the British rule.
No good result would apparently be obtained by an attempt to compare tbe numbers reported for other provinces with the estimates of a more or less vague character which were made on previous occasions.

EXTRACT FROM ALL INDIA CENSUS REPORT FOR THE 1881 CENSUS
CHAPn;R XIV
MOVEMENT OF THE POPULA nON General Condition
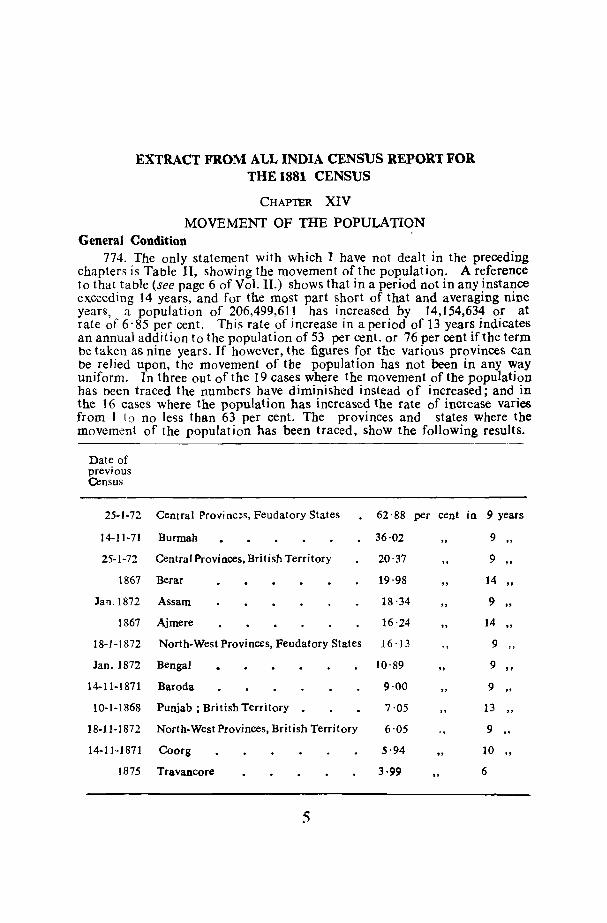
774. The only statement with which I have not dealt in the preceding chapters is Table II, Showing the movement of the population. A reference to that table (see page 6 of Vol. II.) shows that in a period not in any instance exceeding 14 years, and for the most part sbort of that and averaging nine years, a population of 206,499,611 has increased by 14,154,634 or at rate of 6· 85 per cent. This rate of increase in a period of 13 years indicates an annual addition to the population of 53 per cent. or 76 per cent iftbe term be taken as nine years. If however, the figures for the various provinces can be relied upon, the movement of tbe population has not been in any way uniform. In three out of the 19 cases where the movement of the population bas Deen traced the numbers have diminished instead of increased; and in the 16 cases where the population has increased the rate of increase varies from I t (l no less than 63 per cent. The provinces and states where tbe movement of the population has been traced, show the following results.
Date of previous Census
25-1-72 Central Provinc.::s, Feudatory States 62'88 per cent in 9 years
14-11-71 Burmah 36'02 9 "
25-1-72 Central Provinces, British Territory 20·37 9 " 1867 Berar 19·98
" 14 " la-a. 1872 Assam 18'34 9 "
1867 Ajmere 16·24 14 "
18-1-1872 North-West Provinces, Feudatory States 16· ]3 9
Jan. 1872 Bengal 10'89 9 "
14-11-1871 Baroda 9·00 9 .. 10-]-1868 Punjab; British Territory . 7'05 13 ..
18-11-1872 North-West Provinces, British Territory 6'05 9 .. 14-1 ]-1871 Coorg 5·94 10
1875 Travancore 3·99 6
5
Date of previous Census
6
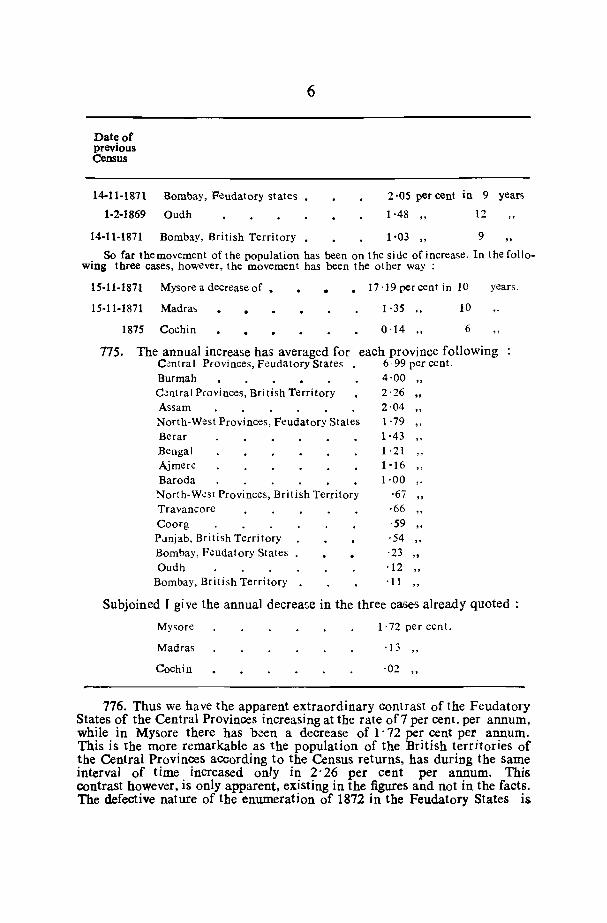
14-11-1871 Bombay, Feudatory states 2 ·05 per cent in 9 years
1-2-1869 Oudh 1·48 " 12
14-11-1871 Bombay, British Territory 1'03 " 9
So far the movement of the population has been on the side of increase. In the following three cases, however, the movement has been the other way:
15-11-1871 Mysore a decrease of • • 15-11-1871 Madras
1875 Cochin
• 17·19 percent in 10
1 . 35 "
0·14 "
10
6
years .
775. The annual increase has averaged for each province foHowing C~ntral Provinces, F.::udatory States 6 ·99 per cent. Burmah 4 . 00 " C~ntral Provinces, Bri tish Territory 2 '26 .. Assam North-West Provinces, Feudatory States Berar Bengal A.imerc Baroda North-W<!st Provinces, British Territory Travancore Coorg Punjab, British Territory Bombay, Feudatory States Oudh
Bombay, British Territory
2 '04 " 1·79 " 1·43 " 1 '21 " 1'16 " 1 . 00 "
·67
·66 " . 59 "
'54 " '23 " '12 " ·11 "
Subjoined I give the annual decrease in the three cases already quoted :
Mysore
Madras
Cochin
1·72 per cent.
·13 "
·02
776. Thus we have the apparent extraordinary contrast of the Feudatory States of the Central Provinces increasing at the rate of7 per cent. per annum, while in Mysore there has been a decrease of 1 . 72 per cent per annum. This is the more remarkable as the population of the British territories of the Central Provinces according to the Census returns, has during the same interval of time increased only in 2'26 per cent per annum. This contrast however, is onty apparent, existing in the figures and not in the facts. The defective nature of the enumeration of 1872 in tbe Feudatory States is
7
the Cause of thi~ great apparent increase of the population and the extent of the inaccuracy is illustrated by the following case, quoted from page 21 of Vol. II of the Central Provinces Report :
"The Zemindari of Chapa returned a population of 2,615 souls in 1872, though at the settlement (i.e., at a time shortly preceding the enumeration) it was believed to contain 18,666 inhabitants, and though the village of Chapa itselfwas known to be one of the most important and flourishing in the whole district. The Census of 1881 shows the population is 23,769."
The marked increase everywhere in the Case of the Feudatory States rende:'s it absolutely certain that the figures in 1872 were defective and that tbe population was not correctly enumerated. It will be found also 1 hat in other instances than the Feudatory States of the Central Provinces. the variarions in the movement of thc population which are so conspicuous when the annual increments are contrasted as they are in the figures above, are due less to real increase of the population than to other circumstances. In some Cases undoubtedly the increase is real; for instance in Burmah. where there has been a large addition to the population produced by immigration to tInl province. So possibly in Assam, whcre the numbers of the people are cl.)ntinually being added to by emigration there from the neighbouring coun' :-ies. But in the Central Provinces BritiSh Territory, there can be no doub: that there was a similar understatement of the population in 1872, though not so great as was apparent in the Feudatory States, under the same administration.
777. The same may be said of the great apparent increase in the population :)f the Feudatory States of the North-West Provinces; and in the British Territory, North-West Provinces, there was grave under statement of th'~ ~,),)Jlation in 1872. Mr. While in his remarks on this subject at page 21, et. seq" goes v\~ry thoroughly into this que:;1 ion, and gives very good rcaSon fo!' th~ conclusion at which h,;: arrives, that the population of the NorthW.;:s P:'ovinces has not incr';:ased and may have d,:crcased. Amongs1 other proo;~ ()f the defective nature of the previous enumeration in the NorthWesi P:'ovinces to which h,; refers, is the very mark,;:d difference in the movemenT. of the two Scx,;s. The male pop'alation has increased 647,864 on 16.414.037 and the female population 1,239,317 on 15,659,227; that is, the popuLt ion has increased 3' 95 p~r (x~nt, while the female population has increased 8' 99 per cent.
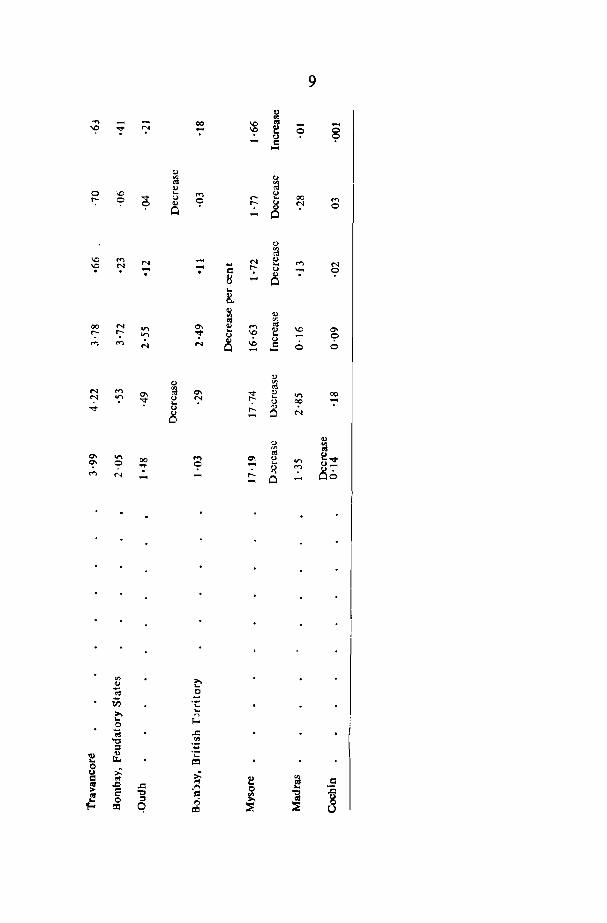
778. This proof of defect in preceding enumerations is almoST universal, and is not confined to the North-West Provinces. In the accompanying abstract the increases and decreases in the various provinces are given on the population as returned by the Census of 1881 compared with the population as shown in the last preceding enumeration. These figures are shown in tbe form of percentages for both sexes and for the two sexes separately. In the first three columns the actual increment or decrement, during the time that has elapsed between the two enumerations, is given; but as the enumerations in diff::rent provinces have occurred at varying dates, and the time interven!ng is not identical in every case, the three last columns have been added, whIch show the actual annual per centage of increase or decrease for the entire population, and for either sex in every province.

-= 8 .. g,
.... 00
'"
o 0'1 o 0 ..... ..., '" N
00 N 00 0
N '" '" ...,
N
N 00
0'1
s
N -.:t
00 0'1
0'1
N
-.:t o N
-;
o 0'1
o ,_ ,_
be> 9
..., N
1,0 -;
0'1 ,_ 00
... N
o ...,
00 -.:t
o
0'1 00
o
..., 00
o 9
.... o 6
00 '1' ,_
o o 0'1
0'1 ,_ ,_
9
Q
'" ~ - - 00 1,0 ., - -'i:> "'" ";'l ":" ':' ~ 0 8 c -
OJ Q td ~ ..
0 \0 ... ..... Q 00 "'" OJ ,.._ ... ..... r:- 0
9 Q 9 r:- ~ ";'l 0 Q 0
<:)
'" ., \0 ..... N <:) ..... N N C; ... ':' ';'I - - ':- OJ -: 9 . .
8 0 ... & '" <:) '" ., '" N 0- '" .... oS
0-00 .,... ... '? '" \0 r:- ':- ~ ""! (j ... 9 (j ..... ..... N M 0 \0 C 6 0 -Q
'" '" '" oS
M ..... 0- oS 0- "'" 2 .,., 00 ~ ~ ""! Q ~ r:- 0 ~ ":" ...
" "T OJ ..... 0 N 0 .., II>
'" ~ oS II> 0- .,., 00 ..... 0- '1> .,., ... "",
~ 0 9 ... tJ_ '7 ${ ':' 00 ..... M ..... 0
'" >. Q ... tU B ti5 0:: ... >. ., ...
""' 0 tU .c 't:I til
::J -~ &:
0;: co
0 ~ ~ u
~ en
C C 01
'"' f! !: .c .c -" 0 0:c E: "0 = ~ "0 ;. 0 :::J 0 ~ ~ co q co ~
10
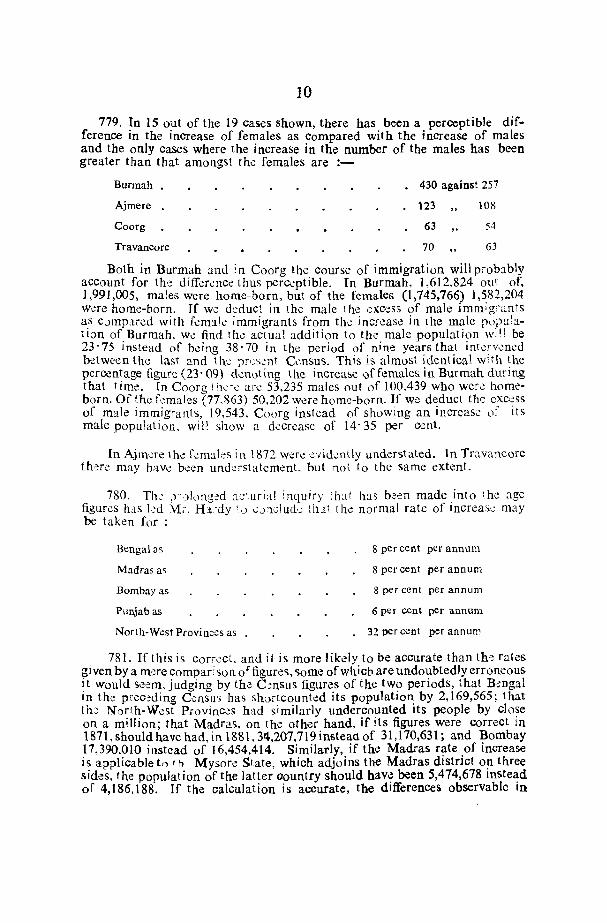
779. In 15 out of the 19 Cases shown, there has been a perceptible difference in the increase of females as compared with the increase of males and the only Cases where the increase in the number of the males has been greater than that amongst the females are :-
Burmah
Ajmere
Coorg
Travancore
430 against 257
123 108
63
70
54
63
Both in Burmah and in Coorg the course of immigration will probably account for th'~ difference thus perceptible. In Burmah, 1,612,824 out of, 1,991,005, males were home-born, but of the females (1,745,766) 1,582,204 were home-born. If we d':duc! in the male the eXC':::SS of male immig"~nts a,s compared with femJle immigrants from the incrcas,;: in the male populaIlon of, Burmah, we find fhe actual addition to the male population wi!] be 23'75 Instead of being 38'70 in the period of nine years that interv,~ned between the la:;t and til.; ~r{;:s~nt C\~nsus. This is almost identical with the percentage figure (23' 09) denoting ~hc increase of females in Burmah during that time. In Coorg the~\: arc 53,235 males out of 100.439 who were homeborn. Of the f'~males (77,863) 50,202 were hOffi'>born. If we deduct the cxe,~ss of male immigrants, 19,543, Coorg instead of showing an increase 0: its male population, will show a decrease of 14' 35 per cent.
In Ajm;re the f,_;m;ll,~s in 1872 wer'_; evidently understated. In Tr;lvancorc th·~re may have been understatement. but not to the same extent.
780. Til: ,1·)long~d ac~urja! inquiry ihal hls b~en made into the age figures has kd Mo'. Hl'dy '0 c,nGlud·: tlul the normal rate of increa:;:: may be taken for:
Bengai<Js
Madras as
Bombay as
Punjab as
North-Wast Provinces as
8 per cent per annum
8 per cent per annum
8 per cent per annum
6 per cent per annum
32 per cent per annum
781. If this is correct, and it is more likely to be accurate than th·~ rates gi ven by a m~re compari son or figures, some of which are undoubtedly erroneous it would seem, judging by the C~nsus figures of the two periods, that B.mgal in the preo~ding C..::nsu> has shC)rtcounkd its populatio~ by 2,169,565; that t h~ N orlh-West PfOvine,~s had similarly undercounted Its people by close on a million; that Madras, on the other hand, if its figures were correct in 1871,shouldhave had, in 1881, 34,207,719 instea<1 of 31,170,631; and Bombay 17,390,010 instead of 16,454,414. Similarly, if the Madras rate of increase i~ applicable tn ( h Mysore State, which adjoins the Madras district op. three SIdes, the population of the latter oountry should havl! been 5,474,678 Instead of 4,186,188. If the calculation is accurate, the differences observable in

11
these last three Cases would show the number which the population had lost ,~ither by extra deaths or by a disease prevailing beyond the ordinary limits, and represent a loss in Madras of 3,037,088, in Bombay of 935,596 and in Mysore of 1,288,490.
The calculation in Abstract XCI, for MadIa;, Bombay, and Mysore give the figures for the population in each case at each succeeding year, allowing for the additions occurring annually in the three populations. They are made on Mr. Hardy's rates of increases.
ABSTRACT XCI _ .. _._.--_._
Mysore Madras Bombay ----.------- _-"_ -----~- -"_.-- ~---~
Increasing Increasing Increasing annually annually annually at at 8 per at 8 per 8 per Mille Mille bet- MilJc bet- between
ween 1871 ween 1871 1871 and and 1881 and 1881 1881
-.---.~-....-
Po.'.! • ; ,l[] at pr()c~ding C.;nsus 5,055,412 31,597,872 16,285,636
I ~t y~ar succ\!cding . 5,055,854 31,850,fi54 16,315,916
2 5,136,620 32,095,457 16,446,444
3 5,177,712 32,351,950 16,578,014
4 5,219,134 32,610,762 16,710,638
5 5,25),851 32,871,648 16,1l44,322
6 5,3ll2,938 33,134,621 16,777,276
7 5,3+5,352 33,399,697 17,115,074
8 5,388,124 33,666.895 17,251,994
9 5,431,229 33,936,229 17,390,010
10 5,474,678 34,207,719
782: Th,;!re can b~ little doubt that th,:! great decrease in the Mysore populatIon a decrease not only upon the estimated figures, but on the actual figures as recorded at the two enum~ration can be largely, traced to the effects of the famine of 1817-78.
783. Unfortunately, the local knowledge which would have illustred the Census figures in connexion with this subject is wanting, as no Censu report for the Mysore State has yet been published. The districts in Mysore which suffered most in the calamity of 1877 are described to me by Major Cunningham, who is employed in the Mysore administration and who has been good enough to give me a brief note on the subject on Tumkur Kolar Hassan, Chitaldroog and Bangalore. In these districts the famineis said to have been most severe.
12
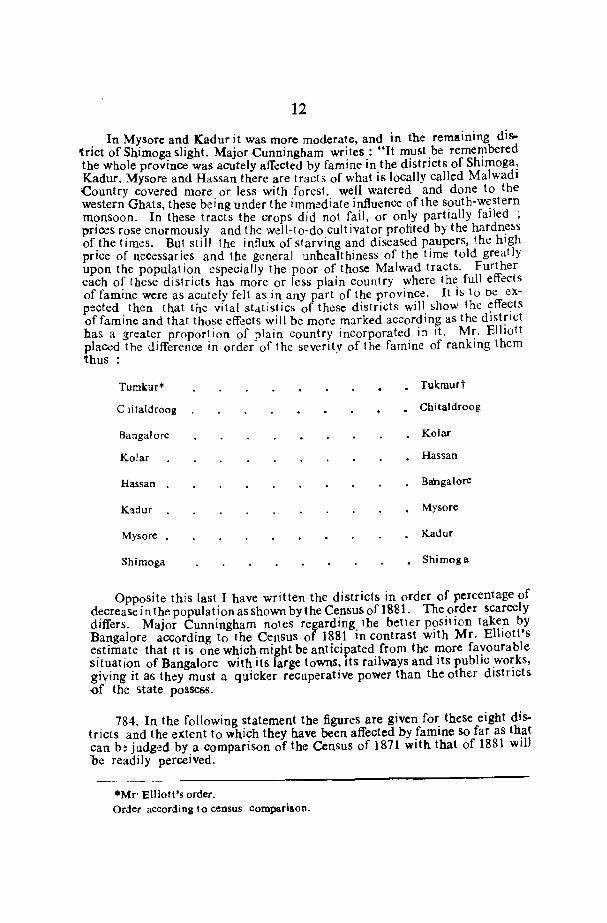
In Mysore and Kadur it was more moderate, and in the remaining di~ trict of Shimoga slight. Major Cunningham writes: "It must be remembered the whole province was acutely affected by famine in the districts of Shimoga, Kadur. Mysore and Hassan there are tract s of what is locally called Malwadi Country covered more or less with foreGt. well watered and done to the western Ghats, these being under the immediate influence of the south-western mc;msoon. In these tracts the crops did not fail, or only partially failed ; prices r<:lse enormous!y and the wdl-to-do cultivator profited by the hardn~~s of.the times. Bu.t still the influx of starving and diseased p~upers, the hIgh price of neceSSarIes and the general unhealthiness of the tIme told greatly upon the population especially the poor of those Malwad tractS. Further each o~ these districts has more or less plain country where th~ full effects of famllle were as acutely felt as in any part of the province. It IS to oe eXpected then that thc vital statistics of these districts will show the effects of famine and that those effects will be more m:lrked according as the dist~ict has a greater proportion of plain country incorporated in it. Mr. Elltott placed the difference in order of the severity of the famine of ranking them thus : .
Tumkur* . Tukmurt
eli taldroog Chitaldroog
Bangalore Kolar
Kolar Hassan
Hassan Bangalore
Kadur Mysore
Mysore Kadur
Shimoga Shimoga
Opposite this last I have written the districts in order of percentage of decrease in the population as shown by the Census of 1881. The ordu scarcely differs. Major Cunningham notes regarding the better position taken by Bangalore according to the Census of 1881 in contrast with Mr. Elliott's e~timate that It is one which might be anticipated from the more favourable Situation of Bangalore with its large towns, Its railways and its public works, giving it as they must a quicker recuperative power than the other districts -of the 'itate possess.
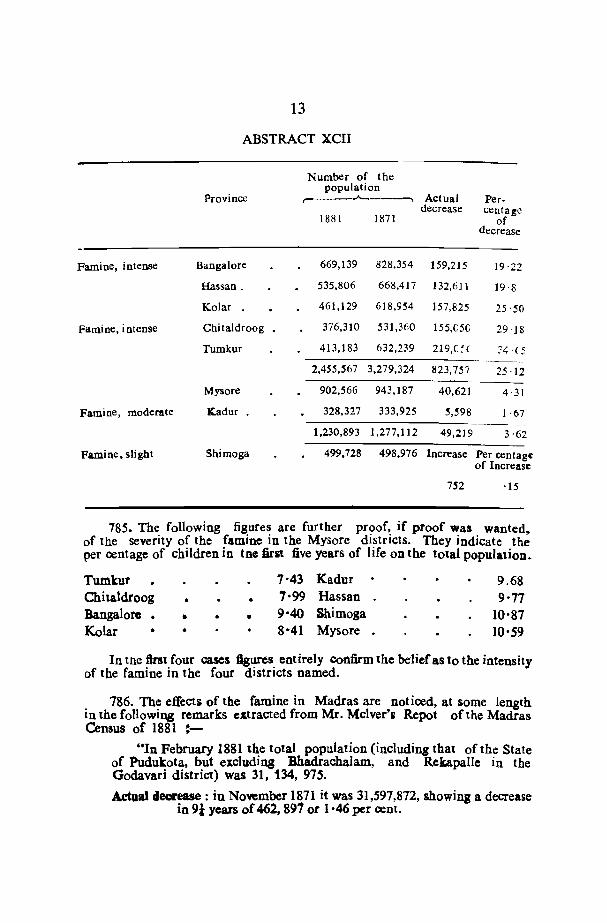
784. In the following statement the figures are given for these eight districts and the extent to which they have been affected by famine so far as that can b! judged by a comparison of the Census of 1871 with that of 1881 will be readily perceived.
*Mr' Elliott's order. Order according to census comparison.
13
ABSTRACT XCII
Number of the population
Province .A-_----, Actual Per-decrease centage
1881 1871 of decrease
Famine, intellSe Bangalore 669,139 828,354 159,215 19'22
Hassan. 535,806 668,417 132,611 19 8
Kolar 461,129 618,954 157,825 25'50
Famine, intense Chitaldroog • 376,310 531,360 155,e50 29 18
Tumkur 413,183 632,239 219,(~( ::<: . (5
2,455,567 3,279,324 823,757 25 '12
Mysore 902,566 943,187 40,621 4·31
Famine, moderate Kadur . 328,327 333,925 5,598 1 ·67
1,230,893 1,277,112 49,219 3'62
Famine, slight Shimoga 499,728 498,976 Increase Per centage of Increase
752 ·15
78S. The following figures are further proof, if proof was wanted~ of the severity of the famine in the Mysore districts. They indicate the per centage of children in tne Brit five years of life on the total population.
Tumkut Chitaldroog Bangalore • Kolar
•
7'43 Kadur 7'99 Hassan . 9'40 Shimoga 8 '41 Mysore .
9.68 9'77
10'87 10'59
In the ftrst four oases ftgures entirely Confirm the belicf as to the intensity of the famine in the four districts named.
786. The effects of the famine in Madras are noticed, at some length in the following remarks extracted from Mr. Mciver's Repot of the Madras Census of 1881 =-
"In February 1881 the total population (including that of the State of Pudukota, but excluding BhadrachaIam, and Rekapalle in the Godavari district) was 31, 134, 975.
Actual decrease: in November 1871 it was 31,597,872, showing a decrease in 91 years of 462, 897 or 1·46 per cent.
14
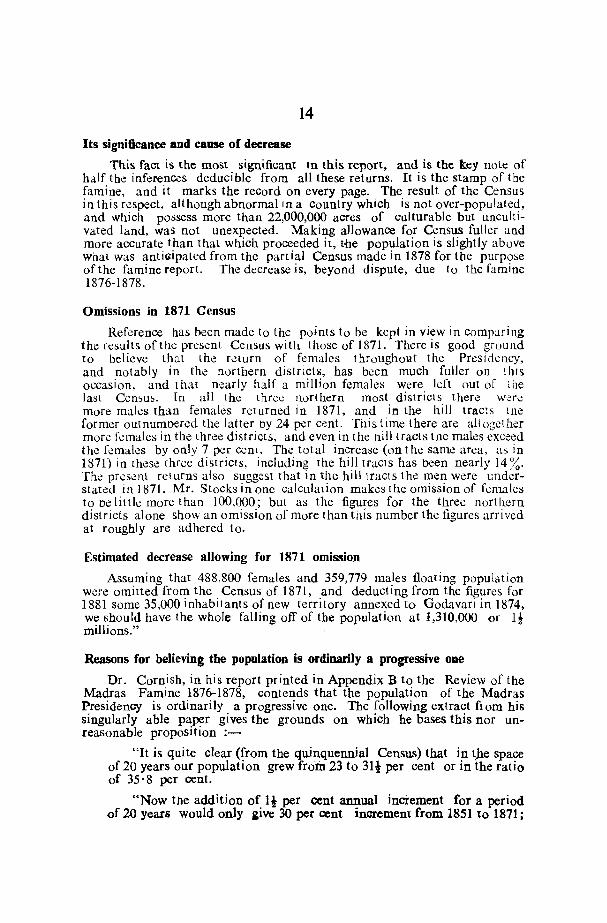
Its significance and cause of decrease
This fact is the most significant In this report, and is the key nole of half the inferences deducible from all these returns. It is the stamp of the famine, and it marks the record on every page. The result of the Census in this respect, although abnormal in a country which is not over-populated, and which possess more than 22,000,000 acres of culturable but uncultivated land, was not unexpected. Making allowance for Census fuller and more accurate than that which proceeded it, vhe population is slightly above what was antiaipated from the partial Census made in 1878 for the purpose of the famine report. The decrease is, beyond dispute, due to the famine 1876-1878.
Omissions in 1871 Census
Reference has been made to the points to be kept in view in comparing the results of tile present Census with those of 1871. There is good ground to believe that the return of females throughout the Presidency, and notably in the northern districts, has been much fuller on this occasion, and thut nearly half a million females were left out of ,he last Census. [n all the lhree northern most districts there w.:re more males than females returned in 1871, and in the hill trac:s tne former outnumbered the latter by 24 per cent. This time tbere are alt ogel her more females in the three districts, and even in the nill tracts tne males exc~ed the females by only 7 per cent. The total increase (on the same area, as in 1871) in lhes~ rhree disrricls, including the hill tracts has been nearly 14%. The present relurns also suggest that in the hilllracls the men w~re understated in 1871. Mr. Stocks in one calculation makes the omission of females to be little more tban 100,000; but as the figures for the three northern districts alone show an omission of more than this number the figures arrived at roughly arc adhered to.
Estimated decrease allowing for 1871 omi~ion
Assuming that 488,800 females and 359,779 males floating population were omitted from the Census of 1871, and deducting from the figures for 1881 some 35,000 inhabitants of new territory annexed to Godavari in 1874, we should have the whole falling off of tbe population at 1,310,000 or It millions."
Reasons for believing the population is ordinarily a progressive ODe
Dr. CorniSh, in his report printed in Appendix B to the Review of the Madras Famine 1876-1878, contends that the population of the Madras Presidency is ordinarily a progressive one. The following extract flom his singularly able paper gives the grounds on whicb he bases this nor unreasonable proposition :-
"It is quite clear (from the quinquennial Census) that in t,he space of 20 years our population grew froril 23 to 3It per cent or in the ratio of 35·8 per cent.
"Now tile addition of It per cent annual increment for a period of 20 years would only give 30 per cent increment from 1851 to 1871;
15
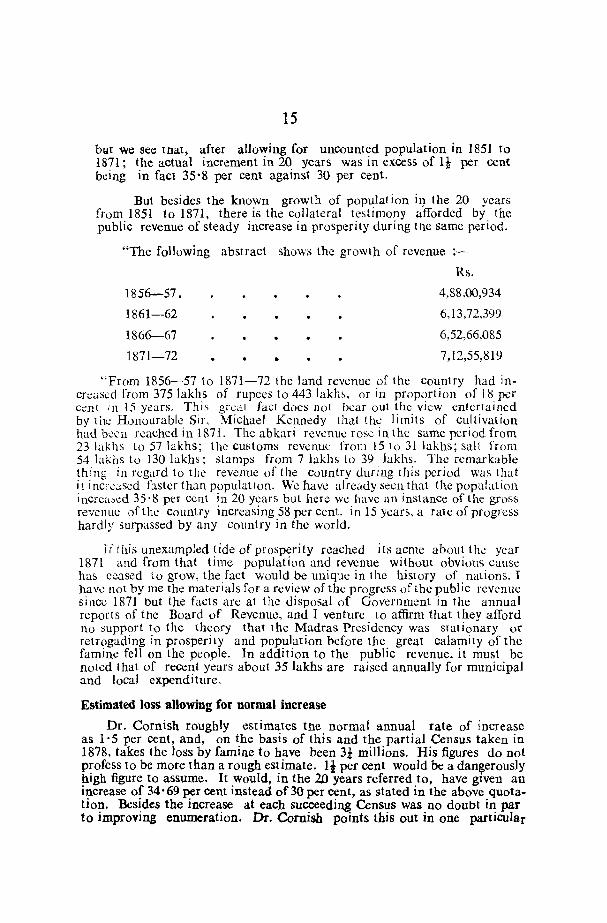
l:mt we see roat, after allowing for uncounted population in 1851 to 1871; the actual increment in 20 years was in excess of Ii per cent being in fact 35-8 per cent against 30 per cent.
But besides the known growth of population iI} the 20 years from 1851 to 1871, there is the collateral testimony afforded by the public revenue of steady increase in prosperity during tne same period.
"The following abstract shows the growth of revenue ;
Rs.
1856-57.
1861-62
1866-67
1871-72 •
4,88,00,934
6,13,72,399
6,52,66,085
7,12,55,819
"From 1856-57 to 1871-72 the land revenue of the country had incrcas~d from 375 lakhs of rupees to 443 lakhs. or in proportion of 18 per cenl ill 15 ycars. This great fact does not bear out the view entertained by the Honourable Sir, Michael Kennedy that th.: limits of cultivation had b;:;::n rl.!ached in 1871. The abkari rcvenu..: rose in the same period from 231akhs to 57 lakhs; the customs revenue from 151031 lakhs; salt from 54 bkhs to 130 lakhs; stamps from 7 lakhs to 39 lakhs. The remarkable thing in regard to the revenue of the country during this period was that it i ncrcascd faster than populatlon. We haw already seen that the population increa"ed 35' 8 per cent in 20 years but here we have an instance of the gross revenue of the country increasing 58 per cent. in 15 years, a rate of progress hardly surpassed by any country in the world.
T[this unexampled tide of prosperity reached its acme about the year 1871 and from that time population and revenue withoUt obvious Cause has ceased to grow, the fact would be unique in the history of nations. I haw not by me the materials for a review of the progress of the public revenue since 187] but the facts arc at the disposal of Government in the annual reports of the Board of Revenue, and I venture to affirm that they afford no support to the theory that the Madras Presidency was stationary Of
relrogading in prosperity and population before the great calamity of the famine fell on the people. In addition to the public revenue, it must be noted that of recent years about 35 lakhs are raised annually for municipal and local expenditure.
Estimated loss allowing for normal increase
Dr. Cornish roughly estimates the normal annual rate of increase as 1'5 per cent, and, on the basis of this and the partial Census taken in 1878, takes the loss by famine to have been 31 millions. His figures do not profess to be more than a rough estimate. Ii per cent would be a dangerously high figure to assume. It would, in the 2,0 years referred to, have given an increase of 34 -69 per cent instead of 30 per cent, as stated in the above quotation. Besides the increase at each succeeding Census was no doubt in par to improving enumeration. Dr. Cornish points this out in one particular
16
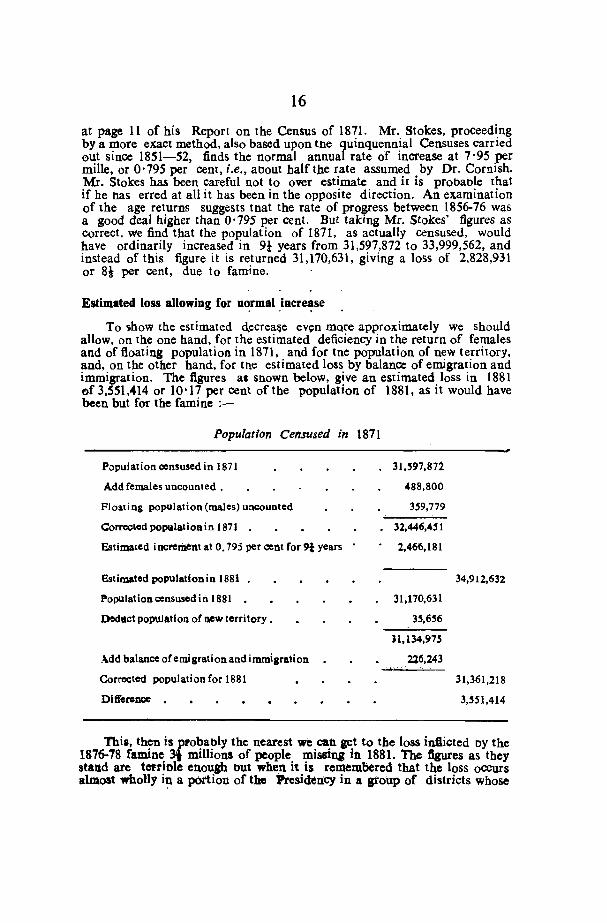
at page 11 of his Report on the Census of 1871. Mr. Stokes, proceeding by a more exact method, also based upon the quinquennial Censuses carried out since 1851-52, finds the normal annual rate of increase at 7'95 per mille, or 0'795 per cent, i.e., aoout balf the rate assumed by Dr. Cornish. Mr. Stokes has been careful not to over estimate and it is probable that if he has erred at all it has been in the opposite direction. An examination of the age returns suggests tnat the rate of prO$l'ess between 1856-76 was a good deal higher than 0'795 per cent. But taking Mr. Stokes' figures as correct, we find that the population of 1871, as actually censused, would have ordinarily increased in 91 years from 31,597,872 to 33,999,562. and instead of this figure it is returned 31.170,631. giving a loss of 2.828.931 or 81 per cent. due to famine.
Estimated loss allowing for n~rmal .iRcr~se
To show the estimated d.ecrea~e even mQre approximately we should allow, on the one hand. for the estimated deficiency in the return of females and of floating population in 1871. and for tne population of new territory. and. on the other hand. for tne estimated loss by balance of emigration and immigration. The figures as Shown below, give an estimated loss in 1881 of 3,551,414 or 10-17 per cent of the population of 1881, as it would have been but for the famine :-
Population Censused in 1871
Population ccnsused in 1871
Add females uncounted.
Flouing popUlation (males) uncounted
Corrected populatioain 1871 _
Estimated increment at 0.795 per cent for 91 years
Estimated population in 1881 .
POpUlation ccnsused in 1881 _
Dedllct population of new territory _
Add balance of emigration and immiaration
Corrected population for 1881
Difference •
31,597,872
488,800
359,779
32,446,451
2,466,181
31,170,631
35,656
ll,134,97S
2l6,243
34,912,632
31,361,218
3,551,414
This, then i~probably the nearest we can. get to the loss infticted by the 1876-78 famine 3t millions of people missina in. 1881. The dgures as they stand are tetriole enouJh Dut when it is remembered that the loss occurs almost wholly i~ a p6ttion of the Presidency in a group of districts whose
17
people should now have nwnoored 141 millions and actually number under 12 millions the total deficit is even more significant. It means that famine. whether by deaths from sheer starvation or from starvation induced disease, by lost fertility or by enforced migration. has reduced tne present popu· lation of the famine zone by nearly 18 per cent.
Estimated population in 1876
From tne age taoles it seems clear that In 1871 there was an abnormally high birth rate, and that this continued down to 1876. Then: is little douot that at this period the population was increasing a good deal faster rhan at the normal rate. But a!'5uming the norm,l! rate accepting the d<"fective r~turn of 1871 and deducting the etitimated loss by emigration the population in 1876 would have reaeh~d 32,761,093 or 1,626,118, more than it is found to be in 1881.
In 1881, therefore, there is a loss of 1.46 per cent on the actuals of 1871 of 5 p~r Co.!nt on th~ ';;,illmate of 1876, and ,)f 10'17 IXl' cent on what there ought to have b;cll in 1881 even if The population had not been increasing at an abnormal rate.
Check to progress not confined to famine zone
In examining the age tables we find vcry distinctly that the scarcity affected thc population, not only by a heavy modality but by checking birth; and we find clcar sigh that in 1881 tne enfeebled population was recovering itself and that the birth-rale was gradually rising towards its former figure. The abnormal loSS of population on what it was that it is to say, the effects off.lminc: mortality---may be taken to have been confined to the famine districts. The loss in population, on what it ought to have been is not confined to the famines zone. Throughout the Presidency the famine told on supply and on prices. In some socalled non-famine districls tne famine pressure was severe. In pans of these districts tllcre were failure of monsoons and of crops, relief works, and famine camps; in others there was severe distress. In all there were high prices and scarcity. These conditions therefore would affect, and did affcct, the population. They did not per· haps (eKcept to a small degree) lead to an abnormal mortality in those districts they put an effective check on rapid reproduction.
It may safely be accepted that when food is scarce there are fewer births; whether this is exclusively fhe resull of prudence, and whether that prudence is deliberate or instinctive it is not here necessary to inquire. It remains stamped on the age tables tn:!! !:1 187678 very m ... ch few.:;;: ;:;:1i:d.cn were begotten throughout the Presidency tnan in previous or sub6cquent years, and that this is true of the famine districts. Tne result is that, although the non famine district" "how an increased popuJ:,!fion they do not show such an increase as, allowing for improved enumeration, they would have shown had there been no famine in 1876-78.
In the non-famine districts the population has increased by 1,288,430 or 7.19 peT cent, that is to say, within 29,907, or 0.16 per cent, of what might have been expected at the normal rate of increase. In the famine districts, including Pudukota, the actuallo6s has been 1,751,327 on a population of
4-1 R. G. India/72
18
13,684,510, or nearly 13 per cent on the previous Census and the populatiolll is 2,508,437, or m0anG 18 per ccnt below what it ought to have reached in f881."
787. The following remarks by Mr. White in regard to the movement of the population in the Norln-Western Provinccsare of interest :-
"We find that thc population of Oudh at the previous Census was overestimated relatively to that the North-Western Provinces, but to what extent we cannot ascertain. In the central tract, consisting of the Lucknow division and the two districts, Rae Bareli and Sulianpur, the decrease of nearly 8 per cent must be an indication of a real loss. It cann~t be ascribed to the ovcr cstimate of the previous Census, because that IS a condition which would affect the province generally; but we have here a well-defined tract showing a decrease, which another shows an increase. There m'lr,t COll';I)q:ll~n~ly h:1V.) br~en t>omc condition t>pecially affecting 'tile population of these diGtricts. Such a condition we find from the drought ·of 1378 and (h,~ ft:wr of 187~, from whic,l .his ccnlrallracl suffered c6pecially. 'That the population ofthe&e districis was thUG especially affected we find from <the smaller proport ion of children living of (he years of birth of 1878 and 1879. There can, therefore, be no doubt that the 'population of this trae: actually has diminished by 60mewhcre about 8 per cent. Owing to the effects of lhose two fatal yearti.
Th~ te.rib!'! dLct of th%c two yl~an; may be shown clearly by the following conHidcration. The ratc of increa6c in the Fyzabad district iii 3.8. that in Pratapgarh 5 5. If we assume thai the central tract in question would have increased by about 4 per cent bu: for the mortality of 1878-79, then the male population of 1869 .;hould have increased from 2,488,156 to 2,587,682, at the POC6(:Illt census. The number enumerated waf> only 2,292.084. which is 295,598 tess. Thus these fatal yean; would appear 10 have caw;cd a loss to the population of lh'~t;e five dit>,ric~[; ur neal Iy 300,000 makb.
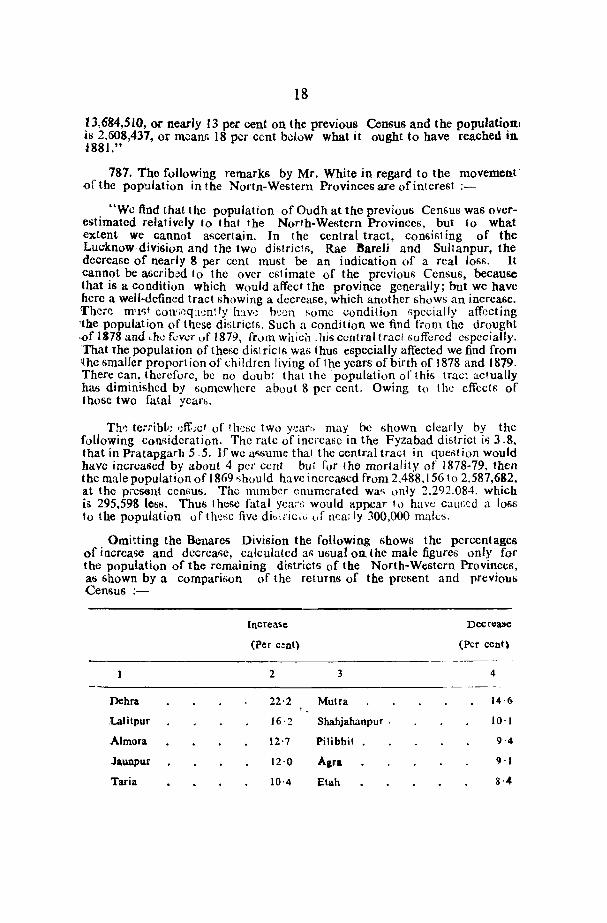
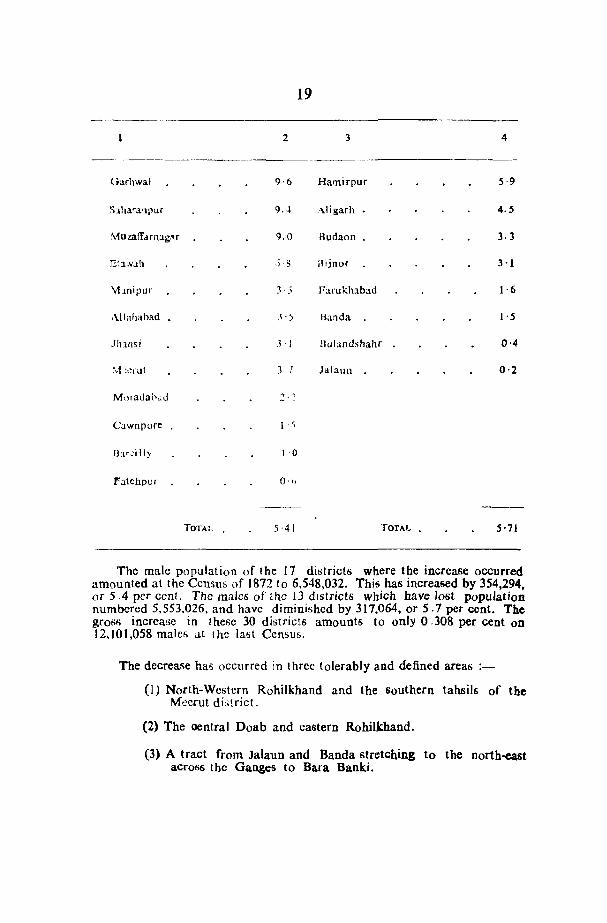
Omitting the Benares Division the following shows the percentages of increase and decreat'le, calculated as usual on. the male figurcs only for the population of the remaining districts of the North-Western Provinces, as shown by a compari6on of the returns of the present and previous Census :-
IncreaSe Decrease
(Per c!nt) (Per cent)
-----2 3 4
Dehra 22'2 Mutra 14,6
Lalitpur 16'2 Shahjahanpur . 10·)
Almora 12'7 Pilibhit 9'4
Ja~pllr 12·0 A,ra 9'1
Taria 10'4 Elah 8·4
19
-------.- --------------------2 3 4
Garhwal 9·6 Hamirpur 5·9
9.4 .·\.ligarh 4.5
9.0 Hudaon 3.3
:; 8 llijnor 3'1
'vhnipur 3·5 Farukhabau 1·6
Allahabad 3'5 Banda ),5
Jhlnsi 3·, Bulandshahr 0·4
\·1Xfllt 3 7 Jalaull 0·2
M()rada0~d '>.'
Cawnpore I . ,
Il;,r:illy 1·0
Fatchpur 0'1>
TOTAl 5·41 TOTAL . 5·71
The male population of the 17 districts where the increase occurred amounted at the Census of 1872 to 6,548,032. This has increased by 354,294, or 5.4 per cent. The males of the 13 districts which have lost population numbered 5,553,026, and have diminished by 317,064, or 5.7 per cent. The gross increase in these 30 dititricts amounts to only 0.308 per cent on 12,101,058 males at the lafit Cen-;ufi.
The decrease has occurred in three tolerably and defined areas
(1) North-Western Rohilkhand and the southern tahsils of the Meerut di,;!rict.
(2) The oentral Doab and eastern Rohilkhand.
(3) A tract from Jalaun and Banda stretching to the north-east acr06S the Ganges to Bara Banki.
20
The first tract includes the whole of the Bijnor district except tabsil Nagina the adjacent tahsils of Amroha, Thakurdwara, and Moradabad in the district of Moradabad. From the Basta tah6il of the Bijnor diRtrict it crosses the Ganges and includes the Ghaziabad and Hapur tahsils of the Meerut district. Tlae second tract includes the whole of Pilibhit district except tahsil, Puranpur, the whole of Shahjahanpur, and all Budaon except the Bisauli tahsil. It crosses the Ganges and includes all Farukhabad except Tirwa, a.ll Btab, Agra and Muttra, and the Khurja tahsil of Bulandshar. The population of this central tract has decreased more than that of either of the otherf). The last tract begins from Bara Banki on the north-cab(, includee; the five central districts of Oudh, crosses the Ganges, including the Jajmau, Ghatampur, and Bhoghnipur tahsils of Cownpore, all Fatehpur except \.ahsils Fatebpur and Hatgaon, all Hamirpur and Banda except tahf;il Ra'h .. K~:Ipahar. Banda and Badausa, the Jalaun, and Atta tahf;iit; of Jalal.ln, and the Bara tahsil of Allahabad.
If these three tracts be marked out on the map each will be found to spread out in a continuous area. No single tah(;il in the p,ovillCcr> har, lost in population which is not connected with these tract:;. Were thi., decreal;e due to irregularities in the former Cenl;us, the tahsil" in which it OCC1ITr-- would be found scattered over the province witnout thi& contiguity. We find. however, that the lincs of conncxion are geographical, not checked by dl6trict or even provincial limits; thus any local careIcs,;ness in the prevIous enumeration will not suffice to explain this phenomenon. There Can, I think, be no doubt that the real explanation is to be found in the drought of 1878 and the epidemic fever of 1879. All the district officers concur in ailributilli the diminitihed population of their districts to this cause.
As already pointed out, the death-rates of one district cannOt 5afeIy be compared with those of another, because the accuracy of th'~ reports has hither to depended much on the idiotiyucra.,ict> of district offic(';;"G. Taking, however, a group of districts, we may compare the rates on l.be asc;umption that the rate of omission will be equal. 1;pc mean deatn ratc giVl:n by [he mortality returns for the two year!"' 1878-79 in tne 13 di(itricts whl:re the decrease occurs in 55.07 in the other 17 districts, in quest ion it if; 0nty 38.9. Again, the scarcity of 1878 wa~ caused by the failure of the rainr; in !he preceding ycar. In the tract were the population has diminisht;d. the mean rainfall of June-September was 6 .9 iUC::lC6; in other di·_;trictf> it wa" I) . 9 i ncheo. The latter tract has also a slight advantage in the number of malt children sUiviving from tbe births of 1878, viz., 1.19 per ccnt on the tolal mal~.
We find then, that in order to estimate the movement oftbe population in these provinces, we must fimt set aside entirely the Benaraf> Division in which the previous Census was so extremely inaccurate. A comparison of the figures for tne rest of the province shows that both in the NorthWestern Provinces and Oudh there are well defined areas of incrcaGc and decrease. The previous Census of the 12 districts of Oudh was taken on tbe Ist February 1869; that of the North-Western Provinces on the 18,h January 1872. In the one case, theref(])re, an interval of 12 years and a fraction, and in the other of 9 years and fraction has elapsed between the previous and present Census. Omitting the fractions as unimportant, we have the following
21
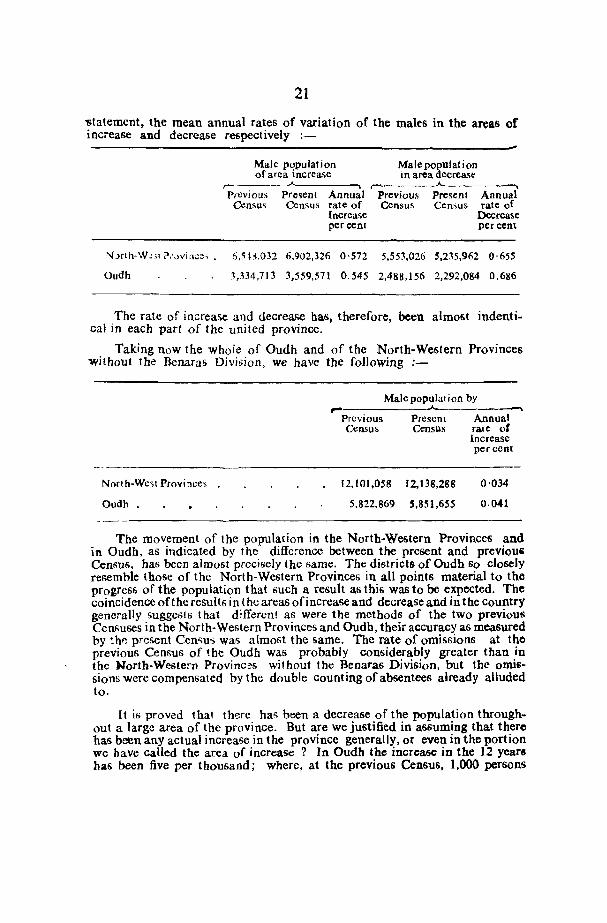
1>tatemcnt, the mean annual rates of variation of the males in the areas of increase and decrease respectively :-
N->rtil-W~~a ?',.lViil';'~' .
Oudh
Male population of area increase
,-~~-~
PrevioLis present Annual Census Census rate of
Increase percent
6,5 B,032 6.902,326 0'572
~,334,713 3,559,571 0.545
Male population in area decrease
Previous Present Census Census
Annual rate of
Decrease percent
5,553,026 5,235,962 0'655
2,488,156 2,292,084 0,686
The rate of increase and decrease has, therefore, been almost indentical in each part of the united province.
Taking now the Whole of Oudh and of the North-Western Provinces without the Benaras Divi6ion, we have the following :-
North-West Provinces
Oudh •
Male population by r-------------~--------~
Previous Present Census Census
12,101,058 12,138,288
5,822,869 S,85 1 ,655
Annual rate of Increase per cent
0·034
0,041
The movement of the population in the North-Western Provinces and in Oudh, as indicated by the difference between the present and previoui Census, has been almost precisely the 6ame. The districts of Oudh So closely resemble those of the North-Western Provinces in all points material to the progress of the population that such a result as this was to be expected. The coincidence of the result6 in the areas ofincrease and decrease and in the country generally suggests that different as were the methods of the two previous Ccnf>uses in the North-Western Province6 and Oudb, their accuracy as measured by the present Cen"u6 waG almost the same. The rate of omissions at the previous Census of the Oudh was probably considerably greater than in the North-Western Provinc~s without the Benaras Division, but the omissions were compensated by the double counting of absentees already alluded to.
It is proved that there hal> been a decrease of the population throughout a large area of the province. But are we justified in assuming that there has been any actual increase in the province generally, or even in the portion we have called the area of increase ? In Oudh the increase in the 12 years has been five per thousand; where. at the previous Census, 1.000 persons
22
were counted, on the present occasion we counled 1,005. In the North:Western Provinces (without, the Benaras Division) the incrcaGc in nive yeans has been three in a thousand; where, at previous Census, we counted 1,000 persons, we have now counted 1,003. If, now, We con&ider the careful preparation for the present enumeration and the laborious checking to which the schedules were subjected, and compare this with the manner in wbich the operation waS carried out the previous Cent;uscs. we may, I think, fairly suspect that this very small increase of from three to five in a thousand is due to : he more accurate counting. The fact& of the relative proportion!> of the sexes at the present and previous cenSUG, and the great neglIgent with which the previous enumeration was effect~d in the Benaras Division generally, afford strong confirmation of thir; view. I think, therefore, the comparif;on tends to show that the population hat; not increased, and may have decreased.
Within the area of incrca(;c in Oudh and tbe North-WI~stcrn Provinces the increment is equivalent to rate of 67 and 54 pcr millc respect ivcly. The coincidence of the rates calculated on the two independenl Ccnt;u&es of Oudh and the North-W.!st:!rn Provinces rai(ies a p;c!)U1nplion that fiome inc-rease hal) actually taken place, though p,"obably Ie,,,; than the figures ShoW; the annual ratef'; ofincrcaGc, 5.72 per mille for North-We<tcrn Provinces, and 5.45 per mille for Oudh, arc tne limilt, of the pObf,ible incicase. This rate of incre.ise correGpondr; very c!o,;cly wi:11 [nat 01 the so-called stationary population of France during l11C fUllr year,; whieh intervened between the CcnsuG of 1872 and 1876, viz., 5.5 pel' mille annually. Taking therefore. the areas of increaGe only, we find a rate of progret.ti the h<lll1e UI>
that of thc rno!>t tilowly moving populat ion (11' Europe."
788. Bombay Presidency It will have heen app<lrent from the preceding remark(; that though not Guffering to the Game ex(ent ali Madras and M)'Gore for the Bombay population findG no 8btiolutc de(;rea6e in the numbert> of its population-the Bombay Prc~idency hab by no lheanti c(;c-aped the faminc which Go Gc~ioUGly affected the more houlhernly portion" of India in 1877-78. If the ratc of incrcatic arrived at by Mr. Hardy ali the normal ratc of illcrea6c annually in Bombay had been maintained continually from 1872 to 1881 [ have shown in a prcceding paragraph Ihat the pupulation in the Britilih territory of Bombay, would havc cxcced(:d that now accounted there at the Ccn~us of 1881 by vcry nc~rly.! million. Our figures. however, are l1'.)t ,.;uffi:;ien1[y accura~e to permit of our ,;aving that the dcffieicncy of 935.596. the figure arrived at in a previ()u,; calcuhl~i"n. reprct>cn(F the less of life occa6ioned by famine and con"eqLlent di~eal;c. There can, however, be no doubt thdl the effects of the famine have been fclt 6cvcrely in Bombay, and e~pecially tio in certain districts, to which Mr. Baines refers in his report.
78Y. Tue following extracts exhibit Me. Baine,;'s views on the subject.
"The famine area may be sdid, in a general way, to have included the whole of Kaladgi, nearly the whole ofSholapur and Ahmednagar, with the eastern districts of Poona, DharWlI.r, Belagum and Satara. Some portions of Khandesh and the South and east of Nasik. were also affected to a less extent by scarcity amounting to famine. but
23
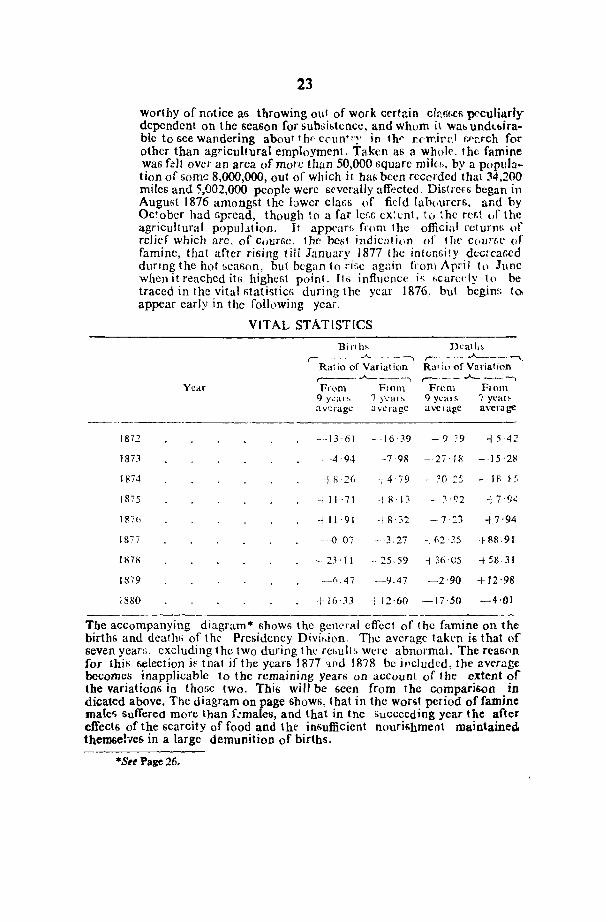
worthy of notice aG throwing Oul of work cl"rtain cIQt>f~f> peculiarly dependent on the season for subl,ibtcncc, and whum it Wat .. undcbirahIe to see wandering abouf t hr COllD' r~' in th.' rclT'jrl:1 f,"l'.rch for other than agricultural employment. Taken as a whole, thc famine was fdt over an area of morc thun 50,000 squarc mile!;. by a population of 60me 8,000,000, out of which it bali been recorded tbat 34,200 miles and 5,002,000 people were severally affected. Distren; began in August 1876 amongst the lower clat;s of field lab(.urer&. and by Oc!ober had spread, though to a far Icr,r, cX:l:nt. to :he rcct of the agricultural popul.~tion. It appcaTf> fr(lm the official rctufllG uf relief whieh arc, of courGe, the bcst indication of the C(.lll'C,e of famine, that after rising till January 1877 the intensity d(.;crcaGcd during the hot GeaGon, but began tn rir,e agr.in from April to J\InC when it reached its highest point. ItG influence if> bcarcdy to be traced in the vital GtatisticG during the year 1876. but bcgin(; tOl appear early in the following year.
VITAL STATISTICS
Birth' Deatb r- -_ '.--.. --. .A.~ •.. --- ......., ,- -.,., .A-___ ....
Rat io of Variation Rn( io of Variation ,----- -"------, r-- - _ . .A- ---..
Year Fr,'n1 FlO 111 From Fmm 9 y~ars 7 ye'ars 9 yea. s " year ~ ave rag" aVlOragC avcrage average
-------_._------------------------1872
IBn
J 874
1875
1877
1878
1879
1880
--·13 '61
-4 94
-J il 2(,
"1 II ·71
.j 11 ·91
-0 07
-23·11
--(" 47
-1- 16·33
-. 16· 39
-791:;
-i 4 79
-j 8 13
-18' 32
-- 3.27
--25.59
--9.47
12·60
-9 :9 -j 5 42
--27,18 - 15 21'
-. ~O ,< . ..) - If' ,.:,;
- 1 "2 -1 7 .(j~
-- 7 23 +7'94
·1 (,2 25 -+ !lS·91
-j 36 C5 -+511.31
-2·90 +12'98
-17,50 -4'01
The accompanying diagram'" shows the general effect of the famine on the' births and deatht; of the Presidency Divir-.ion. The average taken i6 that of seven yean;, excluding the two during the rebullh were abnormal. The rea60n fOT this !>election i~ tna! if the yean; 1877 'U'd 11178 be ipcludcd, the average becomes inapplicable to tbe remaining years on acCount of the extent of the variation6 in th06e two. Thi6 will be 6een from the comparison in dicated above. The diagram on page sbows, t,hat in thc won~ period of famine male'> suffered more than f:malcs, and that In tne bucceedlng year the after effect6 of the 6carcity of food and the insufficient nouri6hment maintained themseh'es in a large demunition of births.
·Set Page 26.
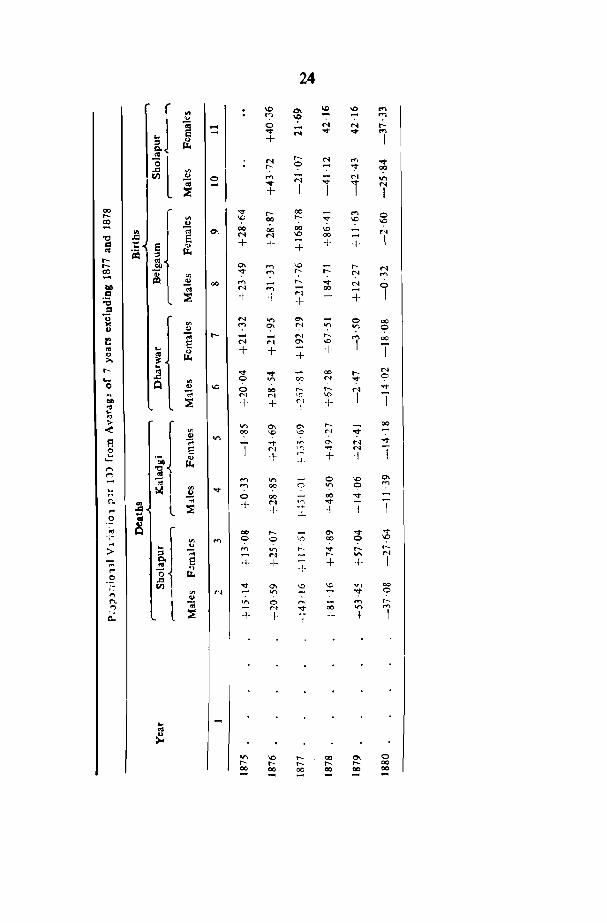
24
r ~J '"
\0 '" \0 ..0 ..,
4J '" ~ M
~ 0 M N ...:. ~ N "1- ..,. ..,
'I.) + I ~
II N ,...
N ff' ..,. on
,... '? ":" v ~ ., 0
,..., '" ." -; N "'" I
v i N
~ + 1 I 00 v ,... 00 M ,...
VI ~ '!" r:- "': ~ 0
co ., 1.0 - II> -; '" 00 00 00 \0 N 1.0 N
"0 .c: e N 00 I ~ ;:: IS <> + -I- + -I- -I-'" .~ ;:l ~
..... ~ ..... 0\ ,..., \0 0-- N co OJ v ~ r:- r:- ':" - '" ,..,
~ ., 00
,..., 0-- oot N 6 till -; N ,.., 00 c:J ~ -I -I N + + I :.0 -I-.: ~ '"
N ." '" 0 00 CI)
., ~ ~ N '0 '0 '? t:
-;;; ..... - - N 0-- ..... 00
E! N N 0- \0 I '" ~ + -I- + T ., 01 'I.) + ;., ~ p:..
,... ... 01 ..,. ..,. ""1- 00 ..... N
..c: '? .... c:l Ul 0 ." 00 N "1-
0 0 1.0 0 00 t- t- N ..".
0;, 00;; N N ':0 '" I 1 ~ -I- + rl -I-
~ 1-I-,> >
~J V)
,_ - 00
< 0\ c-or>
~ \0 '? '" ..,.
CI) ."
fl ;;; .,. '" '" N ..,.
8 E N ,.., .,. N
I ., -I- + + ..... ~ + ,.., ,..,
~I 0\ ,..., V) 0 1.0
... Ul "1- '":' ~ 0 ." 0 '":' "
0 0 00 ..,. I -:;; 00
0. go + N ''C ..". ..., ..::t l ~ + -+- -I-0 .. + ;., ~
11 00 ..... Oe ..,. 'T
VI M 0 0 \1' 00 0 ~ ... .... .;.., ,_ >- -;;; V) r-- ..". t-
N t- ." '" ;:; e + + + -1- I
" -1-.2 ~
" "1- 0\ \0 \0 .,., 00 ,., I '" N V)
..,. 0 .. '" l -;;; V) 0 '"'
,.., t-
.? :; N ..,. 00 '" M
0.. + + -l-+- + I
... '" ~
'" 10 ..... 00 '" 0 0-- 0-- 0-- ..... t- oo 00 00 00 00 00 00
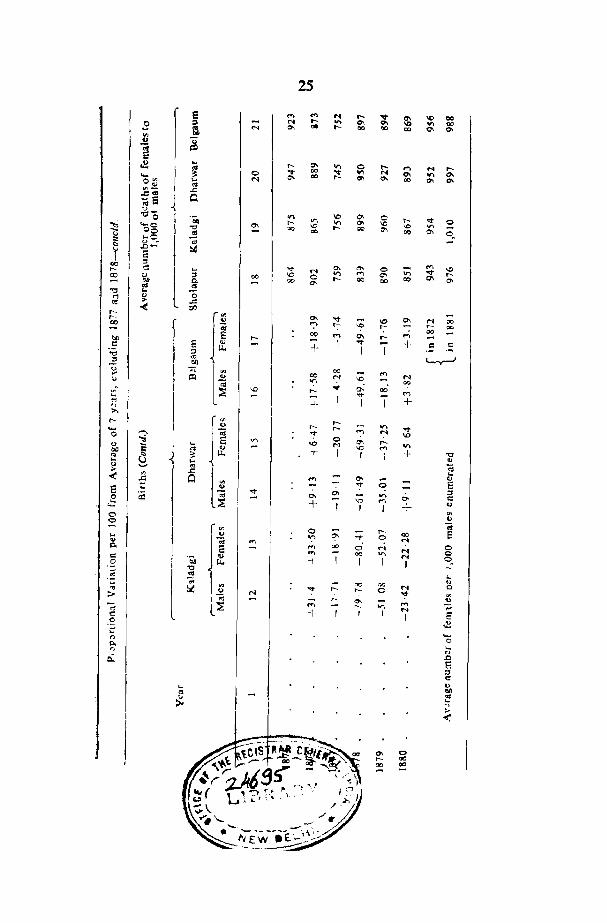
2S
f e .... <'> f'I .... "It '" '" 00 N ..... '" c- o. \I> ." eo B ;::J
'" .,_ "" .... 00 00 00 0\ 01
'" ~ ~
I " <If t:tJ e c2 I I- ..... '" on 0 .... .... '"
,_ I <IS
"'" co "'" .,., N 01 '" 0-... j
~ 0 a.. 00 t- '" '" OC '" 01 0"" ... N
"'.!: CO ..c: .ded Cl ~a
0,-
'" "'0 I 'bi! '" >r, \0 0 ..... '¢ 0 ..... on '" Ie \b .,.. :ti '-0 I "'" 01 00 10 r- OO a.. 00 a.. 00
'" CO o. ~ "'0
1 d <> •
.0- ~ 1 e eo " '" '" 0 .... \b ..... el
l ... ... N on M '"
.,., "<t ,_ IX) '" " 00 10 0 .... 00 00 00 0'1 '" "" 0. 00
"" ed '" 'tI .. "0 .., '" cd ;> ..c: -< ttl ,.._
IJ 0- "It - \D 0- M 00
r-eo
[ ':' r:- '-0 r:- r- OO
00 0() .... '" r- ,., btl r-
I .. + .:= c:: c E + ! ::l "to
'" ""-'v-' .E 011 <.>
" l~ 00
00 - .... N ....
~ ':'I 10 OJ
'" 00 I OJ:) ,.._ .. ",' 0:)'
'" v, ... ....
j -4- I + '" 'J
>. I'- r~ .... r- on r- ..,. ..... ,.... j] ... '" ':'I ID 0 '1:i 0
"" r--., i ... 0.0 '" IC '"
on be .. 11: + I f I + "Cj '" a 3c '" .. .. Os .. '-' '" ;>
."
f .r::
l~ ... -< Cl ,.,
"" - '" .c ... 0 E e ;:; ..,. '" .,; " 0- 0> c:: 0 ~ + "" M
+ ., .::: , I '" 0
" <::-
I~ -;
0 r- eo e ... .,., ~ ... c: ..... ., ... . ,., "" o· N N 0 Po .., "" '" 0 N O.
c:: I 'Os 11: -t- I I , 0
"" ~ I '" ... -;;;
l~ " .... "" co
'" 0 .., ~ N
..,. r- t- o "!" '" > l ....
'" .. ,., ,_ '"
M -;;; --;:; N c:: + , I e
.~ ~ c: ..... " 0 0. .... <? _g Q;
I E " t: l> ... "" <'I - oJ '" ... >- ., > -<
{clsr~'-C~i~ 00 '" 0
~ ~ oo~ Ji' ,_ 00
,\'f- "" S'" """,', ao 00
~ ~6B - -«,\ .1' .,., ,,' ~ ( L' ,:,>~. \ .' .1 - I ~\. :, .. ".- .. <) ~ ~. - .
~E:'W--.E. ~0~/. '-_"_' _.---:::::;
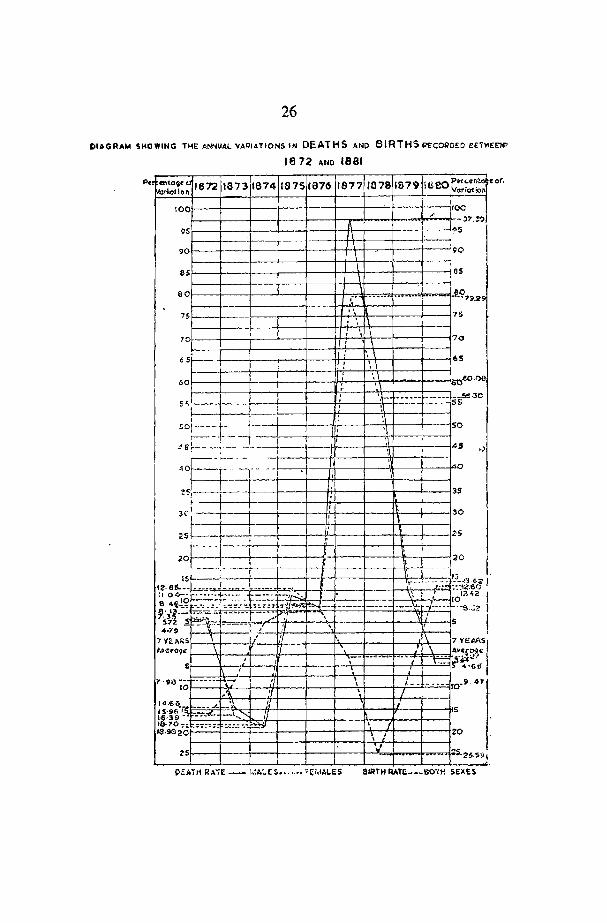
26
CIAGR ...... ~1I0WING THE ANNUAL VAIlI"TlON~ IN DEATHS AND BIRTHS P£CORO~O eEiWEE:M'
1872 ... NO 1881
P. entag(" 18n 1873187418751876 18771/378 1879 leeOiP .. '~.nt( (0(. ~riotlon lv,,, 'Qt "'"
15~--~---+1--~----~---~~~---4----~--~
10 --_~ __ --~I--~---+--~~~T+--~---+--~
60'~---~---+--~~--r---4LHr'~-+~~~--+---~ ,
'.\- -.---- ------ 5~-3C
" t 1 20
J 2S;!----+---f--+---+--I--+-lI",.,.j_.,~.j.,,~~ .. s..2S.5ti.
DEATl1 flA.E - \,!AL(S ..... •• "'i\1AL~$ BIRTH RAT," ___ SO'(H SEXE:>
27
The smaller mortality amongst females than amongst males appears to be a general characteristic throughout tbe four di&tric16 most affected, and jf the year of greatest mortality be taken, it will be seen that though the l\urnber and proportion of the deaths diff< r hO widely in the four districts, the proportion of the females that dicd to malcs is singularly uniform, more so than in any other year of the serie6. The act ion of the famine in equalising the numbers of the two sexes, too, i6 seen in the comparison of the figureG for the two enumeration". The range of variation is from 32 per mile in BeJgaum to 56 in Ka!adgi, where the relative proportions of the 6exes have been most largely altered. In Sholapur, where the difference is only a little above that in Belgaum, the mortality docs not seem to have been 60 concentrated as in the colkctoratc6 of the houth, And in 1877 the ratio of female to male deaths waS higher lhan in the other three districts, whilst the rate of incr,aGe over tbe average wa!:> considerable. The table afford!) a slight indication of the relative recupc~ rative power of the diGtriets, though not perhdPs of much value. [t appearG, for instance, that the number ofdeathti receded below the average a year sooner in Dharwar than in the restofthe four, but that it was in Kaladgi, even making all allowance for the dimini':ihed population after the acute cri.,is of 1877, that the mOl,t Gudden transition took place. It apparently. too, took the female population long~r to recover from the disturbance than the malc. With regard to1hc birth!:> recorded, there is little to be iiaid in explanation of the figurcs given, ao it is notorious that the rcg.is~ration of thil; cla(>s of domct>tic occurrence!; ii, more neglec1ed th~n that of &~athr-, which arc accompanied, by morc important ceremonIal obtiervancel'. The main faci to be gleaned it> that the year rollowing the t;Cvere(.t dit;,re(;(-; war; dil)tinguished by the abnormal falling offin the birth!:> registered, to th{~ extent of over o11e quarter in the Prer-ide11cy as a whole, with far g'"/~ater variations in the famine area. Tn Kaladgi, for inGtance. 1he decn~a','~ i6 between 70% and 80 per cent. for the two sexel'> together, and in Dharwar and Belgaum it i6 61 and 49 rc[;pcctivdy. In Sholapur, however the changc wal) not So marked as in the following year. With respcc( to the cause of this decrease, there are 6cveral facts to be considered. Firt>t, no doubt,a half starved populationis likely to be le6s prolific. Thon, the population itr>t1f was much reduced in numbcr. La(,tly, there iii always the chance of non-regi6tration. Even in ordinary years thc accountant of the village knowG more of the dea1h(, that take place than of births, and in tbe time of famine after Stringent ruler> regarding the reporti ng of a!l deaths to the Circle Relief Supcrvi&or had been enforced by tbe Government, it is pOGGible that a heavily worked village offi:::ial would confine his clerical labours to tbe blanch on which the stress laid by his superiors was morc immediately before him. There are, however, general ,features of some value. In 1876 the return6 for all the four districts show the births to have been above the average. Next year they fell below it with more or less uniformity. and the decrease is more marked in Sholapur • where the distress began earlier, than elsewhere. The year after. Kaladgi anc;l Dharwar sbow a far larger decrease than either BeJgaum or Sholapur. Up to the end of 1880 neither Sholapur nor Kaladgi had made rapid progrc6s towards recovering their former rate of increase. It is worthy of notice, thougb .the character of tbe registration does not admit of our appreciating the

28
'fact very highly, that in the two W<>Tst years of famine, and in three dis--tricts out of four, the falling off in female births is greater than that of males, and in the two districts where the range of mortality was highos t .the same characteristic is observable in 1819 also .
ST A TBMENT SHOWING THE PROPORTIONAL DISTRIBUTION 1872-80
Proportional Distribution of total Number R~lativc Prevalence
of Deaths* of Epidemic Year ,- __ ~__.A,. __ -----,. ,- ...... ----""""
All 'Epi- Fever SllOla- Kala- Dhar- Bel-Causes demic pur dgi war gaum
1872 10·7 14'50 9'14 24·50 16'59 9·63 12'88
1873 8'09 3 ·50 8 ·23 1·47 1·99 4'56 1·08
1874 7'74 1·36 8·05 0·19 1 ·36 1·75 1'84
1875 10·68 17·56 9·79 22·89 7·64 9 ·69 1 1·78
1 K76 1 :)·31 29·02 9 ·66 15 ·11 24 ·35 26-99 19 ·73
:1877 18·03 15·01 15 '21 15·67 37'40 41'11 32'52
1'I7K 15 ·12 17·49 16'06 20·00 10·61 6·86 20·13
1879 10'79 1 ·22 12'87 0·15 0-04 0·02
11180 9'17 0·35 10·99 0-02 0·02 0·01 0·02
Total 9 years 100·00 100·00 100·00 100·00 100 '00 100·00 100·00
*ln the whole I'(e~idencycxduding Sind.
Epidemic
Cholera was more prevalent than usual during the two years of abnormally high mortality. The true cause of death iR very apt to be misunderstood by the agency for registration in an Indian village, So the rec()l'd is canything but Satisfactory. For the last nine year", for example, o .... er 62 per cent of the death" in the Presidency Division. have 011 an average been attributed (0 fever alone, and it is probable. I am informed, that a certain proportion of the deaths (>ct down as caused by cholera are really cases of oth'~r diseases having some of the symptoms of that dreaded epidemic. Taking, however. the record as it stands, the year of greatest mortality is distinguished by thl! highest proportion of deatbs from epidemics. though as regards fever, it t~kes the :.econd place only. The above table ~ives a general idea of th,) dIstribution of the total mortality of t be nine ye:\r amongst the several units of the period. In three of the four districts selected as being the most affected the proportion of deaths from bots the above m~ntionl!d Causes was highest in 1811. but in Sholapur the
29
years following seems to have been quite as bad, and with respect to epidemic a good deal worse. It is impossible from, th? nomenclature and clascification adoph;d in the village regil>tcrs, to ascertaIn the extent of the mortality due to famine as distinguiLhed from ordinary or epidemic disea&c, but it seem6 abundantly proved that both of the latter are many times more fatal when they attack a population wcakened and di&pirited by any sudden change for the worse in their ordinary diet and mode of life. Judging by the age retw-lls, the brith 6tatiftiu; jUl;;. quoted give a fairly approximate c&timatc ofthc decrcaGC in the ycar 1877-78 and, thaI the greate6t suffers, amongst the younger children Were those of under a year of both sexes, and girls at the critical pcrit,d of 13 and ]4. The decrease in the number men 20 to 29 which is al60 marked, in thc four district!> if) apparently to be di!ilributcd bdwecn n~ortaJily and (;Jl1igrati( j, u-: the return!> indicate that the latter movement took place to a conl'>iderable extent in certain partG of that tract.

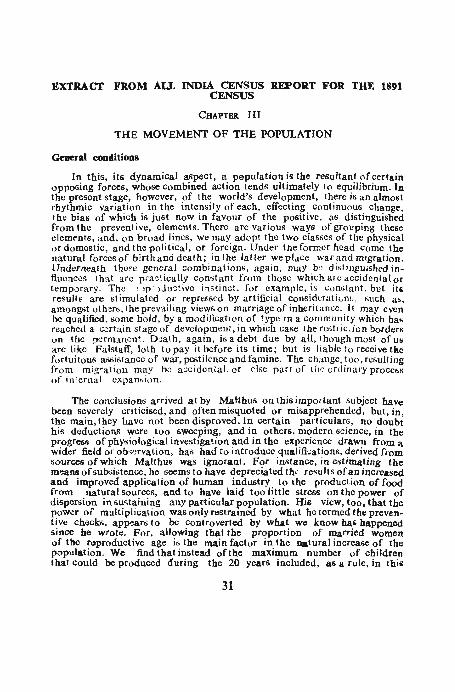
EXTRACT FROM ALL INDIA CENSUS REPOR.T FOR THE 1891 CENSUS
CHAPTBR III
THE MOVEMENT OF THE POPULATION
General conditions
Tn this, its dynamical aspect, a papulation is the resultanf ofccrtain opposing forces, whose combined action tends ultimately to equilibrium. In the present stage, however, of the world's development, there is an almost rhythmic variation in the intensity of each, effecting continuous change, the bias of which is just now in favour of the positive, as distinguisbed from thc preventive, elemcnts. There arc various ways of grouping these elements, and, on broad lines, we may adopt the two clastics of the physical or domestic, and the political, or foreign. Under the former head come the natural forces of birth and death; inthe latter weplace warandmigration. Underneath theFC general combination", again, may be distil'lgUl6hed influencet; that are pra~tically constant fcom those which arc accidental or temp0rary. Th'~ r'~p-,)Ju,_;tivc in&tinct. for example, is conli1ant. but iti resultl2 are stimulated or repressed by artificial considcrati(Jnr., ,,"ueh ab, amongst others, the prevailing views on marriage of inheritance. It may even be qualified, some hold, by a modification of type in a community which has reached a certain stage of development, in which Case the rCt)trjc~jon borders on the permanl~nt. Death, again, is a debt due by all,thoughmo!>t of us arc like Falstaff, loth topay it before its. time; but is liable to receive tke fortuitous assistance of war, pestilence and famine. The Change, too, resulting from migration may be accidental, or clf>C part of tl1'.:: ordinary proce!>!> of internal expan,;ion.
The conclusions arrived at by Ma~thu6 on this important subject have been severely criticised, and often misquoted or misapprehended. but, in, the main, they llave not been disproved. In certain particulars, no dOUbt his deductions were too sweeping, and in others, modern science, in tbe progress of physiological investigation and in the experience drawn from a wider field or ob~0rvation, has had to introduce qualificationt>, derived from sources of whiCh Malthul'> Was ignorant. For instance, in estimating the means of 5ub-.;istence, he seems to have depreciated thi' results of an jncreased and improved application of human industry to the production of food from natural sources, and to have laid too little tiMes!) on the power of dispersion in su<;taining any particular population. His view, too, that the power of multiplication was only restrained by what he termed the preventive checks, appears to be controverted by what we know halO happened since be wrote. For, allowing that the proportion of married women of the r~productive age is the main factor in the natural increaiie of the population. We find that instead ofthe maximum number of children that could be produced during the 20 years included, as a rule, in this
31
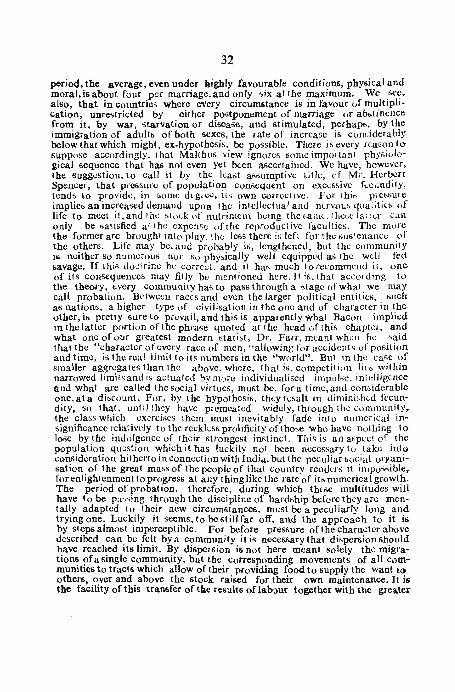
32
period, the average, even under highly favourable conditions, physical and moral, is about four per marriage, and only 6ix at the maximum. We .&cf?~ also, tbat in countries where l.."'Very circumlOtance is in favour of multIplIcation, unrestricted by either P05tponement of marriage or abbtinence from it, by war, starvation or disoase, and stimUlated, perhapt>, by the immigration of adult6 of both sexes, the rate of increase is cont,iderably below that which might, ex-hypothet>i&. be possible. There is every reaGon to suppose accordingly, that Malthur-; view ignore!> some impoltant physioloiical sequence that bas not even yet been ascertained. We have, however. the suggestion, to call it by the least a8sumptivc title, of Mr. Herbert Spencer, that pressure of population consequent on exc.,;sf.ive fecundity, lends to provide, in [,ome degree, ils own corrective. For thib prc&(-;ure implies anincreascd demand upon. the intellectual and nUVOUb qlla(itiu, of life to meet it,andthc stockof nutriment being thct;amc,lhc(:;el<lr1cr can only be satisfied at the CXpCllf;C of the reproductive l'aculLic6. The more t.he former are brought into play, the less there it; left for the t-iU6'el1anCC or the others. Life may be, and probablY is, lengthened, but the community ii neither So numcrout> nor t)o phy!>ically well equipped a6 the well fed savage. If thit) do-:;!rine be correct. and it hat'; much torecommend it, one of its consequences may fitly be mentioned here. 1t is, that according to the theory, every communityhasto passthrougha Btageofwhat we may call probation. Between races and even the larger political entities, such as nations, a higher type of civilisation in the one and of character in the other, is pretty sure to prevail, and this is apparently what Bacon implied in the laHer portion of the phrase quoted at the head of this chapter, and what one of our greatest modern statist, Dr. Farr, meant when he f>aid that the '\;haracter of every race of men, "allowing for acddentt-; of position and time, is the real limit to its numbers in the "world". But in the case of smaller aggregates than the above, where, that is, competition lies within narrowed limltt> and it; actuated bYIUQTe individualised impullic, intelligence nnd what are called the social virtues, must be, for a time, and cOllf;idcrable one, at a dibcount. For, by the hypothesis, they result in diminif.hcd fecundity, So that, until they have premeated widely, through the community. the class which cxercisct; them must inevitably fade into numerical insignificance fda! ivcly to the recklcbs prolificity of thobt: wbo have nothing to lose by the indulgence of their strongest instinct. This is all a"pecl of the population qu:.:stion which it has luckily not been necessary to take into consideration hitherto in connection with India, but the peculiar bocial organisation of the great mass of the people of that country renders it impohsible,. for enlightenment to progress at any thing like the rate of its numerical growth. The period of probation, therefore, during which th{6e multitudes will have to be par.sing through the discipline of hardship before tbey arc mentally adapted to their new circumstances, must be a peculiarly long and trying one. Luckily it seems, to be still far off, and the approach to it is by steps almost imperceptible. For before pressure of the character above described can be felt by a community it is necessary that dispersion should have reached its limit. By dispersion is not here meant solely the migrations ofa !>ingle community, but tbe corresponding movements of all communities to tracts which allow of their providing foocl to supply the want l()
others. over and above the stock raised for their own maintenance. It is the facility of this transfer of the results of lab:>ur together with the greater
33
industry and intelligence brought to bear on the soil where the arable area is fully occupied, that makes it possible to say that in the prescnt day the food supply has increased not only in line with, but even in advance of the growth of the population, and, other things being equal. this will continue to be the case, So long as there is land to be found on the globe fit for remunerative tillage.
Coaditions in India
We can now consider the part respectively played in the movement of the population of India by the birth-rate, by famine, by epidemic disease and otber causes of death, and by migration. War has happily been, for this generation, a factor in abeyance. Of the rest, the natural caUSC6 of change, that iG, the birth and the normal death rates, are ne~es6arily entitled to the fi;·tit place in the list, and in connection with them, the special causes of mortality, be epidemic and famine, will have to be discussed. Migration will then be treated separately.
Marriage custCJ111D8
Now, the number of births depends, as was remarked above, very much on the proportion of married women of the reproductive age, so we are here brought face to face Wil h the marriage customs of the people and the tendency towards matrimony prevailing in India. In anticipation of a more detailed examination of this wide subject, which will be specially handled in a later chapter, a few generaloooervations must suffice to explain its connection with our preGcnt topic. We should omit Burma, for the prescnt, from the qucr,;tion, since the social system of that province is entirely different from that of the rest of the country. In India, as thus rC6tricted, marriage is regulatcd by a few leading principles which nominally prevail amongst at least three-fourths of the populdtion. Strict conformity with <'1.11 is probably confined to a not very large minority, but such is the prevading influence of the system indigenous to the country, that a good many of its special tenets have been adopted by mott ofthosc communities that are brought into close contact with it, even though the orthodoX prescriptions of their own sY6tcm may be oppOGed to them. One (lfthe most prominent universal dutics impos..:d by thit) h')terogenous public opinion is that of marriage. In the Case of the Brahmanic communi!y thit> if; intelligible, at> 1 heir currcnt (;Yl>tem dooms a man to a particular region of pandemonium unlct;!; he leavel> a son to perform (he propcr obsequic> for hiG rclea(ie. The duty iti abo connected with the law of inheritance which i;, ~o tiomeextcnt, binding on the ma:;ccs. The forest tribet, conform a, th(;y b';COlllC civili"ed and are incorpora~cd with the re,,1. The Muc;almanr.i, who a"c, for the mOt;! part, converts from the ranh of Brahmanism, have not abandoned it, and the re5t of the dcnominalions of Indian g"owth equally obscrve the obligation. Then, again, amongst the higher and middle da,;lies ofaHdenominations there is the general feeling that the patcrnal hearth jE) disgraccd by the presence of a gi::l who has arrived at womanhood unmarried. Polygamy, too, though undoubtedly rare, is allowed to all, whilst polyandry is confined to two or three comparatively small communitics. It is scarcely necessary to dwell on the main fact ind icated by these tendencies, that is, the enormous number of births tbal i'; likdy to result from them. At the 5ame 4-1 R. G. India/72
34
time, it must be pointed out that it is the universality of marriage, not the early age at which it is contracted, that is here in question. The latter has sometimes been erroneously put forward as one of the CaUses of an increase in the child population. whereas its chief and direct effect in India seems to be only to shorten the m~an lifetime of a generation, and not to increase the number of births per marriage, possibly owing to the physiological cause mentioned above, the nature of which has not yet been ascertained. Furthermore, the relative age at marriage is largely a matter of local custom, as well as of social position, and in certain tracts the upper classes marry, as a rule, at a higher age than the lowest in others. It should also be borne in mind in regard to this part of the subject, that the term marriage includes both the formal betrothal, which is the principal ceremony, and the subsequent handing over the bride in manum viri, the interval between the two being, as above mcntionl)d, dependent on the local custom or the rank of the con'racting parties, as the case may be. Amongst the Hi II tribes and many of the labouring classes, the ceremonies are not distingui&hed, as girls are not married in either sense till they are grown up. In its ceremonial aspect, th'~ betrothal is the binding and m )re impnrtant pari of m1.rriagc, but from our present standpoint it is superfluous to pay attention to morc than the latcr stage of this social arrangomcnt. Thus we find that 94 per cent of the unmarried females are bdow t 5 years of age, and that though the proportion of women be! ween 15 and 40 years of age is but a trifle in excctiS of the corresponding ratio in Europcan countries in India, no less than 84 per cent ofthom are married, whereas in Europe, if we omit Hungary, where the Tal io riGCS to more I han 63, th'~ average is not above 40. The period in question, too, contain in [ndia about 70 per cent of th'~ total married female population, but in Europe, excluding Hungary, as before, the averagc is only just above OD.'~ haIr. Th:s fact take,I) us a s'lep fL~rlher in the analysis of the re.:urn, for if we sub-divide the period inlo two, it seems that of women in India between 15 and 25 years old 87 per c(~nt are married; but in Europe th0 higncst proportion, to the west of the Leith is in France, wh')re it is only 22. In the remaining period, from 25 10 40, the ratio of wives in India falls to 81 per cent; whereas in the West, it advances to about 70. The divergence is h'~re due to the Indian custom as to widow-marriage. The orthodox Brahmanic view, whether it be well founded or not we need not inquire, absolutely prohibits the marriage of females whose husband!) are dead, so t hat a girl betrothed in infancy, whose affianced bappens to die befon.: the latter part of the ceremony hali taken place, is as as much a widow as t;he who ent.erli that condition at the dGciine of life. This rule is only strictly observed amongsllhe comparatively small communities orthe upper clatitics, and throughout the masses there is great variety of practice. The lower and lower middle classes are, on the whole, influenced chiefly by local opinion 011 the matter, and where adult marriage is the rule, there it'; generally found no objection to the "maimed rites" and less expensive pro;.;cdure involved in bringing home a housewife at secondband. On tbe other hand, the general tendency of social a6pirantf> to adopt the custom" of those immediately above them, is extended to the case of the widow of course, and when a man of this class has. as the Freach say, "arrived", he makes the fact apparent by secluding his womenkind aad abjuring widow-marriage. The above remarks apply to the Brahmanic community only, Of, at most, to the fringe of Hill tribes lhat border on the
35
plains. The Musalmans have no prejudice in the matter, tests the first matrimonial venture of the prophet himself, but even amongst them the pervading atmosphere of Brahmanism has had a certain effect. On the whole the proportion of women who are returned as widows is 17' 6 per cent of the total of the sex, or about 3.5 to every widower. In Europe, the average ratio is about one half the above, and there are only about 106 widows to 100 m~n in the sam~ condition. To som~ extent, therefore, we may take into consideration this rejection of second marriages amongst females as a check on the number of cbildren tbat might be brought into the world under the operation of the great stimulus given by the religious sense of the majority to the indulgence of the strongest animal instinct of humanity. But, looking at the prevalence of marriage, it is clear that more than the existence of a few millions of widows, 'more or less, it> roquired to account for the comparatiVely slow growth of the population under the impetus of So enormous number of births. The clue is to ~ found in the accompanying high mortality. The birth rate is indeed very far above that of any European country, if we except Russia, and reachet> nearly 48 per mille on the whole country. But tbe death rate is equally abnormal, even if we omit the more frequent occurrence of famine and epidemic disease in India, and may be taken to reach, on an average, 41 per mille. This matter will be 14iscus&cd JU its due sequence, but, speaking g'.:n'.rally, it can be attributed to an excessivc mortality arnongtit infants of both sexes, a large mortality amongst young motners in childbirth, and a general want of "titaying pow~r" after about 50 years of age. Of these factors, Lhe first is the most prominent as about 26 per cent of the children born do not live to the end of the first year of their life. In England the rat(, is not higher than 15.6, The operation oftne second cause is more ·difficult to determine, as the retron is complicated by the admitted repugnance in some paris of the country and among certain cla(>6cs to communicating any information about the married or nublie women of their household. As to the last, the returns as they stand uncorrected indicated morc than five per cent deficiency of persons of 40 years old and upwards, as compared with the age-table() of Europe. The gl;:neral divcrg'!nce of the constil ution and age ditilribution of the two communities Can be appreciated to some extent from the average duration of life, which is little more than 24 years in India, against nearly 44 in England. These figures arc given merely for the purpose of comparison. They do not show the actual mean age of the population, as it stood at the census, but the higher e"limate obtained by considering the community as stationary. The former averages would, necessarily, in the case of increasing populations be some years lower. Still, tne fact is made prominent by them that in India the generations must succeed each other with much greater rapidity than they do in the West.
Birth and death registration
Inestimating the growth of the population ofIndia by what we have termed the natural inc(eas'e, tnat is by the excess of births over deaths, we are without the aid of complete registers of these occurrencee:. Registration ba9 been in force for a considerable time and a good deal of attention has been paid to it, but the circum6tances of the country are against it. In municipalities, especially where town-duties are levied on imports, the deaths are registered with approximate accuracy, as the corpse has to be carried out to the
36
cemetery .or burning-place past one of the toll-bars. Births, however, even hers escape registration to a very considerable extent. In tne rural tracks, Where th~ country is open, the villages close together, and thl}ir staff of officials fairly complete, the results art', on (ne wnole, \ .. ~rv good; the births, indeed, are probably as correctly entrered as in the towns. But in the hill tracts, where locomotion is difficult and the villages far a part, even if stationary, and tbe people not only illiterate, but suspicious of everyone who is not equally so, the returns are too often altogether neglected, or kept by the headman by means of knots in a piece of string hung up to a beam in his roof till the next visit oftbe accountant or otber officer, who writes up the register from dictation. In many parts of Bengal, too, the absence of a village staff placed registration for a long time in the hands of the lower grades of the rural police, so that the"return was trustworthy in towns only. Then again, there are tracts wnere registration is not even attempted. owing partly to the density of the forest and the sparsity of the inhabitants, or again, to the nature of the tenure, which varies greatly in its degree of independence of State control. The large area under the feudatory chiefs is excluded from the returns. In a few ca&e&, such as Mysore and Baroda there is a system of registration. but in most of the larger States infonnation of this sort is not available. Finally, we come to the pen,onat grounds of objection to the system. The householder of rank dislikes inquiries of any sort as to his family affairs. The rest do not fall in with the official idea of its utility, even if they understand the question. The death of an adult male member of a family is an event known to tbe Whole village, and is registered accordingly, 60 is the birth or the death of a son. But mothers, wives, and daughters pass away without leaving a ripple on the surface of village life, and it is with respect to them that registration is most deficient. It is plain, however, from the returns, that the greater accuracy is annually being obtained, and is one or two provinces, as was remarked above,1he results forthe 10 years that elapsed between the two enumeration& 60 nearly coincided with those of the census that both operations may be congratulated on their successful issue. Elsewhere, the latter is the only means of, as it were, taking stock of the population. Even in England. where registration of domes~ic occurrences has reached So high a degree of accuracy, the last census showed that the results, apart from migration, were not quite what were expected. There in another point in_connection with these returns for India that requires notice. The increasing accuracy of the registration. especially where the lattcr has becn hitherto backward, is likely, if !lot duly discounted in the returns, to lead to the astiumption that changes are taking place in the birth and death rates which. in fact, are not taking place. This is the mo:-e noticeable when the population on which thc raics are cal,,""UIated it> maintained, as it often is, at th,,: figure of the la(>l cen'iUS throughout the deCade. 60 that even though the regi&tration may havc becn uniform in its degree of accuracy during the whole interval, there is a sudden descent in the rates when the increase of perhaps 10 or more per cent in the population, shown by the census, is brought into the returns. With all tbeir deficiencies in respect to the absolute figures, tbese returns afford most useful data in comparing oIle year witb anotber; for the error to be found in them is in all probability constant and uniform throughout the Whole Geries. It is in this capacity tbat tbey bave been used in preparing the corrections to be applied to the age-returns, which, as. will be shown in a later chapter, enable us to dispense, to some exteDt. with the actual numbers.
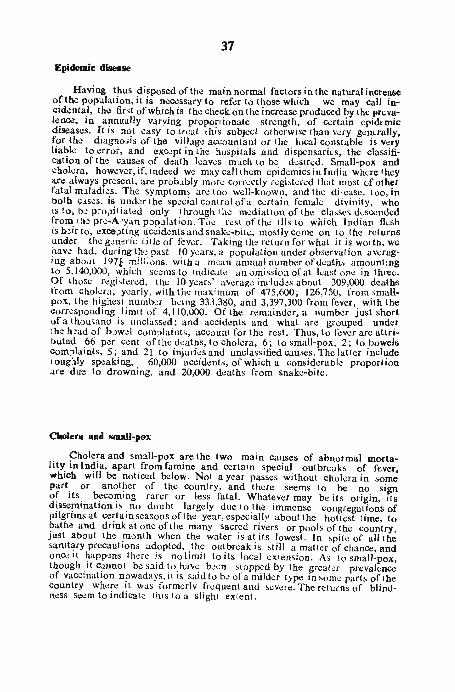
37
Epidemic disease
Having thus disposed of the main normal factors in the natural increase of tbe population, it is ne~ssary to ref..:r to those which we may call incidental. the first of which is the check on the increase produced by the fJrevale~. in annually varving proportionate strength, of C\:rtain epidemic diseases. It is not easy to m::at lhis subject otherwise than vay gcnaally. for the diagno:iis of the villag·.; accountant or the local constable is very liable to error, and exc.;pt in the hospitals and dispensaries, the classification of th'~ causes of death leavcs much to be d . .:sircd. Small-pox and chol..:ra, however, if, indeed we may call them epidemics in India where they axe always present, are prob.tbly more correctly reghtercd (hat most of other fatal m.lladics. The symptoms arc too well-known, and (hc di:;case, (00, in ooth C.ises, is und·.:r the sp-!cial control of a certain female divinity, who is to, b.! prOpitiated only through the ffio.!diation of the classcs d\:sccndcd from lh-~ pr·.;-Aryan popJ.lation. The rest of the ills to which Indian 1ksh is h·;!ir to, exoe,.>ting accidents and snake-bite, mostly come on to the returns under the g,.!",~rjG tille of fev~r. Taking the return for what it is worth, we haw had, during th(~ past 10 years, a population under observation averaging about I 97!· m.illions, with a mJan annual number of deaths amount ing to 5,140,000, which seems to indicate an omission of at least one in three. Of those registered, the 10 years' average includes about 309,000 deaths from Cholera, y·~arly, with thl; maximum of 475,600; 126,750, from.smallpox, the highest numl"}.:r b-.:ing 333,380, and 3,397,300 from fever, WIth the corresponding limit of 4,110,000. Of the remainder, a number just short of a thousand is unclassed; and accidents and what are grouped under the h'~ad of b)w.!l com;>laints, account for the rest. Thus, to fever arc attributed 66 per cent oflhe do.!aths, to cholera, 6; to small-pox, 2; to .bowds com;Jlaints, 5; and 21 to injurio.!s and unclassified causes. Thc latter Include roug:lly sp'~aking, 60,000 accidents, of which a considerable proportion are due to drowning. and 20,000 deaths from snake-bite.
Cholera aDd small-pox
Cholera and small-pox are the two main causes of abnormal mortality in India, apart from famine and certain special outbreaks of fever, which will be noticed below. Not a year passes without cholera in some part or anothcr of the country, and there seems to be no si~n of its becoming rarer or less fatal. Whatever may be its origin, Its dissemination is no doubt largely due to the immense congregations of pilgrims at certain seasons oflhe year, especiallv about the hottest time, to bathe ahd drink at one of the many sacred rivers or pools of the country, just about the month when the water is at its lowest. In spite of all the sanitary precautions adopted, the outbreak is still a matter of chance, and once it happ<:ns there is no limit to its local exlension. As to small-pox, though it cannot be said 10 have h.:cn stopped by the greater prevalence of vaccination nowadays, i( is said to h.! of a milder type in some parts of the country where it was formerlv frequent and severe. The returns of blindness seem to indicate this to a slight extent.
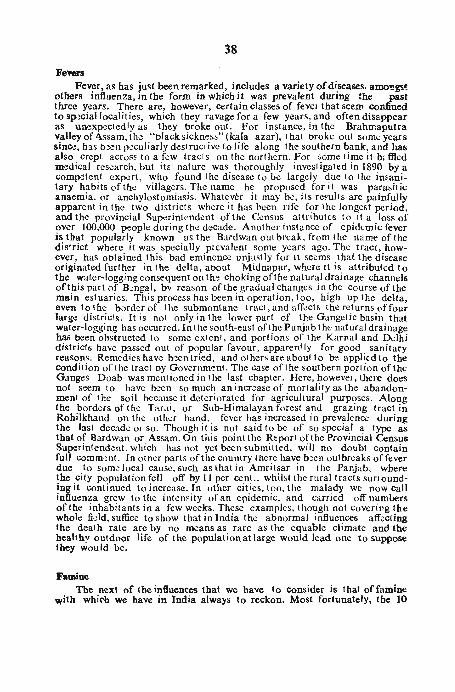
38
Fel'ers Fever, as has just been remarked, includes a variety of diseases. amo!!gs~
others influenza, in the form in which it was prevalent during the past three years. There are, however, certain classes of fevel that seell'l confined to sp!ciallocalities, which they ravage for a few years, and often disappear as un.:!xpectedlyas they broke out. For instance, in the Brahmaputra valley of A.ssam, th·:! "black sickness" (kala azar), that broke out some years sinru, has Men p~culiarly destructive to life along the southern bank, and has also crept across to a few tracts on the northern. For f>ome time it b~ ffied m~dical research, but itg nature was thoroughly investigated in 1890 by a comp-;:tent expert, who found the disease to be largely due to the insanitary habits of the villagers. The name he proposed for it was parasitic anaemia, or anchylostomiasis. Whatever it may be, its rCl'ults are painfully apparent in the two districts where it has been rife for the longest period, and the provincial Superintendent of the Census attributes to it a loss of over 100,000 p-:!ople during the decade. Another instance of epidemic fever is tbat popularly known as the Bardwan out break, from 1he name oflhe district where it was specially plevalent some years ago. The tract, however, has ootained this bad eminence unjustly for it seems that the disease originated further in the delta, about Midnapur, where it is attributed to the water-logging consequent on th~ Choking of the natural drainage channels of this part of B:ngal, bv reason of the gradual changes in the Course of the main estuaries. This process has been in operation, too, high up the delta, even to the border of the submontane tract, and affects the returns off OUT large districfs. It is nol only in the lower part of the Gangetic basin that water-logging has occurred. In the south-east ofthe Punjab tht:: natural drainage has been obstructed to some extent, and portions of the Karnal and Delhi districts ha .. e passed out of popular favour, apparently for good sanitary reaSons. Remedies have been tried, and others are about to be applied to the condit ion of the tract oy Government. The case of t he southern portion of the Ganges Doab was mentioned in the last cbapter. Here, howevel, there does not seem to have been so much an incr.:!ase of mortality as the abandonment of tbe soil because it deteriorated for agricultural purposes. Along the bord·:!rs of the Tar ,ti, or Sub-Himalayan forest and grazing tract in Rohilkhand on the other hand, fever has increased in prevalence during the last decade 01 so. Though it is not said to be of so special a type as tbat of Bardwan or Assam. On this point the Report of the Provincial Census SUp-:!rintendcnt, which has not yet been submitted, will no dOUbt contain full comm~nt. In other parts of the country there have b:!en outbreaks of fever due to some local cause, such as that in Amritsar in the Panjab. where the city population fell off by II per cent., whiht the rural tracts surrounding it continued to increase. In other cities, too, the malady we now call influo.!nza grew to the inten~ity of an epidemic, and carried off numbers of the inhabitants in a few weeks. These examples, though not covering the whole fi.::ld, suffice to show that in India the abnormal influences affecting the death rate are by no means as rare as the equable climate a.nd the healthY outdoor life of the population at large would lead one to suppose they would be.
Famine The next of the influences that we have to consider is that of famine
with whi<"b we have in India always to reckon. Most fortunately. tbe 10
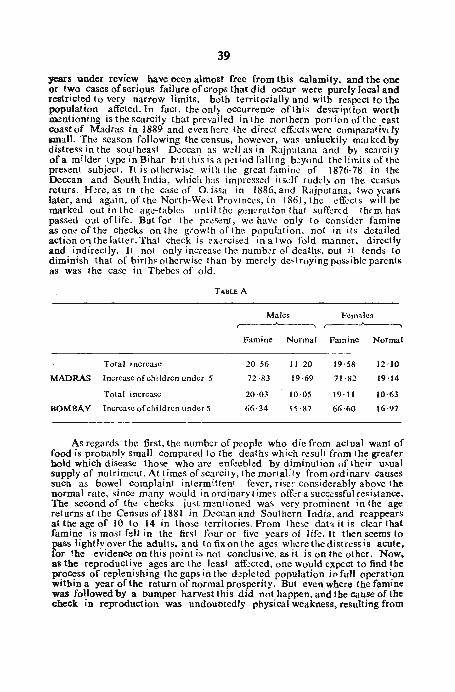
39
years under review have oeeD almost free from this calamity, aDd the one or two cases of serious failure of crops that did occur were purely local and restricted to very narrow limits, botb territorially and with respect to the population affcted. In fact, the onl~ occurrence of this description worth mentioning is the scarcity that prevailed in the northern portion oftbe east coast of Madras in 1889 and even here the direct efi"..:cts ~rc compararivdy small. The season following the census, however, wa~ unluckily marked by distress in the southeast D-:ccan as wdl as in Rajputana and b)' scarcity of a milder type in Bihar but this is a p,..:t iod falling b:yond the limits of the prelocnt subject. It is otherwise with the great famine of 1876-78 in the Deccan and South India, which has impressed it self rudely on the census returs. H.!re, as in the case of Oi·issa in 1886, and Rajputana, two years later, and again, of the North-West ProvinCeS, in 1861, the cff~cts will be marked out in the age-tables until the generation that suff:::rcd them has passed out oflife. But for the present, we have only to consider famine as on<: of the Checks on the growth of the population. not in its detailed action on the latter. That check is cx'~rciscd in a two fold manner, directly and indirectly. It not only increase the numb;;r of deaths, out it tends to diminish that of birth!' otherwise than by merely de~troying pos:.ible parents as was the caSe in Thebes of old.
TABLE A
Males Females ,.-__ ..A..---., ,....---._.A.-----"
Famine Normal Faminc Normal
Total increase 20-56 11 -20 19'58 12'10
MADRAS Increase of chi Idren under 5 72·83 19·69 71 -82 19'J4
Total increase 20-03 10·05 19·11 10·63
BOMBAY Increase of chi Idrcn under 5 66-34 15 ·87 66·60 16-97
As regards the first, the number of people who die from actual want of food is probaoly smalI compared to the deaths which result from the greater bold which disease those who are enfeebled by diminution of their usual supply of nutriment. At times ofscarcity, the mortality from ordinary causes snell as bowel complaint intermittent fever, riser considerably above the normal rate, since many would in ordinary times off..:r a successful resistance. The second of the checks just mentioned was vcr'Y prominent in the age returns at the Census of 1881 in Deccan and Soutbern India, and reappears at tile age of IO to 14 in those territories. From these dah it is clear that famine is most felt in the first four or five years of life. It then seems to pass lightly over the adults, and to fix on the ages where the distress is acute, for the evidence on this point is not conclusive, as it is on the other. Now. as the reproductive ages are the least aff'.!cted, one would expect to find tbe J>I:ocess of replenishing the gaps in the d'.!pleted population in full operation within a year of the return of normal prosperity. But even where the famine was followed by a bumper harvest this did not happen, and the cause of the check in reproduction was undoubtedly physical weakness, resulting from
40
the long spo!ll of insuftbient nourishment endured by the masses. It took from three to four years, according to [he returns, to restore the vitality of th,! worst tracl.s, but tbe m3.rginal table shows that since then a con~;iderable amount oflce-way pas b~n made up. In regard to this table it should be borne in mind HUll the famine was far more severe and of longer duration in Mldras than in B~mblY. There is also an indication that the resistance off:rcd to distress is grt:uter on the part of females than of males. On the w bole we have only to read of the terrible mortality tbat accompanied the historic famin';;s of 100 or ) 50 y:ars ago to appreciate the advance that has been m'lde within the present g'~ll';ral ion in administrative experience of how to d'~al with these c.llamilics, so that their effects may b;: mi,jgated, though to prev..::nt th'!m is im?raclicabk. BJ the aid of line of railwa} and tclegrapo., th'~ tract threalcn~d with scarcilY is brought into speedy communication wah those in whieh t he harvest thas !>.!en ab:mdant, so that from the lattec food pours in as long: as lhe prices at the mlrket of the former keel' the transport remunerative. 1 he ease of the classes thrown out of work by a failur~ of the crops, who have n,~i!her g -ain ofthdr own nor cash in hand to buy what is pby j';ally within their reach, has b~el1 duly considered, and So far a~ a crisis of Ihis sort is coneered, the probL:m of State aid for the unemployed has been solved. An estimate bast:d olllocal inquiry, <,ollated with the CenSus n:lurns of caste and Occup.llion is prescribed for each district, showing the approxim;;.te uumbe.s oflhe c0mm'.luily that are most prone to suffer, classHbd acca:ding to th..: order in which they arc rcsp.:clivcIy likdy to be thrown upon State support. E;I imatc and plans of undertakings of public ll~.ilily involving th·~ em)L)ym~nt of th·:: rcq'lisile amount of unskilled labour are k!pt in rcadin-::ss by the public works Branch ofLhe Local G )Vcrnment, and by cach of lh,;: latter a cod.:: of ruks regarding famine administration has bt;en fram :d, which includ·.!s minutiae of sanitary arragments, daily tasks, the laying out of camps of work and refug·::. with olh..::r ffio,';asurcs of r:;lief that t be experience of the last 30 jcars had proved (0 be the most efficient in the circum::.tanccs of the tract ani! population to which they are to be made applicable. The lossoflifcwnichis inevitable in time oEEamine is thus likely to b;! redu(.ed to a minimum.
Probable dimhrutioD of Dormal mortality
The present system of administration is conducive also to the preservation of life in less abnormal circum·>tances. The spread of vac;;ination though uneven, is doing much to mitigate the ravages of small-pox, cholera, which it seems impossible to prevent alrog,~ther, is localised by segregation. or by the strong m0a .... Ure of proh;biting religious gathGrings, whenever tbeyare likely to kad to an outbreak ofthi6 scouragc, and in all such cases the sanitary arfang~m\.!nts of the locality are placed under the control of special SJP~rintend<':ll s. As for normal disease. every year sees in increases in the number of ditip'~n'~arie:), which are, in fact. small hospitals under trained m'~n. scattered about lhl: rural tractt>, whilst in larg(~r towns the lower grade of m~dical practitioner, turned out by the univert>itics, is growing in popJ.(ar favour again"t th: riValry about the }]I~rbalist and exorciser. There seem'>, again. no lmm,!diatc pro';p,!cts of any turned rural amelioration of the views of ,h: pvp.dal:.'~ re')p'~:;llng ma·-riag'!. which will remain, therefore, to be one of th·; chief dutict'i of man. whillit th/) cX'en.,ion of trained historic aid of late yt:am will in time probably do soml~ihillg to counteract the resulst

41
immature mothers and their progeny of the ruthless empiricism orthe barber's wife who at present is the chief officiator in this capacity. But can there be any to tbe result towards which all these provisions tend?
In countries where there are no large tracts of unoccupied arable land. the. rate increase of the population is, other things being equal, inversely .as .ts numerical of every census shows that in compliance with the tendency IlOted in earlier in this chapter, as a country fill~ up, the annual rate of iDccease diminishes. The conditions on which that rate can be maintained at a uniform level are either the increa'jc of return from the cultivated land. to which the limit is soon reached, or dispersion of one of the two kinds already spr;cifil;d. The community must be taken itself to occupations other than food-producmg, and ind·:nt for their nutriment 011 oth~r parts of thl~ wucld. wh ;rc th) product!) of th0ir industry arc in higber demand than food; or the dispersion must be over fresh land in their own country.
Whilst and where this lalit is to be got, pressure of population amounts to no more than local cong,!stion, for so long as there is room, actually potentially productive, relief is only a matter of time, more or less according to the character of the people concerned. their adaptability to change, and aature of the tract within their reach.
Qaality of agricuJture.
Now, in India, there are several tracts where tbe agricultural skill and experience of the people have bJen said by experts to get the maximum y!eld ou.: ofthe soil. In others, the harvcst does not respond so thorougbly to tbe care be6towed on it owing to the scanty or uncertain rainfall. but the aid of irrigation can be called in to preserve the crops. In most parts of the country there is a great wa'ite of the ml.terial available for fertilisation. Cattle ace very numerous, but they are turned out to stray over waste land. or where they can pick up a little grazing more or less scanty, So that their droppings are either wasted or collected only for fuel, and their bones are being exported for use in Europe in increasing quantities. In som! parts of the country sheep and goats are systematically hired out to be penned at night on the fidd, but this practict> can aff<jct but an insignificant portion ofthc dry-cropped area. As to rotation, experts have a good deal to say against tne somewhat primitive cycle received by the Indian husbandm~n from his forefathers, and it may, perhaps, be possible to increase or sustalD the productiveness of the soil by a change in system, but this, like so many other suggestions in the same direction is at present a matter of conjecture. The variety of character amongst the cultivating classe£>, too, is a factor in the situation, aG well as that of the soil. The chance, under the preBent conditions, of many more tracts in India rivalling the fertility ofOudh and the great deltas is about equal to that of the scratcher of the hillside in the forests, or the manY-acred dti ver of the Maratha plough. settling down into a market gardener. Sa far as lies within our present purview, neither o17e nor the other is probable or im~()Gsible.
42
Prospects of dispersion
It appears from what has been sketched above, that throughout the greater portion of India the occupied land has, probably, not yet reached the limit of its productivencss, and in the preceding chapter it WaS shown tnat congestion ofthe population WaS at pre6cnt found to comparativcly a small extent. Wc have to consider now the question of dispersion, whdher vertically, by change of occupation or produce, or laterally, by change of locality, as to tht: fOi'ml~r, circum&lancet> seem to point to a long continuance of the present position of India as a r;clf-sus.'aining country. With its existing population it manages (OI,C( a,;ide very con6id'~rable areas for the p roduct1on of raw material other than food, and throughout the decade under review, the outturnofthis cIati!; of producet;eem'; to have increa6ed ra1her than to have becn restricted by th'~ grow,h of t he population. From onc quarter. cotton and wheat, from another, indigo, jute and tea; rice from third, and oil 6eedt> and opium impartiallY, pour into the seaports, in close respont>e, apparently, to the opponunitiet; offered in foreign marke~5. The easier tatik for the cultivator would doubJess be to confine hit> efforts tp the g·"ow'h of foodg"ain or p .. lI!;e, 50 hit> frce adop~ion of the alternative rov'.;l> that be app."cciatef; its sup'~rior advan:ag'~6. As for manufacturing industry, its p"og··e(;[;, though rapid of laic, bal) no~ been divcrt>e enough, eithcr in kind or locality, to make much impression on th'~ country at large. It haS certainly 11itherto won only a comparatively small portion oftbe community away from the agriculture to which thdater IS traditionally devoted. For one thing, India is at present at a disadvantage in eompari6on with many ('fits compeers as regardl) a suffi;ient native t>upply of good coal and iron. Its labour IS plen! iful enough; whether it is cheap or not depend I> on itt;. quality relatively to that of I hi; mo,e highly paid wage receiving clasti elf:cwhcre. Sume branch"::t> of industry, it it> true, have taken root to an exen! that seemt> to open out the way for th': traniSer of capital to Tndla from countriC's Where, for various re31;on6 not yet prevalent in the East, profit!> arc., to put it mildly, uncertain. Among6! thet>t' are, of court>e, cotton and jute workt:;, to which may now be add·;d pap'~r-making and articleti of leatbe .. The wider e'{tellt>ion of any ofthctie operates towardti the dispert;ion of the popula ' ion fro mthe land, and 60 far tends to lighten th<' burden 3S it becolDO& heavier in tbe course of ycars.
Finally, therc if; the quct>tion of lateral extension to measure ,he possi ... bilitic(; in this direction it il; necessary to ascertain the area of Mable land still available for cultivation. alld <hi~', as Wdt> "hown in a prcvious chapter, we are unaole to d,), with even approximate accuracy, for the country at large. It will be more convenient, thercfor!, to touch briefly upon the puiot in conn~ction with th,! p:'ovin';es for which the best information is available. For our p:-cscnt parp,he, the returns of birth place, Which form par~ of the g!n~ral scries, will enable us to app:-eciate to some extent the t:mdcncy towal"d\) migration within India. Thi!> tendency, it is clear from the tables, is at p·esent remarkably weak; and that tbissbould bethe case is no moTe than s to be expected from a community 60 devotedly agricultural, a cla,si; nvariably opposed.
43
MigratiOD
Migrare vetusto De nemore, et proQvis habitatas linquere silvas. In India, too, there is toe additional attractive power of the village organisation and the prevalent connubial system. With regard to expr..nt=;ion within the limitti of the land appertaining to the village itself t bere is no diffi;ulty, but cultivators from outside are, as a rule, only admitted with considerable rcltJ('tancc, and in many p'iorts of Inaia would not obtain land at all. Then, too, where the availablt.: wastc land liefi in iJ compact tracl wit hi nan ea',;Y distance ofthc anc~striJl village, tpe population ifi able to advance on it, at'. it were in line, and is tbis in a position to form fre'>h communilicti on exactly the old model, and to keep in tOl.;ch also with the home and tradition of their forefathers. The objection to ag icultural migl'iJ:ion beginfi where the tract to be occupied is tiep'lrated f.om the nativc land of the emigranjs by a populal ion diffcring from tbe lattcr in race or language, and except in a few fip('cial cal,efi, al1cIl1pts at migration of thi6 !'oC!, to any great exit Jl!, have not yet been Fuccciltiful. In AS"am, a good many of the immigrant labourers on tea plantatioQs have setded down on plott> of land ncar the ticene of their work, made over to them for hom;: cultivation.
Tn Ibe west of the province, too, there il> a flouri;;lling colony 0f the same class, under Il1iF;;ionary supervision. An attempt to relieve parts of Bibar b" means cf S'ate granl6 of land in Burma naS been made within the last few years, and though it if) too soon as yet to judge of the result", tb~ progres5 madr on a small-f'cale scemf) encouraging. The difference in race and language, however, will prohably be found as obstacle to any rote extcmion of the movement. T~mporafY di5placement of the population, however, both agricullural and other, ifi by no mCdns rare, and is increasing in both number and variety. The movement is not yet extending to any significant degree to Foreign counties. For i.l&!anCl', <lurinp. the la!'t 10 years, the numbel of emigulnlF regist~red W<JS only 130,483, the greater pOILion of whom were bou,ld for tbe We!'t Indicsand Guiana. But Burma aad Ceylon from Madrar.;, and from BI!ngal to the tea gardcnt' of Assam, the annual movement is conhiderable. The doclffi and mills of Bombay and Calcutta, too, and the whea< harvests of variou6 parts ot northern and central India, and the plantationfi of Coorj?, 'lttract a considnable Humber of extra hands the Droceed~ of the labour s('ning to susViin the whole family during the rcriod wben tbe cultivation of their plot ofland at home doc!' not cntail thcir presence.
Interchange of wives between contiguous villages
Now, the important feature in the above is the fact that no less than 9,661 persons out of every 10,000 were born in or touching Lhe dist rict or State where they were enumerated, and that by far the larger proportion of these were natives of the place in which the census found them. Then, again, the movement from the contiguous territory is not migration, in the ordinary sense. Instead of being the transfer of families, it is mainly the interchange of chldren in marriage, a practice which obtains to a greater or less extent according to the predominance of the influence of Brahmanic prescription, with its strict observance of endogamy, as it is usually termed, within the caste or tribe and the accompanying prohibition of marriage within certain degrees of relation-Ship, of which ~ome are, according to western motions, rather
44
remote. In order to make this clear, two columns have been added to the statement, giving the ratio of females to males, first, amongst the districtborn, andagain, in the case of those who come from other parts of the country but, touching the unit of tabulation. There are, of course, other factors that enter into the proportion, such as the complexity of territory with other districts or States, which is the case in Bombay and B~roda. But, on the whole, the marriage system is at the bottom of the divergence. Thus, in B~ngal, where it will b::: notic~d that the diff~rence in this respect between the two groups is small, it app-:ars from the more d dailed tables of the Province that the ratio is but 687 fem:l.le:; to 1,000 miles in the ea';tern division, though thC're. too, the fem,des are on the Whole, in excess. But here the bulk of the people are Mllsalman, on whom the >tricl mlTriage law of the B-ahman is not binding, and we find in all the rest of the province a proportion varying from 812 in th~ n )rth. wh~re wom~n are altogether in defect as compared with men to 1,934 in Orissa, the population of which is Wholly Brahmanic in belief. It is th:: sam ~, t hrJugh to a ;m lller d ~grec, in Bihar, where society and the village are o'gani,cd v;:;ry m:Jch a<; in the n~ighbouring territory to the west. In this last, the proportion of females from across the district bo(dcr is remarkably high, and for this the small size of the unit may be to some ex.t'!nt a-;;c0un'abk. N~t to dw~1l too long on this point, it will be seen that in B.,Uma, where the Buddhist form offdith is predominant, the ratio is low, and the sam~ feature re:,ults in Assam and Coorg from the prevalence of male immigraticn to the plantations.
Summary of conditions
Summing up what ha~; been said above as to the conditions that effect the growth of the population of India, it seem.. first that the number of children annually born into the country is a very high one, and that there is no prospect of its speedy or extensive decrease. Then, again, that the tendency of British administration is to prolong the normal life, and to protect it, as far as possible against the abnormal atlacks to which it is there liable. As regards provision a~).in'l t'l! cOltig:::nci~s to w:lich. th'! ab)Ve coniitions give rise, there is, first, the prospect, of, for a time, at least, increasing the yield offood supply from the soil. Secondly, the resources for the purchase of food may be increased by the production of material in demand abroad, or in home manufacture. Thirdly, the growth of the non-agricultural industries, and, fourthly the increase of the area of land under tillage, due to either the extension of irrigation or, still more, to the slow migration of the surrounding population, as pressure increase, to land as yet untouched by the plough. Thus, in brief may be stated the population question, as it exists at present in India, and after the statistic';' bearing on the movement that has taken place within the last 10 years have been di~cussed, there may be room for a few words on the question of how far, up to the present date. has the growth of the resources of the country been commensurate with that of the people.
General variation in population
The second table in the general series gives the figures showing the variation in popUlation that has taken place since 1881. It is divided into two sections first, the tracts for which returns at both the enumerations arc available, and
45
again, the total accretion to the population in the decade, both by growth and addition. In the last category will be found Kashmer, which was not enumerated in 1881, and the Q (eHah settlements. as well as Upper Burma. Fort Steadman, and North Lmhai land, which arc new acquisitions. Internal modifications, such as transfers or exchanges, will be found noted on the fly-leaf of the table. The remarks that follow refer, of course, only to tke nett variations, and exclude the increase that may be caJIed accidental. The territory what was enumerated in 1881 returns an increase during the decade of 27,821,420, a number exceeding the whole population of Engl~d. and nearly equal to that of the kingdom of Italy. The British provinces account for 19,294,509, nearly the population of Spain and Norway together, and the Feudatory States for 8,526,911, a little short of that of Scotland and Irelana. But, large as this growth seems in absolute numbers, if we take it with reference to the population to which it has been superadded, it shrinks into very moderate proportion'). In British provinces it amounts to 9·70 per cent; and in the States to 15·52 or to 10·96 for the whole country. It is composed of an increase of 11'52 per cent over 94'56 per cent of the population of 1881. accompanied by a decrease amounting to 2'40 per cent over 5·44.
The annual rate of increase is thus 9·3 per mille. That this is but average is shown in the '0' table on prepage in which, out of 28 countries, India COOle 20th. It is indeed an open question whether the acutal rate is not a little below tbis. The details of age and sex indicate a certain growth of confidence as well as of popUlation, so that there are persons, especially amongst the forest tribes, who now appear for the first time in the return, though, no doubt, they should have been in that of IO years back also. Then, too, the return of girls between the ages of 10 and] 5, or even 20, is considerably better than it was in 1881, but it still affurds evidence that reticence about tnis portion of the household is by no m::ans uncommon, more particularly in the north ofIndia. There the example of the Musalman conquerors, and the traditions of the military tribes of the Arya and some of the other settlers, are all in favour of the strict seclusion of women of the upper classes, and the middle, as is its won't, follows suit. In other parts of the country the practice is common, but as an imitation, not an injigenous growth, so that there, it seems, the objection to the census inquiry regarding the females of the family stops at a demJ.nd for impection. This demand was specially prohibited in the rules, and the head of the family manifest~, as a rule, no unwillingness to dictate to tbe enum::rator all particulars about the secluded class, barring their names though, of course, all information thu') obtained has to be taken on trust. In the north, where the custt,m is of immemorial standing, or is a poipt of racial distinction, it is too probable that an inquiry, even as to the bare numbers would meet either with no response, or a denial of the existence of such perSons. On these considerations, the omis~ions at the Census of 1891 may be to some extent set off against those of 1881 which were repaired on this last occasion. But the genearal ratio of females to males at the two enumerations in the absence of special cause for aisproportion, such as may be found. for example, in famine tracts, is a m~asure of some value of the confidence of the people in the intention of the State in making the inquiry. Judged by this test, the census under review brought on to the register a greater number of those left out in 1881 than it omitted of those concealed till they creep out
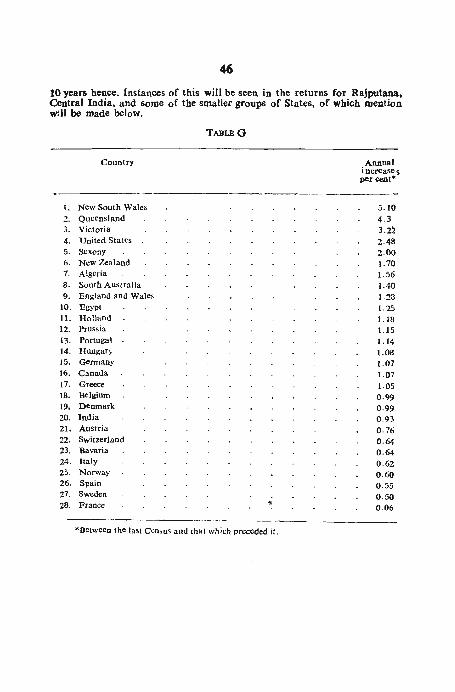
46
10 years hence. Instances of this will be seen in the returns for Rajputana. Central India, and some of the smaller groups of States, of which mention wHl be made below.
1.
2. 3. 4. 5. 6. 1. S. 9.
10. 11. 12. 13. 14. 15. 16. )7. IS. )9. 20. 21. 22. 23. 24. 25. 26. 27. 2S.
TABLEG
Country
New South Wales Queensland Victoria United States Sexony New Zealand Algeria South Australia England and Wales Egypt Holland Prussia Portugal Hungary Germany Canada Greece Belgium Denmark India Austria Switzerland Bavaria Italy Norway Spain Sweden France '!Ii
*Bctween the last Census and [hat which preceded it.
Annual increases per CCDt*
5.10 4.3 3.22 Z·48 2.00 1.70 1.56 1.40 1.28 1.25 1.18 1.15 1.14 1.08 1.07 1.07 1.05 0.99 0.99 0.93 0.76 0.64 0.64-0.62 0.60 0.55 0.50 0.06
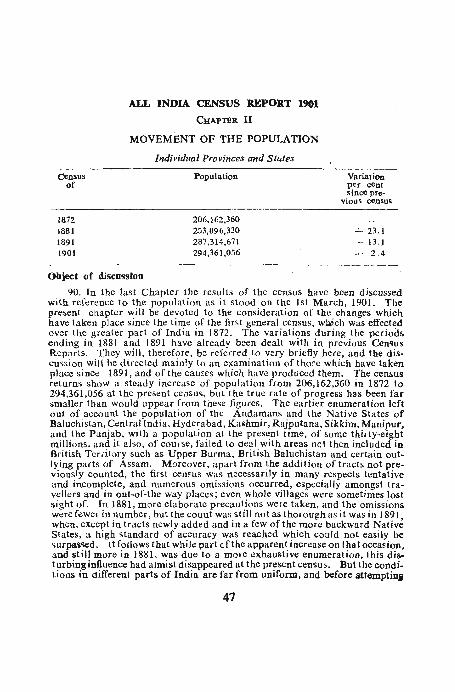
Census of
1872 1881 1891 1901
ALL INDIA CENSUS REPORT 1901
CHAPTER II
MOVEMENT OF THE POPULATION
Individual Provinces and StMes
Population
206,162,360 253,896,330 287,314,671 294,361,056
Object of discussion
Variation per cent since pre-
vious census
-I- 23.1 + 13.1 -I- 2.4
90. In the last Chapter the results of the census have been discussed with reference to the population as it stood on the 1st March, 1901. The present chapter will be devoted to the consideration of the changes which have taken place since the time of the first general census, w~ch was effected over the greater part of India in 1872. The variations during the periods ending in 1881 and 1891 have already been dealt with in previous Cen<ius Reports. They will, therefore, be referred to very briefly hefc, and the discu'>sion will be di.rected mainly to an examination of tho~e which have taken place since 1891, and of the causes which have produced them. The census returns show a steady increase of population from 206,162,360 in 1872 to 294,361,056 at the present ce.1SU'i., but t he true rate of progress has been far smaller than would appear from taese figures. The earlier enumeration left out of account the population of the Andamans and the Native Slates of Baluchistan, Central fndia, Hyderabad, Kashmir, Rajputana, Sikkim, Manipur. and the Punjab, with a population at the present time, of some thirty-eight millions, and it also, of COUlse, failed to <leal with areas net then included in British Terdtory such as Upper Burma, British Baluchistan and certain outlying parts of Assam. M3reover, apart from the addition of tracts not previously counted, the first cen~us was necessarily in many respects tentative and incomplete, and numerous omissions occurred. especially amongst travellers and in out-of-the way places; even whole villages were sometimes lost sight of. In 1881, more elaborate precautions were taken, and the omissions were fewer in number, but the count was still not as thorough as it was in 1891 when, except in tracts newly added and in a few of the more backward Nativ~ States, a high standard of accuracy was reached which could not easily be 'iurpa'i'ied. it fOllows that while part (.fthe apparent increase on that occasion, and stil1 more in 1881. was due to a mOle exhaustive enumeration, this disturbing influence had almist disappeared at the present census. But the condi. tions in different parts of India are far from uniform, and before attemptiJlB
47
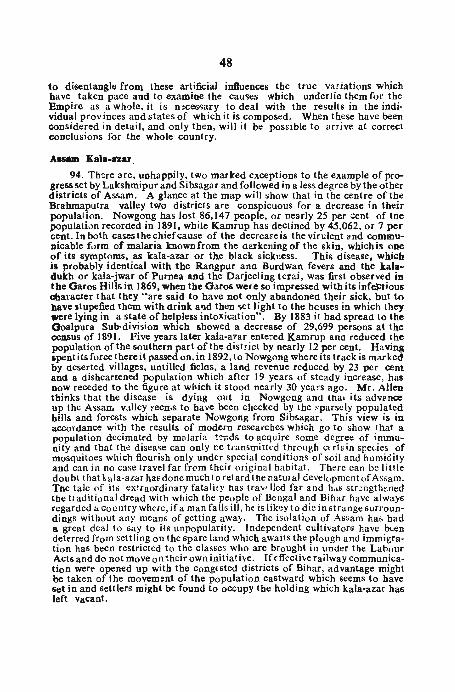
48
to disentangle from these artificial in1luences tbe true variations which have taken pace and to examine the cauc;es wbich underlie them for the Empire as a whole, it is n!cessary to deal with the results in the individual provinces and states of which it is composed. When these have been considered in detail, and only then, wi)) it be pos~ible to arrive at correct conclusions for the whole country.
Assam Kala-a~ar.
94. There are, unhaPl'ily, two marked exceptions t() the example of progress set by Lakshmipur and Sibsagar and followed in a less degree by tbe otber districts of Assam. A glance at the map will show that in the centre of the Brahmaputra valley two districts are conspicuous for a decrease in their popula1ion. Nowgong has lost 86,147 people, or Dearly 25 per ;:ent of tne population recorded in 1891. wbile Kamrup has declined by 45,062, or 7 per cent. In both cases the chief cause of the decreafe is tbe virulent 8nd communicable furm of malaria known from tbe darkening of the skin, which is one of its symptoms, as kala-azar or the black sickness. This disease, which is probably identical with the Rangpur and Burdwan fevers and the kaladukh or kala-jwar of Purnea and the Darjeeling terai, was first observed in the Garos Hills in 1869, when tbe Garos were so impressed with its infd=tious obalaeter tbat they "are said to have not only abandoned their sick, but to have stupefied them with drink alld tben 'Oet ligbt to the hcuses in which they were lying in a state of helpless intoxication". By 1883 it had spread to the Goalpura Sub-division which showed a decrease of 29,699 persons at the census of 1891. Five years later kala-a:tar entered Kamrup anC] reduced [he population of the southern part of the district by nearly 12 per cent. Having spent its force thereit passed on,in 1892, to Nowgong where its track is marked by deserted villages, untilled fielas, a land revenue reduced by 23 per cent and a disheartened population which after 19 years of steady increase, has now receded to tbe figure at wbich it stood nearly 30 years ago. Mr. Allen thinks that the disease is dying out in Nowgong and that its advpDCe up tbe A'>sarr. valley ~eerr.s to have been checked by [he !"parsely populated bills and forests which separate Nowgong from Sibsagar. This view is in accQldance with the results of modern researches wbich go to show that a population decimated by malaria !<:nds to acquire some degree of immunity and that the disea<oe can only oe transmitted tbrough ccrti)in species of mosquitoes which flourish only under special conditions of soil and humidity and can in no case travel far frem their original habitat. There can be little doubt that ka1a-azarha6 donemuchto retard the natural deveJupmentof Assam_ The talc of its extraordinary fatality has travdlcd far and hd.6 str;:ngthwed the tIaditional dread with which the people of Bengal and Bihar have always regarded a country where, if a man falls ill, he i61ikcy to die in strange surroundings without any means of getting awa}. The i6olation of Assam has had 8. great deal to say to its unpopularity. Independent cultivators have been deterred from settling on the spare land which awaits the plough and immigration has been restricted to the classes who are brought in under the Labour Actsand do not move on their own initiathe. If dfecth,e railway communication wert" opened up with the congested districts of Bibar, advantage might be taken of the movement of the population eastward wbich seems to have set in and settlers might be found to occupy the holding which kala-azar has left vacant.
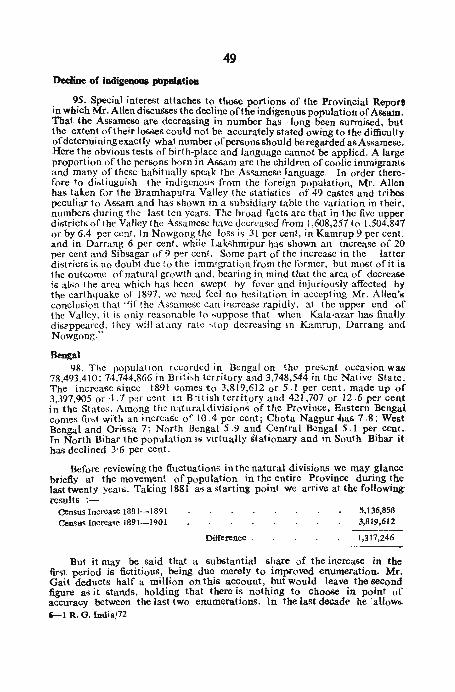
49
Decline of indigenous .-poIation
95. Special interest attaches to those portions of the Provincial Report in which Mr. Allen discusses the decline of the indigenous population of Assam. That the AS5amese are decreasing in number has long been surmised, but the extent of their los8e5 could not be accurately stated owing to the difficulty of determining exactly wbat number of persons should be regarded as Assamesc. Here the obvious tests of birth-place and language cannot be applied. A large proportion of the perSons born in Assam are the children of coolie immigrants and many of these habitually speak the Assamese language. In order therefore to distinguish the indigenous from the foreign population, Mr. Allen has taken for the Bramhaputra Valley the statistics of 49 castes and tribes peculiar to Assam and has shown in a subsidiary table the variation in their, numbers during the last ten years. The broad facts arc that in the five upper districts of the Valley the Assamelie have decreased from 1,608,257 to 1,504,841 or by 6.4 per cent. In Nowgong the loss iii 3 I per cent, in Kamrup 9 per cent. and in Darrang 6 per cent. while Lakshmipur has shown an increase of 20 per cent and Sibsagar of 9 per cent. Some part of the increase in the latter districts if> no doubt due to the immigration from the former, but most of it is the outcome of natural growth and, bearing in mind that the area of decrease is also t he area which has been swept by fever and injuriously affected by the earthquake of 1897, we need feel no hesitation in accepting Mr. Allen's conclusion that "if the Assamese can increase rapidly, at the upper end of the Valley, it if) only reasonable to suppose that when Kala-azar has finally dis?ppeared, t hey will at any rate stop decreasing in Kamrup, Darrang and Nowgong."
Bengal 98. The population recorded in Bengalon the present occasion was
7S,493,41O; 74.744,866 in British territory and 3,748,544 in the Native State. The incl'Cat;c since 1891 comes 1:0 3,819,612 or 5.1 per cent. made up of 3,391,905 or 4.7 per c~nt in B:itish territory and 421,701 or 12.6 per cent in the States. Among the natural divisions of the Province, Eastern Bengal comes firf>t with an increase of 10.4 per cent; Chota Nagpur flas 7.8; West Bengal and Oris'Sa 7; North Bengal 5.9 and Central Bengal 5.1 per ceur. In North Bihar the population is virtually stationary and in South Bibar it has declined 3'6 per cent.
Before reviewingthe fluctuations in the natural divisions we may glance briefly at the movement of population in the entire Province during the last twenty years. Taking 1881 as a starting point we arrive at the following results :-
Qensus Increase 1881-1891 CenStlS Increase 1891-1901
Difference
5,136,858 3,819,612
1,317,246
But it may be said that a substantial share of the increase in tbe first period is fictitioUS, being due merely to improved enumeration. Mr. Gait deducts half a million on this account, but would leave tbe second figure as it stands, holding that there is nothing to choose in point of accuracy between the last two enumerations. In the last decade he' allows-i-l R, O. India/72
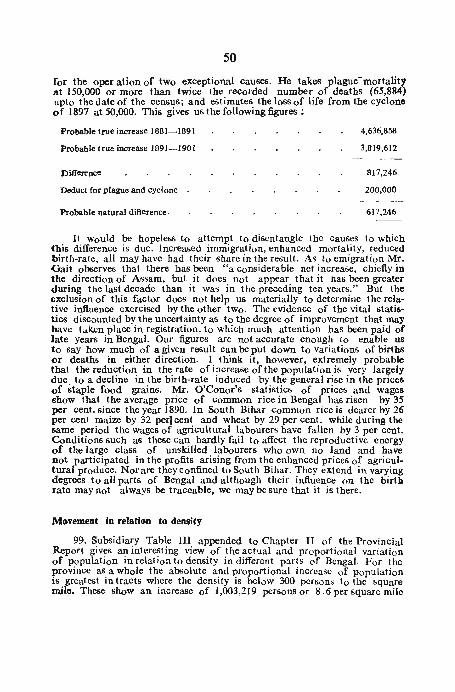
50
for the opec ation of two exceptional causes. He takes plague-mortality at 150,000 or more than twice the recorded number of deaths (65,884) up to the date of the census; and estimates the loss of life from the cyclone of 1897 at 50,000. This gives us the following figures!
Probable true increase 1881-1891
Probable true increase 1891-1901
Difference
.Deduct for plague and cyclone
Probable natural difterence.
4,636,838
3,819,612
817,246
200,000
617,246
It would be hopeless to attempt to disentangle the causes to which this difference is due. Increased immigration, enhanced mortality, reduced birth-rate, all may have had their share in the J·esult. As to emigration Mr. Gai1 observes that tbere bas been "a considerable net increase, chiefly in the direction of Assam, but it does not appear that it nas been greater during the last dccade than it waS in the preceding tcn years." But tbe exclusion of this factor does not help us materially to determine the relative influence exercised by the other two. The evidence of the vital statistics discounted by the uncertainty as to the degree of improvement that may have taken place in registration, to which much attention has been paid of late years in Bengal. Our figures are not accurate enough to enable us to say how much of a given result can be put down to variations of births or deaths in either direction. I think it, however, extremely probable that the reduction in the rate of increase of the population is very largely due. to a decline in the birth-rate induced by the general rise in the prices of staple food grains. Mr. O'Conor's statistics of prices and wages show that the average price of common rice in Bengal has risen by 35 per cent. since the year 1890. In South Bihar common rice is dearer by 26 per cent maize by 32 perJ cent and wheat by 29 per cent, while during the Same period the wages of agricultural labourers have fallen by 3 per cent. Conditions such as these Can hardly fail to affect the reproductive energy of the large class of unskilled labourers who own no land and have not participated in the profits arising from the enhanced prices of agricultural produce. Nor are they confined to South Bihar. They extend in varying degrees to all parts of Bengal and although their influence on the birtll rate may not always be traceable, we may be sure that it is there.
Movement in relation to density
99. Subsidiary Table III appended to Chapter II of the Provincial Report gives an interesting view of the actual and proportional variation of population in relation to density in different parts of Bengal. For the province as a Whole the absolute and proportional increase of popUlation is greatest in tracts where the density is below 300 persons to the square mile. These show an increase of 1,003,2 I 9 persons or 8.6 per square mile
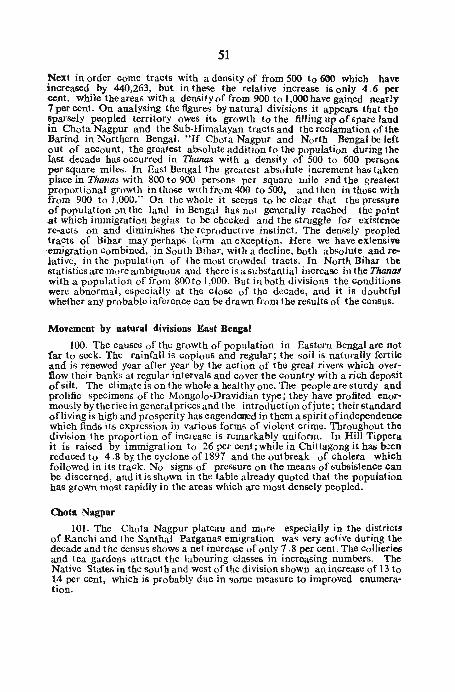
51
Next in order come tracts with a density of from 500 to 600 which have increased by 440,263, but in these the relative increase is only 4.6 per cent, while the areaS with a density of from 900 to 1,000 have gained nearly 7 per cent. On analysing the figures by natural divisions it appears that the sparsely peopled territory owes its growth to the filling up of spare land in Chota Nagpur and tbe Sub-HimalaYan tracts and the reclamation of the Barind in Northern Bengal. "If Chota Nagpur and North Bengal be left out of account, the greatest absolute addition to the population during the last decade has occurred in Thanas with a density of 500 to 600 persons per square miles. In East Bengal the greatest absolute increment has taken place in ThanaJ with 800 to 900 per&ons per square mile ?nd the greatest proportional growth in those with fl'om 4()0 to 500, and then in those with from 900 to 1,000." On the whole it seems to be clear that the pressure of popUlation on the land in Bengal has not generally reached the point at which immigration begins to be checked and the struggle for existence re-acts on and diminishes the reproductive instinct. The densely peopled tracts of Bihar may perhaps form an exception. Here we have extensiw ·emigration combined, in South Bihar, with a decline, both abSolute and relative, in the population of the most crowded tracts. In North Bihar the statistics arc more a,mbiguou& and there is a substantial increase in the Thanos with a popUlation of from 800to 1,000. But in both divisions the conditions were abnormal, especially at the close of the decade, and it is doubtful whether any probable inference Can be drawn from the results of the census.
Movement by natural divisions East Bengal
100. The causes of thc growth of population in Eastern Bengal are not :far to seck. The rainfall is copiouS and regular; the soil is naturally fertile and is renewed year after year by the action of the great rivers which over~ fiow their banks at regular intervals and cover the country with a rich deposit of silt. The climate is on the whole a healthy one. The people arc sturdy and prolific specimens of the Mongolo-Dravidian tY}>e; they have profited enormously by the rise in general prices and the introduction of jute ; their standard ofliving is high and prosperity haS engend~d in them a spirit of independence which finds its expression in various forms of violent crime. Throughout the division the proportion of increase is remarkably uniform. In Hill Tippera it is raised by immigration to 26 per cent; while in Chittagong it has been reduced to 4.8 by the cyclone of 1897 and the outbreak of cholera which followed in its track. No signs of pressure on the means of subsistence can be discerned, and it is shown in the table already quoted that the population has grown most rapidly in the areas which arc most densely peopled.
Chota Nagpur
101. The Chota Nagpur plateau and more especially in the districts of Ranchi and the Santhal Parganas emigration was very active during the decade and the census shows a net increase of only 7.8 per cent. The collieries and tea gardens attract the labouring classes in increasing numbers. The Native States in the south and west of the division shown an increase of 13 to 14 per cent, which is probably due in some measure to improved enumeration.
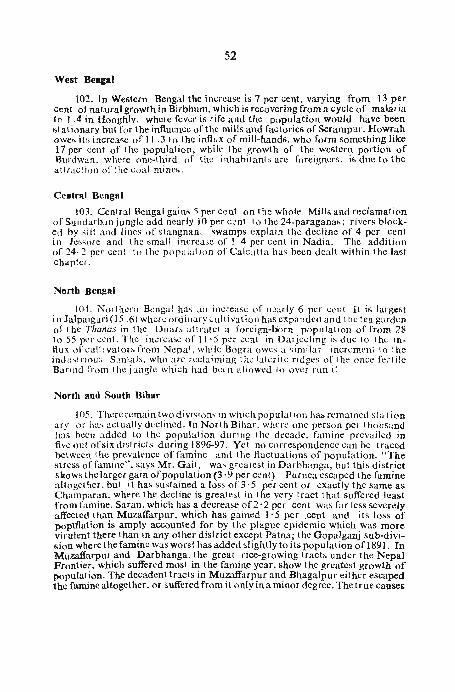
52
West Bengal
102. rn Western Bengal tbe increase is 7 per cent, varying from 13 per cent of natural growth in Birbhum, which is recovering from a cycle of malaria to 1 .4 in Hooghiv. where fever if; rife and the population would have been stationary but for the influence of the mills and factories of Serampur. Howrah owe;; itt; increaf;C of J I .3 to the influx of mill-hands. who form something like 17 per cent of the population, while the growth of the western portion of Burdwan. where one-third of the inhabitant;.; are foreignerr" is due to the atl rac! ion of! he coal mines.
CeDtral Bengal
103. Central Bengal gains 5 per Cellt on the whole. Millf; and reclamation of Sundarbanjungle add nearly 10 per Cl:l1t to the 24-paraganas; river!> blocked by tiilt and lines of stangnant swamps explain the decline of 4 per cent in JCh'.;ore and thc bmall inereat>c of I· 4 per cent in Nadia. The addition of 24· :2 per cent to the population of Calcutta has been dealt within the last chapter.
N..,rtb Bengal
104. Norlhern Bcngal has an increasc of n..:arly 6 per Cent It is largebt in Jalpaiguri (15.6) where ordinary cultivation hasexpandea and t 11(; tea garden of the Thanas in the Duars atlratct a foreign-born popUlation of from 28 to 55 per c'~nt. The increase or 11·5 p~r cent in Darjccling is dut: to the influx of cuI! ivators from Nepal, while Bogra owes a similar increment to the indll~tri()ll:; Santals, Who arc reclaiming !he laterite ridges of the once fertile Barind from the j lingle which had been allowed [0 over run it.
North and South Bihar
105. There remain two divisions in wltichpopulatioll has remained sta r ion ary or ha,. actually declined. Tn North Bihar, where one person per thousand has. been added to the popUlation during the decade, famine prevailed in five out of six districts during 1896-97. Yet no correspondence can bc traced between the prevalence of famine and the fluctuations of population. "The stress of famine". says. Mr. Gait, was greatest in Darbhanga, but this. district skows the larger gain ofpopulatioll (3·9 per cent) Purnea escaped the famine altogether. but it has sustained a loss of 3·5 per cent or exactly the Same as Champaran, where the decline is greatest in the very tract that suffered least from famine. Saran, whiCh has a decrease of 2· 2 per cent Was far less severely affected than Mllzaffarpur, which has gained 1·5 per .cent and its loss of popUlation is amply accounted for by the plague epidemic whieh was more vi rulent there than in any other district except Patna; the Gopalganj sub-division where the famine WaS worst has added slightly to its population of1891. In Muzaffarpur and Darbhanga, the great rice-growing tracts under the Nepal Frontier. which suffered most in the famine year, show the greatest growth of population. The decadent tracts in Muzaffarpur and Bhagalpur either escaped the famine altogether, or suffered from it only in a minor degree. The true causes
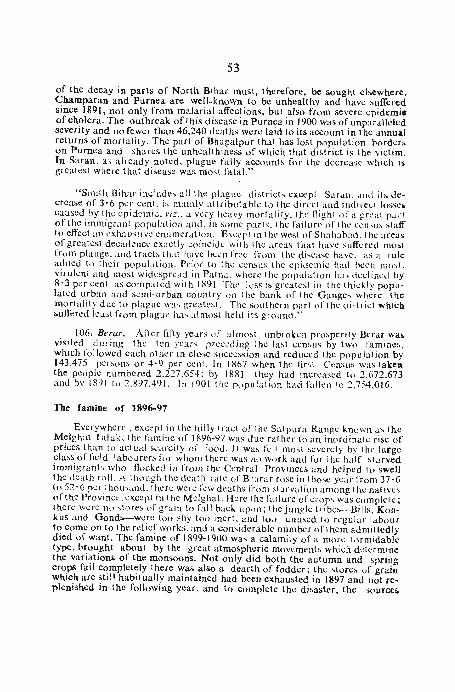
53
of the decay in parts of North Bihar must, therefore. be sought elsewhere. Champaran and Purnea are well-known to be unhealthy and have suffered since f891, not only from malariaL affections, but also from severe cpidemis of cholera. The outbreak of this disease in Purnea in 1900 was of unp:lra\leled severity and no fewer than 46,240 deaths were laid 10 its account in the annual returns of mortality. The part of Bhagalpur that has lost population borders on Purnea and shares the unhealthiness of which that district is the victim. In Saran, a:, already noted. plague fully accounts for the decrease which is grealest where that disease was most fataL"
"South Bihar inGludes all the plague district,; ex.cept Saran. Clnd it::. decrease of 3'6 per cent. is mainLy attributablc to t he direct and indirect losselO caused by the cpidemic, viz., a very heavy mortality, the flight 01' a great pari of the immigrant population and, in some parts, the failure l)fthc t:cn:-;ll~ staff to effect an exhau,;tiw cnllmeration. E.xcep! in the wet;t ofShahahad. the arc<l1S or greates.t decadence exactly coincide with the aTl'as Ihat have suffered 1l)Oto.( from ptaugc, and tract!> that llave ocen free from the disease have. as a rule ad(led to their popul:ltion. Prior to the c:.:n~us the epidemic had been mmt, virulent and most widespread in Patna, where t he population ha~ declined by 8·3 per cent as comrarcd with 1891. The loss is greatest in the thickly populated urban and semi-urban country on lhe hank of the Gange:-- where the mortality due to plague was greate;.t. The southern pari of the di:·lrict which. i>uffaed Ica;:,t from pla.gue ha:-. almost held its grollno."
106. Herar. After filly year:-; of almost unbrok.en prosperity Bcrar waf> visited during Ihe ten years prec,~ding lhe last cenSllS by two famines, which followed each other in close succession and reduced the pnpulation by 143,475 per~l)ns or 4·9 per cent. In 1867 when the fir~l Censlls wa~ taken the people numbered 2,227,654; by 188 I they had increased to 2,672,673 and by 1891 tl) 2,897,491. In 1901 the popUlation had falkn to 2,754,016.
The famine of 1896-97
Everywhere, except in the hilly t racl of the Satpura Range known as the MeLghat Taluk, the famine of 1896·97 was due rather to an inordinate rise of prices than to actual scarcity of i{)od. It wab fell most ~even.:ly by t he large cla:-.s or field labourers for whom there was no work and for (he half :-.1:J.rved immigranh who flocked in from the Central Provinces and helped to swell the death roll. j\ltholigh the deat h rale oj' B 'arar rose in those yc,u' from 37'6 1052'6 per ~holl~:.J.nd, there wen: Cew deaths from starvation among til": native" (If the Province, except in t he M(~lghat. Here the t'ailure of crop" was complete; there were no ~tore:-. of grain to fall back upon; the jungle tribcs- .. Bills, Konkus and Gonds-were too ,hy too inert, and to,) unused 10 n:gular labour to come on to the relief vy'()rks, and a considerable number oft hem admittedly died of want. The famine of 1899-1900 Was a calamity of a more formidable type, brought about by the great atmospheric movements which ddcrmine the variation~ of the monsoons. Not only did both the autumn and spring crops fail completely there was also a dearth of fodder; the store::. ()f grain which arc still habitually maintained had been exhausted in 1897 and not re~ plenished in the following year, and to complete the disaster, the Sourcclit

54
of water supply c1ried up and a large number of cattle perished from thirst. The death rate rose from 40 to nearly 83 per thousand; the birtb rate fell from 50 to 31. The number of deaths returned was, 236,022, being nearly 126,000 in excess of the decennial average, and nearly four times as many as occurred in 1898. Some of these people no doubt were immigrants from the saeighbouring parts of Hyderabad, but no estimate of their number can be made, and it is impossible to doubt that there was considerable mortality amcmg the inhabitants of the Province. The daily average number of persons relieved was 265,744 or 9'2 per cent of the population, while in July 1900 the ~ure rose to 601,424 or nearly 21 per cent.
CHlpariSGD of census figures with vital statistics.
107. In respect of the accuracy of its vital statistics'Berar ranks higher [nan almost any other Province in India and a comparison of the census figures with the returns of births and deaths fully bears out this reputation. The recorded excess of deaths over births during the ten years 1891-1900 comes to 150,803 persons, while the census shows a loss of 143,475. And a calculation made by Mr. Chinoy, in paragraph 80 of his report, from the vital statistics combined with the birth place returns, brings out a total population of 2,750,542 persons or only 2,474 less than that ascertained in the census. Another form of calculation, set out in subsidiary table vr compares the population actually found in the census with that which would have been in existence if the rate of increase which prevailed from 1881 to 1891 had gone on for the next ten yean. On this hypothesis, which takes for granted the continuance of unbroken agricultural prosperity, "we find that Berar has, during the decade, suffered a loss of387,224 persons for 12'3 per cent. Butthe vital statistics and the nature of the seasons during the decade show that in only five years. i.e., from 1891 to 1893 and 1898 and 1899 the population was progressive, as there was a large ex.cess ofbriths and deaths in each of those years, while in the remaining five years deaths outnumbered births excessively. Taking the normal annual rate of increase in Berar for the five years in which the population was progressive and adding the net gain of 14.215 by migration. the population of Berar in 1901 should have been 3,031,120 Of 277,104 more than it WaS actually found. This difference amounts to 10 per cent, and is probably the nearest we ca.n get to the loss inflicted by the two famines and unhealthy years."
Bombay
110. During the last decade there has been a cons.iderable growth of industrial activity. The number of cotton mills has risen from 87 to 138 and the number of employees from 18,000 to 810,000. There has also been a considerable extens.ion of the system of railways. But these conditions have only a small influence compared with the state of agriculture and the public health. For some years after 1891 the seasons were normal and, withtheexoeptionof occasional visitations of cholera, there was no unusual mortality; but tl:uLD followed "a succession of famines, bad seasons and plague epidemics unrivalled in the recent history of any other part of India."

5S
Conditions affecting movement between 1891 and 1901
Plague first appeared in Bombay City in September 1896, and gradually spread all over the Province especially in the Deccan and the South Maratha country, and in Thana, Cutch and the larger towns 11'1. Sind-Karachi, Hyderabad, and Sukkur. The total registered mortality from plague upto the 1st March 1901, the date of the census, waS nearly a third ofa million. The Superintendent has not given his opinion as to the ~xtent to which these figures indicate the actual mortality, but it is well-known that in the case if all serious out-breaks of epidemic disease the machinery for reporting vital occurrences becomes disorganised. The plague Commissioners were of opinion that the true death rate from plague was greater by at least 35 per cent than that actually reported, and in Bengal it has been estimated that the deaths from the disease were more than twice as numerous as those shown in the returns; it would thus probably be safe to say that in Bombay the plague was responsible for a reduction in the population of from half to two thirds of a million persons.
At the time when the censUs was taken plague was raging in the Bombay City and in the Belgaum and Thana districts; in the plague districts of Bengat it was found that the consequent alarm and confusion affected the accuracy of the enum::ration, but in Bombay Mr. Enthoven thinks that the plague was a help rather than an obstacle, as the days of scare were over and the people were accustomed to constant censuses for plague purposes. However that may be,it is probable that the Bhils and other wild tribes, who rubbed oft" much of their shyness on the famine relief works, were more completely accounted for OD the present occasion than at any previous enumeration.
The famine of 1896-97 fell most heavily on the Deccan districts and Bijapur In the rest of the Presidency the scarcity did not amount to famine, and relief works were not necessary, but there was widespread suffering from the high prices which prevailed. During the next two years the crops seem to h.ave been fair, except in the Deccan, but then came the famine of 1899-1900. This calamity, following as it did on a succession of lean years, caused even greater distress in the Deccan than its predecessor of 1896-97, but the brunt of it feU OD the well cultivated and usually fertile plains of Gujarat, the garden of Westem India", which until then had been regarded as outside the famine zone.Sind, owing to its dependence upon irrigation, again escaped, and so did the X.onkan and South Maratha country. The area affected on this occasion Wall :aearly twice as great as in the famine of 1876-78 and the maximum daily a~rage number of persons relieved was three times as great. When the censu. was taken over 100,000 persons were still in the relief camps.
Bxcluding Aden the number of immigrants of all kinds has fallen from 988,980 in 1891 to 804,014 at the present cenSUS, and that of emigrants to other parts of India from 706,542 to 626,799.
-ntat is to !lay at the present day. 'De terrible famine which devasted Gujaral ill 1630 was probably one of the most severe of these scouraes than o,er "jailed India.
56
The result of the adverse conditions of the decade is that the census of 1901 shows a decrease ofa million and a half, or 5 per cent, as compared with that taken ten years previously; the popUlation of British territory has fallen to 18,550,561, a drop of2 percent, while that of the Native States is now only 6,908,648, or 14 per cent less than in J 891. The returns of the Sanitary Department show an excess of births over deaths to the extent of 645,000 in the first six years of the decade, and of 47,000 in the years 1898 and 1899. whi Ie in the two famine years, J 897 and 1900, there was an excess of deaths amounting to 120,OOOinlheformcr. and 813,OOOin thelatteryear*
CENTRAL PROVINCES
Decrease in the past decade
122. The events or the ten years preceding the la~t cenSus have .~;gnally falsified the optimist ic views of the first ramine Commissi(m. A succession of bad seasons culminated in the first great famine of 1896-97, which was followed, after a single year's respite, by the widespread calamity of 1899-1900. Epidemics of cholera prevailed in seven years out of the period and malaria fever was on several occasions unusually frequent and severe. These disasters, coming upon a weakened and impoverished people, reduced tb.eir number to 11,873,029 persons. a dec! ine of 1,071,776 or 8· 3 per cent.
Its probable causes
(i) FJmigration: 123. We have no means of lietermining wi th any approach to precision to what extent this loss of population is due; (I) to c:migration excecding immigration. (2) 10 a reduced birth rate, (3) to an enhanced death rate. All these causes have no doubt contributed in varying degrees to the result, but it is impos~ible to separate them with certainty and to slate definitely what effect each has produced. Let us first con,ider emigration and immigration. The returns of birth-place show that 482,228 persons born in the Cent ral Provinces were cnumerated in other parts of fndia, and conversely, that 460,694 per ... 80ns born elsewhere were enumerated in I he Centra I Provinces. The former figure represents an incrcest' of 1,66" and the laUer a decrc2.se of 71 ,672 on thc correspondngstatistics of 1891. But neithcrthe one nor t he other is a true measure of the real movem-!nt of 1 he period. E:lch merely shows the net result of m!gration and reduction by death on the total number of emigranb and immIgrants respectively. Thc number ofpeopk that :lctuully migrated can only bc estimated approximately. The method I adopt for this purpose has the Sancti~m of the high authority of Mr. Necl Humphreys and has been used by my frte:nd Dr: Longstaff in estimating the movement of population with in the UnIted Kingdom. On the system it is assumed that the average number of
*In the Memorandum on the Material Condition of the people of Bombay Presi~ dency 1892-1901, it is said that plague and famine by increased mortality and reduced bu-th rate caused a loss of two and a half millions in British territory and of two millions in the Bombay State.
57
<Alntral Provinces people in other parts of lndia during the decade was the arithmetical mean between the number at its b~ginning and end, thus .-
482,228 +480,565 =481,396. 2
A death rale of 40 per 1,000, which is a fair f«lin 1o \<th. would in \e-n years carry off two-nfths of the ave rage pOpll lat ion
481,396 '< 2 --2-- =192,558.
Adding to this the cenSu:, incrcae,\: or \.663 we get 194,221. a~ (he probablt! number of emigrants during t he ten )'eus. By tne &amc Pf('CC;iS. only deducting tne census d"::crease in immigrants of 71 ,672, the immigrant populationis calculated at 126,940. The differcucl" of 67,28 I r(:presents Uw cxtent to whIch (hc balanccofemigratiol1 and immigration hasconlributc\l to thedcclinc of po pulation in Ule Central Provinces. Sn far as emil!,r:,tion i~ concerned, (he figure assumed above do\:~ not differ WI')' mah:rially-rroffi Mr. RU~"Llell'~ ~stima~c of between one and a half :l1ld twn-lakh\. But he omits to lake Immlg,raJH.lTI In!o account and 'l.~sume:,; that the whote number \)\ cmigrant~; (::\n he deducled from the dclcine in popu1ation brought out hy the cenl>u:'.. Thi~, d' coursc IS not th.e C:.\SC, I think it po-,;sible, however. that tnc number of emigrants. to As-sam may have been understated owinl:! to many Dr tlw tea co\)lic~> recrultcd In lb.c Central Provinces, being colkc\edVat Purulh and returned as native" of Bengal. 'People ofthc coolie class do not distinguish very clearly hclwecll CI~nta Nagpur and the Central 'Provinces and aIC apt to speak of both mdlfficrcntlyall, 'Nagpur'. On lhe whok thcn the net l()~, \0 the Provim;~ by migr,mtioll dUl"mg the ten years may be estimated at 70,000.
124. The general conclusion i, thai cmigmtion accounts i'or only all in significant proportion of the cCI1~u~decrcase or population. Thi~ is in the main wh;ll the circums.tance~ lead LIS to expect. That there ~hould have b~en a large Increase in the number ofper::.on~, who werccollveyed to Assam undcrthc Labour Act is natural enough; a famine is the reentiler';, opportunity, and a~."I~tcd emigration is a most effective form of relief. It lakes the ruined cullivator or I andles~ labourer to a new country where his.labollr is wanted, and in a larg~ number of Case& he a.nd his family ~ctllc down and prosper in Assam. But while assisted emigration incn::ascd, ordinary or ::.pontancou:-, emigrat
l()l1
to neighbouring provincc~ declined, d()Llbtlc~~ for the sufficient rcason lI~a! people had nothing to gain by wand~ri!lg into adjacent tract::; where the famlllt.; was as severe a~ m the Cc~ntral Pr()vinces, and tlte relief arrangemcnb , at any rate in the second famine, less complete and liberal. .
(ii). RedlJced birth rate 125. For the fir\,t four yean; of the decade the bIrth fatc War; not very mlrkcdlv beloW the average rate (40,3) of the decennial period 1881-91. In 1895 it dropped suddenly from 39 per thousand to 33; in the next year there Wa6 a fall to 32 and in 1897 it fell to 27. III 1898 the rate rorle to 30 and ill:
58
1899 i.t reached th~ very high ~gure of 47 per thousand, declining again, to 12 In the followIng year. It IS not contended that these std.tistics are absoult~ly accura~c. stillles~ that they can be made the basis of any precise calculatIon. Thcu fiu(.tuatlons, however, show a clo&c correspondence with the comparative sevi':rity of dist.ress in different districts and we may credit them .with a rair degree of relative accuracy. In 1895, for example, the drop In tne bIrth-rate WaS peculiarly conspicuous in the districts of Saugor, Damoh and Jubbulpore regarding which the Famine Commission of 1898 ~bserved that the whole machinery of famine relief ought to have been brougbt Into play at the beginning of 1896. At this critical time, indeed, the birth rate appears to have given a clearer note of warning than the death-rate. The former declined in Saugor by 50 per cent. in Damoh by 39 pcr cent, and in Jubbu.lpore by 3, per cent; while the rise in the death-rate was only 18 per ce~t In Saugor, 11 per cent in Damoh and 8 per cent in Jubbulpore. The pomt seems to deserve some attention. The relation between the rise and fall <?fT!rices and the fluctuations of the birth-rate is known to be very regular and tntl~tC and therc are physiological rcasons for believing that the reproductIve functions are the"first to bc affected by any marked reduction or deterioration of diet. It follows that in a country where 6carcity and faIninc recu~ at uncertain intervals special attention 6hould be paid to thp registration ~f ~lrt~6 and their variations &houJd be rccogniscd as giving a tru&tworthy mdlcatlon of any continued dccline in the material condition of the people. They arc of course nine or ten months in arrCar of the cau&es which give ~ise to them, but where thesc causcs themselve& have been overlooked or misInterpreted the fall in the birth-rate tells a decit>ivc talc. Our sources of information as to the prosperity of the ma6Se& arc not So infallible that we CAn afford to neglcct even a tardy warning.
(iii) Enhanced death-rate 126. Turning now to the death-ratc wc find that in 6ix yean, out of ten it WaS sub&tantially in excess of the averaged ratio (32.4) f,)r Ih'! p)riod 1881-1891, that in 1896 it ro·;e to 49 per thouGand and in 1897 to 69, the rate for 1900, the year of the second famine. being 56.7. For the fin,t famine the returns of deaths are probably a good deal below the mark. In many district6 the reporting officers, mostly illiterate village watchmen of the lowe&t castes, were greatly overworked, lura! liocicty Wa6 disorganized by famine and cholera, and large number& or people especially. membe~s of t~e wilder tribes, had left their ~ome~ an~ ""andered away Into th~ J?ngles. In search of food. A~curate r~gl&tratlon 16 difficult enough to attalD In ordmary years; when panIC ha& sct In on a large scale it become6 impo&sible. In 1900 the elaborate organiza tion of famine kitchens kept natives of the Province in their villages, special work of a congenial nature was provided for the jungle tribes, and aimless roaming. about the country seems·to have been reduced to a minimum. It may therefore be assumed that the mortality stati&tics in 1900 are approximately correct. For the purpo&e of estimating the deaths directly and indirectly traceable to the second famine, the Famine Commission of 1901 take tbe decennial average or recorded deaths at 351,548 and deduct this from 539,234, tbe number of deaths registered in 1900. They thus arrive at 187,686 as tbet excess mortality of tbat year in British Di&tricts. If we follow their Il_lcthod, and deduct the same decennial average from the number of deaths reglstered in 1896 and 1897 we get 424,195 as the exce6& mortality of the first famine, and:
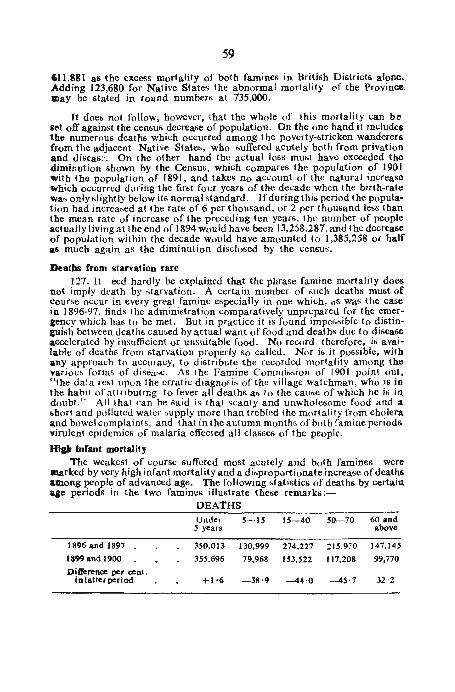
59
'11,881 as the excess mortality of both famines in British Districts alone .. Adding 123,680 for Native States 1 he abnormal mortality of the Province may be stated in round numbers at 735,000.
It does not follow, however, that the whole of this mortality can beset off against the census decrease of population. On the one hand it includes the numerous deaths which occurred among the poverty-stricken wanderers from the adjacent Nathe States, who suffered acutely both from privation and dist.'as:. On the other hand the actual los6 must have exceeded tbe diminution shown by the Census, which compares the population of 1901 .... ith the population of J891, and takes no account of the natural increase which occurred during the first four years of the decade whcn the birth-rate was only slightly below its normal standard. If during this period the popula~ tion had increased at the rate of 6 per thousand, or 2 per thousand less than the mean ratc of increase of the preceding ten years, the number of people actually living at the end of 1894 would have been 13,2)8,287. and the decrease of population within the decade would have amountcd to 1,385,258 or half as much again as the diminution disclosed by thc ccnsuti.
Deaths from starvation rare 127. It ecd hardly be explained that the phrase famine mortality does
not imply death by starvation. A certain number of such deaths must of course occur in every great famine e!>pecially in one which, <is was the case in ] 896-97, finds the administration comparatively unprepared for the emer~ gency which has to be met. But in practice it is found impor,sible to distin~ gui&h between deaths caused by actual want of food and deathli duc to disca&e accelerated by insufficient or unsuitable food. No rccord therefore, i(, available of deaths from starvation properly So called. Nor i6 it pos6ible, with any approach to accuracy, to distribute the recorded mortality among the varioufi formfi of disease. As the Famine Commit>sion of 1901 point out, "the da'a rest upon the erratic diagn06is of the village watchman, who is in the habit of attributing to fever all deaths as to the caUfie of which he is in doubt." All that can be said is that scanty and unwholesome food and a short and pollutcd watcr supply more than trebled the mortality from cholera and bowel complaints, and that in the autumn months of both famine periods virulent epidemics of malaria effected all c1asfics of the people.
High Infant mortality The weakcst of course suffered most acutely and both famines were
-.a,rked by very high infant mortality and a disproportionate increase of deaths among peoplc of advanced age. The following sfatistics of deaths by certain age periods in the two famines illustrate thefie remarks:-
DEATHS Under 5-15 15-40 50-70 60 and 5 years above
1896 and 1897 350,013 130,999 274,227 215,9:0 ]47.145
1899 and 1900 355,695 79,968 153,.522 117,208 99,770
Difl'crence per cent. i D latter period +1·6 -38,9 -4-4·0 -45·7 32'2
60
The figures bear striking testimony to the great advance in the organi;o zation of relief and the higher degree of SucceSG in saving Ii fe which distinguish the famine of 1890-1900 from that of 1896-97. In the second famine indeed the infant mortality wat> conc;picuously high, but if allowance iEi made fOT
defective reporting in the fin;t famine therc iG little to choobc between the two. lt roUtit further be rcmembered that in 1899 the birth-ratc rose by nearly 60 per cent, and that half of the birth6 took place in the last "ix months of the year, tio that when famine conditiont; set in an abnormally large number of children were expot;ed to exceptional :-ish. The precil,c CaWiCS of the enormow, mortality that occurred beeID to be rather obscure. It is not alleged that the parcntb were :,pccially reduced. Gratuitiout; reJicfwa" liberally given to nursing mothers and to women advanced in pregnancy. but most of tbem preferrcd 10 follow their hUbbandl' 10 the relief worb and "it was a common 6ight to c;ee a healthy strong woman, with a miserable pining infant wasted toa likelton, unable apparently to nouri6h i1.'· One j" 'empted to t:onjcclure that (.ome ..:ongenital influence mll,;t have b,~cn at work. It is concciv.ablc that the oUlbun;t of fecundity whieh follow!; upon a period of :,cracity may contain wil hin ili-ielf thc clement,; of imperfect vi1ality and {hat a crop whidl hab sprung lip 1'0 quickly may bc forcdoOl]1l.;d It) peril.h prcmatllrely. Howe\!._;[ t hit; may be, the flgurc,; f()r at I i he later age period b .. i ng 011t a remarkable contraGt between the fir,,! famine and the c;econJ. putting a:;ide the financial abpect(; of the problcm, and the rather over-rated danger of demoralizing the people hy indic;crect liberality. there can he nu qllc.'t-ition that in 1899-1900 the admini:;tration of the Central Provinces wa ... "ignally i;uccesbful in keeping alive Ihe large :;ection of Ihe population who!>e only want WaS a sufficiency of ordinary food. Children at the hreat.;t alone could not be t;aved ; their need" were, and alway" will be, of t(>t) tipecial and delicate a character tt} be mel by the rough machinery of famine relief.
Madras
Conditions afrCCfing movcment between 1891 and 1901
132. Since 1891 the cl)nditl(lllt, in Mad:a:. ha\'.: 11('1 becn favourahle t,) a rapid incrca~e Oflhc population. According to Mr. Francis. "Plague ch~clced trade and el1terprir:-.e, and then; were three t>can;itics- -in 1891-1892, in 1897, and in 1900. The fir:;! or Ihc;.c wa" lllol;t I,evcrely Cclt ill the D,~ccan di-;tricts el>pecially in the ClImhum and Markapur taluk6 ofKurn(wl. and in Ihe adjoin:.. ing wl.:stern lalukfi of N:llorc. The Second affedcd the Deccan Divil,ion again. and Ihe Galljam, Vizagapa1am and Godavari di,;tric;" ofthc East Coa"t Dlvi",ion. The thi:d war. again wort-it in the Deccan (c6pecially in CuJdapah) and ;he Wl:tolcrn parI of Nell ore, and allin attacked the wc!;l ofKistna adjoining. What {hc precise eJT,;c{ "f each of thel,c visitation,; W<t'. it it. no! eat-;y to hay. The Sanitary COllnnibL,ioTler concluded from the vital ,;lat i6tic Ihat though no actual deaths from Gtarvation, Were repo;·ted during thc l>can;ily of 1897, lhe tolal diminution of poplllathlll due to the famine (.;onditioD& whi;;;h then prevailed. buch ati a rcdw.:cd birth-rate, increased sUbceptibility to ordinary dccreatic among ill-norished person", and 50 on, wafi over 20,000 person!>. MOl>t of fhit> losb was et>timated to have occurred in the Deccan districts," It may be added that the above famines were le~5 severe in Madras thanin many other parts of T ndia. The worst WaS that of 1896-97, but thank:s to
61
the prompt measures of relief undertaken by the Madras Government and in tbe caGe of the East Coast district6. to the fact that the previous four years had been yean> of plenty, the l:iuffcrings of the people Wl're far lcst> than they would otherwise have been.
The volumc of emigration hat> grown remarkably l;ince 1891, especially to Ceylon and Burma. Tn Ceylon there arc now at leal>t 403,000 native!) of Madras oompared with 235,000 and in Burma 189,810 compared with 129,345, in the Strait:, SettlcnH:~Jltfi the prchcnl number is 51,800 again!'>t 48,064 in 189]. There is albo all adver[;c balance ofmigralion in the Ca[;e ofmovementt> between Madras and other part'> of India. excluding Burma. aggn::gating 214.000, as agains( some 138,000 in 189(.* So far as the information availahle goCh, it may be concluded that the nct lo\>:> on account of migration hat> risen from 550,000 in 1891 t n 858,000. There arc llWrClwcr many cmigrantt> from Madras in Natal. Mallritiw. and other cllioniet;, but l'XCact figurcb arc not fortIKoming
On the other hand the productivenct;s of the land hab been increat;ed during the decade by the RUt;hikulya and Periyar irriga(ipn [;Ch4;mel> in Ganjalll and Madura re6pcctivcly, and by greater attentron to irrigation from tanh and wellt-. Communication!> have been great Iy improvni. ano (heft,; an.: now more than 3,000 milet; of railway c(impared with about ~,OOO in 181)1. There hat. abo been a considerable deVelopment of indll,;trial cntcrpr i!.(~, c!;pecial1y ill n':t>pcci of (;l)(lon mill,; which in 1901 employed an average 01 16,000 perbont; daily compar('d with 6,000 ill 1891. At t.he hame lime a rate of progrCt;f; equal to1hat which obtained during the ten yVll"l-; preceding the Ccnfillf.. of 1891 war; clearly !lot to be expected III the decade under review, and the fact that the pClpulation hai; increar;cd byar> mu(;h ah 7.8 per cent, affordf> unmit;takabk: evidence of the genera! well-being of fhe people and of their growing capacity to rChi6t the evil etTec(r> of crop failure.
UNITED PROVINCES
141. Since J 891 the Provinceh nave suffered from a !:>uccebf;ion of calamilie6. In the earlier part of the decade the rainfall was cxcessive and badly dir:>tributed, and not only caused 6crio lll'; damage, in many parts, to the crop!:>, but also led to a bevere outbreak of malarial fcver, which in 1894, raised the deathrate to an exceptional height and sapped the vitality of the people to such an extent tnat tne birth-rate in 1895 waS unusually low. Then followed several years of deficient rainfall. In 1895 the monsoon cea!'.ed early in September and in the ensuing cold weatner t!tere was scarcelv any rain. The autumn harvest was in consequence 20 per cent below the average and that of the fol)owing spring yielded barely three-fifths of the normal outturn. The eastern
"'II is not stated in the local report that the census of 1881 was generally less accurate thanthconctakentenyears,latcr, butthis was the casein other provinces and it may be assumed tohave beenso in Madras also. In J acc'lSC of thc Ganjam district it was admitted tha\lhepopulationhadbccn"muchunderslatedinI881". and it is probable thaI in other districts also the standard of accuracy wa~ less high than that attained, with the aid of grow·· iOI experience, al the census of 1891.
It is impo<;,ible to ascertain the exact figure now.
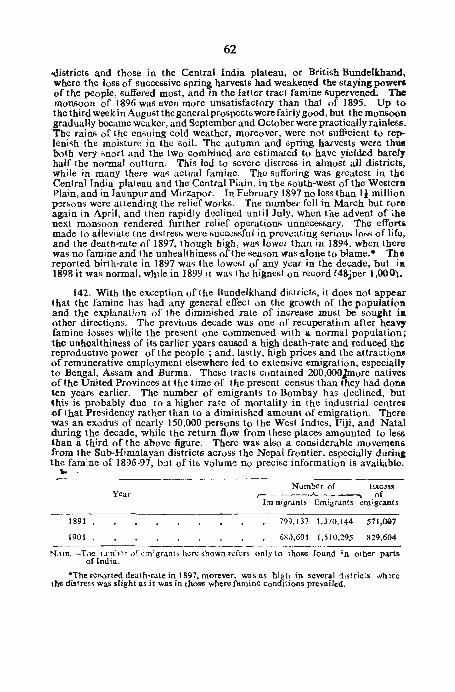
62
,districts and tbose in tbe Central India plateau, or Britisb Bundelkband, where the loss of successive spring harvests had weakened the staying poweR of the people, suffered most, and in the latter tract famine supervened. The monsoon of 1896 was even more unsatisfactory tban that of 1895. Up to tbe third week in August tbe general prospects were fairly good, but the monsoon gradually became weaker, and S'!ptemher and October were practically rainless. The rains of the ensuing cold weather, moreover, were not sufficient to replenish the moisture in the soil. The autumn and spring harvests were thul both very snort and the two combined are estimated to have yielded barely half the normal outturn. This led to sevele distress in almost all districts, while in many there WaR actual famine. The suffering was greatest in the Central India plateau and the Central Plain, in the soutb-west of the Western Plain, and in Jaunpur and Mirzapor. In February 1897 no less tban Ii million p'.:rsons Were attending the relief works. The number fell in March but rore again in April, and then rapidly declined until July, when tbe advent of .. he next monsoon rendered further relief operations unnecessary. The effort' made to alleviate tne distress were succcssful in prcventing serious loss of life, and the death-rate of 1897, though high, was lower than in 1894, when there was no famine and the unhealthiness of the season wastl.lone to blame.· The reported birth-rate in 1897 was the lowest of any year in the decade, but ia 1898 it was normal, while in 1899 it was the hignest on record (48.jper 1,000).
142. With the ex:ception of the Bundelkhand districts, it does not appear that the famine has had any general effect on tbe growth of the population and the explanation of the diminished rate of increase must be sought i. other directions. The previous decade was one of recuperation after hea", famine losses while the present one commenced with a normal population; the unhealthiness of its earlier years caused a high death-rate and reduced the reproductive power of the people; and, lastly, high prices and the attractions of remunerative employment elsewhere led to extensive emigration, especially to Bengal, Assam and Burma. These tracts contained 200,OOOJmore natives of the United Provinces at the time of tbe present census than they had done ten years earlier. The number of emigrants to Bombay has declined, but this is probably due to a higher rate of mortality in the industrial centre, of that Presidency rather than to a diminished amount of emigration. There was an exodus of nearly 150,000 persons to the West Indies, Fiji, and Natal during the decade, while the return flow from these places amounted to less than a third of the above figure. There was also a considerable movcmens from the Sub-Himalayan districts across the Nepal frontier, especially durin, the famine of 1896·97, b:.lt of its voluml! no precise information is available.
'"
1891
1901
Year Number of E"c~ss
,-----....__-----"' of Im·uigrants Emigrants emigrants
7'):>,)37 1,370,144 571,007
6Sl1,691 1,510,295 829,604
N.)TB.-The 1:1 n'}:r or 0:n; grants here shown refers only to those found in other parts ofIndia.
·The re[lorted death-rate in 1897. morever, was as high in several districts wh!re the distre~s was slight as it was in those where famine conditions prevailed.
63
On the other hand, there w~re various circumstances which tended to ·mitigate the misfortunes due to adverse climatic conditions. The main system of canals had been completed prior to 1891, but numerous minor channels and drainag~ cuts w~re made during the decade and the area irri.gated in 1896-97 was far greater than it had ever been before. The length of railways in the Provinces rose from 2,699 miles in 1891 to 3,569 in 1901 and the high prices of 1899 and 1900 b!nefited the cultivatoTl; in the tracts that escaped crop failure, who were able in those years to export 1 t million tons of grain to other parts of India. There was also a great development {)f various industrial undertakings, chieflY at Cawnpore and Agra, and nearly 30,000 hands were employed in cotton, woollen and jute millti, leather factories, brass and iron work~, and the like, compared with barely balf that number at the commencement of the decade.
<Central India
TJw loSS of population is greatest in the Western States i.e., in the elevated tract lying along the ArravaUi, Satpura and Vindhya ranges. In several years the rainfall was deficient and the crops were poor. This tract did not suffer from ticarcity in 1897, but in 1899, an almost complete failure of the monsoon following close on a deficient rainfall in the previous year, brought on a very severe famine, which was accompanied, as usual, by Cholera and bowel complaints and a sort of paralysis attributed to the eating of a kind of wild pulse. The mortality WaS very high, and resulted at the present census in a decrease of more than tWo-fifths in tbe population of the Malwa Agency, and of nearly the same proportion in that of Bhopal. In the Indore Agency nearly a third. and in Bhopawar a sixth, of the population of 1891 has disappeared. These figures, appalling as they are, have their counterpart in the adjoining States of Rajputana. The least unsatisfactory figures in this tract are those for the Indore Residency, where the decrement is only 5 per cent, an amount sufliciently large in itself, but small in comparison with the enormous losses in the neighbouring States. During the famine there was a great deal of emigration to the Central Provinces and Indore, from Bhopal and other States, but by the time of the census the great majority of the survivors from amongst these refugees had returned to their homes, and, in the case of the Central Provinces, the number of persons who owned Central India as their birth place, was considerably less than in 1891. It seems clear, therefore, tbat the d~crease recorded in the population of these States is due in the main to the heavy mortality of the famine year. The States of Bundelkhand and Baghelkhandcscaped the famine of 1899-1900 but were hit very hard by that of 1896-97. They had, moreover, suffered from excessive rainfalJ, which saturated the heavy black-cotton soil, in the earlier years of the decade. The public health was bad in several years, especially in 1897. The result of thcse adverse .conditions is a decline of 10.2 per cent in Bundelkhand and of 13.0 pcr cent in Baghelkhand.
Hyderabad
Since 1891 the S~ate has suffered from a succession of bad seasons and in only l Wo years was the rainfall favourable to the crops. The western districts which adjoin the Bomb.lY Deccan, shared in the famine of 1896-97, the di,,;tres~ being g.-eatest in the south-western tract Which had suffered most severely in 1876·78. The evil cff.!'cts of this famine were, however, slight compared

64
with those of its successor of 1899-1900, which was most severely felt in the Borth-western districts, Aurangabad. Birh, Parbhani and Naldrug or 00&manabad. Plague appeared in 1897 in the tract adjoining Bombay and, by the time of the census, 7,811 deaths from the disease had been reported, of which considerablY more than a third occurred in the district of Oosmanabad. The immigrants from out&ide fell from 383,713 in 1891 to 325,197 at the present cenf>lIt; and tbe cmigrantf> from 387,983 to 317,790. Migration, therefore had only a minor share in producing the decrease disclosed by the prel-icnt ccnl)ut>, which it, aU ributable mainly to a t)uccesl>ion of bad seasons and c6pecially to the famine of 1899-1900.
Kashmir
152. The period. binGe 1891 hab on the whole been prosperous. The greater part oj' Jammu l.;ulTered from famine in 1899-1900; Kashmir proper cscaped but pI'ICO; haw risen. owing to improved communications and better facilitich for trade. The pcople have profited greatly by the extenr-:ion of liCulement opc:'alions, among"! the beneficial rc&uitl> of which may be ment ioned a greater fixity of tenure, the 6ubhtitution of caiih for revenue in kind. lhe abolition of middlemen and of various vcxatiout> impo!';tt>, the regulation of the system of forced labour and the remission of outstanding arrean> of revcnue. There have becn two severe epidemicii of cholera. but otherwit>c the public health hat> been fairly good. Steady progress in vaccination hal; cheked one of the chief causeii of mortality and the Srinagar water-work!; and i mpl'oved city "anital ion have mitigai ed the ravage!> of cholera. The number or cmigrants from Kashmir to the Punjah hat) fa.llen from 111,775 in 1881 to 87,545 in 1891 and 83,240 a1 the prc6en! ce1l6US. The Cel1i'JUS Superintendent attributel; Ihit> (0 the imp:-ovemclltl'i which have been made of late yean; in the adminit.;tration of the State. The immigrant!'> of all kinds number 35,597 compared with 69,257 in 1891; they come l:hiefly from the di6tricts of Punjab frontier Sailkot, Guardaiipur, GUjarat an.d Hazara. Amongst hoth cmigran(!.; and immigrantc!> females are slightly more numerow> than malcli. The caUSCt) of the varying ratc of progresii disclosed by different parts of the State have not been very clearly stated in the local report. The general increa6e is assigned in the main to the advantage!'> which thc cultivators have derived from the settlement operations but in one of the Jammu districtt>, Bhimbar, the portion which hal' been settled ha,.; lower population and the net increase in the district at large comes from two tahsil6 which have not yet been brought under settlement. It i& understood that the latter escaped the famine while those which had been settled did not. There seem to have been some alterations of boundaries since 1891.
Mysorc
154. Since 1891 the agricultural conditions have on the Whole been good The crops failed to some extent in the Maidan, or eastern portion of the State. in 1891-92 and again in 1896-97, but the distress was local and did not amount to famine. The public health waS fairly satisfactory until plague appeared in August 1898 and did great mischief. The total registered mortality from this cause upto the time of the census exceeded 35,000, of whieh more than half occurred in the cities of Mysore and Bangalore, including the Civil and Military Stations, The epidemic had also serious indirect consequence'
65
in the dislocation of trade and the return to their old homes of many settler from ot~er tracts. On the other hand. the rapid development of the Kolar Gold millet; and the consequent general expansion of trade and industrial activity. including tne constructin of the Cauvery Power Works where electricity jl'> generated for working the machinery in the Gold Fields a hundred miles away. coupled with the extet:l"ion of the State system of railways and irrigation worb. have not only prOVided the labouring classcti within the State with remunerative employment and grea'.ly augmented in the general prosperity of the people. but have al"o stimulated immigration in a remarkable degree. As stated above, tbe plague which was raging when the cent;us wa6 taken must have driv?n a~ay many (?f the temporary settlers. but in spite of this the number of Immigrant has risen from 195.798 at the previous t(l 306.263 af the prespnt centiw;. The number of emigrant;; hat> fallcn from 143.533 to 131,682. The net gain from thc5e 1l10wmentt; of the people accountl> for about a fiiXlh of tbe to!al ~rowth of the population.
Rajpl'Jtana
157. Sincc 1891 the country has suffered from a succession of season!; of defici\:nl 0" ill-di~tribllted rainfall. In the first year of thc decade severe scarcity was fdl in Marwar, Bikane~ and Jaisalmer, the thrce States lying west of 111-' A.r:tvall i r-tng.~, in the- region of sandy de_~ert and scanty rainfall which forms thc "North-West Dry Area", descrihed in the last chapter. Tn 1895 the sam~ tract obtained ~arcly. two-thirds of its ordinary rainfall and rclief or:rations wcrl~ started In Jalsalmer. The next seaSon was also unfavourahk and famine conditions sprcad into Bikaner; Marwar waS affectcd hv scarcity and lnere was also some distress east of tnc Aravallis, in Dholpur a~d Blnratpur, which lie in tile "Indo-Gangetic Plain. West". The rainfall was again dcficient in 1898, wllile in 1899 the monsoon practically ceased towards the end of July, and: th,c a~normal heat withered the grass and standing crops. dried up m:l11Y of the Irrigation tanks and wells. and brought on a famine more "severe even than that of 1868-69. Everythmg that the Supreme Government could do to cope with the calamity was done. Loans were made to fhe various durhars on favourable terms; a Famine Commissioner was appointed. and ~~gine~rs and St.aff Corps officers were deputed to assist in supervising the admlntstratlon of rehef. The duroars were, however, un·· prcr-ared , and valuable time ~as lost in making. the necessa.ry arrangement an~ collecting the required c6tabhf;hmentt;. The dlstrest:; contlUued to grow unUI June 1900 when 5 per cent of the populati.on was in receipt of relief. * During the next three month;;, however, heavy ramfall ana the number on the relief workf> rapidly dwindled away. Fever epidemiC!> broke out in 1892, 1899 and 1900, the most virulent of all bcin~ that whi.Ch f~Ilo.wed the heavy rajn~ fall of August and September 190~, which .w~s aided In Its .rav~ges ?y the imrnired vitality of th~ p~ople. Vital statistICS scarcely eXIst In RaJPutana but the general consensus of opinion is that the mortality from fever from Au~st 1900 to F~bruary .1901. ex~~ded that ~auscd by want of food in the reriod during which famlUe ~ondltlons preyall,cd. However, that may be it is probable that the population at the beglnnlUg of 189? waS at least as great as in the 1891, and that the whole of the decrease which bas taken placc
*For a severe famine the proportion of persons reoeiving relief was very small [11 some parts of British ter_ritofY, in !he course of t~e same fromine, oyer 20 pCI' cent of tbe population were at one time In receipt of State ald.
7-1 R. O. Indiaf72
66
is attributabl~ to famine and disease during the two years immediately preceding thl! present (>!nsus. It has been said that much of the loss is due to emigration, and it is w~ll-known that during the famine the relief works in to} adjoining Bdtish territory w..::re crowded with half-starved wanderers from Rajputana. In th~ R:ljputana Famine Report the number of famine emigran'.s is pLic:d at n :arly thr..::>quarters of a million. The traditional euslom~ of lh! inhlbitanls of lh·~ vast desert tracts forming the western States is to emigrate with their flocks and herds on the first sign of scarcity, b.!fore th·;') grass withers and lhe scanty sources of water supply dry up, th·! famin·;, refug·~es must either hav..! died or return·!d home b~fore that day (iO that at th! sam! tim! the numb!r of p~rsons born in Rajputana who w.:re found in oLh!r PMt:> of [ndia on th·,: night of lhe C\:nsus was almost I.h) S:lm! as i t W.l" L .. m y :1f." c].rlicr, and it would seem, therefore, that th·.: emigration of naliws o~ lh~ Rujputana Slates cannot be held responsible for any appreciable part of th! falling off. The number of immigrants from outside, however, has d;cr...:as~d during the d..:cade by about 173,000 and this may possibly b; due mlinly to th,,; return to their old hom~s of p<!rsons born elsewhere. B:Jt ewn so, th0 loss';s owing to famine and its sequdea, must exo;:ed two milliont> or, say, 171 per cent.
GENERAL SUMMARY
Elimination of variations due to census of new areas
159. Th'~ mOVclll':nt of lhc population in ~ach of the provinces and stat..:s which make up this great Empire having now been briefly reviewed, an attempt will be made to focus the main results and to pn:s<:nt thcm from a wider and more general asp!ct. Th·! proportionate growth of the population disclos'::d oy the returns for successive enumerations is shown in Subsidiary Table No. I. The gross increase of lh~ population during the decade preceding the census of ]901 was 2-4 p.::r O.:nt compared with 13-1 and 23'1 per cent In the p.:riods 1881-91 and . .1872-81 f.::sp·!ctivcly, bul, as already explained. the real progress is obscured by the gradual cxt...:nsion of the area included within the seop.:: of the cenSus op':;ralions. Of the increase of near1y 48 millions recorded in 1881, no less than 33 millions was derived from the counting of new areas. * and of the increases of 34 million~ and 7 millions registered in 1891 and 1901,S! millions and 21 millions respectively were obtained in the same way. The exclusion of these fictitious gains reduced the rate of increase in the three periods 1872-1881, 1881-1891, and 1891-1901 to 6'S, 10-9 and 1-5 per cent respectively.
*Thc n~w areas are as follows : In 1881-Convict Settlement in Andamans, Central India Agency, Hyderabad, Punjab State, Rajputana, Manipur. In 1891-:-{ Jrth L~lllui, Upp;:r Burml (:!)(cluding Sh.ah States), Quetta. Kashmir, Sikkim. In 1901-
Native Tribes in Andaman, Manipur (Schedules destroyed in 1891, part of Lushia Hills, Shah State, part of Upper Burma, Malakand, Dh, Swat, Chitral, Kurr&m and Shirani Country in North Western Frontier Province, Baluchistan and Balu
chistan Agency.
67
EUaiDatiOD of variations on account of better elDllerations.
160. It is less easy to estimate the effect of the gradual improvement wbich has taken place in the accuracy of each fresh enumeration. There 'can be no doubt whatever that serious omissions occurred in 1872**, and in the report on the results oftne present census in Bengal, where some strikina instances of the incompleteness of that pioneer count are quoted, (he conclusion is arrived at thai, of Ihe increase of lli per cent recorded in 1881, half, at the very least, was dU0 to this cause. In the United Provinces, which endured the horrors of famine in 1877-78, the Census Superintendent of 1881 was of opinion that the gain of 5·3 per cl:!nt then disclosed was wholly fictitious, b:!ing due solely to faulLy enumeration in 1872. It is not likely that the c~nsus of th:lt year in !h'~s0 two provinces whiCh, with their states, contained between them more tnan half Ihe tolal population then enumerated, was below t h<~ g .. ~n'~ral standard of accuracy attained elsewhere. and if this assumption be granted, (he inclease of population bd~en 1872 and 1881, which has been reduced to 6'8 pa cenl by lhe exclusion of areas dealt with for the first tim:: in I88!, almost or Wholly disappcarst. In any Case it may fairly be conc!ud~d that the (rue rale or progress during tnis period was certainly no! gr'';~lt...:r (lnn !Jnt during the d~cade preceding the Census of 1901.
B~tween ISSI and 1891 Ih<~ g,tin due to the greater completeness of the enum:(a~lon W,lS m<1C:l sm tit :r, blll it was n.;v~rlhekss c~H1siderable. In B:.::ngcd it ius 0 :,:n c;; : In lkd, on Ctirly reasonable grounds, to amount to half a million, and In I he United Provinces, to morc than a third of a million. It must llave b~en P;'upoftionakly great . .;r in t ne tracts of which the first census wa'> tak';:n in 1891, and it seems ptobabk thaI in India as a Whole the gain on this account may have been more, but was certainly not less, than I pl!r cent. In 1891 the g:n~ral standard of .u:curacy was So high that there was little room for further improvemcl1t.~~
Estimated true variation in population since 18n
16]. It may th::rc!orc b: COIlChld·~d that the true growth of the population since 1872 has been as follows
From 1872 to I 831--Po,,,ibily nil, and certainly not more than 1'5 per cent.
From 1881 to 1891-about 9·8 per cent.
From 1891 to J901-about 1'5 per cent.
·*In ~om'~ Pro vi r1<;:, , II',; i1(';1 "iltlJl1;ra, ion was eff.:cteu in other yt.:ars, viz., in 1871 in Madra',and Mywrc,in 1875 illC0chin and Travancore, and in 1868 in the Punjab.
tTil~ [::l>.:acyi'l .vfll't;ill !~71 WI; ;,l'};;qLlmtly estirnatedtobeaboul 850,000. If'Q, \ he d~gree or (:'·ror: h~re was less than in Bengal and the United Provinceb bur owi ng to the famine Wilich intcfv-.::ncd before the next enumeration, it was more Jifficult th~rc I han elsewhere to form an opinion as to the extent to whick the G!nsus of 1871 was de f<:-c(ive.
::::::There was a c)r1;id~rable i ncr-::a~e owing to better enumeration in Ul)per Burma and a few rcmotetracts, chiefly in Native States. but the total population of these areas is ;0 smlllcJm,nrcd with that of the Whole country. that the consequent gain is inappreciable and i~ c!rtaintly not greater than the loss due to new omissions in places whereplague was prevalent at the time when thecensus of 1901 was takea
68
Brief analysis of variatiou, 1891-1901 162. The net increase disclosed by successive enumerations is the resul
tant of very divergent figures for individual provinces and states. The changes that have taken :place in the population of each political unit sin~ 1872 ~ave already been dIscussed, and the results for some of the maIn provInces art shown in graphic form in the accompanying diagram. In spite .of the exclusion in tbe case of Burma. of the gain due to the enumeratIon of fresb arcas, this province shows a far more rapid rate of progress than any other part of India, and its population has almost doubled in the short space of 29 years. Assam also is growing fast, but its true increase since 1891 is obscured by tne addition of new tracts not dealt with in that year. The Central Provinces which rivalled Assam in its progress during the first two periods dealt with has exp~rjcn~d a severe set-back and its population is now almost tne same as it was 20 years ago. Bombllyalso has lost ground but, thanks to the steady growth of Sind, where the physical and climatic condi. tions resemble those of the Punjab rather than Bombay proper the famine has produced a comparatively small decrease in the population taken as a whole. The only other remark suggested by the examination of this diagram is the general irregularity of the curves. Tn Burma the rale of growth is both rapid and uniform but elsewhere periods of decadence have been followed by periods of rapid growth, and these again have been marked by a slackened rate of increase in the ensuing decade. This would seem to suggest a specially rapid development during the next lO years in Bombay proper and the Central Provinces but it iG always unsafe to prophesy and is especially so at the present time when the grim shadow of the plague is still growing broader and blacker.
] 63. Taking the district or corresponding division of Native States as the unit, I have distinguished in subsidiary Table No. V tbe areas in each provin~ or state which have added to their population from those which have lost ground during the last decade. It thus appears tnat the increase of l' 5 per cent in India as a Whole (excluding the gain due to tbe enumeration of new areas) is the combination of a growth of 8·6 per cent In an area of943,016 square miles, with a population at the present census of 193,790,645 persons and a density of 205 p.!rsons per square mile, with a decline of 10-1 per cent in an arca of 606.973 square miles with a J.?resent population of 97,886.087 and a density of 161 persons to the square mile. In British territory there has been a gain of 8'2 per cent over about three-quarters of the total area and population, and a loss of 5'7 p~r cent in the remaining onc-quarter. In the States and Agencies the area Showing a gain is considerably less than that where there has been a decline ; the populat ion of tbe former has rigen from 25 to nearly 28 mill ions, or at tbe rate of 11· 1 per c,;!nt, while that of the latter has fallen from 41 to 34 millions, a decrease of 17·3 per cent. The net result of these variations in gain of 3·9 per cent in the population of British Territory and a decline of 6·6 per cent in that of the Native States.
Comparison of ceosos results with those indicated by the returns of births and deaths.
164. It is impossible in the space available to deal at any len$th with the returns of births and deaths collected in various parts of Indla. These atistics are based on information received periodcally from village watch
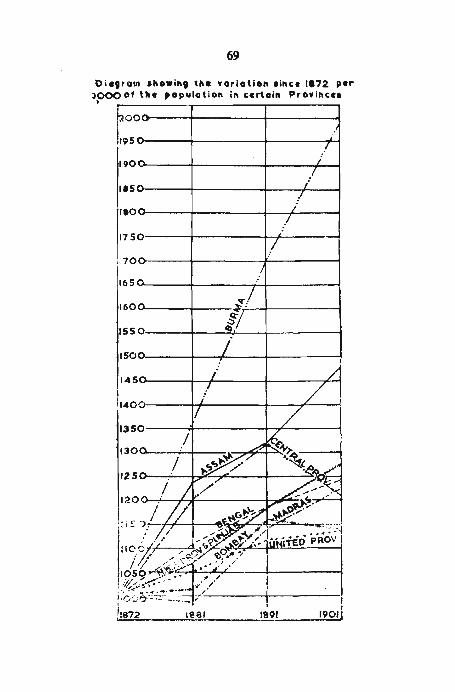
69
t>i."afn showift, tha voriotion tinc .. "72 pI" looo 0'1 Ut. population in ccrtoift P,o"ine ... ,
~ooo-_-----+--------~~------~ ./
195~o-----~----------+-------~~ .I
190~u------;--------__ +-____ ~/~:~ .I
1.50----~~------~--~i-·--~ !
I.O~v_----+-------_r--~i----~ ./
17S0------1----------+-~I-·------.~
/ ii 70o-~----__+-------.,_-----_;
./ 16S0, _____ ~------~~-------~ ~/
160nu-____ -+ _____ ~r:--+_--------;
II rsso-----~-~-~-_+--------~
ISO~u_----~--~~/·----+_--------~
70
men and other similar subordinates, who possess little o~ ~o education and over whom it is impossible to exclcise very close supervIsIon. In the lar~er provinces considerable attention has been paid, of recent years, to the Improvement of the returns and, in some cases, so far as the total number of Thai occurrences is concerned, the degree of error has bee!! greatly rcduced. so that even if a certain number of births and deaths are sl1ll left unreported, the consequent inaccuracy is believed to be small and fairly constant. 1n Subsidiary Table No. VI, a comparison will be found between the actual. population of the main tracts where vital statistics are recorded, as shown by Ihe Census of ]901. with Ihe results obtainc~ by adding to Ihe corresp0t:ld-ing population of 1891 the births reported dUrIng the de~ade. and dedu~lOg the deaths. The figures are in some cases obscured by mIgratIon, espec l ally in Assam and the United Provincef, but elsewhere the estimated population indicated by the vital statistics com:sponded to a remarkable degree with that asc.;:rtained at the c<:nsus. Tt appears, therefore, that thebe r.;:turns now a~ord a fairly correCl indication, not only of the variations that take place from time to time in the public healh, but also of the actual growth or decadence of the population, and reference has accordingly been made to them repeatedly, in the notes on the movement of the populat ion of different provinces as affording a measure of the comparative healthiness or unheaH)1iness of different seasons and of the effects of famine on the mortality. *
]11 other dileclions very little reliance can be placed on these returns. The error in respect of age at dealh isjus( as great a1 it is in the CaFe oflhe age relurn of the census. The diagnosis of diseascf is also very imperfect. Cholera, dysentery anJ smallpox arc known, bul most other complaints arc indiscriminately classed as fever.
Factol'8 on which movement depends
16~. The movement of the population depends on various factors, falling hroadly into two distinct groups. On the one hand. there arc tbe social practices of the people. amongst which may be enumerated (he age at, and universality of marraige, the extent to which widowers and widows remarry. the prevalence of :.thortion and infanticide. ,l11d the degree of care and intelligence with which children arc ushered into life. and brought up, especially during the critical first few months after birth. On the other, there are the physical, material or external factors which affect their longevity aud fecundity. such as famine. changes in their general material condition. disease and migrat ion. The former groUf' of factors. which change but slowly and whose influenc~ is fairly constant for long periods of time, will be dealt with :-vhcn .the a$c and. marriage stat.isl ics are brought under examinat ion, and the dISCUSSion In thiS chapter Will be confined to the second group. i.e., to the exlcmal factors. which are those that chiefly affect the fluctuations in the rate of growth in successive decades. Tt may, however. be noted in respect of the social factors that marriage is almost universal and that, al-
"'It seem~ probable that the deaths of small childrenarenotsofull¥reportedasthose of adul Is and thal the standard of accuracy falls off whenever epidemic disease is specially. prevalent. This certainlY happens with plague and it is probably also the case with cholera. A' the same time it would appear. from the general result described above. that the omi .ions rrom both side, of the aCCount more or less balance one another.
71
though the prohibition of widow marriage amon~t large sections of the community renders sterile a considerable numbc i of women capable of bearing children, the birth-rate in India is far higher than in any country of Western Europe. Owing partly to a heavy mortality amongst small children, the deathrate is also high. but the resultant tendency of the social factors is to produce a fairly rapid growth of the popula! ion. The extent to which this growth is fastered or checked depends upon the external factors which will now be passed in review. *
Migration
166. In the case of some individual provinces and States, such as Assam., Burma and Mysore, we have seen that immigration plays an important part in determining the variation in the population, but in India, as a whole. it is an item of very small account. The total number of immigrants from foreign countries at the present census was only 642.000, or 2 per 1,000 of
C'.:ylon
~~raiis S!:tkmcnl!,
Numherof Emigrnnts ,-_ ... _ - .. .A..-- . __ --,
1901 1891
436,622 264,580
57,IS0 53,927
the population. compared with 600,000 in 1891 and 409,000 in 1881. Of tho corresponding emigration complete information is not availaole. The number of persons born in India who were numbered in Ceylon and the State. Setllem~n{s at th.e last two censuses of those Colonies is noted in the above table.
liri,ish Guiana 125,875
T,iniJad 85,615
M.lUritiU5. 265,163
Natal 65,925
Fi7.i 15,368
Jamaica 15,278
~urinam 18,000
~t, Lucia 1,2CO
MaritniQuc 3,764
Guadeloupz 1.5,276
TOTAL 611,464
*T:l: rajJid rate at which the population is capable "f IJrowinl when all coDdidOO$ areflvourable will be seen from the results already describedlD the cascof LowcrBurma aDd. Bastern Benpl.
72
We have no means of gauging the number of emigrants to Nepal, Afgha~istan, Tibet and Bhutan, but in the case of Nepal. at least, the number IS belIeved. to be considerable. Neither are the census returns available for European countries or British Colonies other than the two already mentioned. The number of natives of India residing in Europe is inconsiderable, while for the colonies, we may, in the absence of the census figures, refer to those obtained by the Protector of Emigrants. According to the returns published by bim there were no less than 61 J ,464 natives of India residing in the places shown in the previous table" during the year 1900*. There was also, upto the 31st March 1901, a total immigration of 34,147 natives ofIndia recrUited. for work in Uganda. of whom 9,864 had again returned to India on the terminal ion of th~ir, Agreements and 710 had died. There were in addition 2,430 free emgrants regarding Whose sllosequent movements details are not available. It may be assumed that about 26,000 natves of India were actually in Uganda at the time of the census. It was estimated in 1898 that there were at that lime, 5,000 natives ofIndia in the Transval, and a year later tbe number in Cape Colony. Basutoland and South Rhodesia was reported to be 3,9] 3; there are believed to be about 10,000 in Zanzibar and tile C;!nsus of 1891 showed about ]5,000 jn Australia and New Zealand for all these places combined we may place the total at 35,000. If we assume that Nepal contains the same number of emigrants from India as are recdved from that State by the BritiSh districts which adjoin it, or about 158,000, and, making a rough guess, take 50,()()(), as the number who are resident in Afghanistan, Bhutan and other countries, for whiCh no definite information is forthcoming, the aggregate number of emigrants amounts to 1,374,000, or more by 732,000 than the number of emigrants counted in India on the 1 st March 1901. The adverse balance, though considerable by itself, forms a very small fraction of the total population and migration may, therefor.:, b: neglec:ed wben dealing wit h the movement of the population in India as a whole.
Aclnrse conditions of decade
(i) Famine 167. We nave seen that the main influence causing flUCtuations in the
rate of growth of a community at diff~rent periods isits material c0ndition and in a country like India, where two-thirds of thl'~ people ar.; dependellt en agriculture, this vades with the state of the harvests. When Ihe crops are good the people are prosperous, but when they fail the pinCh of scarcity is at once felt. It bas been rep~atedly shown, in discussing the movement of population in the 1 diff~rent provinc,~s and states, hiJW intimately the variations which have ~cn reveal at succeeding enuIn!rutions are Connected with the occurrence of famine. When there has been a famine in the period between two censuses, the population is stationary or decadent, but when there has been no famin'~, it is progr..:ssive. The rate of growth is greatest
*The statistics of emigration to the colonies show thaI in all 198,585, persons left Indiaduriog the decade of whom 120,550 were nalivesoftheUnited Provinces, 30,775 of the Punjab, 2S.314 of Madras, and 11,357 of Bengal. the balance being made up of smaller CODtributiom by the other provinc<:s and various nalive states. (Financial and Commercial Statistics of B~itish India. Ninth issue page 436.) Having relPrd to the number of natives ofIndia actuallyr.~sided in the Colonies it seems doubtful iflhc returns of emigration are C:On;J.Plcre. Abouton~-quarteror tile emigrants eventua,ly return home, bringing with them savlnas which in the decade preceding the present censu!>, were estimated at 70 lakbs of rupees.
·"'See on page 69.
73
during a period of good crops followIng close on the heels of a famine. The rca80n for this is partly tbat a calamity oftbe short causes a high mortality, ohiefly amongst the very old and the very young and other ~rsons already of a feeble constitution, so that when it is over, the population contains an unusuaUy high proportion of healtby persons at tbe reproductive ages, and partly because, by reducing the number of dependents to be supported. Jts ultimate eff~ct is to improve the resources of the poorer classes and so encourage them to have lar~er families. * Thus Orissa, which lost a quarter of its population in tbe famIne of 1865-67, gained nearly 18 per cent in the period betw.een the censuses of 1872 and 1881. Madras having suft'ered severely in the famine of 1876-78, added 15.1 per cent to its population b~tween 1881 and 1891, and Bombay which shared in the same calamity bad an almost identical increment.
169. In India. as a Whole, (he decad~ cading in 1891 was remarkably free from serious crop failure, while the preceding period witnessed several widespread famine. It is thus easy to sec why the population waS very nearly stationary between 1872 and 1881 and grew rapidly in the next len years. But it was not likely that such rapid progress would be maintained. Even with a continuanc~ of good s~ason& a p,.!riod of rapid increase would naturally be succ'!ed~d by one of slow~r growth owing to the diminished number of persons at the pr~-productiv.: ag..:s about 15 yo.!ars aftcr a famine and the exceptionally largo;! numb'~r of young children. Moreover good seasons and bad of in cycles and a succession of fat y.;:ars is invariably followed by a series of lean ones. This sequence of events wa'i noticed by Mr. Baincs who, in dealing with the results of the census of 189), wrotc:-
'Tn'! rale oflll;;rea~i! IhU'; i.n)1 ied is not I ikcly to b': maintained, and afler so many years of average sea~on~, previous experience in India warrants (he CXpl."l:la,tion of check to the growlh of population such as rhat which occurred between 1861 and 1871 and 187) ~JOd 188 L The measures 10 prevent r he 10.'15 of ife I hal have been briefl) louch'!d upon I ell:, :r III will,n', 'I,)ubt, Illitigate Ihe severity with which Ihis check isappticd,so far a ilsdireclaclion is in qlJ~slion. but. n'!v.:rtheles~. it will nOl be surp 'Ling to I h l';e w',o iuv ~ ~n'l;;j,,; c h!;: ;1 ati ;', ics. j fthere be in 1911, if not 10 y:ars sooner, a c<lt1;iderable readjustment of the age di~!ribullon al the beginntng an end of thetabks,"
The anticipated has happened and the period from 1891 to 1901 was even morc disastrous to the cultivators than that from 1872 to 1881. The adverse conditions of the decade have been repeatedly mentioned in thc notes on movement in individual provinces and states, but it will be convenient to give a brief summary of their leading features in India as a whole. In 1891-92 there was scarcity over a considerable area in Madras and Bombay, and in parts of Bihar. In 1895 a weak monsoon led to extensive crop-failure in the southern districts of the United Provinces, and a sudden cessation of the
*11 has more than one: b!cn p.>inlcd our by S'!l (ICmcn! Officers thaI Ihe sizo: of (he familyvarie~ with (h~ mt'erial condition of the people; that a landless JabAurer's (umily IS on',he aver.g~ ~m"lller than that of a small cultivator, and the familY of the laUer than that of on ~ wi t h a I arlic holdi ng, vide Muzaffolrpur So.l\ lJemeni Report, page 364, and Ref.f:~d13~atcriaIC'ln ition of~mlllagriculturistsand Labourers in the Gaya District. pages
A rapidrisein the)irth-rate after any unu,>ual, cata~trophe is a w::ll-known phenomenon. M. B~rtillon says; "La natalito' s8abaisse, a la suite de la nuptialilc, orsque La pupulation ~ubit queleque desastre (guerre, disette, cnomaae. etc.) La oeriode de crise ul1::fois 'llssee,la natalitedevienr plusfortt"qu'ellen'elait avant la crisc, commesi la popuJa: tion eprouvait Ie besoin de reparcr Ie temps perdu." (Cours Elemenlaire de ~lali&tique Admienistrative, page 477.)
74
rains of 1896 resulted in famine in the United Provinoes, the Central Provinoes, and Derar, and parts of Madras, Bombay, Bengal, and Punjab, UpperBurma, Rajputana, Central India and Hyderabad. Altogether an area of about 300,000 square miles with a population of nearly 70 millions was affected and, on the average, two mtllion persons were relieved daily during the twelve months from October 1896 to September] 897; the number roseto more than 4 millions at the time of greatest distress. The loss offood crops was placed at 18 or 19 million tons. The Commission appointed to review the system on which relief was administered in this famine and to gather up its lessons came to the conclusion that "while the areas over which intense or severe distress prevailed were greater than in any previous famine, the degree of success :lttaincd in the relief of distress and the saving of human life was, if not complete, far greater than any that has yet been recorded in famines that are at all comparable with it."i
Tn 1899 the monsoon again failed, and the results were even more disastrous, for though the population affected was slightly less than in 1896-97, famine conditions prevailed over an area half as great again and with less casy means of communication, the drought was much more severe, the people had not yet recovered from the previous visitation, the mortality amongst cattle from want of fodder and water was very heavier, and the tracts which suffered most lay for the greater part in Native States, where the r~lief organization was necessarily less perfect than in British territory. In the height 0'" this famine there were for weeks together over six million persons in rec,:jpt ofrdief, and the value of the agricultural production of the year was t~~timated by the Viceroy to hJ.w h~cn 60 millions sterling below the average: t here was also a loss of some millions of cattle.
170. It is impossible to say with any pretence to accuracy what was the actual mortality caused by these calamities. The Commission of 1901 thought that about a million deaths were attributable to the famine of 1899-1900 in British territory, and it would probably be safe to assume that anothcr three millions must have occurred in the Native Slates. which contained morc than three-fifths of the populat ion afflicted and where the relief operations were ~enerally far less successfu1. No estimate has been made of the excess mortality In 1896-91 but it cannot have been much less than a million. The total mortality du·: t (\ (h·.~ two famine mays ~herefore, be taken roughly at five millions. Th·,: dil11ini-;h·,:d vitality of the people resulted also in heavy fall in the birth-rate, but t his was to some extent counterbalanced by an unusually high rate of reproduction when the people had recovered their normal condition.
(ii) Plague
171. Excluding a small tract in [he Himalayas where it has long been endemic. bubonic plague made irs first appearance in India in modern times in Bombay City in September 1896 and after spreading over the Western Presidency, notwithstanding the measures taken to prevent its dissemination, gradually extended its revages to other parts of India. By the date of thocensus the recorded mortality was nearly half a million, to which Bombay Contributed seven-tenths and Bengal two-thirds of the remainder; Mysore witb 35,731 reported deaths hlid suffered heavily in proportion to its poulation and so too had Baroda and Hyderabad. The extent to which the actual number of deaths exceeded that reported is uncertain, but it is known that the-
7S
difference waS very considerable and it may be assumed that the true mortality from plague was not less than three-quarters of a million and may possibly have been a millon. neir effect smaller than migbt have been expected
172. In a period which has witnl!ssed the two greatest famines cf the Glentury and the appearance of a new and deadly disease, the wonder is. not that the pace at whicn the population has grown is less than it was during the previous ten years, when the rale of progress was morc rapid {han usual, but that there should have been any increment at all. In ancient times tbe occurrence of a severe famine was marked by the disappearance of a third ar a fourth ofthc population of the area afflicted, and the fact that in British I ndia the famines of 1896-97 and 1899-1900 (';hould have rC6ulted in an excess mortality in those years of only 15 and 30 per mille respectively isarcmarkable proof of the efficiency of the relief operat ions. III
Conditions making for progress (i) Railways
173. In other respects the past decade has been one of great progrt'slil The railways open in 1890-91 had an aggregate length of 17,000 miles, which in 1900-01 had grown to 25,000. an increasc of morc than 50 per cent. The advantage:. of these improved communication~. and ofth(" facilities which they afford to, rade and migratiun are most marked in times of scarcity. II has been proved by recent experience that. even in. years oj" severe famine, India has ample supplies of food. in areas beyond the afflicted zone. to support the whole population. and the extcn;ion of railway communication has now made it possible to carry it to the tracts where the crops have failed. During the twelve months ending 30th September 1900 food grains and pulses to the cx:cn.t of nearly 72 million maunds were imported by the affected provinces (other than the Punjab). which ill ordinary year:> expon .'.bout 7 million maunds, and priCeS never rose to the extreme height common in former periods of scarcity. But for thc railways it would haw been impossible to effecl these vast mowmcnts of grain. Which, be it observed. were brought about cntin:ly by the ordinary busines!; agency ofth<: country without any special a",~istanc,' from Government. **
(ii) Irrigation 174. Great :;trides have been made of latc years in the development of
theStatcsystern ofcan"J.lsforirrigation purpo~;es. andin 1901.43.000milcs of Cam. Is were in op::ration. compared with only 9,000 ten years previollsly. The Lotal irrigated area in B,-itish rndia now averages 30 millan acres, of which abl)ut one-half is. watered by irrigation works owned or controlled by the State. The great b~ndit conferred by these works was clearly shown in
"'In'l r:wof:h! ''lulie-rand moreb:lckward NalivcMatesthefamineof 1899·1900 caused aterrible loss of population but,as a general rule, evenin Native !>tates, the admin ... tration of "elief wa~ fM m::H~ :ffi.:ienl and etfectuallhan it had ever becn before. A brief account of some of the famines which occurred before (he advent of the British and of their disa~trous con'i~quenccs will be found in Chapter III of Mr. C. W. McMiun's little book on "Pamine Trutln, H'l.l f Truth.s. Untruth~."
**Thc jmpor[anc~ of good com!TlUlcatlon as a m:::ans of m.llg'lling Inc suffering cau.~ed by famine is w:ltillu;\ reated by the history of the Orissa Famine of 1865-66 when shipslacl:m wilhgrain w~rc prevented by the winds ofrhesouth-wcst monso mfromleav ng the nor! of Cdculfa. and 'I W.lS imDossible to supply food to theslarvin& ~pJe untiJhuDdrcds of thousands haddicd.
76
:the famine years, especially in the Punjab, where the crops raised from the irrigated fields of the Chenab Colony were of the greatest use in meeting the demand for food in other parts of that Province. *
(iii) Development 0/ coal mines, etc 175. The persons mainly affected by 'famine are the landless labourers;
the a.cLual cultivators usually have sufficient food stocks or savings to enable them to tide over bad times, but the labouring classes live from hand to mouth and, on the advent of famine, are deprived at once of the means of employment on which they chiefly depend. Not only is there less Held work to be done, but what little there is, is done by the land occupants themselves. The most effective remedy. therefore, lies in the opening out of other means of livelihood, and great strides have been made in lhis direction during the past ten years, The expan~;ion of the railway system above described has caused an increase in the number of natives employed in connt:ction with itfrom 248 to 357 thousand. The coal minesofB:ngal have shown a remarkable development, and in 1901 t he out-put of eoal was 5! million tons, or morc than three times the quantity Won in 1891; the production in other parts oflndia, which now exceeds a million tons, has nearly doubled duri:ag the sami: p;;rind. The average number of labourers employed daily in the coal mines has riS\!ll from 35,000 to 95,000. Tht: quantity of petroleum extracted (almost wholly in Burma) exceeded 50 million gallons in 1901 compared with barely l)ne-eigh~h of that quantity ten ycars previously. The value of gold taken from the Mysore Mines has risen from one to three crores of rupees. The ptl)dm;,joll of m::tnganesc orc in Madras. orlin in Burma, and of mica in B;;llgal and M.lctras has also inc;ea;;ed considerably.
(iv) Growth of factories and mills 176. The development ofthc coal minc~ ha~; provided the country with
an, abundant supply of cheap fuel and has greatly encouraged all kinds of Industrial activity. Thejute mills of Bengal number 34 against 25 in 1891 and the number of their ..:mployees has grown from 61 to t 10 thousand; there arc also 168 jute presses employing 21,000 persons compared with 33 e~ploying 8.000 persons in 1891. The number of cotton mills in Bombay has Clsen from 89 tt) 138 and thaloflhc labourerscngaged in thcmfrom 7S to 107 thollsand. Tile jute industry is s~ ill a monopoly of Bengal, but rivals to the cotton mills of Bombay are springing into existence in many places. In respect of ()th'~r indu::;tries the development. though les~ marked, has been very c.omiderable, and cotton ginning and pressing mills, iron and brass foundncs. pap;!r mill~, oil mill::;. potteries, sugar factories and tanneries are rapidly growing in numb:r:; and importance in differi:nt parts of the country. During the dec..:nnium the foreign trade of India by sea has risen in value from 1,956 to 2,547 millions of rupees the coasting trade from 778 to 948 millions. and lhe foreign :radc by land from 83 to 136 million:;. Joint stock companies have risen in number from 950 to 1.366, and their paid up capital, has increased from 266 to 330 millions of rupees. Every thing seems to the fact that India has entered upon an era of great industrial development
"'An a,,;count of the advantages d!rived from irrigation in the r~mine ('( )890-97 and of the pI Jgress made in d'!veloping of the Slate system of irrigation during the previous 20 years willbC found in the "Narrative orthe Faminein India" by Mr. T. W. H"lderness. parqraphs 103 to Ill.
77
and jf so, not only may a marked improvement in the material condition of the poorer classes be looked for, but the danger of loss ofHfe, in the event of crop failure, will in future be very greatly diminished. The demand for labour in Calcutta and other great industria} centres already far exceeds the supply and one of the problems of the immed.iate future is the devising of means whereby the employers may be brought into touch with the classes who would benefit most by taking to the new means oflivelihood created by llritish capital.
(v) Cultivation of special products 177. The cultivation of coffee and indigo has received a check and that
area under these crops is less than it was ten years ago. The area under tea on the other hand. has ,isen from 345 to 525 thousand acres and the number of tea-garden collies has risen in st ill greater proportion, the total number employed in 1900 was 719.000. In Bengal the profitablejute plant is replacing other less remunerative crops and the area devoted to its cultivation in 1900 was reported to be 2k million acres, or more by 50 per cent. than it was ten years previously. The crop statistics of Bengal, especially those of earlier years, are very unreliable, but it is a matter of general observation that the cultivation of jute is spreading in all directions.
('vi) Probable improvement in public health. 178. It is impossible ill the present state of the vital statistic .... which
have only recently attained a fair degree of accuracy, to draw from them any conclusions as to variations in the death-rate. and whatever opinion may be formed on this subject must be based solely on a prior grounds. In all the larger towns the water-supply and sanitary arrangements have been greatly improved. Much has been done in the smaller towns also, and even in the villages. Great care is taken to guard against epidemic disease at the fairs and festivals where the people assemble in large numben, and in most cases they can nClW reach them by rail and thus ecsape the horrors which attended the old journey by road. while they no longer disseminate disease in the villages along their line of march. When cholera breaks out, efforts are made to eradicate it by the disinfection of wells and other sources of water-supply. Theprotection of the people from smallpox by means of va cci nat ion is making steady progress. Where the public health is found to be suffering from obstructed drainage. efforts are made to remove the defect. and numerous artificial drainage channels have been cut during the last few years, ch;efly in Upper India. Lastly the number of d;spensaries established by Government and local bodies is rapidly increasing and medical aid is thus beinl:; brougnt nearer to the people. It would seem tbat these and other measures cannot fail to have a marked effect, and that, apart from plague and the obscure fever epidemics, such as the "Burdwan fever" or the "Kala-azar" of Assam which break out from time to time, the general health of1he people malst be steadily improvinng ..
* Altbough not spxially liable to epidemic disease. the whole of the sub-Himalaya region from the Punjab to Assam is, and has long been. very unhealthy and the poPulation aenerally decadent j n spite of the existence of large areas of waste land fit for cultivation. Climate is still a more Important factor than density in determining the Irowth or decay of the population.
78
1be Outlook for the future
179. With all these causes making for progress, the present outlook is a hOiJ:!flll on~, anj unl!.>s Ltmin! shoJld again supervene, there is every prospect of a st.-:ady growth Of prosp!rity which is likely to bear fruit in an aC:!i:h:rated rate of increase of the population during the next few years.
[t m].y be j lid thlt fnJia hlS already more inh<lbitants than It can support, bJt this i:, n)t r.::.tlly :he C:lSC. [t will bJ seen from subsidiary table HI of the last c·upt!;!r, in which th...: u:lit is th.:: district or state. that a fifth of th'~ LOt.:!1 pJpilL,tiun of the cJ,Jn~ry i" c,')ngregated on less than a tw.::ntieth of ,)! _t:'~J., W;l;~~ ~h.!rc Llrc m )r...: thln 600 p::r:)oU3 to the squtrC mile, a quartermJfCOll alwc!fth :)flllCarca, c.lfryingfrom 400 t0600p('r square mile, and n :.trly a !1;'th on an !igh'h \)t' l!l~ .tr.:a .¥ith a density between 200 and 400. Taking Lh-::;'~ n~lI(C~> tog'~:h:r W~ timi ~ll.ll n~arly fwu-thirds of the total pO:'llhtion or r ndia occupy only a qU:lrtcr of the wh"le area, while the rem ;inins llil!-lilird i:; :-;clttcrcd over threc-quarters of the area, which is still V:;;-Y ;;) l,·.;:ly inil,lbitcd anJ n)w:lcre c;)ntains as mtny as 200 p~rsons to the square mile.
There arc no doubt cc::rlain localities, chiefly in parts of Bihar and in the ea,t of tile United Provinces, whcre the pressure on che soil is already felt, but it i:> b-:li,:vcd that with morc scientific farming the present produce 0f the sl)il might b; greatly incrc<\$cd. in which Case not only would the dearth of land now fdl di .• appcar. but room would be made for an even greatcr p:)pula~ion. Tnae. ,)fe, m:lrcowr,. many tra.cls wh~rc. even under present c,mdittons. there IS amplc room I,)f CXp:tllSlon. There seems to be no r..:ason why Burma as a whole shnuld not support a popuLltion at least half as dense as th~t of Bengal, with its ex(elnive areas of hill and ravine in the enola Nlgpur flla~,e~lu :l1lJ elsewhere, in w:lich case its inlubitants would number l1'.!arly 60 mill inns in the place oflile Wi millions it now contains. The waste lands of Assam arc crying aloud for colonists and even in densely populated B!ngal l ilc:re are exten"ive areas still aWi)ilillg reclamation. * Lastly, many trac's which arc n,)w btrren and inhospitable and support only a scanty population Can be made productive by means of an artificial supply of W;lter. P.trts of South Bihar (hat were very sparsely inhabited only tw::nty-five years ago now C:lrry a f.lirly dense population, owing to the con,irlldioJl, by Hl~ p?oplc th.::m;dvcs. ofreSI.!fv0i rs and water channels wnich have enabled them to ~ub'lit.ute rice for scantier and more precarious crops. We have already seen how the sandy desert bc::tween the Sutlej and the Cbe.nab has recn transformed in a few short years into valuable corn fields. But what has y(!t b!en done is p:!rhaps only a small i.nstalmcnt of that which the future has in store. Taere is enough water in the rivers of India, now running usdess to the sea, to render fit for the plough many millio.ns of acres at present b:J.rren and uncultivabk. The great desert in the west of Rtjputana has blrely five inhabitants to the square mile, but there is evidence that it WaS well·peopled in ancient tim!s, before the rivers that once flowed th:-ou8h it took another course, and it seems not impossible that some scheme of jrd~ ~~tion, bolder than any yctdev;sed, may restore its lost fertility.
"'Such as the Barind, the MadhuPllr jungle, the Sllndarbans, the Western Duars etc.
79
180. Ov.!rcrowding, m)f~over, is a purely relative term, and mere density -of population m~ans but little unless it is correlated with the degree of productiveness of the soil. There is probably no part of India where the people .are mJre prosp~rous than they are in E':l.stern B!ngal, but although more than three-quarters of the inhabitants of this tract are dep.'!nded on agriculture. the den:;ity is un~ually great, risil1g to 952 persons per square mile in the Dacca district and to 848 in Tipp~ra; the population moreover isstill growing very rapidly, the increase since 1872 in the two districts named being 45 and 51 per cent respectively. *
.Ithasshown in theca.seofB~nga) that, with a f..:w exceptions for which there are sp~cial rca~ons, the ab~olute growth of the papulation is greater in th;; thickly populated tracts th:ln it is in tho:;e whi~h arc more sparsely inhabited and it will be s~en from sub;idiary table No. IV at Ihc end of this chapter that the same appears 10 be the ~a!>e generally. The figul(,t> in this table arc les'; conclu.;ive than lhm:e in the B~ngal Report, which arc based up:;)n 'h.~ ':.lti,tics lor police circles, a:, the di:itrict ha~ been taken as the unit, and a ai.ilrict covers so large an ar,~a that lhe mcan dcn:;ity is often the ou~com~ ofv~ry divc:'gcnt pr\)p~lrti\ms in :he :;mdlcr administrative units of which i: i:i co:nl),)i,~.j, Til::n till -eiLlI:., h lI'h'vcr, ,','mains the same, and the grcak,! grow:!l of tile population l1a:> occll"icd in di.;tric(s which in 1891 had already a dcn<;ity of 500 10 60l) pers()n~ per sqllare mile; the next greatest increment i.> '-ec lrded Llr di;,:ric:s with from600 to 700; (hcll follow in ordcrtjlCdistrictswi(h apopuktion in Ig91 oflcs~(h~m 100,200 (0300, 300 to 400.400 to 500, and 700 ;lnd 'lV,'r. while at the bottom of the list ,Ire those wi th a p:)pula' ion (If 100 ::l 200* *. Tile ad vaJ1tag~ held by tracts with a com;J trativdy d.:nsc r 'pulation would be eWll more nnrkcd if we ex~llIded Burm:l, th~ circum"anccs of whi~h arc cxceptional, and the Punjab. where the growth of the Chcn,~b colony h:1S di:;lurbed the figures. EI~'cwhcre the more thinly inh'lbited ('-acl:; show a J1':t lh;~rcasc sinl:c 1891. It must. however, be rcm:mb::r..:d tb:lt ! hC>iC arc Ille arc~\~ that suffcrcd most from the famines and at th~ n~xt c?n~w' a relatively rapid rak of growth may be looked for in thc areas in this category.
The population or fnelia has been kept down in the pa~t by war, famine and p~'lileJ1ce. The j''':ctf of W.lf has been removed by the e,lablishment oftbe Pax Britallir:a. Famine ;d~;I' iii no long':r the terrihle t>courgc that it was in days gO'1e by, and rcu',ul1f; have heen given for hoping that ill) vir>itationl) will have a con,;tantly dimini&hing effect. it is only in the case of peEtilencc that the p:w;pcct is gloomy, Plague it; :;til! sp-c:.lding over [h;: land and jH taking a yeady incrca~ing :o!l. H()w long it will continue to gain ground, or when it ~ill d:!:iapp~ar, it is imp')";ibl; to predict, but (hiti much r;ccmf certain th11 it ~ill be a factor to be, ak(~n f;criou~ count ofwnel1 the lime comCF for reviewing the resulu; of the next ccn',uioi. ----------------
-It is curious to n;:lti.;c that Dr,V,)lcck~r, in his bonk on the improvement or Indian Agricul!ure. m~ntions Da.:.;a a, a plac:.: where nat ive agricultural methods are indifferent and susceptible of i morovem~nt. whi Ie he i n')tance~ Gujaral a~ a tract where exist ing methods cannot w~llb~ am:liora'''!d, Both Dacca and Gujaral have in alluvia! soil, but while the ormer,uooortswi\h'~;bl! n~arlya! hou,and p~rsons ro the square mile, Gujaral wilh barely quaner ofthar num1>eris impov::rished.
. • *Thi sresultdiffers from that arrived at in t 891 but on I hat occasion the true rales of Increase were ob:;cured by h ~ glln') derived from the greater accuracy of the enumeration These were largest;o (he m )re iplr.;ely inhabited tracts wh~re tbe deficiencies in [he Census of 1881 were most marked.

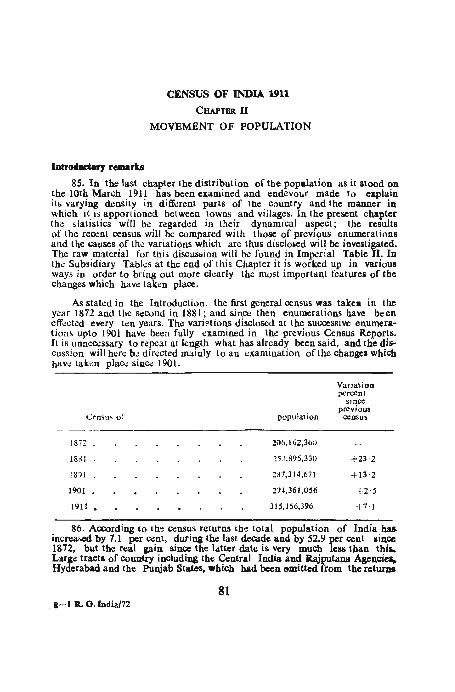
Introductory remarks
CENSUS OF INDIA 1911
CHAPTBa II
MOVEMENT OF POPULATION
85. In the last chapter the distribution of tbe pop.lation as it stood on the 10th March 1911 has been examined and endevour made (0 explain its varying density in diff~rent parts of the country and the manner in which it lS apportioned between tOWDI> and villages. In the present chapter the slatistics will be regarded in their dynamical aspect; the results of the reQ;;nt census will be compared with those of prevIous enumerations and the causes of the variations which arc thus disclosed wiIJ be investigated. The raw material for this discuStJion will be found in Imperial Table II. In the Subsidiary Tables at the end of Ihis Chapter it is worked up in various ways in order to bring out morc clearly tbe most important features of tbe changes which have taken place.
As stated in the Introduction. the first general census. was take. in the year 1872 and the second. in 1881; and since then enumerations have been effected every ten years. The vari?tions disclosed at the successive enumerations upto 1901 have been fully examined in tbe previous Census Reports. H is unnecessary to repeat at length what has already been said, and the discussion will here b~ directed mainly to an examination of the change. which haV\.! taken pla~ since 1901.
Variation percent
since previous
C~nSllS of population census
----------------------------------------------------18n
18&1
18:)1
1901
1911 •
2()6.1 (,2.360
25 .~,896.330
2~i.314,671
214.361,0.56
315.156,396
+23'2
+13'2
+2-5
-P'I
86. According to the census returns the total popUlation of India has. increased by 7.1 per cent, during the last decade aDd by 52.9 per cent since 1872. but the real gain since the latter date is very mucb less tban tbis. Large tracts of coul1try including the Central India and Rajputana Agencies.. Hyderabad and the Punjab States. which had been emitted from the rcturJlS.
81 8-1 'R.. G.lDdia/72
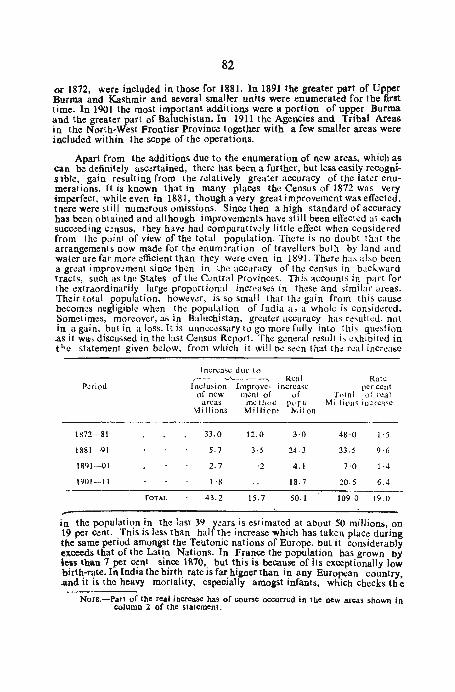
82
or 1872, were included in those for 1881. In 1891 the greater part of Upper Burma and Kashmir and several smaller units were enumerated for tbe first time. In 1901 the most important additions were a portion of upper Burma and th'~ greater part of Baluchistan. In 1911 the Agencies and Tribal Areas in the North-West Frontier Provine.: together with a few smaller areas were included within the scope of the operations.
Apart from the add!tions due to the enumeration of new area~, which a.s can be definitely ase.:rtalned, there has been a further, but less easIly recogn1-Slble, gain resulting from the rl!latively greater accuracy of the lakr enumerations. It is known that in many places the Census of 1872 was very :imperfect, while even in 1881, though a very great improvement was effected, tnere were still numerous omissions. Since then a high standard of accuracy has been obtained and although improvements have still been effected at each suce.:eding c.!nsus, they haw had comparativdy little effect when considered from the poinl of view of the total population. There is no doubt thaI the arrangements now made for th·;: enum.!ration of travdlers both by land and water are far more efficient than they were even in 1891. There has also been a gr.::at improwmcnt since then in the accuracy of the census in backward tracts, such as tne States of the Central Provinces. This accoun1 s in part for the extraordinarily large proportional increases in these and similar areas. Their total population, howevl!r, is so small that th~ gain from this cause becom~s negligiole when the population of India a::; a Whole is considered. Sometimes, moreover, as in Baluchistan, greater accuracy has rcsulkd, not in a gain. but in a loss. It is unn..:ccssary to go more fully into this question as it was discussed in the last Census Report. The general resull is ex.hioilcd in tl,e statement given below, from which it will be seen that th.:: real increase
Increase d UI: to ,--_-A-_------, Real Ratl:
P.:riod Inclusion Improve- increase per cent of new ment of of Tolal of real
areas meth(ld pI'r u Mi lions incn.:ase \-lillions Million' !VIi I on
1872-81 33.0 12.0 3 ·0 48'0 1 ·5
1881·_·91 5.7 3 ·5 24.3 33.5 9 ·6
1891··-01 2.7 '2 4.1 7'0 1·4
1901--1.1 1 ·8 18.7 20.5 6.4
TOTAl. 43.2 15.7 50.1 1090 19.0
in the population in the last 39 years is estimated at about 50 millions, on 19 per e.:nt. .Tnis is less than halft~e inc!ease .... hich has tak~n place during the same penod amongst the TeutOnIC natIOns of Europe, but It considerably exceeds that of the Latin Nations. In France the population has grown by less than 7 per cent since 1870, but this is because of its exceptionally low birth:-r~te. In India the birth. rate is far, higner tban i~ any European country, .and It IS the heavy mortality, espeCially amogst Infants, which checks the
NOTE.-Part of the real increase has of course occurred in the new areas shown in column 2 of the statement.
83
rate of increase. This subject will be dealt with more fu.lly in a subsequent paragrah. Meanwhile it may be noted that, if the population were to continue to grow at the same rate as it has done since 1872, it would double itself in about a century and a half.
Effect of migration on the growth of population
87. We may first however, enumerate the various factors which determine the growth of population and pass briefly in review the conditions in respect of them which have prevailed during the decade. One of the m@st obvious of these factors is migration. If the number of immigrants exceeds that of the emigrants the natural growth of population will of course be artificially augmented, while the reverse is the case when emigrants are in excess. It is in th,;: smaller units, such as districts, that the effect of migration is most marked; and we shall s';:e further on that, even in the case of provinces, this factor is often of considerable importance. In India as a whole, however, it counts for very little. Table XI shows that the number of immigrants into India from other countries was about 627,000 in 1901 and 650,000 in 1911. It is less easy to ascertain the number of emigrants. We know froin the Census returns for Great Britain and the Colonies that the total number of persons there enumerated Who were born in India was about 915,000 in 1901 and 1O,23,OQO in 1911, but we have no information regarding the emigration to adjoining countries in Asia, including Afghanistan, Nepal, Bhutan and China. There is, however, no reason to suppOGe that its volume has varied much during the last ten years. In the Report for 1901 the total number of emigrants to these adjoining countries was estimated roughly at 208,000. If we assure that the number is still the same we get 581,000 as the net excess of emigration over immigration in India at the present census, as compared with 496,000 ten years ago. The adverse balance thus shows an increase of 85,000 during the decade. This is too small to be worth consideration when dealing with a variation of mor~ than twenty millions.
Th<~ other asp;:cts of the mov~m·~nts to and from India will be considered in the next Chapter.
Other factors which determines the growth of population
88. Apartfrom migration the growth of the population is determined by the relation which exists between the oirth and death rates; and this again depends partly on the racial characteristics and social practices of the people and partly on external conditions, such as their material weJI-being and the state -ofth\:: public health. It is difficult to distinguish between the influence of race and that of social customs. Some races undoubtedly have a greater fecundity and longevity than others, but it is impossible to say how far these Characteristics are inherent and how far they are the outcome of their customs and environment. In India the birth-rate is every where much nigher than in Europe, but this is due largely to the universality of marriage. It is higher amongsf Muhammadans and Animists than amongst Hindus, but this is because the Hindus have a much larger proportion of widows at the child bea~.ing ages. The high birth-rate again is largely discounted by a heavy
84
mortality, especially amongst infants and women at child-birth. This aspect of the subjeCt will beconsidered more fully in the chapters on age and BeL It will su1lioe to say here that social practices change but slowly, and that the periodic fluctuations in the rate at which the population is growing depend almost entirely on the second set of factors, namely, those affecting the material condition of the people and the state oftbe public health, which we shall now proceed to discuss.
, ... ine
89. In a country like India, where more than two thirds of the inhabitants arc dependent on agriculture the state of the harvests is of primary importance. When the crops are good the people are prosperous, but when tbey fail famine supervl.!nes. All agricultural eountries are liable to the scourge And India is peculiarly so, owing partly to the variability of its rainfall and partly to the way in which the soil is parcelled out amongst petty farmers, who have no capital and no organised sYt>tem of credit, and whose millions of field labourers are at once thrown out of work when the crops fail. In former times the effects of famine were far more serious than tbey are at the present day. There was no organised system of State relief; and in the absence of railways, even Joca) crop failure meant starvation to many. All this has now been changed. A watcbful eye is kepI on the state of th~' crops. tbe Course of pric..:s and the returns of births and deaths. Programmes of relief works hav.;! be.::n prepared and are carefully kept up to date, and all l'Ieressary arrangements have been made for commencing relief operations the moment they an.: needed. But even so, there are many obstacles in the way of complete success. especialJy in thc Native States, where the preliminary organization i~ less comJ?1ete than in British territory; and whenever a severe famine occurfoi ils effect IS immediately seen in a diminished birth-rate and a high mortal 'y. In British territory, at least, the mortalilY is rarely due to acruaJ t>tarvlllion. but rather to diseases brought on by improper food and epidcm.ic~ of cholera, which frequently atlack the crowded relief camps. Tlae illflucne,~ of famJne will be repeatedly referred to in the discussion of the growth of the population in individual Provinces and States. We shall see how thl! famine of 1877 reduoed the population of Mysore and Madras and h,;w (bose of 1897 and 1900 caused heavy losses in the Central Provinces and lIerar. Rajputana, Central India and Bombay. We shall also see that the immediate effect of these visitations soon disappears. The pcrsons who die are t hose at the extremes oflife, the very old and the very young many of Whom would in ~ny case .ha~e died ~urjng the next few years. The n~mber of peC60ns in the prrme of hfe IS but lIttle affected. Also. after a perIod of suspeftded activity, the reproductive powers of the people reassert themselves. For some y~ars after a famine births are thus morc numerous than usual and tbere is au abnormally low death-rate. The result is an unusually rapid growth of population. Thus in the deCade 1881-91 which followed on the great south India famine of 1877. Madras badAn increase of 15.1 and Mysore of 18.1 per cent and after the famines of 1897 and 1900 the Centra] Provinces and Derar gained 17.9 per cent, in the decade 1901-11. That the rebound was not equally great in Bombay and Rajputana is due to. a continuance of adftrse conditions as wiJl be explained. below.
85
State of crops in decade 1901-1910
90. The decade preceding the c~nsus of 191] was free from widespread famines such as those of the preceding ten years. In 1907 there was a partial failure of the monsoon which was felt over a wide area, extending from Bihar to the Punjab and Bombay, and caused actual famine in the United Provinces and in a few di:;tricts eLcwhcre. In several other years the crops suffered locally to a varying extent from want of rain or, occasionally, from an excess of it. Prices ruled high in most years, but this, though it pressed hard on the poorer sections of the non-agricultural population was beneficial to the cultivators and did no great harm to the landless labourers. whose wages, when not paid in kind, rose in much the same proportion. There has bee.n an extension of the area under special crops, such as Jute and cott?n, which are more profitable to the cultivators than foodgratns. The period ~as certainly not so favourable as that ending in 1891, but in rndia as a whole It may be regarded as one of moderate agricultural prosperity.
The state of the public health
91. India is peculiarly I iable to fatal epidemics. From time to time cholera breaks out with great virulance and small-poxaIso at times causes a very heavy mortality. Until recently, howevcr, the greatest harm has becn done by epidemic fevers, such as the Burdwan fever epidemic which devasted West and C<!ntral B:ngal a third of th;: century ago and Kala azar which more rec.!ntly brought such havoc in the Brahmaputra valley. In. the decade which has just ended epidemics of malarial fcver decimated the Irn· ~ated tracts of the Eastern and Cental Punjab and the Ganges-Jammua Doab In the United Provinces, where in 1908 alone the reported mortality from "fevers" was nearly two millions. On the whole, however, the decade might perhaps have been regarded as an average one from thc point of view of the public health, had it not been for the revages of plague, from which Ind.in had been practically free in recent times, until it broke out in Bombay In
1896. Spreading from that City it had already by March 1901 caus~<.l recorded mortality of about half a million. Since then it has continued Its revages, especially in Bombay and Upper India. The mortality from it rose from about a quarter of a million in ] 901 to 1.3 millions in 1907. It fell below a quarter of a million in each of the next two years, but in 19)0 it ex.ceeded half a million. The total number of deaths from plague during the decade wag nearly 6.5 millions of whiCh over one-third occurred in the Punjab and two-fifths in the United Provinces and Bombay taken together. The disease fortunately has failed to establish itselfin Bengal. ASGam and On the East Coast and in the extreme south of the peninsula. This moreover is only the rec.orded mortality. As is !well-known, when epidemics are raging,. the reportmg agency breaks down and a large number of deaths escape reglstration. The omissions are most numerous in the Native States, where registration is usually far less accurate than in British Territory. A peculiarity of plague which has been noticed and explained elsewhere is that. in Northern India at least, it attacks women more than men. and people in the prime oflife lDore than young and old. Consequently its after effects must shortly become apparent in a diminished birth rate in the tracts most seriously aft'ected.
86
If it be accepted that the mortality .f the decade apart from plague was normal, it follows that, but for this disease, the population at the census of 1911 would have been greater than it was by at least 6.5 millions. In other words the population would have increased by 9.3 instead of 7.1 per cent.
Irrigation
92. G.-eal progress continues to be made with the extension ofirrigation f.lc;lities. Tne total area aotually irrigated in 1910-11 was 22.5 million acres (this was about half the area "commanded") against 18.9 million acres at the commencement of the decade. The total capital expenditure on Government irrigation works classed as productive, which in 1910-11 yielded a return of more than 8 per cent, now exceeds 42 crores of rupees as compared with 34. ~ crores in t 900-01. and that on protective works has risen du 1 ing the same p::riod from 2 to 4 crores. Even more rapid progress may be expected in the ncar future. The great Tripal Canal Project in the Punjab. which is nearing completion at a cost of more than ten crores of rupees, is designed to irrigate two million acres in the Chej, Rechana and Bai Doabs. A still more ambitious scheme is the proposed Kistna reservoir in Madras Wllich is expected to cost 8.5 crores, alld to have a capacity double that of the enlarged Assuan dam. Various other large schemes are in contemplation. and some of them have alreadY been sanctioned.
Progress of trade and industry
93. Although Indian trades and indutries are still in their infancy, as comp:tred with those of Western countries, rapid progress has been made in rec~nt y\!urs, and especially, so during the la:,t decade. The estimated value of the imports of merchandise from foreign count ric:; rOM: from 53 crores of rupees in 1880-81 tn 81 crores in 1900-0 I and to 134 croies in 1910-1 J. The exports of merchandise were valued at 75 crors in 1880-81, at 108 crorcs in 1900-01 and at 210 cmr;::; in 1910-11. During the first mentioned period of twenty years the growth in thevalueofimportswas52pcrcen~.andit was 65 per cent during the ensuing period of ten years. The corresponding increases in exporf/) were 44 and 95 per cent respectively. Since 1900-01 the value of the imports of metals , maChinery and railway materials has ri~;en by 100 and that of cotton. including piece goods. by 50 per cent. In 1880-81 there were in the Whole of India only 58 cotton mills employing 48 thousand operatives. By 1910-11 the number of mills had risen to 250 and that of their employees to 231 thousand. During the same period the number of jute mms from 21. to 58, and the number of persons employed in them from 35 to 216 thousand. The Burma Oil Industry has made great strides. There has been a remarkable expan:.ion of railway and engineering workshops., arms and ammunition factories and the like. The most notable and promising of recent developments is the establishment of Tata's Iron and Steel Works. at Sakchi which. ~ith its imitators when they come. may be expected to make India self-supporting in the m:ltter of rails and girders. In 1880-81 the total production of coal wasbarely onemillion tons; but in 1910-11 it exceeded 12 millions. The expansion of these and other industries is not only a benefit to the country as a whole. but is also of great use in opening out fresh avenues of employment for the sawarm of landless labourers who formerly
87
were dependent :i.llcly on ayicultural lab"ur for their subsistence. Another way in wh.ich the growth of the m].l.:rial prosp.:!rity in recent years can be gauged is by the rate at which the precious metals are being absorbed. The v due of the l1~t imports of gold and silver in 1880-81 was respectively 3.7 and 5.3 c,-ures. In 1900-01 it WlS 11.19 and 12.7 crores, and in 1910-11 27.9 and ll.8 crores. The n!l impJrlS of gold showed a further rise of 50· per cent in 1911-12.
Improl'ement in communications by rail
94. The improvem~nt in railway communications since 1880 has been very great. In that year the numb.:r of miles open to traffic was less than 9,000; since then there In; b!en an addition of roughly 8,000 miles in each successive decade; and by the end of 1910 the total mileage exceeded 32,000. The traffic ha'i increa'>ed even mJre rapidly. In 1910 over 371 million pa\lsengcrs and 66 million tons of good> were carried, as compared with49 and JO millions respectively in 1881. The net earnings of the State and guaranteed railwa ys in 1910 represented 5t per cent 011 the capital outlay.
GENERAL SUMMARY
Summar)'
130_ Having passed f!Y;'!W th! c:llngl.~ which hav.! occurred during the decld·! in the individual Provinces and States, we are now in a position to focus the m3in results for the Empire as a Whole. We have already seen (Paragraph 86) 111:11, after allowing for additions due to the inclusion of new arcas and more accurate cnum!ration, the net increase of population during the kn ycar~ ending in March 1911 was 0'4 p;:r c.:nt as compared with 1'4, 9'6 and 1'5 p-:r c:nt respccli\<dy in [11,.' thr,,;-,: prcc.:ding inl.:rcensal periods. Th'~rc ar<.', moreow:r, great local, as well as periodic, variations in the ratc of g;-(\w h. The g-:neral awrag.;: for India as a whole is the rcsul!ant of very diff;!',_ n l figures for variou:, parts of Iho..: Empire. Th,! changes which have tak,:n plae..: in the main provinc,~s in eaeh of the last four decades are shown
11 lh'~ accomp:mying diagram.
2350 REFERENCES 3002
2200
Assam
Bengal
Bihar & O·-j ,'a
2100 B()mbay
Burma
2000 C. P. & Serar
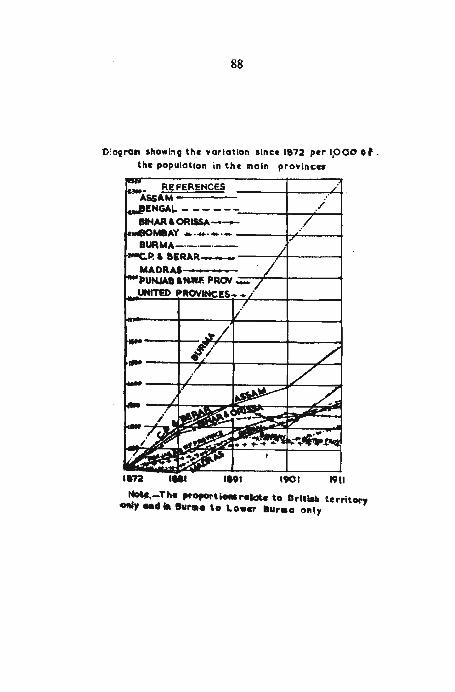
88
'0109"°'" showing the variation since 1&72 per 1,000 of: th« populatIon in the moln pro'flnc«.
Mot,.-Th. ,.-oporti .. ,..IcJt. to a ....... te .... itor, 0ftI)' .ad" But •• '0 Lo • ., .uraa ollly
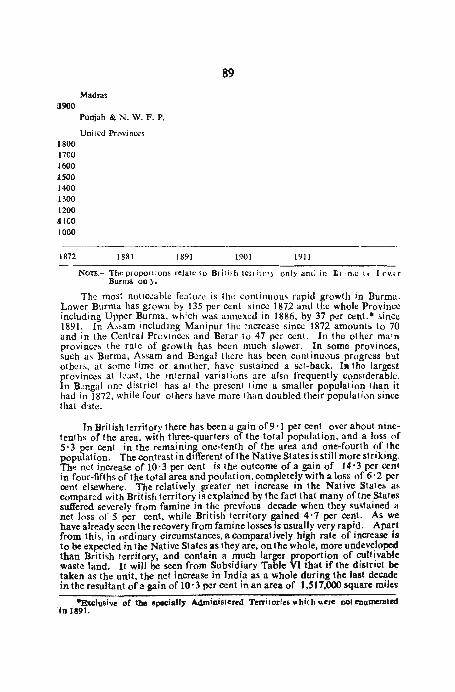
J900
1800 1700 1600 JSOO 1400 1300 1200 .11(0 1000
1872
89 Madms
Punjab & N. W. F. P.
Uni!cd Provi nces
1881 1891 1901 1911
NOTE.- The proportions relate to Britifh tcnil("1), onl~ ant; in El'ln,c I \ 1(1\11 r Burma only.
The most notiC\!able feature is the continuous rapid growth in Burma. Lower Burma has grown by 135 per cent since 1872 and the whole Province including Upper Burma. which was annexed in 1886. by 37 per cent.- since 1891. In A~sam including Manipur 1 he increase since 1872 amounts to 70 and in the Central Provinces and Berar to 47 per cent. In the other main provinces the rate of growth has been much slower. In some provinces, such as Burma, Assam and B,:!ngal there has, been continuous progress but otbers, at some tIme or another, have sustalDed a sel-back. 1ft the largetit provinces at kast, the internal variations are also frequently considerable. In B!ngal one ~istrict has at the present time a smaller population than it had in 1872, while four others have more than doubled their population since that d'lle.
In British territory there has been a gain of 9'1 per cent over about ninetenths of the area, with three-quarters of the total populat ion, and a loss of 5' 3 per cent in the remaining one-tenth of the area and one-fourth of the population. The contrast in different of the Native States is still more striking. The net increase of 10'3 per cent is the outcome of a gain of 14'3 per cent in four-fifths of the total area and poulation. completely with a loss of 6'2 per cent elsewhere. The relatively greater net increase in the NaTive States as compared with British territory is explained by the fact that many oftne States suffered severely from famine in the previous decade when they sustained a net loss of 5 per cent, while British territory gained 4'7 per cent. As we nave already seen the recovery from famine losses is usually very rapid. Apart from this, in ordinary circumstances, a comparatively high rate of increase is to be expected in the Native States as they are, on the whole, more undeveloped than British territory. and contain a much larger proportion of cultivable waste land. It will be seen from Sub'lidiary Table VI that if the district be taken as the unit, the net increase in India as a whole during the last decade in the resultant of a gain of 10'3 per cent in an area of 1,517.000 square miles
~xclusive of the specially Administered Territories ",lli(}1 \litre nol enumerated -in 1891.

90
with a population of 245 millions and a present density of 162 to the square mile, and a loss of 5·5 per cent in an area of 218,000 square miles WIth a population of 68 millions and density of 312 to lhe square mile.
Variations in relation to density
13I. In Sub:;idiary Table V the variations in the population which havetaken place in th'! minor administrative units (lahsils, taluks or thanas) are co-ordinated with th,!ir density. Half the net increase in the population has occurred in tahsils which in 1901 had less than 150 inbabitants to the square mile and almost the whole of it in tbose with less than 450. Those with a greater density than tnis had a net increase of less than half a million, the gains in three of the higher density groups being largely counter-balanced by losses in the other towns. The losses in th·;!se groups were exceptional and were due entirely to the epidemics of plague and malarial fevers which raged during tbe decade in some of tne most prosperous districts of the United Provinces. But ewn So it is clear that in India as a whole the rate of increase tends to vary inversely with the existing density of the population. There are of course local exceptions to this rule, e.g., in Bengal, where some of the most thickly peopled districts are growing marc rapidly than others with a relatively sparse population. Dacca with 952 persons to the square mile in 1901 has since add·:!d 12 p.;!r o.mt to its population and Tippera with 848 nearly 15 per ~nt.
Comparison of Census results with vital statistics
132. If the registration of births and deaths were accurate it would be \!asy al allY tim! to asc!rtain thi~ pllpulat ion of a given tract, except in so far as it is aifo;:cled by migration. by adding to tbe population as~rtained at the previous o::nsus Inc numb:r of· births ~inc..: recorded and d-.:ducling from it tn'.! numb.!!' ~)f d'!alhs. [n ord~:- to ·~Iucidak (his point have ~hown in S:Jb"idiary Table rv Ih~ num~r 0:' l}'rcilS and d\!aths recorded during the dec:ld·! 1901-10. I.h! birtll and d'Ja' It r,ltes p;r mik and the n;t excess of births over d·!aths. Thisexc!ss is c,)l!jled with Ih'; v,lriations disclosed by th·; census of 1911 in the actual, and also in the lutural population. The figures for the natural population are not in all cases quite accurate, as it has som'~timt:s been difficult to make allowanc: for thi~ areas in wbich vital statistics arc not at present r.~gistered. In lh·! mlin Brit ish provinces the vital statist ics for t ne d,~c3.de show ano:xc·!SS of9·4 million birtbs over deaths whereas the census shows that the actual increase in (h·~ population was 12·1 millions. The c!nsUS figures show an ,:xc~ss owr lh·'! vital statistics in all Provinces ex.cept th~ United Provinces wh)re if th'! vital c;!atistics were correc l , th';!re should have been an increase of a million in lh~ population instead of a decrease of· more than hl.lf tbat amoun r, and Bih'lr and Orissa, where th-~ vital statistics indicate an illcrl!ase of 1'9 millions. against an increase according to tbe census of 1-8 millions in th! natural population. The two figures in tho:: latter case corrl!spond wry c1osdy. Els,!wh'!re the n·~arest approx.imation bdween the two sets ofstatistics is in th·: O:nl ral Provinces and Derar, where th,,! excess of r . .:p~rted births OVl!r deaths was 1·6 millions against a census increase in t}l.;: na.tural population of 1-9 millions, and Madras, wh·:re the figures are 2-8 and 3·2 millions respeclivdy. It is unn~<A!ssary to ex.amine the figures.
91
in greater detail. Enough has been said to show that we cannot at present rely on the vital statistics for accurate inter-censal est imates of the population. At {he same time. exC!pt in the case of severe epidemics when thl! reporting agency breaks down. the de~ree of error may bi: assumed to be fairly constant, and the p·:!riodic variatIons in the returns may be relied on as reftecting the real changes in the numb,~r of births and deaths.
The imperfection of the recorded vital statistics is not be wondered at when we remember the weakness of the reporting agency. In this connection Mr. Blunt writes as follows :-
"In rural circles, the reporting agency is the chaukidar, a low paid, totally illiterate person. who bring, his record of births and deaths (which is written up by the patwari' orotherlilerate person in the village to thethana with him whcn he visits il. He is frequently away from his circle onduly. as~isling the Police, mounting gaurd al camps, or givingevidenc~ in c.)urts ;and it i~ obvious Ihat errors from omission in such cases must frequently occur. Hc is a~sited occa~ionalJy by th~ village headman or chief landlord. if these happ-:n to b~ p~rsons with som': small amount of public spirit; but it i~ clearly quite'possible Ihat births and deaths (especiallydealhl' in the ourse of epidemics) may escape his notice altogether. His powers of judging of the Cau~es of death are nOl particularly ~real; and unless il is a well known and ea;;lyJis:inguishable disease,his diagonsls of adcath is not reliable. Apartfrom dealh~duc 10 injurY()I' Ic;idmt. his knowledge of diseases islimitedto small-pox cholera. plague and fever; everything which is nol a case of one of I he first three, and a good many ca~es Ihat are, go down under fewr. For our present purposes, however, Ihis is less important then the completeness of this record.
In t his decade t here have b~~n reasons why his records should he less comnlete than usual. When plauge was ragings (especially in the early years of plague when it was formoref~red thani! i,now), "1: ..:Inukidarmwwell haveshirkedhisdulies to some extent. Even if he did not. with death succeedin& dealh in rapid succession, he mlyv~ry well hav~ failed to find oul on his return all the cases that had occurred during one of his frequent ahsences from his circle. The same, Ihough in less degree. applies to (he malaria epidemic of 1908. During famine he was wanted for various other duties and wa'i ap' to neglect his duties in respect of vital statistics ; for famine disorganizes most things; and lastly plague and malaria spared him no mor\! than any on! ehc, and r ~gl s( ra: ion wa'> disorganised loIecausc of the illness of death of t he report ing chaukidar. We might reasonablyexpect (hat though registration tends, normally, to improve with time, the calamities of lhe decade should have gl'.:atly relarded that improv!tn!nt or ev!n cau<;ed retrogression. Further, since plague and malaria were the: ehief utitimlte cau,es which would pl'event him in someway or another from properly discharging his dul ies, and since they caused f<'f n.oft; loss among women than m~n, w~ might also cxp:ct that the omissions in the vital record would be rather of i.l~alh., than birth" and rather of fem'ile t han male deaths.
In towns matters are different, and j1 can be a~serted with some confidence (hat r!gi<;lration there j<; m:>re <;:ll.isfactory. The head of the hou~e, the policeman .of the beat. the sweeper employed In the house, one or all have to rel}ort Ihe birth or death. Moreover the agency is far better educated. in some places (Meeru( for instance) the causes of death are all tested by a medical man; and generally speaking, it is probable thaI little fault can be found with urban vital slalislk~ in auy; respect."
The wonder is not that the returns arc still incomplete but thaI they are as good as they are. In some prov;nc~s the number of omissions is now extremely small. In tne Central Provinc~s and Berar, for example, the births actually reported during the decadi~ represent 49'6 per mile of the population of 1901. The actuary who cxamin·~d the ag·; statisfics did not deal' with the Central Provinc.:s and B;:rar but his estimates of th-: actual birth· rates elsewhere ranged from 41'0 in Bombay to 46'7 in Bengal.
92
in lhi) conn!ction it mlY be mentioned that the statistics compiled by a sp!cial staff miintained for three years in a small area in Bengal showed a total of 4,607 births and 6,910 deaths against 4,690 and 6,917 respectively retufno!d by th·~ ordinary reporting agency. The excess of 20 births in the ordinary returns was the n~t result of the inclusion of two cases of abortion, 26 of still-births, and three of double registration, and the failure to report 11 births. The excess of seven deaths was due to the erroneous inclusion "f lhree CdS''!S of abortion, 23 of still-births and one death occuring outside the period of enquiry on the one nand, and the omission of 20 deaths on the othcr. Thr: actual ':!xc·!SS of deaths over births differed only by 13 from that returtl!d by the ordinary reporting agency. It has to be remembered, however, that the knowledg.:: that a separate record was being prepared must have put th·! ordinary r';!portcrs on their m:!ttle and made tbem more careful (han usual.

CENSUS OF lNDIA 192)
CHAPlER i
DistributioJl ud MoveJncnt of the population.
MOl'emeat of the population
6. According to the o;:nsus r..:turns of 1921 the populalion of India bas increased by 1 '2 per cent. during the decade. Th..: figures of previous C(~nsus with [he variations per c~nl are given in tne following table:-
Census of Population
1872 • 206,152,3(0
1881 253,896,330
1891 287,314,671
1901 294.361,056
1911 315,156,396
1921 318,942,480
Variation per cenl
since PICvious census
+23·2
·+13'2
./ 2·:;
-i 7'1
-I 1'2
Th·_; average increase since the census of 1872 falJs at a rate of 5'5 per c~nl but the real gain is considerably less than this figure owing to two factors, (a) the additions of area and poulation included at each census, and (b) the progressive increase in tne accuracy oftbe enumeration from census to o:!nsus. Tne effect of these factors on the past figures has been discussed in previous census reports and need not be further dealt with here. It is clear that their influence must steadily decline as organized adminislrationextends and the system and practice of enumeration improve. So far as the prescnt census is concerned the additional area and population included amountS to 2,675 square miles and 86,533 persons respectively, while for the present purpose it may be taken that tne enumeration of 1921 was, as regards numbers, as accurate but no( more accurate than that of ) 911. The general result, after allowing for tbe factors of extension and accuracy is given in the following statement.
93
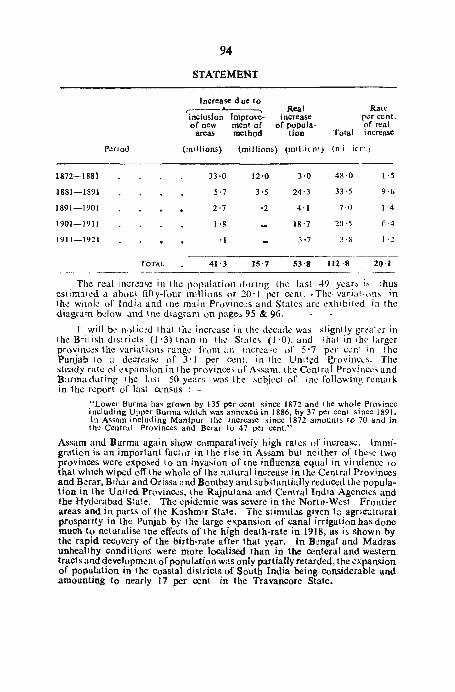
li72-1881
1881-1891
1891-1901
1901-1911
1911-1921
P.:riod
TOTAL
94
STATEMENT
Increase due to ,.---"---... Real inclusion Improve- increase of new ment of of popula-
areas method tion
(millions) (millions) (millicm)
33'0 12'0 3·0
5 ·7 3 ·5 24·3
2·7 ·2 4'1
1 '8 ]8·7
,1 3 ·7
41·3 15·7 53'8
Rate per cent. of real
Total increase
(n,ii in:)
48·0 1 ·5
33 ·5 9·6
7·0 1·4
20·5 (> 4
3·8 1 -2
))2 ·8 20-1
The real incr-:ase in the population during the last 49 years is thus cst ima1l,:d a about fift y-four mi II ions or 20' I per c.:nl. • Thc-' Va riat ions in th~ whole of India and (11~ m',dn Provinc·;s and States are l:xhibiled in the diagram bdow and ttle diagram on paget; 9S & 96.
ft will be lutic,_!d that the increase in the decack was sjiShlly greaTer in the British districts (J '3) Inan in the States (J '0). and that in the larger provinces the variations range from an incrca~c of 5'7 per cenl in the Punjab 10 a decrease of 3' J per cent. in the United P.,rovinc.:'s. The steady rate of expansion in the provinces of Assam. the Central Provinces and Burmaduring the last 50 years was the subject of tJJC following remark in the r~port of last census :-
.. Lower Burma has grown by 135 per cent since 1872 and t he whole Province including UPI)Cr Burma which was annexed in 1886, by 37 per ccnt since 1891. In Assam including Manipur the increase since 1872 amounts 10 70 and in the Central Provinces and Berar to 47 per cent."
Assam and Burma again show comparatively high rates of increase. Immigration is an important factor in the rise in Assam but neither of theloie two provinces were exposed to an invasion of Ine influenza equal in virulence 10
that which wiped offthc whole of the natural increase in the Central Provinces andB..:rar, Bihar and Orissa and Bombay and substantially reduced the population in the United Provinces, the Rajputana and Central India Agencies and the Hyderabad State. The epidemic was severe in the Nortn-West Frontier areas and in parts of the Kashmir StOit<:. The stimul.ts given to a~naulrural prosperity in the Punjab by the large expansion of canal irrigation has done muCh to ncturalisc tne effects of the high death-rate in 19]8, as is shown by the rapid recovery of the birth-rate after that y~ar. In B·:ngal and Madras unhealthy conditions were morc localised than in the centeral and western tracts and development of population was only partially retarded, the expansion of population in tbe coastal districts of South India being considerable and amountjng to nearly 17 per cent in the Travancore State.

95
DIAGRAM SHOWING THIINCRUSI 0" DICRIASIPERClNT .. TtC TJON 0' PRO\IIIICU AND STATU OF INDIA OUR .. THE INTIRCENSAL PPIOO'
tt~921 PERCENTAGE INCREASE 0" DECRPSE
-5 0 +5 +10
I:
II
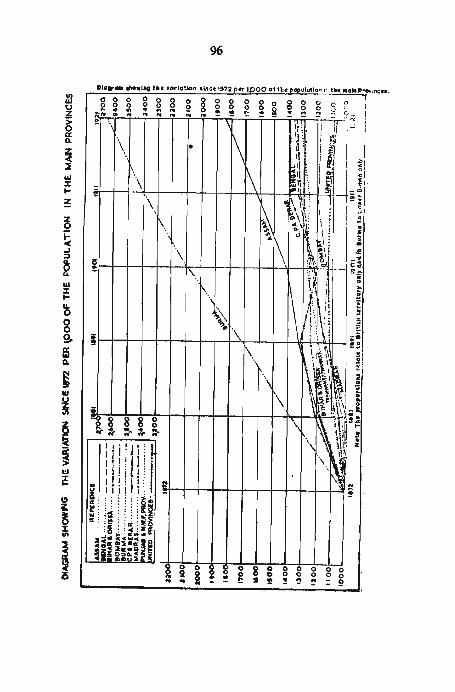
:a \) z >: ~ Q.
I ...
\
96
\
~\
o 0 o 0
97
Mi .... tto. 7. An obvious factor inftueneing the variation of population in any area
is physical movement of people in and out of tbat area. So far as the whole of India is conC<!fUo!d, 1his faclor is impossible to eSlimate exactly and in any case is not the real importance. Tne sladstics of birtn-place in Imperial Table XI give completc figures of those who wcre born outside and enumerated in India, but (be numbers of those natives of India who, at tne time of the ~nsus, w.!re residing in P~rsia, Afghanistan. Nl!paJ. China and otner Asiatic countries in whicn no census is taken, are not known. It was shown, however, in paragraph 87 of th·;: report of 1911 that on such figures and estimates as are available the excess of emigration over immigration in India migbt be placed roughly at about 581,000 persons in 191), The number of immigrants into India from outside has decreased from 650 thousand in 1911 to 600 thousand at the present census or by about 46,000 persons. At regards emigration tne excess during the d·~cad·; in the number of soldiers and students who have left for foreign countries is probably more than balanced by a reduction in the emigration of labour OWing the restrictions thereon while there is no reason to suppose that emigration to other Asian countries bas increased. Even if the additional loss to India during the decade on tbe balance of emigration amounts to as much as 150,000 persons or about double the loss estimated for the previous decade the figure is of little imporlanoc compared with tbe gain or loss due to natural causes dependiag on the health and wdl-being of the peop'le and shown in the birth and death-rate. Before studying these causes. it WIll be well to review brielly the general circumstanoea, of the decade wnich were likely to affl!ct the growth of tbe population.
TIle War 8. While many of the factors and conditions set out in the next paragrapJl
are indirectly due to the war, tne war itself had little direct effect on the population of India. Sucb efi'..!ct could operate in three ways U) by death casualties, (2) by increasing the number of persons outside India at the census. and (3) by decreasing the birth-rate. The actual number of death casualties among the officers and ranks of Indian Army units and labour corps was 58,238. The maximum number serving out of India in combatant and labour units at anyone tim·! bet~en 1914 and 1919 was, approximately, Indian troops 150,000, labour corps 230,000, total 480,000 ; the number about the time of census being troops 105,000 labour corps 20,800, total 125,800. A fair prO:portion of combatants was drawn from the fighting races of the Punjab and some statistics for that Province are !!,iven by Mr. Middleton in his report
He writes as follows !-"It comes as a sbock to the imagination to compare the mortality directly
caused by tbe war with that due to natural causes; thou_gh was casualties -wre amongst toe piok of the population they were numellcal1y unsignificant when contrasted with the deatn-roll caused by the slightest of epidemics ; indeed it is undoubtedly true, as observed by Mr. Leigh, tnat the war saved more lives in tne Punjab owing to tbe collection of ID!.!n in cantonments where the ravages ofinfiuenza in 1918 ~re met by efficient lD"'..dical precautions and remedies than it wasted on the field of battle. It is possible that tne absen.cc of so large a proportion of the able-bodied from th·!ir homes indirectly affected tne population by lowering the birtn-rate, but SO many of these men were able to visit th-;ir homes on leave that tbe effect was not areat .. eDO~ to be:
9-1 R. G. Iodia/72

~8
discoverable from statistics. With regard to effect upon tne numbers of the population th·;: war is an almost negligible factor in a decade which in itselt will render unique in his.tory as. long as civilisation lasts."
Other provinc.:s contributed their quota to the labour corps which w~re sent across the Si::as and local figur..:s arc affected, especially in ih~ Nor1h-West Frontier Provillc,~, by thi! distribution and movements of troops; but so far asthc larger totals are conc~rned the war is not a direct factor of any importanc,.: in the Census in any province.
Economic conditions of the decade
9. In Considering the faclors which determined the movement of the population the decad..: may conveniently be divided into two periods, (a) a fairly normal period from 1911 to 1917, and (b) tne disastrous epidcmi~ year 1918, accompanied by scarcity and followed by a second crop failure ;n 1920. As will be seen the war hardly ~gan to affect the ordinary life of the people (ill about tne third year after its outbreak. Agricultural oonditions during the carlier period were on the whole favourable. In 1911·12 and 1912·13 there was a serious shortage of rain in parts of the Bombay Presidency resulting in scarcity conditions over cerain areas of the Bast-Deccan, but on the whole insufijcient rainfall was confin·~d to restricted localities. The year 1913-14 was abnormally dry. The United Provinces and Central Provinces suffered from an early c~ssation of the monsoon rain of 1913, which caused a fall in the Qullurn of wheat, and there was some distress in parts of the former Province., fn1914-15 the rainfall, abundant and well distributed in the centre and north and east of the country, was unfavourable in the eastern portions of Bengal and in Madras and BJrma and tne rice crop was somewhat below normal" Rainfall in 1915·16 varied considerably over the country, tne heavy late rain causing floods in th·;: eas.tern Provinces and parts of the United Provincc$ and Central Provinces, but on the whole the harvest of the year was fair and the rice crop was above the normal. Tne monsoon of the two following years was heavy and wdl distributed and both wneat and rice were excep+tionally good, giving a large out turn on a full acreage. Cotton and jute, the principh:: mercanlilecropswere both below the average in 1913-14and 191 S-16~ but in tnc case of these crops tne higlJer prices obtainable in a pO,or year tend to recoup the grower in value for what be loses in quantity. Meanwhile Ihe economic conditions in India were gradually undergoing a change. The outbreak of war in 1914 caused an immediate decline in tne bulk of India's oreign trade by the contraction of Shipping. Tne influence on prices was
not fdt f.,:verdy during the first two years of the war, fair narvests and full stocks k';(.'ping the prices of foodstuffs from any considerable movement. In 1917 howcverthe conditions ofIndia began to respond to tnc world-disturban~ of the war. Men for the fighting and labour units and food. ammunitionS' Ilnd war makl'ial of all kinds were demanded. Tne strain on I he railway organization dislocated (Ile loCal markets and the distribution system in tne country began 10 give troubl.~, while {he rising pric.:s of imported necessities such as salt. oil and cloth hit tn,: poorer classes severely. The harvests of 1917 were good but tn';! year was w~t and unhealtny and a virulent outbreak of "Iague in the north and west of India caused heavy mortality. Wages had not yet begun to move with the upward movement of prices and there'
was a general feeling of restlessness among the labouring classes, whkn rapidly increased under the iuflUl:m~ of political propaganda. Then followed the disastrous seasons of 1918-19. The monsoon of 1918 was exceptionally feeble and gaw practically no rain after the ~ginning of S..:ptember. In the Punjab and the ~ntral and western portions of the continent the crops failed over considerable areas and scarcity, aggravated by the high level of prices, was declared in, parls of the Punjab. United Provin~s. Central Provinces Bombay, and B har and Orissa, wllile agricultural conditions were equally bad in parts of the Hyderabad and Mysore States. The outturn of rice fell from nearly 40,000 to 24,000 tons while the wheat harvest in the spring of 1919 was equally poor. The crop failure was as bad as, if not worse than that of 1900 and prices of foodstuffs, cloth and other necessities oflife, already high, rose to highest n·.!ver previously reached. Famine relief organization is now 60 highly perfected in Ind;a that scarcity is not necessarily accompanied by high mortality. But meanWhile the influenza epidemic, starting in the I attet part of 1918, visited almost every portion of the country and wiped out in a few months practically the whole natural increase in lhe population for tho previous seven years. Emergency measures were taken. Transport, the export of foodstuffs, and the distribution of the necessities of life were all placed under Government control, and it was only the wonderful resisting power of the people, acquired from years of steady economic improvement, that enabled the oountry to tide without absolute disaster over a year of uil" pt'ecedented difficulty and strain. These conditions lasted through the ftrst half of 1919 ; but an abundant though not very well distributed monsoon in that year brought some welcome rdief, though prices temained high and it waS neeessary to stop all export of food grains and to reinforce the stoCks of the country by importing wheat from Australia. The monsoon of 1920 "a~ poor; the autumn rains failed and the winter rains were in defect. Famine was declared in one district in Bombay and scarcity in another district of· that Province and in seven districts of the Central Provinces. Famine conditions in Hyderabad were pronoune,;,--d and d·istress prevailed in certain di&-' tricts of Madras. ~y the end of 1920 nearJy 100,000 persons were on reliof and gen·!rous remiSSIons of revenue had to be given. It was not till the end of 1920 and the beginning of 1921 that prices graduallY began to come down,
P~bIJc Heatlb
10. Apart from the more normal cauGCIl of mortality the distinctive feature of the decade of 1901 and 1911 had b~en the progress through India oftb'l plague epidemic and the mortality which it caused. The recorded number. of deaths from plague during the period was about 6. millions. In the recent . decade the deaths, recorded less than half that number. There were, however.· serious outbreak" of plague in Bombay, the Punjab, the United Provinces and tbe Central Provinccs in the first two years of the decade, the mortality was again l1igh in 1915 and higher s~i11 in 1917 and 1918. when tbe disease was.severe in practically every part of northern and central India. Cholera IS normaly most prcvelant in tne Eastern Provinces. It was s:pecially virulc.nt m ASBam and in parts of Bibar and OriLisa and Bengal, while In several pro" vlnces outb:-caks of the diGCase either accompaincd or immediately follOWed the in1luenza eipdemic. Cholera in its most severe form has usually been 'associated with the deterioration in. physique which accompanied famine
100
conditions before famine organization had been perfected. Virulent as the epidemic can still be when its nold is established it is not usually of a temporary and local nature, and the total deatb-rate in British India from the disease during the decade did not amount to more than l' 5 per cent. By far the larg,~t number of deaths in India are entered under tbe category of 'fever', and allowing for inaccuracy of diagnosis it has usually been assumed that about two-thirds of tbe deaths so recorded may be ascribed to malaria. Recent investigations made in special areas, nowever, suggest that this proportion bas been conl)iderably over-estimated and that malaria only accounts for from one-fifth to one-fourth of the number of reported fever cases, the remainder being cases of dysentry, pneumonia, phtnit;is and other diseases.· Malaria is endemic in large areas of tne continent, both in the forest clad country Which fringes tbe mountain ranges and in tracts of Bengal, Assam and Burma,. Where the configuration of the countr) prevents the draiJ:w.ge of the flood-water after tne monsoon. In SUCD areas, besides raising tbe average level of the death-rate, it permanently lowers the "itality of the people and reacts both on the birth-rate and on their general economic Condition. In parts of Western Bengal th~ population, bas been described as sodden with malaria. Epidemic malaria was specially severe in the Putljab and United Provinces in tne earlier years of tbe decade and again in 1917 when, owing to tbe speCially heavy monsoon, mortality from this disease was high in almost every province. In tne last few years the prevalence of an affection whicb is tbe cause of conl)iderable mortality called Relapsing ]<ever has reoei.ved considerable attention by the Health Department. Tbis disease bas been diagnosed as common in most parts of tbe country, specially in the northern provinces and in toe Central Provinces and Becar and Bombay, but tne extent of the mortality whicn can be ascribed to it cannot at present be estimated. lior can figures be given of phthisis wnicn is undoubtedly respoo'iiblo fa. COJ1ljiderable mortality; especially in the towns of western India. the deaths from tbedisease in Ahmedabad amounting in 1918 to 5 per mille oftbe population.·· All otber factors in the health of tne people have, however, been over-shadowed by the influenza epidemic of 1918 and 1919 wbich bas dominated tbe population figures at tbe present census.
De Influenza epidemic of 1918-1919 11. The influenza epidemic of 1918 invaded the continent of India in
two distinct wares. The first infection apparently radiated from Bombay and progressed eastward from there, but its ori~in and foci are uncertain. It may n'llve been introduced from ship-ping 1n Bombay during May, and there is a suggestion of st>me sort of mtld influenza in the Bombay district, Delhi and Meerut in the spring ; but the existence of the disease in epidemic form cannot be established without dOUbt before June, The disease became ,e'neral in India in both the military and civil population during August and infection spread rapidly from place to place by rail, road and water. The first epidemic was most prevalent in urban areas, but it was Dot of a specially virulent tYJ>e and, probably for that reason, it is said to have affected Young children and old people most severely. The mortality curve went to a peak in July and then dropped, and there is evidence of a distinct interval between tbe first and second waves but not of any real break of continuity, as sporadic cases were reported throughout the intervening period. It is imp066ible
.PCVCrl in the Tropics by Sir L. R.oaers, 2nd Edition. p. 200 • •• Tb:rculosis in India by .... Ltvrlwter, (P. 49) Butter worth &: Co. '20.
lOt (1) ..., whore tho IDOl"C ¥irulcnt vinaa of tbe aecoacl invuion came from. TheN are oarWn facts which wacst that tho clitcaIe bcpn in thO Pooaa diltriot Ua September. It spread from proviuce to province, iastina in a viruleat Corm pnerally from eight to ten weeks, w hen mortality, usually duo to res~tory dieeases, reached it" highest point. The rural areas were most severel, mfocted, the reason probably being that while, villages have little advaQtap over towns in the matter of overcrowding, sanitation, ventilation the urbau areas have the benefit of qualified medical aid and organised. effort. Mortality was specially high among adults (20--40), particularly among adult females the disease is generally fatal to women in pregnancy. It is suggested tbat the high mortality among women may have been due to the fact that, in addition· to the ordinary tasks of the house, on them fell the duty of nursing tne othOl1 eYen when themr.elves ill. The figures show that the excess mortality between the ages 20 and 40 amounted in some cases to nearly four times the mean. It is no exaggeration to say that at the worst period whole villages were absolutely laid desolate by the disease. There was sometimes no means of disposing of tbe dead, crops were left unharvested and aU local official action was largely paralysed, owing to the fact that the majority of the official staff were put out of action by the epidemic. To add to the distress the disease camo at a period of widespread crop failure and reached its climax in November when the cold weather had set in ; and, as the price of cloth happened at the time to be at its highest, many were unable to provide themselves with the warm clothing that was essential in tbe case of an illness that so readily attacked the lungs. The disease lasted in most pro'Vinces well into 1919 and save a high mortality in that year in Bengal and the United Provinces. Byet after it had subsided there were in the Central Provinces, Bombay and Burma mild recrudescences later in the year, while local outbreaks continued o'Ver the country during the next two years.
The comparative severity of the epidemic in the different parts of India is shown in tbe map on the opposite page.· IT IS not possible to explain the peculiar vat iations in the local preva!enee of the disease which seems to have been entirely capriciouli in its incidence. The cost line escaped with a low mortality while in the hilly country the disease was usually specially fatal, though this waG apparently not always the case in the Punjab. The Eastern Provinces escaped lightly and Calcutta. was not attacked as severely as other cities. It has been sugg:sted that the mortality was determined by the comp:uative liability of the people to respiratory complications or, in othcr words, th·~ir susc'~ptibili(y to pD>~umonia, and it looksas iftheepidemic was more virulent in a cold dry climate than where there was comparative warmth or humidity.
There is no direct m~ans of asc~rtaining the mortality from the epidemic. Influenza was unkown to the registration staff as a specific form of illness and the deaths were entered under the heads fever or respiratory disease. Various estimates have been made based on the excess mortality over some suitable ID'!an. The average of these calculations gives a total number of deaths in the areas under registration of about 7,100,000 in 1918, as shown in the following table ; to which must be added, as the results of similar cal. culations, another Ii million deaths in 1919, giving a total reCorded mortality of nearly Sf millions in the two years.
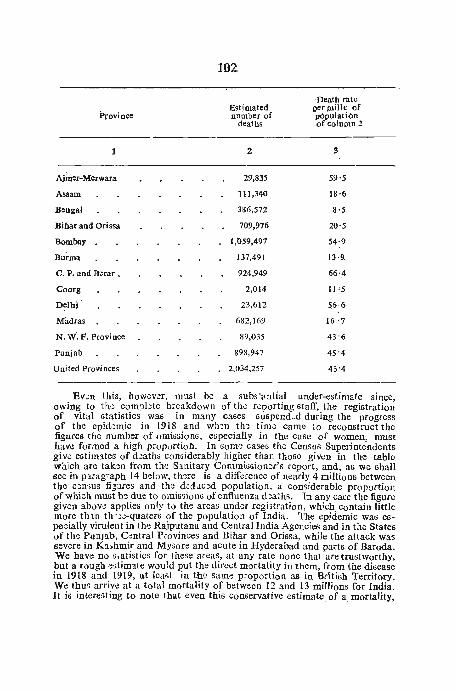
102.
·Death rate Estimated p'er Plillc of
Province Dumber of population deaths of column 2
1 2 9
A,imer-Merwara 29;835 59·5
Assam 111,340 18·6
Bengal 386,572 8·5,
Bihar and Orissa 709,976 20·5
Bombay 1,059,497 54·9
Bu~ma 137,491 13·9.
C. P. and Berar . 924,949 66·4
Coorg 2,014 II '5
D~]hi 23,612 56·6-
Madras 682,169 16'7
N. W. F. Province 89,035 43'6
Punjab 898,947 45'4
United Provinces 2,034,257 43'4 0 _________
Ev.m this, how.;:v.;r, m'..lst be a subs'antial under-estimate since, owing to th·~ com?bte breakdown of tho.; reporting staff, the registration of vital statistics was in many cases suspendvd during the progress of the epid·;:mic in 19 18 and wh':m the time Came to reconstruct the figures the number of omissionG, especially in the case of women, must have formed a high p:-oportiotl.. In some caseS the Cen()us Superintendents giv<! estimltes of d~aths considerably higher than those giveu in the table which arc tak<;:n from thf.! S3.nitary Commissioner's report, and, as we shall see in p3.rag'"aph 14 bdow, th-::re is a difference of nearly 4 millions between the c~n')Us figures and the dcd Jc,~d population, a considerable proportion of which must b:! due to omissions ofenfluenza d~a:hf). In any cace the figure given abow applies only to the areas under regi3tration, which contain little more thlll th".)-:-quaters of the population of India. The epidemic was es~ pedally virulent in thf.) Rajputana and Central India Agencies and in the States of th0 Punjab, Central P,ovinces and Bihar and Orissa, while the attack was severe in K"l>hmir and MYGore and acute in Hyderabad and parts of Baroda. We have no s~ati5tics for these areas, at any ratc none that are trustworthy, but a rough e:1timate would put the direct mortality in them, from the disease in 1918 and 1919, at lear,t in the same proportion as in British Territory. We tbur; arrive at a total mortality of between 12 and 13 millions for India. It is intereGting to note that even this conservative estimate of a. mortalfty,
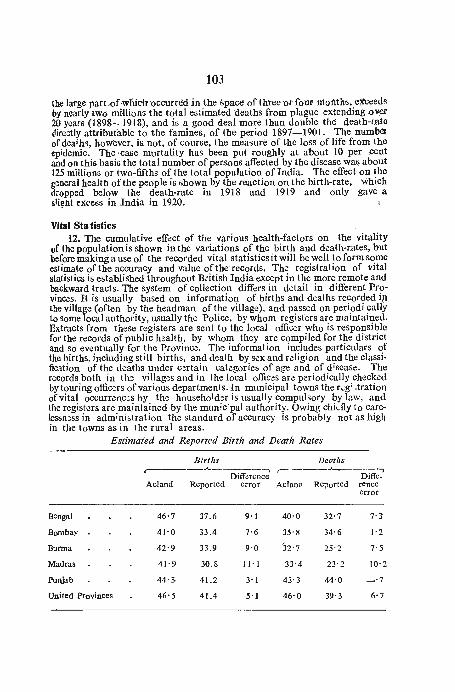
103
the large parLof·wliich"occurred in the space of three 'or four moIith~, e~eeds by nearly two millions the total estimated deaths froni plague extepding OV.&. 2(} years (1898"-. 1918), and is a good deal more than double the death-rate directly attributable to the famines, of the period 1897-1901. The number of deafh'), however, is not, of course, the measure of the loss of life from the epidemic. The ·case mortality has been put roughly at about 10 per .cent and on this basis the total num ber of persons affected by the disease WM about 125 millions or two-fifths of the total population of India. The effect on the general health of the people is shown by the reaction on the birth-rate, -which dropped below the death-rate in 1918 and 1919 and only gave a slight excess in India in 1920.
Vital Sta tistics 12. The cumulative eff~ct of the various health-factors on the vitality
of the populationis shown in the variations of the birth and death-rates, but before making a use of the recorded vital statistics it will be well to form some estimate of the accuracy and value of the records, The registration of vital litatistics is established throughout British India except in the more remote and backward tracts. The system of collection differs in detail in different Provinces. It is usually based on information of births and deaths recorded ip the village (often by the headman of the village), and passed on periodi cally to some local authority, usually the Police, by whom registers are maintained. Extracts from th·~se registers are sent to the local officer who is responsible for the records of public h~alth, by whom they are compiled for the district and So eventually for the Province. The information includes particulars of the births, including still births, and death by sex and religion and the claSsification of the deaths under c;!rtain categories of age and of disease. The records both in th~ villag·~s and in the local offic.;!s are periodically checked by touring offic;!rs of various departments. In municipal towns the r..:g;Jtration of vital occurrenc·.:;s by th·:;: household~r is usually compulsory by la.w, and the registers arc maintained by the munic:pal authority. Owing chkfly to care· lessn;!ss in adminibtration the standard of accuracy is probably not as higb in the towns as in the rural areas.
Estimated and Reported Birth and Death Rates
Births De{Jths r------.A..---------,
Difi"l!rence r--
Difi"e-Acland Reported error Aclam· Reported rence
error
Bengal 46'7 37.6 9'1 40'0 32'7 7'1
Bombay 41'0 33.4 7'6 35'8 34'6 1'2
Burma 42'9 33.9 9'0 32'7 25'2 7'5
Madras 41'9 30.8 11'1 33'4 23'2 10'2
Punjab 44'3· 41.2 3'1 43'3 44'0 -'7
United Provinces 46'S 41.4 .5'1 46'0 39'3 6'7

104
Attempts haw from time to time been mado to gauge tho e~tent of errol'S by placing certain tracts under a special staff responsible for watchios the rep::>rting. but such attempts are themselves full of di:Biculties and their COIlelusions have not be~n a~pted as of any final statistical value. The resul~ of some attempts of this kind are described in Appendix II to Chapter V of tho &::ogal report. The perc:mtage of omissions found varies considerably in different regions and the samples can hardly be considered altoge'her representative because, on the one hand, the examination of the vital statistics was usually performed by a staff engag.!d on fewer investigation in tracts wh;ch were sp.!cially unhealthy, and, on the other hand, the presenoe of the enquiri~ staff probably stimulated the reporting agency to greater accuracy. StatistIcal analysis, bas:::d on a comparison h:::tween the recorded birth and death -rates and thl! population and ag'~ distribution according to the census, also afford a valuable means of check, Comparing the estimated birth and death-rates givcn by Mr. Acland in his acluarial report on the 1911 census figures with the reported rates of the decade ending with that year, we find that the apparent omission in the reported figures vary between 7 and 8 per mille for births and are slightly less in the case of deaths, Tests made by Mr. Thompson (B!ngal) on the basis: (1) of a comparison between the populati01l returns and th,! p;)pu1:J.tion d,!duc~d from tne vital statistics of the decade with allowance for migration, (2) th~ mean population, (3) tbe statistics of infant mortality in 1920. toe year before the census. and (4) the results oC special enquiries into the size and con'ititution of familil!s, suggest tbe following conclusions as applicable to lkngal:-(a) about 25 per cent. of deaths that occur remlin unreported. (b) the omission in the Case of female deaths is ordinarily about 2 p.;r C!nt more th:ln for mlles. and (c) the omission in th~ record of births is g'~n·!rally between 1 and 2 per cent more than in the case of d'!aths. Mr, Middleton (Punjab) was able from calculations based on the comparison between the enumerated and deduced population to obtain a correction faclor for the qrrorS in birth and death registration in diff~rcn! dislricts which varied from'S to 16.6 per cent in :hc C:lSC of death ralet> and 9 to 29.4 per cen i comitting one esrecially defective case) in birth regj"lrations. rn reviewing [h'2se calculations Mr. Jacob in App':ndix I to the r..:-port has sugg:tcd som: am:ndm:nls in the working. and on ev'~n more elahL)r.I"'~ c lk:ti:ll i,las of hi; own Ins arriwd at I he following conclusion:"thlt t h: vir II "I a' is' ics or I h,~ Punjal) are I ikdy to b,: about 7 or 8 p:r cent in error and (Int. provinci:llly, errors ofubl)Ut II p:r c·~n1 in the birth-rate and of say 5 p~r c.:nl in th·~ d;ath'l'ales may b,,: adopted as prob:lble. Finally iIi s ckar that the c,'nsus fignr..:s of 1911 and 1921 do nol establish the accuracy of th·_; vital statistics!()'-a gro:atcrti-:grcc ofaccllracy than 7 01'8 per cent of O:1T()L"
As a r :Slll! of! h~ vari()ll~ l·_;::;ls which hwc b:<:n nlldo and of the g'~ncral CXP':f1',~llC'': or thl)S': who ar,,~ in th; b.:st pDsition to cstimak the value of these records th~ followin; propc)sitiollS may perhaps be acceptcd:---
(I) In rural areas the omissions in the ro:cord of numbas vary up to about 20 per cent.
(2) Th~ rcc()rd of births is normally less accurate than that of deaths.
(3) In urban areas the standard of accuracy varies greatly according to the attention given by tbe local authorities. It is usually lower than
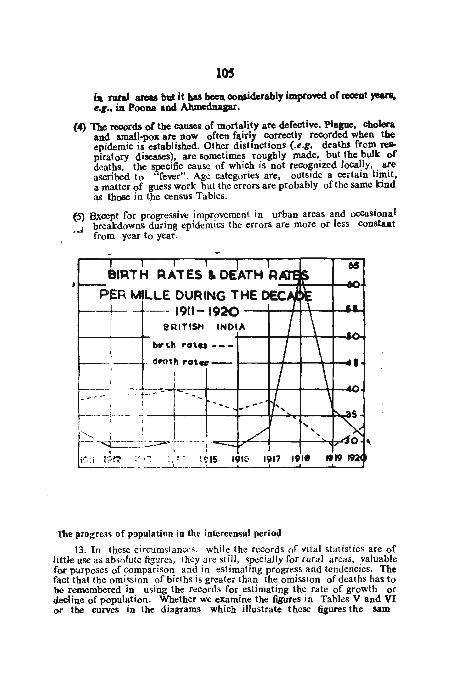
lOS ill rurat aRI8S but it baa been oouiderably impro~ of reoent )"OU'I. '-t., ill PooP and Ahmednagar.
(4) The records of the causes of mortality are defective. Plaaue. chol«a and small-pox are now often fairl), correctly recorded when tile epidemic is established. Other distinctions (.e.g, deaths from reapiratory diseases), are sometimes rougbly made, but the bulk of deaths, the specific cause of which is not reco~nized loeally, are ascribed to "fever". Age categories are, outside a oertain limit, a matter of guess work but the errors are probably oftbe same kind as those in the oensus Tables.
(5) axoept for progr~ssive .impr?vement in urban areas and occasional • ..J breakdowns during epidemics tbe errors are more or less constaat
from year to year.
,
eRITISH INO'"
br~" rot •• --
. dnnh rot" -- t---+-+---f--+-+--4
The prDgre~"l of popUlation in the intercensal period
13. In these circumstances. while the records of vital stalistics are of little use as absolute figures, they are stil1, specially for rural areas, valuable fOl" purposes of comparison and in estimating progress and tendencies. The fact that the omission of births is greater than the omission of deaths has to be remembered in using the records for estimating the rate of growth or decline of population. Whether we examine the figures in Tables V and VI ~r the curveS in the diagrams which illustrate these figures the sam
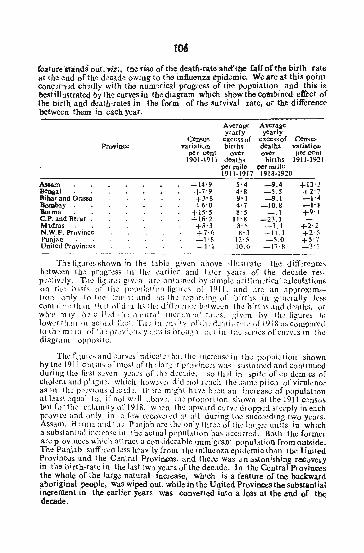
r06
feature stands our ... iz:, tne rige of the deatll-rafe~ and'the faU oCthe birth rale at th·, end of the d"eade owing to the induenza epid',mic, We are at lhis pOInt eone,"n·,d eh,iJjy wilh the nUllorical progress of <ne popuialion and tbis is besi iIIuslrated by the curveS in the diagram which show the coMbined e~el of the birth and death-rateS in tbe form of the survival rale, or the dIfference between them in each year,
Average Average yearly yearly
Census excess of excess of Censu... .... Province variation births deaths variatiOll
per cent over ove' per cent 1901-1911 deaths births 1911-1921
per mile -per mille 1911-1917 1918-1920
A>aam +14'9 5'4 _9.4 +13'3 Beogal . . +7'9 4'8 -5.5 +2'7 Bihar and Orissa +}'8 9'1 -9.1 -I" IIomb,y +6'0 4'7 _10,8 _I·t Burma +15'5 8' 5 -,1 +9'1 C.P. and Borar • +16'2 11'8 -23.1 Mldr.a.s +8'3 ~. 5 -3.1 +2'2 N. W. F. Pr~vinc~ +7'6 g'3 -11.1 +2" Punjab -1'8 12· .5 -5.0 +5'7 United Province!' -1'1 10.6 -17·8 _3'1 -------
Th,:! f1~~lr(:s t~hown in th'~ tahL!; g;v~n ahoy,; i1iustl'(ltc the diif...:rcnccs h;tw(:~n th-: progr...::ss in th,.:: carlH::r and ht"_~r y.:ar:-; of thc dCC~ldc r~t-p~cl.iv,.)ly. Ti\·_; li.;Jr..::-; giv:a arc pblain·:d by simpl~ arit:lm:t!cJ.! c.dculatioDfi on the b:tsis or (h~ P~)pl.lJa(10n figur~s or 1911, and arc an approximation only t(llilO: {ruth; and as ,[il': r,,::p,);·ting or birth~ in g·.'n..::ralJy )c:-;(> com)l~'c dnn (Il t ! ofd ':llh" {h,; d!ff,'j\:nc,_; b,~tw;.: ... 'n Ill·,: bIrlhs and d··aths. or Whll IllLy ,b~ cdl_~d Ill: I1tiural il\c~· . .:m_'il( r.lks. grv-:n hy Ih,.: figarcs it> low.:rfhm til ae'tld r,l~:, TIt:: tn',_.:n,;lly o;·1;1;J.·.'a(h-r:'_('~'o,fI918ascompJr(.'d to th.; m~,l.l 01'1 il~ \F,:v/"Hl; Y_\ttS IS hruu_:::-;li OU{ in ([1\; saj~S ofcurv·.:s in tho.: diagram opposik.
The flL;ufl'" and curv..:s lnd;c:lk !h:1I (hL' ,incI"(':asc in i he pupal;!l ion shown hy tn·;: 1911 c;ns.lIS of mos.1 ofth: larg:~r prl)Vlnc~s W:1', su~tain,~d and continued during thl.: first :-:,,:wn y_'ars or (h: d:c:.ul~, so 11nl. in spik: of cpid..:mics of chol,xJ, and phg~1-:, w:l!ch lh)w.!v.:r d:d nol f,:~lC:l Jh,:; sam,; pitch ofvirulcncc as in lh~ p:·,;vinu ... (LcJd:, th~r<..: rn;gltl h'-lV,: h.:,_;n an increase of population at kasl eqll<ll (0. if n\)~ w;l1 abov'.:, li\':~ proportion shown at thc 1911 (}.::nsus but for th,,: c:11:1m;1y or 1918. wh<~n IIF.! upward cury.:: dropp2d steeply in each prov;c..; and only in a f..::w rccov.::rcd at all during tn<.:: Suco_\.:ding two years. Assam, R.lrm·l.1nd th·') Punjlh ar~ the only three ofth·_; brl::;,.:r unils in which a substantial inc!C';(sl..': in the actual population has occllrrcd~ Both the former arc p"ovinc(:s wh;ch atlract a con·;id..::rable i_mm:gran1 population from out6id~, Th'! P..Lnjab s.uff:r(:d kss h~aviJy from the mftu':nza cpid~mic than Ihe United Ptovinc~s and the C~ntral Provi~oo, and there was un astonishing r:Cuvery in the birth-rate in the lJ.st two years. of lhe deca.de. Tn the Central Provinces tbe whole of the large natural increase, which is a feature of tne backward aboriginal people, was wiped out, while in the United Provinces the substantial increment in the earlier years was conVefled into a lo.s at the end of til<: decade.
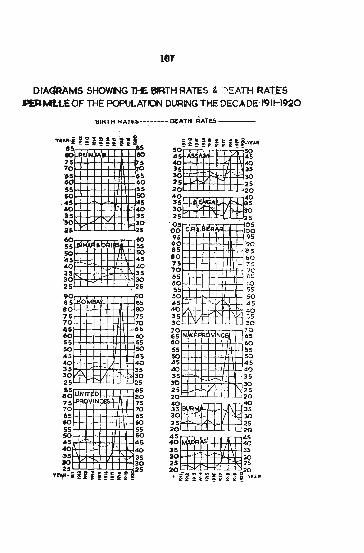
lOT
OIAclRAMS SHOWING THE BIRTH RATES & DEATH RA1ES PERMl.L£ OF THE POPULAilON DURING TH,!: DECADE 1'91l-I~O
BIRTH _RATES-...... ~ .. -- DEATH RATES --'-, -
60. to 5,5 HA' S5 !IQ 50
:5-- -. ~ : l5 ' , 35 30 ' - 30 25 , ,25
to°r:r::r::l=rT-r-n90
8511°IBIIIISS
BO 80 75 75 70 70 65 65 60 60 55 55 50 50 AS 45 AO 40 35 35 30 30 25 25
:gP:!~!':E.0 :~ 15 R, Y1N 75
70f-j:l::t:tt~~ 70 I15S}- 65 60 60 55 5S 50 50 4S 4S
<IOIOOm40 -3'5 35 30 30
Y~:~i ! j ! i.! i , ~ _ 25
50.~g~~~Hn~;; .. :J ",, ~ ~ -' - "-~ 2S 2S 20 20 40 40
HHmtttt!~ 85 C.P.'. RA IO~ 95 95 90 ?O 85 :as 80 ,80 75 :'~ '0 .,c 65 ()!j
6111'60 55 I 55 50 150 4 45
~~ , -- ;~ 30'LL~LL~_LLj30
~~.'. ViNe ~~ 60 60 55 55 50 so 45 45 40 40 35 . ~ 35 30 -_ ~ - 30
25 25 20 20
UffimttmH ifill'S", , ~ 25 . 25 20 20 • ~-g i ~ ~ i i ~~ ~_~i!"'R
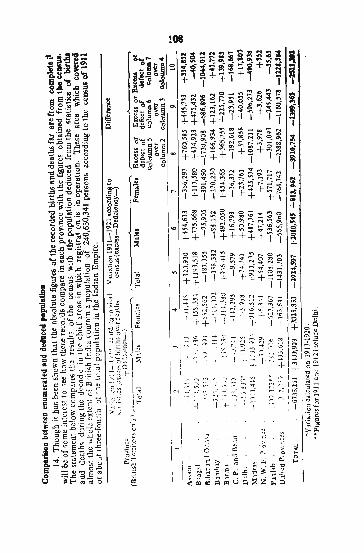

109-110
DIAGRAMS SHOWING IN INDIA ""CERTAIN PROVINCES THE
SURVIVAL RATE PER MILLE OF THE POPULATION DURINC
THE DECADE 1911-1920
(Oirt .. ",nc::.: bet_un. alrt..h end Dcatn IilClt,,: EXCESS+,DEFECr-)
+05 +'0 ... 5
o
- 5
-os -20
- - -
v
t-- ---t---
-~R~TI~H lNc'IA-r-- r---,
1/
.~ F e-f-
-25 r--~t-- .- . . _.
- r- ec'MM r-
... 5 '\ ~1 f- \-l'
o -- --- ..... 1--- f-~
" ,__ ./' r j- f-e-os
r --50
-60
... 20
""0 + 5
o - 5
-40
-45
L I
/
~,.,._
5 , tl
,
UNIT DPR
-... ./'
~ .'!§A / --=::
i-e-
I-f- fL ,~
A" AM
f'\ f-~
VINC S
\
......
-----; -~~g~~~"'~~~ 9,.-R O.1ndiiC/72
- - - - - - - -MADRASI :'2 --.,
.. j.-+, t--V .. _--.--+ .
\ l -(
-~fr~~ f-r- .- +-{, !:--hft""-"Ir--:-F:.~ ... t" aERARl:~:
f f--.j---t--+--t---"f''\I/- .- -H~': I-I-t-I-t-t--tt-t-H 0
f--+--+--+--t--+f-it--l---:ri-s
~d::::: _ ~~~ii-&~ tI~fA" '0
\
- - ----+--+--t--+-Irt--~-5S
V N.WF R VINCE ... -.. +<0
~/ H - V
'0 B R"A ::.--
I,
35
0; ~ ~ '" ~ ~ ~ ~: ~ ~ !: !!:

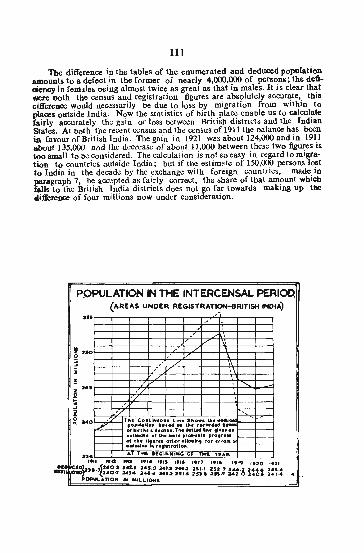
111
The difference in the tables of tbe enumerated and dedu,ced population amounts 10 a defect in the former of nearly 4,000,000 of persons; Ihe defteiency in females oeing almost Iwice as greal as thaI in males. It is clear that were DOth the ",nsus and registration figures are absolutely accurate, Ihi. cifference would necessari1y be due to loss by migration from within to places outside India. Now the statistics of birth place enable us to ealeulate fairly accurately the gain or loSS between British distriCls and the Indian States. At both the r.""nt consus and the COnSuS of 1911 the balance has been in favour of British India. The gain in Inl was aboull24,OOO and in 1911 aboul135,OOO and the decrease of about 11,000 between tbese two figures i. 100 small to t)C considered. The calculation is not so easy in regard to migra· tion to countries outside India; but jf the estimllte of 150,000 persons lost to India in the decade by the exchange with foreign countries, made in paragraph 7, be accepted as fairly correct, the share of tbat amount which fall. to the Brilish India districts does nol go far towards making up lI,e tliiference of four millions now under consideration.
• -.
PQPULATION IN THE INTERCENSAL PERIOD. (AREAS UNDER REGISTRATION-BRITISH INDIA) _-
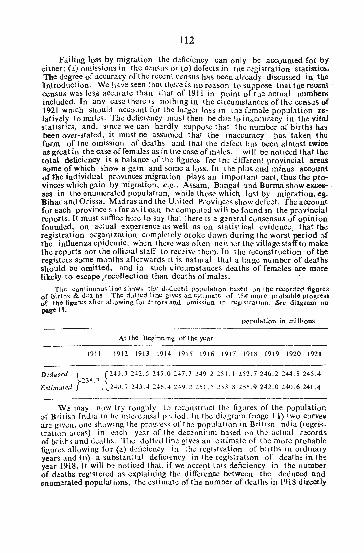
112
Failing loss by migration the deficiency Can only be accounted for by eitner; (a) omissions in the Ccnsu'i or tb) defects in tne registration statistiCS. The d'~grce of accuracy of the recent census has ~en already discuss.ed in the Introduction. We have s.een that there is no reason to suppose tnat toe recent. census was 105.0 accurate than that of 1911 in point of the aClual numbers included. In any case [here is. no(hing in the circumstances of the census of 1921 wnich should account for the larg\!c loss in tne female population Ie~ latively to mll~s. The deficiency must then be due 10 inaccuracy in the vital statistics, and, sinc<.! we can hardly SUppoSe tbat the numb.;r of births hag been over-stated; it must be assumed that the inaccuracy bas taken the form of the omission of dealhs and [hat the &~f~d has been almost twice as great in the case of females as in tne case of males. will be noticed that the total deficiency is a balance of the figures for tne ,::jff~rent provincial areas: some of which show a gain and some a loss. In the plus and minus account of tile individual provinces migration plays an important part, tbus the provinces which gain by migration, e.g., Assam. Bangal '.!nd Burma show exces" ses in the enumerated population. while those which lost by migration, ego Bihar and Orissa, Mldras and the United Provinces show defect. The account for each province So far as. it can bo: comput:.'!d wiH be found in the provincial reports, It must suffice here to say that th\!fC is a g!n,:ral conSensus of opinion founded. on aClu':ll experience as well as on statistical evidence, that the registrat ion org~nlza,( ion completely broke dow~ during t1.1C Worst period of the influenza epidemic, when Lherl! was often neIther the Village staff to make the reports nor the official staff to.i'!;,c.::-ivc them. fn the reconstruction of tIle registers some months afterwards It Is natural that a large number of deaths should be omitted. and in such circumstances deaths of females are more likely to escape ;recollection than death~ of males.
The C()n~inllOu" tine shoWS the t].;uuced population based on the recorded figures of birlhs & dealhS. The.dotted line gives an C.S1imale. of the more probable progreslI of the figures artt.:r allowlOg ror errors and ollllssion In registra1 ion. Set! diagram on pagelL
populatkm in millions
At the Beginning of the year
1911 1912 1913 1914 1915 1916 1917 191R 1919 1920 1921
D.:d.;Jced ') 12040.,3 HZ.S 245.0. 2·~1.3 2:l-9.2 251.1252.7246,2244.8245.4 ;"238, I' i
E~tllll!lted J . lHJ.7 !-B,-i ~-J.6'+ 2-l"J,2 251..5 253.8 255.9242,0240.6241.4
W..::. may now try roughly to r.;construct tho;: figun;s of tb~ population of B~itish rndla In h~ intcrv.::nsal p::riod. In lh'.! diagram (page lI) two curVe'" arc giY.:n, 011.1..': s!ll...)wing Th·! pfo~rcss oftilC pl?fmlation in Brhisn ndia (regeif\tration arcas) 11\ I..";}ch y:.::ar of t~e d<.!c~nnlum b,:!-scd. on thL' ac[ual r~cords. of brilhs and deaths, Th~ dotl~d lIne: gives an estimate of th'~ more probable figUl'~s. allowillg for (a) d?ficicncy . in th,e regist[a~ion ,of bir!hs in or-d.inary years and (.D) a substantial defiCiency ll\ the registration 01. deaths. In the year 1918, It will b~ noticed that, if we accept this deficiency In the number of dcaths registered as. explaining the diff>!rence between the deduced and enum·!rated populations, th~ estimate of the number of deaths in 1918 directly
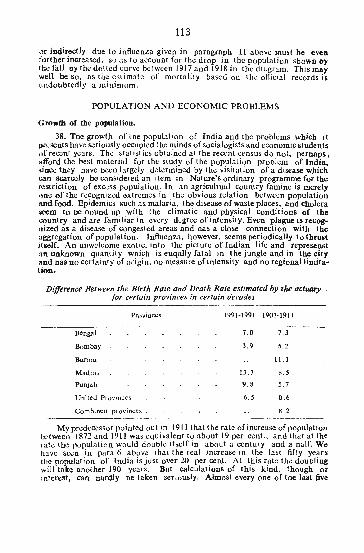
113
or indirectly due to infiucn-la given in paragraph 1 J above must be e\"en further increased, 80 as to account for the drop in the population shown 0)' lbe fall oy the dOl ted curve between 1917 and 1918 in the diogram. Tbis may well be So, as the estimate of mortality based on lhe official records is undoubtedly a minimum,
POPULATION AND ECONOMIC PROBLEMS
Growth of the population.
38. Tne growth of tne population of India and the problems whicb it presents have seriously occupied thl! minds of sQciaJogists and economic st udents ofreccnt Y0ars. The statistics. obtained at the recent census do not, pernaps. afford the best material for the study of the population problem of India, !Ioincc they nave oceo largely determined by the visitation of a discase which can scarQ!ly be considered an item in Nature's ordinary programme for the rcstricllon of exc..:ss population. In an agricultual country famine is merely o.}ne of the r~(.jogniz..:d extremes in the obvious relation between population and food. Epidemics such as malaria, the disease of waste places. and cholera seem to De oound up wIth the climatic and physical conditions of the country and are familiar in every do:grce ofintensi1y. Even plague is recognized as a disease of Congested areas and nas a close connection with tbe aggregation of population. Influenza. however, seems periodically to tbrust itself, An unwelcome ex.otic. into the picture of Indian life and representit an unknown quantity wnich is cuqally fatal in the jungle and in the city and nas no certainty of origin. no measure of intensity and no regionallimita" tion.
Difference Between the Birth Rate and Death l/JJte estimated by the actulll'Y for certain provinceJ' in cerJain decade~
Bengal
Bombay
Burma
Madras
Punjab
United Province"
Provinces
Combinca provinces.
1991·1991
7.0
3.9
13.3
9.8
6.5
--------------------
1901-1911
7.3
3.2
11.1
i'S.5
3.7
0.6
8.2
Mypredc<A.!ssor pointed out in 1911 that the ratc ofincrcasc ofpopuJatioll h:Jwecn 1872 and 1911 was equivalent to about 19 per cent.. and that at the ratc the population would double itself in aoout a century and a naif. We have seen in para 6 abov~ (bat the rcal jncrease in the last fifty years the population of India is just over 20 per ~nt. At t.his T.atc the douoling will take another 190 years. Bur calculauon~ of IhIS kind, though or interest, Can nardly oe taken seriously. Almost everyone of toc last live
114
dec.d·,. bas witnessed some special disaster. A severe famine in Soutb India checked the increase in tbe decade 1872-1881. The decennium 1891-1901 was dominated by the great famines ofth. closing period. Growtn in Northern aad Wostern India was checked in the succeeding decade ~y plague and "'" have had in the past decennium an epidemic which has caused more Concentrated mortality than any previous calamity. The decade 1881-1891 alone waS free from any exc~ptional calamity and is usually Considered a period of fairly normal progress. The increase in the population in that decade we 9.6 P" c,nt for India. With this figure we may compare (I) the rate of6'4 per ",nt. in tho decade 1901-1911, when plague considcraoly reduced the population of Ihm~ay, the United Provinces and the Pul\iao, (2) the stead y rate of progress i n B!ngal amounting to nearly 8 per cent in each of the three decades from 1881 to 1911 and (3) the incremental rates for some oftbe large provinces for the decades 1881-1891 and 1901-1911 based on actual calculation. It is perbaps n an unreasonable estimate to pla~ fae proDaole natural increm-:mt in India at ner present state of development and apart from exceptional calamities a" between 7 and 8 per cent. in the decade.
The rate of growth for India as a whole is of course tbe resultant of Dumoer of very differen~ ra~eS in different parts of the country. In discussing the Bubjec( in [he report of 1911 my predecessor pointed oUt That increaS'e tends to vary inversely with tne existing density of tne popUlation. The hiRh rateS of increase in tne s.parsely populated area of Assam, tne Central India tracts. and Burma contras.t with tne lower rates in the valJeys of tne Gang-as and Jumna. The rate of growtn of population in India is not greater than that of many counnies of Europe. It IS, however, toe product of different conditions, the natural increment being the diff~renoo between a very high birth rate and a correspondingly high dearn~rale and obtained. therefore at an enormoUS sacrifice of life especially of infant life. The high India binn-rate is largely the result of universal early man iage and uncontrolled marital relaLions, the rate diff~ring in diff~rent communities and regio .. owi~ partly to difference of martial customs and parlly to variations in fertility. The Muhammadans and aboriginal tribes, who have rew wido_ in the reproductive age-periods, have a higher birth-rate than Hindus. Tho birla-rate ,which seems to be higher in tne lower strata of Society, may ako 'Vary with racial differences in ferdlhy or, according to some modern theocies with tne influence of cultural and economic conditions. in different stage of development. But any diminution ofthe birth~rate due to influences of the last kind must be very gradual in their action, and unless, as is extremeJy unlikely, tdefe is some revolucionary(cnange in the outlook: oftbe mass of the people towards marriage. it ~ms im{!ossiole.tbat there will be any general downward movement of the blrtn~rat-e In India for many years to come. On tbe otner hand systematized attack is being made on mortality at every point oatb officially and privately by the improvement of sanitation, tbe ex.tension of medical relief and the organiud efforts towards infant and maternal welfare. Any substautial su""""s in sucb measures would mean the widening of the difference between toe birth~rate and tae deatn -rate aDd a corresponding rise in the rate of increase of population. Carr Saunders in bi. inleresting book on "The Poplliatiou Proolem" (Clarendon Pres., 1922) shows that India is one of (he countries in an intermediate stage as reg:uds the process of population growth. She has. abondoned:-ar more or}e .. ab In doned-the old fashIoned methods ofhmltlng population to an optimum, 'iz.
115
periodic abstention from intercourse, abortion and infanticide and she bas not yet adopted the m!thods of advanO!d countries. viz., postponement of marriage and voluntary birth-control. She is at a point where her population is controlled b~ disease and disease only. Poll· would possibly already find in the lower birth-rates of some of the mor¢ advan03d classes evidence of the sterilizing effect upon them of the increased nervous energy developed by their progressive culture and wealth.
We have already briefly reviewed the figures of density of population in India and the provinces. In writing of the relation of persons to areas Proof Bowley·· remarks:-
"The d0nsity of population involves further conceptions. It is, of course a matter of simple arithmetic to divide the number of persons recorded by the number of square mil\:s in the disniet which they inhabit; [he difficulty is to attach meaning to the quotient. We have. in fact, two hcterogeneollc6 totals. and the items of lhe onc have a varying relation to the items of the otber. The population total includes male and female, old and young, workers, own~rs and d.:!p ;ndo,!:Qts. The area total includes fertile and barren acres. mountainous and plain. metalliferous and valueless, urban and tura]. The relationship may be one of accidental residenoe or ofcompletedependcnoe onthc products of\he land. Before we take any average we must make sure (hat all the members of the denominator ha'YC another Common characteristiC6, and that these Characteristics have some relationship to each~other.to
Nowhere are the problems of the aggre~ation of population more complex than in India with its extraordinary dIversity of physical and economic conditions. The discussion of the spatial density of population and its pressure on accommodation belongo; to the next chapter. hut we may note that tne actual physical proximity is a factor in growth which is not by any means confined to lawnS. lfwe eXCo.!pt certain UaClS in the east and souta of the country, where the village is a mere administrative expression and the houses arc scattered and isolated, the congestion in the areas actually inha~ bited is probably as great in the villages as in aU but the most congested towns; and this actual physical proximit)' of the people in rural as welJ as in urban areas it; an important factor in India, whel e So much of the morta~ lity is due to diseaSeS whicn are either infectious or epjdemic and So little regard is paid &0 questions of sanitation. Those who have seen the vilJges in some of the more backward parts of the central tracts of the country bill appreciate lhe statement thai, whether it Dc due to the physical conditions which limit '[he available residential sites or to the traditional habits of the people~ at any rate, in India as in the "cong..:sted" districts of Western Ireland, the mere figures of area divided by population are not index of the real ag~ gregation of the population in any tract. The social and eConomic problems of popUlation in India have been treated in an interesting manner in a pamphlet entitled "The Population Problem in India" by Mr. P. K. Wattat. Besides oringing out, by means of statistics from tne Census of 1911. the misery and scarifice of life entailed in the methods by which population i. sustained and developed in India, the author examines the question as to
*'TllC IAw or Births aqd Doaths" by C.1l. Poll. **Tbe Meascu'~Jr.Dt of Social PhODomCI18 (page 40) by Prof. A. L. Bowley.
IO-IIt.,G.ladla/72
116
whether the productive capacily of the country can be improved So as to provide food for the IncreaslDg millions and concludes Ihat. unless there is considerable redu~t1on in tbe birtb~rate~ there is imminent danger of serious Hover-population". Other writers on social and economic question in India such as Messrs. Mukerjec and Kale apear to hold somewhat similar views.
Th~ conc.::ption of over-population is however its.elffull of complexities~ [t exprcs::-..:s an economic relation between lhc population of a c.::rtain area and th'.! m~ans of production in thlt. ar~a which i:-; rn':aninglcss without a clear d.!finition of each rdated elemi:nt and of th':: area consid·:,r~d. Population is m~rdy nun con~id·.!rcd in a quo:,mtitativc s'.:nsc, and ma.n may include anything from a naked ab.:>riginal to an industrial plutocrat. ~g'1in means of production may rang~ from the glthering of edible fruits In the Jungle to the digging up of nugg!ts out of a gold-mine. while the arl!u populated and exploited may b: a villag..:;, a district, a provinw or the Whole country. If we try to express the idea of pressure of population mor,;,;: precisely we arc still fac~d with difficulties. Wo:. may con)id~r lhe reliltion b..!tween th\! number of the p~opb of a c!rrain ddim:!d tract at thdr pr~sent intellectual. moral and m'veriul standard of living, on the onc hand. and the aV'0rag>! productivity of the area according to existing methods of exploitation on the other hand, and say that if thi S pl)puiat ion cont i nnes to increase numerically at its pres\!nt rate it cannot maintain its maL::rial 6tandard of living under condittons as they cx.ist at pres._:;nL In the various forms in which it oCCurs the situation as describ::d, viz., the ov~rtaking of the exis.ting material resour~s by thi! exp:msion of population. provides ih\! Chief s.timulus to progress. It forc::s th'~ pop:llation to enhance lh':: food resouro:s by increasing th·: pro· ducilivity of th,: [ract and to ov\!rCOm~ th·; limitation of af..:a by improving th.~ facilities of communication. The enterprise inyolved, reacting on the mental and mora.l cquipm·:nt of the p'~opte, widens tne sCope of their lives and. by raising th.::ir standard~. creates a new economic stress and thus establishC% a continuity of progrl!ss by a succ~s.sion of reactions.]n the historical life of a nation Of a people {he moral b-.::ndits of over-population in this sense are probably worth the ll:mpJra··y diffi-::ul1ies, and sacrifices which fl!SUlt from the in~vitablc ddays and lmp.3rfections in the adjus.tment of resources to growth. Th.e Cens.us Superintendent of Burma fl!ffiJ.rks in this respect:-
"A country is obviously over~populated in a static scns~ when, even if all its resources w.:re fully and most advantag..::ously employed, it would b·J un1.bl~ tn sllPi)Jil its p.Jp:ll·tlion s:ltisfac'orily eith'!f with its own products or with gOl)dj vbtain:;d in cxcnang"! for its OWll products. The word. ,'iatis{i.lc'wrily m.l~·"'s this d~finition s(lm'~what vagu:,;: and. d.;:pcnd·;nt upon a con~lanlty ch',~ns ng s(and:nd of comfort and efficiency ~ and mOreOVl!r it is always. imp'")~'ilbl.: t\., say wh:tha a country's rCSl)wc:s ar~ fully and most adv:l1l l ag!Oll,>ly ~mploy,.:':d. Th~ word'", av..::rag~ rate or \vh.:at production is 13 bush,:;:ls p...-r aCf.; and in England in 1921 the av.::ragc was 35.3; hut Prw t~ssor' BifT:n\; Yl.!om in wh:al IllS yielded 96*. Arc the f('Slmrces of EngliSh agdcul'tlr.; fldly ':ll1r.1loy~d? Th.::r..;: i:-.; mucl\ t.o b; -" .. tid aO',HII tnat ~rQre calling England ov..::rpopulakd in th..;: s<;n~e now consid::,red. That Poland has increa~d h~r wh·:at and rye crops hy 250 per cent in the last ten years suggestt; thal th~ last word ~n f(~od nroduc:.inn IlJS probably not ~en 'said yet in Burma. Malthus~ In hIS Essay, " Commonly supposed to have had the
"'Sec the Ch::\ptcr on Soil and Crops. in Crcny'~ Discoveries and InW'ntiollS of tiJe Twencierlt Century (1922).
117
.{ati<; oonoeptiOll of overpopulation described above; but really M understood the term ill the kinetic sense and described a country as overpopulated wMn Ihe rate of increase of the population exceeded the rate of increase of Ihe supply of calories in Ihe triple form of food, clolning and shelter, This i. a very diff~rt!Dt conception indeed; a Country might be overpopulated ac· Cording to citb,~r of these ddinitions without bdng overpopulated according to the other. Underpopulation might oc ascrib..::d to a country by its own people, if they thought an increase of population would enable them to colkct more capital Of take advantage of bdlcr organization and So raise thc1r standard of life. It might also bl.! aficribcd in the Case in which an increase of population. though it mighl, either d..:press the standard or living or leave it unchang,,;d, would frl!c the cuuntry from dread of so~n..:: military or economic invasiDn Jt might also b.: a::;crib·.:d to one country by the people of another, if the la.ter w.:re looking for an. area of less economic pressure to which they could emigrate. Mor.:owr, as man docs not live a human Hfe on the minimum of economic support. other and wider considerations enter into the discussion."
In India where tbe population is predominantly agricultural the economic aspect of density resolves itself in to the qu~stion of the relation between the population and th~ productivity of the land. Attempts were made in the' Census of 1911 to correlate the dit;tribution and growlh of the population with the cultivable and cullivmcd area and t'he out-turn of different kinds of crops. It seems clear that while the ex.l<, .. "Il~ of. the culti"a~Je area is a factor in determining the dIstribution and eJLpenslon of an agncultural population, tbe proponioll of the cultivable area which is actually cultivated, on the other hand. 18 the esult. not the cause of (he growlh of lhe population. C()l'rela~ tions between the population and the ar,ca cu1dva,tcd, Jher~forc. arc chietly of interest as a means of measuring the e~tcrprise of the people. th~ productivity of the soil under th..:ir efforts and.tn,,;ir standard of riving. They art! not~ so long as the whole cultivabl~ area J5 not fully cult ivatcd. a clue to the pressure of population or to its polcnt.ial expansion. Exci;!pt wi{hiD very wide limits correlations between population and cuhivable a~ca arc rendered nugatory ~Y the vagucn~5s of th..: lenn "culti.vabl~ area", slnC~ laud at any particular tlmc classed as unculturabl~ IS continually bdng opened out to cultivation by irrigation, as in the Punjab and United Provinces, or by the cutting back of forest arcaS. as. in tho; c.;nlrai tracts. of the country and elsewhere. Again the capacity orth..:: land 'to support population d(;pcnds, apart from its ex.tent on its. scientific treatment and economic ora:anization, And agriLl1hural methods, choice of crops, distribu1ion of holdings, system of tenure ar~ factors which have varying infht¢nc~ in diff..:rcnt localities and must b~ studied in connection with local conJilions. and probkms. Economic pressur\! may I..!xillt at any dcgrl.:\! of d';-:I1.')ily, It j" respon<;ibl.; for a large amount of the unrest in the tribal areas of the North~\Vcst Frontier, wh,~rc the crude d-:nsity i6. a ridiculously low figure; and Dr. Mann has shown in his discussion of the conditions of typical villages in the Bombay Deccan that pressure exis.ts in tracts where the actual deno;ily is not much above the average, that it keeps part of the population at a wry low l"tandard or living and is only partJally relieved by the flow of th\! population into the industrial cities ofthc residency. Studies of thiS sort lie beyond the scope of a census report and it will only be possible h'.;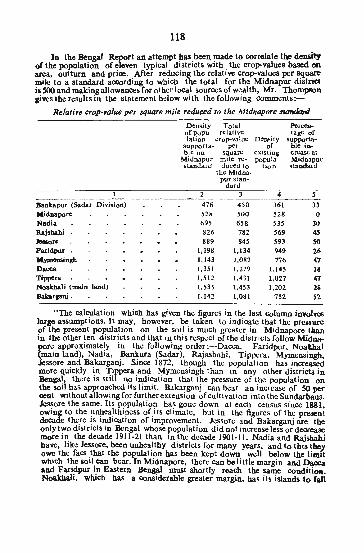
118
In the Bengal Report an attempt bas been made to Correlate the density of the population of eleven typical distrIcts with the crop-values based on area, out turn and price. After reducing the relative crop-values per "!Iua:re mile to a standard aCCording to wblcb the total for tbe Mldnapur dlstnc:t is 500 and making allowances for otherlocal sources of wealtb, Mr. Thompoon giveslhe results in the statement below witb tbe following comments:-
Relalire crop-,alue per square mile reduced to the Midnapore 8IanIIo,d
Density Total Per"",," ofpopu- relative tage of latioo crop-value Density supporta ..
support a- per of ble in--ble on squa~ existini crease at
Midnapur mile rc- popuJa- Midllapur standard ducea to lion standard
the Mi('1na-pur stan-
dard 3 4 31--
" ___ --BaoJcapur (Sadar Division) 476 450 361 33 Wdnaporc 528 500 528 Nadia 695 658 535 30 Rajsbahi 826 782 569 4$ ......, ... 889 845 593 50 Paridpur 1,198 1.134 949 2.6 1Ilymonsinsh 1.143 1.082 776 47 Dacca I,35 I 1.279 1.145 UI Tippera I.512 1.431 1.027 41 Noakbali (main land) 1.535 1.453 1.202 28 Bakarlanj . 1.142 1.081 752 n
"The calculation which has given the figures in the last Column in¥OlT<6 large assumptions. It may. however, be taken to indicate tbat the pressure of the present population on the soil is much greater in Midnapore tllan in the otber ten districts and that m this respect of the district. follow Midnapore approximately in the following order:-Dacca. Faridpur. Noakhal (main land), Nadia, Bankura (Sadar). Rajashahi, Tippera, Mymensingb. kssore and Bakarganj. Since 1872. tbough tbe population has increased more quickly in Tippera and Mymensingh than in any otber districts in Bengal~ there is still no indication that the pressure of the population on the soil has approacbed its limit. Bakarganj can bear an increase of 50 per cent without allowing fot further extension of cultivation into the Sundar-bans. Jessore the same. Its population has gone down at each census since 1881, owing to the ~nhealthiness of its climate. but in the figures of the present decade there IS Indlc.atlon of Improvement. Jessore and Bakarganj are the only two districts jn Bengal whose population did not increase less or decrease more in the decade 1911-21 than in the decade I'IOI-II. Nadia and Rajsbabi have. like Jessore, heen unhealthy districts for many years, and to this they owe the fact that the population has been kept down well below the limit which the soil can bear. In Midnapore, tbere can be little margin and Dacca and Faridpur in Eastern Bengal must shortly reach the same ccndit;oa. Noakbali, which has a Considerable greater margin. has ils islands to fall
119
back. Ita population bas been crowdOO into a small.r space tban before by tile ~n of the sea-face. and it shows signs of relioving tbe pc ... ute oa tile sotl by taking more keenly to the cultivation of jute than formerly.
The examination of the agricultural statistics for these eleven districts bas shown how varying capacity ofthc soil, under climatic conditions varying from place 10 place, enables very different densities of population to final support in diff-:rent parts of the proyjnce, and how it is possible for a population over 1,000 persons to the squa.r..:: mile in parts of Eastern B..::ngal to go on increasing rapidly, while a population less than half as dcns~ in rural district in Western H.:ngal remJ.ins stationary Of decr~ases. WIth tile pro" gress of civiliZation and the improvement of communications. the standard of livj~ adjusts i(~lf to vdriations from place to plao..= in the capacity for production, wh,:!thcr In agriculture or indu~tr'l. Th..; standard of living malntamed in agrh .. "uhural popula\ Ions in Europe seems to have been adjusted to a density Dot morc than some 250 fX!rsons to the square miJe. Th;: surplus population is. drawn off in! 0 ot.~.::r imlustrial and eomm·.!{ciul enterprises and th? standard' of living among agrIculturists malntainl.:d and eVi!n considerably Improycd. rn India. a stag\: of civilization has not yd been reaChed at which such enter .. prise draWi' off even a small portion of thr: labour not absolutely required for agricultural purposes. A stage has occn reached in which the land available for ,cultivation is nol suffir.:ient to give full employment to a great multitude who ~ no oocurution but agriculture_to which th·:y can turn their hands. Tile next stag,.;: th"calcns Lo b~ a long 11m'.:: b\':fore it is reached, and the time must n~;ss.ariJy b~ the long~r on account oft he fact that so larg.:: a proportion ofthos.e cnglg..::d in agriculture own substan! jal rights in the little plots they cultivat~. and will not rl.':adiJy give lhem up when the time comes (0 leave agriculture for anolha occupation. In Europe. the maintenance of the standard of living plac.:s it limit on the increase in the numbers who continue to support thems~lvcs by agricullure, but in India, ,this is not the casco An ex,planation or th,;! facl that Elstern Bengal districts arc able 10 support th'.!ir agricultural popula! i;:m at a higher standard orliving than in W~slern B'~ngal, is Sometimes sough!' in th·.; highd proportion of aborigines wh,?se backward civilization demands only a low standard ofliving. This explanation. howevet1
does not go nearer to the root of th·~ matter than the ex.planation of the, low standard ofl~v!ng in India compared with that in Europe in t~c backward!Jess of Indian CIVIlization. The true explanation of the possibility of a bigher standard of living among cultivators in Eastern than in Western B'~ngal districts is to ~ fOLlnd in such an an:ilysis of agricultural statistics which has jut lx!en given for cleven districts."
An interesting point whicb lbe figures bring out is tbe fact that tbou'" there is a close correlation b-!tw-xn dcn'iily and the deVelopment of resources tbete i. no relation between tbe pressure of population and tbe aude density. We shallse. in a later cbapter bow the population of tbe Mymensingh and Dacca districts is being drawn off northwards to the waste areaS in tbe Assam valley.
Anotber area of very high rural density, reacbing in part. to 1,000 or eWOn 1.200 persons to the squa ... mile, i. found in tbe coastal tracts oftbe south of India including tbe States of Cochin and Travancore. Here. in addition to the favourable climatic conditions, the steady .ubstitution of
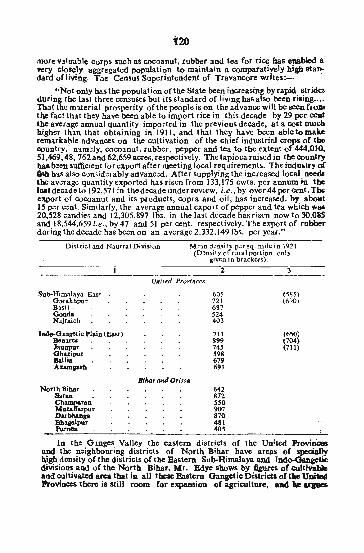
120 lIlQre vllllable corp' such as cocoanut, rubber and tea for rice bas enabled a' ?ery closely aggregated population I<) maintain a comparatiV'ely high Mal>dard ofliving. Tile Consus Superintendent of Travaneon: writes:-
"Not only has the population of the State been increasing by rapid strides during the last three censuses but its standard of living has also been rising. ... That the m,terial prosperity of the people is on the advance will be oeen from the fact that they have been able to import rice in this decade by 29 per cent tbf:: average annual quantity imported in the previous decade, at a Cost much higher than that obtaining ill 1911, and that they have been ablel<)make remarlcable advances on the cultivation of the chief industrial crops of the country, nam,ly, cocoanut, rubber, pepper and tea to the extent of 444,010, 51,469,48, 762 and 62,659 acres, respectively. The tapioca raised in the count..,. baa b:en sufficient for exportt after meeting local requirements. The indu5try of Ii<b has also c0n;iderably B<tv.nced. After supplying the increased local needs the average quantity exported has risen from 133,175 cwts. per annum in the laatdecadeto 192,571 in the decade under review, i.e., by over 44 per cent. The export of cocoanut and its products~ copra and oil, has increased, by about 15 per e'nt. Similarly, the average annual export of pepper and tea which W85 20,528 candies and 12,305,897 Ib,. in the last decade has risen now ta 30,083 and 18.544,659 i.e., by 47 and 51 per cent. respectively. The export of rubber during the decade has been on an average 2,332,149Ibs. per year."
Di~lTict and Nautral Division M~'ln d;";n,,ily pl:r sq. mile in 1921 (Densitycfruralportion only
given in bracket!;.),
Sub-Himalaya, East O()rakbpUT B:l$ti . Gonda Najraich
Iade-O.lDgetic Plain (Bast) BcQ:uCG huopur Ghazipur Ballia A_b
North Bihar Snan . Champaran Muzaff'arpur Darbl!aDga Bhagalpur Purnea
United Provinces
BJIuJ,. and OrisSd
. .::2'--____ ._. ____ _
605 721 687 524 403
711 899 745 598 679 691
642 872 550 907 870 481 405
(jR5) (6t)O}
(65<)) l704} (711)
In the G lOges Valley the eastern districts of the UnHed PrOviDClllS and the neighbouring districts of North Bihar have areas of spec:ially lUsh density af!he districts oftlae Bastern Sub-Himalaya and Indo-Oangetic divisioQ' and of the North Bihar, Mr. Edye shows by figaros of cultift"ble and cUltivated area tbat in all theSe Eastern Gangetic Districts oftlae UDi1ed Jlrovioccs there is still room far elCpllJl&ian of agriculture, aDd be .....-
121
ftom the home-loving and unenterprising character of Ihe people Ihat until the limit of cultivating capacity is realised the population will continue to expand. He writes:-
"In support of my argument.1 may mention the carre of Gorakhpur) district with which I happen to have a close personal acquiantance. This district has increased in density from 707 to 723. It consists (If six. tabsils. The headquarters tahsil has the highest density. followed closely. by Hata. The Mlharajganj lahsil with much jungle and undeveloped land. has far the lowest demity. The headquarters tahsiJ has. now increased ;n denos,ity by six. Hata by five (two units more tban any other tahsils), and Maharajganj by one. Maharajganj is reputed to be by far the most unhealthy tahsil in the district. Again, in Bundelkhand (Central India Plat.au), with parts of which I am also well acquainted. there is the kt:enest competition for tenants. on the part of landowners and it is commonly said that an extra abJebodied man means an extra nine acres of cultivation.· But the country is ex.tremely unhealthy and the climate severe; and an unresponsive soil and a very low water-level involve a degree of exposure and exertion which the phYbique of the people is unable to sustain. It is of course obvious that a point must sooner or later be reached at which the mean"> of support derivable from a~rjculll!rc cannot be expanded further; and if meanwhile other means of support have not been developed. dcn~ity wilJ then be determined by agricultural conditions. The contention here advanced is that that point is not yet in sight. The above arguments arc valid alr.o fOT the mount;~inous and hilly portir,ns of the Province (Himalaya West and East Satpuras). but their application is somewhat different. Where the country is cultivable at all. there is no evidence that the limit of agricultural development has. been reached, so as to interfere wi1h a further increase of population and density. But for large tracts of the country the limit has manifestly been reached since the beginning of historical time. The Himllayan snows could never have supported an agriculttJraf popuJatium,; for these tracts of course deniity is determined by agricultural possibilities.
At that time. as we shal1 s.ee later, a constant drain of 1tbour flows out of these dist ricts into Bengal, the remittances of the emigrants largely incresing the resources of the tract, So that, in spite of the heavy receipts in the densely populated di.trict of Azamgarh, the district has a deficit treasury owing to the enormously heavy payments made from it to meet postal remittances from outside.
Of the districts of North Bihar. Mr. Tallents writes:-"The density of population in this district (Saran) is 872 to the square mile
the population is almost entirely agricultural and it needs no argument to show that u1l1ess some radical and hitherto undreamt of change is introduced into the system of agriculture the soil cannot bear a greater pressure of population than it is doing at present. The revisional settlement has shown that the cultivated area has increasd and that the scarcity of pafiturage for the cattle'has become a menace. It seems improbable thaI any further substantial increase will occur in the population of this district. In Champaran the case is different. The standard of cultivation is not SO high as it is in Saran and in many parts cultivators are in possession of more land than they can culti-
iDa1~~r;~I~~;,5 t~=~tin:hl:rd t~ ~ i:t:s: =D~-~ =~ == that l~are not IIOW cnoup men for the laboriOUI t;:UltivatiQD ip,\I()lVOd.
122
.atc. In tbe I ... t twenty-live ycars tbere bas actually been a reduction in tbe cultivated area. This means that there is still room for expansion and intensi .. fication of agriculture in several of tbe tbanas. Rents are low. being on the average less than balf wbat they are in Saran, and tbere is reaSOn to suppose tha.t immigrants will still be attracted to the district, especially to the notth!rn and western parts of the Bettiah 6uf>...division, where the development would be rapid but for the prevalence of malaria. In these respects Purnea resembles Champaran. Both districts run up towards the foothills of the Himalayas and parts of them are extremely malarious. Rents in Purnea are even lower than they are in Champaran and the densit.y of population i& less. There is ample rnom for the cxpawiiun of cultivation particuarIy it. now that the Kosi has swung right across into Bhagalpur district and thel c is little doubt that the population would increase rapidly but [or the scourge of malaria. On this occa:-.ion there has been a shctrp decrca.'.;.c of population in the K1shanganj sulrdivision owing to the ravagcsofmalaria and a temporary slump in thejutctrade, but this has been morc than made good by {he increase ofpopulati()n in Araria, and in the areas reclaimed from the Kosi in the SJdar sub~diyision. In Muzaffarpur and Darbhanga there has been a heavy decrease of population in the south while in the north, where the dens.ity of po pula lion is alreadY greater it has been morc nearly stationary. The gradual northward movement of the population is. st.i11 marked and is apparently continuing. The underlying reaSons for this movement seem to be {hat the south of these districts is less healthy and that on the whole rents. are lower in the north while the cultivation of rice which predominates in the north is more remunerative and capable of supporting a denser popu]at ion. Here a:; in S:tran, it b imposs.ible to expect a cons.iderable expan:-.ion of cultivation Of of population, A tenth part only of these dis.tricts is uncultivated but cultivabk ana nearly half of this is devoted to mango groves which are valuable for food, timb::r and fuel, the remainder barely suffices for tbe pasturage of c~lttle. Tile dcn<;ity of population in Muzaffarpur is 907 persons to the square mile and in Darbhanga 870. The population is predomimttcly agricultural and is likely 10 remain SQ, for there is 110 mineral wealth to attract any industry unconn~ctcd with agriculture. In these circumstances it is impossible to suppose that an incrasc of population is either likely or desirable:'
In the Punjab the economic problem of population in each districst has b~en ex.haustively examined by Mr. Middleton in Chapter I of his Report. He finds evidences of pressure in tracts which vary comiderbly in character, (e.g., Kangra. Hoshiarpur, Simla. Gurgaon. Ambala and Gujarat; but the eoonomic .;;ituation in this part of the country is at present solved by the progressive extension of canal irrigation. The additional land brought under G,wcrnment canal irrigation during this decade amounts to 2,500 square miles an increase of 22 per cent. The mean density of agricultural population i.:: no where so high in the Punjab as in the Eastern plains of the Ganges. There has been a steady flow of colonists from congested areas to the canal tracts. amounting to about 160,000 persons in the decade, and tnere are still schemes in hand involving further large extensions of irrigation. In his book, "The wealth and welfare of the Punjab", Mr. Calvert is able to show that in spite of the enormous margin which still exists for the development of agricultural wealth in this mainly agricultural province, the average Pu1\iab peasant already lives at a standard oflife whicb is distinctly abovethatofa large portion ofthepesantry in&outhern and eastern Europe.
123
staaoWt of liruag . 39. The Dumber of the population which can be supported by tbe re. sources of any tract in any oouDtry must be vitally affected by the standard of living of that populatioll. On the other hand the increase in tbe demand on tbe lu~uries (as oppo.ed to the bare nece .. ities) oflife must, like an increase in numb~rs, stimulate them to develop further the resources of their environment. On the other hand the reduction of the rc'SOurces. of the environment by the law of diminishing returns. must either put a limit to the number of the population or cause a retraction in the standard of living. The statistical measure of the standard or riving ofthe Indian population demands enquiries of an exact and difficult nature; and though it was at one time thought such an investigation would be undertaken along with the census operations, it waS. ev~ntually decided that the practical diffiLlIlties were too great. Some information, has. however been collected by certain Superintendents and in the Reports of Assam and Bombay will be found the results of enquiries into family budgets in different types of population, which are valuable additiOJ}i to the contribulions which arc being made by the many experts student,«this very difticult and interesting study. The subject is one which is far beyond the scope of a cenSus report, even if it were poss.ible on the material yet available, to draw conclusions which arc not dangerously uncertain and trans.ient. In a large portion of the population the manner of living has little relation to the economic capacity or resources actual ur potcnlla1 of the family or injividual. It i~ determined by tradition and limited by ignorance. It is not unusual for a family to live in comparative squalor and yet spend large Sums. on a marriage festival or a law~suit. A large part of the labour troubles in lhe country is due to the fact that the labourer will only work. sufficiently to maintain himself and his. family at the lowest standard, and the slackness. of agriculture in many parts of the country is the result of low rents which enable the cultivator, with a minimum of effort, to produce ~cient to support his family at a standard which he is. too backward and unenterprising to attempt to improve.
Still less. is il true, as is no often asserted in Sanitary Reports and elsewhere. that the temporary variations in the "economic" circumstances of the people form the principal factor in determinjng the variations of the birth or death~rate; though where. as in ca~es of famine or great scarcity, the available s.upply of food falls below the minimum subsistence limit, the Hecomic"·· factor becomes necessarily dominant. In India, as in every other country. the most prolHic portion of the popuJation is at the lowest stratllOl oflife~ and modern theories incline to tbe view tbat a maximum fertilit,. is associated with a simplicity oflife which includes, or at any rate appears 1I&ually to be attended by a minimum subsistence diet, and that fertility dedi .....
*1I!l'.g. Mr. Jack in Bengal, Dr. Mann io the Bombay, Deccan, Dr. Stator in So-th Iadia. the BombllY Labour Bureau iu the indllStrial areas of the Presidency, the EcoDOl]lic Societies of the United Provi.nces, Punjab and other Provinces.
··Thc word economic is uged here in thCsense in which it i, usually applied, namely wi'h reference to the Runcial and material resources ofUving. In it, wider sense, pll .... reforriQJ to all the _CoDditions and circumstances of a "household", domestic, lOci_i. taa;r::.~~~al.'it is mucb more ocarlyiden.ti1lca1 with the idea implied by tl!:e J .....
124
as life becomes more complex, more luxurious and more individuali:oedandlhe ,:aervours train increases. This economic simplicity of living in the Jargerportion ofthepopulation, along with the custom of universal marriage which seem to 'b: Independent of economic consideration', and of uncontrolled marital r~lation, IllS giv~n Iniia a high average birth-rate. Diseases due to ctimat.e ami phYiical coniilions, combined wilh the non-hygienic customs and IradJtiOtiI of the p:opl. and their complete ignorance of and indifference towards all the circumstances from tbe cradle to the grave which make for health alId reduce the power of resistance to disease, keep up the level of the deat'" rate. These are the constants whicb regulate tbe standard and which can chanS" only slowly wilh the progress of education and social culture and witb lbe improvement of the environment. Of the fluctuating influences which deterDline the periodic divergencies from the average the most important is undoubtedly the climatic variable. It is exoeedingly difficult to obtain material sum.. ciently accurate to admit of definite statistical correlations, e.g., rainfan or prices., or outturn of crops with birth rates and death rates. Correlations between tbe birth-rate and prices in Bombay made by Mr. Sedgwick OIl
the data of twenty years were inconclusive and such as I have been able t('l attempt have not been of any help owing to the intrusion of extrancOUf> 'actors. It bas recently been put forward by the Health Ollicer of BengoI that low prices accompany a high deatb-rate. and not as formerly thoughl a low death rate, and the reaSon waS ascribed to the economic toss to tbe cu]tiYa~ot. As a matter of fact tbe economic effect of prices, as Dr. Mann has shOwn in his studies. diff":-:fS in different classes of tbe agricultural community. It is well-known, however. that it is the dry years which are on the whole the healthiest, though they arc not usually the years of economic prosperity, and any connection between outturn. prices and death-rat~ 18 probably due to a third common factor of this sort. On the one band tbere is always in a rural agricultural population, even among those neaf the subsistence limit. a considerable margin of resource which enables them to' resist in a remarkable way temporary economic stringency. On the other band there appears to be an intimate connection between the quantity and distribtltion of the rainfall and the inten&ity oftbe infection of such diseaees as malaria. relapsingfever,dysentery and So forth wbicbarechiefly respon';g.. bIe for the mortality.
The annual fiuctuations of the birth and death-rate are, therefore, plilbably much more dependent on the intensily of Ihe onslaught of the pri .... oipel diseases. due to conditions of climate and environment. than on aft)' IIIJpposed variation in tbe resisting power to them of Ihe poeple owing the eGOnomic oircumstances. In a grapb showing the death-rates ofthe people oIl long period of years the trend of a mean line drawn through tbe 1Iuctuatio .. _uld give the cultural and m.terial progress of lhe population and it. surroundings, while the annual fiu.luations from the mean would usually aho", the result of temporary climatic and environmental changes and onty occ.sionally economic catasIrophes. A good deal of vague thoUgb.t has ari .... rr~ this confusion of the waveS with the tide. The progress of this tide halo probahly altered but little in the last SO year •. The undoubted de ... lop_I of mllerial resources has not in the ordinary rural oo1DlDUD.ity. been _mpanied by a cullural advance sueb as would aft'ect the. populatioR' qaanlitatiwly. The old customs and attitudes toward. vilal eonditioM rcmaiot:

.1IJIIItuInged. and until they change in the direction either of greater economy '01" greater care of infant life the trend of the death-rate will not much alter """"p! in So far a' scientific effort. can improve t ne surrounding condition and fend off the onslaughts of the more virulent epidemic diseases. Of tbe relation between the standald of living of the population of Northern India and its capacity for further expansion Mr. Edye writes:-
Reasons have also been given for the belief that the limit of pressure of population on moans of SUbsistence has not yet been reached anywhere in the provinoo. Will the people therefore go on multiplying indefinitely, and win nature conti nue to interfere every few years with a calamity to check the pace' Thi., I think, is a reasonable expectation. A belief is generally held tbat a risc in tbe standard of living operates as a natural check on increase. This may 00 true of other countries. but here it is to put the cart before the horse. The Hindustani peasant has, as will be agreed by all obsoner8, a wonderful faculty for cutting his coat according to his cloth. He will give bimselfall the necessaries and luxuries available to him ifhe Can afford them; if the pressure on means of subsistence increases. he will Cheerfully dispense not only with luxuries but also with what others might call necessaries. These characteristics are apparent in times of famine and they are very noticeableevcn in children. WhcreanEnglishchild needs halftbe contents of a toyshop to amuse him, an Indian child is content to play in the mud. If toys come his way no one could appr~ciate them more jf he los8e6 tbem again he is quite happy without them.
The population of India at the death of Akbar is roughly estimated by Mr. Moreland to have been about 100 millions. of whiC'h I he share of what is now the Unired ProvinC-!s would not exv.!cd 20 millions. The common people of Northern India w.;:;rc (h.m undoubtedly almost naked. Blankets were unknown to them; sh.o·~s w\!.e seldom worn and tittle furniture waS used save a few earthim v~ssels. * Th .. ;:: population is noW 46 millions, and the people have long been more or less substantially clothed and shoed; tbere are few who do not pos~ess blankets. and brass pots are in almost universal use. The amusement which the peasantry gets out of attendance at the law court. and railway travolling-these two diversion' are to the Indian what the picture place is to the English proletariat-is entirely new since Akbar'. day.
·For tho above facts and the evidence on which they rest see "Moreland's Iodi. at tbeDeath of Akbl.T", pages 9 to 23 and 25310270. Mr. M!>reland estimate,UlC population of NortheTn locii. between Multan and Monghyr at Soomctimes OveT 30 mi1liom.. Hill mothod of cal~,datioR for the tract (population=cultivated , acres x labour aeccu:ary to cultivate an acre) iQ~pires more confidence than that for Southern India for which the
~~=~~tr!:~~':~~chJ~'tH~~:a~fi~:;~~h::itOh':,-;~~:~=~rU;r~~~:: ~~tc!:t~t~~ :::::}1~~:l~~A~r~~bl=:1!:lt~~e'::e~l~~tr~ PoJt;C. (or instl.l\OC would be alleged tbousa'DCb_actual hundroos.
allejlCd tbousalll1s actual hundred &'-----2----- 2
wouldbeequJ1Yl.rguable. The oumbersof. massed bodyeall oaJy be known by COUDliac ~~. cYeuwbenmadcbycducatedipCnoDl are,asis wcJl·lmowD,ofthcwi.dosI
126
In r .... nt times tbe standard of living has not risen in such lUI. obYio .. way, but, even during tbe last fifteen years there has been obeenable an increasing addiction to the use of small Comfort, and Convonienoo, such as tea, ciglCettes. matches, lanterns, buttons, pocket knives, looking glasses, glasses___.,ven gramophones; and of countless similar trifles. It seems unquestionable that up to the present timo tile numhers of the people and the standard of living hav..! b!en rising tog,::th~r. And b-~fore it is assumed that the province, or any part of it,is so congested that further increase of population is imposible, it must be remem~red that the same assumption was made or implied by the travoller Fitch at t he end of the sixteenth and by Sleeman at the beginning of the nineteenth century. If a stage is reached-and when aU has bo..."Cn said it may not be far distaint for the density of some of the castern districts is unparalleled in any rural tracts outside China-when hoth the population and th0 standard of living CanUoL be maintained it is quite possible that the latter and not the forml!r will contract. But perhaps by that time industry wiJl have become a factor for g~neral support. At present it is negligible; such industrial conc;rns as eXIst arc too concentrated-ill CaW'nporc: and a few other towns-to affect the province as a Whole for labour is immobile and shown no signs of acquiring mobility.
CENSUS OF INDIA 1931
CHAPTER I
DISTRIBUTION AND MOVEMENT OF POPULATION
Movement
5. The actual increase since 1921 is 33,895~298 that is to say 10.6 per f£nt on the population at the last census I and 39 per cent on the population of India fifty years ago and an increase of 12 persons per square mile in 50 years, during which time the increase in areas has been princjpal1y if not entirely, confined to comparatively thinly populated areas, and amounts to 426,055 sq. miles. These figures may be compared with an increase in E:agland and Wales since last census of only 5.4 per cent but of 53.8 per Cent in the last 50 years the last census whh an increase of nearly 18 per centin Ceylon and with an increase in Java of 20 per cent with an increase in the United States of 16 per cent, Since the last census and of as much as 26 per cent in the outer islands of the Netherlands Indies. The population of Java is of course not comparable with tbat of India as a Whole on aCCount of its small size and limited area, but having (with Madura) the very high density of 817 persons per _square mile it is comparable with the more densely populated parts of India already mentioned. This illustrates the fact that the density in India is so variable that it is impossible to consider the question of movement of the population without going into the question of the distribution and variaHon of density, for density of population in India depends not on industry as in the United Kingdom, but on agriculture and is greatest of Course in the most fertiJe areas. At this census, however, the greatest increase is in the States where generally speaking the density is lowest and therefor the increase in the p<>pulation shown by the figures of this census appears at first sight indicative of pressure upon the margin of cu1tivation but while the greatert increase has been in Bikaner (41.9 per cent) this must be put down largely to the increase of irrigation and to the consequent immigration from outside and one of the next highest increases is that of Travancore in which '(he density was already among the highest in India. The increase in Hyderabad St~te again is partly to be attributed to an increase of efficiency in the taking ofthe census and cannot, therefore. be safely used as a basis of any comparison of the population as it is now and was then. Obviously the greatest increase in population is to be expected in areas such as that of Burma where the rainfall is above the mean and the density of the population below it. Where the rainfall and the density are at balance, that is, where the population is dense and the rainfall is just adequate as in tbe Southern Punjab, Eastern Rajputana, United Provinces, Central India generally and H.E.H. the Nizam's D~minions. irrigati?n .bas abated the l.iabiIi1y to complete loss of crop and Improved commUnIcatIons have made It possIble to prevent heavy Joss of life in times of scarcity thus enabling tbe population to increase on the margin of subsislence. How high a population can be_ supported byagricu1turewhen conditionsarefavourable, is shown byCochjn with areas here and there carrying-over 2~OOO and in one rural unit actually 4,090 persons. to the sq. mile on land producing Irice and coconuts, but principaUy the
127
128
latter which leaves more room for the erection of buildings and brings in a higher return than rice in actual cash. In such areas e.g., Cochin and Teavancore the increase in tbe population has been higher tban in the sparsely populated areas like Baluchistan or JaisalII1-er State where there is no general extension of irrigation although there would appear to be more sCope for an extension of cultivation. On the other hand when these thickly populated areas are examined in detail it appears that the actual rate of increase in. pOPulation is gr-.;atest in the less populated and less fertile areas. Thus in Travan" core th~re are three natural divisions the lowland-very fertile the midlandless so and [he highl<l:nds, where the scaple crop is tapioca and where irrigation is not practised. Now in these [hree natural divisions the density in 1921 was 1.403 p~rsons to the sq. mile, 700 persons and 53 respectively,' which increas-ad during the decade to 1,743, 892 and 82 that is by 24.2,27.4 and 54.7 p~r c~;:nt respectively showing a vastly higher rate of increase 'i;o. the area of l,~ast d-ens.ity which is also' the area of least fertility though not as great a nU!ll:::r::::ial in?rease. Sim!larly in Bengal. the ,greats~ fate of i~cr~~ has been tn the· Chlttagong Hdl Tracts and In Madras In the NllgUl8. Where, th·erefore, there is a population already dense, there is a clearly petceptible spread towards the less profitable land. \. 1
The increase of population has also been dependent in some cases. ,o~ migration, while, on the other band, the apparent increase may have depended on the failure to migrate. Thus the increase of 35 per cent in Ahmadna~ district, a rather barren upland in the Daccan which suffers from recurnn8 famines, is not due so much to a series of good years or to an extension of cultivation on the s~bsisten~ margin, as. to trade de~ressi.on., r~sulting i~ numbers of the poulatIon staylng at home Instead of mIgratIng to the ports of Bombay and elsewhere where in normal years they are employed during the census months of February and March. Bombay shows a corresponding decrease, probably due, in the particular case of Bombay, largely to thf same cause. Otber deceases there are which are not so easy to explain.
Migration
6. Immigration, when India is taken as a whole, influences the population very little. Table VI shows 730,562 persons as born outside India as against 603,526 in 1921, without t!lking count~n either,case ofperso!ls born in French or Portuguese possessions. The Increase IS almost entlfely in persons born in Asiatic countries. Againsi this there must be set off on account of emigration about one million persons who are estimated as having emigrated during t~e d~cade under revj~w. Migratio~, howeve~, i~ of :f!1<?re importance as aff..::ctlUg lnte!nal ,fiuctua~Ions of populatIons, vary1U~ In ~rltlsh India, from 1,244,249 (net) Immlgrants IUto Assam to 15,536 (net) ImUl1grants into the North-We~,t Frontier Province. These figures however, include all those whose birth-place was outside the province, and'do not refer to the de'cade 1921-31 only. If we take the actual increase due to immigration during the decade in Ass1.m it is found to be only 121,648, consequently if a percentage be taken on.the i:ncre~se ofpopulat~on, A.ss~m <?wes only 1~.5 per c~nt of its increase to ImmlgratlDn, thougb Its ImmIgratlon figure]s the hIghest among ~ll provinces .. Conversely Bibar. and Orissa with the greatest lo,ss by emigratIon shows an Increase of 10.8 a Iltt~e m~re tJ:lan th.at for all Ind]a, In spite of tbe fact that the total loss by emIgratIon IS eqUIvalent to almost a
129
t!lilll' oftbe adtua\ fi~ure of increase. Migration as belween BriIish India and tbe Slates bas tended in tbe past to he from tbe latter to the former, bul' during the last decade this position has been reversed and the trend ofmigraLion on the whole is from British India to the Slates. where the density is g,nerally lower. Bikancr. where lhe immigranls Tolal 161,303, i.e., 58, per cent of its increase in population. is a striking instance; tbe greater numbel; of its immigrants (abou 1 S4 %) come from Bd I bh India. and while the nat ural increase of the p;)pulalion of Bikancr stale plus the normal jmmigrat iOll as rec:orded in 1921 would haw: re~u1ted in a g~ne[al increase of 28 per ct"nt; and thoJfcby brought the popUlation back to the 1891 level merely, the hi-crease at this censcus is much in ex~ss of that amount, and thisexccss may' be put down entirely to the extension of irrigation.
Mortality
7. Another factor to be considered is 1 he relation of the birth ralc (0 the death ratc and this factor is far from being the same in different section& of Ute popu.lation. How far the fecundity of different races. and castes in India is the result of ..:.nviLonm·:nt and how far it may have becomo.! an inherited racial trait fLX,;d at sam·; p!riod in the past hisrory orlhe people, and how far it d~p)nds on pf':!:vJ.iling social practices, is extremely difficult to determine in thdight oflbeexistinginformation, but it iscasy to showtha( there is marked variation in diffacnt parts of India and this question will be revcr1cd 10 in the chapters. on age and fOCX. M~anwhile it is enough to point out that in India the birth tatc IS cV..:!fywh'!re much higher than in Europe. largel, on account ohlw univ~rsalily of marriage, the Parsis being perhaps the only Indian community in which latc marriage and small families are the rule instead oflhe exception. The birth rate is lower among the Hindus than in most of other communlLil!s probably to some extent on account of the general disapproval of widow remarriage, rcsultingin larger number of women being unrcproductive at the child-bearing ~.a:e. and to some extent on that oftbe grcaterprevalcnC\! ofimmalurc matermty. On the other hand, the high bir\h rate of India is larg.~ly discountcd by a hr:;h death rale, paflicularly among infants as also apparently among wom'.:n at child-birl h. Here again social factors have to be res.koncd with, the custom of purdah perhaps cx·.!rcising its worst efi~ct among the poorer class of Muslims who appear to b.:: more rigid in its observance than tho3' corresponding class of Hindus. This eff~ct is particularly noliceilble in corw~d urban areas, in which the space availahJe to a woman in purdah and p()or cireumstanccsis so small as seriously to afkc{ her health. lu th~ matter ofepidcmics and of deaths Irom famine or want, the decade h.JS h<~en particularly favourable to an increase in population. It is true that t he' int1u~nza epidemic at the end of ttv~ previouf decadc is believed to have fallcn mOSl scv~rcly on the most reproductive ag';!s, und should. therefore. hav..:: fl.ad a much more lasting effl!ct than the reduction caused by famine which takes th·~ old,:;st and the Yl)ung.:st first. There has, however., been ":0 s.~rious famine i~ the d-.::cn.d·~ under review, and cv..::-ry year sees improved' m~thodr.; of fighting such epidemics as cholera. plagut: or kala aZar. Tn~ecd a compldel~' eif..:ctive treatment for the latter pest has been perfected since tho; last C'~ilSUS. and has mad~ it possible to stamp out the disease. The antimony treatm~nt of kala azar was discovered ascarly a&'1913, but the original Ireatmelll Took I'Hee months to apply anll therefore did little to prevent the epidemk. The tr..:atmenl with organic antimony compounds, introduced
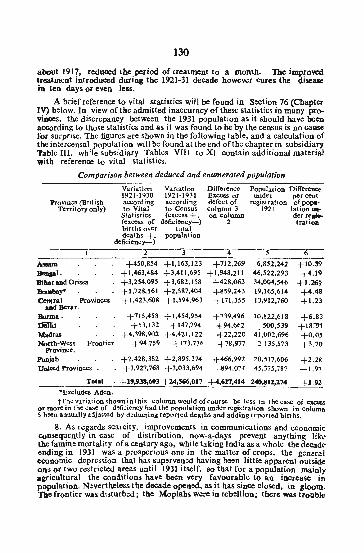
130
about 1917, reduced the period of (featlnent to a mont]]. The improWld treatment introduced during the 1921-31 decade however cures the disease iD ten days or even less.
A brief reference to vital statistics will be found in Section 76 (Chapt.". IV) bolow. In view oftbe admitted inaccuracy ofthes. statistics in many provi:noes, the discrepancy between the 1931 popUlation as it should have been according to those statistics and as it was found to be by the census is no cause for surprise. The figures are shown in the following table, and a calculation of the intercensal population will be found at the end oflhe chapter in subsidiary Yable III, while subsidiary Tables VIII to Xl contain additional material with reference to vital statistics.
Comparison between deduced and enumerated population
Variation Variation Difference PoPUlation Differeace 1921-1930 1921-1931 Excess or under per cent
Provia:::.: (British according according defect of registration ofpopa~ Territory only) to Vital to Census column 3 1921 latioDUSl'"
Statistics (excess +. OD Column derrep.-(excess of deficiency-), 2 tration births over total deaths -h
deficiency-) population
4 6
"- +450.854 +1,163,123 +712,269 6,852,242 +10.39 ~1. +1,463,484 +3,411,695 +1,948,211 %,522,293 +4.19 Bihar and Odssa +3,254,095 +3,682.158 +428,063 34,004,546 +1.:36T Bomba .. +1,728,161 +2,587,404 +859,243 19,165,614 +4.48 Centra]
and Befltr. Provinces. +1,423,608 +1,594,963 +171,355 13,912,760 +1.23
Burma . +715,458 +1,454,954 +739,496 10,822,618 +6.83 UOlli-; +53,132 +147,794 +94,662 . 500,539 +18.~ Mad .... +4.398.902 +4,421.122 +22,220 41,002,696 +0.05 Nortb-West
Province. Prontier +94,759 +173,736 +78,977 2,135,573 +3.70
PutUab +2,428,382 +2,895,374 +466,992 .20,517,606 +2.2R Uoiled Provinces +3,927,768 +3,033,694 -894,074 45,375,787 -1.97
Total . +19,938,603 +24,-,017 +4,627,414 240,81l,274 +1.92 *Excludes Aden. tThcyuiationshowninthis columnwouldofcoursc be less in thecase of~
or more in the case of deficiency had tbe population under registration shown in column 5 b~ annulily adju~ted by deducting reponed deathS and adding reported births.
8. As regards scarcity, improvements in communications and economic consequently in ease of distribution, now-a-days prevent anything like the famine mortality of a century ago, while taking India as a whole tbe decade ending in 1931 waS a prospcrious one in the matter of crops, tbe gen.:ral economic depression that bas sup~rvened. having been littJe apparent outside one or two restricted areas until 1931 itself, So that for a population mainly agricultural the conditions have been very favourable to an increase in populatiol1. N,vertheless the decade opened, as it has since closed, in gloom. The frontier was disturb:d; tbe Moplahs were in reb.llion; there was trouble
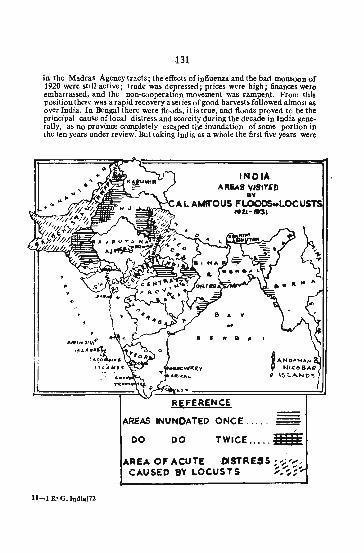
131
in the Madras Agency tracts; the effects of in6uenza and the bad monSOOn of 1920 were still active; trade was depressed; prices were high; finances were embarrassed, and the Don-cooperation movement was rampent. From this position tbere was a rapid recovery a series of good harvests followed almost as over India. In Bengal there were ti(lods, it is true, and floods proved to be the principal cause of local distress and scarcity during the decade in India generally, as no province completely escaped the inundation of some portion in the ten years under review. But taking Jndia as a whole the first five years were
IHO'A "REAS VlSITIiD ..,
ALA~OUSF~wLOC "U-"'3,
INUNDATED ONCE .... = DO TWICE ..... HBE
OF ACUTE ·DlSTRESS '-;~;. CAUSED BY LOCUSTS ~:::':
11-1 R' G.lndial72
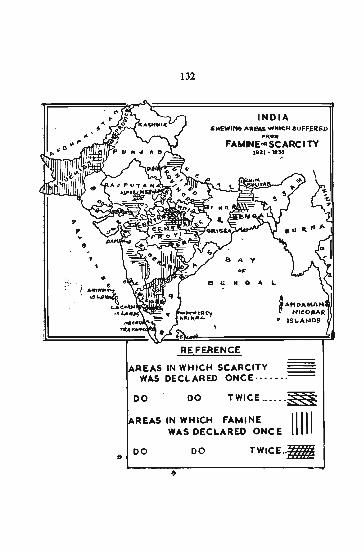
132
INDIA SMEWlftl AREAS wHICH .sUFFfRED
"ROW
FAMINE""SCARCITY t82.1 •• 33
REFERENCE
AREAS IN WHICH SCARCITY --WAS DECI.ARED ONCE··· •••. ~
DO DO TWICE •••••• ~
- REAS IN WHICH FAMINE IIIII WAS DECLARED ONC E
DO DO TWICE •• _
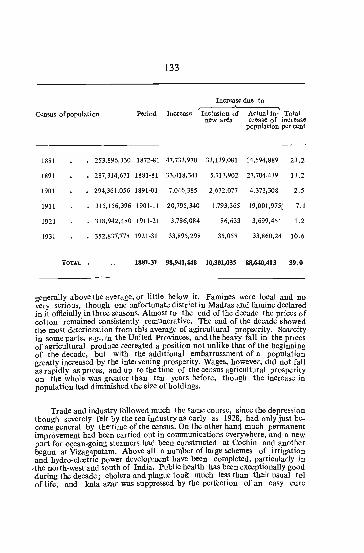
Census of population Period
1881 253,896,330 1872-81
1891 287,314,671 1881-81
1901 291,36['056 1891-01
1911 315,156,396 1901-11
1921 318,942,480 1911-21
1931 352,837,778 1921-31
TOTAL 1881_31
133
Increase due to ,..----'-_
Increase Inclusion of Actual in- Total
47,733,970
33,418,341
7,046,385
20,795,340
3,786,084
33,895,298
98,941,448
new area crease of increase population per cent
33,139,081 14,;94,889 23.2
5,713,902 27,704,439 13.2
2,672,077 4,373,308 2.5
1,793,365 19,001,9751 7.1
86,633 3,699,451 1.2
35,058 33,860,24 10.6
10,301,035 88,640,413 39.0
generally above the average, Of little below it. Famines were local and no very serious, though one unfortunate district in Madras and famine declared in it officially in three seasonS. Almost to the end of the decade the prices of cotton remained consistently remunerative. The end of the decade showed the most deterioration from this average of agirculturaI propserity. Scarcity in some parts, e.g., in the United Provinces, and the heavy fall in the prices of agricultural produce recreated a position not unlike that of the beginning of the decade~ but with the additional embarrassment of a population greatly increased by the intervening prosperity. Wages, however, did not fall as rapidly as prices, and up to tbe time of the census agricultural prosperity .on the whole was greater than ten years before, thougb the increase in population had diminished the size of holdings.
Trade and industry followed much the Same course, since the depressi.on though severely felt by the tea industry as early as 1928, had only just become general by the'time of tbe census. On the other hand much permanent improvement had been carried out in communications everywhere, and a new port for ocean~going steamers had been constructed at C.ochin and an.other begun at Vizagapatam. Above all a number of large schemes of irrigation and hydro--electric power development have been completed, particularly in .the north-west and south of India. Public bealth has been exceptionally good during the decade; cholera and plague took much less tban their usual tol of life, and kala azar was suppressed by the perfection of an easy cure
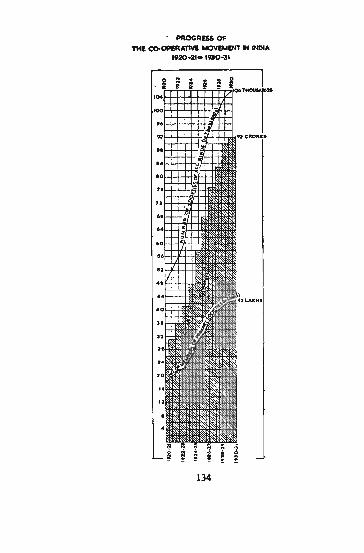
· PROGIIESS OF nil Cl>OPEIIATM! MOVEMENT tI INDtA
1920-21" 1930-31
CROA£f.
LAICHS
134
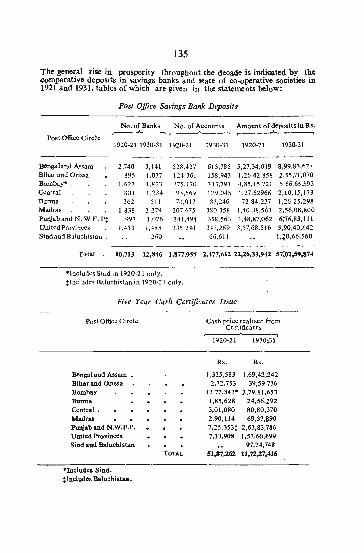
135
The general rise in prosperity througbout tbe decade is indicated by tbe .comparative deposits in savings banks and state of co-operative societies in 1921 and 1931, tables of which are given in the statements below:
post Office Savings Bank Deposits
No. of Banks NQ.ofAccounls AmountofdeposltslnRs.
Post Office Circle ~....-" ,--.....___..., r-_""'__'_"
1920-21 1930-31 1920-21 1930-31 192()..21 1930-31
Bengal and A<;sam 2,740 3.141 523,427 615,785 5,27,34,019 8,99,83,627 Bihar and Orissa 895 }'037 t:!4,361 158,943 1,26.42,858 2,55,71,070 Bombay· . 1,627 1,823 375,170 333,793 4,85,15,721 5,66,65,593 Ce-ntral 8()t J ."234 95,569 1::!9,O45 1,27,62966 2,10,15,173 Burma 362 511 70,017 87,246 72,84,237 1,26,25,298 Madras 1,838 2,279 201,075 380,358 1,40,38,563 2,56,08,800 Punjab and N. W F. P! 997 1,076 241,494 358,563 4,48,87,062 6;76,83,111 United Provinces 1,453 (,485 235,144 3n,269 3,57,68.516 5,90,40,642 SindandBlluchistan. 260 66,611 1,?O,66,560
Total 10,713 12,8-16 1,817,957 2,477,612 22,26,33,942 57;02,59,874
"'Includes Sind in 1920·21 only. tIncludes Baluchistan in [920·21 only,
Five Year Cash Certificates Issu(!
Post Office Circle
Bengal and Assam • Bihar and Orissa BombaY Burma Centra) • Madras PwUab and N.W.F.P. United Provinces Sind and Baluchistan
·Includes Sind. :Includcs Baluchista ••
TOTAL
Cash price realis.ed from Certificates
,.------A----, 1920-2] 1930~1
Rs. Rs.
1,325,583 1,69,42,242 2,72,753 39,59,736
13,72,843· 2,79,8],653 1,85,628 24,56,292 3,01,080 80,80,370 2,90,114 69,37,690 7,25,353: 2,63,83,786 7,13,908 1,53,60,699
97,24,748 51,87,262 11,72,27,416

Province or State
India British
Provinces
136
Five Year Cash Certificate Issue-cootd. ----
Share capital paid up
Loans and de. Reserve and posits held at the other funds end oflhe year
Total
..-"---. r--"-----l ~ ....-----'----"""
1920-21 1930-31 1920-21 19 0-31 1920-21 1930-31 1920-21
(I) (2) (3) (4) (5) (6) (7) (8)
4rl,525 t.:H,O,;;:J !J,23,02 69,t~,27 2.14,6610,31,1226,42,9391,91,22 .3,53,59 10,60,16 18,87,90 63.92,31 1,99,40 9,07,08 24,40,8983,59.56
Ajmer-Merwara • 7,04 6.73 32,58 30.90 2,85 9.67 42,47 47,30
Assam 2.36 8.09 12,17 59,94 2.31 10,01 16.84 78,04
Denial • 42,28 1,98,92 2,64,63 12,04.27 26.37 1.59,32 3.33.28 15.62,51
Bihar ao.d Orissa. 10,57 56,42 1,02,10 4,71,60 10,27 54,88 1.22.94 5.88.90
Bombay • 46,18 1,77.46 2,70,6211.08,35 17,771,04,91 3,34,57 13,90,72
Burma 55,23 88,78 2,23.25 1,05,19 28,42 75,07 3,06,90 2,69.04
Central Provinces. 26,49 Defar
34,57 2,56,81 4,3,,99 16,14 66,17 2,99,50 5,31,73
Coorg 99 2,75 53 5,81 60 2,47 2,12 11,03
D~lhi . 13 2,59 82 20,37 2,11 95 25,07
Hyderabad (Admi-nistered Area)
19 1.98 11 3.10 26 30 5,)2
Madras 64,87 2,42,16 407,66 14,39,78 18,37 1.27,94 4.90,90 18,09.88
N,W,P,P. 2,08 10,44 43 12,95
Punjab · 69,52 1.81.15 2,33,0313,72,21 57,99 2,50,93 3,60,54 18,04,29
United Pro'lil1ces 27,14 55,61 83,53 1,23,36 13.31 42,91 1 ,29,S~ 22.2;8
States 51,66 1,80,66 1,35,12 5,25,96 15,26 1,25,04 2,02,048,31,66
Barods 1,85 5,80 21,08 59,45 2,'l8 6,69 ".71 74,94
Bbopai 29 1,31 11,21 14,90 18 8,36 !l,70 24,57 ~hiD 3,03 1~,IS 3,06 21.24 Ow.Hor 15,03 56,06 20,53 91,62 Hyderabad 1S,11 45,41 65,91' 1,39,62 5,J6 13,12 86,404 2,08.15
Indore 3,51 37,79 • " 13,46 4,76 Xashmir 24,42 56 .. 74 16.57 97,73 Mysoro 34,35 48,89 36,90 1,16,34 6.94 24,09 78,191.89,32 Travaacortl, 33,26 29,91 ~.16 69.93
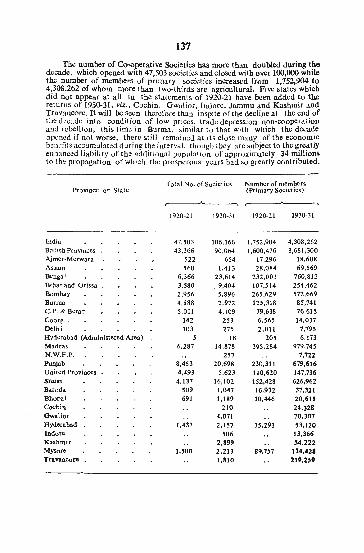
137
The number of Co-operative Societies has more than doubled during the decade, which opened with 47,503 societies and closed with oycr 100,000 while the number of members of primary societies increased from 1.752,904 to 4.308,262 of whom more than two-thirds are agricultural. Five states wbich did nol appear at all in tbe statements or 192()'21 have been added to the returns of 1930..31, viz., Cocbin. Gwalior. Tndorc, Jammu and Kas.hmir and Travam::ore. It will be Seen therefore than in:ipitc of the decline at the end of the d-:cade into condition of low prices. trade depression non~cooperation and n:bellion. this time in Burma, similar to that with which the decade opened if not worse, there still remained at its close mauy of tbe economic benefits accumulated dur!ng the interval. tht)ugh Ihey are s.uhject to the greatly enlunccd liability of tbe additional popul:.l.tion of approximately 34 millions to the propagation of which the prosperous years had so greatly contributed.
Tota! No. of Societies Number of members Province or State (Primary Societie:.)
~ ~
1920~21 1930-31 1920-21 1930,3t
----~-------------------------
India 47,503 106,166 1,752,904 4,308,262 British Provinces 43,366 90,064 1,600,476 3,681,300 Ajmer-Merwara 522 654 11,296 IS,608 Assam 560 1,413 28,084 69,569 Bengal 6,366 23,614 232,001 760.812 Bihar and Orissa . 3,580 .9,404 107,514 254,462 Bombay 2,956 5,896 265,629 572,669 Burma 4,888 2,972 125,318 85,741 C.P. & Berar 5,011 4,109 79,638 76,615 Coorg, 142 253 6,565 14,037 .Delhi 103 215 2,011 7,795 Hyderabad (Administered Area) 5 18 205 6,173 Madras 6,281 14,878 395,284 979,745 N,W.F,P. 257 7,722 Punjab 8,453 20,698 230,311 679.616 United Provinces • 4,493 5,623 110,620 147.736 States 4,137 16,t02 152,428 626,962 Baroda 50' 1,047 16,932 37,321 Bhopal 691 ],]89 10,446 20,611 Cochin 210 24,328 Owalior 4,011 70,307 Hyderabad 1,437 2,157 35,293 53,120 Indore 506 ]3,366 Kashmir 2.899 54.222 Mysore 1.500 2,213 89,757 134,421 Travancore . 1,810 219,259
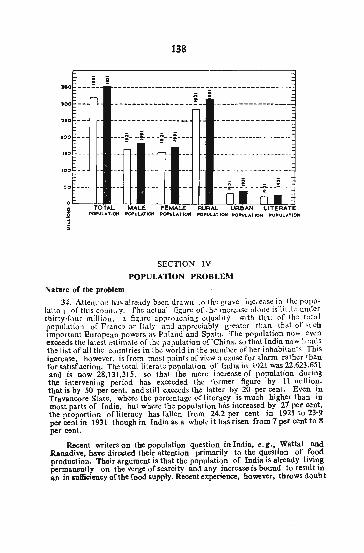
.00
"0
,00
>0
138
-- ------------------------ ------- ----- - _-= i ~ -... _-_ .. -.. ___ .... _- ._=-
--+-.;.-- -~- +-- ------------- _. -----~
TOTAl,.. MALE FEMALE RURAL URBAN LITERATE POPUI.. ... TIQfoI PCflUIoAT.Qt POP\JLATlott PO'ULA,T,OH POPl,l\.ATION PO .. UL. ... TION
SECTION IV
POPULATIO:>l PROBLEM
Nature of the problem
34. A.ttenliun [],'.lS already b~en drawn to th'.: grave Increase in the popul:J,tion ofth.is c':)llnlry. The actual figure of the increase atone is"little under tbirty-fuur million. a fisurc approaching equality with that of th-; total population of Franc;! or Italy and appreciably greater than that of such important European powas <l!l. Poland and Spain. The population now even e.xceeds the Latest estimate of the population of 'China, so that India noW h:;ads the list of all the countries in the world in the number of her inhabitants. This increase. however, is from most pnints of view a cause for alarm rather than for satisfaction. The total literate population of India in 1921 was 22,623,651 and is now 28,131,315, so that the mere increase of population during the in.tervening period has exceeded the former figure by 11 million. that is by 50 per cent. a.nd still exceeds the latter by 20 per cent. Even in Travancore State, where tbe percentage of literacy is much higher than in most parts of India. but where the population has. increased by 21 per cent. the proportion of literacy has fallen from 24.2 per cent in 1921 to 23'9 per cent in 1931 though jn India as a Whole it has risen from 7 per cent to 8 per cent.
Recent writers on the population question in India. e. g., Wattal and Ranadive. have dire&ted their attention primarily to the question of food production. Their argument is that the population of India is already living permanently on the verge of scarcity and any Lncrease is bound to result in an in &ufficiency oflhe food supply. Recent experience, however, throws doubt
139
on tbis tbeor~; the g~nera] ,slump, in tbe price of food, and the difficulty found by cultivators In sel~lng theIr produce, suggest that the danger of a ~bortage of the food, s~pply IS not the most seri()us aspect of the question. It 15 not ar~ued that thIs ,IS not a danger to be reckoned with, and in any case ,the maxlmum,populat,lon possible is very far from identical with the maximum,popu1atlon deSirable, since the rise of population on the subsistence margin must reduce the standard of living. but it would seem tbat the point bas not yet, been. reached at which the ability of the country to feed its occupants IS seriously taxed, The position of economistl> in regard to
the west now appears to be that "tbe devastating torrent of babies" is being reduced to a tnckle., and that eyen if it were swelled again the rapid developments both mechanical and bIological that arc taking place ill the world production of food. would be more than sufficient to cope with the flood, so that it,is progres:)ivcly casier to obtain subsistence. It may be doubted whether either supposition is yet applicahlc to Indian conditions. In the first place there ar~ as yet no. indications of any tendency on the part orlhe countryman to modify his vIew of the blessedness of the man who has a quiverful of sons and IS not a shamed to meet his enemy in the gate, and, in the second little sign that agriculture is likely to be appreciably affected during the next decade by means such as those which have so greatly increased wheat production on the American continent. It is however obvious that a,Part from the law of diminishing returns the ability of agriculture to provide an occup:ltion is limited, fn Europe il has been estimated that the maximum population which can he f>upportcd by agriculturnl occupatioII' is 250 to the sq. mile. while an estimate of somewhat higher dcn,ity has been made in the case orthe United States of America. and the i,\land of Porto Rico in the West rndies has an agricultural populntion of near'y 400 to thc sq. mile. The number is, as we have seen. v;:ry much greater than (hi, in many parts of India and the rllml population which attains IJle extraordinary density mentioned of parts of Bengal and of the Malabar Coast indicates the extent to which fertile land intensively cultivated together wilh fish-yielding walers could sustain a population Whose material wanls ar': to be reduced to the minimum by the natural environment of a tropical climate. These. of c{Jurse, are extreme cases taken from the two most fertile parIs of India, * but generally speaking the maximum density of the agricultural population can be far greater in India than in Europe. not only on account of the greater fcrtiJ!ty of the land but on account of the diminution in the absolute necessitIes of life corresponding to a less rigorous dimate. The real difficulty i~ that to cultivate on anything like economic lines the number of individuals that can work on a given area of ground is limited; and though the food pro·duct may be ample for many more than that number, a large in areas i,n the population, must either lead to the census sub-division of the areas cultIvated and So to a diminution in production on account of uneconomic holdings, Of on the other hand, to a floating population which is not engaged in agri
,culture and which has nothing to exchange with the producers for the food which it requires. The employment of this surplus in industrial activity would of course. meet the difficultv for a time, but can only prove a permanent cure if the increase oftbe population be limited not only to the food producible but also to tbe saturation point of tbe demand for industriallabout.
*An examination of tbe population question as regards Bengal by the Census 'Superintendent of the Province is printed as an apPendix { 0 this Chapter.
140
When .tbe latter point is passed, as in tbe United Kingdom, where the in .. crease In population during tbe last decade was approximately equivalent to the number of unemployed in 1931, unemployment will arise and the fact that food ,supply is adequate is to tbis extent irrelevant. As in some parts of Europe, ltfe on the land as a cult! vator 1S an end in itself rather than a mere ~eans of production of victuals, hence the real danger of a growth of population which must suffer discomfort because this cnd becomes rapidly more difficult of realisation. The present problem in India would, therefore, seem to b~ less the actual total incresc ill population, tban the increase of that P?ctlon of tbe population. by far the greater part of course, which is occu~ pled in agriculture and allied pursuits, i.e .• lhe population represented by sub-class. I of tbe Occupation Table; and an additional complication of tbe problem appears in the facl that the cultivating classes. in Tndia generally lack the capital required for the extension of cultivation beyond the existing margin. particularly where the cultivation practised is already dependent on a somewhat problematic rainfall. Mechanical improvements which reduce the need for labour are a doubtful palliative, though no such doubt attaches. to biological improvem..:nts, enabling a better crop to be obtained from a smaller area. Labour-I)uving devices will do tittle for a peasantry whose work takes up parl only of the year and certainly they will not enable a greater number of peasants to live on the same area of land where there is neither de rAnd nor m:trket facilities for the minor products of agriculture which contribute to the income of the European small holder or on which, such as poultry, pigs or potatoes, he may principally depend.
Remedies.
35. It appears to be the general opinion of Indian economists who discuss the population problem of this country that the only practical method of limiting the population is by the introduction of artificial methods. of birtb control, though it is not easy to exaggerate the difficulties ofintroducing such methods in a country where the vast majority ofthc population regard the propagation of male offspring as religious duty and the reproach of barrenness as a terrible punishment for crimes committed in a former incarnation. It is justly pointed out by the Cens.us Superintendent of Mysore State that the practice of universal and of early marriage is a social custom a~d is not in fact. followed from religious motives. but it is almost always religiOUS arguments which are put forward in opposition to a c-range in social custom by any society anywhere, and though the religious sanction may be the result ratJ:ier than the cause of the social custom, tris fact only gives tbe sanction greater force. Nevertheless a definite movement towards artifICial birtbcontrol appears to be takj,lg place and is perhaps less hampered by misplaced prulary than in some countries which claim to be more civilized; thus not only is artificial control publicly advocated by a number of medical writers but Madras can boast a Neo~M.altbusian League with two Ma-rarajas, three Higb Court judges and four or five men very prominent in public life ELi its sponSors. Meanwhile it would appear, in view of the present rate of' increase that efforts to reduce the rate oflnfantile mortality should be preceded by precautions to reduce tbe birth-rate. and that iftbe luxury of baby weeks
be permitted tbey sbould at least be accompanied by instruction in hirtbcontrol. A move in this direction has already been made by the Government
141
of Mysore State, which in 193() sanctioned tbe establishment of birth-control clinh::s in tbe four principal hospitals oftbe State.
Th~re are perbaps otber methods of checking an excessive increase in population. It bas been clearly demonstrated in Europe that a rise of tbe standard in living is normally accompanied by a fall in tbe birtb-rate, and tbe safU~ prio.ciple no doubt op::rates in this country; but, even while we must admit the trutb of Bacon's aphDrism tbitt .< Repletion is an Enemy to G~n:eration". a mere superfluity of food supply is not enough. as it only enables tbe possessor to breed up to the sllbsistence level 3.gain. Tn order tbat a higber standard of living may affect the rate of rcprodw.::lioll it is apparent that not only is an increase in ~duciltion and culture involved. since it seems definitely established that Intellectual activity acts Uti a check upon fertility, but also the psycbological appreciation of a higher probability of survival. Recent studies of the population problem in the Pacific by Rivers, Pitt-Rivers, Roberts and others have ckarly demonstrated the importance of p:;,ychological factors as affecting the increase or dccr~asc of the popUlation. and although tbe environment is generally entirely different in India, ti'at is no reasOn for <.;upposing that psychology is any less important here in it!" action on tbe rate of reproduction. It is also likely tbat a cflangcd outlook in wbich a greater value was attached to the goods of tbis world and less regard paid to the speculative possibilities of the next, would operate in tho same direction; but it seems doubtful jf a materialistic standpoint would commeud itself to Indian culture.
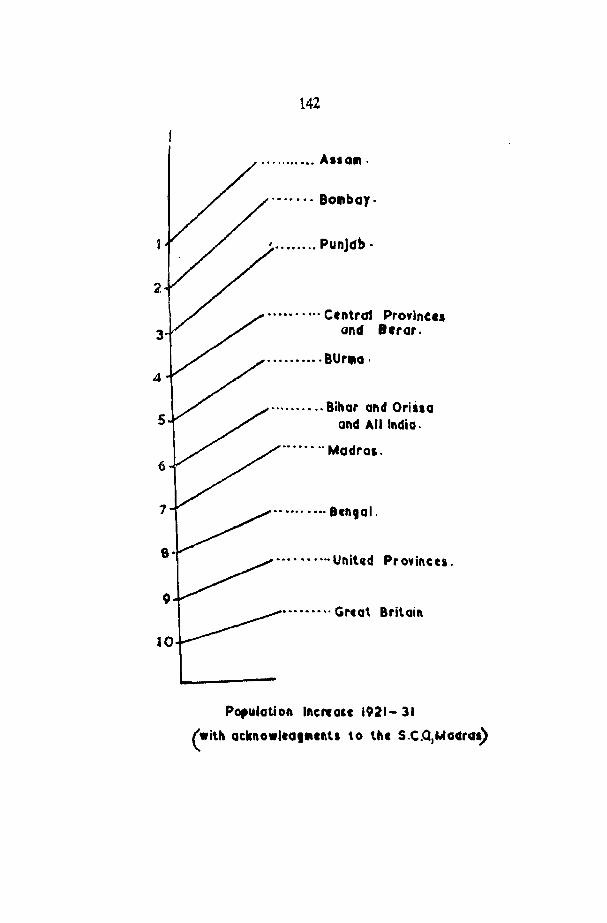
3
4
5
1
9
142
........... All a 11'1 •
....... Bo"bay·
' ........ PunJdb .
..... . . ... Central Provineci and Berar.
.......... 8Ur.o·
..•...••.. 8ental .
•.•••• .... U"ihd Provincu.
......... Great Britain
Population Inel'loct 1921- 31
(With acknowltOl"lII.tl t.o tl\l S.C.Q)MGCraa)
APPENDIX TO CHAPTER I
By A. E. Porter-The problem oJpopulation growth and an estimate of ,h. Juture population oj Bengal
Maltbas and Doubleday
Starting with the proposition that population is necessarily limited by the means of subsistence there arc in the field two principal ri\'al theories of population growth. That deriving from Malthus has been* stated thus:. first lnat population invariably increased where the means of subsistence increased unless prevented by some very powerful and obvious checks and secondly that tbese checks which repress the superior power of populat.ion and keep its effects on a level with the means of subsistence are all rc!:>Olvable into moral restraint, vice and misery. In other words nat un.' having arranged for population to increase at a rate at which it is bound 1.0 overtake and pahs the ~eans of subsistence periodically redresses the balance by famines, epidemiCS and other calamit.ies unless human intel1igence steps in and prevents the excessive increase either by moral restraint or by mcallures for limiting the birth rate or for despatching the excess of population. The other theory derives from Thomas Doubleday and gives nature a rather less sinister rolif'. It is that when the existence of a species is endangered ·'u corresponding; effort is invariably made by nature for its preservation and continuance by an increase of fertility. and that this especially takes place whenever huch danger arises from a dimi~ution of proper nourislunent or food, SO that co~s~quentJy the state of depiction or the deplcthorie siale is favourable to fert IIlty, and that, on the other hand, the plethoric state or the state of replet Ion. is unfavourable to ferLility in the ratio of the intensity of each state". It has been thought that this statement lays too much stress. upon food and the position has been thus trestated: "In circumstances of case the birth-ratc tends La fall: in circumstances ofhard&hip the birth-rate tends to rise."
Pell's La" of Births and Deaths
The recorded census figures of population in Bengal probably cover too short a period [0 offer clear suport to either onc of thcEoe theories agains.t the other. During the last sixty years the populat1on of Bengal has. become nearly half as large again as it was. in 1872. There can be no .question of i.ntelligence checks having operated, and Bengal has been free from major calamities except in the decade before last when the influenza epidemic fr~m which virtually the whole world suJ}'ered operated to reduce the ratc of In~ crese during the decade to a figure lower than any in its recorded census history .. Ifthe MalthusianJ doctrine holdS, nature is not yet aware of any need to apply
"E. g., by W. S. Thompson-Population, A study in Malthusianism' 1915.
tBy H. Sutherland, see Proceedings of World Population Conference 1927, page 58.
143
144
a check to the increase of population in Bengal. If the Darwinian theory holds and "fecundity is in direct relation to the chances of death", and if the "law" of Doubleday applies, nature still finds it necessary to maintain in Bengal a high birth-rate in order to replace with the high death-rate. In Some points at least the Malthusian theor~ fails to explain l~e facts. In European countries and America, where most Investigation has been carried out, it has been found* (a) that the birth-rate is negatively Correlated with wealth and (b) that the indirect psychological and social effect of relative poverty as contrasted with relative wealth exprc6s themselves definitely a6
clearly in the sexual activity of human b:;!ings and through sexual activity in birth-rates. On the Malthusian theory in the wealthier classes where the means of subsistence arc plentiful the population should increase more rapidly than in the poorer classes where they are less plentiful unlel:>s there were some voluntary interference with the rate of birth. The evidence of any such v{_)luntary res.triction is not conclusive and the theory generally held is that f~rtility itself decreases in the higher classes with increasing wealth and culture. The Malthusian doctrine also fails to account for the fact that a high birth-ratc and a high death-ralc are apparently invariably found together and that conversely where there is a low birth-rate there is also a low deathrate. This fact and the ex.treme doubtfullncss of any evidence to show that cOfl')ciollslimitation ofthcfamily can account for the whole or a considerable part orthe decrease in the birth-rate where it is low have led to the enunciation of the theory·· that "the net result of the variations of the degree of fertility under the direct action of the environment will bear an inverse proportion to the variations of the c,lpacity for survival." Under this theory variations in the birth-rate are mainly due to the operation of a natural law which adjusts the degree of fertility to suit the death-rate of the raCe. The theory involves the postulate that the same conditions which lead to a reduction in the death-rate lead also to a dccrea'ic in fertility in some manner n01 yet known. The author orthe theory suggests that the hormones assist in regulating th:! fertilit.y of the germ cells. that the output of hormones by the endoctrine glands is rcguhted by the nervous stystem which responds to tbe action orthe environment and that the variations in the degree of fertility in response to the direct action of the environment will bear an inverse proportion to the development of nervous energy.
Raymond Pearl's Logistic Cane
What may be considered to be a development of the second of these two theories is that put forward by Raymond P~ar1. tThis theory deduces that populations gorw in size according to the Same mathematical law that individual antmals and plants foHow in the growth of their bodies in size, and that human populations grow according to tbe same law as do exp erimental populations of lower organisms. The law of growth postulated on these
·Pearl-Biology of Population Growth, 1926.
"C.B.Pell, The law ofBirtbsand DealJu;, 1921.
tR.. Po.rl, Studies ill Human Biology, 1924; the Biology of Population Growth, 1926.
145
deductions may be expressed by an equation with three constants, and the ,curve representing this equation is called by P~ar) a "logistic curve".
Equations have been worked out and fitted to the populations of fifteen countries. of the world, the whole world and the populations of certain cities and have been shown to give over the whole recorded census history of each a very reasonable congruity with the recorded facts. Assuming the mathematical form of the curve this theory allows account to be taken of the fact that a population is necessarily confined to a certain area and therefore must have an upperlirnit of population as well as a lower (whiCh may be nil) and for the fact tnat population growth takc~ place in cycles conditioned amongst other factors by cultural achievement. It is po~sible that over a restricted period the logistic curve may not give 50 accumte an approxim:lloin to the recorded population as a curve of some other form. A'i a method of predicting future growth aI~) it IS liable 10 thc irrupti{lll (Jf influc-nces not previousy prevalent. P~ar1 states: :'predicI ions or future growth may at any l!mC bc altered by the entrance Tnfo Ihe:.;iluatlon of new economic or social factors of a diffaen! s0rt It,) those which have operated during that past period which the equation c<)vcrs. Th(: population may be stimulated to start upon a new cycle of growth or slighter but stjll in kind new factors m:ty alter som-:;what the uppcrlimiting value ofthc present cycle." In c~rtain instanc~s however the logistic cur've cJ.lculatcd by him givc!1. asto ... nishingly close approx.im:ltions to the population actually recorded later. Forthc United States of Amctrica in 1930, foOr instance, a curve worked out before the Cen~us. of 1920 sugge'ited a population within 5 per 1,000 of that actually cnuml~ratcd.
Three curves of P.::arl·s logis.tic type haw heen fitted to the census population of Bengal and the popUlation calculated from them. . . . .. is compared with the obscrved population. The first is thccquation worked out by Mr. P. J. Griffiths, l.e.S.,and it was hoped to give jnan appendix brief notes nn the method by which it was calculated. Difficulties in setting up that rather com~ plicated ma.thematical formulae invt)lvcll, however, have prc~ntcd them. "Briefly however, that method consists in fitting a curve of the required type to three of the recorded cens.us figures and then adjusting it by successive apprDx.imations to all the recorded figures. The desired approximation is onC in which the algebraic sum of differences between the calculated and the actually recorded populations is nil and the sum of the squares of these differences is a minimum. Mr. Griffith,<;,~ Curve was worked out for the population actually recorded in Bengal treating the interval between each census count as being exactly ten years and as suming that a negligible error only was introduced by this trcatment and by neglecting to make an adjustment for change of area. For the other two calculations the recorded census population was adjusted to repre. sent the estimated population in the area now constituting Bengal on the ht March ofcach consu' year after 1881 and on the 1st March 1871. In making this calculation it was a.'\sumed that the population between any two census years changed at a uniform rate and that the rate of change between March 1871 and the date of the cen.'us in 1872 was the Same as between 1872 and 1881. In arriving at the third equation allowance has been made for a smaU factor which Mr. Griffiths has noted as being disregarded in his calculation. The equations give a curve of reasonable fit and the last shown in th.e most accurate approximation for the observations in so far as the algebric sum and the sum

146
of squares of differences between the observod and oalcui.ted population at all cenSus year including 1871 the Sum of the differences is least and the snm of their squares not indeed least but very near to it.
Gemetal teadeacles of poplllati .. gr.lTtb a.~ upper limit of p.p",atloa suggested
On the first eql.1ation the rate of increase was being successively enchanced till 1881 when it began to decline and the maximum population would b, "bout 74 million', which would be practically attained in 2063 A. D. On th~ third equation the point 'of maximum increase was passed 1872, the rate of growth is also diminishing and a max.imum population of of about 6&1 millions would be expected which 6hould be approximately reached' in 2076 A. D. On neither equation is any lower limits of population implied, i.e., the equations do not suggest that the present cycle of population growth began at any definite period, although on the third equation B,ngal should bave had a population ornot less than two millions in 1668 A.D.
Mr. Griffith.o;; also fitted curves to the population of Muslims and Hindus. ...........•.. The correspondence of these figures, particularly for Hindus. is not &0 cio&e as. is obtained by the equation for the total population, but the Muslim equation gives. a reasonable fit for the years 1881 to 1921. The total nllximum population towards which the equations suggest that each community is tending would be for Muslims about 32 millions and for Hindus about 23i millions: in aggregate these figures fall short by 14 to 20 millions of the upper asymptotic population calculated for all communities. The Muslim and HinduequatioDs imply that the point at which the ratc of increase ceased to be successively greater than in previous. decades was passed in a 1 ',ut 1886 by the Muslims and 181.2 by the Hindus. who are now approaching a stationary population. In any case the implication is that the Hindu community is. further along its present growth cycle than the Muslim: in other words that it is approaching its maximum whilst by comparison ther'Mus,lim community is till rapidly growing. It is pos.sible to find a suggested explanation, jf this. is actually true, in the f~lct that Muslims live mainly in the healthier regions of Ea.stern Bengal and Hmdus in the les.s healthy and less. progressive portions. of West Bengal: but it would be interesting ifsimllar caJculations have been made, to know whether the implication aris.es also in the case of other provinces.;
Estimate of population in 1941
The equations for total population suggest a population of between 53 and 53! millions in 1941. The communal equations appear (and Mr. Griffith. holds them) to be inappropriate. Equations of a more complicated form might give closer corre!1.pondence with the observed census figures, but the calculation involves very great labour, they might give no better estimates for the future and in any case they are scarcely worth making in view of the fact that only seven counts are on record. For the future all that can be said is that if the type of equation used is applicable to population growth and if the conditions inJIuencing population growth in Bengal over the period to which it has been applied continue substantially unchanged for the future, tbe estimates of total popUlation made by use of the equations deduced
147
should represent the popuia<ion to be expected. The equation themselves suffer however by being fitted to so few observed counts and the conditions. infiuencing population growth Cannot be predicted and are di:ffi.cult to discover if a change in the cycle suggests their existence. Thus after the fonnation of the German Empire and the institution of the present consti .. tutions in Japan, Pearl found that the cycle ofgrQwth was, as it were, speeded up and Germany and 1apan starting from the population of that critical time took a leap forward and continued their cycle as if they had been at an earlier stage when growth was more rapid. It is by no means impossible that constitutional change may have a similar effect in Bengal and may affect the different communities to a different degree.
CaD Bengal support a larger population ?
The prospect or cven the possiblity of so considerable an increase in a population already one of the densest in the world may lead to appre. hension that the populatiun of Bengal is rapidly approaching numbers which cannot be sustained at any reasonable standard of living upon the means of subsistence which Bengal Can produce for long. If population actuaI1y does increase according to some such law as that illustrated by the logistic curve the fact that cOll[)iderable increases arc inevitable makes the apprehtnsion futile. P.:arl himself has poinTed out that this inevilable increase nerd not neo.::ssarily increa:i>e the misery in the world since firsr this result has not happened up to the present, secondly Hthe orderly evolution of human knowledge justifies us in assuming that science will keep pace in discoverinB means. of expanding oppo~tunitics of happy human suhsistencc", and thirdly the human organism is ttseIf adaptable to an extent not yet imagined. It cann.ot be denied that a large part of the populallon of Bengal lives at a very low levd of s,..bsislence, and that any increase of population mUli11cad to increased distress unless the po1enlialitics of ~he province arc developed. What is suggested here is [hat these poteniial111cs are such that pessimism as to the future condition of its population if conf"jdcrable increase take pial:! is not n~cessarily justified. Like the rest of India Bengal is notable for it, undeveloped resources and the inefficiency with which such resourct's as it has are exploited. The soil is probably unlike1y to deteriorate furth(,T and the general opinion abou.t areas such as Bengal .. where scanty manuring neressitates small crops, IS that a dead level ofyJc1d was reaChed long age and is conditionrd by the rate at which plant food constituents are made available by weathering. The cultivator in Bengal practically ever enrichn; the 'Soil With any manure and the u"e of manures together with an improvement in ihe implements of agriculture which would then be rendercd possible would probably increase enormously the output of the soi1. It has been· cs1i· mated that improved methods would result In a reasonable expectation of increased food output of 30 peT cent throughout the whole of India. There is no doubt that any additional labour required under a more intensive form of cultivation could easily be obtained since the agriculturIst in Bengal on
·0. Clarke, Proceedings of the XVllth Indian Science Conference. 12-1 R. G.lndia/72
148
the whole probably ~orks. less than agriculturists in almolit any otber part of the world. Sub sidlary Table I (Bengal Repon) also shows that of the lOlal area cu\livablc only 67 per centis now actually under cultivation. Ifrhe lota.l cu.lllvable area were brought under cultivation and if improved methods. of eullivalion yielding an increase of 30 per cent over the pre~Dt yield were adopted i tis clear from a simple rule of three calculationt that Bengal could support at its prc&cnt !itandard oflivjng a population very n~ady twice as large as. that recorded in 193J _ Fresh arcas In course oftirnc Will be brought umh:r CultIvation as lands Oll Ih..: Bay or Bl)llgai accrdc and r~ach a stage suitable fOf cultivation. Ewn at present it is clear that by far the majl)rily oftb.t,; food stutTs. consumed In B';:l1.gal arc locally produc..::d. During 1930·31 taking only grains, pulses and flour, salt., sugar and spic...:s, provisinns and oilman's storc~- BI.!Ilgal imported goods of thl.; value 01 Rs. ~21 JaLl,~ and expOl"lcd good~ Oflhc value of Rs. 281 iakhs. Bilt tlll,.' bd,lanc~ (lftrad~ d~lring the sam',; y..:ar amounted to R'), 34,52.411akh~ of mort,: than thrc~ 'im..:~ lh..:: aggrcg:Hc ..!xport and import trad(;. The scaborm: trade or CalcllPa is not c()nfincd 10 go()ds origInating in or mcanj excluSolvdy for n'-lls,!l, but In til.:: year 1930·1931 jute, ka and hllh.:s cl)ntribuled 771- p':r l:.._n! L,j"lhl' total and B~ngQI contributed all thcjutcs, nearly ~dj the hides and ~ wry cunsiucrablc part of the tea. It i~ CI)11')Cl,p,-'ll!ly ckar thai Ihe favourabk balance oflrJ.dc Lo a v,;;ry small \~xtcnl only Wi.l~ Jissipakd outside Bengal ~Ind that 1he balanc,;ilsdfproyides suffi';icnlJy for an enormously incrl:ascd imp:_';-la'\ Ion or l'Ol)U stuffs W'.,!fC it ll<:c",:s5ary to import them al any t !me. Ni)'_ ,J]lly ~Lgriclillur(: bUI also l nd.I.l~lry is "l pr.._~s.',;nl in B(:ngai practically in ll~ infancy. Rcvj(:w1ng produl:lion in India a R:ngai1wrilcr* In 1924camelo thG COllc;usion that tllC ··ol.llst.lnding feature oflhc prOdllCllVt; system of India i"'l[~ in..:fii· ciency which is shown by the great wastag...: of resources on (hL" llTI.:" hand and Ih~ lower productivity of the industri.::s on th,_; other ... It is in suffici~:nt produclion to which it) dw..:: India.'s poverty. both absolute and rclaliw .... The lack ofcapila\ is panly responsible fOl'lhe prescflJ low prodllctivity bu1 could not ...... be regarded as. the fundamental cause or ins.ufficient production in India ........ Ins.ufficicnt production is the result of inefficient labour, i.e. lack of capacity on th~ part ofthc people to mobilise the phYciical, in~e1-Jeclual and moral forces of the country and to organise land and capital ~ffl!ctivc1y for national production". Improvemcnt in met hods of production both agricuHural and industrial should therefore very ca"ily make po~sihJe thc subsistence of such an increased population as is sugg:!skd by the figures a1ready t.lisausscd. and the considerations deduced tn thIS parag1 aph also makeit possible 10 hope that such an increase of population may be attended with a v~ry considerable increase in the material condition of the pcopl~ and in the standard ofliving. It is clear alleast that it is not yet time to ind:ulge in gloomy fMC bodings on t he ground that &ngal is over-populated, prl) vlded full US,! is made of the available resourCes of the country by improved methods.
t 100 130 ~ x - =194 67 100
.• Rl jani Kanta DaSt Production in India.
149
Extra.agent methods of population iacrease are a practical problem
A final problem suggested by the growth of population in Bengal concerns the enormous wastage of life with which that growth IS achieved. It lS clear thal _wha1 IS of importance in population growth is the rale of increment. A high ratc ofincrem..::ut can be achieved by a relatively low birth rate if the dcaLh·ratc is also low, whilst on the conlrary a comparatively low rate of incc'.!a"e (\:s,ults from even a higll birth-ratc if the dcath~rate also is high .......... actually both the: birth-ratc and the death ratc in Bengal are very high and .. _ ...... tJu::r~ is COllSl:qllcntly an appalling wastage of rc-productivl;': energy In maintaining the present increase of population. lft.he JogiS.li~ theory of poplliation growth is correct a rctard~d ratl~ of incr~asc isincv!tabk althcuppr;;:rstage~oflhccycleofgrowlh unlil finallyapopula~ tion is. r.;ach....:u whi~h tu all inLents and f'urpo~cs. is slationary. France in Europe where there I:. a nol~lTinlJ~ly -'ow birth-rate probably illustr3tc:. tillS pos.ilion bi.:st but ancxhaustrvc* cnqulry JI)lo the Arah poplJiation pf Aigilrs sugg...:slcd to P...:arJ that th...: retardation of the rate ~)f incr..:as(" IS in g~ncral aif.:ct.:::d at the upper litag,:;:; of the popula! Ion gruwth by d~crC;lSC hqth In the birth-ratc and In lhe death-rate. The Arab pl)pulal ion ofAlgh:r:-., showcd both a (kcrc'-lsc III til,: birth-ral(: which wOldd n~)1 be ascflrn:d to Impr{)wment in public health measures since thl" IraullionaJ custom ol"llle An'lbs offer the ulmo-i\ possiblc rl,., ... islance III ~lllY chmlg~s in their habib which would improve sanitary condi.liom;, Atlcmpt~ 10 df...:ct a rl'tardalioll of the rate of InCtC3.se by volUlltary {Imila! ion llrlh~ birth-rate arc almost certainly doomed to failure parlicularly III B:llgal. Th.,;y arc Tcpugn,mt 1 0 Cl)mmon sen1 imenl jn Inis eLlun1f''y, I]1C mdhodsadoplCd arc so o:xp.:nslv,: as 10 be beyond the reach oflhe great m:tjority 0fthc inhabitants and il is probably true io say that there arc as yd none which can b~ rdled upon as bcing absolutely ccr· tain and satisfactory. Figures for the differenl strata of society .... show that there is no evid .. .mc..: to bdlCv.: that contraCl.·ptive m..:.aslIfC!'l. art: used by the upr-::r class·:s or those ..:ngag..::d in professions and Ihe liberal arls; and it is c'!rtain that they arc not pracllc.:d at all in thc lower strata of socicity. :What app<~ars to h'lpp.::n, i ruw an(il(lg.~' orWcslcrn Europe may be acccplcd. IS that a d.!cresc in lhe d.:ath·ralc is In,:vJtably followed at some period by aCo.)rre5pondingd.;cn:a~ in t I1:c birth-rate. It isclcaralsothatfcrtilily in WCf.tern countries dccrcascs With th,~ meresc of w.:.alth and intellectual interests., II is th,:r-:forc possible to exp-.-:ct thal a reduction ofth~ birth~ratc by the adoption of improved m!aSUf":S of public h·::-ahh accompanied by an improwmcnt in 1hl; standard of living, an incrcas~ in the: spread of education and perhaps principally by a further cmaD:cipation of women and their introduction to spheres of usefu.lness and actIvity from which they arc now in Bengal g~n'::!rally debarred by social custom and by the inslitution of purdah wiJI in due course result in a decro:ase in the birth·ratc corresponding with the decrease in the dea.th~rale which it is the object of public health mca~ures to bring about.
·Biology of POPulation Growth,

CENSUS OF INDIA 1941
I-GENERAL India proper has added over 50 millions to its population in ten years.
Ln other words, the mere decade increment is itself greater than the entire population of any European country except Germany or Russia. Thi~ waS not unanticipated by any means. More than onc observer had predickd a population oftilc-se dim~nsions and between census observation had shown that it was on the way.
Undoubtedly this massive increase must impress forcibly and even come as a shock lO those without knowledge ofrhe factors behind it, and onc can detect in some oflhe lessinstrucled uttcra!l.C(:sa kind of despair, as if population increase was a kind of snowball whIch once starled must rush on till som,,;: catastrophe arr~sts it So momentum. The true positibn is very different. Ten years is a long lime even to an aduh and a kind of minor enlcrniry 10 youth. But it is Jess than half a g~neration and the pulse of life beats, not by the year but by the g~ncration. When onc influences reproductive forcc~ one cannot think in decades. Whcn one rcduC!.!s maternal mortalif~' one does not only preserve so many women in the fale ofhea4s; one also preserve a reproductive force and each Woman's contribution IS not one, but two, three, four, etc., d'..liingthep.::riod of her m1.rricdlifc.I have touched on this. gen~ral aspect in a separate note and need only impress there the importance ofth~ orgdnic point of view. When one makes such reductions of maternal or infanLih:: mJrlality, cte., onc has added a reproductive force, whiCh. in Indian conditions, will be applied. Everything thal reduccs tne death (al'e from diseases which attack persons in youth or [he prime of life to some extent performs the same feat.
AI1 this is different in degree from changes which preserve persons of matuu ycars.long,~r in ·,;:xistenc!, allhoug~ this effect also is apparent in India. In fact one is not operating by m,~re addition at all. We are in the realm of diff~rentjals and on·:: of my ambitions was to attempt a differential expression oftheseconddcgreeasagcncral statement of the Indian_populat,ion problem at the present day. That possibility has gone, but the pOint remains that what has happ::n,::d in India in the-last 1wenty years has been not So much the preservjng of life as a large accession of potential.
There are many variables in the reproduction equation and if this were morc geno:rally realied what is called the population problem would receive a readier and wider comprehension. Such an outcome is in itself greatly to be desired. Some of the variables arc measurable. others arc not. If1he age at marriage rises we can, given reasonable statistics, measure its effect on population. As public health produces its effects of lowered maternal mortality, lower d'~ath rate from epid.emicdiseascs, lower in fantiJe mortality. etc., we can, aglin given reasonable statistics. measure them. And in fact tbe mathematics. oflarge numbers has as one of its most interesting: and valuable attributes the power to extend prognostic efforts beYond what would be possible on thetimited scale of town or even district. So far1he indirect, the intangible forres Can be measured only by their effects. In other words,
151
152
jf social or economic causes are operating 011 population growth then their measurement is from their result and we are really deducing causes after they have operated. That is the position )n the many and varied discussions of the population problem in the West. The tende,ncies have been noticed and the effects measure and from the effects we have tfled to deduce the operating causes. It would be a great advantage jf OUT social observations could be So extended as to enable us to take these intangible caUSes before they had operated on the generations. It would be difficult to base such observations entirely on figures, but there are other lines which could be developed and figure would always help; thus a full system of hirth, marriage _ and deatb regis.tration in India would in itself be a great aid.
This time we have not in India even the age tables to work on, but pos~ sibly these will appear later for British India and.in any Case they wiH be forlhcoming from the major states which here. as In other lines, should offer a most valuable field of information and study of all interested in India's population.
The increase is by no means uniform although, a greater figure than for the previous decades is practically universal. Rates are noticeably larger in the north than in the south and have two distinct peaks in the extreme west and north-west andin thecast. In faCl we have in the Punjab and Eastern Bengal two swarming areas. Both arc comparatively young from a habitation point of view. The Punjab irrigation is by no means ancient and when applied was applied not to land with a substantial settled populati(ln and long local practice, but to a scmiwdescrt. So, as it were, it ~tartcd from scratch. The Punjab phenomena show themselves this time in Blkaner where the Sikh has followed the water and produced a 40 per cent. increase. Similarly in Bhawalpur, where you have an empty country suddenly presented with the means for fining it, the filhngproccss star1:-; al a high bpeed. In effect you have an open frontier. America had the open frontier too, although it prcticntcditselfIhere is a different form. In essence, however, the phenomenon was the same ;.e., empty lands suitable for habitation. or in other words for 6warming. The difference is that in America the empty lands were suitable from tne beginning. In the Punjab they were unsuitable tilJ the water~ carne. Oncelhcy were suitable. the human tideftowed.
When the frontier is closed the pace rlrOPb rapidly. Th? U IT_( will happen 1 n the Punjah and in India. Front icr!' arc of m:,l1Y k;l:C5>. no1 only physica1 but also mental and social; their influence, hcwever, i,S always the same.
In East Bengal. we have another kind of new Country. From a habita~ tion 'ppint of view it is far youn!?cr than West Bengal. It has a practically unfaIling water supply and the nver floods have a healthy and cleansing influence as well. We have. therefore, this land. whose inhabitants taken all ,ov~r are on a lo~er level of living than West Ben.gal mu~tipJying freely whlle Increasec capacHy proceeds. In other words, theIr frontier is open too .
. ~ndia as a geographicaJ unit and as a home ofdvili2::::ti('n is old, but Within that oldness It c.overs.also much that is n(.w, a point which it is important to bear always In mInd. Moreovcr~ th<..ugh old it is not necessarily
153
~tatic and when new circumstances Come new affects will follow. The basic point remains U\al wh~n a country i6 empty and the means of filling it come, it will be filled.
Another dement was present behind the general increase which has some beariug on the diff~rential rates as between North and South India. And indeed, the v~ry exi::.tenCt! of th·.:!se differences squares with past experic!Ice which would have indicated them as to be expected. The factor in questIon is the degree of under-enumeration in 1931.
At lbat time Mr. Gandhi's civil disobedience campaign was in full swing and all over North Inc ia the census, as a governmental activity, incurred hostility as sm:h. In Ahmedabad dty, the census cou]d not be taken at aU and similar effects were undoubtedly apparent in Surat and other Gujarat are2.s. Lik~wise in the larger towns and particularly the cities, where enumeration in any Case is always difficult, the risks of assault, intimidation Of hostility in 1931 undoubtedly existed and were not such as to encourage unpaid enumerators to absolute thoroughness of discovery. The dimensions of the leak. as it were, are indeterminable, but we have several lines of indi~ cation whicr enable 1.S at lea'it to locate its more prominent appearance. For example. such is the quality of the Indian village staffs and rural population general1y that there is no reaSOn to suppose it reached any marked dimenSion outs.ide towns except possibly in such areas as Guajrat; and in the South) wber~ head~ are harder, it did not cntel at all. It \\las undoubtedly present however, in the- larger towns and other regions in Northen lngia.
Consequently if the adverse circumstances of 1931 no longer existed onoJ would eJfpect their removal to show an effect in an apparent greater increase in the regions where these Cause~ had operated most at the earli("r cenSus. In other words. one ,,"auld look for a larger increase rate for 1931~4l in such places as Abm:)dabad. Surat then, say. corre8ponding citief' elsewhc1e; and in gencaral in North lndia than in the South. This has been borne om by experience: increase lates in the Souih are below those in the -north, ,,_hOc the presem bgme for Ahmedabad bears no relation to the 1931 detennillation.
Much the same influence eniers in another wav, affecting tbis time rather the s.ystem as a whole than particular di:,turbfng causes. Ten years ago, and indeed at all previous cenms. tbe peopl~'s attitude towards emlmeration, ~ight be described af., passive. In 1941 it. was extremely active. rn p~st decades If some one were left OUI, Ihe chances where againsI him taking any trouble to g.;[ himself put in. All that was changed in 1941, and we had for example the spectacle of 11 not particularly wealthy or healthy individual taking a substantial Journey to the headquarters of a province in order to assure himself that .h~ had been tecorded:' Thanks to the acute intero:st in community figures, pract Ica,lly all communities this time were census-consciom. and took pains to see that their _houses were in the lisis and that they themselves were counted. In other words, the second and predominant item in any cens.us was at work; the citizens wanted to be Counted. Unfortuna{eiy yhejr anxiety was not always guided by reaSon or consideration and their enthusiasms created great difficulties for the census staff in certain areas. Neverlheless, The fact remains that an appreciable ihougb undetelminable slack hc.s Ibis time been taken up.
154
VI-PUBLIC HEALTH AND ALLIED MATTERS
Another point m"~riling parlicular attention is the e~timation aspeci of India's population and] had hoped to go fully int.o thiS, to e.x.am1ne the data\~x.isting. show what they off~red and what they lacked, thC_lT zon~ and djr~ciion of vJ.riation, and in fact ev~rything that would throw lIght on our capa.city to indicJ.tc the probable growth of India's population. not in the n'~xt fdW years but in lh·~ n·,;xt several d~cades and indeed generations. Apart from the n·::c.!;ssity of the inquiry itself the question is one of great impoftanc.~ for India for the Comm:Jnw~alth and for the 'Yorld. He~c and there an occ.l:iionaJ fragm ~nl of the contemplated treatm':!nt wIll be seen I~, fOT exam.,l.~, th·-; cmoha~is I,dd on vital s.tatlstics. Perhaps som~one else will be granl(!d the I im!" and th<~ opportunity to takethis synoptic view of a great is.sue.
Another fragm:~nt is. discussed below and starts from a brief note by the Public H~aHh Commission,:!r for India which he waS good .:nough to give me on three points put to him, nam~ly a summing-up ov~r the las.t 20 years on--
(a) maternal mortality, (b) infantile mortality, (C) m)rta1ity rate~ for the mlin epidemic diseases.
Tabl,:;s prl!p'lr·.!d by him arc giv~.n below and also four diagrams for British India.
Th'! g~ncral ·.:!ff~c( can b:! summ:d up a_,: a little changing: but high brith-rate, a fdling d'~ath-ratc and a markedly dropping infantile death-rate accompany a downw.lrd trend in the dealh-ratefrom Cholera an thl: continued diminu!ion of plague at> a caul'ie of mortality. AU Ihese tendencies laken tog~th.er point in one direction namely a substantial growth.rate in the population. They bear out in fact in a more specific way the general Tendency described eisewheJI!.
The vLtal statistics in India arc not Comple1e and 1n some Case!-. far from it. Th¢ir d~v.~lopm'~nt however is in the dlrection of greater fullness and accuracy and consequently variations in the ratios of birth or mortality, etc., due to variations in the quality of the statistics win be only in one direction. i:e .• of apparently raising the ratio. since if in one year X births on Y popuJa· tlon are reported or discovered and later on X+A births are discovered over the sam~ PJPulation owing to imp10vements in methods, the birth ratio rises apparently from XIY to (X+A)/Y in each case multiplied by a thousand. Consequ~nty although as. thl! Public Health Commissioner says the downward trend in the death ratc has not reach~d the extent of technical statistical sigl1ificlnc·! it is jllstifi'..lble to conclude that such a trend i n fact exists.
Wh.,re infantile mortality is concerned the fall is significant as the graph ~hows. When one rem :o:mbers what a I arge proportion of deat hs actual1y occur In the first Yl!ar of life. reduction of infant ile mortality from 195 in 1920 to 160in 1940 represents a sUbstantial accretion to the population.
This can at once be appreciated if one applies the reduction to a birth-rate of say 33 p"r I ,000, on a population of 390 million modified by a death.rate of.22; the result is an annual accretion of the order of 3 lakhs and for the last del:'ade 3 millions. from the singie Cause of a reduced infantile mortality.

ISS
1::13>- r ® .... '" ~ g:;:'-=
j ~
C> ® .... ... t ... £~ e t 0 ;: ..; .~ ~ e ri =08 Q _. '" ~
~
2e~~ ~ ~
~ 3 '" 0
"C ~~ ~ ri
~ q ~..c:.=~ ~ ~ " " ri
~.§;; § E f ~ '" ot:~¢: 8 e ~ ~ '" gJl5~ " N
~ e
j ~
~ to"g'o.§ <i ,.: .E:.:a~ a '0 '" ~~~@" 0
'" '" ~ 'Q ~
s;::~~ '"
1
3 0 N ~
's ,,;: ~ c.....C':I<ft:a ;;:
.8:.g ~,~ ~ .,.; ~
<i
a-§~ ;;; r .~ '" ... i$-i'~q::
I § '" ~ .... 'E ~~ ~ g g ~~ §:.~ '0 .. ... iii I; ~
~; ..;
~2:5;E z . ~ ~ 0
;;.~ :~ l g 00
'" 00
£ '" 4-00 ci • E ~ N g "tIS 1U.2~ ..; ..;
]~.~.~ '" d~~& 1; ~
!;; o t' <l) VJ
'" ~ ~ ll~~ ~ 5 0 .gG
.I. <I'I..c::'lc..~
~~_g] ~ ...... _ - a:I ~ 0.02 .. fi -e «J M_ 0 .. ill: .~ .:! ~ .. .~
8. 01, "ii 0 ... Cto~ ..... ""1' "- li .S: .- u.I <1'10"-
B ~ 4: "c-fi ~ g'~;i .. ..
.g .::l 0
~;]= ;.;; .E f .~ 1 ~ '0 ~ Qr.Il t':! 0 l!!' ._ . u 0 i!' 1! .~~g~ ~ '§ \0 '§
~ j .~~:f;a is ] g
'" ~ ~.~e ~ ~ ~ ~ .~'- >. '" ,",0.0 ... iii
156
Thus even if the infant mortality Tate cont.inues to be J60per mille (the figll.!e for 1940) for the next two dccados, substantial additions of 6,5 and 11.1 mIllions are likely (0 result by 1951 and 1961. If on (he other hand. i nfan! mortality should continue to decrease at the Same rate as during 1920 to 1940, the corresponding figures will be 7.0 and 13.4 millions respectively.
These figures give some indication of the probable effect on populat ion growth of one aspect ofpubUc health activity, viz., the campa1gn for the saving of infant life; and the nature of the portent exposed for the attention of governments and citizens alike.
Registration of maternal mortality is So limited that a figure cannot be based on country-wide statistics. The public Health Conunissioncr hovycver refers me to three specific enquiries conducted by medical men in Madras. Calcutta and Bombay which yIelded figur .. respectively of 16.6. 24.4 a~d 8.9 per 1.000 total births. The variation is So wide as to caB for a cerlaln cauti,on in uiing the figures or even in quoting them. Sir John Megaw's.;) enqUIry often years ago based on questioni put to village djspensary doctors a]] over British India indicated a maternal mortality ra1e equal to t.he. Calcutta figure above, i.e., 241 per 1,000. The Public. Health C~mmlssloner sugges.ts that it would not be an unreasonable working assump_llon to take the figure for the count.ry as a whole as being somewhere i n the nel ghbourhood of 20 per 1,000. As soon as we compare this with tbe figure ~or ~ngla~d and Wales, 2.9, we see at once the effect on potential of a reduc110n In thIS ratc. For it is women Who represent the reproductive potentialsincc it is they who bear t he childrcn. The scope for appreciable reduction of this figure of 20 per 1.000, IS obvious \":ven if we leave out of aCl;ount for the: present any question of approximation to figures comparable with that for England and Wales.
Supposing the maternal mortality WC!C reduced by 10 per thousand We have no age tigUies unfortunaldy or nus census. So we have .no total of m.ar~ied women at tbe reproductive age to. wlllc~ to apply thls concept Tak1ng however the 1931 figures as giving dimenSions at least, we find that the .s8:ving in fcn,talc life per year would be 635,000 or in a decade oyer 6 millions. Even If mat'crnal mortaIJ1y is rcduce,d only by 1 per thoUt';~nd, 63,000 women should bc added to 1 he populal ion 1 n a year or 600,000 In a decade even allowIng for the falit Ihal the ordinary death rate would consequently apply to them. And all these women will be left not only 10 contri~ bute their own quota of one hut the additlonal clements rcpre~cnted by the children they will hear. If on~ multiplies the saving of mothers by a repro~ ductivc poTenlial we can secure alleasl an idea of the accretion of popula~ tion involved. Though every allowance may be made- for the approximatlon of the statistics. and every caution obscrwd in their discussion. lhere remains the in'?Ontestable fact of nol only a probability hut a certainty of i!lcrcase on ~hlS account. Causes precede their effects, the time lag varylng w1th the partIcular phenomenon. Likcwis~ changc& in potential. When you affect the infantile mortality rate you have an immediate straight forward addition and also a deferred addition of thc sccond degree which will operate about 20 ~ears later. Wben you affect ma1ernal mortality you make the direci addit Ion and in the immediately succeeding years. what 1 caB the second degree of add it jon also. You also however make what I may can a third degree ddltion in as much as you create the conditions in which later on the new reproductive sources win operate.
157
The Public_ Health CommiiSsloner's figures show that lJl 11 tll\.. ':0 )can" 1920-39 approximately 4 mIllion dtt:d frem cholera but more- than hCiH dIed in the first half of the decade and only 1/5 in the last quartu. EVl.n as it st~nds !herefore the figures show th.at taking Ihe 1925-29 rates ~l' a bus.i~ ~(l.rncthlDg hke 5,00,000 persons fewer dh:d from thl1i disCfl&C 111311 In the pn. .. VJClUS decade. Or in other words) 1- million people were added 10 our 194] pupula-1ion, who otherwise would have nol lived into it. If the apparent trend 01 the figures continues one observes immediately the 1 ikely effect. Plague .ha~ nc_vcr been in recent years So great destroyer as cholera. But even So the dIminution in itsravagesrepresentsthesavingofamillioll lives as againt'il IhepH.vious tcn years. So marked has been the diminution in its lethal cff(ct. Smallpox on the other hand shows a less marked decllne and indeed over the last decade no decline at all although the figures arc well below the bluek Imtrum 1925-29. Taking however these two diseases, cholrra and plague. bolh cnd(.mic to India~ we see that ~ojng on the 1920-29 figures, thc 1929-39 experience represents a saving of It mHlion lives. R(member that nn publIC health statistics are as complete as we should wi:-;h them and make all allowances necessary; but eveu so We Sec here the effect of protective rnaesurcs and can rea]Js~ the greater sCope of mel hods which affect potential .as distine\ fr(lm the more Isolated occurrences of a year.
Al1 oflhis maki:s a slatjslical problem as interesting 'IS it is imp_orlant. The value Zone and the figures. thl.:m:-,elvc:-; nCfd mo~t carl.'ful dch:rmlna1ion before one could emb'.lrk on any elaborate prcdiclj\,c enquify and the gaps in Indian vital s.tali!:>t1cs arc such a~ 10 make this a{ fin,t Sigh! an undertaking of every speculative yalue. Given, however, the time andthc patience ~lld a full acquin1ancc wlth the information I hat q .. at hand ()ne cou~d achieve mure in the way ofpredict.ion than is rcaii(-;cd.1! is particularly Important in t his sort of enquiry however to have an absolute familiarity \\-jlh the orginal data .. It is onc thing to operatc from const~n1s or from figurCb of cS-tablu;hcd valldlly wnhil) a definilc z{)ne; it is a Vl.Ty dJfferenl mattcrto operate on figUles ~hemseJves based on.data of varying ql~atify. A figure i n itself m.:ans nothing. It may be a fa?"t, a rea~onablc approxlma11on. a guess, an error-~or even for that matter aile. It is very necessary therefore, to be ablclo attach the proper category (0 the figures from , ... hich we start and into such an t.'stimat(; enlers at once a clear knowledge of how they arc obtained. For 1hi& knowledge it isneccssary to Sec or note how thcba~icdataarccol1cClcd. for onc()f IndIa's addltional problemsis that the mcthod~ Of standards of culkclioL V(lry WIdely as between different parts of the ~;ub-contin(.nf. HcnCt..· 1 he imporJ .,ret· of a associating a skilled statistical treal.ment .with a profllund.undl..'r:'>l~ndjr,g ofthe quality ofth-! original data. ThiS app]i(~ in any l>ci l nllfe ftld.·n Ihe sense that the two m~st never be divorced although they may b~:· in. dim rent hands, but.it is partIcularly important in a pfobkm like th;1I 01 tlSlng h'ghly variable orJginal data to produce efl'or1s of predIction.
Vital statistics are ~prjmarjly demographic in relevance. a~though of course their Connection with the pub1ic health administration is obvious enough; and perhaps their importance from the demographic aspect has been obscured hy the tendency t.o look at them as a pureJy departmental feature affecting the Public Health CommiSSioner and provincia1 Publio Health Officers. The popu1ation deve10pments in a country of this size are of much more than public Health significance however. fOT in one way Of
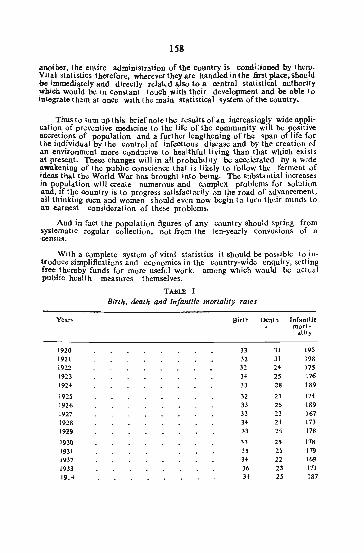
lSI
another, the entire administration of the Country is conditioned by them. Vita) s.tatistics therefore, wherever they arc handJed inthe fifllt place, should be immediately and directly related also to a central statistical authority which would be in Constant touch with their development and be able to Integrate them at once with the main statistical system of the country.
Thus to s.um up this brief note the results of an increasingly wide appli~ cation of prcv..::ntive medicine to the life of the community will be positive accretions of population and a further lengthening of the span of1ife for the individual by the control of infectious disease and by the creation of an environment more conducive to healthful living than that which ex.ists at present. These chang •• will in all probability be accelerated by a wide awakening of the public conscience that is likely to follow the ferment of ideas that the World War has brought into being. The substantial increases in population will create numerous and complex problems for solution and, if the country is to progress satisfactorily on the road of advancement, all thinking men and women should even now begin to turn their minds to an e.a.rnest consideration of these problems.
And in fact the population figures of any country should spring from systematic regular collection, not from the ten~yearly convusions of a -census.
With a complete system of vital statistics it should be possible to in~ traduce simplifications and economics in the country~wjde enquiry. setting free thereby funds for more useful work, among which would be actual pUblic health measures themselves.
TABLE I
Birth. death and infantile mortality rates
Years Birth Deatb Infaatilc mort·
ality
1920 33 JI 195 1921 32 31 t98 1922 32 2' 175 1923 34 25 116 19H 33 28 189
192.5 32 2' 174 1926 33 25 t89 1927 33 23 167 1928 34 2' 173 192~ 33 24 178
1930 33 25 178 1931 35 25 179 1932 34 22 t69 1933 36 23 !7!
193 34 2S 187
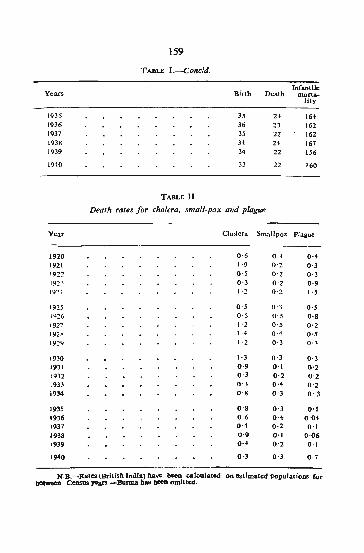
159
TAlILE I.-conc/d.
Years Birth Death Infantile
morta-lity
1935 3, 24 16' 1936 36 23 162 1937 3' 22 162 1938 34 2'1 167 1939 3. 22 1'6
IMO 33 22 160
TABLE II
Death rates for cholera, small-pox and plague
Year Cholera Smallpox PJasuc
1920 0-6 O"l 0" 1921 1-9 0-2 0-3 1922 0-, 0-2 0-3 1923 0-) 0-2 0'9 1921- 1-2 0-2 1-5
I925 0-5 0-3 0·5 1926 0'5 0'5 0·8 1927 1'2 0·, 0'2 1928 1 ·4 0--1 O'S 1919 1'2 0-3 0,)
,930 I·) 0') 0'3 19JI 0'9 0'1 0'2 1932 0·3 0'2 0'2 ,933 0'3 0·4 0'2 1934 0'8 0'3 O' 3
1935 0'8 0-3 0-1 1936 0'6 0" 0·04 '937 0·4 0·2 0·1 1938 0·9 0'1 0·06 J939 0·' 0'2 0-1
1940 0·3 0') 0'7
N.B.-Ratcs (,British India) haye been calculated on estimated popula(;oQ.S for I;JetweeD census)'Cal'S -Burma has beeD omitted.
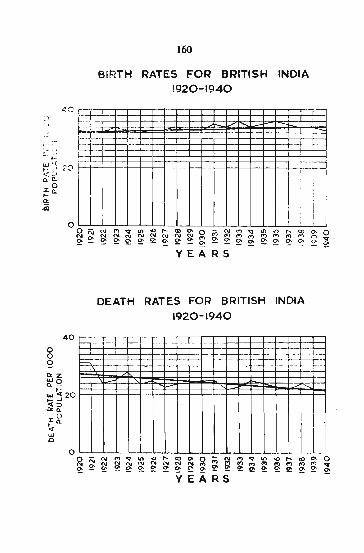
160
BIRTH RATES FOR BRITISH INDIA 1920-1940
: I II i
°2~N=-~~=-=-=-~f-~~~~~~~~~~_L-L~
2' ~ £'
.., .. '" <> r- '" .,.
0 .., N .., .. '" <> ..... ([)
'" N N N N '" '" .., .., .., PI ,., ..,
~ 2: ~ 2: £: ~ £: ..,
£: 2: 2: ..,
£: 2: £: £: 2: 2: Y E A R S
DEATH RATES FOR BRITISH INDIA
1920-1940
~ 0 0- ..
£:
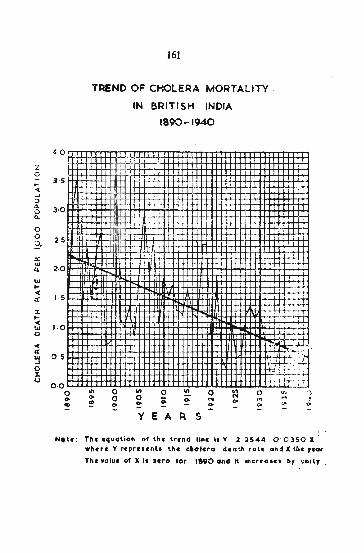
z 0
... ... _, ::> a. 0 <l.
0 0 ~.
a: IU u.
w ,_ ... a:
::t ... ... '" a ~ a: w ...J 0 l: V
161
TREND OF CHOLERA MORTALITY
IN BRITISH INDIA
1890-1940
~·o
3·5
n 3-0
, t 2·5 .1#
t~t:tt 2-0
1·5
1·0
05
0-0
'" ... '" ... 0 0 0 0 0 " . 0- '" 0 0 ;;; '" ... ..
" " '" ~ !! 0- !!! .,. ~ '" y E A R S
Note: The cquc:rtion of the- trend 'int: i, y 2 25",4 0 0150 • whetc Y rcprclcnta lh. c'ofero death ratc Qnd' X U •• ,cor
The value of X I. tiro fer 1890 and it .ncr-eon. by unUy

CENSUS OF INDIA-J9.fl
NOTE lIY MR. ~ATYA SWAROOP, STATISTICIAN, OFFICE OF THE DIRECTOR GENERAL. INDIAN MEDICAL SERVICE, ON THE PROBABLE EFFECT OF A DECREASE IN INFANTILE
MORTALITY ON THE FUTURE POPULATION OF INDIA
In British India the trend of the infantile mort.ality rate has heen defi· nitely downwards during the period 1920-40. This is clearly .hown by the diagram on palle 38 of the census report. This downward trend has heen shown to be ~gnificant statistically. This decrease in infantile mortality results in an additional sav~ng of infAnt life each year and in this note an attempt is made to estimate tbe probable effect of this saving oCHfe on the future growth of India's population. The figures avai1ablc for estimating this growth of population rdate to British India alone but, ~y making the assumption that the British Indian rales Dl11Y reasonably be appn.:d to India as a whole, the increases in population set out in this nole by the middle of the Census years 1931, 1941, 1951 and 1961 Sivc 'orne idea of population growth for BritiSh India and lndian States.
The ::mnual infantile mortality rates for British India are given in column 2 of Table I. These ha>e been smoothed by fitting a straight lin. by the method of least squares. The expected figure for infantile mortality is shown against each year In column 3 ofthc: same table. The oalculations of growth in population are based onthe'IJc expected values for infant mortality. Column 4 presents tbe decrea .. in th. rate for each year from that for 1920, if these annual decreases are multiplied by the total live births in each year the additional result of the declining infantile mortality rale are obtained for successive years.
The population€' in British India of areas where registration of vital ,tatistics was in force at the 1921 and 1931 censuses numbered 230,648,533 and 253,614,115 respectively while the corresponding populations for the whole oflndia, including the Indian States, were 305,730,288 and 338,170,632. In column 5 of table 1 are shown the annual births recorded in the regi.tration areas of British India and jn the next column are given the births for the whole of India obtained by increasing the births in column 5 in proportion to the increase in population. In making these calculations the population fOI the regi.tration areas of British India and of India as a whole were estimated to the middle of each year.
The figures set out against each of the- ye~r~, 192()"1940, in roh!tt111 7 were obtained by multiplyinJ! the annual births in India (column 6) with the decrease ininfantile mortality (column4). These are Inc additional numbers of infants who survived their first year of life a~tbe result of a continuous fall in infantile mortality. .
It is difficult to predict the trend of infantile mortality in the coming years. The abnormal conditions that prevail as a result of the war add an element of uncertainty which makes any guess about the future
163 13-1 R. O. IDdia/72
164
hazardous. Nevertheless it must be remembered that even the rale of 160 per mille in 1940 was high and that in many countries of the world the rate waS below 100 per mille. If this rail in the rale during 1920·40 were to be marntained in the coming years the rate for 1960 would still be a,s bigh as 132. The assumption that the infant morlalily rate may continue to fall for the next two decades may not therefore prove to be unreasonable. However, in ordel' to avoid the possibility ofa wide margin of error if the projected decline in infant mortality did not take place, estimates of the survival of infan1s during each year from 1941 onwards have been made on two bases, .;z .• (i) tnat the rail 10 infantile mortality recorded during J92O-J940 continue~ unabated in the next 1 wcnty years and (i i) that the ratc of 160 per rnme dUTlng 1940 continued at the same level till 1961. Estimates of births fOT
the years 1941-6J have also to be made. These were done by filting a straight line to the 8.gurcs of column 6 for the years 1920-40 and by projec(ing it so .• ' to Cover the period. J94J-61.
In column 7. beginning with the year ]94J two sets of annual survivors of 'itt-rants are therefore shown. the sci (a) based on the assumption that the i .. rantile mortality rale remains at 160 per mille and the other set (b) based on the idea of a Coni inuous faU in the rate.
In discussing the probablc cff..::ct of the saving of in rant life on the growth of population we have also to lak(' inlo account the contribution that the female section of these infants will make when they enter their reproductive life. For this purpose we must know the specific fertility ralc by age as well as the numbers surviving in each Yl!aT of the reproductive span of life. S_pcc1fic fertility rates by age arc not available for India because of tne omisslon to record the age of the mother in lh'! birth registration form. Mr. YraUs has, for the first time in the c'~n~u~ history of fnd!a. arrang<:d 10 !,;olkcl information whkh wlluld throw som~ "gh! on Ih..: f,':i(:!:ly of womU1 in different parts of India. [l is understood thal an analy:.is of these data for the whole of India bas not yet been undertaken .. The compilayjon of the numbers of children horn to married women at individual ages~ has however been carried out for a few randomly selected areas in different prQvinces. As the ferttlity rates required for the calculations carried out in this paper should be based on tbe total female population at each age (married, widowed and unmauied) it has not oocn possible to make usc of Mr. Yeatts's figures. In part IV, Volume XXIV of the 1941 Census Report of Rajputana and Ajm-;r-M-:rwara. in the iiection rdating to demographic survey. table 10 giv~.s the actual numbers of wom~n returned at Clach individual age and the c~lildrt:n born to lhcm. This information was collected from fifteen villages selected at random in Ajmcr~Merwara. Our ~cond table showfl in the first three columns the total numbers of females observed at each year of age and the total children born to them. Rates based on the recorded number of children born to the females at each year of age are set out in column 4 of table II. In view of the wide ftuctuations in the rates their graduation was. essential before they could be further utilised. This graduation presented Bome difficulty. Different methods of smoothing were cmployed and satisfactory results were obtained by fitting to these rates a curve of the form, log y=log k+ tic logg usually called after tbe name of Gompertz. The extent to which a satisfactory fit has been obtained may be seen from [he diagram in whicn the fitted curve is superposed on the observed rates. The equation orth. fitted curve was found to be log y = 3'746.651(>-2. 175,476
(0'837,860)' wore' i. (aken as zero for age 15 and its value increases by unity for each successive year of age. The expected values of y calculated from rhi. equation are shown in column 5 of table II. These are rbe totOll numb';::rs of children born to 1,000 women at individual ages. It lS necessary to state here that, in the census report, against each person the age has been recorded only in completed years, the months being left out. The rates t herdore show the children born to 1,000 women up to an age approximately half a y~ar more than the: age shown in col~mn S of table n. Thua against age 24 the figure appearing in columll 5 is 2013'56 which means that up to ag" 24'5 years a thousand women would have had 2013'56 children born to them. First order differences of the series of figures in column 5 are gi¥cn in thl; next column and these Show the numbers of children born in any oo.e year to 1,000 women of any par~icular age. These are the specific fertility rates and have been used for estimating the numbers of Gbildren likely to be born to female I nfants who survive their Drst year of life.
Tbe number offemale infants surviving at each year of the reproduoti¥c life fUust be calculated. The to~al number of infants who survive their first year of life being known fof each year from column 7 of table I, the number of females among them should first be estimated. The sex ratio of males to females a( birth was 51,919 to 48,081 during the five years, 1929-1933. These years have been chosen because the year 1931 for which life table, showing rates of survival at different ages are available, falls in the middle of tnis range. By applytng the 1931 I ife table rate of survival to the male and female infants. it is seen that 39,005 males and 36.910 females reacbed tbeir first year of life. Therefore females formed 486 per tbousand of the total children surviving to age onc. The figure:. in column 7 of table I have therefore !»en multiplied by 0 '486,203 to get tbe number. of female infants surviving to tn·,;ir firs.l y~ar of life. These are shown in column 8 of table I. If the number of female infants surviving to age one is taken as 1,000, by tbe application of the survlval rates of the Ail·Jndia life tables for females (1931), the survivors of 1.000 women at age one are given in column 7 of table fi. Starting with 1,000 females at age one, the product of the specific fertility rates at any age with the survivors shown in column 7 for tbe corresponding: age gives appr.x'.ffiately1hc total unrober of children born in that particular yeat. These fi.gur~_s are shown in column 8 of table II and Can be considered to be the net f...:rtllilY rateS SlartIng with 1,000 females at age one. By [he repeated application of these net fertility rates of column 8 (table II) to the series of female infants showm In column 8 of table I the numbers of chiidren born each year hav~ been calculated and are shown in ta.ble m. Tbus in 1933 the 1921 group of 6,894 femal<> passil1g through their ~ 13 wi)] give ,birth to a c~rtain number of infants and this nu~r is, as will be seen from table III 17.( 6·894 x 2'50=17). In 1934 tbe 1922 ",0"1' of 13,640 femdes will .lso reach (he reproductive age 13 and tbe births r_rded in (bat year will be contributed by the 1921 group of 6,894 females as well as by tbe 1922 group. The total number of births in 1934 will therefore be 814, (6'89 x7·24+13·640x2·SO-84). In each successive year a new ... oup of females will be~;n to contrib~te to the birtbs in additIon (0 tbe one& aJieady el1gaged in actIve reproduction. Tbe total numbers of childxen tbu. bo<ll ineacb year are shownlncolumn9 of table I. From 1946 onward< the survivors of the female children among tbose sbown in Qolumn 9 of table 1 will alto
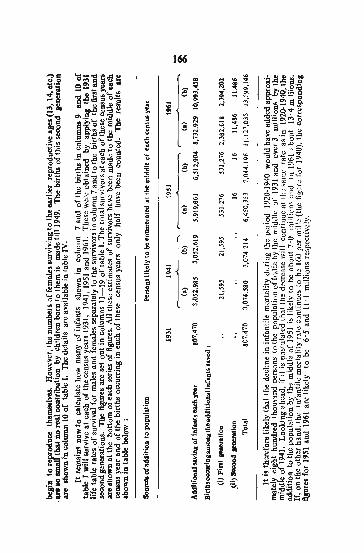
166
~" ;i;!] i~ ~
r ii ~ ~ ·~~~~.f <>0
" .. __ ~ II
... ~ -;; ;:: ~ tt.t~= g :!H "O.8.s<l)'O~ ~ : l1;~hl ~ - 0 ,.; GIS 4I:l~ e i' ::j"!;l, ii\ - -g §c,v e - '" !
... :g§~~8 ~'"
i~~l~~ ~
~
0
i~ II 'Gi ~ ~ ;:; ~ a.S;;,g ~ ~ ~ ~ cd.d- .d
~ :;; «If""I <1'10"""
.~ . .a ~£]~2] ,.; = ,.c,",(!J.o,~ "'0 u <~o ,,- .9"0] ~-8 § '0
fA' & ~ :e ~ "3~2-~ "8"0 '" ~-g e~: ~~r~~a8 .!! ~ ~ ~~ ...... _...... t::: :g I~
",' o ~ E ~2 ~~~~E.8 li
~ [8 ~ .
~~ ~~ ~ ... :.0 o 0 ~.~..8 ~ ~.l! --5et---~'Vr:
I ~, :e ~ ~::55~ ~f-o ~ ~ e ~ ~~ 1ii
;::o~~~ ~~
~-.c ~ ~ .]~ g§~~ -g~o~~= ~
-~ E ..; _,; 0_ ~~.E :.~.a ~ ~"~f§ sa·E -_ ... -= -=_;~~~-a- ~ '" ~~~~ &~ ,,~
'" '" ~ :e.g~ 8\O>~"'o .E
r _ ...... _ U'>
~1l~ ~~::-E.£<O U) 2 e~ ;:; ;i ~E"~g~ ~ u-g~~~3 ., ~ ~ ~ ~
.S:.s~ ~ ~ I ~ '§.,5 ~.g:; g
~.- .... ~~~.8~§ 'H'~ - ~ ~ ~~E~'~ a ~ 0
'" :11 ~ ~~3: s ~'5l:o gtf .... 0 ~ .&...:~1~8 ~
N ;i ~'B~"*>§::: ~=] ~~- ~;> ~ ~-!.a~~ e ~ ..... ~';::-l8: v"3 _g:::: I=l''''d
~;;;M ~~~ :::§'-.~gg .. :. .E~ ~8"'; 0 ~ ~ ~ !:l.."8_ to
=~~ ~ ~e,;.--"'~~ ~]'3 '0 ~l.E ~1 '" ~ ~ . .s=1~ ~\C .:"-ll ~~~ .... c:::e,;.
1 .E3~'o:!:~ ~~~ a <1'1 >d 6'0.$ v",o.~.):;
~ r::l .... fIl co .!! §.~~ 52 ~ .. ~ .. ~ 51.!!.!:!
] ~ R~'s ~b ~'2~ ]~] ~ ~:: . .8~ .!!-e1l",.g~ i .!: Q ._ 'l.l::)J
:5].g:s~~ ~'ES .s:!'Ok~~", II a ~ ~~£] ~ r~ .2'€=~'oE '" .~ 80 g " !! ~ s·;:; 3 : ! -.,g tlQg 0-
~~~ il. >.- r::::._.c\O-o U._ ~" u"
.~ ~ ! ],,=,;Q.5"'""'~~ ... ~ ~ ::g~ ~ 8. .l! .~ ~ ~.agg:g~ !.I~~ it:~""a,o<.-...s 2 .. i S,t'oov°_8 '0 I il ec~8..a~ i.l& a ~ :fi~"gJl .~ ~ l ]jL.:.8~~ ~.S ._ QPO- t- «1,.1;1 ..; i ..
I <.-Ci\-""'"' !] = as e rJ:~!! ':t a
.~ !S~: E'O:: " iI' eiJ.lllh!l..l: '8 ] 1 ,!!'Uo c .8c2 ~ .ll ~~:;~~a: J s 5, ~-t';3:E g ~ .. i-
~ }U :0.,28"2,, ! ~~:g "i ./!;:: lil:'!.I'li ... e a cd:=:
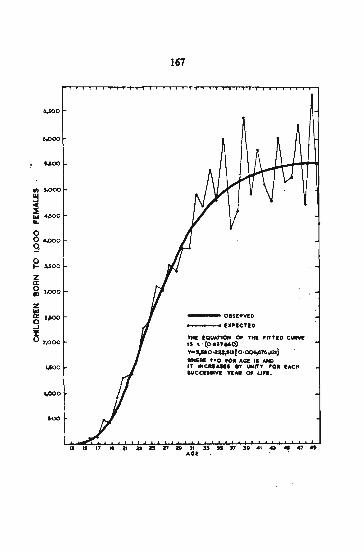
.,.00
o o A,C)Oo
S E 3,500
Z IX :i! l,OOO
z ~2,>00
~ (J 2.000
0,000
100
167
-OIS£RYf.D
_!X~.CTID
,... IQlIATION OF TKI "T1'IO e..w II ,. (.0'8" MD) ...... 0 ........ !0·006,67 .. '.') __ t.O PO. AGI II .utO
IT IMCR.AIII ... UNITY 'OR lAC" IUCCI.IIYI VI .. Of un.
29:1f UII,.,. 3941 G 4547'" •••
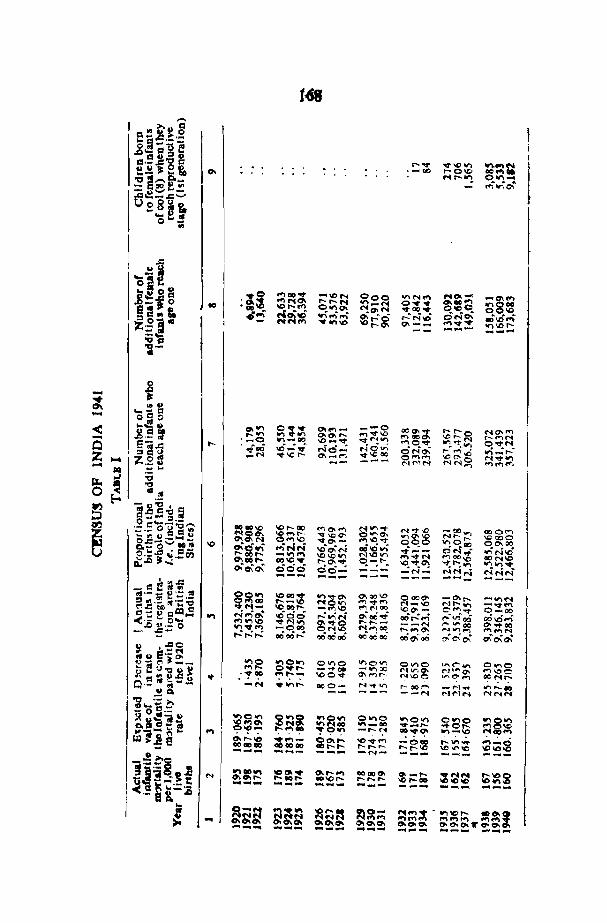
1. I
,..., » e=
R!!! ~.!? j~-;'~i! c:I.S,!'O g "..,. ",.>0", ""4"IN f..2~ei, 0. . -00 .... 0\0 00"" •
..... ""l q"1.-:' 't:I m""'CO ... "".,,,,, - 00 '" ,_ "....-e_ l3'£s1i
"S ~
.l:: '01 t .8 0" . ;Ii :::~~ -ION 000 VlN .... MOI- ""'8'" ~.c: c:I
"I"-N ~;:~ 0 ...... ~~~ ..... DO 9'i ~ i- to 'lID \0"'" 0",0. ..,.00 .... o 10 c:!, '" . " v\.,..;"" ~:::g "':M..o ONo\ .i-.d' ..... z~itll N~~ ......... \0 0.- .... ... ..,. .... ..... 101"---- ----.... "Ca 1-
- ~ .... 01- ... ..
... -c:I - olio < "-a " OIl'" ~:.:; OII ... -
.... -0 ~:~ 1"-""'0 No\ .... .... '" 0.0\t- .... ",.'"
"' ..... rq ........ N - .&.- : '_0 "'-00 "'_"1' ..,.<'1", .... 0"1' W'l..~ . .,.. O..,.M Q ~!.l:: ,....
. ';00 '45"":'; NO"': NO'''; O'N~ ,._,..., . ~....;r-: ..,.>000 100-'" Z Z.2~ _1"1 ...,.1Or- 0._<",> 0 ........ MMg "'..,.'" ~ --- NNN ...,..., .... .... IQ ... ...
~ ...I 'tI
~ ~
0 .... ., ~.s].o :; !:l ° ... ::1.-tt.) ,::.~ c'g 'g'E' 0000'" "'I"-OC> ""0\ ..... N""_" "".,.10 -00 .... 000'"
~ ;:8~ "' ....... "">oC- 0 .... '" .... "'\0 N ....... \0000 o.a~~~iG 0 .... '" ""0\- .... ""..,. 000 v.° oo 00.00 10 ~g~ ...;'NN ..o"'N 00..c",; ..;r-:_ ON • _.; N"''' o.t:_g 'I::l'" .... .... -"'''' "''''''''' N\DV'I .... ..,.N "'oo~ OON\D e·- ~ \!._rIl 0\110 .... 00"' .... .... 0\..,. ~ -:. 1"-. \D""'O\ .,. .... "" "'''' .... G;..o '" 0\0\0\ oeo 00'''': --- ":N""; NNN NNN --- --- --_ ---_ c l!::Ii
~a~ 0\00\0 O!.- ... e·=.~ ~~~ ..... ..,.c- 000", -0. ...... -"'1"1 ~ .L~ tV"C "0 MO ..... ...,.,. .... r-._"D N ..... '" -..,. .... g€:f Cl =.5 'Coo .... -..,1,0 f'f"If"ltw:) \p.0\. -:. e .... ..,. 0_00
'" N"';o\ '4500 r-:";M O\"oC"; 00 ......... ";V;oO 06'45...;' 0(:0 ~.~'O .... "'\0 ""1"1'" g""'o ............ - --1"1 """'00 "',,""00 "'",...., -00!) "110 N .... .., ........ (70) ..... "' .... ......... 1"1 - .c- ...:...:,.: oooc": 0000"'; 000000 000'''; ~C;t:J\ 0\'13\0\ ... ~ ,-s~ It" S·-o.
"'0 ~s:~ ""0'" 0"'0 ~CiSi: ... - 0""'0 0",,0 l"'~.fI"'l, ........ - .... C* -"',., ~~~ N''''''"" ""'00 y.~;'3.8~ 'It : or "'!' "" ..... - \00..,. o...,r- l ...... e-.f"""!. OON ...... Q.- :..-- -N .. .,., ..... 000- N"",,,, r--oo~ -""",I .... .,., ..... 00
~Q, --M <'1"1<'1 <"INN 't:I ._ >.
!'O~.:: ""~.,., $;::i :::~::2 0"'0 ""0"", 0""'0 ;:{g~ ~8'a:;~ ~~~ .... _01>
.... _ ..... """0 ....
!'1~ S .. ... ......... ".o~ - ..... M "'''''(1', '" -10 MOO .... (70) ..... .., :""- 00\,... \0..,. .... "";0:8 ..... \t) .... ~.:.g OO ... O!) ...... 110 ........... ............ ,.... ..... \011'>10 \0.., --- --- -N- --- ---0»
l=-~ 1'- .! ..... '" ..,01 .... (1), ....... 00 ... 0. 00._ .... ~~~ :c~~ ~'a '3 ..;.! 1: '" 00.0. ..... ..... 110 ..... 00\01' ..... .......... \0 ....... --- --- --- --- --- -- ... -; l-:C
:; ~~~ ~~'" 'C) ..... ~ ~C- """" .... -..,'C .... tIIO\I ::: 0. ~ <'IN .......
~g!~ ~~:;: .. ~g: 0.0\ OIIO\CJ\ --- --- --- --- --- --- ---
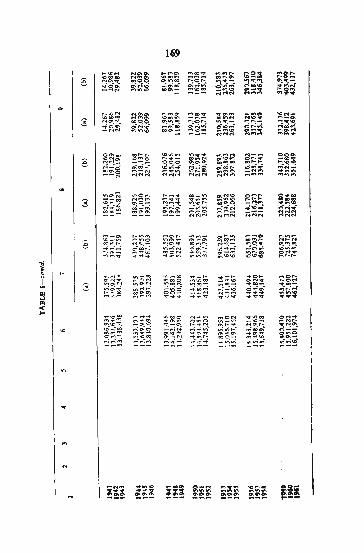
169
~~~ ~8§ ~~~ ::!::::~ ~~~ ~2;! ~~!: ~~'" e ~ .. ~ ~ .. - "'!.""t~ t~~ ";60; 0( ...... .0- ":citD ~~'" Q..c..; ".'" _M", ~~~ ,000'0= :!~~ _M'" =;:;;1; "' ...... M",,,
~~ ... .... "'''' ~~'" ::~:!; .. "'~ -~'" "'''-3 "'~~ .... M'" "'~~ ~" ... ~;e! M_",
",!~..,. .. ~~~ ~~~ ~;r:;;' " .... - -.. '" .... '" 2~~ ~~~ N...o..-i _N'" ~"'" ::~= ....... '" M,.. :;;~~
fE~g: ®~~ "''''~ " ..... ~M ... ... -- co'" e "'~o 8~o ~" ... ","'M o~ .. ~~3 ~~i ;;:-:5;: ",,,,,,,
®-~ -~~ ~:$~ :ir:g ~"';r-': ~~;i ~-M ~"'o ~::::~ ... "' ... ...... '" "'''' ... ....... M ~~ ...
or.o-~ "'o~ ~- ... --" "' .... '" 0 ...... o .. ~ 3 ~;::IX! ... M ... ~ ..... .. "" ""'''' ~~ ... .. ....
~~~ M~'" ~~~ ~~~ ~~; """:"'l.~
~;; .,..j":~ ~~~ ~~~ e-~O ~~-
!"INN .......... ......... ...'" ... -'" 1"-"' ... , -"'~ ~ ... - ", ... " ~-'" ~"~ "'-~ ~S3
~"' .. "'~'" ~~3 .. ~~ ...... "
'" ®~ ... ~"' .. ~~ ... ~O .. "' ..... ;!~:: ~~~ ~~~ ~~i
\t)"""',..;' ... -", ",- ... "' ....... ........ "'''''' ""'''' ~ ....... .,;
1 ~NOO
~~r1 ~~o
.. _ ... ~::;:;; 6:~:; ... 0'"
o..,..t",," ... ~~ ...0'" "!.C:_{'l "~M ~oo-
~~~ .... _ .... -
~
E~~ oo~p.: "':"":;0-
~~E g"i~ ...;,.:...r OJ 00"'''' 00- N ...... ~~~ .., ,..M'" ...... .. .,. ... ...... .. -< "" _",00 .-:~-+ <>000 N"'" 0"''' "'00'" ",..,'" :;~;: "'~o ~~~ :!:~~ ... N'"
~~~ ~i~ ..... N .... "' ... ~('t"'l.
":,...jN ~;t~ ";10"":- ::;~ o __
00 ... 00 ", .. ", "'-'" O~O
~8; ;;2 "'.,,;_r-. .. 0- ..... '" ""'-:::~:i :!:!:!: ::~~ ~::~ ~::!!!
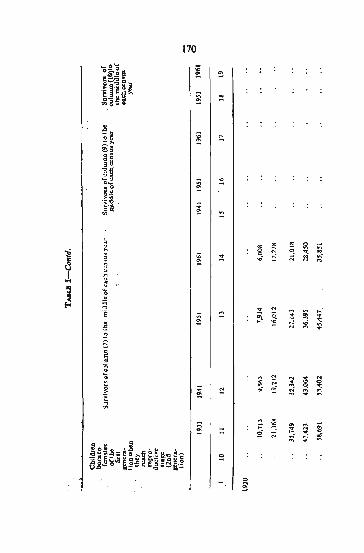
170
'O~]a ~ ~ s::.:g.a .~ ~e 8: t """ ~ := ~8H
~~ ~ ':: o_ '" ~~
U ~~
~ ~ o~ eO 02 >.,.
.;;'t:I
! fa :::
[ g ~ ~
~ ~
1 N ~ ®
" ~ ::! .,; N ;::; ~ :i
~ ~ j
!! 0
~ . '3 .. .... ] :;: ~
E ::: '" ;:; :t ... ,.: :e :::; ~
..,. ~ .; ...
! ....
* ~ ~ ~ :>: N
~ ; ~ '" 0:: ::f ~ .,
~ '" '" N :!l '" = ~ ;::; ~ ~ ~ = ,i0;.l! . .l! B . j§ E I!! it ~~ ... _ ~'eI e!'i 2 a ~-a~ l~-! e e! ~~l·g
g
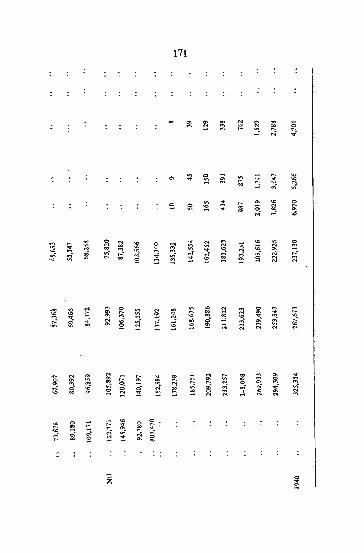
~ :i ~
~ '" ~
~ ::: N ~
:::r
'" ~ 3 '" ~
3: S; ~ ~ !O '" .;
~ 0 ~ ~ ~ '" ~ g '" ~ ~
'" 0 ::i ~ '"
!;;: ~
~ ~ ~ ~ ::1 .. N
~ '" 0
~ a ~ :g
~ N "'. ~
~ ~ r! :;; :;: :! E ~ ;- $l ~ ~
'" :;; ~ 0
§l ~ ~ '" s i ;;; '" '" '" ~ ~ .. ~ ~ s ~ .. ~ M
§ '" ~ ,~ $ ;t ~ E ~ ~ ..; ..; N .: ~
'~ ~ '" z: ~
:;:; .. ~ ~ ~ .g ~ ~ ~ ~
~
~ ~ N
~ :;: N '" ili g g ~ ~ ,; ~ t ~ i1 '" "
~ 0 ~ '" f;l ~ : ~ ~
~ '" g; ~ E a ~ .~
z ;
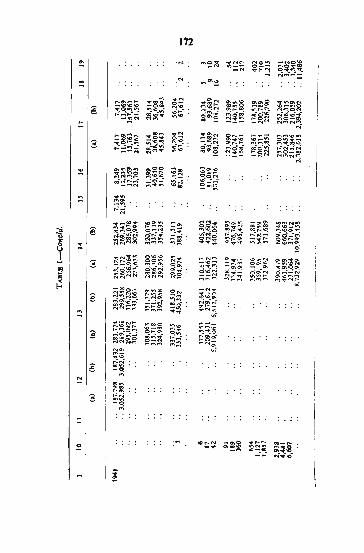
172
~ :N : ~C" :\~!:; MO~ _NOlO _N
-'" ~t=:rq ~~~~ : V)O\:::: : : :
t--O\<"'lr- ''''-Il10''' .. ",
;~~ ~:::8 ~~~ ~""O\N 0-e ~~~~ -C~ :;;~ -~O
~~~ : ~~~ N .... ON
~::!:N "'~ ~'" O;~ ~8~ ~8~·i ::; " - --- _MM N .... N:l
r-o.""r-- ~~i. ..... ."'M O~_ ~:!;;: <"'l .... I,CCIO
_>0 10 .0 C-
~!~ ", .. ", $ ~~~:- :;~~ ~~ : B~~ ;g~ ~~~~ --,.. 000.2 ..,o_co
_M N NMN"'" N
~ ~~~~ 8: 2 :e ~~ M ... ",
..... 10.<.0.
a~ ~o~
oO:!~~ ;;~;;:: ~~~ ::: ~~
"':;:-J :
~~a~ ,,""~ ~; ~~~ ~~:q - ...... ~~~~ :l! e "'M~ :~~ O-N
2~~ '"l_>O.C'J.""". .. ~~~~ or-:. E~ §S~ ~~~ Cl\O_ ....
",M~ : O\Or-OI '" MM~ ~!;;"'" 1.0\0..,0-
13 ::!: ~ 1 ~E~~ g"'''' ~;! ~~::: ~~~ ~~N 3 o~ ~~:Z:t;.
~ ~~~~ 2~~ i~ ~",M
~"'''' =:.,.,~
~o;.O.Q\, ~~'" : ~.~~ ~~.~ 60\", ~~;;:;t:
~ NNN Ng ........ ,<"\ ~~:;; .... .",.""I~
f-o
§~~~ "'~" ~::::! -"';:; e ... ~~ .!..o.,. ~~~ :J-~ N'a\,.j
~N;;;:; ;~ :
~~;;; ::: <i
~~~~ 8~~ ~'" M-_ ~M",
$ ~~ ~"If;.o
~~~~ "o"';--t-!;;"'" : ~~~ g-'" MM M;:;
N ... ;;; .,.;
r-!"N' : e ,,~
-~ ~
~:6 ... '" :
3 r: .... ~~
= : : :
: : : .~ ", ... M ;;:;~ ~ ...... ,,- ... e - ... "'~ S:~! <>-&
I _
I !
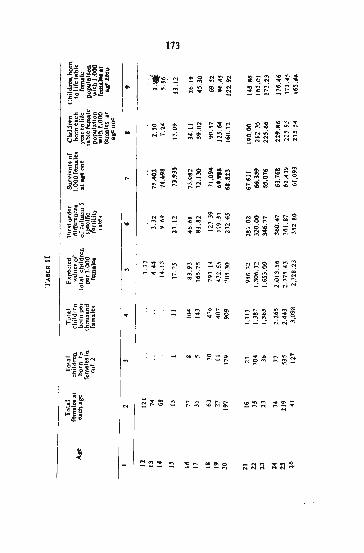
m
j:a .~§.~
I~ "1- "JII :"t:li ~ !:ill ~~~ "'-'" "'~'" !Li~ft~
~OM "':"':~
'" ~..; C'I.QN ~~2 .. ~~
:a2 8,!t .. "", "'''''' ~~!e
u I . I~ e~~a.~g:~ _M ~ ..... '0 v, ...
;g s :~.;';.; ~ ; S!: ~ g _c> ~"'- g':::8 ~"'~ t-i""': ~ i~ gE~
0\";"; e2~~8]i· ~~a NN-
I N"'''
~. 02
~~~ :U ::! ~~ ~~E ~~~ c"'~
'Eg~ ., .. ~'" ~~
t--~ '"': 00_
~S'; :61i ~ ~t= ~~~ "'''-", .. ",
,.~
~Ij~§~ . ~ ~ ~ ~N ~;;:B ~gl=: ...... 0
'E~8l]~ .. '" ~~~
.. ~~ ...:;0:
'" .c~ ~~~ g~~ ji;"I:Io'" ... .. '" --M ",,,,'"
C
::: ~'o~OJ '"
! ..,=g !:!~:: ~ "'''' ~:2~ l'l ",co, .. ",'"
1I 1(.]"5..;i "';...-i. "'~ ","'c> ", .... <"!
:~ "''''''' ~..o",; ..... .,.;00
~ ~!t~8.~ '" "'~o ~~~ -...... ........ ~;:~
0""" ~.;~~~ .. '" ~~~ "' ... ~ ~",,,,
2:! _c'" ~:~ ~~2~~ ::::: NM'M
d 0.= o;e ..... ('1 g::~ ;::;~;!! ~E~ -'0 c: c;. •
~:E.8~8 o ~
I ii~~
I ~~~ ~ ... '" "' ...... .."'''' .. ",-'0"';..= \ON~
_ ...... ro"I;::j""
,",e~
I .!l"
I ~
I - ~~~ ~ ~!:; "''''0 _ ...... ;$~~ - - 1"1 ","'N
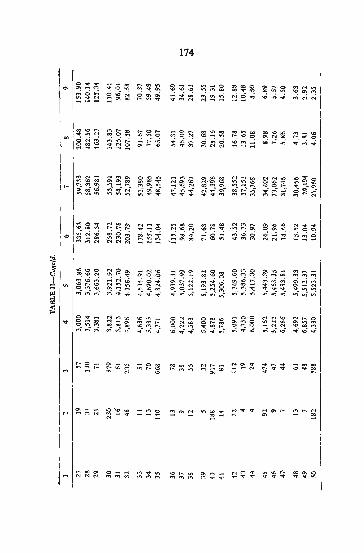
&!;:!; ... ~o.,.; 'I'l;:!;~
NO",
"'~" ~~~ ~:-7J
'" ~ 0.00 ..;.~.;. ..., 01. "'1 ~~~
";"';..j
174
"'''' M"'_ ~"':N :;';1">1 ",;.n.r;
"'oM.,. ...
g~~
:;;~~ ~M'" ,n",;-...)
'" ~ ~ ~ ~ M ... ~~ ........
.ri".;-".;
~:;;~ c\N "'_N ... ~ on...)
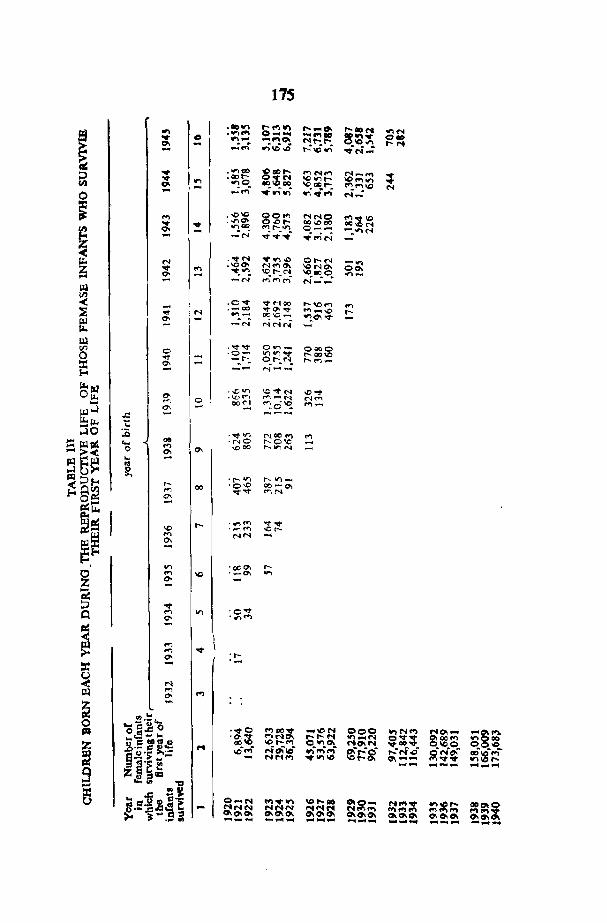
175
• 110 on .... fOI ..... .... -GI ..... OOt'l "'N
~ .... ..... CO"> 0-_ -..,. !~~ 0_ ..,. 0 W"l,~ -CO"> 0\ "!.t-:.I-. ....N 01 -.... .,;V;;,& "",,,on ~N":
..,. • ." (1) ~t1C ..... ..... ('1 ..... M_ .... ~ ;;l
"" on .:;:; 2$&l "'onl- '00 .... '" en 01 "'acr- ~ ..... '" N ... ...:~ .. .,:;.,:; ";';f4i M_ 0
i .... • -0'" go..., NNO ::z~ 0'; .... • '" 0>- .0 .... QI)I,O CIO ...,,,,, """"'"
0 __
~ .. "'M
~ - _:ON ..; -i "t' -i«iM
...... f"4 """'.0 01-('1 -.... ~ N • '" 0'1 .-.. .... 0\ 'ONO'I 00\ ~ "" fOI ... '" \0,,"<'1 \0.,0 "'_ 01 "':N ("";'(f")"M' M_ .. ..,.: -[.IJ
II) .0 oS' 00( - ..... NCO .... \0 .... .....
~ . -00 ""'O'I-r "'-..0 r-'<I' N "'- 0010_ ":,01 .....
If 0-. -N MM.,.
[.IJ .'<1''''' 0"'_ OQOO Vl 0 ·0- """""1- ..... 00 1.0 0 '<I' -"" c!. ..... N_ ......... -i5 0-. . . -- N--
I&.~ . .0 .,., \0 ..... .-.. .o-=t Op.., c- o .\0"" ""'·-N """" ~. 1lO~ ('O"~o~ ""_ .... 0\ -~...l .c:: ---""'lot. 1:: ;:jO :.0 ."".,., N""'" ..,
=~~ .... 011 ·,.,,0 ""'0'0 0
.., 0'1 .0 00 ..... "'N - -< 0'1
~ ~ .. -'"
III ::> f-< ~
'1"-'" ,.....,..,_
I"- 00 '0'" 00-0> tl A~ ..... ""..r .... <'1 0 ..... ~ ~(;I.,
I ~es .... . .,.,,,,, ..". ..... '" ....... .., -0 ....
~,~ .., NN 01 -.,., '000- ,....
~ ..... '" '_01 .,., 01
'2 ::J "" '0-.:1-Q ..... .,.,
01 . "' .....
~ ..... """
\ ..... . r-0'1 '-::r: -~ N ~ ..... ..,
'" ~ U').:c.... 0 .... =1: 0 · ..... 0 "'00..,. _ ION 000 ..... Nt') MOI _
-8~ !Xl o tC ...... .~~ .... NO'I .......... M ""-<'I o~~ 0'100"'" on 00 "''EIIDOIG '" 1- ..... conO\ MOl <'I O.IQ.C. ~ .10_ Z $.- f:1~'" f't ~ .. : NeAte ";";<"i ~~:::'g ~"";.o' :;;:t'lCI'I ~~~ W u·s: ._
MI'I ..... "",,1I'l1Q 01-- -.:1''''' ~- -It ""fE -- -... _ -... -9 z~ ::sll:l 0,;, '" "I:J - ..c ~~ ::r: 0_'" ..... ..,.'" "' ..... 110 CII~_ ~~~ 110010 t:J g·~~Jie MI"!.". ... ~~~ NNN ~~~ ~O\~ .... .., .....
~~~ GlCJ\O\ 17\010- 010.01 ~ jI: ..... ~ -_ ... -... _ _ .... - ... -- --- --- --,...
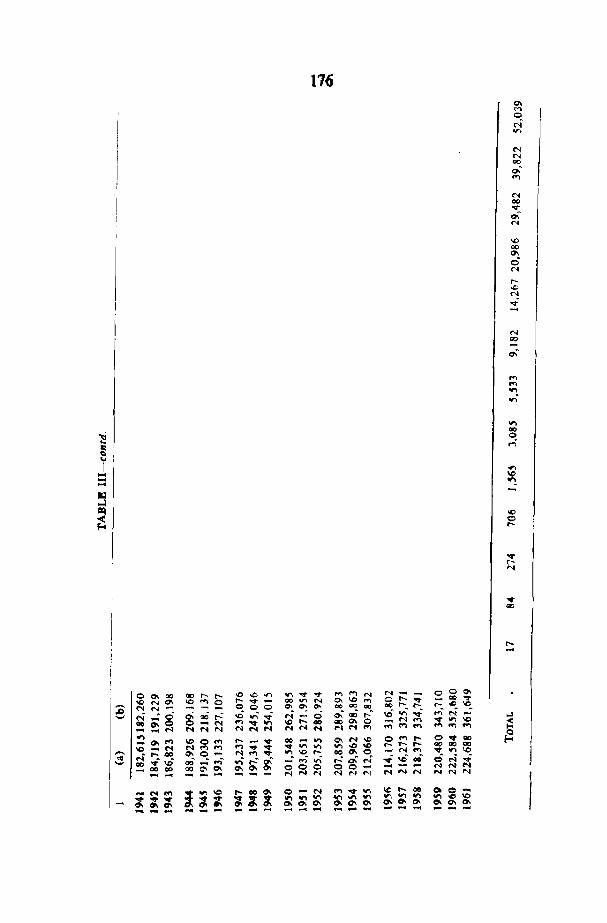
176
W'I"<t''''" """'N 010\0\ .-i' _ 0 101"'00 NN....,
OO-or) "" .......... ..... "",...
.. ~"" 000 NNN
.... ""N <:1\10.., 000000
o\oCf-. 00010 NM ....
0>"''''' .... ..010 00"'0 r.: 0." N 00-NNN
Q\ .... q N .... N N 00
0\ .... N 00 "1" 0\ N
10 00 01 ($ N
I"' .c N ..;
N 00
01-
..., .... ""_ .....
.... 00 0 ,...;
..., ~
"" 0 t-
"<t' I"' N
..,. 00
"
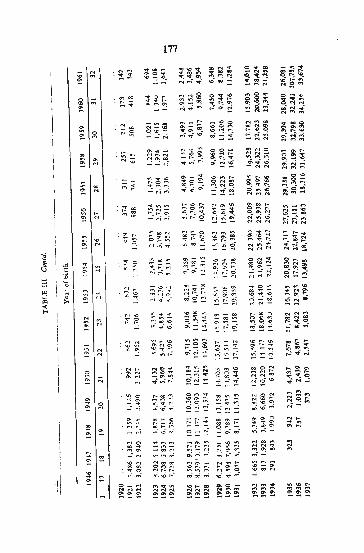
~
'" N
'" '" ;:;
177
~~~
..... 00 ... , if:,~ ,.; N~~ 00"', M~~
vi.o:r-::
-'" ~ ~ It") _ '"
~"..;,,.:,
~~r-oO,r,.,,;
"'~ ,., ..... 1""1 e>~
-:,,£,,_':"...-I
M~~
"'~ '"'1.,.,0 v5"';~
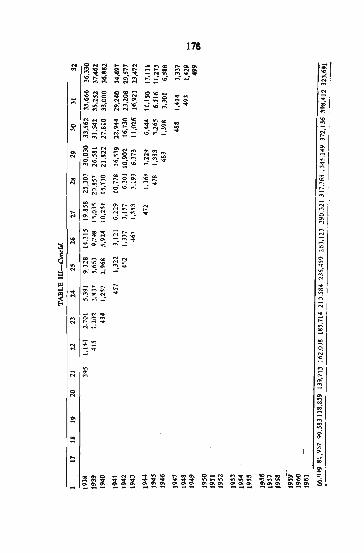
178
~ Iii"'''' ........... -., .. :;;1l.\8: il ~~~ , ........ -......
~ ... -"'" ~ ...... ..; ... "'~ ~=>D ...-i'_" MMM ~"'''' ;;l
"'", .. If<O- 0 .. _ '" "' ..... ..'" .,-:;; "'M ... ;;; ~:;;; ~~~ -'" MMM ..... - ~~~ "" .. ~
IN N 0 ::f 0 '" ::f~" '" ~ ~~~ M '"
.. "' .... 0 ::~: ~ M_ .... r-i"1rO"'; g MM'" ",--
Iii-N :1i"'M '" ~ ~:::; ... g~5 "'!~:;;
I~ "'''' ~2'Li' :;':;..t-
~~~ .. -M
~~ .. ...... '" '"
....M_
..... 0.,; ~..o", "'",-..... - "' .... M '" ~ ;~~ ~~~ '" ~ 'Ii"';"';
I~ ~ ~ r:;:;;-~ '" 10 "'"!. r-- 0-. ;:;::;~ ..; 0,; N ~.,; vi:
! ~ "M .. ~~ '" ., "''''''' :\' I M",,,,
E '" oi"')~ ~ ~ ;:~:;;
....
~I ;!; ~
~ M ..... ... wi "i .:
-N" ... M OOM ;:: '" ~::;~
~ ". ... ..
M "'- M M :;..;- <>
~ ;::; '"
if l'l
~ :!: M
M
:: g f,; "'.
!:: ;;;
i~ 2;0 ~.
~§! ;g! ... .,'" ..... '" ~~~ ~~~ ~ I'" co ~t !!; ;!! ., ...... ~~~ ~~,~ ~~~ ~~~ ""
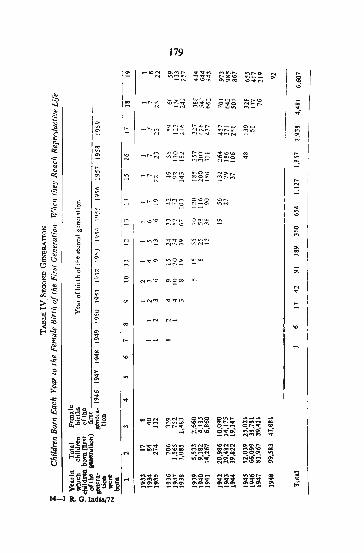
-f
~ I; ~ ~
'0 '" :;; '0
179
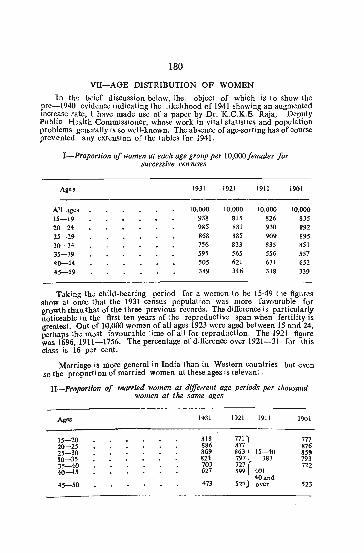
180
VII-AGE DISTRIBUTION OF WOMEN
In the brief discussion be1ow, the object of which is to show the pre-1940 evideo", indicating thc likelihood of 1941 showing an augmented IncreaSe rate, I have made use of a paper by Dr. K,C.K.E. Raja, Deputy Public H!alth Commissioner, whose work in vital statistics and population problem!; generally is So well-known. The absen~ of age-sorting has of course prevented any extension of the tables for 1941.
J-Proportion of women at each age group per 10,000 females for successive censuses
Aae" 1931 192t 1911
All ages 10,000 10,000 10,000
15-19 938 815 826 20-24 985 881 930 25-29 868 885 909 30~34 756 833 835 35-39 595 565 556 41)-44 505 621 631
45-49 389 346 338
1901
10,000 835 892 895 851 557 652 339
Taking th03 child-bearing period for a women to be lSA9 the figures show at once that the 1931 CCnsuS population was more favourable for growth than that of the three previous records. The difference is particularly noticeable in the first ten years of the reproductive span when fertility is greatest. Out of IQ,OOO women of all ages 1923 were aged between 15 and 24, perhaps the m;)st f3v;)urJ.blc time of all for reproduction. The 1921 figure was 1696, 1911-1756. The per",ntage of difference over 1921-31 for tbis class is 16 per ccnt.
Marriage is morc general in India than in Western countries but even 30 the proPGrtion of married wom~n at these ages is relevant.
II-Proportion of married women at diJJerrent age periods per thousand women at the same ages
Ages 1931 1921 1911 1901
15-20 818 7711 777 20-25 886 877 876 25-30 869 8631 15-40 85' 30-35 82' 797 J 383 793 35-40 703 727 722 41)-45 627 599 401
40 and 4S-50 473 527 over 523
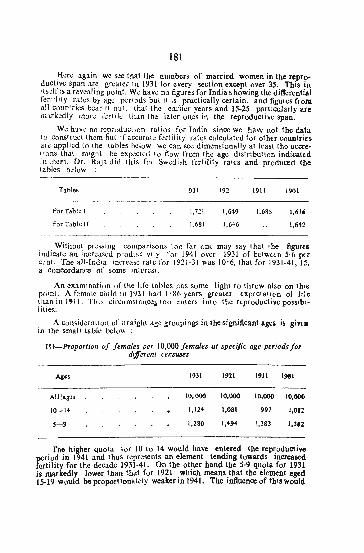
lSI
Here aglin we sec that the numbers of married women in the re,Pro" ductive span are greater in 1931 for every section except over 35. ThlS in its . .:I.f is a revealing point. W.: have no ~gures for India showiIlg the differential f~nl]lty r.a.les by ag..:: j)Crlods. but it IS practically certain. and figures from all c()un1nes benr il our, that the earlla years and IS~25 particularly are nllrk,,;dty more r~r{ile than the later ones in the reproductive span.
W..:; hav~ no reproduction ratios for India since we have not the data lo construct lh'~m but if accurate fertility rates calculated for other countries arG applied to. (he tables below we can sec dimensionally at le~st 1he aCCTc-tron!lo thaI m'gnl be expected to flow from the age distribution indicated in th~m. Dr. Raja did this for Swedbh fertility rates and produced tbe tables bdow
Table::. 19_1l 1921 1911 1901
----------~-----------------
For Ta.ble I
For Td.blc(f
1,721
1,681
1,649
1,6-16
1,685
WithouL prc:s.sing c.;omparisons too far one may fiay that ihe figure&. indIcate an increased producllvily fOf 1941 over 1931 ()f bciwun 5~6 per C;;llt. The all~lndi3 incrc3~e rate for 1921~3J wali 10'6, tbat for 1931~41. IS. a concordance of some interest.
An examlnation of the life tables nas some light 10 throw also on this roint: A female _Child in 1931 had "86 years_ greater <-xplctalicn of life than III 191 I. ThiS clfcumstancca (00 enters Inio the reproductive possibi~ lilies.
A comid..::ration of :,Iraight ag-e groupings in the&ignificant ages is give. in the smaJI table below:
nT-Proportion of female,. per 10,000 females ar specific age periods for different celtswes
10-14
'-9
1931 1921 1911 1981
10,000 10,000 10,000 10,000
1,124 1,081 997 1,032
1,280 1,49' 1,383 1,312
The higher quota for 10 (0 14 would have entered (he reproductive period in 1941 and lhus represents an element tend1ng towards Increased fertility for the decade 1931-41. On the other hand lbe 5-9 quota for 1931 is markedly lower tnan that for 1921 which means that the elem~nt aged 15.19 would be proportionately weaker In 1941. The tnlluence of thIS would
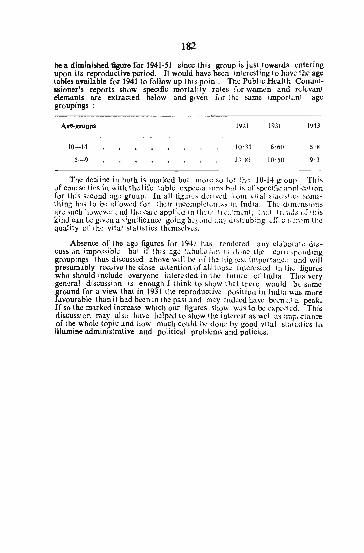
182
bea diminished figure for 1941-51 since this group is-just towards entering upon its reproductive period. It would have been Interesting to have 1he age tables available for 194110 follow up this point. The Public Heahh Commissionerts. reports show specific mortality rates for women .and n:.iLvanl e:lemanls are extracted below and given for t he same imporl ant .age groupings:
10-J4
5-9
1921
10·34
1931 1!H3
The decline in bOlh is marked but mon° So for [he 10-14 group., This of COllr~e Ih~1i in with the life table expcclnl i(.lfl~ hut 1~ of specific appl'Ct1.lion for this second ag·~ group. In all figur<.'~ d',:rlV~'d from Viliillc:la[I~I.I,;:, ~omcthing has to b,~ allowed for lh~ir incumph.:knes.s in India. Tht: dim'~nsjons arc such how..;wr and th\! care applil:d in iheir irL',Liml'n1, th,~( !i" ii.J,'> oflhi~ k.inJ ~.111 0;; giy.;u a ,ignific.lUw going b<,,'yund aay J i~(, ubing dLc~~, t'rcm the quality or th'.! vital s.tati~tics th-:msclvcs.
Absence of the ag0 ~gures for 1941 has r-:ndcr~d any d'lh.mih: discussion imp,):;')ihlc bU1 If this. ag.:: 14bula(i~m 1~; dnnc, the corn-'sp(lnding. groupings lhus discu';5.~~d abov~ wi~1 b,' of the !tlgll''::Sl lmportanc'_: and will presumably re~jyc the close attention of alJ 1 hosl.! inlercskd in the ftgurcti who shouJ~ incll!de ~vcryonc inLCf?stcd in the fulure of India. TjllS wry gen'~tal diSCUSSion IS enough I think 10 show thai t~lcre wou~d be some ~round for a view that in 1~31 the reproductive _ po:)itlon in India wa:. more tavourable than it had been 1n The pasl and may Imked have be..:n at a peak. If so th,? marked increase which our figures show was to be ~x[X.c!cd. This discussion may also hav0 helped to s.how the interest as well as 1mpvrtance of the whol.;: topic and how. much could be done by good vital sl;,IIS(lCt> to illumine administrative and political problems and policies.
CENSUS OF INDIA-1951
CHAPTER IV
BEFORE AND SINCE 1921
A-Growfh of population: Checked and unchecked
THE PICTURE give'" in the 1",t three chapters of the number and di,· trjbuti{m of p~ople on the land and the pattern of life and iivC'lih('lod relates {O 1951. Butthe piClUTC docs not remain the sarne, evenforaday;it changes imr~rceptibly but nonctltekss surely; and the rate of change has. been quickening in recent dl!ca.dcs. It is necessary that. we should have a clear appreciation of Inw dt~ piclllrc chang~d in the past; a.nd also in so far as it is possible to kn()w th.;,'i, why it changed as it did nol otherwise. If we f.n1ccccd in gaining a correct and complete appreciation of the way in which the wheels of life lw.v2 b;~n ~ucn;ng in the pas~, we shall be ahlc to peer into the fulure and form a c)rr~ct opinion about the changes which are likely to come about in thc future. The! future. of COllfSC. is noL totally determined by the past. Neither j!) it (:lS some are apt to SUrp(l~e) 'iimply clay in our hands to be moulded as we may fancy. It lic~ within ollr power so to influence the course of events as lo awrt danger and prolTI,)!c welfare and happiness; but there an very definite limits to this power. Thns(' who have the responsibility of governance have to distinguish between rig,ht and wrong action with reference mainly 10 thel\e limits. The purpose ort~is Chapler i& to bring the pa&t under review in such a way that the cour~ of rrghl action for Ihe future may become alieast a little clearer than it is.
2. As the C\:n<;us is taken at len yearly intervals, our unit oftime for the measurement of changes mU'$t be t he decade. The minimum requirements for a review of changes mU:-;l. therefore, be alleast two decades before 1951, in order th'lt tnc trend of change disclosed by two successive decades might give us an in~ighl inln the decade immediately following the 1951 CensuS.
This is, however. not long enough. Though we live in a fast.movinl world, we need to IOClk b:1Ck longer in order to gain a clear perspective.
It is proposed in thi& chapter to review the changes which took place over Six decades-three bl.:fore and three after the1921 Census. On the basis of this review. it is suggested that an attempt should be made to visualise the prospect for 1981.
As it happens. the choice of 1921 as the centra! year of the review period is not merely convenient-,-it is a necessity. There is a profound. difference between the trend of growth after that year and the trend of growth in preceding decades. Dry figures of the census which record the growth of the people acquire meaning and significance only when the sharp contrast between the decades before and since 1921 is clearly understood aud constantly horae in mind.
113
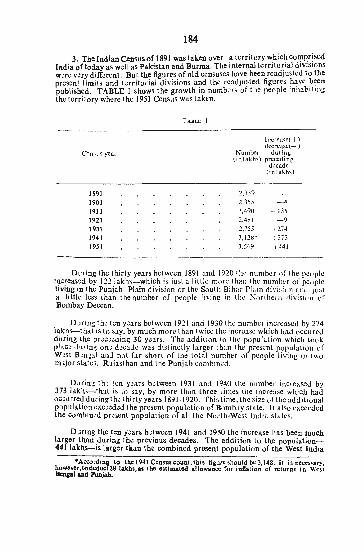
184
3. The Indian eon.us of 1891 wa. taken over a territory which coml'rised India of today as well as Pakistan and Burma. The internal terrJto~Jal dIvIsIOns w.:re very diff..!rent. But the figures of old censuses haye been readjusted to the pre'ient limits and territorial divisions and the readjusted figures .have ~~en published. TABLE 1 shows th.e growth in number~ of the people mhabltmg the territory where the 1951 Census waS taken.
Ccn~ll<; year
1891 1901 1911 1911 1931 1941 1951
TABLE 1
Inc rC3SC{ +) dC.crc.lsel~ )
NUlllbo.::r during (tn lakh~) preceding
decade (iniakh<;)
2,359
2,:'\55 ---4
2,490 -, 135 2,4HI -"9 ~,755 +274
1,128* -j 3iJ .),569 '41
During the thirty years betw~en 1891 and 1920 lhe number of 1he pen pIc increased by 122 lakh~--which is Just a little more than Ih? nurnh~'r of' people living in the Punjab Plain division or the South Bihar PlilJIl did.',l{ 11 .. nil Just 3 little less than thenumbcr of people living in the Northern divisi('n of Bombay Deccan.
Dtldng the tcn y~ars between 1921 and J 930 t he number increasr.:d by 274 lakl1':t-that is to say, by much more than Twice the increas.e which had occurcd during the prcc",cding 30 years. TIle addition io the population which look plac.! d'Hing on~ d-.!cJ.('.k was dis.tinctly larger than the prescnt population of W~"it B!npl allJ not far short or lh~ total number or people living in two Ill.l.jor statcs., R'.l.jasthan and the Punjab combined.
During the ten y-!ars between 1931 and 1940 the number increased by 373 laklu-!hat is tu say. by JD~He than three times the increase which had oc::urred during the thirty y~ars 189]-1920. Thi:. time. the size of the additional poplllation t":x:c~edo!d the present population of Bombay state. 11 abo eXCI;eded the combin::d pres.ent population of all the Norlh~W.::.t India strtle5.
OJ.ring tne ten y.::ars b::tween 1941 and 1950 the increase has been much larger than during the previous decades. The addition to the population-441lakh>-is larger titan the combined present population of the West India
*Ao;ord1nlil to l}&e19t1 Census count, this figureshouhl bt:3,148. It :is necessary. howovcr,todedUCl2G laths,as the esthm,tcd allowance fi)f in1lalion of retUJns in West Benpl and Punjab.
185
states. It is larger lhan the presenl population of Bihar and no' far shorl of the combined present populatjon of West Bengal, Orissa and Assnm.
During the thirty years following 1921) our numbers have inc!'ras(d from roughly 25 crores to 36 crofes. The addition--of about 11 Cf()fcs.....-almost exa~tly the number of people at, presI."n 1 livlns in North India alld Central fndla combined; Of in South India and W~st India combined.
5. When we pause and think of these figures and their implications., the first reaction is one of wonder whethi;r they could really be true, or whether ::.om~thiug has gon<;; wrong with the figures somewhere. It seem!!. so difficult to bolieve lha. 1921-50 could have been So very diffierent, aller all, from 1891-1920. Though the number of people who arc old enough to remember aU about J891 from personal experience must be quite small now. yet aimost every person who is. over forty can rec~llJ enough facls from personal expcriencf" which might induce him to distrust these figures.
Reasoning based on common sense and per8<lnll.l cxperj~ncc would run on some such lines as follow~ :
"We know roughly how many children arc born 1hcsedays to ~'ornenfolk in our oWn families and friends. We all'.O know the numbers botn to thl womenfolk of an older generation-our mothers and grandmothers. It is t.rue enough that our womenfolk do not practise contraception as they do in wes tern countrier, and so many have more children, We nced not quarrel with rhe figures given in an earlier chapter; they arc prob~bly correct. But then this is nothing new, Our mothen and grandmothcrlo did not practise contracept ion either. They b0f1..' as far as we can judge. just as many childrcn--ifnot. indeed. morc. So. it cannot be true that our number began to incrcase all nf a sudden b~causc of any sudden cltange in the chiJd .. bearing habits of our womenfolk. W..:ll then, if we rule out a large increase of birth~, then we should a<;.sumc a sensational decrease in the deaths ~,o account for contrat~t b~twccn the two thirlypyear periods. Bul has there b.::en any such decrease? We have very grave doubt!l., There has~perhapst been some decreas.e. It is true t hat htl~pituh. and dispc:nsaric!' have been springing up and doctors have increased in numbcrs. Therc arc also the public health staff ... Something is being done about. vaccination and inoculation and the rcst of it. New m:dicincs are advertised and sold in !lh{Jps. Gn·.nte-d all this; how muchdo they all amount to? And what diff\!rencc has it made to the villages of which we have personal knJwJedge'! Is il true that many more people are living longer? Where is tb.e evidcnce? We can recall SO many people of an older generation who I ived long. In some ways, perhaps, they were a much hardier type than the present generation. No, there must be something wrong about these figures."
The reaSoning based on common Sen'>e and general experience is plausible to some e~tent it is. also correct. Yet the conclusion is wrong. There is no reasonable doubt that the startling differences in the numbers added to the population during the two thirty~year periods arc real. The explanation would be simple if we draw a distinction between what may be called 'normal deaths' and 'abnormal deaths' . It is correct that child-bearing habits have not materially changed. It is also correct that the incidence of normal deatb. haS 1lisktly diminished. but not sensationally. The diminution in the incidenee of IIOrmaJ death. in whollyh15ufficient toaccounl for the contrast between the twoperioda.
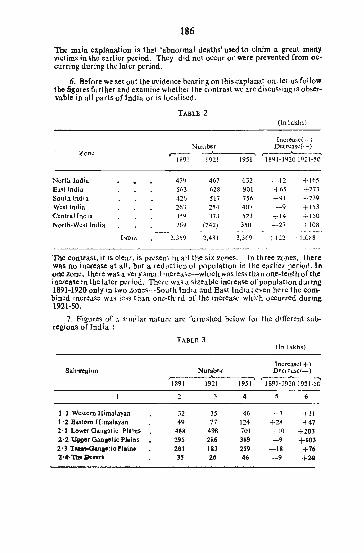
186
The main ex-planation is that 'abnormal deaths' used to claim a great many victims. in the ear Her period. They did not occur or were prevented from OC4
cUfring during lhe later period.
6. B~fore we set out the evidence bearing on this explanation, let u~ fol1ow the figures furtner and examine whetner the contrast we are discU5&ing is ob&e:rvable in aU parts of India or is localised.
TABLE 2 (rnlakb~:)
h(.;['ea<;e(+ ) Nllmber J)ccreasc(-)
Zone r----~---..., .-__ .....____h .. -...,
IS91 1921 1951 1891·19201921-50
North India 479 467 632 -12 +165 East India 563 628 901 +65 +273 Soulhlndia 426 517 156 +91 +239 West India 263 254 401 -9 I 153 Central India 35. 373 523 +14 +150 Norlh-WeSllndia 269 (242) 350 -27 108
INDIA 2,J59 2,481 3,569 -1122 + 1,0'8
The contrast. it is clear. is present in all the six zones. In three zones, there was no increase at ail. but a reduction of population in the earlier period. In one zone, there was a very small increa.se-which was less than one-tenth of the increase in the later period. There was a. si'zcab1e increase of popUlation during 1891-1920 only in two z1}nes~S()uth [ndia and East India; even here the combin~d incroJ.3c wJ,s less than one-third of the increase which occurred dur;ng 1921-50,
1. Figures. of a ~imilar nature arc furnished below for the different subregions orIndia :
1·1 Western Himalayan 1·2 Ea:itern Hinlalayan 2'1 LtlwerGangetic Plains 1'2, Upper Ganlc:tic Plains 2') T,..",O*n.getic Plains 2·4, ThI Desert
TABLE 3
Number ,--___ Jo--,,_--.
1891 1921 1951
32 35 46 49 77 124
4SS 498 701 295 286 389 261 183 259 35 215 46
(!n lakhs)
Increase( +) Decrcase<--)
~-........_----,
1891-19201921-50
+3 +11 +28 +47
~ 10 +203 -9 +103
-18 +76 -9 +20
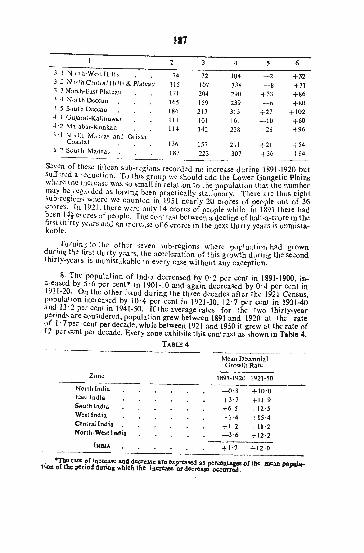
3 I "N,'\'[h~W~';1 Hills 74 72 104 -2 +lZ 3'2 NJI':hC~ntraIHiJJs&Plateau 115 107 IJ8 -8 ~31 J.J N:lrlh-Ea\t Platcatl 171 204 290 -+33 +86 ] -4 North Deccan 165 159 239 --6 +80 :I. 5 S(luth Deccan 186 213 31.5 +27 +IOZ ..; -1 Gujarat-Kathiawar III 10, 161 -10 +60 4' 2 ~alabar"Konkan 11. 142 238 -j 28 +96 5·1 ~"j,(h \1J.lira<; and Ori~~a
Coastal 136 157 211 -! 21 -l54 5 -2 South Madra~ 187 223 307 -! 36 -l-R4
S:ven of these fifteen sub-regions recorded no increase during 1891-1920 but slllTcr::d a ,e,juclion. To this group we should add the Lower Gangetic Plains where the IllCrease wa~ So small in relation tu the population that the nUID:bcr m.ty b,,:: (..::gafd~J. a5 having been praclically stationary. There ale lirU5. eIght slIb-rcgion-.; where we counted in 1951 nearly 20 crores of people (,Jut of 36 crUTes. In 1921- there were only_14 crOTer.; of pcopk ~hilc in 1891 thel~ had bl:cn J4i Cwres of people. Tlw contrast between a uecllfie of ha.lfMa-crore In lhe fir.r.;llhirty years and an increase of 6 crores in the next thirty years is unmistakable_
Turning to the other seven sub~regions where poplualion had grown during the fir:-;t thirty years, the acceleration of this growth during the second thirtyMyears. is unmistakable in every CaSe without any ex.ception.
8_ The population of India decreased by 0-2 per cent in 1891-1900, in. creased by 5'6 per cent· in 1901-10 and again decreased by 0'4 per cent In 1911-20. On th~ other hand during the three decades after the ]921 Census., population increased by 10'4 per cent in 192]M30. 12'7 peT cent in 193140 and 13'2 per cc:'nt in 1941-50. lfthe average rates for the two thirty-year periods are cons.idered, population grew between 1891 and 1920 at the rate ·of f· 7per cent per decade, while between 1921 and 1950 it grew at the rate of 12 per cl:nt per decade. Every zone exhibitti this contrast as shown in Table 4.
TABLe 4
Zone
Norlhilldia East India ~uthlndia Weslllldia Central [ndia NorthMWcst India
h.wA
Mean Dc:ccnnial Growth Rate
189)wi920 1921M50
-08 +10-0 +3-7 +11-9 +6-5 +'2-5 -1-4 +15-4 +1-2 +lI-Z -3-6 +12-2
+1-7 +12-0
*The rate or iQcte.ue aad decru1C arec:(pres.sed as perQelQt.agcs ofthc: mean pepuJa. tion of the period du.rtng which the Increase ordecl'Clasc occurred.
188
9. If we anlly3e the figures of increase and decrease during 1891~1900 division by division and group the divisions according to the rates of increase ordccrease recorded, the results are as follows:
In::reJ'>'';s w:rc r~c:}'"ded in divi5ions representing two-thirds of the country (l)n a p~)PiJlation bl")is). The increase ranged between 5 per cent and 10 per c!nl ov.![ twu-fiilh<;. of the country. Higher rates of increase were recorded in v.;ry .'i:ll ill ar..::aS, while lower rates of im.;rease were far more common.
The decreases occurred in the parts of the country inhabited by a third of tile people. The rates of decrease were very heavy. exceeding 25 per cent in R:~jasthan Dry Area. Rljasthan Hills, Rajasthan Plateau, Madhya Bharat Plateau, .Madhya Bharat Hills, Bhopal and Bombay~Gujarat_ Decreases ranging b~tween 15 and 20 per cent occurred in Slurashtra and North Hyderabad; b~tween 10 and 15 per cent in Ajmer. Kutch. Vindhya Pradesh. NorthNest Madhya Prade'h and ElSt Madhya Pradesh; between 5 and 10 pcr cent
jn Elst R.l.ja'>than Plain. Uttar Pradesh Hil1s & Plateau and the Northern divjsion of Bombay Deccan; and less than 5 per cent in South-West Madhya Pradesh, Elst Uttar Prade~h Plain, South Bihar and Himalayan Punjab.
lO. The principal reason for these decreases during the decade 1891-,1900 must be found in the very severe famines. which an: known 10 have raged In the greater parts. of these division" during the d~caJc, The following I'efe~ ren;;~ to these c:llamilie~ i:-. extracted from I he 1901 All-India Census Report :
"In 1891-92 there was scarcity Oyer a cons.idcrable area in Madras and B~mbay and in parts of Bihar. In 1895 a weak mOI1.~oon kd to extensive crupfailure in the southern districts of the United Provinces.and a sudden cessation of the rains of 1896 rcsuil!.:d in famine in the Uniled Provinces, the Central Province~ and B;::rar and parts ofM'ldras, Bombay. Bengal, the Punjab, Upper Burma, R:t.jputana, Centra] India and Hyderabad. Altogether an area of about 30[),OOO square miles with,a populalion of nearly 70 millions w~, aff.:ctcd and on the average. tw,) rnill10n persons were relieved daily dUring Ihe twelve m'Jnths from O;:ob~r 1896 to S:::ptcmber 1897; the number rose to more than 4 million at the time of greatest distress,"
"In 1899 the monioon olguin failed, and the resulsts were even more dj6~ astrous, for though the population affected waS sl ightly less than in 18P6-97, famine conditions prevailed over an area half us great again and with less easy mean'» of communications, the drought was much more severe, the people had not y!t recovered from the previous visitation, the mortality amongst cattle for want of fodder and water was far heavier, and the tracts whieh suffered mostly for the greater part in Native States, where the relief organisation was necess.arily less p:rfect than in British territory. In the height of this famine the~e were for weeks together over six. million persons in receipt of relief. and the value of the agricultural produclion oflbe year was estimated to have been
189
60 millions sterling below the average: there was also a loss of some millions' of clttle. It is impossible to say with any pretence to accuracy what was the actual m )[ta\ity c.iu~d by these calamities. The Commis.sion of 1901 thought that .lb)llt a million Jelth" w~rc attribl1!able to the famine of J899-1900 in B,-ii ish territory, and it would probably be safe to assume that another three milliom mllS~ have oc~urrcd in thl! N_ltivc S!at~s. which contained mOTe than thre~-fifths of the population afflicted and where l"hc c.!licf operations were g:..:n~rally far Ie"s ~'UCC!SSrul. No c<;timatc h1JS been mJ.dc of the exc..::ss. mortality in 1896-97 but it C.lnnot haw been muehle-55 than a million. The total mOlality due to the two famines may therefore bL' takcn roughly al the miJli()n~, The diminished vitality of the people resulted abo in a heavy fall in the,birth rate, b:lt this was t·_) som': CX:,Cllt countcr-h.ilanccd by an unusu~.lIy h.gh rate of reproduction when the pcopk bad recovered their nonnal f,;onditit.)n~·."
1 L An'Jlher C.-l.U:l~ of h:avy III ll'tality during the I.kca.dc was plague. "E"c1uding a smalllru(;t in the HimalayCl.s where it has long b::en endemic, bubonic pligUC nnde its first appcrance in India in moJern times in Bombay City in September J 896 and after 6preading owr th'': WC6tern PrcGidency. notwiths~anding the measures taken to prevent its diss~rniJ]ati{m. gradually rcc;"ded mDrtality was nearly half a mijJion, to which Bombay contrihuted sewn-tenths and B~ngal two-thirds of the remainder; Mysore with 33,731 reported deaths had suff~rcd heavily in proporlion to its population and So too hld B.lroda and Hydcrab:td. The extent to which the actual number of deaths exceeded that rep\)rled is uncl."rlain, but it is known that the difference' was very ':t>l1';ickr<:lblc and it may b;! assumed that the true mortalitvfrom pJague was nol Ics~ ttUtll three-quarters of a milliun and may plls:-.ibly have been a million".
This. b:-icf acc{)unt i~ :>urr'lLlrtcd by several rCICHl1CCS in local census repar ,S oj; ;<;:-tbing th:.: ravages of plague.n dilf.;rcnt paris o[thl.' country and as"cssing th:::ir dfen in arresting the growth of numbers.
Som~ rart:-- of the c{)untry, e.g .. B:har, wefe visited by both famine and plagu: at 111.: S'.lm:- time. The fi~urcs. discl{)s.ed~cvcn after ful! altowancc for errors and unc.!rtainlies-an unlnis!akable stagnation of the ratlt of growth. The reports contain a detailed di ,eussion and some: difference ()f opinion as. 10' which waS the more cIfce: ivc c1u:ck. Onc rCIX)rt citcsa series or (omparalivc figures tending 10 show that plague wa~ the real killer and not famine; it 5cem~d that the decline of population was closely correlated to the known ::.cv.:rity of the incidence of the plague, while there waS nel only no declinc1hut some modest increase in areaS where famine was known to have been severe. According to a different view it is "extremely pmbable that the reduction in the rate of increase of the population i~ very largely due to a decline in the birth rate induced by the general fiSC in the price of staple foodgrain~. In S',mth Bihar, common rice is dearer by 26 per cent, maize by 32 per cent and wheat by 29 per cent~ while durjng the same reriod the wages of agricu1tural labourers have faIlen by 3 per cent. Conditions such as t~_c;e can hardly fail to affl!:ct the reproductive energy of the large class of unskilled labourers whO' own no land and have no! participated in the profits ari~ing fron, the en .. hanced prices of agricultural produce. Nor are they confinl!d to South Bihar. They extend in varying degre.s to all parts of Bengal and although their ~~uence on the blrth~rate may not always be traceable, we may be sure that Jt lit there".

190
'12. While famine and plague raged over very ..:xtensive areaS there are ;!llso references to the localised deadlmess of epidC'alics of maJaria, kala~azar and other fevers. Thus, in the United Provinces, excessive and badly distributed rainfall inthe early years of thedecadc"led to a severe outbreak of mala .. rial fcverwhichin 1894, raised thedcathratetoanexCCJltionalheightand sapped the vitality of the people to such an extent that the birth rate in 1895 was unusually low". In Western Bengal, the natural grov,·th was normal in areas which. were "recovering from a cycle of malaria"but it was only 1'4 per cent in HOt)ghly "where fever is rife: and the population would have been station,1.ry but for the influence oflhe mills and factorie" of Scrampur". In Assam. "kalaaZar ~nh~rcd Kamrup and reduced the pop~lation of the southl:ln parl of the
,dlstflct by nearly 12 per cent. Having spent Its force there, it pasfed on LD 1892 to Nowgong where its tract is marked by descrted villages. un-t il1e.d fieldS, a land revenue reduced :,y 2." per centr and a disheartened pepuletien which afier 19 years .of steady increase has now receded to the figure at which it stood nearly 30 years ago".
13. During tht' ncr.! decade (1901-!O) the srasonal cond i1 i(lns wen' much mon .. : favourable. The local c~nsusrepor[5 refer frequently to 'agricuhur<:1 ::onditions' b'o:in~ "normal' or 'prosp<:rous'. Droughtsappear to ha~e vidled i.heir usualhullnls In the brown and yellow beHs--follo\\edbyscarclty, b.OID-:,tlnlCS even by famine. There is also an isolated rcfcrcn('c to crop failure in the Coa!>IaJ divi!;.ion of Orissa. But \ h~: d"ys. when pcopil..' di(d in larg(,_' numb< J <, b(,_'CElI~~ of local crop failures. secmed to have been cnded. To for see the approach of scarcities and famines, to take mcasurCb to prevent Of mitigtt( their actual incidence. and to organise and administer rcli( fso as to sav..; lift' with certainly and ycL do it ccono~ically"-alll h(~s.c !.H,h had been accepted, learnt and reduced to routine admlnistrat ive operal ions. The rcpons ofthi~ d(cadc contain no suggestion of mortality or ot her ilh~fTects ari~ing out of famim'. But there were other checks on the growth of population. The reports show dearly thaI plugue was continuing to take even heaVli:r loll than In the previous de·cad~::. "The mortality from it rose from about a quarler of a million in 1901 10]'3 millions in 1907. ]1 fcllbclow a quarter ofa million in ("(lch cfthc next TWO years, but in 1910 it exceeded half-a-milliClD. The total number of deaths from p1ague during the decade was nearly "6' 5 millions, of which .. .wer on-c-third occurred in the Punjab and t~oflflhs in tne Unite(j Provinces and Bombay taken together. The diseaf.e fortunately has failed to e~tablj6h I[self in Bengal. Assam and on the: East Coas1 and in the extreme south of the peninsula. This, moreover, is onlv the recordt:d mortality. A!> is well known. when epid .... mk:s are ragin& the report ing agency breaks down and a large number of deaths escape rcgHltr~llion. The omissions. are mo:;.l numerous in the Na1jve tittates, whl,rc rel:,istra1i on is usuaI1y far less J.c,,"-urate tban in British terri lory!' P1ague was not the only kilkr during the decade. "Epidemics of malarial fever decimated the irrigated tracts of the Eastern and ~I!ntral Punjab and the Ganges-Jumma Doab in the United Provinces, w,here, In 1908 alone, the reponed mortality from fever5' was nearly two milhons .... The reference in tbese Ca'Scs is not to the areaS where the disease is endemic; but to outbreaks of the disease in epidemic form. A report from tne United 'ProvhlC'cs explain& that the "malaria epidemic appealS to haw made most headway in those distrie\, where the dis.ea •• is not all • rule specially prevalent :.andl..,ast in those in which it is ina high degree endemic.'·

191
14. The diff~rences in conditions, thus described. between the two decades.: is refkcted in the pattern of growth. Whereas in the earlier dtcadc incrcases, were recorded in t wo4hirds of the count.ry, I hey occurred during lhlS deer.de in about thr~c-rol.lrths of~hi'" counlry. Areas in which the increllsc c~c('l.d\d IO per cent c~nlained only4'3 per cent of the, pol?ulation in tbe carlIer decade, they conialll,~d 26'4 p~r c~nl of the: pt?puli.ll1on III lh~ ~a~,.·r d(cadl'. The an:~~ in wili~i.1 u.;G,'-.;a:)_'..:s ol;curr~d, waS limlled to !hr(:c dlVH,Jons of UI1ar Pradesh. 1~1.: Punjab, (he Patiala and East Punjab "t'lies Union and 1h\.' _Southern diviSion of Bl)mbay Dl.!ccan. In the country as a whok. popuiailon grl'n from 2,355 lakh' (0 2,490 lakh,.
l5. T,h:: n:xl d~c3.d,: (1911-20) waS .,;x'raordinary:n many ways, The op.;uingy,_;:<lr Wd~ u':lh.:::all hy--a ~harp inGrca~e inal(acksand d,,,itlh~ from plague, Cll,~,L::ra and m.i.larl<l 0ct.:arr..:'d In wl(Jdy JIJT...:n:nf paris of the. cOlmlry. Ti.\ 11 fOl five Y0ars. lhcr~ were good s<:a&om and good crops and public h~~,dlh was much b.~Ul,,;r. T:l': Firs! World War b,~ganand cnd':'d. Th~ last llm.:~, \'l.~ j-: of the d<:cad·::; j urn·,'d out to be deadly. Economic di~orgalli~al il)J1-1 tiC «fiu Ruh ofwar-coindd...:d wilh two suco..!ssiw h:'!d scaS('l~" :ln0 c'xh Jl'-.ih· cr"T- h:ill', 1,.1 •. pl~'lru..._: <-lnll l..IHd:ra r.::-.um..:d lh'~lr way. A:.,.;:.am rcporl(d a nl:!"lIdnClIlCl'
nf'kaL.'t-a:!:al-·. In B.:ngal"malaria was specially stverc jnr(lugr,ou1 t111.' pcrlcd. which was characterised by a low birth rate and a mortali1y which in 5(vl .. n.:.1 di:-;ti-jds ,,[, aJil.Y ~xc..:~d~d th.,; hirths". But alllhe!'.c nti:,forltin .. ~; p<-;_kd into insignificanC\; whc-n a ~orld-wid,: epidemic of influenza ~wepl I he coun1ry fT(',m on.:.; "':ild l", :h.; l)ll1..:r lil twu W.lVI!S, one closely foHowIng the other. A full aCCl)un1 or: i1is (:·-rib1<.: vi:-.ilat ion will b~ fuuud among the papers. printed in Appendix IV. The account includes ". 'conservative Cbt imah:' of 1 he mortality at "h.::twlcn 12 and 13 millions for lndia~ a large part of which occurred in! ht' s?:.-Jo.' of three or four months".
In general. the coastal areas escaped Wilh a low moriaL1y. So nls(l Ea:-.1 India. U!! ar Prad'~:~h. Punjab, Bomb.,.y and Madhya. Pradesh suff(,TCd heav~ly. The rural aro.:as w;!r~ most s~vcrcly 1l1fected, "~hc reaSons probably beIng that whib villag~s have no advantage over towns in the matter of oycrcrowd~ng sanitation and v..-:.ntilation, the urban areas have the benefit of qualJfi(d medIcal aid and organised effort. H
The pattern of growth during the decade J911-20 reflected Ihe condit ions thus d<.::scrib~d. There was an overall decrease from 2,490 lakhs in 1911 to 2,4811akhs in 1921. In the (wo earlier decades the divisions in wl1ich decreases occur;-ed w~re one-third and one-f9urll! 9~ India . (on a population basis). In th18 decade, decreases occurred In diVISIons whIch conlamcd more than one-half of the total population of India. Even where increases occurred hey were smatJ the divis.ions where increases exceeded 5 per cent rcprefl<uted only about one-tenth of In.dia. The natural checks which rcstl'ain the growth of popula.tion were seen at their worst during this decade. .
16. We now reach the turning point. W. hear no longer aloont abnormal deaths-until we come to the Bengal Farn'ne of 1943.
Already, !Is mentioned before, famine had lostits terror. In 1921, tbe Cen-iUS C:?mmIS~loner wrot~ : ~.'Famine relief organil>a1ioD is now so h;ghly pcrfectedlI.lndla that scarcIty I. not necessarily accompanit-d by higt, mOTlEIJI y ....
192
tIis SU(,"CCSSOf iR.1931 could say : ··There was, however, been no serious famine jo the decade under review ........ Improvements in communications, now-adays prevent anything like the famine mortality of a century ago .... Faminc5 were local and not y..:,ry serious, though onc unfortunate district of Madras had famine declared in it officially for three seasons."
It was nol merely t.he fruijs of \lictory over famine that the coun1ry was enjoying. A n.;w note of confidence in tne fight against cpid\:mic di~cas(s was beginning to be heard. According to the 1931 Census Report, "Every year sees improved mclhods of tighiing ~uch cpid.:mics as Cholera, Plague. Of
_kala-azar. Indeed. a completely cff.;:ct lVC treatment for the laUer pest has been pafceted sino: the last C..:!llS.US., and has. made it po~sjble to s1.<trnp oUl the .disease" .
'O!tailcd accounts of I he course of l he ~cason5 and condition:. of public 'health during tbe last and earlier decades are given in state census reports published separately. They need not be recQunt-:d here.
Though {he usual cycles of vicissitudes of the seasons continued and Ihe brown and ydlow belLs of the country con! inucd to suffer from Glroughts which ~au5ed severe scarci I ies and sometimes, famines, t here was no extraordinary calamity (except the Ikngal Famine of 1943). By about 1921, the freedom movement acquired a g~nujnely national character; and the British GovertU11l:nt were carrying out reforms which culminated in the transfer of pow~r in 1947. There was a conscious effort to develop <nation building' services and a spurt of activity occurred in the 'transferred' departments which dealt mainly with public health and education. For a few years before the outbreak of World War
11. when Provincial Autonomy arrived and popular .ministries took charge of provit:lcial Governments, further advances were reglstered. In the result, the organ1sation of public health establishments has been steadlly strengthened and their methods of combating epidemic diseases-especiaJly through control of fairs and festivals~have become increasingly dficienL Mention has been made already of the distinction between outbreaks or malarial fever in the form of cpidemie~ and their perennial prevalence in many parts of the country where the disease lS endemic. It seems likely, that in these areas the death rate must have been consistently higher and the birth rate consislanlly lOWe:! than elsewhere. Though the data are not conclusive there are indications to the
.. effect that the lethal effects of endemic malaria were getting progressively reduced during: the last thrity years and this progress has been substantially aCce~erated during the last decade.
17. We may now go back to our question-Aretbe figuresreally true?and our answer that they arc. There is no doubt that during the thirty years before the 1921 Census severe checks of one kind or other wer~ in operation ,p,ohich tended to increase deaths abnormally. Sucn Checks also had the effect, ~n some cases, of diminiShing the births abnormally. The natural checks on :population growth fan in three groups as below:
(i) Famines (including famine diseases)
(ii) Epidemic diseases, and
,liii) Endemic diseases.
193
These three groups of nalural cnecks were responsible for keeping the ~mean ..deccJlll1ial rate of growth~ during the first. thirty-year period as low as 1'7 per cent, and aclualJy bdnging about a reduction of population in tbree zones out of six. Evenduring 1891-1900, when the first oftbese checks, vi?., famine,s (including famine diseases) were at their height, human inlellig<.nce was already dc-vising and perfecting the countcr-cht:cks by which j he natural checks could be prevented from operating. These cuunter-checks comprised : First, the cr~ation of condit ions in which the dcvdopmcnt of agricultural production could b..::: both possible and profitable and take place o:f its own accord; Secondly, the development of transport and communicallons (sC) as to op'en up all areas liabl~ to ~carcity and famine and thereby ensure the availabIlity of comm<!rcial supplies of foodgrains): and Thirdly, the organisation of efficient administrative arrangements for provision of empl.oymcnl and wages to the landless rural people in those places and at those lImes when prolonged and "I!vere droughts occurred and they were unemployed and wit hout purchasirg power. So much for the counter-checks. on onc group of nalural checks.
The counter-checks devised for dealing with the other natural chcck~ are m0re obvious. Th..:y consisted of hygi~nc and medicine br{)ught t() bear on the problem through deparl mcnts of publIc health,and the gradual growth in num\}<.;rS ofthc 111 !dical profcs~ion. Thac can be no dO\Jbt that the counter-checks pr(l,,~d df~ctivc and succeeded in eliminating the operation of one of thc!ie natural checks and materially diminished thc incidence of others.
18. H would. however. he an excessive claim 10 atlrilnltt' the whole of this improvcmcnllo human intellig.:nt.:.:. Nature: also "c\.m~ 10 have been kindlier. Some :-;tat;"ticc. compiled by th...:- Meteorological Department. which are shown in the diagrm facing {hib page· appear to show that as between t he two thirlyyear periods under study, the carlier period was worse favoured by nature than the later one. Droughts were clearly more frequent and more wide .. spread in the earlier period. The difference is also refieeled in the oCCUrranCCS of excessive rain which not only cause floods but heJp to start outbreaks of epidemic diseases.
19. The Bengal Famine of 1943, as IS well known, marked a tragic reversal of thi6 trend towards elimination of abnormal deaths. The circum .. staftOes iR which this reversal took place are recorded in the report ofa statutory Commis.sion of Inquiry. Relevant extracts from the report ofthib Commission will be found in Apfend'x IV.
Notwithstanding the very full account given in this report. there is very J ittle publiE realisation of the fact that the occurrence of this famiDe marks a new phase in the effort to combat famine in this counlry.
A basic assumption underlying the classic methods of prevention and relief of famine has been the presence within the country (which formerly included nol only India and Pakistan but Burma also) of an overall .urplus .offoodgrains. The presence of this surplus was a guarantee that commercial supplies of foodgrains would become available at any place and at any time in tbe quantities needed. A physical shortage of supplies was not a contingency to be guarded against. So long as the basic assumption remained vaJid, the old ~thod8 which were designed merely to inject purChasing flower proved succes~ sful in saving life. Bul the growth of populat ion (induced In part by the .u_ ..
·Not reproduced here.
194
ofthese very mothods) has brought tbe counlry and the people face to face with a new s,ituation in which this assumption is no longer valid. The iIll.pH~ cat~ons of this change are far reaching. Let us:note that fact; we shall revert 101t later.
20. We may :onclud\~ Ihis section with. a compari!>clTI of thf r;~jl'S of population growth .expcrienv.:d in India with those of other coun1riu, of lhc world and other times.
The 'mean d\~cennial growth ratc' in India, a~ already expl~jmd. was. 10·4 per cent in 1921·30. 12'7 pa cent in 1931·40, "nd 13·2 per CCI\111l1941·50. The 1:\o;t ml!nl loned rale is thl_: diff:rcnce bdw~en a 'ml~an d...:;ccnn'~! b~:'!~: rak7 of40 per cent and a 'mean dc<x:nnial death rate' of 27 per CC"nt.
Th~ 'mcu.n d-:ccnni~d growl h rat,;' in (he Urdt(.:d Sta,t(.s (-If Am~ ··:c .. :";-:PGlr~ 10 haw been 19'0 (1910). 13·9 (1920), 14'9(1930),7'0(1940) and 13'0(1950). In the United Kingdom. the rate w~s 9-6 between 40 and, 50. ),',,-,,;':; :.g'.' and 4'4 during [he lap_ Iv,':l.:n1y Yl.:i~r~, R.,'c\.'nt figures fur Franc..: jlldIC,tI ... :.i. ~:",dJT\c; increascs were n.:glskrcd dUTlng 1921-30 at the rate ()f ahout 6 per (;~BT. The figures for Italy yield r;:lt~sjlllhencighb()urhood of6, 7 Of 8 fC:- c',_n i h~r :::,_vGal decades. The ral:s for Japan appear to bl!' running consbh.: n! ly hlglLlJ lImn the rates for India-in 111(; neighbourhood of 14 per cent.
In general, Wcste_rn European rates of growth,an.: distinc11y lower than in India even though thelT d~ath ralclS are lower than In India. This is due 10 the fact that Western European peoples pracl ise ConI racrpt ion and thus succeeded in k~pingthc birth rate at a much lower level than ours; though) if they imposed no such checks,their women-folk are likely to have at 1east as many cbildren as our womcnk .. folk do have. Tn the United Statc~ of ArneTte,] the JW{"p], prac~ tise contraception. Bur lill!ir birth ratc(though distinctly lower than in India) it higher than in Western Europe-an countries. Their dea1h ratc IS wry low. In the result, they are keeping up a rate of growth similar Lo ours :1nd much bigher than in Western European countdcs.
21. This is the position in recent years. It is ,necessary. if pos£ib!c. to .asccrtain how the present total strength of mankind has grown, in order 10 determine whether there is such a thi~g ~s a 'natural' rate of growth. As might be excepted, we have verylitt1c statistical information oftbe kine. we have been discussing So far. Yel, we arc not entirely ignorant on the sub~ct; Ih(.~r{' are a number of books where the results of expert study of all available data .about world population are set out. It is true that much of tbis study consists of piecing together fragments of Rsccrt .. dned fact with a good deal of g...te~~work. But the guesswork is not arbitrary; it rpresents the best judgement of scholars who are well qualified to form an oyinion also free from eonsciOll' b;as. A brief summary of rel~vant informatlon of tbis nature is ,given below.
Round about 1150, tbe 'olnl strength of mankind consisl.d only of 13 "'ores of people. Our own number-it will be recalled-is 36 Cfores today. Thus tw<> hundred yean ago. the wbole world COlltaiDed only twice as many buma!! beings as there are in India alone today.
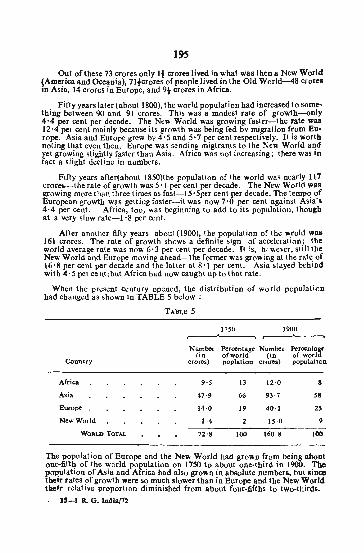
195
Out ofthes. 73 erores only Ii erores lived in what was tben a New World {America and Oceania), 71 ierores of people lived in the Old World-48 crores 1fi Asia, 14 crotes in Europe, and 91- crOfes in Africa.
Fifty years later (about 1800), the world population had increased to something between 90 and 91 crores. This was a modest rate of growth-only 4·4 per cent per decade. The New World was growing faster-tbe rate was 12'4 pel cent mainly because its growth "as being red bv mi_gration from Europe. Asia and Europe grew by 4' 5 and 5' 7 per cent respec(lvely. It is worth noting that even then, Europe was scndin!!, migtrants to the New World and yet growing slightly faster than Asia. Africa was not increasing; there was in fact a slight decline in numbers.
Fifty years after(about l850)the population of the world waS nearly 117 crOTes-the rate of growth was 5'1 per cent per decade. The New World was growing more than three times as fast-IS' Sper cent per decade. The tempo Of. European growth was getting faster-it was now 7'0 per cent against Asia's 4-4 per ccnt. Africa, too, was beginning to add to its popuJation, though at a ver} slow rate-I' 8 per cent.
After another fifty years about (1900), the population of the wrold wa~ 161 crores. The rate of growth shows a definite sign of acceleration; tbe world average rate was now 6·3 per cent per decade. It :s, he v,evcr, still the New Wor1d and Europe moving ahead-the former was growi.ng at the rate. of 16'8 per cent per decade and tbe latter at g'l per cent. ASia stayed behind with 4'5 pel cent~but Africa had now caught upto that rate.
When the present century opened, the distribution of world populaticn had changed as shown in TABLE 5 below:
TABLE 5
)750 1900
Number Percen1age Number Percentage (in ofworId (in of world
Country crores) popla1ion croJ"Cs) populati(lD.
Africa 9·5 B 12·0
Asia 47·9 66 9~'7 58
Europe 14'0 19 40·1 25
New World 1·4 15·0 9
WORU> TOTAl. 72'8 100 160'8 100
The population of Europe and the ]'\jew World had grown from being about one-fift.h of the world population on 1750 to about one·third in 1900. The population of Asia and Africa had also grown in absolute numbers, but since their rates of growth were So much slower than in Europe and the New Wortd their rdative proportion diminished from about four~fifths to twa-thirds.
IS-I R. O. IndiaJ72
196
This was the position in or about 1900. During the last fifty years the practice of contraception has ¥fown, and become part of the normal mode of conjugal life among the majority of the peoplein Western Europe and people of their stock inhabiting the New World. As a result, their birth rates have been falling fast. Their death rates had already begun to fall much earlier during tbe last century. Tnis was the result partty of the fact tnat the masses of tbe people had begun to eat more food and better food tnan they nad ever known bdore, and partly oftbe fact tnat water supply and s~nitation, hygiene, and medicine nad begun to make progress. So long as the birth rates remained stationary while tne death rates feH, the growth rate was well ahead of the rest of tbe world. Hence the difference in the figures of Asia and Europe already observed. But when the European peoples started contraception and tne habit grew, toe birth rates fell faster tnan the death rates-with he result tnat the European rate of growth has been falling. Duri ng the last half-century tnc m·~an decennial wowth rate of Europe nas been 6'0 per cent per 4·.:cad0; while tnat of ASIa is higher, viz., 6·8 Africa has forged ahead with 9·3 while (he rate in the New World has dropped from 16'8 (015' J.
Th, latest position tround about 1950) seems to be as follows. World population is now 239 crores-well over tnree times the number of 1150. Europe and tne New World have about 88 crores which is well over a third of the population orthe world. Asia and Africa have 151 crores waich is well below two-thirds of the population oftbe world. If the trends of the last fifty years continue to operate during the next fifty years, the numbers of the Eu .. ropean peoples should become stationary (it not declining) and Asia and Africa should keep growing even faster than at present-the rate of growth iB the New World falling to the same level. But, there are good reasons to think (as will appear later in this report)tbat the 'if' is a very big one, and the assumpw tion is unlikely to hold good.
21. Tn the account given above, it has been asserted that the decline during the latest half-century of the rate of growth of Western European people and people of the same stock in the New World-which is an observed fact which admits of no doubt-has b¢en caused by the development of the practice of conrraception. Until recently. this statement-though widely suspected to be probably true--<:ould not bo regarded as firmly establisned by adequate evidence. During the tnirtics. a theory was in vogue: that the observed fall in the birth rate was a biological phenomenon-independent of conscious human volition. There was, it was asserged. a law of nature which induces a fall in the birth rate among people who achieved rising standards of Ihring. Even DOW one still comes across this idea, in some form or other. But it is no longer necessary to invoke an unproved biological law in order to explain something which needs no rurher explanation, if the practice of contraception is now available. The Royal Commission on Population in the United Kingdom b .. collected and analysed a mass of evidence and the findings of that Commission are conclusive. Revevant extracts from the papers of this Commission will be found in APPENDIX VII. The findings of the Commission confirm what is also indicated by a good many other' enquiries conducted in the United C;tates of America and certain Western European countries) that the practice of contraception by .umciently large numbers of people is tbe main operative cause offaUing births rates. They also indicate that tbe alleged
197
biological law is unlikely to be true and tbat an improwment of the nullitiollal standard or other standards of living is by no means incompatible with til'> mlintenano. of a high rate of child·bearing, If the people So desired.
23. One more comment is necossary on tbe figures sbowing tbe rate of growth of population in different part' of the world. It may be agreed tbat <M increase o/populatlon o/the order o/between 10 and 15 per cent per decmk is biologically natural and has been experienced by many of the advaned countries of th~ wl)rld and 1S ':iti(( exp,rienced by som~ of them. Wh~ther or not tbis can conti,nue indofinitely in future is a question of high importance for nllnkind a') a wh·:>le. Th!~ quc~tion is at present involved in acute contraversy into which WJ n'~,ed not cnter at this stag..:. One thing. however, il~ certain. It could not h3.ve b!"n a norm'll characteristic ofhurn'J.u history for an indefinite period in the past.
Within til'> I,'t two hundred yea" mankind haS more than trebled it. num,,,,-,nd this h" hppcncd while the rate of growth per decade was vr~ry m~;;h l·'!"',·, thln [0 p~r c';:nt. Wr:. can ea'iily see th'lt even the rate which actul.lly prevailed during the Lalit two centuries-trebling intwo centuriesm.ust be regarded as abuorm1.1 and very much fa'3.ter than in pro ceding cen· turies. On any other 6uppo~ilion. we mus.t be led to the conclu~ion tbat,wh," Elmlpror A'oka ruled (273-232 B.C.), and w;< ,ending his mi"ionaries to vd.riou" c;)untries of th~ World. tho what::: of mankind must have numb'.)red only a few ten'> of th.)usand'_l-which is absurd. W~ sha.ll not see th" picture of hUIUln grow~h in its p:'op~r p!rsp~~tiw: unlef;s we realise t.nat what we feel to bJ a 'biologically n::rtural' rate o/growth is by no m'!an.r natural in the senSe of hllfbfg r<!gularly occurred at all places from time immzmorial. The exact oppo$ite is 'Harer thr:! truth. Th'~ ra.tes ofg~owth which we arc discussing Should, therefore, b~ regard·~d a') an epi'iod\! in an a{tog'~tner exceptional epoch in huml.u h"lstory. This epoch is pt0bJ.b~y now drawing to its close. With this o~rvation, WJ mlY leav(: the wJrld figurcii alone for a while; and return to India. and limit OUTiiClves aglin to a review of changes which occurred during .a mucb shorter period-viz., thirty years. before and since 1921.

CHApTER II
F-llirth Rates and Death Rates
BIRTHS AND DEATHS are among the most important events which occur in the life of every housebold. Our knowledge of how the number and the living pattern of our people have changed in the paf-t and, therefore. our opinion about how they may be expected to change in the future are bound to be vague and sketchy, if Dot incorrect, unless we achieved a clear under6tand~ iug of the relations bip between thc!)cvitai cvcn1s and the changing pattern oflife.
70. G.JvcrnmGnt have made arrangomcnts for !)ccuring that birth~ and death!> arc reported ar. and when thl~y occur and the occurcnCCN at'c placed on record tog·~th...:r with essential minimum information regarding date and place and pa,ties concerned. There i\; the sy:-;tem of official regit>tration of births and deathl'. The prim:lry da'a tbm. secured are then compiled and returns showing the numbers ofbirthf> and deaths in different parts of the country as well a~ birth rates and death rates computed from them. arc puhlished at regular intervals by State Governments, for each State and by the Central Government, for India.
If reporting is complete and the baGic record!.; arc correctly maintained, the changes in numberti recorded by the censuli at ten-yearly intervatf'> r:;hould tally with the balance of birth" and death5 during the ten-year period. leaving only a relatively t:imall margin to h..: explained by the net balance of migratlon of pcrople, in and out of the territory in quc5tjon.
71. Let Ufi tako;! U~tar Prad~6h a& an illustration. In 1951 the 5tate hada total population of 632 Lakh, •. T..:n y..,ars earlier. according to the 1941 Cen~u6, there w~re 565 lakh:i of p'"!ople in the liamc territory. The number had grown by 67Iakh:; in ten y~arfj. Th';;n; w-.:rc arrangcm'~n~fl for regis.tration ofhirLht; and death"> in most villages and towns of the state-but some small bitt; oflerri1ory (of the princely states which w·~re ~mergcd' in ULtar PradeSh Shortly before the 1951 Census) did not have them. This is a complication but a small oocbecaulie the population uf the area where there waS no registration was a little under one fortieth of the Whole slate and we may make allowance6 accordingly.
Dllring ten years preceding the 1951 Cenl'lus the authorities of Uttar Ptadesh registered 145 lakhs of births. They alGo registered 97 lakhs of deaths. The excess of births over:..deaths being 48 lakhs. the population must. have increased by that number. According to the cem'U5, the increa6e was 671akhs. How are we to account for the remaining 19 Lakhs? Were they ditiplaced pet&on6 whQ had come into the state from Pakistan? No. we have counted them; they are only 5 Lakh'i. We also know that at about the time they came in. others migrated to Pakistan from Uttar Pradesh. Though we do not know this number precisely. we have reasons to believe that it was not perhaps far short of tbe number who Came in. So the question about the 19 lakhG remains to be answered. Evidently. a great many birth6 escaped registration; and So ako, no doubt, deaths. Tbe b:l&ic record is materially incomplete.
199
200
This incomplteenss is indicated by census results in another way also. The births registered during 10 years work out to a rate (in round figures) of25 thousand people per annum. We have already noted in the last section, however, that the C-olint of infants in this state yielded 33 per thousand. May be, this number was somewhat swollen by counting 13 mont,h old babies alGo, as infants, But, even so, if we make allowance for the number of infants who must have died during the year preceding the census, the census count of infants is a clear indication that actual births must have exceeded _registered birthS fairly substantially.
The problem is-how are we to have_a reasonably close estimate of the actuaillumber of births and tbe actual birth rate is against the registered birth ratc? There is a similar problem about deaths and death rates.
The importance of solving this problem cannot be overstressed. To iHustrate, the registration figure of Uttar Pradesh show that in each of the two previouS decades 1931-40 as well as 1921-30, registered births were working out to an average rate (in round figures) of 34 per thousand people per annum. There is a sharp difference between 25 (the regiGtered birth ratc during 1941-50)and 34 (at each of two preceding decades). If this difference is real and if similar drops were observed in other states, the figures wiIl prove that there is no such thing as a population problem in India; and if there was, the problem was solving itself. That is, in fact, what a number of people think and say. But suppose the difference is due merely to the fact that the registration system has become ICGS efficient than before; ana. 60 more births escaped registration during the last· decade than during two previous decades. Suppose further, that we could form a reliable estmatc of the extent of omission in different decades. Then the inferences to be drawn from the figures will be very different~ Our appreciation of the problem and our approach to its solution will turn out to be very different.
72. Uncertainties ofthis kind are present in every state. Among the major states, Madras, Bombay, Madhya Pradesh and the Punjab are the only four states where the registration system functions reasonably well and omist)lOlls are not unduly large. The other states fall into tbree groups-those for which figures are availablc over a long period, though they are not very good figures; those for which figures (not very good) are available now for somc recent years but not over a long period; and those for which there are no figures at all even now. If we exclude the last two categories, we are left with a territory which contains roughly three-quarter of India's population.
It was no use merely saying that we do not have complete informatioa and can, therefore, come to no conclusion. It will take a long time before we get data which are frce from all uncertainties. Meanwhile, we have to form as good a judgement as we Can-on all the materials before us-about how the observed growth of population as disclosed by censuses Should be split up into births, deaths, and the net balance of migration. To this end, it was necessary to bring together all available data thrown up by registration of births and deaths as well as by the census and subject them to close and careful study and UBe every scrap of collateral information which can help uS to piece together this jig~saw puzzle.

201
73. Sucb a study bas been carried out, and it bas yielded resulls whick serve our present purpose. The nature of this study, and the results, are fiet out in detail in a golf-Contained paper· which is printed an APPI!NDIX II to tbis report. The conclusions reached in this paper may be thus stated :
I. The India picture is as follows :
(i) Birth. have occurred (during the ten years 1941-50) at an average rate of 40 per thousand per annum.
(ii) Deaths have occurred (during the ten years 1941-50) at an average rate of 27 per thousand per annum.
(iii) Hence, the natural increase of the population has been occurring (during the ten years 1941-50) at an average rate of 13 per thousand per annum ..
We may refer 10 Ibese rates as the birlh rate (40), death ral"(27) and natural increase rate (13). They relate to fndia within her present boundaries during the decade preceding the 1951 Ccmus.
II. The zonal variations of the India picture are as follows:
(i) Th·, ~ighcst birth rate is found in Central India (44). and the loweet birth rate in South India (36 or 31). The birth rates of other Zones in order, are; WeBt India (42), North-West India (41 or 42). North India and East India (for of which the birtb rates are 38 or 39).
(ii) The highest death aratf' is found in Central India (34). and the lower death rate in South India (21 or 22). The death rat"' of other zones in order, are: North India (27 or 28), East India (26 or 27 or 28) w .. t I"diu (26) ana North-We't India \24 or 25 or 26).
(iii) The highest natural increase rate is found in North-Wcfi.t India (16 of 17) and West India (Hl). and the lowest natural increase ratc is found in Central India (10). The natural increase rates of other zones, in order, are: South India (15), East India (I 1 or 12) and North lndia(II).
74. The foregoing figures do not represent a simple computation from census data or registration data (If both. They are something morc complex than a computation, they const'i~ ute a judgement. They represent what the present writer considers to be rol)')t probably what occurred during 1941-5() in India and the six Zones. All the evidence which has led him to form tni9-judgement is fully set out in print; so, it if} possible for readers (if they disagree witn tbe conclusions) to fOfro their own judgement.
It will be noted that in some cases, more than one figure have been givenhis represents what seems to the present writer to be the unavoidable residuum
of uncertainty, whicn has to be accepted.
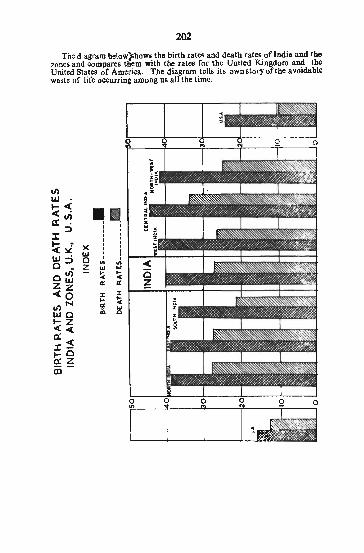
202
The d'agram belowJshows the birtb rate. and death rates of India and the zones and compares tbem with the rates for the United Kingdom and tbe United Stales of America. The diagram tells its ownstoryoftbeavoidable waste of life occurring among uS all the time .
. ~ I I I I I ' I ' I I I ' , I I ,
'" .. w w ... ... .. .. II a: :t ... a: iii
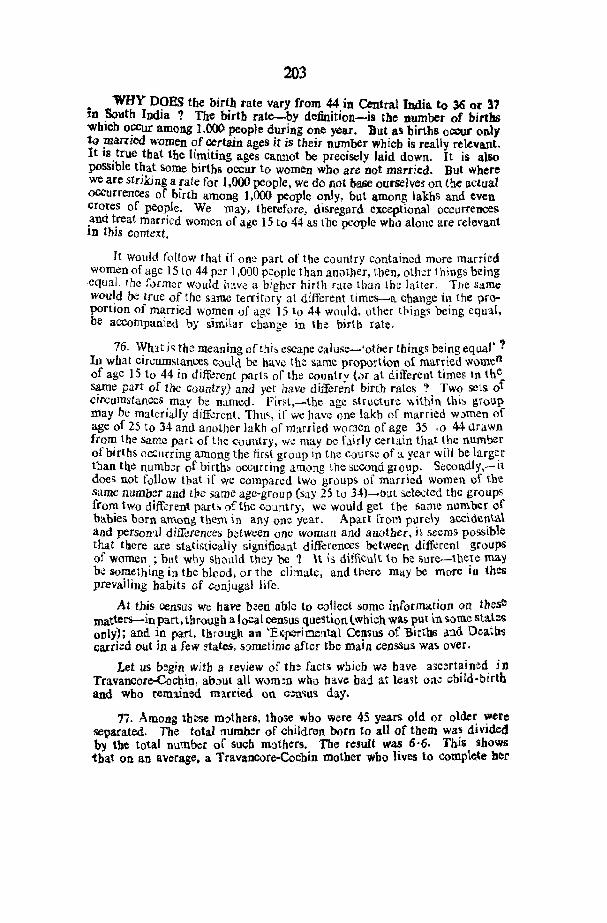
203
• WHY DOES the birth rate vary from 44 in Central India to 36 or 37 lD ~utb India ? The birtb rate-by definition-is the number of births "Wblcb o~ur among 1,000 people during one year. But as births occur on.ly 10 TBatrled women of certain ages it is tbeir number which is really relevant. It IS. true tbat tbe limiting ages cannot be precisely laid down. It is also possible that some births occur to women who ace not married. But where we are striking a rate for 1,000 people, we do not ba.&e ourselves on the actual occurrences of birth among 1,000 people only, but among lakhs and even (;ro~es of peoJ?le. We may. tberefore. disregard exceptional occurrences .ann t.reat mamed women of a6c 15 to 44 as the people who alone are relevant In tblS context.
It would follow that if one part of the counlry contained more married women of age IS Lo 44 per 1,000 people than another, then, ot.ber things being ,equaJ, the former would h3.ve a bigher hirtb raw than the laHer. The same WOU~d be true of the same territury at different times-a change in the proportion of married women of age 15 to 44 would. other fhings being equal. be accompallted by similar change in til'! birth rate.
76. WhItis tite meaning ofthi~ escape caluse-'otber things being equal' ? In what circumstances could be have the "'arne proportion of married women of age 15 to 44 in different parls of the Country (;>r at different times 1n tbe same part of the Country) and yet have dHfcrent birth rates ? Two sels of circumstances may be named. FlrRl,-the age structure within this group may be materially different. Thu .. , if we have one lakh of married w.)men of age of 25 to 34 and another lakh Df married women of age 35 <0 44 urawn from the same part of the country, we may be fairly certain that the number of births occurring among the first group in the course of a year will be larg~r tban the numb~r of births occurring among the second group. Secoudly,-It does not f{)llow tbat if we compared two groups of married women of the same number and t]1e same age-group (saY 25 to H)-{)ut &elocted tbe groups from two diff,;;rent parb of the co,m1ry, we would get tbe same nllmber of babies born among, them in anyone year. Apart from purdy accidenta\ and persom.l differences b~tween Qnc woman and anotber. it seems possible that there are statistically significant differences between different groups of women; bllt why should they be '1 it i:i difficult to be surc-tbcIC may be something in tbe bllJod, of the climate, and tJ:!crc may be more in thes prevailing habits of conjuga.l life.
At this census we have b~en able to collect some information Oil these matters-in part, tbrough a local census question twbi.ch was put in some state;; only); and in part, tb;()LJgh an 'E"p.."'Timental Census .of Birt'n6 and De.atb'G carried out in a few states, sometime after the main censsus W3ii over.
Let us begin with a review of thOl facts which W~ have a>cert~ined. j n Travancore-Cochin, ab.:>ut all wom~n who ba.ve bad at least one cblld-blrth and who reltl1ined ml.rried on cen'lu~ day.
77. Among these motbers, tb()5e who were 4S years old or older were separated. Tbe total number of children born to all of them was divided by tbe total Dumber of sucb motbers. The result was 6,6. TillS shows
'tbat on an average. a Travancore-Cochin mother who lives to compte,te ber
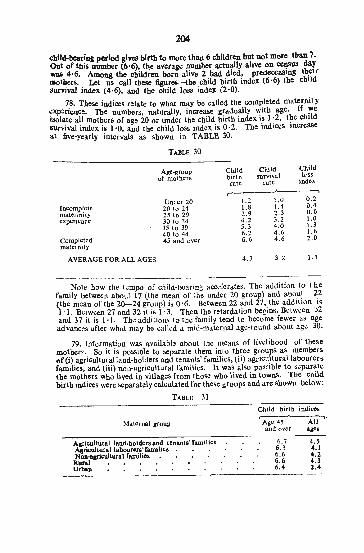
204
child-bearing period give, birth to more than 6 children but not more tban 7. Out of tbis number l6·6). tb," average number actually alive on censUS day w .. 4·6. Among tbe cbildren born alive 2 bad died. predeceasing tb_elr molhers_. Lot us call tbes" figures-the child birtb index (6-6) tbe cblld SUrvival Index (4·6). and tbe child loss index (2-0)_
78_ These indices relate to wbat may be called tbe comr>leted matemit y ~xp:rIence. The numbers, naturally, increase gradually wItb age. If "!'Ie Isolate all mothers of age 20 Of under the cbild birtb index is 1-2, the cblld survival index is 1'0, and the child loss index is 0·2. The indices increase at five-yearly interval. as sbown in TABLE 30.
TABLE 30
Age~group Child Child ChUd
of mothers birth survival loSS
rate rate index
Under 20 1.2 1.0 0.2
]ncomplete 20 to 24 1.8 1.4 0.4
rnater.inity 25 to 29 2.9 2,3 0.6
cltpenencc 30 to 34 4.2 3.2 1.0
35 to 39 5.3 4.0 1.3 40 to 44 6.2 4.6 1.6
Completed 45 and over 6.6 4.6 2.0 maternity
AVERAGE FOR ALL AGES 4.3 3.2 1.1
Note how the tempo -of cbild·bcaring accelerates. The addition to the family between about 17 (the mean of the under 20 group) and about 22 (tbe mean of tbe 20-24 group) is 0-6. Between 22 and 27. the addition is 1·1. Between 27 and 32 it is 1· 3. Then the retardation begins. Between j2 and 37 it is I-t. The additions Lo the family tend to become fewer as age advances after what may be called a mid-maternal age-round about age 30.
79_ Information waS available about the means of livelihood of these motherf. So it is possible to :.eparate them into tbree groups as members of (0 agricultural land-holders and tenants' families, (ii) agricu\turallaDourers families, and liiL) non-agricultural families. It was also posrible to separate the mothers who lived in villages from tbose who lived in towns. The cbi1d birth indices were separately ca\clllated for these g;roups and are sbown below:
TABLE 31
Child birth indices
M1.tcrnal group
r--A. ___ . Age 45 All and Qv:!r age5
Aariculturalland.boldersand lenants'familie» 6.7 4.5 Agricullurallabourers'families . 6.3 4.1 NOJ'1-o6Iticuitura.l fa.milies. . 6.6 4.2 Rural 6.6 4.3 Urmm ______________________________________ 6_.4 ____ ~l __ .4
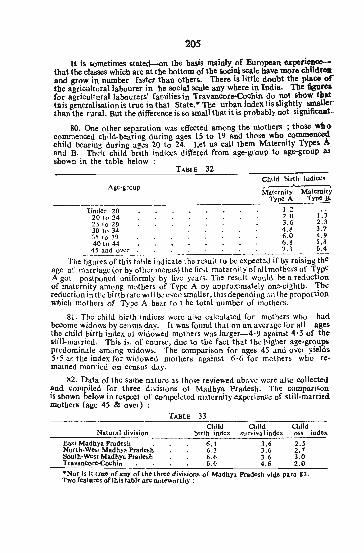
205
It is sometimes stated-<ln the basis mainly of European experiencetbat tbe classes which are at tbe bottom ortb. social scale bave more cbildrelt and grow in number faster tban otbers. There is little doubt tbe place 0; the agricultural labourer in be social scale any wbere in India. The figure. for agricultural labourers' families in Travancore~Cochin do not show that t~js generalisation is true in tbat State.' Tbe urban index lis sligbtly smaller than tbe rural. But tbe difference is so small tbat it is probabl} not signili<""t.
80. One other separation WaS effected among the mothers ; tbose wb 0 commenced cbild·hearing during ages 15 to 19 and those who commenced child bearing during ages 20 to 24. Let uS call tbern Maternity Types A and B. Their child brith indices differed from age·group to age-group as sbown in tbe table below
Age-group
Under 20 20 10 24 25 10 29 30 to 34 35 to 39 40 to 44
45 and over -_._--_ ... _._
TABLE 32 Child birth indices ~___,___.....,
Maternity Maternity Typo A Type B
U d 3.6 2.1 4.8 3.1 6.0 4.9 6.8 5.S
. ....:._-'-_-'-. ....:._-'-__ 7:..:.:3 6.4
The figures oftbis table indicate the result to be expected if by rais.ing the age of marriage (or by oth:::r mena5) the firs.t maternity of all mothers of Type A got pos.tponed uniformly by five years. The result would be a reduction of maternity among m;Jthers of TyPe A oy approximately one-eigbtb. The red.uction in t}-le birth rate will b~ even smaller, this depending ()n the proportion whIch motbers of Type A bear to t he total number of mothers.
81. The child birth indices were also calculated for mothers who had become widows by censuS day. It was found that on an average for aU ages tbe child birtb index of widowed mothers waS larger-4'9 again.t 4·3 of tbe stili-married. This is. of course, due to tbe fact tbat the bigher age-groups predominate among widows. The comparison for ages 45 and over yields 5'~ a~ the in~ex for widowed mothers against 6·6 for molbers who remaIned marned on census da),.
82. Data of the Same nature as thoSl!: reviewed abuve were also collected ~nd compiled for three d;visions of Madhya PradeSh. The comparIson IS shown below In respect of cornpeleted maternity experienCe of stiU~marrjed. _tbers (age 45 & over) :
TABLE 33 Child Child Child
Natural division birth index suryivalindex oss East Madhya Pradesh, . 6.1 3.6 2.5 North~Wesl Madhya Pradesh 6.3 3.6 2.7 South-West Madhya Pradesh 6.6 3.6 3.0 Travaneore-COChin 6.6 4.6 2.0
·Nor is it true of ,any of the three divisions or Madhya Pradesh vide para 83. Two features OfthlS table are noteworthy;
index
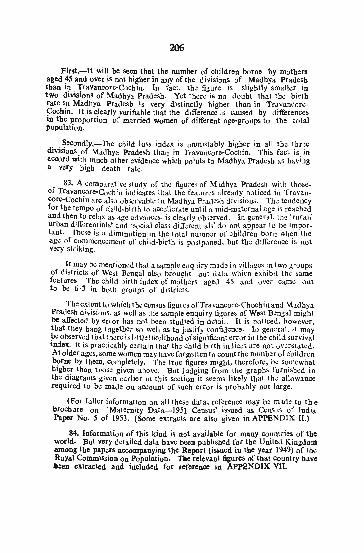
206
First.-It will be seen that the number of cbildren borne by mother. aged 45 and over is not higher in any of 'he divisions of Madhya Pradesb tban in Travan~ore~Cochin. In facI, the figure is. slightly smal1er in two divisions of Madhya Pradesh. Y¢! tbere is no doubt tbat the birth rate in Madhya Pradesb is very distinctly higher than in TraV'ancore~ Cochin. It iii clearlY verifiable that the difference iii caused by differences in the proportion of married women of difft':rent age~groups to the total population.
Secondly,-Tbe child loss index is unmistably bigber in all tbe three divisions of Madhya Pradesh than in T1'avancore~Cochin. This fad is in Record witb much otber evidence which point.s to Madhya Pradesh as having a very high death rate.
83. A comparative study of the figu,T:S of M.ldhya Pradesh with thosc:of Travancore-Cochin indica.tes that the fcatures alreadY noticed in Travan_ coreMCochin are also ob~rvable in Madhya Prade,c;h divisinn:.. The tendency for the tempo of child-birth to acccllerate until a mid-matcrnal age is reached and the~ to rel~x as age advances, is cle<l.rly observed. In general, the .'rurall urban dlff~rcntfals' and 'social c1as.<; diffJrcntiats' do nol appear to be Important. Thc~e is a diminution in the total numb::!r of children born when the age of ~0t?mencement of child·birth is postponed, but the diff.::rcnce is not very stokIng.
It may be mentioned that a sample cI1quiry made in villages in two gr'Jups of districts of West Benga1 also brought out d:1.ta which ex.hibit the! same features. The chi1d birth index of motbers aged 45 and oyer Carne out to be 6·3 in hotb groups of districts.
The extent to which the CensuS figures ofTravaneorc*Chochin and Madhya Pradesh divbion5, as welJ as tbe sample enquiry figures of West B:mgal might be affected by error has not been stUdied in detail. It is noticed, }1owcver. that tbey bang together So well as to justify confiJence. In general, it may ~ observed tbat th~re i::; [ittlt: likelibood of significant errOf' in the cbild survival Index. It is practkably C~rlain tbat th''! child birth in:iice.i are not ovo:rslated. Atolder ages. some women may have forgotten to count the numb~r of children 1>?rne by tbem, completely. The true.fig.u~es might. tbcrerore~ be s(),mewb~t blgber than tpo~e given above. But Judging from tbe grapbs furnIshed In the diagrams given earlier in this section it seemi Likely that th~ allowance required to be made on aCCount of sueh error is probably not large.
{For fuller informa.tion on all these data, reference may bz made to tb e brochure on 'Maternity Data-1951 Census' issu.ed as Cen'].ll~ of India Paper No.5 of 1953. (Some extracts are also given in APPENDIX II.)
84. Information of tbis kind is not available for many countries of tbe world. !lut very detailed data bave been publisbed for tbe United Kingdom among tbe papers accompanying tbe Report li!lSued in tbe year 1949) of tbe R.oYal CommiSsion on Population. The relevant figures of tbat country have ltcen extracted and included for reference in AppBNDIX VII.
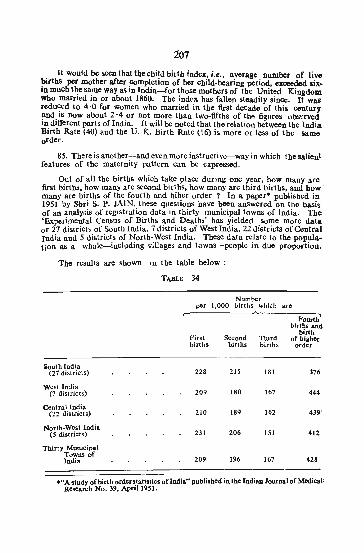
207
It would be seen tbat tbe cbild birth index, i.e., average number of Jive !>irtbs per motber after ~ml'l.etion of ber cbild-bearing period, exceeded sixIn mucb tbe same way as [n Ind[a-for tb()Se motbers of tbe United Kingdom wbo married in or about 1860. Tbe index bas fallen steadily since. It waS reduced to 4·0 for women wbo married in tbe first detade of tbis century and is now about 2'4 or not more than two~fifths of tbf: figures ubserved in different parts of India. it will be noted tbat tbe relation between tbe India Birtb Rate (40) and tbe U. K. ilirtb Rate (6) is more or less of tbe same order.
85. Tbere is anotber-and even more instructive-way in whicb the salient features of the maternity pattern can be expressed.
Out of aU tbe birtbs whicb take place during one year, how many are tirst birtbs, bow many are second birtbs, how many are third birtbs, and bow many are births of the fourth and hiber order 1 In a paper· publisbed in 1951 by Sbri S. P. JAIN, tbese questions bave been answered on tbe basi. of an anaiYf:;is of registration data in tbirty municipal towns of India. Tbe 'Experimental Census of Births and Deatbs' bas yielded . some more data or 27 districts of Soutb IndIa. 7 dIstricts of West india, 22 dlstncts of Central India and 5 districts of Nortb-West India. These data relate to the population as a whole-including villages and towns-people in due proportion.
The results are sbown in tbe table below :
50utb India (21 districts)
West India (7 districts)
Central India (22 districts)
North~West India (5 districts)
Thirty Municipal Towns of India
TABLE 34
Nwnbcr per 1,000 births which arc
First births
228
209
210
231
209
Second births
215
180
t89
206
196
Fuurth births and
birth Third of bigher births order
181 376
t67 444
t62 439'
151 4t2
167 428
."A study C)f birth orderstatistics of India" published in the Indian 10urnaJ of Medical. Research No. 39, April 19S1.
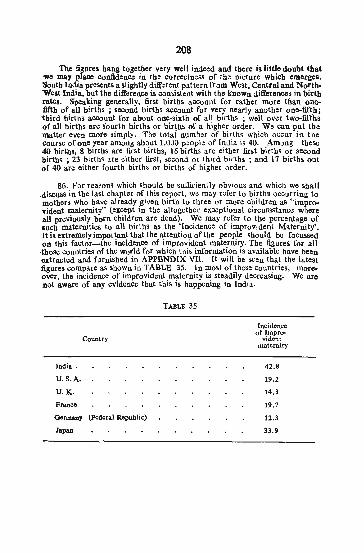
208
The figures bang togetber very well indeed and tbere is little doubt tbat -we may place con.fidence in tbe correctness of til'!! oicture wbicb emerges. South India presents a slightly different pattern from West, Central and NorthWe,t India, but tbe difference is comistent with tbe known differences in birtb rates. Speaking generally, first birtbs account for ratber more tban onefiftb of all birth. ; second births account for very nearly anotber one-fiftb; tbird birtbs account for about one-sixtb of all birtbs ; well over tw(>ofiftbs of all births are fourth births or bir\bs of a higber order. We Can put tbe matter even more simply. The total numb:r of births which occur in the course of one year among about 1,000 p,ople of India is 40. Among tbese 40 birtbs, S births are first birtbs, 16 birtbs are eitber first birtbs or second births; 23 births are either first, second or third births; and 17 births out of 40 are eitber fourtb births or birtbs of bigher order.
86. For reaSons which should be sufficiently obvious and which we shall ,discuss in the last cbapter of.this report. we may refer to births occurring to mothers Who have already gtven birth to three or more children as "impro-... ident maternity" (except in tbe altogether exceptional circLUnstance where all previously born children are dead). We may refer to tbe percentage of such maternities. to all birtbs as tbe 'Incidence of improvident Maternity·. It i. extremelyimpo(~ant tbat tbe a.ttention oftbe peo~le sbould be focussed on this factor-the lncldence of ImprOVident maternuy. The figures for all .those countries of the world fof whicb tbis information is available have been .xtracted and furnished in APPBNDIX vn. It will be seen tbat tbe latest .figures compare as Shown in TABLE 35. In most of tbese countries, more .. over, the incidence of improvident maternity is steadily decreasing. We arc not aware of any evidence tbat this is bappening in India.
TABLE 35
Incidence of Impro~
Country vident maternity
India. 42.8
U.S.A. 19.2
U.K. 14.3
France 19.7
o.rmaoy (Federa1 Republic) 12.3
Japan 33.9
CllAPtllR V
THE PROSPECT - 1981
A-Future Growth or Population
OF ALL COUNTRIES in tbe world, Great Britain has perhaps tbe largest .assemblage of tbe most reliaole .l"'Pulation data, e~tending in a systematic time series over the longest period in the past. Yet wben tbe Royal COIllmiiSion .on popula!ion set out, t~ ~'examine tbe facts relating to the preseU.t populatJon trends In Great BrItain; to investigate the causes of tbese trends and to consider their probable consequences ; to consider what meaSures if any, sbould be taken in the n3tional interest to influence tbe future trenct' of population and to make recommendations~', it found. the data insufficient in material parli~ulars. So, arra1l:.gements WC~~ mad~ for spe~ial enquiries to be conducted In order to provIde tbe addItIonal information required by tbe Commission.
After a !borougb analysis and prolonged study of abundant material, the CommISSIon achieved a forecast of tbe future growth of populations Before setting out and discussing tbe forecast, tbe: Commission made the ,followjng preliminary observations :
"In this and tbe following cbapter we shall try to follow tbe trend of population some way into the future. Our first and main concern will be to explore the prospects of natural increase. Making the assumption that there is no ne:t migration, we shall seek to find out how the population might develop under the influence of fertility and mortality alone ......
"We shall have to b'gin by looking at tbe existing population, wbich naturally conditions future possibilities. We sball be led tbereby into a consideration of tae number of probl.ble survivors at various future dates of the popUlation now living, and for tbis purpose it will be necessary to make SOlBe assumptions about future deaths. We sball have, therefore, to consider in the ligbt of past bistory and present knowledge what seems likely to be the trend of mortality rates in future. To complete tbe picture it will be necessary to have figures for the numbers in the age-groups noLyet born, and this involves forecasting future fertility rates. Tbe analysis we bave made of tbe past suggests tbat tbis will have to be talren in two stages-Cl) forecasting tbe number of married couples and (2) foreCasting marital fertility rates. We must emphasize that we do not use the word 'forecast' here in sense of confident prediction ; tbe procedure will rather be to work: out the <lonsequences of various aUernatives witbin the bounds of reasonable probability. It is wben we come to tbe forecasting of birtb, tbat tbese bound • .are widest and tb. prediction oftb. numbers of any gronp containing persons all ;yet unborn is, tberefore, particularly difli.cult."
209
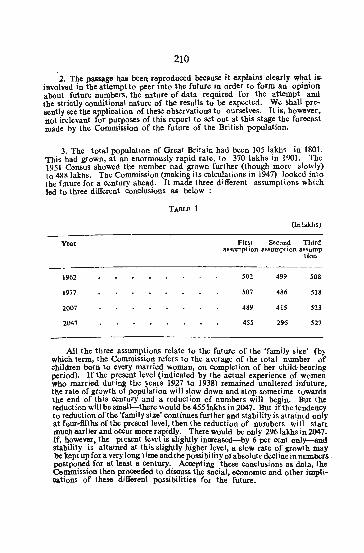
210
·2. Tbe passage has been reproduced becau ... it explains clearly w~a~ is. involved in the attempt to peer Into tbe future In order to form an opinIon about future numbers, tbe nature of data required for the attempt and tbe strictly conditional nature of tbe results to be expected. We sball presently see the application of the~ observations to ourselyes. It is, however .. not irelevant for purposes of tblS report to set out at tbls stage tbe forecast made by the Commission of tbe future of tbe Britisb population.
3. The total population of Great Britain had been 105 lakhs in 1801. This had grown, at an enormously rapid rate, to 370 lakhs in 1901. The 1951 Census showed the number bad grown further (though more slowly) to 4881aktls. The Commission (making its calculations in 1947) looked inlo [be future for a century ahead. It made three different assumptions which led to three different conclu,ions as below :
TABLE 1
(lnlakhs,
Year First Second Third assumption assumption assump
tion
1962 502 499 508
1977 ~07 486 518
2007 489 415 523
2047 455 296 527
All the three assumptions relate to the future of the 'family si.e' (by which term, the Commission refers to the average of the total number of children born to .every married woman, on completion of her Child-bearing period). If tbe present level (indicated by the actual experience of women who married during tbe years 1927 to 1938) remained unaltered infuture, the rate of growth of population wiJl slow down and stop sometime towards the end of this century and a reduction of numbers will begin. But the reduction will be small-there would be 4551akhs in 2047. But if the tendency to reduction of the 'family size' eontinuesfurther and stability is attain(d only at f"ur-fifths of the present level, tben the reduction of numbers will start much earlier and occur more rapidly. There would be only 2961akhs in 2047. If, however, the present level i. slightly increased-by 6 per cent only-and stability is attained at this slightly higher level, a slow rare of growth may be kept up for a very long rime and rhe possibility of absolute decline in numbers po.tponed for at least a century. Accepting these Conclusions as data, the Cemmission then proceeded to discusithe SoCial, eConomic and other imphcations of these different possibilities for the future.
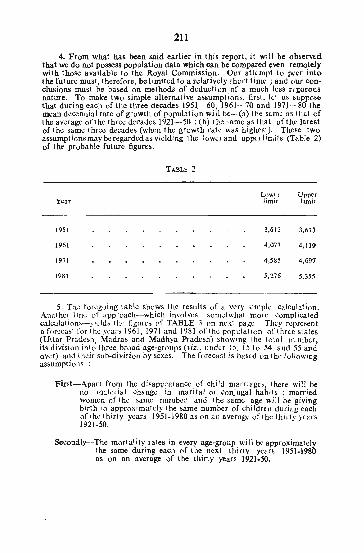
211
4. From what has been said earlier in this report, it will be observt.d that we do not possess population data which can be compared even remotely with those available to the Royal Commissjon. Our att(mpt to peer intothe future must, therefore, be limited to a relatively fbort time; and our conclusions must be based on methods of deduction of a much less regorolls nature. To make two simple alternative assumptions, fu'st, Id us SHPPof,C that during each of the three decades 1951-60, 1961-70 and 197J-80 the mean decennial rate of growth of population will bt:-(a) the snme I:IS Ihat of the average of the three decades 1921 -50 ; (b) t he ,arne as that of the latest ofthc same three decades (wh~n the growth rate waS highesl). These two assumptions may be regarded as yielding the lower and upperllmils (Table 2) of the probable future figures.
TABLE 2
Lower Upper Year limit lunlt
1951 3,613 3,613
]96] 4.077 4,1]9
]971 4,585 4.691
198] 5.216 5,355
5. Th.e foregoing table shows the results of a vcr)' simple calculation. Anolhc~ line of approach~which involves somdwhat mor.:; complicatfd calculatJon~---yidd,). 1 he figures of TABLE 3 on next pag~. They represent a for..::cast for tho: y..:ars 1961,1971 and 1981 ofthc populatJon ofthn:c staies (Uttar PradeSh, Madras and Madhya Pradesh) showing the total nllmber. itsdivis10n into three broad age-groups (viz .. under 15.151054 and 55 and over) a~d thdr sub-dividon by sexes. The forecast is based on Ihe following assumptIons :
First-Apart from the disappearance of child rnarriBgcfi. Ihere will be no mat~rial change in marital Of conjugal habits; married Women of the same number and the same age wjJJ be givjng birth to approxirnafely the same number of children during each ofihcthirty years 1951-1980as on an average oflhelhirtyytars 1921-50.
Secondly-The mortality Iates in every age-group wi)) be approximately the same during each of the next thir1y yean 1951-1980 as on an average of the thirty years 1921-50.
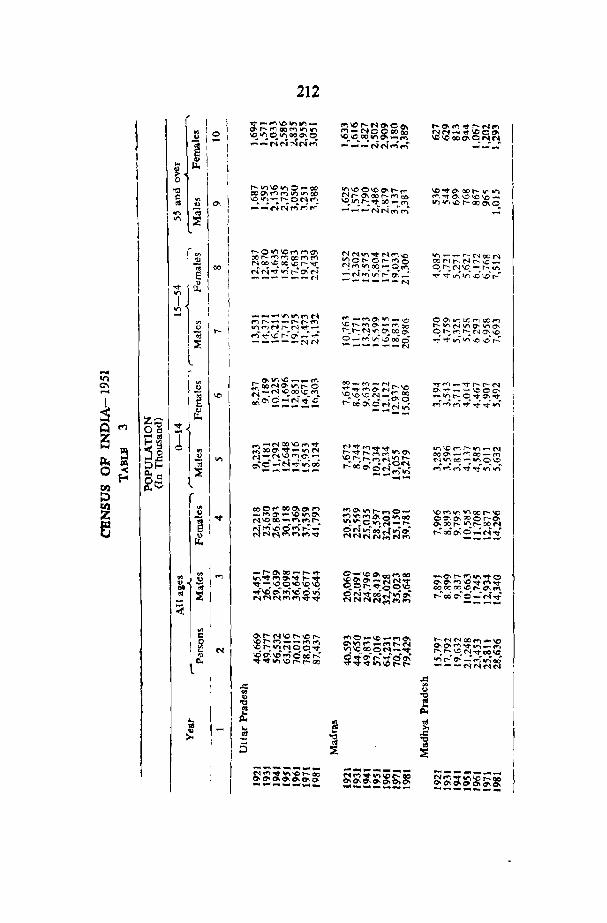
· '" '"
"<t .... I .... -
212
o
~I~ Oi! ~I
[::; l ~ 00 I
~ I, I I !
MI
I o\!'-NIO.,..","
:8~~NO~~ N 1_ -00\,0";000"': _ '<1"..,..,.,\0 .... ,....'"
1.8 f!
t:J.. ... .& :5
.... \.00..:>0- .... ...., Nr--C\ 00 r-t"'"'l0') \Q'1I").r-'l:tOO-t1'1 _:_;"';NN~M
NM"''<I"N<''\'oO V"iOI""'--Or-f'f":I0 N('f"IV'lcK:l-OM _;N~v)r:o-:-_: -------N
f't'1-M~ar._\O \Ct-,.,..o-.-ff",OO r- .... N", "'00", C;_;~~..,oorJO -------N
~~!:;~(Os~ lC\Oooo-.Qfil'1 ---
~-.._t--Noc~ OONt---Nr--.\,O_ Or---f\tv:;·-t-1lI"\ ..,;..; .r:V:.,£,-,,"~
OO'<('JOOMiX'M r--.V'.MIr'lO'-ViO\ 01-..,0-"''''-0 -;"';":;V:;..e..cr-:
"""('1'")_Vr-...t-N "'","--IC·O'" -"' ..... 0..,."'''''" ~M~~~-i.,,;
~\OMr--V)_N OOO'l_f"'lOO_M ('.I,V"l.CO-Ir)O'.O
MMr')~~V'i"trl
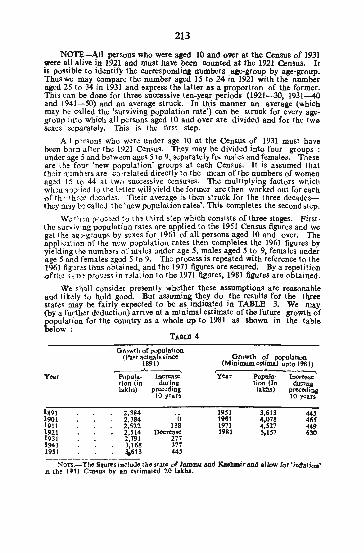
213
NOTE-All persons who were aged 10 and over at tbe Census of 1931 were all alive in 1921 and must bave been Counted at the 1921 Census. It is po .. ible to identify the Corresponding numbers age-group by age-group. Thuswe may Compare the number aged 15 to 24 in 1921 with the number aged 25 to 34 in 1931 and express the latter as a proportion of the former. This can be done for tnlee successive (en-year periods (1921-30, 1931-40 and 1941-50) and an average struck. In this manner an average (which may be called the 'surviving population rate') can be struok for every age~ group into which all persons aged 10 and over are divided and for the twe sexes separately. This is the first step.
All p·"sons wno wore under age 10 at the Census of 1931 must have been born after the 1921 Census. They may be divided into four groups: under 1ge 5 and between ages 5 to 9, separately fOi males and females. These are the fou," "new population' groups at each Census. It is assumed that th~ir 'l:lmb~rs are co-related directly to the mean of the numbers of women ag~d (5 to 44 at two successive cens.uses. The multiplying factors which wh<!n ,)'"):J1ied to the btter will yield the former are then worked out for each ofth-~ ;h~0C d0CJ.d~s. Tbeir average is then struck for the three dccadesthey mw b" called the 'new population rates'. This completes the second step.
We th m proc!~d to the third step which consis.ts of three stages. First· the surviving population rates are applied to the 1951 Census figures and we get th~ ag~-groups by sexes for 1961 of all persons aged 10 and over. The application of the n"w population rates then completes the 1961 figures by yielding the numb!rs of m"lles under age 5, males aged 5 to 9, females under age 5 and females aged 5 to 9. The process is repeated with reference to the 1961 figures thus obtained, and the 1971 figures are secured. By a repetition ofth·~ s!"D.~ pror:~ss in rdation to the 1971 figures, 1981 figures arc obtained.
We S.hll1 com·ider presently whether these assumptions are reBBonable and likely to hold good. But assuming they do the results for the three state, may be fairly expected to be as indicated in TABLE 3. We may (by a further deduotion) arrive at a minim.1 estimate of the future growth of population for tbe country as a whole up to 1981 as shown in the table below:
TAlJU! 4
Ga~-::~ a~~~fs~:~~n 1891)
Growth of population (Minimum. estimal upto 1981)
,.--""_______ Year Popula- Increase year Popula· Incre ...
HOD (in during lion (In during lakhs) preceding lakhsl precedins
10 y~ars 10 years
1891 2.384 . 0 1951 3,613 44' 1901 2,384 1961 4,078 465 1911 2.522 138 1971 4,527 449 192t 2,514 Decrease 1981 5.157 630 1931 2,791 277 1941 3,168 377 1951 ~6I3 445
~ors.-The figures include th~ state of lammu and Euhmir and allow for ',ntiarioo' n the 194.1 C=D'JUS by an estimated 20 lakh&.
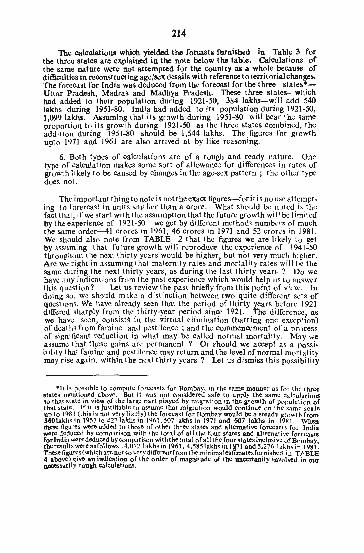
214
The ca1culatiolll! which yielded the forcast. furnished in Table 3 for the three states are el<piained in the note below the table. Calculations of the same nature were not ,[templed for the Country as a whole because of difficulties in reconstructing age/sex details with reference to lerrirorialchanges. The forecast for India waS deduced from the forecast for the three states t .
Uttar Pradesh, Madras and Madhya Pradesh. These three states-··which had ad~::d to their population during 1921-50, 384 lakhs-will add 540 lakhs during 1951·80. India had added to its pcpulation dnring 1921-50, 1,099Iakhs. Assuming that its growth during 1951-80 will bear the same propordon to its growth during 1921-50 as the three states combined, the addition during 1951-80 should be 1,544 lakhs. The figures for growlh upto 1971 and 1961 are also arrived at by like reasoning.
6. BDth types of calculations are of a rough and rcady nature. One type of caloulation make ... some sort of al10wance for differences in rates of growth likely to be caused by changes in the age-sex: pattern; the other type does not.
The important thingto noteis not the exact figures-forit is no use attempt_ ing to forercast in units smaller than a crore. What should lx noted j~ the fact I hat, if we start with the assumption th~t the future growth wil! be limited by the experience of 1921-50 We get by different methods numbl;_rs of much the same order-41 crores in 1961. 46 crores in 1971 and 52 crorl~S in ]981. We should also note from TABLE 2 that the figures We are likely to get by a'isuming that future growth will reproduce the experience of 1941-50 throughout the nex.t thirty years would be higher, hut not very much higher. Are we right in assuming that maternity rates and mortality rates will be the same during the nex.t thirty years, as during the last thirty years? Do we have any indications from the past experience whi(',h would help us. to answer this question? Let us review t he past briefly from this point of view. In doing So, w:; sh'JUld m'Lk·e a distinction between two quite different sets of ques.tions. We hav~ already seen that the period of thirty years before 1921 differed sharply from. th~. thirty-y~ar peri,?d .sin~e 1921. .The difference, as we have seen, consists In the Virtual cllmlflatlon (barrIng one cxcrpfion) of deaths from famine and pestilence; and the commencement of a process of slgnitlcant reduct i?n i~ what may be called normal mortality. May 'we assum~ that these g:'l.Ins. are permanent? Or ~hould we accept as a possiIlility that famine and pestilence may return and the level of normal mortality may rise again, within the nl:xt thirty years? Let us dismiss this possibility
"'II is r>\,~'tiblc to compute fCHccasts for Bombay, in the same manner as for the three states mentioned above. But it was not con."idcrcd safe to appJy the same calculations to that state in view of the large parI played by migration in the growth of populat km of that state. Ir .it is J'U~lifiable to as.SwnC that migration would continue on the sume scale up to 1931 (thIS is not verylikely) the forecast for Bombay would be a steady growth from 360lakhs in 1951 to 4271akhs in 1961, 5071akhsin 1971 and 607 lalms in 1981. When these figures were Ildde.d .to those of other three slates and allernative forecaStS for India were deduced by comp:lT1S0n wilh the total of all the four states and alternalive fort'casts for India were deduced bycompClrison w~ththelotal of alJthe.fourstatesinclusivc ofB('mbay. the results were asfollows : 4,072 lakhs In 1961, 4,585Iakh~ In lj11 and 5,276 lakhs in 1981. These figures(whicharenol so veryJifferentfrom the minima lestlmatesfumishcd in TJ:! BLE 4 abo-.,.e) give an indication of the order of magnilude of the uncert.nity involved in our gOCessarily rough calculations.
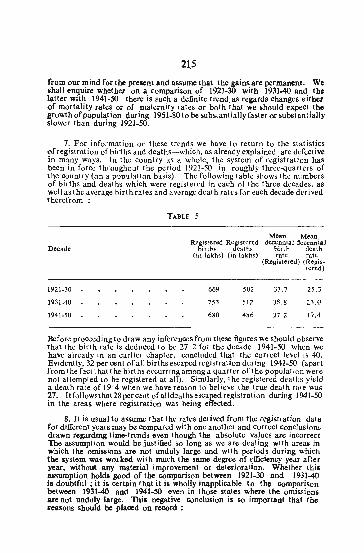
21.5
from our mind for the present and assume that the gains are permanent. We shall enquire whether on a <omparison of 1921·30 with 1931-40 and tb. latter with 1941·50 there is mch a definite trend. as regards changes either of mortality rates or of maternity rates or both that we should expect the growth of population during 1951·80 to be substantially faster or subst antially slower than during 1921.50.
7. For information on these trends we have to return to the statistics of registrat ion of births and deaths-which~ as already explained arc defective in many ways. In the country as. a whole, the system of registration has been in force throughout the period 1921-50 in roughly three-quarters of the country (on a p:>pulation basis). The following table shows the numbers of births and deaths which were registered in each of the three decades, as well as the average birth rates and avaage death rates for each decade derived therefrom:
TABLE 5
Mean Mean Registered Registered decennial decennial
Decade births deaths birth death (in lakhs) (in lakhs) rate rate
(Registered) (Regis. tcred)
1921.30 669 502 33.7 25.3
1931-40 753 512 39.8 23.0
1941·50 680 486 27.2 19.4
Before proceeding to draw any inferen~s from these figures we should observe that the birth rate is deduced to be 27.2 for the decade 1941·50 when we have already in an earlier Chapter. concluded that the correct leVel is 40. Evidently. 32 per cent of all births escaped registration during 1941·50 (apart from the fact that the births occurnng, among a quarter of the population were not attempted to be registered at all). Similarly, the registered dealhs yield a death rate of 19'4 when we have reason to believe lhe true death rate was 27. Itfollowsthat28percmt of all doat hs escaped registration during 1941-50 in the areas where registration was being effected.
8. It is usual to assume that the rates derived from the registration da~a for different years may be compared with ODe another and correct ConclusionG drawn regarding time-trends even though the absolute values are incorrect The assumption would be justified so long as we are dealing with areas. in which the omissions. are not unduly large and with periods during which the system was w~ked with much the same degree of efficiency year after year, without any material improvement or deterioration. Whether this assumption holds good of tbe comparison between 1921·30 and 1931-40 IS doubtful; it i. certain that it is wholly inapplicable to th~ Comparison between 1931-40 and 1941·50 even in those states where the omissions are not unduly large. This negative Conclusion is So important tbat the reasons should be placed on record :
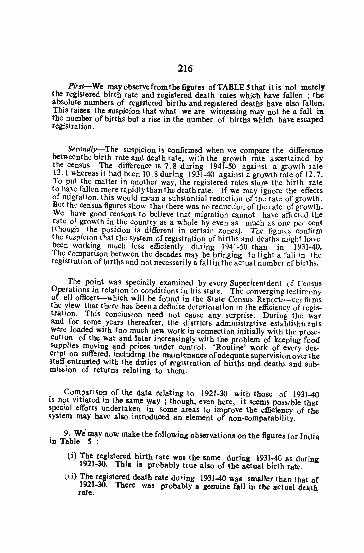
216
First-We mayobservefrollltbefigures ofTABLESthat itis not merely the registered birth rate and registered death rates which have fallen; the ab.olute numbers of regi.tered births and registered death, bave also falleu. This raises the suspicion that what we are witnessing may not be a faB In tbe number of births but a rise in tbe number of birtbs whicb have escaped registration.
Secondly-The suspicion is confirmed when we compare the difference betweenthe birth rate and death rate, with the growth rate ascertain(d by the census. The difference is 7.8 during 1941-50 against a growth rate 13.1 whereas it had been 10.8 during 1931-40 against a growlh rate of 12.7. To put the matter in another way, the registered rates. show tbe birth ra1e to have fallen more rapidly than the death rate. If we may ignore the effects of migration, this would mean a substantial reduction oftne rate of growth. But th,! census figures show that there was no reducdon of the rate of growth. We have good reaSOnS to believe that migration cannot have aif(ctt:;d the rate of growth in the country as a whole by even as much as onc per cent (though the position is different in certain zones). The figuru confirm the suspicion that the system of registration of births and deatbs migh1 have been working much less efficiently during 1941-50 than in 1931-40. The C'omparison between the decades may be bringing to light a fall in the registration ofbirtbs and not necessarily a fall in the actual number of births.
The point was specially examined by every Superitenldent of Cens.uS Operations in relation to conditions in his state. The converging test in:ony of all officers-which will be found in the State Census Reportl-conf!lms the view that there has been a definite deterioration in the efficiency of regis~ tration. This conclusion need not Cause any surprise. During the war and for some y'!ars thereafter, the districts adminis1rative estab1hhrr_ents were loaded with too much new work in connection initially with the prose~ eution of the war and later increasingly with the problem of keeping food sU'pplies moving and prices under control. 'Routine' work of every desCttpt ion suffered, including the maintenance of adequate supervision over the staifenirusted with the duties of registration of bitths and deathb and submission of returns relating to them.
Comparison of [he data relating 10 1921-30 with those of 1931-40 is not vitiated in the same way ; though, even here, it seems possible that special efforts undertaken in some areas to improve the efficiency of the system may have also introduced an element of non-comparabiJity.
9. We may now make the following observations on the figures for India in Table 5 :
ti) The registered birth rate WaS 4he same during 1931-4G as during 1921-30. Thi, i, prohably true also of the actual birth rate.
~ii) The registered death rate du<ing 1931-40 Wa& ,maller than that of 1921-30. There was probably a genuine fall in tbe actual deatb rate~
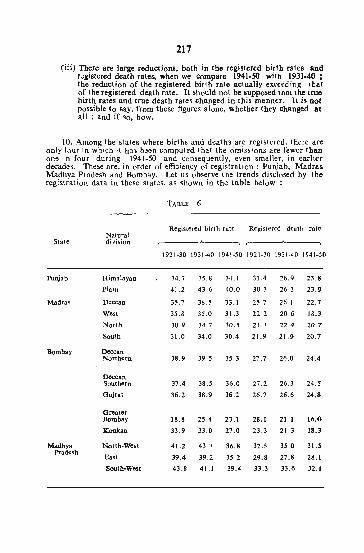
217
(iii) There are large reductions, both in the registered birth rates and registered death rates, when we Compare 1941-50 with 1931-40; the reduction of the registered birth rate actually excndiT1g ~bat of the registered death rate. It should not be supposed tna. the truo birth rates and true death rates changed in this manner. II h not possible to say, from these figures alone, whether they changed at all ; and if So. how.
10. Among the states. where births and deaths aTe registered. there are only four in which it ha, b0en computed that the omiss.ions are fewer than one in four during 1941-50 and consequently, even smaller; in earlier decades. Th-.;::se are, in order of efficiency of registration: Punjab, Madras Madhya Pradesh dnd Bombay. Let us observe the trends disclosed hy the registration data in these states, as shown in the table below
Slate
Punjab
Madra:-.
Bombay
Madhya Pradesh
Natural division
Himalayan
Plain
DeCcan
West
North
South
OW:an Northern
DecCan Southern
Gujrat
Greater Bombay
IConkan
North-West
East
South~West
TABLE 6
Registered birth rate Registered death rate .. ---"---~ ,--~---~ 1921-30 1931-40 194]-50 1921·30 193]·,10 ]94]~50
34.7 35.8 34.1 31.4 26.9 23.8
41.2 43.6 40.0 30.3 26.3 23.9
35.7 38.5 33.1 25 7 26.1 22.7
35.8 35.0 3].3 22.2 20.6 18.3
30.9 34.7 30.5 21.3 22.4 20.7
31.0 34.0 30.4 21.9 21.9 20.7
38.9 39.5 35.3 27.7 26.0 24.4
37.4 38.5 36.0 27.2 26.3 24.5
36.2 38.9 36.2 26.7 26.6 24.S
18.8 25.4 23.1 28.1 21.1 16.11
33.9 33.0 27.0 23.3 21.3 18.3
41.2 43.7 36.8 32.5 35.0 31.5
39.4 39.2 35.2 29.8 27.8 28.1
43.8 41.1 39.4 33.3 33.6 32.)
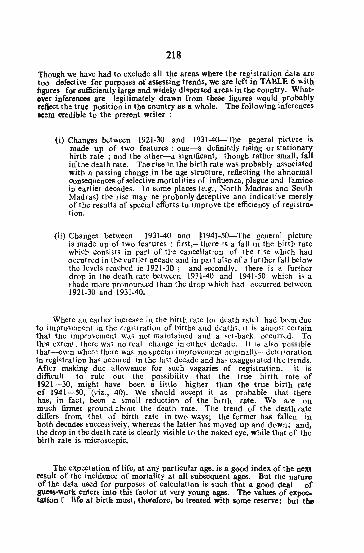
218
Though we have had to exclude all the areas where the registration data are 100 defeclive for purpo,es of a ..... ing trends, we are left in TABLE 6 with figures for sufficiently larl!" and widely di'pe"ed area. in tbe country. Whate""r inferences are legitImately drawn from tbese figures would probably refteGt the true position in tbe country as a whole. The following inferences scem credible to tbe prerent writer :
(i) Changes between 1921-30 and 1931-40-Thc general pirtrle is made up of two features: one-a definitely rising or stationary birth rate; and the other-a significant, though rather small, fall in'the death rate. The rise in the birth rate was probably assodated with a passing change.in the age structure. reflecting the abnormal consequences of selective mortali1ies of influenza. plague and famine in earlier decades. )n some places ~e.g .• North Madras ano South Madras} the rise may oe _probably deceptive ana indicative merely of the results of special efforts to improve tbe efficiency of registra .. tion.
(ii) Cha.nges between 1931-40 ana ,1941-SO-The general picture is made up of two features: first,- there is a faJI in the birtr rate wt-ic}'o consists in part of tre cancellation of tl>e rise which had occ-urred in the earlier Oeca(]e and in part also of a further fall below the leve1s reached in 1921-30; and 6econdly,--there is a further drop in the death rate between 1931-40 and 1941-50 wbich is a E>hadc more pronounced than the drop which had occurred between 1921-30 and 1931-40.
Where an earlier increa~c in :he birth rate (or death rate) had been due to improvement in the r~gi'.tration of births and deaths, it is almust certain that the improvement W,lS not maintained and a set-back occurred. To this extent, there waG no real change in eithes decade. It is aIfo pGssible tbat-even where there wa:5. no special improvement originallY--dctcrioration in registration hap oCcured in the last decade and ha~ exaggerated lhc trends. After making due allowance for such vagaries of registration, it is difficult to rule out the possibility that the true birth rale of 1921-30, might bave been a little bigher than the true birth rate of 1941-50, (viz., 40). We sbould accept it as probable that there has, in fact, been a small reduction of the birth rate. We are on much firmer ground about the death rate. The trend of the death rate differR from that of birth rate in two ways; the former has fallen in both decades SucccGfively. whereas the latter hal' moved up and down; and, tbe drop in the death rate is clearly visible to tbe naked eye, while that of tbe birtb rate is micro5Copic~
Tbe expectation of life, at any particular age, i. a good index of tbe next result of tbe incidence of mortality at ail subsequent ages. But the nature of the data used for purpose< of calculation i. sucb that a good deal of gu .... work enter< into this factor at very young ages. Tbe values of expectation f lifo at birth must, tberefore, be treated with some reserve; but the
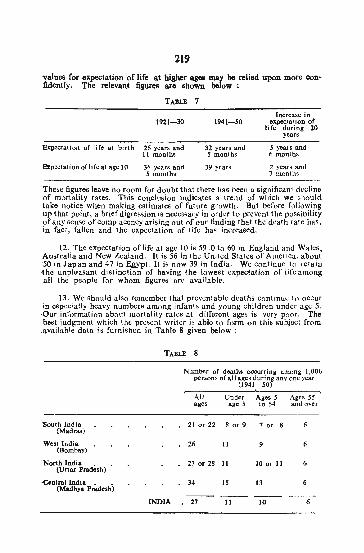
219
"Values for expectation of life at higher ages may be relied upon more confidently. The relevant figures arc shown below :
TABLE 7
1921-30 1941-S0 Increase in
ex.pectation of life during 20
years
'Exp:ctation of life at birth 26 years and 11 months
32 years and S months
S years and 6 monihs
Bzp~ta.tjon of life at age 10 36 years and 5 months
39 years 2 yea.rs and 7 m.onths
'These figures leave no room for doubt that there has been a significanl decline of mortality rates. This conclusion indicates a trend of which we ~hould take notice when making cstimatc6 of future growth. But before following up that point, a brief digrct>sion is necessary in order to prevent the p05sibility of any sense of complacency arising out of our finding that the death rate has, in fact, fallen and the expectation of life has increased.
12. The expectation of life at age 10 is 59.0 to 60 in England and Wales, Australia and New Zealand. It is 56 in the United States of America, about '50 in Japan and ~7 in Egypt. It is noW 39 in India. We continue ,1() retain the unpl~a.sant distinction of having the lowest expectation of LIfe among all the people for whom figure, arc available.
13. We should also remember that preventable deaths continue to occur in especially heavy numbers among infan1& and young children under age 5. ,Our information about mortality rates at different ages is very poor. The best judgment which the present writer is able to form on thi6 subjccl from
.available data is furnished in Table 8 given below:
'South India (Madras)
We3t India (Bombay)
'NQrth India (Uttar PradCsh)
oCentratlndia (Madhya PrOde'h)
TABLE 8
INDIA
Number of deaths occurring among 1,00(, perSons of all ages dud ng anyone year
(1941-50) ,.....------~---------,
All Under Ages 5 Ages 55 ages age .5 to 54 and over
21 or 22 8 or 9 7 or 8
26 11
27 or 28 11 10 or 11
34 IS 13
27 11 10
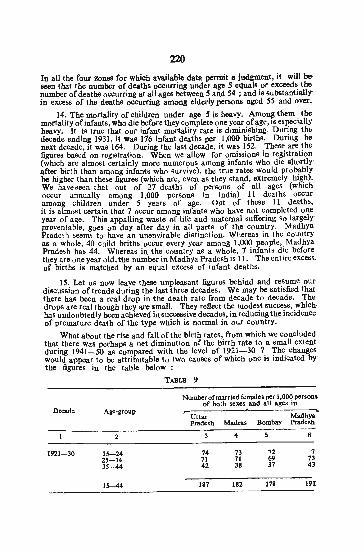
220
In all the four zoneS for which available data pennit a judgment, it will be seen that the number of deaths occurring under age 5 equals or exceeds the number of deaths occurring at all ages between 5 and S4 ; and is substantially in excess of the deaths occurring among elderly persons aged SS and over.
14. The mortality of children under age S is heavy. Among them the mortality of infants, who die before they complete one year of age, is especially heavy. It is true that our infant mortality rate is diminiShing. During the decade endill$ 1931, it waS 176 infant deaths per 1,000 births. During he next decade, It was 164. During the last decade, it was 152. The,e are the figures based on registration. When we allow for omissions in registration (which are almost certainly more numerous among infants who die Shortly after birth than among infants Who survive), the true rates would probably be higher than these figures (which are, even as they stand, extremely high). We baveseen that out of 27 deaths of persons of all ages (which occur annually among 1,000 persons in India) 11 deaths occur among cbildren under S years of age. Out of these II deaths, it is almost certain that 7 occur among infants who have not completed one year of age. Tbis appalling waste of life and matemal suffering So largely preventable, goo. on day after day in all parts of the country. Madhya Pradesh lieem~ to have an unenvitable distinction. Whereas in the country as a Whole, 40 child briths occur every year among 1,000 people, Madhya Pradesh has 44. Whereas in the country as a Whole, 7 infants die before they are one year old. the number in Madhya Pradesh is 11. The entire exceSs. of births is matched by an equal eXcess of infant deaths.
IS. Let us noW leave these unpleasant figures behind and resume our discussion of trends during the last three decades. We may be satisfied that there has been a real drop in the death rate from decade to decade. Thedrops are real though they are small. They rellect the modest success, which has undoubtedly been achieved in sUcce6sive decades~ in reducing the incidence of premature death of the type which is normal in our country.
What about the rise and fan of the birth rates, from which we concluded that there Was perhaps a net diminution of the birth rate to a small extent during 1941-50 as compared with the level of 1921-30 ? The changes would appear to be attributable to two causes of which one is indicated by the figures in the table below :
TABLB 9
Number of married females per 1,000 persoos' of both sexes and all ages in
Decade Ase-group ,.... Uttar Madhya Pradesh Madras Bombay Pradesh
1921-30 15-24 74 73 72 1 25-34 71 71 69 13 35-44 42 38 37 43
15-44 187 182 178 19(
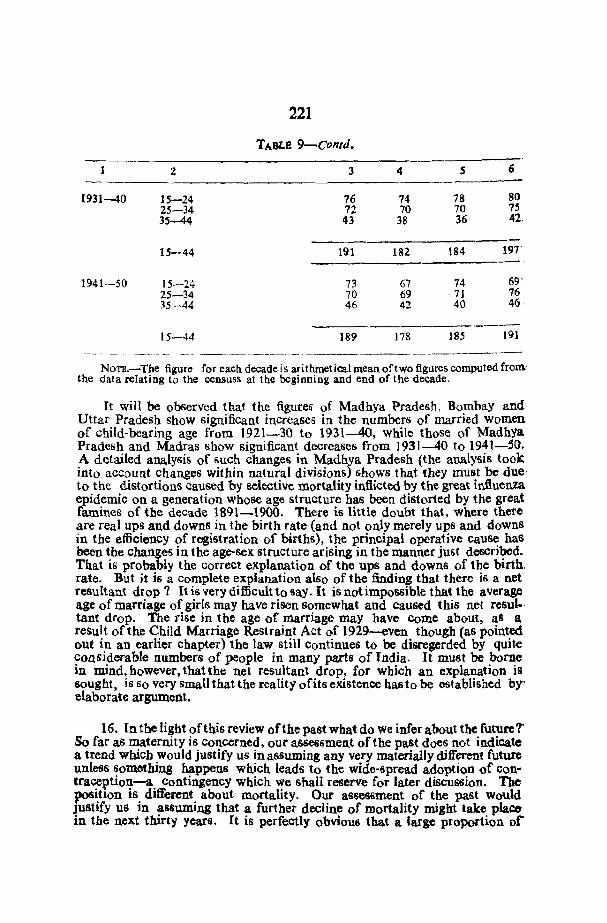
1931-40
1941·-50
2
15-24 25-34 35-44
15--44
15--24 25-34 35 -44
15-44
221
TABLE 9-contd.
3
76 72 43
191
73 70 46
189
4
74 70 38
182
67 69 42
178
S 6 ---78 80 70 75 36 42 _-
184 197·
74 69' ·71 76 40 46.
._.---185 191
NOTll.-The figure r or each decade is ari thInet ical mean of t wo figures computed from the data relating to the censUSS at the beginning and end of the decade.
It will be observed that the figure~ of Madhya Pradesh, Bombay and Uttar Pradesh show significant increases in the numbers of married women of child-bearing age from 1921-30 to 1931-40, while those of Madhya Pradesh and Madras show significant decreases from 1931-40 to 1941-50. A detailed analysis of such changes in Madhya Pradesh {the analysis took into account changes within natural divisions) shows that they must be due to the distortions caused by selective mortality inflicted by the great influenza epidemic on a generation wbose age structure has been distorted by tbe great famines of the decade 1891-1900. There is little doubt that, where there are real ups and downs in the birth rate (and not only merely ups and downs in the efficiency of registration of birthS), the principal operative Cause has been the changes in tbe age-sex structure arising in the manner just described. That is probably the correct explanation of the ups and downs of the birth. rate. But it is a complete explanation also of the findin" that there is a net resuttant drop '1 It is very difficult to say. It is not impOSSible that the average age of marriage of girls may have risen somewhat and caused this net resut-· tant drop. The rise in the age of marriage may bave come about, as a result of the Child Marriage Restraint Act of 1929-even thougb (as pointed out in an earlier chapter) the law still continues to be disregerded by quite cO.Qsiderable numbers of people in many parts of India. It must be borne in mind, however, that the net resultant drop, for which an explanation is sought, is So very small that the reality of its existence has to be ostablisbed bY' elaborate argument.
16. In the light of this review of the past what do we infer about the future?' So far as maternity is concerned, OUl.' assessment of the past does not indicate a trend which would justify us in assuming any very materially different future unle6s something happens which leads to the wide-spread adoption of contrace"tion-a contingency which we shall reserve for later discussion. The position is different about mortality. Our assessment of the past would Justify uS in assuming that a further decline of mortality might take place in tbe next thirty years. It is perfectly obvious that a large proportion or
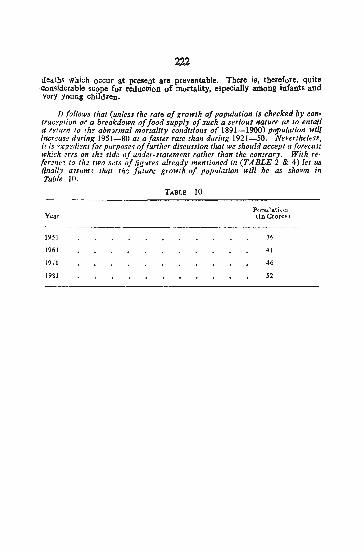
deaths which occur at present are preventable. There is, therefore. quite c"n.iderable scope f"r roducvioD of mortality, especially among infants and very young children.
ft follows that (unless the rate of growth of population is checked by contrac2ption or a breakdown of food supply of such a seriouJ nature as to entail a retuflt to the abnormal mortality conditions of 1891-1900) population will Increase during 1951-80 at a faster rate than during 1921-50. Nevertheless, ft is ·~x.'J'3dient for purposes o[furlher discussion that we should accept aforecGJt which '!rrs an the side of und!r·statement rather than the contrary. With re,erene, to th, two sets offigures already mentioned in (TABLE 2 & 4) let us finally aUU1n:! that the future growth of population will be as shown in Table 10.
TABLE 10
Year Population (In Crorcs)
1951 36
1961 41
1911 46
1981 52
CHAPTER V
THE PROSPECT 1981
C-Tf11providenf M;Jfernity : Reducing Targets
53. Our appraisal of the possibilitie, of development of agricultural productivity has led us to the conclusion that it might be possible to achieve an overall increase of agricultural productivity by about one~third of iff: present level-and this would correspond to the- needs of a total population strength of 45 crones. This may be reached sometime round about 1969. That would give us a maximum of about 15 years for planned meaSures to limit births. to become effective and yield results. It is not a very long period fOf such a large enterprise; but it cannot also be said to be far too short. Let. us define our general aim tn be : so to limit thi' nU11'ber of births thaI they do not materially exceed. the number of deaths and thus achieve a substantially stationary population be {ore our number exceeds 45 crOTes. That would be the fir~l step towards a crystallisation of ideaS on targets and priorities.
54. Though the objective as thus defined is clear enough, it will serve the purpot-ie of indicating the needed practical rneaSureti much betlcr, if it can be put in a form in which everyone may perceive his or her own Share of thc (..:(}Heclivc obligation. It it> in this context that the conception of 'improvident maternity', which WaS touched upon in an earlier chapttr, aCquires practical importance. The birth rate is something for which responsibility can be fastened on no une, But the number of births which occur to a married couple are, cx¥hypothcsi, controHablc by them. Jf) it possible to sepc(.:ifY,a maximum. numbt.:r .of child-birthfio whic~ every married coupJe can have Wllhllut creating a natJonal probk'TIl regardIng the future of their offspring,? There are rcaSoDfio to believe that this is possib1e ; and that the numbcr 16, three. Let us. therefore, define 'improvident maternity' as a child-birth occurring to a mother who has a/ready given birth to three or more children, of whom at least one is alive. LeI us alt\o define the 'incidence of improvident 'maternity' a6 the figure obtained by expressing the number ofbirths of thi(; nature as a percentage of all hirthfio occurring in any particular area during any particular pcriud of time. A relatively simple calculation shows that if.we can put an end to improvident malernity as thus fined or ar any rate, reduce its incidence drastically, the excess of bjrlh~ over deaths will be reduced to negligible numbers and a substantially stationary population achieved. As this conclusion is important, the reJevant calculation should be explained.
55. It has been estimated that the incidence of improvident maternity is, at present, ~om~where ~t ween 40 per cent and 45 per cent in our country. Out of every 40 births WhlCh ()CeUT among every 1,000 people in the Course of one year, 17 births are of this nalluc. Suppose we succeed in inducing,
223
224
the people to avoid such birth •. Our national birth rate would then fall from ·40 to 23. Our national death rate is at present 27. Out of the 27 deatbs -which occur among 1,000 people in the course of one year there are 1 t children under 5 years of age, of whom 7 are infante who have not completed one year of age. A reduction in tbe number of births from 40 to 23 is likely, therefore, to be followed by a reduction ofth«e II death. to 6. In other words. avoidance of improvident maternity will not only reduce the national birth rate from 4() to 23* but it will also reduce the national death rate from 27 to 22 .at the same time. The net result will he to reduce tbe rate of growth of population from about 13 per cent per decade to about one per cent per decade. If improvident maternity is not avoided altogether, but its incidence is very substantially reduced-to (say) 5 per cent-, we shall still get a birth rate of 2S and a death rate of 23 and a growth rate of only t\\oo per cent per decade. When that stage is reached, it is no doubt likely that further diminution of the de::l.th ratc might be expected to oCCur a6 a result of general improvement of health S'tandards. We may confidently expect thi!) to be offset by further diminution of tbe birth rate. ThiB will happen becauf:ie the people Who have got rid of improvident maternity will, ex-hypothesi, have acquired effective control over child·bearing. It will then be easy and natural for them to pass over from avoidance of 'improvidence' to positive 'prudence', An increasingly large proportion of mothers will limit themseive6, of their own aCCotd, to two children without being urged to do 60. Thus the fall in the birth rate may be expected to keep pace with the fall in the death rate.
56. Let us, therefore, define our objective, not in the general terms already mentioned in paragraph 53, but specifically in relation to improvident maternity. The task before the nation is first of all to bring about such a change in the climate of public opinion that every married couple will accept it as their duty (to themselves, to their family. and to that larger family-the nation) that they Should aVoid improvident maternity. The occurrence of improvident maternity Should evoke social disapprovaI~ as any other form of anti-social self-indulgence. This is necessary ; but not enough. There should be standing arrangements for ensuring that advice is given to every married couple on the various ways open to them for discbarging this duty and to make available the necessary facilities. In order to regulate the scale and tempo of planned mea6ureS designed to achieve this purpose, the following target should he fiexd: The incidence of improvident maternity should be reducedfrom its present level of over 40 per cent to under 5 per cent within 15 ·years.
57. It will he noted that we are moving heYond the general statement that it is desirable for mothers to limit the total number of births, to space births, and 50 on. Approaching the subject from the point of view of national nece· ssity. a single common limit is suggested for all. Consistently witb this approach it is immaterial if, in a particular Case, the pecuniary circumstances of the family or the state of health of the mother are such that further maternity may he allowed to occur and the offspring supported without much difficulty. Whether or not the individual can afford it, the nation cannot-and hence it is 'improvident maternity' all the same. While this must be made clear beyond doubt. it is also necessary to point out that there is, in fact, no -conflict in this matter between the interests of the individual. of the family,
·Barl ier in this report (of Chapter n. para 80), the view has been Clxpressed that such measures as ra.isingthe a&e of marriage will have only a very limited effect, and cannot
"bring about larl') red.uctioD of the order indicated by these fisures.
225
and of the nation as a whole. No elaborate argument is ncce6sary in order to show that if improvident maternity were universally avoided, no one will be unhappy orw","" off. On the other hand. mothers will live longer. healthier .and happi~r lives ; and cbildren will be better fed. better looked after and acquire an altogether b~tter start in life. There will be an enormous reduction in the u'lmoor6 of infants Who die within a year of tbeir birth. If we can convert ourGelves to the view that improvident maternity is a form of antisocial'idf~illdulgence which all orus should avoid-and if we can equip ourselves with the kn.)wLedge and the material means of avoiding it-, we shall have don~ more to reduce human suffering and promote human happiness than by all measures of economic and social planning combined.
GIPN-IIS-l R. G. IodiaJ72-19-1()..72-ISOO
Copyright © 2022 FDOKUMEN