Portrait of Population - Linguistic Survey Of India
149
OENSUS OF INDIA 1981 MAHARASHTRA A PORTRAIT OF POPULATION DIRECTORATE OF CENSUS OPERATIONS MAHARASHTRA
-
Upload
khangminh22 -
Category
Documents
-
view
3 -
download
0
Transcript of Portrait of Population - Linguistic Survey Of India

OENSUS OF INDIA 1981
MAHARASHTRA
A
PORTRAIT
OF
POPULATION
DIRECTORATE OF CENSUS OPERATIONS MAHARASHTRA

(1) All the maps included in this publication are based upon Survey of India map with the permission of the Surveyor General of India.
(2) The territorial waters of India extend into the sea to a distance of twelve nautical miles measured from the appropriate base line.
(3) The boundary of Meghalaya is interpreted from the North Eastern Areas (Reorganisation) Act, 1971, but has yet to be verified.
(4) © Government of India Copy right, 1988.

·~
I I • : I
rf
.~
« ~
< o o

Lord Ganesh-Most popular pubnc festival -
l A- 244 R G INDIA/ ND/ 88

Foreword Preface • Maharashtra at a glance •
CHAPTER I Introduction
CONTENTS
Location (1), What is Census? (I), How a census is taken (I ).
CHAPTER II
How many are we ? How are we distributed (5), How much are our members growing (7), District wise area andPopulation (9 ) Average Population of a district (! 0), Density of population in the district (II), Rural and Urban distribution of the population (II ), Average village size (1 3).
CHAPTER HI
PAGE
VII IX Xl
5
Village dwellers and town dwellers . 15 Urban areas (: 5), Comparison of villages (15), Average population of a village (15), Urban Agglomeration (20), Distribution of towns in 1971- -81 (22), Size class of towns (23), Standard urban area (24).
CHAPTER IV
Are the number of men and woemen balanced ? Sex ratio (27), Sex ratio in rural and urban areas (29), Age specific sex ratio (29). How old are we ? (30), Age distribution by 5 years age group (31), Dependency ratio (3 i), Marital Status (33).
CHAPTER V
27
How many of us can read and write? 39 Literacy (39), Rural and Urban literacy (41), Decadal growth
of literacy (48), Literacy among SC and ST (49), School and college attendance (53).
CHAPTER VI
Languages spoken
(i)
54

(ii)
PAGE
CHAPTER VII
The religions we follow 59-1981 Census distribution (61), Rural and Urban distribu-tion (64), Trends (67)
CHAPTER VIII
Scheduled Castes and Scheduled Tribes 68 Scheduled Caste (68), Scheduled tribe (68), Rural and Urban distributiOn of Scheduled Caste (69), Dispersal of SC Population within State (69), Rural and Urban distri-bution of scheduled Tribe (71), Sex ratio of Scheduled caste (72), Sex ratio of scheduled Tribe (73) Literacy of Scheduled Caste (73), Rural Urban literacy of Scheduled Caste (75), Literacy of Scheduled Tribe (77), Rural/Urban literacy of Scheduled tribes (77).
CHAPTER IX
How many of us work ? 79 Main activities (79), Workers (79), Categories of workers (79),
Cultivator (79), Agricultural Labourer (80), Household industry (80 ), Other worker ( 80), Distribution of workers by categories ( 80), Non workers (82), Proportion of workers and non-workers (83) Percentage ofworkers(83), Scheduled Castes/Tribes workers ( 88)
CHAPTER X Fertility levels and trends . . . . . .. 89
Fertility level (90), Fertility trend (9J), Number of children ever born (92), Parity (93), Fertility and religion (95).
CHAPTER XI
Movement of Population • What is meant by migration (96), Internal and international migration (97). Migrants by place of birth (97), Impact of migration on growth rate of population (99) Migrants by place of last residence (10(1), Rural-Urban components of migration (! OJ), Impact of migration on Urbanisation (! 03), Reasons for Migration (1 (6), Migrants to Urban areas (1 06), Migrants to Rural areas (108), Movement of Population to Greater Bombay (108).
CHAPTER XU
Summary. A brief population profile. 1981 (11 I) •
96
111 111

(iii)
LIST OP TABLES
Table Description PAGES Nos.
2.1 Population and area of states & UTs, 1981 5
2.2 Population of Maharashtra since, 1901-81 7
2.3 Districtwise distribution of population of Maharashtra. 1981 9
2.4 Density of population for districts, 1981 11
2.5 Urban population in the districts, 1981 12
2.6 Number of inhabited villages in the districts 1981 r3
2.7 Average population of a village in the district, 1981 14
3.1 Statewise villages classified by population size, 1981 16
3.2 Villages in Maharashlra classified by population size, t 981 18
3.3 Distribution of towns by size class and population in 1971-81. 24
3.4 Standard urban areas from 1971-81 Censuses. 25
4.1 Sex Ratio in Maharashtra , 27
4.2 Sex Ratio in India,Mallarashtra and other States & UTs. 1981 28
4.3 Sex Ratio in the Rural and Urban areas in Maharashtra 29
4.4 Sex Ratio in different age_groups in Maharashtra, 1961, 1971 and 1981. 29
4.5 Age distri bution of the population Maharashtra 1961, j 971 and 1981. 32
4.6 Dependency Ratio in Maharashtra, 1911 to 1981 censuses 33
4.7 Percentage of population in each age-group by sex and marital status 35
4.8 Percentage distribution of population of Mahaharashtra Marital Status, 1971-·81 cens ~es 37
5.1 Percentage of literates to total population, 1981 40
5.2 Ranking of districts according to literacy rate (per cent) males and females combined, 1981· 42
5.3 Literacy percentage of class I and class II towns ill Mahara-shtra, 1981 47
5.4 Growth of literacy 49
5.5 Literacy rates in age-group rural and urban areas, Maha-rashtra, 1981 . • . . . . 49

Table No.
5.6
5.7
6.1
6.1
7.1
7.2
7.3
8.1
8.2
8.3
8,4
9.1
9.2
9.3
9,4
9.5
10.1
10.2
10.3
10,4
10.5
(iv)
Description
State & Districtwise iiteracy rate among SC;ST and general population, 1981 Census
Percentage of population attending school/college in Mahar. shtra State, 1981 Census
(Parl-A)Spe ker, of Household populo la';")1 bY l:mgllage m 'inly:;pr)k,m, s[lccified in Schc(lulc YP 0 '0 'he cons 'ituti.o'lofJndj" .
(Part-B) Speakers of Household population by language mainly spoken, (inclusive of variants where grouped) in Schedule VIII to the constitution of India .
Religion composit ion of the population in IndIa and in Maharashtra
Percentage dislribution of population by religion in Slates for 1981 Census
Growth of general population and major religious communi-ties for 1971-81 in the districts of Maharashtra
Rural/Urban distribution of SC;ST in Maharashtra
Sex Ratio of Maharashtra since 1961
Literacy rates for SCjST in Manarashtra since 1961
Literacy showing SC;ST with General population by total! Rural/Urban areas for 1961, 1971 & 1981 Censuses
Distribution of Main workeres by categories, 1981 Censm,
Distribution of Non-workers by types of Non-workers, 1981 Census.
Proportion of workers and Non-workers by sex, rural and urban areas, 1981 Census .
Distribution of workers among the nine industrial categories in the Districts, 1981 Census.
Percentage distribution of SCjST Workers and Nonworkers, 1981 Census
Fertility indices, Maharashtra-1981
ASFR (per 1,000 women) from 1981 Census compared with ASFR 1971-75 (SRS)
GMFR & TMFR Maharashtra, 1971-81
Average number of children. ever born per woman in the age group 45-49 by different classifications of women .
Ever Married women by present age parity-1981 Census
Pages
50
53
54
55
60
62
65
70
72
74
76
81
82
85
85
88
90
91
92
92
94

(v)
Table No. D;;scrip!iun
10.6 Fertility differentials by religioll-19S1 Censsus.
11.1 Percentage distribution of migrants by place of birth
11.2 Inter-State Migrants to Maharashtra, 1971-S1
11.3 Percentage distribution of Migrants by place of last residence
11.4 Distribution of : 981 Census Migrants by place of last resid-ence and place of birth
11.5 Rural and Urban composition of Internal migrants by place of birth 1971--SI
11.6 Rural and Urban composition of internal migrants by place of last residcnce, 1971-81
11. 7 Migrants whose duration of residence is 0-9 years, 1981 Census
11.S Reasons for migration to Urban areas
11.91 Reasons fOf migration to rural areas
11.10 Di,lribution of Migrants by place of last residence
11.11 Migrants to Greater Bombay from other states in India
Pages
95
98
99
100
101
102
104
105
107
109
110
110

(vi)
LIST OF MAPS, DIAGRAMS
Description
(1) Position of Maharashtralin India, 1981 I-A Maharashtra Administrative Division, 1981
Page
Inner COver back facing Facing page X After page XIII Facing page 5
(2) India, Area and population, 1981 (States/UoTs) 0
(3) Comparative Area (Rural/Urban) Populaton Growth decadewise 0
(5 Growth of urban population 1901-81 (6) Growth of urban population (c1asswise) (7) Number of ,Urban Area according to size class
1901-81 (Maharashtra) (8) Sex ratio Rural/Urban 1901-81 (9) SeX ratio 1971-81 .
(10) Sex ratio 1981 (Age group) (11) POPul~tion by age:groupe (1961. 1971 & 1981) (12) Marital status by' Age 'and Sex 1981 . (13) Literacy Rates 1981 (States/U.Ts.)
Fad ug page 6 Facing page 14 Faciag page 20
Facing page 24 Facing page 25 Facing page 26 Facing pllge 30 Facing l'rge 31 Facing page 36 Fac..ing page 39
(14) Literates by age-group. Sex and level of Education 1981. . . . . . . . . Facing page 53
(15) Religious wmposition of population in Indill and Mah~rashtra 1981 '" Between prge 58 & 59
(16) Classification of Main workers 1981 0 Facing P::ge 78 (I7) Percentage of workers by categories 1981
(Maharashtra). . Between'page 78 & 79
(18) Percentage of workers. Marginal workers and Non-workers, 1981 (Maharashtra)
(19) Classification of Main workers, Maharashtra 1981
LIST OF PHOTOGRAPHS
(1) Lord Ganesh-Most popular Public Festival
(2) Adult eduation class in progress
Facing page 79 Facing p3ge 85
After India Map
Facmg page 46
(3) Agricultural University-Importance for agriculture Education . . . . . . 0 Facing page 48
(4) Saint Dnyneshwar-Founder of Bhagwat Dharma Facing page 58
(5) A woman in a traditional dres~ Betw('eu page 58 & 59
(6) Devote:lS of shri Vilhoba of Pandharpur • Frcing page 59
(7) Varli Tribe Song and dance Facing page 70
(8) A sugar .factory in rural co-operative movement
a;ea, out come of Between page 78 & 79

FOREWORD
The Indian Census is now more than hundred years of age. Synchronous decennial Censuses have been taken in an unbroken sequence since 1871.
Each Census has been yielding vast quantities of data concerning the various facets of the life of the people. It is only natural that over the decades the sweep as well as the depth of the information yielded by the Census have gone on increasing. Of course, no exercise of this type and magnitude, can yield all that one may desire to know in all areas of enquiry. Within this limitation, however, the data thrown up by the Census constitute, verily~ a mine of information which enter into plans and programmes, debates and writings, affecting almost all walks ()f the life of the common Indian.
And yet, for the common reader, this information and the large number of publications carrying it, remain, by and large, a distant, uninteresting, even intimidating, corpus.
At the time of the 1971 Census was, therefore, conceived the idea of bringing the essential Census information together in handy and readable volumes with such lay and average readers and students in view. This 1981 Census series of State/UTwise "Portrait of Population" follows up the similar 1971 Census series.
It will be realized that it is not easy to convert dry facts .and statistics into flowing narration. Very few indeed can be
gifted with the talent of a Jawaharlal Nehru or a C. Rajagopala
.chari or a Hendrlk.van Loon or a Minoo Masani for writing
(vii)

(viii)
about history or mythology or economics in an absorbing, storytelling style. It has also to .be ,appreciated that my colleagues. have undertaken this work in the midst of a very mundane and busy office routine.
I thank them and all those who have collaborated with them in this project and hope that these volumes will serve theit ·intended purpose. llhe credit for getting the 1981 -Census conducted and for getting all the data gamered and put through the initial processing in the first instance goes, of course, te my illustrious predecessor, Shri P. Padmanabha and the veryable band of Directors of Census Operations for that Census.
NEW DELHI VIJAY S. VERMA
July 4, 1988 Registrar General, India.
PREFACE
One of the novel features of the Census Publications is the' attempt to bring out the present volume to cater to the growiIlg need for the basic data collected during 1981 Census. Indian Census is a mine of informations. But- the general readers including students hardly derive any benefit from the forbiddingly voluminous census reports and tables. It is with a view to catering for this group of readers that this little volume 'A Portrait of PopUlation' has been prepared. It ..has been written in a simple and non-technical language.
It was late Shri A. Chandra Sekhar, former Registrar 'General.& Census Commissioner of 1971 Census who firat ga.ve an .idea of ,bFinging out 'Portrait ,of Population' .for .each State/ UT at the time of J9Jl Census. tEncouraged by "'the response of general readers to that publication it has been desired by 'Shri V. S. Verma, Registrar General, India to revive this publica'tion at the 1981 'Census also.
The Director of Census Operations, Shri P. P. Mahana, under whose guidance the entire operations were 'carried out -deserves all credit for the success of the operations. But he had' -to leave the Organisation for taking up important assignment before the volume in question ·could be made ready for the press. I must record my deepest sense of gratitude to Shri P. Padma.nabha, .Ex-R~istrar General, India and Shri V. S. Verma, 'Registrar General, India for their valuable guidance and sincere -help to us at every stage to 'bring out this publication in time. ·1 also thartk the ·officers and staff of the Data Processing Division, Census Division and Printing Division of the office of the Registrar General, India associated with this task. The processing of the data was undertaken by the Data Processing Division of the Registrar General's office under the able guidance of S/Shri A. Sen Gupta, Joint Director (Data Processing), and K. R. Unni, Joint Director (programming) with the help or their staff.
(ix)

(x)
I thank Shri N. Rama Rao, Asstt. Registrar General (c&T) and his colleagues S/Sbri R. P. Tomar and V. P. Rustagi, Deputy Directors and Babu Lal, Asstt. Director who have taken great pains to go through the draft and suggested various .changes in the write-up.
I am also grateful to my office colleagues who have laboured hard to bring out this publication particularly S/Shri R. N. Pongurlekar, ~. S. Lal, G. M. D. Lone, Asstt. Di_rectors and Smt. P. S. Kekre, V. S. Nagle~ A. S. Kulkarni, B. S. Amrite and D. G. Katre, Investigators, who have done their best to prepare the write-up. The tables and statements contained in this publication were prepared by Shri B. S. Amrite and Smt. J. S. Pednekar, Investigators, under the guidance of Shri K. K. Akol-kar, Asstt. Director. The views expressed in this report and the conclusions drawn are those of the Author and do not in any way reflect the views of the Govenment.
The charts, diagrams, maps etc. included in this monograph were prepared in the Map Section under the guraance of Shri K. S. Thakur, R. O. (Map). The cover design was prevared by Shri V. V. Govekar. Sr. Artist of this directotate. Smt. A. Sam, and Smt. R. Vijayan, Jr. Stenographers typed the entire manuscript and the tables meticulously. T express my deep 'sense of gratitude to all of them and to many others in my office ·who gave me unstinted co-operation in this venture.
'BOMBAY
A. S. DANGE Deputy Director of Census Operations,
Maharasfttra, Bombay.
Independence Day 15 August 1988

, 18
ARABIAN SEA
UN UlHASNAGAR
~ l P KHALAPUR
PlP POlADPUR
M~l ~~HABAli:SHWJlR
SHW SHA~UWADI
Lit UWISlMIPUR
14
,o! I.OU·I
. 14
11'
70'
11
MAHARASHTRA
BOUNDARIES
iT!1E OliTR~r
TAHSil
lTATCWlTilL
W~!rl Q dlSlrlcl's~r IQnill's ilUfIl! dilim IrOOI thai of
liS h'lj~UQ(lers Itl! same IS sh~\IIn within brcckeli,
78
80'
80'

MAHARASHTRA AT A GLANCB
1. Population
2. Decennial population growth rate (1971-81) .
3. Area (kml)
4. Density of population (per kmt)
5. Sex ratio
6.- Literacy Rate
7. Percentage of Urban population to total population
8. Age compositon
Total
Rural
Urban
Persons Males Females Persons Males Females Persons Males Females
Persons Males Females
Males
32,415,126 12,320,484
8,5$0,462 7,358,764 2,172,220
Proportion Females
All ages 0-14 15-29 30--49 50-59
60 and above & age not stated 2,013,196
9. Percentage to total population (a) Main workers
(b) Marginal Workers
(c) Non-workers
(xi)
100-00 30,369,045 38-01 11,747,024 26·38 7,765,669 22'70 6,854,875
6·70 1,918,003
6'21 2,083,474
Persons Males Females
. Persons Males Females
Persons Males llemales
62,784,171 32,415,126 30,369,045 40,790,577 20,527,456 20,263,121 21,993,594 11,887,670 10,105,924
+24'54
307,690 ·00
204
937
47'18 58'79 34-7CJ
35 '03
Proportion
100-00 38'68 25·57 22'57
6 ·32
6'86
38·71 52'51 23'98
3·85 1 '22 6'~5
57'44 46'27 69·37

(xii)
1I.0. Break-up of Main Workers (percentage among main workers) (i) Cultivators
(ii.)_ Agricultural laboUrers
Persens Males Females
• Persons Males Females
(iii) ~ivestock, Forestry, Fishing, Hunting and Plantations, Orchards
. and Allied activities.
Persons Males Females
'(iv) Mining and Quarryins- • Persons Males Females
(v) Manufacturing, processing, servicing and repairs
(a) Household Industry
(b) Other than Household Industry
(vi) Construction
~(vii) Trade and Commerce ..
• Persons, Males Females
Persons Males Females
• Persons Males Pemales
• Persons Males Females
(viii) Transport, Storage and communi-cations Persons
(ix) Other Services •
Males Females
• Persons Males Females
11. Percentge of Scheduled Caste popula- Persons tioD to total population Males
Females
12. Percentage of Scheduled Tribe popula- Persons tion to total population Males
Females
13: No. of occupied residential houses
14. Number of villages (i) Total .'
.(ii) Inhabited (iii) Un-inhabited
35 ·12 33 ·69
'3&·48 26·63 18 '51 45·61 2·01 2·51 0·83
0'27 0·33 O·q
2·55' 2·62 2 '41
11 ·43 14·97 3'13
2·09 2'43 1 ·31
7 ·18> 9·45 l' ·87
3·3D 4'52-. (J' ,44'
9'42 10'97 5',80'
7 '14 7'09 7 ·18
9·19 9'02 9·38
11,353,406
41,833 39,354
2,479
(xiii)
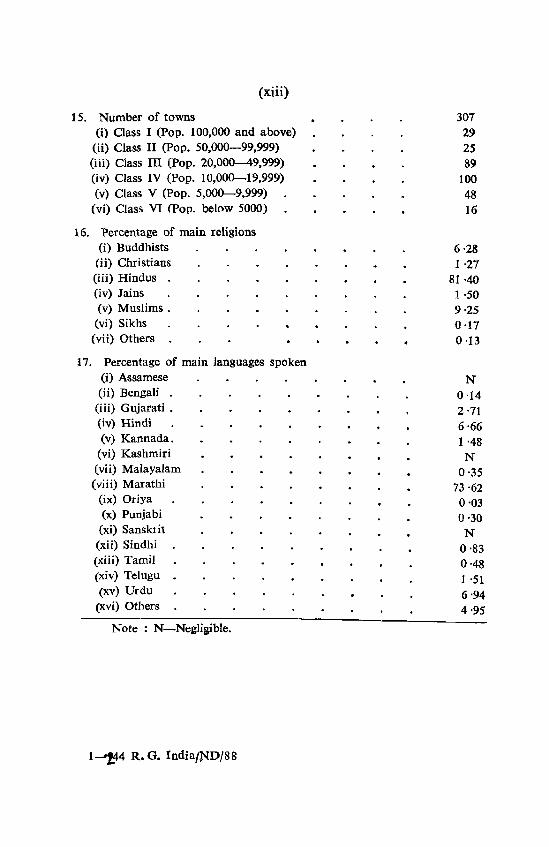
15. Number of towns (i) Class I (pop. 100,000 and above)
(ii) Class II (Pop. 50,000-99,999) (iii) Class III (Pop. 20,000-49,999) (iv) Class IV (Pop. 10,000-19,999) (v) Class V (Pop. 5,000-9,999)
(vi) Class VT (Pop. below 5000)
16. Percentage of main religions (i) Buddhists
(ii) Christians (iii) Hindus . (iv) Jains (v) Muslims.
(vi) Sikhs (vii) Others .
17. Percentage of main languages spoken (i) Assamese (ii) Bengali .
(iii) Gujarati . (iv) Hindi (v) Kannada.
(vi) Kashmiri (vii) Malayalam
(viii) Marathi (ix) Oriya (x) Punjabi (xi) Sansklit
(xii) Sindhi (xiii) Tamil (xiv) Telugu (xv) Urdu
(xvi) Others
Note : N-Neiligible.
1-1.44 R. G. India/ND/88
307 29 25 89
100 48 16
6·28 1·27
81 ·40 1 ·50 9·25 0'17 0·13
N 0'14 2 '71 6'66 1 '48 N
0-35 73 -62 0-03 0-30 N
0'83 0'48 1 '51 6'94 4·95

CENSU~ of INDIA
li~ All UNION lERRI10mEI
HI PONDICHERRY
l'oO O,Ol
HO MIZORAM
0'04
l,W 51KKIM 0,11
l-Ull G, Inilia/ND/!!
INDIA
A~EA AND POPUlAII~N 1~~1
AREA (mmH Km!)
N01E'1 rlGUmiEl~W lHE NAMES or SIAIES/UNION lERRI10RIES
AREINPERctN1.
1, W1Al POPUlAllON OF INDIA INClUDES1HE PR~JECIED PDPUlAl10N OF ASSAM fOR I!il
POP~lAliON (oilli'!~l )
i \
All UNWN lmRlmRI[1
HARIANA .... Ii!
1H~ACHAl ~DESH
PffilDICHERR O,O!
MIIDRAM 001
lAKSHADWEEP 0,01
GOA DAMAN 10lU
0·10
DElHI
D·!I
001 JAMMU AND DADRA & NAGAR KASHMIR HAVEli 0,01
Oi1 CHANOIGARH 0,01
ARUNACH~l PRADEIH
DO!
, ANDAMAN &NICD8AR IslANDI
O'Ol
IIO~ l

tocatimr
CHAPTER L
INFRODUCTION
The State of Maharashtra came into existence on 1 :M!a:l 1960 as a €oos.equence of bif:u:n:ati41n of the bilingual State of Bombay into me unilingual States ou. Maharashtra arDd Guiarat. It has. aIl1 area m 301,69') sq. kms. and a pGpulatioTh of &2,784,171 person&.
The ~te of MahaIashtra extends from 15° 45' N to 22° N latitude and 72° 45' E to 80° 45' E longj.tude. It ha& Guiarat and Dadra and. Nagar HaveY to its nortb-we~ Madhya Pradesh to its north a.1ild" east, Amihrlt Pradeshr Karnata:k.a and Goa. to its sooth and the Arabian Sea toits West. !he coast liae is 720 kms. in length.
'For administrative purposes the State is divided into' 26 districts. For convenience of administration the 26 di'>tricts are grouped iato four div-i~on8 viz. Bombay (comprising Gr. Bombay, Thane, Raigarh, Ratnagiri, Nashik, Dhule and Jalgaon districts) Pune (compri~ing Ahmadnagar" Pune, Satan!., Sangli, Solarpur and Kolhapur distdcts), Aurangabad (comprising Aurangabad, P'arbhani, Bid, Nanded and Osmana13ad districts) and Nagpur (comprising Buldana, .M;da, Amrayati, Yavatmal, Wardha, Nagpur, Bhandara and Cbandraptw dffitricts). Bombay is the capital of Maharashtra.
What is a Census 1" To get a true picture of a country to gauge the
progress achil!ved by it and to assess the requirements for future development, one must know among_ other things, viz. ies. papulation, sex and age composition of the pop:u1a-tian, ~at-Ufban break up of population, effects of migration on ~lation, the number of persons engaged in various economic' actiVities, population of school~going children, fertility, growth of population, etc. All this information can be bacf from the census conduyted at regular intervals.
lImf a censtfs is taken?
India has a .l<mg tradition Qi census taking. The firs,-, Indian census .w~s conducted in f872. Thereafter a censui- ,
3-244 R. G. India/ND/88

2
is conducted every ten years from 1881. The last census was taken in 1981.
The census operations are conducted in two stages, tho houselisting and the actual census or the final population count. In the first stage operations, known as house listing operations, all the houses in the country are numbered and listed.
In a sense the houselisting operations is a full scale dre-ss rehearsal of the final population count in that we ask the machinery of the census enumerators to list all the housing structures in their respective charges and the households residing in them. This gives an idea of the population residing in housing structures that has to be covered in the final count. 1 he houselists prepared in these operations serve as a frame for the final population count. It is true that the population covered at the houselist .stage can only be an approximation. Nevertheless it gives a fairly reliable picture of the population to be covered and \elps in adjusting the workload of the enumeration blocks of the final count, if necessary.
In the 1981 census, the houselisting operatIons were t.:arried out in Maharashtra from March 1980 to July 1980. In the houselisting operations, account was also taken of the physically handicapped persons in the households.
The population of a country like India, cannot be enumerated in a day. Therefore, the census operations are spread over a period of a few days and the popuhition is ~then updat': ed as of a particular day (called the reference date) by correct ing the population through a revisional round.
For the final population count the period of enumeration was fixed from ,9 February to 28 February 1981. The sunrise of 1 March 1981 was the reference date. To update the information collected during the period 9 February to 28 February 1981 with reference to the reference date, a'TeVJ.sional round was conducted between 1st and 5th March, 1981.
Two schedules were canvassed at the flnal count. One was household schedule which contained various particulars 'and details of the people residing in it. The other and the main schedule was individual slip. This was canvassed in respect of all persons-infants, children. adults, young, aIdmen and women. The important characteristics on 'which

information was collected at the 1981 census in respect of each individual are listed below :-
1. Relationship to head. 2. Sex 3. Age. 4. Marital status. S. Mother tongue. 6. Two other languages known. 7. Religion. 8. Scheduled castes/Scheduled tribes. 9. Literacy.
10. Educational attainment. 11. Attending school! college. 12. Economic activity, industry & occupation. 13. Migration. 14. Fertility.
The information so collected was then processed manually and on computer and tabulated. An attempt is made to analyse the data and to present through it the portrait or picture of popUlation of Maharashtra in the subsequent pages.
5A-144 R. (t. IndiA/Sa,

CENSUS OF INDIA
COMPARATIVE AREA (in 000 5 km2)

CHAPTER n HOW MANY ARE WE ?
How are we distributed? 'How many are we?' and 'How are we distributed l' are
two important questions to ask about the population of any country or area. On 1 March 1981, Maharashtra had little more than 62.8 million persons. A country's population has to be viewed in the context of its natural resources, the extent to which modern production methods are used in agriculture and industry, the existirtg standard of living and the effort needed to improve that standard of living. The oensus date is usually 1 March in order to ensure comparison of the data of one census with another census.
According to the 1981 Census, there are 62,784,171 people in Maharashtra. We are part of the country's total population and it would be interesting to see that how much of the total population of India is in Maharashtra. The details of the population and areas of the various States and Union Territodes in India are given in Table 2.1.
TABLE 2.1 Population and area of States and Union Territories, 1981 Census
India/States/Union Population Area Ten'itories ~------
Total propor- Total proportion tion to to total
total area of population of country
country
2 3 4 5
INDIA 685,184,692 100 '00 3,287,263 '0 100 '00
StQtes 1. Andhra Pradesh 53,549,673 7'82 275,068 '0· 8·37 2. Assam. 19,896,843 t 2'90 78,438 ·0 2 ·39 3. Bihar 69,914,734 10'20 173,877 '0· 5'29 4. Gujarat 34,085,799 4·97 199,024'0* 5·96 S. Harayana 12,922,618 1'89 44,212 '0· 1 '35 6. Hiniachal Pradesh 4,280,818 0'62 .sS,673 '0 1 '69
5

6
TABLE '2.1-Contd.
2 3 4 5
7. Jammu &'Kashmir 5,987,389 0'87 222,236 '0** 6'76 8. Karnataka 37,135,714 5.42 191,791 ·0 5·83 9. Kerala. 25,453,680 3 ·11. 38,863 '0* 1 'lS
10. Madhya Pradesh 52,178,844 7·62 443,446 '0* 13 ·49 11. Maharashtra 62,184,171 9 '16 307,690 '0* 9·36 12. Manipur 1,420,953 0·21 22,327 '0 0·68 13. Meghalaya 1,335,819 0·19 22,429 '0* 0'68 14. Nagaland 774,930 o 'll 16,579 '0 0'50 15. Orissa . 26,370,271 3·85 155,707 ·0 4'74 16. Punjab 16,788,915 2·45 50,362 '0 1 ·53 17. Rajasthan 34,261,862 5'00 342,239 ·0 10 '41 18. Sikkim 316,385 0·05 7,096 '0 0'22 19. Tamil Nadu 48,408,077 7·06 130,058 '0* 3·96 20. Tripura 2,053,058 0'30 10,486 ·0 0'32 21. Uttar Pradesh 110,862,013 16 'IS 294,411 '0* 8'96 22. West Bengal 54,580,647 7·97 88',752 '0* 2·70
Uhion Territories 1. Andaman & Nicobar 188,74l 0·03 8,240 ·0 0·25
Islands 2. Arunachal Pradesh 631,839 0·09 83,743 ·0 2'55 3. Chandigarh • 451,610 0'07 114 '0* N 4. Dadra & Nag~r Haveli 103,676 0·02 491 ·0 0·01 5. Delhi 6,220,406 0·91 1,483 ·0 0·05 6. Goa, Daman & Diu 1,086,730 0'16 3,814 '0 0'12 7 .. Lakshadweep 40,249 0·01 32·0 N 8. " izoram 493,757 0'07 21,081 ·0 0·64 9. Pondicherry 604,471 0'09 492·0 0·01
------j Pro 'ected gopulation (1981 census in Assam was not conducted due
to dIsturbed con itions prevailing there then). '" Provisional. ** Includes 78,114 sq. kms. under illegal occuption of Pakistan,S, 180-
sq. kms. illegally handed over by Pakistan to China and 37,555 sq. kms. under iJIegaJ occupation of China. The area figures are provisional.
With an area of 307,690km!l and a population 62,784,171, Maharashtra ranks third among the States and UTs in the country in terms of both population and area. In terms of population, the States of Uttar Pradesh and Bihar take ranks 1 and 2 above Maharashtra. In terms of area, the States of Madhya Pradesh and Rajasthan take ranks 1 and 2 above Maharrashtra. Maharashtra accounts for. 9.16 per cent of India's population and for 9.36 per cent of India's area.

CENSUS OF I NDlti
POPULATION GROWTH
~ o o o .!!
.~ ~ a. ~
3B-244/1 R G INDIA/ND/88
1901-1981

7
India is the second largest 'populated country in the world. Maharashtr:I's population ig larger than that of the countri!!s in Europe except USSR and West Germany. Nearer home, it is larger than the combined population of our neighbours Burma, Sri Lanka and Nepal.
It was mentioned earlier that there are 62,784,171 persons in Maharashtra State according to the 1981 Census. As per 1971 census there were 50,412,235 persons in the State. Thus, in 10 years we have increased by more than 12.4 million people. Obviously, our members are growing but it is necessary for us to know how fast our population is increasing. Everybody knows that a birth adds to the population and that a death reduces it. The difference between the births and deaths, with births exceeding deaths, is the increase in the po~lation. In our country, therefore, the increase in population is mainly due to the faster decrease in the death rate. In addition to births and deaths, the PQPul~tion of an area increases or decreases if 'ft large .humber of people leave the ar~ or come into it. This -movement of people from one area to -'another is called tnigtation.
How much are our Members growing? Table 2.2. shows the popUlation of Maharashtra State since
1901 onwards. TABLE 2.2
Population.of Maharasbtra State since 1901 to 1981 Census
Census year Population Increase or Growth decrease in rate in number per cent
r 2 3 4
1901 19,391,643
1?11 -21,474,523 .1 2,082,880 --10 ·74 (-i 5 '73)
1921 20,849,666 -624,857 -2'91 (-0·31)
1931 23,959,300 -I 3,109,634 - 14 ·91 (+11 ,00)
1941 26,832,758 -' 2,873,458 -I 11 '99 { [-14 '22)
.. J~51 32,00Z.164 -15,169,8Q6, +19 '27 .) . ,~ 'i~lH1
8
TABLE 2.'2-Contd.
2 3 4
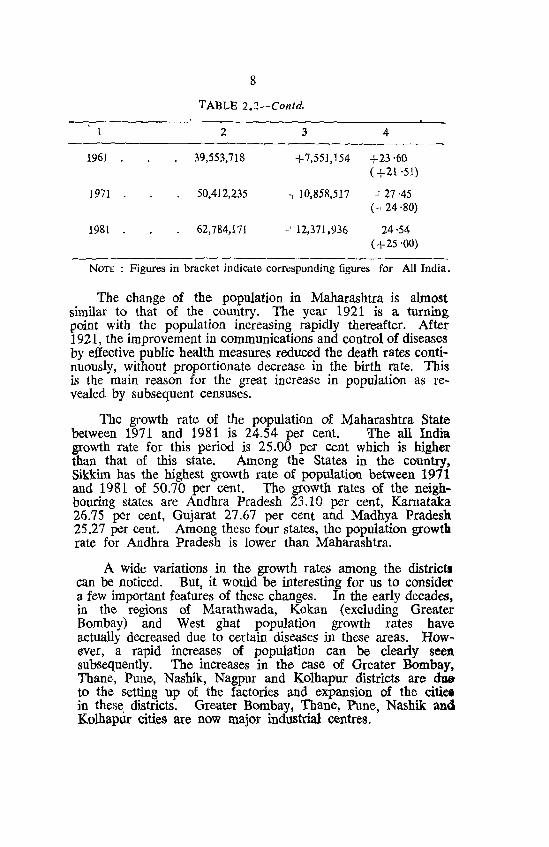
1961 39,553,718 + 7,55],154 +23 '60 (+21 '51)
]971 50,412,235 -I 10,858,517 -127 ·45 (~ 24 '80)
1981 62,784,171 _' 12,371,936 24·54 (+25 '00)
NOTE : Figures in bracket indicate corresponding figures for All India.
The change of the population in Maharashtra is almost similar to that of the country. The year 1921 is a turning point with the population increasing rapidly thereafter. After 1921, the improvement in communications and control of diseases by effective public health measures reduced the death rates continuously, without proportionate decrease in the birth rate. This is the main reason for the great increase in population as revealed by subsequent censuses.
The growth rate of the population of Maharashtra State between 1971 and 1981 is 24.54 per cent. ~he all India growth rate for this period is 25.00 per cent which is higher than that of this state. Among the States in the country, Sikkim has the highest growth rate of population between 1971 and 1981 of 50.70 per cent. The growth rates of the neighbouring states arc Andhra Pradesh 23.10 per cent, Karnataka 26.75 per cent, Gujarat 27.67 per cent and Madhya Pradesh 25.27 per cent. Among these four states, the population growth. rate for Andhra Pradesh is lower than Maharashtra.
A wide variations in the growth rates among the districts can be noticed. But, it would be interesting for us to consider a few important features of these changes. In the early decades, in the regions of Marathwada, Kokan (excluding Greater Bombay) and West ghat population growth rates have actually decreased due to certain diseases in these areas. However, a rapid increases of population can be clearly seen subsequently. The increases in th~ case of Greater Bombay, Thane, Pune, Nashik, Nagpur and Kolhapur districts are duB to the setting up of the factories and expansion of the citiel in these, districts. Greater Bombay! Thane! Pune, Nashik and Kolhapur cities are now major industrial centres.

9
Districtwise area and population
The folllowing table (2.3) shows the districtwise distribu-tion of population of Maharashtra State.
TABLE 2.3
D.istrictwise distribution of population of Maharashtra State, 1981 Census
State/District Area Population
Area in per- Rank Population Percen- Rank sq. kms. centage in tage to in
to area State popu-State's papu- la-area lation tion
2 3 4 5 6 7
MAHARASHTRA 307,690'0100·00 62,784,171 100·00
1. Gr. Bombay 603 ·0 0·20 26 8,243,405 13 ·13 1 2. Thane 9,558 ·0 3 ·11 20 3,351,562 5'34 3 3. Raigarh 7,148 ·0 2 ·32 24 1,486,452 2'37 24 4. Ratnagiri 13,054 '0 4·24 10 2,111,311 3'36 12 5. Nashik . 15,530 ·0 5·05 5 2,991,739 4·76 4 6. Uhule 13,150 ·0 4·27 9 2,050,294 3'27 14 7. Jalgaon 11,765 ·0 3·82 13 2,618,274 4 '17 6 8. Ahmadnagar 17,048 '0 5·54 2 2,708,309 4'31 5 9. Pune 15,642 ·0 5·08 4 4,164,470 6·63 2
10. Satara 10,484 ·0 3 ·41 17 2,038,677 3 '25 1$ 11. Sangli 8,572 ·0 2'79 22 1,831,212 2'92 18 12. Solapur . 15,017 '0* 4·88 6 2,610,144 4 '16 7 13. Kolhapur 8,047 ·0 2·62 23 2,506,330 3'99 9 14. Aurangabad 16,305 '0* 5·30 3 2,433,420 3'88 10 15. Parbhani 12,561 ·0 4·08 11 1,829,378 2·91 19 16. Bid 11,085 ·0 3·60 14 1,486,030 2·37 25 17. Nanded. 10,502 ·0 3 ·41 16 1,749,334 2'79 21 18. Osmanabad 14,210 ·0 4·62 7 2,230,620 3 '55 11 19. Buldana 9,661 ·0 3·14 19 1,508,777 2'40 23 20. Akola 10,575 ·0 3·44 15 1,826,952 2'91 20 21. Amravati 12,212 ·0 3 '97 12 1,861,410 2'96 16 22. Yavatmal 13,584 ·0 4'41 8 1,737,423 2'77 22 23. Wardha 6,310 ·0 2·05 25 926,618 1 '48 26 24. Nagpur 9,931 ·0 3'23, 18 2,588,811 4'12 8 25. Bhandara 9,213 ·0 2'99 21 1,837,577 2'93 17 26. Chandrapur 25,923 ·0 8·43 1 2,055,642 3 ·27 13
• Provisional.

10
It is important for us to notice tbat the number of people is .oat always ,Prop.ortionate to the area of the district. We all knbw that people move more in areas where employment opportunities are available by way of agriculture or industry and less in forest or dry are:as. Among the districts in the State Chandrapur (25923 km2 ) is the largest district in terms of area in Maharashtra and ranks '7th in India. More than one-fourth of the total area .of this district is under iorests, and it is the most sparsely populated district in the State.
Gr. Bombay with an area of only 603 km!! is the smallest district in Maharashtra and third smallest district in the Indian Union, but highest in terms of population criterion, Barring Chandrapur and Gr. Bombay of the two extrem~s, th!; remaining 24 districts in Maharashtra have areas ranging between 17,048 kms2 (Ahmadnagar) and 6,310 km:! (Wardha) (see Table 2.3). The average area per district in Maharashtra is 11,834 km:! as compared to the all-India average of 7979 !<m!l. Next to Gr. Bombay district with a popu.lation 8.24 millions, Pune is second populous district with 4.16 millions people. W,ardha is the least populous district with 0.93 million persons.
Average population of a district We can have a comparative picture of the distri!)ution of
people by considering the average population of a district which i~ easily calculated by dividing the total population of the state b;Y. the number of districts. In Maharashtra State the ,populahan is 62,784,171 and there are 26 districts. Therefore, the average population of a district in the state works out t-o 2,414,776. The urban district of Gr. Bombay has a population wl)ich is about three and half times of the average. In addition to Gr. Bombay the other districts where the populatioR i" hi,gher than the average population are Pune, Thane, Nashik, Ahmadnagar, Jalgaon, Solapur, Kolhapur, Nagpur and Aurangabad. In all the other districts the population is less than this averag.e. Incidentally we must notice that the Wardha ditltrict has a population less than one million.
Maharashtra bas 232 tahsils. The largest in area i~ Sh'oncha tahsil '{8000 km2 ) in Chandrapur district. Tbe smallest is Pune city tahsil (184 km2) which comprises only one viUage besides the Pune Municipal Corporation area. The average population per tahsil is 270,621. Nagpur is the lllO$j p.clpulous tahsil. Mahabaleshwar tahsil (36,475) in Satara district is the least populous.

11
Del\Sity ,of population in 1he distrkt
We can now consider the densities of population in the ,district 'Ol Maharashtra state. These.are indkated in Table '2.4.
TABLE 2.4
Density of population for districts: [981 CCIlSUf
Densities
Above 250 201-250 151--200 101--150 100 and below
1 2 3 4 5
Greater Bomb<,y Raigarh(208) Ratnagiri(162) Aurangabad Chandrapur (13671) (149~ (79)
Thane (351) Pune (266) Kolhapur (311)
Nagpur (261)
Jalgaon (223) Nashik(i93~
Sangli (214) Dhule (156) Ahmadnagar
(159)
Parbhani (l 46)/ Bid (134) Yavatrnal (128)
Waroha <147) Satara (194) Solapur (174) Osmanabad(157) Nanded (167) Buldana (156) Akola (173) Amravati (152) Bhandara (199)
Obviously, the densities of populations vary from district to distirct. This is natural because people are not, as we saw earlier, evenly distributed.
The density of population in Maharashtra is 204 per km2, This is little less than India's density of 216 persons per lcm2 •
Greater Bombay district, which is highly urban~sed area, has an exceptionally high density of pop'ulati9n 13,671. Thane with 351 comes second, then Kolhapur with 3.11 and Pune with 266. All these districts are urbanised anq industrially developed. Chandrapur at the other end has. only 79 persons per km2 •
Rw:al and urban distribution ot the population We may now consider the rural and urban distribJ!tion of
the population in the State. In Maharashtra State there l!Ce 26 districts. According to \ the 1981 Census there are 62,184,171 people in Maharashtra State. Of those 40,790;5.77
,Of' ~.97 per cent live in rural areas and 21,993,594 or 35...03

12
per cent live in urban areas. The rural population consists of those who live in the villages. The village is a well-recognised administrative unit and the boundaries of every village are defined in the records of the Revenue Department. All villages are not necessarily inhabited. There are few villages which are uninhabited. The total area of the Maharashtra is 307,690.0 km2 while that of rural area is 301,802.2 km2 or 98.09 per cent and urban is only 5,887.8 km2 or 1.91 per cent.
We may now consider some of the important factors of theurban population in the state. As mentioned earlier 21,993,594 persons or 35.03 per cent of the population of the state lives in urban areas. In other words 35.03 per cent of the people of the state live in only 1.91 per cent area of the State.
The proportion of urban population among the districts, varies, as will be seen from the following table.
TABLE 2·5
Urban population in the districts, 1981 census
State/District Total Urban Percentage population population of urban
population to total
population
2 3 4
Maharashtra 62,784,171 21,993,594 35 '03
1. Gr. Bombay 8,243,405 8,243,405 100'00 2. Thane 3,351,562 1,486,220 44'34 3. Raigarh 1,486,452 209,876 14 '12 4. Ratnagiri 2,111,311 170,917 8 ·10 5. Nashik 2,991,739 928,145 31 '02_ 6. Dhule 2,050,294 400,181 19'52 7. Jalgaon 2,618,274 658,257 25 '14 8. Ahmadnagar 2,708,309 351,368 12·97 9. Pune 4,164,470 1,971,082 47'33
10. Satara 2,038,677 265,792 13'04 11. Sangli 1,831,212 394,089 21 ·52 12. Solapur 2,610,144 767,466 ,29·40 13. Kolhapur. 2,506,330 ,622,022 24·82 14. Aurangabad 2,433,420 537,535 22'09 15. Parbhani. 1,829,378 342,822 18'74 16. Bid 1,486,030 229,771 15·46 17. Nanded 1,749,334 327,849 18'74

13
TABLE 2 ·5-(Contd.)
2 3 4
18. Osmanabad 2,230,620 343,237 15 '39-19. Buldana . 1,508,777 278,986 18'49 20. Akola 1,826,952 454,662 24·89 21. Amravati 1,861,410 544,499 29·25 22. Yavatmal. 1,737,423 262,135 15 ·09 23. Wardha . 926,618 231,510 24'98 24. Nagpur 2,588,811 1,469,279 56·75 25. Bhandara. 1,837,577 240,754 13 '10 26. Chandrapur 2,055,642 261,735 12·73
Among the 26 districts in Maharashtra, Greater Bombay is the urban district. In Nagpur district, more than 50 per cent population lives in urban areas and in the Pune district 47.33 per cent. A very low urban proportion (8.10%) is in Ratnagiri district.
Average village size The number of inhabited villages in the districts is indi
cated in the following table. TABLE 2·6
Number of inhabited villages in the districts, 1981 Census
Villages
Below 1000 1000-1499 1500-1999 2000-3000
2 3 4 -- ---------------------"'--Greater Bom- Jalgaon (1475) Thane (1746)
bay (-) Ratnagiri (2038)
Satara (1417) Raigarh (1827) Chandrapur (2978)
Sangli (708)
Solapur (1104) Nashik (1742)
Kolhapur (1200) Dhule (1516) Bid (1256) Ahmadnagar (1503) Nanded (1425) Pune (1753) Buldana (1273) Aurangabad (1959) Wardha (1015) Parbhani (1615)
Osmanabad (1527) Akola (1546) Amravati (1698) Yavatmal (1751) Nagpur (1658) Bhandara (1624)

14
Within the district, the populations of the villages vary considerably, many of them being very small and some of them very large. There are 116 villages in the State with a population of more than 10,000. Of the other inhabited villages in the state, 579 have population between 5,000 to 9,999, 3,604 between 2,000 to 4,000, 8,954 between 1,000 to 1,999, 12.330 between 500 to 999, 9,248 between 200 to 499 and 4,523 have population below 200.
We can see that more than one third (13,771) villages in the state are small villages with population less than 500. But these small villages, though large in number, account for only about 9.14 per cent of the total rural population. As against this, only 116 villages or 0.29 per cent which have population of more than 10,000 inhabit 1,505,789 persons or 3.69 per cent of the total rural population.
The average population of a village for 1981 Census in Maharashtra works out to 1037. In 1971 it was 970. The increase in population is reflected in the higher average population of a village. The average population of a village in tbf' districts, is indicated in table 2.7.
TABLE 2·7
Average pOpu)lltioll of a village in the district, 1981 Census
. '. verage population size
-500-999 1000-1249
1 2
Raigarh (699) Thane (1068)
Ratnagiri(952) Nashik (l185) Aurangabad Dhule (1088)
(968) Parbhani(920) Nanded (998)
Bid (1000) Osmanabad
Buldana (966) Alcola (888) Amr"vati(776) YavatmaJ(843) Wardha (685) Nagpur (675) Bhandara (983) Chandrapur (GO?,)
(1236)
1250-1499 1500-1999
3 4
Jalgaon (1329) Ahmadnagar (1568)
Pune (1251) Solapur (1669) 'Satara (1251) Kolhapur
(1570)
2000 I
5
Sangli (2030)
--- - --------NB : Excludes Gr. Bombay district, which is entirely Urban.

22
20
18
16
c ~ 12
.!2 _g ::J g. 10 n. c o -e 8
::>
G.
I.
MAHARASt1 TRA
GROWTH OF URBAN POPULATION 1901-81
:11 1901 1911 1921 1931 1941 1951 1961 1971 1981
Census Years
3C-244 R G INDIAIND/88

CHA:PTER III
VILLAGE DWELLERS AND TOWN DWELLERS
Urban areas
India!). Census defines an urban area and then treats whatever does not satisfy these criteria as rural. Areas under a Municipal Corporation or Council or a cantonment or a civil line are treated as urban. Where this is not so some empirical tests are applied such as (j) whether the place has a minimum population of 5,000, (ii) a density of not Tess than 400 persons per km2 (1,000 per sq. mile), (iii) and whether 75 per cent of its male working population is engaged in non-agricultural (and allied) pursuits. Places having these qualifications are <11so treated as urban. Other form rural areas.
Comparison of viUages
Total number of inhabited villages in India are 557,137 according to 1981 Census. Maharashtra has 39,354 villages. Tliere are 1,834 villages in India which have population 01 1'0,000 or more. Out of which Kerala has maximum number of.- villages (905 or 49.35%), followed by Bihar (192 or 10.47%), Tamil Nadu (182 or 9.92%), Andhra Pradesh (163 or 8.89%) and then Maharashtra (116 or 6.32"%). Table 3.1 shows the statewise number of villages classified by population size 7,202 villages or 1.29 per cent in India are having popnlation 5,000 to 9,999. In this size of villages, Andhra Pradesh has maximum number of villages (1058 or 14.69%) followed by Bihar (1054 or 14.63'%). Tamil Nadu (1,000 or 13.89%), Uttar Pradesh (751 or 10.43%), West Bengal (702 or 9.75%) and then Maharashtra (579 or 8.04%). In the size of population less than 200, Uttar Pradesh has maximum number of villages (22,391 or 18.65%), followed by Orissa (15,924 or 13.26%). Minimum number of villages in this size are in Kerala (3).
Average population of a village
. Average population per inhabited village works out to 911 in 'india. The highest average population per inhabited village is found in Kerala 16,967 followed by Tripura 2,135. 'For Maharashtra it is only 1,037.
15

16
° 0 .... '" N ~ ~
11"1 11"1 .... 'C
O"'~ «'t \0 0\ <'I 0 ,..., OC::,a .... 00 • - - 0\ .... 0<$«1
..... -§~ ~ 00 .... 00 N M 0 0 N
VI 0\ .,.. .,.. ..... N or. t-
o ~ O. q .... N .... N Ifl
.... 1'1
V')O\ ..... .....
c:: .52
§~ N ~ ~
Ifl \0 N '" 1'1 N \0 g
1 0\ N .... 0\ 0\ N ....
0\ 00 '0 00 I- <"l. «'t r--. I- O. \0
N"'" ItS vi V)' M ..... N N <"i
0- .... 0 p.. 'C
'0 6~ $ ..... 00 rt') V \0 0\ M 00 ....
00 "'" 0 00 \D ..... .,., 8~ i ~
00 .... 00 "" c;~ rf'l .... .... 0\
00 N
I .M 0 vi ..; .,.; 00' 00 ... ..... .....
., r.n U
00 t- ~ \0 \D t'I ~
N 0
g~ N N ....... t- "'"
11"1 N 00 <'"l
.... ..... 0\ 1'1 r-- 0\ I-;, ("'I. .... N <'"l
00 OJ') 11"1' .,..' v' t-. "" 0\ M ..... r-:'
0\ 11"10\ <"I ..... ..... ..... ..... .... ~ ~ 00 0 N "'"
00
IS :0 ..... l- N
.....
'!il g~ \Q c; ~.
.... .... "'" t-. 0 O. Vl
~ t- 0\ N .....
~ \0 0 v· 0\ <'l .,f r-:' vi 0\
N"'" V') ..... N .....
"7' .....
1 t- o 11"1 \0 I(') .... 11"1 1'1
\Q <"I
<'l me:: ~ 0\ 00 00 1.0 .... r1'l 0 N
~mO Vl r- t- M. .... Vl ~ . ..... 00
.,., ~ ~ I ,rlO
..... .,f 0" ....
V)" .,f
...l .....:l ... N N .... ..... .,f
~ .... .... ....
~ '" ~I 6"gu 8 ~ \0 r-- ....... r--
f-4 ., ..... 0\ 0\ <"I 0 t- t- M M
S m::J g._..- til) "'" 0\ IrI,. Q\ N. ..... N <"I t- \0 00 ° t1 ~.- ~:E!:!
t- 0\ Q\ Vl ..; III
.... ..... - \IS
'" ;.~~.,m:;:: ~ -< _c,,rl>
..... "0 ~
tae: r- \0 ..... r- OO Vl
I-
~ 00 0\ r- .... '" .... 1.0 ....... 00
r-
.... 0 r- ~ vi ..... N 00 00 0 ~ ..... on
til) ::1'- '0 ..,f vi ..f 0\ ...... sf
0"
a .... 01 M ....: 0\ ItS ..0 M '0 ..... 00 0\ or> 0\
01'3 0 o. v 0 0\ N 0 00 r-
;> \Q
,....;'
'" 0 ",. r- .... \0 ......... 0 .... 0. r-:' ~ \0 ..; \IS ~. ..... "'" 00 M M "'" ., f-4p.. 0
'" .,..
'i o·~ t- 0\ \D V .,., l- N
.... 0 t- oo 0\ on .. Z~'O~
M I- .... .... .... 00 ('- 8! N I/) r1'l
S N ..... <"I Vl .... ..... ..s """
"). 0\
ffJ Ol c:: 2 ~ t..:' t-" (,-" cO <IS 1.0' r-:' ,....;' ;::: M
Vl N I.C ..... N ........ :::::I II') o ._ f-4'o >
.rl .!:f (fJ
~ ,rl ,rl Q)
(fJ "0
.. ~
m ~
0
£ ... "0 " Po. e :a
~~ 01 d(3 m ~ ... ~
os ..\( i'I
~
~ 'fi 0:1 <$ .. I
.... 0:1 >. ~
] Ill;§ ~. :a m 0:1 ca ..c:I
~ 8 ~ 'tl
:$ ~~ ';:i' ~ m
0 ~ 0 ::x: ~ ... ;:.:: ~
Z r.n ,...; M ..i ~ vi v5 t-= 00 0; e .... ....

17
.... ...... ..... ..... N ..... N M M 00 10 00 .....
N ..... I- 0 ...... 8. \0 ..... g ...... V N M 10 10 ..... '" l- I-.....
0 V l- V \0 10 00 ...... v 00 ..... 0\ M V "" 10 ..... 00 I- ::! 00 N. "!. "" "" N "" M· v· 00 ~
rt 10 "" ..... 0\ 00 0 0 M 0 00 00 v \0 ..... \0 \0 I- 10 00 M ..... 10 00 • v. 10 M "" 10 ~ N 10 ~ ci ...: N
:$ ~ ..... 10 M I- ,_ M
~ I- \0 v 0 ...... M M r-- ~ 0\ N "" N 00 1-. 10 ......
"" 0\.
"" 00 "". o· 0\" e')
\0 0 M 00 "" 10 I- M ...... r-- "" .,., 0\ 00 \0 M ,_
e') 0\ ..... "" 10 "!. "" 0'1 00 v ..... 1-. 00 I-~ M 0" 0" 0\ ..... ..... ""
00 0'1 I- ;:!i .... .... 00 v v ...... 00 "" 0'1 0'1 ,_ \0 10 0'1 "" 0'1 \0 0\ ..... M 0\ "l 00 I- M ..... ~ 10" 1-" ~" liS
v e') 0\ '8 v rt M 0 10 00 10 ..... M 00 00 0 10 e') 0 II') II') M II') .,., 0\ I- \0 0 ~
00 0" M" .....
<"l \0 \0 v 00 v .... ~ 0 00 \0
~ 00 0\ 00 "" "" 0 0\ 0\ M v \0 0\ -:. "l "" N v 00 0\. ",," v" v· 0\" ..... ..... .,.; \0" ,_. M "" q q 10 10 ~ 10 \0 10 M \0 M \0 "!. ° N v 00. 0'1 ..... ...... .... M M" r--" M" ..... o· o· N ..... M M 0\ v
10 g N <"l ~ 00 0 ..... \0 \0 v M ...... 10 \0 ; "" 10 \0 N 0 0'1 ... In M 0\ 00 00 II') 0" M ~ vi M v" '" M 00 v ..... ..... ..... ..... "" .....
e 01
~ Poll
.t:1 c::
:l '" "a ':a . CI) ::I '" "0 "0 Poll ~ .E "0 § Z til = !; P:: CI) § .0 ~ ,5 '" ~ [JJ ,9- '" til !; l 'i til - 1d ... <II 's = '" l '" ~ Q, '" ~ ~ z 'I:; ~ ~- ~ 5 ~ 0 ~ z
,_; N ,..; ..; .,.; ..0 r-: 00 0\ ci ,_; ...... ..... ..... ...... ...... .... ...... .... .... M M

I , ...... , .....
o
1.8
\~ ._ ._
g S~iJj~~~~~H~~~~~~ <"i

19
00
4-244 R. G. India/ND/88
20
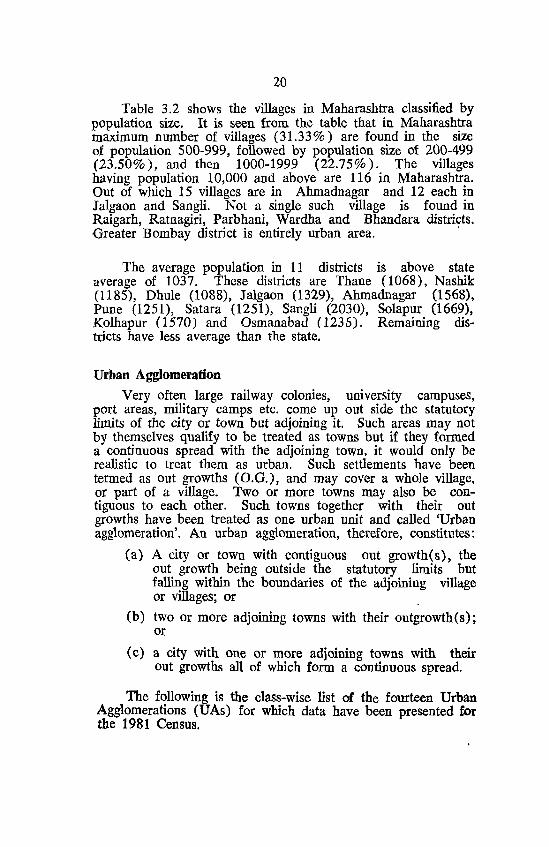
Table 3.2 shows the villages in Maharashtra classified by population size. It is seen from the table that in Maharashtra maximum number of villages (31.33%) are found in the size of popUlation 500-999, followed by population size of 200-499 (23.50%), and then 1000-1999 (22.75%). The villages having population 10,000 and above are 116 in Maharashtra. Out of which 15 villages are in Ahmadnagar and 12 each in Jalgaon and Sangli. Not a single such village is found in Raigarh, Ratnagiri, Parbhani, Wardha and Bhandara districts. Greater Bombay district is entirely urban area. .
The average population in 11 districts is above state average of 1037. These districts are Thane (1068), Nashik (1185), Dhule (1088), Jalgaon (1329), Ahmadnagar (1568), Pune (1251), Satara (1251), Sangli (2030), Solapur (1669), Kolhapur (1570) and Osmanabad (1236). Remaining districts have less average than the state.
Urban Agglomeration
Very often large railway colonies, university campuses, port areas, military camps etc. come up out side the statutory limits of the city or town but adjoining it. Such areas may not by themselves qualify to be treated as towns but if they formed a continuous spread with the adjoining town, it would only be realistic to treat them as urban. Such settlements have been termed as out growths (O.G.), and may cover a whole village, or part of a village. Two or more towns may also be contiguous to each other. Such towns together with their out growths have been treated as one urban unit and called 'Urban agglomeration'. An urban agglomeration, therefore, constitutes:
(a) A city or town with contiguous out growth(s), the out growth being outside the statutory limits but falling within the boundaries of the adjoining village or villages; or
(b) two or more adjoining towns with their outgrowth (s) ; or
(c) a city with one or more adjoining towns with their out growths all of which form a continuous spread.
The following is the class-wise list of the fourteen Urban Agglomerations (UAs) for which data have been presented for the 1981 Census.

CENSUS OF INDIA
GROWTH OF URBAN POPULATION ( CLASSWISE)
210
200
190
180
170
160
150
'1'0
130 .. 0 0
120 0 0 0
c 110 2 .3 " 100 I>.
II 90
80
70
60
SO
40
30
20
TO
5 E !!!
4A-244 R G INDIA/ND/88
N M ~ ~ ~ ~ ~
YEAP.S
<D ,... e '"
;;; !!!
.. <> u o n Q

21
Class I 1. Pune Urban Agglomeration(a) Pune City (M. Corp.) (b) Pimpri Chinchwad City (M) ( c) Pune Cantonment (d) Kirkee Cantonment (e) Dehu Road Cantonment (f) Hadapsar (g) Lohagaon (h) Khadakvasla (i) Dehu 2. Nagpur Urban Agglomeration(a) Nagpur City (M. Corp.) (b) Kamptee (M) ( c) Kamptee Cantonment.
3. Ulhasnagar Urban Agglomeration(a) Ulhasnagar City (M) (b) Kalyan City (M) (c) Dombivli City (M) (d) Ambarnath (M)
(e) Katemanivali (f) Mohone
4. Solapur Urban Agglomeration(a) Solapur City (M. Corp.) (b) Solapur O. G.
5. Nashik Urban Agglomeration(a) Nashik City (M) (b) Nashik Road Deolali (M)
(c) Deolali Cantonment (d) Satpur (M) (e) Bhagur (M)
6. Thane Urban AgglOmeration(a) Thane City (M) (b) Majiv~de (cJ Kalwa

22
7. Kolhapur Urban Agglomeration(a) Kolhapur City (M. Corp.) (b) Gandhinagar
8. Aurangabad Urban Agglomeration(a) Aurangabad City
(i) Aurangabad (M) (li) Chikhalthana O.G.
(b) Aurangabad Cantonment
9. Sangli Urban Agglomeration(a) Sangli City (M) (b) Miraj City (M) (c) Madhavnagar
10. Ahmadnagar Urban Agglomeration(a) Ahmadnagar City (M) (b) Ahmadnagar Cantonment
11. Bhusawal Urban Agglomeratlon-·· (a) Bhusawal City (M) (b) Kandari
Class II 12. Vasai Urban Agglomeration(a) Vasai (M) (b) Manikpur (c) Sandor
Class III 13. Daund Urban Agglomeration-(a) Dauud (N.M.) . (b) Daund (M)
Class IV 14. Dahanu Urban Agglomeration(a) Malyan (b) Dahanu
Distribution of Towns in 1971-81 Out of 4029 urban.'" ~la~es in India according to 198.1
Census with a population of 159.73 million. Maharashtra, has 307 urban places with a population of 21~99 million. 'Uttar Pradesh has the hi~t number of towns (704) in 1981,

23
followed by Tamil Nadu (434). Maharashtra is fourth in rank in so far as number of towns (307) is concerned. However, in terms of percentage urban population, it ranks first (35.03%) among the 22 States in India.
There were 289 towns in Maharashtra in 1971 Census. Out of 307 towns of 1981 Census, 225 are municipal towns, 75 are non-municipal towns and 7 are cantonment boards.
The districtwise distribution of towns, in 1971-81, shows that in both the Censuses Thane dis~ict has maximum number of towns (24 in 1971 and 34 in 1981), followed by Pune district (22 in 1971 and 26 in 1981). Number of towns decreased in 1981 than 1971, in the district of Ratnagiri (15 in i.971 and 13 in 1981), Nashik (20 in 1971 and 19 in 1981), Satara (14 in 1971 and 10 in 1981) and Amravati (13 in 1971 and 12 in 1981).
Size class of Towns
The towns and urban agglomerations have been grouped mto SIX population size classes. The size classes remain the same as these were in the preceeding census of 1971.
According to Indian Census convention a town which has already attained a population of 100,000 or over is designated as a city. Table 3.3 shows distribution of towns by size classes and population for 1971 and 1981 Censuses. It is "seen from the table that; at the 1981 Census in Maharashtra, a total at .307 places were treated as urban or as towns including 29 cities where as in 1971 there were 289 towns with 17 cities. There 'lias been a net increase of 18 towns in Maharashtra in 1981 1rver 1971. 91!lsses I, III, IV and VI have gained in the hUlnber' of towns. The largest increase of 24 towns is in class III. Class II has the same number of towns and Class V has lost 22 towns. If the percentage of urban popUlation in the various population size c1ass_es to the total urban popUlation are considered it will be seen that in 1981 class I has a substantial jncrease (71.57%) over the level in 1971 ('64.75%). Whereas class, II proportion of urban population has gone down from ~U)7:'per cent in 1971 to 7.82 per cent in 1981. The lower population size-class~ namely II to VI covered nearly 21 per ~ent of the -total urban population which is less by about 3 points than 19'H percentage.

24
TABLE 3·3
Distribution oftowns by size class and population in 1971 and 1981 censuses,
No. of Towns and population in . Size class of Town -----------
Tov.ns 1971 Towns 1981 in population in population 1971 1981
1 2 3 4 5
All classes 289 15,711,211 307 21,993,594 I (100,000 or over) . 17 10,173,715 29 15,740,723 a) (one million and above) 1 5,970,575 3 10,666,217
(b) (500000 to 999999) 2 1,722,181 514,860 (c) (100000 to 499999) 14 2,480,959 25 4,559,~46
II (50000 to 99999) 25 1,739,880 25 1,71~,771
III (20000 to 49999) 65 1,840,040 89 2,617,594 IV (10000 to 19999) 98 1,378,891 100 1,473,029 V (5000 to 9999) 70 531,848 48 387,725 VI (Less than 5000) 14 46,837 16 54,752
Standard Urban area (S.U.A.)
The concept of standard urban area was adopted at tlJ.e 1971 census.
A standard urban area was defined as the projected growth area of a city or town having 50,000 or more population in 1971, and would also include the surrounding villages that showed promise of urbanisation in the long term. The S.U.A. will thus be an area which will extend beyond the main city or town and would contain all likely development over the ped!Jd. upto 1991. Thus, it will remain as a Statistical reporting ,unit during three successive censuses irrespective of the changes in the boundaries of the local administrative units within them.
~he essential requirements for the constitution of a standard Urban area are ;-
(i) it should have a core town of a minimum population of 50,000.
(ii)
(iii)
the contiguous areas made up of other urban as rural administrative units should have socio-economic links with the core town and in all probability this entire area should get urbanised in a period of two or three decades.
as well mutual
fully

MAHARASHTRA
NUMBER OF URBAN -AREAS ACCORDING TO SIZE CLASS 1901-81
400
350
300
~ ~ 250 4
~ ~ ZOO LA. o IX L1J
~ 150 ::J z
100
so
o Census Ve4t'S
SIZE CLASS OF URBAN _CLASS I ~ (100 000 and above) ~
O CLASS II \ o_ (50000- 99999) _CLASS III (20000-49999 )
4B-244 R. G. India/S8
.,'l,
.i ~"'~'1,.1'
I(t, 1-
• ...;4
AREAS '....,' CLASS IV 't; ( 10000 -19 999) CLASS V ( 5000-9999) CLASS VI (Belbw Sooo)

CENSUS OF INDIA
SEX RATIO 1901-1981
[ RURAL
I 1100
• tine of Pllrlly ... tODG - .-. _. ,-- -- -- , --- -- I--,J
~ ~ ~ < f{L1 Vh; ~ ~ ~ ~ ~ ~ ~ ~ ~ ~ ~ x .. .. \
' . T7/.c/L ra ~ a: 100 hI. Averas. w CI. III ... _, ct :E '00 '" IL ,
700
I ,,-
1 URBAN .. ," -
1100
L1UT
Of p~rlty til ,000 +- -~ ~- --.--1-- -- --I .)-- I- _. ---- !I----- .. -.. -~. '" 777
I ... 7'r Sta t. Avtrag ~ \ ct
X
~ ~ ~ ~ ~ ~ ~ ~ . .~. ..
~ ~ ~ . .. ~~~V~'~ ~ 900 ex:
~ ~ % ~ ~ ~ ~ f% ~ ~ ~~~~~ ~ 1&1 G-
III "<-< ~ % % ~ ~ ~ ~ Y.Z ~ .ra;~~~.~ ~.
'" ... ct aDO :E i""Q: 77. '/ ~ R ... .-IL ,
I
7GO .. - .. - .. .. ~ .. ; .. .. ... - ... ... • ... .. .. .. .. .. :: .. .. .. - - - .. .. .. '\ " .. ... t YWS
~.
~ -

25
According to 1971 census there were 25 SUAs and these were: (1) Greater Bombay-Thane, (2) Bhiwandi, (3) KalyanUlhasnagar, (4) Malegaon. (5) Nashik, (6) Dhule, (7) Bhusawal, (8) Jalgaon, (9) Ahmadnagar, (10) Pune, (11) Satara, (12) Sangli, (13) Solapur, (14) Kolhapur, (15) lcnalkaranji, (16) Aurangabad, (17) Jalna, (18) Nanded, (19) Khamgaon, (20) Akola, (21) Amravati, (22) Yavatmal, (23) Nagpur, (24) Kamptee and (25) Chandrapur.
In 1981 Census eight new SUAs are considered and these are (1) Nandurbar (2) Amalner (3) Barshi (4) Pandharpur (5) Parbhani (6) Latur (7)" 'Wardha and (8)' Gondiya.
The dctails of eaeh standard urban area and its component have been published in Table A-5, "Census of India 1981, Series 12-Maharashtra. Part TI-A General Population Tables".
The idea is to present basic data for these areas for twothree decades so that the urbanisation process in those areas can be studied. However, there are some changes in the Standard Urban Areas of 1981 Census as compared to those of ] 971. These are shown in Table 3.5.
TABLE 3·4
Standard urban areas from 1971 and 1981 Censuses
1971 1981
Urban Rural Urban Rural Name of Standard Urban Area compo- compo- compo- compo~
nents nents nents nents
2 3 4 5
(I') Gr. Bombay:Thane 5 50 9 59
(2) Bhiwandi . 28 3 30
(3) Kalyan-Ulhasnagar 6 57 10 62
(4) Nashik 4 3 5 2
(5) Maiegaon. 4 1 4
(6) Dhule 2 1
(7) Nandurban I
(8) Amalner . 1 6
(9) Bhusawai 2 2

26
TABLE 3.4-Concld.
2 3 4 5
(10) Jalgaon 2 1 2
(11) Ahmadnagar 2 9 2 9
(12) Pune 9 48 13 50
(13) Satara 2 2
{14) Sangli-Miraj 3 6 3 5
{1S) Barshi
(16) Pandharpur 1
(17) Solapur • 1 2 4
(18) Ichalkaranji 2 2 1
{19) Kolhapur 2 8 2 10
(20) Aurangabad 2 9 2 7
(.21) lalna 7 7
<22) Parbhani • S
(23) Nanded 13 14
(24) Latur I 20
(25) Khamgaon 1 1
(26) Akola 7 1 S
(27) Amravati 2 8 2 13
(28) Yavatmal 1 4 1 4
(29) Wardha • 1 9
(30) Kamptee . 3 6 3 6
(31) Nagpur 17 2 17
(32) Gondiya • 1
(33) Ch,mdrapur 4

(') 1'1'1 Z
~ .... -- - Ut 1.0 0 .. IV,
'-I CO 0 0 0 [5 0 0 0 0 0 Q;
0 0 ,"1\
Z 0
RATNAGIRI ~
SATARA
RAIGARH
BHANDARA
SANGL[ I I I
KOLHAPUR I I
PAR8HANI I I I
l/) 810 I I I
o .... rr1 I I _ to I Ul-..J I ..... -I ~J>
NANDED I () :z ::0 I ..... 0 I
~ ~ J>: I I UltO I rn~~ I I -YAVATMAL I 0 I
BULOANA I I I I
JALGAON I I
AKOLA I I
AURANGA I
WARDHA
SOlAPUR
PUNE
~~I:IJK r-AMRAVATI
,_. I~
NAGPUR I :9-
THANE ,,, '0 ,~.
OR.BOMBAY 1-,'<
4C-244 R. 9. In~

CHAPTER IV
ARE THE NUMBER OF MEN AND WOMEN BALANCED!
'Sex Ratio:
The growth of a population is governed, among other things, by the ratio between the number of men and women. The ratio of females per 1,000 males is called the sex ratio.
The male and female populations and the sex ratio in Maharashtra at each of the census year 1901 to 1981 are presented in Table 4.1. The all India sex ratio is also presentI()d for comparison.
.census year
1901
1911
1921
1931 .
1941
1951
1961
1971
1981
TABLE 4'1
Sex ratio in Maharashtra,1901-81
Maharashtra
Males Females
2 3
9,802,189 9,589,514
10,922,671 10,551,852
10,692,865 10,156,801
12,305,958 11,653,342
13,769,460 13,063,298
16,490,039 15,512,525
20,428,882 19,124,836
26,116,351 24,295,884
32,415,126 30,369,045
India
Sex Sex ratio ratio
4 5
978 972
966 964
950 955
947 950
949 945
941 -946
936 941
930 930
937 934
It may be seen that the sex ratio in the state has been -adverse to females all-along. The sex ratio has been deteriorating upto 1971. It has shown an increase in 1981: The general trend in sex ratio'of the state is the same as .that of the . all India sex ratio. . ,
27

28
Table 4.2 presents comparative statement of the 1981 census sex ratio for India, Mahfll'ashtra and other slates and Union territories in India.
TABLE 4·2
'Sex ratiojn India, Maharashtra and other States and Union territorirs, 1981 census
State/Union territory sex State/Union territory Sex ratio ratio
(l) (2) (I) (2) •
INDIA* 934
STATfS
Andhra Pradesh 975 Rajasthan. 919
Bihar 946 Sikkim 835
Gujarat 942 Tamil Nadu 977
Haryana 870 Tripura 946
Himachal Pradesh 973 Uttar Praqesh 885
Jammu & Kashmir 892 West Bengal 911
Karnataka 963 UNION TERRITORIfS
Kerala 1032 A. & N. Islands. 760
Madhya Pradesh 941 ArunacpaJ Pradesh 862
~harashtra 937 Chandigarh 769
Manipur 971 D. & N. Haveli 974
Meghalaya 954 Delhi 80l
Nagaland 863 Goa, Daman & Diu 981
Orissa 981 Lakshadweep 975
Puniab 879 Mizoram 919
Pondicherry 985
--------------------------------------------------~
*Excludes Assam.
Kerala alone, among our states and union territories, has' an excess of females over maIes. All the states adjoiningMaharashtra have a sex ratio higher than ours.

29
Sex ratio in rural and -urban areas Table 4.3 depicts the sex ratio in rural and urban areas
of Maharashtra at each of the censuses 1901 to 1981.
TABLE 4·3 Sex rl!tio in rural and urban areas of Maharashtra, 1901-81
Sex ratio Census Year
Rural Urban
2 3
1901 1,003 862 1911 1,000 796 1921 994 776 1931 987 790 1941 989 810 1951 1,000 807 1961 995 801
-1971 985 820 1981 987 850
The rural areas are more in balance than the urban areas. The imbalance in the number of men and women in urban areas is due to sex-selective male migration to urban areas in search of employment or for professing various occupations. The urban sex ratio is showing an improvement since 1971. Mote women may now be accompanying the immigrating males til an in the past.
Age-specific sex ratios Table 4.4 presents the sex ratio in quinqennial age-groups
for Maharashtra for 1901, 1971 and 1981 censuses.
TABLE 4·4 Sex ratio in different age-groups in Maharashtra, 1961, 1971 and
1981- censuses
Sex ratio Age-group
1961 1971
2 3
0-4 983 97, 5-(1): 984 97.9 1'0-14 " '\.,.~ . 895 9D5
1981
4
961 968-' 932' ,HI

30
TABLE 4.4-Concld.
2 3 4
15-19 . 913 83:! 853 20--24 . 1,037 959 927 25-29 . 953 1,002 956 30--34 . 882 968 954 35-39 . 845
. 898 953
40-44 . 872 874 911 45--49 . 851 824 896 50--54 . 873 866 899 55-59 . 821 818 860 60--64 . 990 983 1,017 65-69 . 1,010 947 1,003 70 '- 1,116 1,062 1,090
MAHARASHTRA 936 930 937
There has been a gradual decrease in the sex ratios in age-groups 0-4 and 5-9 from census to census. The sex ratios in age-groups 45-49, 50-54 and 55-59 are consistently low at each of the three censuses.
How old are we? The age structure of any territory has an important bear
ing on its demographic character beth for the present and the future. Indian censuses have from the very beginning included a question on 'age', though its form has kept changing. Since 1951 Census 'age completed last birthday' is ascertained. Thus in 1981 census, the age of every individual in total years completed on his/her last birthday was recorded instead of -the year funning. In respect of infants who had not completed -one year by the day of enumeration, their age was ilivariably recorded as '0'.
While studying the age profile of any territory, it is customary to compare the population in different age groups. Usually, the population is divided into three broad age groups ~.g., young (children in age group 0-14), 'adults' (those_in age group 15-59) and 'aged' (those who are 60 and above). In -developing countries like India where fertility and mortality rates are comparitively high, the population is more youthful because of the large number of children born from year to year and fewer people surviving upto old age. The most important age group is 15-59, as it includes persons economic'ally productive and biologically c.ap~ble oC repr.oduction.

CENSUS OF INDIA
SEX RATIO 1981 (by age-groups) ----
70+ ~1090
65-69~1003
60-6G~1017
55-59~8GO
50-54~999
45-49~a96
t.0-4t.~9tl
35-39~953
30-3t.~95~
25-29~9S6
20-2t.~921
15-19 ~853 "
10-'r..~932
5-9~968
O-t.~96~
4D-244 R. G. Iudia/88

MAHARASHTRA
POPULATION BY AGE GROUPS ( 1961, 1971 &. 1981)
AGE-GROUPS .Q ~ _ 70+ iiiiI
.I SS -69 i .60-64_
~. ~ iliIiiii 55 - 59 .IiIi ~ ~ IIiiIfIiiIj 50 - 54 iiiIfIiiIII
16 14 12 10 8 6 ~ "2 0
PER
~ t. 5 - 49 iiiiiiIfIIII
40 - 44
35 - 39
30 - 34
024
C E N T
1:-:.;·:-:1 1961
~ 197' _ m8l

31
The age profiles fo~ all. the states (inclu.ding Maharashtra) are of the same type wIth hIgh percentages In age group 0-14 resulting from a high level of fertility.
The youthful population in age ~roup 0-14 in Maharashtra (3~U9%) is less t~mn the all In~a average (3~.s7% ~ ,presumably because it IS a more urbamsed and more mdustrIalised state than many other states.
As regards age group of 'Adults' or working age group of 15-59, Tamil Nadu has the largest percentage (58.57%) and Uttar Pradesh the lowest (51.49). Maharashtra with 55.22 per cent ranks eighth among the states of India.
Age distribution by 5 year age groups Table 4.5 shows the age distribution of the population of
Maharashtra based on 1961, 1971 and 1981 censuses.
The proportion of population in the age group 0-9 has declined from 29.07 per cent in 1971 to 25.30 per cent in 1981. In 1961 this proportion was 29.49 per cent. The proportion in the age group 0-14 slightly increased from 40.64 per cent in 1961 to 41.34 per cent in 1971 but has declined to 38.33 per cent in 1981. The proportion in the age group 0-4 has, comparatively, more declined than that in the age group 5-9. This may be due to a decline of fertility in the latter half of the last decade. In fact the absolute numbers in age groups 0-4 and 5-9 have increased only by 2.85 per cent and 13.86 per cent during the decade 1971-81 as aaginst the corresponding increases during the 1961-71 decade of 22.24 per cent and 29.11 per cent, respectively.
Dependency Ratio ·People in the middle age groups or worklllg age group
generatlly support the young and the old. We find that some times persons from age groups 0-14 and 60 and above are also engaged in economically active work. Over looking the marginal participation of persons from 0-14 and 60 above in acttve work, the burden of dependency is described as the ratio between 100 persons from the working. age group (15-59) and the. number. of persons in age groups 0-14 and 60 and above. The' ratIO is called the dependency ratio with its two components - youth -dependency' and old age aependency. The- dependency. ratio in Maharashtra for. each of the censuses 1911 to 1981 is presented in Table 4.6:

9 ~ ~ ~ 8 "l <"l "l 00 00 ..............
32
~ ~ ? G ~ ~ ; ~ B ~ ~ ; ~ ~ ? ~ ..... <"l ~ ~ 00 ~ ~ ~ ~ ~ M N N N 0 ..... .... .....
~ ~ $ ~ ~ ~ """"' ('f1 ~ 0\ 00 r..... .... .....
~ ~ ~ ~ ~ N N _·N 0
~ ~ ~ 0 ~ ~ 00 ~ N ~ 00 <"l N 00 ~ .... ~ 9 9 9 ~ 9 ~ ~ 9 9 ~ ~ ~ ~ 9 9 v ~ N.oo 00 00 ~ ~ ~ v ~ N N _ N 0 .........
? ~ 9 ¥ $ ~ ~ ~ ~ ~ ~ ~ ~ ~ 00 ~ ~ ~ ~ ~ ~ ~
~ ~ ~ ~ ~ ~ ~ 8 ~ ~ ~ v v N 00 00 ~ ~ ~ ~ v ~ .... .... ....
o ~ ~ 0 ,...., ~ ~ ~ '?' <:;> N N _ .... 0
0'\ f'. 0\ ~ ....-t
~ ~ ~ 9 ~ ~ v 0 oe ~ .... .... ....
~ ~ 8 ~ ~ ~ ~ ~ ~ ~ Q 00 ~ ~ v ~ M N N 0
~:;;~~9~~B~~$~~~~~ v v .... 00 00 00 ~ ~ ~ ~ <"l N N .... .... 0 .... .... ....
$ ~ ~ ~ ~ ~ ~ 9 9 ~ ~ 8 ; :;; ~ 9 ~ v .... 00 00 00. ~ ~ ~ ~ <"l N N .... .... 0 .... .... ....
+ ~
33
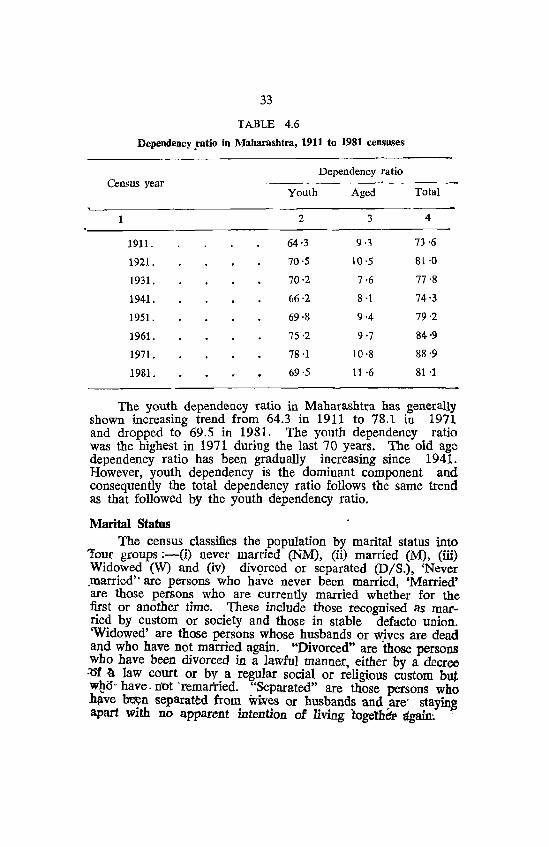
TABLE 4.6
Dependency ,ratio in Maharashtra, 1911 to 1981 censuses
Dependency ratio Census year
Youth Aged Total
2 3 4
1911. 64·3 9·3 73·6
1921. 70·5 10 ·5 81·0
1931. 70·2 7·6 77'8
1941. 66·2 8 ·1 74·3
1951. 69·8 9·4 79'2
1961. 75·2 9'7 84'9
1971. 78 ·1 10 ·8 88·9
1981. 69·5 11 ·6 81-1
The youth dependency ratio in Maharashtra has generally shown increasing trend from 64.3 in 1911 to 78.1 in 1971 and dropped to 69.5 in 1981. The youth dependency ratio was the highest in 1971 during the last 70 years. The old age dependency ratio has been gradually increasing since 1941. However, youth dependency is the dominant component and consequently the total dependency ratio follows the same trend as that followed by the youth dependency ratio.
Marital Status The census classifies the population by marital status into
'lour groups :-(i) never married (NM), (li) married (M), (iii) Widowed (W) and (iv) divc;>rced or separated (DIS.), 'Never ,married" are persons who have never been married, 'Married' are those persons who are currently married whether for the first or another time. These include those recognised as married by custom or society and those in stable defacto union. 'Widowed' are those persons whose husbands or wives are dead and who have not married again. "Divorced" are -those persons who have been divorced in a lawful manner, either by a decree ~1' ~ law court or by a regular social or religious custom but w!J.O" have. n'ot 'remairied. "Separated" are those persons who hp.ve ~n separated from wi¥es or husbands and are' stayin~ apart with no apparent intention of living ~ogethdJ:' ligain~ .

34
Early and universal marriage, especially of women, has been traditionally favoured in India which is reflected in statistics on marital status collected through the census. According to the 1981 census, there were 137.4 lakh married males and 137.5 lakh married females in Maharasbtra. The number of married males is almost equal to that of married females. This may be due to large scale sex-selective male migration into Maharashtra. The corresponding figures in 1971 were 108.6 lakh males and 107.6 lakh females. Of the 137.5 lakh married females, 105.5 lakh were in reproductive age groups 15-44. In 1971, there were 86.3 lakli married females in this reproductlve age group. The growth rate during the decade 1971-81 of married females in this reproductive age group is 22.2 per cent which is lower than that.of the general population.
The distribution of males and females in rural and urban areas of YIaharashtra by marital status is presented in Table 4.7.
Only 5.56 per cent of the males in tbe age group 15-19 are married. The proportion married rises sharply to ~"i.Ol per cent in the age group 20-24.
-Among females 3.20 per cent in tbe age group 10.14 are
married. The proportion shoots to 38.16 per cent in age group 15-19 and further 83.85 per cent in age group 20-24.
The proportion of widowed females increases sh~ly after the age group 45-49 both in the rural and urban -areas:-
Very wide variations, in th~ proportions of. widowed males and {emales are observed both in rural' and urban areas. This rimy be due .to the f!l.s:t iliat·'in -me male dominated Indian Society Vt~ry few males come forward to marry widowed females.
Table 4.8. presents .the distribution of male and female populations1n Maharashtra'by marital status for-1971 ~and 1981.
A much largt'l' proportion of lp.ales are never married as compared to fe~ales both in rural and -urban areas. A slight fall in the proportion.of widpwed is -discernible in 1981, com-pared to 1971. .

35
"'''' :~ ~~ ""'''' "'''' "'00 ~~ '" ..... (Il ~~ ':'"'\fl <:'I'? <:'Ir:- .,r---- 00 0 00 00 00 00 00 00 ~
= <'l\O - ..... ..... 10 ~~
1010 -Cl'" .,.,'" 0 ..... os
~ 0 <:'1'0 ... ? 9 <?~ ~., .~ r:-., f'!'l",;" .r> ..... ..... r-- - 0 00 00 0 ..... 0..., 0'" ......... ~ .....
'" ..., ::... 00 <'l1O ~~ 0'"
00 '" "'- ON
I~ '" <:'I'? ~ '0 7''''r t;109 "!<:'I r:--~ ~r:--
'" "'''' 0_ ""j-or. 'r> N \00 "'..., VN V"I \C
= vv <'l <'lr-- 1001 00'" "'''' "'00 5 u
I r--oo :~ 10", "'0 \Ov '" '" \0", -.:to .... I~ 00 <:'1'0 90:> "!'0 '9<"!"' 'P~ '0'!'o '0~
~ A, 00 0 00 0_ 0 ..... 0 ..... 00 00 .... I ~
]I~ I = r<l r-- -'" ~~ OI<'l (">'" v ..... r--r-- <'1('00
S f'o '7't;I 99 <:'19 '?~ ~'0 ''!It:'''' f!1'P rt:l "'01 00 00 0 ..... 0 ..... 0...., ..... '" NO
I .... -;
~I~ ;t: N ..... .. 0 ..... Ov \000 MN ""'M \0", 000
~ I
'11_ ~O? "!'? "?'!'o r:-'? C?C? "!9 ~<:'I
'" <'l1O ......... "'''' NO ("> '" VV \0 .... ""CO '"CI VV v V'" 0001 "'''' 01", 0"100 c: I
r- eo: ..,f
~ 1m
"'I NO • <'I "'N 000 r-- co OON ;~ ;~ (Il
/0-<:'1'0 '9 9'? t;l,:" "!9 "!9
e3 >. 00 0 00 0 ..... 0 ..... 0 ..... 00 00
III .c ! -< Cl.o E-< = ~~ ..... N '" '" 0", \Or- IOv N", vol co 99 9<:'1 <:'I"'? "!'? r:--~ "";"1'9 0\00 Ilh cu ~ .:. 0 i '0 v ..... 00 00 00 00 0 ..... 0", ...... '" f E-< .....
-5 000 r-N \0\0 ..... .,., vr-- ""0 "'r-- ffJ~ a3 ~ .." "!<:'I .......... tQ'7' 9~ '!'or:- 'Qf!"l r:-r:-... ~:~
..... ..., '" 00 or...., .,.,,,,
~~ "'N "'r--.5 ..., "'00 r-", "'''' "'00 c: .S '" ~
v -;
'" en '" '" CoO
8- Ei ~ '" '" '" '" ~~ ~ :l <lJ N til <II .,- .,tiI rltiI ~~ ~-; ~t; Cl.o ~ ~ 8 ~-B .!! e til e ~~ ~~ 'S ::S~ ~~ <II '" ~~ ::S~
j ~ ~~ ::s~
1 .....
0. - V Q\ ;:1f '1 .v Do
J = * 1 I '" -, 0 ~ J J 50 '" ~ ,"" os -- ...... ,<,,) "". ~ < -<
5-244 R. G. India/ND/88

o
.....
36
N('f"') cf"I~ ['or-- O~NO'\ 000\ <:'~ ~II"I ~<:' <:'''r~~ <:'~ 00 00 00 0000 00
~ ~ ; ~ 00 00
~~;~ ~~ 0000 00
~~ ~9~~ o~ \.ON""tf") 0\ \0 00 '<t 00 <'l
00 00'<1" o· • 00 .,., -t--
O\t-- ...... t--,....oo C'l0\ <:'''r "r"r"r<:' 'r~ 00 OOOC 00
('fl 1""'"1, -"4 '" r- r-~'Q~'r <?"? ~ r- "III:t v") "('f"\ 01 -1tr\l""""C\O NOO
~? ~~9~ ,....trr\ \C....-("""'CT'l 0\ \0 OC '<t 00 ..,
+ 1:

0 ~
g
0 en
0 GO 0
W W _, 0 ';:t <1: " :::E !r
W & ..... 0 <JO W
X 1Il
W 0 0::
'" (f) 0
<:> a fa 0
-.J W
~ U
Z !r
g 0
« > 3 15
W 0 N
D I ~ (.9 ~ 0 «, Ul 0 t- o.. 0
::r: >- ::) 0 If) CD ~ 0 en .... en
0
« CO n:: + Ul ..., N ~ ~
a:(f) en 0 0 I I I I ~ I
<D '" 0 '!1 0 0
«:::> ~ " "" w
~ a (/) & ::r:~ z 0
«~ « (f} '<i
~ cr \~ 0
~(f) W W Q._ IX 0:: w
0 > cr. __j
N W <1: z ::E « a
I- M
~ ~ 0:: 0
« ....
~ 0
'" w 0
<D _, <1: ::E 0
"-
C; <Xl
'" en
'" <;2
§ a' N
SA-244 R. G. India/ND/88

~37
TALLE 4·8
Percentage distribution of population of Maharashtra by marital status, 1971 and 1981 Censuses
Total Rural Urban Marital Year Status Males Females Males Females Males Females
1 ' 2 3 4 5 6 7 8
Never married.' 1981 55 ·47 45 ·50 55·03 44·03 56·24 48 ·44 1971 55·92 45'95 55·56 44·71 56·65 48·97
Married 1981 42 ·40 45 ·28 42·50 46 ·11 42'23 43'63 1971 41 ·60 44·29 41·64 44'99 41 ·52 42'58
Widowed 1981 1 ·80 8·70 2·13 9'27 1 ·22 7·56 1971 2'14 9·30 , 2'~0' 9·80 1 ·60 8'08
Divorced/~epa- 1981 0·22 0·50 0·27 0·58 0·15 0'36 rated. 1971 0·29 0·43 0'36 0·46 0'16 0·34

In Per cenl 80
70 60 50
40
30
20
10 o
0 e 7
6 0 0
0
1;0
3b
20 10
o 'I .c
" "' 0 '0 c:
LITERACY RATES 1961
" ... _-"'" I '
I
I I I iii ':: ~ 0 .c CI ~ 0 ~
\ I
\I
1
I II ~
I 1

CHAPTER V
HOW MANY OF US CAN READ AND WRITE?
Literacy Maharashtra has made considerable progress in the field
of education for half a century now. Even before the achieve~ ment of independence, a large number of selfless, social workers had set up school and colleges in different parts of the state and inspite of immense odds, made them enduring institu~ tions.
There are 7 universities, 995 colleges, 64,400 secondary and primary schools in this State. There have been all round efforts to educate masses with the result that the number of literates, educated and educational institutions is on the increase. Though the reduction of illiteracy has been consi~ derable, the over all picture today suggests there is more to do in the field of literacy.
Indian census has always defiend literacy to include only those persons who are able both to' read and write. For being considered a literate it is not absolutely essential to enroll, oneself as a student in school. If a person can both read and write a simple letter with understanding in any language, then he is considered as a literate person. Mere ability to sign one's name will not entitle a person to be called a literate. Children in the age-group 0-4 years .were treated as illiterate even though some of them were found going to school.
Literacy rates are computed in two ways. Gross literacy tates (GLR) are worked out 'for the population of all ages while effective literacy rates (ELR) ate based on population of 5 years and above. The gross literacy rate (percentage of literates to total population) for Maharashtra, accordmg to the 1981 census is 47.18 while it is 36.23 for the country. Thus out. of 100 p~rsons, 53 are illiterate in,Maharashtra and 64 in India. Table 5.1 shows that Kerala is well ahead of aU states with a literacy percen.tage of' 70.42. Maharashtra and then .Tamil .Nadu follow way behind. All our foUr_ neighbours, Gujarat, KamataJp}, 1ndhra Pradesh ana Madliya Pradesh have lower percentage. Out of 21 states, 11 have' percentages higher than InQia's liteyacy.· ,
39

40
TABLE 5.1
Percentage of Literdtes '10 to'M \i';putation, 1981 Census
Percentage of liteartes to total Literacy Unit population. rank
Persons Males Females
2 3 4 5
Kerala 70'42 75'26 65'73 2 Maharashtra 47 ·18 58 ·79 34·79 3 Tamil Nadu 46·76 58·26 34·99 4 Gujarat 43 '70 54·44 32 ·30 5 Nagaland 42'57 50·06 33 ·89 6 Himachal Pradesh 42'48 53 '19 31 ·46 7 Tripura 42'12 51.70 32·00 8 Manipur 41 ·35 53 '29 29'06 9 West Bengal 40·94 50·67 30·25
10 Punjab 40·86 47 ·16 33·69 11 Karnataka 38'46 48'81 27·71 12. Haryana 36'14 48'20 22:27 13. Orissa 34 -23 47'10 ~1 :)2 14 Meghiilaya 34.'08" 37 ·89 30-08 15 Sikkim 34'05 43'95 22'20 \6 Andhra Pradesh . . ' 29·94 39·26 20'39 17 Madhya Pradesh 27'87 39'49 15 ·53
27·i6 .
38 '76 14 ~04 18 Uttar Pradesh 19 Jammu & Kashmir 26·67 3.6 ·.2J 15·88 '20 b1Uar . 26·20 1&-"'11 13'62 21 Rajasthiin 14T~38 36'30 11'42
INDIA 36 :23 46 '8'9 24"';82
.:: Note :-E,xcldues Assam .
• A~ in ~il}~ ~~!l~e of. total, Jit'eJ;:ates, ..I)-erala ... - Maharas!J.Jra. and 'f'amil N'll;.oll. ~ls~ .occupy. 'ihe ,.mst . three ranks ill male and female iheracy rates., 'More ;th~li three;-fourth of the male population j?f l}erala "ip~ ~ql:6 Jita:nl_half. 'the,"malc:; pop;qlation pf, Maharas~.tr~ an? 'TalUil' ~dp llre. li~erate. lyfore. t,han half ·,.the f~mare'papfiratio'l1 of Ketala anQ,.Mc,. {bjrd', of tht;.· popruation of Maharashtra, Tamil Nadu, N"agat~ind and Punjab are literate.

41
There are 29.62 million literates in Maharashtra comprising 19.05 million male literates and 10.56 million. female literates. Out literacy percentag~s is thus 47.2 as agamst 39.2 in 1971. This means a percentage rise in literacy of 49.96 ~ against 24.54 in population between 1971 and 1981. ThIS compares with 49.36 as against 21.41 for IJ?dia (excluding Assam). The percentage for males and females is 58.8 and 34.8 respectively compared to 51.0 and 26.4 in .1971. Understandably, the highest literacy rate for the total (68.18), ~ales (73.91) and females (60.75) are in Greater Bombay. The lowest is in Nanded district.
Table 5.2 shows the district-wise percentage of literates to total population.
Out of our 26 districts, 16 districts come below the state literacy levels. Two in Khandesh region (Jalgaon & Dhule district) one in Konkan region (Raigarh district) all the five diStricts of Marathawada region (Aurangabad, Parbhani, Bid Nanded and Osmanabad districts) and four out of the eight districts of Vidarbha region (Buldana, Yavatmal, Bhandara and Chandrapur districts) fall in this group. The spatial distribution reveals that as we go towards the interior ~he "literacy rates decrease. . The intluence of urbanisation is ev!9.ent from the rates for Greater Bombay (68.18), Thane (50.50), Pune (54.03) and Nagpur (54.56) districts. The low rates for Dhule (37.51), Nanded (29.78) and Chandrapur (34.69)., would have been higher if there had not been so higb a concentration of tribal population in those districts, or remained backward in comparison with other districts.
The m9st b!lckward traltt so far as literacy is concerned is the five districts of Maratha'Yada region and Chandrapur district. Literacy percentage in these districts is below 50.
Rural ~nd Urban literacy
The urban population, as expected, is more literate tpan its rural counterpart because of the need for literate and educated persons in urban occupations and the greater facilities for euucation' availal:1le in urban centres. In Maharashtra, 63.92 per cent of the urban population is literate as agaInst 38.15 among the rural population. Thl'! literacy rates in urban areas of all districts are higher than those' for the (ural areas. The rural liter.acy rate$ vary from 47.71 in Amrayati 9istrict to 25.37 in Nanded district. The literacv rates for urban areas vary from 69.48 for Ratnagiri to 48.12 in Parbhani qistrict.

42
~ 00 J -.i ..... 00\0' ~O'" '-00\ ..... "<too"<t
'"' .,", "''''_ 't9'r 'rlf'9 '"' 't,'Q .s '" '"0 bll I t::- ...
~ "<t .... "'0\00 0\0"'" 0\0\00 0\ 0\ 00 8 ~ ~.5,...,-,...; ,..., "t "t -+ ++T + ',' "l ~', + '-'_!:Ir-- 0 0 '--... 0", OIuu
'" & 0. 0I)'\:l ~..._..
= '" = .;.: 0' ., N u §<=i~ - C
oc ~.-~ Q\ ... -= '"
N .N .....0 .... 0",0\ 0\ '0 <"I 0\1/')1-., ~ 0::- .0::- lQ~'Q ~~~ If'~If' ~'tlf'
.5 ~ I/') I/') «"101", NO\O -r--<"I 01/')'" ~ E '-' '" I/') «"I ...... "<t «"I .... '" "'I'l"<f' MI'lV a ...... ~ 8 I-
0\
'" .... • I/') 0\1/')0\ ov .... ", ..... 0 '" '"
I/') oor--oo -; of OJ If' .,? 9r:--'7* C!i~C? ~~O? 'Qr:-9 e ~ ta ,-...
0- 0\ 'OM 10 'O",0'1'l001'l I'lr--r--00 ~ ... ::E "-' \0 '0 ......... '0 '" V r-- ......... \0 ""'V'O .., >.
= u 01 til
'" E '"
"<t .V 100\_ I'l ..... r-- 10 I'll/') .... 01'0 <II
::l "? .,,? ~C1''r '9r-:-~ ,",90::- o::-o::-"? -; c 8 0
S «"I '" "'-\0 VI'l"'" 1'l00<"l _10'0
~ 10 10 V<"Ion V«"IIO .... "'1/') V«"Ion ..
~
~ = on • I/') 1'l00", v_on on 0 '<I' M .... '<I' ., '" U til 0::- '0::- If'''?9 ~C!'r:-- ~O?~ 'Q~'Q \l.)
~ t ';; €
0 0 '<1'0\\0 Noo .... Nr-v 0",\0
=- - E \0 10 v<'1", VNI/') VMon VMon 00
'" a:: IX) ., .... <1: -;
of f- .. ,..., :~
vOOI'l 10'<1'10 OM'<I' ,...,onv >. ~ '" v:; q'I r:--~:t ~~~ ~9O!J 90::-'? ... ., u ';; M "" M<'1N "'\OV 0 .... 00 .... IOM 0: '-'
t >. ::E r-- .... 101/') .... \Ov>1- 10",\0 ",,,,r--u
~ til ... ..:I 2 g ::l i '" oc • 00 10000 M ..... <'1 <'1_00 V'l .... 0
<=i ":'" 'Q~':' 90::-'f "?o::-O::- 9~"t co 0 ~ ~ I~ 00 co v-..q VNIO ..... I- ~ ...... '" '" \0 10 1/')'<1'", "''<1''0 I/')v\O onv\O
~ 01 _c tJ 3~Z
,-...
'" f-~~ f-p:i~ f-~~ f-~~ f-P:;~ .S:! ~~:5 '-'
tI til
:a .... 0 >. co '" ,D
~ E 0 = .~
,-... III .~ 01 t!-o:: ~ i3 o:s
'" ;> ..c Ci 6ll u '" '0 ... 1il ., = s ... Z &:: ~ ~ -< .;.:
1 S" ac:~ I'l M V '" cr::._-

11"\\0\0 fflO<"> 0'0"" O?t:"'t:'" O?~'Q ~~~ 0\00"" 0I0t-- NN"" -rTT +-;'-+.. i--t-
""NO ~O?t:'" 00101 """N""
43
r- r--- trI N r---. ~ <:'l '? '7" ~ ~ ':" 0000\0 f"I-OO -r~, ~r- -+-!-r
00
QOt--1I) 0I01t-
+ + T + -' +
t--"lN <:'l,:,,<:'l 00t-,..... ..... -t-, r-
I-<a::~ I-<~::J I-<~~ I-<~;::> I-<~::J I-<~O I-<~;::> I-<~~
~
co ..... ..... N .....

44
I ~"'\O 0-'" \OM<t NOON ('<)0\00 00 '" ('<) O\<t'" .~'f' ~~~ 9<:49 ":'~"t ~o::-q- r:-r-:-"'r \QP""l~
! - 0\0\\0 I'- I'- I'- 00 I'- 00 OCI'-O\ \OIDM 'D\O", r:, r:,'oo .... I -+ -+ + +++ "i ++ -, ++ -I + "i- t- + T +++
0 \Q 1'1 M '" <t 00 0 .... - - - - 1'1
""'NO 00""1'1 I'- I'- I'- 0\",,,, ..... ,....., V'> 0\ <"I '" 00 .... 1'1
~~r:- 'P~O!J <:'r:I":' ":'r:I":' ~'7''f> "tr:l'f' 0?t:""'Q 0\ O"<tN 1'10\0\ M'D_ 0000- NO\O o"'"<t ~~~ N,.....,,,,,, 1'1_<"1 N_.q- <'I~'" <'IN"", N_<'>
~~Q «>1'-0\ <:'r:I<:'I
"'<tOO "tC!'<:'I
..... "'N 9"!'<:, I'- ..... '"
<?'~r:--ON'" ~~~ ~~~
00 ~~~ ..... 00 '" ~~$ Ot-\O OOIDO \OON ~~~ V'><t\O "'''''\0 "<t"<tl'- <t"<t\O
8~~ "<t\OO 0_0\ 00\ ..... M M I'- 0\01'1 Ol'-N <:'C!'<:'I <:'''t''t "t9"t <:'1<:''0 ~~~ '9~~
~ t-
~~:g I'- <'> '" "'O\M '" ........ '" '" 0\ MOO 0\ ~~&} ;: M<'I'" MN'" M",.,., M M V'> "'N"<t
tl I 0\ ..... _ 1'-1'-1'- "'0"" 0\",1'- <t-- IDM"'" .oNo\
« r-:-~";l <.?'r:"0? c1?'Q~ "i'r:I"i' <:'I~~ C!'9<:' ,,?~<;I vi \0
O"<t_ 0\"'00 """"" M ~ 0\\0 .... 0\ '" N
\0 __
\ONO <'IN", NN"<t "'N'" NN'" NN'" NN"'" ('iN'"
iII ,_;j
~ "'"<tOO 00 M 00 0\""", - '" '" _000 ..... '" '" ..... QO I'-E-< ~'7'~ ~,,!,C!' 9<:40::- <:,q-o::- ":'~<:'I ~9,,!, r:l0::-C!'
'" 0,"' ..... 00"-'0 \00-0 00",,,, \0 M M "'OOID ..... r-O\ '" '" I'-
.,-,.,-,r- "'"<tl'- .,-,,,,1'- ",.,-,1'- ",.q-IO .,.,"<t'O
\0 00 '" "",r--"-' ~I$~ NI'- ...... 10 N '" 00 ,....; '" '" ..... I'-"<t <:'0::-<:'1 'f'9<:' ~9"!' '7'~"0 '9C!''':' <:'I":''':'
"'O\N <tl"l\Q ::j:~~ ~IO_ C'l \Q
M_N <t"<t'"
MO", ""''<T\O
o<t"<t "'11\10
""''"''''' '" '" \0
'" E-<~~ E-<~;::l E-<~O E-<~O E-<~~ E-<~::> E-<~O
.... N 01
CIl
II '" t1I tii til .... CI 01 .... § Q ,.,.
"0 "0 ::l til :E:: til
'" '1;) CI e ~ 01 ., 01 > "3 :l ..CI ..CI 0 >!
I~ !Xl ~ ~ til
"<t V) \0 I'- 00 '" ,....; ..... ..... ..... ....

~9~ B~~ ~~8 ~8~ ~~~ ~~~ ~~~ VI.,...",," r-.,...'P r-'Ooo r-r-r- r--or- -0.,.,-0 r-VlO\ -,- +, ,- T + + + t-- + 1- --j- + T + -~ t-
-0 00 ..... '!'~7
'N. 00 Il'\ ~""'O
O\Mr-O?~'? ..... r-'"
'MNtr)
...£ ::s . .c: 0
~
- '"C) os .0
~ c:: os ... ;:l
--<
N
.
"<1-0\0 t!',?,r;l
~n;; ~
'"C) os
.0 os c:: os e .., 9. N N
..... 01"1 -000'" . '
3 .§' ...
"0 :: os .c u
'" N
~ ~.~ '0"'-0 '" "'.,.,
"0
iXS
"<l-N
'2 os
..c::
..c:: ... os Q.,
V"; N
'" N
"0 OJ
'"C) :: os z '0 N

46
Literacy rates are less than 50 per cent in the urban areas of only two districts. The two districts are Parbhani (48.12 per cent) and Nanded (48.90 per cent). Urban literacy rates of Sangli (60.53), Kolbapur (62.26), Buldana (60.35), Amravati (61.78), Yavatmal (60.57), Wardha (65.40), Nagpur (64.46), Bhandara (62.83), Greater Bombay (68.18), Thane (65.46). Ratnagiri (69.48), Nashik (61.53), Ahmadnagar (63.55), Railgarh (66.01), Satara (66.41) and Pune (66.62) districts exceed 60 per cent.
Among the 307 towns or urban areas, the highest percentage of literates is found in Dombivli town (79.87%) in Thane district which is predominantly populated by the middle class. The lowest rate of literacy is noticed in Kundalvadi (27.15 % ) in Nanded district. Out of 29 cities having more than one lakh population, J alna city (49.83 %) has less than 50 per cent litc[ates. The Jalna city has a sizeable number of migrant labourers, many of whom may be illiterate. 214 towns have aboye 60 per cent literacy and balance 64 towns are having rates varying between 31 and 59. Kundalwadi is the only town of Nanded district, having the percentage of literates less than 30.
Cities having more than one lakh population account for 73.47 per cent of the total urban literates. The urban concentration of literates is such that above 90 per cent of urban literates arc in towns with more than 20,000 population and only 10 per cent are in the small towns.
Table :-.3 shows the literacy percentage of class I and class II towns.
Male literacy (58.79) exceeds female literacy (34.79) in the State. Out of 29.6 million literates, 19.0 million are males and 10.6 million are females. This may mean that approxima1elv for every literate woman in the population there are two DlaJe liter~tes.
!\mong our districts we find the highest percentage of male (73.91) and female (60.75) literates in Greater Bombay. The districtwise percentage variation among male and female literates is very significant and that of females is considerable. The male literacy vary from 43.32 in Nanded to 73.91 in Greater Bombay while tbe: female literacy rates vary from 15.53 in Parbhani to 60.75 in Greater Bcmbay. The lowest maJe literacy rate is 43.32 in Nanded district which is almost equal to the highest female literacy rate (If 44.62 in Nagpur di~trkt.

47
TABLE 5.3
Literacy percentage of class I and class IT towns in Mabarashtra, 1981 Censll
Total Male Female literates literates literates
('ity/Town to total to total to total popula- male female tion popula- popula-
tion tion
1 2 3 4
Class I 1. Gr. Bombay 68 '18 73·91 60'75
2. Nagpur 65 ·81 73·12 57 ·82.
3. Pune 67·34 74·73 59 ·19
4. Solapur 53 '11 65·57 39'76
5. Kolhapur. 66·85 75·52 57'22 6. Thane 68 ·37 74·75 60·47
7. Jturangabad 58·94 68·74 47·65 8. ' Ulhasnagar 61 ·15 68'32 53 ·13 9 .• Nashik 67 ·10 74'86 58·63
10 .. Amravati 64·72 71 -39 57'43 11. Malegaon 50·94 59·98 41 ·82
12. Akola 60·94 68 ,01, 53 '18 13 .• Pimpri-Chinchwad 60 ·03 68 '56 49·83 14 .. Dhule 60·69 69·69 50·71 15. Nanded 53 ·89 65 :15 41 '46
16. Sangli 63 ·37 72 :Zs 53'54 17. Jalgaon 64·20 73·28 54·31
18. Ahmadnagar 68 ·12 76·79 58'59 19. Kalyan 72·05 77·85 65·45
20. Ichalkaranji 56'47 66·85 44·27
21. Bhusawal 65 '82 74'67 56'23 12. Jalna 49·83 62 ·16 36·80
23. Chandrapur 64'56 73 ·8-1 54'23 24. Bliiwandi 56·84 63 ·19 47'26
25. Latur 52·91 65·94 38·26
26. Parbl)lLni . 50·62 61 '95 38 '14
21. Miraj 58·97 69·56 47'63
211. Dombivli 79·87 82·42 79'96
2fJ. GondiYa. 63·67 73·75 53 '10

48
TABLB S.3-Contcl.
2 3 4
Clasf II 1. Ambarnath 58·78 67·42 48·48 2. Y"vatmal. 67·16 74·37 59·29 3. Wardha 70-03 76·98 62'48 4. Pune cantonment 74·27 82'00 67·09 5. Satara 72·60 79 ·69 64 :1)8 6. AchaJpur 58 ·62 65·91 50·85 7. kirkee cantonment . 73'68 82 '32 61·69 &. Bid 57 ·04 68'95 43 :93 9. Nashik Road Deolali 65,76 74'83 55·65
1<!. Barshi 58·94 71 ·09 45'5Q 11. Amalner. 57'32 69·90 43·81.
12. Kamptee . 60·22 68 ·90 51 ·15 13. Nandur]Jar 62 -01 72 ..23 59·93 14. Pandharpur 62'26 72'90 50'715 l~. Khamgaon 65 ·.15 73·94 55·52 16. Ballarpur 51 ·47 60-88 40·95 11. . Chalisgaon 61 ·38 73 ·.45 48'19 18,. Hinganghat 62 -62 71 '77 52·78
1~. Deolali Cantonment 73,91 84-75 52·65
2Q. Bhandara. 65'Z8 74,85 55·13 21. Shrirampur 57 '35 66'52 47·66 22. Karad 65 '-34 73 '.73 55 '71 23. Akot 55·99 63·26 48·30 24. Manmad. 61 ·67 72·15 50·59 25. Udgir 54·69 67·33 40 ,39'
- __ .. _-The female literacy rates are so poor that in 9 out of 26 districts there are more ihan 75 femal~ illiterates among ev~ry l(jU females. In the districts of ~\lhrathawada region and in Cbandrapur -district, the position is still worse. The percenta~
-of female literates in these districts are less than 20. .
Decadal growth of literacy The number of literates in Maharashtra rose from 20 mil
lions in 1971 to nearly" 30 millions in 1981, a percentage growth of 49.96 as against 49.36 for India. During the same period, the number of male literates went up from 51.04 per cent itt. 1971 to 58:79 per c~nt in .1981 and that .o{ fe~ale litera~. from 26.43 per cent ill 1971 to 34.79 per cent m 19tH.

Adult education class in progress
5B- 244 R. G. Indict/88

49 TABLE 5·4
"GrOwth of literacy -------------------_._. __
1971
1981
Percentage increase (19'71-81) Maharashtra
India
Person literates
19,752,608
29,620,806
49·96
49'36
Male literates
13,331,079
19,056,503
42·95
43·99
Female literates
6,421,529
10,564,303
64'51
61 ·55
All th'e five districts of Aurangabad division (Aurangabad, Parbhani, Bid, Nanded, Osmanabad) and Chandrapur district,
",which. at:e considered backward in literacy, have registered a higher growth of literacy ilian other districts. The variation is from 49.13 in Osmanabad to 63.60 in Nanded. TIe districts in which the number of female literates has near about doubled are Thane, Nashik~ Dhule, Ahmadnagar, Sangli, Kolh'apur, Bul~ dana, Yavatmal, Nagpur and Chandrapur.
- - ~
The figures for Maliarashtra for age-group 5 -9, 10-14 and 15 -19 for rural and urban areas is given in table 5.5. .
TABLE 5·5
Literacy rates in age-group (excluling 0-4) for rural and urban areas of Maharashtra, 1981 Census
Age-group Rural Urban
M F M F
f 2 3 4 5
. All ages. 100·00 100·00 100'00 100'00 5-9 11.50 17 ·49 9·78 13 ·54
10-14 20·62 -28 ·13 14'46 19'08 15'-19 '. 13 ·42 15 ·44 12 ·66 14'47
~ - - -,::LiteracY"among S~ and Sr. .::'" . ~oW' we ~~ c6nsi~et: th~ literacy. rate of scheduled castes "arW ~h.eEuf~ trl~es :popul~ioI} in, Malfarashtra with the; general -popUlatIon.

50
.8 .., ...r on 0\ \D t- on <'I 00 ..., 00 a- t- a- \0
~ q'lr:- <:'I ., "? <? r:- q'I ':" r:- ':" <? 'f' <?
·c ..... .... \0 \D a- \0 00 \0 00 t- ..,. 01 on t- ~ !-<t:l 8 .... rfl .... .... <'I .... rc:s.9 ~ .,--01 ::1;3
000 ..". on .... ~ ~ a- .... .... ? ~ ~ ~ ~& ~ ~~ ~ ~ ~ ~
"" <:'I '" \0 <'101 N rfl rfl on rfl 0 \0 0 0 v ~ ~ = <a '" til M on N N N <'I rfl N ..,. ..,. on c ~ ., U ...
rflN t- \0 co ,..., 00 ..... N ..,. ..... \0 II") ao .., 00 0\ ., 'Q'r q'I 'f' q'I ~ 'Q <? ~ ~ "? 'Q ':" "? .....
!; <a on .... co .... ..,. \0 \0 0 00 0 t- V ~ II") 00
§ ~ NM rfl rfl N <'I N .... N N N ..... ......
(Ijt:l :.-: Uo ~ "'0 ',0
.,01 on on 00 ...... ~ on t- '" ~ .... rfl \0 00 0 8- "3"3
<IJ O?O? <? "? <? ':" 'Q 'f' 'r q'I 'Q 'r ""Co. c::>. "0 ~ ...r 00 0 ~ t- .... \0 «> 0 0\ ..,. V .... '" 0
f .go. 01 V \0 11"1 on on If'I on ..,. 11"1 II") .,... ..,. II")
., til ~ C .,
t;!l t:l '"
0- 11"1 11"1 t- 11"1 on .... 0- ~ ~ I""- 0 \0 0-.., 0 ., ~r:- ':" <:'I ':" "? <? ~ 'f' 'f' q-. r:-
c .~ Cd rfl ..,.0 0 ..,. co ...... \0 ..,. 0\ ~ 11"1 ..., '" 0
ell
"& 8 ..., \0 V .... .... <'l N M N ...., ""' N rfl
!-< ~ 00 0 ~
.., 0. CI
~ 0\ ...... ~ ~ ~ $ ..... 0\ ... \0 '" 0 ,..., If'I
If'I ell '" r:-~ ~ ':" 'Q ':" ~ r:- ~ 'r
~ U .£ N 00 .., '" I""- 0- 100 00 ...... 100 11"1 ..... 0- ""' C7\ til ~ ~
ont- VI 11"1 VI 00 V '" .,., '" \0 on on 11"1
~ '" 0 fS -= -101)
c 0 E! <II
~ <IS .... >. Co> os ...
:E C> .ra ! u :e u.
2i ... ... co os
~ ~ ~ S .~
i 00
J r ~ .t:l :a 8 ~ ~ !:I
• ~'<~ ii 8 :a -3 '" j j .Il. J 00 fa ~ ~J ~ 8 ~ til til rn ~ .:.: . ..,i ~ ~ on \d"r-= 00 0\ d .. N"coi .....
'i' ... ... ...

51
..;- r- oc '" 00 00 .... 0- '" M N 0- 00 "? '" <:' ""!" '? ":" <:' '0 '!' '!' '? '!' ":"
'" '" 00 r- 0 M 0 '" !'l M 0 r--..... N ..... N M
00 M .,... 0\ 0 r- '" r--~
r- ~ r- 0 'Q ':"' 'Q ":" <:' '!' <:' '!' ':"' '!' "'t ':"' r- oo 'I;> <') V) 0 'I;> '<t '" '" M 00 ..., N N N '" M '<t '<t '" '" '<t 10 '<t M.
0 00 0 r-- .,... 'I;> 0\ 00 00 N 9 ..... ":" 'Q r:- "'t '? '!' ":" "';" ':"' "? '!' 0- r- 00 r- ..... 10 0\ 00 0 0 '<t M 0 ..... ..... N N M M M N
0- 10 M '<t '" 00 '<t M r- M 0\ '<t .,... ~ "'t 'Q "? '!' '" <:' "? '!' "'t "? <:' "? r- 0 ...., ..... '" r- oo M '"' '<t '"' M 10 M M M '" M '<t '<t .,... ~ 10 10 '"' '<t
'I;> M r-- ~ 0 r- IO .,... '"' M N 0\ N
~ 'Q ":" ""!" '!' "'t 'Q "? 'Q '? "'t ":" 0-. 10 r-- V'> N 0-. .,... N '"' 0 :1= 0\ '" N M '<t N V N !'l
0 r-- N N M 00 V 0 ..... 9 "<t .... M "? '? "? '!' r:- '? 'Q 'Q ":" r:- '!' t;-o ~ .,... M 00 00 0- 0 ..... r<l 00 \0
'" ..;- "<t "<t V 10 .,... '"'
.,... '" '" 10 '<t
"'0 os "0 .... .0 01 S-os
"(3 .0 ~ / os bJl
"0 os os ~ e os ~ ... ~ os os c os II.) c c os > :g '0 '0
::l .s::: '0 os os "0
os ~ 6'ii c C .0 c e "0 e .... ... ... "0 ""3 > os os os ::1 os os ell ~ os os .s::: .s::: _-<: ~ ~ z 0 ~ -<: -<: >< ~ \~ ~ U
~ vi I.Ci r-: 00 0\ 0 .... N ...; v vi I.Ci .... - .... N N N N N N N
5D-244 R G INDIA/ND/i8

1.5
1.0
30
30
~ 25
" <t ..J
Z ;;; 20 w \-. <1: cr W
S lS
10
S
0
MAHARASHTRA LITERATES BY AGE -GROUP, SEX AND LEVEL OF EDUCATION 1981
.. ..
.. ..
.. ..
.. ..
<II '" "B C ::r E
•..
Graduate and above Matric/Hlgher S.econdary/ ] Dip.(Tech.& Non-Tech.) Mid~le
Primary
Literate (without·educational lev"l)
~/ ~
• 60+
AGE- GROUPS

53
The male literacy rate is 58.79 per cent among the genera] population, 48.85 per cent -among the SC population, and 32.38 per cent among the ST population. The female literacy rate is 34.79 among the general population, 21.53 per cent among the SC popu1ation and 11.94 per cent among the .ST population. The lowest _literacy is in Parbhani district for general as well as SC and ST popu1ation.
School and college attendance Now, let us consider the persons attending School/Colleges
in Maharashtra State. Table 5.7 shows the age-group wise percentage of rural and urban popu1ation attending schools and colleges.
TABLE 5·7
Percentage of population attending school/college in Maarashtra State, 1981 census
Age:Group
All ages
0-4
5-9
10-14
15-19
20-24
25-29
30--34
35-t
Rural
Male Female
2 3
20·53 11 ·60
0·33 0·28
52'01 38·98
67 ·31 39·93
31 ·91 8'23
6'48 0·66
1 '20 0'22
0'48 0·14
0'30 0·08
Urban ----
Male Female
4 5
26·24 22·87
2·29 2·04
69·09 64·78
84·74 75·26
53·69 37·95
17·59 7·51
3 ·84 1 '36
1 '49 0'7
0·89 0·40
It may be seen that population percentage attending school! college is more in urban areas than' in rural and 5-9, 10-14 and 15-19 are the age-groups where main concentration of l'opulation attending school! college is observed.

CHAPTER VI
LANGUAGE SPOKEN
In the 1981 Census a new question on the 'language mainly spoken in the Household' was asked in the Household Schedule alongwith the two usual language questions on 'mother tongue' and 'other languages known' in the Individual Slip. The institutional households which are linguistically heterogeneous and may not have a uniform household language are excluded from these data. Out of the total population of 62,784,171 in the 'State, the institutional population is only 553,889 constituting 0.88 per cent.
Question 5 on 'Language mainly spoken in the household' in the Household Schedule was canvassed in all the households other than institutional households. The raw returns were rather unusually large. AU these returns were scrutinised following usual linguistic methods including studying 'Language specimens' and undertaking field investigations.
The distribution of the 1981 household population by languages, grouped into scheduled languages and languages other than scheduled, is shown in alphabetical order in parts A and B of Table 6.1.
TABLE 6'1
PART A
Table showing the speakers of Household population by language mainly spoken in the housebold (inclusive of Variants grouped under eadl) spfcifietl
in Schedule VllI to the Constitutlon of India
1. Assamese
2. Benga!i 3:-0uj!irathi
4. Hindi S. Kannada 6. Kashmiri 7. Malayalam
Languages
S4
Number of speakers
2
593 88,040
D584,.323 4,147,199
920,1~8
1,098
220,871 ,

8: M:trathi 9. Oriya
10. Punjabi 11. SanskTit 12. Sindhi 13. fami! 14\ Te!ugu
IS! Urdu
55
TABLE 6. -Colltd.
TABLE 6.1 PART B
2
45,816,753 15,581
184,053 281
517.874 300,348
936,928 4,319,067
59,153,116
Table showing the speakers of Household population by languages mainly spoken in the Household (inclusive of Variants where grouped) other than those specified in Schedule VIn to the Constitution of India.
Languages -------------
1. Adi
2. Agami
3. Ao
4. Arabic/Arbi
5. Bhili/Bhilodi
6. Bhumij •
7; Goorgi/.!{oda&u
8, .Qogri
.~ Englisb. • 10. Gondi
1., GotidlitliJNepali
l~ Jfld~b). l~~."IlWa.w.1 .
6--244 R. G. India/ND/88
'_
No. of speakers
2
29·
7
1,281
757,140
12-85
273·
11!6~
452,'413'
23,428
l0'6;O§g. 5,

56
TABLE 6.1 PART B-Conld.
2
14. Khandeshi 107,646
15. Kharia . 16
16. Kinnauri 42
17. Kisan 6
18. Khoda/Kora 3
19. Kolami . 64,974
20. Konkani . 212,214
21. Korku 109,085
22. Karwa . 18
23. Koya 52
24. Kurukh/Oraon 427
25. Ladakhi . 28
26. Lahanda 2,487
27. Lushai/Mizo 54
28. Manipuri/Meithei 85
29. Munda . 101
30. Mundari . 95
31. Naga 4
32. Santali 34
33. Bavara 3
34. Tibetan 804
35. Tulu 46,]44
36. Other Languages 97,247
TOTAL 3,077,166
Out of tho total population (exclnding institutional househo)d population) of 62,230,282 in the State, 59,153,116 are the speakers of schedule VIII languages constituting 95.06 per -cent and 3,077,166 are the speakers of other languages consti.tuting 4.94 per cent to total household population.
In both parts A & B of the table, variants have been grouped in some cases under the relevant languages. This has been done on the basis of linguistic information readily available or in the light of studies already made. These identifiable

57
variants which returned 10,000 or more speakers each at allIndia level and have been grouped under Parts A and B languages are shown below: Part: A
1. Gujarati
2. Hindi
3. Kannada
4. Kashmiri
5. MaI.tyalam
{i. Oriya
7. Punjabi
8. Sindhi
9. Tandl
10. Telugu
Part B
1. Bhil/Bhilodi
2. Gontdi
3. Khandeshi
4. Konkani
S. Korku
6. Lahanda
Gujarao/Gujarau, Saurashtra
Awadhi, Banjari, Bhadrawahi, Bhojpuri, Braj Bhasha, Bundeli, Bundelkhandi, Chattisgarhi, Garhwali, Haryanvi, Kangri, Khariboli, Kumauni, Iabani, Lamani/ Lambadi Loria, Lodhi MagadhijMagahi, Maithin, Malvi, Morwari Mewari, Mewati. Nimadi, Padari, Pahari, Pangwaali, Pawaxij Powori, Rajasthani, SadanjSadri, Sugalin
Badaga Kuruba/Kurumba
Kishtwari
Yerava
ReJli
Bagri
Kachchhi
Kaikad i, YerukaLJ fYerukula
Vadari
Baori, Bareli, Bhilali, Dhodia, Gamtij Gavit, Kokna/kokni/lfukna, Mawchi, Pardhi, Rathi, Tadavi, Varli, Vasava, Wagdi.
DorIi, Kalari, Kawan, Maria, Muria
Ahirani, Gujori-Khandeshi
Malwani
Muwasi
Multani
All other returns falling under Par~ B and which returned less than 10,000 speakers each at the All-India level or were not linguistically identifiable are included in the Category 'others' occurring as the last entry in Part ~.

Saint Dyneshwar-Fonnder of Bhagwat Dharma
6A- 244 R G INDJA / ND / 88i

,..,.,.,. rFf I II nnr-..
~ , 'I <t:
z ...- 1, 1 ~ 0 co 'iF- I
C1> , 0 (/)
~~ ' -....1 ' <t:
~ ...- 1 · 1 (flO
~ :::~ : : ::::: :. ;,:,,1 ,- 0::
W CD <t: zZ
_j 'I 0<1:
~ ~ \ .S" .. .. IIIIIII :
I -(fll-
• <DO • I I I 1
i <t: S?20
CL
Ir ~lr ~ (fl -'02
~ I- W~
0 U') ~ a:~60
a I: J~ I: I: ~ : 1: :r vi a:::>-w
« 0 2 W(flS?t-
-;J! tfl '1:.:I;:'?r" 0 :ra:-'<I:
LL 0:: ::> « 'f-::>Wr
,...." r-.. 1,1,1,' CD --. ~o._a:U1
CD I-- -N I
I • I
001 0;"
z U') a « t- o::: lJ) « 0 I CL « ~~
2 2 ~~ 0 o . (fl
u 0 0 z
(fl « Z
(fl ~ i= U') «
::::> ::: ~ U1
~ 0 lJ) a: :r: z ::::> I :>::
0 « I ~ U Vi
(.!) 0 ~ 1m _j z <t:
LLJ - a
a:: z z
~ 0 z "-u. a 0
III ::> III z W u --------------

woman in a traditienal dr ...
68-244 R. G. fudia/j

J \.
.... o
'" '" '" "0 .. '" Q

CHAPTER VII
The Religions we follow India whi£h is a seculal" State and every decennial Ulnsus
provides' atl interesting picfute. 'ot ~tne 'religi9bs persuasiods of the people. . .
The figures represented are based '()n th~ :in'formation collected 'on tM religion of .... the head' 6f l1otlsehold from the household schedules canva·ssed at the time of 1981:: Census .
.;.
In ·the census, information 'On turned by. the person en~erated. religion" it ~was recorcfea ~ sucb. charactt!riStic or pojmlhtion.
['eligion is recordeo as ;'eIT anybody said he has no
Religion is an impordmt
Hindus, Muslims, Christians, Sikhs, Buddhists and Jltins are the nume];ically itbportant religious communities in India. The Hindus, with '82.63 per cent share in total pOllulation, predominate and are followed by Muslims with 11 . .,,6 per cent, Christians 2.43 per cent, Sikhs 1.96 p'er cent, Buddhists e.n per cent and Jains 0.48 per cent.
Table 7.1 shows the religious composition of 'the population in India and in Maharashtra.
The percentages. of Hindus 81.40, Muslims 9.25, Christians 1.27 and Sikhs 0.17 in Maharashtra of its total population are less than those of India for these ,religions. The per<$ntages of Buddhists (6.28%) and Jains (1.50%) are higher than those recordea for these religions on India level. As in Iifdia and other states, Hindus in 'Mahatashtra, numbering more ihan 51 million, form the largest single community. Muslims "'ith a population, of more than 5.8 million 'are the second largest religious grot1):i'though their population is around une-nineth of the Hindus. The third largest group is Buddhists with -3.9 million population. The percentage of Buddhists in Waha:rashtra (6.28%) is about nine times larger than the India ngure. This concentration is owing to the fact that a sizeable populatido of Hindu scheduled castes- embraced Buddhism in 1956. In T951 Census only 2,395 'Buddhists popplatitm 'was enumerated. Out of them 1,497 were in Greater Bombay district. Jains, Christians and Sikhs follow with 9.39 lakhs, 7.95 lakhs and 1.07 lakh!! respectively.
S9

60
I~

61
An overwhelming percentage of Indian Jews reside in Maharashtra. Other religions and persuasions reported only 74,386 and religion not stated only 6~283.
Table 7.2 shows the details distribution of population (per cent) by religions in States for 1981 Census.
On numerical strength, Uttar Pradesh and Bihar States have more Hindus than Maharashtra. Maharashtra's share of the country's Muslim, Christian and Sikh populations is comparatively smaller, but its share of Buddhists 3,946,149 or 83.61 per cent and Jains 939,392 or 29.30 per cent is the largest among the states in India. Uttar Pradesh, Bihar and West Bengal have more Muslims than Maharashtra. Karnataka, Goa. Daman & Diu, Manipur, Meghalaya, Nagaland, Andaman & Nicobar Islands, Mizoram, Kerala, Tamil Nadu and Andhra Pradesh have more Christians compare to other religions. Punjab accounts for 77 .99 per cent of the total Sikh population in the country. Similarly, out of the total other religion!! and persuasions 2,766,285 in India, only 74,386 (2.69%) are in Maharashtra. Bihar, Jammu & Kashmir, Kerala, Karnataka, Uttar Pradesh and West Bengal and Union Territories Lakshadweep have larger percentages of Muslim population.
1981 Census Distribution HINDUS are in majority in all the districts of Maha
rashtra, the percentage varying from 69.30 in Greater Bombay to 90.02 in Dhule. Dhule has the highest percentage of tribal population, most of whom have returned their religion as Hindus. Thane and Chandrapur which have also sizeable tribal population have shown a high proportion of Hindus. Hindus form more than iO per cent of the population in all the districts except the district of Greater Bombay (69.30% and the contiguous districts of Aurangabad (74.05%), Parbhani (75.46%), Nanded (77.49%), Buldana (75.71%), Akola (69.51%). Amravati (76.41%) and Nagpur (77.77%). Most of the districts of Bombay and Pune divisions (except Greater Bombay) have -high pTOportions of Hindus population while the districts of Aurangabad and Nagpur divisions (except Bid, Osmanabad, Yavatmal, Wardha, Bhandara and Chandrapur) have less proportion of Hindus. The share 01' districts of the Hindu population generally .... conforms to their share in the total population of tbe state. Greater Bombay district has largest proportion (13.13 %) of the totarpoJ5ulation of Maharashtra and of the total Hindu popUlation (11.18 %) of the state. On the other hana, Wardha district has least proportions (1.48%), of the total population and of tl!e Hindu population (1.47 %) of the state.

'" I'l .;S 'iii .;:::: .c U
'" .§ ,gj J::E
I'" 1-6 c:
Ii
~
62
r->'oI-_NV) f'I~V"'¢" ·~'VX)v-vNO
~ 9 r:-- 9 r:-- ~ '7"Y'? 'Q . 'Q r:- ~ ~ '7' C? t::"" ~ NO oonNO~N ~--O"'O_~ N -_
r-NN ~l 9 9 000
'9$~$~~?~~~9:? OO""!._N ::!-O\oooo
?~~~~99~~~~9$98~~ ~9:r8 8°o~-oo~o~~ooooo~ '?"¢~ -$09~~~~~ ~'P999!;~~q!$~~~ 00000--0 8
66°00 00 0--:0 ....-'(~
~~~~~~$999~9?9~~~ 8°00'O0-00-00000~ ......
0 t- OO N 00 N~ '" OOOON_ V\ lrr r-- ~~ 9 "? '0 "?9 99 r:- ':''7'~~ r;. ~~ "':"'r:-' 0 00 ~ 00 00 0
~ ~N ~N ~"'N _0 -O 0 'Xl tr)0\0\0\ -,j" t- -0\ ...... '0 N '0 NO
.......
~
9 0
9 o
-':' t-
~
'" .::> 00 7'9 ~ o -00 00 ~
0 0 9 00'000 ""!" '";" ':' '9":"'99 '0 r:-~ ':' ~1.0 ",18 .... .0 '" <"'>0 0'" '"
t- ,... t-ooo 0 0<"'> <"'> 0 M~ N ..... -
0 ""' '" '" 0 ""''''0 0- N 0 '0 "'1" NOOMt- "¢ N <'>0 "¢
9 ~ '0 '0 -~~O? ~ "? ~~ 99'Q7''Q 9 "? ~~ ~ 8
00 0 '" NOO '" N 00 0\0 00 ~ -'" 0 t- o '0 r-N - ~
::) 'd I'l ro

63
MUSLIMS the second largest religious group in the state, :is also spread over all our districts. Greater Bombay accounts for about one-fifth of the entire Muslim population of the st~te. There is no large scale concentration elsewhere in any of districts. However, there are some concentrations in some tahsils ·ahu towns. The five districts in Aurangabad division together have 21.08 per cent of the state's Muslim population while "eight districts of Nagpur division contains 18.20 per cent. The ~lowest share 0.64 is found in Wardha district.
The district-wise percentage of Muslims to total population varies from 2.39 in Bhandara to 15.97 in Aurangabad. In aU the districts of Aurangabad division which was a part of the -erstwhile Hydrabad state, the percentage of Muslims exceeds "the state average of 9.25 per cent. The other districts which hllve higher percentages of Muslims than the state average of 9.25 are Greater Bombay 14.80, Nashik 9.67, Jalgaon 10.83, Solapur 9.48, Buldana 11.00, Akola 13.12 and Amravati 10.91. The districts where the percentage is less than 5.00 of total population are Satara 4.24, Wardha 4.03, Bhandara 2.39 and Chandrapur 2.92.
BUDDHISTS in Maharashtra are concentrated more in the districts of Nagpur division which contain 42.87 per cent of their total population in the State that is twice as great as the share of these districts in the state's general population. While that of the districts in Pune division (12.50%) is half as much as the share of their general population. The share of the districts in Bombay division (25.08%) is about two-third as small.
The district-wise percentage of Buddhists to total population varies from 1.01 in Kolhapur to 16.21 in Akola. In all -districts of Nagpur division, it exceeds the state average of 6.28. The other districts where it is higher than the state average are A'Urangabad 7.89, Parbhani 11.91 and Nandcd 9.84 of Auran!,rabad division.
CHRISTIA~S account for 1.27 pcr cent of the total population or the state. Greater Bombay (4.79°,{) has the hig-hest p~;-c(."ntngc of Chrbtians followed by Thane (3.29"C). The only two other districts having a population of Christian popu)ation above one per cent are Pune 1.82 and Ahmadnagar 1.39.
Of the total Christian populatipp in Maharashtra, 90 per cent is found in the districts of Bombay and Pune divisions. Less than half c5f the total Christian population is found in Greater Bombay 49.62 ner cent. Than<.: with 13.84 per cent, Ahm'lltlnagar with 4.72 per cent and Pune with 9.53 per cent.

64
The Christians are generally concentrated in towns which'were formerly European settlements. In Maharashtra, 77.84 per cent population resides in urban area and only 22.16 per cent in rural areas.
JAINS form 1.50 per cent of the total population of Maharashtra. Kolhapur district has the largest percentage of 4.86, followed by Greater Bombay with 4.15, Sangli 3.68, Pune 1.58, Ahmadnagar 1.24 and Thane 1.36. In all the remaining 20 districts Jains form less than one per cent of the district's population.
More than the one-third of the Jains in the State i.e. 36.40 per cent are found in Greater Bombay and another one-third i.e. 34.50 per cent live in six districts of Pune division. Kolhapur district has 12.97 per cent, Sangli 7.17 per cent and Pune 7.02 per cent.
SIKHS in Maharashtra form hardly 0.17 per cent at Ule total population of the state. They form a very small part of the total population in the State. Highest concentration of Sikh population is in Greater Bombay. They constitute 51,808 persons or 0.63 per cent of the total Greater Bombay population. Greater Bombay has concentration of 48.30 pef'" cent of the total Sikh population of Maharashtra. Pune has 11.07 per cent. Nagpur 8.48 per cent and Nanded 5.37 per cent, Nanded has a famous gurudwara, but the Sikh population in this district is considerably less than in Greater Bombay.
Rural and Urban distribution Slightly more than one-fourth of the total Hindus and one
third Buddhist population stay in urban areas. In contrast, two-third of the total Muslim population and over three-fourtbl of the total Christian population is found in urban areas. About two-thirds of J ains reside in urban areas and practically the 90 per cent population of other religions and persuasions is found in urban areas.
The proportions of Sikhs and Jains in urban areas are also very high.
This is in keeping with the general trend that religious ' minorities have large proportions of tbeir population living itt urban areas.
Table 7.3 shows the grow.th of general population ano. major religious communities of Maharashtra for 1971-81.

.S
to-
j
00
65
~ ~ ~ ~ ~ g ~ ~ ~ g ~ ~ g ~ ~ ~ M M
o ~
l' I
~ ~ ~ ~ ~ 9 ; ~ ~ ~ ~ ~ ~ I 1 ~ ~ ~ I ~ ~ ~ ~ ~ ~ ,
~ ~ ~ ~ ; ~ ~ ~ 9 ~ ~ ~ ~ 1 0 1 7 1
tr'I 00 ("r'} t-c;> ~ ~ ~ o \0 ~ !'t
I I I 'I ~ ~ ~ ~ ~ ; ; ~ ~ ~ ~ ~ ~ ~ 3 : ~ ~ ~ ~ ~ ~ ~ ~ ~ ~
~ ~
~ tq\ M 0"'1 00 """'" v 0 t'f') tf'j V) l.f') 00 ('f') ('fj
~ ~ ~ 9 ~ q:: ~ 00 ~ ~ M 3
8 ~ ~ ~ 8 , , $ ~ ~ 00 ; ;
~ ~ ~ ~ ~ ~ N ~ ~ ~ 00 ~ ~
~ 9 ~ , ~ ~ ~ ~ ~ ~ ~ ~ ~ ~ ~ ~ ~ \0 ~ ~ ~ ~ ~ 00 00 ~

66
N 0 ~ ~ ~ ~ N ~ 0 ~ 2. ~ ~ ~ ~ ~ ~ ~ ~ ~ - ~ ~ ~ 9 ~ ~
~ 0 ~ ~ ~ 00 ~ ~ ~ ~ ~ ~ ~ ~ ~ I~ ~ N " N N N N ,,~ ~ ~ ~
~ I; ~ 8 ~ ~ ~ 8 ; ~ ; : ~ 00 ~ ~ ~ I ~ i ~ ~ 0 ~ ~ I ~ ~ ~
~ ~ v 00 ~ ~ ~ ~ ~ 00 ~ ~ N ~ ~ ~ 9 ~ ~ ~ ~ ~ 9 ~ ~ ~ ~ ~
~ ~ 0 ~ N ~ ~ ~ ~ M ~ ~ ~ ~ ~ INN 0 ~ I I ~ ~ ~
~ ~
't "':" ~ ~ ~ ~ ~ ~ ~ ~
~ ~ ~ ~ ~ ~ ~ ~ ~ ~ ~ ~ ~ 8 N ~ ~ N ~ ~ ~ ~ N ~ ~ ~ ~ ~ ~
2 o Z

67
Trends
Hindus have increased. from 41.3 million in 1971 (26.98 per c~t during 1961-71) to 51.1 million in 1981 (23.73 per cent during 1971-81). Thus, it may be seen that growth rate f9f, l;Iindus has gone down by 3.45 points. The districts-wise percentage increase in Hindu population is from 4.23 in Ratna&!r~j tp 41.47 in Thane.
-The Buddhist population rose from 3.3 million in 1971
to 3.9 million in 1981 that is by 20.89 per cent as against 24.54 fpI:., the total general. pppulaJioq. Ip. 1951, there were only 2,395 Buddhists in Maharashtra. Following the conversion of large numbers. of Hindu scheduled castes to Buddhism, their population rose to 2.8 million in 1961. Table 7.3 shows the <listrict-wisc _decadal variation in Buddhist population is from' 3.01 in Satara to a rise of 64.51 in Greater Bombay. The Ch,ri~tian -population in Maharashtra rose from 717,174 in 1971 to, 795~464 in 1981. During 1951-1961, the Christians had s4Qwn a growth rate of 29.39 per cent, which was higher than the average for all religions.
There were 4.23 million Muslims in Maharashtra in 1971. Their population in 1981 rOSe to 5.81 million, an increase of 37.15 per cent which is more than that for any other major religion. In Thane, and Chandrapur their population rose by 94.99 per cent and 69.39 per cent respectively. Other districts wJljch have shown more than 40 per cent increase are Greatel' !t~!?!lY (44.65%), PUne (56.41 %), Dhule (42.48%), KolhaRur (49·_?2%), Nagpur (47.07%) 'and B:qandara (48.45%). Th~ higher lOcrease appears to be due to comparatively higher fertility rates and immigration Qf this community from outside the state. The Muslim growth rate has always been higher than t~ average for all religious groups.
-. T.h~ growth of Sikh population appears to be substantial d.uq~g. the last dec,ade. In 1951 there were 37,017 Sikhs in Maharashtra. In 1961 their number rose to 57,617. It increased to 101,762 in 1971 and further increased to 107,255 in 1981 showing a growth rate of 5.40 per cent during 1971-81..,
Jatns. in Maharashtra have also shown rapid growth upto l~i-h 'Lhe rates fQ):" 1951-61 and 1961-71 were 43.86 per cent- and 44:88 per cent. The high rates appear to be due to immigration from outside the state and a greater tendency to get themselves returned as Jain~. Growth rate for 1971-81. is 33.50 per cent. - -

CHAPTER vm SCHEDULED CASTES & SCHEDULED TRIBES
Scheduled castes and scheduled tribes constitute a sizeable chunk of India's population. Scheduled caste population of 104,754,623* persons forms 15.75 per cent of the population. While members of various scheduled tribes number 51,628,638.
and account for 7.76 per cent of India's population.
Under the constitution scheduled castes mean such castes, races or tribes or part or group within such castes: Race or tribes as are declared to be scheduled castes by the President by notification under article 341 (1) of the constitution. Similarly scheduled tribes mean such tribes or tribal communities, or part of group within such tribes are tribal communities as are declared by the President to be scheduled tribe under article 342 of the constitution. The list of scheduled castes and scheduled tribes applicable to Maharashtra has been taken from the lists of earstwhile States of Bombay, Madhya Pradesh and Hyderabad, irrespective of whether a particular scheduled caste or scheduled tribe existed in Maharashtra or not.
Scheduled Castes :
At 1981 Census 4,479,763 persons were enumerated as belonging to scheduled castes in Maharashtra. Thus they form seven per cent of the total population of the State. Although Maharashtra contains 9.2 per cent of India's population its scheduled caste population accounts for only 4.28 per cent of the scheduled caste popUlation of the country.
Uttar Pradesh has the highest number of scheduled caste population in the country (23,453,3~9). Apdhra ~radesh, Bihar, Madhya Pradesh, Karnataka, Onssa, Punjab, Rajasthan, Tamil Nadu. and West Bengal also rank above Maharashtra in this regard.
Scheduled Tribes : It has 'been mentidned that the scheduled tribe population
accowUs for 7.76 per ,cent of the total population of the country.
'" Excluding Assam.
-68

69
States like Haryana, Jammu and Kashmir, Punjab and the Union Territories of Chandigarh, Delhi and Pondicherry do not have scheduled tribe population at all. On the contrary, Union Territories of Lakshadweep and Mizoram have over 93 per cent scheduled tribe population notwithsta~ding the fact that their population forms almost insignificant proportion of the scheduled tribe popUlation of the country. Over 80 per cent such population has been found in Meghalaya and Nagaland also. The Union Territory of Dadra and Nagar Haveli has over 78 per cent constituting just 0.16 per cent of the scheduled tribe population. In the most populous State of the country i.e., Uttar Pradesh scheduled tribe population has been found constituting only .232,705 or 0.21 per cent of its population. From amongst the other populous States, it is Madhya Pradesh that has absorbed a sizeable proportion of scheduled tribe population 11,987,031 or 22.97 per cent. By far the largest proportion of country's such population has been found in tbis State (23.22%).
In Maharasbtra's population of 62,784,171, scheduled tribe population numbers 5,772,038 persons. In otber words 9.19 per cent of State's popUlation and 11.18 per cent of country's scheduled tribe population is found in our State. When compared with distribution of 100 ST population of the state among districts, it is found that Dhule district tops with 14.40 per cent such population. Thane, Nashik and Chandrapur claim second, third and fourth rank with 12.64, 12.16 and 9.52 per cent respectively. 0.23 per cent each, the lowest proportion has been returned from Satara and Bid. Districts with above 3 per cent scheduled tribe popUlation are Raigarh, Jalgaon, Ahmednagar, Nanded, Amravati, Yavatmal, Nagpur and Bhandara.
Rural and Urban Distribution
Rural and Urban distribution of Scheduled Castes
The following table 8.1 reveals in detail the growth or otherwise of the Scheduled Caste popUlation with rural-urban differentials since 1961. Needless to say, more than two-tbirds of the scheduled caste population has been found in rural areas of Mabarashtra and 31.56 per cent in urb1!n. The corresponding percentages for the general population are 64.97 and 35.03.
-Dispersal of SC population within State
From amongst tbe districts the highest percentage of SC population to total population is found in Osmanabad (15.35),

70
0 :::c "T N N q:-0- "<I"
'" "? N "? "'. r:-c ",'
2 00 0 <3 ~ CIj 00 N '-
1-2 r- I \0
I~
'" I C)' ;;;- V) ~ \0 ,.....,
0 I "<I" V) '" r-.0 N -;' '" '7 0 ~
i5 I r-' .n 0 I" e 00 N ~ 0 N '-' r- ,.....
'0 \0 <"l 00 ._. ;::; ....; ....; .n,
0 f~' "5 '0 , 0
.c:: '-' (]\ -(0' Vl '" G 00 c;:;-or ;;!i M
<;> "? 0 '7'-
OJ .......
':£, ..r V) ....; e <'J 0- V) "-' r-.!;:, '0 lr) M '" r-';;;" 1 N ....; v-; ~.
,_, "" li I
o:s I ~
('<" lr) In V) v-, .... ;S N ..... I
.5 1 "<I" '" r- oo "'!"
C v{ .::: ~ "<I" ,;. ~ I ~ '15 00 .q- '-"
00. '¢ -.' t-- '<I. -';< U
I .... ~C\C! 00. I~
~ .... 0 """
!:Q .~ B·~
~M \0 ~ 00 N "'-,~ "a N .q, '0 . _ ~ "<1". "", • 0 '0 ::: _". \0 ~~. ,.Q -0- OJ
'V) r-·c 'M • . .... /-". ~ '-"
Jil 0) .... r- • N "5 ,::1 ...... - N M', :a ''0' r ~"
c 0' .. .J:!i 01 ~'i ,.Q
2. I "<I" ;;;- ~ S M q:-I ~
\0
'; ~ r- <;> r- ,..... .. 1- ..0 ~ .n '" 0\ " I~
N q '...- r-~ C"l N "" N <"'1 ..r
I
.... CIj
~.
I ~ ~ ~ -~. ,..... ,.....

'VarIi' Tribe song and dance
7-%« It O. India/II

71
Solapur (14.29), Kolhapur (12.()8~ and ~id (11.47) are the othe~~ ~i§e .di,st,ri_cJS wh.e~e the per~~ntage is },RQre than ten.
In so far a~ the proportion of schedu,led c~stes populati,on -to the total schedUled castes population 'in fh~ state is con<;ert}.e,d, Oreat~ Bombll;Y, Solapur and -0s~_B;Q.ad o~cupy the :fu;St three 'pl1\ces respectively with 8.9 t 8.33 and'" .63 per cent.
Ruml aud Urban distribut!on of_ Sc~~dule~ 'fribes 'Scheduled tribe pOPJllat~Qn in thy ""ountry increased froJ.;ll
2&.11 million in 19M JO 36;401. n:vIDOI} in 1971 aug to 51.63 w.iJlion in '1981. *Yi~lcJing a ,decennial gr.owth rate of 29.53 per certt and 41.80 ,per ~llt rellpectively. 'In -fact the gro,Wth ra,te during 1971-,8"1 js d~:6tuitely 'hi,gh.e( .(han tq,e general population :growfh ~ 75 <trer _pent. -
The table !g. 1 reveals ~ip. detaIl the ~rowtp in 'Schetluled -tribe 'pOplila'tlon';glflC€{ 119'61 'boHi' in ·url)~h' ,an<J rural areas .of -itie State.
In Maharashtra the growth rate of 23.24 per cent in 1961-71 is almost in .~~epin,g with We Ilational sAAeduled tribe growth ..of 29.5 .per .cent . ..But, .gIaFingly abnormal gre-wth -()f 95.38 -per cent has been observed in 1971-81. This may be attributed to the _ removal of area I:t;striction imposed on tribals prior to 1976. This abnormal .growth is more manifest in the rural areas of the state where the scheduled tribe popUlation has increased .!rom 2.31 Hlillion -in -l--%l -to 2.-82 in -1-9--71 and 5.17 .Ql.i:Jlion in ·}981. 0.11 the other hand meagre growth from 0.Q8 per cent to ,0.12 and to 0.60 has been respectively observed in 1961, 1971 and 1981 in urban areas of the state. This trend i,s almost consistent with that found at the national level.
In the rural areas of the state the highest proportion of scheduled tribe population has been found in Dhule district (15.44%) followed by Thane (13.40%). Two other districts with mom than 10 per cent scheduled tribe population are Nashik (12.73%) and Chandrapur (10.17%). Of the urban areas of the state Nagpur district has (27.97%). Schedukd Tribe population, followed by Or. Bombay (13.97%). Other districts where it is more than 5 per cent are Thane (6.10%}, Na&hik (7.26%) and f>hule (5.40%). The impact of removal (jf area restriction is ..felt.in Buldana, Akola, Waroha, Nagpur l!lnd Bhandara districts. DUl'ing 1961 and 1971 no scheduled ltribe population was returned from this districts.
lit EKG}uding Ass~m
8-244 R. G: India/ND/88

72
$ex Ratio of Scheduled Caste Scheduled caste population for 1981 Census, compnslllg
of 2,299,098 males and 2,180,665 females, yields a sex ratio ()f 948 as compared to 937 for general population. In 1971 and 1961 the same was found at 947 and 930 respectively. Though the sex ratio for scheduled castes is masculine, on the whole they have a preponderance of females compated to general population. Further, there are more females among sche<luled caste (903) in urban areas than in the general urban 'population (850). The sex ratio for general population in urban areas is low. In fact 1971 registered a decline in the urban sex-ratio for Scheduled Castes from 903 in 1961 to 895. 'The same picked up again in 1981 (903). Similar trend has been observed in rural areas also. On the other hand sex-ratio for the general popUlation of 801 in 1961 in urban areas pro.gressed to 820 in 1971 and to 850 in 1981. Table 8.2 shows the sex-ratio for the general population and scheduled castes and scheduled tribes in Maharashtra since 1961.
TABLE 8·2
Sex-Ratio of Maharashtra since 1961
Item Sex Ratio
1961 1971 1981
2 3 4
General population T 936 930 937 R 995 985 987 u- 801 820 850
Scheduled Castes T 962 947 948 R 979 964 970 U 903 895 91)3
Scheduled Tribes T 978 973 974 R 981 977 981 U 911 895 9'13
Of the various districts in the state, Greater Bombay has the lowest general sex ratio of 772 females per 1000 males in 1981 Census. This is much lower than found in the scheduled caste population (948). Thane district follows almost closely with sex-ratio of 884. Other districts having the sex-ratio lower than the Scheduled Caste sex-ratio are Nagpur (930), Wardha (939), Pune (940), Amravati (941) and Solapur, (947).
73
Ratnagkl, Satara and Bhandara are the three districts where ~cheduled caste females outnumber the scheduled castes males with the sex-ratio of 1094, 1003 and 1002 respectively.
Scheduled caste sex-ratio has been found higher, as expected, in the rural areas (970) than in urban areas (903). A detailed view of the same can be had from the Table 8.2, reflecting the growth of or otherwise of the same, since 1961.
Sex Ratio of Scheduled Tribe Sex-ratio for scheduled tribes of 1981 Census, indicating
the number of females per one thousand males, has been found at 974. This obviously much higher than found in the sister community scheduled castes, where it has been found at 948. The same at the national and the state level bas been returned at 934 & 937 respectively. It may not be out of place to mention that Bhandara district had no scheduled tribe population in 1961 & 1971. The same has been found now at 298,039 comprising of 148,034 males and 150,005 females yielding the highest sex-ratio of 1013 in the state. Other districts having a sex-ratio above the state sex-ratio of scheduled tribe population are Dhule (994), Satara (989) Chandrapur (986), Nashik (979), Yavatmal (978) and Thane (977). 'The lowest sex-ratio of 931 has been found in Solapur district. In the rural areas the highest sex-ratio of 1015 has been observed in Bhandara district followed by 1005 in Satara. The general sex-ratio of such population in rural areas stands at 981. Other districts with a rural for scheduled tribes above the state average are Dhule (997), Chandrapur (989) and Thane, Nashik. and Yavatmal with 982. The lowest ratio of 935 has been observed in Solapur.
1981 sex ratio for scheduled tribes in the urban areas has been found at 913. The highest preponderance of females accounting for 1024 for 1000 males is seen in urban Ratnagiri district. Other districts having a urban ratio above the state scheduled tribe sex-ratio average, arc Bhandara (990), Jalgaon (995), Raigarh (954), Nanded (952), Nashik (943), Wardha (941), Nagpur (939), Chandrapur (933), Ahmadnagar (927), Amravati (923), Solapur (920), Kolhapur (916) and Parbhani (914). The lowest ratio (822) has been found in Gr. Bombay district. Table 8.2 reveals,at length the growth of sex-ratio in both rural and urban areas of the state since 1961.
Literacy of Scheduled Caste 3S.55 per cent of the scheduled caste population has been
found literate during 1981 census. Literacy rate on the other

I ~
~ 't;t .; o '"" "'" _ ... ...
. ~,~ ~ 't>~ ~ Pi ~
,,~ ~ ~ th on.,.., on
M ..,

1,5
hand in the general population works out t9 47.1 & per cent. Table 8.3 indicates the growth of lite~cy. since 199~ for total. male and female scheduled c!JSte PQPulcgion... sc~duled tribe population and General population of Maharashtra.
There are about 6S illiterat~ fpr yvery 100 ~hedq1ed caste persons compared to S3 for every 100 o~ gel!efa! population. The literacy rate for scheduled caste males ij; 4S.aS per cent. as against 58.79 per cent for the generl1.1 populations. The female literacy rate is, howev~, "y~ry low (21.53%) wlien .compared with the female lit¥r~y for geQ!!ral oopql~on (34.79% ).
The literacy rates for sched$d ~stes though found lqwer than the general popUlation in 1991 ~4. 1971, tbe trend of growth during the same perioq between the two cohorts of population appears to be consistent. Consistencr in the gro}Vth of literacy in respect of SchedvleQ_ c!l&te pop,ula,tion l\~s been observed in 1971-81 also. A si~ilar. trena b,as ala<> b~en Qbserved in the general populat1on, also.
Rural-Urban literacy of Sched¢.e~ C~te~ 47.13 per cent literacy ha~ q~en foul1d ill. th~ lp'~an sqhe
duled castes population. The corresponding liter~cy in futj general population stands at 63.92 per cent. The rural J.itli{aci; is somewhat consistent with the general rural population. In: the former case it has been found at 30.21 pef ~ent ag$lst 38.15 in the latter. Literacy in the urban are,as ~ sch~q\lled castes population has revealed sporadic increa,se !;han in thl1 g~neral population. An increase by'aqQut)O points in 19QJ-71 and by 9 points in 1971-81 has bej!n -found. Cop-es.pol!ding iI).c:J;ease at the state level has been by 'J and '{; points qnIy. The ~nd in the rural areas is almost qonsistent between the schedllied castes population and general popwation IlS woqld be :teen a,:-om Table 8.4. -
Sex-differentials in literacy are also revealing. Whereas the general literacy in the state has improved from 29Jl2 per cent in 1961 to 47.18 in 19811, it has progressed from 1$.78 to 35.55 in case of scheduled gastes popUlation during the same period. In case of males the i):lcrease has been from 42.04, per cent to 58.79 in the former casq and 25.46 to 48.85 in the l~ter. In case of female literacy, the rate of growth appear.§ consiitent betWeen the two groups of populations, in as much a~ the same has progressed fwm 16.76 per ceQt to 34.79 per cent in case of general population and from 5.7Q per cellt to 21.53 in case of

76
N ..... on (:l Cl' ~ 'Q
.2 0 on on !;;. 0
..... M
'" .. ~ III '" I- - .,., 5i .. "? ..... r;>
,D <U U 0': '" ID ..... GIl .... E-< ~ - ......
~ '0 .... .. "CO '3 v GIl = '0 ~ ~ .. r:- t:l ... 13 'OJ 00 l- N r-- en "0 N CI'I .... IE-< ... \C
I-CI'I on .... ... 12
r:- t:l ":"
oS I- 00 00 I-
0 N '" "<t
i! .. ~
'" Vl N = £ ";" 9 8 ~ '" ] 8 ID N ..... 0
;:J ..... N ..,
]" '0 ~ QJ
'3 00
~ '0 l- on
-: .. <U r:- <;'I ":' 00 13 "0 on on Vl on
~ C en E-< N '" E-<
~ >. .0
= l- I- M 0 (:l 9 9 ~ .~ 0:1 V .... 00 "" 8.
,D Vl on \C
0 0 ~ § f '" "" on 0';:: -: ~ ";" .. ~ ! ~
M .... 0 00 Po N t"l M
0
;§ Po
<U ~ t N 00 00 E-< c:: 'OJ "? .... .... rJ'J .. .. N '" '" I-
U 0 0 N M V
rJ'J E-< ::II
o~ 0
.c:: '" t'
~ '" ~~ u> .... .... ....
'" I- 00
'" '" '" .... .... -

17
scheduled castes population. The table 8.4 reveals in detail the steady growth in literacy since 1961.
Literacy of Scheduled Tribe The rate of literacy is disappointingly very low when com
pared with that found in the scheduled castes population and the general population. On the whole in the state we have a literacy of 47.18 per cent in 1981. The literacy rates among the scheduled tribe males and females are 32.38 and 11.94 per cent respectively. The overall literacy for the scheduled castes population is 35.55 and the same for the scheduled tribes population it is just 22.29 per cent.
Rural/Urban literacy of Scheduled Tribes For 1981 census in the rural areas literacy rate of 19.35
per cent has been found for scheduled tribes against 38.15 per cent in the general population and 30.21 per cent for scheduled caste population. Again the rural literacy does not reveal significant improvement in as much as it has improved, from 6.87 in 1961 to 11.11 in 1971 to 19.35 in 1981. A comparison of rate of growth in literacy for scheduled castes population is 19 points increase. During 1961-81 as against 15 points only in case of scheduled tribes population. In the urban areas the literacy has improved from 51.07 per cent to 63.92 in general population during 1961-81. An increase by 19 points has been observed in scheduled caste population i.e. from 28.77 in 1961 to 47.13 in 1981. A gigantic leap is discernible in case of scheduled tribe urban literacy in as much as it has gone up from 15.92 per cent in 1961 to 47.55 in 1981.

CENSUS OF INDIA
MAHARA5HTRA
CLASSIFICATION OF MAIN WORKERS 1981
TOTAL
lliIlllJ CIJLTIVATORS
2·55%
MALE
-AGRICUtTURAL LABOURERS
HOUSEHOLD -INDUSTRY WORKERS
8A-244 R. O. India/88
FEMALE
r ..... "1 ....... . , ..... ...... .
OTHER WORKERS

iENSUS or INDIA
PERCENTAGE OF WORKERS BY CATEGORIES 1981
OTHER
MAHARASHTRA PERCENTAGE
o 10 20 30 1.0 SO 60 70 80 90 100
u ~ ............. :- .............. . l, ':':\-:':':'I:':':'f:-:\':-:-r':q':',:_':':\-' --!--I--! o 10 20 30 1.0 50 60 70 60 90 100
P!:.RCENTAGE
~MALE
L1 FEMALt
R - RURAL
U -URBAN

f."-~
\' I ~ ~ .
!\
L
a 8
1 .9

CENSUS OF INDIA
PERCENTAGE OF WORKERS, MARGINAL WORKERS AND NON WORKERS
1981 MAHARASHTRA
TOTAL POPULATION 62784171

CHAPTER IX
HOW MANY OF US WORK?
Main AlItivities THe popuiatioft of a 'Country is generally divided into two
groups workers and non-workers. Those who are classified as economically active are called workers and ~4ose, who ~re clf1,s~fled as not economically active are called non-workers. The
>CellSUS oollects pa'rticulars regHrding the type of work or other at:ti'Viti~ of eyclIJ j)CJlSon. "I:his information is of great use because !)y chtsS1fyfilg. it we- get a c<!Implete picture 9f the distribution of the population among various types of activities. For 1981 census, the working population can be oonsidered f>&Jtlll~tely alb the. basis ~£ the maio. workers and. the marginal workers.
Wodtets We must linderstand the terms "worker" q_nd "non-worker"
correctly because these words are used in a special sense in the census and other economic Of social analysis. A worker was defined as a person whose nwin activity was participatjon in
• ttny economically productive work by his physical or mental activity. Work involved not only the actual work but effective supervision and direction of work.
Categories of workers Workers are mainly considered on the basis of main
workers and marginal workers. Main wOJ;kers are those who have worked for the major part of the year and whose main activity was in either cultivation· or as an agricultura11abourer or in household industry or in other work. Ma1;ginal workeJ;~ are those who have not worked for the major part of the preceding year concerned but neve~ tho less h~\(e dorte some WOf~ dudng l:¥lY. time ill the tefer~n£e perioU. In othel; wo~, such workers WDUe I;1Ot being capable Qf be,4lg q1,a$ified &S m~in wQr~rs .
. Ctdtlvtttol' For the purposes of 'the census, a person is working as a
~tti\tat(Jr if h~ or 'sh~ is engl®ffi-411 ~ultivation by himself or herself gl' by SUj1eTVision or direction in one's capacity as the ~ner or lQ:ases of land held ftom gdVetnment or as tenant- of
79

80
land held from private persons or institutions for payment of money, kind or share.
Agricultural labourer An agricultural labourer is one who works in another
persons' land for wages in money, kind or share. He has no risk in the cultivation but he merely works in another's land for wages.
Household Industry Workers engaged in any production, processing, servicing or
repair of goods which is carried on as a household industry he or she is classified as working in the household industry.
Other worker All workers who are not cultivators, or agricultural labourers
or in household industry are 'other workers' - "OW"
The industrial categories adopted in the 1981 census are as follows :-
I - Cultivators
II - Agricultural labourers
III - Livestock, forestry, fishing, hunting and plantations, or-chards and allied activities.
IV - Mining and quarrying
V - Manufacturing, processing, servicing and repairs (a) house-hold industry, (b) other than household industry.
VI - Construction
VII - Trade and Commerce
VIII - Transport, storage and communication!,
IX - Other services
Distribution of workers by Categories The total population of the Maharashtra State is 62,784,171-
Of these 24,301,793 or 38.71 per cent are main workers. 2,416,437 or 3.85 per cent are marginal workers and 36,065,941 or 57.44 per cent are non-workers.
We have seen earlier that workers are divided into variouscategories according to the types of jobs they do. Table 9.1 gives the distribution of the workers in the state among the various categories for 1981 Census. It also indicates thedistribution among the categories of male and female workers.

81
..... co ..... '" N 9 M 8 I- ~ $ 8 "'!" '9 "? ..... "':' "? "? co \r, 0 0 N '" 0 If') 8 ~ I- M "'" p..
"'''' If') r- \r, ..... N '" '" .... .... r- 0/') _ .... "''''
...,. '" \t) 0/') .,., I'- I'- M "'" 00 0\
e~ ..., o. \t) ,_ ..... N. .... VI Cl\ N ~
~~ tJ N g «;; or) 00 vi ..c .... N N '" l- N '" '" M N 00
CO M .... N V ('!_ N rri r-
'5 0\ ;;;; ~ ...., N ,_ '" V"> N ,_
$ u '9 'Q ~ '9 '!' ~ ~ 'Q '!'
~ M CO N 0 N '<t N '" '<t 0 § V"> '" ~ .....
'" ::0 0/') CO N V N ~ N .,., '" CO '" '" M I: .... '" CO CI'I .,., M ..... '" I- 0'\
'" «>'" VI I- CI'I M c<l on "'_ I- '" \0 .,., ... _,:.: M 0\ r-: ..0 or) cO '" r-: 0'1- ..0 0\ "' .... .... ~~ V M '<t ~ Vl ~ '<t ~ 0 '" \0 0 CO t- ..... '<t .,.,
~ r- oo_ 0'\ or) M N r-: .... .;; 'i5 N c:rI ;;; r- ." c<l '" CO 0 c:; ~ • 2! 8
.... '9 ~ 'Q "!' c:;> "':' ~ .. .,., '" N 0 N .... N I- M 0'1 0 0 .... M M N .... 0 CD t3! ....
"':' ~ 0- II
;... '" 0 V) I'- N \t) 8 OJ') M \0 \0 M III ca tl ..... V) .,., ,_ 0 ~ '<t 0 '" '" ....1 .=. 0'1 00 '" o_ V) 00 N "'. 0'1 t-. ~,:.: or) 0 cO 0 ..c 0\ ~ ..... 00 j:Q '" ~~ N OJ')
8 -< t M I- 00 '" N r- 0 0 00 .,., '<t '<t '" l- V"> 1-, 00 N M Eo-< .:.: 00 ..c N N ~ ~
....
.5 <= E .... 0 III
c:: CI 0 0 .~
~ ()
'a .t: ;::l .f!) § CI
0 ;>.,
€ u .... ., <.) ." 0
~ ~ 1) CD d .... .~ ~
::I 8 '" a ::I ;>., ." «> 0 ... .9 ! tll) .D ~ t:: '" '" ::I .:i '" ." ." ~ IS ::I .13 '0 .! 0 d 0 cil ]
p. i 0 u IS ,:.:' 0!3 ~ '" 'g .:
::I 0!3 ... -:;; 0 -5 0 E 0 fI)
1 i ell
~ > .~ '" -9 '" II) t
~ ::I d d ." d
> ~
0 0 0 '" '" -s -< ',:j I:Ii Z u r:: ~ 0
~ e .... ~ 1=1
...... S ~ > ~ es ..... ....

82
In our state or generally in our country, the largest proportions of the workers are in agriculture either as cultivators or as agricultural labourers. Of the total workers in the state, nearly 61. 75 per cent are in agriculture, the proportions in the other categories being very much smaller. After agriculture, the next highest proportion of workers is in non-household industry and then other workers. Trade & Commerce are almost equal with other services and Mining Quarrying claiming lowest proportion.
Both among males and females, the highest proportions of workers are in agriculture but the proportions are high for female workers. We see from the table that the proportions of female workers in all the other categories are less than that of male workers. NOR-Workers
We have seen that of the population of 62,784,171 of our state, 24,301,793 or 38.71 per cent are workers and 2,416,437 or 3.85 per cent are marginal workers. This means that 36,065,941 or 57.44 per cent are non-workers. The nonworkers consist of those carrying on household duties, students, retired persons or rentiers, dependents, beggars etc. inmates of institutions and other non-workers.
Among males 46.27 per cent are non-workers while among females 69.37 per cent are non-workers. The larger proportions of women are mainly involved in house-hold duties and are, therefore, classified as non-workers.
As mentioned earlier, the non-workers in the state are 36,065,941. Of these non-workers 14,999,781 arc males and 21,066,160 are females. The number of female non-workers ill Ij.early one and half of the male non-workers and can be divided into the seven types. The detailed broad distribution of the non-yvorkers is given in table 9.2.
TABLE 9.2 Distribution of non-workers by types of nOD-workers, 1981 Census -----
Type of non-workers Number Percentage to total
non-workers
1. Household duties 8,903,833 24·69
2. Students 11,690,447 32·41
3. Dependents etc. 14,564,785 40·38 4. Retired persons, rentiers etc. 338,128 0·94
5. Beggars, Vagrants etc. 67,580 0'19 6. Inmates of institutions 33,621 0·09
7. Other non-workers 467,545 1 '30 -__ ._

83
Children and other dependents are the largest group of non-workers, followed by those involved in household duties. These groups together .cover nearly 97 per .cent of . the nonworkers. The proportion of women and gLrlS fallmg under household duties is tnuch more than that among men and boys.
Ptoportion of w()rkers and non-workers We have seen earlier that workers and non-workers are
divided into various categories according to the types of jobs they do. Now, we will consider the distribution of workers. nou-wmkers and marginal workers. Table 9.3 gives the proportion of workers and non-workers among male and female and between rural and urban area.
The interesting differenece in the proportion of workers and non-workers between rural and urban areas are also brought out dearly when We consider the workers male and female separatly. In the rural areas, the largest proportion of workers are cultivators and agricultural labourers.
The total non-workers is nearly one and half of the total workers and in urban areas more than double that of urban workers. A very less proportion of marginal workers are seen in the state.
Percentage of workers and works We may now consider the percentage of workers in each
industrial category to total main workers in the state and the district. Table 9.4 indicates this distribution.
Frotn this table we notice again the importanc~ of agriculture in our economy. If cultivators and agricultural labourers are considered together. we find that in all the district, except Greater Bombay, Thane, Pune and Nagpur, thl workers in agricultural activities are nearly 65 per cent anci in many cases even much more than 65 per cent. In the state, more than 60 per cent workers are in these two categories. Compared to the other districts, the proportion of cultivators and agri. cultural labourers in Greater Bombay is significantly low, followed by Pune, Thane and Nagpur districts. This i~ because in these districts comparatively high proportions of workc1'3 are found in other categories. In the state, about 40 per cent workers are engaged in other categories. In Greater Bombay district, non-household industry, trade and commerce, transport, storage and communications and other services account fC?r ~igh proportions of workers. Thane district is adjoining dlstnct of Greater Bombay and all the non-household industries

84
are spread over in this district account for high proportions in manufacturing, trade and commerce, transport, storage, and other services. Like Thane, Pune, Solapur, Kolhapur and Nagpur district also, have good proportion of workers engaged in non-household industry, trade dnd commerce, transport, sto· rage and other selviccs. In Raigarh, Parbh!lni, Bid, Nanded and Chandrapur districts, forests, garden crops and plantations (umil:r category Ill) account for high proportions of workers. In Bhandara district, the plOportion of workers in household indu"try is high followed by Nagpur district. However, in Ja1gaon and Dhule districts, agriculture (or categories I and II togcth:;r) accounis for the highest percentage of workers among the various categories indicating the importance of this sector of our eCO!lOmy.
Th..: proportion of workers in category III Livestock, Forestry, Fishing, Hunting, Plantations, Orchands and allied activities is generally small in aU the districts. The Raigarh (3.56%), Ratm,giri (4.28%), Parbhani (3.29%), Bid (3.14%), Nanded (3.14%) and Cbandrapur (3.13%) are the districts where the workers in this category are high. Many person work in these forests as labourers. Fishing is widely carried on along the coast in Raigarh and Ratnagiri districts and pond fishing in Bhandara district.
Mining and quarrying or category IV is important in Nagpul distrist. In Nagpur the mining of coal, manganese, iron ore, limestone are the main mining activities. In fact, a large scale coal field has been found in this district.
Household Industry or category V(a) is an important economic activity. In a household industry goods art' manufactured, processed, serviced, or repaired mainly by the memberll of same household and generally within their house or pre· mises. A household industry is generally on a small-scak. In Maharashtra State, Bhandara district has the highest proportion of workers in household industry (10.68%). In this district the manufacture of becdics or becdi-rolling is a major activity in which women are mostly employed. Large beedi manufacturers distribute the tobacco, the covering leaves and other materials to innumerable households and collect the finished product later, the persons involved being paid for this process. The weaving of sarees is an important household industry in Nagpur district. The weaving of chaddar is very famous in Solapur district. The manufacture of consumer articles such as puffed rice, pickles, papads and other food stuffs baskets, toys etc" is a common household industry all over the state.

r- V) \0 ~ ~ ~ 0\ 0\ 0\ -D Vl ""
I~ ~ ~ '" i~ ~ *
N
I-
¥ ~ ~ ~r- -1 t"
v, If) '0
-' 0 0 r:-- r-: r-r: ()C M ...... ~, ~ t"f'",
85
>< -o ....;
t'fi,tr)1.nM\OC"4 ?~~-:> ... '" ~MOOt-"""tn
C?~~9~'~ s -n N ('1 N
~?9;~~ ;::i.::tJlr)~l.()..q-
tr, 0 "<T n \0 C".t cr. 00 If) r:1 t:- "1" M r':.N
.---oj ("",, '<:'j- l"l r::t V 0"?''-?~·00 ~Ar-t<jC,,¢
~ -"1 -=t,~ r:'", ('.l
-.::r r:-- ~. r- 0'\ ot:-.l ("'.1 ~l N
~~~t;~9 00 000
9gJ;~~2h NM'<!-
:::8~;1.~~ o ex: V, (,F \0
N Ir,...c ~~,

86
~?~~8~~~~?~~~9~~8~$~ ~~~OO~~~~~~~~~~~~~~~~ -
o ~~~;~~~~~98~9~~~~~~; N ~NNNN NNO ~
~~~$~~~~~~~8~8~~~~~~ ~V®~~~~V~~V~MVV~V~MN
00
.t--~9~~~~~~~9~~~~$~~~~~ ~~~~~ ~~N~~mN~~N~O~~ - -9~~~~9;~~~9~~8~~~ NNNNNt")N IN
999~9889~~$~$$9~99~~ OOOOOOOOOOOOOOOOONO
~ ~~9~~~8~~~;(fJ9~~~~8~8 N N ~~~N 0 N ~
~8~~8~~~?~~~~~~~~~9~ ~~MOO~~~~~~~~~~~~~~~~
~~~~~~~~~~~~~~~~~;8~ ~~~~~~~~~~~~~~~g~~~~
--
N -

CENSUS QF IN~'A
,i
20
1'1'
NOn:: f'f'!l"l\ 'Mi4e o( oot\\11 tilt IGtII.IH !M.l<;I.t. ~!(~~IlIG
i lefPllt~. ~qontl of n\il~ <ttI!km
88-244 R. G. IndialND/88
~
~~KNl. ,..010 ~ N 1(1 60 ~
OI,TlIICT
KAHARASHTRA
CLASSIFICATION OF MAIN WORKERS 1981
~CULlIVATO"
/'1AGRICULTUUL ~l"IOURnS
~HOl)SffjOLDINOU$TRl' ~WOUERS
AOTHEaWORkERI
~
C CULTIVATO~
41. J,G~TCULTU~AL lABOU(lE"tS
eo'
10

87
When goods are manufactured, processed, serviced or repaired in large factories employing a number of people and often run by electric or other power they are said to fall into the non-household industry sector or category V(b). In our state 2,776,801 or 11.43 per cent persons work in this industry. Greater Bombay district has the highest proportion of such workers (38.91 %) followed by Thane district with the proportion 24.36 per cent. Bombay city is a very highly industrialised area where many large-scale public sector and private. factories have been set up. Due to the fact that Bombay is the capital of the state and the facilities available near it such as land, water and power are suitable, many industries have come up near the city. In fact, more than one third of the workers in organised industries in the state are in Bombay city.
Next to Greater Bombay district the districts in which the proportions of workers in non-household industry are high are Thane, Pune, Solapur. Kolhapur and Nagpur. Many Iron and steel works are in Thane and Pune districts. The Bajaj scooter is famous in Pune district. Some textile mills are located in Nagpur and Solapur districts. In short, the high proportion of workers in non-household industry in these districts can be clearly associated with the existence of these large-scale industries.
Workers in category VI-construction form only 2.09 per cent of the total workers in the state. This category includes those working on construction and maintenance of buildings, roads, bridges, railways, irrigation projects etc. Fairly high proportion of such workers can be seen in Greater Bombay, Raigarb, Pune, Satara and Nagpur districts.
Trade and commerce (or category VII) is very important economic activity and employs a large number of persons. Greater Bombay has the highest proportion (21.80) of workers in this category. Bombay is the trade and commercial centre of the state as well as the country. In all the districts trade and commerce is an important activity. This includes both wholesale and retail trade.
Category VIII-Transport, storage and communications accounts comparatively high proportions of workers in Greater Bombay but is an important source of employment in the other districts also. Transport of goods by road and within cities by smaller vehicles, including hand carts, is flourishing business. Workers in the railways, airlines and the water tr~nsport system also fall within this category. 9~244 R. G. India/ND/88

88
Category IX--Other services accounts for 9.42 per cent of the workers in the state. This category includes those working in electricity generation and distribution systems, water supply, all public services under government or local bodies, sanitary. educational, medical, health, vetarinary and community services etc. In Greater Bombay 22.03 per cent of workers are in this category. This is understandable because Bombay city is the administrative headquarters of the state government and aU the major and important departments of government including Mantralaya, are located in Greater Bombay city. 'Other services' also account good proportions in all the districts
Scheduled Castes/Tribes workers The total population of the Maharashtra state is
62,784,171. Of these 44,479,763 or 7.14 per cent are scheduled castes population. Among them 1,989,348 or 44.41 per cent are main and marginal workers. The remaining 2,490.415 or 55.59 per cent are non-workers.
The population of the scheduled tribes in Maharashtra is 5,772,038 or 9.19 per cent. Of these 3,071,847 or 53.22 per cent are main and marginal workers. The remaining 2,700,191 or 46.78 per cent are non-workers.
The scheduled castes and the scheduled tribes are mainly agriculturists. Among them, 25.14 per cent scheduled castes and 40.59 per cent scheduled tribes work on the land of whom the large number work as agricultural labourers. Only 6.29 per cent of the scheduled caste and 1 8.85 % of the scheduled tribe population are cultivators who either own land or have taken on lease. Table 9.5 shows the percentage of workers, marginal workers and non-workers of the scheduled caste and scheduled tribe population in Maharashtra state.
TABLE 9·5 Percentage distribution of scheduled caste and scheduled tribe workers and
non-workers, 1981 Census
Category of workers -------- -----_---- ------_._----
I In Yea) III, IV, V(b) Marginal Non-Cultivators Agricultu- House- & vno IX workers workers
ral labou- hold in- other rers dustryetc. workers
-1- 2 3 4 5 6 7
SC 6·29 18·85 2'57 12·54 4 '16 55·59 ST 18·93 21 '66 0·96 6·35 5·32 46·78

CHAPTER X
FERTILITY LEVELS AND TRENDS
The growth of population depends entirely on human fertility. Any society replenishes itself to the process of human fertility. It is, therefore, obvious that if fertility is higher, population replacement will be higher. Therefore, knowledge of fertility levels and trends is essential.
In the 1981 census four questions relating to fertility were canvassed. These are related to age at marriage, number of surviving children, number of children ever born and whether any child was born during the last one year. The first three were asked from each evcr married woman and the last one was asked from each currently married woman only.
The fertility indicators on which information is presented herein, namely, Age Specific Fertility Rate (ASFR), Age Specific Marital Fertility Rate (ASMFR), General Fertility Rate (GFR), General Marital Fertility Rate (GMFR) , Total Fertility Rate (TFR) , Total Marital Fertility Rate (TMFR) are based on the questions on, "births during last year".
These terms are defined as followed :-Age Specific Fertility Rate : The average number of children born alive during the last year per woman of a particular age group.
Age Specific Marital Fertility Rate : The average number of children born alive during the last year per married woman of a particular age group.
General Fertility Rate : The number of children born alive during the last year per 1,000 women of child bearing ages. In 1981 tabulation, the age group 15-49 and in the 1971 tabulation, the age group 13-47 have been considered as child bearing ages.
General Marital Fertility Rate : The number of children born alive during the last year per 1 ,000 married women of child bearing ages. In the 1981 tabulation, the age group 15--49 and in the 1971 tabulation, the age group 13-47 have been considered as child bearing ages.
89

90
Total Fertility Rate : Total number of children that would have born alive per woman had the current schedule of age specific fertility rates been applicable for the entire reproductive period. It is calculated as the sum of the age specific fertility rates in five year age groups multiplied by five.
Total Marital Fertility Rate : Total number of children that would have born alive per married WOman had the current schedule of age specific marital fertility rates been applicable for the entire reproductive period. It is calculated as the sum of age specific marital fertility rates in five year age groups multiplied by five.
Limitations for these indices are :-(i) Question of birth during the last one year is canvass
ed only for currently married women for operational reasons.
(ii) Babies born during the last year to mothers who may have died before the census date have been left out.
(iii) In the absence of any data on deaths of females during last year, the number of females classified by age groups as reported in the census has been used without any adjustment.
Fertility Level Table 10.1 presents the ASFR and ASMFR for rural and
urban areas separately.
TABLE 10.1
Fertility IndiCes, Maharashtra-1981
Age ASFR ASMFR groups
Total Rural Urban Total Rural Urban
1 2 3 4 5 6 7
15-19 0·060 0'072 0·040 0·157 0·157 0'157 20-24 0·207 0'236 0'160 0'246 0·260 0'219 25-29 0·187 0-208 0-154 0'199 0·217 0'169 30-34 0·118 0-135 0'086 0'125 0·142 0,(')92 35-39 0·064 0·073 0·044 0·069 0·079 0·048 40-44 0·028 0-034 0·016 0-032 0-038 0-019 45-49 0·010 0-012 0'006 0·013 0·015 0·007

91
The fertility rates are seen to be higher in the age group 20-24 in both rural and urban areas. About 30 per cent of the total fertility is accounted for by this age group. The age group 25-29 years accounts for about 28 per cent of the total fertility. Thus, about 60 per cent of the total fertility is accounted for by the age group 20-29 years. The fertility rates decline after age 30. The fall in fertility after age 30 is sharper in urban areas. In all the age groups, fertility rates are higher in rural areas than in urban areas. This is true about both ASFR and ASMFR.
Fertility trend
Table 10.2 gives the trend in ASFR of the 1981 census with that of 1971-75 as derived from the results of Sample Registration Scheme (SRS).
TABLE IO.2
ASFR (per 100 women) from 1981 Census compared with ASFR 1971-75 (SRS)
Rural Urban Age ------~---
groups Census SRS Col. 2 Census SRS Col.S 1981 71-75 --x 100 1981 71-75 --x100
Col.3 Co1.6 ----- ------
2 3 4 5 6 7
15-19 72 83 86·75 40 74 54·05
20-24 236 238 99·16 160 221 72·40
25-29 208 227 91 ·33 154 212 72·64
30-34 135 176 76·70 86 129 66'67
35-39 73 103 70·87 44 72 61 '11
40-44 34 42 80·95 16 24 66'67
45-49 12 15 80·00 6 7 85 ·71
It may be seen that fertility has declined in all ages, with the percentage decline being higher in the older age groups. This decline is higher in urban areas and_ among older age groups than rural areas. The decline in the age group 20-24 in rural areas is oJlJ.ly marginal. The decline in the age group 15·19 may be due to fall in proportion of married females.

92
Fertility trend through indices of GMFR and TMFR for the 1971 and 1981 censuses are compared below in Table 10.3.
TABLE 10.3
GMFR and TMFR, Maharashtra, 1971 and 1981
Rural Urban
Rural.
Urban
General Marital Fertility rate
1971 1981
2 3
166 144·3 (86 '93)
145 115·9 (79 '93)
Total Marital Fertility rate
1971 1981
4 5
5'0 4·5 (90 '00)
4·2 3·6 (85 '71)
Note : 1. The denominator for calculation of GMFR is married females in the age group 13-47 in 1971 and 15-49 in 1981. 2. Figures in bracket below the 1981 figures indicate the proportion
(percent) of the 1981 level compared to the 1971 level and is indicativeof the relative decline.
It is clear from the above table that fertility has declined in Maharashtr.fl in both rural and urban areas. The decline in fertility in urban areas is higher than that in the rural areas.
Number of children ever born The average number of children ever born per woman is
given in Table 10.4. TABLE lOA
Average number of children ever born per woman in the age group 45-49 by differrent classifications of women
Classification Total Rural Urban
2 3 4
All women 4·95 5 ·16 4'48
A. Religion Hindus 4·91 5 '12 4'34 Muslims 5·52 5·68 5 ·40
Christians 3 ·93 4·72 3·75
Sikhs 4·24 4·22 4·24
Buddhists 5·29 5·42 4-99

93
TABLE lO.4-Contd.
2 3 4
B. Educational level
Illiterate 5 ·11 5·17 4·87
Literate but below middle 4·85 5 ·11 4·65
Middle but below matric . 4 ·20 4·68 4·07
Matric but below graduate 2·90 3·37 2·87
Graduate and above 2·13 2·75 2 ·11
From the table it is seen that Muslims had the highest numb5r of children ever born in both rural (5.68) and urban (5.40) areas. In rural areas Sikhs and in urban areas Christiallf; have the lowest number of children ever born. In the state as a whole Christians have the lowest number of ever born children.
As regards educational level of women and fertility in terms of average number of children ever born, it is seen that the number of children born declines steadily by level of edu
cation. While on an average more than five children are born to illiterate woman, the number drops to 2.13 for graduates. In rural areas the corresponding fall is from 5.2 children for illiterates to 2.7 children for graduates. In urban areas the fal] is even greater, from 4.9 children in case of illiterates to 2.1 in case of graduates. These figures indicates the impact of education fertility.
Parity
Women may be -classified according to the number of children born alive to them. For instances, the first parity women are those who have given birth to one child, the second parity women are those who have given birth to two children and so on. This information is given in Table 10.5 for Maharashtra by rural and urban areas.
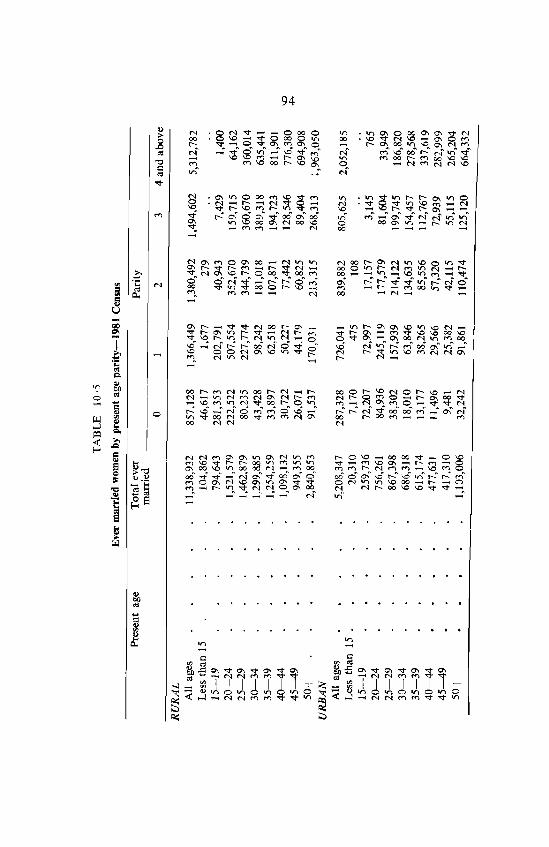
94
CIj <'I 8MV~~OOOO Vl Vl 0\0000'10\"<1"<'1 > 00 ~~z~~~~;g 00 'J:l "<1"<'1 'J:l_0\ OM 0 r- .... r- ~~~~~~~~~:;~ .D <'I" _ .... ~ 0 .... tr) .... 1"""'4" \1:)'" 'V'" r-r)" "l o:!
'0 .... \C1..O~ ....... r-O\\O .,., MOOt-MOO\O\O M M'J:l 00 r-'J:l 0'1_ 0 ~NC'f"'jNN\o
~ ",-
'" o:! "<I"
<'I O'I"'OOOM'J:l~ M '" O"'i§'" r-r-O'I"'0 0 ("\I...-.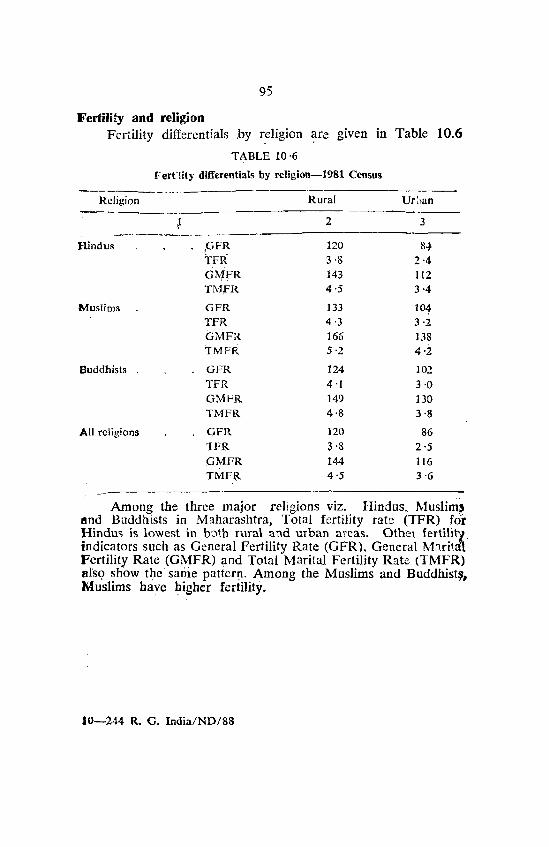
95
Fertility and religion Fertility differentials by religion are given in Table 10.6
TABLE 10'6
Jiern!ty differentials by rcligion-1981 Census
Religion Rural Ur:"un .---_
2 3 --,.--------- --- -----
Hindus CFR [ - 120 8~
TFR 3·8 2·4 CMFR 143 112 TM,FR 4·5 3·4
Muslims GFR 133 101 TFR 4'3 3'2 GMFR 166 138 TMFR 5'2 4'2
Buddhists GFR 124 102
TFR 4·1 3 ·0 GMFR 149 130 TMFR 4'8 3'8
All religions GFR 120 86 1FR 3'8 2'5 GMFR 144 116 TMFR 4'5 3'6
Among the three major religions viz. Hindus. Muslim, end Buddhists in Maharashtra, Total fertility rate (TFR) for Hindu,> is lowest in b'.)th rural and urban areas. Gthel fertility. indicators such as General Fertility Rate (GFR). General Maritll1. Fertility Rate (GMFR) and Total Marital Fertility Rate (TMFR) alsQ show the' same patterIl' Among the Muslims and Buddhist~, Muslims have higher fertility.
10-244 R. G. India/ND/88

99
l'abte 11/2' sho,*s' the' coritributiom 'af ·'thtse :eight states'fu the migrant, population of Mahsnisbtra.
TABLE 11·2
luter-state milrants to Maharasbtra. 1971.....s1
MigrMlts 'Vrirlilti'On Percerita~e 6fmigran\s
Place of birth (in lakhs) 1971-81 'tQ'tOtal (in lakhs) inter-state
1971 1981 migrants -_._----
2 3 4 5 ._-_----_ .. - ----Uttar Pradesh 6·08 9 ·30 3·22 21 ·11 Karnataka . 6·64 9'25 2·61 21 ·01 Gujarat 6'46 7·77 1 ·31 17 ·65 Madhya Pradesh 3·04 4·84 1 ·80 10·99 Andhra Pradesh 2'93 3 ·34 O·..}l 7·58 Kerala 1 ·71 2 ·16 0·'::,5 4·91 Rajasthan 1 ·60 2·00 0·40 ·H4 Tamii Nadu 1 ·51 hiS o ·J4 4",9
~-----'-' - -- ----__ ._----_.
Total for eight states 29·97 40·51 10·54 91 ·98 _--
The eight states together account for 40.51 lakhs (or 91.% per cent) out of 44.04 lakJs inter-state mi~rants. These 40.51 lakh migrants ate equivalent to 6.45 per cent of Maharashtra's total population.
Among intcr:state migrants the contributions of Uttar Pradesh, Karnataka and Madhya Pradesh have gone up. The contributions of GujaraL Kerala, Andhra Pradesh, Rajasthan and Tamil Nadu together is less than tha: of Uttar Pradesh. The Maximum proportio~atc increase being from Uttar Pradesh.
Impact of migration on growth rate of population Inter-state migrants :1ave increased from 32.83 fflkhs in
1971 to 44.04 la:khs in 1981. In other words, there nas been a minimu:n inter-state migration of 11.21 Iakhs during the period 1971-81. On the other hand the migrants from other countries has decreased from 3.i7 lakhs in 1971 to 2.73 lakhs in 1981 or there has been a decrease of 0.44 1akhs in the number of sucb migrants during the same period. Thus, the net minimum addition to the, populatinn due to' in migration
I r 244 R G INDIA/ND/88

100
duang' the' de~.Ilde is' of the order of' 10.77, lakb persdns in 504.12 lill persons cOlJIlted in .th~ state in 1971.
Migrants by place of last residence
As mentioned earlier, migration data bave also been collected by place of last residence for 1981 census. Table 11.3 gives the, distribution of migrants by place of last residence in Maharashtra.
TABLE 11'3
Perc:el!tage distribution of migrants by place of last residence
1971 1981 PlaCSl <;If (ast residence
Persons Males Females Persons Males Females ~.--------
--.-- , A. Migrants within
the state of enu-'nieration to total migrltnts
(6 'Migrants who have - resided else-:'I£h~r<; ir( . qistrict of enumeration to
2 3 4
80·]2 71 ·54 -85 ·91
5 6 7
83 18 76'52 87'61
fotalfl'ligrants - 51'69 ~9'13 60·18 54'37 44·21 61'13
(ii) Migrants who h ve resided in other districts of the state to total migrants 28 '43 32 ·41 25 ·73 28 -81 32 ·31 26 '48
B. Migrants who have l'esid~d in 9ther states of IndIa to total migrants 17'54 25·50 12'18 16·01 22·39' n'76
C. Migrants who have resided in other countries to total .mjgrants 1 ·32 1 ·79 1 ·01 0·81 1 ·09 0'63
There are 267 .62 ~afcJ;l Il).igrants. by place of last residence as against 261.44 la1ch mIgrants by place of birth. The. abs.olute figures in 'respect of intra-distri~t, inter-district, int~r-stat~ and international migrants by' place of last' residence and place of birth arl.· preh'nted in 1 abk 11.4.

101
TABLE 11·4
Oiitribution of 1981 census migrants by place of last residence and place of birth
(in lakhs)
By place of llst By place of birth residence
Type of migration Persons Males Females Persons Males Females
2 3 4 5 6 7
Total migrants 267·62 106·98 160'64 261 ·44 104·68 156·76
Intra-district 145·51 47 ·30 98'21 138 ·20 44·44 93'76
Inter-district 77'10 34·56 42·54 76'47 34·09 42,38
lnter-state 42·83 23·95 18·88 44·04 24·70 19 ·34
Inter-national 2·18 1 ·16 1 ·02 2·73 1 ·45 1·28
Major and substantial differences are observed in the number of males and females in respect of intra-district migratIOn. Females out number male intra-district migrants.
The inter-state and international migration by place of last residence by and large follows a similar pattern as that followed by place of birth.
Rural-urban components of migration The flow of migrants would consist of four streams such
as rural to rural, rural to urban, urban to rural and urban to urban. Table 11.5 presents the data on the basis of these various streams in the case of migrants classified by place of birth. The table presents data only in relation to internal migrants.
Of the total intra-state migrants of 214.66 lakhs, 60.95 per cent were rural to rural, 10.44 per cent were urban to urban, 21.01 per cent were rural to/urban and 7.56 per cent were urban to rural.
The fall of about 3 percentage points in the rural to rural .component and the increase in the urban to urban component by abOl~t 2 percentage point_!; during 1971-81 may be partly due to the formation of a number of new towns in Maharashtra in 1981. The same trend is observable for both the sexes.

102
-;;;-
I V'> t=:' 0""' ..... ~ -'"" ''It=:' ~G\
~ 'Q - ...... "'t ('IV'> s::l "'t ,9 "'t .,?, '?''(> "1'1
'" t- V'> 1'1 V'> "<t' ..!! .D t- \0 - "<t ...... 1'1 0 '" 0'1 0 t- .....1'1
0 '" t!. - t- 1'1 ~ e
~ ._.. ._.. ._..
-""' .." """' 8~ .." '"" 1'1 t=:' 0 CO' ...... '" "?
.,... "? V'> r;-
«i ''Q '?' 9 ":-' ":"' "? - t- co 0 §,
\0' co 0 t- \0 co
~ \0 "<t M ..... t:;. e 0'1 ...... :e C3. ;::.
..... ~ .... I ~g .." CO' "<t S ~g t- ~ 1'1 ""' .... '?' '?' '? 9 9 r;- ~~
t- t;j "<t' V'> 00 "<t' 00 V'> \0 CI'I V'> _0 t- ...... .." 00 "<to 1'1 .." .... "0 ('18 ..... e ;::. 0 :e .." ..... ._..
-= Eo-< ._.. ._.. - ~ .!:: 0 .0
.~ ... 0 i) &:;N co """' 1'1 ...... 00 ...... V'l CO' -""' .. 'Q 1'1 000 ~~ '?' \0 CO U 8 t:l ' '" 'Q ' t- 'Q ' M
~ '" \0' 1'1 ..,,' \0' "<t -.;., ::s .D "<t "<to'l '" 0 _00 ('IN - V'> -e c 0 t!. t!-._.. e ~ ;;.. ~
,.0 .... i 0
~ = ~ t- '"" '" """' 0 ...... V'> ,-... \0 '"' V'> '"'
.~ <:leo t- ..... ","00 "? ..... V'>- N .....
~ «i '? ,"<t ' ...... "? ' 0'1 ' 00 8 .....
~ 1'1 o· ::t:, V'> "<t";' ..... ..;,
t.rJ t- .." -0 0 ~ t- ._..
";! 0'1 ~ t- ;::. ..... -l - ._.. ._.
~
~ j ;:: "0 "<t S -"""' ('I ,....,
~§' Nt=:' \0 G\ "? C')C') 1'1 00 'Q"'t "?
CI t;j ? ' 0'1 ' CO ":-' 1'1 00 .."..;, V'>' ('I' 0'1 ~~ .S; "0 V'> 0 N~ "'8 0'1
;;:: 0 ~e ~ Eo-< ..... ._.. ..... ._..
'" ...... ._.. 0
f I c a
CI '@ ~ '" '@ «i '" = ... -e "0 ~ ..0 ,c 0 ::s 0 ;;'S E-< ~ ;:J Eo-<
'CI 1:1 OJ
~ -; c ~ ..c1
..... '-,; ~ ~ 0
~ Iii ., tI.i B ..... 50 '" 0 .8 ....
~ 's tZl .... ..... «i ,S .s ~ ~ ~ 0
,S ,El
3 ,...; N
0 E-<

103
Against migrants from other states into Maharashtra numberifig 44.04 lakhs, 16.17 per cent were rural to rural, 32.29 per cent urban to urban, 47.57 per cent rural to urban and only 3.86 per cent were from urban to rural areas. Thus, 63.74 per cent of the migrants into Maharashtra from other states were born in rural areas. Nearly 80 per cent of the migrants. fro~ other states h~ve migrated to urban areas of Maharashtra.
The rural-urban components of migrants based on place of last residence arc presented in Table 11.6 .
. The.re were a total of 222.60 lakh migrants on the basis of place of last residence within the state, of whom 60.55 per cent were rural to rural, 11.77 per cent were urban to urban, 19.58 per cent rural to urban and 8.06 per cent wem urban to rural.
In the case of migrants from other states numbering 42.83 lakhs, 15.71 per cent were rural to rural, 33.65 per cent were urban to urban, 46.77 per cent from rural to urban and only 3.78 per cent from urban to rural.
80.13 per cent of the within the state migrants were from rural areas and 19.83 per cent were from urban areas. 68.63 per cent of within the state migrants had moved to rural areas and 31.37 per cent to urban areas.
Impact of migration on urbanisation The urban population of Maharashtra bas increased from
157.11 lakhs in 1971 to 219.93 lakhs in 1981, an increase of 62.82 lakhs. The urban growth rate during the decade works out to 39.99 per cent. It would be interesting to consider how much of this increase is attributable to migration, addition of ne,w towns and natural growth. The last component is often difficult to determine since, even in towns which have continued from 1971, new areas might have been added to such town!! during the decade and the population of such new areas would add to urban growth. Strictly speaking, to assess the impact of migration during 1971-81 on urbanisation one should take into consideration changes in residence either urban to urban or rural to urban as at 1971 and 1981. "However, in the censu~ a question on "residence" at the specific point of the 1971 census was not canvassed nor was a question asked as to where one resided 10 years ago. Therefore, it is possible that intermediate movements which might have taken piace in between 1971 and 1981 which affect the growth of urbanisa. tion attributable to migration only. However, it is possible

-co 0\ -
104
coc:;-9", .".. coCO
'" ._..
0\ ....... O?a~ Ira· _0 .... e
0 ....... ",0\ . .". 1.0. .... -C
0\ ....... N·0 ,_. NO\
C
"" '""' coO ·0 ('l.
""8 -._..
.". '""' ,_", • 0
1.0. N'" e
'" ....... 0"" . .". 1.0. _t-e
~~ ('l. _co
e

105
to arrive at he quantum attributable to migration if one makes an assumption that during the span of ten years between 1971 '91ld 1981 there has not been more than one change in place of residence. H this assumption is made, the interdecadal rural-urban migration can be estimated. Table 11.7 gives the a\nnber of migrants which have resided at the place of enumerallpn for ~riods ranging from 0 to 9 years.
TABLE 11·7
Migrants whose duration of residence is 0-9 years, 1981 Census
Place of enumeration Place of last residence
Total Rural Urban
2 3 4
Within the state Total 9,527,930 6,245,394 3,282,535 Rural 7,209,955 5,253,287 1,956,668 Urban 2,315,374 990,827 1,324,547
putside the state Total 1,886,291 477,654 1,408,637 Rural 1,231,414 378,962 852,452 Urban 653,601 98,449 555,151
Others 33,713 3,335 30,377
Movement within Maharashtra has been of the order at 1,956,668 persons from rural areas into urban areas during the ;decade. As against, this, 990,827 persons have moved from urban to rural areas. Net migration into urban areas, which is .the difference of these two streams is, therefore, of the order -Ot 9.66 lakhs. From other states 1,408,637 persons moved -intO' the urban areas of Maharashtra. In addition 30,377 'persons have moved into Maharashtra from other countries =during the decade. In all, therefore, apout 24.05 lakh persons "Can be estimated as having moved into- the urban areas at the state during the decade. The growth rate of urbanisation ·during 1971-81 attributable to migration is, therefore, the .proportion of 24-:05 lakh persons to the urban population at 1971 of 157.11 lalchs or in other words 15.31 per cent.

106
The '29 towns which have been classified for the first time as urban areas in 1981, have a population of 3.24 lakhs. Their ~ntribution to urban growth rate taking into consideration the corresponding 1971 population is 2.07 per cent.
Taken together, the contribution to urban areas, by migra~ tion and classification of urban areas is 17.38 per cent. Of tho total growth rate of urbanisation during the decade of 39.99 per cent, the growth attributable to natural increase is, therefore, of the order of at least 22.61 per cent.
Reasons for Migration
For the first time in the census, reasons for migration were elicited in 1981. Keeping operational constraints in view, the reasons for migration were broadly categorised as employmBnt, education, marriage, consequent on family movement and other reasons. Reasons for migration have been elicited only with reference to movement from place of last residence.
Migrants to urban areas
Table 11.8 presents the reasons for migration to urban areas.
It may be seen that in general migrat!on to u~ban areas employment is the main reason among males while marriago ,is for females. Little less than half (46.0%) males have migrated to urban areas due to the reason of employment. Whereas 42.41 per cent females have migrated to urban areas due to marriages. More or less the same pattern is observed for migrants moving in the same State.
As regards migrants from rural areas of other States and UTs to urban areas, majority of males (61.26%) have migrated due to the reason of employment and 39.27 per cent females because of ,marriages. Migrants whose place of last resldenco is in urban areas and are migrating to other urban areas, proportion of male migrants due to employment is 49.05 per cent. Thus, it may be seen that more males from rural areas than urban places migrate to urban areas. This is true for both migrants from within the State and migrants from other States

107
I~ t- '" ..., M OM O~ 'ON lOt--6' ~ ~ a- t--r:- 00'" '" 'Ot NO? "'~ 0 '" ..... a- M N' ...... .....
~ 00 t- O t-- 00 r--E- N ..... M -5 a- 10 MO ~'" a-", 00", ~:; 0 ::;a '" t--'t "''0 t- - ~~ r--O M '" M . ...... ..... ~ 'Ot • 0 00 M 0 N N M N 'Ot
~ 0 ..... 0'Ot t-N 'Ott- "'1.0 ~a-
'"' N N'Ot 0'" 'Ot1O a- <"1 10", ..... '9 ro ..... NN 0 '" . N • N
1 ..... t- a- a- a- 'Ot 'Ot 'Ot M M '" ..... ~ vo '" '" 00'" 10 or. "'....,
z~ ::;a ""If> ..... If> If> 'i; '9 I 0 0 0 0 0 0 '0
~ I~ - '" NO ",,,, ("<)\0 a-t- ..... 00 0 0 ...., '9 .......... t-V t-V NN v'0 8 1.0 10 v' N . N . Q N 0\ V 1.0 '<t N 0
]I~ ....,
'" ("<) N") ...., v 'i 00 M '" '" vv "''''' t--"" 10 ...., a- 0 't :::J:r:- \0 M a-.,., ~\.f) M't N ",,' ...... ..... a- a- or> ..... M ·s '"' N N N '"
II> a- N a-oo a1 .... Q
00 -.N 0'" a- "" ("<)V) .8 .8 ~ ("<)If> IOO? N'";" ..... '0 -O? <;> ... ..... ('S ~ N N "'I N N ..., '" (.) = c: ;l ...., ..... V"" ""v <II 0 '0
~ t- ("<) ..... t- ..... '" '" .Q '" r.<l N '0 v 00 t-C!' "''0 v'9 '0 .. ro V N • ;:3 <I) t- O V) V) V P::: I:; V "? ~ ..... a-oo 00 ..... N ..... 0t--
..... <I) \0 ("<)~ "'I ..... ~ ~ t- 't "'r:- V't ""'t 9 = ("<) N "" 'Ot V N r.<l ~ 0 :c 0.. ~ ...J
·1 V) ("<)0 O\a- N r-- 0\ 10 O\V) M '<t IXl 8 0\ 0 "'N N 0\ ION t--O N9 ~ r.<l '" 0\ • V t-- "" . NIO V ...., \0 0\
~ ¥J V '<t .... V ... Q V 00 VO 00 00 0 a-O ~$ oS ti, '"'
00 00 009 vo 100 o . NO "" r-- 1.0 . "'0 ..... 0 0 0 0 '" ~ 0 0 0 0 0 0 = -0
'" <lI 1.00 1.00 -0 "'0 NO a-O ... c; .... 0 "'0 VO "'0 t--O 00 " \0 . N • N N t- . ...... "0 ;2; ("<) ""0 NO _ 0
..... 0 0 0 f-< 0 0 0 0 0 0 ..... ..... -..... <1)--
0t>g;;c; 8 ro <!)..o .... N f-< P::: ~ ~ ro-~~~ ~ f-< s:; f:!
..!:!' Q ....
~ .Q
<I). 's. :.a ..Q'-.... 1:: ..Q ~ '" .~ O~ "0 Q
~ ~ '" 8 8§ 8 r ~ 'E 0._ 0 ro 0 -¢:Q <!:: Z Q 60 <!:: ~ .2 ~ Vl "''0 '" ~ .... <1) §; E~ I)
.~ Q ....
~ c; roro ro·_ ........ 60"'''''' 6O.';j ~ "0 bIltl.l
~-E ._ ~ 4) .- Q f-< ::s o;·c ::sg .... 0
< tI.l ... .0 p:1 c.5 ~

108
and UTs. And, the proportion of male migrants who move for employment reason increases with distance.
Migrants to roral areas Reasons for migration to rural areas has been present~d
in Table 11.9.
Here, it may be observed that employment and education reasons for migration to rural areas are not important. Family moved and marriages (more particularly for females) share substantial proportions.
Female migration from rural areas to rural areas within the State due to marriages is substantially high (70.64%), as compared to urban female migration (43.84%) to rural areas.
Movement of population to Gr. Bombay The discussion on movement of population to Maharashtra
would be incomplete without considering the migration to Gr. Bombay from within the state from other states in India and from other countries.
By place of last residence, 51.46 per cent of the total population of Greater Bombay is migrant population. The corresponding proportions for Pune urban agglomeration and Nagpur urban agglomeration are 48.39 per cent and 34.89 pel cent respectively.
Table 11.10 shows the distribution of migrants by place of last residence for Gr. Bombay, Pune U.A. and Nagpur U.A.
The absolute figures give us a clear idea as to the volume of _Jnigration to these three important urban centres.
Greater Bombay city is a district by itself and, therefore, the question of inter-district migration does not arise in its respect.
The number of inter-district migrants to Gr. Bombay is 18.02 lakhs as compared to 4.19 lakhs and 1.82 lakh migrants to Pune U.A. and Nagpur U.A. respectively.
The volume of inter state migration to Bombay (23.27 lakhs) is considerably higher than that for Pune U.A. (1.62 lakb) and for Nagpur U.A. (1.41 lakh).
The pattern is not different in respect of international migrants. As many as 1.12 Iakh of the total international migr~nts (2.18 lakhs) to Maharashtra have migrated to

109
§ :\ ... t- ....... 00 ..... \0 c- ..... """" ",V'>
'" N- <:'I<? O\N c- \0 Nr:- '::> g ~ M~ '" . r--co 0\ 0\ ." 0\ l:....- .......... '" '" N
:2f5 ",0 co 10 101'- \00 ff'lii) ~ 00C!' ..... 0 NN M'Q ... 00 • "<1". .....
I NIO Noo "<1" "<l" ..... N .,., N.,., .,., "<1" "<1" .... "<1" N'" IO~ "<l""<1" ..... 0 ..... N ~~ ~ N ."C!' I'-,,? ..... 00 .... "?
~ ..... V'> • N o:s tt{O 1'-0 .... "<1" 0 0 .~ 101'- "<T V) "<1"
.... 0\'" 1;0~ IO~ V)O zr;: z~ ::E ~ ..... O\C!' r:-
'" 0 0 0
1\~ 0 0\<"1 (8~ NCO ooN ...., ..... ..... ~ ..... ..... C!' "<1"'::> oor:- N,,? ......... 0\0 N ....
'" 00 I'-..... - - N N .,.,
c::
i\~ N
0 .,,0 06~ 0\10 .... 0 0\"<1" MOO ·i 0\ oo""!" o..r:- co<:" ..... "? r:-NV) 0\." ..... .,., 0\ .... 10 ..... N N N N N ....
·8 0"<1" 00 0 OV ..... ~ z~ z~ .... c:: Il< 00 IO'Q v'0 ..... C!' TIl . 9 ! ~ 0 0 0 0 0 0
co m 11 1010 v~ .,..,0\ v ..... N~ Z~ c:: ::::I
~ 0 "<:I ::E I'- 00 I'- • N<:" ""!" N· m III "<1" ..... V .... N 0 o:s ~ ..... C. Q c:: N- .,.,0.. "<1"- ON ....,~ Z~ -- ~ Il< 10 -<? r--r:- NC!' -'" - § - 0 N N ....
~ :: 0 1'-0\ i "E. ::E 01'- .,., rn \0 \0 "<1" .... NOO
~
Jl '" 00\ o..C!" N,:", \OC!' N<? ':"' « 10· .... 0\ ..... \0 a - .... 0\ 0\ . E-< N '" ..... ... ~~ :2$
00 ~8 ~$ 10$ ~ '" "<1" NO
fA
! Il< 38 ~§ o . M
8 0 § -8 8 0 .. - - - - -i ·8 NO M8 MO ~$ 000 ~ ~
..., 100 r--O ~8 <? '3 O· ~8 I'- . '" . "'8 8 0 8' 8 0 0 E-< ..... ..... ..... ..... -
'0 8]"t;j 8~~-e!3 N E-< c.:: P c.:: P E-< o:s-._pc.:: c: e
.9 ~ • .!. ~ 0)
.c: .c: .... ..s :0 ........ '" .~ oE2 0 ~ ~
0)
<Il as e ~ rn ~ E3 0·- 0 0 -=8 -= j c:: ..... th -= o.
.~ ·8 '" Cl) "'''<:I '" .......... ~§ 'E:l th 13 ~ ...
t;j I_·C 0
~ thfJ'l th"'''' th ... z '0 ._ CD C1) .- c:: ._ 0)
~ 1;j·c ::Eg E-< ::E..s .... 0
.( Ili .fJ'l ..... .0
C,; 0

110
Gr. Bombay. The corresponding figures for PUne U.A. and Nagpur U.A. are 0.15 lakh and 0.09 lakh respectively.
The proportion of migrants from each state to Gr. Bombay to the total migrants to Maharashtra from that state is shown in Table 11.11.
TABLE 11'10 Distribution of Migrants by place of last residence
Gr. Bombay Pune City U.A. NagpurU.A. Place of last
residence Persons Percen- Persons Percen- Persons Percen-tage to tage to tage to total total total migrants migrants migrants
Total 4,242,298 100'00 816,006 100·00 454,337 100'00 Elsewhere in the District of enu-meration 219,853 26 ·94 122,313 26 '92 Other Districts in Maharashtra . 1,802,536 42'49 418,807 51 ·32 182,128 40'09 Other States in India 2,327,550 54·87 161,968 19·85 140,947 31 '02 Other countries 112,213 2.(;4 15,376 1 ·89 8,948 1 ·97
TABLE 11·11 Migrauts to Greater Bombay from other Districts states in Iudia
Place of last residence
INDIA Andhra Pradesh Bihar Gujarat . Karnataka Kerala Madhya Pradesh Orissa Punjab Rajasthan Tamil Nadu Uttar Pradesh West Bengal Delhi Goa, Daman & Diu
Proportion of migrants to Gr. Bombay to total migrants
of Maharashtra
54'34 35·84 57'72 74'56 34'72 70·07
8·62 52·73 63 ·64 58·83 79·23 73·69 64·09 66-13 75-01

CHAPTER XII
SUMMARY A brief population profile, 1981
At the beginning of first chapter it was said that what was being attempted was a Portrait of Population of the state delineatIng only some of the main features. We have before us in the previous chapters various facts and figures regarding the population of Maharashtra. Some important demographic, social, 'economic characteristics, migrations, occupational distribution, fertility levels and trends have also been described, alongwith certain other important variable like mother tongue, mariral status, educational level, etc.
Maharashtra ranks third among the states of India in terms of both area and population and accounts for 9.16 per cent of the population of India.
At the sun-rise of 1st March 1981, the population of Maharashtra stood at 62,784,171. This yielded a decennial growth rate of 24,54 per cent which was lower than the growth .rate of the 1961-71, decade (27.45 %) and was also slightly lower than the All India 1971-81 growth rate (25.00%).
The decennial growth-rate of 1961-71 was the highest peak ~ince ]901. The 1981 Census results show that tne population curve of the State is showing a small, but significant, downward trend which is a welcome sign.
The sex ratio in the State is generally weighted in favour of males. There are 937 females per thousand males in 1981 as against 930 in 1971. In the urbanised setting of Greater Bombay and Thane, the sex ratio is 712 and 883, respectivyly. This is probably because 'of the large influx of male working population to the industries located in these districts. fn the cities and urban agglomerations of size-class I, the sex ratio is generally much lower than the average state ratio.
. The density of population in Maharashtra State, as rf"lvealed from the .results of the 1981 census has gone upto 204 ·persons per sq. km. as against 164 persons -in 1971. Maharashtra Stato is some what less densely populated compared to' the country's density as a whole, which is 216 persons per 1iQ. km.
III

112
On literacy front we have done better than Tamil Nadu, ,Gujarat, West Bengal, Punj~b, Karnataka, Orissa, Megbalaya. Andhra Pradesh, Madhya Pradesh, Uttar Pradesh, Bihar, .Rajasthan, when compared increase in literacy points during 1971-81. In 1981, the percentage of literates to the total population has gone up to 47.18 as against 39.18 in 1971. Among the States and Union Territories of the country, Maharashtra occupies 9th position in so far as the number of literates .to the total population is concerned. The literacy rate in the rural areas is mucF lower (38.15%) as compared to the rate in urban areas (63.92%).
Greater Bombay district with the literacy percentage of 68.18 leads amongst the districts of the State. Another noticeable feature is that literacy rate of women is much 10w~r -compared to that of men. However, this gap is narrowing since 1951.
The 1981 census results show that 64.97 per cent of tho State's population lives in the rural areas as against 68.83 per ,cent in 1971. This also means that the proportion of urbaii ·population has gone up from 31.17 per cent in 1971 to 35.03 per cent in 1981. With this percentage of urban population Maharashtra occupies first place among the States, followed by Tamil Nadu with 32.95 per cent. and Gujarat with 31.10 per cent. It is only in the Union Territories of Chandigarh, pelhi, Pondicherry and Lakshadweep that the proportions ot ~ban population is more. In fact, the proportion of urban population in Maharashtra has been much higher in the pre· ceeding decades, also, when compared to the country as a 'Whole. And, if the present policy of industrialisation continues. tt is likely to accelerate; further in near future.
The growth in the number of towns and cities is at a -steady slow pace after the highest number reached in 1951. It can be readily noted that since 1951, while the towns in the j!ize-class I have appreciably increa..sed in number, the increase is not so evident in the case of the other size-classes more particularly in size-classes IV to VI. This, perhaps, indicates
:that growth of urbanisation is more pronounced in the top bracket of the size-classes rather than the bottom ones. Over 1he past three decades urban population seems to be ~avitating ~to the cities in size-class I, even though the percentage of towns 1n that class is less than one tenth of the total number in 198!. This cannot be said in case of the towns in the other siz6-c1b.sses which arc either stagnant or at any rate growing less rapidly. This urbanisation trend showing rapid population growth in

113
the towns of size-class I, and at best uneven growth in tho' 9th~r size-classes, has socio-economis; implications and indic~tes the need for reorienting our approach to urban planning.
In 1981, there are twelve cities/urban agglomerations in. the country having population exceeding one-million. Out of these, three namely Greater Bombay City (M. Corp.), Pune City urban agglomeration and Nagpur City urban agglomeration are in Maharashtra. This means that 51.07 per cent of the total urban population in the State is concentrated in these threemajor urban centres. Among other things such large concentrations of urban population at 3 places have to face implications from the paint of view of urban planning, housing and ~ther civic needs.
In Maharashtra, Greater Bombay City is a class by itself. From just less than one million in 1901, the city has crossed" 8 million mark in 1981, having grown more than eight times in the intervening period. The city reached two peaks of growth rate, one in the decade 1941-51 and second in the decade 1961-71. Even though, the growth rate, in the decade 1971-81 has somewhat declined, it is still one of the higest in the State. At the present growth-rate, it is not difficult to visualise Greater Bombay topping the ten million mark by the turn of the century.
Since the reorganisation of the states wag. done on the basis of language criteria, it is obvious that Marathi speakers will predominate the state. In 1981 census, Marathi accounted for'majority of speakers i.e. 45,816,753 persons, comprising 13.62'per cent of the state population. Of the total speakers, constitutional languages constitute the percentage of 95.06 and only 4.94 per cent are the speakers of other languages. '
Like language, religious picture of the state is also dominated by one- religion, namely Hindu. The other two religions of some consequence are Muslim and Buddhists. Hindus account for 81.40 per cent, Muslims for 9.25 per cent and Buddhists 6.28 per cent as per 1981 census. Jains, Christians ansi Sikhs together constitute about 3 per cent of the total populati6n of the State.
&onomic activity of the state is not bad when compared With other st'ateS: Work participation rates in. Mabarashtra are higher both, for main workers (38.71 %) and main and marginal workers combined (42.56) when compared with ~ Intlia level of 33.4S and 36.77 respectively. The present lever (i.e. 1981 census) of' total work participation rate in the state

114
is, also, an improvement over the level (36.48%) in· 1971. Among the male population of the State, the work participation rate has only marginally increased from 52.09 per cent in 1971 to 52.51 per cent in 1981. There is, however, a sizeable increase in the work participation rate of the female popUlation which has gone up to 23.98 per cent from 19.70 per cent in 1971. In SOl far as the rural areas are concerned the total wQirk participation rates for males and females have registered an increase over 1971 levels. This increase though slender in the case of the male population, is quite significant for females. But in the urban areas there is a slight fall in the work participation rate of the total workers as well as the male workers, compared to 1971. It is only in the case of the female population that the wQirk participation rate has gone up compared tQi 1971 even in urban areas. In fact, this position is generally repeated if the combined work participation rate of the workers and non-workers with secondary work of 1971, and main and marginal workers of 1981 are considered.
The growth of population is largely based on human fertility. If there is higher fertility the replacement of population will also be higher. From the analysis of 1981 census data on fertility for Maharashtra, it was revealed that total fertility rate (TFR) and general fertility rate (GFR), have declined during the period 1970 to 1981. The decline is faster in urban areas and gradual in rural areas. GFR declined by 20 points in rural areas, whereas it has declined by 30 pOlots in urban areas for t11e same period. Similarly, the TFR declined 'by 0.7 points in rural areas, whereas it has declined by 1.5 points in urban areas during 1970-81. However, these declines are not enough to restrict the impact of population explosion. Much more and at faster pace, action needs to be taken to bring down the fertility level drastically at the earliest possible time. The present indication of declining fertility level in the state generates definite hope for better prosperity for the people of the state,
Migration is third component of population change, Por every 100 persons there are 43 migrants enumerated, in the State as per 1981 census. More than 55 per cent, of the total migrants migrate within the district of enumeration. About 30 per cent of the migrants migrate from other districts of the State. Migrants constitute half of the population in major cities like Bombay, Pune etc. In these cities, 60 to 70 per cent of the
'lnigrants, migrating 'for employment, 'are from rural areas.

115
Maharas1J.tra is 00. the top of the industrial map of the country. Foundation stone of Indian industry was first laid in Bombay at Kurla when the fi,rst Textile Mill was started by Indian Capitalists under the name of 'Swadeshi Mills'. Today, Bombay-Pune region and Bombay-Nashik region are the largest industrial belts of the state.
Maharashtra, although having one-tenth country's popu1ation, contributes a little over 20 per cent of the National Income of India.
Today's Maharashtra, with its leading position in industry and commerce and its modern innovations in agriculture, literature and arts, serves as a shining example in the task of national reconstruction. However, one must remember the famous word of our beloved former Prime Minister Jawaharla1 Nehru:
Yesterday is far behind, Today is already over, What will be tomorrow like? The only answer is:.
Tomorrow's Maharashtra (India) will be what we make it by today's labour.
GMOIPN-~ 3-Dt.244 RG India/(ND)88--19-1-89-300.