Portrait of Jewish Baltimore
128
Foundation of Our Future: Portrait of Jewish Baltimore BALTIMORE’S JEWISH COMMUNITY STUDY 2020 Authors: Matthew Boxer Matthew A. Brookner Eliana Chapman Harry Aaronson Daniel Mangoubi Matthew Feinberg Janet Krasner Aronson Leonard Saxe
-
Upload
khangminh22 -
Category
Documents
-
view
0 -
download
0
Transcript of Portrait of Jewish Baltimore

Foundation of Our Future:
Portrait of Jewish BaltimoreB A LT I M O R E ’S J E W I S H CO M M U N I T Y S T U DY 2020
Authors: Matthew BoxerMatthew A. BrooknerEliana ChapmanHarry Aaronson
Daniel MangoubiMatthew FeinbergJanet Krasner AronsonLeonard Saxe

© 2020 Brandeis University Maurice and Marilyn Cohen Center for Modern Jewish Studies www.brandeis.edu/cmjs The Cohen Center for Modern Jewish Studies (CMJS), founded in 1980, is dedicated to providing independent, high-quality research on issues related to contemporary Jewish life. The Cohen Center is also the home of the Steinhardt Social Research Institute (SSRI). Established in 2005, SSRI uses innovative research methods to collect and analyze socio-demographic data on the Jewish community.
i | 2020 Baltimore Jewish Community Study
preface To the Readers: The data for the 2020 Baltimore Jewish Community Study were collected from April to July 2019 and, as such, predate the coronavirus pandemic. Although the study was conducted under relatively normal times, as we write this in March and April 2020, things have shifted considerably for the Jewish community and the world at large. We often tell people that Jewish community studies are snapshots in time that have a “shelf life” of roughly 10 years under normal circumstances, but that sharp changes in local or national trends can shorten the amount of time before the data really need a “refresh.” The COVID-19 pandemic, which began in January 2020, but first became a subject of significant public attention in the United States in late February and early March, seems likely to touch many aspects of our lives. How it will affect the physical, mental, and financial health of the Greater Baltimore Jewish Community as of this writing remains unknown. Nevertheless, we believe the study will be extremely useful to you now and in the years to come. The findings of the study are the most accurate representations of the Baltimore Jewish Community—prior to the world changing—that we can produce. They are the baseline for comparing the community before, during, and after the pandemic. The study shows what “normal” looked like and can help establish benchmarks for gauging communal recovery. It shows where the community was strong before the pandemic, and where the community can use its strengths to aid in recovery. And it shows where the community had some challenges before the pandemic, which suggests opportunities for creative efforts to strengthen the community in a time of crisis. As we shelter in our own homes, we remember that both the Jewish people and the United States have endured many crises in our history. Rabbi Joseph B. Soloveitchik reminds us that this crisis will not define us and that we are called upon to “transform fate into destiny and a passive existence into an active existence; an existence of compulsion, perplexity and muteness into an existence replete with a powerful will, with resourcefulness, daring and imagination” (Kol Dodi Dofek). Although we are geographically distant from you today, we are experiencing the same challenges; we are with you in spirit and are confident that our communities will get through this crisis together. We look forward to the day when you will be able to use the results of this study not only to aid with recovery, but to grow and strengthen the Baltimore Jewish Community with “resourcefulness, daring, and imagination.” From, The Authors

ii | 2020 Baltimore Jewish Community Study
Page intentionally blank

iii | 2020 Baltimore Jewish Community Study
Dear Baltimore Community, On behalf of The Associated: Jewish Federation of Baltimore, we are pleased to present the results of our 2020 Community Study – Foundation of Our Future: Portrait of Jewish Baltimore. As The Associated celebrates its centennial this year, the study provides a snapshot of a strong and vibrant Jewish community that continues to evolve. The data yielded by the study will help us prepare for the challenges and opportunities that will present themselves in the coming years. How large is our community? Where does our population live? How do we engage in Jewish life and connect with the Jewish community? How many of us live in poverty or have unmet financial needs? How many people with disabilities live in Jewish Baltimore? How do we connect to Israel? This study answers these and many other questions that are relevant to the present and future of our community. We thank the Cohen Center for Modern Jewish Studies at Brandeis University and, in particular, Dr. Leonard Saxe and Dr. Matthew Boxer for their wisdom, guidance and expertise in conducting this research. It is thanks to them that we can tell the story of our community through a wealth of data and analyses. We also thank Ruth Greenfield Miller, Chief Planning Officer of The Associated, for her skilled leadership and her invaluable insights; Carrie Parker, Director of Impact Assessment, for her efforts from beginning to end, and all those at The Associated who supported the study. Thanks, as well to the Community Study Management Team, a group of lay leaders whose sound judgment and institutional knowledge contributed immeasurably to the study, and to the Community Study Task Force, whose members helped make the study useful to the entire Jewish Community. Finally, we thank MileOne Autogroup for its generosity in sponsoring the 2020 Community Study. MileOne’s support made this research possible. We now begin the process of assisting the community in realizing the benefits that the study is intended to achieve. We look forward to the wide range of discussions, insights and initiatives that will emerge from our collective review of the information and help guide us into the next decade. Sincerely, Martin S. Himeles, Jr., Co-Chair, Community Study Mark D. Neumann, Co-Chair, Community Study Debra S. Weinberg, Chair of the Board Marc B. Terrill, President
Letter from the Associated

iv | 2020 Baltimore Jewish Community Study
2020 Community Study Management Team
Jacob Benus Jonathan Cordish
Juliet Eurich Josh E. Fidler
Benjamin K. Greenwald Bradley Hecht
Martin S. Himeles, Jr. Allison Magat
Ruth Greenfield Miller Mark D. Neumann
Carrie Parker Michael Saxon
Larisa Spirt Sally Wolf
2020 Community Study Task Force
Gary Applebaum Becky Brenner David Carliner
Joan Grayson Cohen Renee Dain
Micah Damareck Dr. Dan Durand
Joel Fink Beth H. Goldsmith
Rabbi Joshua Gruenberg Barak Hermann
Martin S. Himeles, Jr. Stephen Knable Janet Livingston
Mark D. Neumann Fran Pruce
Laura Rubenstein Rabbi Elissa Sachs-Kohen
David Schimmel Rabbi Shmuel Silber
David Uhlfelder Debra S. Weinberg Mitchell Whiteman
Larry Ziffer Ruth Greenfield Miller
Carrie Parker

v | 2020 Baltimore Jewish Community Study
CMJS/SSRI ACKNOWLEDGMENTS
The Brandeis research team is grateful to the Associated for the opportunity to collaborate to develop and conduct the 2020 community study. The study was proposed and sponsored by The Associated: Jewish Community Federation of Baltimore. The Federation staff, Board of Directors, and Community Study Committee provided valuable input on the study design, questionnaire, and report. We are particularly grateful to Ruth Miller, Chief Planning Officer, Carrie Parker, Director of Impact Assessment, and Martin Himeles and Mark Neumann, co-chairs of the community study committee. They helped us learn about the community and ensured that our work would be of the highest quality and utility for the Baltimore Jewish community. We also thank the respondents who completed the survey. Without their willingness to spend time answering numerous questions about their lives, there could be no study. The University of New Hampshire Survey Center served as the call center for this study. We are grateful to Zachary Azem, who was our main point of contact, the survey instrument programmer, and the supervisor for data collection. Sean McKinley was instrumental in testing the survey. Robert Durant and Carolyn Lamb managed the calling operation, including training and supervising callers, fielding callbacks, and countless other tasks. We would also like to thank the many callers who collected data from respondents. This project also could not have been conducted without the assistance of our colleagues and students at the Maurice and Marilyn Cohen Center for Modern Jewish Studies at Brandeis University. We are deeply appreciative of their efforts. Elizabeth Tighe, Raquel Magidin de Kremer, and Daniel Parmer led the efforts to develop an estimate of the adult Jewish-by-religion population of Baltimore as part of the Steinhardt Social Research Institute’s American Jewish Population Project. Yi He, Hannah Taylor, and Harry Abrahams helped code responses to open-ended questions. We thank Deborah Grant for her editorial advice, and for preparing this report for publication. We are also grateful to Masha Lokshin and Ilana Friedman for their logistical and editorial support throughout the study.

vi | 2020 Baltimore Jewish Community Study
Page intentionally blank

vii | 2020 Baltimore Jewish Community Study
Table of Contents
List of Figures and Tables ............................................................................................................... x
Executive Summary ......................................................................................................................... 1
Chapter 1. Introduction ................................................................................................................... 9
History .................................................................................................................................... 10
Methodology Overview ....................................................................................................... 10
How to Read This Report ................................................................................................... 11
Reporting Qualitative Data ................................................................................................. 12
Comparisons across Surveys ............................................................................................... 12
Report Overview ................................................................................................................... 12
Report Appendices ............................................................................................................... 13
Chapter 2. Demographic Snapshot of the Baltimore Jewish Community ............................. 15
Chapter Highlights ................................................................................................................ 15
Jewish Population Estimate ................................................................................................ 16
Jewish Adults ......................................................................................................................... 16
Jewish Households ............................................................................................................... 18
People in Jewish Households .............................................................................................. 18
Age and Gender Composition ............................................................................................ 19
Household Composition ..................................................................................................... 20
Geographic Distribution ...................................................................................................... 21
Residency and Length of Residence .................................................................................. 24
Extended Family in the Region .......................................................................................... 25
Jewish Denominations ......................................................................................................... 25
Inmarriage and Intermarriage ............................................................................................. 26
Subpopulations ...................................................................................................................... 27

viii | 2020 Baltimore Jewish Community Study
Chapter 3. Patterns of Jewish Engagement ............................................................................... 29
Chapter Highlights ............................................................................................................... 29
Index of Jewish Engagement ............................................................................................. 30
Background: Classifications of Jewish Identity ................................................................ 30
Measures of Jewish Engagement ....................................................................................... 31
How We Developed these Categories .............................................................................. 31
Patterns of Jewish Engagement ......................................................................................... 32
Jewish Behaviors and Jewish Engagement ....................................................................... 33
Demographics and Jewish Engagement ........................................................................... 33
Jewish Background and Jewish Engagement ................................................................... 36
Attitudes about Being Jewish and Jewish Engagement .................................................. 37
Attitudes about Jewish Community .................................................................................. 39
Essentials of Being Jewish .................................................................................................. 41
Chapter 4. Financial Well-Being and Health Needs ................................................................. 43
Chapter Highlights ............................................................................................................... 43
Educational Attainment and Employment ...................................................................... 44
Economic Well-Being .......................................................................................................... 45
Economic Insecurity and Poverty ..................................................................................... 48
Health Status and Needs ..................................................................................................... 51
Caregivers .............................................................................................................................. 52
Older Adults ......................................................................................................................... 52
Health Limitations and Jewish Life ................................................................................... 53
Economic Insecurity and Health Limitations .................................................................. 55
Chapter 5. Jewish Children ........................................................................................................... 57
Chapter Highlights ............................................................................................................... 57
Jewish Children ..................................................................................................................... 58
Religion of Children by Household Characteristics ........................................................ 59
Participation in Jewish Education ...................................................................................... 60
Drivers of Participation in Jewish Education .................................................................. 61
Chapter 6. Synagogue and Ritual Life ......................................................................................... 65
Chapter Highlights ............................................................................................................... 65

ix | 2020 Baltimore Jewish Community Study
Synagogues and Congregations .......................................................................................... 66
Congregation Types ............................................................................................................. 66
Synagogue Participation ...................................................................................................... 69
Ritual Practices ..................................................................................................................... 71
Chapter 7. Social and Communal Life ........................................................................................ 73
Chapter Highlights ............................................................................................................... 73
Jewish Organizations and Programs .................................................................................. 74
Perceptions of Jewish Organizations ................................................................................ 78
Volunteering and Philanthropy .......................................................................................... 79
Barriers to Community Involvement ................................................................................ 82
Informal Involvement in the Jewish Community ........................................................... 86
Informal and Cultural Activities ......................................................................................... 87
Antisemitism ......................................................................................................................... 89
Chapter 8. Connections to Israel ................................................................................................. 91
Chapter Highlights ............................................................................................................... 91
Travel to Israel ...................................................................................................................... 91
Types of Israel Travel .......................................................................................................... 93
Emotional Connection to Israel ......................................................................................... 94
News about Israel ................................................................................................................. 96
Views about Israel ................................................................................................................ 97
Comfort Discussing Israel .................................................................................................. 98
Chapter 9. In the Words of Community Members ................................................................ 101
Social Life ............................................................................................................................ 101
Religious and Spiritual Life ............................................................................................... 103
Activities .............................................................................................................................. 104
Jewish Education ................................................................................................................ 105
Resources ............................................................................................................................. 106
Regional Limitations .......................................................................................................... 107
Services, Aid, and Support ................................................................................................ 108
Looking Toward the Future ............................................................................................. 109
Notes ............................................................................................................................................. 111

x | 2020 Baltimore Jewish Community Study
LIST OF FIGURES AND TABLES
Figure 2.1. Age-gender distribution of Jews in Baltimore ............................................................ 19
Figure 2.2. Household composition ................................................................................................ 20
Figure 2.3. Dot density map of Jewish households, entire area .................................................. 22
Figure 2.4. Dot density map of Jewish households, zoomed-in southern Baltimore County and City of Baltimore .................................................................................................................. 23
Figure 3.1. Patterns of Jewish engagement ..................................................................................... 32
Figure 3.2. Being Jewish is a matter of ethnicity ............................................................................ 37
Figure 3.3. Being Jewish is a matter of culture ............................................................................... 37
Figure 3.4. Being Jewish is a matter of religion .............................................................................. 38
Figure 3.5. Being Jewish is part of daily life ................................................................................... 38
Figure 3.6. Being Jewish is a matter of community ....................................................................... 39
Figure 3.7. Connections to worldwide Jewish community........................................................... 39
Figure 3.8. Connections to local Jewish community ..................................................................... 40
Figure 3.9. Essential to being Jewish : Being part of a Jewish community ................................ 40
Figure 3.10. Essential to being Jewish : Leading an ethical and moral life ................................ 41
Figure 3.11. Essential to being Jewish : Working for justice and equality in society ................ 41
Figure 3.12. Essential to being Jewish: Belief in a divine or higher power ................................ 42
Figure 4.1. Educational attainment .................................................................................................. 44
Figure 5.1. Marital status of parents of Jewish children ............................................................... 58
Figure 5.2. Religion raised, children of inmarriage ........................................................................ 59
Figure 5.3. Religion raised, children of intermarriage ................................................................... 59
Figure 7.1. Jewish friends .................................................................................................................. 86

xi | 2020 Baltimore Jewish Community Study
Table 2.1. Jewish population of Greater Baltimore, summary ................................................... 18
Table 2.2. Jewish population of Greater Baltimore, detail .......................................................... 18
Table 2.3a. Age of Jewish individuals in Baltimore and the United States ................................ 19
Table 2.3b. Age of non-Orthodox Jewish individuals in Baltimore and the United States .... 19
Table 2.4. Geographic distribution of the Baltimore Jewish community .................................. 21
Table 2.5. Geographic region of Jewish households and children .............................................. 24
Table 2.6. Geographic region of Jewish individuals by age .......................................................... 24
Table 2.7. Internal mobility within Baltimore ................................................................................ 24
Table 2.8. Denomination of Jewish adults in Baltimore in 2010 and 2019 compared to the US Jewish community ................................................................................................................. 25
Table 2.9. Age by denomination of Jewish individuals ................................................................. 26
Table 2.10. Marriage, inmarriage, and intermarriage rates of Baltimore Jewish households and of the US Jewish community .............................................................................................. 27
Table 2.11. Age of Jewish respondent by inmarriage and intermarriage .................................. 27
Table 3.1. Jewish behaviors and Jewish engagement .................................................................... 34
Table 3.2. Age by Jewish engagement ............................................................................................. 35
Table 3.3. Marriage and children by Jewish engagement .............................................................. 35
Table 3.4. Residence by Jewish engagement .................................................................................. 35
Table 3.5. Denomination by Jewish engagement .......................................................................... 36
Table 3.6. Jewish background by Jewish engagement ................................................................... 36
Table 4.1. Standard of living ............................................................................................................. 46
Table 4.2. Household income in 2018 ............................................................................................. 47
Table 4.3. Economic needs: Summary ............................................................................................ 48
Table 4.4. Economic insecurity by household characteristics ..................................................... 49
Table 4.5. Health challenges for anyone in household ................................................................. 51
Table 4.6. Type of health issue, special need, or disability ........................................................... 52
Table 4.7. Health limitations to Jewish life ..................................................................................... 54
Table 5.1. Religion of children in Jewish households ................................................................... 58
Table 5.2. Ages of children in Jewish households ......................................................................... 58
Table 5.3. Children raised Jewish by household characteristics .................................................. 59
Table 5.4. Children in formal Jewish education during 2018-19 school year ............................ 60
Table 5.5. Children in informal education during 2018-19 school year ..................................... 60
Table 5.6. Participation in formal Jewish education by household characteristics, 2018-19 ... 62

xii | 2020 Baltimore Jewish Community Study
Table 5.7. Participation in informal Jewish education by household characteristics ................ 63
Table 6.1. Synagogue membership .................................................................................................. 67
Table 6.2. Household membership of congregations of different types .................................... 68
Table 6.3. Denomination of brick-and-mortar synagogues ......................................................... 69
Table 6.4. Jewish religious services .................................................................................................. 70
Table 6.5. Ritual practice ................................................................................................................... 72
Table 7.1. Household memberships ................................................................................................ 75
Table 7.2. Involvement in Baltimore Jewish organizations in the past year .............................. 76
Table 7.3. Location of programs, activities, or services ................................................................ 77
Table 7.4. Perceptions of Jewish organizations ............................................................................. 78
Table 7.5. Volunteering in Baltimore .............................................................................................. 80
Table 7.6. Philanthropy ..................................................................................................................... 81
Table 7.7. Donors to types of local Jewish organizations ............................................................ 82
Table 7.8. Any barrier to Jewish community connections ........................................................... 83
Table 7.9. Frequency of participation in informal and cultural activities, past year ................. 85
Table 7.10. Connection to Baltimore Jewish community and barriers to involvement ........... 85
Table 7.11a. Frequency of participation in informal and cultural activities, past year ............. 87
Table 7.11b. Frequency of participation in informal and cultural activities, past year ............. 88
Table 7.12. Antisemitism ................................................................................................................... 89
Table 8.1. Travel to Israel .................................................................................................................. 92
Table 8.2. Types of Israel travel ....................................................................................................... 93
Table 8.3. Emotional connection to Israel ..................................................................................... 95
Table 8.4. Frequency of seeking news about Israel, past month ................................................. 96
Table 8.5. Views about Israel ............................................................................................................ 97
Table 8.6. Comfort expressing opinion on Israeli-Palestinian conflict ...................................... 98
Table 8.7. Reasons for discomfort expressing opinion on Israeli-Palestinian conflict ............ 99

1 | 2020 Baltimore Jewish Community Study
EXECUTIVE SUMMARY
In anticipation of their hundredth year in 2020, The Associated: Jewish Community Federation of Baltimore contracted with the Maurice and Marilyn Cohen Center for Modern Jewish Studies (CMJS)/Steinhardt Social Research Institute (SSRI) at Brandeis University to conduct a local Jewish community study. The goals of the research were to estimate the size and characteristics of the Jewish population of the catchment area under the purview of The Associated and generate findings that could help Jewish organizations in Baltimore plan for the next decade and serve the Jewish community as effectively as possible. A diverse group of lay and professional leaders from across the Baltimore Jewish community aided in the design of the study; CMJS/SSRI used the latest available sampling and survey techniques in conducting the study. The data from the study, collected and analyzed throughout 2019, provide a snapshot of a community and the ways in which members of Baltimore’s Jewish community engage with Jewish life. This summary outlines some of the highlights of the findings. Readers may explore the full report or individual chapters, where more detail is provided. Technical appendices are also available, which describe details of the study design and provide comparison charts (Appendix B) that provide detailed cross-tabulations of the findings for key segments of the Baltimore Jewish community. The Baltimore Jewish community consists of approximately 46,700 households that are home to 115,400 individuals, including 95,400 Jews (74,900 adults and 20,500 children) and 20,000 non-Jews (18,000 adults and 2,000 children). The community is exceptionally strong in Pikesville, Owings Mills, and the Park Heights and Cheswolde neighborhoods of the City of Baltimore, where many of the central institutions of the Baltimore Jewish community are located. Jewish families and individuals who live farther away from these institutions do not have the same access or opportunities to engage in Jewish communal life and feel their needs are not fully met. Just as the Baltimore Jewish community is diverse demographically, so too is there a variety of types of Jewish identification and means of engagement in Jewish life. Examining the ways in which Jewish adults not only view, but also enact their Jewish identities is necessary to understand the population and the ways in which Jewish life in the region can be enhanced. The study

2 | 2020 Baltimore Jewish Community Study
includes an “Index of Jewish Engagement,” created uniquely for the Baltimore Jewish community, that focuses on Jewish behaviors—the ways in which individuals participate in Jewish life—rather than self-defined identities or demographic characteristics. Baltimore’s synagogues and Jewish educational programs—particularly its day schools, yeshivot, and Hebrew schools—are one of the community’s greatest strengths. At the same time, however, nearly 40% of the population do not participate synagogue life, and 35% of children in grades K-12 are not currently enrolled in any Jewish educational programming. The JCC’s many social, cultural, volunteering, and other programs are critical for this segment of the population. Nevertheless, a significant group within the community feels that the Jewish community is not sufficiently providing for their needs. Most of the community is middle-class, but a substantial minority feels economic insecurity. Many households struggle to pay their bills and, for some, this is a significant obstacle to participation in Jewish communal life. Related, a substantial proportion of households in the community include someone with a significant disability or chronic physical or mental health condition that limits their ability to work, go to school, or do housework. These needs can also be obstacles to participation in Jewish communal life, and they often overlap with significant financial challenges. Many Jewish adults in Baltimore are also providing care for relatives, separate from routine childcare, and many have parents living in a group home, assisted living facility, nursing home, or independent living community. The Baltimore Jewish community’s strong ties to Israel are reflected in community members’ high rates of travel to Israel, high rates of following news about Israel, and robust sense of connection to Israel. Members of the community are nearly unanimous in their view of Israel as a homeland for the Jewish people, and strong majorities perceive Israel as a source of pride and as a lively democratic state. Key specific findings from the study include:
DEMOGRAPHY
The Baltimore Jewish community includes approximately 46,700 Jewish households, an increase of 11% since 2010.1 These households include: 115,500 individuals (+4% since 2010) 95,400 Jewish individuals (+4% since 2010)
74,900 adults 20,500 children
20,000 non-Jewish individuals 18,000 adults 2,000 children

3 | 2020 Baltimore Jewish Community Study
The mean age of Jewish adults in Baltimore is 50, similar to the national Jewish population.
The mean age of all Jews in Baltimore, including children, is 41. Twenty-six percent of all Jewish households in Baltimore include at least one child under age
18. Of Jewish adults in Baltimore, 20% are ages 18-34, 24% are ages 35-49, 30% are ages 50-64,
22% are ages 65-79, and 4% are 80 or older. Nearly half of Jewish adults (45%) were raised in Baltimore. Baltimore has one of the largest Orthodox populations in the United States. Twenty-one
percent of Jewish adults in Baltimore identify as Orthodox. Similar proportions identify as Conservative (19%) and Reform (18%). Three percent belong to another denomination. Thirty-nine percent identify with no particular denomination.
Sixty-eight percent of Jewish households in Baltimore include a married couple. Of these, 55% are inmarried and 45% are intermarried. The intermarriage rate is far lower than the national rate (64%).
Households that include an intermarried couple tend to feel that the community is not welcoming to them, does not care about them, and does not support them.
One-in-ten Jewish households in Baltimore include someone who identifies as lesbian, gay, bisexual, transgender, or queer. Four percent of Jewish adults in Baltimore identify as LGBTQ. Households with an LGBTQ member are about evenly split between those who describe
the Jewish community as welcoming to them and those who feel it is not welcoming. Eight percent of Jewish adults in Baltimore identify with a racial category other than non-
Hispanic white. Many of these members of the community feel they are not fully included as a result of their race or ethnicity.
GEOGRAPHY
Pikesville/Mount Washington is the largest area of Jewish residence, with 22% of Jewish households and 25% of Jewish individuals in the community. The next largest areas are Owings Mills/Reisterstown, with 15% of Jewish households and 16% of Jewish individuals, and Park Heights/Cheswolde, with 9% of Jewish households and 15% of Jewish individuals.
Jewish young adults (ages 18-34) disproportionately live in the City of Baltimore compared to older adults. Very few Jewish adults ages 80 or older live in Carroll and Harford Counties.
PATTERNS OF JEWISH ENGAGEMENT
The Index of Jewish Engagement is based on measures from four categories of behavior: family holiday celebrations, ritual practices, communal activities, and personal activities.

4 | 2020 Baltimore Jewish Community Study
Five distinct and mutually exclusive patterns of behavior emerge from the data: Familial (16% of Jewish adults): Characterized by participation in family and home-
based dimensions of Jewish life. Personal (19% of Jewish adults): Characterized by participation primarily in Jewish
activities that can be done individually. Less active in communal and ritual activities. Involved (12% of Jewish adults): Characterized by participation in most aspects of
Jewish life at a moderate level. Communal (26% of Jewish adults): Characterized by participation in communal and
personal activities. Immersed (27% of Jewish adults): Characterized by high rates of participation in all
aspects of Jewish life. Each group includes people of all ages and denominational identities.
FINANCIAL WELL-BEING
Thirty-eight percent of households are not confident in their ability to live comfortably during retirement. One quarter of households do not have enough funds to cover three months of expenses were they to face an unexpected loss of income.
The Baltimore Jewish community is highly educated. Seventy-three percent of Jewish adults in Baltimore have earned at least a bachelor’s degree, including half with at least one post-graduate degree.
Seventy-one percent of Jewish adults in Baltimore are working, either full (57%) or part time (14%). An additional 18% of the population is retired. The remaining 11% are stay-at-home parents, unemployed, on temporary leave, or studying for a degree.
Four percent of the community describe their standard of living as “prosperous” and nearly one third (31%) say they are “living very comfortably.” Another 50% say they are “living reasonably comfortably.” But 13% of Jewish households say they are “just getting along,” a possible indication of economic vulnerability, while 1% say they are “nearly poor,” and 2% say they are “poor.”
Respondents were also asked about life changes in the previous year that resulted in economic hardship. Overall, 18% of households reported encountering such a hardship.
Ten percent of households include someone who, in the past year, was constrained by financial issues from participating in the Baltimore Jewish community. The most commonly cited issues were synagogue dues, tuition for Jewish educational
programs, and fees for other programs. Financial constraints were most common for Orthodox households and families with
children.
5 | 2020 Baltimore Jewish Community Study
HEALTH
Twenty-nine percent of Jewish households in Baltimore include at least one person who is limited by some sort of health issue, special need, or disability.
In 14% of households, or almost half of those with a need, the health issue causes a limitation in the ability to work, attend school, or do housework, including 26% of households where the head of household is 80 or older and 32% of households that describe their standard of living as “just getting along,” “nearly poor,” or “poor.”
Two percent of households do not receive the services needed to address the health issue.
Thirteen percent of Jewish households are serving as primary caregivers for a relative, separate from routine childcare.
Thirty-four percent of caregivers (representing 4% of households) provide care for someone living in their own household.
Sixty-six percent (9% of all households) provide care for someone in another household in the Baltimore area.
Fourteen percent (2% of all households) are providing care for someone outside the Baltimore area.
Ten percent of caregiving households provide care to people in two or more of these categories.
Sixteen percent of Jewish adults ages 65 or older are dissatisfied with the amount of time they spend with friends and family. The issue is particularly acute for those who live in the City of Baltimore.
Eight percent of households include someone who, in the past year, was constrained by health issues from participating in the Baltimore Jewish community. This share includes 20% of households in which the head of household is age 80 or older.
CHILDREN Among the 22,500 children who live in Baltimore Jewish households, 20,500 (91%) are
being raised Jewish in some way, either by religion, secularly or culturally, or as Jewish and another religion.
Among the 2,000 children not being raised Jewish, 1,600 are being raised with no religion, 200 are being raised in another religion, and 200 have not yet had a religion decided for them.
Virtually all inmarried parents are raising their children Jewish, and among children of intermarried parents, 75% are being raised Jewish in some way.
Half of Jewish children in grades K-12 were enrolled in some form of Jewish school during

6 | 2020 Baltimore Jewish Community Study
the 2018-19 academic year. This includes 39% in day school or yeshiva, and 12% in part-time school.
Of Jewish children in grades K-12, 50% participated in at least one form of informal education.
Of Jewish children who are not yet in kindergarten, 17% were enrolled in a Jewish preschool program.
Among households with at least one child age 12 or younger, 44% receive books from PJ Library. Expanding enrollment in PJ Library may also serve as a gateway to participation in other Jewish educational programs.
SYNAGOGUE AND RITUAL LIFE
One third of households (approximately 15,000) include someone who belongs to a synagogue or another Jewish worship community of some type. Forty percent of Jewish adults live in synagogue-member households, similar to the rest of the country.
Twenty-seven percent of households are dues-paying members of “brick-and-mortar” congregations, traditionally structured with buildings and ordained clergy.
One-in-five synagogue-member households belong to multiple congregations or prayer groups (e.g., independent minyan, Chabad).
Among households who are members of local brick-and-mortar synagogues, 53% are members of Orthodox congregations, 31% are members of Conservative congregations, 18% are members of Reform congregations, and 1% are members of synagogues of other denominations.
Ten percent of households with an intermarried couple and 22% of households with no married couple are members of a Baltimore-area congregation.
Approximately 65% of Jewish adults attended services at least once in the past year, including 43% of those who are not members of a congregation.
Passover and Hanukkah are observed by the largest proportion of the Baltimore Jewish community, with 83% attending a seder and 82% lighting Hanukkah candles.
High Holiday services were attended by 51% of Jewish adults. One quarter (25%) of Jewish adults in Baltimore keep kosher at home.
SOCIAL AND COMMUNAL LIFE
The Baltimore Jewish community is tightly knit, with most households having lived in the Baltimore area for decades and nearly half of Jewish adults having been raised in the community. This insularity can make it difficult for newcomers to the community, and people who

7 | 2020 Baltimore Jewish Community Study
lack the Judaic knowledge of those who were raised in the community’s schools, to find their place in the community. Many of these people are interested in social and educational programming but are unwilling to join a synagogue.
Newcomers are looking for programs to help them learn about the community and acclimate to it, without the pressure or expectation that they will become members of local synagogues or immediately become active supporters.
Members of the community without extensive Jewish educational backgrounds feel their lack of knowledge is a significant barrier to participation and are looking for low-pressure adult education programs, where little to no prior knowledge of Jewish texts or traditions, or of Israel, are assumed.
Two thirds of Baltimore Jewish adults read material from at least one local Jewish organization in the past year, and one third read this type of material at least once a month.
Forty percent of Jewish adults attended at least one Jewish-sponsored program, activity, or class in Baltimore in the past year, and 13% participated at least once per month.
A majority of Baltimore’s Jews, 59%, attended a program, activity, or service at a local synagogue or congregation in the past year. Thirty-eight percent participated at the JCC of Greater Baltimore, and 15% attended a local Chabad program or service.
Seventeen percent of Jewish adults volunteered for a local Jewish organization.
More than half of Jewish households (56%) gave to at least one Jewish organization, representing 69% of households who made any sort of charitable donation. Forty-one percent of Jewish households gave to organizations that primarily serve the Jewish community of Baltimore.
Almost one quarter (23%) of households donated to a Jewish congregation.
There a number of reasons why people may not feel connected to the Jewish community. Not being able to find interesting Jewish activities has been a concern for 44% of Jewish adults in Baltimore. A similar proportion, 42%, do not feel they know enough people at Jewish organizations and programs. For 38% of Jews, a lack of connection is related to discomfort with their level of Jewish knowledge.
The vast majority (95%) of Jews in Baltimore have at least some close Jewish friends, and 42% report that most or all of their closest friends are Jewish.
Members of the Baltimore Jewish community are concerned about antisemitism, but that worry is more directed at the national (59%) than the local level (26%).
Nineteen percent of Jewish adults in Baltimore say that safety or security concerns are a barrier to participation in Jewish communal life.

8 | 2020 Baltimore Jewish Community Study
CONNECTIONS TO ISRAEL More than half (59%) of Baltimore Jewish adults have been to Israel at least once.
Seventeen percent of Jewish adults have traveled with a Jewish organization on a mission or other sponsored trip to Israel. Adults who have traveled to Israel on an educational or volunteer program represent 11% of the population. Twenty-seven percent of age-eligible adults—those younger than age 47—have been to Israel on Birthright.
Eighty percent of Jewish adults feel at least “a little” connected to Israel, including 34% who feel “very connected.”
Nearly all Jewish adults see Israel as a homeland for Jews throughout the world (87%).
Eighty-two percent of Jewish adults feel at least a little comfortable discussing the Israeli-Palestinian conflict, and 32% feel very much comfortable.
9 | 2020 Baltimore Jewish Community Study
The 2020 Baltimore Jewish Community Study, conducted by the Maurice and Marilyn Cohen Center for Modern Jewish Studies (CMJS) and the Steinhardt Social Research Institute (SSRI) at Brandeis University and sponsored by The Associated: Jewish Community Federation of Baltimore, employed innovative state-of-the-art methods to create a comprehensive portrait of the characteristics, attitudes, and behaviors of present-day Baltimore Jewry. Some of the issues explored in the study grew out of conversations surrounding the Pew Research Center’s A Portrait of Jewish Americans (2013), which pointed to growing and shrinking US Jewish sub-populations, declining affiliation in traditional institutions, new forms of Jewish engagement, a rise of both secular and Orthodox Jews, and a relationship between intermarriage and community growth.2 With the Pew study and the related national discourse as a backdrop, the Baltimore Jewish Community Study seeks to describe the current dynamics of its population. The principal goal of this study is to provide valid data about the Baltimore Jewish community that can be used by communal organizations and their leadership to design programs and policies that support and enhance Jewish life. Valid data are essential to effective decision making, allocation of resources, strategic priorities, community support, robust participation, and outreach. Specifically, the study sought to:
Estimate the number of Jewish adults and children in the community and the number of non-Jewish adults and children who are part of those households
Describe the community in terms of age and gender, geographic distribution, economic well-being, and other sociodemographic characteristics
Measure participation in and attitudes toward community institutions, programs, and services
Understand the multifaceted cultural, communal, and religious expressions of Judaism that constitute Jewish engagement
Assess attitudes toward Israel and Judaism
Gauge need and potential need for human services
The Baltimore Jewish Community Study provides a snapshot of today’s Baltimore population and considers trends and developments that diverge from those of the past.
CHAPTER 1
INTRODUCTION

10 | 2020 Baltimore Jewish Community Study
HISTORY The present study is the latest in a succession of occasional studies about the Baltimore Jewish community. The first study that was regarded as scientific, conducted in 1968, identified 106,300 Jews living in 35,000 households. The most recent demographic study, in 2010, found 92,100 Jews in 42,200 households.3 All reports on previous studies can be found at the Berman Jewish Data Bank, <http://www.jewishdatabank.org/studies/us-local-communities.cfm>.
METHODOLOGY OVERVIEW
CMJS/SSRI community studies utilize scientific survey methods to collect information from selected members of the community and, from those responses, extrapolate information about the entire community. The 2019 Baltimore Jewish Community Study is based on data collected through telephone and internet surveys from April to July 2019 from a total of 2,597 Jewish households residing for at least part of the year in The Associated’s catchment area. The response rate for the primary sample was 35.4%. Households invited for the survey were randomly selected from a combination of contact information provided by local community organizations and purchased lists of likely Jewish households. To ensure that the households were representative of the entire community, we used additional information to develop the estimates of population size and characteristics reported in this study. We estimated the population size and basic demographic characteristics using an innovative enhancement of the traditional random digit dial (RDD) survey method. Instead of deriving information about the population from a single RDD phone survey of the local area, the enhanced RDD method relies on a synthesis of national surveys, conducted by government agencies and other organizations, that include information about religion. The synthesis combined data from hundreds of surveys and used information collected from Baltimore residents to estimate the Jewish population in the region. See ajpp.brandeis.edu for more information about this approach to Jewish population estimates. In all studies of members of the Jewish community, more involved members are more motivated, and therefore more likely, to complete a survey than are less involved members. To minimize the bias that this introduces, we validated all results against known benchmarks of community participation and adjusted as needed. Examples of benchmarks are the total number of synagogue member households and the total number of children enrolled in Jewish schools. See Appendix A for more detail about the survey methods used for this study.

11 | 2020 Baltimore Jewish Community Study
HOW TO READ THIS REPORT The present survey of Jewish households is designed to represent the views of an entire community by interviewing a randomly selected sample of households from the community. In order to extrapolate respondent data to the entire community, the data are adjusted (i.e., “weighted”). Each individual respondent is assigned a weight so that his/her survey answers represent the proportion of the overall community that has similar demographic characteristics. The weighted respondent thus stands in for that segment of the population and not only the household from which it was collected. (See Appendix A for more detail.) Unless otherwise specified, this report presents weighted survey data in the form of percentages or proportions. Accordingly, these data should be read not as the percentage or proportion of respondents who answered each question in a given way, but as the percentage or proportion of the population that it is estimated would answer each question in that way had each member of the population been surveyed. No estimate should be considered an exact measurement. The reported estimate for any value, known as a “point estimate,” is the most likely value for the variable in question for the entire population given available data, but it is possible that the true value is slightly lower or slightly higher. Because estimates are derived from data collected from a representative sample of the population, there is a degree of uncertainty. The amount of uncertainty depends on multiple factors, the most important of which is the number of survey respondents who provided the data from which an estimate is derived. The uncertainty is quantified as a set of values that range from some percentage below the reported estimate to a similar percentage above it. This range is known as a “confidence interval.” By convention, the confidence interval is calculated to reflect 95% certainty that the true value for the population falls within the range defined by the confidence interval, but other confidence levels are used where appropriate. (See Appendix A for details about the magnitude of the confidence intervals around estimates in this study.) When size estimates of subpopulations (e.g., Orthodox households) are provided, they are calculated as the weighted number of households or individuals for which the respondents provided sufficient information to classify them as members of the subgroup. When data are missing, those respondents are counted as if they are not part of the subgroups for purposes of estimation. For this reason, all subpopulation estimates may undercount information on those least likely to complete the survey or answer particular questions. Missing information cannot reliably be imputed in many such cases because the other information that could serve as a basis to impute data is also missing. Refer to the codebook, included as Appendix D, for the actual number of responses to each question. Some tables and figures that present proportions do not add up to 100%. In some cases, this is a result of respondents having the option to select more than one response to a question; in such cases, the text of the report will indicate that multiple responses were possible. In most cases, however, the appearance that proportional estimates do not add up to 100% is a result of rounding. Proportional estimates are rounded to the nearest whole number.

12 | 2020 Baltimore Jewish Community Study
For simplicity, in some tables, not all groups will be shown. For example, if the proportion of a group who participated in a Passover seder is shown, the proportion who did not participate will not be shown. When a percentage is between 0% and 0.5% and would otherwise round down to 0%, the number is denoted as < 1. In some cases, there were insufficient respondents to provide reliable estimates. In those cases, the table entry shows “—“. Some tables report on proportions of households, and others report proportions of adults or Jewish adults. This is always indicated on the top row of the table. When tables report individual characteristics for households, the Jewish engagement group is that of the Jewish respondent for the household. Age is set at the age of the head of household (typically the oldest married Jewish person if there is one; otherwise it is the respondent’s age.) Denomination at the household level is based on the most ritually observant denomination of any adult in the household.
REPORTING QUALITATIVE DATA The survey included a number of questions that called for open-text responses. These were used to elicit more information about respondents’ opinions and experiences than could be provided in a check box format. All such responses were categorized, or “coded,” to identify topics and themes that were mentioned by multiple respondents. Because a consistent set of responses were not offered to each respondent, it would be misleading to report the weighted proportion of responses to these questions. Instead, we report the total number of responses that mentioned a particular code or theme. This number appears in parentheses after the response without a percent sign, or in tables labeled as “n” or number of responses. In most cases, sample quotes are also reported, with identifying information removed and edited for clarity.
COMPARISONS ACROSS SURVEYS As part of the goal to assess trends, comparisons of answers to a number of questions are made to earlier local data (in particular, the 2010 study4) and data from national studies (in particular, Pew’s 2013 A Portrait of Jewish Americans5). All comparisons to the United States Jewish population are based on data drawn from the Pew study. Although these analyses are informative, because of methodological differences, comparisons across studies are less precise and reliable than the data from the present study alone.
REPORT OVERVIEW This report presents key findings about the Baltimore Jewish Community. Beginning with a portrait of the community as a whole, the report continues with a more in-depth look at topics of interest to community members and leaders.

13 | 2020 Baltimore Jewish Community Study
Chapter 2. Demographic Snapshot This chapter provides an overview of the demographic composition of the Baltimore Jewish community and discusses changes in the Jewish population size and characteristics since 2010. Chapter 3. Patterns of Jewish Engagement This chapter describes the multifaceted ways in which the Jews of the Baltimore define and express their Jewish identity. A set of behavioral measures characterize Jewish engagement based on participation in Jewish life. A typology of Jewish engagement helps explain Jewish behaviors and attitudes. This chapter also reports on attitudes about the meaning and importance of Judaism. Chapter 4. Financial Well-Being, Health and Special Needs This chapter examines the living conditions of Baltimore Jewish households, in particular with regard to economic well-being, economic hardship, and health and social service concerns. Chapter 5. Jewish Children This chapter discusses Jewish children and families as well as participation in Jewish education. Chapter 6. Synagogue and Ritual Life This chapter discusses synagogue membership and levels of participation in Jewish ritual life. Chapter 7. Social and Community Life This chapter discusses membership and involvement in organizational, social, and personal Jewish life as well as volunteering and philanthropy. Chapter 8. Israel This chapter describes frequency and types of travel to Israel and other markers of Israel connection. Chapter 9. In the Words of Community Members The concluding chapter uses comments from survey respondents to summarize key findings of the study and make recommendations for the future.
REPORT APPENDICES The appendices, available in a separate document, include: Appendix A. Methodological Appendix Details of data collection and analysis. Appendix B. Comparison Charts Detailed cross-tabulations of all survey data for key subgroups of the population.

14 | 2020 Baltimore Jewish Community Study
Appendix C. Latent Class Analysis Details of the latent class analysis method that was used to develop the Index of Jewish Engagement. Appendix D. Survey Instrument and Codebook Details of survey questions and conditions, along with the original weighted responses. Appendix E. Study Documentation Copies of the recruitment materials and training documents used with the call center. Appendix F. Anne Arundel County Description of the Anne Arundel County residents who affiliate with Baltimore-area Jewish organizations.

15 | 2020 Baltimore Jewish Community Study
CHAPTER HIGHLIGHTS Understanding the character, behavior, and attitudes of members of the Baltimore Jewish community requires knowledge of the size, geographic distribution, and basic socio-demographic characteristics of the community. The ways in which members of Jewish households identify and engage with Judaism and the community all vary significantly based upon who they are, where they live, their household composition, their ages, and their Jewish backgrounds. This demographic overview describes the size of the community and the basic characteristics of community members.
The Baltimore Jewish community numbers approximately 115,500 adults and children living in 46,700 Jewish households. These households include:
74,900 Jewish adults
20,500 Jewish children
18,000 non-Jewish adults
2,000 non-Jewish children
The mean age of Jewish adults in Baltimore is 50, similar to the national Jewish population. The mean age of all Jews in Baltimore, including children, is 41.
Twenty-six percent of Jewish households in Baltimore include children under age 18.
The plurality of the Jewish population, 22%, lives in the Pikesville area, followed by 15% in Park Heights/Cheswolde. These areas, plus the Mt. Washington neighborhood, include 40% of the Jewish population of Baltimore.
Young adults (ages 18-34) disproportionately live in the City of Baltimore compared to older Jewish adults. Very few Jewish adults ages 80 or older live in Carroll and Harford Counties.
The Baltimore Jewish Community Population Estimates, 2019
Total people in Jewish households 115,500
Total Jewish households 46,700
Total Jews 95,400
Adults
Jewish 74,900
Non-Jewish 18,000
Children
Jewish 20,500
Non-Jewish 2,000
Jewish population estimate
CHAPTER 2
Demographic Snapshot

16 | 2020 Baltimore Jewish Community Study
Compared to the national Jewish population, the Baltimore Jewish community is more Orthodox and non-denominational, and less Reform. However, there are roughly equal shares of Jewish adults who identify with the three major denominations: Orthodox (21%), Conservative (19%), and Reform (18%).
The individual intermarriage rate (i.e., the proportion of married Jewish adults with a non-Jewish spouse) is 29%, far lower than the national intermarriage rate of 44%.
JEWISH POPULATION ESTIMATE The present community study estimates that the Baltimore Jewish community numbers approximately 115,500 adults and children living in 46,700 Jewish households. These households include 95,400 Jewish individuals (see below for definitions). From 2010 to 2019, the number of households grew by 11% (excluding Harford County, 8%), and the number of Jewish individuals increased by 4% (excluding Harford County, < 1%).6
In the City of Baltimore, and Baltimore, Carroll, and Harford Counties, the total population in 2018 (the most recent data available) was about 1,853,000 people. Approximately 5.1% of residents of the catchment area are Jewish, compared with approximately 2.2% of the population of the United States. The regional population growth from 2010 to 2018 was 1%, similar to the rate of growth in the Jewish population. A more appropriate comparison, however, is that of the Jewish community to the non-Hispanic white college-educated population ages 25 and older, which increased across the area by approximately 13% between 2010 and 2018.7 Although an imperfect proxy because there are many Jews who are people of color, not college educated, or who are under 25 years old, patterns of growth or decline in the non-Hispanic white college-educated population are typically correlated with growth or decline in the Jewish population.
JEWISH ADULTS Estimates of the size of the Jewish population rest on a set of fundamental questions about who is counted as Jewish for the purposes of the study. Recent surveys, such as the Pew Research Center’s 2013 study, A Portrait of Jewish Americans, classify respondents according to their responses to a series of screening questions: What is your religion? Do you consider yourself to be Jewish aside from religion? Were either of your parents Jewish? Were you raised Jewish? Based on the answers to these questions, Jews have been categorized as “Jews by religion” (JBR)—if they respond to a question about religion by stating that they are solely Jewish—and “Jews of no religion” (JNR)—if their religion is not Judaism, but they consider themselves Jewish through some other means. Jews by religion tend to be more engaged with Judaism than Jews of no religion, but many JBRs and JNRs look similar in terms of Jewish behaviors and attitudes. For the purposes of this study, and to ensure that Baltimore’s Jewish community could be compared to the population nationwide, a variant of Pew’s scheme was employed, supplemented by several other measures of identity. Included in the Jewish population are those adults who indicate they are Jewish and another religion; we refer to this category as “Jews of multiple religions” (JMR).

17 | 2020 Baltimore Jewish Community Study
DEFINITIONS Jewish households are households that include at least one Jewish adult. Jewish adults are those who say they are currently Jewish and either have at least one Jewish parent, were raised Jewish, or converted to Judaism. They include three groups:
Jewish by religion (JBR): Indicate their religion is Jewish. Jews of no religion (JNR): Indicate they have no religion but are ethnically or culturally
Jewish. Jews of multiple religions (JMR): Either they consider themselves having two religions,
Jewish and another religion, or they have another religion but also consider themselves ethnically or culturally Jewish.
Non-Jewish adults include three groups: Jewish background: Those who report that they had a Jewish parent or were raised Jewish,
but do not consider themselves currently Jewish in any way. Jewish affinity: Those who consider themselves Jewish but were not born to Jewish parents,
were not raised Jewish, and did not convert. Many in this group are married to Jewish adults.
Not Jewish: Do not consider themselves Jewish and have no Jewish background. Jewish children are classified based on how they are being raised by their parents.
Jewish by religion (JBR): Parents say they are raising their children Jewish by religion. Jews of no religion (JNR): Parents say they are raising their children culturally Jewish. Jews of multiple religions (JMR): Parents say they are raising their children as Jewish and
another religion. Non-Jewish children are children being raised with no religion or a religion other than Judaism, or whose parents have not yet decided on a religion.
No religion: Parents say they are raising their children with no religion. Not yet decided: Parents say they have not yet decided how they will raise their children in
terms of religion. This response is most commonly provided for children who are too young to enroll in religious education.
Another religion: Parents say they are raising their children in a religion other than Judaism.
Among Jewish adults in Baltimore, 78% (58,600 individuals) identify as Jewish by religion (JBR). This proportion is similar to that of the overall United States Jewish population as reported by Pew (78%).8 Of the remaining Jewish adults, 17% (12,600 individuals) identify as Jews of no religion (JNR), and 5% (3,800 individuals) identify as Jews of multiple religions (JMR).9

18 | 2020 Baltimore Jewish Community Study
JEWISH HOUSEHOLDS Jewish households are defined as households that include at least one Jewish adult. Baltimore’s Jewish population resides in 46,700 households. (Table 2.1). This number represents an increase of 11% since 2010.10
Including adults and children, 115,500 individuals11 reside in Jewish households. This total includes 74,900 Jewish adults and 20,500 Jewish children as well as 18,000 non-Jewish adults and 2,000 non-Jewish children.
PEOPLE IN JEWISH HOUSEHOLDS For the purposes of this study, all adults and children in Jewish households have been classified according to their Jewish identity (see box on page 17 for definitions). As shown in Table 2.2, the largest population growth in Jewish households appears in the increased number of non-Jewish adults who live in those households. This trend corresponds to the increase in intermarriage, as discussed below.
2019 201012 Change
2010 to 2019
Households with at least one Jewish adult
46,700 42,200 11%
Total Jewish adults and children
95,400 92,100 4%
Total people in Jewish households
115,500 111,500 4%
Table 2.1 Jewish population of Greater Baltimore, summary (rounded to nearest 100)
Table 2.2 Jewish population of Greater Baltimore, detail
2019 2010 Change
2010 to 2019 Jewish adults 74,900 71,100 5% JBR adults 58,600 JNR adults 12,600 JMR adults 3,800 Non-Jewish adults in Jewish households 18,000 13,100 37% Jewish background 1,200 Jewish affinity 1,600 Not Jewish 15,200 Jewish children in Jewish households 20,500 21,000 -2% JBR children 14,400 JNR children 4,500 JMR children 1,600 Non-Jewish children in Jewish households 2,000 *13 No religion 1,600 Not yet decided 200 Other religion 200
Note: Rounded to nearest 100; sums may not add up to total due to rounding.

19 | 2020 Baltimore Jewish Community Study
AGE AND GENDER COMPOSITION The age composition of the Baltimore Jewish community is generally similar to that of the US Jewish community as a whole. Compared to the national Jewish population, the local Jewish community has more adults between ages 65-79 (Table 2.3a). The mean age of Jewish adults in Baltimore is 50 and the median is 51; similarly, the national median age of Jewish adults is 50.14
Including children in the analysis lowers the mean age. The mean age of all Baltimore Jewish individuals is 41 and the median is 44. Because of the higher birth rates among Orthodox Jews, it is often assumed that the non-Orthodox Jewish population is, on average, older when Orthodox Jews are included. Table 2.3b displays the ages of non-Orthodox Jews in Baltimore in 2019 and in the United States in 2013. The apparent differences in the ages of Baltimore’s non-Orthodox Jews compared to the overall Jewish community of the United States are not statistically significant. The age-gender pyramid shows the distribution of Jews in Baltimore (Figure 2.1). The largest
Table 2.3a. Age of Jewish individuals in Baltimore and the United States
Baltimore 2019 (%)
US Jewish community* (%)
Age 0-17 22 26 Age 18-34 14 21 Age 35-49 18 16 Age 50-64 27 20 Age 65-79 16 13 Age 80 + 3 5 * Source: Pew 2013
Table 2.3b. Age of non-Orthodox Jewish individuals in Baltimore and the United States
Baltimore
2019 (%) US Jewish
community* (%) Age 0-1715 17 23 Age 18-34 12 20 Age 35-49 19 16 Age 50-64 32 22 Age 65-79 16 13 Age 80 + 4 5
* Source: Pew 2013
Figure 2.1. Age-gender distribution of Jews in Baltimore

20 | 2020 Baltimore Jewish Community Study
share of Jewish individuals is between the ages 60-69, followed by those ages 50-59 and 0-9. Overall, the Baltimore Jewish community has more females than males (52% and 48%, respectively), with less than 1% of adults identifying as a gender other than male or female. Gender is fairly evenly distributed across all age groups.
HOUSEHOLD COMPOSITION Households with children under age 18 (including single-parent, two-parent, or multigenerational households) make up 26% of Jewish households in Baltimore (Figure 2.2). The mean household size is 2.5 individuals. Among households with children, the mean number of children ages 17 and younger is 1.8. Couples without children constitute 34% of households. Multigenerational households, constituting 14% of households, are defined as parents and adult children of any age living together. This category can include adults who are living with children in their 20s or adults living with a parent in their 80s. Twenty-three percent of households include an adult living alone: 13% are seniors ages 80 and older, 30% are seniors ages 65-79, 22% are ages 50-64, 14% are ages 35-49, and the remaining 22% are under age 35.
Figure 2.2. Household composition

21 | 2020 Baltimore Jewish Community Study
GEOGRAPHIC DISTRIBUTION Aligning with, and building upon, regional definitions used in the 2010 report, the Jewish community of Baltimore can be divided among 11 regions, assigned based on ZIP code and neighborhoods. (See Appendix A for a detailed breakdown of how respondents were classified into regions.) The plurality of the Jewish population, 22%, lives in the Pikesville area, followed by 15% in Park Heights/Cheswolde. These areas, including the Mt. Washington neighborhood, include 40% of the Jewish population. Maps showing the distribution of Jewish households appears below (Figures 2.3, 2.4).16
Geographic region Jewish
households (%)
Jewish individuals
(%)
All individuals
(%)
Pikesville 19 22 20
Roland Park/Guilford/Midtown 15 11 12
Towson/Lutherville/Timonium/I-83 13 12 13
Park Heights/Cheswolde 9 15 12
Downtown 9 6 9
Reisterstown 8 10 9
Owings Mills 7 7 6
Mt. Washington 3 3 3
Randallstown/Liberty Road 2 1 1
Other Baltimore County 7 7 8
Carroll & Harford Counties 6 6 6
Undetermined/Unknown 1 2 1
Table 2.4. Geographic distribution of the Baltimore Jewish community

22 | 2020 Baltimore Jewish Community Study
Figure 2.3. Dot density map of Jewish households, entire area

23 | 2020 Baltimore Jewish Community Study
Figure 2.4. Dot density map of Jewish households, zoomed-in southern Baltimore County and City of Baltimore

24 | 2020 Baltimore Jewish Community Study
The Jewish population of Baltimore can also be divided among three municipal regions: the City of Baltimore, Baltimore County, and Carroll and Harford Counties (Table 2.5). These three areas will be used throughout the report for analysis.
Table 2.6 displays the distribution across the region by age. Young Jewish adults ages 18-34 disproportionately live in Baltimore City compared to older adults. Very few Jewish adults ages 80 or older live in Carroll or Harford Counties.
RESIDENCY AND LENGTH OF RESIDENCE The Jews of Baltimore have been living in the area for an average of 34 years; those who were not born in the Baltimore area have resided there for an average of 17 years. Nearly half, 45%, of Jewish adults were raised in the Baltimore area. There are high rates of internal mobility within the Baltimore Jewish community. Among those who have not lived in Baltimore for their entire lives, 61% have lived elsewhere in the region before their current residence. Table 2.7 shows the proportion of households whose previous home was in a different Baltimore-area region.
Table 2.5. Geographic region of Jewish households and children
Jewish households
(%) Jewish individuals
(%) All individuals
(%)
Baltimore City 37 35 36 Baltimore County 58 60 57 Carroll & Harford Counties 6 5 6 Total 100 100 100
Table 2.6. Geographic region of Jewish individuals by age
All Jewish
individuals (%)
Ages 0-17 (%)
Ages 18-34
(%)
Ages 35-49
(%)
Ages 50-64
(%)
Ages 65-79
(%)
Ages 80 + (%)
Baltimore City 35 36 60 29 24 26 26 Baltimore County 60 59 35 67 68 68 74 Carroll & Harford Counties 5 6 6 4 7 6 < 1 Total 100 100 100 100 100 100 100
Table 2.7. Internal mobility within Baltimore Households in these regions with previous home in different Baltimore-area region
(%)
Owings Mills 73 Reisterstown 70 Pikesville 47 Mt. Washington 47 Park Heights/Cheswolde 63 Randallstown/Liberty Road 74 Roland Park/Guilford/Midtown 86 Downtown 59 Towson/Lutherville/Timonium/I-83 74 Other Baltimore County 67 Carroll & Harford Counties 58

25 | 2020 Baltimore Jewish Community Study
Among the 24% of Jewish adults who plan to move within the next three years, 23% intend to stay in their immediate area, and 33% plan to leave the Baltimore area entirely; the rest hope to find another home somewhere in the region.
EXTENDED FAMILY IN THE REGION One quarter of Jewish households have adult or minor children who live in another household in the Baltimore area. Twenty percent of households have adult or minor children who live outside of Baltimore. Among those ages 75 and younger, 39% have a parent living in Baltimore but in a separate household. Among those ages 50 and older, 31% have grandchildren in another Baltimore- area household, and 32% have grandchildren outside of Baltimore.
JEWISH DENOMINATIONS Denominational affiliation has historically been one of the primary indicators of Jewish identity and practice. There are roughly equal shares of Jewish adults who identify with the three major denominations, Orthodox (21%), Conservative (19%), and Reform (18%). Those who indicate they are secular, just Jewish, or have no specific denomination constitute 39% of Jewish adults (Table 2.8); as will be seen throughout this report, these individuals tend to engage in fewer Jewish behaviors and to be less connected to Jewish organizations than adherents to specific denominations. However, many of these individuals are deeply engaged in Jewish life. Denomination is not as predictive of behavior or affiliation as it used to be. (See Chapter 3 for a description of an Index of Jewish Engagement, which will be used throughout the report to describe demographic groups and other subgroups within the population based on their patterns of Jewish behavior.) Compared to the national Jewish population, the Baltimore Jewish community is more Orthodox and non-denominational, and less Reform. The share of the population of Jewish adults who identify as Orthodox has grown slightly since 2010, while the share of the population of Jewish adults who identify as Reform has shrunk. The largest growth is in the share of the population of Jewish adults who identify as secular or “just Jewish.”
Table 2.8. Denomination of Jewish adults in Baltimore in 2010 and 2019 compared to the US Jewish community
Baltimore 2019 (%)
Baltimore 2010 (%)
US Jews (%)
Orthodox 21 17 10
Conservative 19 22 18
Reform 18 27 36
Other 3 8 6
Secular/Just Jewish 39 27 30
Total 100 100 100

26 | 2020 Baltimore Jewish Community Study
When children ages 0-17 are included in the analysis, the share of the population that is Orthodox increases, and the share that identifies as secular or with no particular denomination decreases (Table 2.9). Consistent with a population that includes a large share of Orthodox Jews, younger adults are most likely to identify with a particular denomination, and 41% of Jewish children are being raised by parents or guardians who identify as Orthodox.
INMARRIAGE AND INTERMARRIAGE Among all Jewish households in Baltimore, 68% include a couple who is married, engaged, or partnered. Of these couples, 55% are inmarried and 45% are intermarried. Four percent of couples in Baltimore include someone who converted to Judaism. The intermarriage rate is lower than the national average (Table 2.10). The individual intermarriage rate (i.e., the proportion of married Jewish adults with a non-Jewish spouse) is 29%, far lower than the national individual intermarriage rate of 44%. Regarding individual Jewish adults (Table 2.11), 77% currently have a spouse or partner with whom they live. Because social norms among those who are less religiously observant trend toward delayed marriage, it can be expected that, as more adults ages 23-34 marry, the intermarriage rate among this age cohort will increase.
Table 2.9. Age by denomination of Jewish individuals
All Jews (%)
Jewish adults
(%)
Ages 0-17 (%)
Ages 18-34
(%)
Ages 35-49
(%)
Ages 50-64
(%)
Ages 65-79
(%)
Ages 80 + (%)
Orthodox 27 21 41 34 18 15 18 18 Conservative 20 19 13 14 15 20 24 32 Reform 19 18 16 18 19 17 16 20 Other 2 3 1 3 2 4 3 1 Secular 32 39 28 30 46 44 39 30
Just Jewish 14 18 13 8 19 23 14 21 Total 100 100 100 100 100 100 100 100
Inmarriage and intermarriage definitions
Inmarried couples include two partners who are currently Jewish, regardless of whether they were born Jewish or converted. Intermarried couples include one partner who is currently Jewish and one partner who is not.

27 | 2020 Baltimore Jewish Community Study
SUBPOPULATIONS One-in-ten Jewish households in Baltimore include at least one individual who identifies as lesbian, gay, bisexual, transgender, or queer. These LGBTQ individuals are not all Jewish, however. Among Jewish adults, 4% identify as LGBTQ. Households with an LGBTQ member were asked the extent to which they feel the Baltimore Jewish community is welcoming to LGBTQ individuals. While 40% do not have an opinion, 32% feel the community is “somewhat” or “very much” welcoming. Approximately eight percent of Jewish adults in Baltimore identify with a racial category other than non-Hispanic white.18
Table 2.11. Age of Jewish respondent by inmarriage and intermarriage (includes engaged couples and partners who live together)
Overall
(%) Ages 23-34
(%) Ages 35-49
(%) Ages 50-64
(%) Ages 65-79
(%) Ages 80 +
(%)
Married/ partnered Jewish adults 77 74 87 84 77 58
Inmarried 71 72 67 66 80 91
Intermarried 29 28 33 34 20 9 Total 100 100 100 100 100 100
Table 2.10. Marriage, inmarriage, and intermarriage rates of Baltimore Jewish households and of the US Jewish community
Baltimore 2019
(%) US Jewish
community* (%) Married 68 51 Inmarried 55 36 Intermarried 45 64 Total 100 100
* Source: Reanalysis of Pew 2013

28 | 2020 Baltimore Jewish Community Study
Page intentionally blank

29 | 2020 Baltimore Jewish Community Study
CHAPTER HIGHLIGHTS Just as the Baltimore Jewish community is diverse demographically, so too is there a variety of types of Jewish identification and means of engagement in Jewish life. Examining the ways in which Jewish adults not only view, but also enact their Jewish identities is necessary to understand the population and the ways in which Jewish life in the region can be enhanced. This chapter presents and discusses an “Index of Jewish Engagement,” created uniquely for the Baltimore Jewish community.
The Index focuses on Jewish behaviors—the ways in which individuals occupy and involve themselves in Jewish life—not on self-defined identities.
Engagement groups include people of all ages and of all denominational identities. The Index identifies opportunities to improve communal planning based on people’s
different needs and interests. The following figure illustrates the distribution of the Baltimore Jewish population along
the five categories of Jewish engagement identified in the community. Five distinct patterns of behavior emerge from the data:
Familial (16% of Jewish adults): Characterized by participation in family and home-based dimensions of Jewish life.
Personal (19% of Jewish adults): Characterized by participation primarily in Jewish activities that can be done individually. Less active in communal and ritual activities.
Involved (12% of Jewish adults): Characterized by participation in most aspects of Jewish life at a moderate level.
Communal (26% of Jewish adults): Characterized by participation in communal and personal activities.
Immersed (27% of Jewish adults): Characterized by high rates of participation in all aspects of Jewish life.
CHAPTER 3
Patterns of Jewish Engagement

30 | 2020 Baltimore Jewish Community Study
INDEX OF JEWISH ENGAGEMENT One of the purposes of this Index is to serve as a single metric representing the full range of participation in Jewish life. Throughout the remainder of this report, we present data about individual measures of Jewish engagement, such as synagogue membership or program participation. A review of all of these individual measures does not reveal the relationships among them. For example, some subgroups have high levels of participation in ritual behavior but lower participation in communal behavior, while other subgroups have the opposite pattern. How can these subgroups be compared to one another? The Index presented in this chapter consolidates many of the individual measures so that the pattern of relationships among the behaviors can be identified. In addition, the Index creates the opportunity for behavior-based market segmentation. Each group can be considered separately for identifying interests and unmet needs that will guide the development of targeted programs and initiatives. In the Baltimore Jewish community, we identified five categories of Jewish engagement that describe patterns of participation in Jewish life. The chapter explains how we created these categories and describes the most prevalent Jewish behaviors and attitudes in each grouping.
BACKGROUND: CLASSIFICATIONS OF JEWISH IDENTITY The best-known system to categorize Jewish identity is denominational affiliation. Jewish denominational categories, at least in the past, closely correlated with measures of Jewish engagement, including behaviors and attitudes.19
However, because these labels are self-assigned, their meaning varies from one individual to another. In addition, an increasing number of Jews do not affiliate with any specific denomination (30% of US Jews in 2013).20 Thus, denominational labels are limited in their ability to convey Jewish behavior and attitudes.

31 | 2020 Baltimore Jewish Community Study
MEASURES OF JEWISH ENGAGEMENT We specifically designed the Index of Jewish Engagement to identify opportunities for increased engagement for groups with different needs and interests.21
The Index focuses on behaviors—the ways in which individuals occupy and involve themselves in Jewish life. Such behaviors are concrete and measurable expressions of Jewish identity. Behaviors, in many cases, correlate with demographic characteristics, background, and attitudes, but also cut across them. Jewish adults’ decisions to take part in activities may reflect the value and meaning they find in these activities, the priority they place on them, the level of skills and resources that enable them to participate, and the opportunities available and known to them. To develop the Index, we selected a range of Jewish behaviors that were included in the survey instrument. The set of Jewish behaviors used to develop the typology are inclusive of the different ways—public and private—that contemporary Jews engage with Jewish life. Some of the activities are located primarily within institutions (e.g., synagogue membership), while others are home-based (e.g., Passover seders). These behaviors are classified into four dimensions of Jewish life: family and home-based practices, ritual practices, personal activities, and organizational participation. The behavioral measures include:
Family holiday celebrations: Participating in a Passover seder and lighting Hanukkah candles. (Family holiday celebrations are practiced by many US Jews for religious and other reasons, e.g., social, familial, cultural, and ethnic. In contrast to High Holiday services, these can be practiced at home without institutional affiliation.)
Ritual practices: Keeping kosher, lighting Shabbat candles or having a Shabbat dinner, attending religious services, attending High Holiday services, fasting on Yom Kippur
Communal activities: Belonging to a synagogue, belonging to a Jewish organization or group, attending Jewish activities, volunteering for Jewish organizations, donating to Jewish causes.
Personal activities: Engaging in cultural activities (book, music, TV, museum), following news about Israel, accessing Jewish content online (websites, podcasts, etc.), reading Jewish organization’s material.
How we developed these categories Survey respondents answered questions about their Jewish behaviors; based on their responses, we identified the five primary patterns of behavior that are presented here. Survey respondents were not asked to assign themselves to the groups. The LCA analysis presented here is unique to the Baltimore Jewish community. Both the set of classifications and their names are derived directly from data collected for this study.

32 | 2020 Baltimore Jewish Community Study
We employed a statistical tool, latent class analysis (LCA), to cluster similar patterns of behavior based on respondents’ answers to survey questions. LCA identifies groups of behaviors that “cluster” together by analyzing patterns of responses. The result of the LCA analysis was the identification of five unique patterns of Jewish engagement.
Using LCA, each Jewish adult in the community was classified into one of the five engagement groups according to the pattern that most closely matches the individual’s participation in different types of Jewish behaviors. For purposes of this report, the names of the engagement groups will be used to refer to the groups of Jewish adults who most closely adhere to each pattern. The names of the groups are intended to highlight the behaviors that distinguish each group from the others.
PATTERNS OF JEWISH ENGAGEMENT Jewish adults of Baltimore can be clustered into one of five groups, each with similar patterns of behavior. The patterns are summarized in Figure 3.1 and described below. Table 3.1 shows, for each pattern, the level of participation in each of the 17 behaviors that were used to construct the Index of Jewish Engagement. As shown in Figure 3.1, the groups vary widely in size.
Figure 3.1. Patterns of Jewish Engagement

33 | 2020 Baltimore Jewish Community Study
JEWISH BEHAVIORS AND JEWISH ENGAGEMENT The five patterns differ in degree and types of engagement with a broad set of Jewish behaviors. As shown in Table 3.1, the Jewish behaviors across the five engagement patterns vary widely, but all patterns include at least some behaviors that represent a connection to Jewish life. The table shows the proportion of people in each engagement group who engage in the listed behavior. In this table, the darker the box, the higher the proportion of people who engage in that behavior. The highest level of engagement is found in the 27% of Jewish adults who are in the “Immersed” group. Almost all of the listed behaviors are practiced by nearly everyone in that group. The 26% of Jewish adults in the “Communal” group are similar to the Immersed group, but with somewhat lower rates of engagement on most measures. On the other end of the scale, the lowest level of engagement is found in the 16% who are included in the “Familial” group. Fewer than half of the members of this group attended Passover seders or lit Hanukkah candles. Jewish adults in the two remaining groups have moderate levels of Jewish engagement. Those in the “Personal” group, including 19% of Jewish adults, participate to a high degree in activities that can be done individually, such as reading Jewish books and reading news about Israel. In contrast, the 12% of Jewish adults in the “Involved” group participate in Jewish ritual and communal life, but their participation in individual activities is lower than is the case for the Personal group.
DEMOGRAPHICS AND JEWISH ENGAGEMENT The patterns of engagement are associated with demographic characteristics of respondents. Tables 3.2, 3.3, and 3.4 show the distribution of selected demographic characteristics within the Jewish engagement categories. To best understand demographic patterns, it is useful to compare the distribution of each demographic category within each engagement groups to that of the overall adult Jewish population, shown in the top row of each table. This comparison indicates where each engagement group differs from the overall population. See Appendix B for a table showing the distribution of engagement groups within each demographic characteristic (i.e., column totals rather than row totals). There are some age differences across the engagement groups (Table 3.2). The Immersed group includes the largest proportion of individuals ages 22-34 (33%). Jews ages 50-64 comprise the largest share of adults in the Familial and Personal groups. Because Orthodox Jews are disproportionately younger (see Table 2.9), it is also worth considering how Jewish engagement and age interact solely among the non-Orthodox population. However, there are no significant differences to Table 3.2 regardless of whether Orthodox Jews are included or excluded from the analysis. (See Table 3.5 for more on denomination.)

34 | 2020 Baltimore Jewish Community Study
Table 3.1. Jewish Behaviors and Jewish engagement
Legend 0-19% 20-39% 40-59% 60-79% 80-100%
Familial (%)
Personal (%)
Involved (%)
Communal (%)
Immersed (%)
% of Jewish adults 16 19 12 26 27
Family holidays
Attended seder 40 64 96 96 100
Lit Hanukkah candles 44 66 93 97 100
Ritual practices
Ever attended services 5 16 72 100 100
---Services monthly + 0 0 13 11 92 Attended High Holiday services 0 0 39 80 99
Fasted on Yom Kippur (incl. medical skip) 19 18 68 89 100
Kosher at home/always 2 3 7 9 82
Shabbat candles/dinner 9 27 50 75 100
---Shabbat often/frequently 0 1 18 17 86
Communal activities
Synagogue member 0 0 21 44 98 Member of other Jewish organization 1 6 1 14 26
Donated to Jewish charity (past year) 11 39 51 83 100
Volunteered for Jewish organization 0 4 7 14 44
Attended Jewish program 1 18 36 51 72
---Program monthly + 0 3 3 14 32
Personal activities (past month) Jewish online material (read or streamed) 27 98 7 92 98
Read Jewish material 12 89 18 94 100
Jewish cultural activities 25 91 54 90 97
Sought Israel news 45 86 70 88 95
---News weekly + 6 41 7 33 63

35 | 2020 Baltimore Jewish Community Study
Table 3.2. Age by Jewish engagement
Table 3.3. Marriage and children by Jewish engagement
Age 23-34
(%) Age 35-49
(%) Age 50-64
(%) Age 65-79
(%) Age 80 +
(%) Total
(%) All Jewish adults 24 21 29 21 4 100 Familial 16 22 36 25 2 100 Personal 15 21 34 27 3 100 Involved 30 30 18 18 4 100 Communal 22 20 28 25 5 100 Immersed 33 20 24 19 4 100
Married (%) Inmarried
(of married; %) Has children (%)
All Jewish adults 77 71 30 Familial 73 31 19 Personal 74 52 20 Involved 82 70 32 Communal 72 80 27 Immersed 86 97 46
The Immersed group has the largest share of married couples (86%; Table 3.3), and, among those who are married, the largest share who are inmarried (97%). Married couples in the Familial group include the smallest share who are inmarried (31%). Nearly half (46%) of those in the Immersed group have children, far more than in any other engagement group. The geographic distribution by group is distinct from that of the Jewish population as a whole (Table 3.4). Between 6-10% of each engagement group lives in Carroll and Harford counties, except for the Immersed group (1%). The Immersed group is roughly evenly split between Baltimore City (48%) and Baltimore County (51%), but two thirds of the Familial group (67%) are in Baltimore County.
Table 3.4. Residence by Jewish engagement
Baltimore
City (%) Baltimore
County (%) Carroll & Harford
Counties (%) Total (%)
All Jewish adults 34 60 6 100 Familial 24 67 10 100 Personal 39 55 6 100 Involved 27 63 10 100 Communal 30 65 6 100 Immersed 48 51 1 100

36 | 2020 Baltimore Jewish Community Study
JEWISH BACKGROUND AND JEWISH ENGAGEMENT The following tables describe the Jewish identity and Jewish backgrounds of those in each Jewish engagement category. Tables 3.5, and 3.6 show the distribution of selected Jewish identity characteristics within each of the Jewish engagement categories (row totals) in comparison to the overall Jewish adult population (first row). See Appendix B for a table showing the distribution of engagement groups within each demographic characteristic (i.e., column totals rather than row totals). Jewish denomination corresponds closely to Jewish engagement but is not identical (Table 3.5). Nearly 80% each of the Familial and Personal groups have no specific denomination. The Immersed group is made up of far more Orthodox Jews (69%) than any other group, but there are still some of its members (6%) with no specific denomination. Similarly, although the Familial group consists mostly of people who identify with no specific denomination (79%), it includes adherents to each of the other denominational groups as well, including Orthodox Jews (1%). An individual’s Jewish background (Table 3.6) is associated with Jewish engagement in adulthood. Large majorities of individuals in all groups were raised by two Jewish parents. Nearly three quarters (73%) of all Jews had some Jewish schooling in childhood, but only 52% of the Personal and 59% of the Familial groups had Jewish schooling, compared to 91% of the Immersed group.
Denomination Orthodox
(%) Conservative
(%) Reform
(%) Other
(%) None
(%) Total
(%)
All Jewish adults 21 19 18 3 39 100 Familial 1 5 14 1 79 100
Personal 1 6 13 3 77 100
Involved 7 19 38 1 35 100
Communal 6 35 29 6 23 100 Immersed 69 19 5 2 6 100
Jewish background Parents
inmarried (%) Attended
Jewish school (%) All Jewish adults 83 73 Familial 78 59
Personal 74 52
Involved 73 70 Communal 85 77 Immersed 93 91
Table 3.5. Denomination by Jewish engagement23
Table 3.6. Jewish background by Jewish engagement

37 | 2020 Baltimore Jewish Community Study
ATTITUDES ABOUT BEING JEWISH AND JEWISH ENGAGEMENT Just as Jewish behaviors vary across the engagement groups, so too do attitudes about being Jewish. The figures below show responses to a set of attitudinal questions that illustrate the differences among the groups. As is evident from Figures 3.2 and 3.3, majorities of all groups consider Judaism to be a matter of ethnicity and are nearly universal in thinking it a matter of culture. Interestingly, similar shares of the Familial (18%) and Immersed (17%) groups do not think that being Jewish is a matter of ethnicity. However, the Familial group values the cultural aspects of Judaism less strongly than do the other groups, with 29% saying it is “very much” a matter of culture.
Figure 3.2. Being Jewish is a matter of ethnicity
Figure 3.3. Being Jewish is a matter of culture

38 | 2020 Baltimore Jewish Community Study
With respect to the religious aspects of Judaism (Figure 3.4), there are larger differences in the engagement groups. A large majority of the Immersed group considers Judaism to be a matter of religion (88% “very much”), along with 57% of the Communal group. Forty-one percent of the Familial group and 31% of the Personal group say that Judaism is “not at all” a matter of religion.
With regard to the question of whether Judaism is part of daily life (Figure 3.5), there are clear differences among the engagement groups. Among the Immersed Jews, 89% regard Judaism to be “very much” part of their daily life. Fifty-six percent of the Familial group and 25% of the Involved group say Judaism is “not at all” part of their daily life.
Figure 3.4. Being Jewish is a matter of religion
Figure 3.5. Being Jewish is part of daily life

39 | 2020 Baltimore Jewish Community Study
ATTITUDES ABOUT JEWISH COMMUNITY Respondents were asked about the aspects of Jewish community they believe are most salient. Figure 3.6 displays the extent to which Jews in Baltimore believe that being Jewish is a matter of community. While few overall (8%) do not believe being Jewish is a matter of community, the Familial group had the largest percentage (29%) in this category. Conversely, two thirds of the Immersed group believe that being Jewish is “very much” a matter of community.
Community connections vary widely across the engagement groups, but, in nearly all cases, a feeling of connection to the worldwide Jewish community (Figure 3.7) exceeds that of the local community (Figure 3.8). The lone exception is the Immersed group, for whom a feeling of connection to the worldwide and local Jewish communities is about equal, though with a slightly higher proportion (78% vs. 71%) saying they feel very connected to the local Jewish community.
Figure 3.6. Being Jewish is a matter of community
Figure 3.7. Connections to worldwide Jewish community

40 | 2020 Baltimore Jewish Community Study
Among the Familial Jews, 34% do not feel at all connected to the worldwide Jewish community compared to 14% of the Personal Jews, 12% of the Involved, 5% of the Communal, and 1% of the Immersed. Conversely, 71% of the Familial group do not feel at all connected to the local Jewish community, compared to 36% of the Personal group, 21% of the Involved, and 11% of the Communal. All of the Immersed group feels at least a little connected to the Baltimore Jewish community. Finally, respondents were asked if being part of a Jewish community was essential to what it means to be Jewish (Figure 3.9). Notably, 33% of the Familial group and 74% of the Personal group—the two engagement groups that participate in the fewest communal activities—say that it is important or essential to be part of a Jewish community. This suggests that there may be opportunities for outreach within these groups.
Figure 3.8. Connections to local Jewish community
Figure 3.9. Essential to being Jewish: Part of a Jewish community
Question: How important is each of the following to what being Jewish means to you...Being part of a Jewish community?

41 | 2020 Baltimore Jewish Community Study
ESSENTIALS OF BEING JEWISH To further explore the meaning of being Jewish, respondents were asked about whether various aspects of Judaism were an essential part of being Jewish to them. In Figures 3.10, 3.11, and 3.12, these results are presented for each engagement group. For the two dimensions “Leading a moral and ethical life” (Figure 3.10) and “Working for justice and equality” (Figure 3.11), there is a general pattern among all groups. Moving from lower to higher levels of engagement, the proportion of each group that defines these dimensions as important or essential increases. The one exception to this pattern is that more of the Immersed (13%) than the Involved (9%) or Communal (5%) groups believe that working for justice and equality is not important to being Jewish.
Figure 3.10. Essential to being Jewish: Leading an ethical and moral life
Figure 3.11. Essential to being Jewish: Working for justice and equality in society
Question: How important is each of the following to what being Jewish means to you...Leading a moral and ethical life?
Question: How important is each of the following to what being Jewish means to you...Working for justice and equality in society?

42 | 2020 Baltimore Jewish Community Study
As would be expected, greater shares of groups that participate more frequently and more deeply in ritual Jewish practices feel that a belief in the divine or a higher power is essential to being Jewish (Figure 3.12). Three quarters of the Immersed group see belief as essential, while about two thirds of the Familial (65%) and the Personal (64%) groups do not find a belief in a divine or higher power important.
Figure 3.12. Essential to being Jewish: Belief in a divine or higher power
Question: How important is each of the following to what being Jewish means to you...Belief in a divine or higher power?

43 | 2020 Baltimore Jewish Community Study
CHAPTER HIGHLIGHTS Jewish organizations in Baltimore allocate a significant share of resources toward caring for families and individuals in need. The relative affluence of the community has provided sufficient resources to meet the needs of many. Nevertheless, it is clear that there are some unmet needs in the community. Similar to the US Jewish population as a whole, the Baltimore Jewish community is highly educated and relatively affluent. The vast majority of households describe themselves as living comfortably or better. Nevertheless, there are a significant number of households with unmet financial and health needs, including some that have financial situations limiting their participation in Jewish life. Many Jewish households also include someone whose activity is limited by a health condition, in some cases limiting participation in Jewish life. Some households report that they need health-related services but have not received them.
Of Jewish adults in Baltimore, 73% have earned at least a bachelor’s degree, including half with at least one post-graduate degree.
Seventy-one percent of Jewish adults in Baltimore are working, either full (57%) or part time (14%). An additional 18% of the population is retired.
Four percent of the community describe themselves as “prosperous,” and nearly one third of Jewish households (31%) report they are “living very comfortably.” Those who say they are “living reasonably comfortably” make up 50% of Jewish households. But 13% of Jewish households indicate they are “just getting along,” a possible indication of economic vulnerability. One percent say they are “nearly poor,” and 2% report they are “poor.”
Respondents were also asked about life changes in the previous year that resulted in economic hardship. Overall, 18% of households report encountering such a hardship.
Economic insecurity is felt by a substantial minority of the population. Thirty-eight percent of households are not confident in their ability to live comfortably during retirement. One quarter of households do not have enough funds to cover three months of expenses were they to face an unexpected loss of income.
CHAPTER 4
Financial Well-Being and Health Needs

44 | 2020 Baltimore Jewish Community Study
Twenty-nine percent of Jewish households in Baltimore include at least one person who is limited by some sort of health issue, special need, or disability. In 14% of households, or almost half of those with a need, the health issue causes a limitation in the ability to work, attend school, or do housework.
Thirteen percent of Jewish households are serving as primary caregivers for a relative, separate from routine childcare.
Eight percent of households include someone who, in the past year, was constrained by health issues from participating in the Baltimore Jewish community.
EDUCATIONAL ATTAINMENT AND EMPLOYMENT The Jewish population of Baltimore is highly educated compared to the US Jewish population as a whole, as well as compared to the overall population of the Baltimore area and the United States as a whole. Of Jewish adults in Baltimore, 73% have earned at least a bachelor’s degree, including half with at least one post-graduate degree (Figure 4.1). Among Jews in the United States, over half have attained at least a bachelor’s degree (58%), including 28% who have graduate degrees. In Baltimore overall, 35% of individuals ages 25 or older have at least a bachelor’s degree, including 15% who have a graduate degree. In the US population overall, 30% of adults ages 25 and older hold bachelor’s degrees, including 12% who hold advanced degrees.
Seventy-one percent of Jewish adults in Baltimore are working, either full (57%) or part time (14%). An additional 18% of the population is retired. The remaining 11% are stay-at-home parents, unemployed, on temporary leave, or studying for a degree. Nine percent of Jewish adults, including some already with jobs, are looking for work. Among those under the age of 65, 71% are working full time, 11% are working part time, 4% are retired, and 14% are stay-at-home parents, unemployed, on temporary leave, or studying for a degree. In 2010, 62% of Jewish adults were working, 19% were retired, and 19% were not working due to being stay-at-home parents, unemployed, on temporary leave, or studying for a degree.
Figure 4.1. Educational attainment

45 | 2020 Baltimore Jewish Community Study
ECONOMIC WELL-BEING Overall, Jewish households in Baltimore make up an economically comfortable community. Four percent of the community describes itself as “prosperous” and nearly one third (31%) says it is “living very comfortably” (Table 4.1). Those households that report they are “living reasonably comfortably” make up 50% of the total. But 13% of Jewish households say they are “just getting along,” a possible indication of economic vulnerability, 1% say they are “nearly poor,” and 2% say they are “poor.” There are no major differences in standard of living for households in the City of Baltimore, Baltimore County, and Carroll and Harford Counties. As would be expected, younger households are not as comfortable as older households, and households in which someone is limited by poor health, special needs, or a disability are far more likely to be struggling financially. Among those who responded to the question about income, 48% reported household income of $100,000 per year or greater, including 13% of Jewish households who reported household income of $200,000 per year or greater (Table 4.2). On the lower end of the spectrum, 23% indicated their household income was less than $50,000 per year. By contrast, data from the US Census Bureau indicate that only 7% of households in Baltimore have household incomes of $200,000 or greater per year, and 39% have incomes under $50,000. Household income trends are similar to household standard of living trends.

46 | 2020 Baltimore Jewish Community Study
Table 4.1. Standard of living
Prosperous (%)
Living very comfortably
(%)
Living reasonably comfortably
(%)
Just getting along, nearly poor, or poor
(%) All Jewish households 4 31 50 15 Engagement group
Familial 4 43 33 20 Personal 3 32 48 17 Involved 4 28 60 8 Communal 6 32 50 13 Immersed 4 21 55 19 Geography
Baltimore City 5 31 47 17 Baltimore County 4 31 51 14 Carroll & Harford Counties 3 30 53 14
Head of household age
23-34 2 26 60 13 35-49 3 22 61 14 50-64 4 30 47 19 65-79 6 38 41 14 80+ 5 40 48 7 Marital status
Inmarried 5 29 53 14 Intermarried 6 38 44 12 Not married 3 26 51 20 Parent status
No children in 5 32 49 15
Children in household 4 28 51 17
Household
Orthodox 3 16 54 26 Conservative 6 33 53 7 Reform 4 29 50 17 No denomination 4 37 45 14 Household limitations from health issues, special needs, or disabilities
Yes 2 15 48 35
No 5 33 50 12

47 | 2020 Baltimore Jewish Community Study
Table 4.2. Household income in 2018
$200,000 or more (%)
$100,000-199,999 (%)
$50,000-99,999 (%)
Less than $50,000 (%)
All Jewish households 13 35 29 23 Engagement group
Familial 14 37 18 31 Personal 13 32 33 22 Involved 13 36 27 24 Communal 20 32 27 22 Immersed 10 29 37 24 Geography
Baltimore City 13 32 29 26 Baltimore County 14 37 27 22 Carroll & Harford Counties 10 36 41 13
Head of household age
23-34 8 28 34 30 35-49 20 45 27 7 50-64 16 38 24 22 65-79 11 29 31 29 80+ 5 21 34 41 Marital status
Inmarried 19 39 30 11 Intermarried 17 49 27 7 Not married 4 16 29 51 Parent status
No children in household 10 32 31 28 Children in household 24 41 24 12 Household denomination
Orthodox 7 25 38 31 Conservative 19 37 28 16 Reform 14 35 25 26 No denomination 14 38 26 22 Household limitations from health issues, special needs, or disabilities
Yes 3 16 38 43
No 15 38 27 20

48 | 2020 Baltimore Jewish Community Study
ECONOMIC INSECURITY AND POVERTY Although the majority (85%) of Baltimore Jewish community households self-identify as living comfortably or prosperous, other households struggle with significant economic challenges. As one measure of economic need, respondents indicated whether they received government benefits or skipped necessities in the past year (Table 4.3). These benefits included Social Security Disability Insurance (SSDI) or Supplemental Security Income (SSI); Medicaid; subsidized housing; SNAP (Supplemental Nutrition Assistance Program); or daycare assistance. However, it is important to note that some of these benefits are not entirely restricted to low-income households (e.g., SSDI, Medicaid); accordingly, receipt of these benefits is only a possible indicator of financial need, not a definite indicator. Thirteen percent of Jewish households receive some form of public benefit. Respondents were also asked about life changes in the previous year that resulted in economic hardship. Eighteen percent of households reported encountering such a hardship (Table 4.4) . Nine percent reported a change in health, such as major illness; 8% noted a change in employment, such as a reduction in pay; 3% mentioned a change in family structure, such as divorce; and another 2% experienced a change in housing, such as foreclosure. Financial insecurity is reflected in a lack of financial resources for emergency or future expenses. Of all households, 38% are not confident in their ability to live comfortably during retirement, including 48% of households where the head of household is between the ages of 50 and 64 and 42% of households where the head of household is between the ages of 65 and 79 and not yet retired. One quarter of households do not have enough funds to cover three months of expenses were they to face an unexpected loss of income. Seven percent could not cover a $400 expense in full with cash on hand, money in a bank
Table 4.3. Economic needs: Summary
Percentage of Jewish households
Public benefits
Any benefit 13 Food stamps/SNAP, subsidized housing, Medicaid, or daycare assistance
8
SSDI or SSI 6
Energy or utility assistance 1
Unemployment benefits < 1
Economic hardships
Any hardship 18
Change in health 9
Change in employment 8
Change in family structure 3
Change in housing 2
Financial insecurities Not confident saving for retirement 38
Insufficient savings for three months’ expenses 25
Inability to pay $400 expense 7 Financial constraint prevented participation in Jewish life 6
Skipped rent, mortgage, or utility bill 6
Skipped medication prescription 4
Skipped or reduced a meal 1

49 | 2020 Baltimore Jewish Community Study
Table 4.4. Economic insecurity by household characteristics
Insufficient savings for
three months’ expenses (%)
Any economic hardship
(%)
Any public
benefit (%)
Skipped meal, rent,
or medicine (%)
Insufficient savings for
$400 expense (%)
Financial constraint
in Jewish life (%)
All Jewish households 25 18 13 7 7 6
Engagement group
Familial 25 14 15 5 6 1
Personal 27 23 12 8 13 5
Involved 15 9 8 4 6 8
Communal 21 15 11 7 6 7
Immersed 33 24 22 9 9 10
Geography
Baltimore City 29 22 13 10 9 7
Baltimore County 22 15 13 5 7 6
Carroll & Harford Counties
20 16 12 3 4 2
Head of household age
23-34 31 27 15 6 4 8
35-49 38 14 7 10 15 8
50-64 26 22 16 8 10 7
65-79 14 11 15 5 4 4
80+ 12 8 15 2 3 4
Marital status
Inmarried 25 16 15 6 10 6
Intermarried 24 16 9 6 6 3
Not married 25 20 17 8 8 9
Parent status
No children in household 22 17 13 6 6 4
Children in household 32 18 13 8 12 12
Household denomination
Orthodox 40 25 27 11 9 10
Conservative 14 13 9 4 4 5
Reform 24 15 12 6 9 10
No denomination 22 15 10 7 9 3
Household limitations from health issues, special needs, or disabilities
Yes 43 39 44 20 23 9
No 22 14 8 5 5 5

50 | 2020 Baltimore Jewish Community Study
account, or on a credit card that could be paid off in full when they receive their next bill. Some households had to skip necessities over the last year, including 6% who could not make a rent, mortgage, or utility payment; 4% who could not fill a medication prescription; and 1% who skipped or reduced meals. Financial barriers also present a barrier to fully participating in Jewish life. Of respondents that reported financial impediments to participation in Jewish life, 172 provided additional explanation. Synagogue dues and High Holiday tickets were described as a barrier for 102 respondents, and other membership dues and program fees were difficult to afford for 41. Respondents report:
I can no longer afford membership at my former synagogue. [I am] unable to make a full membership contribution to my synagogue. Also declined to attend congregational dinners or other public events because of associated fees to attend.
Forty-seven respondents reported the cost of Jewish education and Jewish camps as prohibitively expensive.
Difficult for children to attend Jewish school and camps. Cannot afford classes for my children they previously enjoyed at the JCC. It is a struggle to pay my JCC membership. They only give partial scholarship. Would like to send grandchildren to Jewish summer camp, but it is beyond our financial ability.
The most striking differences in economic status reflect differences in age, parent status, and health. It is important to note that these characteristics are interrelated and reflect expected stage-of-life differences. Notably, Orthodox Jews in Baltimore are struggling financially more than other groups. Forty percent have insufficient savings for three months of expenses; 27% have received at least one public benefit in the past year; 11% have skipped a meal, not filled a prescription for a needed medication, or missed a rent or mortgage payment; and 10% have been constrained from participating in Jewish life for financial reasons. Two percent of Jewish households do not have health insurance.
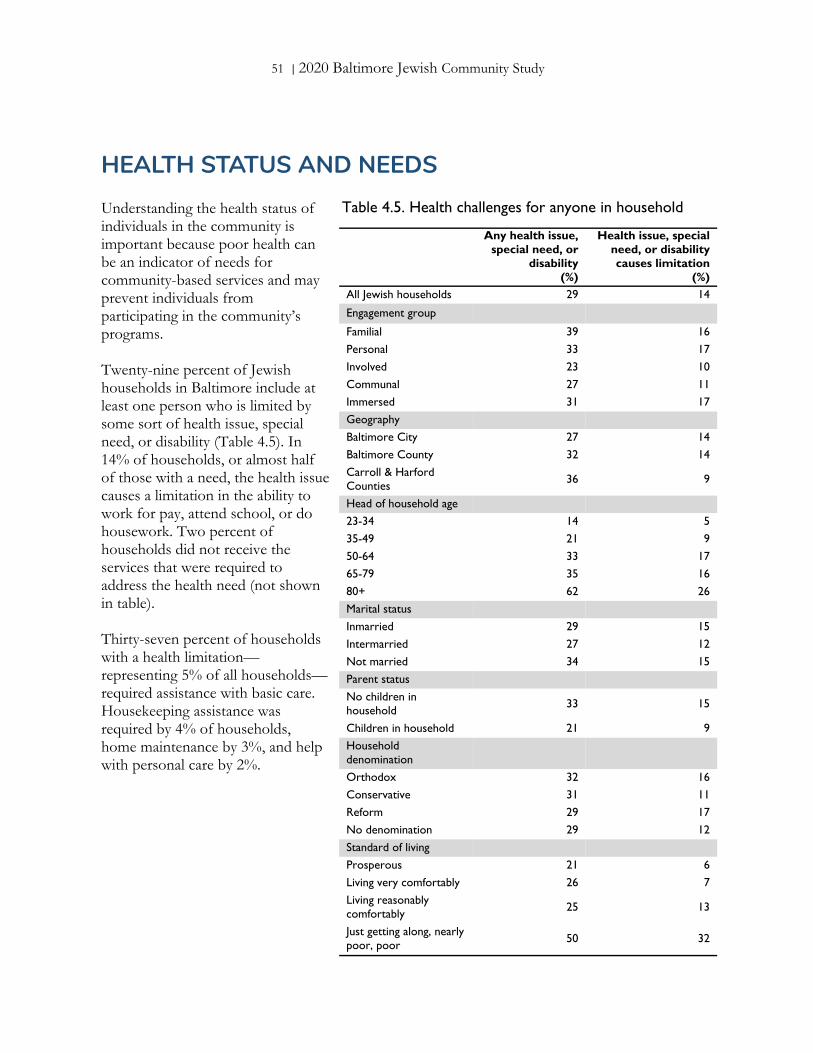
51 | 2020 Baltimore Jewish Community Study
HEALTH STATUS AND NEEDS Understanding the health status of individuals in the community is important because poor health can be an indicator of needs for community-based services and may prevent individuals from participating in the community’s programs. Twenty-nine percent of Jewish households in Baltimore include at least one person who is limited by some sort of health issue, special need, or disability (Table 4.5). In 14% of households, or almost half of those with a need, the health issue causes a limitation in the ability to work for pay, attend school, or do housework. Two percent of households did not receive the services that were required to address the health need (not shown in table). Thirty-seven percent of households with a health limitation—representing 5% of all households—required assistance with basic care. Housekeeping assistance was required by 4% of households, home maintenance by 3%, and help with personal care by 2%.
Table 4.5. Health challenges for anyone in household
Any health issue, special need, or
disability (%)
Health issue, special need, or disability causes limitation
(%) All Jewish households 29 14
Engagement group
Familial 39 16
Personal 33 17
Involved 23 10
Communal 27 11
Immersed 31 17
Geography
Baltimore City 27 14
Baltimore County 32 14
Carroll & Harford Counties
36 9
Head of household age
23-34 14 5
35-49 21 9
50-64 33 17
65-79 35 16
80+ 62 26
Marital status
Inmarried 29 15
Intermarried 27 12
Not married 34 15
Parent status
No children in household
33 15
Children in household 21 9
Household denomination
Orthodox 32 16
Conservative 31 11
Reform 29 17
No denomination 29 12
Standard of living
Prosperous 21 6
Living very comfortably 26 7
Living reasonably comfortably
25 13
Just getting along, nearly poor, poor
50 32

52 | 2020 Baltimore Jewish Community Study
Respondents who indicated that a household member is limited by a health issue, special need, or disability were asked to categorize the issue. The most frequent limitation is chronic illness, occurring in 48% of households with a health issue, representing 14% of all Jewish households (Table 4.6). Physical illnesses are faced by 10% of households. Five percent of households include someone with a mental health issue, 3% include someone with a learning disability, and 2% include someone with a developmental or cognitive disability. The 4% of households with some other health limitation were asked to describe them. Of the 81 who responded, the most commonly cited conditions were heart conditions and hearing impairments.
CAREGIVERS Thirteen percent of Jewish households are serving as primary caregivers for a relative, separate from routine childcare. Jews ages 50-64 are most likely to be providing care to someone else, as they are the generation “sandwiched” between younger children and older parents, and who themselves may be experiencing the first signs of ill health caused by aging. Thirty-four percent of caregivers (representing 4% of all households) are providing care for someone living in their own household, 66% of caregivers (representing 9% of all households) are providing care for someone in another Baltimore-area household, and 14% of caregivers (representing 2% of all households) are providing care for someone outside of the Baltimore area. Ten percent of caregiving households are providing care to people in two or more of these locations. Nearly all caregivers, 87%, are helping a parent or parent-in-law, but some are providing care to a spouse (14%) or a child, whether a minor (5%) or age 18 and older (5%).
OLDER ADULTS Nine percent of Jewish adults have a parent living in a group home, assisted living facility, nursing home, or independent living community in Baltimore (including 3% whose parent resides in a Jewish-sponsored facility), and 12% have a parent living in such an arrangement elsewhere.
Table 4.6. Type of health issue, special need, or disability
Households with a health need (%)
All Jewish households (%)
Chronic illness 48 14 Physical disability 37 10 Mental illness 17 5 Learning disability 9 3 Developmental or cognitive disability 7 2 Other 14 4

53 | 2020 Baltimore Jewish Community Study
Four percent of Jewish adults ages 65 and older in Baltimore live in an assisted living facility, a nursing home, or an independent living community, half of whom are in a Jewish-sponsored facility. Among those who do not live in such a community, 4% are considering moving to one within the next five years. Six percent of Jewish adults ages 70 and older live in an assisted living facility, nursing home, or independent living community in Baltimore, half of whom are in a Jewish-sponsored facility. Of those who do not live in such a community, 7% are considering moving to one within the next five years. Some adults ages 65 and older experience challenges related to aging. Six percent are at least somewhat limited by the transportation needed to go about their daily lives. Isolation is a problem for the 16% of adults ages 65 and older who are dissatisfied with the amount of time they spend with friends and family. Notably, this feeling of isolation is felt more strongly by seniors living in the City of Baltimore than those living elsewhere in the area. As illustrated by Table 4.5, above, 26% of households headed by a Jewish adult ages 80 or older include someone with a health issue, special need, or disability. As displayed in Table 4.7, below, 20% of households with Jewish adults ages 80 and older were unable to participate in Jewish life because of a health limitation.
HEALTH LIMITATIONS AND JEWISH LIFE Eight percent of households include someone who, in the past year, was constrained by health issues from participating in the Baltimore Jewish community (Table 4.7). Greater shares of Jews in the Immersed (16%) and Communal (11%) groups were limited in Jewish life by health restrictions, but this is a result of their greater interest in participation. If respondents who indicated they were not interested in participating in the community are excluded from the analysis, there are no significant differences between engagement groups. Fewer Jewish adults younger than age 65 had health limitations constraining their ability to participate in Jewish life than did Jewish adults ages 65 and older. Respondents who indicated that health limitations affected their abilities to engage with Jewish life were invited to describe the constraints, and 247 gave answers. Participating in services, Jewish rituals, and events and activities was the most commonly cited limitation, with 162 responses. Accessibility concerns, such as clear access to buildings and programmatic spaces or transportation issues because of poor eyesight or injury, were mentioned by 116 respondents. Many respondents indicated that either chronic or short-term health issues made it difficult or impossible for them to attend religious services or other Jewish programs as frequently as they would like.

54 | 2020 Baltimore Jewish Community Study
Table 4.7. Health limitations to Jewish life
Unable to participate in Jewish life
due to health or ability constraint (%)
All Jewish households 8
Engagement group
Familial 4
Personal 5
Involved 3
Communal 11
Immersed 16
Geography
Baltimore City 10
Baltimore County 8
Carroll & Harford Counties 2
Head of household age
23-34 4
35-49 7
50-64 8
65-79 10
80+ 20
Marital status
Inmarried 11
Intermarried 2
Not married 11
Parent status
No children in household 9
Children in household 7
Household denomination
Orthodox 16
Conservative 10
Reform 9
No denomination 4
Standard of living
Prosperous 2
Living very comfortably 4
Living reasonably comfortably 10
Just getting along, nearly poor, poor 14

55 | 2020 Baltimore Jewish Community Study
Examples of respondents describing their difficulties engaging in Jewish life as a result of health conditions include:
Anything held at night because I do not drive after dark. Volunteer activities. Chronic migraines and chronic fatigue get in the way of things all across the board. I’m often too tired and/or too overwhelmed psychologically to do things. Difficult to walk over 20 minutes to shul on Shabbos and Yom Tov.
ECONOMIC INSECURITY AND HEALTH LIMITATIONS Health issues and economic challenges are deeply interconnected within the Baltimore Jewish community. As seen in Table 4.5, half of households that report their standard of living is “just getting along,” “nearly poor,” or “poor” include a member with a health issue, special need, or disability, and in 32% of such households that health issue limits the ability to work or attend school. In “prosperous” households, on the other hand, the respective numbers are 21% and 6%. Additionally, as seen in Table 4.7, households that described their standard of living as “prosperous” or “living very comfortably” were less likely to indicate that health limitations constrained them from participating in Jewish life than households whose standard of living was less affluent. Households with health limitations are more likely to be in deep economic need. They are more than five times as likely to receive public benefits (Table 4.4), and nearly five times as likely to be unable to pay off a $400 expense in full. Twenty percent of them, as opposed to 5% of households without health limitations, have had to skip a meal, housing payment, or medication at some point. These households are also more likely to lack deeper financial cushioning. Forty-three percent of households limited by health issues report not having three months of savings, about twice the rate of Jewish households without such limitations. In terms of saving for retirement, 65% of households without health issues feel confident in their ability to do so, compared to 41% of households with a health limitation.

56 | 2020 Baltimore Jewish Community Study
Page intentionally blank

57 | 2020 Baltimore Jewish Community Study
CHAPTER HIGHLIGHTS This chapter focuses on the choices parents make about how to raise their children and how they take advantage—or not—of Jewish educational opportunities available in Baltimore. The goal is to describe the landscape of educational programs, including Jewish preschools; formal Jewish education programs, both part-time and full-time; and informal Jewish education programs, including camp and youth groups.
Among the 22,500 children who live in Baltimore Jewish households, 20,500 (91%) are being raised Jewish in some way, either by religion, secularly or culturally, or as Jewish and another religion.
Among the 2,000 children not being raised Jewish, 1,600 are being raised with no religion, 200 are being raised in another religion, and 200 have not yet had a religion decided for them.
Virtually all inmarried parents are raising their children Jewish, and among children of intermarried parents, 75% are being raised Jewish in some way.
Of Jewish children who are not yet in kindergarten, 17% were enrolled in a Jewish preschool program.
Half of Jewish children in grades K-12 were enrolled in some form of Jewish school during the 2018-19 academic year. This includes 39% in day school or yeshiva, and 12% in part-time school.
Of Jewish children in grades K-12, 50% participated in at least one form of informal education.
Among households with at least one child age 12 or younger, 44% receive books from PJ Library.
CHAPTER 5
jewish children

58 | 2020 Baltimore Jewish Community Study
JEWISH CHILDREN Among the 22,500 children who live in Baltimore Jewish households, there are 20,500 children (91% of all children) who are being raised Jewish in some way, either by religion, secularly or culturally, or as Jewish and another religion (Table 5.1). Among the remaining children, 1,600 are being raised without religion, 200 are being raised in another religion, and 200 have not yet had a religion decided for them. Of the 20,500 Jewish children, 73% are being raised by inmarried parents, 22% by intermarried parents, and the remainder, 5%, by single parents (Figure 5.1). The age distribution of Jewish children skews young, with 41% being under age six (Table 5.2). About half (52%) of the children not being raised Jewish are teenagers.
Table 5.1. Religion of children in Jewish households
Number All children (%)
Jewish by religion 14,400 64%
Secular/culturally Jewish 4,500 20%
Jewish and another religion 1,600 7%
No religion 1,600 7%
Another religion 200 1%
Undecided 200 1%
Total 22,500 100%
Figure 5.1. Marital status of parents of Jewish children
Table 5.2. Ages of children in Jewish households
All children Jewish children Non-Jewish children
Number Percentage (%) Number Percentage (%) Number Percentage (%)
0-5 9,100 40% 8,400 41% 600 30%
6-12 6,500 29% 6,100 30% 400 18%
13-17 7,000 31% 5,900 29% 1,100 52%
Total 22,500 100% 20,500 100% 2,000 100%

59 | 2020 Baltimore Jewish Community Study
RELIGION OF CHILDREN BY HOUSEHOLD CHARACTERISTICS Overall, 91% of children in Jewish households are being raised Jewish in some way: by religion, as secular/cultural Jews, or as Jewish and another religion (Table 5.3). Nearly all parents who are part of the Communal and Immersed engagement groups are raising their children Jewish in some way. Notably, there is not a real difference by geography in how many parents are raising their children Jewish. Three quarters of parents who do not identity with a denomination are raising Jewish children. Virtually all inmarried parents are raising their children Jewish (Figure 5.2), and among children of intermarried parents, 75% are being raised Jewish in some way (Figure 5.3).
Table 5.3. Children raised Jewish by household characteristics
Raised Jewish in some
way (%)
All children in Jewish households 91 Engagement group
Familial -- Personal 81 Involved 89 Communal 97 Immersed 99
Geography Baltimore City 93 Baltimore County 89 Carroll & Harford Counties 90
Marital status Inmarried 99 Intermarried 75 Not married 76
Household denomination Orthodox 100 Conservative 95 Reform 95 No denomination 75
Figure 5.2. Religion raised, children of inmarriage
Figure 5.3. Religion raised, children of intermarriage

60 | 2020 Baltimore Jewish Community Study
PARTICIPATION IN JEWISH EDUCATION Jewish education occurs in the context of Jewish preschools; formal classroom settings, such as day schools and part-time supplementary schools; and informal settings, including camps, youth groups, and peer trips to Israel. Table 5.4 shows the overall numbers of children in each form of Jewish schooling during the 2018-19 academic year, and Table 5.5 shows participation in informal Jewish education during the 2018-19 academic year. The tables also display the proportion of Jewish children who were enrolled, among the Jewish children who were age-eligible to attend that form of Jewish education. Unlike the tables and figures earlier in the chapter, which focused only on children who are not yet 18, analysis of Jewish education includes 18- and 19-year-old children who are still in high school. Because the vast majority of children in Jewish education are being raised Jewish in some way, the analysis below is restricted to children being raised Jewish in some way. In addition to the data presented in Tables 5.4 and 5.5, fewer than 100 children not being raised Jewish are participating in some form of Jewish education, either formal or informal. Of Jewish children who are not yet in kindergarten, 17% were enrolled in a Jewish preschool program, and half of Jewish children in grades K-12 were enrolled in some form of Jewish school during the 2018-19 academic year. Thirty-nine percent of Jewish children in grades K-12 were enrolled in day schools or yeshivot. Another 12% of K-12 students were enrolled in a part-time school. Table 5.4. Children in formal Jewish education during 2018-19 school year
Jewish student enrollment
(number) Proportion of age-eligible
Jewish children (%)
Jewish preschool 1,300 17% Any Jewish schooling, K-12 6,900 50% Part-time school, K-12 1,600 12% Day school, K-12 5,300 39%
Table 5.5. Children in informal education during 2018-19 school year
Jewish student enrollment
(number) Proportion of age-eligible
Jewish children (%)
Any informal Jewish education, K-12 6,800 50%
Jewish day camp, K-12 4,300 32%
Jewish overnight camp. K-12 1,900 14%
Jewish tutoring/classes, K-12 1,000 7%
Jewish youth group, 6-12 1,200 15%
61 | 2020 Baltimore Jewish Community Study
Of Jewish children in grades K-12, 50% participated in at least one form of informal education in during the 2018-19 school year (Table 5.5). Thirty-two percent of Jewish children in grades K-12 attended a Jewish day camp, as a camper or staff, in the summer of 2018, as did 14% of children at an overnight camp. Seven percent of Jewish children participated in some form of Jewish private tutoring and classes. These lessons included activities such as bar or bat mitzvah tutoring or Hebrew language lessons. Fifteen percent of Jewish children in grades 6-12 participated in a Jewish youth group. Six percent of Jewish high school students (approximately 300) traveled to Israel on a peer trip at some point in the past (not shown in table). Overall, 65% of Jewish children in grades K-12 participated in at least one formal or informal Jewish educational program during 2018-19. Eight percent of Baltimore-area grandparents helped pay for their grandchildren’s Jewish education, whether at local or non-local institutions. Among households with at least one child ages 12 or younger, 44% received books from PJ Library (not shown in table). Another 6% were unaware of the program. Of Jewish children who have reached bar or bat mitzvah age, 68% had a bar or bat mitzvah and another 6% expected to have a bar or bat mitzvah in the future.
DRIVERS OF PARTICIPATION IN JEWISH EDUCATION Because decisions to participate in Jewish education are typically made by parents, those outcomes are linked with the characteristics and Jewish engagement of adults. Tables 5.6 and 5.7 describe the households that participate in various forms of Jewish education. (See Tables 5.4 and 5.5, above, for child participation rates.) In these two tables, for each household characteristic listed, the table shows the proportion of Jewish households with Jewish age-eligible children that enrolled at least one child in that form of Jewish education during the 2018-19 academic year. Formal Jewish Education includes preschool, part-time school, and day school. Rates of participation in Jewish schooling are higher among the Immersed group than any other engagement group, with 32% enrolling their children in Jewish preschool and 89% enrolling their children in some form of Jewish school (Table 5.6). Parents in Carroll and Harford counties send their children to a part-time school at higher rates than do those in Baltimore City or County, although the difference is largely attributable to more Baltimore City and County parents enrolling their children in day schools. Inmarried and intermarried parents send their children to part-time schools at similar rates, but very few intermarried parents enroll children in day schools.

62 | 2020 Baltimore Jewish Community Study
Table 5.6. Participation in formal Jewish education by household characteristics, 2018-19
Jewish preschool
(%)
Any Jewish schooling, K-12
(%)
Part-time school, K-12
(%)
Day school, K-12
(%) Jewish households with age-eligible children 18 43 14 30
Engagement group Familial -- -- -- -- Personal -- 3 2 1 Involved 18 20 11 9 Communal 9 37 29 9 Immersed 32 89 11 78 Geography Baltimore City 30 59 15 45 Baltimore County 14 34 10 24 Carroll & Harford Counties -- 31 31 <1 Marital status Inmarried 24 61 15 47 Intermarried 7 14 12 2 Not married -- 16 8 10 Household denomination Orthodox 34 89 1 89 Conservative 12 47 35 14 Reform 14 26 25 1 No denomination 2 7 2 5

63 | 2020 Baltimore Jewish Community Study
Table 5.7. Participation in informal Jewish education by household characteristics
Any informal education,
K-12 (%)
Jewish tutoring,
K-12 (%)
Jewish day camp,
K-12 (%)
Jewish overnight
camp, K-12 (%)
Youth group,
6-12 (%)
Israel trip, 9-12 (%)*
Jewish households with age-eligible children 49 8 30 17 19 7
Engagement group Familial -- -- -- -- -- --
Personal 18 0 7 11 21 --
Involved 24 0 6 4 27 25
Communal 42 4 23 16 24 1
Immersed 76 14 61 23 34 11
Geography
Baltimore City 46 5 34 16 19 3
Baltimore County 48 12 28 13 26 7 Carroll & Harford Counties 18 3 5 7 21 5
Marital status Inmarried 54 6 42 18 26 6
Intermarried 27 17 5 3 12 <1
Not married 52 6 24 18 32 12 Household denomination
Orthodox 79 14 68 20 33 6
Conservative 36 4 23 19 17 8
Reform 44 2 15 19 33 3 No denomination 25 14 6 2 10 8
Informal Jewish Education includes tutoring, camps, youth groups, and Israel trips. For most forms of informal education, participation follows expected patterns of engagement, with participation highest among families in the Immersed group (Table 5.7). An exception is the Israel trip; it is possible that parents in the Immersed group prefer family trips to peer trips to Israel for their children. Fewer households in Carroll and Harford counties enroll their children in most types of informal education, with the exception of youth groups. Interestingly, more intermarried parents than others have their children participate in some form of Jewish tutoring or private classes.
* Except for trips to Israel, each type of Jewish education in this table is based on the 2018-19 academic year.

64 | 2020 Baltimore Jewish Community Study
Page intentionally blank

65 | 2020 Baltimore Jewish Community Study
CHAPTER HIGHLIGHTS Synagogues have long been the central communal and religious “home” for US Jews, and membership in a congregation is one of the key ways Jews affiliate with the Jewish community. Synagogue membership notwithstanding, many Jews participate in rituals on a regular or intermittent basis at home. Religious and ritual observance constitute one means by which Jews in Baltimore express their Jewish identities.
One third of households (approximately 15,000) include someone who belongs to a synagogue or another Jewish worship community of some type. Forty percent of Jewish adults live in synagogue-member households, similar to the rest of the country.
Twenty-seven percent of households are dues-paying members of “brick-and-mortar” congregations, traditionally structured with buildings and ordained clergy.
One-in-five synagogue-member households belong to multiple congregations or prayer groups (e.g., independent minyan, Chabad).
Among households who are members of local brick-and-mortar synagogues, 53% are members of Orthodox congregations, 31% are members of Conservative congregations, 18% are members of Reform congregations, and 1% are members of synagogues of other denominations.
Passover and Hanukkah are observed by the largest proportion of the Baltimore Jewish community, with 83% attending a seder and 82% lighting Hanukkah candles.
High Holiday services were attended by 51% of Jewish adults.
CHAPTER 6
synagogue and ritual life

66 | 2020 Baltimore Jewish Community Study
SYNAGOGUES AND CONGREGATIONS In Baltimore, 33% of households (approximately 15,000) include someone who belongs to a synagogue or another Jewish worship community of some type (Table 6.1). Forty percent of Jewish adults live in synagogue-member households, similar to the rest of the country (39%). Thirty-one percent of households indicate that they belong to at least one congregation in Baltimore, meaning 2% belong to prayer communities in other places (not shown in table). Twenty-seven percent of households are dues-paying members of “brick-and-mortar” congregations, which typically have conventional membership dues structures, their own buildings, ordained clergy, educational programming for children, and associated amenities and programs, and draw from a relatively narrow range of the denominational spectrum (see box below ).
Synagogue membership is highest among those in the Immersed group (98%), followed by 41% of those in the Communal group. Very few in the Familial or Personal groups have joined a congregation. Geographically, rates of overall congregational membership are similar in the City of Baltimore and Baltimore County, and lower in Carroll and Harford counties. Households with adults ages 80 or older have higher membership rates than all other age groups. Inmarried households and households with children belong to congregations at higher rates than their counterparts. Synagogue affiliation models are no longer limited to “brick-and-mortar” synagogues with a paid dues structure. Organizations such as Chabad, independent minyanim and havurot, and High Holiday congregations have grown in popularity, and voluntary contributions have replaced dues in some congregations.
CONGREGATION TYPES “Brick-and-mortar” synagogue: Typically has its own building, a conventional dues/membership structure, professional clergy, and programs or amenities commonly available in synagogues (e.g., Hebrew school). Usually appeals to a relatively narrow range of the denominational spectrum. Independent minyan or havurah: May lack its own building, conventional dues/membership structure, professional clergy, and/or amenities commonly available in synagogues. High Holiday congregation: Meets only on the High Holidays. Chabad: Typically has its own building, professional clergy, and programs or amenities commonly available in synagogues. Usually does not have a conventional dues/membership structure. Draws from across the denominational spectrum.

67 | 2020 Baltimore Jewish Community Study
Table 6.1. Synagogue membership
Any synagogue member (%)
Local synagogue member (%)
Local brick-and-mortar synagogue, pays dues (%)
All Jewish households 33 31 27 Engagement groups Familial <1 <1 0 Personal 2 2 <1 Involved 17 13 12 Communal 41 37 34 Immersed 98 95 89 Geography Baltimore City 36 34 30 Baltimore County 32 30 27 Carroll & Harford Counties 18 16 14 Head of household age 23-34 37 33 26 35-49 33 33 28 50-64 24 23 21 65-79 36 33 31 80+ 53 50 47 Marital status Inmarried 57 56 50 Intermarried 11 10 9 Not married 25 22 18 Parent status No children in household 29 27 24 Children in household 42 42 35 Household denomination Orthodox 86 85 76 Conservative 53 49 47 Reform 26 24 22
No denomination 3 3 2

68 | 2020 Baltimore Jewish Community Study
Among synagogue member households, 9% say they belong to a local brick-and-mortar synagogue where they do not pay dues (Table 6.2). This represents 3% of all households. Alternative congregational structures affiliated with Baltimore households include Chabad (2% of member households) and a minyan or havurah (1% of member households). Twenty percent of local member households belong to multiple synagogues or worship groups (not shown in table), many of them more than one type of congregation.
Table 6.2. Household membership of congregations of different types
Brick-and-mortar
synagogue, no dues (%)
Out-of-area synagogue member
(%)
Chabad (%)
Independent minyan
(%) Synagogue-member households 9 7 2 1
Engagement groups Familial -- -- -- -- Personal -- -- -- -- Involved 8 23 0 <1 Communal 7 9 <1 <1 Immersed 11 3 2 4 Geography Baltimore City 8 8 1 5 Baltimore County 10 5 2 1 Carroll & Harford Counties 5 19 2 <1
Head of household age 23-34 12 12 <1 4 35-49 18 <1 <1 <1 50-64 7 3 1 7 65-79 5 8 2 1 80+ 3 6 7 1 Marital status Inmarried 10 3 1 3 Intermarried 4 8 3 <1 Not married 8 16 1 1 Parent status No children in household 6 9 2 1 Children in household 15 2 <1 4 Household denomination Orthodox 15 2 3 5 Conservative 3 7 <1 <1 Reform 4 10 <1 <1 No denomination 25 18 <1 1

69 | 2020 Baltimore Jewish Community Study
Seven percent of member households, corresponding to 2% of all households, indicate that they belong to a congregation outside of Baltimore. In most cases, these congregations are just outside of the Baltimore catchment area (e.g., in Howard County). Among younger Jewish adults, these may be the congregations where they grew up and where their parents are still active members. And some of the non-local congregations are in “snowbird” communities or in Israel. Among households affiliated with local brick-and-mortar synagogues, 53% are members of Orthodox congregations, 31% are members of Conservative congregations, 18% are members of Reform congregations, and 1% are members of synagogues of other denominations (for example, Renewal or Reconstructionist) or no denomination (Table 6.3).
SYNAGOGUE PARTICIPATION Sixty-five percent of Jewish adults attended services at least once in the past year, and 28% attended a service monthly or more (Table 6.4). Fifty-one percent of Jewish adults attended High Holiday services. Nearly all synagogue members attended services, but 43% of non-members still attended at least once over the last year.
Table 6.3. Denomination of brick-and-mortar synagogues
Brick-and-mortar synagogue
households (%) Orthodox 53 Conservative 31 Reform 18 Other, no denomination 1

70 | 2020 Baltimore Jewish Community Study
Table 6.4. Jewish religious services
Attended services in
past year (%) Attended services
monthly (%) Attended services High Holidays (%)
All Jewish adults 65 28 51 Engagement group Familial 5 0 0
Personal 16 0 0
Involved 72 13 39
Communal 99 11 80
Immersed 100 92 99
Geography Baltimore City 71 38 56
Baltimore County 62 25 50
Carroll & Harford Counties 52 8 39
Age 23-34 78 42 63
35-49 62 23 48
50-64 55 24 46
65-79 62 24 50
80+ 74 32 62
Marital status Inmarried 77 41 67
Intermarried 42 6 21
Not married 59 20 47
Parent status No children in household 60 23 47
Children in household 75 41 64 Denomination Orthodox 97 84 95
Conservative 90 32 80
Reform 70 16 50
No denomination 33 4 17 Synagogue member Not member 43 3 23
Member 98 66 95

71 | 2020 Baltimore Jewish Community Study
RITUAL PRACTICES The majority of Baltimore Jewish adults mark Jewish holidays over the course of the year, with 83% attending a Passover seder and 82% lighting Hanukkah candles (Table 6.5). Passover and Hanukkah celebrations are nearly universal among the Immersed, Communal, and Involved engagement groups but less frequent among members of the Familial group. In contrast, Shabbat candle lighting and Shabbat meal attendance are widespread among those in the Immersed group but less frequent for all other groups. Over half of Jewish adults fasted on Yom Kippur (58%), including 93% of the Immersed group and majorities of the Involved and Communal groups. Eight-two percent of the Immersed group keep kosher at home, but few members of the Familial, Personal, Involved, and Communal groups observe this practice.

72 | 2020 Baltimore Jewish Community Study
Table 6.5. Ritual practice
Attend Passover seder in
typical year (%)
Light Hanukkah candles in
typical year (%)
Ever light Shabbat
candles in past year
(%)
Ever have Shabbat
meal in past year (%)
Fasted on Yom
Kippur* (%)
Keep kosher at
home (%)
All Jewish adults 83 82 45 54 58 25 Engagement group Familial 40 44 <1 9 18 2 Personal 64 66 13 22 16 3 Involved 96 93 31 43 60 7 Communal 96 97 58 71 79 9 Immersed 100 100 96 98 93 82 Geography Baltimore City 85 88 55 65 62 37 Baltimore County 80 80 44 51 58 20 Carroll & Harford Counties 77 78 26 31 42 2
Age 23-34 90 90 61 73 67 43 35-49 89 86 46 56 60 22 50-64 75 80 40 48 55 21 65-79 72 74 41 46 52 17 80+ 84 68 49 53 53 19 Marital status Inmarried 92 93 63 68 70 37 Intermarried 63 70 14 25 36 3 Not married 76 69 40 54 54 18 Parent status No children in home 77 76 40 50 53 18 Children in home 91 97 62 66 70 41 Denomination Orthodox 98 98 94 95 94 90 Conservative 95 97 60 71 80 21 Reform 84 87 43 54 58 2 No denomination 65 66 16 27 30 6 Synagogue member Not member 70 72 23 34 39 5 Member 98 99 83 86 88 56
* In addition, 6% of Jewish adults could not fast for medical reasons.

73 | 2020 Baltimore Jewish Community Study
CHAPTER HIGHLIGHTS The Baltimore Jewish community offers diverse avenues for communal participation. Jews join local, regional, and national membership organizations and attend an array of cultural, educational, and religious events. They volunteer and donate their time to Jewish and non-Jewish causes. Through their participation, they make Jewish friends and strengthen their ties to the local community. Jewish life also includes informal or personal involvement with Jewish friends and community members. The vast majority of Jews in Baltimore have at least some close Jewish friends, and more than six in ten say at least half of their closest friends are Jewish. Consequently, there are many opportunities for Baltimore Jewish community members to participate in Jewish cultural activities and discuss Jewish topics with friends or on their own. This chapter describes the multiple ways in which Jews in Baltimore interact and participate with their local peers and institutions and points to measures that can enhance these connections. Some of the main findings include:
Two thirds of Baltimore Jewish adults read material from at least one local Jewish organization in the past year, and one third read this type of material at least once a month.
Forty percent of Jewish adults attended at least one Jewish-sponsored program, activity, or class in Baltimore in the past year, and 13% did so at least once per month.
A majority of Baltimore’s Jews, 59%, attended a program, activity, or service at a local synagogue or congregation in the past year. Thirty-eight percent engaged in an activity at the JCC of Greater Baltimore, and 15% attended a local Chabad program or service.
Seventeen percent of Jewish adults volunteered for a local Jewish organization. More than half of Jewish households (56%) gave to at least one Jewish organization,
representing 69% of households who made any sort of charitable donation. Forty-one percent of Jewish households gave to organizations that primarily serve the Jewish community of Baltimore.
CHAPTER 7
social and communal life
74 | 2020 Baltimore Jewish Community Study
Almost one quarter (23%) of households donated to a Jewish congregation. There are a number of reasons why people may not feel connected to Jewish community.
Not being able to find interesting Jewish activities has been a concern for 44% of Jewish adults in Baltimore. A similar proportion, 42%, do not feel they know enough people at Jewish organizations and programs. For 38% of Jews, the reason for the lack of connection is not feeling comfortable in their level of Jewish knowledge.
The vast majority (95%) of Jews in Baltimore have at least some close Jewish friends, and 42% report that most or all of their closest friends are Jewish.
Members of the Baltimore Jewish community are concerned about antisemitism, but that worry is more directed at the national (59%) than the local level (26%).
JEWISH ORGANIZATIONS AND PROGRAMS Baltimore Jews participate in a wide range of Jewish organizations and activities. Ten percent of Jewish households say they belong to a local Jewish organization other than a synagogue or the JCC (Table 7.1). In addition to formal membership organizations, 9% of Jewish households say they belong to an informal or grassroots group in Baltimore, such as a Jewish book club. Two thirds of Baltimore Jewish adults read material from at least one local Jewish organization in the past year (including synagogues or the JCC), and 33% read this type of material at least once a month (Table 7.2). Forty percent of Jewish adults attended at least one Jewish-sponsored program, activity, or class in Baltimore in the past year, and 13% attended a Jewish-sponsored event at least once per month. Program attendance is higher among Jews living in the City of Baltimore and Baltimore County. Notably, Jews ages 80 and older read organization materials at very high rates, but far fewer of them attend programs (see Chapter 4 for more data on how health limitations affect participation in Jewish life). While nearly all in the Immersed group read a Jewish organization’s material (95%) and almost three quarters attended a Jewish organization’s program (72%), also notable are the 71% in the Personal group who read material from a Jewish organization. This group’s high rate of engagement in activities that can be done alone is its defining characteristic. A majority of Baltimore’s Jews, 59%, attended a program, activity, or service at a local synagogue or congregation in the past year (Table 7.3). Thirty-eight percent participated in an activity at the JCC of Greater Baltimore, and 15% attended a local Chabad program or service. Perhaps because they tend to live farther from Jewish institutions, fewer Jews in Carroll and Harford Counties attended programs at these locations. Fifteen percent of adults younger than age 35 participated with one of the local young-adult organizations: BAYiTT, B’nai Israel Young Adults, CHAI Life at Baltimore Hebrew Congregation, Charm City Tribe, Impact, Moishe House, and Repair the World.

75 | 2020 Baltimore Jewish Community Study
Table 7.1. Household memberships
Belong to Jewish organization
other than a synagogue or JCC (%)
Belong to informal Jewish group (%)
All Jewish households 10 9
Engagement Group
Familial 1 <1
Personal 5 2
Involved 1 4
Communal 14 9
Immersed 28 26
Geography
Baltimore City 8 10
Baltimore County 12 9
Carroll & Harford Counties 6 1
Head of household age
23-34 4 15
35-49 6 9
50-64 9 5
65-79 14 9
80+ 24 18
Marital status
Inmarried 17 13
Intermarried 3 4
Not married 9 9
Parent status
No children in household 11 8
Children in household 7 11
Household denomination
Orthodox 21 22
Conservative 20 13
Reform 7 5
No denomination 4 2

76 | 2020 Baltimore Jewish Community Study
Table 7.2. Involvement in Baltimore Jewish organizations, past year
Read Jewish organizational material (%)
Attended program, event, or class (%)
Ever (%) Monthly (%) Ever (%) Monthly (%) All Jewish adults 66 33 40 13
Engagement group
Familial 16 2 2 < 1 Personal 71 25 18 3 Involved 18 5 36 3 Communal 82 38 52 14 Immersed 95 67 72 32
Geography
Baltimore City 70 36 45 17 Baltimore County 65 34 39 12 Carroll & Harford Counties 45 17 21 1
Age
23-34 69 31 53 21 35-49 62 30 38 10 50-64 67 38 32 9 65-79 60 32 39 16 80+ 74 39 37 9
Marital status
Inmarried 76 43 50 18 Intermarried 46 14 19 3 Not married 61 32 39 13
Parent status
No children in household 62 32 35 12 Children in household 74 37 51 15
Denomination
Orthodox 90 67 66 31 Conservative 76 44 51 15 Reform 63 22 48 13
No denomination 49 16 18 3

77 | 2020 Baltimore Jewish Community Study
Table 7.3. Location of programs, activities, or services
A local synagogue or congregation (%)
JCC of Greater Baltimore (%)
A local Chabad (%)
All Jewish adults 59 38 15
Engagement group
Familial 6 10 3
Personal 17 24 3
Involved 58 29 5
Communal 87 42 16
Immersed 99 60 35
Geography
Baltimore City 64 37 17
Baltimore County 60 38 14
Carroll & Harford Counties 31 12 13
Age
23-34 69 34 17
35-49 57 49 13
50-64 53 32 16
65-79 57 33 12
80+ 75 40 15
Marital status
Inmarried 75 47 19
Intermarried 32 19 5
Not married 53 30 16
Parent status
No children in household 56 32 13
Children in household 69 46 20
Denomination
Orthodox 98 60 37
Conservative 80 44 15
Reform 67 32 10
No denomination 28 23 6
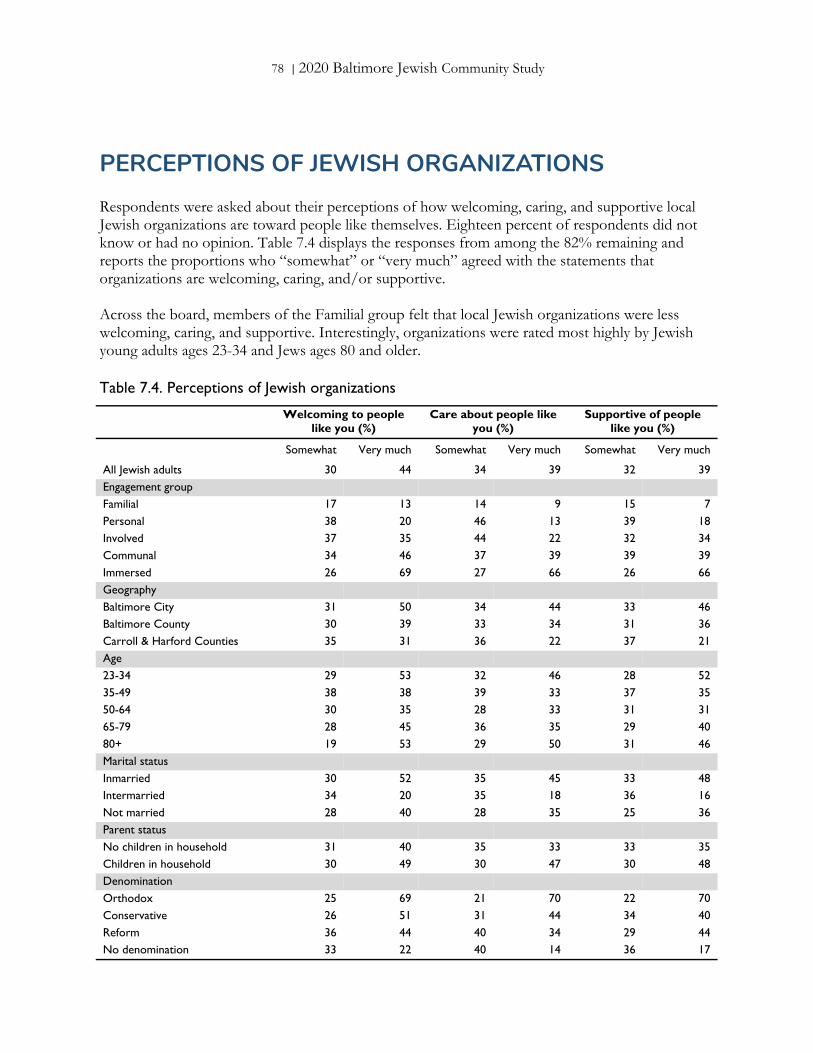
78 | 2020 Baltimore Jewish Community Study
PERCEPTIONS OF JEWISH ORGANIZATIONS Respondents were asked about their perceptions of how welcoming, caring, and supportive local Jewish organizations are toward people like themselves. Eighteen percent of respondents did not know or had no opinion. Table 7.4 displays the responses from among the 82% remaining and reports the proportions who “somewhat” or “very much” agreed with the statements that organizations are welcoming, caring, and/or supportive. Across the board, members of the Familial group felt that local Jewish organizations were less welcoming, caring, and supportive. Interestingly, organizations were rated most highly by Jewish young adults ages 23-34 and Jews ages 80 and older.
Table 7.4. Perceptions of Jewish organizations
Welcoming to people
like you (%) Care about people like
you (%) Supportive of people
like you (%)
Somewhat Very much Somewhat Very much Somewhat Very much
All Jewish adults 30 44 34 39 32 39
Engagement group Familial 17 13 14 9 15 7
Personal 38 20 46 13 39 18
Involved 37 35 44 22 32 34
Communal 34 46 37 39 39 39
Immersed 26 69 27 66 26 66
Geography Baltimore City 31 50 34 44 33 46
Baltimore County 30 39 33 34 31 36
Carroll & Harford Counties 35 31 36 22 37 21
Age 23-34 29 53 32 46 28 52
35-49 38 38 39 33 37 35
50-64 30 35 28 33 31 31
65-79 28 45 36 35 29 40
80+ 19 53 29 50 31 46
Marital status Inmarried 30 52 35 45 33 48
Intermarried 34 20 35 18 36 16
Not married 28 40 28 35 25 36
Parent status No children in household 31 40 35 33 33 35
Children in household 30 49 30 47 30 48
Denomination Orthodox 25 69 21 70 22 70
Conservative 26 51 31 44 34 40
Reform 36 44 40 34 29 44
No denomination 33 22 40 14 36 17

79 | 2020 Baltimore Jewish Community Study
VOLUNTEERING AND PHILANTHROPY In the Baltimore Jewish community, 34% of Jewish adults say they engaged in some volunteer activity in the past month (Table 7.5). Of Jewish adults, 23% volunteered for a local non-Jewish organization in the past month, and 17% volunteered for a local Jewish organization. For Jewish organizations, 12% volunteered in a leadership role, and 11% volunteered in another type of role. Jewish adults outside of the Immersed group volunteer at similar rates, overall and for non-Jewish organizations, but while fewer members of the Immersed group volunteer for non-Jewish organizations (18%), many more volunteer for Jewish ones (44%). Within the Baltimore Jewish community, 81% of households report making a charitable contribution in the past year (Table 7.6). More than half (56%) gave to at least one Jewish organization, representing 69% of donor households. Forty-one percent of Jewish households gave to organizations that primarily serve the Jewish community of Baltimore. Jewish households in Carroll and Harford Counties make donations at similar rates to others, but fewer of them make donations to general Jewish organizations (49%) or those focused on the Baltimore Jewish community (20%). The types of local Jewish organizations that received donations from respondents varied (Table 7.7). Fifty-six percent of those who donated to a Jewish organization gave to a Jewish congregation, representing 23% of all Jewish households. The Associated received donations from 21% of Jewish-organization donors, or 9% of all households. Overall, 53% of Jewish households say they received donation requests from Baltimore Jewish organizations. Notably, 74% of the households that received requests made donations to Baltimore Jewish organizations, compared with 30% of the households that did not receive requests. Two percent of households have designated a local Jewish charity as a beneficiary in their wills or estate plans, but 24% of households do not have wills written.

80 | 2020 Baltimore Jewish Community Study
Table 7.5. Volunteering in Baltimore Type of organization Role at Jewish organization
Any volunteering
(%) Non-Jewish
(%) Jewish
(%) Leadership
(%) Other
(%)
All Jewish adults 34 23 17 12 11
Engagement group
Familial 30 30 0 0 0
Personal 28 27 4 3 2
Involved 33 27 7 4 5
Communal 35 28 14 11 9
Immersed 49 18 44 31 29
Geography
Baltimore City 44 28 24 18 15
Baltimore County 33 25 14 9 9 Carroll & Harford Counties 22 15 9 7 7
Age
23-34 39 22 26 21 14
35-49 39 29 15 10 11
50-64 36 27 13 9 9
65-79 32 25 15 10 9
80+ 30 22 16 11 8
Marital status
Inmarried 37 23 23 18 14
Intermarried 37 35 5 3 3
Not married 33 22 16 8 13
Parent status No children in household 36 27 16 11 10
Children in household 36 22 19 14 14
Denomination
Orthodox 38 13 35 23 27
Conservative 40 31 18 13 11
Reform 40 29 19 14 13
No denomination 31 28 6 5 2

81 | 2020 Baltimore Jewish Community Study
Table 7.6. Philanthropy
Any donations
(%)
Any donations to Jewish organizations
(%)
Any donations to local Jewish organizations
(%)
All Jewish households 81 56 41
Engagement Group
Familial 62 9 3
Personal 73 31 12
Involved 81 45 20
Communal 87 81 56
Immersed 100 100 93
Geography
Baltimore City 82 54 40
Baltimore County 81 58 40
Carroll & Harford Counties 83 49 20
Head of household age
23-34 80 48 30
35-49 81 50 40
50-64 78 50 33
65-79 86 65 45
80+ 89 86 69
Marital status
Inmarried 89 77 65
Intermarried 82 40 17
Not married 73 47 31
Parent status
No children in household 80 55 36
Children in household 86 60 49
Household denomination
Orthodox 95 94 85
Conservative 90 77 55
Reform 77 49 33
No denomination 74 34 16

82 | 2020 Baltimore Jewish Community Study
Table 7.7. Donors to types of local Jewish organizations
Of households that donated to a local
Jewish organization (%) All Jewish households (%)
Jewish congregation 56 23
Jewish school or camp 38 16
Jewish-sponsored human service agency
34 14
The Associated 21 9
Jewish social justice organization 14 6
Another Jewish organization 15 6
BARRIERS TO COMMUNITY INVOLVEMENT Jewish adults offer a number of reasons for their lack of connection to the Jewish community. For 44% of Jewish adults in Baltimore, the main impediment to a feeling of connection is not finding activities that interest them (Table 7.8). A similar proportion, 42%, do not feel they know enough people at Jewish organizations and programs. For 38% of Jews, the obstacle to participation is not feeling comfortable in their level of Jewish knowledge. For a little more than one quarter of the population, barriers include not feeling welcome (27%) or their political views (26%). In light of the last year’s antisemitic violence, it is noteworthy that for 19% of adults, safety or security concerns inhibit their involvement in the Jewish community. For each of these barriers except political views, Jewish adults who feel “a little” connected to the Baltimore Jewish community perceive greater barriers to participation than those who feel “not at all,” “somewhat,” or “very much” connected to the local Jewish community. Those who felt prevented in some way from participating in Jewish life were invited to share more details about what they felt, and why. Nearly 700 provided answers, which were categorized and are presented in Table 7.9. Some respondents felt unwelcomed in Jewish spaces, or feared they would be, because of who they are—in some cases, this belief was a result of direct experience and in others, it was an assumption. This view was expressed in particular by those in interfaith families, Jews of color, and non-Orthodox Jews.
The community of Park Heights is totally insular, with no room for Jews who are not Orthodox. I am Black, and I hate being asked questions about whether I am in the right place. I am concerned that the sensitivities to traditionally observant needs sometimes justify the insensitivities to liberally observant values that are of equal need, despite not being rooted in Halacha (Jewish law).

83 | 2020 Baltimore Jewish Community Study
Table 7.8. Any barrier to Jewish community connections
Haven’t found
interesting activities
(%)
Don’t know many
people (%)
Level of Jewish
knowledge (%)
Not welcome
(%)
Political views
(%)
Safety or security
concerns (%)
All Jewish adults 44 42 38 27 26 19
Engagement group
Familial 35 42 45 40 26 17
Personal 58 60 50 37 41 19
Involved 45 41 49 44 13 26
Communal 52 46 37 29 30 21
Immersed 26 29 16 14 20 15
Geography
Baltimore City 41 51 33 29 26 12
Baltimore County 44 36 37 31 29 23
Carroll & Harford Counties 42 61 50 27 18 24
Age
23-34 47 60 36 27 19 11
35-49 45 46 39 38 19 23
50-64 42 33 38 38 36 20
65-79 38 36 33 20 32 21
80+ 38 31 41 15 28 28
Marital status
Inmarried 40 39 32 25 27 22
Intermarried 41 47 44 38 24 9
Not married 49 49 41 34 31 23
Parent status
No children in household 44 42 39 30 31 19
Children in household 40 44 31 30 19 19
Denomination
Orthodox 22 28 15 15 18 18
Conservative 45 36 32 26 29 20
Reform 47 46 48 36 21 18
No denomination 50 52 47 38 32 20
Strength of connection to Baltimore Jewish community
Not at all 38 46 35 39 27 11
A little 68 64 54 48 31 28
Somewhat 48 47 42 29 33 24
Very much 22 20 20 10 20 15

84 | 2020 Baltimore Jewish Community Study
My wife is not Jewish, so my children are not Jewish according to Halacha, even though I am teaching them about Jewish culture. I feel like my family and I may not be accepted by the Jewish community. As the non-Jewish spouse in a Jewish family, I am worried I won’t be accepted and have felt that way in some Jewish events in the course of my relationship with my husband.
Politics, both domestic and in relation to Israel, can present challenges for conservatives who inhabit predominantly liberal spaces, and liberals who inhabit predominantly conservative ones.
Being a Democrat in the Orthodox community makes one feel like a pariah. Both my wife and I are politically conservative and usually vote Republican. I frequently feel out of place in a Jewish congregation. The Jewish community seems to be too far to the right with respect to Israel. I am quite conservative politically. This tends to self-limit my association with many Jews, because even though many Orthodox Jews share my political beliefs, I don’t have the religious aspect in my life.
Respondents who live outside the areas of highest Jewish concentration wrote about the challenges of going to programs and events farther from where they live.
Much of Jewish life seems to be centered in the Park Heights/Pikesville area. Biggest limit for me is distance from the majority of the Jewish community in the Baltimore area. The closest synagogue is 30 minutes away, and I live almost an hour from the heart of the Jewish community in Baltimore. Although my home in Carroll County is only about a 30 minute-drive to most activities, that ends up being enough of a hindrance, even though it is usually due to the normal stress and distractions from work and household chores. That ends up in a cycle which continues to limit my connection and [doesn’t] give me motivation to make the effort. Downtown Baltimore has no synagogues for me to become involved with, which is too bad, because I suspect there are other Jews like myself, who would like to be more involved, but not have to drive 30-40 minutes to get to a service. All the synagogues are in the county, and you cannot just stop by for services, you must be a member.
Many respondents have experienced social challenges, either because they do not “fit” a prescribed lifestyle or because they do not have deep personal ties to the community.
It’s difficult and sometimes awkward to be more involved with the broader Jewish community that

85 | 2020 Baltimore Jewish Community Study
centers around couples and sometimes extended families, when you are single. Baltimore can be very insular, making it difficult to develop a group of friends. Baltimore is a hard community to break into. So many have been living here all their lives going back a few generations, that it is very clique based. This is especially true when both adults are from elsewhere. It took several years of active participation with preschool parent groups to make solid friendships.
Perceived barriers to community participation are linked to feelings of connection to the Baltimore Jewish community. As noted in Figure 3.8, 76% of Jewish adults feel at least a little like part of the Jewish community in Baltimore, including 30% who feel they are “very much” part of the community. Although at least one limitation described in Table 7.8 is felt by 76% of Jewish adults, about half of those who feel “very much” part of the Jewish community feel a limitation (Table 7.10). Twenty-six percent of all Jewish adults report they feel one of the limitations “very much.” The more connected Jewish adults feel to the Baltimore Jewish community, the fewer barriers to participation they tend to perceive, but even among those who feel very connected to the community, about half (53%) perceive at least one barrier.
Table 7.9. Frequency of participation in informal and cultural activities, past year
Type of limitation/barrier Number of responses
Feeling unwelcomed 203
Political views 136
Time constraints 73 Distance or location of institutions/programs 70
Don’t feel welcome for identity: interfaith, denomination, or racial/ethnic minority
57
Haven’t found a good fit 50
Views about Israel 47 Don’t feel knowledgeable enough 43
Don’t feel socially comfortable 37 Safety, security, and antisemitism fears 32
Something else 106
Table 7.10. Connection to Baltimore Jewish community and barriers to involvement
Feeling any barrier to community involvement (%)
Feeling any barrier to community involvement
“very much” (%) All Jewish adults 76 26 Strength of connection to Baltimore Jewish community
Not at all 80 46
A little 88 35
Somewhat 81 19
Very much 53 13

86 | 2020 Baltimore Jewish Community Study
INFORMAL INVOLVEMENT IN THE JEWISH COMMUNITY Community engagement is closely tied to personal connections and friendships among Jews. The vast majority (95%) of Jews in Baltimore have at least some close Jewish friends, and 42% report that most or all of their closest friends are Jewish (Figure 7.1). Eighty-four percent of the Immersed group say that most or all of their close friends are Jewish, reflecting their deep engagement in the Jewish community, but even 83% of the Familial group have some close Jewish friends.
Figure 7.1. Jewish friends
Question: “How many of the people you consider to be your closest friends are Jewish?”

87 | 2020 Baltimore Jewish Community Study
INFORMAL AND CULTURAL ACTIVITIES Informal and cultural activities include Jewish activities that are not necessarily sponsored by Jewish organizations, such as discussing Jewish topics, streaming Jewish content online, or reading Jewish books (Tables 7.11a, 7.11b). Of all Jewish adults, 92% discussed Jewish topics in the past year, while 38% discussed these topics frequently. About three quarters of the Jewish community engaged in a Jewish cultural activity, such as attending Jewish theatre productions or reading Jewish books (77%), and read Jewish content online, such as websites, newsletters, and social media posts (74%).
Table 7.11a. Frequency of participation in informal and cultural activities in the past year
Talk about Jewish
topics Engage in Jewish culture Read online Jewish content
Activities results Ever (%) Frequently (%) Ever (%) Frequently (%) Ever (%) Frequently (%) All Jewish adults 92 38 77 25 74 27 Engagement group Familial 67 4 25 1 27 <1 Personal 99 30 91 13 97 21 Involved 81 7 54 6 7 0 Communal 99 39 90 17 91 23 Immersed 100 82 97 58 97 60 Geography Baltimore City 96 51 82 33 81 35 Baltimore County 89 35 74 18 71 23 Carroll & Harford Counties 90 11 77 9 65 10
Age 23-34 95 52 81 30 81 26 35-49 93 33 75 20 71 21 50-64 93 39 74 20 75 28 65-79 85 31 78 20 68 27 80+ 95 38 90 34 73 29 Marital status Inmarried 95 50 85 31 79 35 Intermarried 86 16 62 9 66 9 Not married 89 39 75 19 71 23 Parent status No children in household 91 36 76 20 72 23
Children in household 94 48 80 30 80 34
Denomination Orthodox 98 79 95 61 96 62 Conservative 93 44 80 20 79 25 Reform 92 22 75 12 67 12 No denomination 88 24 68 10 63 14

88 | 2020 Baltimore Jewish Community Study
Nearly three quarters of Jewish adults (72%) read a Jewish publication, such as a magazine or newsletter in the past year, and 37% watched or listened to Jewish content online, such as a podcast or by “streaming” religious services.
Table 7.11b. Frequency of participation in informal and cultural activities in the past year
Read Jewish publications Watch/listen to online Jewish content
Activities results Ever (%) Frequently (%) Ever (%) Frequently (%) All Jewish adults 72 24 37 12 Engagement group Familial 12 <1 <1 <1 Personal 89 12 26 1 Involved 18 2 1 0 Communal 94 21 43 8 Immersed 100 59 79 37 Geography Baltimore City 82 29 45 21 Baltimore County 69 22 34 8 Carroll & Harford Counties 48 7 23 1
Age 23-34 76 20 48 21 35-49 67 17 33 8 50-64 72 28 36 11 65-79 72 24 29 6 80+ 85 43 50 7 Marital status Inmarried 84 32 46 17 Intermarried 49 5 17 2 Not married 70 23 38 11 Parent status
No children in household 70 22 32 8
Children in household 79 27 49 21 Denomination Orthodox 97 62 83 43 Conservative 84 27 43 8 Reform 66 9 23 2 No denomination 58 9 18 2

89 | 2020 Baltimore Jewish Community Study
ANTISEMITISM Members of the Baltimore Jewish community are concerned about antisemitism, but that worry is more directed at the national (59%) than the local level (26%; Table 7.12). Older Jews are more concerned about antisemitism than are younger Jews, as are Jews in Baltimore, Carroll, and Harford counties over Jews in the City of Baltimore—despite experiencing antisemitism at similar rates. Sixteen percent of Jewish adults say they personally experienced antisemitism in the past year. Notably, Jewish adults ages 80 and older are most concerned about antisemitism but least likely to have personally experienced antisemitism in the past year.
Table 7.12. Antisemitism
Concerned about antisemitism, very much
In the United States (%) In the Baltimore area (%) Personal experience (%)
All Jewish adults 59 26 16 Engagement group Familial 57 28 10 Personal 60 26 22 Involved 43 17 10 Communal 63 29 15 Immersed 62 26 18 Geography Baltimore City 55 18 17 Baltimore County 61 30 15 Carroll & Harford Coun-ties 64 35 19
Age 23-34 46 6 16 35-49 49 23 18 50-64 66 34 19 65-79 71 37 11 80+ 71 42 3 Marital status Inmarried 58 25 14 Intermarried 57 27 17 Not married 64 29 20 Parent status No children in household 63 28 16 Children in household 51 21 15 Denomination Orthodox 64 30 19 Conservative 66 33 18 Reform 56 26 15 No denomination 54 22 13

90 | 2020 Baltimore Jewish Community Study
Page intentionally blank

91 | 2020 Baltimore Jewish Community Study
CHAPTER HIGHLIGHTS The Baltimore Jewish community has strong ties to Israel, grounded in religious, cultural, and familial connections. Baltimore Jews travel to Israel at higher rates than most Jews in the United States, feel very connected to Israel, and closely follow news about Israel on a regular basis.
More than half, 59%, of Baltimore Jewish adults have been to Israel at least once. Seventeen percent of Jewish adults have traveled with a Jewish organization on a mission or
other sponsored trip to Israel. Adults who have traveled to Israel on an educational or volunteer program represent 11% of the population. Twenty-seven percent of age-eligible adults—those younger than 47—have been to Israel on Birthright.
Eighty percent of Jewish adults feel at least “a little” connected to Israel, and 34% feel “very connected.”
Nearly all Jewish adults see Israel as a homeland for Jews throughout the world (87%). The majority of Jewish adults, 82%, feel at least a little comfortable discussing the Israeli-
Palestinian conflict, and 32% feel very much comfortable.
TRAVEL TO ISRAEL Among Baltimore Jewish adults, 59% have been to Israel at least once (Table 8.1). This includes 24% of Jewish adults who have been to Israel only once, 28% who have visited more than once, and 6% who have lived in Israel at some point. The Baltimore rate of travel represents a substantially higher proportion than among US Jews in general, of whom, as of 2013, 43% had been to Israel. The engagement group with the greatest proportion of members who have been to Israel is the Immersed group (87%), followed by the Communal group (67%). Travel and emotional connection to Israel are deeply linked. As seen in Table 8.1, those with stronger emotional connections to Israel are more likely to have traveled to Israel and visited more often. Eighty-seven percent of those who feel “very much” connected to Israel have been there, compared to 27% who are “not at all” connected.
CHAPTER 8
Connection to israel

92 | 2020 Baltimore Jewish Community Study
On average, those who have been to Israel were last there 13 years ago, in 2006. Eighteen percent of Jewish adults went to Israel in the past year, 32% between 2-9 years ago, 26% between 10-19 years ago, and 24% last traveled to Israel at least 20 years ago.
Table 8.1. Travel to Israel
Never (%) Once (%) Multiple times (%) Lived there (%)
All Jewish adults 41 24 28 6 Engagement group Familial 72 20 7 1 Personal 58 29 9 5 Involved 54 24 16 6 Communal 33 34 29 5 Immersed 13 14 59 13 Geography Baltimore City 33 22 34 11 Baltimore County 43 27 25 4 Carroll & Harford Counties 75 12 13 <1 Age 23-34 22 23 44 12 35-49 51 20 23 5 50-64 48 24 21 7 65-79 48 26 22 3 80+ 24 33 42 <1 Marital status Inmarried 30 26 36 9 Intermarried 62 25 11 2 Not married 47 21 26 6 Parent status No children in household 45 26 24 5 Children in household 32 20 37 10 Denomination Orthodox 11 11 64 14 Conservative 36 29 31 4 Reform 51 30 18 1 No denomination 56 27 11 6 Connection to Israel Not at all 73 15 8 3 Little/somewhat 48 30 19 4 Very much 13 23 51 12

93 | 2020 Baltimore Jewish Community Study
TYPES OF ISRAEL TRAVEL Overall, 17% of Jewish adults have traveled with a Jewish organization on a mission or other sponsored trip to Israel (Table 8.2). Adults who traveled to Israel on an educational or volunteer program represent 11% of the population. Twenty-seven percent of age-eligible adults—those younger than 47—have been to Israel through Birthright Israel.
Birthright Israel
(of age eligible; %)
Federation/organization
mission (%)
Education/volunteer (%)
All Jewish adults 27 17 11 Engagement group Familial 18 6 2 Personal 25 7 5 Involved 37 11 5 Communal 35 23 11 Immersed 17 25 28 Geography Baltimore City 28 15 18 Baltimore County 24 18 10 Carroll & Harford Counties 17 9 1 Age 23-34 35 20 25 35-49 14 14 10 50-64 n/a 15 10 65-79 n/a 14 5 80+ n/a 31 7 Marital status Inmarried 21 19 15 Intermarried 28 8 5 Not married 32 18 13 Parent status No children in household 28 17 10 Children in household 23 17 17 Denomination Orthodox 15 17 26 Conservative 33 30 14 Reform 40 15 6 No denomination 24 10 7 Connection to Israel Not at all 6 4 2 Little/somewhat 30 18 10 Very much 34 22 22
Table 8.2. Types of Israel travel

94 | 2020 Baltimore Jewish Community Study
EMOTIONAL CONNECTION TO ISRAEL Consistent with the high rate of travel to Israel is the community’s strong emotional attachment to Israel (Table 8.3). Eighty percent of Jewish adults feel at least “a little” connected to Israel, and 34% feel “very connected.” By comparison, among the national US Jewish community, 69% feel attached to Israel, including 30% who feel “very” attached. The strongest connections to Israel are found among the Immersed group (70% very much). Nearly all of the Immersed Jews feel a connection to Israel to some extent. Those who have been to Israel feel more strongly about it, with 63% of those who have gone multiple times and 64% of those who have lived there feeling “very much” connected. In contrast, only 10% of Jews who have never been to Israel feel “very much” connected to Israel.

95 | 2020 Baltimore Jewish Community Study
Table 8.3. Emotional connection to Israel
Not at all (%) A little (%) Somewhat (%) Very much (%)
All Jewish adults 20 20 26 34 Engagement group Familial 49 24 20 7 Personal 19 29 33 20 Involved 38 22 27 13 Communal 12 24 31 33 Immersed 3 5 22 70 Geography Baltimore City 19 19 25 37 Baltimore County 20 18 28 33 Carroll & Harford Counties 24 41 21 14 Age 23-34 20 20 27 33 35-49 24 20 30 26 50-64 21 24 25 30 65-79 19 15 26 41 80+ 5 9 30 55 Marital status Inmarried 13 16 27 43 Intermarried 33 27 26 14 Not married 24 21 24 30 Parent status No children in household 21 21 27 31 Children in household 19 17 25 39 Denomination Orthodox 7 2 17 74 Conservative 12 19 29 40 Reform 21 32 33 15 No denomination 30 24 29 18 Travel to Israel Never 36 29 25 10 Once 13 22 34 32 Multiple 6 8 23 63 Lived/Israeli 10 3 23 64

96 | 2020 Baltimore Jewish Community Study
NEWS ABOUT ISRAEL Seventy-eight percent of Baltimore Jewish adults sought out news about Israel in the past month, 45% of whom did so weekly or less, and 33% of whom did so more than weekly (Table 8.4). The Immersed group follows Israel news most closely, as do those who feel very much connected to Israel or who have traveled to Israel multiple times or lived there. Notably, members of the Personal group seek news about Israel quite frequently, and it is one of the activities they engage in most often.
Table 8.4. Frequency of seeking news about Israel in past month Never (%) Weekly or less (%) More than weekly (%)
All Jewish adults 22 45 33 Engagement group Familial 55 39 6 Personal 14 45 41 Involved 31 63 7 Communal 12 55 33 Immersed 6 32 63 Geography Baltimore City 17 47 36 Baltimore County 21 43 36 Carroll & Harford Counties 28 56 16 Age 23-34 26 53 21 35-49 25 46 29 50-64 16 46 38 65-79 17 37 46 80+ 11 24 65 Marital status Inmarried 12 41 46 Intermarried 35 51 14 Not married 22 49 29 Parent status No children in household 19 44 37 Children in household 21 49 30 Denomination Orthodox 6 34 60 Conservative 14 43 43 Reform 25 53 23 No denomination 27 49 24 Travel to Israel Never 31 45 24 Once 17 50 33 Multiple 9 42 48 Lived/Israeli 4 41 55 Connection to Israel Not at all 50 42 8 Little/somewhat 19 56 25 Very much 4 32 64

97 | 2020 Baltimore Jewish Community Study
VIEWS ABOUT ISRAEL Respondents were asked if they agreed or disagreed with a series of statements about Israel (Table 8.5). Nearly all respondents view Israel as a homeland for Jews throughout the world (87%). Almost two thirds of Jewish adults, 64%, see Israel as a source of pride, and 60% agree that the country is a lively democratic society. The Baltimore Jewish community is not without its political disagreements with Israel, however. Thirty percent view Israel as a religious fundamentalist society, and only 29% believe Israel is a defender of gender equality.
Table 8.5. Views about Israel, agree or strongly agree
Homeland for
Jews throughout the world (%)
Source of pride (%)
Lively democratic society (%)
Religious fundamentalist
society (%)
Defender of gender
equality (%)
All Jewish adults 87 64 60 30 29 Engagement group Familial 64 35 36 39 20 Personal 85 58 55 37 24 Involved 82 53 35 30 20 Communal 89 71 63 36 34 Immersed 94 81 79 22 34 Geography Baltimore City 84 52 54 36 27 Baltimore County 86 70 61 30 29 Carroll & Harford Counties 77 62 55 33 24 Age 23-34 83 55 53 29 30 35-49 83 57 50 35 24 50-64 86 63 58 32 26 65-79 88 73 69 36 30 80+ 92 89 84 28 48 Marital status Inmarried 89 70 64 29 30 Intermarried 78 51 46 34 22 Not married 82 58 57 40 31 Parent status No children in household 84 63 58 36 29 Children in household 88 63 59 25 26 Denomination Orthodox 93 82 78 19 39 Conservative 88 73 67 35 32 Reform 89 66 46 39 26 No denomination 78 49 51 34 22 Travel to Israel Never 77 51 45 37 21 Once 90 65 58 36 33 Multiple 93 79 76 25 33 Lived/Israeli 85 66 68 21 32 Connection to Israel Not at all 57 18 19 45 12 Little/somewhat 89 65 56 33 25 Very much 96 88 85 23 43

98 | 2020 Baltimore Jewish Community Study
COMFORT DISCUSSING ISRAEL Respondents were asked how comfortable they felt discussing the Israeli-Palestinian conflict (Table 8.6). The majority, 82%, feel at least a little comfortable, and 32% feel very comfortable. Those who have been to Israel, and those who feel very attached to Israel, feel more comfortable discussing the conflict. The 39% of Jewish adults who felt not at all or only a little comfortable discussing the Israel-Palestinian conflict were asked about the reasons for their discomfort. The most commonly cited reasons were feeling that they did not have a part in the conversation (39%) and not knowing much about the topic (37%). Some simply do not have an opinion on the conflict (15%), and others believe they have a minority opinion on the topic (12%). Five percent are uncomfortable discussing Israel-Palestine because they believe the discourse is too hostile.
Table 8.6. Comfort expressing opinion on Israeli-Palestinian conflict Not at all (%) A little (%) Somewhat (%) Very much (%) All Jewish adults 18 21 29 32 Engagement groups Familial 29 17 26 28 Personal 16 18 31 35 Involved 33 27 23 17 Communal 17 21 37 26 Immersed 7 13 33 48 Geography Baltimore City 14 20 32 34 Baltimore County 21 17 30 32 Carroll & Harford Counties 13 22 39 26 Age 23-34 21 22 35 22 35-49 18 23 30 29 50-64 18 14 35 34 65-79 17 14 25 44 80+ 8 10 31 50 Marital status Inmarried 18 16 29 37 Intermarried 18 22 34 26 Not married 17 20 35 29 Parent status No children in household 19 18 30 33 Children in household 15 19 33 33 Denomination Orthodox 12 8 29 51 Conservative 15 20 31 35 Reform 19 24 35 23 No denomination 21 20 31 27 Travel to Israel Never 23 18 31 28 Once 20 21 29 31 Multiple 10 15 33 41 Lived/Israeli -- -- -- -- Connection to Israel Not at all 37 18 22 22 Little/somewhat 16 22 37 25 Very much 9 12 29 50

99 | 2020 Baltimore Jewish Community Study
Table 8.7. Reasons for discomfort expressing opinion on Israeli-Palestinian conflict
No part in conversation (%)
Don’t know much (%)
No opinion (%)
Minority opinion (%)
Discourse feels hostile (%)
Jewish adults uncomfortable discussing Israel
39 37 15 12 5
Engagement group Familial 24 29 16 27 3 Personal 45 28 16 14 <1 Involved 31 49 7 15 1 Communal 41 31 19 11 8 Immersed 56 22 13 9 7 Geography Baltimore City 48 32 17 13 6 Baltimore County 35 32 15 17 3 Carroll & Harford Counties 20 33 1 16 4
Age 23-34 45 40 11 10 6 35-49 37 36 7 14 1 50-64 46 24 27 15 1 65-79 24 27 13 24 9 80+ 16 20 16 4 23 Marital status Inmarried 37 26 12 14 6 Intermarried 39 35 19 14 3 Not married 40 42 17 21 1 Parent status No children in household 38 33 16 18 5
Children in household 41 30 12 10 2 Denomination Orthodox 36 17 8 10 17 Conservative 34 41 12 13 1 Reform 41 32 17 12 6 No denomination 40 33 15 19 2 Travel to Israel Never 29 35 11 17 4 Once 43 33 19 18 6 Multiple 51 29 18 11 2 Lived/Israeli 56 13 17 2 0 Connection to Israel Not at all 22 33 16 23 6 Little/somewhat 47 35 15 10 1 Very much 44 22 13 15 10

100 | 2020 Baltimore Jewish Community Study
Page intentionally blank

101 | 2020 Baltimore Jewish Community Study
Baltimore Jews were given the opportunity to explain, in their own words, the strengths of the community and the areas for improvement. We also asked them to describe which Jewish experiences they find most personally meaningful. These responses, taken together, reinforce the themes presented elsewhere in the report and provide new insights into community needs and opportunities for improvement. Overall, 1,379 respondents answered open-ended questions asking for their impressions of the strengths of the Baltimore community, as well as the gaps and areas for improvement. Additionally, 1,350 respondents described what experiences they found most personally meaningful. This chapter summarizes the comments of the respondents who provided responses to these questions; many of these respondents commented on multiple topics. The numbers shown in this chapter indicate the actual number of respondents who mentioned each issue. Topics mentioned by fewer than 50 people are not included in this summary.
SOCIAL LIFE Many respondents commented about the social aspects of the Baltimore Jewish community. Of those respondents, 173 felt that the social dynamics and opportunities in the community were positive, while 168 felt those attributes were negative. The remainder felt neutral. Those who indicated the social aspects of the Baltimore Jewish community were positive focused on the inclusive and unified nature of the community.
A lot of unity in the Jewish community is a major strength, even though lifestyles can be so different. Everyone that I have met has been very warm and welcoming in the Jewish community. I am always impressed by the Jewish community’s sense of belonging and contributing to the local community and the support system to other members of the community.
CHAPTER 9
In the Words of Community Members
102 | 2020 Baltimore Jewish Community Study
In contrast, others felt that socially, the Baltimore Jewish community lacked a sense of inclusion or unity in a few key areas, particularly interdenominationally.
Dichotomy between Orthodox and rest of community. I feel the Jewish community is much too divided between very Orthodox members and less Orthodox. Many ultra-observant members look down upon those not as observant and disregard and disrespect the rights of those not in their religious community.
Beyond inter-denominational divides, several respondents indicated that those who relocate to Baltimore have difficulty fully integrating into the community.
It can be very difficult to break into certain social circles if you were not born and raised in Baltimore. I also found that the only way to get my children a serious religious education was to enroll them in a Jewish day school, because after school Jewish education in this area does not seem to be as large of a priority (due to the abundance of day schools for those that want it).
A few respondents noted the difficulty meeting or connecting with other Jews.
It seems difficult to meet Jewish people outside of work if you’re not living in a Jewish neighborhood or explicitly going to temple or a Jewish gathering.
The importance of social aspects of the community are also reflected in the respondents’ discussion of what aspects of Jewish life they find most meaningful. Baltimore residents often felt most connected to their community through friends and family, whether during holidays and religious events or simply in social gatherings. Specifically, 333 respondents mentioned friends and family as central to their most meaningful experiences in Jewish life.
Getting together with Jewish friends and family, celebrating Shabbat, weddings, bat mitzvahs. Being with family. My many, many lifelong friendships in the Baltimore community. Get together with friends and family for activities.

103 | 2020 Baltimore Jewish Community Study
RELIGIOUS AND SPIRITUAL LIFE One hundred eighty-nine respondents described religious and spiritual elements of the community as some of the Baltimore Jewish community’s great strengths or areas where there were some gaps. Of these, 109 individuals felt that this aspect of the community was a strength, while 80 felt there were key shortcomings. For respondents for whom religious and spiritual life is one of the community’s great strengths, the diversity of synagogues and their clergy, educational opportunities, and programs is particularly outstanding:
Baltimore is a very vibrant Jewish community. Lots of diversity in terms of religious and educational options and lots of programming. I am impressed by the variety of congregations and their outreach programs. The diversity of the synagogues, the amazing depth of rabbinic talent, and opportunities for Jewish learning are the strengths. The variety of synagogues in Baltimore allow for an affiliation fit for any interested individual.
The vast majority of respondents—over 1,200—who provided answers about what they find most meaningful in Jewish life mentioned some form of synagogue life, ritual, or worship as crucial to their experience. For many, these practices and settings become the context in which they connect with family and friends, as well as connect more deeply with Judaism.
Sharing Jewish traditions with my grandchildren. Being with my family and observing Jewish holidays with them means the most to me. Things that involve my whole family, going to services, attending special programs our synagogue offers and being involved in our synagogue. Seder with my family. Ritual observance Shabbat dinners, lectures, prayers, holidays, learning. The most meaningful experiences are Shabbat and holiday experiences at the synagogue and numerous music and performing arts events.
104 | 2020 Baltimore Jewish Community Study
Rituals performed with family (Shabbat, seders, etc.) and personal prayer/reflection time.
However, some respondents also noted that despite the abundance of options, many members of the Baltimore Jewish community choose not to participate in religious life.
It seems to me that Baltimoreans believe that living in a Jewish neighborhood is sufficient participation in living Jewishly. This leads to poor participation in religious organizations. Not enough participation in religious activities by other people in the community.
Some pointed to the high cost of participating in synagogue and other religious activities.
Everything is much more expensive than non-Jewish activities. Youth groups and summer camps are extremely expensive. Synagogue dues and fees are high.
Several respondents were particularly concerned about the high costs of synagogue participation for adults ages 65 and older in the community.
Making seniors pay more for membership than young families. Dues to synagogues should be reduced for seniors. There is a gap in providing synagogue experiences if one is single, older, and without family.
ACTIVITIES Many respondents addressed the plethora of activities available in the Jewish community. Of these, 107 felt the extent and quality of offerings were a great strength of the community.
There is a varied amount of recreational, cultural, and educational programs available to members of the Jewish community on a regular and frequent basis. It is up to individuals as to how much and how often they want to partake. The strength of Baltimore’s Jewish community is its huge variety of religious, social justice, and cultural activities.
Strong and plentiful Jewish experience opportunities The strengths are a wide array of activities and experiences.

105 | 2020 Baltimore Jewish Community Study
Despite the plethora of activities, 41 respondents highlighted some opportunities for growth. In particular, some respondents said they would like more activities simply to socialize without other Jews, without necessarily focusing on Judaism.
A lot [of the activities] are very Jewish-history/religiously focused. Sometimes I just want to go to an event and have fun with the people, I don’t need it to be all about Judaism.
A common focus was the demographics targeted in activities. Many single adults, of all ages, are looking for social programs, especially those not focused on dating:
As a ‘middle-aged’ single, there is very little programming geared towards my dynamic.
As someone who moved to Baltimore as a single adult with no children, I’m just unaware of events/programs available.
I am an older, full-time-working, female adult. There are few Jewish evening or weekend activities geared towards me. There is little socially geared towards single Jewish adults (who may not be looking to date).
More activities for 30-somethings in Baltimore.
Not many programs for singles in their 30s to 40s.
JEWISH EDUCATION Seventy-four respondents made Jewish education the central focus of their comments. For those who felt Jewish education was a strength in the community, comments focused on a range of offerings across denominations, in formal Jewish day school settings and as offerings from synagogues.
Jewish day schools for families with a wide range of observance levels. Strong Jewish schools and yeshivas, every variety of Orthodox organization and service, high level of secular and religious education. The strengths are that each synagogue or outreach program offers educational programs and lectures on a variety of Jewish subjects, such as Torah study, Jewish history, Israel, politics, social issues, etc. There are always programs available for a variety of interest.
However, many respondents lamented the high cost of providing Jewish education for their children.
Cost of Jewish education is a problem. The cost and distance for Hebrew school and joining a congregation.

106 | 2020 Baltimore Jewish Community Study
Despite the significant support for Jewish education from communal organizations, some respondents felt that Jewish education is still not receiving the support it deserves and requires for the health of the community.
Education, education, education is the gap. There is not enough emphasis, support, and financial resources for Jewish day schools. Public education is not the answer nor an alternative. You can collect all the survey data you want... without the proper Jewish education, we cannot endure or be strong on any level. It is with great sadness that I find one of the biggest gaps in the Jewish community is that Jewish education does not seem to be of the utmost importance to The Associated. Through the mailings they share, they seem far more interested in non-Jewish causes and in specific agendas rather than in the future of the Jewish people.
Not enough support for the Jewish day schools from officials.
Jewish study and education is also central for Jewish meaning in daily life for Baltimore Jews. Two hundred ninety-five respondents mentioned education and Jewish text study as core to how they find meaning in everyday Jewish life.
Seeing my daughter enjoy Hebrew school at an egalitarian synagogue and grow to be a competent Jewish person. Membership and participation in educational activities. Deep Torah study, daily access to egalitarian prayer. The Jewish education programs my kids went to and the social services they provide are excellent.
Applying Jewish texts and rituals to issues of today. Educational activities. Adult learning classes. Torah study!
RESOURCES Fifty-two respondents focused on the collection and allocation of financial resources. The vast majority, 42, felt that The Associated has been effective at raising funds and distributing them to various organizations and agencies. Some, however, take issue with resource utilization. Respondents who described the system as a strength focused on the depth of resources that the community has at its disposal.

107 | 2020 Baltimore Jewish Community Study
The community is well organized and provides good resources to the core of the Jewish community. It also helps fund a wide range of social programs and services for the Jewish community and beyond. The community is very prominent, well funded, and highly organized. Many resources are available. The Associated system of raising funds collectively for all the organizations and agencies under one umbrella.
Those who spoke of resources as an area for growth focused primarily on the allocation and utilization of resources.
I think that there needs to be increased funding for Jewish day schools. I think that money raised through a Jewish agency should be spent solely on Jewish needs. I can give money to other causes. When I give to The Associated, I expect that money to be used for the Jewish community and not for the wider community.
Others discussed the concentration of resources in the City of Baltimore and Pikesville and described the perceived comparative lack of investment in the rest of the area.
On the other hand, it could be said that this is a gap—many parts of Maryland (including my home county, where I was raised—Harford) have few synagogues and Jewish resources. Therefore, having the Jewish community primarily concentrated in one part of Baltimore may reasonably be considered a gap.
They do well in Baltimore, I suppose. But they do not support the Jewish community in Annapolis and Anne Arundel County.
REGIONAL LIMITATIONS Fifty-two individuals highlighted regional limitations as a constraint on their ability to fully engage the community. These comments focused on the concentration of Jewish institutions and resources in Baltimore itself, even when some feel the community has become more decentralized in its geographic distribution. Although the particular areas where respondents felt there were gaps differs, there were a few mentioned frequently, including areas of Baltimore County outside of Pikesville/Owings Mills. Many Jews in Anne Arundel County look to Baltimore and The Associated for support, but the county is neither part of The Associated’s catchment area nor part of any other federated area. The Associated provides some support, but its focus is directed primarily toward the Jewish community within its catchment area.
Access to temples outside of the historic locations. The community has decentralized from where I grew up, but the temples have not moved out to other communities. Distance and time makes it a hardship to participate with a temple locally. It’s even been hard to determine a Jewish studies plan for my oldest given the distance of our home to the area temples. With most households having two working parents and weekends being dedicated to sports, it makes it hard to determine how to give him a proper Jewish education.

108 | 2020 Baltimore Jewish Community Study
Anne Arundel County, particularly Annapolis, is almost complete ignored/excluded by both DC and Baltimore organizations. If you are in Pikesville/Stevenson there is ample resources and programs, but as you move farther out, less and less. No central location to live for young Jewish Reform and Conservative families anymore. The Baltimore Jewish community has neglected those who live outside the Pikesville/Owings Mills area. We were never ‘welcomed’ by the Jewish community when we moved to town —we live outside the eruv. They need to learn about how the community has diversified and lives all around the area—the city, Timonium, Cockeysville etc.
SERVICES, AID, AND SUPPORT Over 100 respondents commented on the various social and human service offerings the Baltimore Jewish community provides—or falls short in providing. Of those respondents, 47 spoke of service provision as a strength of the community, while 22 spoke of perceived shortcomings. Many praised the high quality of support for physical medical needs, supporting low-income and disabled households, and the work performed by Jewish Community Services. Many of the same individuals, however, also saw shortcomings in the availability or quality of care for mental health and drug addiction support services. In essence, there is much being done well, but also some areas where needs are not being met.
I think Baltimore provides an amazing array of agencies and services for its Jewish community. Amazing support and volunteer organizations for community members with medical need. Limited resources or supports within the community for people with mental health problems. If you are lower income or have a disability, many services are available. If you are not part of those groups, many services are not available, even if you are willing to pay for the services. Strengths are providing supportive services for aging populations, disabilities, youth programming. Gaps- services for mental illness and drug addiction. Lack of services for special needs young and adults. There should be more help for elderly and economically disadvantaged. More in home support.

109 | 2020 Baltimore Jewish Community Study
LOOKING TOWARD THE FUTURE The words of community members, taken together with findings presented in earlier chapters, provide a detailed and nuanced sociodemographic portrait of the Baltimore Jewish community in 2019. Baltimore is unique among Jewish communities in the United States, with one of the highest proportions of Orthodox Jews of any community in the United States and roughly equal numbers of adherents to the three largest denominations. The community’s synagogues are particularly strong, but the majority of households are not involved. The community has very high levels of engagement in Jewish life overall, and high rates of children’s enrollment in Jewish educational programming in particular. However, even though many families have lived in the Baltimore area for generations, many members do not necessarily feel deeply connected to the local Jewish community. The community is mostly middle class, but also includes a substantial number of families and individuals with significant financial need. These dynamics present the community with challenges and opportunities to make the community even stronger. This study measured demographics, participation in programs, institutional engagement, home-based behavior, unmet needs, and many other aspects of Jewish life in Baltimore, using the latest social scientific methods. The Baltimore Jewish community has invested many resources in enhancing programs, reaching out to diverse populations, and building ties within the Jewish community and to the surrounding community. We hope that this snapshot of the community will stimulate discussion about how best to take advantage of the Baltimore Jewish community’s many strengths, face its challenges, and plan for its future.

110 | 2020 Baltimore Jewish Community Study
Page intentionally blank

111 | 2020 Baltimore Jewish Community Study
Notes
1 Throughout the report, estimates from 2010 are based on a reanalysis of the 2010 study, as described in the methodological appendix, Appendix A. Unless otherwise noted, 2019 estimates do include Harford County, which was not part of the 2010 study. 2 Saxe, L., Sasson, T., & Aronson, J. K. (2015). Pew’s portrait of American Jewry: A reassessment of the assimilation narrative. In American Jewish Year Book 2014 (pp. 71-81). Springer, Cham. 3 Throughout the report, estimates from 2010 are based on a reanalysis of the 2010 study, as described in the methodological appendix, Appendix A. Unless otherwise noted, 2019 estimates do include Harford County, which was not part of the 2010 study. 4 Ukeles, J.B. and Miller, R. (2011). The 2010 Baltimore Jewish community study. Baltimore: The Associated: Jewish Community Federation of Baltimore. 5 Pew Research Center. (2013). A portrait of Jewish Americans: Findings from a Pew Research Center survey of US Jews. Washington, DC: Pew Research Center. 6 Throughout the report, estimates from 2010 are based on a reanalysis of the 2010 study, as described in the methodological appendix, Appendix A. Unless otherwise noted, 2019 estimates do include Harford County, which was not part of the 2010 study. 7 Based on US Census data for 2010 and American Community Survey one-year estimates for 2017 and 2018 (where available). 8 If the Jews of multiple religions were excluded from the total Jewish population, as was done in the Pew study, the resulting proportion of Jews by religion would be 82%. 9 The definitions used in this study are similar but not identical to those used in the Pew Research Center’s A portrait of Jewish Americans (Pew Research Center, 2013). Adults who are Jewish and a second religion, if they were raised Jewish or have Jewish parents, are classified by Pew as “Jewish Background” and are not included among the Jewish “count.” This study classifies them as “Jews of Multiple Religions” and includes them in the count of both Jewish adults and Jewish children. 10 Throughout the report, estimates from 2010 are based on a reanalysis of the 2010 study, as described in the Methodological Appendix, Appendix A. Unless otherwise noted, 2019 estimates do include Harford County, which was not part of the 2010 study.

112 | 2020 Baltimore Jewish Community Study
11 The components of the population do not add up to the total due to rounding. 12 Throughout the report, estimates from 2010 are based on a reanalysis of the 2010 study, as described in the methodological appendix, Appendix A. Unless otherwise noted, 2019 estimates do include Harford County, which was not part of the 2010 study. 13 The original 2010 dataset yielded an estimate of 1,600 non-Jewish children in Jewish households, based on 56 children. There are too few cases to reliably revise the estimate based on the CMJS/SSRI reanalysis. 14 Pew Research Center, 2013. 15 Because children’s denominational identities were not asked on the survey, analyses including children’s denominations were conducted by assigning children denominational values equal to those of their parents or guardians. In the event that more than denomination could apply, the more traditionally observant denomination was imputed. 16 For both maps, each dot represents 80 Jewish households who live in a given ZIP code. The dots are randomly placed in the ZIP codes in which the households the dots represent reside. No dot should be interpreted to reflect the specific address of any given survey respondent or member of the community. 17 See Aronson, J. K., Saxe, L., Kadushin, C., Boxer, M., and Brookner, M. (2018). A new approach to understanding contemporary Jewish engagement. Contemporary Jewry. https://doi.org/10.1007/s12397-018-9271-8 18 Data from the American Jewish Population Project. The Baltimore Jewish Community Study suggests that 1% of Jewish adults identify as a person of color, but the confidence intervals of the two estimates overlap. It is believed the number derived from AJPP is more accurate. https://ajpp.brandeis.edu/ 19 Himmelfarb, H. S. (1982). Research on American Jewish identity and identification: Progress, pitfalls, and prospects. In Understanding American Jewry, ed. Marshall Sklare. Waltham, MA: Brandeis University. 20 Pew Research Center, 2013. 21 Also see Aronson, J.K., et al. (2018). A new approach to understanding contemporary Jewish engagement. Contemporary Jewry, 39, 91-113. 22 A description of latent class analysis and details of how it was applied to our data are provided in Appendix C. 23 For a breakdown of the proportions of each denomination that belong to each engagement group, see Appendix B. 24 Pew Research Center, 2013. 25 For all comparisons throughout this report, 2010 estimates are derived from CMJS/SSRI reanalysis. See Appendix A for details.

113 | 2020 Baltimore Jewish Community Study
26 Twenty-six percent of respondents specifically indicated that they preferred not to answer the income question and are excluded from this analysis. However, of respondents who did not answer the income question, 2% indicated that their standard of living was “prosperous,” 39% said they were “living very comfortably,” 45% said they were “living reasonably comfortably,” and 13% said they were “just getting along.” Because these numbers are consistent with the standard of living reported by respondents who did answer the income question, it is likely that results would not be altered substantially if all respondents answered the income question. 27 Based on data from the American Community Survey’s 2017 five-year estimates, which are the most recent data available. 28 There is no statistically significant difference between Orthodox and non-Orthodox grandparents in the proportion who help pay for their grandchildren’s Jewish educations. 29 Olitzky, K.M., & Judson, D. (2002). The rituals and practices of a Jewish life: A handbook for personal spiritual renewal. Woodstock, VT: Jewish Lights Publishing; Olitzky, K.M., & Olitzky, A.S. (2015). New membership & financial alternatives for the American synagogue: From traditional dues to fair share to gifts from the heart. Woodstock, VT: Jewish Lights Publishing. 30 Total adds up to more than 100% because some households are members of more than one congregation with different affiliations. 31 Pew Research Center, 2013. 32 Pew Research Center, 2013. 33 To be clear, Annapolis and Anne Arundel County are not part of The Associated’s catchment area.

Leadership
Martin S. Himeles, Jr. Co-Chair, Community Study
Mark D. Neumann Co-Chair, Community Study
Debra S. Weinberg Chair of the Board
Marc B. Terrill President
The Associated: Jewish Federation of Baltimore
101 W. Mount Royal Avenue \\ Baltimore, Maryland 21201
Community Study Sponsor