A Portrait of Prisoner Reentry in Maryland
77
A Portrait of Prisoner Reentry in Maryland Nancy G. La Vigne Vera Kachnowski with Jeremy Travis, Rebecca Naser, and Christy Visher RESEARCH REPORT March 2003 research for safer communitie s URBAN INSTITUTE Justice Policy Center
-
Upload
independent -
Category
Documents
-
view
2 -
download
0
Transcript of A Portrait of Prisoner Reentry in Maryland

A Portrait of Prisoner Reentry in Maryland
Nancy G. La Vigne
Vera Kachnowski
with Jeremy Travis, Rebecca Naser, and Christy Visher
R
ES
EA
RC
H R
EP
OR
T
March
2003
research for safer communities URBAN INSTITUTE
Justice Policy Center

A Portrait ofPrisoner Reentryin Maryland
Nancy G. La Vigne
Vera Kachnowski
with Jeremy Travis, Rebecca Naser, and Christy Visher

copyright © 2003
The Urban Institute
Justice Policy Center
2100 M Street, NW
Washington, DC 20037
www.urban.org
(202) 833-7200
The views expressed are those of the
authors and should not be attributed to the
Urban Institute, its trustees, or its funders.
The Justice Policy Center (JPC) carries out
nonpartisan research to inform the national
dialogue on crime, justice, and community
safety. For more information on JPC’s
reentry research, visit
http://jpc.urban.org/reentry.
To receive monthly email updates on
JPC research, send an email to
Designed by David Williams
About the Authors
Nancy G. La Vigne is a Senior Research Associate at the
Urban Institute, where she directs several projects related to
prisoner reentry, including Returning Home: Understanding the
Challenges of Prisoner Reentry, a multi-state, longitudinal
study of the reentry experience. Her other research interests
include the geographic analysis of crime, situational crime
prevention, and community policing. Dr. La Vigne has 12
years of experience conducting criminal justice research,
and has previous experience in the areas of crime policy and
the legislative process. Prior to her current position, she was
founding director of the National Institute of Justice's Crime
Mapping Research Center. Dr. La Vigne's other work experi-
ence includes consulting for the Police Executive Research
Forum, the National Council on Crime and Delinquency, and
the National Development and Research Institute. She also
served as Research Director for the Texas Punishment Stan-
dards Commission. Dr. La Vigne has authored articles in
journals, chapters in edited volumes, and textbooks and
monographs in the areas of crime prevention, policing, and
spatial analysis. She holds a Ph.D. from Rutgers University
and a Master's in Public Affairs from the University of Texas.
Vera Kachnowski is a Research Assistant in the Justice Policy
Center at the Urban Institute where she works primarily on
prisoner reentry projects. She devotes most of her time to a
multi-year, multi-state study entitled Returning Home: Under-
standing the Challenges of Prisoner Reentry. She has also
worked on a reentry consulting project for the Center for
Community Safety at Winston-Salem University and an evalu-
ation of an intensive reentry program run by the Pennsylva-
nia Department of Corrections. Prior to joining the Urban
Institute, Ms. Kachnowski worked as a Research Assistant at
Goodman Research Group, Inc., an education research firm
in Boston, MA. There, she worked on many evaluations of
educational programs, materials, and facilities for clients
such as public broadcasting station WGBH-TV, Lesley Univer-
sity, and the National Institutes of Health's National Cancer
Institute. Ms. Kachnowski holds a B.A. in Sociology (summa
cum laude, Phi Beta Kappa) from Boston University.
Jeremy Travis is a Senior Fellow at the Urban Institute and is
co-chair of the Reentry Roundtable—a group of prominent
academics, practitioners, service providers, and community
leaders working to advance policies and innovations on pris-
oner reentry that reflect solid research. Rebecca Naser is a
Research Associate at the Urban Institute where she works on
prisoner reentry and domestic violence projects. Christy
Visher is a Principal Research Associate at the Urban Insti-
tute and is the Principal Investigator of the Returning Home:
Understanding the Challenges of Prisoner Reentry study.
i
Contents
Executive Summary .......................................................................................... 1Introduction ...................................................................................................... 3
CHAPTER 1
What is the Policy Context Surrounding Prisoner Reentry in Maryland? ............. 8PRISON POPULATION ON THE RISE ................................................................................................. 9
EXPLAINING MARYLAND INCARCERATION TRENDS .......................................................................... 9
SUMMARY ...................................................................................................................................... 14
CHAPTER 2
How Are Prisoners Released in Maryland? ...................................................... 16
C H A P T E R 3
What Happens After Maryland Prisoners Are Released? .................................. 20POSTRELEASE SUPERVISION ......................................................................................................... 21
Experiments in PostRelease Supervision ................................................................................... 21
CHAPTER 4
Who is Returning Home? ................................................................................. 24DEMOGRAPHICS ............................................................................................................................ 25
CONVICTION OFFENSE .................................................................................................................. 25
TIME SERVED ................................................................................................................................. 25
CRIMINAL HISTORY AND THE REVOLVING DOOR ............................................................................ 25
MENTAL AND PHYSICAL HEALTH PROBLEMS ................................................................................. 26
LIFE ON THE OUTSIDE ................................................................................................................... 26
CHAPTER 5
How Are Prisoners Prepared for Reentry? ....................................................... 30MARYLAND PRISON PROGRAMMING .............................................................................................. 31
Education and Employment Readiness Programs ...................................................................... 31Substance Abuse Treatment Programs ...................................................................................... 33Physical and Mental Health Treatment ...................................................................................... 34Correctional Options Programs ................................................................................................. 34Comprehensive Prerelease Programming Initiatives ................................................................... 35
CHAPTER 6
Where Are Released Prisoners Going? ............................................................ 38PRISONER REENTRY IN BALTIMORE COUNTY ................................................................................ 40
PRISONER REENTRY IN PRINCE GEORGE’S COUNTY ..................................................................... 42
PRISONER REENTRY IN WASHINGTON COUNTY ............................................................................. 44
PRISONER REENTRY IN ANNE ARUNDEL COUNTY ......................................................................... 46
PRISONER REENTRY IN WICOMICO COUNTY .................................................................................. 48

ii A PORTRAIT OF PRISONER REENTRY IN MARYLAND
CHAPTER 7
Prisoner Reentry in Baltimore City ................................................................. 50OVERVIEW OF RELEASED PRISONERS WHO RETURNED TO BALTIMORE CITY ................................ 51
DRUG OFFENDERS AND SUBSTANCE ABUSE.................................................................................. 51
PAROLE IN BALTIMORE CITY .......................................................................................................... 52
PRISONER REENTRY WITHIN BALTIMORE COMMUNITIES .............................................................. 52
SERVICES FOR RETURNING PRISONERS IN BALTIMORE CITY COMMUNITIES ................................ 60
Southwest Baltimore .............................................................................................................. 57Greater Rosemont ..................................................................................................................... 57Sandtown-Winchester / Harlem Park ........................................................................................... 57Greenmount East ...................................................................................................................... 57Clifton-Berea ............................................................................................................................. 60Southern Park Heights .............................................................................................................. 60
CHAPTER 8
Summary ........................................................................................................ 62HIGHLIGHTS .................................................................................................................................. 62
UNANSWERED QUESTIONS ............................................................................................................ 64
FUTURE RESEARCH ....................................................................................................................... 65
Appendix A. Number and Rate of Prisoners Returning toMaryland Counties, 2001, and Demographic Information by County ................ 68
iii
Figures
CHAPTER 1
What is the Policy Context Surrounding Prisoner Reentry in Maryland? ............. 8Figure 1. Maryland prison population and admissions, 1980–2001 ................................................ 8
Figure 2. Number of property crimes in Maryland per 100,000 residents, 1975–2000 ................. 11
Figure 3. Number of violent and drug crimes in Maryland per 100,000 residents, 1975–2000 ...... 11
Figure 4 Drug offenders as percentage of new commitments to Maryland prisons, 1983–2001 .... 11
Figure 5. Number of parole violators returned to Maryland prisons, 1980–1998 ........................... 13
Figure 6. Parole violators as percentage of total Maryland prison admissions, 1980–1998 ........... 13
Figure 7. Number of technical and new crime revocations, 1992–2002 ......................................... 13
Figure 8. Percentage of parole revocations for technical violations vs. new crimes, 1992–2002 ..... 13
Figure 9. Percentage of Maryland prison population, by sentence length, 1981 and 2001 ............. 14
Figure 10. Mean sentence lengths of released Maryland prisoners, by offense, 2001 ...................... 15
CHAPTER 2
How Are Prisoners Released in Maryland? ...................................................... 16Figure 11. Maryland prison population and admissions and release cohorts, 1980–1998 ............... 16
Figure 12. Percentage of Maryland prison releases, by release method, 2001 ................................. 19
Figure 13. Percentage of Maryland prisoners released by Parole Commission decision,1987–1999 .................................................................................................................... 19
Figure 14. Number of Maryland prisoners released by Parole Commission decision, 1987–1999 .... 19
CHAPTER 3
What Happens After Maryland Prisoners Are Released? .................................. 20Figure 15. Maryland parole population, 1980–1998 ....................................................................... 20
Figure 16. General parole conditions for parole and mandatory releasees ....................................... 21
CHAPTER 4
Who is Returning Home? ................................................................................. 24Figure 17. Percentage of Maryland prison releases, by race, 2001 .................................................. 24
Figure 18. Percentage of Maryland prison releases, by age, 2001 ................................................... 24
Figure 19. Percentage of Maryland prison releases, by primary conviction offense, 2001 ................ 27
Figure 20. Percentage of Maryland prison releases, by time served, 2001 ....................................... 27
Figure 21. Percentage of Maryland prison releases, by percentage of sentence served, 2001 .......... 27
Figure 22. Percentage of Maryland prison releases, by number of prior prison terms, 2001 ............ 27
CHAPTER 5
How Are Prisoners Prepared for Reentry? ....................................................... 30Figure 23. Nationwide program participation rates of prisoners to be released
in the next 12 months, 1991 and 1997 .......................................................................... 30
CHAPTER 6
Where Are Released Prisoners Going? ............................................................ 38Figure 24. Geographic distribution of returning prisoners, by county, 2001 .................................... 38
Figure 25. Percentage of released prisoners returning to Maryland counties, 2001 ......................... 38
Figure 26. Baltimore County ........................................................................................................... 41
Figure 27. Percentage of released prisoners returning to Baltimore County,by conviction offense, 2001 ............................................................................................ 41

iv A PORTRAIT OF PRISONER REENTRY IN MARYLAND
Figure 28. Prince George's County .................................................................................................. 43
Figure 29. Percentage of released prisoners returning to Prince George's County,by conviction offense, 2001 ............................................................................................ 43
Figure 30. Washington County ........................................................................................................ 45
Figure 31. Percentage of released prisoners returning to Washington County,by conviction offense, 2001 ............................................................................................ 45
Figure 32. Anne Arundel County ...................................................................................................... 47
Figure 33. Percentage of released prisoners returning to Anne Arundel County,by conviction offense, 2001 ............................................................................................ 47
Figure 34. Wicomico County ........................................................................................................... 49
Figure 35. Percentage of released prisoners returning to Wicomico County,by conviction offense, 2001 ............................................................................................ 49
CHAPTER 7
Prisoner Reentry in Baltimore City ................................................................. 50Figure 36. Percentage of released prisoners returning to Baltimore City,
by conviction offense, 2001 ............................................................................................ 50
Figure 37. Distribution of released prisoners who returned to Baltimore City, 2001 ........................ 54
Figure 38. Percentage of population receiving TANF, by Baltimore NeighborhoodIndicator Area, 2000 ...................................................................................................... 54
Figure 39. Percentage of female-headed households per 1,000 residents,by Baltimore Neighborhood Indicator Area, 2000 ........................................................... 55
Figure 40. Number of Part 1 crimes per 1,000 residents, by BaltimoreNeighborhood Indicator Area, 2001 ............................................................................... 55
Figure 41. Rank of six high-concentration communities among 55 Baltimore communities,by demographic, 2000 ................................................................................................... 56
Figure 42. Comparison of six high concentration communities to Baltimore Cityaverage: Percent of households with TANF recipients, 2000 ............................................ 56
Figure 43. Comparison of six high concentration communities to Baltimore Cityaverage: Percent of households with female head of household, 2000 ............................ 56
Figure 44. Comparison of six high concentration communities to Baltimore Cityaverage: Number of Part 1 crimes per 1,000 residents .................................................. 56
Figure 45. Distribution of returning prisoners in Southwest Baltimore, GreaterRosemont, and Sandtown-Winchester/Harlem Park communities, 2001 ......................... 58
Figure 46. Distribution of returning prisoners in Greenmount and Clifton-Bereacommunities, 2001 ........................................................................................................ 58
Figure 47. Distribution of returning prisoners in Southern Park Heights community, 2001 ............. 59
Figure 48. Location of social services for ex-prisoners in Baltimore City .......................................... 59
v
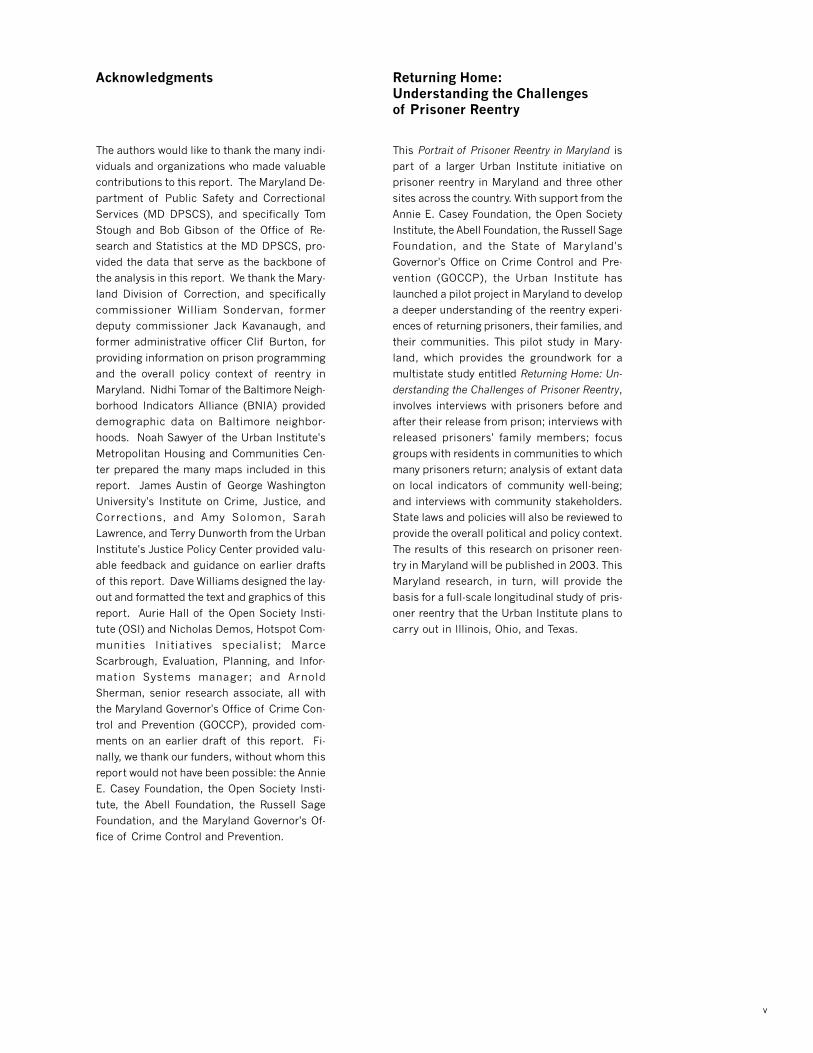
This Portrait of Prisoner Reentry in Maryland is
part of a larger Urban Institute initiative on
prisoner reentry in Maryland and three other
sites across the country. With support from the
Annie E. Casey Foundation, the Open Society
Institute, the Abell Foundation, the Russell Sage
Foundation, and the State of Maryland's
Governor's Office on Crime Control and Pre-
vention (GOCCP), the Urban Institute has
launched a pilot project in Maryland to develop
a deeper understanding of the reentry experi-
ences of returning prisoners, their families, and
their communities. This pilot study in Mary-
land, which provides the groundwork for a
multistate study entitled Returning Home: Un-
derstanding the Challenges of Prisoner Reentry,
involves interviews with prisoners before and
after their release from prison; interviews with
released prisoners' family members; focus
groups with residents in communities to which
many prisoners return; analysis of extant data
on local indicators of community well-being;
and interviews with community stakeholders.
State laws and policies will also be reviewed to
provide the overall political and policy context.
The results of this research on prisoner reen-
try in Maryland will be published in 2003. This
Maryland research, in turn, will provide the
basis for a full-scale longitudinal study of pris-
oner reentry that the Urban Institute plans to
carry out in Illinois, Ohio, and Texas.
The authors would like to thank the many indi-
viduals and organizations who made valuable
contributions to this report. The Maryland De-
partment of Public Safety and Correctional
Services (MD DPSCS), and specifically Tom
Stough and Bob Gibson of the Office of Re-
search and Statistics at the MD DPSCS, pro-
vided the data that serve as the backbone of
the analysis in this report. We thank the Mary-
land Division of Correction, and specifically
commissioner William Sondervan, former
deputy commissioner Jack Kavanaugh, and
former administrative officer Clif Burton, for
providing information on prison programming
and the overall policy context of reentry in
Maryland. Nidhi Tomar of the Baltimore Neigh-
borhood Indicators Alliance (BNIA) provided
demographic data on Baltimore neighbor-
hoods. Noah Sawyer of the Urban Institute's
Metropolitan Housing and Communities Cen-
ter prepared the many maps included in this
report. James Austin of George Washington
University's Institute on Crime, Justice, and
Corrections, and Amy Solomon, Sarah
Lawrence, and Terry Dunworth from the Urban
Institute's Justice Policy Center provided valu-
able feedback and guidance on earlier drafts
of this report. Dave Williams designed the lay-
out and formatted the text and graphics of this
report. Aurie Hall of the Open Society Insti-
tute (OSI) and Nicholas Demos, Hotspot Com-
munities Initiatives specialist; Marce
Scarbrough, Evaluation, Planning, and Infor-
mation Systems manager; and Arnold
Sherman, senior research associate, all with
the Maryland Governor's Office of Crime Con-
trol and Prevention (GOCCP), provided com-
ments on an earlier draft of this report. Fi-
nally, we thank our funders, without whom this
report would not have been possible: the Annie
E. Casey Foundation, the Open Society Insti-
tute, the Abell Foundation, the Russell Sage
Foundation, and the Maryland Governor's Of-
fice of Crime Control and Prevention.
Acknowledgments Returning Home:Understanding the Challengesof Prisoner Reentry

vi A PORTRAIT OF PRISONER REENTRY IN MARYLAND

1
Executive Summary
This report describes the process of prisoner reentry by examining thepolicy context surrounding Maryland reentry, the characteristics ofMaryland's returning inmates, the geographic distribution of return-
ing prisoners, and the social and economic climates of the communities thatare home to the highest concentrations of returning prisoners. This reportdoes not attempt to evaluate a specific reentry program, nor does it empiricallyassess Maryland's reentry policies and practices. Rather, the report consoli-dates existing data on incarceration and release trends and presents a newanalysis of data on Maryland prisoners released in 2001. The data used forthis report were derived from several sources, including the Bureau of JusticeStatistics, the Maryland State Commission on Criminal Sentencing Policy,the Maryland Department of Public Safety and Correctional Services, andcensus data compiled by the Baltimore Neighborhood Indicators Alliance(BNIA). Highlights from the report are presented below.
Historical Incarceration and Release Trends. Maryland's incarceration and re-entry trends are similar to those observed at the national level. Between 1980and 2001, Maryland's prison population more than tripled, from 7,731 to23,752 prisoners. The per capita rate of imprisonment in Maryland morethan doubled over the same period, rising from 183 to 422 prisoners per100,000 residents. The growth in Maryland's prison population is attribut-able to increased admissions rather than to longer lengths of stay in prison.Key factors inf luencing increased admissions include rising crime rates andarrests, more admissions of drug offenders, and more parole violators return-ing to prison. Maryland's release patterns ref lect these rising admissions andpopulation trends: 9,448 prisoners were released from Maryland prisons in2001, nearly double the number released in 1980 (5,436).
How Maryland Prisoners Are Released. In 2001, nearly three-quarters of Mary-land prisoners were released through nondiscretionary means (i.e., mandatoryrelease or expiration of sentence). About one-fifth of prisoners were releasedby parole board decision, a discretionary approach. The number of prisonersreleased by parole board decision has decreased over the past decade.
Profile of Prisoners Released in 2001. The majorit y of released prisoners weremale (91 percent) and black (76 percent). Three-quarters were between 20 and40 years old at release; the median age at release was 34. One-third had beenserving time for drug offenses. About half of the prisoners released in 2001had served two years or less in prison; the largest share (37 percent) servedbetween 40 and 60 percent of their sentences. Seventy percent had been inprison at least once before, and 22 percent had been parole violators at somepoint in their criminal careers.
Reentry Defined
For the purposes of this report,
"reentry" is defined as the pro-
cess of leaving the adult stateprison system and returning to
society. The concept of reen-
try is applicable to a variety ofcontexts in which individuals
transition from incarceration to
freedom, including releasefrom jails, federal institutions,
and juvenile facilities. We have
limited our scope to those sen-tenced to serve time in state
prison in order to focus on in-
dividuals who have been con-victed of the most serious of-
fenses, who have been removed
from communities for longerperiods of time, who would be
eligible for state prison pro-
gramming while incarcerated,and who are managed by state
correctional and parole sys-
tems.
Executive Summary

2 A PORTRAIT OF PRISONER REENTRY IN MARYLAND
How Prisoners are Prepared for Release. In 2001, about 17 percent of inmateswere involved in educational or vocational programs offered by the MarylandDivision of Correction (MD DOC) at any given time (roughly 40 percent overthe course of the year), half had work assignments (e.g., sanitation, food ser-vice) within the correctional institutions, and an additional 7 percent partici-pated in a work-release program. Nearly one-third of all Maryland state prison-ers (31 percent) were classified as idle, which denotes a lack of participation inprogramming or work. In addition to traditional programming, comprehen-sive reentry efforts, such as the Reentry Partnership Initiative (REP), currentlyserve a very small fraction of returning prisoners. REP served 125 of the4,411 who returned to Baltimore City in 2001, or 3 percent. The state plansto use a portion of its recently awarded Going Home funds to expand the REPprogram to serve 500 prisoners returning to the Cit y of Baltimore each year.
Life on the Outside: Parole Supervision. In 2001, 89 percent of released prison-ers were subject to some period of parole supervision after release. The num-ber of people on parole in Maryland has more than doubled, from 6,436 in1980 to 14,143 in 2000. Over the past decade, the number of parole violators,especially technical violators, also has increased. In 2002, 58 percent of pa-role revocations were for technical violations, while 42 percent were for newcrimes.
Geographic Distribution of Released Prisoners. The vast majorit y (97 percent)of Maryland prisoners released in 2001 returned to Maryland; of those, 59percent returned to Baltimore Cit y (4,411 released prisoners). Within Balti-more Cit y, releasees are even more concentrated in just a few communities,including Southwest Baltimore, Greater Rosemont, and Sandtown-Winches-ter/Harlem Park. Some of these communities received more than 200 releasedprisoners in 2001, more than the number that returned to some entire coun-ties in Maryland. These communities also are characterized by high levels ofpovert y and crime.

3
Introduction
1 Office of Justice Programs, Of-fice of Congressional and PublicAffairs. 2002. “Attorney GeneralAshcroft Announces NationwideEffort to Reintegrate OffendersBack into Communities.” Pressrelease, July 15, 2002. Availableat http://www.usnewswire.com/OJP/docs/OJP02214.html. (Ac-cessed October 2002.)
2 Lynch, J., and W. Sabol. 2001.“Prisoner Reentry in Perspective.”Crime Policy Report, vol. 3. Wash-ington, D.C.: Urban InstitutePress.
3 Austin, J. 2001. “Prisoner Re-entry: Current Trends, Practices,and Issues.” Crime and Delin-quency 47(3): 314-334; Hammett,T.M., C. Roberts, and S. Kennedy.2001. “Health-Related Issues inPrisoner Reentry.” Crime and De-linquency 47(3): 390-409; Lynchand Sabol. 2001. “Prisoner Reen-try in Perspective.”
4 For an in-depth discussion ofprisoner reentry nationwide, seeTravis, J., A. Solomon, and M.Waul. 2001. From Prison to Home:The Dimensions and Consequencesof Prisoner Reentry. Washington,D.C.: Urban Institute.
5 Lynch and Sabol. 2001. “Pris-oner Reentry in Perspective.”
6 Ibid.
7 This statistic is based on re-leased prisoners who had beensentenced to one year or more.Sources: 2001 Maryland Depart-ment of Public Safety and Correc-tional Services, Division of Correc-tion data; Bureau of JusticeStatistics (BJS)/Paige Harrison.2000. Sentenced Prisoners Re-leased from State or Federal Juris-diction (corpop22.wk1). NationalPrisoner Statistics (NPS-1).
8 2001 Maryland Department ofPublic Safety and CorrectionalServices, Division of Correctiondata. Statistics on where releasedMaryland prisoners returned arebased on cases for which addressinformation was available(n=8,516). Of the 8,516 casesfor which we had address data,8,222 had addresses in Maryland.Of these 8,222 cases, 7,447 hadviable addresses identified by ourmapping software. We discussgeographic distributions withinMaryland as shares of these7,447 cases.
This report examines the prisoner reentry phenomenon in the State ofMaryland. Prisoner reentry—the process of leaving prison and return-ing to societ y—has become a pressing issue both in Maryland and
nationwide, and with good reason. Rising incarceration rates over the pastquarter century have resulted in more and more inmates being released fromprison each year. Nationwide, an estimated 630,000 inmates were releasedfrom state and federal prisons in 2001, a fourfold increase over the past twodecades.1 Thus, released prisoners, their families, and the communities towhich they return must cope with the challenges of reentry on a much greaterscale than ever before.
And the challenges of reentry are many. More prisoners nationwide arereturning home having spent longer terms behind bars,2 exacerbating the al-ready significant challenges of finding employment and reconnecting with fam-ily. Prisoners today are t ypically less prepared for reintegration, less connectedto community-based social structures, and more likely to have health or sub-stance abuse problems than in the past.3 In addition to these personal circum-stances, limited availabilit y of jobs, housing, and social services in a communitymay affect the returning prisoner’s ability to successfully reintegrate.4
These challenges affect more than returning prisoners and their families;they can also have serious public safet y implications for the communities towhich prisoners return. Reentry concerns are most pressing in major metro-politan areas across the country, to which about two-thirds of the prisonersreleased in 1996 returned—up from 50 percent in 1984.5 Within centralcities, released prisoners are often even more concentrated in a few neighbor-hoods.6 These high concentrations of returning prisoners generate great coststo those communities, including potential increases in costs associated withcrime and public safet y, greater public health risks, and high rates of unem-ployment and homelessness. Thus, developing a thorough understanding ofthe characteristics of returning prisoners and the challenges they face is animportant first step in shaping public policy toward improving the safety andwelfare of all citizens.
In many ways, the dimensions and challenges of prisoner reentry ob-served on the national level are mirrored in the State of Maryland. In 2001,9,448 people were released from Maryland prisons—nearly twice the numberreleased two decades ago (5,436 in 1980).7 During 2001, 97 percent of allmen and women released from Maryland prisons returned to communities inMaryland.8 Of those prisoners who returned to Maryland, well over half (59percent) returned to one jurisdiction in the state, Baltimore Cit y, and the f lowof prisoners was further concentrated in a small number of communities withinBaltimore Cit y. Thirt y percent of the 4,411 released prisoners who returnedto Baltimore City returned to just 6 of 55 communities: Southwest Baltimore,
Introduction
4 A PORTRAIT OF PRISONER REENTRY IN MARYLAND
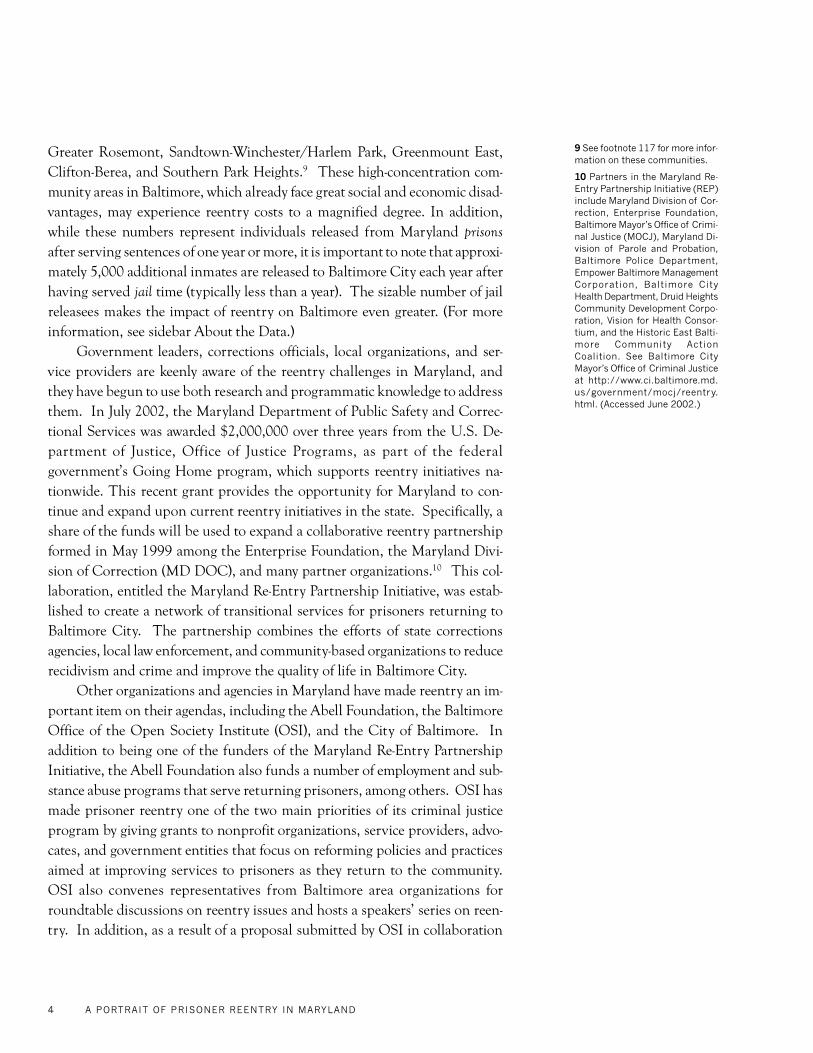
9 See footnote 117 for more infor-mation on these communities.
10 Partners in the Maryland Re-Entry Partnership Initiative (REP)include Maryland Division of Cor-rection, Enterprise Foundation,Baltimore Mayor’s Office of Crimi-nal Justice (MOCJ), Maryland Di-vision of Parole and Probation,Baltimore Police Department,Empower Baltimore ManagementCorporation, Baltimore CityHealth Department, Druid HeightsCommunity Development Corpo-ration, Vision for Health Consor-tium, and the Historic East Balti-more Community ActionCoalition. See Baltimore CityMayor’s Office of Criminal Justiceat http://www.ci.baltimore.md.us/government/mocj/reentry.html. (Accessed June 2002.)
Greater Rosemont, Sandtown-Winchester/Harlem Park, Greenmount East,Clifton-Berea, and Southern Park Heights.9 These high-concentration com-munity areas in Baltimore, which already face great social and economic disad-vantages, may experience reentry costs to a magnified degree. In addition,while these numbers represent individuals released from Maryland prisonsafter serving sentences of one year or more, it is important to note that approxi-mately 5,000 additional inmates are released to Baltimore City each year afterhaving served jail time (t ypically less than a year). The sizable number of jailreleasees makes the impact of reentry on Baltimore even greater. (For moreinformation, see sidebar About the Data.)
Government leaders, corrections officials, local organizations, and ser-vice providers are keenly aware of the reentry challenges in Maryland, andthey have begun to use both research and programmatic knowledge to addressthem. In July 2002, the Maryland Department of Public Safet y and Correc-tional Services was awarded $2,000,000 over three years from the U.S. De-partment of Justice, Office of Justice Programs, as part of the federalgovernment’s Going Home program, which supports reentry initiatives na-tionwide. This recent grant provides the opportunity for Maryland to con-tinue and expand upon current reentry initiatives in the state. Specifically, ashare of the funds will be used to expand a collaborative reentry partnershipformed in May 1999 among the Enterprise Foundation, the Maryland Divi-sion of Correction (MD DOC), and many partner organizations.10 This col-laboration, entitled the Maryland Re-Entry Partnership Initiative, was estab-lished to create a network of transitional services for prisoners returning toBaltimore Cit y. The partnership combines the efforts of state correctionsagencies, local law enforcement, and community-based organizations to reducerecidivism and crime and improve the qualit y of life in Baltimore Cit y.
Other organizations and agencies in Maryland have made reentry an im-portant item on their agendas, including the Abell Foundation, the BaltimoreOffice of the Open Societ y Institute (OSI), and the Cit y of Baltimore. Inaddition to being one of the funders of the Maryland Re-Entry PartnershipInitiative, the Abell Foundation also funds a number of employment and sub-stance abuse programs that serve returning prisoners, among others. OSI hasmade prisoner reentry one of the two main priorities of its criminal justiceprogram by giving grants to nonprofit organizations, service providers, advo-cates, and government entities that focus on reforming policies and practicesaimed at improving services to prisoners as they return to the community.OSI also convenes representatives from Baltimore area organizations forroundtable discussions on reentry issues and hosts a speakers’ series on reen-try. In addition, as a result of a proposal submitted by OSI in collaboration

5
11 National League of Cities.2002. “10 Cities Receive Awardsto Develop Programs that PrepareHard-to-Employ Persons.” Pressrelease, April 17, 2002. Availableat: http://www.nlc.org/nlc_org/site/newsroom/nations_cities_weekly/display.cfm?id=BA50454D–43EB–4A35–AABB71E6 4075B523. (Accessed July 2002.)
12 The statistics on releasedMaryland inmates presented inthis report are based upon thoseindividuals sentenced to one yearor more. For more information,see sidebar entitled About theData.
with the Baltimore Cit y Mayor’s Office of Economic Development and repre-sentatives from government agencies, nonprofit organizations, foundations,and employers, Baltimore City was chosen in April 2002 to be one of 10 citiesnationwide to participate in the National League of Cities’ (NLC’s) Transi-tional Jobs Project. This initiative provides technical assistance to help citiesdevelop a transitional employment program for hard-to-employ individuals.In Baltimore City, the NLC resources will be used to create a Transitional JobsProject that will help ex-offenders find permanent jobs with adequate livingwages.11
These collaborative efforts in Maryland are positive steps toward improv-ing reentry outcomes in Baltimore Cit y, the most critical reentry location inthe state. The premise of these programs is that a well-designed reentry sys-tem can enhance public safet y, reduce returns to prison, control correctionsexpenditures, and help prisoners achieve successful long-term reintegration,potentially resulting in positive outcomes not only for returning prisoners butfor their families and communities as well.
This report is designed to contribute to the efforts currently under way inMaryland to enhance public safet y and improve the prospects for successfulprisoner reintegration in the state. It is important to note that this report doesnot attempt to evaluate a specific reentry program, nor does it empiricallyassess Maryland’s reentry policies and practices. Rather, the process and char-acteristics of prisoner reentry in Maryland are described by answering severalquestions that frame the organization of the report:
WWWWWhat is that is that is that is that is thhhhhe pe pe pe pe policolicolicolicolicy cy cy cy cy contontontontonteeeeexxxxxt surt surt surt surt surrrrrrounding prounding prounding prounding prounding prisonisonisonisonisoner rer rer rer rer reenteenteenteenteentrrrrry in Mary in Mary in Mary in Mary in Mary-y-y-y-y-land? Holand? Holand? Holand? Holand? How do sw do sw do sw do sw do stttttatatatatate sente sente sente sente sentencencencencencing and ping and ping and ping and ping and pososososostttttrrrrreleeleeleeleelease supase supase supase supase supererererervvvvvision prision prision prision prision prac-ac-ac-ac-ac-ttttticeiceiceiceices afs afs afs afs affffffeeeeeccccct tt tt tt tt thhhhhe Mare Mare Mare Mare Maryland ryland ryland ryland ryland reenteenteenteenteentrrrrry picy picy picy picy pictttttururururure?e?e?e?e?
WWWWWhat arhat arhat arhat arhat are te te te te thhhhhe chare chare chare chare characacacacacttttterererererisisisisistttttics of Marics of Marics of Marics of Marics of Maryland’yland’yland’yland’yland’s rs rs rs rs reeeeettttturururururning inmning inmning inmning inmning inmatatatatateeeees?s?s?s?s?
HoHoHoHoHow arw arw arw arw are Mare Mare Mare Mare Maryland pryland pryland pryland pryland prisonisonisonisonisoners prers prers prers prers prepareparepareparepareeeeed fd fd fd fd fooooor rr rr rr rr reenteenteenteenteentrrrrry?y?y?y?y?
WWWWWhat arhat arhat arhat arhat are te te te te thhhhhe Mare Mare Mare Mare Maryland cyland cyland cyland cyland commommommommommunitunitunitunitunitieieieieies ws ws ws ws wititititith th th th th thhhhhe ge ge ge ge grrrrreeeeeatatatatateeeeessssst ct ct ct ct concentoncentoncentoncentoncentrrrrra-a-a-a-a-tttttionionionionions of rs of rs of rs of rs of reeeeettttturururururning inmning inmning inmning inmning inmatatatatateeeees? Ws? Ws? Ws? Ws? What arhat arhat arhat arhat are te te te te thhhhhe ee ee ee ee eccccconononononomic and soomic and soomic and soomic and soomic and soccccciaiaiaiaial cli-l cli-l cli-l cli-l cli-mmmmmatatatatateeeees of ts of ts of ts of ts of those chose chose chose chose commommommommommunitunitunitunitunitieieieieies?s?s?s?s?
The report begins by describing the reentry process at the state level,followed by a description of the characteristics of inmates released from Mary-land prisons in 2001.12 We next turn our attention to an analysis of reentryin Baltimore Cit y, where the largest number and percentage of Marylandreleasees return. The characteristics of Baltimore and the unique challenges
Introduction

6 A PORTRAIT OF PRISONER REENTRY IN MARYLAND
the cit y faces with regard to the reintegration of prisoners are described anddiscussed. The report concludes with a spatial analysis of select neighbor-hoods in Baltimore to which a large percentage of prisoners return. It is ourhope that this report will provide a useful, factual foundation for the individu-als and organizations working to improve reentry outcomes for prisoners, theirfamilies and communities, and the general public in Maryland.
7Introduction
The data used for this report were derived from several sources.
Longitudinal data describing the policy context of incarcera-
tion and reentry trends in Maryland, for example, were de-
rived from a mix of federal statistics, such as the Bureau of
Justice Statistics, and statistics compiled by various agen-
cies within the State of Maryland, such as the Maryland State
Commission on Criminal Sentencing Policy and the Depart-
ment of Public Safety and Correctional Services. Commu-
nity-level data used to develop the maps of reentry and re-
lated demographic and socioeconomic status (SES) data by
Baltimore neighborhood were derived from census data com-
piled by the Baltimore Neighborhood Indicators Alliance
(BNIA). BNIA also provided the files that enabled us to aggre-
gate and map data according to the 55 Baltimore community
areas.
The available data from each of these sources spanned
different time periods—some had data for only a few years,
while others had data for two decades or longer. Rather than
truncating longitudinal data so that graphs and statistics from
all sources cover a common time span, we chose to include
all years for which we were able to obtain data points. As a
result, readers will not always be able to make year-to-year
comparisons across graphs. Much of our consecutive longitu-
dinal data stops at calendar year 1998 or 1999. In some cases,
we were able to obtain a single data point for a more recent
year. In these instances, because of the gaps between data
points, readers may see statistics presented in the text that
are not included in the figures.
Data on the population of inmates released from Mary-
land prisons in calendar year 2001 were obtained from the
Maryland Department of Public Safety and Correctional Ser-
vices, and represent only those released inmates who received
sentences of one year or more to ensure that these data rep-
resent those individuals who were sentenced to serve time in
the state prison system. The reason for this distinction is
that, as a result of acts of the 1991 General Assembly, the
State of Maryland agreed to take over operation of the Balti-
more City detention center complex, providing services and
administering programs associated with processing, detain-
ing, and managing Baltimore Region arrestees [An. Code 1957,
art. 41, § 4–1403; 1999, ch. 54, § 2.]. We acknowledge in
this report that the number of people being released from
Maryland prisons is in fact much higher due to this jail popu-
lation. However, jail inmates are housed for relatively short
periods of time, are not eligible for most prison programming,
and are not subject to postrelease supervision. Thus, the chal-
lenges of jail reentry are substantively different than those of
prisoner reentry and are not addressed in this report.
About the Data

8 A PORTRAIT OF PRISONER REENTRY IN MARYLAND
0
5,000
10,000
15,000
20,000
25,000
1980 1982 1984 1986 1988 1990 1992 1994 1996 1998 2000
Prison Population
Admission Cohorts
2001
25,000
1980
20,000
15,000
10,000
5,000
0
1982 1984 1986 1988 1990 1992 1994 1996 1998 2000 2001
What is the Policy ContextSurrounding Prisoner Reentry in Maryland?
Figure 1. Maryland prisonpopulation and admissions,1980–2001
Source: Bureau of JusticeStatistics, National PrisonerStatistics data series (NPS–1);Harrison, P. and A. Beck. 2002.Prisoners in 2001; Beck, A. andP. Harrison. 2001. Prisoners in2000. (Admissions data onlyavailable through 1998.)
CHAPTER 1
Admission cohorts
Prison population

9
13 Between 1925 and 1973, theper capita rate of imprisonmentin the United States remainedrelatively constant, at about 110per 100,000 residents. Since1973, however, the rate of impris-onment has been steadily increas-ing each year. (See Blumstein, A.,and A.J. Beck. 1999. “PopulationGrowth in U.S. Prisons, 1980–1996.” In Prisons, edited by M.Tonry and J. Petersilia. Chicago:University of Chicago Press.) Byyear-end 2001, the number ofsentenced prisoners per 100,000U.S. residents was 470—morethan four times the rate of impris-onment that had been maintainedduring the early part of the 20thcentury (see Harrison, P., and A.Beck. 2002. Prisoners in 2001.Bureau of Justice Statistics Bul-letin. Washington, D.C.: U.S. De-partment of Justice).
14 Bureau of Justice Statistics(BJS) / Hill, G., and P. Harrison.2000. Prisoners Under State or Fed-eral Jurisdiction (corpop02.wk1).Washington, D.C.: U.S. Depart-ment of Justice. National PrisonerStatistics Data Series (NPS–1).Harrison and Beck. 2002. Prison-ers in 2001.
15 Bureau of Justice Statistics(BJS) / Harrison, P. 2000. Incarcera-tion Rates for Prisoners Under Stateor Federal Jurisdiction, per 100,000Residents (corpop25. wk1). Wash-ington, D.C.: U.S. Department ofJustice. National Prisoner Statis-tics Data Series (NPS-1); Harrisonand Beck. 2002. Prisoners in2001.
16 Harrison and Beck. 2002. Pris-oners in 2001.
17 Beck, A. and Harrison, P.2001. Prisoners in 2000. Bureauof Justice Statistics Bulletin.Washington, D.C.: U. S. Depart-ment of Justice.
18 In addition to these 26 correc-tional facilities, the MD DOC alsooperates a specialized treatmentfacility in Jessup (Patuxent Insti-tution). Since 1991, the MD DOChas also been responsible for theoperation of two jail facilities usedto process, manage, and detainarrestees in the Baltimore region(Baltimore City Detention Center;Baltimore City Booking and IntakeCenter). Source: Maryland Divi-sion of Correction.
Chapter 1. What is the Policy Context Surrounding Prisoner Reentry in Maryland?
In order to understand the reentry phenomenon in Maryland, it is firstnecessary to examine recent trends in sentencing and corrections prac-tices in the state. This section provides an overview of recent sentencing
and incarceration history in the state and describes the factors contributing tothe growth in Maryland’s inmate population, as well as changes in releasepolicies and postrelease supervision practices. This policy context will helpframe the reentry issue and will provide background for the discussion of theneeds and challenges of returning inmates that follows later in this report.
PRISON POPULATION ON THE RISE
The Maryland prison population has grown tremendously over the pasttwo decades, ref lecting the rise in prison populations nationwide.13 Between1980 and 2001, the Maryland prison population more than tripled, increas-ing from 7,731 to 23,752 people. (See figure 1.)14 Over these two decades, theper capita rate of imprisonment in Maryland rose from 183 to 422 per 100,000residents in the state.15 In 2001, Maryland had the 19th highest per capita rateof imprisonment in the nation.16 The Maryland Department of Public Safet yand Correctional Services (MD DPSCS) responded to this growth by build-ing five new correctional facilities with 8,826 new beds between 1990 and2000.17 The Maryland prison system now consists of 26 correctional facili-ties.18
As the incarceration rate has increased in Maryland, so too has statespending on corrections. Maryland’s per capita spending on corrections rosefrom $105 (inf lation-adjusted 1999 dollars) during FY1990 to $172 per capitaduring FY1999.19 Maryland’s per capita corrections expenditures during FY1999were higher than the national average of $162 per capita and represented the16th highest per capita corrections expenditures in the nation.20 MD DOCoperating expenditures have also increased over the past two decades. In2000, MD DOC expenditures totaled well over $500 million, compared with$179 million in 1984 (inf lation-adjusted 2000 dollars).21
EXPLAINING MARYLAND INCARCERATION TRENDS
This section describes how Maryland’s crime rates and revocation prac-tices have contributed to increased admissions over time, driving the growthin Maryland’s prison population. Longer stays in prison often drive prisongrowth as well, but this trend is not observed in Maryland. In fact, Maryland

10 A PORTRAIT OF PRISONER REENTRY IN MARYLAND
19 See Bureau of Labor StatisticsInflation Calculator at http://www.bls.gov/cpi/home.htm.Sourcebook of Criminal Justice Sta-tistics, 1986. Washington, D.C.:U.S. Department of Justice, Bu-reau of Justice Statistics.
20 Gifford, S.L. 2002. Justice Ex-penditures and Employment in theUnited States, 1999. Bureau ofJustice Statistics Special Report.Washington, D.C.: U.S. Depart-ment of Justice.
21 See Bureau of Labor StatisticsInflation Calculator at http://www.bls.gov/cpi/home.htm.Maryland Division of Correction.Quick Facts. Maryland Departmentof Public Safety and CorrectionalServices, Division of CorrectionAnnual Report, Fiscal Year 1984.
22 Maryland 1998 LegislativeHandbook Series, volume IX. Avail-able at http://mlis.state.md.us/other/Legislative_Handbooks/.(Accessed May 2002.)
23 Maryland Department of Pub-lic Safety and Correctional Ser-vices, Division of Correction An-nual Repor ts, Fiscal Years1983–2001.
24 Harrison and Beck. 2002. Pris-oners in 2001;Blumstein andBeck. 1999. “Population Growthin U.S. Prisons, 1980–1996.”
25 Nationwide, parole violatorsaccounted for just over a third ofprison admissions in 1996, upfrom 18 percent in 1980.Blumstein and Beck. 1999.“Population Growth in U.S. Pris-ons, 1980–1996”; Hughes et al.2001. Trends in State Parole, 1990–2000. Bureau of Justice Statis-tics (BJS); Rice, C. and P.Harrison. 2000. Conditional Re-lease Violators Returned to State orFederal Jurisdiction (corpop15.wk1). Washington, D.C: U.S. De-partment of Justice. NationalPrisoner Statistics Data Series(NPS–1).
26 Per email communication withBob Gibson of the Maryland De-partment of Public Safety andCorrectional Services, Office ofResearch and Statistics, Septem-ber 24, 2002.
inmates today are serving shorter prison terms than in the past as a result of moreinmates serving time for offenses that carry shorter sentences, as well as MD DOC’suse of “diminution credits,” which we discuss below. While shorter prison termsalone would result in a smaller prison population, the volume of those admittedwith shorter sentences has increased so dramatically that the net result has beenan increase in the prison population over time.
Rising Crime Rates
Increases in crime rates across the United States in the latter part of the 20thcentury heightened concerns about public safet y and coincided with a shift in thepolitical landscape. This ideological shift toward a more conservative approach tocriminal behavior resulted in more stringent policing practices and more punitivesentencing policies. As shown in figures 2 and 3, Maryland experienced a rise inrates of propert y crimes from the mid 1980s through the mid 1990s, with violentand drug crime rates also rising steadily. Rising crime rates prompted initiatives tomore vigorously arrest and punish offenders and resulted in increased admissionsto Maryland prisons.22 While these crime rates declined in the latter half of the1990s, “tough on crime” policing and sentencing policies remained in practice.
Of particular note is the use of incarceration in response to rising rates ofdrug crimes (possession and sales; see figure 3). As part of the “War on Drugs,”which introduced a more punitive approach to drug offenses in Maryland andnationwide, drug offenders have represented an increasingly larger share of newcommitments to Maryland prisons over the past two decades. In 2001, personsconvicted of drug offenses represented the largest share of new commitments toMaryland prisons (43 percent), nearly four times the share of new commitmentsthat they represented in 1983. (See figure 4.)23 Nationwide, the incarceration ratefor drug offenders in state prisons increased more sharply than for any other of-fense category between 1980 and 1996, representing about 33 percent of the growthin the incarceration rate in state prisons during that period.24
Increases in Parole Violations and Revocations
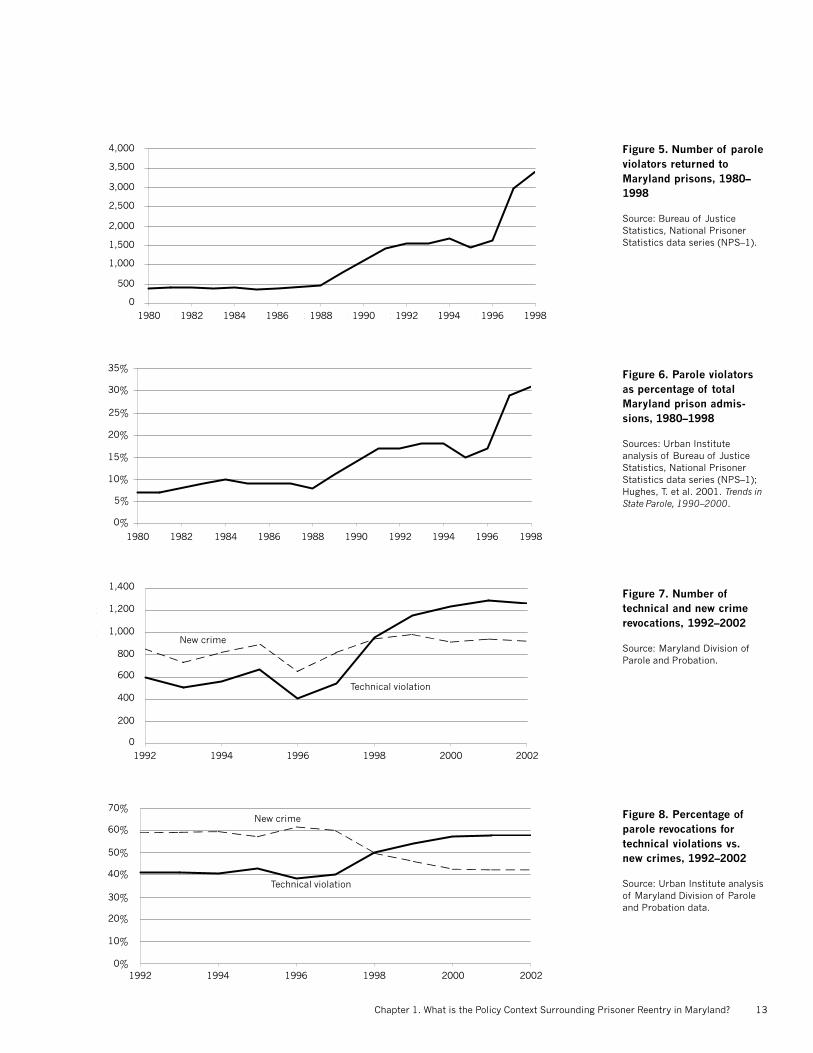
The number of parole violators returned to Maryland prisons also has beenincreasing, rising sevenfold from 1980 to 1998, ref lecting an increase from 7 per-cent to almost one-third of all admissions to Maryland prisons during that sameperiod. (See figures 5 and 6.)25 This increase resembles national parole revocationtrends. Parole revocations can be due to new crimes or technical violations ofparole conditions. In Maryland, technical violations for parolees t ypically involveabsconding from supervision, failure to report to the parole officer as directed, orpositive urinalysis tests for illegal drugs.26 Normally, a warrant is issued and arevocation hearing is held before a parolee is returned to prison on a technical

11
0
2 0 0
4 0 0
6 0 0
8 0 0
1 ,0 0 0
1 ,2 0 0
1 9 7 5 1 9 8 0 1 9 8 5 1 9 9 0 1 9 9 5 2 0 0 0
V io le n t
D ru g
0
1 ,0 0 0
2 ,0 0 0
3 ,0 0 0
4 ,0 0 0
5 ,0 0 0
6 ,0 0 0
1 9 7 5 1 9 8 0 1 9 8 5 1 9 9 0 1 9 9 5 2 0 0 0
P ro p e r ty
0 %
1 0 %
2 0 %
3 0 %
4 0 %
5 0 %
1 9 8 3 1 9 8 5 1 9 8 7 1 9 8 9 1 9 9 1 1 9 9 3 1 9 9 5 1 9 9 7 1 9 9 9 2 0 0 1
Figure 2. Number ofproperty crimes inMaryland per 100,000residents, 1975–2000
Source: FBI Uniform CrimeReports.
Figure 3. Number ofviolent and drug crimes inMaryland per 100,000residents, 1975–2000
Source: Uniform CrimeReporting Program, CentralRecords Division, MarylandState Police.
Figure 4. Drug offenders aspercentage of new commit-ments to Maryland prisons,1983–2001
Source: Urban Institute analysisof MD DPSCS, Division ofCorrection Annual Reports,FY 1983–2001.
0
1,000
2,000
3,000
4,000
5,000
6,000
Violent
1975 1980 1985 1990 1995 2000
0
200
1,000
400
600
800
1,200
1975 1980 1985 1990 1995 2000
0%
10%
20%
30%
40%
50%
1983 1985 1987 1989 1991 1993 1995 1997 1999 2001
Chapter 1. What is the Policy Context Surrounding Prisoner Reentry in Maryland?
Property
Drug

12 A PORTRAIT OF PRISONER REENTRY IN MARYLAND
27 Maryland Division of Correc-tion; Maryland Parole Commis-sion website: http://www.dpscs.state.md.us/mpc/.
28 By year-end 2000, 29 statesand the District of Columbia hadadopted federal truth-in-sentenc-ing statutes that require Part 1violent offenders (murder,nonnegligent manslaughter, rape,robbery, and aggravated assault)to serve at least 85 percent oftheir sentences before becomingeligible for release from prison.Maryland requires violent offend-ers to serve at least 50 percentof their sentences before beingeligible for release (Hughes, T., D.Wilson, and A. Beck. 2001. Trendsin State Parole, 1990–2000. Bu-reau of Justice Statistics SpecialReport. Washington, D.C.: U.S.Department of Justice; Ditton, P.and D. Wilson. 1999. Truth in Sen-tencing in State Prisons. Bureau ofJustice Statistics Special Report.Washington, D.C.: U.S. Depart-ment of Justice).
29 The length of a prisoner’s sen-tence, which is the term of impris-onment meted out by the court,does not necessary correspond tothe actual time served in prison(i.e., prisoners usually serve lesstime than their court-ordered sen-tence lengths).
30 At the national level, the aver-age prison sentence has de-creased. From 1990 to 1999, themean sentence length droppedfrom 69 months to 65 months.Source: Hughes et al. 2001.Trends in State Parole, 1990–2000.
31 Maryland Department of Pub-lic Safety and Correctional Ser-vices, Division of Corrections,Annual Reports. Fiscal Years 1981to 2001.
32 Hughes et al. 2001. Trends inState Parole, 1990–2000.
33 In 1990, the average timeserved for prisoners released fromstate prison was 22 months; by1999, it had increased to 29months. Source: Hughes et al.2001. Trends in State Parole, 1990–2000.
34 As measured by the mean.
35 2001 Maryland Department ofPublic Safety and CorrectionalServices, Division of Correctiondata.
violation. In the case of new crimes that result in new terms of confinement, theparolee t ypically serves the revocation time concurrently with the new sentence. 27
Over the past decade, the number of revocations for technical violations inMaryland has increased, while the number of revocations for new crimes has re-mained relatively stable. (See figure 7.) As a result, technical violations now ac-count for a greater share of all parole revocations in Maryland than they did adecade ago. In 2002, technical violations represented 58 percent of revocations inMaryland, while 42 percent were for new crimes. (See figure 8.)
Reductions in Sentence Length and Time Served
Prison population growth is often affected by increases in the average lengthof stay, which can be driven by longer sentences meted out by the courts as well asby higher percentages of time served. Longer sentences and more time served, inturn, can be affected by changes in sentencing policies such as federal truth-in-sentencing (TIS) statutes that many states, but not Maryland, have implementedover the past two decades.28 Recent changes in Maryland’s sentencing policies,however, do not appear to have resulted in longer lengths of stay, though they mayhave affected the number of admissions to Maryland prisons. (See sidebar Changesin Maryland Sentencing Policy.) In fact, longitudinal data on Maryland prisonersindicate that sentence lengths and time served have both decreased in recent years.Thus, the growth in Maryland’s prison population cannot be attributed to longerlengths of stay by its inmates.
With regard to sentence length, Maryland mirrors national trends, with aver-age sentence lengths29 declining between 1981 and 2001.30 Over the past twodecades, the share of Maryland prisoners given shorter sentences (one to threeyears) increased from 39 percent to 44 percent. At the same time, the share ofprisoners given longer sentences (8 to 10 years, and more than 10 years) decreasedfrom 11 to 7 percent and from 17 to 13 percent, respectively. (See figure 9.)31 Andwhile limited longitudinal data exist on time served by Maryland inmates, we doknow that for violent offenders, the mean time served dropped from 63 months to57 months between 1993 and 1999.32 These statistics run counter to nationaltrends, which indicate increases in time served during the 1990s.33
Several factors explain the shorter sentence lengths and shorter time servedby Maryland prisoners. In terms of average sentence lengths, Maryland’s prisonpopulation has increasingly been comprised of inmates incarcerated for offensesthat carry relatively short sentence lengths, namely drug offenders and parole vio-lators. The average34 sentence length for drug offenders who were released fromMaryland prisons in 2001 was 54 months (about 4.5 years), compared with 72months (6 years) for the entire release cohort. (See figure 10.)35 Parole violatorswho are revoked for technical violations in Maryland (58 percent of parole viola-tors in FY 2002) t ypically return to prison for two- to three-year sentences but often
13
Figure 5. Number of paroleviolators returned toMaryland prisons, 1980–1998
Source: Bureau of JusticeStatistics, National PrisonerStatistics data series (NPS–1).
0 %
1 0 %
2 0 %
3 0 %
4 0 %
5 0 %
6 0 %
7 0 %
1 9 9 2 1 9 9 4 1 9 9 6 1 9 9 8 2 0 0 0 2 0 0 2
0%
10%
20%
30%
40%
50%
60%
70%
1992 1994 1996 1998 2000 2002
0
2 0 0
4 0 0
6 0 0
8 0 0
1 , 0 0 0
1 , 2 0 0
1 , 4 0 0
1 9 9 2 1 9 9 4 1 9 9 6 1 9 9 8 2 0 0 0 2 0 0 2
0
400
600
800
1,200
1,400
1,000
200
1992 1994 1996 1998 2000 2002
0 %
5 %
1 0 %
1 5 %
2 0 %
2 5 %
3 0 %
3 5 %
1 9 8 0 1 9 8 2 1 9 8 4 1 9 8 6 1 9 8 8 1 9 9 0 1 9 9 2 1 9 9 4 1 9 9 6 1 9 9 81980 1982 1984 1986 1988 1990 1992 1994 1996 1998
0%
10%
20%
30%
15%
35%
5%
25%
0
5 0 0
1 , 0 0 0
1 , 5 0 0
2 , 0 0 0
2 , 5 0 0
3 , 0 0 0
3 , 5 0 0
4 , 0 0 0
1 9 8 0 1 9 8 2 1 9 8 4 1 9 8 6 1 9 8 8 1 9 9 0 1 9 9 2 1 9 9 4 1 9 9 6 1 9 9 8
0
1,500
2,000
2,500
3,000
3,500
4,000
1980
1,000
500
1982 1984 1986 1988 1990 1992 1994 1996 1998
Figure 6. Parole violatorsas percentage of totalMaryland prison admis-sions, 1980–1998
Sources: Urban Instituteanalysis of Bureau of JusticeStatistics, National PrisonerStatistics data series (NPS–1);Hughes, T. et al. 2001. Trends inState Parole, 1990–2000.
Figure 7. Number oftechnical and new crimerevocations, 1992–2002
Source: Maryland Division ofParole and Probation.
Figure 8. Percentage ofparole revocations fortechnical violations vs.new crimes, 1992–2002
Source: Urban Institute analysisof Maryland Division of Paroleand Probation data.
Technical violation
New crime
Technical violation
New crime
Chapter 1. What is the Policy Context Surrounding Prisoner Reentry in Maryland?

14 A PORTRAIT OF PRISONER REENTRY IN MARYLAND
36 Typically, individuals exitingprison by parole or mandatoryrelease have a remaining sentenceof two to three years to be servedunder community supervision.This two- to three-year period alsorepresents the maximum amountof time of incarceration that isimposed if the ex-prisoner’s pa-role is revoked for a technical vio-lation. Parole releasees who arerevoked for technical violationscan be granted “street time”credit at their revocation hearings(reduction in time served basedon crime-free behavior prior to theviolation while under supervision)or can earn good behavior dimi-nution credits while back inprison, further reducing the lengthof time they are required to servefor the revocation. By law, man-datory supervision technical vio-lators cannot earn new sentencediminution credits, and thus mayserve longer sentences for theirrevocations than parole releasees.See section entitled How AreMaryland Prisoners Released? formore information on releasemethods. (Source: Maryland Di-vision of Correction, Office of Re-search and Statistics.)
37 Four types of diminution cred-its may be awarded: good conductcredit, industrial credit, educationcredit, and special project credit.
38 Maryland Division of Correc-tion.
0 %
1 0 %
2 0 %
3 0 %
4 0 %
5 0 %
1 t o 3 3 t o 5 5 t o 8 8 t o 1 0 1 0 o r m o r ey e a r s
1 9 8 1
2 0 0 1
Figure 9. Percentage ofMaryland prison popula-tion, by sentence length,1981 and 2001
Source: Urban Institute analysisof MD DPSCS, Division ofCorrection annual reports,FY 1981 and 2001.
0%
10%
20%
30%
40%
50%1981
10 or more years8 to 105 to 83 to 51 to 3
2001
serve a smaller share of that time.36 In terms of lengths of stay, the MarylandDivision of Correction has increasingly employed diminution credits37 to controlcrowding. These credits, which reduce an inmate’s maximum release date, are alsoused to encourage participation in programs. In recent years, MD DOC has beenoffering more good time credits—as much as 20 days for every 30 days served.38
SUMMARY
In summary, increased admissions of offenders carrying shorter terms andmore opportunities to reduce time served through diminution credits have re-sulted in more prisoners cycling through Maryland’s prison system on shortersentences. Shorter sentence lengths and reductions in time served on their ownwould result in a smaller prison population; however, the volume of prisonersadmitted has increased so dramatically that the net result has been growth inMaryland’s prison population over the past two decades.
The volume of inmates serving shorter terms not only explains the growth inMaryland prisons but also significantly changes the profile of the reentry popula-tion in Maryland. For instance, many of these inmates served such short termsthat they were ineligible for prison programming that might have prepared themfor their release and were able to bypass the parole process as well.
Related to the issue of sentence length is that of the mechanisms by whichinmates are released. We now turn to a discussion of the use of parole, mandatoryrelease, and the expiration of sentences in Maryland.

15
Figure 10. Mean sentencelengths of released Marylandprisoners, by offense, 2001
Source: Urban Institute analysis of2001 MD DPSCS, Division ofCorrection data.
*The offense category of CriminalProcedure includes Probation Viola-tions, Parole Violations, Escape,Contempt of Court, Perjury, CriminalProcedure Other, and Attempt to FleePolice. Over two-thirds (68 percent)of the inmates released in 2001 whowere included in the criminal proce-dure category were probation viola-tors. Per email communication withBob Gibson of the Maryland Depart-ment of Public Safety and Correc-tional Services, Office of Researchand Statistics, October 17, 2002.
Chapter 1. What is the Policy Context Surrounding Prisoner Reentry in Maryland?
The past two decades have seen four major changes in
Maryland’s sentencing policies. First, in response to percep-
tions of unwarranted sentencing disparity,a the Maryland ju-
diciary introduced voluntary sentencing guidelines in 1983.
Maryland’s voluntary sentencing guidelines—recommended
sentencing policies not mandated by law—prescribe sentence
ranges based on both the seriousness of the offense and the
criminal history of the offender. Judges are expected to sen-
tence within the guidelines unless “compelling circumstances”
suggest that they do otherwise, in which case they are ex-
pected to document their reasoning.b A 1996 nationwide as-
sessment of structured sentencingc conducted by the Bureau
of Justice Assistance (BJA) found that under guidelines, re-
peat offenders and persons convicted of violent and drug
crimes are much more likely to be imprisoned and to serve
longer prison terms than before guidelines were implemented.d
Guidelines may have affected increased admissions in Mary-
land, but they do not appear to have resulted in the longer
prison terms observed in guideline states across the nation.
In addition, Maryland has enacted mandatory minimum
sentences for certain offenses. Currently, six types of offenses
require a mandatory minimum sentence in Maryland: (1) vio-
lent crimes involving the use of a handgun; (2) use of a fire-
arm in relation to drug trafficking; (3) drug dealing as a sub-
sequent offense; (4) violent crimes as a subsequent offense;
(5) certain felony drug offenses; and (6) first degree murder.e
Maryland also enacted legislation in 1994 patterned after the
“three-strikes-and-you’re-out” model, requiring mandatory life
in prison with no parole eligibility on the fourth strike after
separate prison terms have been served for the first three.f
Finally, in 1994, Maryland began requiring prisoners convicted
of violent crimes to serve at least 50 percent of their terms
before becoming eligible for discretionary parole release.g
e. 1998 Legislative Handbook Series, vol. 9, chap. 9, “Sentencing.” Avail-able at http://mlis.state.md.us/other/Legislative_Handbooks/Volume%20IX/chapter9.htm. (Accessed May 2002.) See also MarylandState Commission on Criminal Sentencing Policy. Guideline Offenses withMandatory Minimums. Available at http://www.msccsp.org/guidelines/mandatory.html. (Accessed May 2002.)
f. Offenses that count as strikes include murder; rape; robbery; first- orsecond-degree sexual offense; arson; burglary; kidnapping; manslaugh-ter; use of a firearm in a felony; and assault with attempt to murder,rape, rob, or commit sexual offense. Maryland later added carjackingand armed carjacking to the list of offenses in the “strike zone.” (SeeClark, J., J. Austin, and D.A. Henry. 1997. “Three Strikes and You’re Out”:A Review of State Legislation. National Institute of Justice Research inBrief. Washington, DC: U.S. Department of Justice.)
g. Maryland Parole Commission website; Ditton and Wilson. 1999.Truth in Sentencing in State Prisons.
a. In the late 1970s and 1980s, the indeterminate sentencing modelthat had dominated American sentencing policy for most of the mid-1900s came into question. Sentencing reforms were established to limitthe discretion of judges and other corrections officials in sentencingmatters, and to combat rising crime rates with tougher sentencing stan-dards (See Tonry, M. 1996. Sentencing Matters. New York, NY: OxfordUniversity Press.)
b. For an in-depth discussion on the evolution of sentencing policy inMaryland, see Sentencing Guideline Overview. Maryland State Commis-sion on Criminal Sentencing Policy. Available at http://www.msccsp.org/guidelines/overview.html. (Accessed May 2002.)
c. “Structured sentencing” is defined to include voluntary/advisorysentencing guidelines, determinate sentencing, presumptive sentenc-ing guidelines, and mandatory sentencing. (See Bureau of Justice As-sistance. 1996. National Assessment of Structured Sentencing, (NCJ153853).)
d. Bureau of Justice Assistance. 1996. National Assessment of Struc-tured Sentencing, pg. 125.
Changes in MarylandSentencing Policy
0 5 0 1 0 0 1 5 0 2 0 0 2 5 0
H o m ic id e
R a p e
R o b b e r y
C r im in a l P r o c e d u r e
O t h e r S e x O f fe n s e s
B u r g la r y
A s s a u l t
D r u g O f f e n s e
W e a p o n s
L a r c e n y
A u t o T h e f t
A L L O F F E N S E S
M o n th s
Homicide
Rape
Robbery
Criminal Procedure*
Other Sex Offenses
Burglary
AssaultDrug Offense
Weapons
Larceny
Auto Theft
ALL OFFENSES
500 100 150 200 250MONTHS
16 A PORTRAIT OF PRISONER REENTRY IN MARYLAND
How Are PrisonersReleased in Maryland?
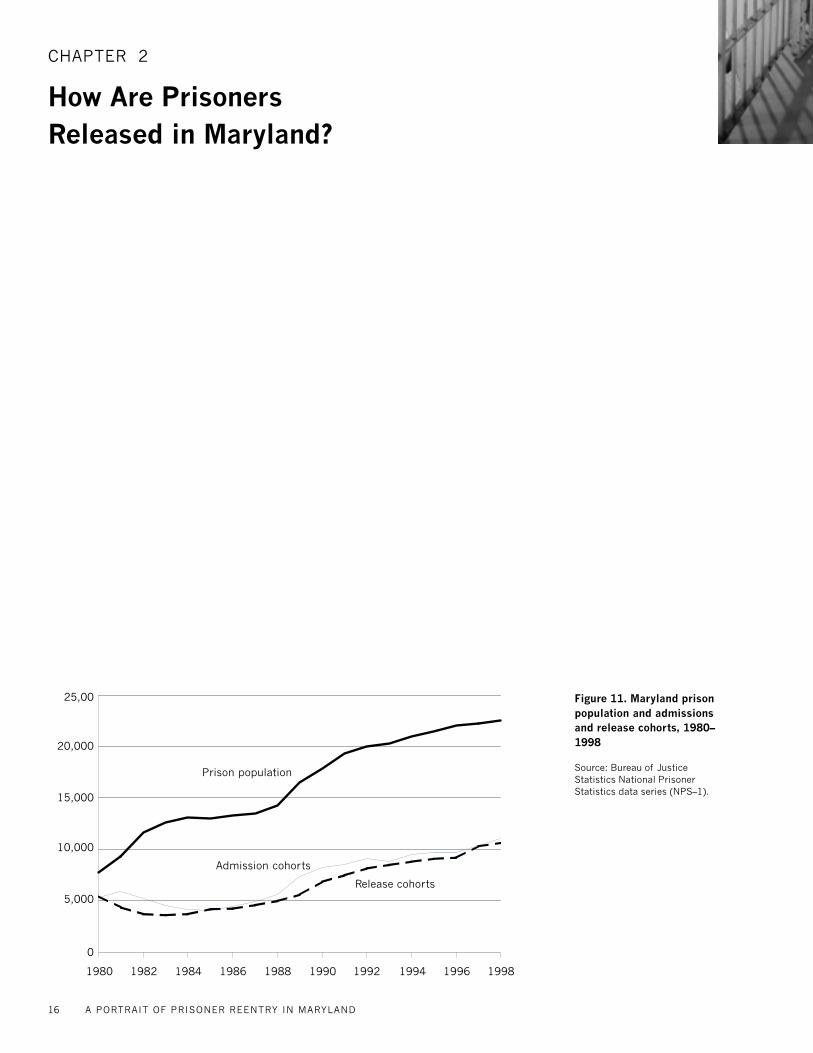
Figure 11. Maryland prisonpopulation and admissionsand release cohorts, 1980–1998
Source: Bureau of JusticeStatistics National PrisonerStatistics data series (NPS–1).
CHAPTER 2
0
5,000
10,000
15,000
20,000
25,000
1980 1982 1984 1986 1988 1990 1992 1994 1996 1998
25,00
20,000
15,000
10,000
5,000
0
1980 1982 1984 1986 1988 1990 1992 1994 1996 1998
Prison population
Admission cohorts
Release cohorts

17
39 Refers to released prisonerswho had been sentenced to a yearor more. Sources: 2001 MarylandDepartment of Public Safety andCorrectional Services, Division ofCorrection data; Bureau of Jus-tice Statistics (BJS)/ Harrison, P.2000. Total Sentenced PrisonersReleased from State or Federal Ju-risdiction (corpop22.wk1). Wash-ington, D.C.: U.S. Department ofJustice. National Prisoner Statis-tics Data Series (NPS–1).
40 The length of a prisoner’s sen-tence can be reduced by as muchas 20 days per month for goodbehavior; performing industrial,agricultural, and administrativetasks; and making progress invocational and educational train-ing. Source: Maryland Division ofCorrection, Case Management.
Chapter 2. How Are Prisoners Released in Maryland?
As shown in figure 11, the growth in Maryland’s prison populationover the past two decades has been mirrored by the number of re-leases from Maryland prisons. In 2001, 9,448 people were released
from Maryland state prisons—nearly double the number who were releasedtwo decades ago (5,436 in 1980).39 Prisoners in Maryland (and nationwide)can be released through either a discretionary or a nondiscretionary process.With nondiscretionary (mandatory) release, the release date is determined bystatute rather than by a panel or board. With discretionary release, the prisoner’srelease from prison to supervision is decided by a parole board or other au-thorit y.
In 2001, most prisoners released in Maryland were released throughnondiscretionary means (e.g., mandatory release, expiration of sentence, orcontinuation of mandatory release; see descriptions below). In total, nearlythree-quarters (71 percent) of the released prisoners in 2001 were releasedwithout the intervention of a parole board or other authorit y, which has im-portant implications for this discussion of prisoner reentry. These inmatesdid not have to appear before the parole board to be reviewed or to present apostrelease home or employment plan.
Mandatory releasees accounted for 58 percent of Maryland prisoners re-leased in 2001. These prisoners served part of their sentence in prison, lessany good time credits,40 and were released to the community to complete theremainder of their terms under parole supervision. Eight percent of Marylandprisoners released in 2001 were released due to the expiration of their sen-tences. These prisoners completed the entire term of their sentences and werereleased to the communit y without being under the supervision of a commu-nity corrections agency (parole). Five percent of prisoners released during2001 were continued on mandatory release (CNT/mandatory release). Theseprisoners had been released earlier for the same sentence and then returned toprison on a parole violation. When these prisoners were re-released in 2001,they continued to fulfill the conditions of their original mandatory release.
The remainder of the Maryland prisoners released in 2001 were releasedthrough discretionary means (e.g., parole, court, and continuation of parole).For about one-fifth (22 percent) of Maryland prisoners released in 2001, theirrelease was decided following review by the Maryland Parole Commission. Asmall percentage (3 percent) of prisoners released in 2001 were released as aresult of a decision by a court, such as deciding to suspend the balance of aprisoner’s sentence. Finally, some prisoners released during 2001 (4 percent)were continued on parole release (CNT/parole). These prisoners had beenreleased by parole decision for the same sentence and then returned to prisonon a parole violation. When these prisoners were re-released in 2001, theycontinued to fulfill the conditions of their original parole release. These dataare shown in figure 12.

18 A PORTRAIT OF PRISONER REENTRY IN MARYLAND
Nationwide, a move away from indeterminate sentencing and
a push for truth-in-sentencing over the past few decades have
prompted many states to eliminate or reduce the role of pa-
role boards in the release process.a In Maryland, the Mary-
land Parole Commission (MPC)—the main paroling authority
in the stateb—still plays a role in the release process, though
the share of prisoners released by MPC decision has decreased
over the past decade. (See figures 13 and 14.) Following a
sharp rise in the percentage of all prison releases attributable
to parole board decisions in the late 1980s (from 29 percent
to 42 percent), the share of prisoners released by parole board
decision declined significantly during the 1990s, dropping
from 42 percent of all releases to slightly more than 20 per-
cent. These statistics reflect national trends: The percentage
of state inmates released from prison as a result of a parole
board decision dropped from 39 percent of all releases in
1990 to 24 percent in 1999.c
There are several reasons for the reduction in the share
of parole board releases over time, including legislation intro-
duced in 1994 that requires prisoners convicted of violent
crimesd to serve at least 50 percent of their terms before be-
coming eligible for discretionary parole release.e According
to some observers, this statute, coupled with a more conser-
vative MPC, has resulted in fewer longer-term prisoners being
released via parole.f
In addition, as mentioned above, a large number of
Maryland prisoners are serving shorter sentences. (See figure
9.) Most Maryland prisoners who have been sentenced to
more than six months become eligible for parole after they
have served one-fourth of their term.g These short-term sen-
tences result in many prisoners reaching their maximum re-
lease date (less pretrial jail and diminution credits) before
they can be scheduled and heard by the parole board.h In-
mates who are still incarcerated after having served enough
of their sentences to be eligible for parole release often opt to
waive the parole hearing process in lieu of serving out their
sentences so that they are not subject to parole supervision
upon release.i
Finally, there has been an increased use of diminution
credits,j which can reduce an inmate’s maximum release date
as much as 20 days for every 30 days served.k With more
opportunities to reduce sentence lengths in this manner, the
parole board has become less instrumental in the release pro-
cess, because inmates are less likely either to seek a parole
hearing or to still be incarcerated by the time they are eligible
for parole.
son, assault first degree, burglary, carjacking, child abuse, escape,housebreaking, kidnapping, maiming and mayhem, manslaughter (ex-cept involuntary manslaughter), murder, rape, robbery, sexual offensefirst and second degrees, use of a handgun, and assaults with intent tocommit certain crimes. There are exceptions to this list, depending onwhen the offense was committed. See Maryland Parole Commission.Annual Report Fiscal Year 98. Available at http://www.dpscs.state.md.us/pcn/fy98.pdf (accessed April 2002).
e. Maryland Parole Commission website: http://www.dpscs.state.md.us/mpc/; Ditton and Wilson. 1999. Truth in Sentencing in State Prisons.
f. Per conversation with James Austin, August 15, 2002, Washington,D.C.
g. Maryland Parole Commission website.
h. Per conversation with James Austin, August 15, 2002, Washington,D.C.
i. Ibid.
j. Four types of diminution credits may be awarded: good conduct credit,industrial credit, education credit, and special project credit.
k. Maryland Division of Correction.
a. See Hughes, T., D. Wilson and A. Beck. 2001. Trends in State Parole,1990–2000. Bureau of Justice Statistics Special Report. Washington,D.C.: U.S. Department of Justice; Ditton, P., and D. Wilson. 1999. Truthin Sentencing in State Prisons. Bureau of Justice Statistics Special Re-port. Washington, D.C.: U.S. Department of Justice.
b. Parole in Maryland has gone through many organizational arrange-ments over time, but since 1976 the Maryland Parole Commission (MPC)has been composed of eight members appointed for six-year terms bythe secretary of public safety and correctional services with approvalfrom the governor and the state senate. While the MPC has parolingauthority over the bulk of prisoners serving Maryland sentences, theBoard of Review of the Patuxent Institution supervises the several hun-dred prisoners in that program. In addition, the governor is respon-sible for making parole decisions about prisoners who are serving lifesentences. (Maryland Parole Commission website: http://www.dpscs.state.md.us/pcn/, accessed March 2002.)
c. Bureau of Justice Statistics, Probation and Parole Statistics. Availableat http://www.ojp.usdoj.gov/bjs/pandp.htm, accessed January 2003.
d. The Maryland Parole Commission (MPC) bases its definition of ”vio-lent crimes” on Article 27, Section 643B of the Annotated Code ofMaryland. Crimes the MPC defines as “violent” include abduction, ar-
Parole Releasein Maryland

19
0
1 ,0 0 0
2 ,0 0 0
3 ,0 0 0
4 ,0 0 0
5 ,0 0 0
1 9 8 7 1 9 8 9 1 9 9 1 1 9 9 3 1 9 9 5 1 9 9 7 1 9 9 9
Figure 12. Percentage ofMaryland prison releases,by release method, 2001
Source: Urban Institute analysisof 2001 MD DPSCS, Division ofCorrection data.
Figure 13. Percentageof Maryland prisonersreleased by ParoleCommission decision,1987–1999
Source: Urban Institute analysisof MD DPSCS, Division ofCorrection annual reports,FY 1987–1999.
Figure 14. Number ofMaryland prisonersreleased by ParoleCommission decision,1987–1999
Source: Urban Institute analysisof MD DPSCS, Division ofCorrection annual reports,FY 1987–1999.
1987 1989 1991 1993 1995 19991997
0
2,000
3,000
4,000
5,000
1,000
0 %
1 0 %
2 0 %
3 0 %
4 0 %
5 0 %
1 9 8 7 1 9 8 9 1 9 9 1 1 9 9 3 1 9 9 5 1 9 9 7 1 9 9 9
0%1987 1989 1991 1993 1995 1999
10%
20%
30%
40%
50%
1997
0 % 1 0 % 2 0 % 3 0 % 4 0 % 5 0 % 6 0 % 7 0 %
C o u r t
C N T / M a n d a t o r y
C N T / P a r o l e
E x p i r a t i o n
P a r o l e
M a n d a t o r yR e le a s e
Court
CNT/ Mandatory
CNT / Parole
Expiration
Parole
Mandatory Release
0% 10% 20% 30% 40% 50% 60% 70%
Chapter 2. How Are Prisoners Released in Maryland?

20 A PORTRAIT OF PRISONER REENTRY IN MARYLAND
What Happens After MarylandPrisoners Are Released?
Figure 15. Maryland parolepopulation, 1980–1998
Source: Bureau of JusticeStatistics Annual Parole DataSurvey data series (CJ–7).
C H A P T E R 3
0
5,000
10,000
15,000
20,000
1980 1982 1984 1986 1988 1990 1992 1994 1996 1998
20,000
1980
15,000
10,000
5,000
0
1982 1984 1986 1988 1990 1992 1994 1996 1998

21
41 2001 Maryland Department ofPublic Safety and CorrectionalServices, Division of Correctiondata.
42 Re-released parole and man-datory prisoners (CNT / parole,CNT / mandatory) are also subjectto supervision in the community.
43 Article 41, Section 4-612 ofAnnotated Code of Maryland, inMaryland Division of Parole and Pro-bation Handbook.
44 Hughes et al. 2001. Trends inState Parole, 1990–2000. Bureauof Justice Statistics (BJS)/Minton, T., and P. Harrison. 2000.Adults on Parole in the United States(corpop12.wk1). Washington,D.C.: U.S. Department of Justice.Annual Parole Data Survey DataSeries (CJ–7).
45 Per email communication withBob Gibson of the Maryland De-partment of Public Safety andCorrectional Services, Office ofResearch and Statistics, October10, 2002.
Figure 16. General paroleconditions for parole andmandatory releasees
Report as directed andfollow parole agentinstructions.
Work regularly.
Get permission to changeaddress, change jobs,and/or leave Maryland.
Obey all laws.
Notify parole agent ifarrested.
Do not possess, use, orsell drugs.
Do not possess, use, orsell weapons.
Do not present a danger
to yourself or others.
Source: Maryland Division ofParole and Probation.
Chapter 3. What Happens After Maryland Prisoners Are Released?
POSTRELEASE SUPERVISION
The majorit y of prisoners released in Maryland in 2001 (89 percent) werereleased conditionally, meaning they were subject to some kind of communitysupervision after release. 41 In essence, prisoners who are released condition-ally serve the last portion of their sentences while back in the community.Prisoners released by parole decision and mandatory releasees both are super-vised in the community for some period of time.42 Indeed, mandatory releaseesare subject to the same rules, regulations, and communit y supervision condi-tions as parole releasees.43 The remaining 11 percent of Maryland prisonerswere released unconditionally, meaning they were not subject to any postreleasesupervision. These prisoners, who were released because of the expiration oftheir sentences or by a court decision, were under no legal obligation to abideby conditions of release such as having a job, participating in drug or alcoholtreatment, or having prearranged housing plans.
All conditional releasees are supervised by the Maryland Division of Pa-role and Probation (MDPP), a separate organization from the Maryland ParoleCommission. With more and more inmates being released from Marylandprisons over the past two decades, the number of people under parole supervi-sion in the community has increased. (See figure 15.) At year-end 2000, 14,143people were on parole in Maryland, compared with 6,436 people in 1980.44
Released prisoners under parole are supervised by parole agents locatedin offices across the state. Maryland parolees are subject to a number of gen-eral conditions, including reporting to parole agents at specified times, work-ing regularly, and obtaining permission to leave the state. (See figure 16.) Someparolees are subject to additional conditions, such as paying restitution. Vio-lating these conditions can result in a return to prison. In recent years, MDPPhas been more likely to initiate formal revocation procedures for violations, inpart due to increased supervision and more frequent urinalysis testing. TheMaryland Parole Commission, in turn, has been more likely to revoke super-vision.45
Experiments in PostRelease Supervision
In response to the increase in parole violators returning to prison, Mary-land has launched several efforts in recent years to improve the outcomes ofparolees, with a particular focus on Baltimore City. These include redesigningthe way the MDPP operates through the Proactive Communit y Supervisionmodel, as well as implementing new communit y supervision programs aimedat reducing crime and recidivism, such as Break the Cycle and the HotSpotsInitiative.

22 A PORTRAIT OF PRISONER REENTRY IN MARYLAND
46 Proactive Community Supervi-sion: A Plan for Making MarylandCommunities Safer. 2000. Reportto the Budget Committees of theMaryland General Assembly.Available at http://www.dpscs.state.md.us/pnp/pppcs.pdf. (Ac-cessed March 2002.) For moreinformation, see Proactive Com-munity Supervision Training Guide-book. Available at http://www.bgr.umd.edu/publication.html. (Accessed December 2002.)
47 Taxman, F., and J. Cronin.2000. Process Evaluation ofMaryland’s Break the Cycle: FirstYear Activities. Bureau of Govern-ment Research: College Park, MD.Available at http://www.dpscs.state.md.us/pnp/btc_eval.pdf.(Accessed March 2002.)
Proactive Community Supervision. Maryland has been planning an aggressive strat-egy to revamp its parole system with the goal of improving public safety and pris-oner reintegration. Parole officers currently have many responsibilities and veryhigh caseloads, leaving little time to work intensively with individuals in the com-munity. Each agent handles about 103 cases—which includes both high-risk andlow-risk offenders. Parole agent performance is currently measured by how manycontacts he or she has with an ex-prisoner rather than by ex-prisoner performanceoutcomes, such as staying substance abuse-free and avoiding violations. The newProactive Community Supervision (PCS) model will gauge agent performance basedupon parolee performance and will redistribute caseloads so that high-risk offend-ers receive appropriate amounts of time and attention from agents. Parole agentswill work with 50 to 55 high-risk, high-need cases or with about 200 low-risk, low-need cases. In addition to changing the way cases are assigned, more staff will behired and improved technology, such as laptops, mobile phones, and body armor,will be made available to more agents.
As the name suggests, this new system envisions a proactive role for agents—working with and in the communities where their assigned parolees live. Underthe old system, parole agents spent most of their time in their offices, and paroleesreported to them. Under PCS, agents are assigned to supervise parolees in a spe-cific area. They will become familiar with the neighborhoods and work with parol-ees in the communit y. In addition, community agencies will help parolees withjob placement, education, and training. 46 While plans for the PCS system areunder way, it is unclear when it will be completely implemented or how it will befunded.
Break the Cycle. As mentioned above, increasing numbers of parole violators re-turning to prison have played a significant role in rising Maryland prison admis-sion rates over the past two decades. Recognizing that offending (and reoffending)is often linked to substance abuse, the Department of Public Safet y and Correc-tional Services launched Break the Cycle (BTC) in 1999. BTC was designed toachieve three main goals: (1) reducing crime, with a focus on crimes committed tosupport drug addictions or other drug-related crime; (2) reducing the number ofparole violators by helping to facilitate greater compliance with parole conditions,thereby reducing prison admissions for new crimes and technical violations; and(3) reducing court caseloads.47 The program has been implemented in seven juris-dictions in Maryland: Baltimore City and Baltimore, Charles, Howard, Mont-gomery, Prince George’s, and Washington counties. BTC uses a combination ofdrug testing, substance abuse treatment, and a system of sanctions and rewards toreduce substance use among parolees. All released inmates who are in specializedsubstance abuse programs or who have been ordered by the court or the ParoleCommission to undergo drug testing or substance abuse treatment are eligible to
23
48 These figures include onlythose who show up for the tests.At the first test, 25 percent of of-fenders did not show up. By the16th test, the no-show ratedropped to 17 percent of offend-ers. See Reedy, D. F. Taxman, T.Klem, and R. Silverman. 2002.Does BTC Deter Drug Use? LessonsLearned from Three Years of Imple-mentation. Bureau of GovernmentResearch: College Park, MD. Avail-able at http://www.bgr.umd.edu/pdf/DeterrentEffectsofBTC.pdf.(Accessed December 2002.)
49 Taxman, F., J. Cronin, K.Moline, K. Douglas, and S.Rosenmerkle. 2001. Break theCycle: Overview of Offender andSystem Issues in Year 2 of Imple-mentation. Bureau of GovernmentResearch: College Park, MD. Avail-able at http://www.bgr.umd.edu/pdf/btc_year2.pdf. (AccessedMarch 2002.)
50 Maryland Governor’s Office ofCrime Control and Prevention(GOCCP) website: http://www.goccp.org/. (Accessed June2002.)
Chapter 3. What Happens After Maryland Prisoners Are Released?
participate in BTC. The Division of Parole and Probation is responsible foradministering drug testing and delivering appropriate sanctions.
An early evaluation of BTC found that, in 2001, the positive drug testrate dropped from 25 percent to 15 percent of participants between the 1stand the 16th drug test.48 Positive results have also been achieved in terms ofrecidivism rates. In 2000, 21 percent of BTC participants were rearrested withinthe first 180 days of their supervision, compared with 29 percent of a compari-son group of released Baltimore Cit y inmates who did not participate in theprogram.49 Despite these promising findings, it is too early to say whether theprogram has been effective in reducing the number of technical parole viola-tors returning to prison and in adequately addressing the drug treatment needsof this population. The Urban Institute is currently conducting an impactevaluation of BTC that will compare rearrest rates in BTC jurisdictions tothose in probation/parole offices not implementing BTC, controlling for dif-ferences among the sites and clients.
HotSpots Initiative. MDPP is also a partner in a community-based crime-fight-ing effort initiated by the Governor’s Office on Crime Control and Preven-tion. The program provides funding to 62 high-crime, at-risk communities inMaryland, called HotSpots. As one might expect, many of these communitiesare also home to high concentrations of returning prisoners. As part of theHotSpots strategy, adults and juveniles on probation and parole in HotSpotscommunities are subject to intensive supervision by joint teams of police offic-ers, parole and probation, juvenile justice, and federal probation officers.50

24 A PORTRAIT OF PRISONER REENTRY IN MARYLAND
Black76%
White22%
Unknown/ Other2%
0 % 1 0 % 2 0 % 3 0 % 4 0 % 5 0 %
6 0 a n d o v e r
5 0 t o 5 9
4 0 t o 4 9
3 0 t o 3 9
2 0 t o 2 9
U n d e r 2 0
Who is Returning Home?
Figure 18. Percentage ofMaryland prison releases,by age, 2001
Source: Urban Institute analysisof 2001 MD DPSCS, Division ofCorrection data.
C H A P T E R 4
Figure 17. Percentage ofMaryland prison releases,by race, 2001
Source: Urban Institute analysisof 2001 MD DPSCS, Division ofCorrection data.
60 and over
50 to 59
40 to 49
White22%
0% 10% 20% 30% 40% 50%
30 to 39
20 to 29
Under 20
Black76%
Unknown / Other2%

25
51 Refers to prisoners who weresentenced to a year or more.
52 As measured by the median.
53 Refers to prisoners who weresentenced to one year or more.Based on Urban Institute analy-sis of 2001 Maryland Departmentof Public Safety and CorrectionalServices, Division of Correctiondata.
54 Although all the men andwomen included in our analysishad been sentenced to a year ormore, many may have earnedgood time credits and been re-leased earlier. In addition, we cal-culated time served and percent-age of sentence served based onwhen they actually entered prisonrather then when their sentencebegan (i.e., they may have servedpre-trial custody time before ad-mission to prison).
Chapter 4. Who is Returning Home?
In order to understand the reentry picture in Maryland, it is important toexamine the characteristics of the population being released from Mary-land prisons each year. This section describes the 2001 release cohort,
including basic demographics, reasons for incarceration, criminal histories,time served, and conditions of release.
DEMOGRAPHICS
In 2001, 9,448 men and women were released from Maryland state pris-ons.51 The composition of this release cohort ref lects the composition of theMaryland prison population. The majorit y were male (91 percent) and black(76 percent). Nearly three-quarters (73 percent) of these released prisoners werebetween the ages of 20 and 40 at the time of their release, with the average ageat release being 34 years old. These data are shown in figures 17 and 18.
CONVICTION OFFENSE
As described in the first section of this report, an increase in convictionsfor drug offenses has contributed to rising incarceration rates in Maryland. In2001, a third (32 percent) of all released Maryland prisoners had been servingtime for drug offenses, including possession and sale. Other common convic-tion offenses of released prisoners include assault, larceny, and robbery. (Seefigure 19.)
TIME SERVED
About half of the Maryland prisoners released in 2001 served two yearsor less in prison, with an average52 time served of 23.8 months. (See figure20.)53 The largest share (37 percent) of Maryland prisoners released in 2001served between 40 and 60 percent of their sentences in prison. (See figure21.)54
CRIMINAL HISTORY AND THE REVOLVING DOOR
Cycling in and out of prison is common among released prisoners, whetherthey are returned to prison while under parole supervision or not. A recentstudy by the Bureau of Justice Statistics, which tracked close to 300,000 pris-oners who were released from prisons in 15 states in 1994, found that withinthree years of their release, nearly 52 percent were back in prison for new

26 A PORTRAIT OF PRISONER REENTRY IN MARYLAND
55 Langan, P., and D. Levin. 2002.Recidivism of Prisoners Released in1994. Bureau of Justice StatisticsSpecial Report (NCJ 193427).Washington, D.C.: U.S. Depart-ment of Justice.
56 Violations may have occurredbefore or after release in 2001.
57 Based on Urban Instituteanalysis of 2001 Maryland De-partment of Public Safety andCorrectional Services, Division ofCorrection data.
58 Maruschak, L., and A. Beck.2001. Medical Problems of In-mates, 1997. Bureau of JusticeStatistics Special Report. Wash-ington, D.C.: U.S. Department ofJustice.
59 Maruschak, L. 2001. HIV inPrisons and Jails, 1999. Bureau ofJustice Statistics Bulletin. Wash-ington, D.C.: U.S. Department ofJustice.
60 Ibid.
61 The Maryland Division of Cor-rection does not maintain compre-hensive data on the health careneeds of and range of servicesavailable to all inmates under itssupervision.
62 For more information about thehealth needs of returning prison-ers nationwide, see National Com-mission on Correctional HealthCare. 2002. The Health Status ofSoon-to-be-Released Inmates. AReport to Congress. Volume 1.Available at: http://www.ncchc.org/pubs_stbr.vol1.html.
63 Those who are medically pa-roled typically are released to ahospital or hospice center. Pertelephone conversation with ClifBurton, administrative officer, Di-vision of Corrections, MarylandDepartment of Public Safety andCorrectional Services, January 7,2003
64 Ibid.
prison sentences or technical violations of the conditions of their release.55 Thecriminal histories of the Maryland prisoners released in 2001 demonstrate similarpatterns of recidivism. For instance, nearly 22 percent of these prisoners hadviolated their parole at some point during their criminal careers.56 Perhaps morestriking, more than two-thirds (70 percent) of the prisoners released in 2001 hadbeen in prison at least once before their most recent term,57 with some havingserved four or more previous prison terms. (See figure 22.) In addition, by thetime these data were compiled in spring 2002, more than 15 percent of the menand women released in 2001 had already returned to prison.
MENTAL AND PHYSICAL HEALTH PROBLEMS
Prisoners nationwide suffer from a range of mental and physical health prob-lems. In 1997, nearly one-third (31 percent) of state prisoners reported having alearning or speech disabilit y, a hearing or vision problem, or a mental or physicalcondition.58 A specific area of heightened concern is HIV/AIDS in prison popu-lations. Nationally, in 1999, 2.3 percent of state prisoners were HIV positive, andthe overall rate of confirmed AIDS cases among the nation’s prison populationwas five times the rate in the U.S. general population (0.60 percent versus 0.12percent).59 In Maryland, 3.5 percent of inmates are HIV positive.60
While we were unable to obtain detailed statistics on the health of Marylandinmates,61 it stands to reason that the state’s soon-to-be-released prisoners haverates of physical and mental health conditions similar to those of inmates acrossthe country.62 The MD DOC does prepare medical discharge plans for someinmates, but these plans are primarily prepared for those who are HIV positive,have serious chronic mental or physical health problems, or are medically paroled.63
In FY2002, discharge plans were prepared for 476 soon-to-be-released prisoners.64
Thus, mental and physical health issues present yet another reentry challenge fora considerable portion of Maryland’s released inmates—one that could significantlyaffect the ease of transition to life on the outside.
LIFE ON THE OUTSIDE
The above description of Maryland’s 2001 releasee cohort has implicationsfor these prisoners’ prospects for reintegration. The t ypical released inmate servedtwo years in prison and may have had limited opportunities for program participa-tion to improve job skills and address substance abuse problems. Most releasedinmates had been in prison at least once before, and more than one-fifth hadserved prison time for a parole violation at some point in their criminal careers.This cycling in and out of prison creates spott y employment histories at best, and

27
Figure 19. Percentage ofMaryland prison releases,by primary convictionoffense, 2001
Source: Urban Institute analysisof 2001 MD DPSCS, Division ofCorrection data.
Figure 20. Percentage ofMaryland prison releases,by time served, 2001
Source: Urban Institute analysisof 2001 MD DPSCS, Division ofCorrection data.
Figure 21. Percentage ofMaryland prison releases,by percentage of sentenceserved, 2001
Source: Urban Institute analysisof 2001 MD DPSCS, Division ofCorrection data.
Figure 22. Percentage ofMaryland prison releases,by number of prior prisonterms, 2001
Source: Urban Institute analysisof 2001 MD DPSCS, Division ofCorrection data.
0 % 1 0 % 2 0 % 3 0 % 4 0 %
4 o r m o r e
3
2
1
0
10% 20% 30% 40%0%
0
1
2
3
4 or more
0 % 1 0 % 2 0 % 3 0 % 4 0 %
8 0 t o 1 0 0p e r c e n t
6 0 t o 8 0 p e r c e n t
4 0 t o 6 0 p e r c e n t
2 0 t o 4 0 p e r c e n t
L e s s t h a n 2 0p e r c e n t
10% 20% 30% 40%0%
Less than 20%
20 to 40%
40 to 60%
60 to 80%
80 to 100%
0 % 1 0 % 2 0 % 3 0 % 4 0 %
1 0 o r m o r ey e a r s
5 t o 1 0 y e a r s
3 t o 5 y e a r s
2 t o 3 y e a r s
1 t o 2 y e a r s
L e s s t h a n 1 y e a rLess than 1 year
1 to 2 years
2 to 3 years
3 to 5 years
5 to 10 years
10 or more years
10% 20% 30% 40%0%
0 % 1 0 % 2 0 % 3 0 % 4 0 %
O th e r
O th e r S e x O ffe n s e
R a p e
A u to T h e ft
H o m ic id e
W e a p o n s
B u r g la r y
R o b b e r y
L a r c e n y
A s s a u lt
D r u g O ffe n s e
Homicide
Rape
Robbery
Other Sex Offenses
Burglary
Assault
Drug Offense
Weapons
Larceny
Auto Theft
Other
10% 20% 30% 40%0%
Chapter 4. Who is Returning Home?

28 A PORTRAIT OF PRISONER REENTRY IN MARYLAND
65 Seventy-four percent of stateprisoners who expect to be re-leased in the next 12 months re-port a history of drug and/or al-cohol use. See Beck, A. 2000.State and Federal Prisoners Return-ing to the Community: Findingsfrom the Bureau of Justice Statistics.Paper presented at the First Re-entry Courts Initiative ClusterMeeting. Washington, D.C. April13, 2000. Available at http://www.ojp.usdoj.gov/bjs/pub/pdf/sfprc.pdf. (Accessed May 2002.)
66 Legal Action Center. 2002.Fifty-State Survey of Collateral Con-sequences Faced by Individuals withCriminal Records.
67 Uggen. C., and J. Manza, withM. Thompson and S. Wakefield.2002. Impact of Recent LegalChanges in Felon Voting Rights inFive States. Presentation at theNational Symposium on FelonyDisenfranchisement, Washington,D.C., Sept. 30, 2002.
68 In Maryland, Temporary Assis-tance for Needy Families (TANF)benefits are referred to as Tem-porary Cash Assistance (TCA)benefits. For the purposes of thisreport we will refer to these ben-efits as “TANF” throughout thetext.
69 Legal Action Center. 2002.Fifty-State Survey of Collateral Con-sequences Faced by Individuals withCriminal Records.
70 Ibid.
often none at all. And, given national statistics, it is likely that the t ypical releasedinmate in Maryland has a history of substance abuse.65 Substance abuse problemscan compound the above-mentioned reentry challenges, leading to relapse, recidi-vism, and ultimately re-incarceration. Mental and physical health problems makefor additional burdens to the released prisoner, who may have difficult y obtainingmedications and treatment that were available while he or she was in prison.
In addition to these personal characteristics, ex-prisoners are often hinderedby laws and policies that may impede successful reintegration. For example, civicparticipation for former prisoners is limited and often never fully regained afterrelease. In Maryland, people in prison, on parole, or on probation are deniedvoting rights. 66 Even after successful completion of postrelease supervision, vio-lent ex-felons with two or more felony convictions are permanently banned fromvoting. Recent legislation that takes effect in 2003 restores voting rights to nonvio-lent ex-felons with two or more felony convictions three years after sentence comple-tion. A recent study indicates that 40,900 ex-felons in Maryland will remain dis-enfranchised when the new law takes effect.67 The effects of disenfranchisementare felt most strongly in communities, such as those discussed in the next section,that are home to large numbers of returning prisoners.
Being an ex-prisoner in Maryland carries other collateral consequences forsome released prisoners. For instance, in order to receive Temporary Assistance forNeedy Families (TANF)68 benefits and food stamps, persons convicted of drug-related felonies must submit to drug testing and treatment for two years followingtheir release from prison or from the end of their parole or probation term (which-ever is later). Individuals who were convicted of drug-related offenses after July 1,2000, are ineligible for any cash assistance or food stamps until one year after theconviction date. Sanctions follow from positive drug test results or failure to com-ply with treatment requirements. 69
Criminal history records also affect ex-prisoners’ abilities to find jobs andhousing. In Maryland, a range of organizations are permitted to obtain criminalhistory information, including employment agencies, membership associations,and landlords. The Baltimore Public Housing Authorit y, for example, considerscriminal history as part of its admission criteria and bars individuals who havebeen convicted of drug-related and violent crimes.70
In summary, the characteristics of Maryland’s released inmates suggest thatsuccessful reintegration is an uphill battle. Criminal and substance abuse histo-ries put returning prisoners at a disadvantage both socially and economically, andstate and local laws and policies may hinder, rather than help, the reentry process.Given the reentry challenges discussed above, it is useful to examine the t ypes ofassistance and preparation provided to inmates prior to their release.

29Chapter 4. Who is Returning Home?

30 A PORTRAIT OF PRISONER REENTRY IN MARYLAND
0% 10% 20% 30% 40% 50%
Education
Vocational
Substance AbuseTreatm ent
19911997
How Are PrisonersPrepared for Reentry?
C H A P T E R 5
Figure 23. Nationwideprogram participation ratesof prisoners to be releasedin the next 12 months,1991 and 1997
Sources: Lynch, J. and W. Sabol.2001. “Prisoner Reentry inPerspective”; Bureau of JusticeStatistics. 2000. CorrectionalPopulations in the United States,1997.
Vocational
Educational
Substance AbuseTreatment
0% 10% 20% 30% 40% 50%
1991
1997

31
71 See Lipton, Douglas, R.Martinson, and J. Wilks. 1975.The Effectiveness of CorrectionalTreatment: A Survey of TreatmentEvaluation Studies. New York:Praeger; Martinson, R. 1974.“What Works? – Questions andAnswers about Prison Reform.”The Public Interest (35): 22-45;Sechrest, L., S. White, and E.Brown eds. 1979. The Rehabili-tation of Criminal Offenders: Prob-lems and Prospects. WashingtonD.C.: National Academy of Sci-ence; Greenberg, D. 1977. “TheCorrectional Effects of Correc-tions: A Survey of Evaluations.”In Corrections and Punishment,edited by D. Greenberg. BeverlyHills: Sage Publications; Wright,W., and M. Dixon. 1977. “Com-munity Prevention and Treatmentof Juvenile Delinquents.” Journalof Research in Crime and Delin-quency 14: 35-67; Robison, J., andG. Smith. 1971. “The Effective-ness of Correctional Programs.”Crime and Delinquency 17(1): 67-80.
72 See Lawrence, S., D. Mears,G. Dubin, and J. Travis. 2002. ThePractice and Promise of Prison Pro-gramming. Research Repor t.Washington, D.C.: Urban Institute;Gaes, G., T. Flanagan, L. Motiuk,and L. Stewart. 1999. “Adult Cor-rectional Treatment.” In Prisons,edited by by M. Tonry and J.Petersilia. Chicago: University ofChicago Press; Wilson, D., C.Gallagher, and D. MacKenzie.2000. “A Meta-Analysis of Cor-rections-Based Education, Voca-tion, and Work Programs for AdultOffenders.” Journal of Research inCrime and Delinquency 37(4): 347-368; Lipsey, Mark. 1999. “CanIntervention Rehabilitate SeriousDelinquents?” The Annals of theAmerican Academy 564: 142-166;Pearson, F., and D. Lipton. 1999.“Meta-Analytic Review of the Ef-fectiveness of Corrections-BasedTreatments for Drug Abuse.”Prison Journal 79(4): 384-410;Lipsey, M., and D. Wilson. 1998.“Effective interventions for seriousjuvenile offenders: A synthesis ofresearch.” In Serious and ViolentJuvenile Offenders: Risk Factors andSuccessful Interventions, edited byR. Loeber and D. Farrington.. CA:Sage Publications; Andrews, D.,I. Zinger, et al. 1990. “Does Cor-rectional Treatment Work? A Clini-cally Relevant and PsychologicallyInformed Meta-Analysis.” Crimi-nology 28: 369-404.
Chapter 5. How Are Prisoners Prepared for Reentry?
Prison programming has historically played an important role in Ameri-can corrections, guided by the belief that providing educational andvocational training to prisoners can help them become productive, law-
abiding citizens upon their return to the communit y. Whether prison pro-gramming does, in fact, contribute to positive postrelease outcomes (e.g., re-duced recidivism) has been the subject of much research and dispute. In the1970s, many studies suggested that prison programming did not work.71 Bycontrast, more recent research and meta-analyses have found favorable results,with treatment groups across programs consistently achieving at least a mod-est reduction in recidivism versus comparison groups.72
While the effectiveness of prison programming is still up for debate, wedo know that prisoners nationwide are less likely to have participated in prisonprograms than they were in the past. The number of soon-to-be-released pris-oners who reported participating in vocational programs dropped from 31percent in 1991 to 27 percent in 1997.73 The number reporting participationin educational programs dropped from 43 percent to 35 percent in that sameperiod.74 In addition, the number of state prisoners who reported receivingformal substance abuse treatment while in prison dropped from 25 percent in1991 to 10 percent in 1997. (See figure 23.)75 With regard to prerelease pro-gramming, in both 1991 and 1997, only about 13 percent of soon-to-be-re-leased prisoners reported participating in such programs.76
MARYLAND PRISON PROGRAMMING
While no historical data exist on prison program participation in Mary-land, we do know that in 2001, about 17 percent of inmates were involved ineducational or vocational programs at any given time. Over the course of theyear, roughly 40 percent of inmates participated in educational or vocationalprograms. Approximately half of all Maryland inmates had work assignments(e.g., sanitation, food service) within the correctional institutions. An addi-tional 7 percent of prisoners participated in a work-release program, whichallows selected prisoners to work in the communit y during the day and returnto their correction institution at the end of the workday.77 However, nearlyone-third of all Maryland state prisoners (31 percent) were classified as idle,which denotes a lack of participation in programming or work.78 The institu-tions do not have enough job and program assignments for everyone, so theseinmates must wait for slots to become available.
Education and Employment Readiness Programs
Finding and maintaining a legitimate job after release could help withreintegration and reduce recidivism. Most released prisoners, however, expe-

32 A PORTRAIT OF PRISONER REENTRY IN MARYLAND
73 Refers to inmates scheduledto be released in the next 12months. Source: Lynch and Sabol.2001. “Prisoner Reentry in Per-spective.”
74 Ibid.
75 Bureau of Justice Statistics.2000. Correctional Populations inthe United States, 1997. Washing-ton, D.C.: U.S. Department of Jus-tice.
76 Lynch and Sabol. 2001. “Pris-oner Reentry in Perspective.”
77 These prisoners are closelysupervised by correctional per-sonnel while in the community.The prisoners use their earningsto reimburse the MD DOC forroom, board, and transportationas well as to make child supportpayments and pay victim restitu-tion fees. Source: Maryland Divi-sion of Correction.
78 Maryland Division of Correc-tion.
79 Fact sheet for the CorrectionalEducation Program in the Mary-land State Department of Educa-tion. Available at: http://www.research.umbc.edu/~ira/Corr_Ed_Fact.doc (Accessed January2002).
80 Holzer, H., S. Raphael, and M.Stoll. 2001. Will Employers HireEx-Offenders? Employer Checks,Background Checks, and Their De-terminants. Berkeley Program onHousing and Urban Policy. Work-ing Paper W01-005. Available athttp://repositories.cdlib.org/iber/bphup/working_papers/W01-005. (Accessed July 2002.)
81 For information on the effec-tiveness of Maryland correctionaleducation in reducing recidivism,see Steurer, S., L. Smith, and A.Tracy. 2001. Three-State Recidi-vism Study. Lanham, MD: Correc-tional Education Association.Available at http://www.ceanational.org/documents/3StateFinal.pdf. (Accessed Octo-ber 2002.)
82 The Maryland CorrectionalEducation Program is adminis-tered by certified staff of theMaryland Department of Educa-tion.
83 Maryland correctional institu-tions other than prerelease facili-ties.
84 Prisoners do not lose theirdiminution credits if they wereunable to participate becausethey remained on a waiting list
rience difficulties finding jobs. They often enter prison with poor educationalbackgrounds and little work experience. The average reading level of Marylandinmates is between the sixth and eighth grade level; less than half hold high schooldegrees or GEDs; and most did not have jobs when they were arrested.79 Duringthe time they spend in prison, inmates may lose work skills, forfeit the opportu-nit y to gain work experience, and sever interpersonal connections that could pro-vide information about jobs. After release, the stigma of their ex-prisoner statusmakes the job search even more difficult. A recent survey of 3,000 employers infour major metropolitan areas revealed that two-thirds of the employers would notknowingly hire an ex-prisoner.80
MD DOC has several programs aimed at educating prisoners, improving jobskills, and providing employment experience. A recent study found the recidivismrates of inmates who participated in Maryland’s educational programs to be lowerthan those of inmates who did not participate.81 One of the programs the MDDOC operates is a mandatory education program in compliance with Marylandstate law that requires prisoners who do not possess a high school degree or GEDand who have a minimum of 18 months to serve when received by the DOC toattend school while incarcerated.82 This program, which is conducted in accor-dance with the Education Coordinating Council for Correctional Institutions,requires eligible prisoners to participate in school at least 12 hours per week inmaintaining institutions83 or 5 hours per week in prerelease system facilities for aminimum of 120 calendar days. Prisoners who meet the eligibilit y requirementsfor this program are assigned by their case manager to the appropriate class andare required to participate. If they refuse to participate or are removed from theprogram because of disciplinary or other problems, the consequences are severe.They lose all diminution credits accrued up to that point and are not allowed toparticipate in any other programs and, therefore, cannot earn any diminution cred-its until certain conditions, as outlined by the case manager, are met.84
Unfortunately, because of teacher shortages, there is not enough room for alleligible prisoners to participate, and many are released without having taken partin the mandatory program. Between 1990 and 2000, Maryland’s prison popula-tion grew 54 percent while the number of correctional educators only increased by4 percent.85 In 2001, more than 1,500 prisoners were on waiting lists to partici-pate in educational or vocational programming. Seventeen percent of the inmatepopulation (4,132 prisoners) participated in the correctional education programin some way during that year.86 Nineteen hundred ten participated in mandatoryeducation, 966 prisoners earned a GED, 1,625 prisoners completed basic literacy/life skills certificates, 500 prisoners participated in postsecondary education pro-grams, and approximately 600 prisoners served as inmate tutors to their peers.
The correctional education program also coordinates 38 vocational programsdesigned to improve job skills. These programs cover 17 skill areas, includingauto body repair; automotive power services; building maintenance; business

33
throughout their term. Source:Maryland Division of Correction.
85 The Job Opportunities TaskForce. 2003. Baltimore’s Choice:Workers and Jobs for a ThrivingEconomy. Baltimore, MD. Avail-able at: http://www.jotf.org/baltimoreschoice.pdf (AccessedFebruary 2003).
86 Not all inmates may need orbe eligible for these programs.
87 Maryland Division of Correc-tion. Not all inmates may need orbe eligible for these programs.
88 Mumola, C.J. 1999. SubstanceAbuse and Treatment, State andFederal Prisoners, 1997. Bureau ofJustice Statistics, Special Report.Washington, D.C.: U.S. Depart-ment of Justice, NCJ 172871.
89 Beck. 2000. State and FederalPrisoners Returning to the Commu-nity: Findings from the Bureau ofJustice Statistics.
90 The Division of Correctionmaintains data on admission tothe program but not on the num-ber of inmates completing theprogram. Not all inmates mayneed or be eligible for this pro-gram.
91 Maryland Division of Correc-tion. Not all female inmates mayneed or be eligible for this pro-gram.
Chapter 5. How Are Prisoners Prepared for Reentry?
data processing; commercial roofing; computer repair; drafting; electrical wir-ing; furniture upholstery; graphic arts; heating, ventilation, and air condition-ing; masonry; plumbing; residential construction; sheet metal fabrication; vo-cational trades internship; and warehousing/distribution. It is important tonote, however, that vocational programs are not distributed equally amongMD DOC institutions, making them unavailable to many inmates who maybe interested in participating in them. About 1,000 inmates, or 4 percent ofthe total inmate population, are trained in vocational programs each year.87
Substance Abuse Treatment Programs
The link between substance abuse and criminal activit y is well docu-mented. In a 1997 national survey, more than half of state prisoners reportedthat they were under the inf luence of drugs or alcohol at the time they commit-ted the offense that led to their imprisonment.88 In another recent nationalstudy, 74 percent of state prisoners who expected to be released within thenext 12 months reported a history of drug and / or alcohol abuse.89 Substanceabuse problems that are not treated both during incarceration and after re-lease from prison can pose a severe impediment to successful reintegration.Not only do they increase the chance of reoffending, they may also hinder thereturning prisoner’s abilit y to complete job requirements and reestablish rela-tions with family.
MD DOC operates several programs that address substance abuse prob-lems. One of these programs, a residential substance abuse treatment (RSAT)program for prisoners who are identified as having a history of substance abuseproblems, provides prisoners with six months of residential treatment at theCentral Laundry Facilit y or the Maryland Correctional Institution for Women.After their release, participants are referred for further treatment at commu-nity-based outpatient centers. In 2001, 610 men and 34 women, or 3 percentof Maryland prisoners, were admitted to the program.90
Another substance abuse program offered by the MD DOC is theWomen’s Intensive Treatment (WIT) program. While much substance abusetreatment within prison systems focuses on inmates who will be released inthe near future, WIT provides female prisoners who are serving longer sen-tences and are not yet close to their release date with intensive drug and alco-hol treatment. The inmates who participate in WIT are t ypically 36 monthsor longer from release. The treatment, which is specifically designed to ad-dress the unique needs of female prisoners, may last up to nine months. Inaddition to drug and alcohol treatment, other components of WIT includeself-esteem and relationship issues, domestic violence, and parenting assistance.In 2001, 73 women, or 6 percent of female inmates, were admitted to the WITprogram. 91

34 A PORTRAIT OF PRISONER REENTRY IN MARYLAND
92 Beck, A., and L. Maruschak.2001. Mental Health Treatment inState Prisons, 2000. Bureau ofJustice Statistics Special Report.Washington, D.C.: U.S. Depart-ment of Justice.
93 Ibid. The Maryland Division ofCorrection does not maintaincomprehensive data on the healthcare needs of and range of ser-vices available to all inmates un-der its supervision.
94 Prisoners are deemed to be atthe ”prerelease” security levelwhen they have a year or less be-fore release. Some prereleaseprisoners do supervised work out-side prison (e.g., road crews), andsome are permitted to go into thecommunity unescorted (work re-leased). Source: Maryland Divi-sion of Correction.
95 Maryland Division of Correc-tion.
In addition, Alcoholics Anonymous (AA) and Narcotics Anonymous (NA)groups are administered by addiction specialists at major facilities and mostprerelease and minimum securit y facilities. Many of the prerelease and minimumsecurit y facilities also have AA and NA groups that are run by inmates. MD DOCdoes not maintain data on the total number of AA and NA programs availablesystemwide.
Physical and Mental Health Treatment
As mentioned earlier in this report, prisoners experience higher rates of men-tal illness and infectious disease than the general population. MD DOC does notmaintain comprehensive data on the physical health care needs of and range ofservices available to all inmates under their supervision. We do know, however,that while in prison, Maryland inmates have access to preventive, standard, andemergency mental health services. Of Maryland’s 26 facilities, 12 screen prisonersfor mental illness at intake, 14 conduct psychiatric assessments, 13 provide 24-hour mental health care, 18 provide therapy and counseling, 18 distribute psycho-tropic medications, 22 report helping released prisoners obtain services, and 2 donot provide any services.92 With regard to usage rates, a small but significantproportion of the Maryland prison population takes advantage of mental healthservices. As of midyear 2000, 15 percent of Maryland prisoners were receivingtherapy or counseling, 12 percent were receiving psychotropic medications, andjust over 1 percent of prisoners had received 24-hour mental health care.93
While prisoners may receive treatment for their mental or physical condi-tions while incarcerated, the chances that treatment will continue after release areoften slim. Furthermore, accessing and paying for necessary prescription or over-the-counter drugs present another challenge for many released prisoners.
Correctional Options Programs
In addition to the programs described above, MD DOC also runs Correc-tional Options Programs (COPs) that are specifically intended to serve low-riskoffenders, many of whom (but not all) are at the prerelease securit y level.94 COPprograms address many different prisoner needs, such as substance abuse treat-ment, relationship and parenting skill building, and other rehabilitative areas.Many of the COP programs are included in a special category of mandatory pro-gramming called mandatory remediation programs. Prisoners who are deemedeligible for participation in these programs, either through case management orassessment, are required to participate.
One version of the COP programs is the Herman L. Toulson CorrectionalBoot Camp, which 4 women and 229 men completed in 2000. This programoffers selected offenders a reduced period of incarceration—usually three to six

35
96 Ibid.
97 Ibid.
98 Maryland Department of Pub-lic Safety and Correctional Ser-vices. 1997. Recidivism Status Re-port on the Correctional OptionsProgram. Available at http://www.ns1dpscs.state.md.us/pnp/cop/coprep.htm. (Accessed Au-gust 2002.)
Chapter 5. How Are Prisoners Prepared for Reentry?
months—during which they must adhere to a program of strict discipline, physi-cal exercise, and work, as well as other rehabilitative programming.95
Another COP program called the Home Detention Unit (HDU), placesprisoners in the communit y. Through this program, prisoners live in an ap-proved private residence and maintain a job. Participants are subject to in-tense monitoring through both electronic means and supervision by correc-tional officers and must continually meet certain requirements of the program.All participants are required to hold gainful employment. Other requirementsmay include substance abuse treatment or educational programs. Almost 850prisoners are placed in the home detention program annually.96
A third COP program, targeted to prisoners in need of specific programsor services in order to successfully reintegrate in the community upon theirrelease, is the Correctional Options Program: Regimented Offender Treat-ment Center (COP: ROTC). This program serves a wide range of nonviolentoffenders, from those who live in traditional incarceration facilities to thoseunder noninstitutional, community-based supervision. The program consistsof a series of graduated sanctions and services, including substance abuse treat-ment, intensive supervision, urinalysis, life skills training, education, and jobreadiness and placement. In 2001, 707 men and 140 women were admitted tothe COP: ROTC program.97
A study of the Maryland COP initiatives by the National Council onCrime and Delinquency (NCCD) found that the prison beds saved by divert-ing offenders to community-based sanctions result in savings of more than$32 million in construction and debt service costs and $9 million in annualoperating expenditures (based on average annual COP participation of 1,593).NCCD also found that COP participants were less likely to return to prisonfor new convictions one year after their release compared with non-COP par-ticipants, though they were more likely to return to prison for technical viola-tions.98
Comprehensive Prerelease Programming Initiatives
The Maryland Re-Entry Partnership Initiative (REP) is a demonstrationproject designed to improve reentry transitions for prisoners returning to asmall number of communities in the City of Baltimore. REP services in thecorrectional facilities include substance abuse treatment, family counseling,and cognitive/behavioral skills development. After release, communit y casemanagers and advocates provide assistance in accessing housing, medical care,substance abuse treatment, and education and employment services. Paroleand probation agents and police officers provide communit y supervision andwork in tandem with the case management team.

36 A PORTRAIT OF PRISONER REENTRY IN MARYLAND
99 In 2002, the Maryland Depart-ment of Public Safety and Correc-tional Services was selected toreceive $2,000,000 over threeyears in Going Home funds fromthe U.S. Department of Justice,Office of Justice Programs.
100 Maryland Division of Correc-tion (DOC) and MD DOC website:http://www.dpscs.state.md.us/doc/prep.htm. (Accessed June2002.)
101 MD DOC website: http://www.dpscs.state.md.us/doc/prep.htm. (Accessed June 2002.)
102 A copy of the handbook isavailable online at http://www.dpscs.state.md.us/doc/prep_booklet_yellow.pdf.
While this program is promising, it currently serves a very small fraction ofthe prisoners who return to Baltimore Cit y (125 of the 4,411 who returned therein 2001, or 3 percent). The state plans to use a portion of its recently awardedGoing Home funds to expand the REP program to serve 500 prisoners returningto the City of Baltimore each year.99 These new federal funds will allow the pro-gram to expand somewhat—though still reaching a small share of released prison-ers—but more funding will be needed to continue and expand this effort.
In fall 2001, MD DOC launched another reentry program, the Partnershipsfor Re-Entry Programming (PREP). To date, this initiative has been implementedin only seven MD DOC facilities to a small percentage of soon-to-be-released in-mates, and currently the program is on hold because of budget constraints. PREPis intended to provide about 150 hours of release preparation and skill develop-ment focusing on the areas of employment readiness, community contacts, cogni-tive skills training, and helping prisoners understand the impact of their crimes ontheir victims.100 A community case manager would meet with a soon-to-be-releasedinmate approximately 75 days before release to create a detailed release plan. Ap-proximately one month before release, the case manager would convene the in-mate, the parole officer, and representatives from other agencies with which thereleased prisoner will have contact, to review the release plan and further preparethe inmate for release. On the day of release, the inmate would be picked up andtaken to preidentified housing arrangements.
In addition to the goals of helping prepare soon-to-be-released prisoners withthe basics of successful communit y reintegration—such as obtaining personal iden-tification, identifying and accessing services, and finding a job—MD DOC expectsPREP to have a long-term, significant impact on the transition from prison to thecommunity for Maryland inmates statewide. Additional goals include increasingMD DOC prerelease and transition services over a three-year period, standardiz-ing prisoner programming from intake through release, tracking participants for12 months, and ultimately reducing recidivism rates by 10 percent.101
Finally, MD DOC has published a handbook entitled Moving On: A Commu-
nity Transition Handbook, to help soon-to-be-released prisoners reintegrate. Thehandbook was prepared by Project YES, an employment readiness program, and isdistributed by employment readiness mentors at Project YES, transition coordina-tors who work with soon-to-be-released inmates, and through some of the Mary-land correctional education libraries. The handbook lists community service pro-viders that released prisoners can contact about substance abuse treatment,employment, health care, financial assistance, legal assistance, credit information,and education. There is no uniform distribution plan for the handbook, however,so not all MD DOC prisoners receive a copy upon release.102 Aside from REP andPREP, MD DOC has no comprehensive plan in place to provide prerelease plan-ning and referrals to community resources for reentering prisoners.
37
103 Wilson, D., and C. Gallagher2000. “A Meta-Analysis of Correc-tions-Based Education, Vocation,and Work Programs for Adult Of-fenders.” Journal of Research inCrime and Delinquency 37(4):347–368; Gaes, G., T. Flanagan,L. Motiuk, and L. Stewart. 1999.“Adult Correctional Treatment.” InPrisons, vol. 26, edited by M. Tonryand J. Petersilia (361–426). Chi-cago: University of Chicago Press;Gerber, J., and E. Fritsch. 1994.“The Effects of Academic and Vo-cational Program Participation onInmate Misconduct and Reincar-ceration.” In Prison Education Re-search Project: Final Report. Hunts-ville, TX: Sam Houston StateUniversity.
104 Gaes et al. 1999. Adult Cor-rectional Treatment.
Chapter 5. How Are Prisoners Prepared for Reentry?
In summary, the Maryland Division of Correction has a broad array ofeducational, treatment, and life skills classes, at least some of which, accordingto research, should help prepare inmates for reentry.103 Of particular note isthe Residential Substance Abuse Treatment program, which begins in prisonand continues in the communit y; this t ype of continuit y-of-care model hasbeen found to be associated with reduced recidivism.104 In addition, the factthat MD DOC already has developed two comprehensive reentry programssuggests that Maryland is ahead of many other states in understanding theimportance of reentry preparation and doing something about it. However,REP is only in the pilot phase, reaching a very small number of inmates, andPREP is currently not in operation. Furthermore, fiscal constraints precludeMD DOC from offering traditional in-prison programs to all inmates whoare eligible and interested in participating. Indeed, many program participa-tion rates are extremely low, suggesting that any positive impact from theseprograms would not occur on a large scale.

C H A P T E R 6
Where Are Released Prisoners Going?
Figure 24. Geographic distribution of returning prisoners, by county, 2001 Source: Maryland Division of Correction.
Baltimore City59%
Baltimore County
10%
Prince George's
6%
Other MD Counties
25%
Figure 25. Percentage of released prisoners returning to Maryland counties, 2001 Source: Urban Institute analysis of 2001 MD DPSCS, Division of Correction data.
38 A PORTRAIT OF PR ISONER REENTRY IN MARYLAND
39
105 2001 Maryland Departmentof Public Safety and CorrectionalServices, Division of Correctiondata. Statistics on where releasedMaryland prisoners returned arebased on cases for which addressinformation was available(n=8,516). Of the 8,516 casesfor which we had address data,8,222 had addresses in Maryland.Of these 8,222 cases, 7,447 hadviable addresses identified by ourmapping software. Using the map-ping software, we were able toidentify the counties in which eachof these 7,447 cases was located,allowing us to examine the datafor these cases on a county-by-county level. Nearly all the courtrelease cases in our data set didnot include address information;court releases are excluded fromthe remainder of the analyses inthis report.
106 See appendix A for the num-ber of returns to each county inMaryland in 2001.
107 Defined as those countiesthat received 3 percent or moreof the released prisoners who re-turned to Maryland.
Chapter 6. Where Are Released Prisoners Going?
During 2001, 97 percent of all men and women released from Mary-land prisons returned to communities in Maryland.105 One percentreturned to Washington, D.C., and the remaining 2 percent returned
to 28 other states, including Virginia, Delaware, and New York. Of the menand women released from Maryland prisons who returned to Maryland, wellover half—59 percent—returned to Baltimore Cit y. The next largest share ofreleased prisoners (10 percent) returned to Baltimore County, which surroundsBaltimore Cit y. About 6 percent of released prisoners returned to PrinceGeorge’s County, which borders Northeast Washington, D.C., and about 3percent returned to Anne Arundel County, which borders Baltimore Cit y tothe south and is home to the state capital, Annapolis. Wicomico and Worces-ter counties each received 3 percent of returning prisoners; Harford, Charles,and Montgomery counties each received about 2 percent. The remaining 15counties in Maryland received 1 percent or less of returning prisoners. Thesedata are shown in figures 24 and 25.106
The communit y context of prisoner reentry can have an important inf lu-ence on postrelease success or failure. It stands to reason that ex-prisonersreturning to communities with high unemployment rates, limited affordablehousing options, and few services are more likely to relapse and recidivate.This section presents findings from a geographic analysis of returning in-mates by county and examines this reentry distribution in relation to the so-cioeconomic characteristics of the counties with the highest percentages ofreleased prisoners in 2001,107 as well as the characteristics of the prisonerswho returned to those counties. We will give special attention to BaltimoreCit y, which received the largest number of released prisoners in 2001, in thenext chapter.

40 A PORTRAIT OF PRISONER REENTRY IN MARYLAND
108 Census, 2000. Summary File1 (SF-1). Profile of General Demo-graphic Characteristics: 2000; U.S.Census Bureau. State and CountyQuickFacts. Available at http://quickfacts.census.gov/qfd/states/24000.html. Bureau ofLabor Statistics (BLS). Labor ForceData by County, 2001 Annual Aver-ages.
109 Throughout these profiles ofcounties with high numbers ofreturning prisoners, we report theconviction offenses that accountfor 3 percent or more of the pris-oners returning to each county.
With more than 750,000 residents, Baltimore Count y (see figure26) is one of t he largest count ies in t he state—in terms of bot hpopulation and geography. About 74 percent of its residents are white, 20percent are black, 3 percent are Asian, and 3 percent are other races. Approxi-mately 6.5 percent of the population are living below the povert y level, com-pared with the state average of 8.5 percent. Baltimore County’s unemploy-ment rate (4.4 percent) is just above the statewide average of 4.1 percent. Itsmedian household income of $50,667 is just below the statewide median house-hold income of $52,868. Female-headed households account for nearly 13 per-cent of all households in the county—just below the statewide average of 14.1percent.108
Quick Facts on Reentry in Baltimore County
In 2001, 755 released prisoners returned to Baltimore County—one per1,000 residents.
The majorit y of the prisoners who returned to Baltimore County in 2001were male (91 percent)—the same percentage as across the state.
About 56 percent of returning prisoners were black, 43 percent were white,and 1 percent were of unknown racial background. While this distributiondiffers from the racial distribution of returning prisoners across Maryland(see figure 17), it is more similar to the racial distribution of BaltimoreCounty residents.
As with returning prisoners across Maryland, the largest share (24 percent)of released prisoners returning to Baltimore County had been convictedfor drug offenses, though this represents a smaller proportion than thestatewide share of returning drug offenders (33 percent). Other commonconviction offenses among those returning to Baltimore County in 2001were assault, larceny, robbery, and burglary. (See figure 27.)109
The majorit y (95 percent) were released to some period of parole supervi-sion. Most (63 percent) were mandatory releases, 24 percent were paroleboard releases, 5 percent were released due to the expiration of their sen-tences, and 4 percent each were released and continued on parole or con-tinued on mandatory supervision.
About 63 percent of released prisoners returning to Baltimore County in2001 had been in prison at least once before. This is less than the 70percent of prisoners statewide with prior incarcerations. By spring 2002,about 15 percent of them had returned to prison after their release in 2001.
PRISONER REENTRY IN BALTIMORE COUNTYBaltimore County

Figure 26. Baltimore County
0% 10% 20% 30% 40% 50%
Other
Auto Theft
Homicide
Weapons Offense
Burglary
Robbery
Larceny
Assault
Drug Offense
Figure 27. Percentage of released prisoners returning to Baltimore County, by conviction offense, 2001 Source: Urban Institute analysis of 2001 MD DPSCS, Division of Correction data.
Chapter 6. Where Are Released Prisoners Going? 41

42 A PORTRAIT OF PRISONER REENTRY IN MARYLAND
Prince George’s County (see figure 28) is the second most populous countyin the state, with more than 800,000 residents. The median householdincome in Prince George’s County of $55,256 is about $2,500 above the state-wide median household income of $52,868. Nearly 8 percent (7.7) of PrinceGeorge’s County residents live below the povert y line, just under the state-wide average of 8.5 percent. Prince George’s County’s unemployment rate isequal to the statewide average of 4.1 percent. In terms of racial distribution,nearly two-thirds of its residents are black and 27 percent are white. Femaleshead 19.6 percent of the households in Prince George’s County. This is higherthan the statewide average of 14.1 percent.
Quick Facts on Reentry in Prince George’s County
In 2001, 458 released prisoners returned to Prince George’s County—0.6per 1,000 residents.
The majorit y of the released prisoners who returned to Prince George’sCounty in 2001 were black (88 percent) and male (94 percent).
As seen across the state, the largest share (24 percent) of released prisonersreturning to Prince George’s County had been convicted of drug offenses—though this is less than the 33 percent of returning drug offenders acrossthe state. Robbery, assault, burglary, and larceny are the next most com-mon conviction offenses of those released in 2001. (See figure 29.)
Nearly 94 percent of Prince George’s County’s returning prisoners werereleased to some period of parole supervision. About 63 percent were man-datory releases, 22 percent parole board releases, 6 percent each expirationof sentence and continued on parole, and 3 percent continued on manda-tory supervision.
About 60 percent of the released prisoners in Prince George’s County hadbeen in prison at least once before; by spring 2002, 7 percent of them hadreturned to prison after their release in 2001. Again, these represent lowerpercentages of people returning to prison than across the state (70 percentwith prior incarcerations, 15 percent returned to prison after release in2001).
PRISONER REENTRY IN PRINCE GEORGE’S COUNTYPrince George’s County

Figure 28. Prince George's County
0% 10% 20% 30% 40% 50%
Other
Weapons Offense
Rape
Homicide
Larceny
Burglary
Assault
Robbery
Drug Offenses
Figure 29. Percentage of released prisoners returning to Prince George's County, by conviction offense, 2001 Source: Urban Institute analysis of 2001 MD DPSCS, Division of Correction data.
Chapter 6. Where Are Released Prisoners Going? 43

44 A PORTRAIT OF PRISONER REENTRY IN MARYLAND
Washington Count y (see figure 30) is home to 131,923 residents,making it one of t he smaller count ies in t he state in terms ofpopulation. The majorit y (90 percent) of its residents are white, 8 percent areblack, 1 percent are Asian, and 1 percent are other races. Approximately 9.5percent of its residents live below the poverty level—higher than the state aver-age of 8.5 percent—and its median household income of $40,617 is about$12,000 below the statewide median household income of $52,868. The un-employment rate in Washington County is equal to the state average of 4.1percent. About 11 percent of the households in Washington County are fe-male-headed, compared with 14.1 percent across the state.
Quick Facts on Reentry in Washington County
In 2001, 242 released prisoners returned to Washington County—1.8 per1,000 residents.
The majorit y of these releasees were male (91 percent).
Just over half were white (51 percent), and just under half were black (48percent)—a much different distribution than that of released prisoners acrossMaryland, though more representative of the overall population of Wash-ington County.
Nearly half (46 percent) of those returning to Washington County hadbeen convicted of a drug offense. This is a much higher share of drug of-fenders than is seen across the state (33 percent). Other common offensesinclude assault, larceny, robbery, and burglary. (See figure 31.)
The vast majorit y of those returning to Washington County were releasedto some period of parole supervision (95 percent). A little more than half(58 percent) were mandatory releases, 27 percent parole board releasees, 6percent continued on parole, 5 percent released due to the expiration oftheir sentences, and 4 percent continued on mandatory supervision.
Two-thirds (65 percent) had been in prison at least once before. By spring2002, about 18 percent had returned to prison after their release in 2001.
PRISONER REENTRY IN WASHINGTONWashington County
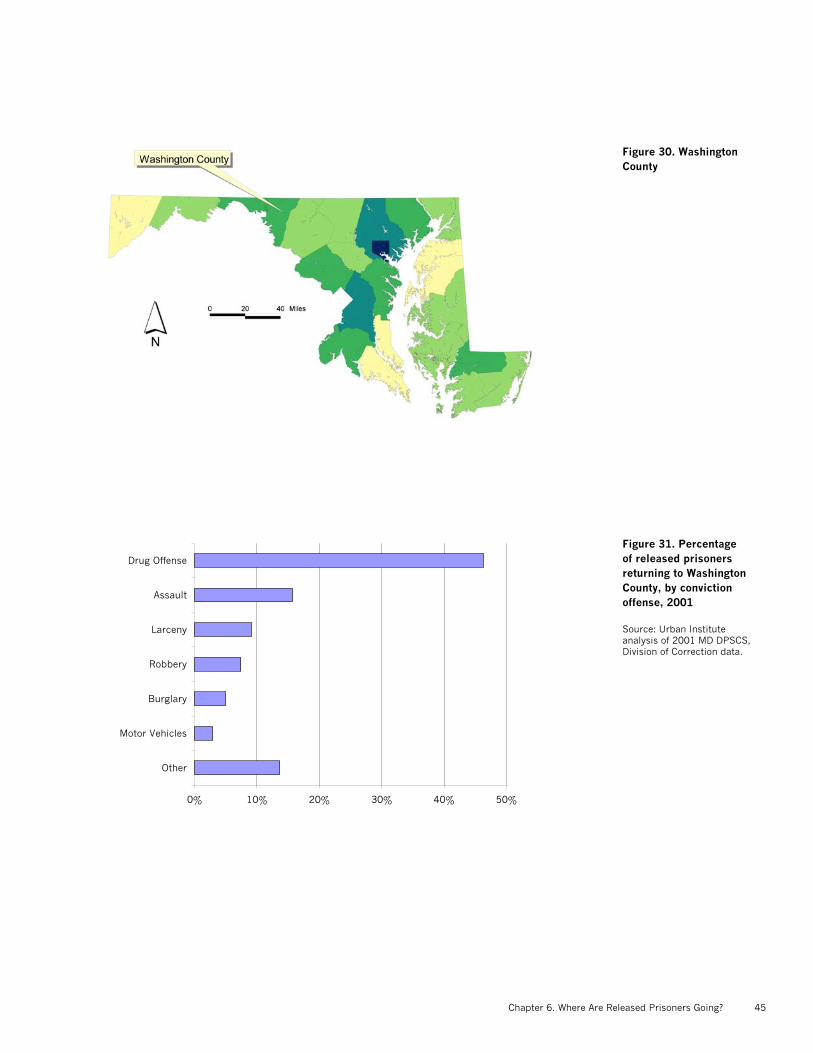
Figure 30. Washington County
0% 10% 20% 30% 40% 50%
Other
Motor Vehicles
Burglary
Robbery
Larceny
Assault
Drug Offense
Figure 31. Percentage of released prisoners returning to Washington County, by conviction offense, 2001 Source: Urban Institute analysis of 2001 MD DPSCS, Division of Correction data.
Chapter 6. Where Are Released Prisoners Going? 45

46 A PORTRAIT OF PRISONER REENTRY IN MARYLAND
Anne Arundel County (see figure 32) has 489,656 residents, most ofwhom are white (81 percent), followed by black (14 percent). The median house-hold income in the county is $61,768—about $9,000 more than the statewidemedian household income of $52,868. Five percent of Anne Arundel resi-dents live below the povert y line—below the statewide average of 8.5 percent.The unemployment rate in Anne Arundel County (3.2 percent) is less thanthe statewide average of 4.1 percent. Female-headed households account for11.1 percent of all households, compared with 14.1 percent across the state.
Quick Facts on Reentry in Anne Arundel County
In 2001, 219 released prisoners returned to Anne Arundel County—0.4per 1,000 residents.
The majorit y of the returning prisoners were male (92 percent).
As in Baltimore and Washington counties, the racial distribution of re-turning prisoners was much different from the statewide average, with whitesmaking up a much greater share of the returning prisoners than they dostatewide (47 percent versus 21 percent statewide). Blacks account for 51percent of the released prisoners who returned to Anne Arundel Countyin 2001.
The most common conviction offense among those returning to AnneArundel County was assault, followed by drug offenses, robbery, larcenyand burglary. (See figure 33.) Anne Arundel is the only county in Mary-land in which an offense other than drugs represents the most commonconviction among the released prisoners.
About 5 percent of those who returned to Anne Arundel County werereleased unconditionally; the remaining 95 percent were released to someperiod of parole supervision. Sixt y-three percent of released prisoners weremandatory releasees, 24 percent were released by parole, 5 percent releaseddue to the expiration of their sentence, 5 percent continued on parole, and4 percent continued on mandatory supervision.
About 68 percent of those returning to Anne Arundel County had been inprison at least once before. By spring 2002, about 11 percent had returnedto prison after their release in 2001.
PRISONER REENTRY IN ANNE ARUNDEL COUNTYAnne Arundel County

Figure 32. Anne Arundel County
0% 10% 20% 30% 40% 50%
Other
Weapons
Other Sex Offense
Rape
Homicide
Burglary
Larceny
Robbery
Drug Offenses
Assault
Figure 33. Percentage of released prisoners returning to Anne Arundel County, by conviction offense, 2001 Source: Urban Institute analysis of 2001 MD DPSCS, Division of Correction data.
Chapter 6. Where Are Released Prisoners Going? 47

48 A PORTRAIT OF PRISONER REENTRY IN MARYLAND
Wicomico (see figure 34) is one of the smaller and more economicallydisadvantaged counties in the state. About 12.8 percent of its 84,644 residentslive below the povert y line (compared with 8.5 percent statewide), and itsmedian household income ($39,035) is approximately $14,000 below the state-wide median of $52,868. Wicomico County’s unemployment rate (5.4 per-cent) is higher than the statewide average of 4.1 percent. The majorit y of itsresidents are white (73 percent), followed by black (23 percent) and Asian (2percent). About 14.1 percent of the households in the county are female-headed,mirroring the statewide average of 14.1 percent.
Quick Facts on Reentry in Wicomico County
In 2001, 219 released prisoners returned to Wicomico County. Because ofthe relatively small population in the county, the prisoners who returnedthere represent a greater per capita share of the population than in theother counties discussed so far—2.6 per 1,000 residents.
Most (95 percent) of the released prisoners who returned to WicomicoCounty were male.
The racial composition of those who returned to Wicomico County closelymatches the statewide distribution: Blacks accounted for 78 percent of thereleases, and whites accounted for 21 percent.
As in most counties, the largest share of ex-prisoners returning to WicomicoCounty were convicted of drug offenses. The next most common offenseswere assault, larceny, and burglary. (See figure 35.)
The vast majorit y of those returning to Wicomico County were released tosome period of parole supervision (95 percent). A greater share of the re-leased prisoners who returned to Wicomico were released by the paroleboard (38 percent) than across the state (22 percent). A little more than half(51 percent) were mandatory releasees, 6 percent were released due to theexpiration of their sentence, and 3 percent each were continued on paroleor continued on mandatory supervision.
Sevent y-one percent of the released prisoners who returned to WicomicoCounty had been in prison at least once before; by spring 2002, 12 percenthad returned to prison after their release in 2001.
PRISONER REENTRY IN WICOMICO COUNTYWicomico County

Figure 34. Wicomico County
0% 10% 20% 30% 40% 50%
Other
Weapons Offense
Robbery
Burglary
Larceny
Assault
Drug Offense
Figure 35. Percentage of released prisoners returning to Wicomico County, by conviction offense, 2001 Source: Urban Institute analysis of 2001 MD DPSCS, Division of Correction data.
Chapter 6. Where Are Released Prisoners Going? 49
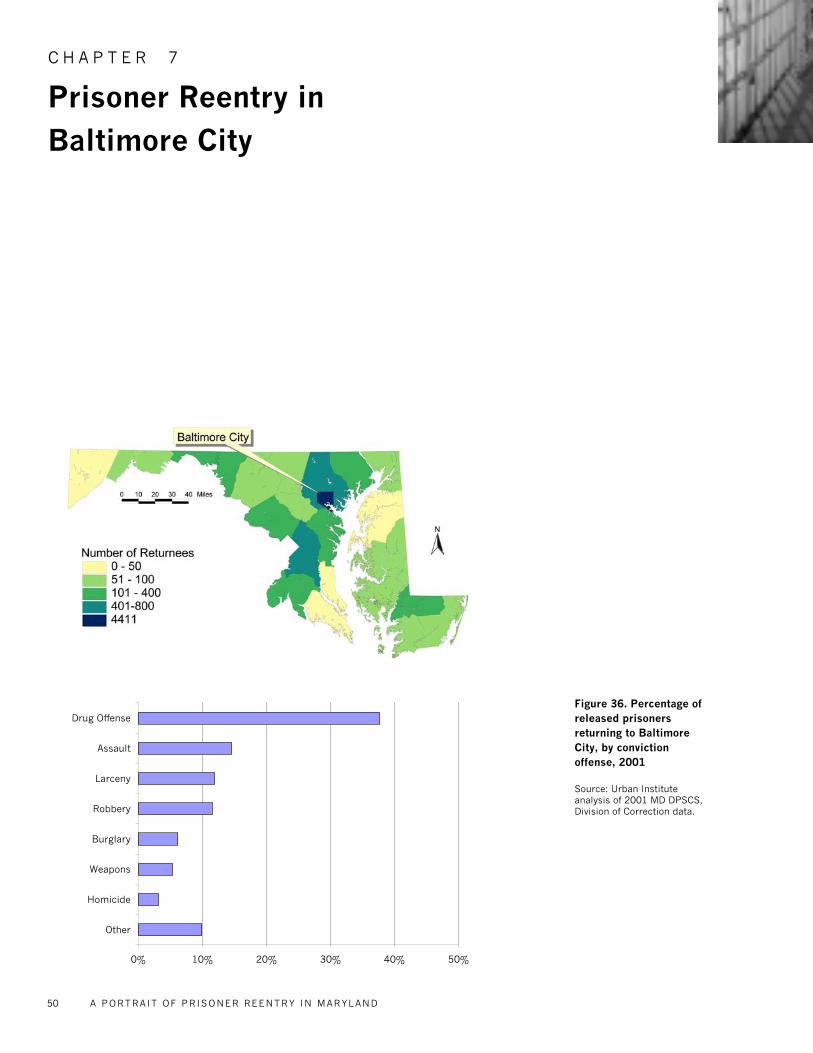
C H A P T E R 7
Prisoner Reentry in Baltimore City
0% 10% 20% 30% 40% 50%
Other
Homicide
Weapons
Burglary
Robbery
Larceny
Assault
Drug Offense
Figure 36. Percentage of released prisoners returning to Baltimore City, by conviction offense, 2001 Source: Urban Institute analysis of 2001 MD DPSCS, Division of Correction data.
50 A PORTRAIT OF PR ISONER REENTRY IN MARYLAND

51
110 Census, 2000. Summary File1 (SF-1). Profile of General Demo-graphic Characteristics: 2000; U.S.Census Bureau. State and CountyQuickFacts.
111 Census, 2000. Summary File1 (SF-1). Profile of General Demo-graphic Characteristics: 2000; U.S.Census Bureau. State and CountyQuickFacts. Bureau of Labor Sta-tistics (BLS). Labor Force Data byCounty, 2000 Annual Averages.
In 2001, the majorit y of Maryland prisoners (59 percent) returned to theCit y of Baltimore. Not only does Baltimore Cit y have the most returns inabsolute numbers (4,411 men and women in 2001), but it also represents
the highest per capita returns in the state, at 6.8 released prisoners for every1,000 residents. In addition, Baltimore is an extremely small geographic areacompared with the counties profiled in the previous section of this report. Forexample, with just 81 square miles, Baltimore City is less than one-seventh thesize of surrounding Baltimore County.110 Thus, the cit y is home to the mostdensely concentrated geographic distribution of returning prisoners in the state.
Baltimore City is not likely to be an easy place for returning prisoners tosurmount the challenges of reentry, especially with regard to finding employ-ment and supporting oneself financially. The 651,154 residents of BaltimoreCity face many economic and social disadvantages compared with other areas inMaryland. The median household income in Baltimore City is $30,078—wellbelow the statewide median household income of $52,868—and is the second-lowest median income in the state, when compared by county. The unemploy-ment level in Baltimore Cit y (7.9 percent) is nearly double the statewide aver-age of 4.1 percent, and almost a quarter (22.9 percent) of Baltimore’s residentslives below the povert y line. This is much higher than the statewide average of8.5 percent and is the highest level of povert y in the state, by county. In addi-tion, female-headed households account for 25 percent of the households inBaltimore Cit y—much higher than the statewide average of 14.1 percent.111
OVERVIEW OF RELEASED PRISONERSWHO RETURNED TO BALTIMORE CITY
The majorit y of the released prisoners returning to Baltimore were male(90 percent) and black (89 percent). Nine percent were white, and 2 percentwere of other races. This ref lects a different racial distribution than that of allreleased prisoners returning to Maryland (78 percent black, 21 percent white,1 percent other). By way of comparison, the majorit y of Baltimore’s residentsare black (64 percent), whites comprise 32 percent of the residents, and otherracial groups make up the remaining 4 percent of the residents. Three-quar-ters of the released prisoners returning to Baltimore were between 20 and 40at the time of their release, with the median age being 33.
DRUG OFFENDERS AND SUBSTANCE ABUSE
As in other Maryland counties, drug offenses top the list of convictionoffenses for the 2001 Baltimore Cit y release cohort. (See figure 36.) Thirt y-eight percent were convicted of drug offenses—a slightly higher percentage thanthe statewide average of 32 percent. Abuse of alcohol and illicit drugs is highlyproblematic in Baltimore. A recent survey conducted by the Center for Sub-
Chapter 7. Prisoner Reentry in Baltimore City

52 A PORTRAIT OF PRISONER REENTRY IN MARYLAND
stance Abuse Research (CESAR) for the Maryland Alcohol and Drug AbuseAdministration (ADAA) estimated that 58,316 Baltimore residents are in needof treatment for alcohol and / or drug abuse—approximately 9 percent of thecit y’s population.112
Heroin use is especially problematic in Baltimore. Nearly three-quarters(72.6 percent) of the Baltimore Cit y residents who were treated for substanceabuse in FY 2001 reported heroin use.113 Heroin use may be even moreprevalent among Baltimore City residents involved in the criminal justice sys-tem. A recent multicit y study by the National Institute of Justice’s ArresteeDrug Abuse Monitoring (ADAM) Program found that in 2001, arrestees inBaltimore City had the highest opiate-positive rate of all U.S. cities studied(38 percent of male arrestees and 49 percent of female arrestees). The studyalso found that the majorit y (70 percent of males and 86 percent of females) ofthe Baltimore City opiate-positive arrestees also tested positive for cocaine.114
As mentioned earlier in this report, the link between criminal activit yand substance abuse is strong. Whether or not they were serving time for adrug offense, many soon-to-be-released prisoners reported a history of drugand / or alcohol abuse.115 In addition to managing the challenges of returningto the communit y, released prisoners who return to Baltimore City also facethe pressures of a thriving drug scene.
PAROLE IN BALTIMORE CITY
In 2001, 92 percent of the released prisoners who returned to BaltimoreCit y were released conditionally—that is, they were subject to some period ofcommunity supervision by the Maryland Department of Parole and Proba-tion. MDPP has many offices in Baltimore City, including specialized officesfor ex-prisoners with unique needs, such as sex offenders and those sufferingfrom mental health problems. In addition, MDPP operates three offices spe-cifically for released prisoners who live in HotSpots communities.
Almost all released prisoners who return to Baltimore spend some timeunder supervision, and the likelihood of their violating the conditions of theirparole is high. Of the inmates released in 2001 who returned to BaltimoreCit y, 23 percent had violated their parole at some point during their criminalcareers. Three-quarters (74 percent) of 2001 releasees who returned to Balti-more had been in prison at least once before. By the time the 2001 releasecohort data were compiled in spring 2002, 20 percent had returned to prisonafter their release in 2001.
PRISONER REENTRY WITHIN BALTIMORE COMMUNITIES
Prisoner reentry affects not only the inmates who are returning home butalso the communities to which they are returning. Conversely, the character-
112 Yacoubian, G., M. Hsu, andE. Wish. 2002. Estimating theNeed for Substance Abuse Treat-ment in Maryland: An Update ofReuter et al. (1998). Census, 2000.
113 Per telephone conversationwith Vickie Kaneko of the Stateof Maryland’s Alcohol and DrugAbuse Administration, March 18,2002.
114 National Institute of Justice,Arrestee Drug Abuse Monitoring(ADAM) 2000 Annualized Site Re-ports. 2001. Washington, D.C.:National Institute of Justice; Na-tional Institute of Justice. ADAMPreliminary 2000 Findings on DrugUse and Drug Markets, Adult MaleArrestees, 2001; Wish, E., and G.Yacoubian. 2001. Findings fromthe 2001 Baltimore City SubstanceAbuse Need for Treatment AmongArrestees (SANTA) Project. CollegePark, MD: Center for SubstanceAbuse Research (CESAR).
115 Refers to inmates scheduledto be released in the next 12months. Beck, A. 2000. State andFederal Prisoners Returning to theCommunity: Findings from the Bu-reau of Justice Statistics.

53
116 See, for instance, Vigilante,K., M. Flynn, P. Affleck, et al.1999. “Reduction in Recidivismof Incarcerated Women ThroughPrimary Care, Peer Counseling,and Discharge Planning.” Journalof Women’s Health 8(3): 409–415.; Kim, J., J. Rich, S. Zierler,et al. 1997. “Successful Commu-nity Follow-up and Reduced Recidi-vism in HIV Positive Women Pris-oners.” Journal of CorrectionalHealth Care 4(1): 5–17; Haines,Kevin. 1990. After-Care Servicesfor Released Prisoners: A Review ofthe Literature. Cambridge, UK:Institute of Criminology, Univer-sity of Cambridge.
117 Baltimore is a city with morethan 260 neighborhoods. Sincethe boundaries for most of theseneighborhoods do not fall alongcensus tract lines, gathering de-mographic information on each ofthese neighborhoods is not pos-sible. Fortunately, the BaltimoreCity Planning Department and theFamily League of Baltimore Cityhave created clusters of Baltimoreneighborhoods along census tractlines to form 55 broader commu-nities about which statistical datacan be reported. The BaltimoreNeighborhood Indicator Alliance(BNIA) has a range of data onthese 55 clusters. (See BNIAwebsite: http://www.bnia.org/for more information.)
118 Lynch and Sabol. 2001. Pris-oner Reentry in Perspective; Rose,D., and T. Clear. 1998. “Incarcera-tion, Social Capital, and Crime:Implications for Social Disorgani-zation Theory.” Criminology (36):441–79. Rose, D., and T. Clear.2003. “Incarceration, Reentryand Social Capital: Social Net-works in the Balance.” In Prison-ers Once Removed: The Impact ofIncarceration and Reentry on Chil-dren, Families and Communities,edited by J. Travis and M. Waul.Washington, D.C.: The Urban In-stitute.
119 Part 1 crimes include mur-der, aggravated assault, rape, rob-bery, larceny, burglary, stolenauto, and arson.
120 For this and subsequent rank-ing tables, the communities arelisted from highest to lowest num-bers of returning inmates.
istics of the communit y to which released prisoners return may affect theirreentry success. For instance, availabilit y and cost of housing, and availabilit yand proximit y of jobs in a community may inf luence postrelease outcomes forreturning prisoners. In addition, availabilit y—or absence—of social services,such as health care and substance abuse treatment, also is likely to affect reen-try transition and recidivism.116
In Maryland, releasees are not only highly concentrated in Baltimore City—the largest metropolitan area in the state—but they are even more concentratedin a few communities in Baltimore. As shown in figure 37, the distribution ofreturning prisoners varies widely across Baltimore City communities, with anespecially high concentration in the western part of the cit y and high concen-trations to the north and east.117 The communities home to the highest con-centrations of returning prisoners are Southwest Baltimore, Greater Rosemont,Sandtown-Winchester/Harlem Park, Greenmount East, Clifton-Berea, andSouthern Park Heights. Some of these communities received more than 200released prisoners in 2001—higher than the number of prisoners returning tosome entire counties in Maryland.
The return of released prisoners to these high-concentration communi-ties is only part of the story. Another important factor is the high rates ofpeople from these communities who are sent to prison. Such high concentra-tions of residents cycling into and out of prison may disrupt social networksand social relationships in communities. Some researchers suggest that com-munities with weakened social networks have less success promoting informalsocial control among residents, which may result in increased neighborhoodcrime, though little is known about this phenomenon.118
What we do know is that, in addition to being home to large numbers ofreturning prisoners, these high-concentration areas are among the Baltimorecommunities most affected by povert y and crime. In 2000, the percentages ofresidents in these communities who received TANF were among the highestin the cit y. (See figure 38.) These communities also have some of the highestshares of female-headed households in Baltimore (see figure 39) and some ofthe highest levels of Part 1 violent crimes119 in Baltimore (see figure 40).
We describe the six communities in Baltimore that received the highestnumber of returning prisoners in 2001 below. Figure 41 lists the 6 communi-ties, among the 55 Baltimore City communities, that received the highest num-ber of returning prisoners in 2001 and ranks each community on the basis ofkey demographic data.120 A lower rank indicates a higher percentage or fre-quency. As figures 42, 43, and 44 show, these communities are almost alwayshigher than the cit y average for each of these demographics. It is interesting tonote, however, that three of the six communities have crime rates that arelower than the cit ywide average.
Chapter 7. Prisoner Reentry in Baltimore City

Figure 37. Distribution of released prisoners who returned to Baltimore City, by Baltimore Neighborhood Indicator Area, 2001 Source: Maryland Division of Correction.
Figure 38. Percentage of population receiving TANF, by Baltimore Neighborhood Indicator Area, 2000 Source: Maryland Department of Human Resources.
54 A PORTRAIT OF PR ISONER REENTRY IN MARYLAND
2 Miles 0 1
2 Miles 0 1

Figure 39. Percentage of female-headed households per 1,000 residents, by Baltimore Neighborhood Indicator Area, 2000 Source: 2000 Census.
Figure 40. Number of Part 1 crimes per 1,000 residents, by Baltimore Neighborhood Indicator Area, 2001 Source: Maryland Division of Correction.
Chapter 7. Prisoner Reentry in Baltimore City 55

56 A PORTRAIT OF PRISONER REENTRY IN MARYLAND
Figure 41. Rank of sixhigh-concentrationcommunities among 55Baltimore communities,by demographic, 2000
Source: Urban Institute analysisof BNIA data.
Figure 42. Comparison ofsix high concentrationcommunities to BaltimoreCity average: Percent ofhouseholds with TANFrecipients, 2000
Source: Urban Institute analysisof BNIA data.
City-Wide Mean10.7%0
Southwest Baltimore 19.6%
Greater Rosemont 14.4%
Sandtown-Winchester / Harlem Park 18.9%
Greenmount 22%
Clifton-Berea 19%
Southern Park Heights 19.6%
City-Wide Mean25%0
Southwest Baltimore 34.8%
Greater Rosemont 37.4%
Sandtown-Winchester / Harlem Park 38.9%
Greenmount 37.3%
Clifton-Berea 41.2%
Southern Park Heights 40.1%
City-Wide Mean1050
Southwest Baltimore 127
Greater Rosemont 86
Sandtown-Winchester / Harlem Park 116
Greenmount 137
Clifton-Berea 85
Southern Park Heights 72
Figure 43. Comparison ofsix high concentrationcommunities to BaltimoreCity average: Percent ofhouseholds with femalehead of household, 2000
Source: Urban Institute analysisof BNIA data.
Figure 44. Comparison ofsix high concentrationcommunities to BaltimoreCity average: Number ofPart 1 crimes per 1,000residents
Source: Urban Institute analysisof BNIA data.
Community area
Average percentage of households receiving TANF
Percentage of female-headed households with no husband
Number of Part 1 crimes per 1,000 residents
Southwest Baltimore 7th of 55 13th of 55 17th of 55
Greater Rosemont 18 9 27
Sandtown-Winchester / Harlem Park 9 8 20
Greenmount East 2 10 14
Clifton-Berea 8 4 29
Southern Park Heights 6 6 38
57
121 Because Baltimore Cityneighborhoods were aggregatedalong Census tract lines ratherthan neighborhood boundaries toform the 55 BNIA communities,some neighborhoods may be in-cluded in more than one border-ing community.
122 Based on Urban Instituteanalysis of 2001 Maryland De-partment of Public Safety andCorrectional Services, Division ofCorrection data; Baltimore Neigh-borhood Indicators Alliance(BNIA). Sources for data accessedfrom BNIA website (www.bnia.org): U.S. Census, Baltimore CityPolice Department, University ofBaltimore Jacob France Center/Maryland Department of HumanResources.
123 Ibid.
124 Ibid.
We now turn to individual profiles of these six Baltimore communities.
Southwest Baltimore. In 2001, 277 prisoners returned to the SouthwestBaltimore community, which has a total population of 20,965 (13.2 prisonersper 1,000 residents; see figure 45). The Southwest Baltimore communit y in-cludes the following neighborhoods: Booth Boyd, Carrollton Ridge, FranklinSquare, Mill Hill, Mount Clare, Penrose, Shipley Hill, Union Square, West-ern, and Pratt-Monroe.121 The population in this communit y is 73 percentblack, 24 percent white, and 3 percent other races. Female-headed householdsaccount for 35 percent of the households in this community. An average of 20percent of the households in this communit y are TANF recipients. In 2000,there were 2,658 reported Part 1 crimes in this communit y (127 per 1,000residents).122
Greater Rosemont. In 2001, 265 released prisoners returned to the GreaterRosemont communit y, which has a total population of 21,877 (12.1 prisonersper 1,000 residents; see figure 45). The Greater Rosemont community in-cludes the following neighborhoods: Greenlawn, Ash-Co-East / Coppin Heights,Easterwood, Evergreen Lawn, Fairmont, Franklinton Road, Midtown-Edmonson, Mount Holly, Rosemont, Walbrook, Mosher, and Winchester.The population in this communit y is 98 percent black, 1 percent white, and 1percent other races. Female-headed households account for 37 percent of thehouseholds in this communit y. An average of 14 percent of the households inthis communit y are TANF recipients. In 2000, there were 1,897 reported Part1 crimes in this community (86 per 1,000 residents).123
Sandtown-Winchester / Harlem Park. In 2001, 250 prisoners returned tothe Sandtown-Winchester / Harlem Park community, which has a total popula-tion of 17,495 (14.3 prisoners per 1,000 residents; see figure 45). The Sandtown-Winchester / Harlem Park community includes the following neighborhoods:Bridgeview / Greenlawn, Easterwood, Harlem Park, Midtown-Edmonson, andSandtown-Winchester. The population in this communit y is 98 percent black,1 percent white, and 1 percent other races. Female-headed households accountfor 39 percent of the households in this community. An average of 19 percentof the households in this communit y are TANF recipients. In 2000, therewere 2,036 reported Part 1 crimes in this communit y (116 per 1,000 resi-dents).124
Greenmount East. In 2001, 185 prisoners returned to the Greenmount Eastcommunity, which has a total population of 11,561 (16 prisoners per 1,000residents; see figure 46). The Greenmount East community includes the fol-lowing neighborhoods: Broadway East,,,,, Gay Street, Greenmount West, JohnstonSquare, and Oliver. The population in this community is 97 percent black, 2percent white, and 1 percent other races. Female-headed households account
Chapter 7. Prisoner Reentry in Baltimore City

Figure 45. Distribution of returning prisoners in Southwest Baltimore, Greater Rosemont, and Sandtown-Winchester / Harlem Park communities, 2001 Source: Maryland Division of Correction.
Figure 46. Distribution of returning prisoners in Greenmount and Clifton-Berea communities, 2001 Source: Maryland Division of Correction
58 A PORTRAIT OF PR ISONER REENTRY IN MARYLAND

Figure 47. Distribution of returning prisoners in Southern Park Heights community, 2001 Source: Maryland Division of Correction
Figure 48. Location of social services for ex-prisoners in Baltimore City Source: Maryland Division of Correction
Chapter 7. Prisoner Reentry in Baltimore City 59
60 A PORTRAIT OF PRISONER REENTRY IN MARYLAND
for 37 percent of the households in this communit y. An average of 22 percentof the households in this community are TANF recipients. In 2000, therewere 1,588 reported Part 1 crimes in this communit y (137 per 1,000 resi-dents).125
Clifton-Berea. In 2001, 159 prisoners returned to the Clifton-Berea commu-nity, which has a total population of 12,496 (12.7 prisoners per 1,000 resi-dents; see figure 46). The Clifton-Berea community includes the followingneighborhoods: Berea, Collington Square, Biddle Street, Broadway East, CliftonPark, Darley Park, East Baltimore Midway, Middle East, and South CliftonPark. The population in this communit y is 98 percent black, 1 percent white,and 1 percent other races. Female-headed households account for 41 percentof the households in this community. An average of 19 percent of the house-holds in this community are TANF recipients. In 2000, there were 1,063reported Part 1 crimes in this community (85 per 1,000 residents).126
Southern Park Heights. In 2001, 174 prisoners returned to the SouthernPark Heights communit y, which has a total population of 15,761 (11 prisonersper 1,000 residents; see figure 47). The Southern Park Heights communityincludes the following neighborhoods: Central Park Heights, Cylburn,Greenspring, Park Heights, Park Circle, Parklane, Towanda-Grantley, and LucillePark. The population in this communit y is 97 percent black, 1 percent white,and 2 percent other races. Female-headed households account for 40 percentof the households in this community. An average of 20 percent of the house-holds in this community are TANF recipients. In 2000, there were 1,138reported Part 1 crimes in this community (72 per 1,000 residents).127
SERVICES FOR RETURNING PRISONERSIN BALTIMORE CITY COMMUNITIES
The profiles of these six communities suggest that these are some of themost disadvantaged areas in the cit y, with the fewest economic and humancapital resources. Perhaps it is not surprising that these communities are hometo more returning prisoners, but these profiles raise important policy ques-tions with regard to the abilit y of these communities both to insulate againstthe potential negative impact of large numbers of returning prisoners and toprovide resources to these ex-prisoners. As shown in figure 48, many of theorganizations that provide services to former prisoners—employment, hous-ing, legal assistance, physical or mental health care, substance abuse treatment,or some combination of these support services—are located in and around thecommunities that are home to the highest concentrations of returning prison-ers.128 However, a significant number of services also are located in central
125 Ibid.
126 Ibid.
127 Ibid.
128 Information on social ser-vices in Baltimore City is drawnfrom the “Ex-Offender” categoryin the First Call for Help data-base—a comprehensive databaseof social services in Marylandcompiled by the United Way. A fewadditional employment servicelocations were drawn from theMoving On handbook developed bythe Maryland Division of Correc-tion to assist prisoners upon theirrelease.

61
Baltimore, which is some distance from these high concentration areas. It isunclear whether prisoners returning to Baltimore are aware of the social ser-vices in the cit y, the extent to which they already use them, and whether theyhave the means to make use of them. For example, transportation issues andcosts of services may be barriers to taking advantage of programs and assis-tance that might smooth the reintegration process. In addition, it is unknownwhether these service organizations can meet the demand of such high num-bers of returning prisoners.
Chapter 7. Prisoner Reentry in Baltimore City

62 A PORTRAIT OF PRISONER REENTRY IN MARYLAND
Summary
C H A P T E R 8
This report highlights the many challenges and opportunities prisonerreentry poses for the State of Maryland and for the individuals released from Maryland's prisons. As the size of the Maryland prison
population has increased over the past two decades, so too has the number ofinmates being released from prison. Thus, more and more returning prison-ers are faced with the many challenges of reentry, including finding jobs, hous-ing, and substance abuse treatment; reuniting with family; and reintegratinginto the community. Given the increasing numbers of returning prisonersand the fact that they are returning to a small number of communities in thestate, the impact of reentry on communities is a particularly pressing problem.Clearly, prisoner reentry is an important policy issue and one that has signifi-cant implications for public safet y and qualit y of life across the state and par-ticularly in the City of Baltimore. This summary section highlights the keyfindings in this report, raises additional questions with regard to reentry inMaryland, and describes future research efforts that will help to answer thosequestions.
HIGHLIGHTS
Over the past quarter century, the growth in prison populations nation-wide has translated into more and more people being released from prisonand reentering society. The State of Maryland has experienced similar incar-ceration and release trends and thus faces the reentry challenges that accom-pany such growth. Between 1980 and 2001, Maryland's prison populationmore than tripled. This growth is attributable to more people, specificallydrug offenders and parole violators, cycling through prison on shorter sen-tences. In 2001, persons convicted of drug offenses represented the largestshare of new commitments to Maryland prisons (43 percent), nearly four timesthe share of new commitments they represented in 1983. Between 1980 and1999, the number of parole violators returned to Maryland prisons rose sev-enfold, ref lecting an increase from 7 percent to almost one-third of all admis-sions to Maryland prisons during that same period. In 2002, 58 percent ofparole revocations were for technical violations, while 42 percent were for newcrimes.
The number of people released from Maryland prisons ref lects theserising admissions and population trends: 9,448 prisoners were released fromMaryland prisons in 2001, nearly double the number released in 1980. Themajorit y of these released prisoners were male (91 percent) and black (76 per-cent). Three-quarters were between 20 and 40 years old at the time of theirrelease, with a median age of 34. One-third had been serving time for drugoffenses; assault, larceny, and robbery were the next most common conviction

63Chapter 8. Summary
offenses. About half of the prisoners released in 2001 had served two years orless in prison; the largest share (37 percent) served between 40 and 60 percentof their sentences.
The percentage of prisoners released by parole board decision in Mary-land has decreased over the past two decades, with 22 percent of prisonersbeing released by this method in 2001 compared with 42 percent in 1990. In2001, nearly three-quarters of Maryland prisoners were released throughnondiscretionary means, such as mandatory release or expiration of sentence.That is, these inmates did not appear before a parole board or other authorit yto be reviewed or to present a postrelease home or employment plan. Whilethe number of prisoners being released by parole board decision has decreased,the number subject to postrelease parole supervision has increased—from 6,436in 1980 to 14,143 in 2000. In 2001, 89 percent of Maryland's released prison-ers were subject to some period of parole supervision in the community.
Returning prisoners in Maryland have many needs as they begin theprocess of reintegration, and the likelihood of recidivating is high. More thantwo-thirds of released inmates in Maryland had served prior terms in prison,and one-fifth had violated their parole at some point in their criminal careers.These extensive criminal histories do not bode well for maintaining crime-freelifestyles; they can also create barriers to employment, housing, and eligibilit yfor food stamps and other forms of welfare, and can limit opportunities forcivic participation. The Baltimore Public Housing Authorit y, for example, con-siders criminal history as part of its admission criteria and bars individualswho have been convicted of drug-related and violent crimes.
The largest share (59 percent) of released inmates who returned to Mary-land returned to Baltimore Cit y, an area that faces great economic and socialdisadvantage compared with the rest of the state. The median household in-come in Baltimore City is the second lowest in the state, the unemploymentrate is nearly double the statewide average, and almost a quarter of Baltimore'sresidents live below the povert y line—the highest poverty level in Maryland.Within Baltimore Cit y, releasees are further concentrated in a handful of com-munities—Southwest Baltimore, Greater Rosemont, Sandtown-Winchester /Harlem Park, Greenmount, Clifton-Berea, and Southern Park Heights. Someof these high-concentration communities, most of which are also characterizedby high levels of povert y and crime, received more than 200 released prisonersin 2001—more than the number that returned to some entire counties in Mary-land. Some services for ex-prisoners are located in close proximity to theneighborhoods with high rates of releasees, but other services are located incentral Baltimore, which is some distance from these high-concentration ar-eas. In all cases, it is unclear whether prisoners returning to Baltimore areaware of these social services and have the means (e.g., transportation, funds)to make use of them.

64 A PORTRAIT OF PRISONER REENTRY IN MARYLAND
Released prisoners who return to Baltimore Cit y—38 percent of whomwere convicted of drug offenses (possession and sales)—also face the pressuresof a prominent drug scene. Abuse of alcohol and illicit drugs, notably heroinand cocaine, is highly problematic in Baltimore. Approximately 9 percent ofthe cit y's population is deemed to be in need of treatment for a substanceabuse problem. Baltimore City residents involved in the criminal justice sys-tem display particularly high rates of heroin use compared with other cities. Arecent study found that in 2001, arrestees in Baltimore City had the highestopiate-positive rate of all U.S. cities studied (38 percent of male arrestees and49 percent of female arrestees).
This report also illustrates the fact that Maryland’s rising prison popula-tion has placed a strain on already limited programming resources. Substanceabuse, vocational training, and educational programs are available to a smallfraction of Maryland inmates. The fact that inmates are serving shorter termsthan previous cohorts means they may have fewer opportunities to take ad-vantage of in-prison programming that might help them on the outside. Inaddition to traditional programming, comprehensive reentry efforts currentlyserve only a small share of returning prisoners. For example, the MarylandRe-Entry Partnership Initiative (REP), which is designed to improve reentrytransitions for prisoners returning to select communities in Baltimore Cit y,served 125 out of the 4,411 released prisoners who returned to Baltimore Cityin 2001 (3 percent). The state plans to use a portion of its recently awardedGoing Home funds to expand the REP program to serve 500 prisoners eachyear; but as with all programming, sustained funding will be needed to con-tinue and expand this effort.
UNANSWERED QUESTIONS
This report represents the first stage of our research on reentry in Mary-land and raises a number of questions that will be answered in later phases ofthe research. While we know much from our analysis of a cohort of releasedinmates in Maryland, there is much more to be learned. Such additional knowl-edge can provide valuable guidance to practitioners and policymakers as theyprepare to expand reentry efforts in the state.
We know, for example, that the majorit y of prisoners released in Mary-land return to Baltimore Cit y and that returning prisoners are concentratedin a few communities. An examination of demographic data for these areasindicates that they are economically disadvantaged compared with the cit yaverage. What we do not know from this research is how these communitycharacteristics might affect individual postrelease outcomes. For example, are

65
released prisoners returning to high-crime areas more likely to recidivate thanthose returning to areas in which the crime rate is closer to the cit y average?
We also know that a history of substance abuse is common among pris-oners and that prisoners returning to Baltimore City return to a cit y that isrife with substance abuse problems, especially heroin and cocaine use. Whatthis current research does not tell us is the extent to which prisoners returningto Baltimore are drawn back into a pattern of drug use and whether they seekand receive treatment for these problems. While substance abuse treatmentprograms exist in Baltimore, it is unclear whether returning prisoners are awareof them, whether cost or transportation issues limit their abilit y to access theseservices, and whether providers have targeted services to prisoners at the mo-ment of their release from prison, when they are likely to be in the greatestneed of assistance.
Very little is known about the family circumstances of released prisoners,or about the role that family and other peer and interpersonal relationshipsplay in either facilitating or preventing recidivism. This information would beuseful in developing the content of family reunification programs both behindbars and on the outside. It could also help guide counseling efforts aimed atencouraging ex-prisoners to establish or renew relationships with prosocial,rather than antisocial, peers.
In addition, we do not know much about the different t ypes of reentrychallenges that different populations might face. For example, youthful ex-prisoners are likely to have different issues and challenges than their oldercounterparts. Similarly, employment issues are probably different for thosewho have served long prison terms than for those who served shorter terms.And reentry challenges experienced by women, who often have different andmore pressing family issues, are likely to be different from those of men. Iden-tifying the different needs of subpopulations of returning prisoners will helpaid in effective program design, avoiding the “one-size-fits-all” model in favorof one that targets individuals’ needs.
FUTURE RESEARCH
This report is the first product of a larger study, Returning Home: Under-
standing the Challenges of Prisoner Reentry, which is examining prisoner reentryin four states. Many of the unanswered questions described above, and oth-ers, will be explored through other components of the Returning Home Mary-land pilot, including interviews with inmates returning to Baltimore bothbefore and after their release, and interviews with inmates’ family membersafter inmates are released. These interviews are critical to understanding theindividual, family, and community circumstances affecting reentry.
Chapter 8. Summary

66 A PORTRAIT OF PRISONER REENTRY IN MARYLAND
Such interviews, combined with analyses of official records, will help toidentify needs of returning inmates that are not currently being met, such ashousing, employment, and health care. The longitudinal aspect of this studywill help practitioners prioritize programs by focusing on some of these needsbefore others. For example, we may learn that enrolling in an outpatient sub-stance abuse program within the first 30 days after release is more importantthan finding a job for certain t ypes of ex-prisoners. We may discover thatsome returning prisoners find a job too early, before they have become accus-tomed to life on the outside, making it difficult to keep the job while managingother pressures of reentry. Such findings can help case managers prepareinmates for release and support them after release.
Interviews with family members may help identify factors that have bear-ing on the returning inmate’s abilit y to stay drug- and crime-free. For ex-ample, we may find that family support in drug rehabilitation is an importantpredictor of staying off drugs after release from prison, suggesting the expan-sion of drug treatment programs that include family member involvement.These family interviews also will enable us to explore the role that expecta-tions—on the part of both the inmate and the family member—may have on theinmate’s reintegration experience.
Returning Home also explores the role of communit y setting and organi-zations on prisoner reentry through an assessment of local community re-sources, assets, and risks; analyses of community administrative and censusdata; interviews with community stakeholders; and focus groups with com-munity residents. Interviews with community stakeholders are intended toshed light on gaps in local resources available to returning prisoners, particu-larly in the areas of heaviest concentrations of returning inmates. Neighbor-hood focus groups can inform grassroots efforts to support returning inmates(e.g., helping them find housing and jobs, and offering child care services).And, by linking individual data on released inmates to data on neighborhoodindicators, we can begin to explore the inf luence that communit y characteris-tics may have on postrelease success or failure.
It is clear that the challenges of reentry in Maryland are great, but so arethe opportunities. The fact that the federal government has awarded the Stateof Maryland $2 million over three years, a portion of which will support areentry program that is well under way, holds great promise for the reentryprospects of future cohorts of released prisoners. As Maryland expands itsreentry efforts, the Urban Institute is preparing to release reports and policypapers and to convene a forum of practitioners and policymakers to discussthe results of the Returning Home study. We hope that this report and theReturning Home research that follows can help shape decisions about the bestways to serve the state's citizens, communities, and returning prisoners.

67
Returning Home’s two primary research questions are: What
is the experience of those being released from prison and
returning home? and What factors influence a released
prisoner’s propensity to reoffend? The first research ques-
tion is primarily descriptive and qualitative in nature. We plan
to document and describe the individual reentry trajectory—
from prison release, to early entry, to reconnection, to full in-
tegration in society—exploring critical stages of integration
and the role of individual life events, family support, commu-
nity context, and state sentencing and release policies in this
trajectory. The second research question is predictive in na-
ture, and is supported by ancillary questions, including:
How do individual characteristics (e.g., demographics,
family and criminal history, psychological attributes, life
events, health and substance abuse status, and attitudes
and beliefs) affect post-release criminal behavior?
How does family support (emotional and financial) affect
post-release criminal behavior?
How do in-prison experiences (both formal and informal)
affect post-release criminal behavior?
How does an individual's post-release supervision status
and conditions of release (if any) affect post-release
criminal behavior?
How do peer relationships affect post-release criminal
behavior?
How do community factors (e.g., economic viability,
housing availability, social service delivery, crime rates,
social capital) affect post-release criminal behavior?
We also plan to explore intermediate outcomes that rep-
resent positive post-prison adjustment and can, in turn, af-
fect recidivism. Examples include acquiring and maintaining
a job, obtaining and paying for housing, and remaining sub-
stance abuse-free.
Returning HomeResearch Questions
Chapter 8. Summary

68 A PORTRAIT OF PRISONER REENTRY IN MARYLAND
Ret
urn
s R
ace
R
eturn
s P
erce
nt
of T
otal
C
ount
y P
opula
tion
R
eturn
s / 1
,00
0
Res
iden
ts
Mal
e Fe
mal
e S
quar
e M
ilea
ge
Bla
ck
Whit
e O
ther
U
nem
plo
ymen
t R
ate
Bal
tim
ore
Cit
y 4
,41
1
59
%
65
1,1
54
6
.8
3,9
80
43
1
81
6
4%
3
2%
4
%
7.9
Bal
tim
ore
75
5
10
7
54
,29
2
1.0
6
86
69
5
99
2
0
74
6
4
.4
Pri
nce
Geo
rge'
s 4
58
6
8
01
,51
5
0.6
4
29
29
4
85
6
3
27
1
0
4.1
Was
hin
gton
2
42
3
1
31
,92
3
1.8
2
21
21
4
58
8
9
0
2
4.1
Anne
Aru
ndel
2
19
3
4
89
,65
6
0.4
2
02
17
4
16
1
4
81
5
3
.2
Wic
omic
o 2
19
3
84
,64
4
2.6
2
08
11
3
77
2
3
73
4
5
.4
Har
ford
1
57
2
2
18
,59
0
0.7
1
43
14
4
40
9
8
7
4
3.9
Char
les
13
6
2
12
0,5
46
1
.1
13
1
5
21
5
26
6
9
5
2.6
Mon
tgom
ery
11
2
2
87
3,3
41
0
.1
10
8
4
49
6
15
6
5
20
2
.3
Dor
ches
ter
76
1
30
,67
4
2.5
6
9
7
55
8
28
6
9
3
9.3
Fred
rick
7
2
1
19
5,2
77
0
.4
65
7
6
63
6
8
9
5
2.8
How
ard
6
7
1
24
7,8
42
0
.3
63
4
2
52
1
4
74
1
2
2.6
Car
roll
65
1
1
50
,89
7
0.4
6
0
5
44
9
2
96
2
2
.8
Wor
cest
er
57
1
46
,54
3
1.2
5
4
3
47
3
17
8
1
2
9.9
Alle
gany
55
1
7
4,9
30
0
.7
50
5
4
25
5
9
3
2
7.6
Cec
il 5
4
1
8
5,9
51
0
.6
49
5
3
48
4
9
3
3
5.7
Car
olin
e 5
3
1
2
9,7
72
1
.8
46
7
3
20
1
5
82
3
5
.1
Som
erse
t 5
2
1
2
4,7
47
2
.1
49
3
3
27
4
1
56
3
7
.5
Tal
bot
5
2
1
3
3,8
12
1
.5
35
1
7
26
9
15
8
2
3
3.1
Sai
nt M
ary'
s
38
1
86
,21
1
0.4
3
6
2
36
1
14
8
2
4
2.8
Ken
t 3
1
0
1
9,1
97
1
.6
29
2
2
79
1
4
80
6
4
.1
Cal
vert
3
0
0
7
4,5
63
0
.4
27
3
2
15
1
3
84
3
2
.5
Quee
n A
nne'
s 3
0
0
4
0,5
63
0
.7
27
3
3
72
9
8
9
2
3.3
Gar
rett
6
0
29
,84
6
0.2
5
1
6
48
0
9
9
1
7.7
MD
TO
TA
L
7,4
47
10
0%
5
,296
,486
1.4
6
,78
5
66
2
9,7
74
2
8%
64
%
8%
4
.1
Appen
dix
A. N
umber
and
Rat
e of
Pri
sone
rs R
etur
ning
to
Mar
ylan
dC
ount
ies,
2001, an
d D
emog
raphi
c In
form
atio
n by
Cou
nty
Sou
rces
: 2001 M
D D
PS
CS
, D
ivis
ion o
f C
orre
ctio
n d
ata;
Cen
sus
2000; B
ure
au o
f La
bor
Sta
tist
ics
2001 u
nem
plo
ymen
t av
erag
es.