volume ix - hyderabad - Linguistic Survey Of India
578
CENSUS OF INDIA, 1951 VOLUME IX HYDERABAD PART I-A-REPORT by C. K. MURTHY 1 I.A.S. Superintendent of Census Operations GOVERNMi!:NT PRESS HYDERABAD-DN. PRICE Rs. 5-0-0
-
Upload
khangminh22 -
Category
Documents
-
view
0 -
download
0
Transcript of volume ix - hyderabad - Linguistic Survey Of India
CENSUS OF INDIA, 1951
VOLUME IX
HYDERABAD
PART I-A-REPORT
by C. K. MURTHY 1 I.A.S.
Superintendent of Census Operations
GOVERNMi!:NT PRESS HYDERABAD-DN.
PRICE Rs. 5-0-0

"The 1951 Census Publications relating exclusively to Hyderabad State consist of
1. Census of India, 1951, Volume IX. This Volume, in turn, is split up into the following four parts :
(i) Part I-A-Report. Ui) Part r-B-Subsidiary Tables. This part comprises in all 78 Subsidiary Tables relevant to
the preceding part. (iii) Part II-A-Tables. This part contains the General Population Tables and Social and
Cult1.U'al Tables as well as the Summary Figures by Districts and Tahsils. fiv) Part Il-B-Tables. This part contains the Household, Age and Economic Tables as well as
the Districtwi<;e Index of Non-Agricultural Occupations.
All these four parts are available for sale with the Manager of Publications, Civil Lines, Delhi·
"2. Villagewise Mother-Tongue Data Handbooks pertaining to the bilingual tahsils in the following districts :-
(i) Bidsr District. (ii) Gulbarga District. (iii) Nanded District. (iv) Nizamabad, Osmanabad, Mahbubnagar and Raichur Districts.
(v) Adilabad District.
The first four of these handbnoks are available for sale with the Government PUblications Bureau, Mint Compound, Khairatabad, Hyderabad-Dn. The fifth, which is in the press, can also be obtained from the same source when printed.
:8. District CeIlsus Handbooks pertaining to each of the districts of Hyderabad State. These handbooks are under print and enquiries regarding them ma.y be addressed to the Bu~eau or Economics and Statistics, Khairatabad, Hyderabad-Dn.
The statements made and conclusions drawn in this report are wholly the responsi,bility of the author alone in his personal capacity and do not necessarily represent ,ihe views of Government.

PREFACE
Most census reports begin with brief descriptions of the topography, history, etc. of the state concerned. But these and other introductory subjects have been excluded altogether from this report because the author has nothing original to contribute in this. respect and the few old (and not always meticulous) reference books pertaining to this, state have been summarised in numerous publications, including the previous census. reports. Such subjects have been dealt with in the course of this report only to the extent necessary for the concerned section.
During the months jrnmediately preceding the 1st of March, 1951, the reference date for the 1951 Census, conditions in the state were not particularly favourable for launching any laJge~scale administrative operati"()ns like the census enumeration. The situation in respect of law and order was still disturbed in certain areas. The myriad Jagiri and other non-governmEnt illaqas, each with its independent administrative set-up, had only renntly been integrated with the state. 'Ihe tahsil and district boundaries had just then bEEn realigned with a view to make thEm cempact and eliminate the previous ancmaliEs. In the proce~s of this HaligrmEnt a fEW nEW tabsils were created and a ftw old ones (induding a district) were abolished. There was an abnormally large number of transfers 31l;d nEW postings among the Collectors, Deputy Collectors and Tahsildars who all functioned as ex-dficio cemus cfficers, because of the reversion of many lent cfficers~wto had been tEmporarily deputed to this state from the adjoining stafes following the Police Action--to their ffspective parent states.
In spite of all these drawbacks, the 1951 Census was conducted with distinct success from many points of view. But this is not at all surprising. The enumeration and subsequently the sorting and tabulation staffs were fully conscious of the fact that it was the first census to be taken after the freedem of the country, a freedom doubly consecrated for tliis state as it mEant liberation not only fIGm foreign domination but also from a feudal order., 'Iheir eagernus to put fOlward their best was further increased due to the stature of the two Ministers in c}large of ({mus during its crucial stages, first Sardar Vallabhbhai Patel and subsequently Shri C. Rajagopalacbari. Again in the annals of the census history of this state, no other Minister took sueh keen and active interest in census as did Shri B. Ramakri~hJ:ia Rao, the thEn Minister for ReVEnue. His interest remained unabated during all the pbases of the 1951 Census--in the recruitmEnt of the honorary enumeration staff, in the wbsequent training of the re(,lUits, in the diSSEmination of the salient features of the 1951 Census to the citizens at large, in the appeal for their cooperation to make it a thorough fluccess, in the inspection of adual enumeration work both in the city and mofussil areas and finally even in the sorting and tabulation of the enumeration slips. Shri Phoolchand Gandhi, the then Minister for Local Government t
also evinced considerable interest in census work. This concern of the two Ministers further guaranteed right from. the beginning that the Revenue and Local Government Departments, the organisations primarily responsible for the enumeration work in the
, rural and urban areas of the state respectively, would leave no stbne unturned to make the 1951 Census a success. The Census Organisation was particularly fortunate in having Shri L. C. Jain as Chief Secretary during the most trying period of the 1951 Census. His help and guidance were repeatedly needed for solving the numerous administrative
v
vi
and recruitment difficulties that cropped up from time to time and also for obtaining requisite facilities and concessions to the enumeration staff. This help and guidance were extended by him with ever increasing readiness. More than at any other census in this state, the citizens had also realized their obligations to the enumeration staff and that it takes two to make a census--the citizen and the enumerator. The All India Radio both at Hyderabad and Aurangabad, the Information and Public Relations Department and the local Press extended their full co-operation and were exclusively responsible for making the people census-conscious. The two Radio Stations together put on the air more than a hundred talks, dialogues, etc., pertaining to census from October, 1950 to February, 1951. The speakers included many prominent citizens. In addition to this, notifications, etc., regarding census were given precedence by these two stations. From 9th to 27th February 1951, the Hyderabad Station set apart daily five minutes in its evening programme for the broadcast of notifications, instructions, etc., pertaining to census enumeration. Shri C. Rajagopalachari's message to enumerators was also repeatedly broadcast. The Information and Public Relations Department was equally prompt in the distribution of Government notifications, press notes, radio talks, features, etc., among the local newspapers. Very often the department had to take upon itself the tedious task of translating such items into the four main languages of the state. The local Press devoted considerable attention to the publication of census items. Notable among the items which received a good deal of publicity may be mentioned the Registrar General's informal address to the Press at the Hyderabad Boat Club on 31st July, 1950, the more important talks broadcast from A.I.R. Hyderabad, the various notifications and press notes issued by Hyderabad Government in connection with the 1951 Census, the concessions extended by Hyderabad Government to the enumeration staff, the census questionnaire, the dates of enumeration and final checking, the progress of census enumeration, the inspection of enumeration work by Shri B. Ramakrishna Rao and Shri Phoolchand Gandhi and Shri Rajagopalachari's message to enumerators. Many of the papers also wrote editorials stressing the importance of census and appealing to the public for full co-operation. Besides these, the newspapers gave timely pUblicity to the appeals of the leaders of certain groups among whom some unhealthy tendencies with regard to some of the census questions were becoming noticeable. Not to be outbeaten by other agencies, about twenty cinemas of the state exhibited freely during their shows slides relating to census dates, the obligations of the citizens in respe~t of census, etc. The departments of Printing and Stationery, Statistics, Settlement and Land Records and Police as well as the N. S. Railway authorities were ever ready to assist the Census Organisation. These departments are mentioned in particular only because repeated demands were made on them. But actually, every department gave a helping hand whenever approached, especially in connection with the recruitment of the enumeration staff. The census enumerators and supervisors of Hyderabad State can be rightly proud of the fact that they truly lived up to Sardar Vallabhbhai Patel's description that the Indian Census was one of the greatest achievements of honorary endeavour. No payment whatsoever was made to the army of over 30,000 supervisors and enumerators that were engaged for the field operations. Considerable improvements were effected in all phases of the census work, namely enumeration, sorting and tabulation and report writing at the 1951 Census. Some antiquated practices and features which were no longer necessary in' the context of the changed status and ideals of the country were deleted altogether. But all these did not represent any local innovations. The entire scheme of census operations in this state from the beginning to the end was based on the framework outlined and prescribed by Shri R. A. Gopalaswami" Census
11*
Vll
Commissioner and Registrar General, India, who can for all practical purposes, be construed as being the preceptor of the Post-Independence Census in our country. It was indeed a great privilege to be guided by his precepts.
Before I close this preface, I must record my deep gratitude to the band of excellent workers with whom it was my very good fortune to work in the Census Organisation at Hyderabad. They gave their best to the Organisation not merely by working during both early and late hours but by attending to their work with absolute sincerity untrammelled by prejudices and loyalties to other causes. In this connection I am indebted in particular to Messrs. P. Gopal Rao, D. Jagganath Rao, C. Narayan Reddy, K. V. Joga Reddy, R. M. Chalgery, K. Krishna Murthy, G. G. Laulkar, Abdul Khadar, P. S. R. Avadhany, Mohd. Karimullah, A. R. Anantha Narayana, B. 'N. Kulkarni, T. Brahmiah, Vyas Rao and D. V. Narayana. The last nine also assisted me in checking different portions of this report.
HYDERABAD-DN. c. K. MURTHY.

CONTENTS
CHAPTER I-General Population
SECTION I-PRELIMINARY REMARKS
Population of Hyderabad State Verification of the 1951 Census Count Substitution of Economic Clasf.ification for Classification based on Religion Principles governing Classification of Persons according to Livelihood Classes Summary
SECTION II-GENERAL DISTRIBUTION AND DENSITY ••
Districtw;se distribution of Population and Area Tahsilwise distribution of Population and Area Density of Population in Hyderabad State Variations in Density within the State Density in Aurangabad District Density in Parbhani District Density in Nanded District Density in Bidar District, , Density in Bhir District " DensitY'in Osmanabad District Density in Hyderabad District Density in Mahbubnagar District Density in Raichur District Density in Gulbarga District Density in Adilabad District Density in Nizamabad District Density in Medak District Density in Karimnagar District Density in Warangal District Density in ,Nalgonda District General Analysis regarding Variation in Density in the State Summary _ "
SECTION III-GROWTH
Factors affecting Growth .. Territorial Changes Migration Natural Increase The Decade 1881-1891 The Decade 1891-1901 The Decade 1901-1911 The Decade 1911-1921 The Decade 1921-1981 The Decade 1981-1941 Agricultural condition.s during 1941-1951
, Public Health during 1941-1951 , . Industrial and Mineral Production during 1941-1951 Transport and Communications during 1941-51 .. Irrigation and Generation of Power during 1941-51 Growth of Population in the State .. Growth of Population in various Districts of the State Aurangabad District •• Parbhani District
IX
III
PAGg.
3
3 3 4 5 6·
7
7 8-9
10 10 13· 14 14 15 16 16 17 17 19 20· 21 22 23 23 24 25-27
29>
29-29' So. 3o. 31 31 32' 33-34-35-37 38 40 43 43 44 4S 49-5()
SECTION III-GROWTH-(Concld.)
Nanded District Bidar District Bhir District .. Osmanabad District Hyderabad District Mahbubnagar District Raichur District Gulbarga District Adilabad District Nizamabad District Medak District Karimnagar District Warangal District Nalgonda District Summary
SECTION IV-MoVEMENT
Instructions to Enumerators and Limitations Types of Migration Temporary Migration Periodic Migration Number and Sex of Immigrants Since 1901 Inter-District Immigrants Immigration from Madras State Immigration from Bombay State Immigration from Madhya Pradesh .. Immigration from Other Parts of India Immigration from Beyond India
viii
Proportion and Livelihood Pattern of Immigrants from Beyond the State Number and Sex of Emigrants Since 1901 Hyderabad Emigrants in Bombay State Hyderabad Emigrants in Madras State Hyderabad Emigrants in Madhya Pradesh Hyderabad Emigrants in Non-Adjacent Indian States Proportion and Livelihood Pattern of Hyderabad Emigrants Inter-District Emigrants Balance of Movement according to Livelihood Classes Balance of Movement in general-Natural Population Summary
SECTION V-BIRTHS AND DEATHS
Registration or-Births and Deaths . . . • Factors influencing Birth Rates in Hyderabad State Present Birth Rate in the State and likely Trend in Future Present Death Rate in the State and likely Trend in Future Summary
SECTION VI~LlVELIHOOD PATTERN
PAGE
50 51 51 52 53 54 55 56 56 58 59 59 60 61 62
65
65 65 66 69 69 72 72 77 79 81 82 83 8Q 90 91 91 92 92 99
100 101 108
108
108 108 111 113 115
116
Nature of Enquiry and Limitations. . 116 Proportion of Agricultural and Non-Agricultural Classes in Hyderabad and Other Indian States 120 Proportion belonging to each of the Livelihood Classes in Hyderabad and the Other Indian States 121 Districtwise Variation in the Proportion of Agricultural and Non-Agricultural Livelihood Classes 124 Districtwise Variation in the Proportion o~ the Livelihood Class of Owner Cultivators . • 129 Districtwise Variation in the Proportion of the Livelihood Class of Tenant Cultivators 135 Districtwise Variation in the Proportion of the Livelihood Class of Agricultural Labourers .. lag Districtwise Variation in Class of Agricultural Labourers in relation to Gross Cultivated Area 1407 Districtwise Variation in the Proportion of Persons principally dependent on Agricultural Rent 151
III*
Xl
SECTION VI-LIVELIHOOD PATTERN-(Concld.) PAGE
Districtwise Variation in the Proportion of the Livelihood Class of Production 153-Districtwise Variation in the Proportion of the Livelihood Class of Commerce 16() Districtwise Variation in the Proportion of the Livelihood Class of Transport 165-Districtwise Variation in the Proportion of the Livelihood Class of Other Services and Miscel-
laneous Sources 17(} Summary 175-
CHAPTER II-Rural Population
SECTION I-DISTRIBUTION AND GROWTH OF RURAL POPULATION
Predominance of Rural Population .. Population of the Average Village . . . . . . . . Distribution of Rural Population according to Villages of different Sizes Districtwise Distribution of Rural Population among Villages of different Sizes Distribution of Rural Population in Adilabad District Distribution of Rural Population in Aurangabad District Distribution of Rural Population in Parbhani District Distribution of Rural Population in N anded District -Distribution of Rural Population in Raichur District Distribution of Rural Population in Bidar District Distribution of Rural Population in Bhir District Distribution of Rural Population in Hyderabad District Distribution of Rural Population in Gulbarga District Distribution of Rural Population in Osmanabad District Distribution of Rural Population in Medak District Distribution of Rural Population in Nizamabad District Distribution of Rural Population in Mahbubnagar District Distribution of Rural Population in Nalgonda District Distribution of Rural Population in Karimnagar District Distribution of Rural Population in Warangal District Growth of Rural Population Growth of Rural Population according to Size of Villages Movement of Population in Rural Areas Summary
SECTION n__:"LIVELIHOOD CLASSES IN RURAL AREAS
Predominance of Agricultural Classes Livelihood ,Class of Owner Cultivators Livelihood Class of Tenant Cultivators Livelihood Class of Agricultural Labourers Livelihood Class of Agricultural Rent Receivers Livelihood Class of Production (other than cultivation) Livelihood Class of Commerce . . . . Livelihood Class of Transport Livelihood Class of Other Services and Miscellaneous Sources Summary
CHAPTER III-Urban Population
SECTION I-DISTRIBUTION AND GROWTH OF URBAN POPULATION
Distinction between Urban and Rural Areas Proportion of Urban Population Population per Town Distribution of Urban Population according to Towns of Different Sizes Growth of Urban Population Growth of Urban Population according to Size of Towns Movement of Population in Urban Areas
181
181 182-183-184-185 186· 187 IS7 IS8-lS~ 19(} 19()' 191 192-193 193· 194 195 195-196-197 20(} 204 206
208-
208-208-209-21() 212 213-217 2]~
22() 223-
22~
22~
22~
230 231 233-236-24()
Xll
:SECTION I-DISTRIBUTION AND GROWTH OF URBAN POPULATION-(Concld.)
Growth of Population of the Very Large Towns of the State Hyderabad City Warangal City Gulbarga Town Aurangabad Town Nanded Town Jalna Town ., Nizamabad Town Raichur Town Kothagudem Town Latur Town .. Parbhani Town Bidar Town .. Khammam Town Bhir Town Mahbubnagar, Karimnagar and Nalgonda Towns Bodhan Town Yadgir Town Hingoli Town .. Jagtiyal Town Narayanpet Town Summary
SECTION II-LIVELIHOOD CLASSES IN URBAN AREAS
Predominance of Non-Agricultural-Classes Individual Agricultural Classes The Livelihood Class of Production (other than cultivation) The I-,ivelihood Class of Commerce .. The Livelihood Class of Transport The Livelihood Cla~s of Other Selvices and Miscellaneous Sources Livelihood Pattern in the Very Large Towns of the State ., Summary
CHAPTER IV-Dependency, Secondary Means of Livelihood and Employment
PAGE
242 242 243 244 244 245 245 245 246 246 247 247 247 248 248 248 24,9 249 249 250 250 251
253
253 254 255 256 259 260 262 263
SECTION 1-DEPENDE~CY 269
Instructions to Enumerators and Limitations . . 269 Proportion of Self-Supporting and Earning and Non-Earning Dependants among the Total,
Male and Female and Rural and Urban Populations 269 Proportion of Self-Supporting and Earning and Non-Earning Dependants in Agricultural and
Non-Ag<'icultural Cla&ses 271 Proportion of Self-Supporting and Earning and Non-Earning Dependants among individual
Agricultural and Non-Agricultural Classes .. ' 271 Proportion of Self-Supporting and Earning_ and Non-Earning Dependants in the Livelihood
Class of Owner Cultivators 273 Proportion of Self-Supporting and Earning and Non-Earning Dependants in the Livelihood
Class of Tenant Cultivators 274 Proportion of Self-Supporting and Earning and Non-Earning Dependants in the Livelihood . Class of Agricultural Labourers 275 Proportion of Self-Supporting and Earning and Non-Earning Dependants in the Livelihood
Class ot Agri( ultural Rent Receivers . . . . . . . . . . 276 Proportion of Self-Supporting and Earning and Non-Earning Dependants in the Livelihood
Class of Produetion (other than cultivation) .. 278 Proportion of Self-Supporting and Earning and Non-Earning Dependants in the Livelihood
Class of Commerce 279 Proportioll of Self-Supporting and Eaniing and Non-Earning Dependants in the Livelihood
Class of Transport 280

X III
SECTION I-DEPENDENCY-(Cqncld.) ,
Proportion of Self-Supporting and Earning and Non-Earning Dependants in the Livelihood Class of Other Services and Miscellaneous Sources . . . . . . . .
Summary
SECTION II-SECONDARY MEANS OF LIVELIHOOD
Instructions to Enumerators tlnd Limitations Proportion of Persons deriving Secondary Income from different Livelihoods an.d the impor-
tance of Agricultural Labour .as a Secondary Occupation. . . . . . . . Secondary Means of Livelihood among different Livelihood Classes Secondary Means of Livelihood in the variou,; Districts of the State Summary
SECTION III - EMPLOYMENT
Scope, Instructions to Enumerators and Limitations Primary Industries (not Elsewhere Specified) .. . . . . . . . . Stock..Raising-Herdsmen and Shepherds--Breeders and Keepers of Cattle and Buffaloes--
Breeders of Pigs Fishing Forestry and Collection of Products not Elsewhere Specified and Wood Cutting .. Plantation Industries-Vegetable, Flower and Fruit Gardening Hunting (including Trapping and G'tnle Propagation and Rearing of small Animals and Insects) Mining and Quarrying .. Stone Quarrying and Clay and Sand Pits Coal Mining Gold Mining; Mica Mining; and Salt Industry Processing and Manufacture of FoodstUffs, Textiles, Leather and their Products Cotton Textiles-Cotton Spinning, Sizing and Weaving-Cotton Ginning, Cleaning and
Pr~ssing-Cotton Dyeing, Bleaching and Printing .. Leather, Leather Products and Footwear-Cobblers-Makers and Repairers of Leather
Products other than Footwear-Tanners Beverages-Toddy Drawers-Brewers and Distillers-Ice Manufacturers-Manufacturers of
Aerated and Mineral Waters Wearing Apparel (except'Footwear) and Made-up Textile Goods-Tailors-Manufacturers of
Hosiery Products and Embroiderers-Makers of Hats, Caps and other Articles of Wear from Textiles--Manufacturers of House Furnishing Textile Al'ticles--Tent Makers--Makers of Other Made-up Textile Goods -
Textile Industries Otherwise Unclassified-Woollen Spinning and Weaving-Rope MakingSilk Spinning and Weaving-Hemp and Flax Spinning and Weaving-Making of Artificial Leather and Cloth
Vegetable Oil and Dairy Products-Vegetable Oil Pressers and Refiners- Milkmen-Manufacturers of Hydrogenated Oils ..
'l'obacco Industries-Bidi Making-Cigarette Industry-Making of Zarda, Snuff and Cigars Unclassified Food Industries-Slaughter, Preparation and Preservation of Meat-Canning
Preservation of Fruits-Other Food Industries Grains and Pulses-Miller& of Cereals and Pulses-Hand Pounders of Rice and Other Per
sons Engaged in Manual Dehusking and Flour Grinding-Grain Parchers-Persons engaged in other Processes of Grains and Pulses
Sugar Industries-Manufacture of Sugar-Making of Jaggery or Gur .. Processing and Manufacture of Metals, Chemicals and their Products
Manufacture of Unclassified Metal Products-Blacksmiths and Other Workers in IronBrass smiths, Copper smiths and Workers in Bell Metal-Workers in Other Metals-Workers in Mints, Lock smiths and Die Sinkers-Cutlers and Makers of Surgical InstrumentsMakers of Arms and Guns
Transport Equipment-Persons engaged in the Manufacture, Assembly and Repair of Railway Equipment-Repairers of Motor Vehicles-Cycle Repairers-Repairers of Air Craft Equipment-Builders or Repairers of Carriages, Rickshaws and Carts .. . . . .
Persons employed inEngineering Work shops (other than Electrical)and Unspecified Mechanics.
PAGE
280 282
284
284
285 286 288 290
291
291 293
294 294 294 294 294 295 295 295 296 296
297
298
299
800
300
301 301
802
302 303 303
304
304 305
XIV
SECTION I1I-EMPLOYMENT-( Contd.) PAGE
Unclassified Chemical Products-Soap Industry-Making of Perfumes, Cosmetic and Other Toilet Preparations-Match Industries-Industries connected with Paints and Varnishes, Ink, Starch', Candle and other Chemical Products 805
Electrical Machinery and Apparatus . . 805 Basic Industrial Chemicals, Fertilisers and Power Alcohol-Acid and Alkali Salts-Dyes,
Explosives and Fireworks-Power Alcohol-Chemical Fertilisers . . . . 305 Medical and Pharmaceutical Preparations 805
Processing and Manufacture not Specified Elsewhere 305 Wood and Wood Products (Other than Furniture and Fixtures)-Carpenters including Turners and Joiners-Basket Makers-Persons connected with Other Industries of Woody Materials
(like the making of patrolis, mats and broomsticks)-Sawyers-Veneer and Plywood Makers 306 Unclassified Manufacturing Industries-Silversmiths and Goldsmiths-Persons engaged in
Miscellaneous Manufacturing Industries, mainly Button Industry-Watch and Clock Repairers-Toy Makers-Manufacturers or Repairers of Musical Instruments_.:._Makers of Stationery Articles (other than Paper and Paper Products )-Makers or Repairers of Photographic or Optical Goods-Makers of Scientific and Controlling Instruments-Makers of Sports Goods-Makers of Plastic or Celluloid Articles ., . . . . . .. 307
Non-Metallic Mineral Products-Potters-Lime Burners-Makers of Miscellaneous Glass Articles-Makers of Crockery-Makers of Glass Bangles and Beads 30S
Bricks, Tiles and other Structural Clay Products; Printing and Allied Industries (including Book Binding); Paper Industry; Cement Industry; Industries connected with Furniture and Fixtures; and Rubber Products 30S
Construction and Utilities 301} Construction amI MaintenancE' of Buildings-Masons and Bricklayers-Stone Cutters and
Dressers-Painters and House Decorators-Other Persons Employcd in the Construction and Maintenance of Buildings 3ll
Construction and Maintenance Operations relating to Irrigation and Other Agricultural Works, including Contour Bunding, Terracing and Land Reclamation 311
Sanitary Works and Services including Scavengers 31Z Construction and Maintenance of Roads, Bridges and Other Transport Works 31 Z Electric Power Generation and Distribution; Domestic and Industrial Water Supply (including
Bhistis or Water-bearers and Plumbers); and Construction and Maintenance of Telegraph and Telephone Lines. . 31Z
Commerce 318 Retail Trade in Foodstuffs (including Beverages and Narcotics)-Kirana Traders or Ration
Shopkeepers-Traders in Mutton, Poultry, Eggs, Fish, Sheep and Goats-Tt;aders in Vege-tables and Fruits-Traders in Oil, Oil Seeds and Ghee-Traders in Grains, Pulses, Tamarind and Chillies-Traders in Other Foodstuffs and Fodder fm Animals-Hawkers and Street Vendors of Drink and Foodstuffs-Dealers in Pan, Bidi and Cigarettc-Traders in Tobacco, Opium and Ganja-Vendors of Wine, Liquors, Aerated Waters and Ice in Shops 314-
Unclassified Retail Trade-Unclassified Hawkers and Steet Vendols-Deale:t:s in DrugsDealers in Other Chemicals-Pnblishers, Booksellers and Stationers-Cycle Taxi Shop Owners-Dealers in Bangles-Traders in Gold and Silver Articles-Dealers iJ,l Hardware, Iron Safes and Trunks-Dealers in All Types of Utensils including Earthenware and Brassware-Dealers in Sewing Machines, Electric Goods, Petro max Lamps, Agricultural Implemen ts and Various Types of Machinery-Dealers in Building and ConstlUction Materials and Sanitaryware-Retail Traders in Crockery, Cutlery, \Vatches, Optical Goods, Toys, Sports Goods, Mirrors and Musical Instruments-Reta;l Traders in Cattle-General Store Keepers, Manyari Merchants and Miscellaneous Shop Keepers 31;; Retail Trade in Textile and Leather Goods-Retail Traders in Cotton and Silk Piece Goods, Cloth and Yarn-Retail Traders in Leather and,Leather Goods including Footwear--Retail Traders in Wearing Apparel, Kambals and Other Made-up Textile Goods inclUding Tape, Rope, Carpets, etc. . . . . ' .. . . . . . . 315
Wholesale Trade in Foodstuffs \ 816 Money Lending, Banking and other Financial Business 316 Wholesale Trade in Commodities other than Foodstuffs 317 Retail Trade in Fuel-Petroleum Distrihutors-Retail Traders in Firewood, Charcoal, Coal
and Cowdung; Insurance; ano Real Estate 317
xv
SECTION III-EMPLOYMENT-( Concld.)
Transport, Storage and Communications Transport by Road-Owners and Drivers of various types of Bandis-Owners and Drivers
of Rickshaws-Owners and Drivers of Tongas-Employees of the Road Transport Department-Other Public or Departmental or Institutional Motor and Lorry Services-Transport through Pack Animals-Manual Transport-Miscellaneous Types of Transport by Road.
Railway Transport-Porters and Hammals in Railway Stations and Yards-Other Railway Personnel ..
Transport by Air; Transport by Water; Incidental Transport Services; Storage and 'Vare-housing; Postal, \Vireless, Telephone and Telegraphs Services . . . . . .
Health, Education and Public Administration Employees of State Government not classifiable under other categories Educational and Research Services and Institutions-Professors, Lecturers and Research
Workers in Universities, Colleges and Research Institutions--Teachers in Other Educational Institutions-Other Employees like Clerks and Servants in all Educational and Research Institutions including Libraries and Museums
Police Service Village Officers, Servants and Watchmen Medical and Other Health Services-Registered Medical Practitioners-Vaids, Hakirns and
Other Persons practising Medicine without being Registered-Midwives-Nurses-Dentists-Vaccinators-Compounders-Veterinary Surgeons or Doctors-Other Categories of Per~ms employed in Hospitals or other Establishments rendering Medical or Other Health Services
Employees of the Union Government Employees of Municipalities and Local Bodies (including Panchayats)
Services not Elsewhere Specified . . . . . . . . Services Otherwise unclassified Laundries and Laundry Services i.e., Washermen and their Employees Domestic Services-Private 'Motor Drivers and Cleaners-Cooks-Gardeners-Other Cate-
gories of ' Domestic Servants Barbers-Tattooers Hotels, Restaurants and Eating Houses Religious, Charitable and Welfare Services Recreation Services Legal and Business Services~Lawyers of all Kinds-Petition Writers and Employees of
Lawyers-Public Scribes, Stenographers and Auditors-Architects and their Employees .. Arts,ILetters and Journalism---Photographers or their Employees-:-Authors, Editors, Journa
lists and Press Employees-Artists, Sculptors and Image Makers .. Summary
CHAPTER V-Houses, Households; Sex and Marital Status Ratios and PrinCipal Age Groups
SECTION I-TERRITORIAL DISTRIBUTION OF HOUSES AND HOUSEHOLDS AND SIZE OF FAMILY HOUSE' HOLDS
Houses-Definition and Limitations .. Proportion of Persons per 1,000 Occupied Houses •• Variation in Proportion of Persons per 1,000 Occupied Houses within the State Variation in Proportion of Persons per 1,000 Occupied Houses in Urban and Rural Areas Distinction between Household, Houseless and Institutional Population .. Size of Households and Pattern of its Variation within the State Variation in Proportion of Persons per 1,000 Households in Urban and Rural Areas Institutional Inmates and Household Population Summary
SECTION II-SEX RATIO
Sex Ratio at the Present and Previous Censuses Sex Ratio in Natural Population Sex Ratio by Age Groups
.. •• ..
PAGE
31'f
318
819
319 320 321
321 321 822
322 323 323 828 324. 325
825 820 327 827· • 827
328
328 328
337
887 83g 84.1 3'8 8441 845 847 849 850
852
8511 352 353
xviii
SECTION 1-1951 CENSUS DATA REGARDING LITERAC~ (Concld.)
Districtwise Proportions of Persons belonging to Various Educational Standards Literacy and Educational Attainments withm the State according to Livelihood Classes Literacy and Education in the I,ivelihood Class of Commerce . . . . Literacy and Education in the Livelihood Class of Other Services and Miscellaneous Sources Literacy and Education in the LIvelihood Class of Transport . . . . Literacy and Education in the Livelihood Class of Production (other than cultivation) Literacy and Education in the Livelihood Class of Agricultural Rent Receivers .. Literacy and Education in the Livelihood Class of Owner Cultivators .. Literacy and Education in the I.ivelihood Class of Tenant Cultivators .. Literacy and Education in the Livelihood Class of Agricultural Labourers Literacy according to Age Groups Semi-Literacv in the State NumbeI of Teachers, Professors, etc., in the State in relation to its Total Population Summary
SECTION II-VARIATIONS SINCE 1901
Limitations Variations in Literacy Percentages since 1901 Summary
CHAPTER IX-The Future Decades
The Future Decades
APPENDICES
PAGE
460 461 462 468 463 464 464 464 465-465 465 468 468 469
472'
472 472-474
477
ApPENDIX A-Review of the Samplc Verification of thc 1951 Census Count 488
ApPENDIX B-Review of the Inter-district Movement of PopUlation 499 Inter-District Migration .. 499-Movement of PopUlation in Aurangabad District 502 Movement of PopUlation in Parbhani District . . 504 Movement of Population in Nanded District 506 Movement of Population in Bidar District 509 Movement of Population in Bhir District 5Il Movement of Population in Osmanabad District 518 Movement of Population in HYderabad District. . 515 Movement of Population in Mahbubnagar District 519 Movement of PopUlation ii~ Raichur District 521 Movement of Population in Gulbarga District 524-Movement of Population in Adilabad District 526 Movement of Population in Nizamabad District 52.9 Movement of Population in Medak District 532 Movement of Population in Karimnagar District 585 Movement of Population in Warangal District 537 'Movement of Population in Nalgonda District 541
ApPENDl'X C-Wardwise and Blockwise figures pertaining to 'No. of Houses, Households and Population in Hyderabad City 545
ApPENDIX D-Figures pertaining to the Mother-tongue speakers of Telugu, Marathi, Kannada, and all Other Residuary Languages in certain Bilingual or Multi-lingual Areas in Hyderabad State •• 549
ApPENDIX E-Index of Languages and Dialects Returned since 1901
ApPENDIX F-Irregularities in the Literacy Returns at the 1941 Census
( For Errata Vide page 559 )
. . .. ..
551
555
MAPS AND ILLUSTRATIONS
PAGE
Density of Population per Square Mile in the Various Tahsils and Districts of the State 11
Districtwise Variation in Population During the Last Fifty Years 45
Immigrants and Emigrants-Hyderabad State 68
Immigrants in the Various Districts of the State 73
Livelihood Pattern of Population 117
Number of Persons belonging to the Livelihood Class of Owner Cultivators, among every 1,000 of thE; Total Population, in the various Tahsils and Districts of the State 131
Number of Persons belonging to the Livelihood Class of Tenant Cultivators, among every 1,000 of the Total Population, in the various Tahsils and Districts of the State 137
Number of Persons belonging to the Livelihood Class of Cultivating Labourers, among every 1,000 of the Total Population, in the various Tahsils and Districts of the State 143
Number of Persons belonging to the Livelihood Class of Absentee Landlords, among every 1,000 of the Total Population, in the various Tahsils and Districts of the State 149
Number of Persons belonging to the Livelihood Class of Production (Other than Cultivation), among every 1,000 of the Total Population, in the various Tahsils and Districts of the State . . 155
Number of Persons belonging to the Livelihood Class of Commerce, among every 1,000 of the Total Population, in the various Tabsils and Districts of the State .. 161
Number of Persons belonging to the Livelihood Class of Transport, among every 1,000 of the Total Population, in the various Tahsils and Districts of the State. . 167
Number of Persons belonging to the Livelihood Class of Other Services and Miscellaneous Sources, among every 1,000 of the Total Population, in the various Tahsils and Districts of the State 171
Growth of Rural PopUlation and its Distribution according to Villages of Different Sizes 201
Growth of ' Urban Population and its Distribution according to Towns of Different Sizes 238
Marital Status among every 1,000 of both Male and Female Populations of Hyderabad State at each Censu~ since 1901 and corresponding Proportions for the Country and the Adjoining Districts of Neighbouring States in 1951 371
Marital Status among every 1,000 of both the Male and the Female Populations in All Districts as recorded in 1951 372
Proportion of Persons in varoius Age Groups per 1,000 of the Population of Hyderabad State and in the States of Bombay, Madhya Pradesh and Madras and in the Country as a whole . . 385
'Superimposed Age Pyramid for Hy~rabad State and Great Britain 397
Distribution of Population According to Mother-Tongue 409
Distribution of Population According to Religion 431
Literacy Percentages in Total, Rura] and Urban Populations 451
xix

CHAPTER I
General Population

SECTION I
PRELIMINARY REMARKS
population of Hyderabad State.-According to the 1951 Census, the eighth decen-nial census to be taken in Hyderabad State, the population of the state is 18,655,108. This figure, which was obtained in the Census Tabulation Office after sorting of all the enumeration slips and tabulating the results, represents an excess of only 2,144, or 0.01 per cent*, over the provisional figure of 18,652,964 announced by the Government of India in April, 1951. The provisional figure had been obtained by merely tota1ling the figures given in the abstracts prepared by each one of the twenty six thousand and odd enumerators immediately after the termination of the census enumeration in March, 1951.
2. Hyderabad State is seventh among the Indian States in order of population. The other states whose population exceeds that of Hyderabad are Uttar Pradesh, Madrast, Bihar, Bombay, West Bengal and Madhya Pradesh, in the order mentioned. Hyderabad State accounts for 5.2 per cent of the total population of 356,879,394 recorded during this census for the country as a whole, excluding, however, the state of Jammu and Kashmir and certain portions of the Tribal Areas of Assamt. Examined in the context of the population of other countries in the world, as given in the United Nations Statistical Year Book of 1952, the population of this state is exceeded by that of only twenty three countries, excluding India. These countries are China, U.S.S.R., United States, Japan, Indonesia, Pakistan, Germany, Brazil, United Kingdom, Italy, France, Spain, Mexico, Korea, Nigeria, Vietnam, Poland, Turkey, Egypt, Philippines, Iran, Thailand and Burma. The population of each of the last three countries is more or less of the same order as that of Hyderabad State. According to the same publication, the estimated 1951 midyear pOl?ulation of the world is 2,.438 millions. On this basis, ro~ghly ou~ of every twenty persons In the world three are IndIans and out of every twenty IndIans one IS a Hydera badi.
3. Verification oftke 1951 Census Count.--It was the practice during the preceding decades to assume that in any census count errors of under-enumeration were offset by those of over-enumeration and the resultant effect on the actual population figures was almost negligible. It was also presumed that the extent of such errors was about con~ stant from census to census. But it has now been established beyond doubt that in at least some of the preceding censUSes such errors were deliberately committed-with an ulterior political or communal motive--on a scale which did prejudice the population count. But whatever justification there might have been in the past for the attitude adopted by the census authorities in this regard, it was now felt that the present concept
• This is by far the smallest difference between the two figures recorded in the census history of this state. At the 1941 Census, the difference between the proviSional and final population figures was as much as 144,221.
t In this Report, unless specified to the contrary, all references to Madras State-including the figures, percentages, etc., given in respect of that stare-relate to it as it was constituted on the 1st of March, 1951, the reference date of the present Census. But Madras state, as it is now constituted, and the new state of Andhra have both an appreciably larger population than Hyder.bad State. This state is, therefore, now the eighth in India from the point of view of population.
* The 1951 Census was not taken in the state of Jammu and Kashmir and in portions of Part B Tribal Areas of Assam.
3
()f a welfare state demanded that all persons and organisations using population figures are fully apprised of the degree of their reliability as determined statistically. With this end in view, a few months after the 1951 census enumeration, the accuracy, or otherwise, of the count was verified in 8,120 sample households by responsible officers who visited each one of the households for the purpose. These households, spread all over the state, h'ld been previously selected in the Census Tabulation Office on a random sample basis. The officers also ascertained, with the help of the National Registers*, as to whether the three houses situated nearest to each of the houses containing the sample households had also been duly accounted for by the enumerator concerned. It was made very clear to these officers that what was sought to be secured by the verification was a purely statistical determination of the degree of error present in the overall census count and that nothing in the nature of praise or blame for the performance of individual officers or -citizens was intended.
4. The verification indicated that in the enumeration of the 8,120 sample households, consisting in all of 15,428 persons, there were 111 cases of clear omission, 41 of fictitious entry, 18 of erroneous count tending to under-enumeration and 8 of erroneous count tending to over-enumeration. If instances where only the sex of the persons enumerated had been wrongly entered are overlooked, the number of cases of Glear omissions are reduced from 111 to 90 and of fictitious entries from 41 to 20, leading in all to a net under-enumeration of 80 persons. This verification further indicated that out of the 9,360 houses situated in the immediate neighbourhood of the houses containing the -sample households, the enumerators had failed to record two households in the National Registers. Thus, according to this verification there has been a definite under-enumeration in the 1951 Census Count. But statistically this under-enumeration ranges only between 0.30 and 0.77 per cent of the total enumerated household population of the statet. A detailed review of the sample verification of the 1951 Census Count is contained in Appendix A to this Report.
5. Substitution of Economic Classification for Classification based on Religion.During the previous decades, the census authorities attached considerable importance to the presentation of various demographic details in terms of the followers of different religions. With this end in view, the enumeration slips relating to each village or town, as the case may be, used to be sorted at the very outset according to the religion returned by the enumerated persons and this separation was maintained during all the subsequent sorting operations conducted for ascertaining various demographic characteristics. Accordingly, not only the primary figures pertaining to the population of individual villages and towns but also the districtwise data relating to age, marital status, literacy, etc., were presented in the census publications with their break-up in terms of the adherents of different religions. Such demographic characteristics _ of the followers of different religions were analysed comparatively in great detail in the relevant chapters of the 'Census reports. At this census, however; the classification of the population according to livelihood classes was substituted for the former classification based on religion. The
.. These registers were generally written during the census enumeration period and contained, with reference to each individual enumerated, the answers given in respect of the more important of the fourteen questions contained in the 1951 Census Questionnaire. The ent~ies in these registers were made separately for each household in the serial order of house numbers.
t Out of the total population of 18,655,108 of the state, household population was 18,511,461 and houseless and institutional population only 143,647.
5
livilihood classes adopted for the purpose were eight in number, four of which were agricultural and four non-agricultural, as indicated below :-
Agricultural Cldsses.
I. Cultivators of land, wholly or mainly owned, and their dependants. This category included pattedars, pote-pattedars, shikmidars, hissedars, arazi maqtadars, inamdars, holders of seri lands, etc., who cultivated the lands owned by them.
II. Cultivators of land, wholly or mainly unowned, and their dependants. This category included qauldars, battaidars, etc., as well as protected tenants under the Hyderabad Tenancy and Agricultural Lands Act of 1950.
III. Cultivating labourers and their dependants.
IV. Non-cultivating owners of land, agricultural rent receivers and theirdependants. This category included all those types of owners of land mentioned under r above who had leased out their lands.
Non-Agricultural Classes.
V. Persons (including dependants) who derive their principal means of livelihood from Production (other than cultivation).
VI. Persons (includjng dependants) who derive their principal means of liveli· hood from Commerce.
VII. Persons (including dependants) who derive their principal means of livelihood from Transport.
VIII. Persons (including dependants) who derive their principal means of liVelihood from Other Services and M:isceJIaneous Sources.
In the 1951 Census Publications, wherever for the presentation or the study of any demographic feature, the break-up of the population, beyond sex, was deemed necessary, the population has been split up according to these eight livelihood classes. In some cases, the demographic features have also been presented or :malysed according to urban and rural areas.
6. Principles governing Classification of Persons according to Livelihood Classes.E'l.ch and every person enumerated at the 1951 Census was classified under one or the other of the eight livelihood classes mentioned in paragraph 5 above on the basis of the principal means of livelihood returned by or for the person. In case of all self-supporting persons, the pTincipal means of livelihood represented the particular livelihood from which they derived all or the greater part of their income. In case of all dependants, whether earning or non-earning, their principal means of livelihood was assumed to be the same as that of the self-supporting persons on whom they were dependant, partly or wholly. Thus, if a pattedar cultivating his own lands also happened to be a qualdar, or an agricultural labourer, or a trader, and had returned his principal means of livelihood as cultivation of his patta lands and his secondary means of livelihood as .One or the other of the occupations mentioned above, then he was classified only under Livelihood Class I, namely as an owner cultivator. Similarly, if a weaver, cobbler or-
2
'3. carpenter, or any village artisan, returned his craft as a secondary means of livelihood and cultivation of owned lands or leased lands, or agricultural labour as his principal means of livelihood, then he was classified only under Livelihood Class I, II, or III, as the case may be. .
7. Livelihood Class 'V. Production' covered both the making and the repaIrmg ,of m')vable property of any kind. Similarly, Livelihood Class'VI. Commerce' covered the buying and selling of movable or immovable property, and included services like Insurance, Money Lending, Banking, etc. When any person happened to be both a producer and a seller, as was quite often the case, he was treated only as a producer. Livelihood Class 'VII. Transport' covered the movement form one place to another of people or goods. The last of the livelihood classes, namely 'VIII. Other Services and Mis·cellaneous Sources' was a residuary class * .
8. Further, in case of non-agricultural classes, the classification of each individual. -amongst one or the other of the first three non-agdcultural classfs, namf ly 'V. Production' or 'VI. Commerce' or 'VII. Transport', as tLe case may be, was based primarily on the nature of the work turned out by the individm 1. F( r example, a truck driver of a factory was classified under 'Transport' and not under 'Production.'. Similarly, a mechanic of the Road Transport or Railway Department went under 'Production' and not 'Transport'. When an individual happened to be an employee and he could not possibly be classified under any of the three non-agl iculturd clas:;-es mentioned above on the merits of his own work, then he was clas~ified on the ba~is of the work turned out by his employer--except that all domestic servants were invariably classified under the last of the livelihood c1asses. namelY 'VIII. Other Services and Miscellaneous Sources'. For example, a watchma'n in a fa"'ctory, the mU11.im of a trader, an accountant in::t motor taxi comp~:my, or a typist in the office of a lawyer were classified under Li,\"t2lihood Classes V, VI, VII and VIn respectively.
9. It is essential for any study of the 1951 Census Publications to be fully acqup,inted with the principles followed in the classification of the population in terms of livelihood classes as indicated in paragraphs 5 to 8 above.
Summary.-With a population of 18,655,108, Hyderabad is now the seventh most populous state in India-eighth after the formation of Andhra. Only twenty three countries in the world, excluding India, have a population larger than that of this state~ Out of every twenty persons in the world three are Indians and out of every twenty Indians one is a Hyderabadi. The 1951 Census Count, however, suffers fr~m a ·definite under-enumeration. But this under-enumeration ranges only between 0.30 and 0.77 per cent of the total hou~ehold population. During the 1951 Census, the basic classification of the popUlation was by livelihood classes and not by religion as in the earlier censuses. It is essential for any study of the 1951 Census Publications to be fully apprised of the principles governing this classification.
,. The details of the industries and services falling under each of these four non-agricultural livelihood classes are given in paragraph 2 of the flyleaf to Economic Table III at page 187 of Part II·B of this Volume and in Appendix II at paie 104. of the ;same Part.
2*
SECTION II
GENERAL DISTRIBUTION AND DENSITY
(The tables rellJVant to this Section are Main Tables 'A I-Area, Houses and Population' and 'E-8ummary Figures by Districts and' Tahils' at pages 1 and 211 0/ Part II-A and Subsidiary Table '1.1 Area and Population, Actual and Percentage, by Tahsil Density" at page 6 oj Part J-B oj this Volume)
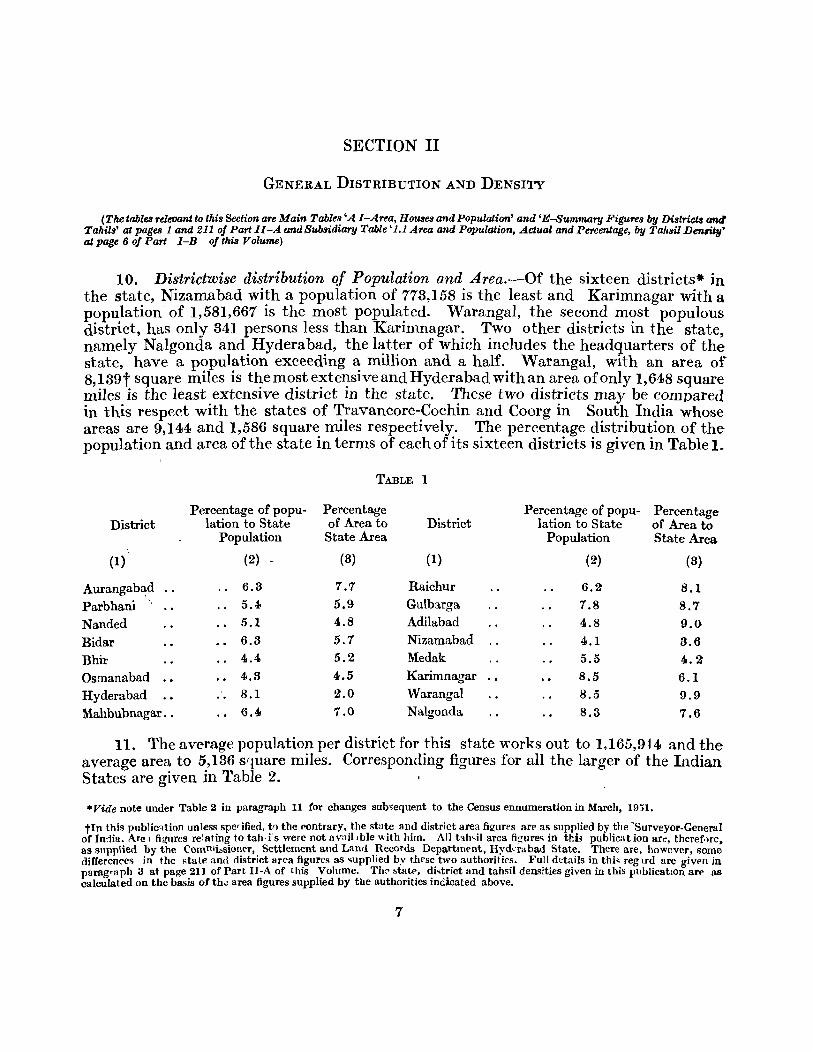
10. Districtwise distribution of Population and Area.--Of the sixteen districts. in the state, Nizamabad with a population of 773,158 is the least and Karimnagar with a population of 1,581,667 is the most populated. Watangal, the second most populous district, has only 341 persons less than Karimnagar. Two other districts in the state, namely Nalgonda and Hyderabad, the latter of which includes the headquarters of the state, have a population exceeding a million and a half. Warangal, with an area of 8,139t square miles is the most extensive and Hyderabad with an area of only 1,648 square miles is the least extensive district in the state. These two districts may be compared in this respect with the states of Travancore-Cochin and Coorg in South India whose areas are 9,144 and 1,586 square miles respectively. The percentage distribution of the population and area of the state in terms of each of its sixteen districts is given in Table 1.
TABLE 1
Percentage of popu- Percentage Percentage of popu- Percentage District lation to State of Area to District lation to State of Area to
Population State Area Population State Area \
(1) (2) - (3) (1) (2) (3)
Aurangabad 6.3 7.7 Raichur 6.2 8.1 Parbhani 5.4 5.9 Gulbarga 7.8 8.7 Nanded 5.1 4.8 Adilabad 4.8 9.0
Bidar 6.3 5.7 Nizamabad 4.1 8.6 BhiI' 4.4 5.2 Medak 5.5 4.2
Osmanabad 4.3 4.5 Karimnagar 8.5 6.1 Hyderabad 8.1 2.0 Warangal 8.5 9.9 }lahbubnagar .• 6.4 1.0 Nalgonda 8.3 1.6
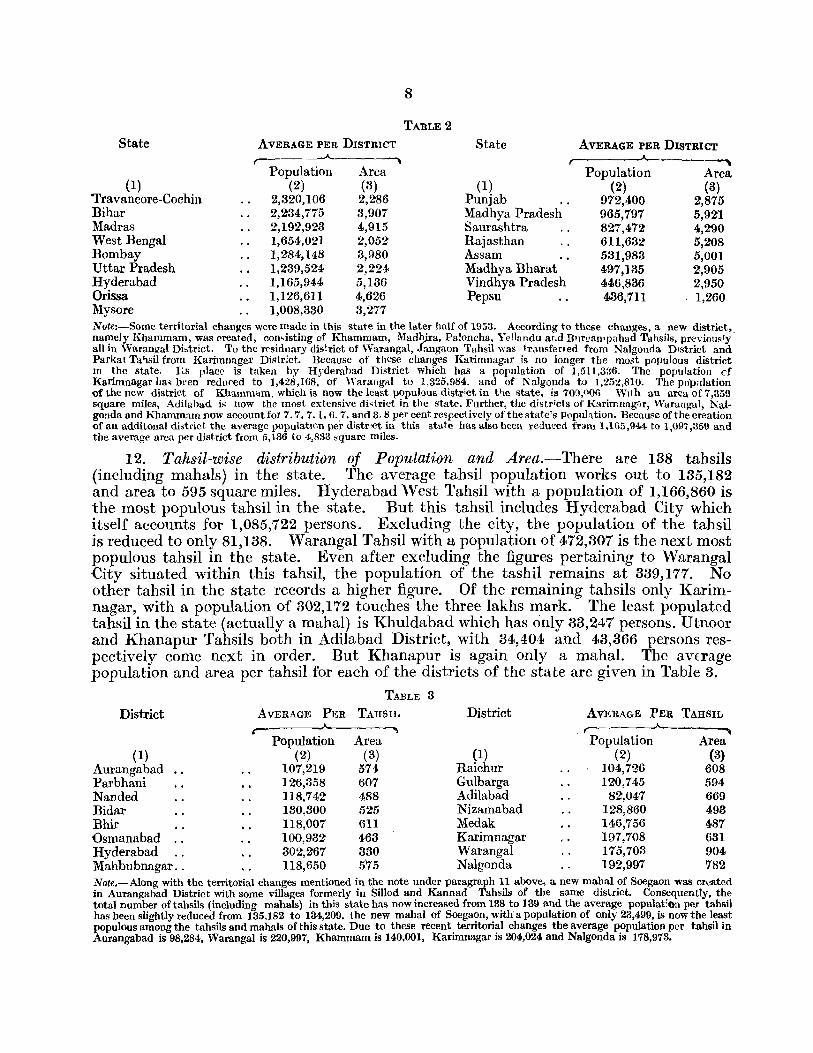
11. The average popUlation per district for this state works out to 1,165,9t4 and the average area to 5,136 s(luare miles. Corresponding figures for all the larger of the Indian States are given in Table 2.
*VitIe note under Table 2 in paragraph 11 for changes sub~equent to the Census ennumeration in March, 1931.
tIn this public1tion unless specified, t'J the rontrary, the state and district area figurt's art' as supplied by the -Surveyor-General of India. Are I figures relating to tah·i's were not availlble with him. All tah,i1 area figure~ in thu publicat ion are, theref'lre. as supplied by the Commbsionef, Settlement and Land Records Department, Hyd~fabad State. There are, however, some differen('cs in the ~tate anrl district II rea figures as ~upplied by these two authoritips. Full details in thi, regud are giVl'n in paragraph 3 at page 211 of Part II-A of this Volume. Th(' &tRIR, di,trict lind tahsil densities given in this publicatton arp as calculated on the basis of th..: area figures supplied by the authorities indicated above.
7
State
(I) Travancore-Cochin Bihar Madras West Bengal Bombay Uttar Pradesh Hyderabad Orissa Mysore
AVERAGE PER DISTRICT --A.. ____ "" ,
Population (2)
2,320,106 2,234,775 2,192,923 1,654,021 1,284,148 1,239,524 1,165,944 1,126,611 1,008,330
Area (3) 2,286 3,907 4,915 2,052 3,980 2,224 5,136 4,626 3,277
8
TABLE 2
State
(1) Punjab Madhya Pradesh Saurashtra Rajasthan Assam Madhya Bharat Vindhya Pradesh Pepsu
AVERAGE PER DISTRICT
,------"-------, Population Area
(2) (3) 972,400 2,875 965,797 5,92'1 827,472' 4,2'90 611,632 5,2'08 531,983 5,001 497,135 2,905 446,836 2,950 436,71I . 1,2'60
Note:-Some territorial changes were made in this state in the later half of 1953. According to these changes, a new district, namely Khammam, was created, con'isting of Khammam, Madhira. Pa!oncha, Yellandu af.d Bllruawpahad Tahsils, previously all in 'Warangal Di,trict. To the rf'siduary district of \-Varangal, J.'lngaon Tahsil was tr.,tnsfefJed from Nalgonoa DIstrict and Parkal Ta'Jsil from Karimnagar District. Because of these changes Karimnagar is no longer the most populous district In the state. ILs placp is taken by Hyderahad District which has a population of 1,511.3::;6. The population cf Karimnagar ha'i bpen reduced to 1,428,168, of Warangal to 1,325,984. and of Nalgonda to 1,252.810. The popalation Qf the new district of Khammtlm. which is now the le<lst populous district in t'1e state, is 70rl,006 Wllh an area of 7,359 square miles, Adilabad is llOW the most extensive di<triet in the state. Furthcr, the districts of Karimnagar, Waraugal, Nalgonda and Khammam now account fOI' 7.7,7.1,6.,7, and 3. 8 per cent respectively of the state's popuhtion. Because of the creation Qf an additonal district the average populatlGn per distr'ct in this state has also been redul?ed fNm 1.165,944 to 1,097,359 and the average area per district from 5,136 to 4,833 square miles.
12. Tahsil-wise distribution oj Population and Area.-There are 138 tahsils (including mahals) in the state. The average tahsil popUlation works out to 135,182 and area to 595 square miles. Hyderabad'Vest Tahsil with a population of 1,166,860 is the most populous tahsil in the state. But this tahsil includes Hyderabad City which itself accounts for 1,085,722 persons. Excluding the city, the population of the tahsil is reduced to only 81,138. Warangal Tahsil with a population of 472,307 is the next most populous tahsil in the state. Even after excluding the figures pertaining to Watangal City situated within this tahsil, the population of the tashil remains at 339,177. No other tahsil in the state records a higher figure. Of the remaining tahsils only Karimnagar, with a population of 302,172 touches the three lakhs mark. The least populated tahsil in the state (actually a mahal) is Khuldabad which has only 33,247 persons. Utnoor and Khanapur Tahsils both in Adilabad District, with 34,404 and 43,366 persons respectively come next in order. But Khanapur is again only a mahal. The aVErage popUlation and area per tahsil for each of the districts of the state are given in Table 3.
TABLE 3
District AVERAGE PER TAHSIL District AVERAGE PER TAHSIL (._ ___ ~ ,~-__ ..)o.____ ___ ...
Population Area . Population Area (1) (2) (3) (I) (2) (3)
Aurangabad 107,219 574 Raichur 104,726 608 Parbhani 126,858 607 Gulbarga 120,745 594 Nanded II8,742 488 Adilabad 82,047 669 Bidar 180,800 525 Nizamabad 128,860 493 Bhir II 8,007 611 Medak 146,756 487 Osmanabad 100,932 463 Karimnagar 197,708 631 Hyderabad 302,267 380 Warangal 175,703 904 Mahbubnagar. . II8,650 575 Nalgonda 192,997 782 Note.-Along with the territorial changes mentioned in the note under paragraph 11 above, a new mahal of Soegaon was cr"ated in Aurangabad District with some villages formerly in Sillod and Kannad Tahsils of the same district. Consequently, the total number oftahsils (including mahals) in this state has now increased trom 138 to 139 and the average populat:On per tahsil has been slightly reduced from 135,182 to 134,209. the new mahal of Soegaon, with! a population of only 23,499, is now the least populous among the tahsils and mahals of this state. Due to these recent territorial changes the average population per tahsil in Aurangabad is 98,284, Warangal is 220,997, Khammam is 140,001, Karimnagar is 204,024 and Nalgonda is 118,973.
9
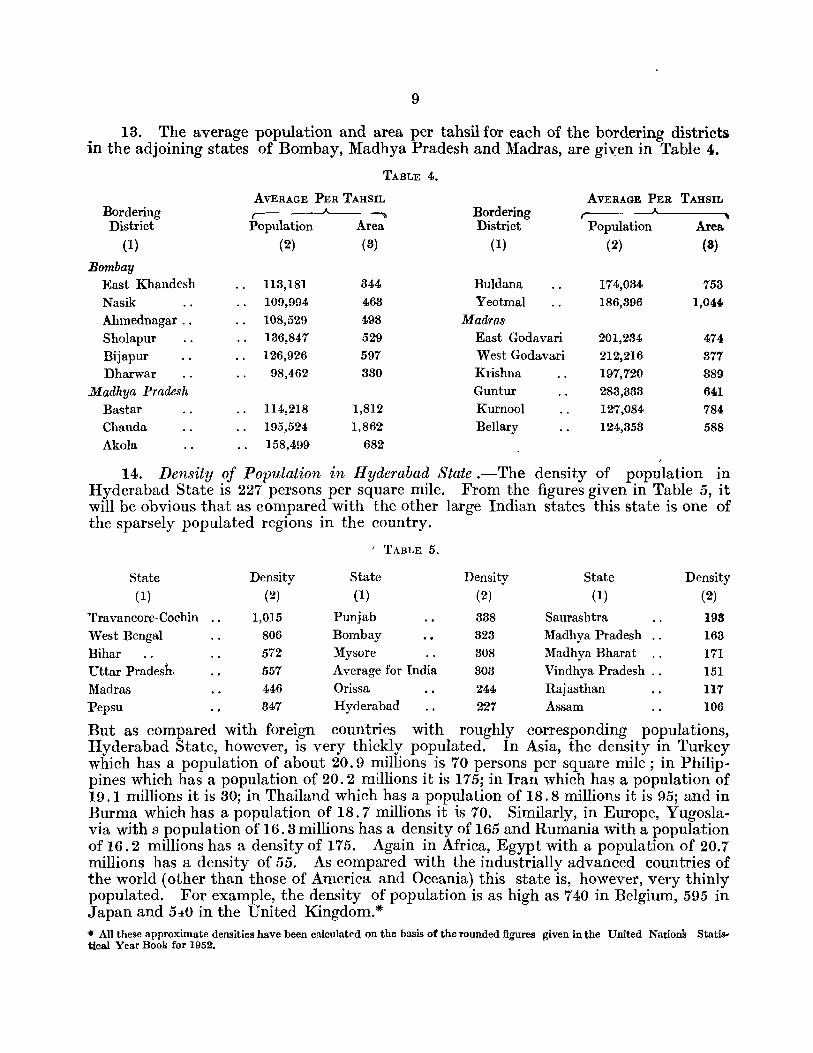
13. The average population and area per tahsil for each of the bordering districts in the adjoining states of Bombay, Madhya Pradesh and Madras, are given in Table 4.
TABLE 4.
AVERAGE PER TAHSIL AVERAGE PER TAHSIL Bordering ,--------"-----;. Bordering r--- ~
District Population Area District Population Area.
(1) (2) (3) (1) (2) (8)
Bombay East Khandesh 113,181 344 Buldana 174,034 753 Nasik 109,994 463 Yeotmal 186,396 1,044 Ahmednagar .. 108,529 498 Madras Sholapur 136,847 529 East Godavari 201,234 474 Bijapur 126,926 597 West Godavari 212,216 377 Dharwar 98,462 330 Krishna 197,720 389
Madhya Pradesh Guntur 283,383 641 Bastar 114,218 1,812 Kurnool 127,084 784 Chanda 195,524 1,862 Bellary 124,353 588 Akola 158,499 682
14. Density of Population in Hyderabad State .-The density of population in Hyderabad State is 227 persons per square mile. From the figures given in Table 5, it will be obvious that as compared with the other large Indian states this state is one of the sparsely populated regions in the country.
State (1)
'Travancore-Cochin West Bengal Bihar Uttar Pradesh Madras
Density (2)
1,015 806 572 557 446
, TABLE 5.
State (1)
Punjab Bombay Mysore Average for India Orissa
Density State Density (2) (1) (2)
338 Saurashtra 198 323 Madhya Pradesh 163 308 Madhya Bharat 171 303 Vindhya Pradesh .. 151 244 Rajasthan 117
Pepsu 347 Hyderabad 227 Assam 106
But as compared with foreign countries with roughly corresponding populations, Hyderabad State, however, is very thickly populated. In Asia, the density in Turkey which has a population of about 20.9 millions is 70 persons per square mile; in Philippines which has a population of 20.2 millions it is 175; in Iran which has a population of 19.1 millions it is 30; in Thailand which has a population of 18.8 millions it is 95; and in Burma which has a population of 18.7 millions it is 70. Similarly, in Europe, Yugoslavia with 9 population of 16.3 millions has a density of 165 and Rumania with a population of16.2 millions has a density of 175. Again in Africa, Egypt with a population of 20.7 millions has a density of 55. As compared with the industrially advanced countries of the world (other than those of America and Oceania) this state is, however, very thinly populated. For example, the density of population is as high as 740 in Belgium, 595 in Japan and 5±0 in the United Kingdom.* * All these approximate densities have been calculated on the basis of the rounded figures given in the United Nations Statistical Year Book for 1952.

10
15. It is thus obvious that the pressure of population on the total area in this state is considerably less than in the country as a whole. But the more densely populated states in India are those which are, industrially or otherwise, appreciably better developed or lie along the coastal regions or in the Indo-Gangetic plains, which contain the most fertile areas in the country. .Most of these states have the advantage of both the factors; i.e., they are better developed and more fertile than this state. Similarly, though the density of popUlation in this state is hardly comparable with those of the very advanced countries in the old hemisphere, it is considerably more than in most countries of the world with comparable populations and which have more or less reached the same standards of industrialisation.
16. Variations in Density within the State .-Within Hyderabad State itself, the density of population varies considerably from district to district as would be obvious from the figures given in Table 6.
TABLE 6
District Density District Density District Density (1) (2) (1) (2) (1) (2)
Aurangabad 187 Hyderabad 917 Medak 301 Parbhani 208 Mahbubnagar 206 Karimnagar 313 Nanded 243 Raichur 172 Warangal 19j. Bidar 248 Gulbarga. 203 Nalgonda 2'1' Bhir 193 Adilabad 123 Osmanabad .. 218 Nizamabad 261
Hyderabad, with a density of 917 persons per square mile, is the most thickly populated district and Adilabad, with a density of only 123, is the most thinly populated in Hyderabad State. But these two districts are the least representative of the conditions generally prevailing in this part of the country. This point is dealt with fully in paragraphs 29 and 37 below. If these two districts are excluded, the districtwise density varies only between 172 in Raichur and 313 in Karimnagar. The most thickly popUlated tahsil in the state is Hyderabad West Tahsil of Hyderabad District with 4,211 persons per square mile and the least thickly populated is Utnoor Tahsil of Adilabad District with only 47 persons per square mile. Of the 138 tahsils in the state, only ;) which account for about 5.6 per cent of the total area of the state and 1.6 per cent of its population, have a density below 100; 17 tahsils, which account for about 14.5 per cent. of its area and 7.9 of its population, have a density ,ranging between 10() and 150*; 38 tahsils, which account for about 28.0 per cent of its area and about 21.4. per cent of its population, have a density ranging between 150 and 200; 56 tahsils, which account for about 37.6 per cent of its area and 40.5 per cent of its population, have a density ranging between 200 and 300; 20 tahsils, which account for about 13.0 per cent of its area and 19.8 per cent of its population, have a density ranging between 300 and 450; and only 2 tahsils in the state, which account for about 1.3 per cent of its area and 8.8 per cent of its population, have a density exceeding 450. These two are the tahsils of Hyderabad West and \Varangal which contain the only two cities of the state. The pattern of density in each of the districts ,of the state is detailed in the following paragraphs.
17. Density in Aurangabad District .-Aurangabad District, with a density of only 187 persons to the square mile, is the least densely populated district in the north-western • The exact density of Kannad Tahsil given as 150 at page 214 of Part II-A of this Volume, is 149.93.
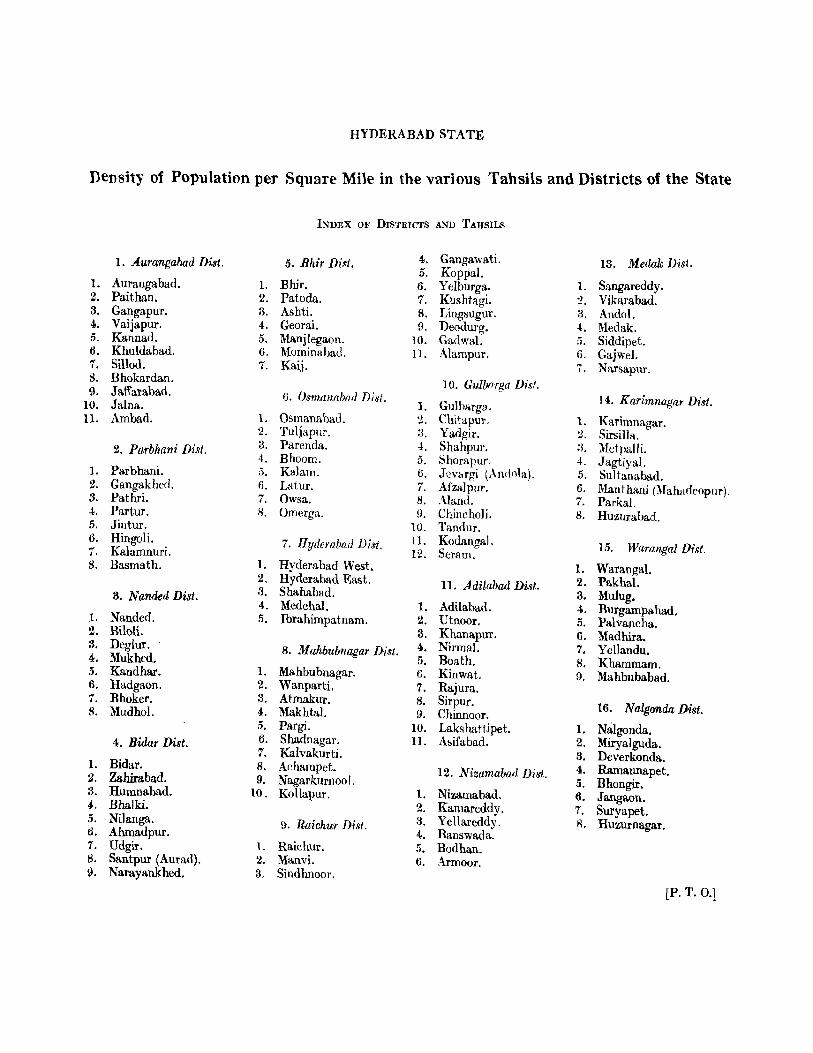
HYDERABAD STATE
Density of Population per Square Mile in the various Tahsils and Districts of the State
INDEX OF DISTRICTS AND TAHSILS
1. A.urangabad Dist. 5. Bhir Disi. 4. Gangawati. 13. Medak Disl. 5. Koppal.
1. Aurangabad. 1. Bhir. 6. Yelburga. 1. Sangareddy. 2. Paithan. 2. Patoda. 7. Kushtagi. 2. Vikarabad. 3. Gangapur. 3. Ashti. 8. Lingsugur. 3. Andol. 4. Vaijapur. 4. Georai. 9. Deodurg. 4. "Medak. 5. Kannad. 5. Manjlegaon. 10. Gadwal. 5. Siddipet. 6. Khuldabad. 6. Mominabad. 11. Alampur. 6. Gajwel. 1. Sillod. 7. Kaij. 7. Narsapur. S. Bhokardan. 10. Gulbarga Dist. 9. Jaft'arabad. 6. Osmanabad Disl. 14. Karimnagar Disi. 10. Jalna. 1. Gulbarga.
ll. Ambad. 1. Osmanabad. ~. Chitapur. 1. Karimnagar. 2. Tuljapur. :3. Yadgir. ~. Sirsilla.
2. Parbhani Disi. 3. Parenda. 4. Shahpur. :~. Metpalli. 4. Bhoom. 5. Shorapur. 4. Jagtiyal.
1. Parbhani. 5. Kalam. 6. Jev&rgi (AnooIa). 5. Sultana bad. 2. Gangakhccl. 6. Latur. 7. Afzalpur. 6. Manthani (Mahaoeopur). 3. Pathri. 7. Owsa. 8. Aland. 7. Parkal. 4. Partur. 8. Omerga. 9. ChinchoJi. 8. Huzurabad. 5. Jintur. 10. Tandur. 6. Hingoli. 7. Hyderabad Dist. 11. KodangaJ. 15. Warangal Dist. 1. Kalamnuri. 12. Seram. S. Basmath. 1. Hyderabad West. 1. Warangal.
2. Hyderabad East. 11. Adilabad Disi. 2. Pakhal. 3. Nanded Dist. 8. Shahabad. 3. Mulug.
4. Medchal. 1. Adilabad. 4. Burgampahad. 1. Nanded. 15. Ibrahimpatnam. 2. Utnoor. 5. Palvancha. 2. Biloli. 3. Khanapur. 6. Madhira. 3. Deglur. 8. Mahbubnagar Dist. 4. Nirmal. 7. Yellandu. 4. Mukhed. 5. Boath. 8. Khammam. 5. Kandhar. 1. Mahbubnagar. 6. Kinwat. 9. Mahbubabad. 6. Hadgaon. 2. Wanparti. 7. Rajura. 1. Bhoker. 3. Atmakur. 8. Sirpur.
16. Nalgrmda Dist. 8. Mudhol. 4. Makhtal. 9. Chinnoor. 5. Pargi. 10. Lakshattipet. 1. Nalgonda.
4. Bidar Dist. 6. Shadnagar. II. Asifabad. 2. MiryaJguda. 7. Kalvakurti. 3. Deverkonda.
1. Bidar. 8. Achampet. 12. Nizamabad Disi. 4. Ramannapet. 2. Zahirabad. 9. Nagarkurnool. 5. Bhongir. 3. Humnabad. 10. Kollapur. 1. Nizamabad. 6. Jangaon. 4. Bhalki. 2. Kamareddy. 7. Suryapet. 5. Nilanga. 9. Raichur Disl. 3. Ye llareddv . R. Huzurnagar. 6. Ahmadpur. 4.. Banswada: 1. Udgir. l. Raichur. 5. Bodhan. 8. Santpur (Aurad). 2. Manvi. 6. Armoor. 9. Narayankhed. 3. Sindhnoor.
[Po T. 0.]
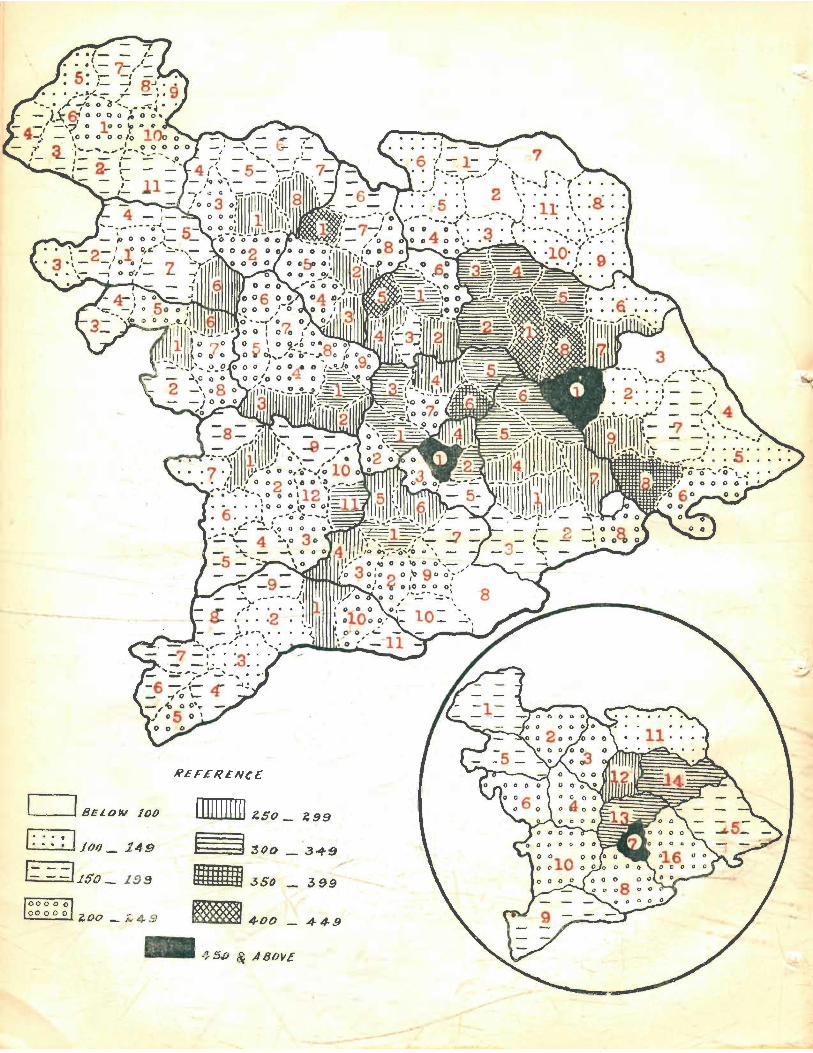
I IBELOW /00
f::: JJOQ_ 1 49
r; .:: =Lso _ 19 !;J
.REFER£N~£
;:'50 _ ;:'99 11111111 !II f I 3~{) _ 3...,.9
Kill II liB 3 So 399
- 4-00 _ 4-~9
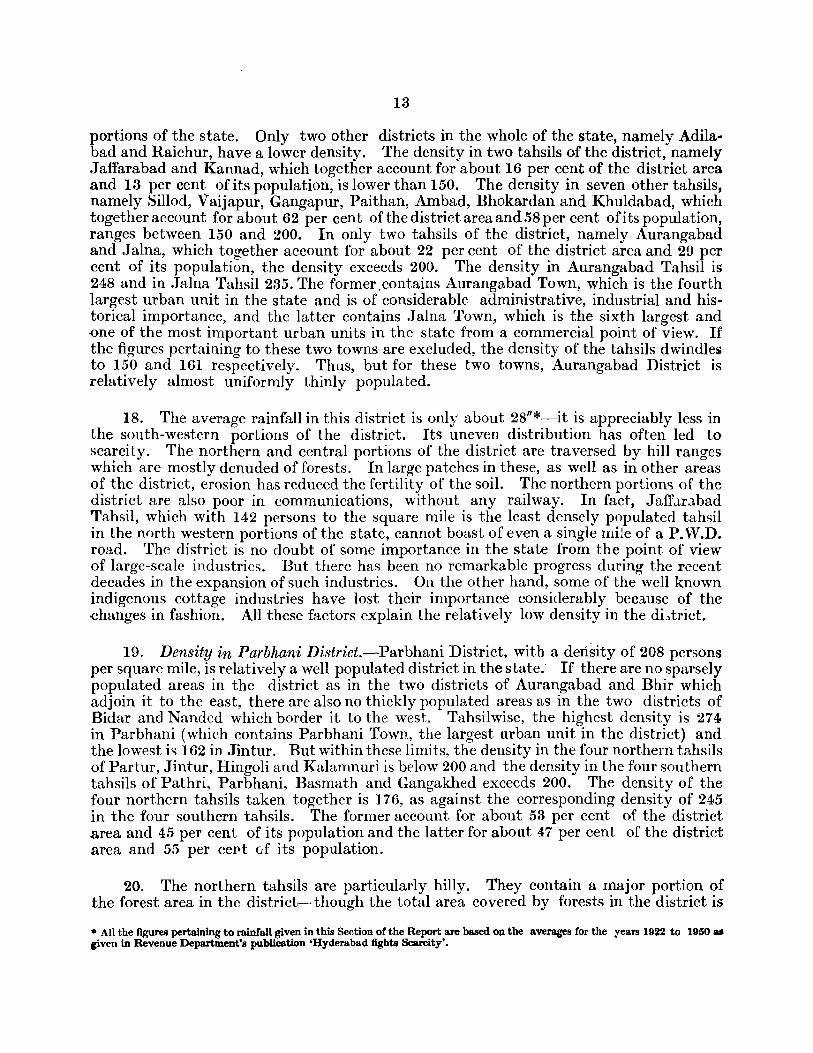
13
portions of the state. Only two other districts in the whole of the state, namely Adilabad and Raichur, have a lower density. The density in two tahsils of the district, namely Jaffarabad and Kannad, which together account for about 16 per cent of the district area and 13 per cent of its population, is lower than 150. The density in seven other tahsils, namely Sillod, Vaijapur, Gangapur, Paithan, Ambad, Bhokardan and Khuldabad, which together account for about 62 per cent of the district area and58 per cent of its population, ranges between 150 and 200. In only two tahsils of the district, namely Aurangabad and J alna, which together account for about 22 per cent of the district area and 29 per cent of its population, the density exceeds 200. The density in Aurangabad Tahsil is 248 and in Jalna Tahsil 235. The former .contains Aurangabad Town, which is the fourth largest urban unit in the state and is of considerable aaministrative, industrial and historical importance, and the latter contains Jalna Town, which is the sixth largest and one of the most important urban units in the state from a commercial point of view. If the figures pertaining to these two towns are excluded, the density of the tahsils dwindles to 150 and 161 respectively. Thus, but for these two towns, Aurangabad District is relatively almost uniformly thinly populated.
18. The average rainfall in this district is only about 28"*-it is appreciably less in the south-western portions of the district. Its uneven distribution has often led to scarcity. The northern and central portions of the district are traversed by hill ranges which are mostly denuded of forests. In large patches in these, as well as in other areas of the district, erosion has reduced the fertility of the soil. The northern portion'; of the district are also poor in communications, without any railway. In fact, JaffJ.rJ.bad Tahsil, which with 142 persons to the square mile is the least densely populated tahsil in the north western portions of the state, cannot boast of even a single mile of a P. W.D. road. The district is no doubt of some importance in the state from the point of view of large-scale industries. But there has been no remarkable progress during the recent decades in the expansion of such industries. On the other hand, some of the well known indigenous cottage industries have lost their importance considerably because of the <!hanges in fashion. All these factors explain the relatively low density in the di_,trict.
19. Density in Parbhani District.-Parbhani District, with a density of 208 persons per square mile, is relatively a well populated district in the state: If there are no sparsely populated areas in the district as in the two districts of Aurangabad and Bhir which adjoin it to the east, there are also no thickly populated areas as in the two districts of Bidar and Nanded which border it to the west. Tahsilwise, the highest density is 274 in Parbhani (which contains Parbhani Town, the largest urban unit in the district) and the lowest i.;; 162 in Jintur. But within these limits, the density in the four northern tahsils of Partur, Jintur, Hingoli and Kalamnuri is below 200 and the density in the four southern tahsils of Pathri, Parbhani, Basmath and Gangakhed exceeds 200. The density of the four northern tahsils taken together is ] 76, as against the corresponding density of 245 in the four southern tahsils. The former account for about 53 per cent of the district area and 45 per cent of its population and the latter for about 47 per cent of the district area and 55 per cept of its population.
20. The northern tahsils are particularly hilly. They contain a major portion of the forest area in the district- though the total area covered by forests in the district is
• All the figures pertaining to rainfall given in this Section of the Report are based on the averages for the years 1922 to 1950 as civen in Revenue Department's publication 'Hyderabad fights Scarcity'.
14
not appreciable. The soil in the hilly tracts of these tahsils is not very fertile. As against this, the southern tahsils are comparatively even and well watered by the Godavari and its tributaries. They are better served by rail. They possess the overwhelming majority of the cotton ginning and pressing factories and oil mills in the district and have also the lion's share of its cottage industries. All the important urban units in the district, except Hingoli Town, lie in the southern portions of the district along the railway line connecting Hyderabad City with Manmad. These factors explain the concentration of the population in the southern portions of the district. But the relatively low density of population in the northern tahsils is nothing peculiar to this district. It is a common feature of all the northern districts of the state.
21. Density in Nanded District.-The density of population in Nanded District is 243 persons per square mile, which is appreciably higher than the density of 227 for the state. The density in two tahsils in the northern and central portions of the district, namely Hadgaon and Bhokar, which account for about 26 per cent of the district area and 19 per cent of its population, is lower than 200. The density in five tahsils in the southern and eastern portions of the district, namely Kandhar, Mukhed, Deglur, Biloli and Mudhol, which account for about 64 per cent of both the total area and population of the district, ranges between 200 and 300. Lastly, the density in one tahsil in the western portions of the district, namely Nanded, which accounts for about 10 per cent of the district area and 17 per cent of its population, is as high as 413. Only five other tahsils in the state, none of which, however, are in the north-western portions of the state, have a density higher than in Nanded.
22. Hadg-aon Tahsil, and to a smaller extent Bhokar Tahsil, are traversed by many hill ranges. The land in the hilly tracts is not very fertile. Hadgaon Tahsil contains the largest area under forests in the district, though its total extent i~ not very appreciable. Until very recently, this tahsil was unconnected by rail. Both the tahsils are very poor in cottage industries and, except for about half a dozen cotton ginning and pressing factories in Umri Town of Bhoker Tahsil, possess no large-scale industries. The largest town in these two tahsils, namely Himayatnagar, can boast of a population of only 5,029. As against this, the other tahsils of the district benefit particularly by the Godavari, the Manjira and some of their tributaries, principally due to the alluvia deposited by themin many places along their banks. These tahsils are considerably richer in cottage industries and among them Nanded and, to a smaller extent Mudhol, have also a number of large-scale industrial establishments. The southern tahsils Gontain six out of the seven agricultural markets in the district which have an annual turn over of about 15 lakhs and over-the seventh is Umri in Bhokar Tahsil. The south-eastern areas of this district bordering Nizamabad, with their tanks and paddy fields, resemble the Telugu districts in most respects. The southern tahsils would have perhaps been more densely populated but for the hill ranges penetrating into Kandhar and Mukhed Tahsils from the west and lack of communications in Mukhed Tahsil. The particularly high density in Nanded Tahsil is very largely due to Nanded Town, which is not only the fifth largest urban unit in the state but perhaps also the most important industrially among all its mofussil towns.
23. Density in Bidar District.-The density of population in this district is 248. This density is not only appreciably higher than the average for the state but is also the highest among its north-western districts. Again, next to Medak, Bidar is the most uniformly well populated district in the state. The density in eight of its nine tahsils,
15
which together account for about 91 per cent of the district area and 87 per cent of its population, ranges between 200 and 300 and the density in the remaining tahsil of Bidar, which accounts for about 9 per cent of the district area and 13 per cent of its population~ is 341.
24. The district has very little forest and, in spite of some hill ranges which traverse it, is more or less flat and very fertile in places. It receives a fair amount of rainfall, about 32" a year-the rainfall is slightly higher in southern plateau regions of the district. It is relatively one of the healthiest districts in the state from the point of view of climatic cenditions. Among the north-western districts of the state, this district is perhaps the richest in live-stock. The road connecting Sholapur and Bombay Cities with the capital city of the state passes right through this district. This is one of the important commercial routes in the state-during the preceding century it was by far the most important. A number of large sized villages and towns have sprung up, on or along this route, which is a feature of the district. Prior to the integration of Jagirs, there were a number of large estates in the district which contained the administrative headquarters for many areas beyond the district as well. Its present density, in spite of the fact that the district is one of the most backward from the point of view of in dustries or irrigation facilities and some of its portions are badly served by communications, is largely the result of the factors mentioned above.
25. Density in Bhir District.-This district, with a density of 193 persons to the square mile, is one of the thinly populated districts of the state. The density in Ashti Tahsil in the extreme west of the district, which accounts for about 14 per cent of the total district area and 10 per cent of its population, is only 148. The density in four other tahsils of the district, namely Patoda, Kaij, Georai and l\ianjlegaon, which together account for about 57 per cent of the district area and 54 per cent of its population, ranges between 150 and 200. 'The density in the remaining two tahsils of the district, namely Bhir and Mominabad, which together account for about 29 per cent of its total area and 36 per cent -of its ,population, ranges between 200 and 300. The highest density is 259 in Mominabad Tahsil.
26. ,'_l'he average rainfall in the district is only about 28/' . It is appreciably lower in the western and higher in the eastern half of the district. It is only about 25" in Ashti Tahsil. But even this scanty rainfall is irregular, with the result that the district, particularly its western portions, are often affected by scarcity conditions. The district is traversed by some prominent hill ranges and the country as a whole has been denuded of forests. Its large scale industries are restricted in all to about a score of modest cotton ginning and pressing factories and oil mills, employing about 500 persons even at the peak period. Its cottage industries are equally unpretentious. It is poor in communications-·especially in railway mileage. Only Mominabad Tahsil, in the extreme east of the district, is connected by rail. All these factors are responsible for the comparatively low density in the district. The salubrious climate of Mominabad 'Tahsil, its relatively good rainfall (over 30"), its importance as a rail head, its populous towns of Parli and Mominabad--the former of which is noted as a pilgrim and commercial -centre in this part of the state-are all responsible for the tahsil's comparatively high density. The density in Bhir reaches the respectable figure of 224, largely because of Bhir Town which is the administrative headquarters of the district, and to some extent because of the labourers attracted to the tahsil on account of the Bendsura Project. If the figures pertaining to these places are excluded, the density in the tahsil- will be
16
only about 175. It is thus obvious that Bhir District, but for Mominabad Tahsil and Bhir Town and Aurangabad District, but for Aurangabad and J alna Towns, constitute a distinct thinly populated zone in the state. As will be seen from the subsequent paragraph this zone extends slightly into Osmanabad District as well.
,
27. Density in Osmanabad District.-The density in this district is 218, which is slightly below the average for the state. Like Parbhani, this district also has neither sparsely nor thickly populated areas. The density in three of its eastern tahsils, namely Parenda, Bhoom and Tuljapur, which together account for about 36 per cent of the district area and 29 per cent of its popUlation, ranges between 150 and 200. The density in the remaining five tahsils of Owsa, Kalam, Omerga, Osmanabad and Latur, which together account for 64 per cent of the district area and 71 per cent of its population, ranges between 200 and 300. The density in the former tahsils, taken together, is only 174 as against 241 in the rest of the district.
28. Although the average rainfall for the district is about 29", it is considerably lower in portions of the district. It dwindles to 23" in Parenda Tahsil. The rainfall in Parenda, Bhoom and Tuljapur is, however, very irregular. This irregular rainfall leads periodically to scarcity conditions. This factor, together with the lack of industries, undeveloped communications (except in Tuljapur), remoteness, paucity of urban units, are responsible for the relative scarcity of population in the three eastern tahsils. In these three tahsils, TuljapurTown, with 7,813 persons, is the most populous urban unit and even this popUlation is mainly due to its importance as a place of pilgrimage. The western tahsils suffer less from scarcity and are economically better developed. The highest density in the district is 283 in Latur Tahsil. This relatively high density is exclusively due to the location of Latur Town within the tahsil. This town, which is twice more populous than even the district headquarters of Osmanabad, is one of the most important agricultural markets in the state, with an annual turnover of over three crores of rupees. It attracts the agricultural produce of Bhir and Bidar Districts as well. Besides, it has some large ginning and pressing factories and oil mills.
29. Density in llyderabad District.-This district, with a density of 917 persons per square mile, is by far the most densely populated district in the state-Karimnagar, which is the next in order in this respect, has only about one third the number of persons per square mile. But this heavy density is entirely due to the location of Hyderabad City within the district. Hyderabad City is the fifth most populous city in the whole of the country and, as explained in greater detail in paragraph 22 of Chapter III, it is almost unique in its overbearing importance as a provincial headquarters. If the figures pertaining to this city are excluded, the density of the district will be reduced to 272. It would be appreciably lower if the figures pertaining to the suburban units around the city are also ignored. But ~ven then the density in the district would represent roughly the average for the state. The country side in the district may present a very rocky appearance. But it contains, like the other Telugu areas, a large number of tanks under which paddy is cultivated. Further, it has all the economic advantages which accrue to an area surrounding a huge city. Tahsilwise, Ibrahimpatnam Tahsil, which accounts for 30 per cent of the district area and 7 per cent of its population, has a density of only 198. The density in two other tahsils, namely Shahabad and Medchal, which together account for 38 per cent of the district area and 10 per cent of its popUlation, ranges between 200 and 300. The density in Hyderabad East Tahsil, which accounts for 16
17
per cent of the district area and 6 per cent of its population, is 312. Lastly, the density in Hyderabad West Tahsil, which accounts for 16 per cent of the district area and 77 per cent of its population, is 4,211. This density, which is by far the heaviest recorded among the tahsils of the state, is again entirely the result of the location of the capital of the state within its limits. If the figures pertaining to this city are excluded, the density in the tahsil is reduced to 419. It would be considerably lower, if the figures relating to suburban units like Osmania University Town, Alwal, Fatehnagar, etc., are also excluded. The relatively low density in Ibrahimpatnam Tahsil is due to the fact that it is hilly in parts, contains the largest extent of the forests within the district, and is comparatively the least developed among the five tahsils of the district from the points of view of industries and communications.
30. Density in ft[ahbubnagar District.--The density in Mahbubnagar District is 206 persons per square mile, which is slightly lower than the df'nsity for the state as a whole. This district, more or less on the pattern of Warangal District, contains both sparsely and well populated regions. The density in Achampet Tahsil, in the southeastern corner of the district, is only 64. Only two other tahsils in the state, namely Utnoor in Adilabad District and Mulug in Warangal District, are less thinly populated than Achampet Tahsil. This tahsil accounts for as much as 19 per cent of the district area and only 6 per cent of its popUlation. The density in two other tahsils, namely Kollapur and Kalvakurti, again in the south-eastern portions of the district, ranges between 150 and 200. These two tahsils together account for about 24 per cent of the district area and 21 per cent of its popUlation. The density in six other tahsils of the district, namely Wanaparti, Atmakur, Makhtal, Pargi, Shadnagar and Nagarkurnool, in the western and central portions of the district, ranges between 200 and 300. These six tahsils together account for about 49 per cent of the district area and 60 per cent of its population. In one tahsil of the district, namely Mahbubnagar, which also lies in the western and central portions of the district, the density is as high as 332. This tahsil accounts for abClut 8 per cent of the p::>pulation of the district and 13 per cent of its area. Thus, the density in the district gradually diminishes as one proceeds from the western to the eastern regions of the district.
\
31. Achampet Tahsil has more area under forests than any other single tahsil within this state. With its forests, hills and plateaus, it may be particularly picturesque, especially iIi'. certain seasons of the year, but it is also highly malarious and one of the most economically backward tracts in the state. Conditions in this tahsil have not progressed much beyond the primitive stages. It is, therefore, not surprising that this tahsil should be so sparsely populated. The lower dens'ities in Kalvakurti and Kollapur are principally due to the fact that portions of these tahsils represent, to a smaller extent, the conditions prevalent in Achampet Tahsil. As against this, the western and central tahsils of the district are relatively well developed ill:. communications and in sources of irrigation. All important urban centres and whatever large scale industries there are in the district are situated within these tahsils-Makhtal Tahsil, in the extreme west of the district is particularly rich in cottage industries as well. Their climate is healthier and, on the whole, they are more fertile than the rest of the district. Among these tahsils, the density in Mahbubnagar Tahsil is the highest because of the fact that the tahsil contains the district headquarters, and is also the best developed of the tahsils from the points of view of communications, commerce and industries.
. 32. Density in Raichur District.-This district, with a density of only 172 persons per square mile, is, with the excepti::>n of Adilabad, the most thinly populated district
18
in the state. A large number of labourers and others have moved into the district from areas beyond the district because of the construction of the Tungabhadra Project. If the number of such immigrants is excluded, the density in the district is reduced to 168. The density in two of its central tahsils, namely Sindhnoor and Manvi, which account for about 22 per cent of the district area and 16 per cent of its population, is appreciably lower than 150. The density in six other tahsils, namely Deodurg, Lingsugur, Gangawati, Alampur, Kushtagi and Yelburga, which account for about 53 per cent of the district area and 50 per cent of its population, is below 200. Of these six tahsils, Alampur is in the extreme east of the district and the rest occupy its central or western portions. The density, in two of these tahsils, namely Deodurg and Lingsugur, again in the centre of the district, is just 151. Only in three tahsils of the district namely Koppal~ Gadwal and Raichur, which together account for about 26 per cent of the total area and 35 per cent of the total population, the density exceeds 200. Of these three, Koppal is in the extreme west of the district and the other two are in the eastern portions of the district. But Koppal Tahsil contains the overwhelming majority ofthe persons who have moved into the district in connection with the construction of the Tungabhadra Project. If this non-indigenous population is excluded, the density in the tahsil will be appreciably lower than 200. Thus, actually in only two tahsils of the district-namely Raichur and Gadwal-which together account for about 17 per cent of the district area and 23 per cent of its population-the normal density exceeds 200.
33. Ignoring the employment available temporarily in the district due to the construction of the Tungabhadra Project, almost 80 per cent ofthe population of the district is principally dependent on agriculture. Again, more than in any other area of the state~ agriculture in this district in turn depends entirely upon timely rains-the proportion of irrigated area in this district to its cultivated area is the smallest amongst all the districts of the state. But its average rainfall of 22" is not only the lowest among all the districts of the state but it is also the most precarious. The peasantry is almost used to expect untimely, or insufficient rainfall, at least every alternate year and a famine once every decade. Ironically, this dQab was once so prosperous that emperors staked their all to include it in their domains. The Tungabhadra Project, when completeq., is bound to alter this picture and make the sustenance of the peasants less precarious. But that happy consummation is yet to come about and perhaps by itself will nut benefit the northern and extreme western portions of the district.
Besides, continuous attacks of malaria and other diseases have not merely affected the vitality of the inhabitants but have also forced some of them to migrate from their ancestral homes. This district is again the poorest among all the districts of the state in cattle wealth--both in terms of the density of cattle per squ-are mile and its distribution per capita. Further, except for the Hutti gold fields and a fairly large number of oil mills and cotton ginning and pressing factories, there is no other large scale industry worth the name in the district. In view of all this it is not at all surprising that its density should only be slightly more than that of Adilabad District. But, as will be seen subsequently, the density is low in these two districts for entirely different sets of reasons. Within Raichur District itself, the density is appreciably higher in the eastern than in the western half. Excluding the figures pertaining to the Tungabhadra Project Camps, the density in the eastern half, con'sisting of the tahsils of Raichur, Gadwal and Alampur, is 225 against only 166 in the western half ce.nsisting of the remaining eight tahsils. The eastern half receives more rain, possesses an overwhelming share of the existing irrigation sources and obviously, therefore, grows more of the irrigated crops, and is
19
richel' in cottage industries and cattle wealth. Sindhnoor Tahsil in the western half' of the district-which is the most representative of the conditions prevailing in that half--is the least densely populated tahsil in the district with only 121 persons per square mile. Raichur Tahsil, in the eastern half of the district, which contains Raichur Town-one of the very important of the urban units in the state----is the most densely populated tahsil in the district with 255 persons to the square mile.
34. Density in Gulbarga District.-The density in this district is 203, as against the average of 227 for the state. But, within the district itself the density varies con~ siderably from region to region. In two of its tahsils, namely Andola (Jevargi) and Afzalpur, situated in the western p0rtions of the district, the density is below 150. In Andola Tahsil it is as low as 122. These two tahsils together account for about 18 per cent of the district area and 11 per cent of its population. In four other tahsils of the district, namely Shorapur, Shahapur, Aland and Chincholi, the density is under 200. These tahsils, the first three of which are again situated in the western portions of the district, account for about 37 per cent of the district area and 88 per cent of its popula~ tion. In five other tahsils, namely Gulbarga, Chitapur, Tandur, Seram and Yadgir, situated in the central and eastern portions of the rlistrict, the density ranges between 200 and 300. These five tahsils together account for about 39 per cent of the district area and 46 per cent of its population. The density in the remaining tahsil of Kodangal, in the extreme east of the district, is as high as 329. ~This tahsil accounts for about 7 per cent of the total district area and 11 per cent of its population. Thus, the central and eastern areas of the district, with the exception of Chincholi Tahsil, are more thickly populated than the western areas. And again, within the former areas-excluding Gulbarga Tahsil which records the relatively high density of 281 solely because of Gulbarga Town-the Telugu areas along the extreme eastern borders of the district areparticularly well populated.
85. The average rainfall in the district as a whole is about 27". But it is markedly lower in the western and particularly low in the south-western portions of the districtthe average in Shorapur Tahsil is less than 23". Besides, the rainfall in the western, more especially again in t.he south-western portions, is very capricious, leading often to drought and scarcity. The western tahsils, with the exception of Aland which is well known for its handloom weaving, are poor in cottage industries. Save for three or four oil and cotton ginning mills in Shahapur and Shorapur 'rahsils, they contain no large scale industries. . Agriculture is practically the only means of livelihood. More than 93 per cent of the total population in Shahapur and Afzalpur, more than 92 in Jevargi and 91 in Aland are principally sustained by agriculture. Besides, these tahsils are also under developed from the point of view of communications and commerce. The only centres of any importance for the marketing of agricultural produce in these tahsils are Shahapur and Shorapur Towns, but even in these two markets the annual turnover is less than fifteen lakhs. These factors explain the low density in these tahsils. As against this, the rest of the tahsils in the district, with the exception of Chincholi, are well served by rail and road. All the large scale industries in the district, including the famous Shahabad stone quarries, are located along the railway route in these tahsils. These tahsils receive more rainfall and suffer less by the vagaries of the monsoon. The particularly heavy density in the extreme eastern i.e., the Telugu areas, especially in Kodangal Tahsil, results from the fact that they are richer in cottage industries and live-stock wealth and possess almost all the tanks and
3
20
-consequently the major portion of the irrigated areas in the district. The low density in Chincholi Tahsil, in the north-eastern corner of the district, is due to the fact that it is hilly in portions and contains by far the largest area covered by forests within this district. Besides, it is under-developed from the points of V lew of communications, commerce and industries.
36. Density in Adilabad District.-Adilabad District, with a density of only 123, is by far the most thinly populated district in the state. This sparsity of population is, in varying degrees, a common feature of most tracts in the distrIct. This is obvious from the fact that in two of its eleven tahsils-namely, Utnoor and Rajura-covering about 20 per cent of the total area and 12 per cent of the total population, the density is below 100 and in seven other tahsils, namely Boath, Asifabad, Kinwat, Sirpur, Chinnoor, Lakshattipet and Khanapur, covering about 64 per cent of the district area and 63 per cent of its population, the density is below 150. Thus, in all, about 84 per cent of the area of the district is populated by a pprecia bly less than 150 persons per square mile. In only two tahsiJs, namely, Adilabad and Nirmal, which together account for about 16 per cent of the district area and 25 per cent of its population, the density exceeds 150.
37. Roughly 3,000 square miles out of total area of 7,359 square miles of the district are covered with forests*-perhaps the densest and the best in the state. The district is traversed by many hill ranges and receives the heaviest rainfall in the state, about 42". Many portions of the district, particularly the central high lands, become inaccessible during the rains when its numerous small N alas swell into mighty streams and its forests become thick with foliage. Except for a short distance to the west, the district is separated fromalltheadjoing districts by the Penganga, Wardhaand Pranahita On the north and north-east and the Godavari in the south. There is only one road bridge across all these rivers. The road mileage in the district is about 4.1 for every 100 square miles of its area, which is the lowest in the state. The majority of the population live in sman villages which are no more than a cluster of poorly built huts. Out of the 1,809 census units (i.e., inhabited villages and towns) in the district, 1,244 have a population less than 500 each. The district is the chief habitat of the Scheduled Tribes in the state. Less than 6 per cent of its population is literate andconditiolls in many parts ofthe district are almost primitive. It is the least irrigated among the Telugu districts and Jess than -80 per cent of its area is under cultivation. The valleys and the land at the foot of the hills, or along the alluvial beds of the rivers, are no doubt fertile. But they are perhaps the most malarial and its peasantry the most backward in the state. The. district has -some potentialities for the generation of hydro-electric power but the resources are as yet unharnessed. Less than 3 per cent--the smallest percentage recorded by any district {)f the state~of its population is principally dependent on ccmmerce. It has only two big agricultural markets, namely Adllabad and, considerably less important than it, Mancherial. The density would have been appreciably lower than even the present figure, but for the fact that the district works some collieries, possesses some nascent ,and prosperous industries, has a fair sized P.W.D. project and a silk factory under 'Construction and its forest wealth is being exploited on an appreciable scale.
38. The least densely populated tahsil in the district, and incidentally.in the whole of the state, is the almost inaccessible and' forest clad' high land tahsil of Utnoof located in the very heart of the district. The population of this tahsil consists largely ., Based on figures supplied by Forest Department.
~I(c
21
of Scheduled Tribes. About 96 per cent of its people, the highest percentage recorded in any tahsil of this state, is principally dependent on agriculture. Conditions in this tahsil are perhaps the most primitive in this state. Its low density of 47 is, therefore, easily explained. The two most densely populated tahsils in the district are Adilabad and Nirmal. The density in the former is 175 and in the latter 214. In Adilabad Tahsil, particularly in its northern portions,forests have been cleared and a comparatively large population, both indigenous and non-indigenous, has settled down to cultivation. The headquarters of the district are located within this tahsil and it has recently been linked with railways. All these factors have contributed to the fair density in this tahsil. Nirmal Tahsil, especially the southern parts of the tahsil, with its level lands, studded with numerous tanks and high proportion of paddy areas, reflects the conditions prevailing on the other side of the Godavari in Nizamabad and Karimnagar Districts. Besides,. Nirmal Town, which is relatively the most historically important town in this district, still continues to be its chief urban centre with about 18,000 inhabitants. The tahsil is also the most advanced in the district from the point of view of cottage industries. Slightly less than a quarter of the total handlooms in the district are in this tahsil. AlI these factors have made this tahsil the most populated in the district. The other three tahsils situated along the alluvial banks of the Godavari are also more densely populated tha~ the interior or northern areas of the district, 'Yith the exception of Adilabad TahSIl.
39. Density in Nizamabad District.-The density of population in this district is 261,. which is considerably above the average for the state. Only three other districts in the state, two of which, namely Medak and Karimnagar, lie along its southern and eastern borders respectively, record a heavier density. This district has no sparsely populated tracts. Only one tahsil within the district, namely Yellareddy, has a density below 200. Its density is 163. This tahsil accounts for about 16 per cent of the district area. and 9 per cent of its population. The density in three other tahsils of the district, namely,. B.answada, Kamareddy and Armur, ranges between 200 and 300. These three tahsils. tdgether account for about 56 per cent of the district area and 53 per cent of its population. The density in the remaining two tahsils of Nizamabad and Bodhan is as high as 336 and 434 respectively. These two tahsils account for about 28 per cent of the district area and 38 per cent of its population. In fact, Bodhan Tahsil is the third most densely populated tahsil in the whole state.
40. The density in this district is well above the average for the state primarily because it is by far the most developed district in the state from the point of view of irrigation. About 16 per cent of its total area is irrigated, which is roughly twice the corresponding percentage recorded in the case of any other district of the state. The Nizamsagar Project itself irrigates roughly sixteen lakhs of acres in the district. The district accounts for about 15 per cent of the paddy and 50 per cent of the sugarcane acreage of the state. Besides, the district is well served by rail and roads. For every 100 square miles in the district, there are almost II miles of road maintained by the P.W.D. This is by far the most impressive figure recorded among the mofussil districts. Further, the district is fairly rich in cottage as well as large-scale industries. The relatively low density in YeUareddy Tahsil is due to the fact that it is hilly in portions and, although all the tahsils in the district have some forests, those in this tahsil are by far the most extensive. Besides, it is not as well developed as the other tahsils from the points of view of communications, industries and irrigation. The heavier density in
22
Nizamabad Tahsil results chiefly from the location of Nizamabad Town within this tahsil. This town is not only the district headquarters but is also of considerable importance in the state because of its population, commerce and industry. The heavy density in Bodhan is entirely due to the fact that it is the best irrigated tahsil in the state (due to the Nizamsagar Project) and also contains a very large sugar factory, in addition to an alcohol factory. The sugarcane and, to a lesser extent, paddy cultivation and the two factories in the tahsil have attracted a very large number of labourers and others from areas both within and beyond the district.
41. Density in Medak District.-This district, which lies in the centre of the state; has a density of 301 persons per square mile. Though two other districts of the. state, namely Hyderabad and Karimnagar, record heavier densities, they are not so uniformly well populated. In fact, only one other district in the state, namely, Bidar, can be compared with Medak District in this respect. But the densities recorded by the various tahsils of Bidar are generally lower as against those recorded by the tahsils of this district. The density in three tahsils of Medak District, namely Vikarab::td, Narsapur and Medak, which together account for 43 per cent of the district area and 37 per cent of its population, ranges between 200 and 300. The density in the remaining four tahsils of the district, namely Sangareddy, Andol, Siddipet and Gajwel, which together account for 57 per cent of the district area and 63 per cent of its population, ranges between 300 and 450. The highest density is 861 in Gajwel Tahsil, but even the lOWEst is as high as 243 in Vikarabad.
42. This district is one of the least developed in the :-tate from the point of view of large scale industries. Its only venture in this sphere are a few rice and oil mills and a small glass radary. There is no mining activity in the district, except for some stone quarries whi0h sustain less than 1,500 full time workers. The district is predominantly rural in composition, the largest town having less than 20,000 inhabitants. But these characteristics which are generally associated with sparsely populated tracts ate counteracted by other factors. The district has a particularly large number of tanks, both old and new and large and small. These tanks, supplemented by wells and a few canals, irrigcl,te almost 9 per cent of the total area of the district, making it the seconq best irrigated district in the state. The average rainfall in this district is 33". On account of this rainfall and the large number of tanks, the district is generally free from scarcity or drought. When compared with the other Telugu districts, the proportion of cultivated area to the total area is fairly high in this district. The Manjira which flows along more than three fourths of the borders of Andol Tahsil, adds considerably to the fertility of the central portions of the district. The district is fairly well placed in respect of cottage industries, particularly handloom weaving, and live-stock. Both the broad-gauge line connecting Hyderabacl City with Bombay and the metre-gauge line connecting it with Manmad pass through the district. It is particularly well served by roads. The great consuming centre of Hyderabad City is within easy reach of almost all its producing areas. This proximity of the city also permits a large number of the persons in the district to earn, or supplement their subsistence by the employment available in the city. All these fdctors are responsible for the thickness of the popUlation in the district. The comparatively low density in Medak, Narsapur and Vikarabad Tahsils is chiefly due to the relatively large areas in these tahsils under forests. Vikarabad Tahsil is in addition particularly hilly in portions and comparatively poor in sources of irrigation.
23
43. Density in Karimnagm' District.-The density of population in this district is as high as 313, which is second only to that in Hyderabad District. But as explain· ed in paragaph 29 above, the high density of 917 in Hyderabad District is enti ely the result of the location within its limits of the capital of the state. If the figure!!. pertaining to the capital city are ignored, Karimnagar District becomes by far the most densely populated district in the state. In spite of this heavy density for the district as a whole, its eastern regions, along the Godavari, are among the most sparsely populated areas of the state. The density in its easternmost tahsil of Manthani (Mahadevpur), which accounts for 16 per cent of the district area and only about 5 per cent of its population, is as low as 104. The density of the other eastern tahsil of Parkal,. which accounts for 11 per cent of the district area and 10 per cent of its population, is 276. The density in the remaining six tahsils of the district, namely J agti) aI, Sirsilla. Metpalli, Sultanabad, Karimnagar and Huzurabad, ranges between 300 and 450. These six tahsils together account for 73 per cent of the district area and 85 - per cent of its population. Among these tahsils, the density in Huzurabad and Karimnagar is as high as 432 and 420 respectively. Only three other tahsils in the state, namelYt Hyderabad West, Warangal and Bodhan, are more densely populat:,d th':,n these two tahsils. But what is remarkable is the fact that these two tahsils attain such a heavy density without possessing any cities as Hyderabad West and 'Varangal Tahsils dO, or any huge irrigation project and large factories as Bodhan does.
44. Like lVIedak District, Karimnagar is also predominantly rural in compostion and poor in large [cale industries. And further, it is not so well served by roads. But again, as in the case of lVledak District, these factols which generally tend to keep the density low, are more than compensated by other features. All the tahsils of the district (except of course Manthani) are among the best irrigated areas of the state. They perhaps contain more tanks than any other comparable area within or even beyond the ~tate. These tanks are well fed byan average rainfall of about 35". The areas in the district lying along the Godavari, which separates it from Adilabad and Madhya Pradesh, to the entire north and east, the Maner, which flows right through the district from the west to the east before joining the forme-, and some of their tributaries, are particularly fertile. Because of these assets this district has suffered comparatively little on aqcount of famine, scarcity and drought. Eesides, this district is, perhaps. the richest in the state in cottage industries, from the points of view of both their diversity and their dimensions. Its live-stock wealth is also of considerable proportions. All these factors enable it to sustain more persons to the square mile than any other mofussil district in the state. The low density in lVIanthani Tahsil is due to the fact that by far the major portion of its area is covered by forests. The conditions in this tahsil are almost as primitive as those prevailing on the other side of the Godavari in Bastar District or in Adilabad District. It is one of the most backward tracts within ~he state.
45. Density in Warangal District.-The density in Warangal District is 194, which is considerably lower than the average for the state. But no other district of the state pr('sents such a contrast in density within its own limits. Some tracts within this district are the most sparsely populated in the state and some others the most thickly. In two tahsils, namely Mulug and Burgampahad, the density is appreciably lower than 100. These two tahsils together account for 25 per cent of the district area but only 7 per cent of its population. The density in two other tahsils, namely Paloncha and Pakhal, is below 150. These two tahsils account for 27 per cent of the district area and
.{
24
Qnly 15 per cent of its population. The density in yet another tahsil, namely Yellandu is 158. This tahsil accounts for 10 per cent of the district area and about 7 per cent -of its population. Of these five tahsils, Mulug, Burgampahad, and Palvancha are situated along the Godavari and the other two, namely Pakhal and Yellandu, occupy the central portions of the district. All these central and eastern tahsils have very extensive forests. They are poor in communications and underdeveloped industrially and commercially. They are relatively unhealthy. The density in all these five tahsils taken together is only 99. In fact, but for the working of the prosperous collieries at Kothagudam and Yellandu-situated in Palvancha and Yellandu Tahsils respectively -which have attracted a large population, both from within and outside the district, the density would have been as low as about 85.
46. As against this, all the remaining four tahsils along the western borders of the district are well populated. In two of these tahsils, namely Madhira and Mahbubabad, which together account for about 20 per cent of the district area and 26 per cent of its population, the density ranges between 200 and 300. In Khammam Tahsil,... which .accounts for 8 per cent of the district area and 15 per cent of its population, the density is as high as 898. Lastly, in Warangal Tahsil, which accounts for 10 per cent of the district area and as much as 30 per cent of its population, the density soars up to 601. This density is exceeded by that of only one other tahsil in- the state, namely Hyderabad West, which contains Hyderabad City. But if figures pertaining to Hyderabad City in Hyderabad West Tahsil and Warangal City in Warangal Tahsil are both excluded, Warangal Tahsil emerges as by far the most thickly populated tahsil in the state. The four tahsils along the western borders of the district together have a density of 878. These tahsils are studded with a large number of tanks which are well fed by an average rainfall .of about 85". These tanks-and some Government canals and a fair number of wellsenable the tahsils to grow paddy on a very extensive scale. These tahsils are also rich in live-stock wealth. They are very well served by rail and road. Warangal District is one of the most important of the mofussil districts in the state from the point of view of large scale industries. It is also one of the most urbanised districts in the state. And all its industries, except for a few saw and some stray rice mills, and all its important towns, except for the two mining towns of Kothagudam and Yellandu, are situated in the western tahsils, along the railway route. All these factors are responsible for the heavy density in the four western tahsils. The density in Warangal Tahsil is especially heavy partly because of Warangal City~the second largest urban unit in the stateand partly because of the fact that it is the best developed tahsil in the district from the points of view of irrigation, industries and commerce. And further, unlike Mahbubabad, Madhira and, to a smaller extent, Khammam, it has relatively only a small area under forest.
47. Density in N algonda District.-This district has a density of 247 persons per square mile, which is appreciably more than the average of 227 for the state. The density in this district decreases as one proceeds from its northern to its southern portions. The two tahsils of Devarkonda and Miryalguda in the south along the Krishna, which together account for 29 per cent of the district area and 19 per cent of its population, is below 200-the density in Devarkonda being only 157. The density in the remaining -tahsil of Huzurnagar in the south and of the three tahsils of Ramannapet, Nalgonda and Suryapet in the centre of the district, ranges between 200 and 300-the density in Huzurnagar being 236. These four tahsils together account for about 47 per cent of the district area and 50 per cent of its popUlation. In the two tahsils of Bhongir and
4*
25
Jangaon to the north of the district, which together account for 24 per cent of the district area and 31 per cent of its population, the density exceeds 300. The density in Jangaon is 334.
48. The average rainfall in this district is only about 26", the lowest among aU the eastern districts of the rtate. It is appreciably lower in the two southern tahsils of Devarkonda and Miryalguda. The district, particularly its south-eastern portions, is periodically affected by scarcity. In addition to this, the district is the least urbanised of all the districts in the state. Its large scale industries do not extend beyond a couple of rice and oil mills, two handloom weaving factories, an R.T.D. workshop, a tannery and a beedi factory, employing in all less than thousand persons. Its biggest agricultural market has a turnover of less than 60 lakhs. A heavy portion of its agricultural produce is diverted to Hyderabad and Warangal Cities and Khammam Town for marketing. It may be better served by roads as compared with many other districts in the state but only two of its eight tahsils are connected by rail. As against these factors, the district, like the adjoining areas, possesses a large number of tanks. These tanks, together with wells and some canals, help to irrigate about 5 percent of its total area whene, er the rainfall is not deficient. It has the smallest area under forests as compared with the other Telugu districts of the state. It is particularly suited for the cultivation of castor-it accounts for more than one third of the total state acreage under castor, and has perhaps, the largest area under the crop among all the districts in India. The district is particularly well endowed in live-stock wealth. It contains over 10 per cent of the oxen and buffaloes and 14 per cent of the sheep and goats in the state. It is fairly rich in cottage industries, particularly weaving. These factors help the district to attain the respectable density of about 250 persons to the square mile. The relatively low density in the south-eastern tahsils of Devarkonda and Miryalguda is chiefly due to the fact that they contain the major portion of the forests in the district, are relatively underdeveloped, and are frequently affected by scarcity conditions. The higher density in Bhongir and Jangaon Tahsils in the north results from the fact that they are better irrigated and aevelopedfrom the points of view of industries, commerce and communications.
·49. General Analysis regarding Variation in Density in Hyderabad State.-As will be seen from paragraphs 17 to 48 above, the density of population depends upon diverse factors. 'It is not possible to list them in the order of their importance as applicable to all tracts of the state. In fact, it is sometimes difficult to determine their relative importance even in a given tract. Prominent among these factors are (i) rainfall, including the extent ot its regularity; (ii) irrigation facilities; (iii) fe~ility of the soil; (iv) area covered by forests and hill ranges; (v) accessibility, including both (a) the proximity to the nerve centres of administration, industries and commerce and (b) the development of communications; (vi) industrialisation, covering both large and small scale industries and mining and quarrying activities; (vii) live-stock wealth; and (viii) climatic and health conditions. Many of these factors, however, are inter-related and are associated in varying degrees in different tracts.
50. The low density in the western tahsils of Raichur District is mainly the result of the scanty and irr~gular rainfall they receive. The higher density in Kodangal Tahsil as against the other tahsils of Gulbarga District, is very largely the result of better development of tf e sources of irrigation. The relatively denser population in the rural areas of Ambad Tahsil in Aurangabad District, of Gangakhed -Tahsil in. Parbhani, or
26
even Andol Tahsil in Medak, as compared with the neighbouring tahsils in the respective districts, is largely the result of the fertility of the alluvial soil along the banks of the rivers-the Manjira in case of Andol and the Godavari in the case of the other two-which flow through or along them. The 'Sparsity of population in Manthani Tahsil of Karimnagar, or Kannad Tahsil in Aurangabad, or Achampeth Tahsil in Mahbubnagar, is primarily due to extensive forests or hilly terrain or a combination of both the factors. The relatively low density in Jaffarabad Tahsil of Aurangabad is largely due to the fact that it is situated in a corner of the district, unconnected, by road or rail, with any important administrative, industrial or commercial centre, within or beyond the district. The relatively low density in Afzalpur Tahsil is,to an extent, due to the absence of large ()f small scale industries in the tahsil and the comparatively respectable density in Chitapur Tahsil-both of which are in Gulbarga District-is, among other factors, due to the cement factory and the stone quarries in the tahsil. One of the factors contributing to the present density in Mahbubnagar District, as a whole, is its wealth in live-stock, which sustains not, only the population breeding the live-stock but also those engaged in subsidiary cottage industries connected with them. Similarly, the fair densities attained in the plateau regions of Bidar District is to an extent due to their salubrious climate. In tahsils like those of Warangal, Huzurabad, Karimnagar, Bodhan and Nanded, where many of the factors favourable to human sustenance are combined to a remarkable extent, the density soars up considerably.
51. The most sparsely populated zone in the state as a whole, is its extreme eastern portion running along the Penganga, the Wardha, the Pranahita and later on the Godavari. This zone covers the whole of Adilabad District with the exception of Ni 'mal 'Tahsil, Manthani Tahsil of Karimnagar, and all the tahsils of Warangal District except its four exV'me western tahsils of Madhira, Khammam, Mahbubabad and Warangal. This zone of the state receives the highest rainfall, is covered by extensive forests and traversed by many hill ranges. It is poor in communications and cottage industries and, except for some nascent industries in Adilabad District and the coal fields both in Adilabad and Warangal Districts, is economically underdeveloped. This region is inhabited by the most backward of the people in this state.
52. Strangely, the most thickly populated zone in this state adjoins the most sparsely populated one described in the preceding paragraph. This populous zone consists of an almost rectangulat area stretching to the south of the Godavari, with its base starting from the place where the districts of Karimnagar and Nizamabad meet and terminating at the confluence of the Maner with the Godavari. This rectangle projects downwards, across the Maner, right up to the Musi and consists of the tahsils of Metpalli, Jagtial, Sultanabad, Sirsilla, Karimnagar and Huzurabad, all in Karimnagar District; Siddipet and Gajwel in Medak District; Bhongir and Jangaon in Nalgonda District; and Warangal in Warangal District. The lowest density in this tract is 301 in Jagtial and the highest is 601 in Warangal. The average density in these 11 tahsi'ls taken together exceeds 375. This tract, as a whole, is the best developed area in the state from the point of view of irrigation and (ottage industries. It is well watered by many streams and rivers and contains a very small area under forests as compared with the other Telugu areas. They receive ~n average rainfall of about 35" which is the least capricious in the state. Apart from the tahsils in this zone, only Nizamabad and Bodhan Tahsils in Nizamabad District, Nanded Tahsil in Nanded District, Bidar Tahsil in Bidar District, Kodangal Tahsil in Gulbarga District, Mahbubnagar Tahsil in Mahbubnagar District, Khammam Tahsil in Warangal District, Andol and Sangareddy Tahsils in Medak
27
District and Hyderabad West and East Tahsils in Hyderabad District, have a density ,exceeding 300. Yet another noticeable feature of density in this state is the fact that, with a few exceptions, all the 53 tahsils of this state which lie along its borders are very thinly populat<:d. The density in these bordering tahsils taken all together is 161 as against that of 275 in the interior tahsils.
Summary:-The average population per district in this state was 1,165,944, the most populous district being Karimnagar with 1,581,667 persons, or 8.5 per cent of the total population, and the least populous being Nizamabad with 773,158 persons, or 4.1 per cent of the total population. The average population per tahsil in the state was 135,182, the most populous tahsil being Hyderabad West (which includes Hyderabad City) with 1,166,860 persons and the least populous being Khuldabad with 33,247 persons. But due to the recent territorial changes, the average population per district and tahsil in this state has been reduced to 1,097,359 and 134,209 respectively. The most populous district is now Hyderabad with 1,511,336 persons, or 8.1 per cent of the total population, and the least populous is the newly created district of Khammam with 700,006 persons, or 3.8 per cent of the total population. The average population per district in this state is less than in most of the Part A states, including the adjoining states of Bombay and Madras, but more than in most of the Part B states. The average tahsil population in this state is less than in the adjoining ,districts of Madhya Pradesh or Madras State but more than in those of Bombay State.
The density in Hyderabad State is 227, which is appreciably lower than in the country as a whole. But the more densely populated of the Indian States are mostly those which are situated in the rich coastal or Indo-Gangetic zones of the country. Similarly, this State has a considerably lower density than most of the industrially advanced countries in the old hemisphere but a markedly heavier density than all countries of the world with comparable populations, many of which are, incidentally, almost as backward industrially ,as this state is. .
Among the eight eastern, i.e., the Telugu districts of the state, the whole of Medak District; Nizamabad District with the exception of Yellareddy Tahsil; Karimnagar District with the exception of Manthani Tahsil; Nalgonda District with the exception of its south-western tahsils of Devarkonda and Miryalguda; Mahbubnagar District with the exception of its south-eastern tahsils of Kalvakurti, Kollapur and Achampet; Hyderabad District with the exception of its southern tahsil of Ibrahimpatnam; the western most tahsils of Warangal, Mahbubabad, Khammam and Madhira in Warangal District; and lastly, Nirmal Tahsil of Adilabad District are all well populated, the density nowhere falling below 200. The heavy density in this area is due to various factors such as the receipt of a moderate rainfall of about 30-35" which is the least .capricious in the state, relatively well developed sources of irrigation and communications, variety and extent of cottage industries, a proportionately heavy share of the live-stock wealth of the state and the location of the capital, which has developed into the fifth largest urban unit in the country, within the area. Within this zone, the block comprising the western portions of Karimnagar District, eastern portions of Medak District and extreme northern portions of Nalgonda District and north-western portions of Warangal District, is very thickly populated, with the density ranging from 301 in Jagtiyal Tahsil of Karimnagar District to {)01 in Wara:ngal Tahsil of Warangal District. The density is very high in this block because most of the factors mentioned above apply to it to a greater degree. But within these eight eastern districts, the extreme eastern tracts along the Penganga, Wardha, Pranahita and Godavari Rivers in Adilabad, Karimnagar and Warangal Districts are very thinly populated-the highest density in this zone is 175 in Adilabad Tahsil and the lowest is 41 in Utnoor Tahsil, both of which are in Adilabad District-because of factors like large areas under forests, unhealthy climatic conditions including a heavy incidence of Malaria, Small-pox, etc., relative inaccessibility and undeveloped communications, paucity of small scale industries, and remoteness from important urban centres. The density is low in Yellareddy Tahsil of Nizamabad District and in Ibrahimpatnam Tahsil of Hyderabad District and the adjoining south-eastern portions of Mahbubnagar and south-western portions of Nalgonda District mainly because of relatively large areas covered with forests and traversed by hill ranges. Scanty and irregular rainfall is, however, the major factor for the low density in the south western tracts of Nalgonda District.
Among the eight western, i.e., the predominantly Marathi and Kannada districts of the state, three, almost distinct zones are thinly populated. They are (i) the extreme northern tracts comprising the tahsils of Kannad, Sillod, Bhokardhan and Jaffarabad, all in Aurangabad District; Partur, Jintur, Hingoli and Kalamnuri, all in Parbhani District; and Hadgaon and Bhokar in Nanded District; and (ii) the extreme western tracts of the state comprising the tahsils of Vaijapur, Gangapur, Paithan and Ambad, all in Aurangabad District, Bhir District excluding its tahsils of Bhir and Mominabad, Parenda, Bhoom and Tuljapur Tahsils
28
in Osmanabad District, Aland, Afzalpur, Andola Shahpur and Shorapur TahsiIs, all in Gulbarga District and the whole of Raichur District excluding its tahsils of Koppal, Raichur and Gadwal; and lastly (iii) the tahsil of Chincholi in Gulbarga. District. The low density in the extreme northern tracts is the result of various factors like hilly terrain, soil erosion, paucity of large and small scale industries, and under developed communications. In the extreme western tracts, especially in the western tahsils of Raichur District, it is chiefly due to scanty and irregular rainfall and limited sources of irrigation. In this area, the lack of any means of sustenance, other than cultivation and undeveloped communications are also important factors leading to the low density in some tahsils, especially in Afzalpur and Andola of Gulbarga District. The low density in the tahsil of Chincholi in the same district is largely due to its comparatively hilly terrain and extensive forests and backwardness from the points of view of communications, industries and commerce.
The remaining areas of the eight western districts are well populated though, except for Bidar and Nanded Tahsils and Kodangal Tahsil in Gulbarga District, they are nowhere thickly populated. This is due to various factors. For example, Aurangabad and Jalna Tahsils in Aurangabad District, Latur Tahsil of Osmanabad District, Gulbarga Tahsil in Gulbarga District and Raichur Tahsil in Raichur District owe their relatively heavy density very largely to the fact that they contain important towns of the state. The present density in Koppal Tahsil of Raichur District and, to a considerably smaller extent, in Bhir Tahsil of Bhir District is due to irrigation projects under construction. Chitapur Tahsil in Gulbarga District owes its present density mainly to a large cement factory and some quarrying activities. Among the factors leading to the relatively heavy density in the southern tahsils of Parbhani and Nanded Districts are better development of large scale industries and communications and greater fertility of the soil due to the alluvium deposits along the Godavari and its tributaries. Similarly, one of the factors leading to the relatively heavy density in Mominabad Tahsil of Bhir District and in Bidar District is their salubrious climate. Again, the higher density in the eastern Telugu tahsils of Bidar, Gulbarga and Raichur Districts is chiefly due to heavier rainfall and greater development of irrigation resources and cottage industries.
SECTION III
GROWTH
(The table8 relevant to this Section are Main Table 'A-Il--Variation in Population during Fifty Year,' at page 70/ Part II-A and Subsidiary Table '1.2-Variation and Density of General Population' at page 8 of Parll·B oJ thi, Volume).
53. Factors affecting Growth.-Territorial changes, scale of immigration and emigration and the rate of natural increase, are the three factors which affect the variation in the population of any state from census to census. This is of course subject to the basic presumption that the population count has been reasonably accurate at each one of the concerned censuses. But there are sufficient reasons to believe that in this state at any rate, there have been many lapses at the earlier enumerations, especially in some of its former feudatory jagirs* and in the forest areas along its borders. Not only individuals or individual households but even entire villages were left unenumerated. And again, it is not correct to presume, as is often done, that the position in this re,Q'ard has consistently improved from census to census. The co-operation extended by the citizens; the presence, or the absence, of communal, political and liJ)..Q'uistic rivalries; the efficiency of the census enumeration and tabulation machinery; and the relative importance attached to census by Government and the other organisations involved, are all matters which affect the final census results and all these have not necessarily improved from census to census. There have been setbacks in between. No attempt was made in the past, as done at the present census, to make a scientific, or any kind of, appraisal of the degree of error present in the popUlation count. It was taken for granted that under-enumeration and over-enumeration would just cancel each other. As indicated elsewhere, in spite of the unprecedented precautions taken and safeguards adopted during the present census, the Sample Verification of its count has revealed an under-enumeration ranging between 0.30 and 0.77 per cent of the enumerated household population. Unfortunately, it is not possible now to assess the degree of error that was present in each of the earlier censuses, and, thereafter, to arrive at a precise estimate of the growth of population from census to census. This is one of the drawbacks which can neither be rectified nor ignored altogether.
54. Territorial Changes.-In so far as the first factor, namely territorial changes, is concerned, there was no change in the territories constituting Hyderabad state, from 1881, i.e., the year when the first census of the State was taken, right up to the end of 1949. But in January, 1950, with a view to rationalise the boundaries of Indian States, certain enclave villages were exchanged between Hyderabad State on the one hand and the states of Bombay or Madras on the othert. The total population of the villafYes transferred from Hyderabad State, as recorded at the 1941 Census, was 86,289 and the correspondin,Q' population of the villages transferred to Hyderabad was 74,874. Thus,
"'At all the previous censuses, quite a few of the feudatory estates including the vast 'Crown' lterritories had their own independent enumerating organisations. ,
tThe details of this exchange of villages are given in paragmph 4 or the flyleaf to Table A-II at page 8 of Pal'L II-A of this Volume.
29
30
the population of this state (as based on 1941 figur('s) decreased by 11,415, or only 0.07 per cent, because of the exchange of the enclave villages. This loss, therefore, does not materially alter the figures as recorded at the earlier censuses. Besides, the population figures pertaining to all the previous censuses-except the 1881 and 1891 Censuses-given in this Section are as adjusted to conform to these territorial changes.
55. Migration.--As regards the second factor, namely the scale of immigration and emigration, the subject has been dealt with in detail in Section IV of this Chapter. It would, however, be relevant to point out here that the total number of (i) persons who were born in all areas beyond the state but were enumerated within its limits, i.e., of all immigrants in the State, and (ii) of persons who were born within the state hut were enumerated in other parts of India, i.e., of Hyderabad emig-rants in the rest of India* was about 7 .7lakhs in 1891, 6.2 in 1901,5.7 in both 1911 and 1921,5.8 in 1981-complete figures are not available for 1941-and as much as about 9.7 lakhs in 1951. ln 1891, these emigrants and immigrants were almost equally balanced--the former exceeding the latter by only 822. Thus, the movement during the decade 1881-1891 did not really affect the popUlation of the state. In 1901, the immigrants exceeded the emigrants increasing the popUlation of the state by 28,906. Since then, the emigrants have always been more numerous than the immigrants, with the result that the state lost, on the whole, 46,134 persons in 1911, 162,109 in 1921, 87,051 in 1931 and 158,933-in 1951. These figures, however, do not take into account the number of Hyderabad emigrants, residing in foreign countries. There is no doubt that the numb~r of such emigrants during the preceding censuses _ was almost microscopic. But because of the events which followed the cr(ation of Pakistan, the number of such emigrants can 'not now be deemed to be negligible. In ViEW of this, the actual loss in 1951 is bound to have been considerably larger than in any of the precedi:rg'census years. There are some demcgraphers who think that emigration does not affect growth. They assert that but for such emigration mortality would increase and, therefore, the growth would be affected adversely, either way. But under the existing conditions, there are no reasons tn presume that this would have happened in Hyderabad State.
56. Natural lncrease.-The rate of natural increase is by far the predominant factor influencing the growth of population in so far as Hyderabad State as a whole is concerned. But, as indicated in detail in Section V of this Chapter, both natality or mortality are so poorly recorded in the state that the relevant figures cannot bear any statistical analysis. It is, however, very obvious that, as expressed by Kingsley Davis, 'the accelerating growth of the Indian population has as its immediate cause the increasing spread between a declining mortality on the one hand and a less rapidly declining futility on the other'. In the earlier decades, epidemics and famines took a heavy toll of life and left many of the survivors too weak to withstand subsequent travails. Lack of communications and transport facilities hindered the extension of timely aid. In fact, vast areas in the state used to be rendered inaccessible during' the rains. Besides, the Government machinery was ill-equipped to control such outb1 eaks or even to localise them. Superstitions and prejudices against the adoption of both preventive and curative measures aggravated the hard~hips and disasters. As a~rainst this, outbreaks of both epidemics and famines are now easily controlled and localised and amdiorati~ measures are adopted in time to minimise mortality and even migration. A consider[ b' e pOl tion of th,e population is sufficiently enlightened, if not educated, to take full advantage of the facilities extended by the Public Healtli Department. For example, during the period September *The number of Hyderabad emigrants beyond India il not available.
81
1948 to March 1950, the Public Health Department carried out 2,247,703 vaccinations and re-vaccinations as well as 673,247 and 1,889,212 inoculations against cholera and plague respectively. Besides, during- this decade, the Governmf'nt machinery, accustomed as it was to the procurement and rationing of foodgrains, was much better equipped to rush supplies in case of scarcity. As a result, famines and epidemics no longer exact the heavy toll in terms of human lives as they used to in the earlier decades. Mortality has also been reduced, especially in urban areas, because of the greater attention paid to sanitation and allied matters. Better care is now taken.of expectant mothers and infants; At any rate, some of the old prejudices and I?ractices which directly increased their death-~te are disappearing at an astonishing speed. All this does not imply that we have made up for the negligence of centuries. Much yet remains to be done. But there is no denying the fact that some marked progress has been achieved in this direction during the recent years. As against this, fertility is not decreasing in an equally marked manner. There is no doubt that few people nowwhether among the rich or the poor or in towns or villages-- relish the idea of a large family. But the only development which has in actual practice tended to limit fertility to an appreeiablc extent is the marked postponement of the marriage age both among the males and the females. But the limitations of the size of family by actual planning is as yet restricted to a microscopic minority even among the educated. As against this, a childless marrir gc still continues to be abhorred. The common man still views procreation as one of the primary justifications for a marital alliance, except that he now trusts-and perhaps also prays-that there would only be a few and not many issues.
57. An attempt is made in the succeeding paragraphs to give a brief review of the agricultural and public health conditions and other aspects of life which have a bearing on both the natural growth of population and the movement of people. But lack of relia ble data and also space are serious handicaps to the review : No attempt has been made to deal with figures which cannot give a comparative idea of conditions existing in different years. For example, though it has been the practice in some of the census reports in India to indicate comparative prices of agricultural commodities from year to year (or decade to decade), such prices have not been included in this Report. Apart from the ~oundness of the manner in which such prices are, or were collected, they convey no meaning unless they can also be correlated with other data like average earnings of an individual, etc.
58'. The Decade 1881~1891.--During this decade seasonal conditions seem to have been particularly unfavourable in the year 1890 in parts of the southern districts of the state. There were also outbreaks of cholera and other epidemic diseases during these ten years in various portions of the state, especially in Nanded District. But in spite -of all these, the decennium seems to have been a fairly prosperous one for the state as a whole from the point of view of both agricultural and health conditions. Marked progress was also achieved in the extension of communications, both in respect of road and railway mileage. The bro!ld gauge line from Wadi to Secunderabad was extended upto Warangal in 1886, upto Dornakal in 1888, and upto Bezwada in 1889. A branch line from Dornakal to Yellandu was also opened for traffic in 1888. Two textile mills were set up in the state, one at Gulbarga in 1886 and the other at Aurangabad in 1889. The collieries at Yellandu, which have since come to play an important part in the development of Warangal District, started operations in 1886 . .....
59. The Decade 1891-1901.-This decade seems to have been particularly depressing for the state. The rainfall was below normal for the majority of the years in the
32
decennium. It was as low as 15.5 inches in the year 1899. In as many as eight out of the ten years, the seasonal and crop conditions were unfavourable necessitating the remission of land revenue on a large scale--the remission in one year exceeded 68 lakhs of rupees, which was a considerable sum considering the then existing resources of the state. During the decennium, the scarcity and distress, which was first felt in 1894, was almost continuous from 1897 " till the middle of 1898 and then came the great famine of 1900." This famine seriously affected one-third of the total area of the state. An idea of its immensity could be had from the fact that during the year 1900, Government. incurred an expenditure exceeding two. crores of rupees in relieving the distress. The maximum number of 'units' relieved was" 440,507 on 4th August, 1900, dis"ibuted between 345,040 on relief works and 95,467 in poor houses." And it is by no means certain that the relief covered all the affected persons or even areas. The districts which suffered heavily during the decade were Aurangabad, Bhir, Parbhani, Osrnanabad,. Nanded and Bidar.
60. The decade was almost equally disastrous from the point of view of publichealth. Cholera of a very virulent type broke out in 1900 and claimed tens of thousands of victims from a population already in the clutches of the Great Famine. It is almost certain that small-pox, malaria, dysentery, etc., must have also exacted a heavy toll. The first recorded epidemic of plague in the state also broke out during this decadei.e., in 1897. Starting from Ambad in Aurangabad District, it spread all over the extreme western tracts of the state, claiming 2,760 victims, as officially recorded, in Osmanabad District alone. The only relieving feature of the decade seems to have been the construction of the Hyderabad-Godavari railway line, 391 miles in all, from Hyderabad City to Manmad. But the state started deriving the full benefits of this important line only in the succeeding decade.
61. The Decade 1901-1911.-This decade is generally supposed to have been' a period of agricultural prosperity.' Its worst handicap in this respect seems to have been deficient rainfall in two years and some floods* in yet another. From the point of view 6f public health also the decade is reputed to have been a considerable improvement over the previous one. But from present day stanp.ards it can hardly be construed as being very satisfactory. Official records indicate roughly 120,000 deaths from plague alone during the decade. The epidemic was particularly severe in the years 1902, 1903-and 1904 and the districts that suffered most were Aurangabad, Osmanabad, Gulbarga, Bidar, Bhir, Parbhani and Raichur. Cholera also seems to have been prevalent in different portions of the state throughout the decade, being rather severe in 1901, 1903" 1904 and 1905. Small-pox and other communicable diseases must have also levied their toll. In spite of this, there must be some truth in the assertion that the famine of the earlier decade had wiped off ' the weak and the worn, the very young and the very old' and that' those who were left were the more virile both as regards fecundity and resistance to the influences tending to death.' -
62. The decade was also characterised by noticeable achievements in the development of the state. The Hyderabad-Godavari Railway line completed in 1900 opened the cotton growing districts of Nanded, Parbhani and Aurangabad and the paddy growing districts of Nizamabad and Medak for railway traffic, linking the north-western and central portions of the state with both Bombay and Hyderabad Cities. This stimulated
" • The Musi floods occurred in 1908.

88
trade to a considerable extent and led to the establishment of a large number of ginning and pressing factories, and some rice mills as well, along the railway route. Latur Town was linked with the Barsi Light Railway about the end of this decade, thus leading to its subsequent growth as one of the most important of the commercial towns in the state. Appreciable progress was also attained in the construction of new irrigation projects, 'or the restoration of old tanks, in the districts of Nalgonda, Waranga! and Medak.
68. The Decade 1911~1921.-This decade is the worst in many respects in living memory. The seasonal conditions during this decennium were very depressing. In seven out of the ten years rainfall was either deficient or irregular. There were heavy rains towards the end of 1910~1911, damaging some crops, especially cotton. The rainfall was scanty in 1911~12 appreciably reducing agricultural production. The deficiency continued in the succeeding year, namely in 1912~13, in the western and northern districts of the state, leading to scarcity and a rather severe fodder famine. During the next three agricultural years, however, the rainfall was both above normal and wen distributed and agricultural production was quite satisfactory. But conditions changed abruptly from the year 1916-17 onwards. During this year, heavy and un seasonal rains affected the Kharif and deficient rains the Rabi crops. The prices of all commodi~ ties started shooting up. In the following year, namely in 1917-18, excessive and unti~ mely rains again seriously affected agricultural production. The prices of food grains soared to rates even higher than those prevailing during the great famine of 1899-1900. The long drawn distress reached its climax in the year 1918-19, when both the south~ west and the north-east monsoons failed to develop, seriously affecting the production of both food and cash crops. The resulting famine, 'both in its extent and severity, was comparable with that of the Great Famine of 1899-1900. Relief works were provided in roughly one-third of the area of the state, employing on an average 85~000 persons a day. Land Revenue to the extent of over seventy lakhs of rupees had to be remitted .. As in the great famine of 1900~ the western districts were the worst affected. During the following year, namely 1919-20, conditions improved slightly though even during this year, the rainfall was relatively scanty and irregular.
64. From the point of view of public health, the decade is still a nightmare to those who were fortunate enough to survive its onslaughts. It was characterised by repeated outbreaks of epidemics on a scale almost unprecedented in recent times. 9fficial records indicate that in all about twolakhs of persons died of plague in the state during this d~cade. Plague broke out in an epidemic form in Hyderabad City for the first time in 1911 taking atoll of about 16,000 lives before it subsided. A subsequent outbreak in 1916~17 was almost equally disastrous to the city. Cholera again made its appearance in many areas of the state and caused more than 42,000 deaths. Malaria also took a very heavy toll of lives and left thousands more, weak and emaciated. But considerably more disastrous than all these was the influenza epidemic of 1918-19 which claimed more than three and a half lakhs of victims. It is popularly said that during this year not a single-hearth escaped unscathed.
65. The Great World War of 1914~18 aggravated the situation though the country was at no time near the theatre of operations. It left unsold a fair portion of the cotton and oil seeds produced during the favourable year of 1914-15. It increased the dearness 'of many commodities and prevented the import and consequently the distribution of supplies to the deficit areas in subsequent years. It may make unhappy reading to feel that a country profits by war anywhere. But it is a fact that the first world war had

very few of the redeeming features which characterised the second world war in so far as, this state is concerned. Bhir and Aurangabad Districts and Hyderabad City were the worst to suffer from the various calamities of the decade. During this decennium the state also lost iI]. all by migration over a lakh and sixty thousand persons. Perhaps the loss would have been even more marked but for the opening of the Purna-Hingoli Railway line in 1912 and the Secunderabad-Mahbubnagar line in 1916 ; the construction of Osmansagar Project (which was completed in 1919), the Himayatsagar Project (which was, however, compl~ted during the succeeding decade) and various small irrigation works; the laying down of over 300 miles of new roads; and the establishment of many new cotton ginning and pressing factories and flour and rice mills in the state.
66. The Decade 1921-1931.-From the point of view of agricultural conditions the decade was on the whole fairly satisfactory, though the rainfall during its first year, namely in 1921, was only about 15 inches-probably the lowest on record during the current century-and portions of the state were adversely affected during certain of the remaining years as well. In 1921, the districts of Aurangabad and Bhir and, more particularly, portions of all the Telugu districts-except Hydtrabad, Nizamabad and Adilabad-were adversely affected due to scanty rainfall. But the scarcity, if any, during the subsequent years was considerably limited in extent. Conditions were not quite satisfactory in portions of Mahbubnagar District in 1923; of Bhir in 1928 ; of Karimnagar and Medak in 1929 and 1930; of Osmanabad'in 1923, 1928 and 1930; of Gulbarga in 1923, 1924 and 1930; and of Nalgonda in 1923, 1927, 1929 and 1930, the scarcity in 1927 being particularly marked. But the worst affected district during the decade was Raichur. Conditions were not quite favourable in this district during the years 1923, 1924, 1927, 1928, 1929 and 1930. Things were especially bad during 1924 and 1927 when relief works had to be opened. But, as stated earlier, the decadc was fairly prosperous for the state as a whole from the agricultural point of view. The districts of Aurangabad and Bhir, which had suffered most from famines and epidemics during the previous decade, had a long speJl of favourable seasons, which helped in completely healing the wounds they had received earlier.
67. Compared with the preceding decade when influenza, plague, cholera and malaria had ravaged the whole country claiming lakhs of victims and emaciating many more, the decade 1921-31 seems to have been remarkably healthy. But even during this decade" over 42,000 deaths were officially recorded as resulting from cholera. The western districts of the state, as usual, and the districts of Medak and Nizamabad were particUlarly affected by this epidemic. Plague also levied a heavy toll especially in Osmanabad and, to a slightly smaller extent, in the other western districts. It claimed
. as many as 24,219 victims in Hyderabad City in the year '1921. But mortality from small-pox seems to have diminished appreciably due chiefly to considerably increased number of vaccinations.
68. Appreciable progress was also recorded during this decade in the expansion of irrigation facilities. In l\1edak District, the Pocharam, Fateh Naher and Ravanpally Projects, which are designed in ::),11 to irrigate about 20,000 acres, were constructed. In Warangal District, the Palair Project, designed to irrigate about 20,000 acres was completed and the ancient Pakhal lake, capable of irrigating about 7,000 acres, was restored. In Nizamabad District, the Nizamsagar Project, designed to irrigate about 2.75 lakhs of acres, was also completed at the end of the decade, though irrigation under the project actually started in the succeeding decade. In Hyderabad District, the large Himayat
35
Sagar Tank which is, however, primarily a flood protecting and water supply project was also completed. The progress achieved during these ten ymrs in the extension of communications was even more marked. The railway route was extended by about 310 miles. The Kazipet-Balharshah line, opened in 1929, linked for tlie first time the districts of Karimnagar and Adilabad with the railway system in the country and simultaneously connected the state with Madhya Pradesh. The Parbhani-Parli and Vikarabad-Bidar lines opened two more districts of the state, namely Bhir and Bidar, for railway traffic. The Karepalli-Kothagudem line fed the newly opened coal fields in Warangal District. The completion of the Secunderabad-Dronachallem line, linking Mahbubnagar District as well as Gadwal and Alampur Tahsils of Raichur District by rail with Madras State was of great importance in the development of these two districts. About 1,456 miles of new roads were also constructed during the decade, over 200 of which were in Adilabad District. Two important road bridges were built across the Godavari, one at Son near Nirmal Town and the other near Nanded Town. The progress attained during this period in the industrial sphere was also not insignificant. The most important achievement in this direction was the establishment of two large textile mills, one at Nanded and the other at Hyderabad City and a cement factory at Shahabad. During this period, in spite of the general economic depression during its closing years, the total value of import and export trade increased from 27 to 39 crores of rupees. As compared with the figures of the preceding census immigrants increased by about 45,000 and emigrants decreased by about 30,000.
69. The Decade 1931-1941.-The agricultural conditions during this decade as a whole, seem to have been fairly satisfactory in the state, except again in Raichur and,. to a smaller extent, Osmanabad and Karimnagar Districts. Scarcity conditions prevailed in some part or the other of Raichur District in nine out of the ten years of the decade, necessitating suspension and remission of land revenue, opening of relief works, etc. Conditions were particularly bad in 1938, when due to deficient rainfall the Kharif crop was poor, and the Rabi crop a complete failure in the central portions of the district. Conditions were none too happy in Osmanabad District. According to a publication of the Revenue Board" remission of land revenue became necessary in the years from 1931 .. 35. In 1937 the taluqs of Parenda and Kalam experienced scarcity conditions. In 1938 relief had to be given to Parenda, Kalam, Osmanabad, Latur and Tuljapur, in fact the whole of the district. Similarly, relief works in 1939, were started in Latur, Tuljapur and Parenda. This was extended in the year 1940". In 1938-39 almost the whole of Karimnagar District was badly affected and various relief measures had to be taken to alleviate the distress. Besides these three districts, the western and, to a, smaller extent, the central portions of Bhir District were affected by scarcity conditions in 1936 and 1939, and conditions were not satisfactory in the south-western portions of the districts of Gulbarga in 1938, of Nalgonda in 1933, 1939 and 1940 and of Aurangabad in 1935.
70. Public healt,h seems to have improved considerably as compared with the conditions prevailing during the previous decade. From a diagram appended in the report of the Public Health Department for 1350 Fasli, the mean annual mortality during the period 1931-40 seems to have been 8,232 from cholera, 5,220 from plague and 3,973 from small pox. Cholera was particularly virulent during 1938-4;,0. It accounted for 16,335 deaths in 1940. Plague claimed n;038 victims in 1933 and 14,529 in 1934. But, unlike in the preceding two decades it was not very much in evidence in Hyderabad City. Small pox was particularly virulent in 1935, when it caused 18,549 deaths. During
5
36
the decade, the districts of Parbhani, Aurangabad and Adilabad seem to have suffered most from cholera, the districts of Osmanabad, Gulbarga and Raichur from plague and N algonda and Medak from small pox.
71. Appreciable progress was recorded during the decade in various directions. Irrigation under the Nizamsagar Project which was completed about the end of the preceding decade~ WaS started in the early part of this decade and was fairly well developed at its close. The achievements in the extension of irrigation facilities included the completion of the Wyra Project and the restoration of Singabhupalam Tank in Warangal District and the completion of the Pendli Pakala Project in Nalgonda District, the Boyalmerchaid Project in Raichur District and the Rooty Project in Bhir District. The area , proposed to be irrigated' under all these projects excc::ded 3 lakhs of acres.
72. Marked progress was also attained during 1931-41 in the extension of communications. Reviewing the work done during the decennium ending with 31st March, 1940, the General Manager of the Nizam's State Railway stated that "during this decade, 122 miles of new railway have been added and another 101 miles are under construction. Of the new lines opened no miles serve the fertile Manjira valley in the western part of the State and 12 miles serve the recently constructed sugar factory at Bodhan which is a centre for the sugarcane area being developed by the Nizamsagar irrigation project. The 101 miles under construction will serve to tap the hitherto undeveloped extensive mineral, forest and agricultural resources of the Adilabad District, particularly along the Penganga valley. Road transport services have been undertaken by the Railway and 4,08.2 miles of road are now being operated by the State Railway Road Transport Department with an up-to-date fleet of buses and lorries totalling 347 vehicles. Air transport has been inaugurated in the State, adequate mulki personnel has been trained in the operation and maintenance of aircraft, charter flights are undertaken, an up-todate aerodrome has been built and equipped and experiments are being carried on with commercial air services". At the end of March, 1941, the route mileage of Road Transport Services had been further extended by 104 miles. Some progress was also recorded in the extension of the road mileage maintained by the Public Works Department. The most notable achievement in this direction was the construction of a bridge across the Krishna linking :Mahbubnagar with Raichur District. This is now one of the very important bridges in the road system of the state. During these ten years, construction of new buildings, official as well as private, was pushed through with great vigour and on an almost unprecedented scale. Hundreds and thousands of structures were constructed in and around the capital city and to a considerably smaller extent in the mofussil towns. The most important building completed during the decade was the Arts College of the Osmania University.
73. At the beginning of the decade 1931-41, the state was still in the clutches of the general trade depression, but when it ended, in common with the other parts of India, it had started benefiting from the war boom. In 1341 Fasli (1931-32), the balance o( trade was markedly against the state, imports amounting to 13 and the exports to 10 crores. But in 1350 Fasli (1940-41), the value of imports had risen to about 17 crores and that of exports stilI higher to about 18 crores. The balance of trade was definitely in favour of the state. Both large and small scale industries recorded appreciable progress during the period and secured orders for the manufacture of various categories of war material, ranging from gun carriage components to Kambals. The more notable of the additions to the large industrial establishments in the state wet"e a sugar factory at
5*
37
Bodhan Town and a textile mill at Warangal City. The number of industrial establishments subject to the Factories Act rose from 469 in 1930-31 to 610 in 1939-40.
74. Agricultural conditions during 1941-1951.-Unfortunately the manner in which agricultural statistics-covering not only production but also acreages-have hitherto been maintained in the state can hardly be termed scientific. Apart from the technical soundness, or otherwise, of the methods in vogue, the instructions issued in respect of the determination of acreages and yields under different crops were not followed uniformly in all areas of the state. In fact, in some of the J agir areas no honest attempt was ever made to implement them. And further, as a result of the levy and procurement of food grains, the restrictions on the acreage under cash crops, and other measures adopted to cope with food shortages or war and post-war requirements, agricultural statistics began to be deliberately distorted by the primary reporting agencies to suit their own ulterior ends. In the year 1950, a committee was appointed by the Government to investigate and report, among other things, on the reasons for the increase in the fallow lands in the state as revealed by the agricultural statistics pertaining to the later half of the decade 1940-50. This committee was of the view that!-
(i) Before the promulgation of the Food Grains Levy Order in 1944, entire survey numbers of dry lands used to be recorded by the reporting agencies as cultivated, even if portions of such lands had been left fallow. This made no difference to the cultivators as their liability in respect of payment of the land reven~e was not affected.
(ii) But, after the promulgation of the Food Grains Levy Order in 1944, allowances were made by the reporting agencies for the uncultivated portions of such survey numbers, as otherwise the cultivators would have had to meet a levy demand beyond what the actual area cultivated by them warranted.
(iii) After the promulgation of the Cash Crops Restriction Order in 1944, wherever cash crops were grown beyond the limits specified in the Order, there was a tendency -with a view to escape from the penalties prescribed under the Order-to indicate the area sown with cash crops as having been left fallow. Thus~ the committee felt that the earlier figures were exaggerated and the subsequent figures were underrated. Besides, the tahsil authorities were so hard pressed by Government* for the early despatch of returns during each season that they were more particvlar about sending some returns in time to the higher authorities rather than about satisfying themselves that each and everyone of the villages within their respective tahsils had been accounted for in the returns. Neither did the Statistics Department, which tabulated the returns for the state, take any measures subsequently to check up the coverage or at least make due allowances for all the non-reporting villages. Even normally, obtaining a complete coverage in this state, as it then existed with its myriad Jagirs and other Illaqas each with its own independent Revenue Administration, was not an easy affair. Apart from all these limitations which are applicable only to the area under cultivation, the estimation of agricultural production during 1941-51 and the earlier decades was even more irregular, based on obsolete methods and highly undependable. Besides, due to the levy demands and the restrictions imposed by the Supply Department, it was in the interests of both the cultivators and the tahsil . authorities (including the' Patwaris) to under-estimate production as far as possible. In view of all this, the agricultural statistics pertaining to 1941-51 and the earlier decades are not reliable enough to estimate the progress, or retrogression, recorded in agricultural production from decennium to decennium. *The Government, in turn, was anxious to have these returns early in order to frame its food policy in time for each agricultural year or season.
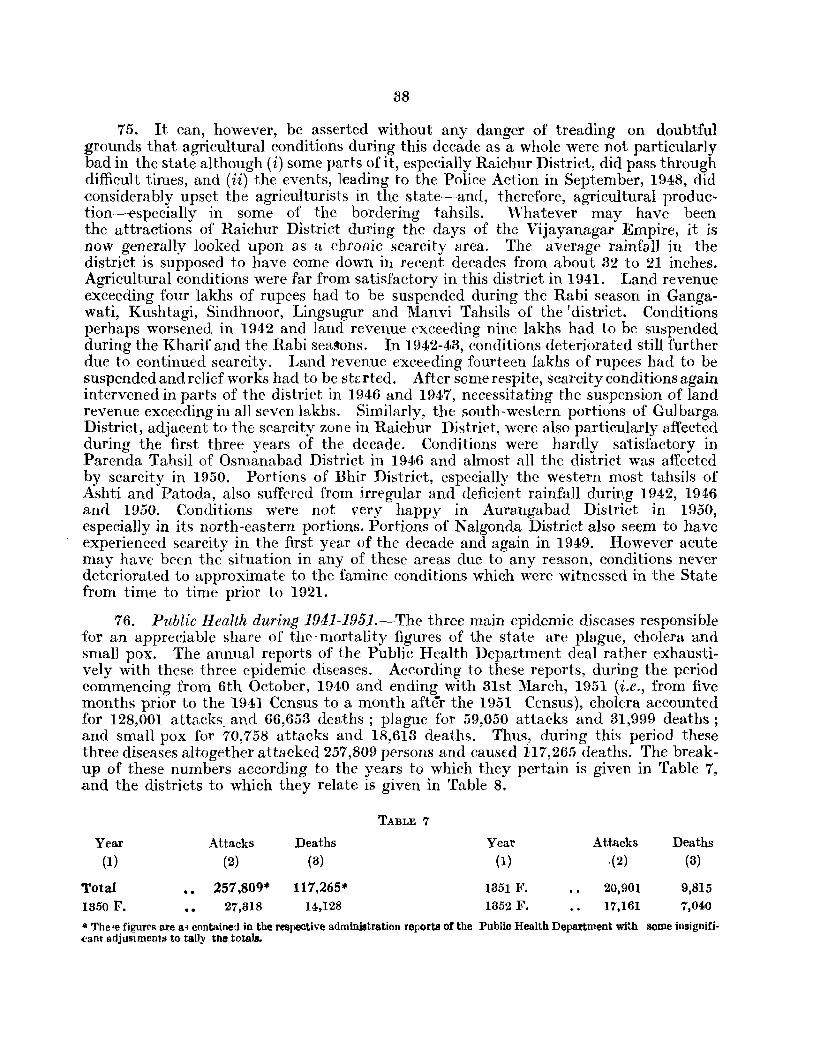
88
75. It can, however, be asserted without any danger of treading on doubtful grounds that agricultural conditions during this decade as a whole were not particularly bad in the state although (i) some parts of it, especially Raichur District, did pass through difficult times, and (ii) the events, leading to the Police Action in September, 1948, did ,considerably upset the agriculturists in the state-and, therefore, agricultural produc~ tion-especially in some of the bordering tahsils. \;Vhatever may have been the attractions of Raichur District during the days of the Vijayanagar Empire, it is now generally looked upon as a chronic scarcity area. The average rainfall in the district is supposed to have come down ill recent decades from about 32 to 21 inches. Agricultural conditions were far from satisfactory in this district in 1941. Land revenue exceeding four lakhs of rupees had to be suspended during the Rabi season in Gangawati, Kushtagi, Sindhnoor, Lingsugur and Manvi Tahsils of the 'district. Conditions perhaps worsened in 1942 and land revenue exceeding nine lakhs had to be suspended during the Kharif and the Rabi sea~ons. In 1942-43, conditions deteriorated still further due to continued scarcity. Land revenue exceeding fourteen lakhs of rupees had to be suspended and. relief works had to be stated. After some respite, scarcity conditions again intervened in parts of the district in 1946 and 1947, necessitating the suspension of land revenue exceeding in all seven lakhs. Similarly, the south-western portions of Gulbarga District, adjacent to the scarcity zone in Raichur District, were also particularly affected during the first three years of the decade. Conditions were hardly satisfactory in Parenda Tahsil of Osmanabad District in 1946 and almost all the district was affected by scarcity in 1950. Portions of Bhir District, especially the western most tahsils of Ashti and Patoda, also suffered from irregular and deficient rainfall during 1942, 1946 and 1950. Conditions were not very happy in Aurangabad District in 1950, especially in its north-eastern portions. Portions of Nalgonda District also seem to have experienced scarcity in the first year of the decade and again in 1949. However acute may have been the situation in any of these areas due to any reason, conditions never deteriorated to approximate to the famine conditions which were witnessed in the State from time to time prior to 1921.
76. Public Health during 1941-1951.--The three main epidemic diseases responsible for an appreciable share of the mortality figures of the state are plague, cholera and small pox. The annual reports of the Public Health Department deal rather exhaustively with these three epidemic diseases. According to these reports, during the period com_mencing from 6th October, 1940 and ending with 31st March, 1951 (i.e., from five months prior to the 1941 Census to a month after the 1951 Census), cholera accounted for 128,001 attacks_ and 66,653 deaths; plague for 59,050 attacks and 31,999 deaths; and small pox for 70,758 attacks and 18,613 deaths. Thus, during this period these three diseases altogether attacked 257,809 persons and caus{d 11 7,26.1') deaths. The breakup of these numbers according to the years to which they pertain is given in Table 7, and the districts to which they relate is given in Table 8.
Year Attacks Deaths (I) (2) (3)
Total .. 257,809* 117,265* 1350F. 27,318 14,128
TABLE 7
Year (I)
1351 F.
1852 F.
Atta.cks ,(2)
20,901
17,161
Deaths (3)
9,815
7,040
* Tbe'e figures ore a~ contained in the respective administration reports of the Public Health Department with some insignifi<'ant adjuslmcotll to tally tile totals.
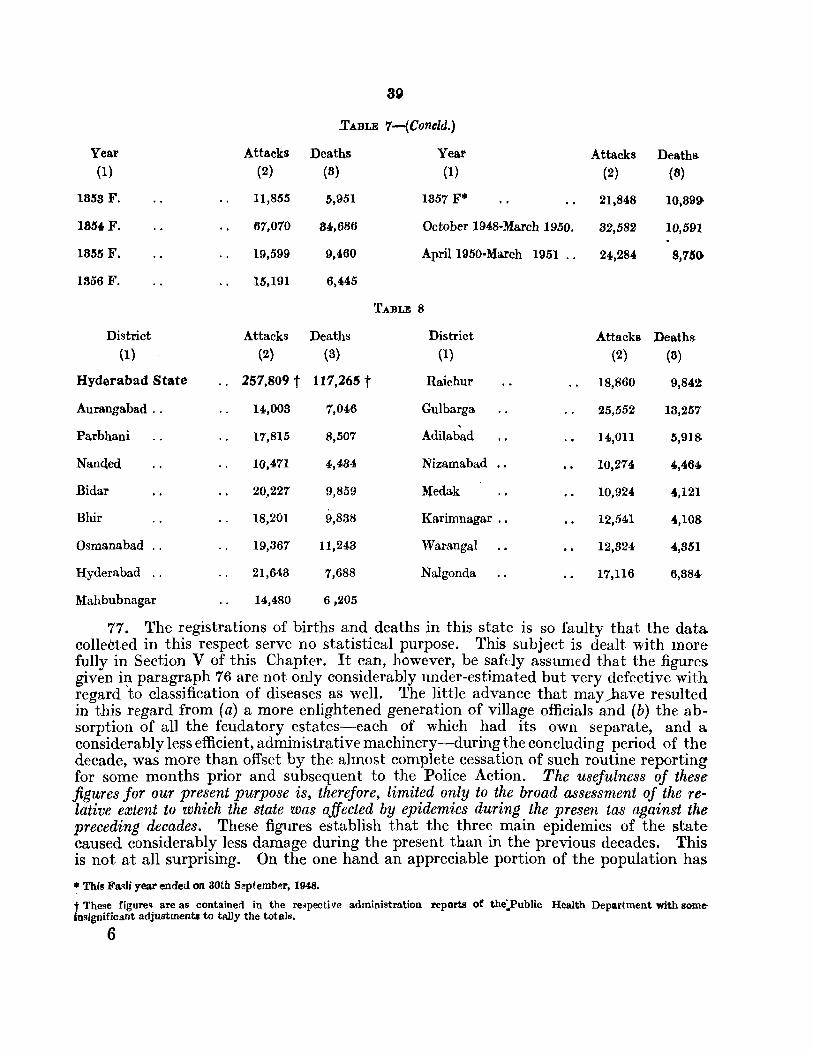
80
.TABLE 7-(Coneld.)
Year Attacks Deaths Year Attacks Deaths (1) (2) (8) (1) (2) (8)
IBM F. 11,855 5,951 1857 F'" 21,848 10,899-
IBIS' F. 67,070 84,686 October I948~March 1950. 82,582 10,591
1855 F. 19,599 9,460 April1950-March 1951 .. 24,284 8,75()
1356 F. 15,191 6,445
TABLE 8
District Attacks Deaths District Attacks Deaths (1) (2) (3) (1) (2) (8)
Hyderabad State .. 257,809 t 117,265 t Raichur 18,860 9,842:
Aurangabad .. 14,003 7,046 Gulbarga 25,552 18,257
Parbhani 17,815 8,507 Adilabad 14,011 5,91S
Nanded 10,471 4,484 Nizamabad 10,274 4,464-
Bidar 20,227 9,859 Medak 10,924 4,121
Bhir 18,201 9,838 Karimnagar .. 12,541 4,108-
Osmanabad 19,367 11,243 Warangal 12,824 41,851
Hyderabad .. 21,643 7,688 Nalgonda 17,116 6,884t
Mahbubnagar 14,480 6,205
77. The registrations of births and deaths in this state is so faulty that the data collected in this respect serve no statistical purpose. This subject is dealt with more fully in Section V of this Chapter. It can, however, be safely assumed that the figures given in paragraph 76 are not only considerably under~estimated but very defective with regard 'to c1assification of diseases as well. The little advance that may)lave resulted in this regard from (a) a more enlightened generation of village officials and (b) the absorption of all the feudatory estates-each of which had its own separate, and a considerably less efficient, administrative machinery-during the concluding period of the decade, was more than offset by the almost complete cessation of such routine reporting for some months prior and subsequent to the Police Action. The usefulness of thesefigures for our present purpose is, therefore, limited only to the broad assessment of the re~ lative extent to which the state was affected by epidemics during the presen tas against the preceding decades. These figures establish that the three main epidemics of the state caused considerably less damage during the present than in the previous decades. This is not at all surprising. On the one hand an appreciable portion of the population has
'" This Fa.~li year ended on 80th Sepfembp.r, 1948.
t These riguTe~ are as containerl in the re~pecti"e administration reports of the:Public Health Department with Borne inSignificant adjustment. to tl\lly the total!!.
6
40
now discarded the old superstitions and prejudices and takes readily to modern preventive .and curative methods, and on the other Government is much better equipped to push through its ameliorative measures. This would be obvious from the fact that from October, H!41 to the end of March, 1951 the Public Health Department itself was responsible for 9,162,187 vaccinations and re-vaccinations and 5,496,726 inoculations against cholera and 4,900,546 against plague. Environmental sanitation has also improved to an appreciable extent since 1941. For example, in 1941 eleven towns containing about '7 per cent of the total population of the state were supplied with filtered water. The number of such towns had increased in 1951 to 21 and they covered about 10 per cent of the total population. Similarly, in 1941, 11 towns containing again about 7 per cent ·of the state's population, were provided with drainage. In 1951, the number of such towns had risen to 22 and they covered more than 10 per cent of the state's population. Almost everyone now feels that plague is no longer so frightening as it used to be in the earlier decades and that mortality from small pox has been reduced considerably. The figures given in Table 8 also make it obvious that in relation to the total population involved, Parbhani, Bidar, Bhir, Osmanabad, Raichur and Gulbarga suffer rr.ost from epidemic diseases.
78. The figures given in Tables 7 and 8, however, by no means establish that there is no great scope for the further reduction of mortality from these and other communicable diseases. Further, the reports of the Public Health Department also indicate that the number of cases of Malaria treated in Government institutions during the present decade, varied from 150,683 in 1352 Fasli (6th October, 1942 to 5th October, 1943) to 334,355 ·during 1st April, 1950 to end of March, 1951. The real magnitude of this scourge will be minimised if it is overlooked tha t these figures only represent cases clinically diagnosed as malaria in Government Hospitals and Dispensaries. Malaria is by no means as fatal as the other communicable diseases in the state. But no other disease is perhaps more -destructive of the potential man-power of the state. Proportionately few succumb to it outright. But annually it leaves tens of thousands of persons weak, emaciated. and easily susceptible to more fatal ailments and with considerably reduced capacity for work. It also increases still births and infant and maternal mortalities. Tuberculosis is yet another scourge. The State Administration Report for 1950-51 estimates that there are about one lakh of tuberculosis cases in the state causing about 20,000 deaths annually. In addition to these, considerable havoc is caused by diseases like diarrhoea, dysentery, enteric fever, diphtheria, etc. As things stood in 1951, there was only one Government Hospital or Dispensary in the state for every 838 sq. miles and 76,770 persons*. In Mysore State, even in 1935, there was one such institution for every 94 square miles and 20,653 persons. The literacy percentage in the state still runs in single digits. But the concept of the welfare state is now strongly entrenched in the country and the coming years are bound to witn'ess considerable expansion in Medical and Public Health activities and in the spread of education. Other things being equal, these factors will by themselves result in considerable accession to the population of the state in future years.
79. Industrial and Mineral Production during 1941-1951.--In the earlier half of the decade there was hectic activity in the expansion of industries. But many of the industries that were set up were ill-conceived, lacked the technical know-how and derived
*This calculation is based on the figure of 243 hospitals and dispensaries, including 45 of the former Jagir dispensaries, _given in the Hyderabad Administration Report for 1950·51.
6·
no special advantage by their location in this state. Consequently, many of them closed down as the artificial conditions created by the Second World War disappeared. In fact, quite a few of them had never even reached the production stage. Again, prior to the Police Action, many attempts were made to render Hyderabad self-sufficient in various directions, but they were also not fruitful for almost identical reasons. These activities, however, did have some beneficial effects. They provided employment on a large, though temporary scale, and some of the establishments that were set up managed to survive through. This is borne out by the fact that the total number of factories on the registers of the Inspectorate of Factories and Boilers increased from 629 in 1940-41 to 861 in 1950. And further, according to the same registers, the average daily number of persons employed in these factories rose during the same period from 42,219 to 63,897. Among the more prominent of the new establishments that survived during this decade are a large paper factory (Sirpur Paper Mills) in Kothapet and a large metal works (the Allwyn Metal Works) and a machine tools factory (the Praga Tools Corporation) in Hyderabad City. A second sugar factory in Bodhan, actually an annexe to the existing factory in the town, and a silk factory in Kothapet were also under construction at the time of' enumeration. Only some stray figures are available regarding the output of large scale industries and there are no figures whatsoever regarding the output of any of the small scale industries-the latter are considerably more important to the economy of the state. The marked increase in the number of large industrial establishments, as wen as of the persons employed in them, amply justify the presumption that there must have been at least an appreciable increase in industrial production. This is also borne out by such of the figures as are available regarding the output of some of the large factories in the state. The quantity of yarn and cloth manufactured in the cotton textile mills of the state increased from 39 million pounds in 1940-41 to 43 million pounds in 1950. The production of cigarettes increased from 3.5 million boxes (each containing 500 cigarettes) in 1940-41 to 9.2 million boxes in 1950-51. The paper factory, which was still under construction in 1941, produced 81,117 cwt~ of paper in 1950. The output of cement which was less than 1. 5lakh tons in 1940-41 was more than 1. 6lakhs in 1950. Similarly, the outturn of sugar increased from about 20,000 tons in 1940-41 to about 22,000 tons, in 1950-51. It may be pointed out here that these figures are based mostly' on returns from only the very large factories in the state and do not cover the output of the majority of the smaller establishments, whose number increased considerably, especially during the war years. There is no doubt whatsoever that during this decade as a whole,. as against the earlier ones, there was an appreciable increase in the output of tanned skins; boots, shoes and other leather goods* ; bidis and other tobacco products; hosiery and hand-loom products of an kinds and miscellaneous textile goods (especially kambals);, and button and other metal products (especially utensils and trunks). Equally pronounced was the wider range of goods manufactured, or repaired, in various kinds of workshops, owned by Government or otherwise.
80. Figures pertaining to the value of the exports of a few selected commodities in the state (covering both those manufactured in large and small scale establishments) •. as based on the reports of the Customs Department for the years 1350 F. (1940-41) and 1950-51, afe given in Table 9.
*In 1940·41 the number of boots and shoes imported into the state was as much as 7.3 Jakh pail'! and in 11150-51 only 3. Z lakhs. This deficiency must have been lal'gely made up by locally manufactUl'ed foot-wear.
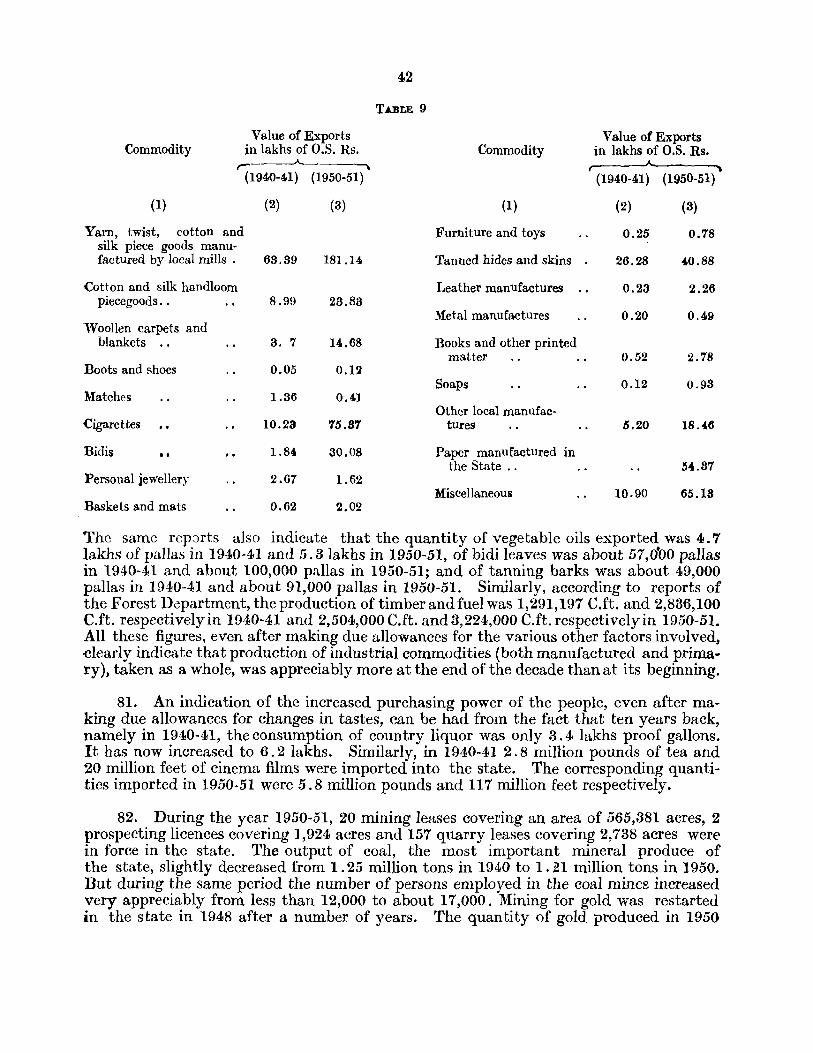
42
TABI;E 9
Commodity Value of Exports
in lakhs of O.S. Rs. Commodity V ruue of Exports
in lakhs of O.S. Rs. ,.- --.,.
(1940-41) (1950-51) (1940-41) (1950-51)
(1) (2) (3) (1) (2) (3)
Yarn, twist, cotton and Furniture and toys 0.25 0.18 silk piece goods manu-factured by local mills . 68.89 181.14 Tanned hides and skins 26.28 400.88
Cotton and silk handloom Leather manufactures 0.23 2.26 piecegoods .. 8.99 23.83
Metal manufactures 0.20 0.49 Woollen carpets and
blankets .. 3. 7 14.68 Books and other printed matter 0.52 2.78
.Boots and shoes 0.05 0.1~
Soaps 0.12 0.93 Matches 1.36 0.401
Other local manufac-Cigarettes 10.28 15.81 tures 5.20 18.4.6
Bidis •• 1.84 30.08 Paper manufactured in the State .. !S4..87
Personal jewellery 2.67 1.62 Miscellaneous 10.90 65.18
Baskets and mats 0.62 2.02
The same rep::>rts also indicate that the quantity of vegetable oils exported was 4.7 lakhs of pallas in 1940-41 and 5.3 Iakhs in 1950-51, of bidi leaves was about 57,0'00 pallas in 1940-41 and about 100,000 pallas in 1950-51; and of tanning barks was about 49,000 pallas in 1940-41 and about 91,000 pallas in 1950-51. Similarly, according to reports of the Forest D~partment, the production of timber and fuel was 1,291,197 C.ft. and 2,836,100 C.ft. respectively in 1940-41 and 2,504,000C.ft. and 8,224,000 C.ft.respectivelyin 1950-51. All these figures, even after making due allowances for the various other factors involved, dearly indicate that production of industrial commodities (both manufactured and primary), taken as a whole, was appreciably more at the end of the decade than at its beginning.
81. An indication of the increased purchasing power of the people, even after making due allowances for changes in tastes, can be had from the fact that ten years back, namely in 1940-41, the consumption of country liquor was only 3.4 lakhs proof gallons. It has now increased to 6.2 lakhs. Similarly, in 1940-41 2.8 million pounds of tea and 20 million feet of cinema films were imported into the state. The corresponding quantities imported in 1950-51 were 5.8 million pounds and 117 million feet respectively.
82. During the year 1950-51, 20 mining leases covering an area of 565,381 acres, 2 prospecting licences covering 1,924 acres and 157 quarry leases covering 2,738 acres were in force in the state. The output of coal, the most important mineral produce of the state, slightly decreased from 1.25 million tons in 1940 to 1. n million tons in 1950. But during the same period the number of persons employed in the coal mines increased very appreciably from less than 12,000 to about 17,000. Mining for gold was restarted in the state in 1948 after a number of years. The quantity of gold produced in 1950
48
-exceeded 7,320 fine ounces. The daily average number of persons employed in the operations was 943. Limestone forms one of the most important mineral products in the state. Its output increased from 3.25 lakhs of tons in 1941 to 4.45 in 1950. These figures are illustrative of the fact that on the whole activities connected with the exploitation of mineral produce in the state were also more pronounced at the end than .at the beginning of the decade under review.
83. Transport and Communications during 1941-51.- During the decade the Mudkhed-Adilabad meter-gauge line, 101 miles in length, was completed. The last section of it was opened for public traffic on 17th May, 1950. The total length of the railway route in this state now open for traffic is about 1,580 miles--i.e., about 1. 9 miles for every 100 square miles of the area of the state. During the concluding year of the last decade, namely in 1940-41, the gross earnings of the N.S.R.-which managed all excepting about 207 miles of the railway route within the state-amounted to Rs.2. 7 crores and it c.1rried 8 9 million passengers and hauled 3.0 million tons of goods. As against this, in 1950-51. i.e., the ccmcluding year of the present decade, the gross earnings of the N.S.R. exceeded Rs. 6.5 crores, it carried almost 26.3 million passengers and hauled about 8.7 million tons of goods. Similarly, in 1940-41 the Road Transport Department of the state had 341 vehicles, operated on 4,186 route miles, carried 13.5 mil1ion passengers, hauled about 65,000 tons of g::)Qdsandearned in all Rs. 84. 9lakhs. In 1950-51, it possessed 867 vehicle.s, operated on 5,187 route miles, carried 47.8 minion passengers, hauled about 107,000 tons of g)ods and earned in all. Rs.2.5 crores. The P.W.D. itself maintained 5,488 miles of road in the state during 1950-51-·i.e., 6.7 miles for eVt'ry 100 square miles of the state. This mileage excludes roads maintained by other bodies like municipalities, district boards, etc. The road works actually in progress at the close of the year, envisaged the extension of the existing road mileage in the state by 416 miles. The numliler of carts in the State in 1940 was 561,417 and in 1951 it was 625,194. The total number of motor vehicles registered in the state during 1850 F (6th October, 1940 to 5th October, 1941) was 7,064 and during 19tJO-51 it was 14,153. In MJ.rch 1941, there were 1.299 Post Offices and 26 Telegraph Offices in the state. Their number had risen to 1,767 and 42 respectively in March 1951. It would be thus obvious that during the current decade considerable progress has been recorded in the spheres of transport and -communications also.
84:" Irrigation and Generation of Power during 1941-51.-In 1941 there were roughly 29,000 tanks in the state, both large and small. In 1951 the corresponding number was about 82,000. Accurate statistics in this respect, however, are not available. Am:mg the more important irrigation projects completed during the decade were the Dindi Project proposed to irrigate 15,000 acres, mostly in Nalgonda District, Chandrasagar Project proposed to irrigate about 3,000 acres in Mahbubnagar District, the Manair Project proposed to irrigate about 17,250 acres in Karimnagar District, and the restoration of B3.ithpally Tank proposed to irrigate 4,800 acres in Warangal District. The less important works completed (or almost complete) during the decade include Chegaon Project in Karimnagar District and the restoration of Arjunapatla and Gagilapur Tanks in Nalgonda District. But the magnitude of the projects under construction at the close of the current decade was something unprecedented in the engineering history of Hyderabad State. The most prominent of these works was, of course, the Tungabhadra Project. It is designed to irrigate, when fully developed, about 4.5 lakhs of acres-excluding about 1. 85 lakhs of acres for pastures and forests-in so far as Ryderabad State alone is concerned. Over one lakh K. W. of power is also expected to be generated. This is one of the most important
projects of its kind in the country. The more important of the other projects under construction were the Kadam Project in Adilabad District and the Rajolibunda Project in Raichur District. The former, which is part of the Godavari North Canal Multi-Purp)se Project, is designed when fully implemented to irrigate 2. 27lakhs of acres. In a:ldition, the project is also expected to water 1.29 lakhs of acres of existing forests. The latter is designed to irrigate 1.32 lakhs of acres. The more prominent of the other projects under construction were the Bendsura Project which, besides supplying water to Bhir Town, is also expected to irrigate 9,300 acres in Bhir District, the Khasapur Project which is expected to irrigate 13,500 acres in Osmanabad District, the Koilsagar and Sarlasagar Projects which are designed to irrigate 14,500 and 4,800 acres respectively in Mahbubnagar District, Yakinpur and Bandalvagu Projects in Karimnagar District and Bhimanpally Project in Nalgonda District, all designed to irrigate between 1,000 to 2,000 acres. In 1940-41, the net area irrigated in the state was 14.6 lakhs of acres. The corresponding figure in 1950-51 was 15. O---but 1950-51 was a relatively bad year in this respect which would be obvious from the fact that in 1951-52, the figure had risen to 18.1 lakhs of acres.
85. In the year 1350 F. 27.7 million K.W.H. units were generated in the state and the total number of consumers was 14,093. In the year 1950-51, about 50 million K.W.H. units were generated in the state and the number of consumers (spread over the cities of Hyderabad and Warangal and the towns of Gulbarga, Aurangabad, Nanded, Nizamabad, Raichur, Yadgir, Karimnagar, Narayanpet and Yellandu) had more than doubled. At the close of the decade, the electrification of the towns of Khammam, l\lahbubabad, Garla and Dornakal were in hand. And further, besides the Tungabhadra HydlO-electric Project referred to in the above paragraph, the Nizamsagar Hydroelectric and the Azamabad Thermal Power Projects were also in progress. The capacity of the former is to be 15,000 K. W. and of the latter 37,500 at the initial stage.
86. Growth of Population in the State.-The population of the state as recorded at each of the censuses since 1881-when the first census of the state was taken-and its percentage increase or decrease as compared with the corresponding figure of the cenSWlj immediately preceding it are given in Table 10.
Year
(1)
1881
. 1891
1901
IIUl ..
Enumerated population
(~)
9,845,59~*
11,537,040
11,183,728
18,361,784
TABLE 10
Percentage Tariation
(8)
+17.2
- 8.5
+20.0
Year Enumerated Percentage population variation
(1) (2) (8)
1921 12,457,721 -6.8
1981 14,428,170 +15.8
1941 16,327,119 +18.2 __
1951 18,655,108 +U.8
87. The population of the state increased at an annual average rate of 1.7 per cent during 1881-91, which was a prosperous decade from the points of view of agricultural production, public health and economic development of the state. At the end of "'All these figurea except those relating to 1881 and 1891 are as adjusted to conform to the present jurisdiction of the state •. For detaillilee paragraph 5 at page 10 of Part II-A of thi. Volunne.
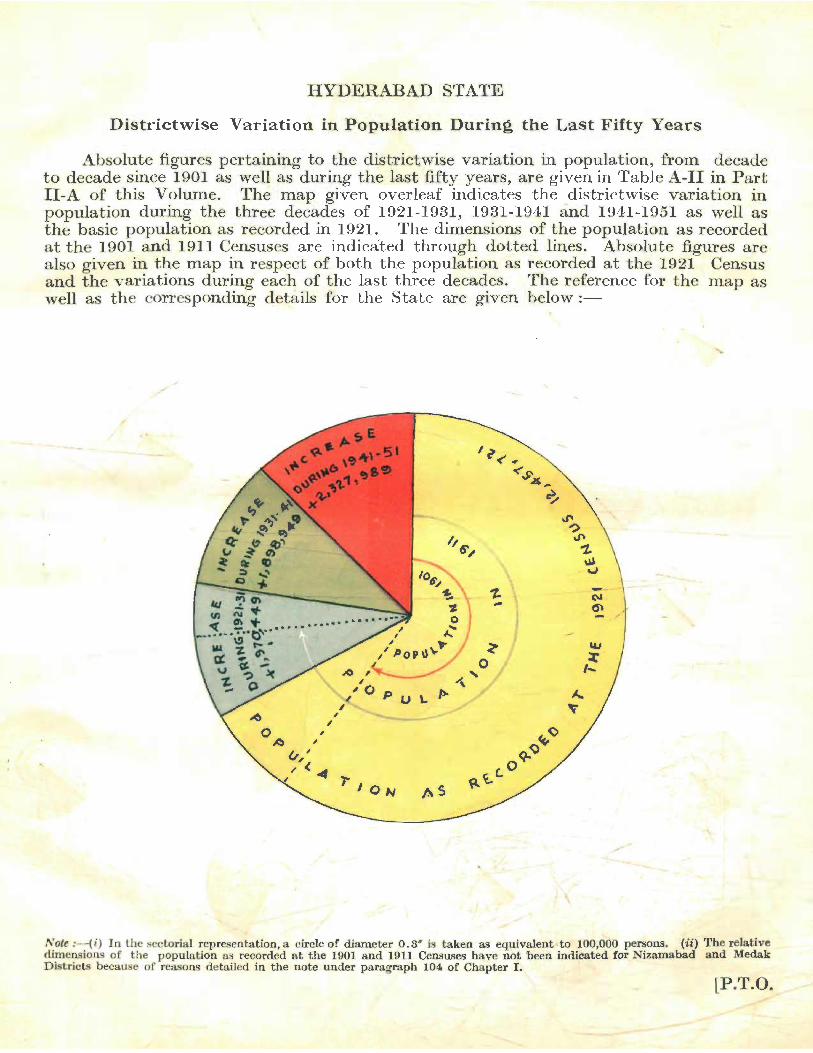
HYDERABAD STATE
Districtwise Var iat ion in Population During the Last Fifty Years
Absolute figures pertaining to the districtwise variation in population, from decade to decade since 1901 as well as during the last fifty years, are given in Table A-II in Part II-A of this Volume. The map given overleaf indicates the districtwise variation in population during the three decades of 1921-1931, 1931-1941 and 1941-1951 as well as the basic population as recorded in 1921. The dimensions of the population as recorded at the 1901 and 1911 Censuses are indicated through dotted lines. Absolute figures are also given in the map in respect of both the population as recorded at the 1921 Census and the variations during each of the last three decades. The reference for the map as well as the corresponding details for the State are given below:-
I'
AU ~
1-
Note :-(i) I n the sectoria l representation, a circle of diameter 0.3" is taken as equivalent -to 100,000 persons. (ii) The relative dimensions of t he popUlation a s recorded at the 1901 and 1911 Censuses have not been indicated for Nizamabad and Medak Districts beca use of reasons det a iled in the note under p aragraph 104 of Chapter I.
lP.T.O.

-
47
this decade the percentage of children aged between 0-4 years (i.e., of those who had not yet completed 5 years of their age) to the total population of the state had risen to 15.1, as against the corresponding percentage of only 13.5 at its beginning. During the succeeding decade, namely in 1891-1901, when the state had persistently poor crops and suffered severely from pestilences and from one of the worst famines on record, the population actually declined by 3.5 per cent. The decline would have been slightly more pronounced but for some gain by migration, largely because of the construction of the Godavari Valley Railway line. The percentage of young children aged between 0-4 to the total population of the state also declined from 15.1 at the start of the decade to 12.2 at its close. During the next decade, namely in 1901-1911, which was perhaps the most prosperous decade in reCf'nt times from the point of view of agricultural conditions and was also characterised by considerable progress in various directions, the population of the state increased at an annual averagerateof2.0per cent, which is a record for the state. The increase would be even more marked if the loss in population by migration during the decade is discounted. The percentage of young children aged between 0-4 to the total population ()f the state increased from 12.2 at its inception to 14.4 at its termination. During the following decade, namely in 1911-21, which is easily the most disastrous one in living memory from the point of view of famines and pestilences, the population declined by 6.8 per cent. Contributing to this decline was a very sizeable loss by migration. The percentage of young children aged 0-4 to the total popUlation of the state also dwindled from 14.4 at its start to 12.2 at its close, the lowest recorded during the current century.
88. Since 1921, however, the population of the state has been increasing consistently at an astonishingly steady rate, quite in contrast to the intermittent growth and decline recorded during the preceding decades. This was quite natural as the state has since then remained free from devastating famines or epidemics. It would perhaps be more correct to my that during the last three decades outbreaks of famines and epidemics are being generally controlled and localised before they take a heavy toll of lives or compel the population affected to migrate to other areas on any significant scale. Besides, greater appreciation of modern curative and preventive methods on the part of the people and improvement in personal hygiene and environmental sanitation have led to a considerable lowering of the death rates. And although birth rates have also decreased to an extent on account of the growing disusage of early marriages, the fall i_s hardly commensurate with the decline in the death rates. Further, the state has steadily forged ahead in various directions providing new avenues of employment and sustenance for the increasing population. During the decade 1921-31, the popUlation of the state increased by 15" 8 per cent. The percentage of young children aged between 0-4 to the total population of the state soared to 16. 8-the highest recorded during the current decade. In the succeedingdecadeof1931-41, the population of the state increased by 13.2 per cent. Young children accounted for 15.5 per cent of the total pupulation, a percentage second only to that registered in 1931. During the next decade, namely in 1941-51, the popu-1ation of the state increased by 14.3 per cent. Young children constituted 13.3 per cent ()f the total population. The percentage would have been appreciably higher but for a marked decline in early marriages. '
89. Since 1921, the population of Hyderabad State has increased by 49.7 per cent "hile that of the three adjoining states of Bombay, Madras and Madhya Pradesh has increased by 60.9, 40.5 and 34.5 per cent respectively. Thus, during the last thirty years the population of Hyderabad State has increased at a considerably lower rate than
48
that of Bombay State hut at an appreciably heavier rate than that of Madras end, even more so, of Madhya Pradesh. As against this, the rates at which the populations of these states have grown during the last fifty years do not exhibit any such mark{;d disparity. Since 1901, the population of the states of Bombay, Hyderabad, Madhya Pradesh and Madras have increased by 69.5, 67.6, 57.8 and 55.5 per cent respectively. In other words, since 1901, the population of this State h.as increased at an average annual rate of 1 .4 per cent while that of Bombay, Madhya Pradesh and Madras has. increased at 1. 4, 1. 2 and 1.1 per cent respectively.
90. During the last half a century this state has increased its popUlation by 7,521,385 a figure larger than the present population of Kenya or Uganda in Africa, or Cuba or Chile in America, or Malaya or Iraq in Asia and Sweden or Austria in Europe,. and roughly comparable to that of Australia in Oceania. But this increase is by no means unique even for areas beyond India. Many countries of the world have recorded equally, if not more, spectaCUlar increases during some period or the other of their demographiC' history. The population of Great Britain itself increased during the sixty years from 1841 to 1901 by almost 100 per cent i.e., at an annual average rate of J .7 per cent. This remarkable increase was achieved in spite of the fact that during this period Great Britain was losing huge numbers by migration to her overseas territories and to the United States of America as well. An idea of the immensity of this loss can be had from the fact that the Royal Commission on Population assessed Great Britain's net loss by migration at 56,000 a year during the period 1871 to 1931. The population of Eastern Europe (including the Soviet Union) increased at an average annual rate of 1.062 per cent during the fifty years from 1850-1900 and at an average annual rate of 1.056 per cent during the thirty years from 1900-1930. During 1935-1989, the natural population of the Soviet Union increased at an average annual rate of 2.3 per cent. Similarly Egypt, a country
, by no means noted for attracting immigrants, has much more than doubled its population since 1882 while during almost the same period the population of this state has increased by 90 per cent.
91. Growth of Population in various Districts of Hyderabad State.-The percentage increa~es of the population of each of the sixteen districts of this state since 1921 as well as 1901 lae given in Table 11.
TABLE 11
District
(1)
Hyderabad State
Aurangabad .. Parbhani Nanded Bidar Bhir Osmanabad .. Hyderabad .. Mahbubnagar
Increase during
1921-1951 (2)
49.7
63.6 31.7
35.8 37.6 72.9 35.1
110.5 50.7
Increase during
1901-1951 (3)
67.6
60.8 55.9 .1)8.1
54.1 63.1 5~.3
127.5 84.3
A districtwise analysis of the growth since ceeding Faragraphs.
Increase Increase District during during
1921-1951 1901-1951 (1) (2) (3)
Raichur .. ·31.7 30,4,
Gulbarga · . 36.7 37.4 Adilabad · . 37.7 86.4 Nizamabad 55.4 18.1 Medak · . 42.9 115.1
Karimnagar .. · . 42.9 87.6 Warangal 72.6 123.3 Nalgonda 50.8 65.8
1921 and also 1901 IS given III the suc-

49
92. Aurangabad District.-During the last thirty years, i.e., since 1921, the popu· lation of this district has increased by 63.6 per cent, which is considerably higher than the corresponding percentage of 49.7 recorded for the state. This marked growth is mainly the result of an increase by over 32 per cent recorded during the decade 1921·:31, when the population of the state had increased by only 15.8 per cent. No reasons have been given in the 1931 Report for this extraordinary increase. Perhaps it was partly the reaction to the very heavy loss, second only to that of Bhir, suffered by the district in the preceding decade, namely in 1911-21, when its population had declined by over 18 per cent. It may be partly due to the progress recorded by the dis· trict in the expansion of large scale industries and in other spheres and to the relatively favourable agricultural seasons it had during 1921-31. At any rate, the growth of its population since 1931 has not been very remarkable. Actually, during 1941-51, the pJpulation of the district grew by only 8.9 per cent, which is the second lowest increase recorded during the decade among the districts of the state. The relatively slow rate of increase during 1941-51 is the result of various factors. The importance of Aurangabad District as an administrative unit has declined considerably since 1941~ especially in so far as the Cantonment establishments at Jalna and Aurangabad Towns are concerned. Industrially also, it does not seem to have made any significant progress since then. The agricultural seasons, especially in the south-western portions of the district, h:we not been very prosperous because of scanty and unevenly distributed rainfall. The north-eastern portions of the district were also adversely affected, particularly during 1950. The movement of population is also one of the contributory reasons for the slow increase. There is no doubt that immigrants into the district have increased ,considerably during recent years. They numbered only 23,047 in 1921, 32,983 in 1931 and as much as 70,616 in 19.51. There is also no doubt, that the scale of emigration from this district to other areas within the state has declined in importance, particularly in relation to the total popUlation of the district at the respective censuses. Such emigrants numbered 21,657 in 1921, 26,948 in 1931 and only 23,714 in 1951. But the number of Hyderab'1d emigrants* in the districts of Madhya Pradesh and Bombay surrounding Aurangabad has increased very markedly during recent years and the emigrants from Aurangab'1d District must have contributed very largely to this increase. The number of such Hyderabad emigrants was 80,221 in 1921, 70,733 in 1931 and is now 112,251. Besides, Aurangabad emigrants must have also contributed to the extraordinary increase ,of Hyderabad emigrants in the non-adjoining districts of Bombay State. Though statisticafly it m'1y not be very significant, more Muslims must have migrated since the Police Action from Aurangabad District to Pakistan, or returned to the other Indian States, from which they or their immediate ancestors came from, than from any other district of this state, with the exception of Hyderab.1d District. Thus, on the whole, the district is bound to have lost significantly in numbers by the movement of population. All th~se factors must have been responsible for its relatively slow increase during the present decade.
Since 1901, i.e., during the last fifty years, however, the population of the district has increased by only 60.8 per cent as against the corresponding increase of 67.6 per cent recorded for the state. As mentioned above, this is largely due to the fact that the district suffered considerably from the epidemics and famines of the decade 1911-21.
... At this census, as in the preceding censuses, information regarding the break-up of Hyderabad emigrants, residing in various districts Qf the other Indian States, according to their district of origin was not collected. Due to this disadvantage, conclusions can only be drawn from the figures relating to the total number of Hyderabad emigrants in areas beyond the state.
50
98. Parbhani District.-The population of this district, as that of Raichur District, has increased during the last thirty years by only 31.7 per cent. But, as indicated subsequently the growth in the population of Raichur District would be appreciably lower if the figures pertaining to the non-indigenous population, temporarily concentrated in the Tungabhadra Project Camps, are left out. Thus, it could be said that next to Raichur, Parbhani District records the smallest increase in the state. This slow rate of growth is due to various factors. The northern portions of this district have been ravaged by rather a malignant type of malaria; It has had its due share of the cholera and plague epidemics in the state. Its progress in industrial and commercial spheres, which was rather marked immediately following the opening of the Godavari Valley Railway line in 1900, has not kept up the same pace during recent decades. Again, about the beginning of this century, with its famous Hingoli Cantonment, it was an important administrative area in the north-western portions of the state. It has now considerably lost its previous importance in this regard. Further, it is no longer attracting immigrants as it used to in the earlier decenniums. In 1921, immigrants constituted 7.5 per cent of its population. They now form only 5.8 per cent. Simultaneously, emigration to other areas within the state has increased considerably. In 1921 only 16,470 persons born in this district were found in other areas of the state. The number of such persons is now almost 45,000. Figures are not available regarding the number of emigrants from this district to areas beyond the state. But the figures pertaining to Hyderabad emigrants in adjoining areas broadly indicate that emigration from Parbhani (and the adjoining district of N anded taken together) to areas beyond the state has declined slightly. Thus, on the whole, there is no doubt whatsoever that this district is now losing appreciably in numbers by the movement of population .
. The increase in the population of this district since 1901, however, is nearer to the corresponding increase recorded for the state. This is due chiefly to the fact that it benefited considerably during the decade 1901-191I, both from the satisfactory crop conditions that prevailed during the period and by the opening of the Godavari Yalley Railway line, and also because among the western districts it suffered comparatively less during the disastrous decade of 1911-1921.
94. Nanded District.--During the last three decades Nanded District has increased its population by 35.8 per cent which is considerably below the corresponding increase of 49.7 per cent recorded by the state. Even this unimpressive increase is to a large extent due to the industrial and commercial prosperity of Nanded Town. This comparatively slow growth is due to various factors. The immigration into the district from all areas beyond the qistrict is not keeping pace with the growth of its population. The iIIlmigrants in this district formed 7.5 per cent of the total enumerated population of the district in 1921. The percentage decreased to 5.7 in 1931, i.e., during the trade depression. It has now again improved to 7.2, but is still lower than what it was in 1921. Contrary to this, emigration from the district to other areas within the state records a decisive increase. These emigrants who numbered less than 19,000 in 1921, increased to 26,655 in 1931 and are now as much as 55,660. As explained in detail elsewhere, the neighbouring district of Nizamabad, is attracting relatively a large number of emigrants from this district. There does not, however, seem to have been any marked varia~ion in the scale of emigration from the district to areas beyond the state. Thus, both accelerated emigration and decelerated immigrati0n are responsible to some extent to the retarded growth of the population of the district as compared to other areas in the state. There is no doubt that this district did record considerable industrial and commercial progress in the earlier
51
decades of this century. But subsequently, apart from the setting up of a textile factory in Nanded Town, the rate of this progress slowed down considerably. Besides, this district has also had its share of the epidemics, particularly plague and cholera, which break out from time to time in the state. Life in this district, especially in Hadgaon Tahsil and Nanded Town, was also dislocated considerably for some months prior to and following the Police Action. All these factors explain its relatively retarded growth as -compared with the average for the state.
The growth of the population of this district since the beginning of this century is, however, relatively more imposing. This is due to the fact that, like Parbhani, this district benefited considerably during the decade 1901-1911 because of the opening of the Godavari Valley Railway line and the consequent expansion of industries and commerce and the fairly prosperous agricultural years which charnctGised the decade.
95. Bidar District.-The population of Bidar District has increased during the last three decenniums by 37.6 per cent, which is considerably below the average for the ·state. The increase during the decade 1941-.51 was by only 7.5 per cent, the lowest recorded among the districts of the state. The main factor responsible for this slow growth is the heavy increase in the scale of emigration from this district coupled with a slight fall in the scale of immigration. The number of emigrants from this interior district to other areas within the state itself was only 28,291 in 1921 and 30,195 in 1931. They now number as much as 75,063, i.e., considerably more than double their strength in 1921. Though the relevant figures are not available, it is a w€ll known fact that emigration from this district to Bombay State is also on the increase. At any rate, comid~ring the trend in the figures pertaining to Hyderabad emigrants in Bombay and other Indian States and the conditions prevailing in this district in the earlier decades, there can be no question of Bidar emigrants heyond the state being now less numerous than what they were at the earlier decades. Contrary to this, the number of im'TIigrants into this district from all areas beyond it was 30,630 in 1921, 36,321 in 1931 and 32,779 in 1951. The percentage of the immigrants to the total population of the district has declined from 3.8 in 1921 to 2.8 in 1951. Even ignoring the number of emigrants from the district to areas beyond the state, Bidar which had gained 2,339 persons in 1921 and 6,126 in 1931, lost 42,284 persons in 1951 due to the movement of population. The actual loss would be more to the extent of Bidar emigrants beyond the state. The rea50ns for the i~crease in the tempo of emigration and for the decrease in that of immigration have been fully explained in para:sraphs 14 to 17 of Appendix B. An additional, though by no means a very significant reason for the slow growth of the population of the district, is the fact that it has had much more than its share of both the cholera and plague epidemics in the state,
The population of Bidar District since the turn of this century has increased by 54.1 per cent, which is relatively more appreciable. This is due to the fact that this district shared the gener"al prosperity of the 1901-1911 decade and was then in a position to sustain most of its increased population within its own borders.
96. Bhir District.-Since 1921, the population of this district has increased by 72.9 per cent, which is remarkably higher than the corresponding increase of 49.7 per cent recorded for the state. But this accelerated growth is due (as in the case of Aurangabad District) almost exclusively to an extraordinary increase of 35.9 per cent recorded dur- " ing the decade 1921·31. Unfortunately, the 1931 Census Report does not give any reasons for this tremendous increase. It is likely that it may have been more or less a reaction to the heavy decline (e~ceeding 25 per cent) recorded in the population of the
52
district in the preceding decade, i.e., in 1911-21, because of epidemics and famines. During the two subsequent decades of 1931-41 and 1941-51 the growth of its population approximated to that of the state-though at both the censuses it was slightly lower. 1he increase of 13.4 per cent in its population during 1941-51 is, however, the highest recorded among the north-western districts of the state. But it would not be surprising if the natural population of this district is increasing at an appreciably higher rate. This pre~vmption is based on the available figures pertaining to migration from and into the district. There is no doubt that the immigration into this district from all areas beyond it has increased appreciably during recent years. The number of such immigrants which was 19,339 in 1921 and 21,816 in 1931 has now risen to 57,931. As against this, the nvml::er of Bhir emigrants residing in other districts within the state itself which was 37,477 in 1921 and 85,468 in 1981 has now risen only to 41,242. On the basis of these two sets of figures alone, the district had lost 18,138 persons in 1921 and 13,652 in 1931 but had gained 16,689 persons in 1951. But in this estimate, the number of Bhir emigrants living in areas beyond the state has not been taken into account. As has been explained in detail in Section IV of this. Chapter, all the western districts of this state bordering Bombay State have not recorded any appreciable progress in industrial and other spheres during recent years. As against this, the adjoining state of Bombay has recorded remarkable progress in these spheres and is now drawing migrants from this state on a considerably increased scale. The number of Hyderabad emigrants in Bombay State has risen from 2.2lakhs in 1921 and 1.7 lakhs in 1981 to 8.5 lakhs now. Bhir, which is one of the most industrially backward districts, not only in the western half of the state but in the whole of the state, must be sending thousands of emigrants to Bombay State. This is borne out by the fact that the number of Hyderabad emigrants in the Bombay district of Ahmadnagar, which adjoins Bhir, has increased from 23,820 in 1921 and 28,084 in 1931 to as much as 63,795 in 1951. Besides, a fair proportion of the Hyderabad emigrants in Bombay and Poona Cities must have migrated from this district-the latter of the two cities is not very far removed from its borders. It would thus be obvious that, on the whole, Bhir District is now losing considerable numbers by the mov(ment of population. The heavy increase in its natural population is explained by the fact that both widow remarriages and early marriages are more common in this district than in most other areas of the state. Only about 13.,5 per cent of its total female population is widowed and only about 71 per cent of its female population aged between 5-14 is unmarried. The former is the lowest and the latter among the relatively low in the state. The proportion of children between 0-4 to every 10,000 of its total popula~ tion is 1,381, the third highest in the state.
The rate of growth of the population of this district since the turn of this century is not at all impressive. During these fifty years its population has increased by 63.1 per cent as against the corresponding increase of 67.6 per cent recorded for the stlte. This relatively slow rate of growth appears chiefly to have been the result of the fact that this district suffered very severely from the famines and epidemics of the decade 1911-21 when, as stated above, its population declined by 25 per cent.
97. Osmanabad District.~During the last three decenniums the population of Osmanabad District has increased by only 35.1 per cent. There is no doubt that the rainfall in the western tracts of this district is particularly capricious with the result that they suffer repeatedly from scarcity. Among all the districts of the state--p,part from Raichur-Osmanabad has been the most affected by irregular or deficient rainfall. The other districts of the state which are often subject
53
to scarcity conditions are Gulbarga, Bhir, Aurangabad and Nalgonda .. But among these four districts, the proportion of the area which constitutes the usual scarcity zone to the total area of the district is the highest in Osmanabad. There is again no doubt that among all the districts of the state this district has suffered most from constant outbreaks of plague and it has also had its due share of the other communicable diseases prevalent in the state. The progress recorded in this district in various directions during the recent decades is also nothing remarkable. Again, it was one of the most disturbed districts in the state for some months both prior to and following the Police Action. But the relatively slow rate of growth of the population of this district is not so much due to all these factors put together as to the district's loss in numbers by the movement or population. It may, however, be argued that the other factors were responsible for this loss by emigration. The immigrants in this district from all areas beyond the district numbered 33,925 in 1921 and 31,566 in 1931 and as much as 65,740 in 1951. But the magnitUde of emigration from this district seems to have increased even more markedly. The number of Hyderabad emigrants in the two Bombay districts of Sholapur and Ahmadnagar, which adjoin Osmanabad District, has increased fro~ 84,126 in 1921 and 82,437 in 1931 to 146,042 in 1951. Similarly, the number of Hyderabad emigrants in the districts of Bombay State which do not adjoin this state has increased from about 52,00() in 1921 to 139,000 in 1951. A heavy portion of the former and a fair portion of the latter are bound to have been drawn from Osmanabad District. The number of Osmanabad emigrants to other areas within the state has also increased during the same period but only from 19,927 in 1921 and 21,088 in 19tH to 25,411 in 1951. Thus, but for the loss by emigration the increase in the population of the district 'would have been appreciably nearer to the corresponding increase recorded for the state.
From the point of view of the growth of its population during the last half a century ~ Osmanabad District has fared relatively better. This is chiefly due to its general prosperity during the 1901-11 decade.
98. Hyderabad District.-Since 1921, the population of Hyderabad District has increased by 110.5 per cent, i.e., it has more than doubled itself. Its average annual rate of increase during the last thirty years has been 3.7 per cent, which is considerably more than twice the corresponding rate of 1.5 per cent for the rest of the state. This extraordinary increase is entirely due to the striking growth recorded in the population of Hyderapad City. The population of this city, which accounts for about 72 per cent of the population of the district, has increased during the same period by about 169 per cent. As has been explained in detail elsewhere, Hyderabad City is by far the most important urban unit in the state from the administrative, commercial, industrial or cultural points of view. There is as yet np sign of its sharing its importance in any of these spheres with the other urban units in the state. Due to this overbearing importance of the city, tens of thousands of persons, drawn both from within and beyond the state, migrate to it annually thus continuously swelling the number of i~s inhabitants. The natural increase in the indigenous population of the city is not likely to have contributed to any great extent towards this striking iq.crease. There is no doubt that due to the heavy concentration of public health and 'allied organisations in the city, its death rate is likely to have been relatively very low. But this would have been counteracted by a relatively low birth rate resulting from the greater sophistication of its inhabitants.
The number of immigrants into this district from all areas beyond it was 152,202 in 1921; 185,780 in 1931 and as much as 309,613 in 1951. The immigrants now constitute over 20 per cent of the total population of the district. As against this, the number of
7,
54
emigrants from this district to the other areas within the state itself has not increased to any appreciable extent. In fact, in relationship to the total population of Hyderabad and all the other districts, this emigration is now on a considerably smaller scale than in the earlier decades. The number of such emigrants was 57,977 in 1921, 56,756 in 1931 and 61,572 in 1951. There is again no doubt, that a fairly large number of persons mig:rate annually from this district to other Indian States and emigration to areas beyond India, which is usually of an insignificant order, was considerably intensified for some months following the Police Action because of the movement of Muslims to Pakistan. In spite of all this, the total increase in the emigration from this district was not in keeping with the enormous increase in the immigration into the district from all areas beyond it. Thus, the gap between immigration and emigration has appreciably widened in favour of the district, resulting in the remarkable increase in its population.
Since the beginning of this century, the population of Hyderabad District has increased by 127.5 per cent as against the state increase of 67.6 per cent. Thus, the increase in the popUlation of the district during the last fifty years, though very heavy, is not so impressive as its increase dudng the last three decades. This is largely due to the fact that Hyderabad City suffered severely by epidemics (influenza and plague) during the decade 1911-21 when actually its population declined by over 19 per cent.
99. Mahbubnagar District.-Since 1921, the population of Mahbubnagar District has increased by 50.7 per cent, which is just one per cent above the corresponding increase recorded for the state as a whole. There is no doubt that certain portions of the district are or, were, at any rate, highly malarious, and it was also affected from time to time by epidemic diseases. But while the record of the district in this respect is not as good as that of Nalgonda, Medak or Karimnagar Districts as a whole, it compares very, favourably with that of the western districts of the state. Similarly, it may have suffered relatively more by Ecarcity than the other eastern districts of the state, with the exception of course of the south-western portions of Nalgonda District, but its sufferings in this respect are definitely not comparable with those of the exterme western tracts of the state. Besides, since 1921 appreciable progress has been recorded .in the district in respect of communications and irrigation. Most of its oil and rice mills and bidi factories were set up during the recent decades. Some of its cottage industries also fared very well due to the conditions created by the Second World War. It is, therefore, not surprising that the popUlation of this district should have grown at a faster rate than that of the state as a whole. In fact, the growth of its indigenous popUlation has been more rapid than what its enumerated popUlation reveals.. The number of immigrants in this district from all areas beyond the district haS incre~ed only slightly from 28,348 in 1921 and 29,593 in 1931 to 31,032 in 1951---:-actually the propol1;jon of the immigrants to the total popUlation of the district has declined from about 3.8 in 1921 to 2.6 in 1951. As against this, the number of emigrants from this district to other areas within the state itself has increased from 41,623 in 1921, and 48,770 in 1931 to 63,385 in 1951. On the basis of these figures alone, the district has lost by migration 13,275 persons in 1921, 19,177 persons in 1931 and as many as 32,?53 persons in 1951. But the actual loss is appreciably more, for these figures do not in~lude Mahbubnagar emigrants in areas be· yond the state. During the present census itself, there were over 18,400 Hyderabad emigrants in the adjoining Madras districts of Kurnool and Guntur as against 16,395 in 1921. And again Bellary District, though not adjoining Kumool had attracted a large number of immigrants from Mahbubnagar Djstrict (especially the Palmur Waddars) in 1951 on account of the construction of the Tungabhadra Project. The number ot
']*
55
Hyderabad emigrants in Bellary District has increased from 4,504 in 1921 to 19,644 in 1951. A fair portion of these emigrants must have migrated from Mahbubnagar District. Besides, a few thousands more from this district must now be residing in areas beyond those mentioned above. Thus, the indigenous population of the district is growing at a considerably faster rate than its enumerated population.
Since the turn of this century, the population of this district has increased by 84.3 per cent, as against the increase of 67.6 per cent recorded for the state as a whole. Mahbubnagar District was one of the few districts in the state whirh actually increased its population, though insignificantly, during the disastrous decade of 1911-1921. This district ·was relatively less affected by the famines and epidemics which prevailed during the decade. Further, the population of the district increased much beyond the state's. average during the prosperous decade of 1901-1911. It is likely that this increase may have been partly the result of under-enumeration in 1901, especially in and around the Amrabad plateau regions which were then particularly inaccessible and unhealthy.
100. Raichur .District.-The population of this district, like that of Parbhani, has increased. by only 31.7 per cent during the last three decades. This is appreciably smaller than the corresponding percentages recorded in the case of all the other districts of the state. But due to the construction of the Tungabhadra Project, the immigration into this district has increased heavily during the present decade. If the figures pertaining to the immigrants in the Project Camps are ignored, ·the increase during the last thirty years dwindles to only 28.6 per cent, which is by far the smallest increase recorded by the districts of this state. During these three decades its annual percentage rate of increase has been 0.95 excluding the immigrants in the Tungabhadra Project Camps and 1.06 even after including them, as against-the corresponding rate of 1.7 per cent recorded for the state as a whole. This unimpressive increase is easily explained. The marital habits of the inhabitants of this district are not as conducive as of those of the other districts of the state to the growth of population. Among the districts of the state~ Raichur has by far the heaviest proportion of widowed females, especially in the higher reproductive age groups, and but for Hyderabad District (due to the socially advanced population in Hyderabad City) the smallest proportion of married females in the younger age groups. Besides, the district has been affected by scarcity, if not by famine, almost every alternate year. Further, the public health conditions in the district have not at all be'en satisfactory. It has suffered considerably by epidemic diseases, particularly plague, and much worse from malaria. Thus, unfavourable marital habits, capricious seasons and indifferent health conditions have obviously increased. the death rate and reduced the birth rate. The progress of the district during the recent decades from the commercial or industrial points of view is also not very impressive. Over 70 per cent of its land is already under the plough and only a very small portion of it is irrigated. The Tungabhadra Project, is perhaps the first sizeable beneficial undertaking in this district since the days of the Vijayanagar Empire, but this project has yet to be completed. Thus, illtreated by nature and hitherto neglected by man, this district records the smallest increase in the state.
The increase in the population of this district since 1901 is even more halting. During all these fifty years, its population has increased by only 27.4 per cent excluding the immigrants in the Tungabhadra Project Camps and 30.4 per cent including them, as against the corresponding percentage of 67.6 recorded for the state. In other words,.
56
during the last half a century the population of this district has increased at an average .annual rate of 0.55 per cent excluding the immigrants in the Tungabhadra Project Camps, and 0.61 per cent including them, as compared with the corresponding rate of 1. 85 per cent recorded for the state. This is largely due to the fact that the district had more than its share of the travails of the disastrous decade of 1911-21.
101. Gulbarga District.-The population of Gulbarga District has increas~d during the last thirty years by 86.7 per cent, which is considerably below the corresponding increase recorded for the state. If figures pertaining to the previous censuses for the tahsils of the district as they are at present constituted were available, its southwestern tahsils would have revealed an appreciably smaller and its eastern tahsils a correspondingly greater percentage of increase. The relatively slow rate of increase of the population of this district as a whole is due largely to the marital condition of the people i.e., a relatively high proportion of widows in the higher reproductive ages coupled with a -comparatively small proportion of the married in the early age groups; and to the fact that the south-western tracts of the district suffer repeatedly from irregular or deficient rainfall. On account of the capricious rainfall, in spite of possessing a fairly good soil, agricultural production in these southern tracts falls down off and on. Again, as in the case -of Raichur District, more than '70 per cent of the area of the district is already under cultivation and the proportion of the irrigated area is very meagre. An additional reason, though by no means so important as those already detailed, is the fact that the district has witnessed some of the worst epidemics of plague and cholera in the state. The indigenous population of this district must, however, have increased at an appreciably higher rate than that of 86.7 per cent recorded for its enumerated population. This would be obvious from the following figures. The net gain to the population of the district by immigration from all areas beyond the district and by emigration only to other areas within the state was 8,706 in 1921, 12,297 in 1931 and 14,713 in 1951. But this gain is not likely to be sustained if any allowance is made, even on a very conservative basis, for the loss resulting from the migration of persons from Gulbarga District to the adjoining state of Bombay-especially to its districts of Bijapur and Sholapur, neighbouring Gulbarga District, and to its urban centres of Bombay and Poona Cities. The number ·of Hyderabad emigrants in Bombay State was 2.2 lakhs in 1921, 1.7 lakhs in 1931 and as much as 3.5 lakhs in 1951. A fair portion of these emigrants must have moved ,out from Gulbarga District. But even if the loss by migration to Bombay State is taken into account, the natural popUlation of this district is not likely to have grown at a faster rate than the enumerated population of the state as a whole.
Since 1901, the population of the district has increased QY only 37.4 per cent. This meagre increase is largdy due to the fact that like the neighbpuring district of Raichur, it suffered heavily during the famine and epidemic ridden decade of 1911-1921.
102. Adilabad District.-Since 1921, the population of Adilabad District has increased by 37.7 per cent, which is considerably smaller than the corresponding increase recorded by the population of the state .. The people in the district have suffered considerably from various communicable diseases, including malaria. This suffering has been particularly accentuated due to the general backwardness of the people. Conditions in the district have been, so unsatisfactory that until very recently Government employees considered it as a form of mild punishment if they were transferred to it. Actually, but for a particularly heavy immigration into the district, from both within and beyond the state, and very early marriages in the district the growth of its population would have been considerably lower-perhaps the 'lowest among all the districts of the state.
57
108. The net gain accruing to the district by migration has been so vital to the growth of its popUlation that it deserves more than a brief reference. The number of immigrants into the district from all areas beyond its borders, was as much as 88,420 in 1921, 112,627 in 1931, and 96,577 in 1951. These immigrants constituted 18 per cent of the total district popUlation in 1921, 15 in 1981 and 11 in 1951. In no other district of the state-except in Hyderabad District due exclusively to the location of the capital city within the district-has there been continuously for some decades such a heavy influx of non-indigenous population. As regards emigration from Adilabad District, complete figures are available only in so far as the number of Adilabad emigrants in other areas within the state itself are concerned. Such emigrants numbered only 5,747 in 1921, 7,781 in 1981 and 14,669 in 1951. The number of Adilabad emigrants in other areas in India or outside, except for the bordering Madhya Pradesh districts of Chanda and Yeotmal and in and around Nagpur City and Wardha Town, is not likely to have been very significant. This is partly because the people of this district are, on the whole, the most backward and unenterprising in the state and partly because during the recent decades employment was available within the district itself on a fairly large scale due in turn, to the laying of railway lines and roads, construction of bridges and dams, working of coal fields, exploitation of forest produce, establishment of new industries, etc. The census figures pertaining to Madhya Pradesh reveal that in 1921 there were 6,045 Hyderabad emigrants in Chanda, 80,703 in Yeotmal and only 1,500 in Nagpur and Wardha. The corresponding figures in 1931 were 12,412, 32,921 and 1,598 respectively, and in 1951, 28,724, 28,599 and 8,389 respectively. But all these Hyderabad emigrants could not have belonged to Adilabad District alone. Chanda District is known to have drawn emigrants not only from the bordering district of Adilabad but from remoter areas of this state as well, particularly from Karimnagar District. Yeotmal would have attracted emigrants in significant 'numbers not only from Adilabad but from the other two adjoining districts of Nanded and Parbhani also. Similarly, Wardha and Nagpur, would have received migrants not only from Adilabad District but from the other three northern districts of this state also in appreciable proportions. In view of this, it can be assumed that at the most about 80 per cent of the Hyderabad emigrants in Chanda, 50 in Yeotmal and 25,in Nagpur and Wardha Districts would have been drawn from Adilabad District. On this basis, and after making very liberal allowances* for Adilabad emigrants in all other areas as well, the total numbers of emigrants from Adilabad District would be roughly abou{ 80,000 in 1,921, 40,000 in 1931 and 56,000 in 1951. Thus, the district would have even on a very conservative estimate gained in all by the movement of population about 58,000 persons in 1921, 73,000 in 1931 and 41,000 in 1951. But the actual gain by the movement of population may be considerably more, as the number of emigrants from Adilabad District to areas beyond the state has been estimated on perhaps a too liberal basis. As against this, according to the enumerated census population figures the district added 35,110 persons to its papulation during 1911-1921, 106,494 during 1921-1931 and 78,900 during 1941-1951. It is thus obvious that the indigenous population of this district is growing, if growing at all, at a painfully slow rate. This halting grGwth is certainly not due to any family limitation resulting. directly or indirectly, from a progressive outlook on life. This point needs close examination by public health experts and demographers. It may be healthy to arrest growth of population by planning. But it is ceo tainly tragic to decline in numbers or be static due to other causes.
Since the turn of this century th~ popUlation of this district has increased by 86.4 per cent, which is appreciably above the corresponding increase for the shde. The di<;trict *On a very liberal basis, and keeping in view the trend of migration from Hyderabad .state, it has been assumed tha\ Adilabai emigrants in all other areas (i.e., other than in Hyderabad State and Chanda, Yeotmal, Nagpur and Wardha Districts of Madhya Pradesh) numbered about 4,000 in 1921, 5,000 in 1931 and 7,000 in 1951.
8
58
recorded a very heavy increase during the prosperous decade 1901-1911. But this increase may have been to an extent the result of under enumeration at the 1901 Census. Conditions in this district, which is even now very backward, must have been almost primitive in 1900. With small, shifting, inaccessible forest dwellings, rendered inhospitable by malaria and other diseases and inhabited by a totally illiterate and superstitious population, the enumeration authorities are bound to have missed not only individuals but also groups of habitations. And again, during the decade 1911-21 when most districts of the state lost in numbers, Adilab3d was conspicuous with a gain of about 6 per cent. No ,doubt this district was comparatively unaffe(~ted by the epidemics and famines which characterised the decennium. But the increase waS largely due to an unprecedented immigration of over 30,000 persons (mostly labourers and their dependants) from Madras because of the construction of the Kazipet-Ballarshah Railway line.
104. Nizamabad District.-During the last three decades, the population of Nizamabad District has increased by 55.4 per cent, which is appreciably above the corresponding increase for the state. This appreciable increase appears to be very largely the result of an increase in the scale of immigration into the district since the completion of the Nizamsagar Project, without any commensurate change in the s'cale of emigration from the district. The number of immigrants in this district from all areas beyond it which was only 14,244 in 1921 and 21,215 in 1981 is now as heavy as 104,970, i.e., more than seven times what it was in 1921. The immigrants now constitute about 14 per cent of the total population of the district. They were less than 3 per cent in 1921. On the other hand, the llumb::>r of emigrants from this district to other areas within the state itself has remained almost stationery. It was 32,483 in 1921,32,195 in 1931 and is now 36,073. On the b3sis of these figures, Niz3mabad District, which lost by the movement of population in 1921 and 1931, has actually g2,ined in all 68,897 persons in 1951 due to the very same reason. This figure is, however, exaggerated as no account has been tgken of the e:i.nignmts from the district to areas beyond the state. But Nizamabad is an interior district in the centre of the state and, even on a very liberal basis, the number of such, emigrants is not likely to have exceeded 10,000 in 1951. Thus, even after making due allowances for 2Jl factors, the district would have gained over 58,000 persons in 1951 by ~he movement of p:Jpulltion. If this g2,in were discounted, the percentage increase of its population would be considerably lower than the aVEr8ge increase for the state. It is, therefore, obvious that quite contrary to the trend revealed by the variation in its ,enumerated population--and in spite of the fact that early me.rriages p,re more common in this district than in any other district of the state-its indigenous population has been increasing r,t an l'),pprecigbly slow rate. Its demogrgphic conditions on the whole seem to b2 m')re akin to those of Adilabad District rathEr thtn to those of Karimnagar and Medak which also e,djoin it. These conditions apparently call for some efllpert examination. It should be p3rticularly useful to determine the change in birth 2.nd de8,th rates consequent on a heavy expansion of irrigation.
It is not considered worth while to comment on the growth of the population in Nizamabad District since 1901 for reasons given in the note below. Note.-It is difficult to trace out the details of all the inter-district territorial changes that were effected in the state, from time to time, during the last five decades and then to adjust the population of each district as recorded at the previous censuses to conform to its present territorial jurisdiction, In fact, the basic records with regard to such changes are not available for the former Diwani or Jagiri Illaqas of the state. 'Even otherwise, it is customary for each Census Superintendent to take the figures for the four preceding censuses from the report of his predecessor and then to adjust them to the extent of the territorial ehanges made only during the decade ending with the current census. But the corresponding adjustments made in the 1941 Report are particularly defective in so far as Nizamabad and Medak Districts are concerned. According to the 1941 CensulO Report, while the adjusted population of Medak District is supposed to have increased in 1911 by over 64 per cent that of the' neighbouring district of Nizamabad is supposed to have declined by over 22 per cent. There is nothing in the 1911 Censu!. Report itself to justify such markedly dissimilar trends. The adjustments made in 1941 are obviously incorrect and it is no~ uo~~iblu to rectify them at this stAge.
8*
59
105. Jl-Jedak District.--Since 1921, Medak District-like Karimnagar--has increased its population by 42.9 per cent, which is appreciably below the corresponding increase for the state. Again, as in the case of Karimnagar Distr1ct, this relatively slow growth results solely from accelerated emigration from the district. The number of emigrants from this interior district to other areas within the state itself which was 47,049 in 1921 and 53,455 in 1931 has now increased to 84,263. As against this, the immigrants into this district from all areas beyond the state have increased only from 34,461 in 1921, and 36,632 in 1931, to 47,290 in 1951. In fact, the percentage of such immigrants to the total population of this district has steadily decreased frem5. 4 in 1921 to 4.6 in 1951. On the basis of these two sets of figures, the district lost in all 12,588 persons in 1921, 16,823 in 1981 and 36,978 in 1951 by the movement of popUlation. This loss, which is impressive even as it is, is under estimated to the extent of Medak emigrants to areas beyond the state. But Medak is an interior district and ther.e is not likely to have been any considerable emigration from the district to areas beyond the state. If, even at a conservative estimate, the number of such migrants is assumed as having beEn about 8,000 in 1921 and 1931 and about 5,000 in 1951, the actual loss would be about 16,000 in 1921, 20,000' in 1931 and 42,000 in 1951. Thus, but for the movement of population, from or into the district, the population of the district would have increased during this decade alone by about 16 per cent instead of the increase of only about 12 per cent recorded in its enumerated population. This relatively heavy increase is largely due to the marital habits of the indigenous population--in this district over 38 per cent of the females in the age group of '5 to 14' and 94 per cent in the age group of '15 to 24' were m'1rried in 1951--and to the fact that the district suffers relatively little from famines and scarcity and perhaps also epidemics. The indigenous population of this district is perhaps second only to that of Karimnagar in the state from the point of view of the rapidity of its growth*.
106. Karimnagar District.--During the last thirty years, the population of Karimnagg,r District ha<; increased by 42.9 per cent, which is appreciably below the corresponding increase recorded for the state. This relatively slow growth is entirely the result of heavy emigration from the district. The number of Karimnagar emigrants in other ar~as within the state itself was already as high as 61,004 in 1921 and 65,202 in 1931. But this figure rocketed to 152,826 in 1951, which is by far the biggest number of emigrants from anyone district to the rest of the dhtricts registered in the census history of the State. As ag'1inst this, the number of immigrants into the district from all areas beyond it has' been rem'1rkably meagre. It was only 10,334 in 1921, 14,092 in 1931 and 28,467 iIi 1951-the number in 1951 was by far the sm':111est recorded among the districts of the state from the points of view of both absolute figures and the proportion to the total district population. On the basis of these figures alone the natural population of the district was in excess of its enumerated population by 51,1l0 in 1981 and 124,859 in 1951, i.e., roughly by 4 and 8 per cent respectively. But the actual excess would be even heavier as the above figures do not take into account the number of Karimnagar emigrants in areas beyond the state. It is thus obvious that the rate of increase of the enumerated population of this district since 1921--which is appreciably below the corresponding rate recorded for the state--hardly reflects the magnitude of the growth of its natural population. The naturpJ population of this district, quite contrpry to the trend in the neighbouring districts of Adilabad and Nizamabad, is increa~ing at an astonishing rate--perhaps almost unprecedented in the state. This remarkable rate of growth is largely due to m'1rital habits of the people (over 40 per cent of the females among them
.See Note given under paragraph 104.
60
in the age group of '5-14' and over 92 in the age group of '15-24' were married in 1951) and to the fact that, among all the districts of the state, Karimnagar is perhaps the least affected by famines, scar~ity conditions and epidemic diseases.
Since the turn of this century, the enumerated population of this district has, however, increased by 87.6 per cent, which is considerably above the corresponding increase of 67.6 per cent registered for the state. This accelerated growth is chiefly due to the tremendous increase in its population (exceeding 35 per cent) during the prosperous and healthy decade of 1901-1911. It is obvious that the district, under the then existing economic conditions, was able to sustain within its own borders a very large portion of the increase in its indigenous population. The increase, however, may also have been the result partly of faulty enumeration at the 1901 Census, particularly in the forest tracts of the district along the Godavari.
107. Warangal District.-The population of this district has increased during the last three decenniums by 72.6 per cent, which is remarkably more than the" corresponding increase of 49.7 per cent recorded by the population of the state. The heavy increase is the result both of considerable accession in numbers by the movement of population and a consistently rapid rate of growth recorded by the indigenous inhabitants. The number of immigrants into Warangal District from all areas beyond it which was already as high as 63,393 in 1921 and 71,976 in 1931 has increased to 138,393 in 1951-As against this, emigration from the district has been relatively unimportant. The number of Warangal emigrants in other areas within the state was only 24,472 in 1921, 23,643 in 1981 and 33,965 in 1951. As stated earlier, the districtwise break up of the emigrants from Hyderabad State in other parts of India are not available for this or any of the earlier censuses. 'Varangal District is bordered on the east and south-east by East and West Godavari Districts and on the south-west by Krishna District of Madras State. East and West Godavari Districts have little attraction for Hyderabad emigrants beyond the bordering areas in Warangal District, and it can, therefore, be safely assumed that about 90 per cent of Hyderabad emigrants in the two districts are drawn from Waranga] District. But Krishna District adjoins Nalgonda District as well. In view of this, and the fact that the volume of employment available in \Varangal District is considerably greater than in Nalgonda, it can at best be assumed that not more than 60 per cent of the Hyderabad emigrants in Krishna District would have migrated from Warangal. The total number of Hyderabad emigrants in East and West Godavari Districts was 8,225 in 1931 and 9,551 in 1951 and In Krish11a District 23,143 in 1931 and 35,345 in 1951. On the basis of the proportions indicated above, out of these Hyderabad emigrants about 21,000 in 1931 and 30,000 in 1951 would have migrated from Warangal District. The number of 'Varangal emigrants in other parts of India, beyond these adjoining areas of Madras State, is not likely to have been very large. The number beyond India would have been only microscopic. Considering the general trend in migration, the number of all such emigrants could not have exceeded 7,000 in 1931 and 10,000 in 1951. On the basis of these figures, Warangal District would have benefited by the movement of population to the extent of atleast about 20,000 persons in 1931 and 65,000 in 1951. No doubt these figures are based on certain assumptions. But the fact remains that the number of Waranga! emigrants beyond the state has been calculated on a very liberal basis-particularly in relation to known figures of Hyderabad emigrants in various states of India. It is, therefore j obvious that but for the net gain accruing to the disstrict by migration, the increase in its population during the last thirty years would have been appreciably nearer to the corresponding increase recorded in the population of the
61
·state. These figures and estimiltes, however, also establish that the enumerated population of War an gal District could not have increased by about 21 per cent in 1931, 18 in 1941 and again by about 21 in 1951 due to the gain by migration alone. It is quite clear that the indigenous population of the district is also increasing consistently at a fairly heavy rate. This is not at all surprising considering the fact that the district has remained almost immune from famines and scarcity, has suffered comparatively little from epidemics and has recorded considerable progress in the development of irrigation, communications, industries, trade and commerce, etc.
The population of this district has increased by 123 per cent since the beginning of the century, which is also strikingly above the average for the state. This remarkable increase is again, to some extent, due to the fact that because of its sparsely populated tracts, its recent development in various directions, its coal mines and prosperous towns, etc., the district has attracted a large number of immigrants, from both within and beyond the state. A slightly more important reason is perhaps the fact that the district escaped very lightly from the severe famines and epidemics of the 1911-1921 decade. A minor reason may be the unsatisfactory coverage of the inhabitants of the forest tracts along the Godavari, at the 1901 Census.
108. Nalgonda District.-The population of this district has increased during the last three decenniums by 50.8 per cent which-as in the case of the adjoining district of Mahbubnagar-is slightly above the corresponding increase for the state. There is no doubt that the south-western tracts of this district have had to face scarcity conditions repeatedly. But their consequences have not been so serious in these tracts as in Raichur District, or even in the western portions of Gulbarga and Osmanabad Districts. There is again no doubt that portions of the district, especially in the south-west, have suffered badly from malaria. But, again as compared with the western districts of the state, the district has remained relatively free from serious epidemic outbreaks. In this respect its record is almost as good as that of Medak or Karimnagar. It is, therefore, not surprising that the rate of growth of the population of this district should be above the average for the state. In fact, the rate would have been considerably more marked but for the. accelerated emigration from the district. The number of emigrants from the district to other areas within the state has increased from 53,356 in 1921 and 56,831 in 1931 to 101,526 in 1951, i.e., it is almost double the previous figures. As against this, the extent of immigration into the district from all areas beyond it has not at all been rematkable. The immigrants numbered only 31,349 in 1921, 24,812 in 1931 and 36,266 in 1951. On the basis of these figures alone, the district has lost 22,007 persons in 1921, 32,019 persons in 1931 and as many as 65,260 in: 1951 by the movement of population. But this loss is very much underestimated as it does not take into consideration Nalgonda emigrants beyond Hyder!lbad State. Hyderabad emigrants in the two Madras districts of Krishna (which adjoins both Nalgonda and Warangal) and Guntur (which adjoins both Nalgonda and Mahbubnagar) have increased from 27,148 in 1931 to 43,915 in 1951. A fair proportion of these Hyderabad emigrants are bound to have been drawn from Nalgonda District. In addition to this, Nalgonda emigrants in other areas beyond Hyderabad State would number at least a few thousands. These figures make it obvious that the growth of the natural population of this district is considerably more than the increase of 50.8 per cent indicated in its enumerated popUlation since 1921. The derp.ographic conditions in the norther,n tracts of this district are very similar to those prevailing in the neighbouring distri~ts of Karimnagar and Medak, whose natural populations are also growing at a remarkable rate.
62
Since the beginning of this century the population of this district has increased by 65.8 per cent which is slightly below the corresponding increase for the state. This is largely due to the fact that in the eastern half of the state (excluding Hyderabad City) Nalgonda District was the worst affected by the pestilences and famines of the disastrous decade of 1911-21.
Swnmary.-Territorial changes, scale of immigration and emigration and the rate of natural increase are the three factors which affect the growth of population. But in assessing this growth, the incomplete coverage of inhabitants, and sometimes even of villages, at the earlier censuses cannot be entirely ignored. To the extent of such omissions the growth, as revealed by the census figures, would have been a.rtificially exaggerated. The effects of territorial changes on the growth of population have, however, been largely neutralised by adjusbng the population of the state and of each of its sixteen districts for an the previous censuses since 1901 to conform to their present territorial jurisdictions. During the earlier decades, the difference in the scale of immigration into the state and of emigration from the state was not large enough to affect the growth of its population to any significant extent. But since 1921, emigration has far outstripped immigration thereby retarding the growth of the population of the state to an appreciable extent. But by far the predominant factor influencing the growth of population in this state is, however, the rate of natural increase, Le., of the increase resulting from the excess of births over deaths. In the earlier decades, epidemics and famines, which broke out from time to time, caused heavy mortality before they ran out their natural course. Death rates soared to abnormal heights in the decades that were especially bad from this point of view. In the subsequent decades, i.e., from 1921-31 onwards, such outbreaks began to be controlled and localised expeditiously and, therefore, they lost considerably their capacity to cause unlimited damage. Again, due to the growing appreciation of modern curative and preventive methods and to the slow but steady improvement in matters of personal 'hygiene and environmental sanitation, mortality from causes other than those directly or indirectly resulting from famines and epidemics is gradually declining though it is apparently still high as compared with most of the advanced areas in the World. Thus, during the recent decades death rates have, on the whole, declined considerably. As against this, there does not appear to have been any commensurate overall decrease in birth rates. They have, however, declined to some extent chiefly because of the postponement of the age of marriage to later years. Apart from this marriages are, if any thing, more universal now thau in the earlier decenniums and the limitation of the size of the family by planning is stm restricted to an insignificant minority among the educated. Due to all these factors, the population of the state has been steadily increasing during the recent decades as against its intermittent growth and decline during the earlier ones.
The population of this state increased by over 17 per cent in 1891, following a fairly prosperous agricultural decade which was also characterised by appreciable progress in respect of the expansion of communications and large scale industries. The population decreased by over 3 per cent during the succeeding decade of 1891-1901 because of epidemics and a series of unfavourable agricultural seasons culminating in one of the worst famines in living memory. The population of the state, however, increased by 20 per cent during the next decade of 1901-1911, which was perhaps the most prosperous one during the current century from the IJoint of view of agricultural production. The decade also witnessed considerable deVelopment, especially in the setting up of a large number of cotton ginning and pressing factories and the construction of irrigation projects. But the population again declined by almost 7 per cent in the following decade of 1911-1921. This decennium was the most disastrous one in the recent history of the state. Severe epidemics and famines, aggravated by the dislocations caused by the First World War, literally claimed lakhs ,of victims in the state. Since then, however, the popUlation of the state has been consistently increasing at an appreciable rate from decade to decade. It increased in 1921-81 by almost 16 per cent, 1981-41 by about 18 per cent and in 1941-51 by about 14 per cent. These decades were free from the famines and epidemics. of the severity witnessed in the earlier ones. Besides, during these thirty years, the state has recorded steady progress in the expansion of communications, industries, irrigation, medical and public health facilities, etc, Even the Second World War, unlike the first gave a considerable impetus to its trade and industries. The growth would have been significantly higher, especially during the decade 1941-51, but for a heavy loss by emigration to Bombay State_ Since the turn of this century the popUlation of this state has increast:d by about 68 per cent and during the last three decades by about 50 per cent. This remarkable increase is by no means unique in the d(mographic history of the World. The population of many states in India, and of many countries in Asia, have registered increases of similar dimensions during the current century itself. Many countries in Europe also registered increases of about the same order during the later half of the nineteenth century.
Though every district of the state has increased its population during the last thirty years, the increase from district to district is by no means uniform, It ranges from III per cent in case of Hyderabad_ to only
63
.82 in case of Parbhani and Raichur. The astounding increase in case of Hyderabad District is predominantly ·due to heavy immigration into Hyderabad City from both within and beyond the state. Next in order come Bhir and Warangal Districts, whose popluations have increased by almost 73 per cent. Bhir was very severely mauled by the famines and epidemics of 1911-1921. As a consequence the virile population which managed to survive the decade multiplied at an extraordinarily fast rate during 1921-31. Its increase even during the current decade was the highest among the north-western districts of the state and would have been considerably higher but for the large number of persons who emigrated from the district to the adjoining state of Bon bay. The marital habits of the indigenous population of this district-a relatively heavy proportion of early marriages and a low proportion of widows--are particularly conducive to a rapid growth. In case of Warangal, the increase is due partly to heavy immigration and partly to a relatively rapid growth of the indigenous population. 'The former resulted from the growing importance of some of its towns and colleries and the sparsity of population in some of its rural tracts; and the latter mainly from the fact that the district is, as a whole, almost immune from famines and scarcity. The population of Aurangabad District increased by as much as 64 per cent during the three decades. But this considerable increase is largely due to a heavy accession to its numbers ·during 1921-31, perhaps as a reaction to its particularly severe sufferings in the preceding, namely the 1911-21 decade, because of famines and epidemics. Actually during 1941-51, the population of the district increased relatively at a very slow rate. This is mainly due to the fact that during recent years the district has not recorded any appreciable progress industrially, portions of it have been adversely affected, from time to time, by scarcity and it is also losing large numbers by emigration, particularly to the neighbouring state of Bombay. Nizamabad District follows next with an increase of 55 per cent. This comparatively fast growth is largely due to heavy immigration into the district since 1931 because of its development in various directions consequent on the construction of the Nizamsagar Project. Actually, if t.\le net gain accruing to the district by migration during the current decade is ignored the increase in its population would be considerably lower than that of the state. Obviously, the existing demographic conditions in the district do not permit any appreciable growth of the indigenous population, in spite of the f~ct that early marriages are more common in the district than in other areas of the state. Nalgonda and its adjoining district of Mahbubnagar have both increased their population by about 51 per cent during the last thirty years. The increase in Nalgonda and, only to a slightly smaller extent, that in Mahbubnagar would have been considerably more significant but for the heavy emigration from the districts, especially to the metropolis of the st~te. In spite of the fact that the south-western portions of Nalgonda are affected by scarcity from time to time and the south-eastern portions of Mahbubnagar suffer badly from malaria, these two districts have, as compared with the western districts of the state, suffered relatively little from famines, scarcity and epidemics.
The populations of all the remaining nine districts of the state have increased during the last thirty years at a rate lower than that of about 50 per cent recorded for the state as a whole. Among these nine districts, the populations of both Karimnagar and Medak have increased by 43 per cent since 1921. But these two districts have lost very heavily by emigration. The migration from these districts, which was already fairly heavy as revealed at the 1921 Census, has now assumed colossal proporticns, especially in case of Karimnagar District. But for this emigration, the increase in the population of Karimnagar District would have been by far the highest in the state and that of Medak District would have been considerably higher than the average for the.,state. This heavy increase in their indigenous population is partly due to the marital habits of the people which are particularly conducive to a fast growth and partly to the fact that the two districts are the least affected in the state from famines and scarcity. The populations of Adilabad and Bidar Districts have increased during the same period by about 38 per cent. In case of Adilabad even this increase is largely due to a continuous and heavy immigration into the district from areas beyond it. It looks as if the indigenous population of the district is increasing at a very slow rate. In fact, it would not be surprising if it is not increasing at all. The halting growth of the natural population of this backward district, which is certainly not due to any family planning demands expert elxamination. Contrary to this, BidarDlstrict has lost heavily during the current decade by emigration to other areas beyond the district. But for this loss, the increase in its population would have been appreciably nearer to the corresponding increase recorded for the state. The population of Gulbarga District has increased by only 37 per cent since 1921. The district has lost appreciably but not heavily by the movement of population. But even if this factor was not operative, its increase would have been appreciably lower than that for the state as a whole. This is due to the fact that the district has had more than its share of epidemics in the state, its south-western tracts are repeatedly affected by scarcity and, among its females. the proportion of the widowed in the more advanced of the reproductive age groups is relatively high and that of the married among the early reproductive age groups is comparatively low. Nanded District has increased its population during the same period by 36 per cent. This comparatively slow rate of growth is due to the increased tempo of emigration from the district to the neighbOluing district of Nizamabad, the retarded rate of its industrial progress during the recent decades, a more than avearge share of the epidemics which broke out in th" state 2nd lastly considerable dislocation in its northern tracts.
64
due to the events preceding and following the Police Action. The population of Osmanabad District hasincreased during the last thirty years by 35 per cent. This relatively slow increase is largely due to the district's heavy loss by emigration to Sholapur District and other areas in Bombay State, the irregular and scanty rainfall in its western tracts, constant outbreaks of epidemic diseases, especially p12gu0, its retarded development during the recent decades and its disturbed conditions both prior to and following the Police Action. The population ofParbhani District has increased by only 32 per cent during the last three decades. This especially slow rate of increase is the result of the unsatisfactory public health conditions preVfliling in the northern tracts of the district, its stagnation in respect of industrial development since 1921 2nd its 10s5 by emigration to other areas within the state. Raichur District, like Parbhani, has increased its population during the last three decenniums by only 32 per cent. But this increase dwindles to -just 29 per cent-by far the lowest recorded in the state-if the temporary accession to its population resulting from the construction of the Tungabhadra Project is ignored. The three most important factors responsible for this unimpressive increase are the marital, the seasonal and public health conditions of the distrid. The district as a whole has an inordinately high proportion of widowed females, in the advanced reproductive age groups and a very low proportion of married females in the earlier age groups; is repeatedly affected by scarcity; and also suffers severely from malaria and various communicable and other diseases.
SECTION IV
MOVEMENT
(The tables relevant to this Section are Main Table' D-IV - Migrants' given at page 161 of Part II-A of thill Volume and ,subsidiary Tables' 1.4 - Immigration', '1.4-A - Distribution of Immigrants according to Place of Birth and Livelihood Clas,es', -I1.5-Emigration', '1.5-A Distribution of Emigrants according to Place of Enumeration and Livelihood Classes', '1.6- Migra.tion between the StaJ.e and Other Parts of India', and.' 1.7 - Variation in Natural Population' given at pages 12, 14, 48, 50, 52 and 52 respectively of Part I-B of this VOluine).
. 109. Instructions to Enumerators and Limitations.-In this report, as in most census reports in India, figures relating to both immigrants and emigrants are based on information collected in respect of the census question pertaining to the place of birth. In the instructions issued to enumerators in regard to this question, they had been directed to ascertain and record in case of every person born within the state, the name of the ,district in which the person was born; in case of every person born beyond the state but within the Indian Union, the name of the state in which the person was born; and in case of every person born beyond the Indian Union, the name of the country in which the p~rson was born. This practice of equating birth place statistics with migration statistics has, however, some drawbacks from a pure1y economic point of view, but the elimination of these drawbacks is not within the realm of possibilities under the present limitations of census enumeration. And again, even from the point of view of birth place statistics, the census data pertaining to emigrants are incomplete. Figures pertaining to emigrants from this state to other Indian States were obtained from the Census Organisations of the respective states, except that the number of Hyderabad emigrants in Kashmir and Jammu could not be similarlv ascertained as no census was taken in that· 'State in 1951. But this omission has littie statistical significance. The number of Hyderabad emigrants to Kashmir and Jammu was only 7 in 1921, 19 in 1931 and 28 in 1941. There is absolutely no reason to presume that the number would be any larger now. A more serious limitation is, however, the non-availability of figures pertaining to ,Hyderabad emigrants in areas beyond the Indian Union. Under normal circumstances, even this limitation would not have affected the final figures to any appreciable ,extent as the number of Hyderabadis residing beyond the Indian Union is very insignifican~ and largely confined to students prosecuting their studies abroad. But during the decade 1941-1951, there has been considerable migration of Muslims from Hyderabad to Pakistan, though not on such a large scale as is sometimes taken for granted. Because of various conflicting factors, it is not possible to estimate the figures involved in this movement on any satisfactory basis. To this extent, therefore, the emigration figures are under-estimated.
no. Types of Migration.-It has been customary in Indian Censuses to classify internal-migration into about half a dozen categories, though no quantitative estimates of the number under each category have been, or could possibly be, given. Hutton, writing in this regard in his 1931 All India Report states that, " Internal migration is of several kinds, for which the following convenient terminology has been used in previous census reports~ Casual migration, involving minor movements between neighbouring villages, largely by way of marriage, only affects the Indian figures when the boundaries crossed happen to be those of provinces or states. Temporary migration is mainly due to the movement in the demand for labour, e.g., on canals or public buildings, and to pilgrimages and fairs. Periodic migration is that caused by recurring seasonal
65
66
demands, as for harvesters. Semi-permanent migration is that of persons who maintain their connection with their pre-migration homes, earning their living elsewhere but ultimately returning and often leaving their wives and families at home during the period of migration. Permanent migration is that in which the migrant leaves one place to settle in another for good. It is necessary also at this census to mention an additional form of migration which may be described as Daily."
Ill. As will be seen subsequently, casual migrants account for by far the largest number of migrants from and into the state. In this country, the proportion of persons marrying beyond the village wherein they reside to the total population of the village is perhaps the heaviest in the world. The initial factor establishing the eligibility of' bride or the bridegroom is that they both belong to the same caste, or most often, even to the same sub-caste. As the number of villages inhabited predominantly by persons belonging to the same caste is limited, in an average village many of its inhabitants are compelled to marry beyond its confines. The educational progress achieved in recent times has not led to the breaking of this caste restriction to any appreciable extent. On the contrary, the progress achieved in communications has actually widened the areas from which the bride or the bride-groom belonging to the same caste could be selected. Such marriages naturally lead to the bride migrating from her place to the village of her husband. She hardly returns to her place permanently, and in the rare cases she does, she would have in all probability become either a childless widow or a divorcee. But, as has been pointed out by various census authorities in the past, social conventions, which do not seem to have changed much in this respect, demand her temporary return to the house of her parents for her first confinement, and in quite a number of cases, for many of the subsequent confinements as well. Thus, many of the issues of such marriages are born beyond the paternal village in which they reside subsequent to their birth, and both the mothers as well as such issues become technically immigrants in the village. When the villages of the parties to a marital alliance happento be on different sides of the frontiers between two states, or two districts within the same state, the marriage leads to casual inter-state or inter-district migration, as the case may be. And what is true of the village, is also true of th~ town with little or no difference. As many as twelve of the sixteen districts of this state lie along the borders of other Indian States and the persons living on either side of the frontiers owe allegiance' to the same pattern of castes and speak the same regional Janguage. The feeling of ,'Moglai " which some times in the past used to keep them separate, has now disappeared almost completely. Besides, just prior to the Police Action, literally thousands of
- Hyderabad Hindus were compelled to leave their homes and seek ~helter in the neighbouring states. One of the results of this movement has been the intensification of the social, cultural and economic contacts of the people on either sides of the frontier. Consequently, casual migration is now much more in evidence than at the previous censuses.
112. Temporary migration, in so far as it pertains to the movement of labour in connection with irrigation or power projects, was quite prominent at the 1951 Census. The Tungabhadra Project, the largest of its kind to be undertaken in this part of the country, had drawn 9,750 immigrants, from Madras State. It is almost certain that a fair portion of the 19,644 Hyderabad emigrants to Bellary District, must have also migrated because of the project works on the other side of the river. The bigger of
- the other projects which also attracted some immigrants, 1;Joth from within and beyond the state, were the Kadam Project in Adilabad, the Azamabad Thermal Works inKarimnagar, the Bendsura Project in Bhir and the Koilsagar Project in Mahbubnagar. There

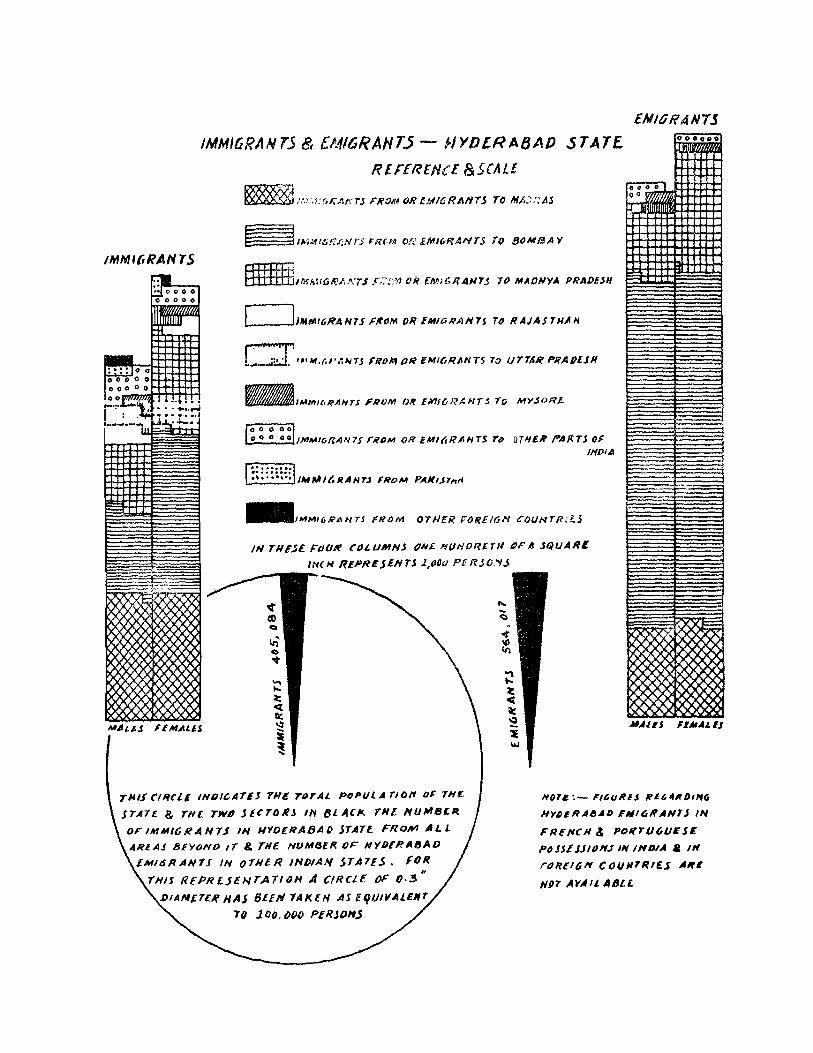
ENlgRANTJ
IMNllr,RAN 1S
IMMIGRIoNTJ & £M!6RANT.5 - f/YOlRABAf) STATE,
RIFER£IUl &5(AL!
~1 /:.::,;:5r.AI';TJ FHO/!4 OR I.MIC RAIITS TO Mk~:; A.S
[ l/AtJ'JlI6RANTS FROM OR EMluRANTS To RAJAJTH~N
uTIIl.1f l".Altn ()~ II{OUl
IN THESE FoUR ('OL UMNj ()N£ HI.JNOI?£TJi ~F A JQUARe
INCH TUPREjENn 1,Q8() PEfUO_"lIj.
,.. -<:I ~ )(XX '", XI'=-"
""' ... ~ <t Ill: ~
~ ~
Till.! C'/lUL£ IHDIC,ATES THE TOTAL pOPIII. A 710ft O~ TH£
J7',A7£ &. THe TWO Jf<TDIiJ IN Bl AtK TH£ NIJMBtR.
OF INlMI61l4NT.J IN H'fO£RA8AD STATE. FRO/lll AL L
AREAS BEYOND IT & THE NIJMIJER. OF" HYOFRABAD
LMI61UJNTJ IN ()THER JND/Aft{ jTA7E.s. fOR. " THIS fUPR£JENTA71()H .If CIRCJ.£ OF 0·3
DIAMLT£.f HAS 6llN lA1(£/'f AS IqlJ/VALENt
7{J J 00. ()()() P£RJDHJ
.... ~ If)
\U
)Ii
~>O. MAUS UNA.HJ
NOT~:- ',&uRES 1t£6ttRDllfG
HYDERA~A" 'ItIItilfAN7J IN
FRFflCH & POI('rU(,UESE
Po SU JJIOI'IJ IN INDIA & lit
rOlUIGIY COUJll7~/E..s A/fl
HDT AYAll A8l£
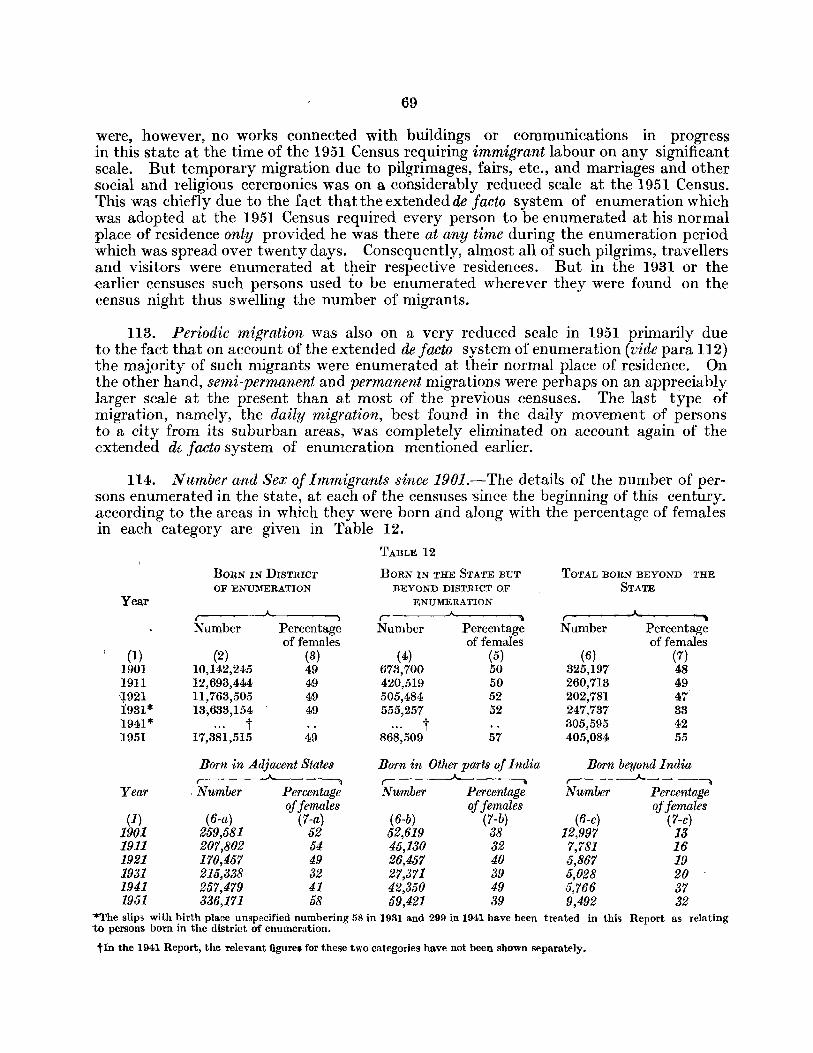
69
were, however, no works connected with buildings or communications in progress in this state at the time of the 1951 Census requiring immigrant labour on any significant scale. But temporary migration due to pilgrimages, fairs, etc., and marriages and other social and religious ceremonies was on a considerably reduced scale at the 1951 Census. This was chiefly due to the fact that the extended de facto system of enumeration which was adopted at the 1951 Census required every person to be enumerated at his normal place of residence only provided he was there at any time during the enumeration period which was spread over twenty days. Consequently, almost all of such pilgrims, travellers and visitors were enumerated at t~eir respective residences. But in the 1931 or the earlier censuses such persons used to be enumerated wherever they were found on the census night thus swelling the number of migrants.
113. Periodic migration was also on a very reduced scale in 1951 primarily due to the fact that on account of the extended de facto system of enumeration (vide para 112) the majority of such migrants were enumerated at their normal place of residence. On the other hand, semi-permanent and permanent migrations were perhaps on an appreciably larger scale at the present than at most of the previous censuses. The last type of migration, namely, the daily migration, best found in the daily movement of persons to a city from its suburban areas, was completely eliminated on account again of the extended dt- facto system of enumeration mentioned earlier.
114. N umber and Sex of Immigrants since 1901.-The details of the number of persons enumerated in the state, at each of the censuses 'Since the beginning of this century. according to the areas in which they were born and along with the percentage of females in each category are given in Table 12.
TABLE 12
BORN IN DISTRICT BORN IN THE STATE BUT TOTAL BORN BEYOND THE
OF ENUMERATION BEYOND DISTRICT OF STATE
Year ENUMERATION
r Number Percentage Number Percentage Number Percentage
of females of females of females (1) (2) (8) (4) (5) (6) (7)
1901 10,142,245 49 673,700 50 325,197 48 1911 12,693,444 49 420,519 50 260,713 49 '1921 11,763,505 49 505,484 52 202,781 47 1931* 13',633,154 49 555,257 52 247,737 33 1941* t t 305,595 42 1951 17,381,515 49 868,509 57 405,084 55
Born in Adjacent States Born in Other parts oj India Born beyond India ,. -")
Year ' Number Percentage Number Percentage Number Percentage oJJemales oJJemales offemales
(1) (6-a) (7-a) (6-b) (7-b) (6-c) (7-c) 1901 259,581 52 52,619 38 12,997 13 1911 207,802 54 45,130 32 7,781 16 1921 170,457 49 26,457 40 5,867 19 1931 215,338 32 27,371 39 5,028 20 1941 257,479 41 42,350 49 5,766 37 1951 336,171 58 59,421 39 9,492 32
""'The slip> wiLh birth pla.ce umpecified numbering 58 in 1931 a.nd 299 in 1941 have been treated in this to persons born in the district of enumeration.
Report as relating
tIn the 1941 Report, the relevant figures for these two categories have not been shown separately.
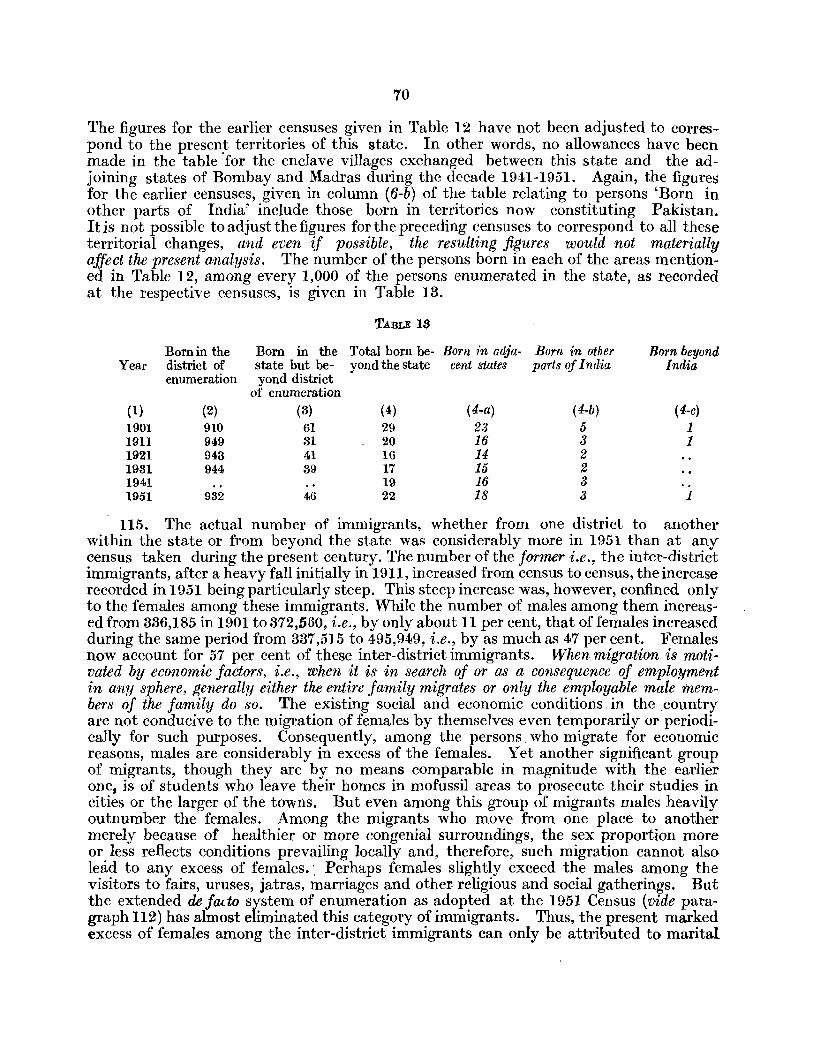
70
The figures for the earlier censuses given in Table 12 have not been adjusted to correspond to the presen~ territories of this state. In other words, no allowances have been made in the table for the enclave villages exchanged between this state and the adjoining states of Bombay and Madras during the decade 1941-1951. Again, the figures for the earlier censuses, given in column (6-b) of the table relating to persons 'Born in other parts of India' include those born in territories now constituting Pakistan. It is not possible to adjust the figures for the preceding censuses to correspond to all these territorial changes, and even if possible, the resulting figures would not materially affect the present analysis. The number of the persons born in each of the areas mentioned in Table 12, among every 1,000 of the persons enumerated in the state, as recorded at the respective censuses, is given in Table 13.
Bornin the Born in the Year district of state but be-
enumeration yond district of enumeration
(I) (2) (3) 1901 910 61 1911 949 31 1921 943 41 1931 944 39 1941 1951 932 46
TA.BLE 18
Total born be- Bom in adja-yond the state cent states
(4) (4-a) 29 2., 20 16 16 14 17 15 19 16 22 18
Born in other parts oj India
( 4-b) 5 3 2 2 3 3
Born beyond India
(4-c) 1 1
1
115. The actual number of immigrants, whether from one district to another within the state or from beyond the state was considerably more in 1951 than at any census taken during the present century. The number of the former i.e., the inter-district immigrants, after a heavy fall initially in 1911, increased from census to census, the increase recorded in 1951 being particularly steep. This steep increase was, however, confined only to the females among these immigrants. While the number of males among them increased from 336,185 in 1901 to 372,560, i.e., by only about 11 per cent, that of females increased during the same period from 337,515 to 495,949, i.e., by as much as 47 per cent. Females now account for 57 per cent of these inter-district immigrants. When migration is motivated by economic factors, i.e., when it is in search of or as a consequence of employment in any sphere, generally either the entire family migrates or only the employable male members of the family do so. The existing social and economic conditions. in the country are not conducive to the migration of females by themselves even temporarily or periodically for such purposes. Consequently, among the persons. who migrate for economic reasons, males are considerably in excess of the females. Yet another significant group of migrants, though they are by no means comparable in magnitude with the earlier one, is of students who leave their homes in mofussil areas to prosecute their studies in cities or the larger of the towns. But even among this group of migrants males heavily outnumber the' females. Among the migrants who move from one place to another merely because of healthier or more congenial surroundings, the sex proportion more or less reflects conditions prevailing locally and, therefore, such migration cannot also lead to any excess of females.' Perhaps females slightly exceed the males among the visitors to fairs, uruses, jatras, marriages and other- religious and social gatherings. But the extended de fado system of enumeration as adopted at the 1951 Census (vide paragraph 112) has almost eliminated this category of immigrants. Thus, the present marked excess of females among the inter-district immigrants can only be attributed to marital
71
alliances. Obviously, it is the chief factor now influencing the inter-district movement. The number of the latter, i. e., the immigrants from beyond the state decreased during the first two decades of this century, and has thereafter increased consistently, the increase during the last decade, namely 1941 to 1951, being particularly heavy. This heavy increase is again confined to females among them. While the males among these immigrants from beyond the state have increased from 169,159 in 1901 to 182,935 in 1951 .. i.e., by only 8 per cent, the females among them have increased during the same period from 156,038 to 222,149, i.e., by as much as 42 per cent. Females now account for 55 per cent of these immigrants. This heavy increase among the female immigrants is in turn, confined to the migrants from the adjacent states, indicating again that casual immigration, i.e., immigration due to marriages, accounts for the majority of these immigrants as well.
116. From the figures given in Tables 12 and 13, it will be obvious that though in absolute numbers immigrants, whether from one district to another within the state or from beyond the state, are now more numerous than they ever were at any of the censuses during the current century, their proportion to the total population of the state is now considerably lower than what it was in 1901. In other words, the increase in the number of these immigrants, however impressive it may be, has not kept pace with the increase in the total population of the state. But this method oj assessing the magnitude of the immigration is deceptive because of the one night census enumeration ,in vogue at the earlier censuus (vide paragraph 112). The figures of the earlier censuses were exaggerated by the inclusion of hundreds and thousands of daily, periodical and temporary migrants, both from within and beyond the state. They covered visitors at uruses, jatras, marriages, death ceremonies and other religious and social gatherings-and such occasions then used to attract considerably larger crowds than they do now; labourers engaged for short periods Jor harvesting or other agricultural operations; and travellers by rail or road who happend to be journeying, or temporarily resting, in any part of the state on the census night. Besides these categories of immigrants who do not now come into the picture at all, in the earlier decades, famines, epidemics and even fodder scarcity used to cause considerable temporary movement of population. But such events now occur less frequently and when they do remedial operations are generally taken in time as a res hIt of which people are not compelled to migrate form their homes on any large-scale. Thus, after making due allowances for all these factors there can be no doubt that immigrants, have increased considerably during the course of this century both in terms of their proportion to the total population of the state and, more especially, absolute figures. But in spite of all this, their present proportion to the total popUlation cannot be deemed to be very impressive. Out of evey 1,000 persons enumerated in this state in 1951, 932 were "stay at homes" in the sense that at the time of enumeration they were in the district in which they were born, and only 68 were immigrants of whom 46 were from beyond the district of enumeration and 22 from beyond the state--of the latter, as many as 18 were from adjacent states and only 3 from other parts of India and just 1 from beyond India. That the po~.ition with regar:d to the movement into this state is neither as dull as in Madras State nor as active as in Madhya Pradesh will be obvious from the fact that while in Madras State, out of every 1,000 persons enumerated in it, only 45 were born in districts other than the district of enumeration and 10 beyond the state, the corresponding proportions in Madhya Pradesh were as high as 57 and34 respectively. The movement reaches almost hectic proportions in Bombay State where out of every 1,000 persons enumerated 82 were born beyond the district of enumeration and 67 beyond the state.
9
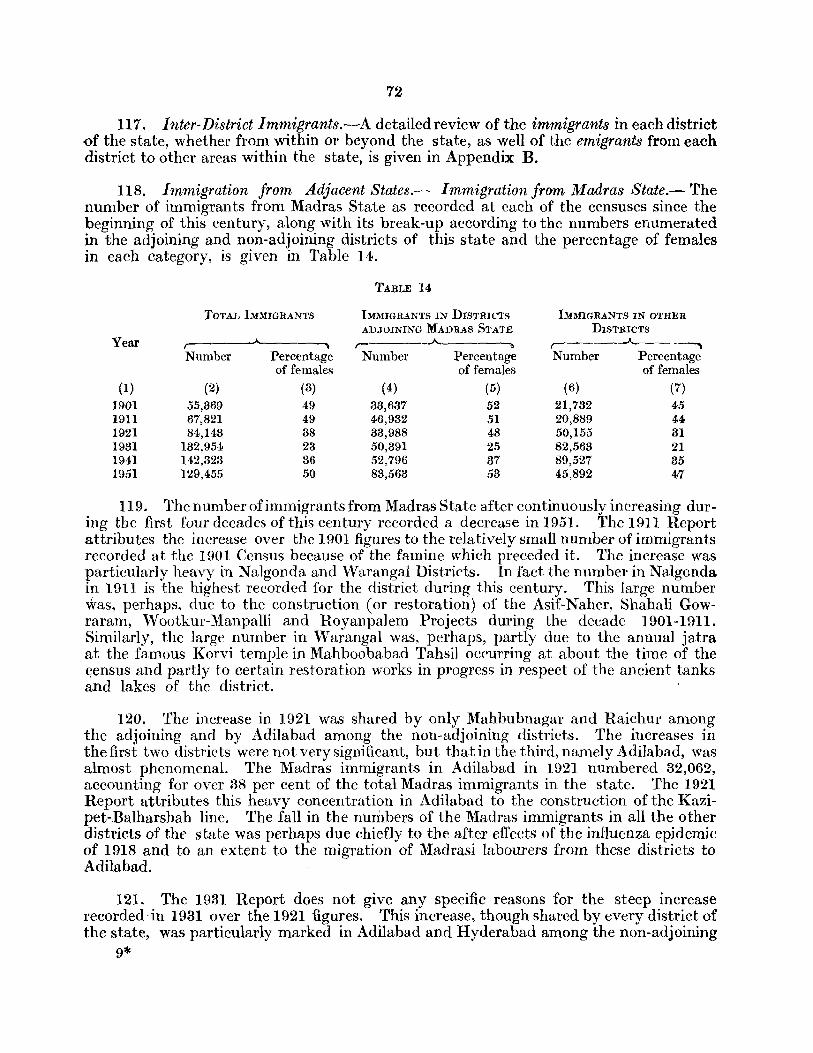
72
117. Inter-District lmmigrants.--A detailed review of the immigrants in each district <>f the state, whether from within or beyond the state, as well of the emigrants from each district to other areas within the state, is given in Appendix B.
118. Immigration from Adjacent States.- Immigration from Madras State.- The number of immigrants from Madras State as recorded at each of the censuses since the beginning of this century, along with its break-up according to the numbers enumerated in the adjoining and non-adjoining districts of this state and the percentage of females in each category, is given in Table 14.
TABLE 14
TOTAL IMMIGRANTS IMMIGRANTS IN DISTRICTS IMMIGRANTS IN OTHER ADJOINING MADRAS STATE DISTRICTS
Year r- r- -~--------, ,.--__ -.A..
Number Percentage Number Percentage Number Percentage of females of females of females
(1) (2) (3) (4) (5) (6) (7)
1901 55,369 49 83,637 52 21,782 45 1911 67,821 49 46,932 51 20,889 44 1921 84,143 38 33,988 48 50,155 31 1931 132,954 23 50,391 25 82,563 21 1941 142,323 36 52,796 37 89,527 35 1951 129,455 50 83,563 53 45,892 47
119. The number of immigrants from Madras State after continuously increasing during the first four decades of this century recorded a decrease in 1951. The 1911 Report attributes the increase over the 1901 figures to the relatively small number of immigrants recorded at the 1901 Census because of the famine which preceded it. The increase was particularly heavy in Nalgonda and Warangal Districts. In fact the number in Nalgonda in 1911 is the highest recorded for the district during this century. This large number was, perhaps, due to the construction (or restoration) of the Asif-Naher, Shahali Gowraram, Wootkur-Manpalli and Royanpalem Projects during the decade 1901-1911. Similarly, the large number in Warangal was, perhaps, partly due to the annual jatra at the famous Korvi temple in Mahboobabad Tahsil occurring at about the time of the Gensus and partly to certain restoration works in progress in respect of the ancient tanks and lakes of the district.
120. The increase in 1921 was shared by only Mahbubnagar and Raichur among the adjoining and by Adilabad among the non-adjoining districts. The increases in the first two districts were not very significant, but that in the third, namely Adilabad, was almost phenomenal. The Madras immigrants in Adilabad in 1921 numbered 32,062, accounting for over 38 per cent of the total Madras immigrants in the state. The 1921 Report attributes this heavy concentration in Adilabad to the construction of the Kazipet-Balharshah line. The fall in the numbers of the Madras immigrants in all the other districts of the state was perhaps due chiefly to the after effects of the influenza epidemic of 1918 and to an extent to the migration of Madrasi labourers from these districts to Adilabad.
121. The 1931 Report does not give any specific reasons for the steep increase recorded' in 1931 over the 1921 figures. This increase, though shared by every district of the state, was particularly marked in Adilabad and Hyderabad among the non-adjoining
9*
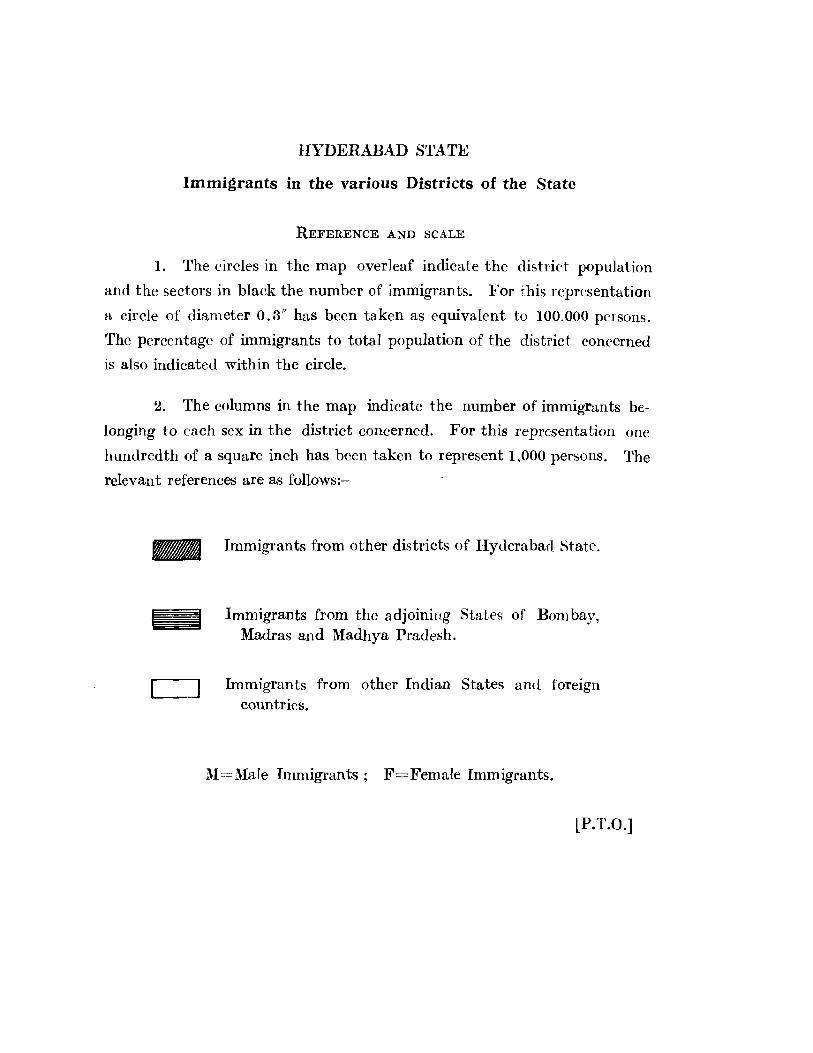
HYDERABAD STATE
Immigrants in the various Districts of the State
REFERENCE AND SCALE
1. The circles in the map overleaf indicate the district population
and the sectors in black the number of immigrants. For this representation
a circle of diameter 0.3" has been taken as equivalent to 100,000 persons.
The percentage of immigrants to total population of the district concerned
is also indicated within the circle.
2. The columns in the map indicate the number of immigrants be
longing to each sex in the district concerned. For this representation one
hundredth of a square inch has been taken to represent 1,000 persons. The
relevant references are as follows:-
rIM Immigrants from other districts of Hyderabarl State.
Immigrants from the adjoining States of Bombay, Madras and Madhya Pradesh.
Immigrants from other Indian States and foreign countries.
M=Male Immigrants; F=Female Immigrants.
[P.T.O.]
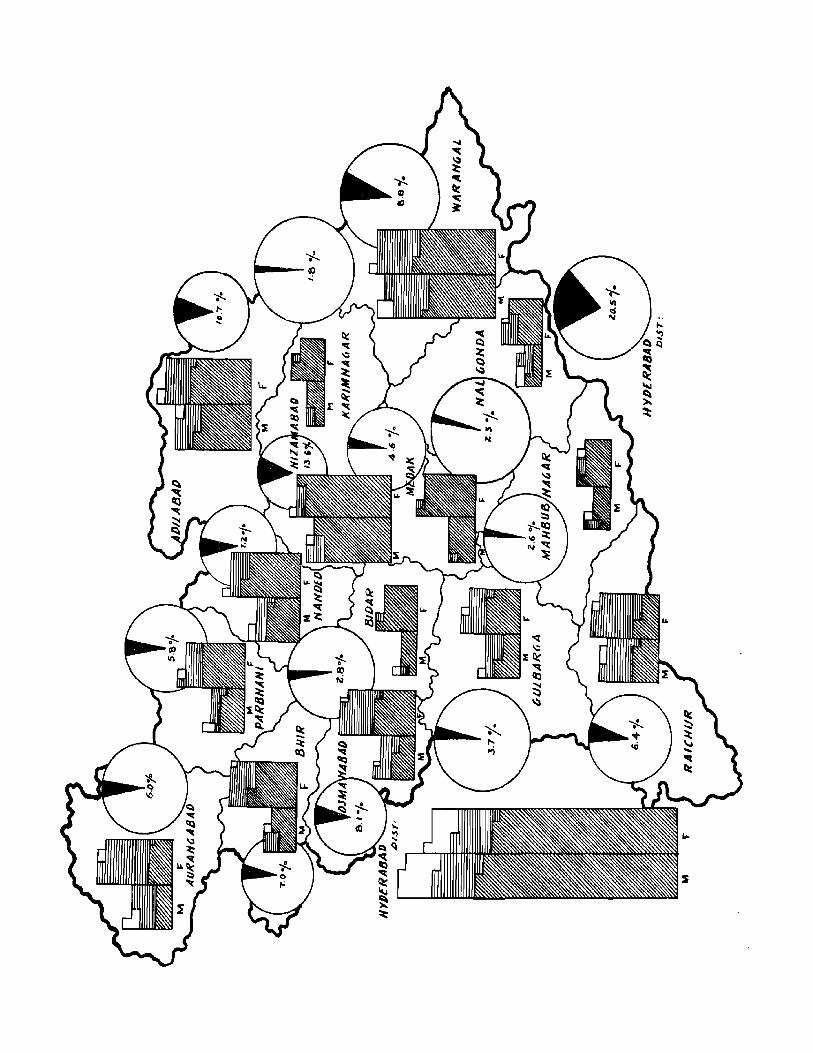
75
and Warangal among the adjoining districts. In fact, the number of Madras immigrants in Adilabad District in 1931, namely 52,412-01' almost 40 per cent of the total Madras immigrants in the state-is the highest recorded by the immigrants of any Indian State (or Province) in any district of Hyderabad during the present century. The 1931 Report states that "it is difficult to guess the reasons for this heavy concentration." Perhaps, the construction of the Soan Bridge across the Godavari, the laying down of many new roads* and the ancillary works connected with the Balharshah-Kazipet Railway line completed in 1929. must have not only sustained the survivors among the earlier Madras immigrants in the district but also attracted additional numbers from both within the state and the adjoining areas of Madras. The 1931 Report attributes the large number of Madrasis in Hyderabad District as being due to the railway offices and trade in Secunderabad. Their employment in the military and ancillary establishments in Secunderabad Cantonment and infiltration into occupations connected with the processing of, or trade in, products like timber, tobacco and hides and skins in Hyderabad City and other mofussil areas, must have also attributed to this increase. The increase in Warangal District must have been mainly due to the Wyra Project which was completed in 1988. The decade 1921-1931 was, however, a landmark in the history of the movement from ".Madras State. Since then the extent of immigration has continued to be formidable in the state as a whole, though the bulk of the movement has now shifted from the non-adjoining to the adjoining districts.
122. The continued increase in 1941 was shared by all the districts except Raichur and Nalgonda among the adjoining and Adilab~d among the non-adjoining districts. The decrease in Raichur was, however, insignificant and it is now difficult to assess the reasons for the decrease in Nalgonda. Perhaps the Madrasi immigrants, particularly those belonging to the labouring and trading classes, migrate~ to areas where better opportunities were available due to activities connected, directly or indirectly, with the war and defence preparations. In spite of the decrease, the number of immigrants in Adilabad, namely 43,489 representing over 30 per cent of the total Mad,ras immigrants in the state, was still very heavy. The 1941 Report does not give any reason for the continued concentration in this district. During the decade 1931-1941, a large paper factory was constructed and started functioning in the district. In addition to this, because of the impetus given both to industry and trade due to war conditions, there was a good deal of activity in the district in other industrial spheres as well, including coal mining, and very brisk trading in commodities like timber, charcoal, beedi leaves, hides and skins, etc., which attract Madrasis in particular. All these activities must have sustained the survivors among the earlier Madras immigrants in the district and perhaps also attracted some additional numbers. Among the other districts, the increase was particularly heavy in the case of Hyderabad and Warangal. In fact, the number in Hyderabad District in 1941 is the heaviest recorded during the current century. It is likely that the increase in this district may have been due, to an extent, to the stationing in Secunderabad Cantonment of a large body of troops and ancillary personnel drawn from Madras State. The Madrasis served in large numbers not only in the regular force~ but were also conspicuous in the domestic services of military officers attached both to the Indian and the State armies. Similarly, the increase in Waeangal District may have been partly due to the intensification of mining activities and to the opportunities available in the district for settlement both as cultivators and cultivating labourers. The increased employment offered in various spheres on account of the war boom and
• About 200, out of the 300 miles of metalled road in this mountainous district were constructed durina the later half of the decade 1921-1931. '"
76
the shifting of some of the Madrasis from the coastal regions to the inland towns due to the war scare, must have also been partly responsible for the increase in both the districts.
123. The decrease in 1951 over the 1941 figures is entirely confined to the nonadjoining districts. In fact, there has been an unprecedented increase in the number of Madras immigrants to the adjoining districts. Their numbers in Warangal, Raichur and Mahbubnagar are the highest recorded in the respective districts during the present century, and in Nalgonda second only to that recorded in 1911. In Warangal District, they constitute 2.8 per cent of the total population. Even among the non-adjoining districts, they have increased slightly in Karimnagar, Bidar and Osmanabad Districts .and heavily in Nizamabad. Their numbers have decreased in all the other non-adjoining districts. But the decrease is significant only in Adilabad and Hyderabad Districts. In fact, the decrease in Adilabad, which is perhaps the chief reason for the overaJI decrease in the number of the Madras immigrants in the state, is almost as striking as the sudden increase recorded at the 1921 Census, 30 years ago. The present figure of 1,853 is in keeping with the number of such immigrants generally found in the non-adjoining districts of the state. It is thus apparent that, apart from some variations in respect of certain districts in certain decades, the number of Madras immigrants in the adjoining areas has increased consistently, except for the set-back in 1921 due to the influenza epidemic of 1918--the increase during the decade 1941-1951 being particularly striking. The trend in the immigration to the non-adjoining areas is, however, not equally consistent. The number of immigrants into these areas after a slight fall in 1911, increased considerably at the 1921 and 1931 censuses due, as stated earlier, to the unusually large influx into Adilabad District, and reached its zenith in 1941 because of the continuation of the large concentration in Adilabad District accompanied by a marked increase in Hyderabad District as well. The number has been reduced by almost half in 1951, due primarily to the movement assuming normal proportions in Adilabad District. In spite of the present decrease over the 1941 and 1931 figures for the state as a whole, the Madras immigrants in this state are more numerous than those from any other state or foreign country. The manner in which they are now sustained in the state is explained in paragraph 144.
124. Though the total number of Madras immigrants in this state at the 1941 and 1931 Censuses exceeds the number in 1951, it is significant to note that the number of females among these immigrants at the present census is the highest recorded at any census taken during this century. They numbered 27,391 in 1901, 33,121 in 1911, 32,099 in 1921, 30,409 in 1931 and 50,876 in 1941 and now number as much as 65,334. The low proportion of females at the 1921, 1931 and 1941. Censuses was presumably largely due to the huge number of Madras labourers who had temporarily moved into Adilabad District in connection with various construction works and to War an gal District for employment in the coal fields. Additional factors leading to the particularly low proportion of females in 1931 must have been the attraction of labourers temporarily to Warangal District in connection with certain irrigation projects, and the outbreak of plague in Hyderabad City in 1931-on account of which a number of the Madras immigrants must have sent their families to their native places. An additional reason for the low proportion in 1941 must have been the stationing in Secunderabad Cantonment of a large number of army personnel drawn from Madras State. At the 1951 Census, for the first time during the last fifty years, females were more numerous than males among the Madras immigrants. They accounted for more than half of the total immigrants in the districts adjoining Madras State and less than half in the other
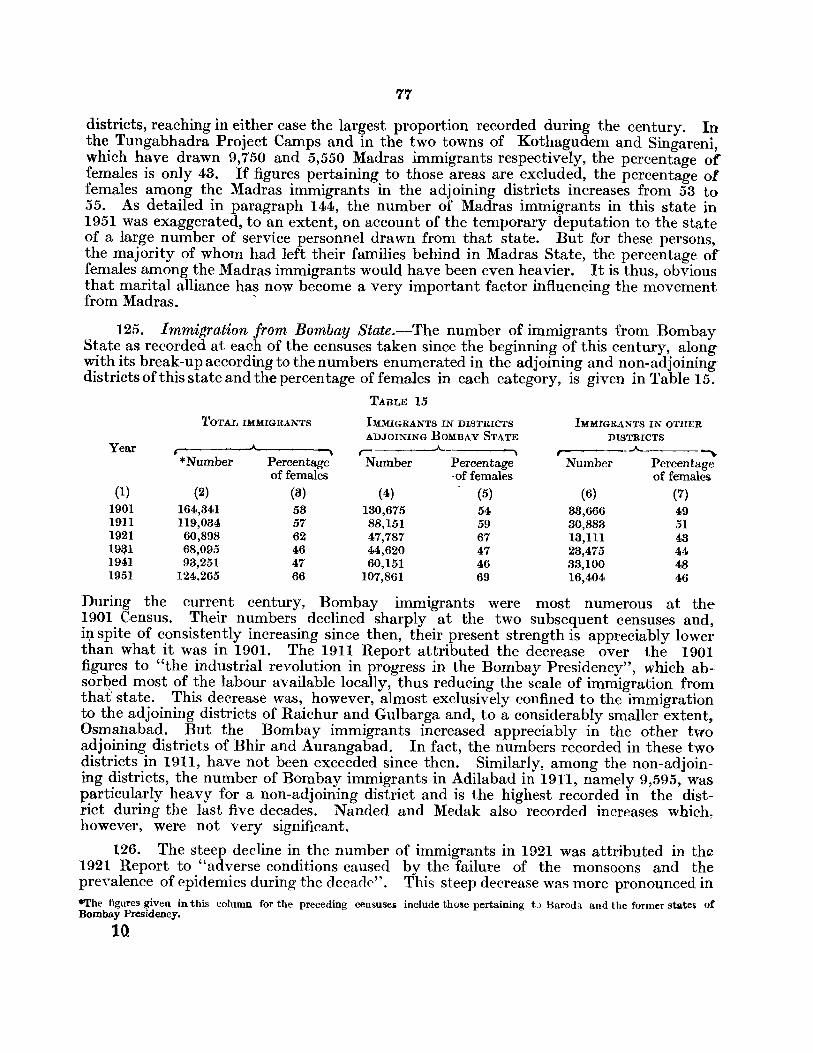
77
districts, reaching in either case the largest proportion recorded during the century. In the Tungabhadra Project Camps and in the two towns of Kothagudem and Singareni, which have drawn 9,750 and 5,550 Madras immigrants respectively, the percentage of females is only 43. If figures pertaining to those areas are excluded, the percentage of females among the Madras immigrants in the adjoining districts increases from 53 to 55. As detailed in paragraph 144, the number of Madras immigrants in this state in 1951 was exaggerated, to an extent, on account of the temporary deputation to the state of a large number of service personnel drawn from that state. But for these persons, the majority of whom had left their families behind in Madras State, the percentage of females among the Madras immigrants would have been even heavier. It is thus, obvious that marital alliance has now become a very important factor influencing the movement from Madras. '
125. lmmi~ration from Bombay State.--The number of immigrants from Bombay State as recorded at each of the censuses taken since the beginning of this century, along with its break-up according to the numbers enumerated in the adjoining and non-adjoining districts of this state and the percentage of females in each category, is given in Table 15.
TABLE 15
TOTAL IMMIGRANTS IMMIGRANTS IN DISTRICTS IMMIGRANTS IN OTHER ADJOINING BOMBAY STATE DISTRICTS
Year r= A_ _.A.. """"\.
*Number Percentage Number Percentage Number Percentage of females -of females of females
(1) (2) (3) (4) (5) (6) (7) 1901 164,341 53 130,675 54 33,666 49 1911 119,034 57 88,151 59 30,883 51 1921 60,898 62 47,787 67 13,111 43 19~1 68,095 46 44,620 47 23,475 44 1941 93,251 47 60,151 46 33,100 48 1951 124,265 66 107,861 69 16,404 46
During the current century, Bombay immigrants were most numerous at the 1901 Census. Their numbers declined sharply at the two subsequent censuses and, in spite of consistently increasing since then, their present strength is appreciably lowerthan what it was in 1901. The 1911 Report attributed the decrease over the 1901 figures to "the industrial revolution in progress in the Bombay Presidency", which absor~ed most of the labour available locally, thus reducing the scale of immigration from that' state. This decrease was, however, almost exclusively confined to the immigration to the adjoining districts of Raichur and Gulbarga and, to a considerably smaller extent, Osmanabad. But the Bombay immigrants increased appreciably in the other two adjoining districts of Bhir and Aurangabad. In fact, the numbers recorded in these two districts in 1911, have not been exceeded since then. Similarly, among the non-adjoining districts, the number of Bombay immigrants in Adilabad in 1911, namely 9,595, was particularly heavy for a non-adjoining district and is the highest recorded in the district during the last five decades. Nanded and Medak also recorded increases which, however, were not very significant.
126. The steep decline in the number of immigrants in 1921 was attributed in th~ 1921 Report to "adverse conditions caused by the failure of the monsoons and the prevalence of epidemics during the decade". This steep decrease was more pronounced in *The figures given in this column for the preceding censuseli include those pertaining tJ Barod'! and the former states of Bombay Presidency.
10
78
the non-adjoining than the adjoining districts. But in spite of this decline in the number of the immigrants in the state as a whole, the numbers in Raichur, among the adjoining districts, and Warangal, Hyderabad and Karimnagar, among the non-adjoining districts, increased appreciably. The decrease was especially marked in the other adjoining ·districts and in Parbhani and Adilabad among the non-adjoining districts.
127. The 1981 Report does not give any reason either for the slight increase in the number of the Bombay immigrants over the 1921 figures or for its continued small dimensions. Actually, on the whole the number of these immigrants decreased slightly in the areas adjoining Bombay State and increased appreciably in the non-adjoining areas as compared with the figures of the preceding census. But even among the adjoining districts, while the number in Osmanabad was the lowest recorded during the -current century and in Raichur slightly lower than in 1921, in each of the other three districts it was slightly more than in 1921. Again, among the non-adjoining districts, while the number increased heavily in Hyderabad, it actually decreased in Mahbubnagar, Nalgonda and Warangal. The continuation of the immigration on a relatively small-scale at the 1981 Census and the fall in the number of immigrants in the adjoining areas as a whole even as against the 1921 figure must have been partly due to the general economic depression which characterised the later half of the decade 1921-1981 and affected 'the agricultural classes in particular, and partly to the cholera epidemic of 1980, which was wide-spread in the Marathwada Districts.
128. The 1941 Report does not give any specific reason for the heavy increase in the number of immigrants, both into the adjoining and the non-adjoining areas, as compared with the 1981 figures. All the adjoining districts, except Raichur, shared the increase but it was particularly marked in the case of Aurangabad and Osmanabad. The number decreased slightly in Raichur. Among the non-adjoining districts, the increase was particularly marked in Hyderabad and only Nalgonda recorded an insignificant decrease. The increase must have been due partly to the recovery of the normal flow- of immigration which had been adversely affected in 1921 principally by the influenza epidemic of 1918, and in 1981 principally by the trade depression, and partly to the increased impetus given to trade and industry on account of the war.
129. The increase recorded in 1951 over the 1941 figures is again equally marked. The movement from Bombay is now fast regaining the dimensions it enjoyed at the 1901 and the earlier censuses. But while the number of Bombay immigrants in the adjoining areas has increased strikingly that in the non-adjoining areas has decreased very considerably. Among the adjoining districts, the number in Osmanabad is the heaviest recorded during the current century; the numbers in Raichur and Gulbarga are second only to that recorded in 1901 ; and the numbers in Bhir and Aurangabad are almost as high as those recorded in 1911. In Osmanabad District, Bombay immigrants now account for more than 8 per cent of the total population. Among the non-adjoining districts, they have increased in numbers in the districts of Mahbubnagar, Nizamabad, Karimnagar, Warangal and Nalgonda-but the numbers involved are not of any large magnitude-and have decreased in all the other districts, particularly in Parbhani, Nanded, Adilabad and Hyderabad. A peculiar feature of the immigration from Bombay State in all the earlier censuses right up to 1941, was the large number of immigrants in the northern districts of Parbhani, N anded and Adilabad which do not adjoin Bombay State. The proportion of the immigrants in the three districts is now more in keeping with the usual numbers recorded in the non-adjoining tracts. The number of Bombay immigrants in these 'three districts taken together was 20,180 in 1901, 28,544 in 1911, 4,961 in 1921, 8,658 in
'!.O·
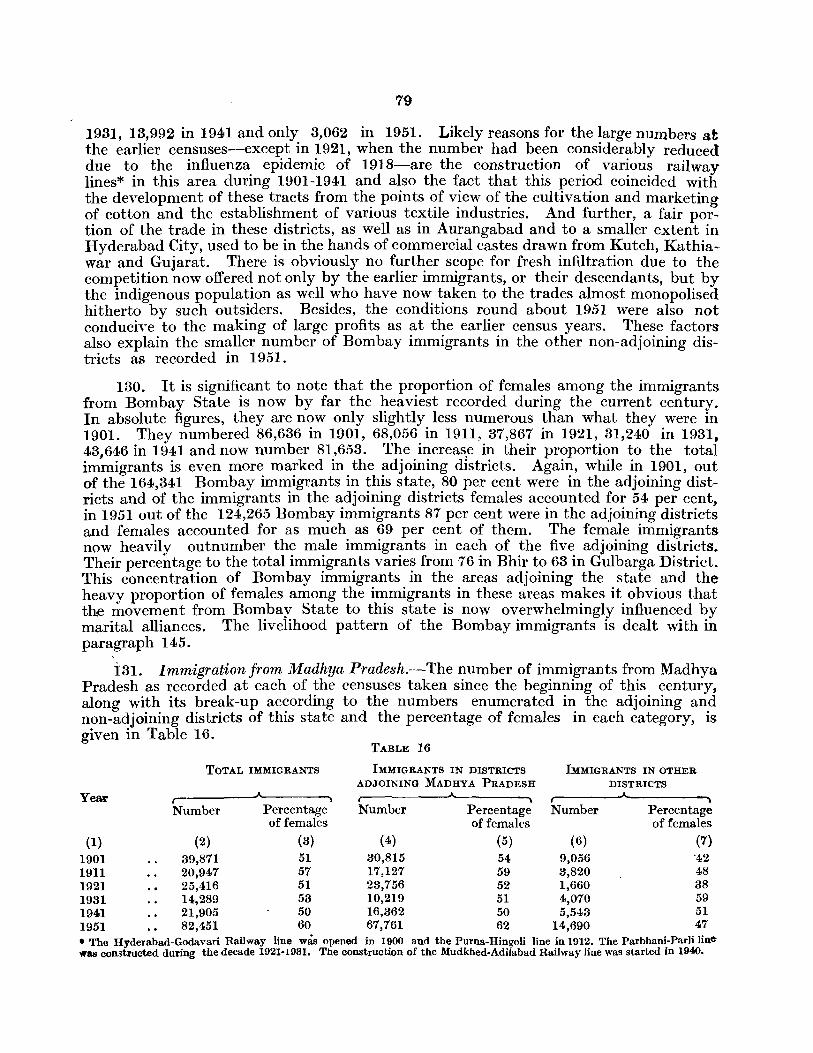
79
1931, 13,992 in 1941 and only 3,062 in 1951. Likely reasons for the large numbers at the earlier censuses--except in 1921, when the number had been considerably reduced due to the influenza epidemic of 1918-are the construction of various railway lines* in this area during 1901-1941 and also the fact that this period coincided with the development of these tracts from the points of view of the cultivation and marketing of cotton and the establishment of various textile industries. And further, a fair portion of the trade in these districts, as well as in Aurangabad and to a smaller extent in Hyderabad City, used to be in the hands of commercial castes drawn from Kutch, Kathiawar and Gujarat. There is obviously no further scope for fresh infiltration due to the competition now offered not only by the earlier immigrants, or their descendants, but by the indigenous population as well who have now taken to the trades almost monopolised hitherto by such outsiders. Besides, the conditions round about 1951 were also not conducive to the making of large profits as at the earlier census years. These factors also explain the smaller number of Bombay immigrants in the other non-adjoining districts as recorded in 1951.
130. It is significant to note that the proportion of females among the immigrants from Bombay State is now by far the heaviest recorded during the current century. In absolute figures, they are now only slightly less numerous than what they were in 1901. They numbered 86,636 in H)ol, 68,056 in 1911, 37,867 in 1921, 31,240 in 1931, 43,646 in 1941 and now number 81,653. The increas,e in their proportion to the total immigrants is even more marked in the adjoining districts. Again, while in 1901, out of the 164,341 Bombay immigrants in this state, 80 per cent were in the adjoining districts and of the immigrants in the adjoining districts females accounted for 54 per cent, in 1951 out of the 124,265 Bombay immigrants 87 per cent were in the adjoining districts and females accounted for as much as 69 per cent of them. The female immigrants now heavily outnumber the male immigrants in each of the five adjoining districts. Their percentage to the total immigrants varies from 76 in Bhir to 63 in Gulbarga District. This concentration of Bombay immigrants in the areas adjoining the state and the heavy proportion of females among the immigrants in these areas makes it obvious that the movement from Bombay State to this state is now overwhelmingly influenced by marital alliances. The livelihood pattern of the Bombay immigrants is dealt with in paragraph 145.
,
i31. Immigrationfrom Madhya Pradesh.-The number of immigrants from Madhya Pradesh as recorded at each of the censuses taken since the beginning of this century, along with its break-up according to the numbers enumerated in the adjoining and non-adjoining districts of this state and the percentage of females in each category, is given in Table 16.
TABLE 16
TOTAL IMMIGRANTS IMMIGRANTS IN DISTRICTS IMMIGRANTS IN OTHER ADJOINING MADHYA PRADESH DISTRICTS
Year ,------'---~
Number Percentage Number Percentage Number Percentage of females of females of females
(1) (2) (3) (4) (5) (6) (7) 1901 39,871 51 30,815 54 9,056 '42 1911 20,947 57 17,127 59 3,820 48 1921 25,416 51 23,756 52 1,660 38 1931 14,289 53 10,219 51 4,070 59 1941 21,905 50 16,362 50 5,543 51 1951 82,451 60 67,761 62 14,690 47 • The Hyderabad-GodavaTi Railway line was opened in 1900 and the Purna-Hingoli line in 1912. The Parbhani-ParJi line was constructed during the decade 1921-1981. The construction of the Mudkhed-Adilabad Railway line was started in 194().
80
132. The immigration from Madhya Pradesh has been both erratic and, until 1951, comparatively insignificant for two states with a common frontier extending to hundreds of miles. As against the figure for the preceding census, the number of immigrants decreased considerably in 1911, increased appreciably in 1921, touched the lowest mark during the century in 1931 and then again increased slightly in 1941. But at none of these censuses was the figure even near about the 1901 figure. In 1951, however, the immigrants increased by about 276 per cent over the 1941 figure, which is perhaps an unprecedented rate of increase for the immigrants from any state during a single decade.
133. None of the previous census reports gives any specific reason for the fluctuation in the immigration from Madhya Pradesh. The decrease in 1911, over the 1901 figures, was spread over most of the districts of the state. The construction of the Manmad-Hyderabad Railway, which runs through three out of the six districts of this state bordering Madhya Pradesh, round about 1900 must have attracted a number of labourers from adjoining areas, both in Hyderabad State and Madhya Pradesh. This may have been the reason for the larger number of Madhya Pradesh immigrants recorded in 1901. Further, the development of Madhya Pradesh, including Berar, both industrially and otherwise, may have absorbed an appreciable portion of the population which would have otherwise moved into this state. -
134. The increase in 1921 was confined to Adilabad and Parbhani among the adjoining, and Osmanabad, Nizamabad and Medak among the non-adjoining districts. The numbers involved in the non-adjoining districts were in no case significant. In fact, the number of immigrants in the two adjoining districts of Adilabad and Parbhani together accounted for about 80 per cent of the total Madhya Pradesh immigrants in the state. The increase in Adilabad must have been due to the recruitment of labourers in large numbers for the construction of the Kazipet-Balharshah Railway line, and in Parbhani to the setting up of a number of ginning and pressing factories. It may be noted that Madhya Pradesh plays a more important part in the supply of man-power to Parbhani District than to Aurangabad or Nanded. The last two districts draw relati~ vely more from other areas. The decrease in all the other districts must have been largely due to the after-effects of the influenza epidemic of 1918, which was wide:spread both in Madhya Pradesh and this state.
135. The steep decrea,se in 1931 was chiefly due to a heavy decline in the immigration into the two adjoining districts of Adilabad and Parbhani. This in turn was perhaps the result of the completion of the Kazipet-Balharshah Railway line which had attracted a large number of labourers at the earlier census and the general agricul~ tural and trade depression which characterised the later half of the decade. At this census the number of Madhya Pradesh immigrants was not significant in any district of the state. The increase in 1941 was mainly the result of increases recorded in all the six adjoining districts. But among these districts, the increase was marked only in the case of Aurangabad. The number of immigrants also increased in all the nonadjoining districts with the exception, of only Raichur, Osmanabad and Bidar Districts. But again in no case was the variation significant. The increase was perhaps the result of the intensification of activities in the industrial, commercial, administrative and other spheres due to the second world war.
136. The steep increase in 1951 is more marked in the adjoining t9-an in the non.adjoining districts. The movement into Aurangabad, Parbhani, N anded and Adilabad, particularly into the last, has assumed vast proportions, comparable for the first time during thi8 ,
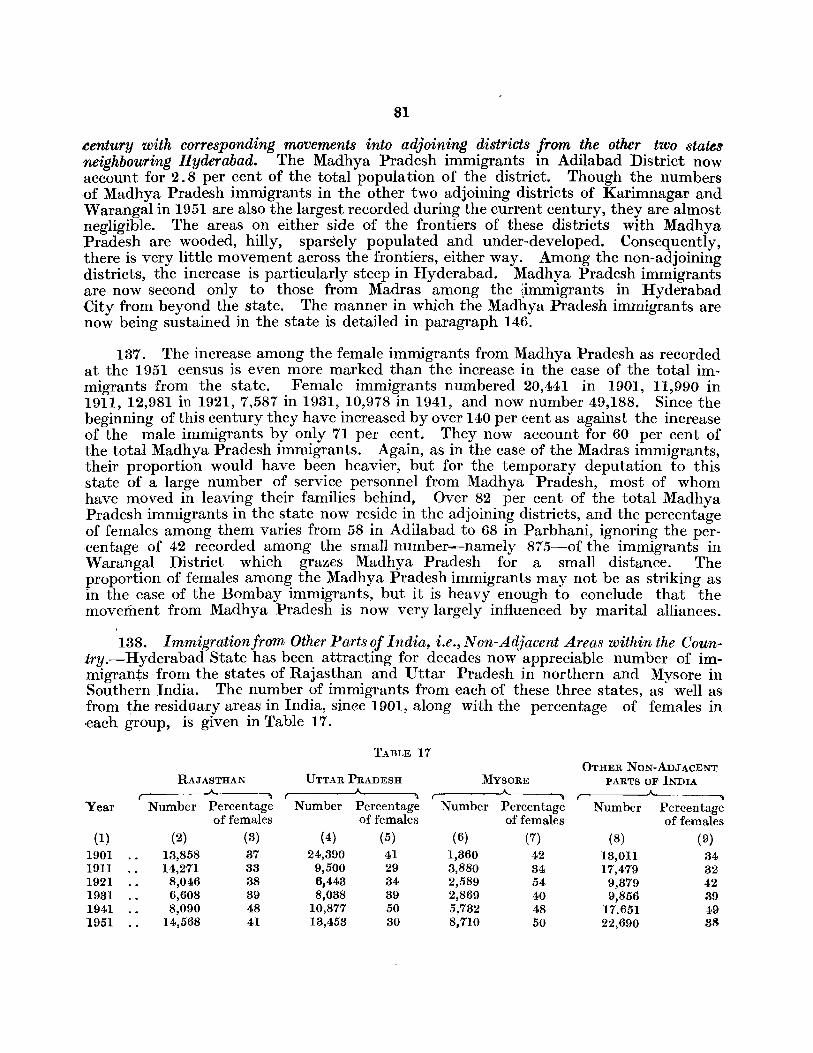
81
eentury with corresponding movements into adjoining districts from the other two states neighbouring Hyderabad. The Madhya Pradesh immigrants in Adilabad District now account for 2.8 per cent of the total population of the district. Though the numbers of Madhya Pradesh immigrants in the other two adjoining districts of Karimnagar and Warangal in 1951 are also the largest recorded during the current century, they are almost negligible. The areas on either side of the frontiers of these districts with Madhya Pradesh are wooded, hilly, sparsely populated and under-developed. Consequently, there is very little movement across the frontiers, either way. Among the non-adjoining districts, the increase is particularly steep in Hyderabad. Madhya Pradesh immigrants are now second only to those from Madras among the iimmigrants in Hyderabad ,City from beyond the state. The manner in which the Madhya Pradesh immigrants are now being sustained in the state is detailed in paragraph 146.
137. . The increase among the female immigrants from Madhya Pradesh as recorded at the 1951 census is even more marked than the increase in the case of the total immigrants from the state. Female immigrants numbered 20,441 in 1901, 11,990 in 1911, 12,981 in 1921, 7,587 in 1931, 10,978 in 1941, and now number 49,188. Since the beginning of this century they have increased by over 140 per cent as against the increase ·of the male immigrants by only 71 per cent. They now account for 60 per cent of the total Madhya Pradesh immigrants. Again, as in the case of the Madras immigrants, their proportion would have been heavier, but for the temporary deputation to this state of a large number of service personnel from Madhya Pradesh, most of whom have moved in leaving their families behind, Over 82 per cent of the total Madhya Pradesh immigrants in the state now reside in the adjoining districts, and the percentage of females among them varies from 58 in Adilabad to 68 in Parbhani, ignoring the percentage of 42 recorded among the small number--namely 875-of the immigrants in Warangal District which grazes Madhya Pradesh for a small distance. The proportion of females among the Madhya Pradesh immigrants may not be as striking as in the case of the Bombay immigrants, but it is heavy enough to conclude that the movement from Madhya Pradesh is now very largely influenced by marital alliances.
138. Immigrationjrom Other Parts oj India, i.e., Non-Adjacent Areas within the Country.-Hyderabad State has been attracting for decades now appreciable number of immigrants from the states of Rajasthan and Uttar Pradesh in northern and Mysore in Southern India. The number of immigrants from each of these three states, as well as from the residuary areas in India, since 1901, along with the percentage of females in .each group, is given in Table 17.
TABLE 17 OTHER NON-ADJACENT
RAJASTHAN UTTAR PRADESH MYSORE PARTS OF INDIA ., , ..A
" r-Year Number Percentage Number Percentage Number Percentage Number Percentage
of females of females of females of females (1) (2) (3) (4) (5) (6) (7) (8) (9)
1901 13,858 37 24,390 41 1,360 42 13,01l 34 1911 14,271 33 9,500 29 8,880 34 17,479 32 1921 8,046 38 6,443 34 2,589 54 9,379 42 1931 6,608 39 8,038 39 2,869 40 9,856 39 ]_941 8,090 48 10,877 50 5,732 48 17.651 49 1951 14,568 41 13,453 30 8,710 50 22,690 38
82
139. The Rajasthan immigrants, called generally as Marwadis in this state irres-ective of the portion of Rajasthan they or their ancestors came from, have pLayed an
important part in the commercial life of the state. Their contribution to its industrial development is also by no means meagre. Thus, their movement has been mainly for economic reasons. They are found practically in all the bigger towns of the state and even in many of the more important of the VIllages in the Marathi speaking tracts. The fluctuation in their numbers, from census to census, reflects mostly the trade conditions prevalent in this state-their lowest number was recorded in 1931 when the country was still in the grips of the general trade depression. The movement from Uttar Pradesh is also mainly due to economic factors but of a different type. The Uttar Pradesh immigrants have for centuries now played an important part in the administration of the state. They have also pervaded into all branches of the learned professjons in this state, particularly since the Mutiny of 1857, when Hyderabad replaced Delhi and Lucknow as the standard-bearer of Indo-Mogul culture. Of late, they have, infiltrated into commercial and industrial spheres as well. The temporary deputation of some companies of the Police Force from Uttar Pradesh to thjs state has exaggerated the present number of the immigrants, particularly in Warangal, Nalgonda and Hyderabad Districts. The immigration from Mysore State is gradually increasing in extent, even after making allowances for the fact that their present number has been inflated due to the temporary deputation to this state of a few compames of Mysore Police and to the movement of 602 persons born in that state to the Tungabhadra Project Camps. The immigration from this state until recently, used to be influenced by inter-marriages only to a minor extent. But now the number of marriages between the people of Mysore and both the Kannada and Telugu speaking populations of this state is on the increase .
. Even in rural areas of the remoter districts of this state, like those of Medak or Karimnagar, quite a few of the cultivators have married in Mysore. As things now stand, the economic factor and marital alliances are perhaps more or less equally balanced in influencing this movement. Among the other areas from which this state draws some numbers of immigrants are S2.urashtra, Kutch, Travancore-Cochin, Madhya Bharat, Punjab and Delhi. The movement from all these states as well as from other parts of India was little influenced by marital alliances. Quite a few of the present immigrants from Travancore-Cochin, Punjab, Madhya Bharat and Delhi consist of Army or Police personnel temporarily posted to this state from other parts of India. Among the immigrants from all the larger of the Indian States, the proportion of females is the lowest amongst those from Travancore-Cochin. This is probably due partly to the' intense attachement of the women in Kerala to their ancestral hOlnes and partly to the high proportion of Army and Police personnel among these immigrants.
140. Immigration from Beyond lndia.--The number of immigrants from areas beyond India is now appreciably lower than what it was in 1901 though it is in excess of the corresponding numbers recorded at the intervening censuses·. ; But the proportion of the immigrants from beyond India to the total population of the state has always been_insignificant and never more than one in a thousand. The present figure of 9,492 includes 3,642 displaced persons born in Pakistan as well as 2,155 born in Nepal. The latter consist of mostly Government personnel temporarily posted to the state in the wake of Police Action. In addition to this, the present figure includes 1,321 persons, other than displaced, born in Pakistan. If all these numbers are excluded, the present figure of immigrants from beyond India dwindles to 2,374. This small number is chiefly the result of two factors. In the previous regimes in this state, persons from countries, like Afghanistan, Arabia and Persia, were particularly encouraged to take to employment .Vide figures given in columns (6-c) and (7-c) in Table 12 in paragraph 114.
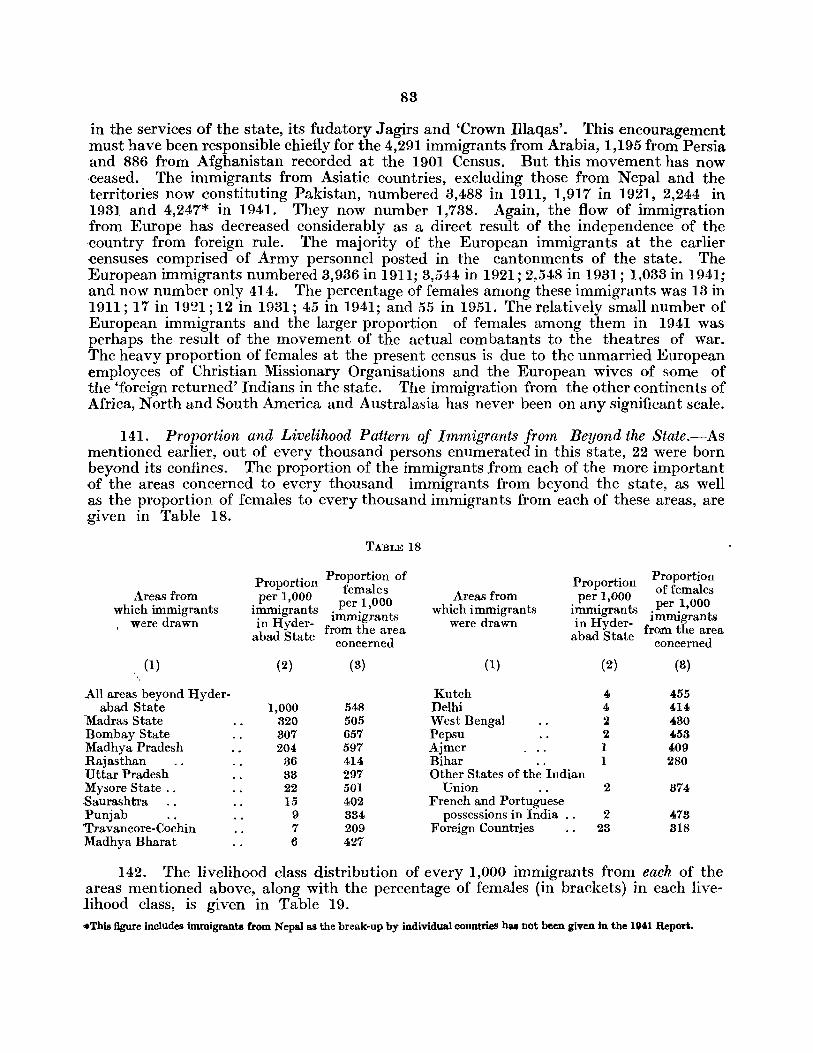
83
in the services of the state, its fudatory Jagirs and 'Crown Illaqas'. This encouragement must have been responsible chiefly for the 4,291 immigrants from Arabia, 1,195 from Persia and 886 from Afghanistan recorded at the 1901 Census. But this movement has now ceased. The immigrants from Asiatic countries, excluding those from Nepal and the territories now constituting Pakistan, numbered 3,488 in 1911, 1,917 in 1921, 2,244 in 1931 and 4,247* in 1941. They now number 1,738. Again, the flow of immigration from Europe has decreased considerably as a direct result of the independence of the country from foreign rule. The majority of the European immigrants at the earlier ·censuses comprised of Army personnel posted in the cantonments of the state. The European immigrants numbered 3,936 in 1911; 3,544 in 1921; 2,548 in 1931; 1,033 in 1941; and now number only 414. The percentage of females among these immigrants was 13 in 1911; 17 in 1921; 12 in 1931; 45 in 1941; and 55 in 1951. The relatively small number of European immigrants and the larger proportion of females among them in 1941 was perhaps the result of the movement of the actual combatants to the theatres of war. The heavy proportion of females at the present census is due to the unmarried European employees of Christian Missionary Organisations and the European wives of some of the 'foreign returned' Indians in the state. The immigration from the other continents of Africa, North and South America and Australasia has never been on any significant scale.
141. Proportion and Livelihood Pattern of Immigrants from Beyond the State.-As mentioned earlier, out of every thousand persons enumerated in this state, 22 were born beyond its confines. The proportion of the immigrants from each of the more important ·of the areas concerned to every thousand immigrants from beyond the state, as well as the proportion of females to every thousand immigrants from each of these areas, are given in Table 18.
TABLE 18
Proportion Proportion of Proportion Proportion females of females Areas from per 1,000 per 1,000 Areas from per 1,000 per 1,000 which immigrants immigrants which immigrants immigrants
were drawn in Hyder- immigrants were drawn in Hyder- immigrants from the area from the area abad State concerned abad State concerned
(1) (2) (3) (1) (2) (3)
All areas beyond Hyder- Kutch 4 455 abad State 1,000 548 Delhi " 4.l4
Madras State 320 505 West Bengal 2 430 Bombay State 307 657 Pepsu 2 453 Madhya Pradesh 204 597 Ajmer I 409 Rajasthan 36 414 Bihar 1 280 Uttar Pradesh 33 297 Other States of the Indian Mysore State .. 22 501 Union 2 874 Saurashtra 15 402 French and Portuguese Punjab 9 334 possessions in India ., 2 473 Travancore-Cochin 7 209 Foreign Countries 23 318 Madhya Bharat 6 427
142. The livelihood class distribution of every 1,000 immigrants from each of the areas mentioned above, along with the percentage of females (in brackets) in each livelihood class, is given in Table 19 .
• This figure includes immigrants from Nepal as the break-up by individual countries haa Dot been given in the IG,U Report.
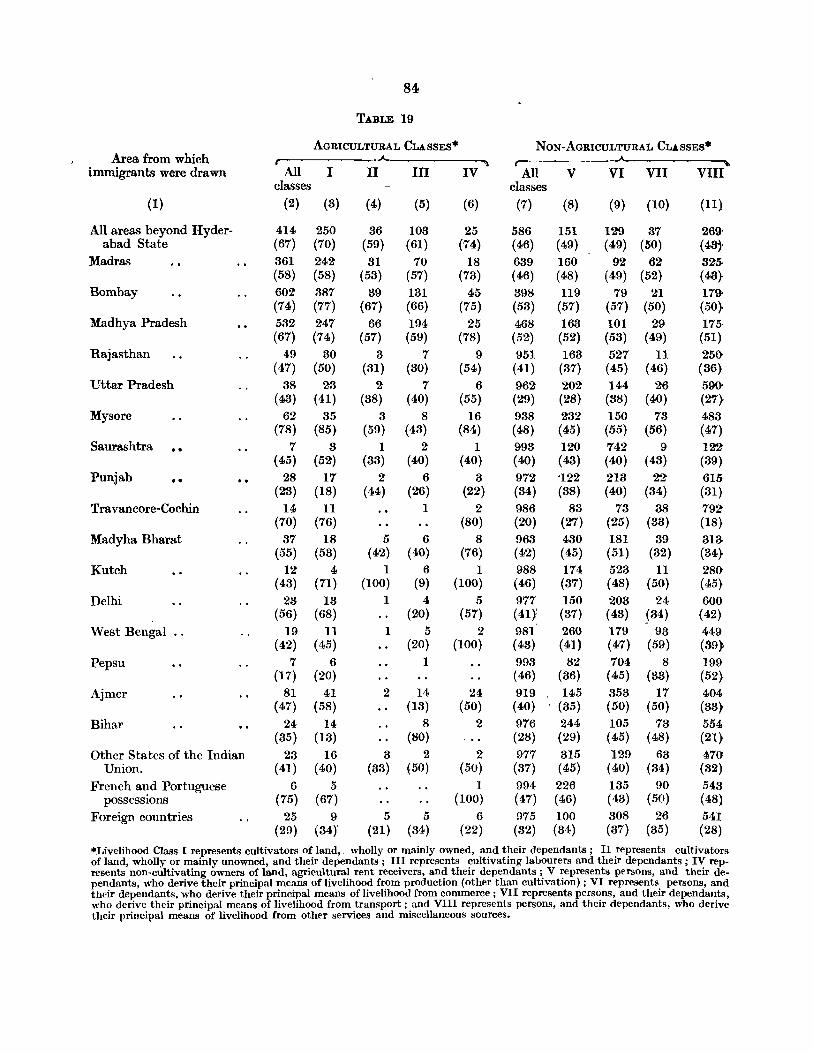
84
TABLE 19
AGRICULTURAL CLASSES. NON-AGRICULTURAL CLASSES· Area from which r- .A..._
immigrants were drawn All I II III IV All V VI VII VIII classes classes
(I) (2) (3) (4) (5) (6) (7) (8) (9) (10) (II)
All areas beyond Hyder- 414 250 36 103 25 586 151 129 37 269 abad State (67) (70) (59) (61) (74) (46) (49) (49) (50) (4~'
Madras 361 2'42 31 70 18 639 160 92' 62' 32'5· (58) (58) (53) (57) (73) (46) (48) (49) (52) (43}
Bombay 602 387 39 131 45 398 119 79 21 179 (74) (77) (67) (66) (75) (53) (57) (57) (50) (50}
Madhya Pradesh 532 2'47 66 194 25 468 163 101 2'9 175 (67) (74) (57) (59) (78) (52') (52) (53) (49) (51)
Rajasthan 49 30 3 7 9 951 163 52'7 11 2'5() (47) (50) (31) (30) (54) (41) (37) (45) (46) (36)-
Uttar Pradesh 38 23 2 7 6 962 202 144 2'6 59(} (43) (41) (88) (40) (55) (29) (28) (88) (40) (27}
Mysore 62 85 8 8 16 988 282 150 73 483 (78) (85) (59) (48) (84) (48) (45) (55) (56) (47)
Saurashtra .. 7 3 1 2 1 998 120 742 9 12'2' (45) (52) (33) (40) (40) (40) (43) (40) (48) (39)
Punjab .. 28 17 2 6 3 972 '12'2 218 2'2' 615-(23) (18) (44) (26) (22) (84) (88) (40) (84) (81)
Travancore-Cochin 14 II I 2' 986 88 73 38 792' (70) (76) (80) (20) (27) (25) (33) (18)
Madyha Bharat 37 18 5 6 8 963 480 181 39 313-(55) (53) (42) (40) (76) (42) (45) (51) (32) (34)-
Kutch 12' 4 1 6 1 988 174 523 11 28(} (48) (71) (100) (9) (100) (46) (37) (48) (50) (45)-
Delhi 23 13 I 4 5 977 150 203 24 600 (56) (68) (20) (57) (4I~ (87) (48) (84) (42)
West Bengal .. 19 11 1 5 2 981 260 179 93 449 (42) (45) (20) (100) (48) (41) (47) (59) (39)
Pepsu 7 6 I 993 82 704 8 199 (17) (20) (46) (86) (45) (38) (52).
Ajmer 81 41 2 14 24 919 145 858 17 404 (47) (58) (13) (50) (40) (85) (50) (50) (88}
Bihar 24 14 8 2 976 244 105 78 554 (35) (18) (80) (28) (29) (45) (48) (21}
Other States of the Indian 23 16 3 2 2 977 315 129 63 470' Union. (41) (40) (88) (50) (50) (87) (45) (40) (34) (82)
French and Portuguese 6 5 1 994 226 185 90 548 possessions (75) (67) (100) (47) ( 46) ( 48) (50) (48)
Foreign countries 25 9 5 5 6 975 100 808 26 541 (29) (34)' (21) (84) (22) (82) (84) (37) (85) (28)
*Livelihood Class I represents cultivators of land, wholly or mainly owned, and their dependants; II represents cultivators of land, wholly or mainly unowned, and their dependants; III represents cultivating labourers and their dependants; IV rep-resents non-cultivating owners of land, agricultural rent receivers, and their dependants; V represents persons, and their de-pendants, who derive their principal means of livelihood from production (other than cultivation) ; VI represents persons, and their dependants, who derive their principal means of livelihood from commerce; VII represents persons, and their dependants, who derive their principal means of livelihood from transport; and VIII represents persons, and their dependants, who derive their principal means of livelihood from other services and miscellaneous sources.
85
143. Of the 405,084 immigrants in the state, 167,900, or 41 per cent, are in agri-cultural and 237,184, or 59 per cent, are in non-agricultural classes. Of those in agricultural classes, 165,451, or almost all, are from the adjoining states and only 2,449 from remoter areas. Females account for over 67 per cent of the former and 50 per cent of the latter. Of the 165,451 in agricultural classes from the adjoining states, 154,977 or the overwhelming majority, live in the bordering districts of this state and among these immigrants the percentage of females is as high as 68. On the contrary, among immigrants in non-agricultural classes, 170,720 are from the adjoining states and a sizeable number, namely 66,464, are from remoter areas. Females account for just 50 per cent of the former and only 37 of the latter. Of the 170,720 immigrants in non-agricultural classes from the adjoining states, only 104,208 live in the bordering districts and even among them the percentage of females is relatively as low as 52. Again, of the 167,900 immigrants in agricultural classes all but 9,582 are in rural areas. Contrary to this, of the 237,184 immigrants in non-agricultural classes, 181,991 are in urban and 55,193 in rural areas and the percentage of females among both the groups is very low--it is 46 among the former and 48 among the latter. Thus, the predominant number of the immigrants into this state in agricultural classes have moved in, directly or indirectly, due to marital alliances, and this movement is confined almost exclusively to rural areas. But a majority of the immigrants into non-agricultural classes have moved in due to economic reasons, and, though this movement is largely to urban areas, a sizeable portion of the immigrants have infiltrated into rural areas as well. The infiltration motivated by economic reasons, is spread over all the four non-agricultural classes, but is particularly marked in occupations and professions connected with the Livelihood Class of Other Services and Miscellaneous Sources. Again, to the extent it exists in agricultural classes, such infiltration ~s most perceptible in the Livelihood Classes of Tenant Cultivation and Agricultural Labour.
144. The Madras immigrants, unlike the Bombay and Madhya Pradesh immigrants, are in considerably larger numbers in non-agricultural than agricultural classes. This preponderance in non-agricultural classes is wholly due to their concentration in Hyaerabad City, the Tungabhadra Project Camps, the two mining towns of Kothagudam and Yellandu and to the fact that a large number of service personnel from Madras had been temporarily posted to this state in the wake of the Police Action. There are 27,026 perSOll'S born in Madras State in Hyderabad City, of whom 49 per cent are females. Their prominence in the city would be evident from the fact that they are more numerous .in it than the immigrants from any district of the state itself with the exceptions of only Nalgonda and Medak. They pervade practically in all walks of life in the city. Numbers of them are employed as domestic servants. They serve in large numbers in the hotels and restaurants and also run quite a few of them. They are employed in large numbers in the managerial staff of the bigger of the industrial and commercial concerns including banks and insurance companies. Quite a few of them even own and run such concerns. They almost monopolise the trade in hides and skins. A number of them also work as artisans-such as mechanics, gold and silver smiths and stone masons. They are employed in large numbers in the railway establishments, both on the traffic and the workshop sides. They are equally prominent in the Government of India Organisations and Offices including the defence and ancillary establishments in Secunderabad Cantonment. Quite a few of them have also taken to the learned professions including journalism. In the Tungabhadra Project Camps, they number 9,750 or constitute 28 per cent of the total population. The majority of these immigrants are labourers and quite a few are skilled artisans, mechanics, etc. In the two mining
86
towns of Kothagudam and Yellandu they number 5,550, constituting 9 per cent of the population. 'lhe collieries in these towns have always attracted a large number of labourers from Madras State. In addition to this, the Madras immigrants have infiltrated in appreciable numbers into non-agricultural occupations similar to those they follow in Hyderabad City in many other urban and some rural areas as well. They form 3 per cent of the population of Warangal City and over 5 per cent of Raichur Town. Only 167 of them in the former and 29 in the latter are sustained by agricultural occupations. A fair portion of the small mining population of the Hatti Gold Fields in Raichur District consists of immigrants from Madras. Further, in the wake of Police Action, a large number of the employees of Madras Government were temporarily deputed to this &tate. At the time of the census enumeration, they were spread practically all over the Andhra and Kannada areas of the state, with a heavy concentration in Hyderabad City and Nalgonda and Warangal Districts.
Of all the immigrants into Hyderabad State, those from Madras have relatively taken most to agricultural occupations in this state, basically as owner cultivators and, to a considerably smaller extent, as tenant cultivators and agricultural labourers. Though it is beyond the purview of the present report, it may be mentioned here that this infiltration has had very beneficial effects-not so much in increasing agricultural production in the state as in setting a fine example to the local cultivators in intelligent husbandry. These cultivators have taken particularly to tobacco, paddy and sugar-cane cultivation in the state and generally avoid the cotton tracts. The Madras immigrants have settled in large numbers as cultivators in "Varangal District, particularly in the southern and south-eastern areas of the district which abut into Madras State. They have also infiltrated as such in some nuders all over Nalgonda District and in the eastern portions of Mahbubnagar. But more striking is their large concentration in the canal zone~ of Nizamabad which is an interior district. In these canal areas, they perhaps represent the most industrious type of cultivators to be found any where in this state. In addition to this, they have also taken to cultivation in stray villages of Hyderabad, Medak, and Karimnagar Districts. The Madras immigrants, returning agricultural occupations in the cotton growing tracts of this state, are mostly persons with agricultural interests in Madras State who have migrated in connection with some subsidiary interest or occupation in this state. For example, in a number of the census enumeration 'slips pertaining to such immigrants, the principal means of liy_elihood was recorded as agriculture in Madras State and the secondary means of livelihood as govern~, ment service or trade in this state.
145. The majority of the Bombay immigrants, the next most numerous in this state, are in agricultural classes. But the movement of this group of Bombay immigrants is almost predominantly the result of inter-marriages though in some villages, particularly in AfzaJpur Tahsil and in other areas in the south-western corner of the state, some of them seem to have infiltrated for economic reasons and settled down in agricultural occupations. Even among the Bombay immigrants in non-agricultural classes, the major factor governing the movement seems to be marital alliances, but the economic factor is also fairly prpnounced in certain areas particularly in Hyderabad City, and in the urban areas of Gulbarga, Aurangabad, Raichur, Bhir and Osmanabad Districts and Nanded Town. The Bombay immigrants are fairly prominent in the western half of the state in retail and wholesale trade in cotton and textile goods and in textile industry. Some of them are also engaged in the trade in oil seeds and pulses. Immigrants from Bombay State constitute a fair, if not a major, portion of
87
the numerous, large and small, commercial and industrial organisations spread aU over the state-particularly in the western half-which have their headquarters in Bombay State, irrespective of whether such concerns are owned by Indians or foreigners. Well known examples of such concerns are the Imperial and the Central Banks in the state, the Shahabad Cement and the Indian Hume Pipe Companies, etc. They are also employed in fair numbers in the Government of India organisations, which have their circle headquarters in western India like the former G.I.P. and the Barsi Light Railways and the Post and Telegraph establishments in the western districts of the state. Again, as in the case of the Madras immigrants but to a smaller extent, the number of Bombay immigrants in non-agri.cultural classes is exaggerated to a noticeable extent on account of the temporary deputation to this state of a large number of service personnel from Bombay State. This explains their large numbers in the Livelihood Class of Other Servi· ces and Miscellaneous Sources not only in the adjoining districts but even in such remote districts as War an gal and Nizamabad. About 17 per cent of the total immigrants from Bombay State in non-agricultural classes are concentrated in the metropolis of the state. They account for 3 per cent of the total population in the towns of Gulbarga and Aurangabad.
146. Slightly more than half of the immigrants from Madhya Pradesh are in agricultural classes. But they are more evenly balanced among the agricultural and non-agricultural classes than the immigrants from either Bombay or Madras. Though a majority of these immigrants have moved into the state because of marital alliances, considerable numbers have infiltrated for reasons unconnected with such alliances and have settled down to various occupations, particularly in Hyderabad City and in the northern districts bordering Madhya Pradesh. A certain amount of infiltration, chiefly as agricultural labourers, and to a smaller extent as tenant cultivators, is noticeable practically in all the rural areas of this state bordering Madhya Pradesh. This infiltration in agricultural classes is, however, more pronounced in the cotton growing tahsils of Adilabad District, wherein it extends to the Livelihood Class of Owner Cultivation as well. But the infiltration is considerably more marked in non-agricultural occupations. Of the 38,603 immigrants from Madhya Pradesh in this state in non-agricultural classes, more than one-fourth, namely 10,802 consisting of 5,704 males and 5,098 females, are in Hyderabad City. A slightly larger number, namely 11,864 consisting of 5,469 males and 6,395 females, is concentrated, in Jalna, Nanded and Aurangabad Towns and the utban areas of Adilabad and Parbhani Districts. The infiltration of Madhya PradEsh immigrants in non-agricultural classes is also fairly perceptible in the rural areas of the tahsils bordering Madhya Pradesh, particularly m Adilabad and Nanded Districts. The weaving mills in Nanded and Aurangabad Towns, the ginning and pressing factories spread over all the northern districts, the paper mills at Sirpur, the collieries of Sashti and Bellampalli, and the learned professions, petty trade (including hawking) and employment in hotels, tea shops, etc., have attracted a fair number of these immigrants. There is no doubt that the number of Madhya Pradesh Immigrants in the Livelihood Class of Other Services and Miscellaneous Sources, in the bordering districts as well as in Hyderabad City and in districts like those of Warangal and Nalgonda, is appreciably exaggerated on account of the temporary deputation to this state of police and other service personnel from Madhya Pradesh. But such infiltration is not entirely novel for this stste. On account of the peculiar political association of Berar and Hyderabad in the past, there used to be a fair number of Beraris, both in Government service and in the learned professions in this state, particularly in the northern districts. Until very recently .Beraris used to be treated as Mulkies (i.e., residents of this state) for all administrative
88
purposes. The present concentration of Madhya Pradesh immigrants in Hyderabad City is, however, largely due to the attempts made during the Razakar regime by the ruling clique to settle in this state Muslims drawn from the neighbouring areas. While most of the Muslims from the other areas, who had migrated into Hyderabad as a result of these attempts returned to their respective homes after the Police Action, a large number of those from Madhya Pradesh preferred to stay on in the city, earning their livelihood as petty traders, ricksha pullers, artisans, labourers in factories, etc.
147. The immigrants in this state from all the areas beyond the three adjoining states of Madras, Bombay and Madhya Pradesh, account for just 17 per cent of the total immigrants in the state. But as mentioned elsewhere"", the movement of a majority of' these immigrants is the result of economic factors. These immigrants are heavily concentrated in Hyderabad City-the percentage of the immigrants in the city to the total number of the immigrants in the state ranges between 10 in the case of the Sikkim immigrants and 87 in the case of the Pepsu immigrants. Of these immigrants, only an insignificant minority are in agricultural classes. Almost all of these immigrants in agricultural classes have moved into the state either on account of their subsidiary occupations, other than agriculture, or as in the case p:lrticubrly of the Mysore iIllIlligrants, due to marital alliances. Few of them have taken to agricultural occupations in this state. The overwhelming majority of these immigrants are in non-agricultural classes and in the urban areas of the state. The immigration from Rajasthan, Saurashtra, Kutch and Ajmer is basically the result of the enterprising spirit displayed, particularly in the commercial and industrial spheres, by certain castes of those states. Over 35 per cent of the immigrants from Ajmer, over 52 of those from Rajasthan and Kutch and over 74 of those from Saurashtra are dependant on commerce. The more important of the co:nmercial enterprises which attract them are banking, money lending and exchange, and trade in cotton, textiles, oil seeds, grains, pulses, machinery, hardware, china-ware, bullion, gold and silver articles, etc. In addition to this, over 14 per cent of the immigrants from Ajmer, 16 from Rajasthan, 12 from Saurashtra and 17 from Kutch are dependant on production. Their activities in this sphere are more or less confined to the processing of the commodities they generally trade in, or to the manufacture of the products of such commod:ties-the Rajasthan immigrants being prominent in the making and selling of sweetmeats as well. The immigrants from these four states are found in relatively large numbers in the northern districts of Aurangabad, Parbhani, Nanded and Adilabad. Some of the immigre.nts from Rajathan, Ajmer, Uttar Pradesh, Mysore and Madhya> Bharat, and a considerably larger portion from Travancore-Cochin, Punjab and Coorg represent the service personnel of the Government of India, or of some of the other Indian States, temporarily posted to this state. Many of the immigrants from Mysore, and to a smaller extent, from Travancore-Cochin have infiltrated into various non-agricultural occupations in the state, more or less on the same pattern as the immigrants from Madrasthe Mysore immigrants being particularly conspicuous in the engineering and allied activities. A fair portion of the Uttar Pradesh immigrants are in government service and other learned professions of this state. More than hal' of the 80,6 Vindhya Pradesh immigrants in this state are engaged in making' KaCa ' in Adilabad District. The numbers of the immigrants from the other Indian States are too insignificant for any special mention. About half of the total immigrants from forejgn countries are from Pakistan and slightly less than one-fourth from Nepal. The overwhelming ma.jority of those from Pakistan are displaced persons. More than half of these displaced persons are engaged in commercial activities, particularly retail trade in cloth and general stores• Vide paragraph 139.
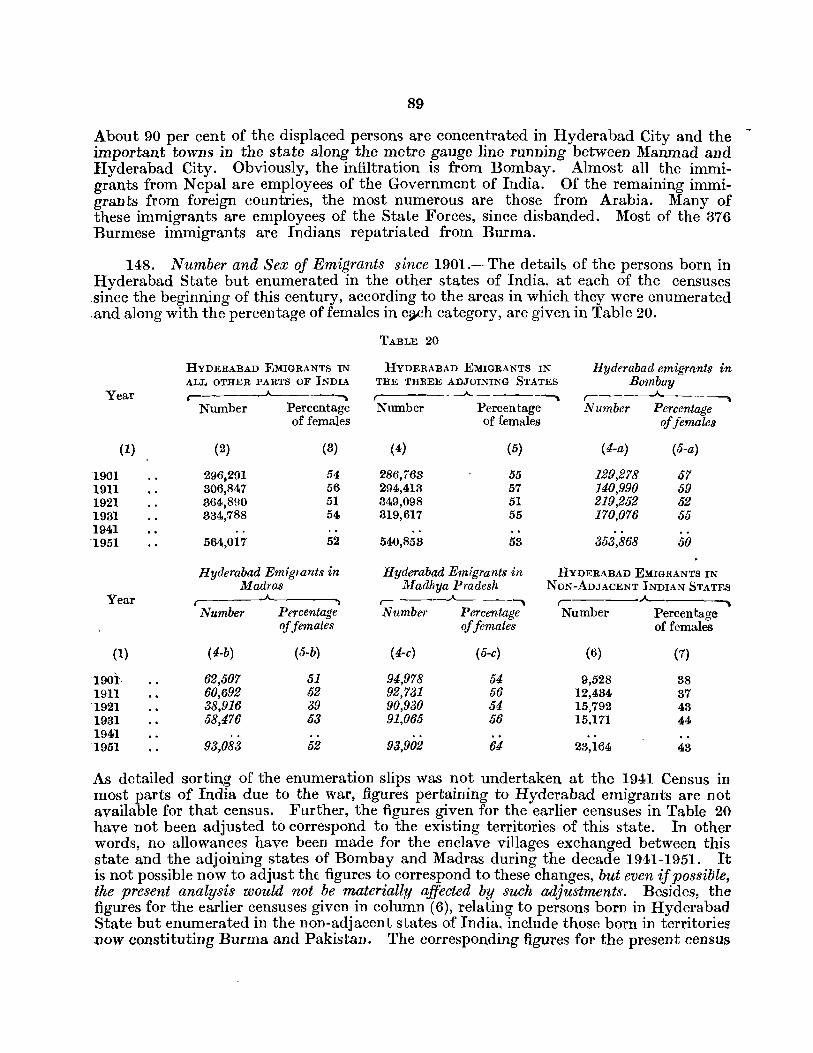
89
About 90 per cent of the displaced persons are concentrated in Hyderabad City and the -important towns in the state along the metre gauge line running between Manmad and Hyderabad City. Obviously, the infiltration is from Bombay. Almost all the immigrants from Nepal are employees of the Government of India. Of the remaining immigrants from foreign countries, the most numerous are those from Arabia. Many of these immigrants are employees of the State Forces, since disbanded. Most of the 376 Burmese immigrants are Indians repatriated from Burma.
148. Number and Sex of Emigrants since 1901.-The detail& of the persons born in Hyderabad State but enumerated in the other states of India, at each of the censuses .since the beginning of this century, according to the areas in which they were enumerated .and along with the percentage of females in e?Ch category, are given in Table 20.
Year
1901 1911 1921 1931 1941 1951
(I)
Year
(1)
1901, 1911 1921 1931 1941 1951
HYDERABAD EMIGRANTS IN ALL OTHER PARTS OF INDIA ,- """""l
Number Percentage of females
(2) (8)
296,291 54 306,847 56 364,890 51 334,788 54
564,017 52
Hyderabad EmigJants in Madras
,-Number Percentage
offemales
(4-b) (5-b)
62,507 51 60,692 52 38,916 39 58,476 53
93,083 52
TABLE 20
HYDERABAD EMIGRANTS IN Hyderabad emigrants in THE THREE ADJOINING STATES Bumbay
--"-_ -~--~ ,-___ ---A.
Number Percentage Number Percentage of females offemales
(4) (5) (4-a) (5-a)
286,768 55 129,278 57 294,413 57 140,990 59 349,098 51 219,252 52 319,617 55 170,076 55
540,853 53 353,868 50
Hyderabad Emigrants in HYDERABAD EMIGRANTS IN Madhya Pradesh NON-ADJACENT INDIAN STATES
---A----, ,- .A--
Number Percentage Number Percentage offemales of females
(4-c) (5-c) (6) (7)
94,978 54 9,528 38 92,731 56 12,484 37 90,930 54 15,792 43 91,065 56 15,171 44
93,902 64 23,164 43
As detailed sorting of the enumeration slips was not undertaken at the 1941 Census in most parts of India due to the war, figures pertaining to Hyderabad emigrants are not available for that census. Further, the figures given for the earlier censuses in Table 20 have not been adjusted to correspond to the existing territories of this state. In other words, no allowances have been made for the enclave villages exchanged between this state and the adjoining states of Bombay and Madras during the decade 1941-1951. It is not possible now to adjust thE figures to correspond to these changes, but even if possible, the present analysis would not be materially affected by such adjustments. Besjdes, the figures for the earlier censuses given in column (6), relating to persons born in Hyderabad State but enumerated in the non-adjacent states of India, include those born in territories ·now constituting Burma and Pakistan. The corresponding figures for the present census
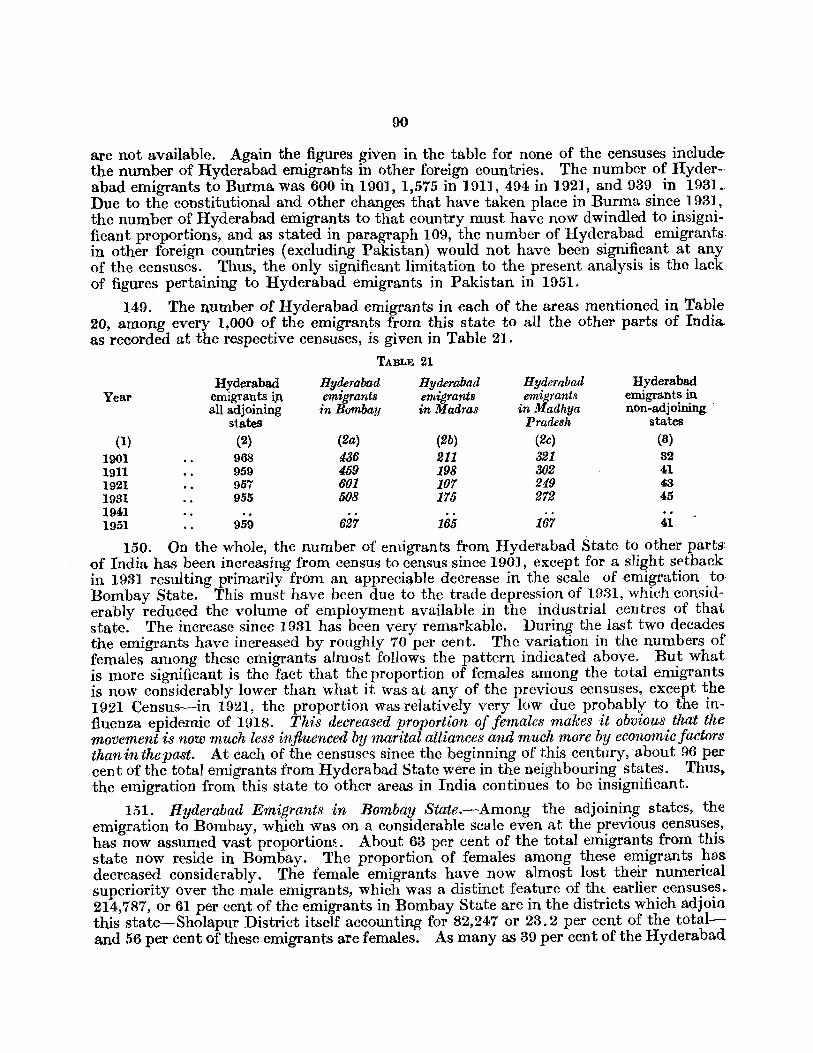
90
are not available. Again the figures given in the table for none of the censuses includethe number of Hyderabad emigrants in other foreign countries. The number of Hyder~ abad emigrants to Burma was 600 in 1901, 1,575 in 1911, 494 in 1921, and 939 in 193!.. Due to the constitutional and other changes that have taken place in Burma since 1931, the number of Hyderabad emigrants to that country must have now dwindled to insignificant proportions, and as stated in paragraph 109, the number of Hyderabad emigrants. in other foreign countries (excluding Pakistan) would not have been significant at any of the censuses. Thus, the only significant limitation to the present analysis is the lack of figures pertaining to Hyderabad emigrants in Pakistan in 1951.
149. The number of Hyderabad emigrants in each of the areas mentioned in Table 20, among every 1,000 of the emigrants from this state to all the other parts of India.. as recorded at the respective censuses, is given in Table 21.
TABLE 21
Hyderabad Hyderabad Hyderabad Hyderabad Hyderabad Year emigrants i.n emigrants emigrants emigrants emigrants in
all adjoining in Bombay in Madras in Madhya non-adjoining . states Pradesh states
(1) (2) (2a) (2b) (2c) (3)
1901 968 436 211 321 32 1911 959 4.59 198 302 41 1921 957 601 101 249 43 1981 955 508 175 272 45 1941 1951 959 627 165 167 41
150. On the whole, the number of emigrants from Hyderabad State to other parts: of India has been increasing from census to census since 1901, except for a slight setback in 1931 resulting primarily from an appreciable decrease in the scale of emigration to· Bombay State. This must have been due to the trade depression of 19tH, which considerably reduced the volume of employment available in the industrial centres of that state. The increase since 1931 has been very remarkable. During the last two decades the emigrants have increased by roughly 70 per cent. The variation in the numbers of females among these emigrants almost follows the pattern indicated above. But what is more significant is the fact that the proportion of females among the total emigrants is now considerably lower than what it was at any of the previous censuses, except the 1921 Census-in 1921, the proportion was re1atively very low due probably to the influenza epidemic of 1918. This decreased proportion of females makes it obvious that the movement is now much less influenced by marital alliances and much more by economic factors thaninthepast. At each of the censuses since the beginning of this century, about 96 per cent of the total emigrants from Hyderabad State were in the neighbouring states. Thus t
the emigration from this state to other areas in India continues to be insignificant.
151. Hyderabad Emigrants in Bombay State.-Among the adjoining states, the emigration to Bombay, which was on a cqnsiderable scale even at the previous censuses, has now assumed vast proportiom.. About 63 per cent of the total emigrants from this state now reside in Bombay. The proportion of females among these emigrants has decreased considErably. The female emigrants have now almost lost their numerical superiority over the male emigrants, which was a distinct feature of tht earlier censuses. 214,787, or 61 per cent of the emigrants in Bombay State are in the districts which adjoin this state-Sholapur District itself accounting for 82,247 or 23.2 per cent of the totaland 56 per cent of these emigrants are females. As many as 39 per cent of the Hyderabad

91
emigrants in Bombay State reside in the non-adjoining districts of the state. Greater Bombay accounts for 88,142 or 24.9 per cent of the total emigrants from Hyderabad, and Poona District for 26,292 or an additional 7.4 per cent. In no adjoining or nonadjoining district is there such a heavy concentration of Hyderabad emigrants as in Greater Bombay. Hyderabadis account for over 3 per cent of its population. Ahmedabad District with 3,268 and Surat with 1,836 have also sizeable numbers of Hyderabad emigrants. The percentage of females among these emigrants in all the non-adjoining districts of Bombay State is only 41. Unlike in the case of the emigrants to Madhya Pradesh or Madras State, those to Bombay State are drawn in appreciable numbers from all over this state and not from any particular linguistic zone or zones. A heavy proportion of the 78,000 Telugu speakers in Greater Bombay, and the overwhelming majority of the 20,439 Telugu speakers in Ahmednagar, 32,565 in Poona, 65,240 in Sholapur, 13,420 in Bijapur and 22,927 in Dharwar District is bound to consist of emigrants, or their descendants from the Telugu areas of this state. A livelihood class analysis of the Hyderabad emigrants to Bombay State, as well as of those to the other areas in India, is given in paragraphs 155 to 161. But on the whole th~ movement to Bombay State is slightly more influenced by economic reasons than marital alliances.
152. Hyderabad Emigrants in 11Jadras State.-The emigration to Madras State declined in extent subsequent to the 1901 Census, the decline recorded in 1921 beinO' particularly heavy due to the after effects of the influenza epidemic of 1918. Even i~ 1931, in spite of a heavy increase over the 1921 figures, the emigration could not entirely recover its 1901 proportions, presumably because of the trade depression. But since then it has more than made up for the lost ground.. The emigrants are now roughly one and a half times their numbers in 1901. Almost the same trend is noticeable among the female emigrants except that their decrease in numbers in 1921 is more marked. Their percentage among the total emigrants is wavering within the narrow limits of 51 and 53. except again in 1921 when it declined to 39. 82,969 or as many as 89 per cent of the Hyderabad emigrants are now residing in the adjoining districts of Madras State-35,345 or 38 per cent of the total being in Krishna and 19,644 or 21 per cent, in Bellary. As will be seen subsequently, the concentration in Bellary is due to the Tungabhadra Project works on the other side of the river. 53 per cent of these emigrants in the adjoining districts are females. 10,II4 or only II per cent of the Hyderabad emigrants are in the non-adjoining districts of Madras State, Madras City itself accounting for 4,535 or 4.9 per cent of the total. The percentage of females among these emigrants in the p.on-adjoining districts is only 40. It is thus obvious that the movement to Madras State is influenced both by marital alliances and economic factors, the former perhaps slightly predominating. But, on account of the vast dimensions attained by the emigration to Bombay State, the relative importance of Madras, as an area absorbing emigrants from Hyderabad State, has diminished in spite of an appreciable increase in the number of emigrants to that state.
153. Hyderabad Emigrants in IJ,ladhya Pradesh.-The trend in the emigration to Madhya Pradesh is very much different from that to the other two adjoining states. There has been very little variation in the number of emigrants since 1901. The influenza epidemic preceding the 1921 Census, or the trade depression of 1931, does not seem to have had any particularly adverse effect on the scale of emigration as a whole. But the fact cannot be overlooked that, for reasons indicated in paragraph 116, the figures for the preceding censuses covered many categories of emigrants (or immigrants) now left out entirely or included only partially. Examined sex-wise, however, the figures indicate significant variations. Excluding the figures for the 1921 Census, which were rather
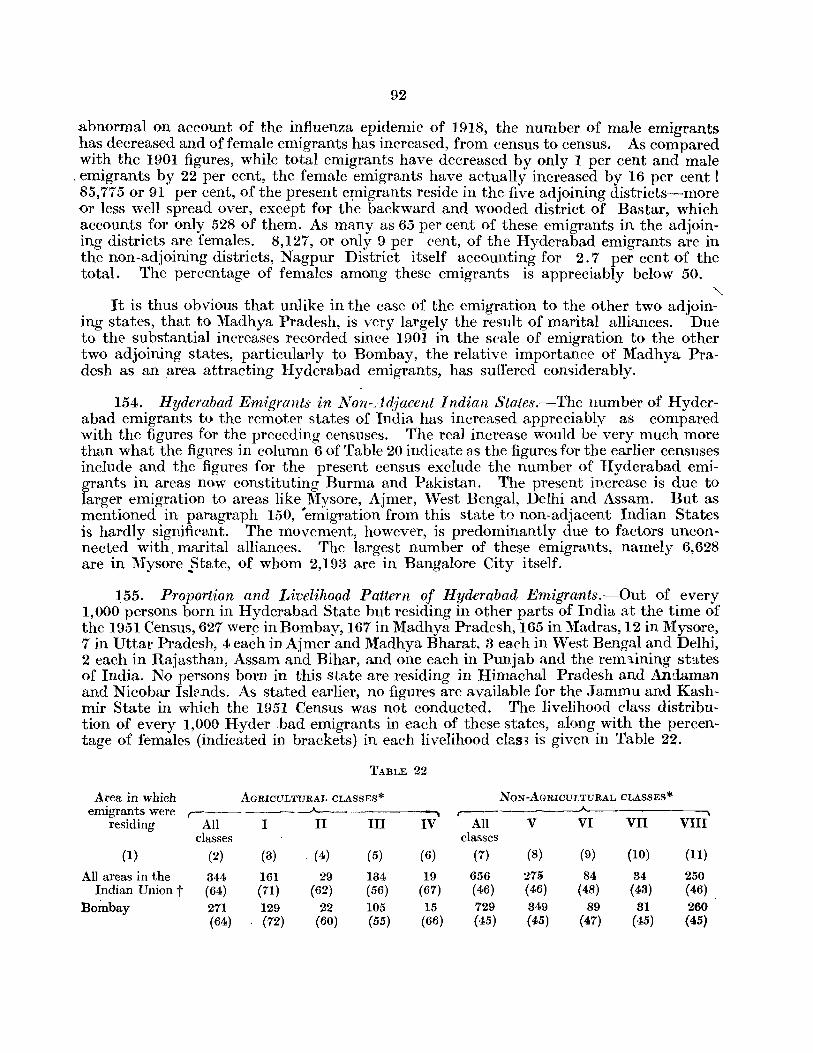
92
abnormal on account of the influenza epidemic of 1918, the number of male emigrants has decreased and of female emigrants has increased, from census to census. As compared with the 1901 figures, while total emigrants have decreased by only 1 per cent and male
. emigrants by 22 per cent, the female emigrants have actually increased by 16 per cent! 85,775 or 91 per cent, of the present e~igrants reside in the five adjoining districts-more <>1' less well spread over, except for the backward and wooded district of Bastar, which accounts for only 528 of them. As many as 65 per cent of these emigrants in the adjoining districts are females. 8,127, or only 9 per cent, of the Hyderabad emigrants are in the non-adjoining districts, Nagpur District itself accounting for 2.7 per cent of the total. The percentage of females among these emigrants is appreciably below 50.
""-It is thus obvious that unlike in the case of the emigration to the other two adjoin-
ing states, that to Madhya Pradesh, is very largely the result of marital alliances. Due to the substantial increases recorded since 1901 in the scale of emigration to the other two adjoining states, particularly to Bombay, the relative importance of Madhya Pradesh as an area attracting Hyderabad emigrants, has suffered con<;iderably.
154. Hyderabad Emigrants in Non-Adjacent Indian States.-The number of Hyderabad emigrants to the remoter states of India has increased appreciably as compared with the figures for the preceding censuses. The real increase would be very much more than what the figures in column 6 of Table 20 indicate as the figures for the earlier censuses include and the figures for the present census exclude the number of Hyderabad emigrants in areas now constituting Burma and Pakistan. The present increase is due to larger emigration to areas like l\Iysore, Ajmer, West Bengal, Delhi and Assam. But as mentioned in paragraph 150, 'emigration from this state to non-adjacent Indian States is hardly significant. The movement, however, is predominantly due to factors unconnected with. marital alliances. The largest number of these emigrants, namely 6,628 are in Mysore .. State, of whom 2,193 are in Bangalore City itself.
~55. Proportion and Livelihood Pattern of Hyderabad Emigrants.-Out of every 1,000 persons born in Hyderabad State hut residing in other parts of India at the time of the 1951 Census, 627 we:t:_e in Bombay, 167 in Madhya Pradesh, 165 in Madras, 12 in Mysore, 7 in Uttar Pradesh, 4 each in Ajmer and Madhya Bharat, 3 each in West Bengal and Delhi, 2 each in Rajasthan, Assam and Bihar, and one each in Punjab and the remlining states of India. No persons born in this state are residing in Himachal Pradesh and Andaman and Nicobar Isle,nds. As stated earlier, no figures are available for the Jammu and Kashmir State in which the 1951 Census was not conducted. The livelihood cIa<;s distribution of every 1,000 Hyder bad emigrants in each of these states, along with the percentage of females (indicated in brackets) in each livelihood c1as, is given in Table 22.
TABLE 22
Area in which AGRICULTURAL CLASSES* NON-AGRICULTURAL CLASSES*
emigrants were ,- ~
residing All I II III IV All V VI VII VIII classes classes
(1) (2) (3) , (4) (5) (6) (7) (8) (9) (10) (ll)
All areas in the 344 161 29 134 19 656 27!i 84 34 250 Indian Union t (64) (71) (62) (56) (67) (46) (46) (48) (43) (46)
Bombay 271 129 22 105 15 729 349 89 31 260 (64) (72) (60) (55) (66) (45) (45) (47) (45) (45)
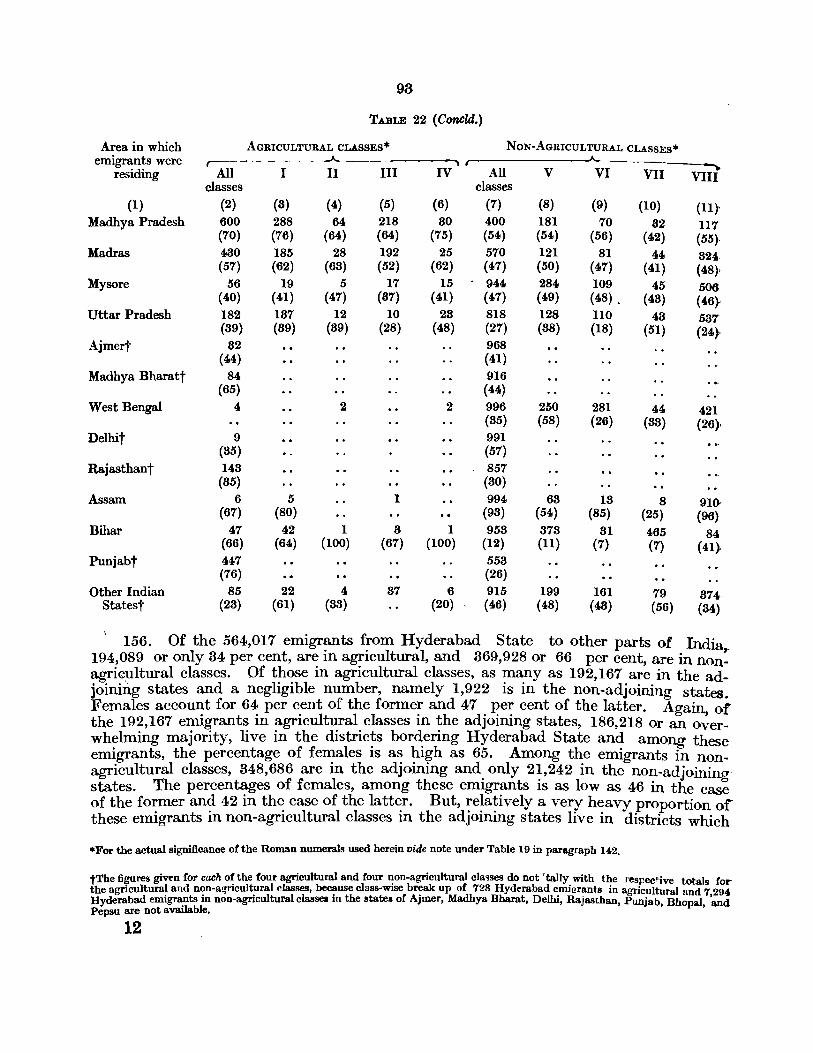
Area in which emigrants were
residing
(1) Madhya Pradesh
Madras
Mysore
Uttar Pradesh
Ajmert
Madhya Bharatt
West Bengal
Delhit
Rajasthant
Assam
Bihar
Punjabt
Other Indian Statest
93
TABLE 22 (Concld.)
AGRICULTURAL CLASSES* NON-AGRICULTURAL CLASSES*
--------------~------------~r-'------------~------------___ ~ All I II III IV All V VI VII VIII
classes classes (2) (8) (4) (5) (6) (7) 600 288 64 218 80 400 (70) (76) (64) (64) (75) (54) 480 185 28 192 25 570 (57) (62) (68) (52) (62) (47)
56 19 5 17 15 944 (40) (41) (47) (87) (41) (47) 182 187 12 10 28 818 (39) (89) (89) (28) (48) (27) ~ 9~
(44) (41) 84 916
(65) (44) 4 2 2 996
9 (85) 148 (85)
6 (67)
47 (66)
447 (76)
85 (28)
5 (80)
42 (6')
22 (61)
1 (100)
4 (88)
1
8 1 (67) (100)
87 6 (20)
(85) 991 (57) 857
(80) 994
(98)
958 (12) 558 (26) 915 (46)
(8) 181 (54) 121 (50)
284 (49) 128 (88)
250 (58)
68 (54)
878 (11)
199 (48)
(9) (10)
70 82 (56) (42)
81 44 (47) (41) 109 45 (48) . (48) 110 48 (18) (51)
281 (26)
18 (85)
44 (88)
8 (25)
(ll)' 117 (55).
824-(48),
506 (46} 587 (2'}
421 (26)
910-(96)
81 (7)
465 84
161 (48)
(7) (41}
79 874 (56) (84)
156. Of the 564,017 emigrants from Hyderabad State to other parts of India 194,089 or only 34 per cent, are in agricultural, and 369,928 or 66 per cent, are in non: agricultural classes. Of those in agricultural classes, as many as 192,167 are in the adjoining states and a negligible number, namely 1,922 is in the non-adjoining states. Females account for 64 per cent of the former and 47 per cent of the latter. Again or the 192,167 emigrants in agricultural classes in the adjoining states, 186,218 or an o;erwhelming majority, live in the districts bordering Hyderabad State and among these emigrants, the percentage of fe~ales is a~ ~i~h as 65. Among t~e emigrants in nonagricultural classes, 348,686 are In the adjOInIng and only 21,242 III the non-adjoining states. The percentages of females, among these emigrants is as low as 46 in the case of the former and 42 in the case of the latter. But, relatively a very heavy proportion of these emigrants in non-agricultural classes in the adjoining states live in districts which
*For the actual significance of the Roman numerals used herein vide note under Table 19 in paragraph 142.
tThe figures given for each o~the four agricultural and four ~on-agricultural cJa~ses do not 'tally. with t~e resrec~ive totals for the agricultural and non-a~rIcuJtural classes, because class-wISe break up of 728 Hyderabad emillrants 10 agricultural lind 7 294 Hyderabad emigrants in non-agricultural classel in the states of Ajmer, Madhya Bharat, Delhi, Rajasthan, Punjab, Bhopal, 'and Pepsu are not available.
12
94
do not border the state-the number in the bordering districts is 197,313 and that in the other districts is 151,373, of whom females account for 51 per cent and 41 per cent respectively. It is thus obvious that a very large number of emigrants in agricultural etas.ses have moved out, directly or indirectly, due to marital alliances but the movement of those in non-agricultural classes is due more to economic reasons than marital alliances. The position with regard to the emigrants in each of the adjoining states and the other states {)f India is explained in the succeeding paragraphs.
157. Only 27 per cent or 95,811 of the emigrants to Bombay State are in agricultural classes. Of these, the overwhelming majority, namely 92,991 are in the adjoining districts, over 64 per cent of them being females. It is thus obvious that this movement is very largely. the result of inter-marriages. But there is also a fair proportion of infiltration into agricultural classes for economic reasons, particularly in the districts of Nasik, East Khandesh and Ahmednagar, in the order mentioned. But the numbers involved in the first two districts, are not very large. On. the whole, the number of Hyderabad emigraJ?ts who have settled down as owner cultivators is not very large, especially in relation to the total number of Hyderabad emigrants recorded in the classsuch infiltration is most perceptible among the adjoining districts in East Khandesh and to a smaller extent in Nasik, Dharwar and Bijapur Districts. The number who have ~ettled down as tenant cultivators is even smaller, though their proportion to the total emigrants in this livelihood class is appreciably larger than the corresponding proportion {)f Hyderabad emigrants who have taken to owner cultivation. The infiltration in this livelihood class is relatively most perceptible in AhmedJ?agar District. As against these, a. very large number of Hyderabad emigrants have taken to agricultural labour in the adjoining districts. This infiltration is most marked, again in Ahmednagar District which accounts for 16,394 of these persons-from among the 37,180 Hyderabad emigrants in this livelihood class in Bombay State---of whom only 51 per cent are females. The proportion of females among the Hyderabad emigrants to Bombay St9.te in the Livelihood Class of Absentee Landlords is not as high as it is generally in the case of such migrants. It is thus obvious that quite a few, at any rate, of the absentee landlords have also moved in to Bombay State in connection with their subsidiary occupations or interests, or because of reac;;ons arising out of their forced migration during the Razakar regime.
158. As many as 73 per cent or 258,057 of the emigrants to Bombay State are in non-agricultural classes. Of these, less than half, namely 121,796 live in tlIe adjoining districts-Sholapur itself accounting for 57,555 of the number. Even among these emigrants in the adjoining districts males and females are almost equa.lly balanced. 186,261 of the emigrants in non-agricultural classes, or as many as 58 per cent of the total, live in the non-adjoining districts. Greater Bombay itself accounts for 88,085 of these persons, and Poona and Thana Districts for 25,066 and 12,3'88 respectively. The percentage of females among these emigrants in non-adjoining districts is as low as 40. Thus, the emigrants in non-agricultural classes, especially those residing in the non-adjoining districts of Bombay State, have moved in mainly due to reasons unconnected with marital alliances.
Almost 85 per cent of the total emigrants to Bombay State are in the Livelihood Class {)f Production. 45,220 of the 123,454 emigrants to Bombay State in this class, or considerably more than one third of the total, reside in Greater Bombay itself. Of this number in Greater Bombay only 39 per cent are females. The districts of Poona, Thana, Ahmedabad 3.nd Surat account for 7,041, 4,851, 2,694) 1,192 of these emigrants and the
12*
95
percentage of females among them is only 44, 47, 37 and 40 respec~ively. The six: adjoining districts account for 61,691 of these emigrants of whom only 49 per cent are femalesSholapur District itself accounting for more than half of the number. The actual nwnbers in Sholapur, Ahmednagar, Nasik, Dharwar, Bijapur and East Khandesh are 33,618, 15,206, 3,761, 3,695, 3,363 and 2,048 respectively of whom females constitute 47, 50, 58, 50, 54 and 56 per cent respectively. The weaving mills and other textile industries in these areas-including h[\ndloom weaving establishments and cotton ginning and pressing factories--must be pr<,viding employment for a major portion of these emigrants. The other large industrial establishments and artisan trades like those of tgjloring, pottery, carpentry, etc., must be sustaining the remainder, both in the adjoining and the nonadjoining areas.
31,470, or about 9 per cent of the total emigrants to Bombay State, are in the Livelihood Class of Commerce. This movement is slightly more influenced by marital alliances than the movements recorded in the other non-agricultural livelihood classes. Among the non-adjoining districts, the infiltration in this class is particularly marked in Greater Bombay, and to a smaller extent in Poona and Thana Districts which accounted for 8,924, 2,634 and 2,233 persons respectively. The percentage of females among these emigrants was 41 in Greater Bombay 47 in Poona and 50in Thana. As in the case of all the other non-agricultural classes, there was a fair amount of infiltration in this class as well in the adjoining districts, particularly in Sholapur. The number of emigrants in this class in Sholapur was 7,079, in Ahmednagar 3,071, in Nasik 2,039, in Bijapur 1,701, in Dharwar 1,568 and in East Khandesh 1,053 and the percentage of females among them was only 48, 42, 61, 54, 52 and 52 respectively. This infiltration must have, as a rule, been restricted to petty trading and to employment in the lower cadres of big and small commercial establishmen,ts.
Only 3 per cent of the Hyderabad emigrants in Bombay State are in the Livelihood Class of Transport, with a heavy concentration in Greater Bombay which accounted for 4,078 of the 11,080 emigrants in this class. Only 41 per cent of the emigrants in Greater Bombay are females. An additional 1,448 of whom only 38 per cent are females, and 480, of whom only 36 per cent are females, are living in the districts of Poona and Thana respectively. Of the remaining, 4,698 are in the five adjoining districts, 1,998 in SholapUr, 974 in Nasik, 902 in Ahmednagar, 346 in East Khandesh, 339 in Dharwar and 139 in Bijapur. The percentage of females among these emigrants was 51, 50, 43, 63, 50 and 58 r,espectiveiy. This infiltration must have been spread over various organisations connected with transport by rail, road or water, particularly in the inferior cadres and independent professions like tonga or cart driving and hammali.
The second biggest group of Hyderabad emigrants in Bombay State is of those wh() are principally dependent upon activities connected with Other Services and Miscellaneous Sources. This livelihood class sustains 26 per cent of the total Hyderabad emigrants in Bombay State. As usual, the biggest concentration in the non-adjoining districts is in Greater Bombay, which accounts for 29,813 of the 92,053 Hyderabad emigrants in Bombay State in this class. Only 36 percent of these emigrants in Greater Bombay are females. Among the non-adjoining districts 13,943 of these emigrants are in Poona,. 5,324 in Thana and 874 in Kolaba of whom 48, 38 and 44 per cent respectively are femg,les. Of the remaining, 38,896 are in the adjoining districts. Among these, 14,860 are living in Sholapur, 10,489 in Ahmednagar, 5,302 in Nasik, 2,829 in East Khandesh, 2,783 in Dharwar and 2,633 in Bijapur and the percentage of females among them was 56, 44, 55, 69, 47 and 54 respectively. This infiltration must have been predominantly into domestic and other services connected with hair dressing, laundry, etc.
96
159. As many as 60 per cent or 56,298 of the Hyderabad emigrants in Madhya Pradesh are in agricultural classes and 70 per cent of them are females. Again 54,911, Qr almost the total number of these emigrants, are in the digtricts adjoining Hyderabad State, 71 per cent of them being females. It is thus obvious that this movement into agricultural classes is predominantly due to marital alliances. Some slight infiltration for economic reasons is, however, perceptible in the Livelihood Classes of Tenant Cultivation particularly in Chanda District, and Agricultural Labour in the three adjacent Ber~ Districts. Of the 5,861 Hyderabad emigrants in the Livelihood Class of Tenant Cultivation, in the adjoining districts of Madhya Pradesh, 65 per cent are females. Chanda and Akola Districts account for 1,033 and 1,034 respectively of these emigrants, of whom 52 per cent in the case of the former and 63 in the case of the latter are females. Of the 20,148 H)'derabad emigrants in the Livelihood Class of Agricultural Labour in the adjoining districts of Madhya Pradesh, 64 per cent are females. Yeotmal, Buldana and Akola account for 8,311, 5,239 and 3,447 respectively of these emigrants, females constituting 63 per cent in Yeotmal and Buldana Districts and 61 Akola.
37,604 or only 40 per cent of the Hyderabad emigrants to Madhya Pradesh, are in non-agricultural classes and even among them females constitute 54 per cent. 30,864, or 82 per cent of these emigrants, are in the adjacent districts of Madhya Pradesh, females constituting 55 per cent of them. The remaining 6,740 of whom females constitute 50 per cent, are more or less concentrated in the districts of Nagpur, Amravati, Wardha and Nimar. It is thus obvious that not only is this movement into non-agricultural classes in Madhya Pradesh very much less influenced by economic reasons than in the case of the corresponding movement to Bombay State-or even to Madras State as will be seen subsequently-but it is also considerably smaller in dimension. 17,014, or 18 per cent of the total emigrants to Madhya Pradesh, are in the Livelihood Class of Production, females accounting for 54 per cent of them. The overwhelming majority of these emigrants, namely 15,041 are in the adjoining districts of Madhya Pradesh and females again account for 54 per cent of them. About half of this number, namely 7,338 are in Chanda, 3,461 in Yeotmal, 2,735 in Buldana, 1,324 in Akola and only 183 in Bastar. The percentage of females among these emigrants is 56, 53, 53, 55 and 12 respectively. The remaining emigrants in this class are concentrated in Nagpur, Amravati, Nimar and Wardha Districts, but the numbers in none of these districts except Nagpur, which is perhaps the biggest industrial centre in this part of the country, exceeds 500. Chanda District with its relatively low density, its coal mines and 'nascent industrial activities is attracting a fair number of the Hyderabad emigrants-not only in this livelihood class but, as wi1l be seen subsequently, in the Livelihood Class of Transport and Other Services and Miscellaneous Sources as well. 6,541, or only 7 per cent of the Hyderabad migrants to Madhya Pradesh, are in the Livelihood Class of Cornmerc'e. Females account for 56 per cent of them and are proportionately more numerous among the emigrants in this class than among those in the other non-agricultural classes. The movement in this class is thus relatively more influenced by marital alliances than the movement in the other non-agricultural classes. The overwhelming majority of these emigrants, namely 5,297, are in the adjoining districts of Madhya Pradesh, and the percentage of females among them is again 56. The largest number, namely 2,188, is not in Chanda but in Yeotmal District which perhaps offers better opportunities for petty trade. Only 53 per cent of these emigrants in Yeotmal are females. 3,064, or only 3 per cent of the Hyderabad emigrants in Madhya Pradesh, are in the Livelihood Class of Transport, females forming only 42 per cent of them. 2,412 of these emigrants are in the adjoining districts and
97
the percentage of females among them is still lower, i.e., 40. The largest number of these emigrants, namely 1,622, are again in Chanda. The percentage of females among these emigrants in Chanda District is only 23 as against the corresponding percentage of 75 for the remaining adjoining districts taken together. It is thus obvious that, though small in dimensions, the movement in this class to Chanda District and to the non-adjoining districts of Madhya Pradesh is largely due to economic factors. 10,985, or 12 per cent of the total Hyderabad emigrants to Madhya Pradesh, are in the Livelihood Class of Other Services and Miscellaneous Sources. This is by far the lowest among the corresponding figures recorded in the movement to the adjoining states from the point of view of both absolute numbers and its proportion to the total number of emigrants. This is perhaps due to the ffl.ct that employment as domestic servants, barbers, washermen, etc., in the neighbouring tracts of Madhya Pradesh is not very attractive because of the keener competition and limited scope locally. This is in spite of the proverbial cook from Manthani who is supposed to make his' lakhs ' in Nagpur. 8,114 of these emigrants are in the adjoining districts of Madhya Pradesh with females constituting 59 per cent of them. The number is more or less well spread over all the adjoining districts, except that the number is the largest in Chanda District. The remaining emigrants in this class are con~entrated in Nagpur, Amravati, and Jabalpur Districts, perhaps mostly at the respective district headquarters.
160. Slightly over 40,000, or 43 per cent of the total number of Hyderabad emigrants to Madras State, are in agricultural classes and. 57 per cent of them are females. The overwhelming majority of this number namely 38,316 are in the bordering districtsKrishna itself accounting for 18,402-and 58 per cent of them ar~ females. Only 1,742 of these emigrants are in the non-adjoining districts of Madras State of whom 767 persons are concentrated in Cuddapah District. 717 of the Hyderabad emigrants in Cuddapah, consisting of 629 males and only 88 females, are sustained by owner cultivation. Apart from this rather inexplicable feature, there is nothing significant about this movement to the non-adjoining districts. Though the movement of Hyderabad emigrants in agricultural classes to all the three adjoining states is influenced more by inter-marriages than other reasons, that to Madras State is proportionately most induced by economic considerations, particularly with regard to the movement recorded in the Livelihood Class of Agricultural Labour. 17,222, or about 19 per cent of the total Hyderabad emigrants to Madras State, are in the Livelihood Class of Owner Cultivation. 15,968 of these migrants, of whom 64 per ~ent\ are females, are in the adjoining districts. Of this number 7,356 are in Krishna ~, 532 in Bellary, 1,784 in Kurnool, 1,670 in East Godavari, 926 in West Godavari and 700 in Guntur. The percentage of females among these emigrants is 66, 68, 64, 58, 55 and 56 respectively. The proportion of females in these six districts, particularly in the last three, is not heavy enough to rule out that the migration is, to some extent, due to economic factors. 2,572, or only 3 per cent of the total Hyderabad emigrants to Madras State, are in the Livelihood C1ass of Tenant Cultivation. 2,520, or almost the whole of the number, are in the adjoining districts. 928 are in Krishna, 608 in West Godavari, 431 in Bellary, 253 in Guntur, 181 in East Godavari and 119 in Kurnool. The percentage of females among them is 64, 53, 74, 84, 50 and 54 respectively. The movement, parti·cularly to East Godavari, West Gjdavari, Kurnool and to an extent Krishna, though insignificant from the point of view of the numbers involved, is due to a minor extent to economic reasons. 17,909, or 19 per cent of the total Hyderabad emjgrants to Madras State are in the Livelihood Class of Agricultural Labour. 17,702, or almost the whole ()f the number, are in the adjoining districts. 9,183 of these emigrants are in Krishna, 2,615 in Guntur, 1,794 in Kurnool, 1,738 in Bellary, 1,269 in West Godavari and 1,103 in
98
East Godavari. The percentage of females among these emigrants is 53, 39, 69, 51, 53 and 40 respectively. The proportion of females in this group is relatively very low except in the case of the emigrants to Kurnoo!' It is thus obvious that in the migration noticed in this class economic factors playa very important if not the major part. 2,355, or only 3 per cent of the Hyderabad emigrants to Madras, are in the Livelihood Class. of Absentee Landlords. 2,126, or the overwhelming majority of this number, are in the adjoining districts-Krishna again accounting for 935-of whom 60 per cent are females. The percentage of females is particularly low for this class in Bellary and Guntur Districts. Of the 542 emigrants in the former and 115 in the latter 40 and 58 per cent respectively are females. A fair portion of these migrants, as well as a few in the other districts-except in the case of the migrants to East Godavari among whom the percentage of females is as high as 86--must have moved to Madras State in connection with their subsidiary interests or occupations. Some of these migrants may be the dependants of absentee landlords from this state prosecuting their studies in Madras State.
53,025, or 57 per cent of the total Hyderabad emigrants to Madras State, are in non-agricultural classes. 44,653 of these emigrants are in the bordering districts, the percentage of females among them being 49. The largest number of these emigrants, namely 16,943, are again, as in the case of the emigrants in agricultural classes, in Krishnathe second largest, i.e. 13,401 being in Bellary. But this concentration in Bellary is largely the result of the Tungabhadra Project works in progress which must have attracted a large number of labourers particularly from Raichur and Mahbubnagar Districts. 8,372 of the emigrants are in the non-adjoining districts, the percentage of females among them being 40. 4,469, or slightly more than half of the number in the non-adjoining districts, are concentrated in Madras City. The low percentage of females makes it obvious that the movement is more the result of economic factors than marital alliances. 11,235, or 12 per cent of the total Hyderabad emigrants to Madras State, are in the Livelihood Class of Production. Males are slightly more numerous than females among these emigrants. 10,073, or the overwhelming majority of the emigrants in this class, are in the adjoining districts, of whom 52 per cent are females. 4,295 of them are in Krishna, 1,889 in Bellary, 1,545 in Kurnool, 1,244 in Guntur, 663 in East Godavari and 437 in \Vest Godavari. The percentage of females among these emigrants is 54, 51, 46, 49, 50 and 64 respectively. The stone quarries in Krishna District, the activities connected with the production and processing of the material required for the construction of Tungabhadra Project in Bellary, the textile mills and handloom weaving in Guntur, the rice mills and tobacco industries in all the adjoining Andhra districts must be maintaining a large portion of these emigrants.
7,508, or 8 per cent of the total Hyderabad emigrants to Madras State, are in the Livelihood Class of Commerce. Of this number, 5,654 are in the adjoining districts of whom 53 per cent are females. 2,289 of these emigrants are in Krishna, 1,423 in Bellary 742 in Guntur, 667 in Kurnool, 268 in West Godavari, 265 in East Godavari. The percentage of females among them being 56, 57, 32, 57, 56 and 49 repsectively. 1,854 of these emigrants are in the non-adjoining districts, of whom 1,370. consisting of 993 males and 377 females, are in Madras City itself. The proportion of females is relatively low enough to assume that there is a certain amount W. infiltration for economic reasons in this class as well. This is not at all surprising as the Telugu Vaishyas, particularly of Nalgonda and Warangal Districts, and the Veerashaiva merchants of Bellary, have considerable trade connections across the border. The export and import restrictions enforced in Hyderabad and the forced migration of some of the members of this class during the previous regime also tended to intensify such contacts.
99
Only 4,151 or 4 per cent of the Hyderabad emigrants to Madras State, are in the Livelihood Class of Transport. Of this number 2,803 are in the adjoining districts of whom 42 per cent are females and 1,348 of whom 38 per cent are females in the non-adjoining districts. Of the latter 914 are in Madras City. 990 of these emigrants are in Krishna, 616 in Kurnool, 599 in Guntur, 453 in Bellary, 97 in West Godavari and 48 in East Godavari. The percentage of females among them being 42, 48, 39, 36, 58 and 50 respectively. It is sometimes said in Hyderabad that one can always be sure of meeting a Hyderabadi rickshawala in Vijayawada. Besides ricksha pulling and cart driving, employment in the railways must be sustaining a large number of these emigrants both in the adjoining' districts and in remoter areas, like Madras City. 30,131, or 32 per cent of the Hyderabad emigrants to Madras State, are in the Livelihood Class of Other Services and Miscellaneous Sources. Of this number 26,123 are in the adjoining districts, females accounting for 48 per cent of them, and 4,008 are in the non-adjoining districts, females accounting for 47 per cent of them. Among the adjoining districts, 9,636 are in Bellary, 9,369 in Krishna. 3,034 in Kurnool, 2,302 in Guntur, 1,228 in East Godavari and 554 in West Godavari. The percentage of females among them being 41, 52, 49, 51, 56 and 46 respectively. Among the non-adjoining districts, the largest concentration is again in Madras City which accounts for 1,660 of these migrants. The large number in this class in Bellary District must be predominantly made up of the labourers engaged in the construction of the Tungabhadra Project. The majority of the emigrants in the other districts must be domestic servants, barbers, washermen, etc.
161. As stated earlier, the number of Hydera~ad emigraRts in the non-adjoining states is insignificant. An overwhelming majority of these emigrants are in non-agricultural classes. Bangalore City, the towns of Davangere in Chitaldurg District and Bhadravat.i in Shimoga District, all in Mysore State. with their importance in industrial, commercial and other spheres, seem to have attracted Hyderabad emigrants in some numbers. The emigr~tion to Uttar Pradesh, Ajmer, Madhya Bharat, Rajasthan and Punjab is perhaps largely the result of the pronounced and continued emigration from those areas to Hyderabad State for some decades now. The contacts created by the present and earlier emigrants (and their descendants) from those areas must have lead in turn to a certain amount of reciprocal emigration. The chief centres of emigration in these states are Meerut and Lucknow Districts in Uttar Pradesh, Jaipur in Rajasthan, I~dore in Madhya Bharat and Ferozpur in Punjab. Delhi, the metropolis of the country, .and, to a smaller extent, Calcutta, have also attracted some Hyderabad emigrants due obv~ously to their importance in diverse spheres. Singhbhum and Manbhum Districts of Bihar, with their industries and coal fields, have also drawn some Hyderabad emigrants. The emigrants to Assam are concentrated in Lakhimpur District. A peculiar feature of the migration to Assam is the predominanceoffemales among the migrants. Of the 1,024 Hyderabad emigrants to Assam, as many as 948 are females. This is perhaps due to the descendant~ of earlier Telugu speaking migrants to Assam (mostly labourers) getting their brides from the Telugu areas of this state. Though, on the whole, the movement of the majority of the emigrants to th~ non-adjoining states must have been influenced by economic and other reasons, quite a large number must have moved out due to marital alliances. The rigours of caste as well as linguistic loyalties compel a number of the present immigrants (or the descendants of earlier immigrants) in this state to marry their daughters to bridegr.ooms belonging to areas from which they themselves (or their ancestors) migrated originally.
162. Inter-District Emigrants.--As stated in paragraph 117 a detailed review of the emigrants from each district of the state to other districts within the state is given in Appendix B.

100
163. Balance of Movement according to Livelihood Classes.-The number of immigrants in Hyderabad State from all areas beyond the state and the number of emigrants from Hyderabad State to other states of the Indian Union as recorded at the 1951 Census,. with their break-up according to the numbers in each livelihood class and the percentage of females in each class, are given in Table 23.
TABLE 28
IMMIGRANTS EMIGRANTS Livelihood Class .A
" Number Percentage Number Percentage of females of females.
(1) (2) (8) (4) (5)
All Classes •• 405,084 55 564,017 52
All Agricultural Classes 167,900 67 194,089 64-
Livelihood Class I 101,188 70 90,790 7I Livelihood Class II 140,568 59 16,285 62-
Livelihood Class III •• 41,719 61 75,655 56 Livelihood class IV •• 10,430 74 10,681 67
All Non-Agricultural Classes 237,184 46 869,928 46
Livelihood Class V .. ~0,998 49 155,150 46 Livelihood Class VI .• 52,858 49 47,886 48:
Livelihood Cla.ss VII 14,967 50 19,859 43 Livelihood Class VIII 108,866 43 140,739 46
Nofe ,-(i) For the exact significance of the Roman numerals vide note under Table 19 in para 142. (ii) In the above table thelh'elihood class break-up of 72A Hyderabad emigrants in agricultural and 7,294 in non-agricultural classes in the states of Ajmer. Madhya Bharat. Delhi, Rajasthan, Punjab, Bhopal and Pepsu could not be given because of their non-availability. To this elltent, therefore, the figures for' All Classes' and for' All Agricultural and Non-agricultural Classes' do not tally wit!! the totals of the figures given for the livelihood classes.
164. The emigrants are appreciably more numerous tl;lan the immigrants in agricultural classes as a whole. Further, though the movement of both is very largely the result of marital alliances, proportionately more emigrants, than immigrants, seem to have migrated due to economic factors. But there are some marked variations in individual agricultural classes. Among the owner cultivators, it is the immigrants who are more numerous. And, though the immigration as well as the emigration are predominantly influenced by marital alliances, the number of immigrants who have moved in for economic reasons is more than that of the emigrants who have moved out for similar reasons. This excess is almost exclusively due to the large number of Madras immigrants who have settled down as owner cultivators in the central and southern parts of this state. Among fhe tenant cultivators, the movement either way is relatively very small in dimensions and largely the result of intermarriages. Though the emigrants are slightly more numerous than the immigrants in this class, proportionately a larger number of tl::e immigrants, than the emigrants, have moved out of their homes because of economic factors. On the whole, therefore, the number of immigrants who have taken to tenant cultivation in this state is about the same as that of the Hyderabad emigrants who have taken to similar occupation elsewhere in India. Among the agricultural labourers, not only are the emigrants considerably more numerous than the immigrants, but their movement is-
101
appreciably more influenced by economic reasons than that of the immigrants. This excess is mainly due to thousands of Hyderabadis who have taken to agricultural labour in the adjoining states of Bombay and Madras-especially in Ahmednagar District of the former and Krishna District of the latter. Among the absentee landlords, the emigrants and immigrants are almost equal in numbers, the former exceeding the latter by only 251. The number of migrants, either way, is very small in this class and their movement is predominantly influenced by marital alliances, especially in the ca5e of the immigrants. Some of the absentee landlords of Hyderabad, however, seem to have migrated to Bombay and Madras States in connection with their subsidiary occupations or interest, or sent their dependants to those states for prosecution of their studies. For reasons stated .elsewhere, the figures for Hyderabad emigrants given in Table 28 do not include Hyderabad immigrants in Pakistan and other foreign countries. But it can safely be presumed for all statistical purposes that none of those emigrants have taken to agricultural occupations.
165. In non-agricultural classes, the excess of emigrants over the immigtants is much more marked than in the agricultural classes, and unlike in those classes, the movement of the emigrants as well as of the immigrants is primarily the result of economic factors. In the LivElihood Class of Production (other than cultiz'ation), the e,('cess of the emigrants O'i:el' the immigrants is particularly htavy andfllrther the mov ment of the emigrants is more markedly influenced by economic factors than that of the immigrants. This heavy excess of the emigrants is almost exclusively due to the large infiltration of Hyderabad emigrants in industrial occupations in Bombay State, especially in Greater Bombayand Sholapur District. In the Livelihood Class of Commerce, the immigrants are slightly in execs, of the emigrants. But if the livelihood class hreak-up of the 7,29"1. Hyderabad emigrants in non-agricultural occupations in the states of Ajmer, Rajasthan, Madhya Bharat. etc., (z l ide note (ii) under Table 28) were available, it is very likely that this excess may be wiped off. In this class while the immigration is from various Indian States, both adjoining and non-adjoining, the emigration is chiefly to Bombay and to a minor extent to the other two adjoining states. And again while most of the emigrants are petty traders, the immigrants are spread over ' big business' as well. In the Livelihood Class of Transport, the emigrants are in excess of the immigrants and their movement is influenced by economic factors to a greater extent than that of the immigrants. This excess of the emigrants is mostly due to the large number of Hyderabadis who have taken to transport activities again in Bombay State, particularly in Greater Bombay. In the Livelihood Class of Other Services and Miscellaneous Sources, the emigrants are appreciably in excess of the immigrants, but their movement is slightly more influenced by,marital alliances than that of the immigrants. But it is obvious that this excess would have been considerable but for the temporary deputation to this state of a large number of Police, Army and Civil servants, drawn from various Indian States, in the wake of Police Action.· The overwhelming majority of these immigrants have since returned to their states. The excess of the emigrants in this class again is due to a concentration of Hyderabadis in occupations connected with Other Services and Miscellaneous Sources in Bombay State--especially Greater Bombay and Poona.
166. Balance of Movement in General or Natural Population :-Figures pertaining to (i) the enumerated population of the state, (ii) the immigrants, i.e., the number of persons enumerated in the state but born beyond the state, (iii) the emigrants i.e., the number of persons born within this state but enumerated in other parts of India,
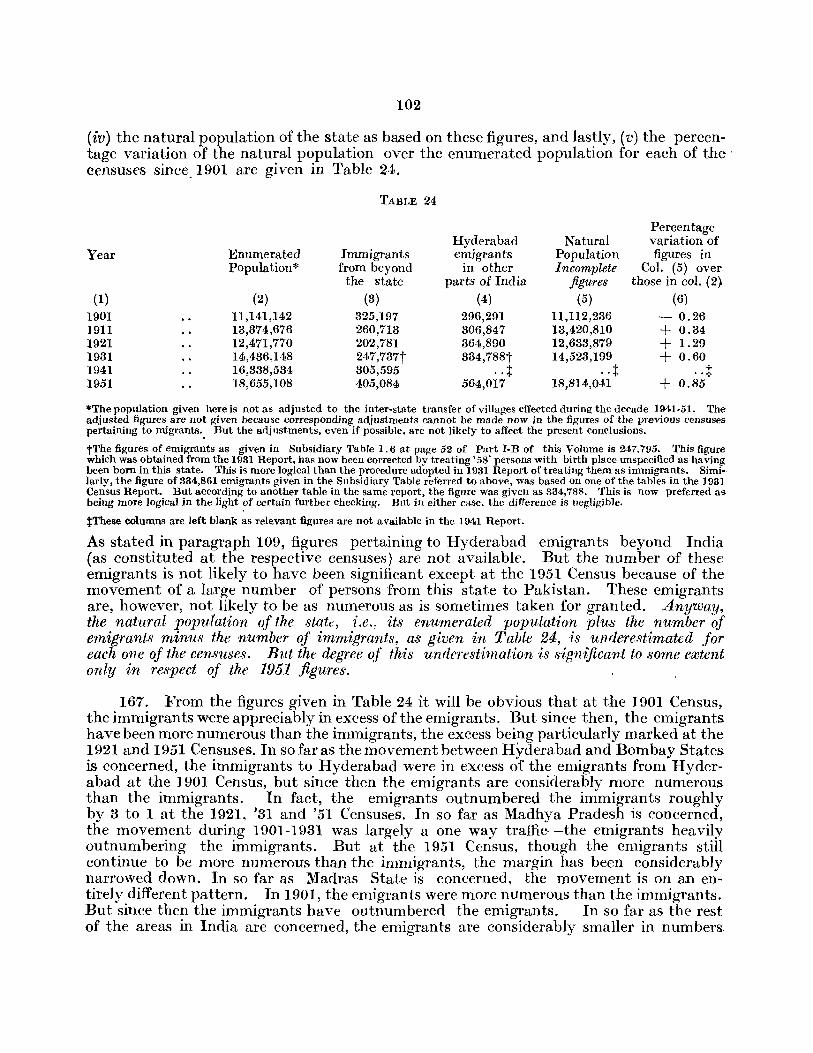
102
(iv) the natural population of the state as based on these figures, and lastly, (v) the percentage variation of the natural population over the enumerated population for each of the· censuses since. 1901 are given in Table 24.
TABLE 24
Percentage Hyderabad Natural variation of
Year Enumerated Immigrants emigrants Population figures in Population * from beyond in other Incomplete Col. (5) over
the state parts of India figures those in col. (2)
(1) (2) (3) (4) (5) (6)
1901 11,141,142 325,197 296,291 11,112,236 - 0.26 1911 13,374,676 260,713 306,847 13,420,810 + 0.34 1921 12,471,770 202,781 364,890 12,633,879 + 1.29 1931 14,436,148 247,737t 334,788t 14,523,199 + 0.60 1941 16,338,534 305,595 .. :J: .. t .. t 1951 18,655,108 405,084 564,017 18,814,041 + 0.85
'liThe population given here is not as adjusted to the inter-state transfer of villages effected during the decade 1941-51. The adjusted figures are not given because corresponding adjustments cannot be made now in the figures of the previous censuses pertaining to migrants., But the acijustments, even if possible. are not likely to affect the present conclusions.
tThe figures of emigrants as given in Subsidiary Table 1.6 at page 52 of Part I-B of this Volume is 247,795. This figure which was obtained from the 1931 Report, has now been corrected by treating' 58' persons with birth place unspecified as having been born in this state. This is more logical than the procedure adopted in 1931 Report of treating them as immigrants. Similarly, the figure of 334,861 emigrants given in the Subsidiary Table referred to above, was based on one of the tables in the 1931 Census Report. But according to another table in the same report, the figure was given as 334,788. This is now preferred a'> being more logical in the light ?f certain further checking. But in either case. the difference is negligible.
~These columns are left blank as relevant figures are not available in the 1941 Report.
As stated in paragraph 109, figures pertaining to Hyderabad emigrants beyond India (as constituted at the respective censuses) are not available. But the number of these emigrants is not likely to have been significant except at the 1951 Census because of the movement of a large number of persons from this state to Pakistan. These emigrants are, however, not likely to be as numerous as is sometimes taken for granted. Anyway, the natural population of the stat.:, i.e., its enumerated popUlation plus the number of emigrants minus the number of immigrants, as given in Table 24, is underestimated for each one of the censuses. But the degree of this underestimation is 8igrl't"jicant to some extent only in respect of the 1951 figures.
167. From the figures given in Table 24 it will be obvious that at the 1901 Census, the immigrants were appreciably in excess of the emigrants. But since then, the emigrants have been more numerous than the immigrants, the excess being particularly marked at the 1921 and 1951 Censuses. In so far as the movement between Hyderabad and Bombay States is concerned, the immigrants to Hyderabad were in excess of the emigrants from Hyderabad at the 1901 Census, but since then the emigrants are considerably more numerous than the immigrants. In fact, the emigrants outnumbered the immigrants roughly by 3 to I at the 1921, '31 and '51 Censuses. In so far as Madhya Pradesh is concerned, the movement during 1901-1931 was largely a one way traffic-the emigrants heavily outnumbering the immigrants. But at the 1951 Census, though the emigrants still continue to be more numerous than the immigrants, the margin has been considerably narrowed down. In so far as Madras State is concerned, the movement is on an entirely different pattern. In 1901, the emigrants were more nUmerous than the immigrants. But since then the immigrants have outnumbered the emigrants. In so far as the rest of the areas in India are concerned, the emigrants are considerably smaller in numbers.
103
than the immigrants. Thus, at each one of the censuses since 1911, Bombay and Madhya. Fradesh States are gaining in numbers from Hyderabad State and Hyderabad State in turn is adding to its numbers from Madras and the rest of the areas in India. But on the whole, Hyderabad's loss is appreciably more than its gain. In other words, even with the under-enumeration of the natural population of the state, from decade to decade as given in Table 24 the natural population of the state has been in excess of its enumerated population at each of the censuses during this century except in 1901. And this excess is fairly significant in 1921, 1931 and 1951.
Summary.*-Census figures relating to migrants are based on information collected in respect of the place of birth of the persons enumerated. No doubt, this method of equating birth-place with migration -statistics is not entirely satisfactory. Further, even the census figures thus obtained in respect of emigrantsas distinguished from immigrants-are incoilllplete because they do not cover the persons born in Hyderabad State who are residing in foreign countries. And again, the 1951 figures regarding immigrants or emigrants are not strictly comparable with the figures of the earlier censuses because of certain procedural changes. At the earlier censuses, all persons who were away from the state where they were born during the particular census day or night, as the case may be, were treated as migrants. But during this census only those per$ons who were away from their state of birth throughout the specified enumeration period of 20 ·days were treated as such. This change has, however, considerably minimised the degree of exaggeration hitherto present in the census data pertaining to migrants. In spite of all these drawbacks, census statistics relating to migrants do not prevent a fairly satisfactory assessment of the general trend in the movement of population, from and into this state, during the last half a century.
The number of i'lnmigrants in this state from all areas beyond it was about 4.1 lakhs in 1951, which is by far the highest figure recorded during this century. Analysedsexwise, this heavy increase results mainly from an inordinate increase in the number of female immigrants. During the last fifty years, they have increased by over 40 per cent as against the corresponding increase of only 8 per cent recorded by male immigrants. In 1951, females constituted 55 per cent of the immigrants. Analysed from the point of view of the place of birth, the heavy increase is entirely due to the intensification of the movement from the adjoining states. The number of immigrants from these states has increased from about 2.6 lakhs in 1901 to 3.4 lakhs in 1951. As against this, the number of immigrants from non-adjacent parts of India has moved up haltingly from about 0.5 lakhs to only 0.6 lakhs and of those from beyond the country has actually decreased from about 13,000 to 9,500. The striking increases in the numbers of female immigrants and of those who have immigrated from the adjacent states make it clear that the major factor now influencing the movement is intermarriages between person's living on either sides of the borders of this state. In 1951, as many as 32 per cent of the immigrants were from Madras. 31 from Bombay and 20 from Madhya Pradesh. Of the remaining 17 per cent, about 4 were from Rajasthan, 3 from Uttar Pradesh. 2 from Mysore and about 6 from the rest of the country. Only about 2- per cent of them were from, foreign countries. The number of Madras immigrants, which had been increasing consistently since 1901, declined in 1951-the decline being appreciable enough to make the number slightly lower than what it was even in 1931. Butin 1951, the percentage of females among the immigrants was 50, the highest recorded during the current century. In fact, female immigrants from Madras were more numerous in 1951 than at any of the preceding censuses during the last fi,'e decades. The number of Bombay immigrants, after declining very steeply during the first two decades of this century, has been in,crea'ling since then, the increase recorded during the last two decades being particularly heavy. Their numher in 1951, although appreciably higher than at the intervening censuses, was still markedly lower than in 1901. But again, the percentage of females among the Bombay immigrants in 1951 was as high as 66 which was by far the heaviest recorded since 1901. The actual number of females among themin 1951 was only slightly lower than in 1901. The variation in the number of Madhya Pradesh immigrants from census to census during this century has been rather erratic. But their number which had hitherto remained unimpressive from the point of view of the movement between adjoining states, increased phenomenally in 1951. The percentage of females among the Madhya Pradesh immigrants was as much as 60 in 1951, which was again appreciably higher than that recorded at any of the earlier censuses. In 1951, the overwhelming majority of the immigrants into this state from all the three adjoining states were heavily concentrated in the districts which border the respective states and in Hyderabad District. The number of these immigrants in the non-adjacent districts of this state was hardly significant, the only exception being the 7,000 Madras immigrants in Nizamabad. As against this, in the earlier censuses in general, there used to be a "'This summa ry coveN the review of the inter-district migration given in Appendix B of this Report as well.
104
very heavy concentration of Madras immigrants in Adilabad (they numbered more than half a lakh in the district in 1931) and of Bombay immigrants in Parbhani, Nanded and Adilabad (their numbers actually exceeded 23,000 in these three districts in 1911). The immigrants from Rajasthan, ettar Pradesh, Mysore and the rem·tining states of the country taken all togethE'r and from beyo, d the country, were also more lJUmer O:lS in 1951 than at any of the earlier censuse~, except that immigrants from Uttar Pradesh and from beyond the country were appreciably more in ] 901. The percentage of females among these immigrants in general has been and is relatiyely very low, a significant exception being the ::\Iysore immigrants who were almost equally spread over the two sexes in 1951. The majority of the immigrants from beyond the country were either from Pakistan or Nepal. From the proportion of f(males among the immigrants, it is obvious that at present the immigration from Bombay State is overwhelmingly and that from Madhya Pradesh very largely influenced by marital alliances. As against this, the immigration from Madras State is influenced both by marriages and economic factors in almost equal degrees, the influence of the former being appreciably more in evidence now than in the earlier ccnsmes. The immigration from both beyond the country and from the non-adjacent states within the country itself, with the exception of Mysore, is due almost entirely to reasons other than marital alliances.
Emigrants Jrorp this state to other parts oj India (excluding the French and Portuguese possessions) numbered 5.6lakhs in 1951. This is considerably more than the figure recorded at any of the previous censuses during this century. In fact, since 1931 itself their number has increased by roughly 70 per cent. Analysed sexwise, although females constituted 52 per cent of the emigrants in 1951, they have contributed compara tively less to the present heavy increase than the males. Actually, their percentage among the emigrants in 1951 was lower than in all the earlier censuses during the current century except in 1921. Analysed from the point of view of the areas to which the persons migrated, although about 96 per cent of the total emigrants were consistently returned from the adjoining states in general at all the censuses during this century, the emigration to Bombay State in particular had increased phenomenally in 1951. And the 1951 emigrants in Bombay State were well distributed among the adjoining districts and the industrial cities of the state. These factors make it obvious that the movement Jrom Hyderabad State to other areas within the country is now much less influenced by intermarriages and much more by economic factors than in the past. In 1951, as many as 63 per cent of the Hyderabad emigrants in other Indian States were in Bombay, 17 in Madhya Praiesh and 16 in Madras. The nmaining 4 per cent were spread over the rest of the states>" the percentage in Mysore being slightly more and that in Uttar Pradesh less than 1. The numberof emigrants to Bombay State, which had been varying between 1.2 and 2. 2 lakhs in the earlier censuses during this century, shot up to S.5 lakhs in 1951. The percentage of females among them was only 50 in 1951, which is appreciably less than the corresponding . " ·fed at the earlier censuses. About 60 per cent of these emigrants were returned from the· this state, over 23 per cent being from Sholapur District itself, and 40 per cent from the non-adjoining districts, about 25 per cent being in Greater Bombay (i. e., Bombay City) wherein they constituted as much as 3 per cent of the total population! The emigration to the other two adjoining states of Madras and Madhya Pradesh was on a considerably smaller scale. The number of emigrants to Madras, which had been varying between 38,000 and 63,000 in the earlier censuses, rose to over 93,000 in 1951. The percentage of females among them was 52 in 1951 which is roughly the same as that recorded in the earlier censuses, except in 1921 when it was considerably lower. Roughly 90 per cent of these emigrants were in the adjoining districts, 38 per cent being in Krishna and 21 in Bellary. There has been little variation in the scale of emigration to Madhya Pradesh. The actual number which was almost 94,000 in 1951, had varied between 90,000 and 95,000 in the earlier decades of this century. But the percentage of females among them was as high as 64 in 1951, which is by far the highest recorded during the current century. The number of Hyderabad emigrants in other Indian States in 1951, though comparatively insignificant, was the heaviest recorded during the last five decades. The actual number Was about 9,500 in 1901 and over 23,000 in 1951. The increase was mostly spread over Mysore, Ajmer, West Bengal, Delhi and Assam States. The percentage of females among these emigrants continued to be very low. being only 43 in 1951. From the proportion of females, it is obvious that the emigration to Madhya Pradesh is influenced very largely by marriages and that to Madras and Bombay by both marriages and economic factors in almost equal degrees-the marriage factor slightly predominating in case of the former and economic factors in c&se of the latter. The emigration to other states of India-which is, however, not of any appreciable order-is due almost entirely to reasons other than marriages.
As regards the balance oj movement from and into this state, in 1901 the number of immigrants into this state from all areas beyond it was appreciably more than the number of Hyderabad emigrants in other parts of India. But since then, the latter have exceeded the former. From 1911 onwards, Hyderabad State is losing many more migrants to Bombay and Madhya Pradesh than what it is gaiLing from Madras and other areas beyond the state. The loss was by as much as about 1.6 lakhs in 1951. In spite of making
105
all allowances for the nwmber of Hyderabad emigrants in areas beyond the country (actual figures regarding whom are not available), it is obvious that since 1911 the natural population of this state is in excess of its enumeratea population. In other words, the rate of growth of the indigenous population is faster than what its enumeratea population figures reiJeal.
As regards immigration into this state for economic reasons, it may be observed that slightly over 40 per cent of the immigrants in this state from all areas beyond it are in Agricultural and slightly less than 60 in Non-agricultural Livelihood Classes. The predominant number of the immigrants in Agricultural Classes have moved in, directly or indirectly, because of marriages and their immigration is almost exclusively restricted to rural areas. And again, the infiltration into Agricultural Classes for economic reasons-to the extent it exists-is mostly confined to persons moviJlg infrom Madras and, to a considerably smaller extent, from Madhya Pradesh. The Madras immigrants have taken in appreciable numbers to owner cultivation and, to a considerably smaller extent, to tenant cultivation and agricultural labour in the eastern districts of the state (other than Adilabad) especially in Warangal, Nizamabad, Nalgonda and Mahbubnagar. The Madhya Pradesh immigrants have taken in some numbers to agricultural labour and, to a smaller extent,. to tenant cultivation in the extreme northern tracts of the state, especially in Adilabad District--whereill they have settled down as owner cultivators as well. The majority of the immigrants in this state in Non-agricultural Livelihood Classes have moved in because of reasons other than marriages, in other words, for economic reasons. This infiltration though marked in urban areas is fairly perceptible in some rural areas as well and is most pronounced "in case of the persons moving in from Madras State. The Madras immigrants have taken to non-agricultural occupations of various descriptions-especially those connected with the Livelihood Class of Other Services and Miscellaneous Sources-at all levels. Their infiltration is most pronounced in Hyderabad City (including all its components of Hyderabad and Secunderabad Cantonments and Municipalities), the Tungabhadra Project Camps, the mining towns of Yellandu and Kothagudem, the Hatti Gold Fields, Warangal City and Raichur Town. Though the majority of the Bombay and Madhya Pradesh immigrants even in Non-agricultural Classes have migrated as a result of marriages, the numbers from these two states who have infiltrated for economic reasons and taken to various non-agricultural oc~ cupations is fairly appreciable. These Bombay immigrants are concentrated in Hyderabad City and in the urban areas of the districts of Gulbarga, Aurangabad, Raichur, Bhir and Osmanabad which adjoin Bombay State, and Nanded Town. Similarly, the Madhya Pradesh immigrants who have infiltrated into the state in Non-agricultural Classes for economic reasons, are more or less concentrated in Hyderabad City, in Jalna. Nanded and Aurangabad Towns and in the urban areas of Adilabad and Parbhani Districts. In so far as rural areas are concerned, their infiltration is most pronounced in Adilabad and Nanded Districts. Comparatively, the Bombay immigrants are employed more at th~ higher levels and the Madhya Pradesh immigrants at the lower levels of the non-agricultural occupations followed by them. Among th~ more numerous of the immigrants from all other areas-who are largely concentrated in Hyderabad City-the Rajasthan, Saurashtra and Kutch immigrants have taken mostly to occupations connected with the Livelihood Class of Commerce; the Uttar Pradesh, Punjab, Travancore-Cochin and Delhi immigrants have taken mostly to occupations pertinent to the class of Other Services and Miscellaneous Sources; and the Mysore and Madhya. Bharat immigrants are dispersed over various non-agricultural occupations, the former being relatively concentrated in occupations pertinent to Other Services and Miscellaneous Sources and the latter in those relevant to Production (other than cultivation). Over 50 per cent of the immigrants from Pakistan (who are mainly displaced persons) have taken to commerce.
As regards the em,igrationfrom this state to other parts of the country for economic reasons, it may be observed that less than 35 per cent of the total emigrants from this state to other parts of India are in Agricultural and over 65 in Non-agricultural Classes. The movement of a decisive majority of these emigrants in Agricultural Classes is due to intermarriages. Again the infiltration into these classes for economic reasons, to the extent it exists, is mostly restricted to those who have migrated to Madras and, to a considerably smaller extent, to Bombay State and, in either case, is most pronounced in the Livelihood Class of Agricultural Labour. The chief centres attracting these emigrants are Krishna and, to a considerably smaller extent, Guntur Districts in the former and Ahmadnagar District in the latter. The majority of the emigrants from this state in other parts of the country in Non-agricultural Livelihood Classes have moved out because of reasons other than marriages, i.e., due to economic causes, and the overwhelming majority of them are in Bombay State wherein they are mostly concentrated in Greater Bombay (i.e., Bombay City), the adjoining districts--especially Sholapur-and Poona and Thana Districts. These emigrants have taken to occupations relevant to all the fuur Non-agricultural Classes, especially to those pertinent to Production (other than cultivation) and. to a lesser degree, Other Services and Miscellaneous Sources. The Hyderabad emigrants in Non-agricultural Classes in Madras State are mostly concentrated in Krishna and Bellary Districts. These emigrants in Hadras State are also spread over occupations pertinent to all the four Non-agricultural Classes, being moat
18 .
106
lmmerous in occupations relating to the Livelihood Class of Other Services and Miscellaneous Sources. The movement of Hyderabad emigrants in Non-agricultural Classes to Madhya Pradesh is, however, due more to marriages than to economic factors. In spite of this, the number of Hyderabad emigrants who have emigrated to that state for economic reasons is by no means wholly insignificant. These emigrants nave taken to occupations relevant to all the four Non-agricultural Livelihood Classes--esperially that of Production (other than cultivation) and Other Services and Miscellaneous Sources-mostly in the adjoining districts, particularly Chanda and in Nagpur, Amravati, Wardha and Nimar Districts. The emigrants in Non-agricultural Classes in the other states of India have moved out mainly because of economic factors. But their numbers are not at all significant. These emigrants have taken mostly to occupations connected with Other Services and Miscellaneous Sources and, to a considerably smaller extent, Production and are rather concentrated in Bangalore City and Davangere and Bhadravati Towns, all in Mysore State, Meerut and Lucknow Districts in Uttar Pradesh, .laipur in Rajasthan, Indor~ ~n Madhya Bharat, Ferozpore in Punjab and SinghboOlp and Manbhoom in Bih:tr, and Delhi and Calcutta CltIes.
There are appreciable variations in the districtwise pattern of immigration. Immigrants from all areas beyond the district account for slightly over 20 per cent, or one fifth of the population, in Hyderabad. About three-fourths of the population of this district resides in Hyderabad City and more than a quarter of the city's population consists of immigrants. Immigrants constitute more than 10 per cent of the population in Nizamabad and Adilabad; more than 8 in Warangal and Osmanabad; and from 5 to 8 in Nanded, Bhir, Raiclmr, Aurangabad and Parbhani. But in case of Raichur District, if the approximately 27,000 immigrants in the Tungabhadra Project Camps are ignored, the figure declines to 4. Among the other districts of the state, the percentage ranges from 2.5 to 5.0 in Medak, Gulbarga, Bidar and Mahl?ubnagar and is only 2.8 in Nal'gonda and just 1. 8 in Karimnagar. The percentage of females' among these immigrants is particularly low in Hyderabad District, being only about 47. From the point of view of the usual sex proportions among ,districtwise immigrants, the corresponding percentage is also very low in Warangal, Adilabad, Raichur and Nizamabad Districts wherein it ranges between 50 and 54. But again in Raichur, if figures pertaining to the temporary immigrants in the Tungabhadra Project Camps are ignored, the percentage increases to 61. Among the other districts of the state, the percentage ranges from 60 to 65 in ~anded, Gulbarga, M:ahbubnaO'ar, Nalgonda, Aurangabad and Parbhani; and between 65 and 70 in Karimnagar, Osmanabad. Bidar, l\re~lak and Bhir. Thus, the proportion of immigrants from all areas beyond the district to its total popUlation, is very impressive in Hyderabad; considerable in Nizamabad and Adilabad; very large in 'Varangal and 013-manabad; and fairly large in Nanded, Bhir, Raichur (including the Tungabhadra Project Camps), Aur,mgabad -and Parbhani; but it is small in Medak, Gulbarga, Bidar and l\Iahbubnagar and almost insignificant in Nalgonda and Karimnagar. And again, keeping in view the fact that an excessive proportion of females among the immigrants is indicative of the movement being influenced by marriages, it is obvious that the immigration into Hyderabad District is basically due to economic reasons; that into Warangal, Adilabad, Raichur (again, including the Tungabhadra Project Camps) and Nizamabad to both marriages and economic factors in roughly equal proportions; that into Nanded, Gulbarga, Mahbubnagar, Nalgonda, Aurangabad 'and Parbhani very largely to marriages; and, lastly, that into Karimnagar, Osmanabad, Bidar, ~Iedak and Bhir Districts due predominantly to marriages. In Hyderabad District, literally tho~sands of immigrants from Nalgonda, Medak, Karimnagar, Mahbubnagar and Bidar from within the state and. ~Iadras from beyond the state have taken to various non-agricultural occupations. The corresponding numbers in the district from Gulbarga and Madhya Pradesh are also very appreciable; and that from practicallY all the remaining distri.cts of the state, especially Warang~l and .Nizamabad, and from the ~tatefl of Bombay, Uttar Pradesh, RaJasthan, Mysore, Travancore-Cochm, PunJab and S,aurashtra-especIalIy Bombay-are fairly appreciable. Besides, a number of immigrants from Nalgonda and, to a smaller extent, Mahbubnagar Districts have also taken to agricultural occupations in the rural areas of the district. Similarly, in Waranf'al District, thousands of immigrants from Karimnagar and Madras, very appreciable numbers from N algOI~da and fairly appreciable numbers from Hyderabad and, to a smaller extent, Uttar Pradesh have infiltrated into non-agricultural occupations. In addition to these, very appreciable numbers from Karimnagar, Nalgonda and Madras have taken to agriculmral occupations within its limits. In Nizamabad District, very appreciable numbers of Karimnagar, fairly appreciable numbers of Medak. Nanded and Hyderabad and, to a smaller extent, Bidar and Madras immigrants are employed in non-agricultural occupations. Further, veryappreciable numbers of Karimnagar and Nanded immigrants and fairly appreciable number.s of Madras, Medak and, to a smaller extent, Bidar and Nalgonda immigrants have infiltrated into agricultural occupations within the distrIct, especially in its canal zones. In Adilabad District, thousands -of Karimnagar immigrants and appreciable numbers of Madhya Pradesh, Hyderabad, Nizamabad, Mahbubnagar, Warangal, Nanded and Madras immigrants are engaged in non-agricultural and very appreciable numbers of Karimnagar and Madhya Pradesh immigrants and fairly appreciable numbers of Nanded immigrants in agricultural occupations. In Raichur District, very appreciable numbers of Madras and Mahbubnagar
1S·
107
immigrants, fairly appreciablc llumbcrs of Hyderabad, Bombay and Gulbarga immigrants and l\Iysore immigrants in some numbers hayc taken to non-agricultural occupations, mostly in connection with the construction of the Tungabhadra Project. Similarly. appreciable numbers of Bombay, ~Iadhya Pradesh, Parbhani. Hyderabac1 and Bhir immigrants in Aurangabad District. almost exclusively in Aurangabad and Jalna Towns; and of Parbhani. Madh~'a Pradesh, Nizamabad. Karimnagar, Bidar, Hyderabad and Medak inllnigrant-; in Nanded District--especi,ally in Nanded Town-have infiltrated into various non-agricultural occupations. Appreciable numbers of Bidar. Bhir and Bombay immigrants in Osmanabad District; appreciable nmnbers of Madhya Pradesh. Aurangabad. -Rhir and, to a smaller extent, Nanded immigrants and Hyderabad tond Karimnagar immigrants in some numbers in Parbhani District; and appreciable numbers of Gulbarga and some numbers of Hyderabad immigrants in Bidar District. are employed in non-agricultural professions. In Bhir District, appreciable numbers of Bombay, Parbhani, Aurangabad and Osmanabad immigrants have taken to non-agricultural occupations and a similar number of Bidar immigrants to agricultural occupations. Similarly, appreciable numbers of Bombay, Bidar, Mahbubnagar, Hyderabad and Raichur immigrants and some significant numbers of Madras immigrants in Gulbarga District; and appreciable numbers of Hyder:>..bad" Nalgonda and Karimnagar immigrants in Medak District, Madras, Hyderabad and Uttar Pradesh immigrants in Nalgonda District, Hyderabad. Madras and Gulbarga immigrants in Mahbubnagar District and Hyderabad immigrants in Karimnagar District have taken to non-agricultural occupations. In addition to tJlese, fairly appreciable numbers of Madras immigrants haye infiltrated into agricultural occupations in both Nalgonda and Mahbubnagar Districts. These represent almost all the significant cases o]'infiltration into the various districts of the state for economic reasons. The numbers involved in the other cases are either insignificant or the proportion of females among the immigrants is sufficiently high to warrant the presumption that their migration is due predominantly to marriages. The available figures pertaining to districtwise emigrants cover only emigrants from each district of the state to other areas within the state itself. They do not take into account the emigrants from these districts' both to other states within the country and to areas beyond it. The numbers of the former are bound to be appreciable in case of the border districts. But of those of the latter are equally certain to be insignificant except in case of Hyderabad District. Anyway, the available figures indicate that the number of emigrants from these districts to other parts of the state exceeds 1.5 lakhs in case of Karimnagar; 1.0 lakhs in case of Nalgonda; 75,000 in case of Medak and Bidar; 50,000 in case of Mahbubnagar, Hyderabad and Nanded; 25,000 in case of Parbhani, Bhir, Gulbarga, Nizamabad, Warangal and Osmanabad; and 15,000 in case of Raichur and Aurangabad and is 15,000 in case of Adilabad. The percentage of females among these emigrants ranges only between 50 and 55 in case of Raichur, Hyderabad, Karimnagar and Mahbubnagar; between 55 and 60 in case of Nalgonda, Medak, Bidar, Gulbarga and Aurangabad; between 60 and 65 in case of Nizamabad, N anded, Warangal, Adilabad and Parbhani; and between 65 and 70 in case of Bhir and Osmanabad. The figures pertaining to, these interdistrict emigrants and the percentage of females among them make it obvious that Karimnagar amI. to a smaller extent, Nalgonda. Medak and Bidar are the chief reserYoirs for the supply of man-power to other areas within the state. It will be obvious from the above that the balance of the movement of populft~ioll is by no means uniform in respect of all the districts of the state. On the basis of (a) the figures pertaining to the number of immigrants in each district from all areas beyond it, (b) the number of emigrants from the district to other areas within the state itself and (c) the dispersal of the emigrants from this state as a whole in the adjoining states and in the districts bordering the respective districts of this state, it can safely b~ pl~esumed that while, on the one hand, Karimnagar and Nalgonda Districts lose very heavily, Medak, Bidar, Mahbubnagar, Bhir, and Osmanabad Districts lose heavilY, Aurangabad, GUlbarga and Parbhani Districts lose appreciably, on the other Hyderabad District gains very heavily and Adilabad, Nizamabad and Warangal Districts gain, more or less, heavily by the movement of population. As against this, the loss or gain, accruing to Raichur and Nanded Districts due to the same reason is not at all significant. In other words, the natural populations of the districts of Karimnagar and Nalgonda are remarkablY more" those of Medak, Bidar, Mahbubuagar, Bhir and O,manabad considerably more and those of Aurangabad, Gulbarga, and Parbhani appreciably more than their respective enumerated populations. The difference between the two is not very significant 'in case of Raichur and Nanded Dirtricts. But the natural popula.tions of Adilabad, Nizamabad and W;rangal Districts are considerably less and that of Hyderabad District remarkably less than their respective enumerated populations.
SECTION V
BIRTHS AND DEATHS
168. Registration of Births and Deaths.-The importance of vital statistics in any study <>f Public Health or demog:.;aphic problems can hardly be exaggerated. But in respect ·of the collection of such statistics Hyderabad State is placed very unfortunately. It cannot be compared with states like Madras, Bombay and Madhya Pradesh, wherein the registration of births and deaths, though imperfect, is yet reasonably statisfactory. Neither can it be compared with other Indian States like Madhya Bharat, Vindhya Pradesh and Rajasthan . which make no pretence whatsoever about the collection and publication of such data. The Public Health Department of this state has been publishing, year in and year out, in its annual reports, figures relating to births and deaths for the whole of the state, invariably characterising the data so furnished as incomplete and unreliable. These figures were collected through the police patels in non-municipal areas and municipal authorities in municipal areas. Even in normal years the coverage remained far from being complete, not only in respect of individual births or deaths but even in respect of entire villages or sometimes even tahsils-especially those situated in the former feudatory estates. But during the months prior to and following the Police Action in September, 1948, when conditions were particularly disturbed in the state, entire districts remained uncovered. From the Administration Report of the Public Health Department for the year 1950-51, it is evident that the draft Act for the compulsory registration of births and deaths in this state, which seems to have been first submitted to Government as late as in 1929, was passed by it during the year under review. The same report adds that the department has taken up the question of framing the rules for the enforcement of the Act. It is hoped that atleast at the next cen<;us, the census authorities will have the advantage of reasonably satisfactory vital statistics and would thus be in a position to present a complete picture of the demographic conditions prevailing in the state.
169. According to the figures supplied by the Public Health Department, during the ,decade 1941-50, births numbered 12 lakhs and deaths 11 lakhs in this ::;tate. rhe fragmentary nature of these figures would be obvious from the fact that Madras State; wher~in the registration of births and deaths is supposed to be reasonably satisfactory, recorded ,during the same period 164 lakh births and 110 lakh deaths. The population of Madras is roughly thrice that of Hyderabad. But the number of registered births and deaths in that state is roughly fourteen and ten times more respectively than in this state. * The corresponding figures relating to the previous decades for this state are equally fragmentary and unreliable. In view of all this, the Registrar General, India, considers that the figures supplied by the Public Health Department of this state are too defective to be worth compiling. In fairness to the Public Health Authorities, however, it must be stated that they have made it absolutely clear in each one of their reports that the figures are of no statistical value. I
170. Factors influencing Birth Rates in Hyderabad State.-In this state, the birth rate-·i.e., the number of live births in a year per 1,000 of the total population-during the
*Again, Hyderabad State's population increased by over 20 lakhs during 1941-51, in spite of a net loss exceeding a lakh and a 'half by the movement of population. But the excess of registered births over deaths covered less than even one tenth of this ancrease'
108
109
current century has been mainly influenced by changes in the marital habits of the people,. their economic condition and the state of public health. In so far as the marital habits of the people are concerned, the popularity of child marriages seems to he waning considerably. This is especially true of the decade 1941-51. But atthe same time, marriages, which were almost universal in the higher age groups in the earlier decades, seem to be even more so now. Again, as a natural corollary to the raising of the age of marriage~ the proportion of widows in the reproductive ages has decreased significantly. As the limitation of the size of the family by planning was almost unknown in the earlier decades and is even now restricted only to an insignificant minority in the bigger of the urban units, it can safely be assumed that the marked increase in the age of marriage must have by itself led to an appreciable reduction in the number of births. But this fall must have been offset to an extent by a decrease in the proportion of widows in the reproductive ages. The greater' universality' of marriage obviously also tends to increase the birth rate. But as the number of unmarried females in the higher age groups in this state, inspite of its variations, has always remained negligible, this factor by itself is not likely to have had any significant effect. Thus, on the whole, changes in the marital habits of the people during the recent decades must have led to an appreciable reduction in birth rates.
An overwhelming majority of the people in the state are dependent on agriculture, or on activities (Jirectly catering to the needs of agriculturists. Thus, the economic position of the state is largely reflected by the prevailing agricultural conditions. As stated in ~ection III of Chapler V, good crops lead to greater number of marriages, or consummation of marriages, and better nutrition of the people and, therefore, to more children. This is nothing peculiar to Hyderabad or India. This is probably true of many countries in the World. Gille in his" The Demographic History of the Northern European Countries in the Eighteenth Century" referring to Sweden, states that" the excess of births over deaths in years after crop failure was only 2.0 per 1,000 on the average but 6.5 per 1,000 after years with medium harvests and 8.4 per 1,000 after years with good harvests". Sweden then must have been as much of an agricultural country as this state is now. There is also no doubt that personal hygiene and environmental sanitation have improved gradually in the state during the recent decades. Due to this, and to the greater appreciation of modern curative and preventive meth(,ds, small-pox, malaria and other fevers, venereal diseases, tuberculosis, etc., must be causing much less havoc now than in the eaI:lier decades. This iinprovemen~ subjef·t to {,ther factors. is condu"ive to an increase in the' numberof live births. Again, in the earlier decades the outbreak of epidemics, from time to time, ltd to considerable fluctuations in birth rates. During the period an epidemic was actually rampant, the number of live births decreased and those of miscarriages and still births increased. But once the epidemic subsided a contradictory trend set in. The more virulent of these epidemics took a comparatively heavy toll of the very young and the very old and left a relatively heavy proportion of virile population in the reproductive ages. Thus, during the years following the outbreaks of epidemics (or famines which were oft-en the cause for such epidemics) the proportion of infants and children to the total population increased very substantially. But during the recent years, especially since 1921, epidemics (and famines), which are n)w being_more expeditiously controlled and localised than in the earlier years, have lo<t much of their capacity to create violent fluctuations in birth rates as well as death rates.
171. Figures for all censuses since 1911 pertaining to the percentage variation of (i) femaleS', (ii) married females in the reproductive age group of' 15 to 45', (iii) married
14
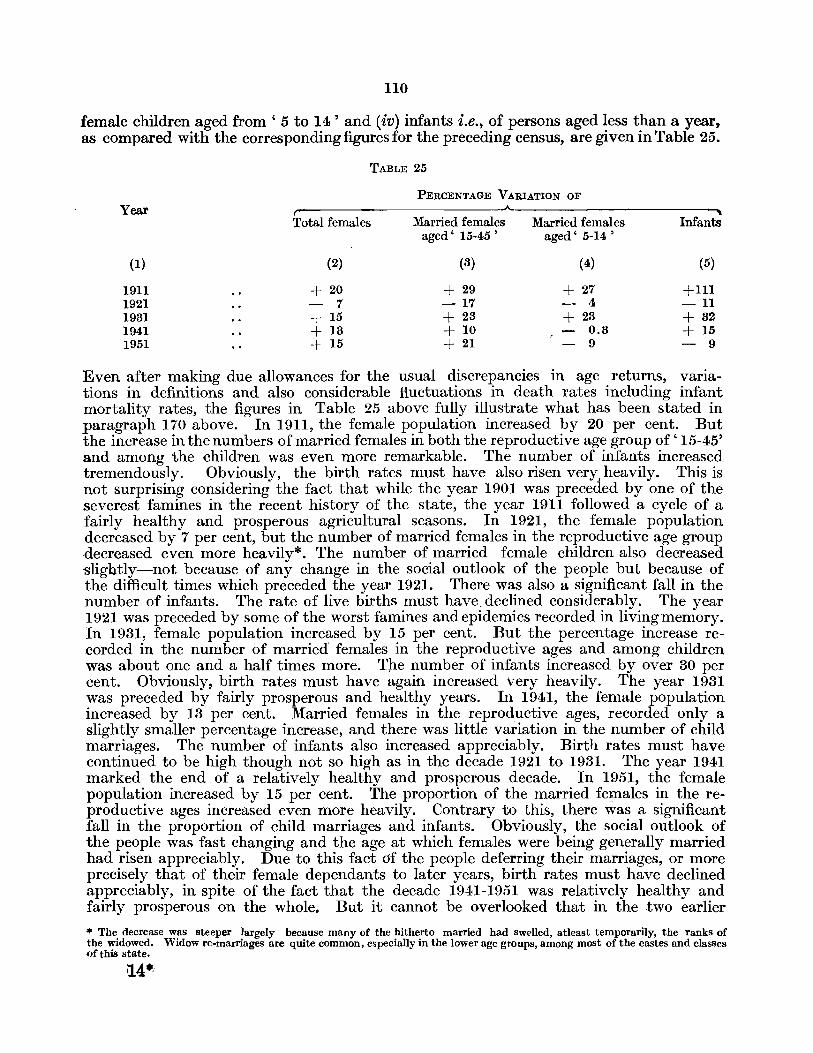
110
female children aged from' 5 to 14' and (iv) infants i.e., of persons aged less than a year, as compared with the corresponding figures for the preceding census, are given in Table 25.
Year
(1)
1911 1921 1931 1941 1951
TABLE 25
PERCENTAGE VARlATION OF ..A.
Total females Married females Married females aged' 15-45 ' aged' 5-14'
(2) (3) (4)
+ 20 + 29 + 27 - 7 -17 - 4 + 15 + 23 + 23 + 13 + 10 0.3 + 15 + 21 - 9
Infants
(5)
+111 -11 + 32 + 15 - 9
Even after making due allowances for the usual discrepancies in age returns, varIations in definitions and also considerable fluctuations in death rates including infant mortality rates, the figures in Table 25 above fully illustrate what has been stated in paragraph 170 above. In 1911, the female population increased by 20 per cent. But the increase in the numbers of married females in both the reproductive age group of' 15-45' and among the children was even more remarkable. The number of infants increased tremendously. Obviously, the birth rates must have also risen very, heavily. This is not surprising considering the fact that while the year 1901 was preceded by one of the severest famines in the recent history of the state, the year 1911 followed a cycle of a fairly healthy and prosperous agricultural seasons. In 1921, the female population decreased by 7 per cent, but the number of married females in the reproductive age group decreased even more heavily*. The number of married female children also decreased slightly-not because of any change in the social outlook of the people but because of the difficult times which preceded the year 1921. There was also a significant fall in the number of infants. The rate of live births must have. declined considerably. The year 1921 was preceded by some of the worst famines and epidemics recorded in living memory. In 1931, female population increased by 15 per cent. But the percentage increase re.corded in the number of married' females in the reproductive ages and among children was about one and a half times more. The number of infants increased by over 30 per cent. Obviously, birth rates must have again increased very heavily. The year 1931 was preceded by fairly prosperous and healthy years. In 1941, the female population increased by 13 per cent. Married females in the reproductive ages, recorded only a slightly smaller percentage increase, and there was little variation in the number of child marriages. The number of infants also increased appreciably. Birth rates must have continued to be high though not so high as in the decade 1921 to 1931. The year 1941 marked the end of a relatively healthy and prosperous decade. In 1951, the female population increased by 15 per cent. The proportion of the married fe~ales in the reproductive ages increased even more heavily. Contrary to this, there was a significant fall in the proportion of child marriages and infants. Obviously, the social outlook of the people was fast changing and the age at which females were being generally married had risen appreciably. Due to this fact of the people deferring their marriages, or more precisely that of their female dependants to later years, birth rates must have declined .appreciably, in spite of the fact that the decade 1941-1951 was relatively healthy and fairly prosperous on the whole. But it cannot be overlooked that in the two earlier
* The decrease was steeper largely because many of the hitherto married had swelled, atleast temporarily, the ranks of the widowed. Widow re-marriages are quite common, especially in the lower age groups, among most of the castes and classes of this state.
114·'
III
decades, especially during 1921-1931, birth rates and consequently the number of surviving infants were abnormally high- due, as stated earlier, to the fact that the calamities of the 1911-'21 decade had deplenished the numbers especially of the very young and the very aged and had left a relatively heavy proportion of the population in the reproductive ages. And again, it is also certain that because of the upheavals in the normal tenor of life caused by the events which preceded and followed the Police Action in September 1948, birth, rates must have declined appreciably in 1949, 1950 and 1951 as well.
172. Present Birth Rate in Hyderabad State and likely Trend in Future.-The census returns pertaining to age indicate that in this state the proportion of infants, i.e., of those who had not completed a year on the 1st of March, 1951, was 25 per 1,000 persons of the total population. But this proportion is bound to be considerably less than the actual birth rate (i.e., the number of live births in a year per 1,000 of the population) during the year ending on 1st of March, 1951 because of the following reasons:-
, (i) The figure does not take into account the number of those infants who were born on or after the 1st of March, 1950, but who died before the 1st of March 1951. The number of such infants is bound to have been appreciable. During recent years, infant mortality rates (i.e., deaths of infants under one year of age per 1,000 live births) have varied in the registration areas of India from 169 in 1944 to 123 in 1949. But due to the higher proportion of child marriages, greater backwardness of the population both in respect of literacy and appreciation of modern medical methods, and the more limited medical facilities in this state than in the country as a whole, there is EVery reason to presume that infant mortality rates in this state would be appreciably heavier than the figures quoted above.
• (ii) The census returns for infants is appreciably underestimated because of the incorrect recording of age and, to a considerably smaller extent, due to the actual omission of infants from the census count. As explained elsewhere, the overwhelming majority of the people in this state are ignorant of their own precise age or that of their dependants. Consequently, the proportion of children actually 10 or 11 months old. or even younger but who were returned as having completed a year, is bound to have been appreciable. As against this, the number of children aged one year or over who were returned as infants, i.e., less than a year old, is not likely to have been significant. Again, the Sample Verification of the 1951 Census count has proved that although the deg'ree of under-eriumeration in the total enumerated household population is insignificant and ranges only between 0.30 and 0.77 per cent, that among infants and young children is not altogether negligible*.
(iii) Lastly, birth rates must have declined temporarily in the state during the years 1949 and 1950. During the months immediately preceding the Police Action in September 1948, the normal tenor of life among the Hindus, who constitute over 86 per cent of the total population of the state, had been considerably upset. Agriculture, trade and industry which chiefly sustained them had been dislocated. In fact, lakhs of Hindus, drawn not only from the educated and the politically conscious groups but even from among the unlettered peasantry had migrated to areas beyond the state. Among
* Out of the 90 ca~es of clear omissions detected during the course of the sample verification of the 1951 Census Count in a sample population of 15,423 there were 7 infants i,e., tho~e aged below 1 year, 9 aged 1 ye.lr,6 aged 2 years, 2 aged 3 years, 4 aged 4 years, 29 aged 5-14 years, 32 aged 15 years and over, and] whose age was not stated. As against this, out of the 20 cases of fictitious entries, there was none pertaining to infants Dr to those aged 1 year, there wa~ only one aged 2 years, () aged 5-14 years, and 10 aged 15 years and over.
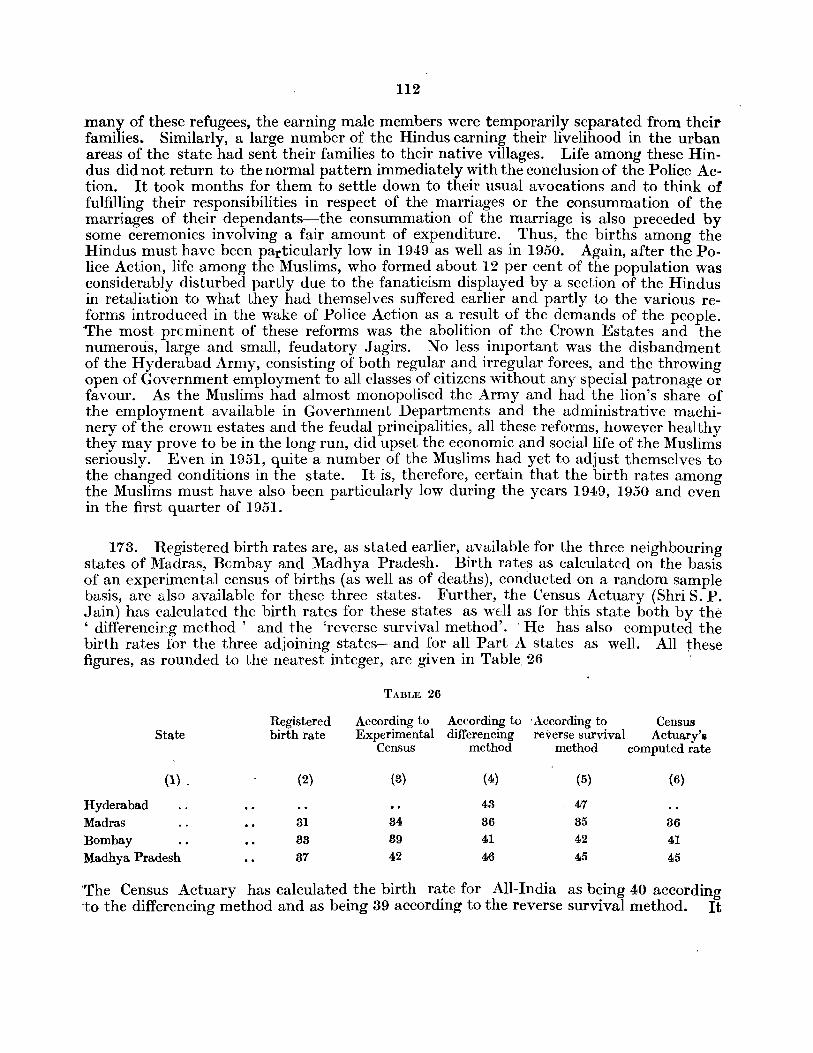
112
many of these refugees, the earning male members were temporarily separated from their families. Similarly, a large number of the Hindus earning their livelihood in the urban areas of the state had sent their families to their native villages. Life among these Hindus did not return to the normal pattern immediately with the conclusion of the Police Action. It took months for them to settle down to their usual avocations and to think of fulfilling their responsibilities in respect of the marriages or the consummation of the marriages of their dependants-the consummation of the marriage is also preceded by some ceremonies involving a fair amount of expenditure. Thus, the births among the Hindus must have been particularly low in 1949 as well as in 1950. Again, after the Police Action, life among the Muslims, who formed about 12 per cent of the population was considerably disturbed partly due to the fanaticism displayed by a section of the Hindus in retaliation to what they had themselves suffered earlier and partly to the various reforms introduced in the wake of Police Action as a result of the demands of the people. The most prcminent of these reforms was the abolition of the Crown Estates and the numerous, large and small, feudatory Jagirs. No less important was the disbandment of the Ryderabad Army, consisting of both regular and irregular forces, and the throwing open of Government employment to all classes of citizens without any special patronage or favour. As the Muslims had almost monopolised the Army and had the lion's share of the employment available in Government Departments and the administrative machinery of the crown estates and the feudal principalities, all these reforms, however healthy they may prove to be in the long run, did upset the economic and social life of the Muslims seriously. Even in 1951, quite a number of the Muslims had yet to adjust themselves to the changed conditions in the state. It is, therefore, certain that the birth rates among the Muslims must have also been particularly low during the years 1949, 1950 and cven in the first quarter of 1951.
173. Registered birth rates are, as stated earlier, available for the three neighbouring ·states of Madras, Bombay and Madhya Pradesh. Birth rates as calculated on the basis of an experimental census of births (as well as of deaths), conducted on a random sample basis, are also available for these three states. Further, the Census Actuary (Shri S. P. Jain) has calculated the birth rates for these states as wtll as for this state both by the , differencing method' and the 'reverse survival method'. . He has also computed the birth rates for the three adjoining states-and for all Part A states as well. All these figures, as rounded to the nearest integer, are given in Table. 26
TABLE 26
Registered According to According to . According to Census State birth rate Experimental differencing reverse survival Actuary'.
Census method method computed rate
(1) . (2) (3) (4) (5) (6)
Hyderabad 43 47 Madras 31 34 36 35 36 Bombay 33 39 41 42 41 Madhya Pradesh 37 42 46 45 45
'The Census Actuary has calculated the birth rate for All-India as being 40 according to the differencing method and as being 39 according to the reverse survival method. It
118
would be interesting to compare with these figures the crude rates for some other countries as given in the United Nations Statistical Year Book of 1952. According to this pubJication, the birth rate was 16 in United Kingdom and 27 in Yugoslavia; 25 in United States and 52 in Guatemala; 48 in Mauritius which is largely inhabited by Indians and 26 for the European population in the Union of South Africa; 24 in Lebanon and 44 in Malaya; and 38 in Fiji Islands which have again a large concentration of Indians, 23 in Australia and 28 in Hawaii. From the above it will be obvious that, in spite of its decline during the last two decades, the birth rate in this state continues to be high as compared with most countries in the world and even many states within India itself. It has been observed by many demographers that birth rates are considerably lower in the industrially developed than in the under-developed countries, among the urban than in the rural areas, and among the European population or population of European descent than among the coloured or mixed people. It has also been noticed that generally in areas where birth rates are low, the marriage age is relatively high and marriages are comparatively less 'universal'. In this context, it may be observed that Hyderabad State is now being urbanised at an accentuated rate. It is also being gradually industrialised. The age of marriage, especially among the females, in the state has already risen appreciably and is still rising. There is also no doubt that, under the present concept of a welfare -state, considerable progress will be recorded during the coming years in respect of the educational advanctment of the people. Consequently, the coming years will witness a keen struggle for increasin g the standards of life. This will in turn lead to an appreciable number of people attempting to limit the size of their families by planning and perhaps to quite a few preferring to stay unmarried. Because of all these trends the birth rate is bound to decline appreciably in the future. But this does not automatically mean that the rate of growth will also be decelerated. The fall in birth rates may perhaps be neutralised by a more striking fall in mortality rates, especially those relating to infants. Be-sides, a lower proportion of the widows may itself arrest, tJ an extent, the decline in birth rates due to other reasons.
174. Present Death Rate in Hyderabd State and likely Trend in Future.-As stated ea,"lier, registration of vital statistics is, and has been, very faulty in the state. The death rates calculated on the basis of these statistics do not even correctly indicate the trend in mortality from decade to decade. It is, however, obvious that violent fluctuation ,in death rates resulting from the outbreak of epidemics and famines from time to time IS a thing of the past. The state has progressed considerably since 1903-1904, when an outbreak of plague claimed about 70,000 victims, or since 1918-1919 when a devastating influenza epidemic took a toll of about three and a half lakhs of lives. Due to increased transport and communication facilities, the advancement of medical science, the greater appreciation of modern preventive and curative methods on the part of the people, fuller realisation of their duties and responsibilities towards the citizens as against the privileged few on the part of the Public Health and other Government Organisation and their increased resources, etc., outbreaks of epidemics and famines are now more expeditiously localised and controlled than in the past. Apart from the elimination of these violent fluctuations, there is, however, no doubt that death rates must have declined due to the gradual, though imperceptible, improvement recorded during the last few decades in respect of environmental sanitation, personal hygiene, pre-natal care, development of medical service both on the curative and preventive sides, labour and social welfare enactments, age of marriage, disappearance of many harmful superstitions and beliefs and standard of life of the average citizen. But this does not imply that we have by any means attained a satisfactory standard with regard to these matters.
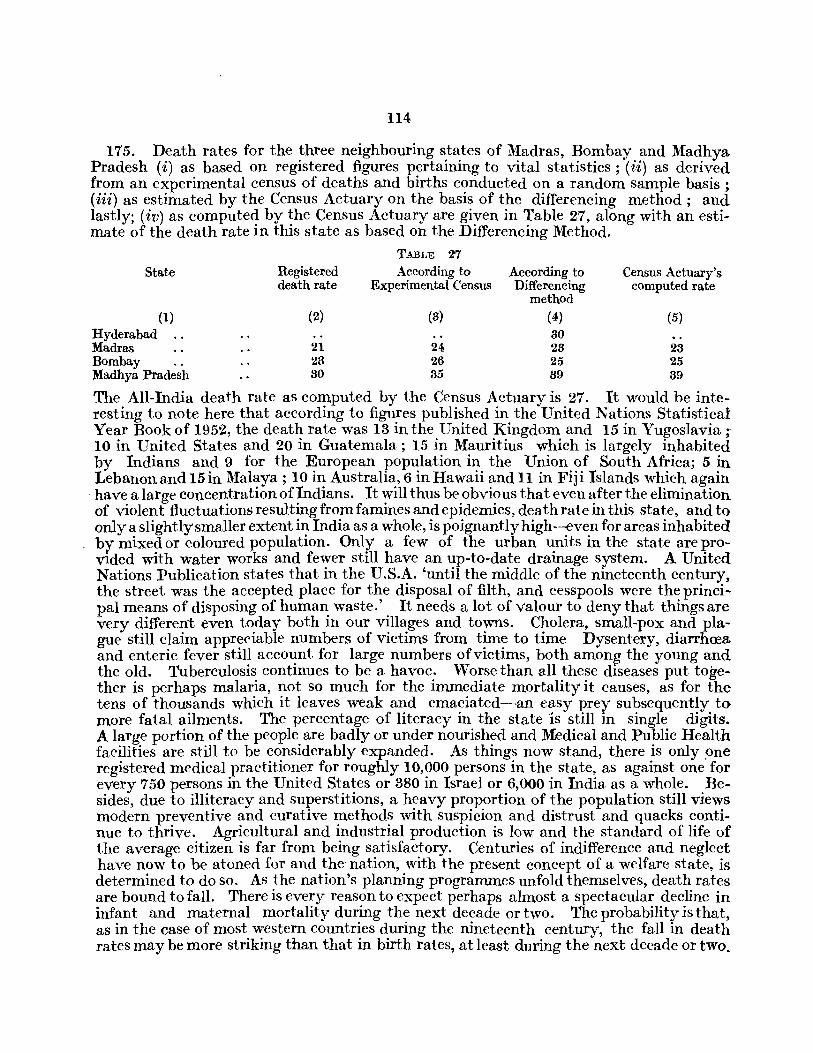
114
175. Death rates for the three neighbouring states of Madras, Bombay and Madhya Pradesh (i) as based on registered figures pertaining to vital statistics; (ii) as derived from an experimental census of deaths and births conducted on a random sample basis; (iii) as estimated by the Census Actuary on the basis of the differencing method; and lastly; (iv) as computed by the Census Actuary are given in Table 27, along with an estimate of the death rate in this state as based on the Differencing Method.
State Registered death rate
TABLE 27 According to
Experimental Census According to Differencing
method
Census Actuary's computed rate
(1) (2) (8) (4) (5) Hyderabad .. 80 Madras 21 24 28 23 Bombay 28 26 25 25 Madhya Pradesh 30 35 39 89
The All-India death rate as computed by the Census Actuary is 27. It would be interesting to note here that according to figures published in the United Nations Statistical Year Book of 1952, the death rate was 13 in the United Kingdom and 15 in Yugoslavia; 10 in United States and 20 in Guatemala; 15 in Mauritius which is largely inhabited by Indians and 9 for the European population in the Union of South Africa; 5 in Lebanon and 15 in Malaya; 10 in Australia, 6 in Hawaii and 11 in Fiji Islands which again
. have a large concentration of Indians. It will thus be obvious that even after the elimination of violent fluctuations resulting from famines and epidenUcs, death rate in this state, and to only a slightly smaller extent in India as a whole, is poignantly high--even for areas inhabited by mixed or coloured popUlation. Only a few of the urban units in the state are provided with water works and fewer still have an up-to-date drainage system. A United Nations Publication states that in the U.S.A. 'untn the middle of the nineteenth century, the street was the accepted place for the disposal of filth, and cesspools were the principal means of disposing of human waste.' It needs a lot of valour to deny that things are very different even today both in our villages and towns. Cholera, small-pox and plague still claim appreciable numbers of victims from time to time Dysentery, diarrhrea and enteric fever still account for large numbers of victims, both among the young and the old. Tuberculosis continues to be a havoc. Worse than all these diseases put together is perhaps malaria, not so much for the immediate mortality it causes, as for the tens of thousands which it leaves weak and emaciated--an easy prey subsequently to more fatal ailments. The percentage of literacy in the state is still in single digits. A large portion of the people are badly or under nourished and Medical and Public Health facilities are still to be considerably expanded. As things now stand, there is only ~)fle registered medical practitioner for roughly 10,000 persons in the state, as against one for every 750 persons in the United States or 380 in Israel or 6,000 in India as a whole. Besides, due to illiteracy and superstitions, a heavy proportion of the popUlation still views modern preventive and curative methods with suspicion and distrust and quacks continue to thrive. Agricultural and industrial production is low and the standard of life of the average citizen is far from being satisfactory. Centuries of indifference and neglect have now to be atoned for and the' nation, with the present concept of a welfare state, is determined to do so. As the nation's planning progranunes unfold themselves, death rates are bound to fall. There is every reason to expect perhaps almost a spectacular decline in infant and maternal mortality during the next decade or two. The probability is that, as in the case of most western countries during the nineteenth century, the fall in death rates may be more striking than that in birth rates, at least during the next decade or two.
115
Summary.-The figures available in this state regarding births and deaths are very incomplete and do not permit of any statistical anaylsis. ,There can, however, be no doubt that during the current century, the birth rate in this state has been influenced mainly by changes in the marital habits of the people and their economic condition and public health. As regards marital habits, the popularity of child marriages has waned considerably, especially during the decade 1941-51. This is bound to have led to a significant decline in birth rate. It is also equally certain that the decline would have been steeper but for a simultaneous decrease in the proportion of the widowed and unmarried among the females in the higher reproductive ages. As regards economic conditions, it is a well recognised fact that in all predominantly agricultural areas, the economic prosperity of the people is primarily dependent on good crops. Good crops lead to better nutrition of the people and generally to more money at their disposal for fulfilling their obligations to society, one of the Iftost important of which still continues to be the marriage of the dependants. Bad crops lead to exactly opposite results. Thus, the birth rate in this state has been, and is still, considerably influenced, subject to other factors, by agricultural seasons. As regards public health, in the earlier decades of this century, conditions used to deteriorate considerably, from time to time, due to the outbreak of epidemics or famines which often led. to the former. During their currency still births and miscarriages increased and live births decreased and the very young and the infirm lost considerably more in numbers than the virile population in the reproductive ages. Thus, the greater the severity of epidemics and famines the wider used to be the margin between the low birth rate during their currency and high birth rate thereafter. During the recent decades, however, famines and epidemics, are being more easily controlled and have, consequently lost much of their capacity to create violent fluctuations in birth rate. Again, during this century, especially since 1921, almost consistent, though not spectacular, improvement is being recorded in respect of personal hygiene and environmental sanitation and availability and appreciation of modern medical facilities. This must have by itself arrested, but only to an extent, the decline in birth rates due to other reasons.
The 1951 Census indicated that 25, out of every 1,000 persons in this state, were infants i.e., aged less than a year. This establishes that the crude birth rate, i.e., the, number of live births per 1,000 persons, could not have been lower than 25 in 1950-51. On the contrary, it ,is bound to have been considerablv more because the census returns exclude the infants who though born'in the twelve months preceding the reference date for the census were dead by that date. Again, considering the infant mortality rates in the registration areas of this country, such infants may number even more than one sixth of those surviving. And again, due to the general inability, or indifference of the people to remember the dates of birth, either of themselves or of their dependants, many infants aged from about to to 11 months must have been returned as being a year old. Again, the Sample Verification of the 1951 CE'nsus Count, indieatE'd that though the extent of the overall under-enumeration in the count was negligible, it was relatively most pronounced among infants and children aged from 1 to 3 years. Apart from these factors, the birth rate even in 1950-51 must have continued to be temporarily low because of the repercussions of the unsettled conditions which prevailed in the state for quite a period prior to and following the Police Action. As regards the future trend of birth rates. it may be pbserved that the state is now WE'll set towards urbanisation, industrialisation, spread of education and rise of the age of marriage, in respect of all which it is just now particularly backward. Judged from the results of the corresponding progress in the more advanced countries of the world, it is certain that the birth rate in Hyderabad State is also bound to decline considerably in the coming decades in spite of its arrest to an extent, from a decline in still birth ratios and miscarriages consequent on an equally marked progress in respect of personal hygiene, environmental sanitation and medical facilities, etc.
The death rate is also bound to have declined considerably in the state, especially since 1921, largely because of the fact that famines and epidemics are being now more easily controlled and localised and not allowed to run their natural courSe as in the earlier decades. Apart from this, as already stated, there has been almost consistent, though not spectacular, improvement in respect of environmental sanitation, personal hygiene, development and appreciation of medical science both on the preventive and curative sides, age of marriage, disappearance of many harmful superstitions, labour and social welfare enactments and standard of life of the average citizen, which must have also led to a significant decline in the d~ath rate. The Census Actuary has computed the death rate for the three adjoining states of Madras, Bombay and Madhya Pradesh as being 23,25 and 39 respectively. The corresponding rate for Hyderabad State would roughly be ranging within these limits, though it is not likely to be relatively as low as in Madras or Bombay. Thus, the death rate in this state in spite of the decline in recent decades is piognantly higher than in most countries of the world. As regards its future trend, it may be observed that this state is, notwithstanding all the progress hitherto made, still very backward in respect of factors such as personal hygiene, environmental sanitation, pre-natal care, the availability and appreciation of modern medical and public health facilities, general education and the standard of life. Tens of thousands still die from epidemics and to a greater extent from ,diseases like malaria, tuberculosis, dysentery, diarrhoea, enteric fever, etc. As the nation's planning programmes unfold themselves, death rates are bound to decline. It is likely that the decline may be more striking than the decrease in birth rates at least during the next decade or two.
SECTION VI
L1VELIHOOD PATTERN
(The tables relevant to this Section are Main Table' E-SummaTY Figures by Districts and Tahsils ' given at prr/J.e 211 of Part ll-A (pld Sutsidiary 7 ables' 1.8-Livelihood Pattern of Gent'ral Population' , '1.8-A- Tahsilwise Di~tribulion per 1.000 PersoT18 of General Populatiull according to AgricultUial and Non-Agricultural Classes', '2.4-Livelihood Pattern of Rural Population', '2. 4-A-Tahsilwise Distribution per 1,000 Persons of Rural Population according to Agricultural and Non-Agricultural Cla.~8es', , 3.6-Number per 1,000 of the General PopUlation and of each Livelihood Class who lil:e in Towns', and '3.7- Livelihood Pattern oj Urban Population' given at pages 53, 54, 61, 62, 70 and 71 nspectively oj PaTt I-B oj this Volume.)
176. Nature of Enquiry and Limitations.-During the present census, the enumerators had been directed to ascertain and record the principal means of livelihood of each and every person enumerated by them. For this purpose, the principal means of livelihood, in case of a self-supporting person *, was deemed to be the particular livelihood which provided the person with all or the greater part of his income; and, in ca')e of a dependant*, whether earning or non-earning, it was assumed to be the same as that of the self-supporting person on whom he was dependent, partly or wholly, as the case may be. The livelihood by means 'of which an earning dependant, irrespective of the degree of his dependance, derived his income was treated only as his secondary or subsidiary means of livelihood. In other words, the occupation through which a self-supporting person derived his income (in case he had only one means of livelihood) or the major portion of his income (in case he had more than one means of livelihood) was treated not only as his principal means of livelihood but as also that of all persons dependent on him, partly or wholly.
177. Subsequently, in the Census Tabulation Office, each person enumerated in the state was classified, under one or the other of the eight livelihood classes indicated below on the basis of his, or her, principal means of livelihood.
Agricultural Classes. I. Cultivators of land, wholly or mainly owned; and their dependants.
II. Cultivators of land, wholly or mainly unowned; and their dependants. III. Cultivating labourers and their dependants. IV. Non-cultivating owners of land; agricultural rent receivers; and their depen
dants.
N on-Agricullural Classes. V. Persons (including dependants) who derived their principal means oflivelihood
from Production (other than cultivation). VI. Persons (including dependants) who derived their principal means of livelihood
from Conunerce. VII. Persons (including dependants) who derived their principal means of liveli-
hood from Transport. ~
VIII. Persons (including dependants) who derived their principal means of livelihood from Other Services and Miscellaneous Sources .
• SeJf-8Upport~ persons or their dependants, whether earning or non-earning, covered both males and females.
116
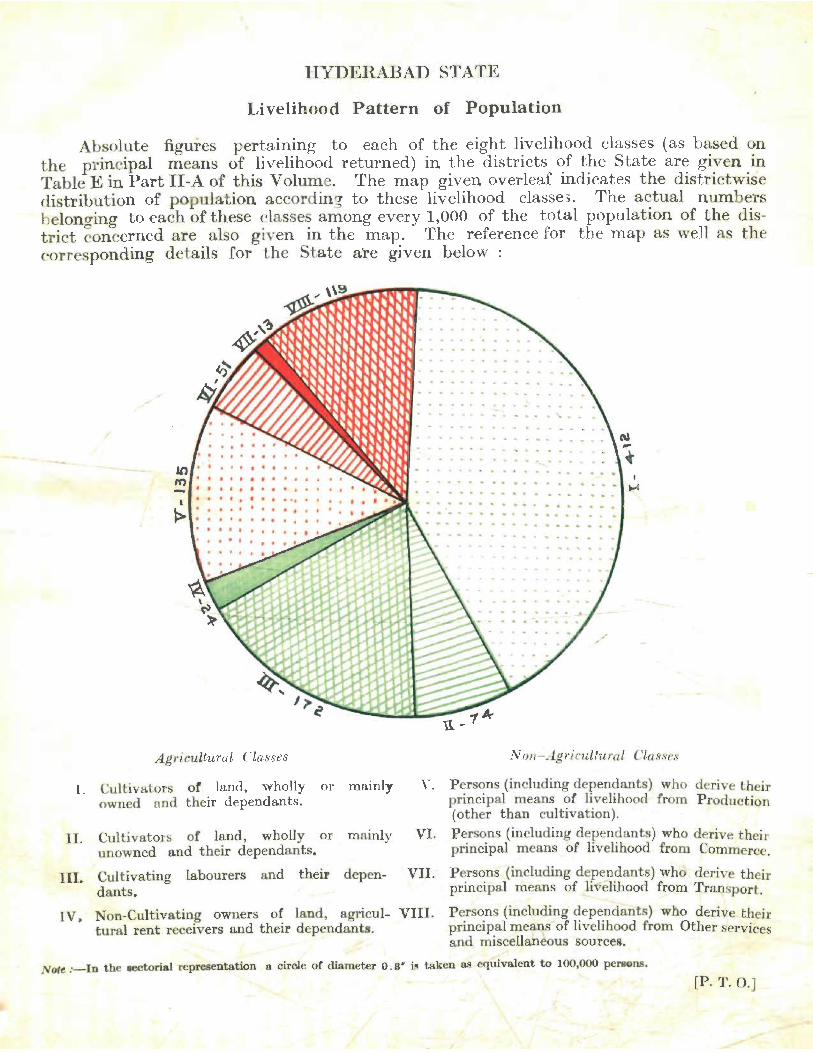
HYDERABAD STATE
Livelihood Pattern of Population
Absolute figures pertaining to each of the eight livelihood classes (as based on the principal means of livelihood returned) in the districts of the State are given in Table E in Part II -A of this Volume. The map given overleaf indicates the districtwise distribution of population according to these livelihood classe~. The actual numbers belonO'ing to each of these classes among every 1,000 of the total population of the district ~oncerned are also given in the map. The reference for the map as well as the eorresponding details for the State are given below :-
· .. . . .. · . . . ... • • .. f •• . .. .. . . . ..
Agricultural Classes
I. Cultivators of lanrl, wholly owned and their dependa.nts.
or mainly
II. Cultivators of land, wholly or unowned a.nd their dependants.
III. Cultivating labourers and theu. dants.
mainly
depen-
.. .. ... .. .. .. .. .. - .. .. .. ... ......
... .. .. .. .. .. .. .... ..... .. .. ..
.. .. .. .. '"'.. .. .....
~ .. .. .. .. ... .. .. .. .. ... .. ... .. .. ... .. .. ..
-~"--"" ....... -- .. - ... .. .. .. .. .. .. .. ... ... .. .. .. .. ..... .. ... . . .. .. .. .. .. .. .. .... .... .. .. .. .. .. .. .. .. ... .. .. ... .. .. .. . """ .. .. .... . " .. .. .. .. .. ... .. .. . .. .. .. - ..
.. ... .. '"' .. .. .... ~ . .. .. .. .... ... ... .. ... .. .. .. .. .. ..
.........................
N () II-rig ri cultttral Classes
V. Persons (including dependants) who derive their
VI.
VII.
principal means of livelihood from Production (other than cultivation). Persons (including dependants) who derive their principal means of livelihood from Commerce.
Persons (including dependants) who derive their principal means of liv elihood from Transport.
IV» Non-Cultivating owners of land, agricul- VIII. tura.l rent receivers and their dependants.
Persons (including dependants) who derive their principal means of livelihood from Other services and miscellaneous sources.
Note :-In the lectorial representation a circle or diameter 0.8* it'! taken as equivalent to 100,000 pelliOns.
[Po T. 0. ]
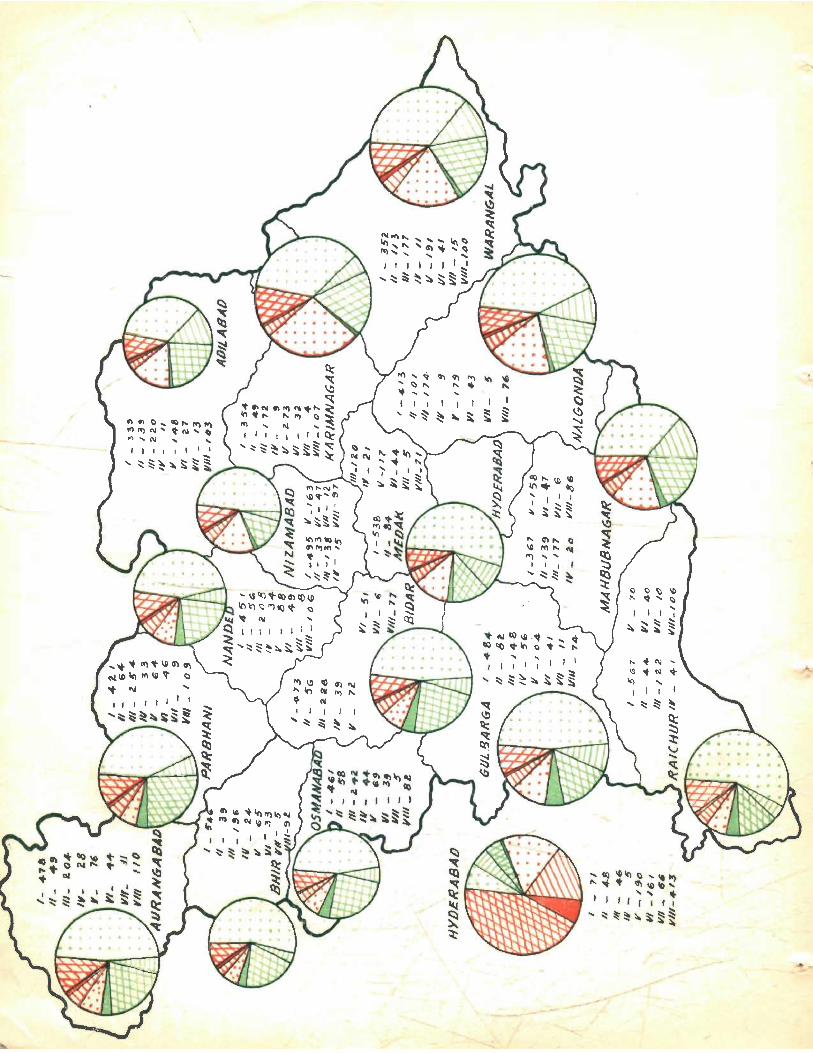

119 _
The principles governing the grouping of the various occupations under one M the other .of these eight livelihood classes have been explained in detail in paragraphs 5 to 9 of this ,Chapter.
178. There are, however, certain limitations to the census data relating to the number of persons belonging to different livelihood classes. These limitations arise partly from the mixed economy prevalent in the state, especially in its rural areas, and partly because ·of certain social traits of the people. It is common in most of the villages for cobblers, barbers, washermen, potters, shepherds, or even carpenters or weavers, to be agricultural labourers. Many of such persons are also owner or tenant cultivators or, in a few cases, absentee landlords. Sometimes, an infirm landlord or a widowed landlady with minor children, finding it difficult to 1J.ndertake the responsibility of cultivating their own lands, may lease them out and supplemC'nt their income, whenever possible, by the less responsible occupation of agricultural labour. Almost invariably the village officers or servants are also owner or, sometimes, tenant cultivators. It is not strange for some of thcm to be absentee landlords as well--atleast in respect of portions of their hmds. Similarly, in urban areas it is not uncommon for the same person to be a trader in respect of some commodities and a manufacturer in respect of c~rtain others. Quite a few government servants, lawyers, doctors, etc., may be supplementing their income, or even be obtaining the major portion of it, through agricultural or building rents, interest from shares and bank deposits, etc. In short, a very large number of persons owe their sustenance to the total income from two or even more distinct means of livelihood. In many of such cases it is genuinely difficult to specify precisely the livelihood through which the persons derive the largest portion of their income.
170. Again, quite a number of the persons having more than one occupation deliberately record as their principal means of livelihood the particular occupation which confers on them a higher status in society and not the one from which they derive the largest portion of their income. A simple illustration of this is that of a pcrson who is primarily an agricultural labourer or a cobbler returning himself as a tenant or an owner cultivator, although the income which he derives from the former occupation is his major source of sustenance. And again, due to the traditions of the joint family system, many a son or a grandson, who is earning-more than is _ strictly necessary for his own maintenance, prefers to be treated only as an earning dependant being partly dependent on the head of the household. Such an attitude is in keeping with the deference due to the paterfamilias. In such of these cases where the occupations of the son or the grandson, as the case may be, and that of the head of the household are not idcnti·cal, and pertain to different livelihood classes, the subsequent classification of the son or the grandson, and of all persons dependant on them, would be erroneous for the simple reason that their principal means of livelihood was not accurately returned. Similarl y, many actually self-supporting females prefer to be treated as earning dependants because of the not very uncommon feeling that a wife ought really to be dependant on her husband. 'The subsequent classification of such females according to one or the other of the eight categories of principal means of livelihood would also be wrong in cases where their occupation and that of their respective husbands pertain to different livelihood categories.
180. Even ignoring all the limitations indicated in paragraphs 178 and 179 above, the basic fa.ct remains that, due to the very mixed economy prevailing in the country, figures relating to each of the eight livelihood classes, as based on the classification of the persons from the point of view of only their principal source of sustenance would
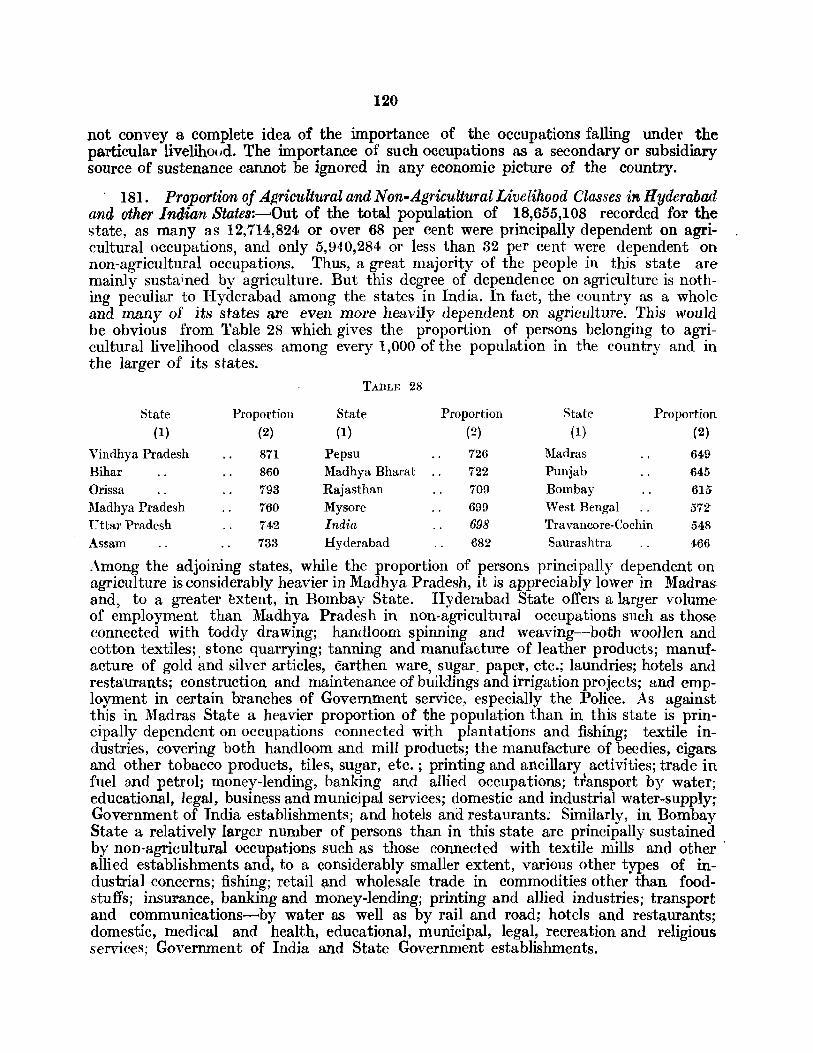
120
not convey a complete idea of the importance of the occupations falling under the particular livelihoud. The importance of such occupations as a secondary or subsidiary source of sustenance cannot be ignored in any economic picture of the country .
. 181. Proportion oj ApriculturalandNon-AgriculturalLivelihood Classes i'1£Hyderabad and other Indian State8:~Out of the total population of 18,655,108 recorded for the state, as many as 12,714,824 or over 68 per cent were principally dependent on agricultural occupations, and only 5,940,284 or less than 32 per cent were dependent on non-agricultural occupations. Thus, a great majority of the people in this state are mainly sustained by agriculture. But this degree of dependence on agriculture is nothing peculiar to Hyderabad among the states in India. In fact, the country as a whole and many of its states are even more heavily dependent on agriculture. This would be obvious from Table 28 which gives the proportion of persons belonging to agricultural livelihood classes among every 1,000 of the population in the country and in the larger of its states.
State (1)
State (1)
Proportion (2)
121
182. Proportion of Persons belonging to each of the different Livelihood Classes in Hyderabad and the other Tndian States.-Among every 1.000 of the population of this state, 412 persons are principally susbined by owner cultivation. 'Ihis is much more than double the corresponding proportion for an)' of the other livelihood classes. But the proportion is even higher in most of the larger of the other Indian States. It is as much as 626 in Vindhya Pradesh,' 623 in Uttar Pradesh, 595 in Orissa, 579 in Assam, 555 in Mysore, 553 in Bihar, 504 in Madhaya Bharat, 495 in Madhya Pradesh, 483 in Pepsu and 433 in Rajasthan. It is, however, only 407 in Bombay, 386 in Punjab, 349 in Madras, 328 in Saurashtra, 323 in West Bengal and as low as 263 in Travancore-Cochin. The proportion in India is 469. Thus, though persons principally sustained by owner cultivation are numerically by far the most important of the livelihood classes in this state, their position is considerably stronger in the country as a whole.
183. Only 74 persons out of every 1,000 in this state are, mainly or wholly, dependent on tenant cultivation. The corresponding proportion in IndIa as a whole is slightly more, being 89. Among the bigger of the Indian States, their highest proportion is 229 in Rajasthan and their lowest is 45 in the adjoining state of Madhya Pradesh. Their proportion is 161 in Punjab, 128 in Assam, 120 in West Bengal, 116 in Pepsu, 102 in Madhya Bharat, 97 in Bombay, 96 in Madras, 83 in Bihar and Saurashtra, which is all higher than in this state. But their proportion is only 71 in Travancore-Cochin, 64 in Vindhya Pradesh, 59 in Orissa, 52 in Uttar Pradesh and 48 in Mysore, which is all lower than in this state. Thus, the proportion of persons mainly or wholly dependent on tenant cultivation to the total population IS not very striking either in this state or even in the country as a whole.
184. 172, among every 1,000 persons in the state, are principally dependent on agricultural labour. Thus, as a principal means of livelihood agricultural labour is second only in importance to owner cultivation. But as a secondary means of livelihood it is even far more important than owner cultivation. As will be seen subsequently, an overwhelming majority of the earning dependants in this state derive their earnings through agricultural labour. Similarly, an appreciable portion of the self-supporting persons, who supplement the income they obtain from their main profession, owe their supplementary income to agricultural labour. In other words, the primary distinction Qf th~ population, especially in the rural areas, between agricultural and non-agricultural £lasses under the census system, or as a matter of fact under any system of classification, is likely to minimise considerably the importance of agricultural lahour in its over-all capacity for, the sustenance of the people.
The proportion of persons principally sustained by agriculturallabour is 219 in Bihar, 204 in Madhya Pradesh, 202 in Travancore-Cochin, 182 in Madras and 176 in Vindhya Pradesh. These are the only Indian States in which persons principally dependent on agricultural labour are relatively more numerous than in this state. Among the other Indian States the proportion is as low as 123 both in Orissa and West Bengal, 107 in Madhya Bharat, 103inPepsu, 91 in Bombay, 77 in Punjab, 68 in Mysore, 57in Uttar Pradesh, 38 in Saurashtra, 31 in Rajasthan and only 17 in Assam. The proportion in the country as a whole is just 126. Thus, proportionately this livelihood class is considerably' more numerous in Hyderabad State than in most of the Indian States or in the country as a whole.
185. Persons mainly or exclusively dependent on agricultural rent number only 24 out of every 1,000 in this state. But it may be pointed out here that all persons who have .been returned under this livelihood class do not necessarily conform to the proverbial representation
122
of the absentee landlords as living in luxury on the sweat of the poor tenants. In fact, a very heavy proportion of this livelihood class consists of widows of owner cultivators--or sometimes of infirm or decrepit land owners themselves-who do not have grown up sons,and being themselves incapable of undertaking the responsibility of cultivating their lands, lease them out to others. This is borne out by the consistently heavy proportion of fema.les in this livelihood cla.ss in all the districts. * Quite a few of these persons are so poor that they are compelled to resort to the less onerous work of agricultural or other labour with a view to supplement the income they derive by leasing out their lands. This.livelihood class also includes many_smaH pattedars who, being unable to secure even the meagre capital required for cultivating their lands, lease them out. The majority of such persons also take to agricultural labour, or other available occupations, WIth a view to augment their earnings from their leased holdings. As against this, the Livelihood Class of Absentee Landlords excludes many of the big landlords who have leased out considerable areas. Quite a number of these persons, especIally those belonging to purely cultivating castes or classes, themselves cultivate the more fertile, or the more conveniently located portions of their lands and return theIr principal means of livelihood as owner cultivation; and similarly quite a number, especi~ly those who do not belong to purely cultivating castes or classes record non-agricultural occupations~ particularly commerce, as their principal source of sustenance.
Apart from the group similarly dependent on transport, this is the least numerou! of the livelihood classes in the state. The proportion of this class among every 1,000 of the population is 29 in Mysore, 23 in Pepsu, 22 in Madras, 21 in Punjab, 20 in Bombay, 18 in Saurashtra, 16 in both Madhya Pradesh and Rajasthan, 15 in Orissa, 12 in Travancore-Eochin, 11 in Uttar Pradesh, 9 both in Assam and Madhya Bharat, 6 in Bihar and West Bengal and only 5 in Vindhya Pradesh as against 15 in the country as a whole. Thus, the proportion of persons mainly or exclusively sustained by agricultural rent in this state, though insignificant, is very high as compared with other indian States. Only Mysore, among all the Indian States, has a slightly larger proportion.
186. The proportion of persons whose principal means of livelihood is production (other than cultivation) among every 1,000 of the population is 185 in this state. This class is third in the state from the point of view of its numerical strength-the first two being the Livelihood Classes of Owner Cultivators and Agricultural Labourers-and is appreciably more numerous in this state than in the country as a whole or in most of its larger units. This would be obvious from the fact that only in the states of Travan.:. core-Cochin, Saurashtra, West Bengal, Assam and Bombay, the corresponding proportion is higher than in this state being 212, 180, 154, 147 and 138 respectively. In the remaining of the larger Indian States it is significantly lower, being 124 in Madras, 106 in Madhya Pradesh, 102 in Mysore, 100 in Madhya Bharat, 89 in Rajasthan, 84 in Uttar Pradesh, 73 both in Punjab and Pepsu, 63 in Orissa, 46 in Vindhya Pradesh and only 39 in Bihar. The proportion in the country as a whole is 106. The higher proportion in HyderalJad State is not so much due to large scale industries as to primary and cottage industries and to toddy drawing which has also been included among the occupations relevant to this livelihood class. .
There can. however, be no doubt that the numerical strength of the livelihood class in this state, as well as in the rest of tl. e country, would have been significantly more but for the return of numerous village artisans like gold and silversmiths, carpenters, blacksmiths, potters and more especially basket and mat weavers, tanners and cobblers and makers of other leatherarticles, as being primarily agriculturists. ~ Vide Sublidiary Table 11.40 at page 182 of Pan I-B of this Volume.
123
187. 51 persons out of every 1,000 in the state are principally dependent on Commerce. The proportion in the country as a whole is slightly more, being 60. The corresponding proportion is 107 in Saurashtra, 93 in West Bengal, 91 in Punjab, 76 both in Bombay and Pepsu, 68 in Travancore-Cochin, 67 in Madras, 66 in Rajasthan and 56 both in Madhya Bharat and Mysore. As against these, it is only 50 in Uttar Pradesh, 44 in Madhya Pradesh, 39 in Assam, 34 in Bihar, 29 in Orissa and only 28 in Vindhya Pradesh. Thus, the proportion of persons principally dependent on Commerce, is not very impressive in the country as a whole and is even less so in this state. It is, howevel', pertinent to recall here that all persons who returned their principal means of livelihood as the production-cumsale of Gny commodity or arliel:: were, treafed as belonging to the Livelihood Class of Production and not of Commerce. The number of such producers-cum-sellers is very large especially in the rural areas of this country.
188. The proportion of persons wholly or mainly sustained by Transport - among every 1,000 of the population of this state is only 13. This is the least numerous
of the livelihood classes in the state. The corresponding proportion recorded in the country as a whole is also as low as 16, the highest being only 40 in Pepsu and the lowest being just 4 in Vindhya Pradesh. Among the larger of the Indian States the proportion is 34 in Travancore-Cochin, 30 in West Bengal, 26 in Saurashtra, 22 in Bombay, 17 in Madras, 15 in Madhya Pradesh, 14 in Uttar Pradesh, 13 in Assam, 12 in Mysore, 11 in Madhya Bharat, 10 in Punjab, 9 in Rajasthan, 7 in Bihar and 5 in Orissa. It is thus obvious that relatively the proportion of persons principally dependent on transport is insignificant in India and even more so in this state;
The almost microscopic proportion of this livelihood class in Hyderabad State is. not at all surprising. The state is still very poor in rail and road transport. The length of the roads and railways for every 100 square miles of its area works out to less than 7 and 2 miles respectively. There is only one licenced motor vehicle in the state for approximately every 1,400 of its inhabitants. It would be interesting to note here that in an advanced country like the United Kingdom the corresponding mileages are as high as 208 and 21 respectively, and there is one licenced motor vehicle for roughly every 22 of its population. Besides, Hyderabad is neither a coastal state nor can its rivers be deemed to be fit for navigation even for country craft, except perhaps for a few miles of the Godavari in an extremely backward tract in the south-eastern corner of the state. Air transport in the state is in its very initial stages of development. There is onlv'one aerodrome in the state-located in Hyderabad City-catering to civil passengers and the number of such passengers is still so meagre that travel by air continues to be regarded as a novelty by many even among the sophisticated inhabitants of the metropolis.
No doubt, according to the Indian Census Economic Classification Scheme adopted for the 1951 Census, drivers, cleaners, etc., attached to private motor and other vehicles were treated as domestic servants. And, all categories of domestic servants have been thrown under the Livelihood Class of Other Services and Miscellaneous Sources. Again, employees such as fitters, mechanics, workshop personnel, etc., pertaining to public transport organisations-including the Railway and Road Transport Departments, from which the livelihood class derives its largest numbers-have also, perhaps very justifiably, been treated as belonging to the Livelihood Class of Production. Further dl persons connected with the letting of vehicles without supplying the personnel for their running, like the owners and employees of cycle taxi shops, have been treated as belonging to the Livelihood Class of Commerce. But even if the benfit of t,he numbers
15
124
J>ertaining to all these categories of persons (inc1uding their dependants) were given to the Livelihood Class of Transport, its over-all proportion to the total population of the state would not increase to any significant extent.
189. Among every 1,000 persons in the state, 119 are principally dependent on Other Services and Miscellaneous Sources. Thus, in order of numerical importance, this residuary class is the fourth in this state. The corresponding proportion in the country as a whole is almost identical, being 121. Among the larger of the other states in India, it varies from 221 in Saurashtra to 51 in Vindhya Pradesh. It is 180 in Punjab, 151 in West Bengal, 149 in Bombay, 143 in l'fadras, 138 in Travancore-Cochin. 131 in .M:ysore and 127 in Rajasthan, which is all higher than in this state. But against these, it is only III in Madhya Bharat, no in Uttar Pradesh, 109 in Orissa, 85 in Pepsu, 75 in Madhya Pradesh, 68 in Assam and 59 in Bihar.
This class has also suffered numerically as quite a large number oj village officers and .servaJlts, barters, washermen, scavengers, etc., in rural areas have returned agriculture as .their principal means oj livelihood.
190. Districtwise Variation in the Proportion oj Agricultural and Non-Agricultural Livelihood Classes.- Within the state itself, the proportion of persons principally sustained by agriculture is distinctly higher in the western, i.e., the Marathi and the Kannada districts of the state, than in the eastern i.e., the Telugu districts. The actual proportion among the western districts is 805 both in Bhir and Osmanabad, 795 in Bidar, 774 in Raichur, 772 in Parbhani, 770 in Gulbarga, 758 in Aurangabad and 749 in Nanded, and among the eastern 763 in Medak and only 709 in Adilabad, 704 in Mahbubnagar, 697 in Nalgonda, 681 in Nizamabad, 653 in Warangal, 584 in Karimnagar and as low as 170 in Hyderabad. The proportion in Hyderabad District, even after excluding the figures pertaining to Hyderabad City and its submban units*, remains as low as 609. Thus, the proportion in only l\Iedak District in the eastern half of the state is comparable with that in the western districts. As will be seen subsequently, the relatively high proportion even in Medak District is due entirely to its western tahsils adjoining the western half of the state. The markedly higher proportion of agricultural classes, or conversely the markedly lower proportion of non-agricultmal classes, in the western than in eastern dis-tricts is due to the reasons given below. '
(a) The proportion of the net area under cultivation to the total district area is considerably heavier in the western than in the eastern districts. It exceeds 70 per cent in Raichur and Gulbarga and ranges from 56 to 66 'in case of Bidar, Nanded, Parbhani, Osmanabad, Aurangabad and Bhir. As against this, it is only about 23 per cent in Warangal, about 28 in Hyderabad and Adilabad and varies from about 35 to 42 in case of Nizamabad, Karinmagar, Nalgonda, Medak and l\Iahbubnagart. Besides, the soil as a whole is considerably more fertile in the western than in the eastern districts. Thus, proportionately a larger number of persons can be sustained by agriculture in the western than in the eastern half of the state. The advantages accruing to the western
*All the other urban units of Hydembad District-vide pages 62 to 65 of part II-A of this Volume-excluding the towns of Shahabad. Ibrahimpatnam, ShlUllfihabad and Medchal, have been treated as the suburban areas of Hyderabad City for purposes of this Section.
tThese percentages are based on the district areas as supplied by the Settlement Department and the net area under cul~ tivation for the year 1951-52 as supplied by the Statistics Department.
15*
125
districts in this respect would have been considerably more but for their comparatively limited resources in respect of irrigation '*'.
(b) As against this, the forest wealth of the state is heavily concentrated in the eastern districts, particularly along the Penganga, the Wardha, the Pranahita and the Godavari, to the extreme east of the state. Due to this, there is considerably greater scope in the eastern than in the western districts for the employment of people by the exploitation of forest produce and the subsidiary industries connected with it.
( c) The eastern districts are also richer in fisheries than the western because of their relatively heavy rainfall, numerous tanks and greater length of perennial rivers and streams. About 15,000 self-supporting persons returned their principal means of livelihood as fishing in the former as against only about 2,000 in the latter.
(d) The mines and quarries of the state are concentrated in its eastern half, except for the stone quarries in Gulbarga and the gold mines in Raichur. But while the gold mines in Raichur employ only about 1,000 persons, the coal-fields of Warangal and Adilabad employ about 17,000 persons.
(e) The eastern districts are richer in livestock wealth. Among these districts, excluding Hyderabad, for every 1,000 of the population there are 687 heads of cattle and 492 sheep and goats, while the corresponding figures for the western districts are only 651 and 284 respectively. The greater wealth in respect of sheep and goats permits the eastern districts to maintain a particularly large number of persons as shepherds and as weavers of woollen goods.
(f) The eastern districts are considerably richer in cottage and rural industries and artisan trades both in respect of their volume and variety. By far the most important of the cottage industries in the state is handloom weaving. Of the 1,82,000 handlooms in the state-excluding those in Banswada Tahsil of Nizamabad District in the eastern half-I8 per cent are in Karimnagar, 18 in Nalgonda, 11 in Mahbubnagar, 10 in Medak, 7 in Warangal, 5 in Nizamabad (excluding those in Banswada Tahsil) and 2 in Adilabad and 1 in Hyderabad. As against this, among the western districts the percentage isI5 in Gulbarga and 6 in Raichur. It is only 4 in Bidar, 2 each in Parbhani, Nanded and Aurangabad and 1 each in Bhir and Osmanabad. Similarly, village crafts like the making of leather products, earthenware, brassware, iron implements, rope, tobacco products, gold and silver articles, baskets and broomsticks, etc., are considerably more in evidence in the eastern than in the western half of the state. Thus, literally thousands more are sustained by cdttage industries in the former than in the latter areas of the state.
(g) The eastern districts have almost a total monopoly of sendhi and toddy trees in the state. Of the 57,874 self-supporting persons in the state who returned toddy drawing as their profession as many as 54,967 were in the eastern districts. This number excludes the self-supporting persons principally dependent on the selling of toddy.
(h) The location of the capital of the state in the eastern half is yet another important factor leading to its relatively high proportion of persons principally dependent on non-agricultural occupations. The capital, namely Hyderabad City, accounts for about one-third of the total urban population of the state. The industrial, commercial,
*Amongthe western districts, the percenta,!!e of the net cultivated area (1951-52) under irrigation to the district area (as supplied by Settlement Commissioner of the state) was below 1 in Raichur, Nanded and Parbhani, ranged between 1 and 2 in Bidar, Gulbarga and Aurangabad and between 2 and 3 in Bhir and Osmanabad. Contrary to this in the case of the eastern districts, the percentage waS slightly above 1 in Adilabad, slightly less than 4 in Mahbubnagar, ranged between 5 and 6 in Warangal, Nalgonda and Hyderabad, was slightly more than 7 in Karimnagar and 8 in l\1edak and was almost 16 in Nizamabad.
126
,administrative, educational, cultural and various types of non-agricultural activities in the state are heavily centered in the city. 'this city by itself accounts for as much as 351 25,23 and 8 per cent of the total number of persons in the state belonging to the Livelihood Classes of Transport, Other Services and Miscellaneous Sources, Commerce and Production respectively, although it contains only about 6 per cent of the state's population. The percentages will be appreciably higher if figures pertaining to the suburban units of the metropolis are also taken into account.
191. (i) Among all the seventy four tahsils in the eight western districts of the state, the proportion of persons principally dependent on agriculture for every 1,0000f the population is not very impressive (i.e., it is below 800) only in the case of the following 29tahsils:-
(a) Alampur in Raichur District; Kodangal and Seram in Gulbarga District; and Deglur and Mukhed in N anded District.
(b) Aurangabad, Jalna and Khuldabad in Aurangabad District; Parbhani, Pathri, Hingoli and Basmath in Parbhani District; Nanded in Nanded District; Bhir and Mominabad in Bhir District; Latur and Osmanabad in Osmanabad District; Bidar, Humnabad and Udgir in Bidar District; Gulbarga and Chitapur in Gulbarga District; and Koppal and Gangawati in Raichur District; and
(c) Yadgir and Tandur in Gulbarga District; Raichur and Gadwal in Raichur District; and Mudhol in N anded District.
All the five tahsils mentioned at (a), other than Mukhed, have a heavy proportion of Telugu mother-tongue speakers and are situated along the borders of the Telugu, i.e., the eastern districts and, like them, are relatively rich in cottage and primary industries. Mukhed Tahsil, which adjoins Deglur, also resembles the Telugu areas in this respect, although it is a purely Marathi tract. This explains the low proportion of agricultural -classes in these tahsils. All the nineteen tahsils mentioned at (b) other than Khuldabad, have a large urban population which, as is often the case, is overwhelmingly non-agricultural in composition. Besides, among these tahsils, in the case of three, namely Koppal and, to a considerably smaller extent, Gangawati and Bhir Tahsils, the nonagricultural population has been further augmented temporarily because of the construction of the Tungabhadra and the Bendsura Projects; in case of two others, namely Aurangabad and Bidar, the popUlation living in suburban villages around Aurangabad and Bidar Towns is appreciably urbanised in character; and in case of yet another tahsil, namely Chitapur, a fairly large number of persons in its rural areas are engaged in the quarrying of stones. Khuldabad Tahsil, however, does not contain any large town. But the important town of Aurangabad is situated only a few miles from its borders. Many families in this tahsil derive their subsistence from occupations in this town. Besides, because Df the historical importance of Khuldabad and the well-known darghas within the tahsil, a heavy proportion of its population is made up of Muslims, who are generally more inclined to take to non-agricultural than agricultural occupations. These factors explain the low proportion of agricultural classes in these nineteen tahsils. All the five tahsils mentioned at (c), are subject to both the major influences which are at work in the case of the other two sets of tahsils. In other words, they are relatively rich in cottage and primary industries and als,o contain a fairly heavy urban population which is predominantly non-agricultural. These five tahsils also lie along the borders of the eastern districts and have a heavy proportion of Telugu mother-tongue speakers.
But even among all the twenty nine tahsils mentioned above, agricultural classes account for a majority of the population. In fact, their percentage to the total population
127
exceeds 60 in all these tahsils except Aurangabad, Nanded, Gulbarga, Raichur and Koppal-each of the first four of these tahsils contains an urban unit inhabited by over 50,000 persons and in the fifth one the Tungabhadra Project Camps themselves account for about 30,000 persons.
(ii) Again, among the eight western districts the proportion of persons principally s~stained. by. agriculture .is inord.ina~ely high in the. we~tern P?rtions of Gulbarga and RalChur DIstrIcts. In RalChur District, the proportIOn IS 904 In Yelburga, 903 in Sindhnoor, 882 in Deodurg, 855 in Manvi, 853 in Kushtagi and 832 in Lingsugur. But Gangawati and Koppal Tahsils do not exactly fit into this pattern. The proportion in these two tahsils is 781 and 734 respectively, excluding the Tungabhadra Camps in the tahsils. It would, however, have been considerably more but for the fact that these two tahsils are the most urbanised and developed among the western tahsils of Raichur District; and a number of persons who have found employment in non-agricultural occupations because of the construction of the Tungabhadra Project are living within the tahsils in areas even beyond the actual project camps. Similarly, in the adjoining western portions of Gulbarga District, the proportion is 929 in Afzalpur, 925 in Andola (Jevargi), 864 in Shahapur, 844 in Aland and 803 in Shorapur. If the figures pertaining to the urban areas and the Tungabhadra Project Camps in all these south-western tahsils of the state are excluded, the proportion exceeds 900 in each one of them except Gangawati and Koppal-and even il} these two tahsils, it is considerably in excess of 850. This unusually heavy proportion of agricultural classes is due to various reasons. These tahsils generally receive scanty and irregular rainfall and consequently suffer repeatedly from drought and scarcity; have an unusually heavy portion of the total area under cultivation* ; have been practically denuded of forests; are poor in cattle wealth; are the least developed, as things now stand, in the state from the point of view of irrigation; are illdustrially unimportant in spite of some handloom weaving centres, oil mills and cotton ginning and pressing factories; are undeveloped in communications; and possess. no administrative or commercial cen1{es worth mentioning. The largest agricultural market in this area is Koppal, which has a turnover of less than forty five lakhs. In case of Aland and Afzalpur and, to a smaller extent, Jevargi Tahsils, the high proportion of agricultural classes is primarily due to their marked backwardness in respect of industries, commerce and communications. The only consoling feature about all these unfortunate tahsils is the fact that they possess a fertile soil which reacts very favourably whenever the, rainfall is timely and sufficient. Consequently, an overwhelming portion of the population has to depend, willy-nilly. on agriculture as its principal source of sustenance and-as will be seen subsequenlty -in most of these tahsils, except perhaps Aland wherein the rainfall is less precarious and the soil particularly fertile, even agriculture is. relatively attractive only if the land is owned by the person cultivating it.
The proportion of agricultural classes is also unusually high in the extreme western portions of Bhir District. It is 880 in Patoda and 857 in Ashti. The proportion would have been appreciably in excess of 850 in the adjoining tahsil of Bhir as well but for the location of the district headquarters within the tahsil and the construction of the Bendsura Project. The high proportion of agricultural classes in these tahsils is, more or less, the result of the same factors indicated er.rlier in respect of the scarcity zones in Raichur and Gulbarga Districts. Besides these tahsils, the proportion of agricultural classes is also high (i.e., in excess of 850), in Jaffarabad and Ambad Tahsils of Aurangabad, Kalamnuri *Among these tahsils the percentage of the gross cultivated to the total ar~a exceeds 60 in case of Koppal and Shorapur, 7() in case of Kushtagi and Deodurg, 75 in case of Manvi, Lingsugur, Shahapur, Aland and Andola (Jevargi), 80 in case of Sindhnoerand 85 in calle of Af:.zalpur and Yelburga. It is lower than 60 in only Gangawati Tahsil.
16
128
'Tahsil of Parbhani, Georai Tahsil of Bhir, Ahmadpur, Bhalki and Santpur Tahsils of Bidar, Owsa Tahsil of Osmanabad and Chincholi Tahsil of Gulbarga. These tahsils do not contain any important urban unit worth mentioning. Besides, their rural areas, like most of the rural tracts in the western districts of the state, are poor in cottage and primary industries. Even otherwise Jaffarabad, Kalamnuri and Chincholi are among the most backward tahsils in the western half of the state. It is, therefore, not surprising that an overwhelming number of the people in these tahsils should be principally depen-dent on agriculture.
192. (i) Quite contrary to the tendency in the western districts of the state, among all the 64 tahsils in its eight eastern districts the proportion of persons principally dependent on agricultural occupations is high (i.e., is 800 or exceeds it) only in the following 10 tahsils :-
(a) Vikarabad and Andol Tahsils of Medak District; and
(b) Utnoor, Kinwat and Boath Tahsils of Adilabad District; Yellareddy Tahsil -of Nizamabad District; Narsapur Tahsil of Medak District; Burgampahad Tahsil of Warangal District; and Pargi and Achampet Tahsils of Mahbubnagar District. The relatively high proportion in the tahsils mentioned at (a) above is largely due to the fact that they are situated along the borders of the western districts and resemble them to an appreciable extent in economic aspects; in the tahsils mentioned at (b) primarily to the fact that they are among the most backward and under-developed tracts in the state. The highest tahsilwise proportion of persons prinicipally dependent on agriculture recorded in the eastern districts, or as a matter of fact in the whole state, is 960 in Utnoor which is supposed to be the chief habitat of the Scheduled Tribes in the state. In the northern district of Adilabad, in the eastern half of the state, in addition to Utnoor, Kinwat and Boath Tahsils mentioned at (b) above, the proportion of agricultural livelihood classes in Rajura, Adilabad, Asifabad and Sirpur Tahsils would have also exceeded 800 but for some coal fields and nascent industries and the location of the district headquarters in Adilabad Tahsil. The rural areas of all these seven tahsils are particularly backward, under-developed and inhabite'd mostly by Scheduled Tribes and Castes and Other Backward Classes. In these rural areas there are no non-agricultural occupations worth mentioning apart from those which are representative of a primitive economy such as stock raising and collection and exploitation of forest produce. Similarly, a tendency for the proportion of agricultural livelihood classes to be relatively'high is -also perceptible in the extreme southern tahsils of the eastern half of the state. This tract includes, in addition to Achampet and Burgampahad Tahsils already mentioned at (b) above, Devarkonda, Miryalguda and Huzurnagar Tahsils in Nalgonda District and Madhira and, but for their collieries, Palvancha and Yellandu Tahsils of Warangal District. In none of these tahsils, however, with the exception of Achampet and Burgampahad, does the proportion actually reach 800. These remote tahsils, except for portions of Huzurnagar and Madhira and the collieries in Palvancha and Yellandu, are also underdeveloped; and the conditions especially in the rural areas of Achampet, Burgampahad, Palvancha and Yellandu are not very dissimilar to those in the tahsils of Adilabad District mentioned above.
(ii) Among the eight eastern districts of the state, the proportion of persons principally sustained by agriculture is particularly low in the tahsils of (a) Hyderabad West, Hyderabad East and Medchal in Hyderabad District; (b) Nizamabad in Nizamabad District; (c) Karimnagar, Sirsilla, Metpalli, Jagtial, Sultanabad and Huzurabad i.e., the western
16*

129
half of Karimnagar District; (d) Warangal and Bhongir in Warangal and N algonda Districts respectively; (e) Asifabad in Adilabad District and Palvancha again in Warangal District. In none of these tahsils does the proportion exceed 600. The unusually low proportion in the three tahsils of Hyderabad District is entirely due to the influence of Hyderabad City and its suburban units. The proportion in Hyderabad West Tahsil, which contains Hyderabad City, is only 44 which is by far the lowest recorded in the state. As, stated earlier, vide sub-paragraph 190 (h), the non-agricultural population of the state is heavily concentrated in this city. The particularly low proportion in Nizamabad Tahsil is largely due to Nizamabad Town, which is one of the important urban units of the state; that in the western tahsils of Karimnagar, to the fact that a large number of persons in these tahsils are principally sustained by cottage and primary industries and tapping of toddy trees or by non-agricultural professions such as those of washermen, beggars, village officials and servants, etc.: that in Warangal and Bhongir Tahsils to a heavy urban population~ especially in the case of the former, and to the large number of persons sustained by cottage and primary industries and toddy drawing in their rural areas; and, lastly, that in Asifabad and Palvancha Tahsils to their collieries. The proportion of agricultural classes is also perceptibly low, though in no case lower than 600, in the tahsils of Lakshattipet, Khanapur and Nirmal in Adilabad District, Armoor and Kamareddy in Nizamabad District, Siddipet in Medak District and Jangaon in Nalgonda District. These tahsils~ like the adjoining western tahsils of Karimnagar District, are relatively rich in rural and primary industries, toddy tapping and certain types of non-agricultural professions.
193. Districtwise Variation in the Proportion of the Livelihood Class of Owner Cultivators.-Districtwise, the proportion of persons principally sustained by owner cultivation among every 1,000 of the population is at its highest 567 in Raichur and at its lowest 71 in Hyderabad. In two other districts, namely, Bhir and Medak, it exceeds 500. In six districts, namely Nizamabad, Gulbarga, Aurangabad, Bidar,Osmanabad and Nanded, it ranges between 450 and 500; and in two districts, namely Parbhani and Nalgonda,_ between 400 and 450. In three of the remaining districts, namely Mahbubnagar, Karimnagar and Warangal, it ranges between 350 and 400. It is only 339 in Adilabad and dwindles, as already stated, to just 71 in Hyderabad. Even if the figures relating to 'Hyderabad City and its suburban units are excluded, the proportion in Hyderabad District remains as low as 258.
194. Thus, the Livelihood Class of Owner Cultivators is markedly higher in the west_ ern districts of the state and in Medak and Nizamabad Districts than in the remaining eastern districts. But this is not exactly in keeping with the pattern observed in the variation of agricultural classes from district to district--vide paragraph 190. Normally, the variation in the proportion of this, or any other individual agricultural class, from area to area should not be contradictory to the corresponding variation in the proportion of agricultural classes as a whole. In other words, other things being equal, the higher the proportion of all agricultural classes the higher should be the proportion of each' of the individual agricultural classe~ (including that of owner cultivators) and ':Jice versa. But in many instances due to certain peculiar features connected with the type of population owning lands, size of average holdings, extent and nature of area under cultivation, kind of crops cultivated, extent or availability of individual agricultural occupations as a subsidiary profession, etc., the variation in the proportion of individual agricultural classes is not in keeping with the corresponding variation in the proportion of all agricultural classes.
130
The relatively high proportion of persons principally dependent on owner cultivation in the western districts of the state as a whole is basically due to the same reasons which are responsible for the high proportion of agricultural classes in those districts i.e., to a heavy proportion of the total area under cultivation and the relative insignificance of non-agricultural occupations, especially those connected with rural and primary industries and artisan trades. It is a well known fact that the size of the average patta holdings in the western districts is considerably larger than in the eastern districts*. This factor should have by itself led to a smaller proportion of the Livelihood Class of Owner Cultivators in the former than in the latter. But the percentage of the area under cultivation to the total area in the western districts is comparatively so heavy that the proportion of this livelihood class remains high in them in spite of the large holdings. In the western tahsils of Medak District, namely in Andol, Vikarabad and, to an appreciably smaller extent, in Sangareddy Tahsil, the high proportion of owner cultivators is largely the result of a heavy p~rcentage of the total area under cultivationt and the relative lack of nonagricultural occupations. But in Nizamabad District as a whole and in the eastern tahsiJs of Medak District, the proportion of this livelihood clags is high, in spite of a relatively low percentage of the total a.rea brought under cultivation and a high percentage of nonagricultural classes, mainly because of their unusually large proportion (even from the point of view of the eastern districts) of small pattedars to the total member of patta holders. The relatively low proportion of this livelihood class in the other eastern districts of Nalgonda, Hyderabad, Mahbubnagar, Adilabad, Karimnagar and Warangal in general is largely due to the same factors which have led to the comparatively low proportion of agricultural classes taken together in those areas--i.e., to a relatively small proportion of the total area under cultivation and the existence on a large scale of rural and primary industries including artisan trades a 11d the tapping of toddy trees. A higher proportion of persons principally dependent on tenant cultivation than in Nizamabad or the western districts, and a more marked tendency for persons to take to owner cultivation as a subsidiary occupation than in the western districts, are also factors contributing to the low proportion of persons principally dependent on owner cultivation in these five eastern districts.
The more prominent of the local variations in the over-all pattern of the proportion of owner cultivators in the western districts, in Nizamabad and Medak Districts and in the other eastern districts of the state. are explained in the succeeding paragraphs,
195. ('i) Among all the 74 tahsils in the eight western districts of the state, the proportion of persons principally sustained by owner cultivation for every 1,000 of the population is low (i.e., below 400) only in the case of the foll,owing ten tahsils :--
(a) Aurangabad, Nanded and Gulbarga Tahsils; (b) Parbhani and Pathri in Parbhani District; Bidar in Bidar District; Latur
in Osmana'8ad District and Jalna in Aurangabad District; (c) Chitapur in Gulbarga District; and (d) Tandur, again in Gulbarga District.
*According to the figures collected by the Statistics Department in 194.'1-which do not appear to have been complete and are also unadjusted to conform to the present territorial jurisdictions of the districts-of the total number of pattedars in each district those holding less than 10 acres formed 67 per cent in Medak, 63 in Nizamabad, 59 in Warangal, 58 in Karimnagar, 51 in Hyderabad, 46 in Adilabad, 42 in Nalgonda and 41 in Mahbubnagar while they formed only 28 per cent in Raichur, 27 in Gulbarga, 25 in Nanded, 18 both in Parbhani and Bidar, 13 in Aurangabad, II in Bhir and 8 in Osmanabad. These figures are, however, good enough to indicate the general districtwise tendency in this regard.
t In Medak District, the percentage of gross cultivated area to the total area in its western tahsils of Sangareddy, Andol and Vikarabad is roughly 60, 60 and 50 respectively, which are very high for eastern districts of the state. But in its ea.'ltern tahsils of Siddipet, Medak, Gajwol and Narsapur the percentage is roughly only 30.
t
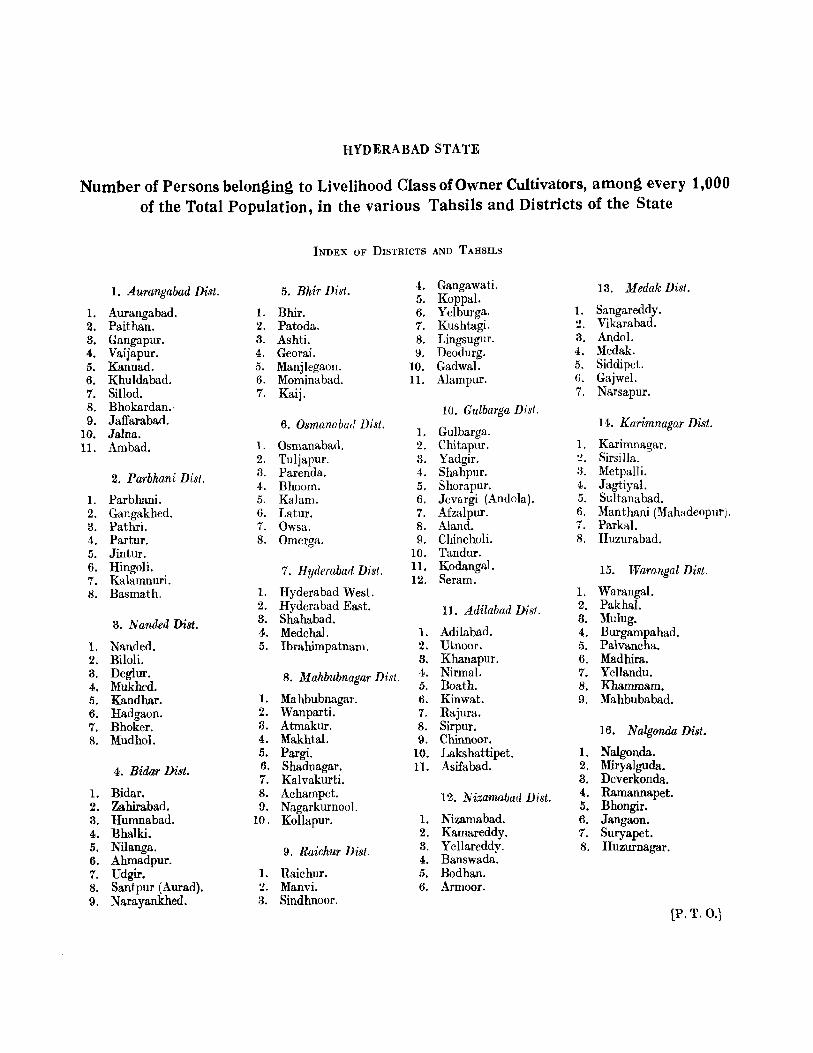
HYDERABAD STATE
Number of Persons belon~in~ to Livelihood Class of Owner Cultivators, among every 1,000 of the Total Population, in the various Tahsils and Districts of the State
INDEX OF DISTRICTS AND TAlfSILS
1. Aurangabad Dist. 5. Bhir Disi. 4. Gangawati. 13. Medak Dist. f5. Koppal.
1. Aurangabad. 1. Bhir. 6. Yelburga. 1. Sangareddy. 2. Paithan. 2. Patoda. 7. Kushtagi. 2. Vikarabad. 3. Gangapur. 3. Ashti. 8. Lingsugur. 3. Andol. 4. Vaijapur. 4. Georai. 9. Deodurg. 4. Medak. 5. Kannad. 5. Manjlegaoll. 10. Gadwal. 5. Siddipet. 6. Khuldabad. 6. Mominabad. 11. Alampur. 6. Gajwel. 7. Sillod. 7. Kaij. 7. Narsapur. 8. Bhokardan.· 10. Gulbarga Dis!. 9. Jaffarabad. 6. Osmanabad Dist. 14. Karimnagar Dist.
10. Jalna. 1. Gulbarga. 11. Ambad. 1. Osmanabad. 2. Chitapur. 1. Karimnagar.
2. Tuljapur. 3. Yadgir. :z. Sirsilla.
2. Parbhani Dis/. 3. Parenda. 4. Shahpur. a. Metpalli. 4. Bhoom. 5. Shorapur. 4. Jagtiyal.
1. Parbhani. 5. Kalam. 6. Jevargi (Andola). 5. Sultanabad. 2. Gangakhed. 6. Latur. 7. Afzalpur. 6. Manthani (Mahadeopur). 3. Pathri. 7. Owsa. 8. Aland. 7. Parkal. 4. Partur. 8. Omerga. 9. Chincholi. 8. Huzurabad. 5. Jintur. 10. Tandur. 6. Hingoli. 7. Hyderabad Dist. n. Kodangal. 15. Warangal Dist. 7. Kalamnuri. 12. Seram. 8. Basmath. 1. Hyderabad West. 1. Warangal.
2. Hyderabad East. II. Adilabad Dist. 2. Pakhal.
3. Nanded Dist. 3. Shahabad. 3. Mulug. 4. Medchal. 1. Adilabad. 4. Burgampahad.
1. Nanded. 5. Ibrahimpatnam. 2. Utnoor. 5. Palvancha. 2. Biloli. 3. Khanapur. 6. Madhira. 3. DegIur. 8. Mahbubnagar Dist. 4. Nirmal. 7. Yellandu. 4. Mukhed. 5. Boath. 8. Khammam. 5. Kandhar. 1. Mahbubnagar. 6. Kinwat. 9. Mahbubabad. 6. Hadgaon. 2. Wanparti. 7. Rajura. 7. Bhoker. 3. Atmakur. 8. Sirpur. 16. Nalgonda Dist. 8. Mudhol. 4. Makhtal. 9. Chinnoor.
5. Pargi. 10. Lakshattipet. l. Nalgonda.
4. Bidar Disl. 6. Shadnagar. 11. Asifabad. 2. Miryalguda. 7. Kalvakurti. 3. Deverkonda.
1. Bidar. 8. Achampet. 12. Nizamabad Disi. 4. Ramannapet. 2. Zahirabad. 9. Nagarkurnool. 5. Bhongir. 3. Humnabad. 10. Kollapur. 1. Nizamabad. 6. Jangaon. 4. Bhalki. 2. Kamareddy. 7. Suryapet. 5. Nilanga. 9. Raichur Disi. 3. Yellareddv. 8. Huzurnagar. 6. Ahmadpur. 4. Banswada·. 7. Udgir. 1. Raichur. 5. Bodhan. 8. Santpur (Aurad). 2. Manvi. 6. Armoor. 9. Narayankhed. 3. Sindhnoor.
[Po T. 0.)
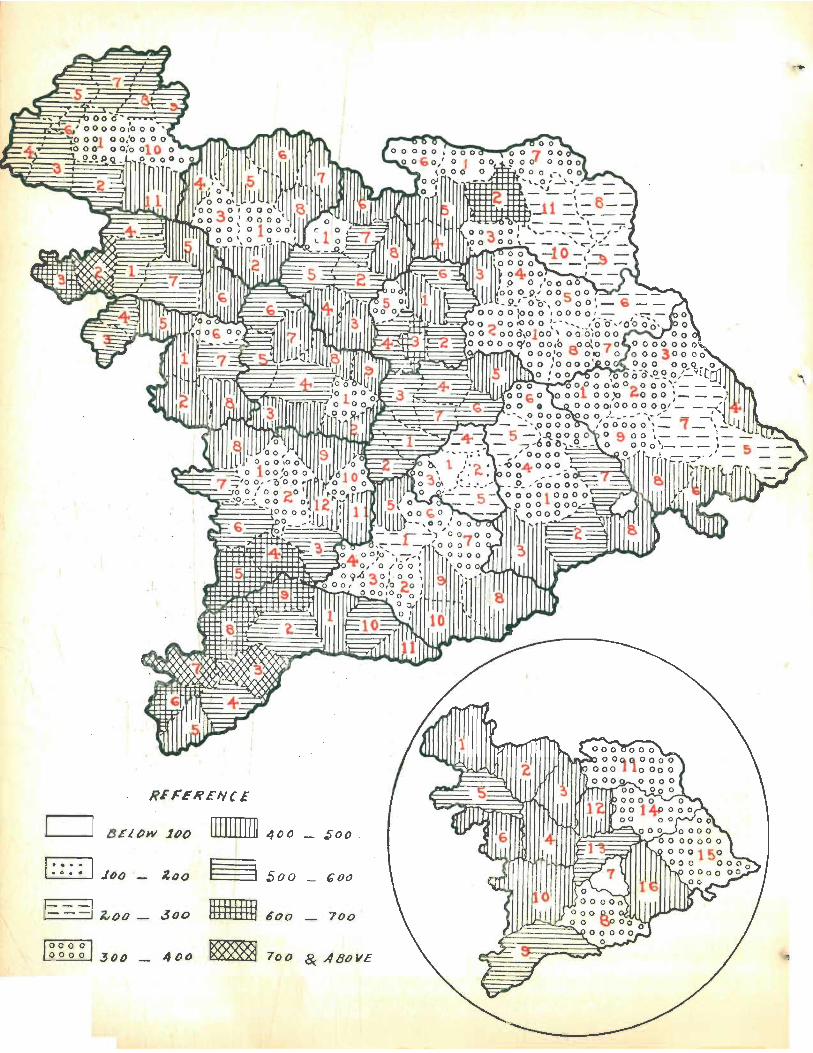
BE' ow 1"0 111111111" 400 - 500
,- ... • 0 •• .Jou - too 3 $00 €OO -
1===llvOO - ,300 IIIIIIII§ 600 - 700
I~~ ~ ~ I 300 - 400 ~ 700 8: A80VE
133
But even among these ten tahsils the proportion is not lower than 800 in any tahsil -it varies from 316 in Nanded to 383 in Tandur. In case of the tahsils mentioned at {a) above, the low proportion is almost exclusively due to the huge non-agricultural population in their urban units. In fact, in Aurangabad Tahsil, if figures pertaining to Aurangabad Town are excluded, the proportion of this livelihood class becomes as heavy as 587. In case of the ta}1sils mentioned at (b) above, the low proportion is largely due to the heavy non-agricultural population in their urban areas. But these tahsils are also located in tracts wherein, even apart from the non-agricultural population in urban areas, there is a perceptible tendency for the Livelihood Class of Owner Cultivators to be slightly less numerous-and for that of Agricultural Labourers to be especially more numerous. The first of these tracts consists of the south-eastern portions of Aurangabad District, northeastern portions of Bhir District and the western portions of Parbhani District; the second of the central and eastern portions of Osmanabad District; and the third of the extreme southern portions of Nanded District and the north-eastern portions of Bidar District. The slightly lower proportion of owner cultivators in these tracts is perhaps due to big landlords as well as considerable areas in the possession of castes and classes which are primarily engaged in commerce or in various services. In case of the tahsil mentioned at (c) above, namely Chitapur, the low proportion is again due largely to the heavy nonagricultural population in its urban units, especially Shahabad Town which is famous for its cement fa.ctory. But, to an extent, it is also due to a fair number of persoll<; employed in the stone quarries of the tahsil and an unmu3.11y large numb3r of persons principally sustained by agricultural rent. All will be seen subsequently, the last is a feature common to many of the central and the north-western tah~ih of Gulbarga District. In case of the tahsil mentioned at (d) above, ng,mely Tandur, the two factors chiefly responsible for the low proportion are the non-agricultural popUlation in its towns of Tandur and Nawandgi and, as in the case of most of the tahsils in the adjoining central Telugu areas of the state, a relatively large number of persons principally dependent on tenant cultivation and on rural and primary industries. ' -
(ii) Again, among the eight western districts, the proportion of persons principally sustained by owner cultivation is unusually high in the western portions of Raichur and in the south-western portions of Gulbarga District. In Raichur District, the proportion is 741 in Sindhnoor, 717 in Kushtagi, 699 in Yelburga, 683 in Lingsugur, 641 in Deodurg and 567 in Manvi. In the remaining two of its western tahsils, namely Gangawati and Koppal, it is 573 and 555 respectively-excluding the figures pertaining to the Tungabhadra Project Camps in them. In Gulbarga District, the corresponding proportion is 628 in Shorapur, 606 in Shahapm and 594 in Andola (Jevargi). The corresponding proportion in the rural areas of these tahsils is extraordinarily heavy being considerably in excess of 750 in Sindhnoor, Kushtagi and Lingsugur and 700 in Yelburga and Shorapur. It is almost 700 in Gangawati, appreciably in excess of 650 in Deodurg and Koppal and slightly above 600 in Manvi. The unusually heavy proportion in these tracts is due to the absence of non-agricultural occupations, a particularly heavy percentage of the cultivated area to the total area and to scanty and irregular rainfall. The last factor is not conducive to the existence of agricultural labourers, and to a smaller extent tenant cultivators, in any appreciable number. For almost identical reasons, the prDportion of owner cultivators is also unusually heavy in the extreme western portions of Bhir and Osmanabad Districts. It is 752 in Patoda, 681 in Ashti and 579 in Parenda Tahsils. In Bhir Tahsil, which adjoins Patoda, the proportion would have also been appreciably in excess of 600 but for Bhir Town and the Bendsura Project under construction.

134
196. As already mentioned in paragraph 194 above, the proportion of the Livelihood Class of Owner Cultivators is fairly heavy in Medak and Nizamabad Districts as a whole, although the reasons for it are not the same in respect of all their tahsils. Within thesetwo districts, however, the proportion is especially low in Bodhan Tahsil of Nizamabad District and especially high in Yellareddy Tahsil of the same district, being only 357 in the former and 646 in the latter. Bodhan Tahsil is the most highly irrigated tahsil in the state-accounting for over one quarteI of the state's sugarcane acreage-----and a vast extent of its irrigated area is under the ownership of the sugar factory at Bodhan Town or a few big landlords. Consequently, agricultural or farm labourers are particularly numerous in the tahsil. Besides, Bodhan Town, which is one of the large industrially important towns in the state, swells the number of non-agricultural classes in the tahsil. As against this, Yellareddy is one of the least developed of the areas in the state and has no town of any importance. Further, small patta holders are relatively very numerous in this tahsil. Besides, a number of persons who generally take to agricultural or other labour as their principal occupation must have migrated from this tahsil to the highly irrigated areas to the extreme east of the district, especially to Bodhan Tahsil. All these factors explain the markedly low proportion of the livelihood class in Bodhan and the markedly high proportion in Yellareddy Tahsil.
197. (i) Among the other six eastern districts of the state, namely Adilabad, Karimnagar, Warangal, Nalgonda, Hyderabad and Mahbubnagar, the proportion of the Livelihood Class of Owner Cultivators exceeds 400 in the case of only 15 out of their 51 tahsils. These Tahsils are Dtnoor, Nirmal and Boath in Adilabad District; Metpalli in Karimnagar District; Burgampahad, Madhira and Khammam in Warangal District; Suryapet, Huzurnagar, Miryalguda and Devarkonda in Nalgonda District; and Achampet, Pargi, Nagarkurnool and Kollapur in Mahbubnagar District. But even among these fifteen tahsils, the livelihood class is in a decisive majority only in Dtnoor (wherein the proportion is 630) and in a slight majority only in l\firyalguda and Suryapet (wherein the proportion is 519 and 501 respectively). The high proportion in Dtnoor Tahsil is partly due to the almost total absence of non-agricultural occupations and partly to the fact that the indigenous population, made up largely of Scheduled Tribes, has not been dispossessed of its small holdings to the same extent as in the other areas of Adilabad District. The relatively high proportion in Boath Tahsil is also largely due to the lack of non-agricultural occupations. Strangely, in the adjoining tahsil of Kinwat, wherein also the agricultural classes are relatively very numerous, owner cultivators are appreciably lower than 400 being only 331. This is perhaps due partly to a large portion of the cultivable area having passed from the ownership of the tribal population to the Maratha and Lambada landlords, quite a number of whom have relatively very large holdings, and partly to the cultivation of cotton on a very extensive scale. It may be observed that among the dry crops cotton needs more agricultural labourers than most others. The relatively high proportion in both Nirmal and Metpalli Tahsils is due largely, as in the adjoining district of Nizamabad, to a high percentage of small patta holders to the total number of pattedars. Perhaps, another contributory factor is the relatively small extent oflands in the possession of non-cultivating castes or classes. As regards the remaining tahsils m.entioned above, it may be observed that all of them, except Pargi Tahsil of Mahbubnagar District, occupy the f'xtreme southern belt in the eastern districts of Mahbubnagar, Nalgonda and Warangal, which is mostly under-developed. The slightly higher proportion of agricultural classes in these tahsils, is due largely to the limited scope of (mployment available in non-agricultural occupations. A large proportion of the total area under cultivation in Huzurnagar and Khammam Tahsils; intensive
185
.cultivation in portions of Madhira, Huzurnagar, Khanunam and Kollapur Tahsils; irregular and scanty rainfall in Devarkonda and parts of Miryalguda Tahsils which, as observed elsewhere, generally tends to increase the proportion of owner cultivators and lower that of agricultural labourers; lack of important towns in all these tahsils except Khammam; the sale, during recent years, of the lands in the possession of big landlords or of landlords belonging to non-cultivating castes or classes, in the southern portions of Nalgonda and the south-western portions of Warangal District; and the comparatively small extent of land owned by non-indigenous cultivating castes or classes in most of these tahsils, may also be factors contributing to the relatively heavy proportion of the livelihood class. The only tahsil in this southern belt which does not fit in with the pattern described above is Palvancha Tahsil in Warangal District. The proportion of the Livelihood Class of Owner Cultivators to the total population is low in this tahsil exclusively because of the heavy non-agricultura1 population sustained by its collieries.
But, as stated above, with the solitary exception of Utnoor in Adilabad, the proportion of the Livelihood Class of Owner Cultivators is not particularly impressive in any of the tahsils in the six eastern districts of Hyderabad, Mahbubnagar, Nalgonda, Warangal, Karimnagar and Adilabad.
(ii) Among these six eastern districts, the proportion of the Livelihood Class of Owner Cultivators to the total population is particularly low in three areas. The first of these consists of Asifabad, Sirpur, Lakshattipet and Chinnoor Tahsils of Adilabad District and Manthani Tahsil of Karimnagar District ;'the second of Yellandu and Palvancha Tahsils in Warangal District; and the third of Hyderabad East, Hyderabad West, Medchal and Ibrahimpatnam Tahsils of Hyderabad District and the adjoining tahsil of Bhongir in Nalgonda District. The proportion in these tahsils is, at its highest, only 278 both in Palvancha and Bhongir and, at its lowest, dwindles to 19 in Hyderabad West, which contains the metropolis of the state. In almost all the tahsils in these three areas, the proportion of personS' whol1y or mainly sustained by tenant cultivation is particularly heavy, for reasons fully explain'ed in the succeeding paragraph. In addition to this, in the first of these areas, the Livelihood Class of Production (other than cultivation) is ,very numerous in all the tahsils, especially Asifabad, and that of Agricultural Labour in Lakshattipet, Chinnoor and Manthani Tahsils ; and in the second of these areas, the Livelihood Class of Production (other than cultivation) is particularly heavy in Palvancha Tahsil. Similarly,in the third of these areas, the proportion of all agricultural livelihood classes themselves is negligible in Hyderabad West Tahsil primarily because of the huge non-agricultural population residing in Hyderabad City; in the tahsils of Hyderabad East and Medchal and, to a considerably smaller extent, in Ibrahimpatnam, because of the influence of Hyderabad City and its suburban units; and in Bhongir Tahsil because it lies in a zone of the state wherein persons principally sustained by occupations connected with Production (other than cultivation) are particularly numerous.
198. Districtwise Variation in the Proportion of the Livelihood Class of Tenant Cultivators.--Districtwise, the proportion of persons principally dependant on tenant cultivation, among every 1,000 of the population, is at its highest 140 in Mahbubnagar and at its lowest 38 in Nizamabad. Among the other districts, the proportion exceeds 125 in Adilabad and 100 in Warangal and Nalgonda; it ranges between 75 and 100 in Medak and Gulbarga ; between 50 and 75 in Parbhani, Osmanabad, Bidar and Nanded ; between 40 and 50 in Karimnagar, Aurangabad, Hyderabad and Raichur; and is just 39 in Bhir. It is thus obvious that the proportion of the Livelihood Class of Tenant Cultivators
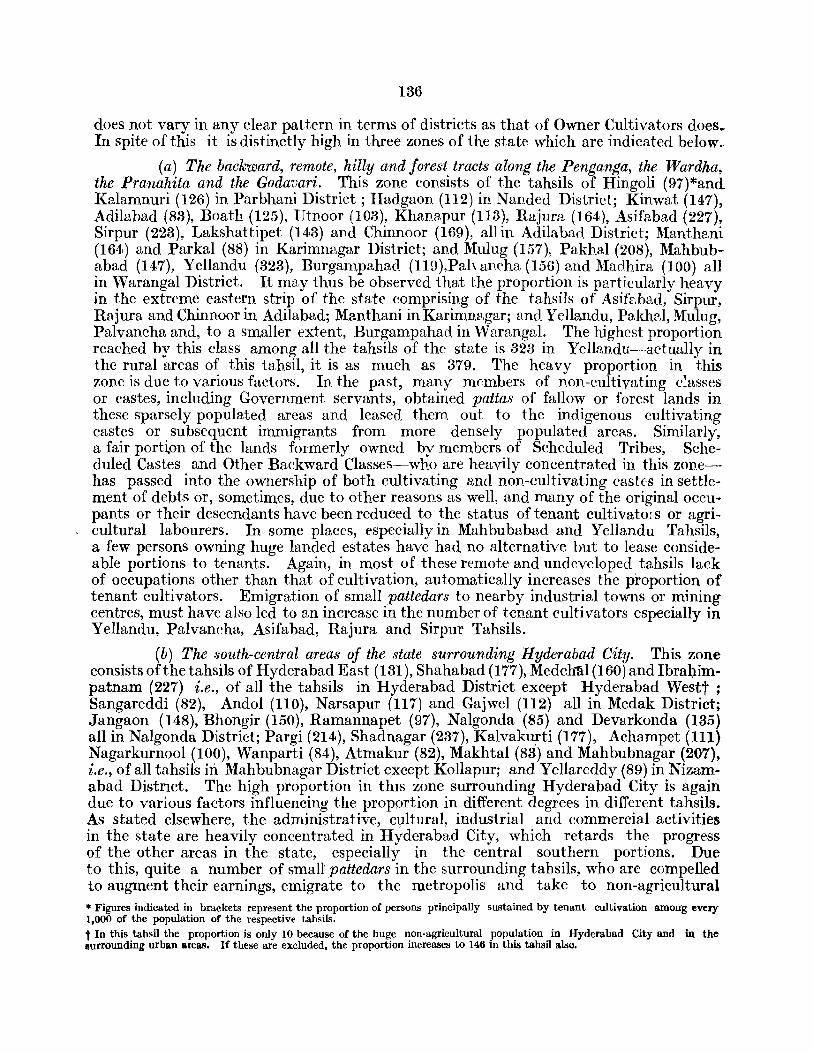
136
does not vary in any clear pattern in terms of districts as that of Owner Cultivators does. In spite of this it is distinctly high in three zones of the state which are indicated below ~
(a) The backward, remote, hilly and forest tracts along the Penganga, the Wardha, the Pranahita and the Godavari. This zone consists of the tahsils of Hingoli (97)*and Kalamnuri (126) in Parbhani District; Hadgaon (112) in Nanded District; Kinwat (147), Adilabad (83), Boath (125), Utnoor (103), Khanapur (113), Rajura (164), Asifabad (227), Sirpur (223), Lakshattipet (143) and Chinnoor (169), all in Adilabad District; ManthBni (164) and Parka I (88) in KarimnBgar District; and l\1ulug (157), Pakhal (208), Mahbubabad (147), Yellandu (323), Burgam.pahad (1I9),Pah ancha (156) Bnd Madhira (100) all in Warangal District. It may thus be observed that the proportion is pBrticularly heavy in the extreme eastern strip of the state comprising of the tahsils of Asifr,bad, Sirpur, Rajura an.d Chinnoor in Adilabad; Manthani in Karimnggar; and Yellandu, Pakhp.l, Mulug, Palvancha and, to a smaller extent, Burgampahad in Warangal. The highest proportion reached by this class among all the tahsils of the state is 323 in Yellandu--actually in the rural areas of this tahsil, it is as much as 379. The heavy proportion in this zone is due to various factors. In the past, many members of non-cultivating c~asses or castes, including Government servants, obtained pattas of fallow or forest lands in these sparsely populated areas and leased them out to the indigenous cultivating castes or subsequent immigrants from more densely populated areas. Similarly, a fair porhon of the lands formerly owned by members of Scheduled Tribes, Scheduled Castes and Other Backward Classes-who are heavily concentrated in this zon.ehas passed into the ownership of both cultivating and non-cultivating castes in settlement of debts or, sometimes, due to other reasons as well, and many of the original occupants or their descendants have been reduced to the status of tenant cultivators or agricultural labourers. In some places, especially in Mahbubabad and Yellandu Tahsils, a few persons owning huge landed estates have had no alternative but to lease consideable portions to tenants. Again, in most of these remote and undeveloped tahsils lack of occupations other than that of cultivation, automatically increases the proportion of tenant cultivators. Emigration of small pattedars to nearby industrial towns or mining centres, must have also led to an increase in the number of tenant cultivators especially in Yellandu, Palvancha, Asifabad, Rajura and Sirpur Tahsils.
(b) The south-central areas of the state surrounding Hyderabad City. This zone consists ofthetahsils of Hyderabad East (131), Shahabad (177), Medch1t1 (160) and Ibrahimpatnam (227) i.e., of all the tahsils in Hyderabad District except Hyderabad Westt ; Sangareddi (82), Andol (110), Narsapur (117) and Gajwel (112) all in Medak District; Jangaon (148), Bhongir (150), Ramannapet (97), Nalgonda (85) and Devarkonda (135) all in Nalgonda District; Pargi (214), Shadnagar (237), Kalvakll!ti (177), Achampet (Ill) Nagarkurnool (100), Wanparti (84), Atmakur (82), Makhtal (83) and Mahbubnagar (207h i.e., of all tahsils in Mahbubnagar District except Kollapur; and Yellareddy (89) in Nizamabad DistrIct. The high proportion in thIS zone surrounding Hyderabad City is again due to various factors influencing the proportion in different degrees in different tahsils. As stated elsewhere, the administrative, cllltural, industrial and commercial activities in the state are heavily concentrated in Hyderabad City, which retards the progress of the other areas in the state, especially in the central southern portions. Due to this, quite a number of small pattedars in the surrounding tahsils, who are compelled to augment their earnings, emigrate to the metropolis and take to non-agricultural • Figures indicated in brackets represent the proportion of persons principally sustained by tenant cultivation amorrg every 1,000 of the population of the respective tahsils. t In this tahsil the proportion is only 10 because of the huge non-agricultural popUlation in Hyderabad City and in the lurrounding urban areas. If these are excluded, the proportion increases to 146 in this tahsil also.
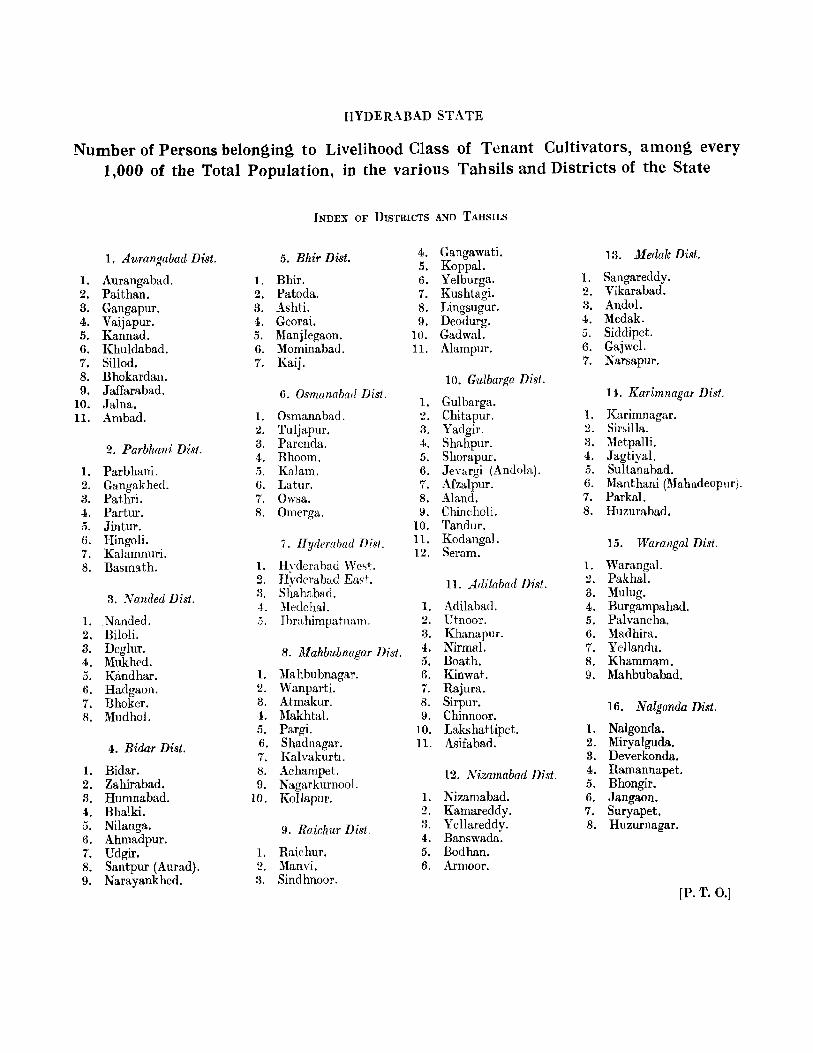
HYDERABAD STATE
Number of Persons belonging to Livelihood Class of Tenant Cultivators, among every
1,000 of the Total Population, in the various Tahsils and Districts of the State
INDEX OF DISTRICTS AND TAHSILS
1. Aurangabad Dist. 5. Bhir Disi. 4. Gangawati. 13. Medak Dist. 5. Koppal.
1. Aurangabad. 1. Bhir. 6. Yelburga. 1. Sangareddy. 2. Paithan. 2. Patoda. 7. Kushtagi. 2. Vikarabad. 3. Gangapur. 3. Ashti. 8. Lingsugur. 3. Andol. 4. Vaijapur. 4. Georai. 9. Deodurg. 4. Medak. 5. Kannad. 5. Manjlegaon. 10. Gadwal. 5. Siddipet. 6. Khuldabad. 6. Mominabau. 11. Alampur. 6. Gajwel. 7. SiUod. 7. Kaij. 7. Narsapur. 8. Bhokardan. 10. Gulbarga Disl. 9. Jaffarabad. 6. Osmanabatl Dist. 14. Karimnagar Disi.
10. Jalna. 1. Gulbarga. 11. Ambad. 1. Osmanabad. 2. Chitapur. 1. Karimnagar.
2. Tuljapur. 3. Yadgir. :3. Sirsilla.
2. Parbhani Disi. 3. Parenda. 4. Shahpur. 3. l\letpalli. 4. Bhoom. 5. Shorapur. 4. Jagtiyal.
1. Parbhani. . 5. KaJam. 6 . Jev&rgi (Andola). 5. Sultana bad. 2. Gangakhed. 6. Latur. 7. Afzalpur. 6. Manthani ("!\fahadeopur). 3. Pathri. 7. Owsa. 8. Aland. 7. Parkal. 4. Partur. R. Omerga. 9. Chincholi. 8. Huzurabad. 5. Jintur. 10. Tandur. 6. Hingoli. 7. HyderabadDisl. 11. Kodangal. 15. Warangal Dist. 7. Kalamnuri. 12. Seram. 8. Basmath. 1. Hyderahad West. 1. Warangal.
Q Hyderabad East. 11. Adilabad Disl . '2. Pakhal. ... 3. :v anded Disi. 3. Shahabad. 3. Mulug.
4. ;\[edchal. 1. Adilabad. 4 . Burgampahad. l. . Nanded. .j. Ihrahimpa tlla m. 2. Utnoor. 5. Palvaneha. 2. Biloli. 3. Khanapur. 6. Madhira. 3. Deglur. 8. lIfahbubnagar Disi. 4. Nirmal. 7. Yellandu. 4. Mukhed. 5. Boath. 8. Khammam. 5. Kandhar. 1. 1\1a hbubnagar . 6. Kinwat. 9. Mahbubabad. 6. Hadgaon. 2. Wanparti. 7. Rajura. 7. Bhoker. 3. Atmakur. 8. Sirpur. 16. Nalgonda Dist. 8. Mudhol. 4. Makhtal. 9. Chirmoor.
5. Pargi. 10. Lakshattipet. 1. Nalgonda.
4. Bidar Dist. 6. Shadnagar. 11. Asifabad. 2. Miryalguda. 7. Kalvakurb. 3. Deverkonda.
1. Bidar. 8. Achampet. 12. Nizamabad Dist. 4. Ramannapet. 2. Zahirabad. 9. Nagarkurnool. 5. Bhongir. 3. Humnabad. 10. Kollapur. l. Nizamabad. 6. Jangaon. 4. Bhalki. 2. Kamareddy. 7. Suryapet. 5. Nilanga. 9. Raichur Dist. 3. Yellareddv. 8. Huzurnagar. 6. Ahmadpur. 4. Banswada". 7. Udgir. l. Raichur. 5. Bodhan. 8. Santpur (Aurad). 2. Manvi. 6. Armoor. 9. Narayankhed. 3. Sindhnoor.
[Po T. 0.]
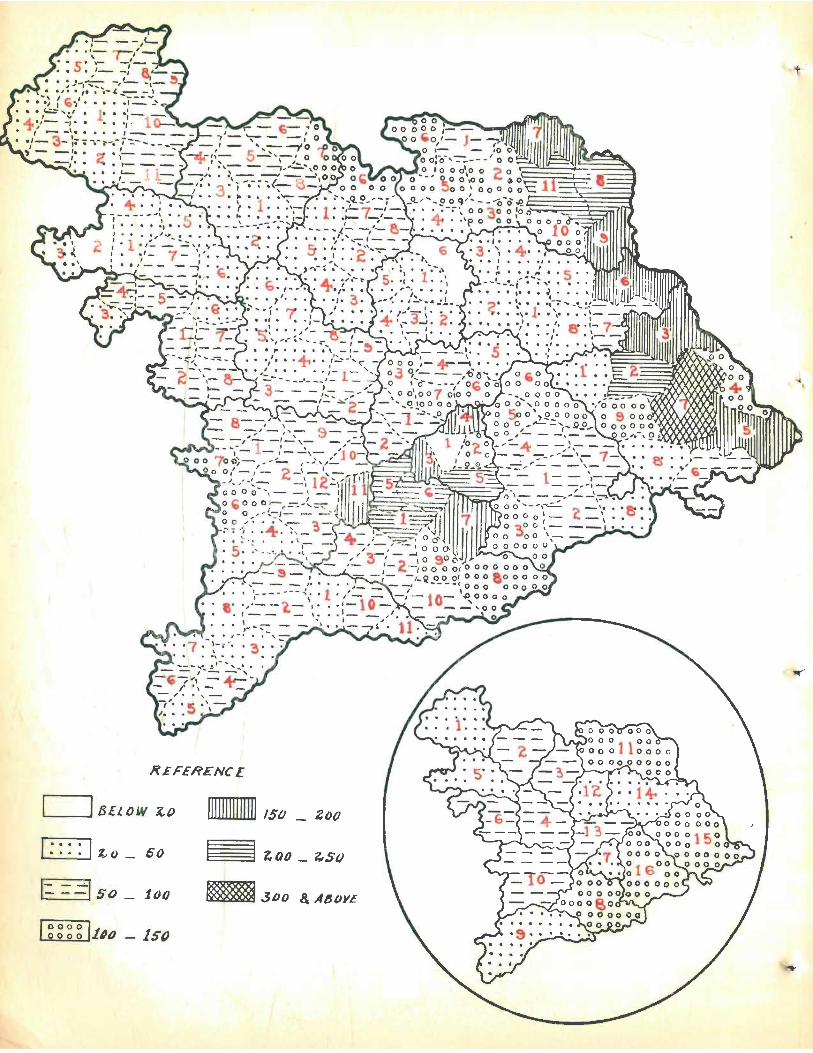
t' .
4 •
REFERENCE
~ _ _, BEL OW '4() 1Illllllllllll ,slJ _ ZOO
l : : : : %,() _ 50 §§j 1. QO _ ~S()
I:. = =1 $D _ joo Ei3DD
000°1 90 0 ol~D - Iso
139
occupations. A fair portion of such emigrants lease out their lands in their native villages thereby swelling the number of tenant cultivators in them. Again, from decades past and until very recently, Government and Jagir employees as well as members ·of other influential classes resIding in the metropolis--and to a considerably smaller extent, in some of the mofussil towns-have been acquiring lands on patta in the surrounding tahsils. Few among these persons themselves cultivate all, or even portions of the lands thus acquired. They usually lease them out, thereby adding to the numbers of tenant cultivators locally. Further, these tahslls also contain a number of landlords with very large holdings-particularly from the point of view of areas which are relatively well irrigated-belonging to indigenous cultivating castes or classes. Many of these landlords lease out their dry lands, or'sometimes even portions of their wet lands, to other persons in their villages. This is also a factor contributing to the relatively high proportion of tenant cultivators in many of these tahsils. In tahsils such as Pargi, Achampet and Yellareddy, the higher proportion of tenant cultivators is, to an extent, the natural result of the fact that they are under-developed and, among the tahsils of the eastern districts, are markedly dependent on agriculture.
(c) Central and Northern Tahsil8 of Gulbarga District and the adjoining Southern Tahsils of Bidar District.- The proportion in this zone is, however, not at all so heavy as in the other two zones. In fact, in a few of its tahsils it is even slightly lower than the average of 74 for the state. But, apart from the other two zones, in no other contiguous group of tahsils is the proportion equally heavy. This zone consists of the tahsils of Kodangal (156), Afzalpur (136), Andola (108), Tandur (100), Chincholi (96), Aland (88), Seram (87), Chitapur (60) and Gulbarga (59), all in Gulbarga District, and Zahirabad (88), Bidar (72) and Humnabad ( 61) in Bidar District. The proportion among the rural population of Gulbarga, Tandur, Bidar, Chitapur and Kodangal Tahsils is markedly heavier than in their total population. As among the agricultural classes themselves, the proportion in this zone varies from 85 in Humnabad to 206 in Kodangal, as againstthe corresponding average ofI08 for the state. The eastern tahsils of Zahirabad, Tandur, Kodangal,and Seram could also be deemed to be part of the central southern zone surrounding Hyderabad City and subject to most of the influences mentioned in sub-paragraph (b) above. Apart from this, among the various factors responsible for the heavy proportion of the Livelihood Class of Tenant Cultivators in this zone are perhaps the migration of relatively small pattedars to ,the industrially important urban units of Sholapur and Hyderabad Cities and Gulbarga and Shahabad Town~; a relatively large proportion of lands in the possession of Muslims and, to a considerably smaller extent, Brahmins and other castes or classes who generally prefer non-agricultural to agricultural occupations; the existence of quite a number of Lingayat landlords who engage themselves in commerce leasing out portions if not most of their lands; and in the case of Andola (Jevargi), Afzalpur and Chincholi Tahsils, particularly meagre avenues of employment in non-agricultural occupations. The marked fertility of the soil in portions of Andola and Afzalpur Tahsils perhaps more than compensates the tenant cultivators for the relatively scanty and irregular rainfall the tahsils receive as compared with the other areas in this zone. The proportion of the Livelihood Class of Tenant Cultivators tends to be heavy .. for almost similar reasons, in the adjoining Tuljapur Tahsil of Osmanabad District as well-the actual proportion in the tahsil is 82.
199. Districtwise Variation in the Proportion of the Livelihood Class of Agricultural Labourers.-Districtwise, the proportion of persons principally sustained by agricultural labour among every 1,000 of the population is at its highest 254 in Parbhani and at its lowest 46 in Hyderabad. If figures pertaining to Hydera bad City and its suburban areas are excluded the proportion in Hyderabad District, however, increases to 165. Among the other
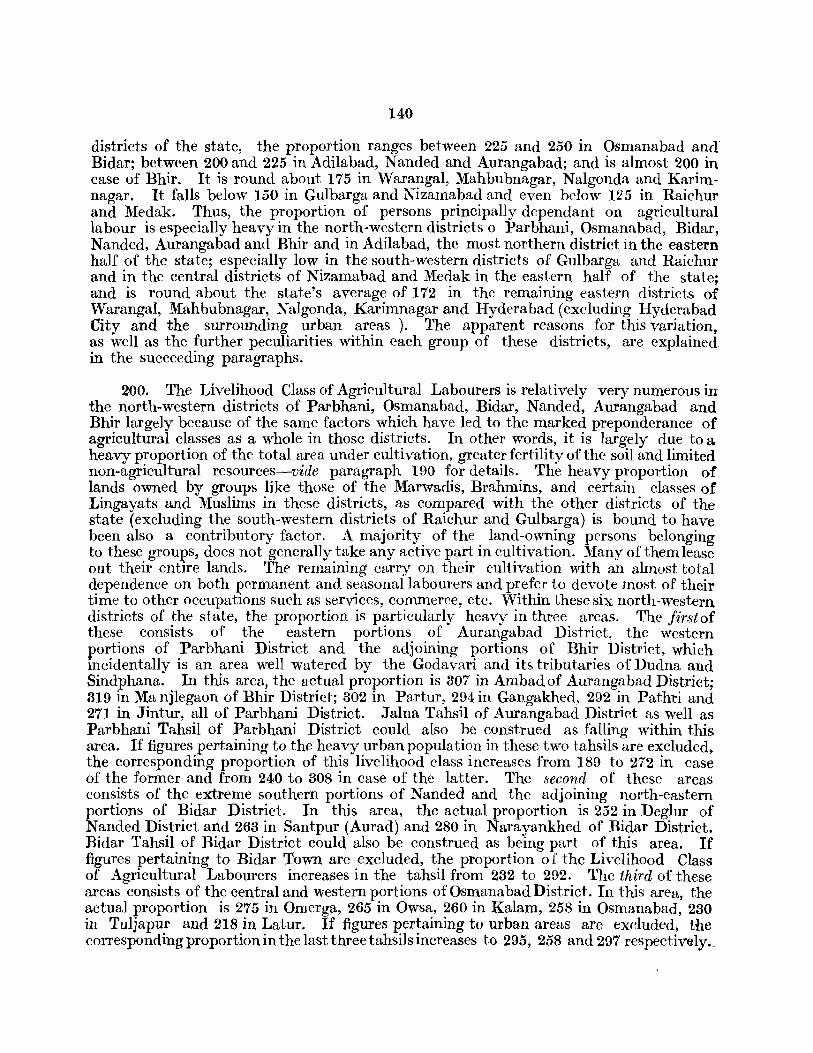
140
districts of the state, the proportion ranges between 225 and 250 in Osmanabad and' Bidar; between 200 and 225 in Adilabad, Nanded and Aurangabad; and is almost 200 in case of Bhir. It is round about 175 in Warangal, Mahbubnagar, Nalgonda and Karimnagar. It falls below 150 in Gulbarga and Nizamabad and even below 125 in Raichur and Medak. Thus, the proportion of persons principally dependant on agricultural labour is especially heavy in the north-western districts 0 Parbhalli, Osmanabad, Bidar, Nanded, Aurangabad and Bhir and in Adilabad, the most northern district in the eastern half of the state; especially low in the south-western districts of Gulbarga and Raichur and in the central districts of Nizamabad and Medak in the eastern half of the state; and is round about the state's average of 172 in the remaining eastern districts of WarangaI, Mahbubnagar, Nalgonda, Karimnagar and Hyderabad (excluding Hyderabad City and the surrounding urban areas). The apparent reasons for this variation, as well as the further peculiarities within each group of these districts, are explained in the succeeding paragraphs.
200. The Livelihood Class of Agricultural Labourers is relatively very numerous in the north-western districts of Parbhani, Osmanabad, Bidar, Nanded, Aurangabad and Bhir largely because of the same factors which have led to the marked preponderance of agricultural classes as a whole in those districts. In other words, it is largely due to a heavy proportion of the total area under cultivation, greater fertility of the soil and limited non-agricultural resources-vide paragraph 190 for details. The heavy proportion of lands owned by groups like those of the Marwadis, Brahmins, and certain classes of Lingayats and Muslims in these districts, as compared with the other districts of the state (excluding the south-western districts of Raichur and Gulbarga) is bound to have been also a contributory factor. A majority of the land-owning persons belonging to these groups, does not generally take any active part in cultivation. Many of them lease out their entire lands. The remaining carryon their cultivation with an almost total dependence on both permanent and. seasonal labourers and prefer to devote most of their time to other occupations such as services, commerce, etc. Within these six north-western districts of the state, the proportion is particularly heavy in three areas. The jirsiof these consists of the eastern portions of Auranga bad District, the western portions of Parbhani District and the adjoining portions of Bhir District, which incidentally is an area well watered by the Godavari and its tributaries of Dudna and Sindphana. In this area, the actual proportion is 307 in Ambad of Aurangabad District; 319 in Ma njlegaon of Bhir District; 302 in Partur, 294 in Gangakhed, 292 in Pathri and 271 in Jintur, all of Parbhani District. Jalna Tahsil of Aurangabad District as well as Parbhani Tahsil of Parbhani District could also be construed as falling within this area. If figures pertaining to the heavy urban population in these two tahsils are excluded~ the corresponding proportion of this livelihood class increases from 189 to 272 in case of the former and from 240 to 308 in case of the latter. The second of these areaS consists of the extreme southern portions of Nanded and the adjoining north-eastern portions of Bidar District. In this area, the actual proportion is 252 in Deglur of Nanded District and 263 in Santpur (Aurad) and 280 in Narayankhed of Bidar District. Bidar Tahsil of Bidar District could also be construed as being part of this area. If figures pertaining to Bidar Town are excluded, the proportion of the Livelihood Class of Agricultural Labourers increases in the tahsil from 232 to 292. The third of these areas consists of the central and western portions of Osman a bad District. In this area, the actual proportion is 275 in Omerga, 265 in Owsa, 260 in Kalam, 258 in Osmanabad, 230 in Tuljapur and 218 in Latur. If figures pertaining to urban areas are excluded, the cOITesponding proportion in the last three tahsils increases to 295, 258 and 297 respectiv~ly.
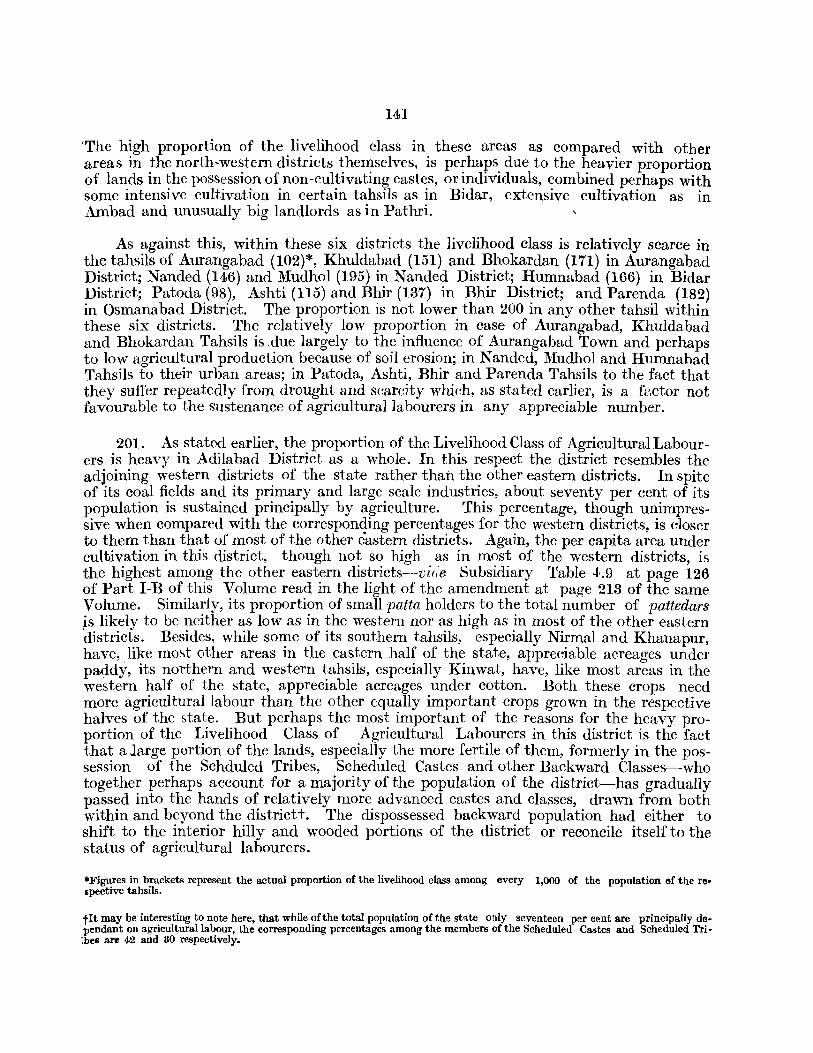
141
'The high proportion of the livelihood class in these areas as compared with other areas in the north~western districts themselves, is perhaps due to the heavier proportion of lands in the possession of non-cultivating castes, or individuals, combined perhaps with some intensive cultivation in certain tahsils as in Bidar, extensive cultivation a.s in Ambad and unusually big landlords as in Pathri.
As against this, within these six districts the livelihood class is relatively scarce in the tahsils of Aurangabad (102)*, Khuldabad (151) and Bhokardan (171) in Aurangabad District; Nanded (146) and lVIudhol (195) in Nanded District; Humnabad (166) in Bidar District; Patoda (98), Ashti (115) and Bhir (137) in Bhir District; and Parenda (182) in Osmanabad District. The proportion is not lower than 200 in any other tahsil within these six districts. The relatively low proportion in case of Aurangabad, Khuldabad and Bhokardan Tahsils is ,due largely to the influence of Aurangabad Town and perhaps to low agricultural production because of soil erosion; in Nanded, lVIudhol and Humnabad Tahsils to their urban areas; in Patoda, Ashti, Bhir and Parenda Tahsils to the fact that they suffer repeatedly from drought and scarcity which, as stated earlier, is a fp,ctor not favourable to the sustenance of agricultural labourers in any appreciable number.
201. As stated earlier, the proportion of the Livelihood Class of Agricultural Labourers is heavy in Adilabad District as a whole. In this respect the district resembles the adjoining western districts of the state rather than the other eastern districts. In spite of its coal fields and its primary and large scale industries, about seventy per cent of its population is sustained principally by agriculture. This percentage, though unimpressive when compared with the corresponding percentages for the western districts, is closer to them than that of most of the other e·astern districts. Again, the per capita area under cultivation in this district, though not so high as in most of the western districts, is the highest among the other eastern districts--vi(:e Subsidiary Table J.9 at page 126 of Part I-B of this Volume read in the light of the amendment at page 213 of the same Volume. Similarly, its proportion of small patta holders to the total number of pattedars is likely to be neither as low as in the western nor as high as in most of the other eastern districts. Besides, while some of its southern tahsils, especially Nirmal and Khanapur, have, like most other areas in the eastern half of the state, appreciable acreages under pa9dy, its northern and western tahsils, especially Kinwat, have, like most areas in the western half of the state, appreciable acreages under cotton. Both these crops need more agricultural labour than the other equally important crops grown in the respective halves of the &tate. But perhaps the most important of the reasons for the heavy proportion of the Livelihood Class of Agricultural Labourers in this district is the fact that a Jarge portion of the lands, especially the more fertile of them, formerly in the possession of the Schduled Tribes, Scheduled Castes and other Backward Classes-who together perhaps account for a majority of the population of the district-has gradually passed into the hands of relatively more advanced castes and classes, drawn from both within and beyond the districtt. The dispossessed backward population had either to shift to the interior hilly and wooded portions of the district or reconcile itself to the status of agricultural labourers.
*Figures in brackets represent the actual proportion of the livelihood class among every 1,000 of the population of the respective tahsils.
tIt may be interesting to note here, that while of the total population of the state only seventeen per cent are principally dependant on agriculturalla~our, the corresponding percentages among the members of the Scheduled Castes and Scheduled Tri·
:bel are 42 and 80 respectIvely.
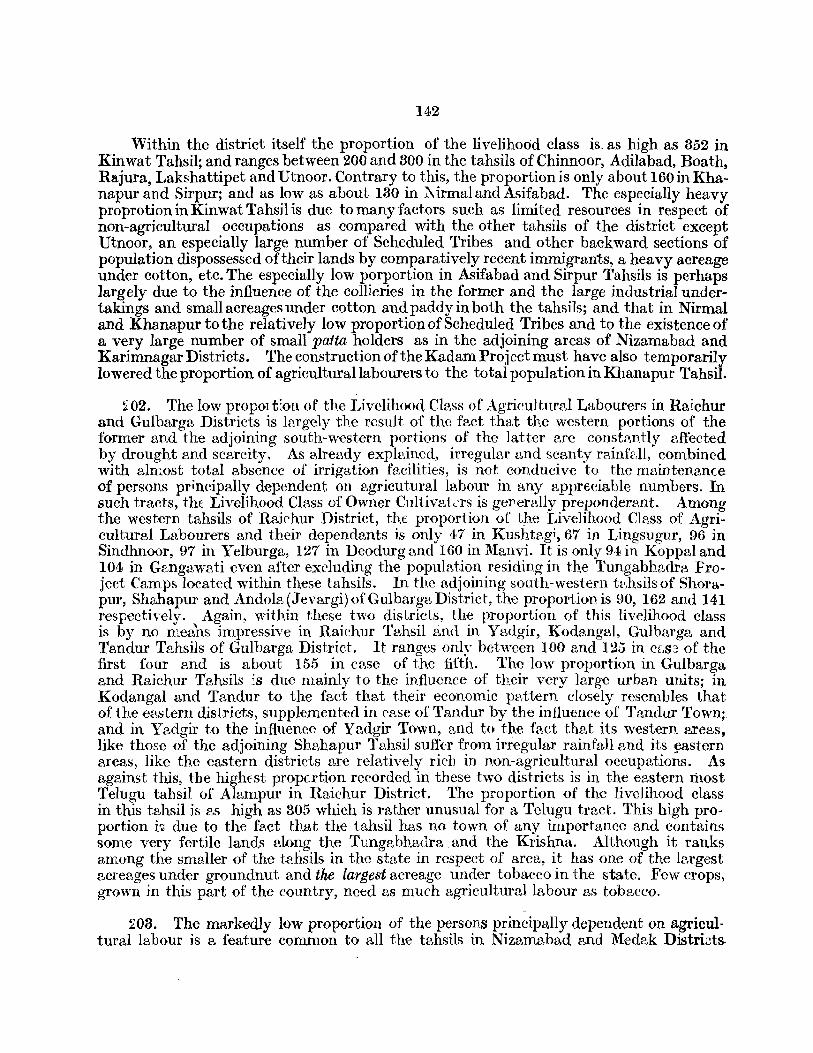
142
Within the district itself the proportion of the livelihood class is. as high as 352 in Kinwat Tahsil; and ranges between 200 and 300 in the tahsils of Chinnoof) Adilabad) Boath, Rajura, Lakshattipet and Utnoor. Contrary to this, the proportion is only about 160inKhanapur and Sirpur; and as low as about 130 in l\irmal and Asifabad. The especially heavy proprotion in Kinwat Tahsil is due to many factors such as limited resources in respect of non-agricultural occupations as compared with the other tahsils of the district except Utnoor, an especially large number of Scheduled Tribes and other backward sections of population dispossessed of their lands by comparatively recent immigrants, a heavy acreage under cotton, etc. The especially low porportion in Asifabad and Sirpur Tahsils is perhaps la.rgely due to the influence of the collieries in the former and the large industrial underta.kings and small acreages under cotton and paddy in both the tahsils; and that in Nirmal and Khana.pur to the relatively low proportion of Scheduled Tribes and to the existence of a very large number of small pafla holders as in the adjoining areas of Nizamabad and Karimnagar Districts. The construction of the Kadam Project must have also temporarily lowered the proportion of agricultural labourers to the total population in Khanapur Tahsil.
:1:02. The low propol t;OIl of the Livelihood CIgss of Agricultur~J Labourers in Raichur and Gulbarga. Districts is largely the result of the fact that the western portions of the former and the adjoining south-western portions of the latter are const::m.tly affected by drought p,nd sCBrcity. As ~Jrep,dy explpjned, irregular and scanty r2jllf2,1l, combined with almost total absence of irrigation facilities, is not conducive to the maintenance of persons principally dependent on agricutural labour in Emy appreciable numbers. In such tracts, thE Livelihood Class of Owner Cultivatcrs is gepemlly preponderant. Among the western tahsils of Raichur District, the. proportion of the Livelihood Class of Agricultural Labourers and their dependl;mts is only 47 in Kushtagi , 67 in Lingsugur, 96 jn Sindhnoor, 97 in Yelburga, 127 in Deodurg [md 160 in Manvi. It is only 94 in Koppal and 104 in GE.,ngaw2Ji even after excluding the populfl,tion residing in the Tungabh2,dra Froject Camps located within th.ese tahsils. In the adjoining south-western ti',hsils of Shorapur, Shahapur and Andolg(Jev~.J'gi)ofGulbargaDistrict, the proportion is 90,162 and 141 respectively. Again, within these two districts, the proportion of this livelihood class is by no means impressive in Raichur Tahsil ti,nd. in Yadgir, KodtmgpJ, Gulbarga and Tandur Tahsils of Gulbarga District. It ranges only between 100 and 125 in CLS~ of the first four and is about 155 in c[',se of the fifth. The low proportion in Gulbarga and Raichur TBhsils is due mainly to the influence of their very large urb::m units; in Kodangal and Tandur to the fact that their economic pp,ttern closely resembles that of the eastern districts, supplemented in case of Tandur by the influence of Tandur Town;. and in Yadgir to the influence of Y2,dgir Town, 2.nd to the fact tha.t its western 8re2.S, like those of the adjoining Sh[l,hapur Tahsil sufft-r from irregular rainfa1l8nd its ~astern t'Xeas, like the eastern districts are rel["tively rich in non-agricultural occupations. As agBinst this, the highfst propcrtion recorded in these two dist.ricts is in the eastern most Telugu tahsil of Alampur in Raichur District. The proportion of the livelihood class in this tghsil is p,s high as 305 which is rather unusual for a Telugu trlOl,ct. This high proportion i;; due to the fget that the tahsil has no town of any importance gnd contains some very fertile lands along the Tungp,bhadra, and the Krishna. Although it ranks among the smaller of the tghsils in the state in respect of area, it has one of the largest BcreBges under groundnut and the largest acreage under tobacco in the state. Few crops, grown in this part of the country, need as much agricultural labour as tobacco.
203. The markedly low proportion of the persons principally dependent on agricultural labour is [I. feature conunon to all the t['.hsils in NizBmaba,d 2,nd Medak Districts.
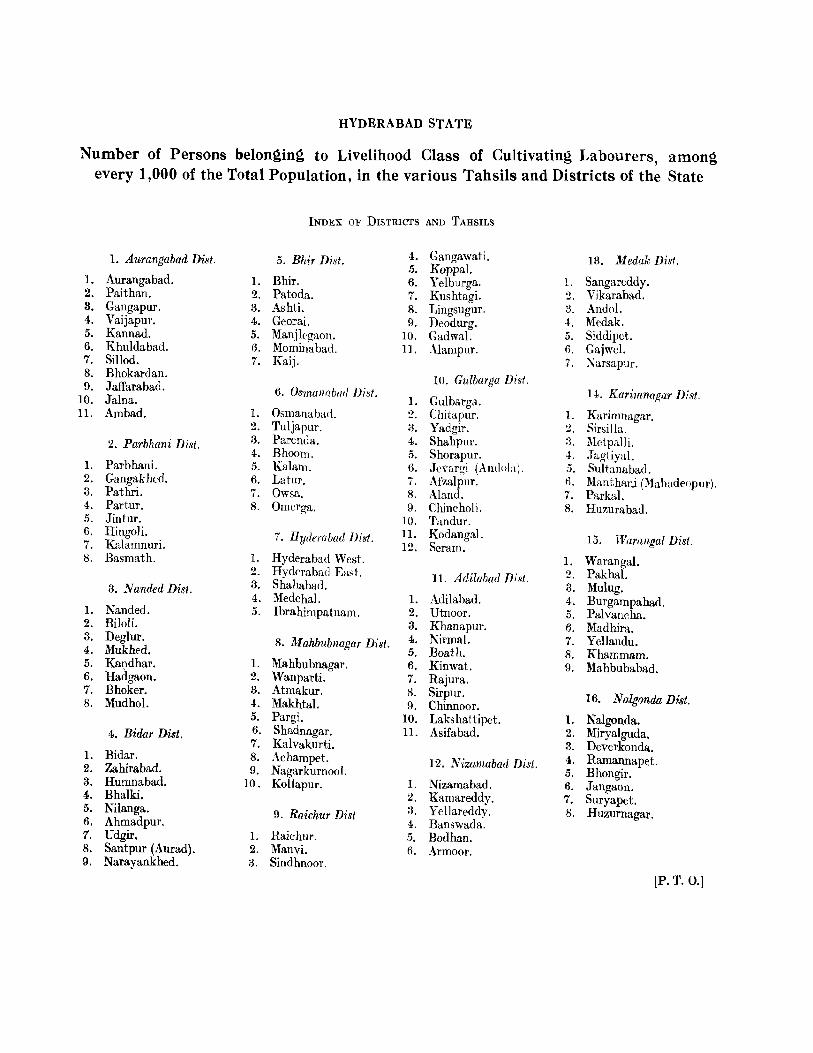
HYDERABAD STATE
Number of Persons belon~ing to Livelihood Class of Cultivating Labourers, among every 1,000 of the Total Population, in the various Tahsils and Districts of the State
I. Aurangabad Dist.
I. Aurangabad. 2. Paithan. 3. Gangapur. 4. Vaijapur. 5. Kannad. 6. Khuldabad. 7. Sillod. 8. Bhokardan. 9. Jaffarabad.
10. Jalna. 11. Ambad.
2. Parbhani DiSI.
1. Parbhani. 2. Gangakhed. 3. Pathri. 4. Partur. 5. Jintur. 6. Hingoli. 7. Kalamnuri. 8. Basmath.
3. Nanded Disl.
1. Nanded. 2. Hiloli. 3. Deglur. 4. Mukhed. 5. Kandhar. 6. Hadgaon. 7. Bhoker. 8. Mudhol.
4. Bidar Dist.
1. Bidar. 2. Zahirabad. 3. Humnabad. 4. Bhalki. 5. Nilanga. 6. Ahmadpur. 7. Udgir. 8. Santpur (Aurad). 9. Narayankhed.
INDEX OF DISTRICTS AND TAHSILS
5. Bhir Disi.
1. Bhir. 2. Patoda. 3. Ashti. 4. Georai. 5. Manjlegaon. 6. Mominabad. 7. Kaij.
6. Osmal!abm/ Disl.
1. Osmanabad. 2. Tuljapur. 3. Parenda. 4. Bhoom. 5. Kalam. 6. Latur. 7. Owsa. 8. Omerga.
7. Hyderabad Disi.
1. Hyderabad West. 2. flyderabacl East. 3. Shahabad. 4. Medchal. 5. Ibrahimpatnam.
8. Mahbubnagar Disi.
1. Mahbubnagar. 2. Wanparti. 3. Atma.kur. 4. Makhtal. 5. Pargi. 6. Shadnagar. 7. Kalvakurti. 8. Achampet. 9. Nagarkurnool.
10 . Kollapur.
9. Raichu"f Dist
l. Raichur. 2. Manvi. ::I. Sindhnoor.
4. Gangawati. .5. Koppal. 6. Yelburga. 7. Kushtagi. 8. Lingsugur. 9. Deodurg.
10. Gadwal. 11. Alampur.
10. Gnlbarga Disl.
1. Gulbarga. 2. Chitapur. 3. Yadgir. 4. Shahpur. 5. Shorapur. 6. Je,'&rgi (Andoia). i. Afzalpur. 8. Aland. 9. Chincholi.
10. Tandur. 11. Kodangal. 12. Scram.
11. Adilabad Disi.
I. Adilabad. 2. Utnoor. 8. Khanapur. 4. Nirmal. 5. Boath. 6. Kinwat. 7. Rajura. 8. Sirpur. 9. Chinnoor.
10. Lakshattipet. 11. Asifabad.
12. Nizamabad Disl.
1. Nizamabad. 2. Kamareddy. 3. Yellareddv. 4. Banswada'. 5. Bodhan. 6. Armoor.
13. Medak Disl.
1. Sangareddy. 2. Vikarabad. 3. Andol. .~. Medak. 5. Siddipet. 6. Ga,jweI. 7. Narsapul'.
14. Karimnagar Dist.
1. Karimnagar. :2. Sirsilla. :3. Metpalli. 4. Jagtiyal. 5. Sultanabad. 6. Manthani (Mahadeopur). 7. Pa.rhl. 8. Huzurabad.
15. lVarangal Disi.
1. WarangaI. 2. Pakhal. 3. Mulug. 4. Burgampahad. 5. Palvancha. 6. Madhira. 7. Yellandu. 8. Khammam. 9. Mahbubabad.
16. Nalgonda Disi.
1. Nalgonda. 2. Miryalguda, 3. Deverkonda. 4. Ramannapet. 5. Bhongir. 6. Jangaon. 7. Suryapet. 8. Huzurnagar.
[P. T. 0.]
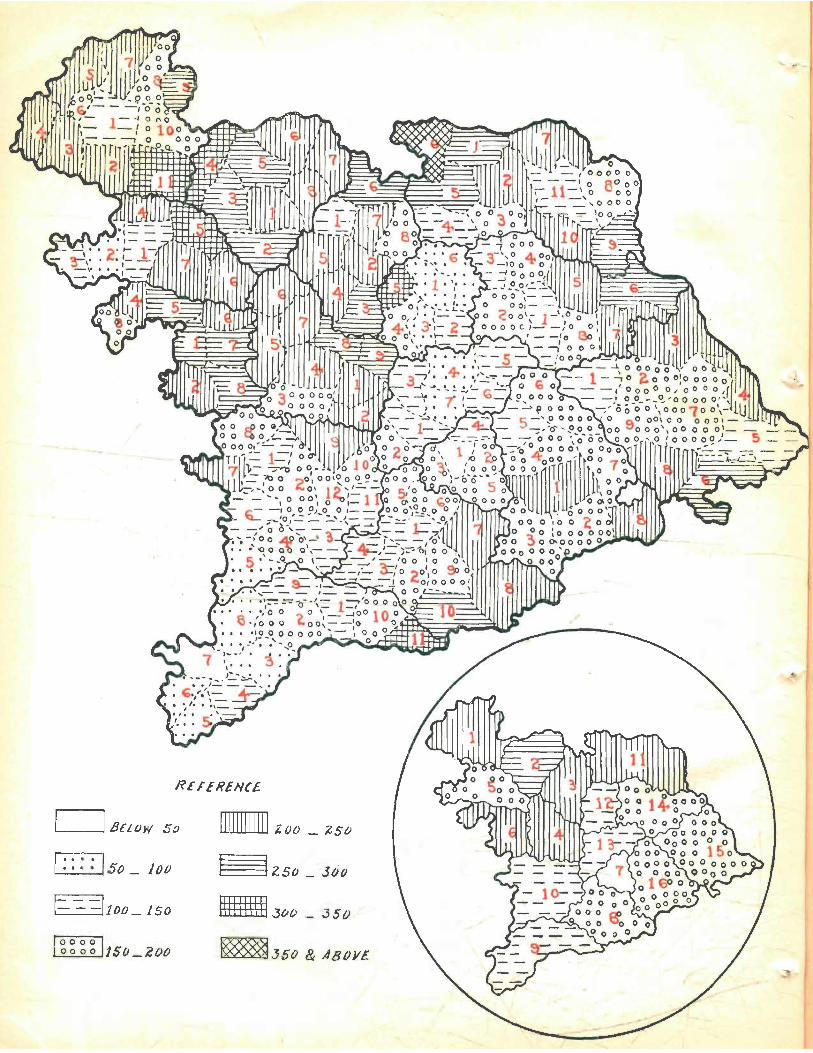
/
REI"EIUN(£
'--_--II BELOW So
.. .. .. . . Iso _ lot)
1--::. -1100_ 150
11 111111 1111 ~ Ol) _ ~S/)
_ l(J()
filii! \1!13()1) ,_ 350
f~\8888b50 & ABOV£
....... "' -
145
except for Bodhan and, to an extent, Banswada Tahsils of Nizamabad District. The actual proportion in Bodhan is 301 and in Banswada 182, whereas in the other tahsils of the· district it ranges only from 74 in Yellareddy to 120 in Kamareddy. In MedakDistrict, the proportion again ranges only from 70 in Medak to 167 in Vikarabad. The especially high proportion in Bodhan, as well as the fair proportion in Banswada Tahsil, are chiefly due to· the vast irrigated ar~as in the tahsils owned by the Bodhan Sugar Factory and a few big' landlords. These agencies employ a large number of farm labourers for the cultivation of sugarcane, paddy, etc. The markedly low proportion of persons principally sustained by agricultural labour in all the other tahsils of the two districts is due to various factors. such as a high percentage of small patta holders among the total number of pattedarsthey are particularly very numerous -in the central and eastern portions of theEe two' districts; migration of agricultural labourers, or of potential agricultural labourel's, to Bcdhan Tahsil and Nizamabad Town in ca~e of the other tahsils in Nizamabad District and to Hyderabad City in case of Medak District; and the existence of cottageand primary industries on a vast scale in all these tahsils, except Yellareddy Tahsil of Nizamabad and the western tahsils of Medak District.
But it has to be pointed out here that although the proportion of the livelihood' class of agricultural labourers-i.e., of the self-supporting persons principally engaged: as agricultural labourers and their dependants, whether earning or non-earningis especially low in these two districts, the proportion of self-supporting persons belonging to other livelihood classes who have taken to agricultural labour as a secondary occupation and of earning dependants belonging to all livelihood classes who derive their earnings through agricultural labour is particularly heavy in them. The actual proportion of such self-supporting persons and earning dependants, among every 1,000 of the popUlation, is as much as 172 in Medak and 149 in Nizamabad,. as against the corresponding figure of 103 recorded for the state as a whole. Thus, the heavy demand for agricultural labour in these two districts, which contain the best irrigated' areas in the state--and are together responsible for over 25 per cent of the state's acreage under paddy and about 55 percent of the state's acreage under sugarcane though they account for less than 8 per cent of the state's area-is met to an appreciable txtent by persons who· take to agricultural labour as a subsidiary occupation.
204. (i) The lower proportion of persons principally dependent on agricultural labour in the five eastern districts of Warangal, Mahbubnagar, Nalgonda, Karimnagar and Hyder~bad, as compared with the corresponding proportion in the north-western districts of the state, is due to various factors. It is, to a large extent, the obvious result of the proportion of agricultural classes taken all together being itself lower in the former than in the latter for reasons explained in detail in paragraph 190. An additional factor is the smaller proportion of lands in them (excluding Hyderabad District) than in the north-western districts owned by non· cultivating castes like those of the Marwadis and the Brahmins and certain classes of the Muslims and Lingayats. Many among these persons who possess lands do not associate themselves actively in the processes of cultivation,. unless they are compelled to do so by force of circumstances. As against this, even the relativel y well-to-do among the persons belonging to cultivating castes and classes, including their' women, deem such association as being part of their normal duties. Naturally, therefore, land owners belonging to cultivating castes or classes engage a smaller number of farm servants or other agricultural labour than similar persons belonging to non -cultivating castes or classes. A heavier proportion of persons principally dependent on tenant cultivation in Hyderabad (excluding Hyderabad City and its suburban units), Mahbubnagar and N algonda
17
146
-Districts and in the extreme eastern tracts along the Godavari in Karimnagar and Warangal Districts-vide paragraph 198 for details-is also a contributory factor. Obviously, persons who are principally dependent on tenant cultivation engage smaller numbers of agricultural labourers than those who are similarly dependent on owner cultivation do. Yet another contributory factor is perhaps a relatively heavier emigration of persons belonging to the labour classes from the rural to the urban areas ~nd their subseguent absorption in non-agricultural occupations. This emigration is mainly directed to Hyderabad City in the case of the rural areas of Hyderabad, Nalgonda and Mahbubnagar Districts,' to Hyderabad City and to the urban areas of Waranga!, Nizamabad and Adil-
_ abad Distri<,ts, in case of Karimnagar District; and to Warangal City, the mining towns of Kothagudem and Yellandu, and to the towns across the border in Madras State in case of Warangal District. Besides, the total demand for agriculturallabour in the eastern districts of Mahbubnagar, Warangal, Nalgonda and Karimnagar is to a very large extent met by persons taking to it as a subsidiary occupation.
The smaller proportion of persons principally sustained by agricultural labour in these five eastern districts as compared with the corresponding proportion in Adilabad District, is largely due to the fact that they are distinctly richer in rural industries, artisan trades, toddy drawing and commerce, although the advantage in respect of natural resources (i.e., primary industries) is perhaps slight1y in favour of Adilabad District. Other factors contrihutin~ to the lower proportion of the Livelihood Class of Agricultural Labourers in these five eastern districts as compared with Adilabad are a lower percentage of Scheduled Castes and Tribes anJ Backward Classe~ who are the most landless among the cultivating castes or classes in the state; a heavier emigration of labour classes from the rural to urban areas, within or beyond the districts concerned, and their subsequent absorption in non-agricultural occupations; greater resort to agricultural labour as a subsidiary occupation except in case of Hyderabad District; and in so far as Warangal and Karimnagar Districts are concerned, a distinctly higher percentage of small land holders to the total number of pattedars.
As against this, the Livelihood Class of Agricultural Labourers in these five eastern districts is relatively more numerous than the south-western districts of Gulbarga and Raichur P!incipally because the rainfall in the ~ormer, u~li~e i~ the case of the latter, is both suffiClent and generally dependable. BeSIdes, the IrrIgatIon resources of these eastern districts are comparatively well developed and they have a heavy acreage under paddy. These factors are conducive to the sustenance of agricultural labourers in larger numbers. The heavier proportion of agricultUJ.'al labourers in these five eastern districts than in Nizamaba.d and Meda~ is primarily due to a lower proportion of small pattedars and to a hIgher proportIon of Scheduled Castes, Scheduled Tribes and other backward sections of the population, who, as stated earlier, are relatively the most landless in the state among the cultivating castes or classes.
(ii) In keeping with the ?ver-all pattern in the five east~rn districts of Waraugal, Mahbubnagar, Nalgonda, Karmll1agar and Hyderabad (excludmg of course the tahsil of Hyderabad West* which contains Hyderabad City), the proportion of the Livelihood 'Class of Agricultural Labourers is neither spectacular nor insignificant in any of their tahsils. . In only three of them, namely Manthani of Kar muagar District, Madhira of
* The proportion in lIyderabad West Tahsil is as low as 10. But if the figures pertaining to Hyderabad City and its sub. urban units are excluded the proportion in the tahsil increases to 101. But even this figure is lower than the corresponding proportion in the n~igl~bourin~ ~hsils. Obviously, ~ very ~arge numbe~ of persons resi~g ~ the vi!lages round about the citv
,are also employed WithIn the City Itself or are engaged In varIOus non-agncultural occupatIons m the Villages catering to the cityfs ;myriad needs.
17·
147
Warangal District and Kollapur of Mahbubnagar District, the proportion exceeds 250. Even in these tkee tahsils, the highest proportion recorded is only 260 in l\{3,nthani. As against this, in none of the other tahsils is the proportion lower than 100.
But within these five eastern districts themselves the proportion of the livelihood class is relatively heavy in two areas. The first of these areas consists of the tahsils of Manthani, Sultanabad and Parkal in Karimnagar District and Mulug and Burgampahad Tahsils in Warangal District, all of which lie in the belt adjoining the Godavari*. The. proportion in these tahsils ranges between 207 in Parkal to 260 in Manthani. Palvancha Tahsil of Warangal District would have also fallen into this pattern but for the influence of its large collieries. A heavy proportion of Scheduled Castes, Scheduled Tribes and other very Backward Classes, acquisition of lands formerly owned by them as well as of fallow or forest lands by comparatively recent immigrants belonging to relatively advanced cultivating and non-cultivating castes or classes, and the existence of some very big landlords, are perhaps the chief factors leading to the comparatively heavy proportion of the Livelihood Class of Agricultural Labour in Manthani, Sultanabad, Parkal and Mulug. A slightly more important factor for the heavier proportion in Burgampahad is perhaps the extremely limited volume of employment available in various types of non-agricultural occupations. The second of these areas consists of the tahsDs of Madhira and Kharnmam in Warangal District, Huzurnagar and Nalgonda in Nalgonda District and Kalvakurti, Achampet and Kollapur in Mahbubnagar District, all of which occupy the southern portions of their respective districts. The proportion in these tahsils ranges between 202 in N algonda to ,257 in Madhira. Relatively limited extent of non-agricultural occupations except in portions of Khammam and Nalgonda Tahsils, a heavy proportion of Scheduled Castes and other very Backward Classes, intensive cultivation in portions of Madhira, Khammam, Huzurnagar, Nalgonda and Kollapur Tahsils, and the existence of fairly big landlords, are perhaps the main factors responsible for the relatively heavy proportion of the livelihood class. In keeping with the general tendency observed in scarcity areas, the proportion of persons principally sustained by agricultural labour is, however, not very significant in Devarkonda and Miryalguda '1'ahsils of Nalgonda District which also fall within this southern
\ belt. The actual proportion in these two tahsils is only 153 and 171 respectively.
As against this, within these five districts excluding Hyderabad West Tahsil in Hyd~rabad District, the proportion is rel~tively low in the tahsils of MetI?alli in Karimnagar, Palvancha in Warangal and Makhtal m Mahbubnagar. The proportIOn in each of these tahsils is only about 112. The low proportion is mainly due in case of Metpalli to the fact that conditions in it resemble those in the adjoining district of Nizamabad, vide paragraph 203; in case of Palvancha to the influence of its collieries; and in case of Makhtal to a large number of persons principally dependent on occupations connected with stock raising and weaving .
. 205. Districtwise Variation in the Livelihood Class of Agricultural Labourers in relation to
Gross Cultivated Area.-There is no doubt that in this state, as mentioned in the earlier paragraphs, the proportion of persons principally sustained by agricultural labour to the total population is especially heavy in the north-western districts and in Adilabad District, especially low in the south-western districts and in the central districts of Nizamabad and Medak in the eastern half of the state, and is round about the state's average in the rest of the eastern districts. But this picture is not entirely in keeping with the * These tahsils form a contiguous belt with Lakshattipet and Chinnoor Tah~iIs of Adilabad ! District J dealt with in paragraph 201 wherein also the Livelihood Class of Agricultural Labourers is relatively very numerous.

148
prevailing conception that agricultural labourers are more numerous in the eastern, i.e., in the well irrigated areas of the state, than in the western, i.e., its poorly irrigated areas. This conception is evidently based on the number of agricultural labourers employed, or available, in different parts of the state in relation to the area under cultivation. This would be obvious from Table 29, which gives districtwise figures regarding the number of persons belonging to the Livelihood Class of Agricultural Labourers per 100 acres of gross cultivated area.
TABLE 29
No. belonging to L.C.* District of Agrl. Labour
per 100 acres of G.C.A.t
No. belonging to L.C. * District of Agrl. Labour
per 100 acres of G.C.A.t (1) (2) (1) (2)
Warangal 24 Parbhani 13
Hyderabad 22 Mahbubnagar 13
Karimnagar 21 Hyderabad State 12
Nalgonda 16 Osmanabad 12
Nizamabad 16 Aurangabad 9
Bidar 15 Bhir 9
Adilabad 15 Gulbarga 7
Medak 13 Raichur 5
, Nanded 13]
*L.C.=Livelihood~Class tG.C.A.=Gross Cultivated Area
There is no doubt that the figures given in the Table 29 are by no means indicative of the number of agricultural labourers employed in terms of a specific unit of cultivated area in any district of the statet. They represent only the proportion of the Livelihood Class of Agricultural Labourers to the gross cultivated area in 1951-52. But, anyway, they are good enough to illustrate how agricultural labourers in relation to cultivated area ·are more numerous in the eastern than in the western districts of the state. The strength of agricultural labour in any tract does not, however, merely dep'end upon the extent of cultivated or irrigated area but also Qn various other factors such as the size of average holdings, nature of crops grown, type of irrigation adopted, propor-_ tion of cultivated area in possession of cultivating or non-cultivating castes, classes and individuals, and the extent to which agricultural labour is followed as a secondary or subsidiary occupation. For example, the heavier proportion of the Livelihood Class of Agricultural Labourers in Hyderabad than in Nizamabad District as a whole, as indicated in Table 29,-in spite of a higher proportion of irrigated and cultivated areas in the latter than in the former-is due to larger holdings, greater proportion of lands owned by non-cultivating classes, and little attraction, or scope, for agricultural labour as a secondary occupation.
~The proportions given in Table 29 relate to the number of persons belonging to the Livelihood Class of Agricultural Labourers i.e., of the self-supporting persons principally sustained by agricultural labour as well as of all their dependants. To this extent, therefore, the figures are in excess of self-supporting persons who returned agricultural labour as their principal occupation. As against this, they do not take into consideration agricultural labourers who follow the occupation as a secondary one or the number of earning dependants working as agricultural labourers. The number of such persons, as stated elsewhere, is very large especially in some areas of the state. Besides, the proportions are based on the area cultivated during both the agricultural seasons of 1951·52. Lastly, they do not take into account tenant and owner cultivators who also take an active hand in all processes of cultivation.

HYDERABAD STATE
Number of Persons belonging to Livelihood Class of Absentee Landlords, among every 1,000 of the Total Population, in the various Tahsils and Districts of the State
INDEX OF DISTRICTS AND TAHSILS
1. Aurangabad Dist. 5. Bhir Dist. 4. Gangawati. 13. llIedak Dist. 5. Koppal.
1. Aurangabad. 1. Billr. 6. Yelburga. 1. Sangareddy. 2. Paithan. 2. Patada. '7. Kushtagi. 2. Vikara bad. 3. Gangapur. 3. Ashti. 8. Lingsugur. B. Andol. 4. Vaijapur. 4. Georai. 9. Deodurg. 4. Medak. 5. Kannad. 5. Manjlegaon. 10. Gadwal. ri. Siddipet. 6. Khuldabad. 6. l\-lominabad. n. Alampur. 6. Gajwel. '7. Sillod. 7. Kaij. '7. Narsapur. 8. Bhokardan.
10. Gulbarga Dist. 9. Jaffarabad. 6. Osmanabad Disi. 14. Karimnagar Dist. 10. Jalna. 1. Gulbarga. 11. Ambad. 1. Osmanabad. 2. Chitapur. 1. Karimnagar.
2. Tuljapur. :3. Yadgir. 2. Sirsilla. 2. Parbhani Disi. :3. Parenda. 4. Shahpur. 3. Metpalli.
4. Bhoom. 5. Shorapur. 4. Jagtiyal. 1. Parbhani. 5. Kalam. 6. Jev&rgi (Andola). 5. Sultanabad. 2. Gangakhed. 6. Latur. '"' Afzalpur. 6. Manthani (~Jaha.deopur). .. 3. Pathri. 7. Owsa. 8. Aland. 7. Parkal. 4. Partur. R. Omerga. 9. Chincholi. 8. Huzurabad. 5. Jintur. 10. Tandur. 6. Hingoli. 7. lfyderabad Dist. 11. Kodangal. 15. Warangal Dist. 7. Kalamnuri. 12. Seram. s. Basmath. 1. Hvdembad West. 1. Waranga!.
2. Hydcmbad Ea,t. 11. Adilabad Dist. 2. Pakhal. 3. N anded Dist. 3. Shahabad. 3. Mulug.
4. Medchal. 1. Adilabad. 4. Burgampahad. 1. Nanded. 5. Ibrahimpatnam. 2. Utnoor. 5. Palvancha. 2. Biloli. 3. Khanapur. 6. Madhira. 3. Deglur .. , 8. Mahbubnagar Disl. 4. Nirmal. '7. Yellandu. 4. Mukhed. 5. Baath. 8. Rhammam. 5. Kandhar. 1. Mahbubnagar. 6. Kinwat. 9. Mahbubabad. 6. Hadgaon. 2. Wanparti. 7. Rajura. '7. Bhoker. 3. Atmakur. 8. Sirpur. 16. N algonda Dist. 8. Mudhol. 4. MakhtaL 9. Chinnoor.
5. Pargi. 10. Lakshattipet. 1. Nalgonda. 4. Bidar Dist. 6. Shadnagar. 11. Asifabad. 2. Miryalguda.
7. KalvakurtI. 3. Deverkanda. 1. Bidar. 8. Achampet. 12. Nizamabad Dist. 4. Ramannapet. 2. Zaillrabad. 9. Nagarkurnool. 5. Bhongir. 3. Humnabad. 10. Kollapur. 1. Nizamabad. 6. Jangaon. 4. Bhalki. 2. Kamareddy. 7. Suryapet. 5. Nilanga. 9. Raichur Dist. 3. Yellareddy. 8. Huzurnagar. 6. Ahmadpur. 4. Banswada. 7. Udgir. 1. Raichur. 5. Bodhan. 8. Santpur (Aurad). 2. Manvi. 6. Armoor. 9. Narayankhed. 3. Sindhnoor.
(P. T. 0.]
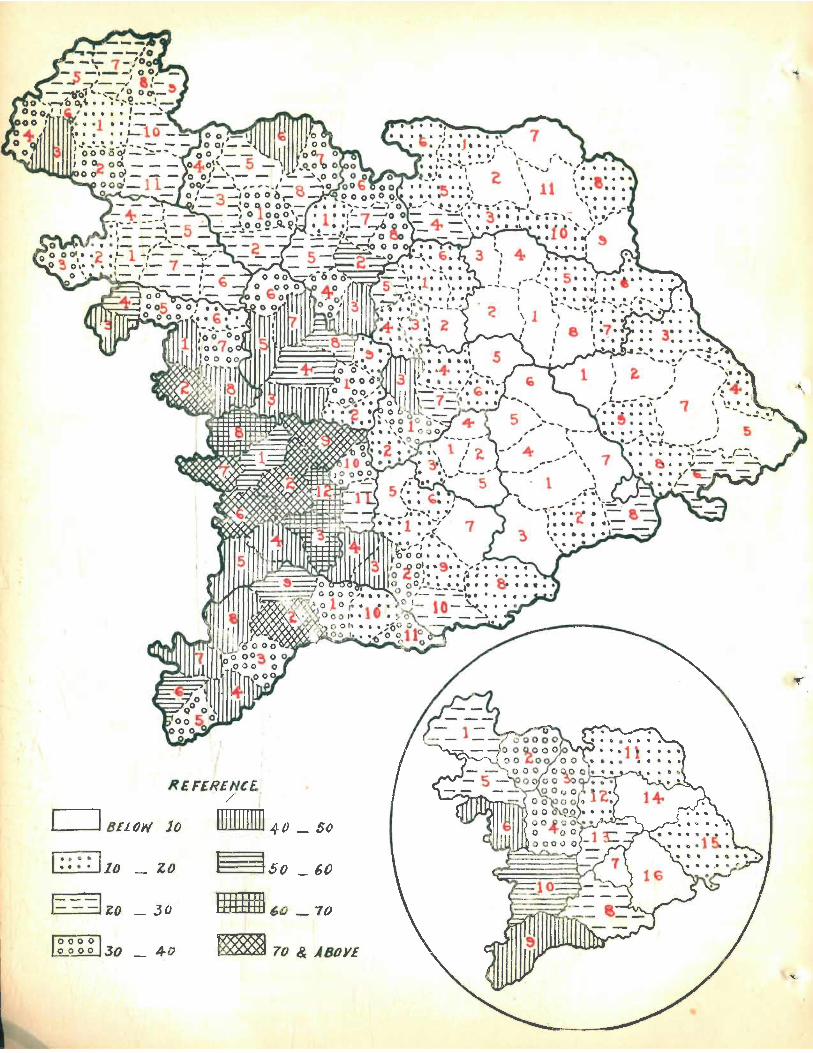
REFERENCE. /
BEL()W 11) 1lI111111111 40 _ 50
.. 110 I 150 • • .. _ Z() _ 6b
1- --Izo _ JO U1ftill1 6 0 _70
[t~30 _ 4 0 ~ 70 & ABOYE
151
206. DistrictwisB Variation in tke Proportion oJtke Livelihood Class oj Persons princi.paUy dependent on Agricultural Rent.-Districtwise, the highest proportion of the number ·of persons principally dependent on agricultural rent among every 1,000 of the population is only 56 in Gulbarga. It is slightly higher than 40 in Osmanabad and Raichur and is almost 40 in Bidar. It tanges between 30 and 35 in Nanded and Parbhani; is 28 in Aurangabad ; varies between 20- and 25 in Bhir, Medak and Mahbubnagar; between 10 and 15 in Nizamabad, Adilabad and Warangal, being lowest in Warangal; and between 5 and 10 in Karimnagar, Nalgonda and Hyderabad. The proportion in Hyderabad is 5 which is the lowest recorded among the districts of the state. Even if the figures pertaining to Hyderabad City and its suburban units are excluded, the proportion in the district remains as low as 7. Thus, the proportion of persons principally sustained by :lgricultural rent is distinctly heavier in the western than in the eastern districts but it can nowhere be deemed to be striking. Further, within the western districts themselves, it is markedly higher in Gulbarga and, to a smaller extent, in the surrounding districts of 'Osmanabad, Bidar and Raichur ; and within the eastern districts themselves, it is markedly lower in Hyderabad, Nalgonda, Karimnagar and Warangal.
207. The distinctly higher proportion of this livelihood class in the western than in the eastern districts of the state, as indicated in the preceding paragraph, can easily be ·explained. It is no doubt, to a large extent, the natural sequence of agricultural classes as a whole being, for reasons detailed in paragraph 190, relatively more numerous in the former than in the latter. But there are other factors, perhaps more important, also at work. The Brahmins, Marwadis, Lingayats and Muslims, are considerably more numerous in the western than in the eastern districts of the state. And perhaps, even .after making due albwances for the larger number of persons belonging to such groups in the western than in the eastern districts of the state, the percentage of the cultivated area owned by them to the total cultivated area is more impres·sive in the former than in the latter. As stated earlier, the Marwadis and the Brahmins generally engage themselves in cultivation only when they have no alternative. The majority of them owning lands devote their time mostly to non-agric~tural occupations- the Marwadis chiefly to commerce, banking, money-lending and' certain types of industries, and the Brahmins chiefly to services (including religious services) and the learned professions. Similarly, although the Lingayats cannot exactly be deemed to be .a non-cultivating caste, very large numbers of them in spite of owning lands, have taken to non-agricultural occupations, especially those connected with commerce. And again, although appreciable numbers of Muslims are actively engaged in agricultural occupatioru;, the majority of them have a distinct preference for non-agricultural occupations parti·cularly those connected with services. This factor also explains, to a large extent, the particular concentration of the Livelihood Class of Absentee Landlords in the western districts of Gulbarga, Osmanabad, Bidar and Raichur, wherein such groups taken ·as a whole, are relatively more numerous than in the other districts of the state.
As against this, in the eastern districts as a whole, cultivating castes like the Kapus, VeJ.amas and Kammas, are well entrenched, especially as c()ro.pared with, the corresponding caste of the Marathas in the north-western districts of the state. In other words, the proportion of the relatively big and ric\ pattedars belonging to such indigenous and purely cultivating castes is considerably more numerous in the eastern than in the western half of the state. Such pattedars almost invariably cultivate themselves most of their ~ands, or at least the best portions of them, leasing out only those portions which are not
18
152
conveniently situated, or whose cultivation they find it difficult to undertake for any particular reason. The majority of these landlords return their principal source of sustenance as being owner cultivation and not agricultural rent. Again, quite a number of persons residing in Hyderabad City own very ('xtensive lands within Hyderabad District or the adjoining districts. The majority of these persons--who are employed in rarious non-agricultural occupations in the city or derive appreciable income from Sources such as interest on deposits, dividends on shares, house rental, mansabs, etc.,have returned, if at all they have done w, agricul tural rent as a secondary and not asthe principal means of livelihood. Thus, not only is the actual number of persons leasing out their lands, in relation to the total population lower in the eastern than in the western districts, but of these persons a- smaller proportion in the former than in the latter return agricultural rent as b~ing their principal means of livelihood.
208. The proportion of the Livelihood Class of persons wholly or mainly sustained by Agricultural Rent to the total population in an overwhelming number of the tahsils in the state is in keeping with the general pattern indicated in par::J.graph 206. Among all the thirty four tahsils in the districts of Aurangabad, Parbhani, Nanded and Bhir in the western half of the state, the proportion is below 10 in no tahsil and is below 20 in only the three tahsils of Aurangabad in Aurangabad District, Nanded in Nanded District and Patoda in Bhir District. The relatively low proportion in the first two of' these tahsils is due largely to the heavy non-agricultural popUlation in Aurangabad and Nanded Towns and to an extent to the fact that many absentee landlords in these towns, as in other urban areas of industrial or commercial importance, must h::we returned theirprincipal source of sustenance as being something other than agricultural rent. The relatively low proportion in Patoda Tahsil is perhaps due to the fact that the Iercentage of purely cultivating castes is extremely heavy in this tahsil which is of very little impor-
, tance from the industrial and commercial points of view and contains no town and possesses few large villages. In fact, the proportion of owner cultiv8ttors in this tahsil is the heaviest in the state. In all the remaining thirty one tahsils in these four districts, the proportion ranges from 20 to 30 in sixteen; from 30 to 40 in eleven, from 40 to 50 in three and is 55 in only one tahsil, namely Biloli of Nanded District. As against ihis, among all the forty tahsils in the remaining districts of Gulbarga, Osmanabad,. Bidar and Raichur in the western half of the state, the proportion is 82, the highest record~ ed in the state, in Andola (Jevargi) Tahsil of Gulbarga District; ranges between 70 and 80 in Chitapur, Chincholi and Afzalpur Tahsils of Gulbarga District, Tuljapur TahsH or Osmanabad District and Manvi Tahsil of Raichur District; 'and between 60 and '70 in Yadgir, Seram and Aland, all in Gulbarga District. The pre portion in Gulbarga. Tahsil itsdf is just 50, because of the heavy non-agricultural population in Gulbarga Town. If figures pertaining to this town are excluded, the proportion'in the tahsil increases to 74-which is in keeping with the corrtsponding proportion in ,the surrounding tahsils. Of the remaining thirty tahsils, the proporticn ranges between 50 and 60 in five; between 40 and 50 in twelve, including Koppal Tahsil of Raichur District minus its Tungabhadra Project Camps; betwef'n 35 and 40 in three ;- and is almost 35 in two other tahsils. As regards the remaining eight tahsils, it ranges between 30 and 35 in Alampur ::"nd Raichur Tahsils of Raichur District and Tandur Tahsil of Gulbarga District; is slightly in excess of 20 in KodangaI; and ranges between 15 and 20 in Gadwal Tahsil. of Raichur District, Latur Tahsil of Osmanabad District and Zahirabad and Narayankhed Tahsils of Bidar District. It may be noticed that all these eight tahsils, except Latur, border the eastern districts and both Latur and Raichur Tahsils have very big towns, which explain their low proportion of this class.
IS*
153
Contrary to the tendency in the western districts, among all the sixty four tahsils, in the eight eastern districts of Warangal, Karimnagar, Adilabad, Nalgonda, Medak, Nizamabad, Hyderabad and Mahbubnagar, the proportion exceeds 40 in only Andol Tahsil of Medak District, Atmakur and Makhtal Tahsils of Mahbubnagar District, the highest being about 45 in Andol; and exceeds 80 in only Wanparti Tahsil of Mahbubnagar and Sangareddy Tahsil of Medak District. It may be observed that all these tahsils adjoin the western districts of the state. In the other tahsils, the proportion ranges between 25 and 80 in only one, between 20 and 25 in five and between 15 and 20 in six. In all the remaining forty seven tahsils it is below 15, being even lower than 10 (i.e., I per cent of the total population) in twenty seven of them.
209. It has been stated in paragraph 198, that the proportion of the Livelihood. Class of Tenant Cultivators is markedly heavy in three zones of the state, namely in (i) the extreme eastern tracts along the Pen ganga, the Wardha and the Godavari, (ii)the south: central areas surrounding Hyderabad City and, to a smaller extent, (iii) the northern. tahsils of Gulbarga District and the southern tahsils of Bidar District. This concentration, except in the case of the third zone mentioned above, is apparently contradictory with the statement made in paragraph 206 to the effect that the Livelihood Classof Absentee Landlords is distinctly heavier in the western than in the eastern districts. One would imagine that these two livelihood classes go together and variations in theirproportions would not, at any rate, be contradictory. This paradox is easily explained. The proportion of persons who have actually returned tenant cultivation as their principal means of livelihood to the total number' of persons who have obtained lands on lease is appreciably higher in the eastern than in the western districts. This is due to the fact that tenant cultivators constitute more of a distinct groupin the former than in the latter. In the latter, tenant cultivation is more often resorted to as a subsidiary occupation, especially by the smaller of the o\\ner cultivators. As against this, the proportion of persons who have actually returned agricultural rent as their principal means of livelihood to the total number of persons who have leased out their lands, wholly or partly, is appreciably lower in the eastern than in the western districts. This is largely due to the fact that more of the landlords, in other worp-s, more of the actual number of persons leasing out their lands, in the eastern than in the western districts in general belong to cultivating castes or classes. "The majority of such persons generally themselves cultivate most or at least portions < of their lands and le~se out only the remaining, and consequently return their principal means or livelihood as owner cultivation and not as agricultural rent. Again, an extraordinarily heavy proportion of the persons residing in Hyderabad City, whether belonging to cultivating or non-cultivating castes or classes, who have leased out their lands in the mofussil areas, return non-agricultural occupations, or sometimes even income from non-agricultural property, as their principal means of livelihood. Very few of them return agricultural rent as such. Thus, in terms of principal means of livelihood,. the census returns for tenant cultivation in the western and that of absentee landlordism in eastern districts suffer to an appreciable extent.
210. Districtwise Variation in the Proportion of the Livelihood Cla8s of P er80ns principally dependent on Production (other than cultivation). Among the districts of the state, Karimnagar has the distinction of supporting, wholly or mainly, by far the largest number of persons, or proportion of the total population, by occupations connected with production (other than cultivation). As many as 273 out of every 1,000 persons in the district-
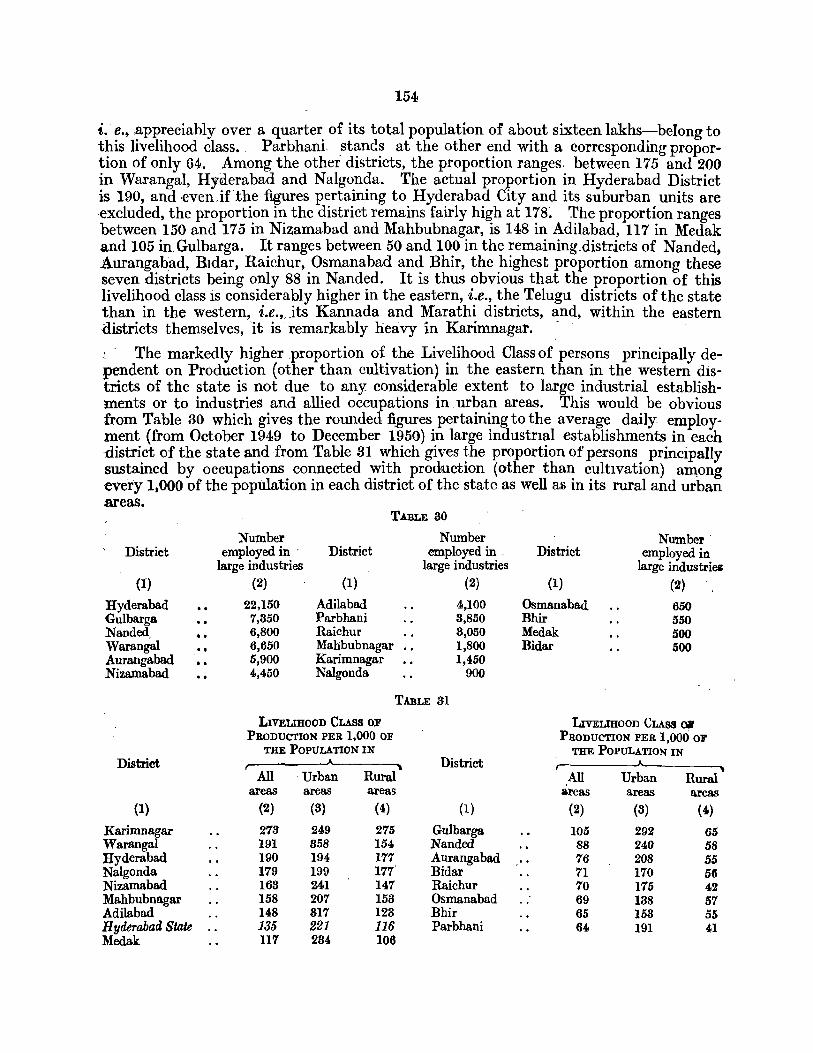
154
i. e.~ ,appreciably over a quarter of its total population of about sixteen lakhs-belong to this livelihood class.. Parbhani, stands at the other end with a corresponding proportion of only 64. Among the other districts, the proportion ranges between 175 and 200 in Warangal, Hyderabad and Nalgonda. The actual proportion in Hyderabad District is 190, and ,even.ifthe figures pertaining to Hyderabad City and its suburban units are excluded, the proportion in the district remains fairly high at 17K The proportion ranges betw:een 150 and 175 in Nizamabad and Mahbubnagar, is 148 in Adilabad, 117 in Medak and 105 in,Gulbarga. It ranges between 50 and 100 in the remaining. districts of Nanded, Aurangabad, Bldar, Raichur, Osmanabad and Bhir, thc highest proportion among these seven districts being only 88 in Nanded. It is thus obvious that the proportion of this livelihood class is considerably higher in the eastern, i.e., the Telugu districts of the state than in the western, i.e." its Kannada and Marathi districts, and, within the eastern districts themselves, 'it is' remarkably heavy in Karimnagar. -
i' The markedly higher ,proportion of the Livelihood Class of persons principally dependent on Production (other than cultivation) in the eastern than in the western districts of the state is not due to any considerable extent to large industrial establishments or to industries and allied occupations in . urban areas. This would be obvious from Table 30 which gives the rounded figures pertaining to the average daily employment (from October 1949 to December 1950) in large industrIal ·establishments in each district of the state and from Table 81 which gives the proportion of persons principally sustained by occupations connected with production (other than cultivation) among every 1,000 of the population in each district of the state as well alii in its rural and urban areas.
TABLE 30
Number Number NU7nber District employed in . District employed in , District employed in
large industries large industries large industries (1) (2) (I) (2) (1) (2)
Hyderabad · . 22,150 Adilabad 4,100 Osmanabad 650 Gulbarga 7,350 Parbhani 3,850 Bhir . 550 Nanded, • • 6,800 Raichur 8,050 Medak 500 Warangal • • 6,650 Mahbubna.gar 1,800 Bidar 500 Aurangabad • • 5,900 Karimnagar 1,450 Nizamabad · . 4,450 Nalgonda 900
TABLE 31
LIVELIHOOD CLASS OF LIvELIHOOD CLASS 06 PRODUCTION PER 1,000 OF PRODUCTION PER 1,000 OJ'
THE POPULATION IN THE POPULATION IN District District
All . Urban Rural All Urban Rural areas areas areas 3l"eas areas areas
(1) (2) (8) (4) (I) (2) (3) (4)
Karimnagar 273 249 275 Gulbarga 105 292 65 Warangal 191 858 154 Nanded 88 240 58 Byderabad 190 194 177 Aurangabad 76 208 55 Nalgonda 179 199 177 Bidar 71 170 56 Nizamabad 163 241 147 Raichur 70 175 42 Mahbubnagar 158 207 153 Osmanabad 69 188 57 Adila.bad 148 817 123 Bhir 65 153 55 Hyderabad State .. 135 221 116 Parbhani 64 191 41 Medak U7 284 106
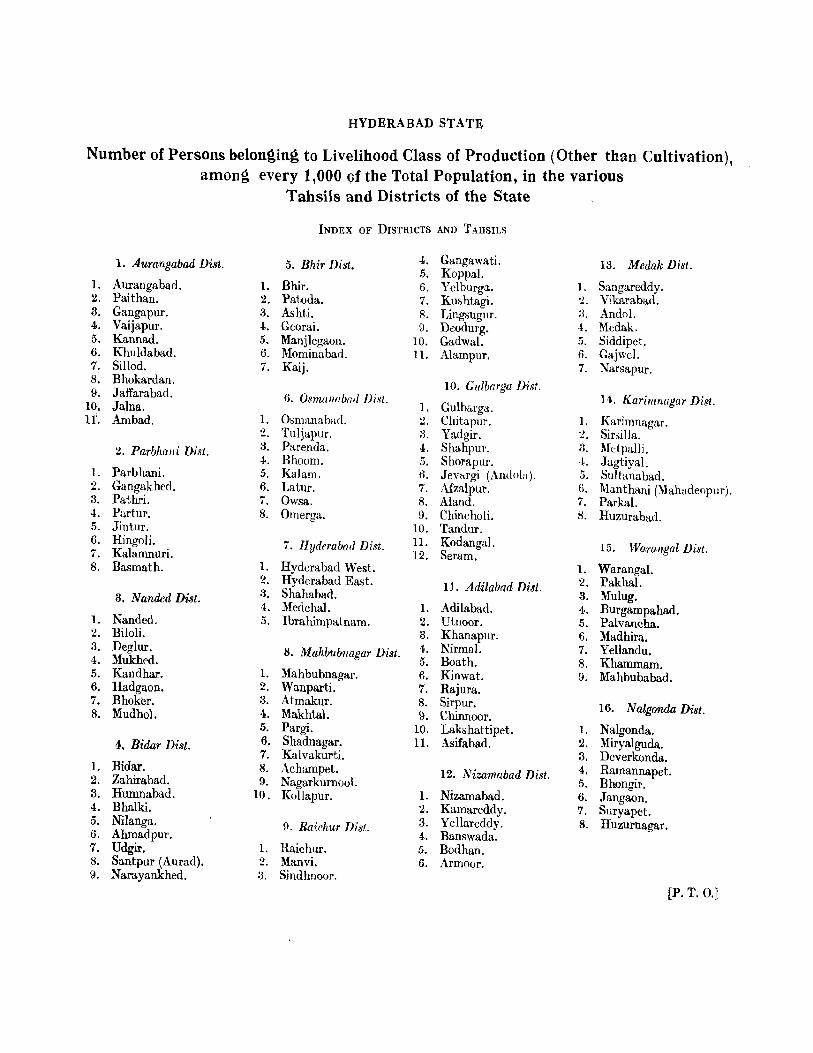
HYDERABAD STATE
Number of Persons belong,ing to Livelihood Class of Production (Other than Cultivation), among every 1,000 of the Total Population, in the various
Tahsils and Districts of the State
INDEX OF DISTRICTS AND T AHSILS
1. Aurangabad Dist. 5. Bhir Dist. 4. Gangawati. 13. Medak Disl. .1). Kappal.
1. Aurangabad. 1. Bhir. 6. Yclburga. 1. Sangareddy. 2. Paithan. 2. Patoda. 7. Kushtagi. :2. Vikarabad. 8. Gangapur. 3. Ashti. 8. Lingsugur. :3. Anda!' 4. Vaijapur. 4. Georai. 9. Deodurg. 4. Medak. 5. Kanuad. 5. Manjlegaoll. 10. Gadwa!. 5. Siddipet. 6. Khuldabad. 6. Mominabad. n. Alampur. 6. Gajwel. 7. SiUod. 7. Kaij. 7. Narsapur. 8. Bhokardan.
10. Gulbarga Disi. 9. Jaffarabad. 6. Osmanobat/ Disi. 14. Karimnagar Dist. 10. Jalna. 1. Gulb",rga. II'. Ambad. 1. O,manabad. 2. Chitapur. 1. Karimnagar.
.~ Tuljapur. 3. Yadgir. .) SirsiJIa. ~.
2. Parbhalli Di.~t. 3. Parenda. 4. Shahpur. 3. Metpalli. 4. Bhoom. 5. Shorapur. 4. Jagtiyal.
1. Parbhani. 5. Kalam. 6. Jev&rgi (Andola). 5. Sultana bad. 2. Gangakhed. 6. Latur. 7. Afzalpur. 6. Manthani (Mahadeopur). 3. Pathri. 7. Owsa. 8. Aland. 7. Parkal. 4. Partur. 8. Omerga. 9. Chincholi. S. Huzurabad. 5. Jintur. 10. Tandur. 6. Hingoli. 7. Hyderabad Diat. n. Kodangal. 15. Warangal Disl. 7. Kalamnuri. 12. Seram. 8. Ba.smath. 1. Hyderabad West. 1. Waranga!.
2. Hyderabad East. D. Adilabad Disi. 2. Pakhal. 3. Nanded Di.Yt. 3. Shahabad. 3. Mulug.
4. Medchal. 1. Adilabad. 4. Burgampahad. I. Nanded. 5. Ibrahimpatnam. 2. Utnoor. 5. Palvancha. 2. Biloli. 3. Khanapur. 6. Madhira. 3. Deglur. 8. Mahbubnagar Disi. 4. Nirmal. 7. Yellandu. 4. Mukhed. 5. Boath. 8. Khammam. 5. Kandhar. 1. Mahbubnagar. 6. Kinwat. 9. Mahbubabad. 6. Hadga.on. 2. Wanparti. 7. Rajura. 7. Bhoker. 3. Atmakur. 8. Sirpur. 16. N algonda Disl. 8. Mudhol. 4. Makhtal. 9. Chinnoor.
5. Pargi. 10. Lakshattipet. I. Nalgonda. 4. Bidar Disl. 6. Shadnagar. 11. Asifabad. 2. Miryalguda.
7. Kalvakurti. 8. Deverkonda. 1. Bidar. 8. Achampet. 12. Nizamabad Disi. 4. Ramannapet. 2. Zahirabad. 9. Nagarkurnool. 5. Bhongir. 3. Humnabad. 10. Kollapur. 1. Nizamabad. 6. Jangaon. 4. Bhalki. 2. Kamareddy. 7. Suryapet. 5. Nilanga. 9. Raichur Dist. 3. Yellareddy. 8. Huzurnagar. 6. Ahmadpur. 4. Banswada. 7. Udgir. 1. Raichur. 5. Bodhan. 8. Santpur (Aurad). 2. Manvi. 6. Armoor. 9. Narayankhed. :~. Sindhnoor.
[Po T. O.J
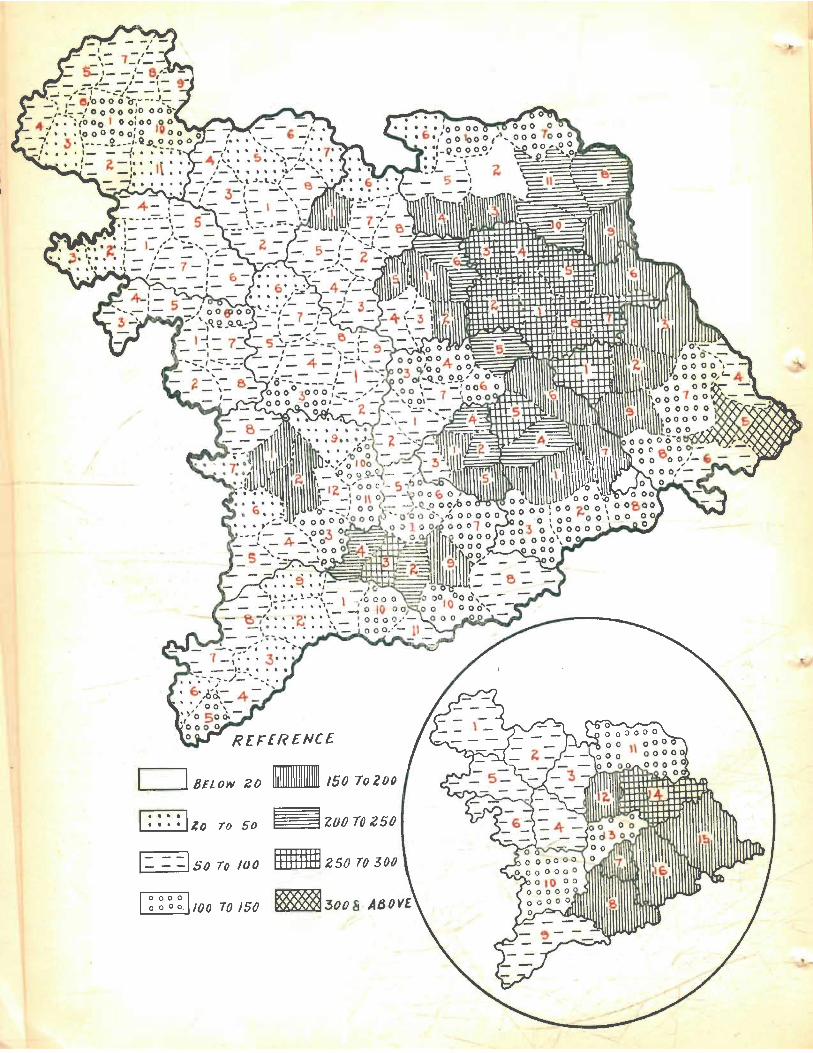
E, 1I111 II 1111.'"
,,-_-,I BELOW ZO _ 150 10200
.... I ' • 'lo 70 50
1= = =1 So To 100 1111111111 Z 50 TO 300
o 000 I o 000. 100 TO ISO ~3008 , A80V£
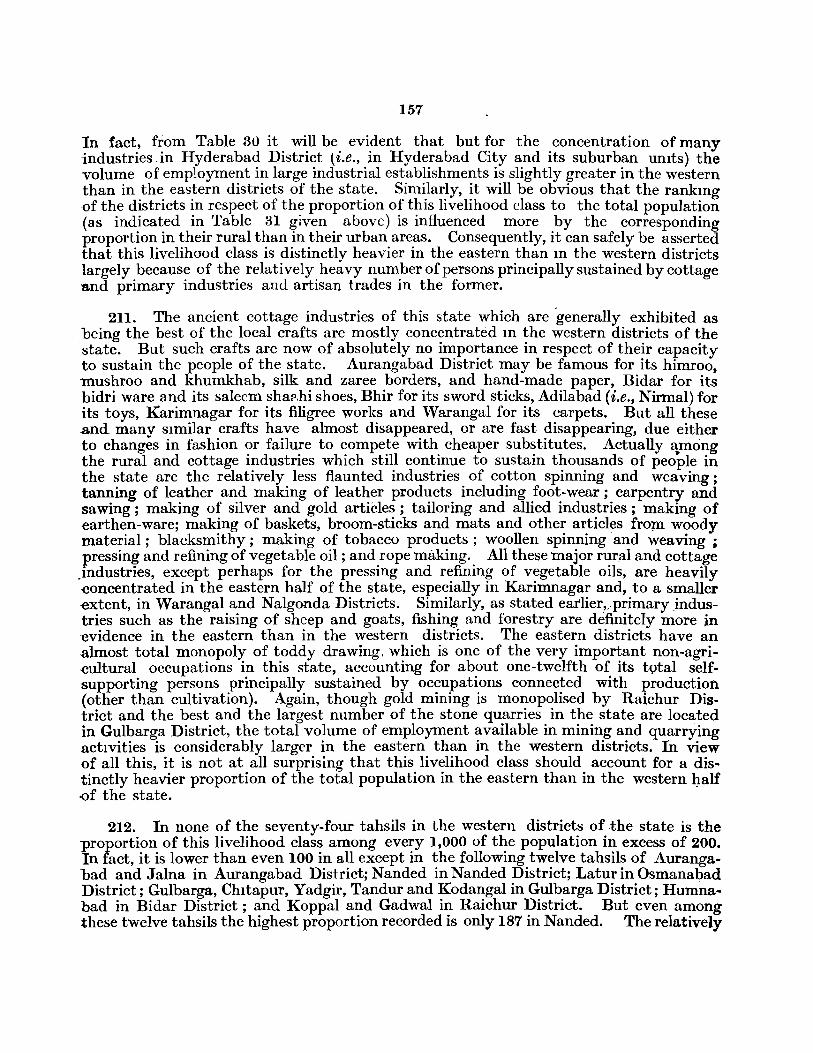
157
In fact, from Table 30 it will be evident that but for the concentration of many industries .in Hyderabad District (i.e., in Hyderabad City and its suburban umts) the volume of employment in large industrial establishments is slightly greater in the western than in the eastern districts of the state. Similarly, it will be obvious that the rankmg -of the districts in respect of the proportion of this livelihood class to the total population (as indicated in Table 31 given above) is influenced more by the corresponding proportion in their rural than in their urban areas. Consequently, it can safely be asserted that this livelihood class is distinctlv heavier in the eastern than m the western districts largely because of the relatively heavy number of persons principally sustained by cottage snd primary industries and artisan trades in the former.
211. The ancient cottage industries of this state which are -generally exhibited as being the best of the local crafts are mostly concentrated m the western districts of the state. But such crafts are now of absolutely no importance in respect of their capacity to sustain the people of the state. Aurangabad District may be famous for its himroo, mushroo and khumkhab, silk and zaree borders, and hand-made paper, Bidar for its bidri ware and its saleem shar,hi shoes, Bhir for its sword sticks, Adilabad (i.e., Nirmal) for its toys, Karimnagar for its filigree works and Warangal for its carpets. But all these and many SImilar crafts have almost disappeared, or are fast disappearing, due either to changes in fashion or failure to compete with cheaper substitutes. Actually among the rural and cottage industries which still continue to sustain thousands of people in the state are the relatively less flaunted industries of cotton spinning and weaving; tanning of leather and making of leather products including foot-wear; carpentry and sawing; making of silver and gold artiCles; tailoring and allied industries; making of earthen-ware; making of baskets, broom-sticks and mats and other articles froIn woody material; blacksmithy; making of tobacco products; woollen spinning and weaving; pressing and refining of vegetable oil; and rope making. All these major rural and cottage
.industries, except perhaps for the pressing and refining of vegetable oils, are heavily -concentrated in the eastern half of the state, especially in Karimnagar and, to a smaller extent, in Warangal and Nalgonda-Districts. Similarly, as stated earlierJ .. primary.industries such as the raising of sheep and goats, fishing and forestry are definitely more in evidence in the eastern than in the western districts. The eastern districts have an .almost total monopoly of toddy drawing, which is one of the very important non-agri-cultural occupations in this state, accounting for about one-twelfth of its t9tal selfsupporting persons principally sustained by occupations connected with production (other than cultivation). Again, though gold mining is monopolised by Raichur District and the best and the largest number of the stone quarries in the state are located in Gulbarga District, the total volume of employment available in mining and quarrying actIvities is considerably larger in the eastern than in the western districts. In view of all this, it is not at all surprising that this livelihood class should account for a distinctly heavier proportion of the total population in the eastern than in the western ~alf -of the state.
212. In none of the seventy-four tahsils in the western districts of the state is the proportion of this livelihood class among every 1,000 of the population in excess of 200. In fact, it is lower than even 100 in all except in the following twelve tahsils of Aurangabad and Jalna in Aurangabad District; Nanded in Nanded District; Latur in Osmanabad District; Gulbarga, Chitapur, Yadgir, Tandur and Kodangal in Gulbarga District; Humnabad in Bidar District; and Koppal and Gadwal in Raichur District. But even among these twelve tahsils the highest proportion recorded is only 187 in Nanded. The relatively
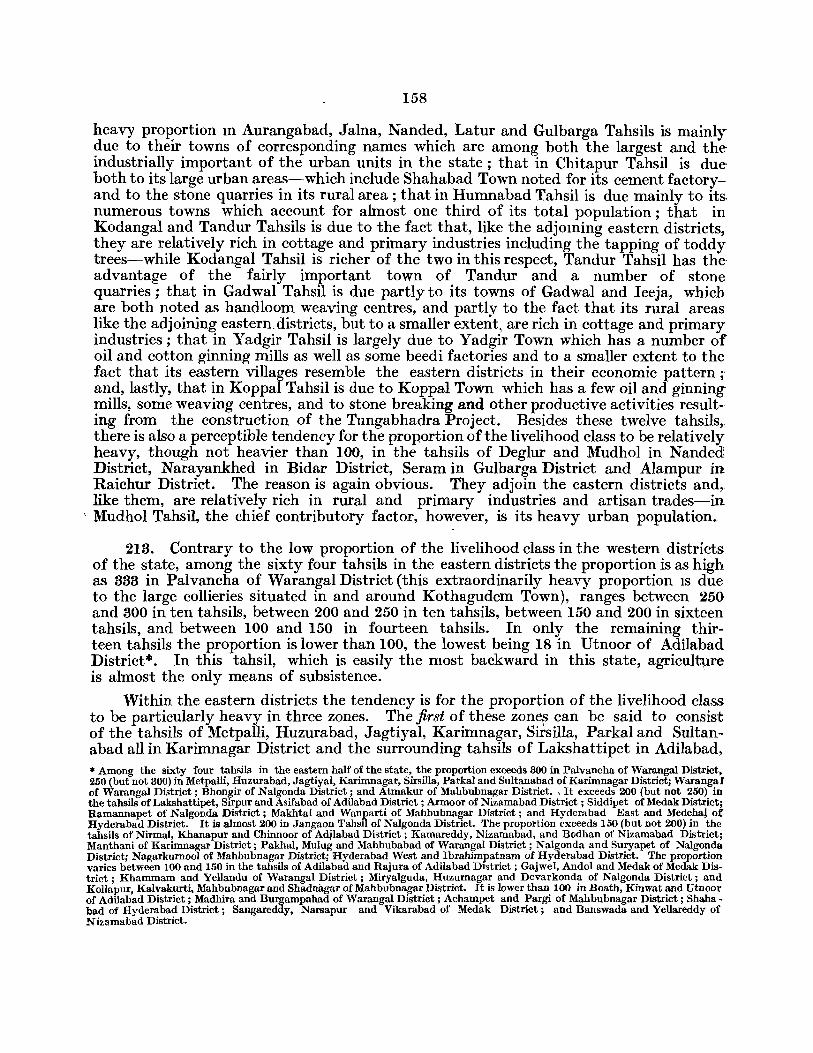
158
heavy proportion III Aurangabad, Jalna, Nanded, Latur and Gulbarga Tahsils is mainly due to their towns of corresponding names which are among both the largest and theindustrially important of the urban units in the state; that in Chitapur Tahsil is dueboth to its large urban areas-which include Shahabad Town noted for its cement factoryand to the stone quarries in its rural area; that in Humnabad Tahsil is due mainly to its. numerous towns which account for almost one third of its total population; that in Kodangal and Tandur Tahsils is due to the fact that, like the adjoming eastern districts, they are relatively rich in cottage and primary industries including the tapping of toddy trees-while Kodangal Tahsil is richer of the two in this respect, Tandur Tahsil has the' advantage of the fairly important town of Tandur and a number of stone quarries; that in Gadwal Tahsil is due partly to its towns of Gadwal and Ieeja, which are both noted as handloom weaving centres, and partly to the fact that its rural areas like the adjoining eastern, districts, but to a smaller extent, are rich in cottage and primary industries; that in Yadgir Tahsil is largely due to Yadgir Town which has a number of oil and cotton ginning mills as well as some beedi factories and to a smaller extent to the fact that its eastern villages resemble the eastern districts in their economic pattern; and, lastly, that in Koppal Tahsil is due to Koppal Town which has a few oil and ginning mills, some weaving centres, and to stone breaking and other productive activities resulting from the construction of the Tungabhadra Project. Besides these twelve tahsils,. there is also a perceptible tendency for the proportion of the livelihood class to be relatively heavy, though not heavier than 100, in the tahsils of Deglur and Mudhol in Nanded District, Narayankhed in Bidar District, Seram in Gulbarga District and Alampur in Raichur District. The reason is again obvious. They adjoin the eastern districts and,. like them, are relatively rich in rural and primary industries and artisan trades-in
, Mudhol Tahsil, the chief contributory factor, however, is its heavy urban population~
213. Contrary to the low proportion of the livelihood class in the western districts of the state, among the sixty four tahsils in the eastern districts the proportion is as high as 333 in Palvancha of Warangal District (this extraordinarily heavy proportion IS due to the large collieries situated in and around Kothagudem Town), ranges between 250 and 300 in ten tahsils, between 200 and 250 in ten tahsils, between 150 and 200 in sixteen tahsils, and between 100 and 150 in fourteen tahsils. In only the remaining thirteen tahsils the proportion is lower than 100, the lowest being 18 in Utnoor of Adilabad District*. In this tahsil, which is easily the most backward in this state, agriculwre is almost the only means of subsistence. .
Within the eastern districts the tendency is for the proportion of the livelihood class to be particularly heavy in three zones. The first of these zone~ can be said to consist of the tahsils of Metpalli, Huzurabad, Jagtiyal, Karimnagar, Sirsilla, Parkal and Sultanabad all in Karimnagar District and the surrounding tahsils of Lakshattipet in Adilabad, • Among the sixty foul' tahsils in the eastern half of the state, the proportion exceeds 300 in Palvancha of Warangal District, 250 (but not 300) in Metpalli, Huzurabad, JagtiyaI, Karimnagar, ,SirsilIa, Parkal and Sultanabad of Karimnagar District; Warangar of Warangal District; Bhongir of Nalgonda District; and Atmakur of Mahbubnagar District. , It exceeds 200 (but not 250) in the tahsils of Lakshattipet, Sirpur and Asifabad of Adilabad District; Armoor of Nizamabad District; Siddipet of Medak District; Ramannapet of NaIgonda District; MakhtaI and Wanparti of Mahbubnagar District; and Hyderabad East and MedchaJ of Hyderabad District. It is almost 200 in Jangaon Tahsil of NaIgonda District. The proportion exceeds 150 (but not 200) in the tahsils of Nirmal, Khanapur and Chinnoor of Adj,labad District; Kamareddy, Nizamabad, and Bodhan of Nizamabad District; Manthani of Karimnagar District; Pakhal, Mulug and Mahbubabad of WarangaI District; NaIgonda and Suryapet of Nalgonda District; NagarkurnooI of Mahbubnagar District; Hyderabad West and Ibrahimpatnam of Hyderabad District. The proportion varies between 100 and 150 in the tahsils of Adilabad and Rajura of Adilabad District; GajweI, Andol and Medak of Medak District; Khammam and Yellandu of WarangaI District; MiryaIguda, Huzurnagar and Devarkonda of NaIgonda District; and Kollapur, Kalvakurti, Mahbubnagar and Shadnagar of Mahbubnagar District. It is lower than 100 in Boath, Kinwat and Utnoor of Adilabad District; Madhira and Burgampahad of Warangal District; Achampet and Pargi of Mahbubnagar District; Shahabad of Hyderabad District; Sangareddy, Narsapur and Vikarabad of Medak District; and Banswada and Yellareddy of N'jzamabad District.
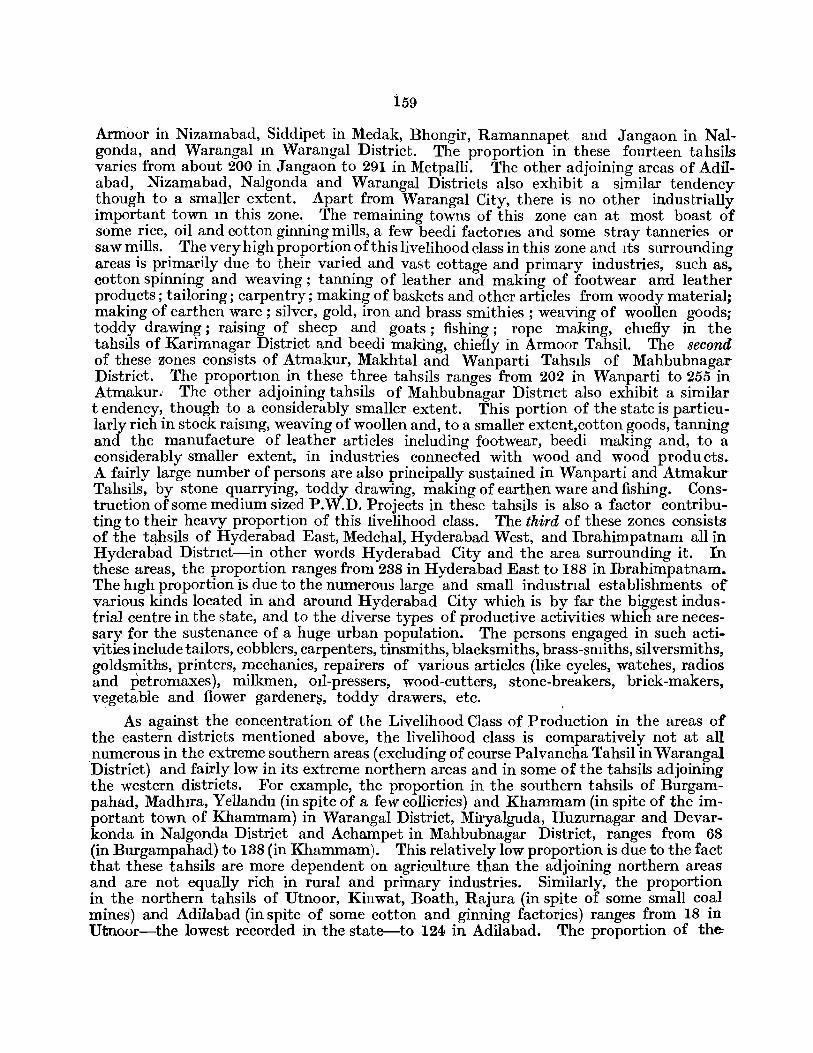
159
Armoor in Nizamabad, Siddipet in Medak, Bhongir, Ramannapet and Jangaon in Nalgonda, and Warangal m Warangal District. The proportion in these fourteen tahsils varies from about 200 in Jangaon to 291 in Metpalli. The other adjoining areas of Adilabad, Nizamabad, Nalgonda and Warangal Districts also exhibit a similar tendency though to a smaller extent. Apart from Warangal City, there is no other industrially important town m this zone. The remaining towns of this zone can at most boast of some rice, oil and cotton ginning mills, a few beedi factorIes and some stray tanneries or saw mills. The very high proportion of this livelihood class in this zone and Its surrounding areas is primarily due to their varied and vast cottage and primary industries, such as, cotton spinning and weaving; tanning of leather and making of footwear and leather products; tailoring; carpentry; making of baskets and other articles from woody material; making of earthen ware; silver, gold, iron and brass smithies; weaving of woollen goods; toddy drawing; raising of sheep and goats; fishing; rope making, chIefly in the tahsils of Karimnagar District and beedi making, chiefly in Armoor Tahsil. The second of these zones consists of Atmakur, Makhtal and Wanparti Tahsiis of Mahbubnagar District. The proportIOn in these three tahsils ranges from 202 in Wanparti to 255 in Atmakur. The other adjoining tahsils of Mahbubnagar DistrIct also exhibit a similar tendency, though to a considerably smaller extent. This portion of the state is particularly rich in stock raismg, weaving of woollen and, to a smaller extent, cotton goods, tanning and the manufacture of leather articles including footwear, beedi making and, to a considerably smaller extent, in industries connected with wood and wood products. A fairly large number of persons are also principally sustained in Wanparti and Atmakur Tahsils, by stone quarrying, toddy drawing, making of earthen ware and fishing. Construction of some medium sized P.W.D. Projects in these tahsils is also a factor contributing to their heavy proportion of this livelihood class. The third of these zones consists of the t~hsils of Hyderabad East, Medchal, Hyderabad West, and Ibrahimpatnam all in Hyderabad DistrIct-in other words Hyderabad City and the area surrounding it. In these areas, the proportion ranges from 288 in Hyderabad East to 188 in Ibrahimpatnam. The hIgh proportion is due to the numerous large and small industrIal establishments of various kinds located in and around Hyderabad City which is by far the biggest industrial centre in the state, and to the diverse types of productive activities which are necessary for the sustenance of a huge urban population. The persons engaged in such activities include tailors, cobblers, carpenters, tinsmiths, blacksmiths, brass-smiths, silversmiths, goldsmiths, printers, mechanics, repairers of various articles (like cycles, watches, radios and petromaxes), milkmen, OIl-pressers, wood-cutters, stone-breakers, brick-makers, vegetable and flower gardener:?, toddy drawers, etc.
As against the concentration of the Livelihood Class of Production in the areas of the eastern districts mentioned above, the livelihood class is comparatively not at all ,numerous in the extreme southern areas (excluding of course Palvancha Tahsil in Warangal District) and fairly low in its extreme northern areas and in some of the tahsils adjoining the western districts. For example, the proportion in the southern tahsils of Burgampahad, MadhIra, YeUandu (in spite of a few collieries) and Khammam (in spite of the important town of Khammam) in Warangal District, Miryalguda, Huzurnagar and Devarkonda in Nalgonda District and Achampet in Mahbubnagar District, ranges from 68 (in Burgampahad) to 188 (in Khammam). This relatively low proportion is due to the fact that these tahsiIs are more dependent on agriculture than the adjoining northern areas and are not equally rich in rural and primary industries. Similarly, the proportion in the northern tahsils of Utnoor, Kinwat, Boath, Rajura (in spite of some small coal mines) and Adilabad (in spite of some cotton and ginning factories) ranges from 18 in Utnoor-the lowest recorded in the state-to 124 in Adilabad. The proportion of the:
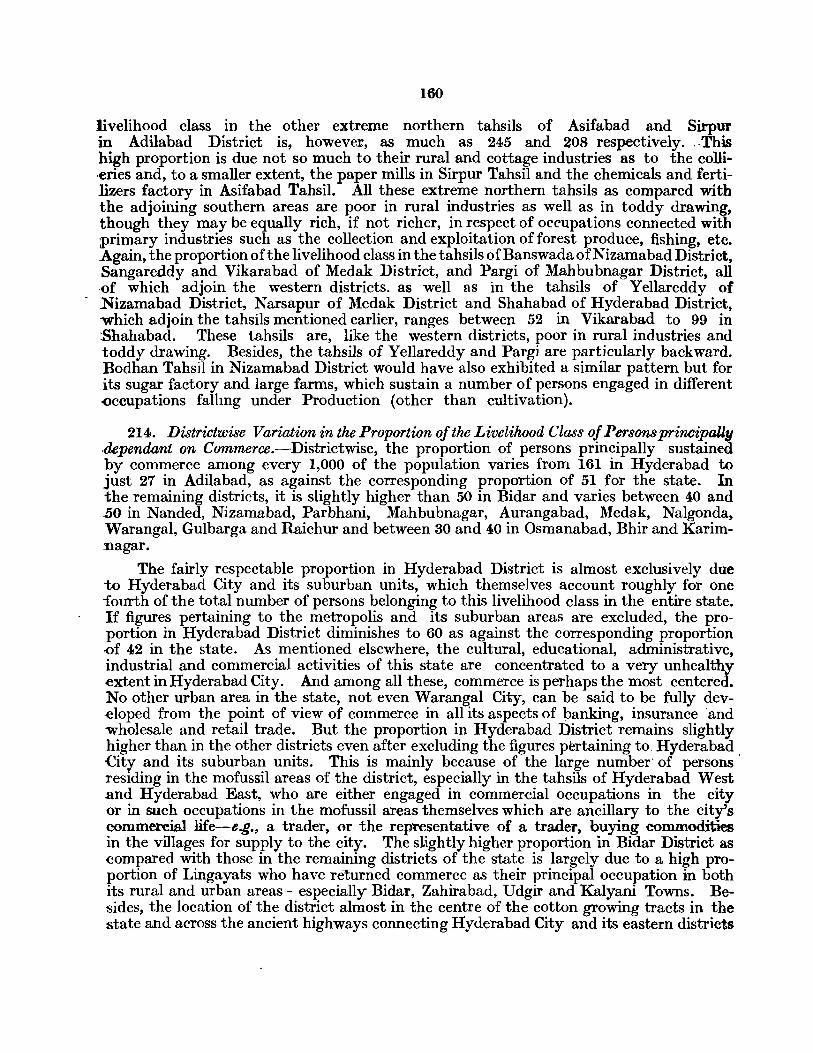
160
livelihood class in the other extreme northern tahsils of Asifabad and Sirpur in Adilabad District is, however, as much as 245 and 208 respectively. ,This high proportion is due not so much to their rural and cottage industries as to the colli·eries and, to a smaller extent, the paper mills in Sirpur Tahsil and the chemicals and fertilizers factory in Asifabad Tahsil. All these extreme northern tahsils as compared with the adjoining southern areas are poor in rural industries as well as in toddy drawing, though they may be equally rich, if not richer, in respect of occupations connected with primary industries such as the collection and exploitation of forest produce, fishing, etc. Again, the proportion of the livelihood class in the tahsils of Banswada of Nizamabad District, Sangareddy and Vikarabad of Medak District, and Pargi of Mahbubnagar District, all ,of which adjoin the western districts. as well as in the tahsils of Yellareddy of
- Nizamabad District, Narsapur of }\ledak District and Shahabad of Hyderabad District, -which adjoin the tahsils mentioned earlier, ranges between 52 in Vikarabad to 99 in Shahabad. These tahsils are, like the western districts, poor in rural industries and toddy drawing. Besides, the tahsils of Yellareddy and Pargi are particularly backward. Bodhan Tahsil in Nizamabad District would have also exhibited a similar pattern but for its sugar factory and large farms, which sustain a number of persons engaged in different -occupations falhng under Production (other than cultivation).
214. Districtwise Variation in the Proportion oftke Livelihood Class of Personsprincipally .dependant on Commerce.-Districtwise, the proportion of persons principally sustained by commerce among every 1,000 of the popUlation varies from 161 in Hyderabad to just 27 in Adilabad, as against the corresponding proportion of 51 for the state. In the remaining districts, it is slightly higher than 50 in Bidar and varies between 40 and .50 in Nanded, Nizamabad, Parbhani, Mahbubnagar, Aurangabad, Medak, Nalgonda, Warangal, Gulbarga and Raichur and between 30 and 40 in Osmanabad, Bhir and Karimnagar.
The fairly respectable proportion in Hyderabad District is almost exclusively due to Hyderabad City and its suburban units, which themselves account roughly for one fourth of the total number of persons belonging to this livelihood class in the entire state. If figures pertaining to the metropolis and its suburban areas are excluded, the proportion in Hyderabad District diminishes to 60 as against the corresponding proportion -of 42 in the state. As mentioned elsewhere, the cultural, educational, administrative, industr.ial and comme~cial activities of this state are conc~ntrated to a very unhealthy extent III Hyderabad CIty. And among all these, commerce IS perhaps the most centered. No other urban area in the state, not even Warangal City, can be said to be fully developed from the point of view of commerce in all its aspects of banking, insurance and wholesale and retail trade. But the proportion in Hyderabad District remains slightly higher than in the other districts even after excluding the figures pertaining to. Hyderabad City and its suburban units. This is mainly because of the large number' of persons' residing in the mofussil areas of the district, especially in the tahsils of Hyderabad West and Hyderabad East, who are either engaged in commercial occupations in the city {)r in such occupations in the mofussil areas themselves which are ancillary to the city's commercial life-e.g., a trader, or the representative of a trader, buying commodities in the villages for supply to the city. The sLightly higher proportion in Bidar District as .compared with those in the remaining districts of the state is largely due to a high proportion of Lingayats who have returned commerce as their principal occupation in both its rural and urban areas-especially Bidar, Zahirabad, Udgir and Kalyani Towns. Besides, the location of the district almost in the centre of the cotton growing tracts in the state and across the ancient highways connecting Hyderabad City and its eastern districts
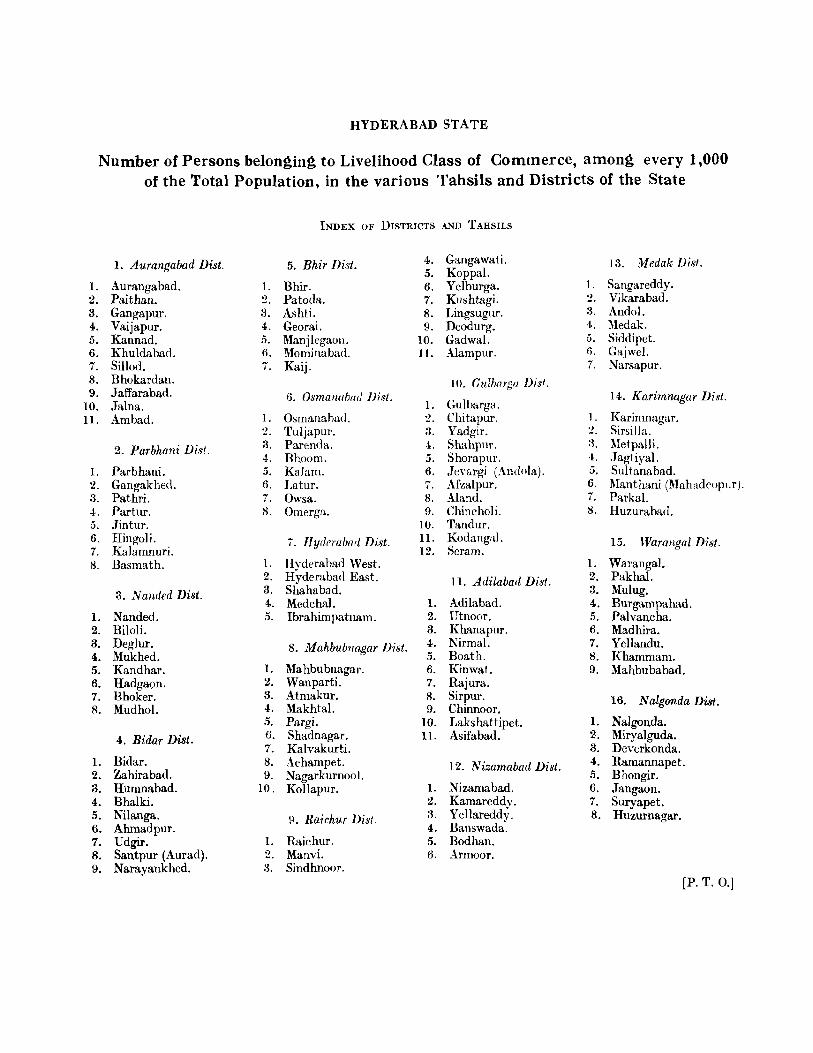
HYDERABAD STATE
Number of Persons belonging to Livelihood Class of Commerce, among every 1,000 of the Total Population, in the various Tahsils and Districts of the State
INDEX OF DISTRICTS A.1"D T AHSILS
1. Aurangabad Dist. 5. Bhir nist. 4. Gangawati. 13. Medak Disl. 5. Koppal.
1. Aurangabad. 1. Bhir. 6. Yelburga. 1. Sangareddy. 2. Paithan. 2. Patoda. 7. Kushtagi. 2. Vikarabad. 3. Gangapur. 3. Ashti. 8. Lingsugur. 3. Ando!' 4. Vaijapur. 4. Georai. 9. Deodurg. 4. Medak. 5. Kannad. 5. Manjlegaon. 10. Gadwal. 5. Siddipet. 6. Khuldabad. 6. Mominabad. 11. Alampur. O. Gajwcl. 7. SiUod. 7. Kaij. 7. Narsapur. 8. Bhokardan. 10. Culb(lrgll Disl. 9. Jafl'arabad. 6. Osmanaba,j Disi. 14. Karimnagl1r Dist.
10. Jalna. 1. Gulbarga. 11. Ambad. 1. Osmanahad. 2. Chitapur. 1. Karimnagar.
2. Tulja-pur. :3. Yadgir. 2. Sirsilla.
2. Parbhani Disl. 3. Parenda. .t. Shahpur. a. Metpalli. 4. Bhoom. 5. Shorapur. 4. Jagtiya!.
1. Parbhani. 5. KaJam. 6. Jer&rgi (Andola). 5. Sultana bad. 2. Gangakhed. 6. Latur. 7. Afzalpur. 6. Manthani (l\Jahadeopllr). 3. Pathri. 7. Owsa. 8. Aland. 7. Parkal. 4. Partur. s. Omerga. 9. Chincholi. 8. Huzurabad. 5. Jintur. 10. 'randur. 6. Hingoli. 7. Hyrleralmri Dist. 11. KodangaJ. 15. lVarangal Dist. 7. Kalamnuri. 12. Scram. 8. Basmath. 1. Hyderabad West. 1. Warangal.
2. Hydcrabad East. 11. Adilabad Dist. " Pakhal. ~.
3. NanrIed Dist. 3. Shahabad. 3. Mulug. 4. Medchal. 1. Adilabad. 4. Burgampahad.
1. Nanded. S. Ibrahimpatnam. 2. Utnoor. 5. Palvancha. 2. Biloli. 3. Khanapur. 6. Madhira. 3. Deglur. 8. Mahbubnagar Dist. 4. Nirmal. 7. YeUandu. 4. Mukhed. 5. Boath. 8. Khammam. 5. Kandhar. 1. Mahbubnagar. 6. Kinwat. 9. Mahbubabad. 6. Hadgal;m. 2. Wanparti. 7. Rajura. 7. Bhoker. 3. Atmakur. 8. Sirpur. 16. N algonda Dist. 8. Mudho!. 4. Makhtal. 9. Chinnoor.
5. Pargi. 10. Lakshattipet. 1. Nalgonda.
4. Bidar Dist. 6. Shadnagar. n. Asifabad. 2. Miryalguda. 7. Kalvakurti. 3. Deverkonda.
1. Bidar. 8. Achampet. 12. Nizamabad Disi. 4. Ramannapet. 2. Zahirabad. 9. Nagarkurnool. 5. Bhongir. 3. Humnabad. 10. Kollapur. 1. Nizamabad. 6. Jangaon. 4. Bhalki. 2. Kamareddv. 7. Suryapet. 5. Nilanga. 9. Raichur Disi. :3. Y cllaredd,:. 8. Huzurnagar. 6. Ahmadpur. 4. Banswada". 7. Udgir. 1. Raichur. 5. Bodhan. 8. Santpur (Aurad). 2. Manvi. 6. Armoor. 9. Narayankhed. a. Sindhnoor.
[Po T. 0.]
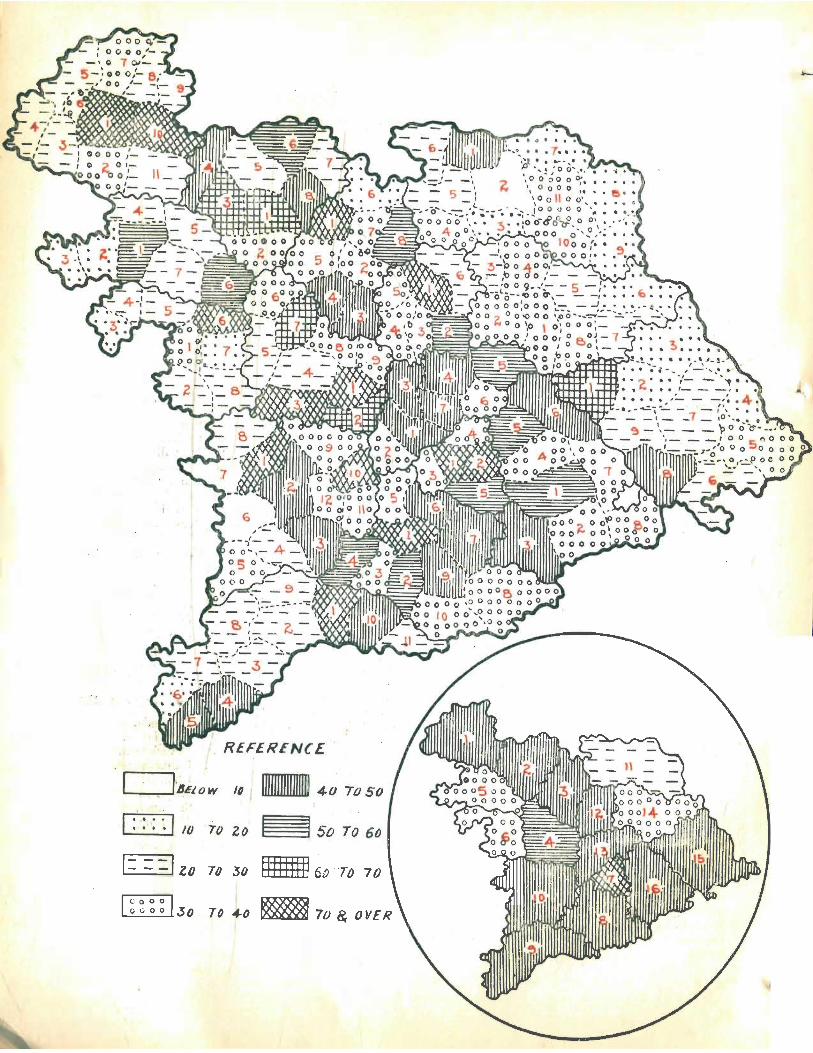
~_".......JI~i'ow .... . . . . 10 70 ZO
1= = -I ZO TO 3D
-50 TO 6()
111111111 ~O "TO 70
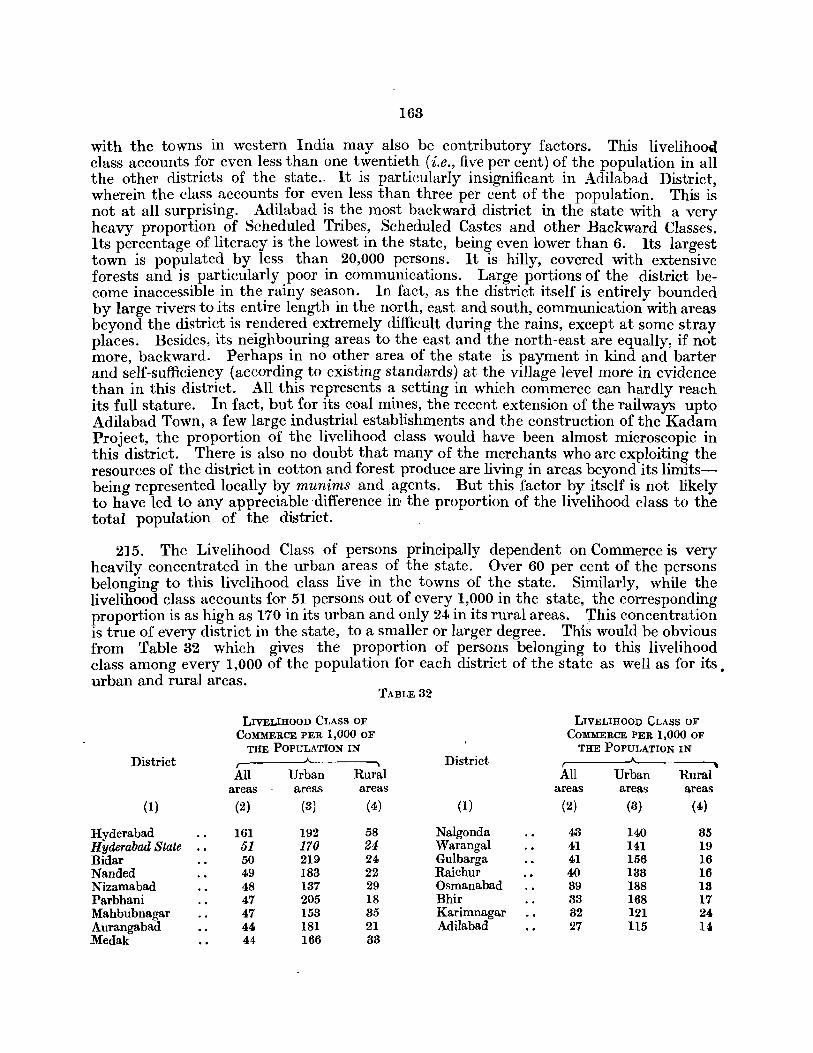
163
with the towns in western India may also be contributory factors. This livelihooQ class accounts for even less than one twentieth (i.e., five per cent) of the population in all the other districts of the state.. It is particularly insignificant in Adilabad District, wherein the class accounts for even less than three per cent of the population. This is not at all surprising. Adilabad is the most backward district in the state with a very heavy proportion of Scheduled Tribes, Scheduled Castes and other Backward Classes. lts percentage of literacy is the lowest in the state, being even lower than 6. lts largest town is populated by less than 20,000 persons. It is hilly, covered with extensive forests and is particularly poor in communications. Large portions of the district become inaccessible in the rainy season. in fact, as the district itself is entirely bounded by large rivers to its entire length in the north, east and south, communication with areas beyond the district is rendered extremely difficult during the rains, except at some stray places. Besides, its neighbouring areas to the cast and the north-east are equally, if not more, backward. Perhaps in no other area of the state is payment in kind and barter and self-sufficiency (according to existing standards) at the village level more in evidence than in this district. All this represents a setting in which commerce can hardly reach its full stature. In fact, but for its coal mines, the recent extension of the railways upto Adilabad Town, a few large industrial establishments and th e construction of the Kadam Project, the proportion of the livelihood class would have been almost microscopic in this district. There is also no doubt that many of the merchants who are exploiting the resources of the district in cotton and forest produce are living in areas beyond its limitsbeing represented locally by munims and agents. But this factor by itself is not likely to have led to any appreciable -difference in the proportion of the livelihood class to the total population of the district.
2]5. The Livelihood Class of persons principally dependent on Commerce is very heavily concentrated in the urban areas of the state. Over 60 per cent of the persons belonging to this livelihood class live in the towns of the state. Similarly, while the livelihood class accounts for 51 persons out of every 1,000 in the state, the cOlTesponding proportion is as high as 170 in its urban and only 24 in its rural areas. This concentration is true of every district in the state, to a smaller or larger degree. This would be obvious from Table 32 which gives the proportion of persons belonging to this livelihood class among every 1,000 of the population for each district of the state as well as for its. urban and rural areas.
TABLE 32
LIVELIHOOD CLASS OF LIVELIHOOD CLASS OF COMMERCE PER 1,000 OF COMMERCE PER 1,000 OF
THE POPULATION IN THE POPULATION IN District District ,.--------A--
All Urban Rural All Urban Rural areas areas areas areas areas areas
(1) (2) (3) (4) (1) (2) (3) (4)
Hyderabad 161 192 58 Nalgonda 43 140 35 Hyderabad State 61 170 24 Warangal 41 141 19 Bidar 50 219 24 Gulbarga 41 156 16 Nanded 49 183 22 Raichur 40 133 16 Nizamabad 48 137 29 Osmanabad 39 188 13 Parbhani 47 205 18 Bhir 33 168 17 Mahbubnagar 47 153 35 Karimnagar 32 121 24 Aurangabad 44 181 21 Adilabad 27 U5 14 Medak 44 166 33
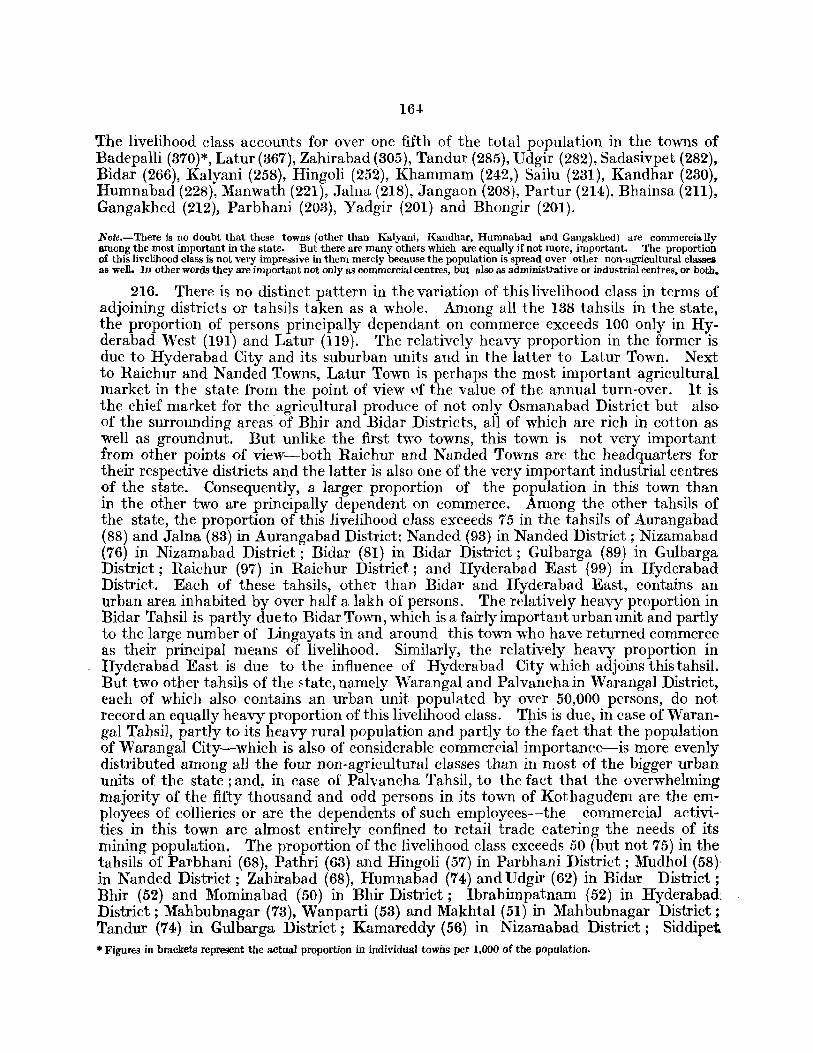
16.t
The livelihood class accounts for over one fifth of the total population in the towns of Badepalli (370)*, Latur (367), Zahirabad (305), Tandur (285), Vdgir (282), Sadasivpet (282), Bidar (266), Kalyani (258), Hingoli (252), Khammam (242,) Sailu (231), Kandhar (230)~ Hunmabad (228), Manwath (221), Jalna (218), Jangaon (208), Partur (214), Bhainsa (211), Gangakhed (212), Parbhani (203), Yadgir (201) and Bhongir (201).
Note.-There is no doubt that these towns (other than Kalyani, Kandhar, Humnabad and Gangakhed) are commercially lIJhong the most important in the state. But there are many others which are equally if not more, important. The proportion of this livelihood class is not very impressive in them merely because the population is spread over other non-agricultural classea as well. In other words they are important not only as commercial centres, but also as administrative or industrial centres, or both.
216. There is no distinct pattern in the variation of this livelihood class in terms of adjoining districts or tahsils taken as a whole. Among all the 138 tahsils in the state, the proportion of persons principally dependant on commerce exceeds 100 only in Hyderabad West (191) and Latur (119). The relatively heavy proportion in the former is due to Hyderabad City and its suburban units and in the latter to Latur Town. Next to Raichur and Nanded Towns, Latur Town is perhaps the most important agricultural market in the state from the point of view llf the value of the annual turn-over. It is the chief market for the agricultural produce of not only Osmanabad District but also of the surrounding areas' of Bhir and Bidar Districts, all of which are rich in cotton as well as groundnut. But unlike the first two towns, this town is not very important from other points of view-both Raichur and Nanded Towns are the headquarters for their respective districts and the latter is also one of the very important industrial centres of the state. Consequently, a larger proportion of the population in this town than in the other two are principally dependent on commerce. Among the other tahsils of the state, the proportion of this livelihood class exceeds 75 in the tahsils of Aurangabad (88) and Jalna (83) in Aurangabad District; Nanded (93) in Nanded District; Nizamabad (76) in Nizamabad District; Bidar (81) in Bidar District; Gulbarga (89) in Gulbarga District; Raichur (97) in Raichur District; and Hyderabad East (99) in Hyderabad District. Each of these tahsils, other than Bidar and Hyderabad East, contains an urban area inhabited by over half a lakh of persons. The relatively heavy proportion in Bidar Tahsil is partly dueto BidarTown, which is a fairly important urban unit and partly to the large number of Lingayats in and around this town who have returned commerce as their principal means of livelihood. Similarly, the relatively heavy proportion in Hyderabad East is due to the influence of Hyderabad City which adjoins this tahsil. But two other tahsils of the ~tate, namely Warangal and Palvanchain Warangal District, each of which also contains an urban unit populated by over 50,000 persons, do not record an equally heavy proportion of this livelihood class. TPis is due, in case of Warangal Tahsil, partly to its heavy rural population and partly to the fact that the population of Warangal City-which is also of considerable commercial importance-is more evenly distributed among all the four non-agricultural classes than in most of the bigger urban units of the state; and, in case of Palvancha Tahsil, to the fact that the overwhelming majority of the fifty thousand and odd persons in its town of Kothagudem are the employees of collieries or are the dependents of such employees--the commercial activities in this town are almost entirely confined to retail trade catering the needs of its mining population. The proportion of the livelihood class exceeds 50 (but not 75) in the tahsils of Parbhani (68), Pathri (63) and Hingoli (57) in Parbhani District; Mudhol (58)' in Nanded District; Zahirabad (68), Humnabad (74) and Vdgir (62) in Bidar District; Bhir (52) and Mominabad (50) in Bhir District; lbrahimpatnam (52) in Hyderabad: District; Mahbubnagar (73), Wanparti (53) and Makhtal (51) in Mahbubnagar District; Tandur (74) in Gulbarga District; Kamareddy (56) in Nizamabad District; Siddipet • Figures in brackets represent the actual proportion in individual towns per 1,000 of the population.
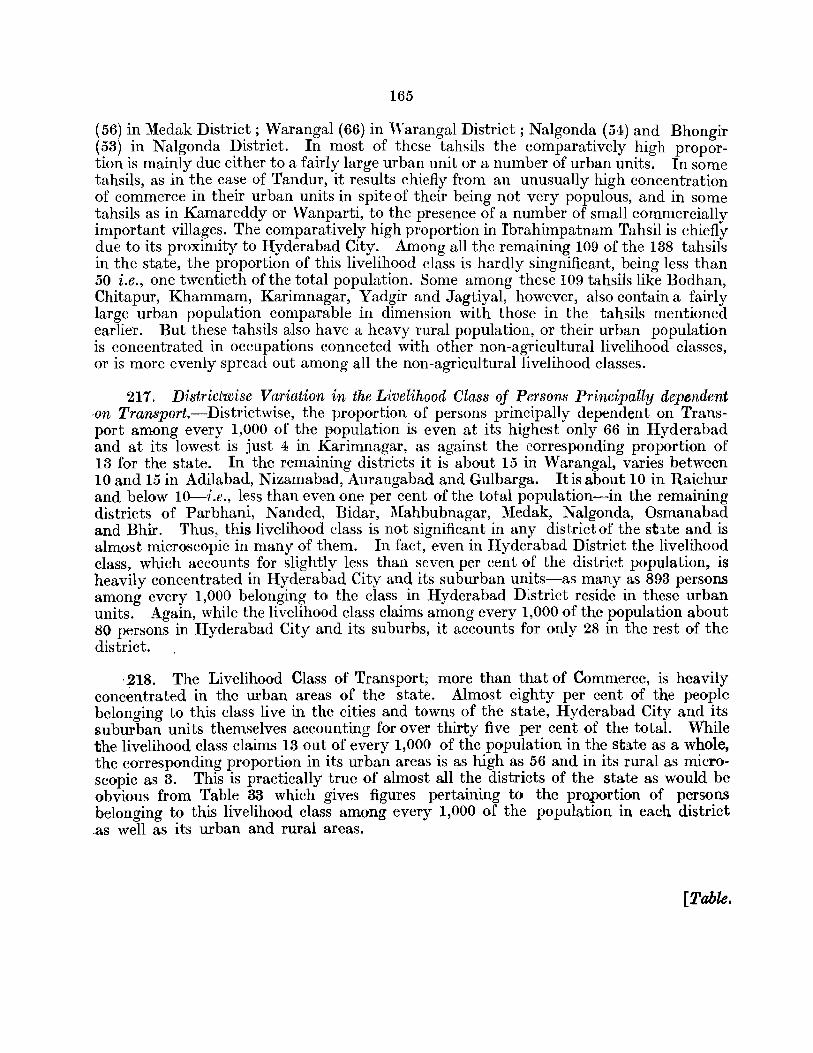
165
(56) in Medak District; Warangal (66) in \Yarangal District; Nalgonda (54) and Bhongir (53) in Nalgonda District. In most of these tahsils the comparatively high proportion is mainly due either to a fairly large urban unit or a number of urban units. In some tahsils, as in the case of Tandur, it results chiefly from an unusually high concentration of commerce in their urban units in spite of their being not very populous, and in some tahsils as in Kamareddy or \Vanparti, to the presence of a number of small commercially important villages. The comparatively high proportion in Ibrahimpatnam Tahsil is chiefly due to its proximity to Hyderabad City. Among all the remaining 109 of the 138 tahsils in the state, the proportion of this livelihood class is hardly singnificant, being less than 50 i.e., one twentieth of the total population. Some among these 109 tahsils like Bodhan, Chitapur, Khammam, Karimnagar, Yadgir and Jagtiyal, however, also contain a fairly large urban population comparable in dimension with those in the tahsils mentioned earlier. But these tahsils also have a heavy rural popUlation, or their urban population is concentrated in occupations connected with other non-agricultural livelihood classes, or is more evenly spread out among all the non-agricultural livelihood classes.
217. Districtwise Variation in the Livelihood Class of Persons Principally dependent ,on Transport.-Districtwise, the proportion of persons principally dependent on Transport among every 1,000 of the population is even at its highest only 66 in Hyderabad and at its lowest is just 4 in Karimnagar, as against the corresponding proportion of 13 for the state. In the remaining districts it is about 15 in Warangal, varies between 10 and 15 in Adilabad, Nizamabad, Aurangabad and Gulbarga. It is about 10 in Raichur and below 10-i.e., less than even one per cent of the total population-in the remaining districts of Parbhani, Nanded, Bidar, l\Iahbubnagar, Medak, Nalgonda, Osmanabad and Bhir. Thus, this livelihood class is not significant in any district of the sbte and is almost microscopic in many of them. In fact, even in Hyderabad District the livelihood class, which accounts for slightly less than seven per cent of the district population, is heavily concentrated in Hyderabad City and its suburban units-as many as 893 persons among every 1,000 belonging to the class in Hyderabad Dlstrict reside in these urban units. Again, while the livelihood class claims among every 1,000 of the population about 80 persons in Hyderabad City and its suburbs, it accounts for only 28 in the rest of the district.
'218. The Livelihood Class of Transport, more than that of Commerce, is heavily concentrated in the urban areas of the state. Almost eighty per cent of the people belonging to this class live in the cities and towns of the state, Hyderabad City and its suburban units themselves accounting for over thirty five per cent of the total. While the livelihood class claims 13 out of every 1,000 of the population in the state as a whole, the corresponding proportion in its urban areas is as high as 56 and in its rural as microscopic as 3. This is practically true of almost all the districts of the state as would be obvious from Table 33 which gives figures pertaining to the pro.portion of persons belonging to this livelihood class among every 1,000 of the population in each district .as well as its urban and rural areas.
[Table.
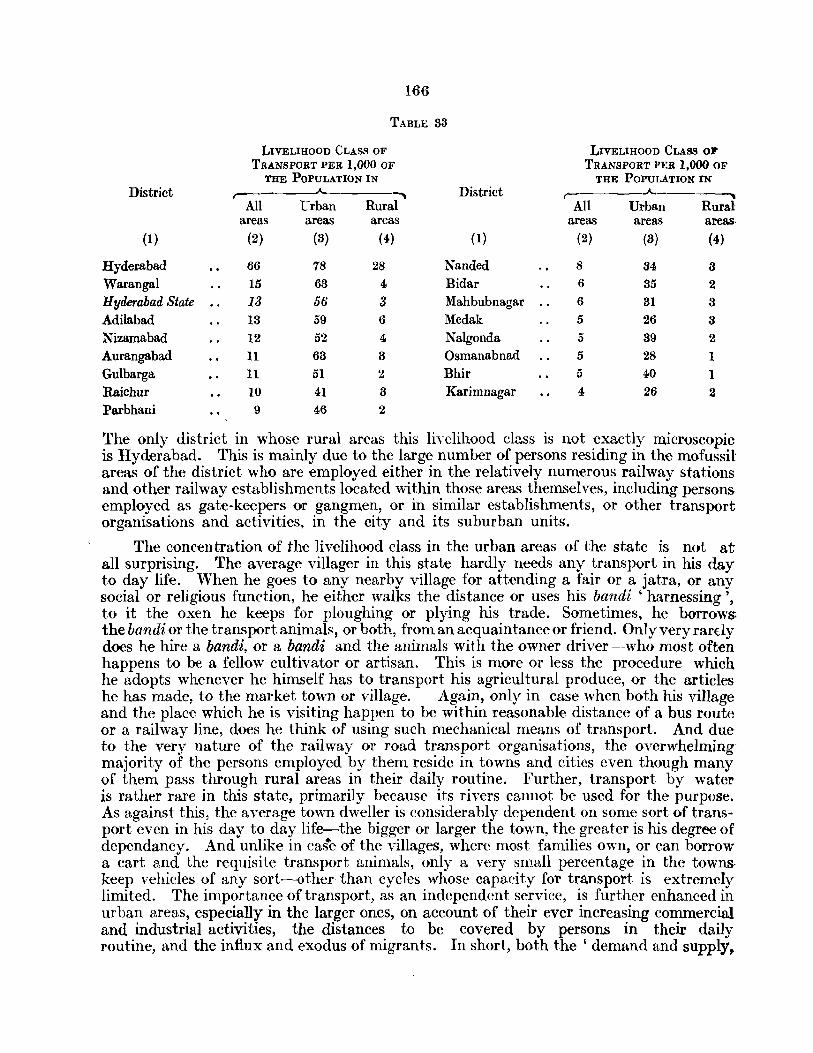
166
TABLE 33
LIVELIHOOD CLASS OF LIVELIHOOD CLASS 0.1'
TRANSPORT PER 1,000 OF TRANSPORT PER 1,000 OF THE POPULATION IN THE POPULATION IN
District r- ~ District r---A.. ___ ~
All Urban Rural All Urban Rural areas areas areas areas areas areas·
(1) (2) (3) (4) (1) (2) (8) (4)
Hydel'8.bad 66 78 28 Nanded 8 84 8 Warangal 15 63 4 Bidar 6 35 2 Hyderabad State 13 56 3 Mahbubnagar 6 31 3 Adilabad 13 59 6 Medak 5 26 8
Nizamabad 12 52 4 Nalgonda 5 39 2
Aurangabad 11 63 3 Osmanabnad 5 28 1 Gulbarga 11 51 2 Bhir 5 40 1 Raichur 10 41 8 Karimnagar 4 26 2 Parbhani 9 46 2
The only district in whose rural areas this livelihood class is not exactly microscopic is Hyderabad. This is mainly due to the large number of persons residing in the mofussil areas of the district who are employed either in the relatively numerous railway stations and other railway establishments located within those areas themselves, including persons employed as gate-keepers or gangmen, or in similar establishments, or other transport organisations and activities, in the city and its suburban units.
The concentration of the livelihood class in the urban areas of the state is not at all surprising. The average villager in this state hardly needs any transport in his day to day life. When he goes to any nearby village for attending a fair or a jatra, or any social or religious function, he either walks the distance or uses his bandi • harnessing', to it the oxen he keeps for ploughing or plying his trade. Sometimes, he borrows-. the bandi or the transport animals, or both, from an acquaintance or friend. Only veryrardy does he hire a bandi, or a bandi and the animals with the owner driver-who most often happens to be a fellow cultivator or artisan. This is more or less the procedure which he adopts whenever he himself has to transport his agricultural produce, or the articles he has made, to the market town or village. Again, only in case when both his village and the place which he is visiting happen to be within reasonable distance of a bus route or a railway line, does he think of using such mechanical means of transport. And due to the very nature of the railway or road transport organisations, the overwhelmingmajority of the persons employed by them reside in towns and cities even though many of them pass through rural areas in their daily routine. Further, transport by water is rather rare in this state, primarily because its rivers cannot be used for the purpose. As against this, the average town dweller is considerably dependent on some sort of transport even in his day to day life-the bigger or larger the town, the greater is his degree of dependancy. And unlike in case of the villages, where most families own, or can borrow a cart and the requisite transport animals, only a very small percentage in the townskeep vehicles of any sort--other' than cycles whose capacity for transport is extremely limited. The importance of transport, as an independent service, is further enhanced in urban areas, especially in the larger ones, on account of their ever increasing commercial and industrial activities, the distances to be covered by persons in their daily routine, and the influx and exodus of migrants. In short, both the' demand and supply,.
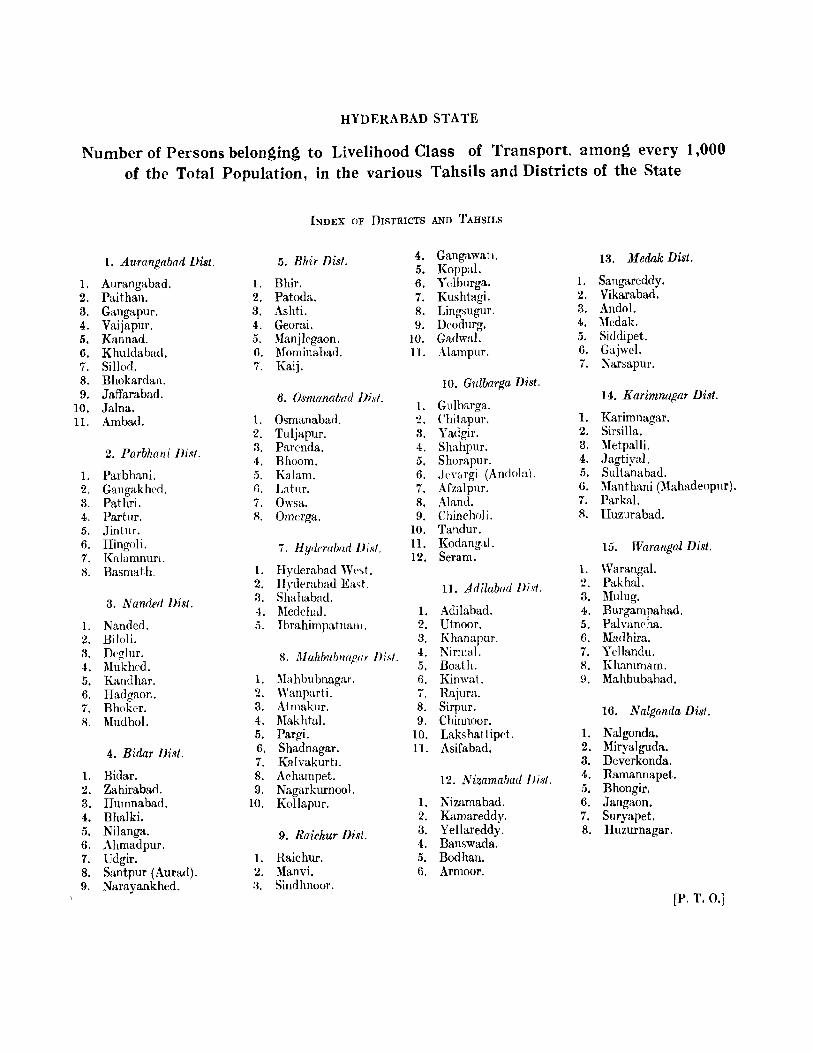
HYDERABAD STATE
Number of Persons belonging to Livelihood Class of Transport. among every 1,000 of the Total Population, in the various Tahsils and Districts of the State
1. Aurangabad Dist.
1. Aurangabad. 2. Paithan. 3. Gangapur. 4. Vaijapur. 5. Kannad. 6. Khuldabad. 7. Sillod. 8. Bhokardan. 9. Jaffarabad.
10. Jalna. 11. Ambad.
2. Parbhani ni.~I.
1. Parbhani. 2. Gangakheo. 3. Pathri. 4. Partllr. 5. Jintur. 6. Hingoli. 7. Kalamnurl. 8. Basmath.
3. Nanded nisi.
1. Nanded. 2. BlIoli. 3. Deglur. 4. l\1ukhe-d. 5. Kamlhar. 6. Hadgaon. 7. Bhokcr. R. Mudhol.
4. Bidar Disi.
1. Bidar. 2. Zahirabad. 3. Humnabad. 4. Bhalki. 5. Nilanga. 6. Ahmadpur. 7. Udgir. 8. Santpur (Aurad). 9. Narayankhed.
INDEX OF DISTRICTS AND TAHSIl.S
5. Bhir Dist.
1. Bhir. 2. Patoda. 3. Ashti. 4. Georai. 5. Manjkgaon. fl. Mominabarl. 7. Kaij.
6. Osmanabad /Jist.
1. Osmanabad. 2. Tuljapur. 3. Pare-nda. 4. Bhoom. 5. Kalam. fl. Latur. 7. Owsa. R. Omerga.
7. Hyricrabad /Jist.
1. Hyclerabad W('~t. 2. H\·derabad East. 3. Sl~ahabao. -4. Me de hal. ."i. Ihrahimpatllalll.
8. Mahbl1bllflpt/1' /)isi.
1. :\lahbubnagar. 2. Wanparti. 3. Atmakur. 4. Makhtal. 5. Pargi. 6. Shadnagar. 7. KalvakurtI. 8. Achampet. 9. Nagarkurnool.
HI. Kollapur.
9. Raichur Disi.
1. Raichur. 2. Manvi. a. Sindhnoor.
4. Gangawatl. 5. Koppal. 6. Yelburga. 7. Kushtagi. 8. Lingsugur. 9. Dcodurg.
10. Gadwal. II. Alampur.
10. Gulbarga Disi.
1. Glliharga. ~. Chitapur. 3. Yadgir. 4. Shahpur. 5. Shorapur. 6. .TeY&rgi (Anoola). 7. Afzalpur. 8. Aland. 9. ChinchoJi.
10. Tandur. 11. Kodang'lJ. 12. Seram.
11. Adilabad /Jist.
1. Adilahad. 2. Utnoor. 3. Khanapur. 4. Nirmal. 5. Boath. fl. Kinwat. 7. Rajura. 8. Sirpur. 9. Chillloor.
10. Laks hattipd. 11. Asifabad.
12. Nizamabad /)isl.
1. Nizamabad. 2. Kamareddv. 3. YellareddY. 4. Banswada. 5. Bod han. 6. Armoor.
13. Medak Dist.
1. Sangareddy. 2. Vikarabad. 3. Andal. 4. l\Icdak. 5. Siddipet. 6. Gajwcl. 7. Narsapur.
14. Karimnagar Disi.
1. Karimnagar. 2. Sirsilla. 3. l\Ietpalli. 4. Jagti)'al. 5. Sultanabad. 6. Manthani (MahadeoplIf). 7. Parkal. R. Huzurabad.
l5. Warangal Dist.
1. Warangal. ~. Pakhal. 3. lUulug. 4. Burgampahad, 5. Palvancha. 6. Madhira.. 7. Yellandu. 8. Khammam. H. Mahbubahad.
16. Nalgonda Diyt.
1. Nalgonda. 2. MiryaJguda.. 8. Deverkonda. 4. Ramannapet. 5. Bhongir. 6. Jangaon. 7. Suryapet. 8. Huzurnagar.
[P. T. O.}
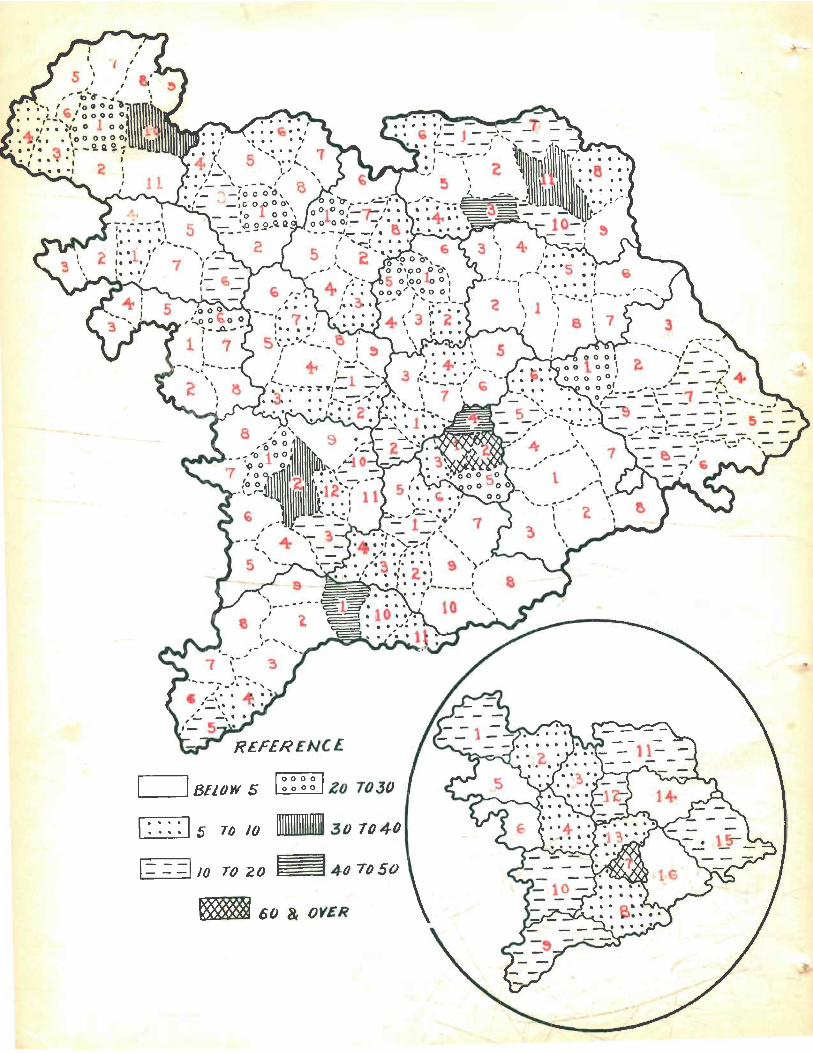
'.
I I f;;k ~~14Q TO SO -:- .= - 10 TO 20 E -
~ 60 Be OYER
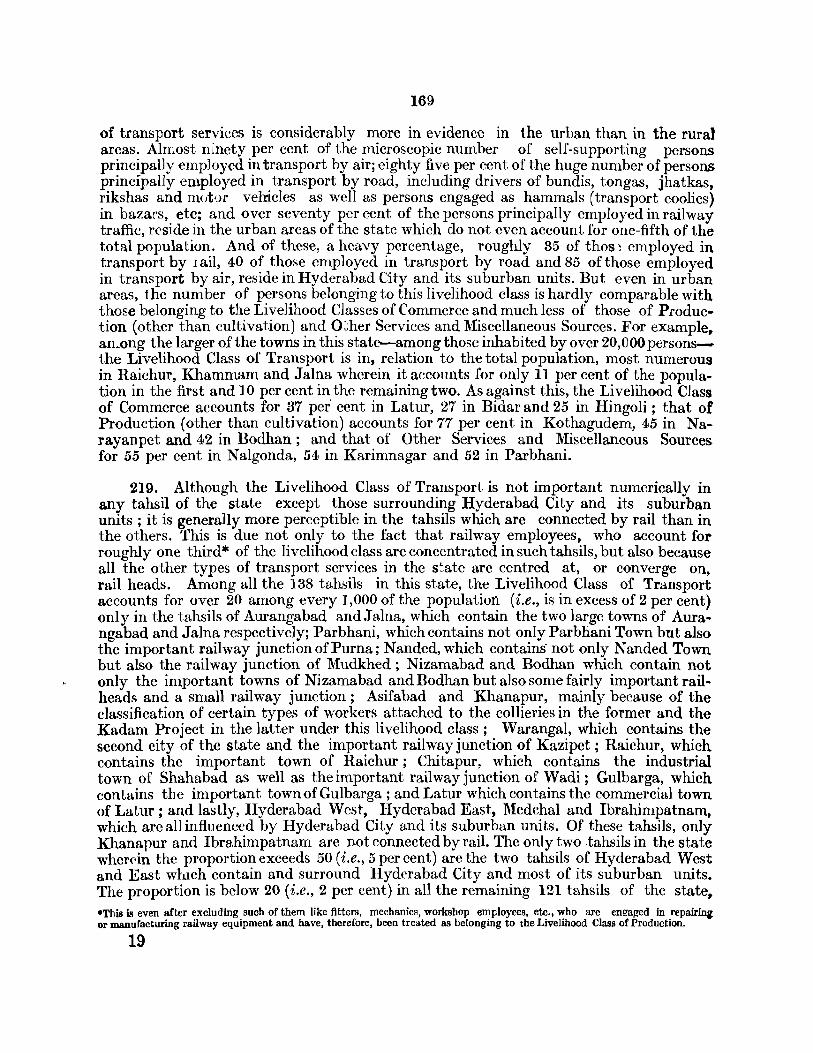
169
of transport services is considerably more in evidence in the urban than in the rural areas. AlrEost ninety per cent of the microscopic number of self-supporting persons principally employed in transport by air; eighty five per cent of the huge number of persons principally employed in transport by road, including drivers of bundis, tongas, jhatkas, rikshas and mvtof vehicles as well as persons engaged as hammals (transport coolies) in bazars, etc; and over seventy per cent of the persons principally employed in railway traffic, reside in the urban areas of the state which do not even account for one-fifth of the total population. And of these, a heavy percentage, roughly 35 of thos~ employed in transport by I ail, 40 of those employed in transport by road and 85 of those employed in transport by air, reside in Hyderabad City and its suburban units. But even in urban areas, the number of persons belonging to this livelihood class is hardly comparable with those belonging to the Livelihood Classes of Commerce and much less of those of Production (other than cultivation) and O~her Services and Miscellaneous Sources. For example, an~ong the larger of the towns in this state--among those inhabited by over 20,000 personsthe Livelihood Class of Transport is in, relation to the total population, most numerous in Raichur, Khammam and Jalna wherein it accounts for only 11 per cent of the population in the first and 10 per cent in the remaining two. As against this, the Livelihood Class of Commerce accounts for 37 per' cent in Latur, 27 in Bidar and 25 in Hingoli ; that of Production (other than cultivation) accounts for 77 per cent in Kothagudem, 45 in Narayanpet and 42 in Bodhan; and that of Other Services and Miscellaneous Sources for 55 per cent in Nalgonda, 54 in Karimnagar and 52 in Parbhani.
219. Although the Livelihood Class of Transport is not important numerically in any tahsil of the state except those surrounding Hyderabad City and its suburban units; it is generally more perceptible in the tahsils which are connected by rail than in the others. This is due not only to the fact that railway employees, who account for roughly one third* of the livelihood class are concentrated in such tahsils, but also because all the other types of transport services in the s~ate are centred at, or converge on, rail heads. Among all the 138 tahsils in this state, the Livelihood Class of Transport accounts for over 20 among every 1,000 of the population (i.e., is in excess of 2 per cent) only in the tahsils of Aurangabad andJalna, which contain the two large towns of Aurangabad and Jalna respectively; Parbhani, which contains not only Parbliani Town bnt also the important railway junctionofPurna; Nanded, which contains-not only Nanded Town but also the railway junction of Mudkhed; Nizamabad and Bodhan which contain not only the important towns of Nizamabad and Bodhan but also some fairly important railheads and a small railway junction; Asifabad and Khanapur, mainly because of the classification of certain types of workers attached to the collieries in the former and the Kadam Project in the latter under this livelihood class; Warangal, which contains the second city of the state and the important railway junction of Kazipet ; Raichur, which contains the important town of Raichur; Chitapur, which contains the industrial town of Shahabad as well as the important railway junction of Wadi; Gulbarga, which contains the important town of Gulbarga ; and Latur which contains the commercial town of Latur; and lastly, Hyderabad West, Hydcrabad East, Medchal and Ibrahimpatnam, which are all influenced by Hyderabad City and its suburban units. Of these tahsils, only Khanapur and Ibrahimpatnam are Dot connected by mil. The only two tahsils in the state wherC'in the proportion exceeds 50 (i.e., 5 per cent) are the two tahsils of Hyderabad West and East whICh contain and surround Hyderabad City and most of its suburban units. The proportion is below 20 (i.e., 2 per cent) in all the remaining 121 tahsils of the state, -This is even after excluding such of them like fitters, mechanics, workshop employees, etc., who are en!!aged in repairing or manufacturing railway equipment and have, therefore, been treated as belonging to the Livelihood Class of Production.
19
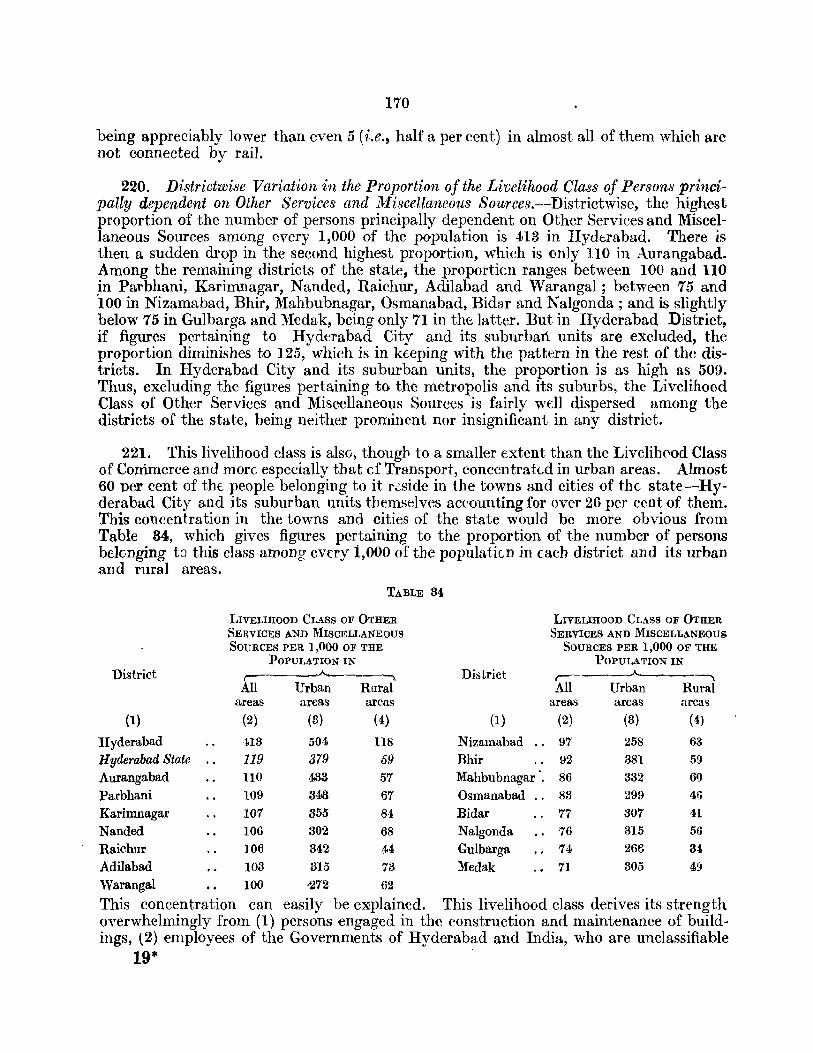
,
170
being appreciably lower than even 5 (i.e., half a per cent) in almost all of them which are not connected by rail.
220. Districtwise Variation in the Proportion of the Livelihood Class of Persons principally dependent on Other Services and Miscellaneous Sources.--Districtwise, the highest proportion of the number of persons principally dependent on Other Services and Miscellaneous Sources among every 1,000 of the population is 418 in Hydaabad. There is then a sudden drop in the second highest proportion, which is only 110 in Aurangabad. Among the remaining districts of the state, the proporticn ranges between 100 and 110 jn Parbhani, Karimnagar, Nanded, Raichur, Adilabad and Warangal; between 75 and 100 in Nizamabad, Bhir, Mahbubnagar, Osmanabad, Bidar and Nalgonda ; and is slightly below 75 in Gulbarga and Medak, being only 71 in the latter. But in Hyderabad District, if figures pertaining to Hyderabad City and its suburban units are excluded, the proportion diminishes to 125, which is in keeping with the pattern in the rest of the districts. In Hyderabad City and its suburban units, the proportion is as high as 509. Thus, excluding the figures pertaining to the metropolis and its suburbs, the Livelihood Class of Other Services and Miscellaneous Sources is fairly well dispersed among the districts of the state, being neither prominent nor insignificant in any district.
221. This livelihood class is also, thougb to a smaller Extent than the Livelih00d Class of Commerce and mort especially that cf Transport, concentrakd in urban areas. Almost 60 per cent of thE, people belonging to it r.::side in the towns and cities of thE, state-Hyderabad City and its suburban units tbemselves accounting for over 26 per cent of them. This concentration in the towns and cities of the state would be more obvious from Table 84, which gives figures pertaining to the proportion of the number of persons belcnging to this class among every 1,000 of the populatic.n in (acb district and its urban .and rural areas.
TABLE 34
LIVELlIIOOD CLASS OF OTIIER LIVELIHOOD CLASS OF OTHER SERVICES AND MISCELLANEOUS SERVICES AND MISCELLANEOUS SOURCES PElt 1,000 OF THE SOURCES PER 1,000 OF THE
POPULATION IN POPULATION IN District r- ..A..--__ --:, District ~
All Urban Rural All Urban Rural areas areas areas areas areas areas
(1) (2) (3) (4) (1) (2) (3) (4)
Hyderabad 413 504 118 Nizamabad 97 258 63
H yderabad State 119 379 69 Bhir .. 92 381 59 Aurangabad no 433 57 Mahbubnagar '. 86 332 6()
Parbhani 109 343 67 Osmanabad 83 299 46 Karimnagar 107 355 84 Bidar .. 77 307 41 Nanded 106 302 68 Nalgonda 76 315 56 Raichur 106 342 44 Gulbarga 74 266 34 Adilabad 103 315 73 Medak 71 305 49 Warangal 100 ·272 62
This concentration can easily be explained. This livelihood class derives its strength overwhelmingly from (1) persons engaged in the construction and maintenance of buildings, (2) employees of the Governments of Hyderabad and India, who are unclassifiable
19*
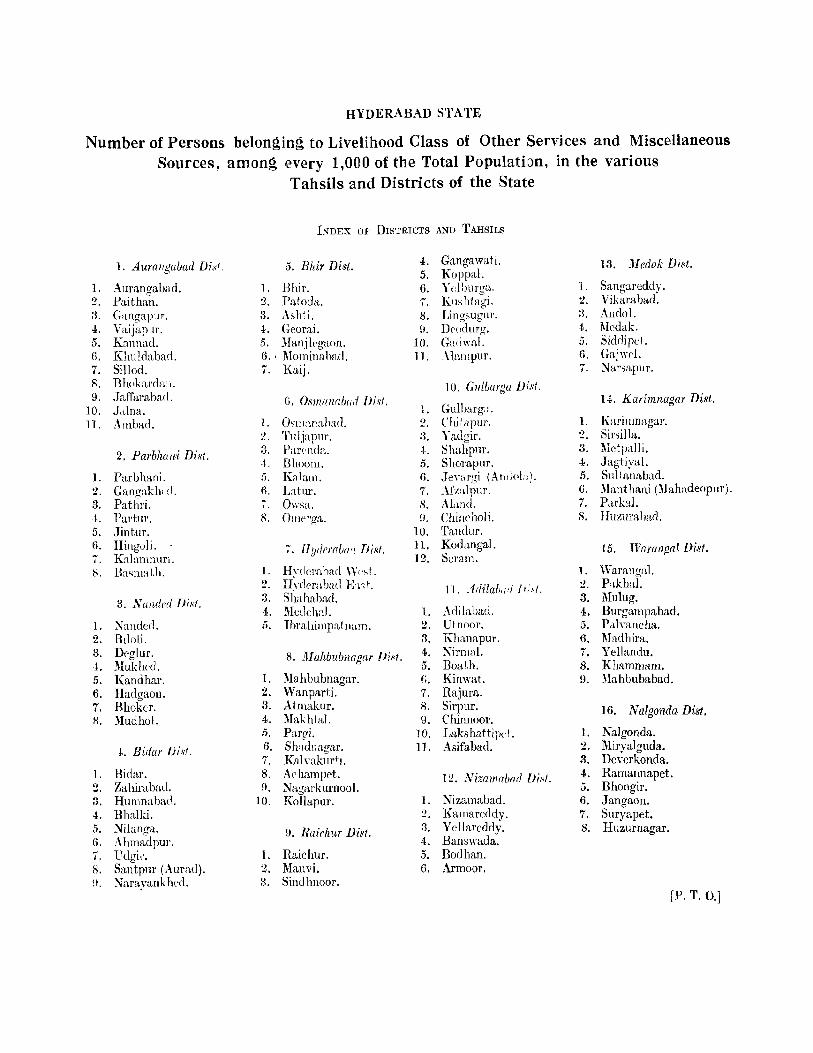
HYDERABAD STATE
Number of Persons belonging to Livelihood Class of Other Services and Miscellaneous Sources, among every 1,000 of the Total Population, in the various
1. Aurallgabad Disl,
1. Aurangabad. 2. Paithan. 3. Gangapur. 4. Vaijap,lr. 5. Kannad. 6. Khuldabad. 7. Sillod. 8. Bhpkarda.:l. 9. JR,ffarabarl.
10. J,dna. 11. Ambad.
2. Parbhani Dis!.
1. Parbhfllli. 2. Gangakh( d. 3. Pathri. 4. PUl't\ll' . 5. Jintur. n. Hing,)]i. i. KaJamnurl. tl. BasmRth.
3. Nallderi Dist.
1. Nanded. 2. Blloli. 3. Deglul'. 4. Mukhf'd. . ~. Kandhar. 6. Hadgaon. 7. Bhoker. R. Mudhol.
t. Bidar Dis!.
1. Bidar. 2. Zahirabml. 3. Humnabad. 4. Bhalki. . S. Nilanga. 6. Ahmadpur. 7. l\lgi,'. tl. Santpnr (Auratl). H. Narayankhrd.
Tahsils and Districts of the State
INDEX O}' DISTRICTS AND T AHSILS
5. Bhir Di8t.
1. Bhir. Z. Patoda. 3. Ashii. 4. Georai. 5. l\Ianjlegnon. 6. ' Mominabarl. 7. Kaij.
G. Osm({nahlld /)isl.
1. Osm:w:.thad. 2. Tuljapur. 3. P:.trtnda. -1. BILoom. . 1. KRlam. 6. Latur. 7. Owsa. 1\. Oillt'l'ga.
';'. llyderaiJw/ Di.~t.
1. Hydcraba(l 'Y(·~t. 2. H"dembad Rd. 3. Sftnhabad. 4. !Hcdclml. ri. Ibmhimpatnam.
8. Mahbubnagar !Jisl.
1. l\lahbubnagar . 2. Wanparti. 3. Atmakur. 4. l\Iakhtal. .S. Parui. 6. Sh!l~lnagar. 7. Kah'akurl:l, 8. Arhampet. fl. ~agarkurnool.
10. Kollapur.
9. Rairhur Disl.
1. Raichur. 2. Manvi. 3. Sindhnoor.
4. Gangawati. 5. Kappal. 6. Ycllmrga. 7. Kushtagi. 8. Lingsugm. 9. DC(ldllrg.
10. Gadwal. 11. _\lal1lpur.
10. Gllibarga Disl.
] . Gulharga. Z. Chitapur. :J. Yadgir. -to Shahpur. 5. Shorapur. 6. Jen.rgi (Anr!(ll:l) . 7. _Uzalpllf. 8. Ahnd. D. Chincholi.
10. Tandur. 11. Kodangal. 12. Seram.
11. Arlila/J.:rI [I;,\f.
1. Adilabad. 2. Utnoor. 3. Kh::mapur. 4. 1\irmal. 5. Boath. f.. Kinwat. 7. Rajura. 8. Sirpur. 9. Chinnaor.
10. Lakshattipd. I J . Asifabad.
12. Nizamab(ui Disl.
1. Nizamabad. 2. Kamarcddy. 3. Yellareddy . 4. Banswada. 5. Bodhan. 6. Armoor.
13. Medak Dist.
1. Sangareddy. 2. Vikarabad. :{. Andol. 4. Mcdak. 5. Sidrlipet. 6. Gajwel. 7. Narsapur.
H. Karimnagar Disi.
I. Karinmagal'. 2. Sirsilla. 3. ~Ictpalli. 4. Jagtiyal. 5. Sllltanabad. G. :\Iantbani (l\Jahadeopur). 7. Pctrbl. S. Huzuraharl.
15. IVaTflllpal Disi.
1. Warangal. 2. Pnkhn.1. 3. Mulug. 4. Burgampahad. 5. Pi\lyancha. 6. Madhira. 7. Yellandu. 8. Khammam. 9. Mahbubabad.
16. Nalgonda Disf.
1. Nalgonda. 2. Miryalguda. 3. Dewrkonda. 4. Ramannapet. 5. Bhongir. 6. Jangaon. 7. Suryapet. 8. Huzurnagar.
[Po T. 0.]
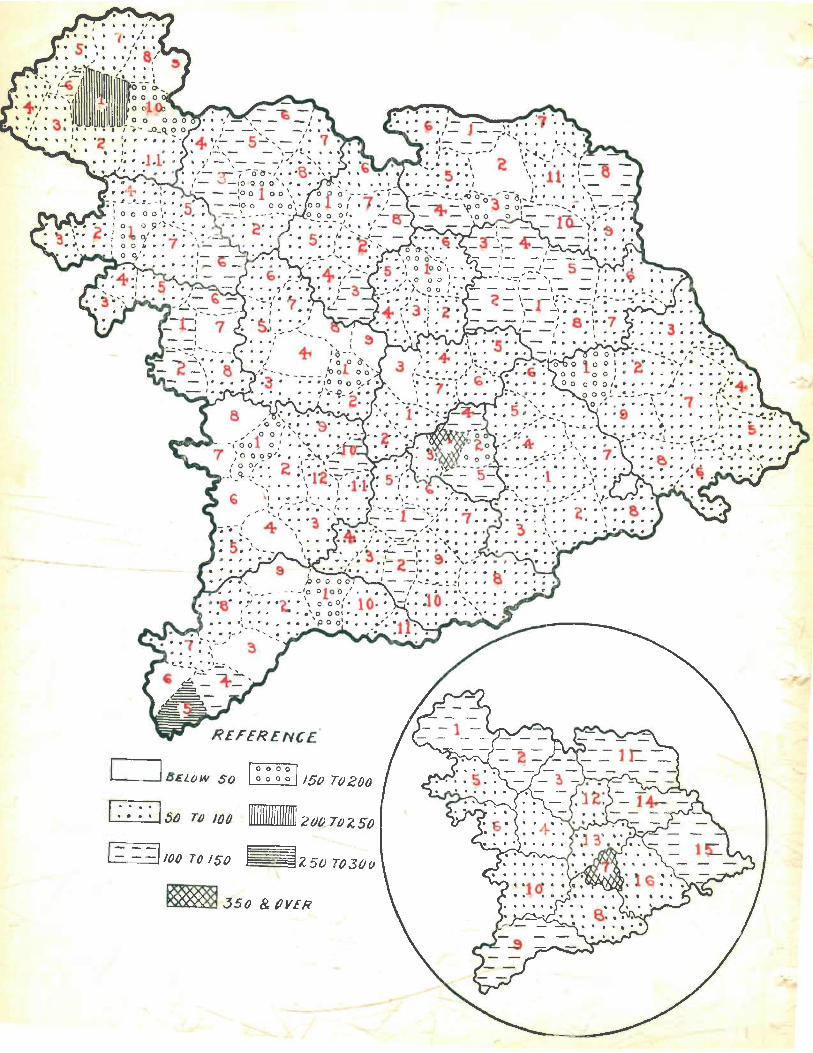
- '
r I I ~ ~ ~ ~J I.. ___ -' BELow $0. _
L..·_·_:_:_.l SO TO 100 ID11II1II1II1@ 21){) TO ~ Sf)
mJSO &PVER
173
under other categories, (3) washermen, (4) domestic servants, (5) beggars and vagrants, (6) employees of educational institutions, (7) police perwnnel, (8) permns living on pensions, mansabs, grants, etc., (9) village officials and servants, (10) barbers, (ll) persons engaged in the construction and maintenance of irrigation projects, (12) owners and employees of hotels, restaurants, etc., (13) persons connected with medical and health services, (14) persons connected with religious and charitable services,' (15) persons belonging to recreation services, (16) scavengers and other persons belonging to sanitary services, (17) persons engaged in the construction of roads, (I8) employees of Munil:ipalities and Local Bodies (not classifiable un~er other categories) (19) legal services, (20) persons employed in the generation, transmission and distribution of electric power, and (21) employees of the former feudatory estates of Sarf-e-khas, Paigahas and Jagirs- the 1951 Census Enumeration was held only some months after the complete integration of these estates--and the dependants of all such persons. Roughly, over 90 per cent of the categories at (18) and (19); over 80 per cent of the categories at (2), (4), (8), (12) and (16) ; over 70 per .cent of the category at (20) ; over 60 per cent of the categories at (1), (7), (11)* and (13); over 50 per cent of the categories at (6) and (15); and lastly an appreciably higher proportion than that warranted by the total population of the areas concerned, of all the remaining categories mentioned above--excluding of course village officials and their servants-reside in the urban areas of the state. Besides, these categories of persons who account for very large numbers, there are many others like those employed in communication service::> (posts, telegraphs, telephones, wireless transmission, etc.,), domestic and industrial water supply, journalism, etc., who do not account for appreciable numbers but are none the less concentrated in urban areas. The concentration of such categories of population in the towns and cities of the state is perhaps to be expected on account of the centralisation of most administrative, educational, commercial and industrial-i.e., of those connected with large industries-activites in the urban areas of the s'~ate, especially the larger ones, and the relatjve backwardness of the villages in all these aspects. It ma.y also be of interest to note here that as many as 33 per cent of the lVIuslims--as against only I)
of the rest of the population of the state are principally dependent on occupations falling within this livelihood class and over 53 per cent of the Muslims live in the urban areas of the state.
It may be true that a quite large number of persons in the rural areas following the occupations mentioned above have returned cultivation as their chief source of sutenancc and have, therefore, escaped inclusion in this livelihood class. But the number of such persons is not likely to have been heavy enough to change materially the pfdtern of distribution as indicated above.
222. Among the 138 tahsils in the state, the proportion of this livelihood class per 1,000 of the popUlation exceeds 100 (i.e., 10 per cent) in the thirty nine tahsils of Hyder- . abad West (499)t, Koppal (255), Aurangabad (243), Raichur (190), Parbhani (182), Nanded (174), Hyderabad East (172), Gulbarga (171), Khanapur (163), Jalna (159), Bhir (158), Nizamabad (156), Bidar (154), Warangal (151), Adilabad (145), Mahbubnagar (142), Medchal (137), Lakshattipet (136), Karimna!!,ar (133), Mudhol (130), Pathri (128), Wanparti (122), Jagtiyal (120), Osmanabad (119), Gangawati (118), lVIoininabad (1l6), Hingoli (114), Nirmal (113), Khuldabad (114), Latur (111), Sultanabad (110), Sirpur (108),
... It mayapp ear strange that over 60 per cent of the persom (including their dependants) principally engaged in the construction and maintenance of irrigation works should be in urban areas. This is due to the fact that the Tungabhadra Project Camps containing the majority of the population falling under this category, were treated as urban areas.
t The figure given in brackets represents the actual proportion of the livelihood class i~ the tahsil concerned per 1,000 of thepopulation.
174
Tandur(107), J intur (107), Deglur(107), Ibrahimpatnam(105), il1etpalli (103), TuJjapur(102), and Sirsilla (101)*. The relatively heavy proportion in all these tahsils, except those indicated in italics, is mainly due to the heavy percentage of urban population ranging from slightly above 16 in Osmanabad to 96 in Hyderabad West. These tahsils cover most of the urban units in the state which are important from the administrative or cultural points of view. As regards the seventeen tahsils in italics, the relatively heavy proportion of this livelihood class in the tahsil of Koppal is due partly to its heavy urban population and partly to the labourers, etc., engaged in the construction of the Tungabhadra Project; in Khanapur and, to an extent, in Bhir Tahsil referred to earlier, is mainly due again to the temporary residence within these tahsils of a large number of labourers, employed in the construction of some P.W.D. Projects; in Hyderabad East, Medchal and Ibrahimpatnam to the fact that they are considerably influenced by the metroplis of the state and also contain some of its suburban units; in Lakshattipet Jagtiyal, Nirmal, Sultanabad, Metpalli, Sirsilla and Karimnagar t-and to a smaller extent in Sirpur Tahsil which also falls under the former category- to heavy numbers of Chakalas U.e., the caste of washermen), beggars and vagrants and, to a smaller extent, of persons employed as village officers and servants or in the construction of buildings or small irrigation works; in Wanparti partly to a P.'V.D. Project under construction and partly to a number of persons who have taken to occupations covered by this livelihood class on account of its former position as a prosperous Samasthan; in Khuldabad and Tuljapur to the large number of pensioners, government employees, priests and other persons belonging to the religious services residing in and around Khuldabad and Tuljapur Towns; and in Jintur and Deglur to a number of persons having returned their principal means of livelihood as unspecified labour. In some of these seventeen tahsils, like Nirmal and Jagtiyal, a fairly appreciable urban population is also a factor leading to the high proportion of the livelihood class.
As against this, apart from a few backward tahsils like Utnoor in Adilabad (wherein the proportion of the livelihood class is almost insignificant being less than 20) or JafTerabad in Aurangabad, this livelihood class is the least numerous in . this state in the south western portions of Gulbarga and the western portions of Raichur District excluding of course, the tahs iis of Koppal and Gangawati mentioned earlier. Among the tahsils in thi s tract, the proportion is lower than even 40 in Afzalpur and Andola (Jevargi), lower than 50 in Yelburga, Sindhnoor, Deodurg and Shahapur, lower than 70 in Shorapur, Lingsugur, and Kushtagi and lower than 80 in Manvi. As already stated, in this scarcity zone of the state, an overwhelming majority of the population subsists principally on agriculture--mostly ·on owner cultivation. *The only two tahsils which contain the district headquarters and are not included among the tahsils mentioned above, are Sangareddy and Nalgonda Tahsils of Medak and Nalgonda Districts respectively. The relatively low proportion in these two tahsils is due to the fact that they have a comparatively heavy percentage of rural popUlation and their headquarter towns have not fully developed because of their proximity to Hyderabad City. An additional factor, in case of Sangareddy, is the dispersal {)f the district offices in other places and, in case of Nalgonda, the disturbed conditions prevailing in the district prior to cen,ug -enumeration, on account of which a number of persons, especially the dependants belonging to this livelihood class, who would have normally resided in Nalgonda Town were living elsewhere. Similarly, in the other tahsils of Humnabad, P.llvancha, B[dhan Chitapur, Asifabad, Yellandu, Lingsugur, Makhtal, Bhoom, Gadwal, Kushtagi and Yadgir, wherein the prop:>rtiOfl of uro tn population is higher than in Osmanabad Tahsil, the Livelihood Class of Other Services and Miscellaneous Sources suff~r3 in numbers because of the importance of certain other non-agricultural classes or even agricultural classes as in the case of Bhoom or Klllhtagi THhsils. Again, the proportion of this livelihood class is not very impressive in Khammam Tahsil, which contains one of the important towns in the state, mainly because of a very heavy rural popiiIation as in the case of Sangareddy or Nalgonda Tahsil. mentioned above.
tIn Karimnagar Tahsil the hi.;h proportion of the class is also due to an appreciable extent to the fact that it contains the district headquarters.
175
Summary.-During this census, every person enumerated has been classified, on the basis of his principat means of livelihood, into one or the other of the eight livelihood classes of persons principally dependent on Owner Cultivation, Tenant Cultivation, Agricultural Labour, Agricultural Rent, Production (other than cultivation), Commerce, Transport and lastly Other Services and Miscellaneous Sources. For purposes of this classification, the means of livelihood through which a self-supporting person derived his income, or the major portion of it, was treated as his principal means of livelihood as well as that of all persons dependent On him, whether partly or wholly. But the data collected accordingly in respect of individual classes suffers from certain limitations. Firstly, in the case of persons deriving their total income from more than one source, it is often difficult, especially in rural areas, to specify prec,isely the means through which the major portion of the income was derived. Secondly, due to the varying degrees of esteem commanded by different professions in society, the principal means of livelihood returned in many cases represents not the occupation which contributed the largest portion of the income but only that which confers the highest social status. And lastly, many actually sf'lf-supporting females, merely out of respect for their traditional role. returned themselves as being partly or entirely dependent on their male relatives and suppressed their own principal means oflivelihood. Apart from these lilllitations, census figures pertaining to any individual livelihood class do not fully reflect the importance ,of the occupations pertinent to it because they do not take into account the number of persons deriving a secondary or a subsidiary income from such occupations.
That the state is primarily agricultural is obvious from the fact that as many as 682, out of every 1,000 persons in it, belong to agricultural classes. Among all classes, whether agricultural or non-agricultural, the Livelihood Class of Owner Cultivators-accounting for 412 out of every 1,000 of the population-is by far the most numerous. The Livelihood Class of Tenant Cultivators is, on the other hand, by no means conspicuous. In fact, it can claim only 74 among every 1,000 persons in the state. The Livelihood Class of Agricultural Labourers is again one of the major classes in this state, accounting for 172 out of every 1,000 of its population. But even this appreciable proportion underrates the total capacity of agricultural labour for the sustenance of the people because, as a subsidiary profession, it is by far the most important among the various occupations followed as such in this state. The Livelihood Class of Agricultural Rent Receivers is, however. numerically not very significant. Actually,it is the least numerous among the agricultural classes, accounting for only 24 out of every 1,000 of the state's population. This class is not entirely identical with the proverbial absentee landlords living in luxury on the .sweat of their tenants. It includes many widows, or infirm or,poor landlords, who are not in a position to cultivate their lands and excludes many big landlords, who let out only portions of their lands and have, therefore, returned themselves as being primarily owner cultivators. The Livelihood Class of persons pI:incipally sustained by Production (other than cultivation) is the most numerous among the non-agricultural classes, claiming 135 out of every 1,000 of the inhabitants of this state. This class derives its strength more from persons principally dependent on primary, rural and cottage industries, artisan trades and the tapping of toddy trees than from those similarly dependent on large-scale industries. There can be no doub~ that this class would have been appreciably more numerous but for the return of many village artisans as being primarily agriculturists. The numbers claimed by the Livelihood Class of Commerce are not at all impressive. Only 51 persons, out of every 1,000 in the state, belong to it. It must, however, uot be overlooked here that all producers-cum-sellers, such as the village artisan traders, have all been v~ry justifiably treated as being basically producers. The Livelihood Class of Transport is the least significant in the state, accounting for only 13 among every 1,000 of its population. Perhaps, this proportion would have been slightly more, but none-the-less insignificant, if employees of transport organisations engaged in productive or repairing activities, persons connected with th~ letting of vehicles without supplying the personnel for their running and domestic servants attached to private vehicles (who have been included in the Livelihood Classes of Production, Commerce and Other Services and Miscellaneous Sources respectively) had all been treated as oelonging to this class. The residuary Class of Other Services and Miscellaneous Sources accounts for 119 among every 1,000 of the population of the state. This class has also suffered numerically because quite a large number of village servants, barbers, washermen, etc., in rural areas have returned agriculture as their principal means of livelihood.
Within the state itself, agricultural classes are in a decisive majority in all its districts-except Hyderabad exclusively because of the large non-agricultural population residing in Hyderabad City and are relatively much more numerous in its western than in its ea'ltern districts. This is due to the fact tJiat while thc fo;rmer have a heavier proportion of area under cultivation and a more fertile soil, the latter are richer in forests, mines and quarries, fisheries, livestock, cottage and rural industries, artisan trades and beverages and have the additional advantage of the location of the capital <'ity with all its variegated and extensive nonagricultural activities. Subject to this overall pattern, the proportion of the class is especially low in tahsils which have a heavy urban population, or are characterised by some special productive activity; and ('specially high in_tahsils which are,particuhirly under developed, or are constantly affected by scarcity. It may seem:
20
176
~trange, but it is a fact, that in the western portions of Bhir, south-western portions of Gulbarga, western portions of Raichur and south-western portions of Nalgonda where the rainfall is most precarious, the proportion -of persons principally dependent on agriculture is inordinately heavy.
The variation in the proportion of the Livelihood Class of Owner cultivators, or of any other individual agricultural class, is not always in keeping with the corresponding variation of all agricultural classes taken together. This is due to differences, from area to area, in respect of the type of populati0n owning lands, size of holdings, nature of crops cultivated, availability of subsidiary occupations, etc. As a rule, the proportion ·of the class is heavier in the western and in Nizamabad and Medak Districts than in the remaining eastern districts of the state. The heavier proportion in the western districts as well as in the western tahsils of Medak results largely from a comparatively high proportion of the area under cultivation and limited extent of non-agricultural occupations; and that in Nizamabad District and in the eastern tahsils of Medak District because of an unusually large percentage of small patta holders to the total number of pattedars. The lower proportion in the remaining eastern districts of the state results largely again from a low percentage of the area under cultivation and the existence on a large scale of rural and primary industries including artisan trades and the tapping of toddy trees. Their heavier percentage of tenant cultivators as compared with the western districts and Nizamabad and of persons who have taken to OWner cultivation as a subSidiary occupation as compared with the western districts are also contributory factors. Subject to this Overall variation, the proportion of the class is low in tahsils which have a heavy urban population, or are marked by some special productive activity, or wherein appreCiable portions of the cultivated area are in the possession of big landlords or of persons belonging to non-cultivating castes or classes; is high in tahsils Which are relatively backward, or wherein the size of the average patta holding is small or relatively very little area is in the possession of non-cultivating c:;Lstes or classes; and is particularly heavy in the scarcity areas of the ·districts of Raichur, Gulbarga, Bhir and, to a less perceptible extent, Nalgonda.
The proportion of the Livelihood Class of Tenant Cultivators does not vary in any settled pattern from district to district. It is, however, distinctly high in three zones of the state. The first of these consists of the backward, remote, hilly and forest tahsils in Adilabad, Karimnagar, Warangal and, to a smaller extent in Parbhani and Nanded Districts; the second of the south-central areas of the state surrounding Hyderabad City, mostly in Hyderabad; Mahbubnagar, Medak and Nalgonda Districts; and the third of the central and northern portions of Gulbarga District and the adjoining southern portions of Bidar District. But the proportion in the third of these zones is not as heavy as in the other two. The heavy proportion in the first of these zones is due largely to considerable fallow or forest lands having gone into the possession of non-cultivating classes or castes, the dispossession of Scheduled Tribes and Castes and Other Backward Classes-who are heavily concentrated in the zone-from the lands originally owned by them or their ancestors by both cultivating and non-cultivating castes, the migration of many small pattedars to industrial towns or mining centres, the existence of some big landed estates and lack of non-agricultural occupations. The heavy proportion in the second of these zones results largely from the emigration of many small pattedars to Hyderabad City, the acquisition of lands locally by persons residing in that city, the existence of some large holdings particularly from the point of view of irrigated areas and limited scope in nonagricultural occupations. The perceptibly heavy proportion in the third of these zones is largely due to the migration of many small pattedars to Sholapur and Hyderabad Cities and Gulbarga and Shahabad Towns the appreciable proportion of lands in the possesssion of Muslims and Brahmins and other ca tegories of per~on~ who generally prefer non-agricultural to agricultural occupations, of the practice of many Lingayat landlords to lease out all or portions of their lands and engage themselves in other Occup&tions, especially commerce, and lack of non-agricultural occupations.
The proportion of the Livelihood Class of Agricultural Labourers is especially heavy in the north-wes tern districts of Parbhani, Osmanabad, Bidar, Nanded, Aurangabad and Bhir and in Adilabad; especially low in the south-western districts of Gulbarga and Raichur and in the central districts of Nizamabad and Medak in the eastern half of the state; and is round about the state's average in the remaining. eastern districts pf Warangal, Mahbubnagar, Nalgonda, Karimnagar and Hyderabad (excluding Hyderabad City and its suburban towns). But this pattern is not quite in keeping with the popular conception that agricultural labourers are most numerous in the state in its relatively well irrigated eastern districts. This conception, however, is ~ased not on the proportion oftke class to the total population but on the number of agricultural labourers in relation to the area under cultivation. The especially heavy proportion in the north-western districts is due largely again to a comparatively high percentage of the total area under cultivation, greater fertility of the soil and limited non-agricultural resOUrces. Comparath"ely vast areas under the possession of non-cultivating castes or classes is also a contributory factor. The especially heavy proportion of the class in Adilabad District is due to the gradual dispossession of Scheduled Tribes and Castes and other Backward Classe<;, who account for the majority of the district's population, by comparatively adYanced, indigenous
20*
177
and non-indigenous, castes and classes. Besides, cultivation of both cotton and rice and, as compared witn the adjoining Telugu areas an appreciably larger per capita area under cultivation and lack of non-agricultural occupations are also factors contributing to the heavy proportion of this livelihood class in the district. The especially low proportion in Raichur 01' Gulbarga District, as a whole, is largely due to the scarcity of rainfall (in their western and south-western tahsils respectively) which is not conducive to the sustenance of agrimJ.itural labourers in any appreciable numbers. The espeCially low proportion in the two districts of Nizamabad or Medak, as a whole, is due to their unusually heavy percentage of small land holders among the total number of pattedars, the emigration of the labour classes to Bodhan and Nizamabad Towns and Hyderabad City and the existence of various types of non-agricultural occupations on an appreciable scale. But, it has to be noted here that the eaJtent qf agricultttrallabottr, as a sttbsidiary occttpation, is appreciable ir.. the~e two districts. The proportion of the livellhood class is low in the remaining eastern districts, as compared with the north-western districts, in general, largely due again to a considerably smaller percentage of the area under cultivation and vaster and more varied non-agricultural resources and also to a higher percentage of the people principally engaged as tenant cultivators, a heavier emigration of the working classes from the rural to the urban areas (including mining centres) and-except in the case ofHyderabad District-to a smaller extent o,f lands under the possession of non-cultivating castes and classes and the resort to agricultural labour as a subsidiary occupation on a proportionately wider scale. The smaller proportion of the class in these five eastern districts as compared with Adilabad is again due to their vaster non-agricultural resources, lower proportion of dispossessed Scheduled Castes and Tribes and Backward Classes, more intensive emigration of working classes from rural to urban areas and, except in case of Hyderabad District, wider resort to agriculuturallabour as a subsidiary occupation and, in case of Karimnagar and Warangal Districts, a higher percentage of small landholders among the total number of pattedars. As against this, the smaller proportion of persons belonging to this class in these five eastern districts, as compared with Gulbarga or Raichur. is largely due to the fact that the former set of districts suffer relatively little from deficiency of rainfall and have large acreages under irrigated crops; and, as compared with Nizamabad and Medak Districts, largely due to their lower percentage of small patta holders to the total number of pattedars and a higher percentage of Scheduled Castes and Tribes and Backward Classes.
The proportion of the Livelihood Class of Agricultural Rent Receivers, though not significant in any district, is distinctly heavier in the western than in the eastern districts. Again, within the western districts themselves, it is markedly higher in Gulbarga and, to a smaller extent in the surrounding districts of Osmanabad, Bidar and Raichur and within the eastern districts itis markedly lower in Hyderabad, Warangal. Karimnagar and N algonda. The distinctly higher proportion of the class in the western than in the eastern districts of the state is very largely merely the reflection of their higher proportion of agricultural classes taken all together for reaSons explained earlier. Vaster areas in the possession of non-agricultural classes or castes is also a contributory factor. An intensification of this factor in Gulbarga and the adjoining districts of Osmanabad, Bidar and Raichur explains their especially heavy proportion of the class. Apparently, the variation in the proportion of this class, from area to area, should be in conformity '[rith the corresponding variation for the Livelihood Class of Tenant Cttltivators. But this is not the case largely because while there is a distinct tendency. dtte to variotts reasons, for the proportion of persons 'li..'ho have actually returned tenant cultivation as their principal means of livelihood to the total number of persons 'li.:ho hm;e obtained lands on lease to be lower in the west~rn half of the state, there is a similar tendency for the proportion of persons 'Lt'ho have actually returned agricultural rent as their principal means of livelihood to the total number oj persons 'who have leased out their lands, wholly or partly, to be lower in its eastern half.
The Livelihood Class of Production is proportionately more numerous in the eastern than in the western districts of the state. Although the large scale industries of the state are more 01' less evenly distributed between the two halves of this state-especially if their heavy concentration in Hyderabad city is ignored-the primary and cottage industries (including toddy drawing,) and artisan trades in the State are concentrated to an appreciable extent in the former. Naturally, therefore, the variation is more perceptible in the rural than in the urban areas of the two halves of the state. Within the western districts themselves, the class is relatively conspicuous in tahsils which have a heavy urban population or adjoin the eastern districts. Again, within the eastern districts, it is especially conspicuous in three zones. The first of these consists ot the western tahils of Karimnagar District and the adjoining tahsils in Adilabad, Nizamabad, Medak, Nalgonda and Warangal Districts. In Karimnagar District, as a whole, the class accounts for appreciably over onefourth of the popUlation. The particularly heavy proportion of the class in this zone is exclusively due to the fact that it contains an unusually large number of persons sustained by primary and cottage industries (including toddy drawing) and artisan trades of most of the descriptions common to the state. The secvnd of these zones consists of Atmakur, Makhtal, and Wanaparti Tahsils of Mahbubnagar District. This zone is partiCUlarly l!'ich in stock raising, weaving of woollen and to a smaller extent cotten goods. tanning of leather, the making
178
-of leather articles, earthenware and beedis, stone quarrying, toddy drawing and fishing. The third of these "Zones consists of Hyderabad City and the surrounding tahsils. The high proportion in this zone results from the numerous large and small industrial establishments located in and around Hyderabad City and to the
-diverse types of productive a.ctivities and artisan trades which are necessary for sustaining a huge urban popula. tion. As against this, within the eastern districts, the class is by no means conspicuous in (a) the extreme south in the districts of Mahbubnagar, Nalgonda and Warangal (excluding of course its coal mining tahsil of Palvancha), (b) the extreme north along the Penganga and the Wardha in Adilabad District (excluding of -course Asifabad Tahsil with its coal mines and Sirpur Tahsil with its paper mills) and (c) in certain tahsils adjoining the western districts. It is also very low in some of the forest tahsils falling in areas other than those mentioned earlier. These a.reas are not as rich in cottage industries and artisan trades and toddy drawing as the -other areas in the eastern half of the state.
The Livelihood Class of Commerce is not numerically conspicuous in any district of the state except Hyderaba.d wherein it accounts for about one·sixth of the total population. The strength of the class in this
-district is, however. derived overwhelmingly from Hyderabad City wherein the commercial activities of the ·state are heavily centred. Among the other districts, the class is proportionately most numerous in Bidar and least in Adilabad. The higher proportion of the class in Bidar District is due to the fact that it has an appreciable proportion of Lingayats and many among them have returned Commerce as their principal occupation. Besides, this district is located almost in the centre of the cotton growing tracts of the state and across the ancient highways connecting it with the coastal towns of western India. The numerical insignificance oofthis class in Adilabad District is due to the fact that it is the most backward district in the state from various points of view and the conditions in it are the least conducive in the state to the sustenance of purely commercial castes and classes. The class generally tends to be particularly conspicuous in tahsils which have large urban units or collectively a large urban population, especially in the cotton and oilseeds tracts of the state.
The Livelihood Class of Transport is insignificant in numbers in all the districts of the state except Hyderabad. But even in Hyderabad District, it accounts for less than 7 per cent of the total population and draws almost 90 per cent of its numbers from Hyderabad City and its suburban towns. The variation in the proportion of this class in the relhaining distncts of the state is within very narrow limits and does not reveal any distinct pattern. Among the individual tahsils of the state, the class is relatively perceptible in those traver-
'sed by rail. Not only the railway personnel but most of the persons employed in other transport organisations or activities, reside in places connecteu by rail. This class is concentrated in the urban areas of the state -even more than that of Com:norce. A<; things now stand, there is very little scope in the Villages for the sustenance of persons-wholly or even mainly-through occupations connected with transport. And .again, the overwhelming majority of the personnel belonging to railway and transport services and catering to the needs of both the rural and urban areas, lives only in towm. But even in the towns the class is numerically by far the least Significant among all the non-agricultural classes.
The Livelihood Class of Other Services and Miscellaneous Sources is neither prominent nor insignificant in any district of the state, except Hyderabad. In Hyderabad District, however, the class claims over forty per cent of the total population. But its heavy proportion in this district results exclusively from the COncentration in Hyderabad City of the persons connected with many of the occupations relevant to the cl~s. Excluding the figures pertaining to this City and its suburban towns, the variation in the proportion ·of this class, from district to district, is within very narrow limits. It then accounts, at its lowest, for about seven per cent of the total population in Medak and, at its highest, for about twelve in Hyder. abad. Again this variation, as in the case of the corresponding variation in the proportions of the Livelihood Class of Commerce Or Transport, is not in accordance with any settled pattern except that the class is con· centrated in urban areas. This is not surprising because a heavy proportion of persons who are principally -dependent on pensions or mansabs and other grants; on municipal, legal, domestic, sanitary, power generaration and supply, police, medical and public health, educational and recreation services; or on hotels and restaurants, construction of buildings, and government employment (unclassifiable under other cate· gOries)-to mention some of the major occupations pertinent to this class-resides only in"places where the administrative, educational or commercial activities of the state or its large scale industries are concentrated. "Tahsilwise also, the livelihood class is especially numerous in areas which have a heavy urban population. Its proportion also tends to be relatively Gonspicuous in tahsils which are situated close to Hyderabad City. or wherein some large P. W. D. or other prQjects are under construction, or which contain important religious centres. The class is alsQ fairly appreciable in the western tahsils of Karimnagar District and the adjoining ..areas of other districts because of a particularly large number of washermen, barbers, beggars and vagrants, village officials, etc. As against this, the class is least numerous in the south-western portions of the state in Gulbarga and Raichur Districts and in some of the very backward tahsils of the state.
CHAPTER II ,
Rural Populatioo

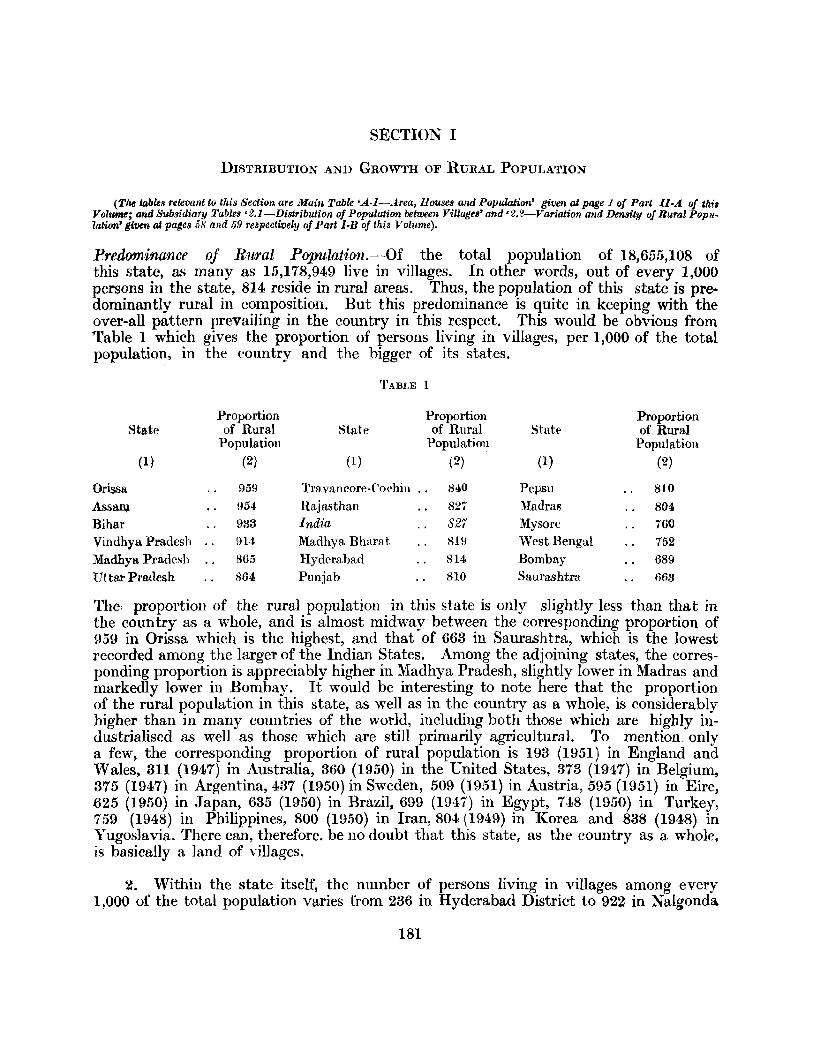
SECTION I
DISTRIBUTION AND GROWTH OF RURAL POPULATION
(The $ables relevant to this Section are Main Table 'A·I-.1:rea, Hausea and Population' giveu at page 1 of Part II·."- of thi' Volume; and Subsidiary Tables' 2.1-Distribution of Population between Villages' and' 2.2-Variation and Density 0/ Rural Popu. ,lation' given at pages 58 and 59 j'espectively of Part l·B of this Volume).
Predominance of Ru,ral Popu,Zation.-Of the total popUlation of 18,655,108 of this state, as many as 15,178,949 live in villages. In other words, out of every 1,000 persons in the state, 814 reside in rural areas. Thus, the popUlation of this state is predominantly rural in composition. But this predominance is quite in keeping with the over-all pattern prevailing in the country in this respect. This would be obvious from Table 1 which gives the proportion of persons living in villages, per 1,000 of the total population, in the country and the bigger of its states.
TABLE 1
Proportion Proportion Proportion State of Rural State of Rural State of Rural
Population Population PopUlation (1) (2) (1 ) (2) (1) (2)
Orissa 959 'fravancore·('ochin .. 840 Pepsu 810
AssaIQ. 954 Rajasthan 827 Madras 804
Bihar 933 India 827 Mysore 760
Vindhya Pradesh 914 Madhya Bharat 819 West Bengal 752
Madhya Pradesh 865 Hyderahad 814 Bombay 689
Uttar Pradesh 864 Punjab 810 Saurashtra 668
The\ proportion of the rural population in this state is only slightly less than that in the country as a whole, and is almost midway between the corresponding proportion of 959 in Orissa which is the highest, and that of 663 in Saurashtra, which is the lowest record~d among the larger of the Indian States. Among the adjoining states, the corresponding proportion is appreciably higher in Madhya Pradesh, slightly lower in Madras and markedly lower in Bombay. It would be interesting to note here that the proportion of the rural population in this state, as well as in the country as a whole, is considerably higher than in many countries of the world, including both those which are highly industrialised as well as those which are still primarily agricultural. To mention. only a few, the corresponding proportion of rural population is 193 (1951) in England and Wales, all (1947) in Australia, 360 (1950) in the United States, 373 (1947) in Belgium, 375 (1947) in Argentina, 437 (1950) in Sweden, 509 (1951) in Austria, 595 (1951) in Eire, .625 (1950) in Japan, 635 (1950) in Brazil, 699 (1047) in Egypt, 748 (1950) in Turkey, 759 (1948) in Philippines, 800 (1950) in Iran, 804 (1949) in Korea and 838 (1948) in Yugoslavia. There can, therefore, be no doubt that this state, as the country as a whole, is basically a land of villages.
2. Within the state itself, the number of persons living in villages among every 1,000 of the total popUlation varies from 236 in Hyderabad District to 922 in Nalgonda
181
182
District. Among the other districts of the state, the actual proportion is 793 in Raichur,. 818 in Warangal, 826 in Gulbarga, 828 in Nizamabad, 836 in Nanded, 847 in Parbhani, 854 in Osmanabad, 859 in Aurangabad, 865 in Bidar, 875 in Adilabad, 895 in Bhir, 903 in Mahbubnagar and 915 both in Karimnagar and Medak. But in Raichur District all the eighteen Tungabhadra Project Camps, as existing on the first of March, 1951, were treated as urban areas. If the population of these camps amounting to about 85,000 is ignored, the proportion in the district also increases to 818. The extraordinarily low proportion in Hyderabad District is due to the fact that it contains the metropolis of the state which is the fifth city. in the country* and dwarfs all the other urban units of this state by the sheer magnitude of its population. Besides, this is a very small district containing less than 500 populated villages. The district, therefore, contains by far the largest urban and the smallest rural population in the state even from the point of view of absolute numbers. Thus, e:x;cluding Hyderabad District and the temporary concentration of the labourers in the Tungabhadra Project Camps in Raichur District, the rural population predominates in all the districts of the state, its proportion varying within the relatively narrow limits of 818 in both Warangal and Raichur and 922 in Nalgonda.
3. Among the 138 tahsils in the state, the rural population accounts for more than 900, among every 1,000 of the total population, in as many as seventy five tahsiIs, for more than 800 in thirty eight tahsils, for more than 700 in fifteen tahsi]s, for more than 600 in six tahsils and for more than 500 in three tahsils. In only one tahsil of the state, namely Hyderabad West, which contains the metropolis of the state, the rural population loses its numerical superiority over the urban. It is interesting to note that even among the tahsils of Warangal, Gulbarga, Nanded, Aurangabad, Jalna, Raichur, Nizamabad, Humnabad, Koppal (including the Tungabhadra Project Camps) and Palvap.cha, each of which has an urban population exceeding 50,000, the rural population is distinctly more numerous than the urban. Thus, except for Hyderabad West Tahsil, even the most urban of the tahsils in the state are basically rural.
4. Population of the Average Village (i.e., Population perVillage).-The rural population of 15,178,949 in this state is spread over 19,909 populated villages, which gives an average population of 762 per village. The corresponding figure for the country as a whole is 529 and that for the adjoining states of Madhya Pradesh, Bombay and Madras is 379,724 and 1,236 respectively. Thus, the average village is significantly more populous. in this state than in the country as a whole. As compared with the adjoining states, the average village of this state is slightly more populous than that of Bombay and more than twice as populous as that of Madhya Pradesh. But it is considerably less populous than the average village of Madras. '
5. VVithin the state itself, the population of the average village varies considerably from district to district. It is extremely high in the south-eastern districts of Warangal, Karimnagar and Na]gonda. The actual figures in these districts are 1,276, 1,242 and 1,144 respectively. In no other district of the state does the figure e:x;ceed 1,000. The corresponding figure for Mahbubnagar District, again in the south of the state, is 869. As against these districts, the average village is the least populated in the state in the extreme northern districts and in Raichur to the e:x;treme south-west. The actual figures for these districts are 440 in Adilabad-the average village in this district is by far the most thinly populated in the state-546 in Aurangabad, 571 in Parbhani, 580 in Nanded and
• This is only in case Delhi City and its surrounding urban units, including New Delhi, are treated as a single urban unit. Otherwise, Hyderabad City becomes the fourth most populous city in the country.
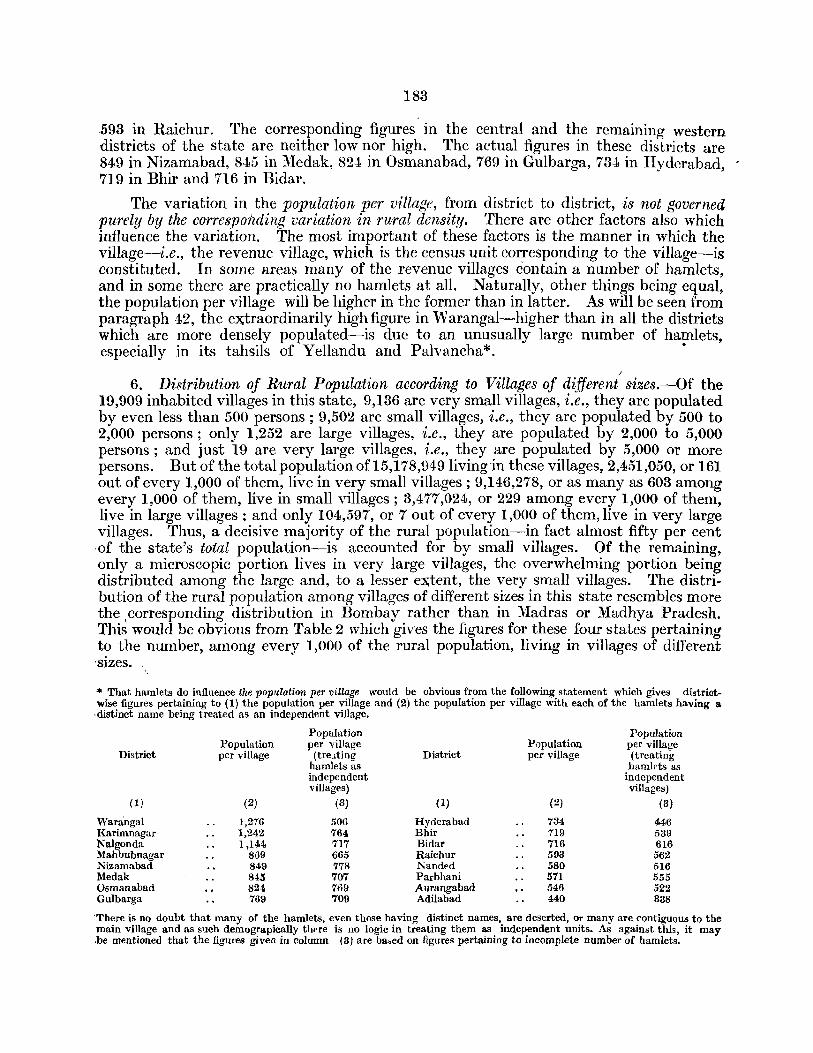
183
~93 in Raichur. The corresponding figures in the central and the remaining western districts of the state are neither low nor high. The actual figures in these districts are 849 in Nizamabad, 84dJ in Medak, 824 in Osmanabad, 769 in Gulbarga, 734 in Hyderabad, 719 in Bhir and 716 in Bidar.
The variation in the population per village, from district to district, is not governed purely by the corresponding variation in rural density. There are other factors also which influence the variation. The most important of these factors is the manner in which the village-i.e., the revenue village, which is the census unit corresponding to the village---is constituted. In some areas many of the revenue villages contain a number of hamlets, and in some there are practically no hamlets at all. Naturally, other things being equal, the population per village will be higher in the former than in latter. As will be seen from paragraph 42, the e:x;traordinarily high figure in Warangal-higher than in all the districts which are more densely populated-is due to an unusually large number of hamlets, especially in its tahsils of Yellandu and Palvancha*. •
I
6. Distribution of Rural Population according to Villages of different sizes.-Of the 19,909 inhabited villages in this state, 9,136 are very small villages, i.e., they are populated by even less than 500 persons; 9,502 are small villages, i.e., they are populated by 500 to 2,000 persons; only 1,252 are large villages, i.e., they are populated by 2,000 to 5,000 persons; and just 19 are very large villages, i.e., they are populated by 5,000 or more persons. But of the total population ofI5,178,949 living in these villages, 2,451,050, or 161 out of every 1,000 of them, live in very small villages; 9,146,278, or as many as 603 among every 1,000 of them, live in small villages; 3,477,024, or 229 among every 1,000 of them, live in large villages; and only 104,597, or 7 out of every 1,000 of them, live in very large villages. Thus, a decisive majority of the rural population-in fact almost fifty per cent of the state's total popUlation-is accounted for by small villages. Of the remaining, only a microscopic portion lives in very large villages, the overwhelming portion being distributed among the large and, to a lesser extent, the very small villages. The distribution of the rural population among villages of different sizes in this state resembles more the ,corresponding distribution in Bombay rather than in Madras or Madhya Pradesh. This would be obvious from Table 2 which gives the figures for these four states pertaining t? the number, among every 1,000 of the rural population, living in villages of different 'SIzes.
'" That hamlets do influence the population per village would be obvious from the following statement which gives districtwise figures pertaining to (1) the popUlation per village and (2) the population per village with each of the hamlets having a ,distinct name being treated as an independent village.
District
(1)
Waraugal Karimnagar Nalgonda l\fahbubnagar Nizamabad Medak Osmanabad Gulbarga
Population per village
(2)
1,276 1,242 1,144
869 849 845 824 769
Population per village
(tre .. ting hamlets as independent villages)
(8)
506 764 717 665 778 707 769 709
District
(1)
Hyderabad Bhir Bidar Raichur Nandt>d Parbhani Aurangabad Adilabad
Population per village
(2)
784 719 716 598 580 571 546 440
Population per village (treating hamlets as
independent villages)
(8)
446 589 616 562 516 555 522 838
'There is no doubt that many of the hamlets, even those having distinct names, aTe deserted, Or many are contiguous to the main village and as such demograpicaUy there is no logic in treating them as independent units. As against this, it may be mentioned that the figures given ill column (8) are ba.ed on figures pertaining to incomplete number of hamlets.
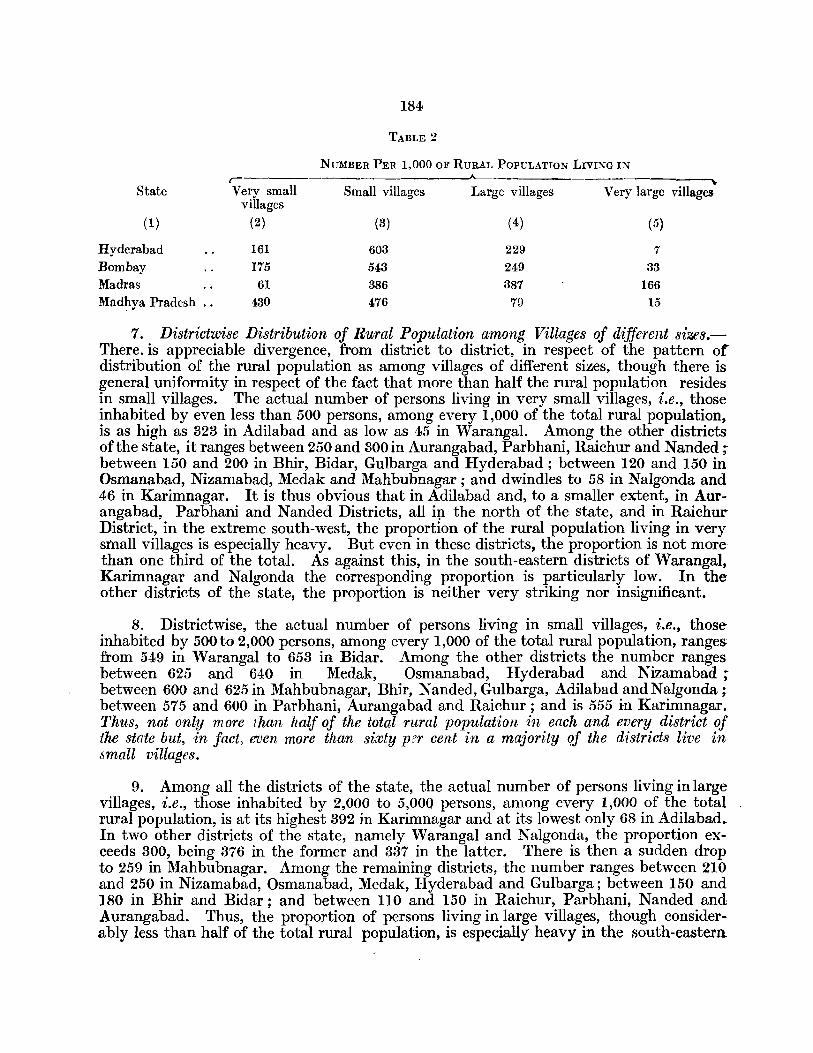
State
(1)
Hyderabad Bombay Madras Madhya Pradesh ..
184
TABLE 2
NUMBER PER 1,000 OF RURAL POPULATION LIVING IN
c--------------__J\.___ Very small Small villages Large villages
villages (2)
161
175 61
430
(3)
603 543 386 476
(4)
229 249 387
79
~
Very large villages
(5)
7
33 166
15
7. Districtwise Distribution of Rural Population among Villages of different sizes.There. is appreciable divergence, from district to district, in respect of the pattern or distribution of the rural population as among villages of different sizes, though there is general uniformity in respect of the fact that more than half the rural population resides in small villages. The actual number of persons living in very small villages, i.e., those inhabited by even less than 500 persons, among every 1,000 of the total rural population, is as high as 323 in Adilabad and as low as 4,1> in Warangal. Among the other districts of the state, it ranges between 250 and 300 in Aurangabad, Parbhani, Raichur and Nanded; between 150 and 200 in Bhir, Bidar, Gulbarga and Hyderabad; between 120 and 150 in Osmanabad, Nizamabad, Medak and Mahbubnagar ; and dwindles to 58 in NaIgonda and 46 in Karimnagar. It is thus obvious that in Adilabad and, to a smaller extent, in Aurangabad, Parbhani and Nanded Districts, all i:p. the north of the state, and in RaichurDistrict, in the extreme south-west, the proportion of the rural population living in very small villages is especially heavy. But even in these districts, the proportion is not more than one third of the total. As against this, in the south-eastern districts of Warangal, Karimnagar and Nalgonda the corresponding proportion is particularly low. In the other districts of the state, the proportion is neither very striking nor insignificant.
8. Districtwise, the actual number of persons living in small villages, i.e., those inhabited by 500 to 2,000 persons, among every 1,000 of the total rural population, ranges from 549 in Warangal to 653 in Bidar. Among the other districts the number ranges between 625 and 640 in Medak, Osmanabad, Hyderabad and Nizamabad; between 600 and 625 in Mahbubnagar, Bhir, Nanded, Gulbarga, Adilabad and Nalgonda ; between 575 and 600 in Parbhani, Aurangabad and Raichur; and is 555 in Karimnagar. Thus, not only more than half of the total rural population in each and every district of the state but, in fact, even more than sixty per cent in a majority Qf the d1'stricts live in 5mall villages.
9. Among all the districts of the state, the actual number of persons living in large villages, i.e., those inhabited by 2,000 to 5,000 persons, among every 1,000 of the total rural population, is at its highest 392 in Karimnagar and at its lowest only 68 in Adilabad. In two other districts of the state, namely Warangal and Nalgonda, the proportion exceeds 300, being 376 in the former and 337 in the latter. There is then a sudden drop to 259 in Mahbubnagar. Among the remaining districts, the number ranges between 210 and 250 in Nizamabad, Osmanabad, Medak, Hyderabad and Gulbarga; between 150 and 180 in Bhir and Bidar; and between no and 150 in Raichur, Parbhani, Nanded and Aurangabad. Thus, the proportion of persons living in large villages, though considerably less than half of the total rural population, is especially heavy in the south-eastern
185
districts of Karimnagar, 'Varangal and Nalgonda. In these three districts as well as in Mahbubnagar, Medak, Nizamabad, Osmanabad, Hyderabad and Gulbarga, relatively more persons live in large villages than in very small villages. As against this, in the districts of Bidar and Bhir, and more especially in Raichur and the northern districts of Parbhani, Nanded, Aurangabad and particularly Adilabad, persons living in large villages are even less numerous than those living in very small villages. But, as already explained, in case of bot~ these sets of districts, the majority lives in the intermediary units, i.e., the small villages.
10. The proportion of persons living in very large villages, i.e., those inhabited by 5,000 or more persons, is insignificant. The fact is that the overwhelming majority of such units in the state have been classed as towns. There are in all just 19 villages of this type in the state. Perhaps some authorities would deem it proper to treat even these nineteen villages as towns. There are no villages at all of this size in Parbhani, Nanded, Bidar, Osmanabad, Hyderabad, Mahbubnagar, Raichur and Nizamabad Districts.
n. Distribution of Rural Population in Adilabad District.-Adilabad is> primarily a district of very small population units. The rural areas of this district are by far the most sparsely populated in the state, their density being as low as 107. Out of 1,796 inhabited villages in it, more than two thirds, namely 1,244, arE\ very small villages, i.e., they contain less than 500 persons each; 529 are small villages, i.e., they contain between 500 to 2,000 persons; and only 22-which is the smallest corresponding number in any district of the state-are large villages, i.e., they contain between 2,000 to 5,000 persons and the remaining one is a very large village, i.e., it is inhabited by over 5,000 persons. 'The average village in the hilly and forest regions of this district, which cover a major portion pf its area, is nothing more than just a jumble of a few poorly built forest dwellings. In fact, if all its hamlets or at least a majority of them--there are more hamlets in this than in the other districts of the state with the exception of Warangal, Nalgonda and Karimnagar-had been treated as independent villages, more than half of its population would have been accounted for by very small villages alone. The population per village in this district is only 440,. which is by far the smallest recorded in the state. But within the district itself, the average village is decisively more populous in its southern tahsils situated along the Godavari and ~djoining Nizamabad and Karimnagar Districts, than in its central and northern tahsils. Among the central and northern tahsils, the population per village is as low as 282 in Utnoor, which is the lo'west recorded among all the tahsils of the state. It is 809 in Rajura, 825 in Asifabad, 408 in Boath, 489 in Kinwat, 464 in Sirpur and 469 in Adilabad-it would have been considerably lower in Boath and Kinwat but for an unusually large number of hamlets in them as compared with the -other tahsils in the district. As against this, among the southern tahsils, the figure at its lowest is 511 in Chinnoor. It is 568 in Khanapur, 610 inNirmal and as much as 717 in Lakshattipet.
12. As already indicated, in no other district of the state are persons living in very small villages proportionately as numerous as in this district. In fact, they account for almost one third of its total rural population. Actually, the number of persons living in very small villages, among every 1,000 of the rural population, is as high as 650 in Utnoor. This is again the only tahsil in the state wherein persons living in very small villages account for a majority of the rural population. Among the other central and northern tahsils Df the district, the corresponding proportion is as high as 488 in Rajura and 419 in Boath, and is 887 in Asifabad, 847 in Sirpur, 327 in Kinwat and 298 in Adilabad. Theproportion~
186
however, diminishes appreciably in the southern tahsils, though even among all of them,. except Lakshattipet, the proportion is higher than the corresponding figure for the state as a whole. The actual proportion is 280 in Chinnoor, 244 in Khanapur, 209 in Nirmal,_ and only 142 in Lakshattipet. But in spite of all this, it is the persons living in the next category of villages, i.e., small villages, who account for a majority of the rural popula-tion in the district as well as in all its tahsils , with the exception of Utnoor and Rajura. In Utnoor, as already stated, those living in very small villages take the lead, and in Rajura the overwhelming portion of rural popUlation is more or less evenly split up among the small and the very small villages. The number of persons living in small villages, among every 1,000 of the rural population, is as high as 775 in Lakshattipet; ranges between 625 and 690 in Chinnoor, Nirmal, Kinwat, Sirpur and Adilabad; is 542 in Boath and slightly above 500 in both Khanapur and Asifabad ; and is only 457 in Rajura and 350 in Utnoor. The proportion of persons living in large villages to the total rural population is hardly significant in the district or any of its tahsils. There is not even a single large village in Utnoor tahsil. There is only one such village in Boath, Kinwat, Rajura (the coal mining village of Sashti), Sirpur and Chinnoor, only two in Khanapur and three in Lakshattipet and Asifabad-the headquarters of all these tahsils and Kothapet, Mancheriyal and Bellampalli in Sirpur, Lakshattipet and Asifabad Tahsils respectively having been treated as towns. Only Nirmal Tahsil of the district can boast of half a dozen large villages. The number of persons living in such villages, among every 1,000 of the rural population, ranges between 110 and 130 in Nirmal, Khanapur and Asifabad; between 55 and 85 in Lakshattipet, Adilabad and Rajura; and is even less than 50 in the remaining tahsils. There is only one very large village in this district, namely, Peddur, in Khanapur Tahsil. But even in the case of this village, its popUlation had swelled temporarily during the enumeration period because of a large number of labourers engaged in the construction of Kadam Project.
13. Distribution of Rural PopUlation in A'llrangabad District.-Out of the 1,85~ inhabited villages in this district-the largest number in the state-1,103, or appreciably more than half, are very small villages, 709 are small villages, and only 41 are large villages, and just 2 are very large villages. In this state, the villages of Aurangabad District are" ne:x;t to those of Adilabad, the least populous. The rural density in this district is just 161 which is among the lowest in the state. The population per village in this district is only 546. Tahsilwise, the figure is 402 in Gangapur, 448 in Khuldabad, 471 in J afferabad, 492 in Aurangabad, 495 in Kannad, 532 in Bhokardan, 537 in Paithan, 588 in Jalna,' 606 in Vaijapur, 634 in Sillod and as much as 700 in Ambad, which is the south.ern most tahsil of the district situtated along the Godavari.
14. Persons living in very small villages are proportionately very numerous in this. district. They account for appreciably over a quarter of the total rural population. In fact, the number living in such villages, among every 1,000 of the rural population, is as high as 426 in its most sparsely populated and backward tahsil of J afferabad ; 396 in Gangapur and 352 in Bhokardan ; ranges between 300 and 340 in Khuldabad, Aurangabad and Kannad; and is 287 in Paithan, 256 in Vaijapur and is slightly lower than 250 in Jalna. The proportion however, decreases to 213 in Sillod and is relatively as low as 179 in its southern most tahsil of Ambad. But as in most areas of this state, it is only persons living in small villages who account for a majority of the rural popUlation in the district as well as all its tahsils--except Jafferabad-but this majority is appreciably reduced. In Jafferabad, the overwhelming majority of the rural population is more or less evenly spread out between the small and the very small villages. The number of
187
persons living in small villages, among every 1,000 of the rural population, ranges betweelb 660 and 700 in Jalna, Ambad and Khuldabad; is 604 in Gangapur; ranges between 56() and 600 in Sillod, Vaijapur, Paithan and Kannad; is 526 in Aurangabad, 519 in Bhokardan and is as low as 484 in Jafferabad. The proportion of the number of persons living in large villages to the rural population is hardly impressive in the district or its tahsils. In fact, in this respect, the district is closer to Adilabad than any other district of the state. Its tahsils of Gangapur and Khuldabad, have not even a single village inhabited by more than 2,000 persons-the headquarters of these two tahsils which are also by no· means very populous, having been treated as towns. The number of persons living in large villages, among every 1,000 of the rural population is, at its highest, only 189 in Sillod. It ranges between 100 and 150 in Aurangabad, Paithan, Jafferabad, Bhokardan,. Kannad, Vaijapur and Ambad; and is as meagre as 61 in J alna. The only two very large villages in this district are Shivar in Vaijapur and Jamkhed in Ambad -all the other seven places in the district inhabited by 5,000 or more persons having been treated as towns.
15. Distribution of Rural Population in Parbhani District.-Out of the 1,500 populated villages in this district, 864 or appreciably more than half are very small villages, 595 are small villages and only 41 are large villages. There is no very large village in this district as all its eleven places inhabited by more than 5,000 persons have been treated as towns. The population per village in this district is very low, only two other districts, namely Adilabad and Aurangabad, recording lower figures. The actual figure for the· district is just 571. But within the district itself, the villages in the fertile southern. tahsils along the Godavari are distinctly more populous than the villages in the northern hilly tahsils. Among the southern tahsils, the corresponding figure is 789 in Gangakhed, 664 in Pathri and 651 in Parbhani. But in the northern tahsils, it is, at its highest, only 550 in Casmath, being 544 in Partur, 524 in Kalamnuri, 496 in Hingoli and only 468· in Jintur.
16. The proportion of persons living in very small villages to the total rural population is appreciable in this district. The actual number of such persons, among every 1,000 of the rural population, is as much as 269 in this district, i.e., slightly over a quarter' of the total. Among its northern tahsils, the corresponding proportion is as high as 864 in Jintur, ranges between 800 and 825 in Hingoli, Partur and Kalamnuri and is 258 in Basmath. But in its southern tahsils, it is, at its highest, 215 in Parbhani, and slightly less than 200 (i.e., about one fifth of the total) in Pathri and Gangakhed. Even theleast of these figures is appreciably higher than the corresponding average of 161 for the· state. In spite of this, it is once again the persons living in small and not very small villages who form the majority of the rural population. The number of persons living in small villages, among every 1,000 of the rural population, is 597 in the district as a whole. But tahsilwise, the proportion is as high as 785 in Pathri ; ranges between 600 and 625 in Kalamnuri, Parbhani and Basmath; between 550 and 590 in Gangakhed, Partur and Hingoli. In Jintur Tahsil, however, the proportion is only 478. The proportion of the number living in large villages is not very striking in this district. In fact, it is among' the lowest in the state. While such persons account for 184, among every 1,000 of the rural population in the district, their corresponding number is, at its highest, 218 in Gangakhed; 176 in Parbhani and 158 in Jintur, and ranges between 100 and 140 in Basmath, Hingoli and Partur; and is as low.as about 66 in both Kalamnuri and Pathri.
17. Distribution of Rural Population in N anded District.-Of the 1,869 populated villages in Nanded District, 764 or appreciably more than half are only very small villages,.
21
188
i.e., they are populated by less than 500 persons; 568 are small villages, i.e., they are populated by 500 to 2,000 persons; and only 37 are large villages, i.e., they are populated by 2,000 to 5,000 persons. There is no very large village in this district, all its ten places populated by more than 5,000 persons having been treated as towns. The population per village in this district, though more impressive than in any of the other extreme northern districts, is still low as compared with the majority of the districts of the state. 'The actual population per village in this district is only 580, as against the corresponding figure of 762 for the state. Within the district itself, the population per village ranges within very narrow limits. It is 513 in Nanded, 518 in Bhokar, 549 in Mudhol, 551 in Hadgaon, 584 in Deglur, 599 in Biloli, 620 in Mukhed and 691 in Kandhar. It is not without significance that within the district itself Kandhar has by far the largest number of hamlets.
18. Slightly over one fourth of the rural population of the district resides in very 'small villages. Tahsilwise, the number of persons living in such villages, among every 1,000 of the rural population, is 330 in Bhokar, 308 in Nanded, 281 in both Hadgaon and Mudhol and varies between 200 and 250 in Deglur, Mukhed, Biloli and Kandhar. But in this district also, considerably more than half of the rural population resides in the next higher category of villages, i.e., in small villages. The number living in such villages in the district, among every 1,000 of its rural population, is 611. Within the district itself, the number ranges between 560 and 575 in Nanded, Bhokar and Kandhar; between 600 and 685 in Deglur, Mukhed and Mudhol ; and is 66.5 in both Biloli and Hadgaon. The corresponding proportion of persons living in large villages to the rural population in this district as a whole as well as in most of its tahsils, is among the least striking in this state. The actual number of such persons among every 1,000 of the rural population, is 126 for the district; and tahsilwise, it is at its highest, 219 in Kandhar; 134 in Mukhed; ranges between 100 and 125 in Nanded, Deglur, Mudhol, Bhokar and Biloli; and is as low as 54 in Hadgaon. Hadgaon Tahsil has only two large villages with a population exceeding 2,000-both Himayatnagar and Hadgaon, though not very populous, having been treated as towns.
19. Distribution of Rural Population in Raichur District.-The rural population of this district is spread over 1,540 villages. Of these villages, as many as 891 are very small, 603 are small and 46 are large. The district does not contain any very large village as all its 18 places, as well as the Tungabhadra Project Camps, populated by 5,000 or more persons have been classed as towns. In this district also, the population per village is by no means striking. This fits in with the fact that the rural areas of this district, because of its western tahsils, rank among the least populated of the corresponding areas in the state. The actual popUlation per village in the district as a whole is only 593. But among its western tahsils it is as 10'Y as 488 in Deodurg, 489 both in Lingsugur and Gan~ gawati, 517 in Kushtagi, 542 in Sindhnoor, 559 in Koppal, 597 in Manvi and 688 in only Yelburga. The rural areas of Yelburga Tahsil are the most densely populated in the western half of this district. As against this, the corresponding figure is 612 in the central tahsil of Raichur and as high as 982 and 802 in its eastern tahsils of Gadwal and Alampur respectively.
20. Over one fourth of the total rural population of this district is returned from very small villages. Within the district itself, the proportion is unusually heavy in the western tahsils and fairly low in the eastern tahsils. Among the western tahsils, the number of persons living in very sm~ll villages, among every 1,000 of the rural population, is higher than 850 in Lingsugur and Deodurg, almost 350 in Sindhnoor, Gangawati and
21·
189
Kushtagi, slightly above 300 in Koppal and below 300 in Manvi and is 222 only in Y elburga~ As against this, among the remaining tashils of the district, the corresponding number is 227 in Raichur, 133 in Alampur and only 77 in Gadwal. But even in this district it is the persons living in small villages-and not the very small villages-who account for more than half of the total rural population, though their majority is considerably reduced. Only 585 persons, among every 1,000 of the rural population of the district, live in small villages. Tahsilwise, the number of such persons is, however, only 493, 491 and 469 in Sindhnoor, Manvi and Koppal respectively. Among the other tahsils, the corresponding proportion is 549 in Deodurg and 576 in Gangawati and ranges between 600 and 650 in Raichur, Kushtagi, Yelburga, Gadwal and Lingsugur. It is as high as 750 in Alampur. The proportion of the rural population living in large villages is not very striking in this district also. Among every 1,000 of its rural population, 146 live in large villages. Tahsilwise, however, the corresponding proportion is as high as 315 in Gadwal and is fairly respectable in Koppal and Manvi being 227 and 220 respectively. Among the othertahsils, however, it is 164 in Yelburga, almost 160 in Sindhnoor and 130 in Raichur, 117 in Alampur, 92 in Deodurg, 78 in Gangawati and. dwindles to even less than 35 in Lingsugur and Kushtagi. The only large village in Kushtagi Tahsil is Chelgeri and in Lingsugur Tahsil the gold :mining village of Hatti. But three places in each of these two tahsils-including their tahsil headquarters-have been treated as towns.
21. Distribution of Rural Population in Bidar District.-Of the 1,418 inhabited villages in this district, 643, or appreciably less than half, are very small villages, i.e., they are populated by even less than 500 persons; 716, or slightly more than half, are small villages, i.e., they are populated by 500 to 2,000 persons; and 59 are large villages, i.e., they are populated from 2,000 to 5,000 persons. There are no very large villages in this district as all its sixteen places populated by 5,000 or more persons have been treated as towns. Although the rural areas of this district are among the densely populated of the corresponding areas in thestate--its rural density is as much as 215 as against that of only 185 for the state-the popUlation per village in the district is not at all very striking. The actual figure for the district is 716 while that for the state is appreciably higher, being 762. Within the district itself, villages in its southern tahsils are distinctly more populous than those in its northern. The population per village in the southern tahsils of Humnabad, Bhalki, Zahirabad, Bidar and Nilanga is 861, 853, 763, 723 and 705 respectively. As against this, the corresponding figure for the northern tahsils of Udgir, Ahmadpur (in spite of its having a fairly large number of hamlets), Santpur and Narayankhed is only 669, 654, 626 and 604 respectively.
22. The proportion of the number of persons living in very small villages to the total rural population in this district is appreciably above the corresponding proportion for the state. But within the district itself, the proportion is heavier in the northern than. in the southern tahsils. While the actual number of such persons, among every 1,000 of the rural popUlation is 188 in the district as a whole, among the northern tahsils~ it ranges between 250 and 255 in Narayankhed and Ahmadpur and between 235 and 240 in Udgir and Santpur, and among the southern tahsils, it is slightly lower than 175 in Bidar and 160 in Nilanga and ranges between 135 and 145 in Humnabad, Bhalki and Zahirabad. Although in all the districts of this state, the majority of the rural population resides in small villages, the majority is most pronounced in this district. As many as 653 persons among every 1,000 of its rural population, live in small Villages. This is the chief distinction of the district in respect of the distribution of rural population. Within the district itself, the corresponding number is as high as 742 in Zahirabad; ran~es between 700 and 720 in Narayankhed, Humnabad and Santpur; between 640 and
190
·670 in Bidar, Bhalki and Nilanga; and is relatively as low as 556 in Ahmadpur and 586 in Udgir. The proportion of the number of persons living in large villages to the total rural population is not very striking in this district also. The number of such persons, .among every 1,000 of the rural population, is 159 in the district as a whole. It is, how'ever, fairly respectable in Udgir, Bhalki and Nilanga wherein it ranges between 200 and 225; is 193 in Ahmadpur ; 161 in Bidar, 148 in Humnabacl and 121 in Zahirabad ; and is ,as low as 64 in Santpur and 27 in Narayankhed. There is only one large village in Narayankhed Tahsil inhabited by slightly more than 2,000 persons (excluding its tahsil head'quarters which has been treated as a town) and there are only two such places in Santpur .including even its tahsil headquarters.
23. Distribution of Rural Population in Bhir District.--Ofthe 1,029 inhabited villa'ges in this district, 485 are very small villages, 498 are small, 44 are large and only 2 are very large villages-all the other seven places in the district, inhabited by 5,000 or more persons, having been treated as towns*. The rural density in this district is only 173, which is appreciably lower than the average for the state. The population per village in the district is also not very high, being 719. It would have been lower still but for the fact that there are more hamlets in this district than in any of the other western districts ()f the state. Within the district itself, the average village is most populous in Patoda 'Tahsil. It may look strange that in this scarcity tahsil, wherein the rural density is by no means appreciable, the average village should be so populous. This is simply due to the fact that, among all the tahsils in Bhir as well as in the other western districts of the state, this tahsil has the largest number of hamlets attached to main villages. The actual population per village in the various tahsils of the district is 918 in Patoda, 764 in Momin.abad, 748 in Kaij ~ 699 in Georai, 683 in Manjlegaon, 670 in Ashti (which also contains a fairly large number of hamlets) and 623 in Bhir.
. 24. The proportion of persons living in very small villages is fairly appreciable in this district. The actual number of such persons, among every 1,000 of the rural popula~ion, is 190 in the district as a whole, as much as 254 in Rhir, is about 220 in both Georai and Ashti, is about 200 in Manjlegaon, 180 in Kaij and about 140 in Mominabad and 120 in Patoda. But considerably more than half of the rural population lives in small villages. The number of persons living in such villages, among every 1,000 of the rural population, is 616 in the district as a whole; is as high as 708 in Ashti ; is 668 in Patoda ; ranges between 610 and 640 in Mominabad, Kaij and Manjlegaon; is about 590 in Georai,; and slightly more than 500 in Bhir. The proportion of persons living in large villages is not very striking in this district. The number of such persons, among every 1,000 of the rural population, is 179 in the district as a whole but is as much as 241 in Bhir. It is 213 in Patoda; ranges between 175 and 200 in Kaij, Georai and Mominabad; is 145 in Manjlegaon; and is only 73 in Ashti. Ashti Tahsil has only two large villages, apart from its tahsil headquarters which has been treated as a town. The only two very large -villages in the district are Pathrud in Manjlegaon and Renapur in Mominabad Tahsil.
25. Distribution of Rural Population in Hyderabad District.-The relatively scanty rural population of this district, is spread over 485 villages, of which 224 are very small, 232 are small and 29 are large. There are no very large villages in this district, because all its places inhabited by 5,000 or more persons have been either treated 80S independent urban units or merged, partly or wholly, with the metropolis of the state~ namely Hyderabad City. In spite of having a high rural density-228 persons to the square mile as against
-* The Revenue village of Pangaon has a population of 6,878. But only a portion of this village, inhabited by 8,499 persons • .bas been treated as a town.
191
the average of just 185 for the state---the population per village in this district is not very striking. It is 734, against the corresponding figure of 762 for the state. Factors such as the proximity of Hyderabad City, the hilly nature of the countryside and ownership of a high proportion of lands by persons residing in Hyderabad City, have checked, to an extent, both the number of the bigger villages and the concentration of population in them as compared with other districts with correspondingly high rural densities. Within the district itself the population per village is smallest, as is natural, in the tahsil of Hyderabad West, which contains Hyderabad City and wherein the countryside is also particularly hilly. The actual figure is 606 in Hyderabad West, 663 in Shahabad, 731 in MedchaL 811 in Hyderabad East and 833 in Ibrahimpatnam.
26. The proportion of persons living in very small villages to the total rural population, though not at all significant as compared with the other districts of the state in general, is fairly high as compared with the districts wherein the rural density is or comparable dimensions. The number of such persons, among every 1,000 of the rural population, is 155 in the district as a whole and is about 120 in both Hyderabad East. and Ibrahimpatnam and ranges between 175 and 200 in Shahabad, Hyderabad West and Medchal. Considerably more than half of the rural population of the district lives in small villages. The number of such persons among every 1,000 of the rural population, is as much as 627 for the district as a whole. The corresponding number is only 515 in Hyderabad East, but is 616 in Ibrahimpatnam, 657 in Medchal, 662 in Hyderabad West and is as high as 704 in Shahabad. The proportion of persons living in large villages to the total rural population, though fairly heavy, is not as high as in the oth~r districts with comparable rural densities. The number of such persons, among every 1,000 of the rural population, is 218 for the district. But within the district itself, the proportion \i aries considerably. It is as much as 366 in Hyderabad East and 264 in Ibrahimpatnam, ranges between 150 and 170 in Medchal and Hyderabad West and is as low as 102 in Shahabad.
27. Distribution of Rural Population in Gulbarga District.-The rural population of this district is dispersed over 1,557 villages. Of these, 671 are very small villages, 791, ,or slightly more than half, are small villages, 92 are large villages and 3 are very large villages. The pattern in this district, in respect of the distribution of rural population, closely resembles that in the state as a whole. But there is considerable diversity in this 'I;egard, from tahsil to tahsil, within the district itself. The population per village in this district is 769 which is slightly higher than the corresponding figure of 762 for the state. Tahsilwise, it is as much as 985 in Yadgir, 936 in Aland, 922 in Chitapur and 894 in Kodangal. It is 797 in Gulbarga, 783 in Afzalpur, 747 in Shahapur and 731 in Seram. It is as low as 691 in Chincholi, 621 in Andola, 619 in Shorapur and only 548 in Tandur.
28. The proportion of the number of persons living in very small villages to the total rural population is not very significant in the district. The actual number of such persons, among every 1,000 of the rural population, is 167 in the district which though slightly higher, is quite close to the corresponding proportion of 161 for the state. Tahsilwise, it is as much as 290 in Tandur; ranges between 250 and 265 in Shorapur and Andola, between 200 and 220 in Seram and Chincholi and between 175 and 185 in Shahapur and Afzalpur; is about 150 in Gulbarga; ranges between 105 and lI5 in Chitapur and Aland and between 80 and 95 in Kodangal and Yadgir-being 81 in the latter. As in the other districts of the state, it is the persons living in small villages who account
22
192
for the majority of the total rural population in this district--and all its tahsils except Seram, wherein the rural population is, as compared with the other tahsils, rather concentrated in large villages. The actual number of such persons, among every 1,000 of the rural population, is 609 in the district as against the slightly lower proportion of 608 for the state. Tahsilwise, the corresponding proportion is 689 in Yadgir and 652 in Gulbarga; and ranges between 610 and 650 in Chincholi, Chitapur, Aland, Kodangal and Shahapur and between 560 and 600 in Afzalpur, Shorapur and Andola; and is 528 in Tandur and only 471 in Seram. Over one fifth of the total rural population of this district is accounted for by large villages. The actual proportion of persons living in such villages, among every 1,000 of the rural population, is 211 in the district--as against 229 for the state-and among its tahsils it is as much as 810 in Seram and 276 in Aland; ranges between 220 and 250 in Kodangal, Chitapur, Yadgir and Afzalpur ; and is almost 200 in Gulbarga, about 180 in Tandur and Andola, about 155 in Shahapur and Chincholi. and is only 114 in Shorapur. There are only three very large villages in this district, namely Sagar in Shahapur, Hakkeri in Shorapur and Damargidda in Kodangal. The first of these villages was once of some importance in the earlier decades, with a famous dargah, but is now primarily a large agricultural village.
29. Distribution of Rural Population in Osmanabad District.-~ The rural population of this district is spread over 887 villages. Of these, only 812 are very small villages, as many as 468 are small villages, and 57 are large villages. There is no very large village in this district, as all its nine places inhabited by 5,000 and more persons have been treated as towns. The population per village in this district is fairly appreciable, being 824. This figure is rather remarkable considering the fact that, unlike in most of the other districts wherein the population per village is also appreciable, the villages in this district have few hamlets attached to them. Tahsilwise, the population per village is as much as 1,025 in Omerga, 985 in Kallam and 912 in Osmanabad. It is 871 in Tuljapur, 806 in Owsa and 784 in Latur. It is relatively low in the extreme western tahsils of Bhoom and Parenda, wherein it is 642 and 617 respectively.
80. The proportion of persons living in very small villages to the total rural population is not very impressive in this district, or in its tahsils e:x;cept Bhoom and Parenda. The number of such persons, among every 1,000 of the rural population, is only 188 in the district. Tahsilwise, the corresponding proportion is as much as 261 in Bhoom and 248 in Parenda, is 159 in Latur, ranges between 110 and 185 in Owsa, Omerga and Tuljapur, and is below 100 in Kallam and Osmanabad-being only 88 in the latter. As against this, the proportion of persons living in small villages is especially heavy in this district. In fact, only t" 0 other districts of the state, namely Bidar and l\Iedak, record a heavier proportion. The actual number of such persons, among every 1,000 of the total rural population, in this district, is as much as 681. Tahsilwise, it is even slightly above 700 in Owsa, Latur and Osmanabad, about 680 in Kallam and 61.5 in Tuljapur, ranges between 565 and 575 in Parenda and Bhoom and is only 478 in Omerga. In Omerga, unlike in most of the other tahsils in the western half of the state, the overwhelming majority of the rUIal popUlation is spread over in more or less comparable proportions between both the small and the large villages. An appreciable proportion of the rural popUlation of the district lives in large villages. The actual number of such persons, among every 1,000 of the rural population, is as much as 281 in the district. Tahsilwise, the corresponding number is as high as 405 in Omerga--which is all the more remarkable considering the fact that it has been attained in spite of two places within the tahsil, namely Gunjoti and Lohara, inhabited by more than 8,000 persons and two others, namely
22*
198
Murum and Omerga, inhabited by over 5,000 persons having been treated as townsand is 276 in Tuljapur, 227 in Kallam and 210 in Osmanabad. It is relatively low in the other tahsils being 179 in Parenda, 174 in Bhoom and only 158 in Owsa and 131 in Latur.
81. Distribution of Rural Population in Medak District.-The rural population of this district is dispersed over 1,113 villages, of which 422 are very small, i.e., they are inhabited by less than 500 persons; 611 are small, i.e., they are populated by 500 to 2,000 persons; and 79 are large, i.e., they are populated by 2,000 to 5,000 persons. There is only one very large village in this district, as all its other six places inhabited by 5,000 or more persons have been treated as towns. The population per village in this district also is fairly appreciable, being as much as 845. It is especially heavy in its eastern most tahsil of Siddipet and hardly impressive in its western most tahsil of Vikarabad. The population pel' village is 1,288 in Siddipet, 896 in Medak, 853 in Gajwel, 831 in Andol, 827 in Sangareddy and only 662 in the forest tahsil of Narsapur and 680 in Vikarabad.
32. The proportion of persons living in very small villages is by no means impressive in this district. The actual number of such persons, among every 1,000 of the total rural population, is only 129 in the district. But it is as much as 248 in Vikarabad and 212 in Narsapur and as low as 44-which is among the lowest corresponding tahsilwise proportions recorded in the state-in Siddipet. It ranges between 100 and 135 in the remaining tahsils of Sangareddy, Andol, Gajwel and Medak. As against this, the proportion of persons living in small villages is particularly heavy in the district. In fact, no other district of the state, except Bidar, records a heavier proportion in this respect. The actual numbt'r of persons living in such villages, among every 1,000 of the rural population, is as much as 638 in the district. Tahsilwise, it i.;; as high as 753 in Sangareddy and ranges between 650 and 675 III Medak, Andol, Gajwel and Narsapur and betwt'en 540 and 555 in Siddipet and Vikarabad. An appreciable portion-in fact, slightly over one fifth--of the rural population of the district lives in large villages. The actual number of persons living in such villages, among every ] ,000 of the total rural popUlation, is 227 for the district: ~ut within the district itself, it is. as hi~h as 402 in Siddipet. Among the other tahsIls, It ranges between 210 and 230 III GaJwel, Medak and' Vikarabad, and is 178 in Andol, 184 in Narsapur and only 113 in Sangareddy. The onlv very large village in this district which has not been treated as a town is Alladurg i~· Andol Tahsil.
88. Distribution of Rural Population in Nizamabad District.-Of the 754 inhabited villages in the district, 314 are very small villages, 384 are small villages and 56 are large villages. There is no very large village in this district as all its nine places inhabited by 5,000 or more persons have been treated as urban areas. The population of the average village in this district also is fairly appreciable, being as much as 849 as against the corresponding figure of 762 for the state. What is more remarkable about this figure is the fact that it has been attained, unlike in the case of the other Telugu districts, with relatively few hamlets attached to main villages. Tahsilwise, the figure is as much as 962 and 935 in its western tahsils of Kamareddy and Armoor respectively. It is 884 in Bodhan and 874 in Nizamabad. But it is only 727 in Banswada and as low as 628 in its forest tahsil of Yellareddy.
34. The -proportion of persons living in very small villages is by no means impressive in the district, except in its tahsi1s of Yellareddy and Banswada. The actual number
194
of such persons, among every 1,000 of the total rural population, is only 130 in the district. Tahsilwise, the corresponding figure is 209 in Yellareddy. 188 in Banswada, ranges between 110 and 130 in Nizamabad, Bodhan and Kamareddy and is only 89 in Arm(}(lr. As against this, the proportion of persons living in small villages in this district is among the heaviest in the state. In fact, such persons number as much as 626 among every 1,000 of the district's rural population. Tahsilwise, the corresponding figure is as high as 773 in Armoor. Among all the tahsils of the state, this is second only to the corresponding proportion recorded in Lakshattipet. In the other tahsils, the figure varies between 605 and 615 in Nizamabad and Banswada, between 550 and 565 in Bodhan and Kamareddy and is only 531 in Yellareddy. The proportion of persons living in large villages is appreciable in this district. In fact, such persons account for almost .one-fourth of its total rural population. The actual number of such persons, among every 1,000 of the rural population, is 244 in the district but as much as 336 in Kama.reddy and 317 in Bodhan. In the other tahsils, it is about 260 in Yellareddy and Nizamabad and slightly over 200 in Banswada. In Armoor, however, it is only 138 because the overwhelming majority of its rural population lives, as already stated. in 'small villages.
35. Distribution of the Rural Population in Mahbubnagar District.-The rural population of this district is spread over 1,233 villages, of which 457 are very small, 672 are small and as many as 104 are large. There is no very large village in this district, as all the ten places in the district inhabited by 5,000 or more persons have been treated .as towns. The average village in this district also is fairly populous. The population .per village in this district is 869 as against the corresponding figure of only 762 for the state. Within the district itself, the corresponding figure is as high as 1,019 in Nagarkurnool and as much as 983 in Kalvakurti and 941 in Mahbubnagar. It is 895 in Makhtal, 893 in Kollapur, 844 in Shadnagar and 825 even in its forest tahsil of Achampet, 814 in Wanparti, 800 in Atmakur, and only 666 in its other forest tahsil of Pargi. Among all the forest areas in the state, the average village seems to be most populous in Achampet Tahsil of this district.
36. The proportion of the persons living in very small villages is not at all signifi.cant in this district. The actual number of such persons, among every 1,000 of the total rural population, is only 121 in this district. Tahsilwise, the corresponding proportion is 198 in Pargi and 165 in Achampet. Among the other tahsils it ranges between 100 and 135 in Atmakur, Wanparti, Makhtal, Mahbubnagar, Shadnagar and Kollapur and is even below 100 in Kalvakurti and Nagarkurnool, being only 87 in the latter. Persons living in small villages are proportionately very numerous in this district. Their actual number, among every 1,000 of the total rural population, is 620 in the district. Tahsilwise, the corresponding number is as high as 713 in Atmakur and ranges between 650 and 700 in Wanparti, Shadnagar and Kollapur,' between 600 and 640 in Kalvakurti, Nagarkurnool and Pargi, and between 510 and 550 in Achampet, Makhtal and Mahbubnagar. The proportion of persons living in large villages is considerable in this district. In fact, it is among the heaviest recorded in the state. The actual number of such persons among every 1,000 of the rural population is 2.159 in the district. Tahsilwise, it is as much as 368 in Mahbubnagar aud 342 in Makhtal. The number ranges between 270 and 300 in Nagarkurnool, Achampet and Kalvakurti and is 239 in Kollapnr. It falls below the state's average of 229 in Shadnagar, Pargi, Wanparti and Atmakur. The number in Atmakur is only 154 as the overwhelming proportion of its rural population lives in smal1 villages.
195
37. Distribution of the Rural Population in N algonda District.--The rural population of this district is spread over 1,245 villages. Of these only 273 are very small villages and as many as 798 are small and 173 are large villages. There is only one very large village in this district, as all its eleven places inhabited by 5,000 or more persons have been treated as towns. In Nalgonda--and, as will be seen subsequently, in Karimnagar and Warangal Districts as well-the proportion of very small villages is the least marked in the state. As against this, the proportion of the next two higher categories of villages, namely the small and the large villages, is the most pronounced in these three districts. It is, therefore, not surprising that the average village in the three districts should be the most populous as compared with those in the other districts of the state. The population per village in Nalgonda distr.ict is as high as 1,144 as against the corresponding figure of only 762 for the state. Within the district itself, the figure rockets to 1,492 in Jangaon, and is as high as 1,379 in Suryapet, 1,352 in Huzurnagar, 1,178 in Ramannapet and 1,127 in Nalgonda. It is 972 in Bhongir. The figure is by no means equally impressive in the south-western tahsils of Devarkonda and Miryalguda, which are often affected by scarcity, being 871 in the former and 847 in the latter.
38. The proportion of the persons living in very small villages is insignificant in this district. The actual number of such persons, among every 1,000 of the total rural population, is only 58 in the district. Tahsilwise, it is appreciably more significant in Miryalguda and Devarkonda, wherein the corresponding proportion is 129 and 107 respectively. Among the other tahsils, it is 84 in Bhongir, slightly less than 60 in Nalgonda, 45 in Ramannapet and as low as 35 in both Suryapet and Huzurnagar and just 21 in Jangaon. Persons living in small villages account for appreciably more than half of the total rural population of the district. The actual number of such persons, among every 1,000 of the total rural population, is 601 in the district. It is even slightly higher than 700 in pevarkonda, Miryalguda and Bhongir Tahsils, slightly higher than 600 in Nalgonda, is about 590 in Ramannapet and is lower than 550 in Huzurnagar, Jangaon and Suryapet, being only 511 in the last of the tahsils. The number of persons living in large villages is very considerable in this district. 337, out of every 1,000 of its rural population, i.e., slightly more than even one-third, live in large villages. Only the two districts of Karimnagar and Warangal record heavier proportions. Tahsilwise, the corresponding proportion is as high as 454 in Suryapet, 431 in Jangaon and 419 in Huzurnagar, which are among the highest of the corresponding proportions recorded in case of the 138 tahsils of the state. The figure is as much as 366 in Ramannapet and 339 in Nalgonda but dwindles to, less than the state's average of 229 in the remaining three tahsils of Bhongir, Devarkonda and Miryalguda, being only 162 in the last of them. The only very large village in this district is Qila Shahapur in J angaon Tahsil.
39. There is no doubt that the number of hamlets in this district is very large, perhaps second only to the number in Warangal. Due to this, the population per village reaches unusual dimensions in the district. But even apart from this, it cannot be denied that the villages in this district, especially in Jangaon and Suryapet Tahsils, are among the most p<?pulous in the state.
40. Distribution of Rural Population in Karimnagar District.-Of the 1,165 inhabited villages in the district, only 255 are very small villages, and as many as 707 are small and 201 are large villages. This district has more large villages than any other district in the state including even Nalgonda and Warangal. There are only two very large villages in the district as all the remaining of its twelve places which are inhabited by
196
5,000 or more persons have been treated as towns. The population per village in this district is very high. In fact, in no other district of the state, except Warangal, are villages more populous than in this distQct. And it is significant, that Warangal attains a slightly higher population per village, primarily because of a considerably larger number of hamlets, especially in its tahsils of Yellandu and Palvancha. The actual population per village is 1,242 in this district. Within the district itself, the figure rockets to 1,771 in Huzurabad and 1,515 in Karimnagar. It is as high as 1,262 in Sultanabad, 1,245 in SirsiIla, 1,198 in Parkal, 1,157 in Jagtiyal and 1,135 in Metpalli. But, quite in contrast to these tahsils, the population per village dwindles to just 566 in its forest tahsil of Manthani.
41. The number of persons living in very small villages is insignificant in this district and in most of its tahsils. The actual number of such persons, among every 1,000 of the total rural population, is just 46 in the district. Among all its tahsils, only in Manthani, the corresponding figure is as much as 225. Among the others, it is only 62 in Jagtiyal; ranges between 40 and 50 in Parkal, Metpalli, Sultanabad and Sirsilla; is just 28 in Karimnagar; and touches the almost microscopic proportion of 10 in Huzurabad. These are among the lowest of the corresponding figures recorded in all the 188 tahsils of the state. No doubt, persons living in small villages form the majority of the total rural popUlation in this district, as well as in all its tahsils except Huzurabad. But this majority is considerably reduced because an unusually large proportion of its rural population resides in villages of the next higher category, namely the large villages. The actual number of persons living in small villages, among every 1,000 of the total rural popUlation, is 555 in the district; and ranges between 600 and 650 in Metpalli, Manthani, Jagtiyal and Parkal; between 580 and 590 in Sirsilla and Sultanabad ; is about 510 in Karimnagar ; but is as low as 409 in Huzurabad. Huzurabad is one of thOse rare tahsils in the state wherein the majority of the rural population resides in large villages. The proportion of persons living in large villages is very considerable in this district. In fact, such persons in the district account for almost forty per cent of the rural population,. which is quite in contrast with the distribution in the adjoining district of Adilabad, wherein such persons hardly constitute seven per cent. The actual number of persons living in such villages, among every 1,000 of the rural population, is 392 in the district and, among its various tahsiJs, it is as high as 559 in Huzurabad and 468 in Karimnagar. It is as much as 372 in both Sirsilla and Sultanabad and 346 in Parkal, 309 in Metpalli and 300 in J agtiyal. It is, however, as low as 142 in its forest tahsil of Manthani. Of the two very large villages in this district, the more populous one is the rural portion of Huzurabad revenue village--this revenue village is inhabited in all by 9,559 persons, of whom 4,427 live within the limits of the town committee and 5,132 beyond it. The other very large village in the district is Kodimiala in J agtiyal.
42. Distribution of Rural Population in Warangal Disirict.-The rural population of this district is dispersed over] ,013 villages. Of these, only 214 are very small, and as many as 621 are small, and 171 are large. In addition to this, there are seven very large villages, i.e., villages inhabited by 5,000 or more persons in this district. Of these seven, as many as four, are situated in Warangal Tahsil itself. It will thus be seen that in respect of the distribution of villages (as well as with regard to the distribution of rural population) the conditions in this district resemble those in the adjoining districts of Karimnagar and Nalgonda. The population per village in Warangal district is the highest recorded among all the districts of the state. It is not without significance that this district, especially its tahsils of Yellandu and Palvancha, have an unusually large number of hamlets attached to main villages. In fact, the number of hamlets in this district is
197
almost double that in any of the other district of the state-the actual number in Yellalldu or Palvancha Tahsil itself being more than in most districts of the state. The population per village is as high as 1,276 in the district. Tahsilwise, the figure soars to 1,862 in Yellandu, not because of its rural density, which is by no means appreciable, but, as already explained, because of the large number of hamlets under each village*. The population per village is also as high as 1,668 in Warangal Tahsil, which-along with the adjoining tahsil of Huzurabad in Karimnagar District-may be said to possess the most densely populated of the rural areas in the state. The corresponding figure is again as high as 1,512 in Mahbubabad, 1,326 in Khammam, 1,176 in Palvancha, 1,052 in Pakhal and 1,024 in Madhira. In the tahsils of Burgampahad and Mulug the corresponding figure is 948 and 618 respectively. The population per village in the forest tahsils of Yellandu, Palvancha, Burgampahad, Mulug and Pakhal reflect not so much their rural density as their large number of hamlets as distinguished from independent revenue villages.
43. Among all the districts of the state, the proportion of persons living in very small villages is the least significant in this district. Only 45 persons, among every 1,000 of its total rural population, live in very small villages. Within the district itself, the corresponding number is, however, as much as 194 in Mulug and 106 in Burgampahad. But among the other tahsils, it ranges only between 65 and 75 in Madhira, Pakhal and Palvancha; is just 32 in Khammam; and dwindles to 20 in Mahbubabad, 19 in Warangal and 10 in Yellandu. The number of persons living in small villages manage to account for the majority of the rural population in this district as in the case of the all the other districts of the state. But this majority is the least significant in the state. The actual number of persons residing in such villages, among every 1,000 of the rural population is 549 in the district. Tahsilwise, it is as high as 739 in Pakhal and as much as 661 in Madhira and 610 in Khammam. It ranges between 520 and 585 in Burgampahad, l\1ulug, Mahbubabad and Palvancha; and is as low as 454 in Warangal and 329 in Yellandu. The proportion of persons living in large villages is particularly heavy in the district. In fact, in this respect "\\r arangal District is second only to Karimnagar among aU the districts of the state. The actual number of persons living in large villages, among every 1,000 of the rural population, is 376 in the district; but is as high as 605 in Yellandu, 461 in Warangal, 428 in Mahbubabad and 413 in Palvancha. The corresponding proportion is 331 in Khammam, 312 in Burgampahad, 236 in Mu]ug and 229 in .. Madhira. But it is only 191 in Pakhal. As already e:x;plained, the high proportion in Yellandu, Palvancha and, to a smaller e:x;tent, that in Burgampahad and Mulug, is largely the result of their numerous hamlets. The proportion of persons living in very large villages, among every 1,000 of the rural population, is 30 in the district. Though small, thIS is double that recorded by any of the other districts of the state. Tahsilwise, the actual proportion is 66 in \Varangal, 56 in Yellandu, 36 in Madhira and 27 in Khammam, which are the only tahsils containing very large villages.
44. Growth of Rural Population.-Figures pertaining to the rural population of the state as recorded at each census since the begining of this century and the percentage variations recorded in its total and rural popUlations at each census-as compared with the corresponding figures of the preceding census--as well as from 1901 to 1951 are given in Table 3.
* In Yellandu Tahsil, there are only 49 main villages and as many as 446 hamlets bearing distinct names. There are thu8 almOlit ten hamlets per village in this tahsil. Similarly, in Palvancha Tahsil, wherein the rural density is among the lowest in the state, there are over 300 hamlets with distinct names as against only about 69 villages.
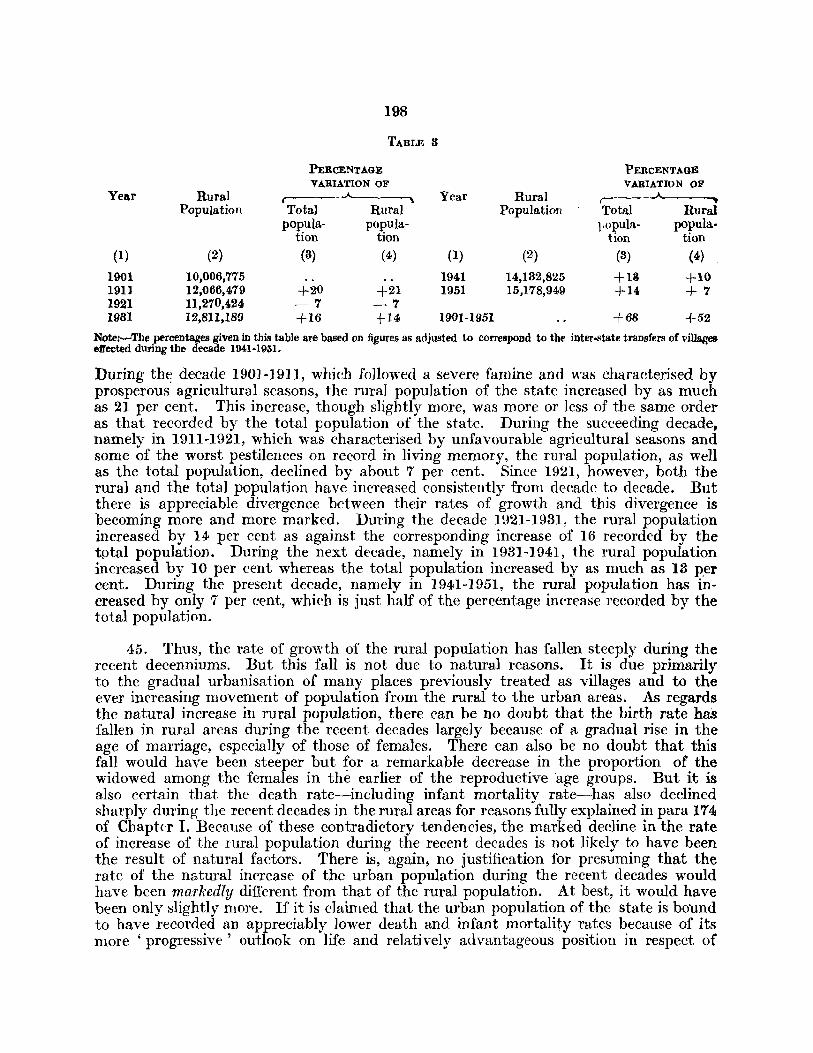
Year
(1)
1901 1911 1921 1981
Rural Population
(2)
10,006,775 12,066,479 11,270,424 12,811,189
198
TABLE 3
PERCENTAGE VARIATION OF
..A,..__~
Total Rural popula- popula-
tion tion (3) (4)
+20 +21 -7 -7 +16 +14
PERCENTAGE VARIATION OF
Year Rural r-Population Total Rural
}Jopula- popula-tion tion
(1) (2) (3) (4)
1941 14,182,825 +13 +10 1951 15,178,949 +14 +7
1901-1951 +68 +52
Note:-The percentages given in this table are based on figures as adjusted to correspond to the inter-state transfers of village& e1fected during the decade 1941-1931.
During tht; decade 1901-1911, which followed a severe famine and was characterised by prosperous agricultural seasons, the rural population of the state increased by as much as 21 per cent. This increase, though slightly more, was more or less of the same order as that recorded by the total population of the state. During the succeeding decade t
namely in 1911-1921, which was characterised by unfavourable agricultural seasons and some of the worst pestilences on record in living memory, the rural population, as well as the total population, declined by about 7 per cent. Since 1921, however, both the rural and the total population have increased consistently from decade to decade. But there is appreciable divergence between their rates of growth and this divergence is becoming more and more marked. During the decade 1921-1931~ the rural population increased by 14 per cent as against the corresponding increase of 16 recorded by the tptal population. During the next decade, namely in 1931-1941, the rural population increased by 10 per cent whereas the total population increased by as much as 13 p'er cent. During the present decade, namely in 1941-1951, the rural population has increased by only 7 per cent, which is just half of the percentage increase recorded by the total population.
45. Thus, the rate of growth of the rural population has fallen steeply during the recent decenniums. But this fall is not due to natural reasons. It is due primarily to the gradual urbanisation of many places previously treated as villages and to the ever increasing movement of population from the rural to the urban areas. As regards the natural increase in rural population, there can be no doubt that the birth rate haS fallen in rural areas during the recent decades largely because of a gradual rise in the age of marriage, especially of those of females. There can also be no doubt that this fall would have been steeper but for a remarkable decrease in the proportion of the widowed among the females in the earlier of the reproductive age groups. But it is also certain that the death rate-including infant mortality rate-has also declined sharply during the recent decades in the rural areas for reasons fully explained in para 17'4 of Chapter 1. Because of these contradictory tendencies, the marked decline in the rate of increase of the rural population during the recent decades is not likely to have been the result of natural factors. There is, again, no justification for presuming that the rate of the natural increase of the urban population during the recent decades would have been markedly different from that of the rural popUlation. At best, it would have been only slightly more. If it is claimed that the urban population of the state is bound to have recorded an appreciably lower death and infant mortality rates because of its more 'progressive' outlook on life and relatively advantageous position in respect of
199
medical and public health facilities, then it could be claimed, with equal vehemence, that the rural population is certain to have registered a higher birth rate because of the greater prevalence of early marriages among them. Thus, natural factors could not have been responsible for the steep decline in the rate of increase of the rural population of the state during the recent decades as compared with the almost steady rate of in~rease recorded by its total population.
46. As regards the gradual urbanisation of many places, it may be observed that at each census a number of population units, treated as villages at the preceding census, haVoe been reckoned as towns because of their subsequent development, while comparatively only a few places-mostly from among the smaller of the population unitstreated as towns at the earlier census have been relegated to the position of villages beeause of their subsequent decline. For example, in 1931 as many as 48 places treated as villages in 1921 were classified as towns. Similarly in 1941, while 30 places treated as villages in 1931 were construed as towns, 25 considerably smaller popul~tion units which had been treated as towns in 1981 were relegated to the position of villages. Again in 1951, 77* places treated as villages at the preceding census were classified as towns and only 7 places treated as towns at the previous census were reckoned as villages. If in 1951, no radical change had been made in the list of place£ treated as towns in 1941, the rural population of the state would have increased by about .10 instead of 7 per cent as now indicated in Table 3. Thus, from census to census, an ever increasing number of places are classified as urban and, on this count alone, the urban population increases at the cost of the rural.
47. As regards the movement of population from the rural to the urban areas, it may be observed that during the recent decades in rural areas the volume of employment available has been stagnant or, at any rate, not keeping pace with the natural increase in their population, while in urban areas the volume of employment has been, more or less, outstripping the natural increase in population. It is beyond doubt that there has been no great increase in the total area under cultivation. It is also certain that agricultural production has not increased during the recent years to any marked extent as the methods of cultivation still continue to be medieval. In fact, many statisticians take the view that there has been a decrease both in the area under cultivation and total agricultural production. It is also beyond dispute, that many village crafts have been wiped off, or ar~ faring indifferently, because of competition from mass production or changes in fashion. As against this, almost all the new large scale industries have been established in towns, which had already a monopoly of the older ones. Similarly, due to improvement in communications and changes in the methods of production and sale of commodities, trade and commerce are being more and more centralised in urban areas. The more advanced of the commercial institutions and activities, including banking, insurance, etc., are now heavily concentrated in towns, especially in the larger of them. Again, transport as an independent profession is on the decline in the rural areas because of modern trends in the organisation and expansion of transport services. Further, the present day transport services, though plying over both rural and urban areas, are- manned largely by personnel residing in urban areas. It can also be asserted that prior to the Police Action, the nation building activities, of both official and non-official organisations, were localised in urban areas to an undue extent. Again, there are appreciable numbers of persons in the villages-from among the relatively well-to-do as well as from
*This figure e~cludes 18 Tungabhadra Project Camps and 14 places which in 1941 were treated as constituents of Hyderabad City, but are now independent urban units.
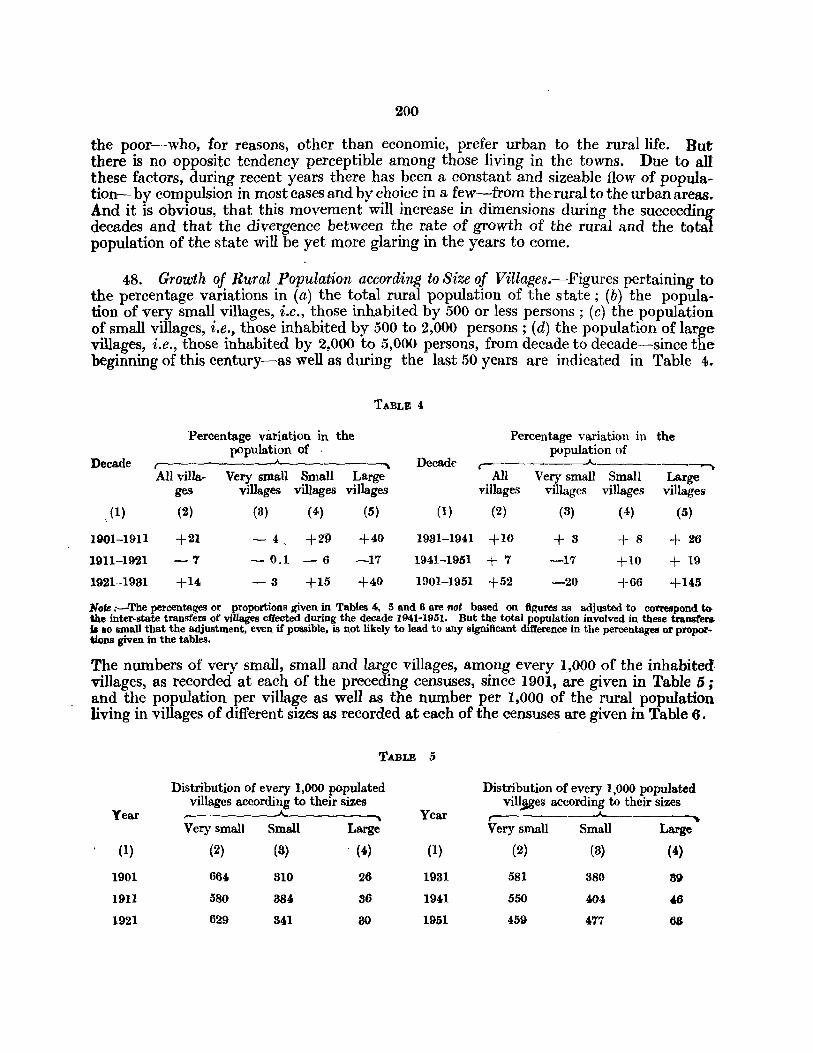
200
the poor-who, for reasons, other than economic, prefer urban to the rural life. But there is no opposite tendency perceptible among those living in the towns. Due to all these factors, during recent years there has been a constant and sizeable flow of popuIation-by compulsion in most cases and by choice in a few--from the-rural to the urban areas. And it is obvious, that this movement will increase in dimensions during the succeeding decades and that the divergence between the rate of growth of the rural and the total population of the state will be yet more glaring in the years to come.
48. Growth of Rural Population according to Size of Village8.-Figures pertaining to the percentage variations in (a) the total rural population of the state; (b) the population of very small villages, i.e., those inhabited by 500 or less persons; (c) the population of small villages, i.e., those inhabited by 500 to 2,000 persons; (d) the population of large villages, i.e., those inhabited by 2,000 to 5,000 persons, from decade to decade-since the beginning of this century-as well as during the last 50 years are indicated in Table 4.
TABLE 4
Percentage variation in the Percentage variation in the population of population of
Decade r--- ____.._________--~ Decade ,---- ---. All villa- Very small Small Large All Very small Small Large
ges villages villages villages villages Villages villages villages
_ (1) (2) (3) (4) (5) (1) (2) (3) (4) (5)
1901-19Il +21 -4 +21} +40 1931-1941 +10 +3 + 8 + 26
1911-1921 -7 - 0.1 -6 -17 1941-1951 +7 -17 +10 + 19
1921-1981 +14 -3 +15 +40 1901-1951 +52 -20 +66 +14.5
Note :-The percentages or proportions given in Tables 4, 5 and 6 are not based on figures as adiusted to correspond to the inter-state transfers of villages effected during the decade 1941-1951. But the total population involved in these transfers ja 10 small that the adjustment, even if possible, is not likely to lead to any significant difference in the percentages or proportions given in the tables.
The nwnbers of very small, small and large villages, among every 1-,000 of the inhabited, villages, as recorded at each of the preceding censuses, since 1901, are given in Table 5 ; and the population per village as well as the nwnber per 1,000 of the rural population living in villages of different sizes as recorded at each of the censuses are given in Table 6.
TABLE 5
Distribution of every 1,OO() populated Distribution of every 1,000 populated villages according to their sizes vil~es according to their sizes
Year --A. Year ----.A...--
Very small Sm.all Large Very sm.all Small Large
(I) (2) (3) . (4) (I) (2) (3) (4)
1901 664 310 26 1931 581 380 8~
1911 580 384 36 1941 550 404 1.6
1921 629 841 80 1951 459 477 63
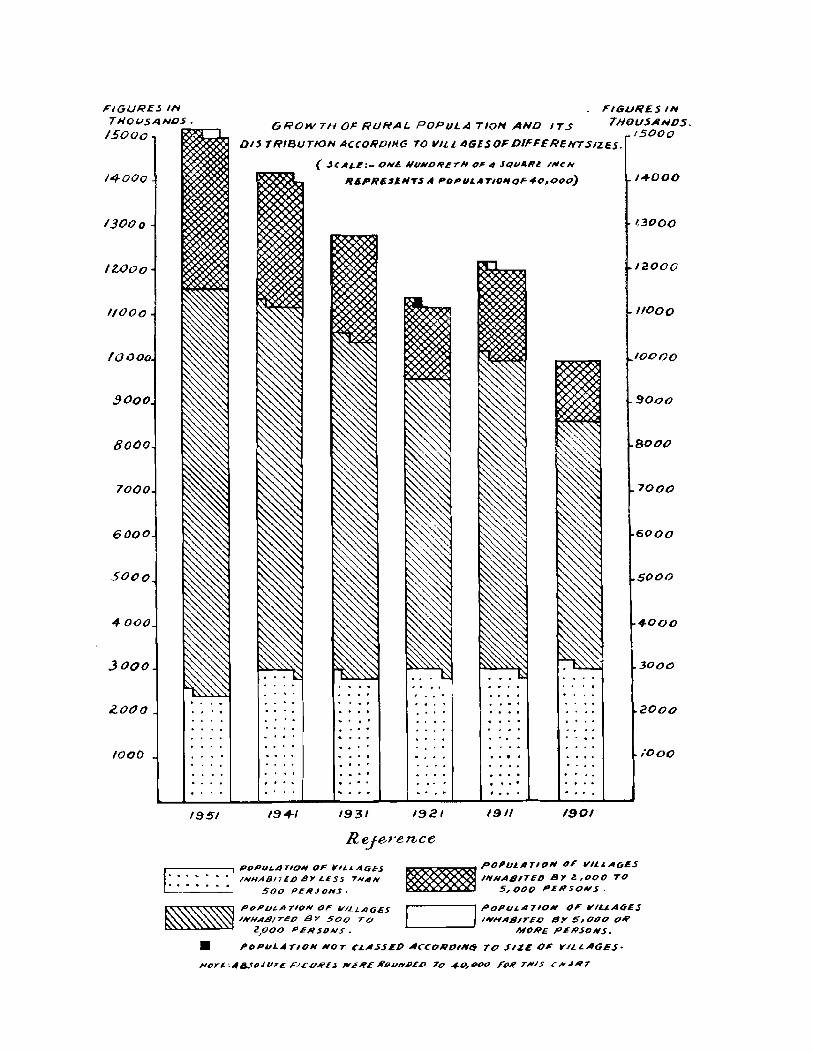
FIGURE.5 IN 7HOl.l5ANDS.
FIGuRES IN
GROW 7H OF RURAL POPULA ,ION AND J T S 7HOUSAND5. 15000 ~....--. /5000
DIS TRli3uTfON A'CORP/HG TO VI/.l AGESOF DIFFERENT SIZES.
14000
13000
IlOoo
1/000
Boco
7000
6000
50()0
4000
3000
ZOOO
/000
( .JtALE:- ONE. NUNDR£TN OF 4 SqUARE "NeN
I'l6.PR£:slNTS A POPIII.ATIONOF "'C~O()O) ,,,,..000
1,3000
12000
11000
10000
9000
8000
7000
6000
5000
4-000
3000
, . 2000 ..
. .. . . . .... ,.000 . , .... . . . . . ~ .... . ".' . .. . ......
195/ 194-1 1931 1921 1911 1901
Rqe,rence
1"------, PoPULATION OF '-'I.L4GES
I:::: : :!INHABITEDSYI.ESS THAN ~.----~. 500 PERJONS.
~ POPLlI-ATION 01" ""'Ll-A6ES ~/IilHABlreo By 500 TO ~~~~~ ~OOQ PERSONS .
m POPULATiON OF VIL.l.A6ES
'''NA8IT£0 By 2,000 TO 5,000 PERSONS.
I POPUlo A TION OF VILLA6£.s
. /lIIHABITIID By 5,00(7 (71P L.,_ ____ _' MORE PIiNSoIVS.
• poPuLIfTIO" NOT CLASSED AC'COROIN(!i To SIZE OF Y/LLAGES'

208
TABLE 6
Number per 1,000 of the Number per 1,000 of the Rural Population living in Rural Population living in
r "-- t "-Year Population Very Small Large Very Year Population Very Small Large Very
per village small villages villages large per village Small Villages Villages large villages villages Vilages Village.
(1) (2) (8) (4) (5) (6) (1) (2) (8) (4) (5) (6)
1901'" 500 307 550 a2 1931 591 222 598 180 1911 599 244 587 164 5 1941 638 208 586 206 1921'" 582 261 589 146 1951 762 161 608 229 7
-..:rbe rural population of 1901 and 1921 Censuses includes some persons returned in encampments, boats, railway quarters, -etc. TheJr numbers which are not very significant, have not been taken into consideration in Columns 8, 4, li and 6 of Table 8 .. they cannot now be placed in villages of different sizes. At the other censuses the population of similar units were treated .all being part of the population of the villages concerned.
49. Figures given in Tables 4, 5 and 6 clearly indicate that the very small villages (i.e., those inhabited by less than 500 persons) are losing ground at a fast rate. At the beginning of this century, almost two thirds of the total number of inhabited villages were very small and these very small villages accounted for almost one third of the total rural population. In 1951, i.e.; fifty years later, such units constituted appreciably less than half of the total number of populated villages and they accounted for even less than one sixth of the total rural population. Since 1901, while the total popUlation of the state has increased by roughly seventy per cent and its total rural population by about fifty per cent, the popUlation of very small villages has actually decreased. And the decrease is by as much as twenty per cent. This decrease in the population of very small villages is again not due to any decline in the rate of growth of their indigenous population. It is due primarily to migration of persons, gradually or otherwise, from such villages to the larger of the population units. In fact, numerous small villages have become entirely depopulated because of this movement. This emigration, in turn, is due to the almost revolutionary changes witnessed during the recent decades in communications, methods of production, organisation of trade, social and cultural outlook of the people, etc. The tempo of this movement increased to an extent in the later half of the decade 1941-51 on account of the disturbed conditions then prevailing in portions of the state.
As against this, the small -villages (i.e., those inhabited by 500 to 2,000 persons) are more than retaining their strong position, especially as among the rest of the rural units. In fact, it would be more correct to state that they have considerably strengthened their relative position during the last fifty years. In 1901, such villages accounted for slightly less than one third of the total number of inhabited villages and for appreciably over fifty per cent of the total rural population. In 1951, they accounted for over forty seven per cent of the total number of populated villages and over sixty per cent of the total rural popUlation. During the course of the last half a century, the population of -such villages has increased by sixy six per cent which is only slightly lower than the -corresponding increase of about sixty eight per cent recorded by the total population of the state and considerably more than the corresponding increase of fifty two per cent recorded by its total rural population.
But it is the large villages among the rural units which have proportionately gained most in strength during the last fifty years. At the beginning of this century, such vil. lages accounted for less than three per cent of the total number of populated villages

204
and they contained less than fifteen per cent of the total rural population. In 1951,. however, they accounted for more than six per cent of the total number of populated villages and almost twenty three per cent--roughly one fourth-of the total rural population. During the last fifty years, the population of large villages has increased by as much as one hundred and forty-five per cent, in other words its percentage rate of increase is roughly thrice tlie corresponding rate of increase recorded by the total rural population and more than twice that recorded either by the population of small villages or the total population. of the state. It is not worthwhile analysing the position in respect of very large villages, i.e., of those inhabited by 5,000 or more persons, for the simple reason that the retention of such ,places as villages is more the exception than the rule. The overwhelming majority of such villages have always been treated as towns. In fact" no population unitofthis size was treated as a village at the 1901,1921,1981 or 1941 Censuses., '
50. With the very small villages losing ground almost consistently since 1921,.it is not surprising that the population per village should be on an increase. The actual population per village was only 500 in 1901. It shot up to 599 in 1911 and receded to 582 in 1921 after the great disasters of the decade 1911-1921. Since then, it has increased consistently and rather sharply. It was 591 in 1931, 638 in 1941 and as high as 762 in 1951. The average village of the state now contains more than one and a half times the number of persons it did in 1901.
Thus, while the rural population of the state has been increasing from decade to decade-except for the set back it received during the calamitous decade of 1911-1921-its rate of increase is slowing down considerably. This is due not to any marked fall in the rate of the growth of the indigenous rural population but to a heavy movement of persons from the rural to urban areas and the gradual urbanisation of many places which were previously rural in character. Again, as between villages of different sizes, the population of very small villages is rapidly decreasing. In fact, it is this decrease which is largely leading to the slowing down of the rate of increase of the rural population as a whole. Contrary to this, the popUlation of the small villages has been increasing appreciably and that of large villages considerably. In fact, as will be seen subsequently, the increase in the population of large villages is second only to that recorded by the population of towns. In brief, the very small population units are losing ground" the small population units are more or less maintaining their position, and the larger of the population units are growing from strength to strength. This is perhaps in keeping wit .. modern demographic trends.
51. Movement of Population in Rural Areas.*-The available census statistics do not permit of any satisfactory analysis of the movement of population, whether in rural or urban areas. This is simply due to the fact that these statistics do not include aU categories of migrants relevant to either of the areas. In so far "as the figures pertaining to immigrants in such areas are concerned, they cover only persons who have moved in from areas beyond the district of enumeration. But it is a well known fact that a very heavy proportion of the immigrants, whether in rural or urban areas, generally consists of persons who have moved in from the towns or villages, as the case may be, located within the district of enumeration itself. As against this, no figures whatsoever are available in respect of emigrants from rural or urban areas-as distinct from the district or state as a whole. Census statistics pertaining to emigrants relate only to persons who have moved out from one district to another .. The movement of population in general has been dealt with exhaustively in Section IV of Chapter I.
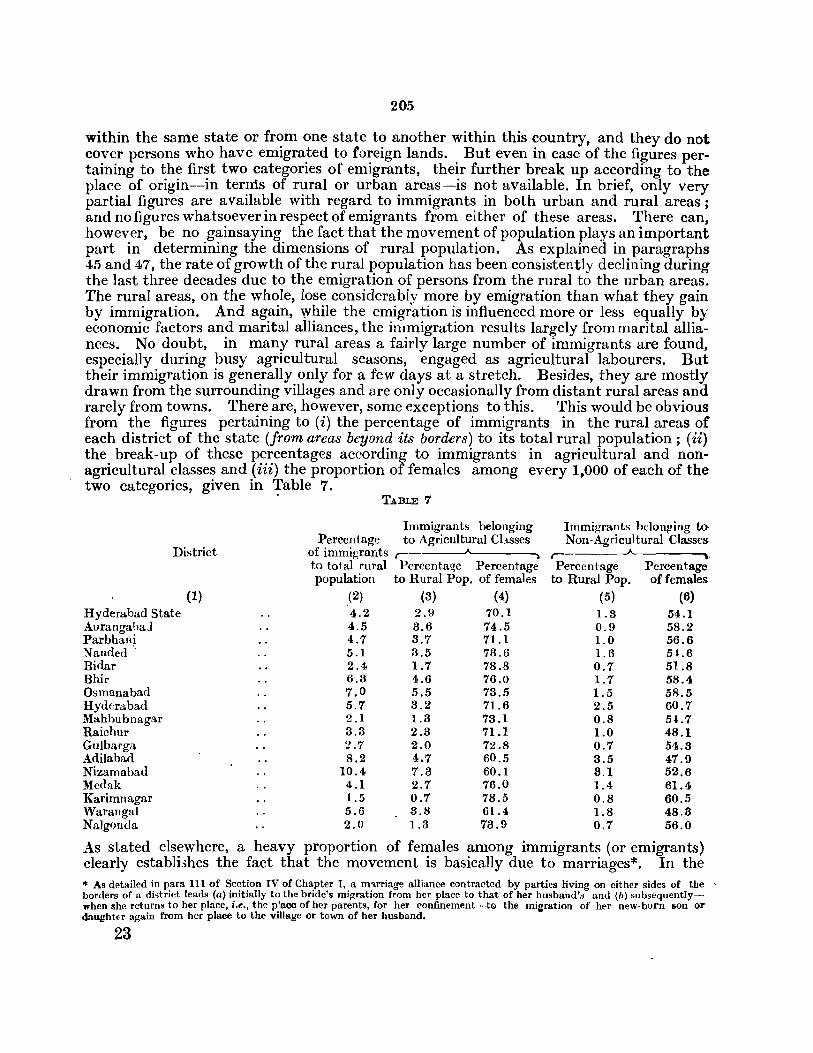
205
within the same state or from one state to another within this country, and they do not cover persons who have emigrated to foreign lands. But even in case of the figures pertaining to the first two categories of emigrants, their further break up according to the place of origin-in terms of rural or urban areas -is not available. In brief, only very partial figures are available with regard to immigrants in both urban and rural areas; and no figures whatsoever in respect of emigrants from either of these areas. There can, however, be no gainsaying the fact that the movement of population plays an important part in determining the dimensions of rural population. As explained in paragraphs 45 and 47, the rate of growth of the rural population has been consistently declining during the last three decades due to the emigration of persons from the rural to the urban areas. The rural areas, on the whole, lose considerably more by emigration than what they gain by immigration. And again, while the emigration is influenced more or less equally by economic factors and marital alliances, the immigration results largely from marital alliances. No doubt, in many rural areas a fairly large number of immigrants are found, especially during busy agricultural seasons, engaged as agricultural labourers. But their immigration is generally only for a few days at a stretch. Besides, they are mostly drawn from the surrounding villages and are only occasionally from distant rural areas and rarely from towns. There are, however, some exceptions to this. This would be obvious from the figures pertaining to (i) the percentage of immigrants in the rural areas of each district of the state (from areas beyond its borders) to its total rural population; (ii) the break-up of these percentages according to immigrants in agricultural and nonagricultural classes and (iii) the proportion of females among every 1,000 of each of the two categories, given in Table 7.
• TABLE 7
District
(1)
Immigrants belonging Percentage to Agricultural Classes
of immigrants ,-to total rural Percenta~e Percentage population to Rural Pop. of females
(2) (3) (4)
Immigrants belon?ing toNon-Agricultural Classes
,----~-----~ Percentage Percen tage
to Rural Pop. of females
(5) (6) Hyderabad State 4.2 2.9 70.1 1.3 54.1 Aurangahaj 4.5 3.6 74.5 0.9 58.2 Parbhani 4.7 3.7 71.1 1.0 56.6 N anded " 5 .1 3.5 73 . 6 1. 6 5 L 6 Bidar 2.4 1.7 78.8 0.7 51.8 Bhir 6.3 4.6 76.0 1.7 58.4 Osmanabad 7.0 5.5 73.5 1.5 58.5 Hyderabad 5.7 3.2 71.6 2.5 60.7 Mahhubnagar 2.1 1.3 73.1 0.8 5.J..7 Raichur 3.3 2.3 71.1 1.0 48.1 Gulbarga 2.7 2.0 72.8 0.7 54.3 Adilabad 8.2 4.7 60.5 3.5 47.9 Nizamabad 10.4 7.3 60.1 3.1 52.6 Medak 4.1 2.7 76.0 1.4, 61.4 Karimnagar 1.5 0.7 78.5 0.8 60.5 VVarangal 5.6 3.8 61.4 1.8 48.3 Nalgonda 2.0 1.3 73.9 0.7 56.0
As stated elsewhere, a heavy proportion of females among immigrants (or emigrants) clearly establishes the fact that the movement is basically due to marriages*. In the • As detailed in para 111 of Section IV of Chapter I, a m'lITiage alliance contracted by parties living on either sides of the ' borders of a di~trict leads (a) initially to the bride's migration from her place to that of her husband's and (h) subsequentlywhen she returns to her place, i.e., the p'acc of h~r parents, for her confinement-tc;) the mil:ration of her new-born son or d.'\ughter again from her place to the village or town of her husband.
23
206
light of this, and the figures given in Table 7, it is obvious that in the rural areas of Nizamabad and, to a slightly smaller extent, Adilabad, Osmanabad, Bhir, Hyderabad, Warangal and Nanded Districts, the number of immigrants is not insignificant. But the majority of these immigrants are in agricultural classes and the proportion of females among the agricultural immigrants is so heavy that one can safely presume that the immi Jration is .almost totally influenced by marital alliances, except in the case of the rural areas of Nizamabad and, to a smaller extent, Warangal and Adilabad Districts, wherein a fair amount of infiltration into these classes for economic reasons is also perceptible. The economic factor is comparatively much more in evidence among the minority of the immigrants in non-agricultural classes in the rural areas of these as well as the other districts of the state--and the relative numbers of such immigrants does not also appear to be quite insignificant in the rural areas of ~dilabad and Nizamabad Districts.
Summary.---Of the total population of 18,655,108 of Hyderabad State, as many as 15,178,949 live in villages. Thus, over 81 per cent of its population is rural. Though, the corresponding percentage in the country as a whole is slightly higher, this state can be regarded as being midway between the most and the least rural of the larger of the Indian States. But this state is more rural than most countries of the world, including not only the highly industrialised ones but also many which are still basically agricultural. Within the state itself, the rural population predominates in each and every district with the solitary exception of Ryderabad. In this district, ~ver 70 per c~nt .of the population resides in Hy~erabad City itself. More than ninety per cent of the populatIon III the dIstrICts of Nalgonda, Medak, Karlmnagar and Mahbubnagar and more than eighty in those of Bhir, Adilabad, Bidar, Aurangabad, Osmanabad, Parbhani, Nanded, Nizamabad, Gulbarga, Raichur (minus Tungabhadra Project Camps) and Warangallives in villages.
The rural population of this state is dispersed over 19,909 populated villages, of which 9,136 are very small, i.e., they are populated by even less than 500 persons; 9,502 are small, i.e., they are populatcd by 500 to 2,000 persons; 1,252 are large, i.e., they are populated by 2,000 to 5,000 persons; and just 19 are very large, i.e., they are populated by 5,000 or more persons. The population per village in this state is 762. But only about 16 per cent of the rural population lives in very small villages, as much as 60 in small villages, 23 in large villages and less than 1 per cent in very large villages. Thus, the majority of the rural population of the state lives in villages populated by 500 to 2,000 persons. This is true of each and every district within the state, except that this majority-without ever being predominant-varies appreciably from district to district. Within the state itself. Adilabad District has the lea~t populous villages. Over thirty two per cent of its rural population-by far the highest recorded in the state-lives in very small villages and over sixty in small villages. Its average village is inhabited by only 440 persons. The districts of Aurangabad, Parbaani Nanded and Raichur come ne::,t in order in thi~ respect. About. 26 to 28 per cent of their rural populatio~ is returned fro~ very small VIllages,. roughly. SIxty. from small VIllages a.nd .less. than even fifteen .frQm large and very large VIllages. The populatIOn per VIllage III each of these four distrIcts IS less than 600, bemg slightly _ lower than even 550 in Aurangabad. As against these districts, the villages in Bidar, Bhir, Hyderabad and Gulbarga Districts can be said to be fairly well populated. Only about 15 to 19 per cent of their rural population lives in very small villages, about 60 to 65 in small villages and from about 15 to 22 in large and very large villages. The popUlation per village in each of these districts tllough higher than 700 is very much lower than 800. But the proportion of the rural population living in small villages is unusually high in Bidar District and of those living in large and very large villages is fairly appreciable in Hyderabad and Gulbarga Districts. The villages in Osmanabad, Medak, Nizamabad and Mahbubnagar can, on the whole, be construed to be very well populated. In these districts, appreciably less than 15 per cent of the rural population lives in very small villages and as much as from 62 to 64 per cent in small and from 23 to 26 in large and very large villages. The population per village is not lower than 820 in any of these districts. In fact, it is as high as 869 in Mahbubnagar. The villages in the remaining districts, namely, Nalgonda, Karimnagar and Warangal, are very heavily populated. In these three districts, very small villages account for even less than 6 per cent of the rural population and small villages from 55 to 60 per cent. But the percentage of those living in large and very large villages exceeds 33 -the percentage in Warangal District being as high as 40 I The population per village in these three districts is extraordinarily high. It is 1,144 in Nalgonda, 1,242 in Karimnagar, and 1,276 in Warangal. The variation in population per village, as well as the distribution of population between villages of different sizes, is influenced not only by rural density but various other factors as well including the manner in which the revenue villages are constituted-i.e., the number of hamlets they contaia in addition to the main villages. Thus, an unusually heavy number of hamlets are partly responsible for
23-
207
the extraordinarily heavy population per village in Warangal and, to a considerably smaller extent, in Karimnagar and Nalgonda Districts. Similarly, the corresponding figure in Adilabad District would have been appreciably lower but for its large number of hamlets.
At the beginning of this century, the rural population of this state (as now constituted) was 10,006,775. During the relatively prosperous decade of 1901·'11, it increased by as much as 21 per cent i.e., by one per cent more than even the total population of this state. In the succeeding calamitous decade of 1911·'21, it declined, as did the total popUlation of the state, by seven per cent. During all the subsequent-and comparatively prosperous and healthy-decades it has been increasing consistently. The increase' during the three decades of1921·'31, 1931·'41 and 1941·'51 was by 14, 10 and 7 per cent respectively, as against the corresponding increase of 16, 13 and 14 recorded by the total population of the state. Thus, though the rural population is consistently increasing, from decennium to decennium, since 1921, its rate of growth is slowing down quite in contrast to the almost steady rate of growth of the total population of the state. This is due not so much to differences in the rates of growth of the indigenous population in the rural and urban areas of the state, as to the gradual urbanisation of many villages and the ever increasing movement of people from the rural to the urban areas. But, there is considerable divergence in the rates of growth of population as between villages of different sizes. Actually, since 1901, the very small villages have declined in popUlation by 20 per cent. It is this decline which is responsible for the slower rate of increase recorded by the rural population as a whole. As against this, the increase recorded during the same period by the population of small villages is almost identical and that of large and very large villages roughly thrice the corresponding increase registered by the total population of the state. These variations are again due not so much as to differences in the rates of growth of the indigenous population of villages of different sizes, as to the increasing migration of persons from the smaller to the larger of the population units-because of changes in communications, systems of production and trade and social and cultural outlook of the people.
SECTION II
LIVELIHOOD CLASS IN RURAL AREAS
(The tables relevant to this Section au Main Table' E-SummIlTY Fi~ures by Diltric19 and Tahsils' given at page 211 oJ Part II-A. oj thl' Volume; and Sub,ridlary TobiN' '2.4-Livelihood Pattrm oj Rural Population' and '2.4-A.-Tah'ilrt·ise Di-lftribution per 1.000 Persons of Rural Population according to Agricultural and Non-Agricultural Classes' given at pa4es 61 and 62 respectivel1l of Part l-B oj thIS Volum~).
52. Predominance of Agricultural Classes.--While in the state as a whole 682, among every 1,000 of the population, belong to Agricultural Classes, the corresponding proportion in its rural areas is as much as 798. Thus, almost four-fifths of the total rural population of this state is primarilyagricultural--and over 95 per cent of the Agricultural Classes in the state live in rural areas. But within the state itself the proportion of Agricultural Classes is distinctly heavier in the rural areas of the western than in those of the eastern districts. Among the western districts, the number of persons belonging to Agricultural Classes, for every 1,000 of the rural population, is as high as 895 in Raichur; is in the neighbourhood of 885 in both Osmanabad and Gulbarga; and ranges between about 850 and 875 in Bidar, Parbhani, Bhir, Aurangabad and Nanded-being, at its lowest, 849 in Nanded. As against this, among the eastern districts, the corresponding proportion, even at its highest, is only 809 in Medak ; ranges between 730 and 785 in Adilabad, Warangal, Nizamabad, :Mahbubnagar and Nalgonda Districts; and declines sharply to 620 in Hyderabad and 615 in Karimnagar.
53. Livelihood Class of Owner Cultivators.-Out of every 1,000 persons living in the villages of this state 487, or slightly less than half, belong to the Livelihood Class of Owner Cultivators. Over 96 per cent of the class in turn is returned from rural areas wherein it is by far the most numerous of all livelihood classes. claiming almost two and half a times the llUmbers pertaining to the Livelihood Class of Agricultural Labourers which comes next in order. The proportion of this livelihood class among the rural population is markedly heavier in the western districts of the state and in Medak and Nizamabad than in the other eastern districts. The actual number of persons belonging to this livelihood class, among every 1,000 of the rural population, is as high as 670 in Raichur, after which there is a rather steep fall. The proportion ranges between 560 and 600 in Bhir, :Medak, Nizamabad and Gulbarga and between 510 and 550 in Aurangabad, Bidar, Nanded and Osmanabad. It is 482 in Parbhani. Among the remaining eastern districts, the number at its highest is only 435 in Nalgonda; ranges between 375 and 415 in Warangal, Mahbubnagar and Karimnagar; is 374 in Adilabad; and dwindles to just 263 in Hyderabad.
54. Within the western districts themselves, the proportion of this livelihood class is extremely high in the western portions of Raichur District, the south-western portions of Gulbarga District and the extreme western portions of Bhir and Osmanabad Districts, all of which, especially the first, constitute the worst of the scarcity zones in the state. :More than 600, among every 1,000 of the rural population, in Manvi Tahsil of Raichur and Parenda Tahsil of Osmanabad, more than 650 in Gagawati, Koppal and Deodurg Tahsils of Raichur District and Shahpur Tahsil of Gulbarga, and more than even 700 in Kushtagi, Sindhnoor, Lingsugur and Yelburga Tahsils of Raichur, Shorapur Tahsil of
208
209
Gulbarga and Patoda and Ashti Tahsils of Bhir belong to this livelihood class. Again~ within the western districts themselves, the proportion of this class is comparatively low in the rural areas of (a) the south-eastern portions of Aurangabad District and the adjoining north-eastern portions of Bhir District; and western portions of Parbhani District, (b) the central and eastern portions of Osmanabad District; (c) the southern portions of Nanded and the adjoining north-eastern portions of Bidar District; (d) the northeastern portions of Gulbarga District, including Chitapur Tahsil; and, lastly, (e) some of the other eastern tahsils-besides those falling under (c) and (d) above-. which adjoin the eastern districts and present generally identical social and economic patterns. The actual number of persons belonging to this livelihood class, among every 1,000 of the rural population, varies betwen 480 and 515 in the tahsils of Jintur, Jalna, Ambad, Manjlegaon, Partur, Parbhani and Pathri falling under the tract mentioned at (a) above; between 480 and 515 in the tahsils of Omerga, Kallam, Latur, Osmanabad and Tuljapur falling under (b) above; between 425 and 500 in the tahsils of Narayankhed, Santpur, Deglur and Bidar falling under (c) above; between 450 and 515 in the tahsils of Kodangal Chincholi, Chitapur, Seram and Tandur falling under (d) above; and it is 499 in Mudhol Tahsil of Nanded District and 488 in Alampur Tahsil of Raichur District, which belong to the categories mentioned at (e) above.
55. Similarly, in the rural areas of Medak and Nizamabad Districts, the proportion of the Livelihood Class of Owner Cultivators is slightly heavier in the western and lower in the eastern tahsils--the marked exception being Bodhan Tahsil wherein the proportion is the lowest within the rural areas of the two districts. In the rural areas of the forest tahsil of Yellareddy this class claims as many as 669 out of every 1,000 of the rural population.
56. In the rural areas of the remaining eastern districts of Adilabad, Karimnagar, Warangal, Nalgonda, Hyderabad and Mahbubnagar, the livelihood class is unusually low in many of the tahsils to the extreme east of the state along the Godavari and in the tahsils surrounding Hyderabad City. The proportion of this livelihood class, among every 1,000 of the rural population, is lower than even 250 in Lakshattipet, Hyderabad East and Ibrahimpatnam Tahsils ; about 800 or appreciably lower in Sirpur, Asifabad, Chinnoor, Manthani, Yellandu, Hyderabad West, Medchal and Bhongir Tahsils. Within the rural areas of these six districts themselves, the proportion tends to be comparatively heavy to the extreme south i.e., in the extreme southern tahsils of Mahbubnagar, Nalgo.nda and Warangal Districts, especially in the tahsils of Nalgonda which are constantly affected by scarcity and the south western portions of Adilabad and the north western portions of Karimnagar, both of which adjoin Armoor Tahsil of Nizamabad. But the highest proportion of the class recQrded in the rural areas of these six districts is in Utnoor Tahsil, wherein it claims as many as 680 persons among every 1,000 of the rural population.
57. Livelihood Class of Tenant CultivatoTs.-Out of every 1,000 persons living in the rural areas of the state, 85 belong to the Livelihood Class of Tenant Cultivators. This proportion may be appreciably heavier than the corresponding proportion recorded by the Livelihood Class of Other Services and Miscellaneous Sources, or more especially of Agricultural Rent Receivers or Commerce or Transport. But it is appreciably less than theproportion recorded by the Livelihood Class of Production, consider a bly less than even half of the proportion recorded by the Livelihood Class of Agricultural Labourers androughly only one sixth of that recorded by the Livelihood Class of Owner Cultivators. Over
24
210
1}3 per cent of the total number belonging to this class in the state reside in its rural areas. Districtwise, the proportion of persons principally dependent on tenant cultivation, among every 1,000 of the rural population, is at its highest 182 in Hyderabad District. In fact, this is the only district in the state wherein this class is proportionately more numerous than that of Agricultural Laboure~s in rural areas. The Livelihood Class of Tenant Cultivators is also fairly appreciable in the rural areas of Adilabad and Mahbubnagar Districts and, to a slightly smaller extent, in those of War an gal and Nalgonda, the corresponding proportion in each of these four districts being 155, 148, 129 and 106 respectively. Among the other districts, the corresponding proportion is 93 in Gulbarga, 87 in Medak, 71 in Parbhani, about 60 both in Osmanabad and Nanded, ranges between 50 and 60 in Bidar and Aurangabad, between 40 and 50 in Karimnagar, Raichur and Bhir ; .and drops to 36 in Nizamal?ad. -
58. It will be obvious from the above that no distinct pattern is perceptible in the proporton of the Livelihood Class of Tenant Cultivators among the rural population in terms of adjacent districts viewed as a whole. The class is, however, relatively very numerous in two zones of the state. The first of these zones consists of the backward, remote, hilly and forest tahsils along the Penganga, the Wardha, the Pranahita and the Godavari. In this zone, the proportion of the livelihood class, among every 1,000 of the rural population, is as much as 379 in Yellandu Tahsil; exceeds 200 in Palvancha. Pakhal, Sirpur and Asifabad Tahsils; exceeds 150 in Mahbubabad, Mulug, Manthani, L2.kshattipet, Chinnoor, Rajura and Kinwat Tahsils; and exceeds 100 in Burgampahad, Khanapur, Utnoor, Boath, Hadgoan, Kalamnuri and Hingoli Tahsils. The second of these zones consists of the south-central tahsils of the state surrounding Hyderabad City. In this zone the corresponding proportion of this livelihood class exceeds 200 in Ibrahimpatnam, Shadnagar, Pargi and Mahbubnagar Tahsils; 150 in Shahabad, Hyderabad West, Medchal, Bhongir, Jangaon and Kalvakurti Tahsils; and is about or exceeds 100 in Hyderabad East, Sangareddy, Andol, Narsapur, Gajwel, Nalgonda, Ramannapet, Devarkonda, Achampet, Nagarkurnool and Makhtal Tahsils. In addition to these two zones, the livelihood class is slightly conspicuous in the rural areas of the central and northern tahsils of Gulbarga District and the adjoining areas of Bidar District-it may be observed that this tract adjoins the south central tracts mentioned earlier. In this tract the corresponding proportion of the livelihood class exceeds 150 in Kodangal Tahsil; 100 in Afzalpur, Tandur and Andola (Jewargi) Tahsils; and ranges between 85 and 100 in Chincholi, Seram, Gulbarga, Aland, Zahirabad and Bidar Tahsils. The rural areas of Tuljapur with a proportion of 85 can also be deemed to be within this'zone.
59. Livelihood Class of Agricultural Labourers.-Out of every 1,000 persons re~ siding in the rural areas of this state, 200 or one fifth of the total, belong to the Livelihood Class of Agricultural Labourers. As stated earlier, this class is the second most numerous of all the livelihood classes in rural areas of the state as a whole as well as in all its districts with the exception of Hyderabad, Nizamabad and Karimnagar. In Hyderabad District not only the Livelihood Class of Owner Cultivators but also those of Tenant Cultivators and persons principally dependent on Production and in the other two districts, especially in Karimnagar, the Livelihood Class of Production is more numerous than this class. Over 94 per cent of the total numbers belonging to this livelihood class in the state reside in its rural areas. Within the state itself, the proportion of the class is comparatively very heavy in its north-western districts and in Adilabad and very low in its central districts of Nizamabad and Medak in the eastern half of the state and in jts south~western districts of Raichur and, to a smaller extent, Gulbarga. In the former
24-
211
set of districts, the actual number of persons belonging to this class, among every 1,00() of the rural population, is as high as 285 in Parbhani, and 263 in Osmanabad; ranges between 240 and 250 in Bidar and Adilabad; and between 230 and 235 in Nanded and Aurangabad; and even at its lowest is 211 in Bhir. In the latter set of districts, the corresponding proportion even at its highest is only 165 in Gulbarga, and is as low as 144 in Nizamabad, 136 in Raichur and 125 in Medak. Among the remaining districts of the state it is 208 in Warangal and ranges between 180 and 190 in Mahbubnagar, Karimnagar and Nalgonda and is Hi8 in Hyderabad.
60. Among the rural population of the north-western districts, the Livelihood Class of Agricultural Labourers is especially compicuJus in three zones which more or less correspond roughly to the zones wherein the I.ivelihood Class of Owner Cultivators is comparatively the least numerous-vide paragraph 54 above. The fir8t of
. these zones consists of the eastern portions of Aurangabad and the adjoining western portions of Parbhani District and northern portions of Bhir District. In this zone, the number, among every 1,000 of the rural populatio~, belonging to the class of Agricultural Labourers exceeds 350 in Pathri Tahsil; 300 in Parbhani, Gangakhed, Partur, Manjlegaon and Ambad Tahsils ; and 250 in Jintur, Georai, J alna and J afferabad Tahsils. The second zone consists of the southern portions of Nanded and the adjoining north-eastern portions of Bidar District. In this zone, the corresponding poportion ranges between 250 and 300 in Santpur, Bidar, Bhalki, Narayankhed and Deglur. The third of these .zones, consists of the central and western portions of Osmanabad District. In this district, the· corresponding proportion of the class ranges again between 250 and 300 in Osmanabad, Tuljapur, Latur, Owsa, Omerga and Kallam Tahsils. The proportion exceeds 200-i.e., the average for the state-among all the remaining tahsils within these north-western districts except in the tahsils of Aurangabad., Khuldabad and Bhokardan in Atirangabad District and Bhir, Patoda and Ashti in Bhir District and Parenda in Osmanabad District, the lowest being 98 in Patoda.
61. Within Adilabad District itself, the proportion of this class, among the rural l'opulation, is heavy in its north-western tahsils-particularly in Kinwat Tahsil wherein the class claims as many as 370 out of every 1,000 of the rural population-as well as in its south-eastern tahsils of Lakshattipet and Chinnoor. As against this, the proportion of this class is comparatively very low in its south-western tahsils of Khanapur and Nirm,al and in its central-eastern tahsils of Asifabad and Sirpur.
62. Again, within Nizamabad and Medak Districts, the proportion of the Livelihood Class of Agricultural Labourers in rural areas, is below the average for the state in all tahsils except Bodhan. Actually, in Bodhan Tahsil the class claims as many as 833 persons among every 1,000 of the rural population. This is among the highest of the corresponding figures recorded in the rural areas of the state. In the rural areas of the remaining tahsils of the two districts, the class tends to te slightly more numerous in the western than in the eastern tahsils, a marked exception being the forest tahsil of Yellareddy in Nizamabad District. The corresponding proportion of the class in this tahsil is only 77.
63. The proportion of the Livelihood Class of Agricultural Labourers in rural areas is also below the average for th~ state in all the tahsils of the south western districts of Raichur and Gulbarga except for Alampur in Raichur District and the northern areas of Gulbarga District adjoining the north-western districts of the State. In fact, among
212
the rural population of the state, the livelihood class is numerically the least conspicuous in south-western portions of these two districts. Less than 170 persons, among every 1,000 of the rural population, in Manvi and Shahpur Tahsils ; less than 150 in Andola, Yadgir, Shorapur, Deodurg and Koppal Tahsils; less than even 100 in Sindhnoor, Gangawati, Yelburga and Lingsugur Tahsils; and less than even 50 in Kushtagi Tahsil belong to this livelihood class. The actual proportion is only 44 in the ;rural areas of Kushtagi and 65 in those of Lingsugur, the former is the lowest proportion recorded by the -class in the rural areas of this state and the latter the second lowest.
64. In all the remaining eastern districts of this state, namely Warangal, Mahbubnagar, Karimnagar, Nalgonda and Hyderabad, the proportion of the Livelihood Class of Agricultural LaboUl'ers, among every 1,000 of the rural population, is at its highest 280 in Manthani Tahsil of Karimnagar District and at its lowest is 103 in Hyderabad West Tahsil of Hyderabad District. But within the rural areas of these five districts themselves, the class is relatively most numerous in the extreme eastern portions along the Godavari and in the extreme southern portions along the Krishna. Among the tahsils falling in the former (other than Manthani mentioned earlier) the corresponding proportion ranges between 200 and 250 in Sultana bad and Parkal Tahsils of Karimnagar and Mulug, Yellandu and Burgampahad Tahsils of Warangal. The tahsils of Chinnoor and Lakshattipet in Adilabad District wherein the proportion of this class is also, particularly heavy-vide paragraph 62 above-:-adjoin this area. But the corresponding proportion iR not equally pronounced in Palvancha Tahsil (being only 176) which also lies within this area. This is mainly due to the tahsil's large collieries which attract a number of persons who would have otherwise worked as agricultural labourers. Similarly, in the second of the tracts mentioned above, the
,corresponding proportion of the class ranges between 210 and 270 in all the southern tahsils of Mahbubnagar and N algonda Districts as well as the extreme southern tahsils of Khammam and Madhira in Warangal District-the significant exception being the scarcity tahsils of Devarkonda and Miryalguda wherein it falls appreciably below 200.
65. Livelihood Class of Agricultural Rent Receivers.-This class is numerically unimportant in the state, whether in its rural or urban areas. It accounts for just 26 out of every 1,000 of the state's rural population. The overwhelming majority of all agricultural classes lives in rural areas. But in case of this class, the majority is perceptibly reduced. Thus, only about 89 per cent of this class lives in rural areas, as against the corresponding percentage of about 95 or more recorded in respect of all the other agricultural classes. This is natural as a significant number of persons belonging to this class take no active part in agricultural operations. Districtwise, the class at its highest -accounts for 63, among every 1,000 of the rural population, in' Gulbarga. The corresponding proportion ranges between 42 and 44 in case of Osmanabad, Raichur and Bidar. Among the other districts, the proportion ranges between 30 and 40 in Nanded, Parbhani and Aurangabad; and is 23 in Bhir, 22 in Medak, 21 in Mahbubnagar and dwindles to just 15 in Nizamabad, 12 in Warangal and 11 in Adilabad and is even less than ten (i.e., one per cent) in the remaining districts of Karimnagar, Nalgonda arid Hyderabad.
66. It is obvious from the preceding paragraph that the proportion of the Livelihood ,Class of Agricultural Rent Receivers among the rural population is more marked in the western than in the eastern half of the state, being comparatively most perceptible in the rural areas of Gulbarga and, to a smaller extent, the adjoining districts of Osmanabad, Raichur and Bidar. This could be further illustrated with reference to the tahsilwise
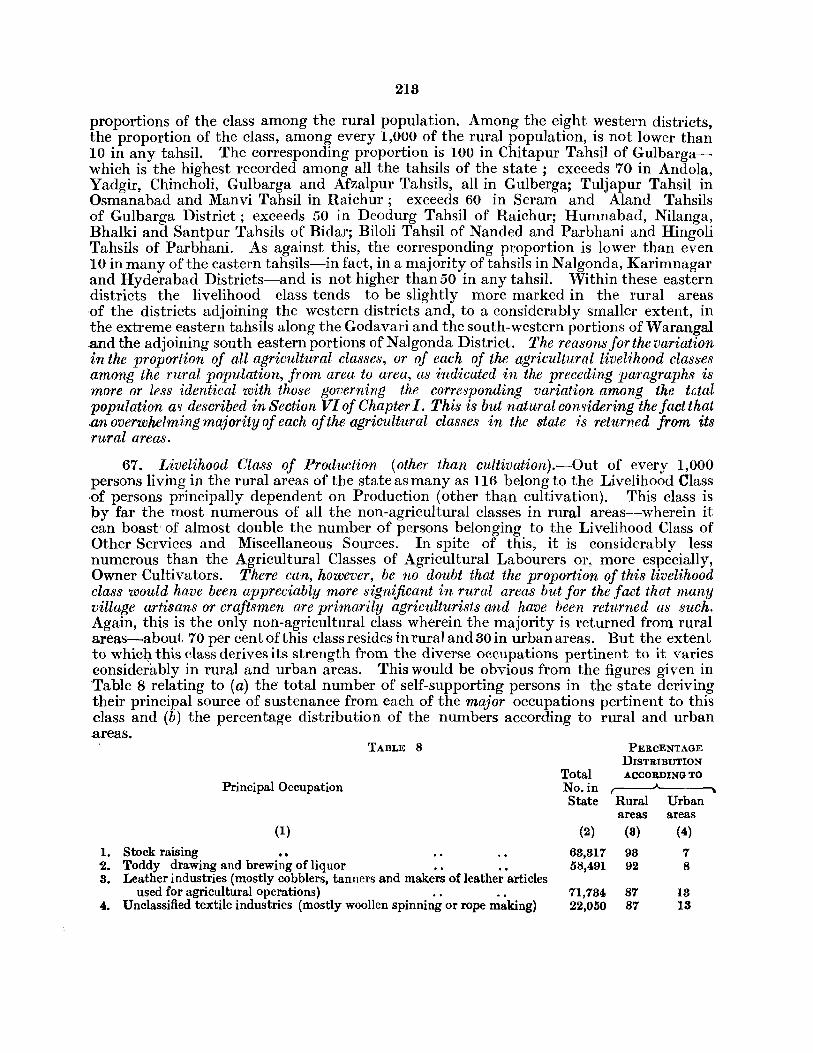
213
proportions of the class among the rural population. Among the eight western districts, the proportion of the class, among every 1,000 of the rural population, is not lower than 10 in any tahsil. The corresponding proportion is 100 in Chitapur Tahsil of Gulbargawhich is the highest recorded among all the tahsils of the state; exceeds 70 in Andola, Yadgir, Chincholi, Gulbarga and Afzalpur Tahsils, all in Gulberga; Tuljapur Tahsil in Osmanabad and Manvi Tahsil in Raichur; exceeds 60 in Seram and Aland Tahsils of Gulbarga District; exceeds 50 in Deodurg Tahsil of Raichur; Humnabad, Nilanga, Bhalki and Santpur Tahsils of Bidar; Biloli Tahsil of Nanded and Parbhani and Hingoli Tahsils of Parbhani. As against this, the corresponding proportion is lower than even 10 in many of the eastern tahsils-in fact, in a majority oftahsils in Nalgonda, Karimnagar and Hyderabad Districts-and is not higher than 50 in any tahsil. 'Vi thin these eastern districts the livelihood class tends to be slightly more marked in the rural areas of the districts adjoining the western districts and, to a considerably smaller extent, in the extreme eastern tahsils along the Godavari and the south-western portions of Warangal .and the adjoining south eastern portions of Nalgonda District. The reasons for the variation in the proportion of all agricultural classes, or of each of the agricultural livelihood classes among the rural population, from area to area, as indicated -in the preced-ing paragraphs is more or less identical with those governing the corresponding variation among the total population a<; described in Section VI of Chapter 1. This is but natural con <;idering the fact that .an overwhelming mqjority of each of the agricultural classes in the state is returned from its rural areas.
67. Livelihood Class of Production (other than cultivation).-Out of every 1,000 persons living in the rural areas of the state as many as 116 belong to the Livelihood Class of persons principally dependent on Production (other than cultivation). This class is by far the most numerous of all the non-agricultural classes in rural areas--wherein it can boast' of almost double the number of persons belonging to the Livelihood Class of Other Services and Miscellaneous Sources. In spite of this, it is considerably less numerous than the Agricultural Classes of Agricultural Labourers 01\ more especially, Owner Cultivators. There can, however, be no doubt that the proportion of this livelihood class would have been appreciably more significant in rural areas but for the fact that many village artisans or craftsmen are primarily agriculturists and have been returned as such. Again, this is the only non-agricultural class wherein the majority is returned from rural areas-about 70 per cent of this class resides in rural and30in urban areas. But the extent to whicl_t this class derives its strength from the diverse occupations pertinent to it varies considerably in rural and urban areas. This would be obvious from the figures given in Table 8 relating to (a) the total number of self-supporting persons in the state deriving their principal source of sustenance from each of the major occupations pertinent to this class and (b) the percentage distribution of the numbers according to rural and urban .areas.
TABLE 8
Principal Occupation
(1)
1. Stock raising ~. Toddy drawing and brewing of liquor 8. Leather industries (mostly cobblers, tanners and makers of leather articles
used for agricultural operations) 4. Unclassified textile industries (mostly woollen spinning or rope making)
Total No. in State
(2)
63,817 58,491
71,784 22,050
PERCENTAGE DISTRIBUTION ACCORDING TO
Rural Urban areas areas
(8) (4)
98 7 92 8
87 13 87 13
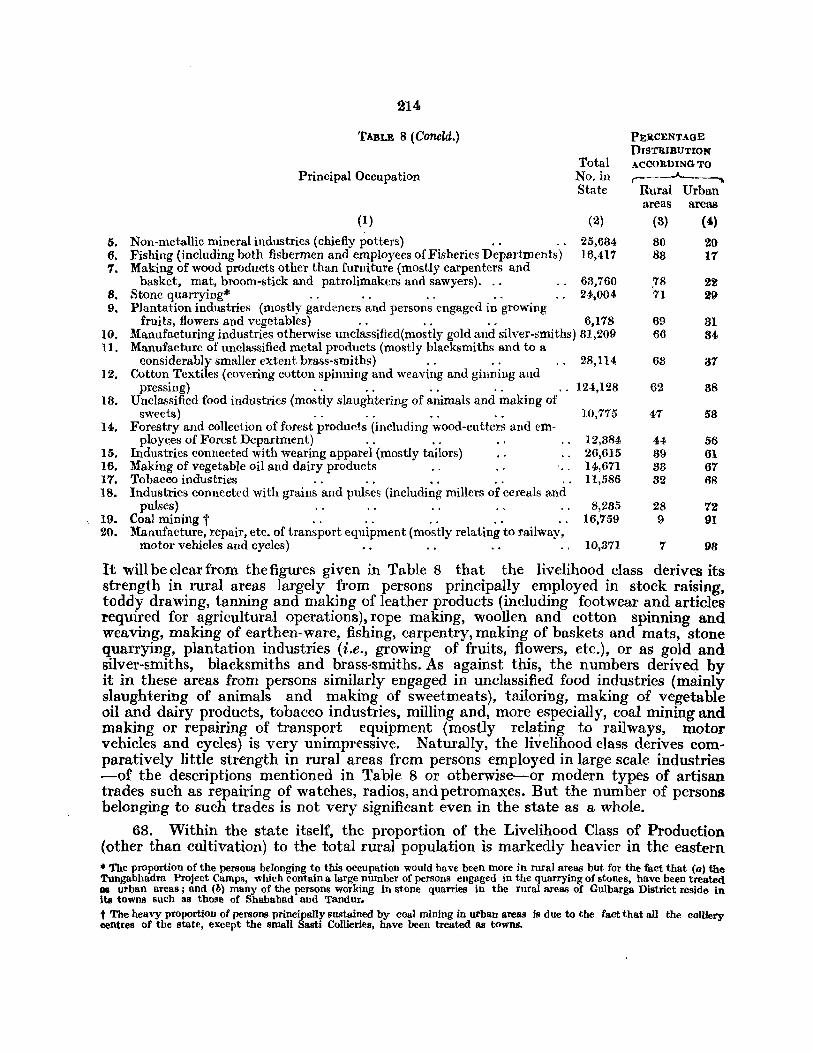
214
TABLE 8 (Concld.) PERCENTAGE DISTRIBUTION
Total ACCORDING TO Principal Occupation No. in ,-----_..A.
'\ State Rural Urban
areas areas (1) (2) (3) (4)
5. Non-metallic mineral industries (chiefly potters) 25,634 80 20 6. Fishing (including both fishermen and employees of Fisheries Departments) 16,417 88 17 1. Making of wood products other than furniture (mostly carpenters and
basket, mat, broom-stick and patrolimakers and sawyers) .. ' 63,7'60 .78 22 8. Stone quarrying* 24,004 71 2lJ 9. Plantation industries (mostly gardeners and persons engaged in growing
fruits, flowers and vegetables) 6,178 69 31 10. Manufacturing industries otherwise unclassificd(mostly gold and silver-smiths) 81,209 66 84-11. Manufacture of unclassified metal products (mostly blacksmiths and to a
conSiderably smaller extent brass-smiths) 28,114 68 37 12. Cotton Textiles (covering cotton spinning and weaving and ginning and
pressing) _ 124,128 62 3S 18. Unclassified food industries (mostly slaughtering of animals and making of
sweets) 10,775 47 58 14. Forestry and collection of forest produ~ts (including wood-cutters and em-
ployees of Forest Department) 12,384 44 56 15. Industries connected with wearing apparel (mostly tailors) 26,615 39 61 16. Making of vegetable oil and dairy products 14,671 33 67 17. Tobacco industries 11,586 32 68 18. Industries connected with grains and pulses (including millers of cereals and
pulses) 8,235 28 7% 19. Coal mining t 16,759 9 91 20. Manufacture, repair, etc. of transport equipment (mostly relating to railway,
motor vehicles and cycles) 10,871 7 98
It will be clear from the figures given in Table 8 that the livelihood class derives its strength in rural areas largely from persons principally employed in stock raising. toddy drawing, tanning and making of leather products (including footwear and articles required for agricultural operations), rope making, woollen and cotton spinning and weaving, making of earthen-ware, fishing, carpentry, making of baskets and mats, stone quarrying, plantation industries (i.e., growing of fruits, flowers, etc.), or as gold and silver-smiths, blacksmiths and brass-smiths. As against this, the numbers deriveq. by it in these areas from persons similarly engaged in unclassified food industries (mainly slaughtering of animals and making of sweetmeats), tailoring, making of vegetable oil and dairy products, tobacco industries, milling and, more especially, coal mining and making or repairing of transport equipment (mostly relating to railways, motor vehicles and cycles) is very unimpressive. Naturally, the livelihood class derives comparatively little strength in rural areas from persons employed in large scale industries -of the descriptions mentioned in Table 8 or otherwise-or modern types of artisan trades such as repairing of watches, radios, and petromaxes. But the number of persons belonging to such trades is not very significant even in the state as a whole.
68. Within the state itself, the proportion of the Livelihood Class of Production (other than cultivation) to the total rural population is markedly heavier in the eastern .. The proportion of the persons belonging to this occupation would have been more in rural areas but for the fact that (a) the Tungabhadra Project Camps, which contain a large number of persons engaged in the quarrying of stones, have been treated as urban areas; and (b) many of the persons working in stone quarries in the rural areas of Gulbarga District reside in its towns such as those of Shahabad and Tandur. t The heavy proportion of persons principally sustained by COal mining in urban areas is due to the fact that all the colliery centreS of the state, except the small Sasti Collieries, have been t~eated as towns.
215
than in the western districts. The strength of the class is particularly impressive in the rural areas of Karimnagar District wherein it claims as many as 275 persons among every 1,000 of the rural population. Among the other eastern districts, the corresponding proportion is as much as 177 in both Hyderabad and Nalgonda, slightly higher than 150 in Warangal and Mahbubnagar and ranges between 100 and 150 in Nizamabad, Adilabad and Medak, being 106 in Medak. As against this, among the western districts the corresponding proportion even at its highest is just 65 in Gulbarga. It ranges between 50 and 60 in Nanded, Osmanabad, Bidar, Bhir and Aurangabad and declines to 42 in Raichur and 41 in Parbhani. In other words, while this livelihood class accounts for over a quarter of the total rural population in Karimnagar District it accounts for even less than one twentieth in Raichur and Parbhani Districts.
69. As a rule, the villages of the western districts are poor in all the more important of the occupations pertinent to this class, the only exception, to an extent, being those connected with vegetable oils and dairy products and grains and pulses (including their milling). Among the major professions pertaining to this class, the villages of the western districts have a particularly small share of toddy drawing. Although, the rural population of each of the eight western districts of Aurangabad, Parbhani, Nanded, Bidar, Bhir, Osmanabad, Raichur and Gulbarga claim from 4 to 8 per cent of the total rural population of the state, their highest share of the 53,872 self-supporting persons returned from its rural areas as being principally employed in toddy drawing and brewing* is about 1.8 per cent in case of Gulbarga District. In fact, it is appreciably less than even one per cent in case of all the others. Similarly in terms of the principal means of livelihood returned by the Rural Population, the western districts of the state are poor in the village industries and artisan trades mentioned below :--
(i) Stock raising-especially the rural areas of Aurangabad, Parbhani and Bhir Districts.
(ii) Plantation Industries (mainly growing of fruits, vegetables, flowers, etc.). ('iii) Industries connected with forest produce and wood cutting--especially the
rural areas of Bidar, Bhir, Osmanabad and Raichur Districts. (iv) Fishing-especially the rural areas of Aurangabad, Parbhani Bidar,
Osmanabad, Raichur and Gulbarga Districts. \
(v) Stone quarrying-with the exception of the rural areas of Gulbarga District. (vi) Tobacco industries- especially the rural areas of Aurangabad, Parbhani,
Nanded, Bidar, Osmanabad and Raichur Districts. (vii) Cotton weaving and spinning-especially the rural areas of Aurangabad,
Parbhani, Bidar, Bhir and Osmanabad Districts. ('viii) Tailoring-except in the rural areas of Aurangabad and Nanded.
(ix) Industries connected with leather and leather products (including tanning and making of footwear).
(x) Manufacture of meta] products otherwise unclassified (mainly black-smiths and to a considerably smaller extent brass-smiths).
(xi) :Manufacturing industries otherwise unclassified (almost wholly gold and sil ver-s miths) .
(xii) Manufacture of non-metallic mineral products (almost wholly potters )-with the exception of the rural areas of Nanded District.
*Figures were not compiled separately in rural areas for toddy drawyers and brewers. But the latter do not count lIlumericaUy. This would be obvious from the fact that in the state as a whole, the number of self-supporting persons principally engaged in toddy drawing was 57,874 as against only 847 engaged in brewing and distilling.
216
The rural areas of the western districts are also generally poor in woollen weaving and' spinning, rope making and basket and mat weaving which principally sustains thousands of persons in the eastern half of the state. But among the western districts themselves, the rural areas of Gulbarga District are the richest in rural industries and artisan trades, especially in stone quarrying and cotton spinning and weaving.
70. The rural areas of the eastern districts have considerably more than their share of the occupations in the state pertinent to this livelihood class. The villages of Karimnagar District---which on the whole account for even less than 10 per cent of the state's, rural population--are responsible for over 50 per cent of the self-supporting persons returned in the rural areas of the state as being principally engaged in unclassified textile industrjes, which in so far as this state is concerned consists mostly of rope making and woollen weaving and spinning. Similarly, the villages of this district account for over 40 per cent of the self-supporting persons principally employed in plantation industries*; over 30 per cent of those similarly employed in fishing; over 25 per cent of those principally engaged in toddy drawing and cotton textiles; over 20 per cent of those similarly engaged in stock raising; and from 12 to 20 per cent of those principally sustained by tailoring and unclassified manufacturing industries (mainly silver and goldsmiths) and industries connected with forest produce, vegetable oils and dairy products, tanning and leather products including footwear, unclassified metal products (mainly iron and brass articles), non-metallic mineral products (mainly earthen-ware) and wood and wood products mainly carpentry and weaving of baskets and mats). In fact, among all the industries common to the rural areas of this state, the villages of Karimnagar District can be deemed to possess'less than their due share of only those connected with stone quarrying, transport equipment, tobacco products and unclassified food articles (i.e., slaughter of animals or making of sweetmeats) and milling of cereals and pulses. The rural areas of Hyderabad District have also much more than their share of the various occupations pertaining to this livelihood class. This is partly because they cater to ari appreciable extent to the needs of the large population in Hyderabad City and partly because a number of persons employed in the various manufacturing industries and artisan trades in the city reside in the surrounding villages. The villages of this district are, however, not very well off, as compared with rural areas of most of the other eastern districts, in respect of persons principally engaged in cotton and woollen weaving and spinning, tobacco industries and fishing. ~ imilarly, the rural areas of Nalgonda District are particularly well off in toddy drawing, tanning and the making of leather articles including footwear, cotton weaving and spinning and, to a smaller extent, stock raising. They have also more than their share of artisan traders ]ike blacksmiths, brass-smiths, silver and goldsmiths, potters, carpenters and tailors. The villages of Warangal District have an especially large share of persons connected with industries relating to forest produce and beverages. They are also relatively well off in respect of persons principally engaged in stock raising, fishing, cotton spining and weaving, tanning and making of footwear and other leather products, carpentry, weaving of baskets and mats and the making of earthen-ware and as gold and silversmiths, tailors or millers of cereals and pulses. The rural areas of Mahbubnagar District are particularly well off in tobacco industries, stock raising, woollen weaving and spinning and, to a smaller extent, stone quarrying. They have also more than their share of toddy drawing and industries connected with plantations(growing of fruits, vegetables, flowers. etc. ),forest produce, cotton spinning and weaving and tanning and making of leather products including footwear and also of silver and goldsmiths, tailors, potters, carpenters, basket weavers and mat makers. The rural areas of Nizamabad District are particularly well off in industries connected with tobacco and, -Mostly persons engaged in the growing of fruits, vegetables, flowers, etc.
217
to a considerably smaller extent, fishing and the milling of cereals and pulses. They have also more than their share of stock raising, stone quarrying, toddy drawing, cotton and wool1en spinning and weaving, silk spinning and weaving, rope making and industries connected with forest produce and also of blacksmiths and brass-smiths, silver and goldsmiths, tailors, potters and persons principally engaged in weaving of baskets and mats. The rural areas of Medak and Adilabad Districts are the poorest among the eastern districts in respect of village industries and artisan trades. But in spite of this, the rural areas of Adilabad District are comparatively very well off in fishing and industries connected with forest produce and have more than their share of stock raising, plantation industries (growing of fruits, vegetables, flowers, etc.) and tanning and mlking of leather products including footwear and of blacksmiths, silver and goldsmiths and carpenters, and the persons connected with the mlking of vegetable oil and dairy products. Similarly, the rural areas of Medak District have more than their due share of stone quarrying and cotton spinning and weaving and blacksmiths and gold and silversmiths.
71. From the variations in the proportion of this class in the rural areas of the different tahsils of the state as a whole, it is obvious that Karimnagar District and the surrounding areas in Adilabad, Nizamabad, Nalgonda and Warangal Districts constitute the richest wne in the state from the point of view of cottage and rural industries and artisan trades. This zone is spread over the tahsils of Jagtial (293)*, Karimnagar (292), Huzurabad (290), Metpalli (284), Sirsilla (280), Parkal (269), Sultanabad (259) and Manthani (168), all in Karimnagar District; Lakshattipet (205), Khanapur (159) and Nirmal (151) in Adilabad District; Armoor (232) in Nizamabad District; Siddipet (191) in Medak District; Warangal (242) and Pakhal (187) in "\Varangal District; and Bhongir (259), Ramannapet (250) and Jangaon (198) in Nalgonda District. The livelihood class is also conspicuous, though not to the same extent, in two other considerably smaller zones of the state. One of these zones consist& of the rural areas of the tahsils of Hyderabad East (238), Medchal (212) and Ibrahimpatnam (188) all in Hyderabad District and the other of those in the tahsils of Atmakur (259), Wanparti (206) and Makhtal (185) all in the south-western portions of Mahbubnagar District. As against this, the rural areas in the western portions of Raichur District and the south-western portions of Gulbarga District are the poorest in ,the state from this point of view. This tract con",ists of the tahsils of Afzalpur (29), Andola (34), Shahapur (32),Shorapur (44) in Gulbarga District and Sindhnoor (19), Yelburga (25), Deodurg (26), l\1anvi (27), Kushtagi (32), Gangawati (33) and Lingsugur (46) all in Ra.ichur District. The rural areas of Kushtagi Tahsil next to those ot' Utnoor Tahsil in Adilabad District has the distinction of being the poorest among the rural areas of the state in respect of the proportion of the numbers belonging to this livelihood class.
72. Livelihood Class of Commerce.-This livelihood class is not at all significant in numbers in rural areas. In fact, in these areas this class is numerically the second least important of all the livelihood classes, whether Agricultural or Non-agricultural. Out of every 1,000 of persons living in the rural areas of the state only 24 belong to this class. Unlike all the Agricultural Livelihood Classes or the Livelihood Class of Production (other than cultivation), only a minority of this class isreturned from rural areas. Out of every 1,000 persons belonging to this class in the state, 620 reside in its towns and cities and only 380 in its villages. And again, the relative strength derived by this class from the different occupations pertinent to it varies considerably in rural and urban areas. This would be obvious from the figures given in Table 9 relating to (a) total "'The figures given in brackets indicate the number of persons belonging to the Livelihood Class of Production (other than .cultivation). among every 1,000 of the rural population, in the respective tahsils.
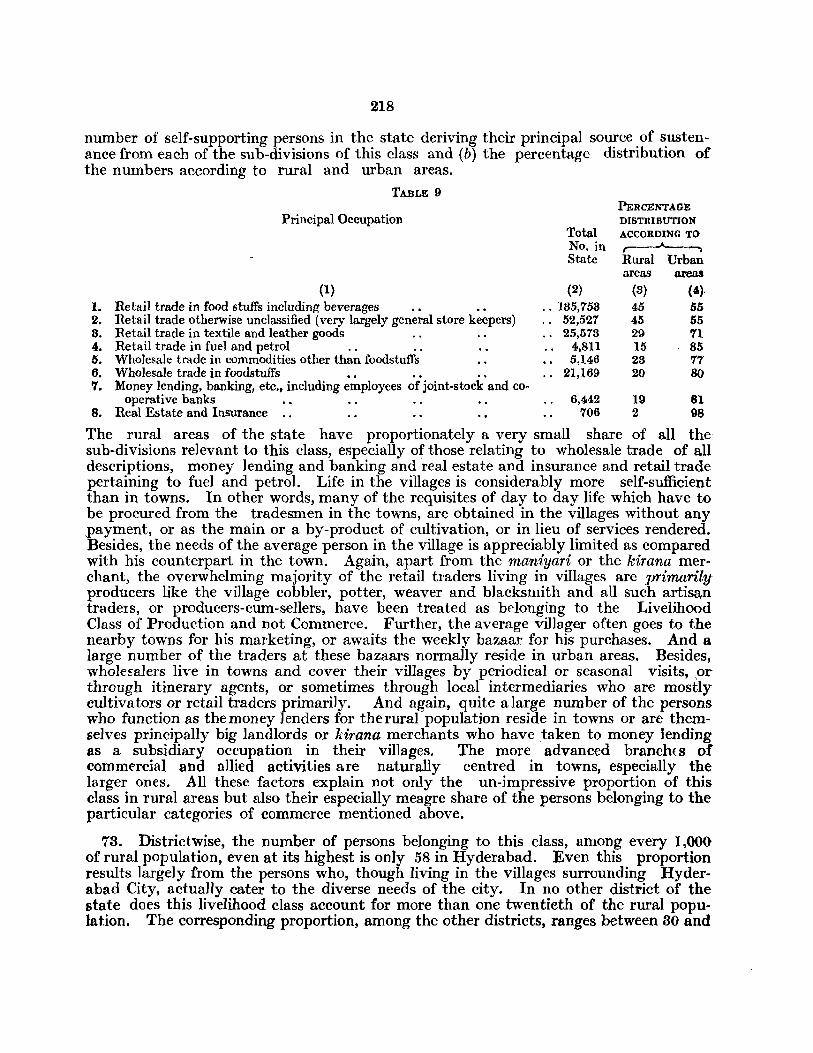
218
number of self-supporting persons in the state deriving their principal source of sustenance from each of the sub-divisions of this class and (b) the percentage distribution of the numbers according to rural and urban areas.
TABLE 9
Principal Occupation
(1) 1. Retail trade in food stuffs including beverages 2. Retail trade otherwise unclassified (very largely general store keepers) 8. Retail trade in textile and leather goods 4. Retail trade in fuel and petrol 5. Wholesale trade in commodities other than foodstuffs 6. Wholesa.le trade in foodstuffs 7. Money lending, banking, etc., including employees of joint-stock and co-
Total No. in State
(2) ., 185,753
52,521 25,518
4,811 5,146
21,169
PERCE1Io'"TAGE DISTRIBUTION ACCORDING TO
,----A---.." Rural Urban areas areas
(8) (4r) 45 55 45 55 29 71 15 85 23 'T7 20 80
operative banks 6,442 19 81 8. Real Estate and Insurance . . 706 2 98
The rural areas of the state have proportionately a very small share of all the sub-divisions relevant to this class, especially of those relating to wholesale trade of all descriptions, money lending and banking and 'real estate and insurance and retail trade pertaining to fuel and petrol. Life in the villages is considerably more self-sufficient than in towns. In other words, many of the requisites of day to day life which have to be procured from the tradesmen in the towns, are obtained in the villages without any payment, or as the main or a by-product of cultivation, or in lieu of services rendered. Besides, the needs of the average person in the village is appreciably limited as compared with his counterpart in the town. Again, apart from the maniyari or the kirana merchant, the overwhelming majority of the retail traders living in villages are primarily' producers like the village cobbler, potter, weaver and blacksmith and all such artisan traders, or producers-cum-sellers, have been treated as belonging to the Livelihood Class of Production and not Commerce. Further, the average villager often goes to the nearby towns for his marketing, or awaits the weekly bazaar for his purchases. And a large number of the traders at these bazaars normally reside in urban areas. Besides, wholesalers live in towns and cover their villages by periodical or seasonal visits,,or through itinerary agents, or sometimes through local intermediaries who are mostly cultivators or retail traders primarily. And again, quite alarge number of the persons who function as the money lenders for therural population reside in towns or are themselves principally big landlords or kira'l2a merchants who have ,taken to money lending as a subsidiary occupation in their villBges. The more advanced branch{s of commercial and nllied activities are naturally centred in towns, especially the larger ones. All these factors explain not only the un-impressive proportion of this class in rural areas but also their especially meagre share of the persons belonging to the particular categories of commerce mentioned above.
78. Districtwise, the number of persons belonging to this class, among every 1,000 of rural popUlation, even at its highest is only 58 in Hyderabad. Even this proportion results largely from the persons who, though living in the villages surrounding Hyderabad City, actual1y cater to the diverse needs of the city. In no other district of the state does this livelihood class account for more than one twentieth of the rural population. The corresponding proportion, among the other districts, ranges between 80 and
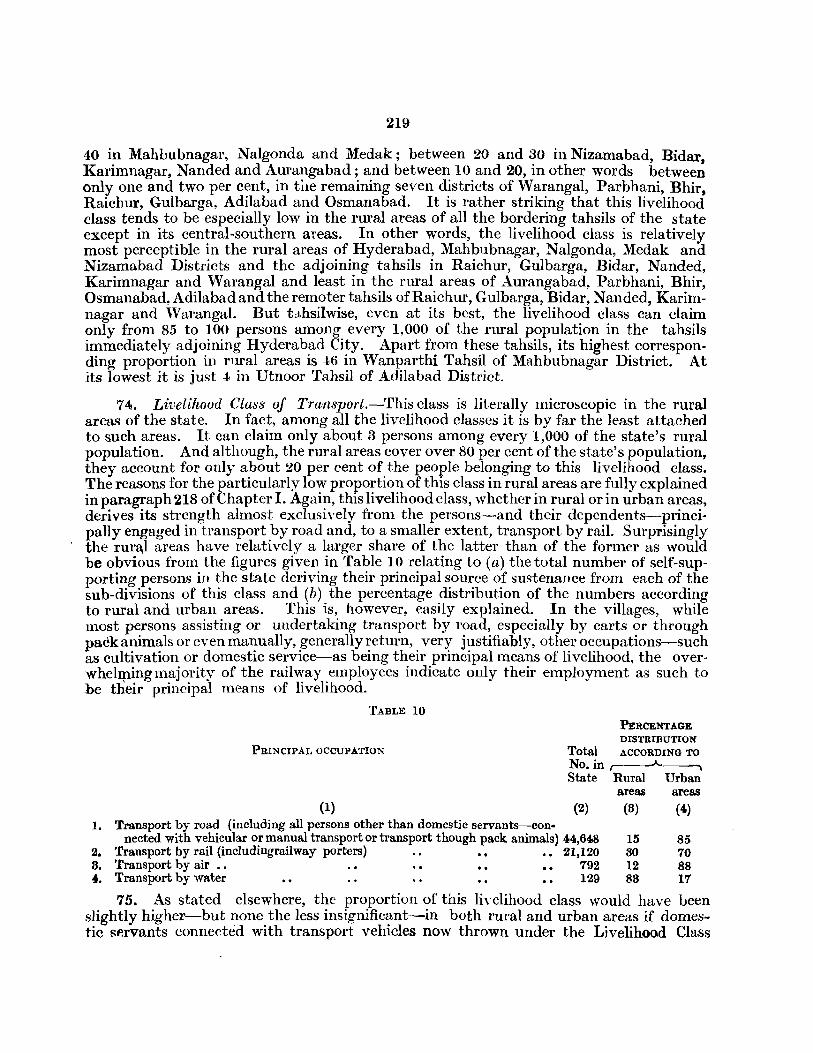
219
40 in Mahbubnagar, N algonda and Medak; between 20 and 30 in Nizamabad, Bidar Karimnagar, Nanded and Aurangabad; and between 10 and 20, in other words betwee~ only one and two per cent, in the remaining seven districts of Warangal, Parbhani, Bhir, Raichur, Gulbarga, Adilabad and Osmanabad. It is rather striking that this livelihood class tends to be especially low in the rural areas of all the bordering tahsils of the state except in its central-southern areas. In other words, the livelihood class is relatively most perceptible in the rural areas of Hyderabad, Mahbubnagar, Nalgonda, Medak and Nizamabad Districts and the adjoining tahsils in Raichur, Gulbarga, Bidar, Nanded, Karimnagar and 'Varangal and least in the rural areas of Aurangabad, Parbhani, Bhir, Osmanabad, Adilabad and the remoter tahsils of Raichur, Gulbarga, Bidar, N anded, Karimnagar and ·Warangal. But t::thsilwise, cven at its best, the livelihood class can claim only from 85 to 100 persons among every 1,000 of the rural population in the tahsils immediately adjoining Hyderabad City. Apart from these tahsils, its highest corresponding proportion in rural areas is 4;6 in Wanparthi Tahsil of Mahbubnagar District. At its lowest it is just 4< in Utnoor Tahsil of Adilabad District.
74. Livelihood Class of Tran8port.-This class is literally microscopic in the rural areas of the state. In fact, among all the livelihood classes it is by far the least attached to such areas. It can claim only about 3 persons among every 1,000 of the state's rural population. And although, the rural areas cover over 80 per cent of the state's population, they account for only about 20 per cent of the people belonging to this livelihood class. The reasons for the particularly low proportion of this class in rural areas are fully explained in paragraph 218 of Chapter 1. Again, this livelihood class, whether in rural or in urban areas, derives its strength almost exclusively from the persons-and their dependents-principally engaged in transport by road and, to a smaller extent, transport by rail. Surprisingly the rura,l areas have relatively a larger share of the latter than of the former as would be obvious from the figures given in Table 10 relating to (a) the total number of self-supporting persons in the state deriving their principal source of sustenance from each of the sub-divisions of this class and (b) the percentage distribution of the numbers according to rural and urban areas. This is, however, easily explained. In the villages, while most persons assisting or undertaking transport by road, especially by carts or through pack animals or even manually, generally return, very justifiably, other occupations-such as cultivation or domestic service-as being their principal means of livelihood, the overwhelming majority of the railway employees indicate only their employment as such to be their principal means of livelihood.
TABLE 10
PRINCIPAL OCCUPA.TION
(1)
PERCENTA.GE DISTRIBUTION
Total ACCORDING TO No. in I .A.~ State Rural Urban
areas areas (2) (8) (4)
1. Transport by road (including all persons other than domestic servants-con-nected with vehicular or manual transport or transport though pack animals) 44,648 15 85
2. Transport by rail (includingrailway porters) 21,120 80 70 8. Transport by air •• 792 12 88 j. Transport by water 129 88 17
75. As stated elsewhere, the proportion of this liyelihood class would have been slightly higher-but none the less insignificant-in both rural and urban areas if domestic gp.rvants connected with transport vehicles now thrown under the Livelihood Class
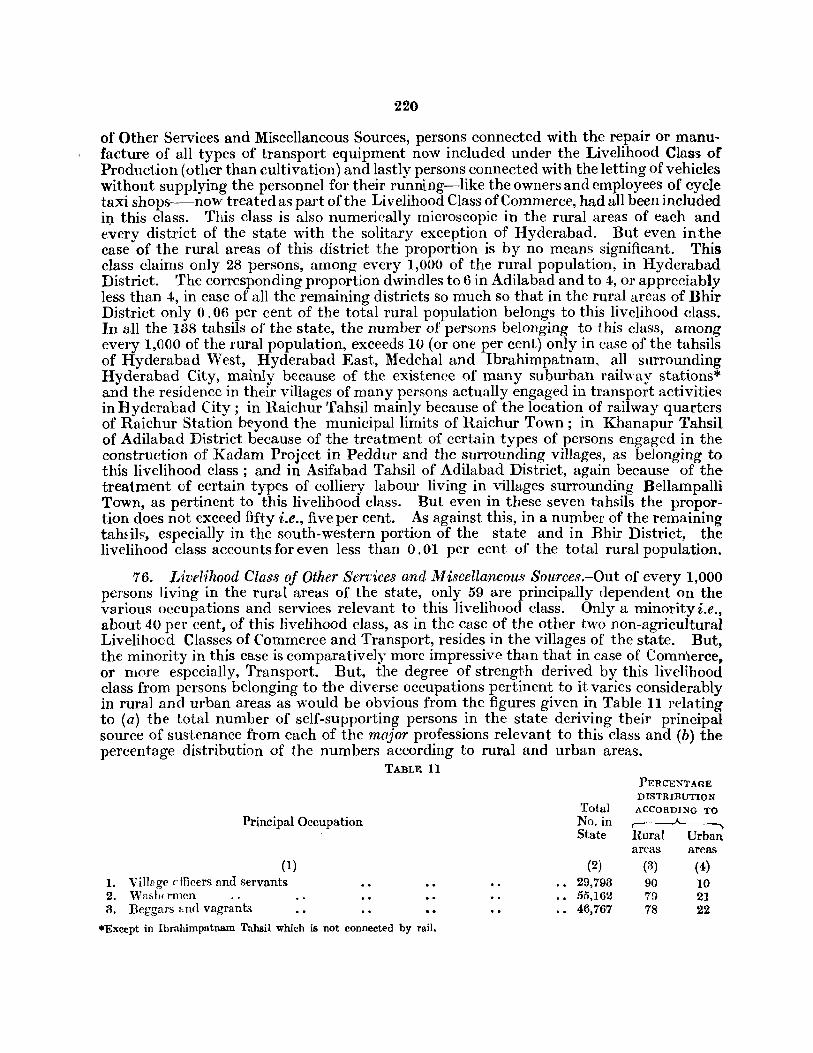
220
of Other Services and Miscellaneous Sources, persons connected with the repair or manufacture of all types of transport equipment now included under the Livelihood Class of Productioll (other than cultivation) and lastly persons connected with the letting of vehicles without supplying the personnel for their running-like the owners and employees of cycle taxi shops-now treated as part of the Livelihood Class of Commerce, had all been included iJ). this class. This class is also numerically microscopic in the rural areas of each and every district of the state with the solitary exception of Hyderabad. But even inthe case of the rural areas of this district the proportion is by no means significant. This class claims only 28 persons, among every 1,000 of the rural population, in Hyderabad District. The corresponding proportion dwindles to 6 in Adilabad and to 4, or appreciably less than c't, in case of all the remaining districts so much so that in the rural areas of Bhir District only 0.06 per cent of the total rural population belongs to this livelihood class. In all the 138 tahsils of the state, the number of persons belonging to this class, among every 1,000 of the rural popUlation, exceeds 10 (or one per cent) only in case of the tahsils of Hyderabad West, Hyderabad East, Medchal and Ibrahimpatnam, all surrounding Hyderabad City, mainly because of the existence of many suburban railway stations* and the residence in their villages of many persons actually engaged in transport activitie'l inHyderabad City; in Raichur Tahsil mainly because of the location of railway quarters of Raichur Station beyond the municipal limits of Raichur Town; in Khanapur Tahsil of Adilabad District because of the treatment of certain types of persons engaged in the construction of Radam Project in Peddur and the surrounding villages, as belonging to this livelihood class; and in Asifabad Tahsil of Adilabad District, again because of the treatment of certain types of colliery labour living in villages surrounding Bellampalli Town, as pertinent to this livelihood class. But even in these seven tahsils the proportion does not exceed fifty i.e., five per cent. As against this, in a number of the remaining tahEib" especially in the south-western portion of the state and in Bhir District, the livelihood class accounts for even less than 0.01 per cent of the total rural population.
76. Livelihood Class of Other Ser'Cices and Miscellaneous Sources.-Out of every 1,000 persons living in the rural areas of the state, only 59 are principally dependent on the various occupations and services relevant to this livelihood class. Only a minority i.e., about 40 per cent, of this livelihood class, as in the case of the other two non-agricultural Livelihood Classes of Commerce and Transport, resides in the villages of the state. But, the minority in this case is comparatively more impressive than that in case of Commerce,. or lllore especially, Transport. But. the degree of strength derived by this livelihood class from persons belonging to the diverse occupations pertinent to it varies considerably in rural and urban areas as would be obvious from the figures given in Table 11 relating to (a) the total number of self-supporting persons in the state deriving their principal source of sustenance from each of the major professions relevant to this class and (b) the percentage distribution of the numbers according to rural and urban areas.
TABLE 11 PF.RCENTAGE
DISTRIBUTION Total ACCORDDiG TO
Principal Occupation No. in r-~ State Rural Urban
areas areas (1) (2) (3) (4)
1. Village rmcers and servants 29,793 90 10 2. Wa&hcrmen 55,162 79 21 3. Beggars :mcl vagrants 46,767 78 22.
*Except in Ibrahimp[\tnam Tahsil Which is not connected by rail.
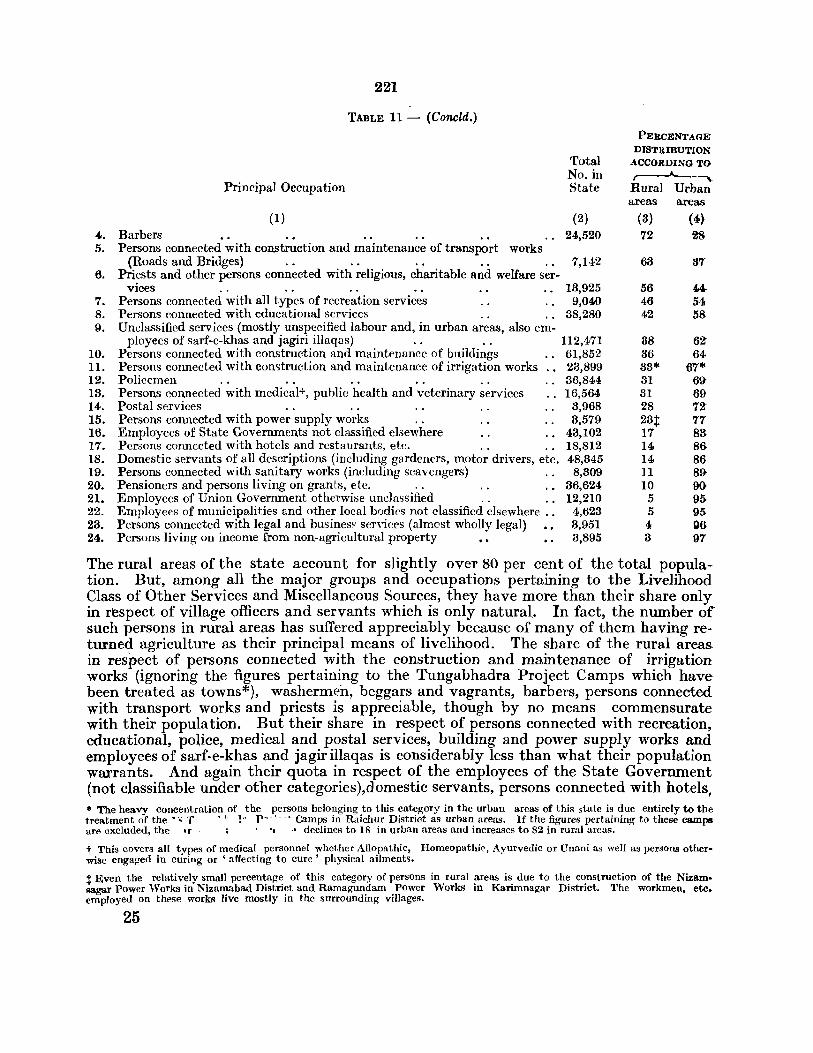
221
TABLE 11 - (Concld.)
Principal Occupation
(I)
Total No. in State
(2) 4. Barbers 24,520 5. Persons connected with construction and maiutenance of transport works
(Roads and Bridges) 7,142 6. Priests and other persons connected with religious, charitable and welfare ser-
vices 18,925 7. Persons connected with all types of recreation services 9,040 8. Persons connected with educational services 38,280 9. Unclassified services (mostly unspecified labour and, in urban areas, also em-
ployees of sarf-e-khas and jagiri illaqas) 112,471 10. Persons connected with construction and maintenance of buildings 61,852 II. Persons connected with construction and maintenance of irrigation works 23,899 12. Policemen 36,844 13. Persons connected with medicalt, public health and veterinary services 16,564 14. Postal services 3,968 15. Persons connected with power supply works 3,579 16. Employees of State Governments not classified elsewhere 43,102 17. Persons connected with hotels and restaurants, etc. 18,812 18. Domestic servants of all descriptions (including gardeners, motor drivers, etc. 48,345 19. Persons connected with sanitary works (including scavengers) 8,309 20. Pensioners and persons living on grants, etc. 36,624 21. Employees of Union Government otherwise unclassified 12,210 22, Employees of municipalities and other local bodies not classified elsewhere , . 4,623 23. Persons connected with legal and businesf' sen'ices (almost wholly legal) 3,951 24. Persons living on income from non-agricultural property 3,895
PERCENTAOE DISTRIBUTION
ACCORDING TO
,-----A----"'""", Rural Urban areas areas
(3) (4) 72 2S
63 37
56 4(-46 54 42 58-
38 62-36 64 33* 67* :31 69 31 69-28 72-23t 77 17 83-14 86 14 86 11 89-10 O()
5 95 5 95 4 g6 3 97
The rural areas of the state account for slightly over 80 per cent of the total population. But, among all the major groups and occupations pertaining to the Livelihood Class of Other Services and Miscellaneous Sources, they have more than their share only in respect of village officers and servants which is only natural.. In fact, the number of such persons in rural areas has suiTered appreciably because of many of them having returned agriculture as their principal means of livelihood. The share of the rural areas. in respect of persons connected with the construction and maintenance of irrigation works (ignoring the figures pertaining to the Tungabhadra Project Camps which have been treated as towns*), washermen, beggars and vagrants, barbers, persons connected with transport works and priests is appreciable, though by no means commensurate with their po pula tiona But their share in respect of persons connected with recreation, educational, police, medical and postal services, building and power supply works and employees of sarf-e-khas and jagir illaqas is considerably less than what their population warrants. And again their quota in respect of the employees of the State Government (not classifiable under other categories),domestic servants, persons connected with hotels, * The heavy concentration of the persons belonging to this category in the urball areas of this state is due entirely to the treatment of the ... T . ,_ !.. p- _' - -. Camps in Raichur District as urban Ilreas. If the figures pertaining to these camps are excluded, the II' • " " declines to 18 ill urban areas and increases to 82 in rural areas.
t This covers all types of medical pcrsonnel whcthcr Allopathic, Homeopathie, Ayurvedic or Unani as well as persoIl8 otherwise engaged in curing or ' affecting to cure' physical ailments.
~ Even the relatively small percentage of this category of persons in rural areas is due to the construction of the Nizamsagar Power Works in Nizamabad District and Ramagundam Power Works in Karimnagar District. The workmen, etc. employed on these works live mostly in the surrounding villages.
25
and restaurants and sanitary works and services (including scavengers), persons living m~lnJy ()I\ pensions and grants and, more particularly, employees of municipal and local bodies and Union Government (not classifiable under other categories) and persons connected with legal and business services or living on non-agricultural property is extremely paltry. The numbers belonging to quite a few of these categories-especially of domestic servants, priests, washermen, barbers and scavengers-would have been appreciably larger in rural areas but for the fact that many persons working in similar capacities in the villages oj the state have returned agriculture as their principal means of livelihood. It may be re-called that the classification of the population, in terms of the various livelihood classes, was based only on the principal means of livelihood returned by the people-their secondary or subsidiary occupations having been ignored entirely for the purpose. In spite of this, there is no gainsaying the fact that the rural areas of the state are basically very poor in respect of most of these professions pertinent to this class-irrespective of whether they are followed as a principal or subsidiary occupation.
77. The proportion of this livelihood class to the total rural population is not conspi. -CllOUS in any district of the state. In fact, it is even insignificant in quite a few of them. At its highest, the class claims llS persons, among every 1,000 of the rural population, in Hyder~bad District. But even this proportion, which is by no means impressive, is exclusively due to the large number of persons who reside in the mofussil areas surrounding Hyderabad City but are actually employed in the city itself or its suburban towns in Occup&tions relevant to this cla&s. The ruml areas of this district have considerably more than their share of the total number of persons living in the villages of the ~ta,te and deriving their principal means of livelihood from pensions and fr-om occupations connected with the construction of buildings and roads and bridges; educational, medical, pqlice, domestic, hairdressing, lallndry, recreation and religious services; and employment in government services (not classifiable under other categories), tlw former sa,rf-e-kh&s and jagir illaqas and hotels and restaurants. The proportion of the livelihood class declines appreciably in case of the rural areas of the remaining districts of the state. The class can claim only 84 persons, out of every 1,000 of the rural population, in Karimnagar, 73 in Adilabad, from 60 to 70 in N anded, Parbhani, Nizamabad and Warangal, from 50 to 60 in Mahbubnagar, Rhir, Aurangabad and Nalgonda, from 40 to 50 in lHedak, Osmanabad, Ra,iohur and Bidar, and, lastly, only 34 in Gulbarga. As a rule, this livelihood class derives proportion~ ately greater strength in the rural areas of the eastern districts from the self-supp0rting: persons principally engaged in thc construction of roads, bridges and irrigation works and in medic~J, educational and laundry services and in those of the western 'districts from persons engaged in domestic and religious services. Further peculiarities within these districts other than Hyderabad, include a high proportion of persons principally employed in the construction of buildings in the rural areas of Mahbubnagar, Warangal and Nalgonda; in police service in those of Warangal and Nalgonda; in unclassified government service in the rural areas of Aurangabad; in unspecified labour, popularly referred to as chillar rnazduri in those of Parbhani and Nanded; in hair dressing, i.e., as bal'bers, and in recreation ser-vioes in the rural areas of Karimnagar; of beggaFs and vagrants in the rural areas of Nanded, Nizamabad, Medak and Karimnagar Districts; and in hotels a,nd restaurants in those of Raichur and, to a smaller extent, Gulbarga. The proportion of pensioners is particularly high in the rural areas of Medak District. And again, among the western districts themselves, the proportion of persons chiefly or solely employed in irrigation works in the rural areas of Bhir*, in domestic services in the rural .l'pi~ !s only a temp_orary phase due to th~ con8t~u~ion of the ~endsura Project in case. of Bhir. The corresponding p1"oportlOn is not heav:-, In the rural areas of Ratehur DistrICt because Its large Tungabhadra Pr;)Ject Camps have been treated ~ urban areas. '
25·

areas Of both Aurangabad and Bhir; and in religious and unclassified goverbfiH~ht sei'vices in those of Aurangabad is fairly heavy. Similarly, among the eastern districts themselves, the proportion of persons principally engaged in irrigation works in the rural areas of Adilabdd* and as washermen in those of Karimnagar; Warangal and Nalgonda is unusually heavy.
Summari/.-The overwhelming majority of the state's rural population is primarily agrimiltural. Out of every 1,000 persons living in its vilIage~ as many as 798 belong to Agricultural Classes. But within the state itself, the corresponding proportion is distinctly heavier in the villages of the western than iii fhose of the eastern districts. Among agricultural classes themselves, or among aU classes whether agricultufal or nonagricultural, the Livelihood Class of Owner Cultivators is by far the most humerous in the rural areas of the state as well as of each of its districts. As many as 487 persons among every 1,000 of the rural population of the state belong to this class. Within the state itself, the correspohding proportion is. however, markedly heavier in the western districts and in Medak and Nizamabad than in the remaining eastern districts. Again, while the proportion of the class is especially heavy in the south-western portions of the state ih Raichurand Gulbarga Districts and the extreme western portions of Bhir and O,manabad Districts, it is ~pecially low in the extreme eastern areas of the state along the Godavari and in the areas surrounding Hyderabad City. The Livelihood Class of Tenant Cultivators accounts for only 85 persons among every 1,000 of the state's rural population. Thus, this class is considerably less numerous than the major classes of the persons principally dependent on production, or on agricultural labour or, more especially, owner cultivation. Districtswise, at its highest, the class accounts for about 18 per cent of the rural popUlation in Hyderabad-being therein even more numerous than the Livelihood Class of Agricultural Labourel'S--'and at its lowest less than 4 per cent in Nizamabad. But the variation in its proportion, from district to district, is not in accordance with any settled pattern. It is, however, proportionately most numerous in three zones of the state, the first of which consists of the backward, remote, hilly and forest tahsils in Adilabad, Karimnagar, Warangal and, to a smaller extent, Nanded and Parbhani Districts; the second of the south-central tahsils of the state, surrounding Hyderabad City in Hyderabad, Mahbubnagar, Nalgonda and Medak Districts; and the third of the central and northern tahsils of Gulbarga District and the adjoining tahsils of Bidar District. The Livelihood Class of Agricultural Labourers accounts for almost onefifth of the total rural population of the state. It is thus second only in numbers to that of Own8r Cultivators in its rural areas. This is also true in case of the rural areas of all the districts except Hyderabad, Nizamabad and Karimnagar-in the first of these three districts the Livelihood Classes of Owner and Tenant Cultivation and Production, and in the remaining two only the Livelihood ClaSses of Owner Cultivation and Production being more liumerous. Within the state itself, the proportion of this class is comparatively heavy in the north-western districts of Parbhani, Osmanabad, Bidar, Nanded, Aurangabad and Bhir and in Adilabad ; and very low in the south-western dhtricts of Gulbarga and Raichur and in the central districts of Nizamabad and Medak in the eastern half of the state. The Livelihood Class of Agricultural ReI,lt Receivers ~s numerically insignificant in the rural areas of the state and ~ll its districts excep~ Gulbarga. It accounts for Just 26 persons out of every 1,000 of the state's rural populatIOn. Its correspondmg proportion in Gulbarga District is 63 which can by no means be deemed to be appreciable. Within the state itself, the prop0:J'tion of the class is heavier in the western than in the eastern districts, being comparatively most marke'd in the rural areas of Gulbarga and the adjoining districts of Osmanabad, Raichur and Bidar. The reasons for the variation in the proportion of all agricultu:-al dasses or of each of the agricultural livelihood classes among the rural population, from area to area, as described above is more or less identical with those governing the corresponding variation among the total population which has been summarised in Section VI uf the preceding Chapter. This is but natural considering the fact that of the total number of persOns in. the state belonging to all agricultural classes and to each of the classes of Owner Cultivators, Thi\ant Cultivators, Agricultural Labourers and Agricultural Rent Receivers, over 95, 96, 93, 94 and 88 pel' cent respectively reside in rural areas.
The Livelihood Class of Production (other than cultivation) is the only non-agricultural class iIi the state which derives a majority of its numbers--about 70 per cent-from the villages. This elMS accounts for 116 out of every 1,000 of the state's rural population and is thus one of the more numerous of the livelihood classes in rural areas. In spite of this, it is heavily out-numbered in those areas by the Livelihood Classes of Agricultural Labourers and, more especially, Owner Cultivators. Its proportion, however, would have been appreciably more significant but for the fact that many village artisans happen to be primarily agriculturists. This class derives its numbers in the villages largely from persons principally employed in stock raising, toddy drawing, tanning and making of leather products (including footwear and articles required for agricultural operations), rope making, woollen and cotton spinning and weaving making of earthen-ware, fishing, carpentry, making of baskets and mats, stone quarrying,
*This is only a temporary phase due to the construction of the Kadam project in Adilabad District.
224
plantation industries (i.e., growing of fruits, flowers, etc.,) or as gold and silversmiths, blacksmiths and brasssmiths. As against this, the numbers derived by it in villages from persons similarly engaged in unclassified food industries (like slaughtering of animals and making of sweetmeats), tailoring or making of vegetable oil and dairy products, tobacco industries, milling and, more especially, coal mining and making or repairing of transport equipment (mostly relating to railways, motor vehicles and cycles) is hardly impressive. Similarly, the class derives little strength in rural areas from persons engaged in large scale industries or the modern types of artisan trades. Within the state itself, its proportion tends to be distinctly more numerous in the eastern than in the western districts, being particularly conspicuous in the rural areas of Karimnagar District wherein it claims more than a quarter of the population. As a rule, the villages of the western districts are poor in all the major occupations pertinent to this class in the state, the only exception, to an extent, being those connected with vegetable oil and dairy products and grains and pulses (including their milling). The rural areas of Karimnagar District and the adjoining portions of Warangal, Nalgonda, Medak, Nizamabad and Adilabad Districts constitute the richest zone of the state in respect of village industries, artisan trades and toddy drawing. The rural areas around Hyderabad City and the so uth-western portions of Mahbubnagar District arc also particularly well off in this respect. A~ against this, the rural areas in the western portions of Raichur and the south-western portion of Gulbarga District are by far the poorest in the state with regard to all the occupations relevant to this class.
The Livelihood Class of Commerce is numerically the second least significant of all the classes in rural areas, claiming just 24 persons out of every 1,000 of the rural population. Only a minority of the class in the state, namely 38 per cent, lives in villages. Again, the class derives its numbers in rural areas mainly from retail traders in foodstuffs, beverages and textile and leather goods and general storekeepers. Its share in respect of wholesale traders, persons principally engaged in banking and money lending and real estate and insurance and retail traders in fuel and petrol is very meagre. Life in the rural areas is much more self-sufficient than in the urban. Again, in the villages the producers-cum-sellers generally themselves function as retail traders. Besides, the average villager often goes to nearby towns or awaits the weekly bazar for his marketing. The wholesalers and their agents operate from towns by periodical visits, or through local intermediaries who are in many cases, pr'incipally cultivators or retail traders. Many of the persons functioning as money lenders for the rural population reside in towns or arc also principally big landlords or Tdrana merchants in the villages. Again the more advanced commercial activities are naturally centered only in towns. The ~lass cannot be deemed to be significant in numbers in the rural areas of any district, 0» tahsil, within the state. At its highest, it accounts for less than six per cent of the rural population in Hyderabad District as a whole and from about eight to ten per cent in the tahsils immediately surrounding Hyderabad City. As against this, in Utnoor Tahsil of Adilabad, the least commercial of all the tahsils in the state, only 0,4 per cent of the population belong to this class.
The Livelihood Class of Transport is by far the least numerous of all classes in rural areas. In fact, it is literally microscopic in the rural areas of the state as well as of all its districts and practically all its tahsils. It accounts for just 3 persons among every 1,000 of the state's rural population. Only about 20 per cent of this class in the state is returned from its rural areas. The class derives almost all its numbers, whether in rural or urban areas, from persons principally engaged in transport by road and rail. But surprisingly, the rural areas have relatively a larger share of the latter than of the former. This is due to the fact that in these areas while most persons assisting or undertaking transport by road return, very justifiably, .other occupations as being their principal means of livelihood, those employed in the railways generally indicate only their employment as, such as their major or only source of sustenance. The proportion of this class in the rural areas would have been slightly higher if domestic, servants connected with vehicles, persons connected with the repair or manufacture of transport equipment. or the letting of vehicles without supplying the personnel for their running, had all been included under this class instead of other dasses. The number of persons belonging to this class among every 1,000 of the rural population is higher than 10 (i.e., one per cent), districtwise, only in Hyderabad and, tahsilwise, only in 7 tahsils of the state, the majority of which are located around Hyderabad City. But eyen in their cases the proportion does not exceed 50 (i.e., 5 per cent). As against this, the corresponding proportion is appreciably lower than 10 in all the other districts and tahsils, being lower than even 1 (i.e., 0.1 per cent) in Bhir District and a number of tahsils in the state.
The Livelihood Class of Other Services and Miscellaneous Sources is one of the minor classes in the rural ~reas of the state as it accounts for only 51) persons among every 1,000 of their population. Orily about 40 per cent of this class in the entire state is returned from rural areas. In terms of the principal occupations def'lared by self-supporting persons, the rural areas of the state have more than their due share on Iv in respect of the total number of village officials in the state. Their quota of washermen, beggars, barbers,
225
priests and persons engaged in transport and irrigation works is also fairly appreciable though not commensurate with their population. But their share of the persons belonging to all the other occupations pertinent to this class is very meagre. The position in this respect is not likely to alter materially even if due allowances are made for thc largc number of persons who takc to such occupations as a subsidiary means of livelihood. This class is not also conspicuous numerically in the rural areas of any district of the state. In fact, it is even insignificant in quite a few of them. In the rural areas of Hyderabad District, the class accounts for slightly more than one tenth of the population, deriving its strength to an appreciable extcnt from persons who are actually employed in Hyderabad City and its suburbs in the various occupations relevant to the class. In the rural areas of the other districts, the class can claim only from 3 to 8 per cent of the population. As a rule, it derives proportionately larger numbers in the rural areas of the eastern districts from persons principally engaged in the construction of roads and bridges and irrigation works and in laundry, educational and medical services, and in those of the western districts from persons "imilarly engaged in religious and domestic services. There are, of course, further peculiarities, from district to district, the more important of which appear to be a high share of persons engaged in building construction in the villages of Mahbubnagar, Warangal and NaIgonda, in police service in those of Warangal and Nalgonda, in hoteh. and restaurants in those of Raichur and Gulbarga and of pensioners in those of Medak and of barbers an.d washel'men in those of Karimnagar.
26

26*

CHAPTER III
,Urban Population

SECTION I
DISTRIBUTION AND GROWTH OF URBAN POPULATION
(The tables relevant to this Section are Main Tables 'A-I-Area, Houses and PopUlation' and 'A-IV-To'llms Cla8sijied by Population with Variations since 1901' given at pages 1 and 23 respectively of Part Ii::"'A of this Volume; and Subsidiary Tables <S.l-Distribution of PopUlation between Towns', '3.2-Variation and Density of Urban Population', '3.4-Towns Classified by Population'. '3.5- Cities-Chief Figures' and '3. 8-Distribution of Immigrants from outside the District in Urban Areas according to Place of Birth and Livelihood Classes' given atpages 66, 67, 69, 69 and 72 respectively of Part I-B of this Volume.)
Di8tinction between Urban and Rural Areas.-The demarcation of the urban from the rural areas has always been a problem to census authorities. The precise stage at which the large village is transformed into a town, or as sometimes happens, the sman town recedes into a village is rather vague and almost always a matter of some controversy. Hutton in his 1981 All India Census Report has remarked that" the distinction between a small town and a large village as far as the conditions of life or occupation of its inhabitants is concerned is often meaningless, and the treatment of any place as urban rather than rural does not necessarily imply any degree of industrialisation and only the minimum degree of a corporate life distinct from that of the ordinary village." And from this point of view, the distinction between the small town and the large village becomes yet more difficult (if not meaningless) in this state, where llfunicipal Administration, on line8 familiar in most other parts of India, was a thing almost unknown until very recently. Yet another disadvantage in this regard is the fact that the procedure prescribed for the separation of the rural from the urban areas not only differed from census to census but the actual separation was also not in conformity with the procedure specified. But a11 this, however, does not mean that the data pertaining to urban areas compiled from census to census is not comparable. After all, the errors in respect of the inclusion or exclusion of any place as a town relate only to comparatively small population units. *
2. Proportion of Urban Population.-Of the total population of 18,655,108 of the stat~, 8,476,159 live in towns and cities. In other words, out of every 1,000 persons in this state, 186 reside in urban areas. Thus, the urban population of this state cannot, as yet, be deemed to be proportionately considerable. And this is more or lcss true of the cOllntry as a whole wherein the corresponding proportion of persons is 178. Among the bigger of the states in the country, the proportion varies from 41 in Orissa to 887 in Saurashtra. Among the neighbouring states themselves, the proportion is appreciably lower in Madhya Pradesh, slightly higher in l\Iadras and markedly higher in Bombaythe actual proportion in these three states being 185, 196 and 811 respectively.
8. It would be interesting to note that the proportion of urban popUlation in this state as well as in the country as a whole is considerably lower than in many countries
* At the 1951 Census, all Municipalities and Cantonments and areas declared by Government as falling under Town Committees were treated as urban irrespective of the size and composition of their popUlation. But an attempt was made for the first time in the census history of this state to differentiate between their limits and those of the revenue villages over which they were spread out. Thus, in respect of all revenue villages, which fell partly within and partly beyond the limits of such local bodies, the hamlets or groups of habitations lying outside the limits of the local bodies were treated as urban only if they were adjacent to the Municipal or Cantonment or Town Committee limits, as the case may be, and in the opinion of the district authorities the composition of their population merited such treatment. In addition to these Municipalities, Cantonments and Town Committees and the groups of habitations lying within the limits of the same revenue villages- selected as indicated above-certain other places, deemed to be locally important by the district authorities from the points of view of commerce or industries or as centres of administration, were also treated as urban units.
229
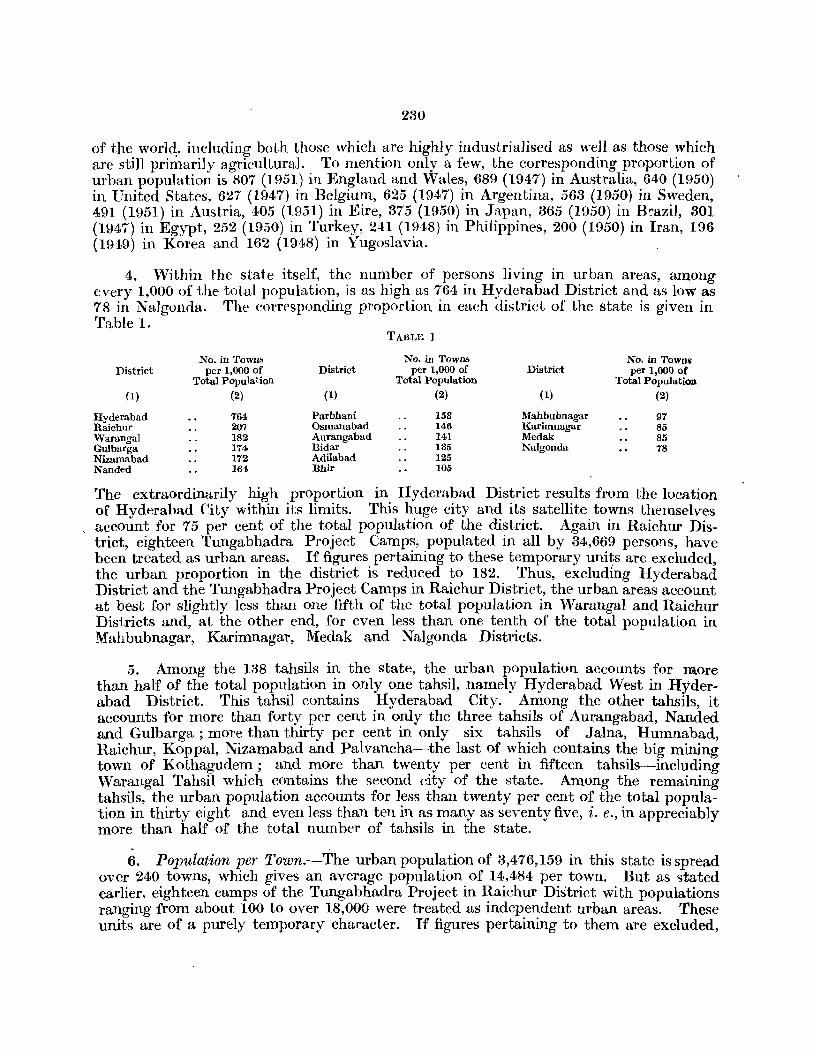
230
of the worl<l:, including both those which are highly industrialised as well as those which are still primarily agricultural. To mention only a few, the corresponding proportion of urban population is 807 (1951) in England and Wales, 689 (1947) in Australia, 640 (1950) in United States, 627 (1947) in Belgium, 625 (1947) in Argentina, 563 (1950) in Sweden, 491 (1951) in Austria, 405 (1951) in Eire, 375 (1950) in Japan, 365 (1950) in Brazil, 301 (1947) in Egypt, 252 (1950) in Turkey, 241 (1948) in Philippines, 200 (1950) in Iran, 196 (1949) in Korea and 162 (1948) in Yugoslavia.
4. Within the state itself, the number of persons living in urban areas, among every 1,000 of the total population, is as high as 764 in Hyderabad District and as low as 78 in Nalgonda. The corresponding proportion in each district of the state is given in Table 1.
TABLE 1
No. in Towns No. in Towns No. in Towni District per 1,000 of District per 1,000 of District per 1,000 of
Total Population Total Population Total Population
(1) (2) (1) (2) (1) (2)
Hyderabad 764 Parbhani 153 Mahbubnagar 97 Raichur 207 Osmanabad 146 Karimnagar 85 Warangal 182 Aurangabad 141 Medak 85 Gulbarga 174 Bidar 135 Nalgonda 78 Nizamabad 172 Adilabad 125 Nanded 164 Bhir 105
The extraordinarily high proportion in Hyderabad District results from the location of Hyderabad City within its limits. This huge city and its satellite towns themselves account for 75 per cent of the total popUlation of the district. Again in Raichur District, eighteen 1'ungabhadra Project Camps, populated in all by 34,669 persons, have been treated as urban areas. If figures pertaining to these temporary uni~s are excluded, the urban proportion in the district is reduced to 182. Thus, excluding Hyderabad District and the Tungabhadra Project Camps in Raichur District, the urban areas account at best for slightly less than one fifth of the total population in Warangal and Raichur Districts and, at the other end, for even less than one tenth of the total population in Mahbubnagar, Karimnagar, Medak and Nalgonda Districts.
5. Among the 138 tahsils in the state, the urban population accounts for more than half of the total popUlation in only one tahsil, namely Hyderabad West in Hyderabad District. This tahsil contains Hyderabad City. Among the other tahsils, it accounts for more than forty per cent in only the three tahsils of Aurangabad, Nanded and Gulbarga ; more than thirty per cent in only six tahsils of Jalna, Humnabad, Raichur, Koppal, Nizamabad and Palvancha-the last of which contains the big mining town of Kothagudem; and more than twenty per cent in fifteen tahsils-including Warangal Tahsil which contains the second city of the state. Among the remaining tahsils, the urban popUlation accounts for less than twenty per cent of the total population in thirty eight and even less than ten in as many as seventy five, i. e., in appreciably more than half of the total number of tahsils in the state.
-6. Population per Town.-The urban population of 3,476,159 in this state is spread
over 240 towns, which gives an average population of 14,484 per town. Hut as stated earlier, eighteen camps of the Tungabhadra Project in Raichur District with populations ranging from about 100 to over 18,000 were treated as independent urban areas. These units are of a purely temporary character. If figures pertaining to them are excluded,
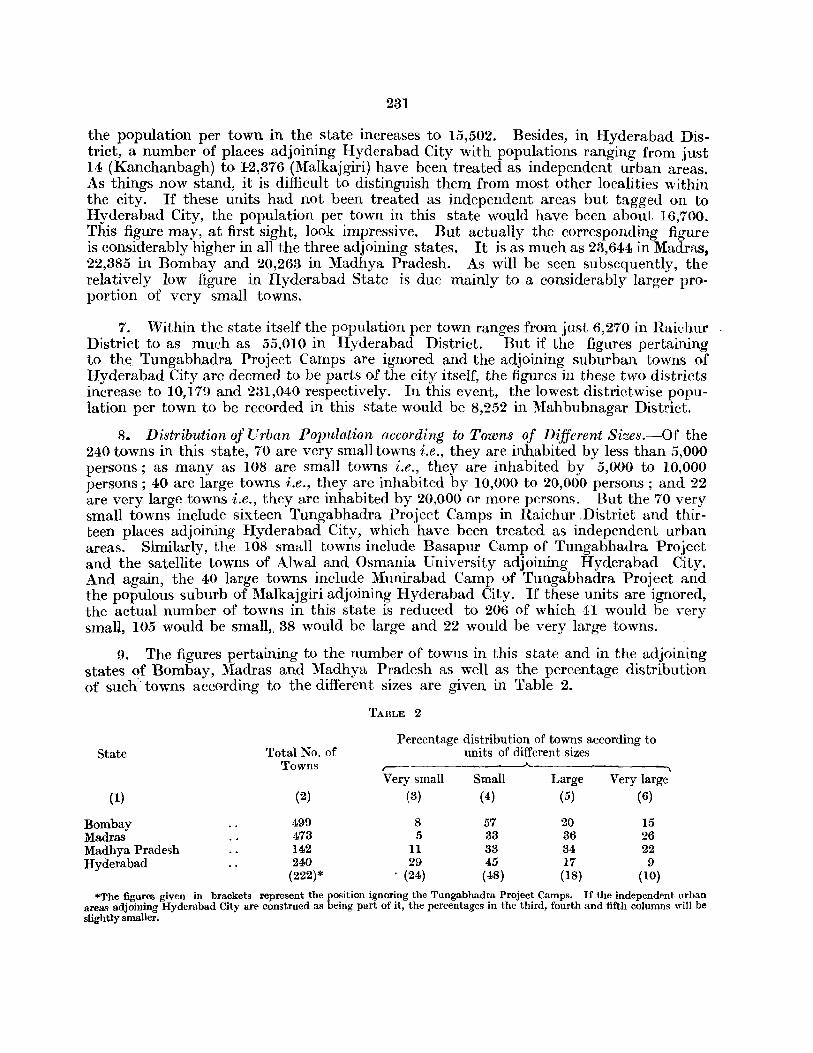
231
the population per town in the state increases to 15,502. Besides, in Hyderabad District, a number of places adjoining Hyderabad City with populations ranging from just 14 (Kancha.nbagh) to 12,376 (Malkajgiri) have been treated as independent urban areas. As things now stand, it is difficult to distinguish them from most other localities within the city. If these units had not been treated as independent areas but tagged on to Hyderabad City, the population per town in this state would have been about 16,700. This figure may, at first sight, look impressive. But actually the corresponding figure is considerably higher in all the three adjoining states. It is as much as 23,644 in Madras, 22,385 in Bombay and 20,263 in Madhya Pradesh. As will be seen subsequently, the relatively low figure in Hyderabad State is due mainly to a considerably larger proportion of very small towns.
7. \Vithin the state itself the population per town ranges from just 6,270 in Raichur District to as much as 55,010 in Hyderabad District. But if the figures pertaining to the Tungabhadra Project Camps are ignored and the adjoining suburban towns of Hyderabad City are deemed to be parts of the city itself, the figures in these two districts increase to 10,179 and 231,040 respectively. In this event, the lowest districtwise population per town to be recorded in this state would be 8,252 in Mahbubnagar District.
8. Distribution of Urban Population according to Towns of Different Sizes.-Of the 240 towns in this state, 70 are very small towns i.e., they are inhabited by less than 5,000 persons; as many as 108 are small towns i.e., they are inhabited by 5,000 to 10,000 persons; 40 are large towns i.e., they are inhabited by 10,000 to 20,000 persons; and 22 are very large towns i.e., they are inhabited by 20,000 or more persons. But the 70 very small towns include sixteen Tungabhadra Project Camps in Raichur .District and thirteen places adjoining Hyderabad City, which have been treated as independent urban areas. Similarly, the 108 small towns include Basapur Camp of Tungabhadra Project and the satellite towns of Alwal and Osmania University adjoining Hydcrabad City. And again, the 40 large towns include Munirabad Camp of Tungabhadra Project and the populous suburb of l\Ialkajgiri adjoining Hyderabad City. If these units are ignored, the actual number of towns in this state is reduced to 206 of which 41 would be very small, 105 would be small" 38 would be large and 22 would be very large towns.
9. The figures pertaining to the number of towns in this state and in the adjoining states of Bombay, Madras and Madhya Pradesh as well as the percentage distribution of such" towns according to the different sizes are given in Table 2.
TABLE 2
Percentage distribution of towns according to State Total No. of units of different sizes
Towns r---Very small Small Large Very large
(1) (2) (3) (4) (5) (6)
Bombay 499 8 57 20 15 Madras 473 5 33 36 26 Madhya Pradesh 142 11 33 34 22 Hyderabad 240 29 45 17 9
(222)* . (24) (48) (18) (10)
"'The figures given in brackets represent the position ignoring the Tungabhadra Project Camps. If the independent urban areas adjoining Hyderabad City are construed as being part of it, the percentages in the third, fourth and fifth columns will be slightly smaller.
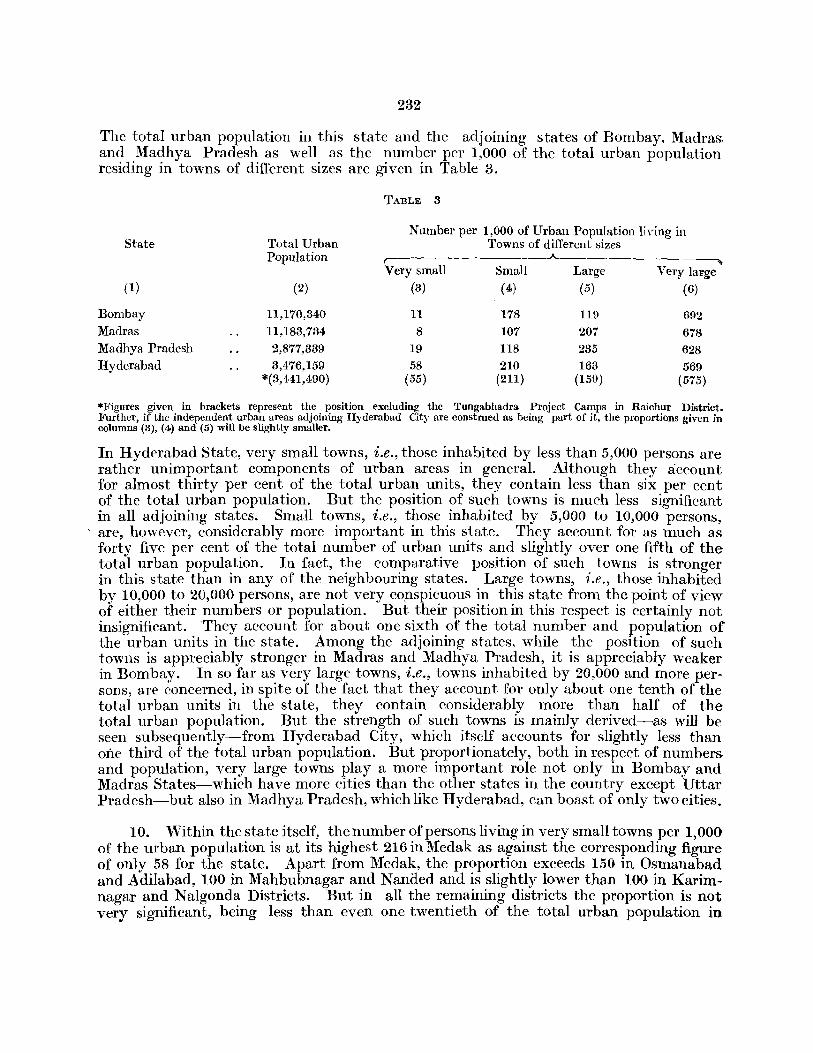
232
The total urban population in this state and the adjoining states of Bombay, Madras and Madhya Pradesh as well as the number per 1,000 of the total urban population residing in towns of different sizes are given in Table 3.
TABLE 3
State Total Urban Number per 1,000 of Urban Population li\Ting in
Towns of different sizes Population ,- .A. __
-~
Very small Small Large Very large (1) (2) (3) (4) (5) (6)
Bombay 11,170,340 11 178 119 692 Madras 11,183,734 8 107 207 678 Madhya Pradesh 2,877,339 19 118 235 628 Hyderabad 3,476,159 58 210 163 569
*(3,441,490) (55) (211) (159) (575)
*Figures given in brackets represent the position excluding thc Tungabhadra Project Camps in Raichur District. Further, if the independent urban areas adjoining Hyderabad City are construed as being part of it, tIle proportions given in columns (3), (4) and (5) will be slightly smaller.
In Hyderabad State, very small towns, i.e., those inhabited by less than 5,000 persons are rather unimportant components of urban areas in general. Although they account for almost thirty per cent of the total urban units, they contain less than six per cent of the total urban population. But the position of such towns is much less significant in all adjoining states. Small towns, i.e., those inhabited by 5,000 to 10,000 persons,
, are, however, considerably more important in this state. They account for as much as forty five per cent of the total number of urban units and slightly over one fifth of the total urban population. In fact, the comparative position of such towns is stronger in this state than in any of the neighbouring states. Large towns, i.e., those inhabited by 10,000 to 20,000 persons, are not very cO,nspicuous in this state from the point of view of either their numbers or population. But their position in this respect is certainly not insignificant. 'They account for about one sixth of the total number and popUlation of the urban units in the state. Among the adjoining states, while the position of such towns is appreciably stronger in Madras and Madhya Pradesh, it is appreciably weaker in Bombay. In so far as very large towns, i.e., towns inhabited by 20,000 and more p.ersons, are concerned, in spite of the fact that they account for only about one tenth of the total urban units in the state, they contain considerably more than half of the total urban population. But the strength of such towns is mainly derived-as will be seen subsequently-from Hyderabad City, which itself accounts for slightly less than oile third of the total urban population. But proportionately, both in respect of numbers and population, very large towns playa more important role not only in Bombay and Madras States--which have more cities than the other states in the country except Uttar Pradesh-but also in Madhya Pradesh, which like Hyderabad, can boast of only two cities.
10. Within the state itself, the number of persons living in very small towns per 1,000 of the urban population is at its highest 216 in Medak as against the corresponding figure of only 58 for the state. Apart from Medak, the proportion exceeds 150 in Osmanabad and Adilabad, 100 in Mahbubnagar and Nanded and is slightly lower than 100 in Karimnagar and Nalgonda Districts. But in all the remaining districts the proportion is not very significant, being less than even one twentieth of the total urban population in

233
Aurangabad, Warangal, Bhir, Raichur* (minus the Tungabhadra Project Camps in it), Nizamabad, Parbhani, Gulbarga, Hyderabad and Bidar Districts. As against this, the number of persons living in small towns, per 1,000 of the total urban population, is at its highest as much as 472 in Mahbubnagar; exceeds 400 in Raicllur and Karimnagar ; ranges between 375 and 400 in Bidar, Osmanabad and Nalgonda; between 325 and 335 in Parbhani and Nanded; between 250 and 300 in Nizamabad, Bhir, Medak and Adilabad; and is 229 in Gulbarga. Among all the remaining districts of the state, the number is lower than the average of 210 for the state, being even lower than 150 in Aurangabad a.nd Warangal and as low as 27 in Hyderabad. It is obvious that in Hyderabad District there is little scope for urban areas, other than Hyderabad City, to develop to any appreciable extent. The number of persons living in large towns, among every 1,000 of the total urban population, varies considerably from district to district within the sfate. As against the average of just 163 for the state, the number is as high as 577 in Adilabad and 503 in Medak. It then drops steeply to 403 in Bidar, 877 in Bhir and to almost 350 in Gulbarga and N algonda. Among the other districts of the state, the corresponding number is 284 in Parbhani and 245 in Raichur (minus the Tungabhadra Project Camps). There is again a sharp fall to 162 in Karimnagar, 146 in Nanded and 127 in Osmanabad. It is even lower than 100 in Warangal, Nizamabad and Aurangabad and is just 11 in Hyderabad for reasons already explained. There is no large town-i.e., any town inhabited by 10,000 to 20,000 persons-in Mahbubnagar. The corresponding number of persons living in very large towns also varies considerably. As against the average of 569 for the state, the number is as high as 940 in Hyderabad District. This is solely because of the location of the metropolis within its confines. It is also as much as 751 in Aurangabad and 734 in Warangal due to Aurangabad and Jalna Towns in the former and Warangal City and Kothagudem T~wn in the latter. Even in Nizamabad District, because of Nizamabad and Bodhan Towns, the number of persons living in very large towns, among ~very 1,000 of the total urban population, is relatively as high as 583. But in all the remaining districts the number is considerably lower than the average for the state. It is 41_7 in Nanded ; ranges between 350 and 400 in Gulbarga, Mahbubnagar and Parbhani ; between 300 and 350 in Karimnagar and Osmanabad ; between 250 and 300 in Bhir and'Raichur (minus the Tungabhadra Project Camps); and is slightly lower than 200.in Bidar and Nalgonda. There is not even a single town of this size, i.e., inhabited by over 2~,000 persons, in both 2'fedak and Adilabad Districts.
Thus, in this respect, the urban population of Adilabad and 1VIedak Districts can be deemed to be primarily composed of persons residing in large towns; and that of Hyderabad, Aurangabad, Warangal and, to a smaller extent, Nizamabad as of those residing in very large towns-in fact, that of Hyderabad District can be termed to be almos.t exclusively composed of city population. The urban population of Parbhani, Nanded, Bidar, Bhir, Osmanabad, l\Iahbubnagar, Raichur, Gulbarga, Karimnagar and Nalgonda Districts is, however,' not concentrated in any particular category of towns.
11. Growth of Urban Population.-Figures pertaining to the urban popUlation of the state and the number in urban areas, per 1,000 of its total population, as recorded at each census since the beginning of this century; and the percentage variations in the total, rural and urban populations of the state for each of the censuses as compared with
* In Raichur District (including the Tungabhadra Pro.iect Camps) the number per 1,000 of the urban population living in very small towns is 79, in small towns 407, in large towns 287 and in very large towns 227. But if figures pertaining to the Tun:gabhadra Project Camps are excluded, the correspondin~ numbers are 40,450,245 and 265 respectively.
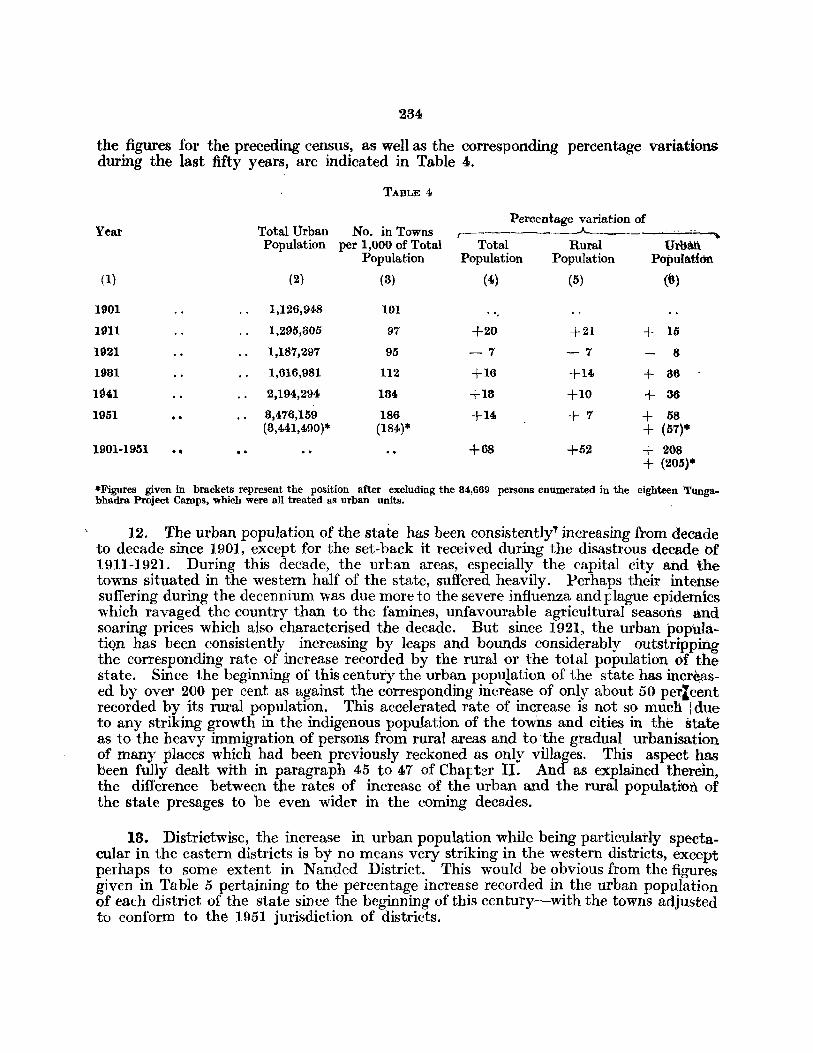
234
the figures for the preceding census, as well as the corresponding percentage variations during the last fifty years, are indicated in Table 4.
TABLE 4
Year Total Urban No. in Towns Population per 1,000 of Total
Population
(1) (2) (8)
1901 1,126,948 101
1911 1,295,805 97
1921 1,187,297 95
1981 1,616,981 112
1{)4.l 2,194,294 184
1951 8,476,159 186 (8,441,490)* (184)*
1901-1951 ••
Percentage variation of ~ ___ ---A. ______ ._.'~~
Total Rural Urbal:i. Population Population Popultltloo
(4) (5) (6)
.. +20
-7
+16
+18
+14
+68
+21
-7
+H.
+10
+7
+52
+ 15
8
+ 36
+ 86
+ 58 + (57)*
+ 208 + (205)'"
*Figures given in brackets represent the pOSition after excluding the 34,669 persons enumerated in the eighteen 'Tunga. bhadra Project Camps, which were all treated as urban units.
, 12. The urban population of the state has been consistently' increasing from decade to decade since 1901, except for the set-back it received during the disastrous decade of 1911-1921. During this decade, the urban areas, especially the capital city and the towns situated in the western half of the state, suffered heavily. Perhaps their intense suffering during the decennium was due more to the severe influenza and plague epidemics which ravaged the countl'y than to the famines, unfavourable agricultural seasons and soaring prices which also characterised the decade. But since 1921, the urban populatiQn has been consistently increasing by leaps and bounds considerably outstripping the corresponding rate of increase recorded by the rural or the total population of the state. Since the beginning of this century the urban population of the state has increased by over 200 per cent as against the corresponding increase of only about 50 perlcent recorded by its rural population. This accelerated rate of increase is not so much: due to any striking growth in the indigenous population of the tow'ns and cities in the state as to the heavy immigration of persons from rural areas and to 'the gradual urbanisation of many places which had been previously reckoned as only villages. This aspect has been fully dealt with in paragraph 45 to 47 of Cha:[:tzr II. And as explained therein, the difference between the rates of increase of the urban and the rural population of the state presages to be even wider in the coming decades. .
13. Districtwise, the increase in urban population while being particularly spectacular in the eastern districts is by no means very striking in the western districts t except perhaps to some extent in Nand.ed District. This would be obvious from the figures given in Table 5 pertaining to the percentage increase recorded in the urban population of each district of the state since the beginning of this century-with the towns adjusted to conform to the 1951 jurisdiction of districts.
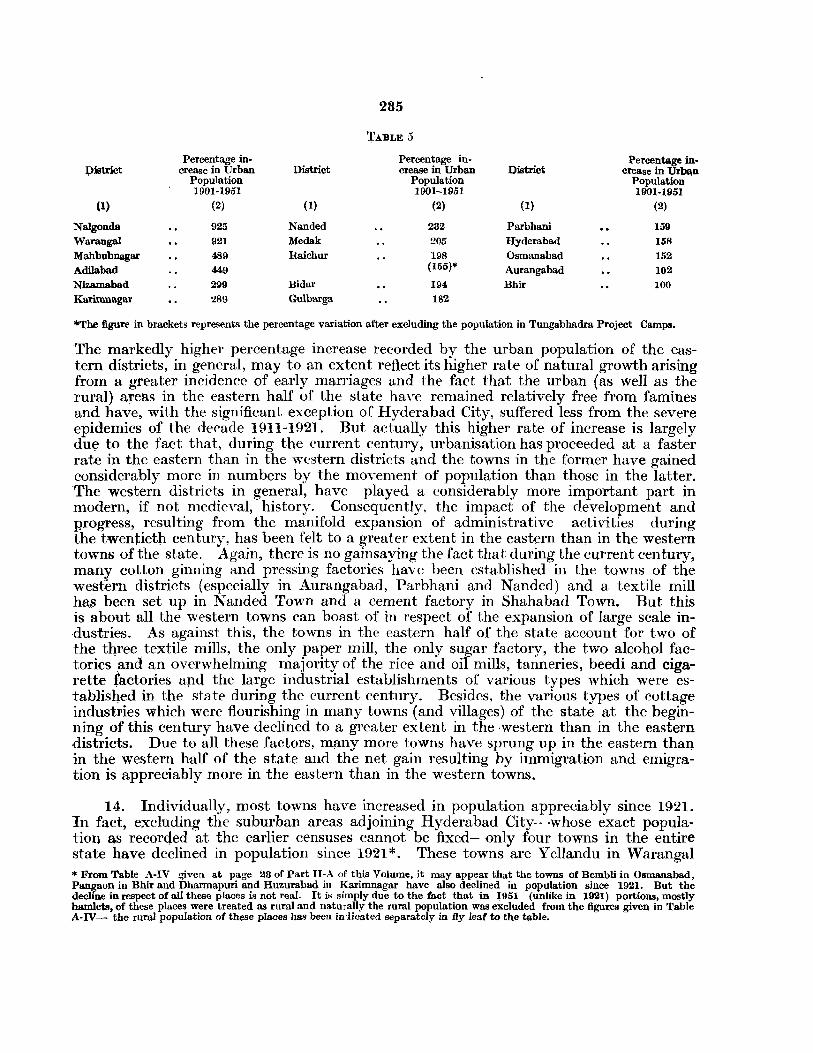
235
TABLE 5
Percentage in- Percentage in- Percentage in-J;>istrict crease in Urban District crease in Urban District crease in Ur~1l
Population Population Population 1901-1951 1901-1951 1901-1951
(I) (2) (1) (2) (1) (2)
Nalgonda 925 Nanded 232 Parbhani 159 Warangal 921 Medak 205 Hyderabad 158 Mahbubnagar 489 Raichur 198 Osmanabad 152 Adilabad 449 (155)* Aurangabad 102 Nizamabad 299 Bidar 194 Bhir 100 Karimnagar 289 Gulbarga 182
*The figure in brackets represents the percentage variation after excluding the population in Tungabhadra Project Camps.
The markedly higher percentage increase recorded by the urban population of the eastern districts, in general, may to an extent reflect its higher rate of natural growth arising from a greater incidence of early marriages and the fact that the urban (as well as the rural) areas in the eastern half of the state have remained relatively free from famines and have, with the significant exception of Hyderabad City, suffered less from the severe epidemics of the decade 1911-1921. But actually this higher rate of increase is largely du~ to the fact that, during the current century, urbanisation has proceeded at a faster rate in the eastern than in the western districts and the towns in the former have gained considerably more in numbers by the movement of population than those in the latter. 'The western districts in general, have played a considerably more important part in modern, if not medieval, history. Consequently, the impact of the development and progress, resulting from the manifold expansion of administrative activities during the twentieth century, has been felt to a greater extent in the eastern than in the western towns of the state. Again, there is no gainsaying the fact that during the current century, many cotton ginning and pressing factories have been established in the towns of the western districts (especially in Aurangabad, Parbhani and Nanded) and a textile mill h8c~ been set up in Nanded Town and a cement factory in Shahabad Town. But this is about all the western towns can boast of in respect of the expansion of large scale industries. As against this, the towns in the eastern half of the state account for two of the three textile mills, the only paper mill, the only sugar factory, the two alcohol factories and an overwhelming majority of the rice and oil mills, tanneries, beedi and cigarette factories and the large industrial establishments of various types which were established in the state during the current century. Besides, the various types of cottage industries which were flourishing in many towns (and villages) of the state at the beginning of this century have declined to a greater extent in the ,western than in the eastern districts. Due to all these factors, m~ny more towns have sprung up in the eastern thaI} in the western half of the state and the net gain resulting by immigration and emigration is appreciably more in the eastern than in the western towns.
14. Individually, most towns have increased in population appreciably since 1921. In fact, excluding the suburban areas adjoining Hyderabad City-whose exact population as recorded at the earlier censuses cannot be fixed-only four towns in the entire state have declined in population since 1921 * . These towns are Yellandu in Warangal * From Table A-IV given at page 23 of Part II-A of this Volume, it may appear that the towns of Bembli in Osmanabad, Pan~on in Bhir and Dharmapuri and Huzurabad in Karimnagar haye also declined in population since 1921. But the dechne in respect of all these places is not real. It is simply due to the fact that in ~951 (unlike in 1921) portions, mostly hamlets, of these places were treated as rural and naturally the rural population was excluded from the figures given in Table A-JV- the rural population of these places has been iniicated separately in fly leaf to the table.
236
District, Soanpeth in Parbhani District, and Gangapur and Ambad in Aurangabad District. Yellandu Town was populated by almost 23,000 persons in 1921. It can now boast of less than 14,000 persons. This decline simply reflects the diminishing importance of this place and the growing importance of Kothagudem Town situated close by as colliery towns. Soanpeth was populated by 5,406 persons in 1921. In 1951 it contained 4,585 inhabitants. This decrease is due partly to the fact that it is no longer the tahsil headquarters of a jagir and partly to the decline of its handloom weaving industry. In 1921, Gangapur and Ambad Towns were populated by 6,027 and 5,178 persons respectively. Their population in 1951 was 5,323 and 5,093 respectively. This decline may be due to the proximity of the important and relatively progressive towns of Aurangabad and Jalna respectively. As compared with the figures of the 1941 census, and excluding again the suburban units adjoining Hyderabad City only 13 towns· have declined in population. These thirteen towns are Yellandu in Warangal; MudhoI, Mukhed, Pet Umri and Madnur in Nanded; Naldurg and Gunjoti in Osmanabad; Khuldabad in Aurangabad; Shankrampet and Dubbaka in Medak; Dharmapuri t in Karimnagar; Sirpur in Adilabad; and Atmakur in Mahbubnagar. The reasons for decline in population of Yellandu Town has already been explained. The decrease in the population of the former Jagiri or Sarf-e-khas towns of Madnur, Gunjoti, Dharmapuri and, to a smaller extent, Khuldabad and Atmakur, is due to the fact that they have lost much of the administrative importance they possessed previous to the integration of all the former Jagir and Sarf-e-khas IIlaqas. In case of Khuldabad Town, the decline is also partly due to the proximity of Aurangabad Town and to the decrease in the importance of the town as a centre of pilgrimage. The decrease in case of Mukhed, Shankrampet and Dubbaka Towns probably reflects the decay of their indigenous cottage industries-especially the making of copper and brass vessels and earthen-ware in the case of the first and weaving and dyeing in case of the other two. l\Iudhol and Pet Umri are probably suffering because of a shift in trade and industry to Nanded Town and to places along the newly opened railway line connecting Adilabad and Mudkhed Towns. The slight decline in the population of Sirpur is probably due to the almost sudden emergence of Kothapet ( Kagaznagar) situated close by as an important industrial centre. The decline in· the population of Naldurg Town is probably due to the emigration of some persons following the Police Action.
15. Growth of Urban Population according to Size of Towns:-Figures p~rtaining to the percentage variation in (1) total urban population of the state; (2) the population of very small towns, i.e., those inhabited by less than 5,000 persons; (3) the population of small towns, i.e., those inhabited by 5,000 to 10,000 persons; (4) the population of large towns, i.e., those inhabited by 10,000 to 20,000 persons; (5) the population of very large towns, i.e., those inhabited by 20,000 or more persons, from decade to decade-since the beginning of this century-as well as during the last fifty years are indicated in Table 6 .
• From Table A-IV given at page 23 of ~art II-A of this Volume, it may appear that Mominabad, Dharur (Fatehabad), Georai and Pangaon in Bhir. Bembli in Osmllflabad ; Bhalki in Bidar ; Kosgi and Kodangal in Gulbarga ; Cherial in Nalgonda ; and Huzurabad and Jammikunta in Karimn(\gar have also declined in population since 1941. But the decrease in respect of all these places is not real because of the same reasons as explained in the preceding foot note.
tIn 1941 the total population of Dharmopuri was 5.577. In 1951 it WaS enumerated in two portions-its urban portion con. tained 4,566 persons and its rural 718. The net loss is, therefore, only 21)3.

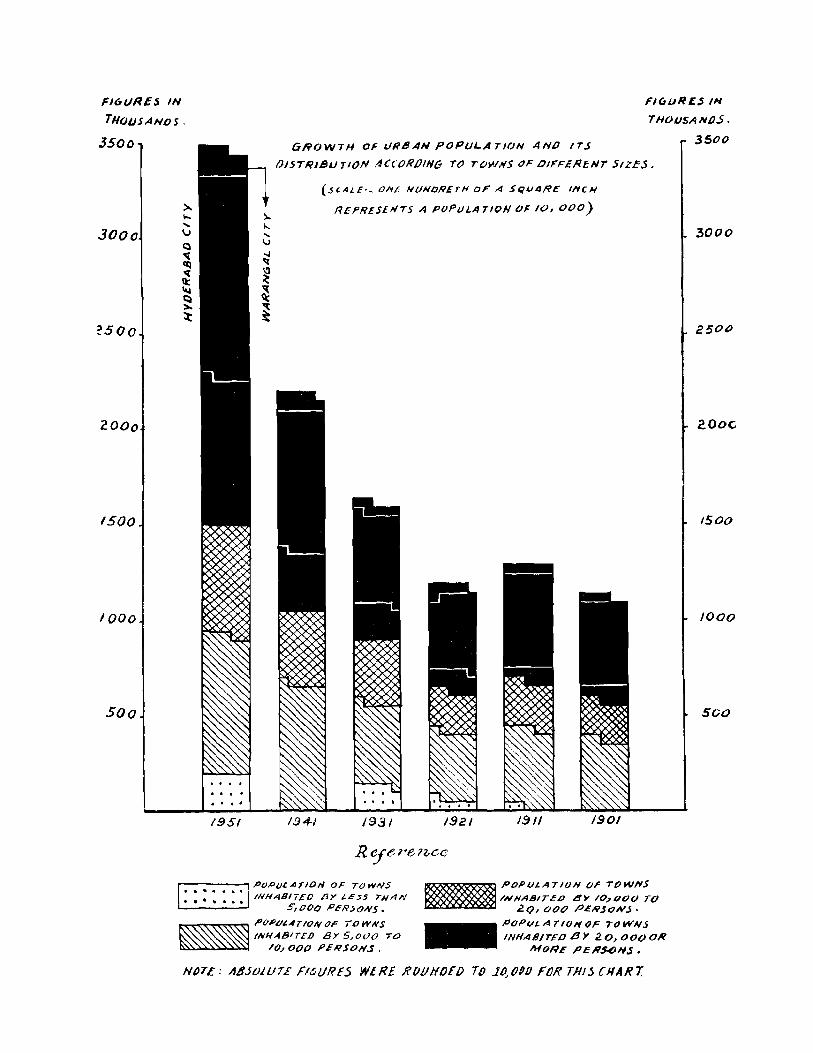
FI6I)R£S IN
THOIJS.4NDS.
FI6uR£.s IN
THOUSANDS.
3500
300
?50o
2000
/500
1000
500
:>.. 10-"-.... Q ~ cq 'It It: ~ ~ >.. :t
.... . . . . 1951
GRrJWiH OF uRBAN POPI)L.A 7101{ AND ITS
OISTRJSU TION t1CCORDIHG TO TOWNS OF LJIFF£IUNi 5IZES.
(.s,.41£·_ OIVE HUNCRErH 01" -4 5QIJ4RE INCH
fUf'RESlNTS.4 P()PLJL.4710H C~ 10,0(0)
r----....,POPUlATIOI'I OF TOWNS BII POPI)LATION Or TOWNS INHA8/TEO 8)' 10,,1700 TO INH,qBI7£0 ,sY LESS rNAN
5jooo PERjONS.
~~~~~ Jf'QPULAT/ONOF i-OWNS ~ INHABITED By 5,o(}(1 TO ~ 10.1 000 I'EIUOH,S .
2.Q/OOO P£,<;J.sONj.
_ POP(lLAT/(JNOi= TOWNS
INHA8IT.€O /3". 2. 0,000 OR MoRE PERS<ON,S.
NNE: A6JOLUTE FI6ljRES Wil?! .RlJUNOEO TO llJ_OPO Fa!? TillS CHART.
3500
3000
2500
1500
1000
soo
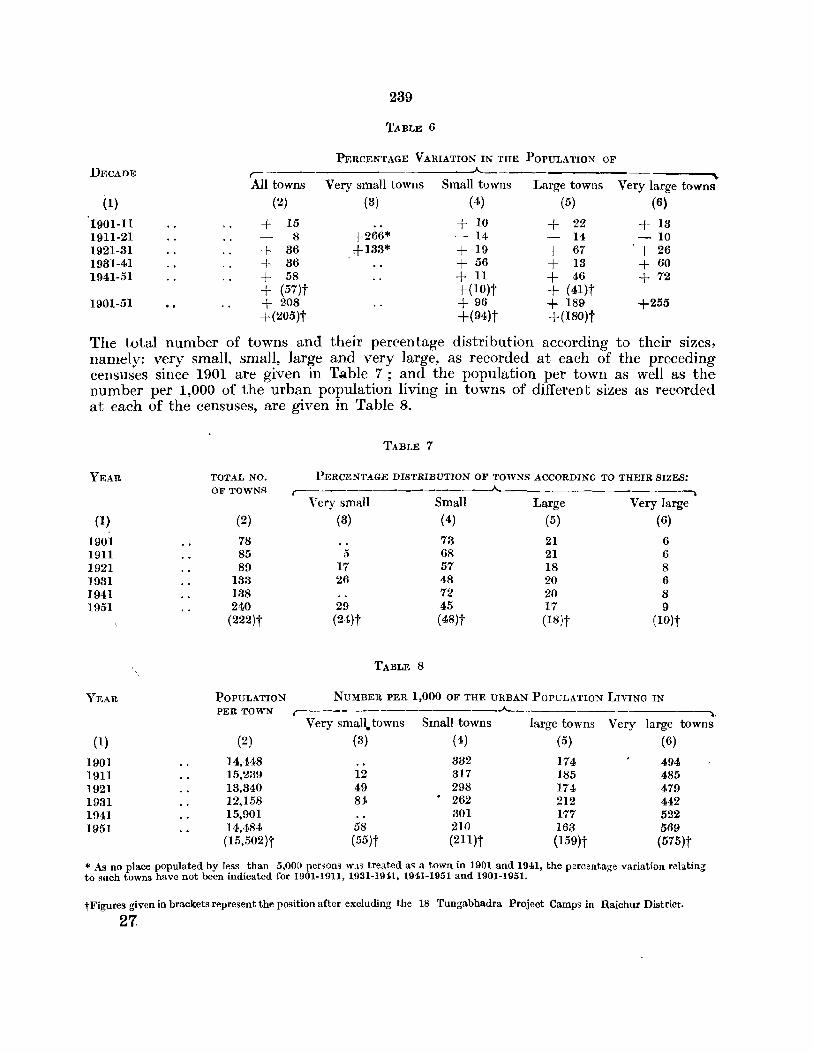
239
TABLE 6
PERCENTAGE VARIATION IN TIlE POPULATION OF DECADE ,-
AIl towns Very small towns Small towns Large towns Very large towns
(1) (2) (3) (4) (5) (6)
1901-II + 15 + 10 + 22 + 13 1911-21 8 +266* -14 14 - 10 1921-31 + 36 +133* + 19 + 67 + 26 1931-41 + 36 + 56 + 13 + 60 1941-51 + 58 +II + 46 + 72
+ (57)t +(lO)t + (41)t 1901-51 + 208 + 96 + 189 +255
+ (205)t +(94)t +(180)t
The total number of towns and their percentage distribution according to their sizes~ namely: very small, small, large and very large, as recorded at each of the preceding censuses since 1901 are given in T~ble 7; and the population per town as well as the number per 1,000 of the urban population living in towns of different sizes as recorded at each of the censuses, are given in Table 8.
TABLE 7
YEAR TOTAL NO. PERCENTAGE DISTRIBUTION OF TOWNS ACCORDING TO THEIR SIZES: OF TOWNS
,-________ -----_..,A.__ ___________ --. Very small Small Large Very large
(1) (2) (3) (4) (5) (6)
1901 78 73 21 6 1911 85 5 68 21 6 1921 89 17 57 18 8 1931 133 26 48 20 6 1941 138 72 20 8 1951 240 29 45 17 9
(222)i" (24)t (48)t (18)t (10)t
TABLE 8
YEAR POPULATION NUMBER PER 1,000 OF THE URBAN POPULATION LIVING IN PER TOWN
,-_______________ ~_..A.. ____________ ~_~,
Very small. towns Small towns large towns Very large towns
(1) (2) (3) (4) (5) (6)
1901 14,448 332 174 494 1911 15,239 12 317 185 485 1921 13,340 49 298 174 479 1931 12,158 84 . 262 212 442 1941 15,901 301 177 522 1951 14,484 58 210 163 569
(15,502)t ( 55)i" (2U)t (159)t (575)t
* As no place populated by less than 5,000 per,.;ons W:13 treated a~ a town in 1901 and 1941, the percentage variation relating to such towns have not been indicated for 1901-1911, 1931-1941, 1941-1951 and 1901-1951.
t Figures given in brackets represent the position after excluding the 18 'rungabhadra Project Camp~ in Raichur District.
27
240
16. It will be obvious from the tables given in the preceding paragraph that the growth of urban population is by no means uniform in the different categories of towns. As the treatment of places inhabited by less than 5,000 persons as towns has been more the exception than the rule at all censuses, no purpose is served by examining the percentage variation of very small towns. Besides, such towns account for less than six per cent of the total urban population. As regards small towns, in 190i, they accounted. for as much as one third of the total urban population of the state. In 1951, they could daim only about one fifth of the total urban population. This fall is certainly not due to any decline in the population of the towns of this category. In fact, their popUlation has roughly doubled itself during the course of the last half a century. What has actuaUy brought down their relative strength in population is their inability to keep pace with the almost spectacular progress recorded in this respect by the towns of bigger -eategories. Similarly, though the percentage of the number of such towns to the total nUIilber of towns has decreased from 73 to 45--mainly because of the relatively large number of very small towns in 1951--their actual number has increased from 57 in 1901 to 108 in 1951.
17. Large towns accounted for over seventeen per cent of the total urban population in 1901. In 1951, the percentage slightly declined to sixteen. This again is not due to any decrease in the total population of such towns. Actually, their population has increased during the last fifty years by over 180 per cent--which is appreciably more than two and a half times the corresponding increase recorded by the total population of the state. The fall in the proportion of the population of such towns to the total urban population results primarily from the especially heavy rate of growth recorded in the population of very large towns. The percentage of the number of large towns to the total number of towns in the state has also decreased from about twenty to seventeen during the last five decades. But this decrease is again only the indirect result of a particularly large number of very small towns in 1951. Actually, the number of large towns has increased from just 16 at the beginning of this century to as much as 40 in 1951.
18. The population of very large towns records the most spectacular increase during the course of the last half a century. They have increased since 1901 by 255 per cent, which is considerably more than three and a half times the corresponding percentage increase recorded by the state's total population! But in this connection it is signifi.cant to note that the metropolis of the state, namely, Hyderabad City, is respensible for this increase to no small extent. The actual population living in such class of towns was only 556,966 in 1901 and in 1951 as much as 1,976,982 -Hyderabad City itself having .contributed 637,256 to the increase. The number of very large towns has also increased more than four-folds during the same period. It. was only 5.in 1901 and 22 in 1951.
19. Movement of Population in Urban Areas*.-It is a generally recognised fact that immigration plays a very important role in the growth of population of urban areas. But unfortunately, census statistics do not permit of any scientific analysis of the subjeCt, not because-they are faulty but b~cause they are incomplete. As stated in Section IV of Chapter I, during this census data was collected in this state-as well as in other states of India-only in respect of immigrants in each district from areas beyond the districtt. Consequently, census figures pertaining to immigrants do not cover the persons who had moved in from the rural to the urban areas (and vice versa) within the -* Movement of Population in general has been dealt with exhaustively in Section IV of Chapter I. t Census figures pertaining to irnIl1:igrants are based. o~ return~ rec.orded in respect of their pla.ce of birth. The census t;numerators had been directed to ascertam and record the dIstrIct of bIrth m case of persons born Within the state, the state of bIrth in case of those born beyond the state but within the country and the country of birth in case of those born beyond the country.
27*
241
same district. And it is an equally well recognised fact that a very hea,vy proportion of the immigrants in most towns consists of persons who have migrated from the surroundina villages within the same district. Subject to this serious limitation, districtwise figures pertaining to (i) the percentage if immigrants in the urban areas from beyond the district to the total urban population and (ii) the break up of these percentages according to immigrants belonging to Agricultural and Non-Agricultural Classes together with the number of females among every 1,000 of each of the two categories, are given in Table 9.
TABLE 9
DISTRICT IMMIGRANTS BELONGING TO IMMIGRANTS BELONGING TO PERCENTAGE OF AGRICULTURAL CLASSES NON-AGRICULTURAL CLASSES IMMIGRANTS TO r--------"------, ---"-----1-
TOTAL URBAN Percentage to Percentage of Percentage to Percentage of POPULATION Urban Pop. Females Urban Pop" Females
(1) (2) (8) (4) (5) (6)
Hyderabad State 18.2 1.2 54 17.0 47
Aurangabad 15.1 0.9 54 14.2 47 Parbhani 11.8 1.2 65 10.6 51 Nanded 17.9 1.5 60 16.4 49-Bidar 5.2 0.7 68 4.5 51 Bhir 13.5 2.1 63 11.4 55 Osmanabad 14.6 2.1 68 12.5 54 Hyderabad 25.0 0.8 40 24.2 46 Mahbubnagar 7.8 0.9 66 6.9 50 Raichur 18.2 1.1 69 17.1 45
(8.1)* (1.2)* (72)* (6.9)* (51)* Gulbarga 8.7 0.9 59 7.8 49 Adilabad 27.9 1.4 56 26.5 49 Nizamabad 29.0 6.1 49 22.9 46 Medak 10.2 1.8 67 8.9 51 Karimnagar 5.5 0.6 64 4.9 50 Warangal 22.8 1.4 49 21.4 45 Nalgonda 6.8 0.7 62 5.6 42
\
* Figures given within brackets represent the position ignoring the Tungabhadra Project Camps.
'20. As stated elsewhere, a heavy proportion of females among immigrants (Oremigrants) clearly establishes the fact that the movement is basically due to marriagesthe bride's migration from her town or village to her husband's place. In the light of this and the figures given in Table 9, it is clear that there is a very heavy movement of population into the urban areas of Hyderabad, Adilabad, Nizamabad and Waraugal Districts from beyond their frontiers because of economic factors and this infiltration is almost exclusively into non-agricultural occupations, except that in the towns of Nizamabad District, roughly one fifth of the immigrants have taken to agricultural occupations as well. Thtre is also no doubt that these immigrants are concentrated in case of Hyderabad District in Hyderabad City; in case of Adilabad District in the mining town of Bellampalli and in the industrial town of Kothapet ; in case of Nizamabad District in Nizamabad and Bodhan Towns-except that the immigrants in Agricultural Classes are also sprea.d over the othpr urban units like YedpaJli and Ranjal in the canal zones of the district; and in case of Warangal District in the mining towns of Kothagudem and Yellandu and to a lesser extent in Warangal City and Khammam Town. Figures pertaining to immigrants were extracted individually only in respect of the more important of the
242
urban units in the state. These figures reveal that 44 per cent of the residents of the mining towns of Kothagudem and Yellandu, 32 of those of Nizamabad Town, 25 of those of Hyderabad City and 18 of those of Warangal City, were born beyond the confines of the respective districts. The movement of population, for economic reasons, into the urban areas of Raichur, Nanded, Aurangabad and, to a smaller extent, Osmanabad, Bhir, Parbhani and Medak Districts is also fairly appreciable, and is predominantly confined to non-agricultural occupations. It is obvious that this movement is very largely restricted to the Tungabhadra Project Camps in case of Raichur District; to Nanded Town in case of Nanded District; to Aurangabad and Jalna Towns in case of Aurangabad District; and to Latur Town in case of Osmanabad District; but is spread over many towns in case of the districts of Bhir, Parbhani, and Medak. As much as 78 per cent of the population of the Tungabhadra Project Camps, 29 of Nanded Town, 21 of Jalna Town and 15 of Aurangabad Town consisted of persons who were born beyond the respective districts. The corresponding percentage was only 12 in case of Raichur Town. The percentage of such immigrants is not very significant in the remaining districts of Gulbarga, Mahbubnagar, Nalgonda, Karimnagar and Bidar. Even in Gulbarga ToWll, the ]arge~t of the urban units in these five districts, their percentage was only 13.
21. Growth oj Population oj the Very Large Towns oj the State.-Among all the 222* towns and cities in the state, only 22 are inhabited by more than twenty thousand persons. Of these only 2, namely Hyderabad and 'Varangal, are cities, i.e., they are inhabited by one hundred thousand or more persons; and seven others, namely, Gulbarga, Aurangabad, Nanded, Jalna, Nizamabad, Raichur and Kothagudem Towns, contain more than fifty thousand persons each. The population of the remaining thirteen of the very large towns of this st~te, namely, Latur, Parbhani, Bidar, Khammam, Bhir, Mahbubnagar, Karimnagar, Bodhan, Nalgonda, Yadgir, Hingoli, Jagtiyal and Narayanpet, is at its highest 35,374 (in Latur) and at its lowest 20,707 (in Narayanpet). The growth of the population of each of these very large towns since the beginning of this century is examined in the succeeding paragraphs.
22. Hyderabad City is by far the largest of the urban units in this state. In fact, it is the fifth largest city in the entire country being less populous than' only its four -cities of Calcutta. Greater Bombay, Madras and Delhit. The next most populous city in the country is Ahmedabad in Bombay state. Hut the population of Hyderabad City exceeds that of Ahmedabad by about forty per cent. Hyderabad City towers over all the other urban units in the state as few of the provincial headquarters do in their respective states. The next largest urban unit in this state,_ namely, ''''aranga] City, -contains only about one eighth of the number of its inhabitants. In fact, Hyderabad City itself accounts for one third of the entire urban population of the state. In Madhya Pradesh, Jabalpur and, to 3 smaller extent, Raipur, Akola and Amrav~ti compete with Nagpur not only in respect of population but also in various other spheres. Similarly, in Madras State, Madurai, Tiruchirapalli, Salem, Coimbatore and many other urban areas compete with Madras City in diverse spheres. And again, in spite of its importance as the 'Gateway of India', Greater Bombay meets with considerable competition from Ahmedabad, Poona, Sholapur, Surat and Baroda and a few other cities as well. But all other urban areas in this state pale into insignificance before Hyderahad City .
• This number excludes the 18 Tungabhadra Project Camps whose population ranges from 94 to 18,555.
t But if old and New Delhi are treated as two independent units, Hyderabad City becomes the fourth largest city in the -entire country.
243
23. The population of Hyderabad City has been increasing, from decade to decade,. since 1901 except for a heavy set back in 1911-1921 due basically to epidemics of almost unprecedented severity. At the beginning of this century, this city was populated by appreciably less than half a million people. Its population increased by about 12 per cent in 1901-1911, declined by about 19 per cent in 1911-1921, increased again by 16 per cent in 1921-1931, by 58 per cent in 1931-1941 and by about 47 per cent in 1941-1951. During the last fifty years its population has increased by 142 per cent which is indeed very remarkable considering the magnitude of its population even in 1901. No doubt, Hyderabad City ('i.e., the Municipalities and Cantonments of Hyderabad and Secunderabad, including the areas formerly known as the Residency and the Chadergha t Municipality) has considerably expanded in area since 1901 and now includes many yillages and towns which were thcn treated as independent units. But this expansion is itself an evidence of the growth of the basic urban unit constituting Hyderabad City. The increase during the decade 1941-1951 itself, would have been much more impressive than what the present figures reveal, but for the fact that in 1941 many distant villages beyond the municipal or cantonment limits, like Gandipet and Pahadi Sharif, were included within the city limits, perhaps with an idea of forming a Greater Hyderabad. During the present Census, it was, however, felt that such an attempt was not only beyond 'census jurisdiction' but would also lead to considerable confusion in determining the population and the demographic characteristics of distinct administrative units. The heavy increase recorded in the population of Hyderabad City is nothing very surprising considering the general trend of accelerated urbanisation in the state, the progress recorded in various spheres such as administrative, educational, industrial, commercial, social and constructional during the last three decades, and perhaps an even more marked tendency since 1901 to centralise all such activities in the state in Hyderaood City.
24. As stated above, at this census the Census City of Hyderabad was taken as consisting of Hyderabad Municipality and Hyderabad Cantonment-the latter of which was actually merged with Hyderabad City a month after the census enumeration in March 1951-and Secunderabad Municipality and Secunderabad Cantonment. The city occupied in all 83.3 square miles and was inhabited by 1,085,722 persons. The percentage distribution of these figures among its four components is given in Table 10.
Hyderabad Municipality Hyderabad Cantonment Secunderabad Municipality Secunderabad Cantonment
TABLE 10
Percentage (Area)
62 10 10 18
Percentage (Population)
74 5
15 6
The wardwise and block wise population for each of these four administrative units IS
given in Appendix C.
25. Warangat City is, as already stated, the only other city in this state besides its metropolis. At the beginning of this century, this urban unit-including Hanumakonda, Mathwada, Warangal and Kazipet-was inhabited by only 31,186 persons. In fact, at that time both the towns of Aurangabad and Jalna (including Kadirabad)* * See note under paragraph 29.
28
244
daimed to be more populous than Warangal. And Gulbarga was only close behind. But now Warangal City has considerably outstripped all the other mofussil towns of the state. Its population increased by 55 per cent in 1901-11 following its link with the railway system of the country in the later half of the preceding decade. It decreased by 3 per cent during the calamitous decade of 1911-21. But it has since then increased consistently and at a fairly heavy rate. The increase during 1921-31, when the city (i.e., Kazipet) was not only connected by rail with the neighbouring districts of Karimnagar and Adilabad but also became an important railway junction on the ,direct railway route linking Madras with Delhi, was by 33 per cent, during 1931-41 by 49 per cent, and during 1941-51 by 43 per cent. It is now populated by 133,130 persons which represents an increase by over 326 per cent during the last fifty years. Among .all the important towns in the state only Kothagudem, Nanded and Nizamabad record more striking increases. Warangal City is now broadly twice as populous as Gulbarga Town which comes next in order. The extraordinary increase in the population of Warangal City is not surprising because like Hyderabad City, though on a considerably smaller scale, it has also developed immensely in importance since 1921, especial1y as .a centre for industries and communications. All but 3,524 of its inhabitants were returned from the municipal area.
26. Gulbarga Town was the fifth most populous of the urban units in the state in 1901, the first four being Hyderabad City and the towns of Aurangabad, Jalna (induding Kadirabad) and Warangal (including Hanumakonda, Kazipet, etc.). But the populations of Aurangabad, Jalna, Warangal and Gulbarga Towns were more or less of the same order. At the beginning of this century, this town was populated by less than even 30,000 persons. Since then its population has increased consistently, from decade to decade, without any set-back even during the disastrous decade of 1911-1921. The increase during the decade 1941-1951 was by over 44 per cent which is fairly impressive. This town is now populated by 77,189 persons, which makes it the third town of the 'State, considerably more populous than Aurangabad or Jalna. Thus, the overall increase in its population during this century (which is by about 164 per cent) is neither as impressive as that in the case of Warangal City nor as insignificant as that in the case of Aurangabad and Jalna Towns. Gulbarga Town has steadily forged ahead in industries and, more especially, commerce without any very serious rivals near by. And now from the point of view of its population, its commerce, its administrative importan,ce and its industries, taken all together, it is perhaps the most important town not only in, the south-western portions of the state but in the whole of its western half. .
27. Aurangabad Town was, in recent history, the foremos,t among all the towns in the Deccan. Its final decline as such, appears to have set in when Asaf Jah the First transferred the capital of his Dominions from Aurangabad to Hyderabad. In spite of some noticeable advance in respect of large scale industries, the construction of the Godavari Valley Railway Line about the beginning of this century and the continuance of its position as a district headquarters and a Cantonment, the population of the town remained almost stagnant during the first three decades of this century and its increase subsequently, though appreciable" is not comparable with the corresponding increases recorded in case of most of the very large towns of the state. This is perhaps the combined result of the fact that its population had swelled up temporarily in 1901 due to the influx of famine stricken refugees from surrounding villages, the decay of its ancient crafts and' cottage industries, the general lead obtained by some other towns in the northwestern regions of the state-especially Nanded and Jalna--in respect of trade and
28*
245
industries, and the growing attraction of Hyderabad City to its relatively advanced Muslim population. Since the beginning of this century, the population of this town has increased by only about 80 per cent which is among the least striking of the corresponding increases recorded by all the important towns of this state. The redeeming feature about this increase is, however, the fact that it results mainly because of the increases by 38 and 31 per cent recorded during the last two decades of 1931-1941 and 1941-1951 respectively.
28. Nanded Town had even less than 15,000 persons at the beginning of this century. It is now inhabited by over 65,000 persons, which makes it a very close second to Aurangabad the fourth town of the state. Thus, its population has increased by as much as 358 per cent during the course of the last fifty years. No other town in the state, apart from Kothagudem which suddenly developed into the largest colliery town in Southern India, records such an unusually heavy increase. But what makes this. increase more remarkable is the fact that, although its population has increased consistently from decade to decade since 1901, the increase was by as much as 77 per cent during the last decade 1941-1951 itself. Nanded Town is now the second biggest of the agricultural, markets in the whole of the state from the point of view of the value of its annual turnover. Besides, it is one of the most important of the state's industrial towns. This decade has firmly established its position as the chief commercial-cum-industrial urban unit in the north-western districts of the state. Its nearest competitor in the future decades is likely to be Jalna Town.
29. Jalna Town (including Kadirabad) was populated by 31,429 persons in 1901 *. It was then the third biggest urban unit in the state, only Hyderabad City and Aurangabad Town being more populous. But it lost this lead in the two succeeding .decades. The population of the town declined to 29,263 in 1911, perhaps largely due to the abandonment of its Cantonment in 1903 and to the fact that the 1901 figure had been temporarily exaggerated due to the influx of some famine stricken refugees to the town from the surrounding villages. It further declined to 25,885 in 1921. This decline was, however, common to most of the towns in the state. Since then it has increased consistently. It was 30,317 in 1931, 38,096 in 1941 and suddenly shot up to 58,478 in 1951, which meant an increase of fifty four per cent over the 1941 figure. This increase is remarkable in view of the fact that in 1941 the town had been vitalised by the revival of its Cantonment and by 1951 this Cantonment had once again been disbanded. J alna Town is now one of the chief commercial centres and agricultural markets in the state. In this respect, apart ~rom Hyderabad City, perhaps only the towns of Raichur, Nanded, LatlIr- and Gulbarga can excel it. Again, apart from the two cities of Hyderabad and Warangal, few towns of the state--not even Nanded-have so many large scale industrial establishments as Jalna has. These establishments cover not only cotton ginning and pressing factories, but also a large number of beedi factories and oil mills. It is also a centre of some importance in respect of handloom weaving. Thus, after many vicissitudes, the town is now well set on the road to prosperity and it will not at all be surprising if during the coming decades it surpasses the district headquarters of Aurangabad in respect of population also.
30. Nizamabad Town had a population of only 12,871 in 1901. Its population, however, increased appreciably during the decade 1901-1911 but, as in the case of most
.The 1901, 1911, 1921 or 1931 population indicated for Jalna Town at page 27 of Part II-A of this Volume does not include the figures pertaining to Kadirabad.
246
towns in the state, declined, though not very heavily, during the disastrous decade of 1911· 1921. The loss was more than made up in the succeeding decade of 1921-1931 due partly to the general prosperity of the state during the decennium and partly to the increased tempo of activities in diverse spheres within the district itself resulting from the actual -construction of the Nizamsagar Project. Since 1921 the population of the town has increased by leaps and bounds. The actual percentage increase was as high as 74 in 1931-1941 and 69 in 1941-1951. In other words, since the beginning of this century the population of this town has increased by as much as 329 per cent. Only two other towns in the entire state, namely Kothagudem and Nanded, have recorded more impressive increases in this respect. This increase very largely reflects the agricultural prosperity of the district following the construction of the Nizamsagar Project. This town is also one of the important industrial towns in the state containing a large number of beedi factories and other large scale industrial establishments including rice mills, besides being a commercial centre of no mean importance.
SI. Raickur Town ranked as the sixth most populous urban unit in this state in 190]. Only Hyderabad City and the towns of Aurangabad, Jalna (including Kadirabad), Warangal (including all its present components) and Gulbarga were then more popukus than this town. But since then it has been outstripped in this respect by Nanded and Nizamabad Towns as well. Consequently, it has now fallen back to the eighth place. No doubt, Raichur Town is one of the most important of the commercial eentres in the state. During the year 1951-1952 the turnover of its agricultural market was in the neighbourhood of Rs. 3.5 crores, which was by far the highest among all the agricultural markets of the state. The agricultural produce--mainly oil seeds and ('otton-of not only the central portions of Raichur District but also the southern portions of Gulbarga and the western portions of Mahbubnagar--all of which constitute perhaps the richest tract for oil seeds in the state--is brought to this town for disposal. Similarly, there is also no doubt that this town is one of the fairly important of the industrial centres in the state. It contains a number of cotton ginning and pressing factories and oil mills. The population of the town has also consistently increased from decade to decade, since the beginning of this century, the increase being particularly heavy during 1941-1951 when the town added over 19.000 persons to its 1941 population. Altogether, during the course of this century, its population has increased by about 144 per cent. But this increase is not at all as striking as the corresponding increases recorded by most of the other towns of the state with comparable populat~ons. The progress of this town, especially during the last two decades, in spheres other than ~ommerce is certainly not as impressive as that of the other towns mentioned earlier with perhaps the exception of Aurangabad. This is probably due to the competition it has had to face not only from the towns of Adoni and Bellary on the other side of the Tungabhadra and from Yadgir in the adjoining district of Gulbarga, but also from Koppal, Gadwal and Gangawati within the district itself. It is very probable that the impressive increase recorded in its popUlation during the decade 1941-1951 was to a large extent due to the intense activity in the district because of the actual construction (If the Tungabhadra Project. But it is very likely that the completion of this project and the consequent irrigation of vast areas in the district, may considerably accelerate the growth of its population in, the coming decades as well. This would have been almost .a certainity but for the probability that the numerous other towns in the project area rr.ay take away the Jion's share of the resulting prosperity.
32. Kothagudem was an inconspicuous village until 1931. But the extension of the coal mining activity in and around this town during the decade 1931-1941 has transformed
247
it into one of' the most populous of the urban units in the state and the largest -colliery town in Southern India. The town has attracted a large proportion of the labour population which was formerly residing in the neighbouring town of Yellandu which has, in turn, considerably declined in importance during the last three decades a~ .a coal mining centre.
33. Latur Town with a population of 35,374 is the largest among the towns of this state populated by less than 50,000 persons. The town has increased in population during the course of the last half a century by as much as 238 per cent in spite of having suffered during the generally prosperous decades of 1901-1911 and 1931-1941. Perhaps the decrease in population as recorded at both the 1911 and 1941 Censuses was temporary and due to the outbreak of plague. In the previous decades, especially in case
Qf commercial towns, an outbreak of plague led to emigration on a very large scale irrespective of the number of persons killed or attacked by the epidemic. The population of the town, however, increased by 42 per cent during the decade 1941-1951. It is likely that the increase during this decade would have been even more striking but for the diversion of some of the town's commerce to places along the Parli-Bidar Railway line completed during the preceding decade. In the context of its commercial and industrial prosperity at the beginning of this century-especially after its linkage with the Barsi Light Railway-it was generally supposed that Latur Town would develop into Qne of the most important of the commercial and industrial centres in this state. Though it is now actually one of the most important of the commercial towns in this state, its earlier promise as a potential centre for industries has not been fully realized.
34. Parbhani Town has increased its population during the last five decades by 236 per cent-the increase during the decade 1941-1951 itself was by as much as 54 per cent. This is one of the towns of the state which has benefited considerably due to the opening ,of the Godavari Valley Railway line. It is now a fairly important commercialcum-industrial centre of the state and would have been perhaps much more so but for the competition it faces with Jalna and Nanded Towns in the adjoining districts and Sailu and Hingoli and a few relatively minor towns within the district itself. Anyway, this town is now almost as important commercially and industrially as Hingoli Town within the district itself which was hitherto supposed to be distinctly ahead in this respect. Parbhani has the additional advantage of being the district lieadquarters also. A contributory factor leading to the growth of the town during the last two decades ha~ been ~he completion of the railway line connecting it with Parli.
35. Bidar Town is now inhabited by 31,341 persons which is in excess of its 1901 population by 176 per cent. As most towns in the state, it also lost in numbers in 1921 but this loss was very slight. As against this, the increase in its population during the decade 1941-1951 has been very striking. It contained in 1951, more than one and a half times the number of persons it had in 1941. But this impressive increa'3e is hardly any justification for presuming that there is a possibility of this ancient town once again towering, at least in respect of trade and industries, over all the other towns in this region. It has now too many competitors, both within and beyond the district, to permit of any such development. The impressive increase merely reflects the general trend of accelerated urbanisation in the state, accentuated to an extent by the abolition, during the 1941-1951 decade, of the numerous large and small jagirs* within the district and the extension of the railway line up to Parli in the preceding decade~ • A large number of persons drawn from Bidar Town, Hyderabad City and other towns had settled down at the jagir headquarters of this district employed in jagir administration or in other occupations. On the abolition of the jagirs, mOllt of these persons moved on to Bidar Town or Hyderabad City.

248
36. Khammam Town has been steadily improving its position since 1901. In 1901, though populated by over 8,000 persons, it was not even treated as a town. It is now a fairly important commercial centre in the state with some pretensions in respect of industrialisation as well-it contains a number of rice and oil mills. The population of this town has increased by as much as 224 per cent since the beginning of this century. The increase recorded during 1941-1951 itself was by 49 per cent, which is fairly impressive.
37. The population of Bhir Town increased dulring the decade 1941-1951 from 15,222 to 25,636, i.e., by over 68 per cent. This extraordinary increase is perhaps nothing more than the reJIection of the general trend of accelerated urbanisation in the state aided by a particularly virile popUlation in the surrounding villages. In spite of this increase, the initial losses suffered by the town at the 1911 and 1921 Censuses-due mainly to a severe famine in case of the former and plague in case of the latter-have kept down the increase recorded during the current century. This would be obvious from the fact that its popUlation has increased since 1901 by only 45 per cent which is one of the smallest among the corresponding increases recorded in respect of the other important towns of the state. Bhir Town has now lost the position it enjoyed in 1901 as one of the most populous of the towns of the state. At the beginning of this century, its population was exceeded by only that of Hyderabad, Aurangabad, Warangal (induding its present components), Gulbarga, Raichur and Jalna. But now over haIfa dozen of other towns in the state have also moved ahead. This loss, in its relative position is due to various factors. The town is not yet connected by rail. It has not registered any significant progress in respect of large industries and has lost for all practical purposes, the cottage industries for which it was once famous. Its present strength seems to be almost entirely dependent on its being the administrative headquarters of
, the district and an agricultural market of minor importance.
38. . The towns of Mahbubnagar, Karimnagar and N algonda have consistently increased in population, from decade to de~ade, since the beginning of this century. The populations of these three towns have increased from 1901 to 1951 by as much as 213, 314 and 277 per cent respectively. During the decade 1941-1951 itself, the increase was fairly impressive in case of Mahbubnagar and Karimnagar and unusually heavy in case of Nalgonda-the actual percentage increases recorded being 45, 37 and 75 respectively. In case of each of these three towns, the increase largely reflects the relatively heavy rate of growth of the indigenous population of the tracts in which they are located and the general trend of accelerated urbanisation in the state. In fact, this movement of population from the villages to the towns and from the smaller to the larger towns, has been accentuated in case of Nalgonda and, to a considerably smaller extent, Mahbubnagar and Karimnagar Districts because of the disturbed conditions which prevailed in their mofussil areas prior to census enumeration. But, in the context of the density and dimensions of the population of their respective districts, it is surprising that these three towns, especially Karimnagar and N algonda, should still be less populous than the headquarter towns of most of the other districts of the state. This is perhaps due to the fact that these three towns are basically poor in large scale industries and are situated too c10se to very prosperous urban areas-Hyderabad City in case Of Mahb1Ubnagar and Nalgonda, and Warangal City in case of Karimnagar. An additional reason in case of Nalgonda and Karimnagar is the fact that they are not connected by rail. Besides, none of them can be deemed to be the chief commercial centres even within their own respective districts. These towns, may be relatively rich in cottage industries and artisan trades as compared with most other towns of the state, but their present impor.tance
249
rests basically on the fact that they are the headquarters of their respective districts and have succeeded in building up some sizeable middle and lower middle class populations.
89. The population of Bodhan Town was just 6,488 in 1901 but as much as 22,491 in 1951. This represents an increase of about 250 per cent. This impressive increase, which has been attained in spite of an appreciable set back during the disastrous decade of 1911-1921, is entirely due to the development of the town after the construction of the Nizamsagar Project. The town is not only located in the very heart of the project area deriving the full benefit of the intensive irrigation all around but also contains a large -sugar factory and an alcohol factory. The population of the town recorded an extraordinary increase exceeding 175 per cent in 1941 i.e., during the decade which witnessed the commencement of irrigation under the project and the setting up of the sugar and alcohol factories. But what is surprising is the fact that the population of the town should have increased only by 16 per cent during the decade 1941-1951. It is likely that this meagre increase for a populous town is due to the very conditions created by the setting up of the sugar and alcohol factories and the ownership of considerable portions of the irrigated lands in the project area by the sugar factory and, to a smaller extent, by a few landlords. These conditions are not conducive to the development of the usual types of commerce and small and large scale industries which characterise most towns in this region.
40. The population of Yadgir Town has increased by 251 per cent since 1901. From a minor town at the beginning of this century it has developed into one of the fairly important industrial-cum-commercial centres in the state. The town has quite a few oil mills and cotton ginning and pressing and beedi factories. The turnover of agricultural produce in its regulated market exceeded a crore of rupees auring 1951-1952. During the decade 1941-1951 itself, the population of the town increased by 25 per cent which is, however, not at all significant as compared with corresponding increases recorded by most of the very large towns in the state. But what is more surprising is the fact that it decreased in population during the earlier decade of 1981-1941. Its, most prosperous decennium during this century appears to have been 1921-1981, when its population increased by about 60 per cent. It is likely that after the completion of the Secunderabad-Dronachalam Railway Line, the town suffered in its importance\as the export point for the agricultural produce of Makhtal Tahsil in Mahbubnagar nistrict. .
41. Hingoli Town was a cantonment of some minor importance in 1901. It was then one of the foremost of the commercial centres of the state-as a cotton market its position could only be compared to that of J alna Town. But it has been gradually iosing its pre-eminent position in spite of the fact that it was linked to Purna by rail in 1912. Its cantonment was abandoned in 1908. A number of towns, both beyond
.and within district itself*, have progressed considerably more than Hingoli Town during the recent decades in respect of both trade in cotton and cotton ginning and pressing factories. Besides,_it has not lived up to its initial advantage and developed other industries besides cotton ginning and pressing, especially as Nanded and J" alna Towns have done. Further, the town seems to have suffered very severely due both to epidemics and the dislocation of trade during the disastrous decade of 1911-1921. It is, therefore, not surprising that the population of this town should have ~ Parbhani District has now many towns which are important for their cotton ginning and pressing factories and cotton markets. Of these Sailu and Parbhani Towns are now almost as important as Hingoli in this respect, at any rate they are .serious ~ompetitors. .
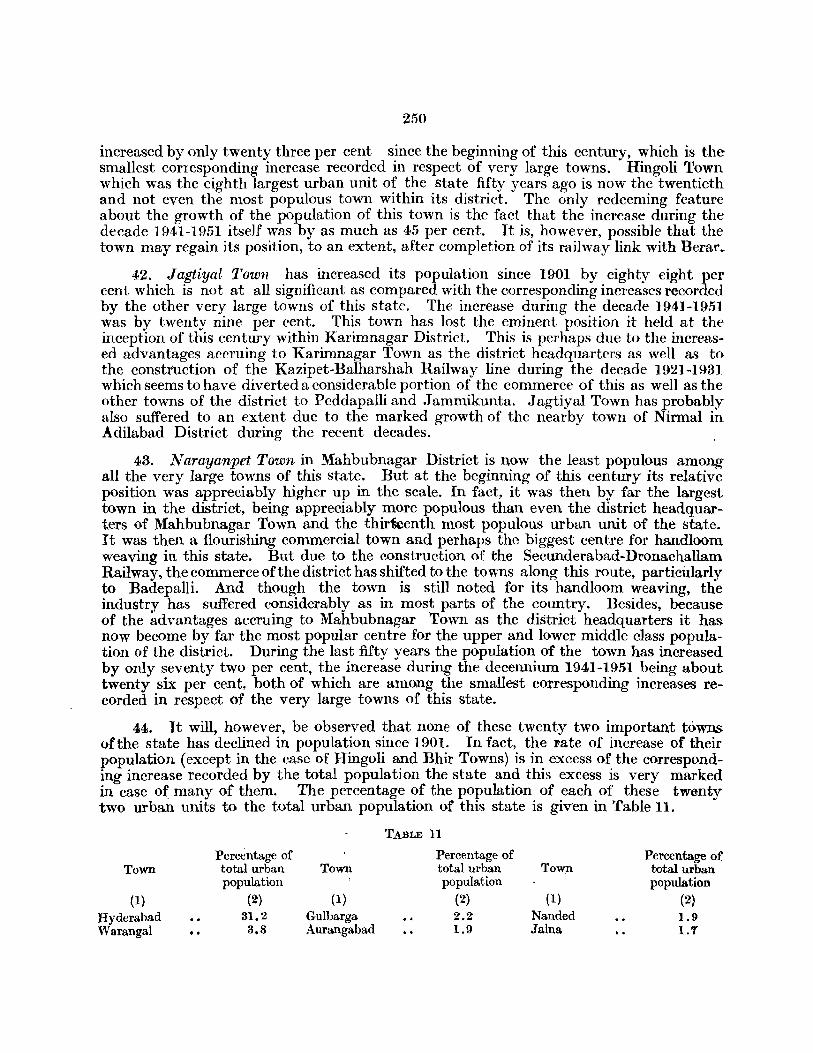
250
increased by only twenty three per cent since the beginning of this century, which is the smallest corresponding increase recorded in respect of very large towns. Hingoli Town which was the eighth largest urban unit of the state fifty years ago is now the twentieth and not even the most populous town within its district. The only redeeming feature about the growth of the population of this town is the fact that the increase during the decade 1941-1951 itself was by as much as 45 per cent. It is, however, possible that the town may regain its position, to an extent, after completion of its railway link with Berar.
42. Jagtiyal Town has increased its population since 1901 by eighty eight per cent which is not at all significant as compared with the corresponding increases recorded by the other very large towns of this state. The increase during the decade 1941-1951 was by twenty nine per cent. This town has lost the eminent position it held at the inception of this century within Karimnagar District. This is perhaps due to the increased advantages accruing to Karimnagar Town as the district headquarters as well as to the construction of the Kazipet-Balharshah Railway line during the decade 1921-1931 which seems to have diverted a considerable portion of the commerce of this as well as the other towns of the district to Peddapalli and Jammikunta. Jagtiyal Town has probably also suffered to an extent due to the marked growth of the nearby town of Nirmal in Adilabad District during the recent decades.
43. N arayanpet Town in Mahbubnagar District is now the least populous among all the very large towns of this state. But at the beginning of this century its relative position was appreciably higher up in the scale. In fact, it was then by far the largest town in the district, being appreciably more populous than even the district headquarters of Mahbubnagar Town and the thirteenth most populous urban unit of the state. It was then a flourishing commercial town and perhaps the biggest centre for handloom weaving in this state. But due to the construction of the Secunderabad-Dronachallam Railway, the commerce of the district has shifted to the towns along this route, particularly to Badepalli. And though the town is still noted for its handloom weaving, the industry has suffered considerably as in most parts of the country. Besides, because of the advantages accruing to Mahbubnagar Town as the district headquarters it has. now become by far the most popular centre for the upper and lower middle class population of the district. During the last fifty years the population of the town has increased by only seventy two per cent, the increase during the decennium 1941-1951 being about twenty six per cent, both of which are among the smallest corresponding increases recorded in respect of the very large towns of this state.
44. It will, however, be observed that none of these twenty two important towns of the state has declined in population since 1901. In fact, the Fate of increase of their population (except in the case of Hingoli and Bhir Towns) is in excess of the corresponding increase recorded by the total population the state and this excess is very marked in case o( many of them. The percentage of the population of each of these twenty two urban units to the total urban population of this state is given in Table 11.
TABLE 11
Percentage of Percentage of Percentage or Town total urban Town total urban Town total urban
population population population
(1 ) (2) (1) (2) (1) (2)
Hyderabad 3}.2 Gulbarga 2.2 Nanded 1.9 Warangal .. 8.8 Aurangabad l.9 Jalna 1.1
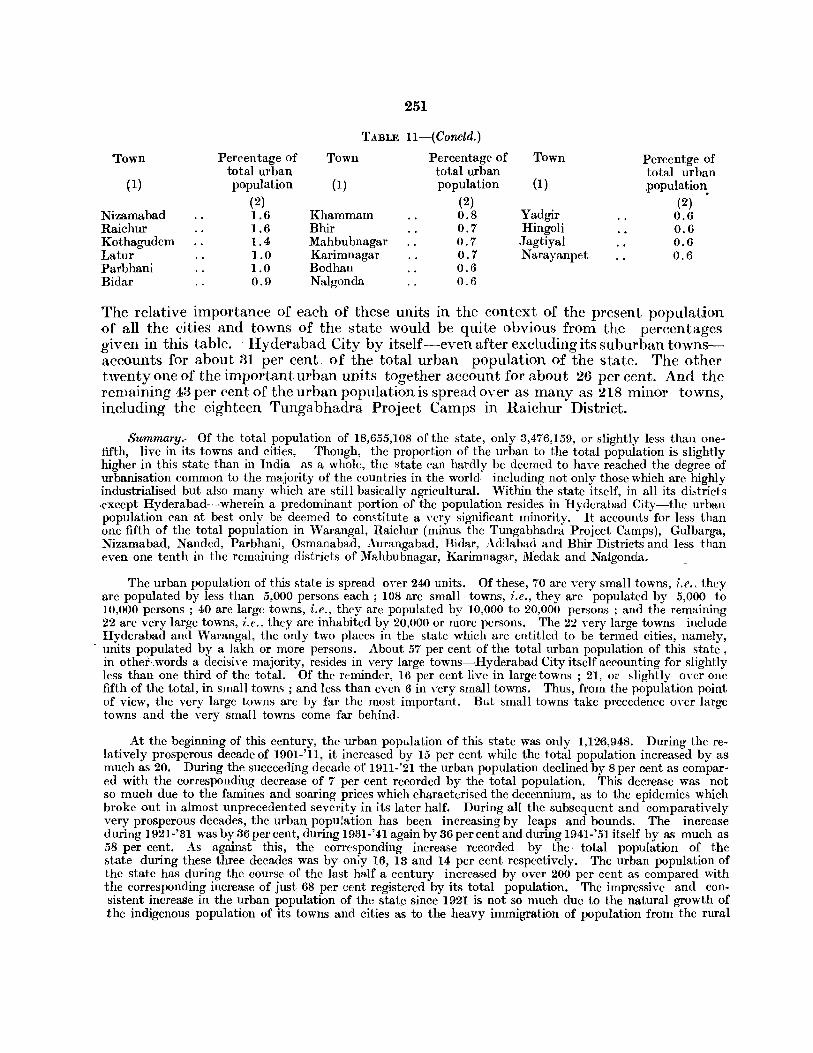
251
TABLE ll-(Concld.)
Town Percentage of Town Percentage of Town Percentge of total urban total urban total urban
(1) population (1) population (1 ) .population. (2) (2) (2)
Nizamabad 1.6 Khammam 0.8 Yadgir 0.6 Raichur 1.6 Bhir 0.7 Hingoli 0.6 Kothagudem 1.4 Mahbubnagar 0.7 Jagtiyal 0.(1 Latur 1.0 Karimnagar 0.7 Narayanpet 0.6 Parbhani 1.0 Bodhan 0.6 Bidar 0.9 Nalgonda 0.6
The relative importance of each of these units in the context of the present population of all thc cities and towns of the statc would be quite obvious from the percentages given in this table. . Hyderabad City by itself-even after excluding its suburban townsaccounts for about 31 per cent, of the total urban population of the state. The other twenty one of the important urban units together account for about 26 per cent. And the remaining 43 per cent of the urban population is spread over as many as 218 minor towns, including the eighteen Tungabhadra Project Camps in Raichur District.
Summary.-Of the total popUlation of 18,655,108 of the state, only 3,476,159, or slightly less than onefifth, live in its towns and cities, Though, the proportion of the urban to the total population is slightly nigher in this state than in India as a whole, the state can hardly be deemed to have reached the degree of urbanisation common to the majority of the countries in the world-including not only those which are highly industrialised but also many which are still basically agricultural. Within the state itself, in all its districts ,except Hyderabad-wherein a predominant portion of the population resides in Hyderabad City-the urban population can at best only be deemed to constitute a very significant minority. It accounts for less than one fifth of the total population in Warangal, Raichur (minus the Tungabhadra Project Camps), Gulbarga, ~izamabad, Nanded, Parbhani, Osmanabad, Aurangabad, Bidar, Adilabad and Bhir Districts and less than even one tenth in the remaining districts of Mahbubnagar, Karimnagar, Medak and Nalgonda.
The urban population of this state is spread moer 240 units. Of these, 70 arc very small towns, i.e .. they are popUlated by less than 5,000 persons each; 108 are small towns, i.e., they are popUlated by 5,000 to 10,000 persons; 40 are large towns, i.e., they are populated by 10,000 to 20,000 persons; and the remaining 22 are very large towns, i.e., they are inhabited by 20,000 or more persons. The 22 very large towns include Hyderabad and Warangal, the only two places in the state which are entitled to be termed cities, namely, units populated by a lakh or more persons. About 57 per cent of the total urban population of this state, in other"words a decisi"e majority, resides in very large towns-Hyderabad City itself accounting for slightly less than one third of the total. Of the reminder, 16 per cent live in large towns; 21, or slightly oyer one fifth of the total, in small towns; and less than even 6 in very small towns. Thus, from the population point of view, the very large towns are by far the most important. But small towns take precedence o,oer large towns and the very small towns come far behind.
At the beginning of this century, the urban population of this state was only 1,126,948. During the relatively prosperous decade of 1901-'11, it increased by 15 per cent while the total population increased by as much as 20. During the succeeding decade of 1911-'21 the urban population declined by 8 per cent as compared with the corresponding decrease of 7 per cent recorded by the total popUlation. This decrease was not so much due to the famines and soaring prices which characterised the decennium, as to the epidemics which broke out in almost unprecedented severity in its later half. During all the subsequent and comparatively very prosperous decades, the urban popUlation has been increasing by leaps and bounds. The increase during 1921-'31 was by 36 percent, during 1931-'41 again by 36 percent and during 1941-'51 itself by as much as 58 per cent. As against this, the corresponding increase recorded by the· total popUlation of the &tate during these three decades was by oniy 16, 13 and 14 per cent respectively. The urban population of the state has during the course of the last half a ccntury increased by over 200 per ccnt as compared with the corresponding increase of just 68 per cent registered by its total popUlation. The impressive and consistent increase in the urban population of the state since 1921 is not so much due to the natural growth of the indigenous popUlation of its towns and cities as to the heavy immigration of population from the rural
252
to the urban areas and to the urbanisation of many places which were previously only villages. It is thus obvious that although the urban population of this state is still less than one fourth of its rural population, the former is increasing at a considerably faster rate than the latter and the difference between their rates of growth is becoming more and more accentuated form decade to decade.
The increase in the urban population is, with a few exceptions. distinctly more marked in the eastern than in the western districts of the "tate. This is primarily due to the fact that during the recent decades, because of the comparatively greater progress recorded by them in diverse spheres, more new towns have sprung up in the eastern than in the western districts and the eastern towns in general have attracted a strikingly larger number of immigrants than the western, both from within and beyond their respective districts. The higher rate of growth of the indigenous popUlation in the eastern than in thc western districts is only a secondary factor. As among the urban units of different sizes, the increase in population, is particularly spectacular in case of very large towns and, to a considerably smaller extent, large towns. During the last five decades, the population of the former has increased by 255 per cent and that of the latter by 189. These two categories of towns are together responsible for over three fourths of the increase of 208 per cent registered by the total urban population of this state since 1901. .
SECTION II
LIVELIHOOD CLASSES IN URBAN AREAS
(TM tables relevant to this Section are Main Table' E-Summary Figures by Districts and Tahsils' given at page 211 of Part II-A o/this Volume and Subsidiary Tallles '3.6-Number per 1,000 of the General Population and of each Livelihood Cla8s who live in Towns' and '3. 7-Livelihood Pattern of Urban Population' given at pages 70 and 71 respectively of Part J-B of this Volume.)
45. Predominance of Non-Agricultural Classes.-The over whelming majority of the persons living in the towns and cities of the state are primarily dependent on nonagricultural occupations or sources of income. The actual number of persons belonging to Non-agricultural Classes, among every 1,000 of the urban population of this state, is as much as 827. But this heavy proportion of Non-agricultural Classes in urban areas is nothing peculiar to this state. In fact, their proportion is even slightly higher in the urban areas of the country as a whole or of the neighbouring states. The corresponding proportion is 860 in the urban areas of India and 828 in those of Madras, 843 in those of Madhya Pradesh and 846 in those of Bombay. Within the state also, Non-agricultural Classes account for a decisive majority .of the total urban population in each and every district of the state. But there is appreciable divergence in the degree of their dominance from district to district. They are proportionately most numerous in the urban areas of Hyderabad District. In f~ct, they account for as many as 968 persons among every 1,000 of its urban population. This extraordinary heavy concentration of Non-agricultural Classes is due exclusively to the overwhelming importance of Hyderabad City and its suburban towns in the industrial, commercial, transport, administrative, social and cultural activities of the state. An idea of the degree of their relative importance can be had from the fact that although they account for- only six per cent of the state's total population, they claim about nine, twenty three, thirty seven and twenty six per cent of the total number of persons in the state belonging to the Lkrelihood Classes of Production (other than cultivation), Commerce, Transport and Other Services and Miscellaneous Sources respectively. Non-agricultural Classes are also relatively very numerous in the urban areas of Aurangabad, Warangal and Adilabad Districts. Their number, among every }"OOO of th~ urban popUlation, is 886 in Aurangabad, 834 in Warangal and 807 in Adilal: ad. Their heavy proportion in Aurangabad is due almost exclusively to Aurangabad and Jalna Towns; in Warangal to Kothagudem and Yellandu towns, Warangal City and, to a smaller extent, to Khammam Town; in Adilabad to the towns of Bellampalli, Kothapet and, to a smaller extent, Adilabad and Nirmal. Kothagudem, Yellandu and Bellampalli are the coal mining centres of the state. Warangal, Aurangabad and Jalna Towns are among the most prominent in the state from the commercial and industrial points of view and the first two are also of conSIderable administrative and cultural importance. Kothapet Town contains a large pawer mill and a silk factory was also under construction at the time of census enumeration. Non-agricultural Classes account for more than three fourths of the urban population in Parbhani, Gulbarga, Nanded and Karimnagar Districts. Their number, among every, 1,000 of the urban population, ranges between 750 and 800 in these four districts. The fairly appreciable proportion in the urban areas of Parbhani District is due largely to Parbhani, Hingoli, Basmath and, to a smaller extent, to Sailu, Manwath and Purna Towns; in those of Gulbarga District to Gulbarga, Shahabad and, to a smaller extent,
258
254
to Shorapur and Tandur Towns; and in Nanded District to Nanded Town. Gulbarga and Nanded Towns are among the most prominent of the towns in the state from the industrial, commercial and administrative points of view, Purna is one of the biggest of the railway junctions in the state, Shahabad is noted for its cement factory and most of the other towns are fairly important as commercial and to a smallerextent, industrial centres. The fairly appreciable proportion of Non-agricultural Classes in the urban areas of Karimnagar District is due to the fact that most of its towns, as compared with those in the other districts of the state, contain a proportionately large number of persons principally dependent on primary and cottage industries or artisan trades or on employment as washermen, barbers, village officers, etc. Non-agricultural Classes are not equally well entrenched in the urban areas of the other districts. Their proportion, among the remaining districts, varies between 720 and 750 in case of Bhir, .Hidar, Medak and Mahbubnagar and between 650 and 700 in Nalgonda, Raichur, Nizamabad and Osmanabad. They are proportionately least prominent in numbers in the urban areas of Osmanabad District, wherein they can claim only 653 among every 1,000 of the urban population. But this 'distinction' passes on to Raichur District, if figures pertaining to its temporary Tungabhadra Project Camps are excluded. In that event the proportion of Non-agricultural Classes in the district is reduced to 638. This comparatively low proportion merely reflects the district's poverty in respect of non-agricultural resources. It may look surprising that the proportion of Non-agricultural Classes should be comparatively so low in Nizamabad District, in spite of its very large towns of Nizamabad and Bodhan. This again is merely an index of the changes brought about in the district by heavy irrigation on an extensive scale. Appreciable number of persons residing in the towns, whether large or small, within the canal zones of the district are principally agriculturists, mostly farm labourers or EmaIl farmers cultivating the highly irrigated areas lying all around such towns.
46. Individual Agricultural Classes.--When Agriculturl Classes taken all together are them.selves not conspicuous in the urban areas of the state, one can hardly expect individual Agricultural Classes to be signi~cant in number in those areas. In fact, except for the Livelihocd Class of Owner Culti"vators, none of the other Agricultural Classes constitute more than Ohe twentieth of the total urban popUlation. Of the 173 persons, among every 1,000 of the urban population of the state, who belong to Agricultural Classes, 84 or slightly less than half belong to the Livelihood Class of Owner Cultivators; only 26 to that of Tenant Cultivators; 49 to that of Agrieultural Labourers; and about 14 to that of Agricultural Rent Receivers. Besides, an appreciable portion of the Agricultural Classes in the urban areas of the state-especially in the more important of its
-towns--consists either of persons who are deriving their major scurce of sustenance from agriculture in rural areas but are residing in urban areas only because of some subsidiary occupation or interest, or of the dependents of agriculturists in villages who are prosecuting their studies in the towns.
47. Dist!iclwise, t~ number of the persons belonging to the Livelihood Class of Owner Cultivators, among every 1,000 of the total urban population, ranges from 174 in Raichur* to just 12 in Hyderabad. The corresponding number is as much as 172 in Nizamabad; aDd varies between 125 and 150 in Nalgonda, l\fahbubnagar, Osmanabad, Medak and Bidar; and between no and 125 in Bhir, Karimnagar, Gulbarga and Nanded; and between 50 and 100 in Adilabad, Parbhani, Warangal and Aurangabad • If the Tungabhadra Project Camps are excluded from the urban areas of Raichur District, the corresponding proportion of the Livelihood Classes of Owner Cultivators, Tenant Cultivators, Agricultural Labourers and Agricultural Rent Receivers increases to 203, 41, 78 and 39 respectively.
255
Districts. Thus, this livelihood class accounts for more than one tenth of the total urban population in all the districts of the state except Hyderabad, Adilabad, Parbhani, Warangal and Aurangabad. But the corresponding number of persons belonging to the Livelihood Class of Tenant Cultivators, at its highest, is just 60 in Mahbubnagar. It is 56 in Medak; and ranges between 40 and 50 in Nalgonda, Osmanabad, Karimnagar and Warangal; between 30 and 40 in Bidar, Raichur, Nanded, Adilabad and Gulbarga; between 20 and 30 in Hhir and Parbhani; between 10 and 20 in Nizamabad and Aurangabad and is less than even ten (i.e., one per cent) in Hyderabad. Thus, this livelihood class is not at all significant in the urban areas of any district of the state. The corresponding number of persons belonging to the Livelihood Class of Agricultural Labourers is at its highest U8. in Osmanabad District; and ranges between 100 and lIOin Nizamabad and Nalgonds; between 80 and 85 in Bidar and Parbhani; betwecn 70 and 75 in Nanded, Karimnagar and Bhir; between 60 and 70 in Raichur, Gulbarga, l\fahbubnagar and Medak; and is 52 in Adilabad, 37 in WarangaI, 28 in Aurangabad; and again less than 10 in Hyderabad. Thus, though the proportion of the Livelihood Class of Agricultural Labourers is not very significant in urban areas in general, it is by no means negligible especially in those of Osmanabad, Nizamabad and Nalgonda Districts. The corresponding number of persons belonging to the Livelihood Class of Agricultural Rent Receivers is, at its highest, 44 in Osmanabad; ranges between 30 and 35 in Raichur and Bhir; between 20 and 30 in Gulbarga, Parbhani, Nanded and Bidar; between 10 and 20 in Medak, Aurangabad, Nizamabad, Mahbubnagar, Nalgonda and Adilabad; and is less than even 10 in Karimnagar, Warangal and Hyderabad.
48. Livelihood Class of Production (other than cultivation).-This livelihood class is the second most numerous of the livelihood classes in the urban areas of the state. It accounts for 221 persons among cvery 1,000 of state's urban population. Very broadly one out of every five persons living in the towns and cities of this state is principally sustained by occupations connected with Production (other than cultivation), which it may be recalled include artisan trades like those of tailoring, smithery, pottery and shoemaking. But this appreciable proportion is nothing surprising in the context of the conditions prevailing in the country as a whole. In fact, this livelihood class is proportionately even more numerous in the country and in all the adjoining states. The actual number of persons belonging to it, among every 1,000 of the urban population, is 244 in India, 236 in Madras, 278 in l\Iadhya Pradesh and as much as 289 in Bombay.
49. This class, though significant in numbers as compared with those belonging to other livelihood classes in the urban areas of each and every district of the state, is especially conspicuous in those of Warangal, Adilabad and Gulbarga Districts. In fact, in the urban areas of these three districts it is more numerous than any other livelihood class, whether Agricultural or Non-agricultural. The class claims, among every 1,000 of the urban population, as many as 358 persons in Warangal, 317 in Adilabad and 292 in Gulbarga. It is also fairly conspicuous in the urban areas of Karimnagar, Nizamabad, Nanded, J\1edak, Aurangabad, l\Iahbubnagar and Nalgonda Districts, wherein it accounts for about 200 to 250 persons among every 1,000 of the pbpulation. The livelihood class is, however, distinctly less prominent in numbers, as compared with those of other classes, in the urban areas of Hyderabad and Parbhani Districts, in both of which its corresponding proportion is in thc neighbourhood of 195. It is least conspicuous in the urban areas of Raichur, Ridar, Bhir and Osmunabad Districts wherein its corresponding proportion declines to 175*, 170, 153 and 138 respectively. * If figures pertaining to the Tungabhadra Project Camps are excluded the corresponding proportion increases to 187 in the district.
29
256
The extraordinarily heavy proportion of the livelihood class in the urban areas of Warangal, Adilabad and Gulbarga Districts is easily explained. With many marked variations in respect of details, and also from town to town within each district, the urban areas as a whole of \Varangal District and, to a considerably smaller extent, those of GUlbarga and Adilabad are relatively rich in large scale industries, cottage and small scale industries, artisan trades, and mines or quarries. Besides, the extent of primary * industries in the urban areas of \Varangal and Aclilabad Districts is also not negligible. It has to be pointed out here that the actual volume of employment in various productive occupations (other than agriculture) may be considerably more in the urban areas of Hyderabad District than in those of either Warangal or Gulbarga; and similarly, that in the urban areas of Hyderabad or some other districts like Nizamabad ma,\' exceed that in Adilabad. But in relation to the total population, the volume of employment available in the urban areas of Warangal, Adilabad or Gulbarga Districts is considerably larger than in those of any other district within this state. The fairly conspicuous proportion of this class in the towns of Karimnagar, Medak, Mahbubnagar and Nalgonda Districts results mainly from their primary and small scale and cottage industries and artisan trades of diverse descriptions, with the exception, that in so far as the towns of Mahbubnagar District are concerned, their large scale industries are also a distinct contributory factor. But the equally prominent proportion of this class in the towns of Nizamabad District is due as much to their large scale industries as to their small scale .and cottage and primary industries and artisan trades; and that in the towns of N anded and Aurangabad is due more to their large scale industries than to their cottage and small scale industries and artisan trades. The comparatively low proportion of this livelihood class in the urban areas of Hyderabad District is only the indirect result of an extraordinarily heavy concentration of the Livelihood Class of Other Services and Miscellaneous Sources in Hyderabad City and its suburban towns. But in terms of absolute figures, the number of persons principally employed in productive occupations in .the urban areas of this district is considerably more than double that recorded even in the urban areas of Warangal. In fact, the urban areas of Hyderabad District account for considerably more than one fourth of the total number of persons belonging to this livelihood class in the urban areas of the state as a whole. This is nothing surprising as Hyderabad City and its suburban towns have the lion's share of not only the large scale industries but also of the small 'Scale industries or artisan trades t within this state. The comparatively low proportion of the livelihood class in the towns of Parbhani District is mainly due to their poverty 'in sm all .scale and cottage and primary industries and artisan trades; and the relatively meagre proportion in the towns of Raichur, Bidar, Bhir and Osmanabad Districts is due to the fact that, although some of them do boast of a few cotton ginning and pressing factories or oil mills or of an appreciable number of handlooms, they are as a whole basically poor in all types of industries and artisan trades.
50. The Livelihood Class of Commerce.-The Livelihood Class of Commerce is fairly well entrenched in the urban areas of the state though it can hardly be deemed to be as numerous therein as that of Production or much less of Other Services and Miscellaneous Sources. This is quite in contrast to its numerical inferiority in rural areas, the reasons for which have been detailed in para 72 of Section II of Chapter II. This class claims as many as 170 among every 1,000 of the state's urban population. But
* The more numerou~ of the primary industries in this state relate to stock raising. flshing and forestry (including collection of forest produce and wood cutting),
tI"yderabad Cit,Y ,h[l,8 a~ ~lllduly large number ()f , tailors, blacksmiths, silversmit~s. etc: But ~ore prominent is the .concentration wlthm Its lImIts of persons connected With modern types of small scale mdustrJes or artisan trades such as ice manufacturer,. Tcpairl'fR of cycles, watches. radios, moto!' cars, etc,
29*
257
this class-like that of Pl'oduction- is evt'll more prominent in the urban areas of the country and in those of the adjoining ~tates. Its corresponding proportion is 207 in the urban arers of the ('ountry and 190. 192 and 199 in those of Madras. Bombay and Madhya Pradesh respectively. As stated elsewhere. the proportion of this livelihood class in urban areas would have been slightly more if producers-cum-sellers had been treated simply as 'sellers' and classified under this livelihood class- as it is, they have been included in the Livelihood Class of Production as being primarily producers. But the difference is not likely to be as apprecia.ble as in the cr,se of rUTal areas.
51. This class is neither very ('onspicuous nor very insignificant in the urban areas of any district of the state. Proportionately, it is most numerous in the urban areas of Bidar and least in those of Adilabad District. In the former it accounts for 219 persons, among every 1,000 of the population, and in the lattf'r for 115. An obvious pattern is, however, discernible in the variation of the livelihood dass in urban areas from district to district. The livelihood class is proportionately more numerous in the urban areas of the western than in those of the eastern districts of the state. The only exception to this are the urban areas of Hyderabad District, exclusively because of the concentration of the livelihood class in Hyderabad City and its suburban towns. In the western districts, its proportion, among every 1,000 of the urban population, exceeds 200 in case ofBidar and Parbhani; 175 in case of Os mana bad, N anded and Aurangabad; and 150 in case of Bhir, Gulbarga and Raichur (excluding the Tungbhadra Projects Camps)*. As against this, among the eastern districts its corresponding proportion is above 175 only in the case of Hyderabad; above 150 only in the case of .Medak and Mahbubnagar; and is below 150 in Warangal, Nalgonda and Nizamabad; and even below 125 in Karimnagar and Adilabad. This livelihood class is no doubt unusually centered in the whole of the ~tate in its urban areas. Roughly two thirds of the persons belonging to this class in the state were returned from its towns. But this concentration is decidedly more marked in the western than in the eastern districts. This would be obvious from the fact that while in all the eight western districts from about 54 to 72 per cent of the total number of persons belonging to this class live in towns, in the eight eastern districts the corresponding percentage is less than even thirty three and one third in Medak, Mahbubnagar, Karimnagar and Nalgonda, less than fifty in Nizamabad, is fifty four in Adilabad and about 63 in Warangal and ninety two in Hyderabad District. This greater concentration of the livelihood dass, as a whole, in the urban areas of western distri~ts is, in turn, due chiefly to two factors. Firstly, although the eastern districts export considerable quantities of oil seeds and some other minor agricultural produce, their agricultural production, in general, is predominantly meant for home or local consumption. Contrary to· this, a considerable proportion of the agricultural produce in the western districts-especially cotton and, to a smaller extent, pulses and oil seeds--are exported beyond the districts mainly to Bombay State. This export trade has led to a comparatively hea vy concentration of commercial castes and classes, drawn locally as well as from
, other states-particularly Rajasthan, Bombay and Saurashtra-at important and convenient centres in the western districts. Such centres, even if they were originally villages,. soon developed into towns. These immigrants gradually spread oyer other commercial and allied occupations-like those of money lending and banking and wholesale and retail trade in textile products--as well. Secondly, cottage industries and artisan trades have languished considerably more in the western than in the eastern districts. In other words, the producers-cum-sellers are fewer in numbers in the western than in the ca,,~ern * The proportion of this livelihood class in Raichur District is 133 including the figures pertaining to the Tungabhadra Project. Camps and 152 excluding them.
258
-districts-whether in rural or urban areas. Consequently, the degree of dependency of the ,~verage person on traders (as against the indigenous artisans or craftsmen) is appreciably more in the former than in the latter. This greater dependency has naturally led to a larger concentration of traders in the towns of the western than in those of the eastern districts. These traders in the western districts-who obtain their wares, directly or through their wholesalers or agents, either from the craftsmen of the eastern districts or from large manufacturing concerns within or beyond the state-cater not only to the needs of the townsmen but also of the persons living in the surrounding villages.
52. As compared with the urban areas in the other districts of the state, the Livelihood Class of Commerce is proportionately most numerous in those of Parbhani and Bidar Districts--in both of which it accounts for more than one fifth of the total urban popUlation. The towns of these two districts present typical examples of the concentration of commercial activities of the western districts in urban areas, which has been dealt with earlier. Few districts of the state have as many important trading centres as Parbhani. Its towns of Sailu, Parbhani, Hingoli, Purna, Manwath and Partur are among the twenty seven of the most important of the regulated agricultural markets in the entire state, each of whose annual turnover exceeds fifty lakhs of rupees. An additional reason for the heavy proportion of the livelihood class in the towns of Bidar District is the fact that many of them are located along the old highways of the state through which its trade used to move in the past. The initial momentum thus gained is not yet entirely lost. Besides, the towns of the district have a heavy proportion of Lingayats, who combine commerce and agriculture as few castes or sects do in the state. 'The proportion of the livelihood class is only slightly lower in the urban areas of Hyderabad District. But this does not at all mean that the urban areas of Hyderabad District are second in importance from the point of view of commerce to those of Parbhani or Bidar Districts. In fact, the actual position is quite the reverse. Hyderabad City towers over all other urban areas of the state in the extent and diversity of its commerce. In terms, of absolute figures, the city and its suburban towns account for 220,119 ·out of the 591984 persons belonging to the Livelihood Class of Commerce in all the towns and cities of the State. The proportion of the livelihood class is low in the urban areas ,of this district as compared with those of Bidar or Parbhani simply because its numbers in the metropolis are largely neutralized by the considerably greater numbers belonging to the Livelihood Class of Other Services and Miscellaneous_ Sources.
This livelihood class is proportionately the least numerous in the urban areas of Adilabad and Karimnagar Districts due to various reasons. The towns of the two dis~ tricts are among the least developed in the state. The largest among them is populated by less than 25,000 persons. Most of the towns in Karimnagar and in the southern portions of Adilabad District contain a large number of producers-cum-sellers (i.e., persons engaged in rural and cottage industries and artisan trades) with the result that the Livelihood Class of Commerce loses both in absolute numbers and proportion to the Livelihood class of Production. Besides, in so far as the towns of Adilabad District ,are concerned the relatively large number of persons employed in coal mines and large scale industries-who naturally go under the Livelihood Class of Production-bring down the proportion of those belonging to the Livelihood Class of Commerce. And lastly, the low proportion is partly a reflection of the particularly backward conditions prevailing in Adilabad District and in the eastern portions of Karimnagar District which are not <conducive to the existence of this livelihood class in appreciable numbers.
259
53. The Li'velihood Class of Transport.--This class is not significant in numbers in the urban areas of the state though it cannot, as in rural areas, be deemed to be exactly microscopic. It can claim only about 56 persons among every 1,000 of the urban population of the state. The numerical position of this class is almost cqual!y insignificant in the urban areas of the country as a whole or in those of the adjoining states. Its corresponding proportion is 60 in the urban areas of the country as a whole and 52, 58, 75 in those of Bombay, Madras and Madhya Pradesh respectively. Thi" class would have been appreciably stronger in numbers, at any rate in urban areas, if domestic servants engaged in transport activities (like motor, tonga or cart drivers), employees of public transport organisations engaged in the repairing or manufacturing of vehicles or their components (like mechanics of motor taxi companies or employees of railway workshops) and persons connected. with the letting of vechicles without supplying the personel for their running, like the owners and employees of cycle taxi shops, had also been included, along with their dependents, in this class. But according to the procedure actually followed these categories of persons have been included under the Livelihood Classes of Other Services and Miscellaneous Sources, Production and Commerce respectively.
54. This livelihood class is also not significant in numbers, as compared with other Non-agricultural Classes, in the urban areas of any district of the state. Its proportion among every 1,000 of the urban population is, at its highest, only 78 in Hyderabad District. The corresponding proportion is about 60 in Aurangabad, Warangal and Adilabad ; slightly above 50 in Nizamabad and Gulbarga; and ranges between 40 and 50 in Parbhani and Raichur* ; between 30 and 40 in Bhir, Nalgonda, Bidar, Nanded and Mahbubnagar; and between 25 and 30 in Osmanabad, Karimnagar and Medak--the lowest being 26 in the towns of Medak District. The comparatively high proportion in the urban areas of Hyderabad District is due exclusively to Hyderabad City and its suburban towns. Over 36 per cent of the numbers belonging to this 1ivelihood class in the state as a whole and over 46 per cent of that in its urban areas are derived from Hyderabad City and its suburban units themselves. This extraordinarily heavy concentration is not at all surprising as Hyderabad City is by far the largest and the most important of the, urban units in the state. The city (i.e., Secunderabad and Lallaguda) has a very large railway population, among the largest in Southern India. An overwhelming number of the employees of the Road Transport Department, which almost monopolises the bus se~vices in the state, reside within the city and its suburbs. Besides, as is natural in any huge urban unit, thousands of private individuals eke out their existence in the city by plying various types of vehicles. The most numerous amongst these individuals are the rickshawalas. -Again, thousands in it derive their principal sustenance by manual transport-the most numerous amongst whom are the hamals in the gunjes. The relatively high proportion of the class in the urban areas of Aurangabad District is due exclusively to .Talna and, to a smaller extent, Aurangabad Towns; in those of Warangal to Warangal City and Khammam and Dornakal Towns--Warangal City (i.e., Kazipet} and Dornakal are important railway junctions within the state; in those of Adilabad to the classification of certain types of colliery employees in Bellampalli Town under this livelihood class. Even otherwise, in so far as the urban areas of Adilabad District are concerned, they have a slightly larger proportion of persons engaged in transport activities than those of most of the other districts of the 8tate. This is perhaps due partly to the difficult terrain of the country in the district.
* In the urban areas of Raichur District the actual proportion of this livelihood olass is 41 including the Tungabhadra Project Camps and about 43 excluding them.
30
260
55. The Livelihood Class of Other Services and Miscellaneous Sources.-This class is by far the most numerous among all the eight classes in the urban areas of the state. Its position in these areas corresponds roughly to that of Owner Cultivators in rural areas. It claims 879 out of every 1,000 persons living in the towns and cities of the state. This is the only non-agricultural class which is proportionately more numerous in the urban areas of this state than in those of the country or of the neighbouring states. It accounts, among every 1,000 of the urban popUlation, for 349 persons in the country, 291 in Madhya Pradesh, 312 in Bombay, 343 in Madras. The urban areas of this state have, proportionately, a very large number of persons deriving their principal means of livel~hood from unproductive activities (persons like pensioners, jagirdars, mansabdars and beggars), construction and maintenance of buildings, from employment in Police* and other Government Departments (whose activities are not classifiable under any distinct Census Division or Sub-Division of Industries and Servicest) and in non-government administrative organisations such as those pertaining to Sarf-e-khas, Jagir and Paigah Illaqas. It is these persons who are largely responsible for swelling the numbers and the proportion of the class in the urban areas of this state.
56. Within the state itself, this class is more numerous than all the others-whether agricultural or non-agricultural-in the urban areas of all its districts with the exception of Warangal, Adilabad and Gulbarga, wherein the Livelihood Class of Production takes the lead. The Livelihood Class of Other Services and Miscellaneous Sources accounts for more than half of the total urban popUlation in Hyderabad District. In this district, the number of persons belonging to the class, among every 1,000 of the urban population, is as much as 504. Its corresponding proportion is 434 in Aurangabad, 381 in Bhir and '355 in Karimnagar; and ranges between 300 and 35() inParbhani, Raichuri, Mahbubnagar,. Adilabad, Nalgonda, Bidar, Medak and Nanded; and between only 250 and 300 in Osmanabad, Warangal, Gulbarga and Nizamabad, being even at its lowest as much as 258 in Nizamabad District.
57. The unusually heavy proportion of this class in the urban areas of Hyderabad District is mainly due to the fact that they account for over seventy per cent of the people in all the towns and cities of this state who have returned the generation and distribution of power, employment under the Union Government (not falling under other categoriest), domestic service, journalism (including arts and letters) and pension (including mansab and other grant) ; over sixty per cent of those who have returned water supply and income from non-agricultural property; over fifty of those who have returned sanitary works and services; over forty of those who have returned medical and health (including veterinary), educational, police, municipal and recreation services or the construction and maintenance of buildings; and over thirty three and one third per cent of those who have returned employment under State Governments (not classifiable under other categoriest), or occupations connected with hairdressing, washing or dry cleaning of clothes, hutels and
... At the time of census enumeration, due to the disturbed conditions prevailing in the state, the Police Forces had beell temporarily augmented by loaned personnel frOm othel' states.
t For details Bee the cloosification of AU IndUJitries and Services given at pages 104 to 111 of Part U-B of this Volume.
~ In Raichur District, the proportion of this livelihood cloos is as· high as 842 only if figures pertaining to the Tungabhadra Project Camps are included. Excluding them, the proportion declines to 257. The labourers and employees in these camps, apart from those engaged in productive activities, have been classified under this class as being persons primarily engaged in the .:lonstruction of irrigation works.
261
res~au.rants, or legal service, as their principal means of suste.n~nce. Similarly, themaJorlty of the employees of Sarf-e-khas, PaIgah and other Jagm Illaqas in the state were returned from Hyderabad City and its suburbs. In brief, the urban areas of Hyderabad District account for considerably more than their share of almost all the occupations relevent to this livelihood class, the significant exceptions being the construction and Jllaintenance of transport and irrigation· works, religious services and employment as village officers and servants, unspecified labourers and beggars and vagrants. But as against all this, it may be recalled that the urban areas of this district account for less than one-third of the state's total urban population. This heavy concentration is nothing surprising considering the overwhelming importance which Hyderabad City has gradually acquired in this state, in diverse spheres, during the course of the last two centuries.
58. On account of this concentration in the urban areas of Hyderabad District, those of the other districts of the state-with the exception of Aurangabad-are left with much less than their share of persons following the various occupations mentioned earlier, especially of those connected with domestic, medical, educational, municipal and police services,. employment under the Government of India, journalism, hotels and restaurents, water supply, generation and distribution of power, sanitary works and construction and maintenance of buildings as well of pensioners and persons living on income from non-agricultural property. The impressive proportion of this class in the urban areas of Aurangaba·d District is due largely to the fact that Aurangabad Town on ace count of its historical, administrative, social and educational importance, is the nearest approach to Hyderabad City in respect of the 'incidence' of the different occupations falling under this livelihood Class. The fairly impressive proportion in the urban areas of Bhir District, as compared with those of the other districts in general, is largely due to the fact that they have much more than their share of persons deriving their principal sustenance from unspecified labour, and, to a considerably smaller extent, from legal, educational, police,. sanitation (including scavengery), and religious services and employment as village officers and barbers and from pensions. Similarly, the fairly impressive proportion in the urban areas of Karimnagar, results largely from the fact that, again as compared with the urban areas of the other districts in general, they have much more than their quota of persons principally sustained by employment as washermen, village and domestic servants, priests and barbers, or in irrigation, building, power supply and transport works and in medical, or educational services; or from pensions. As a rule, however, this livelihood class derives greater strength from occupations connected with unspecified labour. religious and legal services in the towns of the western and from laundry, police, educational, and medical services and irrigation and transport works in those of the eastera districts.
59. The especially low proportion of this class in the urban areas of Nizamabad~ Gulbarga, Warangal and Osmanabad Districts--as well as in those of Raichur District minus its Tungabhadra Project Camps-is due todiverse factors. The towns of Nizamabad District have comparatively small numbers of persons employed as unspecified labourers and priests or in educational and legal services. This paucity is particularly due to Bodhan and Armoor Towns wherein a very large portion of the populaiion is primarily engaged in various types of productive activities. Similarly, the urban areas of the districts of Gulbarga and Raichur (minus the Tungabhadra Project Camps in the latter) are, on the whole, poor in persons .following most of the occupations which are relevant to this class-the significant exceptions being cf beggars and va grants, hotel keepers and servants and, in case' of the urban areas of Gulbarga, of persons principally engaged in water supply and, in case of those of Raichur, of persons principally dependent
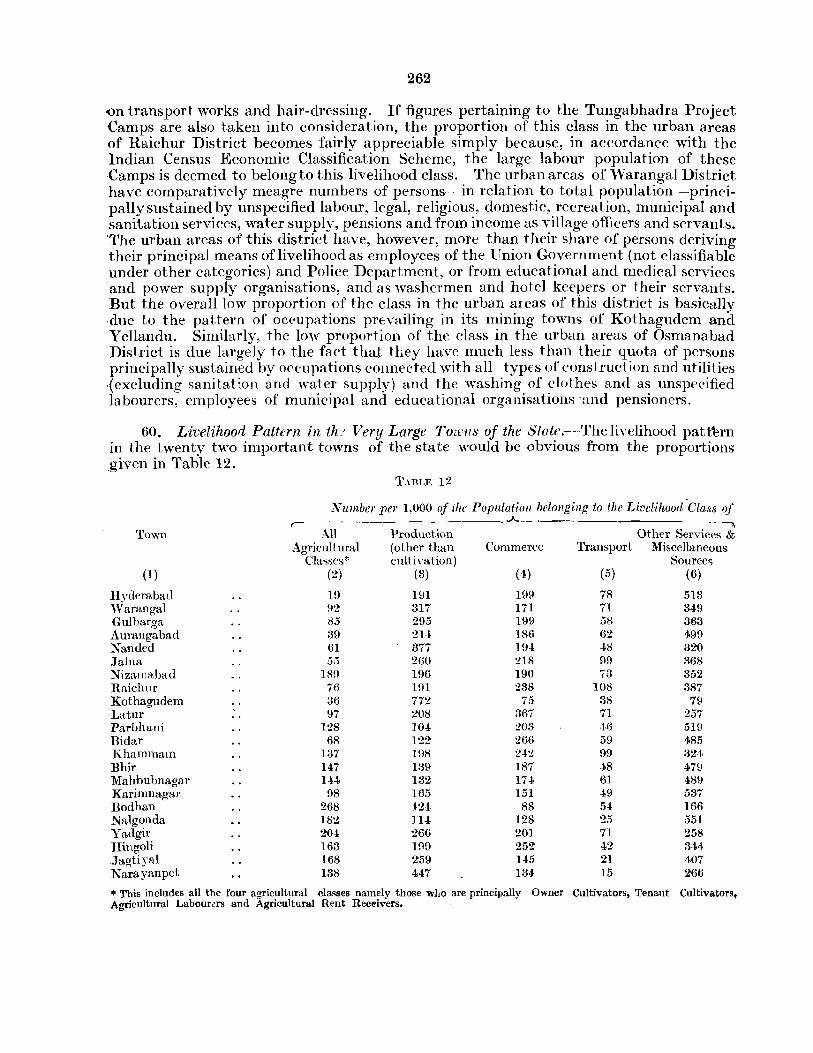
262
()n transport works and hair-dressing. If figures pertaining to the Tungabhadra Project Camps are also taken into consideration, the proportion of this class in the urban areas of Raichur District becomes fairly appreciable simply because, in accordance with the Indian Census Economic Classification Scheme, the large labour population of these Camps is deemed to belong to this livelihood class. The urban areas of Warangal District have comparatively meagre numbers of persons-in relation to total population-principallysustained by unspecified labour, legal, religious, domestic, recreation, municipal and sanitation services, water supply, pensions and from income as village officers and servants. 'The urban areas of this district have, however, more than their share of persons deriving their principal means oflivelihood as employees of the Union Government (not classifiable under other categories) and Police Department, or from educational and medical services and power supply organisations, and as washermen and hotel keepers or their servants. But the overall low proportion of the class in the urban areas of this district is basically due to the pattern of oC('upations prevailing in its mining towns of Kothagudem and Yellandu. Similarly, the low proportion of the class in the urban areas of Osmanabad District is due largely to the faet that they have much less than their quota of persons principally sustained by occupations connected with all types of construction and utilities (excluding sanitation and ~water supply) and the washing of clothes and as unspecified labourers, employees of municipal and educational organisations -and pensioners.
60. Livelihood Pattern in th' Very Large TOlfllS of the State.--The livelihood pat~rn in the twenty two important towns of the state would be obvious from the proportions _given in Table 12.
TABLE 12
Number per 1,000 of the PopUlation belongillg to the Livelihood ~Cla8s of r- ----- ____________ ..A..
~
Town .-\'11 Production Other Services & _-\.gricul tural (other than Commerce Transport Miscellaneous
Cla<;ses* cultivation) Sources (1) (2) (3) (4) (5) (6)
Hvdcrabad 19 191 199 78 513 'Varangal flo) . - 317 171 71 349 Gulbarga 8.5 295 199 58 363 Aurangabad 39 2H 186 62 499 Nanded 61 377 194 .J,8 320 Jalna 5,5 260 218 99 368 Nizamabad 18!) 196 190 73 352 Raichnr 76 191 238 108 387 Kothagudem 36 772 75 38 79 Latur 97 208 367 71 257 Parbhani 128 ]O.J, 203 ·16 519 Bidar 68 19 'J' -- 266 59 485 Khammam ]37 198 2~~ 99 324 Bhir 147 139 187 .J,8 47!) Mahbubnagar 14.J, 132 17,1. 61 489 Karimnagar 98 lOS 151 .J,9 537 Bodhan 268 .J,24 88 54 166 NaJgonda 182 IH 128 25 551 Yadgir 204 266 201 71 258 Hingoli 163 199 252 42 344 .Jagtiyal 168 259 145 21 407 Narayanpet 138 447 134 15 266
* This includes all the four agricultural classes namely those who are principally Owner Cultivators, Tenant Cultivators, Agricultural Labour~rs and Agricultural Rent Receivers.
263
61. It. may be observed that the proportion of Agricultural Classes taken all together is not entirely insignificant even in these very large urban units with the e:x;ception perhaps of Hyderabad City and the towns of Kothagudem and Aurangabad wherein they account for 1ess than one-twentieth of the total population. In the rest of these towns, they constitute from about one-twentieth to as much as about one-fourth of the total population. This is inevitable in a basically agricultural country. But it may be recalled that many of the pers6ns belonging to Agricultural Classes in these towns--especially in such of them as are either the headquarters for their respective districts or contain a particularly large population-are actually engaged in non-agricultural occupations but only derive the major portion of their income from agricultural sources in the villages. Quite a number of them ,are also only dependents of agriculturists from mofussil areas prosecuting their studies in the educational institutions of these towns.
62. The proportion of the Livelihood Class of Production is very significant in each one ,of these towns. It accounts from about one-tenth to two-fifths of the total population, ,excluding the mining town of Kothagudem wherein it claims as much as three-fourths of the total number of inhabitants. This class is the most numerous of all the livelihood classe, in the towns of Nand ed, Bodhan, Yadgir and Narayanpet as well. But its composition, in terms of those principally dependent on large scale industries, small scale and primary and cottage industries and artisan trades, varies from town to town and from region to region. The proportion of the Livelihood Class of Commerce is also very significant in these towns. It accounts for more than one-tenth of the total population in all of them e:x;cept Bodhan and Kothagudem. In fact, it claims more than one-fifth of the total population in .1alna, Raichur, Parbhani, Khammam and Yadgir, more than one-fourth in Bidar and Hingoli and more than even one-third in Latur--wherein it is actually the most numerous of all the livelihood classes. The proportion of the I,ivelihood Class of 'Transport is not significant in any of these urban units except in Raichur. In this town it accounts for slightly more than one-tenth of the total population. This appreciable proportion is due to the fact that the town has a relatively large railway population-at the time of census enumeration it was t-he terminus for both the G.LP. and M. & S.1\1:. Railways-besides the usual quota of persons engaged in various other transport activities common to any big town. But the proportion of this livelihood class cannot e:x;actly be deellled to be microscopic in the remaining of these twenty two towns with perhap3 the exception of Narayanpet. The Livelihood Class of Other Services and Miscellaneous Sources is the backbone of the population in most of these large towns. It accounts for more tl)an half of the total popUlation in Hyderabad City and the towns of Parbhani, Karimnagar and Nalgonda; almost half of the population in Aurangabad Town; more than two-fifths of the population in Bidar, Bhir, Mahbubnagar and Jagtiyal Towns; more than one-third of the population in Warangal City and the towns of Gulbarga, Jalna, Nizamabad, Raichur and Hingoli; and for almost one-third in Nanded and Khammam Towns. Among the rest of the towns it accounts for more than one-fourth of the population in Latur, Yadgir and Narayanpet. Its proportion, however, is relatively not very significant in Bodhan and, even more so, in Kothagudem.
Sumrnary.-The overwhelming majority of the state's urban population is primarily non-agricultural in .composition. Out of every 1,000 persons living in its towns and cities as many as 827 belong to Non-agricultural Classes. But the degree of this dominance varies widdy from district to district. The Non-agricultural Classes account for as many as 968 persons, among every 1,000 of the urban popUlation, in Hyderabad District. Their numerical superiority is, however, considerably reduced in case of the other districts. But they still claim over four-fifths of the population in the lll:ban areas of Aurangabad, Warangal and Adilabad Districts; over three-fourths in those of Parbhani, Gulharga; Nanded and Karimnagar Districts; almost three·fourths
264
in those of Bhir, Bidar, Medak and Mahbubnagar Districts; over two-thirds in those of Nalgonda, Raichur and Nizamabad Districts; and almost two-thirds in those of Osmanabad District.
Individual Agricultural Classes are not very significant in numbers in urban areas. Among every 1,000 of the state's population, 84 belong to the Livelihood Class of Owner Cultivators, 49 to that of Agricultural Labourers, 26 to that of Tenant Cultivators and only about 14 to that of Agricultural Rent Receivers. But even the comparatively small numbers of these classes in urban areas, include many persons who have moved in from the villages on account of some subsidiary non-agricultural occupation or interest or for the prosecution of higher studies. Districtwise, except for the Livelihood Class of Owner Cultivators in the urban areas of Raichur, Nizamabad, Nalgonda, Mahbubnagar, Osmanabad, Medak, Bidar, Bhir, Karimnagar, Gulbarga and Nanded Districts; and of Agricultural Labourers in those of Osmanabad, Nizamabad and Nalgonda, none of the Agricultural Classes accounts for more than one-tenth of the urban population in any district.
The Livelihood Class of Production (other than CUltivation) is, numerically, second only in importance to that of Other Services and Miscellaneous Sources in urban areas. It claims as many as 221 persons out of every 1,000 of the state's urban population. In fact, it is the most numerous of all classes in the urban areas of Warangal, Adilabad and Gulbarga Districts. It accounts for more than one-third of the urban population in Warangal, slightly less than one-third in Adilabad and for considerably more than one-fourth in Gulbarga District. Similarly, it claims more than one fifth of the urban population in Karimnagar, Nizamabad, Nanded, Medak, Aurangabad and l\Iahbubnagar Districts. It is relatively the least numerous in the towns of Osmanabad District, but even in these towns it accounts for more than one-tenth of the population. The class derives its strength in the urban areas of Warangal, Adilabad and Gulbarga from persons engaged in large scale, cottage and small scale industries, artisan trades, and mines or quarries and also primary industries in so for the first two are concerned; in those of Karimnagar, Medak, Mahbubnagar and Nalgonda mainly from persons engaged in primary, small scale and cottage industries and artisan trades; in those of Nizamabad almost equally from the employees of large scale industries and from persons engaged in primary, small scale and cottage industries and artisan trades; and in those of Nanded, Aurangabad and Parbhani, mostly from the employees of large scale industries~although the numbers of persons engaged in cottage and small scale industries and artisan trades is also fairly appreciable in case of the first two. The class draws its numbers in the urban areas of Hyderabad District from the employees of large scale industries as well as from those engaged in small scale industries or artisan trades of diverse descriptions, including the relatively modern ones. The urban areas of Raichur, Bidar, Bhir and Osmanabad are, on the whole, basically poor in all types of industries and artisan trades.
The Livelihood Class of Commerce is fairly well entrenched in urban areas, which is quite in contrast to its numerical insignificance in rural areas. It accounts for 170 persons out of every 1,000 of the state's urban population. Districtwise, it claims more than one-fifth of the urban popUlation in Bidar and Parbhani, almost one-fifth in Hyderabad and more than one-sixth in Osmanabad, Nanded, Aurangabad, Bhir and Medak. It is comparatively the least conspicuous in the urban areas of Adilabad District, but claiming even there for slightly more than one-tenth of the population. Its numerical position would have been slightly more significant if producers-cum-sellers had been treated as traders instead of as producers. With some exceptions, this class is more prominent in the towns of the western than in those of the eastern districts. The heavier export of agricultural produce from the western than from the eastern districts as well as the steeper decline in the numbers of artisans and craftsmen, i.e., of producers-cum-sellers, in the former than in the latter during the recent centuries, have led to a greater concentration of traders, both wholesale and retail, in the western than in the eastern towns.
The Livelihood Class of Transport is not significant in numbers in the urban areas of the state as a whole although it cannot-as in the case of its rural areas-be deemed to be exactly microscopic. It claims 56 persons among every 1,000 of the state's urban popUlation. Nor is the class numerically important in the urban areas of any district of the state. It can at best account for slightly more than one-twentieth of the total urban popUlation in Hyderabad, Aurangabad, Warangal, Arlilabad, Nizamabad and Gulbarga Districts. At the other end, it can claim only about 25 persons out of every 1,000 in the towns of Karimnagar and Medak Districts. It may, however, be recalled in this connection that employees of transport organisations or agencies engaged in the making or repairing, of transport equipment, persons lettir:g vehicles on hire without supplying the personnel for running them and domestic servants engaged in the running or maintenance of vehicles were not treated as belonging to this class--they were clubbed under the Livelihood Classes of Production, Commerce and Other Services and Miscellaneous Sources respectively. The inclusion of such persons (and thcirdependents) under this class would have no doubt increased its meagre strength appreciably. But even then its overall proportion to the total urban population would not have been very Significant.
265
The Livelihood Class of Other SeL'Vices and Miscellaneous Sources claiming 379 out of every 1 000 of the state's urban population, is by far the most numerous among all the classes in urban areas. Districtwise, it accounts for more than half of the total urban population in Hyderabad; more than two-fifths in Aura.ngabad ; more than one-third in Bhir, Karimnagar, Parbhani and-taking into account the population of the Tungabha.dra Project Camps-Raichur as well; almost one-third in Mahbubnagar; and more than one-fourth in all the remaining districts. The unusually heavy proportion in the urban areas of Hyderabad District is due to the concentration of almost all the occupations pertinent to the class in Hyderabad City-the significant exceptions being those connected with the construction and maintenance of transport and irrigation works, religious services, employment as village servants, unspecified labour and begging. Compared with the urban areaS of Hyderabad District, those of the others in general, with the exception of Aurangabad, have much less than their share of persons principally dependent on occupations connected with power and water supply, hotels and restaurants, journalism and comtruction of buildings; medical, public health, veterinary, sanitation, municipal, educational, police and domestic services; and employment in Government of India Departments which is not classifiable under other categories; as well as of persons principally sustained by pensions, or income from non-agricultural property, or as employees of non-government IlIaqas like Serf-e-kha.s and J agirs. As a rule, the class derives greater strength in the western towns from persons principally dependent on unspecified labour and religions and legal services and in the eastern towns from laundry, police, educational and medical services and irrigation and transport works. The south-westem
-<iistricts of Gulbarga and Raichur are especially poor in most of the occupations pertaining to this class.

CHAPTER IV Dependency, Secondary Means of Livelihood and Employment

SECTION I
DEPE~DENCY
~The table6 relevant to litis Seelio" are .Vain Table 'B-I-Livelilwod Classes and Sub-classes' given at page 117 of Part II-B' Suhsidiary Tables' J. l' to ' .J. 5' given at pages 111 to 119 of Part I-B ; and Subsidiary Tables' 5.1' to' 5. {j-B' gi'lJffl at pagt/s J.J1 to 159 again of Part- J-B of this Volume).
I nstrmtioJls t ') (llumerators and Li mitations .--The information collected during this census in respect of economic status covered both dependency and employment. This section deals with the former. The enumerators had been instructed to ascertain and record, in respect of ea('h and every person enumerated 1>y them, as to whether that person was (i) self-supporting. or (ii) an earning dependant, or (iii) a non-earning dependant.
2. It 'was specified in the instructions issued to enumerators that "where a person is in receipt of an income and that income is sufficient at least for the person's own maintenance then he (or she, as the case may be) should be regarded as self-supporting. Any one who is not a self-supporting person in this sense is automatically a dependant. But a dependant may either be an earning or a non-earning dependant. If the dependant secures a regular income*, whether in cash or kind, he should be regarded as an earning dependant. It is immateri~l if thi~ regular inc.om~ is small. But it is obvi<?us that this income should not be sufficIent by Itself to mamtam the dependant, otherwIse he would be a self-supporting person. If, on the other hand. the dependant does not earn any reaular incomf' then he should be regarded as a non-earning dependant". The enumerato~s were also told that "where two or more members of a family household jointly cultivate land and secure an income therefrom, then each of them should be regarded as earning a part of the income. ~one of them is, therefore. a non-earning dependant. Each of them should be classed as either a self-supporting person or an earning dependant, according to the share of income attributable to him or her. The same principle will hold good with regard to any other business carried on jointly. It should also be noted that everyone who works is not n.ecessarily a self-supporting person or an earning dependant. For instance, a housewife who cooks for the family, brings up the children, or manages the household is doing very yaluable work. Nevertheless, she is a non-earning dependant if "he does not also earn an income".
It is, howeyer, certain that on account of the strong sentiments prevailing in the state, especially in. its rural areas, with regard to the role of the paterfamilias as the bread-winner in the joint family and the dependency of women on men folk, quite a large number of c!~iz~ns would not have replied to this question strictly from an econom~c point of view. SImIlarly, the .approach of so~e of the enumera~ors themselves to thIS question may have also been mfluenced, conscIously or unconscIously, by these very sentiments. In spite of all these, the returns are good enough to frame a broad analysis of dependency among the people.
3. Proportion of Self-Supporting and Earning and Non-Earning Dependants, among the Total, Male alld Female and Rural and Urban Populations.-Among every 1,000 * The enwnerators were informed that a regular income meant non-casual income and that it would include income derived from continuous or selillonal employment but will exclude income a('cruing casually and not constituting a source which is regularly depended upon.
269
270
persons enumerated in this state, 258 are self-supporting and ·199 are earning dependants and 543 are non~earning dependants. Thus, about one fourth of the total population of this state consists oj self-supporting .persons, one fifth oj earning dependants and slightly more than one half oj non-earning dependants. Sexwise, among every 1,000 males, as many as 447 are self-supporting and only 149 are earning and 404 non-earning dependants. As against this, among every 1,000 females, just 65 are self-supporting but as many as 249 are earning and 686 non-earning dependants. Thus, while the proportion of selfsupporting persons among the females is roughly only one seventh of that among the males, their proportion of non-earning dependants is appreciably more than one and a half times that among the males. But what is apparently more surprising is the fact that the proportion oj earning dependants among the females is considerably more than that among the males. This, however, fits in with the existing pattern in the state. Among the indigenous. population, except in the case of a few ca$es or sects, the women not only manage all the household work but also assist their men folk, more or less regularly, in their professions and where it is not possible for them to do so because of physical inability or social conventions, they take to other occupations. An example of the latter is of the women among the Mangalas, Nais or Wariks, who engage themselves in professions like mid-wifery or tattooing while their men engage themselves in hairdressing. Among the cultivating castes of this state whether in the Telugu, Marathi or Kanada areasexcluding of course the relatively well to do of their families-women take an. active part in agricultural operations. In fact, some of the operations are entrusted to them almost exclusively. Similarly, among the majority of the other professional castes, females. participate actively in occupations followed by the male members of their family subject only to variations in respect of the degree of their participation. Even among these castes, particular tasks are very often entrusted solely to women. Again, this is true not only of the poorer of these castes like those of the Dhangars and Kumbhars, or to the intermediary castes like those of the Darzis, Telis, Gowlis and Julahas but also of the richer of the castes like those of the Sonars and Komatis. In some castes or groups like those of the Waddars, Lambadas and Yerukalas, the majority of the grown up females are associated in their traditional occupations to such an extent that they can be said to earn much more than their maintenance. But in general, and as stated in paragraph 2 above, the capacity of females to earn their own maintenance, or at least to make a singnificant contribution to it (apart from the household duties undertaken by them), is appreciably underestimated because of certain sentiments. In other words, the census returns pertaining to the non-earning dependants among the females in this state, in general, are exaggerated significantly at the cost of both the self-supporting persons and the earning dependants among them.
4. Among every 1,000 of the rural population, 253 are self-supporting persons,. 227 are earning and 520 are non-earning dependants. As against this, among every 1,000 of the urban population, as many as 280 are self-supporting persons, just 77 are earning dependants and as many as 643 are non-earning dependants. In other words, the rural areas, as compared with the urban, have a slightly smaller proportion of self-support~ ing persons, a considerably smaller proportion of non-earning dependants and a remarkably higher proportion of earning dependants. These variations are due to diverse factors. The joint family system is much more in vogue in the rural than in the urban areas. As stated elsewhere, this system tends to lower the returns for self-supporting persons and increase that for the other two categories, especially the earning dependants. The movement of persons for economic reaSons is mostly from the rural to the urban areas. This type of movement also decreases the proportion of self-supporting persons in the
271
areas from which they emigrate because many of them move out singly leaving their families behind; and conversely increases the proportion in the areas to which they migrate. Again as compared with the urban areas, the rural areas have a mOre back'waru population, considerably limited facilities in respect of educational institutions and a lower proportion of higher and middle income groups but a remarkably larger number of independent occupational units, or establishments, in which all the members of a family can participate. These factors tend to increase the proportion of the earning dependants, particularly among the females and the young persons and grownup children. And again, semi-employment, which is considerably more in evidence in the rural than in the urban areas because of the heavy demand for agricultural labour during particular seasons, also increases the proportion of earning dependants.
5. Proportion of Self-Supporting and Earn'illg alld Non-Earning Dependants among Agricultural and Non-Agricultural Livelihood Classes.-Among every 1,000 persons belonging to Agricultural Livelihood Classes in this state, 248 are self-supporting and 231 are earning and 521 are non-earning dependants. As against this, among every 1,000 persons belonging to Non-Agricultural Livelihood Classes in this state, 279 are self-supporting and only 131 are earning and' 590 are non-earning dependants. In other words, the Agricultural Classes, as compared with the Non-Agricultural Classes, have a slightly smaller proportion of self-supporting persons, an appreciably smaller proportion of non-earning dependants and a markedly higher proportion of earning dependants. As is natural, these variations are broadly identical with the corresponding variations, as detailed in paragraph 4 above, as between the rural and the urban popUlations. The joint family system which, for reasons stated in the same par~graph tends to lower the returns for self-supporting persons and increase the returns especially of earning dependants, is more in vogue among the Agricultural than among the Non-Agricultural Classes as a whole. Again, a low standard of life and literacy attainments keeps the number of earning dependants high and of non~earning dependants Imv. It is a well recognised fact that, as things now stand, the Agricultural Classes are poorer and educationally more backward than Non-Agricultural Classes. And again, the number of persons, especially the youngsters, forsaking agricultural for non-agricultural occupations is considerably more than the corresponding number moving from the non-agricultural to agricultural occupations. This factor tends to increase the number of self-supporting persons among the Non-Agricultural Classes. Thus, more or less, the same factors which are responsible for the variations of these three categories of persons as between the rural and urban populations are also responsible for the corresponding variations as between the Agricultural and Non-Agricultural Classes.
6. Proportion of Self-Supporting and Earning and Non-Earning Dependants among individual Agricultural and Non-Agricultural Classcs.--The proportion of self-supporting persons, earning dependants and non-earning dependants varies appreciably frOID class to class. The actual proportions of these three categories, among every 1,000 of the persons belonging to each of the livelihood classes, in the state with their break up by sex, are given in Table 1.
81

272
TABLE 1
Livelihood Class Self-supporting persons Earning Dependants Non-earn'ing Dependants
(1) Total
(2)
I. Owner Cultivators 224 II. Tenant Cultivators 234
III. Agricultural Labourers.. 306 IV. Agricultural Rent
Receivers 288 V. Persons principallY depen
dent on Production (other than cultivation) •. 265
VI. Persons principally depen-dent on Commerce " 264
VII. Persons principally depen-dent on Transport 275
VIII. Persons principally depen--dent on Other Services &
Males (2a)
208 222 235
198
244
238
264
Females Total (2b) (3)
16 224 12 250 71 250
90 138
21 176
26 72
11 78
Males Females Total Males Females (3a) (3b) (') (4a) ( 4/J)
90 134 552 207 345 96 154 516 199 317 81 169 444 181 263
53 85 574 210 364
64 112 559 206 353
40 32 664 227 437
31 47 647 223 424
Miscellaneous Sources.. 303 253 50 110 41 69 587 216 371
This variation is due to diverse factors. One of the most important of these is the dissimilarities in the literacy attainments of the di{i.",rent classes. Other things being equal, a higher literacy percentage automatically I:i:wans a higher proportion of children and young persons going to schools and a lower proportion of such persons going to work. 'This would be obvious from the figures given in Table 2 pertaining to the proportion of (a) non-earning dependants and (b) litera tes, among every 1,000 persons in the state belonging to each of the livelihood classes.
TABLE 2
Livelihood Class
(1)
III. Cultivating Labourers II. Cultivators of land wholly, or mainly, unowned I. Cultivators of land, wholly or mainly, owned
V. Persons who derive their principal means of livelihood from Production (other than cultivation)
IV. Non~cultivating owners of land (agricultural rent receivers) VIII. Persons who derive their principal means of livelihood from
Other Services and Miscellaneous Sources VII. Persons who derive their principal means of livelihood
from Transport .'. • • VI. Persons who derive their principal means of livelihood
from Commerce ••
PROPORTION OF r-Non-earning dependants Literates
(2) (3) 444 12 516 25 552 68
559 93 574 147
587 228
647 185
664 279
The size of the average family, which is by no means uniform among all classes or areas, is another factor. Other things being equal, the larger the size of the family the smaller will be the proportion of self-supporting persons and that of non-earning dependants higher. The degree of prevalence of the joint family system is yet another factor.
81·
273
As already stated, in joint families the proportion of self-supporting persons tends to be lower and that of earning dependants higher. The sex proportion of each class, which varies considerably, the extent to which women are allowed to participate in activities other than household work in the various communities, castes and sects from which the livelihood classes draw their main numbers and the capacity of the class to absorb persons, -especially youngsters, belonging to other classes are some of the additional factors. It serves no useful purpose to detail all of them as it is not generally' possible to evaluate the relative extent to which they, or those mentioned above, influence the proportions in each class. And some of these influences in operation in respect of the same class tend to produce opposite results. The actual proportions of selfsupporting and earning dependants and non-earning dependants in each of the livelihood classes are examined in greater detail in the succeeding paragraphs.
7. (i) Among the Livelihood Class of Owner Cultivators, the proportion of selfsupporting persons is especially low. In fact, it is the lowest among all classes in the state and each and everyone of its districts. The joint family system is very much in evidence in this state among the indigenous land-owning castes like those of Marathas~ Lingayats and Kapus. As already stated, this system tends to decHm:e the proportion of self-supporting persons and increase the proportion of earning dependants, Again, many youngsters drift from this class, especially from among the families of very small or well educated pattedars, to occupations relevant to other classes. Quite often many widowed females from among the especially poor families of owner cultivators lead almost an independent life by taking to other occupations, particularly agricultural labour. Similarly, many aged or infirm owner cultivators or widowed females of owner cultivators, who have no children (especially sons) or whose children are very young, lease out their lands and either remain economically inactive or take to less responsible occupations particularly to agricultural labour. These factors tend to decrease the proportion of self-supporting persons in this class, or at least to increase it indirectly in the other classes. The corresponding drift of persons from other classes to this class is comparatively negligible in dimensions. While 224 persons, among every 1,000 belonging to this class in the state, are self-supporting, the corresponding proportion in its districts varies from 199 in Bidar to 261 in Nizamabad. There is a distinct tendency for the proportion to be lower in the western i.e., the Marathi and Kannada districts of the state, and higher in the eastern i.e., the Telugu districts. Among the former the proportion ranges between 195 and 225, and among the latter it is 212 in Hyderabad, 224 in Adilabad and ranges between 225 and 265 in the others. But on the whole the variation is not very significant.
(ii) The proportion of earning dependants in this class in the state is very high,. . though not as high as in the Livelihood Classes of Tenant Cultivators and Agricultural Labourers. Among the more important of the factors leading to this high proportion of earning dependants are a relatively low literacy percentage, prevalence of the joint family system, and the practice, at least among the smaller of the pattedars, of almost all the available and able bodied members in the family, of either six, participating in some process or the other of cultivation-in their own lands or quite often in those of others as well. Besides, there are quite a large number of persons in the state whose principal means of livelihood is cultivation of owned lands and whose secondary means of livelihood is some craft (such as shoemaking, carpentry, pottery, etc.,) or trade or service (such as hairdressing or washing of clothes). The junior members in the families of such persons, who assist the elders in cultivation or in the ancestral craft, trade or service, as the case may be, or in both of them, also swell the numbers of earning dependants in this class. Appreciably
274
more than one fifth of the persons in this class in the state are earning dependants. Districtwise, the corresponding proportion is higher than 275 in Nizamabad, l\Iedak, Aurangabad and Bhir, being at its highest 290 in Nizamabad. It ranges between 250 and about 260 in Mahbubnagar and Osmanabad. It is below the state's average of 224 in all the other districts, ranging from 200 to 225 in Parbhani, Hyd..erabad and Bidar and between 180 and 200 in all the remaining districts, being as low as 180 both in Nanded and Adilabad:
Of the 224 earning dependants, among every 1,000 belonging to this class in the state, the biggest group consisting of 98 persons (or 44 per cent) derived its income from agricultural labour. 62 of them (or 28 per cent) did not indicate their source of income at all. Obviously, in case of most of them it was either agricultural labour or a share in the lands on which they depended principally. Among the remaining, 38 (or 17 per cent), 10 and 9 persons derived their income from owner cultivation and occupations connected with production (other than cultivation) and other services anu miscellaneous sources respectively. Thus, an overwhelming majority of the earning dependants in the Livelihood Class of Owner Cultivators. derived their income from agricultural labour and, to a C'onsiderably smaller extent, owner cultivation.
. (iii) The proportion of non-earning dependants in this class is Yer,\' low, although it is not as low as among the Liyelihood Classes of Tenant Cultivators and, more especially, Agricultural Labourers. This is the natural sequence of the high proportion of earning dependants among them for reasons mentioned above. 552 among every 1,000 persons of the state belonging to this class--or appreciably less than sixty per cent-are non-earning dependants. Distrietwise, the corresponding proportion is roughly 600 in Nanded, Bidar, Adilabad, Raichur and Gulbargl'l.; ranges between .560 and 590 in Hyderabad, Karimnagar, Warangal and Parbhani. It is below the state's average in all the other districts, being only -190 in l\redak and 449, i.e., less than even 45 per cent, in Nizamabad.
8. ('i) The proportion of self-supporting persons in the Livelihood Class of Tenant Cultivators is very low, being considerably lower than in all the other livelihood classes with the except.ion of that of Owner Cultivators. This is true of the state as a whole as well as of eaeh of its districts. The more important of the reasons for the very low proportion of self-supporting persons in this class are again the prevalence of the joint family system among the cultiyating castes of the state and the drifting of many youngsters belonging to these ('lasses to agricultural labour or to occupations connected with non-agricultural classes. Again, as in the case of the Livelihood Class of Owner Cultivators, the proportion of self-supporting persons in this class tends to be comparatively low in the western and high in the eastern districts of the state. Among the former, it rallget"' between 208 (in Bidar) and 238 (in Raichur), being heavier than the state's average of 234 only in Raichur. Among the latter, it is 220 in Hyderabad, 228 in :\Iedak, 231 in Warangal and "aries between 235 and 281 in Nizamabad, Nalgonda, -;\IahbubnaO'ar, Karimnagar and Adilahad, being at its highest 281 in Nizamabad. _ 0
(ii) The proportion of earning dependants in this class-and, as will be seen from the succeeding paragraph, in that of Agricultural Labourers-is the highest recorded a.mong all classes. 250, out of every 1,000 persons belonging to each of these two classes, i.e., as much as one fourth of their numbers, are earning dependants. The especially high proportion of earning dependants in this class largely reflects its poor literacy standards and economic backwardness. The number of able bodied adults and grown-up children in the families belonging to this class who do not contribute something towards the total
2i5
sustenance of their respective families is perhaps negligible. This is true more or less of both the sexes. In no other class, except in that of Agricultural Labourers, do females ('ontribute more towards the total family earnings, in cash and kind. For every two earning dependants among the males in this class there were roughly three earning depend~ ants among the females! Districtwise, tht' number of earning dependants, among every 1,000 belonging to this class, is higher than even 300 in Medak, Nizamabad, Aurangabad and Mahbubnagar, being at its highest 31.5 in Medak. It ranges between 250 and 300 in Bhir. Osmanabad and Hyderabad. It is, however, below the state's average in the rest of the districts, being as low as 184 in Raichur and 168 in Adilahad.
Of the 250 earning dependants, among every 1,000 persons belonging to this class jn this state, as Illany as 152 (or over 60 per cent) derived their income from agricultural labour; 51 (or oyer 20 per cent) did not specify the source of their income at all- it must have been mainly through agricultural labour- and 15, 14 and 11 obtained their income from tenant euItivation and occupations connected with production (other than cultivation) and other services and miscellaneous sources respectively. Thus, the ,overwhelming majority of the earning dependants among the Livelihood Class of Tenant Cultivators obtain their earnings through agri('ultural labour.
(iii) The proportion of non-earning dependants in this class is lower than in aU the livelihood classes except that of Agricultural Labourel's. This merely reflects the fact that fl'om the economic- and literacy points of view, this class is, except for that of Agricultural Labourers, the worst placed. While in the state as a whole 516, out of evel'V 1,000 belonging to this class, are non-earning dependants, the corresponding proportion ranges between 550 and 600 in Adilabad, Raichm' and Bidar and between 535 and 550 in Nanded, Warangal, Gulbarga. Parhhani and Karimnagar. It is below the state's average in all ihe other districts ofthe state--being roughly 500 in bothOsmanabad and Hyderal:lad, rangin.g between 450 and 500 in Bhir, Nalgonda, Aurangabad, Medak and Mahbubnagar and being as low as 405 in Nizamabad.
9. (i) The proportion of the self-supporting persons in the Livelihood Class of Agricultural Labourers is the highest re~orded am~ng all liveli~ood cIa,sses. in the state, being slightly higher than the correspondmg proportIon recorded m the LivelIhood Class of Other Services and Miscellaneous Sources and distinctly higher than that recorded in all the other classes. :Many widows, youngsters and some times even aged persons belonging to the Livelihood Class of Tenant Cultivators or to the poorer strata among all the other classes in the rural areas of the state, take to agricultural labour as their principal occupation. Besides, the castes and the sections of other castes or communities which generally take to agricultural labour are beyond doubt the poorest and the most illiterate in this state. This compels even the physically fit among their females and grown -up children to be economically active-as self-supporting, if possible, and if not as earning dependants. Such persons take not only to agricultural labour but also to non-agricultural labour, domestic service etc. It would not be wrong to say that all members in this class, except the very y~ung and the extremely old?r infirm! remain une.mployed only whe~ no employment is available. These factors explam the hIgh proportIOn of self-supportmg persons and, as will be seen from the succeeding sub-paragraph, of earning dependants as well in this class. In the state, 306 out of every 1,000 persons, or very broadly one out of every three, belonging to this class are self-supporting. Districtwise, the proportion is as high as 431 in Nizamabad and ranges between 350 and 375 in Mahbubnagar, Raichur and Nalgonda. Though lower, it is appreciably above the state's average in both Medak and Hyderabad and slightly above in Warangal and Gulbarga. It is below the average in all
32
276
Qther districts, being 301 in Karimnagar and ranging between 275 and 300 in Adilabad and Nanded and between 250 and 275 in Aurangabad. Parbhani, Osmanabad, Bidar and Bhir. But even at its lowest it is as much as 250 in Bhir.
(ii) The proportion of earning dependants in this class and in that of Tenant Cultivators, is the highest recorded among all classes. In no other livelihood class are females equally prominent in respect of their capacity to earn as in this class. The reasons for the especially high proportion of earning dependants in this class have already been detailed in the preceding sub-paragraph. 250, out of every 1,000 persons belonging to this class, or one fourth of the total, are earning dependants. Districtwise, the corresponding proportion is as high as 304 in Bhir, ranges between 275 and 300 in Aurangabad, {)smanabad and Parbhani and between 250 and 275 in Mahbubnagar, Bidar, Medak and Hyderabad. It is below the state's average in all the other districts, ranging between 225 and 250 in Warangal, Nanded, Nizamabad and Karimnagar, between 200 and 225 in Nalgonda, Gulbarga and Adilabad and being only 173 in Raichur.
Of the 250, earning dependants, among every 1,000, of the persons belonging to this class in this state, as many as 139 (or 56 per cent) derived their earnings through agricultural labour and 85 (or 34 per cent) did not specify their source of income .at all. But it can safely be presumed that the majority among the latter also obtained their income through agricultural labour, although a fair number of them must have been employed as miscellaneous labourers, domestic servants, etc. Among the rest, the only significant group, numbering about 12 (or 5 per cent), is of those who obtained their earnings through occupations connected with other services and miscellaneous sources. Thus, almost 95 per cent of the earning dependants in this class obtained their earnin(1s through agricultural labour-or to a very minor extent-from occupations relevant to oth~r seryices and miscellaneous sources.
(iii) As a corollary to the especially high proportion of both self-supporting persons and earning dependants in this class, the proportion of non-earning dependants in it is by far the lowest among all classes in the state. This is also true of each and everyone of its districts. Only 444, among every 1,000 persons belonging to this class or appreciably less than 50 per cent, are non-earning dependants. Districtwise, the corresponding proportion, even at its highest, is 497 i.e., less than 50 per cent, in Adilabad. It is 478 in Nanded and ranges between 444 (the state's average) and 475 in Gulba1'oaa, Bidar, Karimnagar, Osmanabad, Parbhani, Raichur and Bhir. It is below the stat~'s average in all the remaining districts, ranging between 400 and 445 in Aurangabad, Warangal and Nalgonda, between 350 and 400 in Hyderabad, Medak and l\fahbubna(1ar, and being as low as 339 in Nizamabad. It is not without significance that the proportion of non-earning dependants in this class is the lowest in the state in the richly irrigated district of Nizamabad and in the districts of Hyderabad, .M:edak and Mahbubnagar which are not only fairly well irrigated but have also the advantage of Hyderabad City with its vast capacity for the absorption of persons in non-agricultural occupations.
10. (i) The proportion of self-supporting persons in the Livelihood Class of AgricuUural Rent Receivers is fairly high, though not as high as among that of Agricultural Labourers or of persons principally dependant on Other Services and Miscellaneous Sources. This high proportion is due to various reasons, the most prominent of which is the fact that an appreciable number among the widows of owner cultivators not having grown-up sons, lease out their lands and either remain economically inactive or take to less onerous or lighter occupations. Similarly, many females who have acquired or inherited lands generally lease them out unless some dependable relatives or persons are available to super-
32 .,
277
vise the cultivation. These two factors lead to an unusually high proportion of selfsupporting females among this class. In fact, it may be observed from Table 1 that among all the livelihood classes, the proportion of self supporting females is by far the highest in this class. .Besi~es, this clas~ contains a number of self-supporting persons who (a) belong to the hIgher mcome and lIteracy groups, or (b) are too aged (or infirm) and without any grown-up male issues or relatives to assist them in cultivating their lands~ The families of both these categories of persons are, in general, comparatively small and, as stated elsewhere, the proportion of self-supporting persons tends to be high in small families. As many as 288, among every 1,000 persons belonging to .this class in the state, are self-supporting. Districtwise, the corresponding proportion is as high as 3ct5 in Nizamabad, wherein females account for over 40 per cent of the self-supporting persons in this class. Among the other districts, it ranges between 800 and 825 in Nalgonda, Karimnagar, Mahbubnagar, Raichur, Warangal and Adilabad and is slightly above the state's average in l\Iedak. It ranges between 250 and 288 (i.e., the state's average) in all the other districts, except Hyderabad wherein it is as low as 244.
(ii) The proportion of earning dependants in this class is by no means conspicuous and is considerably lower than that recorded in the other agricultural classes~ Only 138, among every 1,000 persons belonging to the class, are earning dependants~ Districtwise, the corresponding proportion is 192 in Mahbubnagar, 173 in Aurangabad. ranges between 150 and 160 in Medak, Bhir, Nanded and Osmanabad and is 145 in Bidar. It is below the state's average in all the remaining districts--ranging between 115 and 136-except in case of Hyderabad wherein it is as low as .'50. The comparatively low proportion of earning dependants in this class, in general, is largely a reflection of its relatively high literacy and economic standards. The unusually low proportion of earning dependants in Hyderabad District is mainly due to the fact that roughly 65 per cent of this class in the district is returned from Hyderabad City and its suburban units. And, in urban areas, especially in the larger of the towns and cities, the class has a high proportion of both the richer of the absentee landlords and of youngsters belonging to this class who are attending schools and colleges. Naturally, therefore, the proportion of earning dependants is especially low-and as will be seen from the succeeding sub-paragraph of non-earning dependants inordinately high-in Hyderabad District.
, Of the 138 earning dependants, among every 1,000 persons belonging tothis class in this state, 72 (or 52 per cent) obtained their earnings through agricultural labour, 15 (or 11 per cent) through other services and miscellaneous sources and ab'out 10 (or 7 per cent) from production and 83 (or 24 per cent) did not specify the occupation through which they derived their earnings. Thus, even in this class agricultural labour is the major source of income for the earning dependants. It is obvious that most of these earning dependants come from those families of small landowners who have been forced, because of the demise of their elders or because of the inadequate return from their own lands, to lease out their lands and seek supplementary sources of income. Unlike in the other classes, the proportion of earning dependants belonging to this class who derive their earnings from the occupation (or occupations) relevant to the class itself is hardly significant. For example, while over 55 per cent of the earning dependants in the Livelihood Class of Agricultural Labourers derive their earnings from agricultural labour itself and over 30 per cent of the earning dependants in the Livelihood Class of Other Services and Miscellaneous Sources obtain their earnings from occupa~ions pertinent to it, only 2 per cent of the earning dependants in this class draw their earnings in shape of agricultural rent. This is but natural.
278
(iii) The proportion of non-earning dependants in this class is fairly high, being higher than in all the other agricultural classes. This again, largely reflects the relatively high literacy and economic standards of the class. 574, out of every 1,000 persons belonging to this class in the state, are non-earning dependants. Districtwise, the corresponding proportion is as high as 706 in Hyderabad and ranges between 575 and 600 in Bidar, Raichur, Gulbarga, Parbhani and Osmanabad. It is below the state's average in aU the other districts, ranging between 550 and 575 in all of them except Aurangabad, Niz3.m3.bad and Mahbubnagar wherein it is as low as 547, 519 and 499 respectively. The reason:; for the inordinately high proportion of non-earning dependants in this class in Hyderabad District have already been detailed in the 'preceding sub-paragraph.
n. (i) Among all the'livelihood classes, the pattern of the distribution of persons according to self-supporting and earning and non-earning dependants in that of Produ,ction (other than cUltivation) bears the closest resemblance to the corresponding pattern in the total population of the state. It is not entirely insignificant that from the point of view of literacy also this class is the nearest approach to the total population. 265, among every 1,000 persons belonging to this class in the state, are self-supporting. Districtwise, the corresponding proportion is at its highest 293 in Raichur and at its lowest 228 in Bidar. Among the other districts the proportion is above the average for the state in Nizamabad, Hyderabad, Mahbubnagar, Nalgonda, Adilabad and Warangal.
(ii) 176, among every 1,000 persons belonging to this class in the state, are earning dependants. This is the highest proportion recorded among all the non-agricultural classes. But this is in keeping with the fact that this class is by felr the most backward among all of them from the point of view of literacy and, unlike the rest of them, derives its major numbers from rural areas. Dlstrictwise, the corresp3nding proportion varies between just 90 in Hyderabad and 245 in Mahbubnagar. The espe
'cially low proportion in Hyderabad District is due to the fact that roughly three fourths of the class in the district is returned from Hyderabad City. And as stated elsewhere, in urban units-especially the larger ones-the proportion of earning dependants tends to be very low and that of non-earning dependants to be very high. Excluding Hyderabad District, the lowest proportion of earning dependants recorded in this class is 136 in Raichur. . _..a::::= ~ -
Of the 176 earning dependants, among every 1,000 of the persons belonging to this class in the state, 80 (or about 45 per cent) obtained their earnings through agricultural labour and 41 (or 23 per cent) through occupatiom connected with the Livelihoo:.i Class of Production itself, Presumably, the majority of the latter consists of the junior m~mbers in the families of artisan castes. Again, 27 (or 16 per cent) of these earning dependants did not specify the occupation through which they obtained their income. It is, however, obvious that the majority of such persons would consist again either of persons in artisan families assisting their elders in the ancestral crafts or of agricultural labourers. Thus, even in this non-agricultural class, the largest number-if not a decisive m ':l.jority~of the earning dependants obtained their earnings through agricul turallabour, This is not surprising as in the rural areas most of the cobblers, potters, stock raisers (i.e., dhangar!J, etc.), fishermen, basket and mat weavers and other categories of artisans-including a fair portion of even the weavers~ oil pressers (i.e., telis), carpenters, etc.-take part in agricultural operations during the busy seasons. In fact, a large number drawn from such occupational castes has even returned agricultural labour and, to a smaner extent, .owner or tenant CUltivation as the principal means of livelihood.
279
(iii) 559, among every 1,000 of the persons belonging to this class in this state, are non~earning dependants. The proportion is as high as 628_in Hyderabad District, for reasons explained in the preceding sub-paragraph. Among the other districts, it ranges between 474 (in Mahbubnagar) and 600 (in Bidar), being higher than the state's average in all the districts except Medak, Bhir, Nalgonda, Nizamabad and Mahbubnagar as well.
12. (i) The proportion of self-supporting persons in the Livelihood Cla'18 of Commerce is lower than in all classes except in those of Owner and Tenant Cultivators. One of the reasons for the low proportion of self-supporting persons in this class is once again the comparatively strong attachment of the indigenous trading castes of this state to
. the joint family system. This attachment is as, if not more, conspicuous in the urban as in the rural areas because many of the important non-indigenous trading castes in the state (the Marwadis, Kutchis, etc.), who are mostly settled in its towns and cities, are probably more attached to this system. 26~ out of every 1,000 persons belonging to this class in the state are self-supporting. Districtwise, the corresponding proportion ranges between 223 (in Bidar) and 293 (in Nalgonda). The proportion is above the state's average of 264 in the districts of Nalgonda, Nizamabad, Mahbubnagar, Hyderabad, Adilabad, Wat'angal, Raichur and Medak.
(ii) Just 72, out of every 1,000 persons belonging to this class in the state, are earning dependants. This is the lowest proportion of earning dependants recorded .among all the classes in this state. This fits in with the fact that this class, ag a whjle, is the most literate of all classes and-in spite of the fact that one often sees fema.les engaged on their own, or assisting their men-folk, in petty trading or hawking-its females are economically the least active. Besides, the class is highly urbanised. A districtwise examination of the relevant figures also reveals that the smallest proportion of earning dependants is recorded either in this class or in that of Transport. The only exception to this is Hyderabad' District, wherein this ' distinction' belongs to the Livelihood Class of Agricultural Rent Receivers because of an unusual concentration in Hyderabad City of the relatively rich absentee land-lords and of students belonging to the class drawn from other areas of the state. Districtwise, the actual proportion of earning dependants, among every 1,000 of the persons belonging to the class, is at its highest 105 in Bhir and at its lowest 41 in Hyderabad. The range woulcl have been narrowe~ still but for the fact that about 90 per cent of this class in Hyderabad District is urbanIsed-being returned from Hyderabad City itself. Excluding Hyderabad District, the lowest proportion recorded is 69 in Warangal.
Of the 72 earning dependants in this class, among every 1,000 persons belonging to it, the three largest groups are (i) of those who obtained their earnings through commerce itself, {ii) of those who derived their earnings through agricultural labour and (iii) of those who failed to indicate the source of their income, the three groups claiming roughly 20, 16 and 16 persons respectively. The second of these groups is slightly less numerous than the third. The majority of the persons in the first and the third groups presumably represent the junior members in the families of the trading castes who are .assisting their elders in their ancestral profession. This is the only class in respect of which agricultural labour plays a secondary -though by no means insignificant-role as a source for supplementing the main income. It is also obvious that the overwhelming majority of the earning dependants in this class, who derive their earnings through agricultural labour, belong to the families of petty traders or hawkers in rural areas.
280
(iii) As a corollary to the unusually low proportion of earning dependants in this class, its proportiop of non-earning dependants is extremely high. In fact, it is the highest among all classes in the state. The actual number of earning dependants, among every 1,000 of the persons belonging to this class, is 664 for the state as a whole. In other words, over two thirds of the total numbers belonging to this class are nonearning dependants. Districtwise, the corresponding proportion ranges within the narrow limits of 617 and 691, the former in Nalgonda and the latter in Bidar.
13. (i) 275, out of every 1,000 persons belonging to the Livelihood Class of Transport in the state, are self-supporting. The proportion would have been appreciably lower but for the fact that roughly one third of the numbers belonging to this class consists of the employees of the railway and road transport organisations and their depen-· dants, whose economic and literacy standards are considerably above the average for the state. Districtwise, the corresponding proportion varies from 244 in Karimnagar to 317 in Nizamabad, being higher than the state',s average in Adilabad, Raichur, Hyderabad and Mahbubnagar, besides Nizamabad.
(U) The proportion of earning dependants in this class is very low.· In fact, it is lower than in all the other livelihood classes except that of Commerce. This is merely a reflection of the highly urbanised composition of the class* and its comparatively high economic and educational standards because again of the fact that about one third of the class consists of the employees of the railway and road transport organisations and their dependants. The number of earning dependants, among every 1,000 persons belonging to this class, is only 78 in the state. Districtwise, the corresponding proportion at its highest is 151 in Nalgonda. It ranges between 100 and 150 in Medak, Nizamabad, Mahbubnagar, Adilabad and Karimnagar. In all these six districts a comparatively heavy proportion of the class is returned from rural areas. The proportion ranges between 75 and 100 in Nanded, Gulbarga, Bidar, Aurangabad and Parbhani and between 65 and 75 in Osmanabad, Warangal, Bhir and Raichur. It is as low as 56 in Hyderabad, wherein roughly 90 per cent of the class is returned from Hyderabad City itself.' ,
Of the 78 earning dependants, among every 1,000 persons belonging to this class in the state, the two biggest groups, numbering 24 (or 31 per cent) and 21 (or 27 per cent) respectively, are the persons obtaining their earnings through agricultural labour and occupations connected with other services and miscellaneous sources. The earning dependants in this class are obviously mostly drawn from persons engaged in manual transport or in transport through pack-animals or animal driven vehicles.
(iii) As a result of the low proportion of earning dependants in this class, its proportion of non-earning dependants is unusually heavy. In fact, in pr.actically all the districts of the state the highest proportion of non-earning dependants is recorded either by this class or that of Transport. 647, out of every 1,000 persons belonging to this class in the state, or roughly two thirds, consists of non-earning dependants. Districtwise,' the highest proportion recorded is 676 in Osmanabad and the lowest is 534 in Nizamabad. It ranges between 600 and 675 among all the other districts except Medak and Nalgonda wherein it ranges betweeen 575 and 590.
14. (i) The proportion of self~supporting persons in the Livelihood Class of Other Services and Miscellaneous Sources is very high. In fact, in the state as a whole, it is • 80 per cent of this class in the whole state, the highest percentage recorded, is returned from urban areas.
281
'Second only to that recorded in the Livelihood Class of Agricultural Labourers, and in ,quite a few of the districts it is the highest recorded among all classes. Incidentally, these two classes present considerable dissimilarities in respect of the proportion of the other two categories of persons, namely, the earning and the non-earning dependants. The Livelihood Class of Other Services and Miscellaneous Sources draws its numbers, more than any other livelihood class, from different strata of society. For example, this class, at one end, includes persons principally employed in legal, educational and medical services or in various government and semi-government organisations-other than those directly connected with productive, commercial or transport activities. Such persons, in general are comparatively highly literate, economically better off than most persons in the state and have-or are drawn from-small families. Besides, they care highly urbanised and semi-employment is relatively rare among them. Consequently, they have a high proportion of self-supporting persons and non-earning dependants -and a low proportion of earning dependants. At the other end, this class also includes persons principally engaged in hairdressing or the washing of clothes. Such persons, in general, are backward from the literacy and economic points of view. The majority ,of them are drawn from rural areas. Their children work as soon as they can and their women remain unemployed only when employment is not available or physical inability prevents them from being active. Consequently, they have a particularly low proportion of non-earning dependants and an equally high proportion of earning dependants.
The actual number of self-supporting persons, among every 1,000 persons belonging to this class, is as much as 303 in the state. Within the state itself, it ranges from 268 in Bhir to 377 in Raichur. But the proportion in Raichur District has been temporarily ,exaggerated to an extent on account of the large concentration of labourers who have moved into the Tungabhadra Project Camps from beyond the district. It may be noted that all labourers engaged in constructional work have also been grouped under this class. Exqluding Raichur District, the highest proportion recorded is 336 in Nizam.abad. Among the other districts, it is higher than the state's average of 303 in Mahbubnagar, Warangal, Nalgonda, Hyderabad, Medak and Adilabad; ranges between 275 and 300 in Nanded, Gulbarga and Parbhanl; and is slightly below 275 in the remaining.
, (ii) Only 110, among every 1,000 persons in this class in the state, are earning dependants which fits in with its relatively high literacy and concentration in urban areas. Districtwise, the proportion ranges between just 44 in Hyderabad to 166 in Bhir. Over 90 per cent of the class in Hyderabad District is returned from Hyderabad City wherein it accounts for more than 50 per cent of the population. The class in Hyderabad District may, therefore, be deemed to be the most representative of the highly urbanised population of Hyderabad City which explains its especially low proportion· of earning dependants. The range is considerably narrowed, if figures pertaining to Hyder.abad District are excluded for, in that event, the lowest proportion recorded is 107 in Gulbarga. The proportion is above the state's average in all the other districts, being about or even higher than 150 in Karimnagar, Nalgonda, Mahbubnagar and Parbhani.
Of the 110 earning dependants, among every 1,000 of the persons in this class in the state, the three biggest groups consist of those who obtained their earnings through agricultural labour and occupations pertinent to the Class of Other Services and Miscellaneous Sources itself and of those who have not specified their source of income at all. 'The majority in the third group consists apparently again of persons who derived their earnings either through agricultural labour or through occupations pertinent to this dass itself. These three groups number 37, 33 and 23 respectively, or in other words,
282
account for 34, 30 and 21 per cent respectively of the earning dependants in this class. The earning dependants must have been mostly drawn from the lower strata of the occupational groups pertinent to this class:
(iii) As many as 587'. among every 1,000 persons belonging to this class in the state, or appreciably more than half of the total, are non-earning dependants. Districiwise, the corresponding proportion is as high as 650 in Hyderabad. It is slightly above 600 in Bidar and Gulbarga and almost 600 in Aurangabad and Osmanabad. It is below the state's average in all the other districts being lower than even 5;30 in Warangal, Nalgonda, Mahbubnagar, Nizamabad and Raichur and being as low as 51S in Raichur.
Summary.- Among every 1,000 persons in this state, 258 are self-supporting and 199 are earning and 548 are non-earning dependants. In other words, about one fourth of its popUlation consists of self-supporting persons and one fifth of earning and slightly more than one half of non-earning dependants. Sex-wise, among every 1,000 males, as many as 447 are self-supporting, 149 are earning and 404 non-earning dependants. As against this, among every 1,000 females, just 65 are self-supporting, but as many as 249 are earning and 686 are non-earning dependants. Thus, one out of every four of the females in this state is an earning dependant. This is in keeping with the fact that in a majority of the castes or sects in this state -whether cultivating, artisan or, to a smaller extent, trading -females generally assist their men-folk in their occupations, unless they are physically unable to do so. Very often, particular tasks are entrusted solely to. them. Actually, the figures regarding the economic status of females, whether as self-supporting or earning dependants, are bound to have been underrated because of certain sentiments still current locally.
The proportion of self-supporting persons is slightly and that of non-earning dependants considerably smaller in the rural than in the urban areas. As against this, that of earning dependants is remarkably higher in the former than in the latter. The lower proportion of self-supporting persons in rural areas, is due, among various other factors, to a greater adherence to the joint family system (which tends to reduce 'the proportion of self-supporting persons and increase that of earning dependants) and a larger emigration of self-supporting persons for economic reasons. Similarly, both the lower proportion of the non-earning and the higher proportion of the earning dependants in rural areas, is largely due to their comparatively more backward population, limited facilities in respect of schools, lower percentage of the higher and middle income groups, greater number of independent occupational units in which all the family can participate and a larger 'incidence' of semi-employment resulting chiefly from the heavy demand for agriculturallabomduring the busy seasons. The agricultural classes, as compared with the non-agricultural, have a slightly smaller proportion of self-supporting persons and an appreciably smaller proportion of non-earning depen~ dants but a markedly higher proportion of earning dependants. Thus, the variations in these proportions. as among these two sets of c1asses, are broadly identical with the corresponding variations as between the rural and the urban areas. The reasons for the variations are also, more or less, identical. Again, the proportion of these three categories, varies appreciably from class to class both among the agricultural or non~ agricultural classes due to variations in the literacy standard, size of the family, degree of adherence to the joint family, sex proportion, relative capacity to absorb persons belonging to other classes and the extent of the participation of women in occupational activities in the various communities, castes, etc., from which each of the classes derives its major numbers. Some of these factors, operating in the same class, tend t<> produce opposite results.
Among every 1,000 persons in the Livelihood Class of Owner Cultivators, 224 are self-supporting and 224 are earning and 552 non-earning dependants. This class, among all classes, records the lowest propor~ tion of the self-supporting and the second highest proportion of the earning dependants. The former results mainly from the continued adherence of the CUltivating castes to the joint family system, the drift of many youngsters and poor widows from this class to other classes and to the fact that quite a number of the widowed females and aged or infirm males of this class, who do not have any grown-up male dependants lease out their lands and either remain inactive or take to other less responsible occupations. The latter i.e: the very high proportion of earning dependants, results mainly from its relatively low literacy and the adherence of the cultivating castes to the joint family system and from the fact that in most of the families belonging to such castes almost all the able bodied members, of either sex, take an active interest in cultivation. Consquent on the high proportion of earning dependants in this class, its proportion of non-earning dependants is very low. Similarly, among every 1,000 persons belonging to the Livelihood Class of Tenant Cultivators in this state, 234 are self-supporting, 250 are earning and 5Hi are non-earning dependants. Thu9 as compared with the other classes in general, this class has a low proportion of self-supportiEg as well as
283
of non-earning dependants but a~ unusually. high-in fact, along with the Li~elihood Class of Agricultural Labourers, the hIghest-proportIOn of earmng dependants. Its low proportIOn of the self-supporting is due again to the prevalence of the joint family system among thc cultivating castes and the drifting of many of the youngsters from this class to agricultural labour or to non-agricultural occupations. Its high proportion of earning dependants is due to its poor literacy and economic backwardness. In no other class, except that of Agricultural Labourers, are women and children economically more active than in this class The high proportion of earning dependants in the class naturally lowers its proportion of non-earning dependants. Out of every 1,000 persons belonging to the Livelihtrod Class of Agricultural Labourers, 306 are self-supporting, 250 are earning and 444 are non-earning dependants. Thus, this class, among all the classes, records the highest proportion of both the self-supporting and the earning dependants and by far the lowest proportion of the non-earning dependants. Because of its particularly low economic and literacy standards all members in this class, except the very young and the extremely old and infirm, irrespective of sex, remain economically inactive only when employment is not available. Besides, many youngsters, widows and sometimes even the aged bclo.lging to the Livelihood Class of Tenant Cultivators or the poorer sections of the other classes drift to agricultural labour. It is, therefore, not surprising that roughly one out of every three in this class is self-supporting, one out of every four an earning dependant and only a minority fails to contribute regularly towards its own maintenance. Out of every 1,000 persons belonging to the Livelihood Class of Agricultural Rent Receivers, 288 are self-supporting, 138 are earning and 574 are non-earning dependants. Thus, in this class, the proportion of the self-supporting is fairly high and of earning dependants considerably lower and of non-earning dependants appreciably higher than in the other agricultural classes. Its high proportion of self-supporting persons results from the fact that many females (including widows) who have acquired or inherited lands lea'le them out. Its low proportion of earning dependants and high proportion of non-earning dependants is largely a reflection of its relatively high literacy and economic standards.
Out of every 1,000 persons belonging to the Livelihood Class of Production (other than cultivation) 265 are self-supporting and 176 are earning and 559 are non-earning dependants. In respect of this distribution, this class, among all classes, bears the closest resemblance to the total population of the state. This class records the highest proportion of the earning and the lowest proportion of the non-earning dependants among all non-agricultural classes. This fits in with the fact that, among all of them, it is the most backward in respect of literacy and proportionately draws the largest number-in fact, a decisive majority-from the rural areas. Out of every 1,000 persons belonging to the Livelihood Class of Commerce, 264 are self-supporting, just 72 are earning and as ma.ny as 66,1, are non-earning dependants. The comparatively low proportion of self-supporting persons in this class is largely due to the marked adherence of both the indigenous and non-indigenous trading castes and sects in the state to the joint family system. Its low proportion of earning dependants (actually, the lowest among all classes) and the high proportion of non-earning - dependants (actually, the highest recorded among all classes) merely reflect the fact that, among all of the classes, it is the most literate and its fema.les are economically the least active. The corresponding distribution in the Livelihood Class of Transport is not very dissimilar to that in Commerce. Among every 1,000 persons belonging to the class'of Transport, 275 are self-supporting, only 78 are earning and as many as 647 are non-earning ,dependants. Its unusually low proportion of the earning and unusually high proportion of the non-earning dependants is due to its concentration in urban areas and to the fact that the economic and literacy standards of the employtes of the railway and road transport organisations and their dependants, who form roughly one third of the class, are considerably above the average for the state. Among every 1,000 persons belonging to the Livelihood Class of Other Services and Miscellaneous Sources, as many as 303 are self-supporting, only 110 are earning and as many as 587 are non-earning dependants. All this fits in with the fact that this residuary class, as a Whole, also draws its strength mostly from urban areas and is comparatively well off from the point of view of literacy. -
SECTION II
SECONDARY MEANS OF LIVELIHOOD
-(The tables relevant to this Section are Main Table' B-lI-Secondary Means of Livelihood' given at page 141 of Part ll-B of this Volume; Subaidiary Tables' 4.2' to' 4.5' given at pages 112 to 119 of Part l-B; and Subsidiary Tables'S.? ',' 5.3 ',' 5."" and' 5.0' given at pages 144, 148 152 and 156 again of Part l·B OF this Volume).
15. Instructions to Enumerators and Limitations.-During this census, the enumerators had been directed to ascertain and record the secondary means of livelihood, if any. in respect of each and every person enumerated by them. The instructions issued in this regard specified that (i) in case of self-supporting persons with only one means of live1ihood, no entry was to be made for the simple reason that such persons had no secondary means of livelihood at all; (ii) in case of self-supporting persons with more than one means of livelihood, the occupation through which they earned the second largest portion of their income was to be recorded as their secondary means of livelihoodthe occupation from which they obtained the largest portion having been treated as their principal means of livelihood; and, lastly, (iii) in case of earning dependantsi. e., of those maintained partly by their own regular income and partly by the income of others-the occupation through which they obtained all or the greater part of their own iQ.come was to be treated as their secondary means of livelihood. In case of the third category of persons, the instructions further clarified that it w~s absolutely unnecessary for the enumerators to ascertain as to which of the two incomes was more important for the maintenance of the persons*.
It will thus be obvious that no notice has been taken of subsidiary means of livelihood beyond the secondary. There are a large number of persons in this state who have more than two means of livelihood. Fairly common examples woul<J be that of a vakil or a doctor or a government servant who is also an agricultural rent receiver and further derives some regular income from buildings rented out or from bank deposits or shares; or of a trader or a village officer who is also an owner cultivator in 'respect of a portion of his lands and an absentee landlord in respect of the other. But more important than this ' lacuna' with regard to the exhaustive listing of all the various means of livelihood through which a self-supporting person, or an earning dependant, derives his total income, is the rather unsatisfactory performance of the enumerators even in re8~ct of recording only the secondary means of livelihood as indicated in the preceding paragraph. It must, however, be said in favour of the enumerators that an appreciable number of citizens themselves are not punctilious about getting their secondary or subsidiary means ofnvelihood recorded. For example, many owner cultivators, who supplement their income through agricultural labour, or tenant cultivation or agricultural rent, or stock-breeding, or through various artisan trades such as the making of footwear or earthenware, or through services such as those pertaining to hairdressing or washing of clothes, do not care to be recorded as anything other than pattedars. Similarly, many traders, lawyers, government servants, etc., who also derive a regular income through building or agriCUltural rents, interests from shares or bank deposits, think it unnecessary to recount their secondary sources of income. It may be that in many of such cases the income so derived is relatively insignificant. Again, a large proportion of youngsters and females in the .The enumerators had been generally directed not to enquire or estimate for purposes of any of the census questions the exact income accruing to any person.
284
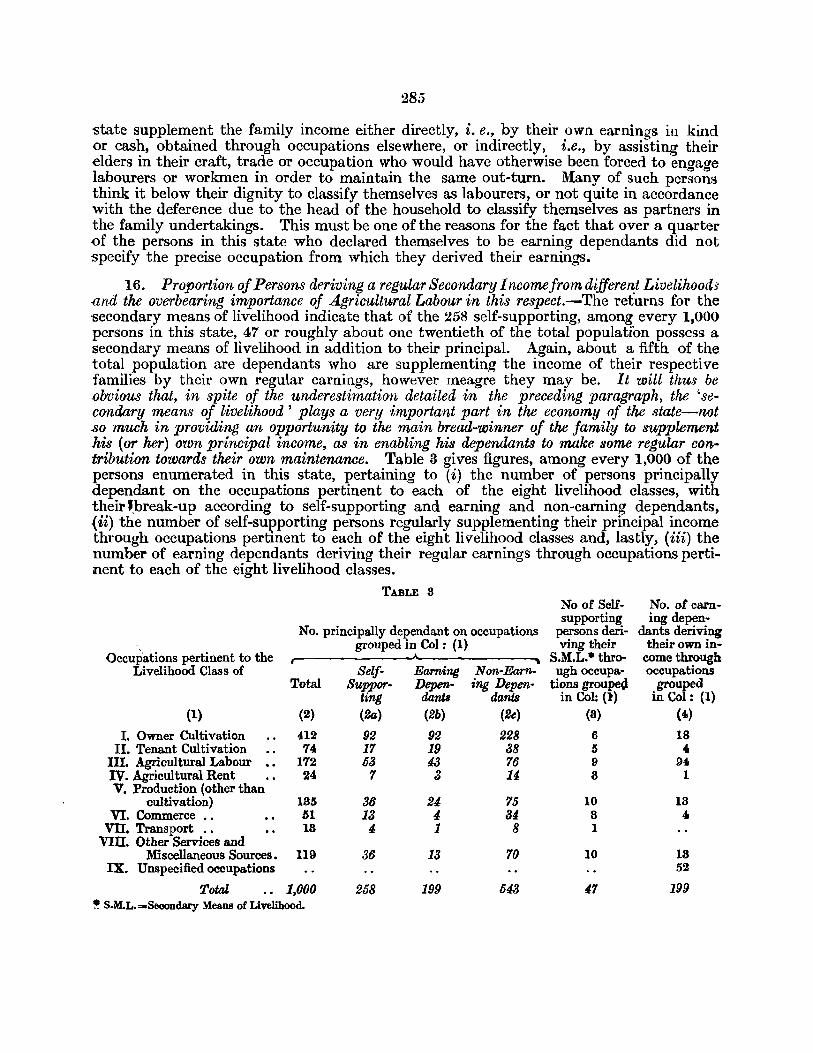
285
state supplement the family income either directly, i. e., by their own earnings in kind -or cash, obtained through occupations elsewhere, or indirectly, i.e., by assisting their elders in their craft, tra.de or occupation w~o would have otherwise been forced to engage labourers or workmen m order to maintam the same out-turn. Many of such persons think it below their dignity to classify themselves as labourers, or not quite in accordance with the deference due to the head of the household to classify themselves as partners in the family undertakings. This must be one of the reasons for the fact that over a quarter -of the persons in this state who declared themselves to be earning dependants did not specify the precise occupation from which they derived their earnings.
16. Proportion of Persons deriving a regular Secondary Incomefromdifferent Livelihood~' -and the overbearing importance of Agricultural Labour in this respect.-The returns for the secondary means of livelihood indicate that of the 258 self-supporting, among every 1,000 persons in this state, 47 or roughly about one twentieth of the total population possess a secondary means of livelihood in addition to their principal. Again, about a fifth of the total popUlation are dependants who are supplementing the income of their respective families by their own regular earnings, however meagre they may be. It will thus be {)bvious that, in spite of the underestimation detailed in the preceding paragraph, the 'secondary means of livelihood' plays a very important part in the economy of the state-not .so much in providing an opportunity to the main bread-winner of the family to supplement his (or her) own principal income, as in enabling his dependants to make some regular contribution towards their own maintenance. Table 3 gives figures, among every 1,000 of the persons enumerated in this state, pertaining to (i) the number of persons principally dependant on the occupations pertinent to each of the eight livelihood classes, with their '.break-up according to self-supporting and earning and non-earning dependants, {ii) the number of self-supporting persons regularly supplementing their principal income through occupations pertinent to each of the eight livelihood classes and, lastly, (iii) the number of earning dependants deriving their regular earnings through occupations pertinent to each of the eight livelihood classes.
TABLE 3 No of Self- No. of earn-supporting ing depen-
No. principally dependant on occupations persons deri- dants deriving grouped in Col: (1) ving their their own in-
Occupations pertinent to the F" ...____ S.M.L .• thro- come through
Livelihood Class of Self- Earning Non-Earn- ugh occupa- occupations Total 8uppl»'- Depen- ing Depen- tions groupe~ grouped
ting dantl dants in Col: (1) in Col: (1) (1) (2) (2a) (26) (Be) (8) (4)
I. Owner Cultivation 412 92 92 228 6 18 II. Tenant Cultivation 74 17 19 38 IS ,
III. Agricultural Labour 172 1)3 43 76 9 94 IV. Agricultural Rent 24 7 3 14 8 1 V. Production (other than
cultivation) 185 36 24 75 10 18 VI. Commerce .• 51 13 4 34 8 ,
vn. Transport .• 18 4 1 8 1 VIn. Other Services and
Miscellaneous Sources. 119 36 13 70 10 18 IX. Unspecified occupations 52
Total 1,000 21)8 199 543 47 199 ~ S.M.L. = Secondary Means of Livelihood.
286
17. From the figures given in Table 3, it will be obvious that oj all the secondary OCClf;
pation81:n this state, agricultural labour is by Jar the most important. Of the total number of self-supporting persons in this state, who have a regular secondary means of livelihood, in addition to their principal, about 19 percent, or slightly less than one fift 11, obtained their secondary income through agricultural labour. But even more impressive is the fact that of the total number of earning dependants ill this state, over 47* per cent, or roughly half, derived their earnings through agricultural labour. In fact, it will not exactly be an exaggeration to assert that from the point of view of the total numbers employed, both Jully and partly (i.e., principally and secondarily), by different occupations in this state, agricultural labour takes precedence over all the others. This point could be further illustratedwithsomefigures. Nodoubt, among every 1,000 of thcpopulation in this state, as many as 412 are principally dependant on owner cultivation and appreciably less than half the number, namely 172, afe similarly dependant on agricultural labour. But as already stated, of these 1,000 persons, 2.58 are self-supporting--of whom, in turn, 47 possess two means of livelihood, principal and a secondary-and 199 are earning dependants and the remaining 543 do not regularly earn anything at all. In other words, the different occupations in the state employ, partly or wholly, 504 persons among every J ,000 of its population. Of these 504 persons, as many as 31 per cent work as agricultura.l labourers, 23 as owner cultivators, 12 each in occupations connected with production (other than cultivation) and other services and miscellaneous sources, 5 as tenant cultivators, 4 in occupations connected with commerce, 2 receive agricultural rent and 1 is engaged in occupations connected with transport. This analysis suffers from many limitations and has no bearing on the relative extent of the capacity of the different occupations in the sustenance of the total population of the state. It, however, clearly establishes the fact that Jrom the point of 'V1'ew oj merely the numbers engaged, both wholly and partly, in different occupation8, agricultural labouris second to none in the state, 'IIot e'cen to owner cultivation. This isnothingsurprising. In the ayerage village, the physically fit among the males, females and the grown-up children who do not work in their own fields or in those belonging to the others in the village, regularly or during the busy seasons, for payment (in cash or kind) or as a matter of norma] routine, form an ' exclusive' minority.
Among the other occupations, owner cultivation is the second most important as a secondary means of livelihood. Next in order, arc occupations connected with other services and miscellaneous sources and production. The rest are not very significant.
18~ Selfondary Means of Livelihood among different Livelihood Classes.--Figures. pertaining to (i) the number of self-supporting persons possessing a secondary income and (ii) earning dependants, among every 1,000 persons belonging to each of the eight livelihood classes in the state, further split up in terms of the occupations from which the self-supporting persons derive their secondary income or the earning dependants obtain their regular earnings, are given in Table 4.
* In addition to this number, about 26 per cent of the total number of earning dependants in this state did not indirete the precise occupation through which they derived their earnings. But considering the fact that of these earning dependants, 49 per cent were from the families of, owner cultivators (~ith females constituting over 57 per cent of them). 28 per cent were from the families of agricultural labourers and 7' were from the families of tenant cultivators, it can safely be presumed that the majority of these earning dependant.. were also earning mainly as agricultural labourers.
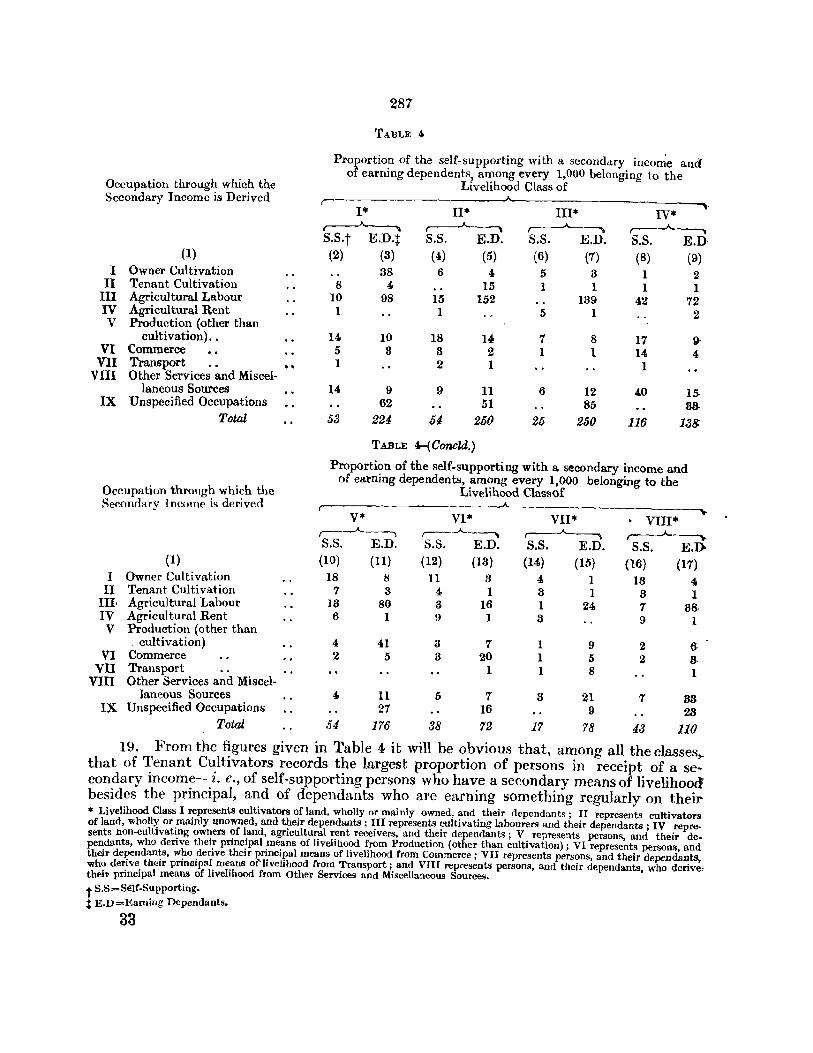
Occupation through which the Secondary Income is Derived
I II
III IV V
VI VII
VIII
IX
(1)
Owner Cultivation Tenant Cultivation Agricultura.l Labour Agricultural Rent Production (other than
cultivation) •. Commerce Transport Other Services and Miscel
laneous Sources Unspecified Occupations
Total
Occupation through which the Secondary Income is derived
(1)
287
TABLE 4.
Proportion of the self-supporting with a secondary inco~e ana of earning dependents, among every 1,000 belonging to the
Livelihood Class of r-
1* II* III* IV· ~ ,--~ ~ ~ S.S·t E.D.:j: S.S. E.D. S.S. E.D. S.S. E.n
(2) (3) (4) (5) (6) (7) (8) (9) 38 6 4 5 3 1 2
8 4 15 1 1 1 1 10 98 15 152 139 42 72 1 1 5 1 2
14 10 18 14 7 8 17 st 5 8 8 2 1 1 14 4 1 2 1 1
14 9 9 11 6 12 40 15-62 51 85 83-
53 224 M 250 2/j 250 116 13~
TABLE 4-( Concld.)
Proportion of the self-supporting with a secondary income and of earning dependents, among every 1,000 belonging to the
Livelihood Classo! r-'--------------
V* r-__A..-~
S.S. E.D. (10) (11)
VI* r--...A...~ S.S. E.D.
(12) (18)
VII * ,---...A..._~
S.S. E.n. (14) (15)
VIII* r-----A--~ S.S. E.})
(16) (17) I Owner Cultivation 18 8 11 3 4 1 13 4. II Tenant Cultivation 7 8 4 1 8 1 3 1
IU Agricultural Labour 18 80 3 16 1 24 7 88. IV Agricultural Rent 6 1 9 1 3 9 I V Production (other than
, cultivation) 4 41 3 7 I 9 I:) 6 VI Commerce 2 5 3 20 1 5 2 3.
VII Transport 1 I 8 1 VIII Other Services and Miscel-
laneous Sources 4 11 5 7 3 21 7 83 IX Unspecified Occupations 27 16 9 28
Total 54 176 38 72 17 78 43 110
19. From the figures given in Table 4 it will be obvious that, among all the classes,.. that of Tenant Cultivators records the largest proportion of persons in receipt of a secondary income- i. e., of self-supporting persons who have a secondary means of livelihood besides the principal, and of dependants who are earning something regularly on their* Livelihood Class I represents cultivators of land, wholly or mainly owned, and their dependants; II represents cultivators of land, wholly or mainly unowned, and their dependants; III represents CUltivating labourers and their dependants; IV represents non-cultivating owners of land, agricultUral rent receivers, and their dependants; V represents persons, and their dependants, who derive their principal means of livelihood from Production (other than cultivation); VI represents persons, and their dependants, who derive their principal means of livelihood from Commerce; VII represents persons, and their dependants, who derive their principal means of' livelihood from Transport; and VIn represents persons, and their dependants, who derive, their principal means of livelihood from Other Services and Miscellaneous Sources. t S.S=Setf-Supporting. :j: E.D=Earning Dependants.
33
288
<>wn. The secondary income of the persons belonging to this class is mostly obtained through agricultural labour. The Livelihood Classes of Owner Cultivators and Agrieultural Labourers come next in order in this respect. In case of both these classes, the secondary income is again mostly derived through agricultural labour. But significantly, the proportion of self-supporting persons with a secondary means of livelihood is comparatively very low in the Livelihood Class of Agricultural Labourers. This largely reflects the fact that most of the regular farm employees are not allowed to, or cannot, engage themselves, simultaneously in other occupations. Their own duties include a variety of tasks-field work, tending of cattle, the repairing and the making of various types of farm implements and accessories, transport of agricultural produce for purposes -.of marketing, etc. Quite often, the household work of their employees is also deemed to be part of their duties. As against this, the proportion of self-supporting persons belonging to other groups who take to agricultural labour, especially in the busy seasons, as a secondary occupation is relatively very heavy. The Livelihood Class of Agricultural Rent Receivers records the next highest proportion of persons with a seconda.ry means of livelihood. The chief distinction of this class in this respect is the fact that a very heavy portion of its self-supporting persons (exceeding 40'per cent) is in receipt of a secondary income. Besides, this secondary income is derived from a wide range of occupations. This is not surprising considering the fact that the persons belonging to this class have to devote very little of their own time for obtaining their principal income. A fairly heavy portion of the persons belonging to this class also obtains its secondary income through agricultural labour. This portion is drawn from the poorer sections of the class including those who cannnot cultivate their own lands because of physical infirmities, or the demise of the adult male members of the family, or the lack. of the requisite capital. The Livelihood Class of Production comes next in order in this respect. Most of the persons with a secondary income in this class obtain the income through agricultural labour, occupations connected with production itself ,(largely due to the fact that in artisan families the junior members and the fema.les are actively associated in the ancestral crafts) and, to a considerably lesser extent, through owner cultivation. The secondary means of livelihood is not relatively conspicuous in the other three Livelihood Classes of Commerce, Transport and Other Services and Miscellaneous Sources. There is no doubt that persons belonging to these three classes, among all classes, are the most indifferen~ in respect of the recording of their secondary, means of livelihood. In spite of this, there can be no denying the fact that on account of their ,comparatively better economic and educational standards, a very large proportion of their youngsters and females remain economically inactive and do not contribute regularly to :the family earnings. To that extent, therefore, the classes are bound to be short of persons deriving a secondary income. Again, the number of self-supporting persons having a secondary means of livelihood is particularly low in the Livelihood Class of Transport. This mainly reflects the fact that relatively few of the railway and road transport employees and persons engaged in transport through vehicles, who form the majority of the self-supporting persons in the class, have a secondary occupation.
20. Secondary Means of Livelihood in the various Dist'ricts of the State.~The proportion of self-supporting persons ,with a secondary means of livelihood (in addition to their principal) and of earning dependants, among every 1,000 of the population, in each district of the state, split-up according to occupations from which th~ self-supporting persons derive their secondary income or earning dependants obtain their regular earnings are given in Table 5.
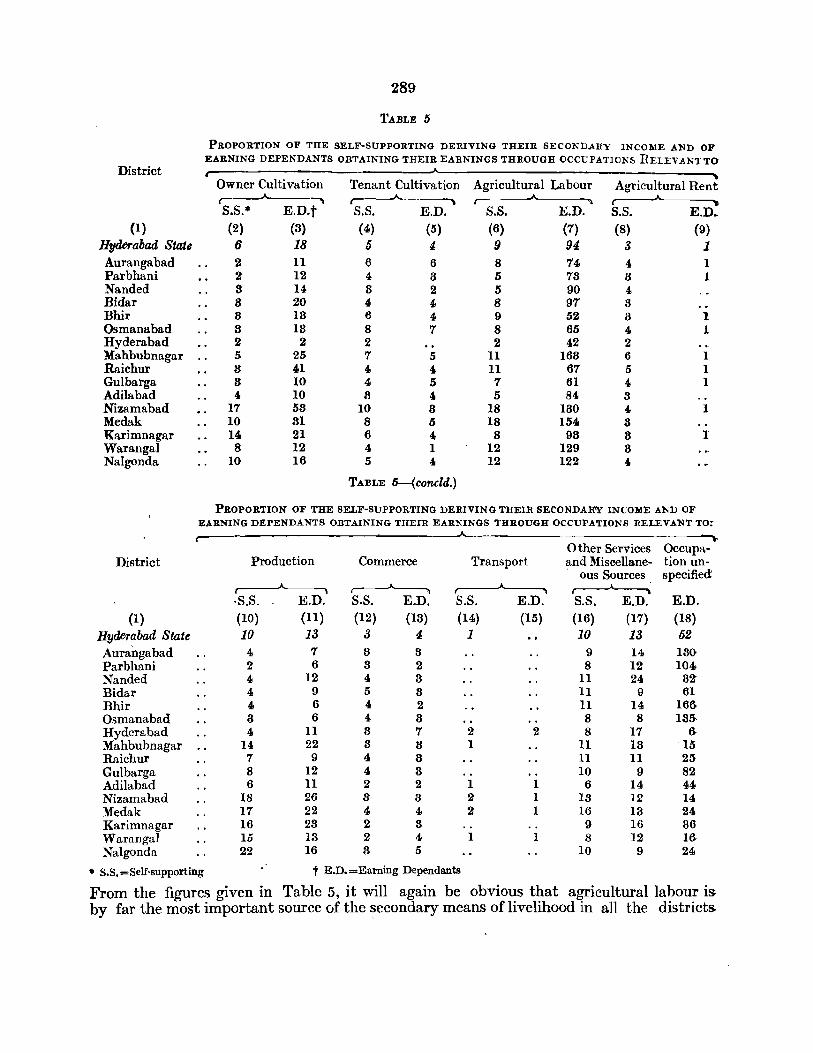
289
TABLE 5
PROPORTION OF THE SELF-SUPPORTING DERIVING THEIR SECONDAIIY INCOME AND OF
EARNING DEPENDANTS OBTAINING THEIR EARNINGS THROUGH OCCUPATIONS RELEVAN'l'TO District r--
Owner Cultivation Tenant Cultivation Agricultural Labour Agricultural Rent -.. r----"--------- ~ (
..A. ~
S.S.* E.n·t S.S. E.n. S.S. E.n. S.S. E.D. (I) (2) (3) (4) (5) (6) (7) (8) (9)
Hyderabad State 6 18 6 4 9 94 3 1 Aurangabad 2 11 6 6 8 74 4 1 Parbhani 2 12 4 8 5 78 8 1 Nanded 8 14 8 2 5 90 4 Bfdar 8 20 4. 4 8 97 8 Bhir 8 18 6 4 9 52 a 1 Osmanabad 8 18 8 7 8 65 4 1 Hyderabad 2 2 2 2 42 2 Mahbubnagar 5 25 7 5 11 163 6 1 Raichur 8 41 4 4 11 67 5 1 Gulbarga 8 10 4 5 7 61 4 1 Adilabad 4 10 8 4 5 84 3 Nizamabad 17 58 10 8 18 180 4 1 Medak 10 81 8 5 18 154 3 Karimnagar 14 21 6 4 8 98 3 1 Warangal 8 12 4 1 12 129 3 Nalgonda 10 16 5 4 12 122 4
TABLE 5-(concld.)
PROPORTION OF THE SELF-SUPPORTING DERIVING THEIR SECONDAR'Y INCOME AND OF' EARNING DEPENDANTS OBTAINING THEIR EARNINGS THROUGH OCCUPATIONS RELEVANT TO:
.-----Other Services Occupa-
District Production Commerce Transport and Miscellane- tion un-ous Sources specified
r____A.._, ~ ~ ·S.S. E.D. S.S. E.n. S.S. E.n. S.S. E.D. E.n.
(1) (10) (11) (12) (13) (14) (15) (16) (17) (18)
Hyderabad State 10 13 3 4 1 10 13 52 Aurangabad 4 7 3 3 9 14 laO Parbhani 2 6 3 2 8 12 104-Nanded 4 12 4 8 11 24 32-Bidar 4 9 5 8 11 9 61 Bhir 4 6 4 2 11 14 166-Osmanabad 8 6 4 8 8 8 135, Hyderabad 4 11 8 7 2 2 8 17 6-Mahbubnagar 14 22 8 3 1 11 13 '15 Raichur 7 9 4 3 11 11 25 Gulbarga 8 12 4 3 10 9 82 Adilabad 6 11 2 2 I 1 6 14 44 Nizamabad 18 26 8 8 2 1 13 12 14 Medak 17 22 4 4 2 1 16 13 24 Karimnagar 16 23 2 3 9 16 36 Waranga] 15 13 2 4 I 1 8 12 16-Nalgonda 22 16 8 5 10 9 24
• S.S.=Self-supporting t E.D. =Earning Dependants
From the figures given in Table 5, it will again be obvious that agricultural labour is by far the most important source of the secondary means of livelihood in districts an the

290
-of the state. The position of agricultural labour in this respect becomes almost pre· eminent if it is assumed-for reasons detailed in the foot note in paragraph 17 above-that most of the earning dependants who did not specify the occupations through which they obtained their earnings were also employed as agricultural labourers. Among the others, owner cultivation and occupations connected with production and other services and miscellaneous sources are the more significant in all the districts from the point of view of the numbers resorting to them as the secondary means of livelihood-except that in Hyderabad District occupations connected with commerce take precedence over owner ·cultivation and in Osmanabad, Aurangabad and Bhir Districts, tenant cultivation takes precedence over those connected with production. Among these three categories them· selves, occupations connected with production in the south-eastern districts of Karim· nagar, Warangal and Nalgonda and in Mahbubnagar and Gulbarga Districts, those connected with other services and miscellaneous sources in Nanded, Bhir, Aurangabad, Parbhani, {)smanabad, Adilabad and Hyderabad Districts, and owner cultivation in Nizamabad, Meaak, Raichur and Bidar Districts offer the largest volume of employment as secondary -occupations.
Summary.-The secondary means of livelihood plays a very important part in the economy of the state· not so much in providing an opportunity to the main bread-winner of the family to supplement his (or her) .own principal income as in enabling his dependants to make some regular contribution towards their own maintenance. The census returns amply prove this in spite of the fact that the recording of the secondary means of livelihood has not been entirely satisfactory. Slightly less than one fifth of the total number of self-supporting persons in the state have a secondary income and over a quarter of the dependants are contributing towards their maintenance by their own regular earnings. Again, among all occupations, agricultural labour holds a pre-eminent position as the secondary source of income or means of livelihood. About 19 per ·cent of the self-supporting persons with a secondary means of livelihood owe their secondary income and Over 47 per cent of the dependants who earn something regularly derive their earnings from agricultural labour. 'The latter percentage is considerably under estimated because over a quarter of the earning dependants drawn mostly from Agricultural Livelihood Classes have not indicated their secondary means of livelihood-which ~ould not have been anything but agricultural labour in a majority of the cases. In fact, it can be claimed that from the point of view of the total numbers employed, in terms of both principal and secondary Qccupations, agricultural labour takes precedence over even owner cultivation. It may be recalled that from the point of view of only the principal occupation, owner cultivation is by far the most important .among all the occupations in the state. Among the other occupations, owner cultiv:ation and those pertinent to both production and other services and miscellaneous sources provide the secondary means of livelihood ·of the largest numbers. Among every, 1,000 persons in the state, the number of self-supporting persons deriving a secondary income from owner cultivation, tenant cultivation, agricultural labour, agricultural rent and from occupations pertinent to production, commerce, transport and other services and miscellaneous sources is 6,5,9,3, 10,3, 1 and 10 respectively. Similarly, the number of earning dependants, among every 1,000 .of the state's population, who are deriving their earnings through OWner cultivation, tenant cultivation .agricultural labour, agricultural rent and occupations pertinent to production, commerce and other service~ and miscellaneous sources is 18, 4, 94, 1, 13, 4 and 13 respectively and 52 of these earning dependants have not 'Specified the occupation through which they obtained their earnings and the proportion of earning depen.dants engaged in occupations pertaining to transport is less than even 1.
Among the individual livelihood classes that of Tenant Cultivators records the largest proportion of persons with a secondary income. The Livelihood Classes of Owner Cultivators and Agricultural Labourel'8 (!Ome next in order. In all these three classes, Agricultural Labour is by far the most important source for the 'Secondary income. The Livelihood Class of Agricultural Rent Receivers, which is next in order, has the distinction of recording by far the largest number of self-supporting persons in receipt of a secondary income, although its proportion of dependants earning regularly is by no means conspicuous. Next in this respect is the Livelihood Class of persons principally dependant on Production. Most of the persons in this class with a secondary income obtain it through agricultural labour and through occupationS connected with production and, to a considerably smaller extent, owner cultivation. The secondary means of livelihood is comparatively the least conspicuous among the remaining Livelihood Classes of persons principally dependant on Transport, Commerce and Other Services and Miscellaneous Sources, in the order mentioned, mainly because of the proportionately !tmall number of dependants deriving any regular income •.
SECTION III
EMPLOYMENT
(Tht tables relevant to this Section are ]}Iain Table 'B-Ill-Employers, Employees and Independent Workers in Indmtrier and Service. by Divisions and Sub··Divisions' and the' Districtlndex of Non-Agricultural Occupations' given at pages 187 and 303 of Part ll-B of this Volume; and Suhsidiary Tables '5.7' to '5.17' given at pages 161 '0 171 of Part I-B of this Volume).
21. Scope, Instructions to Enumerators and Limitations.-The distribution of the population in terms of the primary economic status, i.e., according to self-supporting persons, earning dependan.ts and non-earning dependants has been dealt with in Section I of this Chapter. Economically, of these three categories of persons, while the non-earning dependants are deemed to be passive and the earning dependants to be semi-active, all self-supporting persons are deemed to be active*, unless they happen to, be maintained principally by agricultural rent, income from non-agricultural property such as building rents or interest from shares or bank deposits, pensions, mansabs, grants, charity, or as inmates of asylums, or by following economically unproductive activitief' such as prostitution. Of the 4,811,189 self-supporting persons in the state. (a) 1,570,488 or 33 per cent are principally engaged in all types of industries and services, (b) 1,719,132 or 36 per cent in owner cultivation, (c) 322,863 or 7 per cent in tenant cultivation, (d) 979,777 or 20 per cent in agricultural labour and lastly, (e) 218,929' or 4 per cent are economically inactive, i.e., they belong to the exceptions mentioned in the preceding sentence. This section deals only with the category mentioned at (a} above i.e., of the economically active persons following all types of industries and services, detailing. the distribution of their numbers according both to certain divisions, sub-divisionsand groups adopted for the purposet and as employers, employees and independent u:orkers. In the instructions issued to the enumerators, employers, employees and independent: workers were defined as indicated below.
"A person should be treated as an employer only if he has necessarily to employ any other person (or persons) in order to carryon the business from which he secures his principal livelihood and pays the other person (or persons) a salary or wage, in cash or kind. For purposes of determining an employer, casual or part-time
\ employment, which does not provide the principal means of livelihood of the person (or persons) employed, should not be taken into account. If a person employs a cook or other person for domestic service, he should not be recorded as an emp]oyer merely for that reason.
A person should be treated as an employee only if he ordinarily works undersome other person for a salary or a wage, in cash or kind, as the means of earning his principal livelihood. There may be persons who are employed as managers, superintendents, agents, etc., and in that capacity control other workers. Such persons are also o111y employees and should not be treated as employers.
A person should be treated as an independent worker only if he is not employed by anyone else and who does not also employ anybody else in order to earn his principal livelihood. "
*As stated in paragraph 7 at page 100 in Part II-B of this Volume, economic activities ,include all activities the result of' which is the production of useful commodities or the performance of useful services; but not including the performance of domestic or personal services by members of a family household to one another. t Vide Appendix II to the- Indiar(Census Economic Classification Scheme given at page 104 of Part II-B of this Volume.
291
84

292
22. The census figures pertaining to the number of persons engaged in all industries and services and their divisions, sub~divisions and groups are not exactly representative of the actual numbers employed in the relevant non-agricultural occupations. The difference between the two is due to the following reasons:-
(a) The census figures relate only to self-supporting persons and do not cover earning dependants. It may be recalled that every person in receipt of a regular income, irrespective of the capacity in which he obtained his earnings and the size of such earnings, was deemed only to be an earning dependant if he was dependent, regardless of the degree of his dependency, on any other person. Again, the person's dependency or otherwise was not determined in an abstract manner from the size of his earnings but from the standard of life led by him. Thus, a large number of persons, more especially the junior members following family trades or occupations and earning females, who would normally be treated as engaged in the relevant occupations, haye not been taken account of in these census figures.
(b) The census return'> for self-supporting persons are themselves under estimated, because in a number of cases the classification of persons according to self-supporting, earning and n.on-earning dependants was influenced more by sentiments rather than economic realities. As detailed in Section I of this Chapter, due to the prevalence of the joint family system, many junior members in such families, who were earning much more than what was required for their maintenance, were returned as earning, or sometimes even as non-earning dependants merely out of deference to the paterfamilias. Similarly, because of the conventional role of men as the bread-winners in the family, many females, who were more than fully maintaining themselves out of their own earnings, were returned only as earning dependants.
_ L
(c) These census figures ignore entirely the secondary means of livelihood returned by even the self-supporting persons. And each one of them has been classified, subject to certain principles according only to his (or her) principal means of livelihood and only under one of the divisions, sub-divisions and groups pertinent to all industries and services, although in quite a large number of cases they could, from certain points of view, be deemed to belong to more than one division, sub-division and group*.
On account of these limitations, the actual number of persons engaged in various non-agricultural occupation,,> are bound to be more than the' figures pertaining to the *Thus, the large number of persons in the state who thougu principally owa~r or tenant cultivators, or agricultural labourers or rent receivers, are also engaged in non-agricultural occupations (such ~s stock raisers, fishermen, artisans traders, w3'1hennen, priests, blrb~rs, d'):rn~stic servant'!, un,pecified labourers, etc., in rural a.reas) have been excluded from these eensus figures. Similarly, the fairly large number of persons with more tuan one non-agri6ultural means of livelihood (such as lawyers receiving building rents, general merchant~ also doing bu,ine33 as insurance or new~paper agents or as dealers in petrol or drugs, kirana merchants also engaged in money lending and cobblers also engaged in rope making or scavenging) have been classified only under one of the relevant divisions, sub-divisions a~d grO.lPS according to the principal occupation returned by them. Lastly. in case of the self-supporting persons principally following non-agricultural occupations, their exact classifica_ tion has been made subject to certain broad principles. If the work done by any of such persons in their individual capacity pertained to occupations relating to Production (other than cultivation), Commerce. or Transport then he was classified under the relevant occupation. But if his work did not warrant such a classification and he was n~t a domestic servant. then he was classified accordingly, wherever possible, on the basis of the work turned out by his employer, if any. All the rest of the self-supporting persons, including do:rnestic servants, were classified under the occupations pertinent to Other Services and Miscellaneous Sources. Again, all producers-cum-sellers were treated only as producers and all the repairers were treated as makers or manufacturers. Thus, mechanics or fitters in a railway or road-transport organisation were not classified under the sub-divisions of 'Railway transport' or 'Transport by road', as the case may be, but under that of the manufacture of "l'ransport Equipment'; the driver of any vehicle in a factory, bank or government department (say the Medical or Police) was classified under 'Transport by road' ;, a civil engineer or a doctor in the railways or a textile mill went under the 'Transport by rail' or manufacture of • Cotton textiles' as the case may be ; a workman in a shop or bank went under the relevant sub-division of Commerce; a mechanic in the P. W.D. under 'Manufacture of machinery and Engineering Workshops" and all persons engaged in the making (or the processing) and the selling of article~ like potters, carpenters silversmiths milk: men, etc., were grouped under the relevant suh-division of production and not Commerce.. ' ,
34 •
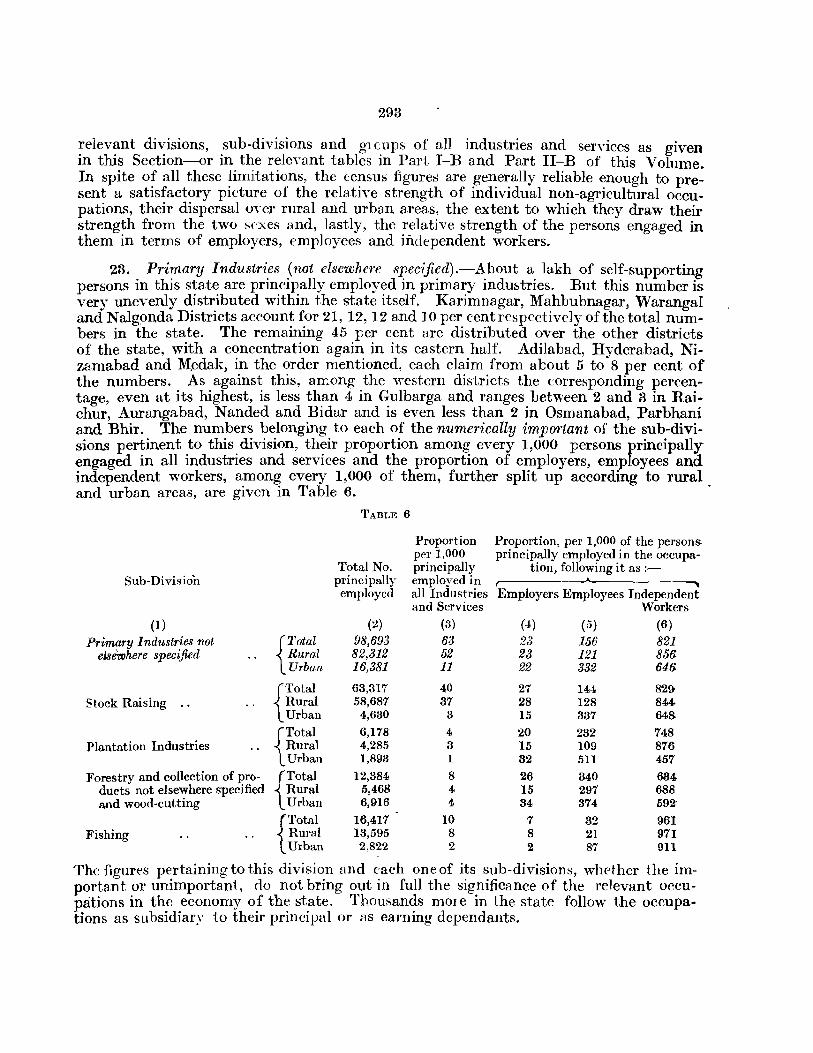
293
relevant divisions, sub-divisions and gl (;UPS of all industries and services as given in this Section-or in the relevant tables in Part I-B and Part II-B of this Volume. In spite of all these limitations, the census figures are generally reliable enough to present a satisfactory picture of the relative strength of individual non-agricultural occupations, their dispersal over rural and urban areas, the extent to which they draw their strength from the two sexes and, lastly, the relative strength of the persons engaged in them in terms of employers, employees and independent workers.
23. Primary Industries (not elsewhere specified).-About a lakh of self-supporting persons in this state are principally employed in primary industries. But this number is very unevenly distributed within the state itself. Karimnagar, Mahbubnagar, Warangal and Nalgonda Districts account for 21, 12, 12 and 10 per cent respectively of the total numbers in the state. The remaining 45 per cent are distributed over the other districts of the state, with a concentration again in its eastern half. Adilabad, Hyderabad, Nizamabad and M.edak, in the order mentioned, each claim from about 5 to 8 per cent of the numbers. As against this, arr.ong the western districts the corresponding percentage, even at its highest, is less than 4 in Gulbarga and ranges between 2 and 3 in Raichur, Aurangabad, Nanded and Bidar and is even less than 2 in Osmanabad, Parbhani and Bhir. The numbers belonging to each of the numerically important of the sub-divisions pertinent to this division, their proportion among every 1,000 persons principally engaged in all industries and services and the proportion of employers, employees and independent workers, among every 1,000 of them, further split up according to rural and urban areas, are given in Table 6.
Sub-Division
(I) Primary Indu,stries not
else'wher:e specified
Stock Raising ..
Plantation Industries
Forestry and collection of products not elsewhere specified and wood-cutting
Fishing
TABLE 6
Total No. principally employed
Proportion Proportion, per 1,000 of the persons per 1,000 principally employed in the occupa-principally tion, following it as :-employed in r---- --"---------~ all Industries Employers Employees Independent and Services Workers
(2) (3) (4) (5) (6) (Total 98,693 63 23 156 821 ~ Rural 82,312 52 23 121 856 L Urban 16,381 11 22 332 646
(Total 63,317 40 27 144 829-~ Rural 58,687 37 28 128 844 L Urban 4,630 3 15 337 64&
{
Total 6,178 4 20 232 748 Rural 4,285 3 15 109 876 Urban 1,893 1 32 511 457
(Total 12,384 8 26 340 634 ~ Rural 5,468 4 15 297 688 L Urban 6,916 4, 34 374 592'
{
Total 16,417 10 7 32 961 Rural 13,595 8 8 2] 971 Urban 2,822 2 2 87 911
The figures pertaining to this division and each one of its sub-divisions, whet her the important or unimportant, do not bring out in full the significance of the relevant occupations in the economy of the state. Thousands mOl e in the state follow the occupations as subsidiary to their principal or as earning dependants.
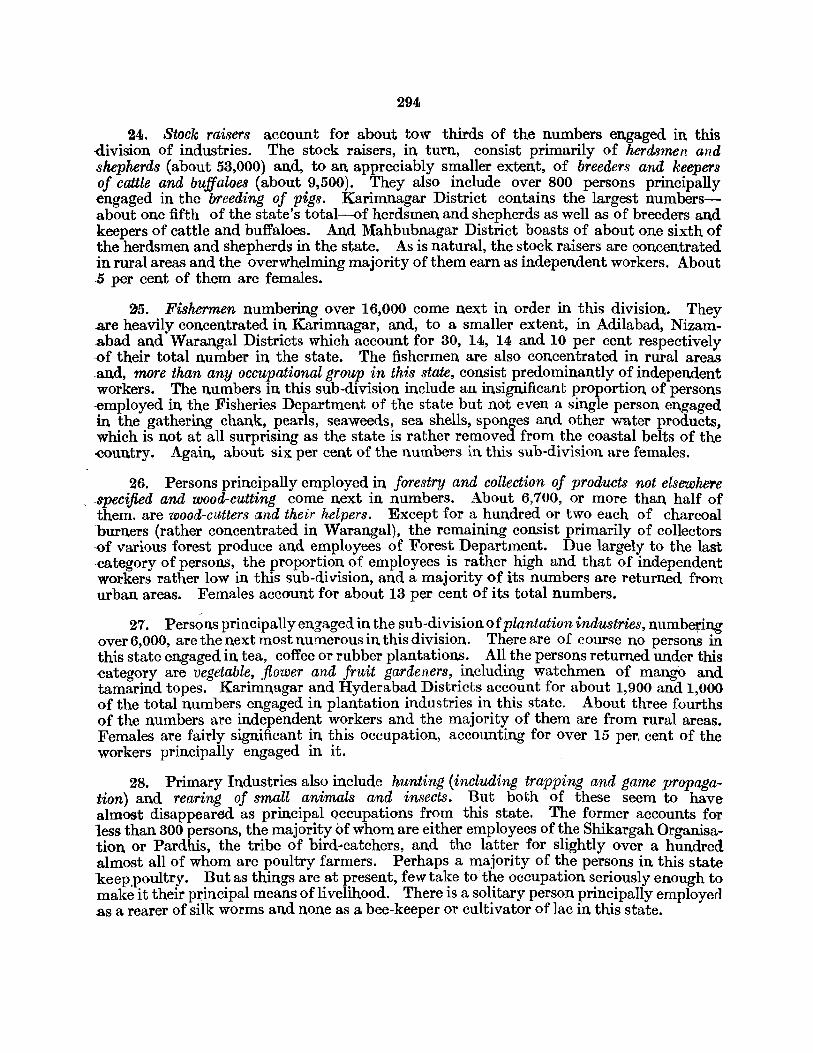
294
24. Stock raisers account for about tow thirds of the numbers engaged in this -division of industries. The stock raisers, in turn, consist primarily of herdsmen and shepherds (about 53,000) and, to an appreciably smaller extent, of breeders and keepers of cattle and buffaloes (about 9,500). They also include over 800 persons principally engaged in the breeding of pigs. Karimnagar District contains the largest numbersabout one fifth of the state's total--of herdsmen and shepherds as well as of breeders and keepers of cattle and buffaloes. And Mahbubnagar District boasts of about one sixth of the herdsmen and shepherds in the state. As is natural, the stock raisers are concentrated in rural areas and the overwhelming majority of them earn as independent workers. About .5 per cent of them are females.
25. Fishermen numbering over 16,000 come next in order in this division. They .are heavily concentrated in Karimnagar, and, to a smaller extent, in Adilabad, Nizam.abad and Warangal Districts which account for 30, 14, 14 and 10 per cent respectively ·of their total number in the state. The fishermen are also concentrated in rural areas .and, more than any occupational group in this state, consist predominantly of independent workers. The numbers in this sub-division include an insignificant proportion of persons -employed in the Fisheries Department of the state but not even a single person engaged in the gathering chank, pearls, seaweeds, sea shells, sponges and other water products, which is not at all surprising as the state is rather removed from the coastal belts of the -country. Again, about six per cent of the numbers in this sub-division are females.
26. Persons principally employed in forestry and collection of products not elsewhere , .specified and wood-cutting come next in numbers. About 6,700, or more than half of
them. are wood-cutters and their helpers. Except for a hundred or two each of charcoal burners (rather concentrated in Warangal), the remaining consist primarily of collectors -of various forest produce and employees of Forest Department. Due largely to the last ,category of persons, the proportion of employees is rather high and that of independent workers rather low in this sub-division, and a majority of its numbers are returned from urban areas. Females account for about 13 per cent of its total numbers.
27. Pers~ns principally engaged in the sub-division of plantation industries, numbering over 6,000, are the next most numerous in this division. There are of course no persons in this state engaged in tea, coffee or rubber plantations. All the persons returned under this .category are vegetable, flower and fruit gardeners, including watchmen of mango and tamarind topes. Karimnagar and Hyderabad Districts account for about 1,900 and 1,000 of the total numbers engaged in plantation industries in this state. About three fourths of the numbers are independent workers and the majority of them are from rural areas. Females are fairly significant in this occupation, accounting for over 15 per, cent of the workers principally engaged in it.
28. Primary Industries also include hunting (including trapping and game propagation) and rearing of small animals and insects. But both of these seem to have almost disappeared as principal occupations from this state. The former accounts for less than 300 persons, the majority of whom are either employees of the Shikargah Organisation or Pardhis, the tribe of bird-catchers, and the latter for slightly over a hundred almost all of whom are poultry farmers. Perhaps a majority of the persons in this state keep.poultry. But as things are at present, few take to'the occupation seriously enough to make it their principal means of livelihood. There is a solitary person principally employed .as a rearer of silk worms and none as a bee-keeper or cultivator of ]ac in this state.
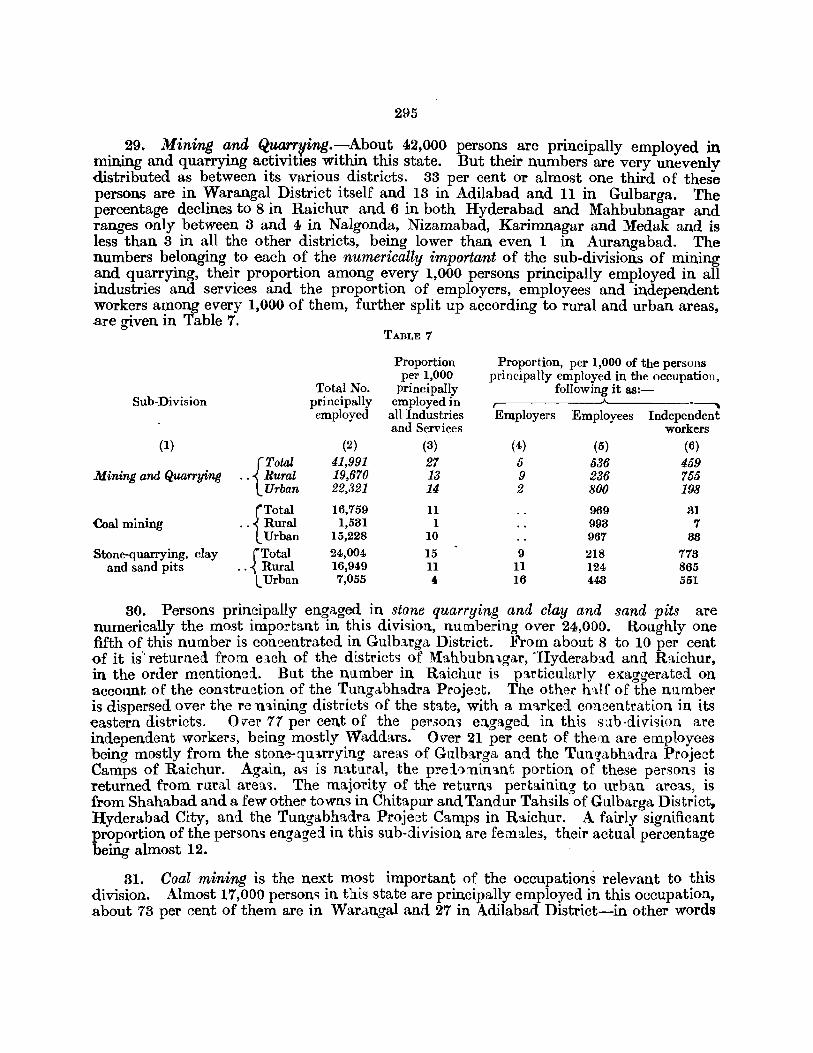
295
29. Mining and Quarrying.-About 42,000 persons are principally employed in mining and quarrying activities within this state. But their numbers are very unevenly distributed as between its v~rious districts. 33 per cent or almost one third of these persons are in Warangal District itself and 13 in Adilabad and 11 in Gulbarga. The percentage declines to 8 in Raichur and 6 in both Hyderabad and Mahbubnagar and ranges only between 3 and 4 in Nalgonda, Nizamabad, Karimnagar and Medak and is less than 3 in all the other districts, being lower than even 1 in Aurangabad. The numbers belonging to each of the numerically important of the sub-divisions of mining and quarrying, their proportion among every 1,000 persons principally employed in all industries and services and the proportion of employers, employees and independent workers among every 1,000 of them, further split up according to rural and urban areas, are given in Table 7.
Total No. Sub-Division principally
employed
(1) (2)
{Total 41,991 Mining and Quarrying .. Rural 19,670
Urban 22,321
{Total 16,759 Coal mining .. Rural 1,531
Urban 15,228
Stone-quarrying, clay {Total 24,004 and sand pits ., Rural 16,949
L Urban 7,055
TABLE 7
Proportion per 1,000
principally employed in
all Industries and Services
(3) 27 13 14
11 1
10 15 11
40
Proportion, per 1,000 of the persons principally employed in the occupation,
following it as:-,-__________ A-_________ ~
Employers Employees Independent workers
(4) (5) (6) 5 536 459 9 236 755 2 800 198
969 31 993 7 967 33
9 218 773 11 124 865 16 443 551
'80. Persons principally engaged in stone quarrying and clay and sand pits are numerically the most important in this division, numbering over 24,000. Roughly one fifth of this number is concentrated in Gulb.lrga District. From about 8 to 10 per cent of it is" returned from elch of the districts of Mahbubn1.gar, -Hyderab.ld and Raichur, in the order mentioned. But the number in Raichur is p.lrticularly exaggerated on account of the con'>truction of the Tungabhadl'a Project. The other h1.1f of the number is dispersed over the ren1.ining districts of the state, with a marked concentration in its eastern districts. 0 vel' 77 per cen.t of the persons engaged in this s:lb·division are independent workers, being mostly Waddars. Over 21 per cent of them are employees being mostly from the stone-quarrying areas of Gulbarga and the Tungabha.dra Project Camps of Raichur. Aga.in, ac;; is natural, the pre:bnina.nt portion of these persons is returned from rural area'>. The majority of the returns pertaining to urban areas, is from Shahabad and a few other towns in Chitapur and Tandur Tahsils of Gulbarga District, Hyderabad City, and the Tungabhadl'a Project Camps in Raichur. A fairly significant proportion of the persons engagee! in this sub-division are females, their actual percentage being almost 12.
81. Coal mining is the next most important of the occupations relevant to this division. Almost 17,000 persons in this state are principally employed in this occupation, about 73 per cent of them are in Warangal and 27 in Adilabad District-in other words
296
in Kothagudem, Yellandu, Bellampalli and Sashti collieries and the villages surrounding them. Microscopic numbers are also returned from Hyderabad and Karimnagar Districts consisting in the former of the employees of the head office of the Kothagudem and Yellandu Collieries located in Hyderabad City and in the latter of labourers from the collieries in the adjoining districts, probably on leave in their home district. The overwhelming majority of these persons are in urban areas. This is but natural considering the fact that all the coal mining centres of the state, except the minor one of Sashti, have been treated as towns. Almost the whole of the number principally engaged in coal mining are employees and there is not even a single employer. Only about 5 per cent of the numbers in this sub-division are females.
32. Gold mining is the most important of the other mining and quarrying activities of this state. But it provides the principal employment for only about a thousand persons in the state of whom over 16 per cent are females. This number is almost totally composed of employees and is returned from Hutti Village in Raichur District. It is obvious that the ancient profession of sifting the sand for gold dust is no longer followed as the principal occupation by any person "in this state. Similarly, the much talked of salt industry in this state now principally sustains only about 200 persons, again mostly in the villages of Raichur District. Mica mining has for all practical purposes disappeared from the economic map of the state. Only one person, a clerk of an almost defunct mica company, returned it as his principal occupation. No person was principally engaged in any other type of mining or quarrying activity in the state.
83. Processing and Manufacture-Foodstuffs, Textiles, Leather &; Products thereof.This division of industries is by far the most important among all industries and services. In fact, it accounts for appreciably over one fifth of the total number of selfsupporting persons principally engaged in them. The numbers pertaining to this division, though spread over all the districts of the state, are rather concentrated in its eastern half, especially in the south-eastern distri~ts of Karimnagar, Nalgonda and Waranga!. Over 18 per cent of them are in Karimnagar, over 13 in Nalgonda and over 11 in Waranga!. Among the other districts, about 9 per cent are in Hyderabad, 8 in Mahbubnagar, between 4 and 7 in each of the districts of Gulbarga, Nizamabad and Medak, about 2 to 4 in each of the districts of Adilabad, Aurangabad, Nanded, Raichur, Bidar and Parbhani and less than 2 both in Osmanabad and Bhir. The numbers belonging to each of the numerically important of the sub-divisions pertinent to this division, their proportion among every 1,000 persons principally engaged in all industries and services and the proportion of employers, employees and independent workers among every 1,000 of them, further split up according to rural and urban areas, ar; given in Table 8.
Sub-Division
(1)
Processing and Manufacture- {Total Food-stuffs, Textiles, Leather Rural and Products thereof Urban
Total No. principally employed
(2)
351,456 239,310 112,146
TABLE 8
Proportion per 1,000
principally employed in all indu$tries and services
(8)
224 152
72
Proportion, per 1,000 of the persons principally employed in the Occupa
tion, following it as :-, ~----------Employers Employees Independent
Workers (4) (5) (6)
25 19 38
197 89
429
7'18 892 i33
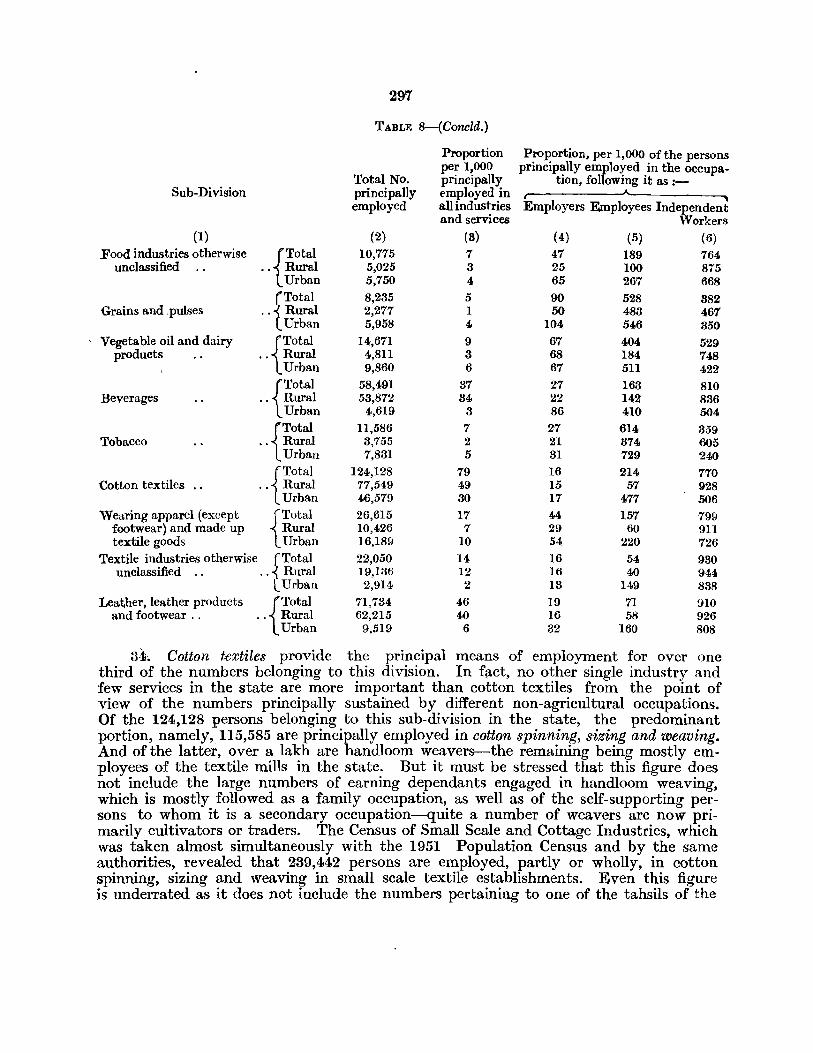
297
TABLE 8-(Concld.)
Proportion Proportion, per 1,000 of the persons per 1,000 princip~ny etlclo~ed .in the occupa-
Total No. principally bon, fo owmg It as :-Sub-Division principally employed in
employed all industries Employers Employees Independent and services Workers
(1) (2) (8) (4) (5) (6) Food industries otherwise {Total 10,775 7 47 189 764
unclassified .. Rural 5,025 3 25 100 815 Urban 5,750 4 65 267 668
(Total 8,235 5 90 528 382 Grains and, pulses .. 1 Rural 2,277 I 50 483 467
(Urban 5,958 4 104 546 350 Vegetable oil and dairy {Total 14,671 9 67 404 529
products .. Rural 4,811 3 68 184 748 Urban 9,860 6 67 511 422
{Total 58,491 37 27 163 810 Beverages .. Rural 53,872 34 22 142 836
Urban 4,619 3 86 410 504
{Total 11,586 7 27 614 359 Tobacco .. Rural 3,755 2 21 374 605
Urban 7,831 5 31 729 240
{Total 124,128 79 16 214 710 -Cotton textiles ., .. Rural 77,549 49 15 57 928
Urban 46,579 30 17 471 506 Wearing apparel (except {Total 26,615 17 44 157 799
footwear) and made up Rural 10,426 7 29 60 911 textile goods Urban 16,189 10 54 220 726
Textile industries otherwise (Total 22,050 14 16 54 930 unclassified .. . .1 Rural 19,136 12 16 40 944
lUrban 2,914 2 13 149 838 Leat;her, leather products {Total 71,734 46 19 71 910
and footwear .. .. Rural 62,215 40 16 58 926 Urban 9,519 6 82 160 808
34. Cotton textiles provide the principal means of employment for over one third of the numbers belonging to this division. In f!lct, no other single industry and few services in the state are more important than cotton textiles from the point of view of the numbers principally sustained by different non-agricultural occupations. Of the 124,128 persons belonging to this sub-division in the state, the predominant portion, namely, 115,585 are principally employed in cotton spinning, sizing and weaving. And of the latter, over a lakh are handloom weavers-the remaining being mostly employees of the textile mills in the state. But it must be stressed that this figure does not include the large numbers of earning dependants engaged in handloom weaving, which is mostly followed as a family occupation, as well as of the self-supporting persons to whom it is a secondary occupation-quite a number of weavers are now primarily cultivators or traders. The Census of Small Scale and Cottage Industries, which was taken almost simultaneously with the 1951 Population Census and by the same authorities, revealed that 239,442 persons are employed, partly or wholly, in cotton spinning, sizing and weaving in small scale textile establishments. Even this figure is underrated as it does not include the numbers pertaining to one of the tahsils of the
298
state. Any way, of the 115,585 persons returned at the 1951 Population Census as principally engaged in cotton spinning, sizing and weaving in this state, over 19 per cent, or almost one fifth, are from Karimnagar, over 13 from Nalgonda, over 12 from Warangal and over 11 from Gulbarga. Of the remaining districts, over 7 per cent are from both Medak and Mahbubnagar, over 5 from Nanded, over 4 from each of the districts of Nizamabad, Hyderabad and Raichur, about 2.5 from Adilabad and less than 2.5 from all the rest of the districts, the percentage being less than even O. 5 in both Bhir and Osmanabad.
,Of the 124,128 persons principally engaged in cotton textiles, only 6,733 are primarily employed in cotton ginning, cleaning and pressing and 1,810 in cotton dyeing, bleaching and printing. The former are mostly concentrated in Parbhani and, to a smaller extent, Aurangabad, Nanded, Adilabad, Raichur and Osmanabad Districts. The majority of the persons in this group in these districts are employees of ginning and pressin,g factories. Karimnagar District has also a few hundreds principally following this . occupation. But they are mostly 'Dudekulas' engaged in cotton cleaning on their own. The latter, i.e., the persons connected with cotton dyeing, bleaching and printing, are' scattered over all the state with a slight concentration in Hyderabad, Karimnagar,. Gulbarga and Warangal Districts.
Though a decisive majority of the persons belonging to the sub-division of cottOIl! textiles, as a whole, are in rural areas, the sub-division draws a very respectable portion of its numbers from the towns and cities of the state. About 77 per cent of the' persons in this sub-division are independent workers, over 21 are employees and less. than 2 are employers. But. the percentage of independent workers increases to 93 in rural and that of employees to 48 in urban areas. This is merely the reflection or the fact that while in rural areas almost all the persons belonging to this sub-division are handloom weavers working in family units, a heavy proportion of those in urban. areas consists of persons working in textile mills and cotton ginning and pressing factories. Females account for about 9 per cent of the total numbers belonging to all the groups of this sub-division--for over 22 per cent in the group of cotton ginning and pressing.
35. The next most important sub-division in this division, and one of the most important among all industries and services, is the processing and manufacture of leather, leather products and footwear. 71,734 persons are principally engaged in these occupations in the state, largely in Nalgonda, Karimnagar, Warangal and Mahbubn~ar Districts, which account for 18, 16, 12 and 10 per cent respectively of the total numbers. Among the other districts, individually, from 6 to 7 per cent of the numbers are from Adilabad and Hyderabad, about 4 to 5 from Aurangabad and Medak, 2 to 4 from Nizamctbad, Osmanabad, Bhir, Bidar, Parbhani and Gulbarga and from I to 2 from Raichur and Nanded. This sub-division includes over 41,000 cobblers, almost 24,000 makers and repairers of leather products other than footwear and over 6,300 tanners. But actually it is rather difficult to demarcate the persons according to these categories. And' again, considering the low esteem in which such occupations are held, especially in rural areas, and the economic backwardness of the professional castes engaged in them, it is almost certain that the census figures pertinent to this sub-division and its various groups, more than in the case of any other major sub-division of all industries, fail to do full justice to the importance of the relevant occupations in the sustenance of the people of the state. A vast number of the persons who 'make leather articles required for agricultural operations, or footwear, or who tan hides and skins in rural areas, have returned themselves as agricultural labourers or owner or tenant cultivators. The traditional duties.

299
-of members belonging to some of the Scheduled Castes include both assistance in agricultural operations and the supply of village requirements in respect of leather articles. A large number of persons following such occupations in rural areas also own lands, though the size of their holdings may almost invariably be small. Besides, as in case of the figures pertaining to other divisions and sub.-divisions, these figures do not include the earning dependants in the families of the village cobblers and tanners. And the proportion of earning dependants is especially heavy among such backward sections of the population.
The numbers returned under this sub-division are also concentrated in rural areas .and, as is natural, the percentage of independent workers among them is extraordinarily high. It is 81 in urban but exceeds 92 in rural areas. The proportion is relatively low in urban areas not only because of the employees in small establishments making footwear but also because of the labourers working in tanneries. About 5 per cent of the numbers belonging to all the groups of this sub-division are females.
36. The next most important sub-division in this division, or again one of the more important of all industries and services, is of the occupations pertaining to bever.ages. This sub-division claims over 58,000 self-supporting persons, i.e., almost 4 per eent of the corresponding numbers principally engaged in all the various non-agricultural occupations of the state. Of this number, all but 1,117 are toddy drawers. Persons principally engaged in toddy drawing are heavily concentrated in the south-eastern portions of the state. Of the total number following the occupation as their principal means of livelihood, over 27 per cent are returned from both Karimnagar and Nalgonda Districts and over 18 from WarangaL The percentage then declines to 7 in Mahbubnagar, 5 in Hyderabad, to 4 both in. Nizamabad and Medak and to 2 in Adilabad. Among the western districts, the percentage does not exceed 2 in case of any district. In fact, it is lower than evcn one in the north . western districts of Bhir, Parbhani, Osmanabad, Aurangabad, Nanded and Bidar. The total numbers following this occupation, whether as the principal or subsidiary, would be significantly more than the cen"Sus return of 57,374 self-supporting persons as being principally engaged in it, as a number of toddy drawers have returned their principal occupation as owner cultivation, or sometimes as trade in toddy or other commodities. Besides, as usual in all rural activities, a number of earning dependants are also engaged in this occupation.
The other groups in this sub-division, which are all microscopic, include 347 brewers and distillers, mostly from Hyderabad and Nizamabad Districts; 301 ice manufacturers, mostly from Hyderabad District; and 469 manufacturers of aerated and mineral waters mostly from Hyderabad and Warangal Districts. The last two groups suffer to an appreciable extent on account of the fact that many persons engaged in the relevant activiti~s have returned other occupations, especially those connected with hotels and restaurants, as their chief source of sustenance.
As is natural, this sub-division is also heavily concentrated in rural areas. But unlike in the case of the other major sub-divisions of industries, which are similarly dispersed, a fairly significant proportion of the persons belonging to it are employees. Over 16 per cent of the numbers in this sub-division, over 14 in rural and over41 in urb an areas are employees. But basically this sub-division is also one of independent workers. Over 81 per cent of its numbers, over 83 in rural and over 50 in urban areas, are independent workers. The employers account for about 3 per cent of its numbers. Females play relatively,an insignificant role in this sub-division. Their percentage in it is less than 4.
800
87. Persons principally engaged in the making or manufacturing of wearing apparel (except footwear) and made-up textile goods come next in order in this division. Of their number of 26,615 all but 1,641 are tailors. The remaining include 645 manufacturers of hosiery products and embroiderers, 198 makers of hats, caps and other articles of wear from textiles, 91 makers of other made-up textile goods, including umbrellas, and 679 manufacturers of house furnishing textile articles. Of these numerically insignificant groups, the first three are heavily concentrated in Hyderabad City and the last in Warangal District. The rest of the 28 persons in this sub-division are tent makers. Thus, this sub-division is basically made up of tailors.
Except for a particularly heavy concentration of this sub-division in Hyderabad District, in other words Hyderabad City, it may be said to be well dispersed over all the districts of the state. About one fourth of the total numbers belonging to it are in Hyderabad District. About 10 per cent are in Warangal, from 5 to 7 per cent in each of the districts of Karimnagar, Gulbarga, Aurangabad, Nalgonda, Raichur and Mahbubnagar; and from 2 to 5 in each of the districts of Nizamabad, Bidar, Nanded, Parbhani, Medak, Adilabad, Osmanabad and Bhir, all in the order mentioned. This sub-division is, however, concentrated in urban areas. In spite of this a heavy majority or the persons belonging to it are independent workers. This is due to the fact that, tailoring, whether in urban or rural areas, still-continues to be primarily a family occupation. That this may not be so in future is already obvious from the fact that 22 per cent of its strength in urban areas is derived from employees and 5 from employers. Females account for about 10 per cent of the numbers belonging to this sub-division, and their percentage is even higher in rural areas.
88. Next in importance in this division'is the sub-dhrision pertaining to textile in-, dustries otherwise unclassified. The total numbers principally engaged in these occupations exceed 22,000. They include 10,713 persons similarly engaged in woollen spinning and weaving -of whom Mahbubnagar District accounts for 31 per cent and Karimnagar for 21. Thus, these two districts together claim more than half of the returns pertaining to this group. About 5 to 7 per cent of the persons principally engaged in woollen spinning and weaving in the state are from each of the districts of Nalgonda, Gulbarga and Bidar and similarly from 4 to 5 are from Warangal, Nizamabad and Medak, from 2 to 4 from Nanded, Hyderab39" Bhir and Aurangabad, and less than 2 from each of the remaining districts of Raichur, Osmanabad, Parbhani and Adilabad, ~eing less than even one per cent from the last two .
._--,_:_ The next most numerous group in this sub-division is of persons principally engaged in rope making. They number 9,096, of whom almost 7,700 are'in Karimnagar District itself. The majority of the remaining are in the adjoining tahsils of Nizamabad and Warangal. The other minor groups pertaining to this division are of the persons principally engaged in (i) silk spinning and weaving, (ii) hemp and flax 8pinning and weaving. and (iii) in the making of artificial leather and cloth. The first of these groups, numbering 1,376, is heavily concentrated in Nizamabad District, and to a considerably smaller extent, Mahbubnagar, Aurangabad, Raichur and Warangal Districts, about half of the second group, numbering just 378, is from Karimnagar, and more than half of the third of these groups, numbering 487, is from Hyderabad and Warangal Districts, i.e., mainly from Hyderabad and 'Varangal Cities. - '
The numbers pertaining to this sub-division, as a whole, are concentrated in rural areas and consist of an extraordinarily heavy proportion of independent workers, which
801
again mainly reflects the fact that both woollen weaving and rope making in this state are almost exclusively carried on as family occupations. This sub-division derives about one tenth of its numbers from females.
39. The sub-division of persons principally engaged in industries pertaininO' to vegetable oil and dairy products is the next in order in this division. It includes 9,622 persons engaged in the pressing and refining of vegetable oil and 5,009 milkmen. The former, are well dispersed over the state with a slight concentration in KarimnaO'ar, Warangal, Aurangabad, Gulbarga and Hyderabad Districts. Karimnagar accounts °for the highest percentage, namely, about 14, and Medak the lowest, namely, 2. The latter are heavily concentrated in Hyderabad District, which itself accounts for over 2,100 of their numbers. But both these groups have lost appreciably in numbers because many oil pressers and milkmen in rural areas are primarily agriculturists. Besides, most of the oil mills in this state also function as rice mills or cotton ginning and pressing factories*, and vice versa. Thus, quite a number of the persons returned as principally employed in oil or rice milling or cotton ginning and pressing, are also similarly engaged in the other occupations in different seasons or even simultaneously. This subdivision further includes about 40 persons principally engaged in the manufacturing of hydrogenated oils.
This sub-division, as a whole, derives its major numbers from urban areas. About 7 per cent of it are employers, 40 employees and 53 independent workers. The percentage of employees increases to 51 in urban and of independent workers to 15 in rural areas. In urban areas, not only the labourers in oil mills but also the servants engaged by gowlis for their trade go to swell the numbers of employees in this sub-division. Females playa significant role in this sub-division, accounting for over 10 per cent of its numbers-actually for over 20 percent in the group of milkmen & milkmaids.
40. Persons principally employed in tobacco industries form a minor sub-division of this division. Of their total number of 11,586, the overwhelming majority, namely, 9,232, are employed in bidi making, and an appreciable minority, namely, 2,191, in the cigarette industry and just 163 in the making of zarda, snuff and cigars. Persons engaged in bidi industry are heavily concentrated in Nizamabad, Mahbubnagar and, to a considerably smaller extent, Gulbarga and Hyderabad Districts. These districts claim '2,728, 2,283, 989 and 906 respectively of total numbers. The remaining 2,326 are, more or less, well dispersed over the other districts of the state, with the exception of Parbhani, Nanded, Bhir and Osmanabad. A number of persons are engaged in this industry in their own homes-the proprietors or their agents generally supplying the material and paying the wages on the basis of the quantity of work turned out. It will not be surprising if an appreciable portion of such persons has been returned only as earning dependants, or as self-supporting but following principally occupations other than bidi making. Both these categories of persons are excluded from the present census figures. Any way, in no industry of the state, whether old or new, are females as prominent as in this industry. Over 48 per cent of the numbers in this group consists of females. In Nizamabad District, the chief strong-hold of bidi industry in the state, over two-thirds of the numbers are females. Persons principally engaged in cigarette industry in this state are almost exclusively concentrated in Hyderabad District and the overwhelming majority of them are employees of large scale establishments. Over 36 per cent of them are females. Persons principally employed in the .Some factories are engaged in aU the three activities.
802
making of snuff, zarda and cigars are returned mostly from Warangal, Karimnagar and Hyderabad Districts.
A majority of the numbers belonging to this sub-division as a whole is from the urban areas of the state, although over 86 per cent of its numbers in Mahbubnagar and over 41 of Nizamabad live in villages. This makes it obvious that while cigarette making is
. exclusively an urban industry bidi making is as much of an urban as a rural industry. The proportion of employees in this sub-division is unusually heavy as compared with most industries in the state. They account for over 72 per cent of the total numbers. in the urban and over 87 even in rural areas. On the whole, they account for over 61 per cent of the numbers beloning to this sub-division, conceding only about 36 p&- cent to independent workers.
41. The sub-division of unclassified food industries accounts for over 10,500 persons. Within this sub-division, by far the most numerous group consists of persons principally engaged as butchers or slaughterers. This group, which numbers 6,118, is· more or less dispersed over all the districts with the exception of Osmanabad, which accounts for only 27 of its numbers, and Gulbarga, which accounts for as many as 1,069. The other groups in this sub-division consist of 4,335 persons principally engaged in other food industries (chiefly making of sweetmeats, etc.,) and 320 persons engaged in canning and preservation of fruits, over one third of the former and almost all of the latterare from Hyderabad District.
The majority of persons belonging to this sub-division are in urban areas. But. in spite of this, it has a fairly heavy proportion, exceeding 75 per cent, of independent workers. Even in urban areas the percentage of independent workers is as much as: 67. This is probably due to the fact that butchers also carryon their trade in family units. In fact, the majority of independent workers would have been appreciably more but for the labourers and servants in sweetmeat shops and large-scale food industries in Hyderabad City. The reasons for the concentration of this sub-division in urban areas. include the fact that the marwadis and similar groups engaged in preparation of sweets, etc., do not find it worthwhile to carry on their trade in rural areas and the villagers. generally prefer to slaughter their animals, when and if they need the meat, rather than buy it from the butchers. Females, account for less than. one-twentieth of the but-chers but over one-sixth of the persons engaged in other food industries. '
42. The sub-division of persons principally employed in industries connected with grains and pulses comes next in order in this division. Its numbers include 4,91 r millers of cereals and pulses, over 1,100 of whom are in Hyderabad District; 1,027 hand-pounders of rice and other persons engaged in manual dehusking and flour grinding, over 250, of whom are in Karimnagar District; 1,668 grain parchers, mostly in Raichur, Aurangabad, Parbhani, Nanded and Bhir Districts; and 623 persons engaged in other processes or grains and pulses. This sub-division loses appreciable numbers to hawkers, domestic servants, etc., who perform many of the activities relevant to it. Besides, as stated in paragraph 39, there is quite an amount of overlapping in. this state among the persons principally employed in vegetable oil industry, rice milling and cotton ginning and pressing.
A decisive majority of the persons belonging to this sub-division are from urban areas. It has comparatively a high percentage of employers. This is largely due to the number of small flour grinding establishments set up in urban areas, especially in Hyderabad City, which do not need any considerable capital. This is one of the
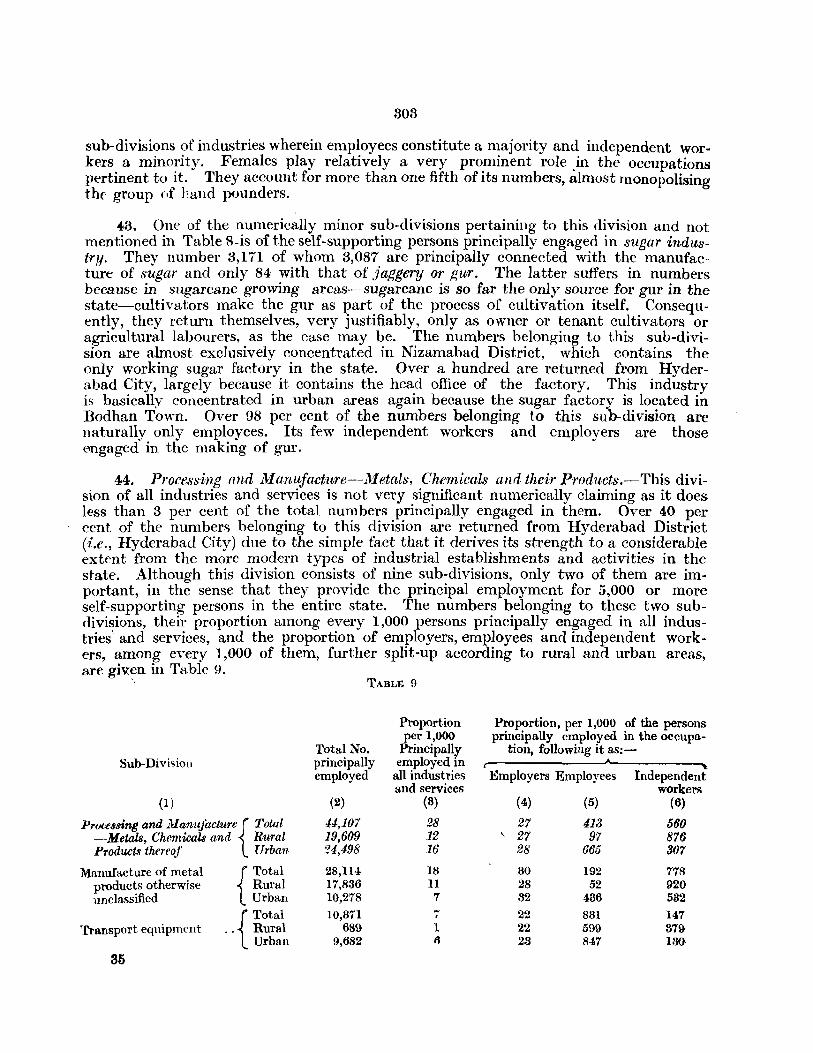
303
sub-divisions of industries wherein employees constitute a majority and independent workers a minority. Females play relatively a very prominent role .in the occupations pertinent to it. They account for more than one fifth of its numbers, almost monopolising the group (If }'and pounders.
43. One of the numerically minor sub-divisions pertaining to this division and not mentioned in Table 8-is of the self-supporting persons principally engaged in 8ugar ind'ustry. They number 3,171 of whom 3,087 are principally connected with the manufacture of sugar and only 84 with that of jaggery or gur. The latter suffers in numbers because in sugarcane growing areas--sugarcane is so far the only source for gul' in the state-cultivators make the gur as part of the process of cultivation itself. Consequently, they return themselves, very justifiably, only as owner or tenant cultivators or agricultural labourers, as the case may be. The numbers belonging to this sub-division are almost exclusively concentrated in Nizamabad District, which contains the only working sugar factory in the state. Over a hundred are returned from Hyderabad City, largely because it contains the head office of the factory. This industry is basically concentrated in urban areas again because the sugar factory is located in Bodhan Town. Over 98 per cent of the numbers belonging to this sub-division are naturally only employees. Its few independent workers and employers are those engaged in the making of gur.
44. Processing and Nlanujactu,re-l1fetals, Chemicals and their Products.-This division of all industries and services is not very significant numerically claiming as it does less than 3 per cent of the total numbers principally engaged in them. Over 40 per cent of the numbers belonging to this division are returned from Hyderabad District (i.e., Hyderabad City) due to the simple fact that it derives its strength to a considerable extent from the more modern types of industrial establishments and activities in the state. Although this division consists of nine sub-divisions, only two of them are important, in the sense that they provide the principal employment for 5,000 or more self-supporting persons in the entire state. The numbers belonging to these two subdivisions, their proportion among every 1,000 persons principally engaged in all industries' and services, and the proportion of employers, employees and independent workers, among every 1,000 of them, further split-up according to rural and urban areas, are giv~n in Table 9.
TABLE 9
Proportion Proportion, per 1,000 of the persons per 1,000 principally employed in the occupa-
Total No. Principally tion, following it as!-Sub-Division principally employed in
employed all industries Employers Employees Independent and services workers
(1) (2) (8) (4) (5) (6)
Processing and jrJanufadure { Total 44,107 28 27 413 560 -Metals, Chemicals and Rural 19,609 12 '- 27 97 876 Products thereof Urba:n 24,498 16 28 665 307
Manufacture of metal { Total 28,114 18 30 192 178 products otherwise Rural 17,886 11 28 52 920 unclassified Urban 10,278 7 82 436 582
{ Total 10,371 .... 22 831 147 I
Transport equipment ., Rural 689 1 22 599 379 Urban 9,682 6 28 847 100
35
804
45. By far the most important of the sub-divisions in this division relates to the persons principally' engaged in the manufacture of unclassified metal products. This sub-division claims for almost two thirds of the total numbers belonging to the division. But its numbers, in turn, are overwhelmingly drawn from black smiths and other workers in iron. These account for 19,696 of the 28,114 persons belonging to this sub-division and are rather concentrated in the eastern half of the state. Both Hyderabad and Karimnagar Districts account for more than 13 per cent of their total numbers, Nalgonda for almost 11, both Adilabad and W·arangal for more than 6 and each of the ·districts of Mahbubnagar, Medak and Nizamabad for more than 5. As against this, among the western districts, only Aurangabad accounts for more than 6 per cent of the ·black smiths and the corresponding percentage varies only between 3 and 5 in each of the ·districts of Gulbarga, Raichur, Nanded, Bidar, Osmanabad and Bhir and is less than even 3 in Parbhani. The next numerieally important group within this sub-division -consists of brass-smiths, copper-smiths and workers in bell metal. They number 3,907, and are mostly drawn from the eastern districts, especially the districts of Karimnagar, Nalgonda and Warangal. Workers in other metals come next in this division, 1,489 of the 2,805 persons belonging to this group, are returned from Hyderabad District. This sub-division also includes 1,531 workers in mints, lock-smiths and die-sinkers, of whom .again as many as 1,424 are from Hyderabad District. 126 cutlers and makers of surgical instruments and .J9 makers of arms and guns, both concentrated in Hyderabad Dis-. trict, also add to the numbers of this sub-division.
Due largely to the black smiths, a majority of the numbers in this sub-division .are in rural areas and are independent workers. In fact, independent workers ace-ount for over 92 per cent of its numbers in rural areas. The employees ace-ount for over 43 per cent of the sub-division in the urban areas. They largely represent the labourers in metal factories (mostly engaged in making trunks and vessels) and the mint in Hy-derabad City. Females do not play any significant role in the industries pertaining to this sub-division, their percentage to its total numbers being less than 8. Again, the numbers following artisan trades like black or brass smithies are bound to the appreciably more as such trades engage a number of earning dependants. Besides, many of ( even the self-supporting black smiths, brass smiths, etc., jn rural areas, have returned cultivation as their principal livelihood.
46. Persons principally engaged in the making and repairing of transport eqt1ipment account for slightly less than a quarter of the total numbers belonging to this division. The] 0,371 persons in this sub-division consist of 4,995 principally engaged in the manufacture, assembly and repair of railway equipment, over 4,400 of whom are from Hyder-abad District; 3,746 similarly engaged in repairing of motor vehicles, over 3,300 of whom are from Hyderabad District; 981 en.gaged in cycle repairing, over 690 of whom are from Hyderabad District; 138 engaged, almost exclusively in Hyderabad District, in the repairing of air craft equipment and lastly 510 engaged in the building or repairing of carriages, rickshaw.'; and carts, of whom over 200 are from Hyderabad District. The category pertaining to cycle repairing loses in numbers because many persons engaged in this activity returned themselves as being primarily owners or employees of cycle-taxi shops and were consequently classified under commerce. Similarly, the last of these categories suffers because the persons who make tongas and bandis are mostly artisans generally classed as carpenters or blacksmiths. The category pertaining to the repairing of motor vehicles has also lost to an extent because some persons returned themselves as only mechanics instead of as motor-mechanics-vide paragraph 47 below. This sub-division, as is natural, is heavily concentrated in urban areas, consists overwhelmingly of employees and records a very low percentage offemales, lower than even one.
35*
305
4<7. The most important of the other minor sub-divisions pertinent to this division is of the persons principally employed in engi neeri Ilg work-shops (other than electrical) and unspecified mechanics. The former number 1,95J and .the latter 728. Considerably more than half of both are returned from Hyderabad District. Of the former, OYtT 300 are in Raichur District, mainly in the Tungabhadra Project Camps, and 99 in Adilabad, mainly in the Kadam Project Camps. As is natural, the overwhelming majority of the persons pertaining to this sub-division are in urban areas and are employees and females account for even less than one per cent of them.
48. This division also includes the persons principally engaged in the manufacture of unclassified chemical products. This sub-division, numbering 1,251, covers in turn 466 persons employed in soap industry, of whom 385 are from Hyderabad District; 891 in the making of perfumes, cosmetic a;nd other toilet prtparations (mostly 'kunkum' and 'Itr'), of whom 152 are from Karimnager; 307 in match industries of whom 200 are from Hyderabad and 86 from 'Varangal; and 28, 19, 14, 12 and 19 in industries connected with paints and varnishes, ink, starch, candle and other chemical products respectively. Most of these persons are from Hyderabad City. Over 950 of the 1,251 persons belonging to this sub-division are from urban areas, slightly more than half of them are employees and over 12 per cent of them are f~males. The proportion of employees would have been considerably higher and that of females markedly lower in this. sub-division. but for the fact that 'kunkum' and 'Itr' making is largely followed as a family occupation.
49. Persons employed in industries connected with electrical machinery and apparatu.'; form also one of the sub-divisions of this division. They number only 709 in all and are mostlv mechanics, fitters, etc., connected with radios, electrical accessories of motor vehicles (including batteries), electricity generating, transmitting and distributing equipment and house-hold electrical appliances. As is natural, they are almost exclusively males, mostly employees and predominantly dl'2,wn from Hyderabad District.
50. Yet another sub-division pertaining to this division consists of persons principally engaged in the making of basic industrial chemicals, fertilisers and power alcohol. They number 489 of whom 26 are engaged in making acids and alkali salts, 168 in dyes> explosives alld fireworks, 41 in power alcohol (mainly in Nizamabad) and 254 in chemical fertilisers (mostly in Adilabad). Slightly less than thirty per cent of the persons in this su"Q-division are independent workers and slightly less than seventy are employees~ Females' account for over 12 per cent of its numbers. A majority of the persons belonging to this sub-division are in rural areas, merely because of the fact that the labourers. of the chemical and fertilisers factory in Adilabad District reside in such areas .
. 51. Persons connected with the manufacture of medical and pharmaceutical prepamtions-numbering 486, of whom over two thirds are from Hyderabad Districtform one of the distinct sub-divisions of this division. The employees in this sub-division,. who account for a majority of its numbers, are almost exclusively workers in the largescale establishments in Hyderabad City and the independent workers, who form an appreciable minority in this sub-division, are persons connected with indigenous medical preparations, mostly in rural areas.
This division also covers persons principally engaged in the basic manufacture of both iron and steel and non1errous metals, the former accounts for only five stragglers and the latter for not even a single self-supporting person in this state.
52. Pl'ocessing and Jt;lanufacture not specified elsewhere.---This division accounts for over 8 per cent of the persons principally engaged in all industries and services. The
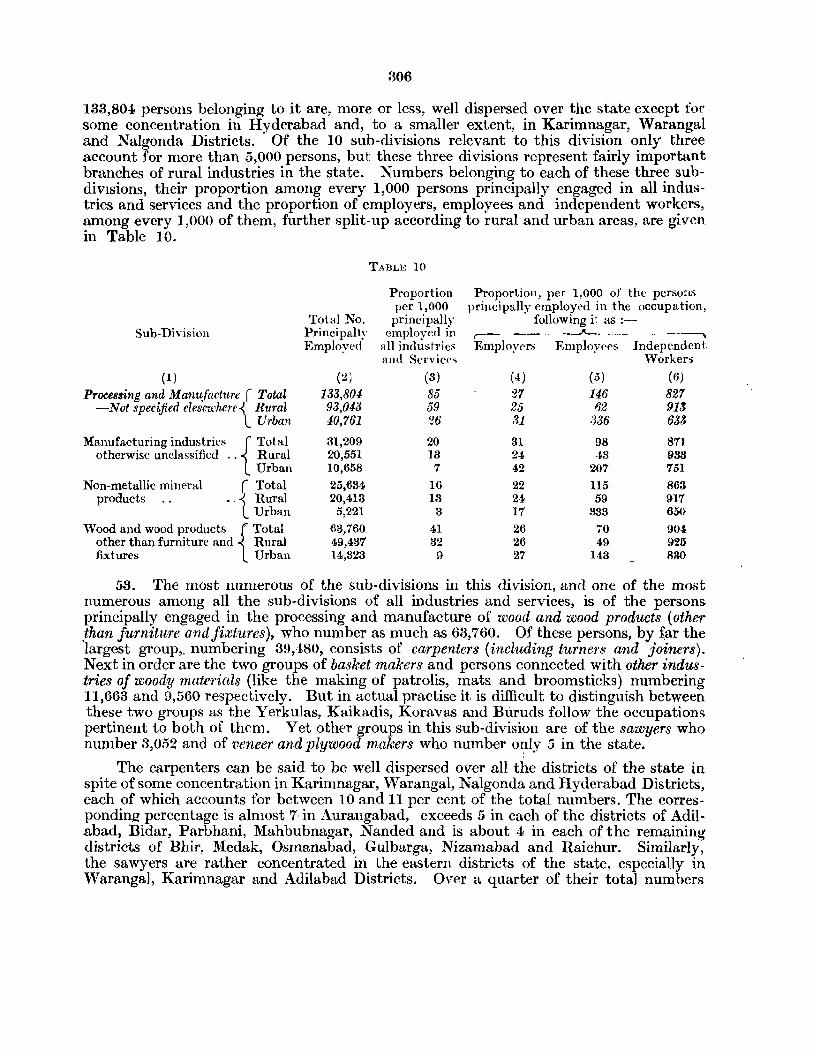
306
133,804 persons belonging to it are, more or less, well dispersed over the state except for some concentration in Hyderabad and, to a smaller extent, in Karimnagar, Warangal and Nalgonda Districts. Of the 10 sub-divisions relevant to this division only three account for more than 5,000 persons, but these three divisions represent fairly important branches of rural industries in the state. Numbers belonging to each of these three subdivIsions, their proportion among every 1,000 persons principally engaged in all industries and services and the proportion of employers, employees and independent workers, among every 1,000 of them, further split-up according to rural and urban areas, are given in Table 10.
TABLE 10
Proportion Proportion, per 1,000 of the persons per 1,000 principally employed in the occupation,
Total No. principally following it as :-Sub-Division Principally employed in r------~----"--------~
Employefl all industries Employers Employ('('s Independent and Servicc,> 'Yorkers
(1) (2) (8) (4) (5) (6)
Processing and Manufacture r Total 133,804 85 27 146 827 -Not specified eleseu.'here~ Rural 93,043 59 25 62 91J
L Urban 40,761 26 31 .336 633
Manufacturing industries r Total 31,209 20 31 98 871 otherwise unclassified " ~ Rural 20,551 13 24 43 938
L Urban 10,658 7 42 207 751 Non-metallic mineral r Total 25,634 16 22 115 863
products " ~ Rural 20,413 13 24 59 917 L Urban 5,221 3 17 333 650
Wood and wood products {Total 63,760 41 26 70 904 other than furniture and Rural 49,437 32 26 49 925 fixtures Urban 14,323 9 27 143 830
53. The most numerous of the sub-divisions in this division, and one of the most numerous among all the sub-divisions of all industries and services, is of the persons principally engaged in the processing and manufacture of wood and wood products (other .than furniture arzdjixiures), who number as much as 63,760. Of these persons, by ~ar the largest group,. numbering 39,480, consists of carpenters (including turners and joiners). Next in order are the two groups of basket makers and persons connected with other industries of woody materials (like the making of patrolis, mats and broomsticks) numbering 11,663 and 9,560 respectively. But in actual practise it is difficult to distinguish between these two groups as the Yerkulas, Kaikadis, Koravas and Buruds follow the occupations pertinent to both of them. Yet other groups in this sub-division are of the sawyers who number 8,052 and of veneer and plywood makers who number o~ly 5 in the state.
The carpenters can be said to be well dispersed over all the districts of the state in spite of some concentration in Karimnagar, Warangal, Nalgonda and Hyderabad Districts, each of which accounts for between ] 0 and 11 per cent of the total numbers. The corresponding percentage is almost 7· in Aurangabad, exceeds 5 in each of the districts of Adilabad, Bidar, Parbhani, :Mahbubnagar, Nanded and is about 4 in each of the remaining districts of Bhir, Medak, Osmanabad, Gulbarga, Nizamabad and Raichur. Similarly, the sawyers are rather concentrated in the eastern districts of the state, especially in Warangal, Karimnagar and Adilabad Districts. Over a quarter of their total numbers
307
is returned from "Tarangal and about or over one tenth from both Karimnagar and Adilabad. The 21,223 persons principally engaged in basket making and other industries of woody materials (like the making of patrolis, mats and broomsticks) are also concentrated in the eastern districts, especially III Karimnagar, Warangal and Nalgonda. Each of these three districts accounts for about 12 to 13 per cent of these two groups. The corresponding percentage is almost 10 in Mahbubnagar, about 8 in Hyderabad, about 6 in each of the three districts .of Nizamabad, Gulbarga and Raichur, is about or roughly 4 in both Bidar and Adilabad and is appreciably lower in all the other western districts, being lower than even 2 in Osmanabad. But it must be stressed here that many persons engaged as carpenters in the state are primarily agriculturists, chiefly owner cultivators, and quite a number of those engaged in Basket making, mat weaving and allied occupations are agricultural labourers. Similarly, quite a number following such activities, especially the latter, are only earning dependants.
This sub-division of wood and wood products, as a whole, is also concentrated in rural areas and has an unusually high proportion of independent workers. The inde-pendent workers account for over 90 per cent of its total numbers in the state-actually for over 92 in its rural areas. This again is indicative of the fact that artisan trades like those of carpentry, sawing, basket making, mat weaving, etc., are mainly followed as family occupations. The percentage of females in this sub-division as a whole is slightly lower than 9. But it is as heavy as 24 in the two groups of basket making and of the persons engaged in other industries of woody materials. This again is due to the fact that the females among the Yerukalas, Kaikadis, Koravas and Buruds are closely associated in their ancestral occupations.
54. The next most numerous sub-division in this division consists of persons principally engaged in unclassified manufacturing industries. Of the 31,209 persons belonging to this sub-division as many as 28,363 are silver-smiths and gold-smiths.* The other groups in this sub-division cover 1,580 persons principally engaged in miscellaneous manufacturing industries, mainly button industry; 568 watch and clock repairers,· 301 toy makers,. 200 persons employed in the manUfacturing or repairing of musical instruments; 157 engaged in making stationery articles (other than paper and paper products) ,. 21 engaged in making or repairing photographic or optical goods; 8 engaged in making scientific and controlling instruments,' 7 engaged in making sports goods; and lastly 4 employed 'in the making of plastic or celluloid articles-the overwhelming majority of the persons in all these groups reside in Hyderabad District, in other words, in Hyderabad City. Thus, this sub-division can be said to consist basically of only silver and gold-smiths. These persons are concentrated in the eastern districts. Karimnagar accounts for over 15 per cent and Nalgonda, Hyderabad and Warangal each accounts for about 10 to 11 per cent of their total numbers. The percentage of silver and goldsmiths ranges froin about 5 to. 6 in each of the other eastern districts of Nizamabad, Mahbubnagar, Medak, and Adilabad, in the order mentioned. As against this, among the western districts the corresponding percentage varies from '4 to 5 in each of the districts of Gulbarga, nidar, Aurangabad and Parbhani and from 3 to 4 in each of the districts of Nanded, Bhir and Raichur and is less than even 3 in Osmanabad.
This sub-division is also concentrated in rural areas and has a heavy proportion of independent workers-their actual percentage is 87 in the state as a whole and exceeds 93 in its rural areas. But significantly about one fifth of its numbers in urban areas , consists of employees. This is indicative of the future trend in the artisan trade of * The actual number of persons working in the state as silver and gold-smiths would also be slightly more as quite a few among them have been returned as earning dependants or as self-supporting but principally engaged in a!¢culture.
36
308
-silver and gold-smithy. Females are not at all active in the occupations pertinent to this sub-division. Their percentage among the self-supporting persons following them is lower than even 3.
55. Persons principally engaged in the making of non-metallic mineral products ,constitute the third most numerous sub-division in this division. This sub-division ,consists of five groups. The first, numbering. as much 22,294, or over 85 per cent of the total belonging to this sub-division, is of the potters. The second, numbering 1,627, is of the lime burners. The lime burners are spread over the state with some concentration in Hyderabad, Raichur and Warangal Districts and over 13 per cent of them are females. The third group, numbering 1,42-1;, almost exclusively returned from Hyderabad District, is of the persons engaged in the making of miscellaneous glass articles. Over 10 per cent of this group consists of females. The last two groups are of the makers of crockery and glass bangles and beads. They number just 200 and 89 respectively, and are again, especially the former,. predomin~ntly fr~m Hyderabad District. Thus, this sub-divisior in turn can be SaId to consIst basIcally of potters. The potters are also rather concentrated in the eastern districts. Karimnagar, Nalgonda and Warangal each accounts for about 10 to 12 per cent of their total number in the state. The corresponding percentage in both Hyderabad and Mahbubnagar is about 7 and in each of the three districts of Medak, Nizamabad and Adilabad from about 5 to 6. As against this, -among the western districts the corresponding percentage is, at its highest, only 'i in Nanded. It is about 5 in both Bidar and Aurangabad, about 4 both in Parbhani and 'Gulbarga and only about 3 both in Osmanabad and Bhir and is less than even :3 in Raichur. But many persons also engaged in making earthenware in rural areas must have returned cultivation as their principal occupation and, thus, escaped classification under potters.
This sub-division is also concentrated in rural areas and is overwhelmingly compo-sed of independent workers, which is but natural considering the fact that the making "0f earthenware is almost wholly followed as a family occupation. Employees, however, .account for one third of this sub-division in urban areas. This is due not so much to .any change in the economic status of the persons employed in making earthenware as to the labourers in the glass or porcelain factories or servants of contractors running lime burners in urban areas, especially Hyderabad City. The role of females does not -seem to be particularly significant in the occupations pertinent to this sub-division' as a whole. Their percentage in it is 7.5. This percentage basically reflects the corresponding percentage of 6.7 among the potters. But a heavy proportion of their females must have returned themselves as only earning dependants,. i.e., as part time workers in this trade.
56. Among the less conspicuous sub-divisions relev..ant to this division are of the persons principally employed in making bricks, tiles and other structural clay products, printing and allied industries, paper industry, cement industry, industries connected with furniture and fixtures and rubber products.
Persons principally engag~ in the production of bricks, tiles and other structural clay products number 3,405 and about 48 per cent of them are in Hyderabad District. A few hundreds are also returned from Karimnagar, Warangal and Adilabad and the remaining are scattered over the other distriets of the state. This sub-division must have suffered slightly in numbers, because some persons engaged in such activity elass themselves as being primarily engaged in actual constructional work. Slightly over
36*
309
one third of the persons belonging to this sub-division reside in rural areas. O,·er two thirds of them are independent workers and considerably over a quarter are employees and ahout 3 per cent are employers. A feature of this sub-division is the important position of women in it. They account for about one fifth of its total numbers.
Persons principally engaged in printing and allied industries number 3,105, of' whom 410 are only book binders. This sub-division is concentrated in Hyderabad District (i.e., Hyderabad City) which returns over 2,600 of its numbers. The remainin.gare spread over the other districts, especially Warangal and AurangabacI. Almost all the persons belonging to this sub-division are in urban areas and are males. Over 86 per cent of them are employees, over 7 are independent workers and about 6 are employers.
The persons principally engaged in paper industry arc heavily concentrated in AdilabacI District which contains the only paper factory in the state. Of the 2,716 persons in this sub-division, 2,360 are in Adilabad and 285 in Hyderabad~an appreciable portion of those in Hyderabad are only the employees of the head office of the paperfactory mentioned earlier and the remaining are makers of paper flowers, kites, etc. The next largest number in this sub-division, namely 44, is returned from 1\fedak Distrid and consists of persons producing 'hand-made' paper. About 87 per cent of this. group is returned from urban and only 13 from rural areas. Of the latter, the majority consists mainly of the persons living in villages surrounding Kothapet Town of Adilabad District~wherein the paper factory is located-and the rest of persons producing 'hand-made' paper. Females account for less than six per cent of the self-supporting workers in this sub-division.
2,355 persons are principally employed in cement industry in this state. 1,525 of them are in Gulbarga District, being almost exclusively employees of the cement factory in Shahabad Town, and 687 are in Hyderabad, most of whom, as well as ofthe sprinkling in the other districts, are engaged in making cement products like pipes, etc~ Over 93 per cent of the persons in this sub-division are employees and over 6 are independent workers. Slightly more than two thirds of these persons live in urban and slightly less than one third in rural areas~mainly in the villages surrounding Shahabad Town. Almo~t 9 per cent of this sub-division consists of females.
About 650 of the 1,544 persons principally engaged in the making of furniture and fixtures 'in the state are in Hyderabad District and 287 in Karimnagar. The rest are, more or less, well dispersed over the other districts. But it must be stressed here that the overwhelming majority of the persons who make the furniture required by the people of this state, particularly in its rural areas, have returned themselves, very justifiably, only as carpenters. About 24 per cent of this sub-division is returned from rural and 76 from urban areas. Only about 29 per cent of them are employees and about 6 are employers, both of them being chiefly from urban areas. About 65 per cent of them are independent workers, over one third of them being from the rural areas. The percentage of females is insignificant in this sub-division as well, being less than even 2.
The 75 persons belonging to the sub-division of rubber products are mostly only vulcanizers of tyres living in Hyderabad City.
57. Construction and Utilities.-This division accounts for about 7 per cent of the total number of self-supporting persons principally engaged in all industries and seryices. Appreciably over a quarter of the persons in this division are in Hyderabad
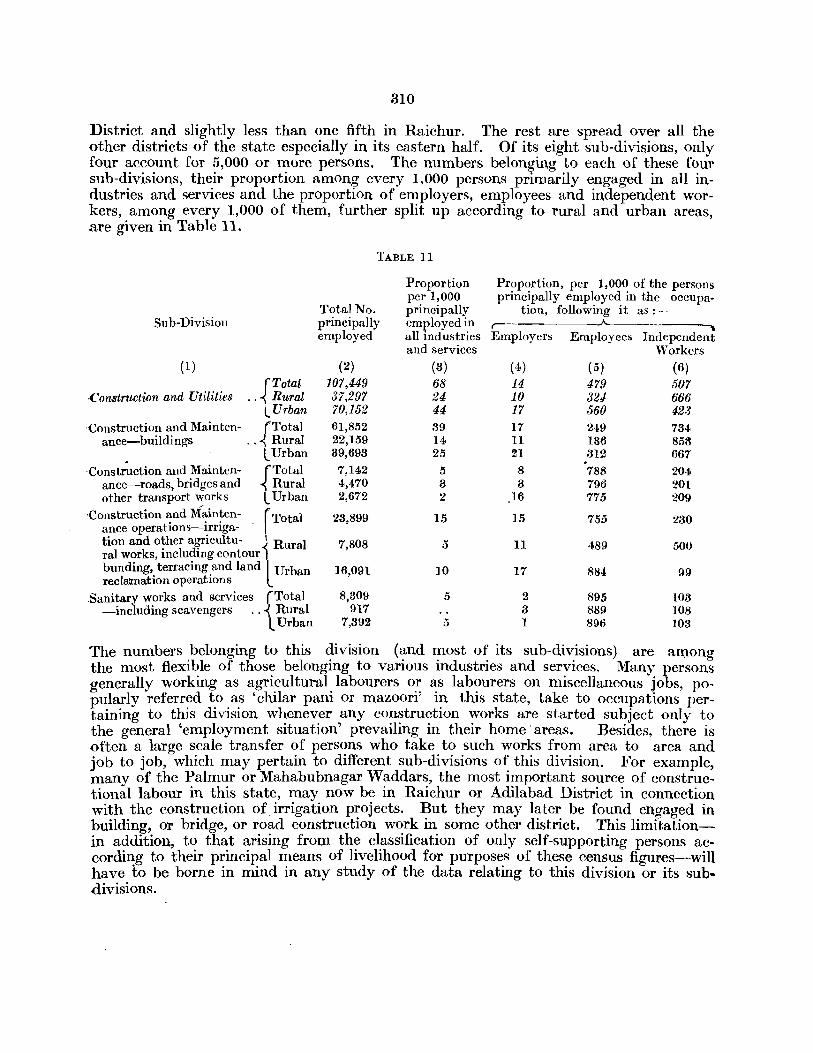
310
District and slightly less than one fifth in Raichur. The rest are spread over all the other districts of the state especially in its eastern half. Of its eight sub-divisions, only four account for 5,000 or more persons. The numbers belonging to each of these four sub-divisions, their proportion among every 1,000 persons primarily engaged in all industries and services and the proportion of employers, employees and independent workers, among every 1,000 of them, further split up according to rural and urban areas, are given in Table 11.
TABLE II
Proportion Proportion, per 1,000 of the persons per 1,000 principally employed in the oCCupa-
Total No. principally tion, following it as:-Sub-Division principally employed in ,-------A-----___
employed all industries Employers Employees Independent and services Workers
(1) (2) (3) (4) (5) (6)
~Total 107,449 68 14 479 507 ·Construction and Utilities .. Rural 37,297 24 10 324 666
l Urban 70,152 44 17 560 42.3 Construction and Mainten- {Total 61,852 39 17 249 734
ance-buildings .. Rural 22,159 14 11 136 853 L Urban 39,693 25 21 312 667
'Cons~ction and Mainten- (Total .
7,142 5 8 788 204 ance-roads, bridges and ~ Rural 4,470 3 3 796 201 other transport ~orks L Urban 2,672 2 16 775 209
'Construction and Maintcn- r Total 23,899 15 15 755 230 ance operations-irriga- . tion and other agricultu- i Rural 7,808 5 11 489 500 ral works, including contour bunding, terracing and land I Urban 16,091 10 17 884 99 reclalIIlation operations L
.sanitary works and services (Total 8,309 5 2 895 103 -including scavengers .. \ Rural 917 3 889 108
Urban 7,392 5 1 896 103
The numbers belonging to this division (and most of its sub-divisions) are aruong the most flexible of those belonging to various industries and services. Many persons generally working as agricultural labourers or as labourers on miscellaneous jobs, popula_rly referr~d t.o .a.s 'chilar pani or mazoori' i~ this state, take to occupations pertainmg to thIS dIVISIOn whenever any constructIOn works are started subject only to the general 'employment situation' prevailing in their home' areas. Besides, there is often a large scale transfer of persons who take to such works from area to area and job to job, which may pertain to different sub-divisions of this division. For example, many of the Palmur or Mahabubnagar Waddars, the most importa.nt source of constructional labour in this state, may now be in Raichur or Adilabad District in connection with the construction of irrigation projects. But they may later be found engaged in building, or bridge, or road construction work in some other district. This limitationin addition, to that arising frorn the classification of only self-supporting persons according to their principal means of livelihood for purposes of these census figures-will have to be borne in mind in any study of the data relating to this division or its subdivisions.
311
A distinct feature of this division is the relatively heavy proportion of females in it. 'They account for over 16 per cent of its strength. These females draw their numbers not so much from bricklayers, masons, stone dressers or much less from the higher cadres of persons employed in constructional activities, as from unskil1ed labourers or assistants.
58. Over 57 per cent of the numbers belonging to this division consists of persons principally employed in the construction and maintenance of buildings. In fact, this category of persons constitutes one of the major sub-divisions of all. industries and services. Of the 61,852 persons belonging to this sub-division, 20,633, or almost exactly one third, are in Hyderabad District. Among the other districts, Warangal accounts for about 10 per cent of them, Nalgonda for 8, Mahbubnagar for 6 and both Aurangabad and Karimnagar for 5. The corresponding percentage ranges between 4 and 5 in both Raichur and Gulbarga, between 3 and 4 in both Adilabad and Bidar, between '2 and 3 in each of the remaining districts of Parbhani, Nizamabad, Nanded, Osmanabad, Medak and Bhir, in the order mentioned. Again, the 61,852 persons belonging to this division include 29,660 masons and bricklayers, of whom over 6,300 are in Hyderabad District; 1,067 stone cutters and dressers, of whom over 630 are in Hyderabad District; 393 painters and house decorators, almost wholly from Hyderabad District; an.d 'over 30,500 other persons employed in the construction and maintenance of buildings. T4e last category, in turn, includes not only unskilled labourers but also engineering personnel.
The majority of the persons belonging to this sub-division are in urban areas, which account for about two thirds of the total numbers. The comparatively low proportion in rural areas is d~e. to diverse factors. .In rural are1_ts, the lab~}Urers e~gaged in such work are less speCIalIzed and take to varIOUS occupatIOns accordmg to dIfferent seasons and requirements. The building activity in such areas is generally restricted to the setting up of small dwellings, in the construction of which the would-be dwellers also take a hand, often the principal. Besides, most of the highly skilled workers and engineering personnel engaged in this occupation mostly reside in towns and cities. Independent workers, account for over 73 per cent of this sub-division (over 85 in rural ' areas), employees for 25 (over 30 per cent in urban areas) and employers. main.ly -contractors, for less than 2 per cent. About 14 per cent of the persons in this sub-divi:sion a;re females.
59. The next important sub-division in this division consists of persons principally engaged in c~nstruc.tion and mainte.nance ope~ations relating to irr~gation and other agricultural works, 'tnclud~ng contour bund~ng, terracmg and land reclamatwn. They number 23,899, of whom over 15,300 or 64 per cent, are in Raichur District because of the construction of the Tungabhadra Project, and over 10 per cent in Adilabad District because of the Kadam Project. The remaining are dispersed mainly over the other eastern districts of the state, especially Karimnagar, and Bhir among the western districts. As stated earlier, various categories of persons in rural areas, including even owner and tenant cultivators when their own lands are involved, undertake the activities pertaining to this division whenever needed. Thus, the numbers indicated above are not at all representative of the actual numbers that are engaged in such operations. They represent only the strength of the self-supporting persons who have returned such occupations as being their principal means of livilihood.
A majority of the persons in this sub-division (over 67 per cent) are from urban areas merely because the TungabharJ.ra Project Camps were treated as 'temporary urban
312
units, "for census purposes and a heavy proportion of the regular P.W.D. personnel connected with irrigation ,yorks as well as the contractors, etc., in the state reside in its towns and cities. OYer 75 per cent of this sub-division consists of employees again due largely to the huge number of labourers employed 1y the contractors for the construction of the Tungabhadra Project. Females account for as much as about one fifth of its total numbers.
60. Yet another sub-division of this division consists of persons principally employed in sanitary w_ol'ks ((nd services {ncluding scavengers. 4,162 or about half of the 8,309 persons belonging to this sub-division in the statc are in Hyderabad District and the remaining are spread over the other districts, with some concentration in Aurangabad and Waranga!. No doubt, a certain number of the persons performing tasks pertinent to this sub-division are bound to have been classified under other categories (especially under agricultural labour or industries connected with leather) on account of the fact that the traditional duties of some of the Scheduled Castes cover works re~ lating to this division also. But there is no gainsaying the fact that sanitary works and services are as yet in their preliminary stages of development in this state. Only a few of even its towns can as yet boast of a modern drainage system. This also explains the fact that a heavy majority of this sub-division is in urban areas. It has a very heavy proportion of employees (about 90 per cent) largely because most of its numbers represent the personnel of the municipal and drainage organisations in the state. The percentage of females in this sub~division exceeds 40!
61. The next most numerous sub-division in this division pertains to the persons principally employed in the construction and maintenance of roads, bridges and other transport works*. The 7,142 persons belonging to this sub-division, though spread over all the state, are rather concentrated in Hyderabad District and, to a smaller extent, the other eastern distriets of the state and Raichur. About 80 per cent of them are employees largely because of the regular gangmen, etc., employed by the Public Works Department, and over 60 per cent of them are in rural areas. Over 18 per cent of the persons in this sub-division are females.
62. The other less conspicuous sub-divisions in this division include the self-sup-· porting persons principally employed in electric power generation and distribution, domestic and industrial water supply and construction and maintenance of telegraph and telephone lines. Persons principally employed in power generation and distribution works and services number 3,579, of whom 2,108 are in Hyderabad District, 592 in Karimnagar
- and 274 in Nizamabad. .The first are mainly connected with the generation and distribution of power to Hyderabad City, the second with the Azamabad Power Works and third with the Nizamsagar Power Works. The majority of the rest are in Raichur, Warangal and Aurangabad Districts. About 23 per cent of this sub-division is in rural areas due to the fact that the Azamabad and Nizamsagar Power Works are -located in rural areas. Of its total numbers about 90 per cent are . employees and the rest consist mostly of independent workers. This sub-division lncludes some persons working on their own as wire-men as well as electric contractors and their regular employees. Females account for less than two per cent of the numbers belonging to this su b-division. .
The persons principally engaged in domestic and industrial water supply works and services number 1,810. About 1,085 of these persons are in Hydembad District,
* This SUb-division does not include the persons principally employed in the maintenance of railway line and buildings in the state. They are claissified under the sub-divi~ion 'Railway Transport'.
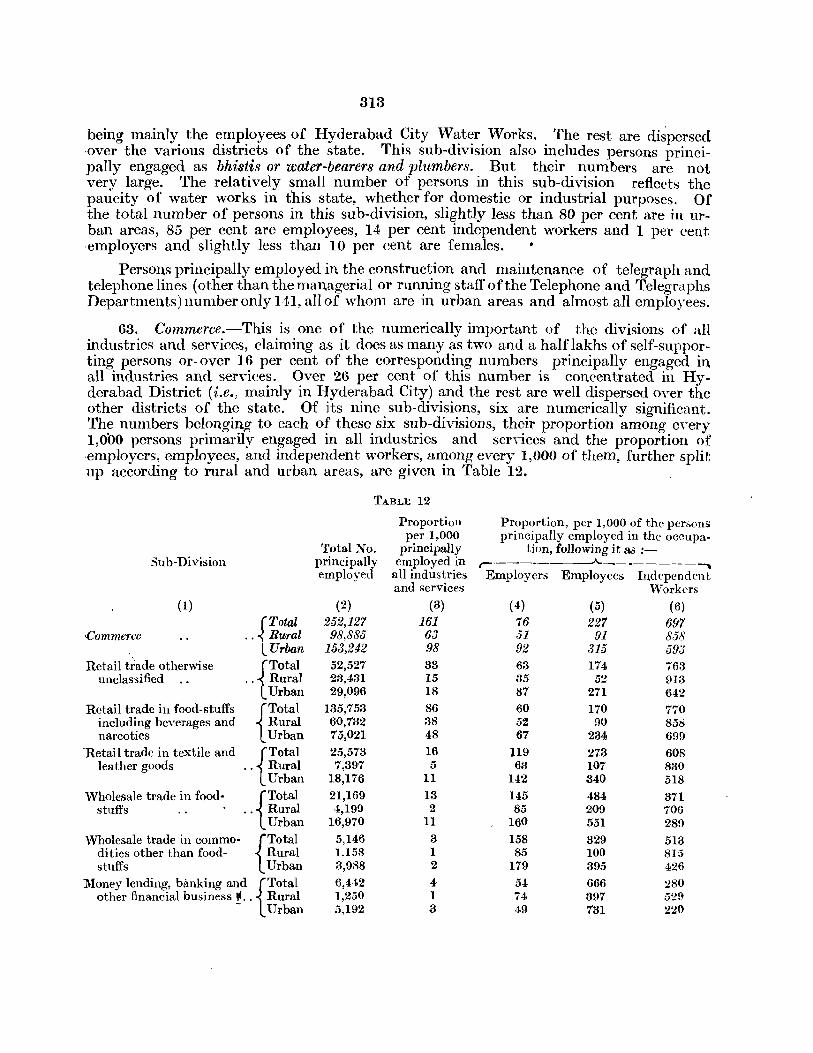
313
being mainly the employees of Hyderabad ~ity W~t~r. Works .. The rest are di~persed -over the various districts of the state. ThIs sub-dIvISIOn also mcludes persons principally engaged as bhi8tis or water-bearers and plumbers. But their numbers are not very large. The relatively small number of persons in this sub-division reflects the paucity of water works in this state, whether for domestic or industrial purposes. Of the total number of persons in this sub-division, slightly less than 80 per cent are in urban areas, 85 per cent are employees, 14 per cent independent workers and 1 per cent employers and slightly less than 10 per cent are females. •
Persons principally employed in the construction and maintenance of telegraph and telephone lines (other than the managerial or running staff of the Telephone and Telegraphs Departments) number only 141, all of whom are in urban areas and almost all employees.
63. Commerce.-This is one of the numerically important of the divisions of all industries and services, claiming as it does as many as two and a half lakhs of self-supporting persons or- over 16 per cent of the corresponding numbers principally engaged in all industries and seryices. Over 26 per cent of this number is concentrated in Hyderabad District (i.e., mainly in Hyderabad City) and the rest are well dispersed oYer the other districts of the state. Of its nine sub-divisions, six are numerically significant. The numbers belonging to each of these six sub-divisions, their proportion among every 1,000 persons primarily engaged in all industries and services and the proportion of -employers, employees, and independent workers, among every 1,000 of them, further split up according to rural and urban areas, are given in Table 12.
TABLE 12
Proportion Proportion, per 1,000 of the persons per 1,000 principally employed in the occupa-
Total ?'J"o. principally tiun, following it as :-Sub-Division principally employed in ,----- "----- - - - --"
employed all industries Employers Employees Independent and services Workers
(1) (2) (3) (4) (5) (6) (Total 252,127 161 76 227 697
Cummerce .. ~ Rural 98,885 63 .51 91 858 L Urban 153,242 98 92 315 593
Retail tiade otherwise {Total 52,527 33 63 174 763 unclassified .. Rural 23,431 15 35 52 913
Urban 29,096 18 87 271 642 Retail trade in food-stuffs {Total 135,753 86 60 170 770
including beverages and Rural 60,732 38 52 90 858 narcotics Urban 75,021 48 67 234 699
Retail trade in textile and {Total 25,573 16 119 27.3 608 leather goods .. Rural 7,397 5 63 107 830
Urban 18,176 11 142 340 518 Wholesale trade in food- {Total 21,169 13 145 484 371
stuffs .. Rural 4,199 2 85 209 706 Urban 16,970 11 160 551 289
'Vholesale trade in commo- {Total 5,146 3 158 329 513 dities other than food- Rural 1.158 1 85 100 815 stuffs Urban 3,988 2 179 395 426
Money lending, banking and {Total 6,442 4. 54 666 280 other financial business tI.. Rural 1,250 1 74 397 529
- Urban .5,192 3 49 731 220
314
As stated earlier, a particular limitation of this division is the fact that all ~ artisan traders and other producers-cum-sellers in the state have been treated only as producers and included under the relevant category of industries. Besides, there is more overlapping within the various sub-divisions of commerce itself-not only as between retail trade in various commodities but also between retail and wholesale trades-than in the SUb-divisions of most divisions of all industries and services.
64. The sub-divisiotl of persons principally employed in retail trade in food-stuffs (including beverages and narcotics) accounts for more than half of the total numbers belonging to this division. In fact, no individual sub-division of all industries and services is numerically more important than this sub-division. It claims for about 9 per cent of the self-supporting persons primarily engaged in all industries and services. About 25 per cent of the numbers belonging to this sub-division are returned from Hyderabad District alone, between 7 and 8 per cent from both Nalgonda and Warangal, 6 from Raichur, between 5 and 6 from each of the districts of Mahbubnagar, Gulbarga, Bidar, Karimnagar and Aurangabad, between 4 and 5 from each of the districts of Nanded, Medak and Parbhani, between 3 and 4 from both Nizamabad and Adilabad and lastly between 2 and 3 from both Osmanabad and Bhir, all in the order mentioned. Of the total numbers pertaining to this sub-division in the state, as many as 60,114, or 44 per per cent, are kirana traders or ration shop-keepers; 7,032, or 5 per cent, mainly trailers in mutton, poultry, eggs, fish, sheep and goats; 12,882, or 9 per cent, traders in vegetables and fruits,. 2,408, or 2 per cent, traders in oil, oil seeds and ghee,. 3,468, or 3 per cent, mainly traders l~n grains, pulses, tamarind and chillies,. 23,924, or 18 per cent, traders in other food-stuffs and fodder for animals,· 4,565, or 3 per cent, hawkers and street-vendors of ,drink and food-stuffs,. 9,962, or 7 per cent, dealers in pan, bidi and cigarette; 1,212, or just 1 per cent, traders in tobacco, opium and ganja; and 10,186, or 8 per cent, are vendors of wine, liquors, aerated waters and ice in shops. An idea of the importance of Hyderabad District (in other words, Hyderabad City) in this respect can be had from the fact that by itself it accounts for about 8,500 of the kirana traders, about 3,000 of the traders in mutton, poultry, eggs, fish, sheep and goats, over 5,100 1 of the traders in vegetables and fruits, over 6.50 of the traders in oil, oil seeds and ghee, over 5,300 of the traders in other food-stuffs and fodder for animals, almost ·4,300 of the hawkers and street-vendors of drink and food-stuffs, for about 3,400 of the dealers in pan, bidi and cigarette, for over 250 of the traders in tobacco, opium and ganja and almost 3,000 of the vendors of wine, liquors, aerated waters and ice in shops. But Warangal and Bidar Districts contain the largest numbers, 776 and 402 respectively, of the retail traders in grains, pulses, tamarind, chillies, etc.
The proportion of independent workers is the heaviest in this sub-division as compared with all the other sub-divisions of commerce. But this proportion is by no means as impressive as in many of the sub-divisions of industries. 77 per cent of the total number of persons in this sub-division are independent workers, the percentage being as heavy as 86 in rural areas. Employees account for 17 per cent of the total numbersfor as much as 23 in urban areas. About 6 per cent of them are employers. This subdivision of retail trade in food-stuffs (including beverages)-as well as that of unclassified retail trade-is very prominent in rural areas as compared with other sub-divisions of commerce. In spite of this, of the total numbers returned under this sub-division, only about 45 are from rural and over 55 from urban areas. Females are fairly prominent in this sub-division, accounting for almost 13 per cent of its strength-their percentage is 31 among the traders in fruits and vegetables and 21 among the hawkers of drink and food.-stuffs.
315
65. The sub-division of persons primarily engaged in unclassified retail trade comes next in order in this division. In fact, it is one of the fairly important sub-divisions in all industries and services, claiming as it does over 52,000 persons. Of its total numbers, 32 per cent, or roughly one third, are in Hyderabad District itself. Among the other districts. about 10 per cent are in Nalgonda, about 8 in Mahbubnagar, about 6 both in Warangal and Karimnagar. about 5 both in Medak and Parbhani, about 4 in each of the districts of ~izamabad, Aurangabad, Gulbarga and Bidar, about 3 in Nanded, only about 2 both in Raichur and Bhir and even less than 2 both in Adilabad and Osmanabad. This sub-division consists of 2,006 unclassified hawkers and street-vendors, 1,289 dealers in drugs, 2,424 dealers in other chemicals, 1,801 publishers, book-sellers and stationers, 3,280 cycle taxi shop owners, 6,176 dealers in bangles, 1,820 traders in gold and silver articles 1<,385 mainly dealers il1 hardware, iron safes and trunks, 2,265 dealers in all types of utensils including earthenware and brassware, 518 mainly dealers in sewing machines, electric goods, petromax lamps, agricllltu'ral implements and various types of machinery, '272 dealers ill building and . construction materials and sanitary ware, 1,.566 mainly retail traders in crockery, cutlery, watches, optical goods. toys, sports goods, mirrors and musical instruments, 2,948 retail traders ill cattle and as many as 24,771, or 47 per cent, general store keepers, manyari merchants and miscellaneous shop keepers. The importance of Hyderabad District (or in other words, Hyderabad City) in this regard can be had from the fact that about 80 per cent of the numbers in the group pertaining to persons principally trading in sewing machines, electric goods, petromax lamps, agricultural implements and various types of machinery, over 60 per cent in the groups pertaining to the persons principally trading in hardware, iron safes and trunks, alm9st or over 50 per cent in the groups pertaining to persons principally trading in drugs, gold and silver articles. cycle taxis and crockery, cutlery, watches, optical goods, toys, sports goods, mirrors and musical instruments, and over 40 per cent in the three groups pertaining to undassified hawkers and street-vendors, publishers, book-sellers and stationers and retail traders in building and construction materials and sanitary ware and over ~o per cent of the three groups pertaining to the persons chiefly trading in chemical stores, utensils and general. manyari and miscellaneous goods are returned from this district.
Over 76 per ('ent of the numbers belonging to this sub-division arc independent workers. The percentage increases to 91 in rural areas. About 17 per cent of its numbers are employees. The percentage increases to 27 in urban areas. About 6 per cent of its numbers consists of employers. The corresponding percentage is almost 9 in urban areas. '. Again, about 45 per eent of its numbers are from rural and 55 from urban are!ts. Females constitute about 10 per Gent of its total numbers. Thus, in all these respects the cOlllposition of this sub-division is, more or less, similar to that of the sub-division of retail trade in food stuffs (including beverages) dealt with in the preceding paragraph.
66. Persons chiefly engaged in retail trade in textile and leather goods constitute the next most numerous sub-division of commerce. This sub-division includes hawkers and street-vendors in piece goods, wearing apparel, made-up textile goods, leather, etc. Of the total number of 25,573 persons belonging to this sub-division, 25 per cent, or a quarter, are in Hyderabad District, over 6 are in each of the districts of Warangal, Parbhani, Gulbarga and .Medak, almost 6 in each of the districts of Bidar, Nanded and Mahbubnagar, about 5 in each of the districts of Aurangabad, Nalgonda and Nizamabad, slightly above 4 in Raichur, between 3 and 4 in each of the districts of Karimnagar, Osmanabad and Bhir and only 2 in Adilabad. This sub-division in turn comists of 21,034 persons principally engaged in retail trade in cotion and silk piece goods, cloth and
316
yam, of whom slightly less than a quarter are from Hyderabad District ; 3,311 persons similarly engaged in retail trade in leather and leather goods including footwear, of whom OYer 22 per cent are in Hyderabad District; and, lastly. of 1,228 persons principally engaged in retail tradp in wear'ing apparel, kambals and other made-up te:rtile goods illclu,diflg tap_'. rope, ca'rpets, ctc., of whom more than one third are from Hyderabad District.
Independent workers, though they constitute 61 per cent of the total numbers belonging to this sub-division. are not as prominent as they are in other sub-divisions of retail trade. As against this, both c:.mployees and employers are appreciably more conspicuous in this sub-division. The percentage of the former is 27 and of the latter 12. In only a few sub-dh-isions of all industries and services are employers relatively more numerous than in this sub-division. This sub-division draws over 70 per cent of' its numbers from urban areas and only about 2 from females. Thus, unlike again in the other sub-divisions of retail trade, the rule of females is insignificant in this sub-division.
67. Of the remaining sub-divisions in commerce, the sub-division of persons principally engaged in wholesale trade in jood-stuffs is numerically the most important. 21,169 self-supporting persons are principally engaged in this occupation in the state~ But this number, unlike all the other sub-divisions of commerce, is not heavily concentrated in Hyderabad District. This district accounts for only 14 per cent of the total numbers belonging to this sub-division. Among the other districts, the corresponding percentage is 9 in Gulbarga, 8 in Osmanabad, 7 in each of the districts of Mahbubnagar, Bidar, Warangal and Parbhani, about 6 in each of the districts of Raichur, Nanded and Nalgonda, about 5 both in Aurangabad and Karirnnagar, about 4 both in Medak and ~izamabad and only 3 in Bhir and just 2 in Adilabad.
The proportion of employers is unusually heavy in this sub-divisiQn. In fact, only two among all the sub-divisions pertaining to industries and services, namely those of wholesale trade in commodities other than food-stuffs and hotels and restaurants, record a heavier percentage of employers. In this sub-division, 15 per cent are employers. 48 employees and only 37 are independent workers. The correspnding percentage of employers increases to 16 and of employees to 55 in urban areas and that of independent workers to 71 in rural areas. But over 80 per cent of the persons belonging to this sub-division live in urban areas. Females account for only ab,?ut 4 per cent of the numbers pertaining to this sub-division. .
68. The sub-division of persons principally employed in money lending, banking and other financial business comes next in order in this division. Only 6,442 persons
- belong to this sub-division. This comparatively small number i,s due to the fact that many money lenders, especially in rural areas, are principally employed in other occupations, including owner cultivation and trade, and the persons and institutions connected with banking and exchange operate in, or from, urban areas. Of the 6,44Z persons belonging to this sub-division, 2,474, or 38 per cent, are in Hyderabad District. The temaining are spread over the other districts of the state, Nalgonda recording the largest number. This sub-division draws over 80 per cent of its strength from urban areas and 5 per cent from females. More than half of the females, however, are return~ ed from rural ~reas. About 5 per cent of the numbers belonging to this sub-division are employers, 67 per cent employees and 28 per cent are independent workers. The proportion of employers would have been higher but for the fact that many money lenders have returned other occupations as their principal means of livelihood and the banks are run on a joint stock basis.
817
69. ~ext in order in this division is the sub-division of persons principally employed in wholesale trade in commodities other than food-stuffs. Of the 5,146 persons in this sub-division, 2,057, or about 40 per cent, are from Hyderabad District. The remallung numbers are dispersed ov~r the other districts. of the state, especially Warangal, Gulbarga, Nalgonda and Karlmnagar. The proportIOn of employers is extraordinarily high in this sub-division. As stated earlier, no other sub-division of all industries and services in the state, records a heavier proportion of employers. About 16 per cent of the numbers in this sub-division consists of employers. 38 of emplqyees and 51 of independent workers. The percentage of employers increases to 18 and that of employees to 40 in urban areas. Similarly, the percentage of independent workers increases to 82 in rural areas. Buf again appreciably over three fourths of the numbers belonging to this sub-division are returned from urban areas. The percentage of females is rather insignificant in this sub-division, being less than 8.
70. Persons principally engaged in retail trade in fuel (including petrol), insurance and Real estate constitute the least numerous of the sub-divisions pertaining to commerce. But the proportion of persons taking to such occupations as a secondary means of livelihood to those taking to them as their principal is probably heavier in case of these occupations than in those of most non-agricultural occupations. The first of these three sub-divisions accounts for 4,811 persons of whom 443 are petroleum distributors and 4,368 are retail traders in firewood, charcoal, coal and cowdung. 260 of the former and 2,121 of the latter are concentrated in Hyderabad District. Over 85 per cent of the persons belonging to this sub-division are in urban areas. The low proportion in rural areas is due to the fact, that there is no scope as yet in such areas for trade in petrol and comparatively few persons therein buy fuel or fire wood. About 65 per cent of this sub-division consists of independent workers, 26 of employees and 8 of employers. The last two categories are almost wholly drawn from urban areas. Females account for over 12 per cent of this sub-division. Only 609 persons in the entire state haye returned insurance business as their principal means of livelihood. Over 500 of them are from Hyderabad District. This number is almost exclusively drawn from urban areas and \ consists predominantly of employees. Persons principally engaged in dealings in real estate in the entire state number only 97 and they are mostly from Hyderabad City.
71:., Transport, Storage and Communications.-This is one of the minor divisions of all industries and services, claiming as it does less than 5 per cent of the total number of self-supporting persons principally engaged in them in the state. This diYision, more than any other division, is heavily concentrated in Hyderabad District, which accounts for over 42 per cent of its total numbers. This concentration is easily explained. The overwhelming majority of the persons in the state principally employed in transport activities belong to the Railway or Road Transport Departments, most of whose large establishments are located in Hyderabad City (which includes Secunderabad). Of the rest, the overwhelming majority can obtain a living only in urban areas, especially in the larger of the urban units. Hyderabad City is not only by far the most important urban unit in the state but by itself it returns about one third of the total urban population of the state. Of the ten sub-divisions pertaining to this division only two are numerically important. The numbers belonging to each of these two sub-divisions, their proportion among every 1,000 persons primarily engaged in all industries and services and the proportion of employers, employees and independent workers, among every 1,000 of them, further split up according to rural and urban areas, are given in Table 13.
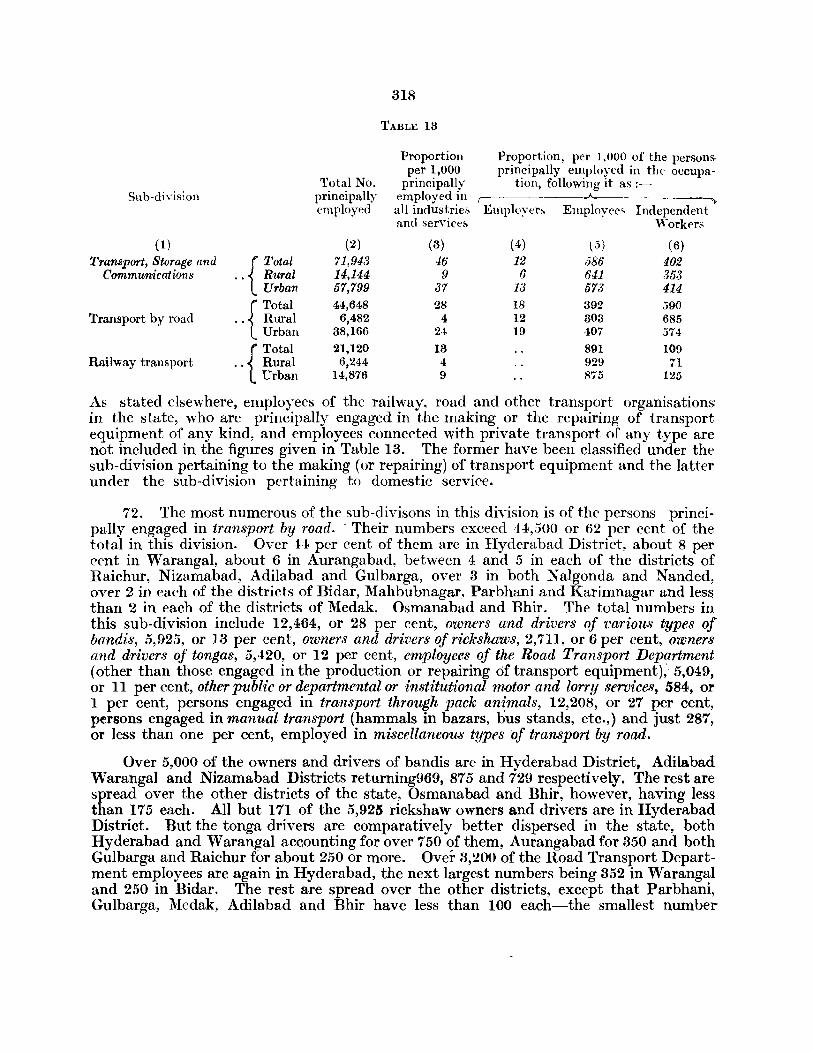
Sub-division
(1)
Transport, Storage and { Total Communications ., Rural
Urban
{ Total Transport by road ,. Rural
Urban
{ Total Railway transport '. Rural
Urban
Total No, principally employed
(2)
71,943 14,144 57,799 44,648
6,482 38,166
21,120 6,244
14,876
318
TABLE 13
Proportion per 1,000
principally employed in all industries and seryices
(3) 46 9
37 28
4 24
13 4 9
Proportion, pel' 1,000 of the persons principally employed in the occupa
tion, following it as:~ ,-- -----___ ..A...------~~ ___ ~
Employer/> EmployeE''' Independent 'Yorkers
(4) ~.5) (6)
12 586 402 6 641 353
13 673 414 18 392 590 12 303 685 19 407 574
891 109 929 71 875 125
As stated elsewhere, employees of the railway, road and other transport organisations: in the state, who are principally engaged in the making or the repairing of transport equipment of any kind, and employees connected with private transport of any type are not included in the figures given in Table 13. The former have been classified under the sub-division pertaining to the making (or repairing) of transport equipment and the latter under the sub-division pertaining to domestic service.
72. The most numerous of the sub-divisons in this division is of the persons principally engaged in transport by road. - Their numbers exceed 44,500 or 62 per cent of the total in this division. Over 44 per cent of them are in Hyderabad District, about 8 per cent in Warangal, about 6 in Aurangabad, between 4 and 5 in each of the districts of Raichur, Nizamabad, Adilabad and Gulbarga, over 3 in both Nalgonda and Nanded, over 2 in each of the districts of Bidar, Mahbubnagar, Parbhani and Karimnagar and less than 2 in each of the districts of Medak, Osmanabad and Bhir. The total numbers in this sub-division include 12,464, or 28 per cent, owners and drivers of various types of bandis, 5,925, or 13 per cent, owners and drivers of rickshaws, 2,711, or 6 per cent, owners and drivers of tongas, 5,420, or 12 per cent, employees of the Road Transport Department (other than those engaged in the production or repairing 6f transport equipment); 5,049, or II per cent, other pubUc or departmental or institutional motor and lorry services, 584, or 1 per cent, persons engaged in transport through pack animals, 12,208, or 27 per cent, persons engaged in manual transport (hammals in bazars, bus stands, etc.,) and just 287, or less than one per cent, employed in miscellaneous types 'of transport by road,
Over 5,000 of the owners and drivers of bandis are in Hyderabad District, Adilabad Warangal and Nizamabad Districts returning969, 875 and 729 respectively. The rest are spread over the other districts of the state, Osmanabad and Bhir, however, having less than 175 each. All but 171 of the 5,925 rickshaw owners and drivers are in Hyderabad District. But the tonga drivers are comparatively better dispersed in the state, both Hyderabad and Warangal accounting for over 750 of them, Aurangabad for 350 and both Gulbarga and Raichur for about 250 or more. Over 3,200 of the Road Transport Department employees are again in Hyderabad, the next largest numbers being 352 in Warangal and 250 in Bidar. The rest are spread over the other districts, except that Parbhani, Gulbarga, Medak, Adilabad and Bhir have less than 100 each-the smallest number-
319
being just 60 in Parbhani. But the persons connected with other motor and lorry services are less concentrated in Hyderabad District. Of their total numbers, less than 1,750 are in Hyderabad District, over 550 are in Raichur. over 400 in Warangal, about 350 in Mahbubnagar, about 300 in both Nizamabad and Nalgonda and over 200 in each of the districts of Gulbarga, Aurangabad and Adilabad. Bidar with about 50 records the smallest number. About 200 of the 584 persons engaged in transport by pack animals are in Nanded and about 100 in Bidar. Of the 12,208 persons enaaged in manual transport about 3,500 are in HyderabadDistrict and about 1,100 in both War~ngal and Aurangabad. The remaining are well distributed over the other districts, the smallest number being 209 in Medak.
59 pel' cent of the numbers in this sub-division,as a whole, consists of independent workers, 39 of employees and just 2 of employers. Over 85 per cent of them are from urban areas. Females account for about 5 per cent of the total numbers in this sub-division. But it is worth-while noting that over 82 per cent of them belong to the group employed fn manual transport.
73. The other conspicuous sub-division in this division consists of the persons principally engaged in railway transport, other than those engaged in the manufacturing or repairing of railway equipment. Over 36 per cent of the 21,120 persons belonging to this sub-division are in Hyderabad District. Both Gulbarga and Warangal Districts account for over 10 per cent of them and each of the three districts of Adilabad, Raichur and Parbhani for over 5 per cent. The rest are dispersed over the other districts of the state except that each of the three districts of Nalgonda, Karimnagar and Bhir account for less than 2 per cent and Osmanabad for even less than one per cent. This division consists of two distinct groups, the first of the porters and hammals in railway stations and yards who number 4,989 and the second of other railway personnel who number 16,131. Over 1,700 of the porters and hammals are in Hyderabad District. In all, about 89 per cent of this sub-division are employees and 11 are independent workers. Females account for only 3 per cent of the total numbers in this sub-division. It draws over 70 per cent of its strength from urban areas.
\
74. The other sub-divisions pertinent to this division include the three transport sub-divisions of persons principally engaged in transport by air, numbering 792 of whom over .. 70p are from Hyderabad District, in transport by water, numbering 129 of whom about 40 are from Raichur and 25 from Adilabad, and in incidental transport services (like carting agencies, hundekari, etc.), numbering 326 of whom over 150 are from Hyderabad District, and the sub-division of persons principally engaged in storage and warehousing, numbering only 44 of whom 30 are from Hyderabad. 1'hese small numbers reflect the limited scope in these spheres in this state. The four communications, subdivisions in this division consist of the persons principally engaged in postal, wireless, telephone and telegraph services numbering 3,968, 438, 289 and 189 respectively, all of them being naturally only employees. Less than 30 per cent of the postal employees and less than 10 per cent of each of the other three sub-divisions are in rural areas. In spite of the fact that these four sub-divisions do not include persons engaged in repairing or construction activities pertaining to their respective services as well as in the studio and broadcasting side (as distinguished from the transmitting side) of wireless services, their small numbers again reflect the backward condition of the state in respect of these communication services.
37
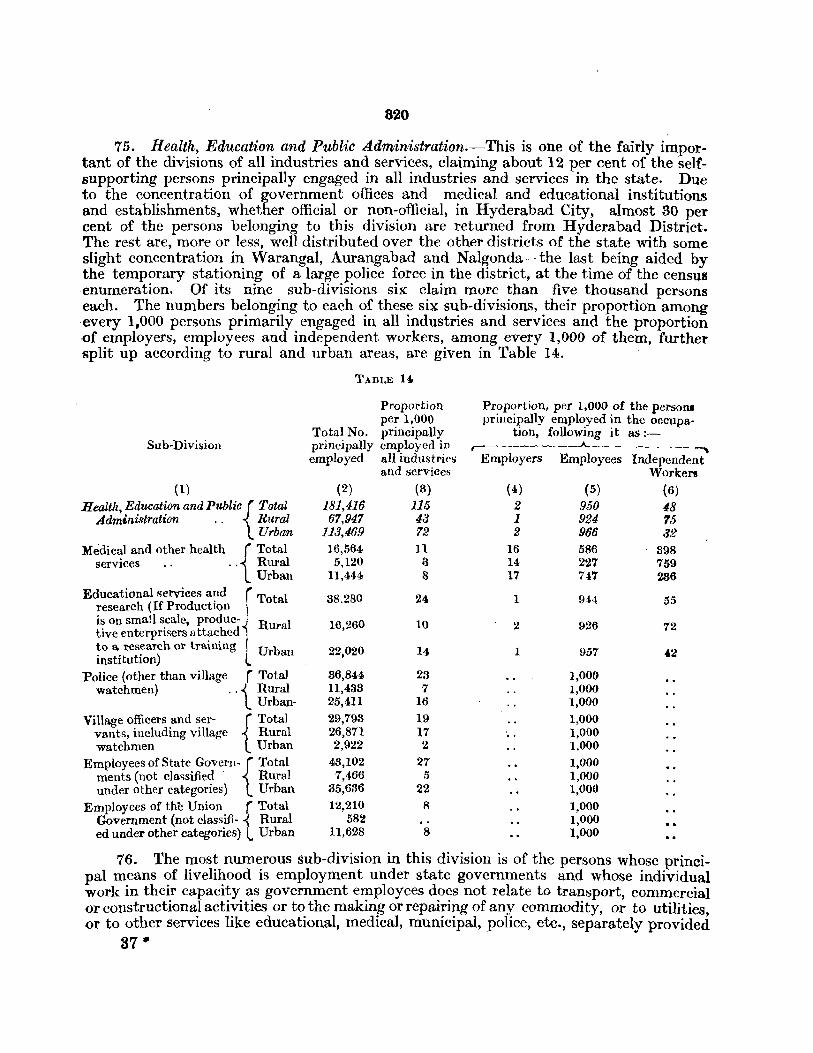
820
75. Health, Education and Public Administration.-This is one of the fairly important of the divisions of all industries and services, claiming about 12 per cent of the selfsupporting persons principally engaged in all industries and services in the state. Due to the concentration of government offices and medical and educational institutions and establishments, whether official or non-official, in Hyderabad City, almost 30 per cent of the persons belonging to this division are returned from Hyderabad District. The rest are, more or less, well distributed over the other districts of the state with some slight concentration in Warangal, Aurangabad and Nalgonda--the last being aided by the temporary stationing of a large police force in the district, at the time of the census enumeration. Of its nine sub-divisions six claim more than five thousand persons each. The numbers belonging to each of these six sub-divisions, their proportion among every 1.000 persons primarily engaged in all industries and services and the proportion .of employers, employees and independent workers, among every 1,000 of them, further split up according to rural and urban areas, are given in Table 14.
Su b-Division
(1)
Health, Education and PubliC{ Total Administration . . Rural
Urban
Medical and other health r Total services .. ..~ Ilural
L Urban
Educational services a~d (Total research (If ProductIon I is on small scale, produc- ~ R I tive enterprisers attached) ura to a research 01' training \ Urb . 't t· ) L an lnsh U Ion
Police (other than village r Total watchmen) .. -< Rural
l Urball-Village officers and ser- r Total
vants, including village -< Rural watchmen l Urban
ments (not cla,>sified . Rural Employees of State Govern-{ Total
under other categories) Urban Employees of the Union r Total
Government (not classifi- i Rural cd under other categories) L Urban
TABLE 140
Proportion per 1,000
Total No, principally principally employed in employed all industries
(2)
181,416 67,947
113,469 16,564
5,120 11,444
38.280
16,260
22,020
36,844 11,433 25,411
29,793 26,871 2,922
43,102 7,466
35,636
12,210 582
1l,628
and services (3)
116 43 '12 11
8 8
240
10
14
23 7
16
19 17 2
27 5
22 8
8
Proportion, per 1,000 of the persona principally employed in the occupa
tion, following it as:-,--_ - ___ ---..A...-. _______ ~
Employers Employees Independent Work.ers
(4)
2 1 2
16 14 17
1
2
1
(5)
950 924 986 586 227 747
944
926
957
1,000 1,000 1,000 1,000 1,000 1,000
1,000 1,000 1,000 1,000 1,000 1,000
(6)
48 '15 32
398 759 236
55
72
402
76. The most numerous sub-division in this division is of the persons whose principal means of livelihood is employment under state governments and whose individual work in their capacity as government employees does not relate to transport, commercial or constructional activities or to the making or repairing of any commodity, or to utilities or to other services like educational, medical, municipal, police, etc., separately provided
87 •
321
for in the census classification of all industries and services. In brief, this sub-division consists basically of the residuary groups of the employees of Hyderabad Government not classified elsewhere. Over 30 per cent of the 43,000 and odd persons belonging to this sub-division are concentrated in HyderabadDistrict, mainly in Hyderabad City, and the rest are well dispersed over the other districts of the state. Warangal, Gulbarga and Aurangabad each accounts for about 7 per cent of their numbers and the smallest of the corresponding percentages is about 3 in Bhir. About 17 per cent of these employees are in rural and 83 in urban areas. Females account for even less than 2 per cent of the total numbers in this sub-division.
77. The second most numerically important sub-division in this division relates to persons principally employed in educational and research services and institutions. Even this sub-division is heavily concentrated in Hyderabad District, which accounts for over 26 per cent of its total strength of 38,280 in the state. About 8 per cent of its numbers are in "\iVarangal, 7 in Aurangabad and 6 per cent in each of the four districts of Karimnagar, Nalgonda, Mahbubnagar and Gulbarga. The remaining are dispersed over the other districts of the state, the smallest percentage returned being 2.8 from Osmanabad. This sub-division in turn consists of only 667 professors, lecturers, and research 'Workers in universities, colleges and research institutions, as many as 28,251 teachers in other educational institutions and 9,362, or 24 per cent of the total numbers in the sub-division, of other employees like clerks and servants in all educational and research institutions, including libraries and museums. The overwhelming majority of the first group, slightly over one fifth of the second and over one third of the last group are in Hyderabad District (i.e., in Hyderabad City).
Females are very prominent in this sub-division, claiming more than 15 per cent of its total numbers. But their percentage among the group of professors, lecturers and research workers in universities, colleges and research institutions is less than 7. This sub-division draws 42 per cent of its numbers from rural and 58 from urban areas. This sub-division is, however, bound to have lost significantly in numbers in rural areas mecause of many teachers having returned other occupations, such as owner cultivation, employment in mosques and temples, etc., as their principal means of livelihood. But in spite of this loss, there is no denying the fact that the rural areas, in relation to their population, have considerably less than their share of this as well as of most other nationbuilding services. Employees account for over 94 per cent of the numbers in this subdivision and independent workers for about 5 per cent. The majority of these independent workers, as well as of the microscopic numbers of its employers, are drawn from rural areas.
78. Next in order in this division is the sub-division of the persons whose principal means of livelihood is employment in the police service of the state. This sub-division excludes village watch-men and the police personnel running or repairing vehicles or engaged in any type of repairing or productive activity. About one third of the 86,844 persons belonging to this sub-division are in Hyderabad District. 12 per cent of them are in Warangal, 9 in Nalgonda and over 5 in Bidar-Iargely due to the location of a police training institution near Bidar Town. The restare, more or less, well spread out among the other districts of the state. But the numbers pertaining to this sub-division are rather exaggerated, especially in lVarangal and Nalgonda Districts, due to their disturbed conditions even in 1951. About 70 per cent of these police employees are in urban and over 80 in rural areas--especially of Warangal and Nalgonda Districts.
022
79. Village officers, servants and watch-men form the next most important sub·division in this division. This is one of the few sub-divisions of all industries and services which is not concentrated in Hyderabad District. But over or about 10 per cent of its numbers of 29,793 are returned from each of the districts of Aurangabad, Parbhani, Bhir, Nanded and Karimnagar. The corresponding percentage is about 5 or exceeds it in each of the districts of Adilabad, Osmanabad, Warangal, Nizamabad and Mahbubnagar. It is about 4 in Xalgonda and 3 in Medak. It is below even 3 in Bidar, Hyderabad, Raichur and Gulbarga. But this sub-division loses considerably in numbers on account of many village officers and servants having returned owner cultivation, agricultural labour or sometimes even tenant cultivation as their principal means of livelihood. It is difficult to estimate the proportions which have thus escaped classification under this sub-division in the state and in its various districts. Only about 3 per cent of the numbers belonging to it are females. But as is natural over 90 per cent of its numbers are drawn from rural areas and all are employees.
80. Persons principally engaged in medical and other health services, who form yet another sub-division of this division, number only 16,564 in the entire state. This subdivision is also concentrated in Hyderabad District, which accounts for one third of its numbers. Among the other districts, Warangal accounts for 9 per cent, Nalgonda for 8, both Karimnagar and Mahbubnagar for 6, both Medak and Nizamabad for 5 and each of the four districts of Gulbarga, Aurangabad, Raichur and Bidar for 4 per cent. 'The corresponding percentage is 3 in both Parbhani and Adilabad and only about 2 in -each of the remaining three districts of Nanded, Osmanabad and Bhir.
1,854, or 11 per cent of the numbers belonging to this sub-division, consist of registered medical practitioners. 657, or appreciably over one third of the numbers, are from Hyderabad District. Raichur, VVarangal and Gulbarga each returned over 150 of these numbers. The remaining are distributed over the state, the highest being 100 in Parbhani and the lowest being 34 in Adilabad. 5,788, or 35 per cent of the total numbers in this sub-division, are vaids, hakims, and other persons practising medicine without being registered. 1,208, or more than one fifth of them, are from Hyderabad District. The remaining are rather concentrated in the eastern districts of the state and in Gulbarga among the western districts. The actual number is almost !900 in Nalgonda and exceeds 750 in Warangal. ~lI1idwives account for 1,004 of whom slightly less than one third are from Hyderabad District, and nurses for 1,019 of whom almost 600 are concentrated again in Hyderabad District. Only 67 persons in the entire state, including 53 from Hyderabad District, have returned themselves as being principally dentists, and 81, including 29 from Hyderabad District, as being principally vaccinators, and 885, or 5 per cent of the total in this sub-division, a.s being compounders*. About half of these compounders are from Hyderabad District. Only 213 persons, including 52 from Hyderabad District, have declared themselves as being primarily veterinary surgeons or doctors. The remaining 5,653, or over 34 per cent of the total belonging to this subdivision, consist of all other categories of persons employed in hospitals or other establishments rendering medical or other health services. This number, however, does not include scavengers or any other sanitary staff. Even in this group, about 40 per cent are returned from Hyderabad District aJone.
Females are particularly prominent in this su~division accounting for about 17 per cent, or one sixth, of its total numbers. They, .however, reach this proportion primarily because of the midwives, nurses and about 450 and odd females in the lower '* Quite a number of persons in the state returned themselves as being engaged in medical service without giving any further -details.
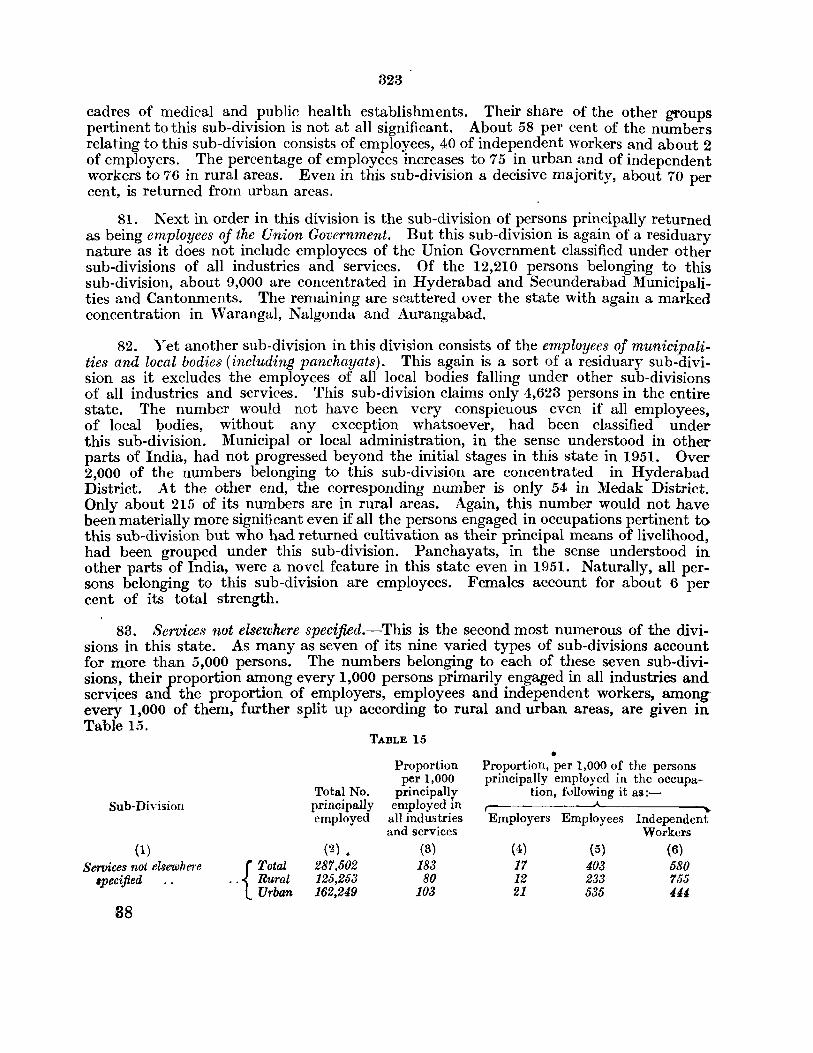
323
cadres of medical and public health establishments. Their share of the other groups pertinent to this sub-division is not at all significant. About 58 per cent of the numbers relating to this sub-division consists of employees, 40 of independent workers and about 2 of employers. The percentage of employees increases to 75 in urban and of independent workers to 76 in rural areas. Even in this sub-division a decisive majority, about 70 per cent, is returned from urban areas.
81. Next in order in this division is the sub-division of persons principally returned as being employees of the Union Government. But this sub-division is again of a residuary nature as it does not include employees of the Union Government classified under other sub-divisions of all industries and services. Of the 12,210 persons belonging to this sub-division, about 9,000 are concentrated in Hyderabad and Secunderabad Municipalities and Cantonments. The remaining are scattered over the state with again a marked concentration in Warangal, Nalgonda and Aurangabad.
82. Yet another sub-division in this division consists of the employees of municipalities and local bodies ('including panchayats). This again is a sort of a residuary sub-division as it excludes the employees of all local bodies falling under other sub-divisions of all industries and services. This sub-division claims only 4,623 persons in the entire state. The number would not have been very conspicuous even if all employees, of local 'bodies, without any exception whatsoever, had been classified under this sub-division. Municipal or local administration, in the sense understood in other parts of India, had not progressed beyond the initial stages in this state in 1951. Over 2,000 of the numbers belonging to this sub-division are concentrated in Hyderabad District. At the other end, the corresponding number is only 54 in Medak District. Only about 215 of its numbers are in rural areas. Again, this number would not have been materially more significant even if all the persons engaged in occupations pertinent tothis sub-division but who had returned cultivation as their principal means of livelihood, had been grouped under this sub-division. Panchayats, in the sense understood in other parts of India, were a novel feature in this state even in 1951. Naturally, all persons belonging to this sub-division are employees. Females account for about 6 per cent of its total strength.
83. Services not elsewhere specified.-This is the second most numerous of the divisions in this state. As many as seven of its nine varied types of sub-divisions account for more than 5,000 persons. The numbers belonging to each of these seven sub-divisions, their proportion among every 1,000 persons primarily engaged in all industries and serv~ces and the proportion of employers, employees and independent workers, among every 1,000 of them, further split up according to rural and urban areas, are given in Table 15.
Sub-Division
(1) Services not elsewhere
'pecified
38
{
Total .. Rural
Urban
TABLE 15
Total No. principally employed
(2). 287,602 125,253 162,249
Proportion per 1,000
principally employed in
all industries and services
(3) 183 80
103
• Proportion, per 1,000 of the persons principally employed in the OCcupa
tion, fullowing it a8:-,---Employers Employees Independent
Workers (4) (5) (6) 17 403 680 12 233 755 21 636 444
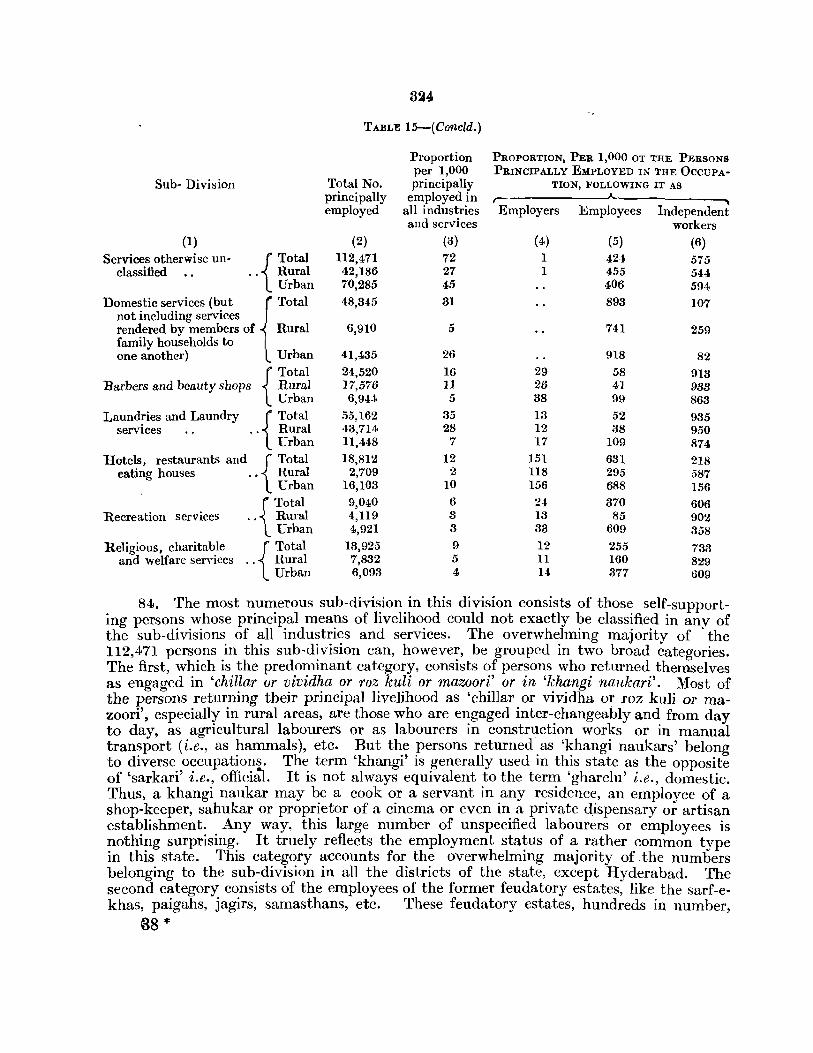
324
TABLE 15-(Concld.)
Proportion PROPORTION, PER 1,000 OT THE PERSONS per 1,000 PRINCIPALLY EMPLOYED IN THE OCCUPA-
Sub- Division Total No. principally TlON, FOLLOWING IT AS principally employed in employed all industries Employers Employees Independent
and services workers (I) (2) (3) (4) (5) (6)
Services otherwise un- { Total 112,471 72 I 424 575 classified " Rural 42,186 27 I 455 544
Urban 70,285 45 406 594
Dom"tic _ire, (but J Total 48,345 31 893 107 not including services rendered by members of Rural 6,910 5 741 259 family households to one another) L Urban 41,435 26 918 82
{ Total 24,520 16 29 58 913 Barbers and beauty shops Rural 17,576 11 26 41 988
Urban 6,944 5 38 99 863 Laundries and Laundry { Total 55,162 35 13 52 935
services , , " Rural 43,714 28 12 38 950 Urban 11,448 7 17 109 874
Hotels, restaurants and r Total 18,812 12 151 631 218 eating houses "i_ Rural 2,709 2 118 295 587
Urban 16,103 10 156 688 156 f Total 9,040 6 24 370 606 Recreation services " Rural 4,119 3 13 85 902
L Urban 4,921 3 33 609 358 Religious, charitable r Total 13,925 9 12 255 733
and welfare services "i_ Rural 7,832 5 11 160 829 Urban 6,093 4 14 377 609
84. The most numerous sub-division in this division consists of those self-supporting persons whose principal means of livelihood could not exactly be classified in any of the sub-divisions of all industries and services. The overwhelming majority of . the 112,471 persons in this sub-division can, however, be grouped in two broad cateaories. The first, which is the predominant category, consists of persons who returned the~elves as engaged in 'chillar or vividha or roz kuli or mazoori' or in 'khangi naukari'. Most of the persons returning their principal livelihood as 'cbillar or vividha or roz kuli or mazoori', especially in rural areas, are those who are engaged inter-changeably and from day to day, as agricultural labourers or as labourers in construction works or in manual tran~port (i.e., as ~ammals), etc. :Sut t~; persons returned ,as '~hangi naukars' belong to dIverse occupatIons. The term khangi IS generally used III thIS state as the opposite of 'sarkari' i.e., offici~. It is not always equivalent to the term 'gharelu' i.e., domestic. Thus, a khangi naukar may be a cook or a servant in any residence, an employee of a shop-keeper, sahukar or proprietor of a cinema or even in a private qispensary or artisan establishment. Any way, this large number of unspecified labourers or employees is nothing surprising. It truely reflects the employment status of a rather common type in this state. This category accounts for the overwhelming majority of ,the numbers belonging to the sub-division in all the districts of the state, except Hyderabad. The second category consists of the employees of the former feudatory estates, like the sarf-ekhas, paigahs, jagirs, samasthans, etc. These feudatory estates, hundreds in number,
38 *
325
covered almost half of the state and were actually 'states within a state' each with its own .parallel administrative machinery. Though these estates were integrated in 1950, all their employees had not been disbanded at the time of the census enumeration in 1951. This category accounts for a decisive majority of the persons in this sub-division in Hyderabad District.
Over 23,000, or one fifth of the numbers belonging to this sub-division, are in Hyderabad District, mostly in Hyderabad City. Parbhani District accounts for 9 per cent of its numbers, both Gulbarga and Nanded for 8 per cent, Raichur for 7 per cent, each of the districts of Warangal, Karimnagar and Bidar for 6 per cent, each of the districts of Aurangabad, Mahbubnagar and Adilabad for 5 per cent, Bhir for 4, each.of the districts of Nizamabad. Medak and Osmanabad for 3 per cent and Nalgonda for 2.
Over 57 per cent of this sub-division as a whole consists of independent workers and over 42 of employees. The sub-division draws about 62 'per cent of its strength from urban and 37 from rural areas. Females account for over one fifth of its numbers.
85. The next most numerous sub-division in this division and one of the fairly important in all divisions is of the persons principally employed in laundries and laundry services, i.e., as washermen or as their employees. This sub-division is concentrated in the eastern districts of the state, especially in Karimnagar and, to a smaller extent, Warangal, Nalgonda and Hyderabad. Karimnagar District alone accounts for over 11,000, or 20 per cent of the 55,162 persons belonging to this sub-division in the entire state. The corresponding percentage exceeds 15 in Warangal, 14 in Nalgonda and 11 in Hyderabad. It is 8 in l\lahbubnagar. 6 in Adilabad and 5 both in Nizamabad and Medak. Among the western districts, the corresponding percentage is, even at its highest, less than 4 in Raichur. It is about 3 in Nanded, 2 both in Gulbarga and Bidar and 1 in each of the remaining four western districts of Aurangabad, Osmanabad, Bhir and Parbhani. No doubt, this division has lost appreciably in numbers, particularly in rural areas, on account of many persons engaged in the occupation having returned themselves as being only earning dependants or as self-supporting but principally engaged in cultivation,. But their numbers are not likely to have affected the distribution pattern indicated above.
About 80 per cent of this sub-division is returned from the rural and only 20 from the urban areas of the state. In no other sub-division of industries or services, except fishing, are independent workers more conspicuous than in this sub-division. They account for over 93 per cent of its numbers in the state. The corresponding percentage increases to-95 in rural areas. Only about 5 per cent of its numbers consists of employees, but the corresponding percentage is fairly significant in the urban areas of the state being as much as 11. About half of these employees in the urban areas of the state are, however, in Hyderabad City itself. Only about one per cent of the numbers in this sub-division consists of employees. Females play a very prominent role in this sub-division, accounting for almost one fifth of its total numbers.
86. The sub-division of persons connected with dornestic services is also one of the most numerous of the sub-divisions in this dIvision and one of the fairly numerous even among all the divisions. But this sub-division is inordinately concentrated in Hyderabad District (in other words, in Hyderabad City) which accounts for over 60 per cent of the total' numbers in the state. The next highest percentage is only about 6 in Parbhani. Among the other districts, the corresponding percentage is about 4 both in
826
Aurangabad and N anded, about 3 in each of the districts of Warangal, Nizamabad, Osmanabad and Raichur, about 2 in each of the districts of Karimnagar, Bhir, Nalgonda, Mahbubnagar and Adilabad and about one in the other districts of Bidar, Medak and Gulbarga. This concentration in Hyderabad District is easily explained. Practically in all the districts, and for obvious reasons, domestic servants are, in relation to the total population involved, considerably more conspicuous in urban than in rural areas and Hyderabad is the only district in the state where the rural population constitutes a minority and the urban a decisive majority. Any way, this sub-division also loses appreciably in numbers, in rural areas, as the demarcation between farm servants or servants employed for various artisan trades and domestic servants is rather vague in most of the rural households concerned.
Of the 48,345 persons belonging to this sub-division 3,048, or 6 per cent, are private motor drivers and cleaners. Of this number, 2,212, or over one third, are from Hyderabad District alone. Again, 6,524, or about 13 per cent, are ·cooks. 3,481, or more than half of these cooks, are from Hyderabad District. 1,609, or 3 per cent, are gardeners, of whom over four fifths are in turn from Hyderabad District. The remaining 37,164, or about 77 per cent, are other categories oj domestic servants. Of these, slightly less than two thirds are from Hyderabad District.
About 90 per cent of the persons in this sub-division are employees and about 10 per cent -are independent workers. It is not uncommon in this state for domestic servants to be employed in more than one household, especially for cleaning of utensils, washing of clothes and sweeping. Such persons account for these returns for independent workers*, Females are more conspicuous in this sub-division than in any other sub-division of industries or services except those relating to tobacco industries and sanitary works and services. They account for as much as 40 per cent of the numbers in this subdivision-for over 32 per cent of the gardeners, for over 41 per cent of the cooks and for over 42 of the other categories of domestic servants.
87. The next important sub~division in this division is of the persons principally employed as barbers. The 24,520 persons belonging to this sub-division are comparatively well dispersed over the state, in spite of some concentration again in Hyderabad, Karimnagar, Warangal and Nalgonda Districts. About 12 per cent of the numbers belonging to it are in Hyderabad, 11 in Karimnagar and about 8 both in Warangal and Nalgonda. Among the other districts, the corresponding percentage is 7 in Aurangabad, about 6 in each of the districts of Adilabad, Parbhani and l\Ia;hbubnagar, about 5 in each of districts of Nanded, Bidar, Raichur, Gulbarga and Bhir and about 4 in each of the three remaining districts of Osmanabad, Nizamabad and Medak. There is, however, no doubt that significant numbers of the persons following this occupation in rural areas have returned themselves either as earning dependents or as self-supporting persons but principally employed in cultivation-and have thus escaped inclusion in the figures under review.
This sub-division has also an extraordinarily high proportion of independent workers. This category accounts for over 91 per cent of the total numbers belonging to this sub-division. The corresponding percentage exceeds 93 in the rural areas of the state. Employees account for about 6 per cent and employers for about 3 per cent of its total numbers. The corresponding percentage is, however, 10 and 4 respectively in urban areas. The proportion of females is insignificant in this sub~ division, being less than one per cent. Only 202, of the 24,520 persons belonging to this sub-division, are females and they are tattooers mostly from the rural areas of the • ride definition of an independent worker in paragraph 21 of this Section.

827
state. Tattooers have been included in this sub-division as it really pertains both to barbers and to those employed in beauty shops-and tattooing is the nearest approach to the latter occupation in this state. As in the case of the preceding sub-division of washermen, a decisive majority, over 70 per cent, of this sub-division is returned from rural areas.
88. Persons principally employed in hotels, restaurants and eating houses also constitute one of the sub-divisions of this division. They number 18,812 and are concentrated in Hyderabad and, to considerably smaller extent, in Raichur, Gulbarga and Warangal Districts. Over 6.250 of the numbers belonging to this sub-division, or 88 per cent, are in Hyderabad District, almost 2,000 or 11 per cent in Raichur, over 1,450 or 8 per 'ce'nt in Gulbarga and about 1,400 or 7 per cent are in 'Varangal. The corresponding percentage is about 5 in each of the districts of Aurangabad, Nizamabad and Nanded, about 4 in Parbhani, about 8 in each of the districts of l\Iahbubnagar, Bidar, Osmanabad and Adilabad and about 2 in each of the remaining districts of Medak, Karimnagar, Bhir and N algonda.
This sub-division is concentrated in the urban areas of the state, which accounts for over 85 per cent of its total numbers. On the whole, the majority in this sub-division consists of employees--but in rural areas it is the independent workers who account for more than half of the numbers. A distinct feature of this sub-division is its unusually heavy proportion of employers. The actual percentage of the employees in this subdivision is 68 (being as much as 69 in urban areas), of independent workers is only 22 (being as much as 59 in rural areas) and of employers is 15 per cent. Females account for slightly over 3 per ('ent of the numbers belonging to this sub-division.
89. Persons principally employed in religious, charitable and welfare services number only 13,925 in the entire state and constitute one of the less conspicuous of the sub<divisions in this division. But it is difficult, especially in rural areas, to demarcate this sub-division from that pertaining to recreation services or beggars. Besides, a number of persons belonging to religious services in the state have returned owner cultivation as their principal means of livelihood. About 16 per cent of the numbers in this subdiV'ision are in Hyderabad District, 12 in Aurangabad, about!) both in Parbhani and Bidar, 8 in Bhir, 7 both in Karimnagar and Osmanabad, 5 in each of the districts of Nalgonda, Warangal and Nanded, about 4 in Mahbubnagar. 3 in each of the districts of Nizamabad, Medak and Gulbarga and only 2 in both Adilabad and Raichur.
Over 56 per cent of the numbers relating to this sub-division are in rural and about 44 in urban areas. About 78 per cent of the persons belonging to it are independent workers, 26 are employees and only about one per cent are employers. Significantly, females account for about 9 per cent of this sub-division, being mostly religiou~ mendicants, nuns, and employees connected with religious, welfare and charitable institutions.
90. Only 9,040 persons are principally employed in recreation services in the entire state. This sub-division includes persons connected with the broadcasting stations in the state (other than those on the transmitting side), producers and distributors of motion pictures, personnel owning or employed in cinemas and theatres, musicians, actors, danc~rs, acrobats, wrestlers, recitors and exhibitors of wild animals. 24 per cent of this subdivision is again concentrated in Hyderabad District, the rest being more or less well distributed over the other districts of the state, with Karimnagar, Warangal, Raichur, Nalgonda, Gulbarga, Nizamabad and Medak Districts each claiming from about 5 to 8 per cent of the total numbers. These small numbers reflect the absolute inadequacy of recreation services in the state.

328
About 61 per cent of the total number of persons in this sub-division are independent workers, 37 are employees and 2 per cent are employers. The corresponding percentage of independent workers increases to 90 in rural areas and of employees to 61 in urban areas. Females account for 9 per cent of the numbers in this sub-division. This subdivision draws 46 per cent of its numbers from rural and 54 from urban areas.
91. Yet another numerically insignificant sub-division in this division is ot the 3,951 persons principally employed in legal and business services. Of this number, 2,670 are lawyers of all kinds, 866 petition writers and employees of lawyer8, 303 are public scribe8, stenographers and auditors and, lastly, 30 are architects and their employees not being state servants. There is no doubt that the actual number of persons employed as lawyers or as their gumastas; etc., is underestimated especially in the s:rp.aller of the towns, as many of them have returned occupations other than legal as their principal means of livelihood. Only about 1 per cent of the persons in this sub-division are returned from the rural and as much as 96 from the urban areas of the state. About 59 per cent of them are independent workers, 37 are employees and 4 per cent are employers. Females account for less than one per cent of their total numbers.
92. The numerically least conspicuous sub-division in this division consists of 1,276 persons principally employed in arts, letters and journalism in the state, mostly in Hyderabad City. Quite a number of persons, however, have taken to activities relevant to this sub-division as their subsidiary occupation and have, therefore, not been included in this figure. But the number of such persons is also qound to be microscopic as compared with those engaged in other occupations. Of these 1,276 persons, 380 are photographers or their employees, 409 are authors, editors, journalists and press employees* and 487 are artists, sculptors and image makers. 58 per cent of the numbers belonging to, 'this sub-division are independent workers, 37 are employees and 5 per cent are employers. Females account for only about 1 per cent of their numbers. And this sub-division derives over 95 per cent of its numbers from urban areas.
Summary.-This section deals with the numbers employed in this state in all industries and services split up according to certain specified divisions, sub-divisions and groups and also detail" their composition in terms of employers, employees and independent workers. males and females and the returns from rural and urban areas. These numbers, however, suffer from certain limitations. Fir8tly, they exclude earning dependents--i.e., the persons who, in spite of their employment in industries or services, continue to be partly dependent on others for their own maintenance-and even those self-supporting persons who, though employed in industries or services, are not deriving their principal income from such employment. In brief, they cover only the self-supporting principally engaged in all industries and services. Secondly, the figures pertaining to all self-supporting persons are themselves underrated because of the sentiments arising from the conventional role of females as being dependent on males and the prevalence of the joint family system. Due to these sentiments many females, earning more than is required for their ,own maintenance, and many actually self-supporting junior male members in joint families have been returned only as earning dependants or sometimes even as non-earning dependa.nts. Thirdly, the Eelf-supporting persons principally engaged in all industries and services have been classified, subject to certain principles, under only one of the divisions, sub-divisions and groups even if their occupation was, from certain points of view, relevant to more than one of them. Thus, the figures for individual occupations, as commonly understood or collected independently for each of them, are generally bound to be more than the census figures for the relevant division, or 6ub-division or group, as the case may be. In spite of all this, the census figures present a satisfactory picture of the relative strength and composition of the individual non-agricultural occupations in the state.
1,570,488 or about 33 per cent of all the self-supporting persons in the state are principally employed in industries and services. Of these (i) 98,693 or only 6 per cent are principally engaged in primary ind118trie8. (ii) 41,991 or just 3 per cent in mining and quarrying, (iii) 351,456 or as many as 22 per cent in the proce88 ing and manufacture of food stuff8, textiles, leather and their products, (iv) 44,107 or yet another 3 per cent
* Other than those connected with actual printing work which has been classed all a diltinct sub. division of industries.
329
in the processing and manufacture of metals, chemicals alld their products, (v) 133,804 or 9 per cent in other _ types of processing and manufacture, (vi) 107,449 or only 7 per cent in construction and utilities (vii) 252 127 or as many as 16 per cent in commerce, (viii) 71,943 or only 5 per cent in transport. storage and co'mmunicatlons (ix) 181,416 or about 11 per cent in health and educational services and public administration and lastlv (x) 287,502 or as many as 18 per cent in services not elsewhere specified. ' • ,
The division of primary industries draws its numbers very largely from its sub-division of stock raising. This sub-division, which accounts for 63,317 persons, is, numerically, one of the most important of the nonagricultural occupations in the state, second in industries only to cotton textiles and the processing of leather and the making of leather products and footwear. By far the major group in this sub-division is of herdsmen and shepherds. The sub-division of fishing accounts for 16,417 or about one sixth of the numbers in this division. Its minor sub-divisions include forestry and collection of forest produce and wood-cutting which accounts for 12,384 persons of whom wood-cutters constitute the biggest group; and plantation industries which accounts for 6,178 persons-these industries in the state are exclusively confined to vegetable, fruit and flower gardening. But all these numbers do not bring out in full the importance of the occupations relevant to this division as they are commonly resorted to by earning dependants or by the self-supporting only as a secondary means of livelihood. This division as a whole and both its major sub-divisions of fishing and more particularly of stock raising are heavily concentrated in rural area~, and they, particularly the sub-division of fishing, consist overwhelmingly of independent workers. In spite of this, ib proportion of employees, if not of employers, is fairly appreciable. In fact, among its minor sub-divisions, employees claim roughly one fourth of the numbers in plantation industries and more than one third in forestry and collection of forest produce and woodcutting-the high proportion in the latter being largely due to the personnel of the Forest Department. Females are not conspicuous in this division as a whole, although they claim oyer one seventh of the person") in plantation industries.
The division of mining and quarrying draws its strength basically from its two sub-divisions of stone quarrying and clay and sand pits and coal mining. The former accounts for 24,004 persons and the latter for 16,759. Its minor sub-divisions in this state consist of gold mining and salt-making. The former provides the principal employment for 1,023 persons and the latter for just 204; In the sub-division of coal mining only about one twentieth are females, the overwhelming majority live in towns and almost all are employees. As against this, in the sub-division of stone quarrying, more than one tenth are females, about 70 per cent live in villages and over three fourths are independent workers and over a fifth are employees. The microscopic number of employers in this division are concentrated in the sub-division of stonc quarrying except for 5 engaged in salt-making. In the sub-division of gold mining almost all live in villages, consist of employees, and roughly one sixth are females.
Over one third of the peJ:Sons in the division of processing and manufacture of food-stuffs, textiles, leather and their products belong to the sub-division of cotton textiles which in turn, includes 6,733 persons employed in cotton ginning, cleaning and pressing, 1,810 in cotton dyeing, bleaching a,nd printing and as many as 115,585 in ~otton spinning, siz'ing and weaving. From the point of view of the numbers sustained, no other industry in this state is more important than cotton spinning and weaving. More than one fifth of the numbers in this division are in its sub-division of the processing of leather and making of leather products and footwear which claims 71.73-t persons, of whom 6,387 are tanners, 41,376 cobblers and 23,971 are makers of leather articles,.(other than footwear). But the distinction between these groups is rather hazy. Any way, next to cotton spinning and weaving, these groups represent the most important in.dustry in the state. Again, about one sixth of the numbers in thi~ division belong to its sub-division of beverages which provides the principal employment for 58,491 persons of whom as many as 57,374 are toddy drawers. Toddy drawing also constitutes one of the most prominent of the non-agricultural occupations in this state. The other subdivisions in this division include the making of wearing apparel (except footwear) and made-up textile goods engaging 26,615 person.s, of whom almost 25,000 arc tailors; other unclassified textile industries engaging 22,050 persons, of whom 10,713 are woollen spinners and weavers, 9,096 rope or string makers and 1,376 silk spinners and weavers,. industries pertaining to vegetable oil and dairy products, engaging 14,671 persons of whom 9,622 are vegetable oil pressers and refiners and 5,009 are milkmen and makers of dairy products,. tobacco industries engaging 11,586 persons of whom 9,232 are employed in beedi making and 2,191 in cigarette making,. unclassified food industries, accounting for 10,775 persons of whom over 6,100 are butchers; and, lastly, industries connected with grains and pulses claiming 8,235 persons of whom 4,917 are millers, 1,027 are hand pounders and 1,668 are grain parchers. Sugar (and gur) industry, employing 3,171 persons, also constitutes a minor sub-division of this division. Again. most of the occupations relevant to this division are more important in the economy of the state than what the figures quoted above indicate-this is particularly true of the processing of leather and the making of leather products and footwear and, to a smaller extent, of cotton weaving, woollen weaving, rope making, oil pressing, dairy industries, beedi making, milling and gur industry. Thousands
330
more engaged in such family occupations have been returned as being principally cultivators or only as earning dependants. The proportion of females IS appreciable in this division. In fact, among all industries in this state, they are most conspicuous in tobacco industry, particularly in beedi making wherein they claim over 48 per cent of the total numbers. They also account for more than one fifth of the numbers in the subdivision of grains and pulses and for roughly one tenth of the numbers in all its other sub,divisions except those relating to sugar industry, leather and its products and footwear and beverages. In these three subdivisions, however, they account for only 6, 5 and 3 per cent respectively of the total numbers. Independent workers are very prominent in this division, accounting for slightly less than 80 per cent of its total numbers. In fact, the corresponding percentage exceeds even 90 in the two sUb-divisions of unclassified textile (i.e., almost exclusively woollen weaving, rope making and silk weaving) and leather and footwear industries. It is equally appreciable in so far as rural areas are concerned, in the two sub-divisions of cotton textiles and industries pertaining to wearing apparel and made-up textile goods (i.e., mainly tailoring). But even if the urban areas are taken into account, the percentage of independent workers is round about 80 in these two sub-divisions as well as in those relating to beverages (i.e., mainly toddy drawing) and unclassified food industries. But their majority declines to just about 53 in the sub-division of vegetable oil and dairy products. And they lose altogether their numerical superiority in the three sub-divisions of grains and pulses, tobacco and· sugar industries, accounting for less than 40 per cent of the numbers in the first two and less than even 2 in the last. The employees account for about one fifth of the numbers in this division. Except in the sub-division of sugar industry, wherein they constitute over 98 per cent of the numbers, and in those of the industries relating to tobacco and grains and pulses, wherein they account for slightly over 60 and 50 per cent respectively of the numbers, they do not form a majority in any of its sub-divisions. Among the rest, they account, at the highest, for 40 per cent in the sub-division of vegetable oil and dairy products and, at the lowest, for only 5· per cent in that of unclassified textile industries. Employers account for slightly more than 2 per rent of the numbers in this division. Their percenta,ge is, at its highest, 9 in the sub-division of industries connected with grains and pulses and, among the others, exceeds 5 only in that of vegetable oil and dairy products. This division on the whole is basically rural in the sense that roughly 70 per cent of its numbers are in the villages. The corresponding percentage exceeds even 85 in its three sub-divisions of unclassified textile industries (almost exclusively woollen weaving, rope making and silk weaving) and industries relating to leather, leather products and footwear and beverages. The rural percentage, however, declines to less than 65 in cotton textiles (largely because of the cotton mills and ginning and pressing factories in urban areas), less than 50 in unclassified food industries (largely due to butchers in towns and cities) and less than even 40 in the other sub-divisions, being only 8 in that of sugar industry-even this percentage is mainly due to the workers of' the sugar factory in Bodhan Town living beyond its limits.
Tl:""di.~i~ion"'Of the processing and manufacture of metals, chemicals and their products, derives its numbers mostly from its two sub-divisions of the manufacture of unclassified metal products and transport equipment. The former accounts for 28,114 persons, of whom 19,696 are black-smiths and other workers in iron, 3,907 workers in brass, copper and bell metal, 2,805 workers in other metals and 1,531 are workers in mints, die-sinkers and lock-smiths. The actual numbers engaged as black, brass or copper smiths are bound to be significantly more not only because of the earning dependants in such artisan castes but also because quite a number of sefl-supporting persons following such occupations have been returned as being primarily cultivators. The latter sub-division claims 10,371 persons,-of whom 4,995, 3,746 and 981 are connected with the making or repairing of railway, motor and cycle equipments respectively. The group of motor repairers suffers numerically because some motor mechanics have returned themselvE.s merely as mechanics and that of cycle repairers because many persons engaged in the occupation are primarily owners or employees of taxicycle shQPs. The second sub-division further includes 510 persons principally engaged in the making or repairing of bandis, rickshaws, and other vehicles. This group also los{;s in numbers because many persons engaged in the work have returned themselves, very justifiably, as carpenters or blacksmiths. The other slibdivisions in this division include the manufacture or repair of electrical machinery and appliances, machinery other than electrical, the manufacture of basic industrial chemicals as well as fertilisers and power alcohol, the making of medical and pharmaceutical preparations and, lastly, the manufacture of unclassified chemical products, employing 709, 2,682, 489,486 and 1,251 persons respectively. Thc sub-diyision of machinery (other than electrical) consists of 1,954 persons employed in engineering ,(J.)orkshops and 728 persons returned simply as mechanics without any details. The sub-division of basic industrial chfmicals includes 254, 168 and 41 persons engaged in making chemical fertilisers, and dyes, fire works and e:rpios1r'es and power alcohol respectively. The sub-division of unclas'bitied chemical industries includ(s 466 persens employ{;d in soap industry, 391 in perfume and cosmetic (mainly Kunkum and Itr) industry and 307 in match industry. Females play an insignificant part in this division. They account for only 2 per cent, or evc-n appreciably less, of the numbers in aIJ its sub-divisions except'in those of basic industrial chemicals and fertilisers, unclassified chemical products (mainly due to the Kunkum and Itr industry) and pharmaceutical preparations,. They are as much as.
331
13 per cent in the first two and 7 in the third of these sub-divisions. The proportion of independent wrokers in this division is not very imposing, although they claim more than half of its numbers. Within the division itself, they are actually in a majority only in its sub-division of unclassified metal products, claiming over three fourths of its numbers primarily due to the blacksmiths and brass-smiths. But among the other subdivisions their highest percentage is about 37 in that of pharmaceutical preparations. Employees account for about 41 per cent of the numbers in this division. But, except in its major sub-division of unclassified metal products wherein they account for about one fifth of the numbers, they are in a decisive majority in all its other sub-divisions, being as much as about 80 per cent, or even more, in those of transport equipment, electrical machinery and machinery other than electrical. Employers form less than 3 per cent of the numbers in this division also, recording a slightly higher percentage only in its sub-division of unclassified chemical products. This division-unlike the other divisions of industries not inclusive of mining or quarrying-is basically centred in urban areas, which claim over 55 per cent of its numbers. In spite of this, its major sub-division of unclassified metal products draws over 60 per cent of its numbers from the villages, mostly due to the iron and brass smiths. As against this, over 93 per cent of the numbers in its second most numerous sub-division of transport equipment are from urban areas.
The division of processing and manufacture not elsewhere specified derives slightly less than half of its numbers from its sub-division of wood and wood products (other than furniture and fixtures) which accounts for 63,760 persons, of whom 39,480 are employed as carpenters, turners and joiners, 3,052 as sawyers and 21,223 in making baskets, patrolis, mats and broomsticks. Next in importance is its sub-division of unclassijied manufacturing industries, which claims 31,209 persons, of whom as many as 28,363 are employed as silver and gold smiths, 568 as repairers of watches and clocks, 200 in making or repairing musical instruments, 301 in toy making and 1,580 in miscellaneous manufacturing industries mainly button making. Next in numbers is the sub-division of non-metallic mineral products, which accounts for 25,634 persons of whom as many as 22,294 are potters, 1,627 lime burners, 200 are makers of porcelain ware, 89 of bangles and 1,424 of other glassware. The minor sub-divisions in this division include those relating to bricks, t'iles and other structural clay products which accounts for 3,405 persons; printing and allied industries claiming 3,105 persons, of whom 410 are book-binders and 2,695 are others like printers, lithographers, engravers, etc .. manufacture of paper and its products which sustains 2,716 persons; the manufacture of cement and its products, which engages 2,355 persons; and the manufacture o{ furniture and fixtures employing 1,544 persons. The actual number working in the state as, silver and gold smiths, carpenters, and more particularly as potters or as makers of baskets, patrolis, mats and broom sticks would be significantly more than the figures indicated above as quite a few among them have been returned as earning dependants or as being principally agriculturists. Females are not numerically very significant in this division. They account for 7 per cent of its numbers. Their percentage is particularly meagre in the sub-division of unclassified manufacturing industries (mainly gold and silver smithies), furniture and fixtures, and printing and allied industries. But they constitute about one fifth of the numbers in the sub-division of bricks, tiles and other structural clay products. Similarly, they {orm 9 per cent of the numbers in the sub-division of wood and woody products-not so much due to their strength among the carpenters and sawyers as among the makers of baskets, mats, etc., about one fourth of whom belong to that sex. Among the other sub-divisions referred to above, their percentage varies from 6 to 9.' More than any other division, this division can be said to consist basically of independent workers. '., They account for over 82 per cent of its numbers. In fact, their percentage exceeds 90 in the sub-division of wood and wood products, and 85 in its other two major sub-divisions of unclassified manufacturing industries (mainly silver and gold smithies)and industries connected with non-metallic mineral products (mainly earthenware). They maintain their majority, though considerably reduced, in the two sub-divisions of furniture and fixtures and bricks, tiles and other structural clay products. But their percentage does not even reach 10 in the sub-divisions of printing, paper and cement industries. The employees are least significant in this division, accounting for less than 15 per cent of its total numbers. In fact, in its three major sub-divisions of non-metallic mineral products (mainly earthenware), unclassified manufacturing industries (mainly silver and gold smithies) and wood and wood products, their percentage declines to 12, 10 and 7 respectively. But they account for about 30 per cent of the numbers in the two sub-divisions of furniture and fixtures and bricks, tiles and other structural clay products and claim the predominant portion (from 85 to 95 per cent) in the three sub-divisions of printing, cement and paper industries. Employers form less than 3 per cent of the numbers in this division a.lso. They are almost non-existent in its two sub-divisions of cement and paper industries. At the higbfst they claim about 6 per cent of the numbers in both the subdivisions of furniture and fixtures and printing and allied industries. A decisive majority, above 70 per cent, of the persons in this division live in rural areas. This is more or less true of all its major sub-divisions. But the overwhelming majority of the persons in all its minor sub-divisions of bricks, tiles and other structural clay products, cement industries, furniture and fixtures, paper and, more particularly, printing and allied industries, resides in towns and cities.
382
The division of construction and utilities derives much more than half of its numbers from its subdivision of construction and maintenance of buildings, which is one of the major non-agricultural occupations in this state employing 61,852 persons. This sub-division includes 29,660 masons and bricklayers, 1,067 stonecutters and dressers, 393 painters and decorators of houses and roughly 31,000 others enf!,aged in the occupation including both labourers and engineering personnel. Among the other sub-divisions in this division are the construction and maintenance of irrigation and other agricultural works including contour bunding, terracing and land reclamation operations which employs 23,899 persons; sanitary works and services (including scavengery) which employs 8,809 persons; construction and maintenance of roads, bridges and other transport worla which employs, 7,142 persons; and works and services connected with electric power and domestic and industrial water supply, which employ 3,579 and 1,810 persons respectively. But the numbers belonging to this division, and most of its sub-divisions, are very flexible. Many labourers, in agricultural or other occupations, take to such works whenever there is scope for employment in them and their employment terms ~re relatively favourable. Besides, persons engaged in such works mOVe from area to area and work to work~which may pertain to different sub-divisions~depending upon the general employment situation. Females are comparatively very prominent in this division, claiming over one sixth of its numbers. In fact, their percentage exceeds 40 in sanitary works and services and is 20 in irrigation works. The corresponding percentage is about 10, or exceeds it, in all the other sub-divisions referred to above except in that of power works and services wherein it dwindles to 2. Slightly more than half of the numbers in this division are independent workers. But within its various sub-divisions, while they constitute as much as 73 per cent in the subdivision of buildings, they are, at best, only a significant minority in all the others. About 48 per cent of the numbers in this division are employees. They, account for only one fourth of the numbers in the sub-division of buildings, but for more than three fourths of the numbers in all the other sub-divisions-claiming even more tha~ 85 per cent of the numbers in the three sub-divisions of power, domestic and industrial water supply and sanitary works and services. Employers are numerically insignificant in this division, their highest percent2ge being 2 in the sub-divisions of building and irrigation works. Over 65 per cent of the persons in this division live in urban areas. In fact, the percentage is roughly, or even exceeds, 70 in the sub-divisions pertaining to power, domestic and industrial water supply and sanitary works and services. The corresponding percentage exceeds 65 in case of irrigation works also. This high urban percentage is merely due to the fact that the Tungabhadra Project Camps were treated as 'temporary towns', More than 60 per cent of the numbers in the sub-division of transport works, however, is returned from the rural areas.
The division of commerce derives more than half of its strength from the sub-division of retail trade in food-stuffs (including beverages and narcotics), which is the most numerous of all the sub-divisions of industries. and services. Of the 135,753 persons in this sub-division, 60,114 trade in kirana stores, 7,032 in mutton, poultry. eggs, fish, sheep and goats, 12,882 in vegetables and fruits, 2,408 in oil, oil seeds and ghee, 3,468 in grains, pulses. tamarind and chillies, 23,924 in other food-stuffs and fodder for animals. 9,962 in pan, beedis and cigarettes, 1,212: in tobacco, opium and ganja and 4,565 are hawkers of drink and food-stuffs and 10,186 vendors of wine, liquors. aerated waters and ice in shops. Next in order in this division, is the sub-division of unclassified retail trade. which sustains 52,5~7 persons of whom 1,289 trade in drugs, 2,424 in othllr chemicals, 6,176 in bangles, 1,820' in gold and silver-ware, 1,385 mainly in hard-ware, iron safes and trunks, 2,265 in all types of utensils including earthenware and bras~ware, 518 mainly in sewing machines, electric goods, petromax lamps, agricultural implements and various types of machinery, 272 in building and construction materials and sanitary ware, 1,566 mainly in crockery, cutlery, watches, optical goods, toys, sports goods, mirrors and musical instruments, 2,948 in cattle and as many as 24,771 in general, maniyari and miscellaneous stores and 1,807 are publishers, book-s~llers ana stationers, 3,280 cycle taxi shop owners or employees and 2,006 are unclassified hawkers. The other sub-divisions. in this divisi(;n ill< lude retail trade in teiVtile and leather good~ accounting fo~ 25,573 persons of whom 21,084 deal in cloth, cotton and silk piece goods and yarn, 3,311 in leather and leather goods including footwear, and 1,22S in wearing apparel, kcmbals and other made-up textile goods including carpets, tape and rope; wholesale trade in food-stuffs whith emrloys 21,169 persons; retail trade in fuel which accounts for 4,811 persons of whom 443-trade in petrol and 4,368 in firewood, charcoal, etc; wholesale trade in commodities other than food-stuffs which employs 5,146 persons; money lending, banking and other financial business which engages 6,442 persons; and, lastly, insurance and real estate, which employ 609 and 97 persons respectively. The numbers pertaining to most of tht'se sub-divisi0ns are underrated not only because of the omission of earning dependants engaged in commerce or of persons following it as a subsidiary occupation but also because persons who both produce and sell any comn'odity have been treatfd only as producers, and there is more overlapping between its subdivisions-not c1ly as between retail trl1de in various commodities but also between retail and wholesale trades-than in those of other divisions., The proportion of females is appreciable in this division. They account for about one tenth of its numbers as well as of those of its three sub-divisions of unclassified retail trade and retail tn.des in food-stuffs (including beverages) and fuel. Within these three sub-divisions, they constitute 31 Fer cent of the traders in vegetables and fruits, 21 of the hawkers of drink and food-stuffs and
388
from. 15 to ~o of the uncla5sified hawkers, vendors of liquo~ (mainly to~~y), wine, etc., and. traders in pan, beedls and CIgarettes. They form 5 per cent of the numbers m the sub-dIvIsIon of money lendmg and banking and are insignificant in wholesale trades, retail trade in textile and leather goods and insurance. Independent workers account for 70 per cent of the numbers in this division. They are in the majority in all its sub-divisions except in those of whole~ale trade in food-stuffs, money lending, banking and other financial bU'liness and insurance; actually claiming more than 75 per cent of the numbers in the sub-divisions of retail trade in food stuffs (including beverages) and unclassified retail trade. Employees account for 23 per cent of the numbers in this division, being as much as 92 per cent in its sub-division of insurance, 67 in that of money lending, banking and other financial business, 48 in wholesale trade in food-stuffs, 33 in wholesale trade in other commodities and 27 in retail trade in textile and leather goods. They, however, account for only 17 per cent of both the uncbssified retail traders and retail trader~ in food-stuffs (ineludillg beverage,>). Employers are more conspicuous in this division than in any other. They claim from about 5 to 6 percent in its three subdivision'> of money lending, banking and other financial business, unclassified retail trade and retail trade in food-stuffs and beverages, 12 in retail trade in textile and leather goods and 15 per cent-among the highest recorded in all sub-divisions~-in wholesale trade in both food-stuffs and non-foodstuffs. More than 60 per cent of the IJ-umbersb:!longin,g to this division, are in urban areas. The urban, percentage is least markedthough exceeling 50-in unch'lsified reta.il trade and retail trade in food-stuffs and beverages.
The division of transport, storage and communications derives over 60 per cent of its numbers from the subilivision of road transport and about 30 from that of railway transport. The former employs 44,648 personsof whom owners and drivers of bandis number 12,464, of rickshas 5,925 and of tongas 2,7U and 5,420 are connected with Road Transport Department, 5,049 with other public motor and lorry services and 12,208 are engaged in manual transport (m'tinly in hammali) and 584 in transport by pack animals. The sub-division of railway transport, consists of 4,989 railway porters and hammals and 16,131 other railway employees. The other three transport sub-divisions in this division are those of transport by water and air and incidemal transport service. {like hundekari) claiming 12g, 792 and 326 persons respectively. These numbers exclude persons engaged in repairing or manufacturing activities. The other sub-divisions in this division include storage and warehousing accounting for only 44 persons; postal, telegraph, telephone and wireless services, accounting for 3,968, 189,289 and 438 persons respectively. These numbers exclude persons engaged in repairing activities or in the ,construction and maintenance of telegraph or telephone lines. The percentage of females is insignificant in this division and practically all its sub-divisions, the higHest recorded being 5 in that of transport by road mainly due to the group of manual transport, wherein they claim 14 per cent of the numbers. Independent workers account for 40 per cent of the numbers in this division. But they are in a majority in its9ub-divisions of transport by road and transport by water. Employees account for over 58 per cent of its numbers-monopolising all the numbers in the sub-divisions of transport by air and postal, telegraph. telephone and wireless services. As against this, employees form less than 40 per cent of the numbers in its major sub-division -of transport by road. The proportion of employers is in'lignificant in this division as well, and their numbers are allnCJ8t exclu5ively restricted to the sub-division of transport by road. This division is the most urbanised in the sense that over 80 per cent of its numbers are returned from urban areas.
The, division of health, education and public administration includes the sub-divisions of employees of state governments (other than those classifiable under other sub-divisions) accounting for 43,102 persons; educational and research services accounting for 38,280 persons, of whom 667 are members of the teaching ataff and research workers in universities, colleges and research institutions, 28,25] teachers and 9,362 other employees of educational and research institutions including libraries and museums; police personnel (other than village watchmen) numbering 36,844; village officers and servants, numbering 29,793; medical and health services accounting for 16,564 persons, of whom 1,854 are registered medical practitioners, 5,788 vaids, hakims and other unregistered medical practitioners, 1,004 midwives, 1,019 nurses, 885 compounders, 213 veterinary surgeons and over 5,600 others engaged in medical or public health services excluding scavengers and sanitary staff; and lastly employees of local bodies and Union Government, numbering 4,623 and 12,210 respectively, excluding in either case persons classifiable under other sub-divisions. "These numbers do not include persons engaged in transport or production or in repairing. The numbers pertaining to village officers and servants suffer particularly became m'lny of them have returned cultivation as their principal livelihood. Similarly, teachers lose in numbers because quite a few of them in the villages have returned teaching as a secondary occupation. Fem3.les are not very significant in this division accounting for less than 6 per cent of its numbers. But they form as much as 17 per cent of the numbers in its sub-division of medical and health services-mainly because Qf the nurses, midwives and the lower cadres in medical institutions-and 15 in that of educational and research services. Em;?loyees m~nopolise all the sub-divisions of this division except those of educational and medical and health services. In the former just 6 per cent are independent workers and a literally microscopic number are employers and in the latter independent workers form 40 per cent and employers just 2. This division and all its iub-divisions, except that of village officers and iervants, are centred in urban areas.
334
Over 90 per cent of the village officers and servants are in rural areas, which also account for about 40 per cent of the numbers relating to educational services and 30 of those relating to both medical and heal til services and the police force.
The division of services (not elsewhere specified) draws its largest numbers from the sub-division of unclassified services which claims as many as 112,471 persons. This number includes ullspecified lab01Lrers and employees of non-government Illaqas, like Sarf-i-khas and Jagirs. The former predominate ill rural and the latte\- in urban .areas. The other sub-divisions in this division are laundTY seTvices accounting for 55,162 persons; dumestic serv'ices accounting for 48,345 persons, of whom 3,048 are motoT drivers and cleaners, 6,524 cooks, 1,609 gaTdeners and 37,164 otheT domestic servants; barbel'S and beauty shops claiming 24,520 persons; hotels and Testaurants claiming 18,812 persons; Teligious, charitable and welfaTe services accounting for 13,925 persons; recreation services claiming 9,040 persons; legal and business services claiming 3,951 persons; and, lastly, aris, letteTS and journalism accounting for 1,276 persons of whom 487 are principally employed as artists, sculptors and image makeTs, 409 as authoTs, editoTs, joumalists and pTess employees (otheT than the pTinting staff) and 380 as photographers. The sub-divisions pertaining to domestic, laundry, hairdn,ssing and religious services lose appreciably in numbers because many persons following such services have returned cultivation as their principal livelihood or were deemed to be only earning dependants. Besides, many domestic servants have indicated their occupation as' Khangi naukari ' without giving any further details. Similarly, the sub-division of arts, letters and journalism and, to a smaller extent, of legal and business services, lose in numbers because many take to them only as secondary occupations. Among all the divisions, females are most conspicuous in this division, claiming more than one fifth of its numbers. They account for about 20 per cent of the numbers in the sub-division of laundry services, 28 in that of unclassified services and almost 40 ill that of domestic services! But their percentage is negligible in the sub-divisions of hairdressing, legal and business services and arts, letters and journalism. Independent workers account for 58 per cent of the numbers ilt this diyision. But they almost monopolise the two sub-divisions of laundry and hairdressing services-claiming 94 per cent of the numbers in the former and 91 in the latter. They are in a majority in all the other sub-divisions also, except of course in those relating to hotels and restaurants, and domestic services. Employees account for 63 per cent of the numbers in the fonner and 89 in the latter. The independent workers among the domestic servants are those who undertake odd jobs in more than one household. Employers, though insignificant in this division as a whole, account for about 3 per cent of the numbers in the sub-division of hairdressing and as much as 15 in that of hotels and restaur811ts. The latter is among the highest recorded in all subdivisions of industries or services. This division draws its major numbers from urban areas. This is especially true of the sub-divisions Qf legal and business services, arts, letters and journalism, hotels and restaurants and domestic services. In spite of this, more than half of the numbers in the sub-division of religious, charitable and welfare services and roughly three fourths of the numbers in those of hairdressing and laundry services are drawn from the villages of the state.
39
CHAPTER V
Houses, Households, Sex and Marital Status Ratios and Principal Age Groups

SECTION I
TERRITORIAL DISTRIBUTION OF HOUSES AND HOU::'EHOLDS
AND SIZE OF FAMILY HOUSEHOLDS
(The tables rele'ranl to this Section are Main Tables 'A-I-Area, Houses and Population' git'en at Fage 1 of Part II-A and 'C-IHousehold Size and Composition)' gir,'en at page 1 of Part II-B and Subsidiary Tables '6.1-Persons per 1,000 house.~ and houses per 100 square miles and comparison with past Censuses' and '6.2-Number oj Households per 1,000 Houses and Distribution by size 0/ 1,000 Sample Households of Rural and Urban Pupulation, !;i'[e~ at pages 178 and 179 respecti'l:ely of Part I-B oj this Volume).
Houses-Definition· and Limitations.--Census statistics relating to occupied houses suffer from various limitations. These limitations arise from the great diversity of structures that would be covered by any workable definition of occupied houses; the lack of uniformity from census to census--and sometimes even from area to area at the same census-in respect of both the definition and the procedure adopted in determining the actual number of occupied houses; and lastly the absence of any precise demarcation, except at the present census, between the house and the household. It is necessary to keep these limitations in view in any comparative study of the census figures pertaining to occupied houses.
2. Houses in this part of the country probably cover a greater variety of structures than in most areas of comparable dimensions in the world. There is considerable difference between the average type of a house in the villages and in the towns of the state, in its black cotton and in its granitic regions and in its forest areas and in its plains, a.s well as from tract to tract within each of these areas depending upon the kind of building material easily procurable locally. Again, there is apprec~able dissimilarity between the average type of a dwelling as built by the Muslims and the Non-Muslims and sometimes even by members of different castes or tribes. This diversity is further amplified in respect of sizes and embellishments (or lack of embellishments) by extremes of riches and poverty and backwardness and enlightenment among the people. Within the metropolis itself, some of the residential buildings in the new extensions can vie with corresponding structures in most advanced countries of the world and some in the old portions recall the description of palaces in Arabian Nights and both exist not far removed from hovels scooped out of ancient ruins or shacks temporised from discarded material. _ The city also contains thousands of medium sized residential quarters attempting to combine the features of both the old and the new types of structures. In many a village, a few (or a solitary) white-washed double storeyed houses stand towering over a cluster of mud plastered dwellings of modest dimensions, at a dignified distance from a jumble of huts belonging to the Scheduled Castes. Some of the conical thatched roof dwellings in the forest areas of the state are not very, different from those in the African wilds. In the construction of houses, some Hindus take as much care to see that the house-wife working in the kitchen can keep an eye on the main entrance of the house and the street or the lane beyond it, as some Muslims do to screen the interior rooms from the most prying of the passers-by. It is neither possible nor necessary to describe in this report the numerous distinctive types of dwellings found in the state. But what is really pertinent is the fact that in this state it is difficult in thousands of cases to draw a line between a permanent dwelling and a make-shift encampment-the value and type of the material used as well as the space covered being identical in both the cases.
3. The exact definition of the term 'house', i.e., the occupied house, has been one of the minor problems for census authorities. It cannot be claimed that this problem has been solved even at the 1951 Census. During this census, in the instructions issued with
887
338
regard to the numbering of houses, the house was defined as a dwelling with a separate main entrance. It was added that while each one of the quarters opening on to a courtyard, or block of fiats opening on to a common stair, should be presumed as a dwelling with a separate main entrance, dwellings inhabited by more than one family should be treated only as a single house unless each one of the families residing in them had an independent access to the outside. But in spite of a uniform set of instructions and almost unprecedented efforts to arrange for house numbering throughout the state 'in a manner in which a single number, forming part of a single intelligible system, could identify a social unit for all purposes', it was difficult in quite a number of cases for Municipal authorities* to differentiate between a taxation unit and a social unit. Perhaps in order to facilitate the demand and payment of municipal taxes they, and the landlords concerned, preferred a single number being allotted to the property, even if such property covered actually more than one house. In some cases, especially in rural areas, attachment to ancestralties was still so strong that, in spite of a partitioned structure with separate entrances, the inmates were anxious to pass off the dwellings as a single house-and in fact for all of them to be recorded as constituting only one household. In addition to all these shortcomings, the definition of the term house itself has varied from census to census as would be obvious from the extracts given in th,e foot notet.
4. In the earlier censuses, the data pertaining to occupied houses were based on figures supplied by the enumerators. These figures sometimes represented the situation not as it existed on the enumeration eve but days or even months prior to it. Again, it has been the practice at all censuses, including the present census, to impress on the house numbering authorities and the individual enumerators, the necessity of numbering all places such as shops, godowns, cha)wdis, places of worship and deserted or locked houses even if they were not used for residential purposes at the time of numbering. This was done with a view to safeguard that no place, occupied or likely to be occupied by human beings, remained unchecked and unvisited subsequently during the actual enumeration. There was no guarantee in the earlier censuses that the figures of 'occupied houses' finally supplied by the enumerators scrupulously excluded all such non-residential structures. During the present census, however, the number of occupied houses in each village and town was worked out in the Census Tabulation Office itself from the respective National Registers. These registers-which were written by the enumerators during or immediately following census enumeration on the basis of the answers recorded
... In Municipal areas the Municipal authorities and in other arefLS the Revenue authorities were in charge of house numhering as well as Census enumeration.
t The 1931 Census Report states th'1t " For Census purposes, the Cen~us Coje of 1881 laid down that a house was the possession of a common courtyard. In 1891 no rigid definition was attempted; but,the main points emphasised were the situation within a comnCln eClclosure, the existence of a com'll()n courtyard with express exception of lanes and semi-public spaces in towns and the e"ceptiou of otltlying h'lt'! anci shelters. In 19(H a hJuse meant every place likely to be occupied, the selection being left to the dis~retion of Cen'an oIThers. In 1lHI the dwelling place of a comn,as'l[ f1mily with its resident dependants such as mother, wibwed sister, YJur'J.'Jer brother5, et~ .. Wets CJtl 1ted as a hou~e. In 1921 a house in rural tracts meant a structure occupied by one commensal f:l.mily with its resident dependants. such as widows and servants. Such detached structures as had no hearth but were likely to h'we one or mJre p~r,;)a, sleepin~ therein Oll the night of the final enumeration were treated as separate houses, so th::tt no person might e3cape erJ.u~n~rettion. In towns and cities' house' meant a structure intended for the exclusive residence of one or mJre c.):n -n~nsal f<tmilies apart from other residents of the street or land, and included semis, hotels and the like W;l~n. t~~y w~re /lot I tq~ e'1Jll~h L) f :Ir.n hbok,. ~hops, schools and other in,titutions, having no hearth but which might p'lBibly hwe S[):n~ OC1e sleepin';{ th~rein on the ni~ht of the final enumeration were numbered as separate houses. Now, in the pr~,eat cen.SU3, a h)lls~ ia rclol tnct3 me:1nt a dw~lling place having a separate main entrance. In towns, where tlte m l'1icip'l.lity lus nll:n'J~rej the h),Be3, e.1~h dwelling place bening a number may be counted as a house; but if any strllcture w B bft u l.nlrIl')~rei by the mUicip tlity it should be given a number. With such varying definitions from decade to deca.de the number of house, wcluld nilt admit of any useful comparison. Plague being prevalent in the Hyderabad City and suburb3 darin~ the period of the CenS1l3, people had to live out in health c.1rnps. The huts temporarily occupied were not counted as hOllses, belt the houses unoccllpied for the time being were reckoned." In 194.1, the instructions issued were more or less the Sl~I13 a3 llid d:Jw,1 i,l H31 althJ:qh their implementation was perhaps less satisfactory.
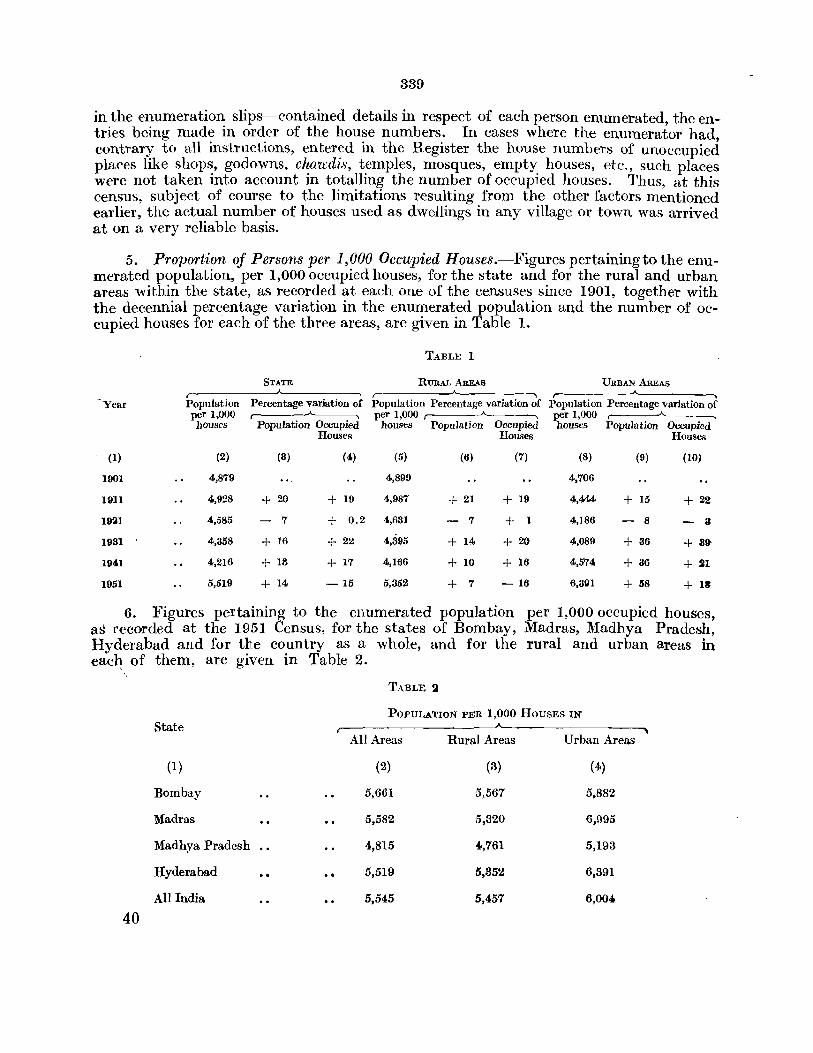
339
in the enumeration slips-contained details in respect of each person enumerated, the entries being made in order of the house numbers. In cases where the enumerator had contrary to all instructions, entered in the Register the house numbers of unoccupied places like shops, godowns, chan'dis, temples, mosques, empty houses, etc., such places were not taken into account in totalling the number of occupied houses. Thus, at this census, subject of course to the limitations resulting from the other factors mentioned earlier, the actual number of houses used as dwellings in any village or town was arrived at on a very reliable basis.
5. Proportion of Persons per 1,000 Occupied Houses.-Figurespertainingtothe enumerated population, per 1,000 occupied houses, for the state and for the rural and urban areas within the state, as recorded at each one of the censuses since 1901, together with the decennial percentage variation in the enumerated population and the number of occupied houses for each of the three areas, are given in Table 1.
TABLE 1
STATE RURAL AREAS URBAN AREAS , Year Population Percentage variation of Population Percentage variation of Population Percentage variation of
per 1,000 per 1,000 per 1,000 .-----A-------., houses Population Occupied houses Population Occupied houses Population Occupied
Houses Houses Houses
(I) (2) (3) (4) (5) (6) (7) (8) (9) (lO)
1901 4,879 4,899 4,706
1911 4,928 + 20 + 19 4,987 + 21 + 19 4,444 + 15 + 22
1921 4,585 - 7 + 0.2 4,631 - 7 + 1 4,186 - 8 - a 1931 4,358 + 16 + 22 4,395 + 14 + 20 4,089 + 36 + 89-
1941 4,216 + 18 + 17 4,166 + 10 + 16 4,574 + 36 + 21
1951 5,519 + 14 -15 5,352 + 7 - 16 6,31H + 58 + 13
6. Figures pertaining to the enumerated population per 1,000 occupied houses, as recorded at the 1951 Census, for the states of Bombay, Madras, Madhya Pradesh, Hyderabad and for the country as a whole, and for the rural and urban areas in eacl~ of them, are given in Table 2.
TABLE 2
POPULATION PER 1,000 HOUSES IN
State All Areas Rural Areas Urban Areas
(1) (2) (3) (4)
Bombay 5,661 5,567 5,882
Madras 5,582 5,320 6,995
Madhya Pradesh 4,815 4.,761 5,193
Hyderabad 5,519 5,352 6,391
All India 5,545 5,457 6,0040
40
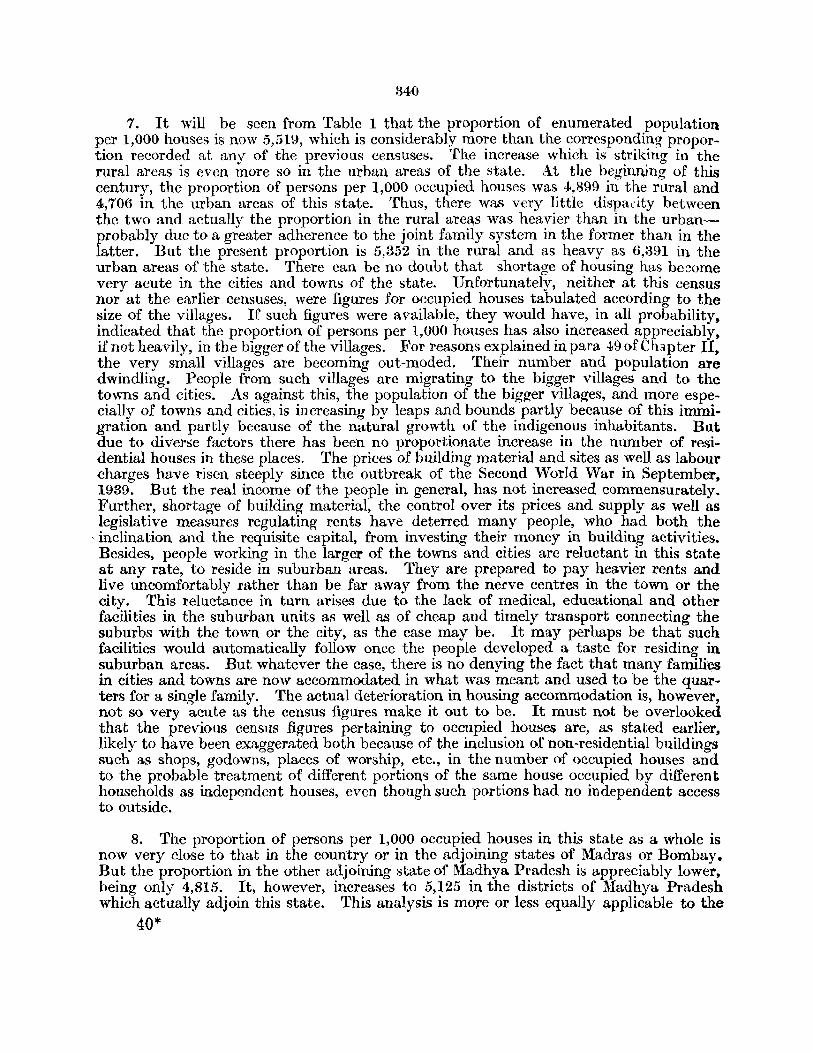
340
7. It will be seen from Table 1 that the proportion of enumerated population per 1,000 houses is now 5,519, which is considerably more than the corresponding proportion recorded a.t any of the previous censuses. The increase which is striking in the rural areas is even more so in the urban areas of the state. At the beginning of this century, the proportion of persons per 1,000 occupied houses was 4,899 in the rural and 4,706 in the urban areas of this state. Thus, there was very little dispadty between the two and actually the proportion in the rural are~s was heavier than in the urbanprobably due to a greater adherence to the joint family system in the former than in the latter. But the present proportion is 5,352 in the rural and as heavy as 6,391 in the urban areas of the state. There can be no doubt that shortage of housing has become very acute in the cities and towns of the state. Unfortunately, neither at this census nor at the earlier censuses, were figures for occupied houses tabulated according to the size of the villages. If such figures were available, they would have, in all probability, indicated that the proportion of persons per 1,000 houses has also increased appreciably, if not heavily, in the bigger of the villages. For reasons explained in para 490fCh3pter II, the very small villages ate becoming out-moded. Their number and population are dwindling. People from such villages are migrating to the bigger villages and to the towns and cities. As against this, the population of the bigger villages, and more especially of towns and cities, is increasing by leaps and bounds partly because of this immigration and partly because of the natural growth of the indigenous inhabitants. But due to diverse factors there has been no proportionate increase in the number of residential houses in these places. The prices of building material and sites as well as labour charges have risen steeply since the outbreak of the Second World War in September, 1939. But the real income of the people in general, has not increased commensurately. Further, shortage of building material, the control over its prices and supply as well as legislative measures regulating rents have deterred many people, who had both the
,inclination and the requisite capital, from investing their money in building activities. Besides, people working in the larger of the towns and cities are reluctant in this state at any rate, to reside in suburban areas. They are prepared to pay heavier rents and live uncomfortably rather than be far away from the nerve centres in the town or the city. This l'eluctance in turn arises due to the lack of medical, educational and other facilities in the suburban units as well as of cheap and timely transport connecting the suburbs with the town or the city, as the case may be. It may perhaps be that such facilities would automatically follow once the people developed a taste for residing in suburban areas. But whatever the case, there is no denying the fact that many familh~s in cities and towns are now accommodated in what was meant and used to be the quarters for a single family. The actual deterioration in housing accommodation is, however, not so very a.cute as the census figures make it out to be. It must not be overlooked that the previous census figures pertaining to occupied houses are, as stated earlier, likely to have been exaggerated both because of the inclusion of non~residential buildings such as shops, godowns, places of worship, etc., in the number of occupied houses and to the probable treatment of different portion~ of the same house occupied by different households as independent houses, even though such portions had no independent access to outside.
8. The proportion of persons per 1,000 occupied houses in this state as a whole is now very close to that in the country or in the adjoining states of Madras or Bombay. But the proportion in the other adjoining state of Madhya Pradesh is appreciably lower, being only 4,815. It, however, increases to 5,125 in the districts of Madhya Pradesh which actually adjoin this state. This analysis is more or less equally applicable to the
40*
341
corresponding ratios in the rural portions of these areas as well. But the ratios differ very widely in the urban portions. The proportion in all the cities and towns' of this state taken together is markedly lower than in the cities and towns of Madras State but appreciably higher than in those of the country as a whole or Bombay State and, much more so, of Madhya Pradesh. But these ratios by themselves are not sufficient to prove that the pressure of population on available housing accommodation in the urban areas of this state is less than in those of Madras, or more than in those of Madhya Pradesh, Bombay or the country as a whole. A higher proportion of persons per 1,000 occupied houses does not necessarily mean a greater degree of overcrowding in so far as the floor space per person is concerned. Much less does it mean a lower standard in the quality of residential accommodation. The space covered by an average house and its quality vary considerably from town to town within the same state* and even from locality to locality within the same town. This is due to the great diversity even in the average type of structures used for residential purposes in different areas and the varying stages of progress recorded by them in respect of the provision of municipal and other amenities. Besides, the average size of a family, which differs considerably from area to arca according to the type of the population inhabiting it, is also a factor governing the floor space per person in the area concerned. The present census reveals that in this state the average size of a family in the purely mining or industrial town is appreciably smaller than in the other towns in the same tract-for details ('ide paragraph 13. But because of this, it cannot be concluded that the living space per person would be more in the former than in the latter. In fact, the actual situation is perhaps quite the opposite. The average size of a family among the l\fuslims (other than in some of their sects) and certain. castes of the Hindus is larger than among the others. Thus, in places where the Muslims, or members belonging to such castes are concentrated, the average size ~ of the family____,.in other words, the number of persons per 1,000 occupied houses-tends to be larger. Lastly,- the different systems of numbering houses followed by different municipalities has also a bearing in determining the proportion of persons per 1,000 occupied houses. Thus, in municipal areas where, in the numbering of houses, the stress is more on the taxation than the social unit, the number of occupied houses te]lds to be underrated. In view of all these factors, it would not be correct to assess the relative extent of over-crowding in different areas, either within the same state or in different states, merely on the basis of the census figures pertaining to occupied houses.
9> Variation in Proportion oj Persons per 1,000 Occupied Houses within the State.Within the state itself the proportion of persons per 1,000 occupied houses varies from 4,881 in Adilabad District to 7,080 in Hyderabad. The proportion, with some marked exceptions, tends to be heavier in the western half of the state, i.e., in the Marathi and Kannada areas than in the eastern half, i.e., the Telugu areas. In the seven western districts of Bhir, Nanded, Bidar, Osmanabad, Gulbarga, Aurangabad and Parbhani, the proportion ranges from 5,205 to 6,266-it is appreciably higher than 5,600 in the first four districts. In the fifth, i.e., Gulbarga District, the proportion is distinctly lower in the north-eastern areas which not only have a large proportion of Telugu popUlation but are also hilly and contain most of the forests in the district. In Aurangabad and Parbhani Districts also, the proportion is comparatively low in the northern tahsils of Kannad (4,865), Sillod (4,946), Bhokardan (5,046), Jaffarabad (5,371)-all in Aurangabad-andJintur (5,031), Hingoli(5,102), Partur (5,U8) andKalamnuri (5,138)-all inParbhani. These tahsils are relatively hilly, agriculturally poor except in parts and contain almost all the
• In Hl88 it was found that the average floor space per person was 26 square feet in industrial areas of Bombay City and '" ill those of Ahmedabad City.
342
forest5 and the Scheduled Tribes the two districts' possess. In all these seven western districts, the proportion is lower than 5,000 in only the two tahsils of Kannad and Sillod in Aurangabad District. As against this, in as many as 28 tahsils, situated mostly in the central belt of these seven districts taken all together, the proportion exceeds 5,600. It is even higher than 6,000 in seventeen of these 28 tahsils. This area in the central belt of the western half is, perhaps, the best in the state from the points of view of agricultural prosperity and general health of the population. Almost all the villages and towns in this belt are'very old-and the size of the average house in these villages or towns-is relatively large. Attachment to the joint family system continues to be quite marked among the people, especially the Marathi cultivating castes, inhabiting the area.
As against this, in the seven eastern Telugu districts of Medak, 'Varangal, Karimnagar, Mahbubnagar, Nalgonda, Nizamabad and Adilabad the proportion ranges from only 4,881 to 5,577-it is higher than'5,500 in only Medak and Warangal Districts. Even in Medak District the proportion tends to increase as one proceeds from its eastern to the western portions. The proportion in its eastern tahsils of Siddipet and Gajwel is only 5,316 and 5,315 respectively and in its western tahsils of Andol, Sangareddy and Vikarabad 6,025, 5,896 and 5,709 respectively. The latter set of tahsils resemble the western districts in respect of their physical and social conditions, except with regard to the language spoken by the people. Apart from Andol Tahsil mentioned above, in all the3~ seven eastern districts, the proportion is in excess of 6,000 in only Warangal Tahsil of Warangal District. The relatively heavy proportion in this tahsil is very largely due to Warangal City which is the second largest urban unit in the state. If figures pertaining to this city are excluded the proportion declines to 5,699. As against this, in these seven eastern districts, the proportion is lower than 5,003 in Achampet Tahsil of Mahbubnagar District; in all the tahsils of Adilabad District except Dtnoor, Boath and Rajura ; in Armoor Tahsil of Nizamabad District; in Sultana bad and Manthani Tahsils of Karimnagar District; in Mulug Tahsil of Warangal District and in Miryalguda and Devarkonda Tahsils of Nalgonda Di~trict. All these tahsils are among the most backward, hilly and forestclad areas in the state. The most significant exceptions to the pattern indicated abovei.e., the tendency for the number of persons per 1,000 houses to be higher in the western half of the state than in the eastern-are Raichur and Hydcrabad Districts. Among the western districts, the proportion in Raichur District is especially low-in fact it is the second lowest in the state*. In only three of its extreme western tahsils of Velburga, Kushtagi and Lingsugur, the proportion is heavier than 5,000, the heaviest being 5,134 in Lingsugur. In all its other eight tahsils the proportion is lower than 5,000, the lowest being 4,718 in Sindhnoor Tahsil. Among the eastern districts, the proportion in Hyderabad District is 7,080. This is considerably higher than that recorded by any other district of the state. If figures pertaining to Hyderabad City are excluded, the proportion in the district, however, decreases to 5,671.
10. The variation in the proportion of persons per 1,000 occupied houses from district to district within the state is thc result of diverse factors. It is not possible to detail or analyse all these factors or to indicate the extent to which they are responsible for the actual proportion in each area. But broadly it is obvious that the reasons for the higher proportion in western half of the state than in its eastern include a more marked adherence to the joint family system and a healthier climate (consequently larger numbers of
• The proportion in Raichur District is 4,946 with the Tungabhadra Project Camps, and 4,982 excluding the Camps.
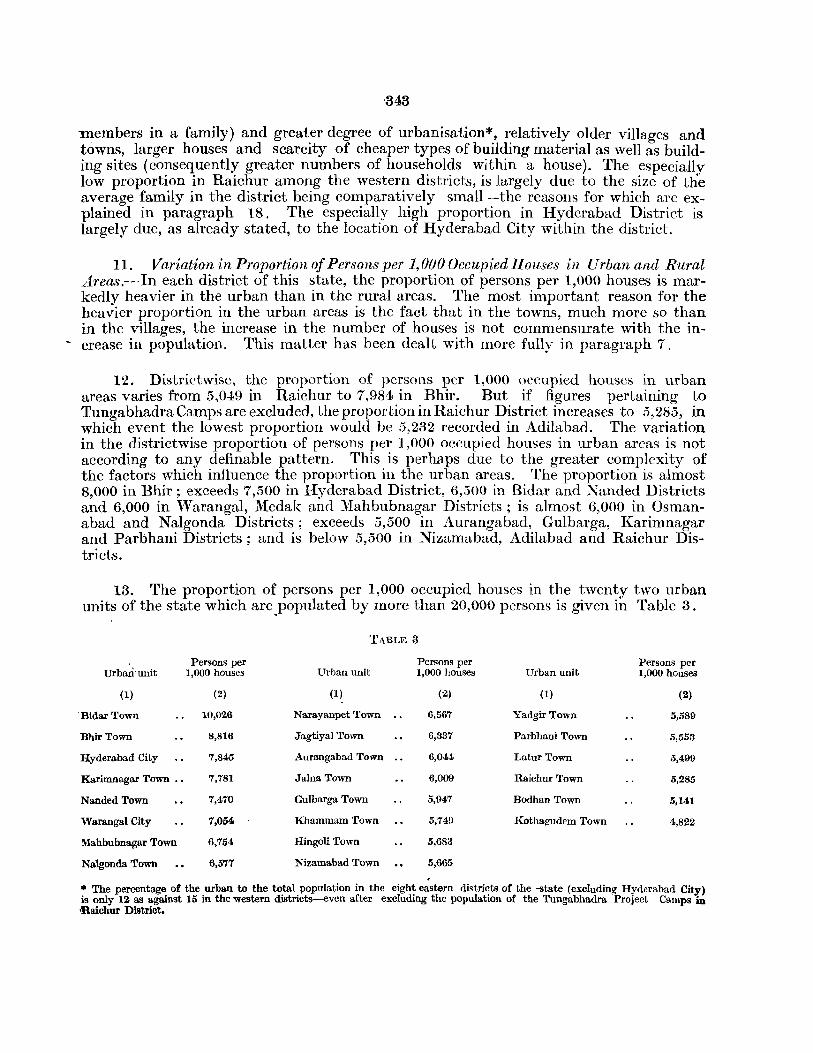
343
members in a family) and greater degree of urbanisation*, relatively older villages and towns, larger houses and scarcity of cheaper types of building material as well as building sites (consequently greater numbers of households within a house). The especially low proportion in Raichur among the western districts, is largely due to the size of the average family in the district being comparatively small-the reasons for which are explained in paragraph 18. The especially high proportion in Hyderabad District is largely due, as already stated, to the location of Hyderabad City within the district.
11. Variation in Proportion of Persons per 1,000 Occupied Houses in Urban and Rural Areas.-In each district of this state, the proportion of persons per 1,000 houses is markedly heavier in the urban than in the rural areas. The most important reason for the heavier proportion in the urban areas is the fact that in the towns, much more so than in the villages, the increase in the number of houses is not commensurate with the in-
- crease in population. This matter has been dealt with more fully in paragraph 7.
12. Districtwise, the proportion of persons per 1,000 occupied houses in urban areas varies from 5,049 in Raichur to 7,984 in Bhir. But if figures pertaining to Tungabhadra Camps are excluded, the proportion in Raichur District increases to 5,285, in which event the lowest proportion would be 5,232 recorded in Adilabad. The variation in the districtwise proportion of persons per 1,000 occupied houses in urban areas is not according to any definable pattern. This is perhaps due to the greater complexity of the factors which influence the proportion in the urban areas. The proportion is almost 8,000 in Bhir ; exceeds 7,500 in Hyderabad District, 6,500 in Bidar and ~anded Districts and 6,000 in Warangal, Medak and Mahbubnagar Districts; is almost 6,000 in Osmanabad and Nalgonda Districts; exceeds 5,500 in Aurangabad, Gulbarga, Karimnagar and Parbhani Districts; and is below 5,500 in Nizamabad, Adilabad and Raichur Districts.
13. The proportion of persons per 1,000 occupied houses in the twenty two urban units of the state which are,populated by more than 20,000 persons is given in Table 3.
TABLE 3
Urbari' unit Persons per Persons per Persons per
1,000 houses Urban unit 1,000 houses Urban unit 1,000 houses
(1) (2) (1) (2) (1) (2)
"Bidar Town 10,026 Narayanpet Town .. 6,567 YadgirTown 5,589
BhirTown 8,816 Jagtiyal Town 6,337 Parbhani Town 5,553
Hyderabad City 7,845 Aurangabad Town 6,044 Latur Town 5,499
Karimnagar Town .• 7,781 Jalna Town 6,009 Raichur Town 5,285
Nanded Town 7,470 Gulbarga Town 5,947 Bodhan Town 5,141
Warangal City 7,054 Khammam Town 5,740 Kothagudem Town 4,822
Mahbubnagar Town 6,754 Hingoli Town 5,683
Nalgonda Town 6,577 Nizamabad Town 5,665 .
* The percentage of the urban to the total population in the eight eastern districts of the -state (excluding Hyderabad City) is only 12 as against 15 in the western districts--even after excluding the population of the Tungabhadra Project Camps in tlaichur District.
344
The proportion in Bidar or Bhir Town is even higher than in Hyderabad City .. This is perhaps largely due to the fact that these two towns are full of old structures each accommodating a large number of households. The relatively heavy proportion in the towns of Karimnagar, Mahbubnagar and Nalgonda-which are not of any appreciable industrial or commercial irr.portance-is perhaps, to an extent, due to the fact that there has been considerable immigration into these towns of entire families from the surrounding rural areas during the recent years without any corresponding extension in the available housing accommodation. The extremely low proportion in Bodhan and Kothagudem results from the relatively small size of the average family in these two towns. This in turn is due to the fact that 9 vast majority of their population consists of immigrant labourers many of whom have left their dependants in their native villages. This tendency is noticeable in almost all the towns of the state which have a large proportion of labour population. The proportion of persons per 1,000 occupied houses is 4,000 in the Tungabhadra Project Camps, 4,018 in Kagaznagar, 4,219 in Peddur (Kadam Project Camps), 4,255 in Hutti Gold fields, 4,437 in Bellampalli, 4,752 in Sashti and 4,778 in Shahabad. An additional but relatively minor factor leading to the low proportion of persons per 1,000 occupied houses in such places may be the fact that a majority of the population in such areas either resides in independent huts or independent quarters provided by the employers. But as explained in paragraph 8 no conclusion can be drawn from these proportions about the relative floor space per person available in each of the urban units.
14. Districtwise, the proportion of persons pel' 1,000 occupied houses in rural areas varies from 4,834 in Adilabad to 6,112 in Bhir. The proportion in the western districts of the state, with the exception of Raichur, generally tends to be heavier than in the eastern. Among the western districts, excluding Raiehur, the proportion exceeds 6,000 ,in Bhir and Nanded, 5,750 in Osmanabad and Bidar, 5,250 in Gulbarga and Aurangabad and falls below 5,250 only in Parbhani. As against this, in the eastern portions of the state, the proportion in no district exceeds 5,750. It exceeds 5,500 in Hyderabad and Medak Districts, 5,250 in Warangal District, 5,000 in Karimnagar, Mahbubnagar and Nalgonda Districts and is less than 5,000 in Nizamabad an~ Adilabad. The proportion in Raichur District is 4,920. The reasons for these variations are more or less the same as detailed in paragraph 10 above. '
15. Distinction between Household, Houseless and Institv,tional Population.-The conception of a household, as distinct from that of a house, was introduced in the state for the first time during the 1951 Census. As stated in paragraph 3, during the present census the house was defined as a dwelling with a separate main entrance and the household as a group of persons who lived together in the, same house and had a common mess. Thus, a structure may consist of more than one house and a house may contain more than one household. This distinction between the house and the household enables a closer and a clearer approach to the basic social unit, i.e., the family. The occupied house in the past, and much more so now with the heavy movement of popUlation from the smaller popUlation units to the larger ones, contained in quite a number of cases of more than one household or family. There is no doubt that even the household is not always co-extensive with a family unit. In quite a number of cases the household may consist of one or more domestic servants, friends, distant relatives, etc., in addition to the members of a family. As against this, in some cases the household may not consist of all the members of a family. Some of them may be residing elsewhere. In spite of this limitation it cannot be denied that the household is considerably more representative of a family unit than the inmates of an occupied house.
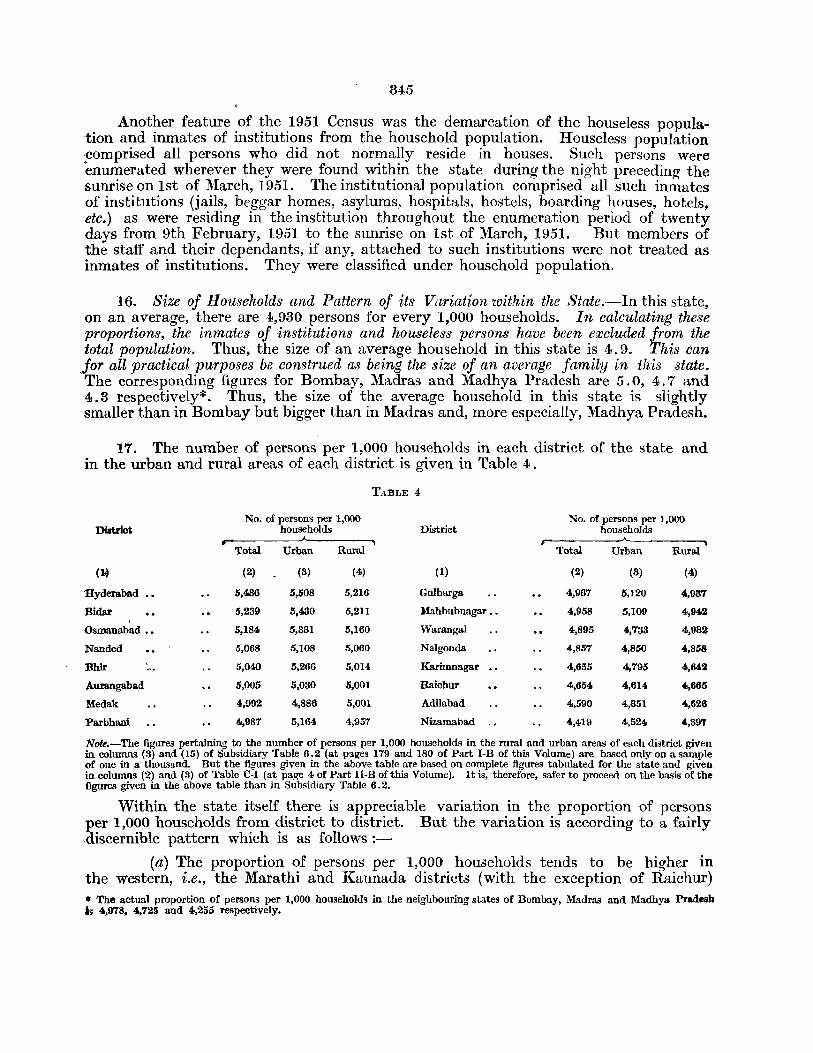
845
Another feature of the 1951 Census was the demarcation of the houseless popula-tion and inmates of institutions from the household population. Houseless population comprised all persons who did not normally reside in houses. Such persons were enumerated wherever they were found within the state during the night preceding the sunrise on 1st of March, 1951. The institutional population comprised all such inmates of institutions (jails, beggar homes, asylums, hospitals, hostels, boarding houses, hotels, etc.) as were residing in the institution throughout the enumeration period of twenty days from 9th February, 1951 to the sunrise on 1st of March, 1951. But members of the staff and their dependants, if any, attached to such institutions were not treated as inmates of institutions. They were classified under household population.
16. Size of Households and Pattern of its Variation within the State.-In this state, on an average, there are 4,930 persons for every 1,000 households. In calculating these proportions, the inmates of institutions and houseless persons have been excluded from the total population. Thus, the size of an average household in this state is 4.9. This can jor all practical purposes be construed as being the size of an average family in this state. The corresponding figures for Bombay, Madras and Madhya Pradesh are 5.0, 4.7 and 4.3 respectively*. Thus, the size of the average household in this state is slightly smaller than in Bombay but bigger than in Madras and, more especially, Madhya Pradesh.
17. The number of persons per 1,000 households in each district of the state and in the urban and rural areas of each district is given in Table 4.
TABLE 4
No. of persons per 1,000 No. of persons per 1,000 Dimlct households District households
Total Urban Rural Total Urban Rura.l
(1~ (2) (3) (4) (1) (2) (8) (4)
'Hyderabad •• 5,436 5,508 5,216 Gulbarga 4,967 5,120 4,987
Bidar 5,239 5,430 5,211 Mahbubnagar •. 4,958 5,109 4,942 \
Osmanabad •• 5,184 5,331 5,160 Warangal 4,895 4,733 4,982
Nanded 5,068 5,108 5,060 Nalgonda 4,857 4,850 4,858
Bhir ,
5,040 5,266 5,014 Karimnagar 4,655 4,795 4,642 -'I'
Aurangabad 5,005 5,030 5,001 Raichur 4,654 4,614 4.,665
Medak 4,992 4,886 5,001 Adilabad 4,590 4,351 4,626
Parbhani 4,987 5,164 4,957 Nizamabad .. 4,419 4,524 4.,897
Note.-The figures pertaining to the number of persons per 1,000 households in the rural and urban areas of each district given in colwnns (3) and. (15) of Subsidiary Table 6.2 (at pages 179 and 180 of Part I-B of this Volume) are based only on a sample . of one in a thousand. But the figures given in the above table are based on complete figures tabulated for the state and given in columns (2) and (3) of Table C-I (at page 4 of Part H-B of this Volume). It is, therefore, safer to proceed on the basis of the figures given in the above table than in Subsidiary Table 6.2.
Within the state itself there is appreciable variation in the proportion of persons per 1,000 households from district to district. But the variation is according to a fairly discernible pattern which is as follows:-
(a) The proportion of persons per 1,000 households tends to be higher in the western, i.e., the Marathi and Kannada districts (with the exception of Raichur) • The actual proportion of persons per 1,000 households in the neighbouring states of Bombay, Madras and Madhya Pradesh 1; 4,978, 4,725 and 4,255 respectively.
3-t6
than in the eastern, i.e., the Telugu districts (with the exception of Hyderabad). In the western districts of Bidar, Osmanabad, Nanded, Bhir, Aurangabad, Parbhani and Gulbarga the proportion ranges between 4,967 and 5,239. It is slightly lower than 5,000 only in the last two districts. In the eastern districts of l\fedak, Mahbubnagar, Warangal, Nalgonda, Karimnagar, Adilabad and Nizamabad the proportion ranges from 4,419 to 4,992. It is below even 4,900 in all these districts with the exception of only Medak~ But the proportion in the western district of Raichur is as low as 4,654 and in the eastern district of Hyderabad is as high as 5,436-which is the highest recorded in the state.
(b) Among the western districts mentioned above, the proportion is especially heavy in the central tahsils, the highest being 5,468 in Nilanga Tahsil-Vdgir, Ahmadpur, Mominabad, Latur, Owsa, Omerga and Humnabad, a11 situated round about Nilanga Tahsil, have more than 5,200 persons per one thousand households.
(c) Again within the western districts the proportion is relatively low in two zones. The first consists of the tahsils of Kannad, Sillod, Bhokardan, Jaffarabad, Partur, Jintur, Hingoli and Kalamnuri. The proportion in these tahsils ranges only between 4,711 in Kannad and 4,988 in Jaffarabad. These tahsils which lie along the northern borders of the state ar(:' generally hilly and mostly underdeveloped. The second zone consists of the eastern, especially the north-eastern tahsils of Gulbarga District. These tahsils contain all the hilly and forest clad areas as well as the Telugu speaking population in the district. In these tahsils, the proportion ranges between 4,738 in Seram and 4,969 in Kodangal.
(d) Among the eastern districts mentioned above, the proportion is especially low in the north and the extreme east. This zone consists of Nizamabad District, :wherein it ranges from 4,177 in Armoor Tahsil to 4,635 in Kamareddy ; Adilabad District (excluding Vtnoor and Boath Tahsils) wherein it ranges from 4,171 in Khanapur to 4;729 in Rajura; KaI'imnagar District (excluding Karimnagar and Huzurabad Tahsils) wherein it ranges from 4,258 in Metpalli to 4,723 in Sirsilla; and Mulug, Burgampahad and Palvancha Tahsils of Warangal District wherein it ranges between 4,356 in Palvancha and 4,750 in Burgampahad. The lowest proportion in the state is recorded in this zone in the three contiguous tahsils of Khanapur in Adilabad District, Armoor in Nizamabad District and Metpalli in Karimnagar District.
(e) Again, among the eastern districts, the proportion is relatively heavy in the southern and western portions of Medak District and the extreme northern portions of Mahbubnagar District bordering Hyderabad District on the one hand and the western districts on the other. It is appreciably higher than 5,000 (but not higher than 5,200 in any case) in Vikarabad, Sangareddy, Andol, Narsapur and Gajwel Tahsils of Medak District and Shadnagar, Pargi, Mahbubnagar and Kollapur Tahsils of Mahbubnagar District.
18. As compared with the eastern districts (excluding Hyderabad), the western districts (excluding Raichur) have the advantage of a healthier climate, lower incidence of Malaria, Small-pox, etc., smaller numbers of child marriages, more even distribution of wealth and a higher proportion, of population living in towns-which are better off in respect of medical aid, sanitation, etc., than the villages. Because of all this it is almost certain that mortality, especially infant mortality, is lower in the western than in the eastern districts. Besides, adherence to the joint family system is more marked
, 847
in the former than in the latter areas. These two factors are mainly responsible for the average family and, therefore, the household being larger in the western than in the eastern districts.
'Vithin the western districts themselves, the especially large size of the average hou<;ehold in the central tracts is mainly due to a particularly marked adherence to the joint family system among the .Maratha and the other indi.genous castes and low mortality rates arising in turn from a relatively richer and healthier peasantry. Exactly opposite tendencies are perhaps responsible for the thinning of the size of the average h{Jusehold in the extreme northel'n tracts as welt as in the eastern, esp~ciany the north-eastern, portions of Gulbarga District.
'Vithin the eastern districts tht'mselves, the particularly small siz~ of the household, i.e., of the family, in the northern and the eastern tracts along the Godavari and its tributaries i'S probably larg.'ly due to a particularly heavy mortality, especially infant mortality, rate--resulting in turn from a high incidence of malaria, small-pox and other diseascs--very early marriages, the weakening of the joint family system and. a heavy immigration or emigration of many earning merrlbtws sing'ly from or into certain pockets in the tract. The relatively large size of the household in the southern and western portions of Medak District and the extreme northern portions of Mahbubnagul' District is perhaps due to the fact that the social and physical conditions in these areas resemble those in the adjoining western tracts*.
The particularly large size of the average household in Hyderabad District is the direct result of the even larger size of the average household in Hyderabad City. The number of persons per 1,000 households in the metropolis is 5,580 as against 5,211 in the rest of the district. The number would perhaps be even lower in the rest of the district but for the overbearing influence of Hyderabad City all over it. The average household i.e., the family, in Hyderabad City is especially large because of considerably improved environmental sanitation, greater medical facilities, relatively 19w infant and general mortality rates, presence of a comparatively large number of domestic servants and others in households, etc. In so far as Raichur District as a whole is concerned, the proportion remains low even if figures pertaining to the Tungabhadra Camps are excluded. The number of persons per 1,000 households in Raichur District is 4,654 including the Camps and 4,701 excluding them. The partiCUlarly small size of the average household or family in this district is due to relatively high mortality and low natality rates, resulting in turn from a severe climate, constant worsening of agricultural conditions, high incidence of malaria and other diseases, heavy proportion of widows, comparatively late marriages, etc. In fact, the figure in this district would have perhaps been even lower than that recorded in Adilai>arl or NizJ.mabad District but for the relatively greater 'prevalence' of the joint family system in the district.
19. Variation in Proportion of Persons per 1,000 Hmtseholds in Urban and Rural Areas.-The proportion of persons per 1,000 households is heavier in the urban than in the rural areas of the state. It is 5,102 in the former and 4,892 in the latter. This is due to various factors like better environmental sanitation and medical aid, lower mortality especially infant mortality rates, presence in larger numbers of domestic servants, etc., in the towns than in the villages of the state. It would be obvious from Table 4 that in Raichur, Adilabad, N algonda, Warangal, and Medak Districts, however, the size of the average household is larger in the rural than in the urban areas . .. In case of the southern tahsils of Medak District an addition'll factor for the sm 1\\ size of the average hoasehold may be the
. emigration of many earners to Hyderabad City.
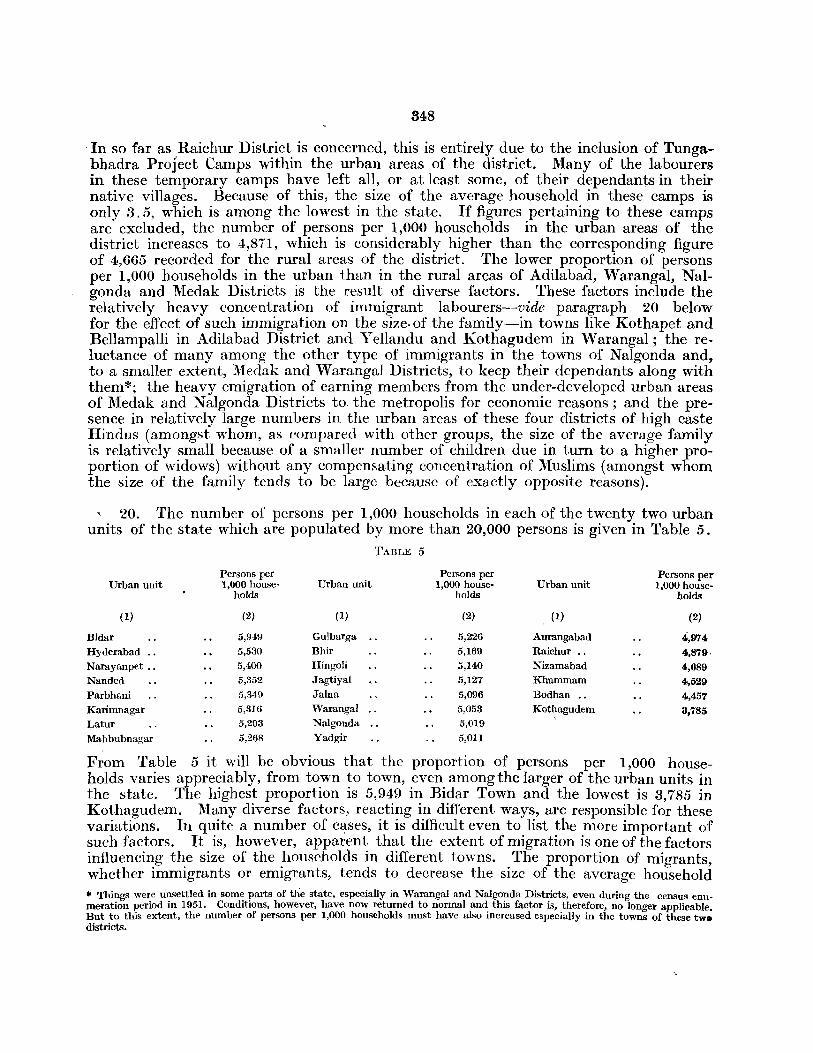
848
. In so far as Raichur District is concerned, this is entirely due to the inclusion of Tungabhadra ProJect Camps within the urban areas of the district. Many of the labourers in these temporary camps have left all, or at least some, of their dependants in their native villages. Because of this, the size of the average household in these camps is only 3.5, which is among the lowest in the state. If figures pertaining to these camps are excluded, the number of persons per 1,000 households in the urban areas of the district increases to 4,871, which is considerably higher than the corresponding figure of 4,665 recorded for the rural areas of the district. The lower proportion of persons per 1,000 households in the urban than in the rural areas of Adilabad, Warangal, Nalgonda and Medak Districts is the result of diverse factors. These factors include the relatively heavy concentration of immigrant labourers--vide paragraph 20 below for the effect of such immigration on the size· of the family-in towns like Kothapet and Bellampalli in Adilabad District and Yellandu and Kothagudem in Warangal; the reluctance of many among the other type of immigrants in the towns of Nalgonda and, to a smaller extent, Medak and Warangal Districts, to keep their dependants along with them*; the heavy emigration of earning members from the under-developed urban areas of Medak and N algonda Districts to. the metropolis for economic reasons; and the presence in relatively large numbers in the urban areas of these four districts of high caste Hindus (amongst whom, as compared with other groups, the size of the average family is relatively small because of a smaller number of children due in turn to a higher proportion of widows) without any compensating concentration of Muslims (amongst whom the size of the family tends to be large because of exactly opposite reasons).
20. The number of persons per 1,000 households in each of the twenty two urban units of the state which are popUlated by more than 20,000 persons is given in Table 5.
TABLE 5
Persons per Persons per Persons per Urban unit 1,000 house- Urban unit 1,000 house- Urban unit 1,000 house-
holds holds holds
(1) (2) (1) (2) (1) (2)
Bidar 5,949 Gulbarga " 5,226 Aurangabad 4,974 Hyderabad .. 5,530 Bhir 5,169 Raichur .. 4,879· Narayanpet .. 5,400 Hingoli 5,140 Nizamabad 4,689 Nanded 5,352 Jagtiyal 5,127 Khammam 4~529
Parbhani 5,341) Jalna 5,096 Bodhan .. 4,457 Karimnagar 5,316 'Varangal .. 5,053 Kothagudem 3,785 Latur 5,293 Nalgonda .. 5,019
Mahbubnagar 5,268 Yadgir 5,011
From Table 5 it will be obvious that the proportion of persons per 1,000 households varies appreciably, from town to town, even among the larger of the urban units in the state. The highest proportion is 5,949 in Bidar Town and the lowest is 3,785 in Kothagudem. Many diverse factors, reacting in different ways, are responsible for these variations. In quite a number of c~ses, it is difficult even to list the more important of such factors. It is, however, apparent that the extent of migration is one of the factors influencing the size of the households in different towns. The proportion of migrants, whether immigrants or emigrants, tends to decrease the size of the average household * Things were unsettled in some parts of the state, especially in Warangal and Nalgonda Districts, even during the census enumemtion period in 1951. Conditions, however, have now returned to normal and this factor is, therefore, no longer applicable. But to this extent, the number of persons per 1,000 households must have also increased especially in the towns of these tw. districts.
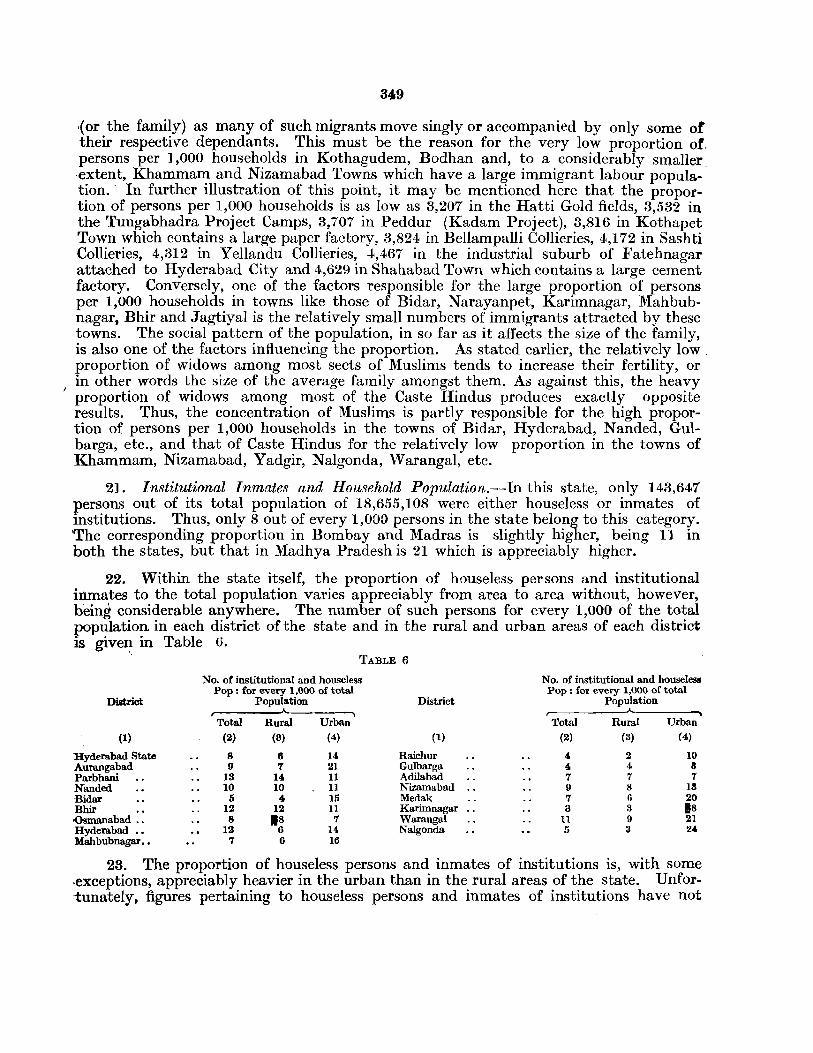
349
(or the family) as many of such migrants move singly or accompanied by only some of their respective dependants. This must be the reason for the very low proportion of, persons per 1,000 households in Kothagudem, Bodhan and, to a considerably smaller. extent, Khammam and Nizamabad Towns which have a large immigrant labour population.· In further illustration of this point, it may be mentioned here that the proportion of persons per 1,000 households is as low as 3,207 in the Hatti Gold fields, 3,532 in the Tungabhadra Project Camps, 3,707 in Peddur (Kadam Project), 3,816 in Kothapet Town which contains a large paper factory, 3,824 in Bellampalli Collieries, 4,172 in Sashti Collieries, 4,312 in Yellandu Collieries, 4,467 in the industrial suburb of Fatehnagar attached to Hyderabad City and 4,629 in Shahabad Town which contains a large cement factory. Conversely, one of the factors responsible for the large proportion of persons per 1,000 households in towns like those of Bidar, Narayanpet, Karimnagar, Mahbubnagar, Bhir and Jagtiyal is the relatively small numbers of immigrants attracted by these towns. The social pattern of the population, in so far as it affects the size of the family, is also one of the factors influencing the proportion. As stated earlier, the relatively low. proportion of widows among most sects of Muslims tends to increase their fertility, or in other words the size of the average family amongst them. As against this, the heavy
I proportion of widows among most of the Caste Hindus produces exactly opposite results. Thus, the concentration of Muslims is partly responsible for the high proportion of persons per 1,000 households in the towns of Bidar, Hyderabad, Nanded, Gulbarga, etc., and that of Caste Hindus for the relatively low proportion in the towns of Khammam, Nizamabad, Yadgir, Nalgonda, Warangal, etc.
21. Institutional Inmates and Household Population.--In this state, only 143,647 persons out of its total population of 18,655,108 were either houseless or inmates of institutions. Thus, only 8 out of every 1,000 persons in the state belong to this category. The corresponding proportion in Bombay and Madras is slightly higher, being 11 in both the states, but that in Madhya Pradesh is 21 which is appreciably higher.
22. Within the state itself, the proportion of houseless persons and institutional inmates to the total population varies appreciably from area to area without, however, being considerable anywhere. The number of such persons for every 1,000 of the total population in each district of the state and in the rural and urban areas of each district is given in Table u.
TABLE 6
No. of institutional and houseless No. of institutional and houseles.
District Pop: for every 1,000 of total
Population District Pop: for every 1,000 of total
Population r-
Total Rural Urban Total Rural Urban
(I) (2) (8) (4) (1) (2) (3) (4)
Hyderabad State 8 (I 14 Raichur 4 2 10 Aurangabad 9 ,. 21 Gulbarga 4 4 8 Parbhani 13 14 11 Adilabad 7 7 7 Nanded 10 10 11 Nizamabad .. 9 8 13 Bidar 5 4 15 Medak 7 6 20 Bhir 12 12 11 Karimnagar o. 3 3 Is .osmanabad .• 8 IS 7 Warangal 11 9 21 Hyderabad •• 12 6 140 Nalgonda 5 3 Z40 Mahbubnagar •• 7 6 16
23. The proportion of houseless persons and inmates of institutions is, with some .exceptions, appreciably heavier in the urban than in the rural areas of the state. Unfortunately, figures pertaining to houseless persons and inmates of institutions have not
350
been tabulated separately in th-is ~tate or anywhere else in India. If this had been done it is probable that in so far as this state is concerned, except for a few districts like Warangal and Nalgonda wherein some Armed Police and Military personnel were posted in rural areas, almost all the inmates of institutions would have been returned from urban areas. Apart from a handful of institutions like the sanatorium at Ananthagiri or the Leper Asylum near Dichpalli, residential institutions of every type are concentrated in the towns, especially in the larger of the towns of the state. But the houseless population would perhaps be more proportionately distributed between the two areas. It is likely that the proportion of tramps and houseless beggars and vagrants may be heavier in the urban than in the rural areas of the state. As against this, there is a distinct type of houseless persons who are more or less found only in the rural areas. This type covers the wandering tribes like the Ghisadi or Baila Kammari or Kambari (the itinerary iron smiths) the Pardhi or Pittalavandlu (the bird catchers), the Dommari or the Kolhati (the acrobats) and sometimes even the Yerukulas, Koravas and Lambadas.
24. In any assessment of houseless population in this part of the country, two factors will have to be borne in mind. The first of these is, as stated elsewhere, the fact that numerous permanent and semi-permanent dwellings in this state can hardly be distinguished from temporary encampments in so faJ as the material and the space covered by them are concerned. The inmates of such dwellings are not treated as houseless merely because they do not constantly change their site of habitation. The second is the factor that a heavy proportion of the houseless persons in this state consisting of the wandering tribes mentioned above are houseless by choice rather than by compulsion.
Summary.-Census statistics relating to houses suffer from certain limitations arising from the great diversity of structures that are covered by any workable definition of the term, the lack of uniformity-from census to cenms-in the definition adopted for the purpo~e, the difficulty in many cases in demarcating a permanent dwelling from a make-shift encampment and, except at the present census, the lack of any precise di~tinction between the house and the household and a rather unscientific method of calculating the number of houses. In the preceding censuses, figures pertaining to houses were collected by patwaris or the enumerators concerned sometimes days and months prior to the census. In many cases, such figures included unoccupied houses or non-residential structures which had been numbered merely to safeguard full coverage at the final census count. During this census, however, the figures were compiled for each village or town in the Central Tabulation Office in Hyderabad City by specially trained staff on the basis of the concerned National Registers which had been written in serial order of house numbers by the census enumerators during the enumeration period itself. All uninhabited structures and non-residential institutions were scrupulously ignored even if they had been numbered and included in the registers.
The number of persons per occupied house in the state is now 5.5 (5.4 in its rural and 6.4 in its urban areas) as against the corrEsponding figure of only 4.9 (4.9 in the rural and 4.7 in the urban areas) in 1901. There is no doubt whatsoever that primarily because of the increase in the number of houses having not kept pace with the increase in popUlation, the pressure of population per house in this state is now considerably more than what it was fifty years ago. This iF truer of the urban than of the rural areas and, within the former, of the cities and the larger of the towns than of the smaller ones, and similarly, within the latter, of the bigger of the villages than of the smaller. But the disproportion between the increase in number of houses in the state and that of its popUlation is not so acute as the figures quoted above make it out to be. It cannot entirely be ignored that the previous figures of houses are exaggerated, to an extent, by the inclusion of non-residential structures. The number of persons per occupied house is 5.5 in the country as a whole and 4.8,5.6 and 5.7 in the adjoining states of Madhya Pradesh, Madras and Bombay respectively as against 5.5 in this state. In the rural areas of these units also, the corresponding figures, though slightly smaller, vary more or less, in the same manner. But the variation is appreciably more marked in their urban areas. In these areas, the number of persons per house is 6.0 in the country as a whole and 5.2, 5.9 and 7.0 in Madhya Pradesh, Bombay and Madras respectively as against 6.4 in this state. But it must be pointed out here that a higher proportion of persons per house does not necessarily mean a greater degree of overcrowding in so far as the floor space per person is concerned. Nor does it necessarily mean a lower standard in the quality of
351
residential accommodation. The number of persons per household is considerably influenced by thc average size of the family. Besides, the system of numbering houses has also a direct bearing on the figures and this system is not uniform in all municipalities within the same state or much less in different states.
The conception of a househ01d, as distinct frem that of a house, was introduced for the first time in this state during the 1951 Census. While the house Was defined as a dwelling with a separate main entrance, the household was defined as a group of persons who lived together in the same house and had a common mess. This distinction decidedly enables a closer approach to the basic social unit, i.e., the family, although in a number of cases the household may contain persons other than tpe members ofthe f3mily or may exclude some of the family members. The average size of the household in this state is 4.9. In the adjoining states of Bombay, Madras and Madhya Pradesh the corresponding figure is 5.0,4.7 and 4.3 respectivply. vVithin this state itself, the figure tends to be higher in the western l\farathi and Kannada districts (with the exception of Raichur) than in the eastern Telugu districts (with the exception of Hyderabad). Among the western districts the figure ranges between 5.0 and 5.2 in Bidar, Osmanabad, Nanded, Bhir, Aurangabad; Parbhani and Gulbarga but is as low as 4 7 in Raichur. Among the eastern districts, the figure ranges only from 4 _ 4 to 5.0 in Medak, Mahbubnagar, Warangal, Nalgonda, Karimnagar, Adilabad and Nizamabad but is as much as 5.4 in Hyderabad. Again, within the western half of the state, the figure is particularly impressive in its central tracts consisting of Nilanga Tahsil of Bidar District and the surrounding areas in Bidar, Bhir and Osmanabad Districts-'-it is as high as 5.5 in Nilanga Tahsil itself. Similarly, within the eastern half of the stat~, the figure is particularly unimpressive in its extn-me eastern and northern areas comprising the districts of Nizamabad. Adilabad and Karimnagar (with the exception of some of their tahsiIs) and the tahsils of Mulug, Burgampahad and Palvancha in Warangal District. In Armoor, l\Ietpalli and Khanapur Tahsils, the size of the household dwindles to about 4.2. The factors leading to the higher number of persons per household in the western than in the eastern half of the state, in general, include a greater degree of adherence to the joint family system and lower mortality, especially infant mortality, rates because of a healthier climate, smaller numbers of child mliTriagcs, relatively better distribution of weal1h, lower incidence of malaria, small pox. etc. The comparatively low figure in Raichur, among the western districts, is due both to relatively high mortality and low natality rates. In fact, the figure would have been appreciably lower-lower than 4.6 recorded in Adilabad or even 4.4 recorded in Nizamabad-but for a relatively marked adherellce of the people of the district to the joint family system. The unusually high figure in Hyderabad, among all the districts of the state, is due mainly to low mortality, including infant morality, rates in Hyderabad City-which, in turn, ffSUltS from improved medical farilities and environmental sanitation-and the presenre of dfme~ti(' servants, etc.) in its households in r~latively large Ilumber~'.
The number of persons per household is appreciably higher in the urban than in the rural areas of the state. The actual figure is 5.1 in the former and 4.9 in the latter. The highcr figure in tOWill, and cities is due to the presence of domestic servants, etc., in their households in comparatively large numbers and their relative superiority in respect of environmental sanitation and medical facilities. But in the districts of Raichur, Adilabad, Nalgonda, Warangal and Medak the size of the household is larger in their rural than in their u\,ban areas. In caSe of Raichur District, however, this unusual tendency disappears if the figuIes pertaining to the Tungabhadra Project Camps are excluded from the urban fif:,rures. As many of the project labourers have moved in singly,orwith only a few of their dependants, the size of the average household in the camps is just 3.5. As regards the other four of these five districts, the smaller size of the households in their urban areas is due to diverse factors such as immigration of labourers singly, or with only some of their dependants, into the industrial and mining towns of Adilabad and Warangal District" (the size of the household is just 3.8 in Kothapet, i. e., Kagaznagar, Kothagudem and Bellampalli Town~); the reluctance of many of the other 1;ypes of immigrants in the towns in the disturbed areas, e~pecially in Nalgonda and Warangal Diptricts, to send for their families; and the presence in comparatively large numbers of caste Hindus without any similar concentration of Muslims-the size of the family tends to be comparatively small among the former because of a higher proportion of widows and to be comparatively large among the latter for precisely the opposite reason.
Of the total population of 18,655,108 in the state 18,511,461 are living in households and 143,647, or less than 1 per cent are either houseless or inmates of institutions. Districtwise, the corresponding percentaage of houseless and institutional population varies from about 0.3 in Karimnagar to '1.3 in Parbhani. Again, the percentage is decidedly higher in the urban than in the rural areas of the state due not so much to the houseles!' popUlation as to the inmates of institutions. But in any assessment of the houseless population it must be borne in mind that numerous permanent and semi-permanent dwellings in the state can hardly be distinguished from temporary encampment!' in so far as the material and space covered by them are concerned and a heavy proportion of houselesf persons consists of the wandering tribes who are homeless by choice rather than by compUlsion.
41
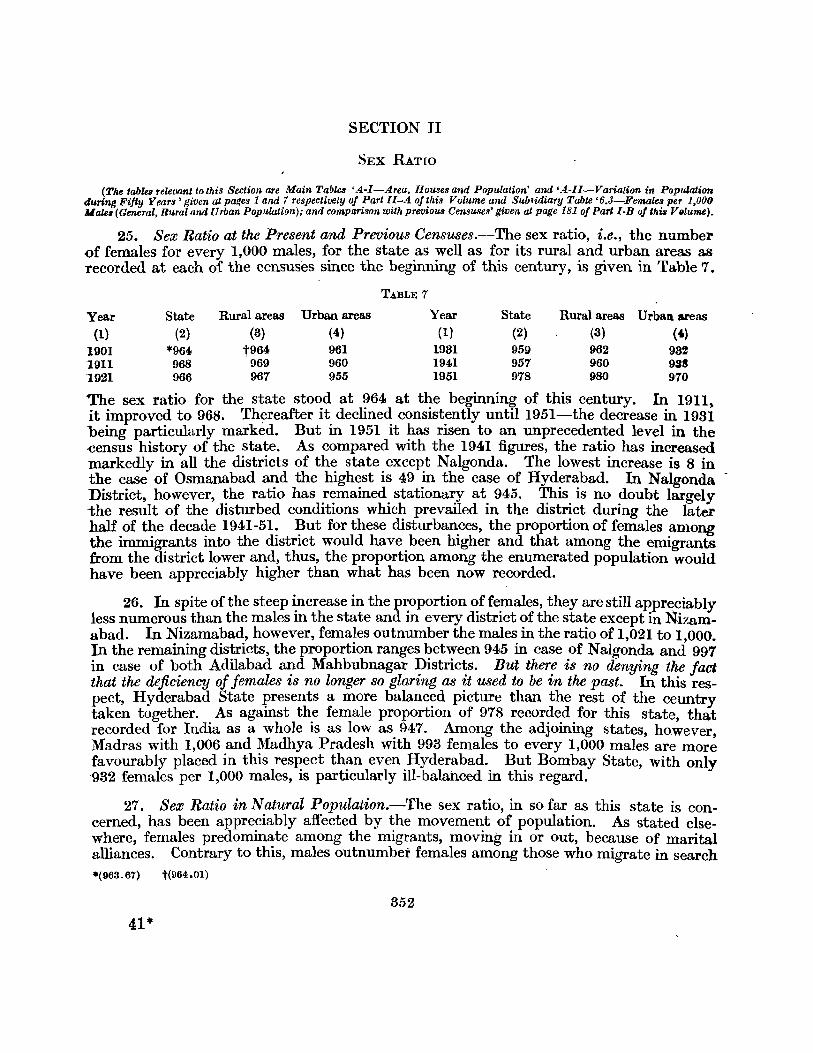
SECTION II
SEX RATlO
(The tables relevant to this Sectioll are /lfain Tablu 'A-I-Area. Houses and PopUlation' and 'A.-II-Variation in Population during Fifty Years' given at pal!es 1 and 7 respectively uf Part II-A of this Vulume and Sub!idiary Table '6.3-Females per 1,000 Males (General, Rural and Urban Population); and comparison with previous Censuses' given at page 181 of Parl I-B oJ this; Villume).
25. Sex Ratio at the Present and Previous Censuses.-The sex ratio, i.e., the number of females for every 1,000 males, for the state as well as for its rural and urban areas as recorded at each of the censuses since the beginning of this century, is given in Table 7.
TABLE 7
Year State Rural areas Urban areas Year State Rural areas Urban areas (I) (2) (3) (4) (1) (2) (3) (')
1901 *964 t964 961 1981 959 962 982 1911 968 969 960 1941 957 960 9aS 1921 966 967 955 1951 978 980 970
The sex ratio for the state stood at 964 at the beginning of this century. In 1911~ it improved to 968. Th~reafter it declined consistently until 1951-the decrease in 1981 being particularly marked. But in 1951 it has risen to an unprecedented level in the -census history of the state. As compared with the 1941 figures, the ratio has increased markedly in all the districts of the state except Nalgonda. The lowest increase is 8 in the case of Osmanabad and the highest is 49 in the case of Hyderabad. In Nalgonda -District, however, the ratio has remained stationary at 945. This is no doubt largely the result of the disturbed conditions which prevailed in the district during the later half of the decade 1941-51. But for these disturbances, the proportion of females among the immigrants into the district would have been higher and that among the emigrants from the district lower and, thus, the proportion among the enumerated population would have been appreciably higher than what has been now recorded.
26. In spite of the steep increase in the proportion of females, they are still appreciably less numerous than the males in the state and in every district of the state except in Nizamabad. In Nizamabad, however, females outnumber the males in the ratio of 1,021 to 1,000. In the remaining districts, the proportion ranges between 945 in case of N algonda and 997 in case of both Adilabad and Mahbubnagar Districts. But there is no denying the fact that the deficiency of females is no longer so glaring as it used tn be in the past. In this respect, Hyderabad State presents a more balanced picture than the rest of the ceuntry taken together. As against the female proportion of 978 recorded for this state, that recorded for India as a whole is as low as 947. Among the adjoining states, however, Madras with 1,006 and Madhya Pradesh with 993 females to every 1,000 males are more favourably placed in this respect than even Hyderabad. But Bombay State, with only ·932 females per 1,000 males, is particularly ill-balanced in this regard.
27. Sex Ratio in Natural Population.-The sex ratio, in so far as this state is concerned, has been appreciably affected by the movement of population. As stated elsewhere, females predominate among the migrants, moving in or out, because of marital alliances. Contrary to this, males outnumber females among those who migrate in search -*(063.67) t{964.0l)
352 41*
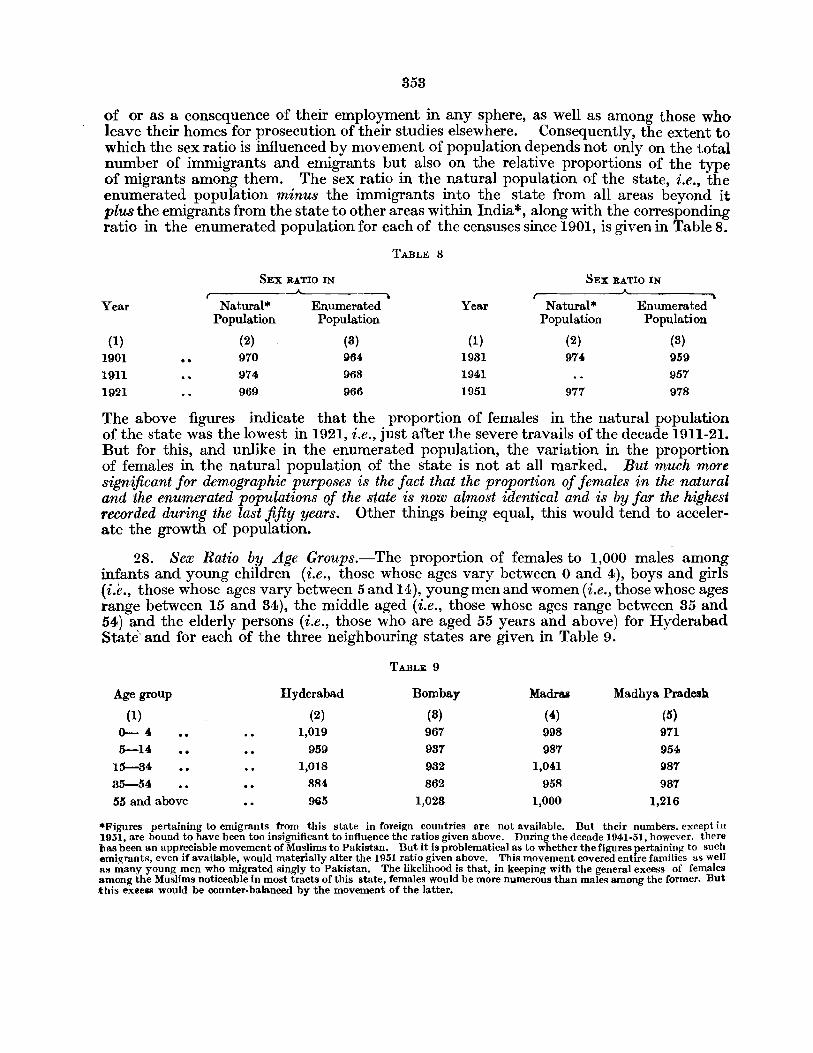
353
of or as a consequence of their employment in any sphere, as well as among those who leave their homes for prosecution of their studies elsewhere. Consequently, the extent to which the sex ratio is influenced by movement of population depends not only on the total number of immigrants and emigrants but also on the relative proportions of the type of migrants among them. The sex ratio in the natural population of the state, i.e., the enumerated population minus the immigrants into the state from all areas beyond it plus the emigrants from the state to other areas within India *, along with the corresponding ratio in the enumerated population for each of the censuses since 1901, is given in Table 8.
TABLE 8
SEX RATIO IN SEX RATIO IN
r- ___...A..______-----. ~
Year Natural* Enumerated Year Natural* Enumerated Population Population Population Population
(1) (2) (3) (1) (2) (3)
1901 970 964 1931 974 959
1911 974 968 1941 957
1921 969 966 1951 977 978
The above figures indicate that the proportion of females in the natural population of the state was the lowest in 1921, i.e., just after the severe travails of the decade 1911-21. But for this, and unlike in the enumerated population, the variation in the proportion of females in the natural population of the state is not at all marked. But much more significant for demographic purposes is the fact that the proportion of females in the natural and the enumerated populations of the state is now almost identical and is by far the highest recorded during the last fifty years. Other things being equal, this would tend to accelerate the growth of population.
28. Sea; Ratio by Age Groups.-The proportion of females to 1,000 males among infants and young children (i.e., those whose ages vary between 0 and 4), boys and girls (i.e., those whose ages vary between 5 and 14), young men and women (i.e., those whose ages range between 15 and 34), the middle aged (i.e., those whose ages range between 35 and 54) and the elderly persons (i.e., those who are aged 55 years and above) for Hyderabe.d State' and for each of the three neighbouring states are given in Table 9.
TABLE 9
Age group Hyderabad Bombay Hadraa Madhya Pradesh
(1) (2) (3) (4) (5) 0- 4 1,019 967 998 971 5-14 959 937 987 954
15-34 1,018 932 1,041 987 35-54 884 862 958 987
55 and above 965 1,028 1,000 1,216
.Figures pertaining to emigrants from this state in foreign countries are not available. But their numbers, except in 1951, are bound to. have been too insignificant to influence the ratios given above. During the decade 1941·51, however, thpre bas been an appreciable movement of Muslims to Pakistan. But it is problematical as to whether the fignres pertaining to such emigrants, even if available, would materially alter the 1951 ratio given above. This movement covered entire families as well as many young men who migrated singly to Pakistan. The likelihood is that, in keeping with the general excess of females among the Muslims noticeable in most tracts of this state, females would be more numerous than males among the formeI'. But -this exeess would be counter·balanced by the movement of the latter.

854
From the figures given in Table 9 above, it will be obvious that generally the deficiency of females is least felt among the elderly persons. In fact, among the very elderly, i.e., those aged 75 and over, the proportion of females ranges from 1,107 in Hyderabad State to 1,228 in Madhya Pradesh. Contrary to this, the deficiency of females is felt most among the middle aged. Among young men and women, females are slightly more numerous than the males in this state-a feature shared only by Madras among the adjoining states. Among boys and girls, females are appreciably less numerous than the males in all the states. But this deficiency is least marked in ease of Madras and Hyderabad. Among the infants and young children in all these states, except in Hyderabad, females are less numerous than the males, but in Hyderabad State they outnumber the males by a fair ~argin. Among all the lower age groups, i.e., among those who have not completed 35 years of age, Hyderabad with 996 females per 1,000 males is much better balanced than Bombay with 940, or Madhya Pradesh with 972 or even Madras, with as many as 1,014 females. As against this, among all the higher age groups, i.e., among those aged 85 years and above, Hyderabad with 906 females is only slightly better balanced than Bombay with 902 females. In this respect, Madras and Madhya Pradesh are much better placed with 970 and 1,007 females respectively to every 1,000 males in the higher age groups. Incidentally, therefore, in so far as this state is concerned, if the births and deaths during the coming years reflect even the existing proportions of males and females in the population of this state, the two sexes are likely to be even better balanced numerically in 1961.
29. Se:V Ratio in Rural Areus.- -Even in the rural areas of the state females are relatively less numerous than the males. But thtir proportion in rural areas is appreciably heavier than in the urban areas, For every 1,000 males there are 980 females in the rural areas of this state as against 970 in its urban areas. One of the reasons for this disparity is the sex-composition of the migrants from and into these areas. In so far as the movement between these areas resulting from marital alliances is concerne:i, females naturally predominate among the migrants either way. But in addition to this there is an almost continuous one way traffic of males from the rural to the urban areas in search of (or as a consequence of their) employment, or for the prosecution of studies, etc. This movement reduces the proportion of males in rural and to the corresponding extent increases their proportion in urban areas. This would be obvious from the fact that among the 6.3 lakh immigrants in the urban areas of this state from all areas beyond the district of enumeration, the proportion of females to 1,000 males is as low as 905. Contrary to this, among the 6.4 lakhs of such immigrants in the rural areas of the state, the proportion of the females is as high as 1,868. These figures, however, do not take into account the movement between the rural and urban areas within each distriet itself. But the sex-wise composition of even such migrants is not likely to indicate any opposite tendency.
This feature, namely the higher ratio ;)f females in rural, areas than in the urban, is nothing peculiar to this state. In the three neighbouring states of Madras, Madhya Pradesh and Bombay, the proportion of females pt'l 1,000 males in rural areas is 1,01l, 1,00-t and 988 respectively, as against 989, 925 and 818 respectively in their urban areas. Similarly, in India as a whole the corresponding proportion in rural areas is 966 as against 860 in the urban.
30. Another feature, which would be rather surprising on a sllperficial examination Df the figures, is the fact that iri, rural areas the deficiency of females ismore'inevidencb in the smaller of the population units than in the larger. In th-r: villages inhabited by less than 500 persons, there are only 96~ females to every 1,000 males. The corresponding
855
proportion in villages inhabited by 500 to 1,000 persons is 977. In both these cases, the proportion of females is appreciably lower than that of 978 for the state and 980 for its rural areas in general. Contrary to this, the ratio-of females per 1,000 males in villages inhabited by 1,000 to 2,000 persons and in villages inhabited by 2,000 or more persons is 98.3 and 984 respectively. This is perhaps the result of various factors. In the smaller villages, . there is. generally no scope for the employment of women ex:cept in agricultural occupatIOlls, whICh are largely seasonal. A fair portion of the women in such Villages desirous of earning their own living move to larger ones situated nearby and secure employment in the households of the relatively well-to-do, or take to occupations like hawking, petty trading, etc. Again the Muslims, the Brahmins, the Vaishyas, and other comparatively advanced groups, amongst whom the proportion of females is high, are found in greater numbers in the larger than in the smaller villages. And again, there is a class of relatively moneyed persons amongst the cultivators, traders, village officers, etc., who live singly in the smaner Villages in connection with their occupations, with their families residing in bigger villages nearby. Sometimes, the agents, gumasthas or servants of such moneyed persons, drawn from the bigger villages, similarly live in the smaller ones. Anyway, the fact remains that the proportion of females in villages inhabited by less than 500 persons in every district of this state and in villages inhabited by 500 to 1,000 persons in all but three districts of this state is lower than in the general rural
. popUlation of the district concerned. And this low proportion of females in small popUlation units is nothing peculiar to this state. In Bombay, the sex ratio of females in villages populated by less than 500 persons is 972 as against that of 988 in the rural areas of the state in general and the corresponding ratios for Madras are 1,004 and 1,011, and that for Madhya Pradesh 1,003 and 1,004 respectively. In Madras State the proportion of females in the village~ populated by 500 to 1,000 persons is also, as in the case of Hyderabad, lower than III rural areas as a ",hole. In Bombay and Madhya Pradesh States, however, the ratio in such villages exceeds that in rural areas in general.
31. Sex Ratio in Urban Areas.--As explained in paragraph 29 the deficiency of females is relatively more marked in urban than in rural areas. In Hyderabad State the sex ratio for urban areas is 970 as against that of 980 in rural areas. The corresponding proportions for India as a whole and each of the three adjoining states namely Madras, Madhya Pradesh and Bombay are 860 and 966, 989 and 1,OU, 925 and 1,004 and 818 and 988 respectively. It is, however, evident from these figures that the deficiency of females in the urban areas of this state though appreciably less than in similar areas of Madhya Pradesh or Bombay State or in India as a whole is slightly more than in the urban t\reas of Madras State.
82. Examined districtwise there are, however, certain significant exceptions to the general tendency for the female proportion to be lower in urban than in rural areas. These exceptions deserve closer examination. In the four districts of Bidar, Hyderabad, Medak and Karimnagar ..the ratio of females to 1,000 males in their urban and rural areas is 982 and 972, 988 and 988, 996 and 989 and 998 and 977 respectively.
In so far as Bidar District is concerned, one of the chief reasons for the reversal of the general trend appears to be the very heavy proportion of Muslims in the urban areas of the district and the excess of females among the Muslims * . In Bidar District, Muslims
*This excess of females among the Muslims is nothing peculiar to Bidar District. In as many as ten districts of the state, the Muslim females are in excess of the Muslim males. In three of the remaining districts, the proportion of Muslim females though lower than that of Muslim males is heavier than the proportion of the female population of the district to the male population. In the state as a whole, while the ratio of females to 1,000 males is only 978 in the total population, 966 among the Christians, 974 among the Hindus, 986 among the followers of Tribal religions, it is a~ high as 1,008 for the Muslims.
42
356
constitute about 12 per cent of the rural but as much as 48 per cent of the urban population. The proportion of females among the Muslims is as high as 1,012 in rural and 1,089 in urban areas as against the corresponding proportion of 972 and 982 recorded for the total population in the .rural and urban areas of the district respectively. An additional factor may perhaps be that the industrially undeveloped urban units of the district lose more male emigrants to Hyderabad City and other important urban centres beyond the district then the number of male immigrants they themselves attract from the rural areas within the district itself.
One of the main reasons for the heavier proportion of females in the urban than in the rural areas of Hyderabad District, is again the heavy concentration of Muslims in its urban areas, particularly in Hyderabad City. The Muslims form less than 8 per cent of its rural but as much as 4"3 per cent of its urban population. The ratio of females to every 1,000 males among the Muslims in the rural areas of the district is 1,027 and in the urban areas 1,015, while the corresponding ratio for the total population of the district is only 988 in rural and 988 in urban areas. An additional reason is the temporary migration of a large number of males (drawn from among the Muslims as well as other groups of population) from Hyderabad City to other districts of the state in connection with their employment in Government organisations, industrial or commercial concerns, learned professions, etc. Many of these persons migrate singly leaving their womenfolk behind in the city.· This is borne out by the fact that the proportion of females among the emigrants from Hyderabad District to other areas within the state is the second lowest recorded among the corresponding emigrants from other d,istricts of the state. .
In so far as Medak and Karimnagar Districts are concerned, the heavier ratio of females in their urban than in their rural areas, results largely from the fact that the 'towns of these two districts are on the whole the least developed industrially in the state and are of little importance from other aspects as well, with the result that their capacity for providing employment is relatively very limited. Consequently, a large portion of the unemployed male population in these towns as well as in the villages within the district is compelle.d to migrate to Hyderabad City and to Nizamabad, Warangal and Adilabad Districts in search of sustenance. Thus, the towns of these two districts lose more males by emigration to areas beyond the district than what they gain by immigration from their surrounding rural areas. An additional factor leading to the heavier proportion of males in the urban than in the rural areas of these two districts may be the disturbed conditions which prevailed in portions of the district just prior to the census enumeration. It is likely that many of the well-to-do persons living in the affected villages may have sent their families to the towns which had remained free from such disturbances.
33. Among the urban units themselves, the general tendency is for the deficiency of feJ)l.ales to increase with the size of the towns. The number of females for every 1,000 males is 988 in towns· populated by less than 10,000, 977 in towns* populated by 10,000 to 20,000 persons, 939 in towns populated by 20,000 to 50,000 persons and 929' in towns populated by 50,000 to 100,000 persons. The corresponding figures pertaining to Madras State also reveal that the proportion of females decreases according to the size of the towns. This is obviously due to the fact that the larger the town, the greater is its attraction of males from other areas in search of or as a result of their employment. But the proportion of females in the two cities of Hyderabad and Warangal does not fall into this pattern. It is as high as 989 in case of Hyderabad City and 954 in case of * El(cluding the Tungabhadra Project Camps in Raichur District.
42'"
357
Warangal City. The relatively heavy proportion of females in Hyderabad City is due to certain peculiar circumstances which have been dealt with in detail in paragraph 32 above. Among the factors leading to the comparatively heavy proportion of females in Warangal City, are the concentration of the socially and educationally advanced groups in the city because of the greater educational and other facilities available within its limits and the migration of the families of the relatively well-to-do persons from the surrounding areas on account of the disturbed ccnditions prevailing in such areas prior to census enumeration.
Summary.- For every 1,000 males enumerated in this ,tate there are 978 females. The female ratio is now distinctly higher than what it was at any of the censuses taken during this century. As compared with the 1941 figures, the female ratio has increased in every district of the state except Nalgonda. In this district, however, it has remained stationary presumably due to a low proportion offemales among those who immigrated into the di~trict and a high proportion among those who emigrated from it during the decade. In spite of all this, males still predominate in every district of the state except Nizamabad, wherein there are 1,021 females to every 1,000 males. Among the other districts. the female ratio at its highest is 997 in both Adilabad and Mahbubnagar and at its lowest 945 in Nalgonda. But there is no gainsaying the fact that the deficiency of females in this state is no longer so glaring as it used to be in the past. Besides, this state is much better balanced in respect of its sex ratio than the country a'l a whole. Again, in the earlier censm:es, there uRed to be significant disparity in the female ratio as revealed by the enumerated and the natural populatiom of the state. But during this censu~ the ratio is almost identical in case of both.
Females are, however, in excess of the males in some of the age groups in the state. Their number, for every 1,000 males, is as much as 1,019 among the infants and young childern i.e., those whose ages range between 0 and 4; only 959 among the boys and girls i.e., those whose ages range between 5 and 14; again as much as 1,018 among the young men and women i.e., those whose ages range between 15 and 34; again, as low as 884 among the middle aged i.e., those who~'e ages range between 35 and 54; and, lastly, 965 among the elderly i.e., those who are aged 55 years and above. Among the very elderly, i.e., those aged 75 and above. their corresponding number increases to 1,107! Similarly, among all the lower age groups taken together i.e .. among all those who have not completed 35 years of age, the female ratio is 996, which makes it much better balanced than in any of the adjoining states. But among all the higher age groups, the eorresponding figure is only 906 in this state-both Madras and Madhya Pradesh being much better balanced in these groups. Thus, if the births and deaths during the eomingyears reflect the existing proportion of the two sexes in the total population, females are likely to be even better balanced in this state in the coming decade.
For every 1,000 males enumerated in the rural areas of this state there are 980 females, as against the corresponding number of only 970 in its urban areas. Thus, though the proportion of females is appreCiably heaVier in the rural than in the urban areas of the state, females are less numerous than the males even in rural areas. One of the reasons for the higher female ratio in rural areas is the predominance of males among the emigrants from the villages to the towns and cities of the state. This heavier proportion of females in the rural than in urban areas is a feature common to the country as a whole as well as all the three adjoining states. :Sut among the villages themselves, the deficiency of females is more in evidence in the smaller than in the bigger of the villages. For every 1,000 males, the number of females in this state is 969 among the total number of persons living in villages inhabited by less than 500 persons and 977 in case of those living in villages inhabited by 500 to 1,000 persons, but is as much as 985 and 984in case of those living in villages inhabited by 1,000 to 2,000 and nlore than 2,000 persons respectively. This apparent contradiction is easily explained. The lower ratio of females in the smaller categories of villages is due, alIlong other factors, to the migration of females in search of employment to bigger villages situated near by; comparative absence of Muslims, Brahmins, Vaishyas and other socially advanced groups, amongst whom the female ratio is heavier; and the habit of the r~latively well-to-do of the persons living in such villages to keep their families in biggel' villages close by. Among the towns themselves, the female ratio generally decreases according to their ~i7.e. It is 988 among the total number of persons living in towns populated by less than 10,000 persons,977 in ca~c of thm e living in towns populated by 10,000 to 20,000 persons, 939 in case of those living in towns populqted by 20,000 to 50,000 persons and 929 in case of those living in towns populated by 50,000 to 100,000 persom. This is again due to the fact that the bigger the town the larger is its attraction for males from other areas for economic reasons. But again, the ratio increases to 989 in Hyderabad City and 954 in Warangal City. This is due, among other factors, to the unusually large concentration in these cities of Muslims, Caste Hindus and other socially advanced groups-taken all together- amongst whom the proportion of females is generally heavy. .
SECTION III
MARITAL STATUS RATIOS
<The table Helevant to tMs Section are -If lin T.l~le ' c-r ll- 4ge ani Civil Co ldWon ' giv3n at p Ige .Jl of P.utll-B ani SU~JiiifJ.ry Tables '6.6--Maritalstalu80j 1,00J of e lCIj see of Ge,l;f.zl P JP ~J'1t;on '11 j In n n 'inn with 'Jrevj?'lfC!'lSUI~I' and' 6.6-,4-Muital status of 1,000 persons of each seJl in different Age Groups' given at p zges IS,) ard 1$8 relp3~ti1)el,.IJ of Put I-H oj this Vollt n ~),
34. Nature of Enquiry.-One of the fourteen questions set for the 1951 Census related to marital status or civil condition. Every person enumerated at the census had to be classified in this rega,rd as 'unmarried', 'married', 'widowed' or 'divorced', as the case may be. In the instructions issued to enumerators (which are repeated in the foot note given below)* the terms' marriage' and' divorce' were defined very exhaustively with a view to cover, in the case of the former, any relationship between a male and ~ female which was conducive to the establishment of a family unit as locally recognised, and in the case of the latter, any disruption of such relationship after once it was established. In one respect, however, the data now collected is still defective from a purely demographic point of view. In this part of the country, especially among the Hindus, there is a considerable gdp, sometimes ext~nding over years, between the marriage ceremony and its actual consummation. Thus, every female or male recorded as ' married' at the census was not necessarily leading a wedded life from the demographic point of view. Similarly, many of the widows, and quite a few of the widowers, recorded as such in the census may never have consummated their marriages, a fact which would be contrary to the conditions prevailing in western countries.
35. The figure], percentages and proportions relating to marital status and age as given in this report relate only to a ten per cent sample of the total enumerated population. The exact manner in which the ten per cent sample was selected is explained in detail in paragraph 1 of the flyleaf to Table C-II pertaining to 'Livelihood Classes by Age Groups' given at page 9 of Part II-B of this Volume. The actual sample population on which all the present figures and observations are based is 1,863,995 a<; against the total enumerated popUlation of 18,655,108 for the state.
*The instructions issued to enumerators in this regard at the 1951 Census were a(follows :
.. Question No.3. Are you unmarried, married, widowed or divorced?
(1) For purposes of this question (a) a marriage may be deemed to have taken place if it was performed in accordallce with any religious rite, or any custom or form of marriage recognised by the caste, tribe, or community concerned, or if it was by registration, and (b) a divorce may be deemed to have been effected if marital ties have been severed as permitted under any religion, or custom or form recognised by the caste, tribe or community concerned or by law or mutual consent of the husband and wife.
(2) Only a person who has never married should be recorded as unmarried. (3) A person should be recorded as married if he or she has been married-in keeping with the definition of marriage given
at sub-para (1) (a)-and has not been widowed or divorced. (4) A person should be recorded a..'i widowed if he (she) has lost his wife (her husband) by death and has not remarried.
• Widowed' will cover both widows and widowers. (5) A person who has or has been divorced from his or her spouse-in accordance with tbe definition of divorce as given
at sub-para (1) (b)--should be recorded as divorced.
Note :- (a) In case a person had more th~n one wife but has not lost by death (or divorced) aU of them, he sboultl be recorded as ' married' and not as 'widowed' (or • divorced ').
(b) In case a woman once widowed or divorced has remarried and is not separated from her second husband by death or divoree, she should be recorded as • married', and not as 'widowed' or 'divorced '.
(6) Do not presume that a woman reported to be a prostitute is 'unmarried '. Enquire and record the a.nswer ai given by har."
858
359
36: Factors .influencing ~aritall}~tios.-!~e distribution of population at any census .accordmg to variOUS categorIes of cIvIl condItion depends upon a number of variable factors, the more important of which are detailed below.
(a) Crop Conditions.-In so far as the people at large in this state are concerned, they still view the marriage of their dependants as one of their primary duties to society. Consequently, at the first opportunity permitted by their financial resources-which of course includes their capacity to obtain loans-they think of marrying off their children. As the overwhelming majority of the people in this state are still dependent on agriculture, or on trades and industries catering to the needs of the agriculturists, good crops result in more marriages.
(b) Marriage Habits.-Another factor, which influences marital ratios, is the slow but nevertheless steady change in the marriage habits of the people. No doubt, the Child Marriage Restraint Act, enforced in the adjoining states in 1929, became applicable to this state only in 1950, and illiteracy here is relatively more widespread than in the neighbouring states. But still the people here have not remained impervious to the influences which in other parts of India led to the enforcement of the Act. Thus, even without any restraining enactment and any considerable change in the concept of the marriage of children as being one of the primary obligations of the parents, the age at which the children are married is being gradually raised. Even in a well placed orthodox Hindu family, at any rate in urban areas, it is no longer considered a social stigma to have an unmarried daughter aged 20. Thirty years back a girl of this age would probably be thinking of the marriage of her own daughter. Thts gradual change has affected females more than males, as the marriage age of male children in the earlier decades was not relatively as low as that of female children. Another change, equally pronounced in the marriage habits of the people, is the narrowing of the disparity between the ages of the hride and the bridegroom. Thirty years back, a bridegroom aged about twenty or more marrying a bride aged seven or even less was a very common sight. But now in many parts of the state the bride would be about twelve years old. Some fond parents would now consider a disparity of even six or seven years between the ages of the bridal pair as being excessive. Some others would now leave such matters to be decided by their children themselves. But the number of such parents is still so small t hat they are generally regarded as being ultra-modern.
(c) Age Distribution and Sex Proportion of the Population.-Another factor which affects marital ratios is the age distribution of the popUlation. Other things being equal, a larger proportion of children results in a lower ratio of the married. Similarly, a higher proportion of the elderly results in a higher ratio of the widowed. The composition of the population in terms of the two sexes also influences m'1rital ratios. The average man in, this country has generally been a monoga.mist and, even if his circu mtances did permit, he has been content with one wife. Polyandry is entirely alien to this state. Consequently, other thing3 being equal, the larger the disparity in the proportions of the two sexes the greater would be the number of the unm'1rried.
(d) Pattern of Migration.-The movement of population is yet another factor which influences marital ratios. For example, when emigration is largely motivated by economic factors, i.e., the search for employment, the proportion of males aged betw~~en 18 to 45 among such emigrants is generally heavy. Most of such males are marned. Their emigration, therefore, would increase the ratio of the unmarried males locally.
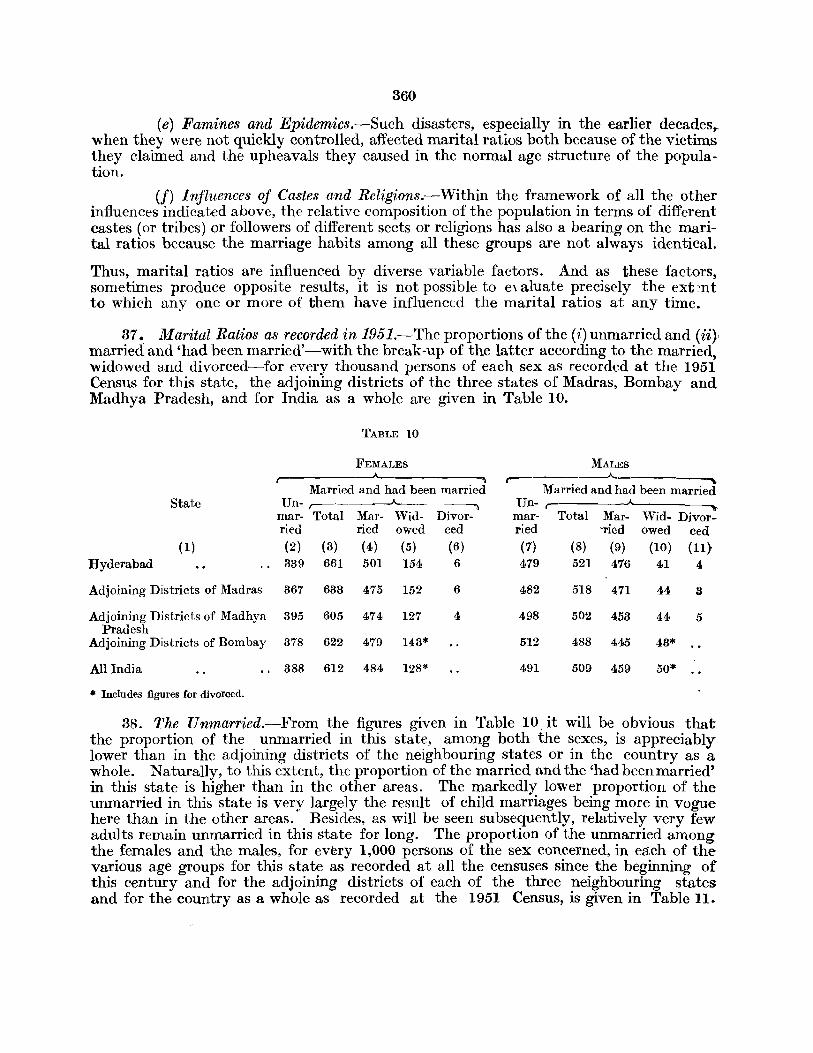
360
(e) Famines and Epidemics.-Such disasters, especially in the earlier decades~ when they were not quickly controlled, affected marital ratios both because of the victims they claimed and the upheavals they caused in the normal age structure of the population.
(f) Influences of Castes and Religions.-Within the framework of all the other influences indicated above, the relative composition of the population in terms of different castes (or tribes) or followers of different sects or religions has also a bearing on the marital ratios because the marriage habits among all these groups are not always identical.
Thus, marital ratios are influenced by diverse variable factors. And as these factors, sometimes produce opposite results, it is not possible to e, aluate precisely the extC'nt to which anyone or more of them have influenced the marital ratios at any time.
37 • Marital Ratios as recorded in 1951.-The proportions of the (i) unmarried and (ii} married and 'had been married'-with the break-up of the latter according to the married, widowed and divorced-for every thousand persons of each sex as recorded at the 1951 Census for this state, the adjoining districts of the three states of Madras, Bombay and Madhya Pradesh, and for India as a whole are given in Table 10.
TABLE 10
FEMALES MALES r----~ r---- --A..
Married and had been married Married and had been married State Un- r- Un- ,-
mar- Total Mar- Wid- Divor- mar- Total Mar- Wid- Divor-ried ried owed ced ried -ried owed ced
(1) (2) (3) (4) (5) (6) (7) (8) (9) (10) (ll) Hyderabad 339 661 501 154 6 479 521 476 41 4
Adjoining Districts of Madras 367 633 475 152 6 482 518 471 44 3
Adjoining Districts of Madhya 395 605 474 127 4 498 502 453 44 5 Pradesh
Adjoining Districts of Bombay 378 622 479 143* 512 488 445 43*
All India 388 612 484 128* 491 509 459 50*
* Includes figures for divorced.
38. The Unmarried.-From the figures given in Table In it will be obvious that the proportion of the unmarried in this state, among both the sexes, is appreciably lower than in the adjoining districts of the neighbouring states or in the country as a whole. Naturally, to this extent, the proportion of the married and the 'had been married' in this state is higher than in the other areas. The markedly lower proportion of the unmarried in this state is very largely the result of child marriages being more in vogue here than in the other areas. Besides, as will be seen subsequently, relatively very few adults remain unmarried in this state for long. The proportion of the unmarried among the females and the males, for every 1,000 persons of the sex concerned, in each of the various age groups for this state as recorded at all the censuses since the beginning of this century and for the adjoining districts of each of the three neighbouring states and for the country as a whole as recorded at the 1951 Census, is given in Table 11.

361
TABLE 11
Proportion of unmarried among 1,000 females in the age group of: State and year ,--
All ages 0-4 5-14 15-24 25-34 35-44 45-54 55 and over
(1) (2) (3) (4) (5) (6) (7) (8) (9)
(1901 312 977 620 84 82 48 24 23
11911 295 971 582 52 25 22 18 ]7
Hyderabad ~ 1921 309 970 622 70 33 25 25 25 .. 1931 311 924 544 65 30 26 22 19 I 1941 314 966 583 118 33 21 15 11 L1951 339 1,000* 728 57 8 6 7 5
Adjoining Districts of Madras 1951 367 903 134 23 15 ]0 6
Adjoining Districts of Madhya Pradesh 1951 395 853 141 36 25 15 16
_Adjoining Districts of Bombay 1951 378 809 80 18 14 11 13
All India 1951 388 851 173 29 15 13 10
TABLE lI-(Concld.)
Proportion of unmarried among 1,000 males in the age group of: State and year
All ages 0-4 5-14 15-24 25-34 35-44 45-54 55 and over
(1) (10) (11) (12) (13) (14) (15) (16) (17)
(1901 459 988 909 485 no 52 39 39 i 1911 445 990 903 443 94 36 27 27'
Ryderabad ~ 1921 457 985 899 479 110 60 43 41 1931 424 953 804 337 86 40 36 36
'. 1 1941 422 973 804 357 127 59 35 26 L1951 479 1,000* 955 511 75 21 14 12
Adjoining Districts of Madra's .... 1951 482 985 617 96 30 19 14
Adjoining Districts of Madhya Pradesh .• 1951 498 968 543 87 27 17 16
Adjoining Districts of 1951 512 978 576 91 Bombay 28 18 15
All India 1951 491 935 542 133 52 38 31
* At the 1951 Census, in this state, as elsewhere in India, persons whose ages ranged between '0 and 4 ' were treated as unmarried irrespective of the answers recorded by the enumeratori! in respect of such persons. Thus, the actual proportion of the unmarried would be less than what has now been tabulated. But the smallest percentage of the unmarried recorded hitherto in this age group to the total population of the sex concerned was as high as 92 for females and 95 for males in 1931. In keeping with recent trends in marriage habits, the number of unmarried in this age group is bound to have considerably increased during the last twenty years. Conse'luently, the percentage of the m::trried in the age group" 0 to .1, , could now be safely assumed as be-ing statistically negligible. Contrary to this, in some of the previous censuses, all prostitutes were automatically treated as unmarried regardless of the answer returned by them. But at this census, they were classified strictiy on the basis of their answers. 'If a similar procedure had been followed in the previous censuses, the proportion of the unmarried females would have been slightly lower than what has been recorded.
362
39. Variations in the Proportion of the Unmarried.-The proportion ~f the unmarried among every 1,OCO females in the state has varied, though within a narrow margin". from census to census. It decreased from 312 in Hl01 to 295 in 1911. This decrease, which was recorded in each and every age group, was largely the result of the improved economic condition of the people. The years preceding the 1901 Census were characterised by famines and unfavourable agricultural seasons, while those preceding the 1911 Census were particularly prosperous. Naturally, therefore, the people at large were in a better position to celebrate the marriages of their dependants in 1911 than in 1901. In 1921, the proportion of the unmarried females again increased to 309. The increase was common to all the age groups except to that of ' 0 to 4 " wherein the proportion of the unmarried females declined by rather an insignificant margin. This overall increase in the proportion of unmarried women was once again lc11 gely the result of the reduced ability of the people to perform the marriages of their dependants. The inability this time was due not only to unfavourable agricultural seasons but also to the disastrous epidemics and the soaring prices which characterised the later half of the decade 1911-21. The slight decline in 1921 in the proportion of the unmarried women in the age group of ' 0 to 4' only, seems to have been the result of a remarkable increase in the proportion of boys in the age group of ' 5 to 14' as recorded in that year. In 1931, the proportion of the unmarried females further inc'reased to 311. The increase this time was not due to any deterioration of the economic condition of the people. In fact, in spite of the trade depression which characterised the closing years of the decade 1921-31, the people were much better off in 1931 than in 1921. Nor was the increase the result of any radical change in the outlook of the people in respect of child marriages, i.e., to the postponement of the marriage of children to later ages. In fact, there are reasons to presume
\ that in the second half of the decade 1921-31, many persons of this state especially those living in the bordering tracts--influenced by the attempts o{ the more conservative of the people living in the adjoining states to marry off their children before the implementation of the Child Marriage Restraint Act in their respectivc states--hurried the marriages of their children before the passing of the Act in 1929. All this is borne out by the fact, that the proportion of the unmarried females actually decreased in 1931, as compared with the corresponding proportion in 1921, in both the higher and the lower age groups. The overall increase in the proportion of unmarried females in 1931 was largely du e to a rather unusual upheaval. in the age structure of the female population. The proportion of children, particularly of female chiJdren, to the total population of the 5tate increased enormously in 1931*. And, as the proportion of the unmarried among children is very heavy, an unusually large number of female children in 1931 resulted in reducing the proportion of the unmarried among females as a whole. In 1941, the proportion of the unmarried among the females again increased to 314. The increase this time was not very much influenced by the changes in the age structure of the females. Actually, the relative numbers of females in the age groups of '0 to 4', '5 to 14' and even' 15 to 24' to the total female population, declined in 1941 as against the corresponding proportion in 1931. If changes in the age structure of females. were the governing influence, then this decline in the relative numbers in the lower age groups, which have a larger proportion of the unmarried, must have also led to a decrease in the unmarried among females as a whole. Nor was the increase in the propor-*Females in the age group of' 0 to 4' forITcd ahrost 18 F€T CEnt of the total female populatJOn in 1981, as against 13 in 1921, 15 in 1911 and 13 in 1901. Though the percentage of male chiJdrfll in this age group to total male popUlation in 1931 was 16, i.e., appreciably lower than that recordcd for females, it was still the highest recorded for male children 5ince 1901. The relative increase in the number of childnn in 1931, was, in tUID, due to the heavy proportion of persons in the reproductive ages at the 1921 Census, the epidemics of the dec( nnium 1911-21 having taken a heavy toll of the infants and
-the very elderly.
868
tion of the unmarried females in 1941 due to any worsening of the economic conditions as against those prevailing in 1981. In fact, the economic conditions of the people had improved considerably in 1941 on account of the artificial conditions created by the war preparations and the actual break out of the Second World War in the later half of the decade 1981-41. The increase in the proportion of the unmarried this time was largely the result of significant changes in the marital habits of the people. The popularity of child marriages was definitely on the decline. This is borne out by the fact that in 1941 while the proportion of the u,nmarried among the females increased considerably in the lower age groups it actually decreased in the higher ones. In 1951, the proportion of the unmarried among the females further increased to 839. It is likely that the disturbed conditions prevailing in this state for some time after the independence of the country and the decrease in the -relative numbers of persons in the higher (i.e., the more married) age groups may have been contributory factors to the sharp increase in the proportion of the unmarried females. But these factors are not very significant. By far the most important reason for the increase was once again the marked waning of the popularity of child marriages. At this census almost 73 per cent of the female children in the age group of '5-14' had remained unmarried.
40. The proportion of the unmarried among every 1,000 males in this state decreased from 459 in 1901 to 445 in 1911. This decrease was pronounced in all the age groups, except in the age group of < 0 to 4 ' wherein the proportion registered a microscopic increase. This overall decline in the proportion "of the unmarried males was, as in the case of females, due to the improved economic condition in 1911 as compared with that prevailing in 1901. But in 1921, the proportion of the unmarried males increased to 457. The increase was very marked in all the higher age groups from' 15 to 24 ' onwards. There was, however, a slight decrease in the proportion of the unmarried in the age group of ' 0 to 4 ' and' 5 to 14' which is rather difficult to explain. The overall increase in the proportion of the unmarried among the males in 1921 was due, as in the case of females, both to the deterioration of the economic condition and to the epidemics and famines which had upset the normal tenor of life during the decennium 1911-21. In 1931, the proportion of the unmarried males further decreased to 424, because of the improved. economic condition of th~ people. Thou~h the proportion of the persons in the le~st married age group of '0 to 4' increased heavily among the males also during this comparatively healthy decade, the increase was not sufficiently heavy (as among the females) to prevent a downward mov-ement in the overall proportion of the unmarried in this sex. In 1941, the proportion of the unmarried males further declined to 422, which is the lowest recorded during the current century. This was largely the result of the economic prosperity in 1941 and the heavier proportion of males in the advanced (i.e., the more married) age groups. It is very significant that this overall decrease was recorded in spite of a heavy increase in the proportion of the unmarried males in the lower age groups. It is thus obvious that even an appreciable advancement in the marriage age of the males could not hold up a general increase in the proportion of the married among them due partly to their improved economic condition and partly to the higher proportion of them in the advanced -ages. In 1951, the proportion of the unmarried males has sharply risen to 479. This remarkable increase is chiefly the result of a very decisive change in the marriage habits of the people. At this census over 95 per cent of the males in the age group of' 5 to 14 'and over 51 per cent in the age group of' 15 to 24 " both by far the highest recorded during the present century, were unmarried. Minor reaSons for this sharp increase in the proportion of unmarried males in 1951 may .also be relatively heavier numbers of males in the lower (i.e., the less married) age groups,
364
th e increased scale of emigration from the state for economic reasons-which in_ turn means an increase in the numbers of married males moving out singly-and the disturbed conditions which prevailed in the state in the later half of the decade 1941-51.-
41. Decrease in the Proportion of the Unmarried in the Higher and Increase in the Lower Age Groups . --The proportion of the unmarried in the higher age groups has never been significant in this state. And at this census it is by far the lowest recorded during thiscentury in all the age groups from' 25 to 34' and onwards, whether for males or females. In fact, the present proportion is so microscopic that it can safely be asserted that almost all persons in this state now marry sooner or later. The figures given in Table 11 will also make it obvious that the proportion of the unmarried in these higher age groups in this state is considerably lower than in the adjoining tracts or in the country as a whole. This decrease in the proportion of the unmarried in the higher age groups in this state is all the more remarkable because of the considerable increasein the corresponding proportion in the lower age groups. The highest proportion or the unmarried among the females hitherto recorded during this century in the age group of ' 5 to 14 ' was 622 in 1921. The proportion is now as high as 728. Similarly, the highest proportion of the unmarried hitherto recorded among the males in the age group" of ' 5 to 14 ' was 909 and in the age group of ' 15 to 24' was 485, both in 1901. Theprop orion has now increased to 955 in the former and 511 in the latter age group. Thus,_ in spite of the fact that the adherence of the people to the institution of marriage as suchis appreciably stronger now than it was ever before during this century, the usage of child marriage is considerably on the decline. Nevertheless, child marriages seem still to be more in vogue in this state than in the adjoining tracts or in the country as a whole. While the proportion of the unmarried among the females in the age group of ' 5 to 14 '
, is as high as 851 in the country as a whole and 903, 809 and 853 in the adjoining districts of Madras, Bombay and Madhya Pradesh respectively, it is only 728 in this state. Again, while the corresponding proportion of the unmarried females in the age group of ' 15 to 24 ' is as high as 173 for the country as a whole and 134, 80 and 141 in the adjoining districts of Madras, Bombay and Madhya Pradesh respectively, it is as low as 57 in this state. But among males, in the age group of ' 5 to 14', though the proportionof the unmarried is higher in the adjoining tracts than in this state, the proportion in the country as a whole is appreciably lower. The proportion of the unmarried males in the age group of '5 to 14 ' is 935 in India as against that of 955 in this state. This lower proportion in India as a whole is not due to its being more conservative in respect of the age at which boys are generally married but probably arises from the fact that the disparity between the ages of the bride and the bridegroom is not so marked in the country in general as it is in this ~tate-i.e., more girls in th~ age group of ' 5 to 14 ,are perhaps married to boys in the same age group in India as a whole than in this state .. But once again in the age group of ' 15 to 24 " the proportion of the unmarried males is less in this state than in the country as a whole or in the adjoining tracts.
42. Comparison with the Unmarried in Great Britain.-It would be interesting to compare the figures of the unmarried in this state with that of an advanced country in the West. In Great Britain, according to the estimates given in the Report of the Royal Commission on Population; in the year 1947, 91 out of every 1,000 males and as many as 165 out of every 1,000 females in the advanced age group of '45 to 54' had remained unmarried. In other word-s, the proportion of the unmarried in Great Britain in this age group, was roughly 6 times more than in this state for males and 24 times
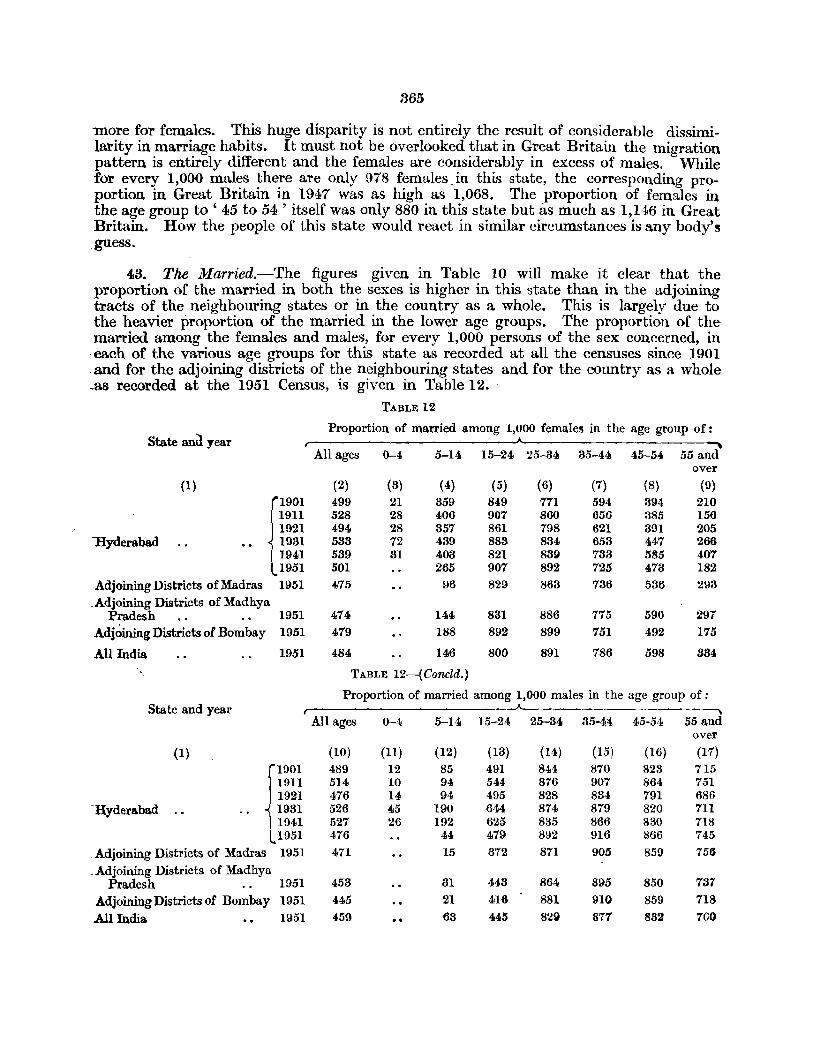
865
more for females. This huge disparity is not entirely the result of considerable dissimilarity in marriage habits. It must not be overlooked that in Great Britain the migration pattern is entirely different and the females are considerably in excess of males. While for every 1,000 males there are only 978 females. in this state, the corresponding proportion in Great Britain in 1947 was as high as 1,068. The proportion of females in the age group to ' 45 to 54 ' itself was only 880 in this state but as much as 1,146 in Great Britain. How the people of this state would react in similar circumstances is any body'~ . guess.
48. The .ft!Iarried.-The figures given in Table 10 will make it clear that the proportion of the married in both the sexes is higher in this state than in the adjoining tracts of the neighbouring states or in the country as a whole. This is largely due to the heavier proportion of the married in the lower age groups. The proportion of the married among the females and males, for every 1,000 persons of the sex concerned, in -each of the various age groups for this state as recorded at all the censuses since 1901 .and for the adjoining districts of the neighbouring states and for the country as a whole .as recorded at the 1951 Census, is given in Table 12.
TABLE 12
State and year Proportion of married among 1,000 females in the age group of:
All ages 0-4 5-14 15-24 25-34 35-44 45-54 55 and over
(1 ) (2) (3) (4) (5) (6) (7) (8) (9)
f"ol 499 21 359 849 771 594 394 210 1911 528 28 406 907 860 656 385 156 1921 494 28 357 861 798 621 391 205
:Hyderabad .. 1931 533 72 439 883 834 653 447 266 1941 539 31 403 821 839 733 5S5 407
L1951 501 265 907 892 725 473 182
· Adjoining Districts of Madras 1951 475 96 829 863 736 536 293
.Adjoining Districts of Madhya Pradesh 1951 474 144 831 886 775 590 297
Adj~ining Districts of Bombay 1951 479 188 892 899 751 492 175
.All India 1951 484 146 800 891 786 598 834
TABLE 12--{Concld.)
Proportion of married among 1,000 males in the age group of: State and year ___A.__
An ages 0-4 5-14 15-24 25-34 35-44 45-54 55 a.nd over
(1) (10) (II) (12) (13) (14) (15) (16) (17)
fOI 489 12 85 491 844 870 823 715 1911 514 10 94 544 876 907 864 751 1921 476 14 94 495 828 834 791 686
. Hyderabad . . .. 1931 526 45 190 644 874 879 320 7Il 1941 527 26 192 625 835 866 830 718
L1951 476 44 479 892 916 866 745
· Adjoining Districts of Madras 1951 471 15 312 871 905 859 756
· Adjoining Districts of Madhya Pradesh 1951 453 31 443 864 895 850 737
Adjoining Districts of Bombay 1951 445 21 416 881 910 859 718
.All India 1951 459 63 445 82g 877 832 700
366
44. Variations in the Proportion of the lliarried.--The proportion of the married. among every thousand females, increased from ,t99 in 1901 to 528 in 1911 and, among every thousand males, from 489 to 514. This marked increase was largely due to the improved economic and health conditions prevailing during the decade 1901-1911, quite in contrast to the travails of the preceding decennium. The proportion of the married females in the advanced age groups of ' 45 to 54 'and '55 and over', however, declined appreciably. Actually, the famines and epidemics which had characterised the earlier, i.e., the 1891-1901 decade, were largely responsible for this decline. In 1901, due to these calamities, the proportion of the widowed and unmarried females, especially of the former, was very heavy in the age groups of' 35 to 44 ' and onwards. Naturally, ten years later, i.e., in 1911, the survivors among these widowed (with further additions from the married females during the course of the ten years) and the unmarried moved into the advanced age groups and thereby decreased the proportion of the married among them. In 1921, the proportion of the married decreased in the case of females to 494 and in the case of males to 476. In other words, the proportions in 1921 roughly approximated to those recorded in 1901. This decrease was common to most of the age groups and was once again very largely the result of the famines and pestilences which had broken out in great severity during the later half of the decade 1911-21. The proportion of both the unmarried and the widowed, especially the latter, had increased at the cost of the married. There was, however, an increase in the proportion of the married among the females in the advanced groups of '45 to 54' and ' 55 and over'. But, as explained above, the proportion of the married females in these two age groups was particularly low in 1911 due to the repercussions of the disastrous decade of 1891-1901. Actually, but for the 1911 figures, the propOl'tion of the married females in 1921 in the age group of '45 to 54' was the lowest recorded during the present century. In 1931, the proportion of the married among the females rose to 533 and among the males to 526. In other words, the set back received in 1921 was more than made up. This sharp increase, which was more or less common to all thc age groups of both the sexes, was very largely the result of the considerable improvement in the health and, to a smaller extent, the economic conditions of the people during the decade 1921-31. In 1941, the proportion of the married further improved to 539 in the case of females and to 527 in the case of males. The improvement in the case of females was restricted to the higher age groups. Actually, the proportion of the married declined appreciably ~mong the females in the lower age groups of' 0 to 4 " ' 5 to 14' and' 15 to 24 '. The fall in the lower age groups was due to changes in marital habits. i.e., the postponing of the age of marriage; the increase in the higher groups was due to further improvement in economic and health conditions; and the overall increase was aided by a smaller proportion of persons in the lower age groups. In 1951, the proportion of 'the married has fallen in the case of females to 501 and in the case of males to 476. Change in the marital habits of the people is again the chief factor influencing the decrease. The proportion of the married among the females in the age group of ' 5 to 14' has decr.eased to 265 and that among the males in the age groups of' 5 to 14' and' 15 to 24 ' has declined to 44 and 479 respectively, which are all the lowest recorded in the state during the current century_ But it is very significant that the increase in the proportion of the married females in 1951 is restricted only to the two important reproductive age groups of ' 15 to 24' and , 25 to 34 '. The proportion of the married females in the higher age groups does not indicate any improvement and actually, among the very elderly, it is the second lowest recorded during the current century. This is not at all surprising because, quite apart from perhaps the more than the normal accession of numbers to the widowed females in these higher age groups due to the strained conditions prevailing in the later half of the decade
367
1941-51, many females in these advanced age groups must have been widowed because of the calamities of the 1911-21 and even the 1891-1901 decades.
45. Variations relevant to Growth of Population.-The present proportion of the married females in the age group of ' 5 to 14 '-most of whom would be nearer 14 than '5-and that of married males in the age groups of ' 5 to 14' and' 15 to 24' is by far the lowest on record during the present century. These changes are very significant as they tend to decelerate the growth of population during the coming years. As against this, the present proportion of the married females in the age ,groups of ' 15 to 24 ' and ' 25 to 34' and of married males in most of the age groups beyond '15 to 24' is the highest recorded in this state since 1901. And again, the present proportion of married females in the age group of ' 35 to 44 ' is the second highest recorded during the present century. These changes tend to accelerate the growth of population. The increase in these groups is, however, not so impressive as the decrease in the case of the former. Thus, on the whole, in so far as these changes in marital status are concerned, they are conducive, other thi1,gs being equal, to a reduction in the rate of growth of population duringthe coming years.
46. The proportion of the married females in this state in the age group of' 5 to 14 ' -in spite of its decline-is markedly heavier than in the country as a whole or in the adjoining tracts. Again, the proportion of the married females in this state in the age groups of' 15 to 24 ' and' 25 to 34', after its present increase, is appreciably heavier than in the country or in the adjoining tracts-except in those of Bombay State to the extent of the age group of ' 25 to 34'. And again, the present proportion of the married males in the age group of '5 to 14', in spite of its present decline, is markedly heavier than in the adjoining areas though not in India in general*. Similarly, the proportion of the 'married males in the higher age groups is now appreciably heavier than in the adjoining tracts or in the country as a whole. 'Thus, as compared with the country as a whole, or the adjoining tracts, this state seems to be more than favourably placed in so far as ,the married in the reproductive age groups are concerned.
47. Comparison of the Ratio of the Married among the two Sexes.-In this state, for every 1,000 males there are 978 females and further the proportion of the married among every 1,000 males is 476. According to this-and on the presumption that normally each married man has only one living wife and there are no other influences at workamong the 978 females for every 1,000 males only 476 ought to have been married. On this basis, the ratio of the married among the females ought to have been 487 per 1,000' females. But the actual proportion of married women is as much as 501, i.e., 14 in excess. Is this excess the result of polygamous marriages contracted by males? If so, then out of every 1,000 males in this state 14 have more than one wife. But this. presumption is only partly correct. Firstly, because of the social conventions prevailing in this state, many females are averse to declare themselves as divorced even if they have been deserted f9r all practical purposes by their respective husbands. In otherwords, there is a class of women in this state, whose numbers are by no means very negligible, who are for all demographic purposes divorced but have returned themselves as married. Most women similarly placed in the western countries would have legally
, established themselves as divorced. As against this, most of the men involved in such cases would have returned themselves as married, if they had married once again, or-
.Vide Paragraph 41 above in this connection.
4S
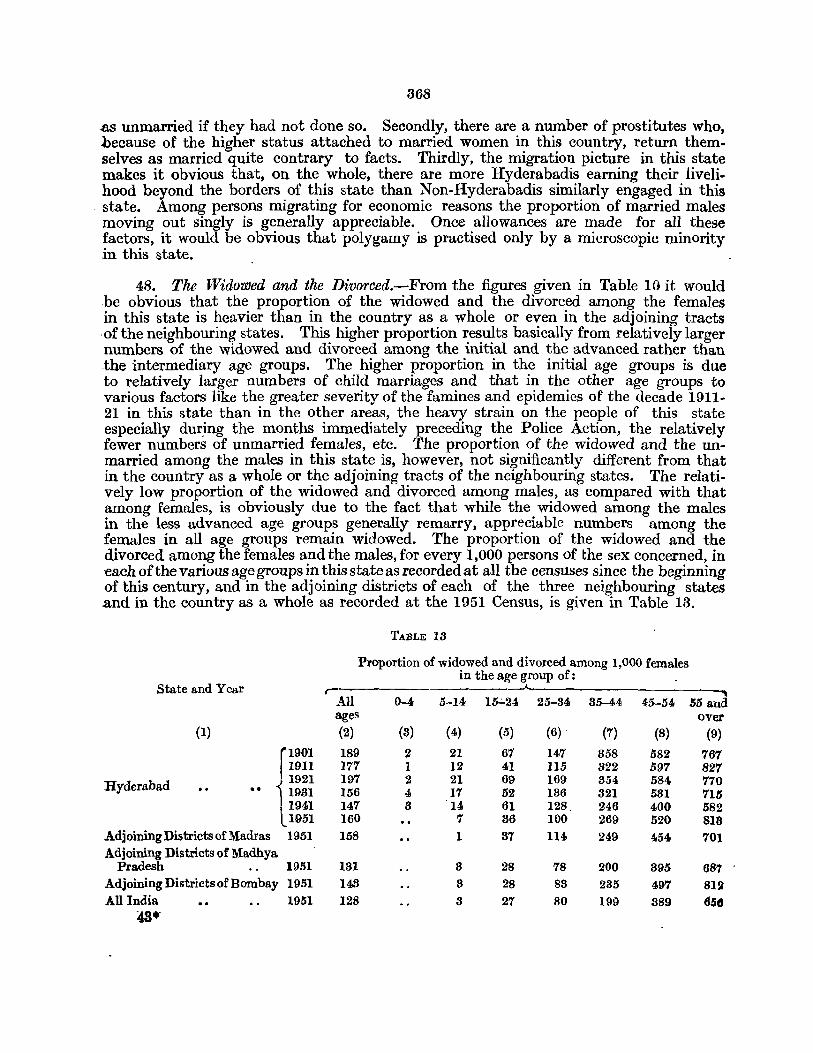
368
.as unmarried if they had not done so. Secondly, there are a number of prostitutes who, because of the higher status attached to married women in this country, return themselves as married quite contrary to facts. Thirdly, the migration picture in this state makes it obvious that, on the whole, there are more Hyderabadis earning their livelihood beyond the borders of this state than Non-Hyderabadis similarly engaged in this
. state. Among persons migrating for economic reasons the proportion of married males moving out singly is generally appreciable. Once allowances are made for all these factors, it would be obvious that polygamy is practised only by a microscopic minority in this state.
48. The Widowed and the Divorced.-From the figures given in Table 10 it would be obvious that the proportion of the widowed and the divorced among the females in this state is heavier than in the country as a whole or even in the adjoining tracts ·ofthe neighbouring states. This higher proportion results basically from relatively larger numbers of the widowed and divorced among the initial and the advanced rather than the intermediary age groups. The higher proportion in the initial age groups is due to relatively larger numbers of child marriages and that in the other age groups to various factors like the greater severity of the famines and epidemics of the decade 1911-21 in this state than in the other areas, the heavy strain on the people of this state especially dur~ng the months immediately preceding the Police Action, the relatively fewer numbers of unmarried females, etc. The proportion of the widowed and the unmarried among the males in this state is, however, not significantly different from that in the country as a whole or the adjoining tracts of the neighbouring states. The relatively low proportion of the widowed and divorced among males, as compared with that among females, is obviously due to the fact that while the widowed among the males in the less advanced age groups generally remarry, appreciable numbers among the females in all age groups remain widowed. The proportion of the widowed and the divorced among the females and the males, for every 1,000 persons of the sex concerned, in each of the various age groups in this state as recorded at all the censuses since the beginning of this century, and in the adjoining districts of each of the three neighbouring states and in the country as a whole as recorded at the 1951 Census, is given in Table 13.
TABLE 18
Proportion of widowed and divorced among 1,000 females in the age group of: .
State and Year r-All 0-4 5-14 15-:-24 25-34 35-44 45--54 55 and ages over
(1) (2) (3) (4) (5) (6) (7) (8) (9)
r1901 189 2 21 67 147 8S8 582 767 19I1 177 1 12 41 115 822 597 827
Hyderabad 11921 197 2 21 69 169 354 584 770 .. 1981 156 4 17 52 136 821 531 715 1941 147 8 14 61 128. 246 400 582 1951 160 7 86 100 269 520 818
Adjoining Districts of Madras 1951 158 1 87 1141 249 454 701 Adjoining Districts of Madhya
Pradesh 1951 181 8 28 78 200 895 687 Adjoining Districts of Bombay 1951 143 3 28 83 235 497 8l!l All India 1951 128 8 27 80 199 389 650
43 t "
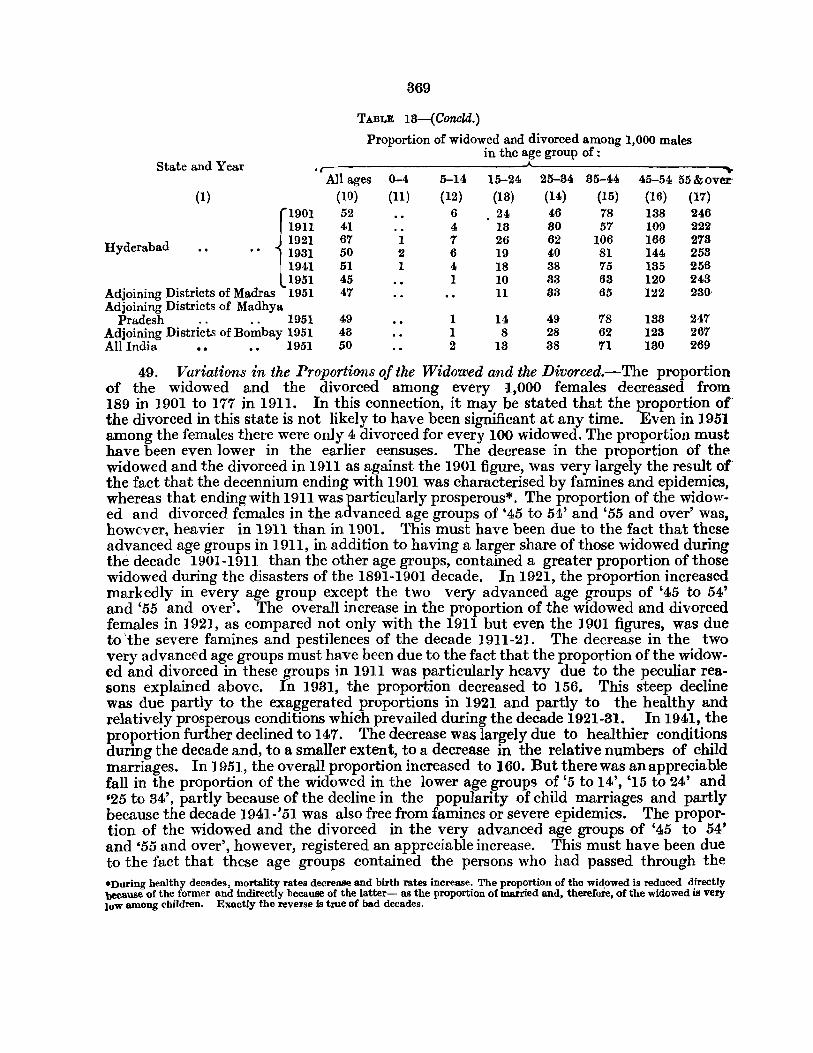
369
TABLE I3-(Concld.)
Proportion of widowed and divorced among 1,000 males in the age group of:
State and Year All ages 0-4 5-14 15-24 25-34 35-44 45-54 55 & over-
(1) (10) (ll) (12) (13) (14) (15) (16) (17)
fI901 52 6 .24 46 78 138 246 1911 41 4 13 80 57 109 222
Hyderabad i 1921 67 I 7 26 62 106 166 273 1981 50 2 6 19 40 81 144 253 1941 51 1 4 18 38 75 135 256
LI951 45 1 10 88 63 120 243 Adjoining Districts of Madras 1951 47 11 83 65 122 23()' Adjoining Districts of Madhya
Pradesh .. 1951 49 1 14 49 78 138 247 Adjoining Districts of Bombay 1951 43 1 8 28 62 123 267 All India 1951 50 2 13 38 7l 130 269
49. Variations in the Proportions of the Widowed and the Divorced.-The proportion of the widowed and the divorced among every :1.,000 females decreased from 189 in 1901 to 177 in 1911. In this connection, it may be stated that the proportion of the divorced in this state is not likely to have been significant at any time. Even in 1951 among the females there were only 4 divorced for every 100 widowed. The proportion must have been even lower in the earlier censuses. The decrease in the proportion of the widowed and the divorced in 1911 as against the 1901 figure, was very largely the result of the fact that the decennium ending with 1901 was characterised by famines and epidemics, whereas that ending with 1911 was particularly prosperous*. The proportion of the widowed and divorced females in the advanced age groups of '45 to 54' and '55 and over' was, however, heavier in 1911 than in 1901. This must have been due to the fact that these advanced age groups in 1911, in addition to having a larger share of those widowed during the decade 1901~191l than the other age groups, contained a greater proportion of those widowed during the disasters of the 1891~1901 decade. In 1921, the proportion increased markedly in every age group except the two very advanced age groups of '45 to 54' and '55 and over'. The overall increase in the proportion of the widowed and divorced females in 1921, as compared not only with the 1911 but even the 1901 figures, was due to'the severe famines and pestilences of the decade 1911~21. The decrease in the two very advanced age groups must have been due to the fact that the proportion of the widowed and divorced in these groups in 1911 was particularly heavy due to the peculiar reasons explained above. In 1931, the proportion decreased to 156. This steep decline was due partly to the exaggerated proportions in 1921 and partly to the healthy and relatively prosperous conditions which prevailed during the decade 1921-31. In 1941, the proportion further declined to 147. The decrease was largely due to healthier conditions during the decade and, to a smaller extent, to a decrease in the relative numbers of child marriages. In 1951, the overall proportion increased to 160. But there was an appreciable fall in the proportion of the widowed in the lower age groups of '5 to 14', '15 to 24' and '25 to 34', partly because of the decline in the popularity of child marriages and partly because the decade 1941~'51 was also free from famines or severe epidemics. The proportion of the widowed and the divorced in the very advanced age groups of '45 to 54' and '55 and over', however, registered an appreciable increase. This must have been due to the fact that these age groups contained the persons who had passed through the *Ouring healthy decades, mortality rates decrease and birth rates increase. The proportion of the wid~wed is reduced directly because of the former and indirectly because of the latter- as the proportion of married and, therefore, of the widowed is very· low among children. Exactly the reverse is true of bad decades.
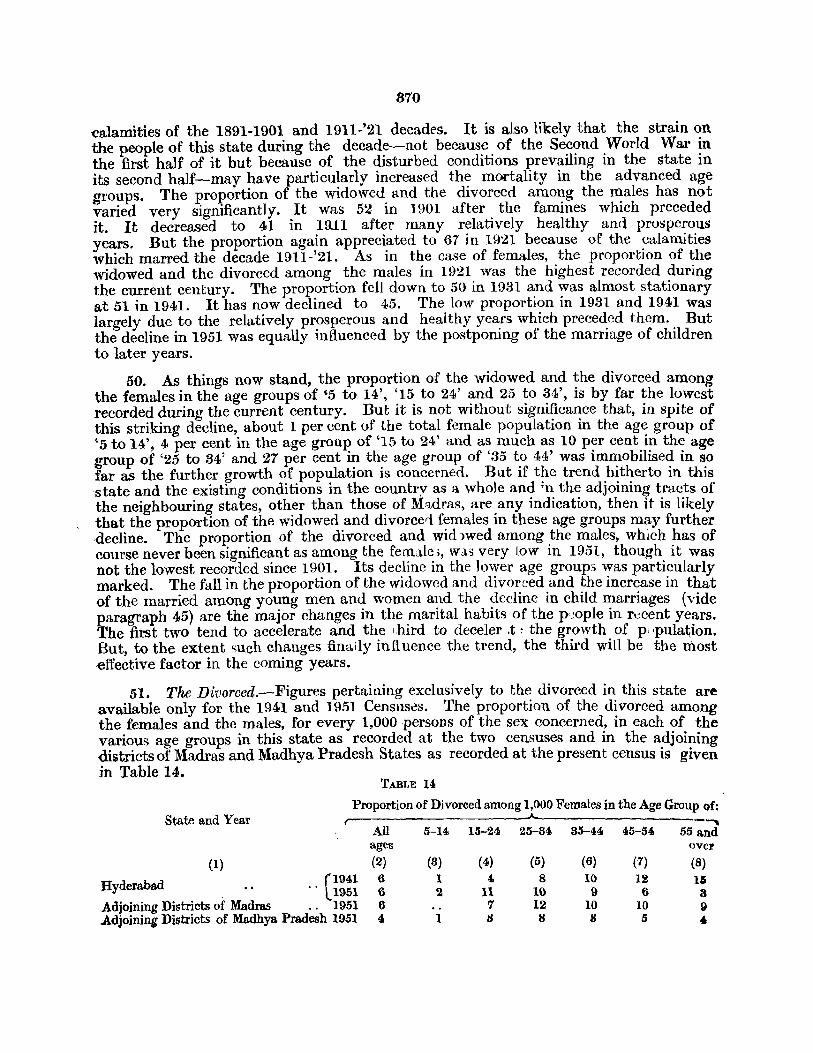
870
<!alamities of the 1891-1901 and 1911-'21 decades. It is also likely that the strain on the people of this state during the decade~-not because of the Second World War in the first half of it but because of the disturbed conditions prevailing in the state in its second half-may have particularly increased the mortality in the advanced age groups. The proportion of the widowed and the divorced among the males has not varied very significantly. It was 52 in 1901 after the famines which preceded it. It decreased to 41 in 19.Il after many relatively healthy and prosperous years. But the proportion again appreciated to 61 in 1921 because of the calamities which marred the decade 1911-'21. As in the case of females, the proportion of the widowed and the divorced among the males in 1921 was the highest recorded during the current century. The proportion fell down to 50 in 1931 and was almost stationary at 51 in 1941. It has now declined to 45. The low proportion in 1931 and 1941 was largely due to the relatively prosperous and healthy years which preceded them. But the decline in 1951 was equally influenced by the postponing of the marriage of children to later years.
50. As things now stand, the proportion of the widowed and the divorced among the females in the age groups of '5 to 14', '15 to 24' and 25 to 34', is by far the lowest recorded during the current century. But it is not without significance that, in spite of this striking decline, about 1 per cent of the total female population in the age group of '5 to 14', 4 per cent in the age group of '15 to 24' and as much as 10 per cent in the age group of '25 to 34' and 27 per cent in the age group of '35 to 44' was immobilised in so far as the further growth of population is concerned. But if the trend hitherto in this state and the existing conditions in the country as a whole and ~n the adjoining tracts of the neighbouring states, other than those of M'l,dras, are any indication, then it is likely that the proportion of the widowed and divorcerl females in these age groups may further -decline. The proportion of the divorced and wid )wed among the males, which has of course never been significant as among the female i, W3.3 very low in 1951, though it was not the lowest recorded since 1901. Its decline in the lower age groups was particularly marked. The fall in the proportion of the widowed and divorced and the increase in that of the married among young men and women and the decline in child marriages (vide paragraph 45) are the major changes in the marital habits of the p<:ople in recent years. The first two tend to accelerate and the i,hird to deceler .t ~ the growth of pi 'pula~ion. But, to the extent such changes finally infl uence the trend, the third will be the most effective factor in the coming years.
51. The Divorced.-Figures pertaining exclusively to the divorced in this state are available only for the 1941 and 1951 Censuses. The proportion of the divorced among the females and the males, for every 1,000 -persons of the sex concerned, in each of the various age groups in this state as recorded at the two censuses and in the adjoining districts of Madras and Madhya Pradesh States as recorded at the present census is given in Table 14.
TABLE 14
Proportion of Divorced among 1,000 Females in the Age Group of: State and Year '""" All 5-14 15-24 25-34 35-44 45-540 55 and
ages over (1) (2) (3) (4) (5) (6) (7) (8)
lIyderabad (1941 6 1 4 8 10 Ii 15
Adjoining Districts of Madras ., L1951 6 2 11 10 9 6 3 .. 1951 6 7 12 10 10 9
Adjoining Districts of Madhya Pradesh 1951 4 I B 8 S 5 ,
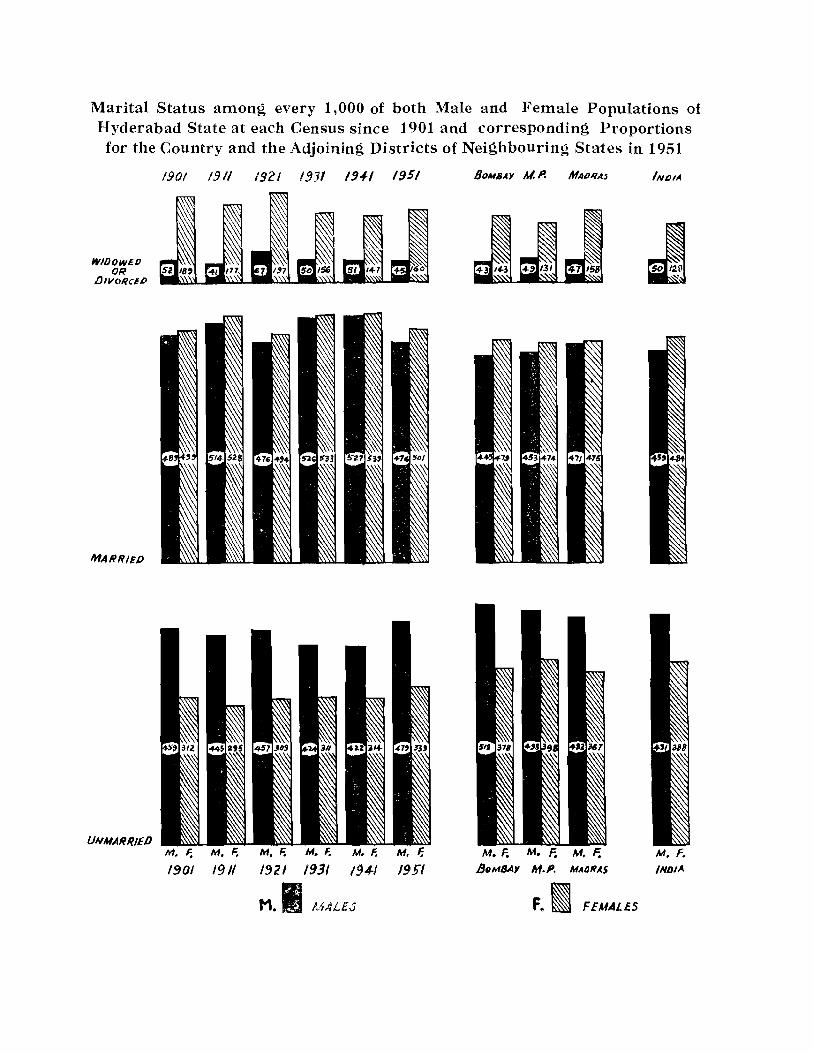
Marital Status among every 1,000 of both Male and Female Populations of Hyderabad State at each Census since 1901 and corresponding Proportions for the Country and the Adjoining Districts of Neighbouring States in 1951
WIDOW£D OR
DlvoRaD
MARRIED
UNMARRIED
190/ /911 1921 13}1 194/ 1951 BOMBAY MoP. MIII"W INDIA
M. F. M. F. M. F. M. F. M. F;
1901 1911 IfJ21 /93/ 194-1 1951
M.I MALES
M. F. M. F. M. F. lJDMBA'f M.P. MADRAS
Fel FEMALES
~ ~
M. F. INDIA

Marital Status among every 1,000 of both the Male and the Female Populations in All Districts as recorded in 1951
IIJ1MAiflll6D
~ -< p:: r!> --: -< "'] :::l -< ...
~ ~
::z -<: i!) ..: Z ;:1, z 0 ..: -< ..: 0 ~ <: <: ;:< - :::: ~ ;:Q z 0 7, -,: :;: z ~ ~
..- .:I ...: ~ :;0; z - ..;: ~ 0 "'] :::; " := .0: u :::I "'l :<l < ... -< S ;>:; ;::l ;z "'- ::0 ~
,.. ,., ~ ;:; -{, Q ::: :::: 0 "'1 ...: ::: - '" -< -< 0 ~ '" ~ < -< < Z "'" ..,. ,_ ..... .... ::::: .. _. z ~ ~
;;.. Z ~ """ '"'"I .... - ,..-; _, ., ......
NIIJOIN£Dlr n ,/)",~ItC''1 R 1m rm rm rm :mJ "" 1m e EJ m a g em D
UNMAN/IIII)
• MAll's
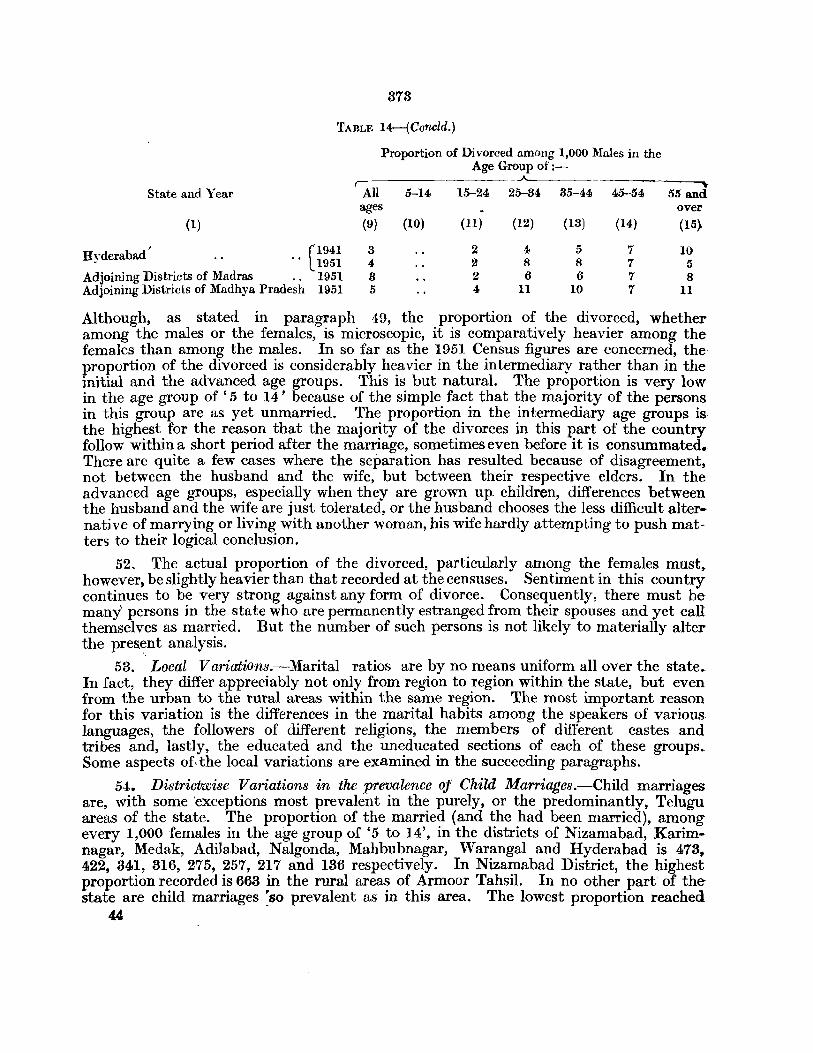
878
TABLE 14-(Coru:ld.)
State and Year
(1)
Hyderabad' [1941 .. 1951
Adjoining Districts of Madras .. 1951 Adjoining Districts of Madhya Pradesh 1951
All
Proportion of Divorced among 1,000 Males in the Age Group of :-
5-14 15-24 25-84 85-44 45--54 ages (9) (10) (ll) (12) (18) (14)
3 2 4 5 7 4 2 8 8 7 8 2 6 6 7 5 4 11 10 7
55 and over (15)
10 5 8
11
Although, as stated in paragraph 49, the proportion of the divorced, whetheramong the males or the females, is microscopic, it is comparatively heavier among the females than among the males. In so far as the 1951 Census figures are concerned, the proportion of the divorced is considerably heavier in the intermediary rather than in the initial and the advanced age groups. This is but natural. The proportion is very low in the age group of '5 to 14' because of the simple fact that the majority of the persons in this group are as yet unmarried. The proportion in the intermediary age groups is the highest for the reason that the majority of the divorces in this part of the country follow within a short period after the marriage, sometimes even before it is consummated. There are quite a few cases where the separation has resulted because of disagreement, not between the husband and the wife, but between their respective elders. In the advanced age groups, especially when they are grown up. children, differences between the husband and the wife are just tolerated, or the husband chooses the less difficult alternative of marrying or living with another woman, his wife hardly attempting to push matters to their logical conclusion.
52. The actual proportion of the divorced, particularly among the females must~ however, be slightly heavier than that recorded at the censuses. Sentiment in this country continues to be very strong against any form of divorce. Consequently, there must be manyl persons in the state who are permanently estranged from their spouses and yet call themselves as married. But the number of such persons is not likely to materially alterthe pres.~nt analysis.
53. Local Variations.-Marital ratios are by no means uniform all over the state. In fact, they differ appreciably not only from region to region within the state, but even from the urban to the rural areas within the same region. The most important reason for this variation is the differences in the marital habits among the speakers of various languages, the followers of different religions, the mem~ers of different castes and tribes and, lastly, the educated and the uneducated sectIons of each of these groups. Some aspects of, the local variations are examined in the succeeding paragraphs.
54. Districtwise Variations in the prevalence oJ Child Marriages.-Child marriages are, with some 'exceptions most prevalent in the purely, or the predominantly, Telugu areas of the state. The proportion of the married (and the had been married), among every 1,000 females in the age group of '5 to 14', in the districts of Nizamabad, Karimnagar, Medak, Adilabad, Nalgonda, Mahbubnagar, Warangal and Hyderabad is 473, 422, 841, 316, 275, 257, 217 and 186 respectively. In Nizamabad District, the highest proportion recorded is 663 in the rural areas of Armoor Tahsil. In no other part of the state are child marriages ~so prevalent as in this area. The lowest proportion reached
44
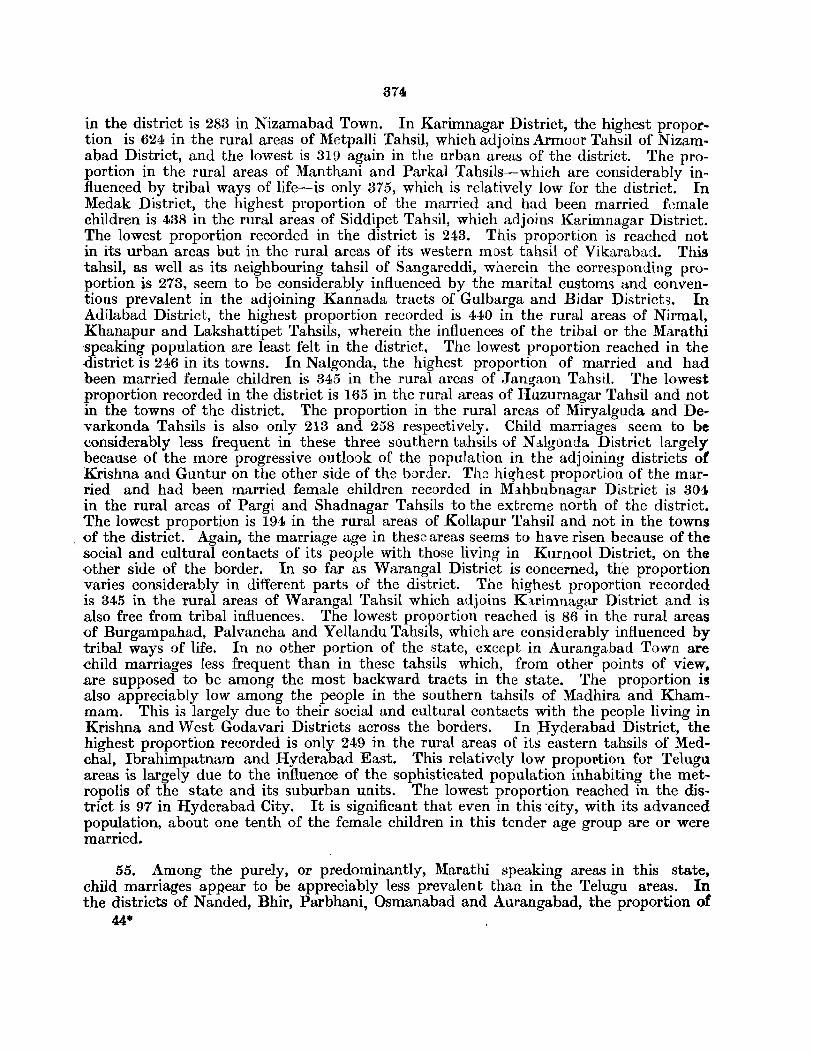
374
in the district is 283 in Nizamabad Town. In Karimnagar District, the highest proportion is 624 in the rural areas of Metpalli Tahsil, which adjoins Armoor Tahsil of Nizamabad District, and the lowest is 319 again in the urban areas of the district. The proportion in the rural areas of Manthani and Parkal Tahsils-which are considerably influenced by tribal ways of life~-is only 875, which is relatively low for the district. In Medak District, the highest proportion of the married and had been married female children is 438 in the rural areas of Siddipet Tahsil, which adjoins Karimnagar District. The lowest proportion recorded in the district is 243. This proportion is reached not in its urban areas but in the rural areas of its western most tahsil of Vikarabad. This tahsil, as well as its neighbouring tahsil of Sangareddi, wherein the corresponding proportion is 273, seem to be considerably influenced by the marital customs and conventions prevalent in the adjoining Kannada tracts of Gulbarga and Bjdar District;;. In Adilabad District, the highest proportion recorded is 440 in the rural areas of Nirmal, Khanapur and Lakshattipet Tahsils, wherein the influences of the tribal or the Marathi speaking population are least felt in the district, The lowest proportion reached in the -district is 246 in its towns. In Nalgonda, the highest proportion of married and had been married female children is 345 in the rural areas of Jangaon Tahsil. The lowest proportion recorded in the district is 165 in the rural areas of Huzurnagar Tahsil and not in the towns of the district. The proportion in the rural areas of Miryalguda and De~ varkonda Tahsils is also only 213 and 258 respectively. Child marriages seem to be considerably less frequent in these three southern tahsils of N algonda District largely because of the more progressive outlook of the population in the adjoining districts of Krishna and Guntur on the other side of the border. The highest proportion of the married and had been married female children recorded in MJ,hbubnagar District is 304 in the rural areas of Pargi and Shadnagar Tahsils to the extreme north of the district. The lowest proportion is 194 in the rural areas of Kollapur Tahsil and not in the towns
, of the district. Again, the marriage age in these areas seems to have risen because of the social and cultural contacts of its people with those living in Kurnool District, on the other side of the border. In so far as Warangal District is concerned, the proportion varies considerably in different parts of the district. The highest proportion recorded is 345 in the rural areas of Warangal Tahsil which adjoins K:trimnagar District and is also free from tribal influences. The lowest proportion reached is 86 in the rural areas of Burgampahad, Palvancha and Yellandu Tahsils, which are considerably influenced by tribal ways of life. In no other portion of the state, except in Aurangabad Town are child marriages less frequent than in these tahsils which, from other points of view, are supposed to be among the most backward tracts in the state. The proportion is also appreciably low among the people in the southern tahsils of Madhira and Khammam. This is largely due to their social and cultural contacts with the people living in Krishna and West Godavari Districts across the borders. In ,Hyderabad District, the highest proportion recorded is only 249 in the rural areas of its eastern tahsils of Medchal, Ibrahimpatnam and Hyderabad East. This relatively low propOl.tion for Telugu areas is largely due to the influence of the sophisticated population inhabiting the metropolis of the state and its suburban units. The lowest proportion reached in the district is 97 in Hyderabad City. It is significant that even in this 'city, with its advanced population, about one tenth of the female children in this tender age group are or were married.
55. Among the purely, or predominantly, Marathi speaking areas in this state, child marriages appear to be appreciably less prevalent than in the Telugu areas. In the districts of Nanded, Bhir, Parbhani, Osmanabad and Aurangabad, the proportion of
44*
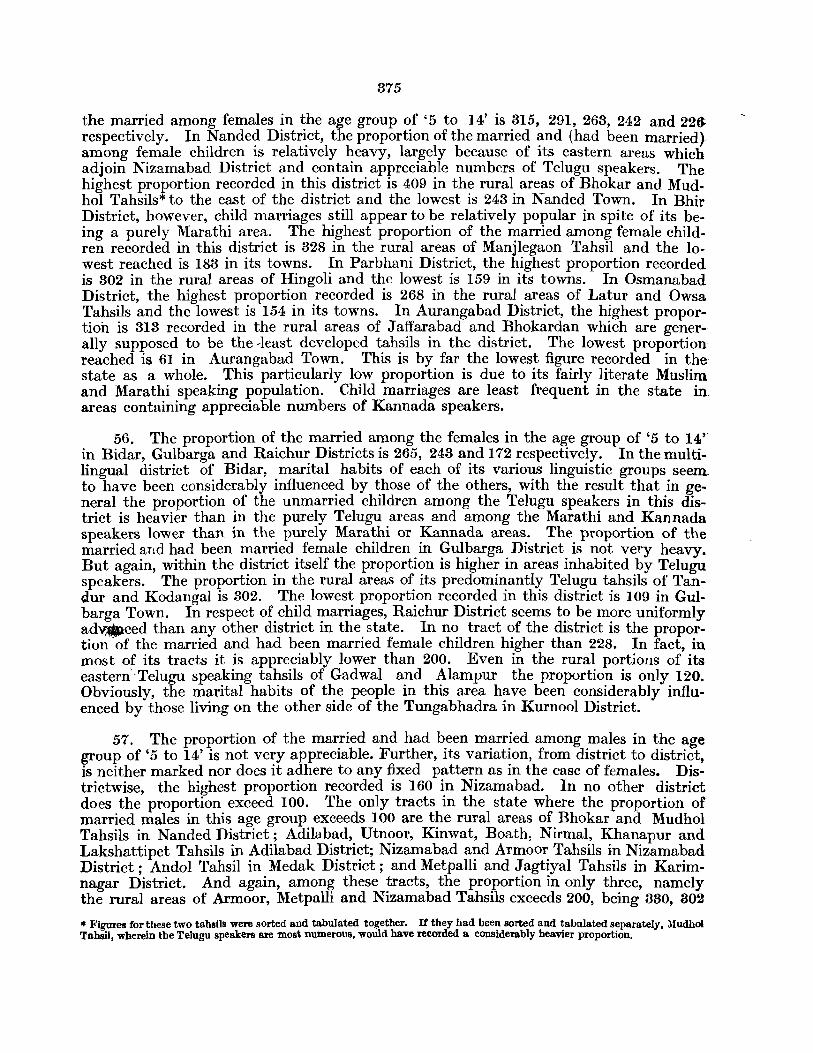
875
the married among females in the age group of '5 to 14' is 815, 291, 268, 242 and 22~ respectively. In _Nande~ Distr~ct, the proportion of the married ~nd (had been married)" among female chIldren IS relatively heavy, largely because of Its eastern areas which adjoin Nizamabad District and contain appreciable numbers of Telugu speakers. The highest proportion recorded in this district is 409 in the rural areas of Bhokar and MudhoI Tahsils* to the east of the district and the lowest is 248 in Nanded Town. In Bhir District, however, child marriages still appear to be relatively popular in spite of its being a purely Marathi area. The highest proportion of the married among female children recorded in this district is 828 in the rural areas of Manjlegaon Tahsil and the lowest reached is 188 in its towns. In Parbhani District, the highest proportion recorded is 802 in the rural areas of Hingoli and the lowest is 159 in its towns. In Osmanabad District, the highest proportion recorded is 268 in the rural areas of Latur and Owsa Tahsils and the lowest is 154 in its towns. In Aurangabad District, the highest proportion is 818 recorded in the rural areas of Jaffarabad and Bhokardan which are generally supposed to be the ~least developed tahsils in the district. The lowest proportion reached is 61 in Aurangabad Town. This is by far the lowest figure recorded in the state as a whole. This particularly low proportion is due to its fairly literate Muslim and Marathi speaking population. Child marriages are least frequent in the state in. areas containing appreciable numbers of Kannada speakers.
56. The proportion of the married among the females in the age group of '5 to 14' in Bidar, Gulbarga and Raichur Districts is 265, 243 and 172 respectively. In the multilingual district of Bidar, marital habits of each of its various linguistic groups seem to have been considerably influenced by those of the others, with the result that in general the proportion of the unmarried children among the Telugu speakers in this district is heavier than in the purely Telugu areas and among the Marathi and Kannada speakers lower than in the purely Marathi or Kannada areas. The proportion of the married and had been married female children in Gulbarga District is not very heavy. But again, within the district itself the proportion is higher in areas inhabited by Telugu speakers. The proportion in the rural areas of its predominantly Telugu tahsils of Tandur and Kodangal is 302. The lowest proportion recorded in this district is 109 in Gulbarga Town. In respect of child marriages, Raichur District seems to be more uniformly adVl'iJ,lced than any other district in the state. In no tract of the district is the proportion of the married and had been married female children higher than 228. In fact, in most of its tracts it is appreciably lower than 200. Even in the rural portions of its eastern"Telugu speaking tahsils of Gadwal and Alampur the proportion is only 120. Obviously, the marital habits of the people in this area have been considerably influenced by those living on the other side of the Tungabhadra in Kurnool District.
57. The proportion of the married and had been married among males in the age group of '5 to 14' is not very appreciable. Further, its variation, from district to district, is neither marked nor does it adhere to any fixed pattern as in the case of females. Districtwise, the highest proportion recorded is 160 in Nizamabad. In no other district does the proportion exceed 100. The only tracts in the state where the proportion of married males in this age group exceeds 100 are the rural areas of Bhokar and Mudhol Tahsils in Nanded District; Adilabad, Utnoor, Kinwat, Boath, Nirmal, Khanapur and Lakshattipet Tahsils in Adilabad District; Nizamabad and Armoor Tahsils in Nizamabad District; Andol Tahsil in Medak District; and Metpalli and Jagtiyal Tahsils in Karimnagar District. And again, among these tracts, the proportion in only three, namely the rural areas of Armoor, Metpalli and Nizamabad Tahsils exceeds 200, being 330, 302
• Figures for these two tahsils were sorted and tabulated together. If they had been sorted and tabulated separately. lIIudhol Tahsil, wherein the Telugu speakers are most numerO\lS, would have recorded a conSiderably heavier proportion.
876
and 268 respectively. It may be recalled that the corresponding proportion of the married females in these three tracts is also the highest in the state. The only thing striking in regard to the proportion of the married and had been married males in this age group is the fact that it is relatively heavy in some tribal tracts. This is due to the fact that the people in these tracts do not as in the others countenance wide disparity between the ages of the bride and the bridegroom. Consequently, even a few married females in this age group in these tracts are sufficient to lead to a relatively larger number of married males in the same group as compared with most other tracts in the state.
58. It will thus be obvious that child marriages in the state are most frequent in its Telugu and least frequent in its Kannada areas. But in Telugu areas where the tribal influence or population is significant the marriage age tends to be higher. Again, subject to these differences in the linguistic zones, child marriages are more common in villages than in towns or cities-partly because of the more 'progressive' outlook in such matters -of the people in the towns and partly because of the concentration therein of Muslims and other socially advanced groups.
59. Districtwise Variation in the Universality of ]larriages.--lt has been stated ·earlier that all persons in this state marry sooner or later. There are, however, some variations in this respect from district to district which are not entirely without significance. Variation in the proportion of the unmarried in the younger age groups in any two tracts is no criterion for assessing the relative degree of the prevalence or otherwise of celibacy in the tracts. It merely reflects the difference in the age at which persons are generally married in the tracts. In view of this, the present analysis is restricted only to the varia· . tions in the proportion of the unmarried in the higher age groups.
60. The proportion of the unmarried among very 1,000 females in the age group of ·'25 to 84' in this state is only 8. But in Adilabad, Raichur, Hyderabad and Gulbarga the proportion is as much as 29, 21, 14 and 10 respectively. In all the other districts it is less than 10. The relatively heavy proportion in Hyderabad District, in other words in Hyderabad City, is easily explained as being the result of a fairly high degree ·of education as well as tile general excess of females among the Muslims who account for over forty per cent of the population of the metropolis. The proportion of the unmarried among every 1,000 females in the age group of '85 to 44' in this state is only 6. Bu.ain in Raichur District it is as much as 15. In all the other districts it is less than 10. The -corresponding proportion of the unmarried females in the age group of'45 to 54' in this state is 7. But, once again in Raichur District it is as heavy as 84. It is 10 in Gulbarga. In all the other districts the proportion is appreciably less than 10. The proportion of the unmarried among the elderly, i.e., among those aged '55 and over' in the state, is .only 5. But in Karimnagar and Mahbubnagar and over again in Raichur, it is as high as 13.10 and 10 respectively. The proportion is microscopic in all the other districts of the state.
61. The proportion of the unmarried among every 1,000 males in the age group of "85 to 44' in the state is 21. But the proportion in Raichur, Bhir and Hyderabad is as much as 42, 38 and 82 respectively. The corresponding proportion among the males in the age group of '45 to 54' in the state is 14. And again the proportion is as heavy as 25 in Raichur District. The proportion of the unmarried males in the age group of '55 and -over' in this state is n. And once again in Raichur District it is as heavy as 20. In all these three age groups, the proportion of the unmarried males in the eastern districts of Adila.abad, Nizamabad, Medak, Karimnagar, Warangal and Nalgonda is appreciably lower than in the other districts of the state.
377
62. It will thus be obvious that though the proportion of the unmarried in all the higher age groups is microscopic in the state, it is by no means negligible in Raichur District. ~ithin ~his district, .th~ proportion of ~he unmarried females in the higher age .groups IS especIally heavy III ItS western tahsIls of Koppal, Yelburga and Gangawati. In fact, in this tract the proportion of the unmarried females in the age group of '35 to 44' is 21 and in that of '45 to 54' is as heavy as 106! This seems to have been one of the important reasons for retarding the growth of population in the district during the previous decades.
63. Districtwise Variations in the Proportion of the Widowed.-The proportion of the widowed among every 1,000 females in the state is 194. But within the state itself the proprotion varies appreciably. In the four districts of Bhir, Warangal, Aurangabad and Osmanabad, it is as low as 18.~, 139, 141 and 143 respectively. In nine other districts, namely Pa-rbhani, Bidar~ Nalgonda, Karimnagar, Nanded, Adilabad, Mahbubnagar, Hyderabad and Medak, the proportion varies within the narrow limits of 145 to 160-the proportion in the first four being lower than the average for the state. In the remaining three districts of Gulbarga, Nizamabad and Raichur it is as high as 168, 177 and 196 respectively. These three districts, especially Raichur, have much more than the average share of the widowed in the state.
6..t. Examined from the point of view of age groups, the proportion of the widowed .among every 1,000 females in the lower age groups does not vary to any remarkable ,extent from district to district. But in the higher age gr;:mps the variation is particularly marked. In the initial age group of '5 to 14', the proportion is not very significant in any district ,of the state. It is as low as 2 in Warangal <,nd 3 in Bidar and Osmanabad Districts and, at the ot.her end, it is 7 in Karimnagar and 9 in both Adilabad and Nizamabad. The relatively heavy proportion in these three districts results only from the greater frequency of child marriages in them. Tractwise, the highest proportion of the widowed females recorded in the state in the age group of '5 to 14' is 22 in the rural areas of both Armoor Tahsil of Nizamabad and the adjoining Metpalli Tahsil of Karimnagar District. In the next higher age group of '15 to 24', the proportion of the widowed females at the one end is 21 in both Aurangabad and Medak Districts and, at the, other, only 30 in Raichur and 33 in 03manabad. But the range becomes s criking in the remaining age groups. In the age group of '25 to 34', the proportion at its lowest is 76 in Nanded and at its highest is 117 in Raichur. In two other districts of the state, namely Nizamabad and Osmanabad, the proportion is also as heavy as 104 and 106 respectively. The proportion in the age group of '35 to 44' ranges from 226 in the case of Aurangabad District to 332 again in the case of Raichur District. In no other district, however, is the proportion heavier than 300. The variation in the proportion of the widowed is especially marked in the age group of '45 to 54' wherein it ranges from 457 in Bhir to as much as 586 once again in Raichur District. In the age group of '55 .and over' the proportion ranges from 752 in Karimnagar to 846 in Raichur.
65. Among the males, however, for reasons already explained, the proportion of the widowed is relatively very Jow. Besides, the variation from district to district is not very significant. Among every 1,000 males in the state only 41 are widowed. At its lowest, the proportion is 29 in Hyderabad and at its highest 54 in Raichur. Examined from the point of view of age groups, the variation in the proportion of the widowed .among every 1,000 males in the age group of '5 to 14' is very negligible. It ranges
378
from one in Aurangabad, Bhir, Osmanabad, Raichur, Gulbarga, Medak and Karimna~ gar to 3 in both Adilabad and Nanded. In the next higher age group of '15 to 24', it varies between 3 in Hyderabad and 14 in Parbhani. In the age group of '25 to 34', it varies from 18 in case of Medak to 40 in case of Parbhani. In the next higher age group' of '35 to 44' it ranges between 35 in case of Hyderabad and 72 in case of Parbhani. In the age group of '45 to 54', it varies from 78 in Hydetabad to 147 in Raichur. Lastly, in the age group of '55 and over', the proportion of widowed, among every 1,000 males, varies from 199 in Mahbubnagar to 301 in Raichur-but in the remaining districts the variation is only from 203 in Hyderabad to 297 in Osmanabad.
66. No doubt, in most areas of this state, the proportion of the widowed among the females is very high even in· the context of the conditions prevailing in the country as a whole. But the proportion is unduly heavy in the south-western areas of the state, where Kannada mother tongue speakers predominate or have considerable influence. In the rural areas of Raichur District, the proportion of the widowed females ranges form 182 in those of Gadwal and Alampur Tahsils to 237 in those of Koppal, Yelburga and Gangawati Tahsils taken together. It is rather pathetic that in the latter tract one out of every four females is a widow. As against this, in the urban areas of the district, where the Muslims and the non-indigenous population groups are concentrated, the proportion of widowed among females is 168 which is considerably closerto the average for the state. The corresponding proportion in the Tungabhadra Project Camps is only 109. The especially small number of widows in these camps is, however, due largely to the fact that the proportion of the elderly females, amongst whom widows predominate, in all such temporary encampments of labourers is generally very low. The lamentably high proportion of the widowed in the rural areas of Raichur District could be better realised by a tractwise examination of their proportion in the different age groups. Fortunately in these areas, unlike in the other rural areas of the state, child marriages have lost much of their popUlarity. Consequently, the proportion of the widowed females in the age group of '5 to 14', at its highest, is only 8 in the rural areas of Sindhnoor, Kushtagi and Lingsugur Tahsils-but even this proportion is heavier than the average for the state. In the age group of '15 to 24', the proportion ranges from 23 in the rural areas of Man.vi and Deodurg to 36 in the rural areas of Sindhnoor, Kushtagi and Lingsugur Tahsils, the average for the state being 25. In the age group of '25 to 34' the lowest proportion of the widowed is 111 again'in the rural areas of Manvi, and Deodurg Tahsils and the highest is as much as 142 in the rural areas of Koppal, Yelburga and Gangawati Tahsils, the corresponding average for the state being only 90. In the age group of '35 to 44', the proportion ranges from 322 in the rural areas of Raichtir Tahsil to 365 in the rural areas of Kappal, Yelburga and Gangawati, as against the proportion of only 260 for the state. In the age group of '45 to 54', the lowest propotion is 551 in the rural areas of Koppal, Yelburga and Gangawati Tahsils and the highest is 644 in the villages of Raichur Tahsil, as against the state average of only 513. Even in the advanced age group of '55 and over' the proportion in every rural tract of this district is higher than that in the state as a whole. The proportion of the widowed is also fairly heavy in Gulbarga District, especially in the rural areas of Shahpur, Shorapur, Chitapur and Yadgir Tahsils. It looks as if the social restrictions on the remarriage of the widows, common to the 'higher' castes in the other areas of this state, have permeated to a majority of the castes in the south western portions of the state. The proportion of the widowed females is also very he~vy in Nizamabad District-in its rural as well as its urban areas. The heavier proportion is perceptible in most of the age groups. One' of the reasons for the heavier proportion of the widowed in the district is no doubt the· greater prevalence of child marriages in the district than in the others.
879
67. Districtwise Variations among the Divorced.-Although the proportion of the divorced in this state is microscopic both among the males and the females, it varies from district to district subject to some significant pattern. The purely and predominantly Telugu areas record a heavier proportion of the divorced than the corresponding Kannada or Marathi areas. Within the Telugu areas, the proportion of the divorced generally decreases in towns-where Muslims and the more advanced Hindu castes are concentrated-and in tracts where tribal influences are perceptible. It is generally supposed that divorce is more popular among the Muslims than among the Hindus. But this is only partly true, for the supposition holds good only in so far as the more advanced Hindu castes are concerned. Actually, divorce seems to be relatively most widespread in the state among the Scheduled Castes and the more backward of the Hindu castes in the Telugu areas- strangely the Scheduled Tribes, amongst whom child marriages are relatively less common, also seem to have a comparatively low proportion of the divorced. It may, however, be that more of the divorced among the Muslims remarry than among these castes.
68. The proportion of the divorced among every 1,000 females in the purely or the predominantly Telugu districts of Medak, Karimnagar, Nizamabad, Warangal, Adilabad, Mahbubnagar and Nalgonda is 10, 9, 9, 8, 8, 8 and 6 respectively. In Hyderabad District the proportion falls down to 4, largely because of Hyderabad Municipality and Hyderabad Cantonment, wherein the Muslim and the non-Telugu population is particularly concentrated. The proportion of the divorced females in Raichur, Gulbarga, Bidar and Nanded Districts, which have also appreciable numbers of Telugu mother tongue speakers, is 5, 4, 4 and 4 respectively. The proportion of the divorced females is particularly microscopic in the Marathi areas. It is 3 in Parbhani and Aurangabad Districts and only 2 in Bhir and Osmanabad Districts.
69. Tractwise, the heaviest proportion of the divorced among every 1,000 females in the state is 1.5 in the rural areas of Andol Tahsil of Medak District. The proportion exceeds 10 in the rural areas of Medak and Sangareddi Tahsils in Medak District; Kamareddy and Yellareddy Tahsils in Nizamabad District; Metpalli, Jagtiyal, Sultanabad and Huzurabad Tahsils of Karimnagar District; Pakhal and Khammam Tahsils of Warangal District; Mahbubnagar Tahsil of Mahbubnagar District; and lastly Nirmal, Khanapur and Lakshattipet Tahsils of Adilabad District. In no urban tract of the state does the proportion exceed 10 except in the mining towns of Kothagudem and Yellandu, the reasons for which are quite obvious. The low ~~t proportion of the divorced females recorded in the state is 1 in the rlH'al areas of K tlamnuri Tahsil in Parbhani District; Manjlegaon Tahsil in Bhir District; Latur and Owsa Tahsils in Osmanabad District; and in Gulbarga and Aurangabad Towns. The proportion in Hyderabad 'City as a whole is 4-but it is only 4 in Hyderabad Municipality and as low as 2 in Hyderabad Cantonment. As against this, the corresponding proportion in Warangal City is as much as 7.
70. The prop6rtion of the divorced among the males varies, more or less, on the 'same pattern as indicated above except that it is even less significant than that among the females. In the districts of Karimnagar, Medak, Nizamabad, Nalgonda, Adilabad, Warangal and Mahbubnagar the proportion is 7, 6, 6, 5, 5, 4 and 4 respectively. It is 4 in Bidar and 3 in Raichur, Gulbarga and Nanded Districts. It is only 2 in Parbhani and Osmanabad and 1 in Aurangabad, Bhir and Hyderabad Districts.
380
Summary.-The data pertaining to marital statu~ as given in the 1951 ('ensus publicatiOlls are based on a ten per cent sample of the enumerated population, excluding the 4,156 displa'('cd persons frem Pakistan. Besides, the other point to be borne in mind is the fact that in this part of the country, especially anlong the Hindus, every person recorded as 'married' is not necessarily leading a WEdded life from the demographic point of view and similarly every person recorded as 'widOWEd' may not hr.ve led a WEdded life at all. It is customary among many of the indigenous castes to leave a considerable interval, sometimes. running to years, between the 'marriage' and its actual consummation.
The distribution of population at any census accorcling to diffE rent categories of civil ccr:diticn depends. upon a number of variable factors such as crop conditions, marriage habits, age distributicn and sex proportion of the population, pattern of migration, occurrence or otherwise of famines 8J~d epidemics and relative strength of dit1:'erent ca&tes and religions. But it is not possible to evaluate precisdy the extent to which anyone or more of these factors influenced the marital ratios as revealed at any census. In 1951, among every 1,000 females in this state, 339 were unmarried and 661 were married or 'had been married'-the latter group consisting of 501 married, as many as 154 widowed and 6 divorced; and among every 1,000 males in this state, 479 were wnmarried and 521 were married or 'had been married'- the latter group con8isting of 476 married and only 41 widowed and 4 divorced.
The proportion o{unmarriedjemales, which was 312 at the beginning of this century, decrEaSEd to 295 in 1911, due largely to the prosperous conditions of the intervening years. But it agnin increal'ed to 309 in 1921 due largely to the famines, bad crops and soaring prices which characterised the 19I1-'21 decade. It further moved up to 311 in 1931 in spite of the fact that the intervening decade was relatively healthy and prosperous. The increase this time, however, resulted largely from an unusual increase in the proportion of children in the age group of '0-4' (who are the least married), due, in turn, to the fact that the virile population which survived the disasters of the 1911-'21 decennium multiplied at a fast rate in the relatively healthy decade of 1921-'31. Actually the proportion had declinEd in most of the age groups taken individually. The proportion further moved up to 314 in 1941 notwithstanding again the continued improvement recorded in economic and public health conditions. The increase this time was due largely to a definite decrea&e in child marriages. The marital habits of the people had started changing. The proportion of unmarried females once again increased, but rather sharply, to 339 in 1951. This was again due mainly to a decisive waning in the popularity of child marriages. In 1951, the proportion in the age group of 5-14 was as much as 728, which is by far the highest recorded during this century--the highest previously registered being only 622 in 1921. As against this, the proportion of unmarried females in eaC'h of the higher age groups in 1951, although it has never been anything but negligible in this state, was the lowest registered since 1901, except that in 1911 the proportion in the age group of '15-24' waS slightly lower. But rather significantly the present proportion of unmarried females in the lowt'r age groups of '5-14' and '15-24' and, to an appreciably smaller extent, in each of the highfl' age groups as well, is very low in this state as compared with the country as a whole. Thus, in spite of the fact that the adherence of the people of this state to the institution of marriage is appreciably stronger now than it was ever before during this century, the usage of child marriage has considerably declined among them. Again, while this state is stj}I very backward as compared with the ('ountry as a whole in so far as child marriages are concerned, it presents a distinctly healthier picture in respect of the universality of marriage as considerably fewer females in the higher age groups have remained unmarried in this state.
The proportion of marriedfemales, among every 1,000 of the sex, increased ftom 499 in 1901 to 528 in 1911 due largely to the healthy and prosperous conditions which prevailed dUIing the intervening years. This increase was shared by all elxcept the very advanced age groups which naturally haa been more seriously handicapped during the disastrous decade of 1891-1901. The overall proportion after again receding to 494 in 1921, due to the calamities of the 1911-'21 decade, moved up to 533 in 1931 more than making up for the earlier loss. This increasf', which was spread over all the age groups, resulted largely because of the relatively healthy and prosperous years whkh preceded it. It further increas{d to 539 in 1941 and this increase, which was attained notwithstanding some decline in the populflrity of early marriages, was largely due to the continued improvement in the economic and health conditions of the people and to a de('rease in the proportion of persons in the lower, i.e., the less married, age groups. But the proportion of married females decreased sharply to 501 in 1951 which was due mainly to a marked waning in the popularity of child marriages. The proportion of married female!. in the age group of '5-14' was only 265 in 1951, which is by far the lowest recorded during this century-the lowest previously registered bting as high as 357 in 1921. Other things being equal, this factor will tend to decelelate the growth of popUlation in the coming years. But this tendency will be counteracted, to an extent, because the proportion in each of the two age groups of '15-24' and '25-34' is now the highest and that in the age group of '35-44' the second highest recorded since 1901. As compared with the country as a whole, the proportion of the married females in the
381
.age group of '5-14' is still very high in this state and this is also true, though to a markedly smaller extent of the important reproductive age groups of '15-24' and '25-84' as well. '
The proportion of widowed and divorced females, among every 1,000 belonging to the sex, was 189 in 1901. Figures for widowed and divorced are not available separately for the earlier censuses. But this group can safely be presumed to consist predominantly of only the widowed. The proportion decreased to 177 in 1911, due chiefly to the healthy year~ which preceded it, in othe): words to the fact that during the decade fewer females were widowed and there waf> a rise in the relative numbers of children who form the least widowed group for the simple rea50n that they are the least married. The proportion shot up to 197 in 1921 because of the pestilences and famines of the 1911-21 decade. The actual proportion in the age groups of '5-14', '15-24' and '25-34' in 1921 was the highest recorded during this century. The proportion, however, steeply receded to 156 in 1931, due largely, as in 1911, to the healthy years of the intervening decade. The proportion further decreased to 147 in 1941,due both to the healthy conditions which prevailed during the intervening ycars and a decliue in the popularity of child marriages. The proportion of the widowed and divorced fcmale5 again moved up to 160 in 1951. But this overall increase was not shared by the lower age groups. In fact, it declined very sharply in the age groups of '5-14" '15-24' and '25-34' due to a low proportion of the unmarried itself in these groups and to the relatively healthy years of the 1941-51 decennium. The actual proportion in each of these groups is now by far the lowest recorded during this century. The increase in highel' age groups was due partly to the fact that they .eontained persons who had been affected by the epidemics and famines of the 1911-21, or, even the 1891-1901, decade and partly to the aged having suffered more because of the strain resulting from the upheavals 'of the 1941-51 decennium. In spite of all this, 1 per cent of the female population in this state in the age group of '5-14', 4 in '15-24', 10 in '25-34' and 27 in that of '35-44' was either widowed or divorced in 1951-the corresponding percentage for India being 0.3, 8, 8 and 20 respectively. But, in view both of the trend locally and the conditions in the country as a whole, the likelihood is that the proportion in these age groups may further d~line appreciably in this state in the coming years. The proportion of the divorced females, among every 1,000 of tpe sex, is now, as stated earlier, only 6 in this state. The actual proportion, however, must be heavier than this, though by no means appreciable. Due to sentimental reasons, many females permanently separated from their husbands continue to record themselves only as married-and do not deem it proper to get themselves 'legally' or 'conventionally' declared as divorced.
The proportion of the unmarried males, among every 1,000 of the sex, decreased from 459 to 445 in the -fairly prosperous decade ofl901-'I1. But it moved up to 457 at the end of the famine and epidemic ridden .decade of 1911-'21. The proportion, however, again declined, quite contrrry to the trend among the females, to 424 in 1931 due to the comparative prosperity of the 1921-'8] decade. The increase in the proportio~ of males in the least married age group of '0-4' du-:ing .this healthy de~ade waS not s_ufficiently nigh-as III case of females-to counteract the overall declIne In the I1toportlOn of unmarrIed males resulting from the improved economic condition of the people. The prop01·tion further declined to 422 in 1941 largely due to tpc continued economic prosperity of the people and a higher proportion of persons in the advanced, i.e., the more married age groups. This overall increase was attained in spite of a perceptible increase in the age of marriage i.e., an increase of the proportion in the hwer age groups. The proportion of unml\rried males, however, incr('ased sharply to 479 in 1951,primarilydueto '1 decisive increase in the age of marriage. Over 95 per cent of the males in the age group of '5-14' and 51 in that of '15-24' had remained unmarried in 1951-the percentage, in either case, being the highest recorded during this century.
The proportion of the married males increased from 489 to 514 during the prosperous decade of 1901-'11. But it steeply decreased to 476 at the end of the disastrous decade of 1911-'21 due to the increase in the ranks of both the widowed and unmarried. The proportion, however, sharply increased to 526 ten years later in 1931 because of the relatively healthy and prosperous years whi('h preceded it. The proportion ,once again increased to 527 in 1941 due partly to the relatively healthy and prosperous years of the intervening decade and partly to a decrease in the proportion of persons in the lower age groups. But the proportion of married males decreased steeply to 476 in 1951 due to a marked dl'cline in the popularity of child marriages. Only 44, among every 1,000 males, in the age group Qf '5-14' were married in 1951-tbe lowest proportion previously registered being 85 in 1901. The corresponding figure in the age group of '15-24' was also distinctly the lowest hitherto recorded. As compared with the country as a whole, the proportion of the married males is distinctly higher in this state in each of the age groups except that of '5-14'. The proportion is higher in this group in the country as a whole not hecause its population, in general, is more conservative in respect of child marriages th<tn the people of this state. The real reason is perhaps the fact that disparity between the ages of the bridal ('ouple is not so marked in the country in general as it is here-in other words, more girls in the age group of '5-14' are married to boys in the same group in India .as a whole than in thi8 state.
382
The variation in the proportion of the widowed and divorced males has not at all been significant in this state during the current century for the simple reason that most ofthem, except in the 2 dvanced age groups, have generally always remarried. The proportion was 52 in 1901, decreased to 41 in 1911, moved up to 67-the highest recorded during this century-in 1921, decrt'ased to 50 in 1931, increased imperceptibly to 51 in 1941 and declined to 45 in 1951. The decline in 1951 was due, to an appreciable extent, to a decrease in the number of married males themselves in the lower age groups. In 1951, the proportion of divorced males, among every 1,000 of tbe sex, was only 4, i.e., about two-thirds the corresponding proportion among females. But it will not be surprising if some of the males estranged permanently from their spouses have recorded themselves as unmarried. Nevertheless, the overall proportion of the divorced males is not likely to have been significant in this state.
The decrease in the proportion of the widowed and divorced and the increase in the proportion of the married among young men and women and the marked increase in the proportion of the unmarried among the children are the three most important of the recent changes in the marital ratios. While the first two tend to accelerate the third tends to decelerate the growth of population. But, to the errtent changes in marital ratios finally influence the growth oj population, the third of these changes is likely to be the most effective one during the coming years.
Within the state itself there are considerable variations in marital ratios because marital habits themselves differ appreciably among the speakers of various languages, followers of different religions, members of different castes and tribes and the educated and uneducated sections among each of them. Child marriages are less common in the towns than in the villages of the state. This is due to the concentration of not only the educated sections of all castes and groups but of Muslims as well in the former areas. Subject to this. child marriages are fairly frequent in the Telugu, less so in the Marathi and)east frequent in the Kannada speaking areas of the state. Again, within the Telugu areas themselves-apart from its urban units-they are least common in areas subject to tribal influences or adjoining the Marathi or Kannada' districts or the socially advanced districts of West Godavari, Krishna, Guntur and Kurnool on the other side of the border; and are most common in the central tracts consisting of the "eastern portions of Nizamabad, the western portions of Karimnagar and the adjoining areas of Mcdak, Nalgonda, Waraugal and Adilabad Districts. In the rural areas of Armoor Tahsil of Nizamabad District and Metpalli Tahsil of Karimnagar District the pro.portion of the married or 'had been married', among every 1,000 female children aged '5 to 14', is higher than 620 and 660 respectively I Within the Marathi areas, the proportion tends to be higher in Bhir District and in the eastern portions of Nanded District adjoining the Telugu districts; and within the Kannada areas-in fact, in the entire state excluding its cities and towns-they are least frequent in Raichur District. On the whole, Auraugabad Town, with only 6 per cent of its female children aged '5 to 14' married, has the distinction of being the most progressive unit in this state in this respect.
Similarly, no doubt the proportion of widows is fairly high in all districts of the state--even in Bhir wherein they are least conspicuous, they claim as many as 135 out of every 1,000 females. Nevertheless~ the proportion is particularly heavy in Nizamabad, Gulbarga and Raichur DistIicts. Conditions in thi~ regard are particularly lamentable in the south-western portions of the state in Raichur and Gulbarga Districts. This could be further illustrated by a few figures pertaining to Raichur District. In this districtand for every 1,000 females in each of the age groups-the proportion of widows is as high as 846 in the age group of '55 and over', 586 in that of' 45-54', 382 in that of '35-44' and 117 in that of '25-84', as against the corresponding proportions of 810, 518, 260 and only 90 recorded for the state. The proportion is not equally conspicuous in the lower groups of '15-24' and '5-14' merely due to the fact that fortunately in this district child marriages are the least frequent in the state. '
. ~gain, although the. proportion of the divorced is. not very signifi?ant in this state, it. is ~istinctly heavl~r III th~ ~elugu .than III the Kannada .or ~ore esp~Cl?,ny the Marathl areas-the proportion IS particularly mICroscopIC In BhIr and Osmanabad DIstrIcts. Withm the Telugu areas themselves, the proportion decreases in towns aIle;! in tracts where tribal influences are most perceptible. Thus, the Scheduled Tribes, who. are among the most backward from other points of view, seem to present a relatively progressive picture with regard to a low 'frequency' of the divorced and married children among the females.
In so far as the 'universality' of marriage is concerned, which can only be judged by the proportion of the unmarried in the higher age groups, although the number offemales who remain unmarried in these groups is almost microscopic in the state, it is by no means negligible in Raichur District. 10 out of every 1,000 females in the age group of '55 and over', as many as 84 in that of '45-54', 15 in that of '85-44' and 21 in that of '25-84' were unmarried in this district, as against the corresponding figures of only 5, 7, 6. and 8 for the state I
SECTION IV
PRI~CIPAL AGE GROUPS
(The tables relevant to thi~ Section are Main Tables 'ColI-Livelihood Classes by Age Groups' 'C-III-Age and Civil Condi. ,tian', 'C-IV- t~;HI Li,t~rclJ' ad 'C-V-SingleYearAgeReturns'givenatpages9, 41, 63 and 89,respfctively of Part ll-B of this Vol','ne and Su'Jiitiary Table~ '6.8' to '6.13' given at pages 194 to 199 of Part I--B of this Volume).
71. Nature of Enquiry and Limitations.-In the instructions issued to enumerators at the 1951 Census, they were asked to ascertain and record the age of each person enumer.ated by them in terms of the number of years completed by the person on the first of March, 1951. But they were directed in case of infants, i.e., those who were not a year -old to enter the age as '0'. The detailed instructions issued in this regard are contained in the foot note* given below.
72. Ignorance of one's precise age still continues to be almost universal, at any rate, in this part of the country. The average villager treats any enquiry regarding his .age or that of his dependants as just an attempt on the part of the sophisticated enquirer to be 'rather funny'. Persistent attempts to obtain reasonable answers generally result in confusing him entirely. He is rendered unable even to make allowances for the minimum margin necessary between his own age and that of his father or son. If at all he makes any thoughtful attempt to give the correct age, he generally equates it to one or the other of a set of specific ages depending on some marked phase in the life of the person concerned--such as, the subsistence of the baby on the mother's milk, the ability of the child to talk or run about, the attainment of puberty by the girl or of motherhood by the young woman, the boy's having started to earn, the man's having become a grandfather or his having grown too decrepit to earn and so on. I once found .a~Patwari putting the age of a young woman with four children as twenty-on the as~ sumption of her having become a mother when fourteen and subsequently having had a child atlintervals of two years. The general ignorance in this respect is reflected in the dumping of the age returns especially at 8, 10, 12, 14, 15, 16, 18, 20 and subsequently at 'all ages ending at fives and tens. Even the educated, as distinguished from the literate, whether in the villages or the towns, generally take an inordinately long time to reply to arw query regarding their age or that of their dependants. Quite often the replies gi ven' by the same person in this regard on different occasions are not consistent. But *The instructions issued to enumerators in this regard at the 1951 Census were as follows :-
" Question No.4. What is your age? (1) For our purposes, age means age attained by the person concerned on his last birthday. The reference date for
fixing the' Jast birthday' is not the date on which you are enumerating the person but the 1st March, 1951. In other words this would mean the number of years completed by a person on 1st March, 1951. •
Illustration :---Supposing that in reply to your query a person, say, Baliah, states he is 30 years and 10 months old. Such an answer leaves no room for further enquiries. Record his age as '30'. Supposing he states that he is 30 years and 11 months old. Then make further enquiries in order to ascertain whether he completes his 31st year on or before 1st Maroh, 1951. If he does so, record him as '81 '. If he does not, record him as '30 '. Supposing Baliah states that he is 80 years old. Then again ascertain his age in years and months (very often people here give their' running' age and not completed age, e.g., what actually Hallah means may be that he is 29 years and some months old). After ascertaining this, proceed as indicated above.
This is an important question. But most people may find it difficult to answer it correctly. In such cases you shQuld make all reasonable efforts to have satisfactory answers. For instance, you could call for the assistance of literate persons in the same household or from the neighbourhood who are well a<Jquainted with the family of the person you are enumerating. You can also determine the age by linking up the birth of the person, or his marriage, or the birth of the first child of such person, etc., to some event or occurrence locally weIlknown.
(2) As stated above record the age on last birthday, i.e., the actual number of completed yeaTS, in case of all persons aged OM year and above. For infants below one year write O.
(8) In case you feel that the person concerned is hesitating to give you an answer, or a correct answer, you can mako it clear to him that replies to all census questions will be treated as confidential, and no individual entry as~such will be published ()r made use of for any other purpose."
383
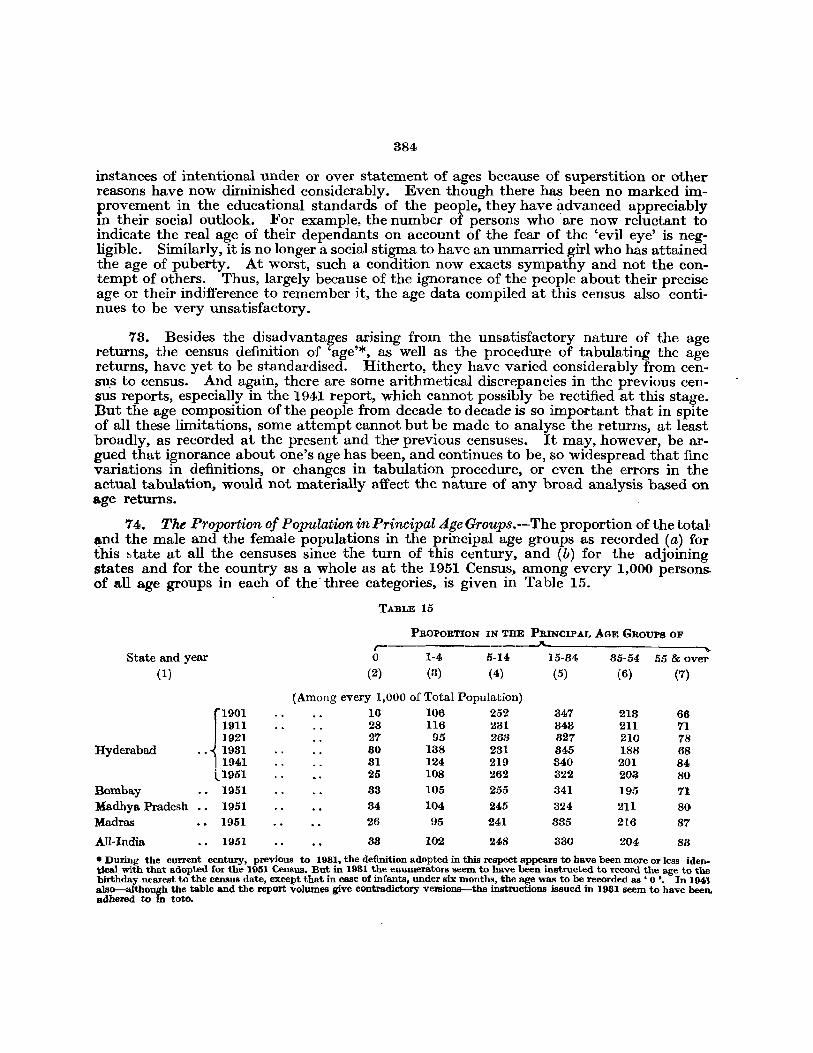
384
instances of intentional under or over statement of ages because of superstition or other reasons have now diminished considerably. Even though there has been no marked improvement in the educational standards of the people, they have advanced appreciably in their social outlook. For example, the number of persons who "are now reluctant to indicate the real age of their dependants on account of the fear of the 'evil eye' is negligible. Similarly, it is no longer a social stigma to have an unmarried girl who has attained the age of puberty. At worst, such a condition now exacts sympathy and not the contempt of others. Thus, largely because of the ignorance of the people about their precise age or their indifference to remember it, the age data compiled at this census also continues to be very unsatisfactory.
73. Besides the disadvantages arlsmg from the unsatisfactory nature of the age returns, the census definition of 'age'*. as well as the procedure of tabulating the age returns, have yet to be standardised. Hitherto, they have varied considerably from censu.s to census. And again, there are some arithmetical discrepancies in the previous census reports, especially in the 1941 report, which cannot possibly be rectified at this stage. But the age composition of the people from decade to decade is so important that in spite of all these limitations, some attempt cannot but be made to analyse the returns, at least broadly, as recorded at the present and the' previous censuses. It may, however, be argued that ignorance about one's age has been, and continues to be, so widespread that fine variations in definitions, or changes in tabulation procedure, or even the errors in the actual tabulation, would not materially affect the nature of any broad analysis based on age returns.
74. The Proportion of Population in Principal Age Groups.--The proportion of the total' ~nd the male and the female populations in the principal age groups as recorded (a) for this ~tate at all the censuses since the turn of this century, and (b) for the adjoining states and for the country as a whole as at the 1951 Census, among every 1,000 persons. of a.ll age groups in each of the" three categories, is given in Table 15.
State and year (1)
Hyderabad
Bombay Madhya Pradesh Madras
All-India
f1901 191.1
I ]921 .. -< 1931
11941 l1951
1951 1951 1951
1951
TABLE 15
PROPORTION IN THE PRINCIPAL AGE GROUPS OF
r- _)\
0 1-4 5-14. 15-84 85-54 55 & over (2) (3) (4) (5) (6) (7)
(Among every 1,000 of Total Population) 16 106 252 847 218 66 28 116 231 343 211 71 27 95 263 827 210 78 30 138 231 845 188 68 81 124 219 840 201 84 25 108 262 322 203 80 83 105 255 341 195 71 34 104 245 324 211 80 26 95 241 885 216 87
88 102 248 880 204 88 • During the eurrent century, previous to 1981, the definition adopted in this respect appears to have been more or less identical with that adopted for the 1951 Census. But in 1981 the enumerators seem to have been instructed to record the age to the birthday nearest to the census date, except that in case of infants, under six months, the age was to be recorded as • 0 '. In 1941 also--aIthou~h the table and the report volumes give contradictory versions-the instructions issued in 1981 seem to have been. adhered to In toto.
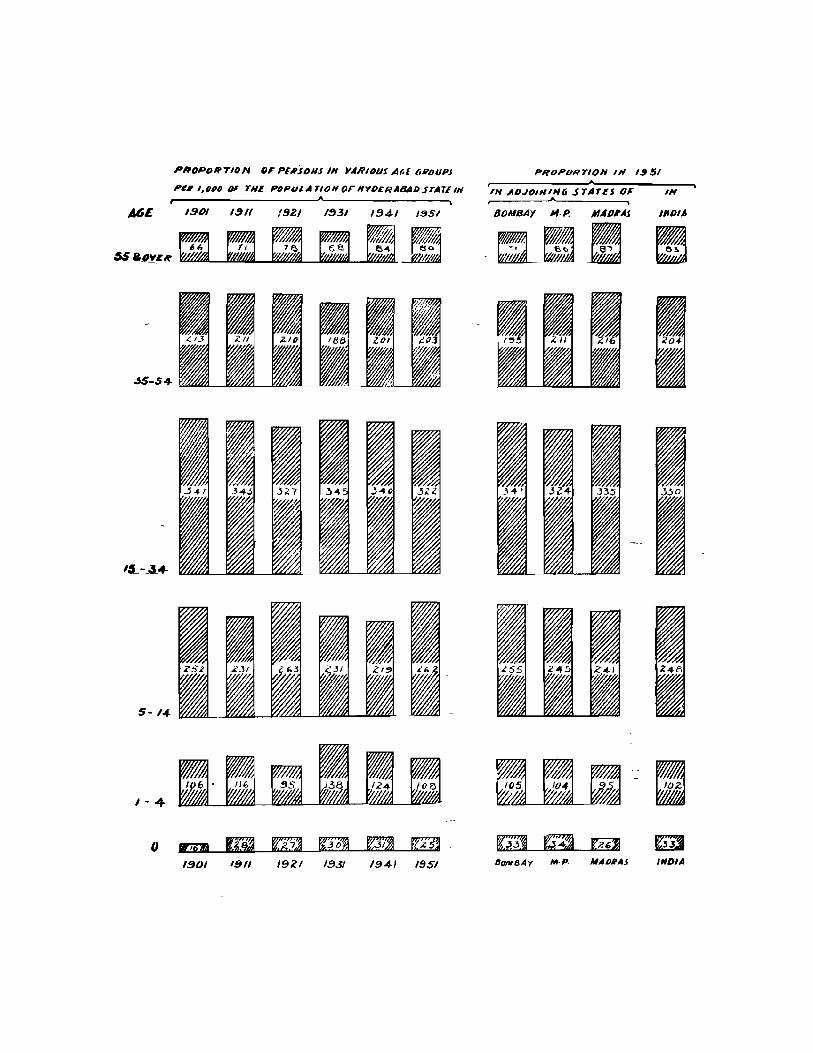
U£
S-/~
1-4
o
""DPDRTIDN ()F PU?S()NS IN II,fRIDUI AM (iIi'OUPJ
,elf l,fJ(JIJ OF TNE PfJPlJI.ATlONorHY/)£RABADJTATEIN
1901 1911 192/ I!HI 1!J4-1 1951
1901 1911 19~1 193/ 1941 19S1
PROPDRTION IN ,"51
IN ADJOININ6 STATES OF IN
80MBAY ",.p. MAD#AS IMDIA
.~!1_E ~
~ BOfIIB/ly HI· P. MA bRA 5 INDIA

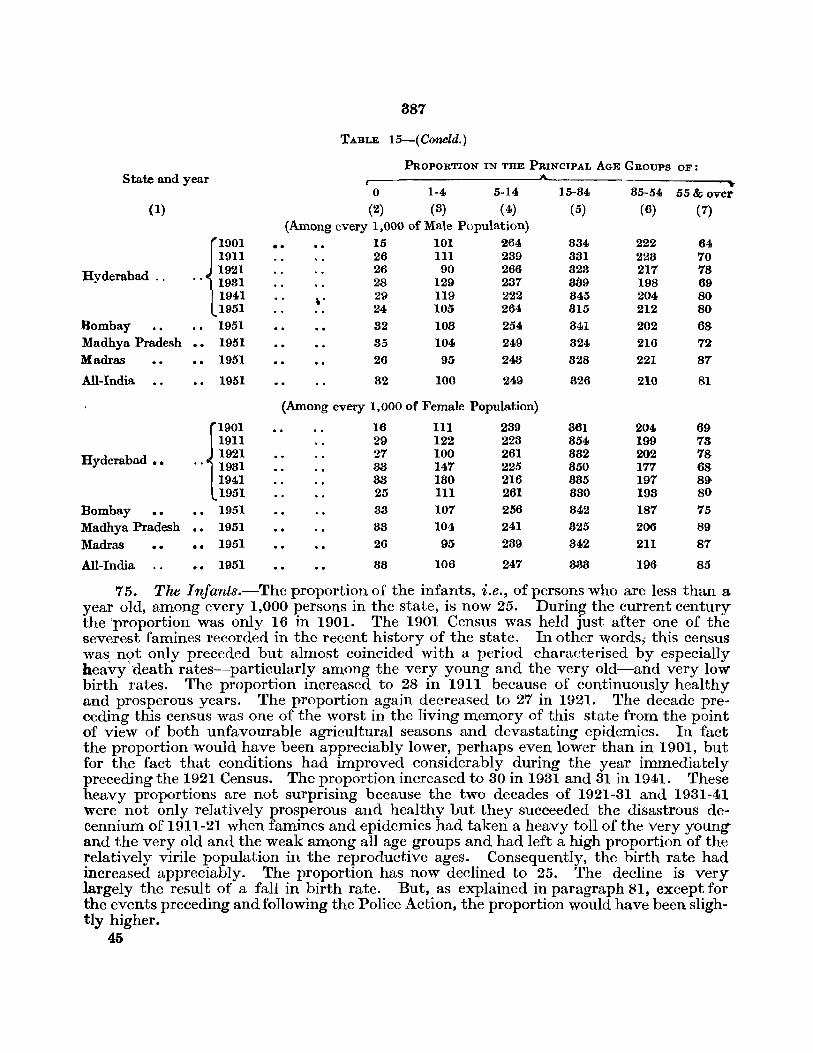
387
TABLE 15-(Concld.)
PROPORTION IN THE PRINCIPAL AGE GROUPS OF: State and year ___A__
0 1-4 5-14 15-34 35-54 55 & ove!' (1) (2) (3) ( 4) (5) (6) (7)
(Among every 1,000 of Male Population)
fOI .. 15 101 264 834 222 64
1911 26 III 289 831 223 70
Hyderabad .. 1921 26 90 266 823 217 78 .. 1931 28 129 237 339 198 69
1941 \. 29 119 222 345 204 80 1951 24 105 264 315 212 80
Bombay 1951 32 103 254 341 202 68 Madhya Pradesh 1951 35 104 249 824 216 72 Madras 1951 26 95 248 328 221 87
All-India 1951 82 100 249 326 210 81
(Among every 1,000 of Female Population)
{'"OI 16 111 239 361 204 69
1911 29 122 223 354 199 73
Hyderabad •• 1921 27 100 261 332 202 78 .. 1931 38 147 225 350 177 68
1941 38 130 216 385 197 89 1951 25 III 261 830 193 80
Bombay 1951 38 107 256 342 187 75 Madhya ~adesh 1951 33 104 241 325 206 89
Madras .. .. 1951 26 95 239 342 211 87
All-India 1951 83 106 247 333 196 85
75. The Infants.-The proportion of the infants, i.e., of persons who are less than a year old, among every 1,000 persons in the state, is now 25. During the current century the 'proportion was only 16 in 1901. The 1901 Census was held just after one of the severest famines recorded in the recent history of the state. In other words, this census was, n?t only preceded but almost coincided with a period characterised by especially heavy death rates--particularly among the very young and the very old-and very low birth rates. The proportion increased to 28 in 1911 because of continuously healthy and prosperous years. The proportion again decreased to 27 in 1921. The decade preceding this census was one of the worst in the living memory of this state from the point of view of both unfavourable agricultural seasons and devastating epidemics. In fact the proportion would have been appreciably lower, perhaps even lower than in 1901, but for the fact that conditions had improved considerably during the year immediately preceding the 1921 Census. The proportion increased to 30 in 1931 and 31 in 1941. These heavy proportions are not surprising because the two decades of 1921-31 and 1931-41 'Were not only relatively prosperous and healthy but they succeeded the disastrous decennium of 1911-21 when famines and epidemics had taken a heavy toll of the very young and the very old and the weak among all age groups and had left a high proportion of the relatively virile population in the reproductive ages. Consequently, the birth rate had increased appreciably. The proportion has now declined to 25. The decline is very largely the result of a fall in birth rate. But, as explained in paragraph 81, except for the events preceding and following the Police Action, the proportion would have been slightly higher.
45
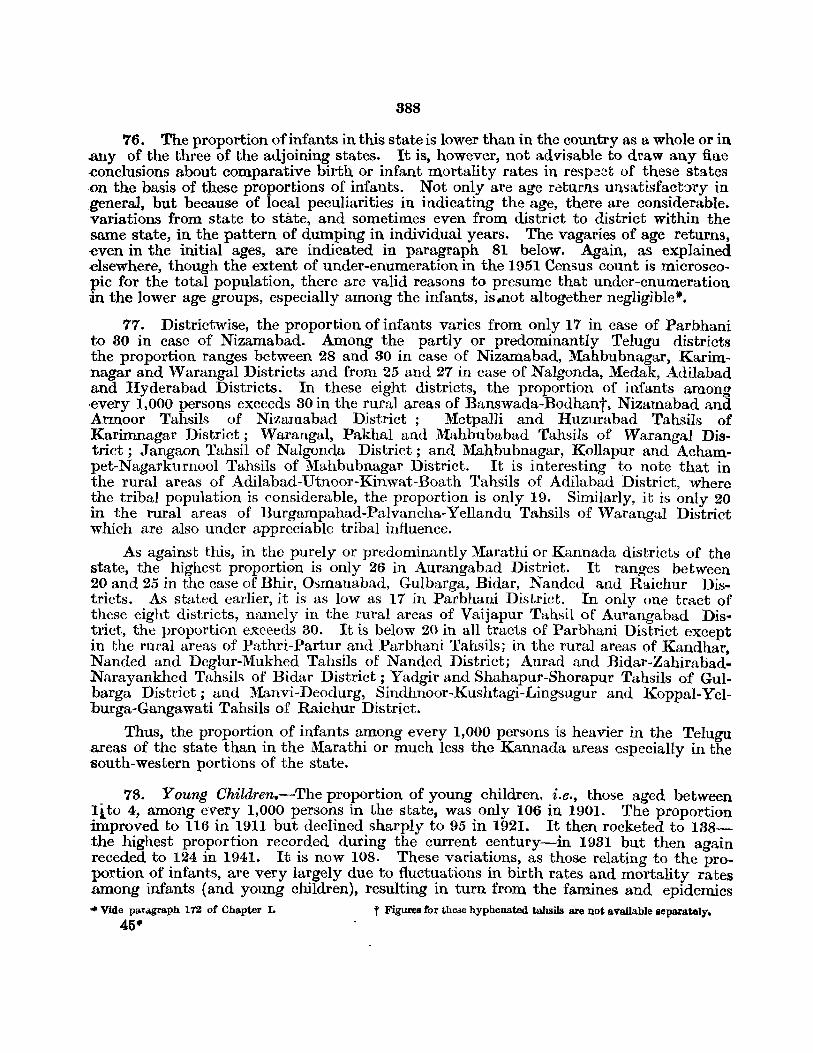
388
76. The proportion of infants in this state is lower than in the country as a whole or in .any of the three of the adjoining states. It is, however, not advisable to draw any fine ·conclusions about comparative birth or infant mortality rates in respect of these states on the basis of these proportions of infants. Not only are age raturns unsa.tisfactory in general, but because of local peculiarities in indicating the age, there are considerable. variations from state to state, and sometimes even from district to district within the same state, in the pattern of dumping in individual years. The vagaries of age returns, -even in the initial ages, are indicated in paragraph 81 below. Again, as explained .elsewhere, though the extent of under-enumeration in the 1951 Census count is microscopic for the total population, there are valid reasons to presume that under-enumeration in the lower age groups, especially among the infants, is.IlOt altogether negligible".
77. Districtwise, the proportion of infants varies from only 17 in case of Parbhani to 30 in case of Nizamabad. Among the partly or predominantly Telugu districts the proportion ranges between 28 and 80 in case of Nizamabad, Mahbubnagar, Karimnagar and Warangal Districts and from 25 and 27 in case of Nalgonda, Medak, Adilabad and Hyderabad Districts. In these eight districts, the proportion of infants among ·every 1,000 persons exceeds 30 in the rural areas of Banswada-Bodhant, Nizamabad and Arruoor Tahsils of Nizamabad District; MetpalJi and Huzurabad Tahsils of Karimnagar District; Warangal, Pakhal and Mahbubabad Tahsils of Waranga.l District; Jangaon Tahsil of Nalgonda District; and Mahbubnagar, Kollapur and Achampet-Nagarkurnool Tahsils of Mahbubnagar District. It is interesting to note that in the rural areas of Adilabad-Utnoor-Kinwat-Boath Tahsils of Adilabad District, where the tribal population is considerable, the proportion is only 19. Similarly, it is only 20 in the rural areas of Burgampahad-Palvancha-Yellandu Tahsils of Warangal District which are also under appreciable tribal influence.
As against this, in the purely or predominantly Marathi or Kannada districts of the state, the highest proportion is only 26 in Aurangabad District. It ranges between 20 and 25 in the case of Bhir, Osmanabad, Gulbarga, Bidar, Nanded and Raichur Districts. As stated earlier, it is as low as 17 in Parbhani District. In only one tract of these eight districts, namely in the rural areas of Vaijapur Tahsil of Aurangabad District, the proportion exceeds 30. It is below 20 in all tracts of Parbhani District except in the rural areas of Pathri-Partur and Parbhani Tahsils; in the rural areas of Kandhar. Nanded and Deglur-Mukhed Tahsils of Nanded District; Aurad and Bidar-ZahirabadNarayankhed Tahsils of Bidar District; Yadgir and Shahapur-Shorapur Tahsils of Gulbarga District; and Manvi-Deodurg, Sindhnoor-Kushtagi-Lingsugur and Koppal-Yelburga-Gangawati Tahsils of Raichur District.
Thus, the proportion of infants among every 1,000 persons is heavier in the Telugu .areas of the state than in the Marathi or much less the Kannada areas especially in the south-western portions of the state.
78. Young Children.--The proportion of young children, i.e., those aged between lito 4, among every 1,000 persons in the state, was only 106 in 1901. The proportion improved to 116 in 1911 but declined sharply to 95 in 1921. It then rocketed to 138-the highest proportion recorded during the current century-in 1981 but then again receded to 124 in 1941. It is now 108. These variations, as those relating to the proportion of infants, are very largely due to fluctuations in birth rates and mortality rates .among infants (and young children), reSUlting in turn from the famines and epidemics .. Vide paragraph 172 of Chapter I.
45· t Figures for the.>e hyphenated tahsils are not available separatoly •
389
of the decades 1891-1901 and 1911-1921 and the relatively healthy and prosperous conditions prevailing during 1901-1911, 1921-1931 and all subsequent decades supplemented by (a) a progressive decline in death rates due to greater appreciation on the part of" the people of modern curative and hygienic measures, (b) the gradual decline in birth rates, especiaJly during the last decade, because of the advan~ement in the age of marriage· and lastly (c) some temporary decline in birth rates during the months preceding and following the Police Action.
79. The prop_9rtion of young children, contrary to that of infants, is appreciably higher in this state, than in the adjoining states or in the country as a whole. This aspect is examined in some detail in paragraph 81.
80. Districtwise, the proportion varies from only 91 in case of Raichur to 118 in case of Parbhani. Among the purely or predominantly Telugu districts, it varies between 110 and 115 in case of Medak, Nalgonda and Mahbubnagar , between 105 and 110' in case of Karimnagar and Warangal, between 100 and 105 in case of Adilabad and Hyderabad Districts, and is only 97-the second lowest in the state-in case of Nizamabad. The proporticm. is less than 95 in the rural areas of Nizamabad and Banswada-Bodhan Tahsils of Nizamabad District; Nirmal-Khanapur-Lakshattipet Tahsils of Adilabad District; and J agtiyal Tahsil of Karimnagar District. The lowest proportion recorded in these tracts is 85 in the rural areas of Nizamabad Tahsil. In only one tract in all these eight districts, i.e., in the rural areas of Hyderabad East-Medchal-Ibrahimpatnam Tahsils of Hyderabad District, the proportion exceeds 120.
As against this, in the purely or predominantly Marathi or Kannada areas of the state, the proportion of young children per 1,000 persons ranges between 115 and 120 in Parbhani and Bidar Districts, between 110 and 115 in Bhir, Nanded and Osmanabad Districts and between 105 and 110 in Gulbarga and Aurangabad Districts, but only in Raichur District tile proportion is as low as 91. It exceeds 120 in all the rural areas of Parbhani District except those of Pathri-Partur and Hingoli TahsiIs in Parbhani District; Kandhar Tahsil in Nanded District; Humnabad and Ahmadpur-Nilanga Tahsilsin 'Bidar District; Mominabad Tahsil in Bhir District; Omerga and Latur-Owsa Tahsils in Qsmanabad District; and Afzalpur and Aland Tahsils in Gulbarga District. All the tracts in the Marathi and Kannada districts of the state in which the proportion of" young children is lower than even 95 are concentrated in the south-western portions of the state. The proportion is as low as 82-which is by far the lowest recorded in the state--in the rural areas of Koppal-Yelburga-Gangawati Tahsils of Raichur District, 86 in the rural areas of Yadgir Tahsil of Gulbarga Distr ict, 92 in the rural areas of ManviDeodurg Tahsils and 98 in those of Sindhnoor-Kushtagi-Lingsugur Tahsils all again in Raichur District. ,Even in the rural areas of Shahapur-Shorapur Tahsils of Gulbarga District, adjoining the other tracts mentioned above, the proportion is only 99
Thus; the chief feature about the districtwise proportion of young children is the fact that, unlike as in the case of the proportion of infants, it is relatively low in Telugu. areas and high in Marathi and Kannada areas with, however, the exception of the Kannada areas in the south-western portions of the state wherein the proportion of young children, as that of infants, is especially low. It is likely, that due to the appreciably larger proportion of married females in the younger age groups, the birth rate is heavier in the Telugu areas of the state than in the N on-Telugu areas. But it also looks as if the Telugu areas cannot sustain this position very long because of heavier mortality
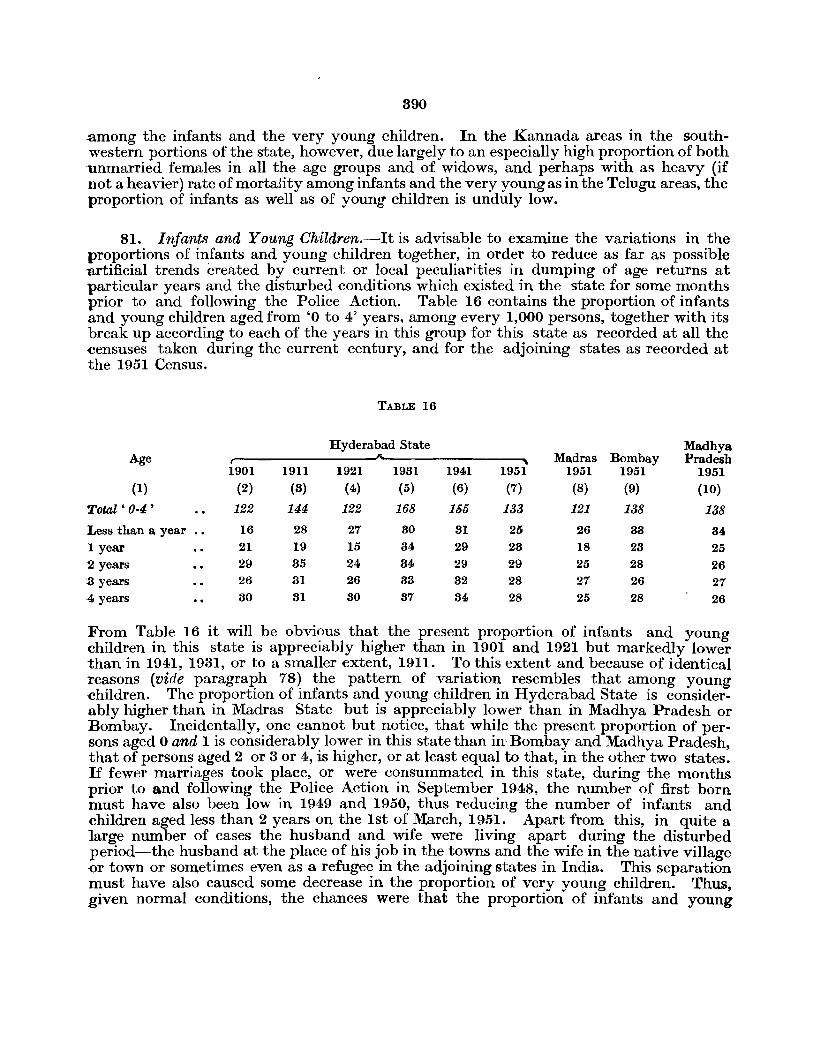
390
.among the infants and the very young children. In the Kannada areas in the southwestern portions of the state, however, due largely to an especially high proportion of both 'unmarried females in all the age groups and of widows, and perhaps with as heavy (if not a heavier) rate of mortality among infants and the very young as in the Telugu areas, the proportion of infants as well as of young children is unduly low.
81. Infants and Young Children.-It is advisable to examine the variations in the proportions of infants and young children together, in order to reduce as far as possible -artificial trends created by current or local peculiarities in dumping of age returns at particular years and the disturbed conditions which existed in the state for some months prior to and following the Police Action. Table 16 contains the proportion of infants and young children aged from '0 to 4' years, among every 1,000 persons, together with its break up according to each of the years in this group for this state as recorded at all the <censuses taken during the current century, and for the adjoining states as recorded at the 1951 Census.
TABLE 16
Hyderabad State Madhya Age ---A- Madras Bombay Pradesh
1901 1911 1921 1931 1941 1951 1951 1951 1951 (1) (2) (3) (4) (5) (6) (7) (8) (9) (10)
Total • 0-4' 122 144 122 168 155 133 121 138 138 Less than a year 16 28 27 30 31 25 26 33 84 1 year 21 19 15 34 29 28 18 23 25 2 years 29 85 24 84 29 29 25 28 26 :8 years 26 81 26 33 82 28 27 26 27 ·4 years 30 31 30 87 34 28 25 28 26
From TabJe 16 it will be obvious that the present proportion of infants and young children in this state is appreciably higher than in 1901 and 1921 but markedly lower than in 1941, 1931, or to a smaller extent, 1911. To this extent and because of identical reasons (vide paragraph 78) the pattern of variation resembles that among young ·children. The proportion of infants and young children in Hyderabad State is considerably higher than in Madras State but is appreciably lower than in Madhya Pradesh or Bombay. Incidentally, one cannot but notice, that while the present proportion of persons aged 0 and 1 is considerably lower in this state than in' Bombay and Madhya Pradesh, that of persons aged 2 or 3 or 4, is higher, or at least equal to that, in the other two states. If fewer marriages took place, or were consummated in this state, during the months prior to and following the Police Action in September 1948, the number of first born must have also been low in 1949 and 1950, thus reducing the number of infants and children aged less than 2 years on the 1st of March, 1951. Apart from this, in quite a large number of cases the husband and wife were living apart during the disturbed period-the husband at the place of his job in the towns and the wife in the native village or town or sometimes even as a refugee in the adjoining states in India. This separation must have also caused some decrease in the proportion of very young children. Thus, given normal conditions, the chances were that the proportion of infants and young
391
children in this state would _have been. equal to,o: only slightly lower, than in Bombay or Madhya Pradesh and consIderably hIgher than III Madras. But because of the diverse factors involved it is not possible to draw from these figures any conclusion regarding the comparative level of birth and infant and child mortality rates in this state as compared with those in the neighbouring states*.
82. Boys anti Girls.-The proportion of boys and girls, i.e., of those aged between '5 to 14', among every 1,000 persons in the state, is now as high as 262. This is only slightly lower than the highest proportion (namely, 263 in 1921) hitherto recorded during this century. The heavy proportion in 1921 was perhaps largely the indirect result of a fall in birth rate and heavier death rate among the infants and young children because of the disasters of the 1911-1921 decade. The present heavy proportion is,. perhaps, very largely the result of relatively greater numbers of infants and chiJdren surviving to enter and sustain this group. The present proportion of boys and girls in this ~ tate is appreciably heavier than in the country as a whole and all the adjoining states including even Bombay and Madhya Pradesh.
83. Districtwise, the proportion of boys and girls ranges between 245 in Medak and 281 in 'Nandcd. In the purely or predominantly Telugu districts, the proportion of boys and girls exceeds 265 only in Adilabad. It ranges between 255 and 265 in Warangal, Karimnagar and Mahbubnagar and between 245 and 255 in Hyderabad, Nalgonda, Nizamabad and Medak Districts. The highest proportion reached in these eight Telugu districts is 278 in the rural areas of Adilabad-Utnoor-Kinwat-Boath Tahsils of Adilabad District, which are under considerable Marathi and tribal influence. The proportion is lower than even 240 in the rural areas of Ramannapet and Nalgonda. Tahsils of Nalgonda District; in those of Narsapur, Andol, Vikarabad and Sangareddy Tahsils of Medak District; Banswada-Bodhan Tahsils of Nizamabad District; and Kalvalrurti Tahsil of Mahbubnagar District.
As against this, in the purely or predominantly Marathi and Kannada Districts,. the proportion is as heavy as 281 in Nanded, ranges between 275 and 280 in Bhir, Parbhani, Aurangabad and Osmanabad Districts, is 271 in Bidar, and varies between 25() and 255 in Gulbarga and Raichur. The proportion is higher than 280 in the rural areas of'Paithan-Gangapur, Aurangabad, Vaijapur, Kannad-Khuldabad and Bhokardan-Jaffarabad Tahsils of Aurangabad District; Jintur and Basmath Tahsils of Parbhani District; Hadgaon, Nanded and Kandhar Tahsils of Nanded District; Ahmadpur-Nilanga Tahsils of Bidar District; Patoda-Ashti Tahsils ofBhir District and Latur-Owsa Tahsils of Osmanabad District. It also exceeds 280 in the towns of Bidar, Osmanabad and Bhir District and the smaller towns of Aurangabad and Nanded Districts. But even in the eight Marathi and Kannada districts, the proportion of boys and girls falls down appreciably in the Kannada areas in the south-western portions of the state. In fact it is· as low as 231 in the rural areas of Yadgir and 235 in those of ~oppal-Yelburga-Gangawati Tahsils.
84. Juvenile Population.-It will be obvious from the above paragraphs that the Telugu districts in general start with a relatively heavy proportion of infants as compar~d with the Marat.hi and t~e Kannada Districts: But subsequently ~hey ~ose their initIal advantage conSIderably III respect of young chIldren and almost entirely III respect of boys and girls. And on the whole, it is the Non-Telugu districts (e:x;cluding of course the
*Vide paragraph 172 of Section V of Chapter I.
46
392
Kannada areas in the south-western portions of the state) which have a perceptibly larger proportion of juvenile population aged '0-14'. The Kannada areas in the south-western portions of the state, however, record a low proportion of boys and girls, though not as markedly low as in the case of infants and young children. On the whole, they have by far the lowest proportion of juvenile population in the state. The proportion of persons aged '0 to 14' among 1,000 persons of all ages ranges between 409 and 417 in Bhir, Parbhani, Nanded, Osmanabad and Bidar Districts. It is 384 in Gulba'rga District as a whole. Among the Telugu districts, it is slightly above 400 (namely 403) only in Adilabad District, which as stated earlier has an appreciable proportion of Non-Telugu population. In the other Telugu districts, the proportion at its highest is only 397 in Warangal and at its lowest 375 in Nizamabad. But the proportion in the district of Raichur in the south-western portions of the state is only 362. It is even lower in its purely Kannada areas. The position in the southern parts of the adjoining district of Gulbarga. also would be more or less the same. The proportion of the population aged '0-14' to the total population of the state is now 395, which is only slightly lower than the peak proportion of 399 recorded in 1931. The corresponding proportion is now 383 in the country as a whole, 362 in Madras, 383 in Madhya Pradesh and only 393 cven in BClmb3.Y. This is a very significant factor, as other things being equal, this would lead to a relatively rapid growth of population in the coming decades.
85. Young Men and Women.-The proportion of young men and women, i.e., of those aged from 15 to 84 years, among every 1,000 persons of the total popUlation, is now only 322. This is by far the lowest proportion recorded for the state during the current century. One of the reasons for this low proportion must have been the rela.tively small number of infants and children at the 1921 Census which was preceded by famines and epi-. demics. The proportion does not, unlike in the case of infants or young children or boys and girls, vary in the different linguistic regions of the state according to any perceptible pattern. It is as high as 355 in Hyderabad District-370 in Hyderabad City and only 316 in the rest of the district including the suburban towns around the metrop::>lis. This high proportion is obviously the result of the attraction of working population to the metropolis from other areas and, to a smaller extent, to the relatively low proportion of infants, young children and boys and girls in the city due in turn to the progressive habits of its people. There is then a sudden faU in the proportion and it ranges between 320 and 880 in the districts of Nizamabad, Raichur, Warangal, Adilabad, Nanded, GulbJ.rga., Parbhani, Aurangabad and Mahbubnagar in the order mentioned. It ranges between 310 and 320 in Medak, Nalgonda, Osmanabad and Bidar Districts. It is below' 310 in Karimnagar and Bhir Districts. That the migration of working population is.. also one of the factors leading to the higher proportion in this age group would be obvious from the fact that the order in which the districts are indicated above, more or less, also represents the order of their industrial and commercial importance in the state. Among the tracts which have a very high proportion of the population in this age group are the Tungabhadra Project Camps in Raichur District and the mining towns of Kothagudem and Yellandu in Warangal,District, which record a proportion of 518 and 394 respectively. In practically every district, the proportion of the popUlation in this age group is distinct· ly heavier in the urban than in the rural areas-the reasons for this being more or less identical with what has been stated above in respect of the high proportion in Hyderabad City.
The proportion of young nien and women in this state is slightly lower than in Madhya Pradesh but appreciably lower than in the country as a whole, or Madras and, more
46'"
393
particularly Bombay State. Sexwise, the variation is more accentuated among the maleSc than among the females. Perhaps, but for the relatively large number of Hyderabad emigrants in Bombay and Sholapur Cities and other industrial centres of Bombay State, the variations in the proportion of the young men and women as between these two states would have been considerably less significant.
86. Middle Aged Persons.-The proportion of the middle aged persons, i.e., of those aged from 35 to 54, is now 203 which is lower than the corresponding percentages recorded in 1901, 1911 or 1921, but higher than those recorded in 1931 and 1941. The fall in 1931 and 1941 is perhaps largely due-for the special reasons already explained in paragraph 75-to the proportion of infants and children being appreciably high during the decades of 1921-1931 and 1931-1941. It looks as if the upheavals in the normal distribution of the age groups created by the calamities of the decade 1911-21 have now almost subsided.
87. The proportion of the middle aged persons is especially heavy in the southwestern portions of the &tate which are largely inhabited by Kannada mother-tongue speakers. It is as high as 225 in Raichur District and 214 in Gulbarga District. In these two districts, the proportion is 253 in the rural areas of Yadgir, 245 in those of KoppalYelburga-Gangawati Tahsils and 234 in those of Manvi-Deodurg Tahsils. The proportion in the purely or predominantly Telugu districts of Nizamabad, Karimnagar, Adilabad, Nalgonda, Medak, Mahbubnagar and Warangal ranges from 200 to 213. The proportion is relatively very low in Bhir, Aurangabad, Parbhani, Bidar, Osmanabad and Nanded Districts, wherein it ranges from 193 to 197. It is only 191-the lowest in the state-in Hyderabad District. The high proportion in Raichur and Gulbarga Districts is perhaps largely the indirect result of the very low proportion of infants~ young children and boys and girls in the districts for reasons already explained in the earlier paragraphs. One of the important reasons for the relatively heavy proportion in Nizamabad, Karimnagar, Adilabad, Nalgonda, Medak, Mahbubnagar and Warangal Districts, is perhaps the fact that these areas suffered less during the disastrous decade of 1911-21 than the oth~r areas of the state. Due to this, the proportion of persons who survived the pestilences and famines of the decade 1911-21 and are still alive is relatively large in these areas of the state. Similarly, one of the important reasons for the low proportion in the districts of Bhir, Aurangabad, Parbhani, Bidar, Osmanabad and Nanded is the fact that they suffered severely from the calamities of the decade 1911-21. Two factors are mainly responsible for the very low proportion in Hyderabad District. Firstly Hyderabad City as well as its suburban towns and villages suffered very heavily during the epidemics of the earlier decades*. Secondly-and this is by far the more important of the two factors-a large number of migrants in the city and its suburban areaS return to their native villages or towns as they grow older and reach the second half of this age group. Perhaps, such persons cannot stand the strain of life away from their native surroundings, or being the more elderly in the family are compelled to take charge of their interests in their native villages or towns. This factor probably also accounts for the very low proportion of middle aged persons in most of the urban units of the state. The proportion is 190 in Warangal City, 189 in Hyderabad City, 188 in Aurangabad Town, 185 both in J_alna and Gulbarga Towns and 169 in Nanded Town. The proportion of the middle aged persons in this state is lower than in Madras State or Madhya Pradesh or in the country as a whole but markedly higher than in Bombay State.
88. Elderly PcrsonS'.-The proportion of elderly persons, i.e., those aged' 55 and over', among every 1,000 persons in the state, is now 80. This is significantly higher .Especially the influenza epidemic of 1918.
894
than the corresponding proportion recorded at any of the previous censuses during the current century except the 1941 Census. This comparatively high proportion is apparently partly due to some slight increase in the longevity of the people.
89. Districtwise, the proportion of the elderly is relatively heavy in the purely or predominantly Kannada districts in the south-western portions of the state and in the corresponding Telugu districts in the eastern portions of the state (with the exception of Adilabad and, to a smaller extent, Hyderabad and Warangal Districts) than in the other areas of the state. The proportion is 85 in Raichur-actually 86 if the Tungabhadra Project Camps are excluded-and 80 in Gulbarga. In these two south-western districts of the state, the proportion is as heavy as 114 in the rural areas of Koppal-Yelburga-Gangawati Tahsils. This is the highest proportion recorded in the state. In the Telugu districts of Medak, Karimnagar, Nalgonda, Nizamabad and Mahbubnagar, the proportion varies between 83 and 93. The same reasons which have led to a heavy proportion of the middle aged in these seven Telugu and Kannada districts-vide paragraph 87 -are also responsible for the comparatively heavy proportion of the elderly within their limits. But in the remaining purely or predominantly Telugu districts of Hyderabad, Warangal and Adilabad, the proportion -of the elderly is as low as 74, 77 and 65 re~pectively, the last of which is the lowest proportion recorded among the districts of the state. The low proportion in Hyderabad District is largely due to Hyderabad City, wherein the proportion of persons in this age group is only 69. A~ in the case of the middle aged, the proportion of the elderly is also, as a rule, low in most of the urban areas of the state-the reasons for which have already been indicated in paragraph 87. As regards Warangal and Adilabad Districts, it is found that the proportion is particularly low in Warangal District-apart from its towns-in the rural areas of Mulug, Burgampahad-Palvancha-Y ellandu, Mahbubabad and Pakhal Tahsils and in Adilabad District, almost in all its tracts especially in the rural areas of its tahsils of Adilabad-Utnoor-KinwatBoath wherein the proportion is only 60. In Karimnagar District, the lowest proportion recorded is in the rural areas of Manthani-Parkal Tahsils. All these tahsils, 1ll Warangal, Adilabad and Karimnagar Districts, lie along the Godavari or its tributaries, are covered by the best of the forests in the state, and contain an appreciable portion of tribal population. It is likely that the longevity of the population in these forest areas along the Godavari and its tributaries is considerably reduced because of constant attacks from Malaria and other fevers. Or, it may be that the normal span of life of the' tribal population living in these areas is smaller than that of the other groups in the. state. In the remaining districts of the state, the proportion of the elderly is 83 in Bidar-actually '93 in the eastern portions of the district adjoining the qther Telugu districts- and ranges between 69 and 78 in Osmanabad, Bhir, Aurangabad, Nanded and Parbhani Districts. The same factors which have led to the low proportion of the middle aged in these five districts are also responsible for their low proportion of the elderly.
90. The proportion of the elderly though low in most urban areas of the state, dwindles down to 53 in the Tungabhadra Project Camps and 59 in the mining towns of Kothagudem and Yellandu. These areas have a very large proportion of immigrant population and the sort of employment available within their limits hardly attracts elderly persons. It is significant that the proportion of the very elderly in this state is slightly lower than in the country as a whole, appreciably lower than in Madras State, the same .as in Madhya Pradesh but markedly higher than in Bombay State. Bombay State attracts considerably larger numbers of immigrants than the other states. Obviously, the proportion of the elderly among such migrants would be very low. Besides, Bombay
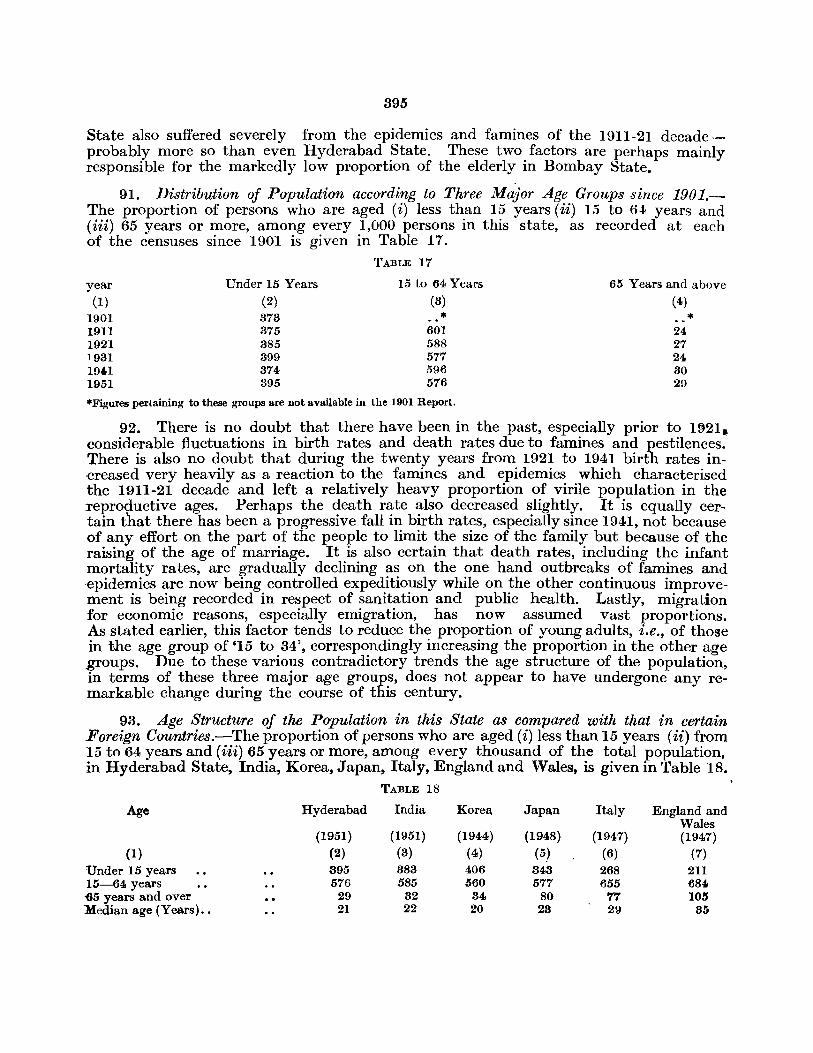
395
State also suffered severely from the epidemics and famines of the 1911-21 decadeprobably more so than even Hyderabad State. These two factors are perhaps mainly responsible for the markedly low proportion of the elderly in Bombay State.
91. Distribution of PopUlation according to Three Major Age Groups since 1901.The proportion of persons who are aged (i) less than 15 years (ii) 15 to 64< years and (iii) 65 years or more, among every 1,000 persons in this state, as recorded at each of the censuses since 1901 is given in Table 17.
TABLE 17
year Under 15 Years 15 to 64 Years 65 Years and above (1) (2) (8) (4)
1901 373 * * 1911 375 601 24 1921 885 588 27 1931 399 577 24 19U 374 596 30 1951 395 576 29
*Figures pertaining to these groups are not available in the 1901 Report.
92. There is no doubt that there have been in the past, especially prior to 1~21. considerable fluctuations in birth rates and death rates due to famines and pestilences. There is also no doubt that during the twenty years from 1921 to 1941 birth rates in·creased very heavily as a reaction to the famines and epidemics which characterised the 1911-21 decade and left a relatively heavy proportion of virile popUlation in the reproductive ages. Perhaps the death rate also decreased slightly. It is equally certain that there has been a progressive fall in birth rates, especially since 1941, not because .of any effort on the part of the people to limit the size of the family but because of the raising of the age of marriage. It is also certain that death rates, including the infant mortality rates, are gradually declining as on the one hand outbreaks of famines and ·epidemics are now being controlled expeditiously while on the other continuous improvement is being recorded in respect of sanitation and public health. Lastly, migration for economic reasons, especially emigration, has now assumed vast proportions. As stated earlier, this factor tends to reduce the proportion of young adults, i.e., of those in the age group of '15 to 34', correspondingly increasing the proportion in the other age groups. Due to these various contradictory trends the age structure of the population, in terms of these three major age groups, does not appear to have undergone any remarkable change during the course of this century.
93. Age Structure of the Population in this State as compared with that in certain Foreign Coumries.-The proportion of persons who are aged (i) less than 15 years (ii) from 15 to 64 years and (iii) 65 years or more, among every thousand of the total population, in Hyderabad State, India, Korea, Japan, Italy, England and Wales, is given in Table 18.
TABLE 18
Age Hyderabad India Korea Japan Italy England and Wales
(1951 ) (1951) (1944) (1948) (1947) (1947) (1) (2) (8) (4) (5) (6) (7)
Under 15 years 395 883 406 348 268 211 15-64 years 576 585 560 577 655 684 -65 years and over 29 32 84 80 77 105 Median age (Years) .• 21 22 20 28 29 85
896
The age structure of the population of Hyderabad and India is very similar to that of Korea. All countries in Asia except Japan exhibit, more or less, a similar pattern. The age structure in Japan is, however, different in so far as it has a lower proportion of' children and a correspondingly higher proportion in the advanced age groups. The pattern in Italy is very different. It has an appreciably lower proportion of children. This fall is made up by a higher proportion of those in the intermediary as well as in the advanced age groups. Most countries in eastern Europe, including Russia, exhibit, more or less, the same pattern as that of Itlay. The pattern in Englandand Wales is entirely different. The proportion of children is roughly half of what it is in Hyderabad, while that of those in the intermediary age groups is about one fifth more and that in the advanced age groups roughly four fold. In fact, the present agestructure in Hyderabad is more or less similar to the age structure which prevailed in England and Wales during the middle of the nineteenth century.
94. Notestein in his publication 'The Future Population of Europe and The Soviet Union' states that "Age structures are constantly changing as the conditions affecting fertility and mortality alter. The European age pyramids ofl940 reflect various stages in the vital revolution associated with industrialization, urbanization, rising levels of living, and the expanding culture of the West. The downward drift of birth and death rates accompanying these conditions has naturally wrought a characteristic transformation in age composition. To oversimplify somewhat, in the dynamics of changing age distributions there are two terminal stages and a transition period. Populations with high fertility and mortality are young both because of failure to survive and becausethere is usually some growth. Those with low fertility and mortality are old, because individuals survive longer and because each age class represents the survivors of a larger number of births than the next younger. The transition from the first to the last stageyields large number of young adults, who for a time support rapid increase. The situation reverses as this group passes into the older ages. Then their deaths hasten the decline, and the final phase of an old population emerges. Shifting age first delays, then hastens the decline". Obviously Hyderabad State as well as the whole of India and most other countries in Asia still continue to be in the first stage.
95. A V.N.O. Publication observes that "Large proportions of children under 15 years old, approximating 40 per cent of the total population, minimal percentages of aged persons, and median ages around 20 years, are the mark of high birth rates and of mortality rates, which if not currently high, have been so in the recent past ..... . these are the conditions which prevail generally in the economically least developed countries." This conclusion is applicable to this state as well.
Summary.-Ku doubt, intentional misstatementb of age because of superstitious or other, reasons were not much in Evimnce a~ the 1951 CeI'sus. 11'hvcrthlEss igr:.orance about one's precise age still continUES to be the rule ratl-Jer than the excfption. BEsidES, the cer.sus definition of ' age' and the procedure adopted for tabulatirg its returLs have varied from ccr.sus to cer.sus ar.d are yet to be standardiSEd. The age returns are, however, so impOl tant from the demographic point of vitw that, in spite of all these limitations, some attempt cannot but be made to analyse them, at least broadly, t!.S recorded at the present and the earlier cer:.suses. At the 1951 CCLSUS, amorg every] ,OCO persors enumerated in the state, 25 were infants, i.e., less than a year old; 108 Were yourg children, i.e., aged between 1 and 4 yeaH,; 262 were boys and girls, i.e., aged between 5 and 14; 822 were yOlU1g men and women, i.e., aged between 15 and 84; 208 were middle aged, i.e., aged between 85 ard ,154; ard, lastly, 80 were dderly. i.e., aged ~5 and over. These proportions are based on a ten per cent sample of the enumerated population minus the displaced perSOI~S from Pakistan.
In so far as infants and young children are concerned, their proportions were just 16 and 106 respectively at the beginning of this century, i.e., in 1901, a year preceded by famines and epidewics. They increased to 28 and 116 respectively at the end of the healthy decade of 1901-1I but only to recede to 27 in case of infants.
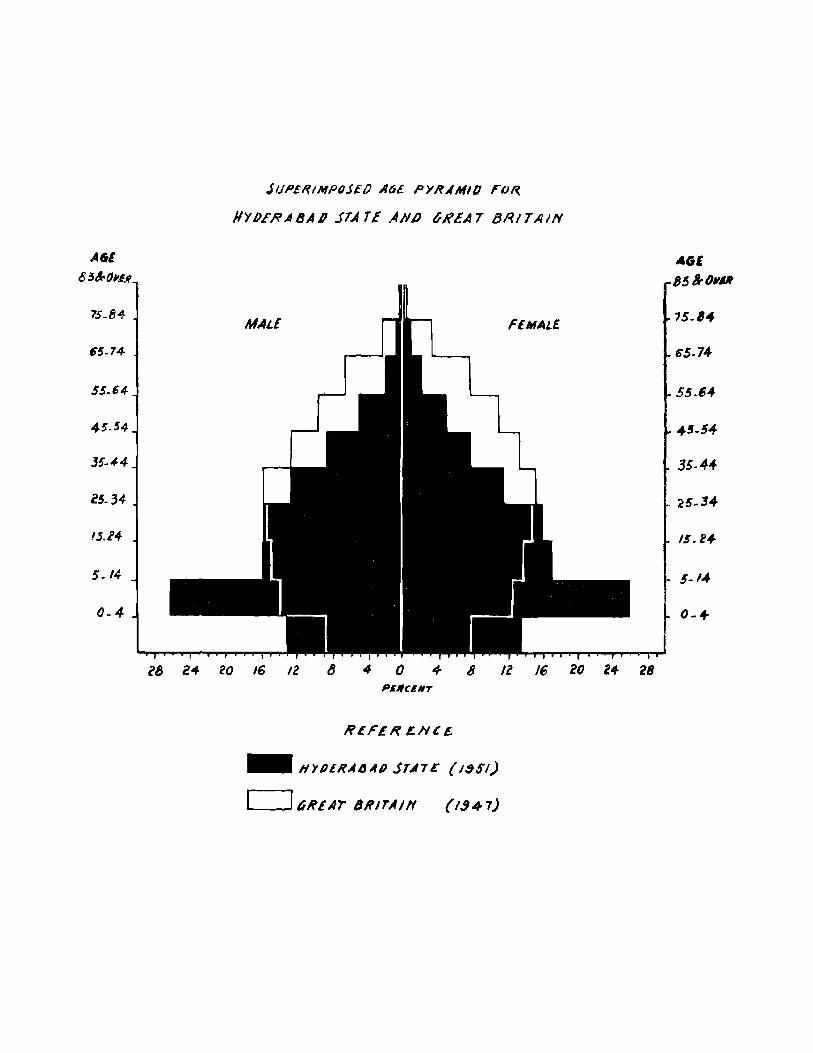
AGE
85&OIlE.f
75-84-
65.74-
$5_64
45.54
J!.4-4
25.34
1.5.24-
5-14-
0.4
J'JP£I?IIr(P(J;U) A6E. PYRAMlll FOR.
H'IIJEI?A8AIJ .ITATE ANI) 6H~A7 8RITAIN
MALE FEMALE
is 24 fO 16 12 8 4 0 + 8 IZ 16 20 24 28 PSIICEIIT
R£F£R£N(£..
_ HYIJl/?AIJAIJ SrA7E (ISSI)
,---~16H£Ar 8/(lrJltf (1947)
AGE 8~&{)YU
15-8.
&5.74-
55-e4
4!-54
35.4.cf.
25.34-
16.l4-
5·14
0-+

399
and 95 in case of young children at the termination of the succeeding calamitous decade of 1911-21. During the next two healthy decadesofl921-31 and 1931-41, the proportion of infants moved up to 30 and 31 and that of young children to 138 and 124 respectively-being in each of these cases higher than those recorded at the remaining censuses during this century. But as stated earlier, in 1951, out of every 1.000 persons in the state, infants numbered only 25 and young children 108. The variations in the preceding decades largely reflect the fluctuations in birth and death rates resulting from famines and epidemics-during such outbreaks birthrates used to decrease and mortality, especially infant mortality, rates Hsed to increase. Immediatelv thereafter, mortality rates used to decline and birth rates used to Soar to unusual levels not (Jnly becaus(:of the healthy eOlldit~OIIS but also because of the ~act tha~ pestilences. us~d to take a heavy toll of the very young and the very old and leave a heavy proportIOIl of vmle populatIon In the reproductIve age groups. An additional reason for the generallpwering of death rates, especially infant mortality rates, and increase of birth rates during 1921-31 and 1931--H WaS the improvement recorded ill respect of medical facilities, pel sOllal hygiene and environmental sanitation. The deereas'=" in the plOportiolls in 1951 is, however, due, among other factors, to the exaggerated proportim s at the preceding cel'sus<:s-resultir,g, in turn, from the age upheavals created by the pestilences of the 1911-2] decade--and a definite decrease in birth rates due to a marked decline in child Ilwrriages and the disturbed eonditiors prevailillg in the state for some mouths prior to and following the Police Action. The decrease would have been steer::er but for a decline in mortality (including infant and child mortality) rates due to improved medical and public health conditions. As things now stand, the propel·tion of infants is markedly heavier in the Telugu than in the Non -Telugu areaS of the state, especially the Kannada areas in its south-western portions. But the plOportion of young children improves distinctly in the Marathi and Kannada areaS (other than in the south-Western portions of the state) and the Telugu areaS lose thcir lead in this group.
The proportion of boys and girls in 1951 was only slightly lower than in 1921, the proportion in 1921 being the heaviest recorded during this century. But while the especially high proportion in 1921 was largely the indirect result of a very low proportion of infants and young children due to the calamities of the
. 1911-21 decade, that in 1951 was largely the result of more infants and young children having survived and moved into this group during the recent years due, in turn, to improved medical and public health conditions. Within the state itself, the proportion of boys and girls is distinctly higher in the Marathi and Kannada areas (excluding again the Kannada areas in its south-western portions) than in the Telugu areas. The Telugu areas, in general, start with a relatively heavy proportion of infants as compared with the NcmTelugu (lreas of the state. This is largely because they have an appreciably higher proportion of married fe·males in the younger age groups and, therefore, a higher birth rate. But the Marathi and the Kannada areas-othertkan the Kannada areas in the south-western portions of the state-steal a march over the Telugu areas among theyoung children due largely to lower infant and child mortality rates. Again, mainly because of the same reason, they establish the lead decisively among boys and girls. Thus, finally the Marathi and Kannada areas (excluding of course those in the south-western portions of the state) record an appreciably heavier proportion than the Telugu areas in respect of the three initial age groups of' 0', ' 1-4' and' 5-14' taken all together. But the Kannada areas in the south-western portions of the state spread over Raichur and Gulbarga Districts, however, record the smallest proportion in the state in each of these three initial age groups due largely to factors such as low birth rates (rest-:!J,ing, in turn, largely from a higher proportion of unmarried females in all the age groups and of widows) and perhaps a heavier infant mortality rate. In the state as a whole, the proportion of persons in the three initial age groups of' 0', ' 1-4' and' 5-14 " taken together, was 39,5 in 1951 which is only slightly lower than the peak proportion of 399 recorded in 1931. This is a very significant factor. As other things being .equal, it is conducive to a rapid growth of population in the coming years.
The proportion of young men and women in 1951-namely, 322 among every 1,000 of the populationwas distinctly the lowest recorded during this century. One of the reasons for this must have been the reduction in the relative numbers of infants and children in the second half of the 1911-21 decade which was characterised by severe epidemics and famines. The districtwise variation of this proportion is not in accordance with any perceptible pattern in terms of the linguistic regions of the state. It is, however, comparatively very high (355) in Hyderabad Di.strict and tends to be high in districts which are important from the points of view of industries, commerce, etc. The unusually high proportion in Hyderabad District is largely due to the heavy immigration into Hyderabad City of working population belonging to this age group. Due, more or less to the same reasons, in practically all the districts of the state the proportion in this age group is heavier in the urban than in the rural areas.
The 1951 proportion of the middle aged-namely, 203, among every 1,000 of the population-was lower than in 1901, 1911 or 1921 but slightly higher than in 1941 and appreciably higher than in 1931. It looks as if the serious repercussions of the epidemics in the later half of the 1911-21 decennium on the 'normal' age structure of the population have almost l'<ln their course. Di.strictwise, the proportion is especially
400
high in south-western Kannada districts and especially low in Hyderabad District. The former is largely the indirect result of a low proportion of persons in the younger age groups. The latter is due mainly to the return of many of the immigrants in Hyderabad City to their native villages and towns when they reach the upper limits of this age group and, to a smaller extent, to the toll taken by epidemics in the earlier decades, especially by the influenza epidemic of 1918. Among the other districts, the proportion is higher in the eastern Telugu districts than in the western Marathi and Kannada districts large)y again due to the fact that the former suffered less by the pestilences of the 1911-21 decade. Due again to the comparatively small numbers of immigrants in this age group, its proportion is very low in m.ost of the important urban units of the state.
The proportion of the very elderly in this state has been invariably insignificant at all the t'ensuses. Subject to this, the proportion in 1951-namely 80, among every 1,000 of its population-was slightly higher than that recorded in most of the preceding censuses. This is perhaps due to some imperceptible increase in the longevity of the people. Districtwise, the proportion tends to be comparatively significant again in the south-western Kannada districts of Raichur and Gulbarga 3S well in the eastem Telugu districts other than Hyderabad, Warangal and Adilabad. In case of the former districts it is the indirect result of a l~w proportion of persons in the lower age groups and in case of the latter the direct result of the pestilences of the 1911-21 decennium which were not so Severe in the eastern as in the western half of the state. As compared with the other Telugu districts, the proportion is low in Hyderabad largely again because of the absence of immigrants belonging to this age group in Hyderabad City and in Warangal and Adilabad Districts largely because of the comparatively smaller span of life among the people living in the forest tracts along the Godavari and its tributaries. The proportion of the elder1y, like that of the middle aged and for identical reasons~ is low in urban areas of the state in general.
On the whole in 1951, about 39 per cent of the people in this state Were aged less than 15 years~ about 58 per cent were aged between' 15 and 64 ' and only 3 Were aged' 65 years and over '-and the median age was about 21 years. The corresponding figures were almost identical in the entire country except that this state had a slightly higher proportion of the first and smaner proportioIlS of the other two of these three groups. This age structure is roughly identical with that prevailing in the lUldeveloped cOlUltries of the world, especiany of those in Asia. It is quite in contrast with the age composition of the population in the advanced countries of the world wherein the proportion of persons undf'r 15 years dwindles roughly to even half of what it is in this state and of those in the age group of '15-64', or more especially '65 and over', is very much higher. All this fits in with the observation made in a U.N.O. Publication to the effect that" Large proportiOns of children under 15 years old, approximating 40 per cent of the total population, minimal percentages of aged persons, and median ages around 20 years, are the mark of high birth rates and of mortality rates, which if not currently high, have been so in the recent past ......•. these are the conditions which. prevail generally in the economically least developed countries."
CHAPTER VI
Languages

SECTION I
1951 CENSUS DATA REGARDING MOTHER-TONGUE AND BILINGUALISM
(The tables relevant to this Section are Main Tables 'D-I (i)-Languages-Mother-Tongue' and 'D-I(ii)Languagu-Bilingua_ "iBm' given at pages 73 and 89 respectively of Part II-A of this Volume).
Instructions to Enumerators.-Two out of the fourteen questions of the 1951 Census Questionnaire related to languages. These two questions were as follows :-
(i) What is your mother-tongue? (ii) What other Indian language do you common1y speak?
These two questions were meant for ascertaining data pertaining to mother-tongue and bilingualism respectively. In the instructions issued to the census enumerators regarding the first question, " mother-tongue" of a person was defined as the language spoken by him or her from the cradle. The enumerators were further directed that, in case the person to be enumerated happened to be a deaf-mute or an infant, the mothertongue was to be assumed as being the same as that of the mother of the person concerned. As regards the second question, the enumerators were told that the test as to whether a person commonly spoke any Indian language, was whether he spoke the language in his daily or domestic life in addition to his mother-tongue. Thus, the mere fact of a person's acquaintance with, or knowledge of, a language was not deemed sufficient for its being recorded as his subsidiary language. The enumerators were further told that in case a person spoke, in addition to his mother-tongue, more than one Indian language in his daily or domestic life, then the language which was spoken by him most commonly was to be ascertained and recorded against the question pertaining to bilingualism. The performance of the enumerators with regard to these two questions was satisfactory. There were, however, some inherent limitations to the question regarding the subsidiary language. In some of the multi-lingual areas of this state, it is not uncommon to find persons speaking in their daily or domestic life more than one Indian language in addition to their mother-tongue. In such areas, it is really difficult for many persons to choose the particular language to be entered as subsidiary to their mother-tongue. In some of these cases, the choice may not have been made with due consideration of the extent to which each of the subsidiary languages were used. But this limitation is not likely to have affected materially the pattern of subsidiary languages for the areas concerned as a whole. And again, in a large number of cases, the distinction between Urdu and Hindi, particularly as a subsidiary language spoken by the people of this state in their daily or domestic life, has perhaps little reality. But this limitation can be overcome by studying the figures for these two subsidiary languages together.
2. Factors underlying E:cisting Pattern of Languagea.-The language pattern in Hyderabad State is influenced by two factors. The first of these is the location of. the state itself in the linguistic map of the country. The state lies across areas where the three main languages of the Deccan, namely Marathi, Kannada and Telugu, meet. The second factor is the intimate political and cultural association, extending over several centuries, of the areas now constituting the state with Northern India. It would not be an exaggeration to claim that no other part of India has played such an important role as the areas now constituting Hyderabad State, in drawing the northern and southern people together and weaving their cultures into a common pattern. This claim is equally applicable to the mingling of the ancient Aryan and Dravidian civilisations, and to the bringing together
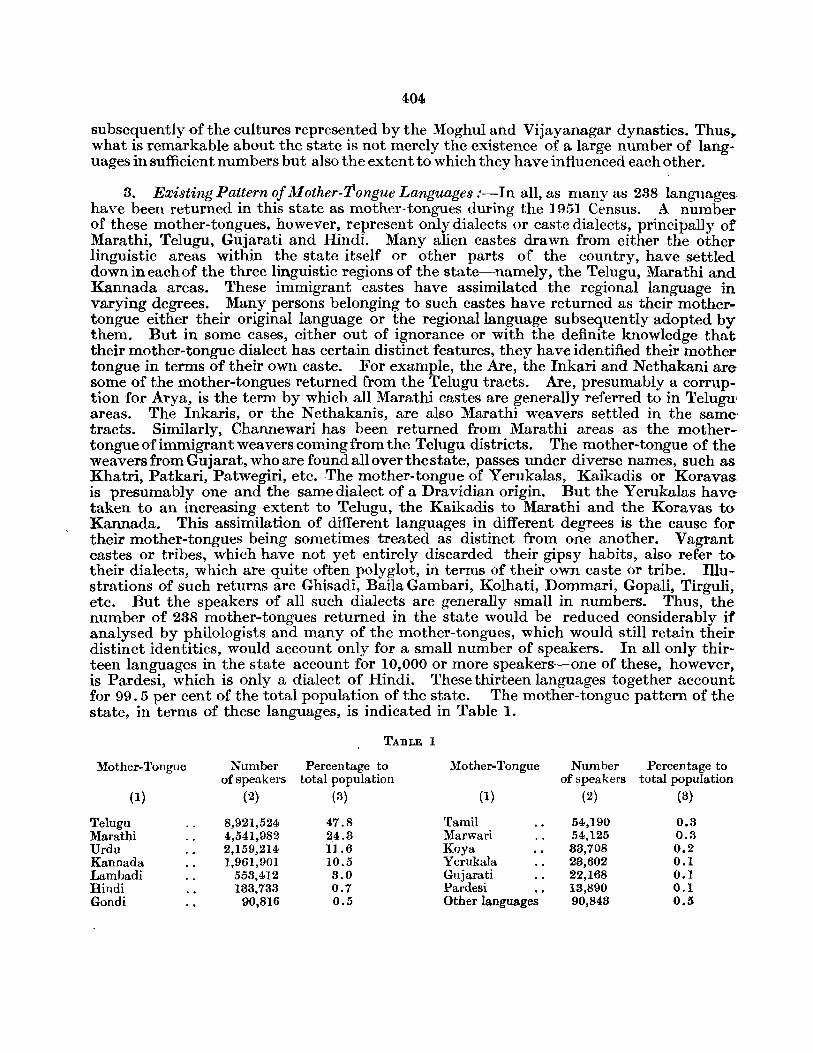
404
subsequently of the cultures represen.ted by the Moghul and Vijayanagar dynasties. Thus,.. what is remarkable about the state is not merely the existence of a large number of languages in sufficient numbers but also the extent to which they have influenced each other.
3. Existing Pattern of Mother-Tongue Languages :-In all, as many as 238 languages. have been returned in this state as mother-tongues during the 1951 Census. A number of these mother-tongues, however, represent only dialects or caste dialects, principally of Marathi, Telugu, Gujarati and Hindi. Many alien castes drawn from either the other linguistic areas within the state itself or other parts of the country, have settled down in each of the three linguistic regions of the state-namely, the Telugu, Marathi and Kannada areas. These immigrant castes have assimilated the regional language in varying degrees. Many persons belonging to such castes have returned as their mothertongue either their original language or the regional language subsequently adopted by them. But in some cases, either out of ignorance or with the definite knowledge that their mother-tongue dialect has certain distinct features, they have identified their mother tongue in terms of their own caste. For example, the Are, the Inkari and Nethakani aresome of the mother-tongues returned from the Telugu tracts. Are, presumably a corruption for Arya, is the term by which all Marathi castes are generally referred to in Telugu' areas. The Inkaris, or the Nethakanis, are also Marathi weavers settled in the same' tracts. Similarly, Channewari has been returned from Marathi areas as the mothertongue of immigrant weavers coming from the Telugu districts. The mother-tongue of the weavers from Gujarat, who are found all over the state, passes under diverse names, such as Khatri, Patkari, Patwegiri, etc. The mother-tongue of Yerukalas, Kaikadis or Koravas is presumably one and the same dialect of a Dravidian origin. But the Yerukalas have taken to an increasing extent to Telugu, the Kaikadis to Marathi and the Koravas to Kannada. This assimilation of different languages in different degrees is the cause for their mother-tongues being sometimes treated as distinct from one another. Vagrant castes or tribes, which have not yet entirely discarded their gipsy habits, also refer to. their dialects, which are quite often polyglot, in terms of their own caste or tribe. Illustrations of such returns are Ghisadi, Baila Gambari, Kolhati, Dommari, Gopali, Tirguli, etc. But the speakers of all such dialects are generally small in numbers. Thus, the number of 238 mother-tongues returned in the state would be reduced considerably if analysed by philologists and many of the mother-tongues, which would still retain their distinct identities, would account only for a small number of speakers. In all only thirteen languages in the state account for 10,000 or more speakers-one of these, however, is Pardesi, which is only a dialect of Hindi. These thirteen languages together account for 99.5 per cent of the total population of the state. The mother-tongue pattern of the state, in terms of these languages, is indicated in Table 1.
TABLE 1
Mother-Tongue Number Percentage to Mother-Tongue Number Percentage to of speakers total population of speakers total population
(1) (2) (3) (1) (2) (3)
Telugu 8,921,524 47.8 Tamil 54,190 0.3 Marathi 4,541,982 24.3 Marwari 54,125 0.3 Urdu 2,159,214 1].6 Koya 83,708 0.2 Kannada 1,961,901 10.5 Yerukala 23,602 0.1 Lambadi 553,412 3.0 Gujarati 22,168 0.1 Hindi 133,733 0.7 Pardesi 13,890 0.1 Gondi 90,816 0.5 Other languages 90,843 0.5
405
The figures for some of the languages given above would be slightly more if the figures for their dialects are also taken into account. But even then, the pattern indicated abovein terms of percentages is not likely to be affected materially in view of the insignificant, number of the persons speaking such dialects.
4. Teluguas ~lother-Tongue.-No single mother-tongue group accounts fora majority of the total returns in the state. But the Telugu mother-tongue speakers, claiming 47.8, per cent of the total, come very near to this mark. They are, however, predominant in all the eight eastern districts of the state, namely Hyderabad, Mahbubnagar, Adilabad, Nizamabad, Medak, Karimnagar, Warangal and Nalgonda. They account for 79.1 per cent of the total population of these eight districts taken together. The highest percentage recorded by them in these eight districts is 93.8 in Karimnagar and the lowest is 53.0 in Hyderabad. The low percentage' in Hyderabad District is due to the multi-lingual character of Hyderabad City. If figures for the city are excluded from the Hyderabad District figures, the percentage for the district would rise to 86.4. In this event, the lowest percentage of Telugu speakers would be 56.3 in Adilabad District and above eighty in all the other seven eastern districts of the, state. In the eight western districts of the state, the percentage of Telugu speakers to the total population dwindles to 10 ,8. In these districts, this percentage ranges between 0.8 in Bhir and 24.3 in Raichur District. Telugu speakers account for 14'4 per cent of the total population in Nanded, 14 ·6 in Bidar and 20 ·6 in Gulbarga. The comparatively heavy percentages of Telugu speakers in these four districts of Raichur, Gulbarga, Bidar and Nanded are due to the fact that they are contiguous to the Telugu districts and contain some Telugu speaking tracts. In Nanded District, the Telugu mother-tongue speakers constitute the single biggest ~roup in Mudhol Tahsil accounting for about 45 per cent of the total population, and they form over 30 per cent of the population of Deglur Tahsil. In Bidar District, they account for a majority of the total population in Narayankhed and Zahirabad Tahsils. Their percentage to the total population in these two tahsils is about 56 and 50 respectively. In Gulbarga District, they constitute the majority in Kodangal and Tandur Tahsils, and form the single biggest group in Seram Tahsil. In these three tahsils their' percentage to the total population is about 84, 74 and 44 respectively. They account for about 24 per cent of the total popUlation in Yadgir Tahsil. Again in Raichur District, they account for a majority of the population in Alampur and Gadwal Tahsils, and Constitute the single biggest group in Raichur Tahsil. In Alampur and Gadwal Tahsils, taken together, they account for about 87 per cent of the total population. In Raichur Tahsil, their cOl'responding percentage is about 44.
5. Marathi as Mother-Tongue.-Marathi mother-tongue. speakers account for 24.3 per cent of the total population of the state. Thus, their num ber is about half of that of the Telugu speakers in the state. The Marathi speakers are, however, con~trated in the north-western portions of the state. They constitute 78.7 per cent of the total population in the five north-western districts of Aurangabad, Parbhani, Nanded, Bhir and Osmanabad. In these five districts, the highest percentage reached by them is 86.6 in Bhir and the lowest is 65. 5 in N anded District. In the remaining eleven districts of the state, they account for only 5.7 per cent of the total population. In these eleven districts, their percentage ranges between 0.3 in Nalgonda and 39.0 in Bidar District. In Adilabad District, they account for 20.6 per cent of the total population. Their comparatively heavy numbers in Bidar and Adilabad Districts are due to the fact that'these two districts, which adjoin the north-western districts, also contain some Marathi speaking tracts. In Bidar District, they predominate in Ahmadpur, Nilanga and Udgir Tahsils. Their
47
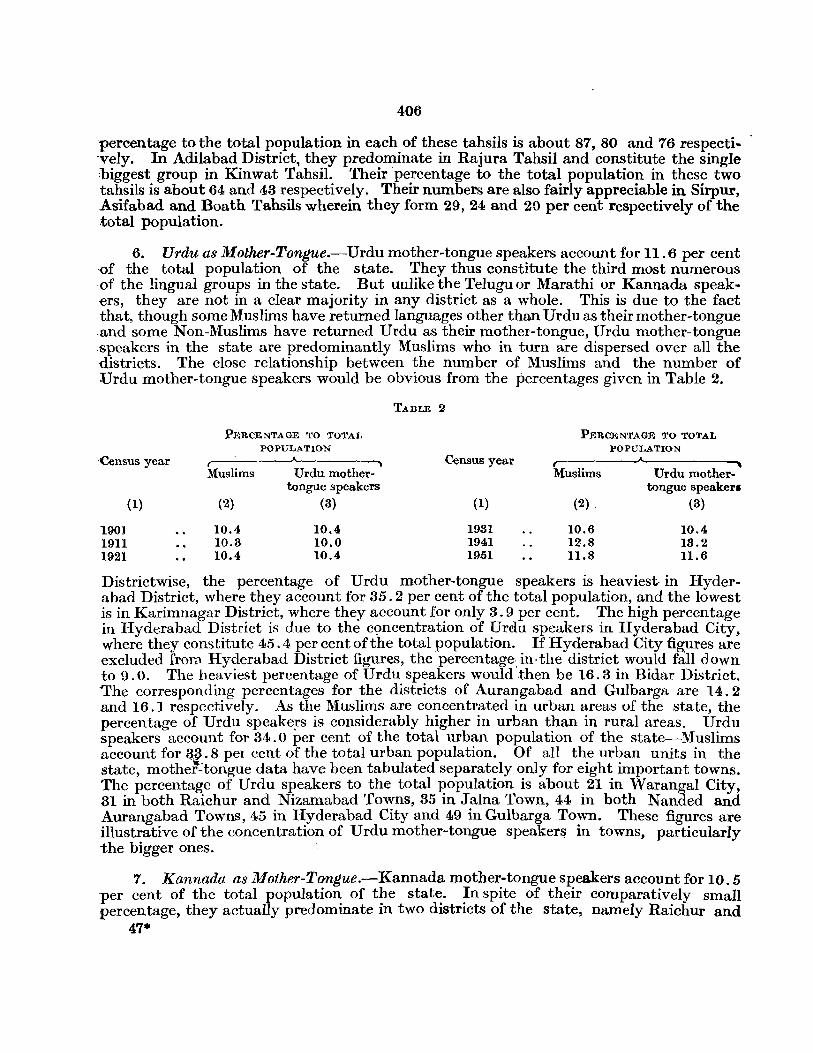
406
percentage to the total population in each of these tahsils is about 87, 80 and 76 respecti .. -vely. In Adilabad District, they predominate in Rajura Tahsil and constitute the single biggest group in Kinwat Tahsil. Their percentage to the total population in these two tahsils is about 64 and 43 respectively. Their numbers are also fairly appreciable in Sirpur, Asifabad and Boath Tahsils wherein they form 29, 24 and 20 per cent respectively of the total popUlation.
6. Urdu as Mother-Tongue.-Urdu mother-tongue speakers account for 11.6 per cent -of the total population of the state. They thus constitute the third most numerous of the lingual groups in the state. But unlike the Telugu or Marathi or Kannada speakers, they are not in a clear majority in any district as a whole. This is due to the fact that, though some Muslims have returned languages other than Urdu as their mother-tongue and some Non-Muslims have returned Urdu as their mother-tongue, Urdu mother-tongue speakers in the state are predominantly Muslims who in turn are dispersed over all the districts. The close relationship between the number of Muslims and the number of Urdu mother-tongue speakers would be obvious from the percentages given in Table 2.
Census year
190] 1911 1921
(1)
PERCENTAGE TO TOTAL
POPULATION
Muslims
(2)
10.4 10.3 10.4
Urdu mothertongue speakers
(3)
10.4 10.0 10.4
TABLE 2
Census year
(1)
1931 1941 1951
PERCENTAGE TO TOTAL
POPULATION
Muslims
(2) _
10.6 12.8 11.8
Urdu mothertongue speaker.
(3)
10.4 18.2 11.6
Districtwise, the percentage of Urdu mother-tongue speakers is heaviest- in Hyderabad District, where they account for 35.2 per cent of the total popUlation, and the lowest is in Karimnagar District, where they account for only 3.9 per cent. The high percentage in Hyderabad District is due to the cc;mcentration of Urdu speakers in Hyderabad City, where they constitute 45.4 per cent of the total population. If Hyderabad City figures are excluded frOID Hyderabad District figures, the percentage in-the district would fall down to 9. o. The heaviest percentage of Urdu speakers would then be 16.3 in Bidar District. -The corresponding percentages for the districts of Aurangabad and Gulbarga are 14.2 and 16.1 respectively. As the Muslims are concentrated in urban areas of the state, the percentage of Urdu speakers is considerably higher in urban than in rural areas. Urdu speakers account for 34.0 per cent of the total urban popUlation of the state--Muslims account for 8.8.8 pel cent of the total urban popUlation. Of all the urban units in the state, mothe~_:tongue data have been tabulated separately only for eight important towns. The percentage of Urdu speakers to the total population is about 21 in Warangal City, 31 in both Raichur and Nizamabad Towns, 35 in J alna Town, 44 in both N anded and Aurangabad Towns, 45 in Hyderabad City and 49 in Gulbarga Town. These figures are illustrative of the concentration of Urdu mother-tongue speaker~ in towns, particularly the bigger ones. '
7. Kannada as Mother-Trmgue.-Kannada mother-tongue speakers account for 10.5 per cent of the total popUlation of the state. In spite of their comparatively small percentage, they actually predominate in two districts of the state, namely Raichur and
47*
407
Gulbarga. They account for 62.8 and 55.0 per cent respectively of the total population of these two districts. In Bidar District their percentage is 27.7. In this district, they constitute the single biggest group in Humnabad, Bidar, Bhalki and Santpur (Aurad) Tahsils. Their percentage to the total population in each of the first three tahsils is 48 and in the fourth 41. They also account for about 20 per cent of the population in Zahirabad and Narayankhed Tahsils of Bidar District as well as the adjoining Deglur Tahsil of' Nanded District.
8. Lambadi as Mother-Tongue.-Lambadi mother-tongue speakers account for 3.0 per cent of the total population of the ~tate. They are thus fifth in the state from the point of view of numbers. The Lambadis are supposed to have migrated to the ,.,tate du~ing the 17th century along with the Moghularmies. But they are now well entrenched in the state. Except in the case of Gulbarga District, they are, however, at present concentrated in areas which were least associated with Moghul or Muslim rule in the Deccan. In Gulbarga District, they form 4.3 per cent of the total population. But in the other three districts of Aurangabad, Bidar and Hyderabad, which contained the former Muslim capitals in this part of the Deccan, their percentage is only 1.9, 1.5 and 0.6 respectively. As against this, they account for 8.5 per cent of the total population in Warangal District, 5.5 in N algonda District and 5.0 in Mahbubnagar District. These three districts in the extreme south of the state account in all for 50.2 per cent of the total Lambadi speakers in the state. They constitute 3.9 per cent of the total population in Adilabad and 3.1 in Nizamabad Districts. It would be too far fetched to presume that in the districts which were most under Muslim influence, the Lambadas have returned Urdu or Hindi as their mother-tongue in greater proportion than in other districts. Incidentally, if this presumption has any basis, it will be difficult to explain their concentration in Gulbarga District. It appears more plausible to presume that the Lambadas, having lost their original profession as carriers of goods between the North and the South, drifted to districts wherein it was comparatively easy to dislodge the indigenous peasants, or which were well endowed with forest and cattle wealth. If this presumption was entirely correct, the Larp.badas ought to have been in greater numbers in Karimnagar District, where they are only 0.8 per cent of the total population. Again, unlike the Urdu speakers, the Lambadi speakers are concentrated in rural areas. Though they account for 3 per cent of the total population of the state, their percentage in urban areas is only 0.6.
9. Hindi and Pardesi as Mother-Tongues.-Hindi accounts for 133,733 mother-tongue speakers in the state and Pardesi for 13,890. These two together account for 0.8 per cent of the total returns. As stated above, the returns for Hindi would be slightly higher if the numbers for some of the dialects like Bondili, Brij Bhasha, Purbi, etc., are also included under Hindi, but the percentage indicated above is not likely to be affected. Hindi speakers are concentrated in urban areas and Pardesi speakers in rural areas. The reason for the latter may be due to the simple fact that in rural areas the speakers are still unsophisticated and refer to their mother-tongue in terms in which they themselves are referred to by the rest of the population. There is not much logic in examining these figures separately. 'Hindi' and 'Pardesi', taken together account for 2.7 per cent of the total urban population as against 0.4 per cent of the rural population of the state.
10. Gondi, Koya and other Tribal Mother-Tongue Languages.-Out of a total of90,816 mother-tongue returns for Gondi, 90,204 have been returned from Adilabad District itself. Of the remaining 612, more than half are from Karimnagar District. In Adilabad District itself, all except 361 of the returns are from rural areas. Of the 33,708 mother-
408
tongue returns for Koya, 30,711 are returned from Warangal District and 2,975 from Adilabad District. All except 482 of the returns are from rural areas of the state. For the first time in the census history of the state, Kolami, Naikpodi, Andhi and Gotte are also returned as mother-tongues. These account for 8,325, 268, 5 and 4 persons respectively. Similarly, Manne Bhasha which was returned only in 1901 again accounts for 2,561 speakers. All these returns, except for 2 of Naikpodi and 4 of Gotte from Warangal District, are from Adilabad District. Again all, except 79 of these returns, are from rural areas. Bhili is returned as mother-tongue by 7,965 persons. All except 579 of these returns are from Aurangabad District. Of the 579, Bhir District accounts for 519 persons. Only 121 of the Bhili mother-tongue returns are from urban areas of the state. All these tribal languages* taken together account for 143,652 persons or 0.8 per cent of the total state population. The speakers of tribal languages form 0 ·03 per cent of the state's urban and 0.9 per cent of its rural population. The total strength of the Scheduled Tribes in the ·state is 354,933. Thus, only -to. 5 per cent pf them speak tribal languages. The rest must have taken completely to Telugu or Marathi. These returns indicate that strictly from a numerical point of view the tribal languages (or dialects) are not at all important in the state.
11. Tamil, J.l;larwariand Gujarati as Mother-Tongues.-Ofthe total number·of 54,190 Tamil mother-tongue speakers in the state, 32,432 (about 60 per cent of the total) are returned from Hyderabad City and 6,064 (about 11 per cent) from Tungabhadra Project Camps in Raichur District. The remaining numbers are also largely returned from other urban areas of the state. Marwari mother-tongue speakers account for 54,125 persons, or 0 ·3 per cent of the total popUlation of the state. The number will be slightly more if returns under some other categories like Rajasthani (1,676), Mewadi (131), etc., are also taken into account. The Marwari mother-tongue speakers are concentrated in l\farathi tracts and in Hyderabad City and in the bigger towns of the Telugu and Kannada areas. ·The six Marathi districts of Aurangabad, Parbhani, Nanded, Bidar, Bhir and Osmanabad account for almost 75 per cent oflheir total returns in the state. Of the total number of 22,168 Gujarati mother-tongue speakers in the state, Hyderabad City and the towns of Aurangabad, J alna and Nizamabad account for 40.1, 7.7, 5'0 and 4.0 per cent respectively. 'The figures given above for Gujarati are exclusive of a number of dialects in the state like Khatri (6,112), Ghisadi (1,825), Patkari (824), Jaini (142), etc.
12. Miscellaneous Mother-Tongue Returns.-Yerukala Bhasha accounts for 23,602 mother-tongue speakers. Almost all the speakers are from the Telugu areas of the state, the largest number being 5,709 from Warangal District. In addition to this, Kaikadi and Korava Bhashas account for 3,942 and 2,629 speakers respectively. Almost all the Kaikadi returns are from Marathi areas and Korava returns from the Kannada areas of the state. These three together account for 30,173 persons constituting 0.2 per cent of the state's population. Some of the other mother-tongue returns though not important from the numerical point of view, yet interesting from other points of view, are the returns of Waddari '(5,702), Pardhi (3,510), Ghisadi (1,825), Dommari (693), Kolhati (517), Pradhan Bhasha {464), Gopali (99), TiruguJi (77jand Chenchu (68). Waddari returned by a few of the large class of earth workers and stone breakers in the state, and Chenchu returned by a few of the small but anthropologically important tribal people in the south of the state are perhaps nothing else than Telugu spoken with some peculiarities resulting from the respective environments, or lack of environments, of the two groups. It is, however,
*Chenchu and Pradhan, which account for 68 and 4640 mother-tongue speakers respectively at the present census, are ;generally supposed to be only Telugu and Marathi respectively.
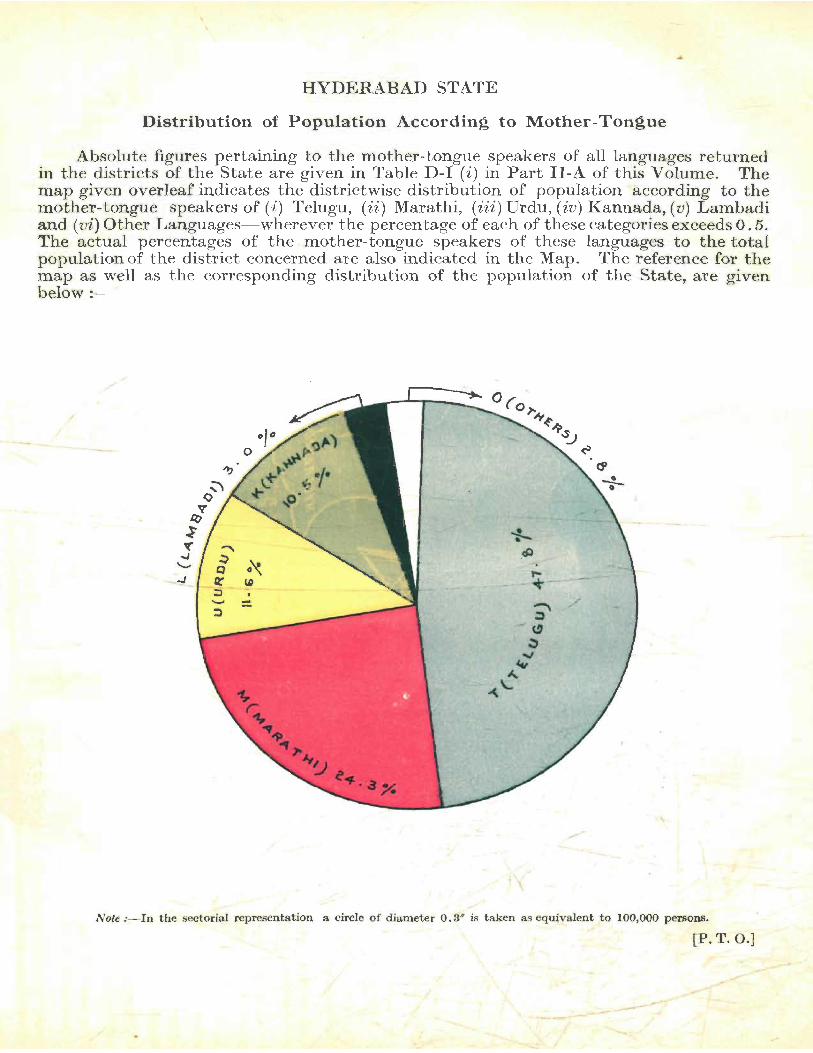
HYDERABAD STATE
Distribution of Population According to Mother-Tongue
Absolute figures pertaining to the mother-tongue speakers of all languages returned in the districts of the State are given in Table D-I (i) in Part II-A of this Volume. The map given overleaf indicates the districtwise distribution of population according to the mother-tongue speakers of (i) Telugu, (ii) Marathi, (iii) Urdu, (iv) Kannada, (v) Lambadi and (vi) Other Languages- wherever the percentage of each of these categories exceeds 0.5. The actual percentages of the mother-tongue speakers of these languages to the total population of the district concerned are also indicated in the Map. The reference for the map as well as the corresponding distribution of the population of the State, are given below:-
N ote :- In the sectorial representation a circle o f d iameter 0 . 3'" is t aken as equivalent to 100,000 persons.
[Po T . 0.]
-' -
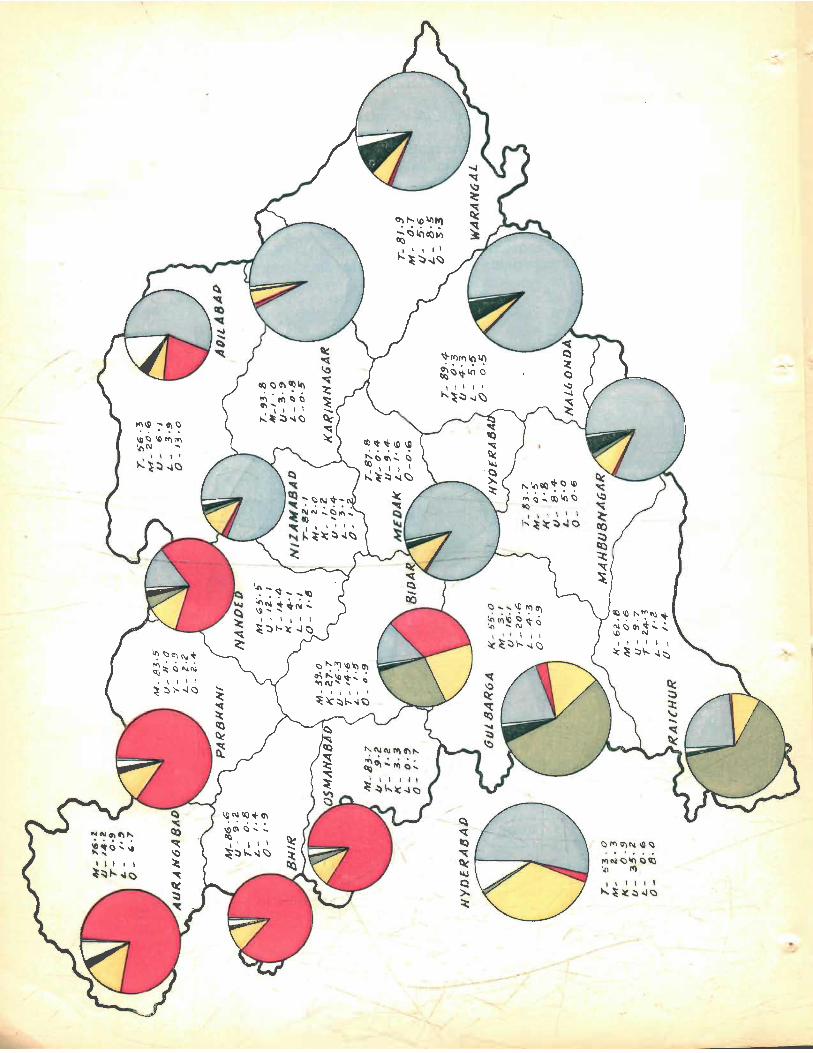
/
"'~ ... GlQ • • III .. ..
\111;) ~ 1<11<\ ~C\I ....
\ \ , ' "':~~.,jC)
CIO()G\~"" ..; . til ~ ~ ~~ . , \
"':~;::'-I~
1;)"'CJ)C\j\l)~
";~~";Q~ :.0 1<\
I I I I 11
..... ~~~ol~
..
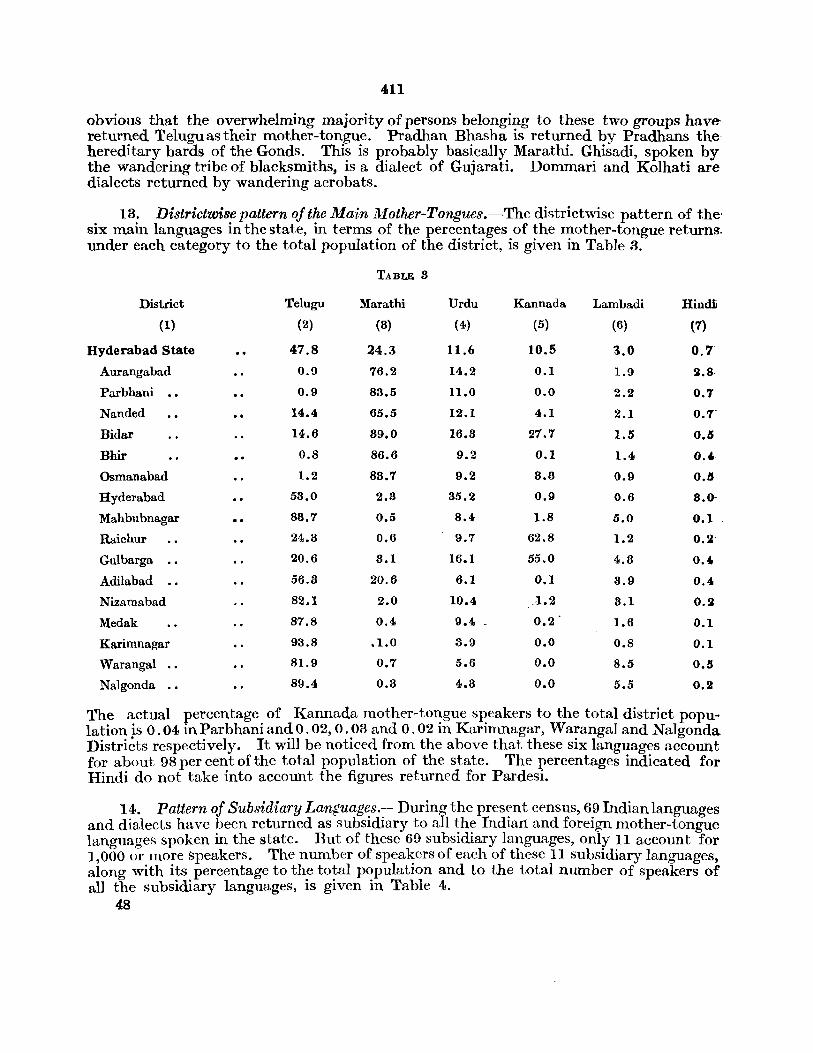
411
obvious that the overwhelming majority of persons belonging to these two groups havereturned Teluguas their mother-tongue. Pradhan Bhasha is returned by Pradhans thehereditary bards of the Gonds. This is probably basically Marathi. Ghisadi, spoken by the wandering tribe of blacksmiths, is a dialect of Gujarati. Dommari and Kolhati are dialects returned by wandering acrobats.
13. Districtwise pattern of the Main Mother-Tongues.-The districtwise pattern of the· six main languages in the state, in terms of the percentages of the mother-tongue returns. under each category to the total population of the district, is given in Table 3.
TABLE 8
District Telugu Marathi Urdu Kannada Lambadi Hindii
(1) (2) (8) (4) (5) (6) (7)
Hyderabad State 47.8 24.3 11.6 10.5 3.0 0.7
Aurangabad 0.9 76.2 14.2 0.1 1.9 ~.8-
Parbhani 0.9 83.5 11.0 0.0 2.2 0.1
Nanded 14.4 65.5 12.1 4.1 2.1 O. '1'
Bidar 14.6 89.0 16.8 27.7 1.5 0.5
Bhir 0.8 86.6 9.2 0.1 1.4 0.'
Osmanabad 1.2 88.7 9.2 8.3 0.9 0.5
Hyderabad 53.0 2.3 35.2 0.9 0.6 8.0-
Mahbubnagar 83.7 0.5 8.4 1.8 5.0 0.1
Raichur 24.3 0.6 9.7 62.8 1.2 O.~'
Gulbarga · . 20.6 8.1 16.1 55.0 4.3 0.'
Adilabad · . 56.8 20.6 6.1 0.1 8.9 0.4
Nizamabad 82.1 2.0 10.4 .1.2 8.1 O.~
Medak 87.8 0.4 9.4 - 0.2 1.6 0.1
Karimnagar 93.8 .1.0 3.9 0.0 0.8 0.1
Warangal 81.9 0.7 5.6 0.0 8.5 0.11
Nalgonda · . 89.4 0.3 4.3 0.0 5.5 0.2
The actual percentage of Kannada mother-tongue speakers to the total district popu-lation is 0.04 inParbhaniandO.02, 0.03 and 0.02 in Karimnagar, Warangal and NaIgonda, Distri~ts respectively. It will be noticed from the above that these six languages account for about 98 per cent of the total population of the state. The percentages indicated for Hindi do not take into account the figures returned for Pardesi.
14. Pattern of Subsidiary Lan{!uag~s.-:- During the pres:nt census, 6.9 Indian languages and dialects have been returned as SubSIdIary to all the IndIan and foreIgn mother-tongue languages spoken in the state. But of these 69 subsidiary languages, only 11 account for 1,000 or more speakers. The number of speakers of each of these 11 subsidiary languages, along with its percentage to the total population and to the total number of speakers of al1 the subsidiary languages, is given in Table 4.
48
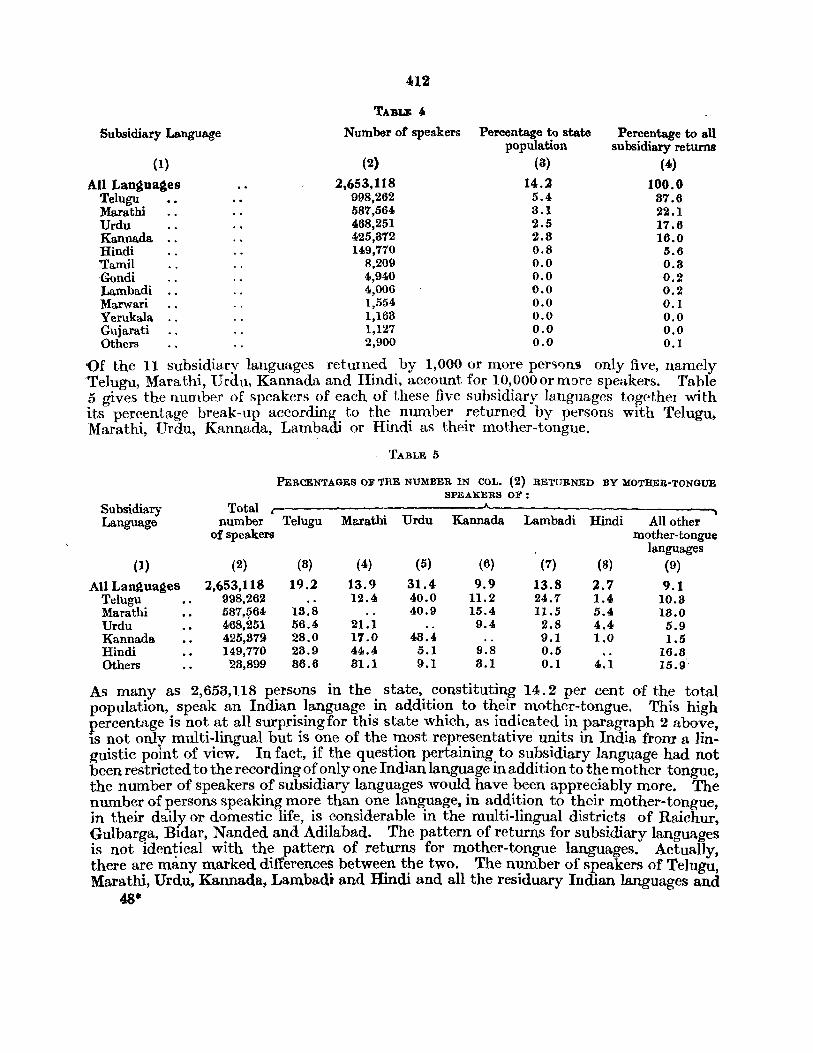
412
TABL'B 4.
Subsidiary Language Number of spea.kers
(I) (2)
Percentage to state population
(8)
Percentage to all subsidiary retu1'JlB
(4)
All Lan~ua~e8 2.653,118 14.2 100.0 Telugu 998,262 5.4 87.6 Marathi 587,564 3.1 22.1 Urdu 468,251 2.5 17.6 Kannada 425,872 2.8 16.0 Hindi 149,770 0.8 5.6 'Tamil 8,209 0.0 0.3 &ndi 4,940 0.0 0.2 Lambadi 4,006 0.0 0.2 Marwari 1,554 0.0 0.1 Yerukala 1,163 0.0 0.0 Gujarati 1,127 0.0 0.0 Others 2,900 0.0 0.1
()f the 11 subsidiary languages return~d. by 1,000 or more per~<)ns only five, namely 'Telugu, Marathi, Urdu, Kannada and HmdI, account for 10,000ormore speakers. Table 5 gives the number of speakers of each of these five subsidiary languages together with its percentage break-up according to the number returned by persons with Telugu, Marathi, Urdu, Kannada, Lambadi or Hindi as their mother-tongue.
TABLE 5
PERCENTAGES OF THE NUMBER IN COL. (2) RETURNED BY MOTIIE&-TONGUE SPEAKERS OF:
Subsidiary Total r-Language number Telugu Marathi Urdu Kannada Lambadi Hindi All other
of speakers mother-tongue languages
(1) (2) (8) (4) (5) (6) (7) (8) (9)
All Langua~es 2,653,118 19.2 13.9 31.4 9.9 13.8 2.7 9.1 Telugu 998,262 12.4 40.0 11.2 24.7 1.4 10.8 Marathi 587,{'64 18.8 40.9 15.4 11.5 5.4 18.0 Urdu 468,251 56.4 21.1 9.4 2.8 4.4 5.9 Kannada 425,379 28.0 17.0 48.4 9.1 1.0 1.5 Hindi 149,770 28.9 44.4 5.1 9.S 0.5 16.8 Others 23,899 86.6 31.1 9.1 8.1 0.1 4.1 15.!f
As many as 2,653,118 persons in the state, constituting 14.2 per cent of the total population, speak an Indian language in addition to their mother-tongue. This high percentage is not at all surprising for this state which, as indicated in paragraph 2 above, IS not only multi-lingual but is one of the most representative units in India from a linguistic point of view. In fact, if the question pertaining to subsidiary language had not been restricted to the recording of only one Indian language in addi tion to the mother tongue, the number of speakers of subsidiary languages would have been appreciably more. The number of persons speaking more than one language, in addition to their mother-tongue, in their daily or domestic life, is considerable in the multi-lingual districts of Raichur, Gulbarga, Bidar, Nanded and Adilabad. The pattern of returns for subsidiary languages is not iden~ical with th~ pattern of returns for mother-tongue languages. Actually, there are many marked dIfferences between the two. The number of speakers of Te)ugu Marathi, Urdu, Kannada, Lambadi and Hindi and all the residuary Indian languages and
48·
413
dialects as a subsidiary language, to every 1,000 persons speaking the same language as mother-tongue is 112 for Telugu, 129 for Marathi, 211 for both Urdu and Kannada 1 for Lambadi, 1,120 for Hindi and 52 for Others. '
15. Telugu as a Subsidiary Language.-The number of persons speaking Telugu as a subsidiary language is by far the most numerous in the state. But their percentage to the total number of speakers of all the subsidiary languages is considerably lower than the percentage of speakers of Telugu as a mother-tongue to the total population of the state-the respective percentages are 87.6 and 47.8. This is principally due to the fact that generally in all the tracts in the state where Tclugu mother-tongue speakers are in a majority, the number of speakers of other mother tongues is comparatively small. In other words, the preponderance of Telugu mother-tongue speakers in Telugu tracts is more complete than that of Marathi or Kannada mother-tongue speakers in their respective areas. As a result, the number of persons, speaking languages other than Telugu as their mother-tongue, who are compelled by force of circumstances to resort to the use of Telugu in their daily or domestic life is relatively not very large.
16. Marathi as a Subsidiary Language.-The number of persons who speak Marathi as a subsidiary language is second only to that of Telugu subsidiary speakers. But as compared with the figures for Telugu, the percentage of Marathi subsidiary speakers to the total number of speakers of all subsidiary languages is very close to the percentage 'of Marathi mother-tongue speakers to the total population of the state. The respective percentages for Marathi are 22·1 and 24 ·8. This is due to the fact that Marathi is not as. preponderant in Marathi tracts as Telugu is in Telugu tracts. Fo)' example, in l\farathi tracts the proportion of Urdu mother-tongue speakers to the total population of the tracts is significantly more than the corresponding proportion in Telugu tracts. As a result, the number of persons speaking languages other than Marathi as their mothertongue~ who have to use Marathi in their daily or domestic life is comparatively heavy. Besides, in many Non-Marathi rural areas in the districts of Adilabad Nanded, Bidar and Gulbarga, Marathi continues to be the language used by village officers,. traders, etc., in the conduct of their daily business. Many among the 'elite' in these districts, whose mother-tongue is Kannada or Telugu, cannot read and write their mothertongue languages. They resort to Marathi or Urdu even for correspondence with their relatives. The popularity of Marathi among the 'elite' in the state as a. whole is. second only to that of Urdu.
17 . Urdu and Hindi as Subsidiary Languages.-It is not logical to examine separately the figures pertaining to the number of persons speaking Urdu and Hindi as subsidiary to their mother-tongue, at any rate, in this state. There is perhaps more difference in Telugu as spoken in the southern and northern parts of the state than there is lwtween Hindi and Urdu, particularly when they are used as subsidiary languages for the conduct of one's daily or domestic affairs. In view of this, the figures pertaining to the number of persons speaking these two languages as subsidiary are dealt with together. These two subsidiary languages are returned in all by 618,021 persons-Urdu by 468,251 persons and Hindi by 149,170. The percentage of the number of persons speaking Urdu or Hindi as. their subsidiary language to the total number of speakers of all the subsidiary languages is 28.3, whereas the percentage of mother-tongue speakers of Urdu and Hindi to the total population of the state is only 12 ·3. The number of speakers of Urdu or Hindi as a subsidiary language to every 1,000 persons speaking either of them as their moth er-tongue is 270 which is much larger than the corresponding number for any other language. This

414
popularity of Urdu and Hindi, as subsidiary languages, is due partly to historical reasons and partly to the multi-lingual nature of the state. Urdu has been for decades now and still continues to be, in a manner, the official language of the state. Earlier to that, Persian held the privileged position for many centuries. Until very recently, Urdu was almost the sole medium of instruction in the secondary ftnd higher stages of education. Urdu or _ Hindi continues to be the lingua franca of the state, particularly in the urban areas. They are almost the only medium of expression when people of different linguistic regions in the state unacquainted with each other's mother-tongue converse with one another. In many cases such persons, even when they are acquainted with the regional languages concerned, prefer to express themselves in these languages. In fact, it is very common to find literate persons with the same regional language as their mother-tongue talking with each other in Urdu or Hindi. Urdu or Hindi films, novels, newspapers, etc., are no where, south of the Vindhyas, as popular as in this state.
18. Kannada as a Subsidiary Language.- The percentage of Kannada subsidiary speakers to the total number of speakers of all subsidiary languages is appreciably high as compared with the percentage of the speakers of Kannada as mother-tongue to the total'population of the state. The respective percentages are 16.0 and 10.5. For every 1,000 persons speaking Kannada as their mother-tongue, there are 217 persons speaking Kannada as a subsidiary language. This proportion is second only to Urdu and Hindi. It may look strange that a language which is comparatively less important than Telugu and Marathi, either from the point of view of numbers or of the economic condition of the mother-tongue speakers, should account relatively for such a high proportion of the subsidiary speakers. But a close study of the figures makes it obvious that it is actually its weakness in numbers as a mother-tongue language that leads to its strength as a subsidiary one. Compared with Telugu or Marathi in their respective areas, Kannada is the least entrenched in the state in Kannada tracts. For example Telugu, Urdu and Marathi mother-tongue speakers together account for nearly 35 per cent of the total population in Raichur District, 40 per cent in Gulbarga District and 70 per cent in Bidar District. Yet Kannada accounts for the majority of the people, or the largest number of the people, in a majority of the tahsils of these three districts. Thus, a comparatively large number of persons with mother-tongues other than Kannada have to use the language in their daily or domestic life. It is not without interest to note here that the proportions of the bilingual returns in the three districts of Bidar, Gulbarga and Raichur, to the total population of the district are among the highest in the state. In Bidar District, though the mother-tongue returns for Marathi are more than that of Kannada, the.subsidiary returns for Kannada exceed that for Marathi.
-19. Other Subsidiary Languages.-Lambadi is one of the important languages in the
state. But while the mother-tongue speakers of the language account for 3 per cent of the total population, subsidiary speakers of the language constitute only 0.2 per cent of the total subsidiary returns. This low percentage of Lambadi as a subsidiary language is due simply to thefact that Lambadas do not constitute a majority in any tract of the state, and, therefore, no other mother-tongue group is forced to adopt their language in the -conduct· of its daily or domestic affairs. Further, the economic status of the Lambadas is not attractive enough to induce others to learn or speak their language. The subsidiary returns for Gondi (and Yeruk&la Bhasha) are also meagre because of almost similar reasons. Of all the languages in the state, Tamil is the most balanced as between the returns for mother-tongue and subsidiary languages. Its percentage in both the categories is 0.8 of the total returns. This is due to the fact that a large number of immigrant
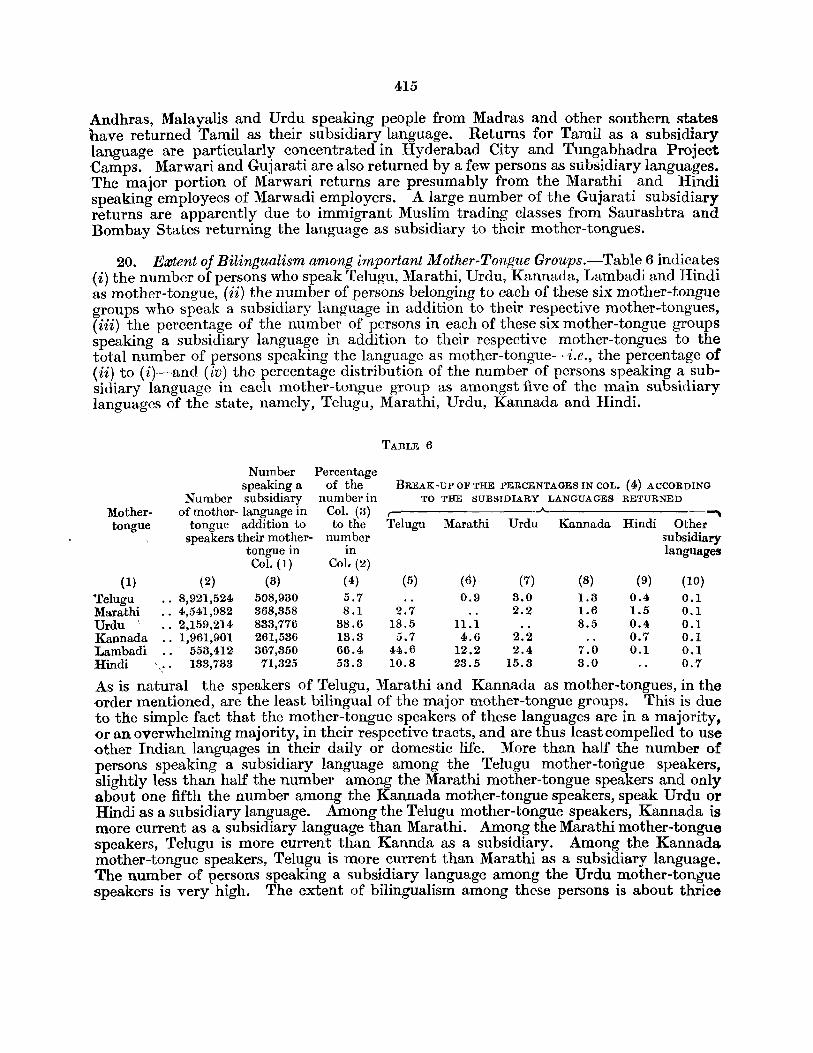
415
Andhras, Malayalis and Urdu speaking people from Madras and other southern states have returned Tamil as their subsidiary language. Returns for Tamil as a subsidiary language are particularly concentrated in Hyderabad City and Tungabhadra Project Camps. Marwari and Gujarati are also returned by a few persons as subsidiary languages. 'The major portion of Marwari returns are presumably from the Marathi and Hindi speaking employees of Marwadi employers. A large number of the Gujarati subsidiary returns are apparently due to immigrant Muslim trading classes from Saurashtra and Bombay States returning the language as subsidiary to their mother-tongues.
20. Extent of Bilingualism: among important Mother-Tongue Groups.-Table 6 indicates {i) the number of persons who speak Telugu, Marathi, Urdu, Kannada, Lambadi and Hindi as mother-tongue, (ii) the number of persons belonging to each of these six mother-tongue groups who speak a subsidiary language in addition to their respective mother-tongues, (iii) the percentage of the number of persons in each of these six mother-tongue groups speaking a subsidiary language in addition to their respective mother-tongues to the total number of persons speaking the language as mother-tongue-i.e., the percentage of (ii) to (i)-and (iv) the percentage distribution of the number of persons speaking a subsidiary language in each mother-tongue group as amongst five of the main subsidiary languages of the state, namely, Telugu, Marathi, Urdu, Kannada and Hindi.
TABLE 6
Number speaking a
Percentage of the BREAK-UP OF THE PERCENTAGES IN COL. (4) ACCORDING
Number subsidiary number in TO THE SUBSIDIARY LANGUAGES RETURNED of mother- language in Col. (3) r- ~ Mother
tongue tongue addition to to the Telugu Marathi Urdu Kannada Hindi Other speakers their mother- number subsidiary
tongue in in languages Col. (1) Co], (2)
(1) (2) (3) (4) (5) (6) (7) (8) (9) (10) Telugu .. 8,921,524 508,930 5.7 0.9 3.0 1.3 0.4 0.1 Marathi .. 4,541,982 368,358 8.1 2.7 2.2 1.6 1.5 0.1 Urdu \ ., 2,159,214 833,776 38.6 18.5 11.1 8.5 0.4 0.1 Kannada .. 1,961,901 261,536 13.3 5.7 4.6 2.2 0.7 0.1 Lambadi 553,412 367,350 66.4 44.6 12.2 2.4 7.0 0.1 0.1 Hindi ,,.. 133,733 71,325 53.3 10.8 23.5 15.3 3.0 0.7
As is natural the speakers of Telugu, Marathi and Kannada as mother-tongues, in the .order mentioned, are the least bilingual of the major mother-tongue groups. This is due to the simple fact that the mother-tongue speakers of these languages are in a majority, .or an overwhelming majority, in their respective tracts, and are thus least compelled to use .other Indian langu,ages in their daily or domestic life. More than half the number of persons speaking a subsidiary language among the Telugu mother-tongue speakers, slightly less than half the number among the Marathi mother-tongue speakers and only about one fifth the number among the Kannada mother-tongue speakers, speak Urdu or Hindi as a subsidiary language. Among the Telugu mother-tongue speakers, Kannada is more current as a. subsidiary language than Marathi. Among the Marathi mother-tongue speakers, Telugu is more current than Kannda as a subsidiary. Among the Kannada mother-tongue speakers, Telugu is more current than Marathi as a subsidiary language. The number of persons speaking a subsidiary language among the Urdu mother-tongue speakers is very high. The extent of bilingualism among these persons is about thrice
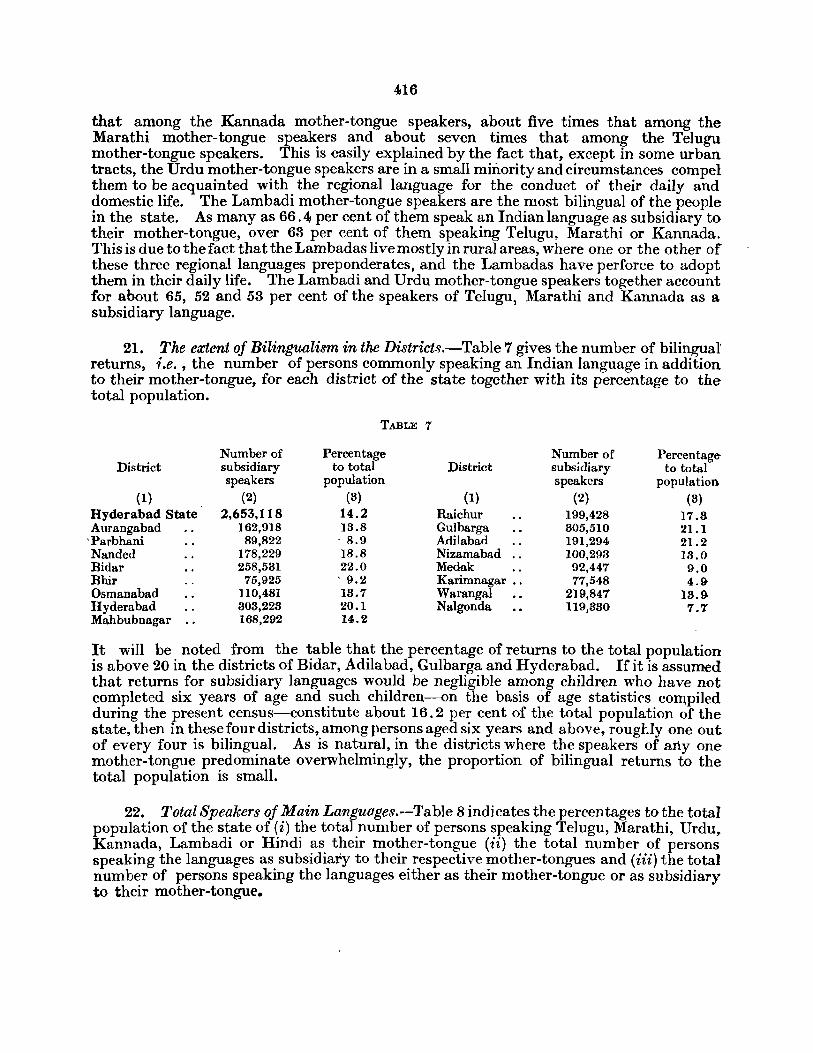
416
that among the Kannada mother-tongue speakers, about five times that among the Marathi mother-tongue speakers and about seven times that among the Telugu mother-tongue speakers. This is easily explained by the fact that, except in some urban tracts, the Urdu mother-tongue speakers are in a small minority and circumstances compel them to be acquainted with the regional language for the conduct of their daily and domestic life. The Lambadi mother-tongue speakers are the most bilingual of the people in the state. As many as 66.4 per cent of them speak an Indian language as subsidiary to their mother-tongue, over 63 per cent of them speaking Telugu, Marathi or Kannada. This is due to the fact that the Lambadas live mostly in rural areas ,where one or the other of these three regional languages preponderates, and the Lambadas have perforce to adopt them in their daily life. The Lambadi and Urdu mother-tongue speakers together account for about 65, 52 and 58 per cent of the speakers of Telugu, Marathi and Kannada as a subsidiary language.
21. The extent of Bilingualism in the Districts.-Table 7 gives the number of bilingual returns, i.e., the number of persons commonly speaking an Indian language in addition to their mother-tongue, for each district of the state together with its percentage to the total population.
TABLE 7
Number of Percentage Number of Percentage District subsidiary to total District subsidiary to total
speakers population speakers population (1) (2) (3) (1) (2) (3)
Hyderabad State 2,653,118 14.2 Raichur 199,428 17.8 Aurangabad 162,918 13.8 Gulbarga 305,510 21.1
'Parbhani 89,822 ·8.9 Adilabad 191,294 21.2 Nanded 178,229 18.8 Nizamabad .. 100,298 18.0 Bidar 258,531 22.0 Medak 92,447 9.0' Bhir 75,925 . 9.2 Karimnagar .. 77,548 4.9 Osmanabad 110,481 13.7 Warangal 2]9,847 18.9 Hyderabad 303,228 20.1 Nalgonda 119,330 7.T Mahbubnagar 168,292 14.2
It will be noted from the table that the percentage of returns to the total population is above 20 in the districts of Bidar, Adilabad, Gulbarga and Hyderabad. If it is assumed that returns for subsidiary languages would be negligible among children who have not completed six years of age and such children-on the basis of age statistics compiled during the present census-constitute about 16.2 per cent of the total population of the state, then in these four districts, among persons aged six years all(~ above, rouglJy one out of every four is bilingual. As is natural, in the districts where the speakers of aTiy one mother-tongue predominate overwhelmingly, the proportion of bilingual returns to the total population is small.
22. Total Speakers of Main Languages.--Table 8 indicates the percentages to the total population of the state of (i) the total number of persons speaking Telugu, Marathi, Urdu~ Kannada, Lambadi or Hindi as their mother-tongue (ii) the total number of persons speaking the languages as subsidiary to their respective mother-tongues and (iii) the total number of persons speaking the languages either as their mother-tongue or as subsidiary to their mother-tongue.
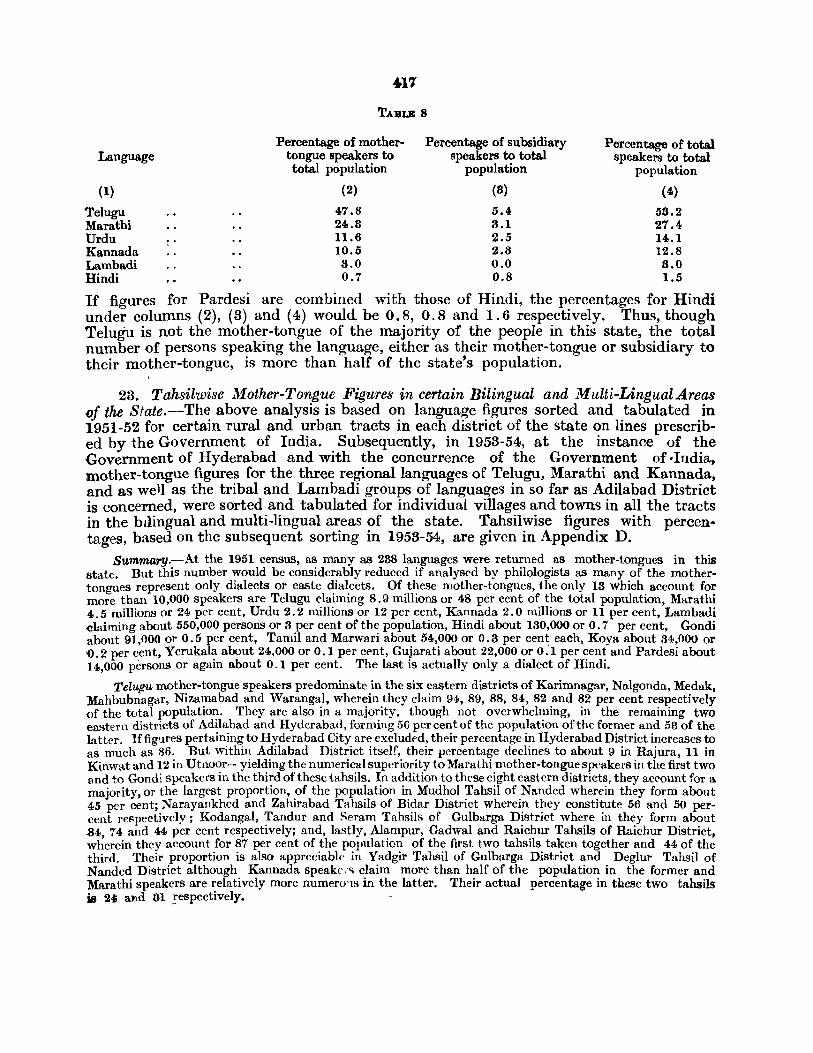
Language
(1)
Telugu Marathi Urdu Kannada Lambadi Hindi
4-11
TABLE 8
Percentage of mothertongue speakers to total population
(2)
47.8 24.8 1l.6 10.5 3.0 0.7
Percentage of subsidiary speakers to total
population
(8)
5.4 3.1 2.5 2.8 0.0 0.8
Percenta"ae of total speakers to total
population
(4)
58.2 27.4 14.1 12.8 8.0 1.5
If figures for Pardesi are combined with those of Hindi, the percentages for Hindi under columns (2), (3) and (4) would be 0.8, 0.8 and 1.6 respectively. Thus, though Telugu is not the mother-tongue of the majority of the people in this state, the total number of persons speaking the language, either as their mother-tongue or subsidiary to their mother-tongue, is more than half of the state's population.
23. Tahsilwise Mother-Tongue Figures in certain Bilingual and Multi-LingualAreas of the State.-The above analysis is based on language figures sorted and tabulated in 1951-52 for certain rural and urban tracts in each district of the state on lines prescribed by the Government of India. Subsequently, in 1953-54, at the instance of the Government of Hyderabad and with the concurrence of the Government of -India, mother-tongue figures for the three regional languages of Telugu, Marathi and Kannada, and as well as the tribal and Lambadi groups of languag-es in so far as Adilabad District is concerned, were sorted and tabulated for individual villages and towns in all the tracts in the bIlingual and multi-lingual areas of the state. Tahsilwise figures with percentages, based on the subsequent sorting in 1953-54, are given in Appendix D.
Summary.-At the 1951 census, as many as 238 languages were returned as mother-tongues in this state. But this number would be considerably reduced if analysed by philologists as many of the mothertongues represent only dialects or caste dialects. Of these mother-tongues, the only 13 which account for more than 10,000 speakers are Telugu claiming 8.9 millions or 48 per cent of the total population, Marathi 4.5 mil1ions or 24 per cent, Urdu 2.2 millions or 12 per cent, Kannada 2.0 millions or 11 per cent, Lambadi dailning about 550,000 persons or 3 per cent of the population, Hindi about 130,000 or 0.7 per cent, Gondi about 91,000 or 0.5 per cent, Tamil and Marwari about 54,000 or 0.3 per cen~ each, Koya about 34,000 or '0.2 per cent, Ycrukala about 24,000 or 0.1 per cpnt, Gujarati about 22,000 or 0.1 per cent and Pardesi about 14,000 persons or again about 0.1 per cent. The last is actually only a dialect of Hindi.
Telugu mother-tongue speakers predominate in the six eastern districts of Karimnagar, Nalgonda, Medak, Mahbubnagar, Nizamabad and Warangal, wherein they claim 94, 89, 88, 84,82 and 82 per cent respectively ()f the total population. They are also in a majority, though not overwhelming, in the remaining two ea."tern districts of Adilabad and Hydcrabad, forming 56 per cent of the population of the former and 53 of the latter. 1f figures pertaining to Hyderabad City are excluded, their percentage in Hyderabad District increases to as wuch as 86. But within Adilabad District itself, their percentage declines to about 9 in Rajura, 11 in Kinwat and 12 in Utnoor- yielding the numerical superiority to Marathi mother-tongue speakers in the first two and to Gondi speakers in the third of these tahsils. In addition to these eight eastern districts, they account for a majority, or the largest proportion, of the population in Mudhol Tahsil of Nanded wherein they form about 45 per cent; Narayankhed and Zahirabad Tahsils of Bidar District wherein they constitute 56 and 50 percent reRpectively; Kodangal, Tandur and Seram Tahsils of Gulbarga District where in they form about .84 74 and 44 per cent respectively; and, lastly, Alampur, Gadwal and Raichur Tahsils of Raichur District, wherein they account for 87 per cent of the population of the first two tahsils taken together and 44 of the third. Their proportion is also appreciablr' in Yadgir Tahsil of Gulbarga District and Deglur Tahsil of Nanded District although Kannada speake:.;; claim more than half of the population in the former and Marathi speakers are relatively more numerO'lS in the latter. Their actual percentage in these two tahsils is 2~ aPld 81 _!'cspectively. -
418
Marathi mother-tongue speakers predominate in the five north-western districts of Bhir, Osmanabad~ Parbhani, Aurangabad and Nanded, wherein they account for 87, 84, 84, 76 and 66 per cent respectively of the population. Thus, they are not so well entrenched in their home areas as Telugu speakers are in their own. Again, within Nanded District itself, their percentage declines to 34 in Mudhol Tahsi] wherein they lose their numerical superiority to Telugu speakers. But they are in a decisive majority in the three tahsils of Ahmedpur, Nilanga and Udgir in Bidar District, forming about 87, SO and 76 per cent respectively of the population of the three tahsi]s. They also account for about 64 per cent of the population in Rajura Tahsil and 43 in Kinwat Tahsil of Adilabad District. Their relative numbers are also appreciable, though they donot constitute the most numerous lingua] group, in Santpur and Bhalki Tahsils of Bidar District and Sirpur, Asifabad and Boath Tahsils of Adilabad District, forming 38, 37, 29, 24 and 20 per cent respectively of their population.
• Kannada mother-tongue speakers account for 63 per cent of the population in Raichur and 55 in Gu]-barga District. But within these two districts they lose their numerical superiority to Tdllb'll speakers in Alampur, Gadwal and Raichur Tahsils in case of the former and Kodangal, Tandur and Seram Tahsils in case of the latter. Their percentage is, however, as much as 37 in casr of both Raichur and Scram Tahsils. They are also the most numerous among the speakers of all mother-tongues, in Bidar, Humnabad, Bhalki and Santpur (Aurad) Tahsils of Bidar District-accounting for about 48 per cent of the population in each of the first three and 41 in the last of these tansils. In addition to these tahsils, the number of Kannada mothertongue speakers is also appreciable in Zahirabad and Narayankhed Tahsils of Bidar District and Deglur Tahsilof Nanded District, wherein they account for 21, 20 and 20 per cent respectively of the population. It will thus be obvious that among the mother-tongue speakers of the three regional languages of the state Kannada speakers are the least entrenched in their own areas.
Urdu mother-tongue speakers are not in a majority in any district of the state. Their percentage to the total population is 85 in Hyderabad District, 16 in both Gulbarga and Bidar, 14 in Aurangabad, ranges between 10 and 12 in Nanded, Parbhani and Nizamabad and between 5 and 10 in Raichur, Medak, Bhir, Osmanabad, Mahbubnagar, Adilabad and Warangal and is just about ~. in both Nalgonda and Karimnagar. They are, however, heavily concentrated in urban areas, especially in the larger of the urban units. They account: tor 84 per cent of the total urban population of the state.
Lambadi mother-tongue speakers, although they originally migraterl to this state along with the Muslims or Moghul armies during the 17th Century, are now, except in case of Gulbarga District, concentrated in
, areas least associated with Muslim rule in the Deccan. They form about 9 per cent of the popUlation in Warangal District, 6 in Nalgonda, 5 in Mahbubnagar, 4 in both Gulbarga and Adilabad, 3 in Nizamabad, 2' in each of the five districts of Parbhani, Nanded Aurangabad, Medak and Bidar and about 1 in all the remaining districts. More than half of them in the state are in the extreme southern districts of Warangal, Nalgonda and Mahbubnagar. Unlike the Urdu speakers, they are concentrated in rural areas.
Hindi mother-tongue speakers are most conspicuous in Hyderabad and Aurangabad Districts claiming 8 per cent of the population in both of them. Their percentage is less than one in all the other districts. The Hindi speakers, like the Urdu speakers, are concentrated in urban areas. All but 612 of the Gondi speakers are from Adilabad District, almost wholly from its villages. Similiarly, the overwhelming majority of the Koya speakers are from Wcn'angal District. The other tribal languages now returned in the state include Bhili, Kolami and Naikopodi. Speakpfs of all the tribal languages in the state number 143,652. Thus, only about 40 per cent of the Scheduled Tribes in the state have returned tribal languages-the rest having recorded their mother-tongue as Telugu or Marathi. The Tamil and Gu.iarati speakers are also ('oncentrated in urban areaS- the former mainly in Hyderabad City and the Tungabhadra Project Camps and the latter in Hyderabad City and Aurangabad, Jalna and Nizamabad Town's. The Marwari speakers are mostly from Hyderabad City, the bigger of the other urban units and in Mnrathi tracts. The Yerukala, speakers are chiefly from the Telugu areas-the speakers of the allied dialects of Kaikadi, numbering about 4,000, and Korat1a, numbering about 2,600, are, however, mostly from the l\Iarathi and Kannada areas respectively.
At the 1951 Census, 2,653,118 persons, or 14.2 per cent of the state's popul:\tion, was bilingual in the sense that they spoke at least one Indian language or dialect in addition to their motht'r tongue in their daily or domestic life. Districtwise, the corresponding percentage is slightly in exceSS of 20 in Bidar, Adilabad, Gulbarga and Hyderahad, ranges between ,15 and 20 in Nanded and Raichur, between 10 and 15 in Mabbubnagar, Warangal, Aurangabad, Osmanabad and Nizamabad, between 5 and 10 in Bhir, Medak, Parbhani and Nalgonda and is about 5 in Karimnagar. Thus, bilingualism is fairly pxtensive in this state. In fact it could be said that in the first four of these districts one out of every four persons aged 6 years and above i~ bilingual.
419
The total number of subsidiary languages returned in thi.'3 state in 1951 was 69. The figures for sub-sidiary languages are, however, subject to the limitation that they are confined to only one of the subsidiary languages, if any, spoken by each person-the one which is most used in daily or domestic life in addition to the mother-tongue. But of these subsidiary languages only five are spoken by more than 100,000 persons each. The insignificance of the rest of them would be evident from the fact that only six of them could individually claim from about 1,00Q to 8,000 speakers. The five main subsidiary languages in the state are Telugu, Marathi, Urdu, Kannada and Hindi, accounting for about 38, 22, 18, 16 and 6 per cent respectively of the total subsidiary returns-there is, however, hardly any distinction between Urdu and Hindi in this state especially when they are used as subsidiary languages. Lambadi and Urdu mother-tongue speakers .are responsible for about 65 per cent of the Telugu and over 50 of both the Marathi and Kannada subsidiary returns. The overwhelming majority of the rest of the subSidiary returns for each of these three regional languages arc from the mother-tongue speakers of the other two of them. Marathi mother-tongue speakers, however, contribLlte s.J.ightly more than the Kannada mother-tongue speakers to the Telugu subsidiary returns; Kannada mother-tongue speakers contribute slightly mure than the Telugu mother-tongue speakers to the Marathi subsidiary returns; and Telugu mother-tongue speakers contribute considerably more than the Marathi mother-tongue speakers to the Kannada subsidiary returns. Naturally, the speakers of these regional languages contribute the overwhelming majority of the subsidiary returns for Hindi and, more especially, Urdu. The proportion of the number of persons speaking a language as subsidiary, for every 1,000 speaking it as their mother-tongue, is very heavy in case of Urdu and Hindi taken together, fairly appreciable in case of Kannada, not very significant in case of Marathi and, more especially, Telugu, and, lastly, literally microscopic in case of Lambadi. The actual proportions being 270, 217, 129, 112 and 7 respectively. This popularity of Urdu (or Hindi) as a subsidiary language is due to the fact that it is the lingua franc.a for the state. Similarly, the greater popularity of Kannada as compared with either Telugu or Marathi, ·or of Marathi as compared with Telugu in this regard, actually reflects its comparatively 'slender' majority in its own region. Lambadi is not current as a subsidiary language merely because it is neither a regional language nor (like Urdu or Hind}) a lingua franca. Again, among the major mother-tongue groups, Lambadi, Hindi and Urdu mother-tongue speakers are the most bilingual in the state. This is due to the fact that they are in a minority in all areas and are compelled to use the regional language in their daily or domes-tic life. For exactly opposite reasons, Telugu, Marathi and Kannada mother-tongue speakers are, in the <order mentioned, the least bilingual in this state.
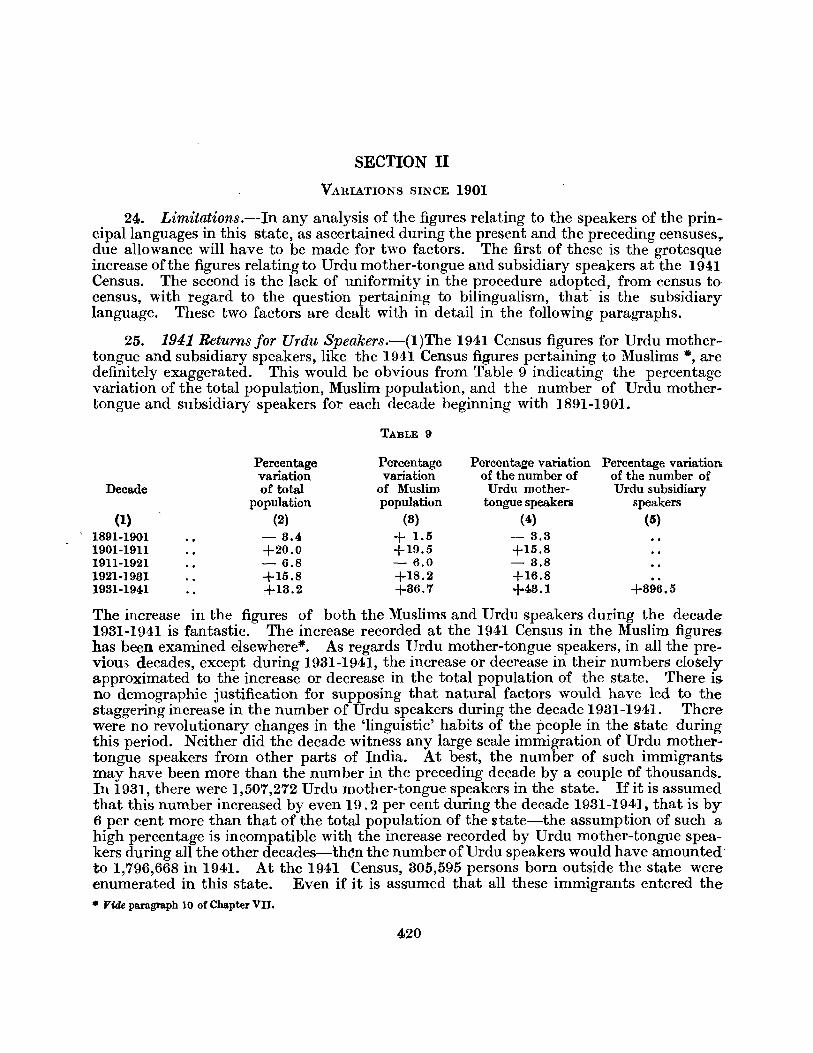
,
SECTION II
VARIATIONS SINCE 1901
24. Limitations.--In any analysis of the figures relating to the speakers of the principallanguages in this state, as ascertained during the present and the preceding censuses,. due allowance will have to be made for two factors. The first of these is the grotesque increase of the figures relating to Urdu mother-tongue and subsidiary speakers at the 1941 Census. The second is thc lack of uniformity in the procedure adopted, from census to· census, with regard to the question pertaining to bilingualism, that" is the subsidiary language. These two factors are dealt with in detail in the following paragraphs.
25. 1941 Returns for Urdu Speakers.-(I)The 1941 Census figures for Urdu mothertongue and subsidiary speakers, like the 1941 Census figures pertaining to Muslims ., are definitely exaggerated. This would be obvious from Table 9 indicating the percentage variation of the total population, Muslim population, and the number of Urdu mothertongue and subsidiary speakers for each decade beginning with 1891-1901.
TABLE 9
Percentage Percentage Percentaie variation Percentage variation variation variation of the number of of the number of
Decade of total of Muslim Urdu mother- Urdu subsidiary population population tongue speakers speakers
(1) (2) (8) (4) (5) 1891-1901 - 3.4 + 1.5 - 3.3 1901-1911 +20.0 +19.5 +15.8 1911-1921 - 6.8 - 6.0 - 3.8 1921-1931 +15.8 +18.2 +16.8 1931-1941 +13.2 +36.7 +43.1 +896.5
The increase in the figures of both the Muslims and Urdu speakers during the decade 1931-1941 is fantastic. The increase recorded at the 1941 Census in the Muslim figures. has been examined elsewhere·. As regards Urdu mother-tongue speakers, in all the previous decades, except during 1931-1941, the increase or decrease in their numbers closely approximated to the increase or decrease in the total population of the state. There is no demographic justification for supposing that natural factors would have led to the staggering increase in the number of Urdu speakers during the decade 1931-1941. There were no revolutionary changes in the 'linguistic' habits of the people in the state during this period. Neither did the decade witness any large scale immigration of Urdu mothertongue speakers from other parts of India. At best, the number of such immigrants may have been more than the number in the preceding decade by a couple of thousands. In 1931, there were 1,507,272 Urdu mother-tongue speakers in the state. If it is assumed that this number increased by even 19.2 per cent during the decade 1931-1941, that is by 6 per cent more than that of the total population of the state-the assumption of such a high percentage is incompatible with the increase recorded by Urdu mother-tongue speakers during all the other decades-th~n the number of Urdu speakers would have amounted to 1,796,668 in 1941. At the 1941 Census, 305,595 persons born outside the state were enumerated in this state. Even if it is assumed that all these immigrants entered the • Vide paragraph 10 of Chapter VII.
420
421
:state during the decade 1981-1941 only, and were entirely made up of Urdu mothertongue speakers, which is again an absurd supposition, the total number of Urdu mothertongue speakers in 1941 could have been only 2,102,268, i.e., less by about 50,000 of the actual number of 2,156,661 recorded at the 1941 Census. It may be of interest to note here that during the decade 1931-1941 while the percentage increase of the total population ·of as many as seven districts was less than 10, of eight districts above 10 and of only one district, namely Hyderabad District including Hyderabad City, above 40, the p.ercentage increase of the number of Urdu mothe~-tongue speakers was less than 10 in only one ·district and less than 20 in only another. It was above 20 in two districts, above 80 in 'six, above 40 in two, above 50 in two, above 60 in one, and almost 90 in yet another!
(2) As stated above, no figures were collected regarding subsidiary languages earlier to the 1931 Census. Thus, comparative figures for Urdu subsidiary speakers during the previous decades are not available. Even then it is obvious that the percentage increase ,of 396.5 recorded during 1931-1941 for Urdu subsidiary speakers, could have no basis in reality. According to the 1941 Census, in the state as a whole, out of the 14,181,873 non-Urdu mother-tongue speakers, 2,238,264, persons were using Urdu' at home or in business'. According to the 1951 age break-up, this would mean that roughly 20 per cent of them aged six years or above spoke Urdu as a subsidiary language. This is a ·staggering percentage considering the fact that Urdu is not generally understood and much less spoken in the predominantly rural areas of the state. The irregularity in these returns or in the compilation of these returns, would be obvious from the fact that the similar' percentage of Urdu subsidiary speakers among the mother-tongue speakers of languages othertha:n Urdu in Adilaba~ Distri?t, ~he most backward in the state, was about 66. Split up seXWIse, the percentage III the dIstrIct was 73 for males and about 60 for females. It is impossible to accept that this huge proportion of the overwhelmingly illiterate women 'of Adilabad District with Telugu, Marathi, Gondi, Kolami, etc., as their mothertongue would have been speaking Urdu as a subsidiary language: It would have been remarkable if even 10 per cent of them understood Urdu. How Irregular the returns are would be obvious from yet another illustration. Among the comparatively advanced women in Hyderabad City with Teluguas their mother-tongue, the corresponding percentage of lJrdu subsidiary speakers was less than 37 but among the illiterate and backward women of Adilabad District with Telugu as their mother-tongue it was 60. '
26. Differences in Approach to the Question regarding Bilingualism.--Figures regarding bilinglialism were coIJected in this state for the first time during the 1931 Census. In 1931, the language or .lang_uage~, if any, ha?it~ally spoken b~ each person in addition to his mother-tongue ~n h~8 datly or dome8t~c life were ascertamed and recorded. The Census Tabulation Office, however, tabulated bilingual data only with regard to Telugu, Marathi, Urdu and Kannada as returned by speakers of thirteen important mother-tongues in the state. In 1941, the language or languages, if any, generally spoken by each person in addition to the mother-tongue at home or in business were ascertained and recorded. The Census Tabulation Office, however, tabulated bilingual data again only with regard to Telugu, Marathi, Urdu and Kannada, but for this purpos~ it appears to have taken into account the speakers of almost all the mother-tongues III the state. In 1951, as .already indicated in paragraph I above, the Indian language, if any, spoken by each person commonly, i.e., in his daily or domestic life, in addition to the mother-tongue, was ascertained and recorded. In case a person spoke more than one language as such, then the one most commonly spoken by him was entered in the census slip. The Tabulation Office made full use of all the answers to this question and tabulated bilingual data for all languages and dialects returned by speakers of all mother-tongues without any exception
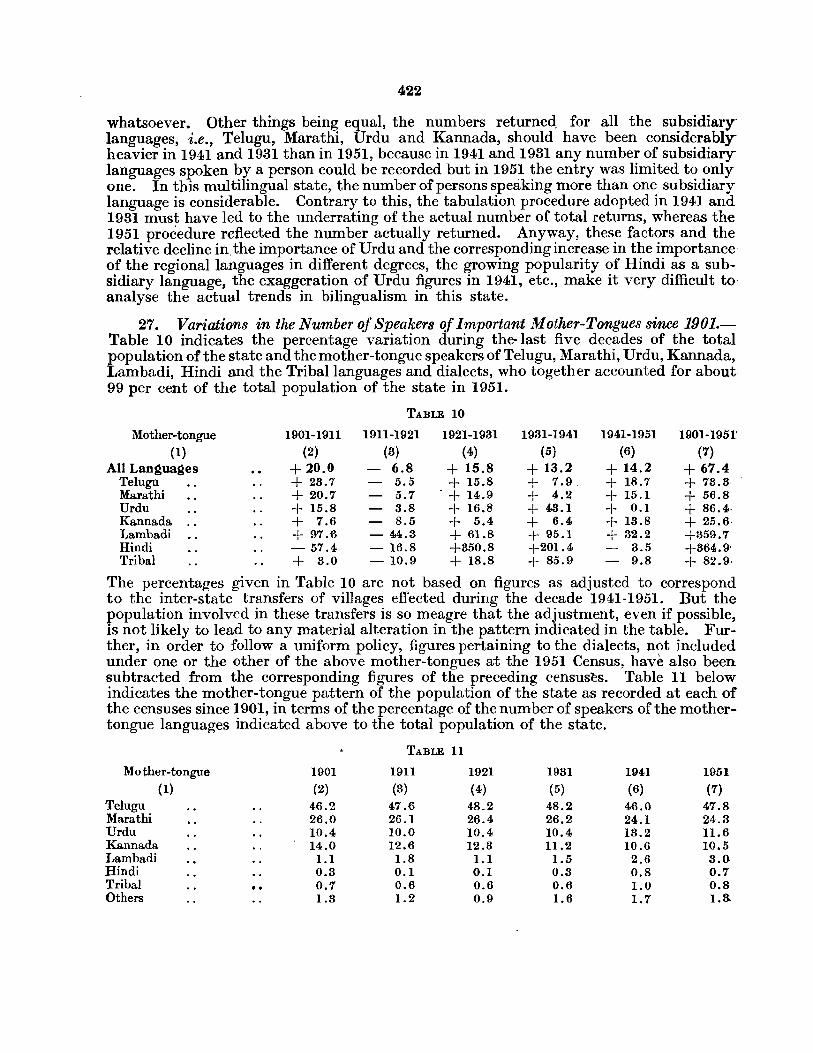
422
whatsoever. Other things being equal, the numbers returneq for all the subsidiary languages, i.e., Telugu, Marathi, Urdu and Kannada, should have been considerably heavier in 1941 and 1931 than in 1951, because in 1941 and 1931 any number of subsidiary languages spoken by a person could be recorded but in 1951 the entry was limited to only one. In this multilingual state, the number of persons speaking more than one subsidiary language is considerable. Contrary to this, the tabulation procedure adopted in 1941 and 1931 must have led to the underrating of the actual number of total returns, whereas the 1951 procedure reflected the number actually returned. Anyway, these factors and the relative decline in. the importance of Urdu and the corresponding increase in the importance of the regional languages in different degrees, the growing popularity of Hindi as a subsidiary language, the exaggeration of Urdu figures in 1941, etc., make it very difficult to' analyse the actual trends in bilingualism in this state.
27. Variations in the Number of Speakers of Important Mother-Tongues since 1901.Table 10 indicates the percentage variation during the-last five decades of the total population of the state and the mother-tongue speakers of Telugu, Marathi, Urdu, Kannada, Lambadi, Hindi and the Tribal languages and dialects, who together accounted for about. 99 per cent of the total population of the state in 1951.
TABLE 10
Mother-tongue 1901-1911 1911-1921 1921-1931 1931-1941 1941-1951 1901-1951:
(1) (2) (3) (4) (5) (6) (7) All Languages + 20.0 6.8 + 15.8 + 13.2 + 14.2 + 67.4
Telugu + 23.7 5.5 + 15.8 + 7.9. + 18.7 + 73.3· Marathi + 20.7 - 5.7 . + 14.9 + 4.2 + 15.1 + 56.8 Urdu + 15.8 - 3.8 + 16.8 + 43.1 + 0.1 + 86.4 Kannada + 7.6 - 8.5 + 5.4 + 6.4 + 13.8 + 25.6, Lambadi + 97.6 - 44.3 + 61.8 + 95.1 + 32.2 +359.7 Hindi - 57.4 - 16.8 +350.8 +201.4 - 3.5 +364.9' Tribal + 3.0 - 10.9 + 18.8 + 85.9 - 9.8 + 82.9;
The percentages given in Table 10 are not based on figures as adjusted to correspond to the inter-state transfers of villages effected during the decade 1941-1951. But the population involved in these transfers is so meagre that the adjustment, even if possible, is not likely to lead to any material alteration in the pattern indicated in the table. Further, in order to follow a uniform policy, figures pertaining to the dialects, not included under one or the other of the above mother-tongues at the 1951 Census, have also been subtracted from the corresponding figures of the preceding census~s. Table 11 below indicates the mother-tongue pattern of the population of the state as recorded at each of the censuses since 1901, in terms of the percentage of the number of speakers of the mothcrtongue languages indicated above to the total population of the state.
TABLE 11
Mother-tongue 1901 1911 1921 1931 H)41 1951 (1) (2) (3) (4) (5) (6) (7)
Telugu 46.2 47.6 48.2 48.2 46.0 47.8 Maratbi 26.0 26.1 26.4 26.2 24.1 24.3 Urdu 10.4 10.0 10.4 10.4 13.2 11.6 Kannada 14.0 12.6 12.3 11.2 10.6 10.5 Lambadi 1.1 1.8 1.1 1.5 2.6 3.0 Hindi 0.3 0.1 0.1 0.3 0.8 0.7 Tribal 0.7 0.6 0.6 0.6 1.0 0.8 Others 1.3 1.2 0.9 1.6 1.7 1.3.
428
The percentages in Table 11 are -again based on figures which are not adjusted tOo correspond to the present territories of the state. But even if they are so adjusted, the percentages given in the table will not be affected on account of the small numbers involved in the inter-state transfer of villages during 1941-1951.
28. Analysis of the Variations in the Number of Speakers of Important M other-Tongues .-(1), During the last fifty years, among the speakers of important mother-tongues of the state, Hindi mother-tongue speakers have recorded the largest increase. Their number hasincreased by about 365 per cent and their percentage to the total population has risen from 0.3 to 0.7. This increase, over and above the increase recorded by the general population, is not merely due to fresh immigrants from northern India but also to the increasing number of Hindus recording Hindi, instead of Urdu, as their mother-tongue. The decrease of 3.5 per cent in the number of Hindi mother-tongue speakers during the decade 1941-1951, is actually converted to an increase of about 6 per cent if returns for the allied dialects of Pardesi, Bondili, Brij Bhasha, Bundeli, Purbi, Magadhi, Bihari, Kaha,ri, Tirhutiya, Chhattisgarhi and Lodhi are also taken into consideration. Among the other important mother-tongues of the state, the increase recorded by Lambadi mother tongue speakers is equally remarkable. During the last half a century, their number has increased by about 360 per cent and they have improved their percentage to the total population from 1.1 to 3. o. This huge increase may be the result, among other factors, of better enumeration in rural areas and to the attraction to this state of Lambadas from the rest of peninsular India. During the last five decades, Urdu mother-tongue speakers have increased by about 86 per cent. Their percentage to the total population of the state has increased from 10.4 to 11.6. This increase in their numbers, beyond the increase in the total population of the state, is partly the consequence of fresh immigration from outside the state, and partly of indigenous groups of Muslims like Dudekulas and Pinjaris, returning Urdu, instead of the regional language, in increasing numbers as their mother-tongue. The small increase recorded during the decade 1941-1951 among the mother-tongue speakers of Urdu, as compared with the increase recorded by the mothertongue speakers of Telugu, Marathi or Kannada. is largely the result of the exaggeration of Urdu mother tongue figures at the preceding census.
(2) During the last half a century, the three regional languages of the state, namely, Telugu, Marathi and Kannada, have increased by about 73, 57 and 26 per cent re~pectively, as against the increase in the population of the state by about 67 per cent. But while the percentage of Telugu mother-tongue speakers to the total population of the state has risen from 46.2 in 1901 to 47.8 in 1951, that of Marathi and Kannada mothertongue speakers has fallen from 26.0 to 24.3 and 14.0 to 10.5 respectively. The comparatively heavy increase recorded by Telugu mother-tongue speakers is merely the reflection of the considerably faster rate of growth of the population in the Telugu tractsas compared with the rate of growth of the population in the Marathi or Kannada tracts. The percentage of the population of the eight Telugu districts of Adilabad, Nizamabad, Karimnagar, Medak, Hyderabad, Warangal, N algonda and Mahbubnagar to the total population of the state which was about 49 in 1901 is now 54. As against this, the percentage of the population of the five Marathi districts of Aurangabad, Osmanabad, Bhir, Parbhani and Nanded to the total population of the state has decreased from about 27 to 26. The corresponding percentage for the two Kannada districts of Raichur and Gulbarga has fallen from about 17 to 14. Similarly, the population of the multi-lingual d:strict of Bidar, which formed about 6.8 per cent of the total population of the state in 1901, now constitutes only 6.3 per cent. Thus, the rate of growth of the mother-tongue speakers of the three regional languages in the state during the last fifty years generally corresponds.
49
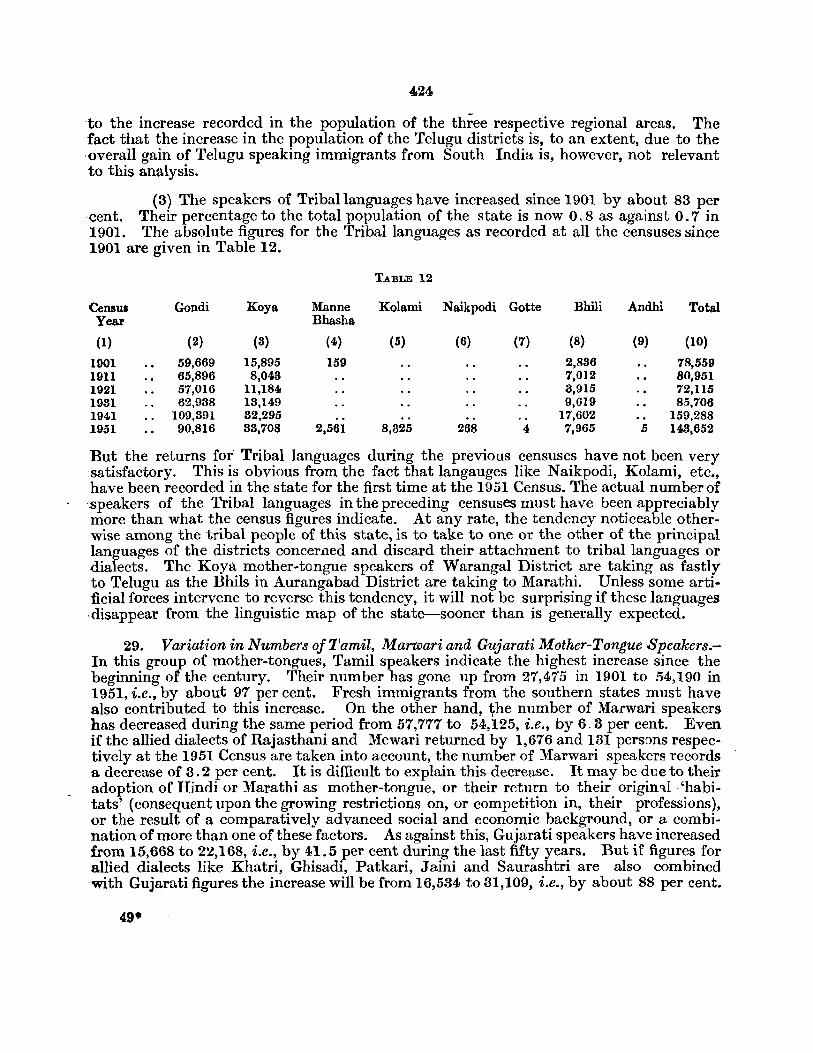
424
to the increase recorded in the population of the three respective regional areas. The fact that the increase in the population of the Telugu districts is, to an extent, due to the ·overall gain of Telugu speaking immigrants from South India is, however, not relevant to this analysis.
(3) The speakers of Tribal languages have increased since 1901 by about 83 per ·cent. Their percentage to the total population of the state is now 0.8 as against 0.7 in 1901. The absolute figures for the Tribal languages as recorded at all the censuses since 1901 are given in Table 12.
Census Gondi Koya Year
(I) (2) (3)
1901 59,669 15,895 1911 65,896 8,043 1921 57,016 11,184 1981 62,938 13,149 1941 109,391 32,295 1951 90,816 33,708
TABLE 12
Manne Kolami Naikpodi Gotte Bhasha
(4)
159
2,561
(5)
8,825
(6) (7)
268 4
Bhili Andhi Total
(8) (9) (10)
2,836 78,559 7,012 80,951 8,915 72,115 9,619 85,706
17,602 159,288 7,965 5 143,652
But the returns for Tribal languages during the previous censuses have not been very satisfactory. This is obvious from the fact that langauges like Naikpodi, Kolami, etc., have been recorded in the state for the first time at the 1951 Census. The actual number of speakers of the Tribal languages in the preceding censuses must have been appreciably more than what the census figures indicate. At any rate, the tendency noticeable otherwise among the tribal people of this state, is to take to one or the other of the principal languages of the districts concerned and discard their attachment to tribal languages or dialects. The Koya mother-tongue speakers of Warangal District are taking as fastIy to Telugu as the Bhils in Aurangabad District are taking to Marathi. Unless some artificial forces intervene to reverse this tendency, it will not be surprising if these languages .disappear from the linguistic map of the state-sooner than is generally expected.
29. Variation in Numbers of7'amil, Marwari and Gujarati Mother-Tongue Speakers.In this group of mother-tongues, Tamil speakers indicate the highest increase since the beginning of the century. Their number has gone up from 27,475 in 1901. to 54,190 in 1951, i.e., by about 97 per cent. Fresh immigrants from the southern states must have also contributed to this increase. On the other hand, ~he number of Marwari speakers has decreased during the same period from 57,777 to 54,125, i.e., by 6.:3 per cent. Even if the allied dialects of Rajasthani and Mewari returned by 1,676 and 131 persons respectively at the 1951 Census are taken into account, the number of l\farwari speakers records a decrease of 3.2 per cent. It is diffi~ult to explain this decrease. It may be due to their adoption of Hindi or Marathi as mother-tongue, or their return to their origin'll. 'habitats' (consequent upon the growing restrictions on, or competition in, their professions), or the result of a comparatively advanced social and economic background, or a combination of more than one of these factors. As against this, Gujarati speakers have increased from 15,668 to 22,168, i.e., by 41. 5 per cent during the last fifty years. But if figures for allied dialects like Khatri, Ghisadi, Patkari, Jaini and Saurashtri are also combined with Gujarati figures the increase will be from 16,534 to 31,109, i.e., by about 88 per cent.
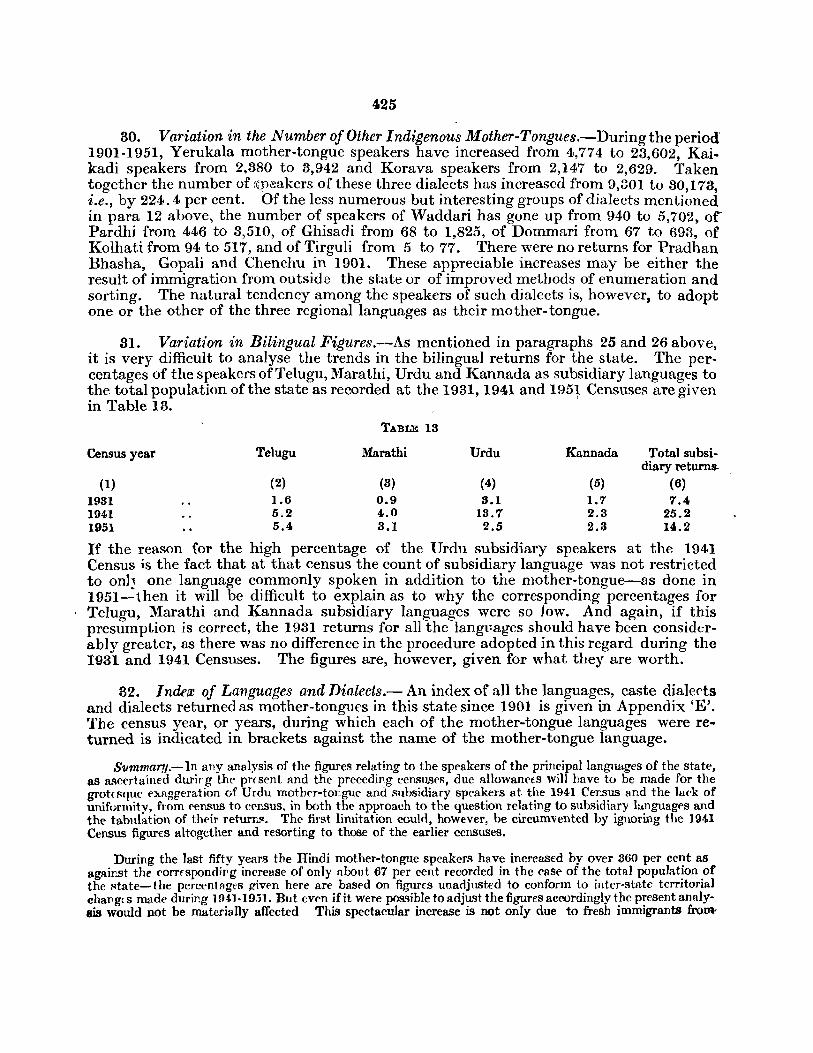
425
30. Variation in the Number of Other Indigenous Mother-Tongues.-Duringtheperiod 1901-1951, Yerukala mother-tongue speakers have increased from 4,774 to 23,602, Kaikadi speakers from 2.380 to 3,942 and Korava speakers from 2,147 to 2,629. Taken together the number of :~p~akers of these three dialects has increased from 9,801 to 30,173, i.e., by 224.4 per cent. Of the less numerous but interesting groups of dialects mentioned in para 12 above, the number of speakers of Waddari has gone up from 940 to 5,702, ot Pardhi from 446 to 3,510, of Ghisadi from 68 to 1,825, of Dommari from 67 to 693, of Kolhati from 94 to 517, and of Tirguli from 5 to 77. There were no returns for Pradhan Bhasha, Gopali and Chenchu in 1901. These appreciable iRcreases may be either the result of immigration from outside the state or of improved methods of enumeration and sorting. The natural tendency among the speakers of such dialects is, however, to adopt one or the other of the three regional languages as their mother-tongue.
81. Variation in Bilingual Figures.-As mentioned in paragraphs 25 and 26 above, it is very difficult to analyse the trends in the bilingual returns for the state. The percentages of the speakers of Telugu, Marathi, Urdu and Kannada as subsidiary languages to the total population of the state as recorded at the 1931, 1941 and 1951 Censuses are given in Table 13.
Census year Telugu
(1) (2)
TABLE 13
Marathi
(8)
Urdu Kannada Total subsi-diary returns..
(4) (5) (6) 1931 1.6 0.9 3.1 1.7 7.4 1941 5.2 4.0 18.7 2.3 25.2 1951 5.4 3.1 2.5 2.3 14.2
If the reason for the high percentage of the Urdu subsidiary speakers at the 1941 Census is the fact that at that census the count of subsidiary language was not restricted to on]~ one language commonly spoken in addition to the mother-tongue-as done in 1951-then it will be difficult to explain as to why the corresponding percentages for
\ Telugu, Marathi and Kannada subsidiary languages were so low. And again, if this presumption is correct, the 1931 returns for all the langt~ages should have been considerably greater, as there was no difference in the procedure adopted in this regard during the 1931 and 1941 Censuses. The figures are, however, given for what they are worth.
32. Index of Languages and Dialects.- An index of all the languages, caste dialerts and dialects returned as mother-tongues in this state since 1901 is given in Appendix 'E'. The census year, or years, during which each of the mother-tongue languages were returned is indicated in brackets against the name of the mother-tongue language.
Summar!/.-ln any analysis of the figures relating to the speakers of thf' principallangnages of the state. as ascertained durirg the present find the precedip.g cenSllses, due allowanceS will have to be made for the grot(Rq~e exaggeration of Urdu m<?theT-toLgue and subsidiary spea~ers at t~le 1941 Ce:..s:us and the lack of uniforllllty, from censUS to census, m both the approach to the question relatmg to subSIdiary languages and the tabulation of thf'lr returruCZ • The first limitation coulrl, however, be circumvented by ignoring the 19n Census figures altogether and resorting to those of the earlier censuses.
During the last fifty years the Hindi mother-tongue speakers have increased by over 860 per c('~t as agairst the ('ofTfspondirg increase of only nbout 67 per cent recorded in the case of the total populatIon of the ",tate-the percentRges given here are based on figures unadjusted to conform to inter-state territorial chaflgc s Jllilde during 1 9t 1-I 9jl. But even if it were possible to adju'lt the figures aecordingly the present analysis would not be materially affected This spectacular increase is not only due to fresh immigrants from-

426
Northern India but also to increasing numbers of Hindus recording Hindi, instead of Urdu, as their mother tongue. The next striking increase is that of about 860 per cent recorded during the Same period by the Lambadi mother-tongue speakcrs. This increase is perhaps due to the gradual conccntration in this state of Lambadas from the rest of peninsular India and improved enumeration in the backward tracts wherein they mostly reside. The Urdu mother-tongue speakers have increased since 1901 by 86 per cent. This percentage increase, beyond the corresponding percentage increase recorded by the total population of the state, is due, among other factors, to indigenous groups of Muslims, like the Dudckulas and Pinjaris, record· ing Urdu as their muther-tongue in greater numbers and fresh immigrants from beyond the state. The triballanguages as a whole(Gondi, Koya, Manne Bhasha, Kolami, Naikpodi. Gotte, Bhili and Andhi)have increased by over 80 per cent since the beginning of this century. But the previous census returns for this group are by no means satisfactory as would be obvious from the fact that fairly well known tribal languages (or dialects) like Kolami and Naikpodi were returned for the first time in this state in 1951. Actually, the tribes ,of this state are gradual1y t8king to the regional language and, unless some artificial forces intervene. they may disappear altogether from the linguistic map of the state sooner than is generally expected. The Telugu, Marathi and Kannada mother-tongue speakers have increased since 1901 by 78, 57 and 26 per cent respectively. Thus, among these three, only the Telugu speakers have increased at a faster rate than the total population of the state. As against this, the increase in case of Kannada mother-tongue speakers is the least impressive among these three major lingual groups of the state. The marked diversity in the rates of increase of these three groups merely reflects the uneven growth of population in the three linguistic regions of the state. Fifty years ago, about 49 per cent of the state's population was aecounted fvr by the eight Telugu distrirts of Karimnagar, Nalgonda, Medak, Mahbubnagar, Nizamabad. Adilabad, Warangal and Hyderabad; 27 per('mt by the five Marathi districts of Aurangabad, Osma.nabad, Bhir, Parbhani and Nandcd; 17 per cent by the two Kannada districts of Raichur and Gulbarga; and lastly 6.8 per cent by the mixed district of Bidar. The percentage has now moved upto 54 in case of the Telugu districts and declined to 26 in ~e of the Marathi districts, to 14 in case of the Kannada districts and to 6.8 in case of Bidar.
50
CHAPTER VII
Religion

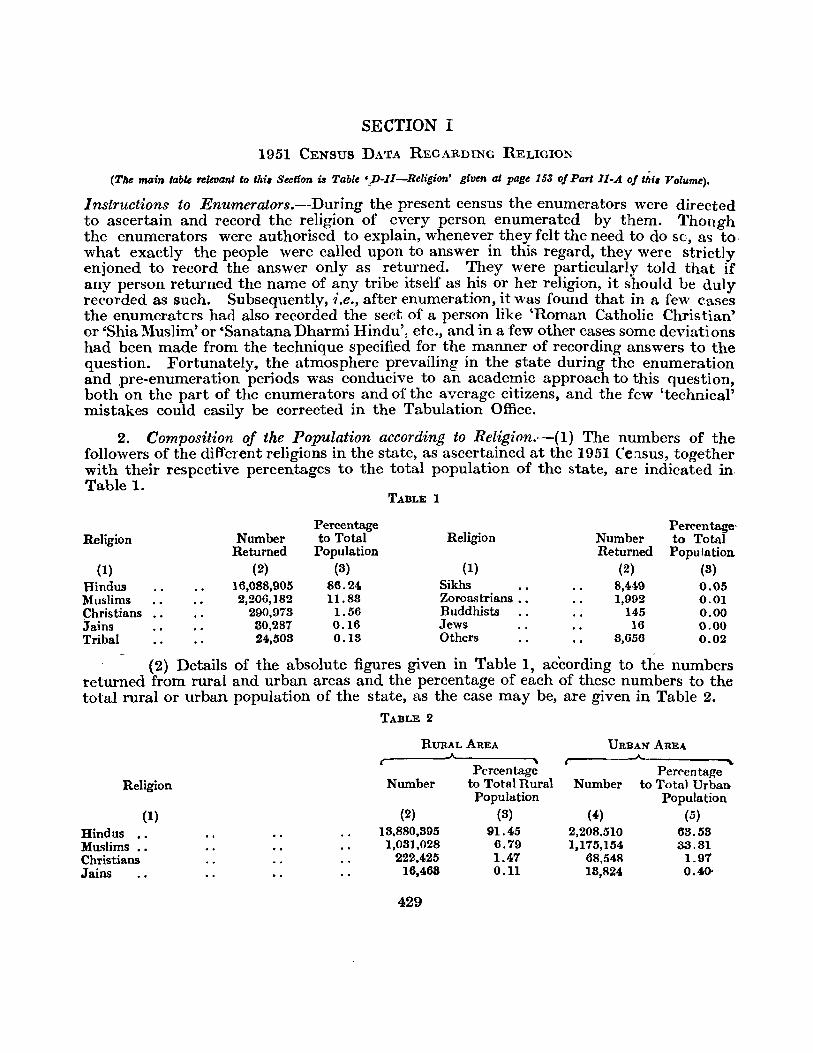
SECTION I
1951 CENSUS DATA REGARDING RELIGION
(The main table relevant to thi, Seetfon it Table 'poll-Religion' given at page 163 oj Part ll-A oj thi, Volume).
Instructions to Enumerators.--During the present census the enumerators were directed to ascertain and record the religion of every person enumerated by them. Thongh the enumerators were authorised to explain, whenever they felt the need to do sc, as to· w~at exactly the people were called upon to answer in this regar~, they were strictly en]oned to record the answer only as returned. They were partIcularly told that if any person returned the name of any tribe itself as his or her religion, it should be duly recorded as such. Subsequently, i.e., after enumeration, it was found that in a few Cases the enumeratcrs had also recorded the sect of a person like 'Roman Catholic Christian' or 'Shia Muslim' or 'Sanatana Dharmi Hindu', etc., and in a few other cases some deviations had been made from the technique specified for the manner of recording answers to the question. Fortunately, the atmosphere prevailing in the state during the enumeration and pre-enumeration periods was conducive to an academic approach to this 'luestion, both on the part of the enumerators and of the average citizens, and the few 'technical' mistakes could easily be corrected in the Tabulation Office.
2. Composition of the Population according to Religion.-(l} The numbers of the followers of the different religions in the state, as ascertained at the 1951 C'e:1sus, together with their respective percentages to the total population of the state, are indicated in Table 1.
TABLE 1
Percentage Per('mtage· Religion Number to Total Religion Number to Total
Returned Population Returned Population (1) (2) (3) (1) (2) (8)
Hindus 16,088,905 86.24. Sikhs 8,449 0.05 Muslims 2,206,182 11.83 Zoroastrians •. 1,992 0.01 Christians 290,973 1.56 Buddhists 145 0.00 Jalns 80,287 0.16 Jews 16 0.00 Tribal 24,508 0.18 Others 8,656 0.02
(2) Details of the absolute figures given in Table 1, according to the numbers returned from rural and urban areas and the percentage of each of these numbers to the total rural or urban popUlation of the state, as the case may be, are given in Table 2.
Religion
Hindus Muslims Christians Jains
(1)
TABLE 2
RURAL AREA
Percentage Number to Total Rural
Population (2) (8)
18,880,895 91.45 1,081,028 6.79
222.425 1.47 16,468 0.11
429
URBAN AREA r-------~--------__
PerC'entage Number to Total Urban
Population (4) (5)
2,208.510 63.58 1,175,154 33.81
68,548 1.97 18,824 0.4(}
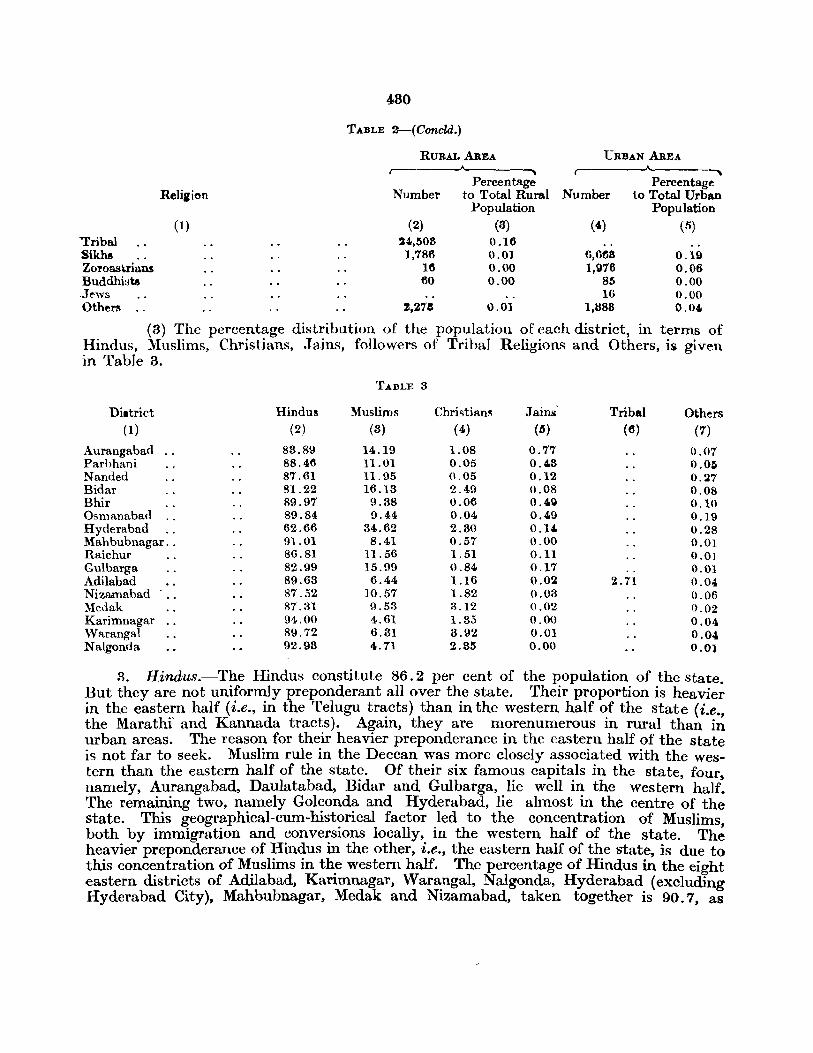
"Tribal Sikh8 Zoroastrians Buddhbta .J~ws Others ..
Reliaion
(1)
480
TABLE 2-(Concld.)
RURAL AREA
,.-----"-------.. Percentage
URBAN AREA
r-------~-------~
Number to Total Rural Number Percentage
to Total Urban Population Population
(2) (3) (') ( 5) 24,508 1,786
If) 60
0.16 0.01 0.00 0.00
G,Gf)S 0.19 1,~76 0.06
85 0.00 16 0.00
2,278 0.01 l,H8S 0.040
(8) The percentage distribution of the popUlation. of each district, in. terms of Hindus, Muslims, Christians, Jains, followers of Trihal Religions and Others, is given in Table 3.
TABI..E 3
Di.trict HindU!! Muslims
(1) (2) (3)
Aurangabad 83.89 140.19 Parbhani 88.46 11.01 Nanded 87.61 11.95 Bidar 81.22 16.13 Bhir 89.97 9.38 Osmanabad 89.84 9.44 Hyderabad 62.66 34.62 Mahbubnagar .. 91.01 8.41 Raichur 86.81 11.56 Gulbarga 82.99 15.99 Adilabad 89.63 6.44 Nizamabad 87.52 10.57 ~IeJak 87.31 9.53 Karimnagar 94.00 4.61 Warangal 89.72 6.31 Nalgonda 92.98 "'.n
Christian~
(4)
1.08 0.05 0.05 2.49 0.06 0.04 2.30 0.57 1.51 0.84 1.16 1.82 3.12 1.35 3.92 2.35
Jains' (5)
0.77 0.4.8 0.12 0.08 O.40Q 0.4.9 0.140 0.00 0.11 0.17 0.02 0.03 0.02 0.00 0.01 0.00
Tribal (6)
2.71
Others (7)
0.07 O.OZi 0.~7
0.08 0.10 0.19 0.28 0.01 0.01 0.01 0.04 0.06 0.02 0.04. 0.04 0.0)
3. Hindus.-The Hindus constitute 86.2 per cent of the population of the state. But they are not uniformly preponderant all over the state. Their proportion is heavier in the eastern half (i.e., in the Telugu tracts) than in the western half of the state (i.e. the Marathi' and Kannada tracts). Again, they are morenumerous in rural than i~ urban areas. The reason for their heavier preponderance in the eastern half of the state is not far to seek. Muslim rule in the Deccan was more closely associated with the western than the eastern half of the state. Of their six famous capitals in the state, four namely, Aurangabad, Daulatabad, Bidar and Gulbarga, lie well in the western half. The remaining two, namely Golconda and Hyderabad, lie almost in the centre of the state. This geographical-cum-historical factor led to the concentration of Muslims both by immigration and conversions locally, in the western half of the state. Th~ heavier preponderance of Hindus in the other, i.e., the eastern half of the state, is due to this conc~ntr.ation of M:uslims in th~ western half. The percentage of Hindus in the eight eastern districts of AdIlabad, Karnnnagar, Warangal, Nalgonda, Hyderabad (excluding Hyderabad City), Mahbubnagar, Medak and Nizamabad, taken together is 90.7, as
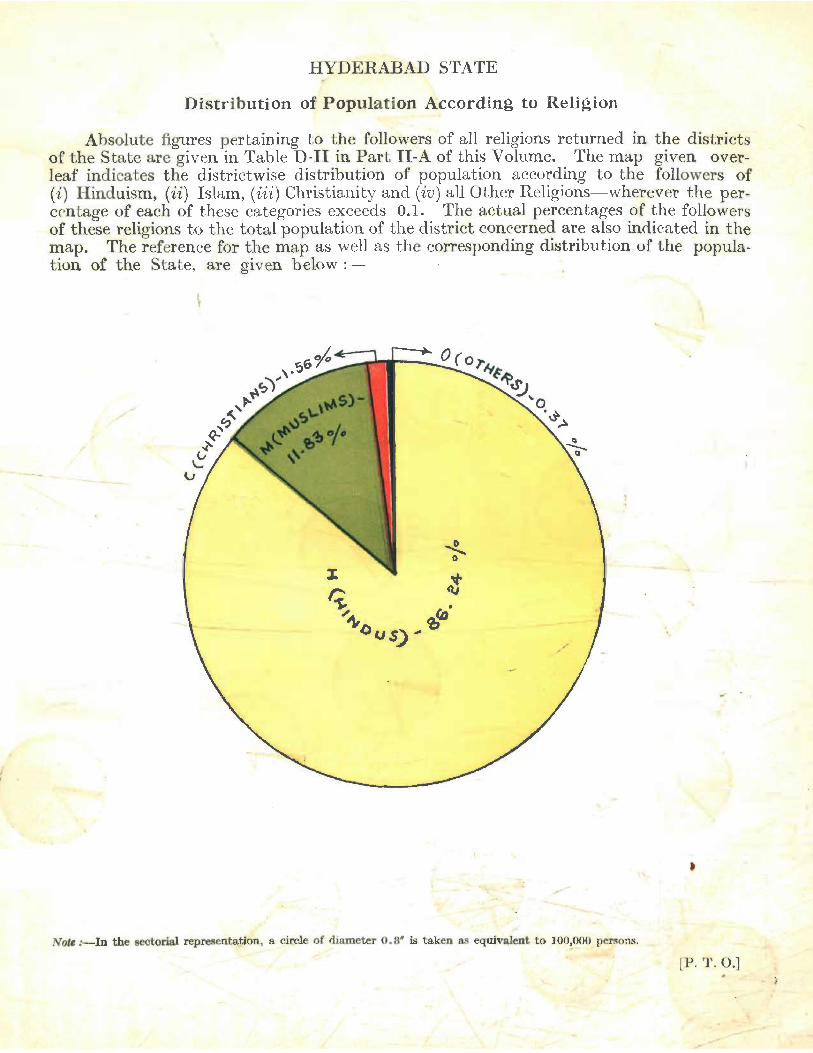
HYDERABAD STATE
Distribution of Population According to Religion
Absolute figures pertaining to the followers of all religions returned in the districts of the State are given in Table D-II in Part II-A of this Volume. The map given overleaf indicates the districtwise distribution of population according to the followers of (i) Hinduism, (ii) Islam, (iii) Christianity and (iv) all Other Religions-wherever the percentage of each of these categories exceeds 0.1. The actual percentages of the followers of these religions to the total population of the district concerned are also inrlicated in the map. The reference for the map as well as the corresponding distribution of the population of the State~ are given below:-
Note :-10 the sectorial representation , a circle of diameter 0.3" is taken as equivalent to lOO~OOO persons.
(P. T. 0.]
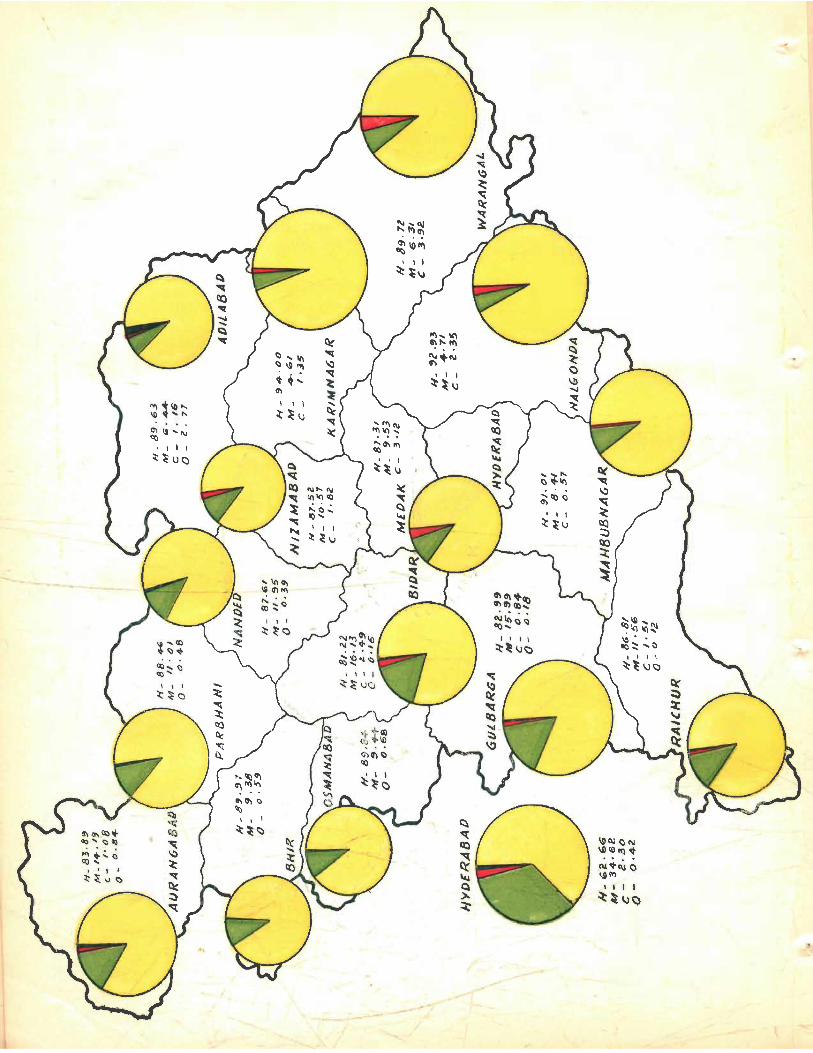
.... ..., - = -
~OI ~ ~
~ 1 1 1
~~~ ~ \DCIIQCII Ql \£lCO,.,,,,,
~ .... c:t ~"'''' () \ill¥) ~ Q 1 I I I
~~\JQ >-~
----
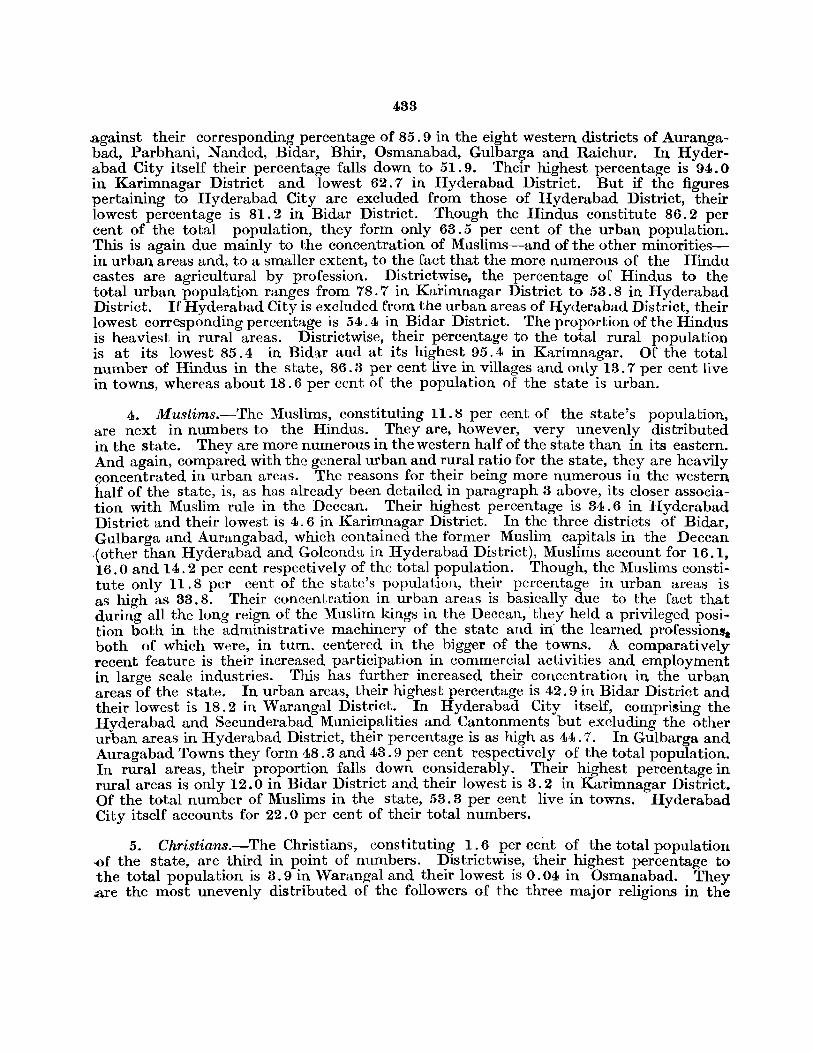
433
.against their corresponding percentage of 85.9 in the eight western districts of Aurangabad, Parbhani, Nanded, Bidar, Bhir, Osmanabad, Gulbarga and Raichur. In Hyderabad City itself their percentage falls down to 51.9. Their highest percentage is 94.0 in Karimnagar District and lowest 62.7 in Hyderabad District. But if the figures pertaining to Hyderabad City are excluded from those of Hyderabad District, their lowest percentage is 81.2 in Bidar District. Though the Hindus constitute 86.2 per cent of the total population, they form only 63.5 per cent of the urban population. This is again due mainly to the concentration of Muslims-and of the other minoritiesin urban areas and, to a smaller extent, to the fact that the more numerous of the Hindu castes are agricultural by profession. Districtwise, the percentage of Hindus to the total urban population ranges from 78.7 in Karimnagar District to 53.8 in Hyderabad District. If Hyderabad City is excluded from the urban areas of Hyderabad District, their lowest corresponding percentage is 54.4 in Bidar District. The proportion of the Hindus is heaviest in rural areas. Districtwise, their percentage to the total rural population is at its lowest 85.4 in Bidar and at its highest 95.4 in Karimnagar. Of the total number of Hindus in the state, 86.3 per cent live in villages and only 13.7 per cent live in towns, whereas about 18.6 per cent of the popUlation of the state is urban.
4. Muslims.-The Muslims, constituting 11. 8 per cent of the state's population, are next in numbers to the Hindus. They are, however, very unevenly distributed in the state. They are more numerous in the western half of the state than in its eastern. And again, compared with the general urban and rural ratio for the state, they are heavily concentrated in urban areas. The reasons for their being more numerous in the western half of the state, is, as has already been detailed in paragraph 3 above, its closer association with Muslim rule in the Deccan. Their highest percentage is 34.6 in Hyderabad District and their lowest is 4.6 in Karimnagar District. In the three districts of Bidar, Gulbarga and Aurangabad, which contained the former Muslim capitals in the Deccan {other than Hyderabad and Golconda in Hyderabad District), Muslims account for 16.1, 16.0 and 14.2 per cent respectively of the total population. Though, the Muslims constitute only 11.8 per cent of the state's population, their percentage in urban areas is as high as 33.8. Their concent.ration in urban areas is basically due to the fact that during all the long reign of the Muslim kings in the Deccan, they held a privileged position both in the administrative machinery of the state and in the learned professions. both of which were, in turn, centered in the bigger of the towns. A comparatively recent feature is their increased participation in commercial activities and employment in large scale industries. This has further increased their concentration in the urban areas of the state. In urban areas, their highest percentage is 42.9 in Bidar District and their lowest is 18.2 in Warangal District. In Hyderabad City itself, compri~ing the Hyderabad and Secunderabad Municipalities and Cantonments but excluding the other urban areas in Hyderabad District, their percentage is as high as 44.7. In Gulbarga and Auragabad Towns they form 48.3 and 43.9 per cent respectively of the total popUlation. In rural areas, their proportion falls down considerably. Their highest percentage in rural areas is only 12.0 in Bidar District and their lowest is 3,2 in Karimnagar District. Of the total number of Muslims in the state, 53.3 per cent live in towns. Hyderabad City itself accounts for 22.0 per cent of their total numbers.
5. Christians.-The Christians, constituting 1.6 per cent of the total populatiou -of the state, are third in point of numbers. Districtwise, their highest percentage to the total population is 3.9 in Warangal and their lowest is 0.04 in Osmanabad. They .are the most unevenly distributed of the followers of the three major religions in the
434
state. The Christians constitute 2.2 per cent of the population in the Telugu districts of Hyderabad, Mahbubnagar, Adilabad, Nizamabad. Medak, Karimnagar, Warangal and NaJgonda; and 0.9 per cent in the Marathi and Kannada districts. In other words, 74.8 per cent of the total Christians live in the former districts and only 25.2 per cent in the latter. And again, in the Marathi and Kannada areas, they are concentrated in Bidal', Aurangabad, Raichur and Gulbarga Districts. These four districts themselves account for 24.6 per cent of the total Christian population of the state, Bidal' itself accounting for 10.0 per cent. There is just a sprinkling of Christie-ns in the remaining four districts of Parbhani, Nanded, Hhir and Osmanabad, which in all contain only 0.6 per' cent of the total Christian population of the state. Further, the Christians are considerably more urbanised than the Hindus but very much less than the Muslims. Of the total Chris~ tians 76.4 per cent live in villages and 23.6 in towns. In urban areas, their highest per~ eentage to the total population is 4.3 in Warangal District and their lowest is 0.08 in Osmanabad District. This heavier concentration of the Christians in urban areas is due mostly to the immigration of Christians-particularly the educated-·from the rural areas.· In rural areas, their highest percentage is 3.8 in Warangal District and their low£st is, 0.02 in Nanded District.
6, Followers of Other Religions.--Hindus, Muslims and Christians cover all but 0.4 per eent (i.e., 69,048 persons) of the total population. The Jains aTe the most numerous of the residuarv group. They number 30,287 and are concentrated in the districts bordering' Bombay State, namely Aurangabad, Bhir, Osmanabad, Gulbarga and Raichur. These five districts account for 68.9 per cent of their total population in the state. They are also found in some strength in Parbhani District and the city of Hyderabad, which account for 14.3 and 6.9 per cent respectively of their total population. Next in number are the followers of Tribal Religions numbering in all 24,503. They are, however, excIu· sively confined to Adilabad District. In fact, over 77.0 per cent of them are returned from Utnoor Tahsil of this district which is generally supposed to be the most 'aboriginal" of the tahsils of the state. The Gonds constitute over 76 per cent of these returns and the Kolams 12 per cent. All the tribal returns are from rural areas. The Sikhs numbering' 8,449 in the state come next in order. Roughly 60 per cent of the Sikhs are returned in about equal numbers from Hyderabad Town and Nanded District. Their concentration in Hyderal::ad City is due chidly to their t'mployment in Government Departments and in Nanded Distr]( t to the fact that Nanded Town is one of their important It:ligious cepbes in the country. The Zoroastrians m:mler ],£92 in the state. Over 99 Fer cent of them are returned from urban are-as, Hyderabad City itself accounting for 72.8 per cent. The' Buddhists in the state number 145. It was found that some inmates of Harijan hostels had als~ returned themselves as such. The Jews in the state number only 16. A consi~ derable portion of the remaining 3,656 persons are also Hindus as most of them be'onged to· sects or castes technically accepted as Hindu. 17 persons returned their religion as Manava Dharma and 21 returned themselves as Atheists.
7. Divelihood Pattern of the Followers of main Religions.-(l} The livelihood pattern of the Hindus, Muslims and Christians, with reference to their principal means of livelihood" is given in Table 4.
[Table ..
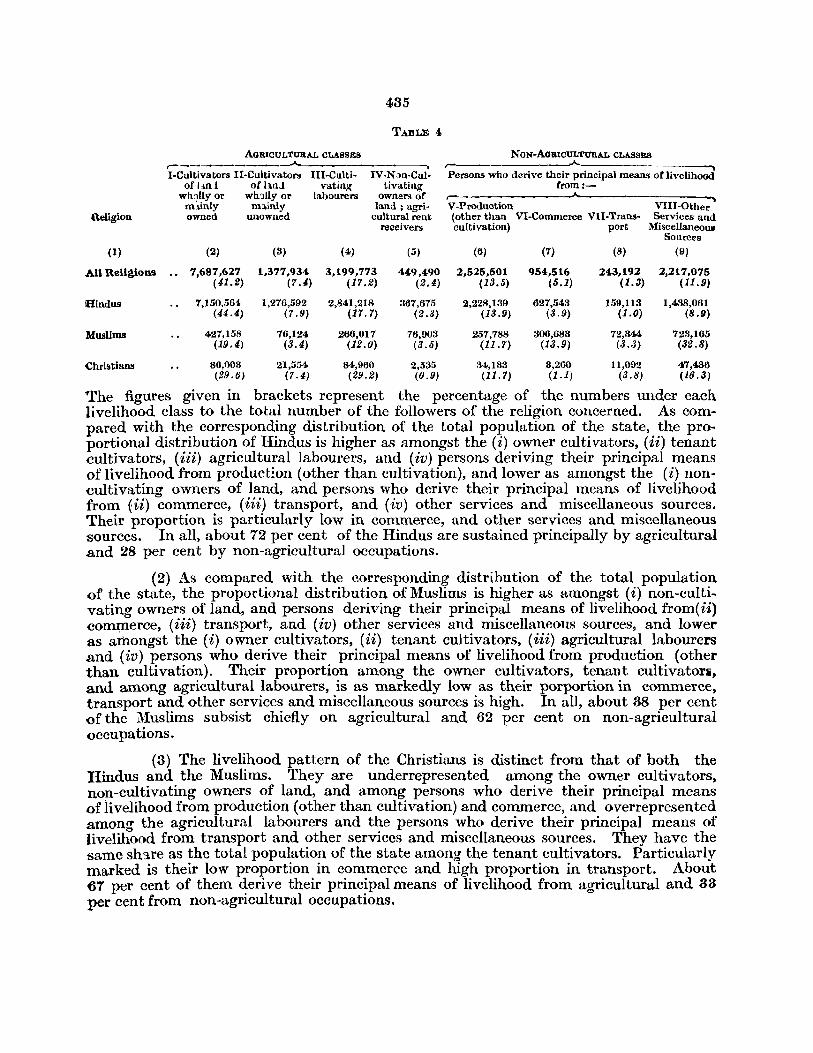
(\eligioll
(1)
All Religions
Hindus
Muslims
485
TABLE 4
AGRICULTURAL CLASSES
~----------~ I-Cultivators II-Cultivators I1I-Culti- IV-N<Jn-Cul-
..
of Lm I of hni vating tivating owner~ of land; agri
cultural rent
wh~lly or wh:lUy or labourers mi.inly m:linly owned unowned
receivers
(2) (3) (4) (5)
7,687,627 1,377,934 3,199,773 449,490 ( 41.2) (7.4) (17.2) (2.4)
7,150,564 1,216,592 2,841,218 367,675 (44.4) (7.9) (17.7) (2.3)
427,158 76,124 266,017 76,903 (19.4) (3.4) (12.0) (3.5)
NON-AGRICULTURAL CLASSES r- -----, Persons who derive their principal means of livelihoOO
from:-r-
___________-A ______ _ V-Production VIII-Other (other than VI-Commerce VII-Trans- Services and cultivation) port Miscellaneous
Sources
(6) (7)
2,525,501 954,516 (13.5) (5.1)
2,228,139 621,543 (13.9) (3.9)
257,788 306,683 (11.7) (13.9)
(8)
24,3,192 (1.3)
159,113 (1.0)
72,344 (3.3)
(9)
2,217,075 (11.9)
1,438,061 (8.9)
723,165 (32.8)
<:hristians 86,003 21,554 84,960 2,535 :34,133 3,260 11,092 47,436 (29.6) (7.4) (29.2) (0.9) (11.7) (l.1) (3.8) (16.3)
The figures given in brackets represent the percentage of the numbers under each livelihood class to the total number of the followers of the religion concerned. As compared with the corresponding distribution of the total population of the state, the proportional distribution of Hindus is higher as amongst the (i) owner cultivators, (ii) tenant cultivators, (iii) agricultural labourers, and (iv) persons deriving their principal means of livelihood from production (other than cultivation), and lower as amongst the (i) nonCUltivating owners of land, and persons who derive their principal means of livelihood from (ii) commerce, (iii) transport, and (iv) other services and miscellaneous sources. Their proportion is particularly low in commerce, and other services and miscellaneous sources. In all, about 72 per cent of the Hindus are sustained principally by agricultural and 28 per cent by non-agricultural occupations.
(2) As compared with the corresponding distribution of the total population of the state, the proportional distribution of Muslims is higher as amongst (i) non-culti~ vating owners of land, and persons deriving their principal means of livelihood from(ii) co~erce, (iii) transport, and (iv) other services and miscellaneous sources, and lower as amongst the (i) owner cultivators, (ii) tenant cu1tivators, (iii) agricultural labourers and (iv) persons who derive their principal means of livelihood from production (other than cultivation)_ Their proportion among the owner cultivators, tenant cultivators. and among agricultural labourers, is as markedly low as their porportion in commerce, transport and other services and miscellaneous sources is high. In all, about 88 per cent ()f the Muslims subsist chiefly on agricultural and 62 per cent on non-agricultural ()ccupa tions.
(8) The livelihood pattern of the Christians is distinct from that of both the Hindus and the Muslims. They are underrepresented among the owner cultivators, non-cultivating owners of land, and among persons who derive their principal means of livelihood from production (other than cultivation) and commerce, and overrepresented amont'J' the agricultural labourers and the persons who derive their principal means of livelihood from transport and other services and miscellaneous sources. They have the same sh'1re as the total population of the state among the tenant cultivators. Particularly marked is their low proportion in commerce and high proportion in transport. About 67 per cent of them derive their principal means of livelihood from agricultural and 88 per cent from non-agricultural occupations.
436
(4) About 50 per cent of the J ains derive their principal means of livelihood from commerce and over 6 per cent from agricultural rent which are the highest percentages recorded in the respective categories by the adherents of any religion in the state. In all, about 33 per cent of them derive their principal means of livelihood from agricultural and 67 per cent from non-agricultural occupations. Over 50 per cent of the Sikhs owe their principal means of livelihood to other strvices and miscellaneous sources, which is the highest recorded in the class for the follower:; of any rcligion in the state. About 17 and 14 per cent of the Sikhs subsist chiefly on production (other than cultivation) and commerce respectively, About 15 per cent of them depend on agricultural and 85 per cent on non-agricultural occupations, Less than 2 per cent of the Zoroastrians in the state are engaged in agricultural occupations. But as against the others, they are well distributed among the persons who derive their principal means of livelihood from production (other than cultivation), commerce, transport and other services and miscellaneous sources. Over 22 per cent of the Zoroastrians are principally dependent on production (other than cultivation), which is the highest recorded for that class by the followers of any religion in the state.
Summury ;-Of the total population of 18,655,108 rt'corded for this state at the 195} Census, 16,088,905 or over 86 per cent are Hindus, 2,206,182 or almost 12 per cent are Muslims, and 290,978 Or less than 2 per cent are Christians, These three account for all but 69,048 or 0,4 per cent of the state's total population. The residuary groups include 80,287 Jains, 24,503 followers of tribal religions, 8,449 Sikhs, 1,992 Zoroastrians. 145 BuddlJists and 16 Jews.
Districtwise, the percentage of Hindus exceeds 90 in Karimnagar, Nalgonda and Mahbubnagar, is almost 90 in Bhir, Osmanabad, Warangal and Adilabad, rangts between 85 and 90 in Parbhani, Nanded, Nizamabad ..
_ Medak and RaichW' and between 80 and 85 in AW'angabad, Gulbarga and Bid9.r and declines to 68 in Hyderabad. They account for as much as 91 per cent of the rural but only 64 per cent of the urban population
, of the state. Their reduced majority in urban areas is due to the concentration (If Non-Hindus, especially Muslims, in such areas and to the fact that the major Hindu casttS arf' agricultural by profession. Thus, their reduced majority in Hyderabad District is simply due to the fact that thcy form only 52 per cent of the population of Hyderabad City. Again, Hindus form over 90 per cent of the population of the eastern districts. (excluding lIyderabad City) but less than 86 per cent of that of the westcrn districts of the state. This is also. the indirect result of the greater CLllcentratlon of Muslims in the western half of the state.
Muslims account for almost 85 per cent of the population of Hyderabad District. Their percentage is-16 both in -:nidal' and Gulbarga, 14 in Aurangabad, ranges between ]0 and 12 in Nandtd, Raichur, Parbhani and Nizamabad and between 8 and 10 in Medak, Osmanabad, Bhir and Mahbubnagar, is about (I both in Adilabad and Warangal and is slightly less than 5 in both Nalgonda and Karillln3gar. They account for only 7 per cent of the rural but as much as for 34 per cent of the state's urban Fopulation-in fact, thev claim 43 per cent of the urban population in Bidar District. Similarly, they constitute 45 per cent of th'e population of Hyderabad City. Appreciably over one-fifth Lf the state'l> Muslim population is returned from this city itself. This concentration of Muslims in Hyderabad District (i.e., Hyderabad City) in the western rather than the eastern districts of the state and in the W'ban than in the rural areas is primari.ly the result of historical factors. The Christians, mOre than the Muslims and much more so than the Hindus, are verv un,' evenly distributed. They are most numerous in WaTangal District wherein they form 4 per cent of the pvpulation. Their percentage is 8 in Medak and ranges between 2 and 3 in Bidar, Nalgonda and Hyderabad and between 1 and 2 in Ni7.amabad, Raichur, Karimnagar, Adilabad and Aurangabad. They are less than 1 per cent in Gulbarga and Mahbubnagar and almost microscopic in Osmanabad, Parbhani, Nanded and Bhir. About 75 per cent of the Christians live in the eastern and 25 in Bidar and the other western districts. of the state. They account for 1.5 per cent of its rllI'al and 2.0 of its urban population.
The Jains are concentrated in the districts bordering Bombay State and in Parbhani District and Hyderabad City. The followers of tribal :r:eligions are exclusively confintd i<- Adilabad District, mainly - to Utnoor Tahsil. Sixty per cent of the Sikhs are from Hyderabad City and Nanded District in about equal' numbers. Over 72 per cent of the Zoroastrians are from Hyderabad City.
In terms of the eight Livelihood Classes, the Hindus are overrepresented among the Owner and Tenant Cultivators and Agricultural Labourers and persons prineipaJIy dependent on Production (other than cultivation). and are underrepresented in the Livelihood Classes of AgrieultW'al Rent Receivers, Commerce, Transport and.
487
<>ther Services and Miscellaneous Sources. The Muslims have more than their share of the Livelihood Classes Qf Commerce, Transport, Other Services and Miscellaneous Sources and Agricultural Rent Receiverfl and are under represented in the other classes. Similarly, the Christians are over represented in the Livelihood Classes of Transport, Other Services and Miscellaneous Sources and Agricultural Labourers, have their due share of Tenant Cultivators and are under represented in the rest of the classes. About half the Jams, belong to the Livelihood Class of Commerce, over half the Sikhs to that of Other Services and Miscel. laneous Sources and over one fifth of the Zorcastrians to that of Production (other than cultivation).
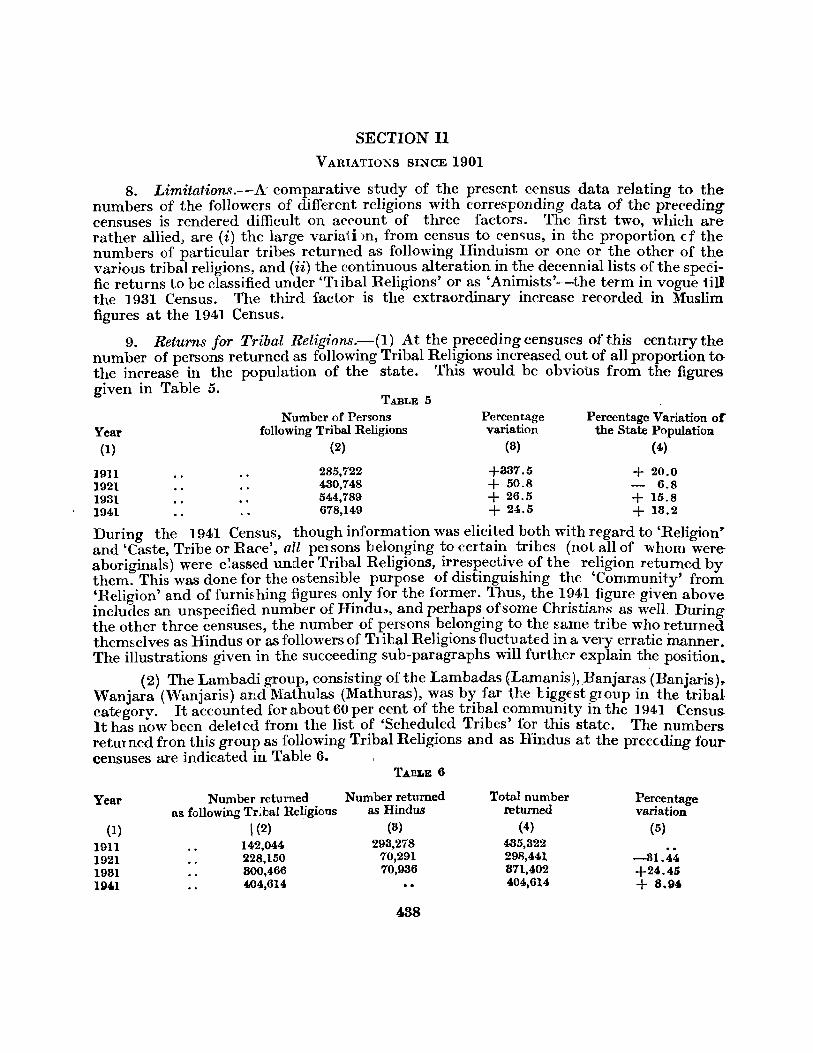
SECTION II
V ARIATIO~S SINCE 1901
8. Limitation.~.-A comparative study of the present census data relating to the numbers of the followers of different religions with corresponding data of the precedinO'" censuses is rendered difficult on account of three factors. The first two, which ar~ rather allied, are (i) the large variati)fl, from census to cemus, in the proportion cf the numbers of particular tribes returned as following Hinduism or one or the other of the various tribal religio~s, and (ii) t}1e ~ontinu?u.s al~eratio~ in ~h~ de,cenniallists ?f the specific returns to be classIfied under TIlbal RelIgIons or as AmmIsts --the term In vogue till the 1931 Census. The third factor is the extraordinary increase recorded in Muslim figures at the 1941 Census.
9. Returns for Tribal Religions .. -(1) .At the p~eced.ing censuses of this century the number of persons returned as fonowIng TrIbal RelIgIons Increased out of all proportion tothe increase in the population of the state. This would be obvious from the figures given in Table 5.
Year (1)
TABLE 5 Number of Persons
following Tribal Religions (2)
Percentage variation
(3)
Percentage Variation or the State PopulatioR
(4)
1911 285,722 +337.5 + 20.0 1921 430,748 + 50.8 - 6.8 1931 544,189 + 26.5 + 15.8 1941 618,149 + 24.5 + 13.2
During the 1941 Census, though information was elicited both with regard to 'Religiontand 'Caste, Tribe or Race', all persons belonging to certain tribes (not all of whom wereaborigina~s) were c~assed under Tr~bal Religions, irr~s~ectiye ?f the religion returned by them. ThIS was done for the ostensIble purpose of dIStInguIShIng the 'Community' from 'Religion' and of furni~hing figures only for the former. Thus, the 1941 figure given above includes an unspecified number of Hindu:;, and perhaps of some Christians as well. During the other three censuses, the number of persons belonging to the mme tribe who returned themselves as Hindus or as followers of Tl ibal Religions fluctuated in a very erratic Inanner. The illustrations given in the succeeding sub-paragraphs will further explain the position.
. (2) The ~a~badi gr<:mp, consisting of the Lambadas (Lam~nis ),.Banjan:,s (Banjaris),. WanJara (WanJans) and Mathulas (Mathuras), was by far 'he bgg€st group In the tribal categorv. It accounted for about 60 per cent of the tribal community in the 1941 Census It has now been deleted from the list of 'Scheduled Tribes' for this state. The numbers returned fron this group as following Tribal Religions and as lIindus at the preCEding four ceususes are indicated in Table 6.
TABLE 6
Year Number returned Number returned Total number Percentage as following Tr;bal Religions as Hindus returned variation
(1) 1(2) (8) (4) (5)
1911 }42,044 293,218 435,322
1921 228,150 70,291 29R,441 -81.44 1931 800,466 70,936 811,402 +24..45 ID'1 -'04,614 .. 404,614 + 8.D'
4.38
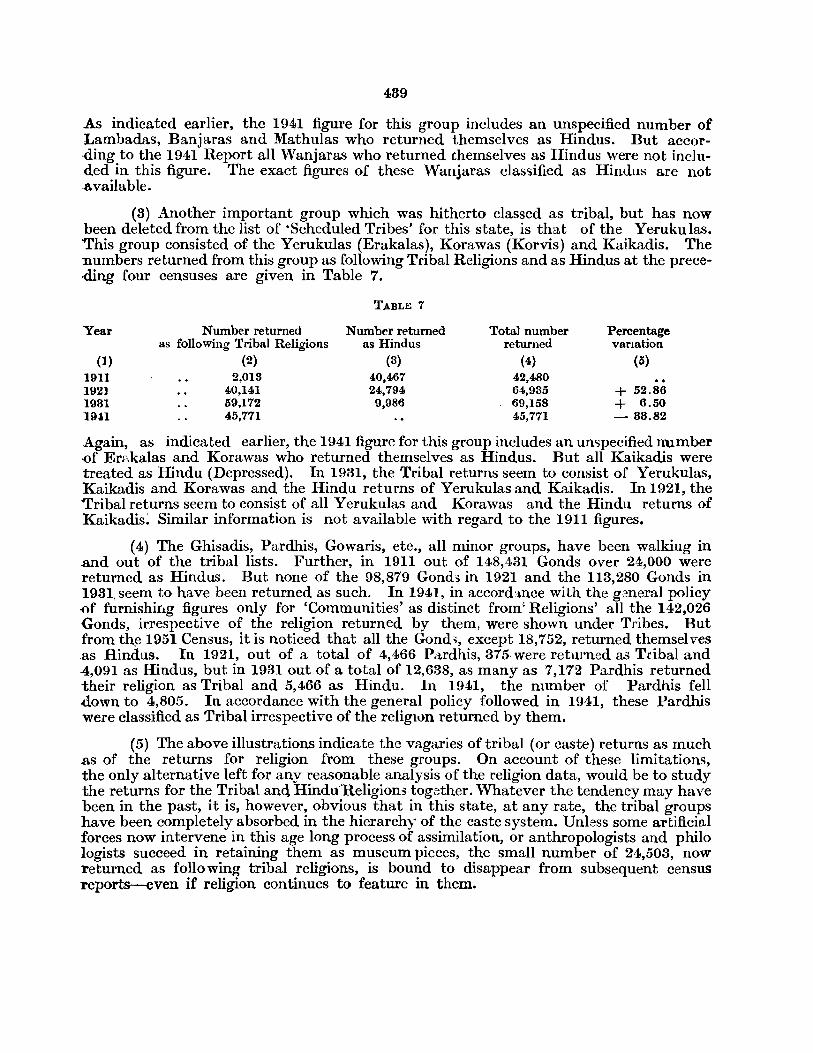
439
As indicated earlier, the 1941 figure for this group includes an unspecified number of Lambadas, Banjaras and Mathulas who returned themselves as Hindus. But accor,ding to the 1941 Report all Wanjaras who returned themselves as Hindus were not included in this figure. The exact figures of these Wanjaras classified as Hindus are not .available.
(3) Another important group which was hitherto classed as tribal, but has now been deleted from the list of ·Scheduled Tribes' for this state, is that of the Yerukulas. This group consisted of the Yerukulas (Erakalas), Korawas (Korvis) and Kaikadis. The numbers returned from this group as following Tribal Religions and as Hindus at the prece-ding four censuses are given in Table 7.
TABLE 7
Year Number returned Number returned Total number Percentage as following Tribal Religions as Hindus returned varJation
(1) (2) (3) (4) (5) 1911 2,013 40,467 42,480 1921 40,141 24,794 64,935 + 52.86 1931 59,172 9,986 69,158 + 6.50 19U 45,771 45,771 - 33.82
Again, as indicated earlier, the 1941 figure for this group includes an unspecified number -of Erakalas and Korawas who returned themselves as Hindus. But all Kaikadis were treated as Hindu (Depressed). In 1931, the Tribal returns seem to consist of Yerukulas, Kaikadis and Korawas and the Hindu returns of Yerukulas and Kaikadis. In 1921, the Tribal returns seem to consist of all Yerukulas and Korawas and the Hindu returns of Kaikadis: Similar information is not available with regard to the 1911 figures.
(4) The Ghisadis, Pardhis, Gowaris, etc., all minor groups, have been walking in .and out of the tribal lists. Further, in 1911 out of 148,431 Gonds over 24,000 were returned as Hindus. But none of the 98,879 Gond~ in 1921 and the 113,280 Gonds in 1931\ seem to have been returned as such. In 1941, in accordance with the gmeral policy -of furnishir1g figures only for 'Communities' as distinct from'Religions' all the 142,026 'Gonds, irrespective of the religion returned by them, were shown under Tribes. But from th~ 1951 Census, it is noticed that all the Gond~, except 18,752, returned themselves as Hindus. In 1921, out of a total of 4,466 Pardhis, 375 were retu]'ned as Tribal and 4,091 as Hindus, but in 1931 out of a total of 12,638, as many as 7,172 Pardhis returned their religion as Tribal and 5,466 as Hindu. In 1941, the nnmber of Pardhis fell down to 4,805. In accordance with the general policy followed in 1941, these Pardhis were classified as Tribal irrespective of the religlun returned by them.
(5) The above illustrations indicate the vagaries of tribal (or caste) returns as much .as of the returns for religion from these groups. On account of these limitations, the only alternative left for any reasonable analysis of the religion data, would be to study the returns for the Tribal and Hindu'ReligioU3 together. Whatever the tendency may have been in the past, it is, however, obvious that in this state, at any rate, the tribal groups have been completely absorbed in the hierarchy of the caste system. Unless some artificial forces now intervene in this age long process of assimilation, or anthropologists and philo logists succeed in retaining them as museum pieces, the small number of 24,503, now returned as following tribal religions, is bound to disappear from subsequent census reports-even if religion continues to feature in them.
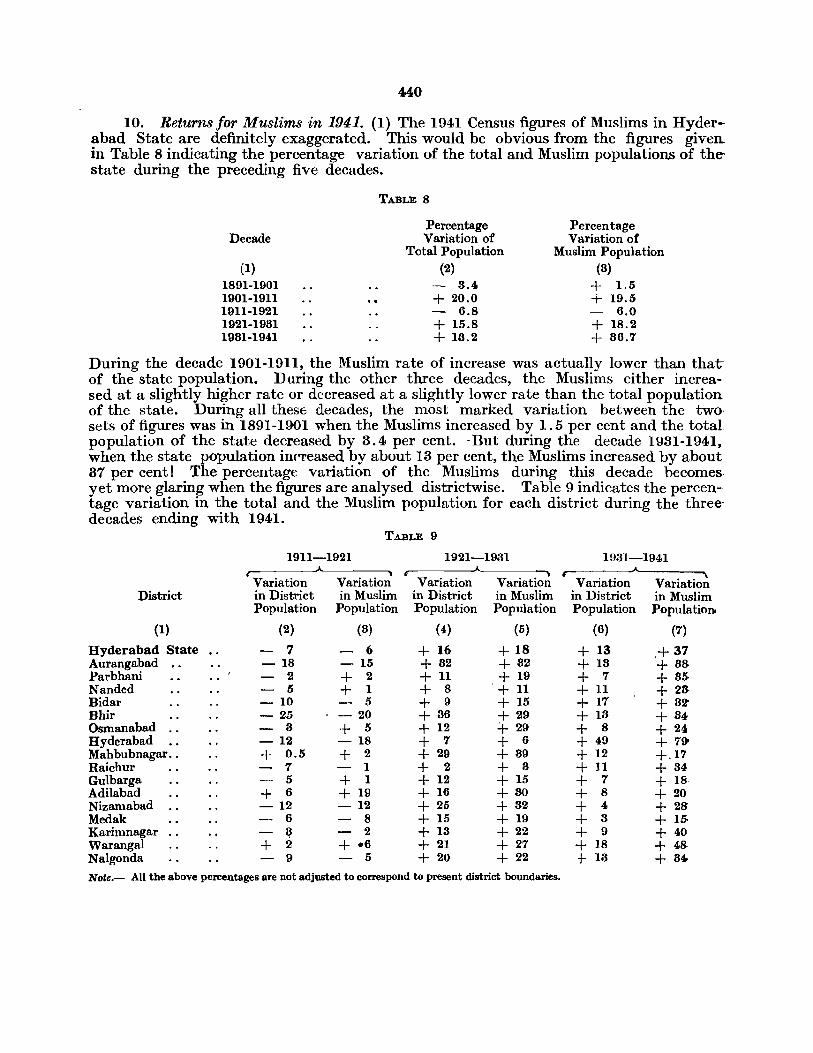
440
10. Returns for Muslims in 1941. (1) The 1941 Census figures of Muslims in Hyderabad State are definitely exaggerated. This would be obvious from the figures given_ in Table 8 indicating the percentage variation of the total and Muslim populations of thestate during the preceding five decades.
Decade
(1) 1891-1901 1901-1911 1911-1921 1921-1931 1981-1941
TABLE 8
Percentage Variation of
Total Population (2)
- 3.4 + 20.0 - 6.8 + 15.8 + 18.2
Percentage Variation of
Muslim Population (8)
+ 1.5 + 19.5 - 6.0 + 18.2 + 86.7
During the decade 1901-1911, the Muslim rate of increase was actually lower than thatof the state population. During the other three decades, the Muslims either increa-sed at a slightly higher rate or decreased at a slightly lower rate than the total population of the state. During all these decades, the most marked variation between the two' sets of figures was in 1891-1901 when the Muslims increased by 1.5 per cent and the total population of the state decreased by 3.4 per cent. -But during the decade 1931-1941, when the state population inC'reased by about 13 per cent, the Muslims increased by about 37 per cent! The percentage variation of the Muslims during this decade becomes. yet more glaring when the figures are analysed districtwise. Table 9 indicates the percentage variation in the total and the Muslim population for each district during the three: decades ending- with 1941.
TABLE 9
1911-1921 1921-1931 1931-1941 r-
Variation Variation Variation Variation Variation Variation District in District in Muslim in District in Muslim in District in Muslim
Population Population Population PopUlation Population Populationo
(1) (2) (8) (4) (5) (6) (7)
Hyderabad State - 7 - 6 + 16 + 18 + 13 ,+ 37 Aurangabad - 18 - 15 + 82 + 82 + 18 + 88-Parbhani - 2 + 2 +11 + 19 + 7 + 35-Nanded - 5 + 1 + 8 . + 11 +11 + 28-Bidar - 10 - 5 + 9 + 15 + 17 + 82-Bhir - 25 - 20 + 36 + 29 + 18 + 84-Osmanabad - 8 + 5 + 12 -+ 29 + 8 + 24 Hyderabad -12 - 18 + 7 + 6 + 49 + 79-Mahbubnagar •. + 0.5 + 2 + 29 + 89 + 12 +.17 Raichur - 7 - 1 + 2 + 8 +11 + 34 Gulbarga - 5 + 1 + 12 + 15 + 7 + IS Adilabad I 6 + 19 + 16 +80 + 8 + 20 T Nizamabad -12 - 12 + 25 + 32 + 4 + 28' Medak 6 - 8 + 15 + 19 + 3 + 15-Karimnagar ~ - 2 + 13 + 22. + 9 + 40 Warangal + 2 + .6 + 21 + 27 + 18 + 48-Nalgonda - 9 - 5 + 20 + 22 + 13 + 84-Note.- All the above percentages are not adjusted to correspond to present district boundaries.

441
During the decade 1911-1921, when the state population decreased by about 7 per cent and the Muslim population by about 6 per cent, in two districts (i.e., Hyderabad, which contained by far the biggest number of Muslims in the state, and Medak), the Muslims relatively lost more in numbers than the district population. In Nizamabad District, their rate of variation was the same as that for the total popUlation. In twelve other districts, they decreased at a slightly lower rate than the total district popUlation or registered only a small increase. Amongst these twelve districts, the 1argest variation was in Osmanabad, w;here the total population recorded a decrease of 3 per cent but the Muslims recorded an increase of 5 per cent. In only one district of the state, namely Adilabad District, the Muslim population increased by about 19 per cent while the total population rccorded an increase of about 6 per cent-but this district contained the smallest number of Muslims in the state, namely 29,668. Duringthe decade 1921-1931, when the state population increased by about 16 per cent and the Muslim population by about 18 per cent, in two districts the Mm;lims actually gained less than the total population. One of these two districts was again Hyderabad, which contained by far the biggest number of Muslims in the state. In a third district, namely Aurangabad, which accounted for the fourth largest numQer of Muslims in the state, their rate of variation was t~e samc as that of the total population. ~n ten other districts, they increased at a slightly higher rate than the total population-the largest variation in these ten districts was in Karimnagar, in which they increased -by 22 per cent against the increase of 13 per cent registered by the district population. In the remaining three districts, their rate of increase was rather marked-the largest variation among these three districts was in Osmanabad, where the Muslims increased by 29 per cent agim;t the increase of 12 per cent recorded by the population of the district as a whole. But during the decade 1931-1941, the Muslim rate of increase was staggering. In three districts, the difference between the rates of increase of the Muslims and the district popUlation was actually thirty per cent or more. In six other districts, it was actually more than twenty. In yet another set of six districts, it was more than 10. In only one district the difference was less than 10.
(2) This unprecedented increase in the number of Muslims in the state during the decade 1931-1941 has no demographic justification. Their natural rate of increase could at best be only about 2 to 3 per cent more than that of the general population. Even this assessment may be exaggerated if comparative superiority in economic and social spheres leads to a proportional decrease in the natural growth of the p<?pulation--it cannot be denied that Muslims in this state are economically and socially more advanced than the rest of the population taken as a whole. It is, therefore, obvious that only two other sources, namely conversion and immigration, could have, individually or jointly, led to this phenomenal increase. As regards the former, the Census Commissioner of the 1941 Census has pointed out in his Report that 'there is no active proselytising propaganda among the :Muslims, and conversions to Islam are few and far between in the state'. It is a fact that the proselytising activities of Muslims in Hyderabad State during the recent decades were not very effective. They were more political than communal in nature and were restricted to platforms and newspapers and only occasionally touched the people. Most of the protagonists of the movement were not Hyderabadis but immigrants, particularly from the former United Provinces and the Punjab. The conversions which were'few and far between' took place generally at the household level and were restricted to Non-Muslim women marrying Muslims or to domestic servants wholly dependent upon their errlployers. Thus, conversions as a factor leading to this phenomenal increase is also ruled out. As regards immigration, the position is slightly different, There is no doubt that since
51
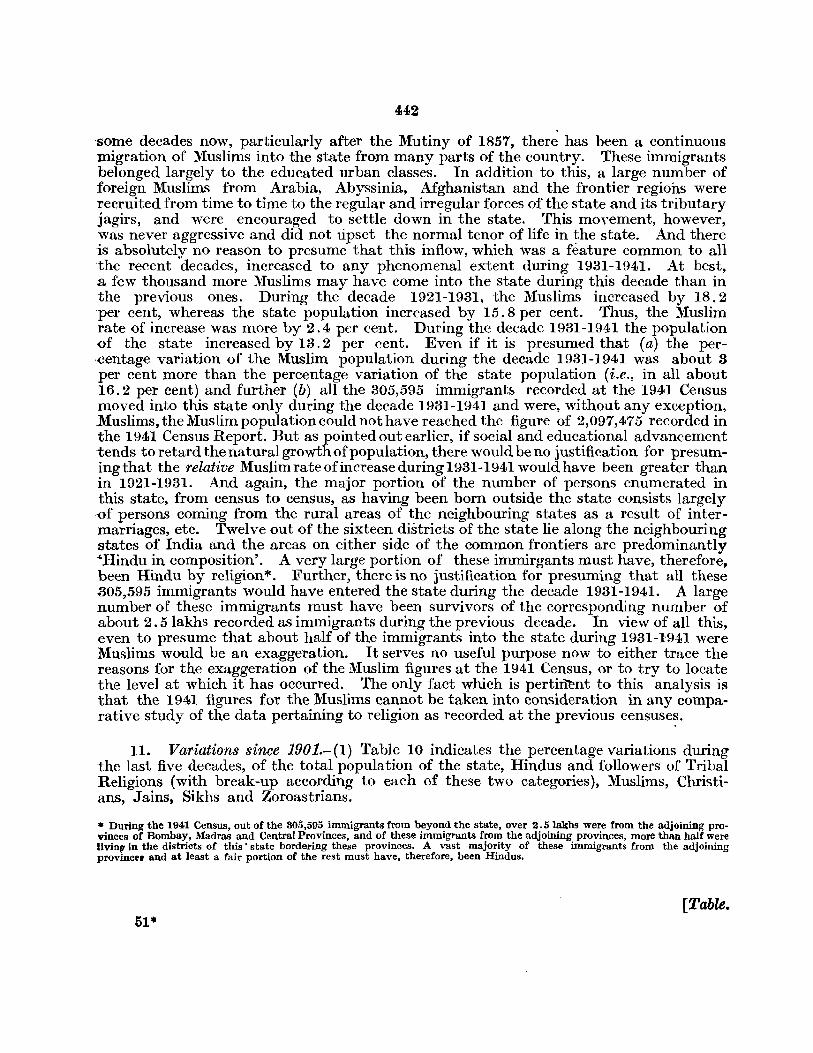
442
'some decades now, particularly after the Mutiny of 1857, there has been a continuous migration of Muslims into the state from many parts of the country. These immigrants belonged largely to the educated urban classes. In addition to this, a large number of foreign Muslims from Arabia, Abyssinia, Afghanistan and the frontier regions were recruited from time to time to the regular and irregular forces of the state and its tributary jagirs, and were encouraged to settle down in the state. This moYement, however, was never aggressive and did not upset the normal tenor of life in the state. And there is absolutely no reason to presume that this inflow, which was a feature common to all the recent decades, increased to any phenomenal extent during 1931-1941. At best, a few thousand more Muslims may have come into the state during this decade than in the previous ones. During the decade 1921-1931, the Muslims increased by 18.2 per cent, whereas the state population increased by 15.8 per cent. Thus, the Muslim rate of increase was more by 2.4 per cent. During the decade 1931-1941 the population of the state increased by 13.2 per cent. Even if it is presumed that (a) the percentage variation of the Muslim population during the decade 1931-1941 was about 3 per cent more than the percentage variation of the state popUlation (i.e., in all about 16.2 per cent) and further (b) all the 305,595 immigrant& recorded at the 1941 Census moved into this state only during the decade 1931-1941 and were, without any exception, Muslims, the Muslim population could not have reached the figure of 2,097,475 recorded in the 1941 Census Report. But as pointed out earlier, if social and educational advancement tends to retard the natural growth of population, there would be no justification for presumingthat the relative Muslim rate of increase during 1931-1941 would have been greater than in 1921-1931. And again, the major portion of the number of persons enumerated in this state, from census to census, as having been born outside the state consists largely ,of persons coming from the rural areas of the neighbouring states as a result of intermarriages, etc. Twelve out of the sixteen districts of the state lie along the neighbouring states of India and the areas on either side of the common frontiers are predominantly "Hindu in composition'. A very large portion of these immirgants must have, therefore, been Hindu by religion*. Further, there is no justification for presuming that all these a05,595 immigrants would have entered the state during the decade 1931-1941. A large number of these immigrants must have been survivors of the corresponding number of about 2.5 lakhs recorded as immigrants during the previous decade. In view of all this, even to presume that about half of the immigrants into the state during 1931-1941 were Muslims would be an exaggeration. It serves no useful purpose now to either trace the reasons for the exaggeration of the Muslim figures at the 1941 Census, or to try to locate the level at which it has occurred. The only fact which is perti~nt to this analysis is that the 1941 figures for the Muslims cannot be taken into consideration in any comparative study of the data pertaining to religion as recorded at the previous censuse~.
ll. Variations since 1901.-(1) Table 10 indicates the percentage variations during the last five decades, of the total population of the state, Hindus and followers of Tribal Religions (with break-up according to each of these two categories), Muslims, Christians, Jains, Sikhs and Zoroastrians .
• During the 1941 Census, out of the 305,595 immigrants from beyond the state, over 2.51akhs were from the adjoining pro· vinces of Bombay, Madras and Central Provinces, and of these immigrants from the adjoining provinces, more than half were livin" in the districts of this· state bordering these provinces. A vast majority of these immigrants frorn the adjoining province. and at least a fair portion of the rest must have, therefore, been Hindus.
[Table. 51*
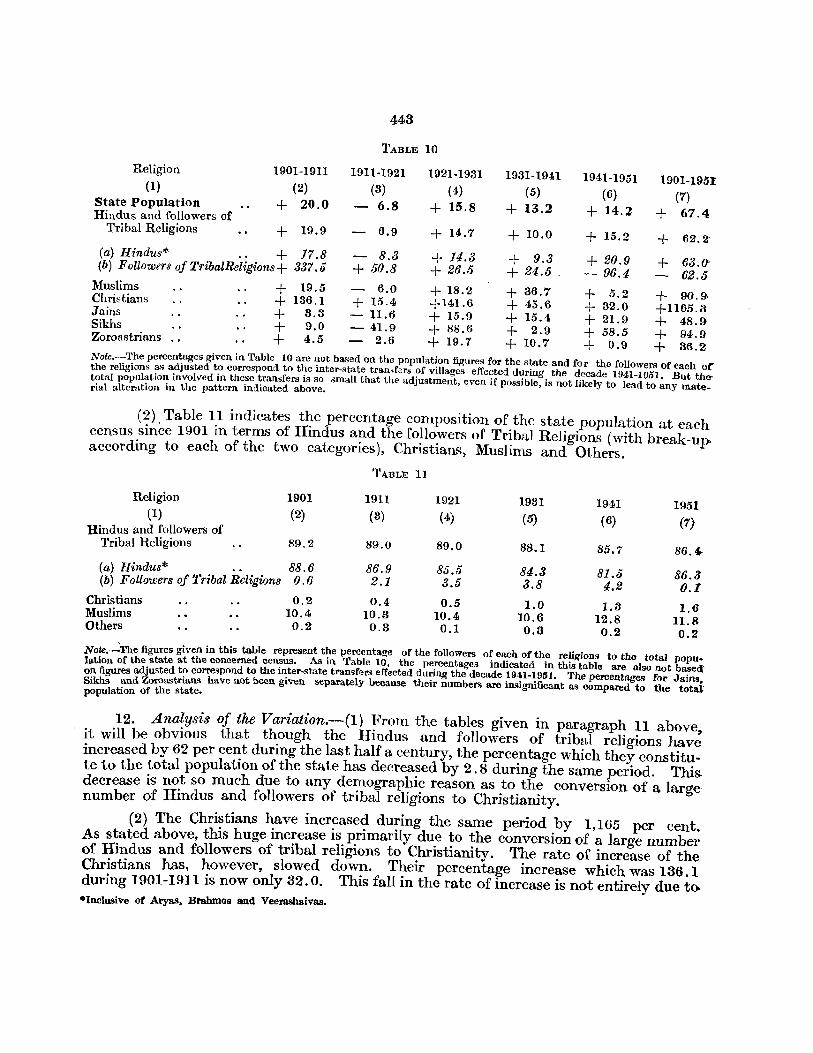
443
TABLE 10
Religion 1901-1911 1911·1921 1921·1931 1931-1941 1941-1951 1901·1951 (1) (2) (3) (4) (5) (6) (7) State Population + 20.0 6.8 + 15.8 + 13.2 + 14.2 + 67.4 Hindus and followers of Tribal Religions + 19.9 6.9 + 14.7 + 10.0 + 15.2 + 62.2'
(a) Hindus* + 17.8 8.3 + 14.3 + 9.3 + 20.9 + 63.0' (b) Followers of TribalReligions+ .'337.5 + 50.8 + 26.5 + 24.5. - 96.4 62.0 Muslims + 19.5 - 6.0 + 18.2 + 36.7 + 5.2 + 90.9, Christians + 136.1 + 15.4 +141.6 + 45.6 + 32.0 +1165.3 Jains + 8.8 - 11.6 + 15.9 + 15.4 + 21.9 + 48.9' Sikhs + 9.0 - 41.9 + 88.6 + 2.9 + 58.5 + 94.9 Zoroastrians + 4.5 - 2.6 + 19.7 + 10.7 + 0.9 + 36.2 Note.-The percentages given in Table 10 are not based on the population figures for the state and for the followers of each of" the religions as adjusted to correspond to the inter-state tran,fers of villages effected during the decade 1941-1951. But the' total population involved in these transfers is so small that the adjustment, even if possible, is not likely to lead to any material alteration in the pattern indicated above.
(2), Table 11 indicates the percentage composition of the state population at each census since 1901 in terms of Hindus and the followers of Tribal Religions (with break-up. according to each of the two categories), Christians, Muslims and Others.
TABLE 11
Religion 1901 1911 1921 1981 1941 1951 (1) (2) (3) (4) (5) (6) (7) Hindus and followers of
Tribal Religions 89.2 89.0 89.0 88.1 85.7 86. " (a) Hindus* .. 88.6 86.9 85.5 84.3 81.5 86.3 (b) Followers of Tribal Religions 0.6 2.1 3.5 3.8 4.2 O.I
Christians 0.2 0.4 0.5 1.0 1.8 1.6 Muslims 10.4 10.3 10.4 10.6 12.8 n.s Others 0.2 0.3 0.1 0.3 0.2 0.2
Note.~The figures given in this table represent the percentage of the followers of each of the religions to the total population of the state at the concerned census. As in Table 10, the percentages indicated in this table are also not based' on figures adjusted to correspond to the inter-state transfers effected during the decade 1941·1951. The percentages for Jains, Sikhs and Zoroastrians have not been given separately because their numbers are insignificant as compared to the total population of the state.
12. Analysis of the Variation.-(I} From the tables given in paragraph 11 above, it will be obvious that though the Hindus and followers of tribal religions have increased by 62 per cent during the last half a century, the percentage which they constitute to the total population of the state has decreased by 2.8 during the same period. This. decrease is not so much due to any demographic reason as to the conversion of a large number of Hindus and followers of tribal religions to Christianity.
(2) The Christians have increased during the same period by 1,165 per cent. As stated above, this huge increase is primarily due to the conversion of a large number of Hindus and followers of tribal religions to Christianity. The rate of increase of the Christians has, however, slowed down. Their percentage increase which was 136.1 during 1901-1911 is now only 32.0. This fall in the rate of increase is not entirely due to·Inclusive of Aryas. Brahmos and Veerashaivas.
444
the smaller number of converts to Christianity. To an extent, it is due to the fact that~ ~ith a considerably increased Christian population now than in the earlier decades, the proportion of the number of converts to the total Christian population has diminished. The _number of conversions to Christianity continues to be still by thousands. This is obvious from the fact that during the present decade they have increased by over 32 per cent .against the increase of only 14 per cent recorded by the state population. In Bidar District itself, Christians have increased by as much as 180.3 per cent. They have improved their percentage to the total population of the state from 0.2 in 1901 to 1.6 in 1951.
(3) During the last 50 years, the Muslims have increased by about 91 per cent. 'Their percentage to the total population of the state is now 11.8 as against 10.4 in 1901. 'Their increase is due more to the immigration of Muslims from outside the state than to any special demographic feature. As stated earlier, there was a continuous migration of Muslims into this state, particularly since 1857, from the rest of India. This immigration, -however, was not aggressive and did not upset the normal tenor of life in the state until about 1947. But the fanatical group which came into power in this state subsequent to the Independence of India, was bent upon changing the state into a Muslim majority region. With this end in view, it started a vigorous campaign and set up a large organisation for the settlement of Muslim immigrants drawn from various parts of India, p~rticularly from the neighbouring states. The number of such immigrants which at first was in thousands soon increased to lakhs, and they were of all descriptions-traders, artisans, domestic and government servants, agriculturists, skilled and unskilled labourers, etc.,-drawn from both the urban and rural classes. This influx, however, came to an abrupt end on the 13th September, 1948, the day on which the armed forces of India moved into the state 'in response to the call of the people'. In fact almost simultane.ously a reverse movement started with most of the immigrants going back to their homes in other states. A number of local 'l\Iuslims also migrated to Pakistan and a few -others went back to their homes elsewhere in India from which thev or their immediate forefathers had come in the recent past. Thus, the 1941-1951 de~ade witnessed both .an influx of Muslims into Hyderabad State and an exodus from it on a very exaggerated -scale.
(4) During the last 50 years, the Jains have increased by about 49 per cent and the Zoroastrians by about 36 per cent. In keeping with their comparatively advanced social
.and economic conditions, these two groups record the smallest increase during all these ·decades. The Sikhs have increased during the same period by about 95 per cent. '1hey increased during the decade 1941-1951 alone by 58.5 per cent. .
Summary.-A comparative study of the 1951 Census data pertaining to religion with the corresponding ·data of the preceding censuses js rendered difficult on account of (i) large variations, from ccnsus to census, in the numbers of particular tribes returned as following Hinduism or the triba,l religion concerned, (ii) contradictions and al tcra tions in the decennial lists of the ~specific returns to be 'Classified under ' Tribal Rel igions'including classification of sections of t~le same caste or tribe under different categories-and, lastly, (iii) the grotesque exaggeration of the Muslim returns at the 1941 Census. The first two limitations can, how·ever, be circumvented by analysing the Hindu and Tribal returns together.
Since the turn of this century, the followers of Hinduism and tribal religions have increased by 62 per cent. But their 7ate of increase is slo~e;r th3;n the corresponding inc!ease of over 67 per cent recorded by the total populatlon of the state. ThIS IS chIefly due to the converSIOn of large numbers of Hindus as well as of the followers of tribal religions to Christianity. It is, therefore, nothing surprising that the Christians
'should have increased during the same period by 1,165 per cent r No doubt, the rate of increase among the Christians has declined in recent decades. But this decrease is not due to any slackening of the rate of conversions to Christianity. The new converts to Christianity do not now constitute such a heavy percen"tage of the basic Christian popUlation as they used to in the earlier decenniums merely because the basic
445
Christian population itself hllB increased enormously during the recent decades. All this would be obvious . from the fact that during 1941-'51, the Christians increased by over 82 per cent against the corresponding increase of only 14 per cent recorded by the total pcpulation of the state-during these ten years they increased by over 180 per cent in Bidar District. While the percentage of the Hindus and followers of tribal religions to the total population of the state has declined from 89.2 to 86.4 during the last five decades, that of Christiaus has increased from 0.2 to 1.6. The Muslims have increased during the last fifty years by about 91 per cent. This increase, over and above the corresponding rate of increase for the total population of tbe state, is due to an appreciable extent to gain by migration since 1901. Since 1901, the 'l\{uslims have improved their percentage to the total population of the statefrom 10.4 to 11.8. Among the minor groups, while the increase re(.'()rded by the .Tains or, much less, the Zoroastrians is hardly significant, that registered by the Sikhs is fairly impressive. The actual percentage increase recorded by each of these three groups since the beginning of this century is 49, 86 and 95 respectively.
52

CHAPTER VIII
Literacy

SECTION I , 1951 CENSUS DATA REGARDING LITERACY
( The tables relevant to this Section are Main Tables' D-VII-Livelihood Classes by Educational Standards' and' C-IV-Age and Literacy' given at pages 189 of Part II-A and 63 of P:ut I£-B re~p~ctively of this Volume; and Subsidiary Tables "l.l--Progress of Literacy', ' 7. 2-Literacy Standard of Livelihood Classes', ''1. 3-Educational Services and Research' and '7. 4-Literacy uy TractsNumlJer of Literates among the Total, Male and Female Population and proportion of literates per 1,000 of each category' given at pages 203, 204. 208 and 209 respectively of Part 1-B of this Volume).
Instructions to Enumerators and Tabulation Proc~dure.-One of the features of the present census is its analytical approach to the usual question pertaining to literacy. During this census, figures were collected in respect of literates-i.e., those who could both read and write any simple letter, either in print or in manuscript, in any languageand illiterates as well as semi-literates 'i.e., those who could not write but could read. Further, in case of every literate, his or her precise educational attainments, if any, were also ascertained. The detailed instructions issued in this regard to the enumerators are repeated in the foot-note below*.
2. Equally marked were the improvements effected in respect of the sorting, compilation and finally the tabulation of the returns. The returo.s were as usual sorted and tabulated separately for males and females but accompanied this time with further break-up both according to rural and urban areas and to the eight livelihood classes of persons principally dependent on Owner Cultivation, Tenant Cultivation, Agricultural Labour, Production (other than cultivation), Commerce, Transport and Other Services and Miscellaneous Sources. Besides, the educated---i.e., those who had passed examinations as distinguished from the mere literates-of each sex, in each of the livelihood classes, were further classified according to the following fourteen standards :-
1. Primary School 2. Middle'School
R. Engineering 9. Agriculture
3. Matriculatp 10. Veterinary 4. Intermediate in Arts or Science 11. Commerce 5. Graduate in Arts or Science 12. Legal 6. post-Graduate in Arts or Science 13. Medical 7. Teaching 14. Others i.e., all other educational standards.
* .. Question No. 12.-Can you both read aud write or can you only read a simple letter? If you can both read and write. have you passed auy eX'lmination, and if so, what is the highest examination you have passed?
You should note that the test for reading is ability to read any simple letter, either in print or in manuscript, in any language. Similarly, the test for writing is ability to write a simple letter in any language.
Start with the first part of the question, and ask whether the person can both read and write or can only read a simple letter. If the answer is that the person can neither read nor write, you should write ,0 on the slip and take up the next question. If the answer is that the person can only read, then you should write 1 on the slip and take up the next question. If on the other hand, the answer is that the persou can both read and write, then further enquire if the person has passed any examination, and if so to state the highest examination passed by him. If the answer is that the person can only read and write and has not passed any examination then you should write 2 on the slip. If the person indicates the highest examination passed by him, then you should write in full the examination indicated by the person. You must, however, note that what we want is the highest examination actually passed. For instance, if a person states that he has studied up to matriculation, it does not mean that he has passed the matriculation examination. you should bear this point in view and make further enquiries whenever you feel the necessity to doso.
In many cases you may not have any difficulty at all in recording the highest examination passed by the person. For instance, you can easily write' Class 2 " or 'Matriculation', or' B.A.', or' B.Sc.', etc. But sometimes you may meet persons highly qualified, or qualified in particular subjects, aud you may not quite follow the examination which he has mentioned. In such a case either request the person to write out the answer on a piece of paper and then copy it out very neatly without making any mistakes, or else show what you have written to the person concerned and obtain his confirmation that it is correct. Be very careful in such cases."
449
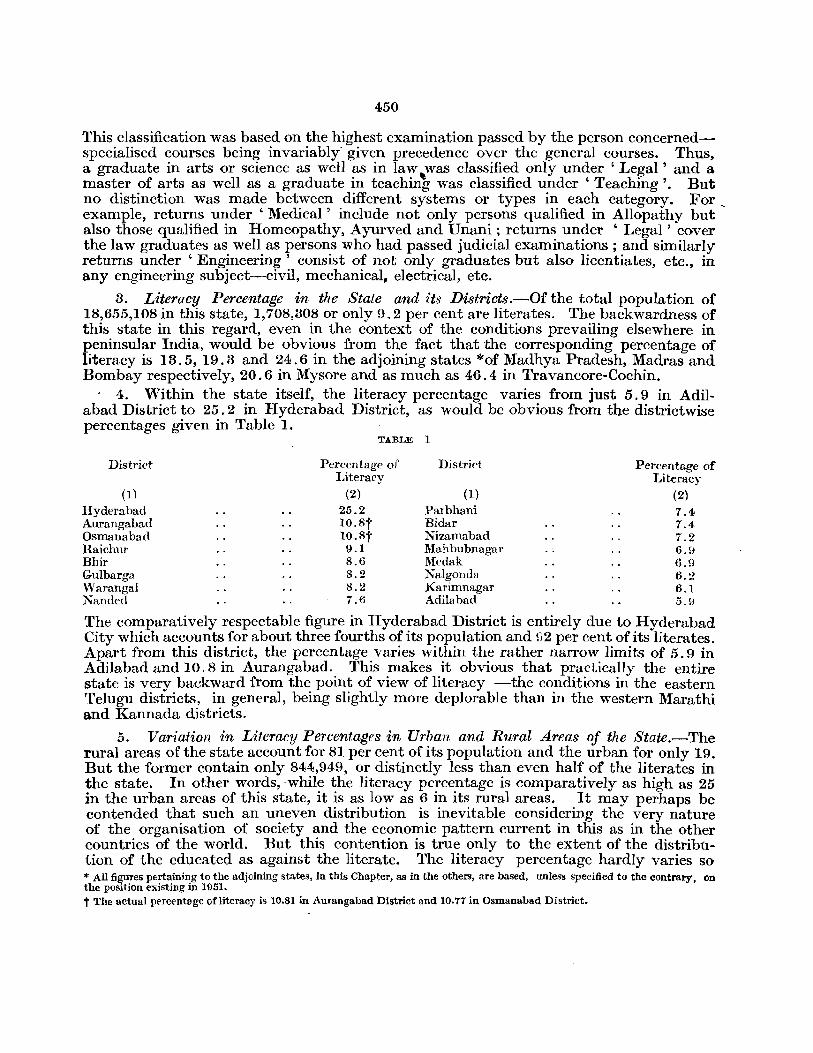
450
This classification was based on the highest examination passed by the person concernedspecialised courses being invariably· given precedence over the general courses. Thus, a graduate in arts or science as well as in law "was classified only under' Legal' and a master of arts as well as a graduate in teaching was classified under ' Teaching'. But no distinction was made between different systems or types in each category. For example, returns under' Medical' include not only persons qualified in Allopathy but also those qualified in Homeopathy, Ayurved and Unani; returns under' Legal' cover the law graduates as well as persons who had passed judicial examinations; and similarly returns under' Engineering' consist of not only graduates but also licentiates, etc., in any engineering subject-civil, mechanical, electrical, etc.
3. Literacy Percentage in the State and its Districts.-Of the total population of 18,655,108 in this state, 1,708,308 or only 9.2 per cent are literates. The backwardness of this state in this regard, even in the context of the conditions prevailing elsewhere in peninsular India, would be obvious from the fact that the corresponding percentage of literacy is 13.5, 19.3 and 24.6 in the adjoining states *of Madhya Pradesh, Madras and Bombay respectively, 20.6 in Mysore and as much as 46.4 in Travancore-Cochin.
4. VVithin the state itself, the literacy percentage varies from just 5.9 in Adilabad District to 25.2 in Hyderabad District, as would be obvious from the districtwise percentages given in Table I.
Distri('t
(1)
TABLE 1
Percentage of I,iteracy
(2)
District
(1)
Percentage of I"iteracy
(2) Hyderabad 25.2 Parbhani 7.4 Aurangabad 10. st Bidar 7.4 Osmanabad 10. St Nizamabad 7.2 Raichnr 9.1 Mahbubnagar 6.9 Bhir 8.6 Medak 6.!1 Gulbarga 8.2 Nalgonda 6 .) Warangal S. 2 Karimnagar 6.1 N anded 7.6 Adila bid 5.9
The comparatively respectable figure in Hyderabad District is entirely due to Hyderabad City which accounts for about three fourths of its population and 92 per cent of its literates. Apart from this district, the percentage varies within the rather narrow limits of 5.9 in Adilabad and 10.8 in Aurangabad. This makes it obvious that practically the entire state is very backward from the point of view of literacy -the conditions in the eastern Telugu districts, in general, being slightly more deplorable than in the western Marathi and Kannada districts.
5. Variation in Literacy Percentages in Urban and Rural Areas of the State.-The rural areas of the state account for 81 per cent of its population and the urban for only 19. But the former contain only 844,949, or distinctly less than even half of the literates in the state. In other words, ·while the literacy percentage is comparatively as high as 25 in the urban areas of this state, it is as low as 6 in its rural areas. It may perhaps be contended that such an uneven distribution is inevitable considering the very nature of the organisation of society and the economic pattern current in this as in the other countries of the world. But this contention is true only to the extent of the distribu~ tion of the educated as against the literate. The literacy percentage hardly varies so * All figures pertaining to the adjoining states, in this Chapter, as in the others, are based, unless specified to the contrary, on the position existing in 1951. t The actual pt'Tcentage ofliteracy is 10.81 in Aurangabad District and 10.77 in Osmanabad District.
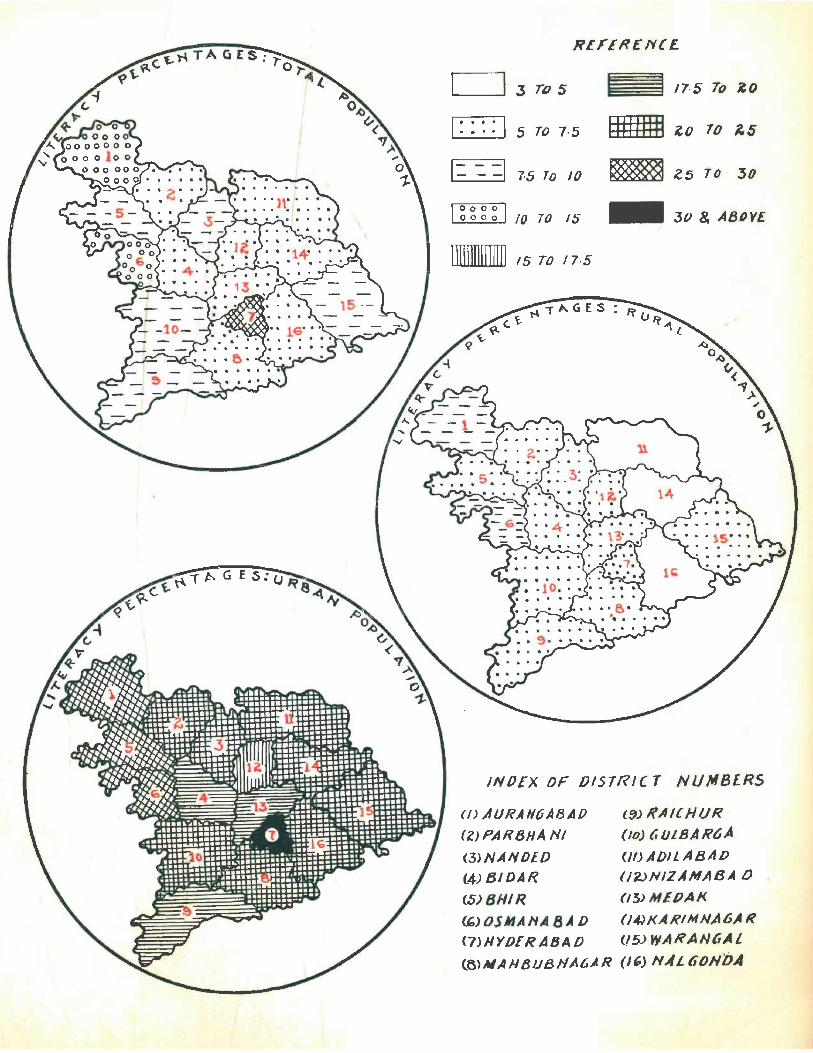
REFERENCE.
J To 5 17·5 To ZO
I : : : : I 5 TO 7·5 ~U It II~ l,O TO 1.5
1= ==1 7·5 TO 10 ~ ZS TO 30
I ~ ~ ~ ~ 1,0 TO IS - 30 & AB'()VE
IlIIillllllllll 15 TO 17·5
INDEX OF Ol5TRIC T NUMBERS
(f) AIJRAN~A8A/)
(Z)PAR8HA HI (3)NANDIO
(4)BIDAR
(9) I(AI( HUR
(10) (,UL8AH6A
{lO Af)ll ABAP ll2>HIZA/tfA8A 0
(S) 8/-11 R (13) MEDAl<
(&,) OSMAN,. 8 AD (/4JI<ARIMN./t6A R
(7) HYDER ABAD U5) WARAIJ(tAL
(6)AlAH8IJBtlIa6AR (/') HAL 60HDA


453
markedly between the two areas in the advanced countries of the world. This is one of the prices which we have to pay for the utter indifference of the previous ruling powers in this state towards the extension of nation-building activities to rural areas. That things in this respect are not so bad elsewhere in peninsular India-not even in the adjoining state of Madhya Pradesh which is by no means noted for its advancement in literacy-will be obvious from the figures given in Table 2.
State
(1)
Hyderabad Madhya Pradesh Madras
TABLE 2
Percentage of Literacy
r--- -..A..-- - -""l\
Rural Urban Areas Areas
(2)
5.6 9.9
15.4
(3) 24.8 36.1 35.4
State
(1) Bombay Mysore Travancore-Cochin
Percentage of Litera('y
~ _..A.. __ - -""l\
Rural Urban Areas Areas
(2)
17.0 14.5 45.4
(3) 41.3 39.6 51.9
6. Districtwise Va ... iation in Urban Literacy.---As already stated, the literates--and considerably more so the educated-are heavily concentrated in the urban areas of the state. Within the state itself, the percentage of literates among the urban population varies significantly, from district to district, as would be obvious from the figures given in Table 3.
District
TABLE 3
Literacy Percentage in Urban Areas
District Literacy
Percentage in Urban Areas
(1) (2) (1) (2) Hyderabad 31.3 Nanded 21.0 Aurangabad 29.3 Gulbarga 20.9 Bhir 26.0 Parbhani 20.9 Osmanabad 25.3 Adilabad 20.7 Nalgonda 23.4 Medak 19.7 Warangal 22.6 Bidar 19.1 Mahbubnagar. . 21. 9 Raichur 17.6 Karimnagar 21.6 Nizamabad 17.4
It is but natural that the urban areas of Hyderabad District, containing the metropolis of the state, should lead in urban literacy. What is tragic, however, is the extent to which the metropolis monopolises all types of the educated in this state. This aspect is dealt with fully in paragraph 16 below. Urban literacy is comparatively impressive in Aurangabad District also, mainly because of Aurangabad Town, which next to Hyderabad City, but at a considerable distance, is the biggest educational and cultural centre in the state. It is fairly heavy in Bhir and Osmanabad Districts not so much due to any educationally important town as to the general level of literacy being relatively high in this part of the state-whether in towns or villages. But for a relatively large number of police and military personnel in Nalgonda District, the literacy percentage among its urban population would have been slightly lower than- 23.4, perhaps lower than the corresponding percentages of 22.6 and 21 .9 recorded in the urban areas of Warangal and Mahbubnagar Districts respectively. Urban literacy suffers in Warangal~
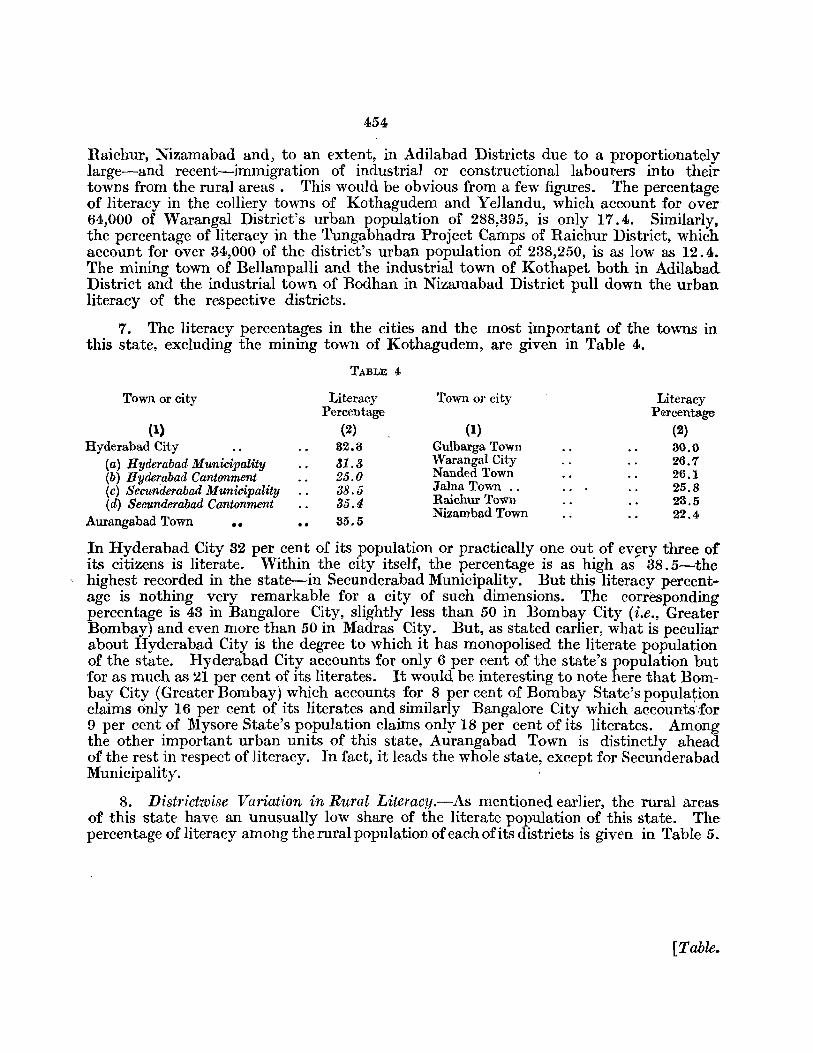
454
Raichur, Nizamabad and, to an extent, in Adilabad Districts due to a proportionately large-and recent-immigration of industrial or constructional labourers into their towns from the rural areas. This would be obvious from a few figures. The percentage of literacy in the colliery towns of Kothagudem and Yellandu, which account for over 64,000 of Warangal District's urban population of 288,395, is only 17.4. Similarly, the percentage of literacy in the Tungabhadra Project Camps of Raichur District, which account for over 34,000 of the district's urban population of 238,250, is as low as 12.4. The mining town of Bellampalli and the industrial town of Kothapet both in Adilabad District and the industrial town of Bodhan in Nizamabad District pull down the urban literacy of the respective districts.
7. The literacy percentages in the cities and the most important of the towns in this state, excluding the mining town of Kothagudem, are given in Table 4.
TABLE 4
Town or city Literacy Town or city Literacy Percentage P€rcentage
(1) (2) (I) (2) Hyderabad City 32.3 Gulbarga Town 30.0
(a) H yderabad Municipality :U.3 Warangal City 26.7 (b) Hyderabad Cantonment 25.0 Nanded Town 26.1 (c) Secunaerabad Municipality 38.5 Jalna Town .. 25.8 (d) Secunderabad Cantonment 35.4 Raichur Town 23.5
Aurangabad Town 35.5 Nizambad Town 22.4
••
In Ryderabad City 32 per cent of its population or practically one out of ev~ry three of its citizens is literate. Within the city itself, the percentage is as high as 38. 5-the
, highest recorded in the state-in Secunderabad Municipality. But this literacy percentage is nothing very remarkable for a city of such dimensions. The corresponding percentage is 43 in Bangalore City, slightly less than 50 in Bombay City (i.e., Greater Bombay) and even more than 50 in Madras City. But, as stated earlier, what is peculiar about Hyderabad City is the degree to which it has monopolised the literate population of the state. Hyderabad City accounts for only 6 per cent of the state's population but for as much as 21 per cent of its literates. It would be interesting to note here that Bombay City (Greater Bombay) which accounts for 8 per cent of Bombay State's population claims only 16 per cent of its literates and similarly Bangalore City which accounts,for 9 per cent of Mysore State's population claims only 18 per cent of its literates. Among the other important urban units of this state, Aurangabad Town is distinctly ahead or the rest in respect of literacy. In fact, it leads the whole state, except for Secunderabad Municipality.
8. Districtwise Variation in Rural Literacy.-As mentioned earlier, the rural areas of this state have an unusually low share of the literate popUlation of this state. The percentage of literacy among the rural popUlation of each of its distriets is given in Table 5.
[Table.
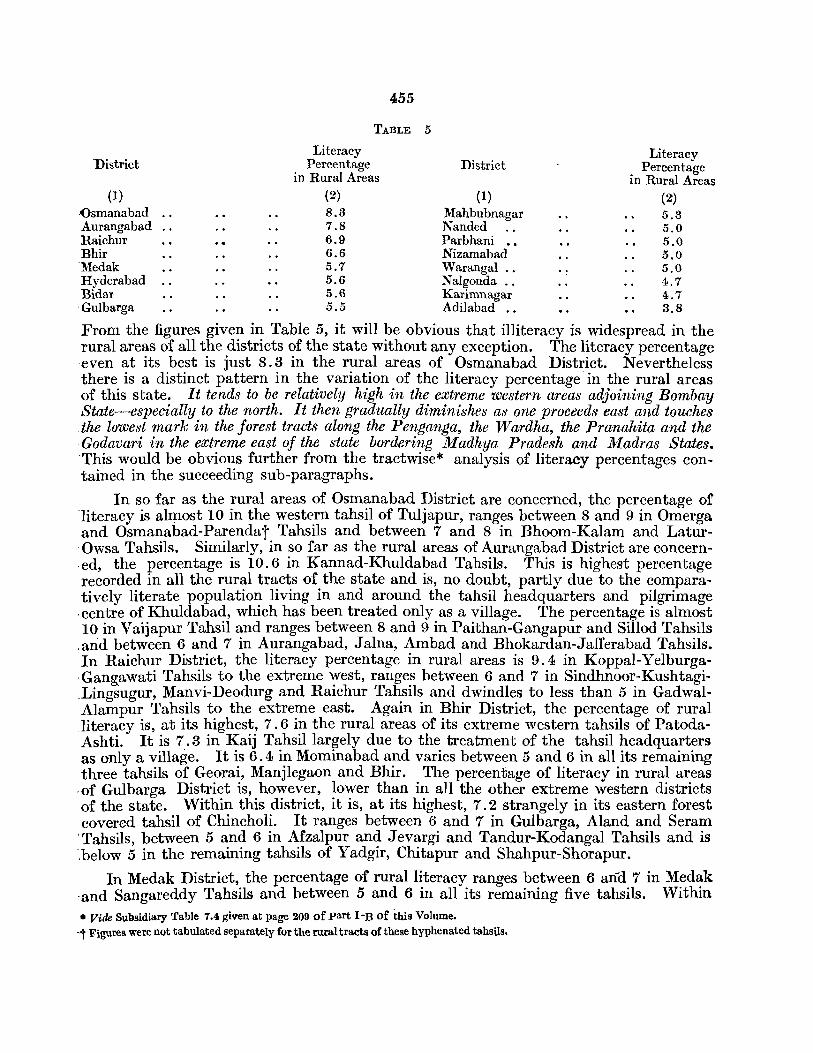
District
(1)
455
TABLE 5
Literacy Percentage
in Rural Areas (2)
District
(1)
Literacy Percentage
in Rural Areas (2)
·()smanabad 8.3 Mahbubnagar 5 .3 Aurangabad 7.8 N anded 5.0 Raichur 6.9 Parbhani •• 5.0 Bhir 6.6 Nizamabad 5.0 -Medak 5.7 Warangal .. 5.0 Hyderabad 5.6 Nalgonda .. 4.7 Bidar 5.6 Karimnagal' 4.7 . Gulbarga 5. 5 Adilabad .. 3.8
From the figures given in Table 5, it will be obvious that illiteracy is widespread in the rural areas of all the districts of the state without any exception. The literacy percentage even at its best is just 8.3 in the rural areas of Osmanabad District. Nevertheless there is a distinct pattern in the variation of the literacy percentage' in the rural areas of this state. It tends to be relatively high in the extreme western areas adjoining Bombay State--especially to the north. It then gradually diminishes as one proceeds east and touches .the lowest mark in the forest tracts along the Penganga, the Wardha, the Pranahita and the Godavari in the extreme east of the state bordering Madhya Pradesh and Madras States. This would be obvious further from the tractwise* analysis of literacy percentages contained in the succeeding sub-paragraphs.
In so far as the rural areas of Osmanabad District are concerned, the percentage of literacy is al:rp.ost 10 in the western tahsil of Tuljapur, ranges between 8 and 9 in Omerga and Osmanabad-Parendat Tahsils and between 7 and 8 in Bhoom-Kalam and LaturOwsa Tahsils. Similarly, in so far as the rural areas of Aurangabad District are concern,ed, the percentage is 10.6 in Kannad-Khuldabad Tahsils. This is highest percentage recorded in all the rural tracts of the state and is, no doubt, partly due to the comparatively literate population living in and around the tahsil headquarters and pilgrimage centre of Khuldabad, which has been treated only as a village. The percentage is almost 10 in Vaijapur Tahsil and ranges between 8 and 9 in Paithan-Gangapur and Sillod Tahsils .and between 6 and 7 in Aurangabad, Jalna, Ambad and Bhokardan-Jafferabad Tahsils. In Raichur District, the literacy percentage in rural areas is 9.4 in Koppal-Yelburga,Gangawati Tahsils to the extreme west, ranges between 6 and 7 in Sindhnoor-KushtagiLings'ugur, Manvi-Deodurg and Raichur Tahsils and dwindles to less than 5 in GadwalAlampur Tahsils to the extreme east. Again in Bhir District, the percentage of rural literacy is, at its highest, 7.6 in the rural areas of its extreme western tahsils of PatodaAshti. It is 7.3 in Kaij Tahsil largely due to the treatment of the tahsil headquarters as only a village. It is 6.4 in Mominabad and varies between 5 and 6 in all its remaining three tahsils of Georai, Manjlegaon and Bhir. The percentage of literacy in rural areas
·of Gulbarga District is, however, lower than in all the other extreme western districts of the state. Within this district, it is, at its highest, 7.2 strangely in its eastern forest covered tahsil of Chincholi. It ranges between 6 and 7 in Gulbarga, Aland and Seram 'Tahsils, between 5 and 6 in Afzalpur and Jevargi and Tandur-Kodangal Tahsils and is .below 5 in the remaining tahsils of Yadgir, Chitapur and Shahpur-Shorapur.
In Medak District, the percentage of rural literacy ranges between 6 and 7 in Medak :and Sangareddy Tahsils and between 5 and 6 in all its remaining five tahsils. Within • Vide SUBsidiary Table 7.4 given at page 209 of part I -B of ihis Volume. -t Figures were not tabulated separately for the rural tracts of these hyphenated tahsils.
456
Hyderabad District itself, the literacy percentage in rural areas is 4.9 in Hyderabad West-Shahabad Tahsils and 6.0 in Medchal-Ibrahimpatnam-Hyderabad East Tahsils. It is a sad commentary on the nation building activities of this state prior to Police Action that even in the villages immediately surrounding its much boasted of metropolis the literacy percentage should be so low. In Bidar District, the percentage of literacy in rural areas tends to be relatively more significant in the western than in the eastern tahsils. It ranges between 6 and 7 in Ahmedpur-Nilanga, Bhalki-Udgir and Santpur Tahsils, is 5 in Humnabad and is less than 5 in Bidar-Zahirabad-Narayankhed Tahsils. In Mahbubnagar District, the literacy percentage in rural areas is, at its highest, 6.1 strangely in its forest tahsils of Achampet-Nagarkurnool. It varies between 5 and 6 in Mahbubnagar, Kalwakurti and Pargi-Shadnagar Tahsils and is less than 5 in Kollapur, WanpartiAtmakur and Makhtal Tahsils. In Nanded District, the corresponding percentage is. 6.3 in Hadgaon Tahsil, to the north, varies between 5 and 6 in Kandhar, Biloli and Nanded Tahsils and between 4 and 5 in the eastern tahsils of Deglur-Mukhed and Bhoker-Mudhol. Similarly, in Parbhani District it is, at its highest, 6.6 in its northern tahsil of Hingoli, ranges between 5 and 6 in Parbhani, Basmath and Kalamnuri Tahsils and between 4 and 5 in Pathri-Partur, Gangakhed and Jintur Tahsils. Again in Nizamabad District, the percentage of literates in rural areas ranges between 5 and 6 in Banswada-Bodhan and Kamareddy-Yellareddy Tahsils and between 4 and 5 in the other two tahsils of ArmoOl~ and Nizamabad.
But the full magnitude of the backwardness of this state in respect of literacy is. evident only in the rural areas of the remaining eastern districts of Warangal, Nalgonda, Karimnagar and Adilabad. In Warangal District, the percentage of literacy in rural areas reaches the relatively respectable figure of 7. I in Madhira Tahsil merely becauseof the influence of the adjoining districts of Krishna and West Godavari across the bor,ders. But it ranges between 5 and 6 in Warangal and Khammam Tahsils, is 4.5-in Mahbubabad Tahsil and declines to even less than 4 in Pakhal, Burgampahad-Palvancha-Yellandu and Mulug Tahsils, being as low as 3.3 in Mulug! Similarly, in Nalgonda, the percentage at its highest is 6.2 in Jangaon, ranges between 4 and 5 in Suryapet, Nalgonda, Ramannapet, Bhongir and Devarkonda Tahsils and is less than even 4 in Miryalguda and Huzurnagar. Again, in Karimnagar District, it exceeds 6 only in Karimnagar Tahsil, ranges between 5 and 6 in Sirsilla and Huzurabad Tahsils, is 4.4 in Sultanabad and is below even 4 in Metpalli, Jagtiyal and Parkal-Manthani Tahsils._ Again in Adilabad District, the percentage of literacy is just 4 in the rural areas of KinwatAdilabad-Boath-Utnoor Tahsils and dwindles to less than even 4 in Rajura-AsifabadSirpur-Chinnoor and Nirmal-Khanapur-Lakshattipet Tahsils. Perhaps the tahsils of this district, other than Nirmal, Rajura and Kinwat, easily' compete' in backwardness
-with the most backward areas in the country as a whole. It will thus be noticed that in the rural areas all along the Penganga, the Wardha, the Pranahita and the Godavari to the extreme east of the state, the literacy percentage nowhere exceeds 4.
9. Literacy among Males and Females.-Of the total number of 1,708,308 literate persons in the state, as many as 1,428,020 are males and only 280,288 are females. In other words, 9.2 per cent of the total population, 15.1 of the males and only 3.0 of the females are literate in this state. Thus, while Hyderabad State is backward as compared with the rest of peninsular lndia in literacy in general, it is particularly so in respect of female literacy. This would be obvious from the percentages given in Table 6.
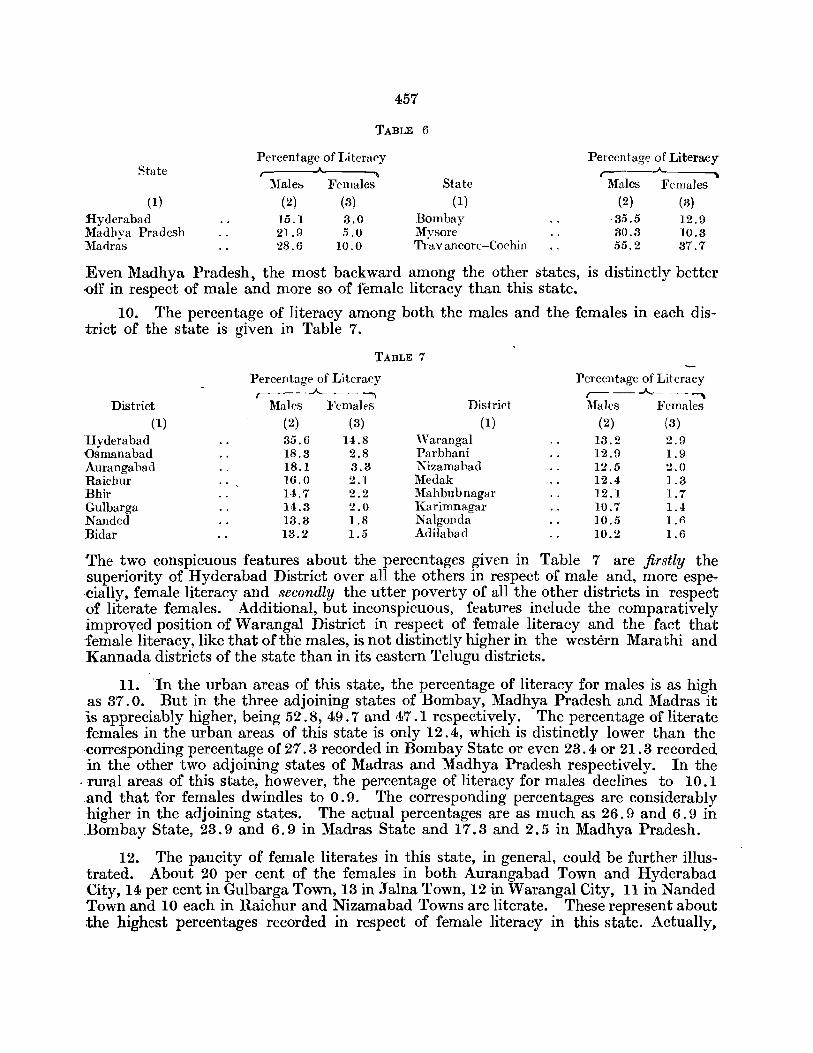
State
(1) Hyderabad Madhva Pradesh Man.r~s
457
TABLE 6
Percentage of I,iteracy ,---_A..., __ ---.
Malet. Females (2)
15.1 21.9 28.6
(3)
3.0 5.0
10.0
State (1)
Bombay ~Ivsore Tr'a v ancon:-Cochin
Percentage of Literacy ,--~
Males Females (2)
-35.5 30.3 55.2
(3) 12.9 10.3 37.7
Even Madhya Pradesh, the most backward among the other states, is distinctly better {)fi'in respect of male and more so of female literacy than this state.
10. The percentage of literacy among both the males and the females in each district of the state is given in Table 7.
TABLE 7
Percentage of Literacy Percentage of Literacy r--- -..A.------.. ~ r-- - ..A.- ---"\
District Males Females DistriC't :Males Females
(1) (2) (3) (1) (2) (3) Hyderabad 35.6 14.8 Warangal 13.2 2.9 Dsmanabad 18.3 2.8 Parbhani 12.9 1.9 Aurangahad 18.1 3.3 Nizamabad 12.5 2.0 Raichur 16.0 2.1 Medak 12.4 1.3 Bhir 14.7 2.2 Mahbubnagar 12.1 1.7 'Gulbarga 14.3 2.0 Karimnagar 10.7 1.4 Nanded ]3.3 1.8 Nalgonda 10.5 1.6 Bidar 13.2 1.5 Adilabad 10.2 1.6
The two conspicuous features about the percentages given in Table 7 are firstly the superiority of Hyderabad District over all the others in respect of male and, more espe·cially, female literacy and secondly the utter poverty of all the other districts in respect of literate females. Additional, but inconspicuous, features include the comparatively improved position of Warangal District in respect of female literacy and the fact that female literacy, like that of the males, is not distinctly higher in the western Marathi and Kannada districts of the state than in its eastern Telugu districts.
, 11. 'In the urban areas of this state, the percentage of literacy for males is as high
as 37.0. But in the three adjoining states of Bombay, Madhya Pradesh and Madras it is appreciably higher, being 52.8, 49.7 and 47.1 respectively. The percentage of literate females in the urban areas of this state is only 12.4, which is distinctly lower than the corresponding percentage of 27.3 recorded in Bombay State or even 23.4 or 21.3 recorded in the other two adjoining states of Madras and Madhya Pradesh respectively. In the
. ·rural areas of this state, however, the percentage of literacy for males declines to 10.1 and that for females dwindles to 0.9. The corresponding percentages are considerably higher in the adjoining states. The actual percentages are as much as 26.9 and 6.9 in Bombay State, 23.9 and 6.9 in Madras State and 17.3 and 2.5 in Madhya Pradesh.
12. The paucity of female literates in this state, in general, could be further illustrated. About 20 per cent of the females in both Aurangabad Town and Hyderabact City, 14 per cent in Gulbarga Town, 13 in Jalna Town, 12 in Warangal City, 11 in Nanded Town and 10 each in Raichur and Nizamabad Towns are literate. These represent about -the highest percentages recorded in respect of female literacy in this state. Actually,
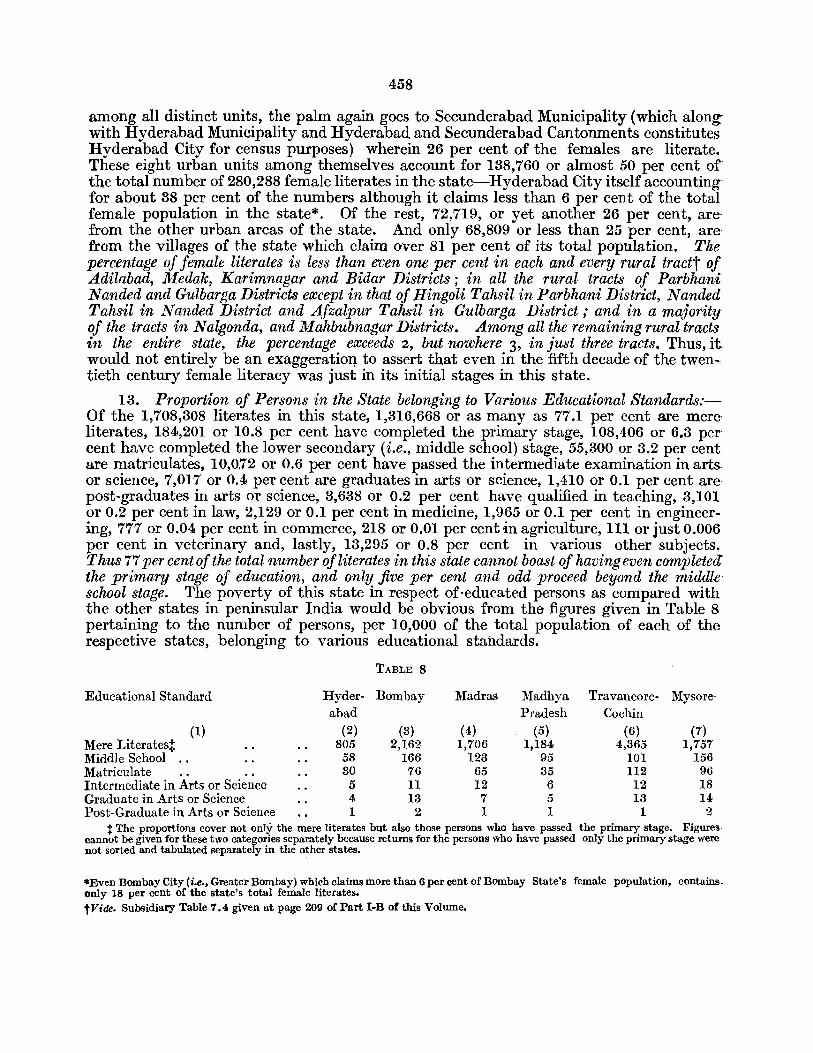
458
among all distinct units, the palm again goes to Secunderabad Municipality (which along with Hyderabad Municipality and Hyderabad and Secunderabad Cantonments constitutes Hyderabad City for census purposes) wherein 26 per cent of the females are literate. These eight urban units among themselves account for 138,760 or almost 50 per cent orthe total number of 280,288 female literates in the state-Hyderabad City itself accounting for about 38 per cent of the numbers although it claims less than 6 per cent of the total female population in the state*. Of the rest, 72,719, or yet another 26 per cent, arefrom the other urban areas of the state. And only 68,809 or less than 25 per cent, arefrom the villages of the state which claim over 81 per cent of its total popUlation. The percentage of female literates is less than even one per cent in each and every rural tractt of Adilabad, Medak, Karimnagar and Bidar Districts; in all the rural tracts of Parbhani: Nanded and Gulbarga Districts except in that oj Hingoli Tahsil in Parbhani District, Nanded Tahsil in Nanded District and AJzalpur Tahsil in Gulbarga District,. and in a majorityoj the tracts in Nalgonda, and Mahbubnagar Districts. Among all the remaining rural tracts in the entire state, the percentage exceeds 2, but nowhere 3, in just three tracts. Thus, it would not entirely be an exaggeratioI). to assert that even in the fifth decade of the twentieth century female literacy was just in its initial stages in this state.
13. Proportion of Persons in the State belonging to Various Educational Standards:Of the 1,708,308 literates in this state, 1,316,668 or as many as 77.1 per cent are mere literates, 184,201 or 10.8 per cent have completed the primary stage, 108,406 or 6.3 per cent have completed the lower secondary (i.e., middle school) stage, 55,300 or 3.2 per cent are matriculates, 10,0.72 or 0.6 per cent have passed the intermediate examination in artsor science, 7,017 or 0.4 per cent are graduates in arts or science, 1,410 or 0.1 per cent arepost-graduates in arts or science, 3,638 or 0.2 per cent have qualified in teaching, 3,101 or 0.2 per cent in law, 2,129 or 0.1 per cent in medicine, 1,965 or 0.1 per cent in engineer~ ing, 777 or 0.04 per cent in commerce, 218 or 0.01 per cent ·in agriculture, III or just 0.006 per cent in veterinary and, lastly, 13,295 or 0.8 per cent in various other subjects. Thus 77 per cent of the total number of literates in this state cannot boast of having even completea the primary stage of education, and only five per cent and odd proceed beyond the middleschool stage. The poverty of this state in respect of·educated persons as compared with the other states in peninsular India would be obvious from the figures given in Table 8 pertaining to the number of persons, per 10,000 of the total population of each of the respective states, belonging to various educational standards.
TABLE 8
Educational Standard Hyder- Bombay Madras Madhya Travancore- Mysore-abad Pradesh Co chin
(I) (2) (3) (4) (5) (6) (7) Mere Literatest 805 2,162 1,706 1,184 4,365 1,757 Middle School .. 58 166 123 95 101 156 Matriculate 30 76 65 35 ll2 96 Intermediate in Arts or Science 5 II 12 6 12 18 Graduate in Arts or Science 4 13 7 5 13 14 Post-Graduate in Arts or Science I 2 I I I 2
t The proportions cover not only the mere literates but also those persons who have passed the primary stage. Figurescannot be given for these two categories separately because returns for the persons who have passed only the primary stage were not sorted and tabulated separately in the other states.
*Even Bombay City (i.e., Greater Bombay) which claims more than 6 per cent of Bombay State's female population, containsonly 18 per cent of the state's total female literates. tVide. Subsidiary Table 7.4 given at page 209 of Part I-B of this Volume.
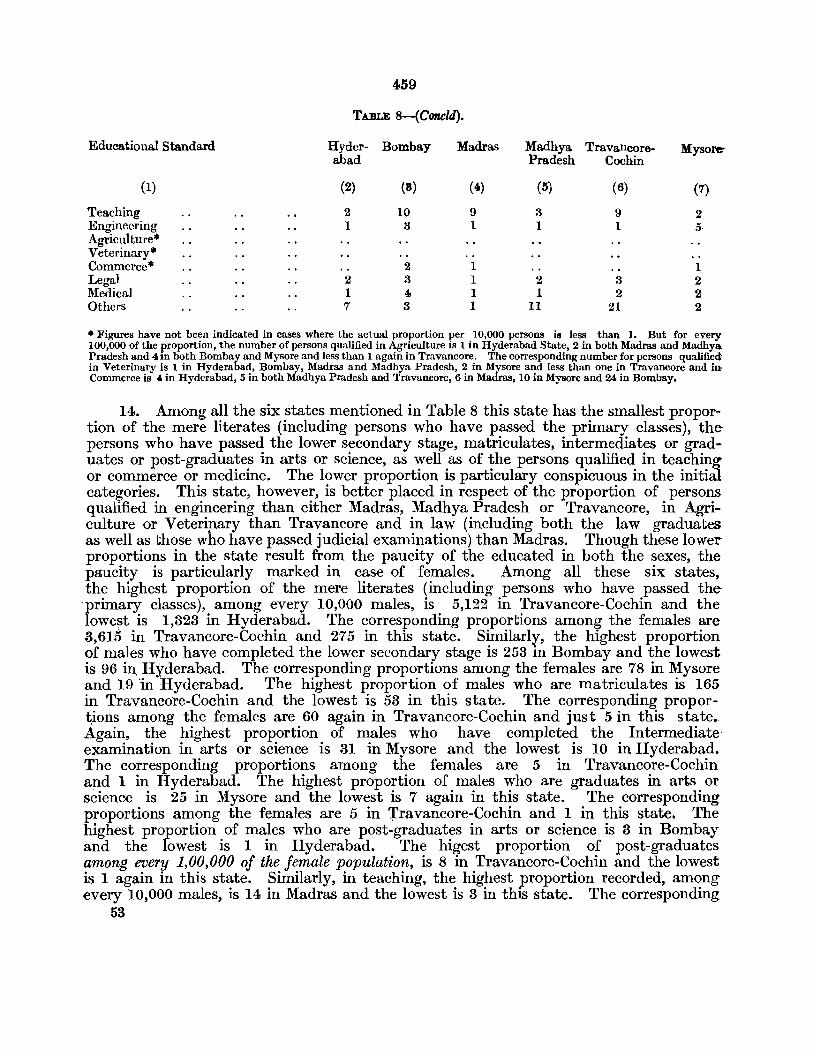
459
TABLE 8-(Conc/d).
Educational Standard Hyder- Bombay Madras Madhya Travancore- Mysol'f: abad Pradesh Cochin
(1) (2) (8) (4.) (5) (6) (7),
Teaching 2 10 9 3 9 2 Engineering 1 3 1 1 1 5 Agriculture* Veterinary* Commerce* 2 1 1 Legal 2 3 1 2 3 2 Medical 1 4 1 1 2 2 Others 7 3 1 11 21 2
• Figures have not been indicated in cases where the actual proportion per 10,000 persons is less than 1. But for every-100,000 of the proportion, the number of persons qualified in Agriculture is 1 in Hyderabad State, 2 in both Madras and Madhya Pradesh and 4 In both Bombay and Mysore and less than 1 again in Travancore. The corresponding number for persons qualified in Veterinary is 1 in Hyderabad, Bombay, Madras and Madhya Pradesh, 2 in Mysore and less than one in Travancore and in Commerce is 40 in Hyderabad, 5 in both Madhya Pradesh and Travancore, 6 in Madras, 10 in Mysore and 24 in Bombay.
14. Among all the six states mentioned in Table 8 this state has the smallest proportion of the mere literates (including persons who have passed the primary classes), the persons who have passed the lower secondary stage, matriculates, intermediates or graduates or post-graduates in arts or science, as well as of the persons qualified in teaching or commerce or medicine. The lower proportion is particulary conspicuous in the initial categories. This state, however, is better placed in respect of the proportion of persons qualified in engineering than either Madras, Madhya Pradesh or Travancore, in Agriculture or Veterinary than Travancore and in law (including both the law graduates as well as those who have passed judicial examinations) than Madras. Though these lower proportions in the state result from the paucity of the educated in both the sexes, the paucity is particularly marked in case of females. Among all these six states, the highest proportion of the mere literates (including persons who have passed the 'primary classes), among every 10,000 males, is 5,122 in Travancore-Cochin and the lowest is 1,323 in Hyderabad. The corresponding proportions among the females are 3,615 in Travancore-Cochin and 275 in this state. Similarly, the highest proportion of males who have completed the lower secondary stage is 253 in Bombay and the lowest is 96 in, Hyderabad. The corresponding proportions among the females are 78 in Mysore and 19 'in Hyderabad. The highest proportion of males who are matriculates is 165 in Travancore-Cochin and the lowest is 53 in this state. The corresponding prop ort,ions among the females are 60 again in Travancore-Cochin and just 5 in this state •. Again, the highest proportion of males who have completed the Intermediate· examination in arts or science is 31 in Mysore and the lowest is 10 in Hyderabad. The corresponding proportions among the females are 5 in Travancore-Cochin and 1 in Hyderabad. The highest proportion of males who are graduates in arts or science is 25 in Mysore and the lowest is 7 again in this state. The corresponding proportions among the females are 5 in 'rravancore-Cochin and 1 in this state. The highest proportion of males who are post-graduates in arts or science is 3 in Bombay and the lowest is 1 in Hyderabad. The higest proportion of post-graduates among every 1,00,000 of the female population, is 8 in Travancore-Cochin and the lowest is 1 again in this state. Similarly, in teaching, the highest proportion recorded, among every 10,000 males, is 14 in Madras and the lowest is 3 in this state. The corresponding
53
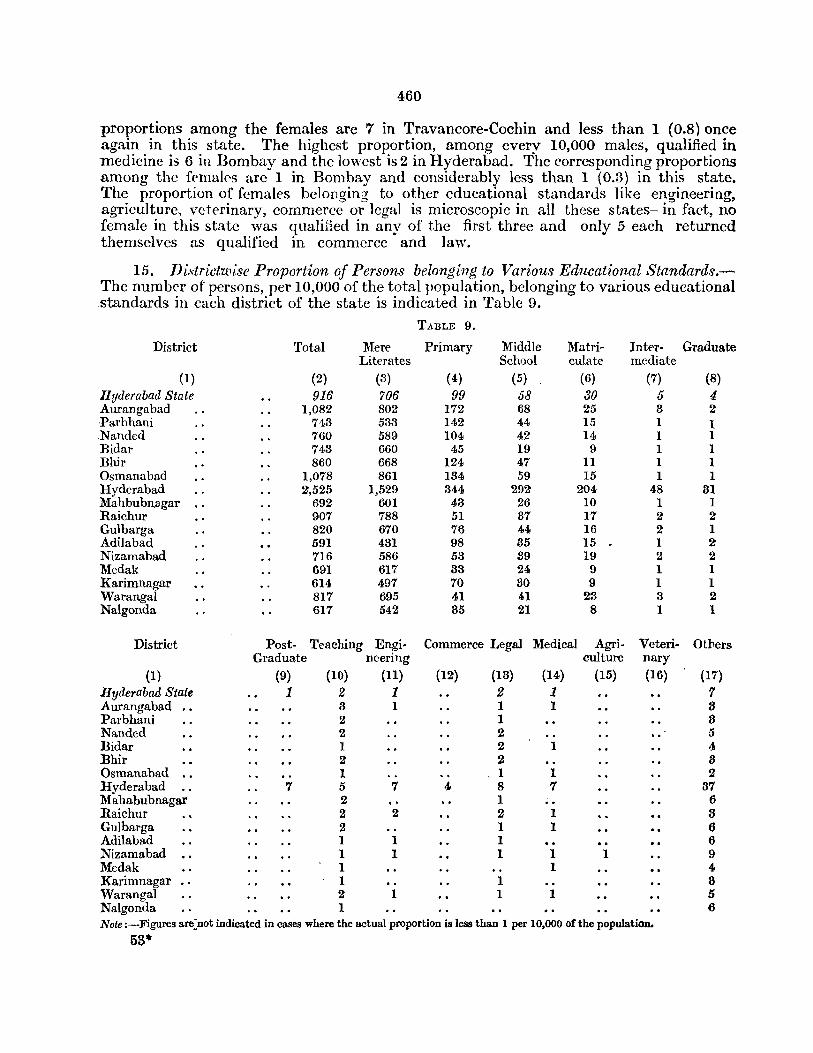
460
proportions among the females are 7 in Travancore-Cochin and less than 1 (0.8) once again in this statc. The highest proportion, among every 10,000 males, qualified in "medicine is 6 in Bombay and the lowest is 2 in Hyderabad. The corresponding proportions among thc ft'mal('s arc 1 in Bombay and considerably less than 1 (0.3) in this state. The proportion of females belonging to other educational standards like engineering, agriculture, veterinary, commerce or legal is microscopic in all these states- in fact, no female in this statc was qualified in any of the first three and only 5 each returned themselves as qualified in commerce and law.
15. Districtwise Proportion of Persons belonging to Various Educational Standards.The number of persons, per 10,000 of the total population, belonging to various educational standards jll each district of the state is indicated in Table 9.
TABLE 9.
District Total Mere Primary Middle Matri- Inter- Graduate Literates School culate mediate
(1) (2) (3) (4) (5) (6) (7) (8) Hyderabad State 916 706 99 58 30 5 4 Aurangabad 1,082 802 172 68 25 3 2 Parbhani 743 533 142 44 15 1 I Nanded 760 589 104 42 14 1 1 Bidar 743 660 45 19 9 1 1 Bhir 860 668 124 47 11 1 1 Osmanabad 1,078 861 134 59 15 1 1 Hyderabad 2,525 1,529 344 292 204 48 31 Mahbubnagar 692 601 43 26 10 1 1 Raichur 907 788 51 87 17 2 2 Gulbarga 820 670 76 44 16 2 1 Adilabad 591 431 98 35 15 1 2 Nizamabad 716 586 53 39 19 2 2 Medak 691 617 33 24 9 1 1 Karimnagar 614 497 70 30 9 1 1 Warangal 817 695 41 41 23 3 2 Nalgonda 617 542 35 21 8 1 1
District Post- Teaching Engi- Commerce Legal Medical Agri- Veteri- Otvers Graduate neering culture nary
(1) (9) (10) (ll) (12) (13) (14) (15) (16) (17) Hyderabad State 1 2 1 2 1 7 AUl'angabad 3 1 1 1 8 Parbhani Z 1 8 Nanded 2 2 5 Bidar 1 2 1 4. 13hir Z 2 :3 Osmanabad 1 1 1 2 Hyderabad 7 5 7 4. 8 7 37 Mahabubnagar 2 .. 1 6 Raichur 2 2 2 1 :3 Gulbarga 2 1 1 6 Adilabad 1 1 1 6 Nizamabad 1 1 1 1 1 9 Medak 1 1 4 Karimnagar 1 1 8 Warangal 2 1 1 1 5 Nalgonda 1 6 'Note :-Figures are:not indicated in cases where the actual proportion is less than 1 per 10,000 of the population.
53*
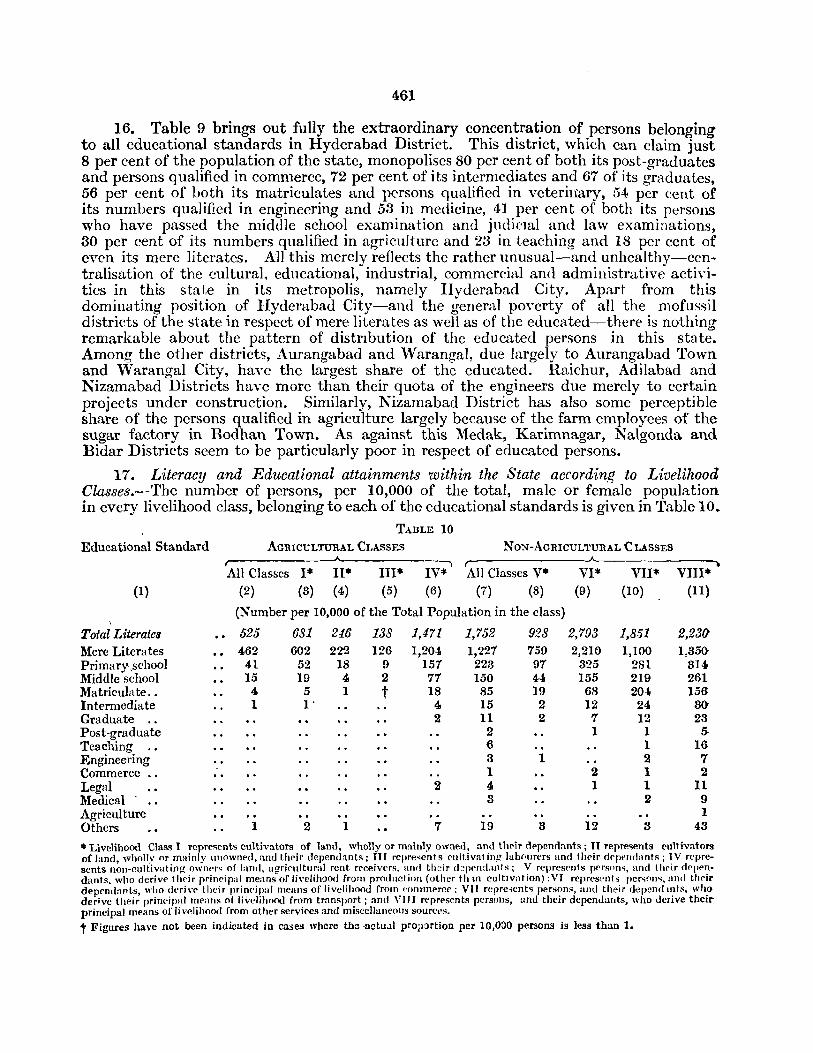
461
16. Table 9 brings out fully the extraordinary concentration of persons belonging to all educational standards in Hyderabad District. This district, which can claim just 8 per cent of the population of the state, monopolises 80 per cent of both its post-graduates and persons qualified in commerce, 72 per cent of its intermediates and 67 of its graduates, 56 per cent of both its matriculates and persons qualified in veteriIi:ary, 54 per ecnt of its numbers qualified in engineering and 53 in medicine, 41 per cent of both its persons who have passed the middle school examination and judicIal and law examinations, 30 per cent of its numbers qualified in a.griculture and 23 in teaching and 18 per cent of even its mere literates. AU this merely reflects the rather unusual-and unhealthy-centralisation of the cultural. educational, industrial, commercial and administrative activities in this state in its metropolis, namely Hyderabad City. Apart from this dominating position of Hyderabad City-and the general poverty of all the mofussil districts of the state in respect of mere literates as well as of the educated-there is nothing remarkable about the pattern of distrIbution of the educated persons in this state. Among the other districts, Aurangabad and Warangal, due largely to Aurangabad Town and Warangal City, have the largest share of the educated. Raichur, Adilabad and Nizamabad Districts have more than their quota of the engineers due merely to certain projects under construction. Similarly, Nizamabad District has also some perceptible share of the persons qualified in agriculture largely because of the farm employees of the sugar factory in Bodhan Town. As against this l\'ledak, Karimnagar, Nalgonda and Bidar Districts seem to be particularly poor in respect of educated persons.
17. Literacy and Educational attainments within the State accordin.4 to Livelihood Classes.-The number of persons, per 10,000 of the total, male or female population in every livelihood class, belonaing to each of the educational standards is given in Table 10.
TABLE 10 Educational Standard AGRICULTURAL CLASSES NON-AGRICULTURAL CLASSES
--"'I ..A..
All Classes 1* II* III* IV* All Classes V* VI* VII* VIII*
(I) (2) (3) (4) (5) (6) (7) (8) (9) (10) (II)
(Number per 10,000 of the Total Population in the class)
Total Literates 525 681 246 138 1,471 1,752 928 2,793 1,8.51 2,230 Mere Literates 462 602 222 126 1,204 1,221 759 2,210 1,100 I,35(} Primary.school 41 52 18 9 151 223 91 325 281 314 Middle school 15 19 4 2 71 150 44 155 219 261 Ma tricula te .. 4 5 1 t 18 85 19 68 204 156 Intermediate 1 l' 4 15 2 12 24 SO Graduate .. 2 11 2 7 12 23 Post-graduate 2 I I 5-Teaching 6 1 16 Engineering 3 1 2 7 Commerce •. 1 2 1 2 Legal 2 4 1 1 11 Medical' .. S 2 9 Agriculture 1 Others 1 2 1 7 19 3 12 S 48
• Livelihood Class I represents cultivators of land, wholly or mainly owned, and tht'ir dppendants ; II repre~ents {'ultivatol'S of land, wholl~' or mainly unownpt!, and th"ir dependants; III repre,ent s eultivat inl! lab(lllfers and their df'pelldants; TV rf'presents non-cultivating owners of land. agrieultural rent receivers, and their d~pemLtnts; V represf'nts p"rson" and tlwir d"jJf'n. dants. who derive thPir prineipal means of livelihood from production (other th III cultlvntion) :VJ represl>nts per~(lII~, and their dependants, wloo deri,,(' tloeir prine'ipal means of livelihood from ('ommerce: VII repreient~ person~, and their depend Ints, who derive their prim'ipal means 01 livelihood from transport; and VIJJ r('presents persons, and their depellJauts, who derive theilpriucipal means of livclihood from other services and miscellaneous sourct>S.
t Figures have not been indicated in cases where th:: -'.latu.!1 pr0.iJ:>rtion per 10,0:)0 persons is les3 than 1.
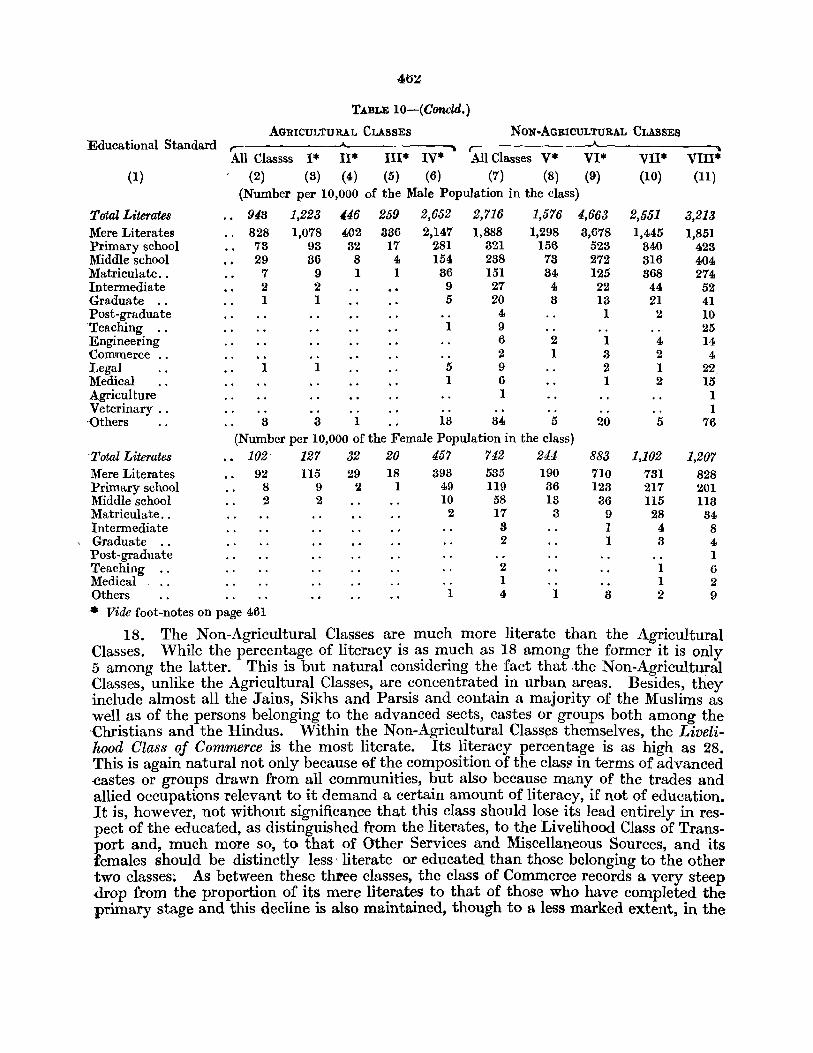
,
4(j~
TABLE IO-(Concld.}
AGRICULTURAL CLASSES NON-AGRICULTURAL CLASSES Educational Standard
All Classss I* II* III* IV* All Classes Y* YI* VII* VIII* (1) (2) (3) (4) (5) (6) (7) (8) (9) (10) (U)
(Number per 10,000 of the Male Population in the class)
Total Literates 943 1,223 446 259 2,652 2,716 1,576 4,663 2,551 3,213 Mere Literates 828 1,078 402 386 2,147 1,888 1,298 3,678 1,445 1,851 Primary school 73 93 32 17 281 321 156 523 340 423 Middle school 29 36 8 4 154 238 73 272 316 404 Matriculate .. 7 9 1 1 36 151 34 125 368 274 Intermediate 2 2 9 27 4 22 44 52 Graduate .. 1 1 5 20 3 13 21 41 Post-graduate 4 1 2 10 'Teaching .. 1 9 25 Engineering 6 2 1 4 14 Commerce .. 2 1 3 2 4 Legal 1 1 5 9 2 1 22 Medical 1 6 1 2 15 Agriculture 1 1 Veterinary .. 1 'Others 3 3 1 13 3,(, 5 20 5 76
(Number per 10,000 of the Female PopUlation in the class) 'Total Literates 102' 127 32 20 457 742 244 883 1,102 1,207 Mere Literates 92 U5 29 18 393 535 190 710 731 828 Primary school 8 9 2 1 49 U9 36 123 217 201 Middle school 2 2 10 58 13 36 115 113 Matricula te .. 2 17 3 9 28 34 Intermediate :3 I 4 8 Graduate .. 2 1 3 4 Post-graduate 1 Teaching .. 2 1 6 Medical 1 1 2 Others 1 4 1 3 2 9
... Vide foot-notes on page 461
18. The Non-Agricultural Classes are much more literate than the Agricultural Classes. While the percentage of literacy is as much as 18 among the former it is only 5 among the latter. This is but natural considering the fact that the Non-Agricultural Classes, unlike the Agricultural Classes, are concentrated in urban areas. Besides, they include almost all the Jains, Sikhs and Parsis and contain a majority of the Muslims as well as of the persons belonging to the advanced sects, castes or groups both among the Christians and the Hindus. Within the Non-Agricultural Class~s themselves, the Livelihood Class of Commerce is the most literate. Its literacy percentage is as high as 28. This is again natural not only because sf the composition of the class in terms of advanced -castes or groups drawn from all communities, but also because many of the trades and allied occupations relevant to it demand a certain amount of literacy, if not of education. 1t is, however, not without significance that this class should lose its lead entirely in respect of the educated, as distinguished from the literates, to the Livelihood Class of Transport and, much more so, to that of Other Services and Miscellaneous Sources, and its females should be distinctly less' literate or educated than those belonging to the other two classes~ As between these three classes, the class of Commerce records a very steep drop from the proportion of its mere literates to that of those who have completed the primary stage and this decline is also maintained, though to a less marked extent, in the
463
proportions relating to the next two categories, namely, the middle school and matriculation standards. This class derives its educated not so much from the persons employed in retail trade as from those engaged in hanking, insurance and certain branches of wholesale trade. Over 46 per cent of its males-roughly one and a half tim('s the corresponding percentage recorded in the class of Other Services and Miscellaneous Sources, which comes next in order in this respect-but only 9 per cent of its females are literate. The comparatively low literacy of its females is evidence of the fact that an improved economic standard does not always lead to improved literacy. Districtwise, the literary percentage in this class varies from 21 in Bidar to 88 in Osmanabad. Sexwise, it varies~ in case of males, from 87 in Bidar to 58 in Osmanabad and, in case of females, from just :3 in Karimnagar to about 14 both in Hyderabad and Aurangabad.
19. Next in order in this regard is the Livelihood Class of Other Services and Miscellaneous Sources with a literacy percentage of 22-82, the second highest percentage recorded in ~ll classes, among its males and 12, the highest percentage recorded in all cla5ses~ among its females. This comparatively high literacy is certainly not due to the washermen, barbers, unspecified and constructional labourers, domestic servants, etc., included in it. It .results entirely from the government servants, village officers, municipal employees, followers of learned professions, etc., who have been clubbed under the class. This also explains its comparatively high proportion of the educated in either sex, especially the females, as compared with other classes. Although this class accounts for less than 12 per cent of the total popUlation of the state, it c1aims over 95 per cent of those qualified in veterinary and teaching, about 90 per cent of those qualified in medicine, about or more tl;lan 80 per cent of the post-graduates and of the persons qualified in engineering and law, over 70 of the graduates, over 60 of the matriculates, intermediates and persons qualified in agriculture and commerce, over 50 of even the persons who have completed the middle school and in all for 29 per cent of the total literates in the state. Districtwise, the percentage of literacy in this class ranges from 13 in Karimnagar to 33-in Hyderabad-Aurangabad being a rather distant second with a corresponding percentage of 25. Sexwise, the corresponding figures, in case of males, ranges between 20 in Karimnagar and 44 in Hyderabad. Exc]uding Hyderabad, the highest percentage recorded is 37 in Aurangabad. Among the females, the lowest percentage recorded is 6bot'hin Warangal and Parbhani and the highest is 22 again in Hyderabad. Apart from Hyderabad, the highest percentage registered is 13 once again in Aurangabad.
20. The percentage of literates is also relatively appreciable in the Livelihood Clas~ of Transport being about 19-sexwise, about 26 per cent of its males and 11 per cent of its females are literate. These comparatively high percentages are not surprising as this class includes not only the persons engaged in manual transport, or transport through animal driven vehicles, but also the employees of the Railway and Road Transport Departments and the perspnnel connected with motor taxi companies, aerodromes, etc., otherthan those engaged in the production or repair of transport equipment who have been clubbed under the Livelihood Class of Production (other than cultivation). The persons with engineering, medical or teaching qualifications in this class are mainly employees of the Railway Department or are the dependants of suc~ employees, Districtwise, the lowest percentage of literates recorded in the class is 8 in Adilabad and the hi~hest is 26 in Hyderabad-the next highest being 19 in Bhir. Sexwise, the corresponding figures~ in case of males, are 12 in Adilabad and 88 in Hyderabad and, in case of females, again 8 in Adilabad and 18 in Hyderabad.
54
464
21. About 9 per cent of the total numbers belonging to the Livelihood Class of Production (other than Cultivation)-16 per cent of its males and just 2 of its females-can claim to be literate. This class is the least literate and educated among all the NonAgricultural Classes. In fact, even the Livelihood Class of Agricultural Rent Receivers is distinctly superior to this class in this respect. This fits in with the fact that this is the only Ndn-Agricultural Class which derives a majority of its numbers from rural areas. Apart from this, a very heavy proportion of persons belonging to it even in the urban areas consists of labourers and other employees of large and small scale industrial establishments .and artisan traders like cobblers and potters who are generally illiterat '. Districtwise, the literacy percentage in this class varies from only 4 in Karimnagar to 21 in Hyderabadthe next highest percentage is only 15 in Aurangabad. Sexwise, the corresponding percentages are, in case of males, 8 in Karimnagar and 31 in Hyderabad and, in case of females, just 0.4 in Karimnagar and 10 in Hyderabad. The percentage of literate females in this class is lower than 1 in Mahbubnagar and Nalgonda Districts as well.
22. Among the Agricultural Classes, the most literate and educated is the Live.lihood Class of Agricultural Rent Receivers. In fact, this class even leads the NonAgrIcultural Class of Production in this respect. The percentage of literates in this class is 15 which is more than double that recorded among the Owner Cultivators. Sexwise,
. it is about 5 among its females but as high as 27 among its males. The percentaO'es would have been appreciably higher but for the fact that the class includes the families ·of poor and infirm owner cultivators, or the widows of owner cultivators, who have been forced to lease out their lands. This is the only Agricultural Class which returns some 'significant proportion of persons belonging to the educated categories. Districtwise, the lowest percentage of literates recorded in this class is 10 in Nanded and the highest is 43 in Hyderabad. The latter is the heaviest percentage recorded in respect of any class
, in any district of the state. This extraordinarily high percentage of literates is largely ,due to the richer of the absentee landlords in the districts who have shifted to Hyderabad City, to the persons in Hyderabad City who have acquired or inherited lands in mofussil areas and depend principally on the rents realised from them, and to the children of the more well-to-do of the absentee landlords in the districts .who are prosecuting their studies in Hyderabad City. Apart from Hyderabad District, the highest percentage recorded in the class declines to 20 in Bhir. Sexwise, the corresponding percentage varies, in case of males, from 20 in Nanded to as much as 58, in Hyderabad and, in case of females, from just 2 in each of the districts of Gulbarga, Bidar and Nanded to 29 in Hyderabad.
23. The percentage of literacy declines to 7 in case of the Livelihood Class oj Owner Cultivators-to 12 among its males and to just I among its females. The decline is steeper still in respect of the educated in this class. In this regard, it'resembles more the other two Agricultural Classes of Tenant Cultivators and Agricultural Labourers rather than the Livelihood Class of Agricultural Rent Receivers or any of the f~ur Non-Agricultural Classes. This could be illustrated from the fact that while the percentage of the mere literates in this class is roughly one fourth' of that in Commerce or one third of that in Other Services and Miscellaneous Sources, the percentage of all the categories of the educated (beginning from those who have completed their primary school) in this class is only one eleventh of that in Other Services and Miscellaneous Sources and one seventh of that in Commerce. Districtwise, the lowest percentage of literates recorded in this dass is 4 in Nizamabad and the highest is 11 both in Hyderabad and Osmanabad. Sexwise, the corresponding figures are, in case of males, 8 again in Nizamabad and 19 in Osmanabad and, in case of females, just 0.6 in Medak and 4 in Hyderabad. The
54*

465
percentage of literates among the females in this class is also less than one in the districts of Nanded, Bidar, Raichur, Gulbarga and Nizamabad as well.
24. The percentage of literates drops down to just 2 in the Livelihood Cia/IS of Tenant Cultivators-it is 4 among its males and as low as 0.3 among its females. The decrease in the proportion of the educated in this class is even steeper-steeper still than in the Class of Owner Cultivators. Although, about 25 persons out of every 1,000 belonging to this class manage to read and write a simple letter, just 2 of them have stumbled through the primary school. Only 4 among every 10,000 in the class have passed the' middle school and just I is a matriculate. Out of its total strength of about 14 lakhs. in the entire state, only 633 (including 32 females) have passed the middle school, just 94 (including 2 females) are matriculates, II (all males) are intermediates and 8 (again all' males) are graduates. Probably, this microscopic number represents mostly the children of tenant cultivators who have managed to secure some outside assistance in the prosecution of their studies. Districtwise, the percentage of literates in this class varies from 1. 6 in both '''' arangal and N algonda to 5.8 in Osmanabad. Sexwise: the corresponding figures are, in case of males, 2.8 in Warangal and 10.2 in Osmanabad and, in case of females, 0.2 in each of the districts of Adilabad, Mahbubnagar, Karimnagar and Nalgonda and 0.9 again in Osmanabad. .
25. The percentage of literacy dwindles to 1.4 in the Livelihood Class of Agricultural Labourers. It is 2.6 among its males and just 0.2 among its females. This is not only by far the least literate of all the classes but also the least educated. Only lout of every 1,000 belonging to this class has managed to pass out successfully through the primary school. Perhaps this person, more often than not, is a gumastha or a servant of a rich landlord, or an employee of an agricultural farm or a dependant of such a person. Out of the 32 lakhs of persons belonging to this class in the entire state, only 676 (including 45 females) have passed the middle school, 97 (including 10 females) are matriculates, 12 (all males) are intermediates, 3 (all males) are graduates and 40 (all males) are qualified in agriculture, 2 (both males) are qualified in medicine and 1 (a male) is qualified in commerce. Of these microscopic numbers, 87 of the persons who have passed the middle school, 57 of the matriculates, 7 of the intermediates, all the 3 graduates, all but one of the 40 qualified in agriculture, both the 2 persons qualified in medicine and the solitary individual qualified in commerce are the employees of the sugarcane farms in Bodhan and Banswada Tahsils. It would not, therefore, be an exaggeration to state that the proportion of literates in this class is literally microscopic and of the educated among its literates even more so. Districtwise, the percentage of literates in this class varies from 0.7 in each of the districts of Karimnagar, Nalgonda and Mahbubnagar to 3.4 in Osmanabad. Sexwise, among its males the corresponding percentage ranges form 1.2 in Karimnagar to 6.3 in Osmanabad and, among its females, from 0.1 in each of the districts of Adilabad, Karimnagar, Parbhani, Nalgonda, Mahbubnagar and Nanded to 0.6 in Nizamabad.
26. Literacy according to Age Groups* .-Only 6.5 per cent of the males and 2.4 of the females in the state in the age group of ' 5-9 ' are literate. The corresponding percentages in the next age group of ' 10-14 ' are 20.0 in case of males and 6.3 in case of females. In these two age groups taken together, the percentage of literates is 13.2
*During this census, figures pertaining to the number of literates in each of the age groups of '5-9', '10-14', '15-24', '25·34', '35-44', '45-54', '55-64', '65-74' and '75 and over' were compiled for the state and each of its districts separately for IIljlles and females, with further break-up by rural and urban areas. This compilation was, however, based on a 10 per cent sample of the enumerated slips-for the actual procedure adopted for obtaining the sample vide paragraph 1 at page 9 of Part n·B of this Volume. All persons in the age groups of' 0·4 ' were, however, presumed to be illiterate although in a few freak cases entries. to the contrary had been recorded by the enumerators.
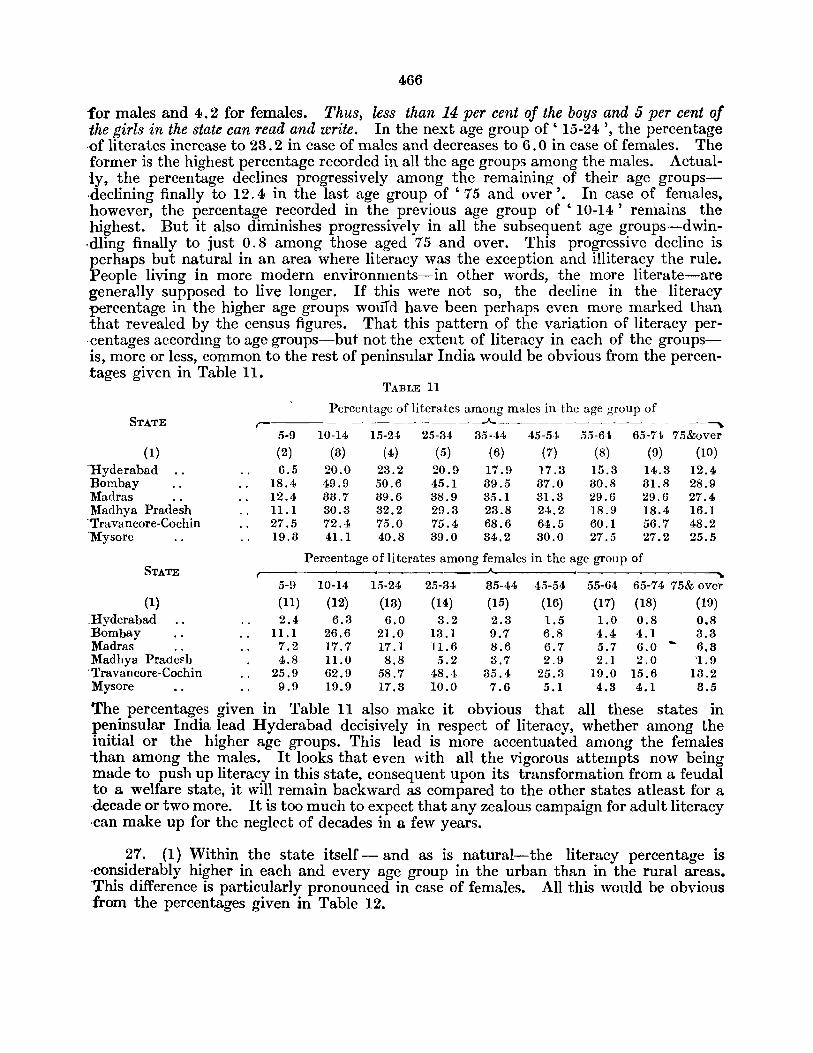
466
for males and 4.2 for females. Thus, less than 14 per cent of the boys and 5 per cent of the girls in the state can read and write. In the next age group of ' 15-24 " the percentage ·of literates increase to 23.2 in case of males and decreases to 6.0 in case of females. The former is the highest percentage recorded in all the age groups among the males. Actually, the percentage declines progressively among the remaining of their age groups·declining finally to 12.4 in the last age group of ' 75 and over'. In case of females, however, the percentage recorded in the previous age group of ' 10-14' remains the highest. But it also diminishes progressively in all the subsequent age groups-dwin·dling finally to just 0.8 among those aged 75 and over. This progressive decline is perhaps but natural in an area where literacy was the exception and illiteracy the rule. People living in more modern environments-in other words, the more literate-are generally supposed to live longer. If this were not so, the decline in the literacy percentage in the higher age groups wou1d have been perhaps even more marked than that revealed by the census figures. That this pattern of the variation of literacy per·centages accordmg to age groups-but not the extent of literacy in each of the groupsis, more or less, common to the rest of peninsular India would be obvious from the percentages given in Table 11.
TABLE 11
Percentage of literates among males in the age group of STATE r-
____A_ _______________ ~
5-9 10-14 15-24 25-34 35-44 45-54 55-64 65-74 75&over (1) (2) (3) (4) (5) (6) (7) (8) (9) (10)
Hvderabad 6.5 20.0 23.2 20.9 17.9 17.3 15.3 14.3 12.4 Bombay 18.4 49.9 50.6 45.1 39.5 37.0 30.8 31.8 28.9 Madras 12.4 33.7 39.6 38.9 35.1 31.3 29.6 29.6 27.4 Madhya Pradesh 11.1 30.3 32.2 29.3 23.8 24.2 18.9 18.4 16.1 'Tra vancore-Cochin 27.5 72.4 75.0 75.4 68.6 64.5 60.1 56.7 48.2 Mysore 19.3 41.1 40.8 39.0 34.2 30.0 27.5 27.2 25.5
Percentage ofliterates among females in the age group of STATE ----------"- ~
5-9 10-14 15-24 25-34 35-44 45-54 55-64 65-74 75& over (1) (11) (12) (13) (14) (15) (16) (17) (18) (19)
:Hyderabad 2.4 6.3 6.0 3.2 2.3 1.5 1.0 0.8 0.8 "Bombay 11.1 26.6 21.0 13.1 9.7 6.8 4.4 4.1 3.3 Madras 7.2 17.7 17.1 11.6 8.6 6.7 5.7 6.0 6.8 Madhya Prade!'h 4.8 11.0 8.8 5.2 3.7 2.9 2.1 2.0 '1.9 'Travancore-Cochin 25.9 62.9 58.7 48.1. 35.4 25.3 19.0 15.6 13.2 Mysore 9.9 19.9 17.3 10.0 7.6 5.1 4.34.1 3.5
The percentages given in Table 11 also make it obvious that all these states in peninsular India lead Hyderabad decisively in respect of literacy, whether among the initial or thE' higher age groups. This lead is more accentuated among the females than among the males. It looks that even with all the vigorous attempts now being made to push up literacy in this state, consequent upon its transformation from a feudal to a welfare state, it will remain backward as compared to the other states atleast for a -decade or two more. It is too much to expect that any zealous campaign for adult literacy ·can make up for the neglect of decades in a few years.
27. (1) Within the state itself- and as is natural-the literacy percentage is -considerably higher in each and every age group in the urban than in the rural areas. 'This difference is particularly pronounced in case of females. All this would be obvious from the percentages given in Table 12.

467
TABLE 12
Percentage of literates among males Percentage of literates among females Age Group
Rural areas Urban areas Rural areas Urban areas (1) (2) (3) (4) (5)
5- 9 3.9 18.3 0.9 9.4 10-14 13.2 47.5 2.2 22.8 15-24 14.8 52.0 1.8 21.2 "25-34 14.8 47.0 1.0 13.5 ·35-44 12.8 42.1 0.6 10.5 45-54 12.1 42.2 0.4 6.4 55-64 11.0 37.7 0.3 4.6 '65-74 10.6 35.5 0.2 3.9 '75 & over 8.6 33.8 0.2 3.8
(2) Districtwise percentages of literates III the various age groups of either :sex are given in Table 13.
TABLE 13
Percentage of literates among males in the age group of District
5-9 10-14 15-24 25-34 35-44 45-54 55-64 65-74 75 & over (1) (2) (3) (4) (5) (6) (7) (8) (9) (10)
Aurangabad 8 25 27 25 21 21 19 17 13 Parbhani 4 16 17 18 17 22 15 16 15 Nanded 6 20 20 18 16 16 13 13 11 Bidar 5 19 21 18 15 15 14 12 11 Bhir 7 23 23 20 16 17 13 12 11 -Osmanabad 10 30 29 24 21 18 15 15 14 Hyderabad 19 41 50 47 41 42 37 32 29 Mahbubnagar 4 16 19 17 15 15 13 13 13 Raichur 6 18 22 23 22 20 20 20 21 Gulbarga 7 20 22 19 17 16 14 14 18 Adilabad 4 13 15 14 10 11 9 10 . 10 Nizamabad 4 15 19 18 16 14 15 11 10 Medak •• 4 14 19 18 16 14 I~ 13 11 Karimnagar 4 16 16 14 12 11 10 10 7 Warangal 5 18 21 19 15 18 12 11 8 Nalgonda 4 14 16 16 . 18 II 10 11 8
Percentage of literates among females in the age group of District _.)._ ,
5-9 10-14 15-24 25-34 35-44 45-54 55-64 65-74 75 & over (1) (11) (12) (18) (14) (15) (16) (17) (18) (I9)
Aurangabad 3 7 6 4 3 2 I I I Parbhani I 4 4 2 1 I I I 1 Nanded 2 4 4 2 1 1 Bidar I 3 3 1 I 1 Bhir 2 5 5 2 1 I I O~manabad 3 7 5 2 2 1 1 Hyderabad 11 25 25 11 14 9 6 6 6 Mahbubnagar .• 1 4 4 2 I 1 I 1 Raichur 2 4 4 2 2 1 I I 'Gulbarga 2 5 4 2 1 1 1 Adilabad I 3 3 2 I Nizamabad 2 4 4 3 I 1 I Medak I 3 3 I 1 Karimnagar I 3 3 2 1 Warangal S 6 6 3 2 I 1 Nalgonda 1 5 8 2 1 1 1 1
468
The percentages given in Table 13 bring out once again, more or less, the same pattern of variations as between different age groups detailed in paragraph 26. This would become yet more obvious if the percentages are not rounded off as done in the' above table. Besides, they exhibit again the superiority of Hyderabad Districtdue exclusively to Hyderabad City-- in respect of literacy in every age group amonp' the males and, more especially, among the females. They once again indicate the slight. lead of the western Marathi and Kannada districts, especially Aurangabad and Osmanabad, over the eastern Telugu districts particularly, Adilabad, Karimnagar and Nalgonda .. And what is particularly significant is the fact that this lead is more perceptible in the' younger than in the older, age groups. This makes it obvious that the western districts. have advanced relatively more than the eastern districts especially during the recent. years. Again, apart from Hyderabad District, the percentage of literate females is· very meagre in all the age groups. The percentages even in the initial groups, though slightly more, are by no means impressive.
28. Semi-Literacy in the State.-As stated earlier data was collected during this. census in respect of semi-literates also-i.e., about persons who are able to read but not. to write. The results, based on a ten per cent sample, reveal that semi-literacy is by no· means so wide-spread as is sometimes imagined. Comparatively, a very small proportion in this state rests content with picking up the knowledge to read without cultivating the capacity to write. Only 0.7 per cent of the states total population-I. 0 per cent of its males and 0.3 of its females-is semi-literate. Thus, even if the figures pertaining to· semi-literates are included among those relating to the literates, the literacy percentage is not altered materially in this state. It just crawls up from 9.2 (I5.I for males and 3.0' for females) to 9.9 (16.1 males and 3.3 for females).
29. Number of Teachers, Professors, etc., in the State in relation to its Total Population.-In the entire state there are in all only 667 professors, lecturers and research workers. employed in universities, colleges and research institutions. Of these just 45 are females. Similarly, all other types of teachers, whether employed in schools or tutoring on their own, in the state number 28,251 of whom 4,282 are females. In addition to these twocategories of actual teaching (and research) staff, there are 9,362 persons otherwise employed in various capacities in educational and research intitutions and libraries and museums in the state. This number includes 1,418 females. No doubt these census figures are underrated, to an extent, because they are based only on the principal means of livelihood recorded in respect of self-supporting persons. As stated elsewhere, quite an appreciable number of teachers in rural areas have returned themselves either as earning dependants or as self-supporting but principally occupied in cultivation or in religious service. Similarly, quite a few females employed in teaching' have, influenced more by current sentiments rather than economic realities, returned themselves as being partly or wholly dependant on their men folk. Notwithstanding an this, there can be no denying the fact that the number of the teaching staff is very meagre in this state in relation to its total population. This will be obvious from the proportions given in Table 14 relating to most of the states in peninsular India.
[TAllLE:
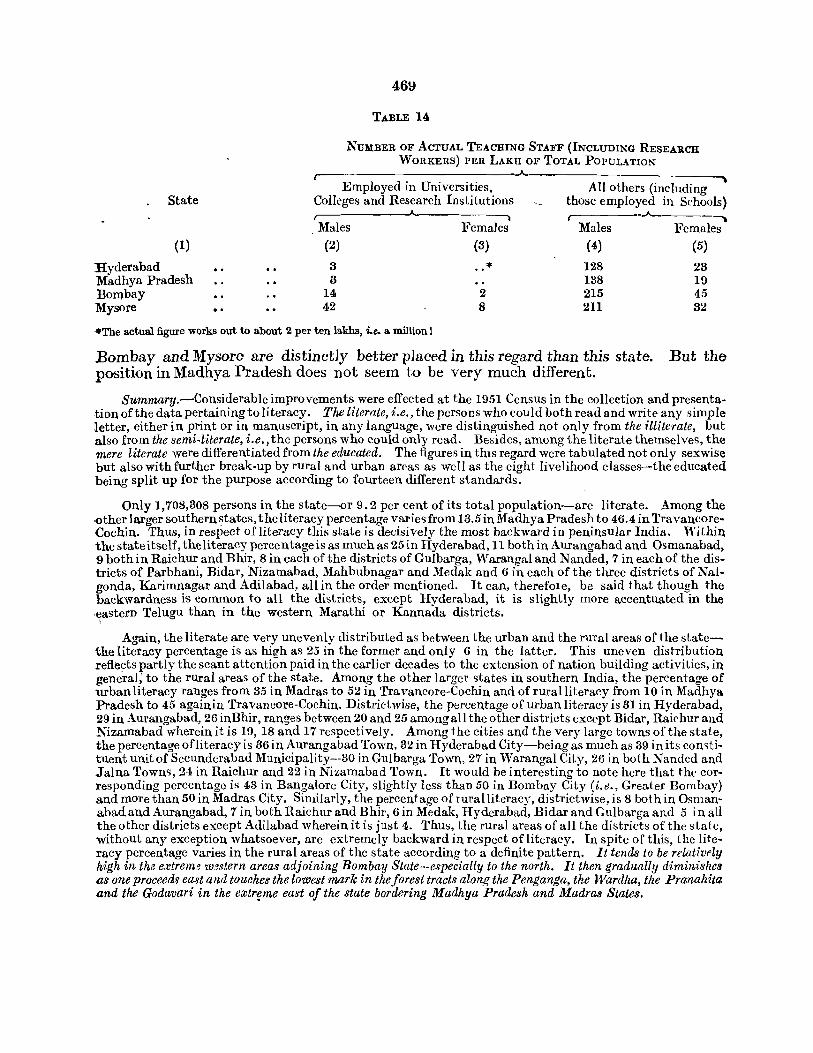
State
(1)
Ryderabad Madhya Pradesh Bombay Mysore
46\J
TABLE 14
NUMBER OF ACTUAL TEACHING STAFF (INCLUDING RESEAltCH WORKERS) PER LAKH OF TOTAL POPULATION
r---------------------------~--------------------------~ . Employed in Universities,
Col1eges and Research Institutions r--Males Females
(2) (8)
3 * 3
14 2 42 8
All others (including those employed in SC'hools)
Males (4)
128 138 215 211
"""" Females (5)
23 19 45 32
'*The actual figure works out to about 2 per ten lakhs, i.e. a million I
Bombay and Mysore are distinctly better pJaced in this regard than this state. But the position in Madhya Pradesh does not seem to be very much different.
Summary.-Considerable improvements were effected at the 1951 Census in the collection and presentation of the data pertaining to literacy. The literate, i.e., the persons who could both read and write any simple letter, either in print or in manuscript, in any language, Were distinguished not only from the illiterate, but also from the semi-literate, i.e., the persons who could only read. Besides, among the literate themselves, the mere literate were differentiated from the educated. The figures in thIS regard were tabulated not only sexwise but also with further break-up by rural and urban areas as well as the eight livelihood classes--the educated being split up for the purpose according to fourteen different standards.
Only 1,708,808 persons in the state-or 9.2 per cent of its total popUlation-are literate. Among the <>ther larger southern states, theliteracypercentage varies from 18.5 in Madhya Pradesh to 46.4 in TravaneoreCochin. Thus, in respect of literacy this state is decisively the most backward in peninsular India. Within the statcitself, the literacy percentage is as much as 25 in IIyderabad, 11 both in Aurangabad and Osmanabad, 9 both in Raichur and Bhir, 8 in each of the districts of Gulbarga, Warangaland Nanded, 7 in each of the districts of Parbhani, Bidar, Nizamabad, Mahbubnagar and Medak and 6 in each of the three districts of Nalgonda, Karimnagar and Adilabad, all in the order mentioned. It can, therefole, be said that though the backwardness is common to all the districts, except Hyderabad, it is slightly more accentuated in the eastern Telugu than in the western Marathi or Kannada districts.
\
Again, the literate are very unevenly distributed as between the urban and the rural areas of the statethe literacy percentage is as high as 25 in the former and only 6 in the latter. This uneven distribution reflects partly the scant attention paid in the earlier decades to the extension of nation building activities, in general; to the rural areas of the state. Among the other larger states in southern India, the percentage of urban literacy ranges from 35 in Madras to 52 in Tra vancore-Cochin and of rural literacy from 10 in Madhya Pradesh to 45 again.in Travancore-Cochin. Districtwise, the percentage of urban literacy is 31 in Hyderabad. 29 in. Aurangabad, 26 inBhir, ranges between 20 and 25 among all the other distrids except Bidar, Raichur and Nizamabad wherein it is 19, 18 and 17 respectively. Among the cities and the very large towns of the state, the percentage of literacy is 86 in Aurangabad Town, 82 in Hyderabad City-being as much as 39 in its comtituent unit of Secunderabad Municipality--30 in Gulbarga Town, 27 in Warangal City, 26 in both Nanded and .lalna Town'>, 24 in Raichur and 22 in Nizamabad Town. It would be interesting to note here that the corresponding percentage is 43 in Bangalore City, slightly less than 50 in Bombay City (i.e., Greater Bombay) and more than 50 in Madras City. Similarly, the percentage of rural literacy, districtwise, is 8 both in Osmanabad an.d Aurangabad, 7 in both Raichur and Bhir, 6 in Medak, Hyderabad, Bidar and Gulbarga and 5 in all the other districts except Adilabad wherein it is just 4. Thus, the rural areas of all the districts of the state, without any exception whatsoever, are extremely backward in respect of literacy. In spite of this, the literacy percentage varies in the rural areas of the state according to a definite pattern. It tends to be relativdy high in the eJJtrem~ W:Jstern area.'f adjoining Bombay Slate--especially to the north. It then gradually diminishes as one proceeds east and touches the lowest mark in the forest tracts along the Penganga, the Wardha, the Pranahita and the Godavari in the erctrf!me east of the state bordering Madhya Pradesh and Madras States.
470
Sexwise, though the percentage ofliteracy is by no means impressive among the males of this state, it is' particularly meagre among its females. The actuaf pcrcentage is 15 in case of the fOJmer and 3 in case of" the latter. Among the other major states in southern India, the percentage of male literacy varies from 22 in Madhya Pradesh to 55 in Travancore-CoC'hin and of female litcracy from 5 in Madhya Prade!>h to 38 in Travancore-Cochin. The literate females of this state, much more than the literate males, art concentrated in urban areas. The percentage ofliteraC'y among males is 37 in urban and 10 in rural areas and that among females is 12 in the former and just 1 in th{' latter. The percentage of literate females in rural aHas,is seven times more both in Bombay and Madras States and roughly two and a half times more even in Madhya Pradesh. Distrietwise, in so far as the percentage of male literacy is concerned, it is 36 in Hyderabad, 18 in botli Osmanabad and Anrangabad, 16 in Raichur, 15inBhir, 14in Gulbarga, 13 in each of the districts of Nandtd, Bidar, Warangal, Parbhani and Nizamabad, 12 in both Medak and Mahbubnagar, II in both Karimnagar and Nalgonda and 10 in Adilabad. Among the females, the corresponding percentage is, at its best, only 15 in Hyderabad and then sharply declines to 3 in each of the districts of Aurangabad, Waranga] and Osmanabad. It is only 2 in an the other districts except Karimnagar and Me;dak in both of whit h it is just 1. The percentage of literate females is less than even one in each and every rural tract of Adilabad, AI edak, Karimnag .• r and Ridar Districts; in all the rural tracts of Parbhani, Nanded and Gulbarga Dtstricts pJ:cept in that of llingoli Tahsil inParbhani District, NandP.d Tahsil in Nanded District and Afzalpur Tahsil in Gulbarga District; and ina majority of the rural tracts in Nalgonda and Mahbubnagar Districts. Among all the remaining rural tracts in the entire state, the percentage e,J;ceeds 2, but nowhere 3, in}ust three tracts. It would, therefore, not entirely be an exaggeration to assert that female literacy is just in its initial stages in this state.
Of the 1,708,308 literates in this state, as many as 77 per cent are mere literates, 10.8 per cent have completed the primary and 6.3 the middle school stage, 3.2 per cent arc matriculates, 0.6 are intermediates,. 0.4 graduates, 0.1 are post-graduates and 0.2 are qualified in teaching, 0.2 in law, 0.1 in medicine, 0.1 in engineering, 0.04 in commerce, 0 .01 in agriculture, 0.006 in veterinary and the remaining 0 . 8 per cent possess various other types of qualifications. Thus, more than three fourths of the literate persors in this state cannot be credited with having completed even the primary stage of education. The poverty of this state in respect of the educated is even more marked than that of its literates as compared with the other large states in peninsular India. This would be obvious from the fact that, among every 10,000 p~rsor:_s in this state, only 4 are graduates, 5 are intermediates, 30 are matriculates and 58 have passed the middle school. In addition to these, roughly 7 are post-graduates or are qualified in teaching, engineering, agriculture, veterinary, commerce, law or medicine. The corr(sponding figures, among the larger of the other southern states range roughly, in case of graduates, between 5 in Madhya Pradesh and 14 in Mysore ; in case of intermediates, betWeen 6 again in Madhya Pradt:sh and 18 in Mysore; in case matriculates, between 85 in Madhya Pradesh and 112 in Travancore-Cochin; in case of the persons who have just completed the middle school, from 95 in Madhya Pradt:sh to 166 in Bombay; and in case of persons who are post-graduates or have qualified themselyes. in teaching, engineering, agriculture, veterinary, commerce, law or medicine, between 8 in Madhya Pradesh and 24 in Bombay. Within the state itself, the educated are heavily concentrated in Hyderabad D:Strict due to· a rather unusual degree of centralization of all the cultural, educational, industrial, commercial and administrative activiti(s of the state in its metropolis, namely, Hyderabad City. This district, which can claim just 8 per cent of the population of the state, monopolises 80 per cent of both its post-graduates and persons quali7 fied in commerce, 72 of its intermediates and 67 of its graduates, 56 of both its ~triculates and persor.s quali-, fied in veterinary, 54 of its numbers qualified in engineering and 53 in medicine, 41 of both its persor,.s who have passed the middle school examination and judicial and law examinations, 30 of its numbers qualified in ~griculture, and 18 per cent of even its mere literates. As among the other districts, Aurangabad and Warangalt have a perceptibly larger share of the educated in the state. ,
The Non-Agricultural Classes are considerably more literate than the Agricultural Classes, the percentageof literacy being 18 among the former and only 5 among the latter. Within the Non-Agricultural Classes themselves, the class of Commerce is distinctly the most literate, boasting a literacy percentage of 28. The corresponding figure is actually as high as 47 among its males but only 9 among its females. There is, however, a very steep decline in the proportion of the educated in this class. In this respect, the Livelihood· Class of Transport and, more especially, that of Other Services and Miscellaneous Sources take the lead. The class of Other Services and Miscellaneous Sources, with a literacy percentage of 22, is the next most literate among all the classes. Although, the literacy percentage among its males is 32 which is distinctly lower than the corresponding percentage in t~e Livelihood Class of Commerce, that among its females is 12 which is the highest recorded in all classes .. Again this class, monopolises the overwhelming numbers of the educated in the state. The Livelihood Class of Transport is also comparatively advanced in respect of both literacy and education, 19 per cent of its total numbers, 26 of its males and 11 of its females, being literate. Next in order, is the class of Agricultural Rent Receivers. 15 per cent.of the total numbers belonging to this class are literates. The corresponding percentage is as much as 27 among its males but only 5-
471
:among its females. This is the only Agricultural Class which returns some significant proportion of persons belonging to the educated categories. The Livelihood Class of Production (other than cultivation) is the least literate and educated among all Non-Agricultural Classes and lags behind even the class of Agricultural Rent Receivers. Only 9 per cent of its total numbers, 16 of its males and only 2 of its females, are literate. 'The percentage of Ii terates, declines to 7 in the Livelihood Class of Owner Cultivators. Sexwise, the Ii teracy percentage is 12 among its males and just 1 among its females. The decline is yet more conspicuous in the ,class in respect of the educated. On the whole, with regard to literacy and education, this class resembles more the two particularly backward classes of Agricutural Labourers and Tenant Cultivators rather than the Non-Agricultural Classes or the class of Agricultural Rent Receivers. The percentage of literates diminishes to just 2 in the Livelihood Class of Tenant Cultivators. Four per cent of its males have managed to become literate. But the corresponding percentage among its females dwindles to only 0.3. The proportion of the educated in this class is negligible-less than 20 out of every 10,000 belonging to the class have stumbled through the primary school and only 1 has reached the matriculation standard. The Livelihood 'Class of Agricultural Labourers presents an even more dismal picture in respect of literacy. The percentage of literacy in this class dwindles to 1.4. Sexwise, only 3 per cent of its males and just 0.2 of its females are literate. The proportion of the educated is even more negligible in this class than in that of Tenant Cultivators. In fact, this class would not have had for all practical purposes any edurated persons at all but for the employees (and their dependants) of some modem farms and well-to-do owner cultivators.
In the age group of' 5-9', only 6.5 per cent of the males and 2.4 of the females are literate in this state. In the next age group of '10-14', the corresponding percentage is 20.0 in case of males and 6.3 in Case of females-the highest percentage of literates recorded among all the age groups in the sta.te is in the next higher age group of '15-24' in Case of males and in this age group of '10-14' in case of females. In all, less than 14 per cent of the boys and 5 of the girls in these two age groups of '5-9' and '10-14' taken together are literates. In the next higher age group of '15-24' , the actual percentage of literacy is as much as 23.2 in Case of males but only 6 in case of females. The percentage diminishes progressively both among the males and the females, in all the rest of the age groups of '25-34', '35-44', '45-54', '55-64', '65-74', and '75 and over'-declining finally in the age group of '75 and over' to 12.4 in Case of males and just 0 .8 in Case of females. The per,centage of literacy in all the age groups, whether the initial or the higher ones, is markedly lower in this state as compared with all the other larger states in peninsular India. This deficiency is particularly aggravated in case of f.emales. The most backward of the other states in this respect is Madhya Pradesh. But even in that state, 11. 1 per cent of its males and 4. 8 per cent of its females in the age group of ' 5-9', 30. 3 per cent of its males and 11.0 per cent of its females in the age group of '10-14', 32.2 per cent of its males and 8.8 per cent of its females in the age group of '15-24' and finally 16.1 per cent of its males and 1.9 per cent of its .females in the age group of '75 and over' are literates.
Semi-literacy is by no means so widespread in this state as is sometimes imagined. Only a very small Propolition of its population rests content with picking up the knowledge to read without cultivating the capacity to write. JustO.7per cent of the total popUlation of the state-l per cent of its males and 0.3 of its females-is semi-literate.
In tht) entire state the actual teaching staff in universities, colleges and research institutions, numbers ·667 of whom 45 are females. All other teaching staff, including private tutors, numbers 28, 251 of whom 4,282 are females. In addition to these, 9,362 persons, including 1,418 females, are otherwise connected with or employed in educational and research institutions, libraries and museums in the entire state. These numbers are, however, underrated, to an extent, because the census figures are based only on the principal meanS ·of livelihood (as against the subsidiary) returned by self-supporting persons (as against the earning or nonearning dependants).
SECTION II
VARIATIONS SINCE 1901
30. Limitations.-The major drawback in a study of the 1951 census data pertaining to literacy, as compared with the corresponding data of the precedmg censusesof the current century. is the exaggeration of the literacy figures at the 1941 Census. In 1941, as in the earlier censuses, provi~ional figures pertaining to literacy were first released on the basis of the data supplied by the district census officers immediately on completion of the enumeration, and thc final figures 'WE're published subsequently on the basis of the tables prepared in the Census Tabulation Office after sorting the enumeration slips received from the districts. But the tables prepared in the Census Tabulation Office in 1941 suffer from serious discrepancies which render them of doubtful value. This matter is dealt with in detail in Appendix F. This drawback can, however, be eliminated by ignoring the final figures altogether and confining the comparision to the provisional figures in so far as the 1941 census dat.a are concerned. In addition to the irregularities of the final figures pertaining to the H}41 Census, there arecertain other minor limitations. The first of these is the lack of uniformity in the approach to the question pertaining to literacy from census to ccnsus. Although at all the censuses taken during this century, every person who could both t:ead and write in any language was deemed to be a literate, no standard was prescnbed for determining precisely this ability prior to 1911. In 1911, however, the capacity to " write a letter to a friend and read the answer to it" was specified as the criterion for classifvinga person as literate. This standard was adhered upto 1941. The instructions issued in 1951 * were slightly more elaborate in so far as they laid down that "the test for reading is ability to read any l'imple letter, either in print or in manuscript, and the test for 'Writing is ability to write sueh a letter." It will, however, be obvious that the lack of any criterion at the 19B Census, or the slight elaboration in the instructions at the 1951 Census, is not likely to influence materially the final pattern in an area where illiteracy has been and is still the rule and literacy the exception. In addition to this, there have been variations in (i) the definition of age, (ii) in the age groups adopted for tabulating the literacy returns and (iii) the inclusion or exclusion of figures pertaining to infants and young children in the relevant census tables-sometimes, and rather strangely, in presenting literacy percentages the figures pertaining to literates amongthe young children were taken into consideration but not their total numbers. In addition to all these, there are the proverbial vagaries of age returns themselves~
- All these factors render difficult any comparative analysis of the p.ecennialliteracy percentages according to individual ages or age groups, however, useful such an analysis may deemed to be in assessing the trend in literacy or the lapse to illiteracy. But, fortunately, one can still calculate de neva the literacy percentages for the total or the total male or the total female popUlation as recorded at each of the censuses since 1901-particularly as the numbers of literates among the 'infants and young'children', whether included or exCluded from the census ta hlcs, are bonnd to have been literally microsCOpIC. These percentages arc given in the succeeding paragraph.
31. Variations in Literacy Percentages since 1901.-The literacy percentages among the total, male and female populations, as recorded at each of the censuses since 1901,._ are given in Table 15 • • Vide C(;olnote en page 449 Cor details
472
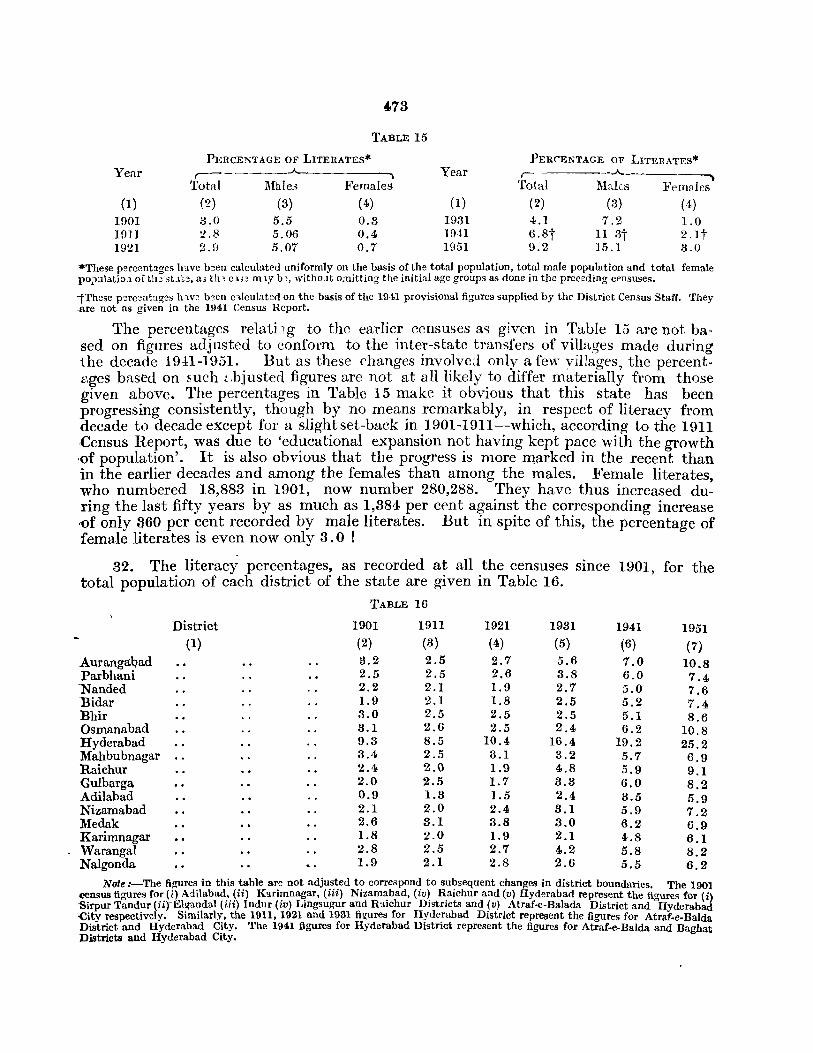
Year
(1) 1001 H) 11 1921
473
TABLE 15
PERCE:KTAGE OF LITERATES* ,--_____ ..A.
~
Total Males Females (2) (3) (4) 3.0 5.5 0.3 2.8 5.06 0.4 2.9 5.07 0.7
Yea.r
(1)
1931 1941 1951
PER('ENTAGE O"F LITERATES* ,------ -..A. __
Total (2)
4.1 6.8t 9.2
Males (3)
7.2 11 3t 15.1
"""\ Femillcs
(-i) 1.0 2, It 3.0
"'These percentages have b3en calculated uniformly on the bnsis of the total population, total male population and total female po,mlatio.l of th3 ,;t.lt3, a, th~ C~l3 m ly b~, witho.lt o:nitting the initial age groups as done in the preceding censuses.
tThese p~rcentages h we b3cn c'llculated on the basis of the 1941 provisional figures supplied by the District Census Staff. They .are not as given in the 1941 Census Report.
The percentages relati 19 to the earlier censuses as given in Table 15 are not based on figures adjusted to conform to the inter-statc transfers of villages made during the decade 19·U-1951. But as these changes involve~l only a few villages, the percentt:?ges based on mch ~,bjusted figures are not at all likely to differ materially from those given above. The percentages in Table 15 make it obvious that this state has been progressing consistently, though by no means remarkably, in respect of literacy from decade to decade except for a slight set-back in 1901-1911-which, according to the 1911 .census Report, was due to 'educational expansion not having kept pace with the growth ,of population'. It is also obvious that the progress is more marked in the recent than in the earlier decades and among the females than among the males. Female literates, who numbered 18,888 in 1901, now number 280,288. They have thus increased during the last fifty years by as much as 1,3811, per ct"nt against the corresponding increase -of only 360 per cent recorded by male literates. But in spite of this, the percentage of female literates is even now only 3.0 !
32. The literacy percentages, as recorded at all the censuses since 1901, for the total popUlation of each district of the state are given in Table 16.
TABLE 16
District 1901 1911 1921 1931 1941 1951 (I) (2) (3) (4) (5) (6) (7)
AurangaQad 3.2 2.5 2.7 5.6 7.0 10.8 Parbhani 2.5 2.5 2.6 3.8 6.0 7.4 "Nanded 2.2 2.1 1.9 2.7 5.0 7.6 "Bidar 1.9 2.1 1.8 2.5 5.2 7.4 Bhir 3.0 2.5 2.5 2.5 5.1 8.6 Osmanabad 3.1 2.6 2.5 2.4 6.2 10.8 Hyderabad 9.3 8.5 10.4 16.4 19.2 25.2 Mahbubnagar 3.4 2.5 3.1 3.2 5.7 6.9 Raichur 2.4 2.0 1.9 4.8 5.9 9.1 Gulbarga 2.0 2.5 1.7 3.3 6.0 8.2 Adilabad 0.9 1.3 1.5 2.4 3.5 5.9 Nizamabad 2.1 2.0 2.4 3.1 5.9 7.2 Medak 2.6 3.1 3.8 3.0 6.2 6.9 Karimna.gar 1.8 2.0 1.9 2.1 4.8 6.1 Warangal 2.8 2.5 2.7 4.2 5.8 8.2 Nalgonda 1.9 2.1 2.8 2.6 5.5 6.2
Note :-The fi~res in this table nre not adjusted to correspond to subsequent changes in district boundaries. The 1901 census figures fo~. (i), Adilabad.,. ~ ii) Kari':llna~ar, (iii) Nizam~bad, (iv~ R_aichur and (v) Hyderabad repr~sent the figures for (i) Sirpur Tandur (ufElgandal (m) Indur (w) LIllgsugur and R31chur DistrACts and (v) Atraf·e-Balada District and Hyderabad -City respectively. Similarly, the 1911, 1921 and 1931 fi~res for Hyderabad District represent the figures for Atraf-e-Balda District and Hyderabad City. The 1941 figures for Hyderabad District represent the figures for Atraf-e-Balda and Baghat Districts and Hyderabad City.
474
It is not advisable to draw any fine conclusions from the percentages given in Table 16 in view of the fact they are not as adjusted to conform to subsequent changes in district boundaries which have been both numerous and extensive during the last five decades. Forexample, l\Iahbubnagar has now lost the lead it held in 1901 over most other districts· of the state in respect of literacy. This may be due simply to the fact that the district no longer includes villages lying almost contiguous to the metropolis of the state. Anyway it is obvious, that during the last half a century there has been very little change in the dominance of Hyderabad District over all the others in respect of literacy. Similarly, Adilabad and Karimnagar have almost consistently remained the most backward of the districts in this state. Again, Gulbarga and Raichur have forged ahead significantly since 1901. Lastly, the western districts as a whole, especially Osmanabad and' Bhir, which slided down appreciably during the intervening decades, have now more than regained their superior position as compared with the eastern districts in generali (excluding of course Hyderabad City).
Summary.-The limitations to any analysis of the data pertaining to literacy as recorded at all the censuses since the beginning of this century include the irregularities in the tabulation of literacy returns at the 1941 Census; the lack of uniformity from census to census in respect of the definitions of literacy and age, the age groups adopted for tabulating the literacy returns and the inclusion or exclusion of the figures pertaining to infants and young children; and subsequent territorial changes. These draw backs make it difficult to analyse the trend in literacy according to age groups. It is, however, still possible to analyse satisfactorily the trend of literacy during the last five decades in the total, male or female population of the entire state because firstly the provisional figures released by the district census officers at the 1941 Census· (which do not apparently exhibit any irregularities) lOuld be utilised instead of the final figures given in the 1941 Census Report, secondly the changes in the definition of literacy have not been very significant particularly for an area which is still basically illiterate, thirdly the literate among the initial age groups are bound to have been numerically insignificant at all the censuses, and lastly the territorial changes at the state level' -unlike at the district level-involved only a few villages.
The literacy percentage has been increasing, from decade to decade, in this state since 1901 except for a slight set back in the decade 1901-1911. In 1901, only 3 per cent of thee; total population of the state, 5.5 of" its males and just 0.3 of its females, were literates. The corresponding percentage for the first two has now increased roughly three fold and that for the third ten fold! In spite of this, the literacy percentage is still 9.2 for the total population of the state and 15.1 for its males and only 3.0 for its females. The progress has been comparatively more marked in the recent than in the earlier decades. Within the state itself, it can be said broadly that during all these fifty years, the dominance of Hyderabad District in respect ofliteracy has not undergone any significant change, Adilabad and Karimnagar Districts have remained the most backward in the state, Gulbarga and Raichur Districts have particularly improved their comparative positions and the western districts, which in general suffered severe set-backs in the intervening decades, have. more than regained their relatively superior position as against the eastern districts, in general,'excluding of course Hyderabad City.
CHAPTER IX Th e Future Decades
55

THE. FUTURE DECADES
It has been customary in census reporting to assess the probable size of population in succeeding decades. But it would' be more in keeping with the demands of the twentieth century if such a task is undertaken by a specialist (i.e., a full-fledged demographer) rather than a census authority or, to be more precise, a census officer. This is all the more imperative when the vital statistics of the area concerned are extremely defective and its social and economic patterns are undergoing revolutionary changes, some tending to accelerate and some others to decelerate the growth of population. The more important of the changes tending to accelerate the growth of population are detaiIed~ or recapitulated, below:-
(i) Increasing capacity of the state to control and localize famines and epidemics expeditiously.
(ii) Improvement in medical and public health services and facilities and environmental sanitation (including the disposal of .sewage, water-supply and housing conditions).
(iii) Accelerated movement of the people from the smaller to the larger of the population units, i.e., to places comparatively better off in respect of medical and public health facilities and environmental sanitation.
(iv) Abandonment of harmful superstitious customs and usages.
(v) Increase in agricultural and industrial production" and more equitable distribution of wealth-in other words increase in the standard of life of the average citizen.
(vi) Progress in respect of both the promulgation and enforcement of social welfare enactments.
(vii) Increased balance in sex-ratio.
\ (viii) Increased 'universality' of marriages--in so far as "it means decreased pro-portion of the unmarried in the reproductive age groups of '15-24', '25-34' and '35-44'.
, (ix) Declining proportion of the widowed in the reproductive age groups of '15-24' and '25-34'-and even '35-44'.
(x) Increased proportion of persons in the age group of '0-14'.
These changes will result in proportionately fewer deaths from epidemics or other diseases and marked decline in the number of miscarriages and still-births and a general increase in number of births. The more important of the changes tending to retard the rate of growth of popUlation are indicated, or recapitulated, below:-
(i) Steep rise in the age of marriage, especially of females. In other words, considerable decline in the popularity of child marriages.
. (ii) Improvement in the literacy and educational attainments of the people. In other words, the number of persons striving hard not only to improve their own standards of life but also to see that their children (if any) are not deprived of the opportunities which they themselves missed, will increase appreciably in the future years. Such
477
478
persons will both be anxious and able to limit the size of their families. This is quite .apart from the fall in birth rates due to the state attempts at popularising family limitation.
(iii) Increasing employment of women in industrial and other non-agricultural spheres coupled with the gradual disappearance of their secondary status, whether in agricultural or non-agricultural occupations.
(iv) Increasing scale of emigration. No doubt, the tempo of immigration presages to increase in the coming years. But the rise in the scale of emigration is likely to be even more impressive, especially because of the comparatively marked progress recorded by western India in various directions. It is also probable that the emigration to the adjoining areas to the north-east and south-west of the state in Madhya Pradesh .and Madras (i.e., now Andhra and Mysore) States respectively may be more pronounced, in the coming years.
The first three of these changes tend to bring down the birth rates and the fourth will result in increasing loss in numbers by the movement of population from and into the state.
2. On the whole, however, it would be safe to assume that for at least a decade or two more the factors tending to accelerate the growth of popUlation would prevail over those tending to retard it. An almost striking decline in the 'death rates during the -coming years coupled with a marked fall in still-birth ratios and miscarriages is almost .a certainty because of the present tempo of welfare activities in the state, which promise to be more and more accentuated. But the decline in birth rates is not likely to keep pace with the decline in death rates as the major factor retarding birth rates in this state in the years immediately ahead appears to be the rise in the age of marriage and not any sustained attempt at family limitation on the part of the average citizen. When all is said and done, state attempts to popularise family limitation, howsoever intensive they may be, will take a decade or two before the average citizen is not only convinced of its necessity but consistently acts up to his (or her) convictions. This would be obvious from the fact that as it is in the metropolis itself only a minority of even the educated .are resorting to family limitation-and a fair proportion among these persons also started taking the requisite measures not after OIl.'e or two issues but after a handful of them. From the statistical point of view, the only step which the average educated person in this state is now taking to limit the size of his family is t9 postpone his marriage to later years. The present birth and death rates in this state can roughly be assumed as being 45 and 30 respectively. On this assumption, the natural population of the state is increasing as it is by 1.5 per cent per annum or about 15 per cent per decade. But the actual increase in 1961 will be significantly more than this because during the coming years-and for reasons already explained-the decline in t,he death rates would be steeper than that in the birth rates, thus widening the gap between the two. But such high rates of growth cannot be sustained indefinitely. Though the factors tending to decrease the birth rates may not be very effective to start with, their influence is bound to increase considerably in succeeding years. The trend in this respect has been, more Qr less, similar in all advanced countries of the world i.e., the growth of their popUlation was considerably accelerated during the initial decades of their transformation from socially and economically backward to comparatively advanced areas but slowed down markedly in subsequent decades.
3. A word of caution to persons interested in or concerned with demographic problems, planning and welfare activities would not be out of place here. No one can question
479
the sobriety of proceeding on the basis of an accelerated growth of population in the coming years in so far as the state as a whole is concerned. But to assume that the accelerated growth will be or has been a feature common to all its components would be unfair to certain areas of the state which seem to be labouring under particularly adverse social, economic and public health conditions. Actually within the state itself~ the rate of growth of population has hitherto varied appreciably from area to area. In some of these cases, the variations were simply due to loss or gain by migration. But in the case of many they resulted from differences-sometimes appreciable-in marital ratios, social and economic conditions and comparative freedom or otherwise from malaria, tuberculosis and other diseases (epidemic or otherwise), famines and scarcity conditions and other factors which influence the growth of population. In fact, there are quite a number of pockets in the state where once due allowances are made for the net gain by migration, the natural popUlation appears to be almost static or increasing only at a very slow rate. Such pockets include not only the scarcity zones of Raichur and Gulbarga Districts, but also the northern uplands of Parbhani District, the wooded and hilly tracts of Adilabad District and the highly irrigated areas of Nizamabad District*. As stated elsewhere in this report, it is one thing to limit the growth of population by family limitation but quite another to allow the population to remain static because of other drawbacks. Such pockets in the state demand the close attention of public health authorities and demographers .
• This aspect has been analysed fally in 80 far as the available census statistics are concerned in paragraphs 91 to 108 of Chapter I.
56

APPENDICES

APPENDIX A
REVIEW OF THE SAMPLE VERIFICATION OF 1951 CENSUS COUNT IN HYDERABAD STATE
(Yide paragraph 4 01 Chapter 1 at page 4)
1. Need for Verification.-(i) Census, as Sardar Patel described it, is an 'administrative operation of great dimensions'. The very magnitude of such operations makes inevit
..-able the occurrence of some errors however well planned and detailed may be the measures adopted for the conCluct of the operations. In the numbering of hundreds of thousands ,of houses in the state by the revenue or municipal authorities, a number of occupied ,or residential houses may have been overlooked. A portion of this number may have remained undetected during the revision of house-numbering conducted by the same authorities. And finally a few of these houses may have escaped the notice of the census ·supervisors and enumerators both during their preliminary survey of their respective areas and their final enumeration and checking rounds. Thus a few households may have been left out of the census count altogether. Or again, some at least of the thirty thousand and odd enumerators and supervisors, knocking at every door within their areas, may have been supplied with incorrect or incomplete information by the head -of the household or by someone less responsible. Or yet again, the names of a few persons constantly moving about from place to place may have been inadvertently omitted altogether or included in more than one place. Thus errors sometimes leading to under,enumeration and sometimes to over-enumeration may have crept into the census count in spite of the efficiency of the average ennmerator ~and the sense of responsibility of the average citizen.
(ii) In the past, it was the practice to take it for granted that the errors of under-enumeration would be off-set by the errors of over-enumeration and the combined
,effect on the final figures would be more or less negligible. It was presumed that the ,extent of such errors was more or less constant from census to census, in spite of the fact that in some areas such' errors' had been deliberately made with an ulterior political for communal motive on a sufficiently large scale to upset the census count or at least to exaggerate the errors as compared with other censuses. In the changed circumstances of the present decade, when accurate population data have become indispensable not ,only for day to day administration but for phmning in all its diverse aspects, such a complacent attitude may not be justifiable. It is, therefore, essential that the persons .and organisations using census data are fully apprised of the degree of their reliability as determined statistically. The United Nations Org::misation in one of its reviews has remarked that" A scientific appraisal of the accuracy of census results has been .avoided by official statistical agencies of some countries. The result is an unfounded impression in the minds of uncritical users of the figures that they are perfectly reliable. In some countries there is a progressive tendency to discuss frankly the defects in census
. statistics, but until this practice becomes general it will be difficult to determine with any precision the degree of reliability in the figures for most areas of the world". In view of all this, the Government of India felt that the time had arrived when it was
·desirable to make a definite ascertainment of the degree of error present in the census ,-count and moved the State Governments to take requisite action in the matter. The -Government of Hyderabad welcomed the proposal and decided to arrange for the con--duct of a sample verification of the 1951 Census Count on lines specified by the Registrar <General, India, Ministry of Home Affairs.
4.88
484
2. Scope of En quiry and Method of Selecting Sample Households.-(i) The 1951 Census Count has now been verified in Hyderabad State by an enquiry conducted on a random sample basis. The scope of the enquiry was limited to determining the percentage of error, which was present in the census count in the form of either under-enumeration or over-enumeration. This meant (i) the verification of the census count in sample households and (ii) the ascertainment as to whether three occupied houses located nearest to eHch of the sample households were numbered for census purposes and found a place in the relevant part of the Nationa.l Register of Citizens*. The enquiry was strictly limited to the ascertainment of the identity of persons and was not concerned with the accuracy or otherwise of the answers to any of the fourteen census questions.
(ii) The sampling fraction aimed at was 1 in 1,000. The 'frame' for the r:mdom felection was the Despatch Notes. These Notes were prepared immediately after the census enumeration separately for the rural and urban areas in each tahsil by the Tahsildar or the Municipal Officer, as the case may be. They contained information villagewise and, in case of towns, wardwise, pertaining to the popUlation with break-up by sex, the number of residential houses, the number of households, etc.
(iii) In rural areas in case of villages having 100 households or more, verification blocks were formed by grouping approximately 100 households. In this process of grouping, if the remainder of households in a village was 50 or more, the residual households were regarded as a distinct verification block, and if less than 50, they were r('garded as constituting a part of the preceding verification block. In the case of villages having ltss than 100 households, the number of households in the next village (or consecutive villages) in the Despatch Note was added till the number of households totalled to 100 or more. If this total was .less than 150, the villages were regarded as one verificetion blo('k, and if it was 150 or more they were regarded as constituting two verification bJocks. For example, if village 'X' had 98 households and village 'Y' had 21 households, totalling 119 households in all, both the villages were treated as constituting one verification block. If villages 'X' and 'Y' had 81 and 94 households respectively, totalling in all 175, they were treated as forming two verification blocks. As far as possible, attempts were IP r,de to I dr.in each big village as an independent verification block (or blocks) and each small villp,ge p,s p, component of a verification block without splitting the village. The verification blocks wele then numbered in serial order. The total number of verification blocks thus formed for p, tahsil (or, in some cases. a combination of Tahsils) was divided byhundred,and one wr,s 2,dded to the remainder. The resulting figure was adopted as representing the number of the first sample verification block and every hundredth verification block thereafter wp,s taken as the subsequent sample verification block for the tahsil or tahsils, as the C[l,£e may be. The 19st house number in every sample verification block was divided by ten, and one was added to the remainder. The household number corresponding to thisfigure was taken as representing the first s8,mple household and every tenth household thereafter as representing the subsequent sample household in the sample verification block
(iv) In urban areas the same procedure as outlined above for rural areas was adopted for the selection of sample verific2.tion blocks except that instead of 100 households 500 households were grouped to form a blork. The towns were first arranged in order of their Census LocHtion Code Numbers for t.he whole district or for the revenue division except that the cities p,nd the big towns in the state were treated 8,S independent units. In the towns of Hydemb[l;d Stgte, the number of households in census blocks • The National Register was generally written in the state during the census enumeration period and contained with reference to each individual enumerated, the answers given to the more important of the census questions. The Register was written in parts, each part being confined to a village or ward or block of a town. The entries in each of the parts were made separately for each household in the serial order of house numbers.
485
varied considerably. In view of this, if a census blockina town contained approximately .500 households, then the block was treated as a distinct verification block, and if it contained a considerably lower number, then the number of census blocks needed to raise the total of households to approximately 500 were grouped together. If a census block had considerably more than 500 households, it was split up into as many verification blocks of 500 households as possible. If the remainder in this process of splitting the census blocks happened to be 250 or more households, it was treated as a separate verification block and if less than 250 it was treated as part of the preceding verification block. The total number of verification blocks thus formed for the alifa was divided by twenty, and one was added to the remainder. The resulting figure was adopted as representing the number of the first sample verification block and every twentieth verification block thereafter was taken as the subsequent sample verification block for the area. The last house number in every sample verification block was divided by fifty, and one was added to the remainder. The household number corresponding to this figure was taken as rcpr~senting the first sample household and every fiftieth household thereafter as representing the subsequent sample household in the sample verification block.
3. Tally of Parts of National Register with Enumeration Slips and their Despatch to Districts.-(i) After selecting the sample households as indicated in the gbove paragraph, a hundred per cent tally was made between the entries jn thc Register and the entries in the enumeration slips for all the census blocks involved in the sample verification blocks. TIle entries in the Register were corrected on the basis of the entries in the slips. or else a record was kept of the differences between the two. It may be noted that the verification was based on the entries in the National Register of Citizens whereas the final census ('ount was based on the enumeration slips. The purpose of the tally referred to above was to eliminate the necessity subsequently to determine the margin of copying error involved in writing the National Register of Citizens from the slips. By the adoption of the above procedure, the matter verified, i.e., the entries in the National Register, WBS corrected to represent fully the matter forming the base for the census count, i.e., the entries in the enumeration slips.
, (ii) After completion of this ehecking with the enumeration slips, the parts of the National Register of Citizens with the sample houses marked therein, along with requisite Instructions and Verification Forms (vide Annexure' A' at page 492) were despatched to the authorities nominated for the field work.
4. Chief Verification and Verification Officers.-(i) Through Chief Secretariat circular No. 3249, dated the 4th July, 1951, the Deputy Collectors were nominated as the Chief Verification Officers for their respective Divisions; the Tahsildars, who are all Gazetted ()fficers in the state in the grade of Rs. 300-600, were nominated as the Verification ()fficers for their respective tahsils excluding such Municipalities, if any, as were in charge of Executive Officers of a gazetted rank; and Executive Officers of Municipalities, provided they held a gazetted ra.nk, were nominated as the Verification Officers for their respective Municipalities. The Collectors were further authorised, if they so desired in any particular case, to appoint instead of the Tahsildars or the Executive Officers referred to above any other Gazetted Officer not below the rank of a Deputy Collector as the Verification Officer for any Tahsil or Municipality. This provision was utilized in one case. In the case of 6 out of 9 Mahals in the state, the Naib Tahsildars, who are very senior non-gazetted employees in the grade of Rs. 225-400, functioned as the Verification Officers. For Secunderabad Cantonment, covering both the civil and
486
military portions, ~fajor W. G. Braganza, Garrison Engineer, Secunderabad, was theChief Verification Officer and Shri Subramanian, Barracks Stores Officer, was the Verification Officer. The verification work, however, was done jointly by both these officers~ For Secunderabad Municipality, Shri M. Ramappa, Municipal Commissioner, was the Chief Verification Officer and Shri Muzaffaruddin Ansari, Executive Engineer, Shri Hari Shankar, Secretary, Municipal Corporation, and Shri V. Bedekar, Assistant Executive Engineer, were the Verification Officers. For Hyderabad Municipality and Hyderabad Cantonment, the Chief Verification Officer was Shri S. A. K. Issaqi, Assistant Commis-· sioner, Municipal Corporation. The Verification Officers were (1) Dr. Ram Murthi, Assistant Health Officer, (2) Dr. Abdul Aleem, Assistant Health Officer, (3) Dr.K. S. Murthy, Assistant Medical Officer, (4) Shri Dhan Mohan Lal, Licence Officer, (5) Shri Fareed Ahmed, Assistant Assessor, (6) Shri Nadir Sher Khan, Assistant Assessor, (7) Shri T. G. Naidu, Assistant Assessor, (8) Shri Gopal Kishan, Mechanical Engineer, (9) Shri Shamsheer Bahadur, Assistant Executive Engineer, (10) Shri Maqbul Sultan, Market Superintendent, (ll) Shri Ahmed Hussain of the Committee Branch, (12) Shri Raghavendar Eao, Assistant Examiner of Accounts, (13) Shri Balaji, Chief Inspector, Entertainment, and (14) Dr. Abdur Rahman of the Health Branch. All these were employees of Hyderabad Municipal Corporation. Of all the Verification Officers only 6 Naib Tahsildars and the three last named of the employees of the Hyderabad Municipal Corporation (Nos. 12, 13 and 14) were non-gazetted.
(ii) The Chief Verification Officers were responsible for the distribution of work amongst the Verification Officers. It was also their duty to instruct the Verifica~ tion Officers regarding the details of the work and subsequently to satisfy themselves. that the instructions had been correctly carried out. It was the duty of the Verification. Officers to visit every sample household personally and to make all enquiries necessary .for purposes of the verification and then to fill up the Verification Forms in accordancewith the relevant instructions.
5. Special Directions given to Verification Officers.-In the circular referred to at sub-para 4 (i) above, the Government of Hyderabad had directed the Collectors to make it clear to all the Verification Officers that what was sought to be secured was a purely· statistical determination of the degree of error present in the over-all census count and' that nothing in the nature of praise or blame for the performance ,of individual officer' or citizens was intended. The Collectors had also been directed that even if short· comings of individual citizens~ enumerators or other census officers, were brought tolight by enquiries in the sample households, no prejudicial action whatsoever was to betaken against the persons involved. Subsequently, the Chief Secretary despatched a special wireless message to the Collectors directing them to instruct once again all their' Chief Verification and Verification Officers not to suppress errors under any circums-· tances.
6. Conduct of Verification.-A period of 20 days after receipt of the National Register of Citizens was allowed for each Verification Officer for completion of the work. But. actually a large number of them exceeded the time limit. This is probably due to the· fact that officers of the cadre selected for the verification work had various other pressing' duties also to attend to. The verification work was generally attended to in Parbhani and Nalgonda Districts in August, 1951, in Mahbubnagar District in September, 1951, in Karimnagar, Nizamabad, Medak and Bhir Districts, and Hyderabad City in October •. 1951, in Osmanabad, Raichur, Gulbarga, Nanded, Hyderabad, Adilabad and Warangal . Districts in November, 1951, and in Aurangabad and Bidar Districts in December, 1951..
487
Thus the verification work was conducted from the sixth to the eleventh month after the census reference point, i.e., the sunrise on 1st March, 1951. Wherever the work had not been properly conducted or had been conducted by officers of a subordinate cadre and not by the Verification Officers personally, the material was returned for re-verification. It was, however, encouraging to note that in a number of cases, the Chief Verification Officers had themselves visited the sample households and checked up the entries, 'etc., by personal enquiries.
7. Number of Households actually Verified.--(i) In all, 3,243 sample households had been selected in the Census Tabulation Office for purposes of verification. Of this number, 2,698 households were in rural and 550 in urban areas. The total number of households in the state was 8,755,144 of which 3,083,205 households were in rural and 671,939 in urban areas. The actual number of households selected was thus 1 in 1,158 for the state i.e., 1 in 1,145 for rural and 1 in 1,222 for urban areas, though the sampling fraction aimed at theoretically was 1 in 1,000. The total number of households actually verified was, p.owever, 8,120 of which 2,634 households were in rural and 486 in urban areas. 'The final sampling fraction, therefore, worked out to 1 in 1,204 for the state, i.e., 1 in 1,171 for rural and 1 in 1,383 for urban areas.
(ii) The reason for the non-verification of 123 households out of the 3,243 households selected for verification was generally their migration from the places where they had been enumerated. These households mostly belonged to labourers, both agricultural and non-agricultural, who had left the place for employment elsewhere; to members of castes like Lambadas, Yerukulas, etc., not all of whom have as yet given up their migratory habits; and to Government servants and businessmen or their employees who h.ad been transferred to other places or who had changed their residence in the normal course of their profession. Sometimes death in the family was adduced as a reason for the migration. With regp,rd to a few of these households also, the Verification Officers made requisite enquiries from persons living in the neighbourhood, and reported that their counting was correct. Such households, however, were not taken account of in the finHI tabulation as the enquiries addressed to former neighbours could not be relied upon to tIle same extent as enquiries addressed directly to the householders concerned. But where the original householders had just moved to other houses in the same village or town and were contacted for purposes of the verification, the households concerned were retained in the tabulation of the final result.
I R. Results of the Verification of Counting in H01,fseholds.-( i) Verification Officers had been instructed (vide Encloure 1 at page 49~) to classify mistakes in counting in each house hold under the four different categories detailed below:
(a) Clear omissions, i.e'., cases of non-enumeration of persons who were members of the household in question and who were actually present in that household during the enumeration period--from 9th February, 1951, to the sunrise on 1st March, 1951.
(b) Fictitious entries, i.e., cases of purported enumeration in the household in ·question of persons who never existed, or the purported enumeration of real persons who did not normally reside in or visit the household during the enumeration period.
(c) Erronfous count oj visitors and absentees tending to under-enumeration, i.e., 'case~ of non-enumeration of persons who were moving about during the period of enumeration and who should h:we been enumerated in the household in question according to the instructions pertaining to. census enumeration.

488
(d) E"oneous Count of visitors and absentees tending to over-enumeration, i.e .... cases of enumeration in the househ~ld in question'pf persons who were moving aboutduring the period of enumeration and who should not have been enumerated in that. household according to the instructions pertaining to census enumeration.
(ii) The result of the verification for Hyderabad State and the two divisions* with break-up by sex and rural and urban areas is indicated below:
NO:aTH HYDERABAD SOUTH HYDERA.BAD HYDEllABAD STATE DIVISION DIVISION
Nature of enumeration error -, ,---~ ~ Rural Urban Rural Urban Rural Urban TotaE ~ ,--..A---, ,....----"---, ~ ~ r---'--.-..
M. F. M. F. M. F. M. F. M. F. M. F. (1) (2) (3) (4) (5) (6) (7) (8) (9) (10) (11) (12) (18) (14)
(a) Clear omissioIlll ao 70 6 5 16 28 14 42 6 .5 III (b) Fictitious entries 20 12 2 T 12 7 1 1 8 5 1 G .1 (c) Erroneous count tending to 'under-
enumeration - G 8 ~ 2 I .5 .. 8 :I :I 18 (d) Erroneous count tending to over-
enumeration IS 8 4. 2 1 1 8
Further details with requisite data for the whole state, but without break-up by sex, are· given in Annexure 'B' at page 496. A few cases of the distorti9ll of names were reported r e.g., 'Pentamma' had become 'Venkamma', 'Buchayya' had become' Lachayya'. Sometimes even a 'Savitri' had turned into a' Padmavati'. In some of these cases, it was found that the persons themselves were addressed by different names by different relatives. Again, a few cases were reported of households which had been entered not under the numbers allotted to their respective houses but under numbers allotted to their , Kottam' (Cattle Sheds) or 'Dukanam' (Shops) located next to or adjoining their·
, places of residence. A few cases were also reported of the house numbers being wrongly written without any similar extenuating circumstances. A few rare cases were reported of persons omitted from a sample household but entered under a household residing in an adjoining house, either because of the enumerator's oversight in entering the house and. household numbers on the enumeration slips and in the Register or because of. the close relationship existing between the two households concerned. A few cases of the entry under a sample household of persons belonging to a household residing in an adjoining house wherein they had not been entered, were also reported. All such cases w~re,. however, not taken account of, as they did not, in fact, constitute any under or overenumeration in the census count. A few cases were also reported of females having been entered as males and vice versa, thus upsetting not the total number in a household but the break-up of its member~ by sex. Sometimes such mistakes were due to confusing names. For example, in one case, the enumerator had -wrongly written Narsimma for Narsamma. It was quite easy in yokel twang to pronounce Narsamma as Narsimma. Perhaps the enumerator after completing his enumeration for the day, while scrutinizing his day's work may have' corrected' the entry of the sex of ' Narsimma ' in the slip from female to a male. Sometimes there was no such confusing background and the mistakes. had just happened. Such cases, however, were, all treated as constituting the omissionof a person belonging to one sex and the fictitious entry of a person belonging to the opposite sex, depending upon the ,nature of the error committed. * For purposes of census tabulation, Hyderabad State has been divided into two divisions namely the North Hyderabad' Division and the South HYderabad Division. The former consists of the districts of Aurangabad, Parbhani, Nanded, Bidar, Bhir and Osmanabad and the latter of Hyderabad, Mahbubnagar, Raichur, Gulbarga, Adilabad, Nizamabad, Medak Karimnagar, Warangal and Nalgonda.
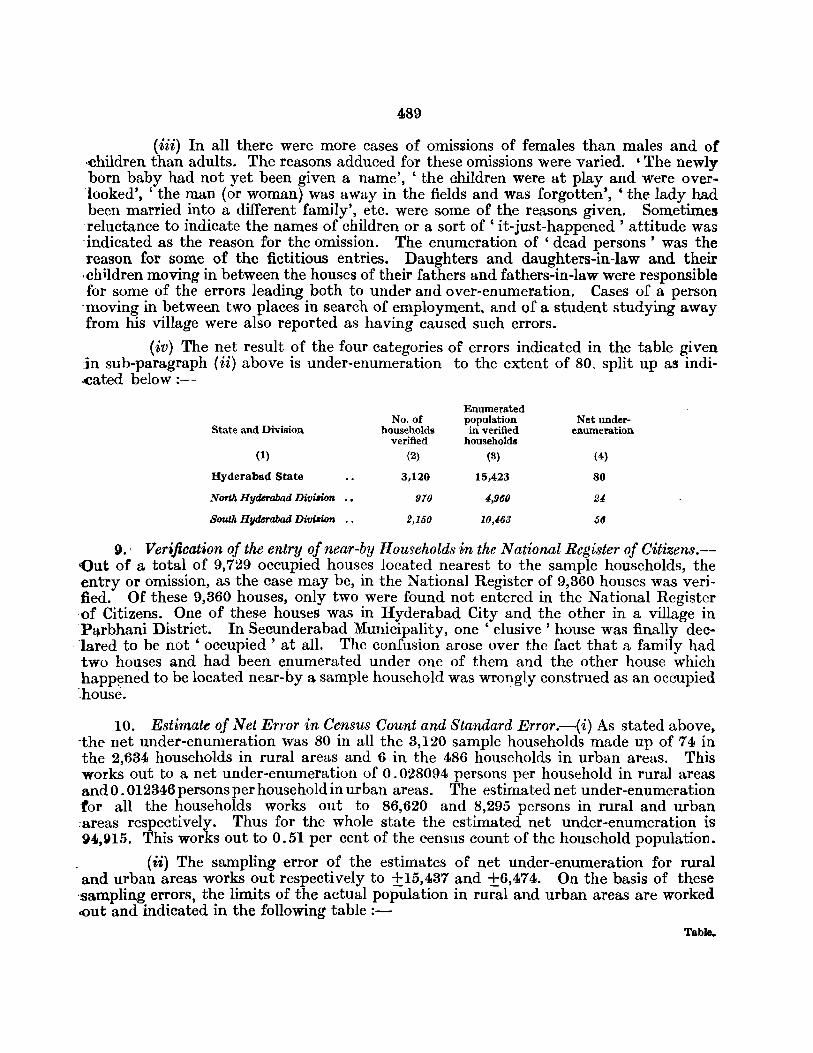
489
(iii) In all there were more cases of omissions of females than males and of -children than adults. The reasons adduced for these omissions were varied. 'The newly born baby had not yet been given a name', ' the children were at play and were over· looked', 'the man (or woman) was away in the fields and was forgotten', 'the lady had been married into a different family', etc. were some of the reasons given. Sometimes reluctance to indicate the names of children or a sort of ' it-just-happened ' attitude was indicated as the reason for the omission. The enumeration of ' dead persons' was the reason for some of the fictitious entries. Daughters and daughters-in-law and their -children moving in between the houses of their fathers and fathers-in-law were responsible for some of the errors leading both to under and over-enumeration. Cases of a person
-moving in between two places in search of employment. and of a student studying away from his village were also reported as having caused such errors.
(iv) The net result of the four categories of errors indicated in the table given in sub-paragraph (ii) above is under-enumeration to the extent of 80. split up as indi.cated below:-
Enumerated No. of population Net under-
State and Division households in verified enumeration verified households
(1) (2) (3) (4)
Hyderabad State 3,120 15,423 80
NorUi Hyderabad DivUion .. 970 4,9(10 21
South HlIderabad DiMon .. 2,150 10,463 5(1
9. I Verification of the entry of near-by Hougeholds in the National Register of Citizens.-'(Jut of a total of 9,729 occupied houses located nearest to the sample households, the entry or omission, as the case may be, in the National Register of 9,360 houses was verified. Of these 9,360 houses, only two were found not entered in the National Register ·of Citizens. One of these houses was in Hyderabad City and the other in a village in Parbhani District. In Secunderabad Municipality, one' elusive' house was finally dec'la~ed to be not' occupied' at all. The confusion arose over the fact that a family had two houses and had been enumerated under one of them and the other house which happ~ned to be located near-by a sample household was wrongly construed as an occupied .house.
10. Estimate of Net Error in Census Count and Standard Error.-(i) As stated above, -the net under-enumeration was 80 in all the 3,120 sample households made up of 74 in the 2,634 households in rural areas and 6 in the 486 households in urban areas. This works out to a net under-enumeration of 0 . 028094 persons per household in rural areas and 0.012346 persons per household in urban areas. The estimated net under-enumeration for all the households works out to 86,620 and 8,295 persons in rural and urban :areas respectively. Thus for the whole state the estimated net under-enumeration is g4,g15. This works out to 0.51 per cent of the census count of the household popUlation.
(ii) The sampling error of the estimates of net under-enumeration for rural and urban areas works out respectively to ±15,437 and ±6,474. On the basis of these ·sampling errors, the limits of the actual popUlation in rural and urban areas are worked <out and indicated in the following table :-
Table.
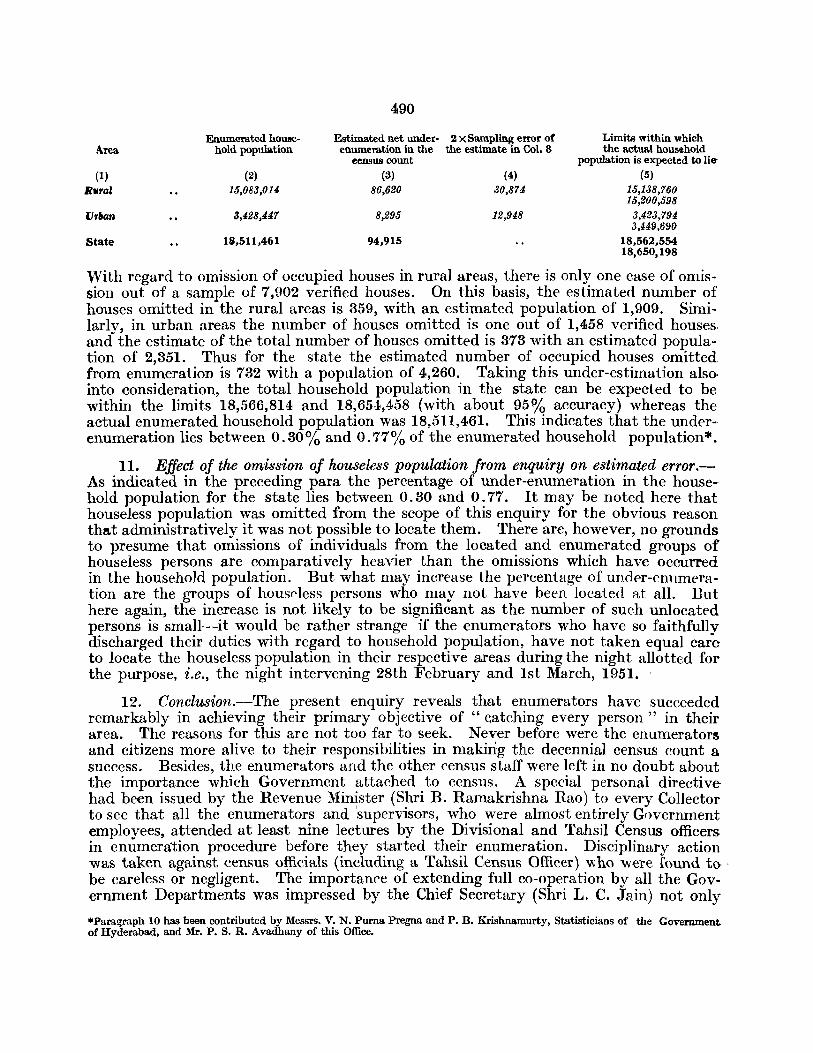
Enumerated house-Area hold population
(1) (2)
R"f'al 15,083,014
VTkn 3,428,447
State IS,511 ,461
490
Estimated net under- 2 X Sampling error of enumeration in the the estimate in Col. 3
eensus count (3)
86,620
8,295
94,915
(4) 30,874
12,948
Limits within which the actual household
population is expected to lie-(5)
15,138,760 15,200,598
3,423,794 3,449,691)
18,562,554 18,650,198
With regard to omission of occupied houses in rural areas, there is only one case of omission out of a sample of 7,902 verified houses. On this basis, the estimated number of houses omitted in the rural areas is 359, with an estimated popUlation of 1,909. Similarly, in urban areas the number of houses omitted is one out of 1,458 verified houses, and the estimate of the total number of houses omitted is 373 with an estimated population of 2,351. Thus for the state the estimated number of occupied houses omitted. from enumeration is 732 with a population of 4,260. Taking this under-estimation also into consideration, the total household popUlation in the state can be expected to be within the limits 18,566,814 and 18,654,458 (with about 95% accuracy) whereas the actual enumerated household popUlation was 18,511,461. This indicates that the underenumeration lies between 0.30% and 0.77% of the enumerated household population*.
II. Effect of the omission of house less population from enquiry on estimated error.-As indicated in the preceding para the percentage of under-enumeration in the household population for the state lies between 0.30 and 0.77. It may be noted here that houseless popUlation was omitted from the scope of this enquiry for the obvious reason that administratively it was not possible to locate them. There are, however, no grounds to presume that omissions of individuals from the located and enumerated groups of houseless persons are comparatively heavier than the omissions which have occurred in the household popUlation. But what may increase the percentage ,of under-enumeration are the groups of houspless persons who may not have been located at all. But here again, the increase is not likely to be significant as the number of such unlocated persons is smaIl--it would be rather strange if the enumerators who have so faithfullv discharged their duties with regard to household population, have not taken equal care to locate the houseless popUlation in their respective areas during the night allotted for the purpose, i.e., the night intervening 28th February and 1st Ma.rch, 1951. '
12. Conclusion.-The present enquiry reveals that enumerators have succeeded remarkably in achieving their primary objective of "c,atching every person" in their area. The reasons for this are not too far to seek. Never before were the enumerators and citizens more alive to their responsibilities in making the decennial census count a success. Besides, the enumerators and the other census staff were left in no doubt about the importance which Government attached to census. A special personal directive had been issued by the Revenue Minister (Shri B. Ramakrishna Rao) to every Collector to see that all the enumerators and supervisors, who were almost entirely Gnvernment employees, attended at least nine lectures by the Divisional and Tahsil Census officers in enumeration procedure before they started their enumeration. Disciplinary action was taken against census officials (including a Tahsil Census Officer) v;ho were found to- . be careless or negligent. The importance of extending full co-operation by all the Government Departments was impressed by the Chief Secretary (Shri L. C. Jain) not only
*Paragraph 10 has been contributed by Messrs. V. N. Purna Pregna and P. B. Krishnamurty, Statisticians of the Government of Hyderabad, and Mr. P. S. R. Avadhany of this Office.
491
through his circulars issued from time to time but also at a special conference of all Heads of Departments and senior officials convened by him for the purpose in the Assembly Hall. Further, repeated and intensive measures were adopted to see that every house in the state was numbered. Large amounts had been allotted to each. tahsil a year before the enumeration in order to improve upon the house-numbering done a few years earlier in the villages in connection with the preparation of the electoral rolls for the then proposed Constituent Assembly. Additional amounts were allotted for bringing housenumbering up-to-date just a month prior to enumeration. Due to the keen interest evinced by the Minister for Local Government (Shri Phoolchand Gandhi) in this regard, all the Municipalities in the state improved upon, and very often did afresh, the housenumbering in their respective areas. Mention may here be made particularly of the house-numbering done in Hyderabad and Secunderabad Municipalities at considerable cost. In Hyderabad Municipality an Executive Engineer (Shri Mohamad Hussain Khan) was specially deputed to divide the City into contiguous blocks and arrange for house-numbering on a scientific basis. In Secunderabad, which had formerly a single serial of house-numbering for the entire Municipality, the method of numbering houses by blocks and wards was introduced. Intensive pUblicity by various organisations and the co-operation of the leaders of various parties were among the factors which contributed to the success of the counting. The local press, the A.I.R. (more than 80 talks, features, etc., had been broadcast from A.I.R., Hyderabad, alone), the Information Bureau (which had also lent its vans for publicity), the Cinemas, the Boy Scouts Association, the Indian Conference of Social Workers, etc., all helped in the creation of census consciousness among the citizens on an unprecedented scale. In the past the practice in the state used to be the declaration of general holidays in connection with census enumeration. During the 1951 Census, however, this procedure was given up as it was felt that it would upset the tenor of normal life particularly in cities and towns, and increase the number of absentees and visitors. In lieu of these general holidays, far greater facilities than in the past were provided by Hyderabad Government to its employees working as enumerators, supervisors, etc., for the conduct of census work both before and during the enumeration period. These facilities included total exemption from office attendanee for five days. The actual inspection of enumeration work by ,the Ministers for Revenue and Local Government, the Departments most concerned with census enumeration, was another factor which helped in spurring the census staff to intensive work. Taken singly, nothing else, perhaps, contributed more to the low percentage of error in the count in Hyderabad and Secunderabad Municipalities than the aJmost daily inspection by the Minister for Local Government of census enumeration in the various wards of the City. These inspections were given wide pUblicity by the local press and this had a very healthy effect on enumeration in the state particularly in urban areas where people are newspaper-minded. It is, therefore, not at all surprising that the enquiry should indicate such a low percentage of error in the census count. It may incidentally be mentioned here that the difference between the provisional popula· tion figures for the state as announced on the basis of enumerator's totals and the final popUlation as announced after sorting and tabulation by the Census Office was the lowest on record in the state. It was only 2,144 for the final population figure of 18,655,108 as against 144,221 in 1941 for the final popUlation figure of 16,338,534. This small variation was a uniform feature of all the districts in the state.
Coleridge has described man as ' more than half of nature's treasure'. The Census Organisation can rest content that it has -given a reliable count of more than half of nature's treasure to its country.
57
ANNEXURE A
INSTRUCTIONS FOR FILLING THE SAMPLE VERIFICATION FORM
(Vide Paragraph 3 oj the Review m page 485)
1. Columns that will be filled by the Census Commissioner's Office.-·The headings on the top of the Form (Vide Enclosure 1 at page 495) and columns 2 to 5 of the form will be filled by the Census Commissioner's Office.
The number of the house (and in case of houses containing more than one household, the alphBbet distinguishing the pBrticular household) as well as the number of the household selected for verification will be entered in column 2 of the Form. These parti-culars will be copied out from the relevant portion of the National Register of Citizens. 'The tot~.l number of persons, the total number of males and the total number of females actually enumerated in the particular household will be entered in columns 3, 4 and 5 l'espectively of the Form, on the basis of the relevant entries in the concerned portion of the National Register of Citizens.
2. Principles which were specified for enumeration.--The Verification Officers may recall the following principles which had been laid down in P[l,rt I of the Instructions to Enumerators for determining the persons to be enumerated at each household;-
"3. (1) During the enumeration period of 20 days, starting right from the very first day, i.e., thc 9th February, 1951, you should visit every house in your village, or in your block or blocks, as the case may be. But remember that for purposes of
_ -census enumerBtion the term 'house' ineludes such places as hotels, hospitals, offices, mosques, temples, dargahs, d"1armashalas, serais, shops and godowns where human beings may be found or may ruide. In each house, starting with the head of the household, you should first enumerate everyone of the persons whom you find there and who is also normally resident in that house. If the head of the household (for definition of the head of household see para 1 (3) of Part III) normally resident'in that house is temporarily absent (Vide sub-para 2 below) you should first enumerate the head of the household by ascertp.ining requisite details from some responsible person of the same household or in the neighbourhood well acquainted with the head of the household. A person* is to be deemed as normally resident in a house if he uses that house as his normal sleeping place. It is immaterial whether the person takes his meals at that house or elsewhere, e.g., a hotel.
(2) You should then enquire whether there are any persons who, though normally resident in that house, are absent at the time you visit the house. If there are any such absentf'es, you should ascertain with regard to each of them as to when they left the hou;se and when they are expected to return. Do not enumerate an.y such absentee if he left the house before the 9th February, 1951 (corresponding to 9th Farwardi, 1360 F.) -and is not expected to come back to the house until after the sunrise on the 1st March, 1951 (corresponding to 1st Ardibehist, 1360 F.). You should enumerate all the rest of such absentees. The idea is that every person should be enumerated at his normal place ()f residence provided he stayed there at any time during the enumeration period. It does not matter if such a person is away frQm the house at the particular time you visit it. . '*Unless specifically mentioned to the contrary, the term 'person' (or' visitor' or' absentee " etc.) include. in thelle instructions a male or female, whether an inCant, child or adult. .
492
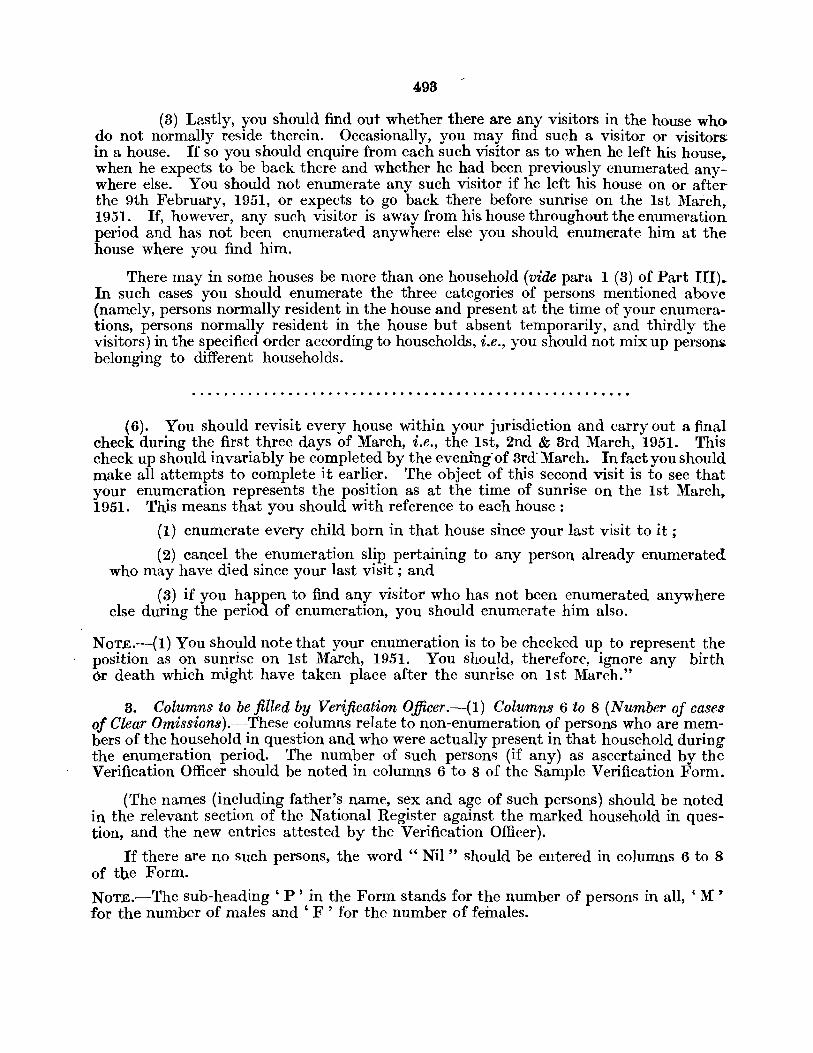
498
(3) Lastly, you should find out whether there are any visitors in the house who do not normally reside therein. Occasionally, you may find such a visitor or visitors: in a house. If so you should enquire from each such visitor as to when he left his house~ when he expects to be back there and whether he had been previously enumerated anywhere else. You should not enumerate any such visitor if he left his house on or afterthe 9th February, 1951, or expects to go back there before sunrise on the 1st March. 1951. If, however, any such visitor is away from his house throughout the enumeration period and has not been enumerated anywhere else you should enumerate him at the house where you find him.
There may in some houses be more than one household (vide para 1 (3) of Part III). In such cases you should enumerate the three categories of persons mentioned above (namely, persons normally resident in the house and present at the time of your enumerations, persons normally resident in the house but absent temporarily, and thirdly the visitors) in the specified order according to households, i.e., you should not mix up person~ belonging to different households.
(6). You should revisit every house within your jurisdiction and carry out a final check during the first three days of March, i.e., the 1st, 2nd & 3rd March, 1951. This check up should invariably be completed by the evenIng"of 3rd-March. In fact you should make all attempts to complete it earlier. The object of this second visit is to see that your enumeration represents the position as at the time of sunrise on the 1st March~ 1951. This means that you should with reference to each house:
(1) enumerate every child born in that house since your last visit to it ;
(2) cancel the enumeration slip pertaining to any person already enumerated who may have died since your last visit; and
(8) if you happen to find any visitor who has not been enumerated anywhere else during the period of enumeration, you should enumerate him also.
NOTE.--(l) You should note that your enumeration is to be checked up to represent the position as on sunrise on 1st March, 1951. You should, therefore, ignore any birth Or death which might have taken place after the sunrise on 1st March."
3. Columns to be filled by Verification Officer.-(l) Columns 6 to 8 (Number of cases of Clear Omissions).-These columns relate to non-enumeration of persons who are members of the household in question and who were actually present in that household during the enumeration period. The number of such persons (if any) as ascertained by the Verification Officer should be noted in columns 6 to 8 of the Sample Verification Form.
(The names (including father's name, sex and age of such persons) should be noted in the relevant section of the National Register against the marked household in question, and the new entries attested by the Verification Officer).
If there are no such persons, the word" Nil" should be entered in columns 6 to 8 of the Form.
NOTE.-The sub-heading' P' in the Form stands for the number of persons in all, ' M ' for the number of males and ' F ' for the number of feinales.
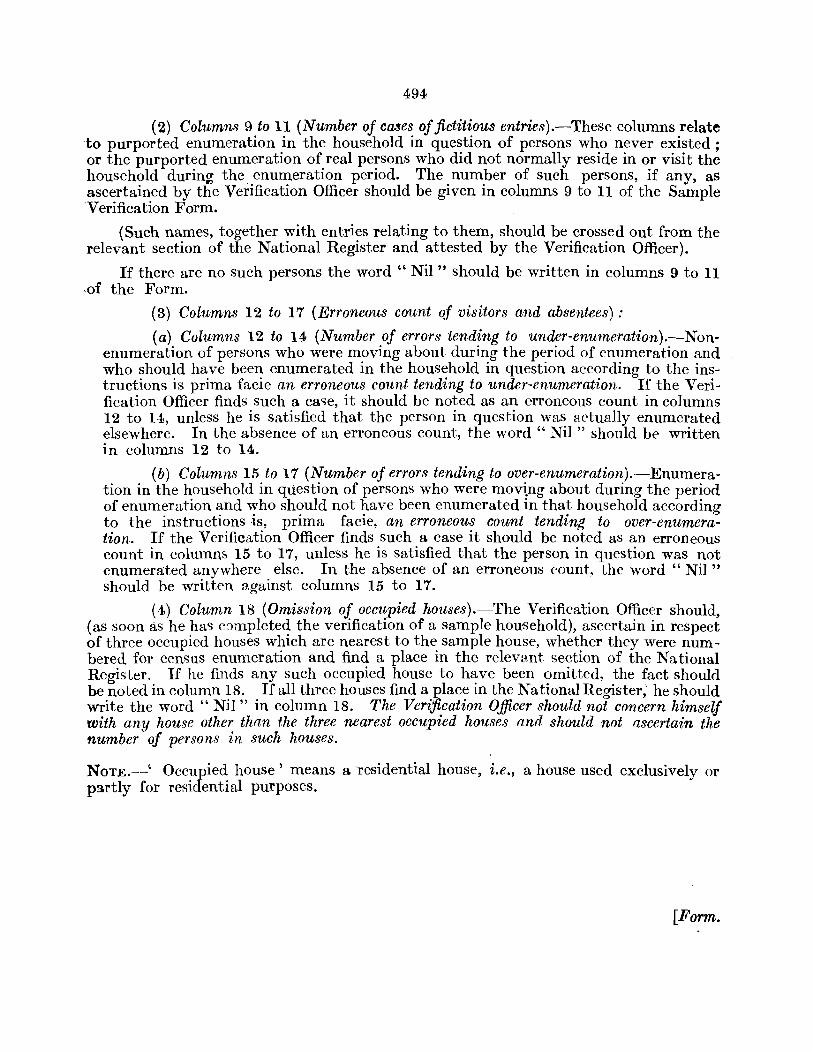
494
(2) Columns 9 to 11 (Number of CMes of fictitious entries).-These columns relate to purported enumeration in the household in question of persons who never existed; or the purported enumeration of real persons who did not normally reside in or visit the household during the. enumeration period. The number of such persons, if any, as ascertained by the Verification Officer should be given in columns 9 to II of the Sample Verification Form.
(Such names, together with entries relating to them, should be crossed out from the relevant section of the National Register and attested by the Verification Officer).
If there are no such persons the word" Nil" should be written in columns 9 to II ,of the Form.
(3) Columns 12 to 17 (Erroneous count of visitors and absentees):
(a) Columns 12 to 14 (Number of errors tending to under-enumeration}.--Nonenumeration of persons who were moving about during the period of enumeration and who should have been enumerated in the household in question according to the instructions is prima facie an erroneous connt tending to under-enumeration. If the Verification Officer finds such a ca~e, it should be noted as an erroneous count in columns 12 to 14, unless he is satisfied that the person in question was actually enumerated elsewhere. In the absence of an erroneous count, the word" Nil" should be written in columns 12 to 14.
(b) Columns 15 to 17 (Number of errors tending to over-enumeration).-Enumeration in the household in question of persons who were mov\ng about during the period of enumeration and who should not have been enumerated in that household according to the instructions .is, prima facie, an erroneons count tending to over-enumeration. If the Verification Officer finds such a case it should be noted as an erroneous count in columns 15 to 17, unless he is satisfied that the person in question was not enumerated anywhere else. In the absence of an erroneous count, the word " Nil" should be written 9.gainst columns 15 to 17.
(4) Column 18 (Omission of occupied houses).-The Verification Officer should, (as soon as he ha~ c~mpleted the verification of a sample household), ascertain in respect of three occupied houses which are nearest to the sample house, whether they were numbered for census enumeration and find a place in the relevant section of the National Register. If he finds any such occupied house to have been omitted, the fact should be noted in column 18. If all three houses find a place in the Na tional Register,' he should write the word" Nil" in column 18. The Verification Officer should not concern himself with any house other than the three nearest occupied houses and should not ascertain the number of persons in such houses.
NOTE.--' Occupied house' means a residential house, i.e., a house used exclusively or partly for residential purposes.
[Form.
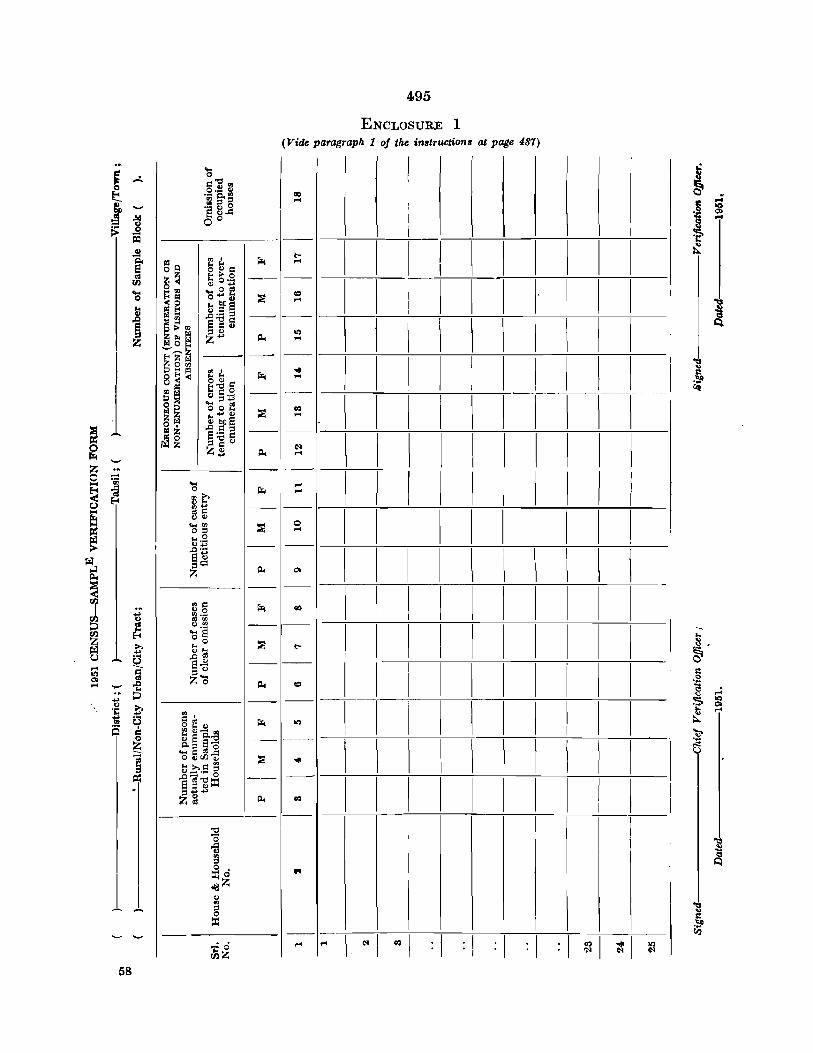
495
ENCLOSURE 1 (Vide paragraph 1 oj the instructions at page 487)
I I I I I ! \ \ I I I I
I I I I 1 1 I· I 1 I
\ \ I \ \ \ \ \ \ \
I I I I I I I I I I . I I \ \ \ \ \ I 1 1
I \ \ 1 1 1 1 \ 1 I - -
I I I I I I I I I I
I I I I I I I I I I I I I I II II \ \ \ \
.... ... 0 ~ ... .,~ ~~ - -~ ., ... '" ::tl 0 o ;:f ...
, t~ - -..o'~ st3 ;:fCl'l
Po. Q> Z -
\ \ I I I I I I I I
I I I I I I I I I I
I I I I I I I I I I
- -., ~
~ 00 '" 0 ,,>.~ <'l ., (.).~ - -'Eg
:::J to-~ ~ 'S~ - -;:f<:>
z'E Po. CI
I I I I I I I I I I - - -
\ II \ II \ II \ \ I \
I I I I I I I I I I I
I I
I'll
1 ~ .. I ~ I ~ I ·1 .! . . ~ '" ." I I . . . • 'N ~ ~
---- ----... I I I I I 58
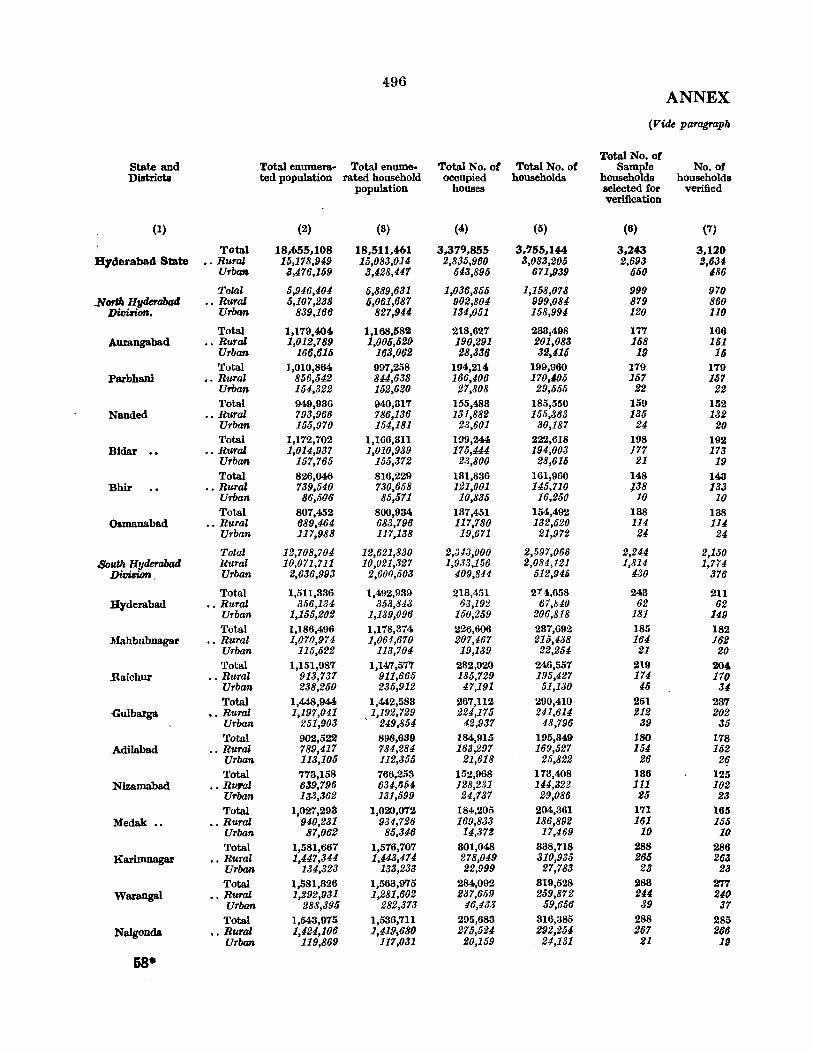
496 ANNEX
(Vide paragraph
Total No. ot State and Total enumera- Total enume- Total No. ot Total No. of Sample No. of Districta ted population rated household occupied households households households.
population houses selected for verified verification
(1) (2) (3) (4) (5) (6) (7)
Total 18.655.108 18.511.461 3.379,855 3.755,144 3.243 3,120 Byderabad State •• Rural 15,178,949 15,083,014 2,835,960 a,083,205 2,693 2,634
Urban 3,476,159 3,428,447 643,895 671,939 550 486
Total 5,946,404 5,889,631 1,036,855 1,158,078 999 9'10 .NortIa Hyderabad •• Rural 5,107,238 5,061,687 902,804 999,084 879 860
Division. Urban 839,166 827,944 134,051 158,994 120 110
Total 1,179,404. 1,168,582 218,627 233,498 177 166 Aurangabad •• Rural 1,012,789 1,005,520 190,291 201,083 168 161
Urban 166,615 163,062 S8,336 32,416 19 16 Total 1,010,864 997,258 194,214 199,960 179 179
Parbbani •• Rural 856,642 844,638 166,406 170,405 157 15'1 Urban 154,322 152,620 27,808 29,555 22 22 Total 949,936 940,317 155,483 185,550 159 152
Nanded " Rural 793,966 '186,136 131,882 155,363 135 132 Urban 155,9'10 154,181 23,601 30,18'1 24 20 Total 1,172,702 1,166,311 199,244 222,618 198 192
Bidal " Rural 1,014,937 1,010,939 1'15,444 194,003 177 173 Urban 157,765 155,372 23,800 28,615 21 19 Total 826,046 816,229 131,836 161,960 148 143
Bhir " Rural '139,540 730,658 121,001 145,710 138 133 Urban 86,506 85,571 10,835 16,250 10 10 Total 807,452 800,934 137,451 154,492 138 138
Osmanabad •• Rural 689,464 683,796 11'1,780 132,520 114 114 Urban 117,988 117,138 19,671 21,972 24 24
Total 12,708,704 12,621,830 2,343,000 2,597,066 2,244 2,150 -South Hyderabad Rural 10,071,711 10,021,327 1,933,156 2,084,121 1,814 1,774
Divi8'i.on , Urban 2,636,993 2,600,503 409,844 512,945 430 376
Total 1,511,336 1,492,939 213,451 27 4,658 243 211 Hyderabad •• Rural 356,134 353,843 63,192 67,840 62 62
Urban 1,155,202 1,139,096 150,259 206,818 181 149 Total 1,186,496 1,178,374 226,606 237,692 185 182
Mahbubnagar " Rural 1,070,974 1,064,670 207,467 'J15,438 164 162 Urban 115,522 113,704 19,139 22,254 21 20 Total 1,151,987 1,147,577 232,920 246,557 219 2040
Raichur " Rural 913,737 911,665 185,729 195,427 174 170 Urban 238,250 235,912 47,191 51,130 45 34 Total 1,448,944 1,442,583 267,112 290,410 251 237
Gulbarga •. Rural 1,197,041 1,192,729 224,175 241,614 212 202 Urban 251,903 ' 249,854 42,937 48,796 39 35 Total 902,522 896,639 184,915 195,349 180 178
Adilabad •• Rural 789,417 784,284 163,297 169,527 154 162 Urban 113,105 112,355 21,618 25,822 26 2~ Total 773,158 766,253 152,968 173,408 136 125
Nizamabad •. Rural 639,796 634,654 128,231 144,322 111 102 Urban 133,362 131,599 24,737 29,086 25 23 Total 1,027,298 1,020,072 184,205 204,361 171 165
Medak •• •• Rural 940,231 934,'126 169,833 186,892 161 166 Urban 87,062 85,3116 14,37~ 17,469 10 10 Total 1,581,667 1,576,707 801,048 838,718 288 286
Karimnagar •• Rural 1,447,344 1,443,474 278,049 310,935 265 263 Urban 134,323 133,233 22,999 2'1,783 23 23 Total 1,581,326 1,563,975 284,092 819,528 283 ?:'17
Warangal •• Rural 1,292,931 1,281,602 237,659 259,872 244 240 Urban 288,395 282,373 46,433 59,656 39 37
Total 1,543,975 1,536,711 295,683 816,385 288 285 Nalgonda •• Rural 1,424,106 1,419,680 275,524 292,254 267 266
Urban 119,869 117,031 20,159 24,131 21 19
58-
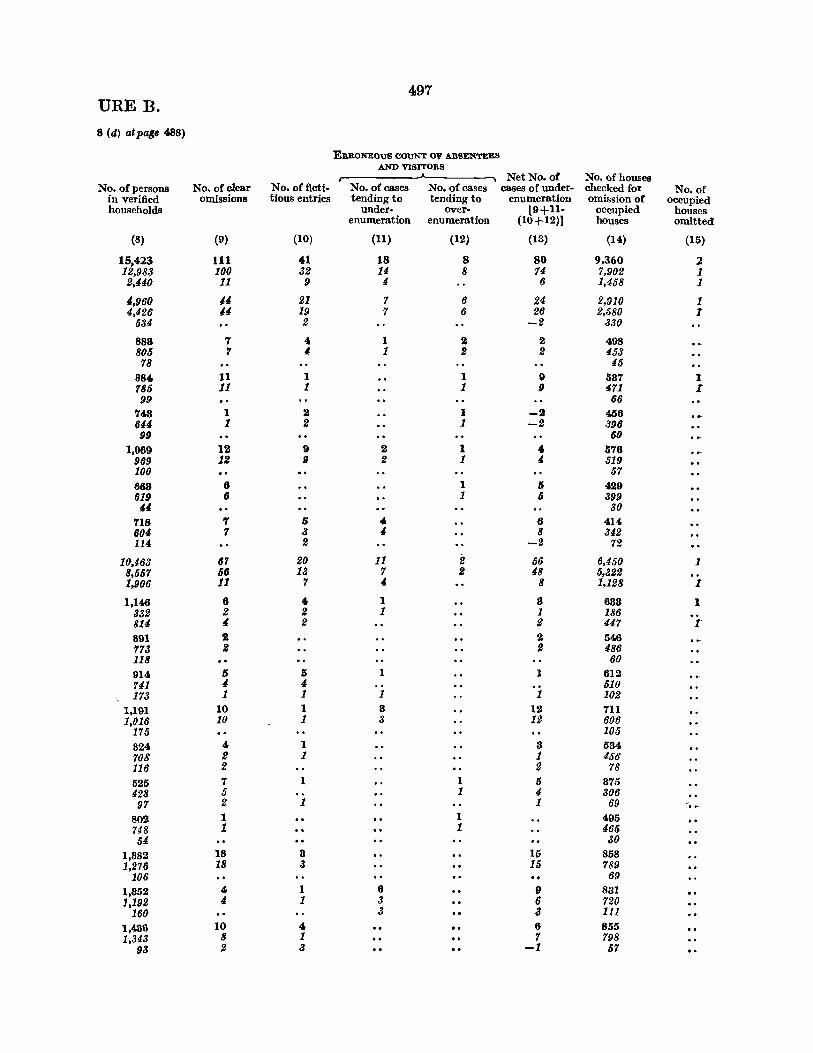
497 URE B.
8 (d) atpage 488)
ElUtONEOUS COUNT Ol!' ABSENTEES AND VISITORS
Net No. of No. of houses No. of persons No. of clear No. of ficti- No. of eases No. of eases eases of under- checked for No. of
in verified omissions tious entries tending to tending to enumeration omission of Occupied households under- over- [9+11- occupied houses
enumeration enumeration (10+12)] houses omitted
(8) (9) (10) (11) (12) (13) (14) (15)
15,423 111 41 18 8 80 9,360 2 12,983 100 32 14 8 74 7,902 1 2,440 11 9 4 6 1,458 1
4,960 44 21 7 6 24 2,910 1 4,426 44 19 7 6 26 2,680 1
534 2 -2 330
883 7 4 1 2 2 498 8(1) '1 4 1 2 2 453 78 45
884 11 1 1 9 587 1 785 11 1 1 9 471 r 99 66
'2'43 1 2 1 -2 456 644 1 2 1 -2 396 99 60
1,069 12 9 2 1 4 576 969 12 9 2 1 4 519 100 57 663 6 1 IS 429 619 6 1 6 399 44 80
'TI8 7 IS " 6 414 604 'I 3 4 8 342 114 2 -2 72
10,463 67 20 11 Z 56 6,450 1 8,557 66 13 7 2 48 5,322 1,906 11 'I 4 8 1,128 r 1,146 6 4 1 8 688 1
832 2 2 1 1 186 814 4 2 E 447 I" 891 2 2 546 773 2 2 486 118 60 914 [; IS 1 1 612 741 4 {, 510 173 1 1 1 1 102
1,191 10 1 8 12 711 1,016 10 1 3 12 608
175 105
824 4 1 8 584 708 2 1 1 456 116 2 2 78 525 7 1 1 IS 875 428 5 1 4 306 97 2 1 1 69 .. ~
802 1 1 495 748 1 1 465 54 30
1,882 18 8 15 858 1,276 18 .3 15 789
106 69 1,852 4 1 6 9 881 1,192 4 1 3 6 720
160 3 3 111 1,486 10 4 6 855 1,343 8 1 7 798
93 2 3 -1 57

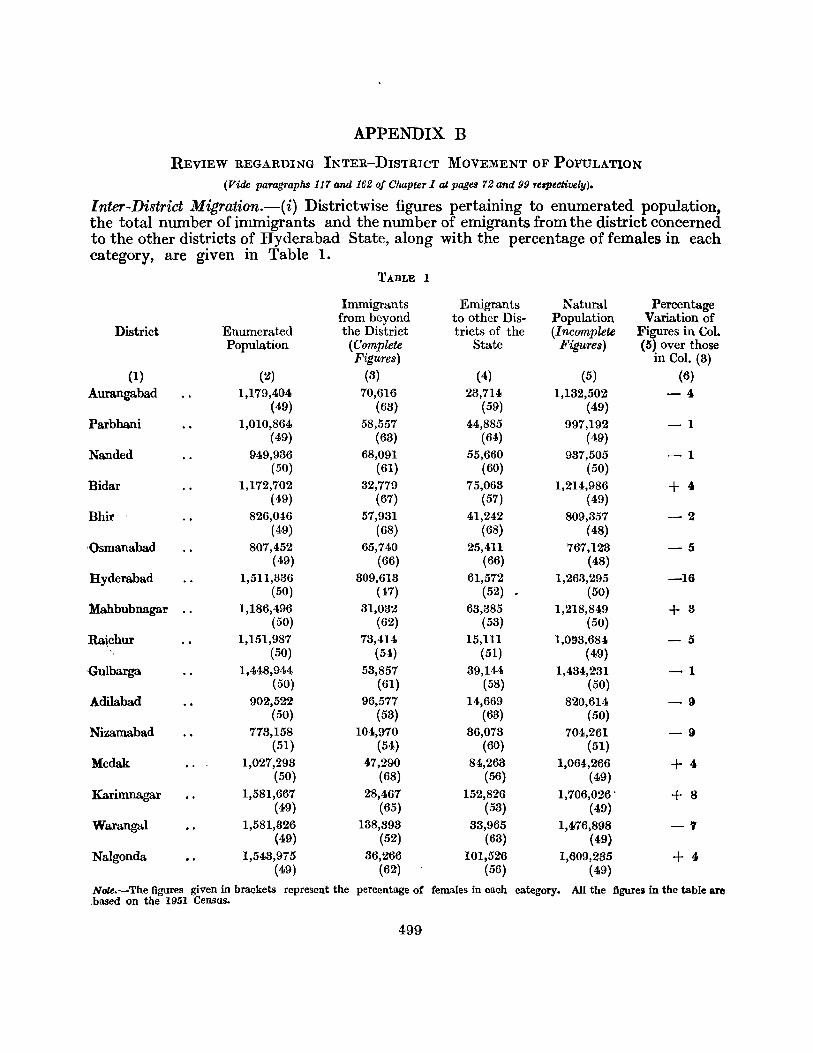
APPENDIX B
REVIEW REGARDING INTER-DISTRICT MOVEMENT OF POPULATION
(Vide paragraphs 117 and 162 of Chapter I at pages 72 and 99 re'pectively).
Inter-District Migration.-{i) Districtwise figures pertaining to enumerated population, the total number of immigrants and the number of emigrants from the district concerned to the other districts of Hyderabad State, along with the percentage of females in each category, are given in Table 1.
TABLE: 1
Immigrants Emigrants Natural Percentage from beyond to other Dis- Population Variation of
District Enumerated the District tricts of the (Incomplete Figures in Col. Population (Complete State Figures) (5) over those
Figures) in Col. (3)
(1) (2) (3) (4) (5) (6)
Aurangabad 1,179,404 70,616 23,714 1,132,502 -4 (49) (63) (59) (49)
Parbhani 1,010,864 58,557 44,885 997,192 -1 (49) (63) (64) (49)
Nanded 949,936 68,091 55,660 937,505 -1 (50) (61) (60) (50)
Bidar 1,172,702 32,779 75,063 1,214,986 + 4t (49) (67) (57) (49)
Bhir , 826,046 57,931 41,242 809,357 -2 (49) (68) (68) (48)
'Osmanabad 807,452 65,740 25,411 767,123 -5 (49) (66) (66) (48)
Hyderabad 1,511,336 309,613 61,572 1,263,295 -16 (50) (~7) (52) (50)
Mahbubnagar .. 1,186,496 31,032 63,385 1,218,849 + 3 (50) (62) (53) (50)
Ra~chur 1,151,987 73,414 15,111 1,093,684 -5 (50) (54) (51) (49)
·Gulbarga 1,448,944 53,857 39,144 1,434,231 -1 (50) (61) (58) (50)
Adilabad 902,522 96,577 14,669 820,614 -9 (50) (53) (63) (50)
Nizamabad 773,158 104,970 36,073 704,261 -9 (51) (54) (60) (51)
Medak 1,027,293 47,290 84,263 1,064,266 +4 (50) (68) (56) (49)
Karimnagar 1,581,667 28,467 152,826 1,706,026' + 8 (49) (65) (53) (49)
Warangal 1,581,826 138,393 33,965 1,476,898 -7 (49) (52) (63) (49)
Nalgonda 1,543,975 86,266 101,526 1,609,235 +4 (49) (62) (56) (49)
NOle.-The figures given in brackets represent the percentage of females in each category. .based on the 1951 Census.
AIl the figures in the table are
499
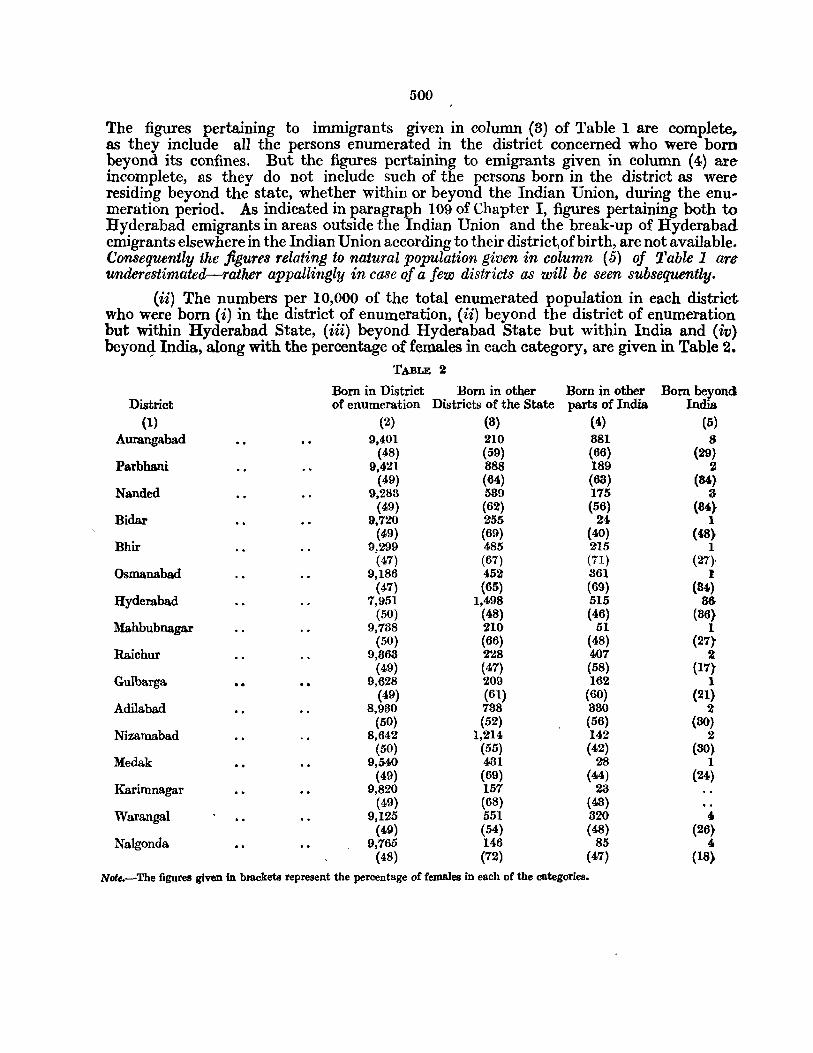
500
The figures pertaining to immigrants given in column (3) of Table 1 are complete~ as they include all the persons enumerated in the district concerned who were bom beyond its confines. But the figures pertaining to emigrants given in column (4) are incomplete, as they do not include such of the persons born in the district as were residing beyond the state, whether within or beyond the Indian Union, during the enu .. meration period. As indicated in paragraph 109 of Chapter I, figures pertaining both to Hyderabad emigrants in areas outside the Indian Union and the break-up of Hyderabad emigrants elsewhere in the Indian Union according to their district, of birth, are not available. Consequently the figures relating to natural population given in column (6) of Table 1 are urulerestimated-rather appallingly in case of a few districts as will be seen subsequently.
(ii) The numbers per 10,000 of the total enumerated population in each district who were born (i) in the district of enumeration, (ii) beyond the district of enumeration but within Hyderabad State, (iii) beyond Hyderabad State but within India and (iv) beyong. India, along with the percentage of females in each category, are given in Table 2.
TABLE 2
Born in District Born in other Born in other Born beyond District of enumeration Districts of the State parts of India. India.
(1) (2) (8) (4.) (5) Aurangaba.d 9,401 210 381 8
(48) (59) (66) (29) Parbhani 9,421 888 189 2
(49) (64.) (68) (84) Nanded 9,283 539 175 3
(49) (62) (56) (84o} Bidar 9,720 255 240 1
(49) (69) (40) (48) Bhir 9,299 485 215 1
(47) (67) (71) (27} Osmanabad 9,186 452 361 I
(47) (65) (69) (84) Hyderaba.d 7,951 1,498 515 86-
(50) (48) (46) (86} Mahbubnagar 9,738 210 51 1
(50) (66) (48) (27~ Raichur 9,363 228 407 2
(49) (47) (58) (17)-Gulbarga 9,628 209 162 1
(49) (61) (60) (21} Adilabad 8,930 738 330 2
(50) (52) (56) (30) Nizamabad 8,642 1,214 142 2
(50) (55) (42) (SO) Medak 9,540 431 28 1
(49) (69) (44) {24} Karimnagar 9,820 157 23
(49) (68) (43) Warangal 9,125 551 820 41
(49) (54) (48) (26) Nalgonda 9,765 146 85 4
(48) (72) (47) (IS}
Note.-The figures given in brackets represent the percentage of females in each of the categories.
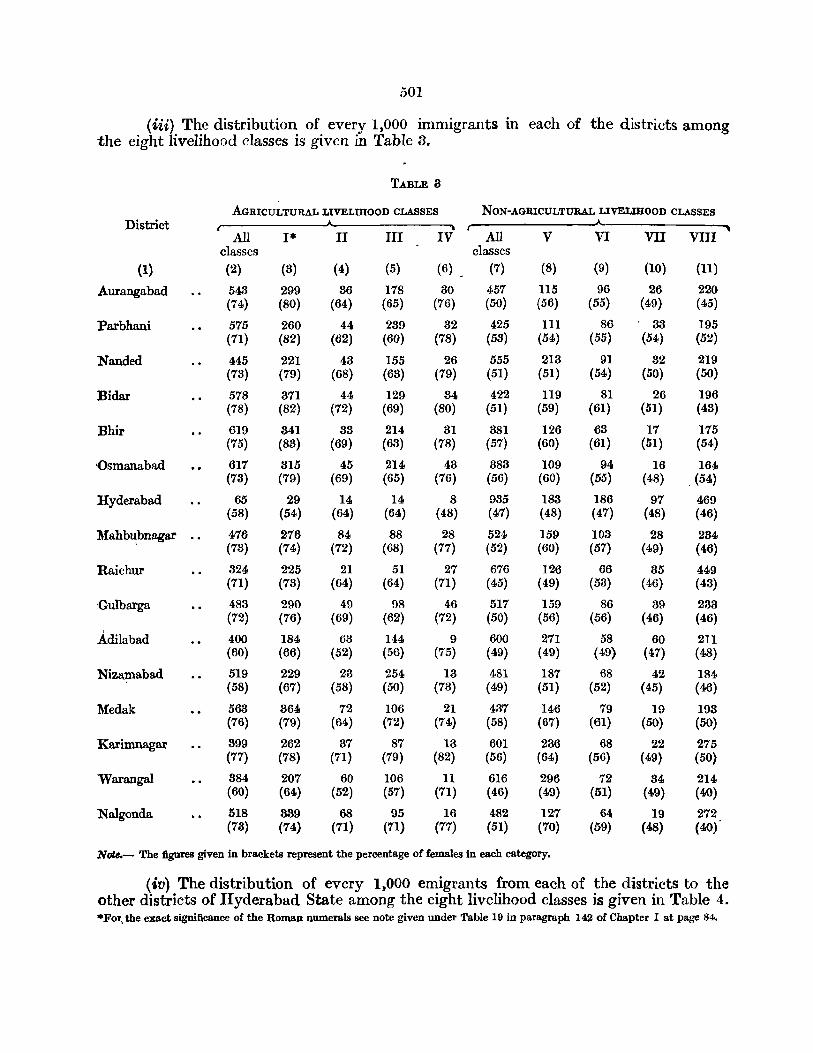

502
TABLE 4
AGRICULTURAL LIVELIHOOD CLASSES NON-AGRICULTURAL LIVELIHOOD CLASSES District ..;.__ -....
All "'I II III IV All V VI VII VIII classes classes
(1) (2) (3) (4) (5) (6) (7) (8) (9) (10) (11)
Aumngabad 871 176 27 146 22 629 181 85 46 811 (72) (83) (64) (61) (79) (50) (53) (57) (48) (48)
Parbhani 478 245 35 167 31 522 141 103 34 244 (75) (83) (68) (65) (75) (53) (56) (58) (49) (50)
Nanded 570 260 31 251 28 430 133 91 28 178 (66) (76) (62) (56) (72) (53) (55) (56) (50) (50)
Bidar 448 207 25 194 22 552 121 138 47 246 (67) (77) (65) (57) (70) (50) (54) (51) (48) (47)
Bhir 637 315 44 248 30 363 86 66 17 194 (74) (82) (68) (65) (77) (56) (64) (59) (52) (52)
Osmauabad 552 319 39 155 39' 448 124 83 16 225 (77) (82) (69) (69) (75) (53) (59) (55) (53) (48)
Hyderabad 189 96 33 47 13 811 192 90 91 438 (72) (76) (73) (65) (68) (47) (50) (53) (48) (44)
Mahbubnagar .. 248 121 48 65 14 752 128 78 79 461 (78) ~78) (67) (68) (66) (46) (54) (51) (45) (44)
Raichur 275 138 Hl 80 38 725 189 89 48 399 (62) (66) (60) (54) (67) (47) (52) (51) (48) (44)
,Gulbarga 348 201 46 70 31 652 146 125 49 332 (74) (78) (67) (66) (73) (50) (56) (52) (47) (47)
Adilabad 468 258 52 133 25 532 167 60 24 281 (72) (74) (66) (71) (74) (55) (62) (56) (44) (51)
Nizamabad 373 256 30 67 20 627 2'03 95 42 281 (75) (76) (71) (72) (74) (52) (55) (55) (47) (49)
lUedak 273 153 31 81 8 727 22'1 127 51 328 (71) (78) (71 ) (59) (65) (50) (52) (50) (48) (49)
Karimnagar 315 134 50 125 6 685 344 50 55 236 (61) (69) (52) (55) (67) (49) (50) (51) (47) (47)
Waraugal 350 229 36 75 10 650 22'0 80 73 277 (80) (82) (74) (76) (71) (54) (63) (55) _ (46) (48)
Nalgonda 329 159 57 105 8 671 200 97 73 301 (65) (72) (61) (57) (64) (51) (54) (52) (46) (49)
NQte.- The figures given in brackets represent the percentage of females in each category.
The position regarding the movement in respect of each of the sixteen districts of the state is explained in the following paragraphs.
2. Aural1gabad District.--94 per cent of the peop~e enumerated in this district were born within the district itself and 6 per cent beyond its confines. Thus, the pro-portion of immigrants in this district is relatively fairly large. Females account for 63 per cent of these immigrants. Over 81 per cent Of the immigrants are from adjoining areas, i.e., the districts of Bhir and Parbhani and the ~tates of Bombay and Madhya Pradesh, and the percentage of females among them exceeds 68--it is as high as 71 in the case of the Bombay immigrants. It is thus obvious that the dimemions of the movement "'For the exact significance of the Roman numerals see note given under Table 19 in para 142 of Chapter I at page 84.
503
care very largely due to marital alliances. But there is an appreciable amount of infiltration for other reasons as well. 38,352, or appreciably more than half the total number of immigrants in the district, are in Agricultural Classes, and the percentage of females among them is as high as 74. All but 919 of these immigrants. are from adjoining areas. On the whole, therefore, the movement in Agricultural Classes is predominantly the result of marital alliances. There are, however, some minor exceptions to this. In Ambad Tahsil, Bhir immigrants in appreciable numbers and Parbhani and Madhya Pradesh immigrants in small numbers have taken to agricultural labour. Besides, insignificant numbers of Bhir immigrants have taken to tenant cultivation and Madhya Pradesh immigrants to owner cultivation in this tahsil. In Vaijapur and Kannad-Khuldabad* Tahsils appreciable numbers of Bombay immigrants have taken to agricultural labour. In Jalna and Bhokardan-Jaffarabad Tahsils, small numbers of Madhya Pradesh immigrants have taken to agricultural labour. An insignificant number of these immigrants have also taken to tenant cultivation in the last two tahsils. Out of the total immigrants in this district, 32,264 are in Non-Agricultural Classes and the percentage of females among them is just 50. As man)' as 12,296 of these immigrants are from the non-adjoining areas and the percentage of females among them is even lower than 40. In rural areas, insignificant numbers of Bombay and Madhya Pradesh immigrants have infiltrated into occupations connected particularly with Production and Other Services and Miscellaneous Sources-the former in Vaijapur and Kannad-Khuldabad Tahsils, and the latter in J alna, Ambad and Bhokardan-Jaffarabad Tahsils. But in urban areas, especially in the two big towns of Aurangabad and Jalna, the infiltration in Non-Agricultural Classes is very heavy. Large numbers of Bombay, Madhya Pradesh, Hyderabad and Parbhani immigrants have taken to occupations connected with all the four NonAgriGultural Classes, the Hyderabad immigrants being particularly concentrated in Other Services and Miscellaneous Sources. Appreciable numbers of Bhir and Warangal and, to a smaller extent, Nanded and Nalgonda immigrants have also infiltrated, especially in the Livelihood Class of Other Services and Miscellaneous Sources. But as most of the Warangal and Nalgonda immigrants were prisoners or under trials in Jalna jail, their movement cannot be construed as representing any infiltration due to economic reasons. Small numbers of Karimnagar, Medak and Nizamabad immigrants have also taken to non-a~ricultural occupations in the towns of the district, especially to those connected with mdustrial activities-presumably mostly textile industries including handloom weaving. Appreciable numbers of Rajasthan and, to a smaller extent, Saurashtra'immigrants, have taken to commerce and allied occupations in these urban areas. A small number of Uttar Pradesh immigrants, representing mostly Government personnel temporarily deputed to the district from beyond the state, were also residing in the towns of Jalna and Aurangabad at the time of census enumeration .
...3. The number of emigrants from this district to the other districts within the state is 23,714, of whom 59 per cent are females. The two adjacent districts of Parbhani and Bhir account for 15,113 of the emigrants, females constituting 66 per cent of them. The other districts account for 8,601 of the emigrants, females forming only 45 per cent of them-4,771, or more than half of this number, are in the administrative, industrial, commercial and cultural metropolis of the state, namely Hyderabad City. 8791 of the emigrants from this district are in Agricultural Classes and females constit~te 72 per cent of them. All but a meagre number i.e., 699 of these emigrants in Agricultural Classes are in the adjoining districts. There is some minor infiltration of Aurangabad emigrants as agricultural labourers to Bhir and Nanded Districts, but on the whole *In case of the tahsils combined by hyphen in this Appendix, figures for immigrants were sorted and tabulatedjointly and are, therefore, not available separately for each of the tahsils involved.
504
their movement in Agricultural Classes is predominantly the result of inter-marriages. 14,928 of the emigrants are in Non-Agricultural Classes, of whom 7,021 are in the twoadjoining and 7,902 in the non-adjoining districts. Females constitute 56 per cent of the former and 46 per cent of the latter. The movement in Non-Agricultural Classes is relatively more influenced by economic reasons than marital alliances. Aurangabad emigrants have moved into rural areas of Bhir Tahsil in appreciable numbers in connection with the construction of the Bendsura Project. They have also taken, but in considerably smaller numbers, to activities connected with Production and Other Services and Miscellaneous Sources in the rural areas of Georai Tahsil and in the towns of Bhir District. They have further infiltrated in large numbers to activities connected with Production, Transport and Other Services and Miscellaneous Sources in the towns of Parbhani District. But their largest infiltration into non-agricultural occupations is in Hyderabad City, especially in occupations connected with Other Services and Miscellaneous Sources. Beyond these areas, their numbers are significant in Non-Agricultural Classes only in Nanded Town-particularly in the Livelihood Class of Production ..
c
4. The number of immigrants into this district from other districts in the state is 24,745, i.e., only slightly more than the 28,714 emigrants from the district to other areaswithin the state. These relatively small numbers of migrants, either way, are largely due to the location of the district in a corner of the state. Classwise, while the immigrants are more numerous in all Agricultural Classes and in the Livelihood Class of Other Services and Miscellaneous Sources, the emigrants are more numerous in all the other three Non-Agricultural Classes.
5. The natural popUlation of Aurangabad District will be considerably more than 1,182,502 as indicated in Table 1, if the emigrants to areas beyond the state are also taken into account. There are 12,881 and 15,842 Hyderabad emigrants in the two Bombay districts of East Khandesh and Nasik respectively, both of which border this district. The overwhelming majority of these emigrants must have, therefore, been drawn from Aurangabad District. Besides, Ahmednagar District, which borders Aurangabad as well as Bhir and Osmanabad Districts, and Buldana District which borders Aurangabad and to a lesser distance Parbhani District, contain 68,795 and 20,788 Hyderabad emigrants·respectively. A good portion o~ the emigrant~ in. t~e former and the major portion in the latter must have also mIgrated from thIs dIstrIct. Further, at least a few thousands ot the 147,208 Hyderabad emigrants residing in the districts of Bombay and Madhya Pradesh States which do not adjoin Hyderabad must have also been born in this district. In view of all this, the natural population of Aurangabad District is bound to be appreciably in excess of eyen its epumer~ted pop~]ation of 1,179,404.
6. Parbhani District.-94 per cent of the people enumerated in this district were born within its limits and 6 per cent beyond it. Thus, the proportion of immigrants in this district also is fairly large. Females form 68 per cent of these immigrants. Almost 88 per cent of these immigrants are from the adjoining areas, i.e., from Madhya Pradesh and the districts of Nanded, Bhir, Aurangabad and Bidar, and over 67 per cent of these immigrants frOID the adjoining areas are females. It is thus obvious that the movement into this district also is very largely influenced by inter-marriages. There are, however, many noticeab!e cases of I?igrati?n for other reasons as well. 83,697, or about 58 per cent of the immIgrants, are In AgrIcultural Classes and females account for 71 per cent of them. All but 1,021 of these immigrants are from adjoining areas. On
505
the whole the movement into Agricultural Classes is, therefore, predominantly the result .of marital alliances. In Gangakhed Tahsil, Nanded, Bidar and Bhir immigrants; in Parbhani Tahsil, Nanded immigrants; and in Hingoli Tahsil, Madhya Pradesh immigrants, all in some numbers, have taken to agricultural labour. In Pathri-Partur Tahsils, Bhir immigrants in some numbers and a small number of Aurangabad and Madhya Pradesh immigrants have taken again to agricultural labour., In Kalamnuri Tahsil, a negligible number of Nanded immigrants have taken to tenant cultivation and equally insignificant numbers of Madhya Pradesh immigrants have taken both to tenant cultivation and agricultural labour. These represent almost all the marked cases of infiltration into the district in Agricultural Classes for economic reasons. 24,860 or about 42 per cent of the immigrants in the district are in Non-Agricultural Classes and of these 9,008, or appreciably more than one third of the number, are from non-adjoining areas. The percentage of females among all these immigrants in Non-Agricultural Classes is 53-while it is roughly 60 among those from the adjoining areas, it is only 43 among those from the non-adjoining. Thus, both economic reasons and marital alliances seem to be the major forces influencing the movement into the Non-Agricultural Classes. Madhya Pradesh immigrants have taken to activities connected both with Production and Other Services and Miscellaneous Sources in the rural areas of Partur-Pathri, ;Hingoli and Kalamnuri Tahsils in negligible numbers. Bhir immigrants have taken to activities connected with Other Services and Miscellaneous Sources in small numbers in the rural areas of Gangakhed and in almost negligible numbers in the rural areas of ParturPathri Tahsils. In urban areas, large numbers of Aurangabad and smaller fnumbers of Madhya Pradesh, Nanded and Bhir immigrants have taken to~activities connected .with all the four Non-Agricultural Livelihood Classes. Hyderabad immigrants have also infiltrated in some numbers, particularly in the Livelihood Classes of Transport (mostly in the railway establishment at Purna) and Other Services and Miscellaneous Sources (mostly in Government Offices) in the towns of the district. Appreciable numbers of Karimnagar immigrants have also infiltrated, particularly into the Livelihood Classes of Production and Other Services and Miscellaneous Sources, in the urban areas of the district. This infiltration reflects the tendency in the Telugu districts to migrate to Marathi and Kannada areas and to take particularly to occupations connected with textile industries (including handloom weaving) and to unspecified labour and domestic service. Bidar and Nizamabad immigrants have also infiltrated in negligible numbers especially in occupations con:Q,ected with Other Services and Miscellaneous Sources. As in the case of Aurangabad District, migrants from Rajasthan and Saurashtra are fairly prominent in the towns of this district also in commercial ... occupations.
7. The number of emigrants from this district to the other districts of the state is 44,885, of whom 64 per cent are fem'lles. The four adjacent districts account for 37,062 of those emigrants of whom 67 per cent are females. Of the rema.ining 7,823 in the non-adjacent districts, Hyderabad City accounts for 3,883, or about half the number, and an additional 900 are in the towns of Nizamabad District and 534 in the towns ,of Osmana.bad District. 21,447, 07 48 per cent of the emigrants from the district, are in Agricultural Classes and fem'lles constitute 75 per cent of them. All but 1,353 of these emigrants in Agricultural Classes are in adjoining districts. Parbhani emigrants have taken in small numbers to agricultural labour in Hadgaon Tahsil of Nanded District, Manjlegaon and Mominabad Tahsils of Bhir District and, in larger numbers, in Ambad Tahsil of Aurangabad District. They have also infiltrated in insignificant numbers as
506
tenant cultivators in Hadgaon and Ambad Tahsils. Apart from these perceptible cases, the movement in Agricultural Classes is almost exclusively influenced by marital alliances. 23,438, or 52 per centof the emigrants from this district, are in Non-Agricultural Classes and females constitute 53 per cent of them. 16,968 of these emigrants are in the adjoining and 6,470 in the non-adjoining districts, of whom 56 and 46 per cent respectively are females. Both marital alliances and economic factors seem to be influencing the movement, the former perhaps being slightly more in operation. Parbhani emigrants have infiltrated in insignificant numbers, mainly in occupations connected with Production and Other Services and Miscellaneous Sources, in the rural areas of Bhir, Manjlegaon and Mominabad Tahsils of Bhir District and in Hadgaon Tahsil of Nanded District. Of the Parbhani emigrants in the Non-Agricultural Classes, 4,709 are concentrated in Nanded Town and 3,672 in Hyderabad City-the largest number being, in. the case of the former,
. in the Livelihood (lass of Production, and in the case of the latter, in Other Services and Miscellaneous Sources. These two urban units account for more than one third of the Parbhani emigrants in non-agricultural classes. Large numbers of Parbhani emi~ grants have infiltrated into non-agricultural occupations in the urban areas of Auran~ gabad and Bhir Districts, and to a considerably smaller extent in Nizamabad District.
8. 44,885 persons have emigrated from this district to the other districts of the state, as against 39,223 persons who have immigrated into this district from the latter areas. This excess of emigrants over the immigrants, which is very largely the result of the balance of the movement between Parbhani on the one hand and Nanded, Aurangabad and Hyderabad Districts on the other, is spread over all the livelihood classes, except that of Agricultural Labour wherein the immigrants are appreciably more numerOus than the emigrants. This is largely due to the movement of agricultural labourers to the fertile tahsil of Gangakhed.
9. As is obvious, the above analysis ignores Parbhani emigrants in Madhya Pradesh and other parts of India-dis~rictwise break-up of the emigrants from Hyderabad State not being available. There are 12,141 Hyderabad emigrants in the Madhya Pradesh district of Akola which borders only Parbhani among the districts of this state. The overwhelming majority of these emigrants must have migrated from Parbhani. Besides, there are about 20,783 Hyderabad emigrants inBuldana District, which bordyrs Aurang~ abad and to a smaller distance this district as well and 28,599 in Yeotmal District, which runs along Adilabad and Nanded Districts to an appreciable distance and this district also for a couple of miles. A fair proportion of these numbers must have also moved out from Parbhani. Again, of the 8,127 emigrants from Hyderabad State residing in the non-adjoining districts of Madhya Pradesh, some must have been drawn from this district. Thus, the natural population of Parbhani District is appreciably more than 997,192 as indicated in Table 1. In fact, it is bound to be appreciably in excess of even its enumerated population of 1,010,864.
10. Nanded District.-93 per cent of the'"people enumerated in this district were born within the district and 7 per cent beyond its confines. Thus, the proportion ofimmigrants is fairly large in this district as well. Females account for 61 per cent of these immigrants. This is the l?w~st percentage recorded. by females am?ng the immigrants in all the north-western dIstrIcts of the state. Agam, 50,232, or slIghtly less than 74 per cent of these immigrants, were born in adjoining areas, i.e., the districts of Parbhani,.
507
Nizamabad, Bidar and Adilabad and the state of Madhya Pradesh. This is again a remarkably low proportion. Of these immigrants, females account for 66 per cent. 17,85~ or about 26 per cent of the total immigrants in the district, were born in non-adjoining areas. The percentage of females among these immigrants is as low as 46. These figures make it obvious that both marital alliances and economic factors are the major factors· influencing the movement, the former being slightly more operative. 80,275, or only about 44 per cent of the immigrants are in Agricultural Classes, of whom 78 per cent are females. All but 2,500 of these immigrants are from adjoining areas. It is thus quite clear that infiltration into this district for economic reasons is not very much in evidence in Agricultural Classes. In Hadgaon Tahsil, some Madhya Pradesh immigrants, a small number of Parbhani immigrants and a negligible number of Adilabad immigrants have taken to agricultural labour. Besides, a small number of the Madhya Pradesh and an insignificant number of the Parbhani immigrants have also taken to tenant cultivation in. the tahsil. In Deglur-Mukhed Tahsils some Bidar immigrants and in BhokarMudhol Tahsils a negligible number of Nizamabad immigrants have taken to agricultural labour. In Bhokar-Mudhol Tahsils very small numbers of Karimnagar immigrants have taken both to agricultural labour and owner cultivation. These are the only perceptible cases of infiltration for economic reasons. 37,816, or as many as 56 per cent of the immigrants are in Non-Agricultural Classes, and the percentage of females among them is only 51. Of these immigrants, as many as 15,359 are from non-adjoining areas of whom females constitute only 45 per cent. It is thus obvious that the migration into the district for economic reasons is preponderantly confined to Non-Agricultural Classes. In so far as rural areas are concerned, small numbers of Madhya Pradesh and a negligible number of Parbhani immigrants have infiltrated into occupations connected with Other Services and ,Miscellaneous Sources in Hadgaon Tahsil. A few of the former have also taken to activities connected with Production in the tahsil. In Deglur-Mukhed Tahsils, a few of the Bidar immigrants have taken to professions connected with Other Services and Miscellaneous Sources. In Bhokar-lVIudhol Tahsils, Nizamabad immigrants in small numbers and Karimnagar immigrants in negligible numbers have taken to occupations connected with Other Services and Miscellaneous Sources and Karimnagar immigrants 'in small numbers and Nizamabad immigrants in negligible numbers to industrial avocations. But in urban areas such infiltration is particularly heavy. The weaving mills, th,e numerous cotton ginning and pressing factories, the other miscellaneous large scale industrial establishments, like oil mills and beedi factories, the prosperous markets of Nanded, Umri, Bhainsa, Dharmabad, etc., have all attracted large numbers of immigrants. In Nanded Town, almost 30 per cent of the total population and 37 per cent of those in the Livelihood Class of Production, are immigrants. In the urban areas of the district, very large numbers of immigrants from Parbhani, fairly large numbers from Madhya Pradesh, Hyderabad and Nizamabad, and appreciable numbers from Karimnagar, Bidar, Medak, Bombay State, Aurangabad, Madhya Bharat, and small numbers from Bhir have taken to various non-agricultural occupations, especially those connected with Production and Other Services and Miscellaneous Sources. Rajasthan and Saurashtra immigrants are fairly prominent in this district also in occupations connected with Commerce. A few immigrants from Punjab State are als0 concentrated in Nanded Town because of its importance to the Sikhs as a holy centre.
11. The number of emigrants from this district to the other districts of the state ·is 55,660 of whom over 60 per cent ar~ females. 46,924 of these emigrants are residing in ,the adjoining and 8,736 in the non-adjoining districts, the percentage of females among 'them being 63 and 48, respeC'tively. Nizamabad District itself accounts for .22,564, Qr
59
508
nearly half of the number, and the percentage of females among them is relatively as low as 58. Adilabad)listrict accounts for 6,765 of the emigrants, of whom females accoun' for 60 per cent. But the other two adjoining districts of Parbhani and Bidar together account for 17,595 of these emigrants amongst whom the percentage of females is as high as 71. Of the 8,736 emigrants in the non-adjoining districts, 4,222 are concentrated in Hyderabad City. These figures make it obvious that while the emigration from this district to Parbhani and Bidar is predominantly influenced by marital alliances, that to the non-adjoining areas within the state and Nizamabad and Adilabad Districts, in the order mentioned, is considerably influenced by economic factors. 31,706, or 57 per cent of the total emigrants from Nanded District to other areas within the state, are in Agricultural Classes, 66 per cent of whom are females. 9,378 of these emigrants are in Parbhani and 3,329 in Bidar Districts, 71 per cent of the former and 80 per cent of the latter being females. This migration is almost wholly due to marital alliances, except for some of the Nanded emigrants who have taken to agricultural labour in Parbhani and Gangakhed Tahsils. Nanded emigrants have also infiltrated in small numbers as owner cultivators and agricultural labourers in the sparsely popUlated areas of Adilabad Revenue Sub-division which adjoins Nanded District. A few of them have also taken to tenant cultivation in this area. But Nanded emigrants have taken to agricultural labour in very large numbers in the irrigated zones of Nizamabad District. 13,520 of the Nanded emigrants to Nizamabad District are in Agricultural Classes, 62 per cent of whom are females. Again, of this number, 7,207 are in the Livelihood Class of Agricultural Labour of whom only 54 per cent are females. This infiltration as agricultural labourers is more or less confined to Bodhan and Banswada Tahsils, wherein a few of the emigrants have also taken to tenant cultivation. The infiltration of Nanded emigrants in Agricultural Classes in other areas is microscopic. 23,954 or only 43 per cent of the total number of Nanded emigrants, are in Non-Agricultural Classes, of whom 53 per cent are females. Of these emigrants~ 16,382 are in the adjoining districts of whom females constitute 55 per cent. 9,044, or more than half of these emigrants are in Nizamabad District, only 51 per cent of them being females. 7,572 are in the non-adjoining districts of whom 47 per cent are females. The Nanded emigrants have taken in very large numbers to non-agricultural occupations in the urban units of Nizamabad District, especially in Nizamabad and Bodhan Towns and in the rural areas of Bodhan-Banswada Tahsils. Their numbers are especially marked in occupations connected with Commerce in Nizamabad Town and in those connected with Production in Bodhan Town. The Nanded emigrants have also taken in very large numbers to non-agricultural occupations in Hyderabad District, that is Hyderabad City, especially in occupations connected with Commerce and Other Services and Miscellaneous Sources. They have also taken in small numbers to non-agricultural occupations, especially to those connected with Other Services and Miscellaneous Sources, in the urban areas of Parbhani District. Some of them have also infiltrated into the rural areas of Nirmal Revenue Sub-division of Adilabad District in non-agricultural occupations, perhaps, mainly due to the Kadam Project under construction.
12. The immigrants to this district from other areas within the state number ..51,142 and the emigrants from the former to the latter 55,660. This excess of emigrants over the immigrants is confined to the Livelihood Classes of Owner Cultivation, Agricultural Labour, Absentee Landlordism and Commerce and is especially marked in Agricultural Labour. Broadly, Nanded])istrictgainsappreciablyinnumbersinthemovem ent between the district on the one hand and the western and south-western districts of Parbhani and Bidar on the other, but it loses considerably more in the movement between· the district on the one hand and the eastern districts of Adilabad and Nizamabad on the other.
59*

509
13. The natural population of this district as indicated in Table 1 is 987,505 as against the enumerated population of 949,986. But in this estimate of the natural population, no .acc?un~ h3:s been taken of the emigrants from the district to areas beyond the state. ThIs dIstrIct IS bounupd on the north by the Madhya Pradesh district of Yeotmal which contains 28,599 Hyderabad emigrants. But Yeotmal District also runs along the northern borders of Adilabad District for a considerable distance and Parbhani District for some distance. Thus, only a fair portion of the Hyderabad emigrants in Yeotmal District would have been born in Nanded District. Further, there are no grounds to presume that the number of Nanded emigrants beyond Yeotmal District is very large. In view of all this, it can, at best, be presumed that the natural population oJ Nanded District is in excess of its enumerated population of 949,986 only to an insignificant extent.
14. Bidar District.-As many as 97 per cent of the people enumerated in this district were born within its limits and only 8 per cent beyond its confines. Thus, the proportion of immigrants in this district to the total enumerated population is small. And further, of these immigrants females form almost 67 per cent. About 80 per cent of these immigrants are from the adjoining districts of Gulbarga, Osmanabad, Nanded, Medak, Parbhani, Bhir and Nizamabad and 73 per cent of them are females. It is, therefore, obvious that not only is the proportion of immigrants to the total population of the district small, but the movement of a predominant number of the migrants was influenced by marital alliances. 18,988, or 58 per cent of the immigrants, are in Agricultural Classes and as many as 78 per cent of them are females. All but 1,182 of them are from' the adjoining districts. The only perceptible cases of infiltration into Agricultural Classes are of a few Gulbarga immigrants into Humnabad Tahsil and of some Osmanabad and of a few Nanded immigrants into Ahmedpur-Nilanga Tahsils, all as agricultural laboUrers. 13,841, or only 42 per cent of the immigrants, are in Non-Agricultural Classes of whom only 51 per cent are females. 8,259 of these immigrants are from the adjoining districts, 8,188 from the rest of the state and 2,899 from beyond the state. Females account for 60, 40 and 35 per cent respectively of these immigrants. Thus, the migration into this district for economic reasons, which is only on a very minor scale, is for
\ all practical purposes confined to Non-Agricultural Classes. The only perceptible caies of infiltration into rural areas in Non-Agricultural Classes are of a few Madras, Bombay, Uttar Pradesh and Hyderabad immigrants in Bidar Tahsil, almost all of whom were poliGe and other service personnel temporarily deputed to the district; and a few Osmanabad immigrants in the Livelihood Classes of Production and Other Services and Miscellaneous Sources in Ahmedpur-Nilanga Tahsils. In urbrl,ll areas of the district, some Hyderabad and Gulbarga immigrants, small numbers of Medak and Bombay immigrants and a few Osmanabad immigrants had infiltrated into non-agricultural occupations. Those from Hyderabad and Bombay were mostly in Other Services and Miscellaneous Sources and consisted chiefly of Government employees-the latter being in the district only temporarily. The infiltration from other areas is too insignificant to merit any specific mention. The 19 Coorg immigrants in the district were all attached to the Police Training School in Bidar Town.
15. The number of emigrants from this district to other areas within the state is as much as 75,068, of whom females constitute 57 per cent. Arr:ong the districts of this state, only three others, namely Karimnagar, Nalgonda and Medak Eent out larger numbers of emigrants. The number of emigrants from this district to areas beyond the state is not likely to be impressive although, of late, a movement from the district to
.no
vorious industrial centres in Bombay State, particularly t·) Sholapur City, is becoming fairly perceptible. Anyway, there is no gainsaying the fact that the number of -emigrants from this district, irrespective of the places to which they have migrated, is comparatively \ ery large. In addition to the industrial backwardness of the district the recent abolition of the large feudatory estates in the district is also responsible to .an extent for the present scale of emigration. These estates used to provide employment for appreciable numbers of persons belonging to a particular community and drawn from Hyderabad City and other areas, both in administrative establishments and in avocations capable of being encouraged by administrative authorities. But many of such migrants, their dependants and descendants, have now emigrated from the district, especially t') Hyderabad City. Of the emigrants from Bidar District, 51,515 are in the seven bordering districts and 23,548 in the rest of the state, females constituting 63 and 46 per cent of them respectively. Of the emigrants in the non-adjoining districts of the state, 21,503, or the overwhelming majority, are in Hyderabad District (mostly in Hyderabad City)--among all the emigrants to Hyderabad District from other districts of the state which do not border it, the number of Bidar emigrants is surpassed by only that of Karimnagar emigrants. The emigration from Bidar District to the neighbouring districts is very largely influenced by inter-marriages but that to the non-adjoining districts is due to a large extent to economic and other reasons. 33,652~ or only 45 per cent of the emigrants, are in Agricultural Classes, of whom 67 per cent are females. All but 1,254 Df these emigrants are in the adjoining districts. In spite of the fact that this emigration is very largely only a 'marriage migration', there are some very significant cases of emigration due to economic reasons as well. A large number of Bidar emigrants in Mominabad Tahsil of Bhir District, Bodhan-Banswada Tahsils of Nizamabad District and in LaturOwsa Tahsils of Osmanabad District, appreciable numbers in Deglur-Mukhed Tahsils of Nanded District and Gangakhed Tahsil of Parbhani District, and rather insignificant numbers in Osmanabad-Parenda and Omerga Tahsils of Osmanabad District, and Sangareddy and Andol Tahsils of Medak District, have taken to agricultural labour. A few of them have also taken to tenant cultivation in Latur-Owsa Tahsils. There are a few Bidar emigrants in Agricultural Classes even in Hyderabad City and nearby important towns like those of Gulbarga, Nanded, Latur, etc. But these erttigrants represent either agriculturists from Bidar with some subsidiary interests in these urban areas or their dependants sent for prosecution of studies. 41,411, or 55 per cent of the Bidar emigrants, are in Non-Agricultural Classes of whom 50 per cent are females. Of these emigrants, 19,117 are in the adjoining and 22,294 in the non-adjoining districts, females constituting 53 per cent of the former and 46 per cent of the latter. Of the latter, as many as 20,141 are in Hyderabad City itself. Marital alliances play only a secondary role in this emigration. Bidar emigrants, literally in their thousands, have taken to various non-agricultural occupations in Hyderabad District, in other words Hyderabad City. They have also infiltrated in various non-agricultural occupations, in very large numbers in the towns of Osmanabad District, especially Latur and in large numbers in the towns of Gulbarga District, especially Gulbarga Town. They have also infiltrated in non-agricultural occupations in some numbers in the urban areas of Nanded, Bhir and Nizamabad Districts and in almost negligible numbers not only in the urban areas of Medak and Parbhani Districts but also in some of the adjoining rural areas of Osmanabad, Nanded and Nizamabad Districts. A significant featu]:e of this movement is the relatively heavy proportion of the emigrants who have taken to commerce. Almost 14 per cent of the total number of emigrants from this district in other areas of the state, are dependant principally on occupations connected with commerce.
511
16. Tht' number of immigrants into this district from other districts of the state is only 29,863 as against 75,063 emigrants from this district to the other districts. This excess of emigrants is particularly marked in the case of the movement between Bidar and Hyderabad and to a If'sser extent between this district on the one hand and the districts of Osmanabad, Bhil', Nizamabad and Nanded on the other. Again this excess of emigrants over the immigrants, is spread over alt the livelihood classes, but is particuhwly marked in the Non-Agricultural Livelihood Classes and in Agricultural Labour.
17. Though for an interior district an appreciable number of Bidar emigrants are generally supposed to be now residing in Bombay State, particularly Sholapur City, the over all number of Bidar emigrants beyond the state is not likely to be very significant in relation to its enumerated population. In view of this, the natural population of Bidar District will r e only slightly more than the figure of 1,214,986 as indicated in Table 1. But even this figure is in excess of its enumerated population of 1,172,702 by as much as 4 per cent!
18. Bhir District.-93 per cent of the people enumerated in this district were born within the district and 7 per cent beyond it. The fairly large proportion of immigrants is chiefly due to females. They account for as much as 68 per cent of the immigrantsa percentage equalled only in the case of the female immigrants in Medak District. Ov(tr 90 per cent of the immigrants in Bhir District are from the adjoining areas, i.e., the districts of Osmanabad, Parbhani, Aurangabad and Bidar and Bombay State. The percentage of females among these immigrants is about 71-it is actually as high as 76 in the case of the Bombay immigrants. It is thus obvious that the movement into this district is predominantly influenced by inter-marriages. But there is also some infiltration, for reasons unconnected with marital alliances, which is, however, not very signific~nt. 35,840, or 62 per cent of the immigrants, are in Agricultural Classes and the percentage of females among them is as high as 75. All but 1,20.,t of these immigrants are from the adjoining areas. These figures make it obvious that the movement into Agricultural Classes is overwhelmingly the result of marital alliances. The only perceptible cases of infiltration for other reasons into these classes are those of a fairly large number of Bidar and a negligible number of Parbhani immigrants who have taken to agricultural labour in Mominabad Tahsil; of a small number of Parbhani and a negligi:. ble number of Aurangabad immigrants who have taken to agricultural labour in Manjlegaon Tahsil; and of a small number of Aurangabad immigrants, "\'vho have taken to agricultural labour in GeortLi Tahsil. 22,091, or only 88 per cent of the total number of immigrants, are in Non-Agricultural Classes and only 4,421 of them, i.e., less than one fifth of the number, are from the non-adjoining areas. The percentage of females even among these immigrants in Non-Agricultural Classes is as high as 57-actually it is 60 in the case of those trom the adjoining areas. It is thus obvious that even this movement into Non-Agricultural Clal';ses is more influenced by marital alliances than economic factors. But in spite of this, there are some significant cases of infiltration into NonAgricultural Classes for economic reasons. In so far as the rural areas are concerned, Bhir Tahsil has attracted in all about 3,337 immigrants in Non-Agricultural Classes consisting of 1,667 males and 1,670 females. Of this number only 413, consisting of 167 males and 246 females are from the district of Osmanabad which adjoins the tahsil*. Almost all these immigrants (except those from Osmanabad District) have moved into the *Ofthe remaining imm;grants in this tah"il, 1,206 are from Aurangabad. 390 from Parbhani, 206 form Mahbubnagar, 109 from Hyderabad, 187 from Nanded, 47 from Raichur, 37 from Nalgonda, 33 from l\ledak, 21 from Bidar, 11 each from Gulbarga and Waranga!, 10 from Karimn1gar, 5 from Nizamab'ld and one from Adilabad, 336 from Bombay, 247 from Madhya Pradesh, 25 from Kutch, II each from Madras and Ra.iasthan, 7 from East Punjab, 4 from Saurashtra,3 from Uttar Pradesh, 2 from Nepal and one each from Madhya Bharat, Mysore, Bihar and Pakistan. These figures exclude 1,781 immigrants COll
sisting of 413 males and 1,368 females in the tahsIl in AgriCUltural Classes.
60
512
tahsil because of the construction of the Bendsura Project. In Patoda.-Ashti Tahsih. Bombay immigrants have settled down to occupations connected with Other Services and Miscellaneous Sources in small. numbers and with commerce in almost negligible numbers. In Georai Tahsil, Aurangabad immigrants, and in Manjlegaon Tahsil Parbhani immigrants, have settled down in negligible numbers to occupations connected with both Production and Other Services and Miscellaneous Sources. In Mominabad Tahsil, negligible numbers of Osmanabad and Parbhani immigrants have infiltrated into occupations connected with Other Services and Miscellaneous Sources. The infiltration into Non-Agricultural Classes is slightly more marked in the urban than in the rural areas of the district, excluding of course the movement resulting from the construction of the Bendsura Project. Parbhani immigrants in large numbers, and Bombay, Osmanabad and Aurangabad immigrants in some numbers, have taken to various Non-Agricultural Occupations in the towns of the district. A small number of Hyderabad and Bidar immigrants have also taken to similar occupations in these areas.
19. The number of emigrants from this district to other areas within the state is 41,242, of whom 68 per cent are females. The four adjacent districts within the state account for 37,202 of these emigrants of whom as many as 70 per cent are females. The number of emigrants in all the other districts of the state is only 4,040, of whom 47 per ·cent are females. The majority of the emigrants in the non-adjoining districts are ·concentrated in Hyderabad City and Nanded Town, the former accounting for 2,294 and the latterfor 500. 26,254, or as many as 64 per cent of these emigrants, are in Agricultural Classes and females constitute 74 per cent of them. All, but 553, of these ~migrants are in the adjoining districts. It is thus obvious, that marital alliances are predominantly responsible for the movement of these emigrants in Agricultural Classes. Bhir immigrants have, however, moved in some numbers to Ambad Tahsil of Aurangabad District, Bhoom-Kalam Tahsils of Osmanabad District and to Gangakhed and Pathri-Partur .Tahsils of Parbhani District, and in negligible numbers to OsmanabadParenda Tahsils of Osmanabad District, all as agricultural labourers. A few of them have also taken to tenant cultivation in Ambad Tahsil. 14,988 of the Bhir emigrants are in Non-Agricultural Classes, of whom females constitute 56 per cent the overwhelming· majority of these emigrants, namely 11,501, are in the adjoining districts and the per-centage of females among them is as high as 59. These figures make it obvious that, -on the whole, the emigration even in Non-Agricultural Classes is more influenced by marital alliances than economic factors. In spite of this, there are some movements for economic reasons in Non-Agricultural Classes, the more noticeable of which are their infiltration in small numbers into the rural areas of Gangakhecl. and, to a lesser, extent of Pathri-Partur Tahsils of Parbhani District in occupations comiected with Other Services and Miscellaneous Sources and of Bhoom-Kallam Tahsils of Osmanabad District in .occupations connected both with· Production and Other Services and Miscellaneous Sources. In addition to this, Bhir emigrants have moved in large numbers to Hyderabad District (Hyderabad City) and towns of Osmanabad District, in some numbers to the towns of Aurangabad and Parbhani Districts, especially to AUl8ngabad Town, and in small numbers to Nanded Town and taken to various non-agricultural occupations.
20. The number of immigrants in this district from the other districts of the state is 40,048, whereas the number of emigrants from this district to the rest of the state is 41,242. The slight excess among the emigrants would have been more appreciable but for the Bendsura Project which had attracted some immigrants.
60·
513
21. The natural population of 809,357 indicated for this district in Table 1 is ~owever, very ~uc~ of aI_l underestimate. ~here are 63,7~5 ~ydera~ad. Emigrant~ III Ahmednagar DIstrIct whIch ras a long and IIreg-ular frontIa wIth thIS dIstrict and also runs along Aurangabad and Osmanabad Districts for some distance. A considerable portion of these emigrants rrust have been drawn from Bhir District. Further, not only a fair portion of the 189,081 Hyderabad emigrants residing in the non-adjoining districts of Bombay State but al[O of the 82,247 of the Hyderabad em ig18nts in Sholapur District must have migrated from this di~trict. Tl,us, its natural }:opulation is bound to be considerably more than even its enumerated popUlation.
22. Osmanabad District.-About 92 per cent of the persons enumeratt:d in the district were born within the district and 8 per cent beyond it. Thus, the proportion of immigrants in this district is very large. But females account for 66 per cent of the immigrants. Again, 92 per cent of the immigrants, the highest recorded in any dish ict of the state, are from the adjoining areas, i.e., the districts cfBhir, BidarandGulbarga End Bombay State and, among these immigrants from- adjoining arEas, the percent::>ge of females is 68. It is thus obvious that the large proportions of the movement into the district is only the result of marital alliances. But in spite of this, certain cases of infiltration for economic reasons are discernible. 40,588, or about 62 per cent of the immigrants are in Agricultural Classu, Gf whom 73 per cent are females. All but 1,223 of these immigrants are frem adjoining areas. In Tuljapur Tahsil, some Bombay immigrants have taken to agricultural labour, and a few of them to tenant cultivation as well. In Osmanabad-Parenda Tahsils again some Bombay and a few Bidar and Bhir immigrants~ and in Omerga Tahsil a few Gulbarga and Bidar immigrants have taken to agricultural labour. , In Latur-Owsa Tahsils a large number of Bidar immigrants have taken to agricultural labour and a few of them to tenant cultivation also. Lastly, in BhoomKalam Tahsils some Bhir immigrants have taken to agricultural labour. Apart from these minor cases of infiltration for economic reamns, almost all the rest of the movement in Agricultural Classes represents only the marriage migration. 25,152, or only 38 per cent of the total immigrants in the district, are in Non-Agricultural Classes, of whom 56 per cent are females. Of these immigrants in Non-Agricultural Classes, 12,532 are from the adjoining districts within the state, 8,541 from the adjoining state of Bombay and 4~079 from other areas. The percentage of females among each of these three groups of immigrants is 55, 61 and only 46 respectively. It is thus obvious that economic factors influence the movement to an appreciable extent. In rural areas the only noticeable cases of infiltration for economic reasons are that of some Bombay and a few Bhir immigrants in Osmanabad-Parenda Tahsils; of a small number of Bombay immigrants in Tuljapur Tahsil; of a few Bidar immigrants in Omerga Tahsil; of a small number of Bidar immigrants into Latur-Owsa Tahsils, and of some Bhir and a small number of Bombay immigrants into Bhoom-Kalam Tahsils. This minor infiltration is concentrated mostly in occupations connected with Production and Other Services and Miscellaneous Sources. The infiltration is, however, as usual relatively more marked in urban areas. A very large number of Bidar and large numbers of Bombay and Bhir immigrants have taken to various non-agricultural occupations in the towns of the district. The Bidar immigrants are most numerous in occupations connected with Commerce. Hyderabad and Gulbarga immigrants have also infiltrated in small numbeis into non-agricultural occupations in the district. The Hyderabad immigrants are, as in the case of most other districts, concentrated in the Livelihocd Class of Other Services and Miscellaneous Sources.
514
23. The number of emigrants from this district to other areas within the state is 25,411, of whom 66 per cent are females. The three adjoining districts of Bhir, Bidar and Gulbarga contain 19,717 of these emigrants of whom females constitute 72 per cent. The other districts account for only 5,694 of the emigrants, females constituting 46 per cent of them. 3,260, or roughly three fifths of the emigrants in the non-adjoining districts are in Hyderabad City, the rest being more or less concentrated in the urban areas of Aurangabad, Parbhani and Nanded Districts., 14,030 of these emigrants, or 55 per cent of the total are in Agricultural Classes and females constitute 77 per cent of them. All but 648 of these emigrants are in the adjoining districts. Except for some insignificant infiltration of these emigrants as agricultural labourers in Ahmadpur-Nilanga Tahsils of Bidar District, the movement in Agricultural Classes is almost entirely due to marital alliances. 11,381, or 45 per cent of the total emigrants are in Non-Agricultural Classes, of whom 53 per cent are females. Of these emigrants, 6,335 are in adjoining and 5,046 in the non-adjoining districts, of whom 59 and 45 per cent respectively are females. It is thus ,obvious that the movement of Osmanabad emigrants to other areas within the state for economic reasons is not of any remarkable dimensions and is almost wholly restricted to Non-Agricultural Classes. A small number of Osmanabad emigrants have taken to non-agricultural occupations, particularly to those connected with Production and Other Services and Miscellaneous Sources, in the rural areas of both Mominabad 'Tahsil of Bhir District and Ahmadpur-Nilanga Tahsils of Bidar District. Some of the Osmanabad emigrants have also emigrated to the urban areas of Gulbarga District, particularly Gulbarga Town, and Bhir District and settled down to non-agricultural occupations, especially to those connected with Other Services and MiscellanEOUS Sources. But the largest infiltration of Osmanabad emigrants for economic reasons is in Hyderabad City. 3,072 of the 3,260 Osmanabad emigrants in Hyderabad City, are dependant on non-agricultural occupations chiefly with those connected with Other Services and Miscellaneous Sources. But a heavy proportion of this number probably comists .of persons who have shifted to the city consequent on the Police Action.
24. Immigrants into this district from other areas within the state number 86,488, as against 25,411 emigrants from this district to the rest of the state. This excesswhich though spread over all the livelihood classes is particularly marked in Agricultural Labour and Commerce-- is largely due to the balance of the movement betw~tn Osmanabad and Bidar Districts.
25. Perhaps, as things now stand, few districts of the 5tate have sent, particularly 'in proportion to their total population, more emigrants to an adjoining state than Osmanabad District. The number of Hyderabad emigrants in Sholapur and Ahmednagar Districts, which adjoin Osmanabad District, is 82,247 and. 68,795 respectively, and in the districts of Bombay State which do not adjoin this state is 139,081. Though Sholapur District, on account of its prosperous textile industry, must have attracted fair numbers of migrants from Bhir and Gulbarga Districts as well as from the remoter areas of the state, yet, considering the length of the common borders and economic contacts, it is obvious that a major portion of the Hyderabad emigrants in the district must have been drawn from Osmanabad. Besides, Osmanabad District must have sent appreciable numbers of migrants to Ahmednagar and to the non-adjoining districts of Bombay State, particularly to Bombay and POoifa Cities. In view of all this, it is certain that the natural population of 767,128 indicated for this district in Table 1 is very much an under estimate and the actual figure will be considerably higher than eveD the enumerated population of 807,452.
515
~6. Hyderabad District.-Only 80 per cent of the people enumerated in this district were. born :with,in the ~istri?t 8;nd .as ~nany as 20 per cent beyond i~s confines. The pro· portIon of ImmIgrants III thIS dIstrict IS, therefore, very heavy. ThIS heavy concentration ,of non-indigenous population is entirely due to the location of the capital of the state, namely Hyderabad City, in the district. In fact, out of the 809,618 immigrants in the district, 276,801 were enumerated in Hyderabad City itself, 12,851 in the other urban units of the district, most of which, like the University Town, are only suburbs of the city, and 20,461 in the rural areas of the district. In other words, over 25 per cent of the population of Hyderabad City, over 17 per cent of the other towns of the district and less than 6 per cent of the rest of the district were non-indigenous. Over a quarter of a lakh of immigrants have infiltrated into this district not only from each of the adjoining districts of Nalgonda, l\Iedak and l\Iahbubnagar but even from Karimnagar, and Madras State. The district has attracted over 20,000 persons from Bidar. Thousands have moved into the distric.t not only from the other districts of the ~tate but also from Madhya Pradesh, Bombay, Uttar Pradesh, Rajasthan, Mysore, Saurashtra, Punjab, Travancore'Cochin, Madhya Bharat and even Pakistan. Of the 68,918 immigrants in this state from areas beyond the adjacent states, almost 50 per cent were in this district. Out of every hundred immigrants in this district, 16 are from Nalgonda, 14 from Medak, 10 from Mahbubnagar, 9 from Madras State, 8 from Karimnagar, 7 from Bidar, 4 each from Gulbarga and Madhya Pradesh, 8 each from Warangal, Bombay State and Nizamabad, 2 each from Rajasthan, Uttar Pradesh, l\fysore State, Aurangabad and Nanded, 1 each from Parbhani, Raichur, Bhir, Osmanabad and Adilabad and 5 from all other areas beyond the state.
27. Only 47 per cent of the 809,618 immigrants in the district were females. This is the lowest percentage recorded among the immigrants in any district of the state. This low percentage makes it clear that the immigration to this district is basically due to reasons other than marital alliances. Hyderabad is not only the fifth city in India and the most important inland city south of the Vindhyas, but the commercial, industrial, administrative and cultural activities of this state are concentrated within its limits to an almost unique degree. In Bombay State, cities like those of Poona, Ahmedabad and Sholapur, in Madhya Pradesh, cities like those of Jabalpur and Amravati and in Madras State, cities like those of Madurai, and Coimbatore, compete with the respective headquarters of tbe states in various matters. But in this state, Warangal is an almost pitiable second to Hyderabad City in every respect, and of the rest not a single urban unit is even entitled to be termed a city. This crushing importance of Hyderabad City not only ,compels outsiders, who are eager to establish commercial, industrial and cultural dealings with the people of this state to flock to the city, but also retards urbanisation in the other areas of the state, particularly the surrounding, and forces the population surplus to the ,economy of those areas to migr~te to the city.
28. 20,289, or less than 7 per cent of the immigrants in the district, are in Agricultural Classes, and even among them the percentage of females is relatively as low as 58. Of the immigrants in Agricultural Classes, 11,824 are in the rural ,areas of the district of whom 72 per cent are females. This movement is basically only a marriage migration from the three adjoining districts of Nalgonda, Medak and Mahbubnagar. The only perceptible cases of infiltration into the rural areas of the district for economic reasons are of a few Madras immigrants as owner cultivators, of some Nalgonda and Mahbubnagar immigrants as tenant cultivators, and again of a small number of Nalgonda and of a few Mahbubnagar immigrants as agricultural labourers. 8,915 of the immigrants ill
tH6 II
Agricultural Classes are in the urban areas of the district of whom only 40 per cent are females. This movement has very little to do with marital alliances. But at the same time, it does not also represent any tendency on the part of the non-indigenous population to take to agriculture in this district. The overwhelming majority of these immigrants are either the richer of the Gwner cultiyators and absentee landlords in the mofussil areas of the state who have migrated to the city in connection with their subsidiary interests or occupations--such as government selvice, the learned professions or even trade and industries-or the dependants of agriculturists in the mofussil areas who are prosecuting their studies at the educational centres in this district. A few of the agriculturists from the mofussil areas may have shifted to the district merely because of the lure of the city. 289,374 or over 93 per cent of the irumigrantsin the district, are in NonAgricultural Classes, of whom females form only 47 per cent. Of these immigrants, 9,187 are in the rural areas of the district, of whom over 60 per cent are females. This movement into the rural areas is again largely the result of marital alliances.. The only noticeable infiltration for economic reasons is of some Medak and an insignificant number of Mahbubnagar and Madras immigrants, especially in the Livelihood Class of Other Services. and Miscellaneous Sources. The 280,287 immigrants in Non-Agricultural Classes in urban areas, of whom only 46 per cent are females, represent the real core of the immigration into the district for economic reasons. From 42 to 44 per cent of the total number of immigrants from each of the three adjoining districts of Nalgonda, Medak and Mahbubnagar in Hyderabad District are in Other Services and Miscellaneous Sources. The overwhelming majority of these are presumably domestic servants, labourers engaged in constructional activities, Government employees in the lower cadres such as peons and police constables, barbers, washermen, etc., and their dependants. 22 per cent of the Medak, 21 per cent of the Nalgonda and 15 per cent of the Mahbubnagar immigrants. are in the Livelihood Class of Production. The majority of these are presumably labourers in the various factories and the railway and road transport workshops in and around the city or the dependants of such labourers. Some of them are also weavers and artisans,.. like carpenters, silver and brass-smiths, etc. 52 per cent of the immigrants from Madras. are in the Livelihood Class of Other Services and Miscellaneous Sources. They represent a prominent non-indigenous element in various walks of life in the city, which have been described in paragraph 144 of Chapter I. 53 per cent of the Karimllagar immigrants are in the Livelihood Class of Other Services and Miscellaneous Sources and as many as 25 in. Production. The livelihood pattern of the Karirunagar immigrants is similar to that from the adjoining districts. The large proportion in Production is not merely due tofactory labourers but also to large numbers of weavers, silver-smiths, etc., carrying on their trade in the city. - 44 percent of the Bidar immigrants are in the Livelihood Class of Other Services and Miscellaneous Sources, and as many as 25 per cent of them are in Commerce. The concentration in Commerce is a recent feature. Many of the Bidar immigrants, particularly the Muslims, are now engrged chiefly in various types of petty tradingand hawking of articles like cloth, fluits, Pan, vegetaOles, bangles and firewood or are employed as servants in the shops, etc., in Hyderabad City, particularly in Hyderabad Municipal and Cantonment areas. 52 per cent of the Gulbarga immigrants are in theLivelihood Class of Other Services and Miscellaneous Sources and as many as 20 per cent of them are in Commerce. Their livelihood pattern n;ore or less corTesponds to those from Bidar, except that they playa more imp-ortant part both in the learned professions and government service in the city. The immigrants from most of the other districts of the' state are heavily concentrated in the Ijvelihood Class of Other Services and Miscellane()us. Sources, especially in the case of those from the remoter districts. The majority of these' immigrants represent government employees or their dependants or persons employed
517
in liberal professions. It must be pointed out here that a certain proportion of the present immigrants in Hyderabad District from other areas, particularly those from the other ,districts within the state, consists of persons who were born in areas beyond this district when their parents tempora:t:ily migrated from this district to those areas in connection with their employment elsewhere in government service, trade, etc. This number cannot, therefore, be construed as constituting immigrants in the sense the term is generally understood. The Madhya Pradesh and, to a smaller extent, the l\Iysore immigrants are more uniformly spread over all the four Non-Agricultural Livelihood Classes. 48 per cent of the Bombay immigrants are in Other Services and Miscellaneous SourCES and 27 per cent in Commerce. 61 per cent of the Rajasthan immigrants are in the Livelihood Class of ,Commerce and the same percentage of Uttar Pradesh immigrants are in Other Services ,and Miscellaneous Sources.
29. The number of emigrants from this district to the other areas within the state is 61,572 of whom only 52 per cent are females. Of these emigrants only 19,135, or 31 per cent of the total, are in the adjoining districts of Medak, Mahbubnagar and N algon· da, of whom females form 63 per cent. The remaining 42,437, or 69 per cent, are in the ·other districts of the state, and only 46 per cent of them are females. Tho:'lg'h Hyderabad emigrants are found all over the state in small numbers, they are rather heavily concentrated in the more important of the towns or centres of administrative activities. 'Their smallest number is 837 in Osmanabad and their largest is 9,392 in Medg,k. They form 1.04 per cent of the total population of Nizamabad and 0.10 per cent of Osmanabad District. Their proportion in the other districts ranges between these two limits. 4,136 of the Hyderabad emigrants are in Warangal City, 2,908 in Nizamabad Town, 1,712 in Nanded Town, 1,336 in Aurangabad Town, 1,297 in Gulbarga Town and 1,094 in Jalna Town. The Tungabhadra Project has attracted 2,924 Hyderabad emigrants and the Kadam Project in Nirmal Revenue Sub-division about 1,400. The two mining towns of Kothagudem and Yellandu have drawn 1,881 of these emigrants. Persons born in Hyderabad District, in other words Hyderabad City, have infiltrated into the administrative machinery and the learned as well as the industrial and commercial pr~fe~sions all over the state out of all proportion to their total population and this infiltration is generally at the higher levels.
30 ... 11,622, or only 19 per cent of the emigrants, are in Agricultural Classes of whom 72 per cent are females. Of these emigrants, 7,887 are in the adjoining and 3,735 in the non-adjoining districts and females account for over 77 per cent of the former ,and 60 of the latter. The movement in Agricultural Classes to the adjoining districts is almost entirely a marriage migration, except for a small number of the emigrants who have taken to owner and tenant cultivation in San.gareddy Tahsil of Medak District. The emigration in Agricultural Classes to the non-adjoining districts is also very largely the result of marital alliances except for the very significant immigration of a large number of Hyderabadis as owner cultivators and agricultural labourers in the canal zones
·.of Nizamabad District. This infiltration as 'agricultural labourers' is actually as employees of the large sugarcane farms, more in managerial and supervisory capacities rather than as field labourers. 49,950 of the Hyderabad emigrants, or 81 per cent of the total, are in Non-Agricultural Classes of whom only 47 per cent are fem3.les. Of this number, only a small portion, namely 1l,248, are, in the adjoining, and 38,702 in the non-adjoining districts. Females form 53 per cent of the former and 45 of the latter. 'This emigration is basically the r~ult of economic factors. Appreciable num'Jers of 'Hyderabad emigrants have infiltrated into activities connected with Production in the
518
towns of Nizamabad and Adilabad Districts, the mining towns of Kothagudem and Yellandu, and in Warangal City. The Bodhan Sugar Factory, the Kamareddy Alcohol Factory, the teedi industries, etc., in Nizamabad District, the Sirpur Paper Mills, the Bellampalli Chemicals and Fertilizers Factory, and coal mines, etc., in Adilabad District, the coal mines in Kothagudem and Yellandu and the Azamj ahi Mills, the tanneries and other industries in Warangal City must have absorbed most of these immigrants. Some of them are presumably repairing personnel like mechanics, fitters, etc., in Railway, Public "'orks and Road Transfort Departments. Smaller numbers have infiltrated into this livelihood class in Nanded Town, presumably due the textile establishments, and in the Tunga bhadra Camps, presumably due to the P. W.D. workshops. Insignificant numbers had also moved into the rural areas of Bodhan, Gajwel and Sangareddy Tahsils, Shahabad and Tandur Towns, the towns of Mahbubnagar District and Kadam Project Camps. Microscopic numbers had moved into practically every area of the state which could boast of any industry other than the usual village crafts. Their infiltration into the Livelihood Class of Commerce is, however, verv much smaller in d:·mensions. Hyderabad emigrants have taken to commerce in the urban units of Warangal District (chiefly Warangal City) in some numbers and in the urban units of Nizamabad and the three adjoining districts in insignificant numbers. Their numbers in this class in other places are almost microscopic. A slightly larger number have infiltrated into the Livelihood Class of Transport. This infiltration is flJmost exclusively as (mr loyees of the Railway and Road Transport Departments, or as drivers of Police and Public Works Department and other Government vehicles-Warangal City, Kothagudem, and Yellandu Towns, Dornakal Junction, NizamHbad and Bodhan Towns, Tungabhadra. Project Camps, Purna Junction, Kadam Project, etc., being the chief centres of this minor infiltration. The chief movement of Hyderabad emigrants for economic reasons is, however, in the Livelihood Class of Other Services and Miscellaneous Sources-not only government service but even the learned professions being the chief sources of employment. Almost 44 per cent. of the total Hyderabad emigrants are in this livelihood class and the percentage of females among them is the lowest, namely only 44. They have infiltrated into this livelihood class in "'grangal City and Tungabhadra Project Camps in large numbers; in Gulbarga and Aurangabad Towns and the urban units of Mahbubnagar, Medak, Nalgonda and Karimnagar Towns in appreciable numbers; in Bodhan and Jalna Towns, the two mining towns of Yellandu and Kothagudem, Kadam Project, and in the other towns in Gulbarga District and ill. the towns of Nanded, Parbhani and Raichur Districts in small numbers. In addition to this, Hyderabad migrants have moved in very small numbers in this livelihood class in almost all the other urban areas as well. Besides, microscopic numbers of Hyderabad immigrants in this class are found in the rural areas of most of the tahsils, due chiefly to their employment in govern-
_ ment machinery even in the inferior cadres.
31. As stated earlier, 226,315 persons born in other parts of the state were residing in Hyderabad District at the time of the census enumeration. As against this, the corresponding number of persons born in this district but residing in the other parts of the &tate was only 61,572. Thus, the district had gained as many as about 165,000 persons by the inter-district movement. Besides, over 83,000 persons, born in areas beyond the state including foreign countries, were also residing in the district during the enumeration period. This apparent gain has, however, to be offset against the number of emigrants from the district to other areas beyond the state, figures regarding whom are not available. No doubt, the numb"er of such emigrants, especially in
·519
the important cities of the adjoining states and Pakistan among the foreign countries, would be appreciable. In spite of making all reasonable allowances for these emigrants, there can be no gainsaying the fact that the district's natural population, though appreciably higher than the figure of 1,263,295 indicated in column (5) of Table 1 would still be considerably lower than its enumerated population of over a million and a half.
32. Mahbubnagar District :-97 per cent of the people enumerated in this district were born within the distriet itself and 3 per cent beyond its limits. Thus, the proportion of the non-indigenous population to the total enumerated population in this district is small. Again, 62 per cent of these immigrants are females. Over 90 per cent of the immigrants are from the adjoining areas namely, the districts of Nalgonda, Hyderabad, Medak, Gulbarga and Raichur and Madras State, and of these almost 64 per cent are females -in fact, in the case of the immigrants from Gulbarga District, who are the most numerous of the group, the pc·.·ccntage of females, is as high as 72. It is, therefore, evident that even the small immigration into the district is very largely the result of marital alliances. But there are some exceptions to this. The immigration from Madras State, which adjoins this district all along its southern borders, is influenced by intermarriages only to a minor extent. This is perhaps due to the fact that the border areas of both this district and Madras State are hilly, wooded and sparsely populated. The majority of the 4,412 Madras immigrants in this district are dispersed in tahsils which do not adjoin Madras State and only 49 per cent of them are females. 14,770, or 48 per cent of the immigrants in the district, are in Agricultural Classes and as many as 73 per cent of them are females. All but 445 of these immigrants are from the adjoining areas. The only discernible cases of infiltration into this district in Agricultural Classes for economic reasons appear to be those of a few Madras immigrants as owner cultivators and Gulbarga immigrants as agricultural labourers in Pargi-Shadnagar Tahsils; of a few Madras immigrants as owner cultivators and Nalgonda imJnigrants as agricultural labourers in Kalvakurti Tahsil; and again of small numbers of both Madras and Nalgonda immigrants as owner cultivators and insignificant numbers of only Nalgonda immigrants as tenant cultivators and agricultural labourers in Achampet--Nagarkurnool Tahsils. In addition to this, a microscopic number of Madras immigrants have also taken to owner cultivation in Mahbubnagar Tahsil. 16,262, or 52 per cent of the immigrants, are in Non-Agr'icultural Classes, amongst whom the percentage of females is relatively as low as 52. 13,735 of these immigrants are from the adjoining and 2,527 from the non-adjoining area'). The percentage of females is only 54 among the former and 43 among the latter. The infiltration for economic reasons into this district is thus largely restricted to the non-agricultural occupations. A small number of Raichur immigrants have moved into the rural areas of Wanparti-Atmakur Tahsils in connection with certain Public Works Department Projects under construction, mostly for the breaking of stones required for the projects. It is rather significant that Mahbubnagar District which has been the supplier of the labour required for the construction of projects all over the state, should have itself drawn some labourers for some of its own projects from Raichur District-presumably from Gadwal and Alampur Tahsils. A few Nalgonda immigrants have taken to occupations connected with the Livelihood Class of Production in the rural areas of Kalvakurti and Achampet-Nagarkurnool Tahsils. A few Madras immigrants have also infiltrated into occupations connected with Other Services and Miscellaneous Sources in the rural areas of Achampet-Nagarkurnool Tahsils. A large number of Hyclerabad
. immigrants, appreciable numbers of Madras and Gulbarga immigrants, and a few Raiehur immigrants have infiltratedinto.non-agriculturaloccupations, especially in the Livelihood Class of Other Services and Miscellaneous Sources, in the urban areas of the district.
520
As stated earlier, a considerable number of the Madras immigrants eonsists of service personnel temporarily deputed to the district from Madras State. These represent almost all the significant cases of movement into the district other than the marriage migrations.
33. The number of emigrants from this district to the other districts within the state is 63,385 of whom only 53 per cent are females. Of these emigrants 58,749 are in the adjoining districts within the state and 4,636 in the rest of the state. 54 per cent of the former and 42 per cent of the latter are females. Again, of these emigrants as many as 23,068, or 36 per cent of the total are in Hyderabad City itself, and 10,124, or-16 per cent, in the Tungabhadra Project and 1,629, or 3 per cent, in the Kadam Project Camps. Among these emigrants the percentage of females is 45, 40 and 40 respectively. The number of Mahbubnagar emigrants beyond these areas is only 28,564 and about 65 per cent of them are females. It is thus obvious that apart from the emigration to the capital of the state and the two projects, the movement is very largely the result of the marital alliances. 15,699 or only 25 per cent of the emigrants are in Agricultural Classes and 73 per cent of them are females. Some Mahbubnagar emigrants have taken to tenant cultivation in the rural areas of Hyderabad District. Insignificant numbers of them have also taken to agricultural labour in the adjoining rural areas of Hyderabad, Gulbarga and Raichur Districts, and in the canal zones of Nizamabad District-the emigrants in Nizamabad District are presumably the survivors of the original migrants to the district employed in the construction of the Nizamsagar Project. The 1,129 Mahbubnagar emigrants in the urban areas of Hyderabad District, are mostly those who have moved into Hyderabad City and its suburbs due to their subsidiary occupations or interests or, in case of some dependants of agriculturists, for the prosecution of stud.ies. These represent all the perceptible cases of emigration into Agricultural Classes for non-marital reasons .. 47,686, or as many as 75 per cent of the emigrants, are in the Non-Agricultural Classes of whom 46 per cent are females. Thousands of Mahbubnagar emigrants have taken to various non-agricultural occupations chiefly with those connected with the Livelihood Classes of Production and Other Services and Miscellaneous Sources in Hyderabad District, in other words, Hyderabad City. Again thousands have moved tothe Tungabhadra Project Camps and a large number to the Kadam Project Camps as labourers. Insignificant numbers have moved to Bendsura Project in Bhir Tahsil and the Arjunpatla Project in Jangaon Tahsil. The Palmur Waddars-Mahbubnagar used to be originally called as Palmur-have been almost invariably the most numerous of the distinct types of labourers employed in the construction of most of the big projects in the
_ ~tate during recent times. The present migrations indicated above, are, therefore, in keeping with this tradition. Mahbubnagar emigrants have also taken to occupations connected with Other Services and Miscellaneous Sources in small numbers and to Commerce in insignificant numbers in Yadgir and the other nearby towns of Gulbarga District. In addition to this, they have taken to occupations connected with Other Services and Miscellaneous Sources in the rural areas of Devarkonda Tahsil in insignificant numbers and in the rural areas of Hyderabad District and Gadwal-Alampur Tahsils in some numbers. A few of them have also infiltrated into the Livelihood Class of Production in the rural areas of Yadgir and Gadwal-Alampur Tahsils.
34. The 'number of emigrants from this district to the other districts of the state is 63,385, as against only 24,894 immigrants into the district from other parts of the state. This heavy excess of the emigrants over the immigrant~, is very largely due to the balance of the movement between the district on the one hand and Hyderabad and Raichur

521
Districts-in other words, Hyderabad City and the Tungabhadra Project Camps-on the o()ther. This excess is spread over all the classes, but is very marked in Other Services and Miscellaneous Sources and, to a smaller extent, Commerce and Production.
35. The natural population of 1,218,849 indicated for this district does not take into account the emigrants from the district in the adjoining state of Madras and in the other areas beyond Hyderabad State. The number in the latter is not likely to be significant. There are 9,859 Hyderabad emigrants in Kurnool District which runs along the southern borders of this district as well as of the tahsils of Alampur and Gadwal in Raichur District. An appreciable portion of these emigrants is bound to have migrated
-from Mahbubnagar District. There are 8,570 Hyderabad emigrants in Guntur District which just grazes this district along its most inaccessible portion. It is, therefore, very unlikely that Mahbubnagar emigrants would account for more than a few hundreds of these emigrants. There are 19,644 Hyderabad emigrants in Bellary District. The overwhelming majority of them are in the Livelihood Class of Other Services and Miscellaneous Sources. Though Bellary District does not adjoin Mahbubnagar, yet it is almost certain that the Tungabhadra Project Works on the other side of the river in this district must have also attracted a few thousands of the Palmur Waddars. In addition to these, there -are about 10,114 Hyderabad immigrants in the non-adjoining districts of Madras State . .some of them are bound to have moved out from this district. In view of all this, the natural population of this district is bound to be c:msiderably in excess of ] ,218,849 indi,cated in Table 1, which by itself is about 3 per cent more than its enumerated population.
36. Raichur District.-94 per cent of the pe::>ple enum~rated in this district were born within the district itself and 6 per cent beyond its confines. The proportion of immigrants in this district is, therefore, fairly large. But, over 36 per cent of these immigrants are in the Tungabhadra Project Camps. If the figures pertaining to these camps are excluded, the percentage of immigrants decreases to 4. Thus, but for the large number of labourers who have temporarily migrated to the district because of the project, the proportion of migrantg in this district would not have been significant at .all. A portion of these immigrants mly, however, settle down round about the project itself after its completion. But this forecast is not pertinent to the present review. Females acCount for 5-1. per cent of the immigrants in the district-41 in the project ,camps and 61 per cent in the rest of the district. It is, therefore, again obvious that but for the immigration due to the project, the movement into this district also is very largely the result of inter-marriages.
87. The total population of the Tungabhadra Project is 34,669, of whom only 43 'per cent are females. Of this number, 7,750 were born within the district itself and -26,919 beyond it. Of the immigrants from beyond the district} 15,560 are from the other areas within the state and 11,359 from outside the state. Further details regarding these numbers are given in Table 5.
[Table
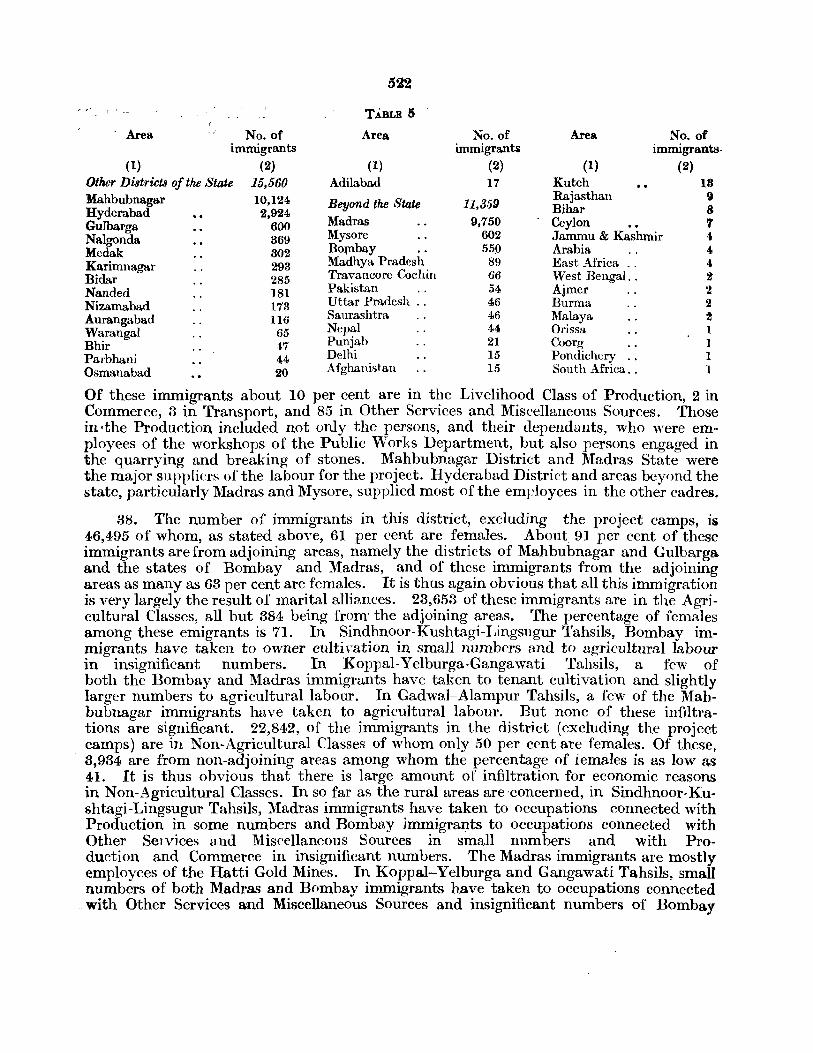
522
,.. _,., I ( __ TABLB 5
Area _) No. of Area No. of Area No. of immigrants immigran1;$ immigrants-
(1) (2) (1) (2) (1) (2) Other Districts of the State 15,560 Adilabad 17 Kutch 18 Mahbubnagar 10,124 Beyond the State 11,359
Rajasthan 9 Hyderabad 2,924 Bihar S Gulbarga 600 Madras 9,750 Ceylon 7 Nalgonda 369 Mysore 602 Jammu & Kashmir 4
Medak 302 BO.jl1bay 55~ Arabia 4
Karimnagar 293 Madhya Pradesh 89 East Africa __ 4
Bidar 285 Travancore Cochin 66 West Bengal .. ~
Nanded 181 Pakistan 54 Ajmer 2 Nizamabad 173 Uttar Pradesh ._ 46 Burma 2
Aurangabad 116 Saurashtra 46 Malaya ! Warangal 65 Nepal 44 Orissa 1 Bhir -1.7 Punjab 21 Coorg ]
Parbhani 44 Delhi 15 Pondichery 1 Osmanabad 20 Afghanistan 15 South Africa .. ]
Of these immigrants about 10 per cent are in the Livelihood Class of Production, 2 in Commerce, 3 in Transport, and 85 in Other Services and Miscellaneous Sources. Those in -the Production included not only the persons, and their dependants, 'who were employees of the workshops of the Public Works Department, but also persons engaged in the quarrying and breaking of stones. Mahbubnagar District and Madras State were the major suppliers of the labour for the project. Hyderabad District and areas beynnd the state, particularly Madras and Mysore, supplied most of the employees in the other cadres.
38. The number of immigrants in this district, excluding the project camps, is 46,495 of whom, as stated above, 61 per cent are females. About 91 per cent of these immigrants are from adjoining areas, namely the districts of Mahbubnagar and Gulbarga and the states of Bombay and Madras, and of these immigrants from the adjoining areas as many as 63 per cent are females. It is thus again obvious that 8.11 this immigration is very largely the result of marital alliances. 23,653 of these immigrants are in the Agricultural Classes, all but 384 being from- the adjoining areas. The percentage of females among these emigrants is 71. In Sindhnoor-Kushtagi-Ijngsugur Tahsils, Bombay immigrants have taken to owner cultivation in small numbers and to agricultural labour in insignificant numbers. In Koppal-Yelburga-Gangawati Tahsils, a few of both the Bombay a.nd Madras immigrants have taken to tenant cultivation and slightly larger numbers to agricultural labour. In Gadwa.1-Alampur Tahsils, a few of the Mahbubnagar immigrants have taken to agricultural labour. But none of these infiltrations are significant. 22,842, of the immigrants in the district (excluding the project camps) are in Non,Agricultural Classes of whom only 50 per cent are females. Of these, 8,934 are from non-adjoining areas among whom the percentage of females is as low as 41. It is thus obvious that there is large a.mount of infiltration for economic reasons in Non-Agricultural Classes. In so far as the rural areas are-concerned, in Sindhnoor-Kushtagi-Lingsugur Tahsils, Madras immigrants have taken to occupations connected with Production in some numbers and Bombay immigrants to occupations connected with Other Selvices and Miscellaneous Sources in small numbers and with Production and Commerce in insignificant numbers. The Madras immigrants are mostly employees of the Hatti Gold Mines. In Koppal-Yelburga and Gangawati Tahsils, small numbers of both Madras and Bombay immigrants have taken to occupations connected
. with Other Services and Miscellaneous Sources and insignificant numbers of Bombay

523
immigrants' have taken to Production and Madras immigrants to both Production and Commerce. In Gadwal-Alampur Tahsils, Mahbubnagar immigrants have infiltrated in small numbers to occupations connected with Other Services and Miscellaneous Sources and in insignificant numbers to Production. The infiltration is, however, considerably more marked in urban areas. A large number of both Madras and Bombay immigrants have taken to non-agricultural occupations in the western towns of the district. The former are most numerous in occupations connected with Other Services and Miscellaneous Sources and the latter in those connected with Production. A few of He Gulbarga and Hyderabad immigrants have also infiltrated intothese towns in the Livelihood Class of Other Services and Miscellaneous Sources. A small number of the Madras immigrants have also infiltrated into the towns in the eastern half of the district; especially in Other Services and Miscellaneous Sources. Again, a large number of Madras immigrants have taken to various non-agricultural occupations in Raichur Town their numbers in the Livelihood Class of Transport being relatively striking. This is presumably due to the location of the terminus of tt e former M.S.l\f. Railways in Raichur Town. As usual, a few of the Hyderabad immigrants have also moved into Raichur T()wn particularly in the Livelihood Class of Other Services and Miscellaneous Sources. But it is obvious that the infiltration if' Non -Agricultural Classes into the district, even to areas outside the Tungabhadra Project Camps, has been accentuated on account otthe construction 01 the project. This is particularly true of ~owns like Raichur, Koppal and Gangawati.
39. The number of emigrants from this district to the other districts of the state is only 15,111 of whom 51 per cent are females. This is the smallest number recorded by any district of the state e:x;cept Adilabad. This small number is the result of the location of the district in a corner of the state with a very IOJig frontier with the adjoining Indian states, sparsity of its population, and the employment provided on a large scale within the district and the adjoining district of Bellary on account of the construction of the Tungabhadra Project. 7,706, or more than half of the emigrants, are in the adjoining and 7,405 in the non-adjoining districts, 59 per cent of the former and 44 of the latter being females. Of the number in the non-adjoining districts, 4,111, or eonsiderably more than half, are in Hyderabad City itself. 4,157, or only 28 per cent of the emigrants, are in Agricultural Classes, of whom 62 per cent are females.,All but 944 of these emigrants are in the adjoining districts. A few of the Raichur emIgrants in ShahapurShorapur Tahsils of Gulbarga District and a larger number in 13 odhan-Banswada Tahsils have taken to agricultural labour. The latter presumably are some of the GadwalAlampur Waddars who were employed in the construction of the Nizamsagar Project. These represent all the significant cases of emigration for economic reasons in Agricultural Classes. 10,954, or 72 per cent of the emigrants are in Non-Agricultural Classes, of whom only 47 per cent are females. Of this number, 4,493 are in the adjoining and 6,461 in the non-adjoining districts, females forming 52 per cent of the former and 44 of the latter. This emigration is mainly for economic reasons. Appreciable numbers of Raichur emigrants have moved both to Gulbarga Town and to the other towns of Gulbarga District, particularly Yadgir, and have taken to occupations connected with Other Services and Miscellaneous Sources and, to a smaller e:x;tent, with Production. Small numberspresumably again the Gadwal-Alampur Waddars--of these Raichur emigrants have taken to employment in the P.W.D. projects under construction in Wanparti-Atmakur Tahsils of Mahbubnagar District and Khanapur Tahsil of Adilabad District. A few of them have also taken to activities connected with Other Services and Miscellaneous Sources in the towns of Mahbubnagar District. But the largest number of Raichur emigrants who have moved out for economic reasons is in Hyderabad City, wherein
61
524
~4 per cent of them are principally dependent on Other Services and Miscellaneous Sources-mostly government service, the learned professions and constructional and miscellaneous labour.
40. The number of immigrants into this district from the other districts of the state is 26,311 as against 15,111 emigrants from the latter to former. This el:;cess is entirely due to the construction of the Tungabhadra Project. The project camps have themselves attracted, as stated earlier, 15,560 immigrants from the rest of the state. But for this project, the emigrants would have been decidedly more numerous than the i~migrants.
41. The natural population of this district as indicated in Table I is 1,093,684. But there are 19,644 Hyderabad emigrants in Bellary District, 9,859 in Kurnool District, 17,713 in Dharwar District and 23,359 in Bijapur District, all of which border Raichur District. An overwhelming majority of these emigrants in Dharwar, more than half in Bellary, a fair portion in Kurnool and a minor portion in Bijapur, would have presumably emigrated from Raichur District. Besides, some of the 10,1l4 Hyderabad emigrants in the non-adjoining districts of Madras State and 139,081 in the non-adjoining districts of Bombay State, are also bound to have migrated from this district. The number of emigrants in the other areas is not likely to be very significant. If the Raichur emigrants in all these areas are taken into consideration, it is likely that the natural population would be about equal to its enumerated popUlation of 1,151,987--there are, however, few reasons to presume that its natural population would be in e:x;cess of its enumerated population.
42. Gulbarga District.-About 96 per cent of the people enumerated in this district were born v,ithin its limits and less than 4 per cent beyond it. Thus, the proportion of the non-indigenous popuh>,tion to the total enumerated population of this district is small. 61 per cent of the immigrants are females. Again, about 83 per cent of the immigrants are from the adjoining areas, namely the districts of Raichur, 2\fahbubnagar, }\fedak, Bidar and Osmanabad and the state of Bombay, and over 63 per cent of thesc immigrants are females. The movement into this district is, therefore, very largely only a marriage migration. There are, however, some significant cases of infiltration for reasons unconnected with marriages. 26,014, or 48 per cent of the immigrants are in Agricultural Classes, of "whom as many as. 72 per cent are fempJes. All but 1,135 of these immigrants in Agricultural Classes ar~ from the adjoining areas, an.d even among those frum the non-adjoining areas the percehtage of females is as much as 66. Roughly half of thc immigrants in Agricultural Classes in the district are from Bombay State but the pcr('ent[!,,~e of females among thpse Bombay immigrant" is about 70. IJ1. faet, in ~'\fzalpur TghsiL Bombay immigrants in Agricultural (_ lasses account for 9 per cent of the total agi'icultural population and Gj per cent of them are females. The only cases of infiltration in this district in Agricultural Classes, none of v,hich, however, arc significant, p.rc of Bombgy immigmnts, in some n.umbers, as agricultural labourers and, in insignif:cal1.t numbers, u.s owner a.nd tCHt'.nt cultivators in Afzalpur Tahsil; and of a few Bombay and Haid1Ur immigrants as agri('ultural labourers in Shahapur-Shorapur Tahsils. Most of the insignific~',:Jt numbers of migrants in Agricultural Classes in the urban areas of the district, 'i,~ho are from Bielar, Raichur, Osmanabad and -:\Iahbubnagar Districts, have moved in only bcc'ause of some subsidiary interest or occupation other than agriculture. 27,843, or 52 per cent of the immigrants in the district, are in NonAgricultural Classes u,p.d the percer .. tagc of females among them is only 50. 19,750 of them are from the adjoining and 8,093 from the non-adjoining areas--the perc<::l1tage
. " 61*
,1)25
of females among the latter being considerably lower than 50. This movement is largely governed by economic factors. The only perceptible cases of infiltration in rural areas in Non-Agricultural Classes are of a few Bombay immigrants in Andola (Jewargi) Tahsil in occupations connected both with Production and Other Services and :\Iiscellaneous Sources and in Afzalpur and Aland Tahsils in occupations connected with Production; and of a few Mahbubnagar immigrants in Yadgir Tahsil again in occupations connected with Production. But the really significant cases of infiltration for economic reasons into this district are in the Non-Agricultural Classes in the urban areas of the district. The weaving mills in Gulbarga Town, the cement factory at Shahabad and the oil mills and the ginning and pressing factories spread along the railway route, the stone quarries in the central and eastern portions of the district, the important commercial centres of Gulbarga and Yadgir, the railway junction at Wadi, are some of the major attractions for the immigrants from outside the district particularly Bombay State. A very large number of Bombay, large numbers of Bidar, Hyderabad and l\fahbubnagar, appreciable numbers of Madras and Osmanabad, and a small number of Rajasthan immigrants have taken to various non-agricultural occupations in the district. The Hyderabad immigrants are, as usual, quite prominent in Other Services and Miscellaneous Sources and the Bombay and :Madras immigrants are well spread over all the four Non-Agricultural Livelihood Classes.
43. The number of emigrants from this district to the other areas within the state is 39,144 of whom 58 per cent are females. The adjoining districts account for 23,804 of these emigrants and the non-adjoining for 15,340. Females form 66 per cent of the former and only 46 of the latter. Of those in the non-adjoining districts, as many as 12,583 are in Hyderabad District-12,042, or practically the whole number, being in Hyderabad City itself. The huge number in Hyder!Lbad City is presumably due mainly to the migration of a large number of persons from the former feudatory estates in the district consequent on their integration with the state. 13,607, or slightly less than 35 per cent of the emigrants, are in Agricultural Classes, amongst whom the percentage of females is as h(: vy as 74". All but 848 of these emigrants are in the adjoining districts, 'I he only discernible cases of emigration in these classes, due to reasons other than marital alliances, are of a few emigrants who have taken to agricultural labour in the rural areas of Omerga Tahsil in Osmanabad District, Pargi-Shadnagar Tahsils in Mahbubnagar District and in Humnabad Tahsil of Bidar District, and of microscopic nu:rp.bers who have taken to tenant cultivation in Sangareddy and Vikarabad Tahsils of Medak District. The small number of Gulbarga emigrants in the Livelihood Class of Owner Cultivators and Agricultural Rent Receivers in Hyderabad District consists mostly of those who have moved out in connection with some subsidiary interest or occupation in Hyderabad City including, in case of dependants, the prosecution of higher studies. 25,537, or about 65 per cent of the emigrants, are in Non-Agricultural Classes, of whom the percentage of females is only 50. 11,045 of these are in the adjoining and 14,492, or considerably more than half of the number, are in the non-adjoining districts, the percentage of females being only 55 among the former and 46 among the latter. This emigration is motivated mainly by economic factors. There is no significant emigration from the district to the rural areas of other districts in Non-Agricultural Classes. Almost 12,000 of these emigrants, are in Hyderabad District, in other words in Hyderabad City itself. More than half of these emigrants are principally dependant on Other Services and Miscellaneous Sources and one fifth on Commerce, government aervice and the learned professions in the case of the former, and petty trade and hawkingin the case of the latter being the chief sources of sustenance. Gulbarga emigrants have-
526
:also moved in large numbers to the towns of Raichur District (including the Tungabhadra Project Camps) and in appreciable numbers to the towns of Bider, Mahbubnagar and Osmanabad Districts. They have taken mostly to occupations connected with Other Services and Miscellaneous Sources and to a considerably smaller extent Commerce.
44. Emigrants from this district to the other areas of the state number 39,144 while the immigrants into the district from the latter number 30,304. Thus, the emigrants are roughly one fourth more than the immigrants. This excess of the emigrant is almost exclusively due to the balance of the movement between this district and Hyderabad District. Again the excess of emigrants is spread over all the livelihood classes, except among the Agricultural Labourers and Rent Receivers, and is particularly marked in Commerce, Transport and Other Services and Miscellaneous Sources.
45. The natural population of this district as given in Table 1 is only 1,434,231. But this figure does not take into consideration Gulbarga emigrants in areas beyond the state. The number of such emigrants, however, will not be very significant except in Bombay State. But in Bombay State, there are 23,359 Hyderabad emigrant" in Bijapur District and 82,247 in Sholapur District, both of which run along the borders of ·Gulbarga District to some distance, particularly the former. Besides, there are 139,081 Hyderabad emigrants in the non-adjoining districts of Bombay State. A very large portion of these emigrants in Bijapur, an appreciable portion in Sholapur, and some among those in the non-adjoining districts of Bombay State, are bound to have migrated from this district. Thus, the natural population of the district is bound to be at least a couple of thousands more than even its enumerated population of 1,448,944.
4<6. Adilabad District.-89 per cent of the people enumerated in this district were born within the district itself and 11 per cent beyond it. The proportion of immigrants to the total enumerated population in this district is exceeded only in two other districts of the state, namely Hyderabad and Nizamabad. The percentage of females among these immigrants is relatively very low, being only 53. Again, only two other districts in the state namely Hyderabad and Warangal, record a lower percentage in this respect. Of the immigrants in the district, less than 81 per cent were born in the adjoining areas, i.e. the district.,; of Nanded, Nizamabad and Karimnagar and Madhya Pradesh. And again only in three other districts in the state, namely Nizamabad, Nanded and Bidar is the corresponding percentage lower. All these factors make it obvious that the movement into this district is not only considerable but is also influenced by factors other than marital alliances to a high degree. This district is the most backward in the state, with comparatively little social and cultural contacts with other areas, either within or beyond the state. But it possesses some thriving nascent industries, contains a few collieries, is rich in forest wealth and is sparsely populated, and at the same time borders some of the most thickly populated areas in the state. Thus, while the extent of marital alliances between the people of this district and the neighbouring areas is proportionately small, there is considerable infiltration into the district for economic reasons from both the adjacent and the remoter areas. The percentage of immigrants in the rural areas of the Revenue .Sub-div isions of Adilabad, Nirmal and Asifabad * and in the urban areas of the district is 9, 12, ,I) and 28 respectively. The proportion of immigrants in the villages of Nirmal Sub-division taken all t'ogether is high for rural areas. This is to an extent the result of the labour employed in the construction of the Kadam Project in Khanapur • AdiIabad Revenue sub-division consists of the tahsils of Adilabad, UtnoClr, Kinwat and Boath ; Nirmal Revenue Sub-division -of the tahsils of Nirm'li, Khanapur and Lakshattipet; and AlIlfabad Revenue Sub-division of the tahsils of Rajura, A1!ifabad • .8irpur and Ghinnoor.
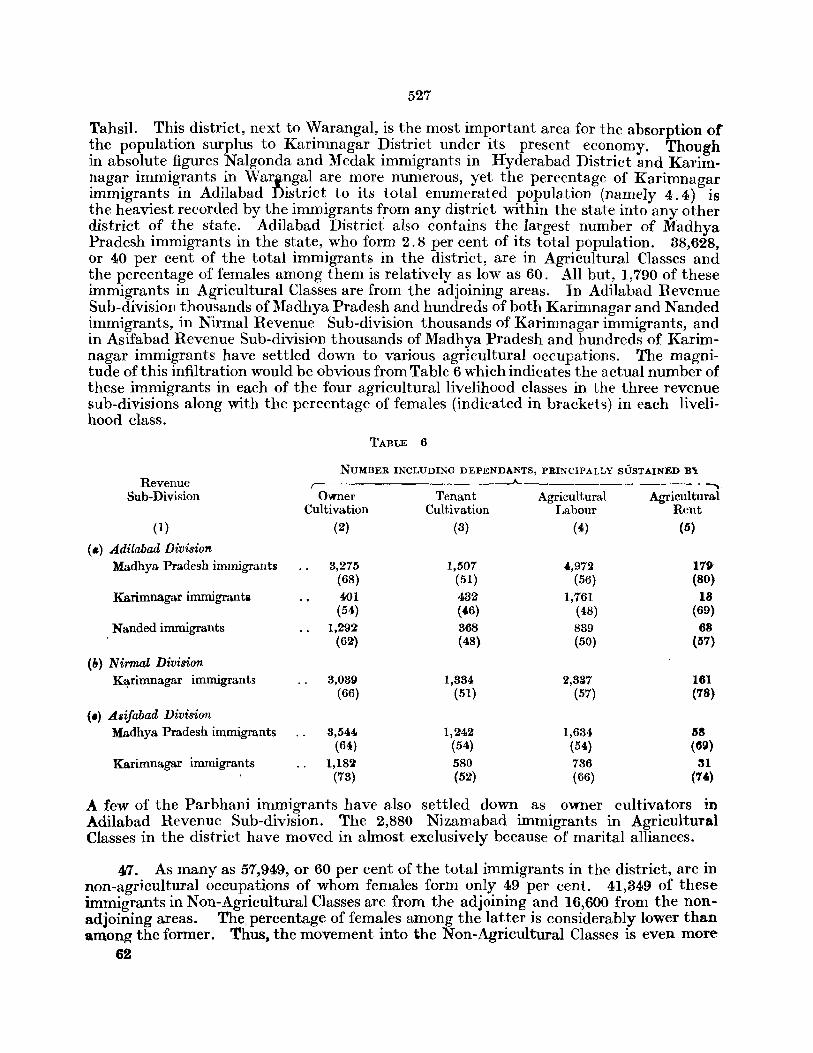
527
Tahsil. This district, next to Warangal, is the most important area for the absorption of ~he population surplus to Karimnagar l?istr~ct und~r its present e.con.omy. Though III absolute figures Nalgonda and Medak ImmIgrants III Hyderabad DIstrIct and Karim~aga.r immig.rants _in Wari~ga~ are ~ore numerous, yet the perceI_ltage of Karimnagar ImmIgrants III AdIlabad DIstrIct to Its total enumerated populatIOn (namely 4.4) is the heaviest recorded by the immigrants f;rom any district within the state into any other district of the state. Adilabad District also contains the largest number of Madhya Pradesh immigrants in the state, who form 2.8 per cent of its total population. 38,628, or 40 per cent of the total immigrants in the district, are in Agricultural Classes and the percentage of females among them is relatively as low as 60. All but, 1,790 of these immigrants in Agricultural Classes are from the adjoining areas. In Adilabad Revenue Sub-division thousands of Madhya Pradesh and hundreds of both Karimnagar and Nanded immigrants, in Nirmal Revenue Sub-division thousands of Karimnagar immigrants, and in Asifabad Revenue Sub-division thousands of Madhya Pradesh and hundreds of Karimnagar immigrants have settled down to various agricultural occupations. The magnitude of this infiltration would be obvious from Table 6 which indicates the actual number of these immigrants in each of the four agricultural livelihood classes in the three revenue sub-divisions along with the percentage of females (indicated in brackets) in each livelihood class.
Revenue Sub-Division
(1)
<a) Adilabad Division Madhya Pradesh immigrants
Karimnagar immigranti
Nanded immigrants
(b) NirmaZ Division K~rimnagar immigrants
(.) A$ifahad Division Madhya Pradesh immigrants
Karimnagar immigrants
TABLE 6
NUMBER INCLUDING DEPENDANTS, PRINCIPALLY SUSTAINED B,\ r- .------"-------~--------,.
Owner Tenant Agricultural Agricultural Cultivation Cultivation Labour Rent
(2) (3) (4) (5)
3,275 1,507 ',972 179 (68) (51) (56) (80) 401 482 1,761 18 (54) (46) (48) (69)
1,292 368 839 68 (62) (48) (50) (57)
3,039 1,334 2,3:n 161 (66) (51) (57) (78)
3,544 1,242 1,634 58 (64) (54) (54) (~9)
1,18~ 580 736 31 (73) (52) (66) (741)
A few of the Parbhani immigrants have also settled down as owner cultivators in Adilabad Revenue Sub-division. The 2,880 Nizamabad immigrants in Agricultural Classes in the district have moved in almost exclusively because of marital alliances.
47. As many as 57,949, or 60 per cent of the total immigrants in the district, are in non-agricultural occupations of whom females form only 49 per cent. 41,349 of these immigrants in Non-Agricultural Classes are from the adjoining and 16,600 from the nonadjoining areas. The, percentage of females among the latter is considerably lower than a.mong the former. Thus, the movement into the Non-Agricultural Classes is eveD more
62
528 •
markedly the result of economic factors than that into the agricultural. In the rural areas of Adilabad Division, a large number of Madhya Pradesh and appreciable numbers of Karimnagar immigrants have taken to non-agricultural occupations, especially to those connected with Production and Other Services and Miscellaneous Sources. The former number 2,428 and the latter 1,540 of whom females form 56 and 44 per cent respectively. Negligible numbers of Nanded immigrants have also taken to activities connected with Other Services and Miscellaneous Sources in these rural areas. In the rural areas of Nirmal Division, there is a heavy infiltration due to the construction of the dam across the Kadam River, as part ofthe Godavari Canal Multi-Purpose Project. There are 6,686 Karimnagar, 2,164 Nizamabad, 1,508 Mahbubnagar, 1,348 Hyderabad and 1,060 Nanded immigrants in Non-Agricultural Classes in these rural areas of whom 48, 51, 40, 40 and 58 per cent respectively are females. In addition to these, small numbers of immigrants from Raichur and Medak, insignificant numbers from Gulbarga and Madras and Madhya Pradesh States and microscopic numbers from various other areas have also moved into the rural areas of this division in N on-Agricultural Classes, A few Vindhya Pradesh immigrants have taken to the manufacture of 'Katha'* in some villages of Khanapur Tahsil. In the rural areas of Asifabad Division, there are 3,272 Karimnagar and 2,038 Mahdhya Pradesh immigrants in Non-Agricultural Classes, rather concentrated in Production. Presumably the coal fields of Bellampalli and Sashti must have absorbed a number of these immigrants. 'The infiltration for economic reasons into Non-Agricultural Classes is particularly marked in the urban areas of the district, the largest number being not in the Livelihood Class :of Other Services and Miscellaneous Sources, but in Production, with a fair amount of dispersal in Commerce and Transport. This infiltration is due to the emploJQllent provided, among other sources, by the coal fields, the paper and chemicals and fertilizers factories, the ginning and oil mills, the exploitation of forest produce (particularly timber and charcoal) and other primary industries, the Gonstruction of the Sirs ilk factory, and the government offices and the learned professions in the district. 15,669, or more than half of the immigrants in Non-Agricultural Classes, in the urban areas of the district, are from Karimnagar, 3,358 from Madhya Pradesh and 2,559 from Hyderabad District. Appreciable numbers of Warangal, Madras and Nizamabad immigrants, small numbers of Rajasthan, Nanded, Mahbubnagar and Uttar Pradesh immigrants, have also infiltrated into non-agricultural ,occupations in the urban areas of the district.
48; The number of emigrants from this district to the other areas of the state is only 14,669, the smallest number recorded by any district of the state. The very factors which attract an unusually large number of emigrants into the district aho detract the indigenous population from moving out. 63 per cent of these emigrants are females. Of the emigrants, 11,074 are in the adjoining and only 3,595 in the non-adjoining districts. The percentage of females is 69 among the former though only 43:among the latter. 6,860, ,or 47 per ('ent of the emigrants, are in Agricultural Classes, of whom 72 per cent are females. All but 556 of these are in the adjoining districts. This migration is almost wholly due to inter-marriages but for some insignificant movement as agricultural labourers into the rural areas uf Hadgaon Tahsil and into the canal zones of Nizamabad District. 7,809, or 53 per cent of the emigrants are in the l\Ton-Agricultural Classes of whom 55 per cent are females. 4,770 are in the adjoining and 3,039 in the non-adjoining districts-females accounting for 62 per cent of the former and 44 of the latter. Insignificant numbers of these Adilabad emigrants have moved into the rural areas of Armcor Tahsil inNizamabad District and of Bhokar-l\fudhol Tahsils in Nanded District and to the urban areas of Karimnagar, Nanded, and Warangal and, in slightly larger numbers, of Nizamabad District. But the largest number of these emigrants, namely 1,592, are in Hyderabad
* Which is used with pan.
62* " ' ,,,
529
City more or less concentrated in the Livelihood Class of Other Services and Miscellaneoul Sources. But none of these movements are significant.
49. The number of immigrants into this district from other areas of the state i5 66,564 as against 14,669 emigrants from this district to the latter. The excess is a common feature of the movement between this district on the one hand and all the other districts of the state on the other, and is particularly heavy in the case of the movement between this district and Karimnagar. Adilabad sends about 4,000 emigrants to Karimnagar and receives from the latter about 40,000 immigrants. Again, this excess is spread over all livelihood classes, and except in the case of the Agricultural Rent Receivers, is more or less equally striking.
50. The natural population of this district as indicated in Table 1 is 820,614. But as usual this figure does not take into account the emigrants from this district to areas beyond the state, but considering the backwardness of the people living in the district, its sparsity of population and the sources of employment available within the district itself, the number of emigrants from the district to areas beyond the state, other than the adjoining state of Madhya Pradesh, is bound to be negligible. There are 23,724 Hyderabad emigrants in Chanda District, 2~,599 in Yeotmal District and 8,127 in the non-adjoining districts of Madhya Pradesh. Chanda District must have drawn a fair number of immigrants from both Adilabad and Karimnagar. Similarly, Yeotmal District must have drawn appreciable number of immigrants from Parbhani and Nanded Districts in addition to Adilabad. It is thus obvious that the natural population of this district, thcugh appreciably ill excess of the incomplete figure of 820,614 indi:. cated in Table 1, i& bound to be considerably lower than its enumerated population of 902,522.
51. Nizamabad District .. -Only 86 per cent of the people enumerated in this district were born within the district and 104,970, or as many as 14 per cent, were born beyond the district. The proportion of non-indigenous population to the total enumerated population of the district is thus very considerable. While only two other districts of the state, namely Hyderabad and Warangal, .have larger numbers of immigrants, in only one district, namely Hyderabad, is the corresponding proportion higher than that recorded in this district. The heavy infiltration into the district of Hyderabad is almost entirely due to the location of the administrative, industrial and commercial metropolis of the state within its limits and that into the district of Warangallargely to its collieries and important urban units, but the magnitude of. the movement into this district is primarily the result of the extension of irrigational facilities, and to a smaller extent, the setting up of the sugar and alcohol factories during the recent decades. The percentage of immigrants to the total enumerated population is only 5, 7 and 8 in the rural areas of Armoor, Kamareddy-Yellareddy and Nizamabad Tahsils. But it is as high as 21 in the rural areas of Bodhan-Banswada Tahsils which benefit most by the Nizamsagar Project. The Project irrigates about 1,60,000 acres in all. The corresponding percentage in Nizamabad Town is 32 and in the other urban areas of the district 27. But of the total population of 78,167 of these other urban areas, the towns of Bodhan, Banswada, Yedpalli and Ranjal (all in Bodhan-Banswada Tahsils) themselves account for 42,757. Thus, most of the 20,980 immigrants in these urban areas are also in Bodhan-Banswada Tahsils.
52. Tens of thousands of immigrants have moved into both the urban and rural areas of this district, from the adjoining as well as the non-adjoining areas, and have
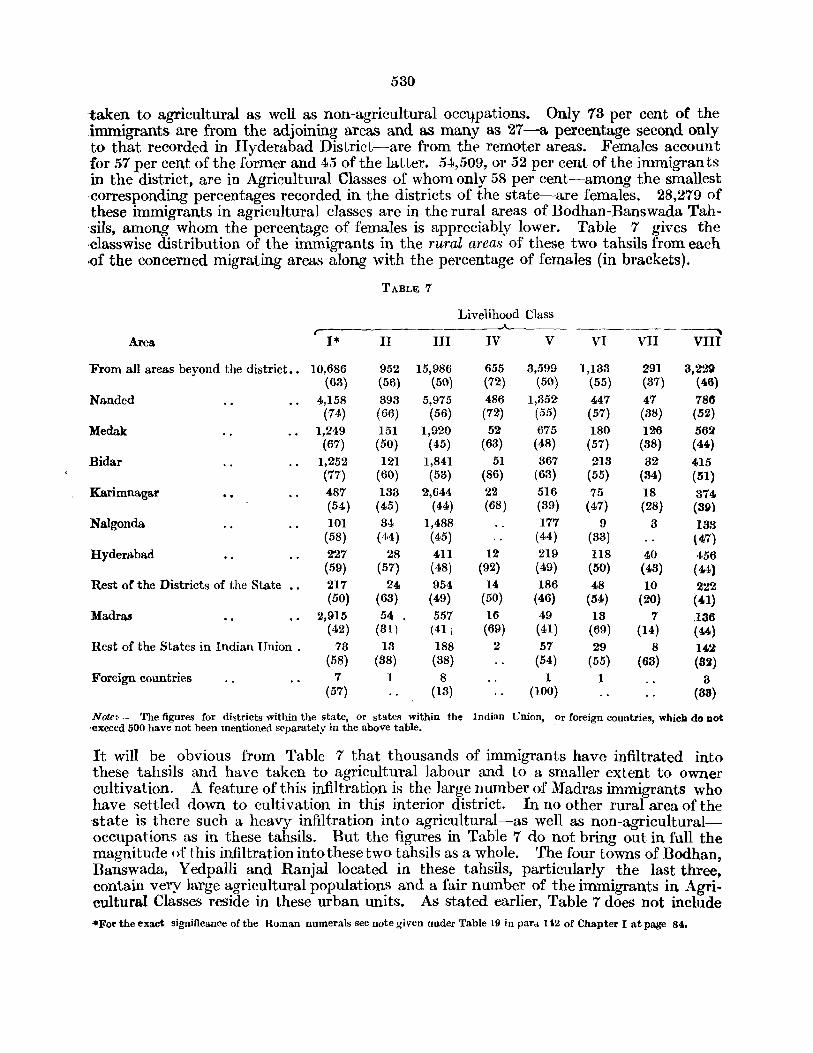
530
-taken to agricultural as well as non-agricultural occlfpations. Only 73 per cent of the immigrants are from the adjoining areas and as many as 27-a percentage second only to that recorded in Hyderabad District-are from the remoter areas. Females account for 57 per cent of the former and 45 of the latter. 54,509, or 52 per cent of the immigran ts in the district, are in Agricultural Classes of whom only 58 per cent-among the smallest 'corresponding percentages recorded in the districts of the state--are females. 28,279 of these immigrants in agricultural classes are in the rural areas of Bodhan-Banswada Tahsils, among whom the percentage of females is appreciably lower. Table 7 gives the ,classwise distribution of the immigrants in the rural areas of these two tahsils from each «)f the concerned migrating areas along with the percentage of females (in brackets).
TABLE 7
Livelihood Class L
Area 1* II III IV V VI VII VIII
From all areas beyond the district •• 10,686 952 15,986 655 3,599 1,133 291 3,220 (63) (56) (50) (72) (50) (55) (37) (46)
Nanded 4,158 398 5,975 486 1,352 447 47 78~
(74) (66) (56) (72) (55) (57) (3B) (52)
Meelak 1,249 151 1,920 52 675 180 12'6 5611 (67) (50) (45) (63) (48) (57) (38) (44)
Bielar 1,2'52 121 1,841 51 867 218 32 415 (77) (60) (53) (86) (63) (55) (34) (51)
Karimnagal' 487 133 2,644 22 516 75 18 374 (54) (45) (44) (68) (39) (47) (28) (ag)
Nalgonda 101 84 1,488 177 9 8 138 (58) (44) (45) (44) (33) (47)
Hyderabad 227 28 411 12 219 118 40 456 (59) (57) (48) (92) (49) (50) (43) (44)
Rest ot the Districts of the State 217 24 954 14 186 48 10 222 (50) (63) (49) (50) (46) (54) (20) (41)
Madras 2,915 54, 557 16 49 13 7 ,l36 (42) (31 ) (41 i (69) (41) (69) (14) (44)
Rest of the States in Indian Union . 78 13 188 2 57 29 8 14.2 (58) (38) (38) (54) (55) (63) (3!1)
Foreign countries 7 1 8 1 1 3 (57) (18) CWO) (88)
Note:- The figures for districts within the state, or states within the Indian Union, or foreign countries, whicb do Dot -exceed 500 have not been mentioned separately in the above table.
It will be obvious from Table 7 that thousands of immigrants have infiltrated into these tahsils and have taken to agricultural labour and to a smaller extent to owner cultivation. A feature of this infiltration is the Jarge number of Madras immigrants who have settled down to cultivation in this interior district. In no other rural area of the state is there such a heavy infiltration into agricultural-as well as non-agriculturaloccupations as in these tahsils. But the figures in Table 7 do not bring out in full the magnitude of this infiltration into these two tahsils as a whole. The four towns of Bodhan, Banswada, Yedpalli and Ranjal located in these tahsils, particularly the last three. contain very large agricultural popUlations and a fair number of the immigrants in Agricultural Classes reside in these urban units. As stated earlier, Table 7 does not include ""For the exact significance of the Ro;nan numerals see note given under Table 19 in para 11.2 of Chapter I at page 84.
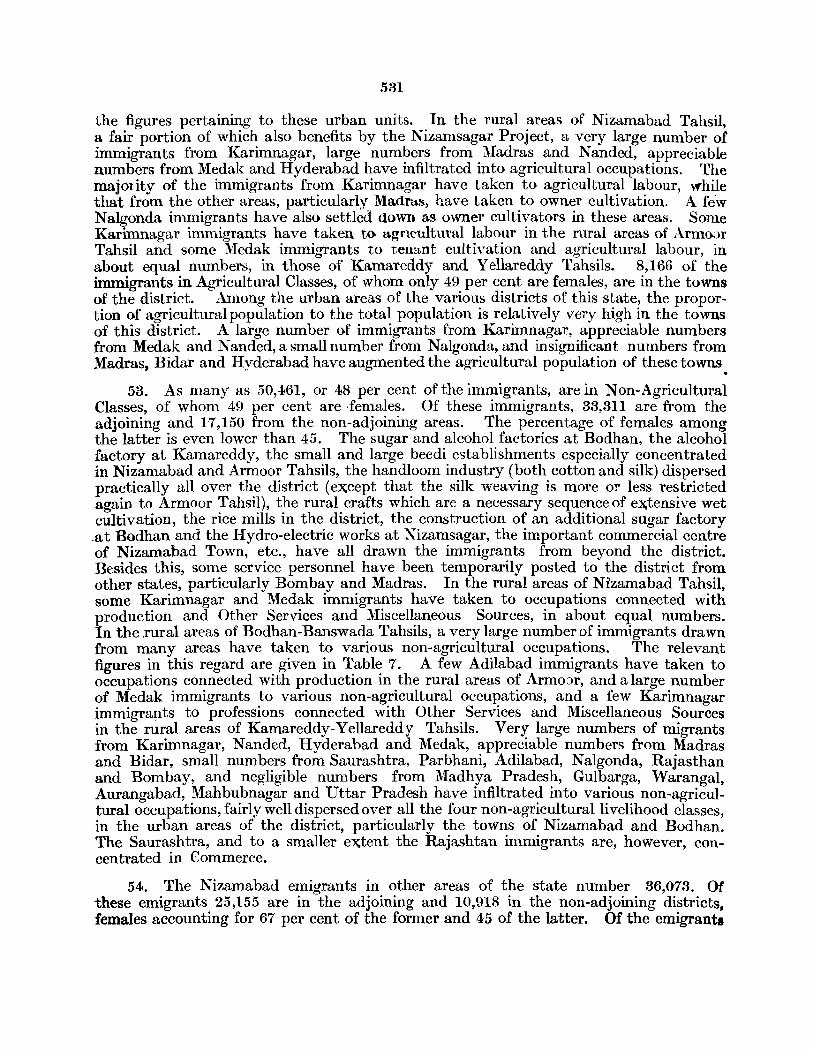
531
the figures pertaining to these urban units. In the rural areas of Nizamabad Tahsil, a fair portion of which also benefits by the Nizamsagar Project, a very large number of immigrants from Karimnagar, large numbers from Madras and Nanded, appreciable numbers from Medak and Hyderabad have infiltrated into agricultural occupations. The majOlity of the immigrants from Karimnagar have taken to agricultural labour, while that from the other areas, particularly Madra.s, have taken to owner cultivation. A fe·w Nalgonda immigrants have also settled down as owner cultivators in these areas. Some Karimnagar immigrants have taken to agncultuml labour in the rural areas of Armoor Tahsil and some Medak immigrants to tenant cultivation and agricultural labour, in about equal numbers, in those of Kamareddy and Yellareddy Tahsils. 8,166 of the immigrants in Agricultural Classes, of whom only 49 per cent are females, are in the towns of the district. Among the urban areas of the various districts of this state, the proportion of agricultural population to the total population is relatively very high in the towns ·of this district. A large number of immigrants from Karimnagar, appreciable numbers from Medak and Nanded, a small number from Nalgonda, and insignificant numbers from Madras, Bidar and Hyderabad have augmented the agricultural population of these towns.
53. As many as .50,461, or 48 per cent of the immigrants, are in Non-Agricultural Classes, of whom 49 per cent are ·females. Of these immigrants, 33,311 are from the adjoining and 17,150 from the non-adjoining areas. The percentage of females among the latter is even lower than 45. The sugar and alcohol factories at Bodhan, the alcohol factory at Kamareddy, the small and large beedi establishments especially concentrated in Nizamabad and Armoor Tahsils, the handloom industry (both cotton and silk) dispersed practically all over the district (e:x;cept that the silk weaving is more or less restricted again to Armoor Tahsil), the rural crafts which are a necessary sequence of e:x;tensive wet cultivation, the rice mills in the district, the construction of an additional sugar factory .a t Bodhan and the Hydro-electric works at Nizamsagar, the important commercial centre of Nizamabad Town, etc., have all drawn the immigrants from beyond the district. Besides this, some service personnel have been temporarily posted to the district from other states, particularly Bombay and Madras. In the rural areas of Ni'zamabad Tahsil, some Karimnagar and Medak immigrants have taken to occupations connected with production and Other Services and Miscellaneous Sources, in about equal numbers. In the .rural areas of Bodhan -Banswada Tahsils, a very large number of immigrants drawn from many areas have taken to various non-agricultural occupations. The relevant figures in this regard are given in Table 7. A few Adilabad immigrants have taken to occupations connected with production in the rural areas of Armo::w, and a large number of Medak immigrants to various non-agricultural occupations, and a few Karimnagar immigrants to professions connected with Other Services and Miscellaneous Sources in the rural areas of Kamareddy-Yellareddy Tahsils. Very large numbers of migrants from Karimnagar, Nanded, Hyderabad and Medak, appreciable numbers from Madras and Bidar, small numbers from Saurashtra, Parbhani, Adilabad, Nalgonda, Rajasthan and Bombay, and negligible numbers from Madhya Pradesh, Gulbarga, Warangal, Aurangabad, Mahbubnagar and Uttar Pradesh have infiltrated into various non-agricultural occupations, fairly well dispersed over all the four non-agricultural livelihood classes, in the urban areas of the district, particularly the towns of Nizamabad and Bodhan. The Saurashtra, and to a smaller e:x;tent the Rajashtan immigrants are, however, concentrated in Commerce.
54. The Nizamabad emigrants in other areas of the state number 36,073. Of these emigrants 25,155 are in the adjoining and 10,918 in the non-adjoining districts, females accounting for 67 per cent of the former and 45 of the latter. Of the emigrant.
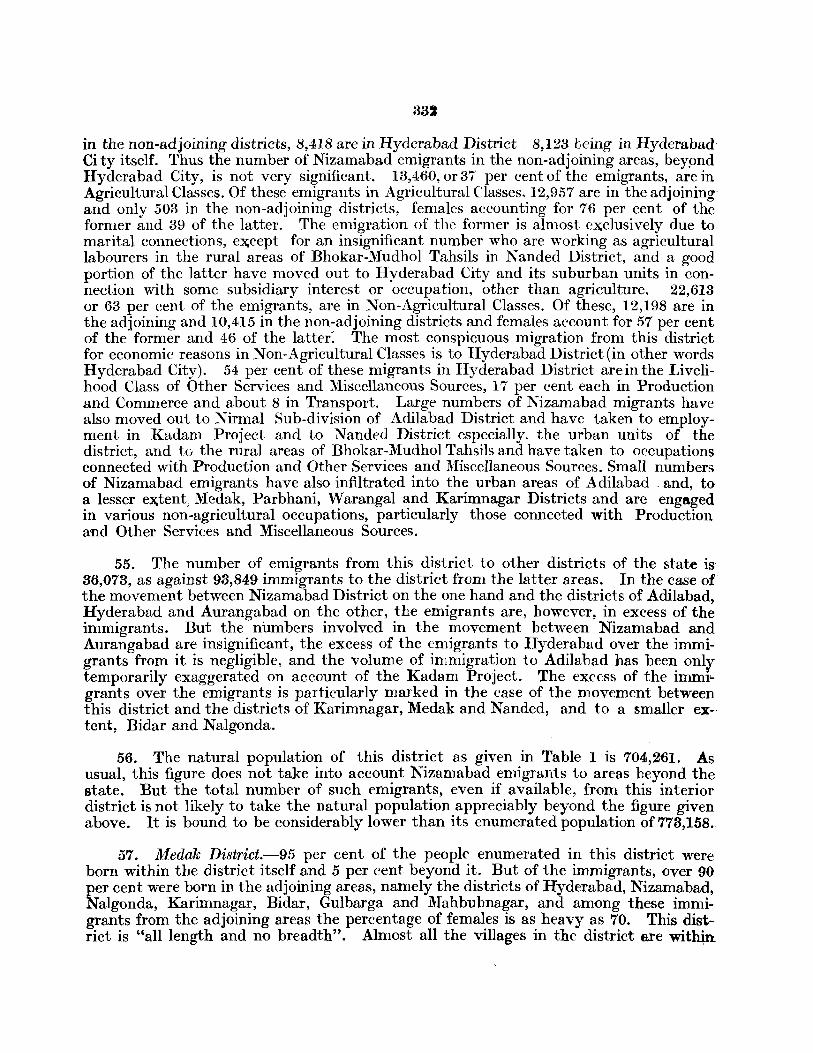
332
in the non-adjoining districts, 8,418 are in Hyderabad District-8,123 being in Hyderabad' Ci ty itself. Thus the number of Nizamabad emigrants in the non-adjoining areas, beypnd Hyderabad City, is not very significant. 13,460, or 37 per cent of the emigrants, are in Agricultural Classes. Of these emigrants in Agricultural Classes. 12,957 are in the adjoining" and only 503 in the non-adjoining districts, females accounting for 76 per cent of the former and 39 of the latter. The emigration of the former is almost e:x;clusively due to marital connections, e:x;cept for an insignificant number who are working as agricultural labourers in the rural areas of Bhokar-Mudhol Tahsils in Nanded District, and a good portion of the latter have moved out to Hyderabad City and its suburban units in connection with some subsidiary interest or occupation, other than agriculture. 22,613 or 63 per cent of the emigrants, are in Non-Agricultural Classes. Of these, 12,198 are in the adjoining and 10,415 in the non-adjoining districts and females aC'count for 57 per cent of the former and 46 of the latter: The most conspicuous migration from this district for economic reasons in Non-Agricultural Classes is to Hyderabad District (in other words Hyderabad City). 54 per cent of these migrants in Hyderabad District are in the Livelihood Class of Other Services and Miscellaneous Sources, 17 per cent each in Production and Commerce and about 8 in Transport. Large numbers of Nizamabad migrants have also moved out to Nirmal Sub-division of Adilabad District and have taken to employment in Kadam Project and to Nanded District especially. the urban units of the district, and to the rural areas of Bhokar-Mudhol Tahsils and have taken to occupations connected with Production and Other Services and Miscellaneous Sources. Small numbers of Nizamabad emigrants have also infiltrated into the urban areas of Adilabad . and, to a lesser e:x;tent; Medak, Parbhani, Warangal and Karimnagar Districts and are engaged in various non-agricultural occupations, particularly those connected with Production and Other Services and Miscellaneous Sources.
55. The number of emigrants from this district to other districts of the state is" 86,073, as against 93,849 immigrants to the district from the latter areas. In the case of the movement between Nizamabad District on the one hand and the districts of Adilabad, Hyderabad and Aurangabad on the other, the emigrants are, however, in excess of the immigrants. But the numbers involved in the movement between Nizamabad and Aurangabad are insignificant, the excess of the emigrants to Hyderabad over the immigrants from it is negligible, and the volume of immigration to Adilabad has been only temporarily exaggerated on account of the Kadam Project. The excess of the imml'" grants over the emigrants is particularly marked in the case of the movement between this district and the districts of Karimnagar, Medak and Nanded, and to a smaller extent, Bidar and Nalgonda.
56. The natural population of this district as given in Table 1 is 704,261. As usual, this figure does not take into account Nizamabad emigrants to areas beyond the state. But the total number of such emigrants, even if available, from this interior district is not likely to take the natural population appreciably beyond the figure given above. It is bound to be considerably lower than its enumerated population of 773,158 ..
57. Medak District.-95 per cent of the people enumerated in this district were born within the district itself and 5 per cent beyond it. But of the immigrants, over 90 per cent were born in the adjoining areas, namely the districts of Hyderabad, Nizamabad, Nalgonda, Karimnagar, Bidar, Gulbarga and Mahbubnagar, and among these immigrants from the adjoining areas the percentage of females is as heavy as 70. This district is "all length and no breadth". Almost all the villages in the district Rre with~n
5311
'easy distance of one or the other of the seven surrounding districts and consequently have social contacts with areas beyond the district. It is, therefore, not surprising that the predominant portion of the 47,290 immigrants have moved into the district, directly or indirectly, because of marital connections. 26,630, or over 56 per cent of the immigrants are in Agricultural Classes and 76 per cent of them are females. All but 1,477 of these immigrants are from the adjoining districts. In the rural areas of Sangareddy Tahsil, negligible numbers of Hyderabad immigrants have taken to owner cultivation and Bidar immigrants to agricultural labour; in those of Andol, a few of the Bidar immigrants have again taken to agricultural labour ; in those of Siddipet a few immigrants from Karimnagar have taken to tenant cultivation and a few from Nalgonda to agricultural labour ; and in those of both }Iedak and Gajwel Tahsils, :Madras immigrants have settled down in negligible numbers as owner cultivators. 20,660, or 44 per cent of the immigrants, are in Non-Agricultural Classes, and even amongst them the percentage of females is relatively as heavy as 58. In so far as rural areas are concerned, in Sangareddy Tahsil, a few Hyderabad immigrants have taken to occupations connected with Production and Other Services and lHicellaneous Sources; in Siddipet Tahsil a few Karimnagar and Nalgonda immigrants and in Vikarabad Tahsil, a few Hyderabad immigrants have settled down in occupations connected with Other Services and Miscellaneous Sources; and in Gajwel Tahsil, again a few Hyderabad immigrants have taken to occupations connected with Production. A large number of the Hyderabad immigrants and small numbers ,of Nalgonda, Bidar, :Madras, Karimnagar and Nizamabad immigrants have infiltrated into non-agricultural occupations in the urban areas of the district. The Hyderabad and Madras immigrants are heavily concentrated in Other Services and Miscellaneous Sources; most of them being dependent on Government Service. The rest of infiltration into this district, whether in Agricultural or Non-Agricultural Classes, is microscopic. 'Thus, o~ the whole, the number of persons who have moved into this district in search of sustenance is not at all significant. An interesting feature which is noticeable in this district, as well as in some other areas of the state, is the predominance of females among the immigrants from Mysore, particularly among those in the Livelihood Classes of Owner Cultivators and Agricultural Rent Ii eceivers, which is due to the practice of getting or sometimes even virtually 'buying' brides from that state.
58. .The number of emigrants from this district to other areas of the state is 84,263. Only two other districts, namely Karimnagar and Nalgonda, record a larger number. This latge number is not so much due to the fact that the overwhelming numbers of the emigrants from this interior district are in Hyderabad State itself, and have, therefore, been fully covered in the census tables*, as to the fact that the district is thickly populated, overwhelmingly rural and industrially under-developed, with no remarkable extension of irrigation facilities during recent decades as in Nizamabad District. Due to these factors, a fair portion of the indigenous population is compelled to move out in aearch of employment. 43,477, or more than half of these emigrants, are in Hyderabad District, wherein they are second in numbers only to the N algonda emigrants-' 36,744 of the number are in Hyderabad City itself. 20,562, or roughly one fourth of the total number, are in Nizamabad District. These emigrants form 3.4 per cent of the population of Hyderabad City, 2.9 of Hyderabad District and 2.7 of Nizamabad District. Thus, Hyderabad City to the south of the district and Nizamabad District to its north, are the chief areas absorbing the population surplus to Medak District under its present
II! As stated earlier in para 109 of Chapter I, the break-up of the number of Hyderabad emigrants in other parts of the Indian Union according to the district of origin is not available. Consequently, the natural population of some of the border dilitrictll ·()f this state as given in Table 1 is appreciably underrated.
534
economic conditions. 23,034, or 27 per cent of the emigrants, are in Agricultural Cl3sses of whom as many as 71 per cent are females. All but 517 are in the adjoining districts, about half the number being in Nizamabad District itself. Hundreds of Medak emigrants have taken to agricultural labour and a few of them to owner and tenant cultivation in Nizamabad District, especially in Bodhan-Banswada Tahsils. But they have not infiltrated into agricultural occupations anywhere else in the state. 963 Medak emigrants, of whom as many as 601 are males, in Agricultural Classes in Hyderabad City are mainly agriculturists of the district who have moved out on account of some subsidiary interest or occupation in the city. 61,229, or 73 per cent of the emigrants, are in NonAgricultural Classes. Of these, 55,999 are in adjoining and 5,230 in non-adjoining districts, females accounting for only 50 per cent of the former and 45 of the latter. Thousands of Medak emigrants in Hyderabad District (chiefly in Hyderabad City) ; hundreds in Nizamabad District (mainly in Bodhan-Banswada Tahsils) ; small numbers in Nanded District (especially in Nanded Town) ; and a few in Aurangabad (almost wholly in Jalna Town), Warangal (mostly in Warangal City), Karimnagar (almost wholly in Karimnagar Tahsil) and Adilabad Districts have all taken to occupations connected with Froduction. Again, thousands of Medak emigrants in Hyderabad District, almost wholly in Hyderabad City, and a few of them in Nizamabad and Bodhan-Banswada Tahsils of Nizamabad District have taken to Commerce. They have also taken to occupations connected with Transport in large numbers in Hyderabad District (almost wholly in Hyderabad City) and in small numbers in the urban areas of Nizamabad District. 27,614, or about 33 per cent of the l\ledak emigrants, are principally maintained by occupations connected with Other Services and Miscellaneous Sources. Of these, 19,154 are in Hvderabad District, of whom again 17,670 are in Hyderabad City itself. These emigrants consist mostly of domestic servants, government employees in the inferior cadres, washermen, barbers, etc., and their dependants. Small numbers of Medak emigrants in the districts of Karimnagar, Nanded and Bidar (especially in their urban areas), in Adilabad District (especially in Kadam Project) and in Warangal District and a few of them in Mahbubnagar and Gulbarga Districts, in the Tungabhadra Project Camps in Raichur District and in the rural areas of Jangaon Tahsil of Nalgonda District have also taken to professions. connected with this livelihood class. .
59. Immigrants into this district from other areas of the state number 44,224 a'l against 84,263 emigrants ftom this district to the latter. The excess of emigrants is almost exclusively the result of very heavy movement to Hyderabad and Nizamabad Districts. In Agricultural Classes, the immigrants are as a whole slightly more numerous than the emigrants, but this excess is confined only to females and is largely the result of marital alliances. Among the Agricultural Labourers, however, the emigrants exceed the immigrants. In the Non-Agricultural Classes, the emigrants'are very markedly in excess of the immigrants.
60. The natural population of this district as indicated in Table 1, is 1,064,266. This figure, however, does not take into consideration the Medak emigrants beyond the state. But the number of such emigrants is not likely to be significant as Medak is an interior district and the number of its emigrants even in the remoter districts of the state itself, including areas like Nanded Town .and Tungabhadra and Kadam Projects which have attracted a large number of non-mdigenous population, is nothing remarkable. But even excluding the figures pertaining to l\f edak emigrants in areas beyond the state, the natural population of the district as given in Table 1, is strikingly in excess of its. enumerated population. .
585
61. Karimnagar District.-As many as 98 per cent of the people enumerated in this district were born within the district itself. Only 2 per cent of them were born beyond the district. This is the smallest proportion of non-indigenous population recorded by any district of the state. This is not at all surprising considering the high density of its population and the small extent of its urbanisation and the non-existence ,of any large scale industries in the district except for a few beedi factories and some rice and oil mills. These factors do not make it worthwhile for outsiders to move in. In fact, the number of the, immigrants would have been still smaller but for the Azamabad Thermal Works in Sultanabad Tahsil, the Maner Project in Sirsilla Tahsil and the Police and other government personnel temporarily deputed to the district from outside the state in the wake of Police Action. Of the immigrants in this district, 65 per cent are females and 76 per cent are from the adjoining areas, namely the districts of Adilabadl Nizamabad, Medak, Nalgonda and Warangal and Madhya Pradesh. Over 71 per cent of the immigrants from the adjoining areas are females. Thus, even the insignificant movement into this district is very largely only a marriage migration. 11,362', or 40 per cent of the immigrants, are in Agricultural Classes of whom 77 per cent are females and all but 1,116 of them are from the adjoining areas. A small number ,of Madras immigrants who have taken to owner cultivation in the central tahsils of the district represent the only perceptible case of infiltration into the district in Agricultural Classes. 17,105, or 60 per cent of the immigrants, are in Non-Agricultural Classes and even amongst these the percentage of females is 5(). In the rural areas, especially of Sirsilla and Sultanabad Tahsils, small numbers of immigrants from Hyderabad and other areas like Medak and Mahbubnagar have infiltrated into Non-Agricultural Classespresumably in some of the P.W.D. projects just completed or nearing completion. A few Medak immigrants have taken to occupations connected with Production in Karimnagar Tahsil. In urban areas, Hyderabad and Warangal immigrants in some numbers and Madras and Medak immigrants in insignificant numbers have taken to various nonagricultural occupations, particularly in the Livelihood Class of Other Services and Miscellaneous Sources. Most of these, as well as the negligible numbers from Uttar Pradesh, Punjab, Travancore-Cochin, etc., are government servants or their dependants, temporarily posted to the district.
62'. The emigrants from this district to other parts of the state number 152,826, the latgest number recorded by any district of the state. The very factors which are responsible for the small number of immigrants in this district, compel the local population to move out and seek sustenance elsewhere. 12'0,448 of these emigrants are in the adjoining and 32',378 in the non-adjoining districts, females accounting for only 55 per cent of the former and 43 of the latter. Karimnagar immigrants number 45,902 in Waraugal, 40,085 in Adilabad and 2'3,999 in Nizamabad and among all these immigrants the percentage of females does not exceed 55. But Karirnnagar immigrants number only 8,2'76 and 2',186 respectively in the other two neighbouring districts of Medak and Nalgonda and among these immigrants the percentage of females exceeds 70. The migration into these two districts, which like Karimnagar have a high density of population and a low degree of urbanisation and lack large-scale industries, is almost exclusively due to marital alliances. Of the emigrants in the non-adjoining districts, '25,227 are in Hyderabad District (23,185 of whom are in Hyderabad City itself), 3,483 in Nanded and 1,497 in Parbhani. Karimnagar emigrants form 2'.9 per cent of the total enumerated population of Warangal, 4.4 of Adilabad, 3.1 of Nizamabad and 1.7 ,of Hyderabad District-2.1 of Hyderabad City. Thus, tens of thousands of Karimnagar emigrants have migrated not only to some of the adjoining districts; but also to
536
Hyderabad City. Appreciable numbers of them have also moved into the urban areas of Nanded and Parbhani Districts.
63. Of these emigrants 48,119, or 31 per cent, are in Agricultural Classes of whom t51 per cent are females. All but 1,840 of them are in the adjoining areas. Large numbers of Karimnagar emigrants have settled down as owner cultivators in Warangal~ Adilabad and Nizamabad Districts. A few of them have also settled down as such in Nanded District. Slightly smaller.numbers have taken to tenant cultivation in Warauga! and Adilabad Districts. A few of them have also settled down as such in Nizamabad and in Siddipet Tahsil of Medak District. Very large numbers of Karinmagar immigrants have taken to agricultural labour in Nizamabad and Adilabad Districts and, to a smaller extent, in Warangal District. A few of them have also taken to this occupation in Nanded District. These emigrants are especially conspicuous in Nirmal Division of Adilabad District, in Bodhan-Banswada Tahsils of Nizamabad District and Mulug Tahsil of Waraugal District. Those in Nanded District are concentrated in Bhokar-Mudhol Tahsils. There are also 694 and 336 Karimnagar emigrants in the Livelihood Class of Owner Cultivators in Warangal City and in Hyderabad District respectively. But these emigrants represent Karimnagar agriculturists 01 their dependants who have moved out in connection with some subsidiary interest or occupation in and around the two cities of Warangal and Hyderabad. 104,707, or 69 per cent of the emigrants are in Non-Agricultural Classes, of whom 7 -t,169 are in the adjoining and 30,538 in the non-adjoining districts-females form 51 per cent of the former and only 43 of the latter. 52,657, of these emigrants, or over 34 per cent of the emigrants from the district, are in the Livelihood Class of Production. In the inter-district movement, this is by far the largest number of emigrants from anyone district in any single livelihood class and is yet another evidence of the important part pIa yed by the people of this district in the industrial activities of the state. Of these emigrants in the Livelihood Class of Production, 21,338 are in Waraugal District, concentrated in the two mining towns of Kothagudem and Yellandu and toa considerably lesser extent in Warangal City and Mulug Tahsil; 14,867 of them are in Adilabad District, much more than half being in the towns of the district; 6,221 of them are in Hyderabad District, almost wholly in Hyderabad City; and 5,315 are in Nizamabad District, especially in the towns of Nizamabad and Bodhan. Karimnagar emigrants have taken to occupations eonnected with Production in Nanded District (in the towns of the district and in Bhokar-}\'Iudhol Tahsils) in appreciable numbers, in the towns of Parbhani District in smaller numbers and in. Aurangabad Town and Bidar Tahsil in almost negligible numbers. Karimnagar emigrants have also taken to Commerce in Hyderabad City and, in Warangal District (especially in Warangal City and the mining towns of Kothagudem and Yellandu in large numbers); in Adilabad District (especially in the towns of the district and in Nirmal Division) in some numbers; and in Nizamabad Town in insignificant numbers. They have taken to activities connected with Transport in Hyderabad City and in Adilabad District (especially in its towns) in large numbers; in Waraugal District (especially again in Warangal City and in the two mining towns) in appreciable numbers; and in the towns of Nizamabad District in small numbers. 36,028 of the Karimnagar emigrants, or the second largest number of the emigrants from anyone district in any livelihood class, are in occupations connected with pther Services and Micellaneous Sources. The majority of these emigrants are dependent on domestic service, unskilled labour 01' are employed as barbers, washermen. 12,076 of these emigrants are in Hyderabad City, 7,643 in Adilabad District, chiefly in its towns and in Nirmal Division, 7,229 in Warangal District, ehiefly in Warangal City and in the two mining towns and in Pakhal
537
'Tahsil, and 3,933 in Nizamabad District, mostly in its t;lrban areas. Insignificant numbers of Karimnagar emigrants have also infiltrated into this class in Siddipet Tahsil, and in the towns of Medak, Nalgonda, Nanded and Parbhani Districts.
64. The number of immigrants into this district from other areas within the state is only 24,799, whereas the number of emigrants from this district to the latter is as heavy as 152,826. This excess is primarily the result of the movement between this district on one hand and the districts of Adilabad, Warangal, Hyderabad and Nizamabad on the other. In the inter-district movement, Karimnagar District loses heavily in numbers to every district of the state, except Mahbubnagar. The number of immigrants from Mahbubnagar exceed the number of emigrants to it (though both the numbers involved are negligible) only because of the employment of some Mahbubnagar Waddars in the P.W.D. projects in the district. Again, this excess is shared by all the livelihood classea.
65. The natural population of Karimnagar District as' indicated in Table I is 1,706,026. But this figure is underestimated as it does not take into account Karimnagar emigrants in areas beyond the state, actual figures regarding whom are not available. Hyderabad emigrants in the Madhya Pradesh districts of Chanda and Bastar number 23,724 and 528 respectively. A portion of the former and perhaps the whole of the latter must have moved out from Karimnagar. In so far as other areas beyond the state are concerned, the popular impression of an unusually heavy emigration from Karimnagar is based on conditions as they existed in the earlier decades when the adjoining districts of Nizamabad, Adilabad and Warangal were not as developed as they are now and, con.equently, did not offer any appreciable scope for the absorption of non-indigenous population. As things now stand, Karimnagar emigrants are finding the employment they need in the adjoining districts and Hyderabad City. There can, however, be no denying the fact that a couple of thousands from this district--especially its weavers, and, to a smaller extent, washermen and barbers-must have also moved out during the recent years to arcas beyond the state, especially to Bombay and Sholapur Cities. Thus on the whole the natural popUlation of Karimnagar is likely to be in excess of the figure of 1,706,026 indicated above by a couple of thousands and not more. But even the incomplete figure of natural popUlation indicated above is in excess of its enumera~ed population--by about 8 per cent, which is indeed very remarkable.
66. Warangal District.-91 per cent of the population enumerated in this district were born within the district and as many as 9 per cent in areas beyond the district. Thus, the proportion of the non-indigenous population to the total enumerated population of the district is very large. In fact, the immigrants in this district are second in numbers only to those in Hyderabad District, though their proportion to the total enumerated population is higher in two other districts of the state, namely in Nizamabad and Adilabad also. T,'ns of thousands of immigrants from Karimnagar, Madras, Nalgonda, and to a considerably smaller extent fronl Hyderabad, have moved into the district. The movement from Karimnagar to Warangal is the second largest inter-district movement recorded in the state. And again, M~dras immigrants in this district are by far the most numerous among the immig ants in any district of the state from any other state of the Indian Union. The Karimnagar immigrants are concenirated in the t\vo mining towns of Kothagudem and Yellandu, the three northern tahsils of the districtparticularly in :\Iulug Tahsil--and Warangal City. In these two mining towns taken together they constitute considerably oyer a quarter of the total population. The Madras immigrants are very numerous in the southern and south-eastern portions of the district including the
538
two mining towns, and in Warang~l Tahsil including Warangal City. :Most of the Nalgonda immigrants live in the western tahsils of Mahbubabad, Warangal and Khammam adjoining Nalgonda District. The Hyderabad immigrants are very heavily concentrated in Warangal City and the other urban areas of the district including the two mining towns. The percentage of non-indigenous population to the total enumerated population in the two mining towns taken together is 44 which is second in the state only to the corresponding figure recorded in the Tungabhadra Project Camps. The proportion of the non-indigenous population exceeds 19 in the rural areas of Mulug Tahsil, which is indeed very significant for a rural tract. This heavy proportion is entirely due to the large influx from the adjoining district of Karimnagar. The corresponding percentages are 18 in Warangal City, 15 in the other towns of the district and in the other rural areas of" the district it varies between 10 per cent in 1\Iadhira and 4 in Burgampahad-PalvanchaYellandu Tahsils. But this large proportion of immigrants in the district is not due mainly to females as for example in Osmana bad District wherein immigrants constitute about 8 per cent of the enumerated population. Actually, the females form less than 52 per cent of the immigrants in Warangal District, which is the smallest percentage recorded in this respect in any district of the state, except Hyderabad. It is, therefore, obvious that the movement into this district is mainly due to economic factors. 53,171, or 38 per cent of the immigrants, are in Agricultural Classes, amongst whom the percentageof females is 60. In Warangal Tahsil, an appreciable number of :Madras immigrants have taken to owner cultivation and a few Nalgonda and Karimnagar immigrants to tenant cultivation. In so far as rural areas are concerned, in Pakhal Tahsil a small number of Madras immigrants and a few of both the Karimnagar and N algonda immigrants have taken to owner cultivation. Karimnagar immigrants have a~o taken in small numbersto tenant cultivation and in negligible numbers to agricultural labour in these areas. In the rural areas of Mulug Tahsil, an appreciable number of Karimnagar and a small number of :Madras immigrants have taken to owner cultivation and large numbers of the former to tenant cultivation and agricultural labour as well. In the rural areas of Burgampahad-Palvancha-Yellandu Tahsils, a large number of Madras and a few Nalgonda immigrants have taken to owner cultivation, small numbers of Madras and a few of the Nalgonda immigrants to tenant cultivation, and an appreciable number of the Madras and again a few of the Nalgonda immigrants to agricultural labour. In the rural areas of l\fadhira Tahsil, Madras immigrantr;; have taken to owner cultivation and to agricultural labour in large numbers and to tenant cultivation in some numbers. A few Nalgonda immigrants have also moved into these areas as agricultural labourers. In the rural areas of Khammam Tahsil, appreciable numbers of :Madras immigrants have taken to owner cultivation and some of them, as well as appreciable numbers of Nalgonda immigrants, to agricultural labour. In the rural areas of :Mahbubabad Tahsil, Nalgonda immigrants have taken in some numbers to agricultural labour and in smaller numbers to tenant and owner cultivation. Some of the owner cultivators (or their dependants) from Karimnagar, and to a lesser extent, from Nalgonda have also moved into Warangal City, chiefly in connection with some subsidiary interest or occupation therein. 85,222, or as many as 62 per cent of the immigrants, are in Non-Agricultural Classes, of whom only 46 per cent are females. Of these immigrants as many as 18,901· are from the non-adjoining areas. About 30 per cent of the total immigrants in the district-the largest recorded in any district from the point of view of either the percentage or absolute figures-are principally dependant on occupations pertaining to the Livelihood Class of Production. The coal fields in and around Kothagudem and Yellandu; the textile mills in Warangal City; the rice, oil and saw mills, the tanning, beedi and other factories in various places of the district; the exploitation of the forest produce of the district; the important railway junctions of'
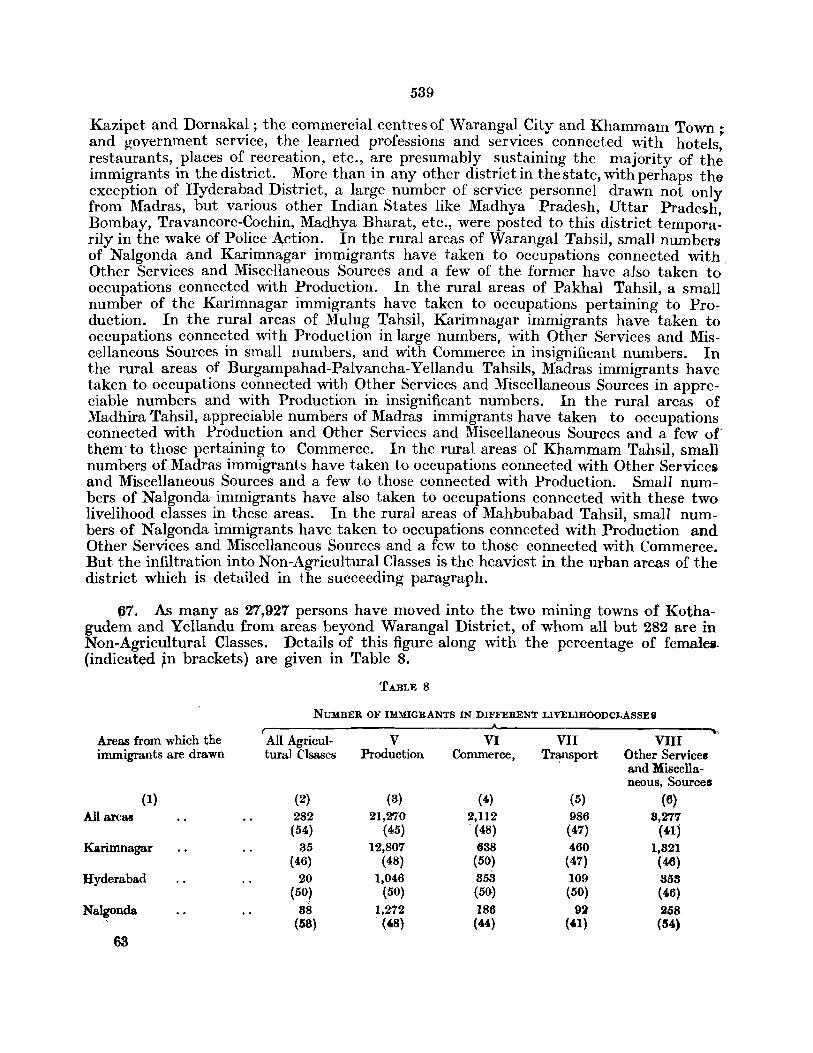
539
Kazipet and Dornakal; the commercial centres of Warangal City and Khammam Town. and (fovernment service, the learned professions and services connected with hotels" b ,
restaurants, places of recreation, etc., are presumably sustaining the majority of the immigrants in the district. More than in any other district in the state, with perhaps the exception of Hyderabad District, a large number of service personnel drawn not only from Madras, but various other Indian States like Madhya Pradesh, Uttar Pradesh, Bombay, Travancore-Cochin, Madhya Bharat, etc., were posted to this district temporarily in the wake of Police Action. In the rural areas of Warangal Tahsil, small numbers of Nalgonda and Karimnagar immigrants have taken to occupations connected with, Other Services and Miscellaneous Sources and a few of the former have also taken to occupations comiected with Production. In the rural areas of Pakhal Tahsil, a small number of the Karimnagar immigrants have taken to occupations pertaining to Production. In the rural areas of Mulug Tahsil, Karimnagar immigrants have taken to occupations connected with Production in large numbers, with Other Services and Miscellaneous Sources in small numbers, and with Commerce in insignificant numbers. In the rural areas of Burgampahad-Palvancha-Yellandu Tahsils, Madras immigrants have taken to occupations connected with Other Services and Miscellaneous Sources in appreciable numbers and with Production in insignificant numbers. In the rural areas of Madhira Tahsil, appreciable numbers of Madras immigrants have taken to occupations connected with Production and Other Services and Miscellaneous Sources and a few or them· to those pertaining to Commerce. In the rural areas of Khammam Tahsil, small numbers of Madras immigrants have taken to occupations connected with Other Serviceri and Miscellaneous Sources and a few to those connected with Production. Small numbers of Nalgonda immigrants have also taken to occupations connected with these two livelihood classes in these areas. In the rural areas of Mahbubabad Tahsil, small numbers of Nalgonda immigrants have taken to occupations connected with Production and Other Services and Miscellaneous Sources and a few to those connected with Commerce. But the infiltration into Non-Agricultural Classes is the heaviest in the urban areas of the district which is detailed in the succeeding paragraph.
()7. As many as 27,927 persons have moved into the two mining towns of Kothagudem and Yellandu from areas beyond Warangal District, of whom all but 282 are in Non-Agricultural Classes. Details of this figure along with the percentage of females. (indicated ~n brackets) are given in Table 8.
TABLE 8
NUMBER OF IMMIGRANTS IN DIFFERENT LlVELIHOODCLASSEB
Areas from which the All Agricul- V VI ~.,
VII VIII immigrants are drawn turaI Clsases Production Commerce, Transport Other Services
and Miscella-neous, Sources.
(1) (2) (3) (4) (5) (6) All areas 282 21,270 2,112 986 8,277
(54) (45) (48) (47) (.n) Karimnagar 35 12,807 638 460 1,821
(46) (48) (50) (47) (46) Hyderabad 20 1,046 853 109 858
(50) (50) (5()} (50) (46)
Nalgonda 88 1,272 186 9lit 258 " (58) , ('8) (44) (U) (54)
63
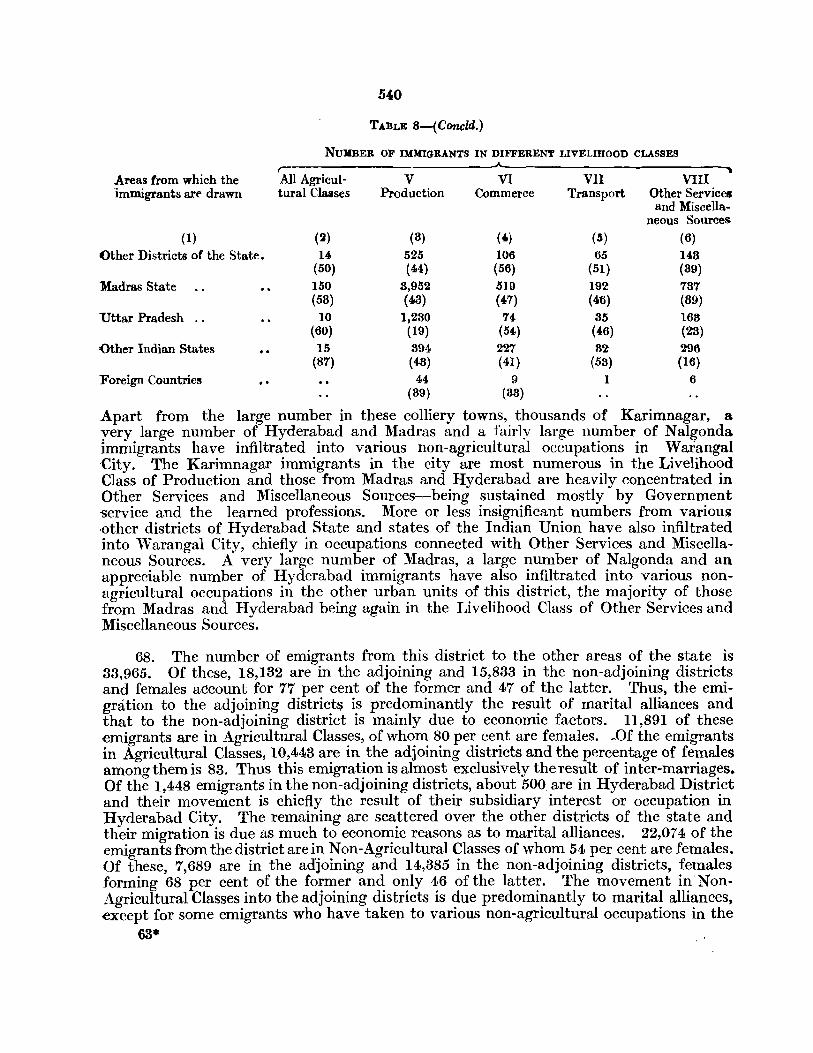
5'0
TABLE 8-{Concld.)
NUMBER OF IMMIGRANTS IN DIFFERENT LIVELIHOOD CLASSES r-
Areas from which the All Agricul- V VI VII VIII Immigrants are drawn tural Classes Production Commerce Transport Other Services
and Miscella-neous Sources
(1) (2) (3) (4) (5) (6) Other Districts of the State. 14 525 106 65 148
(50) (44) (56) (51) (39)
lIadras State 150 8,952 519 192 787 (58) (43) (47) (46) (89)
Uttar Pradesh 10 1,230 74 35 168 (60) (19) (54) (46) (23)
{)ther Indian States 15 394 227 32 296 (87) (43) (41) (53) (16)
Foreign Countries 44 9 1 6 (39) (33)
Apart from the large number in these colliery towns, thousands of Karimnagar, a yery large number of Hyderabad and :Madras and a fairly large number of Nalgonda immigrants have infiltrated into va.rious non-agricultural occupations in WarangaI City. The Karimnagar immigrants in the city are most numerous in the Livelihood Class of Production and those from Madras and Hyderabad are heavily concentrated in Other Services and Miscellaneous Sources-being sustained mostly by Government service and the learned professions. More or less insignificant numbers from various ,other districts of Hyderabad State and states of the Indian Union have also infiltrated into Warangal City, chiefly in occupations connected with Other Services and Miscellaneous Sources. A very large number of Madras, a large number of N algonda and an appreciable number of Hyderabad immigrants have also infiltrated into various nonagricultural occupations in the other urban units of this district, the majority of those from Madras and Hyderabad being again in the Livelihood Class of Other Services and Miscellaneous Sources.
68. The number of emigrants from this district to the other areas of the state is 33,965. Of these, 18,132 are in the adjoining and 15,833 in the non-adjoining districts and females account for 77 per cent of the former and 47 of the latter. Thus, the emigration to the adjoining districts is predominantly the result of marital alliances and that to the non-adjoining district is mainly due to economic factors. 11,891 of these ·emigrants are in Agricultural Classes, of whom 80 per cent are females. -Of the emigrants in Agricultural Classes, 10,443 are in the adjoining districts and the percentage of females among them is 83. Thus this emigration is almost exclusively the result of inter-marriages. Of the 1,448 emigrants in the non-adjoining districts, about 500 are in Hyderabad District and their movement is chiefly the result of their subsidiary interest or occupation in Hyderabad City. The remaining are scattered over the other districts of the state and their migration is due as much to economic reasons as to marital alliances. 22,074 of the emigrants from the district are in Non-Agricultural Classes of whom 54 per cent are females. Of these, 7,689 are in the adjoining and 14,385 in the non-adjoining districts, females forming 68 per cent of the former and only 46 of the latter. The movement in NonAgricultural Classes into the adjoining districts is due predominantly to marital alliances, except for some emigrants who have taken to various non-agricultural occupations in the
63*
541
urban areas of Karimnagar and, to a smaller extent, of Nalgonda District. Of the emigrants in Non-Agricultural Classes in the non-adjoining districts, the overwhelming majority, namely 9,373, are in Hyderabad District-8,881 being in Hyderabad City itself. About 48 per cent of the total Warangal emigrants in Hyderabad District are sustained by qccupations connected with Other Services and Miscellaneous Sources, and 19, 15 and 12 per cent by occupations connected with Production, Transport and Commerce respectively. Some of the Warangal emigrants have also emigrated to the urban units of Adilabad District and taken chiefly to occupations connected with Production. A considerably smaller number have also taken to various non-agricultural occupations in Bodhan-Banswada Tahsils of Nizamabad District. Except for these, there are no other significant cases of emigration from this district for reasons unconnected with marital alliances.
69. The immigrants into this district from other districts of the state number 87,166, as against only 33,965 emigrants from this district to the latter. This excess~ which is almost exclusively due to the heavy influx from Karimnagar and Nalgonda Districts, is spread over all the livelihood classes and is especially marked in Production and, to a smaller extent, in Other Services and Miscellaneous Sources.
70. The natural population of this district as given in Table 1 is 1,476,898, as against its enumerated population of 1,581,326. But the figure for the natural population does not cover ''Varangal emigrants in areas beyond the state. There are 5,236 Hyderabad emigrants in East Godavari, 4,315 in West Godavari and 35,345 in Krishna Districts. Almost the whole of the numbers in the first two and a considerable portion in that in the third are bound to have migrated from this district. In addition to this~ a portion. of the 10,114 Hyderabad emigrants in the non-adjoining districts of Madras State are also bound to have moved out from this district. The number of Warangal emigrants in other areas beyond the state is, however, not likely to be significant. In spite of all this, the total number of Warangal immigrants beyond the state can hardly fill up the existing gap between the natural and enumerated population.., of the district. Thus, the natural population of the district is bound to be considerably smaller than its enumerated population.
71. Nalgo'nda District.-98 per cent of the population enumerated in this district were born .within the district itself and only 2 per cent beyond the district. Thus, the proportion of the immigrants in this district to the total enumerated population is very small-. in fact, except for Karimnagar, it is the smallest recorded among the districts of the state. The small proportion is basically due to the fact that the district has few large scale industries-apart from some oil and rice mills-and practically no urban unit of any distinction. This district is the least urbanised in the state. To a minor extent, it may also be due to the unsettled conditions prevailing in the district for some years prior to the census enumeration in 1951. But this factor, if it has prevented some persons in the commercial and industrial classes from moving into the district, is itself responsible for a larger immigration of government employees into the district. Of the immigrants over 62 per cent are females. But among the immigrants drawn from the adjoining areas, namely the districts of Mahbubnagar, Hyderabad, Medak, Karimnagar and Warangal and Madras State, who account for 90 per cent of the total immigrants into the district, almost 67 per cent are females. It is thus obvious th~t the immigration into this district is not only insignificant in dimensions but is also very largely the result of marital alliances.
542
72. Of the total number of immigrants in the district 18,793, or 52 per cent, are in Agricultural Classes and the percentage of females among them is as high as 73. All but '210 of these immigrants al'e from the adjoining areas. There are 6,590 Madras immigrants in this district in Agricultural Classes (4,699 being in the Livelihood Class of Owner ,Cultivation) of whom 59 per cent are females. Madras immigrants have taken to owner ,cultivation in the rural areas of Huzurnagar Tahsil in appreciable numbers, in those of Nalgonda and J angaon Tahsils in small numbers, and in those of Devarkonda, Ramannapet and Miryalguda Tahsils in insignificant numbers. They have also taken to agricultural labour in the rural areas of Huzurnagar Tahsil in small numbers and to tenant cultivation in most of the above areas in microscopic numbers. Apart from these Madras immigrants, there is no significant infiltration into this district in Agricultural Classes. The 210 immigrants in these classes from beyond the adjoining areas are mostly agriculturists in their home states or districts who have moved into this district merely because of some subsidiary interest or occupation-mostly government service. 17,473, or 48 per cent of the immigrants, are in Non-Agricultural Classes, amongst whom females constitute only 51 per ('ent. 14,020 of these immigrants in Non-Agricultural Classes are from the adjoining and 3,453 from the non-adjoining areas. Madras immigrants have infiltrated in occupations connected with Other Services and Miscellaneous Sources in small numbers in the rural areas of Miryalguda and in insignificant numbers in those of Nalgonda and Huzurnagar Tahsils. In the last of these three areas, they have also taken to activities connected with r roduction again in insignificant numbers. A few of both Madras and Mahbubnagar immigrants in the rural areas of Devarkonda Tahsil, a few of Uttar Pradesh immigrants in those of Ramannapet and Bhongir Tahsils, and a few Uttar Pradesh as well as Mahbubnagar immigrants in the rural areas of Jangaon Tahsil, have infiltrated into occupations connected with Other Services and Miscellaneous Sources-the Mahbubnagar immigrants in Jangaon Tahsil being labourers employed in a P.W.D. project. Appreciable numbers of Madras and Hyderabad immigrants, a small number of Uttar Pradesh and Warangal immigrants, and insignificant numbers ,of Medak, Mahbubnagar, Karimnagar, Rajasthan and Punjab immigrants have taken to non-agricultural occupations in the urban areas of the district. The overwhelming majority of the Hyderabad as well as of the Madras, Uttar Pradesh, Rajasthan and Punjab immigrants are sustained by Other Services and Miscellaneous Sources--mostly by government service. But none of these infiltrations, whether in Agricultural or Non-Agricultural Classes, are of any importance.
73. Nalgonda emigrants in other areas of the state number 101,526, which is the second largest number among the corresponding figur~s recorded by the districts ,of the state. T.,is heavy migration is primarily due to the limited scope within the district itself for any further absorption of the population, wnether in industrial or agricultural occupations. To an extent, however, it may have been the result of the unsettled conditions prevailing in the district for some years. About half of these emigrants, namely 50,130, are in Hyderabad District itself, of whom as many as 39,738 are in Hyderabad City. This movement represents the largest inter-district movement recorded in the state at the present census. In fact, except for the movement of the 52,412 Madras emigrants to Adilabad District during 1931 in connection with the construc~ tion of some large transport w~rks, the present movement from Nalgonda to Hyderabad is the lEost remarkable recorded in this state since the turn of this century. 28,101 of the emigrants have moved to Warangal District, particularly into the adjoining tahsils of the district. This is also one of the major movements recorded among the districts .of the state and is influenced by economic factors to an appreciable degree, though not to
543
the same extent as in the case of the movement to Hyderabad. Nalgonda emigrants have also moved in very large numbers to Medak, Mahbubnagar and Nizamabad Districts,. but the movement into the first two is largely the result of marital alliances.
74. Of the total number of emigrants from this district'to other areas within the state, 33,368 or 33 per cent are in Agricultural Classes, of whom 65 per cent are females. Nalgonda emigrants have taken in large numbers to owner and tenant cultivation and agricultural labour in Warangal District, the largest concentration being in Mahbubabad Tahsil. Small numbers of them have infiltrated into the eastern portions of Hyderabad District, as tenant cultivators and agricultural labourers and to a lesser extent, to Mahbubnagar District, mostly to Achampet-Nagarkurnool Tahsils, as agricultural labourers and, to a smaller extent, as tenant and owner cultivators. A few of them have also taken to agricultural labour in Siddipet Tahsil of l\ledak District. Again, there are 1,915 and 878' Nalgonda emigrants in Agricultural Classes in the urban areas of Hyderabad and Warangal Districts respectively. But most of these are only Nalgonda agriculturists (or their dependants) who have moved out to those urban units' merely because of some subsidiary interest or occupation. A large number of Nalgonda emigrants have taken to agricultural labour in Bodhan-Banswada Tahsils and a few to owner cultivation in Nizamabad Tahsil in Nizamabad District. Beyond the adjoining districts, this is the only area wherein Nalgonda emigrants have infiltrated int" agricultural occupations in perceptible numbers. 68,158 or 67 per cent of the emigrants from this district, are in Non-Agricultural Classes, amongst whom the percentage of females is only 51. The overwhelming majority of these emigrants, namely 44,278 are in Hyderabad District of whom 38,158 are in Hyderabad City itself. Slightly more than half of this huge number are males. Over 41 per cent of the total Nalgonda emigrants in Hyderabad District are sustained by occupations connected with Other Services and Miscellaneous Sources and 21, 14 and 12 by those connected with Production, Commerce and Transport respectively, manning the activities connected with Transport, and to a lesser extent, Production and Other Services and Miscellaneous Sources in Hyderabad District in larger numbers than the emigrants from any other area. 13,460 of these emigrants in Non-Agricultural Classes are in Warangal District. Nalgonda emigrants have taken to occupations connected both with Production and Other Services and Miscellaneous Sources in very large numbers, with those connected with Commerce in appreciable numbers, and with those connecteq with Transport in small numbers in Warangal District, almost wholly in the two mining towns of Kothagudem and Yerandu and in the adjoining tahsils of Warangal District, including Warangal City and Khammm Town. Insignificant numbers of the Nalgonda emigrants have taken to occupations connected with Production and Other Services and Miscellaneous Sources in Siddipet Tahsil and in the urban areas of Medak District, with those connected only with the latter in the urban areas of Mahbubnagar and Karimnagar Districts and with those connected with Iroduction in the rural areas of Kalwakurti and Achampet-Nagarkurnool Tahsils. Nalgonda emigrants have also taken in insignificant number to occupations connected with Other' Services and Miscellaneous Sources in Nizamabad Tahsil and with Froduction in Bodhan-Banswada Tahsils. A few of them have also taken to non-agricultural occupations in the towns of Adilabad District and in Kadam and Tungabhadra Projects.
75. The number of immigrants into this district from other areas within the state is only 22,574 that is roughly one fifth of the number of emigrants from this district to the former. This heavy excess of the emigrants is almost wholly due to the large exodus to Hyderabad, Warangal and to a smaller extent to Medak, Nizamabad and Mahbubnagar
64
544
Districts. This excess though spread over all livelihood classes is particularly conspicuous in Production and Other Services and Miscellaneous Sources.
76.. The natural population of this district as given in Table 1 is 1,609,235. But this figure is an underestimate as it excludes Nalgonda emigrants in areas beyond the frontiers of this state. There are 8,570 Hyderabad emigrants in Guntur District, which borders Nalgonda and for a few miles Mahbubnagar District as well. But the areas on either side of the common borders between Mahbubnagar and Guntur are hilly and wooded and sparsely populated. Most of the Gunturemigrantsmusthave, therefore, been drawn from Nalgonda District itself. Further, there are 35,345 Hyderabad emigrants in Krishna District which mostly borders Warangal and for a few miles Nalgonda Districtas well. But the bordering areas between Nalgonda and Krishna Districts are very important from the point of view of inter-communication between the people living in this state and of those in Madras State. It is also a well known fact that a large number of Nalgonda emigrants have moved out to Krishna District in search of subsi ~ tence. 'Thus, a fair number of. the Hyderabad emigrants in Krishna District are also bound to have moved out from Nalgonda District. Again, some of the 10,114 Hyderabad emigrants in the non-adjoining areas of Madras State would have also moved out from this district. Then umber of Nalgonda emigrants in other areas beyond the state is not likely to be appreciable. But all this makes it obvious that if figures for Nalgonda emigrants beyond Hyderabad State were also available, the natural popUlation of this district would be considerably more than the underestimated figure of 1,609,235 as indicated above. But even this underestimated figure of its natural population is 4 per cent higher .than iti enumerated population of 1,543,975.
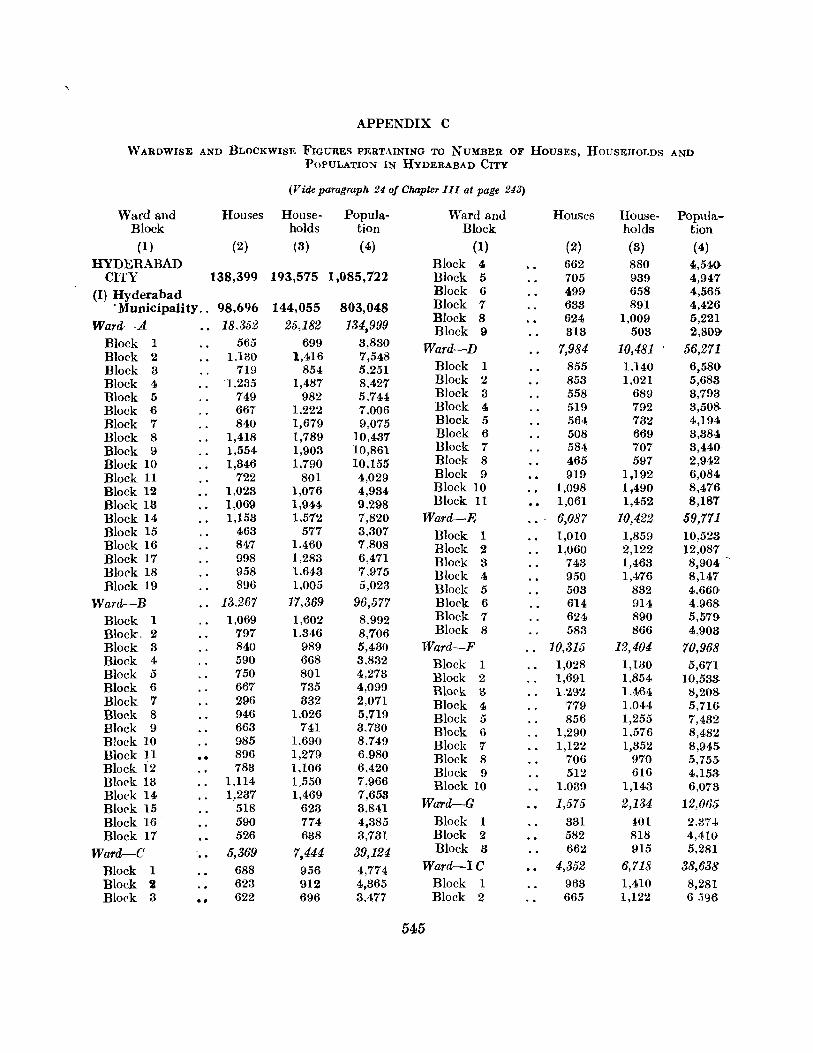
APPENDIX C
W ARDWISE AND BLOCKWISE FIGURES PERTAINING TO NUMBER OF HOUSES, HOUSEHOLDS AND POPULATION IN HYDERABAD CITY
(Vide paragraph 24 of Chapter III at page 243)
Ward and Houses House- Popu)a- Ward and Houses House- Popula-Block holds tion Block holds hon
(1) (2) (3) (4) (1) (2) (3) (4)
HYDERABAD Block 4 662 880 4,54()' CITY 138,399 193,575 1,085,722 Block 5 705 939 4,947
(I) Hyderabad Block 6 499 658 4,565
. Municipality .. 98,696 144,055 803,048 Block 7 633 891 4,426
Ward-A 18,352 25,182 134,999 Block 8 624 1,009 5,221 Block 9 313 503 2,80~
Block 1 565 699 3,830 Ward-D 7,984 10,481 56,271 Block 2 1.130 1,416 7,548 Block 3 719 854 5.251 Block 1 855 1,140 6,58o.
Block 4 '1.235 1,487 8,427 Block 2 853 1.021 5,683
Block 5 749 982 5,744 Block 3 558 689 3,793
Block 6 667 1.222 7,006 Block 4 519 792 3,508
Block 7 840 1,679 9,075 Block 5 564 732 4,194
Block 8 1,418 1,789 10,437 Block 6 508 669 3,384
Block 9 1,554 1,903 10,861 Block 7 584 707 3,440
Block 10 1,346 1,790 10,155 Block 8 465 597 2,942
Block 11 722 801 4,029 Block 9 919 1,192 6,084
Block 12 1,023 1,076 4,934 Block 10 1,098 1,490 8,476
Block 13 1,069 1,944 9.298 Block 11 1,061 1,452 8,187
Block 14 1,153 1.572 7,820 Ward-E .. 6,087 10,422 59,771 Block 15 463 577 3,307 Block 1 1,010 1,859 10,523 Block 16 847 1.460 7.808 Block 2 1,060 2,122 12,081 Block 11 998 1,283 6,471 Block 3 743 1,463 8,904 Block 18 958 1.643 1.975 Block 4 950 1,476 8,141 Block 19 896 1,005 5,023 Block 5 503 832 4.660'
Ward-B 13.267 17,369 96,577 Block 6 614 914 4,968
Block 1 1.069 1,602 8.992 Block 1 624 890 5,579
Block, 2 797 1.346 8,706 Block 8 583 866 4,903
Block 3 840 989 5,430 Ward-P 10,315 12,404 70,968 Block 4 590 668 3,832 Block 1 1,028 1,130 5,671 Block 5 750 801 4,273 Block 2 1,691 1.854 10,533 Block 6 667 135 4,099 Block 3 1,292 1,464 8,208 Block 7 296 332 2,011 Block 4 779 1,044 5,716 Block 8 946 1.026 5,719 Block 5 856 1,255 7,432 Block 9 663 741 3,730 Block 6 1,290 1.576 8,482 Block 10 985 1,690 8,749 Block rr 1,122 1,352 8,945 Block II 896 1,279 6,980 Block 8 706 970 5,755 Block i2 783 1,106 6,420 Block 9 512 616 4,153 Block 13 1,114 1.550 7,966 Block 10 1.039 1,143 6,073 Block 14 1,237 1,469 1,653
Wa'rd-G 1,575 2,134 12,065 Block 15 518 623 3,841 Block 16 590 114 4,385 Block 1 331 401 2.374 Block 17 526 638 3,731 Block 2 582 818 4,410
Ward-C 5,369 7,444 39,124 Block 3 662 915 5,281
Block 1 688 956 4,774 Ward-Ie 4,352 6,718 38,638
Block 2 623 912 4,365 Block 1 963 1,410 8,281 Block 3 •• 622 696 3,477 Block 2 665 1,122 6 :596
545
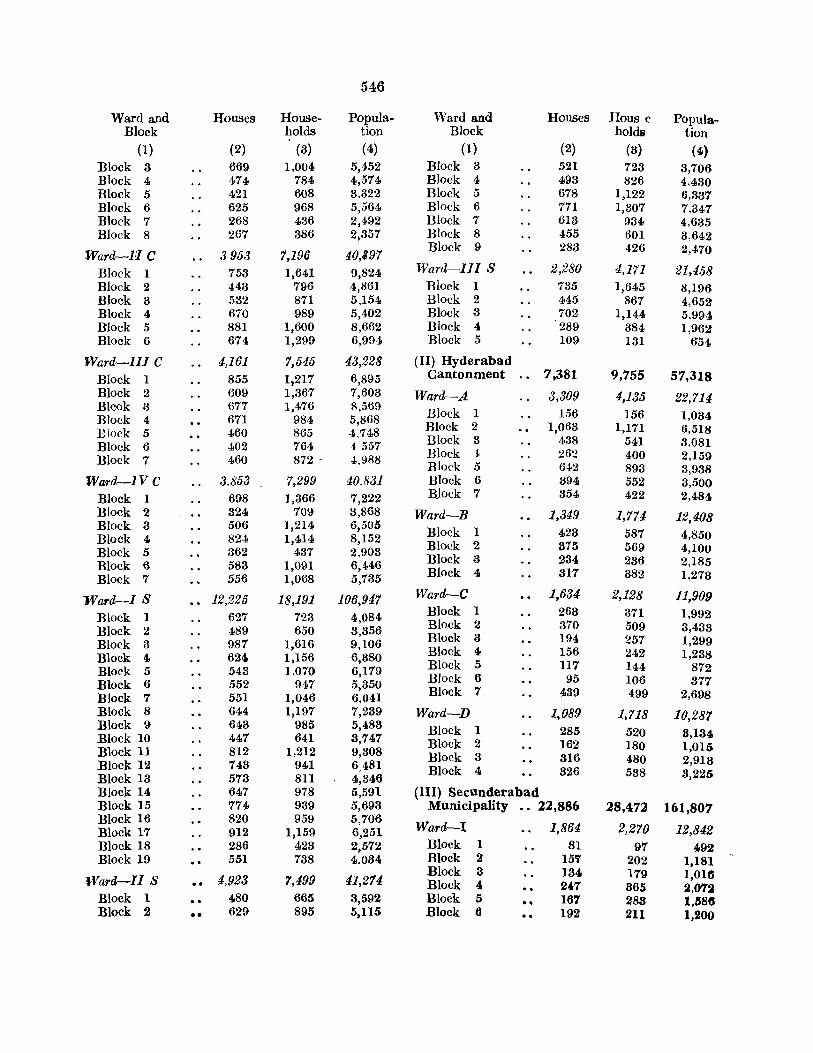
546
Ward and Houses House- Popula- Ward and Houses Rous e Popula-Block holds tion Block holds tion
(1) (2) (3) (4) (1) (2) (3) (4) Block 3 669 1.004 5,452 Block 3 521 723 3,706 Block 4 474 784 4,574 Block 4 493 826 4.430 Block 5 421 608 3.322 Block 5 678 1,122 6,337 Block 6 625 968 5,564 Block 6 771 1,307 7.347 Block 7 268 436 2,492 Block 7 613 934 4.635 Block 8 267 386 2,357 Block 8 455 601 3,642
Ward-I!! C 3953 7,196 40,197 Block 9 283 426 2,470
Block 1 753 1,641 9,824 Ward-III S 2,280 4,171 21,458 Block 2 443 796 4,861 Block 1 735 1,645 8,196 Block 3 532 871 5,154 Block 2 445 867 4,652 Block 4 670 989 5,402 Block 3 702 1,144 5,994 Block 5 881 1,600 8,662 Block 4 289 384 1,962 Block 6 674 1,299 6,994 Block 5 109 131 654
Ward-III C 4,161 7,545 43,228 (II) Hyderabad Block 1 855 1,217 6,895 Cantonment 7,381 9,755 57,318 Block 2 609 1,367 7,603 Ward-A 3,309 4,135 22,714 Blcok 3 677 1,476 8,569
Block 1 156 Block 4 671 984 5,868 156 1,034
Elock 5 460 865 ..Ji,748 Block 2 1,063 1,171 6,518
Block 6 402 764 45.57 Block 3 438 541 3,081
Block 7 460 872 . 4<,988 Block J. 262 400 2,159 BJork 5 642 893 3,938
Ward-IV C 3,853 7,299 40,831 Block 6 394 552 3,500 Block 1 698 1,366 7,222 BJock 7 354 422 2,484 Block 2 324 709 3,868 Ward-B 1,349 1,774 12,408 Block 3 506 1,214 6,505
Block 1 423 Block 4 824 1,414 8,152 587 4,850
Block 5 362 437 2,903 Block 2 375 569 4,100
Block 6 583 1,091 6,446 Block 3 234 236 2,185
Block 7 556 1,068 5,735 Block 4 317 382 1,273
Ward--I S 12,225 18,191 106,947 Ward-C 1,634 2,128 11,909
Block 1 627 723 4,084 Block 1 263 371 1,992
Block 2 489 650 3,356 Block 2 370 509 3,433
Block 3 987 1,616 9,106 Block 3 194 257 1,299
Block 4. 624 1,156 6,380 Block 4 156 242 1,238
Block 5 543 1,070 6,179 Block 5 117 144 872
Block 6 552 947 5,350 Block 6 95 106 377
Block 7 551 1,046 6,041 Block 7 439 499 2,698
Block 8 644 1,197 7,239 Ward-D 1,089 1,718 10,287 Block 9 643 985 5,483 Block 1 285 520 Block 10 447 641 3,747 8,134
Dlock 11 812 1,212 9,308 Block 2 162 180 1,015
Block 12 743 941 6,481 Block 3 316 480 2,913
Block 13 573 811 4,346 Block 4 326 588 3,225
Dlock 14 647 978 5,591 (III) Secunderabad Block 15 774 939 5,693 Municipality 22,886 28,472 161,807 Block 16 820 959 5,706
Ward-I Block 17 912 1,159 6,251 1,864 2,270 12,842 Block 18 286 423 2,572 Block 1 81 97 492 Block 19 551 738 4,034 Block 2 15'i 202 1,181
"Vard-II S 4,923 7,499 41,274 Block 3 134 179 1,01(1
•• Dlock 4 2'7 865 2,072 Block 1 480 665 3,592 Block 5 .. 167 28B l,lS8(1 Block 2 •• 629 895 5,115 Block 6 .. 192 211 1,200
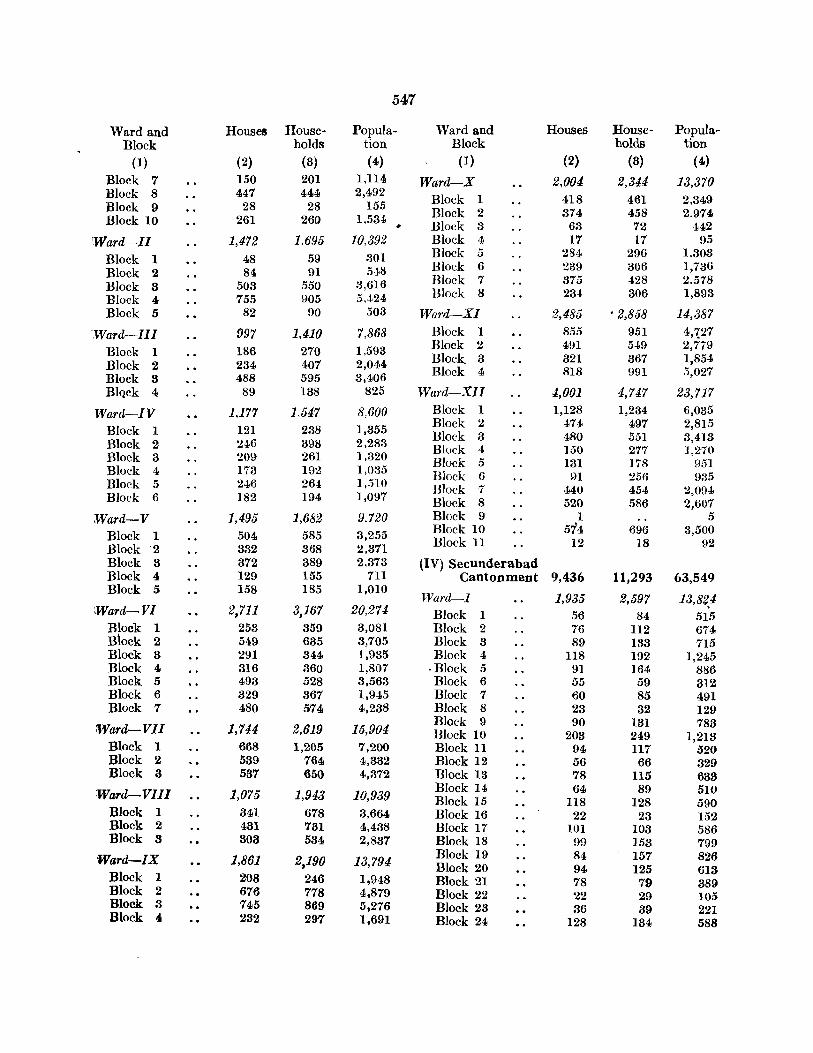
547
Ward and Houses House- Popula- Ward and Houses House- Popula-Block holds tion Block holds tion
(1) (2) (3) (4) (1) (2) (3) (4)
Block 7 150 201 1,114 Ward-X 2,004 2,344 13,370 Block 8 447 444 2,492
Block 1 418 461 2,349 Block 9 28 28 155
Block 2 374 458 2,974 Block 10 261 260 1,534
# Block 3 63 72 442 '·Ward-II 1,472 1,695 10,392 Block 4 17 17 95
59 301 Block 5 284 296 1,303 Block 1 48
Block 6 239 306 1,736 Block 2 84 91 548
Block 7 375 428 2,578 Block 3 503 550 3,616
Block 8 234 306 1,893 Block 4 755 905 5,424 Block 5 82 90 503 Ward-XI 2,485 . 2,858 14,387
Ward-III 997 1,410 7,868 Block 1 855 951 4,,(27
186 270 1,593 Block 2 491 549 2,779 Block 1
Block 3 321 367 1,854 Block 2 234 407 2,044
Block 4 818 991 5,027 Block 3 488 595 3,406 BlQck 4 89 138 825 Ward-XII 4,001 4,747 23,717
Ward-IV 1,177 1,547 8,600 Block 1 1,128 1,234 6,035 Block 2 474 497 2,815
Block 1 121 238 1,355 Block 3 480 551 3,413
Block 2 246 398 2,283 Block 4 150 277 1,270
Block 3 209 261 1,320 Block 5 131 178 951
Block 4 173 192 I,OB5 Block 6 91 256 935
Block 5 246 264 1,.310 Block 7 440 454 2,094
Block 6 182 194 1,097 Block 8 520 586 2,607 Ward-V 1,495 1,682 9.720 Block 9 1 5
Block 10 574 696 3,500 Block 1 504 585 3,255 Block 11 12 18 92 Block '2 332 368 2,371
Block 3 372 389 2,373 (IV) Secunderabad Block 4 129 155 711 Cantonment 9,436 11,293 63,549 Block 5 158 185 1,010
Ward-l 1,935 2,597 13,8~4 ;Ward-VI 2,711 3,167 20,274 Block 1 56 84 515
Block 1 253 359 3,081 Block 2 76 112 674 Block 2 549 635 3,705 Block 3 89 133 715 Block 3 291 344 1,935 Block 4 118 192 1,245 Block 4 316 360 1,807 -Block 5 91 164 886 Block 5 493 528 3,563 Block 6 55 59 312 Block 6 329 367 1,945 Block 7 60 85 491 Block 7 480 574 4,238 Block 8 23 32 129
Ward-VII 1,744 2,619 15,904 Block 9 90 131 783 Block 10 203 249 1,213
Block 1 668 1,205 7,200 Block 11 94 117 520 Block 2 539 764 4,332 Block 12 56 66 329 Block 8 587 650 4,372 Block 13 78 115 633
Ward-VIII 1,075 1,943 10,939 Block 14 64 89 510 Block 15 118 128 590
Block 1 341 678 3,664 Block 16 22 23 152 Block 2 431 731 4,438 Block 17 101 108 586 Block 3 308 534 2,837 Block 18 99 153 799
Ward-IX 1,861 2,190 13,794 Block 19 84 157 826 Block 20 94 125 613
Block 1 208 246 1,948 Block 21 78 79 389 Block 2 676 778 4,879 Block 22 22 29 105 Block 3 745 869 5,276 Block 23 36 39 221 Block 4 232 297 1,691 Block 24 128 134 588
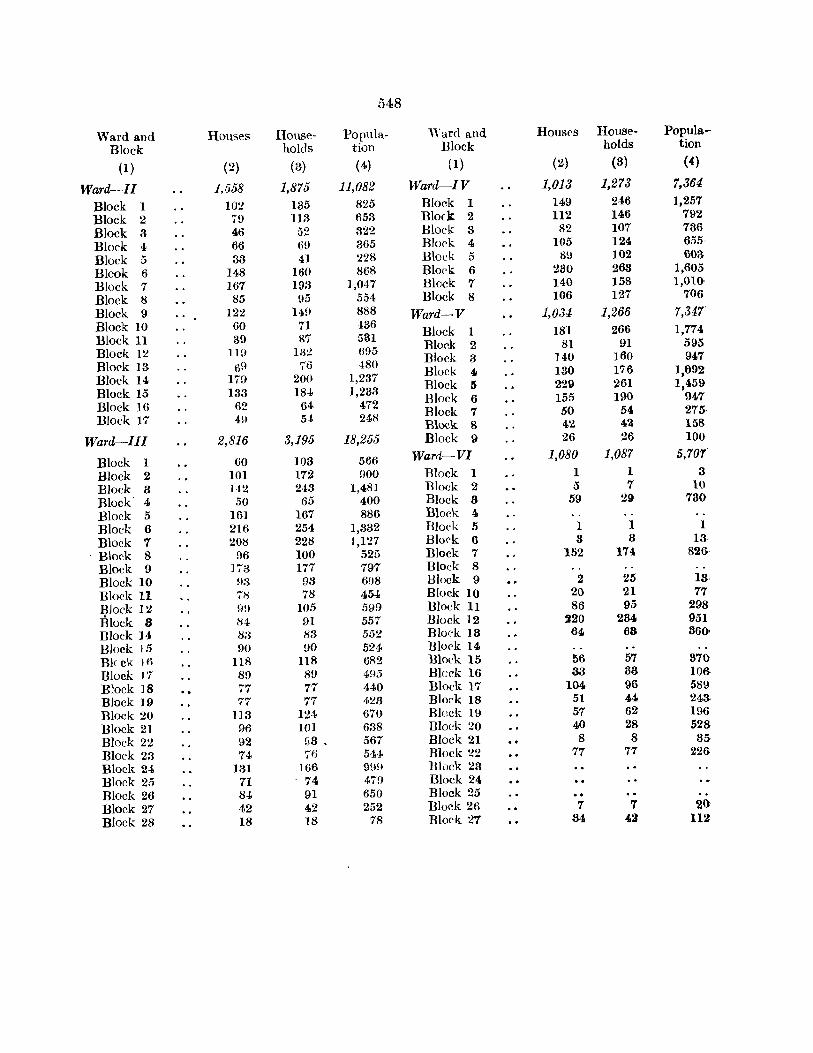
548
Ward and Houses House- Popula- "'ard and Houses House- Popula-
Block holds tion Block holds tion
(1 ) (2) (3) ( 4) (1) (2) (8) (4)
Ward-II 1,558 1,875 11,082 Ward-IV 1,013 1,'273 7,364
Block 1 102 135 825 Block 1 149 246 1,257
Block 2 79 113 653 Block 2 112 146 792
Block :3 46 52 322 Block 3 82 107 736
Block 4 66 60 365 Block 4 105 124 655
Block 5 33 41 228 Block 5 89 102 603
Blook 6 148 160 868 Block 6 280 263 1,605
Block 7 167 193 1,047 Block 7 140 158 1,010-
Block 8 85 95 554 Block 8 106 127 706
Block 9 122 141) 888 Ward-V 1,034 1,266 7,347 Block 10 60 71 486 Block 1 181 266 1,774 Block 11 39 87 531 Block 12 1l!1 IS:! 695 Block 2 81 91 595
Block 13 69 76 480 Block 3 140 160 947
Block 14 179 200 1,237 Block 4 130 176 1,692
Block 15 133 184 ],233 Block 5 229 261 1,459
Block 16 62 64 472 Block 6 155 190 94.7
mock 17 49 54 248 Block 7 50 54. 275~
Block 8 4.2 4~ 158
Ward-III 2,816 3,195 18,255 Block 9 26 26 100
Block 1 60 108 566 Ward-VI 1,080 1,087 5,70r
Block 2 101 172 HOO Block 1 1 1 3
Block :3 142 248 1,481 Block 2 5 7 10
Block' 4 50 65 400 Block 3 59 ZQ 780
Block 5 161 167 886 Block 4
Block 6 216 254 1,832 Bloek 5 1 1 1
Block 7 208 228 1,127 Block 6 3 3 13-, Block 8 96 100 525 Block 7 152 174 826-
Block 9 173 177 797 Block 8 Block 10 !l3 93 608 Block 9 2 25 13,
Block 11 78 78 45,1, Block 10 20 21 77
Block 12 H!I 105 599 Block 11 86 95 298
Block 8 84 HI 557 Block ]2 220 284 951
Block 14 83 83 552 Bloc'k 13 64 68 36()o
Block 1.5 90 90 524 Block 14 Bl( ck 10 118 118 682 Block 15 56 57 370
Block 1'7 8H 8H 495 Block 16 33 33- lOS
B~ock 18 77 77 440 Block 17 104 96 589 Block 19 77 77 423 Block 18 51 44 243-
Block 20 113- 124 670 Bluck IH 57 62 196
Block 21 96 101 638 Block 20 40 28 528-Block 22 92 93 • 567 Block 21 8 8 35
Block 28 74 76 544- Block 22 77 77 226
Block 24 131 166 999 Block 23 Block 25 71 ' 74 479 Block 24 Block 26 8,1, 91 650 Block 25 Block 27 42 42 252 Block 26 7 7 2()
Block 28 18 18 78 Block 27 84 4~ lU
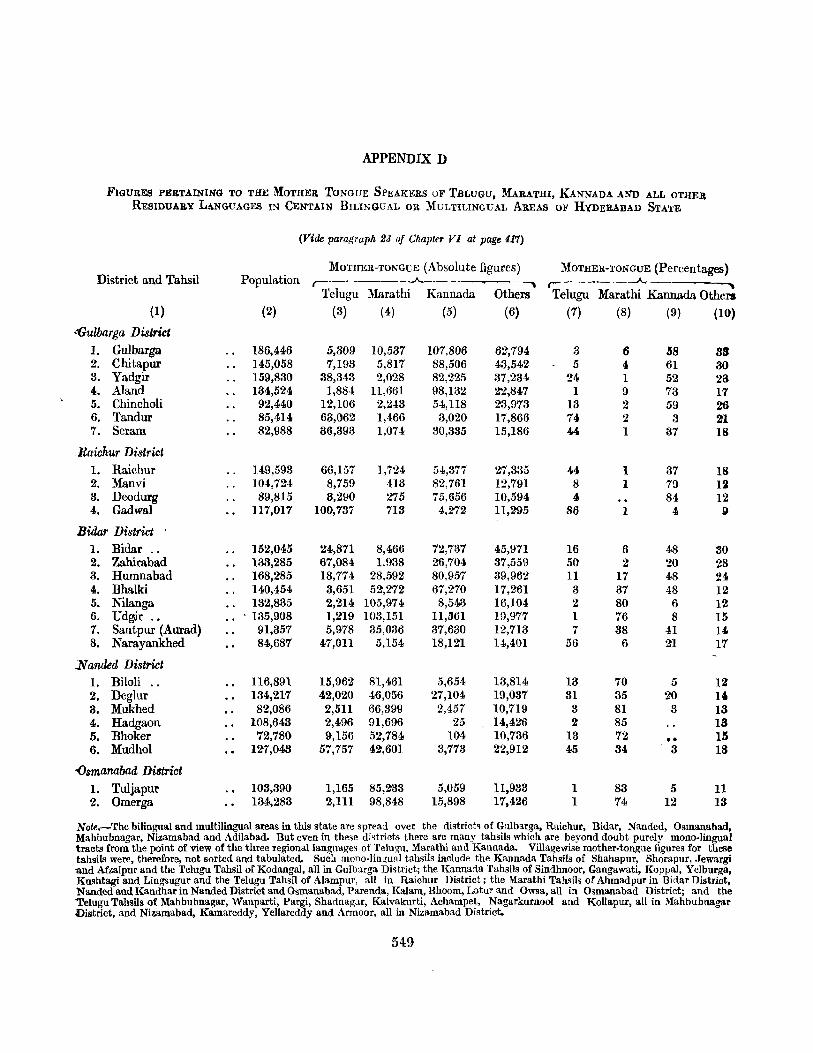
APPENDIX D
FWURES PERTAINING TO THE MOTHER TONGUE SPEAKERS OF TBLUGU, MARATHI, KANNADA AND ALL OTHER RESIDUARY LANGUAGES IN CENTAIN BILINGUAL OR MULTILINGUAL AREAS OF HYDERABAD STATE
(Ji"ide paragraph 23 of Chapter VI at page 417)
District and Tahsil Population MOTHER-TONGUE (Absolute figures) MOTHER-TONGUE (Percentages)
..---- -_____ ..A.. ____ r--------..A..--Telugu Marathi Kannada Others Telugu Marathi Kannada Others
(I) (2) (3) (4) (5) (6) (7) (8) (9) (10)
.(iulbarga District 1. Gulbarga 186,446 5,309 10,537 107,806 62,794 3 6 58 88 2. Chitapur 145,058 7,193 5,817 88,506 43,542 5 4 61 30 3. Yadgir 159,830 38,343 2,028 82,225 37,234 24 1 52 23 4. Aland 134,524 1,884 11,661 98,132 2'J,847 1 9 73 17 5. Chincholi 92,440 12,106 2,243 54,118 23,973 13 2 59 26 6. Tandur 85,414 63,062 1,466 3,020 17,866 74 2 3 21 7. Seram 82,988 36,393 1,074 30,335 15,186 44 I 37 18
Raichur District 1. Raichur }4,9,593 66,157 1,724 54,377 27,335 4.4 1 37 18 2. Manvi 104,724 8,759 413 82,761 12,791 8 1 79 12 3. Deodurg 89,815 3,290 275 75,656 10,594 4 84 12 4. Gadwal 117,OI7 100,737 713 4.272 11,295 86 1 4 I)
Bidar District I. Bidar .• 152,045 24,871 8,466 72,737 45,971 16 6 48 80 2. Zahirabad 133,285 67,084 1,938 26,704 37,559 50 2 20 28 3. Humnabad 168,285 18,774 28,592 80,957 39.962 11 17 48 24 4. Bhalki 140,454 3,651 52,272 67,270 17,261 3 37 48 12 5. Nilanga 132,835 2,214 105,974 8,54.3 16,104 2 80 6 12 6. Udg.ir .. ' 135,908 1,219 103,151 11,361 19,977 1 16 8 15 7. Santpur (Aurad) 91,357 5,978 35,036 37,630 12,713 7 38 41 140 8. Narayankhed 84,687 47,01l 5,154 18,121 14,401 56 6 21 17
N anded District 1. Biloli .. 116,891 15,96Z 81,461 5,654 13,814 13 70 5 12 2. Deglur 134,217 42,020 46,056 27,104 19,037 31 35 20 1" 3. Mukhed 82,086 2,511 66,399 2,457 10,719 3 81 3 13 4. Hadgaon 108,643 2,496 91,696 25 14,426 2 85 18 5. Bhoker 72,780 9,156 52,784 104 10,736 13 72 • • 15 6. Mudhol 127,043 57,757 42,601 3,773 22,912 45 34 3 18
<Jamanabad District 1. Tuljapur 103,390 1,165 85,233 5,059 11,933 1 83 5 11 2. Omerga 134,283 2,111 98,848 15,898 17,426 1 74 12 13
Note.-The bilingual and multilingual areas in this state are spread over the district~ of Gulbarga, Raichur, Bidar, ~anded, Osmanabad. Mahbubnagar, Nizamabad and Adilabad. But even in these di~tricts there are many tahsils which are beyond doubt purely monO-lingual tracts from the point of view of the three regional languages of Telugu. Marathi and Kannada. Villagewise mother-tongue figures for these tahsils were, therefore, not sorted and tabulated. SUCd mono-ling-un I tahsils iliclude the Kannada Tahsils of Shahapur, Shorapur, Jewargi 1l.nd Afzalpur and the Telugu Tahsil of Kodangal, all in Gulbarga District; the Kannada Tahsils of Sindhnoor, Gangawati, Koppal, Yelburga, Kushtagi and Lingsugur and the Telugu Tahsil of Alampur. all in Raichur District; the Marathi Tahsils of Ahmadpur in Bidar District, Nanded and Kandhar in Nanded District and Osmanabad, Parenda, Kalam, Bhoom, Latur and Owsa, all in Osmanabad District; and the 'Telugu Tahsils of Mahbubnagar, Wanparti, Pargi, Shadnagar, Kalvakurti, Achampet, Nagarkurnool and Kollapur, all in Mahbubnagar District, and Nizamabad, Kamareddy, Yellareddy and Armoor, all in Nizamabad District.
549
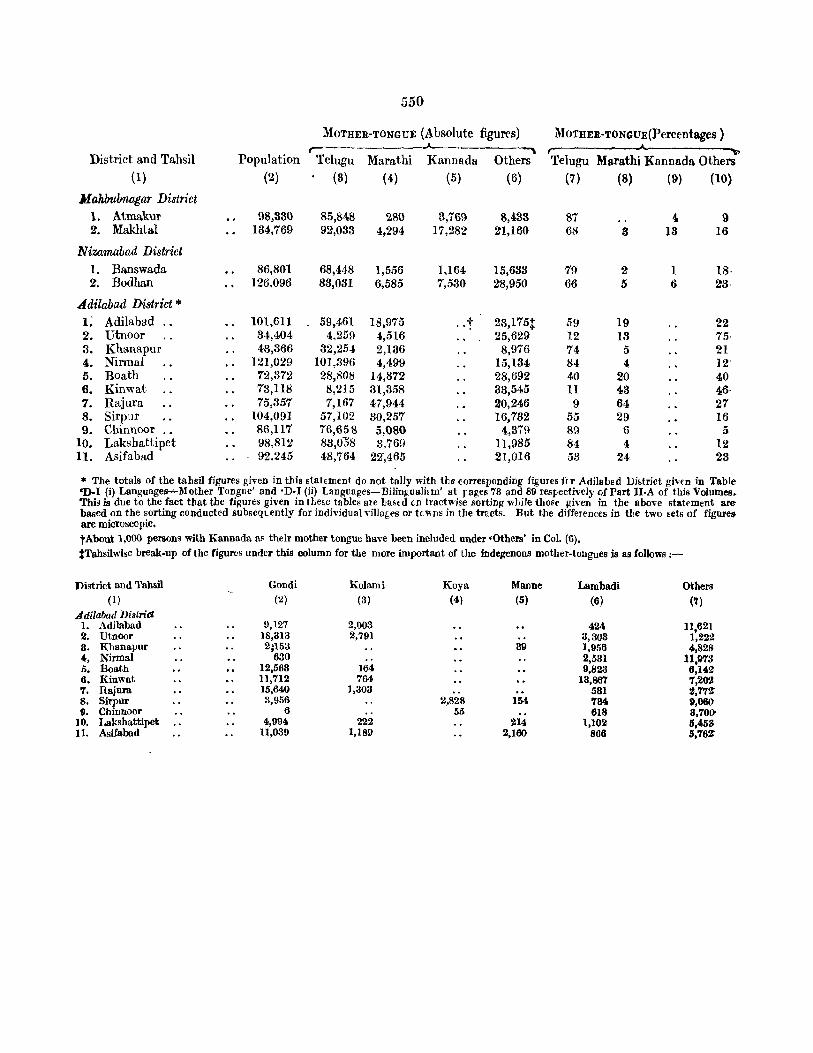
550
MOTHER-TONGUJ: (Absolute figures) MOTHER-TONGUE(Percentages ) r-------------~
District and Ta.hsil Population Telugu Marathi Kannadn Others Telugu Marathi Kannada Others (1) (2) (3) (4) (5) (6) (7) (8) (9) (10)
Mahbubnagar District 1. Atmakur 98,330 85,848 280 3,769 8,433 87 4 9 2. Makhtal 134,769 92,033 4,294 17,282 21,160 68 3 13 16
Nizamahad District 1. Banswada 86,801 68,448 1,556 1,164 15,633 79 2 1 18· 2. Bodhan 126,096 83,031 6,585 1,530 28,950 66 5 6 23
Adilabad District * 1: Adilabad .. 101,611 59,461 18,975 .. t 23,175t 59 19 22 2, Utnoor 34,404 4,259 4,516 25,629 12 13 75· 3. Khanapur 43,366 32,254 2,136 8,976 74 5 21 4, Nim1al 121,029 101,396 4,499 15,134 84 4 ] 2' 5. Baath '{2,372 28,808 14,872 28,692 40 20 40 6. Kinwa.t 73,118 8,215 31,358 33,545 11 43 46· 7. Rajura 75,357 7,167 47,944 20,246 9 64 27 8. Sirpur 104,091 57,102 30,257 16,732 55 29 16 9. Chinnoor 86,ll7 76,658 5,080 4,37~ 89 6 5
10, Lakshattipet 98,812 8a,OD8 8,769 11,985 84 4 12 II. Asifabad 92.245 48,764 22',465 21,016 53 24 23
* The totals of the tahsil figures given in this statement do not tally with tilt! ('orresponding figures flr AdilabBd Di.trict givtn in Table (1).1 (i) Languages--Mother Tongue' and 'D·l (ii) Languages-Bilingualifm' at rages 73 and 89 respectively of Part II·A of this Volumes. This is due to the fact that the figures given in the.e tables are ba&rd cn tractwise sorting wllile those giHn in the above statement are based on the sorting conducted subsequntly for individual villsbes or t(Wns in the tracts. But the differences in tile two sets of figure~ are microscopic. tAbout 1,000 persons with Kannada as their mother tongue have been included under 'Others' in Col. (6),
tTahsilwise break.up of the figures under this column for the more important of the indegenous mother-tongues is as follows:-
District and Tahsil Gondi
(1 ) (2)
Adilabad District 1. Adilabad 9,127 2. Utnoor 18,313 3. Khanapur 2;153 4, Nirmal 630 5, Boath 12,568 6. Kinwat 11,712 7. Rajura 15,640 8. Sirpur 3,956 9. Chinnoor 6
lQ. Lakshattipet 4,994 11. Asirabad 11,039
Kolami (3)
2,003 2,791
164 764
1,308
222 1,189
Koya Manne (4) (5)
89
2,828 1M 55
214 2,100
Lambadi (6)
4240 3,308 1,956 2,531 9,823
13,867' 581 784 618
1,102 866
Others (7)
11,621 1,222 4,828
11,978 6,142 'T,20l! 2,'7'T~ 9,060 3,70() 5,453 5,76~
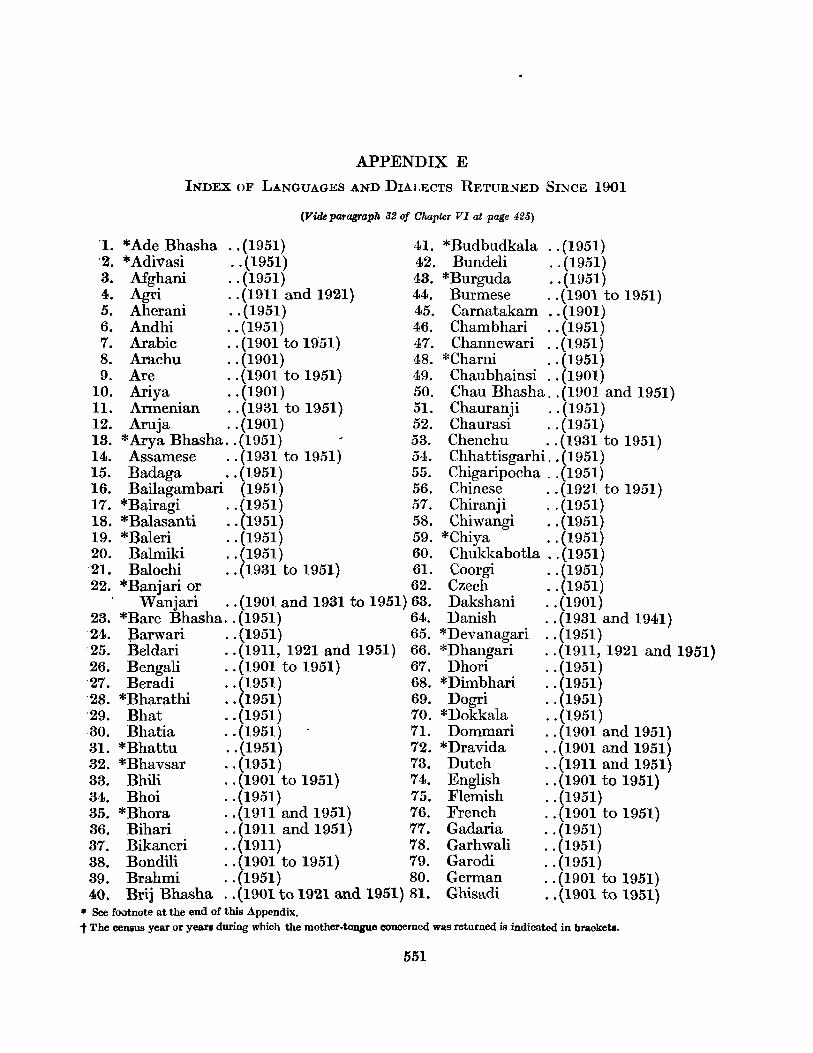
APPENDIX E
INDEX OF LA.NGUAGES AND DIALECTS RETURNED SINCE 1901
(Vide paragraph 32 of Chapter VI at page 425)
L *Ade Bhasha .. (1951) 41. *Budbudkala .. (1951) '2. *Adivasi .. (1951) 42. Bundeli .. (1951) 3. Afghani .. (1951) 43. *Burguda .. (1951) 4. Agri .. (1911 and 1921) 44. Burmese .. (1901 to 1951) 5. Aherani .. (1951) 45. Carnatakam .. (1901) 6. Andhi .. (1951) 46. Chambhari .. (1951) 7. Arabic .. (1901 to 19'51) 47. Channewari .. (1951) B. Arachu .. (1901) 4B. *Charni .. (1951) 9. Are .. (1901 to 1951) 49. Chaubhainsi .. (1901)
10. Ariya .. (1901) 50. Chau Bhasha .. (1901 and 1951) 11. Armenian .. (1931 to 1951) 51. Chauranji .. (1951) 12. Aruja .. (1901) 52. Chaurasi .. (1951) 13. *Arya Bhasha .. (1951) 53. Chenchu .. (1931 to 1951) 14. Assamese .. (1931 to 1951) 54. Chhattisgarhi. .(1951) 15. Badaga .. (1951) 55. Chigaripocha .. (1951) 16. Bailagambari (1951) 56. Chinese .. (1921 to 1951) 17. *Bairagi .. (1951) 57. Chiranji .. (1951) 18. *Balasanti .. (1951) 58. Chiwangi .. (1951) 19. *Baleri .. (1951) 59. *Chiya .. (1951) 20. Balmiki .. (1951) 60. Chukkabotla .. (1951) '21. Balochi .. (1931 to 1951) 61. Coorgi .. (1951) 22. *Banjari or 62. Czech .. (1951)
\ Wanjari .. (1901 and 1931 to 1951) 63. Dakshani .. (1901) 23. *Bare Bhasha .. (1951) 64. Danish .. (1931 and 1941) 24. 13arwari .. (1951) 65. *Devanagari .. (1951) 25. Beldari .. (1911, 1921 and 1951) 66. *Dhangari .. (1911, 1921 and 1951) 26. Bengali .. (1901 to 1951) 67. Dhori .. (1951) '27. Beradi .. (1951) 68. *Dimbhari .. (1951) 2B. *Bharathi .. (1951) 69. Dogri .. (1951) 29. Bhat .. (1951) 70. *Dokkala .. (1951) 30. Bhatia .. (1951) 71. Dommari .. (1901 and 1951) 31. *Bhattu .. (1951) 72. *Dravida .. (1901 and 1951) 32. *Bhavsar .. (1951) 73. Dutch .. (1911 and 1951) 33. Bhili .. (1901 to 1951) 74. English .. (1901 to 1951) 34. Bhoi .. (1951) 75. Flemish .. (1951) 35. *Bhora .. (1911 and 1951) 76. French .. (1901 to 1951) 36. Bihari .. (1911 and 1951) 77. Gadaria .. (1951) 37. Bikaneri .. (1911) 7B. Garhwali .. (1951) 38. Bondili .. (1901 to 1951) 79. Garodi .. (1951) 39. Brahmi .. (1951) BO. German .. (1901 to 1951) 40. Brij Bhasha .. (1901 to 1921 and 1951) B1. Ghisadi .. (1901 to 1951)
• See footnote at the end of this Appendix. t The census year or year. during which the mother-tongue concerned was returned is indicated in brackey.
551

552
82. Goanese .. (1901 to 1951) 132. Khandesi .. (1951) 83. *Gollar .. (1951) 133. Khatri .. (1901 to 1951) 84. Gondi .. (1901 to 1951) 134. Kohati .. (1951) 85. Gopali .. (1951) 135. Kolami .. (1951) 86. Gorkhali .. (1951) 136. Kolhati .. (1901 to 1951) 87. Gosavi .. (1951) 137. Koli .. (1911 and 1921) 88. Gotte .. (1951) 138. *Komati .. (1951) 89. Goundi .. (1951) 139. *Kongani .. (1951) 90. *Gowli .. (1951) 140. Konkani .. (1901 to 1951) 91. Greek .. (1931 to 1951) 141. Konkani Thakur(1951) 92. Gujarati .. (1901 to 1951) 142. Korava .. (1901 and 1931 to 1951 93. * Gurjari .. (1951) 148. Koshti .. (1951) 94. Gurmukhi .. (1901 and 1951) 144. Kotani .. (1951) 95. Halbi .. (1951) 145. Koya .. (1901 to 1951) 96. *Hatkari .. (1951) 146. *Kshatriya 97. Hebrew .. (1951) Bhasha .. (1951) 98. Helava .. (1951) 147. Kumauni .. (1951) 99. Hindi .. (1901 to 1951) 148. Lad .. (1901 and 1951)
100. Hindko .. (1951) 149. Ladsi .. (1951) 101. Hindustani .. (1901 to 1951) 150. Lakay .. (1901) 102. Hungarian .. (1951) 151. Lama .. (1951) 103. Inkari Bhasha (1951) 152. Lambadi (La-104. Irish .. (1911, 1941 and 1951) mani, Labhani)(1901 to 1951} 105. Italian .. (1901 to 1951) 153.* Lingayeth .. (1951) 106. Jagannathi .. (1901 and 1951) 154. Lodhi .. (1911 to 1951) 107. Jaini .. (1911 and 1951) 155. Lohari .. (1951) 108. Jangdi .. (1951) 156. Lushei .. (1951) 109. Japanese .. (1911 to 1941) 157.* Madrasi .. (1951) 110. Jatki .. (1951) 158. Magadhi .. (1951) Ill. Javanese .. (1951) 159. Malavi .. (1951) 112. *Jogi .. (1951)' 160. Malayalam .. (1901 to 1951) 118. Joshi .. (1951) 161. Maldivian .. (1951) 114. Jyad .. (1901) 162. Mali .,.(1951) 115. Kachchhi .. (1901 to 1951) 163. Malvi . '. (1951) 116. Kahari .. (1901 and 1951) 164. *Mandula .. (1951) 117. Kaikadi .. (1901 to 1951) 165. Manipuri .. (1951) 118. *Kalali .. (1951) 166. Manne .. (1901 andjl951)
- 119. *Kamati .. (1951) 167. Marathi .. (1901 to 1951) 120. Kannada (1901 to 1951) 168. Marwari .. (1901 to 1951) 121. *Karwari .. (1951) 169. *Metadi .. (1951) 122. *Kashe .. (1901 and 1951) 170. *Mathura .. (1951) 123. Kashmiri .. (1901 to 1951) 171. Memani .. (1951) 124. Kataba .. (1951) 172. *Menko .. (1951) 125. *Katai .. (1951) 178. l\Iewadi .. (1951) 126. Katari .. (1911) 174. Mochi .. (1951) 127. Kathiyawadi .. (1911,1921 anq 1951) 175. *Modi .. (1951) 128. Kathodi .. (1911 and 1921) 176: Mondi .. (1951) 129. Kayasthi .. (1911 and 1921) 177. *Mudaliar .. (1951) 130. *Kayiti .. (1951) 178. *Mudiraj .. (1951) 131. Kewati .. (1951) 179. Multani .. (1911 and 1951)
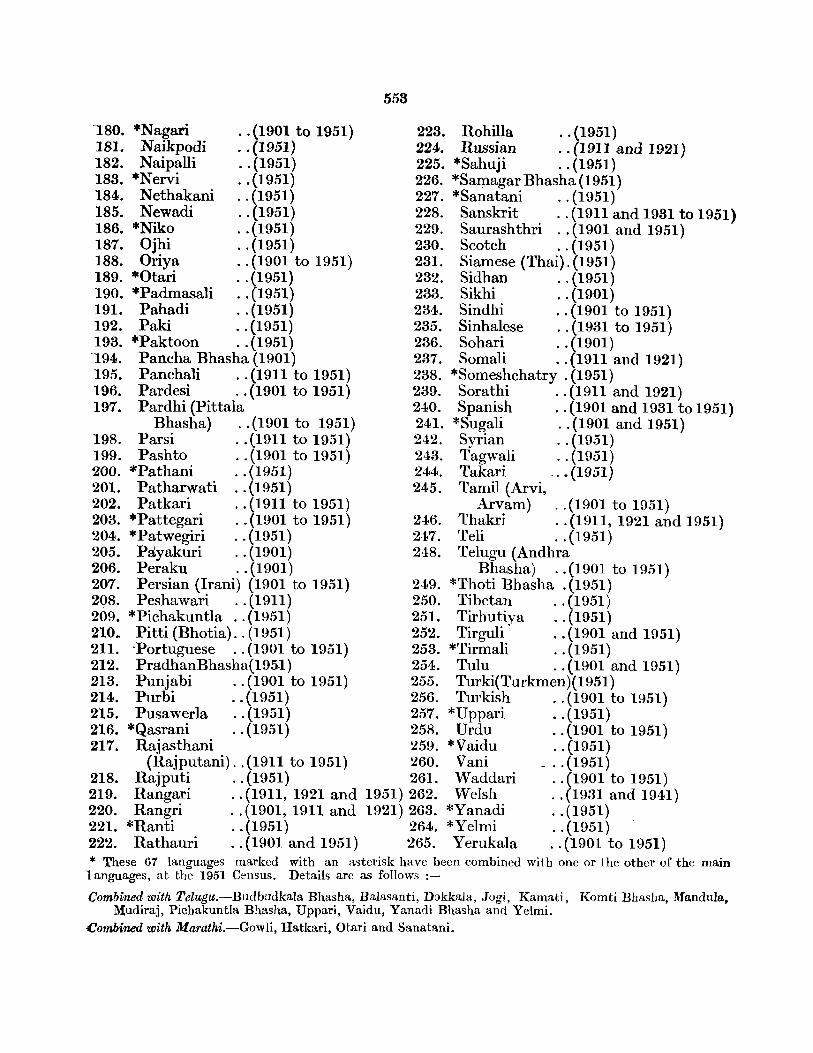
558
180. *Nagari .. (1901 to 1951) 228. Rohilla .. (1951) 181. Naikpodi .. (1951) 224. Russian .. (1911 and 1921) 182. Naipalli .. (1951) 225. *Sahuji .. (1951) 183. *N ervi .. (1951) 226. *Samagar Bhasha (1951 ) 184. Nethakani .. (1951) 227. *Sanatani .. (1951) 185. Newadi .. (1951) 228. Sanskrit .. (1911 and 1981 to 1951) 186. *Niko .. (1951) 229. Saurashthri .. (1901 and 1951) 187. OJ hi .. (1951) 230. Scotch .. (1951) 188. Oriya .. (1901 to 1951) 231. Siamese (Thai). (1951) 189. *Otari .. (1951) 232. Sidhan .. (1951) 190. *Padmasali .. (1951) 233. Sikhi .. (1901) 191. Pahadi .. (1951) 234. Sindhi .. (1901 to 1951) 192. Paki .. (1951) 235. Sinhalese .. (1931 to 1951) 193. *Paktoon .. (1951) 236. Sohari .. (1901) 194. Paneha Bhasha (1901) 237. Somali .. (1911 and 1921) 195. Panchali .. (1911 to 1951) 238. *Someshchatry.(1951) 196. Pardesi .. (1901 to 1951) 239. Sorathi .. (1911 and 1921) 197. Pardhi (Pittala 240. Spanish .. (1901 and 1931 to 1951)
Bhasha) .. (1901 to 1951) 241. *Sugali .. (1901 and 1951) 198. Parsi .. (1911 to 1951) 242. Syrian .. (1951) 199. Pashto .. (1901 to 1951) 243. Tagwali .. (1951) 200. *Pathani .. (1951) 244. Takari -.. (1951) 201. Patharwati .. (1951) 245. Tamil (Arvi, 202. Patkari .. (1911 to 1951) Arvam) .. (1901 to 1951) 203. *Pattegari .. (1901 to 1951) 246. Thakri .. (1911, 1921 and 1951) 204. *Patwegiri .. (1951) 247. Teli .. (1951) 205. Payakuri .. (1901) 248. Telugu (Andhra 206. Peraku .. (1901) Bhasha) .. (1901 to 1951) 207. Persian (Irani) (1901 to 1951) 249. *Thoti Bhasha .(1951) 208. Peshawari .. (1911) 250. Tibetan .. (1951) 209. *Piehakuntla .. (1951) 251. Tirhutiya .. (1951) 210 .. Pitti(Bhotia) .. (1951) 252. Tirguli .. (1901 and 1951) 211. 'Portuguese .. (1901 to 1951) 253. *Tirmali .. (1951) 212. PradhanBhasha(1951) 254. Tulu .. (1901 and 1951) 213. l;>unjabi .. (1901 to 1951) 255. Turki(Turkmen)(1951) 214. Purbi .. (1951) 256. Turkish .. (1901 to 1951) 215. Pusawerla .. (1951) 257. *U ppari .. (1951) 216. *Qasrani .. (1951) 258. Urdu .. (1901 to 1951) 217. Rajasthani 259. *Vaidu .. (1951)
(Rajputani) .. (1911 to 1951) 260. Vani _ .. (1951) 218. Rajputi .. (1951) 261. Waddari .. (1901 to 1951) 219. Rangari .. (1911, 1921 and 1951) 262. Welsh .. (1931 and 1941) 220. Rangri .. (1901, 1911 and 1921) 263. *Yanadi .. (1951) 221. * Ranti .. (1951) 264. *Yelmi .. (1951) 222. Rathauri .. (1901 and 1951) 265. Yerukala .. (1901 to 1951) * These 67 languages marked with an asterisk have been combined with one or the other of the main
1 anguages, at tbe 1951 Census. Details are as follows :-
Combined with Telugu.-Budbudkala Bhasha, Balasanti, Dokkala, Jogi, Kamati, Komti Bhasha, Mandula, Mudiraj, Pichakuntla Bhasha, Uppari, Vaidu, Yanadi Bhasha and Yelmi.
Combined with Marathi.-Gowli, Hatkari, Otari and Sanatani.
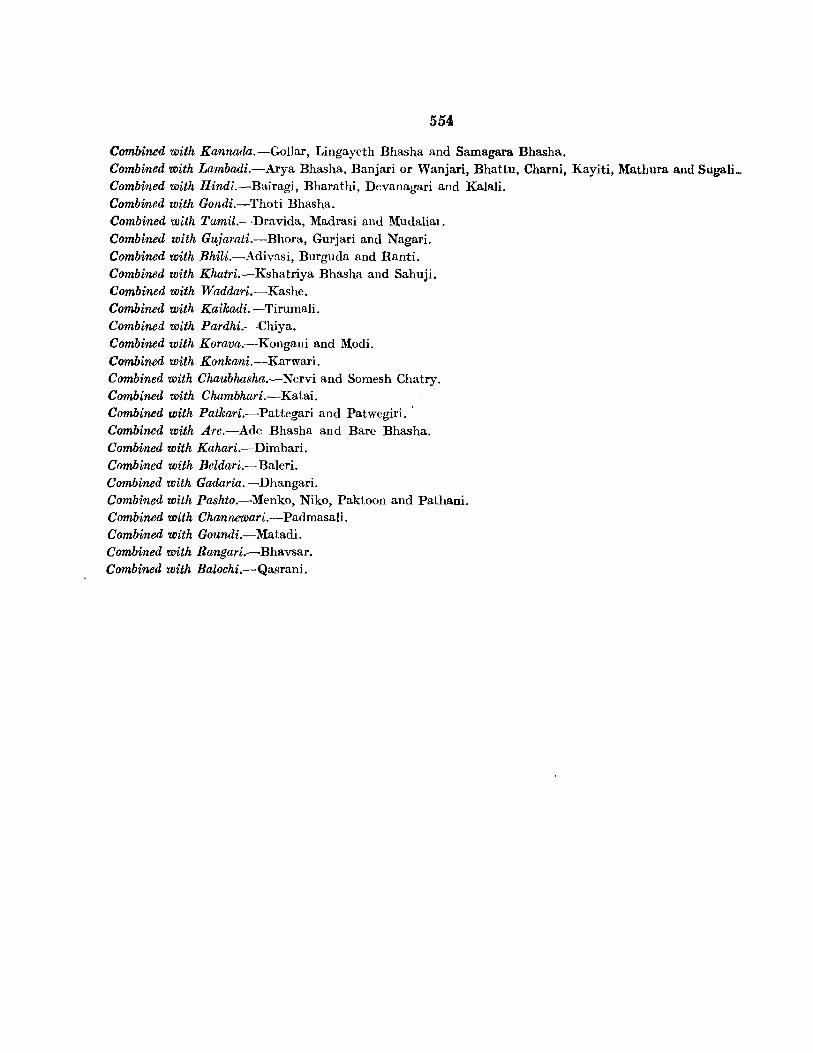
554
Combined with Kannada.-GoIlar, Lingayeth Bhasha and Samagara Bhasha. Combined with Lambadi.-Arya Bhasha, Banjari or Wanjari, Bhattu, Charni, Kayiti, Mathura and Sugali_ Combined with Hindi.-Bairagi, Bharathi, Devanagari and KaIali. Combined with Gondi.-Thoti Bhasha. Combined with Tamil.-Dravida, Madrasi and Mudalial. Combined with Gudarati.-Bhora, Gurjari and Nagari. Combined with Bhili.-Adivasi, Burguda and Ranti. Combined with Khatri.-Kshatriya Bhasha and Sahuji. Combined with Waddari.-Kashe. Combined with Kaikadi. -Tirumali. Combined with Pardhi.-Chiya. Combined with Korava.--Kongani and Modi. Combined with Konkani.-Karwari. Combined with Chaubhasha.-Nervi and Somesh Chatry. Combined with Chambhari.-Katai. Combined with Patkari.-Pattegari and Patwegiri. ' Combined with Are.-Ade Bhasha and Bare Bhasha. Combined with Kahari.-Dimbari. Combined with Beldari.-Baleri. Combined with Gadaria.-Dhangari. Combined with Pashto.-Menko, Niko, Paktoon and Pathani. Combined with Channewari.-Padmasali. Combined with Goundi.-Matadi. Combined with Rangari.-Bhavsar. Combined with Balochi.-Qasrani.
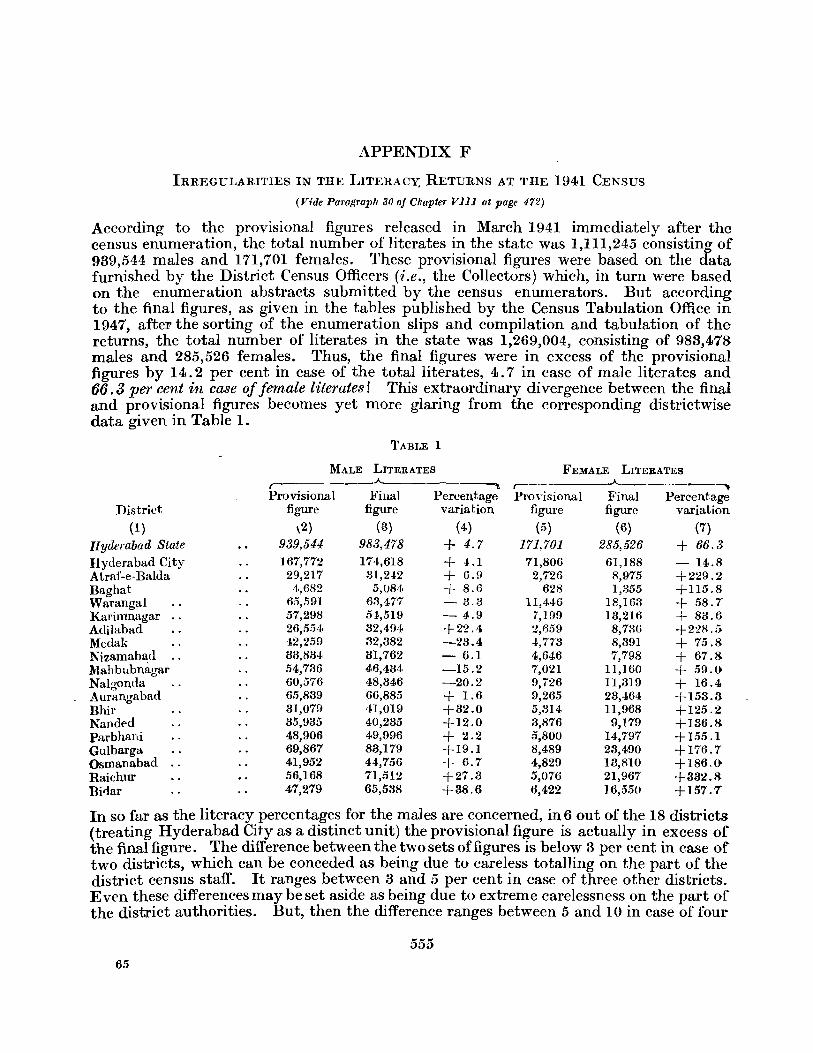
APPENDIX F
IRREGULARITIES IN THE LITERACY, RETURNS AT THE 1941 CENSUS
(Vide Parograph 30 of Chapter VIII at page 472)
According to the provisional figures released in March 1941 immediately after the census enumeration, the total number of literates in the state was 1,111,245 consisting of 939,544 males and 171,701 females. These provisional figures were based on the data furnished by the District Census Officers (i.e., the Collectors) which, in turn were based on the enumeration abstracts submitted by the census enumerators. But according to the final figures, as given in the tables published by the Census Tabulation Office in 1947, after the sorting of the enumeration slips and compilation and tabulation of the returns, the total number of literates in the state was 1,269,004, consisting of 983,478 males and 285,526 females. Thus, the final figures were in excess of the provisional figures by 14.2 per cent in case of the total literates, 4.7 in case of male literates and 66.3 per cent in case of female literates! This extraordinary divergence between the final and provisional figures becomes yet more glaring from the corresponding districtwise data given in Table 1.
TABI.E 1
MALE LITERATES FEMALE LITERATES r-------"------~~ ~
..A.. _______ ~
Provisional Fillal Percentage Proyisional Final Percentage District figure figure variation figure figure variation
(1) \2) (3) (4) (5) (6) (7) llyderabad State 939,544 983,478 + 4.7 171,701 285,526 + 66.3 Hyderabad City ] 67,772 17,~,618 + 4.1 71,806 61,188 - 14.8 A traf-e-Balda 29,217 31,242 + 6.9 2,726 8,975 +229.2 Baghat 4,682 5,084 + 8.6 628 1,355 +115.8 Warangal 65,591 63,477 - 3.3 11,446 18,163 + 58.7 Karirrtnagar 57,298 51,,519 - 4·.9 7,199 18,216 + 83.6 Adilabad 26,5':)4 32,494 +22.4 2,659 8,7::lG +2:!8.5 Medak 42,259 32,382 ~23.4 4,773 8,391 + 75.8 :NizamablJ:d 33,834 31,762 - 6.1 4,646 7,798 + 67.8 .Mah bubnagar 54,736 46,434 -15.2 7,021 11,160 + 59.0 Nalgonda 60,576 48,846 -20.2 9,726 11,3]9 + 16.4 .<\ urangabad 6.5,889 66,885 + 1.6 9,265 23,464 +153.3 Bhir 31,079 41,019 +32.0 5,314 11,968 +125.2 Nanded 85,985 40,285 +12.0 3,876 9,179 +136.8 Parbhani 48,906 49,996 + 2.2 5,800 14,797 +]55.1 Gulbarga 69,867 83,179 +19.1 8,489 23,490 +176.7 Osmanabad 41,952 44,756 + 6.7 4,829 13,810 +186.0 Raichur 56,168 71,512 +27.3 5,076 21,967 +332.8 Bi(jar 47,279 65,53R +38.6 6,422 ] 6,550 +157.7
In so far as the literacy percentages for the males are concerned, in 6 out of the 18 districts (treating Hyderabad City as a distinct unit) the provisional figure is actually in excess of the final figure. The difference between the two sets of figures is below 3 per cent in case of two districts, which can be conceded as being due to careless totalling on the part of the district census staff. It ranges between 3 and 5 per cent in case of three other districts. Even these differences may be set aside as being due to extreme carelessness on the part of the district authorities. But, then the difference ranges between 5 and 10 in case of four
555 65
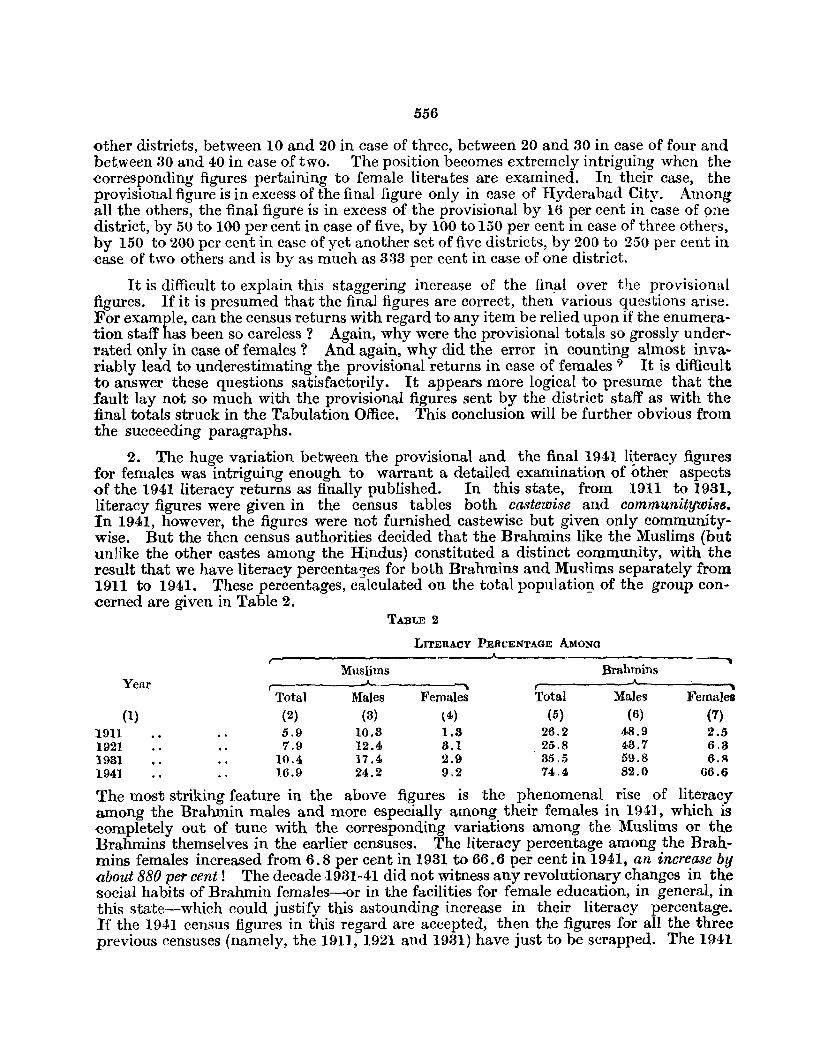
556
other districts, between 10 and 20 in case of three, between 20 and 30 in case of four and between 30 and 40 in case of two. The position becomes extremely intriguing when the eorresponding figures pertaining to female literates are examined. In their case, the provisional figure is in excess of the final figure only in case of Hyderabad City. Among all the others, the final figure is in excess of the provisional by 16 per cent in case of ~::me district, by 50 to 100 per cent in case of five, by 100 to 150 per cent in case of three others, by 150 to 200 per cent in case of yet another set of five district ... , by 200 to 250 per cent in ·case of two others and is by as much as 333 per cent in case of one district.
It is difficult to explain this staggering increase of the fin,al over the provisional figures. If it is presumed that the final figures are correct, then various questions arise. For example, can the census returns with regard to any item be relied upon if the enumera· tion staff has been so careless? Again, why were the provisional totals so grossly under· rated only in case of females? And again, why did the error in counting almost inva· riably lead to underestimating the provisional returns in case of females? It is difficult to answer these questions satisfactorily. It appears more logical to presume that the fault lay not so much with the provisional figures sent by the district staff as with the final totals struck in the Tabulation Office. This conclusion will be further obvious from the succeeding paragraphs.
2. The huge variation between the provisional and the final 1941 literacy figures for females was intriguing enough to warrant a detailed examination of other aspects of the 1941 literacy returns as finally published. In this state, from 1911 to 1931, literacy figures were given in the census tables both castewise and communitywis6. In 1941, however, the figures were not furnished castewise but given only communitywise. But the then census authorities decided that the Brahmins like the Muslims (but unlike the other castes among the Hindus) constituted a distinct community, with the result that we have literacy percenta,?es for both Brahmins and MU"llims separately from 1911 to 1941. These percentages, calculated on the total populati0D- of the group concerned are given in Table 2.
TABLE 2
LITERACY PERCENTAGE AMONG
Muslims Brahmins Year r--,--------~--------~
Total Males Females Total MaJes Females (1) (2) (3) (4) (5) (6) (7)
1911 5.9 10.3 1.3 26.2 48.9 2.5 1921 7.9 12.4 8.1 . 25.8 43.7 6.8 1931 10.4 17.4 2.9 '35.5 59.8 6.!l 1941 16.9 24.2 9.2 74.4 82.0 66.6
The most striking feature in the above figures is the phenomenal rise of literacy among the Brahmin males and more especially among their females in 1941, which is eompletely out of tune with the corresponding variations among the Muslims or the Brahmins themselves in the earlier censuses. The literacy percentage among the Brahmins females increased from 6.8 per cent in 1931 to 66.6 per cent in 1941, an increase by about 880 per cent! The decade .I931-41 did not witness any revolutionary changes in the social habits of Brahmin females-or in the facilities for female education, in general, in this state-which could justify this astounding increase in their literacy percentage. If the 1941 census figures in this regard are accepted, then the figures for all the three previous censuses (namely, the 1911, 1921 and 1931) have just to be scrapped. The 1941
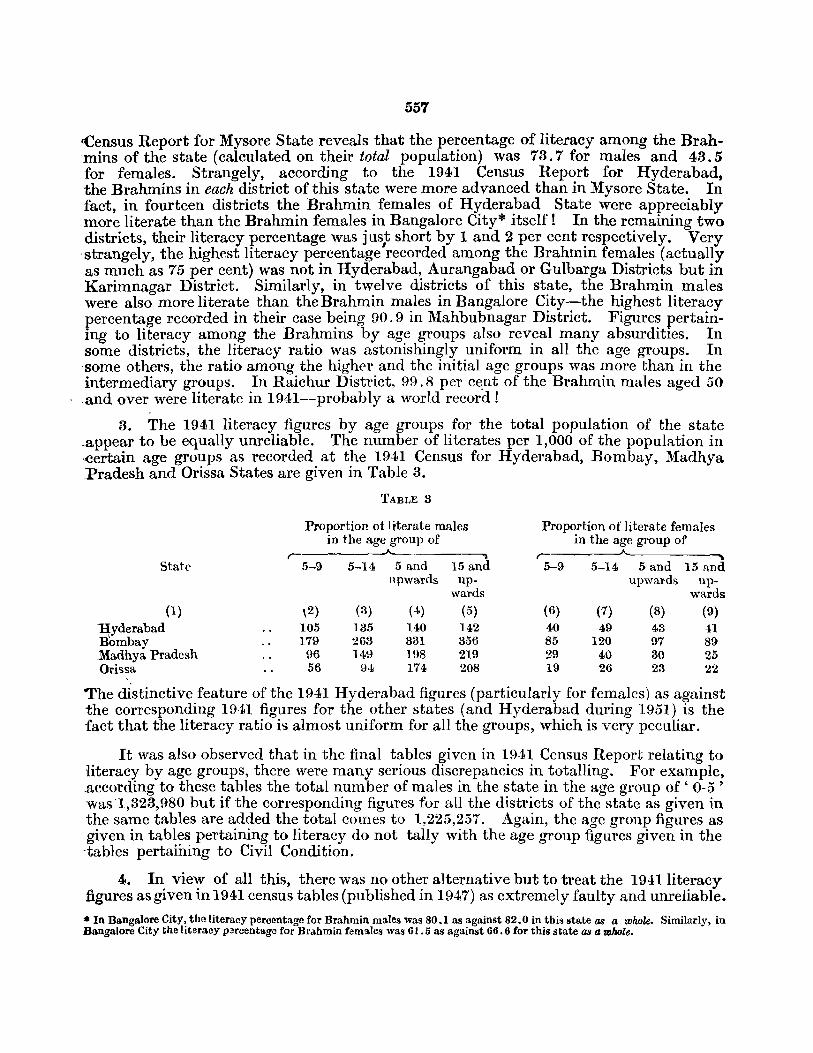
557
<Census Report for Mysore State reveals that the percentage of literacy among the Brahmins of the state (calculated on their total population) was 73.7 for males and 43.5 for females. Strangely, according to the 1941 Census Report for Hyderabad, the Brahmins in each district of this state were more advanced than in Mysore State. In fact, in fourteen districts the Brahmin females of Hyderabad State were appreciably more literate than the Brahmin females in Bangalore City* itself! In the remaining two districts, their literacy percentage was just short by 1 and 2 per cent respectively. Very 'strangely, the highest literacy percentage1recorded among the Brahmin females (actually as much as 75 per cent) was not in Hyderabad, Aurangabad or Gulbarga Districts but in Karimnagar District. Similarly, in twelve districts of this state, the Brahmin males were also more literate than the Brahmin males in Bangalore City-the highest literacy percentage recorded in their case being 90.9 in Mahbubnagar District. Figures pertaining to literacy among the Brahmins by age groups also reveal many absurdities. In some districts, the literacy ratio was astonishingly uniform in all the age groups. In some others, the ratio among the higher and the initial age groups was more than in the intermediary groups. In Raichur District, 99.8 per c~nt of the Brahmin males aged 50 .and over were literate in 1941--probably a world record!
3. The 1941 literacy figures by age groups for the total population of the state .appear to be equally unreliable. The number of literates per 1,000 of the population in ,.certain age groups as recorded at the 1941 Census for Hyderabad, Bombay, Madhya .Pradesh and Orissa States are given in Table 3.
TABLE 3
Proportion of literate males Proportion of literate females in the age group of in the age group of
r- ..A.. r-State 5-9 5-14 5 and 15 and 5-9 5-14 5 and 15 nnd
Ilpwards up- upwal'ds up-wards wards
(1) \2) (3) (4) (5) (6) (7) (8) (9) lIyderabad 105 135 140 142 40 49 43 41 Bombay 179 263 331 356 85 120 97 89 :Madhya Pradesh 96 149 IDS 219 29 40 30 25 Ori<;;sa 56 94 174 208 19 26 23 22
The distinctive feature of the 1941 Hyderabad figures (particularly for females) as against the corresponding 1941 figures for the other states (and Hyderabad during 1951) is the fact that the literacy ratio is almost uniform for all the groups, which is very peculiar.
It was also observed that in the final tables given in 1941 Census Report relating to ,literacy by age groups, there were many serious discrepancies in totalling. For example, .according to these tables the total number of males in the state in the age group of' 0-5 ' was'1,323,980 but if the corresponding figures for all the districts of the state as given in the same tables are added the total comes to 1,225,257. Again, the age group figures as given in tables pertaining to literacy do not tally with the age group figures given in the ·tables pertaining to Civil Condition.
4. In view of all this, there was no other alternative but to treat the 1941 literacy figures as given in 1941 census tables (published in 1947) as extremely faulty and unreliable.
OIl In Bangalore City. the literacy percentage for Brahmin males was 80.1 as against 82.0 in this state as a whole. Similarly, in Bangalore City the literacy percentage for Brahmin females was 61.5 as against 66.6 for this state as a rDhole.
558
As against this, there are no grounds to presume that there is anything basically wrong with the bare provisional districtwise totals for literate males and females as supplied by
. the district Collectors immediately after the census enumeration in 1941. Besides,. these figures fit in with the returns during the 1951 as well as the 1931 and earlier Censuses. These figures have, therefore, been adopted in this Report wherever required instead of the final figures as given in the 1941 Census Report.
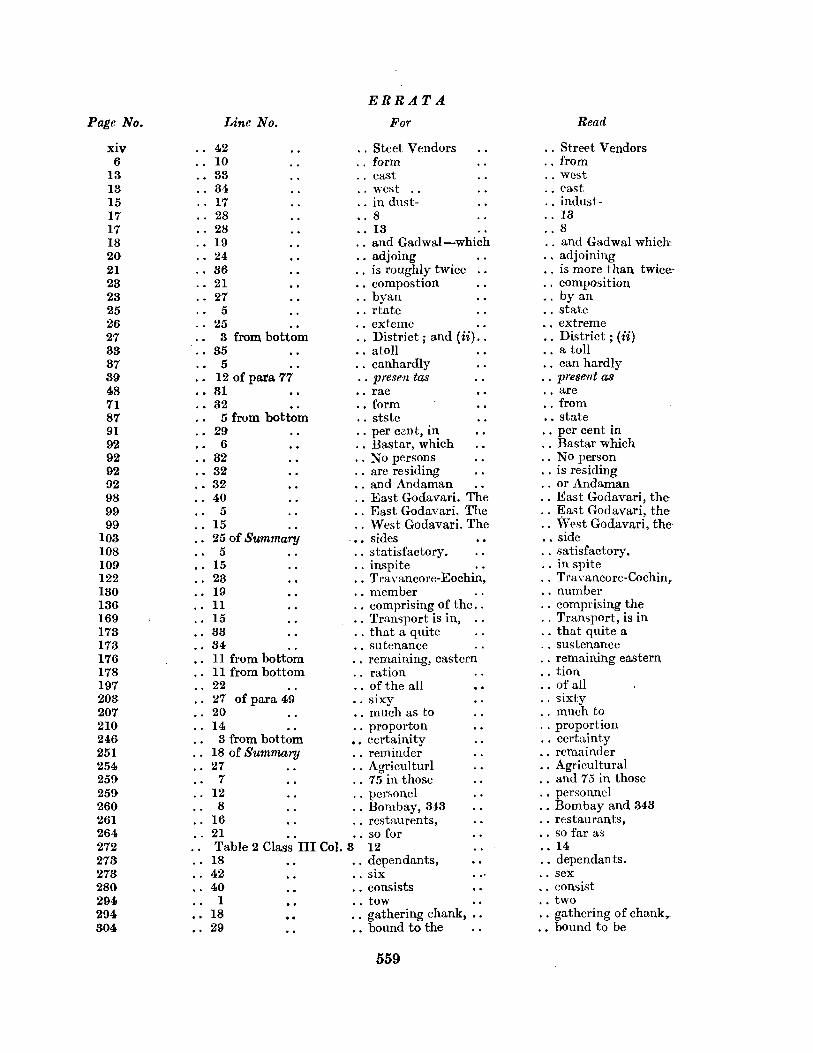
ERRA.TA.
Page No. Line No. For Read
XIV 42 .. Steet Vendors · . Street Vendors 6 10 " form .. from
13 33 " east · . west 13 34 " west " east 15 17 .. in dust- " indust-17 28 .. 8 .. 13 17 28 .. 13 .. 8 18 19 " and Gadwal-which .. and Gadwal which: 20 24 .. adjoing · . adjoinin.g 21 36 " is roughly twice · . is more than twice-23 21 " compost ion · . composition 23 27 " byan " by an 25 5 .. rtate · . state 26 25 .. exteme .. extreme 27 3 from bottom · . District; and (ii) .. .. District; (ii) 33 35 .. atoll .. a toll 37 5 .. canhardly .. can hardly 39 12 of para 77 " presen tas .. present as 48 31 .. rae .. are 7l 32 .. form .. from 87 5 from bottom · . stste .• state 91 29 · . per c2nt, in .. per cent in 92 6 · . Bastar, which · . BastaI' which 92 32 .. No persons .. No person 92 32 · . are residing · . is residing 92 82 .. and Andaman ., or Andaman 98 40 · . Ea'>t Godavari. The · . East Godavari, the 99 5 · . East Godavari. The · . J!:ast Godavari, the 99 15 .. West Godavari. The · . West Godavari, the
103 25 of Summary -•• sides .• side 108 5 · . statisfactory. · . satisfactory. 109 15 · . in.spite · . in spite 122 23 .. Travancore-Eochin, · . Travancore-Cochin, 130 19 " member .. number 136 11 .. comprising of the .. · . comprising the 169 15 · . Transport is in, · . Transport, is in 173 33 · . that a quite · . that quite a 173 34 .. sutenance · . sustenance 176 II from bottom " remaining, eastern · . remaining eastern 178 11 from bottom " ration .. tion 197 22 .. of the all · . of all 203 27 of para 49 .. sixy · . sixty 207 20 .. much as to .. much to 210 14 .. proporton · . proportion 246 3 from bottom •• eertainity · . certainty 251 18 of Summary " reminder .. remainder 254 27 · . Agriculturl · . Agricultural 259 7 " 75 in those · . and 75 in those 259 12 .. perf,onel .. personnel 260 8 " Bombay, 343 · . Bombay and 343 261 16 " restaurents, · . restaurants, 264 21 .. so for .• so far as 272 Table 2 Class III Col. 8 12 .. 14 273 18 · . dependants, .. dependants. 273 42 " six ., sex 280 40 " consists .. consist 294 I " tow .. two 294 18 .. gathering chank, .• · . gathering of chank, 304 29 .. bound to the .• bound to be
559
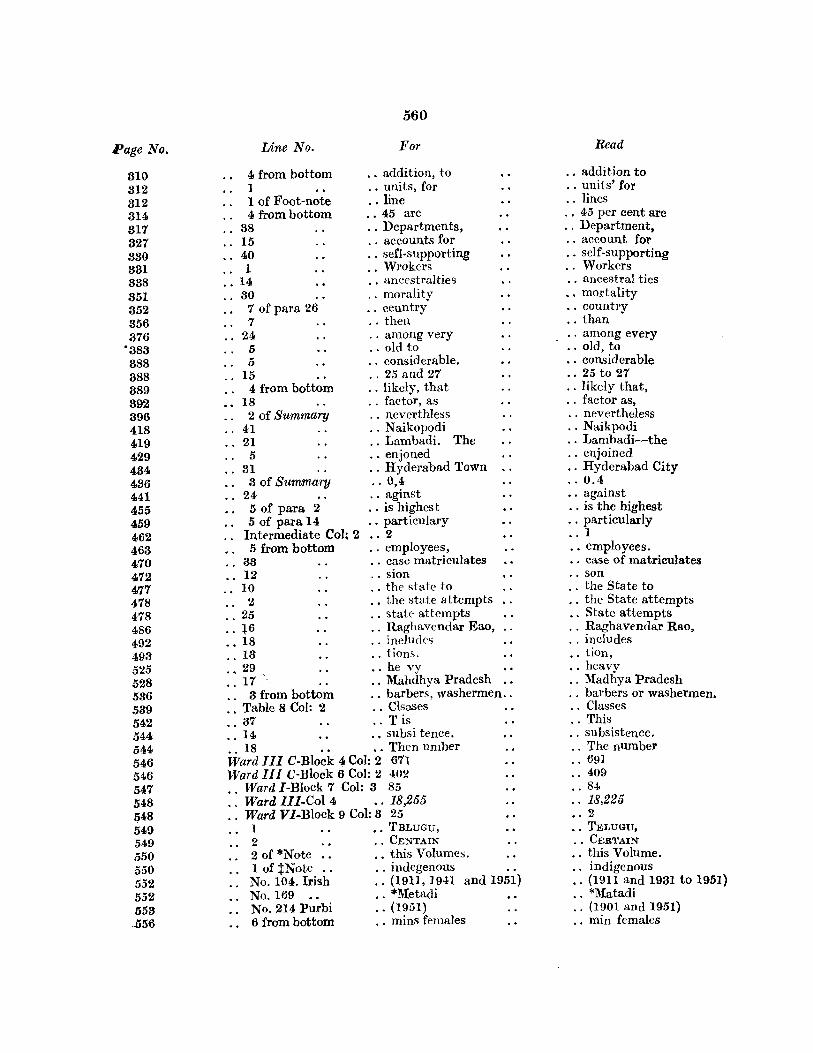
Page No.
310 312 312 314 317 327 330 331 338 351 352 356 376
'383 388 388 389 392 396 418 419 429 484 436 441 455 459 462 463 470 472 4'17 478 478 486 492 493 525 528 536 589 542 544 544 546 546 547 548 548 549 549 550 550 552 552 553 . .556
560
Line No. For
4 from bottom ., addition, to 1 .. units, for 1 of Foot-note .. line 4 from bottom .. 45 are
38 .. Departments, 15 .. accounts for 40 .. sefl-supporting 1 ., Wrokers
., 14 •. ancestralties 30 .. morality
7 of para 26 .. ceuntry 7 ., then.
24 . . among very 5 .' old to 5 .. considerable.
15 .. 25 and 27 4 from bottom .. likely, that
18 .. factor, as 2 of Summary .. neverthless
41 .. Naikopodi 21 ., Lambadi. The
5 ., enjoned 31 .. Hydel'abad Town
3 of Summary .. 0,4 24 ., aginst 5 of para 2 .. is highes t 5 of para 14 .. particulary
Intermediate Col: 2 •• 2 5 from bottom .. employees,
33 .. case matriculates 12 .. sion
.. 10 .. the state to . • 2 ., the state attempts .. 25 .. state attempts .. l6 ., Raghavendar Eao, .. 18 .. ineludes " 13 .. tions. .• 29 •. he vy " 17 ., Mahdhya Pradesh
3 from bottom .. barbers, washermen .. .. Table 8 Col: 2 . . Clsases " 37 .. Tis .. 14 .• subsi tence. .. 18 .. Then umber Ward III C-Block 4 Col: 2 671 Ward III C-Block 6 Co]: 2 402
Ward I-Block 7 Col: 3 85 .. Ward III-Col 4 .. 18,255 .. Ward VI-Block 9 Col: 3 25
1 •• TBLUGu, 2 ., CENTAIN
2 of *Note •• . . this Volumes. 1 of ~Note .• . . indegenous No. 104. Irish .. (1911, 1941 and 1951) No. 169 •. *Metadi No. 214 purbi ., (1951) 6 from bottom . . mins females
Read
.. addition to
., units' for
.. lines .. 45 per cent are . . Department, .. account for · . self-supporting ., Workers ., ancestral ties ., mortality .. country ., than · . among every ., old, to •. considerable .• 25 to 27 · . likely that, · . factor as, · . nevertheless .. Naikpodi · . Lambadi-the ., enjoined .. Hyderabad City .. 0.4 .. against · . is the highest · . particularly ., 1 · . employees. · . case of matriculates .. son · . the State to · . the State attempts •. State attempts · . Raghavendar Rao, · . includes ., tion, ., heavy .. Madhya Pradesh .. barbers or washermen. .. Classes ., This · . subsistence. .. The number .. 691 ., 409 •. 84 .. 18,225 •• 2 ., TELUGU, ., CERTAIN
., this Volume.
., indigenous
.. (1911 and 1931 to 1951)
., *Matadi
., (1901 and 1951)
., min females