Developing SOLEC Forest Indicators
24
Developing SOLEC Forest Indicators Mervyn Han, ECO Federal Government Associate U.S. Environmental Protection Agency Great Lakes National Program Office August 25, 2004 Covering roughly half of the basin landmass, forests are a vital inland component of the Great Lakes basin ecosystem. Adding forest indicators to the SOLEC suite has been a priority in recent years, and SOLEC 2004 will be marked by the submission of data on the first three indicators of forest health. Healthy forests are crucial to maintaining and restoring the waters of the Great Lakes. Due to their central role in the hydrologic cycle, forests have major – and positive – impacts on water resources. The presence of vegetation, porous soils and humus on forested land increases interception of rainfall, water infiltration into the soil, and water removal through transpiration. The combined effect is to decrease surface water run-off. Meanwhile, the extensive root systems of trees, shrubs and herbaceous plants lock soil particles together, helping to prevent soil erosion. These functions allow riparian forests to regulate storm water run-off and reduce the probability of extreme flooding and sedimentation, thereby stabilizing shorelines and maintaining the physical integrity of the watershed. Forests also act as a water “filter” and thus are key to high quality water and healthy aquatic ecosystems. By controlling run-off and soil erosion, forests reduce sediment yields in surface water. Ecological processes on the forest floor cleanse water by taking up nutrients and breaking down toxic contaminants. Shade from the canopy layer reduces water temperatures. Forest leaf litter serves as an important food source for aquatic life, while woody debris in streams, lakes and wetlands provide critical habitat for fish and invertebrates. As such, forests can help to maintain the biological and chemical integrity of the watershed as well. Evaluating forest health will therefore contribute to SOLEC’s mandate of monitoring, assessing and measuring progress made in achieving Great Lakes basin ecosystem health. The SOLEC Forest Indicators Selection Process In December 2003, the U.S. Environmental Protection Agency convened a bi-national working group of forest agency and industry experts in forest sustainability to assist in the development of SOLEC forest indicators. The group agreed to use the Montreal Process suite of criteria and indicators as the starting point for discussion. The Montreal Process is an international system for measuring sustainability in forest use and management that has been adopted in the U.S. and Canada. Since 1995, the U.S., Canada, and other Montreal Process signatories have worked to implement this common framework in their respective jurisdictions. It is important to note that the U.S. and Canadian forestry
-
Upload
independent -
Category
Documents
-
view
2 -
download
0
Transcript of Developing SOLEC Forest Indicators

Developing SOLEC Forest Indicators
Mervyn Han, ECO Federal Government Associate U.S. Environmental Protection Agency Great Lakes National Program Office
August 25, 2004
Covering roughly half of the basin landmass, forests are a vital inland component of the Great Lakes basin ecosystem. Adding forest indicators to the SOLEC suite has been a priority in recent years, and SOLEC 2004 will be marked by the submission of data on the first three indicators of forest health. Healthy forests are crucial to maintaining and restoring the waters of the Great Lakes. Due to their central role in the hydrologic cycle, forests have major – and positive – impacts on water resources. The presence of vegetation, porous soils and humus on forested land increases interception of rainfall, water infiltration into the soil, and water removal through transpiration. The combined effect is to decrease surface water run-off. Meanwhile, the extensive root systems of trees, shrubs and herbaceous plants lock soil particles together, helping to prevent soil erosion. These functions allow riparian forests to regulate storm water run-off and reduce the probability of extreme flooding and sedimentation, thereby stabilizing shorelines and maintaining the physical integrity of the watershed. Forests also act as a water “filter” and thus are key to high quality water and healthy aquatic ecosystems. By controlling run-off and soil erosion, forests reduce sediment yields in surface water. Ecological processes on the forest floor cleanse water by taking up nutrients and breaking down toxic contaminants. Shade from the canopy layer reduces water temperatures. Forest leaf litter serves as an important food source for aquatic life, while woody debris in streams, lakes and wetlands provide critical habitat for fish and invertebrates. As such, forests can help to maintain the biological and chemical integrity of the watershed as well. Evaluating forest health will therefore contribute to SOLEC’s mandate of monitoring, assessing and measuring progress made in achieving Great Lakes basin ecosystem health. The SOLEC Forest Indicators Selection Process In December 2003, the U.S. Environmental Protection Agency convened a bi-national working group of forest agency and industry experts in forest sustainability to assist in the development of SOLEC forest indicators. The group agreed to use the Montreal Process suite of criteria and indicators as the starting point for discussion. The Montreal Process is an international system for measuring sustainability in forest use and management that has been adopted in the U.S. and Canada. Since 1995, the U.S., Canada, and other Montreal Process signatories have worked to implement this common framework in their respective jurisdictions. It is important to note that the U.S. and Canadian forestry

agencies, as in other countries, have amended their assessment frameworks during the implementation stage in order to accommodate domestic goals, values and priorities with respect to forest use. Criteria and indicators have been added or removed, or rephrased in a manner that changes scope and function. Further modifications have been made by forestry agencies at the state or provincial level. These changes may complicate SOLEC reporting by introducing differences in data collection and definitions across the Great Lakes basin. Still, considering the difficulty SOLEC had encountered in its previous attempts to develop an independent set of forest indicators, it appeared most constructive to integrate the Montreal Process in its original form into the SOLEC indicator suite. The Montreal Process comprises 7 criteria and 67 indicators. The term criterion refers to a category of conditions or processes that serve as a standard for assessment. Each criterion is characterized by a set of related indicators. Since the Montreal Process encompasses broader issues of forest sustainability, beyond the impacts of forests on the watershed, the working group identified the 6 criteria and 34 indicators that are direct or indirect measures of Great Lakes basin health. Preliminary discussions on data availability were conducted simultaneously. Data gaps, and differences in inventory methods and data definitions used by the U.S. and Canadian forestry agencies, were noted. A summary of discussion points, along with the lists of criteria and indicators determined to be relevant or not relevant to basin ecosystem health, can be found in Appendix A. The working group agreed that sufficient data are available to complete an assessment of the first three indicators under Criterion 1: Conservation of Biological Diversity. The related data and analysis can be found in the attached technical report and indicator descriptor. The assessment finds that the area of forested land has been increasing across the basin in recent decades, which is positive for basin health and water quality. Available data, however, does not distinguish between forests that lie in riparian zones, where the impact on water quality is the greatest, and those that do not. Data on the distribution of forests by forest type, age-class and protected status is also available, although their implications for basin health are unclear. Considerable work remains in finalizing the set of SOLEC forest indicators. There is a number of Montreal Process criteria and indicators whose relevance to basin health remained undetermined after the December 2003 meeting. The list of SOLEC forest indicators may therefore expand in the future, as the understanding of relationships among forest ecosystems, aquatic ecosystems, and watershed hydrology deepens. At the same time, the working group advised SOLEC to consult a broader range of forest stakeholders, to gain new data and technical expertise, and to ensure that the SOLEC indicator suite is viewed as credible from diverse perspectives. The recent activity in developing SOLEC forest indicators should therefore be seen as a first step towards a comprehensive reporting on the health of Great Lakes forests and the related impacts on the basin ecosystem.

Appendix A: Discussion Points for SOLEC Indicator Selection Meeting
The bi-national working group for the December 2003 meeting was composed of representatives from the U.S.D.A. Forest Service, the Ontario Ministry of Natural Resources, the Canadian Forest Service, the Wisconsin Department of Natural Resources, the National Council for Air and Stream Improvement (NCASI) and the American Forest and Paper Association. Representatives from the National Park Service, the Council of Great Lakes Industry, the Great Lakes Forest Alliance, The Nature Conservancy, and the Great Lakes Indian Fish and Wildlife Commission had actively participated in discussions leading up to and after the December 2003 meeting, but were unable to attend the meeting itself. The working group discussed each indicator under the seven Montreal Process criteria to determine its relevance to Great Lakes basin health. Indicators were separated into three groups: those that are direct or indirect measures of basin health (Table 1.1), those that are not relevant to basin health (Table 1.2) and those whose status requires further discussion (Table 1.3). Preliminary discussions on data availability were conducted simultaneously. Indicators that are direct or indirect measures of Great Lakes basin health Table 1.1 lists the 6 criteria and 34 indicators considered to be direct or indirect measures of Great Lakes basin health. Many, if not all, of these indicators will be incorporated into the SOLEC suite. Due to data gaps, however, reporting on all of these indicators may not be possible at this time. For instance, the working group noted that Criterion 4 indicators, which assess the conservation of soil and water resources, are the most important in the Montreal Process with respect to water quantity and quality. However, since monitoring programs are largely in the development phase, corresponding data remains sparse or unavailable. In other cases, SOLEC reporting has been stymied by the lack of consensus on defining the parameters by which data can be collected and analyzed. The working group experienced particular difficulty in defining forest fragmentation, a Criterion 1 indicator. The disagreement centered on whether tracts of land containing roads or single-species forest should be classified as fragmented. The group advised that further discussion and research would be necessary before the fragmentation indicator could be developed. Indicators not critical for reporting Great Lakes basin health Table 1.2 lists the criteria and indicators deemed not critical for SOLEC reporting. There was some dissention for the Criterion 1 indicators on species diversity. A few working group members contended that these indicators are indeed crucial for measuring forest health and have impacts on the watershed. For the most part, however, it was agreed that the indicators in question would not be included in the SOLEC suite. Indicators whose relevance to Great Lakes basin health requires further discussion As expected, there were criteria and indicators whose relevance to basin health remained unresolved after the December 2003 meeting. These criteria and indicators are listed in Table

1.3. Criterion 5 indicators, which deal with global carbon cycles, were tentatively left in Table 1.1 as indirect measures of forest and basin health. However, there were individual working group members who questioned the geographic scope of these indicators, arguing that the global focus of the data may not be specific or relevant to the Great Lakes basin ecosystem. The Criterion 7 indicators that cover legal, institutional, and economic concerns, were classified as “unknown” in terms of relevance to forest and basin health. The working group pointed out that these indicators, which are listed in Table 1.3, are phrased as guiding principles rather than genuine indicators that can be measured and assessed. Additional work will therefore be necessary to rewrite the Criterion 7 indicators and to determine whether they will be included in the SOLEC suite.

Table 1.1 Indicators: Direct or Indirect Measures of Great Lakes Basin Health Criterion 1: Conservation of Biological Diversity (1) Extent of area by forest type relative to total forest area
(2) Extent of area by forest type and by age class or successional stage
(3) Extent of area by forest type in protected area categories as defined by IUCN or other classification systems
(5) Fragmentation of forest types
Criterion 2: Maintenance of productive capacity of forest ecosystems (10) Area of forest land and net area of forest land available for timber production
(11) Total growing stock of both merchantable and non-merchantable tree species on forest land available for timber production
(13) Annual removal of wood products compared to the volume determined to be sustainable
Criterion 3: Maintenance of forest ecosystem health and vitality (15) Area and percent of forest affected by processes or agents beyond the range of historic
variation, e.g. by insects, disease, permanent flooding, salinisation, and domestic animals
(16) Area and percent of forest land subjected to levels of specific air pollutants (e.g. sulfates, nitrate, ozone) or ultraviolet B that may cause negative impacts on the forest ecosystem
(17) Area and percent of forest land with diminished biological components indicative of changes in the fundamental ecological processes (e.g. soil nutrient cycling, seed dispersion, pollination) and/or ecological continuity (monitoring of functionally important species such as fungi, arboreal epiphytes, nematodes, beetles, wasps, etc.)
Criterion 4: Conservation and maintenance of soil and water resources (18) Area and percent of forest land with significant soil erosion
(19) Area and percent of forest land managed primarily for protective functions, e.g. watersheds, flood protection, avalanche protection, riparian zones
(20) Percent of stream kilometers in forested catchments in which stream flow and timing has significantly deviated from the historic range of variation
(21) Area and percent of forest land with significantly diminished soil organic matter and/or changes in other soil chemical properties
(22) Area and percent of forest land with significant compaction or change in soil physical properties resulting from human activities
(23) Percent of water bodies in forest area (e.g. stream kilometers, lake hectares) with significant variance of biological diversity from the historic range of variability

(24) Percent of water bodies in forest areas (e.g. stream kilometers, lake hectares) with significant variation from the historic range of variability in pH, dissolved oxygen, levels of chemicals (electrical conductivity), sedimentation or temperature change
(25) Area and percent of forest land experiencing an accumulation of persistent toxic substances
Criterion 5: Maintenance of forest contribution to global carbon cycles (26) Total forest ecosystem biomass and carbon pool, and if appropriate, by forest type, age
class, and successional stages
(27) Contribution of forest ecosystems to the total global carbon budget, including absorption and release of carbon (standing biomass, coarse woody debris, peat and soil carbon)
(28) Contribution of forest products to the global carbon budget
Criterion 6: Maintenance and enhancement of long-term multiple socio-economic benefits
to meet the needs of societies
Production and consumption (29) Value and volume of wood and wood products production, including value added through
downstream processing
(30) Value and quantities of production of non-wood forest products
(31) Supply and consumption of wood and wood products, including consumption per capita
(32) Value of wood and non-wood products production as percentage of GDP
(33) Degree of recycling of forest products
(34) Supply and consumption/use of non-wood products
Recreation and tourism (35) Area and percent of forest land managed for general recreation and tourism, in relation to
the total area of forest land
(36) Number and type of facilities available for general recreation and tourism, in relation to population and forest area
(37) Number of visitor days attributed to recreation and tourism, in relation to population and forest area
Investment in the forest sector (38) Value of investment, including investment in forest growing, forest health and management,
planted forests, wood processing, recreation and tourism
(39) Level of expenditure on research and development, and education
(40) Extension and use of new and improved technologies
(41) Rates of return on investment

Table 1.2 Indicators: Not Critical for Reporting Great Lakes Basin Health
Criterion 1: Conservation of Biological Diversity
Ecosystem diversity (4) Extent of area by forest type in protected areas defined by age class or successional stage
Species Diversity (6) The number of forest dependent species
(7) The status (threatened, rare, vulnerable, endangered, or extinct) of forest dependent species at risk of not maintaining viable breeding populations, as determined by legislation or scientific assessment
Genetic diversity (8) Number of forest dependent species that occupy a small portion of their former range
(9) Population levels of representative species from diverse habitats monitored across their range
Criterion 2: Maintenance of productive capacity of forest ecosystems (12) The area and growing stock of plantations of native and exotic species
(14) Annual removal of non-timber forest products (e.g. fur bearers, berries, mushrooms, game), compared to the level determined to be sustainable
Criterion 6: Maintenance and enhancement of long-term multiple socio-economic benefits
to meet the needs of societies
Cultural, social and spiritual needs and values
(42) Area and percent of forest land managed in relation to the total area of forest land to protect the range of cultural, social and spiritual needs and values
(43) Non-consumptive use forest values
Employment and community needs (44) Direct and indirect employment in the forest sector and forest sector employment as a
proportion of total employment
(45) Average wage rates and injury rates in major employment categories within the forest sector
(46) Viability and adaptability to changing economic conditions, of forest dependent communities, including indigenous communities
(47) Area and percent of forest land used for subsistence purposes

Table 1.3 Indicators: Relevance to Basin Health Requires Further Discussion
Criterion 7: Legal, institutional and economic framework for forest conservation and sustainable management
Extent to which the legal framework (laws, regulations, guidelines) supports the conservation and sustainable management of forests, including the extent to which it:
(48) Clarifies property rights, provides for appropriate land tenure arrangements, recognizes customary and traditional rights of indigenous people, and provides means of resolving property disputes by due process
(49) Provides for periodic forest-related planning, assessment, and policy review that recognizes the range of forest values, including coordination with relevant sectors
(50) Provides opportunities for public participation in public policy and decision-making related to forests and public access to information
(51) Encourages best practice codes for forest management
(52) Provides for the management of forests to conserve special environmental, cultural, social and/or scientific values
Extent to which the institutional framework supports the conservation and sustainable management of forests, including the capacity to:
(53) Provide for public involvement activities and public education, awareness and extension programs, and make available forest-related information
(54) Undertake and implement periodic forest-related planning, assessment, and policy review including cross-sectoral planning and coordination
(55) Develop and maintain human resource skills across relevant disciplines
(56) Develop and maintain efficient physical infrastructure to facilitate the supply of forest products and services and support forest management
(57) Enforce laws, regulations and guidelines
Extent to which the economic framework (economic policies and measures) supports the conservation and sustainable management of forests through:
(58) Investment and taxation policies and a regulatory environment which recognize the long-term nature of investments and permit the flow of capital in and out of the forest sector in response to market signals, non-market economic valuations, and public policy decisions in order to meet long-term demands for forest products and services
(59) Non-discriminatory trade policies for forest products

Capacity to measure and monitor changes in the conservation and sustainable management of forests, including:
(60) Availability and extent of up-to-date data, statistics and other information important to measuring or describing indicators associated with criteria 1-7
(61) Scope, frequency and statistical reliability of forest inventories, assessments, monitoring and other relevant information
(62) Compatibility with other countries in measuring, monitoring and reporting on indicators
Capacity to conduct and apply research and development aimed at improving forest management and delivery of forest goods and services, including:
(63) Development of scientific understanding of forest ecosystem characteristics and functions
(64) Development of methodologies to measure and integrate environmental and social costs and benefits into markets and public policies, and to reflect forest-related resource depletion or replenishment in national accounting systems
(65) New technologies and the capacity to assess the socio-economic consequences associated with the introduction of new technologies
(66) Enhancement of ability to predict impacts of human intervention on forest
(67) Ability to predict impacts on forests of possible climate change

Indicator Descriptor: Forest Criterion #1. Conservation of Biological Diversity Measures
(1) Extent of area by forest type relative to total forest area (2) Extent of area by forest type and by age-class or successional stage (3) Extent of area by forest type in protected area categories as defined by IUCN or other
classification systems Purpose Criterion 1 indicators describe the extent, composition and structure of Great Lakes basin forests. They address the capacity of forests to perform the hydrologic functions, and host the organisms and essential processes, that are essential to supplying high quality water and protecting the physical integrity of the watershed. Ecosystem Objective Indicator (1) summarizes total forest area and area by forest type. The extent and diversity of forest cover are positive indicators of basin health. Water draining forested watersheds is of high quality, as measured by sediment yields, nutrient loadings, contaminant concentrations and temperatures. Forests also control soil erosion, increase groundwater infiltration, stabilize shorelines and regulate storm run-off. Leaf litter and woody debris provide critical food and habitat for fish and other aquatic wildlife. Indicator (2) summarizes the structure of forest based on age class. Many ecological processes and wildlife species are associated with vegetative structures (age, diameter and height of vegetation) and successional stages (variable species of vegetation). Indicator (3) summarizes the extent of forest by type in a protected area category. Protected status ensures that specified tracts of land remain under forest cover, and is indicative of the value a society and its policymakers place on forest conservation. Endpoint No endpoints yet. Establishing endpoints requires consensus on desired forest cover patterns. Features U.S. data from U.S.D.A. Forest Service, Forest Inventory and Analysis Database. Raw data available online at: http://ncrs2.fs.fed.us/4801/fiadb/fiadb17_dump/fiadb17_dump.htm. These are statewide data sets and therefore require geoprocessing using GIS software to extract data relevant to basin only. Canadian data courtesy of Ontario Ministry of Natural Resources. Illustration Indicator (1): Pie chart to show proportions of total forest area that lie within each forest type. Indicator (2): Line graphs to compare age-class distributions, by area, of the major forest types (maple-beech-birch, aspen-birch, white-red-jack pine, spruce-fir) to the age-class distribution of the forest at large. Separate graphs will be used for the U.S. and Canadian basin forests, because there are significant differences in the age-class distributions of the two countries’ basin forests.

Indicator (3): Bar chart to highlight the protection rate (percentage of area under protected status) for major forest types. Again, separate charts will be used for the U.S. and Canada because definitions of protected forest differ slightly. Limitations Indicator (1): Data do not indicate if forests are located in riparian zones, where the impact on the watershed is the greatest. More importantly, the data do not indicate if the expansion in forest area is occurring in riparian zones. Indicator (2): No data on extent of forest by successional stage. Although certain species are associated with the various successional stages (aspen-birch tends to be early successional and maple-beech-birch is mid- to late-successional), designation of successional stage is currently made by professional judgment rather than a standard protocol. Indicator (3): IUCN, U.S. and Ontario definitions of protected areas differ slightly. There is substantial overlap among these definitions, but a more consistent classification system would ensure proper accounting of protected areas and would enable aggregation of the two countries’ data. Moreover, existing definitions only incorporates public land and does not include forests that may be protected through conservation easements and land trusts, or timber lands managed in a sustainable manner. Interpretation Implications for water quality and quantity are difficult to establish, but the data provide insight on general trends in forest sustainability. Healthy, vigorous forests are indeed crucial to basin ecosystem health. Interpreting the data with respect to forest health, however, will require additional assistance from forestry experts and stakeholders. Comments Once the U.S.D.A. Forest Service updates Ohio data (current set is from 1991), then the area covered by riparian forests within the U.S. basin can be calculated. Changes in data definitions made in 1999 make it difficult to aggregate Ohio data with data from the other states, which were collected in 2001-2002. Relevancies Indicator Type: state Environmental Compartment(s): land Related Issues: habitat, water quality, run-off regulation, shoreline stability SOLEC Groupings: Habitat and Biodiversity GLWQA Annex(es): 1 (indirectly) IJC Desired Outcome(s): Biological Community Integrity and Diversity, Physical Environment Integrity (Quality and Quantity of Stream Base Flow) Beneficial Use Impairment(s): Degradation of aesthetics, Loss of fish or wildlife habitat, Degradation of fish or wildlife populations Last Revised August 20, 2004

Technical Report: Forest Criterion #1. Conservation of Biological Diversity Related Indicators:
(1) Extent of area by forest type relative to total forest area (2) Extent of area by forest type and by age-class or successional stage (3) Extent of area by forest type in protected area categories as defined by IUCN or other
classification systems Assessment: Mixed, Improving Purpose Criterion 1 indicators describe the extent, composition and structure of Great Lakes basin forests. They address the capacity of forests to perform the hydrologic functions, and host the organisms and essential processes, that are essential to supplying high quality water and protecting the physical integrity of the watershed. Ecosystem Objective Indicator (1) summarizes total forest area and area by forest type. The extent and diversity of forest cover are positive indicators of basin health. Water draining forested watersheds is of high quality, as measured by sediment yields, nutrient loadings, contaminant concentrations and temperatures. Forests also control soil erosion, increase groundwater infiltration, stabilize shorelines and regulate storm run-off. Leaf litter and woody debris provide critical food and habitat for fish and other aquatic wildlife. Indicator (2) summarizes the structure of forest based on age class. Many ecological processes and wildlife species are associated with vegetative structures (age, diameter and height of vegetation) and successional stages (variable species of vegetation). Indicator (3) summarizes the extent of forest by type in a protected area category. Protected status ensures that specified tracts of land remain under forest cover, and is indicative of the value a society and its policymakers place on forest conservation. State of the Ecosystem Indicator (1): Forests cover 27.8 million hectares, or about half (51%), of the land in the Great Lakes basin. The U.S. side of the basin contains 14.8 million hectares of forests (47% of the U.S. basin), while the Canadian side contains 13.0 million hectares (57% of the Canadian basin). Maple-beech-birch is the most extensive forest type, representing 7.6 million hectares, or 27% of total forest area in the basin. Aspen-birch forests constitute the second-largest forest type, covering 6.5 million hectares, or 23% of the total. Other major types include spruce-fir forests (5.0 million hectares, or 18% of total forest area) and white-red-jack pine forests (2.7 million hectares, or 10% of total forest area.) Complete data are available in Table 1.1 Implications for the health of Great Lakes forests and the basin ecosystem are difficult to establish. On a positive note, total forest area appears to have increased across the Great Lakes basin in recent decades (see Table 1.2). Expanding forest area is associated with positive
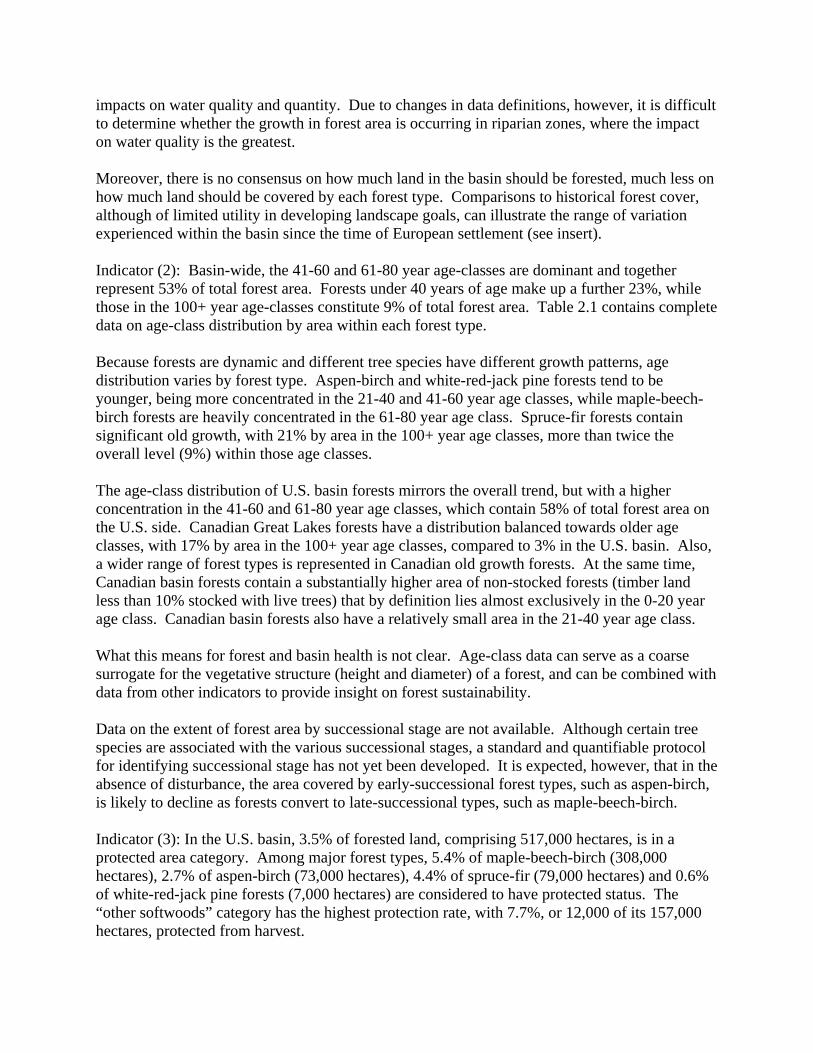
impacts on water quality and quantity. Due to changes in data definitions, however, it is difficult to determine whether the growth in forest area is occurring in riparian zones, where the impact on water quality is the greatest. Moreover, there is no consensus on how much land in the basin should be forested, much less on how much land should be covered by each forest type. Comparisons to historical forest cover, although of limited utility in developing landscape goals, can illustrate the range of variation experienced within the basin since the time of European settlement (see insert). Indicator (2): Basin-wide, the 41-60 and 61-80 year age-classes are dominant and together represent 53% of total forest area. Forests under 40 years of age make up a further 23%, while those in the 100+ year age-classes constitute 9% of total forest area. Table 2.1 contains complete data on age-class distribution by area within each forest type. Because forests are dynamic and different tree species have different growth patterns, age distribution varies by forest type. Aspen-birch and white-red-jack pine forests tend to be younger, being more concentrated in the 21-40 and 41-60 year age classes, while maple-beech-birch forests are heavily concentrated in the 61-80 year age class. Spruce-fir forests contain significant old growth, with 21% by area in the 100+ year age classes, more than twice the overall level (9%) within those age classes. The age-class distribution of U.S. basin forests mirrors the overall trend, but with a higher concentration in the 41-60 and 61-80 year age classes, which contain 58% of total forest area on the U.S. side. Canadian Great Lakes forests have a distribution balanced towards older age classes, with 17% by area in the 100+ year age classes, compared to 3% in the U.S. basin. Also, a wider range of forest types is represented in Canadian old growth forests. At the same time, Canadian basin forests contain a substantially higher area of non-stocked forests (timber land less than 10% stocked with live trees) that by definition lies almost exclusively in the 0-20 year age class. Canadian basin forests also have a relatively small area in the 21-40 year age class. What this means for forest and basin health is not clear. Age-class data can serve as a coarse surrogate for the vegetative structure (height and diameter) of a forest, and can be combined with data from other indicators to provide insight on forest sustainability. Data on the extent of forest area by successional stage are not available. Although certain tree species are associated with the various successional stages, a standard and quantifiable protocol for identifying successional stage has not yet been developed. It is expected, however, that in the absence of disturbance, the area covered by early-successional forest types, such as aspen-birch, is likely to decline as forests convert to late-successional types, such as maple-beech-birch. Indicator (3): In the U.S. basin, 3.5% of forested land, comprising 517,000 hectares, is in a protected area category. Among major forest types, 5.4% of maple-beech-birch (308,000 hectares), 2.7% of aspen-birch (73,000 hectares), 4.4% of spruce-fir (79,000 hectares) and 0.6% of white-red-jack pine forests (7,000 hectares) are considered to have protected status. The “other softwoods” category has the highest protection rate, with 7.7%, or 12,000 of its 157,000 hectares, protected from harvest.

On the Canadian side, 10.8% of forest area, or 1.4 million hectares, are protected. Protection rates range from 9.2% for maple-beech-birch (172,000 hectares) and 10.7% for spruce-fir forests (340,000 hectares), to 12.7% for white-red-jack pine (191,000 hectares) and 13.0% for aspen-birch forests (490,000 hectares). The oak-pine category has the highest protection rate, with 22.5%, or 20,000 of its 90,000 hectares, under protected status. See complete data in Table 3.1. Implications for forest and basin health are again difficult to establish. On one hand, the extent of forest area with protected status appears to have increased in recent decades (see Table 3.2). Particularly large increases in protected forest area in Ontario, New York and Minnesota have more than offset reported declines in Michigan and Wisconsin. However, due to changes in data definitions, it is difficult to determine whether the expansion or contraction of protected forests is occurring in riparian zones, where the impact on water quality is the greatest. There is also no consensus on what proportion of forest land should be protected. Nationally, forest protection rates are estimated to be 8.4% in Canada1 and 14% in the U.S.2 As for the range of variation in protection rates by forest types, protected areas should be representative of the diversity in forest composition within a larger area. However, defining what constitutes this “larger area” is problematic. Policymakers often have had a different jurisdiction than the Great Lakes basin in mind when deciding where to locate protected areas. Since forests are dynamic, the tree species and forest types found on an individual plot of protected land can change over time due to successional processes. Differences among the U.S., Canadian, and IUCN (International Union for the Conservation of Nature) definitions of protected areas should also be noted. The IUCN standard contains six categories of protected areas – strict nature reserves/wilderness areas, national parks, natural monuments, habitat/species management areas, protected landscapes/seascapes, and managed resource protection areas. The U.S. defines protected areas as forests “reserved from harvest by law or administrative regulation,” including designated Federal Wilderness areas, National Parks and Lakeshores, and state designated areas.3 Ontario defines protected areas as national parks, conservation reserves, and its six classes of provincial parks – wilderness, natural environment, waterway, nature reserve, historical and recreational.4 There is substantial overlap among the U.S., Ontario and IUCN definitions, but a more consistent classification system would ensure proper accounting of protected areas. Common to the U.S., Ontario and IUCN definitions is that they only include forests in the public domain. However, there are privately-owned forests similarly reserved from harvest by land trusts, conservation easements and other initiatives. Inclusion of these forests under this indicator would provide a more complete definition of protected forest areas. Moreover, there is debate on how protected status relates to forest sustainability, water quality, and ecosystem health. In many cases, protected status was conferred onto forests for their scenic or recreational value, which may not contribute significantly to conservation or watershed management goals. On the other hand, forests available for harvest, whether controlled by the national forest system, state or local governments, tribal governments, industry or private landowners, can be managed with the stated purpose of conserving forest and basin health.

Pressures and Management Implications Urbanization, seasonal home construction and increased recreational use – driven in part by the desire of an aging and more affluent population to spend time near natural settings – are among the general demands being placed on forest resources nationwide. Stakeholder discussion will be critical in identifying pressures and management implications, particularly those on a localized basis, that are specific to Great Lakes basin forests. These discussions will certainly add to longstanding debates on strategies for sustainable forest management.
1 World Wildlife Fund, 1999. Canada’s commitment to forest protected areas: Forests for life. WWF Status Report. World Wildlife Fund Canada. Toronto, ON. 17 p. Cited in Canadian Council of Forest Ministers. 2000. Criteria and Indicators of Sustainable Forest Management in Canada: National Status 2000. p.7 2 Guldin, R. W. and Kaiser, H. F. 2004. National Report on Sustainable Forests –2003. U.S.D.A. Forest Service. FS-766. p.88 3 Smith, W. B. 2004. United States 2003 Report on Sustainable Forests, Data Report: Criterion 1, Indicators 1, 2, 3, 4, Conservation of Biological Diversity. U.S.D.A. Forest Service. FS-766A. p.24 4 Ontario Ministry of Natural Resources. 2002. State of the Forest Report, 2001. Queen’s Printer for Ontario. pp.3-23

Other Softwoods0.7%
Oak-Pine 0.6%
Spruce-Fir17.9%
Aspen-Birch23.2%
Maple-Beech-Birch27.3%
Other 1.9%
Spruce-Jack Pine-Aspen 1.7%
Elm-Ash-Cottonwood5.9%
Oak-Hickory6.6%
Nonstocked4.5%
White-Red-Jack Pine9.7%
Figure 1. Proportion of Area by Forest Type in Great Lakes basin. Sources: USDA Forest Service, Forest Inventory and Analysis Database. Ontario Ministry of Natural Resources.

0%
5%
10%
15%
20%
25%
30%
35%
40%
0-20 21-40 41-60 61-80 81-100 101-120 121-140 141-160 161-200 200+
% o
f Are
a w
ithin
For
est T
ype
Maple-beech-birch Aspen-birch Spruce-fir White-red-jack pine Overall
Figure 2a. Age-class Distribution of U.S. Great Lakes basin forests. Source: U.S.D.A. Forest Service, Forest Inventory and Analysis Database.
0%
5%
10%
15%
20%
25%
30%
35%
40%
0-20 21-40 41-60 61-80 81-100 101-120 121-140 141-160 161-200 200+
% o
f Are
a w
ithin
For
est T
ype
Maple-beech-birch Aspen-birch Spruce-fir White-red-jack pine Overall
Figure 2b. Age-class Distribution of Canadian Great Lakes basin forests. Source: Ontario Ministry of Natural Resources.

0% 5% 10% 15% 20% 25%
Maple-Beech-Birch
Aspen-Birch
Spruce-Fir
White-Red-Jack Pine
Other Softwoods
TOTAL
% of Area within Protected Category
Figure 3a. Percent of U.S. Great Lakes basin forests in protected category. Source: U.S.D.A. Forest Service, Forest Inventory and Analysis Database.
0% 5% 10% 15% 20% 25%
Maple-Beech-Birch
Aspen-Birch
Spruce-Fir
White-Red-Jack Pine
Oak-Pine
TOTAL
% of Area within Protected Category
Figure 3b. Percent of Canadian Great Lakes basin forests in protected category. Source: Ontario Ministry of Natural Resources.

Historical Range of Variation in the Great Lakes Forests of
Minnesota, Wisconsin and Michigan Data on the historic range of variation in extent of total forest area and area by forest type since the time of European settlement are available for Minnesota, Wisconsin and Michigan in a U.S. Geological Survey study.6 Pre-settlement data were adapted from the General Land Office (GLO) surveys conducted between 1815 and 1866, while modern data were compiled from the USDA Forest Service’s Forest Inventory and Analysis (FIA) database for the period 1977-1983. Vegetation units in the GLO survey were simplified to allow comparison to the FIA forest type groups. The re-classification was conducted based on dominant tree species, as follows: GLO Vegetation Unit Major Tree Species FIA Forest Type Group Boreal Forest-Conifer Swamp White spruce, balsam fir, Spruce-fir northern white cedar, swamp conifer forest of black spruce and tamarack Pine Forest-Barrens White pine, red pine, jack pine White-red-jack pine Northern Mesic Forest Sugar maple, basswood, yellow birch Maple-beech-birch beech, hemlock, some oaks Aspen-Birch Aspen, paper birch Aspen-birch Oak Forest-Savanna Forest and savanna areas of red oak, Oak-hickory black oak, white oak and bur oak Wet Mesic Forest Lowland forests of American elm, Elm-ash-cottonwood green and black ash, silver maple The data presented in the USGS study are statewide for Minnesota, Wisconsin and Michigan, so the U.S. EPA-GLNPO clipped the data using GIS software to extract information relevant to the portions of each state that lie within the Great Lakes watershed. This exercise revealed that extent of area covered by forest declined by 37% between the mid-19th century and 1977-1983, due primarily to the conversion of northern mesic forest (maple-beech-birch) and oak forest (oak-hickory) in southern Wisconsin and Michigan to urban and agricultural use. By forest type, area covered by pine forests (white-red-jack pine) declined by 81%, northern mesic forests (maple-beech-birch) by 64%, and boreal forests (spruce-fir) by 63% over the same period, although the area covered by aspen-birch forests increased by 212%. The late-19th century was marked by extensive logging of pine forests and subsequent conversion to early successional aspen-birch forests. Maps depicting the changes in forest cover can be found on the following page.

.
However, comparing FIA data from 1977-1983 to the most recent data collected in 2001-2002 indicates that further changes have occurred over the past quarter-century. Total forest area has expanded by 5% over the period, while area covered by white-red-jack pine forests has increased by 18%, and maple-beech-birch forests (northern mesic) by 13%. At the same time, aspen-birch forests have retreated by 3%, and spruce-fir (boreal) forests have declined by 12%. Meanwhile, the area of non-stocked forest land (timber land less than 10% stocked with live trees) has dropped by 9%. These data suggest a maturation and steady recovery over recent decades in the Great Lakes forests of Minnesota, Wisconsin and Michigan, as reflected by the progression of natural successional patterns, replanting of non-forest areas, and regeneration of non-stocked forest lands.
.
Pre-settlement Forest Source: USGS, based on General Land Office survey (1815-1866) Modern Forest Source: USGS, based on USDA Forest Service, Forest Inventory and Analysis Database (1977-1983)
6 Cole, K., Stearns, F., Guntenspergen, G., Davis, M. and Walker, K. 1998. Historical Landcover Changes in the Great Lakes Region. In Perspectives on the land-use history of North America: a context for understanding our changing environment, ed. Sisk, T.D., Ch. 6. U.S. Geological Survey, Biological Resources Division, Biological Science Report USGS/BRD/BSR 1998-0003.

Data Tables: Indicator (1). Extent of Forest Type Relative to Total Forest Area Table 1.1 Forest Area by Forest Type in hectares Area of Forest Type % of Total Forest Area Maple-Beech-Birch 7,574,099 27.3% Aspen-Birch 6,460,568 23.3% Spruce-Fir 4,964,154 17.9% White-Red-Jack Pine 2,699,360 9.7% Oak-Hickory 1,838,136 6.6% Elm-Ash-Cottonwood 1,632,339 5.9% Spruce-Jack Pine-Aspen 480,402 1.7% Other Softwoods 182,219 0.7% Oak-Pine 178,744 0.6% Other 519,266 1.9% Non-stocked 1,262,441 4.5% TOTAL FOREST AREA 27,791,728 TOTAL LAND AREA IN BASIN 54,757,612 Table 1.2 Expansion in Forest Area, by State/Province in hectares Earliest Available Most Recent Available Change % Change Illinois nil (1985) 5,726 (2002) *** *** Indiana 118,414 (1986) 121,852 (2002) +3,438 +2.9% Michigan 7,433,913 (1980) 7,848,153 (2001) +414,240 +5.6% Minnesota 1,128,086 (1977) 1,208,050 (2002) +79,964 +7.1% New York 2,616,380 (1993) 2,909,938 (2002) +293,558 +11.2% Ohio * N/A 453,741 (1991) N/A N/A Pennsylvania 64,331 (1989) 76,885 (2002) *** *** Wisconsin 2,053,865 (1983) 2,122,031 (2002) +68,166 +3.3% Ontario ** N/A 13,045,401 ** N/A N/A * Ohio data only available for 1991 ** Ontario data a mosaic of 1978-2001 data *** Illinois and Pennsylvania excluded from calculations due to small sample area

Data Tables: Indicator (2). Extent of Area by Forest Type and by Age-Class or Successional Stage
Table 2.1 Age-class Distribution within Forest Type Combined 0-20 21-40 41-60 61-80 81-100 101-120 121-140 141-160 161-200 200+ Maple-Beech-Birch 4.9% 10.2% 25.9% 33.3% 14.6% 4.4% 2.5% 1.7% 0.8% 0.1%Aspen-Birch 10.5% 14.9% 28.8% 27.8% 13.5% 3.5% 0.8% 0.1% < 0.1% 0.1%Spruce-Fir 4.1% 7.2% 21.5% 26.9% 19.4% 9.8% 7.2% 3.3% 0.5% 0.1%White-Red-Jack Pine 9.9% 16.3% 26.4% 22.6% 15.1% 5.7% 2.4% 0.9% 0.5% 0.2%Oak-Hickory 7.8% 15.9% 26.6% 27.0% 11.8% 3.3% 0.6% 0.1% < 0.1% < 0.1%Elm-Ash-Cottonwood 6.8% 21.1% 39.0% 20.4% 6.1% 2.1% 0.7% 0.3% < 0.1% -Spruce-Jack Pine-Aspen 4.5% 8.5% 19.9% 28.4% 22.4% 8.8% 4.4% 1.9% 1.1% 0.1%
Other Softwoods 6.5% 42.0% 38.4% 4.6% 3.7% 2.1% 1.4% 0.8% 0.2% -Oak-Pine 4.4% 12.5% 21.3% 34.9% 18.5% 5.5% 2.0% 0.6% 0.2% < 0.1%Other 2.1% 7.3% 30.2% 38.8% 15.5% 3.9% 1.5% 0.4% 0.1% 0.1%Non-stocked 99.5% 0.2% 0.1% 0.1% 0.1% < 0.1% - - - < 0.1%TOTAL 11.1% 12.1% 25.5% 27.0% 14.0% 4.9% 2.6% 1.2% 0.4% < 0.1% U.S. Great Lakes Basin 0-20 21-40 41-60 61-80 81-100 101-120 121-140 141-160 161-200 200+ Maple-Beech-Birch 6.3% 12.5% 30.5% 35.5% 10.9% 1.6% 0.3% 0.2% < 0.1% -Aspen-Birch 21.4% 24.8% 30.9% 19.1% 3.3% 0.4% 0.1% < 0.1% - 0.1%Spruce-Fir 5.9% 12.2% 30.4% 28.5% 15.5% 4.2% 1.6% 1.3% 0.3% 0.2%White-Red-Jack Pine 12.5% 26.8% 36.1% 16.8% 5.8% 1.6% 0.4% - - 0.1%Oak-Hickory 8.3% 16.6% 27.2% 26.4% 10.4% 3.2% 0.5% 0.1% - -Elm-Ash-Cottonwood 7.8% 21.4% 38.6% 18.7% 6.0% 2.2% 0.8% 0.3% - -Spruce-Jack Pine-Aspen
Other Softwoods 7.2% 47.9% 42.9% 1.5% - - - - - -Oak-Pine 7.9% 22.2% 27.0% 35.4% 7.4% - - - - -Other Non-stocked 100.0% - - - - - - - - -TOTAL 10.5% 17.5% 31.3% 26.9% 8.9% 1.9% 0.5% 0.3% < 0.1% < 0.1% Canadian Great Lakes Basin 0-20 21-40 41-60 61-80 81-100 101-120 121-140 141-160 161-200 200+ Maple-Beech-Birch 0.7% 3.4% 11.8% 26.6% 25.7% 13.1% 8.8% 6.2% 3.2% 0.5%Aspen-Birch 2.8% 7.9% 27.2% 33.9% 20.7% 5.8% 1.3% 0.2% 0.1% < 0.1%Spruce-Fir 3.1% 4.3% 16.6% 26.0% 21.6% 13.0% 10.4% 4.5% 0.7% 0.1%White-Red-Jack Pine 7.9% 8.0% 18.6% 27.3% 22.5% 9.0% 4.1% 1.5% 0.9% 0.2%Oak-Hickory 1.3% 5.1% 18.9% 36.2% 31.9% 4.9% 1.1% 0.3% 0.3% 0.1%Elm-Ash-Cottonwood 2.3% 19.9% 40.6% 28.0% 7.0% 1.7% 0.5% 0.1% 0.1% < 0.1%Spruce-Jack Pine-Aspen 4.5% 8.5% 19.9% 28.4% 22.4% 8.8% 4.4% 2/0% 1.1% 0.1%
Other Softwoods 2.2% 5.0% 10.5% 23.8% 26.3% 14.7% 10.4% 6.0% 1.1% -Oak-Pine 0.9% 2.0% 15.6% 34.3% 29.5% 11.0% 4.1% 1.3% 0.4% < 0.1%Other 2.1% 7.3% 30.2% 38.8% 15.5% 3.9% 1.5% 0.4% 0.1% 0.1%Non-stocked 99.5% 0.3% 0.1% 0.1% 0.1% < 0.1% - - - < 0.1%TOTAL 11.8% 5.9% 19.0% 27.0% 19.7% 8.4% 4.9% 2.3% 0.8% 0.1%

Data Tables: Indicator (3). Extent of Area by Forest Type in Protected Area Categories as Defined by IUCN or Other Classification Systems Table 3.1 Protected Area by Forest Type U.S. Great Lakes Basin in hectares Area Protected Area Protected as % of Area Maple-Beech-Birch 5,693,178 308,332 5.4% Aspen-Birch 2,684,602 73,402 2.7% Spruce-Fir 1,784,559 79,060 4.4% White-Red-Jack Pine 1,195,641 6,639 0.6% Oak-Hickory 1,716,488 21,823 1.3% Elm-Ash-Cottonwood 1,331,321 15,863 1.2% Spruce-Jack Pine-Aspen - - - Other Softwoods 156,901 12,139 7.7% Oak-Pine 89,200 - - Other - - - Non-stocked 94,485 - - TOTAL 14,746,328 517,260 3.5% Canadian Great Lakes Basin in hectares Area Protected Area Protected as % of Area Maple-Beech-Birch 1,880,921 172,045 9.2% Aspen-Birch 3,775,966 490,108 13.0% Spruce-Fir 3,179,595 339,953 10.7% White-Red-Jack Pine 1,503,720 191,345 12.7% Oak-Hickory 121,648 18,819 15.5% Elm-Ash-Cottonwood 301,019 8,096 2.7% Spruce-Jack Pine-Aspen 480,402 53,180 11.1% Other Softwoods 25,318 2,099 8.3% Oak-Pine 89,544 20,138 22.5% Other 519,266 55,991 10.8% Non-stocked 1,168,003 50,754 4.4% TOTAL 13,045,401 1,402,527 10.8% Table 3.2 Changes in Protected Forest Area by State/Province in hectares Earliest Available Most Recent Available Change Illinois nil (1985) 1,538 (2002) ** Indiana 5,828 (1986) 10,938 (2002) + 5,110 Michigan 275,936 (1980) 124,034 (2001) - 151,902 Minnesota 567 (1977) 57,620 (2002) + 57,053 New York 53,765 (1993) 278,157 (2002) + 224,392 Ohio * N/A 21,215 (1991) N/A Pennsylvania 1,013 (1989) nil (2002) ** Wisconsin 51,194 (1983) 23,758 (2002) - 27,436 Ontario 585,072 (1998) 1,402,528 (2001) + 817,456
* Ohio data only available for 1991 ** Illinois and Pennsylvania excluded from calculations due to small sample area

Acknowledgements Author: Mervyn Han, ECO Federal Government Associate on contract to U.S. EPA-GLNPO. Julie Sims (U.S. EPA-GLNPO), Robert Miller (Ontario Ministry of Natural Resources), Connie Carpenter (U.S.D.A. Forest Service) and Earl Leatherberry (U.S.D.A. Forest Service) assisted in the preparation of this report. Advice on the development and selection of forest indicators was received from: Rich Greenwood (Ontario Ministry of Natural Resources), Bill Meades (Natural Resources Canada), Dave Kreutzweiser (Natural Resources Canada), Bill Route (National Park Service), Stephen Schlobohm (U.S.D.A. Forest Service), Dain Maddox (U.S.D.A. Forest Service), Joe Miller (U.S.D.A. Forest Service), Greg Nowacki (U.S.D.A. Forest Service), Connie Carpenter (U.S.D.A. Forest Service), Earl Leatherberry (U.S.D.A. Forest Service), Teague Prichard (Wisconsin Department of Natural Resources), Ann McCammon Soltis (Great Lakes Indian Fish and Wildlife Commission), Dale Phenicie (Council of Great Lakes Industry), Ben Wigley (National Council for Air and Stream Improvement, Inc.), Brad Williams (American Forests and Paper Association), Randy Swaty (The Nature Conservancy), and Wendy Hinrichs-Sanders (Great Lakes Forest Alliance). Sources Alerich, C. L., Klevgard, L., Liff, C., and Miles, P. D. 2004. The Forest Inventory and Analysis Database: Database Description and Users Guide Version 1.7. U.S.D.A. Forest Service, North Central Research Station. NC-218. Available online: http://ncrs2.fs.fed.us/4801/fiadb/fiadb_documentation/FIADB_DOCUMENTATION.htm Canadian Council of Forest Ministers. 2000. Criteria and Indicators of Sustainable Forest Management in Canada: National Status 2000. Available online: http://www.ccfm.org/ci/2000_e.html Carpenter, C., Giffen, C., and Miller-Weeks, M. 2003. Sustainability Assessment Highlights for the Northern United States. U.S.D.A. Forest Service, Northeastern Area State and Private Forestry. NA-TP-05-03. Available online: http://www.na.fs.fed.us/sustainability/pdf/front_cover.pdf Cole, K., Stearns, F., Guntenspergen, G., Davis, M. and Walker, K. 1998. Historical Landcover Changes in the Great Lakes Region. In Perspectives on the land-use history of North America: a context for understanding our changing environment, ed. Sisk, T.D., Ch. 6. U.S. Geological Survey, Biological Resources Division, Biological Science Report USGS/BRD/BSR 1998-0003. Available online: http://biology.usgs.gov/luhna/chap6.html Eubanks, C. E. and Meadows, D. 2002. A Soil Bioengineering Guide for Streambank and Lakeshore Stabilization. U.S.D.A. Forest Service, Technology and Development Program. FS-683. Available online: http://www.fs.fed.us/publications/soil-bio-guide/ Guldin, R. W. and Kaiser, H. F. 2004. National Report on Sustainable Forests – 2003. U.S.D.A. Forest Service. FS-766. Available online: http://www.fs.fed.us/research/sustain/documents/SustainableForests.pdf Ontario Ministry of Natural Resources. 2002. State of the Forest Report, 2001. Queen’s Printer for Ontario. Available online: http://ontariosforests.mnr.gov.on.ca/spectrasites/Viewers/showArticle.cfm?id=20661E52-EE91-453D-9BD475CE675F7D1A&method=DISPLAYFULLNOBARNOTITLE_R&ObjectID=20661E52-EE91-453D-9BD475CE675F7D1A Sedell, J., Sharpe, M., Dravnieks Apple, D., Copenhagen, M. and Furniss, M. 2000. Water and the Forest Service. U.S.D.A. Forest Service, Policy Analysis. FS-660. Available online: http://www.fs.fed.us/.ftproot/pub/water/water.pdf Smith, W. B. 2004. United States 2003 Report on Sustainable Forests, Data Report: Criterion 1, Indicators 1, 2, 3, 4, Conservation of Biological Diversity. U.S.D.A. Forest Service. FS-766A. Available online: http://www.fs.fed.us/research/sustain/contents.htm U.S.D.A. Forest Service. 2000 RPA Assessment of Forest and Range Lands. FS-687. Available online: http://svinet2.fs.fed.us/pl/rpa/publications_in_support_of_the_2.htm Canadian Great Lakes basin forest data are courtesy of Larry Watkins (Ontario Ministry of Natural Resources). U.S. Great Lakes basin forest data were compiled and analyzed on GIS software by the author using the U.S.D.A. Forest Service, Forest Inventory and Analysis database, with assistance from Geoffrey Holden (U.S.D.A. Forest Service). Raw data files available for download at: http://ncrs2.fs.fed.us/4801/fiadb/fiadb17_dump/fiadb17_dump.htm Historical statewide forest data for Minnesota, Wisconsin and Michigan are courtesy of Kenneth Cole (U.S. Geological Survey) and were clipped to Great Lakes basin boundary using GIS software by the author.