Developing a national water security indicators framework in ...
72
Organisation for Economic Co-operation and Development ENV/WKP(2021)9 Unclassified English - Or. English 27 May 2021 ENVIRONMENT DIRECTORATE Developing a national water security indicators framework in Kazakhstan – Environment Working Paper No. 177 Dauren Oshakbaev, Zhanna Akisheva (1) and Alexandre Martoussevitch (2) 1) Independent consultants 2) OECD OECD Working Papers should not be reported as representing the official views of the OECD or of its member countries. The opinions expressed and arguments employed are those of the author(s). Authorised for publication by Rodolfo Lacy, Environment Directorate. JEL Classification: Q25, Q15, Q28, Q56, D78 Keywords: water security, water security indicators, water-related green growth and SDG indicators, Kazakhstan OECD Environment Working Papers are available at: www.oecd.org/environment/workingpapers.htm JT03477155 OFDE This document, as well as any data and map included herein, are without prejudice to the status of or sovereignty over any territory, to the delimitation of international frontiers and boundaries and to the name of any territory, city or area.
-
Upload
khangminh22 -
Category
Documents
-
view
2 -
download
0
Transcript of Developing a national water security indicators framework in ...

Organisation for Economic Co-operation and Development
ENV/WKP(2021)9
Unclassified English - Or. English
27 May 2021
ENVIRONMENT DIRECTORATE
Developing a national water security indicators framework in Kazakhstan – Environment Working Paper No. 177
Dauren Oshakbaev, Zhanna Akisheva (1) and Alexandre Martoussevitch (2)
1) Independent consultants 2) OECD OECD Working Papers should not be reported as representing the official views of the OECD or of its member countries. The opinions expressed and arguments employed are those of the author(s). Authorised for publication by Rodolfo Lacy, Environment Directorate. JEL Classification: Q25, Q15, Q28, Q56, D78 Keywords: water security, water security indicators, water-related green growth and SDG indicators, Kazakhstan
OECD Environment Working Papers are available at: www.oecd.org/environment/workingpapers.htm
JT03477155 OFDE
This document, as well as any data and map included herein, are without prejudice to the status of or sovereignty over any territory, to the
delimitation of international frontiers and boundaries and to the name of any territory, city or area.
2 ENV/WKP(2021)9
Unclassified
OECD ENVIRONMENT WORKING PAPERS
OECD Working Papers should not be reported as representing the official views of the OECD or
of its member countries. The opinions expressed and arguments employed are those of the author(s).
OECD Working Papers describe preliminary results or research in progress by the author(s) and
are published to stimulate discussion on a broad range of issues on which the OECD works.
This series is designed to make available to a wider readership selected studies on environmental issues prepared for use within the OECD. Authorship is usually collective, but
principal author(s) are named. The papers are generally available only in their original language -English or French- with a summary in the other language.
Comments on OECD Working Papers are welcomed, and may be sent to:
OECD Environment Directorate, 2, rue André Pascal, 75775 PARIS CEDEX 16, France
or by e-mail to [email protected]
--------------------------------------------------------------------------- OECD Environment Working Papers are published on
www.oecd.org/environment/workingpapers.htm ---------------------------------------------------------------------------
This document and any map included herein are without prejudice to the status of or sovereignty over any territory, to the delimitation of international frontiers and boundaries and to the name of any territory, city or area.
The statistical data for Israel are supplied by and under the responsibility of the relevant Israeli authorities. The use of such data by the OECD is without prejudice to the status of the Golan Heights, East Jerusalem and Israeli settlements in the West Bank under the terms of international law. © OECD (2021)
You can copy, download or print OECD content for your own use, and you can include excerpts from OECDpublications, databases and multimedia products in your own documents, presentations, blogs, websites and teaching materials, provided that suitable acknowledgment of OECD as source and copyright owner is given.
All requests for commercial use and translation rights should be submitted to [email protected].
ENV/WKP(2021)9 3
Unclassified
Abstract
Water security is a matter of great national importance for Kazakhstan, with its Security Council
meeting on 26 June 2019 devoted to “Ensuring Water Security”. This paper presents recent
progress in Kazakhstan with regard to identifying water security priorities and establishing
indicators to monitor and measure progress towards achieving water security. The paper also
analyses those water security indicators that simultaneously relate to the “nationalised” Green
Growth Indicators (GGIs) and Sustainable Development Goal (SDG) indicators that are relevant to
water security, and also identifies opportunities for complimentary indicators to be developed to
track the full suite of water security targets. The paper identifies remaining challenges for future
work in this domain, including improving data collection and reporting; and integrating water
security indicators into relevant policy documents, strategies and plans to secure the technical and
political attention necessary to drive progress in this domain.
Keywords: water security, water security indicators, water-related green growth and SDG indicators, Kazakhstan
JEL Classification: Q25, Q15, Q28, Q56, D78
Résumé
La sécurité de l’eau est un enjeu d’importance nationale au Kazakhstan, qui a d’ailleurs consacré à ce thème la réunion de son Conseil national de sécurité tenue le 26 juin 2019. Ce document présente les avancées réalisées récemment par le Kazakhstan dans la définition des priorités en matière de sécurité de l’eau et l’élaboration d’indicateurs pour suivre et mesurer les progrès dans ce domaine. Il analyse également les indicateurs de sécurité de l’eau qui se rapportent à la fois aux indicateurs « nationaux » de croissance verte et aux indicateurs des Objectifs de développement durable (ODD) intéressant la sécurité de l’eau, et met en évidence des possibilités de construire des indicateurs complémentaires pour suivre tout l’éventail des objectifs de sécurité de l’eau. Le document recense les défis qui restent à relever dans l’optique de travaux futurs dans ce domaine : il s’agit notamment d’améliorer la notification et la collecte des données, et d’intégrer des indicateurs de sécurité de l’eau dans les documents d’orientation, les stratégies et les plans utiles, afin de susciter l’attention nécessaire sur le plan technique et politique pour progresser dans ce domaine.
Mots-clés : sécurité de l’eau, indicateurs de sécurité de l’eau, indicateurs de croissance verte et indicateurs des ODD liés à l’eau, Kazakhstan
Classification JEL Q25, Q15, Q28, Q56, D78
4 ENV/WKP(2021)9
Unclassified
Foreword
The fifth National Policy Dialogue (NPD) Inter-ministerial coordination council meeting, was held in Nur-
Sultan in July 2017. A key decision of the meeting was to include the development of national indicators of
water security into the NPD Work Plan as a priority activity. It was agreed that the indicators should be
elaborated taking into account Kyrgyzstan’s recent experience with developing water security indicators. The
Kyrgyz experience was presented at the NPD meeting in the context of regional exchange on water policy
reform facilitated by the OECD.
As a first step in this direction, Kazakhstan decided to support a study focusing on those water security
indicators that simultaneously relate to the “nationalised” (nationally adapted) GGIs and SDG indicators as
well as to “priority indicators” of water security. The study was launched in 2018 and implemented with the
support of the OECD under supervision of a dedicated working group established by the Committee on
Statistics of the Ministry of National Economy of Kazakhstan. The study planned to analyse time series for
the indicators in order to identify general trends and reveal challenging water security issues facing
Kazakhstan. The study also aimed to provide recommendations on steps to regularly monitor the
recommended indicators to strengthen the basis for informed decision-making.
This study was implemented with the financial assistance of the government of the Republic of Kazakhstan
(hereafter – “RK”) and support from the OECD GREEN Action Task Force (former EAP Task Force) under
the OECD – Kazakhstan cooperation agreement. This support is gratefully acknowledged.
The results of the study are presented in this working paper.
Chapter 1 of the paper analyses the OECD GGIs and the nationally adapted green growth indicators in
Kazakhstan (hereafter - GGIs of RK) as well as national indicators used under the Green Economy Concept
adopted in Kazakhstan that are related to water resources and water infrastructure. It also analyses
correspondence between these sets of indicators and recommends using several additional indicators
complementary to nationally adapted GGIs.
Chapter 2 provides an overview of national indicators to monitor implementation of water-related SDGs and
defines a need to use complementary or proxy indicators.
Chapter 3 analyses the correspondence and complementarity between OECD GGIs, GGIs of RK, Green
Economy Concept indicators, and nationally adapted indicators to monitor implementation of water-related
SDGs.
Chapter 4 discusses priorities and relevance of water security related issues, tasks and challenges in
Kazakhstan identified through a questionnaire distributed by the Committee on Statistics of RK that was
completed by national stakeholders.
Chapter 5 defines a set of “priority indicators” related to both: priority challenges of water security of the
Republic of Kazakhstan, GGIs, and SDGs; and highlights selected water security indicators recommended
for monitoring in RK.
Chapter 6 analyses time series for “priority indicators” of water security of RK as a whole as well as for
different categories (e.g. urban versus rural areas, by oblast of RK and city of significance, as well as by
hydrographic basins) where data allowed.
Finally, Chapter 7 presents the main conclusions and recommendations of this study.
ENV/WKP(2021)9 5
Unclassified
Acknowledgements
This working paper was produced based on the final report of a study undertaken under the Agreement between the Government of the Republic of Kazakhstan and the OECD on implementing the project titled «Introduction of Green Growth Indicators and Preparation of the Report on Green Growth in Kazakhstan».
The principal author of this working paper is Mr. Dauren Oshakbaev, Kazakhstani specialist. Other authors are Ms. Zhanna Akisheva, who contributed to collecting data, and building and analysing time series for the suggested priority indicators; and Mr. Alexandre Martoussevitch, who provided supervision of, and methodological support to, the study, comments and inputs to the report and to the drafting of this working paper. The authors are deeply grateful to the specialists of the Committee on Statistics under the Ministry of National Economy of the Republic of Kazakhstan: Ms. A.S. Shauenova, Head of the Division of Production and Environment Statistics, and Ms. A.K. Djartybaeva, Chief Expert of the Department, for contributing to the survey within the framework of the project on further development of the national set of green growth indicators, and to all members of the project working group representing public authorities of the Republic of Kazakhstan and the Green Academy of Kazakhstan for useful discussions and comments to intermediate versions of this paper; to Ms Ekaterina Kozlova for translating into English the report originally produced in Russian, as well as to Mr. Matthew Griffiths and Mr. Guillaume Cohen (both OECD) and Mr. Andrey Isak, Moldovan specialist, for valuable comments on the pre-final draft this working paper, to Mr. Krzysztof Michalak and Mr. Jean-François Lengellé (OECD / GREEN Action Task Force secretariat) for general support to this study and to Ms Soojin Jeong for technical assistance in preparing this working paper for publishing.
The views presented in this working paper are those of the authors and can in no way be
taken to reflect the official opinion of the government of Kazakhstan, the OECD and OECD member
countries.
6 ENV/WKP(2021)9
Unclassified
Table of contents
Abstract 3
Foreword 4
Acknowledgements 5
Abbreviations and local terms 9
Executive summary 11
Introduction on Green Growth, Sustainable Development Goals and Water Security Indicators Frameworks in EECCA countries 13
1 Analysis of Green Growth Indicators related to water resources and infrastructure 17
Overview of the OECD’s water-related GGIs 17
Overview of national indicators used in the Kazakhstan’s Green Economy Concept with special
focus on water-related indicators 18
Overview of water-related GGIs adapted for Kazakhstan and defining a need to use proxy and
complementary indicators 19
2 Nationally adapted indicators to monitor water-related SDGs and needs for complementary indicators 26
3 Analysis of correspondence and complementarity between OECD GGIs and GGIs of RK and indicators to monitor water-related SDGs 31
4 Priorities, tasks and challenges of relevance for Kazakhstan’s water security 35
Water security issues on which Respondents expressed opposing views 37
Annex 4.A. Issues of water security of the Republic of Kazakhstan to which Respondents*
assigned the highest priority 38
Annex 4.B. The Questionnaire 43
Annex 4.C. List of government bodies and organisations that received the Questionnaire (in
November–December 2018) 47
5 Defining a set of priority indicators of water security of Kazakhstan 49
Extent to which nationally adapted GGIs and SDG indicators reflect different aspects of water
security 49
Indicators of water security of the Republic of Kazakhstan recommended to be used for
monitoring 51
ENV/WKP(2021)9 7
Unclassified
6 Analysis of time series for “priority indicators” of water security of the Republic of Kazakhstan 54
7 Conclusions and recommendations 69
Conclusions 69
Recommendations on improving monitoring of nationally adapted indicators of water security 70
References 72
FIGURES
Figure 6.1. The share of population covered by piped water supply in the Republic of Kazakhstan, % 55 Figure 6.2. Number of water samples taken for microbial and chemical analysis, in thousands 56 Figure 6.3. The share of samples non-compliant with national requirements in terms of microbial and chemical
parameters (by source of drinking water), in % 57 Figure 6.4. Water consumption per unit of GDP in the Republic of Kazakhstan in 1995–2017 60 Figure 6.5. Water consumption per unit of GDP in the Republic of Belarus, 1995–2015, in m3 of freshwater per
unit of GDP (1000 of USD PPP*) 60 Figure 6.6. Renewable fresh water resources in the Republic of Kazakhstan in 2000–2017, in km3 62 Figure 6.7. Renewable freshwater resources, water abstractions (in km3, left scale) and water abstraction
intensity (in %, right scale) in the Republic of Kazakhstan, 2000–2017 63 Figure 6.8. The share of wastewater treated according to established norms of total volume of wastewater, % 65 Figure 6.9. The share of water bodies with good ambient water quality in the Republic of Kazakhstan, % 65 Figure 6.10. Water pollution index 66
TABLES
Table 1.1. OECD GGIs related to water resources and infrastructure 17 Table 1.2. Goals of the Kazakhstan’s Green Economy Concept related to water resources and water use 18 Table 1.3. Green growth indicators of RK (GGIs of RK) and correspondence with OECD GGIs 19 Table 1.4. Recommended additional indicators to the GGIs of RK related to water resources and water
infrastructure 21 Table 2.1. Global and nationally adapted water related SDG indicators that are included in the list of national
SDG indicators 28 Table 3.1. OECD GGIs, GGIs of RK and nationally adapted indicators to monitor implementation of SDGs that
are highly consistent with each other 31 Table 3.2. OECD GGIs, GGIs of RK and nationally adapted indicators to monitor implementation of SDGs that
complement each other 32 Table 3.3. OECD GGIs, GGIs of RK, and nationally adapted indicators to monitor implementation of SGDs that
complement each other but should be detailed and/or disaggregated 32 Table 3.4. OECD GGIs, GGIs of RK that lack corresponding nationally adapted indicators to monitor
implementation of SDGs, and vice versa 33 Table 5.1. GGIs and SDG indicators related to water security of households and individual residents 49 Table 5.2. GGIs and SDG indicators related to water security of main sectors of the economy 50 Table 5.3. GGIs and SDG indicators related to resilience of human settlements and economic assets to water-
related emergencies 50 Table 5.4. GGIs and SDG indictors related to security of water resources, water bodies and water-related
ecosystems 51 Table 5.5. Nationally adapted GGIs and SDG indictors related to other issues of relevance and priority for water
security of RK 51 Table 5.6. Indictors that reflect priority issues of water security of RK and are recommended for regular
monitoring 52 Table 6.1. The quality of drinking water in piped water supply systems, in 2013 and 2018, by oblast of RK 57 Table 6.2. The quality of drinking water from decentralised sources, in 2013 and 2018, by oblast of RK 58 Table 6.3. Morbidity due to water-borne diseases in the Republic of Kazakhstan in 2013–2017, number of cases59 Table 6.4. Water productivity in the Republic of Kazakhstan, by sector, in KZT/m3 61
8 ENV/WKP(2021)9
Unclassified
Table 6.5. The share of water bodies with good ambient water quality, by oblast, % 66 Table 6.6. Comprehensive water pollution index values for main rivers of Kazakhstan and Lake Balkhash 67 Table 6.7. Gaps in nationally adapted GGIs and SDG indicators of relevance for water security of Kazakhstan
and some trends requiring policy action 67
Annex Table 4.B.1. List of issues (challenges, tasks) related to water security that might be of relevance and
priority for Kazakhstan 43
ENV/WKP(2021)9 9
Unclassified
Abbreviations and local terms
ADB Asian Development Bank
akimat rayon/district, municipality, city or oblast (province/region) public administration
CCEA Common Classification of Economic Activities
CCHUS Committee for Construction, Housing and Utility Services
CES Committee for Emergency Situations
CGSU Committee of Geology and Subsoil Use
CPHP Committee on Public Health Protection
CQCSGS Committee for Quality Control and Safety of Goods and Services
CS Committee on Statistics (national statistics committee)
CWPI comprehensive water pollution index
CWR Committee on Water Resources
EAP Task Force Environmental Action Programme Task Force
EGS environmental goods and services
FDI Foreign Direct Investment
GDP Gross Domestic Product
GG Green Growth
GGI Green Growth Indicator
GGIs of RK 2018
set of Green Growth Indicators adopted, or developed and under consideration in RK as of November 2018
GNI Gross National Income
GVA Gross Value Added
ha hectare
HTS hydraulic technical structure
IMCC Inter-Ministerial Coordination Council
Kazhydromet Republican State Enterprise “Kazakhstan Hydro-Meteorological Service”
Kazselzashita State Institution “Kazakhstan Mud Flow Protection Service”
Kazvodhoz Republican State Enterprise (established on the right to operate state-owned water systems) “Kazakhstan Water Management”
KZT Kazakhstan tenge
km kilometres
LWWTP local wastewater treatment plant
m3 cubic metres
10 ENV/WKP(2021)9
Unclassified
MoA Ministry of Agriculture of the Republic of Kazakhstan
MoEGNR Ministry of Ecology, Geology and Natural Resources of the Republic of Kazakhstan
MoES Ministry of Education and Science of the Republic of Kazakhstan
MoF Ministry of Finance of the Republic of Kazakhstan
MoHC Ministry of Healthcare of the Republic of Kazakhstan
MoIA Ministry of Internal Affairs of the Republic of Kazakhstan
MoIID Ministry of Industry and Infrastructure Development of the Republic of Kazakhstan
MoJ Ministry of Justice of the Republic of Kazakhstan
MoNE Ministry of National Economy of the Republic of Kazakhstan
n.a. stands for “not applicable”, or “(data) not available”, depending on the context
NPD
NSC
National Policy Dialogue (on water policy)
National Statistics Committee of Kyrgyzstan
oblast province (sub-national administrative-territorial unit; also referred to as “region”)
ODA official development assistance
OECD Organisation for Economic Co-operation and Development
OECD GGI set of Green Growth Indicators recommended by the OECD
R&D research and development
PES payments for ecosystem services
RK Republic of Kazakhstan
Roshydromet Russian Federal Service for Hydrometeorology and Monitoring of the Environment
PPP purchasing power parity
RSBSE Republican State Budget-Supported Enterprise
RSE Republican State Enterprise
RSI Republican State Institution
rayon administrative unit of a province; also referred as (administrative) “district”
SDGs Sustainable Development Goals
SEEA System of Integrated Environmental Economic Accounting
SPNA specially protected natural area
SPZ sanitary protection zone
SRC State Revenue Committee
SRI scientific research institute
USD United States dollar
WPI water pollution index
WWTP wastewater treatment plant
ENV/WKP(2021)9 11
Unclassified
Executive summary
Water security is a matter of great national importance for Kazakhstan, as confirmed by the Protocol of the
country’s Security Council meeting held on 26 June 2019 devoted to “Ensuring Water Security”. In this
context, monitoring of the main components and elements of water security, as measured by relevant
indicators, would strengthen the information base for decision-making in this domain.
The fifth National Policy Dialogue (NPD) Inter-ministerial coordination council meeting, held in Nur-Sultan
in July 2017, included the development of national indicators of water security of Kazakhstan into the NPD
Work Plan. This commitment would include incorporation of the experience of the Kyrgyz Republic in
developing such indicators. In order to avoid an excessive increase in the number of indicators used in the
statistical and sectoral reporting systems, it was decided to use, wherever possible, the existing nationally
adapted green growth indicators (GGIs) that had been elaborated with the support of the OECD, and the
indicators used to monitor implementation of water-related SDGs. A small number of complementary
indicators were to be introduced as needed. It was agreed that the indicators must focus on the priority
problems and challenges of water security of the Republic of Kazakhstan (hereafter – RK).
The results of this work, implemented with assistance of the Committee on Statistics of the Ministry of
National Economy of RK, and with methodological support from the OECD, are presented in this paper.
A questionnaire, prepared by the project team, was distributed among selected respondents by the
Committee on Statistics in order to identify challenging issues of water security in Kazakhstan. The analysis
of the responses revealed the most significant national water security issue to be “the water security of the
population and that of human settlements”. At the same time, the survey findings revealed that only half of
the challenging aspects of water security can be monitored using existing indicators included in nationally
adapted GGIs and SDG indicators. Complementary or additional indicators were identified as being
required to allow monitoring of all aspects of water security. These are recommended in Section 5.2 of this
working paper.
Data availability and accessibility or reliability was identified as a general concern. The data required for
calculating some of the recommended indicators of water security of Kazakhstan were either not published
or did not exist. For instance, there was no available data on the water security of human settlements.
The lack of, or limited access to, data also concerned the data required to calculate the recommended
“priority indicators” of water security of Kazakhstan. It included access to select statistical data of the
Committee on Water Resources of the Ministry of Environment, Geology and Natural Resources of RK
and the Committee for Quality Control and Safety of Goods and Services of the Ministry of Healthcare of
RK.
The analysis of time series for the indicators that reflect priority issues of water security of Kazakhstan for
which data was available (e.g. RSE Kazhydromet publishes detailed data on water pollution) revealed
downward trends, principally concerning the quality of water in the main rivers of Kazakhstan. This is clearly
a risk factor for the overall water security of Kazakhstan.
12 ENV/WKP(2021)9
Unclassified
Since the water security of the country has not been regularly analysed so far, the public bodies responsible
for data collection do not receive feedback that would help to improve data quality, the scope of data
collected and to prepare correct analytical breakdowns to monitor water security and take informed
decisions.
The working paper provides the following recommendations:
revise existing and adopt new indicators of water security;
review the roles and responsibilities of key agencies for individual indicators;
improve the data collection and reporting system to allow regular monitoring of the indicators; and
integrate the indicators into relevant policy documents, strategies and plans.
It is recommended to regularly collect data and monitor the recommended “priority indicators” of water
security reflecting most challenging issues of the country’s water security. To do so, amendments and
additions should be introduced to the state statistical and sectoral reporting, and dedicated statistical
surveys carried out where required. It is recommended that this work should be funded from the national
budget.
One of the key challenges with regard to data collection for monitoring national indicators of water security
will be to coordinate the several public bodies that have complimentary resources and technical capacity
to collect required data, namely:
The Committee on Water Resources, the Committee of Geology and Subsoil Use, and RSE
Kazhydromet of the Ministry of Environment, Geology and Natural Resources of RK;
The Committee for Construction, Housing and Utility Services of the Ministry of Industry and
Infrastructure Development of RK;
The Committee on Public Health Protection and the Committee for Quality Control and Safety of
Goods and Services of the Ministry of Healthcare of RK;
The Committee for Emergency Situations of the Ministry of Internal Affairs of RK;
The Committee on Statistics of the Ministry of National Economy of RK.
It is recommended to appoint a permanent public body that will be responsible for:
(a) coordinating the public agencies involved in collecting data on various aspects of water security; and
(b) monitoring, publishing and analysing data on national indicators of water security.
In this respect, it is also recommended to:
1. Elaborate new or adjust existing legal regulatory acts to fine-tune data collection for monitoring
national indicators of water security. This will be in line with such fundamental principles of statistics
as transparency and independence.
2. Assess the public bodies’ methodologies for, and processes of, collecting statistical data in order
to eliminate possible errors and improve data quality.
3. Develop tools for automated data collection and aggregation to support regular data exchange.
4. Ensure availability and openness of water security indicators, including on the official web-site of
the Committee on Statistics of the Ministry of National Economy of RK (or on the website of RSE
Information and Analytical Centre for Environmental Protection under MoEGNR).
Finally, the integration of the recommended set of priority indicators of water security into relevant strategic
documents of Kazakhstan should be considered.
The implementation of the suggested recommendations would strengthen the information base for sound
decision-making aimed at improving water security of Kazakhstan.
ENV/WKP(2021)9 13
Unclassified
Introduction on Green Growth, Sustainable Development Goals and Water Security Indicators Frameworks in EECCA countries
Water is a global sustainable development issue, inter-sectoral (and often transboundary) and closely
linked to food, energy and environmental security. Particularly the Asian region where up to 3.4 billion
people could be living in water-stressed areas by 2050 was recognized as a global hot spot for water
insecurity and the Asian Development Bank (ADB) helped countries to launch dialogue on water security,
back in 2007. A few years later, the 2013 ADB publication titled Asian Water Development Outlook 2013
provided the first quantitative and comprehensive review of water security in the region. It developed a
water security framework based on five key dimensions (KDs) for household, economic, urban
settlements, environmental security, and resilience to water-related disasters. The overall national water
security of each country was assessed as the composite result of the five key dimensions, measured by
respective indicators on a scale of 1–5, with 1 being a low level of water security and 5 being the exemplary
level (see https://www.adb.org/publications/asian-water-development-outlook-2013). The next similar
outlook of 2016 noted positive trend in strengthening water security in the region since 2013.
That work attracted strong interest in the EECCA region; in Central Asia, for instance, several countries
recognised the need to elaborate and adopt a sound national definition of water security, as well as a
national water security indicators framework to monitor trends and timely take required action. And
some countries, such as Kyrgyzstan, tried to “nationalise” the ADB framework, adapt it to the local context
and integrate it into the national statistics to be able to regularly monitor water security indicators, analyse
trends and take policy action as required. In doing so, experts in Kyrgyzstan noted that for some key
dimensions (and related indicators) positive trend at the national level could well co-exist with negative
trends in some provinces or river basins. Moreover, countries with substantial proportion of rural population
facing significant disparities between urban and rural areas in terms of access to piped water and service
quality were interested in measuring the level of water security of both urban and rural households,
including such element as affordability of water. They also noted that the framework presented in the
ADB 2013 publication lacked the trans-boundary dimension of water security and related indicators.
These observations triggered the need for (i) further elaborating the framework and fine-tuning it to specific
needs of respective country; and (ii) disaggregating data on some key dimensions of water security to
measure associated indicators at both the national and province levels, in both urban and rural areas (note
that such a disaggregation resonate with the 2030 Agenda’s pledges for “no one left behind”), and (where
14 ENV/WKP(2021)9
Unclassified
feasible) also in key river basins; as well as (iii) adding one more key dimension (KD) - on trans-boundary
water security.
The National Statistics Committee (NSC) of Kyrgyzstan, reported in 2018 on implementing the former two
tasks with support from the OECD / GREEN Action Task Force and the Government of Finland, while the
latter task is work in progress supported by the EU, UNECE and OECD.
Another challenge faced by some countries in the region has been to ensure coherence of the water
security indicators framework with the national frameworks for other sets of internationally adopted or
internationally recognized indicators, foremost Green Growth Indicators (GGIs, see Box 1) and the
indicators to measure progress in reaching Sustainable Development Goals (SDGs) relevant for water
security agenda, including SDG 6 – see Box 2. The authors assume that the readers of this technical
paper are familiar with, or have some basic knowledge about, the GGIs and SDG indicators.
Box 1. Green Growth Indicators framework developed by the OECD
The set of Green Growth Indicators (GGIs) developed by the OECD in 2010ies consists of 26 indicators,
some of which have sub-indicators. They help to answer several policy questions, including the
following:
- Are our economies using more efficiently natural resources and environmental services?
- Is the natural asset base of our economies being maintained?
- Does greening growth generate benefits for people? and
- How does greening growth generate economic opportunities?
The 26 indicators proposed by the OECD capture the main features of green growth and help monitor
progress in four main areas. These are i) the environmental and resource productivity of the economy;
ii) the natural asset base; iii) the environmental dimension of quality of life; and iv) economic
opportunities and policy responses. Selected examples (those directly related to water are in bold) are:
Area 1: Resource productivity – output generated per unit of natural resources or materials used.
Area 2: The availability and quality of renewable natural resource stocks including freshwater, forest
and fish resources.
Area 3: (i) human exposure to pollution and environmental risks (natural disasters, technological and
chemical risks), the associated effects on human health and on quality of life, and the related health
costs and impacts on human capital and on labour productivity; (ii) public access to environmental
services and amenities, characterising the level and type of access of different groups of people to
environmental services such as clean water, sanitation, green space or public transport.
Area 4: (i) production of environmental goods and services that reflect an important, albeit partial, aspect
of the economic opportunities that arise in a greener economy; (ii) prices, taxes and transfers that
provide signals to producers and consumers and help internalise negative environmental externalities,
and which are complemented by indicators on regulation and on management approaches.
The OECD GGIs is a living tool with indicators methodology further improved as required to reflect
accumulated experience and emerging priorities: e.g. the 2017 update focused on links between the
GGIs and policy action. - For more detail see OECD (2017).
Source: own elaboration based on OECD (2017).
Note that historically, the GGIs framework (published by the OECD back in 2011) emerged a few years
before the water security indicators and then the SDG indicators frameworks were developed and
ENV/WKP(2021)9 15
Unclassified
published. Moreover, the status of these frameworks and their weight on the domestic socio-economic
policy agenda in EECCA countries have been quite different:
- after adoption by all UN members at the UN Summit in September 2015, development and adoption of a
national framework for SDG indicators became a must, including for all EECCA countries;
- a few years before, typically from 2012 on, several EECCA countries voluntary committed themselves
to the Green Growth agenda, and started developing national framework for the (nationally adapted) GGIs;
- and only more recently (about 2017) such countries as Kyrgyzstan and Kazakhstan volunteered to start
developing and pilot testing national frameworks for water security indicators.
The processes of developing respective frameworks have had different time lines and partially run in
parallel, typically with support from different development partners (OECD for GGIs and WSIs, and UNDP
for SDGs) where good co-ordination between the processes initially was not always ensured. For this very
reason, draft definitions and indicators proposed by different frameworks to measure the same statistical
values (e.g. household access to piped drinking water supply) were not always identical, or coherent. As
mentioned below in this paper, for instance, in Kazakhstan this study helped to reveal and timely remedy
such discrepancies in the nationally adapted definitions of some GGIs and SDG indicators.
Box 2. SDG6 and other Sustainable Development Goals relevant for water security
Goal 6 “Ensure availability and sustainable management of water and sanitation for all”
refers directly to water resources and water infrastructure. This goal includes eight targets, as follows:
(6.1) By 2030, achieve universal and equitable access to safe and affordable drinking water for
all.
[Note that mentioning affordability links this target with SDG1 No poverty]
(6.2) By 2030, achieve access to adequate and equitable sanitation and hygiene for all and end
open defecation, paying special attention to the needs of women and girls and those in vulnerable
situations.
(6.3) By 2030, improve water quality by reducing pollution, eliminating dumping and minimizing
release of hazardous chemicals and materials, halving the proportion of untreated wastewater
and substantially increasing recycling and safe reuse globally.
(6.4) By 2030, substantially increase water-use efficiency across all sectors and ensure
sustainable withdrawals and supply of freshwater to address water scarcity and substantially
reduce the number of people suffering from water scarcity.
(6.5) By 2030, implement integrated water resources management at all levels, including through
transboundary cooperation as appropriate.
(6.6) By 2020, protect and restore water-related ecosystems, including mountains, forests,
wetlands, rivers, aquifers and lakes.
(6.a) By 2030, expand international cooperation and capacity-building support to developing
countries in water- and sanitation-related activities and programmes, including water harvesting,
desalination, water efficiency, wastewater treatment, recycling and reuse technologies.
(6.b) Support and strengthen the participation of local communities in improving water and
sanitation management.
Several individual targets of Sustainable Development Goals 11, 12, 13, and 14 also refer to water security, though not always directly:
16 ENV/WKP(2021)9
Unclassified
Goal 11 “Make cities and human settlements inclusive, safe, resilient and sustainable”.
(Target 11.5) By 2030, significantly reduce the number of deaths and the number of people
affected and substantially decrease the direct economic losses relative to global gross domestic
product caused by disasters, including water-related disasters, with a focus on protecting the poor
and people in vulnerable situations.
Goal 12 “Ensure sustainable consumption and production patterns”.
Within this Goal, sound water consumption can be of relevance, and it entails two targets:
(Target 12.1) Implement the 10-Year Framework of Programmes on Sustainable Consumption
and Production Patterns …. .
(Target 12.2) By 2030, achieve the sustainable management and efficient use of natural
resources.
Goal 13 “Take urgent action to combat climate change and its impacts”
Climate change have significant impact on water resources and water infrastructure. The following target
is considered as very relevant for water security:
(Target 13.1) Strengthen resilience and adaptive capacity to climate-related hazards and natural
disasters in all countries.
Parties to the Paris Agreement on climate took an obligation to adapt the water sector (as well as other
sectors of their economy) to climate change. And finally,
Goal 14 “Conserve and sustainably use the oceans, seas and marine resources for sustainable
development”,
under which several targets are relevant for water security agenda, except in land locked countries – for
more detail see section 2 below.
Source: own analysis based on information available at https://sdgs.un.org/.
ENV/WKP(2021)9 17
Unclassified
Overview of the OECD’s water-related GGIs
The OECD’s approach to monitoring progress towards green growth was presented in its Towards Green
Growth: Monitoring Progress report back in 2011 (see section titled “The OECD Green Growth
Measurement Framework and Indicators”, in OECD (2014)). The OECD proposed a set of green growth
indicators (hereafter – OECD GGIs) numbered from 1 to 26 that monitor progress towards four main policy
objectives: establishing a low-carbon, resource-efficient economy; improving environmental and resource
efficiency of the economy; maintaining the natural asset base; improving people’s quality of life; and
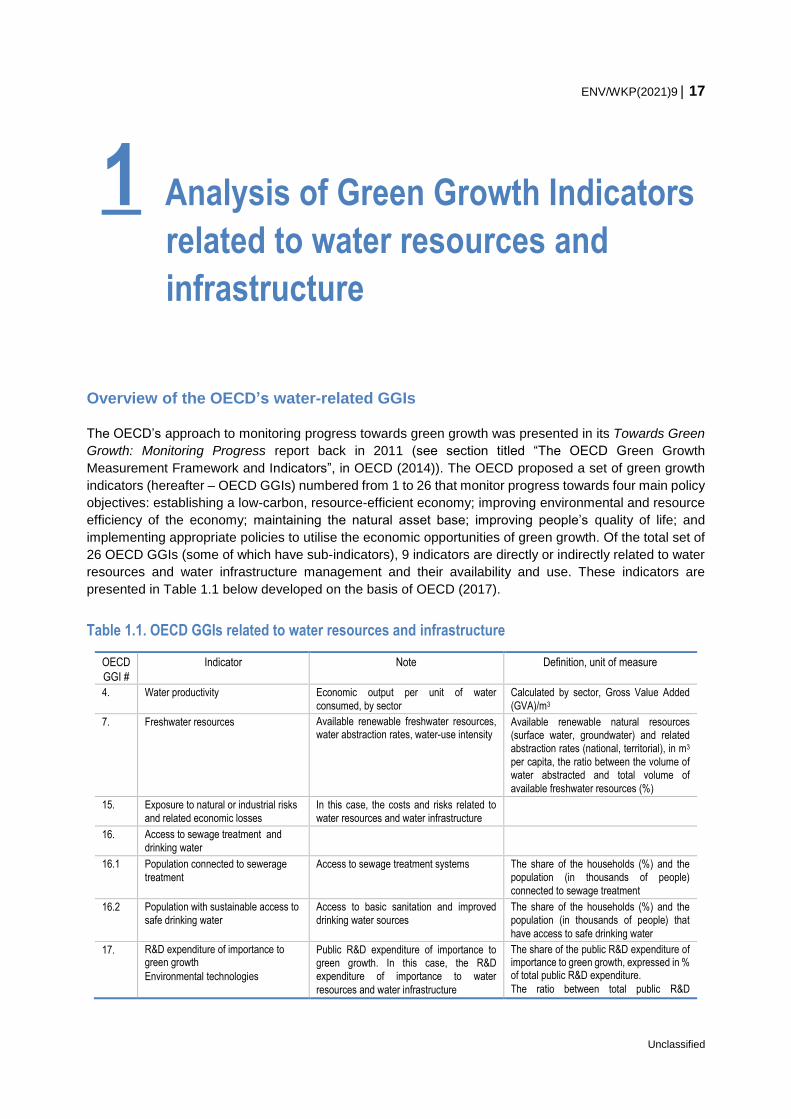
implementing appropriate policies to utilise the economic opportunities of green growth. Of the total set of
26 OECD GGIs (some of which have sub-indicators), 9 indicators are directly or indirectly related to water
resources and water infrastructure management and their availability and use. These indicators are
presented in Table 1.1 below developed on the basis of OECD (2017).
Table 1.1. OECD GGIs related to water resources and infrastructure
OECD
GGI #
Indicator Note Definition, unit of measure
4. Water productivity Economic output per unit of water
consumed, by sector
Calculated by sector, Gross Value Added
(GVA)/m3
7. Freshwater resources Available renewable freshwater resources, water abstraction rates, water-use intensity
Available renewable natural resources (surface water, groundwater) and related abstraction rates (national, territorial), in m3
per capita, the ratio between the volume of water abstracted and total volume of
available freshwater resources (%)
15. Exposure to natural or industrial risks
and related economic losses
In this case, the costs and risks related to
water resources and water infrastructure
16. Access to sewage treatment and
drinking water
16.1 Population connected to sewerage
treatment
Access to sewage treatment systems The share of the households (%) and the population (in thousands of people)
connected to sewage treatment
16.2 Population with sustainable access to
safe drinking water
Access to basic sanitation and improved
drinking water sources
The share of the households (%) and the population (in thousands of people) that
have access to safe drinking water
17. R&D expenditure of importance to green growth
Environmental technologies
Public R&D expenditure of importance to green growth. In this case, the R&D expenditure of importance to water
resources and water infrastructure
The share of the public R&D expenditure of importance to green growth, expressed in % of total public R&D expenditure.
The ratio between total public R&D
1 Analysis of Green Growth Indicators
related to water resources and
infrastructure
18 ENV/WKP(2021)9
Unclassified
expenditure and GVA.
18. Patents of importance to green
growth
In this case, the patents related to water
resources and water infrastructure
Number of issued certificates, licenses, and
patents, in units
19. Environment-related innovation in all
sectors
Innovations (works, services, and technologies) related to environmental protection and sound natural resource use. In this case, the innovations related to water
resources and water infrastructure
The share of eco-innovating enterprises, in
units
20. Production of environmental goods and services (EGS)
In this case, sewage treatment services that are related to water resources management,
for instance
GVA in the EGS sector
Employment in the EGS sector
Environmental expenditure (environmental
costs)
21. International financial flows of
importance to green growth
21.1 Official development assistance
(ODA)
Other countries and international organisations’ assistance. In this case, the assistance related to water resources and
water infrastructure
ODA in terms of volume (in KZT million) and
ODA/GNI ratio, expressed in %
21.3 Foreign Direct Investment (FDI) Attracting foreign investment in mastering, developing and introducing new modernised higher value-added products and services
that would be globally competitive. In this case, the FDIs related to water resources
and water infrastructure
Environment-related investment into enterprises and organisations’ fixed assets,
in KZT million
24. Water pricing and cost recovery This indicator is under discussion
Source: OECD (2017).
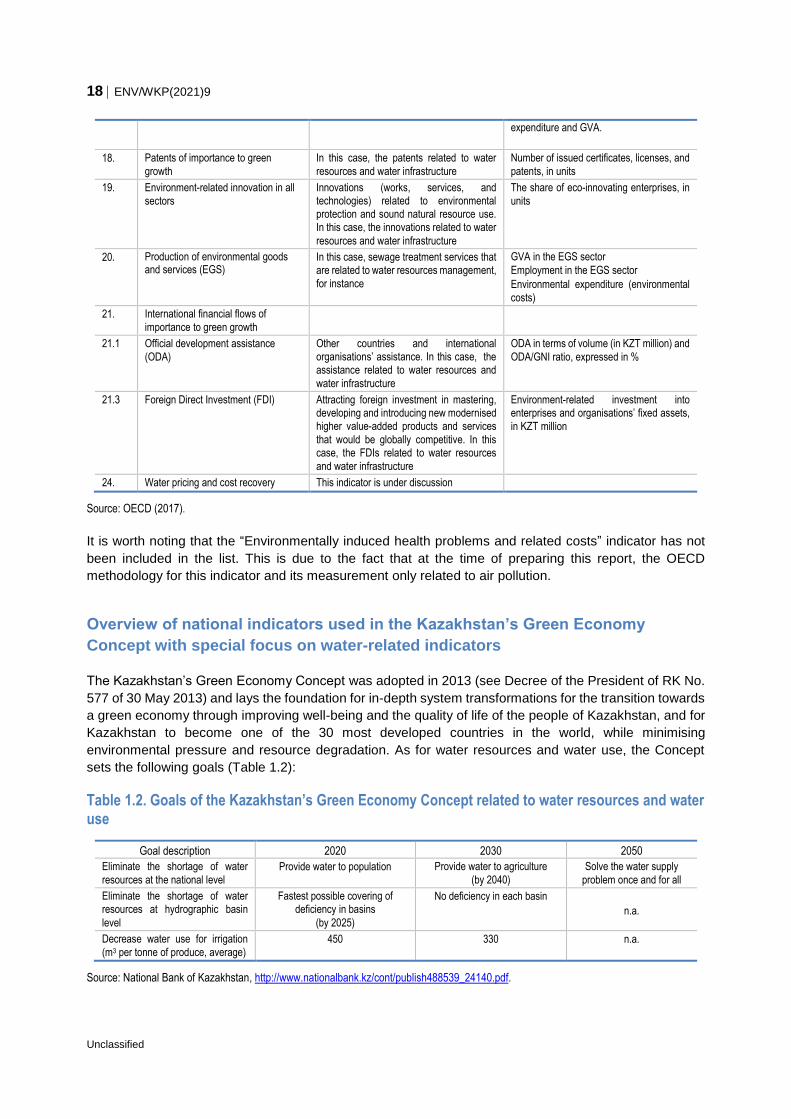
It is worth noting that the “Environmentally induced health problems and related costs” indicator has not
been included in the list. This is due to the fact that at the time of preparing this report, the OECD
methodology for this indicator and its measurement only related to air pollution.
Overview of national indicators used in the Kazakhstan’s Green Economy
Concept with special focus on water-related indicators
The Kazakhstan’s Green Economy Concept was adopted in 2013 (see Decree of the President of RK No.
577 of 30 May 2013) and lays the foundation for in-depth system transformations for the transition towards
a green economy through improving well-being and the quality of life of the people of Kazakhstan, and for
Kazakhstan to become one of the 30 most developed countries in the world, while minimising
environmental pressure and resource degradation. As for water resources and water use, the Concept
sets the following goals (Table 1.2):
Table 1.2. Goals of the Kazakhstan’s Green Economy Concept related to water resources and water use
Goal description 2020 2030 2050
Eliminate the shortage of water
resources at the national level Provide water to population Provide water to agriculture
(by 2040)
Solve the water supply
problem once and for all
Eliminate the shortage of water resources at hydrographic basin
level
Fastest possible covering of deficiency in basins
(by 2025)
No deficiency in each basin
n.a.
Decrease water use for irrigation
(m3 per tonne of produce, average) 450 330 n.a.
Source: National Bank of Kazakhstan, http://www.nationalbank.kz/cont/publish488539_24140.pdf.
ENV/WKP(2021)9 19
Unclassified
Reducing the expected gap (deficit) in the country’s water balance is planned through improving water-use
efficiency in agriculture, industry, and utilities, and also through negotiations on transboundary river use
(e.g. China, Kyrgyzstan, Russia, Uzbekistan), and the construction and rehabilitation of waterworks
facilities (envisaged in respective state programmes an action plans).
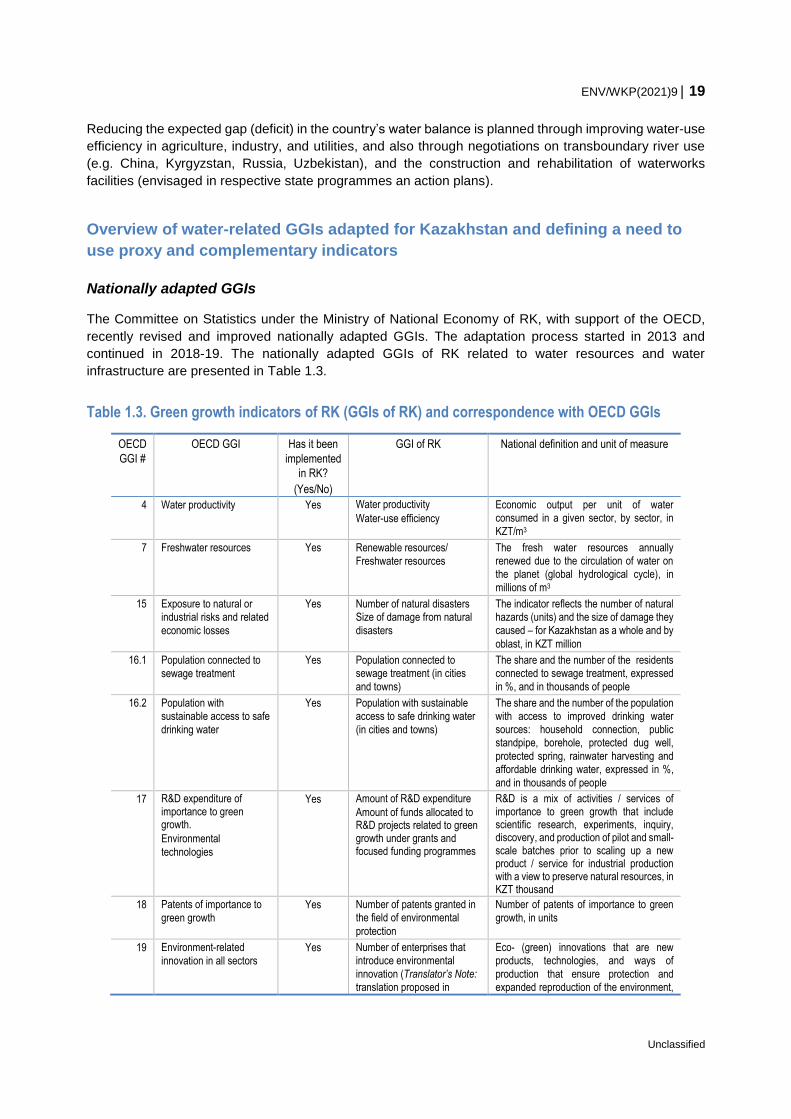
Overview of water-related GGIs adapted for Kazakhstan and defining a need to
use proxy and complementary indicators
Nationally adapted GGIs
The Committee on Statistics under the Ministry of National Economy of RK, with support of the OECD,
recently revised and improved nationally adapted GGIs. The adaptation process started in 2013 and
continued in 2018-19. The nationally adapted GGIs of RK related to water resources and water
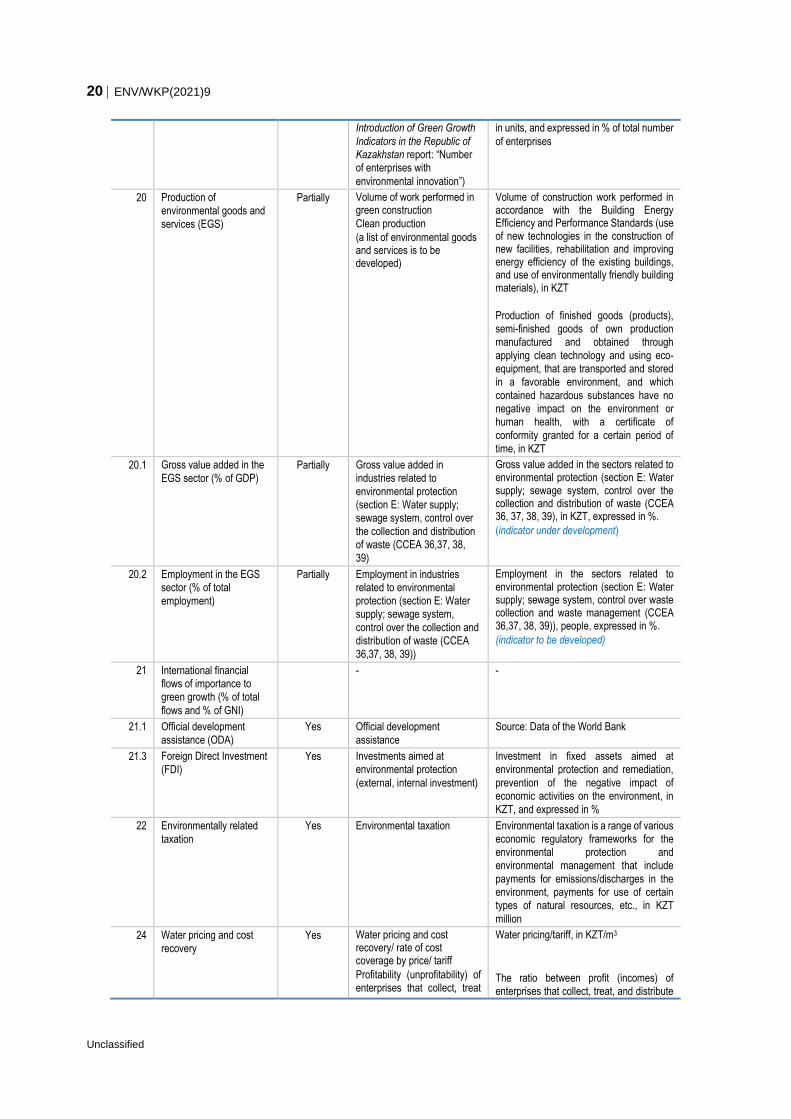
infrastructure are presented in Table 1.3.
Table 1.3. Green growth indicators of RK (GGIs of RK) and correspondence with OECD GGIs
OECD
GGI #
OECD GGI Has it been
implemented
in RK?
(Yes/No)
GGI of RK National definition and unit of measure
4 Water productivity Yes Water productivity
Water-use efficiency
Economic output per unit of water consumed in a given sector, by sector, in
KZT/m3
7 Freshwater resources Yes Renewable resources/
Freshwater resources
The fresh water resources annually renewed due to the circulation of water on the planet (global hydrological cycle), in
millions of m3
15 Exposure to natural or industrial risks and related
economic losses
Yes Number of natural disasters Size of damage from natural
disasters
The indicator reflects the number of natural hazards (units) and the size of damage they caused – for Kazakhstan as a whole and by
oblast, in KZT million
16.1 Population connected to
sewage treatment
Yes Population connected to sewage treatment (in cities
and towns)
The share and the number of the residents connected to sewage treatment, expressed
in %, and in thousands of people
16.2 Population with sustainable access to safe
drinking water
Yes Population with sustainable access to safe drinking water
(in cities and towns)
The share and the number of the population with access to improved drinking water sources: household connection, public standpipe, borehole, protected dug well,
protected spring, rainwater harvesting and affordable drinking water, expressed in %,
and in thousands of people
17 R&D expenditure of importance to green growth.
Environmental
technologies
Yes Amount of R&D expenditure
Amount of funds allocated to R&D projects related to green growth under grants and focused funding programmes
R&D is a mix of activities / services of importance to green growth that include scientific research, experiments, inquiry, discovery, and production of pilot and small-scale batches prior to scaling up a new product / service for industrial production with a view to preserve natural resources, in KZT thousand
18 Patents of importance to
green growth Yes Number of patents granted in
the field of environmental
protection
Number of patents of importance to green
growth, in units
19 Environment-related
innovation in all sectors Yes Number of enterprises that
introduce environmental
innovation (Translator’s Note: translation proposed in
Eco- (green) innovations that are new products, technologies, and ways of
production that ensure protection and expanded reproduction of the environment,
20 ENV/WKP(2021)9
Unclassified
Introduction of Green Growth
Indicators in the Republic of Kazakhstan report: “Number of enterprises with
environmental innovation”)
in units, and expressed in % of total number
of enterprises
20 Production of environmental goods and
services (EGS)
Partially Volume of work performed in green construction
Clean production
(a list of environmental goods and services is to be developed)
Volume of construction work performed in accordance with the Building Energy Efficiency and Performance Standards (use of new technologies in the construction of new facilities, rehabilitation and improving energy efficiency of the existing buildings, and use of environmentally friendly building materials), in KZT
Production of finished goods (products), semi-finished goods of own production manufactured and obtained through
applying clean technology and using eco-equipment, that are transported and stored in a favorable environment, and which
contained hazardous substances have no negative impact on the environment or human health, with a certificate of
conformity granted for a certain period of
time, in KZT
20.1 Gross value added in the
EGS sector (% of GDP) Partially Gross value added in
industries related to
environmental protection (section Е: Water supply; sewage system, control over
the collection and distribution of waste (CCEA 36,37, 38,
39)
Gross value added in the sectors related to environmental protection (section Е: Water supply; sewage system, control over the collection and distribution of waste (CCEA 36, 37, 38, 39), in KZT, expressed in %.
(indicator under development)
20.2 Employment in the EGS sector (% of total
employment)
Partially Employment in industries related to environmental protection (section Е: Water supply; sewage system,
control over the collection and distribution of waste (CCEA
36,37, 38, 39))
Employment in the sectors related to environmental protection (section Е: Water supply; sewage system, control over waste collection and waste management (CCEA 36,37, 38, 39)), people, expressed in %.
(indicator to be developed)
21 International financial flows of importance to green growth (% of total
flows and % of GNI)
- -
21.1 Official development
assistance (ODA)
Yes Official development
assistance
Source: Data of the World Bank
21.3 Foreign Direct Investment
(FDI) Yes Investments aimed at
environmental protection
(external, internal investment)
Investment in fixed assets aimed at environmental protection and remediation,
prevention of the negative impact of economic activities on the environment, in
KZT, and expressed in %
22 Environmentally related
taxation
Yes Environmental taxation Environmental taxation is a range of various economic regulatory frameworks for the environmental protection and environmental management that include
payments for emissions/discharges in the environment, payments for use of certain types of natural resources, etc., in KZT
million
24 Water pricing and cost
recovery Yes Water pricing and cost
recovery/ rate of cost coverage by price/ tariff
Profitability (unprofitability) of enterprises that collect, treat
Water pricing/tariff, in KZT/m3
The ratio between profit (incomes) of enterprises that collect, treat, and distribute
ENV/WKP(2021)9 21
Unclassified
and distribute water as well as
provide sanitation services
(Translator’s Note: translation
proposed in Introduction of Green Growth Indicators in the Republic of Kazakhstan
report: “Profitability (unprofitability) of the production of enterprises
collecting, processing and distributing water, as well as
water disposal”)
water as well as provide sanitation services
and the amount of all expenditures (production costs) of these enterprises,
coefficient
26 Graduates of higher education institutions specialised in
environmental protection
Graduates of higher education institutions specialised in
environmental protection
(Translator’s Note: translation proposed in Introduction of Green Growth Indicators in
the Republic of Kazakhstan report: “Graduation of specialists by higher
educational institutions in
environmental specialties”)
Number of graduates of higher education institutions specialised in environmental protection, number of people, and expressed in % of the total number of
specialists/graduates
Source: own elaboration based on OECD (2019) and OECD (2017).
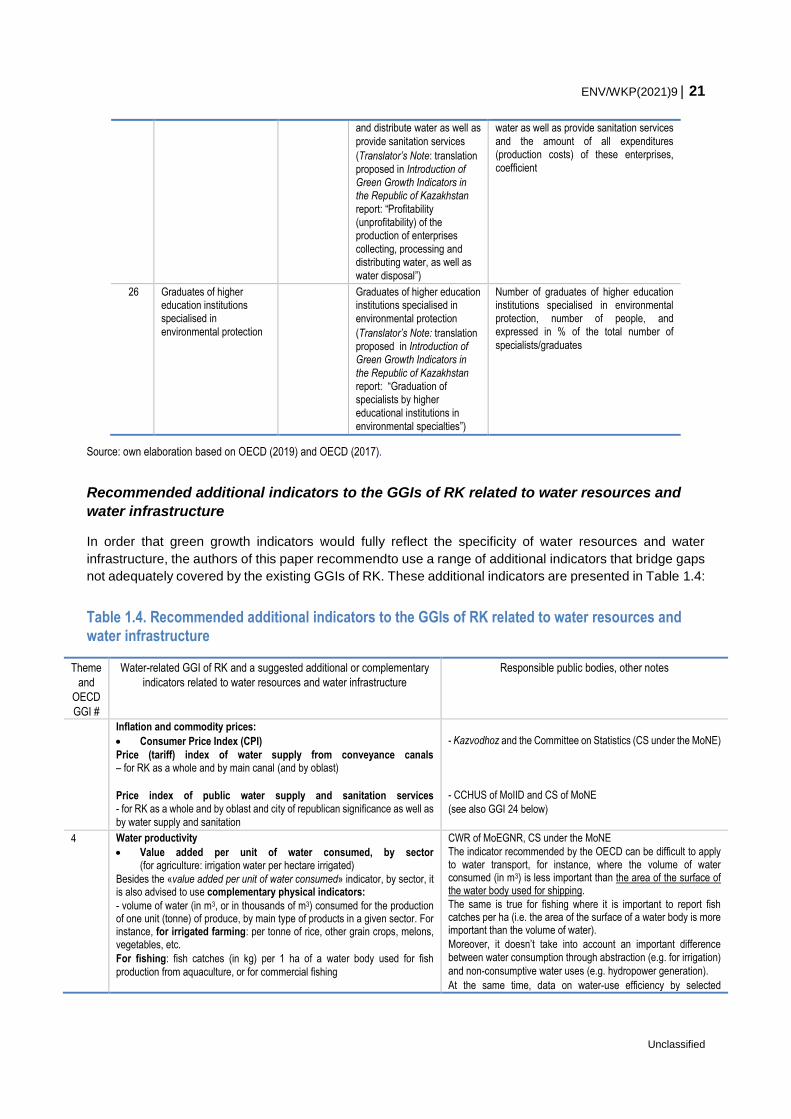
Recommended additional indicators to the GGIs of RK related to water resources and
water infrastructure
In order that green growth indicators would fully reflect the specificity of water resources and water
infrastructure, the authors of this paper recommendto use a range of additional indicators that bridge gaps
not adequately covered by the existing GGIs of RK. These additional indicators are presented in Table 1.4:
Table 1.4. Recommended additional indicators to the GGIs of RK related to water resources and water infrastructure
Theme
and
OECD
GGI #
Water-related GGI of RK and a suggested additional or complementary
indicators related to water resources and water infrastructure
Responsible public bodies, other notes
Inflation and commodity prices:
Consumer Price Index (CPI)
Price (tariff) index of water supply from conveyance canals – for RK as a whole and by main canal (and by oblast)
Price index of public water supply and sanitation services - for RK as a whole and by oblast and city of republican significance as well as
by water supply and sanitation
- Kazvodhoz and the Committee on Statistics (CS under the MoNE)
- CCHUS of MoIID and CS of MoNE
(see also GGI 24 below)
4 Water productivity
Value added per unit of water consumed, by sector (for agriculture: irrigation water per hectare irrigated)
Besides the «value added per unit of water consumed» indicator, by sector, it is also advised to use complementary physical indicators:
- volume of water (in m3, or in thousands of m3) consumed for the production of one unit (tonne) of produce, by main type of products in a given sector. For instance, for irrigated farming: per tonne of rice, other grain crops, melons, vegetables, etc.
For fishing: fish catches (in kg) per 1 ha of a water body used for fish
production from aquaculture, or for commercial fishing
CWR of MoEGNR, CS under the MoNE
The indicator recommended by the OECD can be difficult to apply to water transport, for instance, where the volume of water consumed (in m3) is less important than the area of the surface of the water body used for shipping.
The same is true for fishing where it is important to report fish catches per ha (i.e. the area of the surface of a water body is more important than the volume of water).
Moreover, it doesn’t take into account an important difference between water consumption through abstraction (e.g. for irrigation)
and non-consumptive water uses (e.g. hydropower generation).
At the same time, data on water-use efficiency by selected
22 ENV/WKP(2021)9
Unclassified
economic activity is published under GGIs in Kazakhstan.
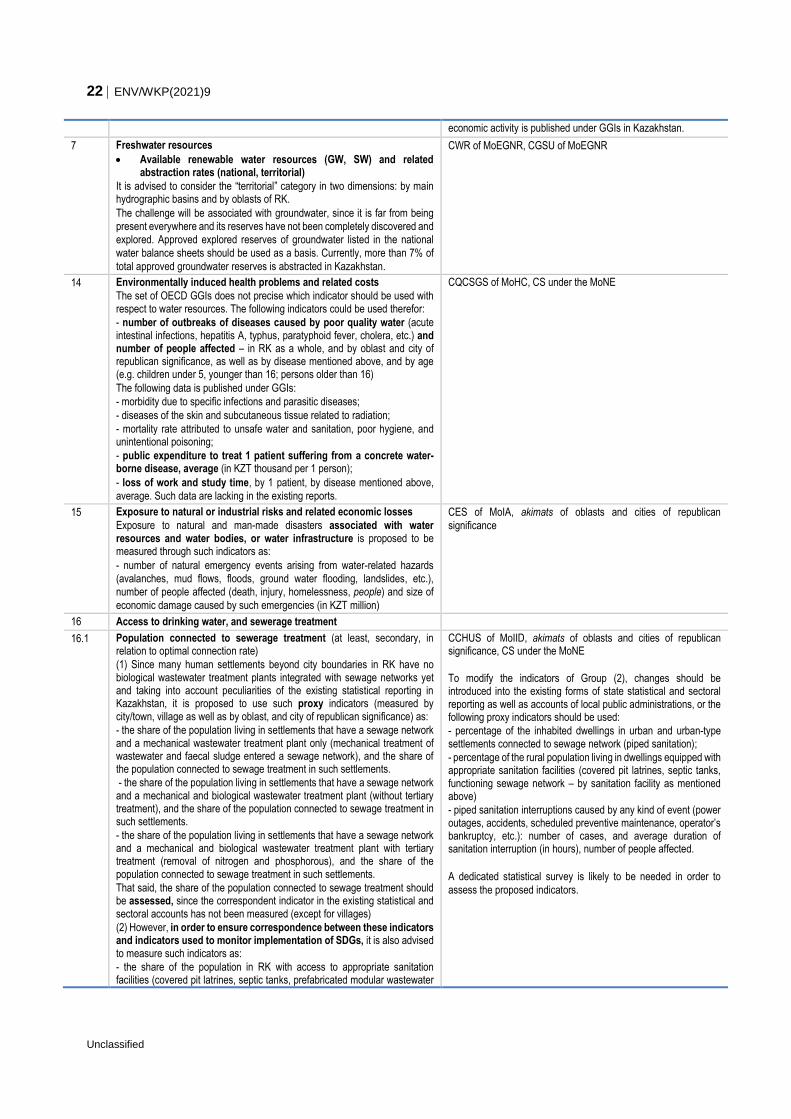
7 Freshwater resources
Available renewable water resources (GW, SW) and related abstraction rates (national, territorial)
It is advised to consider the “territorial” category in two dimensions: by main hydrographic basins and by oblasts of RK.
The challenge will be associated with groundwater, since it is far from being present everywhere and its reserves have not been completely discovered and explored. Approved explored reserves of groundwater listed in the national
water balance sheets should be used as a basis. Currently, more than 7% of
total approved groundwater reserves is abstracted in Kazakhstan.
CWR of MoEGNR, CGSU of MoEGNR
14 Environmentally induced health problems and related costs
The set of OECD GGIs does not precise which indicator should be used with respect to water resources. The following indicators could be used therefor:
- number of outbreaks of diseases caused by poor quality water (acute intestinal infections, hepatitis А, typhus, paratyphoid fever, cholera, etc.) and number of people affected – in RK as a whole, and by oblast and city of republican significance, as well as by disease mentioned above, and by age (e.g. children under 5, younger than 16; persons older than 16)
The following data is published under GGIs:
- morbidity due to specific infections and parasitic diseases;
- diseases of the skin and subcutaneous tissue related to radiation;
- mortality rate attributed to unsafe water and sanitation, poor hygiene, and unintentional poisoning;
- public expenditure to treat 1 patient suffering from a concrete water-borne disease, average (in KZT thousand per 1 person);
- loss of work and study time, by 1 patient, by disease mentioned above,
average. Such data are lacking in the existing reports.
CQCSGS of MoHC, CS under the MoNE
15 Exposure to natural or industrial risks and related economic losses
Exposure to natural and man-made disasters associated with water resources and water bodies, or water infrastructure is proposed to be measured through such indicators as:
- number of natural emergency events arising from water-related hazards (avalanches, mud flows, floods, ground water flooding, landslides, etc.), number of people affected (death, injury, homelessness, people) and size of
economic damage caused by such emergencies (in KZT million)
CES of MoIA, akimats of oblasts and cities of republican
significance
16 Access to drinking water, and sewerage treatment
16.1 Population connected to sewerage treatment (at least, secondary, in relation to optimal connection rate)
(1) Since many human settlements beyond city boundaries in RK have no biological wastewater treatment plants integrated with sewage networks yet and taking into account peculiarities of the existing statistical reporting in Kazakhstan, it is proposed to use such proxy indicators (measured by city/town, village as well as by oblast, and city of republican significance) as:
- the share of the population living in settlements that have a sewage network and a mechanical wastewater treatment plant only (mechanical treatment of wastewater and faecal sludge entered a sewage network), and the share of the population connected to sewage treatment in such settlements.
- the share of the population living in settlements that have a sewage network and a mechanical and biological wastewater treatment plant (without tertiary treatment), and the share of the population connected to sewage treatment in such settlements.
- the share of the population living in settlements that have a sewage network and a mechanical and biological wastewater treatment plant with tertiary treatment (removal of nitrogen and phosphorous), and the share of the population connected to sewage treatment in such settlements.
That said, the share of the population connected to sewage treatment should be assessed, since the correspondent indicator in the existing statistical and sectoral accounts has not been measured (except for villages)
(2) However, in order to ensure correspondence between these indicators and indicators used to monitor implementation of SDGs, it is also advised to measure such indicators as:
- the share of the population in RK with access to appropriate sanitation facilities (covered pit latrines, septic tanks, prefabricated modular wastewater
CCHUS of MoIID, akimats of oblasts and cities of republican significance, CS under the MoNE
To modify the indicators of Group (2), changes should be introduced into the existing forms of state statistical and sectoral reporting as well as accounts of local public administrations, or the following proxy indicators should be used:
- percentage of the inhabited dwellings in urban and urban-type settlements connected to sewage network (piped sanitation);
- percentage of the rural population living in dwellings equipped with appropriate sanitation facilities (covered pit latrines, septic tanks, functioning sewage network – by sanitation facility as mentioned above)
- piped sanitation interruptions caused by any kind of event (power outages, accidents, scheduled preventive maintenance, operator’s bankruptcy, etc.): number of cases, and average duration of sanitation interruption (in hours), number of people affected.
A dedicated statistical survey is likely to be needed in order to
assess the proposed indicators.
ENV/WKP(2021)9 23
Unclassified
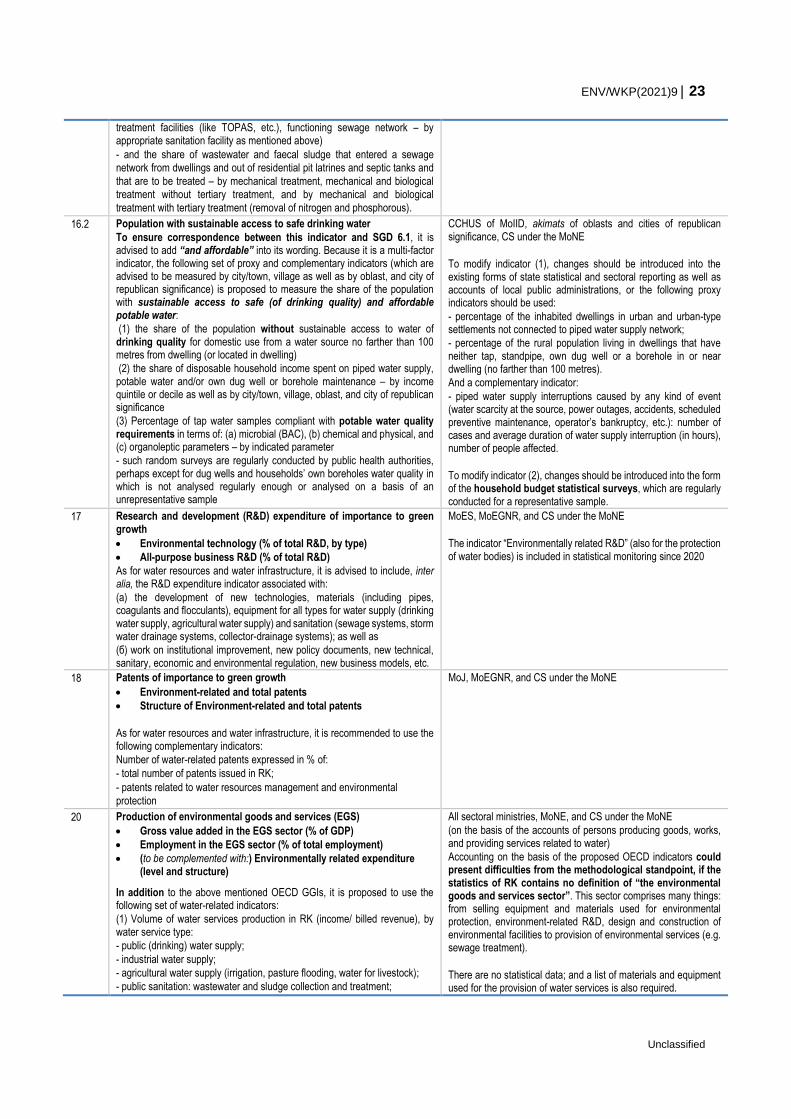
treatment facilities (like TOPAS, etc.), functioning sewage network – by appropriate sanitation facility as mentioned above)
- and the share of wastewater and faecal sludge that entered a sewage network from dwellings and out of residential pit latrines and septic tanks and
that are to be treated – by mechanical treatment, mechanical and biological treatment without tertiary treatment, and by mechanical and biological
treatment with tertiary treatment (removal of nitrogen and phosphorous).
16.2 Population with sustainable access to safe drinking water
To ensure correspondence between this indicator and SGD 6.1, it is advised to add “and affordable” into its wording. Because it is a multi-factor indicator, the following set of proxy and complementary indicators (which are advised to be measured by city/town, village as well as by oblast, and city of republican significance) is proposed to measure the share of the population with sustainable access to safe (of drinking quality) and affordable potable water:
(1) the share of the population without sustainable access to water of drinking quality for domestic use from a water source no farther than 100 metres from dwelling (or located in dwelling)
(2) the share of disposable household income spent on piped water supply, potable water and/or own dug well or borehole maintenance – by income quintile or decile as well as by city/town, village, oblast, and city of republican significance
(3) Percentage of tap water samples compliant with potable water quality requirements in terms of: (a) microbial (BAC), (b) chemical and physical, and (c) organoleptic parameters – by indicated parameter
- such random surveys are regularly conducted by public health authorities, perhaps except for dug wells and households’ own boreholes water quality in which is not analysed regularly enough or analysed on a basis of an unrepresentative sample
CCHUS of MoIID, akimats of oblasts and cities of republican significance, CS under the MoNE
To modify indicator (1), changes should be introduced into the existing forms of state statistical and sectoral reporting as well as accounts of local public administrations, or the following proxy indicators should be used:
- percentage of the inhabited dwellings in urban and urban-type settlements not connected to piped water supply network;
- percentage of the rural population living in dwellings that have neither tap, standpipe, own dug well or a borehole in or near dwelling (no farther than 100 metres).
And a complementary indicator:
- piped water supply interruptions caused by any kind of event (water scarcity at the source, power outages, accidents, scheduled preventive maintenance, operator’s bankruptcy, etc.): number of cases and average duration of water supply interruption (in hours), number of people affected.
To modify indicator (2), changes should be introduced into the form of the household budget statistical surveys, which are regularly conducted for a representative sample.
17 Research and development (R&D) expenditure of importance to green growth
Environmental technology (% of total R&D, by type)
All-purpose business R&D (% of total R&D)
As for water resources and water infrastructure, it is advised to include, inter alia, the R&D expenditure indicator associated with:
(а) the development of new technologies, materials (including pipes, coagulants and flocculants), equipment for all types for water supply (drinking water supply, agricultural water supply) and sanitation (sewage systems, storm water drainage systems, collector-drainage systems); as well as
(б) work on institutional improvement, new policy documents, new technical, sanitary, economic and environmental regulation, new business models, etc.
MoES, MoEGNR, and CS under the MoNE
The indicator “Environmentally related R&D” (also for the protection of water bodies) is included in statistical monitoring since 2020
18 Patents of importance to green growth
Environment-related and total patents
Structure of Environment-related and total patents
As for water resources and water infrastructure, it is recommended to use the following complementary indicators:
Number of water-related patents expressed in % of:
- total number of patents issued in RK;
- patents related to water resources management and environmental
protection
MoJ, MoEGNR, and CS under the MoNE
20 Production of environmental goods and services (EGS)
Gross value added in the EGS sector (% of GDP)
Employment in the EGS sector (% of total employment)
(to be complemented with:) Environmentally related expenditure (level and structure)
In addition to the above mentioned OECD GGIs, it is proposed to use the following set of water-related indicators:
(1) Volume of water services production in RK (income/ billed revenue), by water service type:
- public (drinking) water supply;
- industrial water supply;
- agricultural water supply (irrigation, pasture flooding, water for livestock);
- public sanitation: wastewater and sludge collection and treatment;
All sectoral ministries, MoNE, and CS under the MoNE
(on the basis of the accounts of persons producing goods, works, and providing services related to water)
Accounting on the basis of the proposed OECD indicators could present difficulties from the methodological standpoint, if the statistics of RK contains no definition of “the environmental goods and services sector”. This sector comprises many things: from selling equipment and materials used for environmental protection, environment-related R&D, design and construction of environmental facilities to provision of environmental services (e.g. sewage treatment).
There are no statistical data; and a list of materials and equipment used for the provision of water services is also required.
24 ENV/WKP(2021)9
Unclassified
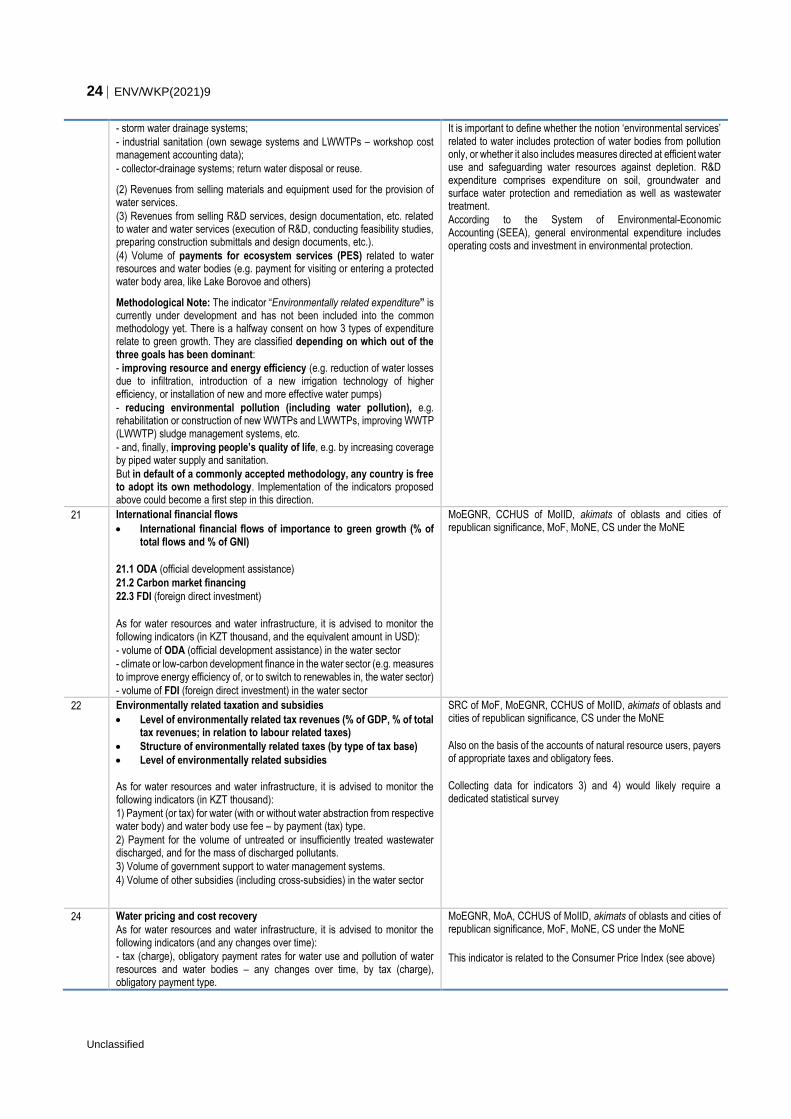
- storm water drainage systems;
- industrial sanitation (own sewage systems and LWWTPs – workshop cost management accounting data);
- collector-drainage systems; return water disposal or reuse.
(2) Revenues from selling materials and equipment used for the provision of water services.
(3) Revenues from selling R&D services, design documentation, etc. related to water and water services (execution of R&D, conducting feasibility studies, preparing construction submittals and design documents, etc.).
(4) Volume of payments for ecosystem services (PES) related to water resources and water bodies (e.g. payment for visiting or entering a protected water body area, like Lake Borovoe and others)
Methodological Note: The indicator “Environmentally related expenditure” is currently under development and has not been included into the common methodology yet. There is a halfway consent on how 3 types of expenditure relate to green growth. They are classified depending on which out of the three goals has been dominant:
- improving resource and energy efficiency (e.g. reduction of water losses due to infiltration, introduction of a new irrigation technology of higher efficiency, or installation of new and more effective water pumps)
- reducing environmental pollution (including water pollution), e.g. rehabilitation or construction of new WWTPs and LWWTPs, improving WWTP (LWWTP) sludge management systems, etc.
- and, finally, improving people’s quality of life, e.g. by increasing coverage by piped water supply and sanitation.
But in default of a commonly accepted methodology, any country is free to adopt its own methodology. Implementation of the indicators proposed above could become a first step in this direction.
It is important to define whether the notion ‘environmental services’ related to water includes protection of water bodies from pollution only, or whether it also includes measures directed at efficient water use and safeguarding water resources against depletion. R&D expenditure comprises expenditure on soil, groundwater and surface water protection and remediation as well as wastewater treatment.
According to the System of Environmental-Economic Accounting (SEEA), general environmental expenditure includes operating costs and investment in environmental protection.
21 International financial flows
International financial flows of importance to green growth (% of total flows and % of GNI)
21.1 ODA (official development assistance)
21.2 Carbon market financing
22.3 FDI (foreign direct investment)
As for water resources and water infrastructure, it is advised to monitor the following indicators (in KZT thousand, and the equivalent amount in USD):
- volume of ODA (official development assistance) in the water sector
- climate or low-carbon development finance in the water sector (e.g. measures to improve energy efficiency of, or to switch to renewables in, the water sector)
- volume of FDI (foreign direct investment) in the water sector
MoEGNR, CCHUS of MoIID, akimats of oblasts and cities of republican significance, MoF, MoNE, CS under the MoNE
22 Environmentally related taxation and subsidies
Level of environmentally related tax revenues (% of GDP, % of total tax revenues; in relation to labour related taxes)
Structure of environmentally related taxes (by type of tax base)
Level of environmentally related subsidies
As for water resources and water infrastructure, it is advised to monitor the following indicators (in KZT thousand):
1) Payment (or tax) for water (with or without water abstraction from respective water body) and water body use fee – by payment (tax) type.
2) Payment for the volume of untreated or insufficiently treated wastewater discharged, and for the mass of discharged pollutants.
3) Volume of government support to water management systems.
4) Volume of other subsidies (including cross-subsidies) in the water sector
SRC of MoF, MoEGNR, CCHUS of MoIID, akimats of oblasts and cities of republican significance, CS under the MoNE
Also on the basis of the accounts of natural resource users, payers of appropriate taxes and obligatory fees.
Collecting data for indicators 3) and 4) would likely require a dedicated statistical survey
24 Water pricing and cost recovery
As for water resources and water infrastructure, it is advised to monitor the following indicators (and any changes over time):
- tax (charge), obligatory payment rates for water use and pollution of water resources and water bodies – any changes over time, by tax (charge), obligatory payment type.
MoEGNR, MoA, CCHUS of MoIID, akimats of oblasts and cities of republican significance, MoF, MoNE, CS under the MoNE
This indicator is related to the Consumer Price Index (see above)
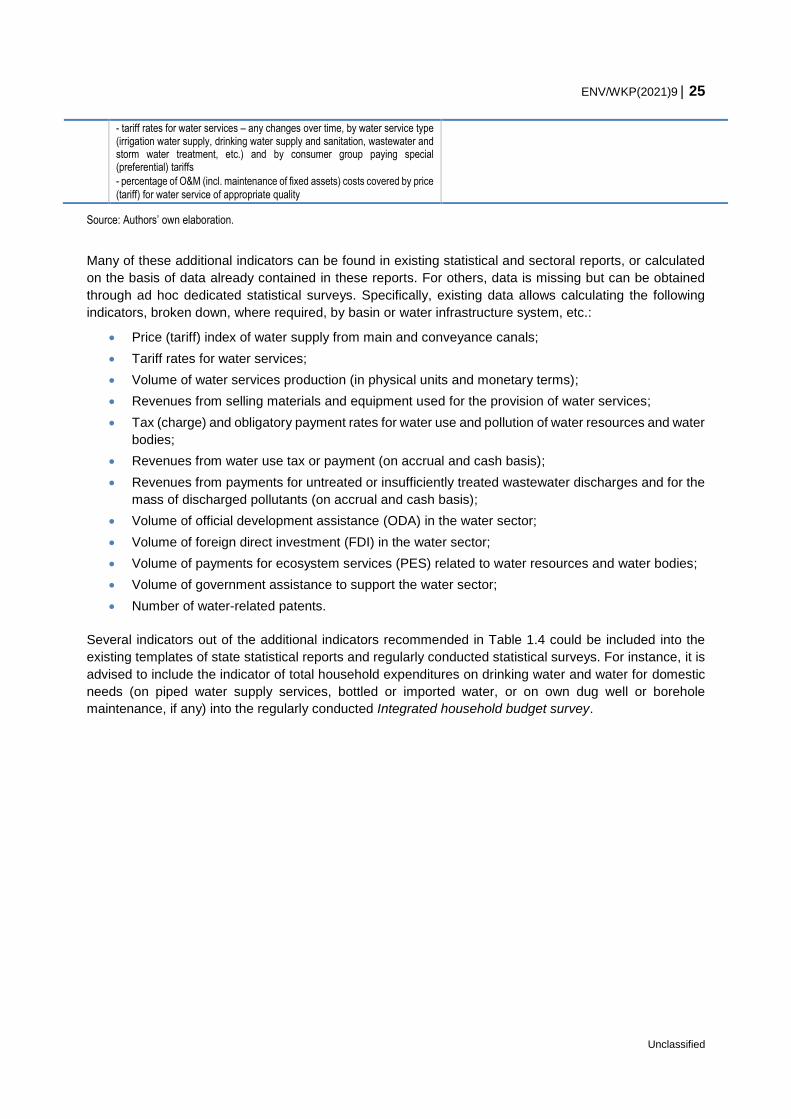
ENV/WKP(2021)9 25
Unclassified
- tariff rates for water services – any changes over time, by water service type (irrigation water supply, drinking water supply and sanitation, wastewater and storm water treatment, etc.) and by consumer group paying special (preferential) tariffs
- percentage of O&M (incl. maintenance of fixed assets) costs covered by price
(tariff) for water service of appropriate quality
Source: Authors’ own elaboration.
Many of these additional indicators can be found in existing statistical and sectoral reports, or calculated
on the basis of data already contained in these reports. For others, data is missing but can be obtained
through ad hoc dedicated statistical surveys. Specifically, existing data allows calculating the following
indicators, broken down, where required, by basin or water infrastructure system, etc.:
Price (tariff) index of water supply from main and conveyance canals;
Tariff rates for water services;
Volume of water services production (in physical units and monetary terms);
Revenues from selling materials and equipment used for the provision of water services;
Tax (charge) and obligatory payment rates for water use and pollution of water resources and water
bodies;
Revenues from water use tax or payment (on accrual and cash basis);
Revenues from payments for untreated or insufficiently treated wastewater discharges and for the
mass of discharged pollutants (on accrual and cash basis);
Volume of official development assistance (ODA) in the water sector;
Volume of foreign direct investment (FDI) in the water sector;
Volume of payments for ecosystem services (PES) related to water resources and water bodies;
Volume of government assistance to support the water sector;
Number of water-related patents.
Several indicators out of the additional indicators recommended in Table 1.4 could be included into the
existing templates of state statistical reports and regularly conducted statistical surveys. For instance, it is
advised to include the indicator of total household expenditures on drinking water and water for domestic
needs (on piped water supply services, bottled or imported water, or on own dug well or borehole
maintenance, if any) into the regularly conducted Integrated household budget survey.
26 ENV/WKP(2021)9
Unclassified
As a UN member, Kazakhstan is committed to the implementation of Agenda 2030 and reaching the
Sustainable Development Goals (SDGs). At the time of writing, the government of RK was progressing its
work to elaborate nationally adapted SDGs. An overview of a national system of indicators to monitor
implementation of SDGs relevant for water security agenda is presented below (as of end-January 2019).
Goal 6 “Ensure availability and sustainable management of water and sanitation for all” refers directly to
water resources and water infrastructure. This goal comprises eight targets as follows:
(6.1) By 2030, achieve universal and equitable access to safe and affordable drinking water for all;
(6.2) By 2030, achieve access to adequate and equitable sanitation and hygiene for all and end
open defecation, paying special attention to the needs of women and girls and those in vulnerable
situations;
(6.3) By 2030, improve water quality by reducing pollution, eliminating dumping and minimizing
release of hazardous chemicals and materials, halving the proportion of untreated wastewater and
substantially increasing recycling and safe reuse globally;
(6.4) By 2030, substantially increase water-use efficiency across all sectors and ensure sustainable
withdrawals and supply of freshwater to address water scarcity and substantially reduce the number
of people suffering from water scarcity;
(6.5) By 2030, implement integrated water resources management at all levels, including through
transboundary cooperation as appropriate;
(6.6) By 2020, protect and restore water-related ecosystems, including mountains, forests, wetlands,
rivers, aquifers and lakes;
(6.a) By 2030, expand international cooperation and capacity-building support to developing
countries in water- and sanitation-related activities and programmes, including water harvesting,
desalination, water efficiency, wastewater treatment, recycling and reuse technologies;
(6.b) Support and strengthen the participation of local communities in improving water and sanitation
management.
Individual targets and indicators of Sustainable Development Goals 11, 12, 13, and 14 also refer to water
security, though not always directly:
Goal 11 “Make cities and human settlements inclusive, safe, resilient and sustainable”.
(11.5) By 2030, significantly reduce the number of deaths and the number of people affected and
substantially decrease the direct economic losses relative to global gross domestic product caused
2 Nationally adapted indicators to
monitor water-related SDGs and
needs for complementary indicators
ENV/WKP(2021)9 27
Unclassified
by disasters, including water-related disasters, with a focus on protecting the poor and people in
vulnerable situations;
The indicator 11.5.1 “Number of deaths, missing persons and directly affected persons attributed to
disasters per 100,000 population" is monitored under this Goal, but without a breakdown by disaster
arisen from water-related emergency situations.
(11.b) By 2020, substantially increase the number of cities and human settlements adopting and
implementing integrated policies and plans towards inclusion, resource efficiency, mitigation and
adaptation to climate change, resilience to disasters, and develop and implement, in line with the
Sendai Framework for Disaster Risk Reduction 2015–2030, holistic disaster risk management at all
levels;
The national indicator “Level of disaster resilient infrastructure coverage” related to water
infrastructure management is used as a global indicator to monitor implementation of the target
(11.b.2).
Goal 12 “Ensure sustainable consumption and production patterns”.
Within this Goal, sound water consumption can be of relevance, and it entails two targets:
(12.1) Implement the 10-Year Framework of Programmes on Sustainable Consumption and
Production Patterns, all countries taking action, with developed countries taking the lead, taking into
account the development and capabilities of developing countries;
(12.2) By 2030, achieve the sustainable management and efficient use of natural resources.
Including these indicators in the national list of indicators under Goal 12 is currently postponed until 2021
due to the lack of a national methodology.
Goal 13 “Take urgent action to combat climate change and its impacts”
Climate change have significant impact on water resources and water infrastructure. The following targets
are considered relevant:
(13.1) Strengthen resilience and adaptive capacity to climate-related hazards and natural disasters
in all countries;
(13.2) Integrate climate change measures into national policies, strategies and planning;
(13.3) Improve education, awareness-raising and human and institutional capacity on climate
change mitigation, adaptation, impact reduction and early warning.
There are currently no international methodologies to calculate the indicators of Targets 13.2 and 13.3,
therefore they are excluded from the national list.
Goal 14 “Conserve and sustainably use the oceans, seas and marine resources for sustainable
development”
The following targets are of relevance to water resources and water infrastructure management in RK
under this goal:
(14.1) By 2025, prevent and significantly reduce marine pollution of all kinds, in particular from land-
based activities, including marine debris and nutrient pollution;
(14.2) By 2020, sustainably manage and protect marine and coastal ecosystems to avoid significant
adverse impacts, including by strengthening their resilience, and take action for their restoration in
order to achieve healthy and productive oceans;
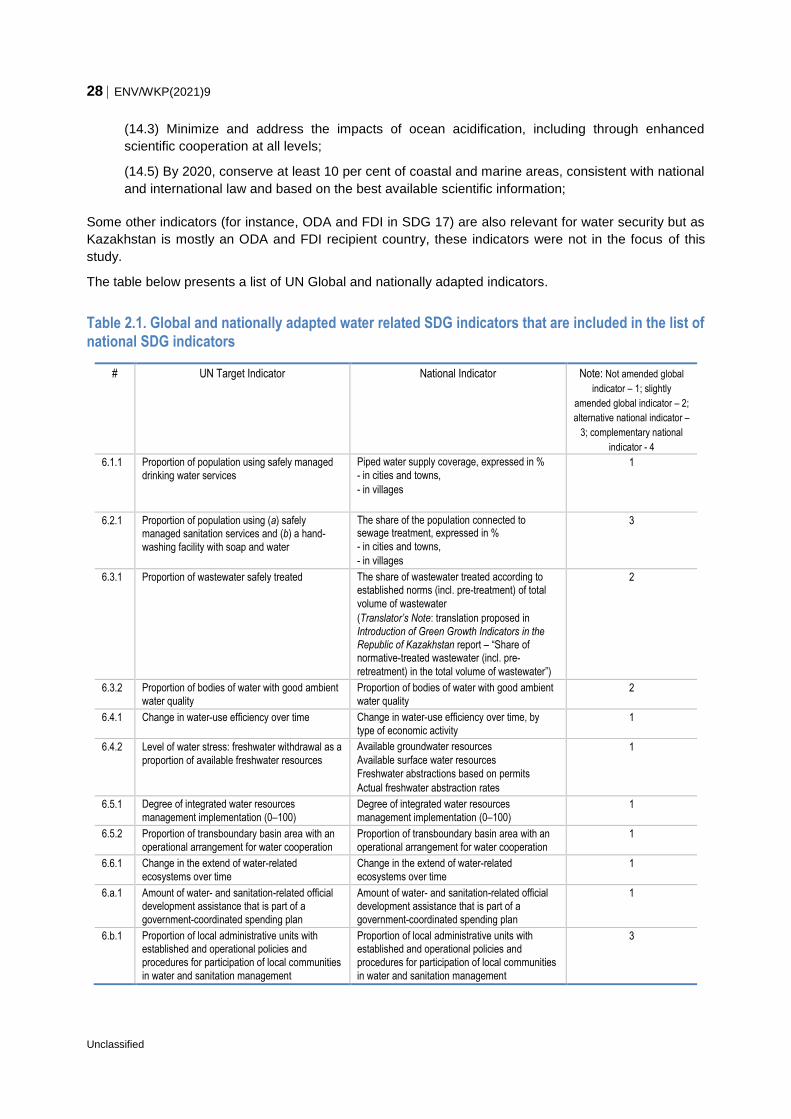
28 ENV/WKP(2021)9
Unclassified
(14.3) Minimize and address the impacts of ocean acidification, including through enhanced
scientific cooperation at all levels;
(14.5) By 2020, conserve at least 10 per cent of coastal and marine areas, consistent with national
and international law and based on the best available scientific information;
Some other indicators (for instance, ODA and FDI in SDG 17) are also relevant for water security but as
Kazakhstan is mostly an ODA and FDI recipient country, these indicators were not in the focus of this
study.
The table below presents a list of UN Global and nationally adapted indicators.
Table 2.1. Global and nationally adapted water related SDG indicators that are included in the list of national SDG indicators
# UN Target Indicator National Indicator Note: Not amended global
indicator – 1; slightly
amended global indicator – 2;
alternative national indicator –
3; complementary national
indicator - 4
6.1.1 Proportion of population using safely managed
drinking water services
Piped water supply coverage, expressed in %
- in cities and towns,
- in villages
1
6.2.1 Proportion of population using (a) safely managed sanitation services and (b) a hand-
washing facility with soap and water
The share of the population connected to sewage treatment, expressed in %
- in cities and towns,
- in villages
3
6.3.1 Proportion of wastewater safely treated The share of wastewater treated according to established norms (incl. pre-treatment) of total
volume of wastewater
(Translator’s Note: translation proposed in
Introduction of Green Growth Indicators in the Republic of Kazakhstan report – “Share of normative-treated wastewater (incl. pre-
retreatment) in the total volume of wastewater”)
2
6.3.2 Proportion of bodies of water with good ambient
water quality
Proportion of bodies of water with good ambient
water quality 2
6.4.1 Change in water-use efficiency over time Change in water-use efficiency over time, by
type of economic activity 1
6.4.2 Level of water stress: freshwater withdrawal as a
proportion of available freshwater resources
Available groundwater resources
Available surface water resources
Freshwater abstractions based on permits
Actual freshwater abstraction rates
1
6.5.1 Degree of integrated water resources
management implementation (0–100)
Degree of integrated water resources
management implementation (0–100) 1
6.5.2 Proportion of transboundary basin area with an
operational arrangement for water cooperation
Proportion of transboundary basin area with an
operational arrangement for water cooperation
1
6.6.1 Change in the extend of water-related
ecosystems over time
Change in the extend of water-related
ecosystems over time 1
6.a.1 Amount of water- and sanitation-related official development assistance that is part of a
government-coordinated spending plan
Amount of water- and sanitation-related official development assistance that is part of a
government-coordinated spending plan
1
6.b.1 Proportion of local administrative units with established and operational policies and
procedures for participation of local communities
in water and sanitation management
Proportion of local administrative units with established and operational policies and
procedures for participation of local communities
in water and sanitation management
3
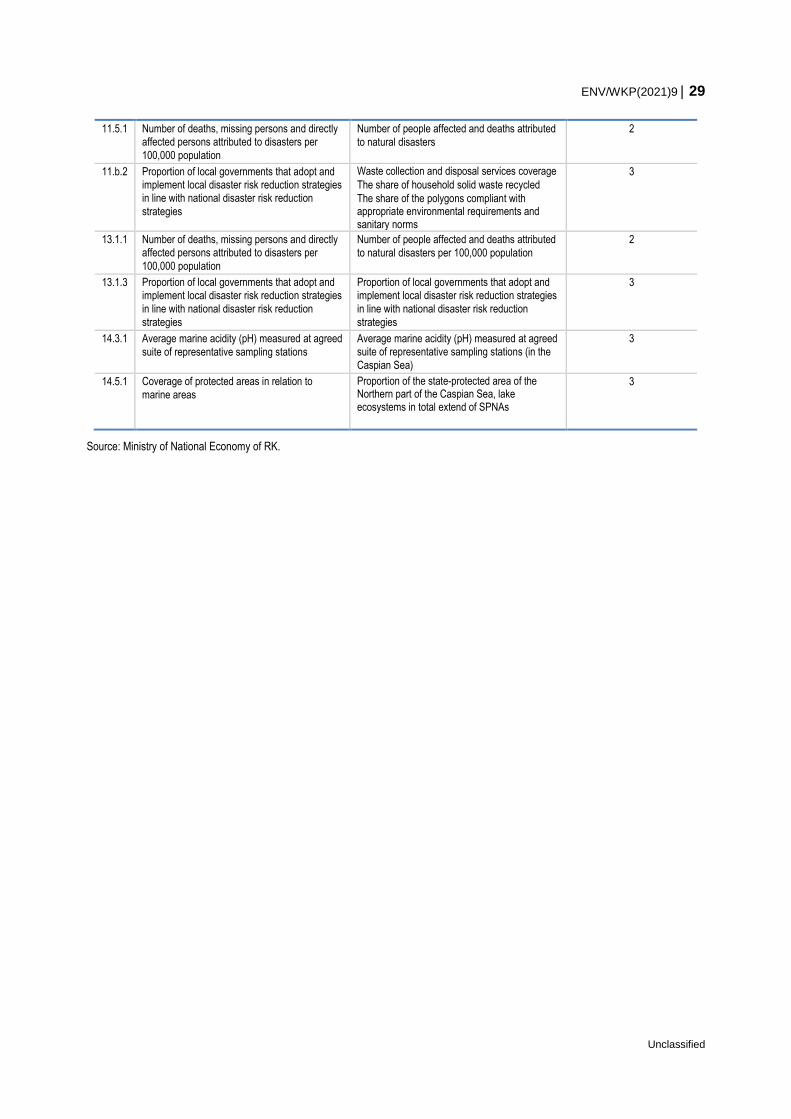
ENV/WKP(2021)9 29
Unclassified
11.5.1 Number of deaths, missing persons and directly affected persons attributed to disasters per
100,000 population
Number of people affected and deaths attributed
to natural disasters
2
11.b.2 Proportion of local governments that adopt and implement local disaster risk reduction strategies in line with national disaster risk reduction
strategies
Waste collection and disposal services coverage
The share of household solid waste recycled
The share of the polygons compliant with appropriate environmental requirements and sanitary norms
3
13.1.1 Number of deaths, missing persons and directly affected persons attributed to disasters per
100,000 population
Number of people affected and deaths attributed
to natural disasters per 100,000 population
2
13.1.3 Proportion of local governments that adopt and implement local disaster risk reduction strategies
in line with national disaster risk reduction
strategies
Proportion of local governments that adopt and implement local disaster risk reduction strategies
in line with national disaster risk reduction
strategies
3
14.3.1 Average marine acidity (pH) measured at agreed
suite of representative sampling stations
Average marine acidity (pH) measured at agreed suite of representative sampling stations (in the
Caspian Sea)
3
14.5.1 Coverage of protected areas in relation to
marine areas
Proportion of the state-protected area of the Northern part of the Caspian Sea, lake ecosystems in total extend of SPNAs
3
Source: Ministry of National Economy of RK.

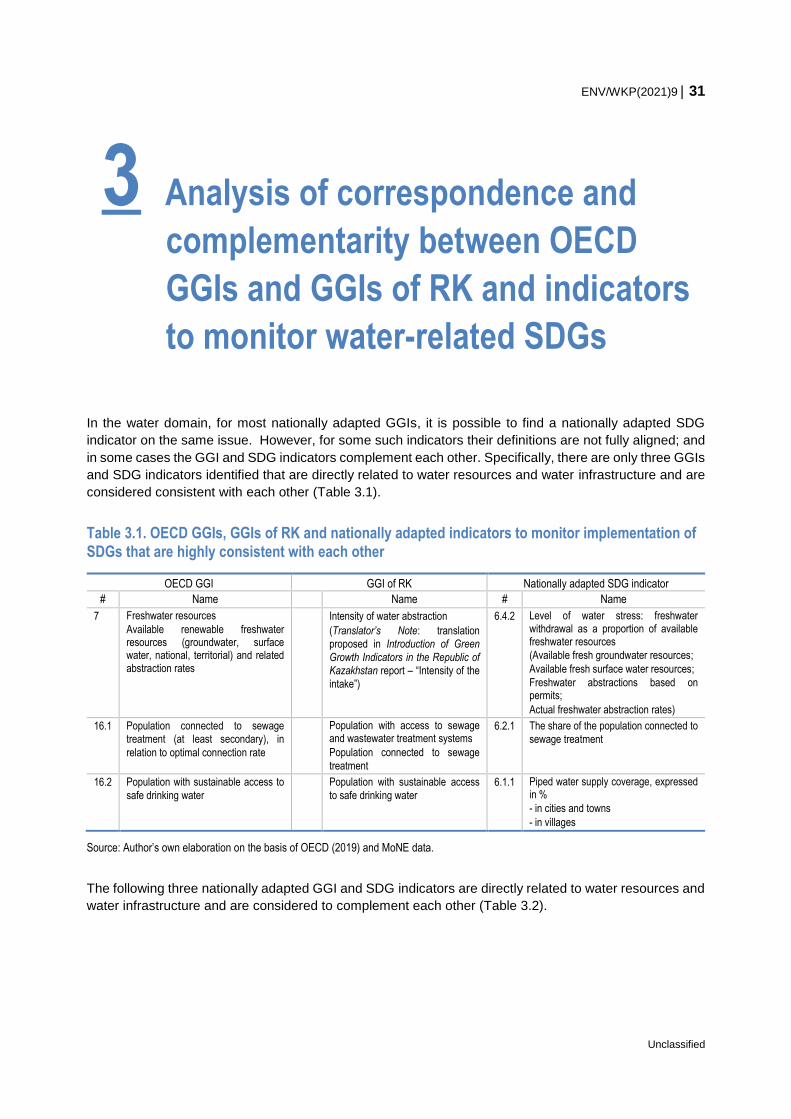
ENV/WKP(2021)9 31
Unclassified
In the water domain, for most nationally adapted GGIs, it is possible to find a nationally adapted SDG
indicator on the same issue. However, for some such indicators their definitions are not fully aligned; and
in some cases the GGI and SDG indicators complement each other. Specifically, there are only three GGIs
and SDG indicators identified that are directly related to water resources and water infrastructure and are
considered consistent with each other (Table 3.1).
Table 3.1. OECD GGIs, GGIs of RK and nationally adapted indicators to monitor implementation of SDGs that are highly consistent with each other
OECD GGI GGI of RK Nationally adapted SDG indicator
# Name Name # Name
7 Freshwater resources
Available renewable freshwater resources (groundwater, surface water, national, territorial) and related abstraction rates
Intensity of water abstraction
(Translator’s Note: translation proposed in Introduction of Green
Growth Indicators in the Republic of Kazakhstan report – “Intensity of the
intake”)
6.4.2 Level of water stress: freshwater withdrawal as a proportion of available freshwater resources
(Available fresh groundwater resources;
Available fresh surface water resources;
Freshwater abstractions based on permits;
Actual freshwater abstraction rates)
16.1 Population connected to sewage treatment (at least secondary), in
relation to optimal connection rate
Population with access to sewage and wastewater treatment systems
Population connected to sewage
treatment
6.2.1 The share of the population connected to
sewage treatment
16.2 Population with sustainable access to
safe drinking water Population with sustainable access
to safe drinking water 6.1.1 Piped water supply coverage, expressed
in %
- in cities and towns
- in villages
Source: Author’s own elaboration on the basis of OECD (2019) and MoNE data.
The following three nationally adapted GGI and SDG indicators are directly related to water resources and
water infrastructure and are considered to complement each other (Table 3.2).
3 Analysis of correspondence and
complementarity between OECD
GGIs and GGIs of RK and indicators
to monitor water-related SDGs
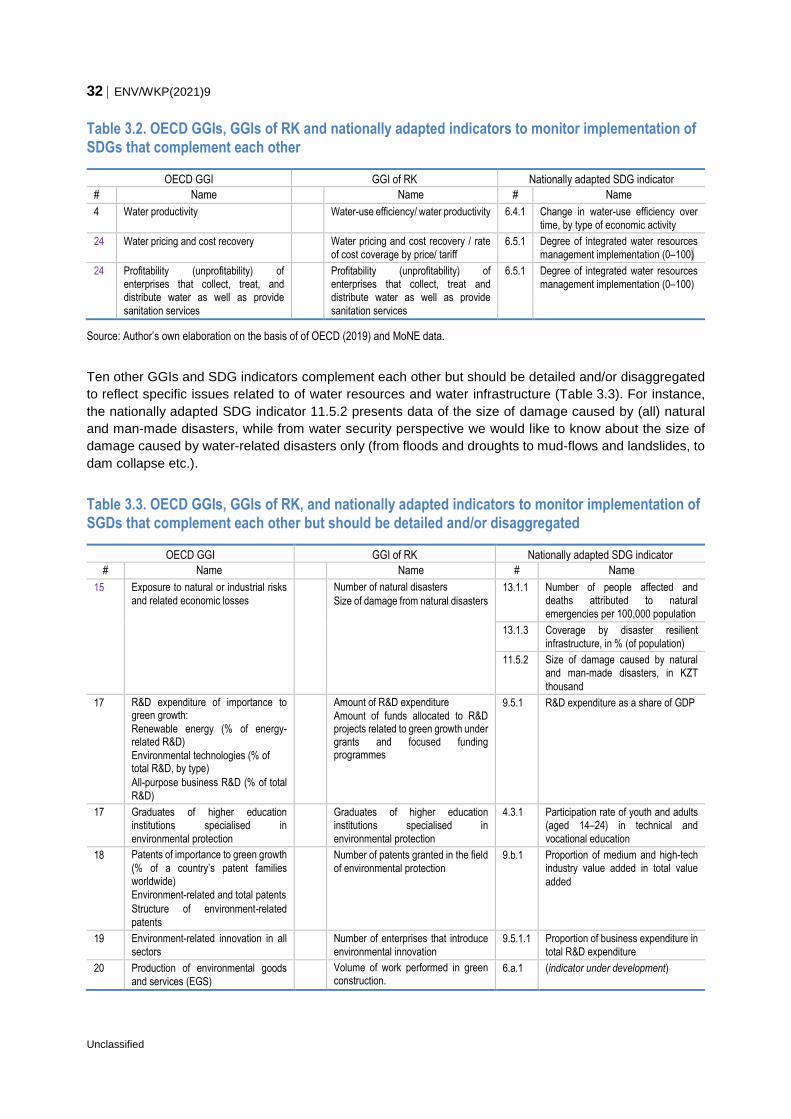
32 ENV/WKP(2021)9
Unclassified
Table 3.2. OECD GGIs, GGIs of RK and nationally adapted indicators to monitor implementation of SDGs that complement each other
OECD GGI GGI of RK Nationally adapted SDG indicator
# Name Name # Name
4 Water productivity Water-use efficiency/ water productivity 6.4.1 Change in water-use efficiency over
time, by type of economic activity
24 Water pricing and cost recovery Water pricing and cost recovery / rate
of cost coverage by price/ tariff 6.5.1 Degree of integrated water resources
management implementation (0–100)
24 Profitability (unprofitability) of enterprises that collect, treat, and distribute water as well as provide
sanitation services
Profitability (unprofitability) of enterprises that collect, treat and distribute water as well as provide
sanitation services
6.5.1 Degree of integrated water resources
management implementation (0–100)
Source: Author’s own elaboration on the basis of of OECD (2019) and MoNE data.
Ten other GGIs and SDG indicators complement each other but should be detailed and/or disaggregated
to reflect specific issues related to of water resources and water infrastructure (Table 3.3). For instance,
the nationally adapted SDG indicator 11.5.2 presents data of the size of damage caused by (all) natural
and man-made disasters, while from water security perspective we would like to know about the size of
damage caused by water-related disasters only (from floods and droughts to mud-flows and landslides, to
dam collapse etc.).
Table 3.3. OECD GGIs, GGIs of RK, and nationally adapted indicators to monitor implementation of SGDs that complement each other but should be detailed and/or disaggregated
OECD GGI GGI of RK Nationally adapted SDG indicator
# Name Name # Name
15 Exposure to natural or industrial risks
and related economic losses Number of natural disasters
Size of damage from natural disasters
13.1.1 Number of people affected and deaths attributed to natural
emergencies per 100,000 population
13.1.3 Coverage by disaster resilient
infrastructure, in % (of population)
11.5.2 Size of damage caused by natural and man-made disasters, in KZT
thousand
17 R&D expenditure of importance to green growth:
Renewable energy (% of energy-related R&D)
Environmental technologies (% of total R&D, by type)
All-purpose business R&D (% of total
R&D)
Amount of R&D expenditure
Amount of funds allocated to R&D projects related to green growth under grants and focused funding programmes
9.5.1 R&D expenditure as a share of GDP
17 Graduates of higher education institutions specialised in
environmental protection
Graduates of higher education institutions specialised in
environmental protection
4.3.1 Participation rate of youth and adults (aged 14–24) in technical and
vocational education
18 Patents of importance to green growth
(% of a country’s patent families worldwide)
Environment-related and total patents
Structure of environment-related
patents
Number of patents granted in the field
of environmental protection 9.b.1 Proportion of medium and high-tech
industry value added in total value
added
19 Environment-related innovation in all
sectors Number of enterprises that introduce
environmental innovation 9.5.1.1 Proportion of business expenditure in
total R&D expenditure
20 Production of environmental goods
and services (EGS)
Volume of work performed in green construction.
6.a.1 (indicator under development)
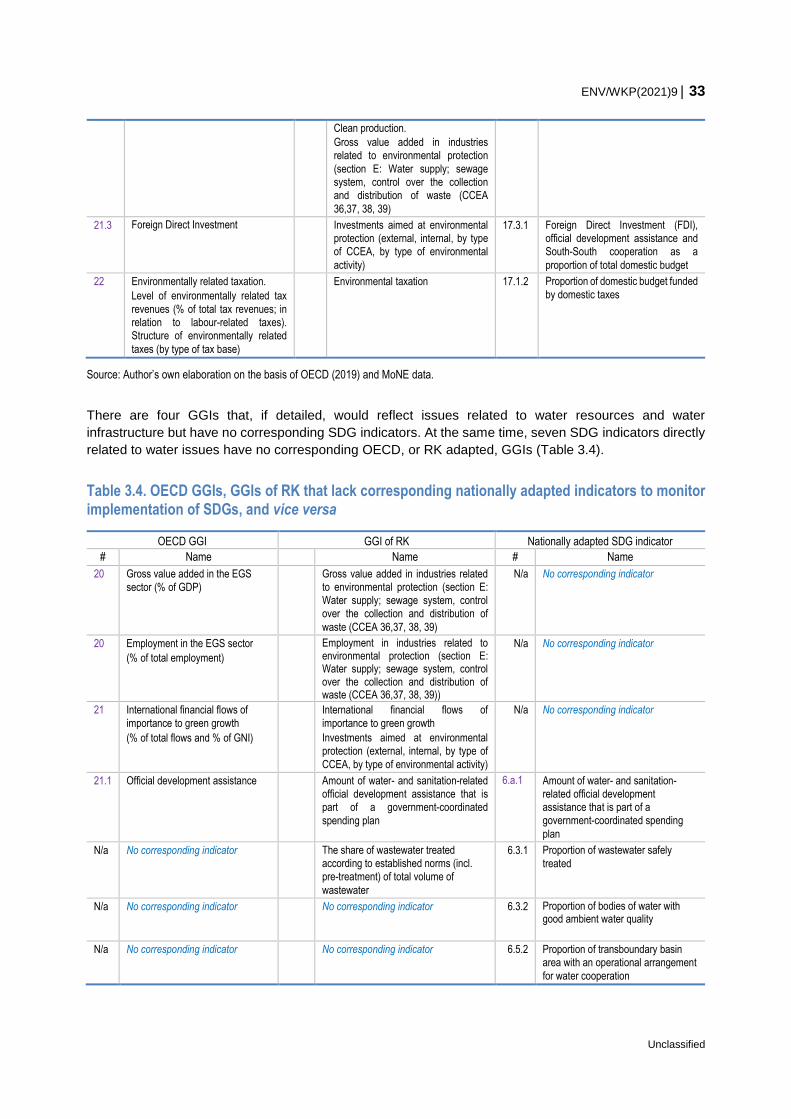
ENV/WKP(2021)9 33
Unclassified
Clean production.
Gross value added in industries related to environmental protection
(section Е: Water supply; sewage system, control over the collection and distribution of waste (CCEA
36,37, 38, 39)
21.3 Foreign Direct Investment Investments aimed at environmental protection (external, internal, by type of CCEA, by type of environmental
activity)
17.3.1 Foreign Direct Investment (FDI), official development assistance and South-South cooperation as a
proportion of total domestic budget
22 Environmentally related taxation.
Level of environmentally related tax
revenues (% of total tax revenues; in relation to labour-related taxes). Structure of environmentally related
taxes (by type of tax base)
Environmental taxation 17.1.2 Proportion of domestic budget funded
by domestic taxes
Source: Author’s own elaboration on the basis of OECD (2019) and MoNE data.
There are four GGIs that, if detailed, would reflect issues related to water resources and water
infrastructure but have no corresponding SDG indicators. At the same time, seven SDG indicators directly
related to water issues have no corresponding OECD, or RK adapted, GGIs (Table 3.4).
Table 3.4. OECD GGIs, GGIs of RK that lack corresponding nationally adapted indicators to monitor implementation of SDGs, and vice versa
OECD GGI GGI of RK Nationally adapted SDG indicator
# Name Name # Name
20 Gross value added in the EGS
sector (% of GDP)
Gross value added in industries related to environmental protection (section Е: Water supply; sewage system, control over the collection and distribution of
waste (CCEA 36,37, 38, 39)
N/a No corresponding indicator
20 Employment in the EGS sector
(% of total employment)
Employment in industries related to environmental protection (section Е: Water supply; sewage system, control over the collection and distribution of waste (CCEA 36,37, 38, 39))
N/a No corresponding indicator
21 International financial flows of
importance to green growth
(% of total flows and % of GNI)
International financial flows of
importance to green growth
Investments aimed at environmental protection (external, internal, by type of
CCEA, by type of environmental activity)
N/a No corresponding indicator
21.1 Official development assistance Amount of water- and sanitation-related official development assistance that is part of a government-coordinated
spending plan
6.а.1
Amount of water- and sanitation-related official development assistance that is part of a government-coordinated spending
plan
N/a No corresponding indicator The share of wastewater treated according to established norms (incl. pre-treatment) of total volume of
wastewater
6.3.1 Proportion of wastewater safely
treated
N/a No corresponding indicator No corresponding indicator 6.3.2 Proportion of bodies of water with good ambient water quality
N/a No corresponding indicator No corresponding indicator 6.5.2 Proportion of transboundary basin area with an operational arrangement
for water cooperation
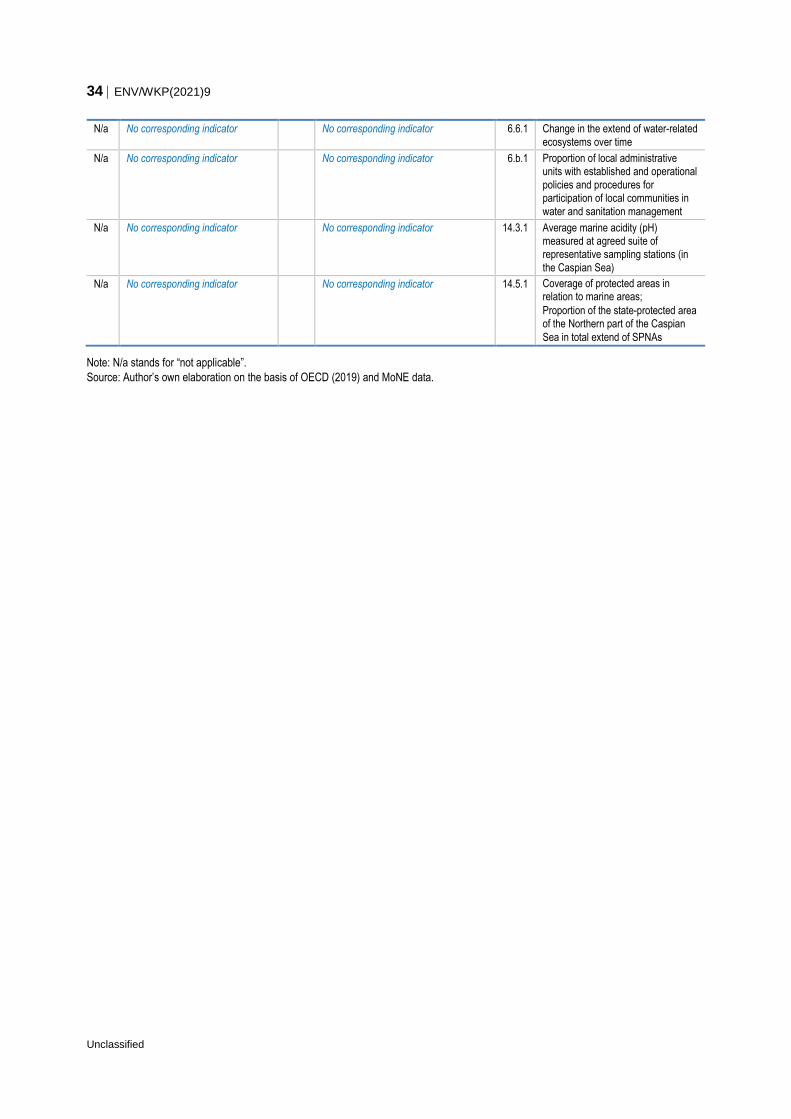
34 ENV/WKP(2021)9
Unclassified
N/a No corresponding indicator No corresponding indicator 6.6.1 Change in the extend of water-related
ecosystems over time
N/a No corresponding indicator No corresponding indicator 6.b.1 Proportion of local administrative units with established and operational
policies and procedures for participation of local communities in
water and sanitation management
N/a No corresponding indicator No corresponding indicator 14.3.1 Average marine acidity (pH) measured at agreed suite of representative sampling stations (in
the Caspian Sea)
N/a No corresponding indicator No corresponding indicator 14.5.1 Coverage of protected areas in relation to marine areas;
Proportion of the state-protected area of the Northern part of the Caspian
Sea in total extend of SPNAs
Note: N/a stands for “not applicable”.
Source: Author’s own elaboration on the basis of OECD (2019) and MoNE data.
ENV/WKP(2021)9 35
Unclassified
In order to identify priorities, key challenges and tasks of relevance for addressing water security issues in
RK, a questionnaire was developed and distributed to key stakeholders with the support of the Committee
on Statistics under the Ministry of National Economy of RK. It was distributed among relevant government
bodies and other organisations of RK, including R&D agencies (hereafter – “Respondents”) involved in
different aspects of water resource and/or water infrastructure management (see Annexes 4.B and 4.C).
6 out of 8 Respondents completed the questionnaire and provided their views. The survey responses were
collected and analysed by the authors between January to February 2019.
Results of this analysis is briefly presented in this section and the detailed notes the Respondents provided
to support their views can be found in Annex 4.A.
Water security issues to which the Respondents assigned the highest priority are as follows:
- water security of population (households);
- water security of main sectors of the economy;
- resilience of human settlements and economic facilities to water-related emergencies and hazards;
- security of water resources and water-related ecosystems;
- transboundary dimension of water security; and
- water security of human settlements.
Finally, strengthening the overall water management in Kazakhstan was mentioned by Respondents as a
key pre-requisite for ensuring water security of the country.
1. According to the Respondents, water security of population (i.e. that of individual households
and residents) is the highest priority component of water security. This is in the spirit of the recent address
of the President of RK who emphasised that “the main priority should be improving the well-being of the
people of Kazakhstan” and, subsequently, “ensuring better quality of life” (see
https://www.zakon.kz/4940220-polnyy-tekst-poslaniya-nazarbaeva.html).
Respondents identified the following most important problematic elements of this component as:
insufficient number of accessible drinking water supply sources and their uneven distribution
across the country;
low coverage by piped water supply. This was noted as particularly concerning the rural population,
but also specific rayons of Almaty;
high risk of piped water supply interruptions mainly due to a high level of deterioration of fixed
assets (networks);
4 Priorities, tasks and challenges of
relevance for Kazakhstan’s water
security
36 ENV/WKP(2021)9
Unclassified
high risk of outbreaks of diseases caused by the poor quality of water used for drinking –
specifically, in terms of microbiological and chemical contamination of tap water or water at the
source.
2. According to the Respondents, water security of main sectors of the economy is also of high
priority.
Under this component, Respondents highlighted:
low water-use efficiency (water productivity) and the need to significantly improve it ;
underdeveloped or deteriorating water infrastructure;
insufficient volume of strategic reserves of freshwater (to meet the demand for water over
prolonged periods of droughts or during low-water years);
lack of financial sustainability of water infrastructure operators.
3. The Respondents also identified resilience of human settlements and economic facilities to water-
related emergencies or hazards as a high priority.
The majority of the Respondents specified such issues as:
a need to shift from the current reactive strategy of responding to water-related disasters to
a proactive strategy for disaster prevention and risk management;
the lack of an automated monitoring and early warning system for natural emergencies;
the lack of a national law on safety of hydraulic technical structures (HTS), such as dams.
4. Ensuring security of water resources and water-related ecosystems was recognised to be an issue
of importance.
The following elements were noted under this component:
violation of minimum requirements for sanitary and environmental flows; and
excessive water abstraction from some watercourses and water bodies, resulting in depletion of
freshwater resources, threatening sustainability of water-related ecosystems.
5. Respondents also found that the transboundary dimension of water security was of high
importance for RK. This particularly concerned issues related to the quality of the water received from
upstream neighbours or of water transferred to downstream countries. These issues were found to outrank
other transboundary issues such as safety of hydraulic technical structures or receiving sufficient volume
of water from the upstream countries.
6. As for the water security of human settlements, the lack of reserve water supply sources in
many rural settlements, towns and cities, and some districts of big cities was a priority issue, according to
the Respondents. When coupled with a high risk of water supply interruptions (see above), it can become
an obstacle to improving the quality of life of Kazakhstan’s population.
7. As part of strengthening the overall water management in Kazakhstan, the Respondents drew
attention to certain issues that were not mentioned in the Questionnaire, such as:
lack of established sanitary protection zones (SPZ) of water supply sources, or violation of existing
SPZ regimes;
a high level of deterioration of sewerage networks and wastewater treatment plants (with an
insufficient number of the latter);
a need to rehabilitate, modernise (through improving technical capacity) and develop hydro-
melioration systems.
ENV/WKP(2021)9 37
Unclassified
Water security issues on which Respondents expressed opposing views
1. The Respondents expressed divergent views with regard to affordability of water and sanitation
services for population:
The majority of Respondents noted that piped water supply and sanitation services are generally
affordable for the population of RK. However, one Respondent identified that a low price or tariff for water
(at the level of 30 KZT for 1 m3, equivalent of 8-9 euro cents at that time) presents a problem for operators,
because it undermines their financial sustainability (see item 3.4 in the Table in Annex 4.A) and
compounds issues of insufficient financing of the sector.
2. Regarding the transboundary dimension of water security (the volume of run-off and the quality
of water resources transferred to the downstream countries as well as the safety of hydraulic technical
structures), the majority of Respondents but two believed that RK respects the terms of agreements on
transboundary watercourses, water resources, and water bodies vis-à-vis the downstream countries better
than neighbouring upstream countries do.
* * *
The indicators of water security that reflect these priority issues and challenges of water security
of RK and that simultaneously relate to GGIs and SDGs are examined in the following section of this
working paper.
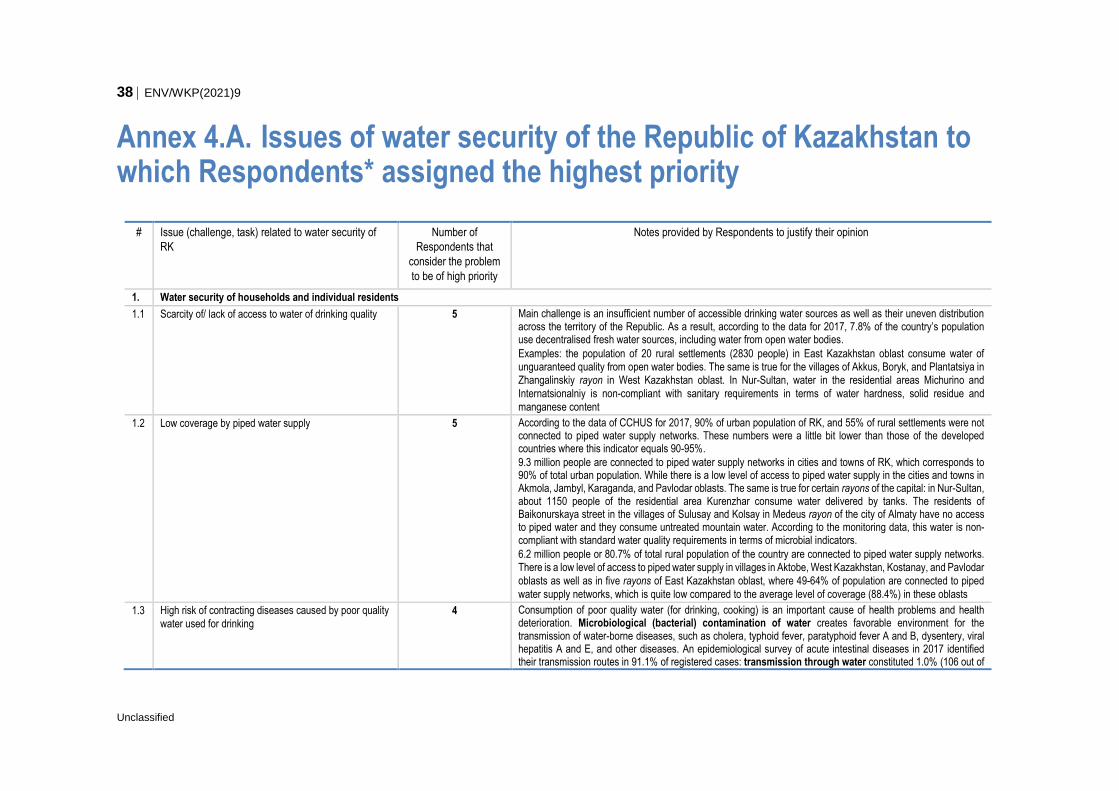
38 ENV/WKP(2021)9
Unclassified
Annex 4.A. Issues of water security of the Republic of Kazakhstan to which Respondents* assigned the highest priority
# Issue (challenge, task) related to water security of
RK
Number of
Respondents that
consider the problem
to be of high priority
Notes provided by Respondents to justify their opinion
1. Water security of households and individual residents
1.1 Scarcity of/ lack of access to water of drinking quality 5 Main challenge is an insufficient number of accessible drinking water sources as well as their uneven distribution across the territory of the Republic. As a result, according to the data for 2017, 7.8% of the country’s population use decentralised fresh water sources, including water from open water bodies.
Examples: the population of 20 rural settlements (2830 people) in East Kazakhstan oblast consume water of unguaranteed quality from open water bodies. The same is true for the villages of Akkus, Boryk, and Plantatsiya in Zhangalinskiy rayon in West Kazakhstan oblast. In Nur-Sultan, water in the residential areas Michurino and
Internatsionalniy is non-compliant with sanitary requirements in terms of water hardness, solid residue and
manganese content
1.2 Low coverage by piped water supply 5 According to the data of CCHUS for 2017, 90% of urban population of RK, and 55% of rural settlements were not connected to piped water supply networks. These numbers were a little bit lower than those of the developed countries where this indicator equals 90-95%.
9.3 million people are connected to piped water supply networks in cities and towns of RK, which corresponds to 90% of total urban population. While there is a low level of access to piped water supply in the cities and towns in Akmola, Jambyl, Karaganda, and Pavlodar oblasts. The same is true for certain rayons of the capital: in Nur-Sultan, about 1150 people of the residential area Kurenzhar consume water delivered by tanks. The residents of Baikonurskaya street in the villages of Sulusay and Kolsay in Medeus rayon of the city of Almaty have no access to piped water and they consume untreated mountain water. According to the monitoring data, this water is non-compliant with standard water quality requirements in terms of microbial indicators.
6.2 million people or 80.7% of total rural population of the country are connected to piped water supply networks. There is a low level of access to piped water supply in villages in Aktobe, West Kazakhstan, Kostanay, and Pavlodar
oblasts as well as in five rayons of East Kazakhstan oblast, where 49-64% of population are connected to piped
water supply networks, which is quite low compared to the average level of coverage (88.4%) in these oblasts
1.3 High risk of contracting diseases caused by poor quality
water used for drinking 4 Consumption of poor quality water (for drinking, cooking) is an important cause of health problems and health
deterioration. Microbiological (bacterial) contamination of water creates favorable environment for the transmission of water-borne diseases, such as cholera, typhoid fever, paratyphoid fever A and B, dysentery, viral hepatitis A and E, and other diseases. An epidemiological survey of acute intestinal diseases in 2017 identified their transmission routes in 91.1% of registered cases: transmission through water constituted 1.0% (106 out of
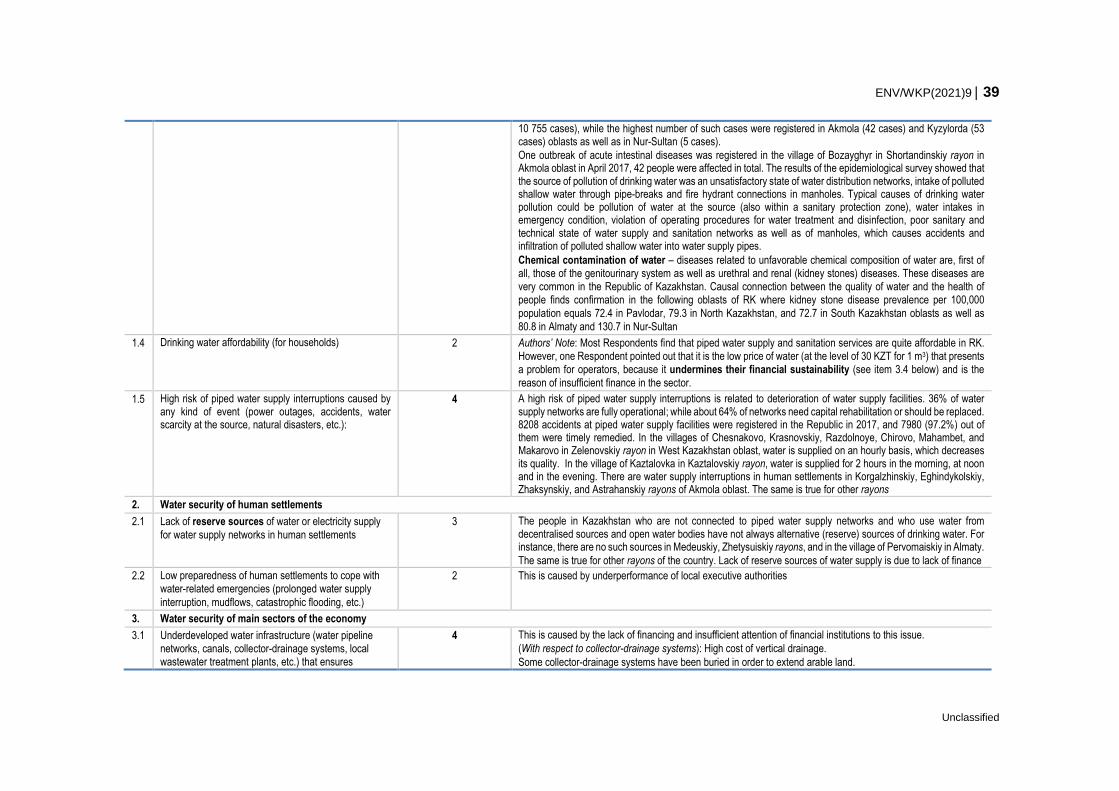
ENV/WKP(2021)9 39
Unclassified
10 755 cases), while the highest number of such cases were registered in Akmola (42 cases) and Kyzylorda (53 cases) oblasts as well as in Nur-Sultan (5 cases).
One outbreak of acute intestinal diseases was registered in the village of Bozayghyr in Shortandinskiy rayon in Akmola oblast in April 2017, 42 people were affected in total. The results of the epidemiological survey showed that the source of pollution of drinking water was an unsatisfactory state of water distribution networks, intake of polluted shallow water through pipe-breaks and fire hydrant connections in manholes. Typical causes of drinking water pollution could be pollution of water at the source (also within a sanitary protection zone), water intakes in emergency condition, violation of operating procedures for water treatment and disinfection, poor sanitary and technical state of water supply and sanitation networks as well as of manholes, which causes accidents and infiltration of polluted shallow water into water supply pipes.
Chemical contamination of water – diseases related to unfavorable chemical composition of water are, first of all, those of the genitourinary system as well as urethral and renal (kidney stones) diseases. These diseases are very common in the Republic of Kazakhstan. Causal connection between the quality of water and the health of people finds confirmation in the following oblasts of RK where kidney stone disease prevalence per 100,000
population equals 72.4 in Pavlodar, 79.3 in North Kazakhstan, and 72.7 in South Kazakhstan oblasts as well as
80.8 in Almaty and 130.7 in Nur-Sultan
1.4 Drinking water affordability (for households)
2 Authors’ Note: Most Respondents find that piped water supply and sanitation services are quite affordable in RK. However, one Respondent pointed out that it is the low price of water (at the level of 30 KZT for 1 m3) that presents a problem for operators, because it undermines their financial sustainability (see item 3.4 below) and is the
reason of insufficient finance in the sector.
1.5 High risk of piped water supply interruptions caused by any kind of event (power outages, accidents, water scarcity at the source, natural disasters, etc.):
4 A high risk of piped water supply interruptions is related to deterioration of water supply facilities. 36% of water supply networks are fully operational; while about 64% of networks need capital rehabilitation or should be replaced. 8208 accidents at piped water supply facilities were registered in the Republic in 2017, and 7980 (97.2%) out of them were timely remedied. In the villages of Chesnakovo, Krasnovskiy, Razdolnoye, Chirovo, Mahambet, and Makarovo in Zelenovskiy rayon in West Kazakhstan oblast, water is supplied on an hourly basis, which decreases its quality. In the village of Kaztalovka in Kaztalovskiy rayon, water is supplied for 2 hours in the morning, at noon and in the evening. There are water supply interruptions in human settlements in Korgalzhinskiy, Eghindykolskiy, Zhaksynskiy, and Astrahanskiy rayons of Akmola oblast. The same is true for other rayons
2. Water security of human settlements
2.1 Lack of reserve sources of water or electricity supply
for water supply networks in human settlements
3 The people in Kazakhstan who are not connected to piped water supply networks and who use water from decentralised sources and open water bodies have not always alternative (reserve) sources of drinking water. For instance, there are no such sources in Medeuskiy, Zhetysuiskiy rayons, and in the village of Pervomaiskiy in Almaty.
The same is true for other rayons of the country. Lack of reserve sources of water supply is due to lack of finance
2.2 Low preparedness of human settlements to cope with water-related emergencies (prolonged water supply
interruption, mudflows, catastrophic flooding, etc.)
2 This is caused by underperformance of local executive authorities
3. Water security of main sectors of the economy
3.1 Underdeveloped water infrastructure (water pipeline networks, canals, collector-drainage systems, local wastewater treatment plants, etc.) that ensures
4 This is caused by the lack of financing and insufficient attention of financial institutions to this issue.
(With respect to collector-drainage systems): High cost of vertical drainage.
Some collector-drainage systems have been buried in order to extend arable land.
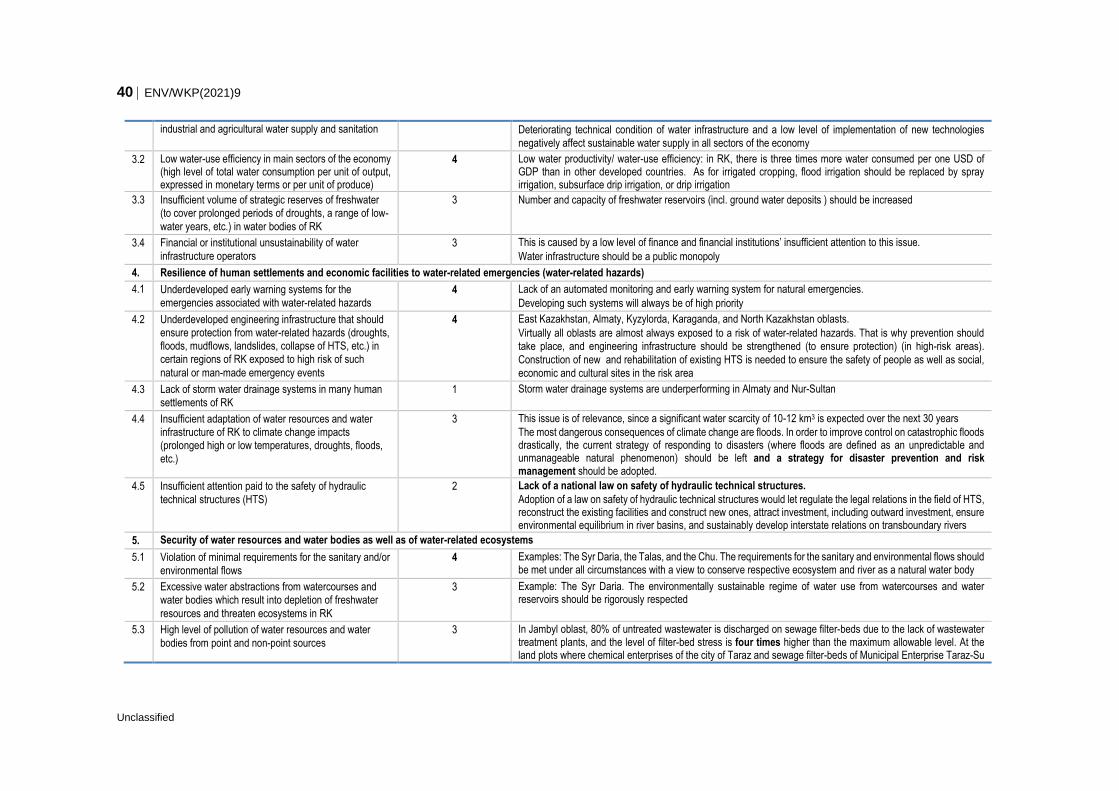
40 ENV/WKP(2021)9
Unclassified
industrial and agricultural water supply and sanitation Deteriorating technical condition of water infrastructure and a low level of implementation of new technologies
negatively affect sustainable water supply in all sectors of the economy
3.2 Low water-use efficiency in main sectors of the economy (high level of total water consumption per unit of output, expressed in monetary terms or per unit of produce)
4 Low water productivity/ water-use efficiency: in RK, there is three times more water consumed per one USD of GDP than in other developed countries. As for irrigated cropping, flood irrigation should be replaced by spray irrigation, subsurface drip irrigation, or drip irrigation
3.3 Insufficient volume of strategic reserves of freshwater (to cover prolonged periods of droughts, a range of low-
water years, etc.) in water bodies of RK
3 Number and capacity of freshwater reservoirs (incl. ground water deposits ) should be increased
3.4 Financial or institutional unsustainability of water
infrastructure operators 3 This is caused by a low level of finance and financial institutions’ insufficient attention to this issue.
Water infrastructure should be a public monopoly
4. Resilience of human settlements and economic facilities to water-related emergencies (water-related hazards)
4.1 Underdeveloped early warning systems for the
emergencies associated with water-related hazards 4 Lack of an automated monitoring and early warning system for natural emergencies.
Developing such systems will always be of high priority
4.2 Underdeveloped engineering infrastructure that should ensure protection from water-related hazards (droughts, floods, mudflows, landslides, collapse of HTS, etc.) in certain regions of RK exposed to high risk of such
natural or man-made emergency events
4 East Kazakhstan, Almaty, Kyzylorda, Karaganda, and North Kazakhstan oblasts.
Virtually all oblasts are almost always exposed to a risk of water-related hazards. That is why prevention should take place, and engineering infrastructure should be strengthened (to ensure protection) (in high-risk areas).
Construction of new and rehabilitation of existing HTS is needed to ensure the safety of people as well as social,
economic and cultural sites in the risk area
4.3 Lack of storm water drainage systems in many human
settlements of RK 1 Storm water drainage systems are underperforming in Almaty and Nur-Sultan
4.4 Insufficient adaptation of water resources and water infrastructure of RK to climate change impacts (prolonged high or low temperatures, droughts, floods,
etc.)
3 This issue is of relevance, since a significant water scarcity of 10-12 km3 is expected over the next 30 years
The most dangerous consequences of climate change are floods. In order to improve control on catastrophic floods drastically, the current strategy of responding to disasters (where floods are defined as an unpredictable and unmanageable natural phenomenon) should be left and a strategy for disaster prevention and risk management should be adopted.
4.5 Insufficient attention paid to the safety of hydraulic
technical structures (HTS)
2 Lack of a national law on safety of hydraulic technical structures.
Adoption of a law on safety of hydraulic technical structures would let regulate the legal relations in the field of HTS, reconstruct the existing facilities and construct new ones, attract investment, including outward investment, ensure environmental equilibrium in river basins, and sustainably develop interstate relations on transboundary rivers
5. Security of water resources and water bodies as well as of water-related ecosystems
5.1 Violation of minimal requirements for the sanitary and/or
environmental flows
4 Examples: The Syr Daria, the Talas, and the Chu. The requirements for the sanitary and environmental flows should be met under all circumstances with a view to conserve respective ecosystem and river as a natural water body
5.2 Excessive water abstractions from watercourses and water bodies which result into depletion of freshwater
resources and threaten ecosystems in RK
3 Example: The Syr Daria. The environmentally sustainable regime of water use from watercourses and water reservoirs should be rigorously respected
5.3 High level of pollution of water resources and water
bodies from point and non-point sources
3 In Jambyl oblast, 80% of untreated wastewater is discharged on sewage filter-beds due to the lack of wastewater treatment plants, and the level of filter-bed stress is four times higher than the maximum allowable level. At the land plots where chemical enterprises of the city of Taraz and sewage filter-beds of Municipal Enterprise Taraz-Su
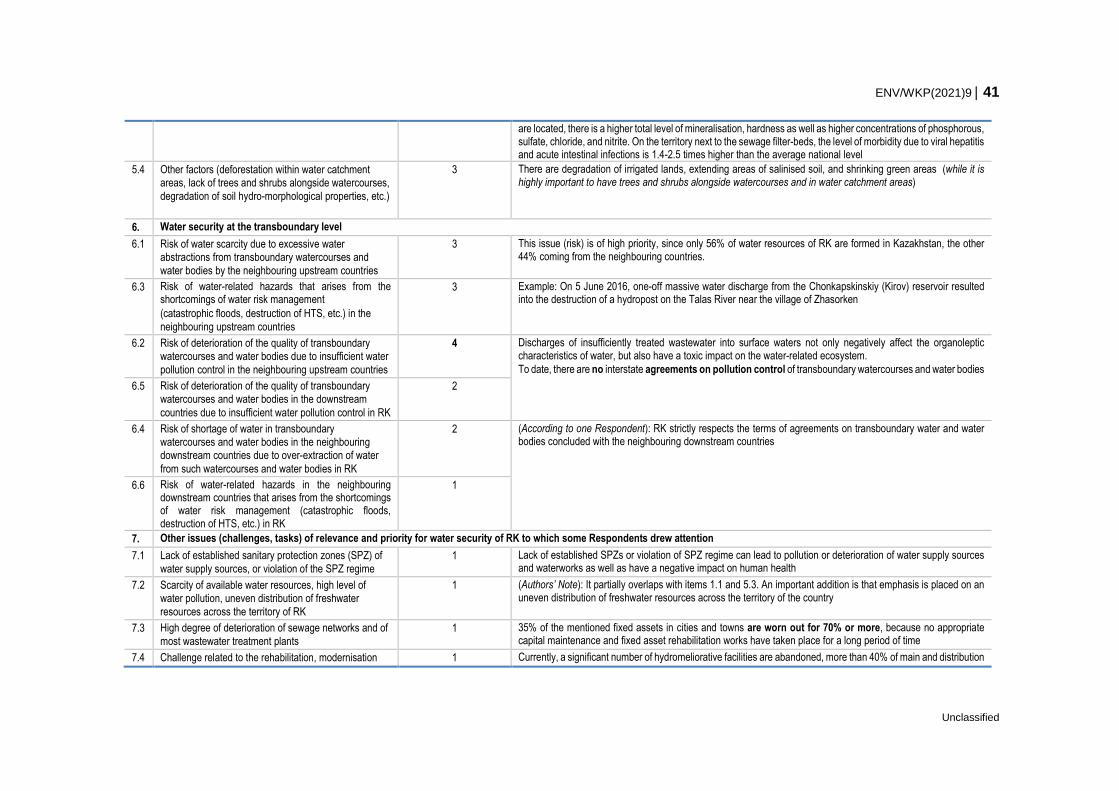
ENV/WKP(2021)9 41
Unclassified
are located, there is a higher total level of mineralisation, hardness as well as higher concentrations of phosphorous, sulfate, chloride, and nitrite. On the territory next to the sewage filter-beds, the level of morbidity due to viral hepatitis and acute intestinal infections is 1.4-2.5 times higher than the average national level
5.4 Other factors (deforestation within water catchment areas, lack of trees and shrubs alongside watercourses,
degradation of soil hydro-morphological properties, etc.)
3 There are degradation of irrigated lands, extending areas of salinised soil, and shrinking green areas (while it is highly important to have trees and shrubs alongside watercourses and in water catchment areas)
6. Water security at the transboundary level
6.1 Risk of water scarcity due to excessive water abstractions from transboundary watercourses and
water bodies by the neighbouring upstream countries
3 This issue (risk) is of high priority, since only 56% of water resources of RK are formed in Kazakhstan, the other 44% coming from the neighbouring countries.
6.3 Risk of water-related hazards that arises from the shortcomings of water risk management
(catastrophic floods, destruction of HTS, etc.) in the
neighbouring upstream countries
3 Example: On 5 June 2016, one-off massive water discharge from the Chonkapskinskiy (Kirov) reservoir resulted into the destruction of a hydropost on the Talas River near the village of Zhasorken
6.2 Risk of deterioration of the quality of transboundary watercourses and water bodies due to insufficient water
pollution control in the neighbouring upstream countries
4 Discharges of insufficiently treated wastewater into surface waters not only negatively affect the organoleptic characteristics of water, but also have a toxic impact on the water-related ecosystem.
To date, there are no interstate agreements on pollution control of transboundary watercourses and water bodies
6.5 Risk of deterioration of the quality of transboundary watercourses and water bodies in the downstream
countries due to insufficient water pollution control in RK
2
6.4 Risk of shortage of water in transboundary watercourses and water bodies in the neighbouring downstream countries due to over-extraction of water
from such watercourses and water bodies in RK
2 (According to one Respondent): RK strictly respects the terms of agreements on transboundary water and water bodies concluded with the neighbouring downstream countries
6.6 Risk of water-related hazards in the neighbouring downstream countries that arises from the shortcomings of water risk management (catastrophic floods, destruction of HTS, etc.) in RK
1
7. Other issues (challenges, tasks) of relevance and priority for water security of RK to which some Respondents drew attention
7.1 Lack of established sanitary protection zones (SPZ) of
water supply sources, or violation of the SPZ regime 1 Lack of established SPZs or violation of SPZ regime can lead to pollution or deterioration of water supply sources
and waterworks as well as have a negative impact on human health
7.2 Scarcity of available water resources, high level of water pollution, uneven distribution of freshwater
resources across the territory of RK
1 (Authors’ Note): It partially overlaps with items 1.1 and 5.3. An important addition is that emphasis is placed on an uneven distribution of freshwater resources across the territory of the country
7.3 High degree of deterioration of sewage networks and of
most wastewater treatment plants 1 35% of the mentioned fixed assets in cities and towns are worn out for 70% or more, because no appropriate
capital maintenance and fixed asset rehabilitation works have taken place for a long period of time
7.4 Challenge related to the rehabilitation, modernisation 1 Currently, a significant number of hydromeliorative facilities are abandoned, more than 40% of main and distribution
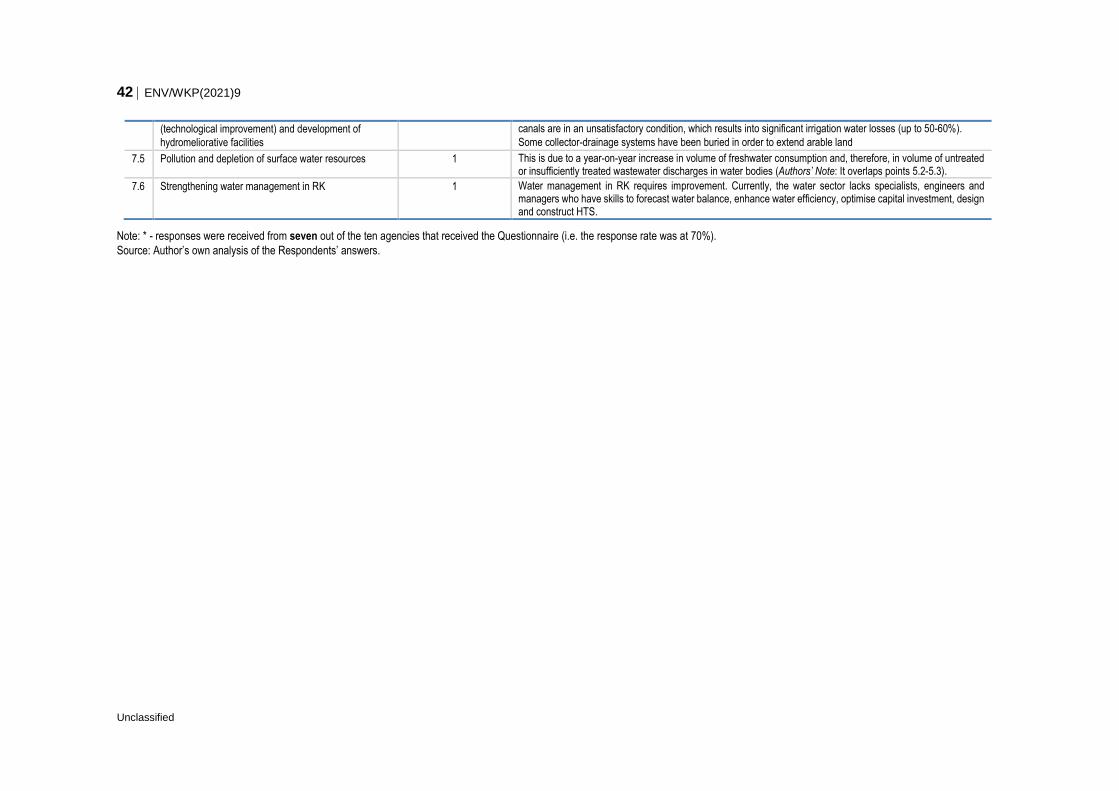
42 ENV/WKP(2021)9
Unclassified
(technological improvement) and development of
hydromeliorative facilities
canals are in an unsatisfactory condition, which results into significant irrigation water losses (up to 50-60%).
Some collector-drainage systems have been buried in order to extend arable land
7.5 Pollution and depletion of surface water resources 1 This is due to a year-on-year increase in volume of freshwater consumption and, therefore, in volume of untreated or insufficiently treated wastewater discharges in water bodies (Authors’ Note: It overlaps points 5.2-5.3).
7.6 Strengthening water management in RK 1 Water management in RK requires improvement. Currently, the water sector lacks specialists, engineers and managers who have skills to forecast water balance, enhance water efficiency, optimise capital investment, design and construct HTS.
Note: * - responses were received from seven out of the ten agencies that received the Questionnaire (i.e. the response rate was at 70%).
Source: Author’s own analysis of the Respondents’ answers.
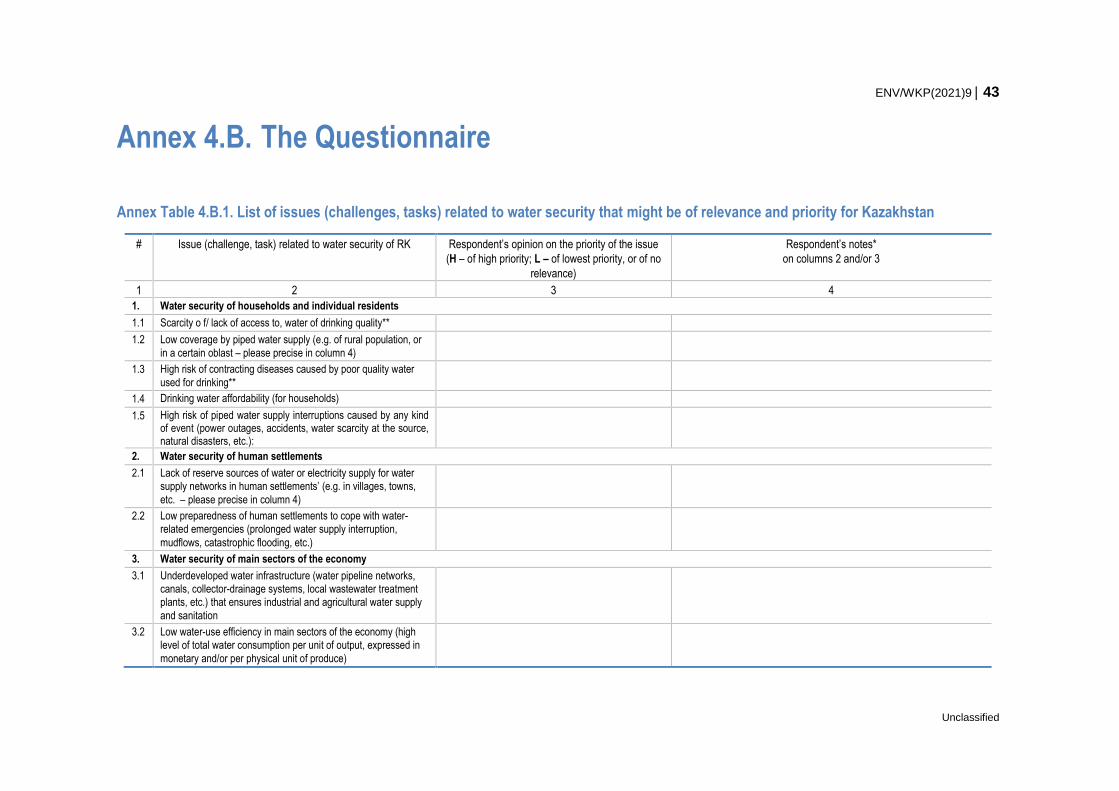
ENV/WKP(2021)9 43
Unclassified
Annex 4.B. The Questionnaire
Annex Table 4.B.1. List of issues (challenges, tasks) related to water security that might be of relevance and priority for Kazakhstan
# Issue (challenge, task) related to water security of RK Respondent’s opinion on the priority of the issue
(H – of high priority; L – of lowest priority, or of no
relevance)
Respondent’s notes*
on columns 2 and/or 3
1 2 3 4
1. Water security of households and individual residents
1.1 Scarcity o f/ lack of access to, water of drinking quality**
1.2 Low coverage by piped water supply (e.g. of rural population, or
in a certain oblast – please precise in column 4)
1.3 High risk of contracting diseases caused by poor quality water
used for drinking**
1.4 Drinking water affordability (for households)
1.5 High risk of piped water supply interruptions caused by any kind of event (power outages, accidents, water scarcity at the source, natural disasters, etc.):
2. Water security of human settlements
2.1 Lack of reserve sources of water or electricity supply for water supply networks in human settlements’ (e.g. in villages, towns,
etc. – please precise in column 4)
2.2 Low preparedness of human settlements to cope with water-related emergencies (prolonged water supply interruption,
mudflows, catastrophic flooding, etc.)
3. Water security of main sectors of the economy
3.1 Underdeveloped water infrastructure (water pipeline networks, canals, collector-drainage systems, local wastewater treatment plants, etc.) that ensures industrial and agricultural water supply
and sanitation
3.2 Low water-use efficiency in main sectors of the economy (high level of total water consumption per unit of output, expressed in
monetary and/or per physical unit of produce)
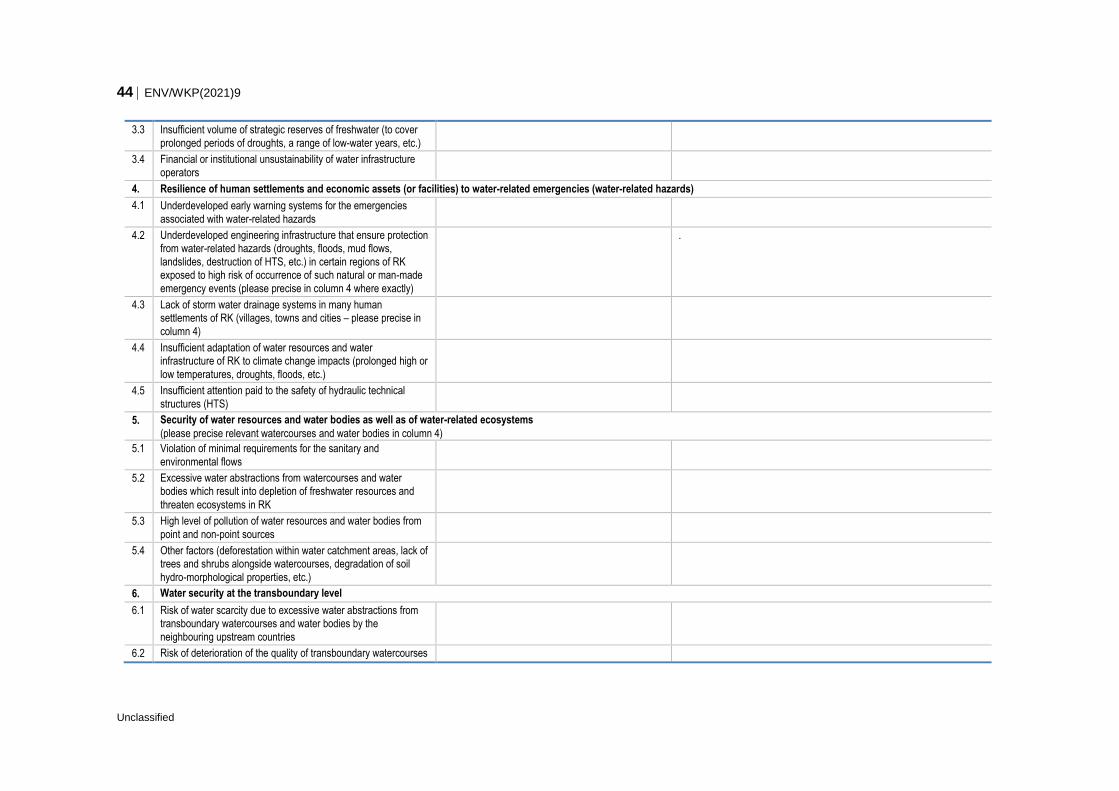
44 ENV/WKP(2021)9
Unclassified
3.3 Insufficient volume of strategic reserves of freshwater (to cover
prolonged periods of droughts, a range of low-water years, etc.)
3.4 Financial or institutional unsustainability of water infrastructure
operators
4. Resilience of human settlements and economic assets (or facilities) to water-related emergencies (water-related hazards)
4.1 Underdeveloped early warning systems for the emergencies
associated with water-related hazards
4.2 Underdeveloped engineering infrastructure that ensure protection from water-related hazards (droughts, floods, mud flows,
landslides, destruction of HTS, etc.) in certain regions of RK exposed to high risk of occurrence of such natural or man-made
emergency events (please precise in column 4 where exactly)
.
4.3 Lack of storm water drainage systems in many human settlements of RK (villages, towns and cities – please precise in
column 4)
4.4 Insufficient adaptation of water resources and water infrastructure of RK to climate change impacts (prolonged high or
low temperatures, droughts, floods, etc.)
4.5 Insufficient attention paid to the safety of hydraulic technical
structures (HTS)
5. Security of water resources and water bodies as well as of water-related ecosystems
(please precise relevant watercourses and water bodies in column 4)
5.1 Violation of minimal requirements for the sanitary and
environmental flows
5.2 Excessive water abstractions from watercourses and water bodies which result into depletion of freshwater resources and
threaten ecosystems in RK
5.3 High level of pollution of water resources and water bodies from
point and non-point sources
5.4 Other factors (deforestation within water catchment areas, lack of trees and shrubs alongside watercourses, degradation of soil
hydro-morphological properties, etc.)
6. Water security at the transboundary level
6.1 Risk of water scarcity due to excessive water abstractions from transboundary watercourses and water bodies by the
neighbouring upstream countries
6.2 Risk of deterioration of the quality of transboundary watercourses
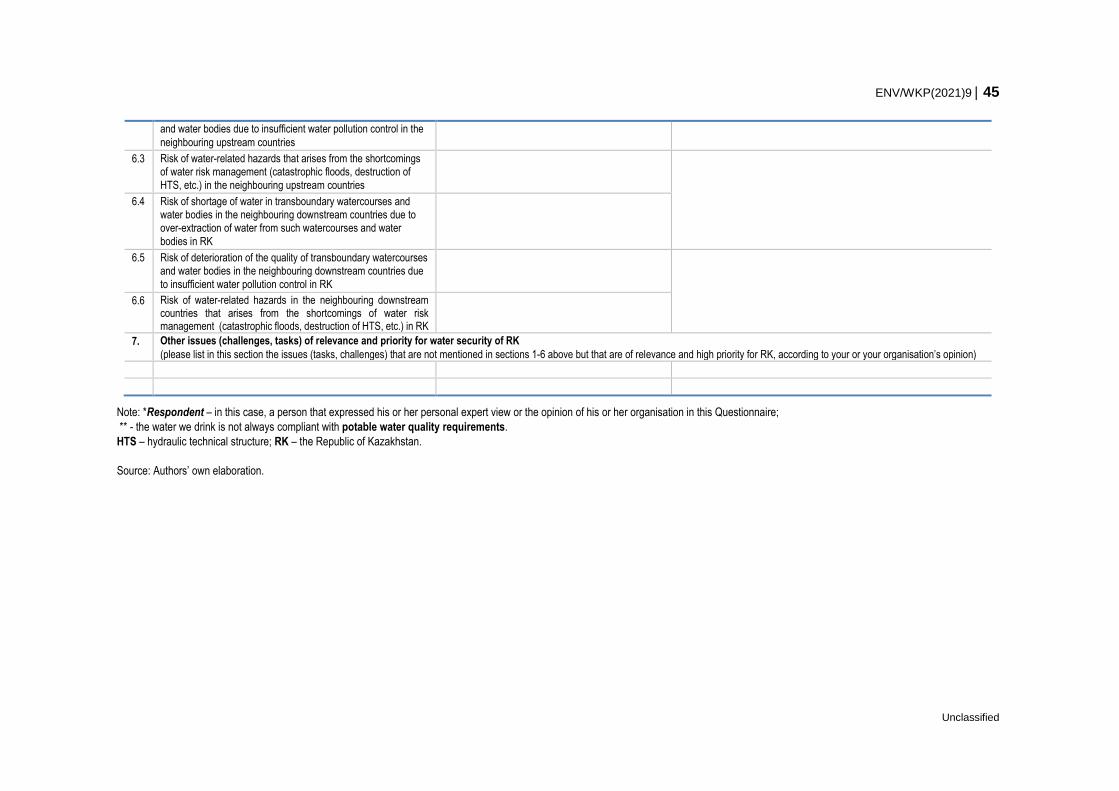
ENV/WKP(2021)9 45
Unclassified
and water bodies due to insufficient water pollution control in the
neighbouring upstream countries
6.3 Risk of water-related hazards that arises from the shortcomings of water risk management (catastrophic floods, destruction of
HTS, etc.) in the neighbouring upstream countries
6.4 Risk of shortage of water in transboundary watercourses and water bodies in the neighbouring downstream countries due to
over-extraction of water from such watercourses and water
bodies in RK
6.5 Risk of deterioration of the quality of transboundary watercourses and water bodies in the neighbouring downstream countries due
to insufficient water pollution control in RK
6.6 Risk of water-related hazards in the neighbouring downstream countries that arises from the shortcomings of water risk management (catastrophic floods, destruction of HTS, etc.) in RK
7. Other issues (challenges, tasks) of relevance and priority for water security of RK
(please list in this section the issues (tasks, challenges) that are not mentioned in sections 1-6 above but that are of relevance and high priority for RK, according to your or your organisation’s opinion)
Note: *Respondent – in this case, a person that expressed his or her personal expert view or the opinion of his or her organisation in this Questionnaire;
** - the water we drink is not always compliant with potable water quality requirements.
HTS – hydraulic technical structure; RK – the Republic of Kazakhstan.
Source: Authors’ own elaboration.

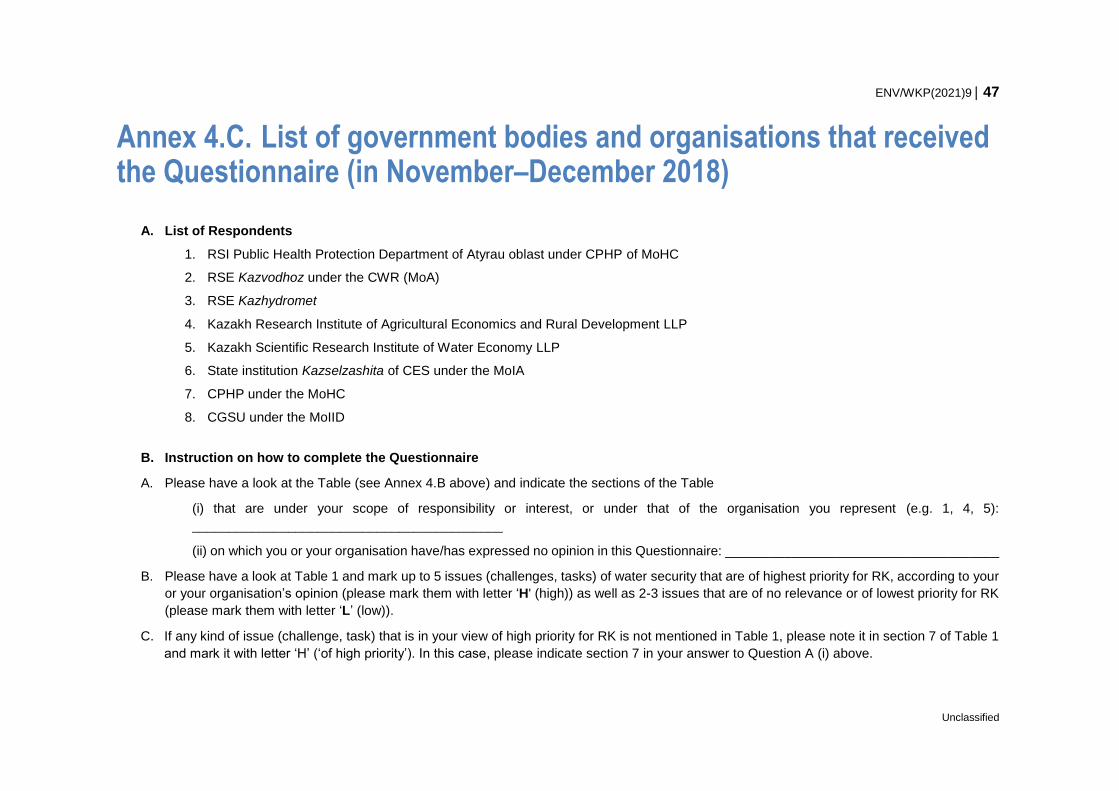
ENV/WKP(2021)9 47
Unclassified
Annex 4.C. List of government bodies and organisations that received the Questionnaire (in November–December 2018)
A. List of Respondents
1. RSI Public Health Protection Department of Atyrau oblast under CPHP of MoHC
2. RSE Kazvodhoz under the CWR (MoA)
3. RSE Kazhydromet
4. Kazakh Research Institute of Agricultural Economics and Rural Development LLP
5. Kazakh Scientific Research Institute of Water Economy LLP
6. State institution Kazselzashita of CES under the MoIA
7. CPHP under the MoHC
8. CGSU under the MoIID
B. Instruction on how to complete the Questionnaire
A. Please have a look at the Table (see Annex 4.B above) and indicate the sections of the Table
(i) that are under your scope of responsibility or interest, or under that of the organisation you represent (e.g. 1, 4, 5):
__________________________________________
(ii) on which you or your organisation have/has expressed no opinion in this Questionnaire: _____________________________________
B. Please have a look at Table 1 and mark up to 5 issues (challenges, tasks) of water security that are of highest priority for RK, according to your
or your organisation’s opinion (please mark them with letter ‘H' (high)) as well as 2-3 issues that are of no relevance or of lowest priority for RK
(please mark them with letter ‘L’ (low)).
C. If any kind of issue (challenge, task) that is in your view of high priority for RK is not mentioned in Table 1, please note it in section 7 of Table 1
and mark it with letter ‘H’ (‘of high priority’). In this case, please indicate section 7 in your answer to Question A (i) above.

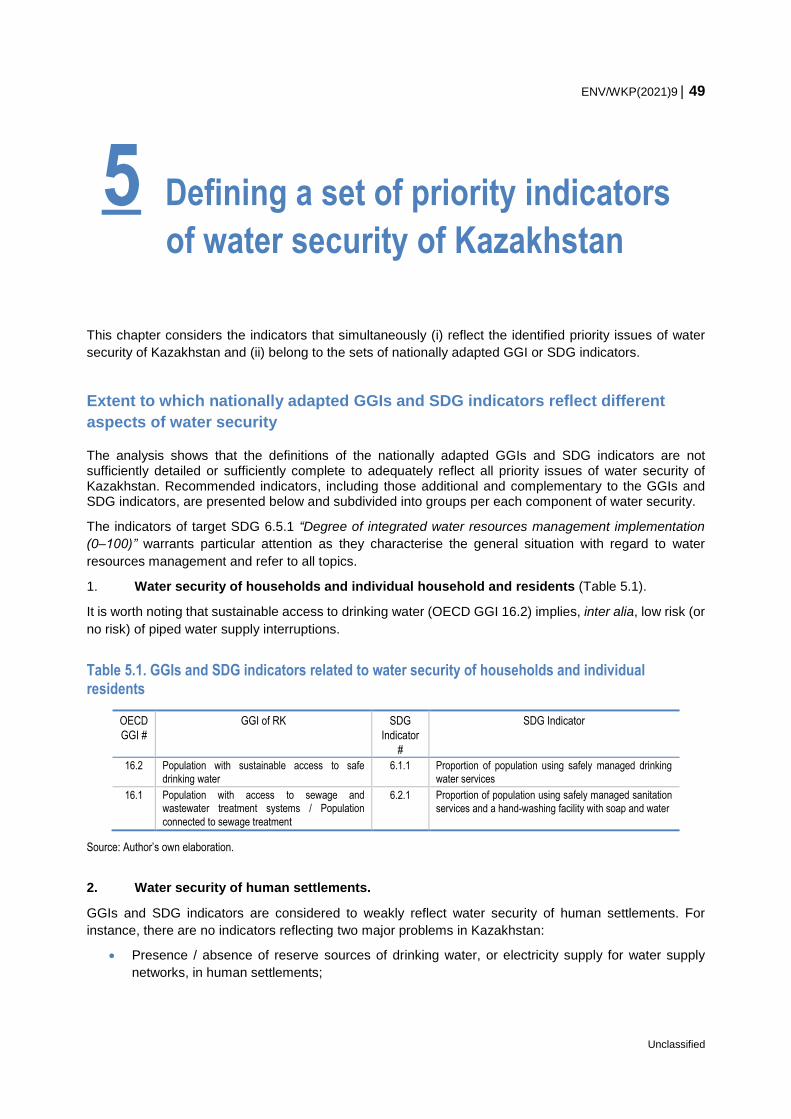
ENV/WKP(2021)9 49
Unclassified
This chapter considers the indicators that simultaneously (i) reflect the identified priority issues of water
security of Kazakhstan and (ii) belong to the sets of nationally adapted GGI or SDG indicators.
Extent to which nationally adapted GGIs and SDG indicators reflect different
aspects of water security
The analysis shows that the definitions of the nationally adapted GGIs and SDG indicators are not sufficiently detailed or sufficiently complete to adequately reflect all priority issues of water security of Kazakhstan. Recommended indicators, including those additional and complementary to the GGIs and SDG indicators, are presented below and subdivided into groups per each component of water security.
The indicators of target SDG 6.5.1 “Degree of integrated water resources management implementation
(0–100)” warrants particular attention as they characterise the general situation with regard to water
resources management and refer to all topics.
1. Water security of households and individual household and residents (Table 5.1).
It is worth noting that sustainable access to drinking water (OECD GGI 16.2) implies, inter alia, low risk (or
no risk) of piped water supply interruptions.
Table 5.1. GGIs and SDG indicators related to water security of households and individual residents
OECD
GGI #
GGI of RK SDG
Indicator
#
SDG Indicator
16.2 Population with sustainable access to safe
drinking water
6.1.1 Proportion of population using safely managed drinking
water services
16.1 Population with access to sewage and wastewater treatment systems / Population
connected to sewage treatment
6.2.1
Proportion of population using safely managed sanitation
services and a hand-washing facility with soap and water
Source: Author’s own elaboration.
2. Water security of human settlements.
GGIs and SDG indicators are considered to weakly reflect water security of human settlements. For
instance, there are no indicators reflecting two major problems in Kazakhstan:
Presence / absence of reserve sources of drinking water, or electricity supply for water supply
networks, in human settlements;
5 Defining a set of priority indicators
of water security of Kazakhstan
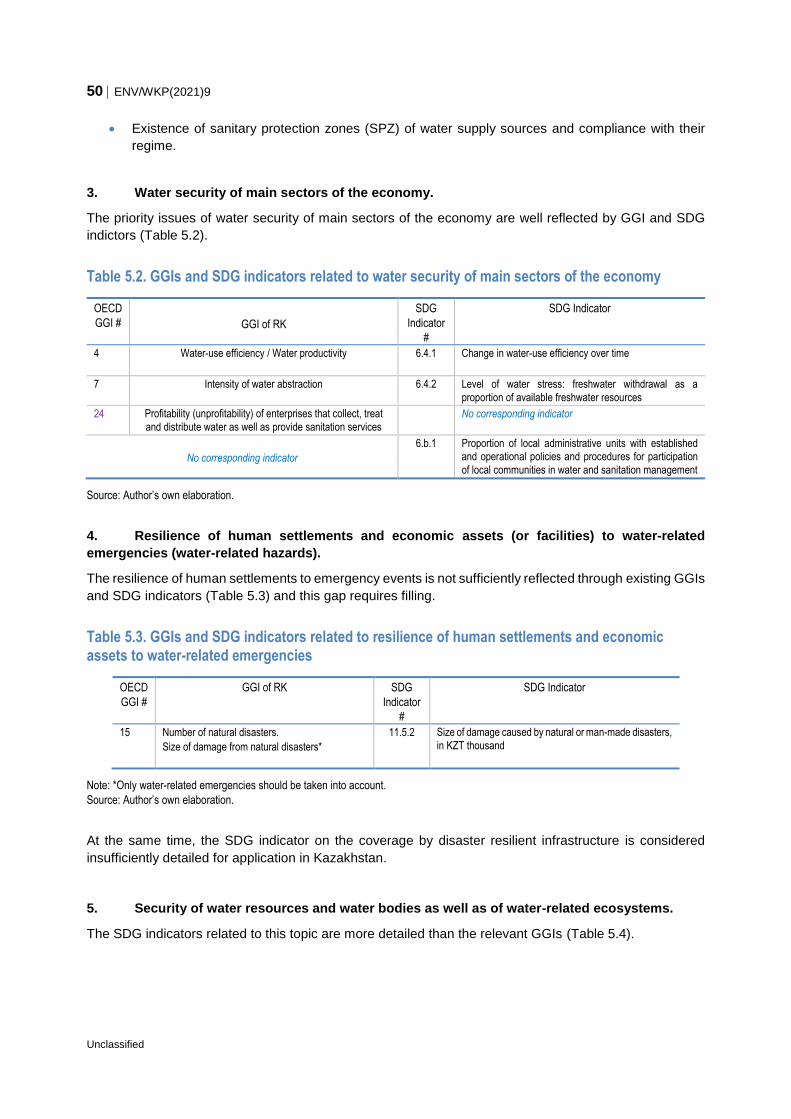
50 ENV/WKP(2021)9
Unclassified
Existence of sanitary protection zones (SPZ) of water supply sources and compliance with their
regime.
3. Water security of main sectors of the economy.
The priority issues of water security of main sectors of the economy are well reflected by GGI and SDG
indictors (Table 5.2).
Table 5.2. GGIs and SDG indicators related to water security of main sectors of the economy
OECD
GGI #
GGI of RK
SDG
Indicator
#
SDG Indicator
4
Water-use efficiency / Water productivity 6.4.1 Change in water-use efficiency over time
7 Intensity of water abstraction 6.4.2 Level of water stress: freshwater withdrawal as a
proportion of available freshwater resources
24 Profitability (unprofitability) of enterprises that collect, treat
and distribute water as well as provide sanitation services No corresponding indicator
No corresponding indicator
6.b.1 Proportion of local administrative units with established and operational policies and procedures for participation
of local communities in water and sanitation management
Source: Author’s own elaboration.
4. Resilience of human settlements and economic assets (or facilities) to water-related
emergencies (water-related hazards).
The resilience of human settlements to emergency events is not sufficiently reflected through existing GGIs
and SDG indicators (Table 5.3) and this gap requires filling.
Table 5.3. GGIs and SDG indicators related to resilience of human settlements and economic assets to water-related emergencies
OECD
GGI #
GGI of RK SDG
Indicator
#
SDG Indicator
15 Number of natural disasters.
Size of damage from natural disasters*
11.5.2 Size of damage caused by natural or man-made disasters,
in KZT thousand
Note: *Only water-related emergencies should be taken into account.
Source: Author’s own elaboration.
At the same time, the SDG indicator on the coverage by disaster resilient infrastructure is considered
insufficiently detailed for application in Kazakhstan.
5. Security of water resources and water bodies as well as of water-related ecosystems.
The SDG indicators related to this topic are more detailed than the relevant GGIs (Table 5.4).

ENV/WKP(2021)9 51
Unclassified
Table 5.4. GGIs and SDG indictors related to security of water resources, water bodies and water-related ecosystems
OECD
GGI #
GGI of RK
SDG
Indicator #
SDG Indicator
No corresponding indicator 6.3.2 Proportion of water bodies with good ambient water quality
7 Intensity of water abstraction 6.4.2 Level of water stress: freshwater withdrawal as a proportion of
available freshwater resources
Source: Author’s own elaboration.
6. Water security at the transboundary level.
Only SDG indicator 6.5.2 “Proportion of transboundary basin area with an operational arrangement for
water cooperation” reflects water security at the transboundary level, but having just one indicator is
insufficient to reflect key aspects of transboundary water security. This gap requires filling.
7. Other issues of relevance and priority for water security of RK
Other problematic issues of water security of RK that were mentioned by the Respondents and that are
not adequately covered by GGIs and SDG indictors (Table 5.5), and require additional indicators are
presented below.
Table 5.5. Nationally adapted GGIs and SDG indictors related to other issues of relevance and priority for water security of RK
GGI of RK
SDG
Indicator
#
SDG Indicator
The share of wastewater treated according to established norms
(incl. pre-treatment) of total volume of wastewater
6.3.1 Proportion of wastewater safely treated
No corresponding indicator 6.5.1 Degree of integrated water resources management
implementation (0–100)
Source: Author’s own elaboration.
Indicators of water security of the Republic of Kazakhstan recommended to be
used for monitoring
Taking into account the above-mentioned information as well as the issues of priority for water security of
RK, it is recommended to regularly monitor nationally adapted GGIs and SDG indicators as well as their
complementary indicators that are presented in Table 5.6 below. It is advised to monitor the situation in
RK as a whole and by oblast and city of republican significance, as well as by urban-rural breakdown (note
that such a disaggregation resonate with the 2030 Agenda’s pledges for “no one left behind”). The
decision on the allocation of responsibility for individual indicators and frequency of measuring them can
be taken following discussion between concerned government bodies.
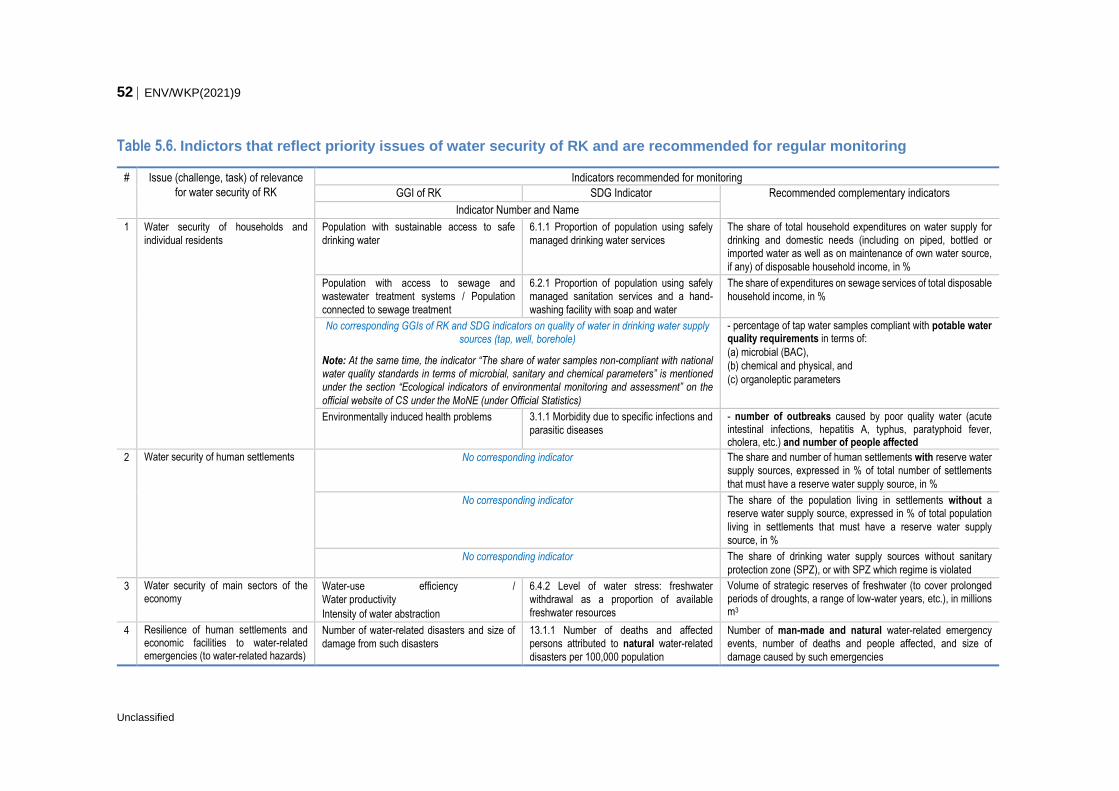
52 ENV/WKP(2021)9
Unclassified
Table 5.6. Indictors that reflect priority issues of water security of RK and are recommended for regular monitoring
# Issue (challenge, task) of relevance
for water security of RK
Indicators recommended for monitoring
GGI of RK SDG Indicator Recommended complementary indicators
Indicator Number and Name
1 Water security of households and
individual residents
Population with sustainable access to safe
drinking water
6.1.1 Proportion of population using safely
managed drinking water services
The share of total household expenditures on water supply for drinking and domestic needs (including on piped, bottled or imported water as well as on maintenance of own water source,
if any) of disposable household income, in %
Population with access to sewage and wastewater treatment systems / Population
connected to sewage treatment
6.2.1 Proportion of population using safely managed sanitation services and a hand-
washing facility with soap and water
The share of expenditures on sewage services of total disposable
household income, in %
No corresponding GGIs of RK and SDG indicators on quality of water in drinking water supply sources (tap, well, borehole)
Note: At the same time, the indicator “The share of water samples non-compliant with national
water quality standards in terms of microbial, sanitary and chemical parameters” is mentioned under the section “Ecological indicators of environmental monitoring and assessment” on the
official website of CS under the MoNE (under Official Statistics)
- percentage of tap water samples compliant with potable water quality requirements in terms of:
(a) microbial (BAC),
(b) chemical and physical, and
(c) organoleptic parameters
Environmentally induced health problems 3.1.1 Morbidity due to specific infections and
parasitic diseases
- number of outbreaks caused by poor quality water (acute intestinal infections, hepatitis А, typhus, paratyphoid fever, cholera, etc.) and number of people affected
2 Water security of human settlements No corresponding indicator The share and number of human settlements with reserve water supply sources, expressed in % of total number of settlements
that must have a reserve water supply source, in %
No corresponding indicator The share of the population living in settlements without a reserve water supply source, expressed in % of total population
living in settlements that must have a reserve water supply
source, in %
No corresponding indicator The share of drinking water supply sources without sanitary
protection zone (SPZ), or with SPZ which regime is violated
3 Water security of main sectors of the economy
Water-use efficiency /
Water productivity
Intensity of water abstraction
6.4.2 Level of water stress: freshwater withdrawal as a proportion of available
freshwater resources
Volume of strategic reserves of freshwater (to cover prolonged periods of droughts, a range of low-water years, etc.), in millions m3
4 Resilience of human settlements and economic facilities to water-related emergencies (to water-related hazards)
Number of water-related disasters and size of
damage from such disasters
13.1.1 Number of deaths and affected persons attributed to natural water-related
disasters per 100,000 population
Number of man-made and natural water-related emergency events, number of deaths and people affected, and size of
damage caused by such emergencies
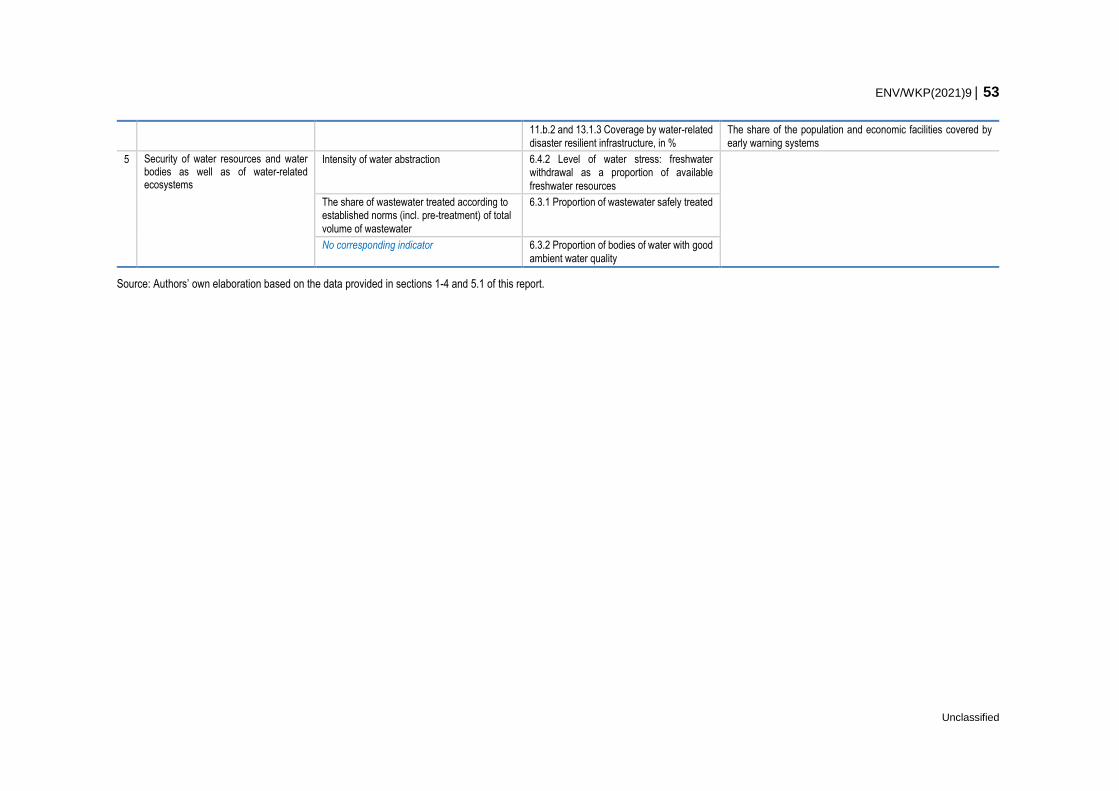
ENV/WKP(2021)9 53
Unclassified
11.b.2 and 13.1.3 Coverage by water-related
disaster resilient infrastructure, in %
The share of the population and economic facilities covered by
early warning systems
5 Security of water resources and water bodies as well as of water-related ecosystems
Intensity of water abstraction
6.4.2 Level of water stress: freshwater withdrawal as a proportion of available
freshwater resources
The share of wastewater treated according to established norms (incl. pre-treatment) of total
volume of wastewater
6.3.1 Proportion of wastewater safely treated
No corresponding indicator 6.3.2 Proportion of bodies of water with good
ambient water quality
Source: Authors’ own elaboration based on the data provided in sections 1-4 and 5.1 of this report.
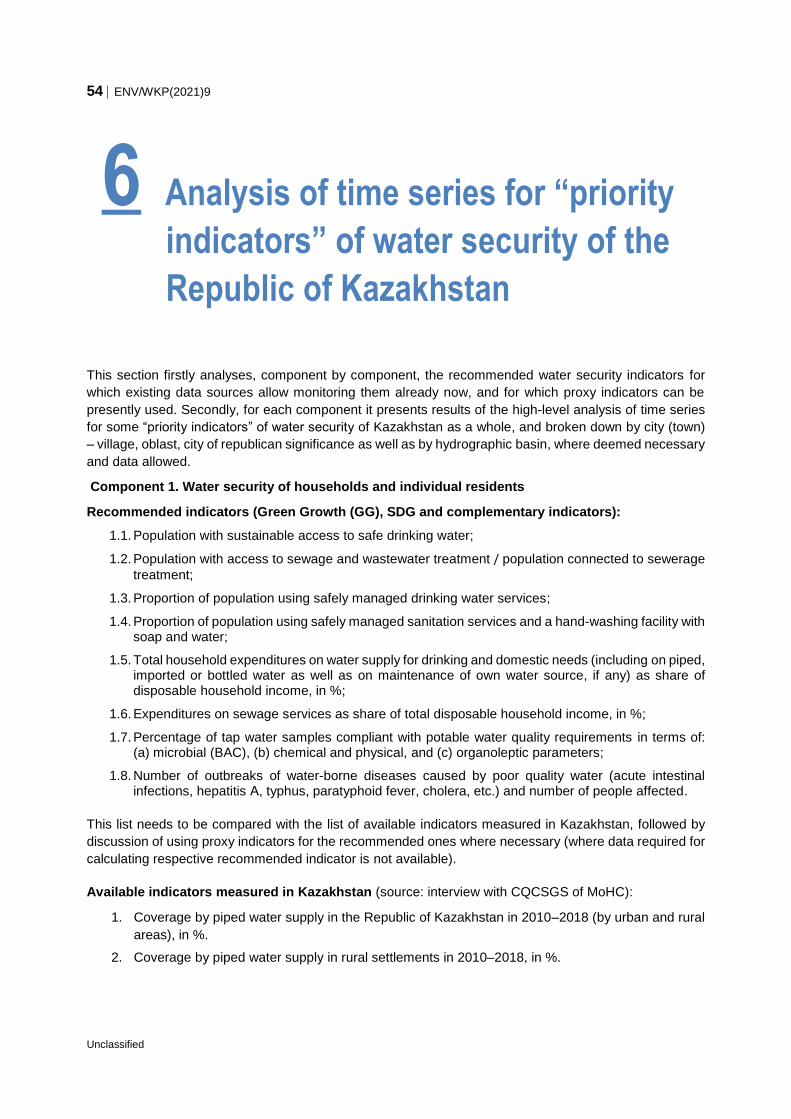
54 ENV/WKP(2021)9
Unclassified
This section firstly analyses, component by component, the recommended water security indicators for
which existing data sources allow monitoring them already now, and for which proxy indicators can be
presently used. Secondly, for each component it presents results of the high-level analysis of time series
for some “priority indicators” of water security of Kazakhstan as a whole, and broken down by city (town)
– village, oblast, city of republican significance as well as by hydrographic basin, where deemed necessary
and data allowed.
Component 1. Water security of households and individual residents
Recommended indicators (Green Growth (GG), SDG and complementary indicators):
1.1. Population with sustainable access to safe drinking water;
1.2. Population with access to sewage and wastewater treatment / population connected to sewerage
treatment;
1.3. Proportion of population using safely managed drinking water services;
1.4. Proportion of population using safely managed sanitation services and a hand-washing facility with soap and water;
1.5. Total household expenditures on water supply for drinking and domestic needs (including on piped, imported or bottled water as well as on maintenance of own water source, if any) as share of disposable household income, in %;
1.6. Expenditures on sewage services as share of total disposable household income, in %;
1.7. Percentage of tap water samples compliant with potable water quality requirements in terms of: (a) microbial (BAC), (b) chemical and physical, and (c) organoleptic parameters;
1.8. Number of outbreaks of water-borne diseases caused by poor quality water (acute intestinal infections, hepatitis А, typhus, paratyphoid fever, cholera, etc.) and number of people affected.
This list needs to be compared with the list of available indicators measured in Kazakhstan, followed by
discussion of using proxy indicators for the recommended ones where necessary (where data required for
calculating respective recommended indicator is not available).
Available indicators measured in Kazakhstan (source: interview with CQCSGS of MoHC):
1. Coverage by piped water supply in the Republic of Kazakhstan in 2010–2018 (by urban and rural
areas), in %.
2. Coverage by piped water supply in rural settlements in 2010–2018, in %.
6 Analysis of time series for “priority
indicators” of water security of the
Republic of Kazakhstan
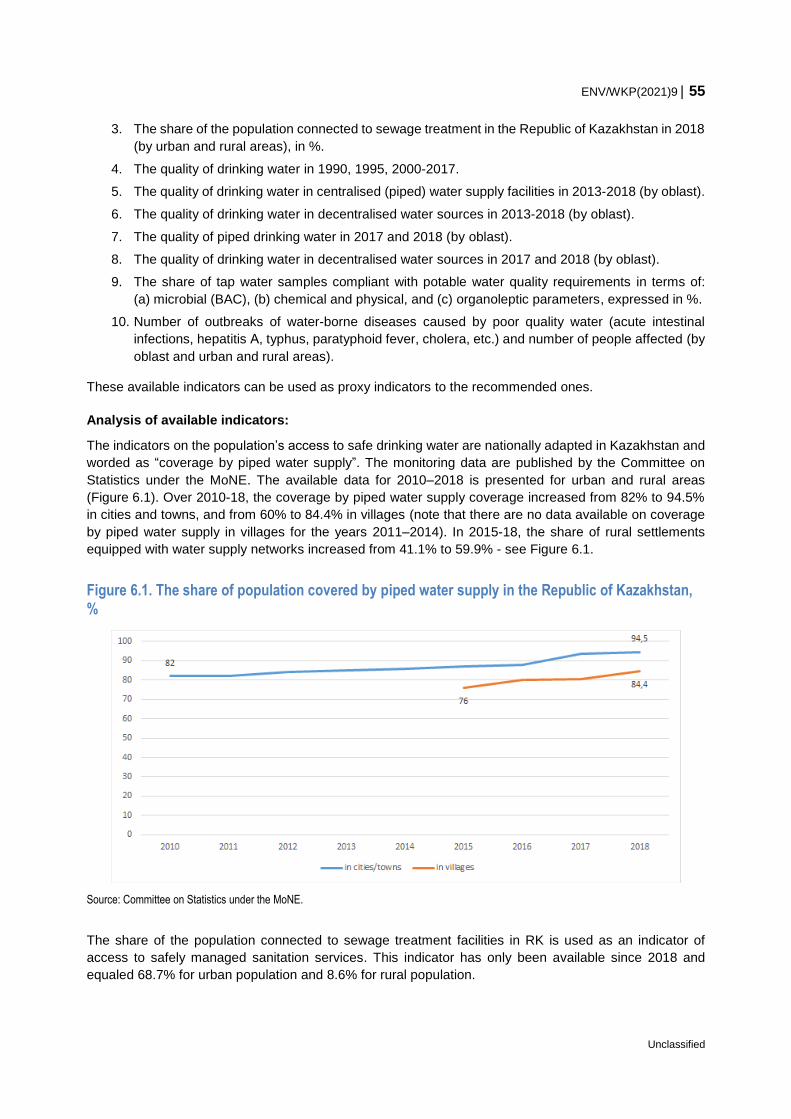
ENV/WKP(2021)9 55
Unclassified
3. The share of the population connected to sewage treatment in the Republic of Kazakhstan in 2018
(by urban and rural areas), in %.
4. The quality of drinking water in 1990, 1995, 2000-2017.
5. The quality of drinking water in centralised (piped) water supply facilities in 2013-2018 (by oblast).
6. The quality of drinking water in decentralised water sources in 2013-2018 (by oblast).
7. The quality of piped drinking water in 2017 and 2018 (by oblast).
8. The quality of drinking water in decentralised water sources in 2017 and 2018 (by oblast).
9. The share of tap water samples compliant with potable water quality requirements in terms of:
(a) microbial (BAC), (b) chemical and physical, and (c) organoleptic parameters, expressed in %.
10. Number of outbreaks of water-borne diseases caused by poor quality water (acute intestinal
infections, hepatitis А, typhus, paratyphoid fever, cholera, etc.) and number of people affected (by
oblast and urban and rural areas).
These available indicators can be used as proxy indicators to the recommended ones.
Analysis of available indicators:
The indicators on the population’s access to safe drinking water are nationally adapted in Kazakhstan and
worded as “coverage by piped water supply”. The monitoring data are published by the Committee on
Statistics under the MoNE. The available data for 2010–2018 is presented for urban and rural areas
(Figure 6.1). Over 2010-18, the coverage by piped water supply coverage increased from 82% to 94.5%
in cities and towns, and from 60% to 84.4% in villages (note that there are no data available on coverage
by piped water supply in villages for the years 2011–2014). In 2015-18, the share of rural settlements
equipped with water supply networks increased from 41.1% to 59.9% - see Figure 6.1.
Figure 6.1. The share of population covered by piped water supply in the Republic of Kazakhstan, %
Source: Committee on Statistics under the MoNE.
The share of the population connected to sewage treatment facilities in RK is used as an indicator of
access to safely managed sanitation services. This indicator has only been available since 2018 and
equaled 68.7% for urban population and 8.6% for rural population.
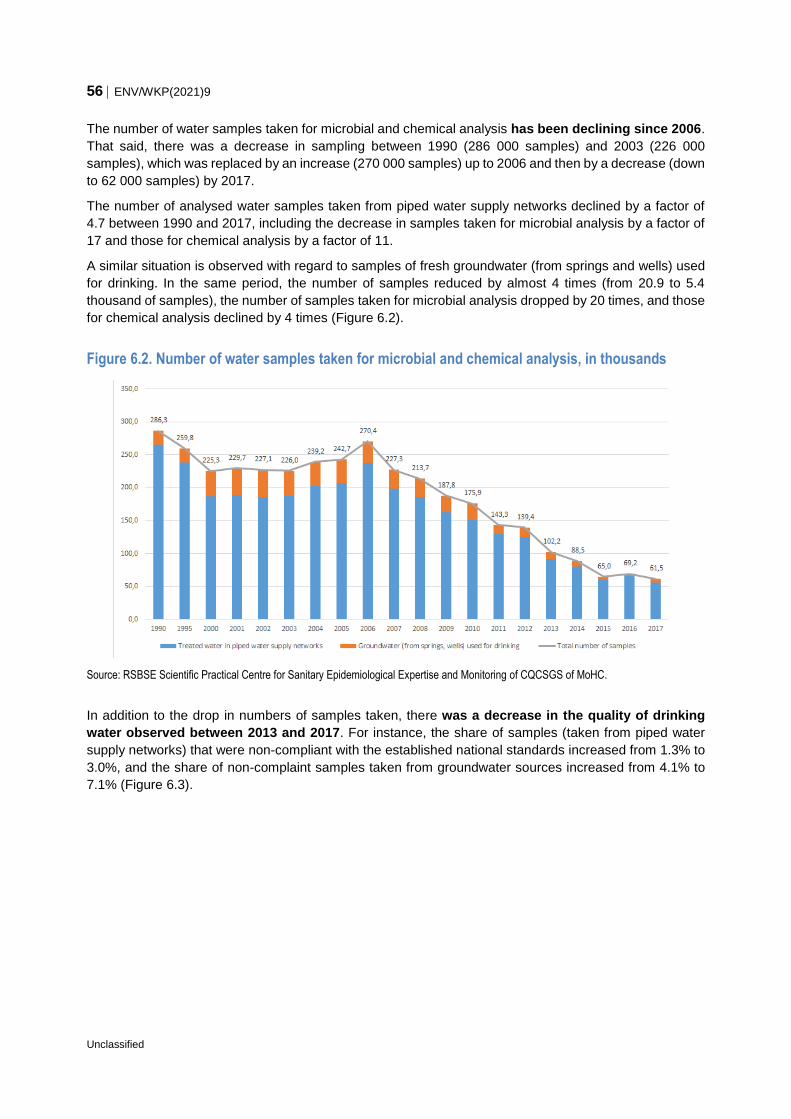
56 ENV/WKP(2021)9
Unclassified
The number of water samples taken for microbial and chemical analysis has been declining since 2006.
That said, there was a decrease in sampling between 1990 (286 000 samples) and 2003 (226 000
samples), which was replaced by an increase (270 000 samples) up to 2006 and then by a decrease (down
to 62 000 samples) by 2017.
The number of analysed water samples taken from piped water supply networks declined by a factor of
4.7 between 1990 and 2017, including the decrease in samples taken for microbial analysis by a factor of
17 and those for chemical analysis by a factor of 11.
A similar situation is observed with regard to samples of fresh groundwater (from springs and wells) used
for drinking. In the same period, the number of samples reduced by almost 4 times (from 20.9 to 5.4
thousand of samples), the number of samples taken for microbial analysis dropped by 20 times, and those
for chemical analysis declined by 4 times (Figure 6.2).
Figure 6.2. Number of water samples taken for microbial and chemical analysis, in thousands
Source: RSBSE Scientific Practical Centre for Sanitary Epidemiological Expertise and Monitoring of CQCSGS of MoHC.
In addition to the drop in numbers of samples taken, there was a decrease in the quality of drinking
water observed between 2013 and 2017. For instance, the share of samples (taken from piped water
supply networks) that were non-compliant with the established national standards increased from 1.3% to
3.0%, and the share of non-complaint samples taken from groundwater sources increased from 4.1% to
7.1% (Figure 6.3).
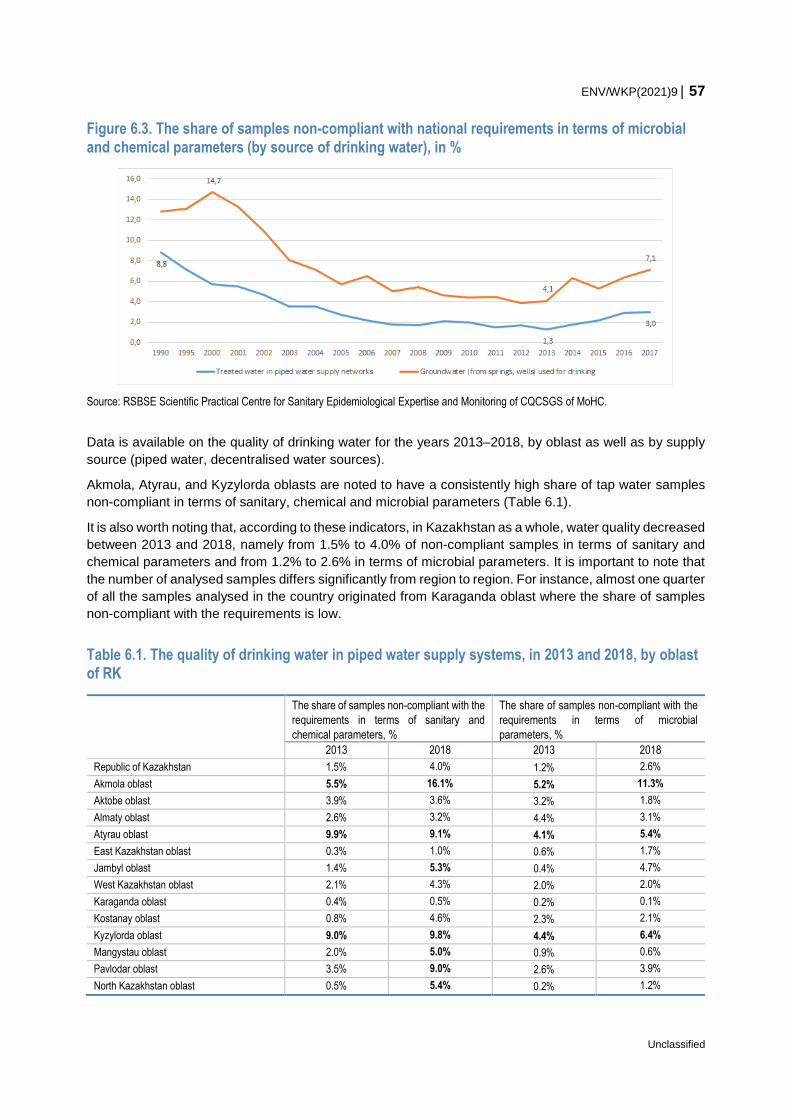
ENV/WKP(2021)9 57
Unclassified
Figure 6.3. The share of samples non-compliant with national requirements in terms of microbial and chemical parameters (by source of drinking water), in %
Source: RSBSE Scientific Practical Centre for Sanitary Epidemiological Expertise and Monitoring of CQCSGS of MoHC.
Data is available on the quality of drinking water for the years 2013–2018, by oblast as well as by supply
source (piped water, decentralised water sources).
Akmola, Atyrau, and Kyzylorda oblasts are noted to have a consistently high share of tap water samples
non-compliant in terms of sanitary, chemical and microbial parameters (Table 6.1).
It is also worth noting that, according to these indicators, in Kazakhstan as a whole, water quality decreased
between 2013 and 2018, namely from 1.5% to 4.0% of non-compliant samples in terms of sanitary and
chemical parameters and from 1.2% to 2.6% in terms of microbial parameters. It is important to note that
the number of analysed samples differs significantly from region to region. For instance, almost one quarter
of all the samples analysed in the country originated from Karaganda oblast where the share of samples
non-compliant with the requirements is low.
Table 6.1. The quality of drinking water in piped water supply systems, in 2013 and 2018, by oblast of RK
The share of samples non-compliant with the
requirements in terms of sanitary and
chemical parameters, %
The share of samples non-compliant with the
requirements in terms of microbial
parameters, %
2013 2018 2013 2018
Republic of Kazakhstan 1.5% 4.0% 1.2% 2.6%
Akmola oblast 5.5% 16.1% 5.2% 11.3%
Aktobe oblast 3.9% 3.6% 3.2% 1.8%
Almaty oblast 2.6% 3.2% 4.4% 3.1%
Atyrau oblast 9.9% 9.1% 4.1% 5.4%
East Kazakhstan oblast 0.3% 1.0% 0.6% 1.7%
Jambyl oblast 1.4% 5.3% 0.4% 4.7%
West Kazakhstan oblast 2.1% 4.3% 2.0% 2.0%
Karaganda oblast 0.4% 0.5% 0.2% 0.1%
Kostanay oblast 0.8% 4.6% 2.3% 2.1%
Kyzylorda oblast 9.0% 9.8% 4.4% 6.4%
Mangystau oblast 2.0% 5.0% 0.9% 0.6%
Pavlodar oblast 3.5% 9.0% 2.6% 3.9%
North Kazakhstan oblast 0.5% 5.4% 0.2% 1.2%
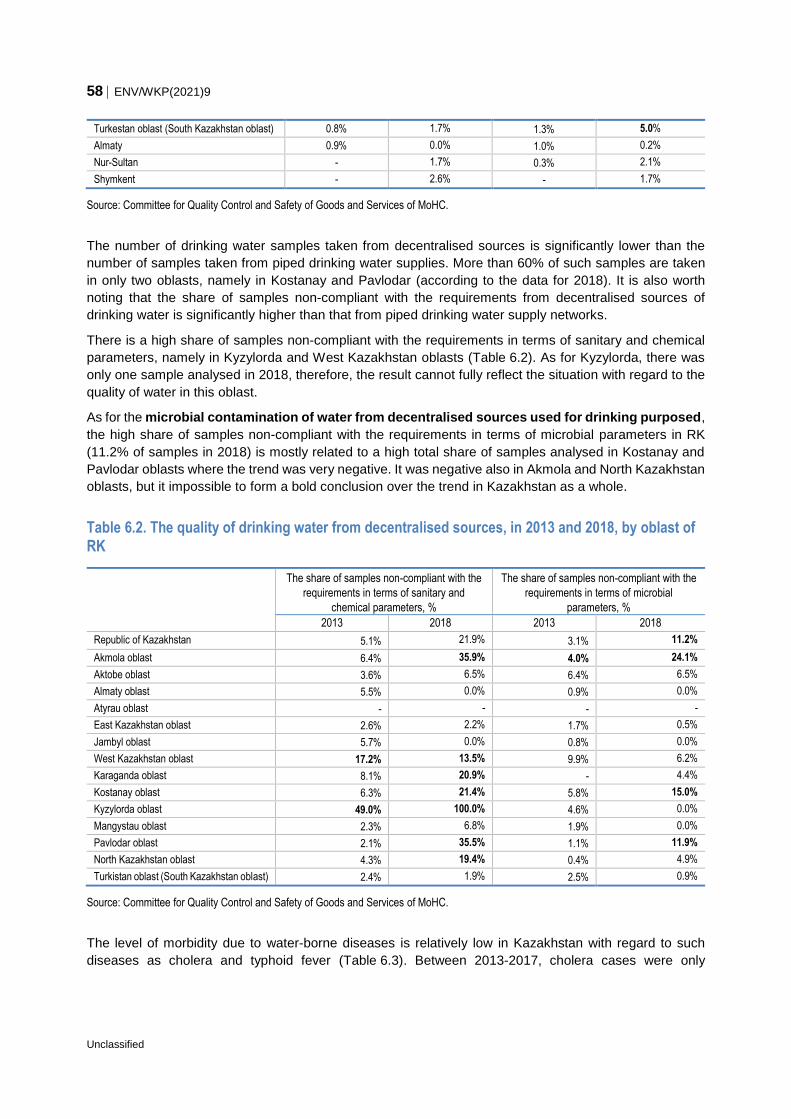
58 ENV/WKP(2021)9
Unclassified
Turkestan oblast (South Kazakhstan oblast) 0.8% 1.7% 1.3% 5.0%
Almaty 0.9% 0.0% 1.0% 0.2%
Nur-Sultan - 1.7% 0.3% 2.1%
Shymkent - 2.6% - 1.7%
Source: Committee for Quality Control and Safety of Goods and Services of MoHC.
The number of drinking water samples taken from decentralised sources is significantly lower than the
number of samples taken from piped drinking water supplies. More than 60% of such samples are taken
in only two oblasts, namely in Kostanay and Pavlodar (according to the data for 2018). It is also worth
noting that the share of samples non-compliant with the requirements from decentralised sources of
drinking water is significantly higher than that from piped drinking water supply networks.
There is a high share of samples non-compliant with the requirements in terms of sanitary and chemical
parameters, namely in Kyzylorda and West Kazakhstan oblasts (Table 6.2). As for Kyzylorda, there was
only one sample analysed in 2018, therefore, the result cannot fully reflect the situation with regard to the
quality of water in this oblast.
As for the microbial contamination of water from decentralised sources used for drinking purposed,
the high share of samples non-compliant with the requirements in terms of microbial parameters in RK
(11.2% of samples in 2018) is mostly related to a high total share of samples analysed in Kostanay and
Pavlodar oblasts where the trend was very negative. It was negative also in Akmola and North Kazakhstan
oblasts, but it impossible to form a bold conclusion over the trend in Kazakhstan as a whole.
Table 6.2. The quality of drinking water from decentralised sources, in 2013 and 2018, by oblast of RK
The share of samples non-compliant with the
requirements in terms of sanitary and
chemical parameters, %
The share of samples non-compliant with the
requirements in terms of microbial
parameters, %
2013 2018 2013 2018
Republic of Kazakhstan 5.1% 21.9% 3.1% 11.2%
Akmola oblast 6.4% 35.9% 4.0% 24.1%
Aktobe oblast 3.6% 6.5% 6.4% 6.5%
Almaty oblast 5.5% 0.0% 0.9% 0.0%
Atyrau oblast - - - -
East Kazakhstan oblast 2.6% 2.2% 1.7% 0.5%
Jambyl oblast 5.7% 0.0% 0.8% 0.0%
West Kazakhstan oblast 17.2% 13.5% 9.9% 6.2%
Karaganda oblast 8.1% 20.9% - 4.4%
Kostanay oblast 6.3% 21.4% 5.8% 15.0%
Kyzylorda oblast 49.0% 100.0% 4.6% 0.0%
Mangystau oblast 2.3% 6.8% 1.9% 0.0%
Pavlodar oblast 2.1% 35.5% 1.1% 11.9%
North Kazakhstan oblast 4.3% 19.4% 0.4% 4.9%
Turkistan oblast (South Kazakhstan oblast) 2.4% 1.9% 2.5% 0.9%
Source: Committee for Quality Control and Safety of Goods and Services of MoHC.
The level of morbidity due to water-borne diseases is relatively low in Kazakhstan with regard to such
diseases as cholera and typhoid fever (Table 6.3). Between 2013-2017, cholera cases were only
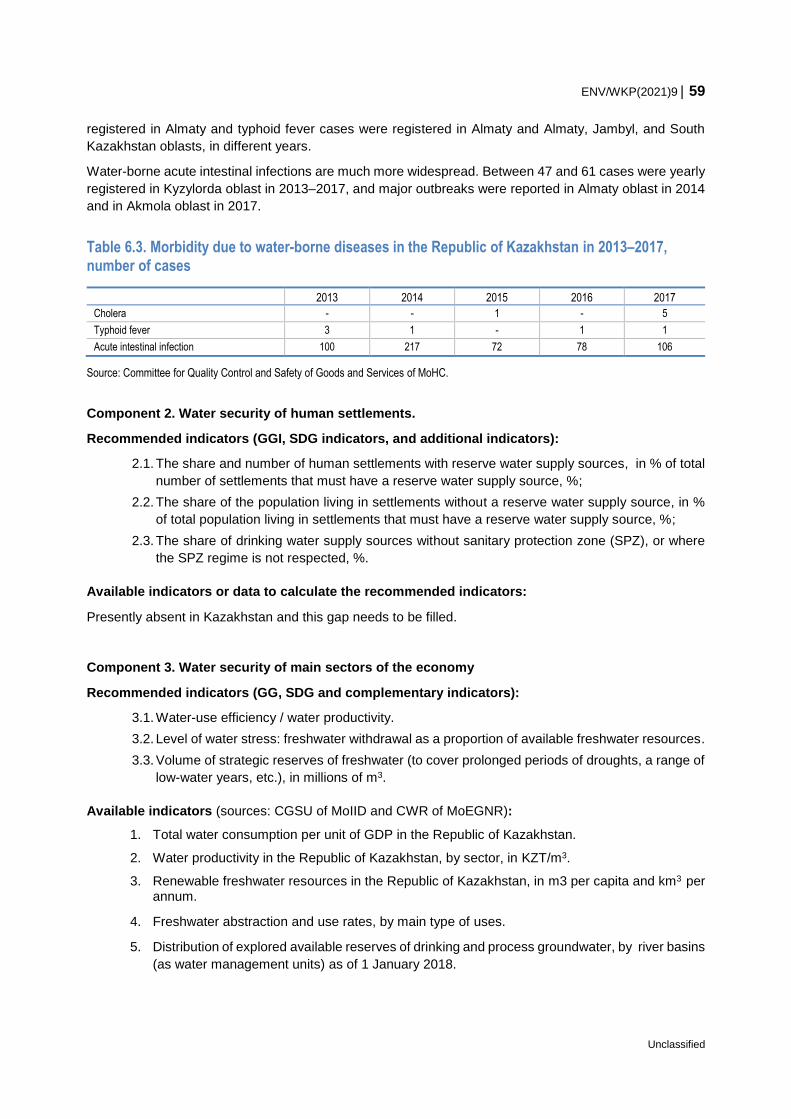
ENV/WKP(2021)9 59
Unclassified
registered in Almaty and typhoid fever cases were registered in Almaty and Almaty, Jambyl, and South
Kazakhstan oblasts, in different years.
Water-borne acute intestinal infections are much more widespread. Between 47 and 61 cases were yearly
registered in Kyzylorda oblast in 2013–2017, and major outbreaks were reported in Almaty oblast in 2014
and in Akmola oblast in 2017.
Table 6.3. Morbidity due to water-borne diseases in the Republic of Kazakhstan in 2013–2017, number of cases
2013 2014 2015 2016 2017
Cholera - - 1 - 5
Typhoid fever 3 1 - 1 1
Acute intestinal infection 100 217 72 78 106
Source: Committee for Quality Control and Safety of Goods and Services of MoHC.
Component 2. Water security of human settlements.
Recommended indicators (GGI, SDG indicators, and additional indicators):
2.1. The share and number of human settlements with reserve water supply sources, in % of total
number of settlements that must have a reserve water supply source, %;
2.2. The share of the population living in settlements without a reserve water supply source, in %
of total population living in settlements that must have a reserve water supply source, %;
2.3. The share of drinking water supply sources without sanitary protection zone (SPZ), or where
the SPZ regime is not respected, %.
Available indicators or data to calculate the recommended indicators:
Presently absent in Kazakhstan and this gap needs to be filled.
Component 3. Water security of main sectors of the economy
Recommended indicators (GG, SDG and complementary indicators):
3.1. Water-use efficiency / water productivity.
3.2. Level of water stress: freshwater withdrawal as a proportion of available freshwater resources.
3.3. Volume of strategic reserves of freshwater (to cover prolonged periods of droughts, a range of
low-water years, etc.), in millions of m3.
Available indicators (sources: CGSU of MoIID and CWR of MoEGNR):
1. Total water consumption per unit of GDP in the Republic of Kazakhstan.
2. Water productivity in the Republic of Kazakhstan, by sector, in KZT/m3.
3. Renewable freshwater resources in the Republic of Kazakhstan, in m3 per capita and km3 per annum.
4. Freshwater abstraction and use rates, by main type of uses.
5. Distribution of explored available reserves of drinking and process groundwater, by river basins
(as water management units) as of 1 January 2018.
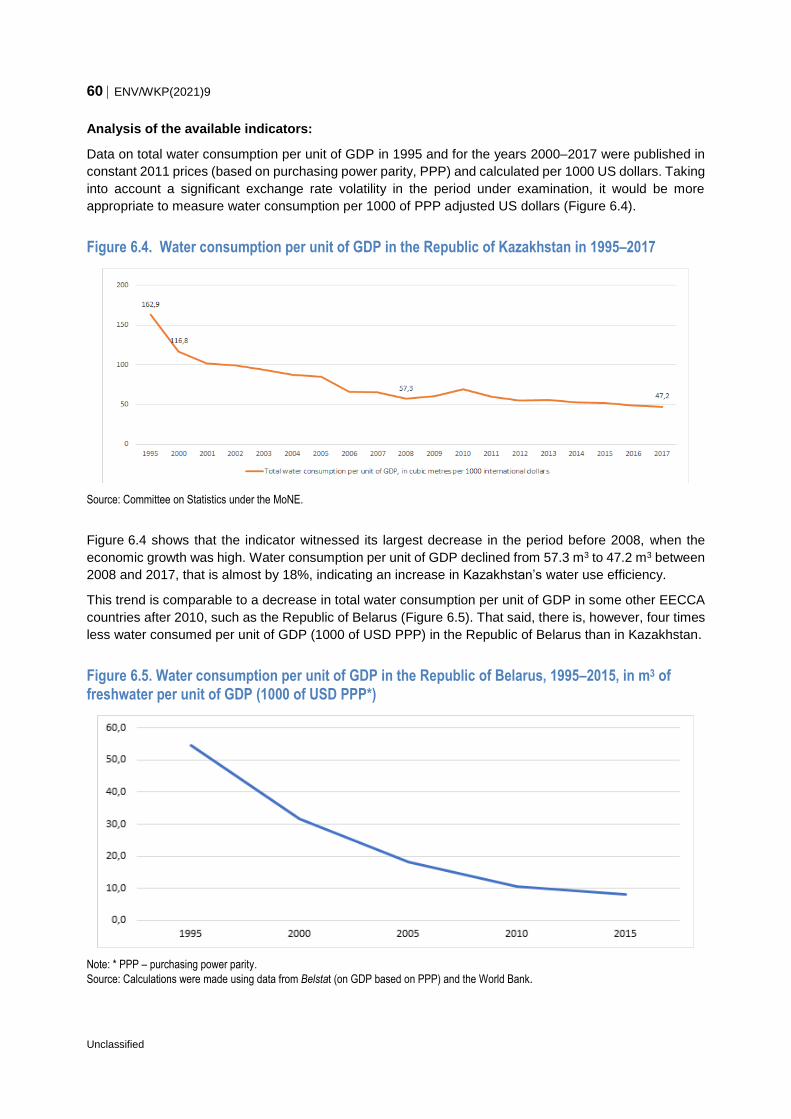
60 ENV/WKP(2021)9
Unclassified
Analysis of the available indicators:
Data on total water consumption per unit of GDP in 1995 and for the years 2000–2017 were published in
constant 2011 prices (based on purchasing power parity, PPP) and calculated per 1000 US dollars. Taking
into account a significant exchange rate volatility in the period under examination, it would be more
appropriate to measure water consumption per 1000 of PPP adjusted US dollars (Figure 6.4).
Figure 6.4. Water consumption per unit of GDP in the Republic of Kazakhstan in 1995–2017
Source: Committee on Statistics under the MoNE.
Figure 6.4 shows that the indicator witnessed its largest decrease in the period before 2008, when the
economic growth was high. Water consumption per unit of GDP declined from 57.3 m3 to 47.2 m3 between
2008 and 2017, that is almost by 18%, indicating an increase in Kazakhstan’s water use efficiency.
This trend is comparable to a decrease in total water consumption per unit of GDP in some other EECCA
countries after 2010, such as the Republic of Belarus (Figure 6.5). That said, there is, however, four times
less water consumed per unit of GDP (1000 of USD PPP) in the Republic of Belarus than in Kazakhstan.
Figure 6.5. Water consumption per unit of GDP in the Republic of Belarus, 1995–2015, in m3 of freshwater per unit of GDP (1000 of USD PPP*)
Note: * PPP – purchasing power parity.
Source: Calculations were made using data from Belstat (on GDP based on PPP) and the World Bank.
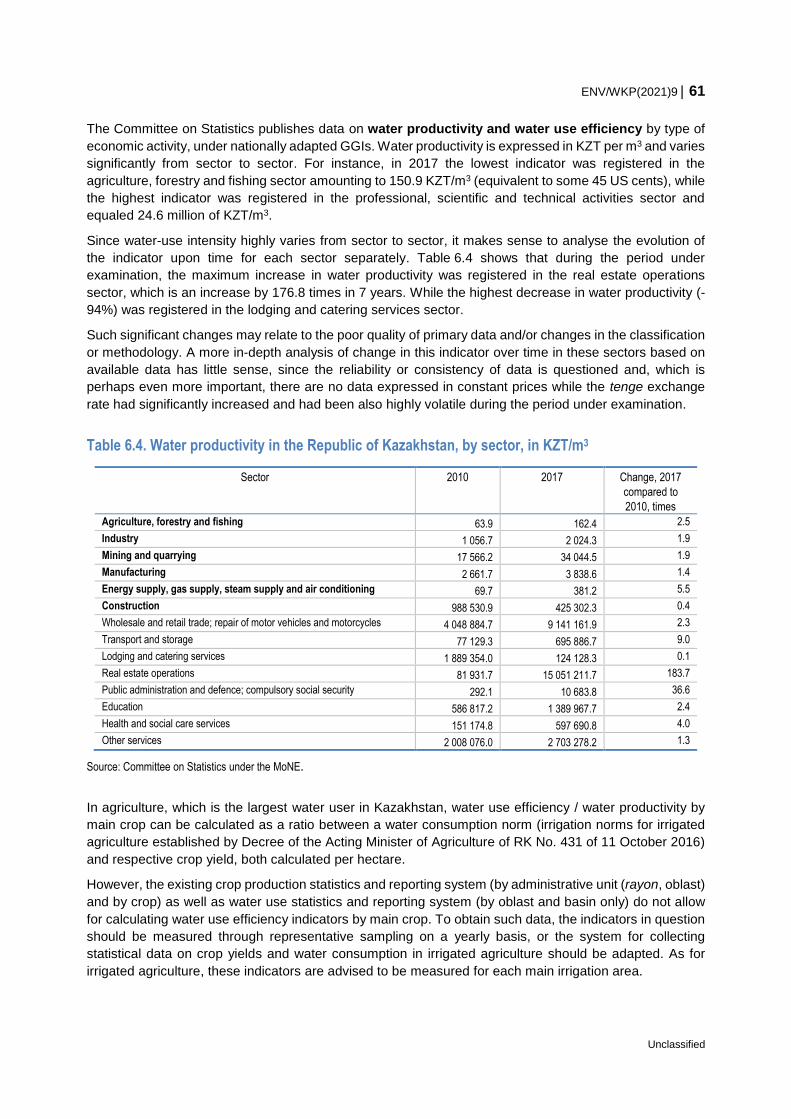
ENV/WKP(2021)9 61
Unclassified
The Committee on Statistics publishes data on water productivity and water use efficiency by type of
economic activity, under nationally adapted GGIs. Water productivity is expressed in KZT per m3 and varies
significantly from sector to sector. For instance, in 2017 the lowest indicator was registered in the
agriculture, forestry and fishing sector amounting to 150.9 KZT/m3 (equivalent to some 45 US cents), while
the highest indicator was registered in the professional, scientific and technical activities sector and
equaled 24.6 million of KZT/m3.
Since water-use intensity highly varies from sector to sector, it makes sense to analyse the evolution of
the indicator upon time for each sector separately. Table 6.4 shows that during the period under
examination, the maximum increase in water productivity was registered in the real estate operations
sector, which is an increase by 176.8 times in 7 years. While the highest decrease in water productivity (-
94%) was registered in the lodging and catering services sector.
Such significant changes may relate to the poor quality of primary data and/or changes in the classification
or methodology. A more in-depth analysis of change in this indicator over time in these sectors based on
available data has little sense, since the reliability or consistency of data is questioned and, which is
perhaps even more important, there are no data expressed in constant prices while the tenge exchange
rate had significantly increased and had been also highly volatile during the period under examination.
Table 6.4. Water productivity in the Republic of Kazakhstan, by sector, in KZT/m3
Sector 2010 2017 Change, 2017
compared to
2010, times
Agriculture, forestry and fishing 63.9 162.4 2.5
Industry 1 056.7 2 024.3 1.9
Mining and quarrying 17 566.2 34 044.5 1.9
Manufacturing 2 661.7 3 838.6 1.4
Energy supply, gas supply, steam supply and air conditioning 69.7 381.2 5.5
Construction 988 530.9 425 302.3 0.4
Wholesale and retail trade; repair of motor vehicles and motorcycles 4 048 884.7 9 141 161.9 2.3
Transport and storage 77 129.3 695 886.7 9.0
Lodging and catering services 1 889 354.0 124 128.3 0.1
Real estate operations 81 931.7 15 051 211.7 183.7
Public administration and defence; compulsory social security 292.1 10 683.8 36.6
Education 586 817.2 1 389 967.7 2.4
Health and social care services 151 174.8 597 690.8 4.0
Other services 2 008 076.0 2 703 278.2 1.3
Source: Committee on Statistics under the MoNE.
In agriculture, which is the largest water user in Kazakhstan, water use efficiency / water productivity by
main crop can be calculated as a ratio between a water consumption norm (irrigation norms for irrigated
agriculture established by Decree of the Acting Minister of Agriculture of RK No. 431 of 11 October 2016)
and respective crop yield, both calculated per hectare.
However, the existing crop production statistics and reporting system (by administrative unit (rayon, oblast)
and by crop) as well as water use statistics and reporting system (by oblast and basin only) do not allow
for calculating water use efficiency indicators by main crop. To obtain such data, the indicators in question
should be measured through representative sampling on a yearly basis, or the system for collecting
statistical data on crop yields and water consumption in irrigated agriculture should be adapted. As for
irrigated agriculture, these indicators are advised to be measured for each main irrigation area.
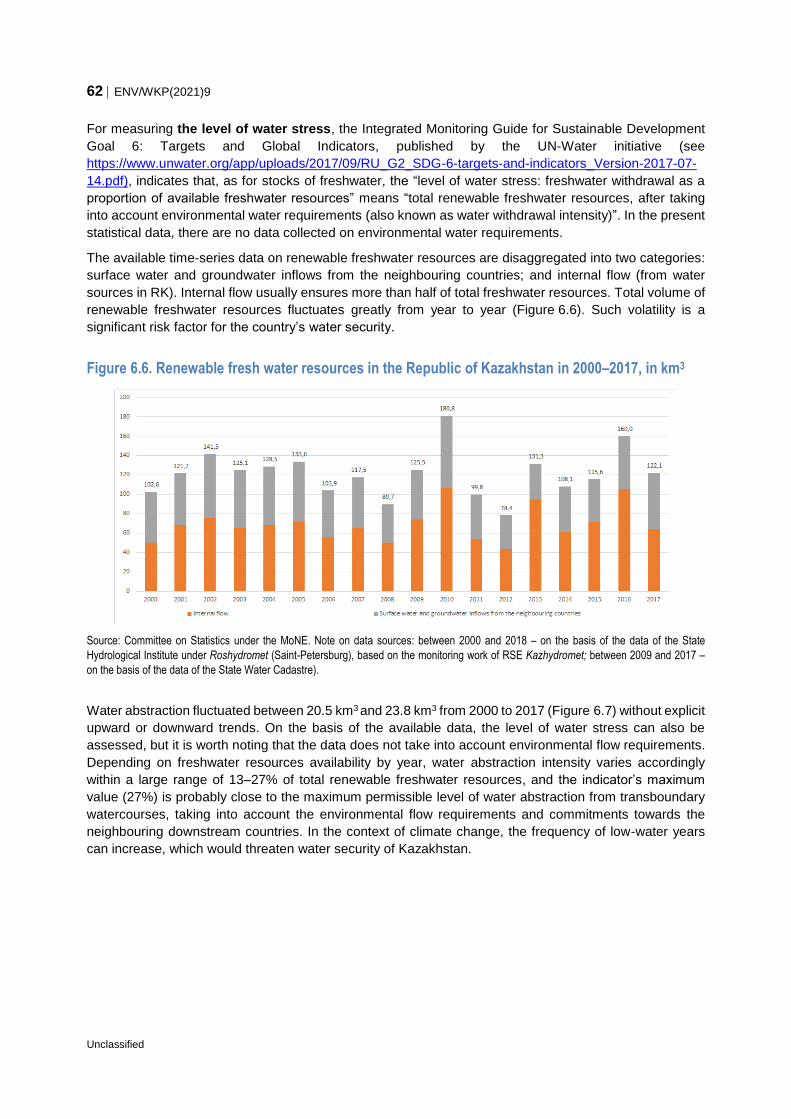
62 ENV/WKP(2021)9
Unclassified
For measuring the level of water stress, the Integrated Monitoring Guide for Sustainable Development
Goal 6: Targets and Global Indicators, published by the UN-Water initiative (see
https://www.unwater.org/app/uploads/2017/09/RU_G2_SDG-6-targets-and-indicators_Version-2017-07-
14.pdf), indicates that, as for stocks of freshwater, the “level of water stress: freshwater withdrawal as a
proportion of available freshwater resources” means “total renewable freshwater resources, after taking
into account environmental water requirements (also known as water withdrawal intensity)”. In the present
statistical data, there are no data collected on environmental water requirements.
The available time-series data on renewable freshwater resources are disaggregated into two categories:
surface water and groundwater inflows from the neighbouring countries; and internal flow (from water
sources in RK). Internal flow usually ensures more than half of total freshwater resources. Total volume of
renewable freshwater resources fluctuates greatly from year to year (Figure 6.6). Such volatility is a
significant risk factor for the country’s water security.
Figure 6.6. Renewable fresh water resources in the Republic of Kazakhstan in 2000–2017, in km3
Source: Committee on Statistics under the MoNE. Note on data sources: between 2000 and 2018 – on the basis of the data of the State
Hydrological Institute under Roshydromet (Saint-Petersburg), based on the monitoring work of RSE Kazhydromet; between 2009 and 2017 –
on the basis of the data of the State Water Cadastre).
Water abstraction fluctuated between 20.5 km3 and 23.8 km3 from 2000 to 2017 (Figure 6.7) without explicit
upward or downward trends. On the basis of the available data, the level of water stress can also be
assessed, but it is worth noting that the data does not take into account environmental flow requirements.
Depending on freshwater resources availability by year, water abstraction intensity varies accordingly
within a large range of 13–27% of total renewable freshwater resources, and the indicator’s maximum
value (27%) is probably close to the maximum permissible level of water abstraction from transboundary
watercourses, taking into account the environmental flow requirements and commitments towards the
neighbouring downstream countries. In the context of climate change, the frequency of low-water years
can increase, which would threaten water security of Kazakhstan.
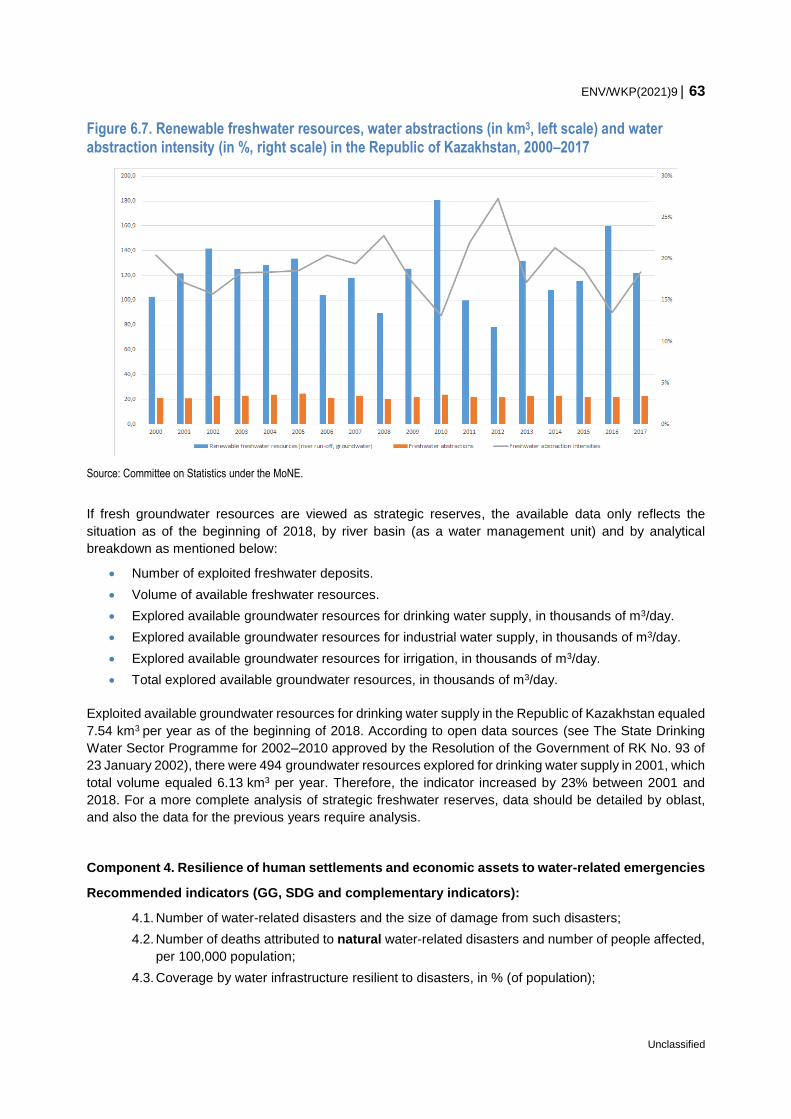
ENV/WKP(2021)9 63
Unclassified
Figure 6.7. Renewable freshwater resources, water abstractions (in km3, left scale) and water abstraction intensity (in %, right scale) in the Republic of Kazakhstan, 2000–2017
Source: Committee on Statistics under the MoNE.
If fresh groundwater resources are viewed as strategic reserves, the available data only reflects the
situation as of the beginning of 2018, by river basin (as a water management unit) and by analytical
breakdown as mentioned below:
Number of exploited freshwater deposits.
Volume of available freshwater resources.
Explored available groundwater resources for drinking water supply, in thousands of m3/day.
Explored available groundwater resources for industrial water supply, in thousands of m3/day.
Explored available groundwater resources for irrigation, in thousands of m3/day.
Total explored available groundwater resources, in thousands of m3/day.
Exploited available groundwater resources for drinking water supply in the Republic of Kazakhstan equaled
7.54 km3 per year as of the beginning of 2018. According to open data sources (see The State Drinking
Water Sector Programme for 2002–2010 approved by the Resolution of the Government of RK No. 93 of
23 January 2002), there were 494 groundwater resources explored for drinking water supply in 2001, which
total volume equaled 6.13 km3 per year. Therefore, the indicator increased by 23% between 2001 and
2018. For a more complete analysis of strategic freshwater reserves, data should be detailed by oblast,
and also the data for the previous years require analysis.
Component 4. Resilience of human settlements and economic assets to water-related emergencies
Recommended indicators (GG, SDG and complementary indicators):
4.1. Number of water-related disasters and the size of damage from such disasters;
4.2. Number of deaths attributed to natural water-related disasters and number of people affected,
per 100,000 population;
4.3. Coverage by water infrastructure resilient to disasters, in % (of population);
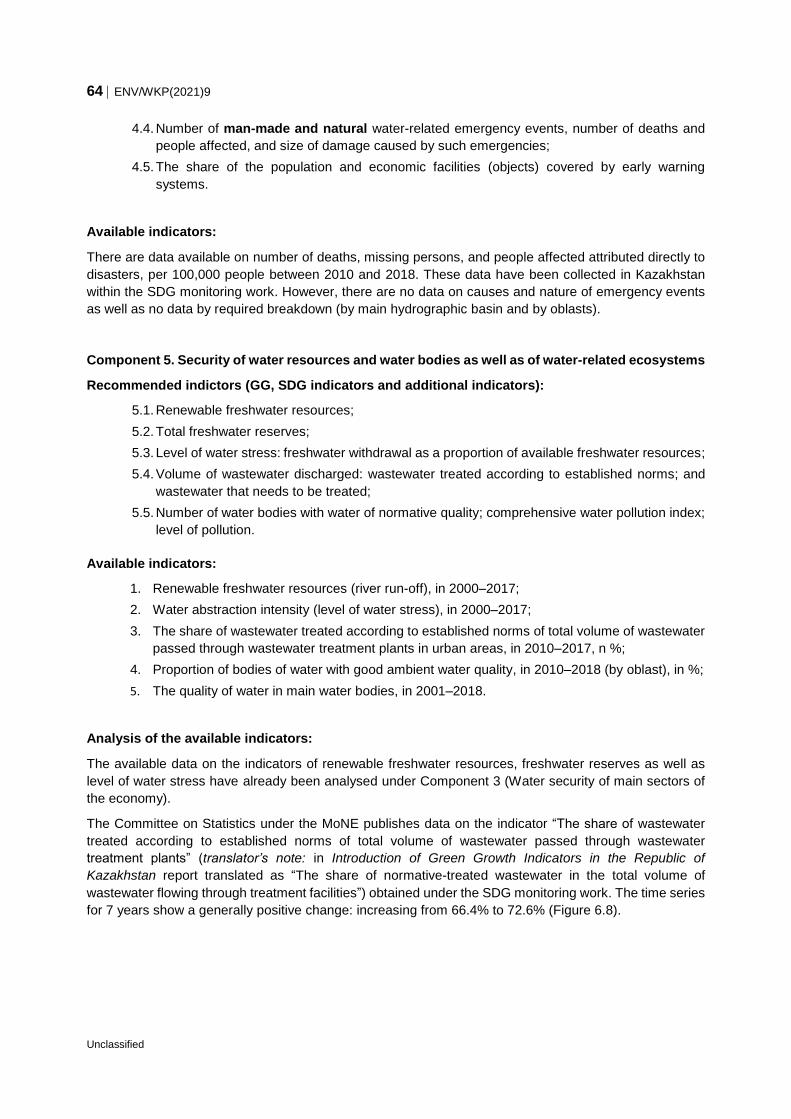
64 ENV/WKP(2021)9
Unclassified
4.4. Number of man-made and natural water-related emergency events, number of deaths and
people affected, and size of damage caused by such emergencies;
4.5. The share of the population and economic facilities (objects) covered by early warning
systems.
Available indicators:
There are data available on number of deaths, missing persons, and people affected attributed directly to
disasters, per 100,000 people between 2010 and 2018. These data have been collected in Kazakhstan
within the SDG monitoring work. However, there are no data on causes and nature of emergency events
as well as no data by required breakdown (by main hydrographic basin and by oblasts).
Component 5. Security of water resources and water bodies as well as of water-related ecosystems
Recommended indictors (GG, SDG indicators and additional indicators):
5.1. Renewable freshwater resources;
5.2. Total freshwater reserves;
5.3. Level of water stress: freshwater withdrawal as a proportion of available freshwater resources;
5.4. Volume of wastewater discharged: wastewater treated according to established norms; and
wastewater that needs to be treated;
5.5. Number of water bodies with water of normative quality; comprehensive water pollution index;
level of pollution.
Available indicators:
1. Renewable freshwater resources (river run-off), in 2000–2017;
2. Water abstraction intensity (level of water stress), in 2000–2017;
3. The share of wastewater treated according to established norms of total volume of wastewater
passed through wastewater treatment plants in urban areas, in 2010–2017, n %;
4. Proportion of bodies of water with good ambient water quality, in 2010–2018 (by oblast), in %;
5. The quality of water in main water bodies, in 2001–2018.
Analysis of the available indicators:
The available data on the indicators of renewable freshwater resources, freshwater reserves as well as
level of water stress have already been analysed under Component 3 (Water security of main sectors of
the economy).
The Committee on Statistics under the MoNE publishes data on the indicator “The share of wastewater
treated according to established norms of total volume of wastewater passed through wastewater
treatment plants” (translator’s note: in Introduction of Green Growth Indicators in the Republic of
Kazakhstan report translated as “The share of normative-treated wastewater in the total volume of
wastewater flowing through treatment facilities”) obtained under the SDG monitoring work. The time series
for 7 years show a generally positive change: increasing from 66.4% to 72.6% (Figure 6.8).
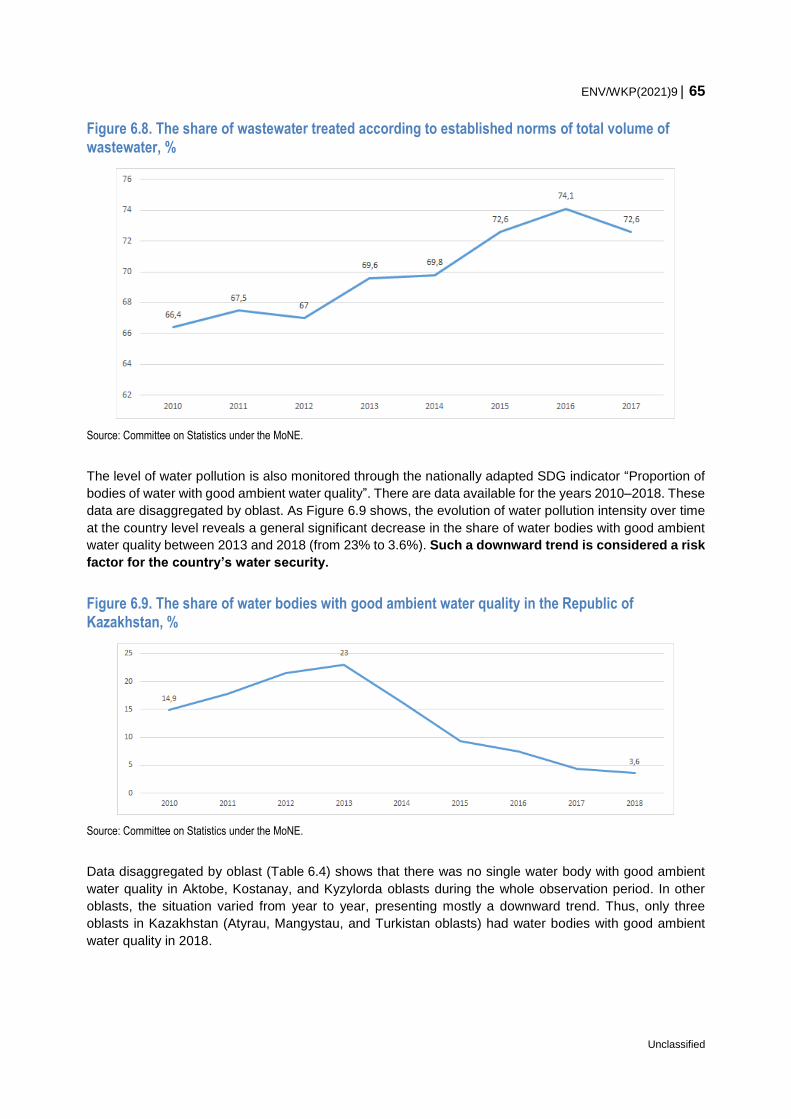
ENV/WKP(2021)9 65
Unclassified
Figure 6.8. The share of wastewater treated according to established norms of total volume of wastewater, %
Source: Committee on Statistics under the MoNE.
The level of water pollution is also monitored through the nationally adapted SDG indicator “Proportion of
bodies of water with good ambient water quality”. There are data available for the years 2010–2018. These
data are disaggregated by oblast. As Figure 6.9 shows, the evolution of water pollution intensity over time
at the country level reveals a general significant decrease in the share of water bodies with good ambient
water quality between 2013 and 2018 (from 23% to 3.6%). Such a downward trend is considered a risk
factor for the country’s water security.
Figure 6.9. The share of water bodies with good ambient water quality in the Republic of Kazakhstan, %
Source: Committee on Statistics under the MoNE.
Data disaggregated by oblast (Table 6.4) shows that there was no single water body with good ambient
water quality in Aktobe, Kostanay, and Kyzylorda oblasts during the whole observation period. In other
oblasts, the situation varied from year to year, presenting mostly a downward trend. Thus, only three
oblasts in Kazakhstan (Atyrau, Mangystau, and Turkistan oblasts) had water bodies with good ambient
water quality in 2018.
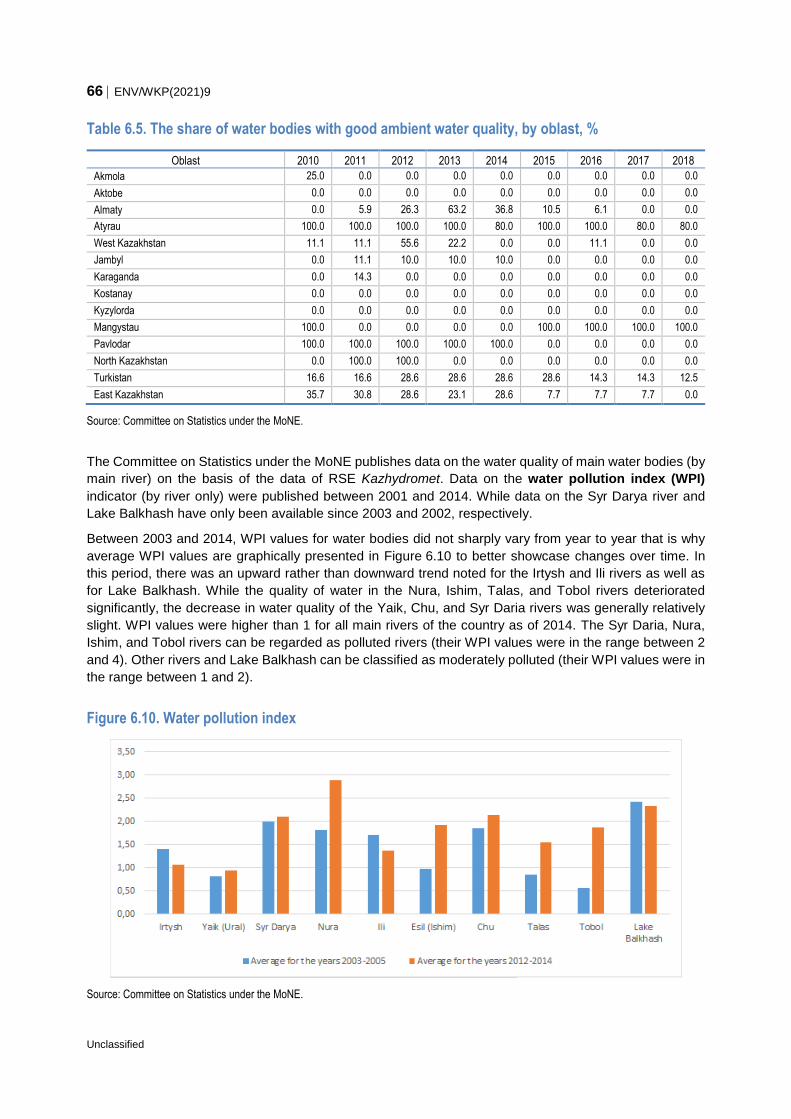
66 ENV/WKP(2021)9
Unclassified
Table 6.5. The share of water bodies with good ambient water quality, by oblast, %
Oblast 2010 2011 2012 2013 2014 2015 2016 2017 2018
Akmola 25.0 0.0 0.0 0.0 0.0 0.0 0.0 0.0 0.0
Aktobe 0.0 0.0 0.0 0.0 0.0 0.0 0.0 0.0 0.0
Almaty 0.0 5.9 26.3 63.2 36.8 10.5 6.1 0.0 0.0
Atyrau 100.0 100.0 100.0 100.0 80.0 100.0 100.0 80.0 80.0
West Kazakhstan 11.1 11.1 55.6 22.2 0.0 0.0 11.1 0.0 0.0
Jambyl 0.0 11.1 10.0 10.0 10.0 0.0 0.0 0.0 0.0
Karaganda 0.0 14.3 0.0 0.0 0.0 0.0 0.0 0.0 0.0
Kostanay 0.0 0.0 0.0 0.0 0.0 0.0 0.0 0.0 0.0
Kyzylorda 0.0 0.0 0.0 0.0 0.0 0.0 0.0 0.0 0.0
Mangystau 100.0 0.0 0.0 0.0 0.0 100.0 100.0 100.0 100.0
Pavlodar 100.0 100.0 100.0 100.0 100.0 0.0 0.0 0.0 0.0
North Kazakhstan 0.0 100.0 100.0 0.0 0.0 0.0 0.0 0.0 0.0
Turkistan 16.6 16.6 28.6 28.6 28.6 28.6 14.3 14.3 12.5
East Kazakhstan 35.7 30.8 28.6 23.1 28.6 7.7 7.7 7.7 0.0
Source: Committee on Statistics under the MoNE.
The Committee on Statistics under the MoNE publishes data on the water quality of main water bodies (by
main river) on the basis of the data of RSE Kazhydromet. Data on the water pollution index (WPI)
indicator (by river only) were published between 2001 and 2014. While data on the Syr Darya river and
Lake Balkhash have only been available since 2003 and 2002, respectively.
Between 2003 and 2014, WPI values for water bodies did not sharply vary from year to year that is why
average WPI values are graphically presented in Figure 6.10 to better showcase changes over time. In
this period, there was an upward rather than downward trend noted for the Irtysh and Ili rivers as well as
for Lake Balkhash. While the quality of water in the Nura, Ishim, Talas, and Tobol rivers deteriorated
significantly, the decrease in water quality of the Yaik, Chu, and Syr Daria rivers was generally relatively
slight. WPI values were higher than 1 for all main rivers of the country as of 2014. The Syr Daria, Nura,
Ishim, and Tobol rivers can be regarded as polluted rivers (their WPI values were in the range between 2
and 4). Other rivers and Lake Balkhash can be classified as moderately polluted (their WPI values were in
the range between 1 and 2).
Figure 6.10. Water pollution index
Source: Committee on Statistics under the MoNE.
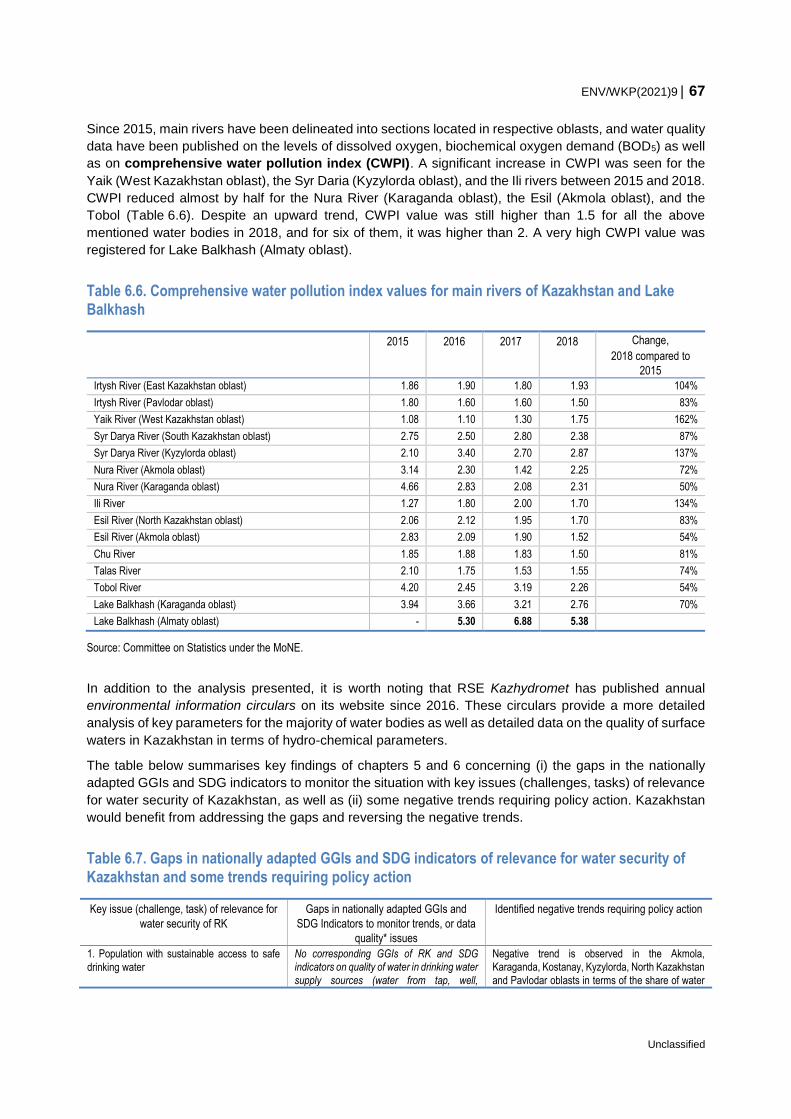
ENV/WKP(2021)9 67
Unclassified
Since 2015, main rivers have been delineated into sections located in respective oblasts, and water quality
data have been published on the levels of dissolved oxygen, biochemical oxygen demand (BOD5) as well
as on comprehensive water pollution index (CWPI). A significant increase in CWPI was seen for the
Yaik (West Kazakhstan oblast), the Syr Daria (Kyzylorda oblast), and the Ili rivers between 2015 and 2018.
CWPI reduced almost by half for the Nura River (Karaganda oblast), the Esil (Akmola oblast), and the
Tobol (Table 6.6). Despite an upward trend, CWPI value was still higher than 1.5 for all the above
mentioned water bodies in 2018, and for six of them, it was higher than 2. A very high CWPI value was
registered for Lake Balkhash (Almaty oblast).
Table 6.6. Comprehensive water pollution index values for main rivers of Kazakhstan and Lake Balkhash
2015 2016 2017 2018 Change,
2018 compared to
2015
Irtysh River (East Kazakhstan oblast) 1.86 1.90 1.80 1.93 104%
Irtysh River (Pavlodar oblast) 1.80 1.60 1.60 1.50 83%
Yaik River (West Kazakhstan oblast) 1.08 1.10 1.30 1.75 162%
Syr Darya River (South Kazakhstan oblast) 2.75 2.50 2.80 2.38 87%
Syr Darya River (Kyzylorda oblast) 2.10 3.40 2.70 2.87 137%
Nura River (Akmola oblast) 3.14 2.30 1.42 2.25 72%
Nura River (Karaganda oblast) 4.66 2.83 2.08 2.31 50%
Ili River 1.27 1.80 2.00 1.70 134%
Esil River (North Kazakhstan oblast) 2.06 2.12 1.95 1.70 83%
Esil River (Akmola oblast) 2.83 2.09 1.90 1.52 54%
Chu River 1.85 1.88 1.83 1.50 81%
Talas River 2.10 1.75 1.53 1.55 74%
Tobol River 4.20 2.45 3.19 2.26 54%
Lake Balkhash (Karaganda oblast) 3.94 3.66 3.21 2.76 70%
Lake Balkhash (Almaty oblast) - 5.30 6.88 5.38
Source: Committee on Statistics under the MoNE.
In addition to the analysis presented, it is worth noting that RSE Kazhydromet has published annual
environmental information circulars on its website since 2016. These circulars provide a more detailed
analysis of key parameters for the majority of water bodies as well as detailed data on the quality of surface
waters in Kazakhstan in terms of hydro-chemical parameters.
The table below summarises key findings of chapters 5 and 6 concerning (i) the gaps in the nationally
adapted GGIs and SDG indicators to monitor the situation with key issues (challenges, tasks) of relevance
for water security of Kazakhstan, as well as (ii) some negative trends requiring policy action. Kazakhstan
would benefit from addressing the gaps and reversing the negative trends.
Table 6.7. Gaps in nationally adapted GGIs and SDG indicators of relevance for water security of
Kazakhstan and some trends requiring policy action
Key issue (challenge, task) of relevance for
water security of RK
Gaps in nationally adapted GGIs and
SDG Indicators to monitor trends, or data
quality* issues
Identified negative trends requiring policy action
1. Population with sustainable access to safe
drinking water
No corresponding GGIs of RK and SDG indicators on quality of water in drinking water
supply sources (water from tap, well,
Negative trend is observed in the Akmola, Karaganda, Kostanay, Kyzylorda, North Kazakhstan
and Pavlodar oblasts in terms of the share of water
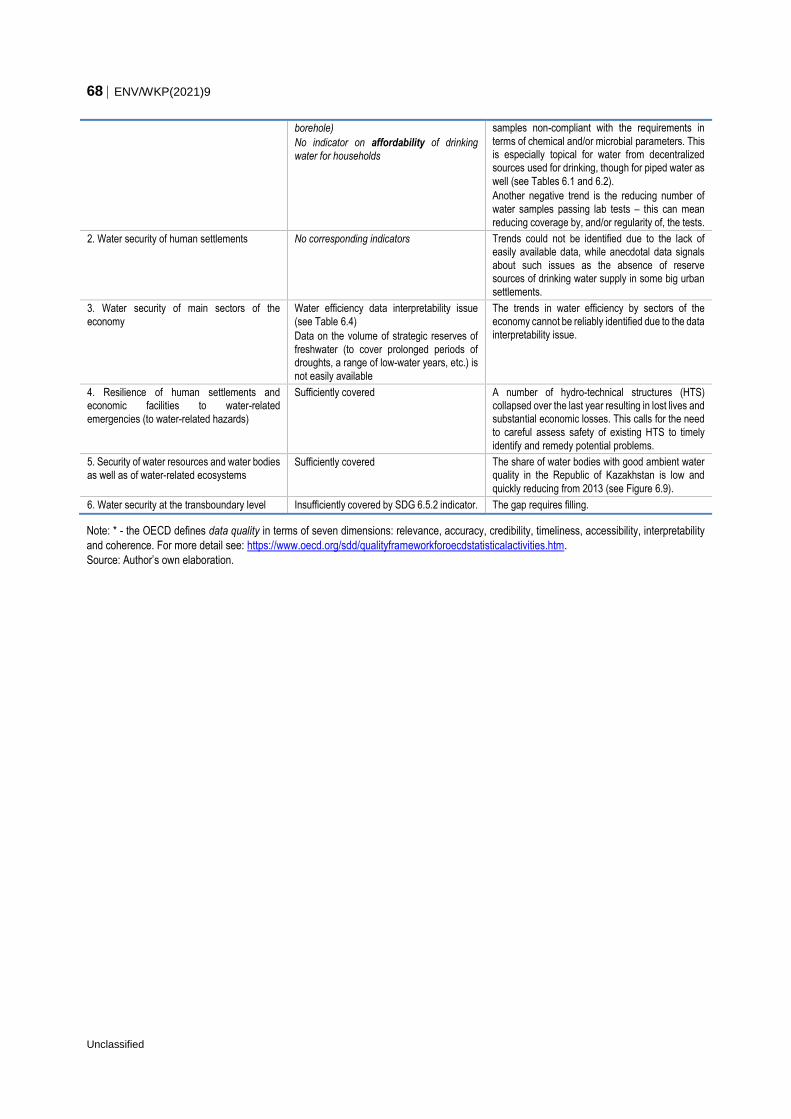
68 ENV/WKP(2021)9
Unclassified
borehole)
No indicator on affordability of drinking
water for households
samples non-compliant with the requirements in
terms of chemical and/or microbial parameters. This is especially topical for water from decentralized sources used for drinking, though for piped water as
well (see Tables 6.1 and 6.2).
Another negative trend is the reducing number of
water samples passing lab tests – this can mean
reducing coverage by, and/or regularity of, the tests.
2. Water security of human settlements No corresponding indicators Trends could not be identified due to the lack of easily available data, while anecdotal data signals
about such issues as the absence of reserve sources of drinking water supply in some big urban
settlements.
3. Water security of main sectors of the
economy
Water efficiency data interpretability issue
(see Table 6.4)
Data on the volume of strategic reserves of
freshwater (to cover prolonged periods of droughts, a range of low-water years, etc.) is
not easily available
The trends in water efficiency by sectors of the economy cannot be reliably identified due to the data
interpretability issue.
4. Resilience of human settlements and economic facilities to water-related
emergencies (to water-related hazards)
Sufficiently covered A number of hydro-technical structures (HTS) collapsed over the last year resulting in lost lives and substantial economic losses. This calls for the need
to careful assess safety of existing HTS to timely
identify and remedy potential problems.
5. Security of water resources and water bodies
as well as of water-related ecosystems Sufficiently covered The share of water bodies with good ambient water
quality in the Republic of Kazakhstan is low and
quickly reducing from 2013 (see Figure 6.9).
6. Water security at the transboundary level Insufficiently covered by SDG 6.5.2 indicator. The gap requires filling.
Note: * - the OECD defines data quality in terms of seven dimensions: relevance, accuracy, credibility, timeliness, accessibility, interpretability
and coherence. For more detail see: https://www.oecd.org/sdd/qualityframeworkforoecdstatisticalactivities.htm.
Source: Author’s own elaboration.
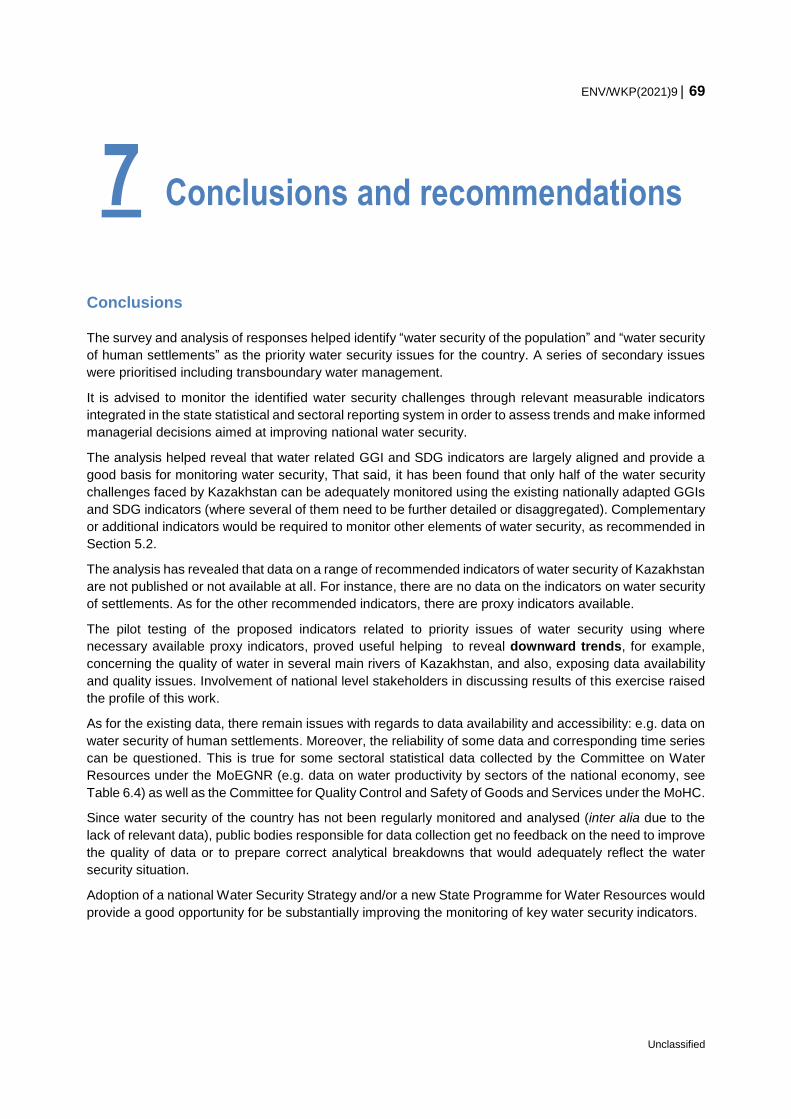
ENV/WKP(2021)9 69
Unclassified
Conclusions
The survey and analysis of responses helped identify “water security of the population” and “water security
of human settlements” as the priority water security issues for the country. A series of secondary issues
were prioritised including transboundary water management.
It is advised to monitor the identified water security challenges through relevant measurable indicators
integrated in the state statistical and sectoral reporting system in order to assess trends and make informed
managerial decisions aimed at improving national water security.
The analysis helped reveal that water related GGI and SDG indicators are largely aligned and provide a
good basis for monitoring water security, That said, it has been found that only half of the water security
challenges faced by Kazakhstan can be adequately monitored using the existing nationally adapted GGIs
and SDG indicators (where several of them need to be further detailed or disaggregated). Complementary
or additional indicators would be required to monitor other elements of water security, as recommended in
Section 5.2.
The analysis has revealed that data on a range of recommended indicators of water security of Kazakhstan
are not published or not available at all. For instance, there are no data on the indicators on water security
of settlements. As for the other recommended indicators, there are proxy indicators available.
The pilot testing of the proposed indicators related to priority issues of water security using where
necessary available proxy indicators, proved useful helping to reveal downward trends, for example,
concerning the quality of water in several main rivers of Kazakhstan, and also, exposing data availability
and quality issues. Involvement of national level stakeholders in discussing results of this exercise raised
the profile of this work.
As for the existing data, there remain issues with regards to data availability and accessibility: e.g. data on
water security of human settlements. Moreover, the reliability of some data and corresponding time series
can be questioned. This is true for some sectoral statistical data collected by the Committee on Water
Resources under the MoEGNR (e.g. data on water productivity by sectors of the national economy, see
Table 6.4) as well as the Committee for Quality Control and Safety of Goods and Services under the MoHC.
Since water security of the country has not been regularly monitored and analysed (inter alia due to the
lack of relevant data), public bodies responsible for data collection get no feedback on the need to improve
the quality of data or to prepare correct analytical breakdowns that would adequately reflect the water
security situation.
Adoption of a national Water Security Strategy and/or a new State Programme for Water Resources would
provide a good opportunity for be substantially improving the monitoring of key water security indicators.
7 Conclusions and recommendations
70 ENV/WKP(2021)9
Unclassified
Recommendations on improving monitoring of nationally adapted indicators of
water security
This report provides the following recommendations. They concern:
revising existing and adopting new (presently missing) indicators of water security, and revising
roles and responsibilities of key agencies for individual indicators;
improving data collection and reporting systems; and
integrating the indicators in relevant policy documents, strategies and plans.
Firstly, Kazakhstan would benefit from regularly collecting data and monitoring the recommended priority
indicators that reflect most problematic issues of water security of the country. To do so, amendments
and additions should be introduced into the state statistical and sectoral reporting, and/or targeted
statistical surveys should be carried out to collect the necessary information. This work should be funded
from the national budget.
It is recommended to establish a permanent government body that will be responsible for:
1. Coordinating the actors involved in collecting data related to water security;
2. Monitoring, publishing and analysing data on national indicators of water security.
Therefore, the following actions are recommended in order to improve the collection of data on problematic
elements and indicators of water security of Kazakhstan:
1. On the basis of the analysis conducted, examine the possibility to collect the required missing data and elaborate policy documents needed to fine-tune data collection;
2. Assess the methodology and process of collecting statistical data in order to eliminate possible errors and improve data quality;
3. Develop tools for automated data collection and aggregation to support regular data exchange;
4. Create a dedicated web-page on the website of the Committee on Statistics under the MoNE and a separate web portal for aggregation of the dataset required to monitor the country’s water security.
At the same time, it is advised to consider the possibility to integrate the recommended set of priority
indicators of national water security into strategic documents on water policy to 2030 that are currently
under development.
One of the key issues with regard to data collection for monitoring national indicators of water security
would be the necessity to coordinate several government bodies that have different resources and
technical capabilities to collect required data. A list of the actors involved in the process is presented below:
The Committee on Water Resources, the Committee of Geology and Subsoil Use, and RSE
Kazhydromet under the MoEGNR;
The Committee for Construction, Housing and Utility Services under the MoIID;
The Committee on Public Health Protection and the Committee for Quality Control and Safety of
Goods and Services under the MoHC;
The Committee for Emergency Situations under the MoIA;
The Committee on Statistics under the MoNE.
To date, some actors are better prepared and equipped to collect and publish reliable statistical data than
others. For instance, RSE Kazhydromet publishes detailed data on water pollution.
ENV/WKP(2021)9 71
Unclassified
At the same time, it has been revealed that some sectoral statistical data of the Committee on Water
Resources under the MoEGNR and the Committee for Quality Control and Safety of Goods and Services
under the MoHC are not readily available or open.
Implementation of the suggested recommendations would strengthen the information base for sound
decision-making aimed at improving problematic aspects of water security as well as strengthen the water
security of the country as a whole.

72 ENV/WKP(2021)9
Unclassified
References
OECD (2019), Introduction of Green Growth Indicators in the Republic of Kazakhstan. [3]
OECD (2017), Green Growth Indicators 2017, OECD, http://dx.doi.org/10.1787/9789264268586-
en.
[2]
OECD (2014), The OECD Green Growth Measurement Framework and Indicators, OECD
Publishing, http://dx.doi.org/10.1787/9789264202030-4-en.
[1]
President (2013), Decree of the President of Republic of Kazakhstan No. 577 of 30 May,
https://online.zakon.kz/Document/?doc_id=31399596.
[4]