Urban agriculture, poverty, and food security: Empirical evidence from a sample of developing...
9
Urban agriculture, poverty, and food security: Empirical evidence from a sample of developing countries Alberto Zezza * , Luca Tasciotti Agricultural Development Economics Division, Food and Agriculture Organization (FAO), Viale delle Terme di Caracalla, 00153 Rome, Italy article info Article history: Received 19 August 2009 Received in revised form 15 April 2010 Accepted 20 April 2010 Keywords: Urban agriculture Food security Poverty Nutrition Household surveys abstract Urban agriculture may have a role to play in addressing urban food insecurity problems, which are bound to become increasingly important with the secular trend towards the urbanization of poverty and of pop- ulation in developing regions. Our understanding of the importance, nature and food security implica- tions of urban agriculture is however plagued by a lack of good quality, reliable data. While studies based on survey data do exist for several major cities, much of the evidence is still qualitative if not anec- dotal. Using a recently created dataset bringing together comparable, nationally representative house- hold survey data for 15 developing or transition countries, this paper analyzes in a comparative international perspective the importance of urban agriculture for the urban poor and food insecure. Some clear hints do come from our analysis. On the one hand, the potential for urban agriculture to play a sub- stantial role in urban poverty and food insecurity reduction should not be overemphasised, as its share in income and overall agricultural production is often quite limited. On the other hand, though, its role should also not be too easily dismissed, particularly in much of Africa and in all those countries in which agriculture provides a substantial share of income for the urban poor, and for those groups of households to which it constitutes an important source of livelihoods. We also find fairly consistent evidence of a positive statistical association between engagement in urban agriculture and dietary adequacy indicators. Ó 2010 Elsevier Ltd. All rights reserved. Introduction Urban agriculture (UA) is defined as the production of crop and livestock goods within cities and towns. According to some ac- counts, 200 million people are employed in urban farming and re- lated enterprises, contributing to the food supply of 800 million urban dwellers (UNDP, 1996). In African countries 40% of urban dwellers are said to be engaged in some sort of agricultural activity and this percentage rises to 50% in Latin American countries (see studies quoted in Ruel et al. (1998)). If these numbers are accurate (and they may well not be, as we discuss in this paper), urban agriculture may have a role to play in addressing urban food insecurity problems, which are bound to be- come increasingly important with the secular trend towards the urbanization of poverty and of the overall population in developing regions. Ravallion et al. (2007) estimate that about one-quarter of the developing world’s poor live in urban areas, but also that pov- erty is becoming more urban and the poor are urbanizing faster than the population as a whole. The recent world food price crisis has rendered the importance of understanding and confronting the causes of food insecurity of the urban poor even more apparent. Poor urban dwellers, being largely net food buyers and depending mostly on markets for their food supplies, are particularly vulnerable to adverse food price shocks, and are consistently the group in society that suffers most from higher food prices (Zezza et al., 2008; Dessus et al., 2008). Analyzing the extent to which urban agriculture might help shield the urban poor from some of these shocks becomes therefore a topical policy question. Our understanding of the importance, nature and food security implications of urban agriculture is however hindered by a lack of good quality, reliable data. While studies based on survey data do exist for several major cities, much of the evidence is still qualita- tive if not anecdotal. This paper attempts to fill some of the key re- search gaps in this area, using a recently created dataset bringing together comparable, nationally representative household survey data for 15 developing or transition countries. Exploiting the wealth of data made available by the dataset, the paper analyzes, in a comparative international perspective, the importance of urban agriculture for the urban poor and food insecure. The paper sets out to address two basic research questions: (i) which is the magnitude of urban agriculture, both in terms of 0306-9192/$ - see front matter Ó 2010 Elsevier Ltd. All rights reserved. doi:10.1016/j.foodpol.2010.04.007 * Corresponding author. Tel.: +39 06 570 539 23; fax: +39 06 570 555 22. E-mail addresses: [email protected], [email protected] (A. Zezza), luca. [email protected] (L. Tasciotti). Food Policy 35 (2010) 265–273 Contents lists available at ScienceDirect Food Policy journal homepage: www.elsevier.com/locate/foodpol
-
Upload
independent -
Category
Documents
-
view
1 -
download
0
Transcript of Urban agriculture, poverty, and food security: Empirical evidence from a sample of developing...
Food Policy 35 (2010) 265–273
Contents lists available at ScienceDirect
Food Policy
journal homepage: www.elsevier .com/locate / foodpol
Urban agriculture, poverty, and food security: Empirical evidencefrom a sample of developing countries
Alberto Zezza *, Luca TasciottiAgricultural Development Economics Division, Food and Agriculture Organization (FAO), Viale delle Terme di Caracalla, 00153 Rome, Italy
a r t i c l e i n f o a b s t r a c t
Article history:Received 19 August 2009Received in revised form 15 April 2010Accepted 20 April 2010
Keywords:Urban agricultureFood securityPovertyNutritionHousehold surveys
0306-9192/$ - see front matter � 2010 Elsevier Ltd. Adoi:10.1016/j.foodpol.2010.04.007
* Corresponding author. Tel.: +39 06 570 539 23; faE-mail addresses: [email protected], azezza@h
[email protected] (L. Tasciotti).
Urban agriculture may have a role to play in addressing urban food insecurity problems, which are boundto become increasingly important with the secular trend towards the urbanization of poverty and of pop-ulation in developing regions. Our understanding of the importance, nature and food security implica-tions of urban agriculture is however plagued by a lack of good quality, reliable data. While studiesbased on survey data do exist for several major cities, much of the evidence is still qualitative if not anec-dotal. Using a recently created dataset bringing together comparable, nationally representative house-hold survey data for 15 developing or transition countries, this paper analyzes in a comparativeinternational perspective the importance of urban agriculture for the urban poor and food insecure. Someclear hints do come from our analysis. On the one hand, the potential for urban agriculture to play a sub-stantial role in urban poverty and food insecurity reduction should not be overemphasised, as its share inincome and overall agricultural production is often quite limited. On the other hand, though, its roleshould also not be too easily dismissed, particularly in much of Africa and in all those countries in whichagriculture provides a substantial share of income for the urban poor, and for those groups of householdsto which it constitutes an important source of livelihoods. We also find fairly consistent evidence of apositive statistical association between engagement in urban agriculture and dietary adequacyindicators.
� 2010 Elsevier Ltd. All rights reserved.
Introduction
Urban agriculture (UA) is defined as the production of crop andlivestock goods within cities and towns. According to some ac-counts, 200 million people are employed in urban farming and re-lated enterprises, contributing to the food supply of 800 millionurban dwellers (UNDP, 1996). In African countries 40% of urbandwellers are said to be engaged in some sort of agricultural activityand this percentage rises to 50% in Latin American countries (seestudies quoted in Ruel et al. (1998)).
If these numbers are accurate (and they may well not be, as wediscuss in this paper), urban agriculture may have a role to play inaddressing urban food insecurity problems, which are bound to be-come increasingly important with the secular trend towards theurbanization of poverty and of the overall population in developingregions. Ravallion et al. (2007) estimate that about one-quarter ofthe developing world’s poor live in urban areas, but also that pov-erty is becoming more urban and the poor are urbanizing fasterthan the population as a whole.
ll rights reserved.
x: +39 06 570 555 22.otmail.com (A. Zezza), luca.
The recent world food price crisis has rendered the importanceof understanding and confronting the causes of food insecurity ofthe urban poor even more apparent. Poor urban dwellers, beinglargely net food buyers and depending mostly on markets for theirfood supplies, are particularly vulnerable to adverse food priceshocks, and are consistently the group in society that suffers mostfrom higher food prices (Zezza et al., 2008; Dessus et al., 2008).Analyzing the extent to which urban agriculture might help shieldthe urban poor from some of these shocks becomes therefore atopical policy question.
Our understanding of the importance, nature and food securityimplications of urban agriculture is however hindered by a lack ofgood quality, reliable data. While studies based on survey data doexist for several major cities, much of the evidence is still qualita-tive if not anecdotal. This paper attempts to fill some of the key re-search gaps in this area, using a recently created dataset bringingtogether comparable, nationally representative household surveydata for 15 developing or transition countries. Exploiting thewealth of data made available by the dataset, the paper analyzes,in a comparative international perspective, the importance ofurban agriculture for the urban poor and food insecure.
The paper sets out to address two basic research questions: (i)which is the magnitude of urban agriculture, both in terms of

266 A. Zezza, L. Tasciotti / Food Policy 35 (2010) 265–273
households engaged in agricultural activities and in terms of in-come deriving from it, and (ii) is there evidence of any significantrelationship between urban agriculture on household food secu-rity, dietary diversity and calories intake.
After a brief review of the literature (Section ‘‘The importanceand role of urban agriculture: facts and artefacts. A brief reviewof the literature”), and a discussion of data and definitions, the pa-per sets out to quantify (Section ‘‘Opening the urban agricultureblack box: what the data say”) the importance of urban agriculturein terms of urban households’ participation in agricultural activi-ties; the share of income rural households generate from farming(in particular with reference to the poor); and the relative impor-tance of crop versus livestock production. In Section ‘‘Urban agri-culture and food security”, both descriptive statistics andmultivariate analysis are used to gauge how participation in urbanagriculture impacts dietary diversity and calorie intake. The keyfindings and policy conclusions of the paper are briefly outlinedin the final Section.
The importance and role of urban agriculture: facts andartefacts. A brief review of the literature
Characterising urban agriculture
In this paper urban agriculture is defined as the production ofagricultural goods by urban residents, according to the official def-inition of the urban space utilised by the surveys we work with.Our definition is eminently driven by the definition of ruralityadopted by national governments and reflected in our dataset,and we do not deal with the conceptual definitional issues dis-cussed for instance by Maxwell (2003), FAO (1996) and Ellis andSumberg (1998).
The two main problems with our dataset (further described inthe next section) are (a) the comparability of the definition of ur-ban and rural across countries, and (b) that we have informationon where the household resides, not necessarily on where theiragricultural production is located. In that sense we should bestrictly speaking of ‘agriculture practiced by urban households’.But having made those caveats, we will for simplicity stick to thestandard expression ‘urban agriculture’.1
One of the objectives of this paper is to attempt a rigorous quan-tification of the magnitude of urban agriculture in a reasonablylarge cross-section of countries, responding to the need for more ef-forts in this direction expressed by several of the authors who havecontributed to this literature (Nugent, 2001; Egal et al., 2001; Ellisand Sumberg, 1998). Possibly the most widely cited claim concern-ing urban agriculture is that ‘‘the United Nations Development Pro-gramme estimates that 800 million people are engaged in urbanagriculture world-wide” (Mougeot (2000); but see also Armar-Kle-mesu (2001) and Nelson (1996)). Tracing this source backward intime we arrived at UNDP (1996). Their Table 2.1 reports the follow-ing estimates: 800 million people actively engaged in urban agri-culture, of which 200 million produce goods for market sale, witha full-time job equivalent estimate in production and processingof 150 million jobs. The source of the table is however ‘‘estimatesby the Urban Agriculture Network based on the authors’ experi-ences and observations and extrapolation from data”. The authorsalso caution that their intent is simply to ‘‘present a thumbnailsketch” and that a more systematic estimation would be needed.Unfortunately many of their readers and citers have overlooked thiscaveat and the figures are frequently quoted as hard evidence. Thismay be partly due to the fact that one substantial strand of the lit-erature on urban agriculture is driven by an advocacy objective,
1 We also cannot make any distinction between urban and peri-urban areas.
more than by analytical rigour (Ellis and Sumberg, 1998). A very dif-ferent figure is quoted by FAO (1996), which states (ironically quot-ing again a UNDP publication) that 100 million people areestimated to earn some income directly from urban farming (oneeighth of the 800 million urban agriculture producers and one halfof the 200 million commercial urban farmers recalled above).
Rigorous quantifications are in fact available, but mostly forcase studies. Reviews of these case studies can be found in Egziaberet al. (1994), FAO (1996), Ellis and Sumberg (1998) and vanVeenhuizen (2006). An annotated bibliography of 170 pages com-piled by Sida and ETC (2003) also provides an interesting overviewof the available figures as well as of the magnitude and directionsin which the urban agriculture literature has expanded. Figuresvary widely between and within countries and regions, and differ-ences in definitions and methodologies compound the uncertainty.
Urban agriculture and food security
One major theme of the literature on urban agriculture is thediscussion of how it can contribute to the food security and nutri-tion of cities as a whole, and of the households that are engaged infarming within urban boundaries.
One distinction that is often made in the literature refers to theextent to which urban households that engage in agriculture havesome degree of market orientation or are purely producing agricul-tural goods for own-consumption. There seems to be a consensus,based on case study reviews, that the direct food security purposeprevails, but that a substantial number of urban farmers also selltheir produce on the market, and more so in Latin America thanin Africa (Maxwell, 2003; Ellis and Sumberg, 1998).
There are a number of ways through which urban agriculturecan, in principle, have an impact on urban food security. At thehousehold level, urban agriculture can be a source of income, canprovide direct access to a larger number of nutritionally rich foods(vegetables, fruit, meat) and a more varied diet, can increase thestability of household food consumption against seasonality orother temporary shortages, and can increase the time mothersspend caring for their children, as opposed to non-agriculturalactivities that are more likely to be located further away fromhome (Maxwell, 2003; Maxwell et al., 1998; Armar-Klemesu,2001; Egal et al., 2001). There is also some evidence, again basedon case studies, that it is the poor households that are mostly en-gaged in UA, although not necessarily the poorest, which may lackaccess to land (Ruel et al., 1998).
Moving beyond the household to a more aggregate level, urbanagriculture can account for an important share of the production ofsome foods, particularly the more perishable ones such as vegeta-bles and milk, and there is evidence that this is indeed the case inseveral of the case studies mentioned above.2
Despite the relatively large number of studies that have looked atthe link between UA and food security, the amount of quantitativework that has been published is surprisingly limited. We could onlyidentify one paper (Maxwell et al., 1998) that explored this link usinga multivariate framework. Their findings, based on data from Kam-pala, indicate that there is indeed an impact of UA on child nutri-tional status, an outcome indicator of food and nutrition security.
Data and definitions
As previously mentioned, this study is fundamentally differentfrom any other study on urban agriculture we are aware of in asmuch as it uses (a) nationally representative data; (b) a compara-
2 Nugent (2001) reports on the importance of urban agriculture for some of thesefoods in a number of cities worldwide.

4 For a couple of countries (Nepal, Madagascar) we have analyzed survey data fromearlier years. From the comparison we gained further confidence that while the
A. Zezza, L. Tasciotti / Food Policy 35 (2010) 265–273 267
ble definition of agricultural activities; and (c) a comparative inter-national perspective.
The data in this study does not allow dealing with anotherdimension of comparability, which is the definition of what consti-tutes an urban area. Countries have their own unique mechanismsof defining what constitutes urban or rural, and these mechanismsdetermine the definition of urban and rural in the dataset used. Onthe other hand, it may make sense to use government definitionssince presumably these reflect local information about what con-stitutes rural and is the definition used to administer governmentprograms.
One additional important caveat is that with the informationavailable we identify an agricultural activity to be urban via thedomicile of the household, not the location of the activity. It is prob-able that a number of what we identify as urban agriculture activ-ities in this study are in fact taking place in nearby rural areas. Inthat sense the study/discussion focuses on urban households’involvement in agriculture, rather than strictly urban agriculturalactivities, and for that reason our results may not be fully compara-ble with other studies on urban agriculture which only include cropand livestock activities taking place within the city boundaries.
A narrow definition of agriculture is used, whereby agriculturalincome accounts for the sale of crops and livestock, crop and live-stock by-products, sharecropping earnings, the consumption ofhome-grown crops and livestock products, net of all expendituresrelated to these activities, such as seed and fertilizer purchasesand the hire of farm labour. Participation in agriculture is definedas the production of any crop or livestock product, whether for saleor for own-consumption. Activities related to the marketing andprocessing of agricultural goods are therefore not included in ourdefinition of urban agriculture.
Our analysis is based on the Rural Income Generating Activities(RIGA) database, which is constructed from a pool of several LivingStandards Measurement Study (LSMS) and other multi-purposehousehold surveys made available by the World Bank and othernational and international institutions. The choice of countries tobe included in the dataset was guided by the desire to ensure geo-graphic coverage across the four principal development regions –Asia, Africa, Eastern Europe and Latin America, as well as adequatequality and sufficient comparability in codification and nomencla-tures. Furthermore, an effort was made to include a number of IDA(International Development Association) countries as these repre-sent developing countries with higher levels of poverty and aretherefore of particular interest to the development and povertyreduction debate.
Using these criteria, survey data from the following countrieswere utilized (corresponding survey years in parentheses): Ghana(1998), Madagascar (2001), Malawi (2004), Nigeria (2004); Bangla-desh (2000), Indonesia (2000), Nepal (2003), Pakistan (2001), Viet-nam (1998); Albania (2005), Bulgaria (2001); Ecuador (1995),Guatemala (2000), Nicaragua (2001), Panama (2003). While clearlynot representative of all developing countries, the list does repre-sent a significant range of countries and regions and has proveduseful in providing insights into the fundamental aspects of liveli-hood strategies of households in the developing world (Davis et al.,2010; Winters et al., 2009; Valdés et al., 2009).
The RIGA database consists of income and household character-istic variables that were constructed by using uniform definitionsand data handling protocols, drawing on data that are collectedusing broadly similar survey instruments. Clearly some differencesin questionnaire design across countries remain, but the degree ofcomparability in the RIGA data is very high.3 While most of these
3 Details of the construction of the income aggregates can be found in Carletto et al.(2007). The RIGA data and their full documentation can be obtained at http://www.fao.org/es/ESA/riga/.
data are fairly recent (collected within the last decade), three ofthem were collected in the 1990s. In the presence of rapid urbantransformation, the picture we paint for a few of the countries cov-ered by our data may therefore have become out of date.4
Opening the urban agriculture black box: what the data say
The first research question of the paper, i.e. the quantification ofthe magnitude of the UA phenomenon in a cross-section of coun-tries is addressed in this section. To quantify the magnitude ofUA in the countries at hand we first look at the rates of participa-tion in, and the shares of income from, urban agriculture.5 The nat-ure of our data also allows us to separate agriculture into crop andlivestock activities. The picture that emerges from these data is oneof an extreme variation (Table 1). The shares of urban householdsthat earn income from agriculture vary from 11% in Indonesia to al-most 70% in Vietnam and Nicaragua. In 11 of the 15 countries inour dataset, the share of households participating is over 30%. Ingeneral livestock activities are less common than cropping activi-ties, but there are cases (Bangladesh, Nepal, Ecuador and Nicara-gua) in which livestock is reared by about one in three urbanhouseholds.
The income shares coming from urban agriculture are, as ex-pected, smaller than the participation rates (Table 2). They rangefrom 1% to 27%, but they are higher than 10% in just five cases(Ghana, Madagascar, Malawi, Nepal and Nigeria).
Looking at regional patterns, no clear regularity can be found interms of participation rates, while it is interesting to note that it isthe four African countries in the sample that display the four largestincome shares. Should this result be representative of Africa at large,one may indeed be inclined to conclude that urban agriculture is asignificant source of livelihoods for urban households in that conti-nent. Outside of Africa, the highest share of income in our dataset arein Nepal at 11% and Vietnam at 9%, with most other countries dis-playing shares of 5% of less, and in several cases much lower.
It needs to be emphasised however that these averages acrossthe urban population may mask the fact that there are particulargroups in urban areas for which agriculture makes up a sizeableshare of their livelihoods. When only households engaged in urbanagriculture are taken into consideration, average shares of incomefrom primary activities are in fact much more substantial. The Afri-can countries still top the table, but three of the five Asian coun-tries also have shares around 20% or greater and another threecountries have shares over 10% (see third column in Table 2).
For between 18% and 24% of all urban households in the Africancountries in the sample agriculture constitutes 30% of total incomeor more. The same is true for 13% of urban households in Nepal,and for 7–10% of households in Guatemala, Nicaragua and Vietnam(fourth column in Table 2).
These results show how urban agriculture – while by no meansnegligible – does not appear to be the major urban economic activ-ity that some of its most enthusiastic advocates sometimes claim itto be. On the other hand, the data do confirm that in a number ofcountries there is a significant share of the urban population thatrelies on the production of crop and livestock products for theirlivelihoods.
By decomposing participation rates and income shares by quin-tile of expenditure levels (our preferred welfare measure) we find
specific country situations may certainly be changing over-time, the results of theoverall cross-country analysis that is the focus of this paper would not be significantlyaffected if we were to substitute our older datasets with more recent ones.
5 In this paper the definition of income includes also income in kind as well theproduction of goods for own-consumption by the household.

Table 1Participation in urban agriculture.
Country and year Total % participation in cropactivities (urban sample)
Total % participation in livestockactivities (urban sample)
Total % participation in agriculturalactivities (urban sample)
Total % participation inagricultural activities(rural sample)
AfricaGhana 1998 38 14 41 89Madagascar 2001 30 13 33 85Malawi 2004 45 14 46 97Nigeria 2004 29 12 32 90
AsiaBangladesh 2000 26 14 30 90Indonesia 2000 10 3 11 64Nepal 2003 52 36 57 98Pakistan 2001 4 13 14 74Vietnam 1998 65 35 69 99
Eastern EuropeAlbania 2005 18 10 19 95Bulgaria 2001 23 13 27 78
Latin AmericaEcuador 1995 17 28 35 93Guatemala 2000 35 21 42 93Nicaragua 2001 65 29 68 95Panama 2003 31 12 34 87Mean 33 18 37 88Max 65 36 69 99Min 4 3 11 64
Table 2Share of total income from agriculture.
Country and year Share of total incomefrom agriculture (urbansample)
Share of total income from agriculture(urban sample and hhs participating inurban agriculture)
% of hhs with income coming from urbanag. equal or higher than 30% (50%) (urbansample)
Share of total incomefrom agriculture (ruralsample)
AfricaGhana 1998 18 44 23 (20) 61Madagascar 2001 21 63 21 (18) 68Malawi 2004 12 26 18 (12) 77Nigeria 2004 27 71 24 (23) 80
AsiaBangladesh 2000 3 9 3 (2) 37Indonesia 2000 3 27 5 (3) 35Nepal 2003 11 19 13 (8) 51Pakistan 2001 3 22 5 (4) 41Vietnam 1998 9 13 10 (7) 62
Eastern EuropeAlbania 2005 3 14 3 (1) 43Bulgaria 2001 2 8 5 (4) 20
Latin AmericaEcuador 1995 2 4 3 (2) 23Guatemala 2000 5 11 9 (5) 50Nicaragua 2001 5 8 7 (4) 57Panama 2003 1 3 1 (0.5) 35
6 One caveat is that our data being nationally representative, we cannot rule outthat agriculture may be playing a more substantial role in some specific urbansettings within a country.
268 A. Zezza, L. Tasciotti / Food Policy 35 (2010) 265–273
confirmation that urban agriculture is eminently an activity prac-ticed by the poor. With very few exceptions, a clear negative corre-lation between participation in agricultural activities and level ofwelfare is noted. Participation rates for the poorest quintile are ex-tremely high, over 50% in 8 out of 15 countries, proving how urbanagriculture plays an important role for a non-negligible number ofpoor households in the developing world (Fig. 1).
The importance of the role played by urban agriculture activi-ties can be best perceived by looking at the shares of income de-rived from agricultural activities in urban areas across quintilesof the consumption expenditure distribution (Fig. 2). The picturethat emerges, points to a stark contrast between the African coun-tries in our dataset and other regions. Ghana, Madagascar andNigeria stand out with over 30% of the income of the poorest quin-
tile originating in agriculture, but rates higher than 20% are alsofound in the poorer strata of the Malawi sample as well. Outsideof Africa, only a handful of the Guatemala, Nepal and Vietnamquintiles display shares surpassing 10%, with all the others well be-low that mark. Again, should this picture be confirmed by a largercross-section of countries, it is hard to see UA playing a substantialrole in poverty alleviation outside of Africa.6 Also, no clear patternseem to emerge from these data in terms of how participation andincome shares may evolve with the level of development (e.g. a

0102030405060708090
Malawi 2
004
Madag
asca
r 200
1
Bangla
desh
2000
Nepal
2003
Ghana
1998
Vietna
m 1998
Nigeria
2004
Pakist
an 20
01
Nicarag
ua 20
01
Indon
esia
2000
Guatem
ala 20
00
Albania
2005
Ecuad
or 19
95
Bulgari
a 200
1
Panam
a 200
3
Poorest quintile 2nd 3nd 4th 5th
Fig. 1. Percentage of households participating in urban farming, by expenditure Quintile. Note: The bars correspond to expenditure quintiles, from the poorest (‘Poorestquintile’, on the left) to the richest (‘5th’, on the right). Countries are ordered by level of Purchasing Power Parity GDP per capita.
0
10
20
30
40
50
60
Malawi 2
004
Madag
asca
r 200
1
Bangla
desh
2000
Nepal
2003
Ghana
1998
Vietna
m 1998
Nigeria
2004
Pakist
an 20
01
Nicarag
ua 20
01
Indon
esia
2000
Guatem
ala 20
00
Albania
2005
Ecuad
or 19
95
Bulgari
a 200
1
Panam
a 200
3
Poorest quintile 2nd 3nd 4th 5th
Fig. 2. Share of income from urban agriculture, by expenditure quintile. Note: The bars correspond to expenditure quintiles, from the poorest (‘Poorest quintile’, on the left) tothe richest (‘5th’, on the right). Countries are ordered by level of Purchasing Power Parity GDP per capita.
A. Zezza, L. Tasciotti / Food Policy 35 (2010) 265–273 269
possible decline in participation and income share as GDP levels in-crease), but this may also be due to the small sample size.
A final point concerns the quantification of the role of urbanagriculture as a proportion of total agricultural production andits degree of market orientation (Table 3). According to the datain the surveys we use, in most countries urban agriculture ac-counts for 5–15% of total agricultural production with peaks above20% in Madagascar and Nicaragua and a low of 3% in Malawi.7 Acommon feature of urban agriculture in most countries appearsto be that it is largely geared towards own-consumption. In onlyfour of the countries in our sample (Madagascar, Bangladesh, Nepaland Nicaragua) is more than a third of agricultural production mar-keted. In another seven countries sales account for between 15%and 26% of the total volume of agricultural production. In theremaining two countries for which this could be computed as
7 It should be noted that large commercial farms tend not to be sampled in LSMS-type surveys. To the extent that these farms are concentrated in rural areas, this mayinduce an upward bias in our estimates of the share of urban agricultural production.The bias will be greater the larger the commercial farm sector in each country.
much as 92% to 93% of the production is consumed within thehousehold.
Urban agriculture and food security
Urban agriculture, as explained in Section ‘‘The importance androle of urban agriculture: facts and artefacts. A brief review of theliterature”, can have a positive impact on household food securityas it generates direct income for the household concerned as wellas providing direct access to the food produced. Households thatengage in farming may have access to comparatively cheaper foodand to a wider variety of particularly nutritious foods, such as veg-etables and products of animal origin (milk, eggs, meat). The lattermechanism may be particularly relevant should urban food mar-kets, particularly in the poorer neighbourhoods, be inefficient. Un-der such conditions direct access to food may allow households toconsume greater amounts of food and a more diversified diet, ri-cher in valuable micronutrients.
In this section we analyse whether this is the case, by looking atthe correlation between participation in agricultural activities
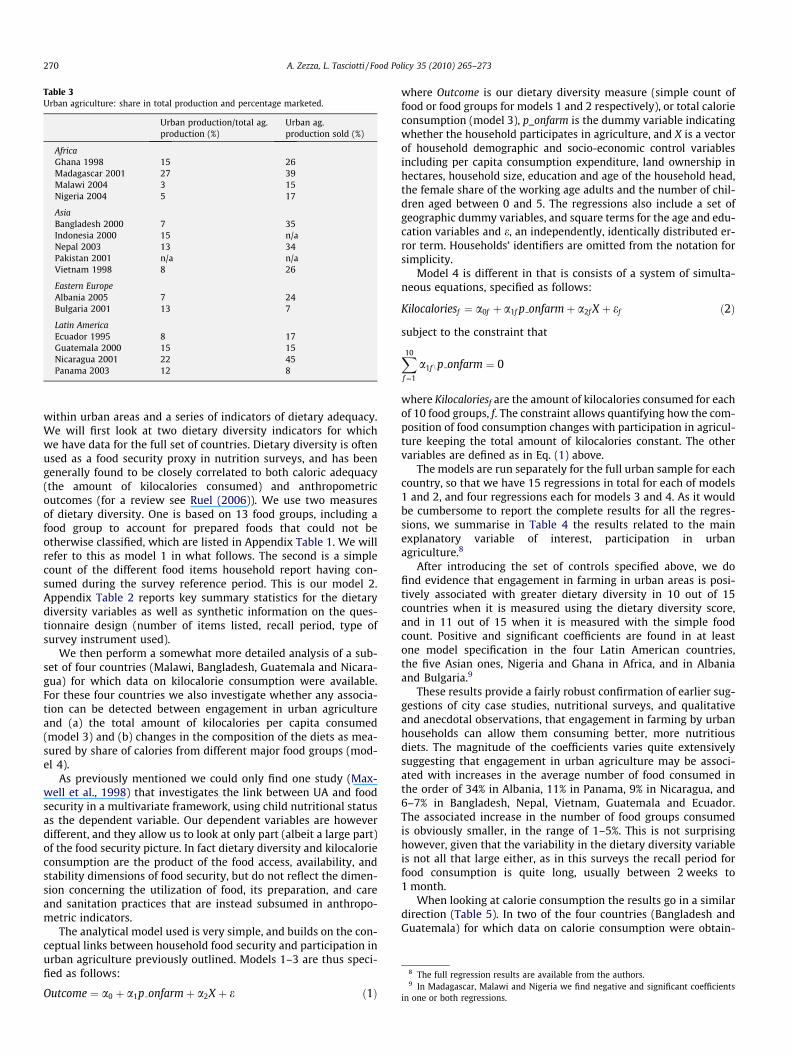
Table 3Urban agriculture: share in total production and percentage marketed.
Urban production/total ag.production (%)
Urban ag.production sold (%)
AfricaGhana 1998 15 26Madagascar 2001 27 39Malawi 2004 3 15Nigeria 2004 5 17
AsiaBangladesh 2000 7 35Indonesia 2000 15 n/aNepal 2003 13 34Pakistan 2001 n/a n/aVietnam 1998 8 26
Eastern EuropeAlbania 2005 7 24Bulgaria 2001 13 7
Latin AmericaEcuador 1995 8 17Guatemala 2000 15 15Nicaragua 2001 22 45Panama 2003 12 8
8 The full regression results are available from the authors.9 In Madagascar, Malawi and Nigeria we find negative and significant coefficients
in one or both regressions.
270 A. Zezza, L. Tasciotti / Food Policy 35 (2010) 265–273
within urban areas and a series of indicators of dietary adequacy.We will first look at two dietary diversity indicators for whichwe have data for the full set of countries. Dietary diversity is oftenused as a food security proxy in nutrition surveys, and has beengenerally found to be closely correlated to both caloric adequacy(the amount of kilocalories consumed) and anthropometricoutcomes (for a review see Ruel (2006)). We use two measuresof dietary diversity. One is based on 13 food groups, including afood group to account for prepared foods that could not beotherwise classified, which are listed in Appendix Table 1. We willrefer to this as model 1 in what follows. The second is a simplecount of the different food items household report having con-sumed during the survey reference period. This is our model 2.Appendix Table 2 reports key summary statistics for the dietarydiversity variables as well as synthetic information on the ques-tionnaire design (number of items listed, recall period, type ofsurvey instrument used).
We then perform a somewhat more detailed analysis of a sub-set of four countries (Malawi, Bangladesh, Guatemala and Nicara-gua) for which data on kilocalorie consumption were available.For these four countries we also investigate whether any associa-tion can be detected between engagement in urban agricultureand (a) the total amount of kilocalories per capita consumed(model 3) and (b) changes in the composition of the diets as mea-sured by share of calories from different major food groups (mod-el 4).
As previously mentioned we could only find one study (Max-well et al., 1998) that investigates the link between UA and foodsecurity in a multivariate framework, using child nutritional statusas the dependent variable. Our dependent variables are howeverdifferent, and they allow us to look at only part (albeit a large part)of the food security picture. In fact dietary diversity and kilocalorieconsumption are the product of the food access, availability, andstability dimensions of food security, but do not reflect the dimen-sion concerning the utilization of food, its preparation, and careand sanitation practices that are instead subsumed in anthropo-metric indicators.
The analytical model used is very simple, and builds on the con-ceptual links between household food security and participation inurban agriculture previously outlined. Models 1–3 are thus speci-fied as follows:
Outcome ¼ a0 þ a1p onfarmþ a2X þ e ð1Þ
where Outcome is our dietary diversity measure (simple count offood or food groups for models 1 and 2 respectively), or total calorieconsumption (model 3), p_onfarm is the dummy variable indicatingwhether the household participates in agriculture, and X is a vectorof household demographic and socio-economic control variablesincluding per capita consumption expenditure, land ownership inhectares, household size, education and age of the household head,the female share of the working age adults and the number of chil-dren aged between 0 and 5. The regressions also include a set ofgeographic dummy variables, and square terms for the age and edu-cation variables and e, an independently, identically distributed er-ror term. Households’ identifiers are omitted from the notation forsimplicity.
Model 4 is different in that is consists of a system of simulta-neous equations, specified as follows:
Kilocaloriesf ¼ a0f þ a1f p onfarmþ a2f X þ ef ð2Þ
subject to the constraint that
X10
f¼1
a1f np onfarm ¼ 0
where Kilocaloriesf are the amount of kilocalories consumed for eachof 10 food groups, f. The constraint allows quantifying how the com-position of food consumption changes with participation in agricul-ture keeping the total amount of kilocalories constant. The othervariables are defined as in Eq. (1) above.
The models are run separately for the full urban sample for eachcountry, so that we have 15 regressions in total for each of models1 and 2, and four regressions each for models 3 and 4. As it wouldbe cumbersome to report the complete results for all the regres-sions, we summarise in Table 4 the results related to the mainexplanatory variable of interest, participation in urbanagriculture.8
After introducing the set of controls specified above, we dofind evidence that engagement in farming in urban areas is posi-tively associated with greater dietary diversity in 10 out of 15countries when it is measured using the dietary diversity score,and in 11 out of 15 when it is measured with the simple foodcount. Positive and significant coefficients are found in at leastone model specification in the four Latin American countries,the five Asian ones, Nigeria and Ghana in Africa, and in Albaniaand Bulgaria.9
These results provide a fairly robust confirmation of earlier sug-gestions of city case studies, nutritional surveys, and qualitativeand anecdotal observations, that engagement in farming by urbanhouseholds can allow them consuming better, more nutritiousdiets. The magnitude of the coefficients varies quite extensivelysuggesting that engagement in urban agriculture may be associ-ated with increases in the average number of food consumed inthe order of 34% in Albania, 11% in Panama, 9% in Nicaragua, and6–7% in Bangladesh, Nepal, Vietnam, Guatemala and Ecuador.The associated increase in the number of food groups consumedis obviously smaller, in the range of 1–5%. This is not surprisinghowever, given that the variability in the dietary diversity variableis not all that large either, as in this surveys the recall period forfood consumption is quite long, usually between 2 weeks to1 month.
When looking at calorie consumption the results go in a similardirection (Table 5). In two of the four countries (Bangladesh andGuatemala) for which data on calorie consumption were obtain-

Tabl
e4
Regr
essi
onre
sult
sfo
rm
odel
s1
and
2–
coef
fici
ents
onth
eur
ban
agri
cult
ure
part
icip
atio
ndu
mm
y.
Dep
ende
nt
vari
able
Afr
ica
Asi
aEa
ster
nEu
rope
Lati
nA
mer
ica
Gh
ana
1998
Mad
agas
car
2001
Mal
awi
2004
Nig
eria
2004
Ban
glad
esh
2000
Indo
nes
ia20
00N
epal
2003
Paki
stan
2001
Vie
tnam
1998
Alb
ania
2001
Bu
lgar
ia20
01Ec
uad
or19
95G
uat
emal
a20
00N
icar
agu
a20
00Pa
nam
a20
03
Die
tary
dive
rsit
yC
oeffi
cien
t0.
25���
�0.
97���
�0.
19�
0.33���
0.52���
0.22�
0.19���
0.09
0.03
�0.
010.
26���
0.36���
0.17���
0.22���
0.56���
Stan
dard
erro
r0.
080.
080.
080.
070.
070.
110.
070.
040.
050.
070.
060.
080.
060.
060.
09R
-squ
ared
0.20
0.44
0.44
0.22
0.33
0.25
0.04
0.19
0.18
0.15
0.24
0.18
0.12
0.17
0.15
Nu
mbe
rof
obs.
2154
3085
1421
3759
2396
4913
1154
5852
1722
1996
1690
3225
3418
2327
3417
Food
coun
tC
oeffi
cien
t0.
16�
2.60���
0.18
�2.
13���
1.63���
0.60��
1.35���
0.42�
0.75���
3.80���
0.73��
2.72���
3.27���
2.06���
5.37���
Stan
dard
erro
r0.
390.
320.
330.
290.
380.
260.
270.
240.
120.
740.
360.
510.
520.
320.
50R
-squ
ared
0.32
0.47
0.55
0.27
0.36
0.26
0.28
0.41
0.28
0.24
0.46
0.26
0.32
0.42
0.23
Nu
mbe
rof
obs.
2154
3085
1421
3759
2396
4913
1154
5852
1722
1219
1690
3225
3418
2327
3417
Not
e:��� ,��
,an
d�
indi
cate
sign
ifica
nce
atth
e1%
,5%
,an
d10
%le
vel,
resp
ecti
vely
.
A. Zezza, L. Tasciotti / Food Policy 35 (2010) 265–273 271
able a positive and statistically significant association betweencalorie availability and engagement in urban agriculture wasnoted. That is related to higher consumption of calories from meatand fruits and vegetables (both countries), and dairy and stapleproducts (Guatemala). In Malawi no statistically significant differ-ence in calorie consumption can be detected, but involvement inagriculture is nevertheless associated with higher consumptionof calories from fruits and vegetables and staples, partly offset bylower amounts of calories from meat. In Bangladesh the diet of ur-ban households engaged in agriculture appears to have a smallerstaple component.10
Taken together these results confirm the existence of an associ-ation between urban agriculture and indicators of dietary adequacyand diversity in a majority of the countries for which we have data.We find that controlling for other factors, households engaged inurban agriculture are more likely, in several but not all countries,to enjoy a more diverse diet, to consume more calories and to haveaccess to a greater number of calories from both basic staples andfruit and vegetable products. It is worth recalling that an increasein calorie consumption is not necessarily a positive developmentif it is concentrated in households that already consume an ade-quate amount of calories. Obesity is a problem even in low incomecountries such as Guatemala (Marini and Gragnolati, 2003), andthese results should therefore be interpreted with some care.
Concluding remarks
This paper set out to tackle two very specific research questionsconcerning (1) the importance and magnitude of agricultural activ-ities for urban households and (2) the relationship betweenengagement in urban agriculture and household food security.Our findings indicate that agriculture is indeed a not negligiblereality of the urban economy, involving anywhere between about10–70% of urban households. In terms of income generation,though, its role appears to be much more limited, with the impor-tant exception of the African countries in our sample, and of thehouseholds in the poorer quintiles in Nepal and Vietnam. Our dataconfirm that urban agriculture is an activity in which the poor aredisproportionately represented, and that this occurs in all regions.
This study also highlights that urban agriculture does appear tobe associated with greater dietary diversity and calorie availability,both measures of an improved diet and hence closely related tofood security. In two thirds of the countries analyzed resultsshowed a correlation between an active participation of urbanhousehold in agricultural activities and greater dietary diversity,this after controlling for economic welfare and a set of householdcharacteristics. Using a smaller set of countries some evidence isalso found of a relationship with greater calorie consumption, withfruits and vegetables being the food group more consistently foundto contribute to the increase in calorie consumption associatedwith the engagement in urban agriculture.
In the context of the recent trends in food markets and the over-all economic crisis, and in light of the well known fact that the ur-ban poor are the most vulnerable to an increase in food prices,these findings acquire particular policy relevance. A commonhousehold response to a real term increase in food prices (or a cor-responding decrease in disposable income) is to adjust consump-tion towards cheaper sources of calories, which often meanstrading off a richer set of micronutrients in the diet to keep calorieconsumption constant. This type of response can be detrimental forthe nutrition of specific population subgroups such as women of
10 The regression results for Nicaragua buck these trends and show a negativeassociation between participation in urban agriculture and most of the outcomevariables.
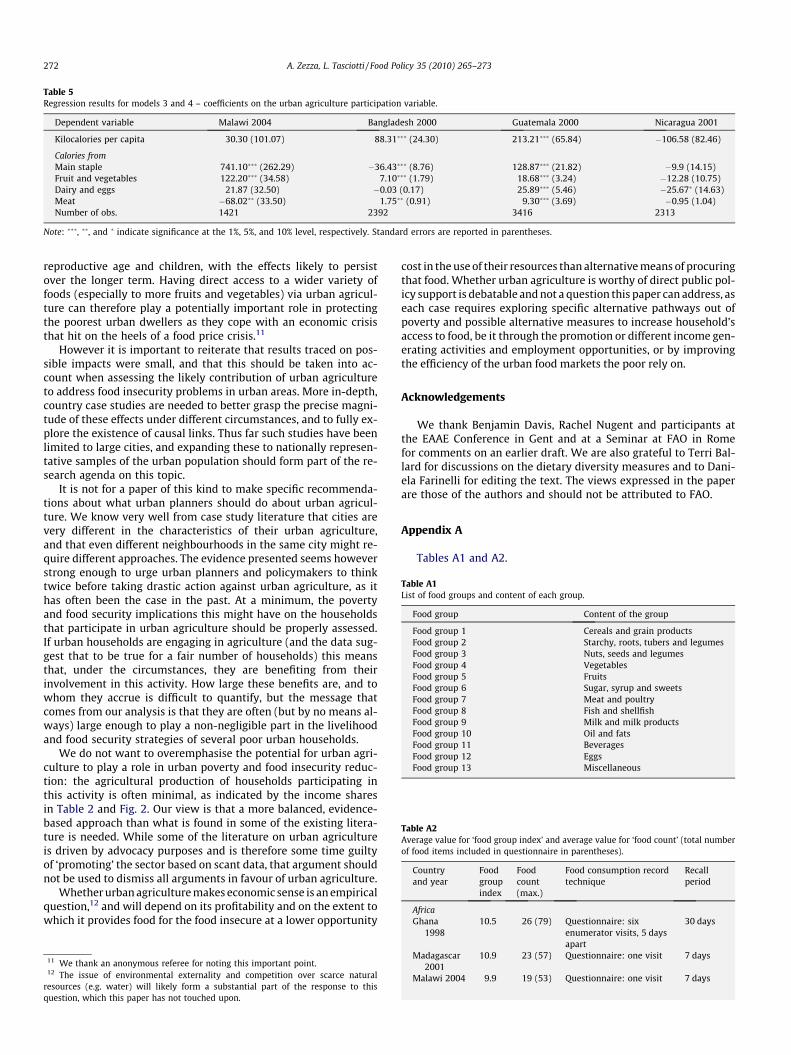
Table 5Regression results for models 3 and 4 – coefficients on the urban agriculture participation variable.
Dependent variable Malawi 2004 Bangladesh 2000 Guatemala 2000 Nicaragua 2001
Kilocalories per capita 30.30 (101.07) 88.31��� (24.30) 213.21��� (65.84) �106.58 (82.46)
Calories fromMain staple 741.10��� (262.29) �36.43��� (8.76) 128.87��� (21.82) �9.9 (14.15)Fruit and vegetables 122.20��� (34.58) 7.10��� (1.79) 18.68��� (3.24) �12.28 (10.75)Dairy and eggs 21.87 (32.50) �0.03 (0.17) 25.89��� (5.46) �25.67� (14.63)Meat �68.02�� (33.50) 1.75�� (0.91) 9.30��� (3.69) �0.95 (1.04)Number of obs. 1421 2392 3416 2313
Note: ���, ��, and � indicate significance at the 1%, 5%, and 10% level, respectively. Standard errors are reported in parentheses.
Table A1List of food groups and content of each group.
Food group Content of the group
Food group 1 Cereals and grain productsFood group 2 Starchy, roots, tubers and legumesFood group 3 Nuts, seeds and legumesFood group 4 VegetablesFood group 5 FruitsFood group 6 Sugar, syrup and sweetsFood group 7 Meat and poultryFood group 8 Fish and shellfishFood group 9 Milk and milk productsFood group 10 Oil and fatsFood group 11 BeveragesFood group 12 EggsFood group 13 Miscellaneous
Table A2Average value for ‘food group index’ and average value for ‘food count’ (total numberof food items included in questionnaire in parentheses).
Countryand year
Foodgroupindex
Foodcount(max.)
Food consumption recordtechnique
Recallperiod
AfricaGhana 10.5 26 (79) Questionnaire: six 30 days
272 A. Zezza, L. Tasciotti / Food Policy 35 (2010) 265–273
reproductive age and children, with the effects likely to persistover the longer term. Having direct access to a wider variety offoods (especially to more fruits and vegetables) via urban agricul-ture can therefore play a potentially important role in protectingthe poorest urban dwellers as they cope with an economic crisisthat hit on the heels of a food price crisis.11
However it is important to reiterate that results traced on pos-sible impacts were small, and that this should be taken into ac-count when assessing the likely contribution of urban agricultureto address food insecurity problems in urban areas. More in-depth,country case studies are needed to better grasp the precise magni-tude of these effects under different circumstances, and to fully ex-plore the existence of causal links. Thus far such studies have beenlimited to large cities, and expanding these to nationally represen-tative samples of the urban population should form part of the re-search agenda on this topic.
It is not for a paper of this kind to make specific recommenda-tions about what urban planners should do about urban agricul-ture. We know very well from case study literature that cities arevery different in the characteristics of their urban agriculture,and that even different neighbourhoods in the same city might re-quire different approaches. The evidence presented seems howeverstrong enough to urge urban planners and policymakers to thinktwice before taking drastic action against urban agriculture, as ithas often been the case in the past. At a minimum, the povertyand food security implications this might have on the householdsthat participate in urban agriculture should be properly assessed.If urban households are engaging in agriculture (and the data sug-gest that to be true for a fair number of households) this meansthat, under the circumstances, they are benefiting from theirinvolvement in this activity. How large these benefits are, and towhom they accrue is difficult to quantify, but the message thatcomes from our analysis is that they are often (but by no means al-ways) large enough to play a non-negligible part in the livelihoodand food security strategies of several poor urban households.
We do not want to overemphasise the potential for urban agri-culture to play a role in urban poverty and food insecurity reduc-tion: the agricultural production of households participating inthis activity is often minimal, as indicated by the income sharesin Table 2 and Fig. 2. Our view is that a more balanced, evidence-based approach than what is found in some of the existing litera-ture is needed. While some of the literature on urban agricultureis driven by advocacy purposes and is therefore some time guiltyof ‘promoting’ the sector based on scant data, that argument shouldnot be used to dismiss all arguments in favour of urban agriculture.
Whether urban agriculture makes economic sense is an empiricalquestion,12 and will depend on its profitability and on the extent towhich it provides food for the food insecure at a lower opportunity
11 We thank an anonymous referee for noting this important point.12 The issue of environmental externality and competition over scarce natural
resources (e.g. water) will likely form a substantial part of the response to thisquestion, which this paper has not touched upon.
cost in the use of their resources than alternative means of procuringthat food. Whether urban agriculture is worthy of direct public pol-icy support is debatable and not a question this paper can address, aseach case requires exploring specific alternative pathways out ofpoverty and possible alternative measures to increase household’saccess to food, be it through the promotion or different income gen-erating activities and employment opportunities, or by improvingthe efficiency of the urban food markets the poor rely on.
Acknowledgements
We thank Benjamin Davis, Rachel Nugent and participants atthe EAAE Conference in Gent and at a Seminar at FAO in Romefor comments on an earlier draft. We are also grateful to Terri Bal-lard for discussions on the dietary diversity measures and to Dani-ela Farinelli for editing the text. The views expressed in the paperare those of the authors and should not be attributed to FAO.
Appendix A
Tables A1 and A2.
1998 enumerator visits, 5 daysapart
Madagascar2001
10.9 23 (57) Questionnaire: one visit 7 days
Malawi 2004 9.9 19 (53) Questionnaire: one visit 7 days

Table A2 (continued)
Countryand year
Foodgroupindex
Foodcount(max.)
Food consumption recordtechnique
Recallperiod
Nigeria2004
8.9 21 (122) Questionnaire: sixenumerator visits, 5 daysapart
30 days
AsiaBangladesh
200010.5 27 (63) 7 day diary compiled by
the household7 days
Indonesia2000
9.9 17 (37) Questionnaire: one visit 7 days
Nepal 2003 11.8 24 (35) Questionnaire: one visit 31 daysPakistan
200110.4 42 (83) Questionnaire: one visit 14 days
Vietnam1998
11.1 11 (20) Questionnaire: one visit 365 daysa
Eastern EuropeAlbania 2005 10.7 11 (74) 14 day diary compiled by
the household14 days
Bulgaria2001
10 27 (56) Questionnaire: one visit 31 days
Latin AmericaEcuador
19959.8 40 (80) Questionnaire: one visit 14 days
Guatemala2000
10.4 51 (88) Questionnaire: one visit 15 days
Nicaragua2001
9.4 24 (61) Questionnaire: one visit 15 days
Panama2003
10.8 47 (82) Questionnaire: one visit 15 days
a Fourteen days recall data are also collected in this survey.
A. Zezza, L. Tasciotti / Food Policy 35 (2010) 265–273 273
References
Armar-Klemesu, M., 2001. Urban agriculture and food security nutrition and health.Thematic paper 4. In: Bakker, N. et al. (Eds.), Growing Cities, Growing Food:Urban Agriculture on the Policy Agenda. DSE, Fefdafing.
Carletto, G., Covarrubias, K., Krausova, M., 2007. Rural Income Generating Activities(RIGA) Study: Income Aggregate Methodology. Agricultural Sector in EconomicDevelopment Service, FAO, Rome.
Davis, B., Winters, P., Carletto, G., Covarrubias, K., Quinones, E., Zezza, A., Stamoulis,K., Azzarri, C., DiGiuseppe, S., 2010. A cross-country comparison of rural incomegenerating activities. World Development 38 (1), 48–63.
Dessus, S., Herrera, S., de Hoyos, R., 2008. The impact of food inflation on urbanpoverty and its monetary cost: some back-of-the-envelope calculations.Agricultural Economics 39 (Suppl.), 417–429.
Egal, F., Valstar, A., Meershoek, S., 2001. Urban Agriculture, Household Food Securityand Nutrition in Southern Africa. Mimeo, FAO, Rome.
Egziaber, A.G., Lee-Smith, D., Maxwell, D.G., Memon, P.A., Mougeot, L.J.A., Sawio, C.J.,1994. Cities Feeding People. An Examination of Urban Agriculture in East Africa.IDRC, Ottawa.
Ellis, F., Sumberg, J., 1998. Food production, urban areas and policy response. FoodPolicy 26 (2), 213–225.
FAO, 1996. The State of Food and Agriculture. FAO, Rome.Marini, A., Gragnolati, M., 2003. Malnutrition and Poverty in Guatemala. World
Bank Policy Research Working Paper No. 2967. World Bank, Washington,DC.
Maxwell, D., 2003. The importance of urban agriculture to food and nutrition. In:Annotated Bibliography on Urban Agriculture. Sida and ETC, Leusden, TheNetherlands, pp. 22–129.
Maxwell, D., Levin, C., Csete, J., 1998. Does urban agriculture help preventmalnutrition? Evidence from Kampala. Food Policy 23 (5), 411–424.
Mougeot, L.J., 2000. The Hidden Significance of Urban Agriculture. 2020 Vision.Focus 3, Brief 6 of 10, August. IFPRI, Washington, DC.
Nelson, T., 1996. Closing the Nutrient Loop. World Watch, 9:6, November–December, pp. 10–17.
Nugent, R., 2001. The impact of urban agriculture on household and localeconomies. Thematic paper 3. In: Bakker, N. et al. (Ed.), Growing Cities,Growing Food: Urban Agriculture on the Policy Agenda. DSE, Fefdafing.
Ravallion, M., Chen, S., Sangraula, P., 2007. New Evidence on the Urbanization ofGlobal Poverty. Policy Research Working Paper 4199. World Bank, Washington,DC.
Ruel, M.T., 2006. Operationalizing dietary diversity: a review of measurement issuesand research priorities. Journal of Nutrition.
Ruel, M.T., Garrett, J.L., Morris, S.S., Maxwell, D., Oshaung, A., Engle, P., Menon, P.,Slack, A., Haddad, L., 1998. Urban Challenges to Food and Nutrition Security: AReview of Food Security, Health, and Caregiving in the Cities. FCND DiscussionPaper No. 51. IFPRI, Washington, DC.
Sida and ETC, 2003. Annotated Bibliography on Urban Agriculture. ETC, Leusden,The Netherlands.
UNDP, 1996. Urban Agriculture. Food, Jobs, and Sustainable Cities. United NationsDevelopment Programme. Publication Series for Habitat II, vol. 1. UNDP, NewYork.
Valdés, A., Foster, W., Anríquez, G., Azzarri, C., Covarrubias, K., Davis, B.,DiGiuseppe, S., Essam, T., Hertz, T., de la O, A.P., Quiñones, E., Stamoulis, K.,Winters, P., Zezza, A., 2009. A Profile of the Rural Poor. ESA Working Paper No.09-04. FAO, Rome.
Van Veenhuizen, R., 2006. Cities Farming for the Future. Urban Agriculture for Greenand Productive Cities. RUAF Foundation, IDRC, Ottawa.
Winters, P., Davis, B., Carletto, G., Covarrubias, K., Quinones, E., Zezza, A., Azzarri, C.,Stamoulis, K., 2009. Assets, activities and rural income generation: evidencefrom a multicountry analysis. World Development 37 (9), 1435–1452.
Zezza, A., Azzarri, C., Davis, B., Covarrubias, K., Tasciotti, L., Anriquez, G., 2008. TheImpact of Rising Food Prices on the Poor. FAO–ESA Working Paper 08-07.