ENVIRONMENTAL INDICATORS Republic of Macedonia
320
ENVIRONMENTAL INDICATORS Republic of Macedonia 2008 2008 Ministry of Environment and Physical Planning Macedonian Environmental Information Center
-
Upload
khangminh22 -
Category
Documents
-
view
0 -
download
0
Transcript of ENVIRONMENTAL INDICATORS Republic of Macedonia
ENVIRONMENTAL INDICATORS Republic of Macedonia
20082008
Ministry of Environment and Physical Planning Macedonian Environmental Information Center


Republic of Macedonia Ministry of Environment and Physical Planning Macedonian Environmental Information Center
ENVIRONMENTAL INDICATORS Republic of Macedonia
20082008
Skopje, August 2008

UNEP/GRID supported the translation
Print: ЕВРОПА 92 Edition: 1000 copies Published by: Ministry of Environment and Physical Planning Pre-press: Macedonian Environmental Information Center Editors: Svetlana Gjorgjeva Katerina Nikolovska Design and tehnical preparation: Svetlana Gjorgjeva Katerina Nikolovska Martina Toceva Cover page author: Gjorgji Bakule Translation: Vera Mircevska Jovanovska Ministry of Environment and Physical Planning Macedonian Environmental Information Center 1000 Skopje, Drezdenska 52 Tel: (02) 30 66 930; Fax: (02) 30 66 931 E-mail: [email protected] Web: www.moepp.gov.mk
CIP - Каталогизација во публикација Национална и универзитетска библиотека “Св. Климент Охридски“, Скопје 502/504(047) ENVIRONMENTAL Indicators: Republic of Macedonia: 2008: (editors Svetlana Gjorgjeva, Katerina Nikolovska); (translation Vera Mircevska Jovanovska) - Skopje: Ministry of Environment and Physical Planning, 2008. - 318 стр.: илустр.; 24 cm ISBN 978-9989-110-70-2 а) Животна средина - Индикатори - Извештаи COBISS.MK - ID 75087370

CONTENT
FOREWORD ..................................................................................................................................... 7
LIST OF ABBREVATION................................................................................................................... 19
1. AIR POLLUTION AND OZONE DEPLETION ……………………………………............................. 25
1. EMISSIONS OF ACIDIFYING SUBSTANCES ........................................................................ 26
2. EMISSIONS OF OZONE PRECURSORS ............................................................................... 37
3. EXCEEDANCE OF AIR QUALITY LIMIT VALUES IN URBAN AREAS ................................... 48
4. CONSUMPTION OF OZONE DEPELTING SUBSTANCES ................................................... 60
2. NATURE AND BIODIVERSITY ..................................................................................................... 71
5. THREATENED AND PROTECTED SPECIES ........................................................................ 72
6. DESIGNATED AREAS ............................................................................................................ 79
7. SPECIES DIVERSITY .............................................................................................................. 87
LIST OF ADDITIONAL INDICATORS .......................................................................................... 92
3. CLIMATE CHANGE ...................................................................................................................... 95
8. GREENHOUSE GAS EMISSIONS AND REMOVALS ............................................................. 96
9. PROJECTIONS OF GREENHOUSE GAS EMISSIONS AND REMOVALS ........................... 102
4. SOIL ............................................................................................................................................. 113
10. LAND TAKE ........................................................................................................................... 114
11. PROGRESS IN MANAGEMENT OF CONTAMINATED SITES ............................................. 122
12. FOREST FIRES ..................................................................................................................... 127
5. WASTE ......................................................................................................................................... 133
13. MUNICIPAL WASTE GENERATION ..................................................................................... 134
6. WATER ......................................................................................................................................... 139
14. USE OF FRESHWATER RESOURCES ............................................................................... 140
15. OXYGEN CONSUMING SUBSTANCES IN RIVERS ............................................................ 146
16. NUTRIENTS IN FRESHWATER ............................................................................................ 152
17. BATHING WATER QUALITY ................................................................................................ 159
18. URBAN WASTE WATER TREATMENT .............................................................................. 163
19. DRINKING WATER QUALITY ............................................................................................... 169
20. IRRIGATED LAND ................................................................................................................. 177
7. AGRICULTURE ........................................................................................................................... 183
21. GROSS NUTRIENT BALANCES .......................................................................................... 184
22. AREAS UNDER ORGANIC FARMING ................................................................................. 189
23. MINERAL FERTILIZER CONSUMPTION .............................................................................. 193
24. CONSUMPTION OF PESTICIDES ....................................................................................... 197
The Ministry of Environment and Physical Planning as a body of the state administration responsible for the affairs of the environment, has proposed set of environmental indicators of the Republic of Macedonia on the basis of which the relevant report will be created as specified in Article 45 paragraph 1 of the Law on Environment (Official Gazette of the Republic of Macedonia No. 53/05, 81/05 and 24/07), Articles 44 and 45 of the Rulebook on the content of the State of the Environment Report (Official Gazette of the Republic of Macedonia No. 35/06), conclusions of the Government of the Republic of Macedonia adopted at the Fifth Session held on 15 May 2007, as well as in the requirements of the EU legislation and international organizations.
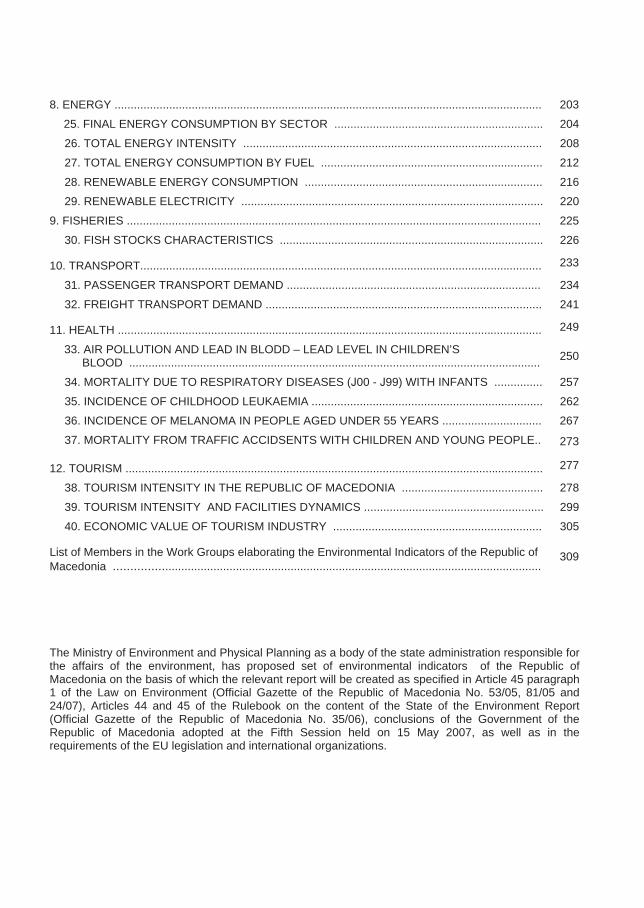
8. ENERGY ..................................................................................................................................... 203
25. FINAL ENERGY CONSUMPTION BY SECTOR ................................................................. 204
26. TOTAL ENERGY INTENSITY ............................................................................................. 208
27. TOTAL ENERGY CONSUMPTION BY FUEL ..................................................................... 212
28. RENEWABLE ENERGY CONSUMPTION .......................................................................... 216
29. RENEWABLE ELECTRICITY .............................................................................................. 220
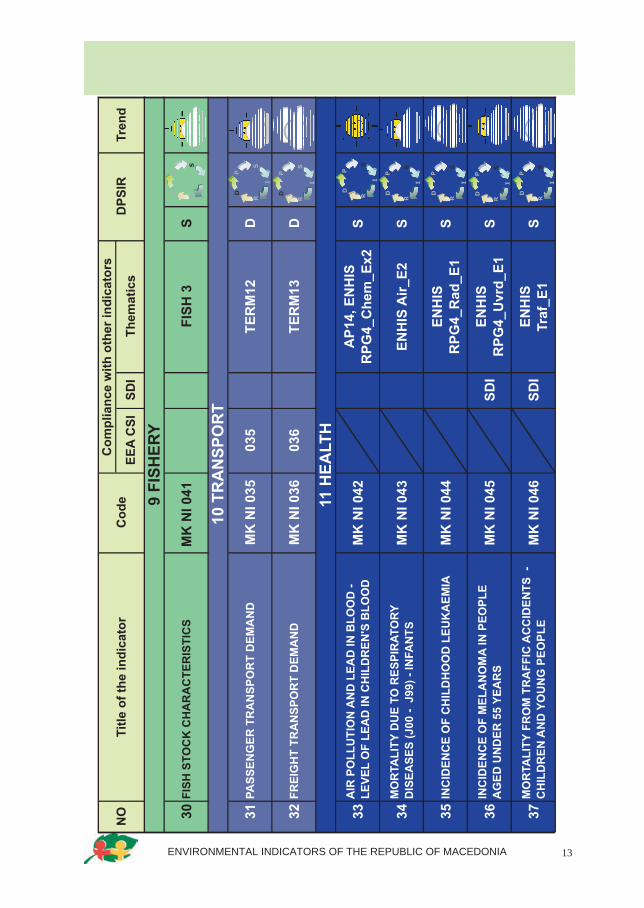
9. FISHERIES ................................................................................................................................. 225
30. FISH STOCKS CHARACTERISTICS .................................................................................. 226
10. TRANSPORT............................................................................................................................. 233
31. PASSENGER TRANSPORT DEMAND ............................................................................... 234
32. FREIGHT TRANSPORT DEMAND ...................................................................................... 241
11. HEALTH .................................................................................................................................... 249
33. AIR POLLUTION AND LEAD IN BLODD – LEAD LEVEL IN CHILDREN’S BLOOD ................................................................................................................................ 250
34. MORTALITY DUE TO RESPIRATORY DISEASES (Ј00 - Ј99) WITH INFANTS ............... 257
35. INCIDENCE OF CHILDHOOD LEUKAEMIA ........................................................................ 262
36. INCIDENCE OF MELANOMA IN PEOPLE AGED UNDER 55 YEARS ............................... 267
37. MORTALITY FROM TRAFFIC ACCIDSENTS WITH CHILDREN AND YOUNG PEOPLE.. 273
12. TOURISM .................................................................................................................................. 277
38. TOURISM INTENSITY IN THE REPUBLIC OF MACEDONIA ............................................ 278
39. TOURISM INTENSITY AND FACILITIES DYNAMICS ........................................................ 299
40. ECONOMIC VALUE OF TOURISM INDUSTRY ................................................................. 305
List of Members in the Work Groups elaborating the Environmental Indicators of the Republic of Macedonia ....................................................................................................................................
309

ENVIRONMENTAL INDICATORS OF THE REPUBLIC OF MACEDONIA 7
FOREWORD The management of the environment in all areas and at all levels is equally complex and important process. Namely, the quality of all environmental media - water, air and soil - adequate management of areas like waste and wastewater, abundance and accessibility of natural resources, determine directly human health and welfare. The manner in which the environment is managed today becomes even more important given the fact it makes (positive or negative) impact on the quality of living of future generations, depending on the decisions we make and measures we take. In the context of this perception, the responsibility of those entrusted to manage this area through adoption of relevant decisions at all levels both in public and private, as well as civil sectors, becomes even greater.
Decisions adopted may from their side be proper and effective if they rely on accurate information of relevance for the specific decision. This notion is of particular importance in the process of environmental management. It is especially important to establish the current state of the environment by applying modern technologies, techniques and methodologies for its qualitative and quantitative assessment. Further on, the causes of certain (negative) developments should be identified, the resulting consequences with regard to human health above all, as well as living and developed environment, social welfare, economic growth or briefly the future sustainable development of the society.
Establishing of the above relations is not an easy task at all. Thus, for example, the increased rate of certain acute disease could be due to some negative environmental impacts, like polluted air, contaminated waters and soils. The source of such impacts could be natural or anthropogenic. Such increased rate of the disease could from its side result in significant social impacts reflected through higher costs for the health care and lower profits due to the reduced productivity of affected population. In addition to this, low quality of the environment could have significant impact on the economic growth of an area or the country as a whole - marketing of agricultural products originating from environmentally polluted area is difficult and at low prices, while tourism could burst in an area promoted as environmentally clean.
Nevertheless, all above mentioned relations, i.e. causes, consequences and trends, can not be analyzed as data to serve as basis for adoption of relevant, well founded decisions for taking appropriate measures while they are at the level of suspicions and assumptions. They should be confirmed and evidenced, which is an exceptionally complex task. Almost equally complex task is the follow-up need to present them in a rational, easy to understand, concise and usable form.
Environmental reporting via indicators is exactly such ambitious undertaking - to produce a report, a picture of the environment presented through as much as possible quantitative data acquired through scientifically based measurements and analysis, indicating the sources, causes, consequences and trends of specific conditions. We believe that this Report, developed by contributions of experts from all relevant areas, besides of fulfilling one of the obligations deriving from the Law on Environment, will establish the basis necessary for appropriate decision making in the process of environmental management, and thus make the expected contribution to the sustainable development of our country.
Dr. Nexhati Jakupi MINISTER OF ENVIRONMENT AND PHYSICAL PLANNING

ENVIRONMENTAL INDICATORS OF THE REPUBLIC OF MACEDONIA 8
EXPLANATION Monitoring and reporting of the state of the environment is an obligation prescribed by the national legislation. Motivated by its aspiration to get closer to the practices of the European Union in this area, the country endeavors to fulfill this obligation in a manner also prescribed by the European law by delivering environmental data and information to the European Environmental Agency (EEA) and shaping the recording according to the requirements of the relevant EU Directives and other regulations. The task to fulfill this obligation has been delegated to the Macedonian Environmental Information Centre of the Ministry of Environment and Physical Planning на Република Македонија.
Experiences gained through data delivery to the European Environmental Agency has resulted in significant increase in environmental data flow, both in quantitative and qualitative terms between the Republic of Macedonia and international organizations. Such experiences have enabled comparisons to be made between databases and thus their improvement through reorganization of reporting processes at national level, intensified exchange of information among experts and better public access to environmental information and data.
WHY ENVIRONMENTAL INDICATORS? The European Environmental Agency with its member states initiated the development of the Core Set of Indicators (CSI) in 2000. It was approved and adopted by all relevant bodies and the set reached 37 indicators in 2004. The main purpose of the process was to prepare environmental indicators based on numerical data which, presenting the environment, the specific characteristic or the trend in certain phenomenon, may warn us of the incurred problems and thus they are a useful tools in the process of environmental reporting. Reasonably selected indicators based on properly selected temporal series present the key trends and facilitate prompt and adequate action by all stakeholders involved in the process of environment protection. This is of particular importance in the context of environment protection policy creation.
The establishment and development of environmental indicators was driven by the need to identify indicators of relevance for the environmental state monitoring and policy creation, in line with the EEA Core Set of Indicators (CSI), including indicators in six themes (Air pollution and ozone depletion, Climate Change, Waste, Water, Biological Diversity and Land) and four sectors (agriculture, energy, transport and fishery). These indicators should respond to the key environmental policy issues on national level.
The Government of the Republic of Macedonia, at its Fifth Session held on 15 May 2007 adopted the Draft Environmental Indicators developed by the Macedonian Environmental Information Centre thus initiating the process of identification of the national set of indicators.
Based on the conclusions adopted by the Government of the Republic of Macedonia and Decision no. 10-2323/29 of 14 September 2007 signed by the Minister of Environment and Physical Planning, 12 working groups were established each for a chapter and they verified and supplemented the proposed environmental indicators of the Republic of Macedonia, including country specific indicators. The members of the working groups have proposed the indicators presented in the Table to be adopted as Environmental Indicators of the Republic of Macedonia:

ENVIRONMENTAL INDICATORS OF THE REPUBLIC OF MACEDONIA 9

ENVIRONMENTAL INDICATORS OF THE REPUBLIC OF MACEDONIA 10

ENVIRONMENTAL INDICATORS OF THE REPUBLIC OF MACEDONIA 11

ENVIRONMENTAL INDICATORS OF THE REPUBLIC OF MACEDONIA 12
ENVIRONMENTAL INDICATORS OF THE REPUBLIC OF MACEDONIA 13

ENVIRONMENTAL INDICATORS OF THE REPUBLIC OF MACEDONIA 14

ENVIRONMENTAL INDICATORS OF THE REPUBLIC OF MACEDONIA 15
CLASSIFICATION OF ENVIRONMENTAL INDICATORS
All indicators in a set have been classified in accordance with the framework known by its abbreviation DPSIR, comprising the following concepts: Driving forces – Pressures - State – Impacts – Responses, where each phase transmits its own meaning (Figure 1). This framework is particularly important and clear with regard to environmental policy creation.
Driving forces are a social and economic factors and activities that cause either the increase or mitigation of pressures on the environment. They may, for example, include the scope of economic, transport or tourist operations.
Pressures are represented by direct anthropogenic pressures and impacts on the environment, such as pollutant emissions or the consumption of natural resources.
State relates to the current state and trends of the environment that determine the level of air, water body and soil pollution, the biodiversity of species within individual geographical regions, the availability of natural resources, such as timber and fresh water.
Impacts are the effects that the environmental changes have on human and non-human health status.
Responses are society’s reactions to environmental issues. They may include specific State measures, such as taxes on the consumption of natural resources. Decisions made by companies and individuals, such as corporate investments into pollution control or purchase of recycled goods by households are also important.
Figure 1

ENVIRONMENTAL INDICATORS OF THE REPUBLIC OF MACEDONIA 16
Indicators are also classified by their type into five categories, namely:
А = descriptive indicator (answering the question What is happening to the environment and to humans?; in other words, it describes the current state )
B = performance indicator (answering the question What is the distance between the current environmental situation and the desired situation (target)?, or it compares the current state of the environment with the specified environmental protection targets and they serve the monitoring of the progress towards such targets).
C = efficiency indicator (answering the question Does the environment improve?, or it states if the socity has improved the quality of products and processes relative to resources, emissions and waste per unit waste)
D = Policy-effectiveness indicator (answering the question How effectively has the official country's environmental policy been implemented? Or if and to what extent the official national policy has been implemented)
E = Total Welfare indicators (answering the question Has the overall state improved?, or it describes if and to what extent has the country practiced sustainable development, i.e. economic development providing social welfare for the citizens and protection for the environment).
PRESENTATION OF ENVIRONMENTAL INDICATORS In order to present indicators in a comprehensive manner, their information and data are presented by brief description of the indicator, prepared in accordance with the template established by the European Environmental Agency in the following order:
Period of the indicator assessment Explanation
Justification for the indicator selection
Definition
Units
Policy relevance
List of relevant policy documents
Legal grounds
Key and specific policy issue
Key message
Assessment
Targets
Methodology for the indicator calculation
Data specification
Data coverage by years
General metadata
Methodological uncertainty
Future activities
Short-term activities
Long-term activities

ENVIRONMENTAL INDICATORS OF THE REPUBLIC OF MACEDONIA 17
Quantitative values of a given indicator are expressed mostly as annual values for a given period, and presented by means of diagrams, tables and maps. They are then followed by explanations interpreting the trend and the possible causes, as well as the measures undertaken and planned to improve or preserve the current status of the environment. Each indicator is accompanied by a symbol making assessment of individual indicators and showing the trend of presented data and specified targets.
Symbols indicating trends assessment
All segments of this concept of presentation are interlinked and support the response to the policy relevant issues. Environmental indicators rely on internationally recognized methodologies, and thus they are by definition internationally comparable. During their elaboration, EEA methodological information on environmental indicators was used.
Separate parts define the indicator, provide basic information on methodology of measurements conducted and manner of the subject indicator presentation. In the assessment of certain phenomenon, it is of vital importance to identify the expected trend and intensity of development. Quantitative values of a given indicator are expressed mainly in annual values for the specified period, and presented through diagrams, maps and tables containing the data.
High amount of data, including data possessed by the MEIC, as well as other sources of data administered by other relevant institutions and organizations, was collected for the purpose of preparation of the Draft Environmental Indicators.
The problems faced with by the working groups in the preparation of environmental indicators are mostly related to environmental data itself, namely:
− lack of data, especially lack of historical data to be compared with the present state, to conduct analysis of phenomena course and development and estimate the trends of the future development;
− lack of relevant data to serve the goals of reporting through environmental indicators;
− quality, i.e. format of data which in most cases required detailed analysis, checking and reprocessing;
− non-continuous data collection by the relevant institutions and organizations resulting in lack of data for certain periods/years and impossibility to track the trend of the given phenomenon;
− existing data is owned by different institutions and regular data/information flow has not been established yet, although the legal grounds to that end has been provided.
Positive development indicating the achievement of a qualitatively or quantitatively defined target
Undefined course of development, insufficient for achieving qualitative or quantitative targets; it may also be a changeable trend within a given indicator
Unfavourable course of development
ENVIRONMENTAL INDICATORS OF THE REPUBLIC OF MACEDONIA 18
FUTURE ACTIVITIES Indicators development is a dynamic process which is subject to continuous updating and improvement. According to the experiences from other countries and international institutions, we are convinced that environmental indicators are effective and useful tool in environmental reporting and efficiency in the implementation of environmental policies.
According to the Law on Environment, the proposed environmental indicators will serve as reporting basis at annual level, and the working groups are obliged to update and improve the respective environmental indicators on continuous basis.
Working groups may propose indicators under additional chapters not elaborated as yet, but deemed to be relevant for the observation of the state of the environment in the Republic of Macedonia (e.g.: noise, chemicals, etc.).
Macedonian Environmental Information Center

ENVIRONMENTAL INDICATORS OF THE REPUBLIC OF MACEDONIA 19
LIST OF ABBREVIATIONS
CSI Core Set of Indicators
EC European Community
EEA European Environment Agency
ENHIS European Environment and Health Information System
EUROSTAT Statistical Office of the European Communities
ISO International Standardization Organization
NEAP National Environmental Action Plan
WHO World Health Organisation
GDP Gross Domestic Product
DPSIR Driving forces - Pressure - State - Impact - Response
LSGUs Local Self-Government Units
EU European Union
EC European Commission
IHP Institute for Health Protection
PHI Public Health Institution
MEPP Ministry of Environment and Physical Planning
UN United Nations
OUN Organization of United Nations
RIHP Republic Institute for Health Protection
HMA Hydrometeorological Administration
HBI Hydrobiological Institute
ENVIRONMENTAL INDICATORS OF THE REPUBLIC OF MACEDONIA 20
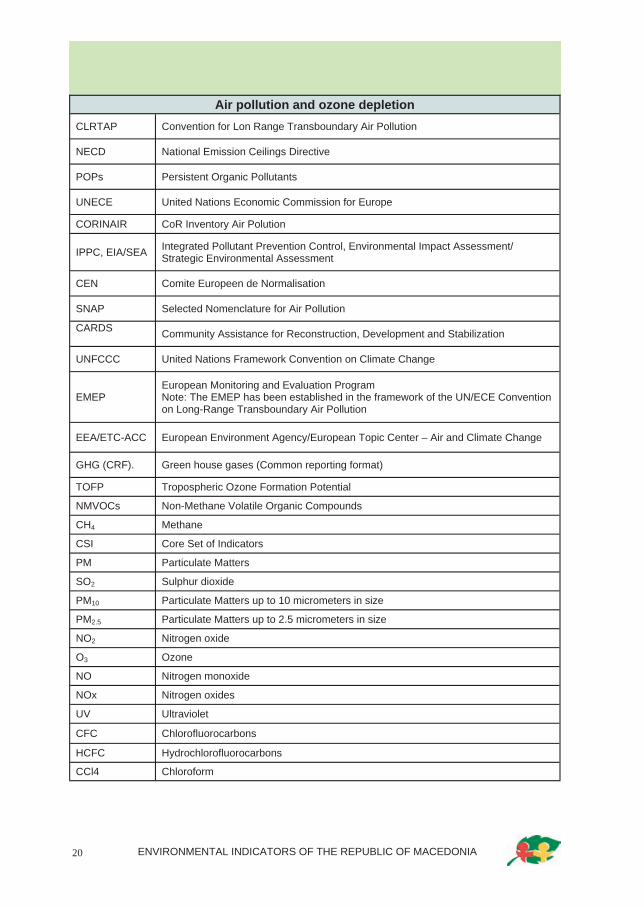
CLRTAP Convention for Lon Range Transboundary Air Pollution
NECD National Emission Ceilings Directive
POPs Persistent Organic Pollutants
UNECE United Nations Economic Commission for Europe
CORINAIR CoR Inventory Air Polution
IPPC, EIA/SEA Integrated Pollutant Prevention Control, Environmental Impact Assessment/Strategic Environmental Assessment
CEN Comite Europeen de Normalisation
SNAP Selected Nomenclature for Air Pollution
CARDS Community Assistance for Reconstruction, Development and Stabilization
UNFCCC United Nations Framework Convention on Climate Change
EMEP European Monitoring and Evaluation Program Note: The EMEP has been established in the framework of the UN/ECE Convention on Long-Range Transboundary Air Pollution
EEA/ETC-ACC European Environment Agency/European Topic Center – Air and Climate Change
GHG (CRF). Green house gases (Common reporting format)
TOFP Tropospheric Ozone Formation Potential
NMVOCs Non-Methane Volatile Organic Compounds
CH4 Methane
CSI Core Set of Indicators
PM Particulate Matters
SO2 Sulphur dioxide
PM10 Particulate Matters up to 10 micrometers in size
PM2.5 Particulate Matters up to 2.5 micrometers in size
NO2 Nitrogen oxide
O3 Ozone
NO Nitrogen monoxide
NOx Nitrogen oxides
UV Ultraviolet
CFC Chlorofluorocarbons
Air pollution and ozone depletion
HCFC Hydrochlorofluorocarbons
CCl4 Chloroform

ENVIRONMENTAL INDICATORS OF THE REPUBLIC OF MACEDONIA 21
ODS Ozone Depleting Substances
HВFC Hydrobromofluorocarbons
МТ Metric tonnes
ODP Ozone Depletion Potential
UNEP United Nation Environmental Programme
UNIDO United Nation Industrial Development Organisation
DGENV European Commission, Environment Directorate-General
Biological Diversity IUCN International Union for Conservation of Nature
NCSA National Capacity Self-Assessment
UNESCO United Nations Educational, Scientific and Cultural Organization
SNR Strict Natural Reserve
NP National Park
MN Monument of Nature
ASNC Area of Special Natural Characteristics
AONRFFS Area Outside Natural Reserve Containing Certain Flora and Fauna Species
ASCI Areas of Special Conservation Interest
CDDA Common Database on Designated Areas
FAO Food and Agriculture Organisation
SEBI 2010 Streamlining of European Biodiversity Indicators by 2010
CBD Convention on Biodiversity
PEBLDS Pan-European Biological and Landscape Diversity Strategy
Climate Change IPCC Inter-Governmental Panel for Climate Change
GHG Green House Gases
LUCF Land Use Change and Forestry
UNFCCC United Nations Climate Change Convention
CDM Clean Development Mechanism
ЕЕ Energy Efficiency
RES Renewable Energy Sources
TPP Thermal Power Plant
WASP Energy system planning tool
GACMO Green House Gases Costing Model

ENVIRONMENTAL INDICATORS OF THE REPUBLIC OF MACEDONIA 22
Soil CORINE Land Cover Coordination of Information on the Environment
JRC Joint Research Centre
Waste ERM Environmental Resources Management
Water WEI Water exploitation Index
PE Public Enterprise
OECD/ EUROSTAT
Organisation for Economic Co-operation and Development / Statistical Office of the European Communities
BOD Biological Oxigen Demand
NH4+ Ammonium ion
FWD Framework Water Directive
EEC European Economic Community
IPPC Integrated Pollution Prevention and Control
pH Measure of solution acidity or alkalinity
NO3 Nitrates
ХПК Chemical Oxygen Demand
Agriculture OECD Organisation for Economic Co-operation and Development
Energy
ECE/UN Economic Commission for Europe/ United Nations
IEA/OECD Institute of European Affairs/ Organisation for Economic Co-operation and Development
NAC National Activities Classification
PARE Price Adjusted Rate Exchange
Fishering FAO Food and Agriculture Organisation
Transport ECMT European Conference of the Ministers of Transport
UNECE United Nations Economic Commission
UIC L’Union Internationale des Chemins

ENVIRONMENTAL INDICATORS OF THE REPUBLIC OF MACEDONIA 23
DG TREN Directorate-General for Transport and Energy
ECMT/UNECE European Conference of the Ministers of Transport/ United Nations Economic Commission for Europe
ROD Report Obligation Database
Health IQ Intelligence Quotient
Pb Lead
IPPC Integrated Pollution Prevention and Control
EIA/SEA Environmental Impact Assessment/ Strategic Environmental Assessment
PM Particulate Matters
HIV/AIDS Human Immunodeficiency virus/ Acquired Immune Deficiency Syndrome
ALL Acute Lymphoblastic Leukaemia
ELF Extremely Low Frequency
AML Acute Myeloid Leukaemia
COMARE Committee of Medical Aspects of Radiation in the Environment
ACCIS Automated Childhood Cancer Information System
REACH Registration, Evaluation, Authorisation and Restriction of CHemicals
UV Ultraviolet
Tourism
WTO World Tourism Organization


ENVIRONMENTAL INDICATORS OF THE REPUBLIC OF MACEDONIA 26
MK-NI 001 EMISSIONS OF ACIDIFYING SUBSTANCES
Period of indicator assessment September 2007— April 2008
Explanation Justification for indicator selection
Emissions of acidifying substances cause damage to human health, ecosystems, buildings and materials, through processes like corrosion. The effects associated with emissions of pollutants included in this type of indicators depend on their acidifying potential and on the properties of ecosystems and materials. The deposition of acidifying substances still frequently exceeds the critical levels in ecosystems throughout Europe.
The indicator supports assessment of the progress towards implementation of the Gothenburg Protocol under the 1979 Convention on Long-Range Transboundary Air Pollution (CLRTAP) and the EU Directive on National Emissions Ceilings (NECD) (2001/81/EC).
Definition The indicator tracks the trends in anthropogenic emissions of acidifying substances, i.e. acidifying processes in the air. These substances include nitrogen oxides, ammonia, and sulfur dioxide, and their acidifying power is weighted by their acidifying potential.
The indicator also provides information on emissions by sectors: energy generation and transformation, road and other transport, industry (processes and energy), fugitive emissions, waste, agriculture and other.
Units − Ktonnes (acidifying equivalent)
Рolicy relevance of the indicator List of relevant policy documents
The National Environmental Action Plan (NEAP II) provides directions for the measures (presented below) that need to be taken to improve the overall status of air, including the reduction of emissions of acidifying substances:
− Development of National Plan for Ambient Air Protection; − Development of Programmes for air emissions reduction and air quality improvement
in certain local self-government units (LSGUs) with action plans (pilot: City of Skopje);
− Establishment of lists of air quality zones and agglomerations;
P
R
D
S
I

ENVIRONMENTAL INDICATORS OF THE REPUBLIC OF MACEDONIA 27
− Capacity building in vehicles technical control at vehicles registration, annual technical inspections and control on roads.
According to the Stabilization and Association Agreement between the EU and the Republic of Macedonia, Action Plan for European Partnership, National Programme for Approximation with the Acquis, the following activities should be implemented:
− Preparation of bylaws in the area of air in accordance with the National Approximation Programme with priorities
− Establishment of national emission ceilings for certain atmospheric pollutants (2001/81/ЕC)
− National Implementation Plan for POPs emissions reduction
− Inventory of Air Pollution by CORINAIR Methodology and reporting to UNECE/CLRTAP.
Legal grounds
The Law on Environment (adopted in 2005) regulates areas of relevance for the air quality and air emissions, especially in the segments of environmental monitoring, environmental impact assessment (EIA) and Integrated Pollution Prevention and Control (IPPC). Consistent implementation of certain Articles regulating IPPC, EIA/SEA will contribute to air emissions reduction, adoption of Local Environmental Action Plans (LEAPs) and climate change mitigation. The Law on Ambient Air Quality (Official Gazette of the Republic of Macedonia Nos. 67/2004, 92/2007) establishes the legal grounds for adoption of several bylaws and the following have been adopted so far:
− Decree on the limit values of levels and types of polluting substances in ambient air and on the alert thresholds, deadlines for the limit values achievement, margins of limit value tolerance, target values and long-term targets (Official Gazette of the Republic of Macedonia No. 50/05)
− Rulebook on criteria, methods and procedures for ambient air quality assessment (Official Gazette of the Republic of Macedonia No. 82/06)
− Rulebook on the methodology for inventory and determination of the levels of polluting substances in the atmosphere in tons per year for all types of activities, as well as other data to be reported to the European Monitoring and Evaluation Programme (ЕМЕP) (Official Gazette of the Republic of Macedonia No. 142/2007).
Two additional bylaws are in adoption procedure.
It has been envisaged to prepare National Plan for Ambient Air Protection and Programme for Air Pollution Reduction and Quality Improvement. These documents will be prepared in accordance with the requirements of the following EU Directives: 96/61/ЕC, 2000/81/ЕC, 2000/76/ЕC, 99/13/ЕC and 2001/81/ЕC. The Law on Ambient Air Quality establishes the legal grounds for the technical check-ups of mobile sources of pollution, performed for the purpose of vehicles registration to include regular compulsory control and demonstrate compliance with legal standards on emission levels.
The Rulebook on air emissions inventory in accordance with the CORINAIR (CoR Inventory Air Pollution) Programme has been adopted and introduced as a national methodology for air emissions inventory.

ENVIRONMENTAL INDICATORS OF THE REPUBLIC OF MACEDONIA 28
The UNECE Convention on Long-Range Transboundary Air pollution has been ratified and steps towards ratification of its eight Protocols have been taken.
Unite Nations Framework Convention on Climate Change – UNFCCC.
By means of endorsement method, 19 ISO and CEN standards in the area of air emissions and quality have been adopted.
Other legislation related to the regulation of air quality and air emissions includes the Law on Road Transport Safety, Law on Standardization, Rulebook on liquid fuels quality with national standards for liquid fuels quality, etc.
Key policy issue What progress has been made in reducing acidifying substances emissions in the air?
At present, activities are carried out in relation to the implementation of the system of Integrated Pollution Prevention and Control based on the Law on Environment and in accordance with Directive 96/61/ЕC. In this context, Decree and Rulebook for their implementation have been prepared. These acts define the business entities, i.e. production facilities obliged to acquire A and B integrated environmental permits, which specify the conditions for air pollution control and the limit values of emissions they will be allowed to release in the air. The introduction of this system will enable control of air emissions and quality, as well as possibility to reduce the emissions of acidifying pollutants in the air.
Specific policy issue Which different sectors and processes contribute to acidifying substances emissions?
Кey message In 2005, in the frames of the CORINAIR Programme, the Inventory of Air Emissions was established in the country, presenting emissions by individual sectors or activities, and assessment was made for the period 2002-2006, which means that the trend presented has some uncertainty.
Sectors based on the CORINAIR Methodology and SNAP – selective nomenclature are given in the table below:

ENVIRONMENTAL INDICATORS OF THE REPUBLIC OF MACEDONIA 29
In the period 2002 – 2006, a varying trend in the emissions of certain acidifying substances was observed in the Republic of Macedonia, ranging from mild falling especially for SO2
(decrease by around 20%) in 2005, to increase to almost stable level in other years. The falling trend in 2005 was due mainly to the decreased number or/and closed production processes in metallurgy which used to be sources of pollution. Taking into account the unstable transition period in the country, the increase in the amounts of emission in 2006 is not surprising. Actually, this is an indication that no continuously falling trend in the quantities of emissions can be achieved at annual level, as well as in longer term, in absence of specific measures and programmes for pollutants emission reduction.
Electricity production remains the main source of pollution with SO2,, mainly as a result of the poor quality (low calorific value) of fuels with high content of sulfur. These processes, together with the transport, are also the main sources of NOx emissions. Data on NH3 is available only for 2005 (the main source being the agriculture).
At this moment, there are no integrated programmes or action plans aimed at reducing the emissions of polluting substances in the atmosphere, at any level in the country.
SNAP 1 СогорCombustion in energy and transformation industries (stationary sources) 2 Non-industrial combustion plants (stationary sources)
3 Combustion in manufacturing industry (stationary sources)
4 Production processes (stationary sources) 5 Extraction and distribution of fossil fuels and geothermal energy 6 Solvent and other product use 7 Road transport 8 Other mobile sources and machinery 9 Waste treatment and disposal 10 Agriculture 11 Nature
0
0,5
1
1,5
2
2,5
3
3,5
4
4,5
5
2002 2003 2004 2005 2006
kton
nes (acidity
equ
ivalen
t)
year
Total emission of acidifying substances
SO2 NOx

ENVIRONMENTAL INDICATORS OF THE REPUBLIC OF MACEDONIA 30
Assessment
In order to identify the amounts of air emissions of the main polluting substances, the Cadastre of Air Polluters and Pollutants in the Republic of Macedonia was developed.
The development of the Cadastre relied on data (2004 - 2005) obtained from business facilities, as well as data obtained by measurement of sulfur dioxide, nitrogen oxides, carbon monoxide and dust, where no data was available. Through this process, data of around 1000 combined air emission sources and around 660 point air emission sources was processed. It
0
0,5
1
1,5
2
2,5
3
3,5
4
4,5
5
2002 2003 2004 2005 2006
kton
nes (acidity
equ
ivalen
t)
year
Total emission of SO2 causing acidification by sectors
11
10
9
8
7
6
5
4
3
2
1
0
0,2
0,4
0,6
0,8
1
1,2
2002 2003 2004 2005 2006
kton
nes (
acid
ity eq
uiva
lent
)
year
Total emission of NOx causing acidification by sectors
11
10
9
8
7
6
5
4
3
2
1

ENVIRONMENTAL INDICATORS OF THE REPUBLIC OF MACEDONIA 31
should be noted that the Cadastre of Air Polluters and Pollutants in the Republic of Macedonia requires review, considering the date of its production (2004 – 2005) and the changes taking place meantime.
The Cadastre identified the polluting substances at the level of facility. However, in an observation of the requirements of the relevant international agreements, such as UNECE/CLRTAP, the CORINAIR Methodology and SNAP nomenclature were introduced in order to obtain compatible and comparable data on the given polluting substances.
The introduction of the uniform methodology for air pollution inventory on national level based on CORINAIR (Core Inventory for Air Pollution) is of great importance in terms of the identification of amounts of individual pollutants. The Republic of Macedonia ratified the UNECE Convention on Long-Range Transboundary Air Pollution, but eight Protocols to this Convention remain to be ratified.
The introduction of the uniform methodology for air pollution inventory (CORINAIR) and the distribution of amounts of polluting substances to all 11 sectors in accordance with the SNAP-selective nomenclature of air pollution on national level, has enabled the Republic of Macedonia to report data which is compatible with the relevant data at the EU level.
SO2 emissions by sectors
By application of the CORINAIR methodology, estimates of series of SO2 emissions were made for the period 2002 - 2006.
Despite of the mildly falling trend in SO2 emissions by 2005, which may be attributed to the decreased number of active industrial processes in the country (closure of certain major industrial facilities), there was a rising trend in the amounts of SO2 emissions in 2006.
The above shows that no persistent falling trend in the quantities of air emissions can be achieved at annual level, as well as in longer term, unless specific measures and programmes for pollutant emissions reduction are introduced.
Electricity production is the main source of this type of emissions. Namely, in 2006, more than 66 % of sulphur dioxide emissions originated from electricity production and use of poor quality and low calorific value lignite.
Major proportion of these emissions is located in the southwestern part of the country, where the biggest thermal power plant for electricity production is located. The quality of both solid and liquid fuels is low (with high content of sulfur), and no data is available on any relevant policy for emission reduction, both on local and national levels.
NOx emissions by sectors
The series of NOx emissions have been estimated for the period 2002 - 2005.
By application of the CORINAIR methodology in nitrogen oxides emission inventory, it can be concluded that the main sources of NOx emission in the country include electricity production (28%), again owing to the poor quality of fuel, transport (37%) and other industrial production processes (no. 4 of the SNAP nomenclature, contributing more than 14% to the estimated emission).
ENVIRONMENTAL INDICATORS OF THE REPUBLIC OF MACEDONIA 32
NH3 emissions– initially calculated for 2005. Agricultural sector is the main source of these emissions (84% of the emission), (data taken from CARDS projects). It should be noted that no data is available on NH3 emissions in 2006.
Targets Does any of the national documents set targets or targets set under international documents should be achieved?
National documents listed as references in the above text provide guidelines and specify actions that should be undertaken as a matter of priority. It is important to mention that the development of new regulations in the area of air emissions is in progress, and they will transpose the following Directives into the national legislation: 96/61/ЕC, 2000/81/ЕC, 2000/76/ЕC, 99/13/ЕC and 2001/81/ЕC.
In accordance with the requirements of the UNECE Convention on Long-Range Transboundary Air Pollution, inventory based on the CORINAIR Programme has been introduced, setting the target of regular inventory of pollutants in tonnes per year.
Inventory of pollutants by main sectors of relevance for climate change is also performed in accordance with the United Nations Framework Convention on Climate Change (UNFCCC).
In order to achieve the targets for reduction of acidifying substances emission, causing degradation of environment and materials, as well as negative effects on human health, it is necessary to adopt all documents planned under the National Programme for Approximation with the Acquis.
Methodology Methodology for the indicator calculation
The methodology for this indicator calculation is based on aggregation and calculation of data on SO2, NH3 and NOx emissions at annual basis, on national level, as overall and distributed to sectors, i.e. activities.
Calculations are in line with the Guidelines of UNECE/EMEP Convention on Long-Range Transboundary Air Pollution, and CORINAIR methodology for inventory and application of the SNAP – selective nomenclature of air pollution. With regard to this specific indicator, factors have been used in order to express the acidifying property potential. These factors are specific to each pollutant, namely NOx 0.02174, SO2 0.03125 and NH3 0.05882. The results are expressed in kilotonness equivalent acidity.
Methodology for deficiencies overcoming
In order to enable analysis of the trend where the countries have not reported data for a period of one or more years, data is interpolated to derive emissions for the missing year or years. If data is missing at the beginning or at the end of the period, it is assumed that the value of the emission is equal to the first or the last reported value. Application of tools for gaps filling may create artificial trends, but they are taken as unavoidable if comprehensive and comparable data set is required on European countries for the purposes of policy analysis. The list of data sets with filled in gaps plus information with reference of data used to fill in the gaps can be

ENVIRONMENTAL INDICATORS OF THE REPUBLIC OF MACEDONIA 33
found on EEA Data Service at: http://dataservice.eea.europa.eu/dataservice/metadetails.asp?id=818
Reference of used methodology
EEA/ETC-ACC Technical Report outlining the methodologies for gap filling, applied for 2004. EEA/ETC-ACC CLRTAP and information on GHG air emissions (CRF).
Data specification
Data coverage (by years): Table 1: Total emission of acidifying substances
Title of the indicator Source Reporting obligation
Emissions of acidifying substances
− State Statistical Office, Energy balance of the country – Report by the Government;
− Cadastre of Air polluters and Pollutants;
− Data from measurements in companies – major polluters:
− Database on motor vehicles of the Ministry of Interior;
− Project: Introduction of CORINAIR Inventory Methodology of the Ministry of Environment and Physical Planning,
− Spatial Plan of the Republic of Macedonia.
− Reporting obligations under multilateral agreements – UNECE/CLRTAP and ЕЕА
− Annual report of processed data on air emissions
Substances (k-tons) 2002 2003 2004 2005 2006
SO2 4,3 4,3 4,7 3,1 4,4
NOx 0,7 0,8 0,9 0,7 1,1

ENVIRONMENTAL INDICATORS OF THE REPUBLIC OF MACEDONIA 34
Table 2: Total emission of SO2 by sectors presented relative to acidification coefficients
Table 3: Total emission of NOx by sectors presented relative to acidification coefficients
SNAP 2002 2003 2004 2005 2006
1 Combustion in energy and transformation industries(stationary sources)
2,8211 2,8714 2,8714 2,8707 2,8811
2 Non-industrial combustion plants (stationary sources) 0,1968 0,1968 0,2320 0,0332 0,2588
3 Combustion in manufacturing industry (stationary sources) 0,1688 0,1688 0,3656 0,2016 0,1688
4 Production processes (stationary sources) и 0,9581 0,9650 1,0369 0,0111 0,9581
5 Extraction and distribution of fossil fuels and geothermal energy
6 Solvent and other product use 0,1244 0,0444 0,1383 0,1244
7 Road transport 0,0161 0,0161 0,0308 0,0242 0,0161
8 Other mobile sources and machinery 0,0078
9 Waste treatment and disposal 0,0001
10 Agriculture
11 Nature 0,0012
total 4,2852 4,3429 4,6750 3,1499 4,4
SNAP 2002 2003 2004 2005 2006
1 Combustion in energy and transformation industries (stationary sources)
0,2667 0,2923 0,2923 0,2848 0,2967
2 Non-industrial combustion plants (stationary sources) 0,0246 0,0246 0,0333 0,0326 0,0446
3 Combustion in manufacturing industry (stationary sources) 0,0328 0,0328 0,0885 0,0596 0,0885
4 Production processes (stationary sources) 0,0906 0,1352 0,1541 0,1072 0,1411
5 Extraction and distribution of fossil fuels and geothermal energy
6 Solvent and other product use 0,0309 0,0309 0,0309 0,0512
7 Road transport 0,2475 0,2467 0,3167 0,2000 0,2914
8 Other mobile sources and machinery 0,0450 0,0871
9 Waste treatment and disposal 0,0005
10 Agriculture
11 Nature 0,0037
total 0,6922 0,7619 0,9157 0,7334 1,0006

ENVIRONMENTAL INDICATORS OF THE REPUBLIC OF MACEDONIA 35
General metadata
Geographical coverage: Republic of Macedonia
Temporal coverage: 2002 – 2006
Frequency of data collection:
Guidelines by EMEP/CORINAIR – Manual on Atmospheric Emissions Inventory, Third edition and SNAP – nomenclature of sectors, annual data processing.
In line with the guidelines, the frequency of data collection and processing is set on annual basis.
Note: There is no data available before 2002 to identify the quantity of emissions of acidifying substances.
Uncertainty Methodological uncertainty and data uncertainty
Use of factors of acidification potential leads to some uncertainty. It has been assumed that factors are representative for Europe as a whole; at local level, different factors may be assessed. Detailed discussion of uncertainty of these factors can be found with de Leeuw (2002).
ЕЕА uses data reported officially by EU Member States and by other EEA Member States, which observe general instructions on emission data calculation and reporting (EMEP/EEA 2001) with regard to NOx, SO2 and NH3.
Future activities Short-term activities
Indicator update by supplementing annual data from the inventory of emissions of acidifying substances from the preceding year.
a. Description of the activity
Calculation of the indicator and approval of updated and supplemented indicator by the Working Group on the national set of air quality indicators.
b. Required resources Engagement of national experts in the area of air quality from governmental institutions.
c. Status In progress
Code Title of the indicator
Compliance with CSI ЕЕА or other indicators
Classification by DPSIR Type Linkage
with area Frequency of publication
MK NI 001 Emissions of acidifying substances
CSI 001 AP1
Emissions of acidifying substances
P B acidification air Annually

ENVIRONMENTAL INDICATORS OF THE REPUBLIC OF MACEDONIA 36
Dead line: 1 year
Long-term activities − Transposition of Directives of relevance for the air emissions area, namely Directives
2000/81/ЕC, 2001/81/ЕC, 96/61/ЕC, as well as preparation of bylaws in this regard. − Preparation of National Plan for Air Protection, − Preparation of Plan for Air Emissions Reduction.
a. Description of the activity
Upon the completion of the above described activities, conditions should be established to enable the implementation of the listed documents, e.g. establishment of ceiling values of annual emissions and their reduction projection in line with the NEC Directive 2001/81/EC.
Introduction of the system of Integrated Pollution Prevention and Control.
b. Required resources
No resources needs have been established.
c. Status
In progress.
Dead line: 01.01.2099 a. Description of the activity
Improvement of the quality of national data reported to the UNECE/CLRTAP/EMEP. b. Required resources
The Gothenburg Protocol enters into force. Ratification has not reached the required number of 16 countries.
c. Status
In progress
Dead line: 01.01.2099

ENVIRONMENTAL INDICATORS OF THE REPUBLIC OF MACEDONIA 37
MK - NI 002 EMISSIONS OF OZONE PRECURSORS
Period of indicator assessment September 2007—April 2008
Explanation Justification of indicator selection
Emissions of non-methane volatile organic compounds (NMVOCs), nitrogen oxides, carbon monoxide and methane contribute to the formation of ground-level (tropospheric) ozone. Their relative contributions can be assessed on the basis of their tropospheric ozone-forming potential (TOFP) (de Leeuw 2002).
Ozone is a powerful oxidant and tropospheric ozone can have adverse effects on human health and ecosystems. It is a problem mainly during the summer months. High concentrations of ground-level ozone adversely affect the human respiratory system and there is evidence that long-term exposure accelerates the decline in lung function with age and may impair the development of lung function. Some people are more vulnerable to high concentrations than others, with the worst effects generally being seen in children, asthmatics and the elderly. High concentrations in the environment are harmful to crops and forests, decreasing yields, causing leaf damage and reducing disease resistance.
Definition This indicator tracks trends in emissions of ozone precursors: nitrogen oxides, carbon monoxide, methane and non methane volatile organic compounds, caused by anthropogenic activities, and each weighted by their tropospheric ozone-forming potential.
The indicator also provides information on emissions by sectors: energy industries; road and other transport; industry (processes and energy); other (energy); fugitive emissions; waste; agriculture and other (non energy).
Units − Ktonnes (NMVOC - equivalent)
Policy relevance of the indicator List of relevant political documents
The National Environmental Action Plan (NEAP II) provides directions for the measures (presented below) that need to be taken to improve the overall status of air, including the reduction of of emissions of ozone precursors:
− Development of National Plan for Ambient Air Protection;
P
R
D
S
I

ENVIRONMENTAL INDICATORS OF THE REPUBLIC OF MACEDONIA 38
− Development of Programmes for air emissions reduction and air quality improvement in certain local self-government units (LSGUs), including the City of Skopje;
− Establishment of lists of air quality zones and agglomerations;
− Capacity building in vehicles technical control at vehicles registration.
According to the Stabilization and Association Agreement between the EU and the Republic of Macedonia, Action Plan for European Partnership, National Programme for Approximation with the Acquis, the following activities should be implemented:
− Preparation of bylaws in the area of air in accordance with the National Approximation Programme with priorities
− Establishment of national emission ceilings for certain atmospheric pollutants (2001/81/ЕC)
− National Implementation Plan for POPs emissions reduction
− Inventory of Air Pollution by CORINAIR Methodology and reporting to UNECE/CLRTAP.
Legal grounds
The Law on Environment (adopted in 2005) regulates areas which make direct impact on air quality and air emissions. Thus, the Law regulates issues related to IPPC, EIA/SEA, Local Environmental Action Plans (LEAPs) and climate change.
The Law on Ambient Air Quality was adopted in 2004 (Official Gazette of the Republic of Macedonia Nos. 67/2004, 92/2007) as framework law in the area of air. This Law establishes the legal grounds for adoption of a number of bylaws in line with the requirements of the relevant Acquis Communitaire.
The following regulations have been adopted so far:
− Decree on the limit values of levels and types of polluting substances in ambient air and on the alert thresholds, deadlines for the limit values achievement, margins of limit value tolerance, target values and long-term ozone targets (Official Gazette of the Republic of Macedonia No. 50/05)
− Rulebook on criteria, methods and procedures for ambient air quality assessment (Official Gazette of the Republic of Macedonia No. 82/06)
− Rulebook on the methodology for inventory and determination of the levels of polluting substances in the atmosphere in tons per year for all types of activities, as well as other data to be reported to the European Monitoring and Evaluation Programme (ЕМЕP) (Official Gazette of the Republic of Macedonia No. 142/2007).
The requirements of the relevant EU Directives have been transposed in the above listed regulations, and two additional bylaws are in adoption procedure.
It has been envisaged to prepare National Plan for Ambient Air Protection and Programme for Air Pollution Reduction and Quality Improvement. These documents will be prepared in accordance with the requirements of the following EU Directives: 96/61/ЕC, 2000/81/ЕC, 2000/76/ЕC, 99/13/ЕC and 2001/81/ЕC. The Law on Ambient Air Quality establishes the legal grounds for the technical checkups of mobile sources of pollution, performed for the purpose of vehicles registration to include regular compulsory control and demonstrate compliance with legal standards on emission levels.
ENVIRONMENTAL INDICATORS OF THE REPUBLIC OF MACEDONIA 39
The Rulebook on air emissions inventory in accordance with the CORINAIR (CoR Inventory Air Pollution) Programme has been adopted and introduced as a national methodology for air emissions inventory.
The UNECE Convention on Long-Range Transboundary Air pollution has been ratified and steps towards ratification of its eight Protocols have been taken.
Unite Nations Framework Convention on Climate Change – UNFCCC.
By means of endorsement method, 19 ISO and CEN standards in the area of air emissions and quality have been adopted.
Other legislation related to the regulation of air quality and air emissions includes the Law on Road Transport Safety, Law on Standardization, Rulebook on liquid fuels quality with national standards for liquid fuels quality, etc
Key policy issue What progress has been made in ozone precursors emissions reduction in Europe?
At present, activities are carried out in relation to the implementation of the system of Integrated Pollution Prevention and Control based on the Law on Environment and in accordance with Directive 96/61/ЕC. In this context, Decree and Rulebook for their implementation have been prepared. These acts define the business entities, i.e. production facilities obliged to acquire A and B integrated environmental permits, which specify the conditions for air pollution control and the limit values of emissions they will be allowed to release in the air. The introduction of this system will enable control of air emissions, thus providing possibility to reduce the emissions of pollutants identified as ozone precursors.
Specific policy issue Which different sectors and processes contribute to ozone precursors emissions?
Key message In 2005, in the frames of the CORINAIR Programme, the Inventory of Air Emissions was established in the country, presenting emissions by individual sectors, i.e. activities, and assessment was made for the period 2002-2005. Application of this manner of data processing, especially due to the lack of data in real time, the trend presented cannot be determined precisely.
Sectors based on the above stated Methodology and SNAP – selective nomenclature are given in the table below:

ENVIRONMENTAL INDICATORS OF THE REPUBLIC OF MACEDONIA 40
In the period 2002 – 2006, a rising trend has been tracked in the emissions of ozone precursors in the Republic of Macedonia, with an exception of NMVOC and CH4 presented only for 2004 as major contributors to air emissions in that year.
Electricity production - sector 1, road transport - sector 7, and nature - sector 11 are the main sources of ozone precursors emission.
At this moment, there are no integrated programmes or action plans aimed at reducing the emissions of polluting substances in the atmosphere, at any level in the country.
The Diagram below shows the annual trend in the emissions of CO (carbon monoxide) and nitrogen oxides presented as ozone precursors:
SNAP
1 Combustion in energy and transformation industries (stationary sources)
2 Non-industrial combustion plants (stationary sources)
3 Combustion in manufacturing industry (stationary sources)
4 Production processes (stationary sources)
5 Extraction and distribution of fossil fuels and geothermal energy
6 Solvent and other product use
7 Road transport
8 Other mobile sources and machinery
9 Waste treatment and disposal
10 Agriculture
11 Nature
0
10
20
30
40
50
60
70
80
2002 2003 2004 2005 2006
NM
VOC
equ
ival
ents
(kto
nnes
)
year
Trends in ozone precursors emissions
NOx CO

ENVIRONMENTAL INDICATORS OF THE REPUBLIC OF MACEDONIA 41
0
20
40
60
80
100
120
140
2002 2003 2004 2005 2006
kton
nes (NMVO
C eq
uivalent)
year
Total ozone precursors emissions
NOx CO NMVOC CH4
0
10
20
30
40
50
60
70
80
2002 2003 2004 2005 2006
NMVO
C eq
uiva
lent
s (kt
onne
s)
year
Total NOx emissions by sectors/year
11
10
9
8
7
6
5
4
3
2
1
0
5
10
15
20
25
2002 2003 2004 2005 2006
NM
VOC
equ
ival
ents
(kto
nnes
)
year
Total CO emissions by sectors/year
11
10
9
8
7
6
5
4
3
2
1

ENVIRONMENTAL INDICATORS OF THE REPUBLIC OF MACEDONIA 42
Assessment For the purpose of identifying the amounts of air emissions of the main polluting substances, the Cadastre of Air Polluters and Pollutants in the Republic of Macedonia was developed in 2004-2005.
The development of the Cadastre was based on data obtained from business facilities, as well on measurements of sulfur dioxide, nitrogen oxides, carbon monoxide and dust.
This Inventory was based on polluting substances at the level of facility. However, in an observation of the requirements of the relevant international agreements, such as UNECE/CLRTAP, the CORINAIR Methodology and SNAP nomenclature were introduced in order to obtain compatible and comparable data on the given polluting substances.
The introduction of the uniform methodology for air pollution inventory on national level as recommended by CORINAIR (Core Inventory for Air Pollution) is of great importance in terms of the identification of amounts of individual pollutants. This methodology made the data of the Republic of Macedonia compatible with the relevant data in the European Union. methodology of air pollution inventory (CORINAIR) presents the quantities of air pollutants emissions distributed to all 11 sectors in accordance with the SNAP – selective nomenclature of air pollution on national level.
Total emission of ozone precursors
Series of emissions of ozone precursors were assessed for the period 2002 - 2006.
Although there are no major temporal annual series of data on ozone precursors, it is possible to conclude the following with regard to total emission of ozone precursors on annual level in the analyzed years from 2002 to 2006: NOx and CO remained with rising trend, while quantities of NMVOC and CH4 emissions could be presented for 2004 only. Namely, these two pollutants were covered in the inventory and their identification was conducted in the process of development of the Cadastre of air emissions, by application of the CORINAIR methodology for 2004. Most of the quantities of NMVOC and CH4 emissions derive from the sector 11, sector 7 and sector 6 under SNAP.
0
20
40
60
80
100
120
140
NMVOC CH4
NMVO
C eq
uiva
lents
(kto
nnes
)
Total emissions of NMVOC and CH4 by sectors/year for 2004
11
10
9
8
7
6
5
4
3
2
1

ENVIRONMENTAL INDICATORS OF THE REPUBLIC OF MACEDONIA 43
Emissions of NOx as ozone precursor by sector
Series of NOx emissions were assessed for the period 2002 - 2005.. Through application of the CORINAIR methodology in the inventory of nitrogen oxides emission, it was found out that the main sources of NOx in the country include electricity production, again due to the poor quality of fuel, transport and other industrial production processes. Emissions of CO as ozone precursor by sectors
Series of CO emissions were assessed for the period 2002 - 2005. Emissions of CO as ozone precursor show mild increase in the total quantity in the given years. If presented by SNAP sectors, sector 7, i.e. transport is prevailing in this regard. Also, CO emission results from combustion processes in heat producing plants (sector 2). Emissions of NMVOC and CH4 as ozone precursor by sectors
Series of NMVOC and CH4 were not available for the period 2002 - 2006. Data available covers only 2004. The application of the CORINAIR methodology in the inventory of NMVOC and CH4 emissions leads to the conclusion that the main sources of this emission in the country originate from the SNAP 11 sector.
Targets Does any of the national documents set targets or targets set under international documents should be achieved?
National documents listed as references in the above text provide guidelines and specify actions that should be undertaken as a matter of priority. It is important to mention that the development of new regulations in the area of air emissions is in progress, and they will transpose the following Directives into the national legislation: 96/61/ЕC, 2000/81/ЕC, 2000/76/ЕC, 99/13/ЕC and 2001/81/ЕC.
In accordance with the requirements of the UNECE Convention on Long-Range Transboundary Air Pollution, inventory based on the CORINAIR Programme has been introduced, setting the target of regular inventory of pollutants in tons per year.
Inventory of pollutants by main sectors of relevance for developments caused by climate change is also performed in accordance with the Uited Nations Framework Convention on Climate Change (UNFCCC).
The above documents provide basis for achievement of the targets for reduction of ozone precursors emission, causing degradation of environment and materials, as well as negative effects on human health.
Methodology Methodology for the indicator calculation
The methodology for this indicator calculation is based on aggregation and calculation of data on CO, NMVOC, CH4 and NOx emissions at annual basis, on national level, as overall and distributed to sectors, i.e. activities.

ENVIRONMENTAL INDICATORS OF THE REPUBLIC OF MACEDONIA 44
Calculations are in line with the Guidelines of UNECE/EMEP Convention on Long-Range Transboundary Air Pollution, and CORINAIR methodology for inventory and application of the SNAP – selective nomenclature of air pollution.
With regard to this specific indicator, factors have been used in order to express the property of ozone precursors. These factors are specific to each pollutant, namely for NOx it is 1.22, for NMVOC it is 1, for CO it is 0.11 and for CH4 this value is 0.014. The results are expressed in kilotons NMVOC equivalent.
Methodology for deficiencies overcoming
In order to enable analysis of the trend where the countries have not reported data for a period of one or more years, data is interpolated to derive emissions for year or years for which such data is missing. If data is missing at the beginning or at the end of the period, it is assumed that the value of the emission is equal to the first or the last reported value. Application of tools for gaps filling may create artificial trends, but they are taken as unavoidable if comprehensive and comparable data set is required on European countries for the purposes of policy analysis. The list of data sets with filled in gaps plus information with reference of data used to fill in the gaps can be found on EEA Data Service at: http://dataservice.eea.europa.eu/dataservice/metadetails.asp?id=818
Reference of used methodology
Methodology applied in the calculation and presentation of this indicator has been taken fro the Guidelines under CLRTAP and de Leeuw, F. (2002), Set of emission indicators of long-range transboundary air pollution, Environmental science and policy.
Data specification
Data coverage (by years): Table 1: Total emission of ozone precursors
Title of the indicator
Source Reporting obligation
Emissions of ozone precursors
− State Statistical Office, Energy balance of the country
− Report by the Government; Cadastre of Air polluters and Pollutants;
− Data from measurements in companies – major polluters:
− Database on motor vehicles of the Ministry of Interior; Project:
− Introduction of CORINAIR Inventory Methodology of the Ministry of Environment and Physical Planning,
− Spatial Plan of the Republic of Macedonia.
− Reporting obligations under multilateral agreements – UNECE/CLRTAP, as well as to ЕЕА
− Annual report of processed data on air emissions.
NMVOC еquivalent (k-tonnes) 2002 2003 2004 2005 2006
NOx 38,8 42,8 51,4 49,1 68,517
CO 8,4 8,4 9,2 10,9 19,768
NMVOC 124,1
CH4 0,8

ENVIRONMENTAL INDICATORS OF THE REPUBLIC OF MACEDONIA 45
Table 2: Total emission of NОx by sectors
Table 3: Total emission of CO by sectors/year
SNAP 2002 2003 2004 2005 2006
1 Combustion in energy and transformation industries (stationary sources) 14,965 16,405 16,405 15,981 16,649
2 Non-industrial combustion plants (stationary sources) 1,379 1,379 1,867 1,831 2,501
3 Combustion in manufacturing industry (stationary sources) 1,842 1,842 4,965 3,347 4,965
4 Production processes (stationary sources) 5,084 7,590 8,647 6,018 7,917
5 Extraction and distribution of fossil fuels and geothermal energy
6 Solvent and other product use 1,732 1,732 1,732 2,873
7 Road transport 13,888 13,845 17,773 11,224 28,731
8 Other mobile sources and machinery 2,524 4,88
9 Waste treatment and disposal 0,025
10 Agriculture
11 Nature 0,205
total 38,847 42,756 51,387 41,158 68,516
SNAP 2002 2003 2004 2005 2006
1 Combustion in energy and transformation industries (stationary sources)
0,181 0,181 0,181 0,042 2,037
2 Non-industrial combustion plants (stationary sources) 0,203 0,203 0,241 4,559 5,621
3 Combustion in manufacturing industry (stationary sources) 0,214 0,214 0,428 0,061 0,054
4 Production processes (stationary sources) 0,520 0,579 0,601 0,990 6,062
5 Extraction and distribution of fossil fuels and geothermal energy 0,061
6 Solvent and other product use 1,825 1,825 1,825
7 Road transport 5,424 5,424 5,963 4,502 4,759
8 Other mobile sources and machinery 0,223 1,235
9 Waste treatment and disposal 0,001
10 Agriculture
11 Nature 0,533
total 8,366 8,426 9,238 10,971 19,768

ENVIRONMENTAL INDICATORS OF THE REPUBLIC OF MACEDONIA 46
Table 4: Total emission of NMVOC and CH4 by sectors/year, for 2004
General metadata
Geographical coverage: Territory of the Republic of Macedonia
Temporal coverage: 2002 – 2006
Frequency of data collection
Data is collected throughout the year, but data processing, presentation and reporting takes place once a year. In this context, Guidelines by EMEP/CORINAIR – Manual on Atmospheric Emissions Inventory, Third edition and SNAP – nomenclature of sectors, annual data processing, are used.
Note: There is no data available before 2002 to identify the quantity of ozone precursors emissions.
SNAP NMVOC CH4
1 Combustion in energy and transformation industries (stationary sources) 1,6901 0,0007
2 Non-industrial combustion plants (stationary sources) 3,5088 0,0306
3 Combustion in manufacturing industry (stationary sources) 0,2105 0,0020
4 Production processes (stationary sources) 1,1078 0,0002
5 Extraction and distribution of fossil fuels and geothermal energy 0,4249 0,1626
6 Solvent and other product use 8,4847 0,0000
7 Road transport 8,8241 0,0026
8 Other mobile sources and machinery 0,9692 0,0002
9 ТретиWaste treatment and disposal рање на отпад 0,0010 0,2023
10 Agriculture 0,0000 0,3877
11 Nature 98,8666 0,0119
total 124,0877 0,8008
Code Title of the indicator
Compliance with CSI ЕЕА or other
indicators
Classification by DPSIR Type Linkage
with area Frequency of publication
MK NI 002 Emissions of ozone precursors
CSI 002 AP19
Emissions of ozone precursors
P А air air quality Annually

ENVIRONMENTAL INDICATORS OF THE REPUBLIC OF MACEDONIA 47
Uncertainty Methodological uncertainty and data uncertainty
Use of factors of the potential for ozone production by precursors leads to some uncertainty. It has been assumed that factors are representative for Europe as a whole; at local level, different factors may be assessed. Detailed discussion of uncertainty of these factors can be found with de Leeuw (2002).
ЕЕА develops this indicator of ozone precursors emissions once a year and it uses it in the reporting on the state of the environment. The uncertainty involved in the calculations and in data sets should be clearly stated in the assessment, in order to prevent misleading messages to impact the policy actions or processes.
Future activities Short-term activities
Indicator update by supplementing annual data from the inventory of emissions of ozone precursors from the preceding year.
a. Description of the activity
Calculation of the indicator and approval of updated and supplemented indicator by the Working Group on the national set of air quality indicators.
b. Required resources
Engagement of national experts in the area of air quality from governmental institutions. c. Status
Continuous activity
Deadline: 1 year
Long-term activities 1. Medium and long-term activities include transposition of Directives of relevance for
the air emissions area, namely Directives 2000/81/ЕC, 2001/81/ЕC, 96/61/ЕC, as well as preparation of bylaws in this regard.
2. Preparation of National Plan for Air Protection.
3. Preparation of Plan for Air Emissions Reduction.
a. Description of the activity
Upon the completion of the above described activities, conditions should be established to enable the implementation of the listed documents, e.g. establishment of ceiling values of annual emissions and their reduction projection in line with the NEC Directive 2001/81/EC.
Introduction of the system of Integrated Pollution Prevention and Control.

ENVIRONMENTAL INDICATORS OF THE REPUBLIC OF MACEDONIA 48
MK - NI 004 EXCEEDANCE OF AIR QUALITY LIMIT VALUES IN URBAN AREAS
Period of indicator assessment September 2007 – April 2008
Explanation Justification of indicator selection
Urban populations are exposed to air pollution with sulphur dioxide, particulate matter (PM), nitrogen oxides and ground-level ozone. Sulphur dioxide (SO2) is directly toxic to humans, its main action being on the respiratory functions. Indirectly, it can affect human health as it is converted to sulphuric acid and sulphate in the form of fine particulate matter.
Epidemiological studies have reported statistical significant associations between short-term, and especially long-term exposure to increased ambient PM concentrations and increased morbidity and (premature) mortality. PM levels that may be relevant to human health are commonly expressed in terms of the mass concentration of inhalable particles with an equivalent aerodynamic diameter equal to or less than 10 micrometer (PM10). Health effect associations for the PM2.5 fraction are even more clearly evident. Although the body of evidence concerning the health effects of PM is increasing rapidly, it is not yet possible to identify a concentration threshold below which health effects are not detectable. There is therefore no recommended WHO Air Quality Guideline for PM.
PM10 in the atmosphere can result from direct emissions (primary PM10) or emissions of particulate precursors (nitrogen oxides, sulphur dioxide, ammonia and organic compounds) which are partly transformed into particles by chemical reactions in the atmosphere (secondary PM10).
Short-term exposure to nitrogen dioxide may result in airway and lung damage, decline in lung function, and increased responsiveness to allergens following acute exposure. Toxicology studies show that long-term exposure to nitrogen dioxide can induce irreversible changes in lung structure and function.
Exposure to high ozone concentration for periods of a few days can have adverse health effects, in particular inflammatory responses and reduction in lung function. Exposure to moderate ozone concentrations for longer periods may lead to a reduction in lung function in young children.
Definition The indicator shows ambient air concentrations of pollutants in excess of the limit value set for the quality of air in urban environments.
Exceedance of air quality limit values occurs when the concentration of air pollutants exceeds
P
R
D
S
I

ENVIRONMENTAL INDICATORS OF THE REPUBLIC OF MACEDONIA 49
the limit values for SO2, PM10, NO2 and the target values for O3 as specified in the Decree on the limit values of levels and types of polluting substances in ambient air and on the alert thresholds, deadlines for the limit values achievement, margins of limit value tolerance, target values and long-term ozone targets (Official Gazette of the Republic of Macedonia No. 50/05), wherein the requirements of the Daughter Directives 1999/30/EC, 2000/69/EC and 2002/3/EC have been transposed.
Where there are multiple limit values (see section on Policy Targets), the indicator uses the most stringent case:
− Sulphur dioxide (SO2): the daily limit value − Nitrogen dioxide (NO2): the annual limit value − Particulate matter of a size up to 10 micrometer (PM10): the annual limit value − Ozone (O3 ): the short term objective
Units Concentrations of sulphur dioxide (SO2), particulate matter sized up to 10 micrometer (PM10), nitrogen dioxide (NO2) and ozone (O3) in the ambient air are expressed in microgramme/m3
(µg/m3).
Policy relevance of the indicator List of relevant policy documents
The National Environmental Action Plan II (2006) specifies the improvement of the quality of the air through measures intended to reduce the emissions of the main pollutants as one of its priority objectives. The same document indicates two basic measures that need to be taken, namely: preparation of National Plan for Ambient Air Protection and strengthening the monitoring process and air quality assessment.
Legal grounds
The Law on Environment regulates areas which make direct impact on air quality and thus may contribute to air emissions reduction. Thus, the Law regulates issues related to IPPC, EIA/SEA, Local Environmental Action Plans (LEAPs) and climate change.
The Law on Ambient Air Quality was adopted in August 2004 (Official Gazette of the Republic of Macedonia Nos. 67/2004). It was later amended (Official Gazette of the Republic of Macedonia No. 92/2007), and it is framework law in the area of air. The main goals of this Law are: avoidance, prevention and reduction of harmful effects on human health and environment as a whole, prevention and reduction of pollution resulting in climate change, as well as provision of the relevant information on the quality of ambient air. This Law establishes the legal grounds for adoption of a number of bylaws in line with the requirements of the relevant Acquis Communitaire.
The following regulations have been adopted so far:
− Decree on the limit values of levels and types of polluting substances in ambient air and on the alert thresholds, deadlines for the limit values achievement, margins of
ENVIRONMENTAL INDICATORS OF THE REPUBLIC OF MACEDONIA 50
limit value tolerance, target values and long-term ozone targets (Official Gazette of the Republic of Macedonia No. 50/05)
− Rulebook on criteria, methods and procedures for ambient air quality assessment (Official Gazette of the Republic of Macedonia No. 82/06)
Targets The Decree on the limit values of levels and types of polluting substances in ambient air and on the alert thresholds, deadlines for the limit values achievement, margins of limit value tolerance, target values and long-term targets, defines the limit values for SO2, PM10, NO2 and target values for O3.
Limit values for concentrations of sulfur dioxide in ambient air
In accordance with the said Decree, two limit values are specified for sulfur dioxide for the purpose of human health protection. Both limit values should be achieved by 1 January 2012:
− Daily limit value of 125 µg/m3 which shall not be exceeded by more than three times during one calendar year
− Hourly limit value of 350 µg/m3, which shall not be exceeded by more than 24 times during one calendar year.
Limit values for concentrations of nitrogen dioxide in ambient air
In accordance with the said Decree, two limit values are specified for nitrogen dioxide for the purpose of human health protection. Both limit values should be achieved by 1 January 2012:
− Hourly mean concentration of nitrogen dioxide shall not exceed the limit value of 200 μg/m3 by more than 18 times during one calendar year.
− The mean annual concentration shall not exceed 40 μg/m3.
Limit values for concentrations of suspended particulate matter of size up to 10 micrometers in the ambient air
The said Decree specifies two limit values for suspended particulate matter of size up to 10 micrometers, for the purpose of human health protection. The achievement of limit values has been planned in two phases. In the first phase, both limit values should be achieved by 1 January 2010, where:
− 24-hourly limit value is 50 μg/m3, and it shall not be exceeded by more than 35 times during one calendar year
− The mean annual concentration shall not exceed 40 μg/m3 . In the second phase, both limit values should be achieved by 1 January 2012, where:
− 24-hourly limit value is 50 μg/m3, shall not be exceeded by more than seven times during one calendar year
− The mean annual concentration shall not exceed 20 μg/m3 .
Target values for ozone concentrations in ambient air
The said Decree, with regard to ozone, specifies target value for the purpose of human health protection and long-term target for the purpose of human health protection.
ENVIRONMENTAL INDICATORS OF THE REPUBLIC OF MACEDONIA 51
− The target value for ozone, for the purpose of human health protection, is specified so that 8-hourly value is calculated from the hourly concentrations in each day. The maximum daily 8-hourly value of ozone shall nor exceed the value of 120 μg/m3 in more than 25 days in the course of the year (calculated as an average value for three years). This target value should be achieved by 2010.
− The Decree also defines long-term target for the purpose of human health protection, set at 120 μg/m3, as maximum daily 8-hourly value during a calendar year.
Key policy issue What progress has been achieved in reducing the concentrations of pollutants in urban areas in order to achieve the limit values (for SO2, PM10, NO2) and target values (for O3) set in the Decree?
Key message Sulphur dioxide - SO2
Excess of mean daily concentrations of sulfur dioxide above limit values has been recorded in Skopje, but not in other cities in the Republic of Macedonia.
Suspended particulate matter of size up to 10 micrometers
Concentrations of suspended particulate matter of size up to 10 micrometers exceed the limit values specified in the Decree in all urban areas where measurements take place. There frequent events of very high concentrations of suspended particulate matter of size up to 10 micrometers.
Nitrogen dioxide
The measured concentrations of nitrogen dioxide are bellow limit values specified in the Decree, at all measuring points, with an exception of Skopje and Kumanovo in the course of 2004 and Kicevo in the course of 2005.
Ozone
The Decree does not specify limit values for ozone, but it sets target value to be applied until 2010. The target value for ozone is in excess in all cities in the Republic of Macedonia where measurements of this pollutant are conducted.

ENVIRONMENTAL INDICATORS OF THE REPUBLIC OF MACEDONIA 52
0
20
40
60
80
100
120
140
2003 2004 2005 2006 2007
Mean annu
al con
centration
(µg/m
3 )
Suspended particulate matter up to 10 micrometers
Skopje Veles Tetovo Kumanovo Kocani
Kicevo Bitola Kavadarci Annual limit value
0
10
20
30
40
50
60
70
80
1998 1999 2000 2001 2002 2003 2004 2005 2006 2007
Mea
n an
nual
con
cent
ratio
n (µ
g/m
3 )
Nitrogen dioxide
Skopje Veles Tetovo Kumanovo Kocani
Kicevo Bitola Kavadarci Annual limit value
0
2
4
6
8
10
12
1998 1999 2000 2001 2002 2003 2004 2005 2006 2007
Num
ber o
f day
s w
ith e
xcee
danc
e
Sulphur dioxide
Skopje Veles Tetovo
Kumanovo Kocani Kicevo
Bitola Kavadarci Permissible exceedance

ENVIRONMENTAL INDICATORS OF THE REPUBLIC OF MACEDONIA 53
Assessment Sulphur dioxide - SO2
Sulfur dioxide in the air most frequently originates from major thermal power plants, as well as from small and medium size boilers for coal combustion in urban environments. The main anthropogenic sources include coal and oil combustion. This pollutant is also released in the air from industrial processes (production of cellulose and paper, sulfuric acid, lead and zinc ores smelting).
According to the available data, the mean daily concentrations of sulfur dioxide have been in excess only in the City of Skopje, in 998, 1999 and 2006. The occurrence of this excess of concentrations above the limit values is due to the higher frequency in traffic, i.e. fuels combustion in transportation means.
PM10
Suspended particulate matters of size up to 10 micrometers are particles able to pass through an opening conducting selection by size, with 50% loss in efficiency at aerodynamic diameter of size less than ten micrometers (10 µm). These particles of size not exceeding 10 micrometers are the so called fine particles or aerosols. Their retention time in the air is long and they originate from natural and anthropogenic sources. Among natural sources, the more prominent include yellow rains, present also with us, forest fires and chemical reactions. Combustion of coal, wood and oil, industrial processes, transport and waste burning are the most significant anthropogenic sources.
Increased concentrations of suspended particulate matters can be recorded in urban areas, especially in autumn-winter seasons, which is most probably due to increased frequency in traffic, fossil fuels combustion and meteorological conditions.
The processed data show that concentrations of suspended particulate matter up to 10
0
20
40
60
80
100
120
140
1998 1999 2000 2001 2002 2003 2004 2005 2006 2007Nu
mb
er o
f day
s w
ith
exc
eed
ance
Ozone
Skopje Veles Tetovo Kumanovo Kocani Kicevo Bitola Kavadarci

ENVIRONMENTAL INDICATORS OF THE REPUBLIC OF MACEDONIA 54
micrometers are in excess of the mean annual concentration of 40 µm/m3, in all cities where measurements of this pollutant take place. The highest mean annual concentration of this pollutant was recorded in Skopje, in 2006, which is most probably due to the living style, density of population, high level of solid fuels in use for households heating in winter period, as well as to sources from industry.
Nitrogen dioxide - NO2
Investigations have testified the presence of several nitrogen oxides in the air, but the most significant among them are nitrogen dioxide and nitrogen monoxide. These pollutants most often originate from natural sources. However, in urban environments, the main source is the traffic, and industry is minor source. The most toxic of all nitrogen oxides is the nitrogen dioxide, the concentrations of which are dependent on season and meteorological conditions. Namely, in concentration of NO is higher in morning hours when the traffic is more frequent, while the intensification of solar radiation during the day leads to transformation of NO into NO2 resulting in increased concentration of NO2. Nitrogen oxides influence the content of ozone and other photochemical oxidants in the air. During the spring-summer period, the concentration of NO2 is higher, while in autumn-winter period, the concentration of NO is higher. The quantity of NOx increases in winter period due to the higher frequency of traffic.
Processed data showed that excess in the mean annual concentration of nitrogen dioxide was recorded in 1998, 2000, 2001, 2004, 2005 and 2006, in Skopje. However, in the period from 2004 to 2007, a decreasing trend was tracked in the concentration of this pollutant.
Among other cities, excess in the mean annual concentration of nitrogen dioxide was recorded in Kumanovo, in 2004 and in Kicevo in 2005. This was most probably due to the high frequency of traffic and operation of industrial facilities in these cities.
In 2007, no excess in the mean annual concentration of nitrogen dioxide was recorded in any of the measuring points in the Republic of Macedonia.
Оzone- O3
Ozone layer is positioned at height of 10 km to 15 km from Earth and it plays the role of a filter for UV radiation and climate stabilizer.
Automatic monitoring stations measure the ground-level ozone formed as a result of photochemical reactions involving nitrogen oxides, volatile organic compounds (most frequently hydrocarbons), etc. However, its content is also dependent on the course of the day (intensity of solar radiation), as well as annual seasons.
The diagram above shows the number of days with excess in target value set for ozone in Macedonian urban environments. As presented, a number of days with excess in ozone target value is tracked in all cities where measurements of this pollutant take place. In the period from 2004 to 2006, the highest number of days with excess in ozone target value was recorded in Bitola, and in 2007 in Veles.

ENVIRONMENTAL INDICATORS OF THE REPUBLIC OF MACEDONIA 55
Methodology Methodology for the indicator calculation
Sulphur dioxide - SO2
For each measuring station located in urban environment, the number of days with mean daily concentration higher than the limit value (daily mean value of125 µg/m3) is calculated from the available hourly data. Selected urban stations include stations of the following types: stations measuring traffic pollution, stations measuring industrial pollution and so called urban background stations. The number of days with excess in a city is obtained by averaging the results of all stations located in that city.
Suspended particulate matter up to 10 micrometers – PM10
For each measuring station located in urban environment, the mean annual concentration (annual limit value is 40 µg/m3) is calculated from the available hourly data. Selected urban stations include stations of the following types: stations measuring traffic pollution, stations measuring industrial pollution and so called urban background stations. The mean annual concentration in a city is obtained by averaging the mean annual concentration of all stations located in that city.
Nitrogen dioxide - NO2
For each measuring station located in urban environment, the mean annual concentration (annual limit value is 40 µg/m3) is calculated from the available hourly data. Selected urban stations include stations of the following types: stations measuring traffic pollution, stations measuring industrial pollution and so called urban background stations. The mean annual concentration in a city is obtained by averaging the mean annual concentration of all stations located in that city
Ozone – O3
For each measuring station located in urban environment, the number of days in which the maximum daily 8-hourly concentration of ozone is in excess of ozone target value for human health protection - 120 µg/m3 is calculated. Selected urban stations include stations of the following types: stations measuring traffic pollution, stations measuring industrial pollution and so called urban background stations. The number of days with excess in a city is obtained by averaging the results of all stations located in that city.
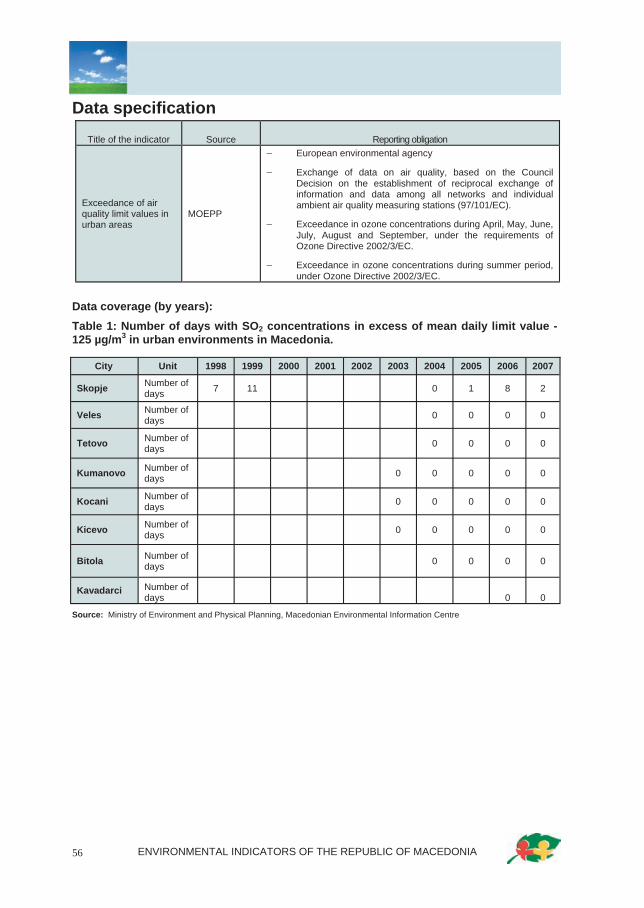
ENVIRONMENTAL INDICATORS OF THE REPUBLIC OF MACEDONIA 56
Data specification
Data coverage (by years): Table 1: Number of days with SO2 concentrations in excess of mean daily limit value - 125 µg/m3 in urban environments in Macedonia.
Source: Ministry of Environment and Physical Planning, Macedonian Environmental Information Centre
Title of the indicator Source Reporting obligation
Exceedance of air quality limit values in urban areas
MOEPP
− European environmental agency
− Exchange of data on air quality, based on the Council Decision on the establishment of reciprocal exchange of information and data among all networks and individual ambient air quality measuring stations (97/101/EC).
− Exceedance in ozone concentrations during April, May, June, July, August and September, under the requirements of Ozone Directive 2002/3/EC.
− Exceedance in ozone concentrations during summer period, under Ozone Directive 2002/3/EC.
City Unit 1998 1999 2000 2001 2002 2003 2004 2005 2006 2007
Skopje Number of days 7 11 0 1 8 2
Veles Number of days 0 0 0 0
Теtovo Number of days 0 0 0 0
Kumanovo Number of days 0 0 0 0 0
Kocani Number of days 0 0 0 0 0
Kicevo Number of days 0 0 0 0 0
Bitola Number of days 0 0 0 0
Kavadarci Number of days 0 0
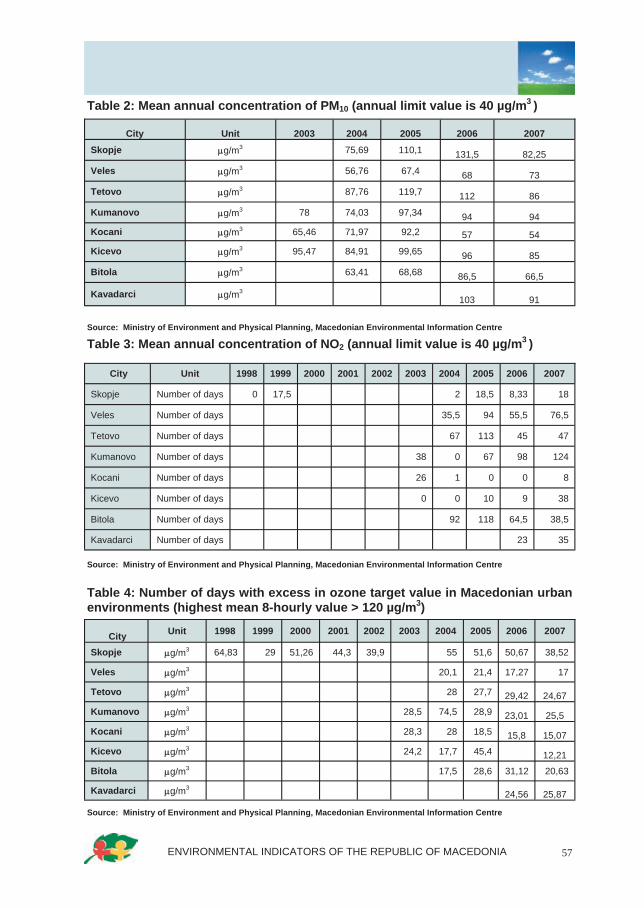
ENVIRONMENTAL INDICATORS OF THE REPUBLIC OF MACEDONIA 57
Table 2: Mean annual concentration of PM10 (annual limit value is 40 µg/m3 )
Source: Ministry of Environment and Physical Planning, Macedonian Environmental Information Centre
Table 3: Mean annual concentration of NO2 (annual limit value is 40 µg/m3 )
Source: Ministry of Environment and Physical Planning, Macedonian Environmental Information Centre
Table 4: Number of days with excess in ozone target value in Macedonian urban environments (highest mean 8-hourly value > 120 µg/m3)
Source: Ministry of Environment and Physical Planning, Macedonian Environmental Information Centre
City Unit 1998 1999 2000 2001 2002 2003 2004 2005 2006 2007
Skopje μg/m3 64,83 29 51,26 44,3 39,9 55 51,6 50,67 38,52
Veles μg/m3 20,1 21,4 17,27 17
Tetovo μg/m3 28 27,7 29,42 24,67
Kumanovo μg/m3 28,5 74,5 28,9 23,01 25,5
Kocani μg/m3 28,3 28 18,5 15,8 15,07
Kicevo μg/m3 24,2 17,7 45,4 12,21
Bitola μg/m3 17,5 28,6 31,12 20,63
Kavadarci μg/m3 24,56 25,87
City Unit 1998 1999 2000 2001 2002 2003 2004 2005 2006 2007
Skopje Number of days 0 17,5 2 18,5 8,33 18
Veles Number of days 35,5 94 55,5 76,5
Tetovo Number of days 67 113 45 47
Kumanovo Number of days 38 0 67 98 124
Kocani Number of days 26 1 0 0 8
Kicevo Number of days 0 0 10 9 38
Bitola Number of days 92 118 64,5 38,5
Kavadarci Number of days 23 35
City Unit 2003 2004 2005 2006 2007
Skopje μg/m3 75,69 110,1 131,5 82,25
Veles μg/m3 56,76 67,4 68 73
Tetovo μg/m3 87,76 119,7 112 86
Kumanovo μg/m3 78 74,03 97,34 94 94 Kocani μg/m3 65,46 71,97 92,2 57 54
Kicevo μg/m3 95,47 84,91 99,65 96 85
Bitola μg/m3 63,41 68,68 86,5 66,5
Kavadarci μg/m3 103 91
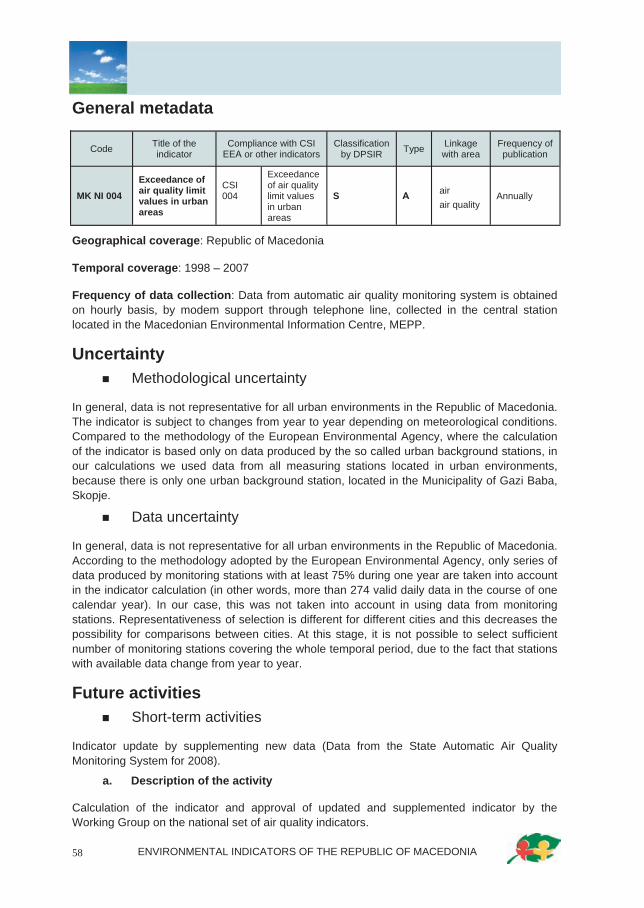
ENVIRONMENTAL INDICATORS OF THE REPUBLIC OF MACEDONIA 58
General metadata
Geographical coverage: Republic of Macedonia
Temporal coverage: 1998 – 2007
Frequency of data collection: Data from automatic air quality monitoring system is obtained on hourly basis, by modem support through telephone line, collected in the central station located in the Macedonian Environmental Information Centre, MEPP.
Uncertainty Methodological uncertainty
In general, data is not representative for all urban environments in the Republic of Macedonia. The indicator is subject to changes from year to year depending on meteorological conditions. Compared to the methodology of the European Environmental Agency, where the calculation of the indicator is based only on data produced by the so called urban background stations, in our calculations we used data from all measuring stations located in urban environments, because there is only one urban background station, located in the Municipality of Gazi Baba, Skopje.
Data uncertainty
In general, data is not representative for all urban environments in the Republic of Macedonia. According to the methodology adopted by the European Environmental Agency, only series of data produced by monitoring stations with at least 75% during one year are taken into account in the indicator calculation (in other words, more than 274 valid daily data in the course of one calendar year). In our case, this was not taken into account in using data from monitoring stations. Representativeness of selection is different for different cities and this decreases the possibility for comparisons between cities. At this stage, it is not possible to select sufficient number of monitoring stations covering the whole temporal period, due to the fact that stations with available data change from year to year.
Future activities Short-term activities
Indicator update by supplementing new data (Data from the State Automatic Air Quality Monitoring System for 2008).
a. Description of the activity
Calculation of the indicator and approval of updated and supplemented indicator by the Working Group on the national set of air quality indicators.
Code Title of the indicator
Compliance with CSI ЕЕА or other indicators
Classification by DPSIR Type Linkage
with area Frequency of publication
MK NI 004
Exceedance of air quality limit values in urban areas
CSI 004
Exceedance of air quality limit values in urban areas
S А air air quality
Annually
ENVIRONMENTAL INDICATORS OF THE REPUBLIC OF MACEDONIA 59
b. Reqiuered resources
Engagement of national experts in the area of air quality from governmental institutions. c. Status
Continuous activity. Deadline: 1 year.
Long-term activities 1. Calculation of data uncertainty a. Description of the activity
Application of ISO and CEN standards in the area of air quality.
Proper development of the State Automatic Ambient Air Quality Monitoring System, including regular maintenance, servicing and calibration of instruments in the monitoring stations should result in more valid data in the course of one year. The goal is to apply the defined methodology of the European Environmental Agency in indicator calculation, i.e. to use only these series of data from monitoring stations with a coverage of at least 75% during one year (i.e. more than 274 valid daily data in the course of one calendar year).
b. Required resources Allocated budget for regular maintenance of the State Automatic Ambient Air Quality Monitoring System, in accordance with the prepared Operational Programme.
c. Condition Continuous activity. Revision of the classification of monitoring stations in order to use only series of data from urban background stations in indicator calculation.
Establishment of new monitoring stations based on Strategic Planning of the MEPP.

ENVIRONMENTAL INDICATORS OF THE REPUBLIC OF MACEDONIA 60
MK - NI 006 CONSUMPTION OF OZONE DEPELTING SUBSTANCES
Period of indicator assessment September 2007 – April 2008
Explanation Justification of indicator selection
In the middle of 1970s, the world scientific community detected the phenomenon of ozone layer depletion positioned at 25-40th km above the Earth surface in the upper layers of the atmosphere, i.e. stratosphere. The identified cause of ozone molecules destruction is related to organic compounds (hydrocarbons) the molecule of which contains atoms of halogen elements (chlorine or bromine). One molecule of the chemicals as CFCs, HCFCs, CCl4, halons, methyl chloroform, and methyl bromide released in the atmosphere during ozone molecules reaction in stratosphere is able of destroying 100.000 molecules of ozone and result in ozone layer depletion. Recognizing the issue of the ozone layer depletion, the international community has adopted two key documents, namely the 1985 Vienna Convention for the Protection of the Ozone Layer and 1987 Montreal Protocol on Substances that Deplete the Ozone Layer, which initiate aggressive action aimed at reduction and full elimination of substances that deplete the ozone layer at global level.
Vienna Convention is a framework document establishing the basis for introduction of rigorous measures for restriction of the use of ozone depleting substances (ODSs), while the Montreal Protocol establishes precise rules and time frames within which the reduction and the elimination of ODSs by means of prohibition and restriction of their production, import and export shall take place. ODSs emissions are not addressed either by the Convention, nor by the Protocol.
In 1994, the Republic of Macedonia ratified both the Vienna Convention and the Montreal Protocol, and in the period 1998 - 2002, the four Amendments to the Protocol (London Amendment, Copenhagen Amendment, Montreal Amendment, and Beijing Amendment) were ratified, too.
The national action towards ODSs elimination has been carried out since 1997, when the Ozone Unit was established within the Ministry of Environment and Physical Planning. Under the financial support provided by the Multilateral Fund of the Montreal Protocol, as much as more than 97% of the total consumption in the country has been eliminated, through substitution of ODSs in all economic branches of their application.
Considering the fact that the Republic of Macedonia has never been producing ODSs, the Ministry of Environment and Physical Planning/Ozone Unit carries out permanent of ODSs import in, export from and consumption in the Republic of Macedonia. Consequently, the indicator will track the ODSs consumption.
P
R
D
S
I

ENVIRONMENTAL INDICATORS OF THE REPUBLIC OF MACEDONIA 61
Definition Substances that deplete the ozone layer (ODSs) are the compounds which cause depletion of the ozone layer. This group includes CFCs, HCFCs, HВFCs CCl4, halons, methyl chloroform, methyl bromide. In general, these compounds are very stable in troposphere and they decompose only under the influence of ultra-violet radiation emitted by the Sun. While decomposing, they release chlorine or bromine atoms which destroy the molecules of stratospheric ozone.
This indicator quantifies the consumption of ozone-depleting substances (ODSs) in the Republic of Macedonia in the period between 1995 and 2005.
Units − ODSs consumption is expressed in ODP tons which means quantity of each
substance in metric tonnes (MT) multiplied by its Ozone Depletion Potential (ODP).
Policy relevance of the indicator Upon the ratification of the Vienna Convention for the Protection of the Ozone Layer and the Montreal Protocol on Substances that Deplete the Ozone Layer, series of policy measures aimed at steady reduction and elimination of ODSs consumption were undertaken in the Republic of Macedonia in the period between 1997 and 2007.
List of relevant policy documents
National Environmental Action Plan (NEAP II, 2006)
Country Programme for Phasing-out Substances that Deplete the Ozone Layer (1996) – strategic document establishing the main directions in the domain of management and elimination of ODSs in the Republic of Macedonia. It was adopted in 1996. Based on the recommendations of the Country Programme, ODSs elimination has been completed in industry (production of refrigerators, flexible and rigid foams), agriculture, private sector. By 2006, more than 97% of ODSs consumption defined in the National Programme was eliminated. Projects have been implemented by means of the financial support provided by the Multilateral Fund of the Montreal Protocol through the Ministry of Environment and Physical Planning/ Ozone Unit.
Legal grounds − Law on the Ratification of the Vienna Convention for the Protection of the Ozone
Layer (Official Journal of SFRY No. 1/90), adopted by the Republic of Macedonia by means of succession in 1994.
− Law on the Ratification of the Montreal Protocol on Substances that Deplete the Ozone Layer (Official Journal of SFRY No. 16/90), adopted by the Republic of Macedonia by means of succession in 1994.
− Law on the Ratification of London Amendment to the Montreal Protocol (Official Gazette of the Republic of Macedonia No. 25/98)
− Law on the Ratification of Copenhagen Amendment to the Montreal Protocol (Official Gazette of the Republic of Macedonia No. 25/98)
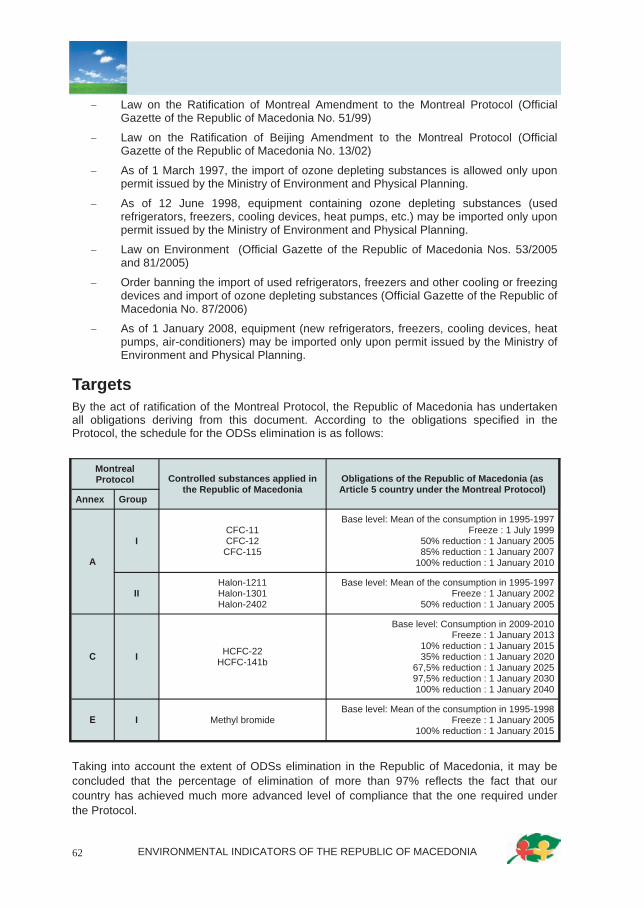
ENVIRONMENTAL INDICATORS OF THE REPUBLIC OF MACEDONIA 62
− Law on the Ratification of Montreal Amendment to the Montreal Protocol (Official Gazette of the Republic of Macedonia No. 51/99)
− Law on the Ratification of Beijing Amendment to the Montreal Protocol (Official Gazette of the Republic of Macedonia No. 13/02)
− As of 1 March 1997, the import of ozone depleting substances is allowed only upon permit issued by the Ministry of Environment and Physical Planning.
− As of 12 June 1998, equipment containing ozone depleting substances (used refrigerators, freezers, cooling devices, heat pumps, etc.) may be imported only upon permit issued by the Ministry of Environment and Physical Planning.
− Law on Environment (Official Gazette of the Republic of Macedonia Nos. 53/2005 and 81/2005)
− Order banning the import of used refrigerators, freezers and other cooling or freezing devices and import of ozone depleting substances (Official Gazette of the Republic of Macedonia No. 87/2006)
− As of 1 January 2008, equipment (new refrigerators, freezers, cooling devices, heat pumps, air-conditioners) may be imported only upon permit issued by the Ministry of Environment and Physical Planning.
Targets By the act of ratification of the Montreal Protocol, the Republic of Macedonia has undertaken all obligations deriving from this document. According to the obligations specified in the Protocol, the schedule for the ODSs elimination is as follows:
Taking into account the extent of ODSs elimination in the Republic of Macedonia, it may be concluded that the percentage of elimination of more than 97% reflects the fact that our country has achieved much more advanced level of compliance that the one required under the Protocol.
Montreal Protocol Controlled substances applied in
the Republic of Macedonia Obligations of the Republic of Macedonia (as Article 5 country under the Montreal Protocol)
Annex Group
A
I CFC-11 CFC-12
CFC-115
Base level: Mean of the consumption in 1995-1997 Freeze : 1 July 1999
50% reduction : 1 January 2005 85% reduction : 1 January 2007
100% reduction : 1 January 2010
II Halon-1211 Halon-1301 Halon-2402
Base level: Mean of the consumption in 1995-1997 Freeze : 1 January 2002
50% reduction : 1 January 2005
С I HCFC-22 HCFC-141b
Base level: Consumption in 2009-2010 Freeze : 1 January 2013
10% reduction : 1 January 2015 35% reduction : 1 January 2020
67,5% reduction : 1 January 2025 97,5% reduction : 1 January 2030 100% reduction : 1 January 2040
Е I Methyl bromide Base level: Mean of the consumption in 1995-1998
Freeze : 1 January 2005 100% reduction : 1 January 2015

ENVIRONMENTAL INDICATORS OF THE REPUBLIC OF MACEDONIA 63
Key policy issue During the last ten years (1997 - 2007), the Republic of Macedonia has phased-out more than 97% of ODSs consumption, which means that it has not only fulfilled its obligations under the Montreal Protocol, but reached beyond the requirements specified in the Protocol.
Key message The act of ratification of the Montreal Protocol (1994) and the establishment of the Ozone Unit under the Ministry of Environment and Physical Planning (1997) was immediately followed by national action to protect the ozone layer, through ODSs reduction and elimination. The main task of MEPP/Ozone Unit is to coordinate the activities related to ODSs phasing-out at national level. Thus, in the period between 1997 and 2007, under the coordination of this Unit, the implemented projects for ODSs phasing-out achieved removal of more than 97% of the total consumption of ODSs in the country. Apart from this, the MEPP/Ozone Unit conducts permanent monitoring of the import, export and consumption of the ODSs in the Republic of Macedonia, monitoring of collected and recycled amounts of ODSs [through the projects “Plan for Management and handling of Cooling Substances and Devices” (2000 - 2005) and “Final CFCs elimination” (2006 - 2010), the services for cooling devices were supplied with equipment for collection, treatment and recycling of ODSs and three ODSs recycling centres were established in the country], works on the awareness of directly affected stakeholders, as well as of the public in general.
Note: Given the fact that the Republic of Macedonia has never produced any ODS, the diagram includes data only on ODSs consumption in the period 1995 - 2007.
Assessment With the establishment of the Ozone Unit under the Ministry of Environment and Physical Planning in 1997, the country has joined actively the global action for ODSs reduction and phasing-out. During the last ten years (1997 - 2007), under the coordination of the Ozone Unit, application of ODSs has been phased-out in all industrial installations where such application has been identified in the Republic of Macedonia. All activities involving substitution of ODSs in industry, as well as in other economic sectors (agriculture, private sector) where ODSs found
0
100
200
300
400
500
600
1995 1996 1997 1998 1999 2000 2001 2002 2003 2004 2005 2006 2007
ODP t/year
year
Consumption of ozone depleting substances (ODP t/year)
Methyl bromide
HCFC‐141b
HCFC‐22
CCl4
CFC‐111
Halon‐1301
Halon‐1211
CFC‐115
CFC‐114
CFC‐113
CFC‐12

ENVIRONMENTAL INDICATORS OF THE REPUBLIC OF MACEDONIA 64
their application, have been implemented by means of financial support provided by the Multilateral Fund of the Montreal Protocol, amounting to US$ 5.000.000.
Reports of the UNEP’s Secretariat for the Protection of the Ozone Layer certify that in the ten year period, through specific investment projects and technical assistance provided by UNIDO, as much as more than 97% of ODSs consumption in the Republic of Macedonia has been phased-out.
According to data contained in the Country Programme for Phasing-out Substances that Deplete the Ozone Layer (1996), the average consumption of ODSs in the period 1995 - 1997 amounted 527 tons. According to the provisions of the Montreal Protocol, the said average has been taken as a base level in determining the extent of reduction to be achieved within the restrictions provided for by the Protocol. Table 1 shows the trend of decline in ODSs consumption, especially in the period of the last ten years (1995 – 2005). Apart from ODSs elimination in industry (production of refrigerators and production of rigid and flexible foams), where technologies using ozone depleting substances before 1997 were replaced by non-ODSs solutions; interventions were also made in agriculture through substitution of methyl bromide with alternative solutions that did not involve application of ODSs, in cooling devices servicing and maintenance through establishment of the system for ODS collection and recycling. In the context of the latter, 109 sets of equipment for cooling fluids and 20 sets of equipment for collection, treatment and recycling of cooling devices have been delivered so far to services dealing with cooling devices and three centres for cooling fluids recycling were established (in Skopje, Ohrid and Strumica). In parallel with the above, in the period 2000 – 2007, more than 220 service technicians were trained in proper handling and management of cooling substances and devices, and 366 customs officers were trained in ODSs control and detection at all border-crossings in the country.
The national action for ozone layer protection has resulted in elimination of more than 97% of the total consumption of ODSs in the Republic of Macedonia
Methodology Methodology for the indicator calculation
The Indicator shows the quantity of consumed ODSs. The value presented has been obtained by multiplying the value of the consumed quantity expressed in metric tons by the Ozone Depletion Potential (ODP). The Table below presents the values of ODP for substances identified to be applied in the Republic of Macedonia and the consumption of which is subject of reduction or control. The Ministry of Environment and Physical Planning/Ozone Unit has data on ODSs consumption in both metric and ODP tons.

ENVIRONMENTAL INDICATORS OF THE REPUBLIC OF MACEDONIA 65
Data specification
Title of indicator Source Reporting obligation
Consumption of ODSs MEPP/Ozone Unit
− UNIDO
− UNEP - Secretariat for Ozone Layer Protection
− Multilateral Fund of the Montreal Protocol
ODSs ODP value
CFC-11 1.0
CFC-12 1.0
CFC-113 0.8
CFC-114 1.0
CFC-115 0.6
CFC-111 1.0
CCl4 1.1
Halon 1211 3.0
Halon 1301 10.0
HCFC-22 0.055
HCFC-141b 0.11
Methyl Bromide 0.7

ENVIRONMENTAL INDICATORS OF THE REPUBLIC OF MACEDONIA 66
Data coverage (by years): Table 1: Consumption of ODSs in the period 1995-2007
* ODP (Ozone Depletion Potential): integrated change in the total amount of ozone per unit mass emission of specific compound relative to integrated change in the total amount of ozone per unit mass emission of CFC-11, Source: Environmental Assessment Report No. 2, ЕЕА, 1999.
ODP tons: consumption in metric tons multiplied by the value of Ozone Depletion Potential.
General metadata
Geographical coverage: Republic of Macedonia
Temporal coverage: 1995 - 2007
Methodology and frequency of data collection: data is collected and processed by the Ministry of Environment and Physical Planning/Ozone Unit at annual basis.
Information on quality (at data level):
Based on the feedback received every year upon delivery of the annual report to international bodies responsible for the implementation of the Montreal Protocol, data meets all international criteria in this field.
Substances ODP t*/year
1995 1996 1997 1998 1999 2000 2001 2002 2003 2004 2005 2006
CFC-11 464,8 420 418,41 7 8,8 7,12
CFC-12 64,74 41 69,1 70,84 183,07 39,6 39,58 34,07 44,53 21,35 11,83 6,99
CFC-113 0,02
CFC-114
CFC-115 0,02 2,72 7,1 0,04 4,8 0,5
Halon-1211 3,87
Halon -1301 30 30 32,4
CFC-111 1,36
CCl4 4,4 0,02 0,1 0,06 0,04 0,01 0,012
HCFC-22 1,5 2,31 1,83 22,16 6,57 4,93 10,36 3,81 5,96 4,76 1,86 2,36
HCFC-141b 0,11 2,31 0,11 0,05 0,11
Methyl bromide 12 12 12,9 27,24 23,37 19,92 5,32
Total 561,04 509,82 537,63 115,31 227,23 77,85 76,96 43,36 55,29 26,61 13,7 9,35
Code Title of the indicator
Compliance with CSI ЕЕА or other
indicators
Classification by DPSIR Type Linkage
with area Frequency of publication
MK NI 006
Consumption of ozone depleting substances
CSI 006 OD3
Consumption of ozone depleting substances
P B DG ENV EEA Eurostat
Annually
ENVIRONMENTAL INDICATORS OF THE REPUBLIC OF MACEDONIA 67
Future activities Short-term activities
Implementation of the project for final elimination of CFCs in the Republic of Macedonia
a. Description of the activity
Project “Plan for full elimination of CFCs in the Republic of Macedonia”
The Project “Plan for full elimination of CFCs in the Republic of Macedonia” is another step forward made by the Republic of Macedonia, but this time the final one after several years of efforts towards full elimination of substances characterized by their highest value of ozone depletion potential, i.e. the well-known chlorofluorocarbons or CFCs.
The main goal of the Project is to ensure timely, sustainable and intensified phasing-out of CFCs through improvement of the current legislation, stakeholders training, use of existing stockpiles, active participation of affected stakeholders and support by decision-makers.
The project will be implemented through the following phases:
− Review of existing and drafting of new legislation (compliant with EU Directives in this area) in relation to import, export and consumption of ozone depleting substances;
− Provision of additional equipment for collection, treatment and recycling of freons for cooling equipment service technicians;
− Establishment of sustainable system for education in acceptable management of CFC-cooling fluids in vocational secondary schools for service technicians of cooling devices and incorporation of CFC-fluids collection and recycling as topics in their curriculum;
− Updating of existing system for continuous monitoring of collected and recycled amounts of CFC-cooling substances;
− Organization of intensive campaign by involvement of public information media and non-governmental sector in activities aimed at informing the general public of undertaken activities.
The Project is actually an advanced phase of the previous Plan for Management of Cooling Substances and Devices. The new activity envisages new, more sophisticated scheme of collection, treatment and re-use of CFCs in cooling systems:
− recording the service providers in need for equipment for CFC-freons collection;
− training in introduction of the procedure for freons collection - recycling (treatment) - refilling;
− delivery of equipment for freons collection - recycling (treatment) - refilling;
− practical application of the equipment;
− reporting to the Ozone Unit on collected/recycled amounts of CFC-freons.
− In addition to the above, the Project has included training of customs officers in CFCs identification and control at border-crossings and granting of detection equipment.
The new approach in the process enables implementation of the entire cycle (collection-recycling-refilling) on the spot, thus making the procedure economically more cost-effective,

ENVIRONMENTAL INDICATORS OF THE REPUBLIC OF MACEDONIA 68
both for the service provider and for the client. In addition to this, the possibility for refilling fluids that have not been treated to the level which will not damage the system is minimized.
Activities for application of new methods of CFC-cooling media collection and reuse enable strict restrictions of the import of ozone depleting substances, within the following frames:
− 15.000 kg in the period between 1 January 2006 and 31 December 2006; − 10.000 kg in the period between 1 January 2007 and 31 December 2007; − 5.000 kg in the period between 1 January 2008 and 31 December 2008; − substances listed in Annex А, Group I of the Montreal Protocol on the Substances
that Deplete the Ozone Layer shall not be imported after 31 December 2009.
All the above indicates that the Project “Plan for full elimination of CFCs in the Republic of Macedonia” will enable finalization of activities for full elimination of CFCs in the Republic of Macedonia and thus fulfillment of the obligations deriving from the Montreal Protocol: 100% reduction by 1 January 2010.
Demonstration project for substitution of ODSs containing centrifugal chillers
The goal of the Project is to demonstrate the reduction in the consumption of ozone depleting substances through substitution of centrifugal chillers that contain these chemicals in the National Bank of the Republic of Macedonia and OHIS.
Specifically, the Project will enable:
− meeting the obligations arising from the Montreal Protocol, − enhancing the energy efficiency through energy saving, as well as reduction of GHG
emissions in the cooling sector and air-conditioning, − facilitation of the substitution of ODS containing chillers with environment friendly
devices of high energy saving performance. b. Required resources
The funds required for the project implementation have been provided by the Multilateral Fund of the Montreal Protocol.
c. Status
Project “Plan for full elimination of CFCs in the Republic of Macedonia”
In the course of one year from the project initiation (2006), the following activities have been implemented:
− Teaching personnel was trained in nine vocational secondary schools, regarding good practices in cooling substances and devices management and handling,
− Ten vocational secondary schools have been furnished with demonstration equipment for collection, treatment and recycling of cooling substances,
− 216 service technicians of cooling devices have been trained and certified in proper management and handling of cooling substances and devices,
− Provision of collection, treatment and recycling equipment for 22 services for cooling devices,
ENVIRONMENTAL INDICATORS OF THE REPUBLIC OF MACEDONIA 69
− 99 customs officers have been trained in ODSs detection and control on border-crossings
− Manual for service technicians of cooling appliances and Manual for service technicians of small commercial equipment, have been prepared.
Demonstration project for substitution of ODSs containing centrifugal chillers
The Demonstration project for substitution of ODSs containing centrifugal chillers is implemented in the National Bank of the Republic of Macedonia and OHIS, Skopje. This Project has enabled substitution of ODS containing cooling equipment with equipment using cooling fluid with ozone depletion potential equal to zero. Premises envisaged for installation of the new equipment have been adjusted to the new system, the equipment has been installed in both the National Bank of the Republic of Macedonia and OHIS, and final preparations for putting the new chillers into operation are in progress.
Deadline: 1 January 2010
Long-term activities
Institutional support – Ozone Unit
The Ozone Unit has operated under the Ministry of Environment and Physical Planning since February 1997. All activities of the Ozone Unit have been financed by the Multilateral Fund of the Montreal Protocol, while the role of implementing agency has been given to UNIDO. The main task of the Unit is to coordinate the implementation of the Country Programme for ODSs Phasing-out, i.e. implementation of the activities aimed at ODSs reduction and phasing-out in the Republic of Macedonia. In this context, during the last ten years, the Unit has implemented several projects in industry, agriculture, private sector, etc., thus phasing-out more than 97% of the total consumption of ODSs in the country.
In parallel to the above, the Unit is active in the field of awareness rising of the issue of ozone layer depletion with persons that are professionally engaged in economic branches which apply ODSs and with the general public. To that end, high number of thematic brochures, documentary films, posters, picture book etc., has been produced.
The Unit attributes particular priority to the activity of permanent monitoring of ODSs import, export and consumption in the Republic of Macedonia. For this purpose, in 1997, a special software (database) was developed, which makes it possible to have a clear picture of the status of ODSs in the country at any moment. Software was developed for records keeping of collected and recycled amounts of ODSs. The two databases facilitate timely meeting of the reporting obligations towards international bodies responsible for the implementation of the Montreal Protocol, as well as of the binding provisions of the Montreal Protocol in general.
b. Required resources
During the last ten years (1997 - 2007), the activities of the Ozone Unit under the Ministry of Environment and Physical Planning, as responsible office for the coordination of the activities for ODSs reduction and phasing-out at national level, have been financed by the Multilateral Fund of the Montreal Protocol.
c. Status
In the frames of the Ozone Unit under the Ministry of Environment and Physical Planning,

ENVIRONMENTAL INDICATORS OF THE REPUBLIC OF MACEDONIA 70
database containing detailed data on the import, export and consumption of ODSs in the country has been established. The database is exceptionally useful tool in the preparation of annual reports towards international bodies responsible for the implementation of the Montreal Protocol. According to data in the database, in the period between 1995 and 2005, more than 97% of the total consumption of ODSs in the Republic of Macedonia was phased-out.
Deadline: underway.

ENVIRONMENTAL INDICATORS OF THE REPUBLIC OF MACEDONIA 72
MK – NI 007 THREATENED AND PROTECTED SPECIES
Period of indicator assessment September 2007 – April 2008
Explanation Justification for indicator selection
There are a number of ways of assessing progress towards the target of halting the loss of biodiversity in Europe by 2010. This indicator tracks changes in the status of species at national level that are threatened at the global level and can thus contribute to assessing progress towards the target by acting as a proxy indicator for the impacts of national policies on European biological diversity.
For many years, the International Union for Conservation of Nature (IUCN) has monitored the extent and rate of biological diversity degradation by assigning species to red list categories through detailed assessment of information against a set of objective, standard, quantitative criteria. This assessment is made at the global level. For species present in European territories and only, and evaluated as globally threatened, this indicator shows the impacts of European and national policies on European biodiversity.
For globally threatened species present in and also outside Europe, some of the species may not be classified as threatened at European or national levels. Nevertheless, Europe has a strong responsibility for the care of these species even though they are not yet threatened. How far European policies on nature and biodiversity take this responsibility into consideration is shown by the information that the indicator provides on the number of globally threatened species that are protected at the European level.
Definition This indicator shows the number of species present in the Republic of Macedonia and assessed as globally threatened and/or protected by European instruments (such as EU Directives and the Bern Convention) protected at national level.
At present, the indicator shows the status of the number of endemic and threatened species at national level, identified in accordance with the relevant international documents and with the national legislation:
− Number of endemic and threatened wild species of plants − Number of endemic and threatened wild species of fungi
− Number of endemic and threatened wild species of vertebrate animals
Units − Number of spieces
P
R
D
S
I

ENVIRONMENTAL INDICATORS OF THE REPUBLIC OF MACEDONIA 73
Policy relevance of the indicator List of relevant policy documents:
The Second National Environmental Action Plan, in its Chapter on Nature, emphasizes the goal of the establishment of integrated system for nature and biological diversity protection, in line with the EU standards and multilateral agreements, through the measure for application of mechanisms for further implementation of the National Strategy for Biological Diversity Protection with Action Plan and the National Capacity Self-Assessment (NCSA), the Law on Nature Protection and creation of appropriate conditions for Natura 2000 network establishment. It envisages action towards development of National Red Lists and Red Book.
The National Strategy for Biological Diversity Protection with Action Plan defines integrated approach to the protection and sustainable use of components of biological diversity. The Action Plan outlines the specific actions to be taken to achieve the goals. One of the measures is the document Protection of Species, through several actions concerning elaboration of National Red Lists and Red Book, vultures protection, protection of endemic and relict species Thymus oehmianus, etc.
Legal grounds The Law on Nature Protection provides for elaboration of Red Lists and Red Book, as well as proclamation of strictly protected wild species and protected wild species, by which they shall acquire the status of natural heritage.
Targets Identification of the extent of threat for certain species of plants, fungi and animals found in the Republic of Macedonia, which are of European or global significance and definition of measures for their protection and management.
Key policy issue How many species of European/global significance are protected by national instruments?
Key message Abundance and variety of species and ecosystems are the main features of biological diversity in the Republic of Macedonia. According to the available information, this wealth comprises the imposing number of around 18.000 taxa, out of which more than 900 taxa are Macedonian endemic taxa.
Considering the fact that national Red Lists of plants, fungi and animals have not been established yet, the analysis of affected / threatened species has been made in accordance with international criteria contained in a number of multilateral documents (conventions, agreements, Global Red List, European Red List, EU Directives), etc.
Thus, the IUCN World Red List contains 72 taxa of higher plants from the Republic of Macedonia, 19 of which are local endemic taxa. The Annexes of the Bern Convention include 12 species of higher plants.

ENVIRONMENTAL INDICATORS OF THE REPUBLIC OF MACEDONIA 74
The European List of vertebrate animals includes 113 species, of which: 30 fish species, 66 bird species16 mammals and 1 reptile species. Out of the total of 20 endemic fish species from the Republic of Macedonia, 17 have been enrolled in the category of globally threatened species. The total number of identified “Emerald” species (under Resolution No.6 to the Bern Convention) on the territory of the Republic of Macedonia is 165 species.
0
500
1000
1500
2000
2500
3000
3500
Mosses (Bryop
sida)
Peat mosses (Lycop
sida)
Horsetails (Sph
enop
sida)
Ferns (Filicinae)
Gym
nosperms
(Gym
nospermae)
Total A
ngiosperms
(Angiospermae)
Dicotyled
onae
Mon
ocotyled
onae
3496 7 42 15
3200
2600
600
2 1 109 520 6 2 16 8283
57
Number of endemic and threatened wild species of flora
Number of species Endemic species Threatened species
10 20 35130
1050
67
0
200
400
600
800
1000
1200
Myxomicota Oomycota Zygomicota Ascomycota Basidiomycota
Number of threatened species of fungi
Number of species Threatened species

ENVIRONMENTAL INDICATORS OF THE REPUBLIC OF MACEDONIA 75
Assessment The flora of higher plants in the Republic of Macedonia is very rich and diverse, represented by around 3700 species. Recent flora of higher plants is represented by a mosaic of various plant elements (Tertiary relict, Mediterranean, Greek-Asia Minor, Illyric, Caucasian, Middle European, Eurasian, Arctic-Alpine, cosmopolitan); there is high number of endemic species among higher plants, too (Balkan, South Balkan, Macedonian, etc.). The highest number of endemic plant species (114) has been recorded with Angiosperms.
The National Red List of threatened wild flora species has not been developed yet. The affected species shown in the Table have been included in accordance with international criteria contained in several international documents (conventions, agreements, Global Red List, European Red List, EU Directives). The IUCN Global Red List contains 72 taxa from the Republic of Macedonia, 19 of which are local endemic taxa. The Annexes of the Bern Convention list 12 species having their area of spreading on the territory of the Republic of Macedonia.
0
100
200
300
400
Fich
(Pisces)
Reptiles (Re
ptilia)
Birds (Aves)
Mam
mals (M
ammalia)
Total
5832
319
82
391
20 4 24301
6616
113
Number of endemic and threatened vertebrate species of fauna
Number of species Endemic species Threatened species
6 12 3 7 17
115
5
8060
27 3055
195
480
0
100
200
300
400
500
600
invertebrates fish amphibians reptiles mammals birds flora
Number of Emerald species
Emerald species identified in RM Emerald species according to Res. 6
ENVIRONMENTAL INDICATORS OF THE REPUBLIC OF MACEDONIA 76
Fungi compose exceptionally heterogeneous group of organisms; however, studies so far have focused on the orders of Ascomycota and Basidiomycota, while other orders are poorly studies. Out of the total number of recorded growing wild fungi on the territory of the Republic of Macedonia (around 1250 species), most belong to the orders Myxomicota (10), Oomycota (20), Zygomicota (35), Ascomycota (130) and Basidiomycota (1050).
The Preliminary National Red List of threatened fungi species includes 67 species belonging to the order of Basidiomycota.
The main feature of the fauna is its high extent of taxonomic diversity, represented by as many as 9339 species and 228 subspecies or 9567 taxa in total.
Among vertebrate fauna, the highest endemism has been tracked with fish class the share amounting 34.5%, while from among other four classes, four endemic taxa have been recorded with mammals only. Out of the total of 20 endemic fish species, 17 have been included in the category of globally threatened species.
From among vertebrate animals, 113 recorded species have been enrolled on the European Red List, namely: 30 species of fish, 66 birds, 16 mammals and 1 reptile species. The National Red List of threatened fauna species has not been completed yet.
Within the species diversity, particular significance is attributed to the identified “Emerald” species. Namely, total of 165 species have been identified, as follows: 6 species of invertebrate animals, 12 species of fish, 3 species of amphibians, 7 species of reptiles, 115 species of birds, 17 species of mammals and 5 species of plants.
Data specification
Data coverage (by years): Table 1: Number of endemic and threatened wild species of flora
Title of the indicator Source Reporting obligation
Threatened and protected species
− Study on the Status of Biological Diversity in the Republic of Macedonia
− Strategy and Action Plan for Bilogical Diversity Protection in the Republic of Macedonia
Number of species
Endemic species
Threatened species
Mosses (Bryopsida) 349 2 20
Peat mosses (Lycopsida) 6 6
Horsetails (Sphenopsida) 7 2
Ferns (Filicinae) 42 1 16
Gymnosperms (Gymnospermae) 15 8
Total Angiosperms (Angiospermae) 3200
Dicotyledonae 2600 109 283
Monocotyledonae 600 5 57
Total 3700 117 392

ENVIRONMENTAL INDICATORS OF THE REPUBLIC OF MACEDONIA 77
invertebrates fish amphibians reptiles mammals birds flora
Emeralds pecies identified in the Republic of Macedonia
6 12 3 7 17 115 5
Emerald species according to Res. 6 80 60 27 30 55 195 480
Table 2: Number of threatened fungi species
Table 3: Number of endemic and threatened vertebrate fauna species
Table 4: Number of Emerald species identified in the Republic of Macedonia
General metadata
Geographical coverage: Republic of Macedonia
Temporal coverage: 2003 - 2004
Total number of species Threatened species
Myxomicota 10
Oomycota 20
Zygomicota 35
Ascomycota 130
Basidiomycota 1050 67
Total 1245 67
Total number of species Endemic species Threatened species
Fish (Pisces) 58 20 30
Reptiles (Reptilia) 32 1
Birds (Aves) 319 66
Mammals (Mammalia) 82 4 16
Total 391 24 113
Code Title of the indicator
Compliance with CSI/ЕЕА or other
indicators
Classification by DPSIR Type Linkage with
area Frequency of publication
MK NI 007 Threatened and protected species
CSI 007
Threatened and protected species
S/I Biological diversity
5 - annually

ENVIRONMENTAL INDICATORS OF THE REPUBLIC OF MACEDONIA 78
Future activities Short-term activities
a. Description of the activity − Development of national Red Lists of plants, fungi and animals. − Definition of national indicator of threatened and protected species.
b. Required resources − Establishment of work group to establish the national indicator of threatened and
protected species. c. Status
− Activities are underway. Deadline: 2008
Long-term activities − Development of national Red Books of plants, fungi and animals. − Elaboration of monitoring programme for species to be identified as threatened.
ENVIRONMENTAL INDICATORS OF THE REPUBLIC OF MACEDONIA 79
MK – NI 008 DESIGNATED AREAS
Period of indicator assessment September 2007 – April 2008
Explanation Justification for indicator selection
Measures to conserve or restore biodiversity are taken at different geographical and policy levels (international, European and national). These measures may have different criteria and objectives but should be complementary. Thus the indicator concentrates on the trends of designated areas according to different policy instruments (ratified multilateral agreements, EC Birds and Habitats Directives and national instruments) and how effective they are in reaching objectives (sufficiency index).
The Sufficiency Index answers to the specific policy question "Are these measures effective in reaching the objectives?" by telling us if species and habitats listed by the EU Birds and Habitats Directives, and Bern Convention, are sufficiently represented in the protected areas.
Definition The indicator shows the proportion of a country designated total area that is protected under national instruments, or under the EU Birds and/or Habitats Directives (Natura 2000 sites), or under the Bern Convention (Emerald sites) and other multilateral agreements.
− Total (cumulative) designated area of sites protected under national instruments, or under the EU Birds and/or Habitats Directives and under multilateral agreements over the time.
The indicator is also broken down to show the different trends of surface area in km2 designated under international conventions and initiatives, under EU Directives and under national legislation:
− Number of protected areas under the national categorization
− Percentile representation of individual national categories of protected areas out of the total protected area
− Changes over time in the number of areas designated under the national legislation
− Changes over time in cumulative surface area of nationally protected sites
− Changes over time in cumulative surface area of Emerald sites (designated under the Bern Convention).
Units − Number of sites, km2 and %.
P
R
D
S
I

ENVIRONMENTAL INDICATORS OF THE REPUBLIC OF MACEDONIA 80
Policy relevance of the indicator List of relevant policy documents
The Spatial Plan of the Republic of Macedonia for the period 2002 - 2020 envisages extension of the total area of protected areas from the current 7.34% to 11.6 % of the national territory in future.
The Second National Environmental Action Plan, in its Chapter on Nature, emphasizes the goal of the establishment of integrated system for nature and biological diversity protection, in line with the EU standards and multilateral agreements, through the measure for application of mechanisms for further implementation of the National Strategy for Biological Diversity Protection with Action Plan and the National Capacity Self-Assessment (NCSA), the Law on Nature Protection and creation of appropriate conditions for Natura 2000 network establishment.
The National Strategy for Biological Diversity Protection with Action Plan, adopted by the Government in 2004, defines integrated approach to the protection and sustainable use of components of biological diversity. The Action Plan outlines the specific actions to be taken to achieve the goals. One of the measures is the expansion of the system of designated areas, as well as elaboration of proposals for nomination of new designated sites, as well as proposals for nomination of new areas for the Global Ramsar List and the List of the World Heritage under the UNESCO.
Legal grounds
The Law on Nature Protection provides for introduction of a system of designated areas aimed at protecting biological diversity in natural environments, natural processes, as well as abiotic characteristics and biological diversity of the area. Protection of nature is carried out through protection of biological and landscape diversity and protection of natural heritage within and outside designated areas.
Targets Expansion of the network of national designated areas up to around 12% under the Spatial Plan and National Strategy for Biological Diversity Protection, and by areas designated under international conventions and initiatives.
Identification of all areas in the National Emerald network and Natura 2000.
Key policy issue What is the progress in designation of areas (km2, %) under the national legislation, EU Directives and multilateral agreements?
Key message As of 1948, when the First National Park “Pelister” was designated in the country, the number and the total surface area of different categories of protected areas have noted permanent growth on national level. Most of those areas are National Parks (58 %) and Monuments of Nature (33 %).

ENVIRONMENTAL INDICATORS OF THE REPUBLIC OF MACEDONIA 81
Under the new Law on Nature Protection, new categorization of designated areas has been adopted in accordance with the model of the International Union for Conservation of Nature (IUCN) (six categories of designated areas).
The National Emerald network of areas of special conservation interest, initiated in 2002, comprises 16 areas which cover a total area of 198.145 ha, or around 7.7% of the total national territory. Activities towards identification of new Emerald areas will continue until its full establishment. Emerald areas will be included in the Natura 2000 network when the Republic of Macedonia becomes a EU Member State.
3 4 3
14
50
0
10
20
30
40
50
60
National Park Strict Nature Reserve Site of Special Natural Character
Area Outside Nature Reserves containing Certain Plant and
Animal Species
Natural Monument
numbe
r
Number of designated areas under national categorization
58,0%
7,0%1,0%
1,0%
33,0%
Share of individual national categories of designated areas in the total surface area under protection, in percentage
National Park Strict Nature Reserve
Site of Special Natural Character Area Outside Nature Reserves containing Certain Plant and Animal Species
Natural Monument

ENVIRONMENTAL INDICATORS OF THE REPUBLIC OF MACEDONIA 82
‐10
0
10
20
30
40
50
60
by 1950 1951‐60 1961‐70 1971‐80 1981‐90 1991‐00 2001‐05
numbe
r
period
Changes, over time, in the number of areas designated under the national legislation
National Park
Strict Nature Reserve
Natural Monument
Site of Special Natural Character
Area Outside Nature Reserves containing Certain Plant and Animal SpeciesTrend ‐ Natural Monument
Trend ‐ Area Outside Nature Reserves
0
200
400
600
800
1000
1200
by 1950 1951‐60 1961‐70 1971‐80 1981‐90 1991‐00 2001‐05
numbe
r
period
Changes, over time, in cumulative area of national designated areas
National Park
Strict Nature Reserve
Site of Special Natural Character
Area Outside Nature Reserves containing Certain Plant and Animal SpeciesNatural Monument
Trend ‐ National Park
Trend ‐ Natural Monument
0,00
500,00
1000,00
1500,00
2000,00
2500,00
2003 2004 2005 2006
sq km
year
Changes, over time, in cumulative area of Emerald areas

ENVIRONMENTAL INDICATORS OF THE REPUBLIC OF MACEDONIA 83
Assessment Since 1948, when the first National Park was designated, there has been constant rise in the total area of different national categories of protected areas. Today, the network of designated areas in the Republic of Macedonia comprises 74 Items of Nature, occupying a total surface area of 188.734 hectares or 7.34% of the national territory. The structure is arranged under the old categorization, as follows: Strictly Protected Natural Reserve (SNR), National Park (NP), Monument of Nature (MN), Site of Special Natural Characteristics (ASNC) and area outside natural reserves containing certain plant and animal species (CPAS). Most of the currently designated protected areas are National Parks (58%) and Monuments of Nature (33%).
Under the new Law on Nature Protection, new categorization is in course of introduction, upon its alignment with the IUCN method: Strictly Protected Natural Reserve, National Park, Monument of Nature, Nature Park, Protected Landscape and Multi-purpose Area. The Law allows for a transitional period of six years from its entry into force, when the revalorization of protected areas designated prior to its adoption will be completed.
According to the Spatial Plan of the Republic of Macedonia, for the period 2002-2020, expansion of the total surface `area of designated areas has been envisaged, to rise from the current 7.34% to 11.6 % of the national territory. For the sake of comparison, the percentage of designated areas in most of the European countries ranges between 10 and 15 % of the total national territory.
Designated areas with internationally recognized status include:
− Monument of Nature “Ohrid Lake” – World Natural Heritage (UNESCO); − Monument of Nature “Prespa Lake” – Ramsar Site; − Monument of Nature “Markovi Kuli” (King Mrko’s Towers) - World Natural Heritage
(UNESCO’s Tentative List); and
− Monument of Nature “Slatinski izvor” (The Springs of Slatino) - World Natural Heritage (UNESCO’s Tentative List).
0
2
4
6
8
10
12
14
16
18
2003 2004 2005 2006
numbe
r
year
Changes, over time, in the number of Emerald areas

ENVIRONMENTAL INDICATORS OF THE REPUBLIC OF MACEDONIA 84
In 2002, the Republic of Macedonia commenced the process of establishment of the Emerald network of areas of special conservation interest (ASCI), established on the territories of the countries Parties to the Bern Convention and important part in the preparation of candidate countries for EU membership.
By means of the implementation of a pilot-project (2002 - 2003), 3 ASCIs were identified and proposed, accounting for around 10% of the total National Emerald Network. Activities aimed at establishing the Emerald network have continued in the following years, to result in 16 areas proposed for inclusion in the National Emerald Network so far. This corresponds with around 80% of the total Emerald Network of the Republic of Macedonia. The total surface area of the so far proposed areas is 198.145 ha, where the smallest area occupies a surface area of 810 ha (The Springs of Smolare), and the largest one is Mariovo with a surface area of 73.088 ha. Part of the proposed areas have already been protected at national level under different categories, as follows: NP Galicica, SNR Ezerani, MN Dojran Lake, NP Pelister, SNR Tikves, MN Demir Kapija, NP Mavrovo, MN Matka, MN Smolarski Vodopad and MN Markovi Kuli.
The Emerald network is an efficient tool in the preparation for the implementation of Birds and Habitat Directives, for the countries moving towards EU membership.
Methodology Methodology for the indicator calculation
The procedure for identification and designation of different categories of protected areas derives from the Law on Nature Protection, EU Directives and provisions of multilateral agreements.
Data specification
Data coverage (by years): Table 1: Number of designated areas under the national categorization
Title of the indicator Source Reporting obligation
Designated areas CDDA
Emrald database
− Annually, to the European Environmental Agency
− Annually, to the Secretariat of the Bern Convention with the Council of Europe
Category DESIGNATED AREA Number Total Area in sq km
A National Park 3 1083.38
A Strict Nature Reserve 4 128.55
A Site of Special Natural Character 3 23.38
A Area Outside Nature Reserves containing Certain Plant and Animal Species 14 26.45
A Monument of Nature 50 625.58
Total 74 1887.34

ENVIRONMENTAL INDICATORS OF THE REPUBLIC OF MACEDONIA 85
Table 2: Share of individual national categories in the total area under protection, in percentage
Table 3: Changes, over time, in the number of areas protected under the national legislation
Table 4: Changes, over time, in the cumulative surface area of national designated areas
Designated area Number Total Area in sq km %
National Park 3 1083,38 58%
Strict Nature Reserve 4 128,55 7%
Site of Special Natural Character 3 23,38 1%
Area Outside Nature Reserves containing Certain Plant and Animal Species 14 26,45 1%
Monument of Nature 50 625,58 33%
Total 74 1887,34 100%
Designated area by 1950 1951-60 1961-70 1971-80 1981- 90 1991-00 2001-05
National Park 2 3 3 3 3 3 3 Strict Nature Reserve 0 0 0 0 0 2 4 Natural monument 0 5 18 23 38 44 50 Site of Special Natural Character 0 0 2 0 3 3 3
Area Outside Nature Reserve containing Certain Plant and Animal Species
0 2 14 14 14 14 14
Designated area by 1950 1951-60 1961-70 1971-80 1981-90 1991-00 2001-05
National Park 855.88 1083.38 1083.38 1083.38 1083.38 1083.38 1083.38
Strict Nature Reserve 0 0 0 0 0 127.3 128.55
Site of Special Natural Character
0 0 22.53 22.53 23.38 23.38 23.38
Area Outside Nature Reserves containing Certain Plant and Animal Species
0 0.06 26.45 26.45 26.45 26.45 26.45
Monument of Nature 0 232.67 232.85 439.58 444.17 554.28 625.58

ENVIRONMENTAL INDICATORS OF THE REPUBLIC OF MACEDONIA 86
Table 5: Changes, over time, in the number and area of Emerald sites
General metadata
Geographical coverage: Republic of Macedonia
Temporal coverage: 1948 - 2006
Frequency of data collection: annual
Information on the quality (at data level): The process of revalorization of the currently protected areas and their re-designation in line with the new categorization, new, accurate data/information on designated areas will be collected.
Note: The CDDA database contains data under the old categorization.
Future activities Short-term activities
a. Description of the activity − Definition of national set of indicators for designated areas.
b. Required resources − Establishment of Working Group to elaborate the national set of indicators for
designated areas.
c. Status − Activities are underway
Deadline: 2008
Long-term activities
Redesignation of the currently protected areas by accurate definition of boundaries and surface area and production of digital boundaries.
Valorization and designation of new areas to be protected under the new categorization. Identification of new areas to be included in the National Emerald Network.
2003 2004 2005 2006
Number 3 3 6 16
Total area in sq km 275,83 275,83 559,38 1981,45
Code Title of the indicator
Compliance with CSI/ЕЕА or other indicators
Classification by DPSIR Type Linkage with
area
Frequency of
publication
MK NI 008 Designated areas CSI 008 Designated
areas R А
Biological diversity
nature policies
Annually
ENVIRONMENTAL INDICATORS OF THE REPUBLIC OF MACEDONIA 87
MK – NI 009 SPECIES DIVERSITY
Period of indicator assessment September 2007 – April 2008
Explanation Justification for indicator selection
The objective of this indicator is to produce a generic indicator that will show the state and trends of biological diversity in Macedonia. At present the trend information for species at national level is very limited, so for the purpose of this indicator it is split into trend assessments for different species groups. It is possible to develop a methodology for trends establishment for more species and species groups, but for now there are initial activities only for birds.
The trends for all species are linked to different habitat types. An assessment of the trend for a group of species linked to a particular habitat type, can give a good indication of the quality of that habitat type.
Selection of the species and species groups is based primarily on the availability of data and the need to show trends for various species groups. Future development of the indicator will involve extending the concept to include other species and species groups, while also defining common criteria for inclusion or deletion of species.
Definition The indicator will show the trend in the number and distribution of selected species or species groups at national level, as relative assessment compared to the baseline of the monitoring commencement.
At the moment, species groups considered are the birds.
The indicator will show the trend of common birds species (developing) and the trend of certain selected species of birds of pray.
Units − Number of species, estimated number of individuals for certain species.
Policy relevance of the indicator List of relevant policy documents
The Second National Environmental Action Plan, in its Chapter on Nature, emphasizes the goal of the establishment of integrated system for nature and biological diversity protection, in line with the EU standards and multilateral agreements. One of the
P
R
D
S
I
ENVIRONMENTAL INDICATORS OF THE REPUBLIC OF MACEDONIA 88
actions envisaged for the goal achievement is development of national monitoring programme for biological diversity components and elaboration of national biodiversity indicators.
The National Strategy for Biological Diversity Protection with Action Plan defines integrated approach to the protection and sustainable use of components of biological diversity. The Action Plan outlines the specific actions to be taken to achieve the goals. The strategic commitment “Research and monitoring” includes action for national biodiversity indicators development.
Legal grounds
The Law on Nature Protection provides for monitoring of the state of the nature. The monitoring methodology needs to be specified in a regulation. The monitoring over the state of nature is carried out through: measurement, observation, assessment and control of the state of species, their habitats, habitat types, environmentally significant areas, ecosystems, landscape types, monitoring and assessment of geological values and monitoring of the state of natural heritage.
Targets Identification of the trend in populations for selected bird species and establishment of the reasons leading to reduction in their number and development and implementation of measures for the negative trend halting (contribution to the achievement of the Target 2010 for biodiversity loss prevention/reduction by 2010).
Assessment Abundance and variety of species and ecosystems are the main features of biological diversity in the Republic of Macedonia. According to the available information, this wealth comprises the imposing number of around 18.000 taxa, out of which more than 900 taxa are Macedonian endemic taxa. According to the analysis of the richness of biodiversity in the countries of the European continent, the Republic of Macedonia is positioned at the very top of the list of states known as “European Hotspot".
The total number of registered bird taxa is 338 (319 species and 19 subspecies). 69 bird species found in the Republic of Macedonia have been included in the European Red List. From among “Emerald” species identified in the Republic of Macedonia (under the Resolution No. 6 of the Bern Convention), 115 species are birds.
In the period from 2003 until present, within the Project for vultures conservation, monitoring of the populations of Griffon Vulture and Egyptian Vulture has been carried out, accompanied also by monitoring of the Imperial Eagle. There is also older data on the said species, as well as on the Golden Eagle, Mediterranean Falcon, Buteo rufunnus G., etc. However, this data should be analyzed again prior to use.
The implementation of the Project for common bird species monitoring was initiated in 2007 and, based on the below described methodology, preliminary data on the trend in certain bird species will be obtained in the course of the next several (three at minimum) years.

ENVIRONMENTAL INDICATORS OF THE REPUBLIC OF MACEDONIA 89
Data specification
Data coverage:
General metadata
Geographical coverage: Republic of Macedonia
Temporal coverage:
− for common bird species: since 2007 − for selected birds of pray: since 2004
Frequency of data collection: annually
Title of the
indicator Source Reporting obligation
Species diversity
− Grubac, B. & VELEVSKI, M. (2004): Survey and monitoring of the status, breeding success and threats to the Egyptian Vulture in Macedonia- 2004. MES. 28 pp. Report to BVCF/FZS.Емералд база на податоци
− Grubac, B. & VELEVSKI, M. (2005): Survey and monitoring of the status, breeding success and threats to the Egyptian Vulture in Macedonia- 2005.
Species Number
Griffon Vulture
Year couples
2004 21-25 couples
2005 14 couples
2006 9 couples
Egyptian Vulture
year couples
2004 35 couples
2005 31 couples
2006 30 couples
Code Title of indicator Compliance with CSI/ЕЕА or other
indicators
Classification by DPSIR Type Linkage with
area Frequency of publication
MK NI 009 Species diversity
CSI 009
Species diversity С biological
diversity

ENVIRONMENTAL INDICATORS OF THE REPUBLIC OF MACEDONIA 90
Methodology Methodology for the indicator calculation
Sample quadrants (10 – 15) with a surface area of 1 km2 will be selected at random and common bird species will be counted there by applying the method of linear transect. The counting will take place in the breeding period (15 April - 15 June), with intensity of two counts per year. Data will be statistically processed to show the rend in species at national level, for which minimum of three years research will be required.
With regard to birds of pray, full census has been envisaged, to cover breeding couples and identify their breeding success.
Source of applied methodology
The methodology used by the British Trust for Ornithology in their census of breeding birds in the United Kingdom will be used.
Uncertainty Methodological uncertainty
Uncertainty derives from the level of expertise of researchers.
Future activities Short-term activities
− Definition of indicators − Selection of sample sites for common bird species − Training of researchers in monitoring of selected species
a. Description of activity
Depending on the number of researchers and their experience, sample sites will be selected by random and birds will be counted within them. The total number of these areas is expected to range between 10 and 15 quadrants.
Training of the researchers is required, to include workshops and practical field work (birds identification, data collection and compilation)
b. Required resources − Organization of two workshops for training in birds identification, data collection and
compilation.
− Organization of workshops to increase the number of participants in the observers’ network.
− Development of practical tools (interactive CD Rom) on birds identification.
− Procurement of optical equipment (binoculars). − Preparation of birds identifier in Macedonian.
ENVIRONMENTAL INDICATORS OF THE REPUBLIC OF MACEDONIA 91
c. Status
Activities are in initial stage.
Deadline: 2010
Long-term activities a. Description of the activity
− Permanent training of researchers and increase in the number of sample sites.
− Selection of other indicator sets and development of methods for their monitoring.
Deadline: 2010 - 2012

ENVIRONMENTAL INDICATORS OF THE REPUBLIC OF MACEDONIA 92
LIST OF ADITIONAL INDICATORS
The Work Group on biodiversity, nature and fishery indicators held three meetings, during which discussions focused on the definition of the national list of biodiversity, nature and fishery indicators, as well as supplementing and verifying the three proposed indicators submitted to the Government of the Republic of Macedonia.
The Work Group made an attempt to propose final list of indicators and experts extended several proposals to that end: three proposal indicators of live stock breeding as specific segment of agriculture related to the indicator under the SEBI 2010 and FAO; four proposal indicators of plant production, three proposal indicators of forests: it was also proposed to include the indicator of fires in this list, as well as one indicator of veterinary health measures. There was another proposal to develop a sub-indicator of fish under the indicator of genetic resources, while under the fishery – fish catch and production.
In order to simplify the work, it was proposed to group the indicators (e.g. wild species/habitats, forestry, agriculture, genetic resources, anthropogenic activity, fishery, etc.) and appropriate subgroups composed by the Work Group members to be formed accordingly. Where needed, additional experts should be invited. The final national list has not been developed yet. This certainly requires additional time, as well as financial resources.
Biodiversity indicators are informative tools summarizing data on complex environmental issues in order to present the state and the trend in biodiversity. They provide indication of how close we have reached to the achievement of certain defined goals, such as the global/European Target 2010 – to reduce/prevent biodiversity loss by 2010.
Biodiversity indicators, regardless of whether assessed at national or global level, build bridges between policy creators and science. Policy creators set the targets and the measurable objectives, while scientists determine certain variables of biodiversity, monitor the current status and develop model to project the future status of biodiversity. A good monitoring programme should identify the biodiversity trend and provide guidelines for undertaking of adequate measures, i.e. interventions by policy makers.
Convention on Biological Diversity (CBD) has set indicators at global level in order to measure the progress towards the achievement of Target 2010, allocated to seven focal areas:
− protection of biodiversity components,
− promotion of sustainable use,
− analysis of threats to biodiversity,
− maintenance of goods and services to support human welfare,
− protection of traditional knowledge, innovation and practice,
− provision of equitable and balanced distribution of benefits resulting from the use of genetic resources, and
− enabling resource transfer.
Based on the above focal areas under the CBD and EU headline indicators and Pan-European Biological and Landscape Diversity Strategy (PEBLDS) at European level under the Project “Streamlining of European Biodiversity Indicators by 2010 (SEBI 2010), the first set of

ENVIRONMENTAL INDICATORS OF THE REPUBLIC OF MACEDONIA 93
European biodiversity indicators has been developed, as follows:
26 indicators have been proposed within the SEBI 2010 process: 1. Abundance and distribution of selected species
2. Red List Index for European species
3. Species of European interest
4. Ecosystem coverage
5. Habitats of European interest
6. Livestock genetic diversity
7. Nationally designated protected areas
8. Sites designated under the EU Habitats and Birds Directives
9. Critical load exceedance for nitrogen
10. Invasive alien species in Europe
11. Occurrence of temperature-sensitive species
12. Marine Trophic Index of European seas
13. Fragmentation of natural and seminatural areas
14. Fragmentation of river systems
15. Nutrients in transitional, coastal and marine waters
16. Freshwater quality
17. Forest: growing stock, increment and fellings
18. Forest: deadwood
19. Agriculture: nitrogen balance
20. Agriculture: area under management practices potentially supporting biodiversity
21. Fisheries: European commercial fish stocks
22. Aquaculture: effluent water quality from finfish farms
23. Ecological Footprint of European countries
24. Patent applications based on genetic resources
25. Financing biodiversity management
26. Public awareness
Considering the fact that the reporting obligation towards EEA and EU will be based on the above indicators, experts should focus their next activities on the elaboration of these indicators. Most of the indicators are complex/aggregate and thus several indicators can be proposed oriented towards the complex indicator and then to remove indicators that are not relevant for the Republic of Macedonia (e.g. Marine Trophic Index of European seas), etc.
In addition to the above, the issue of lack of data has to be settled, namely adequate monitoring programme should be prepared, relevant institutions and organizations for monitoring performing should be accredited as required, to monitor certain biodiversity components and continuous monitoring system should be established at national level.


ENVIRONMENTAL INDICATORS OF THE REPUBLIC OF MACEDONIA 96
МК - NI 010 GREENHOUSE GAS EMISSIONS AND REMOVALS
Period of indicator assessment September 2007 – April 2008
Explanation Justification for indicator selection
Potential impacts of climate change at global level include rising sea levels, increased frequency and intensity of floods and droughts, changes in biotes and food productivity and increase in diseases. There has been constantly growing evidence that greenhouse gas emissions cause increase in global and European surface air temperatures, resulting in climate change (IPCC, 2001, 2007). Efforts to reduce or limit the effects of climate change have been focused on the reduction of the emissions of greenhouse gases covered by the Kyoto Protocol.
At the level of EU Member States, this indicator supports the Commission's annual assessment of the progress in the emission reduction in EU and in individual Member States towards the achievement of the targets specified in the Kyoto Protocol, based on the mechanism for GHG monitoring (Council Decision No. 280/2004/ЕC concerning a mechanism for monitoring Community greenhouse gas emissions and for implementing the Kyoto Protocol. This indicator illustrates the current trends in mand-induced GHG emissions in relation to targets set by the Kyoto Protocol.
In the case of the Republic of Macedonia, the indicator is based on data contained in the National Grenhouse Gases Inventory produced within the process of developing the National Communications towards the United Nations Framework Convention on Climate Change.
Definition The indicator shows the quantities of greenhouse gas emissions on national level. The emissions are presented by greenhouse gas type. The indicator provides information on emissions in the following sectors: energy, industrial processes, agriculture, land use change and forestry and waste.
Units − Tonnes CO2-еquivalent
Policy relevance The Grenhouse Gases Inventory establishes the basis for the analysis of the GHG reduction.
Legal grounds
Republic of Macedonia is a Party to the United Nations Framework Convention on Climate Change and to the Kyoto Protocol. Climate change issues have been incorporated in the Law
P
R
D
S
I

ENVIRONMENTAL INDICATORS OF THE REPUBLIC OF MACEDONIA 97
on Environment, including the requirements for preparation of GHG emission inventories and GHG removal via sinks, as well as development of action plan with measures and activities aimed at GHG emissions abatement and climate change impacts mitigation. In addition to this, by means of amendment of the Law on Environment, provision has been made for Designated National Authority (DNA) to approve the projects under the Kyoto Protocol Clean Development Mechanism (CDM).
Key message This indicator provides information on the trends in total GHG emissions, which is in direct correlation with energy intensity of the economy in the country, as well as with the quality of fuels. The establishment of national system for regular development and updating of GHG inventories is vital.
The diagrams below present the contribution of individual sectors and pollutants that are also greenhouse gases, in kilotons per year and in percentage.
0
2.000
4.000
6.000
8.000
10.000
12.000
14.000
16.000
1990
1991
1992
1993
1994
1995
1996
1997
1998
1999
2000
2001
2002
[kt]
year
Energy Industrial Processes Agriculture LUCF Waste

ENVIRONMENTAL INDICATORS OF THE REPUBLIC OF MACEDONIA 98
71
72
67
66
70
72
72
72
75
76
61
73
78
6
7
8
6
6
6
7
7
7
6
6
7
6
14
15
15
14
15
15
14
12
11
11
9
10
9
3
0
5
8
3
0
1
2
1
1
18
4
0
6
6
6
6
6
6
7
6
6
6
6
6
7
0% 10% 20% 30% 40% 50% 60% 70% 80% 90% 100%
1990
1991
1992
1993
1994
1995
1996
1997
1998
1999
2000
2001
2002
year
Energy Industrial Processes Agriculture LUCF Waste
77
75
74
76
75
75
75
77
79
79
80
78
80
12
13
14
13
14
14
14
13
12
13
12
13
13
9
10
10
9
10
10
9
8
7
7
6
6
5
2
2
2
2
2
2
2
2
2
2
2
2
2
0,0
0,0
0,0
0,0
0,0
0,0
0,0
0,0
0,0
0,0
0,2
0,9
0,2
0% 10% 20% 30% 40% 50% 60% 70% 80% 90% 100%
1990
1991
1992
1993
1994
1995
1996
1997
1998
1999
2000
2001
2002
year
CO2 CH4 N2O CO HFC

ENVIRONMENTAL INDICATORS OF THE REPUBLIC OF MACEDONIA 99
Assessment Subject of analysis are the following gases: CO2, CH4 и N2О, CO and HFC, and the total emission is expressed in CO2-eq. This indicator provides information on GHG emissions from the following sectors: energy, industrial processes, agriculture, land use change and forestry (LUCF) and waste.
The Inventory of Greenhouse Gases prepared under the Second National Communication on Climate Change (scheduled for adoption in September 2008) is summarized in Table 1. The first part of the table presents the amounts of GHG emissions by sectors, as well as total emissions for the period 1990 – 2002 (*). The second part of the table shows absolute and percentile values of CO2-equivalent for all sectors. Detailed analysis of individual sectors and of each GHG separately shows that GHG emissions note certain decrease, namely in the sectors of industrial processes (by 35%) and agriculture (by 22%), while the trend in the LUCF sector is varying and the emissions show no change in the waste sector. Rise in GHG emissions has been observed only in the energy sector (by 6%). Comparatively, the share of the energy sector in total GHG emissions is very high (almost 3/4), followed by agriculture, waste and industrial processes sectors (the share being 10, 8 and 7%, respectively), while the share of the LUCF is below 2%. The falling trend of GHG emissions from industrial processes and agriculture sectors is due to their declining activities within the national economy in the assessed period.
Methodology Methodology for the indicator calculation
GHG emissions are calculated as aggregate of input data and the relevant emission factors. No measurements are required. The 1996 IPPC Methodology for GHG Inventories development was used, in line with the guidelines under the United Nations Framework Convention on Climate Change (UNFCCC).
Data specification
Title of the indicator Source Reporting obligation
Greenhouse gases emissions and remov-als
− Greenhouse Gas Emissions Inventory in: the First National Communication of Macedonia under the United Nations Framework Conven-tion on Climate Change (UNFCCC), Ministry of Environment and Physical Planning, p. 29-46, 2003;
− Second National Communication of Mace-donia under the United Nations Framework Convention on Climate Change (UNFCCC), Ministry of Environment and Physical Plan-ning; www.unfccc.org.mk
− UNFCCC

ENVIRONMENTAL INDICATORS OF THE REPUBLIC OF MACEDONIA 100
Data coverage (by years): 1990 – 2002 Table 1: GHG Inventory in the Second National Communication (*) CO2-eq emissions by sectors
*- The adoption of the Second National Communication on Climate Change has been scheduled for September 2008
Se
ctor
19
90
1991
19
92
1993
19
94
1995
19
96
1997
19
98
1999
20
00
2001
20
02
[kt]
Ener
gy
9.93
9,83
9.
190,
47
8.48
4,18
9.
068,
37
8.83
9,56
8.
925,
02
8.57
8,29
9.
198,
29
9.93
9,13
9.
716,
39
9.22
6,90
9.
355,
70
9.75
5,52
In
dust
ry
889,
29
908,
89
957,
78
831,
36
716,
56
793,
28
819,
71
910,
30
891,
78
742,
43
885,
70
929,
02
784,
05
Agr
icul
ture
1.
908,
27
1.86
6,08
1.
881,
62
1.85
8,08
1.
888,
54
1.82
5,04
1.
682,
11
1.57
1,02
1.
462,
96
1.37
7,56
1.
379,
52
1.31
3,29
1.
073,
39
LUC
F 28
3,66
24
,07
424,
06
758,
82
273,
29
5,67
51
,49
177,
63
89,1
6 99
,57
1.97
3,70
33
6,53
36
,49
Was
te
786,
29
794,
97
806,
08
808,
37
753,
66
778,
67
785,
13
822,
21
827,
12
828,
38
844,
23
836,
38
840,
59
Tot
al
13.8
07,3
4 12
.784
,47
12.5
53,7
2 13
.324
,99
12.4
71,6
1 12
.327
,68
11.9
16,7
2 12
.679
,45
13.2
10,1
5 12
.764
,34
14.3
10,0
5 12
.770
,92
12.4
90,0
4
[%]
Ener
gy
71,9
9 71
,89
67,5
8 68
,06
70,8
8 72
,40
71,9
9 72
,54
75,2
4 76
,12
64,4
8 73
,26
78,1
1 In
dust
ry
6,44
7,
11
7,63
6,
24
5,75
6,
43
6,88
7,
18
6,75
5,
82
6,19
7,
27
6,28
Agr
icul
ture
13
,82
14,6
0 14
,99
13,9
4 15
,14
14,8
0 14
,12
12,3
9 11
,07
10,7
9 9,
64
10,2
8 8,
59
LUC
F 2,
05
0,19
3,
38
5,69
2,
19
0,05
0,
43
1,40
0,
67
0,78
13
,79
2,64
0,
29
Was
te
5,69
6,
22
6,42
6,
07
6,04
6,
32
6,59
6,
48
6,26
6,
49
5,90
6,
55
6,73
T
otal
10
0,00
10
0,00
10
0,00
10
0,00
10
0,00
10
0,00
10
0,00
10
0,00
10
0,00
10
0,00
10
0,00
10
0,00
10
0,00
G
as
1990
19
91
1992
19
93
1994
19
95
1996
19
97
1998
19
99
2000
20
01
2002
[kt]
CO
2 10
.545
,3 3 9.
598,
08
9.32
1,21
10.
048,
55
9.29
0,20
9.
213,
08
8.92
8,41
9.
793,
79 1
0.40
8,98
10.
055,
09
11.2
83,6
0 9.
959,
41 1
0.05
9,08
CH
4 1.
732,
78
1.70
3,43
1.
747,
30
1.77
5,03
1.
697,
21
1.69
5,97
1.
666,
20
1.67
5,40
1.
630,
70
1.62
8,35
1.
741,
23
1.65
6,67
1.
621,
23
N2О
1.
253,
22
1.21
8,64
1.
221,
40
1.19
9,10
1.
224,
80
1.17
3,38
1.
057,
27
970,
94
936,
79
845,
36
959,
99
813,
94
570,
40
CO
27
6,01
26
4,33
26
3,80
30
2,31
25
9,40
24
5,25
26
4,85
23
9,32
23
3,68
23
5,54
30
0,03
22
0,44
20
8,62
HFC
0,
00
0,00
0,
00
0,00
0,
00
0,00
0,
00
0,00
0,
00
0,00
25
,20
120,
47
30,7
1
Tot
al
13.8
07,3 4
12.7
84,4
7 12
.553
,72
13.3
24,9
9 12
.471
,61
12.3
27,6
8 11
.916
,72
12.6
79,4
5 13
.210
,15
12.7
64,3
4 14
.310
,05
12.7
70,9
2 12
.490
,04
[%]
CO
2 76
,37
75,0
8 74
,25
75,4
1 74
,49
74,7
3 74
,92
77,2
4 78
,80
78,7
7 78
,85
77,9
9 80
,54
CH
4 12
,55
13,3
2 13
,92
13,3
2 13
,61
13,7
6 13
,98
13,2
1 12
,34
12,7
6 12
,17
12,9
7 12
,98
N2О
9,
08
9,53
9,
73
9,00
9,
82
9,52
8,
87
7,66
7,
09
6,62
6,
71
6,37
4,
57
CO
2,
00
2,07
2,
10
2,27
2,
08
1,99
2,
22
1,89
1,
77
1,85
2,
10
1,73
1,
67
HFC
0,
00
0,00
0,
00
0,00
0,
00
0,00
0,
00
0,00
0,
00
0,00
0,
18
0,94
0,
25
Tot
al
100,
00
100,
00
100,
00
100,
00
100,
00
100,
00
100,
00
100,
00
100,
00
100,
00
100,
00
100,
00
100,
00
Contribution of CO2, CH4, N2O and HFC in the total CO2-eq emissions from all sectors

ENVIRONMENTAL INDICATORS OF THE REPUBLIC OF MACEDONIA 101
General metadata
Data source(s): Input data: Yearbooks of the State Statistical Office; other publications/projects of Ministries (environment, agriculture, forestry, etc.), Emission factors: 1996 IPCC – Emission factors base
Geographical coverage: Republic of Macedonia
Temporal coverage: 1990 – 2002
Frequency of data collection: The Inventories have been prepared every three years, in accordance with the specified frequency of national reports development.
Uncertainty Uncertainty of data
Lack of adequate data to apply more sophisticated method in the framework of the methodology, inconsistency of data, lack of national emission factors
Activities Short-term activities
− Strengthening of capacity for inventories development a. Description of the activity
− Finalizing activities of preparation of the Second National Communication on Climate Change.
b. Required resources − Training of staff in the MEPP to be capable of updating the inventory by themselves,
including on annual basis if required. Possible employment of additional technical expert to maintain the GHG Inventory.
− Updating and upgrading of existing databases. Deadline: end of 2008
Long-term activities
Regular production of GHG Inventories on annual basis.
Code Title of the indicator
Compliance with CSI/EEA or other indicators
Classification by DPSIR Type Linkage with
area Frequency of publication
MK NI 010
Greenhouse gases emissions and removals
CSI 010 CC5
Greenhouse gas emissions and removals
P B
Greenhouse gases emissions and removals
Annually

ENVIRONMENTAL INDICATORS OF THE REPUBLIC OF MACEDONIA 102
МК - NI 011 PROJECTIONS OF GREENHOUSE GAS EMISSIONS AND REMOVALS
Period of the indicator assessment September 2007 – April 2008
Explanation Justification for indicator selection
Potential impacts of climate change at global level include rising sea levels, increased frequency and intensity of floods and droughts, changes in biotes and food productivity and increase in diseases. There has been constantly growing evidence that greenhouse gas emissions cause increase in global and European surface air temperatures, resulting in climate change (IPCC, 2001, 2007). Efforts to reduce or mitigate the effects of climate change have been focused on the reduction of the emissions of all greenhouse gases covered by the Kyoto Protocol.
At the level of EU Member States, this indicator supports the Commission's annual assessment of the progress in the emission reduction in EU and in individual Member States towards the achievement of the targets specified in the Kyoto Protocol, based on the mechanism for GHG monitoring (Council Decision No. 280/2004/ЕC concerning a mechanism for monitoring Community greenhouse gas emissions and for implementing the Kyoto Protocol).
In the case of the Republic of Macedonia, the indicator is based on data contained in the Report on Climate Change Mitigation in the Republic of Macedonia, produced in the process of development of National Communications towards the United Nations Framework Convention on Climate Change.
Definition The indicator illustrates projected trends in anthropogenic greenhouse gas (GHG) emissions by means of application of the existing policies and measures and/or additional policies and measures. Projected trends are presented by sector types: energy, industrial processes, agriculture, land use change and forestry and waste.
Units − Tons CO2-equivalent.
Policy relevance This indicator is of vital importance for the national climate change mitigation policy. It is also related to future implementation of projects based on the Clean Development Mechanism (CDM) of the Kyoto Protocol.
P
R
D
S
I
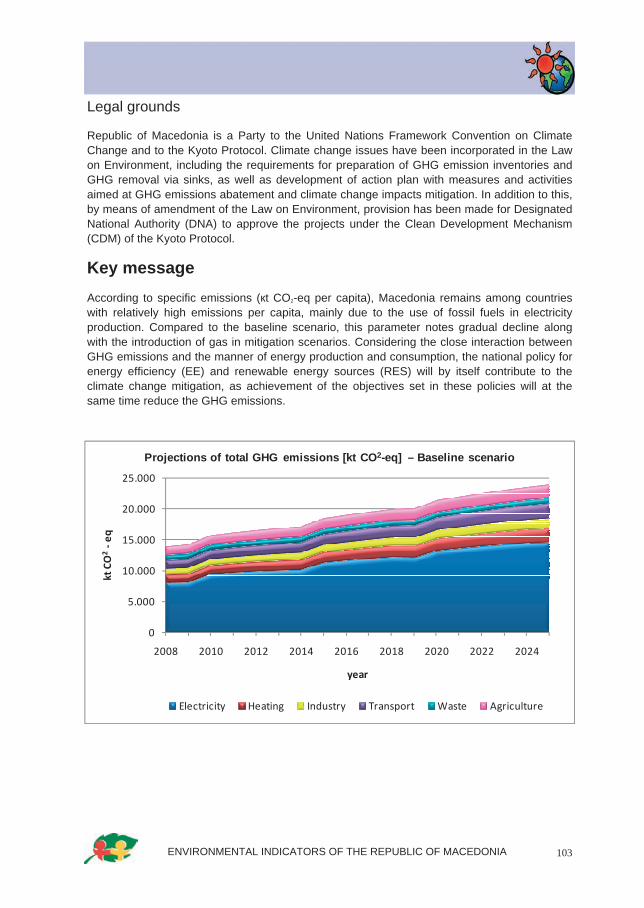
ENVIRONMENTAL INDICATORS OF THE REPUBLIC OF MACEDONIA 103
Legal grounds
Republic of Macedonia is a Party to the United Nations Framework Convention on Climate Change and to the Kyoto Protocol. Climate change issues have been incorporated in the Law on Environment, including the requirements for preparation of GHG emission inventories and GHG removal via sinks, as well as development of action plan with measures and activities aimed at GHG emissions abatement and climate change impacts mitigation. In addition to this, by means of amendment of the Law on Environment, provision has been made for Designated National Authority (DNA) to approve the projects under the Clean Development Mechanism (CDM) of the Kyoto Protocol.
Key message According to specific emissions (кt CO2-eq per capita), Macedonia remains among countries with relatively high emissions per capita, mainly due to the use of fossil fuels in electricity production. Compared to the baseline scenario, this parameter notes gradual decline along with the introduction of gas in mitigation scenarios. Considering the close interaction between GHG emissions and the manner of energy production and consumption, the national policy for energy efficiency (EE) and renewable energy sources (RES) will by itself contribute to the climate change mitigation, as achievement of the objectives set in these policies will at the same time reduce the GHG emissions.
0
5.000
10.000
15.000
20.000
25.000
2008 2010 2012 2014 2016 2018 2020 2022 2024
kt CO2‐e
q
year
Projections of total GHG emissions [kt CO2-eq] – Baseline scenario
Electricity Heating Industry Transport Waste Agriculture

ENVIRONMENTAL INDICATORS OF THE REPUBLIC OF MACEDONIA 104
0
5.000
10.000
15.000
20.000
25.000
2008 2010 2012 2014 2016 2018 2020 2022 2024
kt C
O2
-eq
year
Projections of total GHG emissions [kt CO2-eq] – First mitigation scenario
Electricity Heating Industry Transport Waste Agriculture
0
5.000
10.000
15.000
20.000
25.000
2008 2010 2012 2014 2016 2018 2020 2022 2024
kt C
O2
-eq
year
Projections of total GHG emissions [kt CO2-eq] – Second mitigation scenario
Electricity Heating Industry Transport Waste Agriculture

ENVIRONMENTAL INDICATORS OF THE REPUBLIC OF MACEDONIA 105
‐2.000
0
2.000
4.000
6.000
8.000
10.000
12.000
Electricity
Heatin
g
Indu
stry
Transport
Waste
Agriculture
Total
kt CO2‐e
q
Effectiveness of the three scenarios expressed as absolute emissions growth in 2025 relative to emissions in 2008
Baseline First mitigation Second mitigation
-20%
0%
20%
40%
60%
80%
100%
Ele
ctric
ity
Hea
ting
Indu
stry
Tran
spor
t
Was
te
Agr
icul
ture
Tota
l
kt C
O2
-eq
Effectiveness of the three scenarios expressed as relative emissions growth in 2025 relative to emissions in 2008
Baseline First mitigation Second mitigation

ENVIRONMENTAL INDICATORS OF THE REPUBLIC OF MACEDONIA 106
Assessment This Chapter integrates sectoral emissions in order to project total GHG emissions for the period 2008 - 2025 based on adopted scenarios: baseline, first and second mitigation scenarios. It should be noted that the first and the second mitigations scenarios differ only in electric power sector, where the second mitigation scenario includes additional measures for emission abatement, which will, as shown below, contribute significantly to the overall emission abatement. Total emissions at the beginning and at the end of the period by all scenarios are summarized on Table 1. Further on, Table 2 (and Figure 1), Table 3 (and Figure 2) and Table 4 (and Figure 3) present sectoral and total GHG emissions by years, for each scenario, respectively.
Analysis of the baseline scenario: According to projections presented in Table 2 and on Figure 1, there will be significant increase of GHG emissions by 2025 compared to values estimated for 2008 (around 9.900 kt CO2-eq in absolute value, or around 71% in relative terms), provided that business-as-usual is preserved (Figure 4 and Figure 5, the last group of columns). This increase is mainly connected to the growth in electric power sector (absolute difference of 6.400 kt CO2-eq and 78% relative growth of the value in 2008), which reflects the so called dark scenario, i.e. development scenario of the national energy sector based on lignite (Figure 4 and Figure 5, first group of columns). Other sectors also show significant growth in GHG emissions, so that values in 2025 compared to values in 2008 are higher by 75% - transport, 71% - heating and industry, 60% - agriculture and 6% - waste (Figure 4 and Figure 5).
Analysis of scenarios of emission abatement: The state could improve if development paths include activities/measures leading to GHG emissions reduction. As a result, the first mitigation scenario (as defined in the analysis by sectors) will lead to increase in total emissions of 46% of the values in 2025 compared to the value in 2008 or absolute difference of around 6.400 kt CO2-eq. (Table 3 and Figure 2; also Figure 4 and Figure 5, last group of columns). This increase in total emissions decreases further by 32% (absolute difference of around 4.000 kt CO2-eq) if development paths observe the second mitigation scenario (Table 4 and Figure 3; also Figure 4 and Figure 5, last group of columns).
0
5.000
10.000
15.000
20.000
25.000
2008 2010 2012 2014 2016 2018 2020 2022 2024
kt CO2‐e
q
year
Projections of total GHG emissions kt CO2-eq for the three scenarios
Baseline First mitigation Second mitigation

ENVIRONMENTAL INDICATORS OF THE REPUBLIC OF MACEDONIA 107
With regard to emission projections by sectors for the three scenarios, comparison of emissions in 2025 with those in 2008 shows highest rise of emissions in electric energy sector. Namely, the relative increase of 78% in the baseline scenario falls at 41% in the first mitigation scenario due to the introduction of two plants on natural gas for combined electricity and heat production (the first one in 2009 and the second in 2015). The relative increase drops at 14% under the second mitigation scenario, as a result of reduced consumption by major consumers, introduction of renewable energy sources and termination of the thermal power plant (TPP) in Negotino upon the establishment of the new gas power plant (Figure 4 and Figure 5, last group of columns). As far as the sectors are concerned, there is a notable result in the waste sector, where the relative increase of 6% in the baseline scenario reaches negative relative increase (-13%) under both mitigation scenarios. This means that, under the mitigation scenario, the values of emissions in 2025 will be by 13 % lower compared to their values in 2008 (Figure 4 and Figure 5, fifth group of columns), owing to the introduction of technology for landfill gas combustion at several landfills in the country. Other sectors note minor contribution to the reduction of overall emissions, considering the fact that the relative difference between baseline and mitigation scenarios ranges within 2 - 4%. (Figure 5).
Summary of the projections of total GHG emissions by years, in line with the adopted scenarios, is presented in Table 5 and on Figure 6.
According to its country specific emissions (kt CO2-eq/capita), Macedonia remains among countries with relatively high emissions per capita, owing mainly to the use of fossil fuels in electricity production. Compared to the baseline scenario, this parameter notes gradual decrease with the introduction of gas under mitigation scenarios. The calculated specific emissions for the three scenarios are presented in Table 6.
Table 1 Determining values for the three scenarios
Total GHG emissions in 2008 [кt CO2-eq] Total GHG emissions in 2025 [кt CO2-eq]
Baseline scenario 14.040 23.947
First miigation scenario 13.904 20.348
Second mitigation scenario 12.645 16.713

ENVIRONMENTAL INDICATORS OF THE REPUBLIC OF MACEDONIA 108
Table 2 Projections of total GHG emissions [кt CO2-eq]- Baseline scenario
Table 3 Projections of total GHG emissions [кt CO2-eq]- First mitigation scenario
Electricity Heating Industry. Transport Waste Agriculture Total
2008 8.196 1.328 906 1.390 844 1.376 14.040
2009 8.268 1.375 937 1.432 847 1.517 14.376
2010 9.584 1.423 970 1.475 850 1.553 15.855
2011 9.836 1.472 1.004 1.520 853 1.595 16.280
2012 10.025 1.524 1.039 1.566 856 1.637 16.647
2013 10.154 1.577 1.076 1.614 859 1.679 16.959
2014 10.246 1.632 1.113 1.664 862 1.722 17.239
2015 11.388 1.690 1.152 1.715 865 1.764 18.574
2016 11.719 1.740 1.187 1.775 868 1.807 19.096
2017 12.006 1.792 1.222 1.838 871 1.851 19.580
2018 12.261 1.846 1.259 1.902 875 1.894 20.037
2019 12.199 1.902 1.297 1.970 878 1.937 20.183
2020 13.260 1.959 1.336 2.039 881 1.981 21.456
2021 13.628 2.017 1.376 2.112 884 2.025 22.042
2022 13.954 2.078 1.417 2.186 887 2.070 22.592
2023 14.241 2.140 1.459 2.264 891 2.114 23.109
2024 14.463 2.205 1.503 2.344 894 2.159 23.568
2025 14.600 2.271 1.548 2.427 897 2.204 23.947
Electricity Heating Industry Transport Waste Agriculture Total
2008 8.196 1.328 902 1.258 844 1.376 13.904 2009 7.922 1.353 931 1.296 769 1.517 13.788 2010 8.093 1.401 961 1.335 757 1.512 14.059 2011 8.354 1.451 993 1.375 741 1.546 14.460 2012 8.575 1.502 1.025 1.416 729 1.588 14.835
2013 8.719 1.556 1.059 1.458 720 1.630 15.142 2014 8.831 1.611 1.094 1.502 700 1.673 15.411 2015 8.784 1.647 1.130 1.547 703 1.715 15.526 2016 8.827 1.697 1.163 1.601 706 1.757 15.751 2017 9.071 1.749 1.196 1.656 709 1.800 16.181 2018 9.055 1.803 1.231 1.714 712 1.844 16.359 2019 9.262 1.859 1.267 1.773 715 1.887 16.763 2020 9.428 1.916 1.304 1.834 718 1.930 17.130 2021 9.580 1.975 1.342 1.897 722 1.974 17.490 2022 9.700 2.035 1.381 1.963 725 2.018 17.822 2023 11.131 2.097 1.422 2.031 728 2.063 19.472 2024 11.367 2.162 1.463 2.101 731 2.107 19.931 2025 11.553 2.228 1.506 2.174 735 2.152 20.348

ENVIRONMENTAL INDICATORS OF THE REPUBLIC OF MACEDONIA 109
Table 4 Projections of total GHG emissions [кt CO2-eq]- Second mitigation scenario
Electricity Heating Industry Transport Waste Agriculture Total
2008 6.937 1.328 902 1.258 844 1.376 12.645
2009 7.082 1.353 931 1.296 769 1.517 12.948
2010 6.430 1.401 961 1.335 757 1.512 12.396
2011 6.613 1.451 993 1.375 741 1.546 12.719
2012 6.765 1.502 1.025 1.416 729 1.588 13.025
2013 6.881 1.556 1.059 1.458 720 1.630 13.304
2014 6.973 1.611 1.094 1.502 700 1.673 13.553
2015 6.990 1.647 1.130 1.547 703 1.715 13.732
2016 6.878 1.697 1.163 1.601 706 1.757 13.802
2017 7.042 1.749 1.196 1.656 709 1.800 14.152
2018 7.180 1.803 1.231 1.714 712 1.844 14.484
2019 7.143 1.859 1.267 1.773 715 1.887 14.644
2020 7.290 1.916 1.304 1.834 718 1.930 14.992
2021 7.415 1.975 1.342 1.897 722 1.974 15.325
2022 7.398 2.035 1.381 1.963 725 2.018 15.520
2023 7.586 2.097 1.422 2.031 728 2.063 15.927
2024 7.756 2.162 1.463 2.101 731 2.107 16.320
2025 7.918 2.228 1.506 2.174 735 2.152 16.713

ENVIRONMENTAL INDICATORS OF THE REPUBLIC OF MACEDONIA 110
Table 5 Projections of total GHG emissions for the three scenarios [кt CO2-eq]
Year Baseline scenario First mitigation scenario Second mitigation scenario
2008 14.040 13.904 12.645
2009 14.376 13.788 12.948
2010 15.855 14.059 12.396
2011 16.280 14.460 12.719
2012 16.647 14.835 13.025
2013 16.959 15.142 13.304
2014 17.239 15.411 13.553
2015 18.574 15.526 13.732
2016 19.096 15.751 13.802
2017 19.580 16.181 14.152
2018 20.037 16.359 14.484
2019 20.183 16.763 14.644
2020 21.456 17.130 14.992
2021 22.042 17.490 15.325
2022 22.592 17.822 15.520
2023 23.109 19.472 15.927
2024 23.568 19.931 16.320
2025 23.947 20.348 16.713
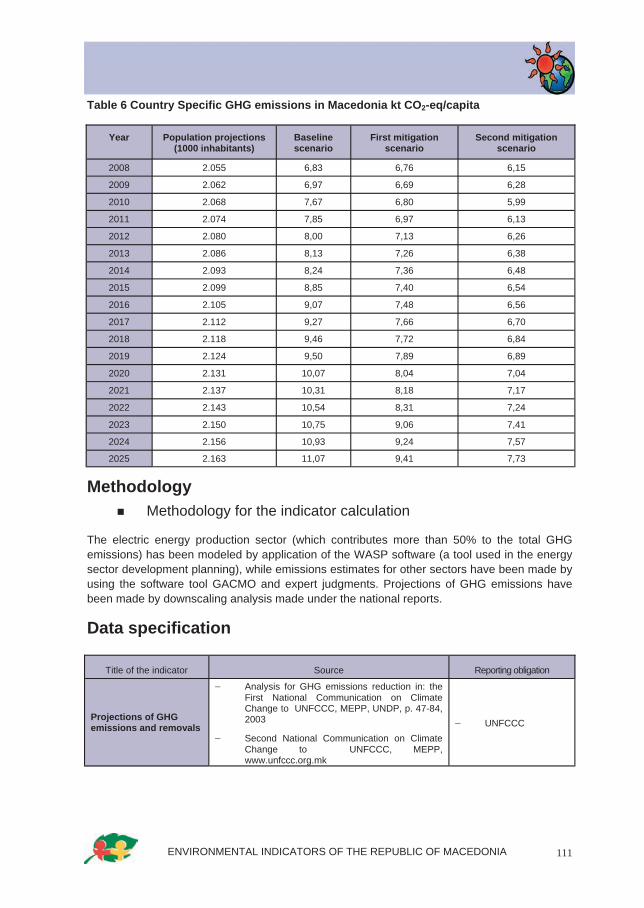
ENVIRONMENTAL INDICATORS OF THE REPUBLIC OF MACEDONIA 111
Table 6 Country Specific GHG emissions in Macedonia kt CO2-eq/capita
Methodology Methodology for the indicator calculation
The electric energy production sector (which contributes more than 50% to the total GHG emissions) has been modeled by application of the WASP software (a tool used in the energy sector development planning), while emissions estimates for other sectors have been made by using the software tool GACMO and expert judgments. Projections of GHG emissions have been made by downscaling analysis made under the national reports.
Data specification
Year Population projections (1000 inhabitants)
Baseline scenario
First mitigation scenario
Second mitigation scenario
2008 2.055 6,83 6,76 6,15
2009 2.062 6,97 6,69 6,28
2010 2.068 7,67 6,80 5,99
2011 2.074 7,85 6,97 6,13
2012 2.080 8,00 7,13 6,26
2013 2.086 8,13 7,26 6,38
2014 2.093 8,24 7,36 6,48
2015 2.099 8,85 7,40 6,54
2016 2.105 9,07 7,48 6,56
2017 2.112 9,27 7,66 6,70
2018 2.118 9,46 7,72 6,84
2019 2.124 9,50 7,89 6,89
2020 2.131 10,07 8,04 7,04
2021 2.137 10,31 8,18 7,17
2022 2.143 10,54 8,31 7,24
2023 2.150 10,75 9,06 7,41
2024 2.156 10,93 9,24 7,57
2025 2.163 11,07 9,41 7,73
Title of the indicator Source Reporting obligation
Projections of GHG emissions and removals
− Analysis for GHG emissions reduction in: the First National Communication on Climate Change to UNFCCC, MEPP, UNDP, p. 47-84, 2003
− Second National Communication on Climate Change to UNFCCC, MEPP, www.unfccc.org.mk
− UNFCCC

ENVIRONMENTAL INDICATORS OF THE REPUBLIC OF MACEDONIA 112
General metadata
Data source(s): Yearbooks and other publications of the State Statistical Office, relevant national strategies/programmes/plans
Geographical coverage: Republic of Macedonia
Temporal coverage: 2000 - 2025
Uncertainty Uncertainty of data
Lack of national sectoral strategies (especially in energy sector).
Activities Short-term activities
− Adoption of the Second National Communication on Climate Change, with incorporated Report on Climate Change Mitigation. .
a. Description of the activity − Based on the data available on the development of energy, industrial and agricultural
sectors, the baseline scenario and additional mitigation scenarios including measures for GHG emissions reduction in the relevant sectors, have been developed.
Deadline: mid of 2008
Long-term activities − Based on adopted national strategies in individual sectors, to create climate change
mitigation scenarios with lower uncertainty.
Code Title of the indicator
Compliance with CSI/ЕЕА or other indicators
Classification by DPSIR Type Linkage
with area Frequency of publication
МК NI 011
Projections of GHG emissions and removals
CSI 011
Projections of greenhouse gas emissions and removals
P А
air air quality Climate change
Annually


ENVIRONMENTAL INDICATORS OF THE REPUBLIC OF MACEDONIA 114
MK – NI 014
LAND TAKE
Period of indicator assessment September 2007 – April 2008
Explanation Justification for indicator selection
Land take by urban and related infrastructure results in major environmental impacts due to the soil take, as well as disruptions caused by transport, noise, resource exploitation, waste disposal and fragmentation and degradation of natural landscapes. Intensity and models of urbanization derive from three main factors: economic development, demand for housing and expansion of transport networks. Despite the fact that, under the legislation, most of the land and urban planning responsibilities have been delegated to local level (Municipalities), national policies have direct or indirect effects on urban development.
Definition Changes in and current status of agriculture, forest and other semi-natural land taken by urban and other artificial land development. It includes areas sealed by construction and urban infrastructure as well as urban green areas and sport and leisure facilities. The main drivers of land take are grouped in processes resulting in the extension of:
− housing, services and recreation,,
− industrial and commercial sites,
− transport networks & infrastructures,
− mines, quarries and waste dumpsites.
Units Units of measurement for changes and current status recording and mapping are hectares. For data presentation, the unit in km2 can be used as well.
Results are presented as:
− current status of land cover based on the nomenclature adopted at European level, at five-year intervals;
− changes in land cover, at five-year intervals, presented in % of the total area of the country and % of the various land cover types.
Note: Particular attention is payed to areas changing as a result of urban systems extension leading to negative impact on the environment.
P
R
D
S
I

ENVIRONMENTAL INDICATORS OF THE REPUBLIC OF MACEDONIA 115
Policy relevance of the indicator Legal grounds
Under the Law on Environment, every citizen is entitled to have an access to environmental state information. This indicator provides not only data on the state of the environment (land cover), but it also facilitates uniform access thereto, both at national and European levels.
Based on the Law on Land Survey and Registration, by means of regular land survey information is provided on the types of land cover. Although these parameters do not correspond with the CORINE land cover nomenclature, there is a possibility for unique integration of land cover elements.
Law on Urban and Spatial Planning.
Targets Tracking the changes in land cover and mapping of current status. Changes are monitored over five-year intervals. Methodology and nomenclature have been additionally harmonized at European level, thus enabling integrated monitoring of changes at regional and European levels.
Key message Based on the CORINE Land COVER methodology applied in the first phase of the project, it has been established that the surface area belonging to the category of forest and semi-natural areas is the largest one in the Republic of Macedonia, covering 15 879 km2 or 61.8 % of the total area. Agricultural area is still significant by size (around 38 % of the total area).

ENVIRONMENTAL INDICATORS OF THE REPUBLIC OF MACEDONIA 116
CORINE Land COVER 2000 (data of 1996)
Artificial areas1,5%
Agricultural areas36,6%
Forests and seminatural areas59,7%
Wetlands0,1%
Water bodies2,2%
Share of individual areas by CORINE nomenclature
Artificial areas Agricultural areas Forests and seminatural areas Wetlands Water bodies

ENVIRONMENTAL INDICATORS OF THE REPUBLIC OF MACEDONIA 117
1
303
311 4
25 16 3 30
50
100
150
200
250
300
350
Continuous urban fabric
Discontinuous urban fabric
Industrial or commercial
units
Road and rail networks and associated land
Airports Mineral extraction sites
Dump sites Green urban areas
Sport and leisure facilities
sq km
Artificial areas
2.547
26260
25833
2.208
2
2.418
1.952
0
500
1.000
1.500
2.000
2.500
3.000
Non
-irrig
ated
ar
able
land
Perm
anen
tly
irrig
ated
land
Ric
e fie
lds
Vine
yard
s
Frui
t tre
es a
nd
berr
y pl
anta
tions
Past
ures
Annu
al c
rops
as
soci
ated
with
pe
rman
ent c
rops
Com
plex
cul
tivat
ion
patte
rns
Land
prin
cipa
lly
occu
pied
by
agric
ultu
re, w
ith
sign
ifican
t are
as o
f na
tura
l veg
etat
ion
sq k
m
Agricultural areas
7.939
495 581
1.965
255 276
4.274
5 2 880
1.000
2.000
3.000
4.000
5.000
6.000
7.000
8.000
9.000
Broa
d-le
aved
fo
rest
Con
ifero
us fo
rest
Mix
ed fo
rest
Nat
ural
gra
ssla
nd
Moo
rs a
nd
heat
hlan
d
Scle
roph
yllo
us
vege
tatio
n
Tran
sitio
nal
woo
dlan
d/sh
rub
Beac
hes,
dun
es,
sand
s
Bare
rock
Spar
sely
ve
geta
ted
area
s
sq k
m
Forests and seminatural areas
20 8
584
0
100
200
300
400
500
600
700
Inland marshes Water courses Water bodies
sq k
m
Wetlands and water bodies

ENVIRONMENTAL INDICATORS OF THE REPUBLIC OF MACEDONIA 118
Assessment Data under CORINE Land Cover was published in 2000 година, and the source of information (satellite Landsat images) was from 1996.
Republic of Macedonia was not actively involved in the Project "Image2000 and CLC2000“ as a joint project of the European Environmental Agency (EEA) and Joint Research Centre (JRC) for the purposes of updating the CORINE Land COVER database.
Preparatory activities for implementation of the Project CORINE Land COVER 2006 (satellite images from 2006) are underway, while mapping of changes and current state is expected by the end of 2008.
In order to enable efficient use of this database at national level, i.e. within the Republic of Macedonia, additional data on Land COVER is needed, concerning area units and additional elements of the basic nomenclature, i.e. addition of the 4th level in the nomenclature.
According to CORINE Land COVER, the highest proportion of the land is covered by forests and semi-natural areas covering 15 879 km2 which corresponds to 61.8 % of the total area. The category of agricultural land takes 9 739 km2 or 37,9 % of the total area, the category of artificial areas covers 389 km2 or 1.5 % of the total area, etc.
Methodology Methodology for the indicator calculation
The assessment of CORINE Land Cover in 2000 was based on data from satellite images.
Owing to characteristics of the land cover of the Republic of Macedonia, out of the possible 44 classifications, 31 were identified. In addition to this and for the same reason, the minimum spatial unit treated within the project was reduced at 20 hectares instead of 25 hectares.
The substance of the process is photo-interpretation of satellite images consisting of:
− Delineation of boundaries of areas representing unique land area units at images with "false" colours;
− Application of interpretation keys, supporting documentation and satellite/aeroplane images for marking with identification number - class in nomenclature;
− Extrapolation of this marking and identification of all segments of the image exhibiting similar characteristics: colour, structure and composition.
Technical Guideline for CORINE Land Cover development was prepared by the European Environmental Agency.
Data specification
Title of the indicator Source Reporting obligation
Land take CORINE Land Cover
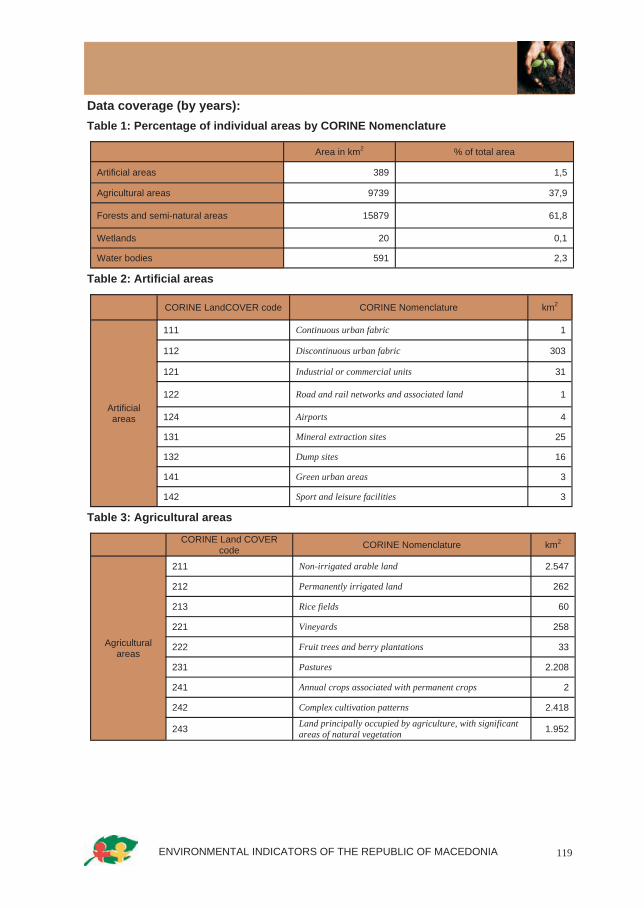
ENVIRONMENTAL INDICATORS OF THE REPUBLIC OF MACEDONIA 119
Data coverage (by years): Table 1: Percentage of individual areas by CORINE Nomenclature
Table 2: Artificial areas
Table 3: Agricultural areas
Area in km2 % of total area
Artificial areas 389 1,5
Agricultural areas 9739 37,9
Forests and semi-natural areas 15879 61,8
Wetlands 20 0,1
Water bodies 591 2,3
CORINE LandCOVER code CORINE Nomenclature km2
Artificial areas
111 Continuous urban fabric 1
112 Discontinuous urban fabric 303
121 Industrial or commercial units 31
122 Road and rail networks and associated land 1
124 Airports 4
131 Mineral extraction sites 25
132 Dump sites 16
141 Green urban areas 3
142 Sport and leisure facilities 3
CORINE Land COVER code CORINE Nomenclature km2
Agricultural areas
211 Non-irrigated arable land 2.547
212 Permanently irrigated land 262
213 Rice fields 60
221 Vineyards 258
222 Fruit trees and berry plantations 33
231 Pastures 2.208
241 Annual crops associated with permanent crops 2
242 Complex cultivation patterns 2.418
243 Land principally occupied by agriculture, with significant areas of natural vegetation 1.952

ENVIRONMENTAL INDICATORS OF THE REPUBLIC OF MACEDONIA 120
Table 4: Forests and seminatural areas
Table 5: Wetlands and water bodies
General metadata
Geographical coverage: Republic of Macedonia
Temporal coverage: Data set on land cover was finalized in 2000, based on satellite images taken in 1996.
Uncertainty Methodological uncertainty
No systematic methodological uncertainty or data uncertainty have been found. Certain digression in the identification of changes and actual state can occur for small size spatial elements that can not be identified uniformly, but have no significant impact on the quality of the indicator.
CORINE LandCOVER code CORINE Nomenclature km2
Forests and seminatural areas
311 Broad-leaved forest 7.939
312 Coniferous forest 495
313 Mixed forest 581
321 Natural grassland 1.965
322 Moors and heathland 255
323 Sclerophyllous vegetation 276
324 Transitional woodland/shrub 4.274
331 Beaches, dunes, sands 5
332 Bare rock 2
333 Sparsely vegetated areas 88
CORINE LandCOVER code CORINE Nomenclature km2
Wetlands 411 Inland marshes 20
Water bodies 511 Water courses 8
512 Water bodies 584
Code Title of the indicator
Compliance with CSI/ЕЕА or other
indicators
Classification by DPSIR Тype Linkage with area Frequency of
publication
MK NI 014 Land take CSI 014 Land take P A
− management − nature − other − population − soil − tourism − transport − urbanization
10 - annually

ENVIRONMENTAL INDICATORS OF THE REPUBLIC OF MACEDONIA 121
Future activities Short-term activities
Active participation of the Republic of Macedonia in CORINE Land Cover 2006. Preparatory activities towards implementation of the Project CORINE Land COVER 2006 (satellite images from 2006) are underway, while mapping of changes and actual state is expected by the end of 2008.
a. Description of the activity − All activities are in accordance with the technical specification of the European
Environmental Agency, ETC "Land Use and Spatial Information” and under their direct supervision.
b. Required resources − In accordance with the recommendations of the European Environmental Agency,
the implementation of the Project will rely on the persons that have worked in the previous phase of the Project who will make the core team, and new persons will be included to establish the basis for the next phases.
c. Status − Commencement of the activities for project implementation.
Deadline: End of 2008.
Long-term activities − Participation in all follow-up phases of the Project, as well as data processing to
generate the fourth level of the nomenclature.

ENVIRONMENTAL INDICATORS OF THE REPUBLIC OF MACEDONIA 122
МК - NI 015 PROGRESS IN MANAGEMENT OF CONTAMINATED SITES
Period of indicator assessment September 2007 – April 2008
Explanation Justification for indicator selection
Emission of hazardous substances from industry, as well as from municipal and industrial waste, may have impacts on the quality of soil and water, and especially groundwater. Management of contaminated sites assumes assessment of harmful effects that cause contamination and undertaking measures to comply with environmental standards required by the relevant legislation. Unfortunately, no standards for the soil quality or defined targets for remediation of the sites with exceeded standards have been put in place in our country. On the other side, numerous activities causing soil contamination have been identified. This concerns especially industrial activities and waste disposal by municipalities and industrial facilities.
The implementation of the existing legislation, especially the Law on Environment which incorporates the Integrated Pollution Prevention and Control Directive, the Law on Nature Protection, the Law on Agricultural Land, the Law on Waste Management with transposed Landfill Directive, as well as legislation pending adoption, such as Law on Waters with transposed Water Framework Directive would result in specific activities that shall be undertaken to reduce soil contamination. However, major efforts are needed to settle the issue of historical contaminations.
This indicator tracks the progress in the management of contaminated sites, as well as the level of financial resources (public and private) that should be allocated for remediation.
Definition The term 'contaminated site' refers to a well-delimited area where the presence of soil contamination has been confirmed and the severity of possible impacts to ecosystems and human health are such that remediation is needed, specifically in relation to the current or planned use of the site. The remediation or clean-up of contaminated sites can result in a full elimination or in a reduction of these impacts.
The term 'potentially contaminated site' includes any site where soil contamination is suspected but not verified and investigations need to be carried out to verify whether relevant impacts exist.
The progress in the management of contaminated sites has been designed to mitigate possible negative effects in case of suspected or confirmed environment degradation and there is a need to reduce potential threats to human health, biological diversity, water bodies, soil, habitats, foodstuffs, etc.
The management of contaminated sites starts with investigation that can further lead to
P
R
D
S
I

ENVIRONMENTAL INDICATORS OF THE REPUBLIC OF MACEDONIA 123
rehabilitation or treatment of contaminated site, measures for its conservation and maintenance and revitalization of contaminated sites.
1. The indicator shows progress in five main steps:
2. site identification/ preliminary study;
3. preliminary investigation;
4. main site investigation;
5. implementation of remediation measures;
6. measure completed.
In future, this indicator would also show the costs to the society for contaminated sites remediation, the main activities contributing to soil contamination and achievements in the management of contaminated sites.
Units − Share of economic activities in soil contamination as percentage of sites where the
activity is present compared to the total number of processed sites.
− Number of sites managed to a certain step out of the five main steps of the indicator.
− Number of sites for which each of the five steps within contaminated sites management has been completed as a percentage of the total number of sites to be processed.
− Expenditures for remediation expressed in EUR per capita per year.
Policy relevance of the indicator Our country lacks legally prescribed standards on soil. Generally, the existing legislation is intended to prevent new contaminations. Implementation of the actual legislation and the adoption of the Law on Waters would result in reduced soil contamination and improved control of contamination caused by natural and other developments.
Legal grounds
Soil protection is regulated by several laws, including the Law on Environment, the Law on Nature Protection, the Law on Agricultural Land, etc., but there is no soil specific law, with clearly defined institutional responsibilities.
According to Article 2 of the Law on Environment, improvement of the state and quality of the environment includes the protection of soil. The same Law, in its Article 9, prescribes the polluter pays principle, while Article 13 introduces the principle of precaution which should assist in avoiding the local soil contamination in future. Article 36 envisages internal monitoring for legal and natural persons possessing emissions and making impacts by their activities on one or more environmental media.
The Law on Nature Protection, in its Article 11 concerning restriction in land use change and in correlation with Article 12 prohibition of nature use in a manner causing degradation of soil and its fertility loss.
The Law on agricultural land, Article 31, prescribes protection of agricultural land against

ENVIRONMENTAL INDICATORS OF THE REPUBLIC OF MACEDONIA 124
pollution and contamination for the purpose of production of health safe food, protection of human health, flora and fauna and uninterrupted use and protection of the environment.
The same Article specifies that the Ministry of Agriculture, Forestry and Water Economy determines the matters which are harmful for agricultural land, their maximum permissible concentrations in soils and measures that have to be undertaken with regard to agricultural land with concentrations of harmful matters above permissible ones.
Targets Implementation of the Operational Programme for pre-accession assistance of the European Union. Implementation of infrastructure projects (wastewater treatment, waste management and industrial hot-spots). Implementation of the National Waste Management Plan, development of local programmes and plans for solid municipal and other waste types management, closure and revitalization of illegal landfills.
Remediation of tailings, stabilization and recultivation of industrial landfills.
Key policy issue What is the share of economic activities contributing to soil contamination in the Republic of Macedonia?
The main contaminants contributing to soil and groundwater contamination should be identified. In order to answer the above question, it is necessary to carry out additional investigations of contaminated sites, as well as inspection of the activities of industrial companies producing contaminants as by-products.
Key message In the Republic of Macedonia, 16 sites have been identified as areas of potential soil contamination, characterized as hot-spots. Preliminary investigations have been carried out with 16 sites, while with two sites main investigations have been carried out and certain remediation measures implemented. Completion of measures has not been recorded with none of the identified hot-spots. With regard to economic activities contributing to soil contamination expressed in percentage, the highest share belongs to mining with 43.75%, followed by metallurgy with 31.25%, organic chemical industry with 12.5% and refinery and leather manufacturing industry with 6.25%.
43,8%
6,3%31,3%
12,5%6,3%
Share of economic activities in soil contamination
mining operation oil extraction and storage
disposal of industrial waste‐metal working industry disposal of industrial waste‐chemical industry
disposal of industrial waste‐leather industry

ENVIRONMENTAL INDICATORS OF THE REPUBLIC OF MACEDONIA 125
Specific policy issue What progress has been made in local soil contamination management and control?
What are the costs for soil contamination remediation and what is the contribution from the public budget and contribution from private budget?
According to the National Waste Management Plan of the Republic of Macedonia, calculations have led to the conclusion that around 77 million EUR or 38 EUR per capita will be needed.
Methodology Methodology for the indicator calculation
Data for the indicator calculation was taken from the National Waste Management Plan of the Republic of Macedonia or Special Study Е.
The shares of economic activities contributing to soil contamination are calculated e.g. [number of mines contributing to soil contamination]/[total number of sites or sites where soil contamination has been confirmed] х 100.
Source of applied methodology
According to European Environmental Agency, European Topic Centre for soils
Data specification
General metadata
Five main steps in the progress in contaminated sites management Identified sites Site identification/preliminary study 16
Preliminary investigation 16
Main site investigation 2
Implementation of remediation measures 1
Measure completed 0
Title of the indicator Source Reporting obligation
Progress in the management of contaminated sites
− Ministry of Environment and Physical Planning − Soil contamination (ТЕ-2)
Code Title of the indicator
Compliance with CSI/ЕЕА or other
indicators
Classification by DPSIR Тype Linkage with
area Frequency of publication
МK NI 015
Progress in the management of contaminated sites
CSI 015
Progress in management of contaminated sites
Р A
chemicals industry management nature soil transport urbanization waste water
annually

ENVIRONMENTAL INDICATORS OF THE REPUBLIC OF MACEDONIA 126
Geographical coverage: Republic of Macedonia
Temporal coverage: 2005
Frequency of data collection: at annual basis
Uncertainty Methodological uncertainty
Although there is a definition of contaminated site, because of the lack of limit values for the concentration of certain toxic chemicals in the soil, it is difficult to determine the exact number of sites where soil contamination has been confirmed.
The assessment of contaminated site depends to a great extent on the individual expert assessment.
Uncertainty of data set
All sites where certain industrial/economic activity is performed have not been accounted as sites with determined contamination, although such activities generate chemical substances. Lack of data on chemical substances from various industrial facilities causing soil contamination. Estimates of the costs related to remediation processes are approximative and based on expert judgments.
Future activities Short-term activities
Establishment of work groups for the purpose of elaboration, final definition and full development of the indicator.
a. Description of the activity
Elaboration, final definition and full development of the indicator.
b. Required resources
Experts in the area of environment, economy, organic and chemical industry, metallurgy, etc.
c. Status
In progress.
Deadline: June 2008
Long-term activities
Long-term activities will be defined by the Work Group.
ENVIRONMENTAL INDICATORS OF THE REPUBLIC OF MACEDONIA 127
МК - NI 038 FOREST FIRES
Period of indicator assessment September 2007 – April 2008
Explanation Justification for indicator selection
Forests are valuable resource and play significant role in the process of air, water, land and biodiversity protection. Forests are global store of carbon and biodiversity. Forests in the Republic of Macedonia cover 950.594 ha representing 37% of the national territory. High trunk forests constitute 30% of the overall forest cover, while low trunk forests makes up the remained 70%. Around 89% of the forests in the Republic of Macedonia are state owned and only around 11% are privately owned. Macedonian dendroflora consists of 319 tree species and shrubs are represented by more than 80 subspecies and varieties. They assemble 81 forest associations. There are 49 endemic and subendemic species. Deciduous trees take 56.10%, conifers 8.46%, mixed deciduous forests 28.70%, mixed conifers 0.79% and mixed deciduous and coniferous trees take 5.95%. Major causes of unfavorable conditions in forestry are forest fires, plant pests and diseases, inadequate individual wood felling, specific natural conditions and insufficient public awareness on the importance of forests. All mentioned pressures result in degradation of forests and land erosion. The statement can be illustrated by the fact that there is a semi-desert area in the central part of the Republic of Macedonia, on the eastern side of Vardar River, as a consequence of wood fellings around Vardar and Crna rivers in the period between 16 and 19 century. In addition to this, in the course of the last 10 years, around 100.000 ha have suffered forest fires, while annual amount of fuel wood acquired by illegal wood cutting has been estimated at 30% of the amount of fuel wood cut in a legal manner. Reduction of the rate of forests degradation and destruction is one of the greatest challenges in forestry.
Definition The indicator provides information on the number of forest fires on the territory of the Republic of Macedonia. It also provides information on the magnitude of forest fires presenting the area subjected to fire and the type of wood mass seized by fire, as well as the total damage caused by fire.
Units The area seized by fire is expressed in ha (hectares), while wood mass seized by fire is expressed in m3. The total damage from forest fires is expressed in denars, as well as number of forest fires.
P
R
D
S
I

ENVIRONMENTAL INDICATORS OF THE REPUBLIC OF MACEDONIA 128
Policy relevance of the indicator List of relevant policy documents:
The Second National Environmental Action Plan (NEAP 2) defines measures for improved protection against forest fires through establishment of indicators as:
− Number of forest fires per year, and
− Area destructed by forest fires each year.
Under the NEAP 2 measures and activities, the following is specified:
− Development of National Strategy for Sustainable Development of Forests,
− Strengthening of capacity for sustainable forests management, and
− Development of Strategy for Forest Fire Prevention.
Legal grounds − Law on Forests (Official Gazette of the Republic of Macedonia No. 47/97 and
amendments no. 7/00) which regulates forests and forest resources management and protection. Protection of forests is integrated and indivisible part of the overall forest management. In the context of forests protection against fires and regulation of measures in this area, we should also mention the 2001 Rulebook on specific measures for forest protection against fires.
− Law on Natural Rarities Protection (Official Gazette of the Republic of Macedonia No. 41/73 and amendments no. 42/76, 10/90, 62/93)
− Around 7.34% of the territory of the Republic of Macedonia is under protection. Protection regimes cover national parks, strict natural reserves, three areas with specific natural characteristics, 14 special plant and animal reserves and 50 monuments of nature.
− Law on national parks Protection (Official Gazette of the Republic of Macedonia No. 33/80 and amendments no. 10/90 and 62/93)
− Law on Designation of Forest Area of Pelister Mountain as National Park (Official Gazette of the Republic of Macedonia No. 38/48 and 16/65)
− Law on Designation of Forest Area around Mavrovo lakes National Park (Official Gazette of the Republic of Macedonia No. 10/49, 23/52 and 16/65)
− Law on Designation of Forest Area of Galicica Mountain as National Park (Official Gazette of the Republic of Macedonia No. 31/58 and 16/65)
− Law on Fire Prevention (Official Gazette of the Republic of Macedonia No. 43/86 and amendments in no. 37/87, 51/88, 36/90, 12/93)
Targets Compliance with the legislation concerning forests and forest resources protection. Reduction of forest fires number, reduction of wood mass and forest area affected by forest fires. Reduction of costs and damages resulting from forest fires. Increase of the public awareness in relation to fire prevention and undertaking all possible measures to reduce human factor as forest fires cause.

ENVIRONMENTAL INDICATORS OF THE REPUBLIC OF MACEDONIA 129
Key policy issue What is the number of forest fires, what is the area and wood mass affected by fire? Diagram 1: Number of forest fires in the Republic of Macedonia
Diagram 2: Area affected by forest fires in the Republic of Macedonia
0
100
200
300
400
500
600
700
1999 2000 2001 2002 2003 2004 2005 2006 2007
numbe
r
year
Number of forest fires
05.00010.00015.00020.00025.00030.00035.00040.00045.00050.000
1999 2000 2001 2002 2003 2004 2005 2006 2007
ha
year
Area affected by forest fires

ENVIRONMENTAL INDICATORS OF THE REPUBLIC OF MACEDONIA 130
Diagram 3: Wood mass affected by forest fires in the Republic of Macedonia
Key message In the period between 1999 and 2007, rapid increase in the number of fires, area and mass affected by fire in the Republic of Macedonia was tracked in 2000. Then, there was fall in 2001 and 2002, retaining relatively stable level up to 2006.
In 2007, there was rapid rise in the above mentioned measured parameters, where the number of fires reached the maximum, while area and wood mass affected by fire is slightly lower compared to the peak reached in 2000.
Specific policy issue What is the status of forest fires in the Republic of Macedonia?
Forest fires constitute one of the biggest problems in forestry, as well as in the environment of the Republic of Macedonia as a whole. Huge amounts of wood mass are destroyed by forest fires and this is thus an economic problem. Forest fires cause air, soil and water pollution. Burn trunks are source of pathogens and pests. There is also an increase in erosion processes in burnt areas, water regime disbalancing, loss of vegetation and desertification. Almost 95% of forest fires is caused by man. Forest fires destroy as much as 2 200 ha forest each year. The mean number of fires is 120 per year. In 2000, due to extreme draughts and human factor, there were 476 fires and around 46 000 ha affected, while in 2007, an area of around 35 000 ha was affected by 652 fires.
0
100.000
200.000
300.000
400.000
500.000
600.000
700.000
800.000
1999 2000 2001 2002 2003 2004 2005 2006 2007
м3
year
Wood mass affected by forest fires

ENVIRONMENTAL INDICATORS OF THE REPUBLIC OF MACEDONIA 131
Table 1: Number of fires, area affected by fires in ha, wood mass affected by fires in m3 in the Republic of Macedonia
What is the total damage resulting from forest fires in the Republic of Macedonia? Table 2: Total damage resulting from forest fires in 2007 presented in denars in the Republic of Macedonia
Methodology Methodology for the indicator calculation
Data and the indicator calculation was processed by the Public Enterprise for Forests Management of the Republic of Macedonia - "Macedonian Forests".
Year Number of fires Area affected by fire in ha Wood mass affected by fire in m3
1999 69 2.414,80 1.905,00
2000 476 46.235,73 711.782,00
2001 161 6.263,30 88.260,00
2002 65 1.186,30 24.661,28
2003 144 1.068,88 10.987,00
2004 94 892.05 4.322,30
2005 182 2.084,10 1.063,00
2006 138 2.085,95 12.978,00
2007 652 35.248,06 617.678,67
Year Total damage from fires in denars
1999 105.837.151,00
2000 969.852.057,00
2001 610.814.677,00
2002 18.531.939,00
2003 15.594.691,00
2004 91.083.591,00
2005 25.287.638,00
2006 148.712.782,00
2007 1.311.167.721,95
ENVIRONMENTAL INDICATORS OF THE REPUBLIC OF MACEDONIA 132
Data specification
General metadata
Geographical coverage: Republic of Macedonia
Temporal coverage: 1999 to 2007
Frequency of data collection: At annual basis
Uncertainty Methodological uncertainty and data uncertainty
There is certain extent of uncertainty in determining the amount of wood mass in m3, as well as in the determining of area affected by fires in ha, deriving from some methodological uncertainty in parameters calculation.
Future activities Short-term activities
− Establishment of work groups to elaborate, finalize definition and develop the indicator.
a. Description of the activity − Elaboration, finalization of definition and development of the indicator.
b. Required resources − Experts in the area of forestry, environment, agriculture, economy, etc.
c. Status − In progress
Deadline: June 2008
Long-term activities − Long-term activities will be defined by the Work Group.
Title of the indicator Source Reporting obligation
Forest fires − Public Enterprise for Forests Management - "Macedonian Forests"
Code Title of the indicator
Compliance with CSI/ЕЕА or other indicators
Classification by DPSIR Тype Linkage with
area Frequency of publication
MK NI 038 Forest fires TE065 Forest fires P
Soil Forestry Agriculture Nature Urbanization
annually


ENVIRONMENTAL INDICATORS OF THE REPUBLIC OF MACEDONIA 134
MK - NI 016 MUNICIPAL WASTE GENERATION Period of indicator assessment
September 2007 – April 2008
Explanation Justification for indicator selection
Waste represents an enormous loss of resources in the form of both materials and energy. The amount of waste produced can be seen as an indicator of how efficient we are as a society, particularly in relation to our use of natural resources and waste treatment operations.
Municipal waste is currently the best indicator available for describing the general development of waste generation and treatment in European countries. This is because all countries collect data on municipal waste; data coverage for other wastes, for example total waste or household waste, is more limited.
Municipal waste constitutes only around 15 % of total waste generated, but because of its complex character and its distribution among many waste generators, environmentally sound management of this waste is complicated. Municipal waste contains many materials for which recycling is environmentally beneficial.
Despite its limited share of total waste generation, the political focus on municipal waste is very high.
Definition The indicator presents municipal waste generation, expressed in kg per person, and the method of treatment (recycling, composting, landfill and incineration), expressed as a percentage of total municipal waste treatment. Municipal waste refers to waste collected by or on behalf of municipalities; the main part originates from households, but waste from commerce and trade, office buildings, institutions and small businesses is also included.
Units − kilogramme per person per year, percentage.
Policy relevance of the indicator List of relevant policy documents:
The Second National Environmental Action Plan (NEAP 2) defines the approach to waste management through incorporation of the basic objectives into the legislation harmonized with the relevant EU law. It establishes monitoring mechanisms, as well as economic instruments
P
R
D
S
I

ENVIRONMENTAL INDICATORS OF THE REPUBLIC OF MACEDONIA 135
for the waste management implementation. In addition, it identifies the relevant stakeholders in the area of waste management (especially in the context of overlapping competences among sectors). The process of decentralization and the need to build institutional capacity have been taken into account, as well as establishment of conditions for adequate financing of waste management in the Republic of Macedonia.
The National Waste Management Plan includes the following activities:
− Analysis of waste at national level: municipal waste, hazardous waste, medical waste and agricultural waste;
− Construction of pilot waste composting plant: analysis of alternatives for composting, designing and implementation of alternatives and recommendations for waste composting;
− Analysis of the market with regard to most demanded recyclable materials: current status, potential opportunities for recovery and recycling, extension of the recycling system coverage and waste treatment system coverage; proposals of legal, economic and financial instruments coordinated by the project NEAP 2; analysis of EU Directives of relevance for waste recovery and recycling;
− Assessment of alternative economic and financial instruments through financial support from municipalities or from other financing sources.
Legal grounds
The basic legal framework for the waste management has been established by the Law on Waste Management. The main characteristics of the waste related legislation include:
− Full approximation with the relevant EU Directives transposed in the Law on Waste Management, taking into account the local conditions;
− The Law on Waste Management incorporates the main principles in waste management (principle of environmental protection in waste management, principle of waste minimization, precaution principle, proximity, universality of service, polluter pays principle, deposit system, etc.),
− The waste management, as public service, is based on the principle of universality of service (non-discrimination, sustainability, quality and efficiency, transparency, affordability and full coverage of the territory).
Key message Data resulting from the Project on waste management show that 73% of collected waste is households waste. Taking into account that 73% of the waste originates from households, the total amount of waste generated has been estimated at 0.86 kg/capita/day or 313 kg/ capita/year. The analysis of waste composition reflects that dominant fractions in the waste are organic matters with 26.2% and small size wastes with 30.9% or more than 50% of the generated waste in total. Paper and cupboard contribute 11.6%, followed by plastics with 9.6%. All other waste fractions, i.e. wood, glass, textile, metals, hazardous wastes from households and other categories contribute all together less than 25% to the waste generated.

ENVIRONMENTAL INDICATORS OF THE REPUBLIC OF MACEDONIA 136
Primary market investigation has shown that there is certain recycling chain established on the Macedonian market.
There is a need to improve regular reporting and statistics of waste generation, disposal and treatment.
Assessment The amounts of generated waste are assessed on the basis of data provided by the State Statistical Office and on the basis of the analysis performed in the frameworks of the Study on Waste Management in Southeastern Part of Macedonia, prepared by ERM Lahmaeyer International GmbH (2002-2004).
The Study on Waste Management in Southeastern Part of Macedonia presents indicators of municipal waste generation in the subject region. According to the analysis made by the Ministry of Environment and Physical Planning (MEPP) on the amounts of generated municipal waste in other parts of the country, it may be concluded that such amounts are comparable to the results contained in the said Study and are thus fully applicable for the whole national territory.
Data from the survey carried out in the framework of the mentioned Study show that 73% of the collected waste is household waste. Taking this into account, it has been estimated that the total amount of generated waste is 0.86 kg/capita/day or 313 kg/capita/year.
The analysis of waste composition shows that the main fractions in the waste are organic matters with 26.2%, packaging waste with 17 %, bulky waste with 5% and other waste types with 52%.
Disposal
There is only one legal landfill in the Republic of Macedonia – “Drisla” in the vicinity of Skopje,
Biodegradable waste26,0%
Packaging waste17,0%
Bulky waste5,0%
Other wastes52,0%
Percentage of generated municipal solid waste by waste types
ENVIRONMENTAL INDICATORS OF THE REPUBLIC OF MACEDONIA 137
where no ground protection has been provided. This landfill is not fully compliant with modern technical standards. The capacity of the landfill is 16.000.000 tonnes, and by 2002, only 4 % of the designed capacity was utilized.
There are 32 municipal landfills, most of which are not fenced and secured, and their construction and operational performance is inadequate. There are also around 1.000 small illegal waste dumping sites in rural municipalities and settlements.
Methodology Methodology for the indicator calculation
Estimates and annual reports by municipalities.
Data specification
Data coverage: Table 1: Generated municipal solid waste by types
General metadata
Geographical coverage: Republic of Macedonia
Temporal coverage: 2004 – 2005
Frequency of data collection: annually
Title of the indicator Source Reporting obligation
Municipal waste generation
− National Waste Management Plan, MEPP − EUROSTAT
Waste stream Amounts (ton/year) (%)
Household waste 417,838 73
Commercial waste 154,543 27
Type of wastes
Biodegradable waste 148,819 26
Packaging waste 97,305 17
Bulky waste 28,619 5
Other wastes 297,638 52
Total MSW 572,381 100
Code Title of the indicator
Compliance with CSI/ЕЕА or other indicators
Classification by DPSIR Тype Linkage with
area Frequency of publication
MK NI 016 Municipal waste generation
CSI 016 WMF8
Municipal waste generation
P А
households population urbanization waste
2 - annually

ENVIRONMENTAL INDICATORS OF THE REPUBLIC OF MACEDONIA 138
Future activities Short-term activities
− Definition of the national set of waste indicators. a. Description of the activity
− Establishment of Work Group for the national set of waste indicators. b. Required resources
− Involvement of national experts from governmental institutions in the area of waste. c. Status
− Early initiative Deadline: 2008
Long-term activities − Long-term activities are to be defined by the Work Group.


ENVIRONMENTAL INDICATORS OF THE REPUBLIC OF MACEDONIA 140
МК - NI 018 USE OF FRESHWATER RESOURCES
Period of indicator assessment September 2007 – April 2008
Explanation Justification for indicator selection
Monitoring the efficiency of freshwater use by different economic sectors at the national and local level is an important factor in determining the rates of extraction, which are sustainable over the long term an policy objective under the EU's Sixth Environment Action Programme (2001-2010).
The indicator shows how total water abstraction puts pressure on freshwater resources. Changes in the WEI (water exploitation index) help to analyse how changes in abstraction impact on freshwater resources by increasing pressure on them.
Definition The water exploitation index (WEI) is the mean annual total abstraction of freshwater divided by the mean annual total renewable freshwater resource at the country level, expressed in percentage terms.
Units − Water exploitation index - WEI (%); water abstraction for irrigation, public water
supply, manufacturing industry and energy cooling (mio. m3 per year).
Policy relevance of the indicator List of relevant policy documents:
The National Environmental Action Plan - 2 and Environmental Monitoring Strategy and Data Management Strategy.
The policy for sustainable use of water resources based on the Sixth Environmental Action Programme and Framework Water Directive requirements.
Legal grounds
The Law on Waters prescribes maintenance and improvement of water regime and sustainable use of available water quantities in accordance with the Water Master Plan of the Macedonia. The Water Master Plan is implemented by issuance of permits for water management or awarding of concessions for water use, which specify the manner and the conditions for water use, the operation regime while managing the water resources or other facilities and plants making impact on water regime, the manner and the conditions for discharging water, waste water and waste substances and the required degree of waste water
P
R
D
S
I

ENVIRONMENTAL INDICATORS OF THE REPUBLIC OF MACEDONIA 141
treatment.
The Law specifies that the maintenance and improvement of water regime is carried out on the basis of River Basins Management Plans. Such Plans contain the environmental protection goals, good status of surface water bodies (good quantitative status and chemical status). River Basins Management Plans will be implemented through issuance of permits for water use, permits for extraction of sand, gravel and stone and permits for water discharges specifying quantitative and qualitative requirements in each case individually.
Use of water for different purposes is specified under the Decree on Water Classification, according to which water is divided into five different classes based on the level of pollution, while water characteristics are determined on the basis of classes and purposes for which water can be used.
Targets No specific targets.
Key policy issue Is water resources approximation based on water resources sustainability?
Key message In the period 1990 – 2004, rising trend was tracked in freshwater resources use. Particular rise was recorded in 2000. Public water supply is the main user of abstracted surface and ground freshwaters, covering more than 94% of the population. Variability of data could be conditioned by discontinuity of industrial processes.
Data is not part of the regular statistics published in the country.
0
50
100
150
200
250
300
350
400
450
500
1990 1995 1999 2000 2001 2002 2003 2004
milion
m3/y
year
Freshwater resources use

ENVIRONMENTAL INDICATORS OF THE REPUBLIC OF MACEDONIA 142
0
50
100
150
200
250
300
350
400
450
500
1990 1995 1999 2000 2001 2002 2003 2004
milion
m3 /y
Use of freshwater resources by sectors
Households Irrigation in agriculture Total Freshwater use
0
200
400
600
800
1000
1200
1400
1600
1800
1990 1995 1999 2000 2001 2002 2003 2004
mili
on m
3 /y
Gross abstracted freshwater
Gross freshwater abstracted
Water abstraction by water supply industry (ISIC 41)
Water abstraction by households
Water abstraction by agriculture, forestry and fishing (ISIC 01‐05)
0
200
400
600
800
1000
1200
1400
1600
1990 1995 1999 2000 2001 2002 2003 2004
mili
on m
3 /y
Gross abstracted fresh surface water
Gross fresh surface water abstracted
Surface water abstraction by water supply industry (ISIC 41)
Direct surface water abstraction by households
Direct surface water abstraction by agriculture, forestry and fishing (ISIC 01‐05)

ENVIRONMENTAL INDICATORS OF THE REPUBLIC OF MACEDONIA 143
Assessment In the period 1990 – 2004, rising trend was tracked in freshwater resources use in the country. Particular rise was recorded in 2000. Public water supply is the main user of abstracted fresh surface and ground waters, especially in 2004. There has been discontinuity of industrial processes, reflected in water abstraction.
Methodology Methodology for the indicator calculation
− Data is collected and processed by sectors and types of industry.
0
50
100
150
200
250
300
1990 1995 1999 2000 2001 2002 2003 2004
mili
on m
3 /yGross abstracted fresh groundwater
Gross fresh groundwater abstracted
Groundwater abstraction by water supply industry (ISIC 41)
Direct groundwater abstraction by households
Direct groundwater abstraction by agriculture, forestry and fishing (ISIC 01‐05)
0
100
200
300
400
500
600
1990 1995 1999 2000 2001 2002 2003 2004
mili
on m
3 /y
Gross distributed freshwater for industry supply
Freshwater losses during transport ‐ Losses by leakageNet freshwater delivered by water supply industry (ISIC 41) HouseholdsAgriculture, forestry and fishing (ISIC 01‐05)Other economic activities

ENVIRONMENTAL INDICATORS OF THE REPUBLIC OF MACEDONIA 144
Data specification
Data coverage (by years): Table 1: Use of freshwater resources
Table 2: Use of freshwater resources by sectors
Table 3: Gross freshwater abstracted
Table 4: Gross fresh surface water abstracted
Table 5: Gross fresh ground water abstracted
Title of the indicator Source Reporting obligation
Use of freshwater resources
− State Statistical Office − Water Management Administration − Public Water Supply and Sewerage
Enterprise
− OECD/EUROSTAT
Unit in mio m3/y 1990 1995 1999 2000 2001 2002 2003 2004
Freshwater use 64 78 73,3 315,5 373 360,7 471,3 319,6
Unit in mio m3/y 1990 1995 1999 2000 2001 2002 2003 2004
Gross fresh groundwater abstracted 93,9 65,2 45,6 56,5 62,3 48 125 247,1
Gross fresh groundwater abstracted by industry water supply 44,5 32,6 20,5 14,2 12,2 8,5 84 192,9
Direct fresh groundwater abstracted by households 49,4 32,6 25,1 35,6 38,1 35,7 36,1 34,8
Direct fresh groundwater abstracted by agriculture, forestry and fishery 6,7 12 3,8 4,9 19,4
Unit in mio m3/y 1990 1995 1999 2000 2001 2002 2003 2004
Gross freshwater abstracted 302 333,8 315,5 539,3 660,9 627,1 816,3 1663
Freshwater abstracted by industry water supply 105,4 129,8 113,6 95,4 148,5 133,5 202,7 1199
Freshwater abstracted by households 196,6 204 201,9 204,7 205,7 212,2 220,3 219,2
Freshwater abstracted by agriculture, forestry and fishery 239,2 306,7 281,4 393,3 244,8
Unit in mio m3/y 1990 1995 1999 2000 2001 2002 2003 2004 Gross fresh surface water abstracted 208,1 268,6 269,9 482,8 598,6 579,1 691,3 1415,9
Gross fresh surface water abstracted by industry water supply 60,9 97,2 93,1 81,2 136,3 125 118,7 1006,1
Direct fresh surface water abstracted by households 147,2 171,4 176,8 169,1 167,6 176,5 184,2 184,4
Direct fresh surface water abstracted by agriculture, forestry and fishery
232,5 294,7 277,6 388,4 225,4
Unit in mio m3/y 1990 1995 1999 2000 2001 2002 2003 2004 Households 64 78 73,3 76,3 66,3 79,3 78 74,8
Irrigation in agriculture 239,2 306,7 281,4 393,3 244,8
Total freshwater use 64 78 73,3 315,5 373 360,7 471,3 319,6

ENVIRONMENTAL INDICATORS OF THE REPUBLIC OF MACEDONIA 145
Table 6: Gross distributed fresh water for industries supply
General metadata
Geographical coverage: Republic of Macedonia
Temporal coverage: 1990 - 2004
Frequency of data collection: collection of annual data.
Note: Data is available only for certain sectors.
Future activities Short-term activities
a. Description of the activity − Regular updating of indicator
b. Required resources − Involvement of national experts from governmental institutions in the area of water
resources c. Status
− Continuous
Deadline: one year
Long-term activities − Long-term activities are to be defined by the Work Group.
Unit in mio m3/y 1990 1995 1999 2000 2001 2002 2003 2004
Gross freshwater distributed for industries water supply 76,8 51,9 63,3 78,1 49,4 86,3 100,3 99,9
Water loss during transport 119,8 99,7 138,6 366 421,1 407,3 515,7 363,4
Net freshwater distributed for industries water supply 64 78 73,3 76,3 66,3 79,3 78 74,8
Households 239,2 306,7 281,4 393,3 244,8
Agriculture, forestry and fishery 55,8 21,7 65,3 50,5 48,1 46,6 44,4 43,8
Code Title of the indicator
Compliance with CSI/ЕЕА or other
indicators
Classification by DPSIR Тype Linkage with
area Frequency of publication
MK NI 018 Use of freshwater resources
CSI 018 Use of freshwater resources
P A water annual

ENVIRONMENTAL INDICATORS OF THE REPUBLIC OF MACEDONIA 146
МК - NI 019 OXYGEN CONSUMING SUBSTANCES IN RIVERS
Period of indicator assessment September 2007 – April 2008
Explanation Justification for indicator selection
Large quantities of organic matter (microbes and decaying organic waste) can result in reduced chemical and biological quality of river water, impaired biodiversity of aquatic communities, and microbiological contamination that can affect the quality of drinking and bathing water. Sources of organic matter are discharges from wastewater treatment plants, industrial effluents and agricultural run-off. Organic pollution leads to higher rates of metabolic processes that demand oxygen. This could result in the development of water zones without oxygen (anaerobic conditions). The transformation of nitrogen to reduced forms under anaerobic conditions in turn leads to increased concentrations of ammonium, which is toxic to aquatic life above certain concentrations, depending on water temperature, salinity and pH.
Definition The key indicator for the oxygenation status of water bodies is the biochemical oxygen demand (BOD) which is the demand for oxygen resulting from organisms in water that consume oxidisable organic matter. The indicator illustrates the current situation and trends regarding BOD and concentrations of ammonium (NH4) in rivers.
Units − Annual average BOD after 5 or 7 days incubation (BOD5/BOD7) is expressed in mg
O2/l and annual average total ammonium concentrations in micrograms N/l.
Policy relevance of the indicator List of relevant policy documents:
The National Environmental Action Plan - 2, the Environmental Monitoring Strategy and Environmental Data Management Strategy, as well as EU Directives aimed at achieving and improving the quality of water and reducing discharges and impacts of organic matter. The most important is the Framework Water Directive (FWD) 2000/60/ЕЕC, according to which, by the year of 2015, rivers in EU should achieve good ecological status or good ecological potential. The goal of the Directive on nitrates (91/676/ЕЕC) is to reduce nitrates and pollution by organic matter originating from agricultural lands, as well as the requirements of the Directive on urban wastewater treatment (91/271/ЕЕC) aimed at reducing the pollution from sewerage and industrial wastewater treatment plants. Directive on Industrial Pollution Prevention and Control (IPPC) 96/61/ЕЕC is aimed at control and prevention of water resources pollution by industry
P
R
D
S
I
ENVIRONMENTAL INDICATORS OF THE REPUBLIC OF MACEDONIA 147
Legal grounds
The Law on Waters prescribes maintenance and improvement of water regime to be implemented on the basis of river basins management plans. Such plans contain environmental protection objectives aimed at achieving good status of surface water bodies (good quantitative and chemical status, including good ecological potential) and of ground water resources (good quantitative and chemical status).
For the purpose of maintenance and improvement of the quality of water and establishment of the adequacy of water for use for different purposes, the Law on Waters specifies classification of waters and categorization of water bodies, as well as specification of deadline for achievement of the water quality goals for each water category and specification of the minimum standards for water quality and environmental protection goals for all water bodies. According to the Law, Programme with measures for environmental protection goals shall be adopted for each river basin.
Use of water for different purposes is specified under the Decree on Water Classification, according to which water is divided into five different classes based on the level of pollution, while water characteristics are determined on the basis of classes and purposes for which water can be used.
The Decree on categorization of water courses, lakes, accumulations and water resources (1999) specifies the quality of water by specific classes of water in water bodies, lakes, accumulations and groundwater resources. This Decree also establishes five categories of water courses. In order to maintain the quantity and the quality of the water (water regime), the competent authority issues water management consent in relation to construction, reconstruction, connection or extension of facilities that make impact on waters and water management permit for use of water as resource or as recipient. In circumstances of absence of emission standards for individual polluters and pollutants, the said documents are issued on the basis of specific expert assessment by the competent authority, for each case separately, taking into account the principle of sustainable use of water resources and providing care for the quality of wastewater discharged, in order to prevent the water to exceede the quality standards applied for the recipient.
The Law on Public Health Protection specifies that the Regional Institutes for Health Protection, coordinated by the Republic Institute for Health Protection, are obliged to monitor environmental-health and other conditions of relevance for the protection of drinking water and to undertake measures for active protection of the population against communicable and other diseases of high health and social relevance. These Institutes perform microbiological, parasitological, hygiene, toxicological and biochemical analyses within the scope of their activity.
Monitoring of the surface waters quality at all points of health relevance is performed under the Programme for Preventive Public Health Protection, in order to enable undertaking of timely measures for public health protection. Waters used as drinking water sources, for sports and recreation, as well as for primary agriculture production, are of highest interest.
The National Strategy for Waters is adopted for 30 years time horizon. It should provide sustainable development of waters, through meeting the demands of all users, protecting waters against pollution, protecting and improving aquatic ecosystems and providing protection

ENVIRONMENTAL INDICATORS OF THE REPUBLIC OF MACEDONIA 148
against harmful impacts of waters. The Strategy should be adopted by the Assembly of the Republic of Macedonia.
Targets Reduction and prevention of water pollution and thus achievement of good ecological status or potential of waters. Requirements of the relevant EU Directives, namely FWD, on urban wastewater treatment, on nitrates, on hazardous substances, as well as Directives on drinking and bathing waters, have been transposed in the Law on Waters).
Key message During the assessed period from 1988 to 2006, no reduction in BOD 5 and concentrations of ammonium in rivers was tracked in the Republic of Macedonia. At some monitoring stations, located on the rivers Crna Reka and Vardar, eutrophic water status with high BOD value was recorded. These results could reflect the status of inefficient treatment of urban and industrial wastewaters in the country, as well as the inadequate protection of river basins.
Adequate protection of rivers, and especially the introduction of regular wastewater treatment in the country, is the top priority of the policy at both national and local levels.
0
2
4
6
8
10
12
14
1988 1989 1990 1991 1992 1993 1994 1995 1996 1999 2000 2001 2002 2003 2004 2005 2006
mg/
lO2
year
BOD 5 in rivers

ENVIRONMENTAL INDICATORS OF THE REPUBLIC OF MACEDONIA 149
0
5
10
15
20
25
1988 1989 1990 1991 1992 1993 1994 1995 1996 1999 2000 2001 2002 2003 2004 2005 2006
mg/
lO2
BOD 5 in rivers, by river
Vardar Bregalnica Crna Reka
00,20,40,60,81
1,21,41,61,8
1988 1989 1990 1991 1992 1993 1994 1995 1996 1999 2000 2001 2002 2003 2004 2005 2006
mg/
lN
year
Total ammonium in rivers
0,00
0,50
1,00
1,50
2,00
2,50
3,00
3,50
1988 1989 1990 1991 1992 1993 1994 1995 1996 1999 2000 2001 2002 2003 2004 2005 2006
mg/
lN
Total ammonium in rivers, by river
Vardar Bregalnica Crna Reka

ENVIRONMENTAL INDICATORS OF THE REPUBLIC OF MACEDONIA 150
Assessment A trend of rising BOD 5 and ammonium concentrations was tracked in the rivers in the Republic of Macedonia at certain measuring points in the period 1988 - 2006. Eutrophic status with high BOD was particularly recorded in two rivers: Crna Reka and Vardar. These results could reflect the status of inefficient treatment of urban and industrial wastewaters in the country, as well as the inadequate protection of river basins.
Methodology Methodology for the indicator calculation
Indicators calculation is based on the methodology established by Eurowaternet, determined by the European Topic Centre for water under the European Environmental Agency.
This process defines the manner of selection of the monitoring stations, the types of parameters to be monitored, as well as the frequency of their collection.
Data specification
Data coverage (by years): Table 1: BOD 5 in the rivers
Table 2: BOD 5 in the rivers, by individual river
Table 3: Total ammonium in the rivers
Title of the indicator Source Reporting obligation
Oxygen consuming substances in rivers
− MEPP
− HMA
− HBI
− ЕЕА
mg/lO2 1988 1989 1990 1991 1992 1993 1994 1995 1996 1999 2000 2001 2002 2003 2004 2005 2006
BOD 5 5,39 5,22 4,98 4,44 4,62 5,06 4,48 8,82 4,67 5,75 7,21 12,41 13,19 10,11 10,69 8,69 7,79
1988 1989 1990 1991 1992 1993 1994 1995 1996 1999 2000 2001 2002 2003 2004 2005 2006
Vardar 5,78 6,11 4,74 4,52 5,46 5,69 4,36 6,74 6,73 4,82 5,85 11,35 13,3 7,18 10,3 7,46 6,52
Bregalnica 4,67 4,78 4,95 4,55 4,22 4,60 4,21 8,7 2,62 2,04 3,61 6,1 7,35 4,71 8,99 8,55 7,44
Crna Reka 5,72 4,76 5,25 4,25 4,18 4,9 4,88 11,02 10,41 12,1 19,76 18,94 18,4 12,82 10,08 9,41
mg/lN 1988 1989 1990 1991 1992 1993 1994 1995 1996 1999 2000 2001 2002 2003 2004 2005 2006
Total ammonium 0,85 0,66 1,66 0,17 0,44 0,83 0,94 1,01 0,55 0,42 0,76 1,28 0,6 0,48 0,41 0,37 0,43
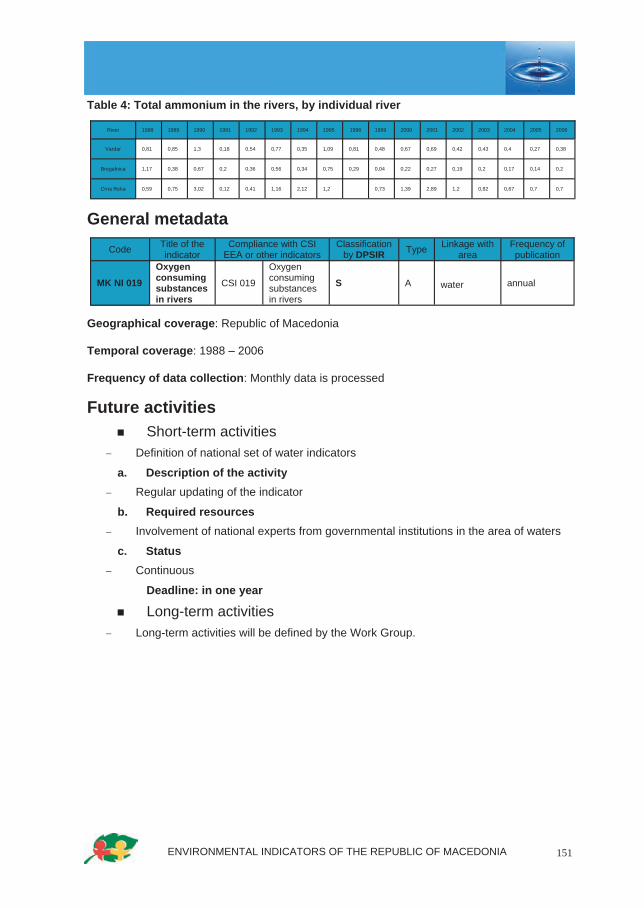
ENVIRONMENTAL INDICATORS OF THE REPUBLIC OF MACEDONIA 151
Table 4: Total ammonium in the rivers, by individual river
General metadata
Geographical coverage: Republic of Macedonia
Temporal coverage: 1988 – 2006
Frequency of data collection: Monthly data is processed
Future activities Short-term activities
− Definition of national set of water indicators
a. Description of the activity − Regular updating of the indicator
b. Required resources − Involvement of national experts from governmental institutions in the area of waters
c. Status − Continuous
Deadline: in one year
Long-term activities − Long-term activities will be defined by the Work Group.
River 1988 1989 1990 1991 1992 1993 1994 1995 1996 1999 2000 2001 2002 2003 2004 2005 2006
Vardar 0,81 0,85 1,3 0,18 0,54 0,77 0,35 1,09 0,81 0,48 0,67 0,69 0,42 0,43 0,4 0,27 0,38
Bregalnica 1,17 0,38 0,67 0,2 0,36 0,56 0,34 0,75 0,29 0,04 0,22 0,27 0,19 0,2 0,17 0,14 0,2
Crna Reka 0,59 0,75 3,02 0,12 0,41 1,16 2,12 1,2 0,73 1,39 2,89 1,2 0,82 0,67 0,7 0,7
Code Title of the indicator
Compliance with CSI ЕЕА or other indicators
Classification by DPSIR Type Linkage with
area Frequency of publication
MK NI 019
Oxygen consuming substances in rivers
CSI 019
Oxygen consuming substances in rivers
S A water annual

ENVIRONMENTAL INDICATORS OF THE REPUBLIC OF MACEDONIA 152
МК - NI 020 NUTRIENTS IN FRESHWATER
Period of indicator assessment September 2007 – April 2008
Explanation Justification for indicator selection
Large inputs of organic matter (microbe and decaying organic waste) in river waters can lead to decreased chemical and biological quality, unbalanced biodiversity in aquatic communities and microbiological contamination making impact on the quality of drinking and bathing waters. Sources of organic matter include discharges from wastewater treatment plants, industrial effluents and agricultural run-offs. Organic pollution leads to higher rates of metabolitical processes which demand oxygen. This can result in formation of oxygen free aquatic zones (anaerobic conditions). Transformation of nitrogen in lower forms under anaerobic conditions causes higher concentrations of ammonium, which is toxic to the aquatic living organisms if found above certain concentration, depending on the water temperature, salinity and pH value.
Definition Concentrations of orthophosphate and nitrate in rivers, total phosphorus and nitrate in groundwater bodies. The indicator can be used to illustrate geographical variations in current nutrient concentrations and temporal trends.
Units − Concentration of nitrate is expressed as mg nitrate (NO3)/l, and orthophosphate and
total phosphorus as microgram P/l.
Policy relevance of the indicator List of relevant policy documents:
The National Environmental Action Plan - 2 and the Environmental Monitoring Strategy and Environmental Data Management Strategy.
EU Directives aimed at achieving and improving the quality of water and reducing discharges and impacts of organic matter. The most important is the Framework Water Directive (FWD) 2000/60/ЕЕC, according to which, by the year of 2015, rivers in EU should achieve good ecological status or good ecological potential. The goal of the Directive on nitrates (91/676/ЕЕC) is to reduce nitrates and pollution by organic matter originating from agricultural lands, as well as the requirements of the Directive on urban wastewater treatment (91/271/ЕЕC) aimed at reducing the pollution from sewerage and industrial wastewater treatment plants. Directive on Industrial Pollution Prevention and Control (IPPC) 96/61/ЕЕC is aimed at control and prevention of water resources pollution by industry.
P
R
D
S
I

ENVIRONMENTAL INDICATORS OF THE REPUBLIC OF MACEDONIA 153
Legal grounds
The Law on Waters prescribes maintenance and improvement of water regime to be implemented on the basis of river basins management plans. Such plans contain environmental protection objectives aimed at achieving good status of surface water bodies (good quantitative and chemical status, including good ecological potential) and of groundwater resources (good quantitative and chemical status).
For the purpose of maintenance and improvement of the quality of water and establishment of the adequacy of water for use for different purposes, the Law on Waters specifies classification of waters and categorization of water bodies, as well as specification of deadline for achievement of the water quality goals for each water category and specification of the minimum standards for water quality and environmental protection goals for all water bodies. According to the Law, Programme with measures for environmental protection goals shall be adopted for each river basin.
The Decree on categorization of water courses, lakes, accumulations and water resources specifies the quality of water by specific classes of water in water bodies, lakes, accumulations and groundwater resources. This Decree also establishes five categories of water courses. In order to maintain the quantity and the quality of the water (water regime), the competent authority issues water management consent in relation to construction, reconstruction, connection or extension of facilities that make impact on waters and water management permit for use of water as resource or as recipient. In circumstances of absence of emission standards for individual polluters and pollutants, the said documents are issued on the basis of specific expert assessment by the competent authority, for each case separately, taking into account the principle of sustainable use of water resources and providing care for the quality of wastewater discharged, in order to prevent the water to exceede the quality standards applied for the recipient.
The Law on Public Health Protection specifies that the Regional Institutes for Health Protection, coordinated by the Republic Institute for Health Protection, are obliged to monitor environmental-health and other conditions of relevance for the protection of drinking water and to undertake measures for active protection of the population against communicable and other diseases of high health and social relevance. These Institutes perform microbiological, parasitological, hygiene, toxicological and biochemical analyses within the scope of their activity.
Monitoring of the surface waters quality at all points of health relevance is performed under the Programme for Preventive Public Health Protection, in order to enable undertaking of timely measures for public health protection. Waters used as drinking water sources, for sports and recreation, as well as for primary agriculture production, are of highest interest.
The National Strategy for Waters is adopted for 30 years time horison. It should provide sustainable development of waters, through meeting the demands of all users, protecting waters against pollution, protecting and improving aquatic ecosystems and providing protection against harmful impacts of waters. The Strategy should be adopted by the Assembly of the Republic of Macedonia.

ENVIRONMENTAL INDICATORS OF THE REPUBLIC OF MACEDONIA 154
Targets
The indicator is not related directly to the requirements of a single Directive. Ecological quality of surface water requiring reduction of eutrophication and nutrient concentrations is a target specified in several Directives, namely:
− Directive on drinking water (98/83/ЕC) – maximum permissible concentration of nitrates is 50 mg/l;
− Directive on abstraction of surface water intended for drinking (75/440/ЕЕC) requires nitrates concentration of 25 mg/l.
− Directive on nitrates (91/676/ЕЕC) requires identification of groundwater bodies where the annual concentration exceeds or may exceed 50 mg/l nitrates.
− Directive on urban wastewater treatment (91/71/ЕЕC) specifies reduction of the pollution caused by organic matter as its objective.
Key policy issue Has the nutrients concentration in water courses shown rising trend?
Despite of the absence of continuous monitoring of the status of groundwaters quality in the Republic of Macedonia during the last years, it can be stated that the concentration of nitrates in drinking water has been in a stable environmental health status.
With regard to rivers, increased annual mean value of nitrates and orthophosphates has been recorded at certain points in the River of Vardar.
Throughout the investigation period, the Lake of Ohrid has sustained its oligotrophic nature as shown on the Table on the concentrations of phosphorus and nitrates. Significantly higher concentration was found in the waters of the Lake of Prespa, where the content of organic matter has reached high level, thus increasing the risk of Lake’s water eutrophication
0
0,5
1
1,5
2
2,5
3
3,5
1988 1989 1990 1991 1992 1993 1994 1999 2000 2001 2002 2003 2004 2005 2006
mg/l
Nitrates and orthophosphates in rivers
Nitrates Orthophosphates

ENVIRONMENTAL INDICATORS OF THE REPUBLIC OF MACEDONIA 155
0
1
2
3
4
5
6
7
1988 1989 1990 1991 1992 1993 1994 1999 2000 2001 2002 2003 2004 2005 2006
mg/
lNitrates in rivers by river
Vardar Bregalnica Crna Reka
0
0,2
0,4
0,6
0,8
1
1,2
1,4
1,6
1,8
1999 2000 2001 2002 2003 2004 2005 2006
mg/
l
Orthophosphates in rivers by river
Vardar Bregalnica Crna Reka
0
0,01
0,02
0,03
0,04
0,05
0,06
0,07
1988 1989 1990 1991 1992 1995 1997 1998 1999 2000 2001 2002 2003 2004 2005 2006
mg/l
Total phosphorus in lakes
Ohrid Lake Prespa Lake

ENVIRONMENTAL INDICATORS OF THE REPUBLIC OF MACEDONIA 156
Note: No data is available before 2000
Assessment Annual mean concentrations of nitrates and orthophosphates have remained relatively stable since the beginning of 1990’s. It has been found out that the concentration of these parameters is higher at certain measuring points of Vardar River.
Analysis of the results from the measurements in the plagial parts of Ohrid Lake throughout the period has confirmed the oligotrophic nature with relatively stable concentrations of phosphorus (below 0.015 mg./l) and nitrates (mean annual concentrations below 0.55 mg/l). Concentrations are significantly higher in Prespa Lake, where organic compounds are found at high levels, thus increasing the risk of Lake’s water eutrophication.
Methodology Methodology for the indicator calculation
The calculation of the indicator is based on the methodology established under Eurowaternet, established by the European Topic Centre for waters of the European Environmental Agency.
Under this process, the manner of selection of monitoring stations is defined and the type of monitoring parameters and the frequency of their collection are specified.
Data specification
Title of the indicator Source Reporting obligation
Nutrients in freshwater − MEPP − HMA − HBI
− ЕЕА
0
0,1
0,2
0,3
0,4
0,5
0,6
0,7
0,8
0,9
2000 2001 2002 2003 2005 2006
mg/l
Total nitrate in lakes
Ohrid Lake Prespa Lake

ENVIRONMENTAL INDICATORS OF THE REPUBLIC OF MACEDONIA 157
Data coverage (by years):
Table 1: Nitrates and orthophosphate in rivers
Table 2: Nitrate in rivers by river
Table 3: Orthophosphates in rivers by river
Table 4: Total phosphorus in lakes
Table 5: Total nitrate in lakes
General metadata
Geographical coverage: Republic of Macedonia
Temporal coverage: 1998 – 2006
Frequency of data collection: Monthly data is processed
1988 1989 1990 1991 1992 1993 1994 1999 2000 2001 2002 2003 2004 2005 2006
nitrate (mg/lN) 1,35 1,45 1,34 1,81 1,81 1,78 1,72 1,11 1,20 1,56 1,63 3,00 1,66 1,73 1,89
orthophos-phate (mg/lP) 0,81 0,82 0,34 0,61 0,59 0,83 0,24 0,19
River 1988 1989 1990 1991 1992 1993 1994 1999 2000 2001 2002 2003 2004 2005 2006
Vardar 1,74 1,48 1,59 2,14 2,03 1,98 2,07 1,26 1,46 2,12 1,73 1,76 1,82 2,17 2,37
Bregalnica 1,19 1,59 1,4 1,98 1,85 1,77 1,87 1,02 1,05 1,54 1,6 6,28 1,53 1,76 1,74
Crna Reka 1,12 1,31 1,03 1,32 1,58 1,61 1,21 1,04 1,11 1,05 1,57 0,97 1,63 1,27 1,57
River 1999 2000 2001 2002 2003 2004 2005 2006
Vardar 1,6 1,438 0,514 0,85 0,71 1,05 0,31 0,27
Bregalnica 0,38 0,42 0,26 0,52 0,62 0,8 0,2 0,15
Crna Reka 0,44 0,6 0,26 0,46 0,46 0,64 0,22 0,16
Lake 1988 1989 1990 1991 1992 1995 1997 1998 1999 2000 2001 2002 2003 2004 2005 2006
Ohrid 0,01 0,01 0 0,01 0,01 0 0 0 0,01 0 0,01 0,01 0,01 0,005 0,007
Prespa 0,02 0,04 0,03 0,05 0,034 0,059 0,044
Lake 2000 2001 2002 2003 2005 2006
Ohrid Lake 0,28 0,38 0,05 0,551 0,428
Prespa Lake 0,57 0,8 0,85 0,58 0,665 0,449
Code Title of the indicator
Compliance with CSI/ЕЕА or other indicators
Classification by DPSIR Type Linkage
with area Frequency of publication
MK NI 020 Nutrients in freshwaters CSI 020 Nutrients in
freshwater S A Water Annually

ENVIRONMENTAL INDICATORS OF THE REPUBLIC OF MACEDONIA 158
Future activities Short-term activities
− Definition of the National Set of water indicators
a. Description of the activity − Regular updating of indicator
b. Required resources − Involvement of national experts from governmental institutions in the area of waters
c. Status − continuous
Deadline: within one year
Long-term activities − Long-term activities will be defined by the work group.

ENVIRONMENTAL INDICATORS OF THE REPUBLIC OF MACEDONIA 159
МК - NI 022 BATHING WATER QUALITY
Period of indicator assessment September 2007 – April 2008
Explanation Justification for indicator selection
The Bathing Water Directive (76/160/EEC) was designed to protect the public from accidental and chronic pollution incidents, which could cause illness from recreational water use. Examining compliance with the Directive therefore indicates the status of bathing water quality in terms of public health and also the effectiveness of the Directive.
The Bathing Water Directive is one of the oldest pieces of environmental legislation in Europe and data on compliance goes back to the 1970s. Under the Directive, Member States are required to designate coastal and inland bathing waters and to monitor the quality of the water throughout the bathing season.
Definition The indicator describes the changes over time in the quality of designated bathing waters in terms of compliance with standards for microbiological parameters (total coliforms and faecal coliforms) and physicochemical parameters (mineral oils, surface-active substances and phenols) introduced by the EU Bathing Water Directive (76/160/EEC).
Units − The data is expressed in a form of percentage of inland bathing waters with
mandatory standards and levels specified in guidelines for microbiological and physicochemical
Policy relevance of the indicator List of relevant policy documents
The National Environmental Action Plan - 2 and the Environmental Monitoring Strategy and Environmental Data Management Strategy.
Bathing Water Directive (76/160/ЕЕC) requires the countries to designate water bodies intended for bathing and carry out monitoring of their quality during the bathing period. Water bodies designated for bathing are those water bodies designated by the competent authorities and those where bathing has been practiced traditionally by high number of swimmers. The bathing period is determined in accordance with the period during which the highest number of swimmers is present. Qualitative monitoring takes place on daily basis during the bathing season, as well as two weeks before the commencement of the bathing season. 95% of the samples have to comply with mandatory standards.
P
R
D
S
I

ENVIRONMENTAL INDICATORS OF THE REPUBLIC OF MACEDONIA 160
Legal grounds
Law on Waters, Decree on categorization of water courses, lakes, accumulations and water resources.
Targets It is necessary that all water bodies designated for bathing comply with mandatory values of water quality specified in Bathing Water Directive.
Law on Waters transposing the requirements of EU in relation to bathing should be adopted, thus enabling reduction and prevention of water pollution, as well as achievement of hygienic and sanitary safety of bathing water.
Key message Natural and some of the artificial lakes comply with the relevant standards for bathing waters quality and thus the quality of lake water is at constantly satisfactory level. It has been noted that the water in the biggest natural lake – Ohrid Lake – has been improving as a result of the construction of appropriate wastewater system in the region. However, there are still parts at which rivers entering the Lake contribute to deterioration of the status of water quality of the Lake. The percentage of samples with inadequate quality is still high (especially for physicochemical parameters). Settlements around the three natural lakes are among the rare ones with wastewater treatment plants available in the country.
National legislation and standards in this area should be harmonized with the EU Bathing Water Directive.
0
5
10
15
20
25
30
35
40
45
50
1997 1999 2000 2004 2005
%
Quality of bathing freshwater - lakes
Physico‐chemical % Improper Microbiological % Improper

ENVIRONMENTAL INDICATORS OF THE REPUBLIC OF MACEDONIA 161
Assessment The greatest proportion of water areas in the country belongs to natural lakes, the shores of which are used for recreation purposes. The quality of water in these lakes is threatened by uncontrolled discharges of wastewater, uncontrolled use of lake waters for agricultural and tourism purposes, as well as by weather conditions. Apart from natural lakes, there are artificial lakes - water accumulations in the Republic of Macedonia, used for both recreation and economic purposes.
The problems of bathing water quality protection in the lakes are closely related to the implementation of one of the highest priorities in the country's environment protection - construction of adequate wastewater treatment facilities.
As international waters, the waters of the biggest natural lakes, i.e. Ohrid and Prespa, are also subject of bilateral and trilateral agreements between the Republic of Macedonia, Republic of Albania and Republic of Greece, respectively.
Methodology Methodology for the indicator calculation
Standard methodology for sampling - annual data.
Data specification
Title of the indicator Source Reporting obligation
Bathing water quality − RIHP − WHO
0
20
40
60
80
100
120
2003 2004 2005
%
Quality of bathing freshwater - artificial lakes
Physico‐chemical ‐ % Improper
Microbiological ‐ % Improper

ENVIRONMENTAL INDICATORS OF THE REPUBLIC OF MACEDONIA 162
Data coverage (by years): Table 1: Bathing water quality – lakes
Table 2: Bathing water quality – artificial lakes
General metadata
Geographical coverage: Republic of Macedonia
Temporal coverage: 1997 - 2005
Data presentation: Annual reports
Weaknesses: There is a difference between national and international standards for bathing water and they need to be harmonized with the EU Bathing Water Directive (76/160/EC).
Future activities Short-term activities
− Definition of the national set of water indicators
a. Description of the activity − Regular updating of the indicator
b. Required resources − Involvement of national expert from governmental institutions in the area of waters.
c. Status − continuous
Deadline: within one year.
Long-term activities − Long-term activities will be defined by the work group.
Physico-chemical Microbiological
Number of samples % Improper Number of
samples % Improper
1997 77 35,60 77 9,00 1999 80 38,67 80 6,67 2000 73 45,80 73 9,47 2004 59 43,13 59 8,63 2005 65 34,37 63 1,93
Number of samples % Improper % Proper 2003 18 0 100 2004 20 0 100 2005 16 0 100
Code Title of the indicator
Compliance with CSI/ЕЕА or other indicators
Classification by DPSIR Type Linkage
with area Frequency of publication
MK NI 022 Bathing water quality
CSI 022 Bathing water quality S B shore
water annually

ENVIRONMENTAL INDICATORS OF THE REPUBLIC OF MACEDONIA 163
МК - NI 024 URBAN WASTE WATER TREATMENT
Period of indicator assessment September 2007 – April 2008
Explanation Justification for indicator selection
Wastewater from households and industry represents a significant pressure on the water environment because of the loads of organic matter and nutrients as well as hazardous substances. With high levels of the population in EU Member States living in urban agglomerations, a significant fraction of wastewater is collected by sewers connected to public wastewater treatment plants and then discharged into recipients. The level of treatment before discharge and the sensitivity of the receiving waters determine the scale of impacts on aquatic ecosystems. The types of treatments and conformity with the Directive are seen as proxy indicators for the level of purification and the potential improvement of the water environment.
Primary (mechanical) treatment removes part of the suspended solids, while secondary (biological) treatment uses aerobic or anaerobic micro-organisms to decompose most of the organic matter and retain some of the nutrients (around 20 - 30 %). Tertiary (advanced) treatment removes the organic matter even more efficiently. It generally includes phosphorus retention and in some cases nitrogen removal. Primary treatment alone removes no ammonium whereas secondary (biological) treatment removes around 75 %.
The indicator tracks the success of policies to reduce pollution from wastewater by describing the trends in the percentage of the population connected to public wastewater treatment plants with different levels of purification.
Definition Percentage of population connected to primary, secondary and tertiary wastewater treatment plants. The indicator illustrates:
1. changes in wastewater treatment;
2. conformity in terms of providing primary, secondary and tertiary treatment;
3. levels of urban wastewater treatment in large cities (agglomerations >150 000 p.e.).
Units − Percentages of population connected to primary, secondary and tertiary wastewater
treatment.
Policy relevance of the indicator List of relevant policy documents
P
R
D
S
I

ENVIRONMENTAL INDICATORS OF THE REPUBLIC OF MACEDONIA 164
The National Environmental Action Plan (NEAP) 2.
Environmental Monitoring Strategy and Environmental Data Management Under the Urban Wastewater Treatment Directive, the EU Member States are required to provide connection to wastewater collection systems in all agglomerations exceeding 2 000 population equivalent. Secondary (biological) treatment must be provided in all agglomerations exceeding 2 000 population equivalent and discharging wastewater directly into receiving freshwater resources. It provides for specific requirements for different deadlines for compliance achievement depending on the sensitivity of receiving waters with regard to agglomerations exceeding 10 000 population equivalent.
The performance of wastewater treatment is monitored for five different parameters: BOD, COD, total suspended matter, total nitrates and total phosphorous.
In the case of smaller agglomerations and those connected to wastewater collection systems, the treated wastewater at the outlet has to comply with quality targets of the recipient.
Legal grounds
The Law on Waters prescribes maintenance and improvement of water regime carried out on the basis of river basin management plans. Such Plans contain environmental protection objectives, good ecological status of surface water bodies (good quantitative and chemical status, including good ecological potential) and groundwater resources (good quantitative status and good chemical status).
River Basins Management Plans will be implemented through issuance of permits for water use, permits for extraction of sand, gravel and stone and permits for water discharges specifying quantitative and qualitative requirements in each case individually.
For the purpose of maintenance and improvement of the quality of water and establishment of the adequacy of water for use for different purposes, the Law on Waters specifies classification of waters and categorization of water bodies, as well as specification of deadline for achievement of the water quality goals for each water category and specification of the minimum standards for water quality and environmental protection goals for all water bodies. According to the Law, Programme with measures for environmental protection goals shall be adopted for each river basin.
The Decree on categorization of water courses, lakes, accumulations and water resources specifies the quality of water by specific classes of water in water bodies, lakes, accumulations and groundwater resources. This Decree also establishes five categories of water courses with regard to water quality goals specified therein. In order to maintain the quantity and the quality of the water (water regime), the competent authority issues water management consent in relation to construction, reconstruction, connection or extension of facilities that make impact on waters and water management permit for use of water as resource or as recipient. In circumstances of absence of emission standards for individual polluters and pollutants, the said documents are issued on the basis of specific expert assessment by the competent authority, for each case separately, taking into account the principle of sustainable use of water resources and providing care for the quality of wastewater discharged, in order to prevent the water to exceed the quality standards applied for the recipient
The Law on Public Health Protection specifies that the Regional Institutes for Health

ENVIRONMENTAL INDICATORS OF THE REPUBLIC OF MACEDONIA 165
Protection, coordinated by the Republic Institute for Health Protection, are obliged to monitor environmental-health and other conditions of relevance for the protection of drinking water and to undertake measures for active protection of the population against communicable and other diseases of high health and social relevance. These Institutes perform microbiological, parasitological, hygiene, toxicological and biochemical analyses within the scope of their activity.
Monitoring of the surface waters quantity is performed under the Programme for Preventive Public Health Protection, adopted at annual basis and published in the Official Gazette of the Republic of Macedonia. Monitoring of the surface waters quality at all points of health relevance is performed under the Programme for Preventive Public Health Protection, in order to enable undertaking of timely measures for public health protection. Waters used as drinking water sources, for sports and recreation, as well as for primary agriculture production, are of highest interest
The National Strategy for Waters is adopted to cover 30 period. It should provide sustainable development of waters, through meeting the demands of all users, protecting waters against pollution, protecting and improving aquatic ecosystems and providing protection against harmful impacts of waters. The Strategy should be adopted by the Assembly of the Republic of Macedonia.
Targets Requirements of the relevant EU Directives, (FWD, on urban wastewater treatment, on nitrates, on hazardous substances, as well as Directives on drinking and bathing waters) have been transposed in the Law on Waters, thus enabling reduction and prevention of water pollution and achievement of good ecological status or potential of waters.
The Urban Wastewater Treatment Directive, aimed at protecting the environment against impacts caused by urban wastewater discharges. In addition to this, compliance with the requirements specified in the Urban Wastewater Treatment Directive and Directive on Integrated Pollution Prevention and Control is incorporated in the goals of the Framework Water Directive, the main goal of which is the achievement of good chemical and biological status of all waters by 2015.
Key message The requirements of the Directive concerning municipal wastewater treatment have not been implemented in the current Law on Waters.
According to the results on the distribution of the population in the Republic of Macedonia in relation to treated municipal wastewaters involving only mechanical treatment, biological treatment and latest treatment technology, it can be concluded that there is no conformity with the Urban Wastewater Treatment Directive. The percentage of the population covered by municipal wastewater treatment with included biological treatment is very low. Therefore, the introduction of regular treatment of wastewaters in the country is top priority, both at local and national levels.
In the past period, no reduction in BOD 5 and in concentrations of ammonium in rivers (MK NI 019) has been observed in the Republic of Macedonia. At some monitoring stations, located

ENVIRONMENTAL INDICATORS OF THE REPUBLIC OF MACEDONIA 166
on the rivers Crna Reka and Vardar, eutrophic water status with high BOD value was recorded. These results could reflect the status of inefficient treatment of urban and industrial wastewaters in the country, as well as the inadequate protection of river basins.
Assessment According to the results on the distribution of the population in the Republic of Macedonia in relation to treated municipal wastewaters involving only mechanical treatment, biological
0
2
4
6
8
10
12
14
16
1990 1995 2000 2005
%
Treatment of wastewater from the public sewerage network
Other sewage treatment
Biological treatment
Mechanical treatment only
0
20
40
60
80
100
120
1990 1995 2000 2005
%
Percentage of population with and without public sewerage network
No public sewerage or independent sewerage
Total public sewerage

ENVIRONMENTAL INDICATORS OF THE REPUBLIC OF MACEDONIA 167
treatment and application of latest treatment technology, and in relation to public sewerage, it can be concluded that the percentage of such population is very low. Despite of the rising trend, the current state is unsatisfactory with regard to EU requirements.
Methodology Methodology for the indicator calculation
In accordance with the requirements of EUROSTAT
Data specification
Data coverage (by years): Table 1: Percentage of public sewerage with and without treatment
Table 2: Percentage of population with and without public sewerage
Title of the indicator Source Reporting obligation
Urban wastewater treatment − Republic Institute for Health
Protection, Ministry of Health
− EUROSTAT
1990 1991 1992 1993 1994 1995 1996 1997 1998
Number of population connected to public sewerage
1000's 1.945.000 1.955.000 1.965.000 1.970.000 1.972.000 1.975.000 1.978.000 1.980.000 1.990.000
Total public sewerage with treatment % 5,0 5,0 5,0 5,0 5,0 5,0 5,0 5,0 5,0
Public sewerage without treatment % 95,0 95,0 95,0 95,0 95,0 95,0 95,0 95,0 95,0
1999 2000 2001 2002 2003 2004 2005 2006
Number of population connected to public sewerage
1000's 2.025.000 2.050.000 2.038.651 2.022.547 2.029.892 2.035.196 2.038.514 2.043.000
Total public sewerage with treatment % 5,0 5,0 6,0 6,0 6,0 6,0 6,5 7,0
Public sewerage without treatment % 95,0 95,0 94,0 94,0 94,0 94,0 93,5 93,0
1990 1991 1992 1993 1994 1995 1996 1997 1998
Total public sewerage % of pop. 43,0 44,0 44,0 44,0 44,0 45,0 45,0 45,0 46,0
Mechanical treatment only % of pop. 5,0 5,0 5,0 5,0 5,0 5,0 5,0 5,0 5,0
Biological treatment % of pop. 4,5 4,5 4,5 4,5 4,5 4,5 4,5 4,5 4,5
Other sewage treatment % of pop. 0,5 0,5 0,5 0,5 0,5 0,5 0,5 0,5 0,5
Public sewerage without treatment % of pop. 33,0 34,0 34,0 34,0 34,0 35,0 35,0 35,0 36,0
No public sewerage or independent sewer-age % of pop. 57,0 56,0 56,0 56,0 56,0 55,0 55,0 55,0 54,0
of which with independent treatment % of pop.

ENVIRONMENTAL INDICATORS OF THE REPUBLIC OF MACEDONIA 168
General metadata
Geographical coverage: Republic of Macedonia
Temporal coverage: 1990 - 2006
Frequency of data collection: annual
Uncertainty Methodological uncertainty and data uncertainty
Data is collected by means of survey and there is uncertainty of data resulting from the methodology itself.
Future activities Short-term activities
− Definition of the national set of water indicators, including urban wastewater treatment.
a. Description of the activity − Regular updating of the indicator.
b. Required resources − Involvement of national expert from governmental institutions in the area of waters.
c. Status − continuous.
Deadline: within one year.
Long-term activities − Long-term activities will be defined by the work group.
1999 2000 2001 2002 2003 2004 2005 2006
Total public sewerage % of pop. 49,0 49,0 50,0 51,0 52,0 53,0 54,0 55,0
Mechanical treatment only % of pop. 5,0 5,0 5,5 5,5 5,5 6,5 7,0 8,0
Biological treatment % of pop. 4,5 4,5 6,0 6,0 6,0 6,0 6,5 7,0
Other sewage treatment % of pop. 0,5 0,5 0,5 0,5 0,5 0,5 0,5 0,5
Public sewerage without treatment % of pop. 39,0 39,0 38,0 39,0 40,0 40,0 40,0 39,5
No public sewerage or independent sewerage % of pop. 51,0 51,0 50,0 49,0 48,0 47,0 46,0 45,0
Of which with independent treatment % of pop. 25,0 24,0 23,0 22,0 21,0 20,0
Code Title of the indicator
Compliance with CSI/ЕЕА or other indicators
Classification by DPSIR Type Linkage
with area Frequency of publication
МK NI 024 Urban wastewater treatment
CSI 024 Urban waste water treatment
Р A water waste
Annually

ENVIRONMENTAL INDICATORS OF THE REPUBLIC OF MACEDONIA 169
MK NI 039 DRINKING WATER QUALITY
Period of indicator assessment September 2007 – April 2008
Explanation Justification for indicator selection
Drinking Water Directive (80/778/ЕЕС) and its amendment (98/83/ЕС which entered into force in 2003) aim to ensure that the water intended for human consumption is safe. It has to be free of any microorganism, parasite or substance that could potentially threaten human health. The Directive sets the minimum requirements for certain parameters. Member States are obliged to establish standards for such parameters which may not be more tolerant than those specified in the Directive and to perform monitoring of the quality of drinking water in accordance with such standards.
With reference to non-EU countries, like the Republic of Macedonia which is a candidate country for EU membership, the World Health Organization has set the priority that "all people, regardless of the level of their development and their social and economic conditions, shall have the right to an access to adequate supply of safe drinking water". In order to assist in the achievement of this goal, the WHO published the "Guidelines for Drinking Water Quality" (the last edition is the 3rd one) and the countries are obliged to achieve them in order to ensure health for their populations.
The monitoring of drinking water quality varies throughout Europe, candidate countries and newly independent states, so that some countries perform water monitoring at the points of its consumption (e.g. tap), others monitor the water at the source (the point of water extraction) or where the water leaves the distribution network.
In the Republic of Macedonia, the quality of the drinking water is performed at the point of water abstraction, at filtering stations, at different measuring points in the water supply network (start, middle and end) and at the most frequent points of water consumption for drinking purposes.
Consumption of contaminated drinking water containing thermo-tolerant coliform bacteria may cause water borne diseases, water associated diseases (leichmaniasis, schistosomiasis), water related diseases (malaria), diseases of dirty hands (faecal and oral diseases - hepatitis A) and diseases induced by inhalation (legionaries disease). Water may give rise to diseases involving contaminants from physico-chemical point of view and radiological pollutants.
Definition This indicator shows the exceedance of limit values set in Drinking Water Directive (80/778/ЕЕС) and its amendment (98/83/ЕС which entered into force in 2003) and in the Rulebook on drinking water safety (Official Gazette of the Republic of Macedonia No.57/04), as well as the
P
R
D
S
I

ENVIRONMENTAL INDICATORS OF THE REPUBLIC OF MACEDONIA 170
guideline values set for the quality of drinking water by the World Health Organization (WHO, 2004 and 2006).
Exceedance of drinking water quality limit values occurs when the concentration/dose of the pollutant exceeds the limit values specified in the above listed regulations.
Where more than one limit values exist (see the section on Policy goals), the indicator shall adopt the most strict case.
Units − Number of aerobic mesophilic bacteria in 1 ml,
− Number of coliform bacteria in 100 ml,
− Number of thermo-tolerant coliform bacteria in 100 ml, concentration of physico-chemical pollutants in mg/l,
− Parameters for radiological safety of drinking water in bekerels/l and total indicative dose in mSV/l.
Policy relevance of the indicator List of relevant policy documents:
The National Environmental Action Plan - 2 (2006) sets the improvement of the quality of drinking water through reduction of emissions of the main pollutants into surface and groundwaters as its main objective. The same document specifies the primary measure to be applied: to strengthen the processes of drinking water quality monitoring and assessment.
The 1999 National Environmental Health Action Plan (NEHAP) sets two main objectives:
− Reduction and minimization of health risks for the population through provision of drinking water for every citizen, which is safe from health point of view, sufficient in quantity, with guaranteed microbiological, organoleptical and physico-chemical composition, compliant with national standards and WHO Guidelines, as well as waters intended for sports and recreation and healthy food production;
− Reduction of exposure to toxic chemicals through water originating from agriculture and industry.
The NEHAP also sets the following priorities:
− approximation of the legislation on the quality of ambient and drinking waters with the recommendations of the EU (approximation completed in 2004) and with the WHO Guidelines (approximation with the 2006 Guidelines is in progress 2006);
− introduction of disincentive process for non-earmarked consumption of drinking water by commercial and non-commercial users and restrictive prices for the population in circumstances of draught for the purpose of consumption streamlining (implemented under the Law on Drinking Water Supply and Urban Wastewater Collection (Official Gazette of the Republic of Macedonia No.68/04 and 28/06));
− establishment of sanitary protection zones around water supply sources in order to prevent contamination of anthropogenic origin (permanent process performed and most of the public utilities have established zones in line with the Elaborates for sanitary protection zones developed by the Public Health Institution RIHP and other authorised vocational institutions);

ENVIRONMENTAL INDICATORS OF THE REPUBLIC OF MACEDONIA 171
− construction of municipal and industrial wastewater treatment systems (constructed and operational in Struga including Ohrid, in Resen, Dojran, Makedonski Brod, Kumanovo and Sveti Nikole, the last one currently out of operation);
− monitoring of the quality of surface and groundwaters, especially at drinking water abstraction, places intended for sports and recreation and points for abstraction of water for irrigation, monitoring of discharged untreated and treated municipal and industrial wastewaters in accordance with EU and WHO Guidelines (monitoring is performed regularly and continuously by the Public Health Institution Republic Institute for Health Protection (PHI RIHP) - Skopje and the 10 Regional PHI IHPs with their local units);
− introduction of drinking water fluoridation as the most efficient, the least costly and socially and medically most fair means for massive caries prophylaxis (delivered Project proposal for drinking water fluoridation, with Bitola as pilot Municipality, through the Ministry of Health).
Legal grounds
Under the Law on Health Protection (Official Gazette of the Republic of Macedonia No.38/91, 73/92, 46/93, 55/95, 17/97, 21/98, 9/00), Article 2, paragraph 1, health protection consists of measures, activities and procedures for health and environment preservation and improvement, the rights and the obligations exercised within the health insurance, as well as measures, activities and procedures undertaken by organizations in the area of health for the purpose of human health preservation and improvement, diseases prevention and control, injuries and other health related issues, early detection of diseases and health state, timely and efficient treatment and rehabilitation by application of expert medical measures, activities and procedures. The Law on Waters (Official Gazette of the Republic of Macedonia No. 4/98), in its Article 1, regulates the conditions and the manner of water use, protection against harmful effects of water, protection of waters against over-abstraction and pollution, water resources management, water sources management and financing of water management activity, awarding the water for use upon approval, concession, transboundary waters and other issues of relevance for the provision of unique water regime in the Republic of Macedonia.
The Programme for preventive health protection in the Republic of Macedonia for 2006 (Official Gazette of the Republic of Macedonia No.31/06) specifies: the measures, tasks and activities envisaged in the Programme for implementation of the Institutes for Health Protection in cooperation with the Republic Institute for Health Protection, also provide for application of provisions contained in a number of laws regulating issues of monitoring, research and study of the health status of the population, the reasons for appearance and spread of communicable and other diseases of social and health relevance, as well as impacts of environmental factors on human health, proposal and undertaking measures for the purpose of protection and improvement of human health.
The Law on Drinking Water Supply and Urban Wastewater Collection (Official Gazette of the Republic of Macedonia No.68/04 and 28/06), in its Article 1, regulates the conditions and the manner of drinking water supply, termination of drinking water supply and urban waste water discharges into recipient through sewerage and water supply systems, respectively, construction, maintenance, protection and connection to water supply and sewerage systems, relationships between service provider and user, as well as supervision over the implementation Decree on Water Classification (Official Gazette of the Republic of Macedonia No.18/99), in its Article 2, specifies five classes of surface watercourses, lakes and
ENVIRONMENTAL INDICATORS OF THE REPUBLIC OF MACEDONIA 172
accumulations and ground water resources. The Law on Food and Foodstuffs and Materials in Contact with Food (Official Gazette of the Republic of Macedonia No.54/02), in its Article 1 specifies that the Law regulates the conditions for provision of safe food and safe foodstuffs and materials in contact with food, production and trade, rights and obligations of natural and legal persons processing food or performing trade in food in order to protect human health, to protect consumers from misleading and to enable free trade in the internal and external markets. Article 2, item 1 specifies that food is any substance intended for human use through nutrition and drinking, as well as any ingredient used for production, processing and preparation of food. Food also includes drinking water from public water supply systems, intended for the market, and water intended for food
The control over the drinking water safety and the frequency of monitoring are prescribed by the Rulebook on drinking water safety (Official Gazette of the Republic of Macedonia No. 57/04).
In the Law on Nature Protection (Official Gazette of the Republic of Macedonia No.67/04), one of the main goals defined in Article 4, item 6 of the Law is the securing of the right of citizens to a healthy environment.
For the purpose of protecting the sources of drinking water, the National Council for Health and Social Policy adopted the Rulebook on the manner of establishment and maintenance of protection zones around drinking water sources (Official Gazette of SRM No.17/83).
The following EU Directives have been transposed in the new Rulebook:
Drinking Water Directive (80/778/ЕЕС) and its amendment (98/83/ЕС which entered into force in 2003).
Targets The Rulebook on drinking water safety (Official Gazette of the Republic of Macedonia No 57/04), specifies the limit values for the parameters monitored in drinking water in terms of human health protection.
Limit values of concentrations of certain parameters in drinking water − According to the said Rulebook, limit values have been specified for the purpose of
human health protection, harmonized with the EU Directive and WHO Guidelines on the quality of drinking water (2004).
Key policy issue What progress has been made in reducing the concentrations of pollutants in urban and rural environments in order to reach drinking water limit values specified in the Rulebook

ENVIRONMENTAL INDICATORS OF THE REPUBLIC OF MACEDONIA 173
Key message Bacteriological contamination of drinking water in rural environments, where no regular disinfection of drinking water is carried out in local water supply systems.
Drinking water quality
Analysis of data from water supply in rural settlements shows that sanitary and hygienic safety of analyzed samples of drinking water are generally satisfactory, i.e. within the expected results, compared to the previous years. The most frequent reason for unsafe findings in physico-chemical analysis is the absence of residual chlorine or increased content of iron in raw water, but not in the water supply network. The water in the water supply system in Sveti Nikole was banned for consumption due to increased content of aluminium and trihalomethanes (ban issued in 2003, still in effect).
Analysis of the results on health safety of drinking water in the period 2001 - 2006 shows that the percentage of unsafe samples according to physico-chemical analysis is in the range between 4.2 and 7.5%, and the percentage of unsafe samples according to microbiological analysis is in the range between 0.8 and 1.5%.
Analysis of data from water supply in rural settlements in 2006 showed that sanitary and hygienic state of facilities and health safety of analyzed drinking water samples was satisfactory in general, i.e. within the limits of expected results, compared to previous years. The most frequent reason for unsafe findings in physico-chemical analysis is the absence of residual chlorine or increased content of iron in raw water and in very low percentage it is the increased content of nitrites from digged or drilled wells of individual users.
The evaluation of data contained in the reports of the Institutes for Health Protection on rural populated places leads to the conclusion of the following state:
− Around 218.995 inhabitants are connected to urban water supply systems, and thus the state of maintenance of the water supply facilities and drinking water quality corresponds with the status of cities where those are connected. With reference to physico-chemical analysis, 9.53% unsafe samples have been found, while 3% have been unsafe in bacteriological analysis.
− 476.059 inhabitants are supplied with drinking water from water supply systems in rural settlements using their own springs and managing the facilities by themselves. 21% of the analyzed samples have been unsafe with regard to physico-chemical parameters, mostly due to the lack of residual chlorium, while 25% of analyzed data have been bacteriologically unsafe.
− Local water supply facilities (wells, pumps, rural taps, springs) are still used as main source of drinking water for around 128.102 inhabitants. 32.9% of the analyzed samples have been unsafe with regard to physico-chemical parameters, mostly due to the lack of residual chlorium, while 34% of analyzed data have been bacteriologically unsafe.

ENVIRONMENTAL INDICATORS OF THE REPUBLIC OF MACEDONIA 174
Assessment Quality of drinking water
The current control measures, frequency of monitoring and standards applicable to drinking water quality and safety in urban areas in the Republic of Macedonia are in accordance with EU regulations and with the WHO Guidelines on drinking water quality. Almost entire carstic and surface water, as well as significant quantities of well water, is of low fluoride content (which is a caries protective factor and therefore fluoridation of water intended for drinking has been proposed), with an average of 0.1 mg/l. Some wells of raw drinking water in Veles, Stip and Kocani have relatively high content of iron and manganese and therefore water filtering stations have been built and thus treated water is absolutely meeting the legal standards. Toxic parameters are also compliant with legal standards.
In the segment of health safe drinking water supply in rural populated places, the deficiencies in terms of undefined sanitary protection zones around drinking water sources, lack of adequate equipment fro drinking water filtering and disinfection and inappropriate technical maintenance, have been constantly present. Therefore, there is high percentage of bacteriologically unsafe samples from local water supply facilities (25%).
The access to safe drinking water in the Republic of Macedonia has reached 93% (period 2003 - 2006), with a remark that the access to safe drinking water for urban population is 99%, and in rural settlements 78% of the population consumes health safe drinking water, while the rest are exposed to occasional risk of bacteriological contamination of drinking water.
4,2
5,3
7,5
5,6 5,6
3,8
1,3 1,5
0,8 0,8 0,81,4
0
1
2
3
4
5
6
7
8
2001 2002 2003 2004 2005 2006
%
Drinking water quality in percentage
Physico‐chemical % Improper Microbiological % Improper

ENVIRONMENTAL INDICATORS OF THE REPUBLIC OF MACEDONIA 175
Methodology Methodology for the indicator calculation
Drinking water quality
The 10 Regional Institutes for Health Protection in Skopje, Kumanovo, Veles, Stip, Kocani, Strumica, Prilep, Bitola, Ohrid and Tetovo, through their hygiene-epidemiological stations in cooperation with the PHI Republic Institute for Health Protection – Skopje, carry out regular and continuous monitoring of drinking water quality in line with the number of monitoring points and frequency defined in the Rulebook on drinking water safety (Official Gazette of the Republic of Macedonia No.57/04). The Institutes perform basic physico-chemical and bacteriological analysis of drinking water samples, while the PHI Republic Institute for Health Protection carries out surveillance over periodical physico-chemical analysis, analysis of pesticide residues, analysis of contaminants, parasitological and radiological analysis.
Data specification
Data coverage (by years): Table 1: Drinking water quality in percentage
Title of the indicator Source Reporting obligation
Drinking water quality
− HP – 10 Regional
− RIHP
− European Environmental Agency
− Exchange of data on drinking water quality, based on the Council decision on the establishment of reciprocal exchange of information and data on drinking water quality (98/83/EC).
− World Health Organization - ENHIS
− Drinking water quality, in line with the WHO Guidelines on drinking water quality of 1987 and 2004, respectively. .
Code Title of the indicator
Compliance with CSI/ЕЕА or other
indicators
Classification by DPSIR Type Linkage with
area Frequency of publication
MK NI 039 Drinking water quality WEU13
Drinking water quality
S А Water quality Annually

ENVIRONMENTAL INDICATORS OF THE REPUBLIC OF MACEDONIA 176
Temporal coverage: 2001 – 2006
Frequency of data collection: Data from PHI Institutes for Health Protection in Skopje, Kumanovo, Veles, Stip, Kocani, Strumica, Prilep, Bitola, Ohrid and Tetovo, on drinking water quality, is received once per year, via mail, in the PHI Republic Institute for Health Protection - Skopje.
Uncertainty Methodological uncertainty
Generally, data is representative for the entire urban environment in the Republic of Macedonia. The indicator is subject of changes from year to year, depending on the introduction of new stations for drinking water filtering and in line with the rising trend of connection of rural population to safe drinking water supply.
Data uncertainty
Generally, data is representative for the entire urban environment in the Republic of Macedonia. The representation by choice of monitoring is in accordance with the requirements of the EU Directive 98/83/EC.
Future activities Short-term activities
− Finalized definition of the national set of water indicators. a. Description of the activity
− Establishment of Work Group for the national set of drinking water quality indicators to comply with the ISO standards.
b. Required resources − Engagement of national experts from governmental institutions in the area of drinking
water quality. c. Status
− Early initiative Deadline: one year.
Physico-chemically % unsafe
Microbiologically % unsafe
2001 4,2 1,3
2002 5,30 1,50 2003 7,50 0,80 2004 5,60 0,80
2005 5,60 0,80
2006 3,80 1,40
ENVIRONMENTAL INDICATORS OF THE REPUBLIC OF MACEDONIA 177
МК - NI 040 IRRIGATED LAND
Period of indicator assessment September 2007 – April 2008
Explanation Justification for indicator selection
Monitoring of the efficiency of the use of water for irrigation of agricultural land at national and local levels is an important factor in the establishment of the water abstraction rate, which is an objective for sustainable and long-term policy under the policy objective under the EU's Sixth Environment Action Programme (2001-2010).
The indicator shows how the overall water abstraction makes pressure
Definition The indicator tracks the trend in irrigated areas in a given time interval on the whole territory of the Republic of Macedonia, as well as total quantities of consumed water on the entire territory and proportion of irrigated land compared to the total cultivable land area.
Units − Area of irrigated land (expressed in hectares), quantity of water used for irrigation
expressed in cubic meters consumed at annual level, % of irrigated land in the total cultivable land area.
List of relevant policy documents:
The National Environmental Action Plan - 2 and Environmental Monitoring Strategy and Data Management Strategy.
The policy for sustainable use of water resources based on the Sixth Environmental Action Programme and Framework Water Directive requirements.
Legal grounds
The Law on Waters prescribes maintenance and improvement of water regime and sustainable use of available water quantities in accordance with the Water Master Plan of the Macedonia. The Water Master Plan is implemented by issuance of permits for water management or awarding of concessions for water use, which specify the manner and the conditions for water use, the operation regime while managing the water resources or other facilities and plants making impact on water regime, the manner and the conditions for discharging water, waste water and waste substances and the required degree of waste water treatment.
The Law specifies that the maintenance and improvement of water regime is carried out on the
P
R
D
S
I

ENVIRONMENTAL INDICATORS OF THE REPUBLIC OF MACEDONIA 178
basis of River Basins Management Plans. Such Plans contain the environmental protection goals, good status of surface water bodies (good quantitative status and chemical status). River Basins Management Plans will be implemented through issuance of permits for water use, permits for extraction of sand, gravel and stone and permits for water discharges specifying quantitative and qualitative requirements in each case individually.
Use of water for different purposes is specified under the Decree on Water Classification, according to which water is divided into five different classes based on the level of pollution, while water characteristics are determined on the basis of classes and purposes for which water can be used.
Targets No specific targets.
Key policy issue Is the water abstraction based on water sustainability?
Key message An uneven trend in water use for land irrigation was observed in the period between 2001 – 2006, due to weather conditions in the given year, as well as to organizational restructuring of the sector. Particular increase was recorded in 2003.
Data is not part of the official statistics published in the country.
0
50.000
100.000
150.000
200.000
250.000
2001 2002 2003 2004 2005 2006
thou
sand
m3
Use of water resources
Annual consumption of water for irrigation

ENVIRONMENTAL INDICATORS OF THE REPUBLIC OF MACEDONIA 179
0
5.000
10.000
15.000
20.000
25.000
30.000
35.000
2001 2002 2003 2004 2005 2006
ha
year
Total irrigated land area
4,69 4,33 3,91 1,24 3,62 3,920%10%20%30%40%50%60%70%80%90%
100%
2001 2002 2003 2004 2005 2006
%
year
Percentage of irrigated land area compared to the total cultivable land area
Total irrigated area Total cultivable area

ENVIRONMENTAL INDICATORS OF THE REPUBLIC OF MACEDONIA 180
Assessment An uneven trend in water use for land irrigation was observed in the period between 2001 – 2006. There is an interesting data that the quantity of water consumed by this sector in 2004 was significantly lower compared to the entire successive interval. This is due to the favorable weather conditions in 2004, when increased number of precipitation and increased water masses were noted. Table 4 presents the percentage of irrigated land area compared to the entire cultivable land area in the Republic of Macedonia, showing that the percentage is really low with the average being below 5% for the entire time interval.
Methodology Methodology for the indicator calculation
Data is collected and processed by years.
Data specification
Data coverage (by years): Table 1: Use of water resources
Table 2: Area of irrigated land
Table 3: Total cultivable land
Table 4: Percentage of irrigated area compared to total cultivable area
Title of the indicator Source Reporting obligation
Irrigated land − State Statistical Office − OECD/EUROSTAT
2001 2002 2003 2004 2005 2006
Annual consumption of water for irriga-tion (thousand m3) 157 847 121 186 211 569 147 500 159 494 147 294
h/y 2001 2002 2003 2004 2005 2006
Total irrigated land area, hectares 28 722 25 019 22 267 6 967 19 787 21 038
h/y 2001 2002 2003 2004 2005 2006
Total cultivable land area, hectares 612 000 577 000 569 000 560 000 546 000 537 000
2001 2002 2003 2004 2005 2006
% 4,69 4,33 3,91 1,244 3,62 3,92

ENVIRONMENTAL INDICATORS OF THE REPUBLIC OF MACEDONIA 181
General metadata
Geographical coverage: Republic of Macedonia
Temporal coverage: 2001 - 2006
Frequency of data collection: Collection of annual data.
Note: Data is available for some sectors only.
Future activities Short-term activities
− Definition of the national set of water indicators
a. Description of the activity − Regular updating of the indicator
b. Required resources − Involvement of national expert from governmental institutions in the area of waters
c. Status − continuous
Deadline: one year
Long-term activities − Long-term activities will be defined by the work group.
Code Title of the indicator
Compliance with CSI/ЕЕА or other indicators
Classification by DPSIR Тype Linkage with
area Frequency of publication
MK NI 040 Irrigated land WQ4 Irrigated
land D A Water Annually


ENVIRONMENTAL INDICATORS OF THE REPUBLIC OF MACEDONIA 184
MK - NI 025 GROSS NUTRIENT BALANCES
Period of indicator assessment September 2007 – April 2008
Explanation Justification for indicator selection
The balance of mineral matters enables to understand the links between nutrients used in agriculture, changes in the environment and sustainable use of soil nutrient resources. Constant surplus in mineral matters indicates potential environmental problem, while constant deficit indicates potential problem in sustainable agriculture, i.e. poses the risk of reducing the nutrients in the soil. The main determinant is the absolute value of mineral suficit/deficit related to local practice of mineral matters management in agriculture and agroecological conditions, such as soil types and weather events (rain falls, vegetation periods, etc.).
Gross nitrogen balance provides indication of the possible water contamination and identifies agricultural systems, i.e. areas loaded with excessive amounts of nitrogen.
Definition The nutrient balance or nitrogen balance establishes the link between nutrients used in agriculture and changes in the quality of the environment, in order to achieve sustainable use of soil nutrients in terms of their input and output.
The indicator estimates the potential surplus of nitrogen on agricultural land. This is done by calculating the balance between nitrogen added to a hectare agricultural land. The indicator accounts for all inputs to and outputs from the farm. The inputs consist of the amount of nitrogen applied via mineral fertilisers and animal manure as well as nitrogen fixation by legumes, deposition from the air, and some other minor sources. Nitrogen output is contained in the harvested crops, or grass and crops eaten by livestock. Uncontrolled escape of nitrogen to the atmosphere, e.g. as N2O from agriculture is difficult to estimate and therefore not taken into account.
Units − The gross nitrogen balance is expressed in (kgN/year) per hectare (ha).
Policy relevance of the indicator The gross nitrogen balance is an issue regulated by the Framework Law on Waters, which is in a phase of adoption in our country, incorporating the requirements of Nitrates Directive (91/676/ЕС) and Framework Water Directive (2000/60/ЕС). The Nitrates Directive is aimed at reducing and preventing in future the water pollution by nitrates from agricultural sources. This Directive restricts the application of manure at 170 kg N/ha/year. The goal of the Framework Water Directive is the achievement of good ecological status of surface and ground waters in
P
R
D
S
I

ENVIRONMENTAL INDICATORS OF THE REPUBLIC OF MACEDONIA 185
terms of quality of biological communities, hydrological characteristics and chemical characteristics.
List of relevant policy documents
The National Environmental Action Plan 2 (NEAP 2) specifies the measures for ratinal use of natural resources, as well as controlled use of pesticides, i.e. plant protection products, as well as the measure for establishment of soil monitoring and information system to monitor the status of pesticides consumption.
Legal grounds
The Law on Agricultural Land, in its Articles 9 and 10, specifies the measures for improved agricultural land fertility through application of agro-technical measures, hydro-amelioration, agramelioration and anti-errosion measures. Article 36 of the Law specifies that, for the purpose of agricultural land protection against pollution and contamination, the provisions contained in the regulations on environment and nature protection and improvement shall apply accordingly.
The Law on Nature Protection, in its Article 4, specifies the goals of protection, including preservation and recovery of existing biological and landscape diversity in a state of natural balance and prevention of harmful activities and nature disruption.
The Law on Environment, in its Article 8, promotes the principle of sustainable development, meaning that, when undertaking or performing any activity, rationale and sustainable use of natural resources shall be taken into account, thus meeting the needs for healthy environment, as well as social and economic needs of present generations, without jeopardizing the rights of future generations to meet their own needs.
Targets No specific targets.
Key policy issue Has the impact of agriculture on the environment improved?
Key message In the period from 2000 to 2001, significant rise in gross nitrogen balance was tracked, followed by a period of stagnation, to note rapid drop in the period from 2002 to 2003 and further slight fall in the gross nitrogen balance expressed both in thousand tonnes and kilograms nitrogen per hectare agricultural land (kgN/ha). Constant suficit in nitrogen balance indicates potential environmental problems, while constant deficit indicates potential risk of reduced nutrients in the soil.

ENVIRONMENTAL INDICATORS OF THE REPUBLIC OF MACEDONIA 186
Methodology Methodology for the indicator calculation
Methodology for the indicator calculation has been taken from OECD/Eurostat national nutrient balances, which takes into account all input and output matters in the farm.
Input nitrogen matters consist of:
1. Total amount of applied fertilizers
− Inorganic fertilizers
− Organic fertilizers (manure excluded)
2. Manure
3. Nitrogen fixation by legumes
4. Deposition from the air
5. Other minor sources (semen and other reproductive material)
Output nitrogen matters include:
1. Harvested crops placed on the market, including also forage crops
2. Grass and crops eaten by livestock
Uncontrolled escape of nitrogen to the atmosphere in a form of N2O from agriculture is difficult to estimate and therefore not taken into account.
Source of applied methodology
OECD/Eurostat Gross Nitrogen Balances Handbook (12/2003)
0
2
4
6
8
10
12
0
1000
2000
3000
4000
5000
6000
7000
8000
9000
2000 2001 2002 2003 2004
Kg N/ha uaa
N balance (t)
Gross nitrogen balance in thousand tones and kgN/ha agricultural land
Nitrogen balance (000 tonnes) kgN/ha agricultural land area

ENVIRONMENTAL INDICATORS OF THE REPUBLIC OF MACEDONIA 187
Data specification
Data coverage (by years): Table 1: Gross nitrogen balance expressed in thousands tones and kgN/ha agricultural land in the period 2000 - 2004
Table 2: Nitrogen input in agriculture, 2000 - 2004
Table 3: Nitrogen output from agriculture, 2000 - 2004
General metadata
Geographical coverage: Republic of Macedonia
Temporal coverage: 2000 - 2004
Frequency of data collection: annually
Title of the indicator Source Reporting obligation
Gross nutrient balance
− Statistical Yearbook 2005, State Statistical Office
− Calculation of the gross nitrogen balance was made by the Faculty of Agricultural Science and Food, University of “St. Cyril and Methodius”, Skopje
2000 2001 2002 2003 2004
Nitrogen balance (000 tonnes) 4117 7956 7978 3111 2053
kgN/ha agricultural land area 5,33 10,12 10,11 3,96 2,66
Nitrogen input in thousands tones 2000 2001 2002 2003 2004
Via mineral fertilizers 11798 17289 18716 12999 15072
Via manure 13846 13385 13117 13097 13234
Biologically fixated nitrogen 2094 2160 1783 2232 2214
Total 27738 32834 33616 28328 30520
Nitrogen output in thousands tones 2000 2001 2002 2003 2004 Contribution by market non-forage and forage crops 8571 7381 7894 7124 9916
Contribution by non-market forage crops and pastures (harvested- grazed) 15050 17498 17745 18103 18551
Total 23621 24878 25638 25217 28467
Code Title of the indicator
Compliance with CSI/ЕЕА or other indicators
Classification by DPSIR Type Linkage with
area Frequency of publication
MK NI 025 Gross nutrient balance
CSI 025 Gross nutrient balance
P A agriculture water
3 - annually

ENVIRONMENTAL INDICATORS OF THE REPUBLIC OF MACEDONIA 188
Uncertainty Methodological uncertainty
Data used in the calculation of this indicator has been partially based on estimates by experts, using harmonized methodology which might not always reflect specific circumstances in our country, Certain coefficients used in calculations differ significantly from country to country. Data on nitrogen input is considered more adequate and more comprehensive than on the output. Uncertainty is present with regard to harvested forage crops, as well as grass crops eaten by livestock.
Based on the above, data on gross nitrogen balance in our country should be taken with certain extent of precaution.
Uncertainty of data sets
Data on the amounts of applied manure are accompanied by certain extent of uncertainty, and statistical data on semen and other reproductive material, as well as data on grass crops eaten by livestock, i.e. those that are not placed on the market, should be taken by certain extent of uncertainty, too.
Future activities Short-term activities
− Establishment of Work Group with a task to define, elaborate and develop the indicator in full..
a. Description of the activity − Definition, elaboration and full development of the indicator..
b. Required resources − Experts in the area of environment, agriculture and other relevant fields.
c. Status − In progress
Deadline: June 2008
Long-term activities
Long-term activities are to be defined by the Work Group.
ENVIRONMENTAL INDICATORS OF THE REPUBLIC OF MACEDONIA 189
MK - NI 026 AREAS UNDER ORGANIC FARMING
Period of indicator assessment September 2007 – April 2008
Explanation Justification for indicator selection
The need to select this indicator is related to the specific nature of organic farming which is distinct from other manners of farming in the application of certain standards, production rules, certification procedures, specific labeling, as well as products placement on specific market. Farming is considered organic if it complies with the Law on Organic Farming and regulations that are in a process of adoption. The provisions of this Law have been harmonized with international and European ones, especially with EU Regulation No.2092/91, because of the future development of trade exchange of organic products with European countries. Organic farming has been developed in order to be sustainable from environmental point of view, while observing clearly verified rules.
Definition Organic agriculture is a production system reducing or eliminating the use of GMOs and input of synthetic chemicals such as synthetic chemical fertilizers, pesticides, hormones and growth regulators in agriculture. Instead, the use of good practices in the agro-ecosystem management for crop and livestock production is promoted. Organic farming differs from conventional in the application of production rules, labelling schemes and certificates.
The indicator is calculated as share (percentage) of area under organic farming (sum of existing areas under organic farming and areas in a process of conversion for organic farming) in the total area or total cultivable land area.
Units The indicator is presented as sum of area under organic farming and area being converted for organic farming, measured in ha. Share of organic farming is given as a percentage of total utilized agricultural area.
Policy relevance of the indicator Legal grounds
The framework for the organic farming is established by the Law on Organic Farming and regulations which are in a process of adoption. The provisions of this Law have been harmonized with international and European ones, especially with EU Regulation No.2092/91, which is of particular importance in the context of future development of trade exchange in organic products with European countries. Officially, the organic (ecological or biological) farming started in 2005 under the Programme for encouraging and development of organic agricultural production for 2005.
P
R
D
S
I

ENVIRONMENTAL INDICATORS OF THE REPUBLIC OF MACEDONIA 190
Targets No specific targets have been set.
Key policy issue Which are the key trends in agricultural production systems from environmental point of view?
Key message In 2005, the share of the area under organic farming in the Republic of Macedonia amounted 0.049% and 0.060% area under conversion in the total cultivable land. Out of the total agricultural land area, 0.127% of the area was used for organic farming, including also forest areas, pastures and uncultivated land and 0.027% area under conversion.
Methodology Methodology for the indicator calculation
The indicator is presented as sum of area under organic farming and area being converted for organic farming, divided by the total cultivable land area or total agricultural area. This value is multiplied by 100 in order to present the value in percentage.
Source of applied methodology
The method of the European Environmental Agency.
total in ha as % of total utilized agricultural area Total utilized agricultural area 545.514,00 100%
Utilized organic area 266,00 0,049%
Area in a process of conversion 326,54 0,060%
total in ha as % of total utilized agricultural area Agricultural area 1.229.150,00 100%
Utilized agricultural area + Forest organic area, pastures, uncultivated land
1.566,00 0,127%
Area in a process of conversion 326,54 0,027%

ENVIRONMENTAL INDICATORS OF THE REPUBLIC OF MACEDONIA 191
Data specification
Data coverage (by years): Table 1: Total utilized agricultural area and total agricultural area in 2005
Table 2: Areas under organic farming in 2005
General metadata
Geographical coverage: Republic of Macedonia
Temporal coverage: 2005
Frequency of data collection: annually
Uncertainty Methodological uncertainty
Impossibility to observe the trend due to the lack of data for several years.
Future activities Short-term activities
− Establishment of Work Group with a task to define, elaborate and develop the indicator in full..
a. Description of the activity − Definition, elaboration and full development of the indicator..
Title of the indicator Source Reporting obligation
Areas under organic farming
− State Statistical Office
− Ministry of Agriculture, Forestry and Water Economy, Division of Organic farming.
Utilized agricultural area in ha Total agricultural area in ha
545 514 1 229 150
Production areas under organic farming in ha
Forest land areas, pastures, uncultivated organic land in ha
Area under conversion in ha
266 1 300 326,54
Code Title of the indicator
Compliance with CSI/ЕЕА or other
indicators
Classification by DPSIR Type Linkage with
area Frequency of publication
MK NI 026
Area under organic farming
CSI 026 IRENA 07
Area under organic farming
R A agriculture biological diversity
Annually

ENVIRONMENTAL INDICATORS OF THE REPUBLIC OF MACEDONIA 192
b. Required resources − Experts in the area of environment, agriculture and other relevant fields.
c. Status − In progress
Deadline: June 2008
Long-term activities − Long-term activities are to be defined by the Work Group.

ENVIRONMENTAL INDICATORS OF THE REPUBLIC OF MACEDONIA 193
MK - NI 08 MINERAL FERTILIZER CONSUMPTION
Period of indicator assessment September 2007 – April 2008
Explanation Justification for indicator selection
The Second National Environmental Action Plan (NEAP 2) specifies the measure for rationale use of natural resources, as well as controlled use of mineral fertilizers.
Definition Mineral fertilizers are substances containing chemical elements required for plants growth, especially nitrogen, phosphorus and potassium.
This indicator shows the consumption of mineral fertilizers in the Republic of Macedonia, by presenting total amounts in tonnes consumed substances, and their application per hectare cultivated land area.
Units − Total amounts in tonnes consumed mineral fertilizers, and their application per
hectare cultivated land area (kg/ha).
Policy relevance of the indicator List of relevant policy documents:
The Second National Environmental Action Plan (NEAP 2) specifies the measure for rationale use of natural resources, as well as controlled use of mineral fertilizers. The same document also specifies the measure for establishment of monitoring and information system for soil, to monitor the mineral fertilizers consumption.
Legal grounds
The Law on Agricultural Land in its Articles 9 and 10 specifies the measures for improved agricultural land fertility through undertaking of agrotechnical measures, one of them being fertilizers application. Article 31 concerning agricultural land protection against pollution and contamination specifies that the protection of agricultural land against pollution and contamination is performed by prohibition, restriction and prevention of direct input of harmful matters in soil, input of harmful matters through water and air and undertaking of other measures for its productivity maintenance and improvement. Article 36 of the Law specifies that, for the purpose of agricultural land protection against pollution and contamination, the provisions contained in the regulations on environment and nature protection and improvement shall apply accordingly.
P
R
D
S
I

ENVIRONMENTAL INDICATORS OF THE REPUBLIC OF MACEDONIA 194
The Law on Nature Protection, in its Article 4, specifies the goals of protection, including preservation and recovery of existing biological and landscape diversity in a state of natural balance and prevention of harmful activities and nature disruption.
Targets No specific targets.
Key policy issue Has the impact of agriculture on the environment improved?
Key message Mineral fertilizer consumption in agriculture noted a falling trend in the period from 2000 to 2005. Consumption of nitrogen mineral fertilizers dropped by 29.8%. Consumption of potassium fertilizers dropped by 92.3%. Consumption of combined mineral fertilizers dropped by 53%, while the total consumption of mineral fertilizers dropped by 39.7%. Consumption of phosphorus fertilizers only increased by 31%.
Assessment It is difficult to connect the reduction in mineral fertilizers consumption directly with the impact on the quality of the environment. The ultimate effect on the quality of environment depends to a great extent on other factors, such as use of organic fertilizer, yield from crops, soil types, management of agricultural farms, etc.
Methodology Methodology for the indicator calculation
Consumption of individual groups of mineral fertilizers as combined mineral fertilizers, nitrogen fertilizers, phosphorous fertilizers, potassium fertilizers, as well as total mineral fertilizers per
02.0004.0006.0008.000
10.00012.00014.00016.00018.000
2000 2001 2002 2003 2004 2005
tonn
es
Mineral fertilizers consumed
Combined mineral fertilizers Nitrogen fertilizers Phosphorous fertilizers
Potassium fertilizers Total mineral fertilizers

ENVIRONMENTAL INDICATORS OF THE REPUBLIC OF MACEDONIA 195
hectare utilized agricultural area is obtained by dividing the total quantity of consumed group of mineral fertilizers in kg by the total utilized agricultural area presented in ha.
Data specification
Data coverage (by years): Table 1: Mineral fertilizers consumption, 2000 - 2005 (in tonnes)
Table 2: Total utilized agricultural area in thousand hectares (ha), 2000 - 2005
Table 3: Mineral fertilizers consumed per utilized agricultural area (kg/ha)
General meta data
Geographical coverage: Republic of Macedonia
Temporal coverage: 2000-2005
Frequency of data collection: annually
Title of the indicator Source Reporting obligation
Mineral fertilizer consumption
− Statistical Yearbook, 2006, State Statistical Office
Year Combined mineral fertilizers
Nitrogen fertilizers
Phosphorous fertilizers
Potassium fertilizers
Total mineral fertilizers
2000 7409 8833 161 13 16416
2001 4732 4625 515 81 9953
2002 2536 7386 618 53 10593
2003 3588 6250 234 2 10074
2004 3498 6217 213 3 9931
2005 3488 6200 211 1 9900
2000 2001 2002 2003 2004 2005
Total utilized agricultural area in thousand ha 598 612 577 569 560 546
2000 2001 2002 2003 2004 2005
Mineral fertilizers consumed per utilized agricultural area (kg/ha)
27,45 16,26 18,35 17,7 17,73 18,13
Code Title of the indicator
Compliance with CSI/ЕЕА or other indicators
Classification by DPSIR Тype Linkage
with area
Frequency of
publication
MK NI 08 Mineral fertilizer consumption
IRENA 08 Mineral fertilizer consumption
D Agriculture Annually

ENVIRONMENTAL INDICATORS OF THE REPUBLIC OF MACEDONIA 196
Uncertainty Uncertainty of data
Data on the quantity of consumed mineral fertilizers contains certain extent of uncertainty, especially when originating from private sector. Some of the values have been obtained by estimation.
Future activities Short-term activities
− Establishment of Work Group with a task to define, elaborate and develop the indicator in full.
a. Description of the activity − Definition, elaboration and full development of the indicator.
b. Required resources − Experts in the area of environment, agriculture and other relevant fields.
c. Status − In progress.
Deadline: June 2008
Long-term activities − Long-term activities are to be defined by the Work Group

ENVIRONMENTAL INDICATORS OF THE REPUBLIC OF MACEDONIA 197
MK - NI 09
CONSUMPTION OF PESTICIDES
Period of indicator assessment September 2007 – April 2008
Explanation Justification for indicator selection
In order to preserve and revive the existing biological diversity in a state of natural balance and prevent harmful activities in agriculture that may result in disruption in nature, it is necessary to monitor the application of plants protection products.
Definition Plants protection products or pesticides are chemical substances which restrain diseases and pests in plants. This indicator shows the quantities of pesticides used for plants protection, such as fungicides, herbicides, insecticides and category of total including, apart from the mentioned ones, other plant protection products.
Units − Total quantities of used substances in tones, share of different groups of pesticides,
as well as their application per hectare utilized agricultural area (kg/ha).
Policy relevance of the indicator List of relevant policy documents:
The Second National Environmental Action Plan (NEAP 2) specifies the measure for rationale use of natural resources, as well as controlled use of pesticides, i.e. plant protection products. The same document also specifies the measure for establishment of monitoring and information system for soil, to monitor the pesticides consumption.
Legal grounds
The Law on Agricultural Land in its Articles 9 and 10 specifies the measures for improved agricultural land fertility through undertaking of agro-technical measures, hydro-amelioration, agramelioration and anti-errosion measures. One of the agrotechnical measures is control of weeds, diseases and pests. Article 31 concerning agricultural land protection against pollution and contamination specifies that the protection of agricultural land against pollution and contamination is performed by prohibition, restriction and prevention of direct input of harmful matters in soil, input of harmful matters through water and air and undertaking of other measures for its productivity maintenance and improvement. Article 36 of the Law specifies that, for the purpose of agricultural land protection against pollution and contamination, the provisions contained in the regulations on environment and nature protection and improvement shall apply accordingly.
P
R
D
S
I

ENVIRONMENTAL INDICATORS OF THE REPUBLIC OF MACEDONIA 198
The Law on Nature Protection, in its Article 4, specifies the goals of protection, including preservation and recovery of existing biological and landscape diversity in a state of natural balance and prevention of harmful activities and nature disruption.
The Law on Plants Protection, in its Article 1, regulates the protection of plants against diseases, pests and weeds, as well as use of plant protection products. Article 38 specifies that producers of plant protection products are obliged to keep records of quantities of products produced and released for trade, while legal persons importing such products from foreign producers are obliged to keep records of quantities of products imported and released for trade in the Republic of Macedonia.
Targets No specific targets.
Key policy issue Has the impact of agriculture on the environment improved?
Key message Application of pesticides in agriculture, including all plant protection products, like fungicides, herbicides, insecticides and total quantity shows a trend of slight reduction in quantity consumed in the Republic of Macedonia in the period between 2000 and 2005, with an exception of 2001 when increase in quantities consumed was recorded. In terms of share of pesticides in 2005, the highest quantity consumed was of fungicides by 67%, followed by insecticides with 11% and herbicides with 22%.
0
50
100
150
200
250
300
350
2000 2001 2002 2003 2004 2005
tonn
es
Pesticides consumed
Total* Fungicides Herbicides Insecticides

ENVIRONMENTAL INDICATORS OF THE REPUBLIC OF MACEDONIA 199
Methodology Methodology for the indicator calculation
The share of different pesticide groups as fungicides, herbicides and insecticides is obtained when the quantity of each group is divided by the total quantity of consumed pesticides, and then the value obtained is multiplied by 100. The application of individual group per hectare utilized agricultural area is obtained when the total quantity of consumed pesticides expressed in kg is divided by the total utilized agricultural area in the Republic of Macedonia expressed in ha.
Data specification
Data coverage (by years): Table 1: Total utilized agricultural area in thousand hectares (ha), 2000 - 2005
Title of the indicator Source Reporting obligation
Consumption of pesticides
− Statistical Yearbook, 2006, State Statistical Office
2000 2001 2002 2003 2004 2005
Total utilized agricultural area in thousand ha 598 612 577 569 560 546
Fungicides66,4%
Herbicides22,1%
Insecticides11,4%
Share of individual pesticides consumed in 2005
Fungicides Herbicides Insecticides

ENVIRONMENTAL INDICATORS OF THE REPUBLIC OF MACEDONIA 200
Table 2: Consumed pesticides, 2000 - 2005
*The category “total”, apart from recorded fungicides, herbicides and insecticides, covers other pesticides as well
Table 3: Total pesticides consumed per total utilized agricultural area (kg/ha)
General metadata
Geographical coverage: Republic of Macedonia
Temporal coverage: 2000 - 2005
Frequency of data collection: annually
Uncertainty Uncertainty of basic data
Data on the quantity of consumed pesticides contains certain extent of uncertainty, especially when originating from private sector. Some of the values have been obtained by estimation.
Future activities Short-term activities
− Establishment of Work Group with a task to define, elaborate and develop the indicator in full
a. Description of the activity − Definition, elaboration and full development of the indicator..
b. Required resources − Experts in the area of environment, agriculture and other relevant fields.
Year Total* (tonnes)
Fungicides (tonnes)
Herbicides (tonnes)
Insecticides (tonnes)
2000 308 189 50 57
2001 333 200 59 66
2002 245 113 73 54
2003 222 116 52 42
2004 273 179 32 51
2005 159 99 33 17
Code Title of the indicator
Compliance with CSI/ЕЕА or other indicators
Classification by DPSIR Тype Linkage
with area Frequency of publication
MK NI 09 Consumption of pesticides IRENA 09 Consumption
of pesticides D agriculture Annually
2000 2001 2002 2003 2004 2005
Total pesticides consumed per total utilized agricultural area (kg/ha) 0,51 0,54 0,42 0,39 0,48 0,29

ENVIRONMENTAL INDICATORS OF THE REPUBLIC OF MACEDONIA 201
c. Status − In progress
Deadline: June 2008
Long-term activities − Long-term activities are to be defined by the Work Group.


ENVIRONMENTAL INDICATORS OF THE REPUBLIC OF MACEDONIA 204
МК - NI 027 FINAL ENERGY CONSUMPTION BY SECTOR
Period of indicator assessment September 2007 – April 2008
Explanation Justification for indicator selection
The trend in final energy consumption by sector provides a broad indication of progress made in reducing energy consumption and associated environmental impacts by the different end-use sectors (transport, industry, services and households). It can be used to help monitor the success of key policies that attempt to influence energy consumption and energy efficiency.
Data on final energy consumption help estimating the environmental impacts of energy use. The type and extent of energy-related pressures on the environment depend both on the sources of energy (and how they are used) and on the total amount of energy consumed. One way of reducing energy-related pressures on the environment is thus to use less energy. This may result from reducing the energy consumption for energy-related activities (e.g. for warmth, personal mobility or freight transport), or by using energy in a more efficient way (thereby using less energy per unit of demand), or from a combination of the two.
Definition Final energy consumption is energy supplied to meet the demand of the final consumers and is calculated as the sum of final energy consumption from all sectors, namely industry, transport, agriculture, households, etc.
The indicator "Final energy consumption by sector" can be expressed in presented in thousand tonnes of oil equivalent (ktoe) and in percentage as a ratio between final energy consumption by each sector and final energy consumption by all sectors.
Units − thousand tonnes of oil equivalent (ktoe)
− percentage (%)
Policy relevance of the indicator Legal grounds
Law on Energy (Official Gazette of the Republic of Macedonia No. 63/2006, 36/2007);
Energy Balance of the Republic of Macedonia - annual planning document defining the demands for energy and the possibility for their supply (Article 16 of the Law on Energy).
P
R
D
S
I

ENVIRONMENTAL INDICATORS OF THE REPUBLIC OF MACEDONIA 205
Key message Policies in energy sector should favour measures aimed at rational and efficient energy consumption, especially by households and industry.
Assessment Given the fact that sectoral shares depend on the country's economic circumstances, country comparisons of the shares are meaningless unless accompanied by a relevant measure of the importance of the sector in the economy. As the interest is focused on the reduction of final energy consumption and not on the sectoral redistribution of such consumption, the absolute values should be preferred as a more meaningful indicator of progress.
Depending on the characteristics of economies and the extent of efficiency in final energy consumption, diverse structure of energy consumption can be found in individual sectors. In
0
200
400
600
800
1.000
1.200
1.400
1.600
1.800
2.000
1995 1) 1998 1) 1999 1) 2000 1) 2001 1) 2002 1) 2003 1) 2004 1) 2005 1)
ktoe
Final energy consumption by sector
Final energy consumption Industry Transport Households Agriculture Services
0,0
5,0
10,0
15,0
20,0
25,0
30,0
35,0
40,0
45,0
1995 1) 1998 1) 1999 1) 2000 1) 2001 1) 2002 1) 2003 1) 2004 1) 2005 1)
%
Final energy consumption by sector [%]
Industry Transport Households Agriculture Services

ENVIRONMENTAL INDICATORS OF THE REPUBLIC OF MACEDONIA 206
2001, major share in the total energy consumption in the Republic of Macedonia belonged to the industry (31.7%), followed by households and road transport (30.6% and 21.9%, respectively).
Final energy consumption in the Republic of Macedonia correlates closely with the dynamics of industrial production, due to the high share of industry in the total final energy consumption. Thus, the reduced industrial activity in 2004 resulted in final energy consumption fall thus reducing its share in the total final energy consumption (28.9%). During the second half of 2004, industrial facilities being also major energy consumers were restarted, leading to intensified economic activity in the country and increased final energy consumption in 2005 (33.5%), indicating higher share of industry in the total final energy consumption.
Methodology Methodology for the indicator calculation
Statistical methodology for calculation:
− Common surveys on: coal, oil, natural gas, electricity and heat, renewable energy for 2005, by Eurostat, ECE/UN and IEA/OECD
− Energy Statistics Methodology Eurostat F4, 1998"
− National Classification of Activities (NCA) (Official Gazette of the Republic of Macedonia No. 09/2006)
Data specification
Data coverage (by years): Table 1: Final energy consumption by sector
Title of the indicator Source Reporting obligation
Final energy consumption by sector
− State Statistical Office
− Eurostat, ECE/UN and IEA/
OECD.
ktoe 1995 1) 1998 1) 1999 1) 2000 1) 2001 1) 2002 1) 2003 1) 2004 1) 2005 1) Final energy consumption 1.572 1.652 1.670 1.606 1.423 1.780 1593 1600 Industry 543 643 499 535 458 438 460 462 562 Transport 385 364 411 368 349 376 353 353 350 Households 435 429 456 485 442 452 493 490 487 Agriculture 71 65 48 56 58 32 29 63 36 Other sectors 137 152 256 161 118 482 260 232 244
Source: State Statistical Office 1) Previous data

ENVIRONMENTAL INDICATORS OF THE REPUBLIC OF MACEDONIA 207
Table 2: Final energy consumption by sector (%)
General metadata
Geographical coverage: Republic of Macedonia
Temporal coverage: 1995 - 2005
Frequency of data collection: At annual basis.
Future activities Short-term activities
Adoption of the national set of energy indicators.
a. Description of the activity
The national set of energy indicators verified by the established Work Group will be delivered for adoption to the Government of the Republic of Macedonia as part of the Environmental Indicators.
b. Required resources
Possible engagement of technical expert who would handle the data obtained by the State statistical office.
c. Status
Energy indicators elaborated up to 2005.
Deadline:
Long-term activities
Updating of the adopted national set of energy indicators.
(%) 1995 1) 1998 1) 1999 1) 2000 1) 2001 1) 2002 1) 2003 1) 2004 1) 2005 1)
Final energy consumption 100,0 100,0 100,0 100,0 100,0 100,0 100,0 100,0 100,0
Industry 34,5 38,9 29,9 33,3 32,2 24,6 28,9 28,9 33,5
Transport 24,5 22,0 24,6 22,9 24,5 21,1 22,1 22,1 20,9
Households 27,7 26,0 27,3 30,2 31,0 25,4 30,9 30,6 29,0
Agriculture 4,5 3,9 2,9 3,5 4,1 1,8 1,8 3,9 2,2
Other sectors 8,7 9,2 15,3 10,0 8,3 27,1 16,3 14,5 14,5
Source: State Statistical Office
1) Previous data
Code Title of the indicator
Compliance with CSI/ЕЕА or other indicators
Classification by DPSIR Тype Linkage
with area Frequency of publication
MK NI 027 Total energy consumption by sector
CSI 027 EE 18
Final energy consumption by sector
D А energy Annually

ENVIRONMENTAL INDICATORS OF THE REPUBLIC OF MACEDONIA 208
МК - NI 028 TOTAL ENERGY INTENSITY
Period of indicator assessment September 2007 – April 2008
Explanation Justification for indicator selection
The type and extent of energy-related pressures on the environment depends on the sources of energy and in which quantities they are used. One way of reducing energy-related pressures on the environment is to use less energy. This may result from reducing the consumption in energy-related activities (e.g. for warmth, personal mobility or freight transport), or by using energy in a more efficient way (thereby using less energy per unit of demand), or from a combination of the two.
The indicator identifies to what extent there is a decoupling between energy consumption and economic growth, but it does not show any of the underlying reasons that affect the trends. A reduction in total energy intensity can be the result of positive improvements in energy efficiency or changes in energy demand resulting from other factors including structural, societal, behavioural or technical change.
Definition Total energy intensity is the ratio between the total energy demand (or total energy consumption) and the Gross Domestic Product.
The total energy consumption as the sum of the total energy demand from solid fuels, oil, natural gas and renewable sources.
The Gross Domestic Product (GDP) is converted by the Price Adjusted Rate of Exchange (PARE) method, applying the OUN Methodology (2000 database).
The total energy demanded (or total energy consumption) is expressed in thousand tonnes oil equivalent, and Gross Domestic Product in million US$.
The indicator "Total energy intensity" is expressed in kilograms oil equivalent per 1000 US$ (kgoe/1000 US$).
The indicator is also calculated in indexes with 2000 as base year (2000=100).
Units − million US$
− thousand tonnes oil equivalent (ktoe)
− kilograms oil equivalent (kgoe)
− indexes (2000=100)
P
R
D
S
I

ENVIRONMENTAL INDICATORS OF THE REPUBLIC OF MACEDONIA 209
Policy relevance of the indicator Legal grounds
Law on Energy (Official Gazette of the Republic of Macedonia No. 63/2006, 36/2007);
Energy Balance of the Republic of Macedonia - annual planning document defining the demands for energy and the possibility for their supply (Article 16 of the Law on Energy);
Key message − Structural changes in industry by favoring less energy intensive industries
− Introduction of market based energy proces (energy prices rationing), thus improving the performance of domestic energy producers and providing significant incentives for energy saving. Adoption of the secondary legislation to support projects in the area of energy efficiency. It is also needed to harmonize the laws and regulations in different sectors linked with energy efficiency
− Improvement of energy efficiency on the side of production, but also on the side of the demand through targeted programmes, trainings and public awareness improvement.
Assessment Comparative analysis of energy consumption relative do GDP, so called indicator of energy intensity, has shown that the Republic of Macedonia belongs to the group of countries with relatively high energy consumption levels, due to the high energy intensity of the facilities that lead the economic growth. Almost one third of the electricity consumption comes of high energy intensive industries. The greatest energy consumers consume more electricity at annual level than the total electricity generated by hydro-power plants. In addition to this, due to the long-lasting treatment of the electricity price as a social category, the residential sector uses significant quantities of electricity for heating.
0
20
40
60
80
100
120
140
160
1995 1) 1998 1) 1999 1) 2000 1) 2001 1) 2002 1) 2003 1) 2004 1) 2005 1)
%
година
Total energy intensity
Total energy demand Gross Domestic Product Total energy intensity

ENVIRONMENTAL INDICATORS OF THE REPUBLIC OF MACEDONIA 210
Methodology Methodology for the indicator calculation
Statistical methodology for calculation:
− common surveys for coal, oil, natural gas, electricity and heat, renewable energy for 2005 by Eurostat, ECE/UN and IEA/OECD
− Energy Statistics Methodology Eurostat F4, 1998"
− Price Adjusted Rate of Exchange (PARE) method, applying the OUN Methodology (2000 database).
Data specification
Data coverage (by years): Table 1: Total energy intensity
General metadata
Geographical coverage: Republic of Macedonia
Temporal coverage: 1995 - 2005
Frequency of data collection: Data is collected at annual basis.
Title of the indicator Source Reporting obligation
Total energy intensity State Statistical Office − Eurostat − ECE/UN − IEA/OECD
1995 1) 1998 1) 1999 1) 2000 1) 2001 1) 2002 1) 2003 1) 2004 1) 2005 1) Total energy demand (ktoe) 2694 2904 2837 2765 2677 2892 2740 2749 2863
Gross Domestic Product (mio US$) 2377 3157 3340 3588 3706 3872 4119 4298 4534
Total energy intensity (kgoe/1000 СUS$)
1133,3 920,0 849,5 770,6 722,5 746,9 665,2 639,5 631,5
index 2000=100 Total energy demand 97,4 105,0 102,6 100,0 96,8 104,6 99,1 99,4 103,5
Gross Domestic Product 66,2 88,0 93,1 100,0 103,3 107,9 114,8 119,8 126,4
Total energy intensity 147,1 119,4 110,2 100,0 93,8 96,9 86,3 83,0 81,9
Source: State Statistical Office 1) Previous data
Code Title of the indicator
Compliance with CSI/ЕЕА or other indicators
Classification by DPSIR Type Linkage
with area Frequency of publication
MK NI 028 Total energy intensity
CSI 028 EE 23
Total energy intensity R B energy Annually
ENVIRONMENTAL INDICATORS OF THE REPUBLIC OF MACEDONIA 211
Future activities Short-term activities
Adoption of the national set of energy indicators.
a. Description of the activity
The national set of energy indicators verified by the established Work Group will be delivered for adoption to the Government of the Republic of Macedonia as part of the Environmental Indicators.
b. Required resources
Need to engage technical expert who would handle the data obtained by the State statistical office.
c. Status
Energy indicators have been elaborated by 2005.
Deadline:
Long-term activities
Updating of the adopted national set of energy indicators.
.

ENVIRONMENTAL INDICATORS OF THE REPUBLIC OF MACEDONIA 212
МК - NI 029 TOTAL ENERGY CONSUMPTION BY FUEL
Period of indicator assessment September 2007 – April 2008
Explanation Justification for indicator selection
Total energy consumption disaggregated by fuel type is a leading indicator describing the development of energy sources and the corresponding levels of consumption. The environmental impact of each fuel is very specific.
The consumption of fossil fuels (such as crude oil, oil products, hard coal, lignite and natural and derived gas) provides a proxy indicator of resource depletion, CO2 and other greenhouse gas emissions and air pollution levels (e.g. SO2 and NOx). The degree of the environmental impact depends on the relative share of different fossil fuels and the extent to which pollution abatement measures are used. Natural gas, for instance, has approximately 40 % less carbon content than coal and 25 % less carbon content than oil and contains only marginal quantities of sulphur.
Renewable energy consumption is a measure of the contribution from technologies that are more environmentally benign, as they produce no (or very little) net CO2 and usually significantly lower levels of other pollutants. Renewable energy can, however, have impacts on landscapes and ecosystems. The incineration of municipal waste is generally made up of both renewable and non-renewable material and may also generate local air pollution. However, emissions from the incineration of waste are subject to stringent regulations including tight controls on quantities of cadmium, mercury and other such substances. Similarly, the inclusion of both large and small-scale hydropower provides only a broad indicator of environmentally benign energy supply. While small-scale hydro schemes generally have little environmental impact, large-scale hydro-power facilities can have major adverse impacts (flooding, impact on ecosystems, water levels, requirements for population resettlement).
Definition Total energy consumption or gross inland consumption represents the total quantity of energy necessary to satisfy the total national needs for energy for energy transformations, all types of consumption by energy sector and final energy and non-energy consumption.
The total energy consumption is calculated as sum of the total energy consumption originating from solid fuels, oil, natural gas and renewable sources.
The indicator "Total energy consumption by fuel" is expressed in thousand tonnes of oil equivalent (ktoe) and in percentage as ratio between the total energy consumption per fuel and the total energy consumption of all fuels.
P
R
D
S
I

ENVIRONMENTAL INDICATORS OF THE REPUBLIC OF MACEDONIA 213
Units − thousand tonnes of oil equivalent (ktoe)
− percentage (%)
Policy relevance of the indicator Legal grounds
Law on Energy (Official Gazette of the Republic of Macedonia No. 63/2006, 36/2007);
Energy Balance of the Republic of Macedonia - annual planning document defining the demands for energy and the possibility for their supply (Article 16 of the Law on Energy).
Key message Policies in energy sector should favour measures aimed at change in the mix of fuels in favour of the natural gas and renewable energy sources. This is a very useful indicator reflecting depletion of resources, emissions of CO2 and other GHGs and levels of air pollution (e.g.: SO2 and NOX).
‐2000
200400600800100012001400160018002000220024002600280030003200
1995 1) 1998 1) 1999 1) 2000 1) 2001 1) 2002 1) 2003 1) 2004 1) 2005 1)
ktoe
Total energy consumption by fuel
Gross inland consumption (ktoe) Solids Oil Natural gas Electricity Renewable energy forms
‐20,0
0,0
20,0
40,0
60,0
80,0
100,0
120,0
1995 1) 1998 1) 1999 1) 2000 1) 2001 1) 2002 1) 2003 1) 2004 1) 2005 1)
%
Final energy consumption by sector (%)
Gross inland consumption (ktoe) SolidsOil Natural gasElectricity Renewable energy forms

ENVIRONMENTAL INDICATORS OF THE REPUBLIC OF MACEDONIA 214
Assessment In 2001, dominant energy sources in the Republic of Macedonia were coal and oil and oil derivatives (with a share of 56.7% and 30.5%, respectively), while from among other energy types the fuel wood is represented in significant quantity (5.7%). In 2004, dominant energy sources in the Republic of Macedonia were coal and oil (with a share of 50.3% and 30.8%, respectively), and from among other fuels, fuel wood is represented as well (share of 6.2%).
Methodology Methodology for the indicator calculation
Statistical methodology for calculation:
− Common surveys for coal, oil, natural gas, electricity and heat, renewable energy for 2005 by Eurostat, ECE/UN and IEA/OECD.
− Energy Statistics Methodology Eurostat F4, 1998"
Data specification
Data coverage (by years): Table 1: Total energy consumption by fuel
Table 2: Percentage of the total energy consumption by fuel
Title of the indicator Source Reporting obligation
Total energy consumption by fuel State Statistical Office
− Eurostat − ECE/UN − IEA/OECD
1995 1) 1998 1) 1999 1) 2000 1) 2001 1) 2002 1) 2003 1) 2004 1) 2005 1) Gross inland consumption (ktoe) 2694 2904 2837 2765 2677 2892 2740 2749 2863
- Solids 1513 1672 1543 1406 1553 1352 1415 1385 1459 - Oil 914 951 955 967 790 1173 876 895 912 - Natural gas 0 18 33 54 71 74 65 57 62 - Electricity (import-export) 10 0 -9 10 37 68 82 101 137
Renewable energy sources 258 264 315 329 226 225 302 310 293
Source: State Statistical Office 1) Previous data
1995 1) 1998 1) 1999 1) 2000 1) 2001 1) 2002 1) 2003 1) 2004 1) 2005 1) Gross inland consumption (%) 100,0 100,0 100,0 100,0 100,0 100,0 100 100 100
- Solids 56,2 57,6 54,4 50,8 58,0 46,8 51,6 50,4 51,0 - Oil 33,9 32,8 33,7 35,0 29,5 40,6 32,0 32,6 31,8 - Natural gas 0,0 0,6 1,2 1,9 2,7 2,6 2,4 2,1 2,2 - Electricity (import-export) 0,4 0,0 -0,3 0,3 1,4 2,4 3,0 3,7 4,8
- Renewable energy sources 9,6 9,1 11,1 11,9 8,4 7,8 11,0 11,3 10,2
Source: State Statistical Office 1) Previous data
ENVIRONMENTAL INDICATORS OF THE REPUBLIC OF MACEDONIA 215
General metadata
Geographical coverage: Republic of Macedonia
Temporal coverage: 1995 – 2005
Frequency of data collection: Data is collected at annual basis
Future activities Short-term activities
Adoption of the national set of energy indicators.
a. Description of the activity
The national set of energy indicators verified by the established Work Group will be delivered for adoption to the Government of the Republic of Macedonia as part of the Environmental Indicators.
b. Required resources
Need to engage technical expert who would handle the data obtained by the State statistical office.
c. Status
Energy indicators have been elaborated by 2005.
Deadline:
Long-term activities
Updating of the adopted national set of energy indicators.
Code Title of the indicator
Compliance with CSI/ЕЕА or other indicators
Classification by DPSIR Type Linkage
with area Frequency of publication
MK NI 029 Total energy consumption by fuel
CSI 029 EE 24
Total energy consumption by fuel
D А energy Annually
ENVIRONMENTAL INDICATORS OF THE REPUBLIC OF MACEDONIA 216
МК - NI 030 RENEWABLE ENERGY CONSUMPTION
Period of indicator assessment September 2007 – April 2008
Explanation Justification for indicator selection
The share of renewable energy consumption in the total energy consumption in the Republic of Macedonia provides a broad indication of progress towards reducing the environmental impact of energy consumption, although its overall impact has to be seen within the context of the total fuel mix, potential impacts on biological diversity and the extent to which pollution abatement equipment is fitted.
Renewable energy sources are generally considered environmentally benign, with very low net emissions of CO2 per unit of energy produced, even allowing for emissions associated with the construction of the plant. Emissions of other pollutants are also often lower for renewable energy production than for fossil fuel energy production. The exception to this is municipal and solid waste (MSW) incineration which, due to the cost associated with separation, usually involves the combustion of some mixed wastes including materials contaminated with heavy metals.
Most renewable (and non-renewable) energy sources have some impact on landscape, habitats and ecosystems, although many of these impacts can be minimised through careful site selection. Large hydropower schemes in particular, can have adverse impacts including flooding, disruption of ecosystems and hydrology, and socio-economic impacts if resettlement is required. Some solar photovoltaic schemes require relatively large quantities of heavy metals in their construction and geothermal energy can release pollutant gases carried by its hot fluid if not properly controlled. Wind turbines may have visual and noise impacts in the areas of their location. Some types of biomass and biofuel crops also have considerable land, water and agricultural input requirements such as fertilisers and pesticides.
Definition Renewable energy sources are defined as renewable non-fossil energy sources: hydropower, geothermal, solar and wind power; solid biomass; biogas, liquid biofuels, etc.
The indicator "Renewable energy consumption" is expressed as ratio of total renewable energy consumption and the total energy consumption originating from all fuels (in percentage).
Renewable energy consumption is expressed in thousand tonnes of oil equivalent (ktoe).
Units − thousand tonnes of oil equivalent (ktoe)
− percentage (%)
P
R
D
S
I
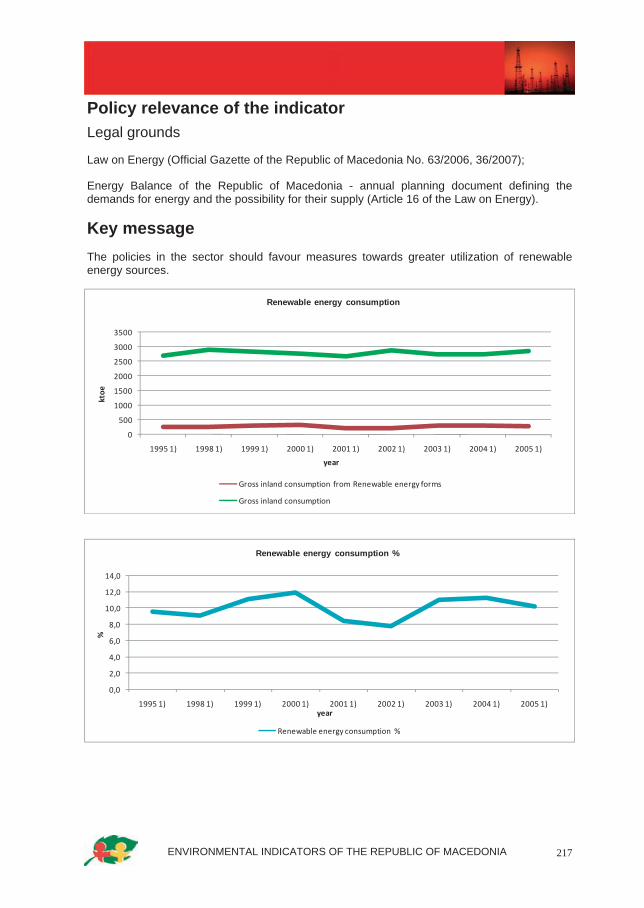
ENVIRONMENTAL INDICATORS OF THE REPUBLIC OF MACEDONIA 217
Policy relevance of the indicator Legal grounds
Law on Energy (Official Gazette of the Republic of Macedonia No. 63/2006, 36/2007);
Energy Balance of the Republic of Macedonia - annual planning document defining the demands for energy and the possibility for their supply (Article 16 of the Law on Energy).
Key message The policies in the sector should favour measures towards greater utilization of renewable energy sources.
0
500
1000
1500
2000
2500
3000
3500
1995 1) 1998 1) 1999 1) 2000 1) 2001 1) 2002 1) 2003 1) 2004 1) 2005 1)
ktoe
year
Renewable energy consumption
Gross inland consumption from Renewable energy forms
Gross inland consumption
0,0
2,0
4,0
6,0
8,0
10,0
12,0
14,0
1995 1) 1998 1) 1999 1) 2000 1) 2001 1) 2002 1) 2003 1) 2004 1) 2005 1)
%
year
Renewable energy consumption %
Renewable energy consumption %

ENVIRONMENTAL INDICATORS OF THE REPUBLIC OF MACEDONIA 218
Assessment Relatively low share of renewable energy in the total energy consumption (10% at an average) indicates the dominant use of fissile fuels which is unfavorable in terms of both energy resources depletion and environment pollution.
Methodology Methodology for the indicator calculation
Statistical methodology for calculation:
− common surveys for coal, oil, natural gas, electricity and heat, renewable energy for 2005 by Eurostat, ECE/UN and IEA/OECD.
− Energy Statistics Methodology Eurostat F4, 1998"
Data specification
Data coverage (by years): Table 1: Renewable energy consumption
General metadata
Geographical coverage: Republic of Macedonia
Temporal coverage: 1995 - 2005
Frequency of data collection: Data is collected at annual level
Title of the indicator Source Reporting obligation
Renewable energy consumption State Statistical Office
− Eurostat
− ECE/UN
− IEA/OECD
1995 1) 1998 1) 1999 1) 2000 1) 2001 1) 2002 1) 2003 1) 2004 1) 2005 1) Renewable energy consumption ktoe ktoe ktoe ktoe ktoe ktoe ktoe ktoe ktoe
- Gross inland consumption from Renewable energy sources
258 264 315 329 226 225 302 310 293
- Gross inland consumption 2694 2904 2837 2765 2677 2892 2740 2749 2863
% % % % % % % % % Renewable energy consumption 9,6 9,1 11,1 11,9 8,4 7,8 11,0 11,3 10,2
Source: State Statistical Office 1) Previous data
Code Title of the indicator
Compliance with CSI/ЕЕА or other indicators
Classification by DPSIR Type Linkage
with area Frequency of publication
MK NI 030 Renewable energy consumption
CSI 030 EE 26
Renewable energy consumption
R B energy annual

ENVIRONMENTAL INDICATORS OF THE REPUBLIC OF MACEDONIA 219
Future activities Short-term activities
Adoption of the national set of energy indicators.
a. Description of the activity
The national set of energy indicators verified by the established Work Group will be delivered for adoption to the Government of the Republic of Macedonia as part of the Environmental Indicators.
b. Required resources
Need to engage technical expert who would handle the data obtained by the State statistical office.
c. Status Energy indicators have been elaborated by 2005.
Deadline:
Long-term activities
Updating of the adopted national set of energy indicators.

ENVIRONMENTAL INDICATORS OF THE REPUBLIC OF MACEDONIA 220
МК - NI 031 RENEWABLE ELECTRICITY
Period of indicator assessment September 2007 – April 2008
Explanation Justification for indicator selection
Renewable electricity is generally considered environmentally benign, with very low net emissions of CO2 per unit of electricity produced, even allowing for emissions associated with the construction of the electricity production facilities. Emissions of other pollutants are also generally lower for renewable electricity production than for electricity produced from fossil fuels. The exception to this is the incineration of Municipal and Solid Waste (MSW), which due to high costs of separation, usually involves the combustion of some mixed wastes including materials contaminated with heavy metals.
Definition Renewable electricity sources are defined as renewable non-fossil sources of energy, such as: hydropower, geothermal, solar and wind power; solid biomass; biogas, liquid biofuels, etc.
The indicator "Renewable electricity " measures the share of electricity produced from renewable sources in gross national electricity production (in percentage).
The gross national electricity consumption is a sum of the total gross production and import of electricity minus electricity exported.
The gross national electricity consumption is expressed in GWh.
Units − GWh
− percentage
Policy relevance of the indicator Legal grounds
Law on Energy (Official Gazette of the Republic of Macedonia No. 63/2006, 36/2007);
Energy Balance of the Republic of Macedonia - annual planning document defining the demands for energy and the possibility for their supply (Article 16 of the Law on Energy).
Key message In the context of the indicative goal of 21% of gross consumption of electricity originating from renewable energy sources in EU-25, as specified by the EU in its Directive No. 2001/77/EC, the need for greater utilization of renewable energy sources in the Republic of Macedonia is in
P
R
D
S
I

ENVIRONMENTAL INDICATORS OF THE REPUBLIC OF MACEDONIA 221
line with the practices in developed countries and their efforts to reduce pollutants emission and support the sustainable development. Republic of Macedonia needs to set the national goal for renewable energy share in line with the potential of the available renewable energy sources.
The share of electrcity originating from renewable sources in the gross electricity consumption in the Republic of Macedonia is rather low. It makes relatively high annual fluctuation depending on hydrological conditions.
In 2004, 19.9 % of the total consumption in Macedonia was renewable electricity originating from hydropower plants.
Further increase is required to reach the EU's indicative goal of 21% share by 2010. (Law on Energy).
0
1000
2000
3000
4000
5000
6000
7000
8000
9000
1995 1) 1998 1) 1999 1) 2000 1) 2001 1) 2002 1) 2003 1) 2004 1) 2005 1)
GWh
year
Trend gross electricity consumption and renewable electricity, 1995 - 2005 година
Electricity produced from renewable energy sources
Gross national electricity consumption (Production+Import‐Export)
0,0
5,0
10,0
15,0
20,0
25,0
1995 1) 1998 1) 1999 1) 2000 1) 2001 1) 2002 1) 2003 1) 2004 1) 2005 1)
%
year
Electricity production from renewable sources
Renewable electricity (GWh)

ENVIRONMENTAL INDICATORS OF THE REPUBLIC OF MACEDONIA 222
Assessment The production of electricity from renewable sources in the Republic of Macedonia is based on the hydropower. Production in large hydropower plants is predominant.
At present, the share of renewable electricity in the overall electricity consumption is very important and depends on hydrological conditions during the year. Compared to 1995, the share of renewable electricity in the gross electricity consumption has increased the most in 1999 (20.5%), followed by significant drop in 2001 (9.2%), as a result of lower production of hydropower due to reduced precipitations.
During the observed period 1995 - 2005, and according to available data, the trend was even. The highest share of renewable electricity was recorded in 1999 and 2004 (20.5% and 18.9%, respectively).
Methodology Methodology for the indicator calculation
Statistical methodology for calculation:
− common surveys for coal, oil, natural gas, electricity and heat, renewable energy for 2005 by Eurostat, ECE/UN and IEA/OECD.
− Energy Statistics Methodology Eurostat F4, 1998"
Data specification
Data coverage (by years): Table 1: Trend in gross electricity consumption and renewable electricity consumption, 1995 - 2005
Title of the indicator Source Reporting obligation
Renewable electricity State Statistical Office
− Eurostat
− ECE/UN
− IEA/OECD
1995 1) 1998 1) 1999 1) 2000 1) 2001 1) 2002 1) 2003 1) 2004 1) 2005 1) GWh GWh GWh GWh GWh GWh GWh GWh GWh - Electricity produced from renewable energy sources
801 1083 1388 1170 626 757 1374 1482 1492
- Gross national electricity consumption (Total gross production+Import-Export)
6249 7046 6760 6923 6792 6881 7690 7841 8541
Source: State Statistical Office 1) Previous data

ENVIRONMENTAL INDICATORS OF THE REPUBLIC OF MACEDONIA 223
Table 2: Renewable electricity production in %, 1995 - 2005
General metadata
Geographical coverage: Republic of Macedonia
Temporal coverage: 1995 - 2005
Frequency of data collection: Data is collected at annual basis
Future activities Short-term activities
Adoption of the national set of energy indicators. a. Description of the activity
The national set of energy indicators verified by the established Work Group will be delivered for adoption to the Government of the Republic of Macedonia as part of the Environmental Indicators.
b. Required resources
Need to engage technical expert who would handle the data obtained by the State statistical office.
c. Status
Energy indicators have been elaborated by 2005.
Deadline:
Long-term activities
Updating of the adopted national set of energy indicators.
1995 1) 1998 1) 1999 1) 2000 1) 2001 1) 2002 1) 2003 1) 2004 1) 2005 1) Renewable electricity % 12,8 15,4 20,5 16,9 9,2 11,0 17,9 18,9 17,5
Source: State Statistical Office 1) Previous data
Code Title of the indicator
Compliance with CSI/ЕЕА or other indicators
Classification by DPSIR Type Linkage
with area Frequency of publication
MK NI 031 Renewable electricity
CSI 031 EE 27
Renewable electricity R B energy Annually


ENVIRONMENTAL INDICATORS OF THE REPUBLIC OF MACEDONIA 226
MK - NI 041 FISH STOCK CHARACTERISTICS
Period of indicator assessment September 2007 – April 2008
Explanation Justification for indicator selection
There is diverse fish fauna at relatively small area in the Republic of Macedonia. Characterization of the fish stock will have great practical significance in terms of various fish species distribution, fish stocks management and their sports, fishing, scientific and other meaning. This will create the possibility for sustainable exploitation of fish stocks, their qualitative and timely protection and implementation of adequate interventions aimed at increased fish populations density in fishing waters.
Definition The indicator shows the number of freshwater species living in waters and lakes in the Republic of Macedonia and the fish species represented in fishponds that are subject to aquicultural production.
At present, the indicator shows the status of:
− catch of two economically significant fish species in fishing waters;
− total catch of other fish species in fishing waters;
− total aquicultural fish production in fishponds.
Units Number of fish species, kilograms (tones) fish catch.
Policy relevance of the indicator List of relevant policy documents
The Study on the State of Biological Diversity in the Republic of Macedonia and the National Strategy for Biological Diversity Protection with Action Plan establish integrated approach to the protection and sustainable use of biological diversity components including fishery.
Legal grounds
The Law on Fishery and Aquiculture (Official Gazette of the Republic of Macedonia No. 62/2008) regulates the management, planning, commercial management and aquicultureof fish in fishing waters, fish ponds, semi fish ponds, cages and other fish breeding resources.
P
R
D
S
I
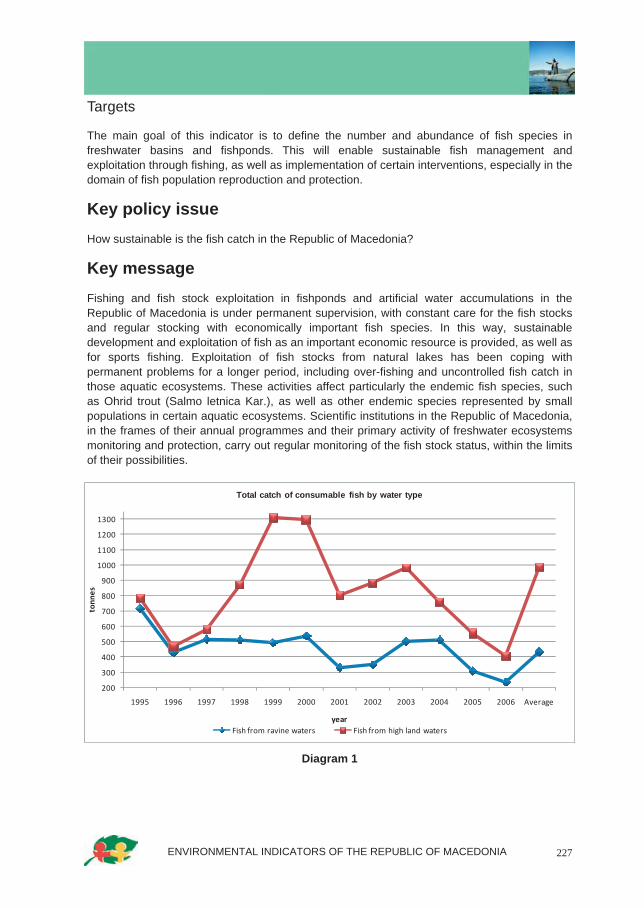
ENVIRONMENTAL INDICATORS OF THE REPUBLIC OF MACEDONIA 227
Targets
The main goal of this indicator is to define the number and abundance of fish species in freshwater basins and fishponds. This will enable sustainable fish management and exploitation through fishing, as well as implementation of certain interventions, especially in the domain of fish population reproduction and protection. Key policy issue How sustainable is the fish catch in the Republic of Macedonia?
Key message Fishing and fish stock exploitation in fishponds and artificial water accumulations in the Republic of Macedonia is under permanent supervision, with constant care for the fish stocks and regular stocking with economically important fish species. In this way, sustainable development and exploitation of fish as an important economic resource is provided, as well as for sports fishing. Exploitation of fish stocks from natural lakes has been coping with permanent problems for a longer period, including over-fishing and uncontrolled fish catch in those aquatic ecosystems. These activities affect particularly the endemic fish species, such as Ohrid trout (Salmo letnica Kar.), as well as other endemic species represented by small populations in certain aquatic ecosystems. Scientific institutions in the Republic of Macedonia, in the frames of their annual programmes and their primary activity of freshwater ecosystems monitoring and protection, carry out regular monitoring of the fish stock status, within the limits of their possibilities.
Diagram 1
200
300
400
500
600
700
800
900
1000
1100
1200
1300
1995 1996 1997 1998 1999 2000 2001 2002 2003 2004 2005 2006 Average
tonn
es
year
Total catch of consumable fish by water type
Fish from ravine waters Fish from high land waters

ENVIRONMENTAL INDICATORS OF THE REPUBLIC OF MACEDONIA 228
Diagram 2
Diagram 3
Assessment National literature contains numerous works dealing with certain aspects (systematic, biological, economic, sports and fishing aspects). Several authors, like Stanko Karaman in his work „Pisces Macedoniae” of 1924, Mirce Naumoski in „Fish in Macedonia. Systematic association, biology and importance” of 1995 and Simo Georgiev in „The key in identification of Osteichthyes and Cephalaspidomorpha in the Republic of Macedonia” of 1998, focus on ihtiofauna in our country.
The State Statistical Office of the Republic of Macedonia collects data, on annual basis, on fish
Trout39,75%
Carp32,28%
Wels catfish0,21%
Other fish27,76%
Total fish catch by fish species in 2006
0
100
200
300
400
500
600
700
800
900
1000
1995 1996 1997 1998 1999 2000 2001 2002 2003 2004 2005 2006
tonn
es
year
Total fish catch of the main fish species
Trout In fishponds Trout At open Trout Total catch
Carp In fishponds Carp At open Carp Total catch
ENVIRONMENTAL INDICATORS OF THE REPUBLIC OF MACEDONIA 229
catch in fishing areas, as well as on fish production in fish ponds, which is further processed as total fish catch by species, from ravine and high land waters, fish balance and by fish ponds types.
Table 1, with regard to total catch (production of commercial fish and fishing by sports fishermen), shows that the average fish catch in the Republic of Macedonia is 1 285 tonnes of different fish species, noting that the yield has decreased during the last several years because some fishing companies, business entities and concessionaires have lost their licenses for fishing activities in certain water basins, and significant number of sports fishing clubs have been terminated. In the total commercial fish catch, the contribution of catch from high land waters is 2/3, but it has to be noted that this value also incorporates the production of commercial fish in fish ponds.
Diagram 1 shows that the carp is predominant fish species in the total fish catch from both water types, while trout is leading in high land waters.
Methodology Methodology for the indicator calculation
Source of data and methodology for the indicator calculation
The source of data on the characteristics of fish stocks in the Rerpublic of Macedonia is the State Statistical Office and their methods are used for data processing.
Uncertainty
Uncertainty derives from the assumed incomplete data on fish catch in rivers and lakes. The uncertainty increases further because of the limitted number of literature data on genetic structure of fish populations in natural aquatic ecosystems.
Data specification
Title of the indicator Source Reporting obligation
Fish stock characteristics − State statistical office − FAO – Fisheries and Aquacul-
ture Department
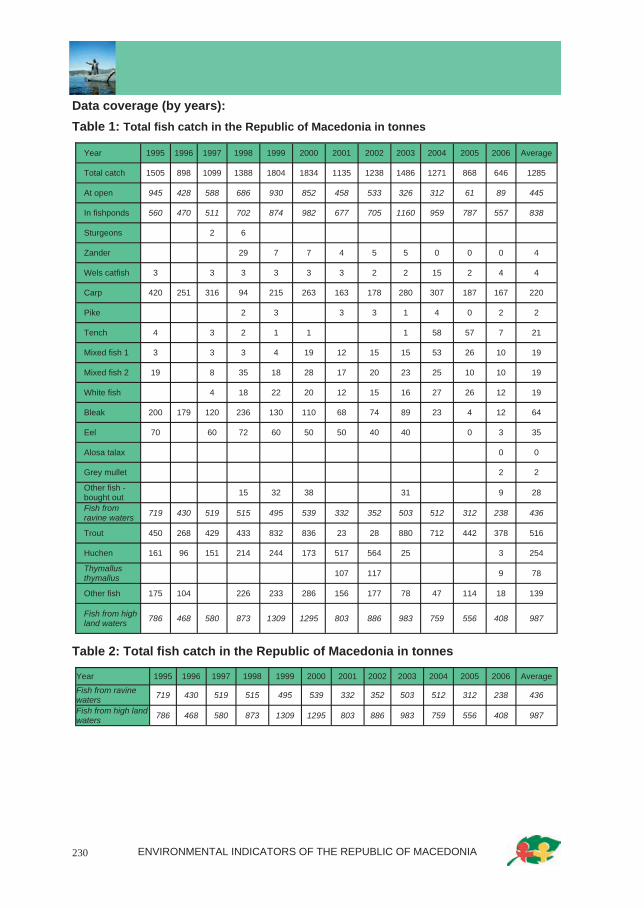
ENVIRONMENTAL INDICATORS OF THE REPUBLIC OF MACEDONIA 230
Data coverage (by years): Table 1: Total fish catch in the Republic of Macedonia in tonnes
Table 2: Total fish catch in the Republic of Macedonia in tonnes
Year 1995 1996 1997 1998 1999 2000 2001 2002 2003 2004 2005 2006 Average
Total catch 1505 898 1099 1388 1804 1834 1135 1238 1486 1271 868 646 1285
At open 945 428 588 686 930 852 458 533 326 312 61 89 445
In fishponds 560 470 511 702 874 982 677 705 1160 959 787 557 838
Sturgeons 2 6
Zander 29 7 7 4 5 5 0 0 0 4
Wels catfish 3 3 3 3 3 3 2 2 15 2 4 4
Carp 420 251 316 94 215 263 163 178 280 307 187 167 220
Pike 2 3 3 3 1 4 0 2 2
Tench 4 3 2 1 1 1 58 57 7 21
Mixed fish 1 3 3 3 4 19 12 15 15 53 26 10 19
Mixed fish 2 19 8 35 18 28 17 20 23 25 10 10 19
White fish 4 18 22 20 12 15 16 27 26 12 19
Bleak 200 179 120 236 130 110 68 74 89 23 4 12 64
Eel 70 60 72 60 50 50 40 40 0 3 35
Alosa talax 0 0
Grey mullet 2 2 Other fish -bought out 15 32 38 31 9 28 Fish from ravine waters 719 430 519 515 495 539 332 352 503 512 312 238 436
Trout 450 268 429 433 832 836 23 28 880 712 442 378 516
Huchen 161 96 151 214 244 173 517 564 25 3 254 Thymallus thymallus 107 117 9 78
Other fish 175 104 226 233 286 156 177 78 47 114 18 139
Fish from high land waters 786 468 580 873 1309 1295 803 886 983 759 556 408 987
Year 1995 1996 1997 1998 1999 2000 2001 2002 2003 2004 2005 2006 Average Fish from ravine waters 719 430 519 515 495 539 332 352 503 512 312 238 436 Fish from high land waters 786 468 580 873 1309 1295 803 886 983 759 556 408 987

ENVIRONMENTAL INDICATORS OF THE REPUBLIC OF MACEDONIA 231
General metadata
Geographical coverage: Republic of Macedonia
Temporal coverage: 1997 - 2007
Frequency of data collection: The database of the State Statistical Office of the Republic of Macedonia contains major temporal series on the total catch of freshwater fish species existing in our natural and artificial water basins and that temporal series is divided into two parts – data before 1987 and data on the total fish catch after 1987. Data is collected from two sources: commercial entities registered under the national classification of activities, as commercial fish producers – fish ponds and different forms of fishing associations – sports fishermen. There are two main types of commercial fish production in fish ponds the Republic of Macedonia: fish ponds for trout production, dominated by Californian trout and fish ponds for carp production, where one could also rarely find the species of wels catfish, carp, etc.
Future activities Short-term activities
− Definition of autochthonous fish species in rivers and lakes; − Taking of measures for protection of introduced alien species not specific for the
relevant aquatic ecosystems in the past; − Population and genetic investigation of fish populations, especially endemic and
threatened species. c. Status − Activities are underway
Deadline: Activity is permanent
Long-term activities − Undertaking of comprehensive population and genetic study of several fish species,
especially endemic and threatened species.
Code Title of the indicator
Compliance with CSI ЕЕА or other indicators
Classification by DPSIR Type Linkage with
area Frequency of publication
MK NI 041 Characteristic of the fish fund
FISH 3 Fish stock characteristics С
Water Biodiversity Tourism
Annually


ENVIRONMENTAL INDICATORS OF THE REPUBLIC OF MACEDONIA 234
МК - NI 035 PASSENGER TRANSPORT DEMAND Period of indicator assessment
September 2007 – April 2008
Explanation Justification for indicator selection
Transport is one of the main sources of greenhouse gases and pollutants that give rise to significant air pollution, which can seriously damage human health and ecosystems. The indicator helps to understand the impact of pollution from the transport on the environment.
The environmental impact of passenger transport arises from resources transfer, fuels consumption, greenhouse gas emissions, pollutant and noise emissions, land consumption (conversion), accidents etc. Due to the different types of origin of pollution from the transport and modal shifting (types of means of transportation), determination of the overall environmental effects becomes difficult. The total environmental effect of modal shifting can in fact only be determined on a case-by-case basis, where local circumstances and specific local environmental effects must be taken into account (e.g. transport in urban areas or over long distances, etc.).
Definition The indicator "passenger transport demand" will be presented in two different ways:
1) To measure decoupling of passenger transport demand from economic growth, the volume of passenger transport relative to GDP will be used, including separate trends for its two components. Both passenger transport demand and real GDP growth will be indexed on 1995 as baseline determined by EEA. The decoupling indicator is defined as the ratio between passenger-km (inland modes) and GDP (Gross Domestic Product in constant 1995 EUR). It will be indexed on year t-1 in order to be able to observe changes in the intensity of passenger transport demand relative to economic growth. In the presentation of this indicator in the Republic of Macedonia, the index 2001=100 is taken as baseline year for comparison.
2) Modal split share of passenger transport: This indicator is defined as the percentage share of transport by passenger car in total inland transport. The unit used is the passenger-kilometre (pkm), which represents one passenger traveling a distance of one kilometre. It is based on transport by passenger cars, buses and coaches, trains and air.
All data should be based on movements on national territory, regardless of the nationality of the vehicle. However, data collection methodology should be harmonised at the EU level.
Units The unit used is the passenger-kilometre (pkm), which represents one passenger travelling a
P
R
D
S
I

ENVIRONMENTAL INDICATORS OF THE REPUBLIC OF MACEDONIA 235
distance of one kilometre. It is based on transport by passenger cars, buses and coaches, and trains. Passenger transport demand and GDP are shown as an index (2001=100). The ratio of the former to the latter is indexed on year t-1 (i.e. annual decoupling/intensity changes).
Policy relevance of the indicator List of relevant policy documents
The National Strategy for Transport has been prepared and adopted by the Government of the Republic of Macedonia. It determines the main directions of the transport policy development in the Republic of Macedonia through identification of goals and development strategy for road, rail and air transport sectors.
Legal grounds The road transport is regulated by the Law on Road Transport (Official Gazette of the Republic of Macedonia No. 68/04 and 127/06). It regulates the conditions and the manner of performing transport of passengers and goods in internal and international road transport.
The Law has implemented the requirements of several relevant EU Directives and Regulations, namely: Directive 96/26ЕC, Directive 84/647ЕЕC, Regulation 56/83ЕЕC, Regulation 684/92ЕЕC, Regulation 881/92 ЕЕC, Regulation 3118/93ЕЕC, Regulation 792/94ЕC, Regulation 3315/94ЕC, Regulation 12/98ЕC and Regulation 2121/98ЕC.
Transportation of dangerous goods is regulated by the Law on Dangerous Goods Transportation in Road and Railroad Transport (Official Gazette of the Republic of Macedonia No. 92/07), regulating the conditions under which transport of dangerous goods shall be performed (preparation of matter, loading, transport, on road procedures, unloading, safety in transportation, vehicles equipment and staff training). The following EU legal measures have been implemented in the Law: Directive 94/55/ЕC, Directive 2000/61/ЕC, Directive 2001/7/ЕC, Directive 95/50/ЕC, Directive 2001/26/ЕC, Directive 2004/112/ЕC, Directive 1996/35/ЕC, Directive 2000/18/ЕC, Directive 98/91/ЕC, Directive 96/49/ЕC and Directive 2006/90/ЕC.
Railroad transportation is regulated by the Law on Railroads (Official Gazette of the Republic of Macedonia No. 64/05 and 24/07), Law on Agreements on Transportation in Railroad Traffic (Official Gazette of the Republic of Macedonia No. 55/07), Law on Agency Regulating Railroad Transport Services Market (Official Gazette of the Republic of Macedonia No. 07/08) and Law on Railroad Transport Safety (Official Gazette of the Republic of Macedonia No. 40/07).
Air transportation is regulated by the Law on Rail Transport (Official Gazette of the Republic of Macedonia No. 14/06 and 24/07)
Waterway transportation is regulated by the Law on Inland Waterway Transport (Official Gazette of the Republic of Macedonia No. 55/07).
Targets The indicator is targeted at presenting information to be used in the preparation of documents and actions aimed at reducing the negative effects on the environment and people.
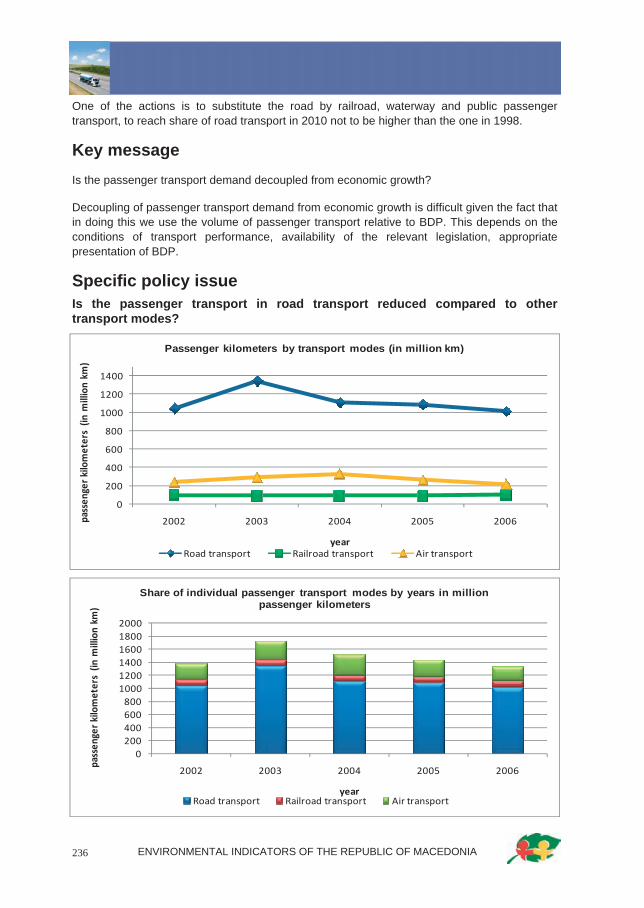
ENVIRONMENTAL INDICATORS OF THE REPUBLIC OF MACEDONIA 236
One of the actions is to substitute the road by railroad, waterway and public passenger transport, to reach share of road transport in 2010 not to be higher than the one in 1998.
Key message Is the passenger transport demand decoupled from economic growth?
Decoupling of passenger transport demand from economic growth is difficult given the fact that in doing this we use the volume of passenger transport relative to BDP. This depends on the conditions of transport performance, availability of the relevant legislation, appropriate presentation of BDP.
Specific policy issue Is the passenger transport in road transport reduced compared to other transport modes?
0
200
400
600
800
1000
1200
1400
2002 2003 2004 2005 2006passen
ger kilometers (in million km
)
year
Passenger kilometers by transport modes (in million km)
Road transport Railroad transport Air transport
0200400600800100012001400160018002000
2002 2003 2004 2005 2006
passen
ger kilometers (in million km
)
year
Share of individual passenger transport modes by years in million passenger kilometers
Road transport Railroad transport Air transport
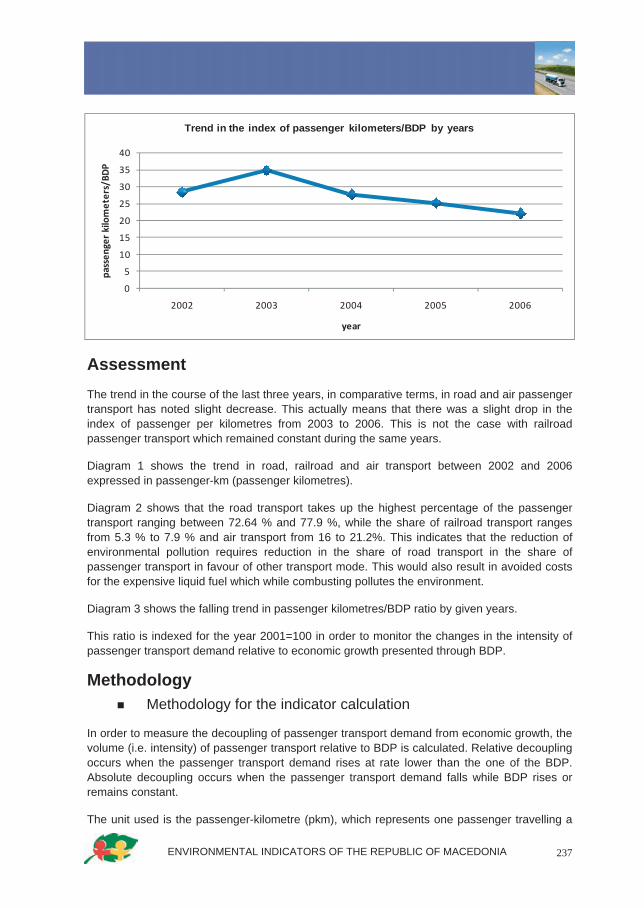
ENVIRONMENTAL INDICATORS OF THE REPUBLIC OF MACEDONIA 237
Assessment The trend in the course of the last three years, in comparative terms, in road and air passenger transport has noted slight decrease. This actually means that there was a slight drop in the index of passenger per kilometres from 2003 to 2006. This is not the case with railroad passenger transport which remained constant during the same years.
Diagram 1 shows the trend in road, railroad and air transport between 2002 and 2006 expressed in passenger-km (passenger kilometres).
Diagram 2 shows that the road transport takes up the highest percentage of the passenger transport ranging between 72.64 % and 77.9 %, while the share of railroad transport ranges from 5.3 % to 7.9 % and air transport from 16 to 21.2%. This indicates that the reduction of environmental pollution requires reduction in the share of road transport in the share of passenger transport in favour of other transport mode. This would also result in avoided costs for the expensive liquid fuel which while combusting pollutes the environment.
Diagram 3 shows the falling trend in passenger kilometres/BDP ratio by given years.
This ratio is indexed for the year 2001=100 in order to monitor the changes in the intensity of passenger transport demand relative to economic growth presented through BDP.
Methodology Methodology for the indicator calculation
In order to measure the decoupling of passenger transport demand from economic growth, the volume (i.e. intensity) of passenger transport relative to BDP is calculated. Relative decoupling occurs when the passenger transport demand rises at rate lower than the one of the BDP. Absolute decoupling occurs when the passenger transport demand falls while BDP rises or remains constant.
The unit used is the passenger-kilometre (pkm), which represents one passenger travelling a
0
5
10
15
20
25
30
35
40
2002 2003 2004 2005 2006
passen
ger kilometers/BD
P
year
Trend in the index of passenger kilometers/BDP by years

ENVIRONMENTAL INDICATORS OF THE REPUBLIC OF MACEDONIA 238
distance of one kilometre. It is based on passenger transport by buses and coaches and trains.
With regard to EU Member States, according to Regulation on road transport and Regulation (EC) No 91/2003 on railroad transport statistics, data is based on all movements of passenger transport on national territory.
Source of used methodology
Structural indicators of Eurostat on transport
State Statistical Office.
Methodological uncertainty and data uncertainty
All data is based on the movements on the national territory, regardless of the nationality of the vehicle. The methodology of data collection has been harmonised at EU level, but there is still not data provided on the transport by passenger car. Sources include EUROSTAT, National statistical offices, ECMT, UNECE, UIC, DG TREN.
In order to answer the question whether the passenger transport demand is decoupling from economic growth, the intensity of passenger transport relative to changes in real BDP is considered.
Uncertainty of data sets
The unit used to measure the volume or intensity of passenger transport, as defined in the indicator, is the passenger-kilometre (pkm). It represents one passenger travelling a distance of one kilometre. Data on the transport by passenger car (i.e. average number of passengers per car) is not compulsory variable as there is no legal ground in place. All data on the passenger transport is collected through the Common Survey on transport statistics of EUROSTAT/ECMT/UNECE.
The loading of the vehicle is the key factor which plays a vital role in the assessment of whether there is decoupling of passenger transport demand from BDP growth. In order to obtain full picture of passenger transport demand and corresponding problems in the environment, it would be very useful to supplement data with data on the number of passenger-kilometres by vehicle-kilometres.
Uncertainty of grounds
In the context of environment protection, it is important not to overlook the trends in the total passenger transport volume. Real absolute values are of key importance for the understanding of the pressures on the environment originating from increased passenger transport demand.

ENVIRONMENTAL INDICATORS OF THE REPUBLIC OF MACEDONIA 239
Data specification
Data coverage (by years): Table 1. Passenger kilometres by years (in million km)
Table 2 Share of passenger kilometres (in million kilometres) of individual passenger transport modes
Table 3 Ratio between passenger kilometre and BDP
General metadata
Geographical coverage: Republic of Macedonia
Temporal coverage: 2002 to 2006
Frequency of data collection: Data is collected at monthly basis from regional departments, and processed and presented on annual basis, periodically and annually.
Title of the indicator Source Reporting obligation Passenger transport demand − State Statistical Office
2002 2003 2004 2005 2006
Road transport 1042 1344 1110 1087 1016
Railroad transport 98 92 94 94 105
Air transport 236 289 324 263 214
% 2002 2003 2004 2005 2006
Road transport 75,7 77,9 72,64 75,3 76,1
Railroad transport 7 5,3 6,1 6,5 7,9
Air transport 17,1 16,7 21,2 18,21 16
year pkm BDP pkm/BDP
2002 1140 4005 28,46
2003 1436 4129 34,78
2004 1204 4355 27,65
2005 1181 4705 25,10
2006 1121 5069 22,11
Code Title of the indicator
Compliance with CSI/ЕЕА or other indicators
Classification by DPSIR Тype Linkage
with area Frequency of publication
MK NI 035 Passenger transport demand
CSI 035
Passenger transport demand
P B
-Passenger transport per kilometre -BDP
Monthly, periodically, annually

ENVIRONMENTAL INDICATORS OF THE REPUBLIC OF MACEDONIA 240
Data is prepared and processed in accordance with the methodology set in the Guide on transport statistics of EUROSTAT and regulations applicable for each transport mode.
Future activities Short-term activities
− Identification and definition of indicators in the area of transport that may show the state of the passenger transport demand in passenger- kilometre and ton- kilometre in the indicator of the freight transport demand.
a. Description of the activity − The indicator of passenger transport demand is calculated and presented based on
data collected and processed by the State Statistical Office in the adequate format by specified methodology.
b. Required resources − Engagement of national experts from governmental institutions with knowledge of the
passenger transport demand to take part in the indicator development.
c. Status − Continuous
Deadline: 1 year
Long-term activities a. Description of the activity
− Activities concerning transposition of Directives of relevance for the transport, strategy for transport, plan for improvement of the transport performance.
b. Required resources − No required resources have been identified.
c. Status − In progress
Deadline: 1 January 2099

ENVIRONMENTAL INDICATORS OF THE REPUBLIC OF MACEDONIA 241
МК - NI 036 FREIGHT TRANSPORT DEMAND Period of indicator assessment
September 2007 – April 2008
Explanation Justification for indicator selection
Transport is one of the main sources of air pollution through emissions of greenhouse gases and other pollutants. This is the reason why transport can affect and harm human seriously health and ecosystems.
Reduction in the freight transport demand will result in reduced environmental damages and lower impact on human health from freight transport. Therefore, the need for decoupling the freight transport related to BDP is also related to environmental impacts.
The environmental impact of freight transport arises from resources transfer, fuels consumption, greenhouse gas emissions, pollutant and noise emissions, land consumption (conversion), accidents etc. Due to the different types of origin of pollution from the transport and modal shifting, determination of the overall environmental effects becomes difficult. The total environmental effect of modal shifting can in fact only be determined on a case-by-case basis, where local circumstances and specific local environmental effects must be taken into account (e.g. transport in urban areas or over long distances, etc.).
Definition The indicator "freight transport demand" will be presented in two different ways:
1) To measure decoupling of freight transport demand from economic growth, the volume of freight transport relative to GDP will be used, including separate trends for its components. Both real GDP growth and freight transport demand will be indexed on 1995 as baseline at the level of EUROSTAT. The decoupling indicator is defined as the ratio between tonne-km (inland transport) and GDP (Gross Domestic Product in constant 1995 EUR). It will be indexed on year t-1 in order to be able to observe changes in the annual intensity of freight transport demand relative to economic growth.
2) Modal split share of freight transport: This indicator is defined as the percentage share of freight transport in total inland transport. The unit used is tonne-kilometre (tkm), which represents movement of one tonne over a distance of one kilometre. It includes road and railroad inland transport. Railroad transport is based on movements on national territory, regardless of the nationality of the vehicle. Road freight transport is based on all movements of vehicles registered in the reporting country.
P
R
D
S
I

ENVIRONMENTAL INDICATORS OF THE REPUBLIC OF MACEDONIA 242
Units The unit used is the tonne-kilometre (tkm), which represents the movement of one tonne over a distance of one kilometre. It includes transport by road and rail. Rail transport is based on movements on national territory, regardless of the nationality of the vehicle. Road transport is based on all movements of vehicles registered in the reporting country. Freight transport demand and GDP are shown in EUROSTAT as an index (1995=100). The ratio of the former to the latter is indexed on year t-1 (i.e. annual decoupling/intensity changes).
Policy relevance of the indicator List of relevant policy documents
The National Strategy for Transport has been prepared and adopted by the Government of the Republic of Macedonia. It determines the main directions of the transport policy development in the Republic of Macedonia through identification of goals and development strategy for road, rail and air transport sectors.
Legal grounds The road transport is regulated by the Law on Road Transport (Official Gazette of the Republic of Macedonia No. 68/04 and 127/06). It regulates the conditions and the manner of performing transport of passengers and goods in internal and international road transport.
The Law has implemented the requirements of several relevant EU Directives and Regulations, namely: Directive 96/26ЕC, Directive 84/647ЕЕC, Regulation 56/83ЕЕC, Regulation 684/92ЕЕC, Regulation 881/92 ЕЕC, Regulation 3118/93ЕЕC, Regulation 792/94ЕC, Regulation 3315/94ЕC, Regulation 12/98ЕC and Regulation 2121/98ЕC.
Transportation of dangerous goods is regulated by the Law on Dangerous Goods Transportation in Road and Railroad Transport (Official Gazette of the Republic of Macedonia No. 92/07), regulating the conditions under which transport of dangerous goods shall be performed (preparation of matter, loading, transport, on road procedures, unloading, safety in transportation, vehicles equipment and staff training). The following EU legal measures have been implemented in the Law: Directive 94/55/ЕC, Directive 2000/61/ЕC, Directive 2001/7/ЕC, Directive 95/50/ЕC, Directive 2001/26/ЕC, Directive 2004/112/ЕC, Directive 1996/35/ЕC, Directive 2000/18/ЕC, Directive 98/91/ЕC, Directive 96/49/ЕC and Directive 2006/90/ЕC.
Railroad transportation is regulated by the Law on Railroads (Official Gazette of the Republic of Macedonia No. 64/05 and 24/07), Law on Agreements on Transportation in Railroad Traffic (Official Gazette of the Republic of Macedonia No. 55/07), Law on Agency Regulating Railroad Transport Services Market (Official Gazette of the Republic of Macedonia No. 07/08) and Law on Railroad Transport Safety (Official Gazette of the Republic of Macedonia No. 40/07).
Air transportation is regulated by the Law on Rail Transport (Official Gazette of the Republic of Macedonia No. 14/06 and 24/07)
Waterway transportation is regulated by the Law on Inland Waterway Transport (Official Gazette of the Republic of Macedonia No. 55/07).

ENVIRONMENTAL INDICATORS OF THE REPUBLIC OF MACEDONIA 243
Targets The indicator is targeted at presenting information to be used in the preparation of documents and actions aimed at reducing the negative effects on the environment and people.
One of the actions is to substitute the use of road freight transport by railroad and waterway transport, to reach share of road freight transport in 2010 not to be higher than the one in 1998.
Key message Is the freight transport demand decoupled from economic growth?
To measure decoupling of freight transport demand from economic growth, the volume of freight transport relative to GDP is used, including separate trends for its components. The decoupling indicator is defined as the ratio between tonne-km (inland transport) and GDP (in relation to EUROSTAT Gross Domestic Product in constant 1995 EUR). It will be indexed on year t-1 in order to be able to observe changes in the annual intensity of freight transport demand relative to economic growth.
Specific policy issue Is the percentage of freight transport in road transport reduced compared to other transport modes?
0
1000
2000
3000
4000
5000
6000
7000
8000
2002 2003 2004 2005 2006
tonn
e-ki
lom
etre
s (in
mill
ion)
year
Tonne-kilometres by transport modes (in million)
Road transport Railroad transport Air transport

ENVIRONMENTAL INDICATORS OF THE REPUBLIC OF MACEDONIA 244
Assessment The trend in freight transport demand in tonne-kilometres by transport modes presented in Diagram 1, in the period from 2002 to 2006, noted continuous increase for the road freight transport almost identical at annual basis up to 2005, followed by rapid increase between 2005 and 2006. In the domain of railroad and air freight transport, there was almost no change in data at annual level and the trend remained constant without major notable variations.
Diagram 2 shows clearly that the freight transport was dominated by road transport ranging between 88.11 and 91.7 % presented by all analyzed years. Freight transport by railroad was in the range between 8.4 and 11.3 % of the total freight transport. This is sufficient indication that the indicator should attend to reduce the road transport in favour of other freight transport modes. The reason for this lies in the fact that the road freight transport consumes costly liquid
0
1000
2000
3000
4000
5000
6000
7000
8000
2002 2003 2004 2005 2006
tonn
e-ki
lom
etre
s (in
mill
ion)
year
Share of individual freight transport modes by years in million tonne-kilometres
Road transport Railroad transport Air transport
0
20
40
60
80
100
120
140
160
2002 2003 2004 2005 2006
tkm/BDP
year
Trend in the index of tonne-kilometres/BDP for individual years
ENVIRONMENTAL INDICATORS OF THE REPUBLIC OF MACEDONIA 245
fuels which during combustion on road cause significant pollution of environment, air, soil, biodiversity, etc.
Diagram 3 shows that the trend in the index of tonne-kilometres relative to BDP was rising from 2002 to 2003, followed by a period of falling up to 2005, and then noted rapid rise between 2005 and 2006.
The ratio is indexed for the year 2001=100 in order to monitor the changes in the intensity of freight transport demand relative to economic growth presented through BDP.
Methodology Methodology for the indicator calculation
In order to measure the decoupling of freight transport demand from economic growth, the volume (i.e. intensity) of freight transport relative to BDP is calculated. Relative decoupling occurs when the freight transport demand rises at rate lower than the one of the BDP. Absolute decoupling occurs when the freight transport demand falls while BDP rises or remains constant.
The unit used is the tonne-kilometre (tkm), which represents movement of one tonne over a distance of one kilometre. It is based on passenger transport by buses and coaches and trains. It includes road and railroad inland transport. Railroad inland transport is based on movements on national territory, regardless of the nationality of the vehicle. Road freight transport is based on all movements of vehicles registered in the country.
According to Regulation (EC) No 1172/98, data on road transport is based on all movements of vehicles registered in the reporting country. All other data on transport refer mainly to movements on national territory, regardless of the nationality of the vehicle.
Sources of used methodology Structural indicators of EUROSTAT on transport
State Statistical Office.
Methodological uncertainty and data uncertainty
All data is based on movements on national territory, regardless of the nationality of the vehicle. Methodology of data collection has been harmonized at EU level, but there is still not data provided on the freight transport by road. Sources include EUROSTAT, National statistical offices, ECMT, UNECE, UIC, DG TREN.
In order to answer the question whether the freight transport demand is decoupling from economic growth, the intensity of freight transport relative to changes in real BDP is considered.
Uncertainty of data sets The unit used to measure the volume or intensity of freight transport, as defined in the indicator, is the tonne-kilometre (tkm). It represents movement of one tonne over a distance of one kilometre. Data on the freight transport is collected through the Common Survey on transport statistics of EUROSTAT/ECMT/UNECE.

ENVIRONMENTAL INDICATORS OF THE REPUBLIC OF MACEDONIA 246
The loading of the vehicle is the key factor which plays a vital role in the assessment of whether there is decoupling of freight transport demand from BDP growth. In order to obtain full picture of transport demand and corresponding problems in the environment, it would be very useful to supplement data with data on the number of tonne-kilometers by vehicle-kilometre.
Uncertainty of grounds
In the context of environment protection, it is important not to overlook the trends in the total freight transport volume. Real absolute values are of key importance for the understanding of the pressures on the environment originating from increased freight transport demand.
Data specification
Data coverage (by years): Table 1 Freight transport by modes in tonne-kilometers (in million km)
Table 2 Share in percentage of tonne-kilometres (in million km) of individual freight transport modes
Table 3 Ratio between tonne-kilometres and BDP
Title of the indicator Source Reporting obligation
Freight transport demand − State Statistical Office
2002 2003 2004 2005 2006
Road transport 2693 4130 4004 3930 6732
Railroad transport 334 373 426 530 614
Air transport 0,331 0 0 0,45 0,44
% 2002 2003 2004 2005 2006
Road transport 88,95 91,7 90,4 88,11 91,6
Railroad transport 11,3 8,3 9,6 8,4 8,4
Air transport 1,05 0 0 0 0
year tkm BDP tkm/BDP
2002 3207 4005 80,07
2003 4503 4129 109,07
2004 4430 4355 101,73
2005 4460 4705 94,79
2006 7346 5069 144,92
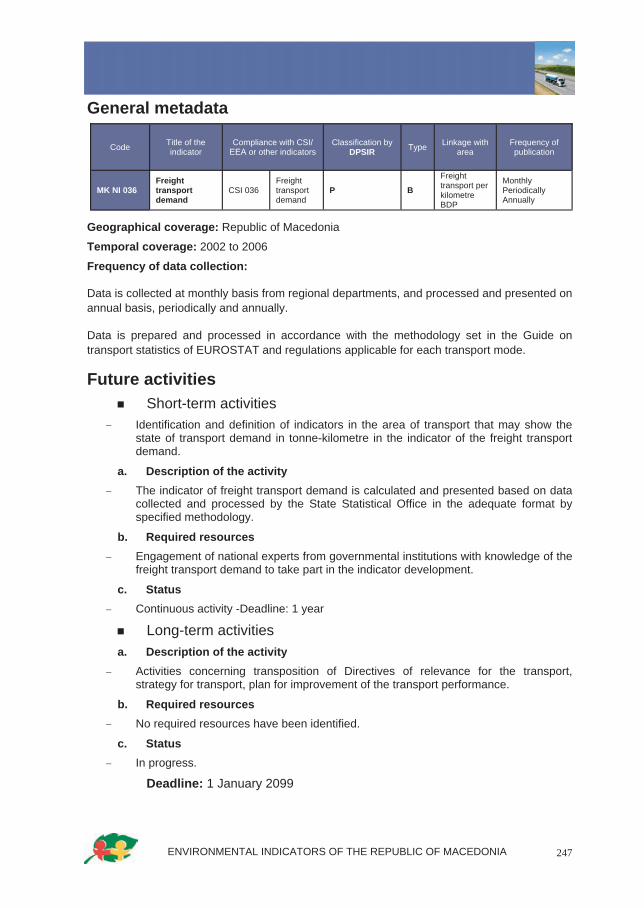
ENVIRONMENTAL INDICATORS OF THE REPUBLIC OF MACEDONIA 247
General metadata
Geographical coverage: Republic of Macedonia Temporal coverage: 2002 to 2006 Frequency of data collection:
Data is collected at monthly basis from regional departments, and processed and presented on annual basis, periodically and annually.
Data is prepared and processed in accordance with the methodology set in the Guide on transport statistics of EUROSTAT and regulations applicable for each transport mode.
Future activities Short-term activities
− Identification and definition of indicators in the area of transport that may show the state of transport demand in tonne-kilometre in the indicator of the freight transport demand.
a. Description of the activity − The indicator of freight transport demand is calculated and presented based on data
collected and processed by the State Statistical Office in the adequate format by specified methodology.
b. Required resources − Engagement of national experts from governmental institutions with knowledge of the
freight transport demand to take part in the indicator development.
c. Status − Continuous activity -Deadline: 1 year
Long-term activities a. Description of the activity
− Activities concerning transposition of Directives of relevance for the transport, strategy for transport, plan for improvement of the transport performance.
b. Required resources − No required resources have been identified.
c. Status − In progress.
Deadline: 1 January 2099
Code Title of the indicator
Compliance with CSI/ЕЕА or other indicators
Classification by DPSIR Тype Linkage with
area Frequency of publication
MK NI 036 Freight transport demand
CSI 036 Freight transport demand
P B Freight transport per kilometre BDP
Monthly Periodically Annually


ENVIRONMENTAL INDICATORS OF THE REPUBLIC OF MACEDONIA 250
MK - NI 042 AIR POLLUTION AND LEAD IN BLODD – LEAD LEVEL IN CHILDREN’S BLOOD
Period of indicator assessment September 2007 – April 2008
Explanation Justification for indicator selection
Urban population is exposed at air pollution with lead. Lead is toxic to living beings, including humans. Contact with lead and its compounds and thus exposure to its harmful effect in a form of acute, sub acute and chronic poisoning is possible under various conditions. Non-occupational poisoning occurs under every day living conditions, through emissions released from lead smelters, motor traffic where engines use ethyl containing fuel or from other industrial facilities and craftsman workshops, as well as through transmission from soil in the nutrition chain or drinking water by intake in the organism usually by inhalation and ingestion. In the case of lead intake through food and water children are more sensitive than adults because the lead with them is resorbed up to 59%, while with adults this extent is 10%. In lead intake by inhalation, there is a difference due to respiratory volume amounting 20 m3/day with adults and only 5 m3/day with children, and absorption is around 40% with both population groups.
Behavioural and mental retardation problems have been evidenced with children exposed continuously to low concentrations of lead. As a result of the use of lead in water supply pipes, wide use of lead containing dyes, extensive use of petrol with tetraethyl lead and lead particles emissions from zinc and lead smelteries, the lead has become a common pollutant of the environment. When the level of lead in the blood of exposed population is above 15 mg/dl, certain measures for exposure reduction should be undertaken. Children exposed to lead have been proven to suffer from hemoglobin falling at lead level in the blood of 40 mg/dl. Examination of children aged 4 and older with lead levels in the blood below 25 mg/dl showed deficit by 2-3 points for IQ (intelligence coefficient), and at each further increase in lead level in the blood by 10 mg/dl, IQ falling by 2-3 points could be estimated. According to such estimates, the average IQ with lead non-exposed population is 100, while the average IQ with comparable population with 25 mg/dl lead in the blood is only 95.5.
Definition This indicator tracks the exceedances of guideline values of lead level in children’s blood in urban areas. The level of lead in the blood of children in the municipality, region or country is expressed as average value of individual concentrations of lead in the blood in micrograms/deciliters (μg/dl).
Excess in air quality limit values occurs when the concentration of pollutant exceeds the limit values specified for lead in the Decree on the limit values of levels and types of polluting substances in ambient air and on the alert thresholds, deadlines for the limit values
P
R
D
S
I

ENVIRONMENTAL INDICATORS OF THE REPUBLIC OF MACEDONIA 251
achievement, margins of limit value tolerance, target values and long-term targets (Official Gazette of the Republic of Macedonia No. 50/20005).
Where there are several limit values (see the section on Policy goals), the indicator uses the most stringent case:
− Lead (Pb): annual limit value in ambient air
− Lead (Pb): level of lead in blood
Units − Lead (Pb) concentrations in ambient air are expressed in micrograms/m3.
− Lead level in the blood is expressed in micrograms/dl.
Policy relevance of the indicator List of relevant policy documents:
The Second National Environmental Action Plan – NEAP 2 (2006) sets the improvement of air quality through reduction of basic pollutants emission as its main priority. The same document specifies two basic measures that need to be taken: to prepare national plan for ambient air protection and strengthen the ambient air quality monitoring and assessment process.
The 1999 National Environmental Health Action Plan identifies the goal of implementation of targeted epidemiological investigations of the health status primarily with vulnerable population groups in health risky areas (Lead and Zinc Smelter - Veles) in terms of air pollution (non-ferrous metallurgy).
Legal grounds
The Law on Environment regulates areas that have direct impact on the quality of air, i.e. should contribute to air emissions reduction. Thus, the Law regulates the issues of IPPC, EIA/SEA, local environmental action plans and climate change.
The Law on Ambient Air Quality was adopted in August 2004 (Official Gazette of the Republic of Macedonia No. 67/2004) It was amended (Official Gazette of the Republic of Macedonia No. 92/2007) and represents framework law in the area of air. The goals of this Law include: avoidance, prevention and reduction of harmful effects on human health and environment as a whole, prevention and reduction of pollutions leading to climate change, as well as provision of adequate information on the ambient air quality. This Law stipulates adoption of high number of bylaws in accordance with the requirements of the Acquis Communitaire.
The same Law, together with the Decree on the limit values of levels and types of polluting substances in ambient air and on the alert thresholds, deadlines for the limit values achievement, margins of limit value tolerance, target values and long-term targets (Official Gazette of the Republic of Macedonia No. 50/05) transposes the requirements of the relevant EU Directives.
To be more precise, the following EU Directives have been transposed in the Law and the Decree:

ENVIRONMENTAL INDICATORS OF THE REPUBLIC OF MACEDONIA 252
− Framework Air Quality Directive 96/62/EC on ambient air quality assessment and management
− Directive 1999/30/EC on limit values for sulfur dioxide, nitrogen dioxide and nitrogen oxides, suspended particulate matters and lead in ambient air.
The level of lead in ambient air and lead in the blood of exposed population are defined in the WHO Air Quality Guidelines of 1987 and 2000.
Targets The Decree on the limit values of levels and types of polluting substances in ambient air and on the alert thresholds, deadlines for the limit values achievement, margins of limit value tolerance, target values and long-term targets specifies the limit values for lead. The WHO Air Quality Guidelines define the guideline values for the lead concentration in ambient air and lead level in the blood of exposed population.
Limit values for the lead concentrations in ambient air and lead level in children's blood
According to the said Decree, with regard to lead the limit value for human health protection has been defined. The limit value should be achieved by 1 January 2012 in the vicinity of specific industrial sources located at places polluted by industrial activities.
− Annual limit value of 0.5 µg/m3 in ambient air.
− Lead level in children’s blood below 10 µg/dl.
Key policy issue What progress has been made towards reduction of pollutants concentrations in urban environments in order to achieve the limit values for ambient air in urban environments defined in the Decree?
What progress has been made towards reduction of lead level in blood of vulnerable segment of the population, such as children in urban environments defined in the WHO Guidelines?
Key message Lead - Pb
The lead concentrations have generally reduced since 2001 and excess in limit values of 0.5 µg/m3 in ambient air specified in the Decree has been recorded only in Veles; however, this has not been the case in Skopje with continuously low concentrations significantly below the limit values set for the lead in ambient air.

ENVIRONMENTAL INDICATORS OF THE REPUBLIC OF MACEDONIA 253
Assessment Lead
The lead in the air most frequently originates from lead and zinc ores smelting. The occurrence of high lead concentrations in the ambient air in Veles in the period before 2003 resulted from the emissions released by Lead and Zinc Smelter in Veles.
High difference in lead concentrations in Veles measured in the period 2001-2002 was due to the emissions released by Lead and Zinc Smelter, while lead concentrations in ambient air decreased between 2003 and 2005 as a result of the terminated operation of the Smelter.
The level of lead in the blood of school aged children between 10 and 14 has been falling along with the improvement of the ambient air quality with regard to lead as air pollutant. In the period from 2001 to 2003, the level of blood with children in Veles was in excess of the levels recommended by the WHO. In 2004, when the Lead and Zinc Smelter was out of operation, the recorded levels of lead in school aged children's blood was below the guideline value of
0,3
0,1 0,1 0,1 0,1
0,94
0,6
0,220,15
0,048
00,10,20,30,40,50,60,70,80,91
2001 2002 2003 2004 2005
µg/m
3Lead in ambient air
Skopje Veles
37,25
16,51
7,64
21,21
0,00
5,00
10,00
15,00
20,00
25,00
30,00
35,00
40,00
2001 2003 2004 2005
µg/dl
Lead level in children’s blood in Veles (aged 10-14)
Veles

ENVIRONMENTAL INDICATORS OF THE REPUBLIC OF MACEDONIA 254
WHO. In 2005, there was another increase in the level of lead in children’s blood.
The graphical presentation shows the falling trend in lead concentrations in the ambient air in the period between 2001 and 2005.
The graphical presentation shows the falling trend in the levels of lead in children’s blood in the period between 2001 and 2005.
Methodology Methodology for the indicator calculation
Lead in ambient air – Pb µg/m3
For each station located in urban environment, annual lead concentration in ambient air annual limit value of 0,5 µg/m3) is calculated using available 24 hourly data during entire year. Selected urban stations include stations of the following type: stations measuring the pollution from the traffic, stations measuring pollution from industry and so called urban background stations. The average concentration is obtained by averaging the results from all stations located in Veles. In Skopje, there is only one monitoring station with discontinued monitoring.
Lead in children’s blood – Pb/blood µg/dl
Analysis is made on vein blood taken from school aged children between 10 and 14 in Veles and the individual levels of blood recorded have provided the average level of lead in the blood (Guideline value of WHO is below 10 µg/dl). Analysis is made to estimate the level of current exposure of children to lead in urban environment resulting from historical pollution (up to 2003) and pollution caused by traffic.
Data specification
Data coverage (by years): Table 1: Average annual concentration of lead in ambient air (average annual value – 0.5 µg/m3 in Macedonian urban environments
Source: PHI Republic Institute for Health Protection
Title of the indicator Source Reporting obligation
Excess in air quality limit val-ues in urban areas Level of lead in children’s blood
IHP Veles
RIHP
− European Environmental Agency
− Exchange of air quality data based on the Council Decision on the establishment of reciprocal ex-change of information and data from all networks and individual ambient air quality measuring stations (97/101/EC).
− World Health Organization - ENHIS
− Levels of lead in children’s blood, according to WHO Air Quality Guidelines, 1987 and 2000.
City Unit 2001 2002 2003 2004 2005
Skopje μg/m3 0,3 0,1 0,1 0,1 0,1
Veles μg/m3 0,94 0,6 0,22 0,15 0,048

ENVIRONMENTAL INDICATORS OF THE REPUBLIC OF MACEDONIA 255
Table 2: Level of lead in children’s blood (Guideline value by WHO is 10 µg/dl)
Source: PHI Republic Institute for Health Protection
General metadata
Geographical coverage: Republic of Macedonia
Temporal coverage: 2001 – 2005
Frequency of data collection: Data collection by the Public Health Institution (PHI) Institute for Health Protection – Skopje and Veles on ambient air quality with regard to lead concentration is performed on annual basis, sent via mail to the PHI Republic Institute for Health Protection – Skopje.
Data on the level of lead in children’s blood is obtained on the basis of examinations conducted by the PHI Republic Institute for Health Protection – Skopje in cooperation with the Institute for Health Protection - Veles. Data on the level of lead in the blood is reported to ENHIS (European Environment and Health Information System).
Uncertainty Methodological uncertainty
Generally, data is not representative for the whole urban environment in the Republic of Macedonia. The indicator is subject to changes from year to year, conditioned by the operation of the Lead and Zinc Smelter in Veles. Compared to the defined methodology of the European Environmental Agency, where the indicator is calculated using data only from the so called urban background stations, in our indicator calculation we have used data on ambient air quality with regard to lead content produced by one measuring station in the Municipality of Centre in the City of Skopje, with monitoring of discontinuous type. Such monitoring has not been established in other cities of our country.
Uncertainty of data
Data is generally not representative for the whole urban environment in the Republic of Macedonia. According to the defined methodology of the European Environmental Agency, only data series from monitoring stations with at least 75% coverage in the course of one year
City Unit 2001 2003 2004 2005
Veles μg/dl 37.25 16.51 7.64 21.21
Code Title of the indicator
Compliance with CSI/ЕЕА or other indicators
Classification by DPSIR Тype Linkage
with area
Frequency of
publication
MK NI 004
Excess in air quality limit values in urban areas
CSI 004 AP14
Exceedance of air quality limit values in urban areas
S А Air quality
Annually
MK NI 042 Level of lead in children’s blood
ENHIS RP G4_Chem_Ex1
Blood levels in children S Health Annually

ENVIRONMENTAL INDICATORS OF THE REPUBLIC OF MACEDONIA 256
shall be taken into account in the indicator calculation (or more than 274 valid daily data during one calendar year). In our case, this was not observed in the use of data from the monitoring station in Skopje. Representativeness of choice in the case of monitoring stations in Veles on ambient air quality with regard to lead content complies with the requirements of the EU Directive 1999/30/EC.
Future activities
Short-term activities
− Definition of the national set of indicators of air quality and lead level in children’s blood.
a. Description of the activity
− Establishment of work group concerning the indicators of air quality and lead level in children’s blood.
b. Required resources
− Engagement of national experts from governmental institutions in the area of air quality and health assessment of the level of lead in children’s blood.
c. Status
− Early initiative
Deadline: 1 year.
Long-term activities
− Long-term activities will be defined by the work group.

ENVIRONMENTAL INDICATORS OF THE REPUBLIC OF MACEDONIA 257
MK – NI 043 MORTALITY DUE TO RESPIRATORY DISEASES (Ј00 - Ј99) WITH INFANTS
Period of indicator assessment September 2007 – April 2008
Explanation Justification for indicator selection
Environmental pollution, especially the presence of PM, ozone, nitrogen oxides and sulphur oxides in ambient air of indoor and outdoor environment is a proven factor of adverse impact on human health, specifically on bronchial tubes and respiratory pathways and organs. In this context, children are particularly vulnerable group and morbidity in correlation with air quality has been proven exactly with this population. According to the WHO Review of effects of air pollution on children’s health and development (2005), there is a strong causal relationship between air pollution and mortality of respiratory diseases in neonatal period. Although infant mortality caused by respiratory diseases can be also linked with other pathological conditions or factors with infants, it is still used as indicator of environmental burden, i.e. air pollution.
Definition The indicator shows mortality rate of respiratory diseases (Ј00 - Ј99) with infants. In this contents, infants are alive born children aged 1 to 12 months, respiratory diseases are acute or chronic condition of respiratory systems, including acute respiratory infections, bronchitis, pneumonia or influenza (Ј00—Ј99). According to data available from epidemiological studies, infants’ mortality could be in correlation with the level of air pollution in the environment, along with series of other factors that can influence respiratory diseases mortality and morbidity. Therefore, the indicator is considered useful in the assessment of the load of diseases attributed to ambient air quality.
Units − Number of deaths per 1000 alive born infants aged between 1 and 12 months.
Policy relevance of the indicator List of relevant policy documents
The Second National Environmental Action Plan – NEAP 2 (2006) sets the improvement of air quality through reduction of basic pollutants emission as its main priority. The same document specifies two basic measures that need to be taken: to prepare national plan for ambient air protection and strengthen the ambient air quality monitoring and assessment process.
The 1999 National Environmental Health Action Plan identifies the goal of implementation of targeted epidemiological investigations of the health status primarily with vulnerable
P
R
D
S
I

ENVIRONMENTAL INDICATORS OF THE REPUBLIC OF MACEDONIA 258
population groups in health risky areas (Lead and Zinc Smelter - Veles) in terms of air pollution (non-ferrous metallurgy).
The National Children’s Environment and Health Action Plan in which the current children’s health profile in the country is presented, identifies the current environmental health risks to children from air pollution, indoors primarily passive tobacco smoking and outdoors, including the lead.
The Handbook – Planning to protect Children against hazards – The Regional Priority Goal III reads: We aim to prevent and reduce respiratory diseases due to outdoor and indoor air pollution thereby contributing to a reduction in the frequency of asthmatic attacks in order to ensure that children can live in an environment with clean air. We aim to achieve a substantial reduction in the morbidity and mortality from acute and chronic and respiratory disorders in children and adolescents.”
Legal grounds
The Law on Environment regulates areas that have direct impact on the quality of air, i.e. should contribute to air emissions reduction. Thus, the Law regulates the issues of IPPC, EIA/SEA, local environmental action plans and climate change.
The Law on Ambient Air Quality – the principle of precautionary and accountable behaviour stipulates that: In the course of activities that may affect the quality of ambient air, everyone shall be obliged to behave in a careful and responsible manner in order to avoid and prevent ambient air pollution and harmful effects on human health and environment as a whole.
Targets To reduce the mortality rate from respiratory diseases (Ј00 - Ј99) with infants. Or prevent the mortality rate increase.
Key policy issue What steps have been taken to reduce or prevent the increase in the mortality rate from respiratory diseases (Ј00 - Ј99) with infants?
What cross-sectoral policies have been implemented so far in order to reduce respiratory morbidity and mortality with the general population and with infants in particular?

ENVIRONMENTAL INDICATORS OF THE REPUBLIC OF MACEDONIA 259
Key message The mortality rate from respiratory diseases (Ј00 - Ј99) with infants, in the period 2002 – 2006, ranged between 0.18 and 0.52. The analysis of the trend indicates a variable state in the said period with an evident drop in 2005 which increased again the next year. The increased mortality rate with infants from respiratory diseases can be attributed to exposure at pollutants in the ambient air both indoors and outdoors, while the falling of the rate results from improved conditions and air quality. However, such significant changes in the levels of air pollution were not observed. Different criteria in diagnosis setting and reporting of death and causes leading to it may have had influence on this variable trend. Respiratory diseases with infants are not attributable only to air pollution, but also to biological and genetic factors of infants, presence of allergens, infective agents, nutrition, socio-economic factors and parents’ educational background. In some developing countries, other congenital or gained diseases play an important role, such as HIV/AIDS and malaria – all these can have impact on the mortality rate.
The mortality rate is also dependent on the effectiveness of the health care system and availability of health services. Mortality rates from respiratory diseases in developed countries have remained stable for decades, and even reduction in mortality has been tracked despite of the rising morbidity rate.
The analysis of the causes for death with the general population for the period 2003 - 2005 concluded that respiratory diseases as cause for death with the general population held the fifth position with a rate between 3.9 and 3.4, while the rate of conditions appearing in the prenatal period was 1.0.
On the other hand, mortality rate with infants was 11.3 in 2003, 13.2 in 2004 and 12,8 in 2005,meaning that respiratory diseases in infancy had very low contribution to the total mortality of this population.
0
0,1
0,2
0,3
0,4
0,5
0,6
2002 2003 2004 2005 2006
Mortality rate
year
Mortality rate from respiratory diseases (J00-J99) with infants

ENVIRONMENTAL INDICATORS OF THE REPUBLIC OF MACEDONIA 260
Methodology Methodology for the indicator calculation
The indicator of mortality from respiratory diseases (Ј00 - Ј99) with infants is calculated as a rate of infants died from respiratory diseases (Ј00 - Ј99) per 1000 infants aged from 1 to 12 months.
Data specification
Data coverage (by years): 2002-2006 Table 1: Mortality rate due to respiratory diseases (Ј00 - Ј99) with infants
General metadata
Geographical coverage: Republic of Macedonia
Temporal coverage: 2002 – 2006
Frequency of data collection: annually.
Title of the indicator Source Reporting obligation
Mortality due to respiratory diseases (Ј00 - Ј99) with infants
− State Statistical Office
− Every doctor stating death is obliged to fill in the reporting list on the death event, stating the causes for the death and then such data is collected in the national database of the State Statistical Office
Code Title of the indicator
Compliance with CSI/ЕЕА or other indicators
Classification by DPSIR Type Linkage with
area Frequency of publication
MK NI 043
Mortality due to respiratory diseases (Ј00—Ј99) with infants
ENHIS Air_E2
Mortality due to respiratory diseases
С
Air Health Traffic Local self-government
Annually
Year 2002 2003 2004 2005 2006
Mortality rate 0,29 0,52 0,51 0,18 0,35
ENVIRONMENTAL INDICATORS OF THE REPUBLIC OF MACEDONIA 261
Future activities Short-term activities
a. Description of the activity − Comparable methods of information collection, classification, description and
recording are important in order to facilitate comparisons of mortality. Rising quality and coverage of population by European registers of mortality establish solid basis for the future monitoring activities. National databases with comprehensive data on the overall mortality and specific mortality rates are of vital importance. An important co-indicator is the concentration of individual pollutants in the air, children living in humid homes, children exposed at tobacco smoke, accessibility of health care services, socio-economic data on the family.
b. Required resources − Multi-sector team composed of national experts in the area of traffic, transport,
education, medicine, building with regard to adequate planning solutions of the space, urban and rural development in the context of the public awareness rising and capacity building in relation to this issue.
c. Status − Activities are underway.
Deadline: June 2008

ENVIRONMENTAL INDICATORS OF THE REPUBLIC OF MACEDONIA 262
MK – NI 044 ИINCIDENCE OF CHILDHOOD LEUKAEMIA
Period of indicator assessment September 2007 – April 2008
Explanation Justification for indicator selection
The causes of childhood leukaemia remain unknown in most of the cases. Certain number of causes and highly suspected risk factors has been identified, but reviews underline that they are responsible only for low number of cases. The known and highly suspected causes include genetic factors (2 – 3% of the cases are connected with Dawn syndrome), exposure to Epstein Barr virus (for certain types of childhood Hodgkin's lymphoma), intrauterine and after birth exposure to ionizing radiation. Infectious diseases may play a role in the aetiology of childhood leukaemia, especially acute lymphoblastic leukaemia (ALL). Delayed exposure to infection in early childhood could result in abnormal reaction leading to leukaemia development. Leukaemia could also be a rare reaction to specific, although not identified infectious agents.
Other risk factors, including environmental factors, have been less clearly identified. International Agency for Research on Cancer has concluded that extremely low frequency (ELF) magnetic fields are possibly carcinogenic to humans, based on consistent statistical associations of high-level residential magnetic fields with a doubling of risk of childhood leukaemia. Several studies have indicated that children exposed to certain dangerous chemicals (benzene, hazardous air pollutants) are at higher risk of childhood leukaemia, where benzene could be possible causal agent. Several works have demonstrated statistical relationship between the risk of childhood leukaemia and exposure to insecticides used in households on plants and green areas and in the lice shampoos.
There are different leukaemia types with different patterns of geographical distribution. Among children aged between 0 and 14 years app. 75% of leukaemia is classified as ALL; in developed countries, this includes 70% of pre B-cell type representing peak occurrence in early phases of life and explains the difference observed in the global standardized incidence of leukaemia between countries. Actually, ALL shows an incidence up to 40 cases per million in Western countries among white population, from 20 to 30 cases per million in Eastern European countries, but below 15 to 20 cases per million in sub-Saharan countries. Second most frequent type of childhood leukaemia is the acute myeloid leukaemia (AML), accounting for 20% of all cases of leukaemia and shows a remarkably stable worldwide incidence of 4-10 cases per million.
The Committee on the Medical Aspects of Radiation in the Environment (COMARE) has reported that the rates of many childhood cancers, including those of leukaemia, are slightly higher in areas with high socioeconomic status compared to more deprived areas. The reason for this is not known. The correlation could be relevant for the differences observed in the results between Eastern and Western countries obtained by ACCIS. Due to the insufficiently
P
R
D
S
I

ENVIRONMENTAL INDICATORS OF THE REPUBLIC OF MACEDONIA 263
clear causal factors of leukaemia, policies for incidence reduction are difficult to formulate.
Definition Incidence of leukaemia is the rate of new diagnosed cases of leukaemia defined by ICD-10 codes C90-95 in children aged 0 to 14 years.
Units − Number of diagnosed cases of leukaemia per 100 000 persons aged 0 to 14 years.
Policy relevance of the indicator List of relevant policy documents
Leukaemia is often discussed when environmental issues and childhood diseases are considered. The causes of the majority of cases are, however, unknown. As a result, there is a lack both of policies aiming directly at reducing the incidence of leukaemia and of major programmes fostering research into the potential risk factors for leukaemia in Europe.
The new Regulation of the European Parliament and the Council concerning the Registration, Evaluation, Authorization and Restriction of Chemicals (REACH) is of relevance. It considers that the carcinogenicity, mutagenic and reproductive toxicity of chemical industrial substances are priority criteria when they are submitted to security constraints and declarations authorizing their use. The target of REACH is to substitute progressively substances that are known to be safer for most carcinogenic, mutagenic and toxic industrial substances. Of further relevance is Council Directive 97/43/EURATOM, which aims to protect patients from excessive exposure to radiation for medical use and ensure that there is minimum exposure during pregnancy and early childhood.
The Second National Environmental Action Plan - NEAP 2 (2006), as its main goal, sets the achievement of environmental quality by which concentrations of pollutants will not lead to significant impacts or risks to human health, establishment of effective system of prevention, control and assessment of health risks in accordance with the requirements of the national and EU legislation, as well as with WHO recommendations, through taking the specific measure of NEHAP review and further implementation, with particular accent on the risks to children's health.
The 1999 National Environmental Health Action Plan, in its section on ionising and non-ionising radiation, specifies the priorities and specific activities that need to be undertaken to reduce negative impacts from these radiations on human health.
Legal grounds
The provisions of Article 89 of the Law on Chemicals, section on Overall human health and environment protection, provide legal grounds for the Minister of Health and the Minister of Environment and Physical Planning to order temporary prohibition or restriction of production, distribution or use of hazardous chemicals in case of suspicion that they are harmful for human health and environment.
The Law on Ionising Radiation incorporates provisions concerning the protection of the

ENVIRONMENTAL INDICATORS OF THE REPUBLIC OF MACEDONIA 264
population against ionising radiation. The legal person causing ionising radiation, in case of caused release of radioactive substances in the environment, and consequently adverse impacts on human health, shall compensate the damage.
The Law on Non-Ionising Radiation is under drafting and it has been scheduled for adoption by the end of 2008. The draft of this law incorporates provisions concerning particularly the protection of children population against non-ionising radiation during their stay at school, pre-school institutions and hospitals.
Targets To reduce leukaemia incidence in children aged 0 to 14.
Key policy issue
What progress has been made to reduce the incidence of childhood leukaemia?
Key message The incidence of childhood leukaemia shows a stable trend in the reporting period 2001-2005, with a peak of the incidence in 2004. During the past several years, environmental management capacity in the Republic of Macedonia has been strengthened in order to reduce exposure to certain agents and thus improve the health of the population.
Assessment The indicator uses data from the national register of malignant diseases for the period 2001 - 2005. The indicator is based on data on children aged 0 - 14 years.
Considering the fact that causal factors of leukaemia are not clear, policies to reduce incidence are difficult to formulate or have limited effects. For example, policies to reduce exposure to
0
0,1
0,2
0,3
0,4
0,5
0,6
0,7
2002 2003 2004 2005 2006
rate
year
Childhood leukaemia incidence in children aged between 0 and 14 years
Leukaemia C91 ‐ C95 (rate) Trend
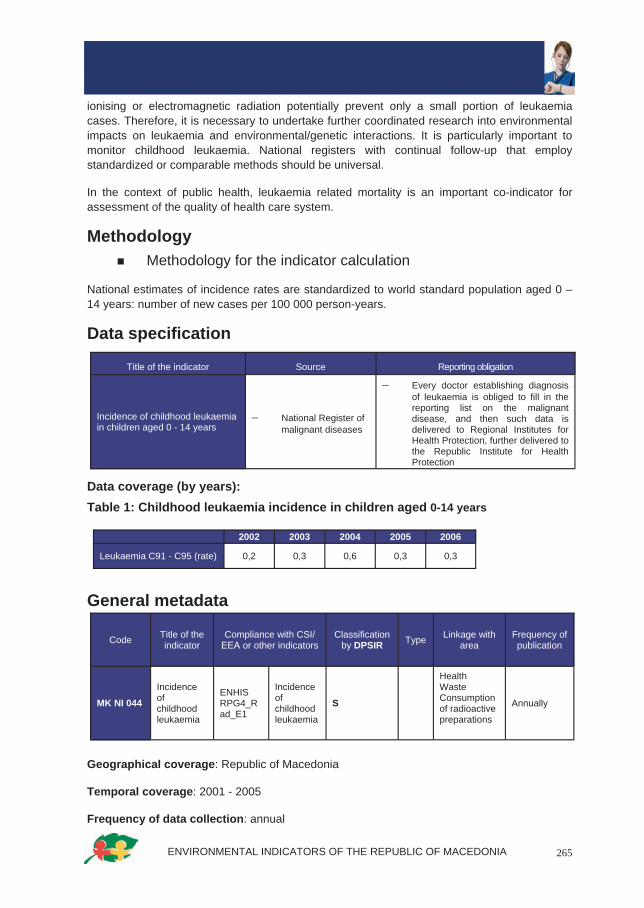
ENVIRONMENTAL INDICATORS OF THE REPUBLIC OF MACEDONIA 265
ionising or electromagnetic radiation potentially prevent only a small portion of leukaemia cases. Therefore, it is necessary to undertake further coordinated research into environmental impacts on leukaemia and environmental/genetic interactions. It is particularly important to monitor childhood leukaemia. National registers with continual follow-up that employ standardized or comparable methods should be universal.
In the context of public health, leukaemia related mortality is an important co-indicator for assessment of the quality of health care system.
Methodology Methodology for the indicator calculation
National estimates of incidence rates are standardized to world standard population aged 0 – 14 years: number of new cases per 100 000 person-years.
Data specification
Data coverage (by years): Table 1: Childhood leukaemia incidence in children aged 0-14 years
General metadata
Geographical coverage: Republic of Macedonia
Temporal coverage: 2001 - 2005
Frequency of data collection: annual
Title of the indicator Source Reporting obligation
Incidence of childhood leukaemia in children aged 0 - 14 years
− National Register of malignant diseases
− Every doctor establishing diagnosis of leukaemia is obliged to fill in the reporting list on the malignant disease, and then such data is delivered to Regional Institutes for Health Protection, further delivered to the Republic Institute for Health Protection
Code Title of the indicator
Compliance with CSI/ЕЕА or other indicators
Classification by DPSIR Type Linkage with
area Frequency of publication
MK NI 044
Incidence of childhood leukaemia
ENHIS RPG4_Rad_E1
Incidence of childhood leukaemia
S
Health Waste Consumption of radioactive preparations
Annually
2002 2003 2004 2005 2006
Leukaemia C91 - C95 (rate) 0,2 0,3 0,6 0,3 0,3

ENVIRONMENTAL INDICATORS OF THE REPUBLIC OF MACEDONIA 266
Future activities Short-term activities
a. Description of the activity − Comparable methods for information collection, classification, description and
registration are important in order to enable comparisons of leukaemia incidence and mortality. Rising quality and coverage of the population by European cancer registers establish solid basis for the future monitoring activities. National registers with comprehensive data on leukaemia are of vital importance.
b. Required resources − Improvement of human and technical resources for leukaemia diagnostics and
treatment. Introduction of measures to reduce exposure to ionising and non-ionising radiations, adequate waste disposal to reduce environmental burden and population exposure accordingly.
c. Status − Activities are in progress.
Deadline: June 2008.

ENVIRONMENTAL INDICATORS OF THE REPUBLIC OF MACEDONIA 267
MK – NI 045 INCIDENCE OF MELANOMA IN PEOPLE AGED UNDER 55 YEARS
Period of indicator assessment September 2007 – April 2008
Explanation Justification for indicator selection
Melanoma is a malignant transformation of pigment cells (melanocites) in the skin. Most of the melanomas seem to be caused by acute, irregular and excessive exposure to the sun, mainly during childhood, although exposure in adult age also contributes to increased risk factor for melanoma. The light skin prototype (types I and II), high number of birthmarks or atypical and family history of skin cancer are the most frequent predictors of risk for melanoma.
Melanomas occurring in those aged under 55 years seem to be strongly linked to exposure to UV radiation in childhood. These melanomas are often localized on the body trunk (males) and on the legs (females). The fact that melanoma in the elderly occur on the most chronically exposed parts of the body illustrates that chronic exposure is more important for melanomas occurring among elderly people. Melanoma is more frequent among people in the higher socioeconomic layers and among northern European populations. This is probably due to their higher excessive intermittent exposure to UV radiation in combination with a light skin prototype.
The main way to prevent melanoma is to advise people to limit their exposure to the sun by avoiding such exposure during the hours of the day when UV radiation is most intense (approximately two hours each side of the solar noon) and to wear appropriate clothes, hats and sun-glasses. Special attention needs to be paid to children. The use of sunscreen preparations may help to prevent sunburn and skin cancer but may also lead to increased exposure to the sun. Survival is strongly linked to the stage of the disease at diagnosis, which provides a rationale for considering organized screening programmes for melanoma. Since the incidence of melanoma is expected to keep increasing in the future, early detection remains an important strategy to combat the disease. Prevention campaigns carried out in north-western European countries since the 1980s have probably resulted in a decrease in the average thickness of melanomas and stabilization in melanoma mortality in young people.
Definition The incidence of melanoma in people aged under 55 years is the number of detected cases during one year expressed per 100 000 residents of selected population.
The incidence is obtained by calculating the number of cases on the mean population size during the period considered. The age-standardized rate is calculated using the age groups. The age group considered here are those aged 0–54 years.
P
R
D
S
I

ENVIRONMENTAL INDICATORS OF THE REPUBLIC OF MACEDONIA 268
Units − number of cases per 100 000 person-years.
Policy relevance of the indicator List of relevant policy documents
Melanoma is strongly linked with exposure to UV radiation during childhood and is therefore largely preventable. WHO has launched the INTERSUN Global UV Project to stress the importance of increasing awareness and knowledge about the potential negative health effects of exposure to UV radiation, especially during childhood. This information should be readily available through various channels such as television, radio, campaigns, meteorological websites and in schools. Representatives of the tourism industry can also play a crucial role in minimizing the risks associated with exposure to the sun by disseminating information to their customers and by taking essential measures in tourism facilities and services. A UV radiation index can help to identify appropriate action based on the measured UV radiation levels. Furthermore, the use of sunbeds by children should be strongly discouraged, if not forbidden. The INTERSUN Project recommendations can serve as a framework for an action plan to reduce exposure to UV radiation.
Nevertheless, there are at present few official regulations in most European countries on policies to reduce excessive exposure of children to UV radiation. There are thus major opportunities for developing policy as well as for harmonizing and strengthening efforts to reduce such exposure. National policies to reduce exposure to artificial UV radiation, including regulations for the use of sunbeds by children and teenagers should be implemented in more countries in the WHO European Region.
Excessive exposure to solar UV radiation can best be prevented by regional and local awareness-raising and information campaigns, especially in educational institutions. The aim is to encourage schoolchildren to take measures to protect themselves against the sun.
The Second National Environmental Action Plan - NEAP 2 (2006), in its part on non-ionising radiation, specifies the main targets and measures towards the establishment of effective system of environment protection and control against harmful effects of non-ionising radiation in the Republic of Macedonia.
The 1999 National Environmental Health Action Plan, in its section on non-ionising radiation, specifies the priorities and specific activities that need to be undertaken to reduce negative impacts from this radiation on human health.
The National Strategy for Climate Change, in its part 6.6. Health, provides an overview of climate change impacts on human health.
Targets To reduce the incidence of melanoma through implementation of cross-sectoral policies aimed at public awareness increase and improved education of the population.

ENVIRONMENTAL INDICATORS OF THE REPUBLIC OF MACEDONIA 269
Key policy issue What steps have been taken to prevent the rising trend of melanoma?
What cross-sectoral policies have been implemented so far to reduce the exposure of the general population and especially children, as it seems that the latter population is the most sensitive and exposure during this period of life leads to consequences in later age?
Key message The analysis of the incidence of melanoma over five year period shows significant rising trend in the 2001-2002 period, which is then retained, but with increased incidence rate. The rising trend is an alarm for taking preventive measures, i.e. protecting the population against UV radiation.
The incidence of melanoma skin cancer in people aged under the age of 55 years in Europe varies considerably between countries. The highest incidence rates are found in northern and western countries and the lowest in southern countries, with rates from three to eight times lower for men and women, respectively. In eastern European countries the incidence rates are low to intermediate. These variations are likely to be linked to specific behaviour (winter holidays, sun-seeking behaviour) as well as to improved diagnoses resulting from better detection of melanoma.
Assessment The incidence of melanoma ranges between rates of 0.9 in 2001, retained at 1.4 during the follow-up years, which means that it tracks an increasing trend.
Melanoma is one of the cancers with the fastest rates of increase among people in Europe, and this trend has been observed in our country, too. Trends in rates differ between regions: in northern Europe where the rates are high, they appear to have levelled off since the 1990s, particularly among people aged less than 55 years. This seems to be the result of a change in sun-seeking and protective behaviour against UV radiation among the younger generations. In
0
0,2
0,4
0,6
0,8
1
1,2
1,4
1,6
2001 2002 2003 2004 2005
rate
year
Melanoma incidence rate in the population aged 0- 54 years

ENVIRONMENTAL INDICATORS OF THE REPUBLIC OF MACEDONIA 270
contrast, in southern and eastern
Europe, as a Region where the Republic of Macedonia belongs, the rates are generally still increasing steeply in all age groups.
The main way to prevent melanoma is to advise people to limit their exposure to the sun. Thus, the national policy should pay greater attention to the prevention of over-exposure to UV radiation during childhood, in observation of recommendations of expert literature and scientific research evidence. This policy approach is supported by the experiences from western European countries. The stagnation, as of 1990s, in previously rising trends in northern Europe among people aged under 55 years supports the conclusion that specific protective activities against UV radiation in these countries have proven effective.
Methodology Methodology for the indicator calculation
The incidence of melanoma in people aged under 55 years is calculated as the number of new diagnosed cases of melanoma during one year per 100 000 residents.
Data specification
Data coverage (by years): Table 1 Incidence rate of melanoma in population aged 0 - 54 years, 2001 - 2005
General metadata
Geographical coverage: Republic of Macedonia
Temporal coverage: 2001 - 2005
Frequency of data collection: annual.
Title of the indicator Source Reporting obligation
Incidence of melanoma in people aged under 55 years
− National Register of malignant diseases
− Every doctor establishing diagnosis of melanoma is obliged to fill in the reporting list on the malignant disease, and then such data is delivered to Regional Institutes for Health Protection, further delivered to the
Year 2001 2002 2003 2004 2005
rate 0,9 1,4 1,4 1,3 1,4
Code Title of the indicator
Compliance with CSI/ЕЕА or other indicators
Classification by DPSIR Тype Linkage with
area Frequency of publication
МК NI 045
Incidence of melanoma in people aged under 55 years
ENHIS RPG4_Uvrd_E1
Incidence of melanoma in people aged under 55 years
S
Health Climate change Tourism
Annually

ENVIRONMENTAL INDICATORS OF THE REPUBLIC OF MACEDONIA 271
Future activities Short-term activities
a. Description of the activity − Comparable methods of collection, classification, description and registration of
information are important to allow comparisons of melanoma incidence and mortality. The increasing quality and population coverage of European cancer registries are good bases for future monitoring efforts. Complete national data registries for melanoma are of crucial importance. Estimates of mortality from melanoma are an important co-indicator, since melanoma prognosis is strongly correlated with the type of the tumour at diagnosis.
b. Required resources − Multi-sectoral team composed of national experts in the fields of medicine,
environmental health, education, tourism, finance, etc., in order to develop a long-term project aimed at public awareness increase and capacity building with regard to this issue.
c. Status − Activities concerning diagnosis, recording, data delivery and strengthening the
national register of malignant diseases are in progress, as this risk presents a challenge to public health.
− With regard to public education aimed at awareness increase, activities have been undertaking starting in primary education, through daily information via media. Republic of Macedonia, as southern European country, has many sunny days during the year and hot waves during summer season. Thus, HMA informs the citizens on daily basis via the media on the value of UV index. At days with exceptionally high values of UV Index, the RIHP and Ministry of Health address population with information including recommendations for the behaviour in such conditions.
Deadline: June 2008
Long-term activities a. Description of the activity
− Preparation of Strategy for protection against UV radiation and reduction of melanoma incidence, to elaborate in detail all long-term activities and stakeholders to take part in its implementation. Multidisciplinary approach should be the ground for the development and implementation of this strategy.
− Targets to be established in this strategy should take a prominent place in the development of future NEHAPs.
− Capacity building and promotion campaigns on the meaning of UV radiation and its UV Index value, the impact of UV radiation on ecosystems, effects on human health and especially adverse health effects. Protection and prevention measures with regard to adverse health effects.
b. Required resources − Multi-sector team composed of national experts in the area of traffic, transport,
education, medicine, building with regard to adequate planning solutions of the space, urban and rural development in the context of the public awareness rising and capacity building in relation to this issue.
Deadline: December 2010.

ENVIRONMENTAL INDICATORS OF THE REPUBLIC OF MACEDONIA 272
MK – NI 046 MORTALITY FROM TRAFFIC ACCIDSENTS WITH CHILDREN AND YOUNG PEOPLE
Period of indicator assessment September 2007 – April 2008
Explanation Justification for indicator selection
Traffic injuries are leading cause of death for children and young people in the European Region and mortality rates are unacceptably high, recording differences which in certain areas reach as much as eight times. On the other side, intervention measures in certain countries indicate however that injuries attributable to traffic accidents and deaths related to them are preventable, i.e. their rate can be easily be reduced. All this indicates that there is an urgent need to implement safety policies in transport and strategies for injuries prevention. Children and young people constitute a vulnerable group with regard to traffic accidents due to their different psychological and physical features compared to adults. Children under the age of 10 years have limited ability to get along with traffic and thus they are exposed at higher risk in conditions of dense overcrowded traffic, restricted and lower visibility, reduced prediction of the outcome of situations, etc. The risk is further increased when drivers fail to focus on cyclists or pedestrians. In case of accident, children are particularly vulnerable, as their head/torso proportion increases the risk of head injury, and their tallness increases the probability that vital bodily organs are injured in accidents. Traffic accidents lead to post-trauma stress with almost 33% of children, and all this in combination with their risky behaviour, limited experience in traffic and higher sensitivity at alcohol increase their vulnerability.
Environmental conditions contribute significantly to traffic accidents, with attributive fraction being assessed at 25% in European Region. It has been assessed that as much as 35% of traffic accidents is due to environmental conditions, especially to urban planning policies and practice, roads design, traffic congestion and density of population, as well as number of motor vehicles.
Definition The indicator shows the mortality rate from traffic accidents for children aged 0 - 14 years and young people aged 15 - 24, the trend in a given period and comparison of data on European Region and policy relevance related thereto.
Units − Number of deaths per 100 000 children aged 0 - 14 years or per 100 000 young
people aged 15 - 24 years, respectively.
P
R
D
S
I

ENVIRONMENTAL INDICATORS OF THE REPUBLIC OF MACEDONIA 273
Policy relevance of the indicator List of relevant policy documents
The National Children and Environment Protection Action Plan which presents the current health profile of children in the country defines the existing environmental health risks for children for the purpose of their protection against accidents and trauma.
The Guidebook - Planning of Children's Protection against Hazards – Regional Priority Goal II reads: "We aim to prevent and significantly reduce health consequences from accidents and injuries and pursue a decrease in morbidity from lack of adequate physical activity, by promoting safe, secure, and supportive human settlements for all children".
Legal grounds
The Law on Traffic Safety at Roads - This Law regulates the safety and protection on roads; obligations in case of traffic accident; conditions for acquiring the right to drive a vehicle; candidates training for drivers; driving examination taking and checking of driver's ability; checking of vehicles, devices and equipment that are compulsory for the vehicles; dimensions, total mass; axial loading of vehicles and conditions that shall be met by vehicles in traffic; technical check-ups of vehicles; special safety measures; organization and tasks of the safety at roads councils, as well as misdemeanour sanctions and misdemeanour procedure administered with regard to misdemeanours in the field of traffic at road.
Targets To reduce the mortality rate from traffic accidents with children and young people populations through appropriate intervention programmes, i.e. to prevent the mortality rate increase.
Key policy issue What steps have been taken to reduce the mortality rate from traffic accidents with vulnerable groups like children and young people or prevent its increase? What cross-sectoral policies have been implemented to reduce the number of traffic accidents for the general population and especially children population, as it appears that this population is the most sensitive and exposure in childhood results in consequences at later age?
Key message The mortality rate for children aged 0 - 14 years and young people aged 15 - 24 years was low during 2002 - 2004, ranging between 0 and 0.24 for children and 0 to 0.61 for young people. The rate is relatively low compared to specific mortality rates in other European countries like Greece, Spain, France, Germany. However, there was a rapid increase in 2005, tracking as high as 10 times higher rate, namely 2.74 for children aged 0 - 14 years and 6.7 for young people aged 15 - 24 years. The rapid increase in 2005 could reflect the improved system of reporting of causes of death. Nevertheless, this growth could be a fact indicating the need for introduction of intervention programmes as part of cross-sectoral policies.

ENVIRONMENTAL INDICATORS OF THE REPUBLIC OF MACEDONIA 274
Methodology Methodology for the indicator calculation
The indicator mortality from traffic accidents (800 and 848) is calculated as rate of deaths attributable to traffic accidents involving persons aged 0 - 14 years and aged 15 - 24 years per 100 000 residents from among the said age groups.
Data specification
Data coverage (by years): Table 1 Mortality from traffic accidents in children aged 0 - 14 years and young people aged 15 - 24 years
Title of the indicator Source Reporting obligation
Mortality from traffic accidents in children and young people
− State Statistical Office
− Every doctor stating death is obliged to fill in the reporting list on the death event, stating the causes for the death and then such data is collected in the national database of the State Statistical Office
0 - 14 years 15 - 24 years
2002 0,23 0
2003 0 0,30
2004 0,24 0,61
2005 2,74 6,70
Mortality rate
0,23 0 0,24
2,74
0 0,3 0,61
6,7
0
1
2
3
4
5
6
7
8
2002 2003 2004 2005
mortality rate
year
Mortality rate from traffic accidents with children and young people
0 ‐ 14 years mortality rate 15 ‐ 24 years

ENVIRONMENTAL INDICATORS OF THE REPUBLIC OF MACEDONIA 275
General metadata
Geographical coverage: Republic of Macedonia
Temporal coverage: 2001 - 2005
Frequency of data collection: annual.
Future activities Short-term activities
a. Description of the activity − Comparable methods of information collection, classification, description and
recording are important in order to facilitate comparisons of mortality. Rising quality and coverage of population by European registers of mortality establish solid basis for the future monitoring activities. National databases with comprehensive data on the overall mortality and specific mortality rates are of vital importance. An important co-indicator is the rate of injuries caused by traffic accidents, considering the fact that the mortality rate is in close correlation with the injuries rate.
b. Required resources − Multi-sector team composed of national experts in the area of traffic, transport,
education, medicine, building with regard to adequate planning solutions of the space, urban and rural development in the context of the public awareness rising and capacity building in relation to this issue.
c. Status − Activities are underway.
Deadline: June 2008
Code Title of the indicator
Compliance with CSI/ЕЕА or other
indicators
Classification by DPSIR Тype Linkage
with area Frequency of publication
MK NI 046
Mortality from traffic accidents in children and young people
ENHIS Traf_E1
Mortality from traffic accidents
S А
Health Transport Local self-government Physical planning
Annually


ENVIRONMENTAL INDICATORS OF THE REPUBLIC OF MACEDONIA 278
МК – NI 047 TOURISM INTENSITY IN THE REPUBLIC OF MACEDONIA
Period of indicator assessment September 2007 – April 2008
Explanation Justification for indicator selection
Justification for the selection of tourism indicators should be seen in the fact that tourism is social, economic and significant spatial phenomenon. This means that tourism is in close correlation with the environment.
The above correlation can be identified in its incentive interdependence on the environment. Cases of environmental degradation and devastation, absence of innate environmental elements in the place of permanent residence and contradiction between emitting and attractive environment are among the main reasons for involvement of the local population in tourist activity.
The attractiveness of the environment is the leading reason for tourists visit and stay. The extent of visits and stays appears as indicator of environment attractiveness. Attractiveness without tourists interest would remain only potential value of the environment.
Development of tourism assumes sustainable use of environmental elements. This means that the basis of tourism development should also constitute environment protection. However, tourism development often leads to threats to stability of ecosystems and authentic characteristics of the space due to enormous and inadequate building of reception facilities and improper attitudes of visitors towards the environment.
Tourist indicators as tourist visits and stay through the intensity, structure and dynamics of development are suitable for monitoring as data is available and official.
1.1 International tourist intensity
Justification for the selection of the indicator of international tourist visits is based on the fact that higher extent of international visits reflects the environment as an environment of international importance. Advanced experience of foreign tourists implies greater attractiveness for visits. The intensity of visits should be analyzed by registered tourists in catering establishments, through transport, registration by interview and data on regional distribution.
1.2 Foreign tourist stay Foreign tourists with their stay indicate the level to which the environment has been adapted to their demands. In this way, the trend of attractiveness at international level will be assessed.
1.3 National tourist intensity This indicator shows the level of interest demonstrated by national tourists for visits and stay in
P
R
D
S
I
P
R
D
S
I
ENVIRONMENTAL INDICATORS OF THE REPUBLIC OF MACEDONIA 279
tourist areas. In this way it also indicates the ratio between stay and visits in terms of length of stay, reflecting the achievement of environment adaptation to the demands of tourists.
Definition The indicator shows:
1.1 International tourist intensity
The total number of foreign tourists by years shows the development dimension. Using the growth rate, the extent to which the attractiveness of the environment as receptive environment will be utilized may be estimated, the needs for expansion of accommodation and other reception establishments may be defined. In this context, the expansion of attractive substance in receptive environment can be defined in terms of foreign tourist visits.
The number of foreign tourists by month determines the seasonal concentration. This indicator supports the determination of activities and measures by which appropriate supply should be offered in the period of seasonal concentration in order to prevent disruption of environmental balance while satisfying tourist demands of foreign visitors.
The structure of visitors by country of origin determines the emitting spatial zones. Monitoring of the trends in the level of visits provides the opportunity for regional adaptation of the elements of environment as tourist supply of the receptive space to tourist consumption.
1.2 Overnights of foreign tourists
The total number of overnights of foreign tourists in the Republic of Macedonia by years has had a varying trend, marking growing or dropping of overnights by years for certain temporal period.
The total number of overnights of foreign tourists by years reflects the attractiveness and satisfaction of tourists with the stay in receptive environment as development dimension. This is the way by which both positive and obstructive undertakings in this context can be observed by years.
The stay acquired by months enables to assess the stay in seasonal terms and determine the activities in that regard.
The structure of realized overnights by country of origin enables to assess the acceptability of attractive properties of environmental elements in certain emitting environments and monitor the development in that context.
The average stay of foreign tourists expresses the ratio between the realized overnights and the number of tourists. Monitoring of these indicators enables the progress in the satisfaction of tourists in the receptive country with the visit to be observed, which facilitates justified approach to tourist supply improvement with reference to foreign tourist market.
1.3 National tourists intensity
National tourist intensity reflects the aspiration of domestic tourists towards the environment and its properties. The growth in the number of national visitors assumes that the receptive and attractive resources are affordable to national tourists.

ENVIRONMENTAL INDICATORS OF THE REPUBLIC OF MACEDONIA 280
Regional distribution within national tourist industry shows the level of attractiveness and receptiveness of individual tourist regional target areas as distinct environments.
The indicated stay of national tourists expresses the ratio between realized overnights and number of tourists. Monitoring of this data enables to determine the progress in the satisfaction of tourists with the visit in receptive environment, which facilitates justified approach to tourist supply improvement with reference to national tourist market.
Units − Number, intensity and structure.
Policy relevance List of relevant policy documents
− National Strategy for Tourism Development 2008 - 2012 − National Environmental Action Plan - 2 - in Section 4.2.6. Tourism, describes the
main challenge for sustainable tourism development, implementation of economic potential with minimum possible impact on the environment.
− Spatial Plan of the Republic of Macedonia – in its Chapter 5.4. "Tourism development and organization of tourist areas", defines the objectives and planning determinations for tourism development.
− National Strategy for Sustainable Development of the Republic of Macedonia – in the section on tourism, presents the directions for sustainable development of tourism, within short, medium, and long-term frames, up to 2030.
− Strategy for Biological Diversity Protection in the Republic of Macedonia with Action Plan – under measure C.5 "Stimulation of traditional use of biological diversity and eco-tourism", defines the action for identification of sites suitable for eco-tourism.
Legal grounds
The Law on Tourist Activity ("Official Gazette of the Republic of Macedonia" No. 62/2004) specifies the conditions and the manner of performing tourist activity (Chapter 15 Services in rural, ethno and eco-tourism, Article 51).
The Law on Environment, the Law on Nature Protection, the Law on Waste Management, the Law on Ambient Air Quality and the aw on Waters regulate partially the requirements for environmental protection in tourist activity.
Targets − Integration of the principles of sustainable development and environmental
considerations in tourist sector
− Identification of areas of priority importance for tourism development
− Encouragement of exchange of best practices between public and private tourist interests
− Protection of natural heritage and biological diversity in tourist destinations

ENVIRONMENTAL INDICATORS OF THE REPUBLIC OF MACEDONIA 281
− Adoption and implementation of legislation in the area of tourism to regulate the protection of the environment
− Promotion of organic farming, healthy food production and especially traditional production of certain products (e.g. cheese, wine), production of honey, herbs growing, etc.
− Promotion of certain types of tourism such as wine tourism, hunting tourism, birds observation tourism, etc.
Key policy issue 1. What is the impact of tourism on the environment?
Tourism is a development factor with regard to phenomena and interactions in the environment, both in economic and non-economic activities. Tourism is not a product of natural and anthropogenic impact of environmental elements, but it is a significant transformer of the environment. The impacts of tourism on the environment may be systematized in all domains of tourist industry. In the domain of emitting environment, tourism appears as environment transformer in a form of numerous billboards, illuminated advertisements, and shop windows. In the communication domain, transportation means for tourist purposes are employed, such as railways, cable railways, abandoned trains and cars, even trunks, advertisements on by-road billboards and transportation means. New properties are introduced in the attractive-reception environment. Mountains obtain skiing terrains and view platforms, hunting is related to drinking and feeding places and observatories, shores contain well arranged beaches, parter and horticultural substances, interior and exterior developments are present, rural areas are adapted to receive tourists, the space is planned for infrastructure and communal services, and commercial network undergoes evolution and turns into tourist merchandise profile through sales of souvenirs and articles for tourist activities.
2. Does the increased number of tourists make enhanced pressure on the environment?
Increased number of tourists should not by itself imply enhanced pressure on the environment. Such pressure occurs in conditions of weak organization. In such conditions, the increased number of tourists may cause confrontations and misunderstandings among stakeholders involved in tourist industry, insufficient observation of traffic regulations, lack of care for public hygiene, non-observation of the code of conduct in tourist resort, robberies and destruction of nature and artifacts and sociofacts, criminogene conduct in terms of dealings with drugs, alcohol, prostitution, violations and other types of crime.
Development of tourism and increased number of tourists are accompanied by building activities that are not in accordance with the regulations and in harmony with authentic features of natural values.
Specific policy issue
What is the contribution of tourism in pollutants emission? Increased number of tourists in communication and receptive-attractive environment, the length of stay and activities they perform can contribute significantly to the emission of pollutants resulting in pollution. Pollution can take the following forms:
− exhaust gases of transportation means to move through the space;

ENVIRONMENTAL INDICATORS OF THE REPUBLIC OF MACEDONIA 282
− enhanced intensity and inadequate structure of accommodation establishments, as well as increased number of visitors and overnights lead to increased amounts of:
− wastewater;
− solid waste;
− dust and
− smoke
− use of water resources for bathing assumes modification of the chemical composition and introduction of biological agents;
− increased use of freon containing appliances causes not only change in atmospheric relations in the local environment, but also global change.
− use of water resources by motor driven vessels leads not only to higher exhaust gases emission, but also higher discharge of fuel and maintenance products;
− enhanced intensity and inadequate structure of accommodation establishments and overnights result in increased level of smoke in the air;
− increased level of smoke can also come from barbeques and certain tourist animation activities.
Key message Data and information provided by this indicator show that there have been no significant achievements in development. Stagnation in terms of tourist visits, stay, intensity and quality of accommodation establishments has been evident throughout the period from the independence of the Republic of Macedonia to the last analyzed year. During this period, the levels of 1999 and 2000 have not been reached. Nevertheless, the problems of pollution have not been settled.
Considering the fact that tourism is organized activity, monitoring of these indicators is necessary and so are the actions of all stakeholders for the purpose of environment protection and improvement through timely interventions and planned activities.

ENVIRONMENTAL INDICATORS OF THE REPUBLIC OF MACEDONIA 283
1.1 International tourist intensity
0
50.000
100.000
150.000
200.000
250.000
1997 1998 1999 2000 2001 2002 2003 2004 2005 2006
numbe
r
years
Total number of foreign tourists in the period 1997 - 2006
Total trend
0
50.000
100.000
150.000
200.000
250.000
300.000
350.000
Austria
Albania
Belgium
Belarus
Bosnia and …
Bulgaria
United Kingdom
Germ
any
Greece
Denmark
Ireland
Iceland
Italy
Norw
ay
Poland
Portugal
Romania
Russian Federation
Slovakia
Slovenia
Ukraine
Hungary
Finland
France
The Netherlands
Croatia
Czech
Republic
Switzerland
Sweden
Spain
Other European
…
Australia
New Zeeland
Canada
USA
Israel
Japan
Turkey
Other non‐European
…
number of foreign tourists
country
Total number of foreign tourists by country of origin in the period 1997-2007

ENVIRONMENTAL INDICATORS OF THE REPUBLIC OF MACEDONIA 284
Note: Foreign tourists arrivals by transportation mode, structure, according to interview conducted in 2004
Note: Foreign tourists arrivals by transportation mode, structure, according to interview conducted in 2004
0
10
20
30
40
50
60
Car Bus ‐ regular Bus ‐ tourist tour
Motorcycle Plane ‐ regular flight
Plane ‐ charter flight
Train
%
Foreign tourists arrivals by transportation mode, structure
Vacation and recreation24,7%
Rest during short stay 9,0%
Healing purposes0,8%Business purposes
41,1%
Attending congresses9,2%
Religious rituals0,8%
Transit stay9,6%
Stay for round trip 1,5%
Other3,4%
Purpose of foreign tourists' stay, structure

ENVIRONMENTAL INDICATORS OF THE REPUBLIC OF MACEDONIA 285
0100.000200.000300.000400.000500.000600.000700.000800.000900.000
Pelagonia region
Northeastern region
Southe
astern region
Polog region
Southw
estern region
Vardar region
Eastern region
Skop
je re
gion
numbe
r
statistical regions
Total number of foreign tourists' arrivals, by statistical regions, in the period 1997-2006
0
50.000
100.000
150.000
200.000
250.000
300.000
350.000
Serbia and
Mon
tene
gro
Greece
Bulgaria
Albania
USA
Germ
any
Turkey
Sloven
ia
Croatia
Unite
d
Kingdom Italy
The
Netherland
s
France
Bosnia and
Herzegovina
Austria
Russian
Fede
ratio
n
numbe
r
Countries with significant share in the number of foreign tourists

ENVIRONMENTAL INDICATORS OF THE REPUBLIC OF MACEDONIA 286
1.2 Overnights of foreign tourists
0
100.000
200.000
300.000
400.000
500.000
600.000
1997 1998 1999 2000 2001 2002 2003 2004 2005 2006
overnights
year
Total number of overnights of foreign tourists in the period 1997-2006
Total trend
0
100.000
200.000
300.000
400.000
500.000
600.000
700.000
Austria
Albania
Belgium
Belarus
Bosnia and
Herzegovina
Bulgaria
United Kingdo
mGermany
Greece
Den
mark
Ireland
Iceland
Italy
Norway
Poland
Portugal
Romania
Russian Fede
ratio
nSlovakia
Sloven
iaSerbia and
Mon
tene
gro
Ukraine
Hun
gary
Finland
France
The Nethe
rlands
Croatia
Szech Re
public
Switzerland
Swed
enSpain
Other Europ
ean …
Australia
New
Zee
land
Canada
USA
Israel
Japan
Turkey
Other non
‐Europ
ean …
overnights
country
Total number of overnights of foreign tourists by country of origin in the period 1997-2006
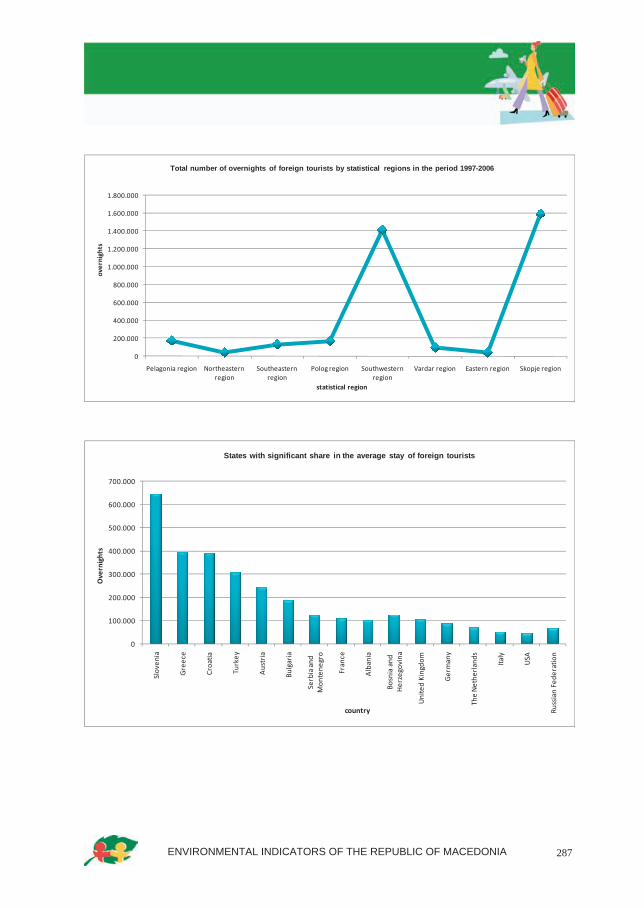
ENVIRONMENTAL INDICATORS OF THE REPUBLIC OF MACEDONIA 287
0
200.000
400.000
600.000
800.000
1.000.000
1.200.000
1.400.000
1.600.000
1.800.000
Pelagonia region Northeastern region
Southeastern region
Polog region Southwestern region
Vardar region Eastern region Skopje region
overnights
statistical region
Total number of overnights of foreign tourists by statistical regions in the period 1997-2006
0
100.000
200.000
300.000
400.000
500.000
600.000
700.000
Sloven
ia
Greece
Croatia
Turkey
Austria
Bulgaria
Serbia and
Mon
tene
gro
France
Albania
Bosnia and
Herzegovina
United Kingdo
m
Germany
The Nethe
rlands
Italy
USA
Russian Fede
ratio
n
Overnights
country
States with significant share in the average stay of foreign tourists

ENVIRONMENTAL INDICATORS OF THE REPUBLIC OF MACEDONIA 288
1.3 National tourist intensity
0
0,5
1
1,5
2
2,5
3
3,5
4
Total
Austria
Albania
Belgium
Belarus
Bosnia and
Herzegovina
Bulgaria
United Kingdo
m
Germany
Greece
Den
mark
Ireland
Iceland
Italy
Norway
Poland
Portugal
Romania
Russian Fede
ratio
n
Slovakia
Sloven
ia
Serbia and
Mon
tene
gro
Ukraine
Hun
gary
Finland
France
The Nethe
rlands
Croatia
Czech Re
public
Switzerland
Swed
en
Spain
Other Europ
ean coun
tries
Australia
New
Zee
land
Canada
USA
Israel
Japan
Turkey
Other non
‐Europ
ean …
numbe
r of d
ays
country
Average stay of foreign tourists by country of origin
0
50.000
100.000
150.000
200.000
250.000
300.000
350.000
400.000
450.000
1997 1998 1999 2000 2001 2002 2003 2004 2005 2006
numbe
r of n
ational tourists
година
Total number of national tourists in the period 1997-2006.
Tourists trend

ENVIRONMENTAL INDICATORS OF THE REPUBLIC OF MACEDONIA 289
0
1
2
3
4
5
6
1997 1998 1999 2000 2001 2002 2003 2004 2005 2006
numbe
r of n
ational tourists
година
Average stay of national tourists in the period 1997-2006
Average stay trend
0
200.000
400.000
600.000
800.000
1.000.000
1.200.000
1.400.000
1.600.000
1.800.000
2.000.000
Pelagonia region
Northeastern
region
Southe
astern
region
Polog region
Southw
estern
region
Vardar region
Eastern region
Skop
je re
gion
numbe
r of n
ational tourists
statistical region
Total number of national tourists by statistical regions in the period 1997-2006

ENVIRONMENTAL INDICATORS OF THE REPUBLIC OF MACEDONIA 290
Assessment
1.1 International tourist intensity Data presented in Table 1 and diagrams show that the Republic of Macedonia has been visited by tourists from many countries in the world. Tourists from Europe, Asia, Australia and North America dominate. During the ten year reporting period, the structure of visits is dominated by tourists from the neighborhood of the Republic of Macedonia. Table 5 indicates that the leading position is occupied by tourists from Serbia and Montenegro, followed by Greece, Bulgaria and Albania. Development of attractive and receptive base in the Republic of Macedonia should provide grater presence of tourists from Western European countries with longer tourism tradition, and thus higher tourism and culture level.
Data in Table 2 and the Diagram show that most of the foreign tourists arrive by car. This indicator is in the context of the use of this type of transport mode in other state destinations, too. However, tracking the mode of foreign tourists arrival will help us identify the use of more rationale transport modes, such as railway, bus and plain, because they make lower negative impact on the environment.
Table 3 presents the purposes for tourists' visits. Data reflect that the business purposes are predominant, which is by itself a negative feature, as such foreign tourists do not use the attractions of the environment, but urban possibilities instead. Observation of this aspect will enable an insight in the extent to which foreign tourist intensity will increase in terms of vacation and recreation as reflection of the properties of the environment.
Regional distribution presented in Table 4 and the Diagram shows that leading regional centers are Skopje and Southwestern regions, indicating two differentiated regions with different characteristics. Namely. the Southwestern region is predominated by the attractiveness of the resources, while Skopje region offers possibilities for business activities. Other regions incorporate alternative opportunities based on different environments, and
0
2.000.000
4.000.000
6.000.000
8.000.000
10.000.000
12.000.000
Pelagonia region
Northeastern
region
Southe
astern
region
Polog region
Southw
estern
region
Vardar region
Eastern region
Skop
je re
gion
overnights
statistical region
Total number of overnights by national tourists by statistical regions in the period 1997-2006

ENVIRONMENTAL INDICATORS OF THE REPUBLIC OF MACEDONIA 291
therefore it is important to monitor the scale of foreign tourists visits for the purpose of redistribution of visits.
1.2 Overnights of foreign tourists Table 6 indicates that overnights follow the visits of foreign tourists in the Republic of Macedonia. The summary results presented in Table 9 lead to the conclusion that the highest number of overnights was realized by tourists from neighboring countries to the Republic of Macedonia, while such results in relation to tourists from Western European and other countries with recognized tourist tradition lag behind in the stay. Observation of this trend can help us assess the rate at which the attractiveness of the environment has adapted to the demands of these visitors.
Regional distribution of accomplished foreign overnights presented in Table 7 shows that the highest number of such overnights was done in Skopje region, which is an unfavorable circumstance in the context of foreign tourism intensity, because they relate to visitors in mainly urban environment. Observation of the relations in the regional distribution of overnights accomplished by foreign tourists will enable the assessment of measures undertaken to redistribute overnights to other regions with specific values.
The average stay of foreign tourists, presented in Table 8, enables us to observe the level of domination of environmental characteristics. The Table indicates that the length of stay of foreign tourists in the Republic of Macedonia is relatively short. Such length was around 2.26 in the analyzed period, reflecting significant lagging behind relative to the average length of stay of national tourists. The observation will help us realize the extent to which the length of stay of foreign tourists in the Republic of Macedonia has improved.
1.3 National tourism intensity Table 10 indicates that the number of national tourists has stagnation characteristics. Namely, during this ten year period, the level of intensity tracked in 1997 was not reached. This by its side means that no significant improvement in the offer was made. The overnights acquired by national tourists track similar characteristics. Highest number of overnights was recorded in 1998, reflecting evident stagnation. The results of average length of stay reflect similar relations. Observation of the intensity and dynamics of national tourists' visits shows the extent to which tourist supply has been adapted to the demands of national tourists. Elements of the environment, as attractions for national tourists, should be observed by applying the approach of average stay length in the coming period, too.
Data in Table 11 show that the dominant region in the context of distribution of national tourists is Ohrid and Prespa region, which could be assessed as advantage, but also as unbalanced distribution. Observation of these indicators should facilitate the estimate of the extent to which the number of national tourists will increase in other regions as a result from the promotion of the elements of the environment in tourist supply at the national tourist market.
Table 12 indicates that the number of overnights is comparable to tourist visits as reflection of the attractiveness of the environment, and thus the highest number of overnights has been recorded in Ohrid and Prespa region. Observation of overnights will enable to assess the extent to which regions will improve the attractive basis as a factor of acquiring higher number of overnights.

ENVIRONMENTAL INDICATORS OF THE REPUBLIC OF MACEDONIA 292
Methodology Methodology for the indicator calculation
The trend in tourism development through dynamics and intensity of tourist industry.
The scale and the intensity, as well as the share of individual countries in the total number of foreign tourists arrivals and overnights, national tourists arrivals and overnights, regional distribution and average number of days of stay.
Methodology for data manipulation (measurements):
Number and percentage.
Data specification
Title of the indicator Source Reporting obligation
1. Tourism intensity in the Republic of Macedonia 1.1 International tourism
intensity 1.2 Overnights of foreign
tourists 1.3 National tourism
intensity
− State Statistical Office
− Yearly to EUROSTAT
− World Tourist Organization (WTO)
− Annual tourist review of tourism and other services
− Five-year interview of foreign tourists in accommodation establishments
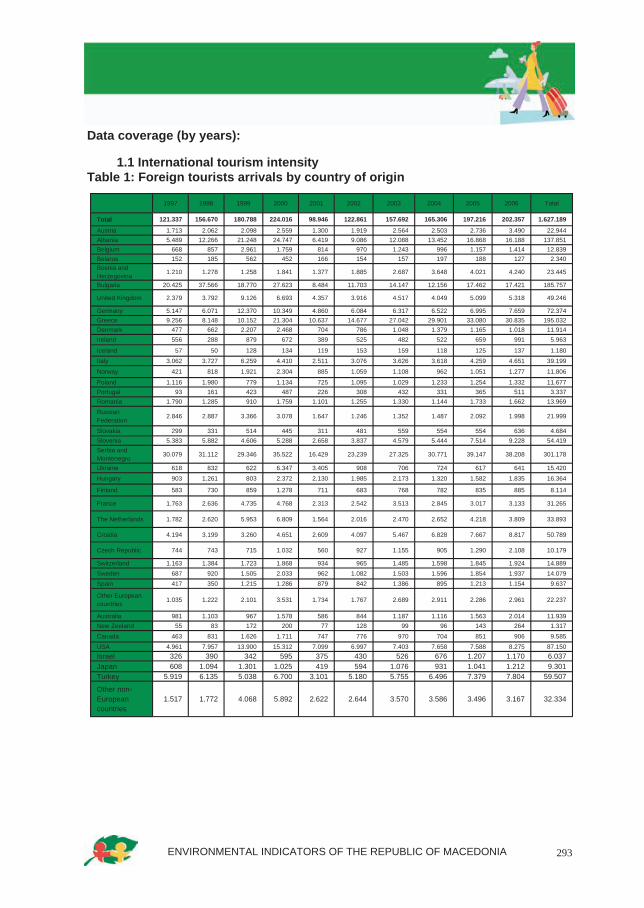
ENVIRONMENTAL INDICATORS OF THE REPUBLIC OF MACEDONIA 293
Data coverage (by years):
1.1 International tourism intensity Table 1: Foreign tourists arrivals by country of origin
1997 1998 1999 2000 2001 2002 2003 2004 2005 2006 Total Total 121.337 156.670 180.788 224.016 98.946 122.861 157.692 165.306 197.216 202.357 1.627.189
Austria 1.713 2.062 2.098 2.559 1.300 1.919 2.564 2.503 2.736 3.490 22.944 Albania 5.489 12.266 21.248 24.747 6.419 9.086 12.088 13.452 16.868 16.188 137.851 Belgium 668 857 2.961 1.759 814 970 1.243 996 1.157 1.414 12.839 Belarus 152 185 562 452 166 154 157 197 188 127 2.340 Bosnia and Herzegovina 1.210 1.278 1.258 1.841 1.377 1.885 2.687 3.648 4.021 4.240 23.445
Bulgaria 20.425 37.566 18.770 27.623 8.484 11.703 14.147 12.156 17.462 17.421 185.757
United Kingdom 2.379 3.792 9.126 6.693 4.357 3.916 4.517 4.049 5.099 5.318 49.246
Germany 5.147 6.071 12.370 10.349 4.860 6.084 6.317 6.522 6.995 7.659 72.374 Greece 9.256 8.148 10.152 21.304 10.637 14.677 27.042 29.901 33.080 30.835 195.032 Denmark 477 662 2.207 2.468 704 786 1.048 1.379 1.165 1.018 11.914 Ireland 556 288 879 672 389 525 482 522 659 991 5.963
Iceland 57 50 128 134 119 153 159 118 125 137 1.180
Italy 3.062 3.727 6.259 4.410 2.511 3.076 3.626 3.618 4.259 4.651 39.199
Norway 421 818 1.921 2.304 885 1.059 1.108 962 1.051 1.277 11.806
Poland 1.116 1.980 779 1.134 725 1.095 1.029 1.233 1.254 1.332 11.677 Portugal 93 161 423 487 226 308 432 331 365 511 3.337 Romania 1.790 1.285 910 1.759 1.101 1.255 1.330 1.144 1.733 1.662 13.969 Russian Federation 2.846 2.887 3.366 3.078 1.647 1.246 1.352 1.487 2.092 1.998 21.999
Slovakia 299 331 514 445 311 481 559 554 554 636 4.684 Slovenia 5.383 5.882 4.606 5.288 2.658 3.837 4.579 5.444 7.514 9.228 54.419 Serbia and Montenegro 30.079 31.112 29.346 35.522 16.429 23.239 27.325 30.771 39.147 38.208 301.178
Ukraine 618 832 622 6.347 3.405 908 706 724 617 641 15.420
Hungary 903 1.261 803 2.372 2.130 1.985 2.173 1.320 1.582 1.835 16.364
Finland 583 730 859 1.278 711 683 768 782 835 885 8.114
France 1.763 2.636 4.735 4.768 2.313 2.542 3.513 2.845 3.017 3.133 31.265
The Netherlands 1.782 2.620 5.953 6.809 1.564 2.016 2.470 2.652 4.218 3.809 33.893
Croatia 4.194 3.199 3.260 4.651 2.609 4.097 5.467 6.828 7.667 8.817 50.789
Czech Republic 744 743 715 1.032 560 927 1.155 905 1.290 2.108 10.179
Switzerland 1.163 1.384 1.723 1.868 934 965 1.485 1.598 1.845 1.924 14.889 Sweden 687 920 1.505 2.033 962 1.082 1.503 1.596 1.854 1.937 14.079 Spain 417 350 1.215 1.286 879 842 1.386 895 1.213 1.154 9.637
Other European countries 1.035 1.222 2.101 3.531 1.734 1.767 2.689 2.911 2.286 2.961 22.237
Australia 981 1.103 967 1.578 586 844 1.187 1.116 1.563 2.014 11.939 New Zeeland 55 83 172 200 77 128 99 96 143 264 1.317
Canada 463 831 1.626 1.711 747 776 970 704 851 906 9.585
USA 4.961 7.957 13.900 15.312 7.099 6.997 7.403 7.658 7.588 8.275 87.150 Israel 326 390 342 595 375 430 526 676 1.207 1.170 6.037 Japan 608 1.094 1.301 1.025 419 594 1.076 931 1.041 1.212 9.301 Turkey 5.919 6.135 5.038 6.700 3.101 5.180 5.755 6.496 7.379 7.804 59.507 Other non-European countries
1.517 1.772 4.068 5.892 2.622 2.644 3.570 3.586 3.496 3.167 32.334

ENVIRONMENTAL INDICATORS OF THE REPUBLIC OF MACEDONIA 294
Table 2: Arrivals of foreign tourists by transport mode, structure*
* Based on data from the Interview of foreign tourists, 2004 Table 3: Purpose of stay of foreign tourists, structure *
* Based on data from the Interview of foreign tourists, 2004 Table 4: Foreign tourists arrivals by 8 statistical regions
Table 5: Countries with significant share in the number of foreign tourists in the period 1996 – 2006
Transportation means of arrival % Car 47,85 Bus - regular 6,39 Bus - tourist tour 2,88 Motorcycle 0,81 Plane - regular flight 38,83 Plane - charter flight 1,97 Train 1,26
Purpose of stay in the Republic of Macedonia %
Vacation and recreation 24,72 Rest during short stay 8,95 Healing purposes 0,75 Business purposes 41,08 Attending congresses 9,17 Religious rituals 0,76 Transit stay 9,6 Stay for round trip 1,54 Other 3,42
1997 1998 1999 2000 2001 2002 2003 2004 2005 2006 Total Total 121.337 156.670 180.788 224.016 98.946 122.861 157.692 165.306 197.216 202.357 1.627.189 Pelagonia region 8.027 7.392 6.760 9.435 4.695 6.464 9.225 11.238 12.550 12.472 88.258 Northeastern region 3.974 5.667 6.624 5.455 845 1.325 985 1.739 2.011 1.580 30.205 Southeastern region 4.966 4.225 4.784 5.268 6.927 5.006 7.792 9.559 16.518 12.696 77.741
Polog region 5.412 7.126 13.959 16.765 6.236 5.013 4.898 7.529 8.506 9.185 84.629 Southwestern region 28.039 55.393 48.893 77.500 15.501 34.234 51.551 53.497 66.226 72.258 503.092
Vardar region 5.392 4.421 3.145 13.141 5.364 3.624 3.323 3.208 3.332 3.894 48.844
Eastern region 1.543 1.682 1.054 1.240 1.075 1.714 1.995 2.330 2.302 3.079 18.014
Skopje region 63.984 70.764 95.569 95.212 58.303 65.481 77.923 76.206 85.771 87.193 776.406
Country Tourists Serbia and Montenegro 301.178 Greece 195.032 Bulgaria 185.757 Albania 137.851 USA 87.150 Germany 72.374 Turkey 59.507 Slovenia 54.419 Croatia 50.789 United Kingdom 49.246 Italy 39.199 The Netherlands 33.893 France 31.265 Bosnia and Herzegovina 23.445 Austria 22.944 Russian Federation 21.999

ENVIRONMENTAL INDICATORS OF THE REPUBLIC OF MACEDONIA 295
1.2 Overnights of foreign tourists Table 6: Overnights of foreign tourists by country of origin
Table 7: Overnights of foreign tourists by 8 statistical regions
Total tourists 1997-2006
Total overnights 1997-2006
Average stay of for-eign tourists
Total 1.627.189 3.673.416 2,26 Austria 22.944 48.253 2,1 Albania 137.851 308.279 2,24 Belgium 12.839 24.931 1,94 Belarus 2.340 7.951 3,4 Bosnia and Herzegovina 23.445 52.575 2,24 Bulgaria 185.757 391.148 2,11 United Kingdom 49.246 126.480 2,57 Germany 72.374 188.062 2,6 Greece 195.032 396.171 2,03 Denmark 11.914 25.185 2,11 Ireland 5.963 13.959 2,34 Iceland 1.180 2.273 1,93 Italy 39.199 107.414 2,74 Norway 11.806 27.109 2,3 Poland 11.677 31.345 2,68 Portugal 3.337 6.687 2 Romania 13.969 34.340 2,46 Russian Federation 21.999 66.519 3,02 Slovakia 4.684 10.922 2,33 Slovenia 54.419 108.189 1,99 Serbia and Montenegro 301.178 644.882 2,14 Ukraine 15.420 38.077 2,47 Hungary 16.364 31.449 1,92 Finland 8.114 14.138 1,74 France 31.265 69.769 2,23 The Netherlands 33.893 88.598 2,61 Croatia 50.789 103.205 2,03 Szech Republic 10.179 25.852 2,54 Switzerland 14.889 32.004 2,15 Sweden 14.079 31.701 2,25 Spain 9.637 20.363 2,11 Other European countries 22.237 54.130 2,43 Australia 11.939 29.794 2,5 New Zeeland 1.317 2.621 1,99 Canada 9.585 22.444 2,34 USA 87.150 246.401 2,83 Israel 6.037 13.297 2,2 Japan 9.301 20.724 2,23 Turkey 59.507 125.160 2,1 Other non-European countries 32.334 81.015 2,51
1997 1998 1999 2000 2001 2002 2003 2004 2005 2006 Total
TOTAL 265.524 359.538 474.394 493.867 212.751 274.720 346.200 360.589 442.988 442.845 3.673.416
Pelagonia region 17.262 13.225 10.630 19.653 7.172 11.435 14.708 22.974 31.589 26.676 175.324 Northeastern region 5.264 8.720 7.785 7.600 1.326 2.134 1.661 3.045 3.446 2.939 43.920 Southeastern region 7.377 7.824 7.704 8.994 10.050 8.593 12.143 15.957 27.998 26.107 132.747
Polog region 12.609 17.417 30.006 34.378 11.714 8.335 8.358 14.320 16.824 18.525 172.486 Southwestern region 87.636 154.410 147.493 233.204 40.347 96.323 135.213 141.684 184.048 192.216 1.412.574
Vardar region 8.515 8.861 6.567 20.063 18.592 8.855 7.599 6.514 6.865 7.417 99.848
Eastern region 3.388 3.466 2.232 2.458 2.731 4.343 5.053 6.998 5.579 7.657 43.905
Skopje region 123.473 145.615 261.977 167.517 120.819 134.702 161.465 149.097 166.639 161.308 1.592.612

ENVIRONMENTAL INDICATORS OF THE REPUBLIC OF MACEDONIA 296
Table 8: Average stay of foreign tourists
Table 9: Countries with significant share in ten-year period
Total tourists 1997-2006
Total overnights 1997-2006
Average stay of foreign tourists
Total 1.627.189 3.673.416 2,26 Austria 22.944 48.253 2,1 Albania 137.851 308.279 2,24
Belgium 12.839 24.931 1,94 Belarus 2.340 7.951 3,4 Bosnia and Herzegovina 23.445 52.575 2,24 Bulgaria 185.757 391.148 2,11
United Kingdom 49.246 126.480 2,57
Germany 72.374 188.062 2,6
Greece 195.032 396.171 2,03
Denmark 11.914 25.185 2,11 Ireland 5.963 13.959 2,34
Iceland 1.180 2.273 1,93 Italy 39.199 107.414 2,74 Norway 11.806 27.109 2,3 Poland 11.677 31.345 2,68 Portugal 3.337 6.687 2 Romania 13.969 34.340 2,46 Russian Federation 21.999 66.519 3,02 Slovakia 4.684 10.922 2,33 Slovenia 54.419 108.189 1,99 Serbia and Montenegro 301.178 644.882 2,14 Ukraine 15.420 38.077 2,47 Hungary 16.364 31.449 1,92 Finland 8.114 14.138 1,74 France 31.265 69.769 2,23 The Netherlands 33.893 88.598 2,61 Croatia 50.789 103.205 2,03 Czech Republic 10.179 25.852 2,54
Switzerland 14.889 32.004 2,15
Sweden 14.079 31.701 2,25 Spain 9.637 20.363 2,11 Other European countries 22.237 54.130 2,43 Australia 11.939 29.794 2,5 New Zeeland 1.317 2.621 1,99 Canada 9.585 22.444 2,34 USA 87.150 246.401 2,83 Israel 6.037 13.297 2,2 Japan 9.301 20.724 2,23 Turkey 59.507 125.160 2,1 Other non-European countries 32.334 81.015 2,51
Tourists Overnights Average stay by foreign tourists Serbia and Montenegro 301.178 644.882 2,14 Greece 195.032 396.171 2,03 Bulgaria 185.757 391.148 2,11 Albania 137.851 308.279 2,24 USA 87.150 246.401 2,83 Germany 72.374 188.062 2,6 Turkey 59.507 125.160 2,1 Slovenia 54.419 108.189 1,99 Croatia 50.789 103.205 2,03 United Kingdom 49.246 126.480 2,57 Italy 39.199 107.414 2,74 The Netherlands 33.893 88.598 2,61 France 31.265 69.769 2,23 Bosnia and Herzegovina 23.445 52.575 2,24 Austria 22.944 48.253 2,1 Russian Federation 21.999 66.519 3,02

ENVIRONMENTAL INDICATORS OF THE REPUBLIC OF MACEDONIA 297
1.3 National tourism intensity Table 10: Arrivals and overnights of national tourists
Table 11: Arrivals of national tourists by 8 statistical regions
Table 12: Overnights of national tourists by 8 statistical regions
1997 1998 1999 2000 2001 2002 2003 2004 2005 2006 Total Tourists 330.534 418.410 368.842 408.507 234.362 318.851 325.459 299.709 312.490 297.116 3.314.280
Overnights 1.321.622 2.066.923 1.838.748 1.940.772 1.041.831 1.575.664 1.660.667 1.504.845 1.527.053 1.474.550 15.952.675
Average stay 4 4,94 4,99 4,75 4,45 4,94 5,1 5,02 4,89 4,96 4,81
1997 1998 1999 2000 2001 2002 2003 2004 2005 2006 Total TOTAL 330.534 418.410 368.842 408.507 234.362 318.851 325.459 299.709 312.490 297.116 3.314.280 Pelagonia region 52.200 56.894 59.559 63.679 45.062 56.118 54.464 45.472 46.003 39.498 518.949 Northeastern region 6.150 5.536 4.571 6.299 3.827 3.709 3.555 1.634 1.661 853 37.795 Southeastern region 40.221 23.620 38.120 32.687 26.884 26.613 27.521 34.535 45.333 45.881 341.415 Polog region 31.636 44.992 36.065 36.151 10.579 7.414 11.357 15.150 12.049 12.705 218.098 Southwestern region 144.315 238.926 198.021 219.039 107.808 183.790 189.829 169.453 170.208 160.960 1.782.349
Vardar region 14.881 11.326 7.904 13.803 9.196 10.139 9.429 5.145 4.246 4.327 90.396 Eastern region 7.117 8.233 5.787 7.349 11.687 12.803 6.553 7.516 7.061 8.942 83.048 Skopje region 34.014 28.883 18.815 29.500 19.319 18.265 22.751 20.804 25.929 23.950 242.230
1997 1998 1999 2000 2001 2002 2003 2004 2005 2006 Total
TOTAL 1.321.622 2.066.923 1.838.748 1.940.772 1.041.831 1.575.664 1.660.667 1.504.845 1.527.053 1.474.550 15.952.675
Pelagonia region 176.788 199.679 204.705 215.011 120.325 187.393 187.716 153.956 147.225 128.785 1.721.583
Northeastern region 11.723 12.348 9.536 11.954 9.535 4.305 4.704 2.639 2.620 1.064 70.428
Southeastern region 211.107 104.520 224.406 152.621 115.686 100.202 156.957 217.781 180.860 191.970 1.656.110
Polog region 76.438 113.409 105.108 99.193 35.503 14.549 31.178 39.130 33.652 35.299 583.459
Southwestern region 750.950 1.554.501 1.238.887 1.378.770 663.758 1.164.009 1.203.809 1.028.797 1.104.087 1.052.271 11.139.839
Vardar region 26.533 21.191 15.528 24.887 28.966 31.802 23.338 11.310 8.985 9.518 202.058
Eastern region 24.558 23.906 15.241 19.301 37.354 42.753 17.040 19.356 14.283 21.277 235.069
Skopje region 43.525 37.369 25.337 39.035 30.704 30.651 35.925 31.876 35.341 34.366 344.129

ENVIRONMENTAL INDICATORS OF THE REPUBLIC OF MACEDONIA 298
General metadata
Geographical coverage: Republic of Macedonia
Temporal coverage: 1997 - 2006
Frequency of data collection: yearly – every five years
Future activities Short-term activities
a. Description of the activity − Continuous work of the working group which should include members from tourist
association, culture and economy to define the national set of tourism indicators, monitoring of indicators and reporting therewith.
b. Required resources − Human resources are required in the State Statistical Office.
c. Status − Activities are in progress.
Deadline: Activities are continuous.
Code Title of the indicator
Compliance with CSI ЕЕА or other indicators
Classification by DPSIR Type Linkage
with area
Frequency of
publication
МК NI 047
Tourism intensity in the Republic of Macedonia
TOUR 12 TOUR 33
Tourism intensity Overnights spent in tourism accommodations
D, P А
Biological diversity Nature Policies Waste Water Air Transport Soil
Yearly Every five years

ENVIRONMENTAL INDICATORS OF THE REPUBLIC OF MACEDONIA 299
МК – NI 048 TOURISM INTENSITY AND FACILITIES DYNAMICS
Period of indicator assessment September 2007 – April 2008
Explanation Justification for indicator selection
This indicator includes the number of accommodation units, number of rooms and beds and structure of facilities. The selection of this indicator is justified by the fact that it can track the level of development and receptive development. The number of such establishments should reflect the utilization of the space for tourist purposes, and the number of rooms in accommodation establishments is an indicator of the trend in accommodation intensity. The structure reflects the quality and its trend in accommodation units and establishments.
Definition Accommodation establishments are supra-structural facilities facilitating visits and stay of tourists in a given environment. Their observation enables the assessment of regional development.
Units − Number of facilities, number of rooms and number of beds.
Policy relevance List of relevant policy documents
− National Strategy for Tourism Development 2008 - 2012 − National Environmental Action Plan - 2 - in Section 4.2.6. Tourism, describes the
main challenge for sustainable tourism development, implementation of economic potential with minimum possible impact on the environment.
− Spatial Plan of the Republic of Macedonia – in its Chapter 5.4. "Tourism development and organization of tourist areas", defines the objectives and planning determinations for tourism development.
− National Strategy for Sustainable Development of the Republic of Macedonia – in the section on tourism, presents the directions for sustainable development of tourism, within short, medium, and long-term frames, up to 2030.
− Strategy for Biological Diversity Protection in the Republic of Macedonia with Action Plan – under measure C.5 "Stimulation of traditional use of biological diversity and eco-tourism", defines the action for identification of sites suitable for eco-tourism.
P
R
D
S
I

ENVIRONMENTAL INDICATORS OF THE REPUBLIC OF MACEDONIA 300
Legal grounds
The Law on Tourist Activity ("Official Gazette of the Republic of Macedonia" No. 62/2004) specifies the conditions and the manner of performing tourist activity (Chapter 15 Services in rural, ethno and eco-tourism, Article 51).
The Law on Environment, the Law on Nature Protection, the Law on Waste Management, the Law on Ambient Air Quality and the aw on Waters regulate partially the requirements for environmental protection in tourist activity.
Targets − Integration of the principles of sustainable development and environmental
considerations in tourist sector
− Identification of areas of priority importance for tourism development
− Encouragement of exchange of best practices between public and private tourist interests
− Protection of natural heritage and biological diversity in tourist destinations
− Adoption and implementation of legislation in the area of tourism to regulate the protection of the environment
− Promotion of organic farming, healthy food production and especially traditional production of certain products (e.g. cheese, wine), production of honey, herbs growing, etc.
− Promotion of certain types of tourism such as wine tourism, hunting tourism, birds observation tourism, etc.
Key policy issue What is the impact of accommodation establishments on the environment?
The number of accommodation units may have both positive and negative impacts. Positive impacts are related to proper utilization of the space, and negative impacts are made when the space is occupied by accommodation establishments in inadequate manner.
Key message To pay attention to the intensity and dynamics of accommodation establishments and the manner of their utilization in the environment. It is particularly important to undertake preventive measures against pollution of waters, air and soil caused by accommodation establishments.

ENVIRONMENTAL INDICATORS OF THE REPUBLIC OF MACEDONIA 301
05101520253035404550
Hotels ‐total
Boarding
hou
ses
Motels
Hostels
Holiday villages
Spa he
aling sites
Mou
ntain ho
mes and
ho
uses
Workers' resorts
Tourist cam
ping
site
s1)
Children and youth
summer resorts
Tempo
rary
accommod
ation
establishm
ents
%
Accomodation establishments in catering - facilities
Structure 1997 Structure 2006
051015202530354045
Hotels‐total
Hostels
Motels
Boarding
hou
ses
Holiday villages
Spa he
aling sites
Mou
ntain ho
mes and
ho
uses
Workers' resorts
Tourist cam
ping
site
s1)
Children and youth
summer resorts
Tempo
rary
accommod
ation …
Slee
ping
cars
Hou
seho
lds (private
room
s)
%
Accomodation establishments in catering - rooms
Structure 1997 Structure 2006

ENVIRONMENTAL INDICATORS OF THE REPUBLIC OF MACEDONIA 302
Assessment Table 1 indicates that the intensity of accommodation establishments as facilities in the analyzed period tracks an increase of around 20%, reflecting an increase that has to be observed. In this context, it is of particular importance to underline that increases have been noted with facilities of hotel nature, while decrease have been observed in the area of workers’ resorts. This can be assessed as positive trend because it is a result of the transformation of non-commercial into commercial sector which will have to be more observant of environmental protection standards.
Tables 2 and 3 indicate falling trend in the number of rooms and beds resulting from decreased number of rooms in camping sites. In environmental terms, this is a positive aspect.
Methodology Methodology for the indicator calculation
Development trend of accommodation units.
Share of individual types of accommodation establishments in the total number.
Methodology of data manipulation (measurement):
Number and percentage.
Data specification
Title of the indicator Source Reporting obligation
Tourism density and facilities dynamics − State Statistical Office
− Statistical Yearbook
− WТО
− EUROSTAT
0
5
10
15
20
25
30
35
40
Hotels‐total
Hostels
Motels
Boarding
hou
ses
Holiday villages
Spa he
aling sites
Mou
ntain ho
mes and
ho
uses
Workers' resorts
Tourist cam
ping
sites1)
Children and youth
summer resorts
Tempo
rary
accommod
ation …
Slee
ping
cars
Hou
seho
lds (private
room
s)
%
Accomodation establishments in catering - beds
Structure 1997 Structure 2006

ENVIRONMENTAL INDICATORS OF THE REPUBLIC OF MACEDONIA 303
Data coverage (by years): Table 1: Accommodation establishments in catering industry – number of facilities – status on 31 August
Table 2: Accommodation establishments in catering industry – number of rooms – status on 31 August
1997 1998 1999 2000 2001 2002 2003 2004 2005 2006 Structure 1997
Structure 2006
TOTAL 308 320 332 323 327 334 333 352 347 359 100,0 100,0
Hotels - total 86 90 91 94 98 98 98 107 107 112 27,9 31,2
А category 10 10 11 12 13 12 12 13 14 14 3,2 3,9
B category 60 63 65 68 71 72 73 79 78 83 19,5 23,1
C category 7 7 7 6 6 6 6 7 7 7 2,3 1,9
D category 9 10 8 8 8 8 7 8 8 8 2,9 2,2
Boarding houses - - - 1 2 5 5 5 5 5 0,0 1,4
Motels 21 24 27 29 28 29 30 36 35 39 6,8 10,9
Hostels 7 7 8 11 12 16 17 18 20 23 2,3 6,4
Holiday villages 2 2 2 2 2 2 2 2 1 1 0,6 0,3
Spa healing sites 6 6 6 5 5 5 5 5 6 6 1,9 1,7
Mountain homes and houses 5 5 7 4 4 4 4 4 2 3 1,6 0,8
Workers' resorts 134 137 141 127 126 126 122 125 122 122 43,5 34,0
Tourist camping sites1) 15 15 15 14 14 13 13 13 12 11 4,9 3,1
Children and youth summer resorts 31 33 34 35 35 35 35 35 35 35 10,1 9,7
Temporary accommodation estab-lishments 1 1 1 1 1 1 2 2 2 2 0,3 0,6
1997 1998 1999 2000 2001 2002 2003 2004 2005 2006 Structure 1997
Structure 2006
TOTAL 28.077 28.476 29.066 27.143 27.242 26.877 27.017 27.222 26.925 26.503 100 100
Hotels-total 5.593 5.677 5.916 5.895 5.961 5.983 5.935 5.989 6.024 6.086 19,90 23,00
А category 1.497 1.497 1.632 1.598 1.616 1.618 1.635 1.661 1.675 1.706 5,30 6,40 B category 3.652 3.711 3.830 3.900 3.948 3.968 3.912 3.914 3.921 3.968 13,00 15,00 C category 204 224 224 176 176 176 174 179 181 178 0,70 0,70 D category 240 245 230 221 221 221 214 235 247 234 0,90 0,90 Hostels - - - 20 33 57 57 64 64 64 0,00 0,20
Motels 352 425 423 435 434 443 491 498 558 627 1,30 2,40
Boarding houses 51 52 59 74 86 118 130 155 151 180 0,20 0,70
Holiday villages 360 360 360 212 212 212 212 212 86 86 1,30 0,30
Spa healing sites 472 472 472 432 432 432 420 423 421 422 1,70 1,60
Mountain homes and houses 29 35 54 33 33 33 33 33 11 17 0,10 0,10
Workers' resorts 2.431 2.484 2.527 2.446 2.455 2.462 2.452 2.544 2.452 2.446 8,70 9,20
Tourist camping sites1) 5.663 5.603 6.006 3.756 3.756 1.715 1.703 1.720 1.700 1.678 20,20 6,30
Children and youth summer resorts
1.699 1.941 1.922 1.739 1.739 3.739 3.779 3.779 3.690 3.343 6,10 12,60
Temporary ac-commodation establishments
168 168 168 168 168 168 252 252 250 250 0,60 0,90
Sleeping cars 364 364 364 376 376 376 376 376 372 372 1,30 1,40
Households (private rooms) 10.895 10.895 10.795 11.557 11.557 11.139 11.177 11.177 11.146 10.932 38,80 41,20

ENVIRONMENTAL INDICATORS OF THE REPUBLIC OF MACEDONIA 304
Table 3: Accommodation establishments in catering industry – number of beds – status on 31 August
General metadata
Geographical coverage: Republic of Macedonia Temporal coverage: 1997 - 2006 Frequency of data collection: yearly - August Information on quality (at data level): August in the current year is taken as critical.
Future activities Short-term activities
a. Description of the activity − Continuous monitoring of the state is necessary.
b. Required resources − Human resources are required in the State Statistical Office.
c. Status Activities are in progress.
Deadline: Activities are continuous
1997 1998 1999 2000 2001 2002 2003 2004 2005 2006 Structure 1997
Structure 2006
TOTAL 78.425 78.974 79.203 73.759 74.130 73.985 72.059 72.276 72.637 71.021 100 100
Hotels-total 13.882 14.125 14.564 14.468 14.626 14.629 14.434 14.536 14.369 14.539 17,70 20,50
А category 4.027 4.027 4.297 4.251 4.276 4.249 4.203 4.269 4.229 4.242 5,10 6,00 B category 8.675 8.840 9.043 9.269 9.402 9.432 9.323 9.289 9.132 9.327 11,10 13,10 C category 637 706 706 422 422 422 411 421 423 416 0,80 0,60 D category 543 552 518 526 526 526 497 557 585 554 0,70 0,80 Hostels - - - 46 63 110 110 110 127 109 0,00 0,20 Motels 895 1.035 1.042 1.018 1.013 1.035 1.053 1.089 1.371 1.512 1,10 2,10 Boarding houses 125 121 138 159 184 258 264 308 347 420 0,20 0,60
Holiday villages 574 674 674 456 456 456 436 436 193 193 0,70 0,30
Spa healing sites 1.329 1.329 1.329 1.225 1.225 1.225 1.142 1.142 1.096 1.090 1,70 1,50
Mountain homes and houses 170 177 309 204 204 204 204 204 47 77 0,20 0,10
Workers' resorts 7.612 7.886 7.995 7.561 7.598 7.640 7.336 7.669 7.347 7.221 9,70 10,20
Tourist camping sites1) 17.006 16.632 16.606 12.608 12.608 8.088 7.845 7.797 7.717 7.773 21,70 10,90
Children and youth summer resorts 8.484 8.647 8.398 7.976 8.115 12.582 11.158 10.908 11.991 10.685 10,80 15,00
Temporary accom-modation estab-lishments
304 304 304 304 304 304 528 528 534 534 0,40 0,80
Sleeping cars 1.604 1.604 1.604 1.596 1.596 1.596 1.596 1.596 1.680 1.680 2,00 2,40 Households (private rooms) 26.440 26.440 26.240 26.138 26.138 25.858 25.953 25.953 25.818 25.188 33,70 35,50
Code Title of the indicator
Compliance with CSI ЕЕА or other
indicators
Classification by DPSIR Type Linkage
with area Frequency of publication
МК NI 048
Tourism density and facilities dynamics
TOUR 14 Tourism density S, P А
Biodiversity Nature Policies Waste Water Air Transport
Annually

ENVIRONMENTAL INDICATORS OF THE REPUBLIC OF MACEDONIA 305
МК – NI 049 ECONOMIC VALUE OF TOURISM INDUSTRY
September 2007 – April 2008
Explanation Justification for indicator selection
This indicator should show what are the effects of tourism development, in economic terms, on the environment, and through its share in GDP it will be placed in the context of the overall economic development.
Definition Share in BDP is the share of the gross value added, in percentage, in the area of tourism in the total Gross Domestic Product on national level.
Units − %.
Policy relevance List of relevant policy documents
− National Strategy for Tourism Development 2008 - 2012
− National Environmental Action Plan - 2 - in Section 4.2.6. Tourism, describes the main challenge for sustainable tourism development, implementation of economic potential with minimum possible impact on the environment.
− Spatial Plan of the Republic of Macedonia – in its Chapter 5.4. "Tourism development and organization of tourist areas", defines the objectives and planning determinations for tourism development.
− National Strategy for Sustainable Development of the Republic of Macedonia – in the section on tourism, presents the directions for sustainable development of tourism, within short, medium, and long-term frames, up to 2030.
− Strategy for Biological Diversity Protection in the Republic of Macedonia with Action Plan – under measure C.5 "Stimulation of traditional use of biological diversity and eco-tourism", defines the action for identification of sites suitable for eco-tourism.
Legal ground
The Law on Tourist Activity ("Official Gazette of the Republic of Macedonia" No. 62/2004) specifies the conditions and the manner of performing tourist activity (Chapter 15 Services in rural, ethno and eco-tourism, Article 51).
The Law on Environment, the Law on Nature Protection, the Law on Waste Management, the Law on Ambient Air Quality and the aw on Waters regulate partially the requirements for environmental protection in tourist activity.
P
R
D
S
I

ENVIRONMENTAL INDICATORS OF THE REPUBLIC OF MACEDONIA 306
Targets − Integration of the principles of sustainable development and environmental
considerations in tourist sector
− Identification of areas of priority importance for tourism development
− Encouragement of exchange of best practices between public and private tourist interests
− Protection of natural heritage and biological diversity in tourist destinations
− Adoption and implementation of legislation in the area of tourism to regulate the protection of the environment
− Promotion of organic farming, healthy food production and especially traditional production of certain products (e.g. cheese, wine), production of honey, herbs growing, etc.
− Promotion of certain types of tourism such as wine tourism, hunting tourism, birds observation tourism, etc.
Key policy issue What is the impact of tourism relying on the characteristics of the environment on the economic development of the Republic of Macedonia?
Specific policy issue What is the possibility to invest financial resources in attractive areas of the Republic of Macedonia’s environment?
The revenues acquired through tourist charges and taxes will enable environment management and protection, and such revenues will also provide possibilities for legal and natural persons to improve the living conditions and the working performance.
Key message Tourism is an important economic activity accelerating economic and non-economic activities, while in functional terms it is expressed as multiplicator of economic achievements, induces activities, possesses conversive character by attributing market nature to phenomena and relations that have no economic meaning; it balances the payment balance of the country, balances development relations in different environments and contributes to the employment.
Increased charges for municipal development will result in humanization of the environment and its protection and promotion.

ENVIRONMENTAL INDICATORS OF THE REPUBLIC OF MACEDONIA 307
Assessment The Table shows that the share of tourism in GDP is relatively low with falling trend. I.e. with no improvement. Observation should enable insight in the extent in which effects from tourist development on the environment improve.
Methodology Methodology for the indicator calculation
Share of value added from tourism in GDP.
Data specification
Title of the indicator Source Reporting obligation
Economic value of tour-ism industry − State Statistical Office
− Yearly publication on GDP
− Statistical Yearbook
0,00,20,40,60,81,01,21,41,61,82,0
1997 1998 1999 2000 2001 2002 2003 2004 2005 2006
%
year
Share of tourism in GDP in %
Share of tourism in GDP in % Trend

ENVIRONMENTAL INDICATORS OF THE REPUBLIC OF MACEDONIA 308
Data coverage (by years): Table 1: Share of the sector “Catering and tourism” or “Hotels and restaurants in Gross Domestic Products (production method).
General metadata
Geographical coverage: Republic of Macedonia
Temporal coverage: 1997 - 2006
Frequency of data collection: annual
Future activities Short-term activities
a. Description of the activity − Continuous monitoring of the status is necessary.
b. Required resources − Human resources required in the State Statistical Office.
c. Status − Activities are in progress.
` Deadline: Activities are continuous.
Code Title of the indicator
Compliance with CSI ЕЕА or other indicators
Classification by DPSIR Type Linkage with
area Frequency of publication
МK NI 049
Economic value of tourism industry
TOUR 35
Economic value of tourism industry
D В
Biodiversity Nature Policies Waste Water Air Transport
Annually
Share of tourism in GDP in %
1997 1,5
1998 1,6
1999 1,9
2000 1,5
2001 1,5
2002 1,7
2003 1,9
2004 1,6
2005 1,5
2006 1,5

ENVIRONMENTAL INDICATORS OF THE REPUBLIC OF MACEDONIA 309
List of Members in the Work Groups elaborating the Environmental Indicators of the Republic of Macedonia
Established under Decision no..10-2323/29 of 14 September 2007, signed by the Minister of Environment and Physical Planning.
Coordinator Katerina Nikolovska Ministry of Environment and Physical Planning
1. Air pollution and ozone depletion
Leader Aneta Stefanovska Ministry of Environment and Physical
Planning Deputy Leader M. Sc. Aleksandra Nestorovska Krstevska
Members M. Sc. Marijonka Vilarova Ministry of Environment and Physical
Planning Emilija Kupeva Ass. Prof. Mihail Kocubovski, PhD Republic Institute for Health Protection
Liljana Todorova - Talevska Hydrometeorological Administration
Vesna Pavlovska Ljiljana Oncevska - Nadzinska
City of Skopje Irina Sentevska Zoran Penovski
Prof. LJupco Melovski, PhD Faculty of Natural Science and Mathematics, Institute of Biology
Ana Petrovska REC

ENVIRONMENTAL INDICATORS OF THE REPUBLIC OF MACEDONIA 310
2.Biological diversity Leader M. Sc. Robertina Brajanoska Ministry of Environment and Physical
Planning Deputy Leader Vesna Indova
Members Dimitar Rolevski Ministry of Environment and Physical
Planning Pance Nikolov
Ministry of Agriculture, Forestry and Water Economy
Pejo Todevski Jurant Dika
Blagoja Stevanovski Jadranka Ivanovska Veterinary Administration
Elisaveta Filipovik Phitosanitary Administration
Stevanka Projcevska PI National Park Pelister Bitola
Tomislav Petrov
Naume Razmoski PI National Park Park Galicica Ohrid
Andon Bojadzi Lidija Velkova Jordanoska Hydrobiological Institute - Ohrid
Prof. Dragan Kolcakovski, PhD Faculty of Natural Science and Mathematics, Institute of Geography Prof. Dragan Vasileski, PhD
Prof. LJupco Melovski, PhD Faculty of Natural Science and Mathematics, Institute of Biology
Blaga Dimitrovska Hydrometeorological Administration
Liljana Despotova Petkovik
Violeta Drakulevska
City of Skopje Irina Sentevska
Aleksandra Dimitrievska
Prof. Sonja Ivanovska, PhD Faculty of Agricultural Science and Food Prof.Sreten Andonov, PhD
Katarina Stojkovska REC
Cvetanka Markusoska Agency of Spatial Planning
Prof. Nikola Nikolov, PhD Faculty of Forestry

ENVIRONMENTAL INDICATORS OF THE REPUBLIC OF MACEDONIA 311
3.Climate Change
Leader M. Sc. Marijonka Vilarova Ministry of Environment and Physical Planning Deputy Leader Emilija Kupeva
Members M. Sc. Teodora O.
Grncarovska Ministry of Environment and Physical Planning
Natasa Markovska Macedonian Academy of Science and Arts (MASA)
Pece Ristevski
Hydrometeorological Administration Rada Bojkovska
Vasko Stojov
Vladimir Kendrovski, PhD Republic Institute for Health Protection
Prof. Mihajlo Zikov, PhD Faculty of Natural Science and Mathematics, Institute of Geography
Ass.Prof.Slavco Hristovski, PhD
Faculty of Natural Science and Mathematics, Institute of Biology
Aleksandra Dimitrievska City of Skopje
Irina Sentevska
Dusko Mukaetov, PhD Institute of Agriculture
Prof. Ordan Cukaliev, PhD Faculty of Agricultural Science and Food
Ana Petrovska REC

ENVIRONMENTAL INDICATORS OF THE REPUBLIC OF MACEDONIA 312
4.Soil
Leader M. Sc. Margareta Cvetkovska Ministry of Environment and Physical
Planning Deputy Leader Caslav Tosevski
Members Sokol Klincarov Ministry of Environment and Physical
Planning Gordana Kozuharova
Milan Kostov Ministry of Agriculture, Forestry and Water Economy
Borka Spasovska-Gerasimovska Ministry of Economy
Slobodan Prckovski State Statistical Office Ass.Prof. Mihail Kocubovski, PhD Republic Institute for Health Protection
Violeta Mircevska Ministry of Transport and Communications State Agency of Geodesy Maca Trosanska
Prof. Tatjana Mitkova, PhD Faculty of Agricultural Science and Food
Dusko Mukaetov, PhD Institute of Agriculture
Lidija Trpenoska-Simonovik Agency of Spatial Planning
Silvana Stevkova Hydrometeorological Administration
Ljupco Dimidzijevski PI National Park Galicica Ohrid Cvetanka Ikonomova - Martinovska
City of Skopje Violeta Drakulevska
Aleksandra Dimitrievska
Nikola Jovanovski
Katarina Stojkovska REC

ENVIRONMENTAL INDICATORS OF THE REPUBLIC OF MACEDONIA 313
5. Waste
Leader Valeri Penev Ministry of Environment and Physical
Planning Deputy Leader M. Sc. Margareta Cvetkovska
Members Kiril Kalkasliev Ministry of Environment and Physical
Planning Dimitar Mladenovski Marija Andonova, PhD Ministry of Health Ass.Prof. Mihail Kocubovski, PhD Republic Institute for Health Protection
Elmaz Maliki Ministry of Local Self-Government Firus Memed
Ministry of Agriculture, Forestry and Water Economy
Blazo Janervski
Roza Nakova
Goce Gjorgjiev City of Skopje
Nikola Jovanovski Violeta Panovska
State Statistical Office Suzana Stojanovska
Saso Todorovski Public Utilities Ass.Prof. Olgica Dimitrovska, PhD
Faculty of Natural Science and Mathematics, Institute of Geography
Naumce Noveski PI National Park Galicica Ohrid
Lenka Ugrinovska Ministry of Economy
Prof. Metodija Trajcev, PhD Faculty of Agricultural Science and Food
Ana Petrovska REC
Snezana Davcevska Directorate for Radiation Safety
Trifce Sandev

ENVIRONMENTAL INDICATORS OF THE REPUBLIC OF MACEDONIA 314
6.Water
Leader LJupka Dimovska - Zajkov Ministry of Environment and Physical Planning Deputy Leader Kosta Trajkovski
Members LJiljana Riskovska Ministry of Environment and Physical
Planning Ilber Mirta
Bojan Durnev Ministry of Agriculture, Forestry and Water Economy - Water Management Administration Aleksandar Sapundzioski
Blaga Unevska Hydrometeorological Administration
Rada Bojkovska
Goce Kostoski, PhD Hydrobiological Institute - Ohrid
Suzana Stojanovska State Statistical Office
Violeta Panovska
Asim Ramadani, PhD Ministry of Health
doc. d-r Mihail Kocubovski Republic Institute for Health Protection
Cvetanka Ikonomova - Martinovska City of Skopje Aleksandra Dimitrievska
Prof. Dragan Vasileski, PhD Faculty of Natural Science and Mathematics, Institute of Geography
Prof.Svetislav Krstik, PhD Faculty of Natural Science and Mathematics, Institute of Biology
Ognen Dostinoski PI National Park Galicica Ohrid
Sonja Georgieva-Depinova Agency of Spatial Planning Ass.Prof. Vjekoslav Tanaskovik, MSci.
Faculty of Agricultural Science and Food
Florent Cice Ministry of Economy
Ana Petrovska REC

ENVIRONMENTAL INDICATORS OF THE REPUBLIC OF MACEDONIA 315
7. Agriculture
Leader M. Sc. Margareta Cvetkovska Ministry of Environment and Physical
Planning Deputy Leader Caslav Tosevski Members Ilber Sabani Ministry of Environment and Physical
Planning Gordana Kozuharova
Vase Simovska – Boskova Ministry of Agriculture, Forestry and Water Economy Pance Nikolov
Ass.Prof.Vladimir Kendrovski, PhD Republic Institute for Health Protection
Prof.Ordan Cukaliev, PhD Faculty of Agricultural Science and Food
Slobodan Bandzo, PhD Institute of Agriculture
Katerina GJurgulovska Agovska
State Statistical Office
Angelko Angeleski Hydrometeorological Administration
Nikola Jovanovski City of Skopje
Katarina Stojkovska REC

ENVIRONMENTAL INDICATORS OF THE REPUBLIC OF MACEDONIA 316
8.Energy
Leader M. Sc. Teodora Obradovik Grncarovska Ministry of Environment and Physical
Planning Deputy Leader M. Sc. Marijonka Vilarova
Members Dejan Zrmanovski Ministry of Economy
Lefterija Kalevska State Statistical Office
Vesna Antoska
Goran Angelovski Directorate for Radiation Safety
Dimce Kiteski
Zdenka Stojanovska Republic Institute for Health Protection
Pece Ristevski Hydrometeorological Administration
Kosta Ugrinski
Blagoja Jankov Agency of Spatial Planning
Zoran Penovski
City of Skopje Nikola Jovanovski
Irina Sentevska
Natasa Markovska MASA
Pance Atanasovski Agency for Energy
Igor Nikolov ELEM
Nikola Bitrak MEPSO Branka Stanoevska

ENVIRONMENTAL INDICATORS OF THE REPUBLIC OF MACEDONIA 317
9.Fishery
Leader M. Sc. Robertina Brajanoska Ministry of Environment and Physical Planning Deputy Leader Vesna Indova
Dimitar Rolevski Ministry of Environment and Physical Planning
Igor Bojadziev Ministry of Agriculture, Forestry and Water Economy
LJupco Madzirov State Statistical Office
Lidija Velkova Jordanoska Hydrobiological Institute-Ohrid
Prof.Mirce Naumovski, PhD Faculty of Agricultural Science and Food
Prof.Dragan Vasileski, PhD Faculty of Natural Science and Mathe-matics, Institute of Geography
Vasko Kostov Live-Stock Breeding Institute
Members
10.Transport Leader M. Sc. Marijonka Vilarova Ministry of Environment and Physical
Planning Deputy Leader Dragan Pavlovski
Members Svetlana Karovska Ministry of Environment and Physical
Planning Ljupco Mancevski
Sonja Kostovska Ministry of Transport and Communications State Agency of Geodesy
Dusan Popcevaliev Civil Aviation Directorate
Ljubica Damkeska State Statistical Office
Lidija Trpenoska-Simonovik Agency of Spatial Planning
Prof.Blagoja Markoski, PhD Faculty of Natural Science and Mathematics, Institute of Geography
Blaga Unevska Hydrometeorological Administration
Nenad Tonik City of Skopje
Mile Dukovski Directorate for Radiation Safety Gordana Nikolova
Cane Kostovski Ministry of Interrior
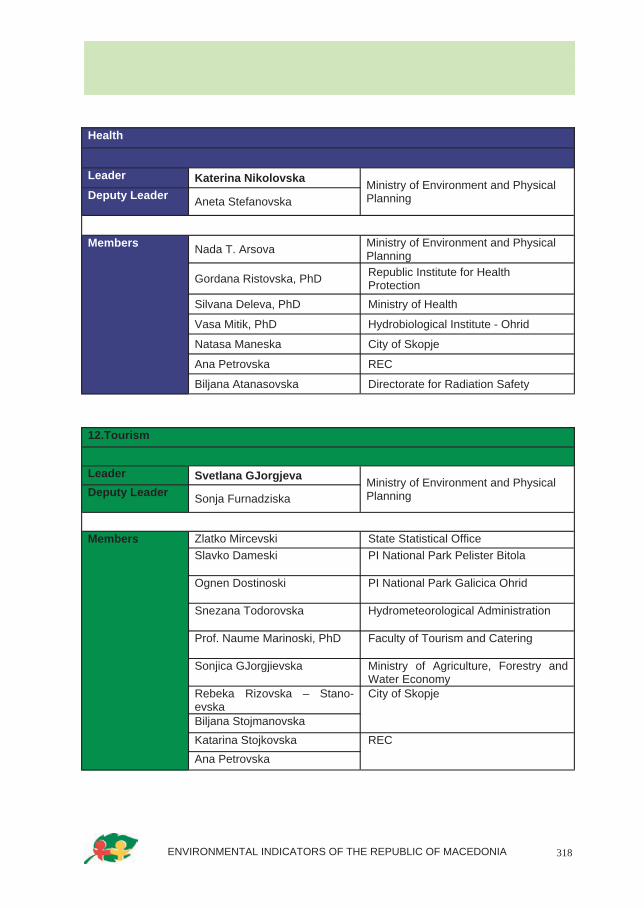
ENVIRONMENTAL INDICATORS OF THE REPUBLIC OF MACEDONIA 318
Health
Leader Katerina Nikolovska Ministry of Environment and Physical Planning Deputy Leader Aneta Stefanovska
Members Nada T. Arsova Ministry of Environment and Physical
Planning
Gordana Ristovska, PhD Republic Institute for Health Protection
Silvana Deleva, PhD Ministry of Health
Vasa Mitik, PhD Hydrobiological Institute - Ohrid
Natasa Maneska City of Skopje
Ana Petrovska REC
Biljana Atanasovska Directorate for Radiation Safety
12.Tourism
Leader Svetlana GJorgjeva Ministry of Environment and Physical
Planning Deputy Leader Sonja Furnadziska
Members Zlatko Mircevski State Statistical Office
Slavko Dameski PI National Park Pelister Bitola
Ognen Dostinoski PI National Park Galicica Ohrid
Snezana Todorovska Hydrometeorological Administration
Prof. Naume Marinoski, PhD Faculty of Tourism and Catering
Sonjica GJorgjievska Ministry of Agriculture, Forestry and Water Economy
Rebeka Rizovska – Stano-evska
City of Skopje
Biljana Stojmanovska
Katarina Stojkovska REC
Ana Petrovska


www.moepp.gov.mk