
INDICATORS SUITE - JFD Brokers
110
USERGUIDE INDICATORS SUITE
-
Upload
khangminh22 -
Category
Documents
-
view
0 -
download
0
Transcript of INDICATORS SUITE - JFD Brokers

USERGUIDE INDICATORS SUITE

TABLE OF CONTENTS
1. INSTALLATION OF THE INDICATORS SUITE
2.ADDING INDICATORS TO A CHART
3.ABOUT THE INDICATORS SUITE
4. LIST OF INDICATORS
A. JFD BAR CHANGER
B. JFD CANDLE COUNTDOWN
C. JFD CHART GROUP
D. JFD CHART-IN-CHART
E. JFD DONCHIAN
F. JFD FREEHAND DRAWING
G. JFD GRAVITY
H. JFD HIGH-LOW
I.JFD KELTNER
J. JFD MAGNIFIER
K. JFD MINI CHART
L. JFD ORDER HISTORY
M. JFD PIVOT
N. JFD RENKO
O. JFD SYMBOL INFO
PAGE 03
PAGE 05
PAGE 06
PAGE 07
PAGE 07
PAGE 14
PAGE 19
PAGE 23
PAGE 31
PAGE 37
PAGE 39
PAGE 42
PAGE 49
PAGE 53
PAGE 59
PAGE 76
PAGE 81
PAGE 86
PAGE 101
INDICATORS SUITEUSERGUIDE
2

1
3
2
INSTALLATION OF THE INDICATORS SUITE
Before installing JFD’s MT4+ Add-ons, close your MT4
terminal. The add-ons cannot be installed if the MetaTrader 4
terminal is running.
NOTE
In order to install the Indicators Suite, follow the steps
below:
1. Click here to download the retrofit installer
containing the full package of JFD MT4+ exclusive
add-ons.
2. Run the installer file (1)on your computer.
3. Select the MetaTrader 4 Terminal folder (2) where
you would like to install the Add-ons package and
press the Install button (3).
4. Press OK in the confirmation dialog box that will
appear after successful installation.
INDICATORS SUITEUSERGUIDE
3

After successful installation, open your MT4+ terminal and you
will find the full list of JFD indicators along with all other default
ones in the Navigatorwindow under Indicators.
INSTALLATION OF THE INDICATORS SUITE INDICATORS SUITEUSERGUIDE
4

You add any of the indicators to a chart in the usual way, either by dragging it from the Navigator window onto a chart, or by double-
clicking on it in the Navigator window. You can also use standard MT4 features such as adding the indicator to your list of Favorites, or
assigning a hotkey to it. In the Common tab (1) of the indicator’s options window, you need to turn on the Allow DLL imports (2) setting.
1
2
ADDING INDICATORS TO A CHART INDICATORS SUITEUSERGUIDE
5

JFD provides a package of useful, commonly-requested chart indicators that can be a valuable addition to any trading toolkit providing
useful insights on the markets being analysed for identification of new investment opportunities. The indicators listed in the suite are
developed for enhancing your experience with JFD’s MT4+ platform.
ABOUT THE INDICATORS SUITE INDICATORS SUITEUSERGUIDE
6

A. JFD BAR CHANGER
JFD Bar Changer indicator creates an offline chart in MT4+ containing a modified version of the chart on which the indicator is running.
JFD Bar Changercan make the following modifications to the bar data:
▪ Adjust the time of each bar (e.g. shift each bar backwards by 2 hours)
▪ Invert the price, or adjust it to thousands (e.g. converting 1.23456 to 12345.6)
▪ Exclude parts of each day, e.g. only include 09:00-16:59
The facility to set daily time ranges is mainly intended for filtering the chart activity on index CFDs which have 24-hour pricing but are
only actively traded during core market hours. Most indicators and EAs can then be used on the offline chart just like a normal MT4 chart.
LIST OF INDICATORS INDICATORS SUITEUSERGUIDE
7

You need to choose a timeframe to identify the offline chart, using the respective setting (2) on the indicator’s Inputs tab (1). If you set
the value to zero then the indicator will automatically select a number based on the chart on which it is running. Once ready, press the OK
button (3).
2
2
1
LIST OF INDICATORS INDICATORS SUITEUSERGUIDE
8

The entries which the indicator creates in the MT4 Experts log (1) will confirm which number it is using.
1
LIST OF INDICATORS INDICATORS SUITEUSERGUIDE
9

You can then open the offline chart by using the File menu selecting Open Offline (1), and choosing the entry corresponding to the
symbol name and your specified timeframe value, then pressing the Open button (2).
12
LIST OF INDICATORS INDICATORS SUITEUSERGUIDE
10
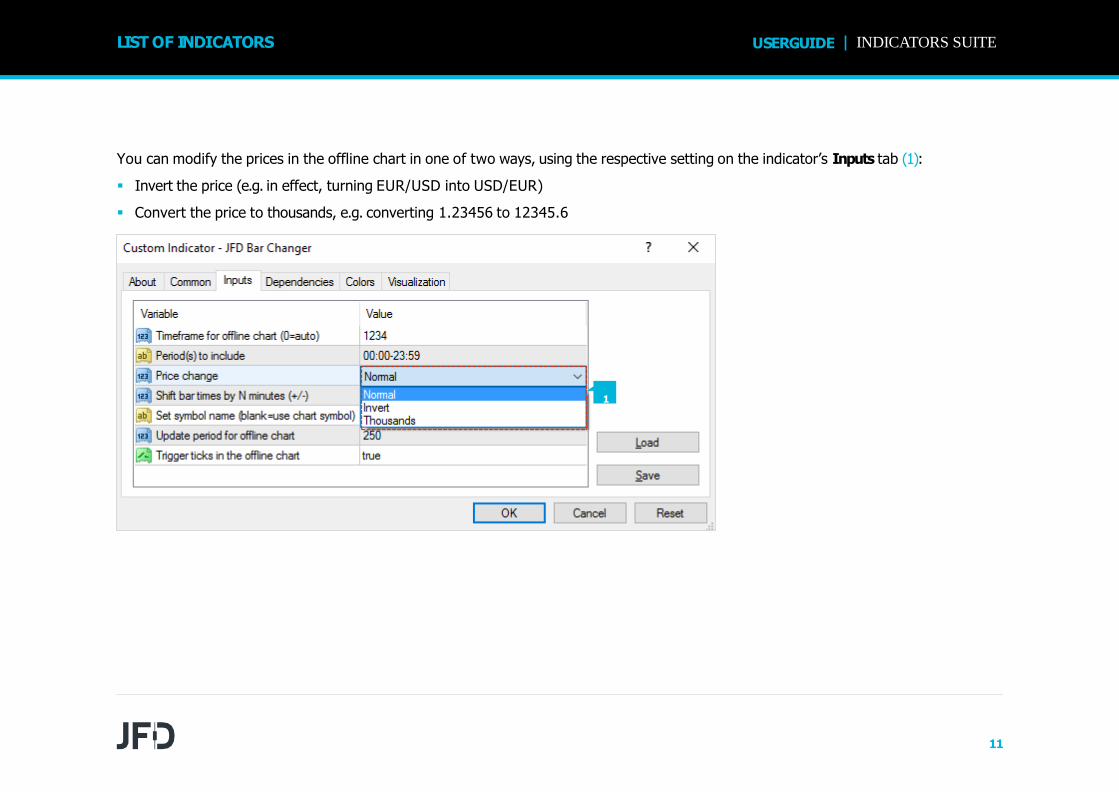
You can modify the prices in the offline chart in one of two ways, using the respective setting on the indicator’s Inputs tab (1):
▪ Invert the price (e.g. in effect, turning EUR/USD into USD/EUR)
▪ Convert the price to thousands, e.g. converting 1.23456 to 12345.6
1
LIST OF INDICATORS INDICATORS SUITEUSERGUIDE
11

You can set daily time ranges using the respective setting in the Inputs tab (1). Any price data outside of these ranges is then excluded
from the offline chart. This is mainly intended as a way of filtering the bars on index CFDs which have 24-hour pricing but are only
actively traded during core market hours. You specify time ranges in MT4/broker time (not your local time), and in the format hh:mm-
hh:mm. For example: 09:00-14:59. To handle daily trading hours which span midnight, you can specify multiple ranges separated by
commas. For example: 22:00-23:59,00:00-02:59. The end times should (normally) be specified as xx:59 rather than xx:00. For example,
the range 00:00-05:00 would include the 1 minute of price data starting at 5 am.
1
LIST OF INDICATORS INDICATORS SUITEUSERGUIDE
12

You can use the respective setting in the Inputs tab (1) to adjust the time of each bar, adding or subtracting a number of minutes to the
standard MT4/broker time. Please note that this applies a constant adjustment throughout the trading history. The difference between
your local time and MT4 time may vary over the year because of daylight-savings changes happening on different dates.
1
LIST OF INDICATORS
Most EAs and indicators can be used on the offline chart just like you would use them on a normal MT4 chart. The only exceptions are
EAs/indicators which need to look at specific timeframe data rather than the chart on which they are running (e.g. “multi-timeframe” MTF
indicators). If you configure such an indicator to look e.g. at H1 data, then it may look at the normal H1 data in MT4 rather than your
offline chart even if the offline chart has been based on H1 data.
INDICATORS SUITEUSERGUIDE
13

B. JFD CANDLE COUNTDOWN
JFD Candle Countdown indicator shows the time remaining in the
current bar (1). By default, it will use the timeframe of the chart on
which it is running. You can also add multiple copies of the
indicator to show the time remaining in different bar timeframes.
If you are putting multiple copies of the indicator on a single chart
then you will need to alter the X and/or Y positions so that the
labels do not overlap.
1
LIST OF INDICATORS INDICATORS SUITEUSERGUIDE
14

You can configure the indicator to alert you N seconds before a bar is about to end. The alerts can be issued as pop-up messages and/or
as sounds. To turn off either the pop-up message or the sound, simply leave the value blank (1).
1
LIST OF INDICATORS INDICATORS SUITEUSERGUIDE
15

You can set the timeframe for the countdown: either whatever is the period of the current chart, or a fixed period (1).
LIST OF INDICATORS
1
By default, the indicator will use your
computer’s local clock, and will continue
to count down even when the market is
quiet and there are no new ticks from
the broker. If you turn off this setting
then the countdown will only update
when there are new ticks.
INDICATORS SUITEUSERGUIDE
16

You can set the label position, e.g. bottom-right of chart, top-left of chart (1), the colour (2), and the font (3).
LIST OF INDICATORS
1
2
3
INDICATORS SUITEUSERGUIDE
17

You can also set the text of the label (1), using the variable {TIME} which the indicator replaces with the time remaining.
LIST OF INDICATORS
If you are using multiple copies of the
indicator on the same chart then you will
typically want to change the labels to
remind you which timeframe each copy
refers to.
1
INDICATORS SUITEUSERGUIDE
18

C. JFD CHART GROUP
JFD Chart Group indicator is a professional
trading tool linking charts so that changing the
symbol on one chart automatically changes other
linked charts. If you have open EURUSD charts,
for M1, M5, M15 and M30, you can use the
indicator to link them together. Changing one of
the charts to a new symbol such as GBPUSD
automatically updates all the other charts to
GBPUSD. Thus, the indicator provides a quick
way of switching multiple charts between
different symbols without having to use MT4
profiles and setting up a different profile for each
symbol. You can also use the indicator to
synchronize timeframes instead of symbols. If
you have open charts for EURUSD, GBPUSD,
and USDJPY, changing the timeframe on one of
the charts automatically changes the timeframe
on the others.
LIST OF INDICATORS INDICATORS SUITEUSERGUIDE
19

By default JFD Chart Group indicator will synchronise the symbol on all linked charts. You can tell it instead to synchronise the timeframe
using the option on the Inputs tab of the indicator settings (1).
LIST OF INDICATORS
1
INDICATORS SUITEUSERGUIDE
20

The indicator creates a text box, in the bottom-right corner of a
chart by default (1). You link charts together by giving them the
same group name. For example, you can assign a chart to a group
called SCALP, and it will then change – or be changed by – any
other charts which are also assigned to that group. You can have
any number of charts, either all assigned to the same group or to
different groups.
To make it easier to identify which charts are linked together, if
you use the group names R, G, or B, then the group box is set to
red, green, or blue. If you have more than one group of charts, it is
then easier to see that the red charts are linked to each other and,
separately, that the blue charts are linked to each other, rather
than just having to read the group names in the text boxes. For an
even wider range of colours, you can use the group names 1 to 6:
1 (Red), 2 (Blue), 3 (Green), 4 (Purple), 5 (Black), 6 (Grey).
LIST OF INDICATORS
1
1
INDICATORS SUITEUSERGUIDE
21

All MT4 users know how to change the timeframe of a chart. It is less obvious that you can also change the symbol of a chart (e.g. change
an existing chart from EURUSD to GBPUSD, rather than closing the EURUSD chart and opening a new GBPUSD chart).
In case you were not already aware of this… you can change the symbol of a chart by dragging a symbol from the MT4 market watch onto
the chart (in the same sort of way that you add an indicator to a chart by dragging the indicator from the Navigator onto the chart).
LIST OF INDICATORS INDICATORS SUITEUSERGUIDE
22

D. JFD CHART-IN-CHART
JFD Chart-in-Chart indicator shows the price action for an additional symbol in a sub-window on the main chart, allowing bar-by-bar
comparisons of price action on the main chart symbol against the subsidiary symbol. You can add multiple copies of the indicator to a
chart in order to show multiple extra symbols. You can choose to invert prices, e.g. so that USDJPY is shown as JPYUSD. Although the
sub-window cannot provide the full functionality of a main MT4 chart, you can add popular technical indicators such as moving averages
and envelopes to the display, and you can choose to display the levels of open positions and pending orders.
LIST OF INDICATORS INDICATORS SUITEUSERGUIDE
23

You set the symbol to display using the Symbol parameter (1) in the Inputs tab. The symbol must be entered as presented in the MT4
Market Watch. To display more than one symbol, you simply add multiple copies of the indicator to the chart. You can invert prices by
turning on (Yes) the respective option (2). For example, this will convert USDJPY into JPYUSD.
1
2
LIST OF INDICATORS INDICATORS SUITEUSERGUIDE
24

You can choose between different drawing styles (1):
▪ Price candles
▪ Line showing close price only
▪ Lines showing high and low prices
1
2
3
LIST OF INDICATORS INDICATORS SUITEUSERGUIDE
You can set the colour of the candle “wick”, or of the close or high
and low lines (2). For candles, you can also set different colours for
up (“bull”) and down (“bear”) bars (3). Hovering the mouse over a
candle, or over the close or high and low lines, displays a pop-up
tooltip giving the price values at that point in time.
25

By default, the indicator will draw a horizontal line showing the current (bid) price. You can change the colour of this line (1). Changing the
colour to “none” turns off the line.
1
LIST OF INDICATORS INDICATORS SUITEUSERGUIDE
26

You can turn on the display of trade levels (1):
▪ Entry price for open positions
▪ Stop Loss and Take Profit of open positions
▪ Entry price for pending orders
Each of these settings has a different colour parameter.
LIST OF INDICATORS INDICATORS SUITEUSERGUIDE
Choosing a colour other than “None” turns on the display of this
information. Hovering the mouse over one of these lines will then
show information about the open position or pending order. If you
invert prices, then the display of trade levels is also inverted. For
example, a USDJPY buy will be shown as a JPYUSD sell.
1
27

The sub-window cannot provide the full functionality of a main MT4 chart – for example, you cannot drop an indicator from the
Navigator onto the sub-window in order to add it to the price display for the extra symbol –but you can choose to include some popular
technical indicators in the price display. The Inputs tab contains 5 blocks of settings (1) which you can use to define technical indicators.
Each of these has a choice of indicator, a colour, a line-style, and parameters for the indicator.
LIST OF INDICATORS INDICATORS SUITEUSERGUIDE
1
28

LIST OF INDICATORS INDICATORS SUITEUSERGUIDE
The indicators which are available are as follows:
▪ SMA (simple moving average)
▪ EMA (exponential moving average)
▪ SMMA (smoothed moving average)
▪ LWMA (linear-weighted moving average)
▪ Bollinger band
▪ Envelope based on SMA
▪ Envelope based on EMA
▪ Parabolic SAR
▪ Yesterday’s daily (D1)close price
▪ Yesterday’s daily (D1)high and low prices
▪ Fixed price (equivalent to drawing a manual horizontal line on the chart)
29

LIST OF INDICATORS INDICATORS SUITEUSERGUIDE
The meaning of the “parameter 1” and “parameter 2” settings depends on the type of indicator:
TECHNICAL INDICATOR PARAMETER 1 PARAMETER 2
SMA Period for moving average (not used)
EMA Period for moving average (not used)
SMMA Period for moving average (not used)
LWMA Period for moving average (not used)
Bollinger bands Period for moving average Number of deviations
Envelope (SMA or EMA) Period for moving average Deviation %
Parabolic SAR Step value Maximum value
D1 close (not used) (not used)
D1 high and low (not used) (not used)
Fixed price Level for price line (not used)
30

E. JFD DONCHIAN
JFD Donchian indicator shows Donchian channels: the high and low of the previous N bars. In addition to the classic Donchian
calculation, the indicator also has three other options: average (mean) of the highs/lows; mid-point of the highs/lows; and lowest-high
rather than highest-high. You can also choose to expand (or contract) the Donchian channel: by a fixed percentage, or a price amount, or a
multiple of ATR or SD. You can also turn on pop-up alerts when the current price breaches the high or low lines.
LIST OF INDICATORS INDICATORS SUITEUSERGUIDE
31

By default the indicator will be based on the same timeframe as the current chart, and will change if you alter the chart’s timeframe.
However, you can use the Inputs tab to make the indicator use a higher timeframe but not a lower one (1). For example, you can show the
D1 Donchian high and low on an H1 chart.
1
LIST OF INDICATORS INDICATORS SUITEUSERGUIDE
32

You use the Inputs tab to tell the indicator how many bars to include (1), and how many bars to shift back by (2). The classic Donchian
values are 20 and 1: use the last 20 bars up to but excluding the current bar. If you set the shift to zero then the current bar’s high and
low are included in the calculation.
1
2
LIST OF INDICATORS INDICATORS SUITEUSERGUIDE
33

The classic Donchian calculation is to take the highest-high and lowest-low of the selected range (1). However, the indicator also provides
three other calculations:
▪ Average (mean) of the highs and lows
▪ Mid-point of the highs and lows, i.e. halfway point between highest-high and lowest-high, and between lowest-low and highest-low
▪ Lowest-high and highest-low
1
LIST OF INDICATORS INDICATORS SUITEUSERGUIDE

You can tell the indicator to expand its high-low range (1). You choose a mode on the Inputs tab, and an amount to expand (2) by (which
can be negative in order to contract the range rather than expanding it). The expansion modes are as follows:
▪ Percentage. The high is increased by N% and low is decreased by N%. (Therefore, it you set the parameter to 10, the total high-low
range is increased by 20%.)
▪ Price amount. You set the parameter to a value such as 0.0010, and this is added to the high and subtracted from the low.
▪ ATR multiple. The high is increased and the low is decreased by the specified multiple of the ATR for the period.
▪ Standard Deviation multiple. The high is increased and the low is decreased by the specified multiple of the SD for the period.
1
2
LIST OF INDICATORS INDICATORS SUITEUSERGUIDE
35

You set the colours and style for the Donchian lines in the usual way, using the Colors tab. However, you can also use the Inputs tab to
tell the indicator to draw the Donchian channel as a filled histogram instead of as lines (1).
You can turn on pop-up alerts (2) when the current price goes beyond the high or low values. The indicator will only generate one alert
per bar (treating the high and low independently). For example, if the high is breached, then the indicator will not issue another alert about
a breach of the high before the start of the next bar.
1
2
LIST OF INDICATORS INDICATORS SUITEUSERGUIDE
36

F. JFD FREEHAND DRAWING
JFD Freehand Drawing indicator lets you draw onto MT4 charts, in order to mark or highlight events on the chart. It is particularly useful
if you are running a live webinar for clients, or distributing screenshots or chart files to people. You draw on the chart simply by holding
down a key while you move the mouse. You can change colours using keyboard shortcuts, and you can quickly undo any drawing which
went wrong.
LIST OF INDICATORS INDICATORS SUITEUSERGUIDE
37

You draw on the chart simply by holding down the D
key while you move the mouse. You can start drawing
in a new colour using keyboard shortcuts. For
example, after pressing the B key, all further drawing
will be in blue. The list of colours and their keys is as
follows: R = red, B = blue, G = green, Y = yellow, N =
black, W = white. You can delete the most recent
drawing by pressing the X key. Pressing X again
deletes the previous drawing etc. You can change the
width of the drawn lines using the settings (1) on the
Inputs tab when you add the indicator to a chart. You
can also use these settings to change all the shortcut
keys (2). You can even change the colours (3), e.g. so
that “red” (pressing R) then draws in purple.
LIST OF INDICATORS INDICATORS SUITEUSERGUIDE
1
2
3
38
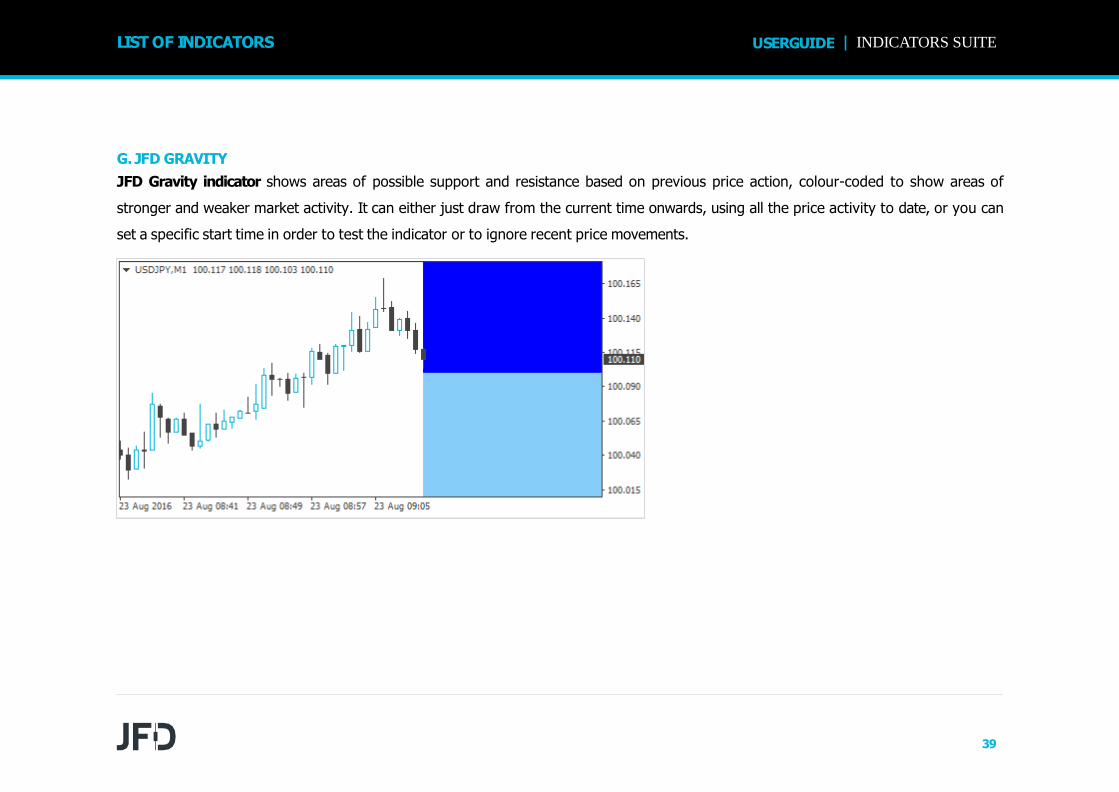
G. JFD GRAVITY
JFD Gravity indicator shows areas of possible support and resistance based on previous price action, colour-coded to show areas of
stronger and weaker market activity. It can either just draw from the current time onwards, using all the price activity to date, or you can
set a specific start time in order to test the indicator or to ignore recent price movements.
LIST OF INDICATORS INDICATORS SUITEUSERGUIDE
39

JFD Gravity indicator is colour-coded, showing areas of stronger support/resistance in darker colours. You can adjust the colours (1) using
the settings on the Inputs tab. The indicator has two modes. By default it will show a relatively long-term assessment of support and
resistance. For short-term trading, e.g. intra-day trading using an M5 or M15 chart, you can also use the Inputs tab to tell the indicator to
use a shorter-term calculation (2).
1
LIST OF INDICATORS INDICATORS SUITEUSERGUIDE
2
40

By default JFD Gravity indicator will show a future indication of support and resistance using price activity right up until the current time.
However, you can adjust the indicator’s start time by creating a vertical line on the chart and giving it the name GStart, for example (1).
The indicator will then only use the price action up until the start time, without looking into the future at what subsequently happened,
and will draw its support and resistance calculation starting from the line. You can use this either to test the indicator, seeing how reliable
it would have been in the past, or as a way of telling the indicator to ignore recent price activity which you may regard as abnormal and
irrelevant.
1
LIST OF INDICATORS INDICATORS SUITEUSERGUIDE
41

H. JFD HIGH-LOW
JFD High-Low indicator is a very flexible tool for showing highs and lows on a chart, from any timeframe and based on any number of
bars. You can add multiple copies of the indicator to the same chart in order to display different levels, e.g. the D1 and H4 highs and lows
on an H1 chart. The indicator can also show open and close prices as well as the high and low, and can be set to use a daily time range
rather than looking at an entire day’s trading. You can also configure the indicator to generate alerts when the current price breaches the
historic high or low.
LIST OF INDICATORS INDICATORS SUITEUSERGUIDE
42
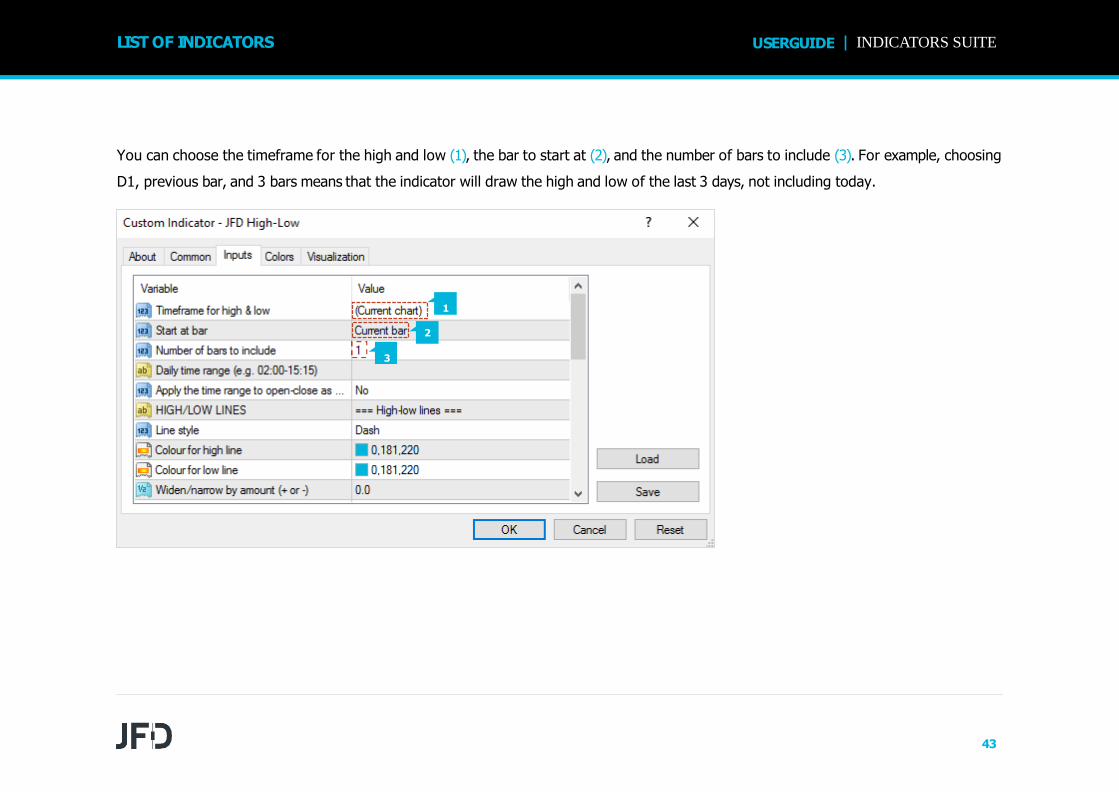
You can choose the timeframe for the high and low (1), the bar to start at (2), and the number of bars to include (3). For example, choosing
D1, previous bar, and 3 bars means that the indicator will draw the high and low of the last 3 days, not including today.
LIST OF INDICATORS INDICATORS SUITEUSERGUIDE
2
1
3
43

You can set a daily time range (1) so that the indicator only looks at part of each day’s trading. This can be particularly useful in relation to
equity markets where there is 24-hour trading, but only a core period of e.g. 8 hours during which the market is truly active. You set the
time range in the form hh:mm-hh:mm, e.g. 08:00-15:59. You can also choose whether the time range is only applied to the high and low,
or whether it also affects the open and close prices which the indicator calculates (2).
1
LIST OF INDICATORS INDICATORS SUITEUSERGUIDE
2
44

You can set the style (1) and colours (2) for the high and low lines. If you are using multiple copies of the indicator on the same chart in
order to display different levels, it is obviously best if you set different colours for each indicator. You can turn off the high or low by
settings its colour to none. You can also choose to widen the high and low lines (3), e.g. adding (or subtracting) 5 pips from the price. This
widening also affects any alerts which you set up. The widening can be defined in terms of pips (e.g. 20), or a price amount (e.g. 0.0020),
or a percentage of the range between the high and low. A negative value for the widening narrows the lines.
1
LIST OF INDICATORS INDICATORS SUITEUSERGUIDE
2
3
For example, if the low is at 1.2345, then a
value of 10 pips will move the line to
1.2335 (widened away from the high) and
a value of -10 will move the line to 1.2355
(narrowed towards the high).
45

You can choose to display lines for the open, close, and previous close (1). The close line is only useful if you configure the indicator to
start at the previous bar rather than the current bar, or if you apply a daily time range. Otherwise, the close line will simply be the current
price. You can turn each of these three lines on and off individually by choosing a colour for it or setting the colour to none.
LIST OF INDICATORS INDICATORS SUITEUSERGUIDE
1
46

You can choose whether the indicator displays a label for each line (1), e.g. D1 High, and you can control the text of the label (2). You can
add the variable {PRICE} into the text to make the indicator display the price value associated with the line.
LIST OF INDICATORS INDICATORS SUITEUSERGUIDE
1
2
47

You can choose to get alerts whenever the price goes beyond the high or low lines (1), including any widening which you have defined.
Alerts can be issued as pop-up messages (2) and/or as sounds (3). You can set a minimum period between alerts (4) to avoid repeated
notifications, and you can also configure the indicator to ignore the first N seconds of the current bar (5).
LIST OF INDICATORS INDICATORS SUITEUSERGUIDE
2
3
1
4
5
48

I. JFD KELTNER
JFD Keltner indicator shows Keltner channels: similar to Bollinger® bands, but with the size of the channel varying based on ATR rather
than standard deviation. You can configure the indicator to give you alerts when the price crosses the upper or lower channel (usually
regarded as a reversal signal).
LIST OF INDICATORS INDICATORS SUITEUSERGUIDE
49

You set the parameters for the indicator calculation via the Inputs tab. There are three main settings which control a Keltner channel:
▪ The moving-average period (1), e.g. 20 bars
▪ The ATR period (2), e.g. 10 bars
▪ The multiple of the ATR to add/subtract to the moving average (3), e.g. 2
In addition, you can also choose the type of moving average (4) to use (SMA, EMA etc), and what type of price (5) to base it on: close
price, median, “typical” etc.
5
4
1
2
3
LIST OF INDICATORS INDICATORS SUITEUSERGUIDE
50

The indicator draws three lines: the mid-point (moving average), plus the high and low channels. You can set the colour and style for these
lines in the usual way, via the Colors tab for the indicator.
LIST OF INDICATORS INDICATORS SUITEUSERGUIDE
51

You can use the Inputs tab to turn on pop-up alerts (1) whenever the current price crosses the upper or lower channel. To prevent
repeated and too-frequent alerts, the indicator will only display a maximum of one alert per bar. Once the price has crossed the upper or
lower band, a new alert will not be generated until the price has crossed back inside the channel, and then there is a new cross beyond the
upper or lower channel in a later bar.
LIST OF INDICATORS INDICATORS SUITEUSERGUIDE
1
52

J. JFD MAGNIFIER
JFD Magnifier indicator creates a draggable, resizable sub-window inside a main MT4 chart which “zooms in” on the selected bars,
showing them in more detail from a lower timeframe (e.g. M30 bars on an H1 chart). You simply drag JFD Magnifier around the chart to
zoom in on different historic periods.
LIST OF INDICATORS INDICATORS SUITEUSERGUIDE
53

By default JFD Magnifier will show the next lowest timeframe. For example, if the main MT4 is H1, then JFD Magnifier will show M30.
Alternatively, you can set a different, fixed timeframe using the setting on the indicator’s Inputs tab (1).
LIST OF INDICATORS INDICATORS SUITEUSERGUIDE
1
54

You can use the Inputs tab to change
the style and colours (1). The mini chart
offers a range of drawing styles:
▪ Candles
▪ Bars (i.e. a central high-low bar with
open and close horizontal markers)
▪ A line showing each close price
▪ Close points (i.e. dots at each close
price, without a line)
▪ Lines showing the high and low (but
not the close)
▪ A filled channel showing the high
and low, with a line showing the
close inside the channel
LIST OF INDICATORS INDICATORS SUITEUSERGUIDE
1
55

By default the mini chart will automatically draw horizontal grid lines. It will choose the nearest power of 10 (e.g. 0.01, 0.001) which does
not create an excessive number of visible lines. You can set a specific grid size (1) using the Inputs tab, setting the parameter to a price
amount such as 0.0020, or you can turn off the grid entirely by setting the parameter to zero.
By default the mini chart will automatically draw vertical grid lines based on the chart timeframe which you select. You can change the
vertical grid lines, or turn them off, using the Inputs tab (2).
LIST OF INDICATORS INDICATORS SUITEUSERGUIDE
1
2
56

You can use the Inputs tab to set the indicator’s initial position within the MT4 chart (1). You can define a position in terms of pixels
(replacing the default values of -1) from a specific corner of the chart.
LIST OF INDICATORS INDICATORS SUITEUSERGUIDE
1
57

The number of historic bars which are shown in JFD Magnifier depends on the combination of a number of factors:
▪ The zoom level of the main MT4 chart. If the bars on the main MT4 chart are small, then the bars in JFD Magnifier also need to be
small.
▪ The ratio between the main MT4 chart timeframe and the magnified timeframe. For example, if the main MT4 chart is H1, and you set
JFD Magnifier to M1, then it has to display 60 M1 bars for each H1 bar on the main MT4 chart – and will not be able to fit many in.
▪ The candle size which you select for the indicator, in the Inputs tab. By default JFD Magnifier will select its own size, but you can
override this. The larger you make the candles, the fewer which can be fitted in to JFD Magnifier’swindow.
LIST OF INDICATORS INDICATORS SUITEUSERGUIDE
58

K. JFD MINI CHART
JFD Mini Chart indicator creates a chart in a draggable, resizable sub-window inside a main MT4 chart. It lets you see the price action on
other instruments and/or timeframes without needing to switch between different MT4 charts. The mini chart has a wide variety of
features:
▪ Timeframes such as M4 and H3 in addition to standard timeframes such as M1 or H1
▪ Tick bars (e.g. bars made up of 10 ticks each) and seconds bars (e.g. 20-second bars)
▪ Range, Renko, Kagi and Point & Figure charts
▪ Data-transformations such as Heikin Ashi and Three Line Break
Although you cannot add MT4 indicators to a Mini Chart, it does provide its own options for showing popular indicator calculations such
as moving averages and Bollinger bands.
LIST OF INDICATORS INDICATORS SUITEUSERGUIDE
59

You set the symbol to display using the Symbol parameter (1) in the Inputs tab. The symbol must be present in the MT4 market watch. To
display more than one symbol, you simply add multiple copies of the indicator to the chart. You can also leave the symbol set to (current).
This will then display the same symbol as the main MT4 chart, and will change if the main chart changes. You can invert prices by turning
on the option (2) on the Inputs tab. For example, this will convert USDJPY into JPYUSD.
1
2
LIST OF INDICATORS INDICATORS SUITEUSERGUIDE
60

You choose the chart timeframe, or a type such as Kagi, using the option (1) on the Inputs tab. If you leave the timeframe set to (current)
then JFD Mini Chart will use the same timeframe as the main MT4 chart, and will change if the main chart changes.
1
LIST OF INDICATORS INDICATORS SUITEUSERGUIDE
JFD Mini Chart offers a range of
different timeframes and chart types:
▪ Standard timeframes such as M5 and
H1
▪ Extra timeframes such as M4 and H6
▪ Sub-minute, seconds-based time
periods such as S10 and S30
▪ Tick-lines, i.e. lines showing each
change in the ask and bid price
▪ Tick charts, i.e. candles which are not
time-based and are instead made up
of the same number of ticks
▪ Price-based charts such as Renko and
Kagi
MT4 does not have historic data at frequencies under 1 minute (M1). Therefore, the Mini Chart cannot show a history for a seconds-
period such as S30 when it loads. The indicator can only start recording and showing the data from the time that it starts running.
61

Tick charts draw a new bar every N ticks (i.e. they are based on activity, not on time). You need to fill in the number of ticks you want to
use in the setting (1) on the Inputs tab. A tick-lines chart shows the ask and bid prices as separate lines, updating whenever either the ask
or bid price changes (i.e. each new tick).
LIST OF INDICATORS INDICATORS SUITEUSERGUIDE
1
62

Renko, Range, Kagi, and Point & Figure charts are price-based rather than time-based, and draw new bars based on price movement
instead of time elapsing. All of them use a “block” size, which you set using the Inputs tab (1). This defines the minimum price movement
which is required before the chart changes. It can be set (2) either to a price amount (e.g. 0.0010), or a value in pips (e.g. 10), or to a
percentage change (not applicable to P&F).
LIST OF INDICATORS INDICATORS SUITEUSERGUIDE
1
2
63

With Range charts, a new bar is drawn each time that the price rises or falls by the block size. JFD Mini Chart indicator also offers stacked
range charts, where consecutive bars in the same direction are combined into a single bar.
Renko charts are similar to range charts, but the price must reverse by two whole blocks before a new block is drawn in the opposite
direction to the current trend. The Mini Chart indicator offers a variant on standard Renko charts which draws the “tails” on each bar, i.e.
the movement in each bar against the trend.
In Kagi charts, the chart changes direction when the price reverses by the block size from the previous high/low. Each additional
movement in the direction of the current trend extends the Kagi line, and therefore, unlike range or Renko charts, Kagi highs and lows are
not aligned to a grid.
Point and Figure charts are similar to range charts, but traditionally drawn in a different way, with consecutive movements stacked rather
than displayed as separate bars, and with a reversal rule where a new bar is not drawn in the opposite direction until the prices reverses
by three units.
LIST OF INDICATORS INDICATORS SUITEUSERGUIDE
64

For Range and P&F charts you can also set the “reversal” amount (1) which is required before the chart changes direction. If left at zero,
then Range charts will use a reversal factor of 1 – i.e. the threshold for a new block in the opposite direction is the same as for a
continuation – and P&F charts will use the standard P&F reversal factor of 3 – i.e. the price must reverse by 3 units before a new column
is drawn on the P&F chart.
LIST OF INDICATORS INDICATORS SUITEUSERGUIDE
1
65

When JFD Mini Chart loads, it will create historic data for Range, Renko, Kagi, and P&F charts using the price history in the trading
platform. By default the history is from M1 data (1). If you use a large block size (e.g. 1 whole cent, price change of 0.01, on EUR/USD),
then there may not be many historic blocks over the period covered by the M1 data in the platform. To go further back in time you can
choose a longer base period such as M30 or H1. The disadvantage of longer timeframes is that the indicator cannot be certain what
happened inside each historic bar. It can only “see” the high and low.
LIST OF INDICATORS INDICATORS SUITEUSERGUIDE
1
If a historic bar covers a price range such
as 0.04, and the block size is 0.01, then
the Mini Chart does not know, and has
to guess, whether the price went
up/down in four simple sequential blocks
rather than bouncing up and down
within the bar, creating several historic
blocks.
66

JFD Mini Chart provides popular transformations of the bar data:
▪ Heikin Ashi
▪ Three Line Break
▪ 2-bar average (i.e. each bar is the average of itself and the previous bar)
▪ 3-bar average
Transformations are different to chart types such as Kagi or Renko. With a chart type such as Kagi, there is a price-based rule for
when/how to draw each new bar, i.e. a rule which is not simply based on time such as H1 or S30. A transformation such as Heikin Ashi
takes bar data such as H1 and applies averaging to it. A Heikin Ashi chart has an underlying timeframe, such as H1. A Kagi or Renko chart
does not.
LIST OF INDICATORS INDICATORS SUITEUSERGUIDE
67

You can use the Inputs tab to change the style and colours (1). The Mini Chart offers a range of drawing styles:
▪ Candles
▪ Bars (i.e. a central high-low bar with open and close horizontal markers)
▪ A line showing each close price
▪ Close points (i.e. dots at each close price, without a line)
▪ Lines showing the high and low (but not the close)
▪ A filled channel showing the high and low, with a line showing the close inside the channel
▪ No drawing – the bars themselves are not drawn, and only indicators are displayed
LIST OF INDICATORS INDICATORS SUITEUSERGUIDE
Please note that the drawing style is fixed for tick-lines,
Kagi, and P&F charts. Changing the style setting has no
effect for these types of chart.
1
68

By default JFD Mini Chart will automatically select a high and low range to draw based on the bars which are visible (as MT4 itself does).
You can use the Inputs tab to tell the indicator to include any values in the high-low. Otherwise, as in MT4, indicator values may be
invisible off the top or bottom end of the chart. You can also set a fixed maximum and/or minimum price for the chart (1).
LIST OF INDICATORS INDICATORS SUITEUSERGUIDE
1
69
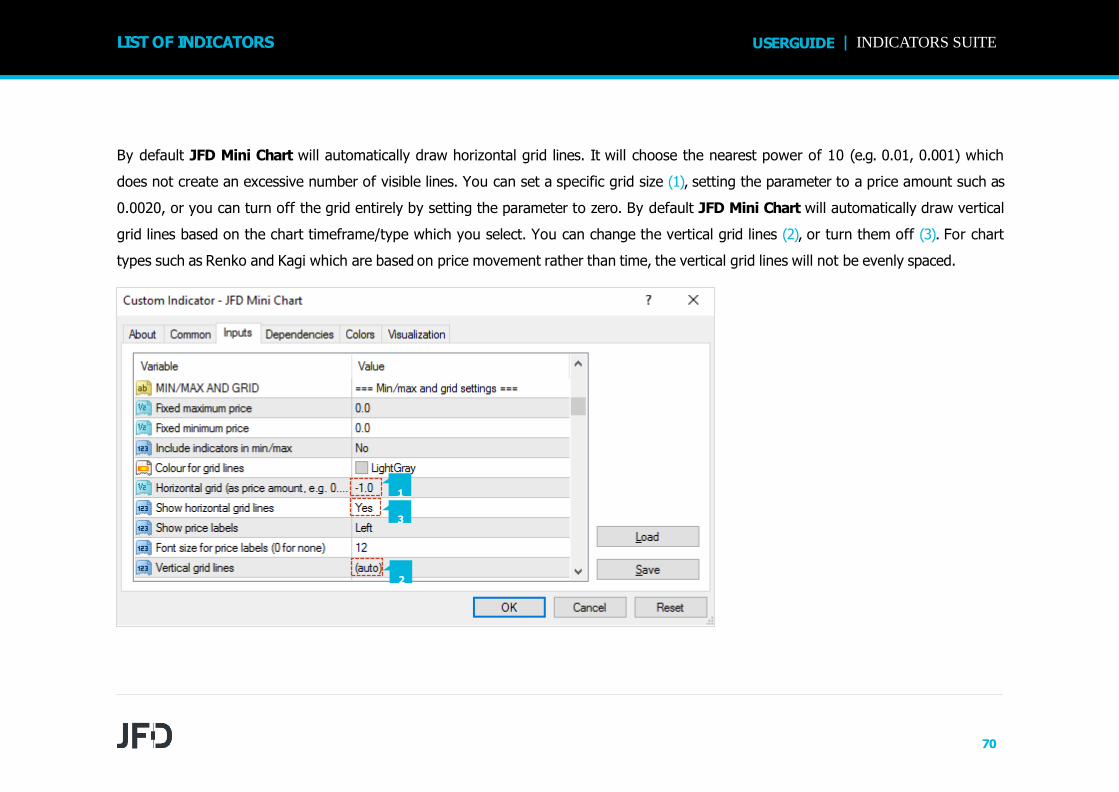
By default JFD Mini Chart will automatically draw horizontal grid lines. It will choose the nearest power of 10 (e.g. 0.01, 0.001) which
does not create an excessive number of visible lines. You can set a specific grid size (1), setting the parameter to a price amount such as
0.0020, or you can turn off the grid entirely by setting the parameter to zero. By default JFD Mini Chart will automatically draw vertical
grid lines based on the chart timeframe/type which you select. You can change the vertical grid lines (2), or turn them off (3). For chart
types such as Renko and Kagi which are based on price movement rather than time, the vertical grid lines will not be evenly spaced.
LIST OF INDICATORS INDICATORS SUITEUSERGUIDE
1
3
2
70

You can use the Inputs tab to set the indicator’s initial position within the MT4 chart (1). You can define a position in terms of pixels
(replacing the default values of -1) from a specific corner of the chart. JFD Mini Chart is both draggable and resizable, in the usual way by
pressing and holding the mouse over the sub-window’s title bar or border. By default the indicator will then choose a corner of the chart
to “dock” itself to. For example, if you drag the sub-window close to the bottom-right corner, the indicator will then dock itself to that
corner of the chart. If you resize the chart window, the indicator will automatically re-position itself so that it maintains the distance from
the edge(s) of the chart. You can manually override the docking (2) using the setting on the Inputs tab.
LIST OF INDICATORS INDICATORS SUITEUSERGUIDE
1
2
71

You can also change the following settings for the chart:
▪ The zoom level, i.e. how large each candle/bar is (1)
▪ The amount of space (in pixels) at the top and bottom of the chart (2)
▪ The amount of space (in pixels) at the right of the chart, i.e. equivalent to the chart-shift on MT4’s own chart (3)
▪ The height of the bar which shows the time and price corresponding to the position of the mouse. You can turn off this information bar
entirely by setting the height to zero (4)
LIST OF INDICATORS INDICATORS SUITEUSERGUIDE
1
2
3
4
72

You cannot add MT4 indicators (e.g. moving averages) to JFD Mini Chart, but you can use the Inputs tab to configure the display of
popular indicator calculations. This includes drawing lines at fixed prices (1), i.e. the equivalent of drawing a horizontal line on a main MT4
chart. You can define up to 10 indicator calculations. For each one, you can choose a drawing style and a colour. For some indicators, you
can change the parameters and/or or the type of price (2) – close, high, low etc – which is used in the indicator calculation. In other
words, the meaning of the Parameter A and Parameter B values (3) on the Inputs tab depends on the type of indicator (4).
LIST OF INDICATORS INDICATORS SUITEUSERGUIDE
4
3
2
1
73

Movingaverages (SMA, EMA, SMMA, LWMA)
The Parameter A value defines the period for the moving average calculation. You can also choose which price to apply the average to.
Parameter B is unused.
Bollinger®bands
The Parameter A value defines the period for the average (the mid-point of the bands). The parameter B value defines the number of
deviations for the bands, from the mid-point. You can also choose which type of price to use in the calculation.
Envelopes(SMA and EMA)
The Parameter A value defines the period for the moving average (the mid-point of the envelope bands). The Parameter B value defines
the %for the envelopes, e.g. 0.1% from the moving average mid-point. You can also choose which type of price to use in the calculation
H1 highand low
Same as the D1 high and low, with the same meaning for the Parameter A and Parameter B values, but using H1 data rather than D1 data.
LIST OF INDICATORS INDICATORS SUITEUSERGUIDE
74

LIST OF INDICATORS INDICATORS SUITEUSERGUIDE
D1 highand low
Draws horizontal lines at the D1 high and low. The Parameter A value defines the offset, and the Parameter B value defines the number
of D1 bars to include (defaulting to 1 if left at zero). For example, Parameter A =1 and Parameter B =3 means “the high and low of the 3
D1 bars starting yesterday”.
Linear regression
Draws a line showing the linear regression of the last N bars, defined by the Parameter A value. You can choose which type of price is
used in the calculation (e.g. linear regression of the highs rather than the closes). The Parameter B value is unused.
Fixedprice
Draws a horizontal line at the fixed price specified by Parameter A, i.e. the equivalent of manually drawing a horizontal line on an MT4
chart. You can also use the Parameter B value to draw a second line at a different price.
Current bid price
Draws a horizontal line at the current bid price (i.e. constantly changing). The Parameter A and B values and the price-type are not used.
75

L. JFD ORDER HISTORY
JFD Order History indicator draws your historic trades on a chart, showing the entry and exit prices and times, and also displays bands
which indicate when you were in and out of the market. The blue bands at the bottom of the screen indicate when there was an open
position for the chart symbol, and the grey bands indicate when there was an open position in any other symbol. Switching between
different chart timeframes (D1, H1, M1 etc) in effect provides a way of zooming in on historic trading activity. Hovering the mouse over a
historic trade shows the details of that trade. Hovering the mouse over the blue or grey bands shows the details of the trades which were
open during that period.
LIST OF INDICATORS INDICATORS SUITEUSERGUIDE
76

You can choose whether the indicator should include current open trades (1). The indicator draws entry and exit markers for each
individual trade on the chart’s symbol. You can choose whether these are colour-coded based on win versus loss, or on buy versus sell (2).
You can also set the style of entry and exit marker - arrows, price labels etc. (3), and the width of the line between the markers (4). You
can choose to turn on extra lines showing any Stop Loss and Take Profit on each trade. You can set both the style of the line and also its
colour (5). The prices which are shown are the final (or current) Stop Loss and Take Profit for a trade. MT4 does not maintain a record of
previous s/l and t/p levels for a trade.
LIST OF INDICATORS INDICATORS SUITEUSERGUIDE
1
2
3
4
5
77

You can change the summary text which is displayed for each order (when hovering it with the mouse) using the indicator’s settings. You
can use the following variables in the text. Please note that these pop-up messages are limited in length by MT4, and will not be displayed
if they exceed 256 characters.
LIST OF INDICATORS INDICATORS SUITEUSERGUIDE
VARIABLE REPLACED BY
{CRLF} New line
{TICKET} Order ticket number
{BUYSELL} Buy or Sell
{WINLOSS} Win or Loss
{LOTS} Trade lot size
{SYMBOL} Trade symbol
{OPENPRICE} Trade open price
{CLOSEPRICE} Trade close price
{OPENTIME} Trade open time
{CLOSETIME} Trade close time
{PROFIT} Gross profit
{SWAP} Swap
{COMMISSION} Commission
{NETPROFIT} Net profit: gross profit plus swap plus commission
78

1
2
The blue and grey bands at the bottom of the chart indicate when there was an open trade for the chart symbol (blue) and for any other
symbol (grey). You can control the colour (1) and size (2) of the bands using the indicator’s settings. The bands are affected by any filtering
which you use. The blue band in fact illustrates all the trades for the current chart symbol which match the filtering. The grey band
illustrates all trades for all other symbols, plus any trades for the current chart symbol which do not match the filtering.
LIST OF INDICATORS INDICATORS SUITEUSERGUIDE
VARIABLE REPLACED BY
{SL} Current/final stop-loss price
{TP} Current/final take-profit price
{COMMENT} Order comment
{MAGIC} Order magic number
{CURR} Account deposit currency
79

You can use filter to control which historic trades are
drawn on the chart as markers, and which trades are
included in the blue versus grey activity bands. You
can filter on several different conditions:
▪ Buy or sell (1)
▪ Win or Loss (2)
▪ Lot size (3)
▪ Open time (4)
▪ Close time (5)
▪ MT4 magic number (6)
▪ Order comment (7)
▪ Amount of net profit (8)
For example, you can draw only your historic losing
trades by setting maximum net profit to zero.
LIST OF INDICATORS INDICATORS SUITEUSERGUIDE
1
2
3
4
5
6
7
8
80

M. JFD PIVOT
JFD Pivot indicator shows a classic pivot calculation based on historic price action: a central pivot price, with 3 support and resistance
levels either side (R1-R3 and S1-S3). The indicator can be based on any timeframe – for example, you can choose to display H4 pivot
levels on an M30 chart – and you can configure the indicator to generate alerts when the current price crosses a support or resistance
level.
LIST OF INDICATORS INDICATORS SUITEUSERGUIDE
81

You choose the timeframe for the pivot calculating using the first of the parameters (1) on the Inputs tab. You can either make this the
same as the current chart, so that the pivot calculation changes if you alter the timeframe of the chart, or the pivot can be a different
fixed timeframe such as D1.
LIST OF INDICATORS INDICATORS SUITEUSERGUIDE
1
82
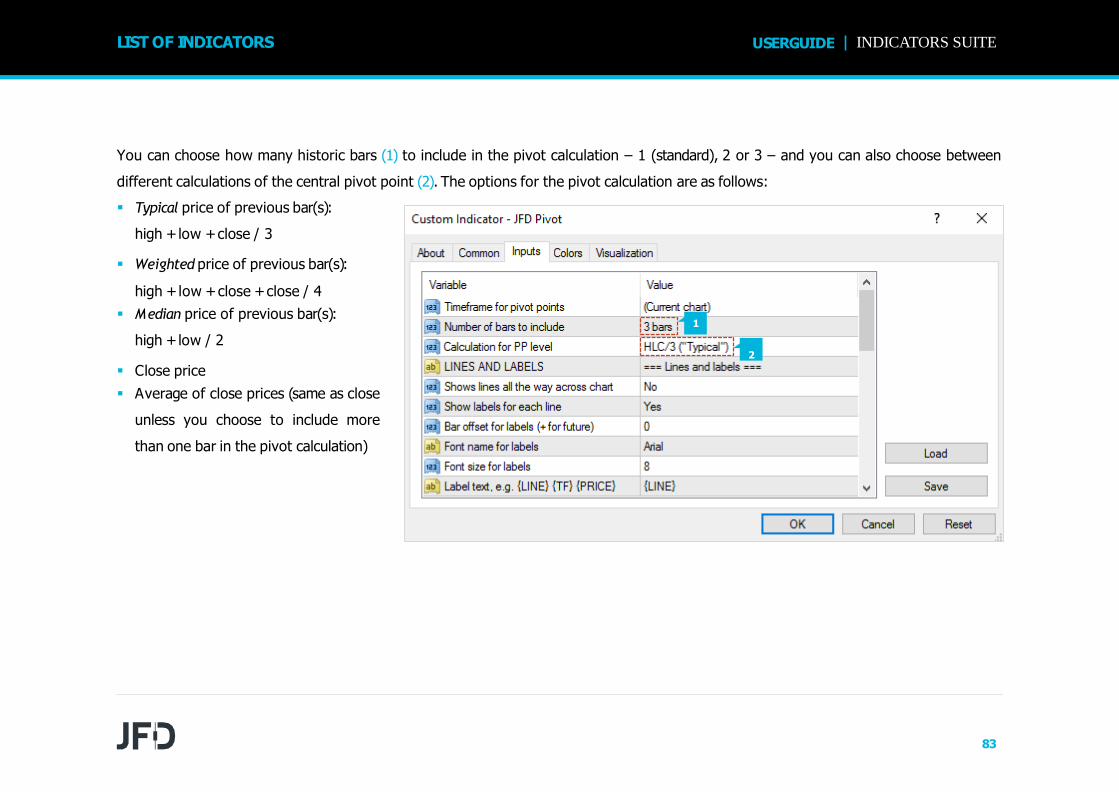
You can choose how many historic bars (1) to include in the pivot calculation – 1 (standard), 2 or 3 – and you can also choose between
different calculations of the central pivot point (2). The options for the pivot calculation are as follows:
LIST OF INDICATORS INDICATORS SUITEUSERGUIDE
1
▪ Typical price of previous bar(s):
high +low +close / 3
▪ Weighted price of previous bar(s):
high +low +close +close / 4
▪ Median price of previous bar(s):
high +low / 2
▪ Close price
▪ Average of close prices (same as close
unless you choose to include more
than one bar in the pivot calculation)
2
83

You can change the display of the pivot lines using the
options on the Inputs tab. You can choose whether the pivot
levels are drawn all the way across the chart (1), i.e. into the
past, and you can whether to display labels for each point (2).
Each line also has a setting which controls its colour and its
style (3), i.e. solid, dashed, etc. Turning off the display of a line,
by setting its colour to “None”, will prevent any alerts being
displayed about that pivot level.
LIST OF INDICATORS INDICATORS SUITEUSERGUIDE
1
2
3
84
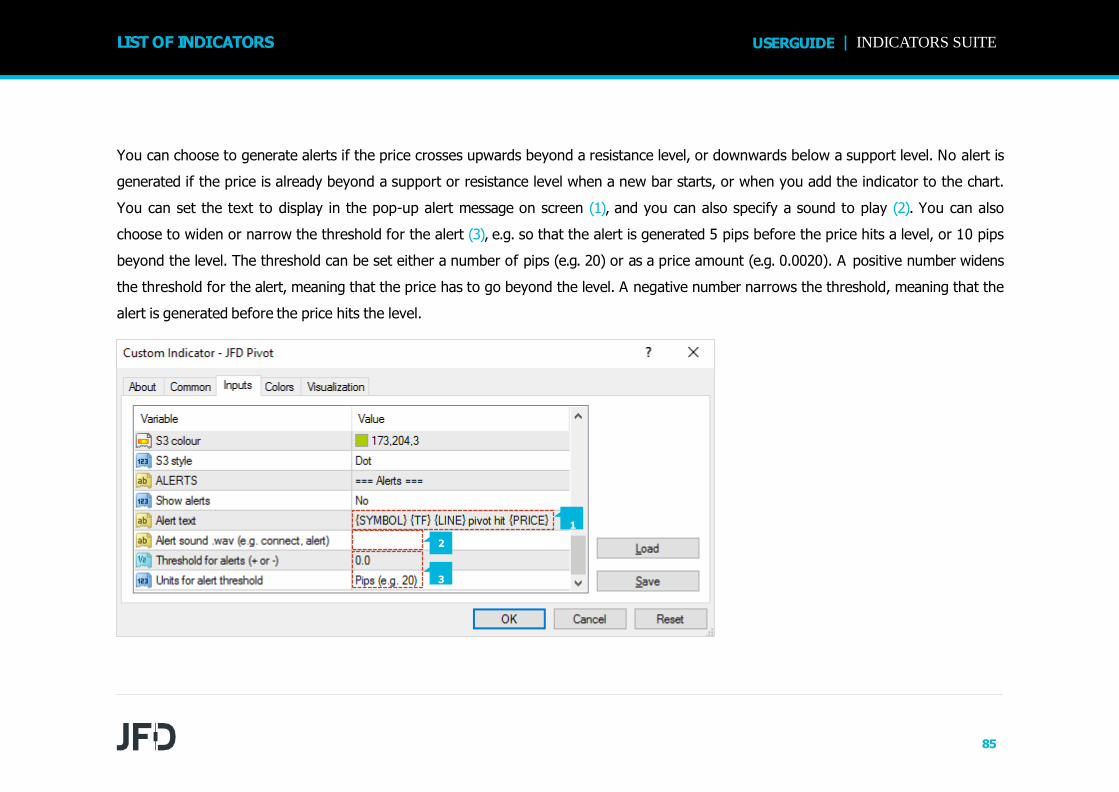
You can choose to generate alerts if the price crosses upwards beyond a resistance level, or downwards below a support level. No alert is
generated if the price is already beyond a support or resistance level when a new bar starts, or when you add the indicator to the chart.
You can set the text to display in the pop-up alert message on screen (1), and you can also specify a sound to play (2). You can also
choose to widen or narrow the threshold for the alert (3), e.g. so that the alert is generated 5 pips before the price hits a level, or 10 pips
beyond the level. The threshold can be set either a number of pips (e.g. 20) or as a price amount (e.g. 0.0020). A positive number widens
the threshold for the alert, meaning that the price has to go beyond the level. A negative number narrows the threshold, meaning that the
alert is generated before the price hits the level.
LIST OF INDICATORS INDICATORS SUITEUSERGUIDE
2
1
3
85

N. JFD RENKO
JFD Renko indicator draws Renko blocks on a normal MT4 time-based chart. The blocks can either be drawn as continuous, or as
separated elements whenever a new Renko block is completed. The blocks have varying widths, or gaps between them, because Renko
bars are not time-based and have varying durations. The indicator can also be used to create an offline MT4 chart containing only the
Renko blocks – a more traditional Renko chart which is not time-based like a normal MT4 chart.
LIST OF INDICATORS INDICATORS SUITEUSERGUIDE
86

The indicator calculates the Renko blocks from M1 data, regardless of the timeframe of the chart on which you use the indicator.
Therefore, you need as much M1 data in your MT4 platform as possible, and you may need to use Tools / History Center in MT4 to
download extra M1 data. If you only have 5 days of historic M1 data, then Renko bars will only be drawn for the last 5 days even if you
are looking at e.g. an H1 chart which goes back much further. During each time-based candle on the MT4 chart, e.g. an H1 candle, there
can be anything between zero and many new Renko blocks. For example, if the chart timeframe is very long (H4), the Renko block size
can be very small (a few pips pips). As a result, there are lots of Renko bars during each chart candle, creating many red and blue Renko
blocks which are overlaid. A chart such as this is unreadable because the H4 timeframe simply is not suitable for looking at a Renko block
size as small as a few pips. You should use a lower chart timeframe for such a Renko size.
LIST OF INDICATORS INDICATORS SUITEUSERGUIDE
87

You set the Renko block size (1) as a number of pips, e.g. 20,
rather than a price amount such as 0.0020. The indicator will
automatically calculate a pip size based on the number of
digits in the instrument’s price. For example, if prices are
quoted to 1DP, e.g. 2048.7, then the indicator will use a pip
size of 0.1, and a setting of e.g. 20 pips would mean a price
change of 2.0. On some non-forex symbols such as equity
indices, you may want to change the pip size. For example,
prices may be quoted to 2DP such as 13456.00, but you
may want to use a pip size of 1.00 instead of the default
0.01. The indicator has an additional setting (2) which lets
you specify your own pip size.
You can set the colours for the up and down Renko blocks
on the chart (3). These colours are also used for the optional
lines which show where a new Renko block will start.
LIST OF INDICATORS INDICATORS SUITEUSERGUIDE
1
2
3
88

By default the indicator displays lines which show the prices
at which a new Renko up or down block will start. You can
change the style of these lines (4), e.g. from dashed to solid,
or you can turn the lines off completely. You can choose to
draw the Renko blocks as semi-transparent rectangles on
top of the price bars (5), instead of in the background.
You can turn on pop-up alerts (6) in MT4 which tell you
whenever a new Renko block has been formed.
By default the start and end prices for each block will be set
so that they are a multiple of the block size. For example, if
the block size is 10 pips (0.0010) then the prices at which
blocks start and end will always be a multiple of this, e.g.
1.2340, 1.2350, 1.3890, 2.2670 etc. You can turn off this
rounding (7), and instead base the start and end of the Renko
blocks on the first price in the M1 history. For example, if
the opening price of the M1 data is 1.23743 and the block is
0.0010 (10 pips) then the start and end prices of all the
Renko blocks will be x.xxx43, e.g. 1.23843, 1.23943,
2.41543 etc.
LIST OF INDICATORS INDICATORS SUITEUSERGUIDE
4
5
6
7
89

You can limit the maximum number of blocks which the
indicator will draw on the chart (8). This can help to save
memory on low-powered computers. Please note that this
setting does not affect how much data is created in an
offline chart.
As explained above, the indicator builds the historic Renko
data from M1 prices in the MT4 platform. This is, in fact,
configurable: you can choose to use a different base period
such as M5 (9).
The advantage of a higher time period such as M5 or M30 is
that the historic data may go back further in time than M1,
and it may be possible for the indicator to draw more historic
Renko blocks.
LIST OF INDICATORS INDICATORS SUITEUSERGUIDE
8
9
90

The disadvantage is that the Renko blocks will be less
accurate during periods of high volatility. For example:
▪ Renko block size is 10 pips (0.0010)
▪ A single historic bar covers several Renko blocks, e.g. low
price was 1.2056 and high was 1.2128.
▪ The range inside this bar was 0.0072, and therefore there
were 7 Renko blocks which were formed during this
single price candle in the MT4 history data. In fact, there
could have been many more than 7 if the price bounced
up and down during the bar.
▪ However, the indicator can only see the historic high and
low, and it is impossible for the indicator to know in what
order the blocks were formed.
▪ Therefore, under circumstances such as this, the indicator
has to guess and simplify the Renko block history. It is
possible for this to happen even on M1 data, but using
higher timeframes makes the problem more frequent.
LIST OF INDICATORS INDICATORS SUITEUSERGUIDE
8
9
91

In addition to drawing the Renko blocks on a normal MT4 time-based chart, the indicator can also be used to generate an offline MT4
chart showing only the Renko blocks. This creates a more traditional Renko chart which is not time-based like a standard MT4 chart.
Offline, in MT4 terminology, means that the price data for the chart is not being provided directly from JFD’ server. The offline chart will
nevertheless continue to update for as long as the indicator is running, and you should be able to use most EAs and indicators on such an
offline chart.
LIST OF INDICATORS INDICATORS SUITEUSERGUIDE
92

You tell the indicator to create an offline chart by entering any non-zero number of your choice (1), e.g. 1234 or 7777. The only
restriction is that you cannot use a number which corresponds to the minutes in a normal MT4 chart (1, 5, 15, 15, 30, 60, 240, 1440,
10080, 43200). The offline chart continues to update with new prices and blocks for as long as the Renko indicator is running on the main
price chart. If you close the normal MT4 chart which has the Renko indicator on it, then the offline chart will stop updating.
LIST OF INDICATORS INDICATORS SUITEUSERGUIDE
1
93

You can then view the offline chart by using File / Open Offline in MT4, and selecting the special chart (1) which the indicator has
created, e.g. EURUSD,M1234.
LIST OF INDICATORS INDICATORS SUITEUSERGUIDE
1
94

By default the indicator will continuously update the offline chart, drawing the current price and an “in-progress” bar since the last Renko
block, and updating the offline chart with all new completed Renko blocks. Please note that these updates require the Allow DLL imports
setting (1) to be turned on.
LIST OF INDICATORS INDICATORS SUITEUSERGUIDE
1
95

You can also turn off these continuous updates (1). If so, the
offline chart will only be updated when each new Renko
block completes, and you will need to do a manual refresh of
the chart to see the changes.
LIST OF INDICATORS INDICATORS SUITEUSERGUIDE
1
96

MT4 charts cannot display more than one candle per minute. If the market was very volatile and/or your block size is very small, then
there can be multiple Renko blocks per minute and the offline chart will only be able to show one of them. For example, there could be a
gap – a missing block (1) – if there were two Renko blocks within the same minute, because MT4 can only display one of them. You can
use the TSV/CSV log to check the actual history if MT4 is unable to represent it in full.
LIST OF INDICATORS INDICATORS SUITEUSERGUIDE
1
97
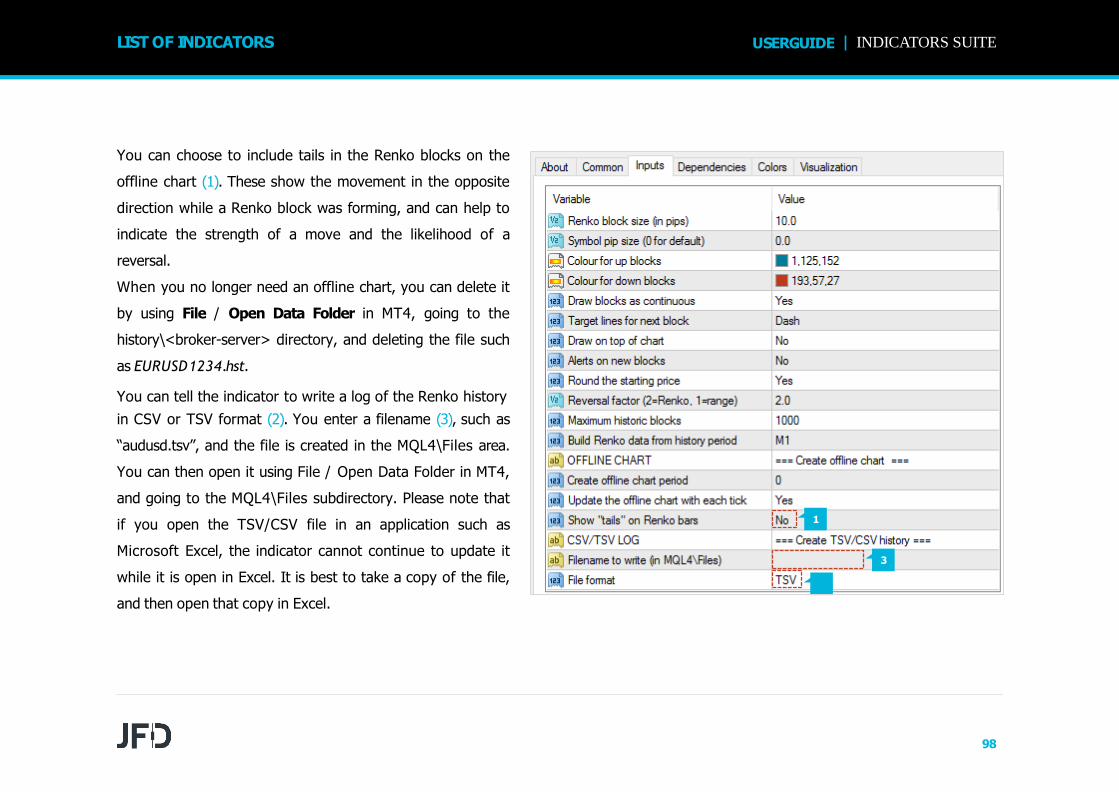
You can choose to include tails in the Renko blocks on the
offline chart (1). These show the movement in the opposite
direction while a Renko block was forming, and can help to
indicate the strength of a move and the likelihood of a
reversal.
When you no longer need an offline chart, you can delete it
by using File / Open Data Folder in MT4, going to the
history\<broker-server> directory, and deleting the file such
as EURUSD1234.hst.
You can tell the indicator to write a log of the Renko history
in CSV or TSV format (2). You enter a filename (3), such as
“audusd.tsv”, and the file is created in the MQL4\Files area.
You can then open it using File / Open Data Folder in MT4,
and going to the MQL4\Files subdirectory. Please note that
if you open the TSV/CSV file in an application such as
Microsoft Excel, the indicator cannot continue to update it
while it is open in Excel. It is best to take a copy of the file,
and then open that copy in Excel.
LIST OF INDICATORS INDICATORS SUITEUSERGUIDE
1
3
2
98

You can set a start time for the Renko blocks by drawing a vertical line on the chart, and using the object properties to set the name of the
line to RenkoStart (1). The indicator will not draw any Renko blocks before this line. The start time also affects the history which is written
to any offline chart or TSV/CSV log file.
LIST OF INDICATORS INDICATORS SUITEUSERGUIDE
1
99

Warning:
Using various third-party tools, it is possible to feed custom price data into the MT4 strategy tester. For example, you can take an offline
chart (the .hst file) created by the Renko indicator and use that in MT4 backtesting. Using Renko data as the input for backtesting is quite
popular in the MT4 community. However, you should not do this. You will get unrealistic, very favourable results.
It is possible to write an EA which places 100% winning trades when backtested on Renko data rather than normal price data because the
presence or absence of a gap between the current bar-open price and the last bar-close price tells you which direction the price is about
to move in. More generally, EA results will tend to be unrealistic even if the EA is not deliberately trying to exploit the price clues in the
Renko data. For example, measures of volatility will increase when a Renko reversal is happening because of the gap between last-close
and current-open, and an EA which uses volatility as one of its strategies will in effect be looking at a characteristic of the Renko data
rather than real price information which it would have had historically in real life.
LIST OF INDICATORS INDICATORS SUITEUSERGUIDE
100

O. JFD SYMBOL INFO
JFD Symbol Info indicator creates a status overview for a symbol in a draggable sub-window inside a main MT4 chart. It shows the price
change, the distance from the recent high and low, plus an optional set of indicators giving a matrix of up and down signals on different
timeframes. You can add any number of copies of the indicator to a chart, to display different symbols or timeframes, with any
combination of different settings.
LIST OF INDICATORS INDICATORS SUITEUSERGUIDE
101

You set the symbol to display using the Symbol parameter (1) in the Inputs tab. The symbol must be present in the MT4 market watch. To
display more than one symbol, you simply add multiple copies of the indicator to the chart. You can also leave the symbol set to (current).
This will then display the same symbol as the main MT4 chart, and will change if the main chart changes.
LIST OF INDICATORS INDICATORS SUITEUSERGUIDE
1
102

The indicator’s main display is the change in the symbol’s price in % terms (and also in pips). You can choose which timeframe to use for
this calculation via the parameter (1) on the Inputs tab, and you can also choose the number of bars (2). For example, D1 and 3 would
mean show the change since the open price 2 days ago (today, plus the 2 D1 bars before that). The indicator shows the change in price in
terms of pips as well as %. By default it will use an automatic definition of the pip size, based on the number of digits in the price (e.g. 4 or
5 digits =pip size of 0.0001). For some CFDs, you may want to override this calculation of the pip size using the respective setting (3).
LIST OF INDICATORS INDICATORS SUITEUSERGUIDE
3
1
2
103

The indicator also shows the current price in relation to the high-low range. You can choose the timeframe and number of bars to use for
the calculation of the high and low (1). These can be the same or different to the settings used for the % change. You can use the Inputs
tab to change the colours which are used for rises and falls (2).
LIST OF INDICATORS INDICATORS SUITEUSERGUIDE
1
2
104

You can use the Inputs tab to set the indicator’s initial position on the chart (1). You can define a position in terms of pixels (replacing the
default values of -1) from a specific corner of the chart. Once it has been created, you can drag the sub-window around the chart in the
usual way, by pressing and holding the mouse over the sub-window’s title bar. By default the indicator will then choose a corner of the
chart to “dock” itself to. For example, if you drag the sub-window close to the bottom-right corner, the indicator will then dock itself to
that corner of the chart. If you resize the chart window, the indicator will automatically re-position itself so that it maintains the distance
from the edge(s) of the chart. You can manually override the docking using the setting on the Inputs tab.
LIST OF INDICATORS INDICATORS SUITEUSERGUIDE
1
105

You can configure the Symbol Info indicator to display a
matrix of indicator up & down signals on different timeframes
or you can turn these off, and only have the indicator display
the price change and high-low range. You can set up to 10
rows of indicator information (1). Some of the indicators, e.g.
EMA or MACD, need parameters which you enter as a
comma-separated list such as 12,26.
The Price change shows an up or down signal depending on
whether the price is rising or falling on each timeframe. The
parameter for the indicator is the number of bars to use for
the change calculation. This defaults to 1 (i.e. current bar) if
left blank. Changing/setting the parameter to 2, for example,
would mean price change since the start of the previous bar.
The SMA (simple moving average) indicator shows an up or
down signal depending on whether the current price is above
or below a simple moving average. The parameter for the
indicator is the number of bars for the average (defaulting to
14 if left blank).
LIST OF INDICATORS INDICATORS SUITEUSERGUIDE
1
106
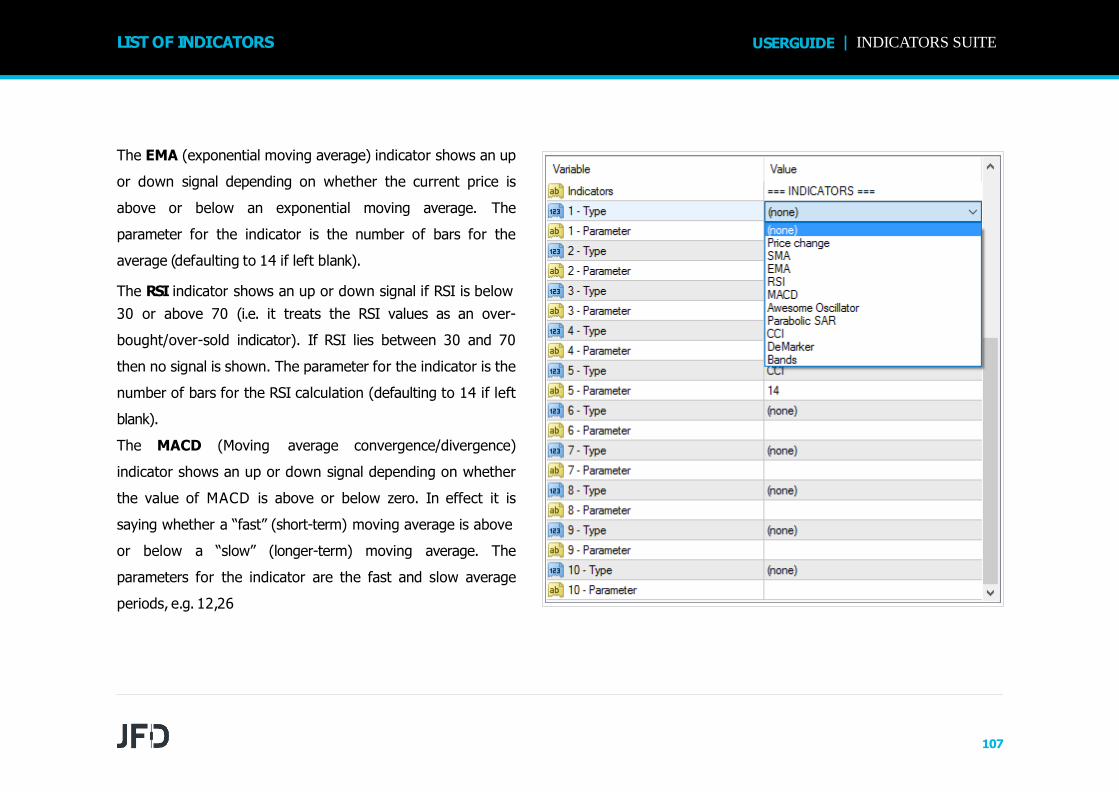
The EMA (exponential moving average) indicator shows an up
or down signal depending on whether the current price is
above or below an exponential moving average. The
parameter for the indicator is the number of bars for the
average (defaulting to 14 if left blank).
The RSI indicator shows an up or down signal if RSI is below
30 or above 70 (i.e. it treats the RSI values as an over-
bought/over-sold indicator). If RSI lies between 30 and 70
then no signal is shown. The parameter for the indicator is the
number of bars for the RSI calculation (defaulting to 14 if left
blank).
The MACD (Moving average convergence/divergence)
indicator shows an up or down signal depending on whether
the value of MACD is above or below zero. In effect it is
saying whether a “fast” (short-term) moving average is above
or below a “slow” (longer-term) moving average. The
parameters for the indicator are the fast and slow average
periods, e.g. 12,26
LIST OF INDICATORS INDICATORS SUITEUSERGUIDE
107

The Awesome Oscillator (AO) indicator shows an up or down
signal depending on whether the AO value is above or below
zero. This indicator does not have any parameters. The AO is
simply a comparison of the 5-bar and 34-bar simple moving
averages.
The Parabolic SAR indicator shows an up or down signal
depending on whether the current price is above or below the
PSAR price. The parameters for the indicator are the step and
maximum values for the PSAR calculation, e.g. 0.02,0.2.
The CCI (Commodity Channel Index) indicator shows an up or
down signal depending on whether the value of CCI is above
or below zero. The parameter for the indicator is the number
of bars for the CCI calculation (defaulting to 14 if left blank).
LIST OF INDICATORS INDICATORS SUITEUSERGUIDE
108

The DeMarker indicator shows an up or down signal if the
value of the indicator is below 0.3 or above 0.7 (i.e. it treats
the DeMarker, like RSI, as an over-bought/over-sold
indicator). The parameter for the indicator is the number of
bars for the DeMarker calculation (defaulting to 14 if left
blank).
The Bollinger® band indicator shows an up or down signal if
the current price lies below or above the lower or upper
bands (i.e. it treats the Bollinger® bands as an over-
bought/over-sold reversion-to-mean indicator). If the current
price lies between the bands then no signal is displayed. The
parameters for the indicator are the period to use for the
moving average, and the number of deviations for the bands
(defaulting to 20,2 if left blank).
LIST OF INDICATORS INDICATORS SUITEUSERGUIDE
109

JFD is a leading Group of Companies offering financial and investment services and activities. “JFD Brokers”is a brand name and registered trademark owned and used by the JFD Group of Companies, which includes:JFD Group Ltd, a company with registration number HE 282265, authorized and regulated by the CyprusSecurities and Exchange Commission - CySEC (Licence number: 150/11) and JFD Overseas Ltd which isauthorized and regulated by the Vanuatu Financial Services Commission (License number 17933).
Kakos Premier Tower
Kyrillou Loukareos 70
4156 Limassol, Cyprus
Fax: +357 25763540
Tel:+357 25878530
Helpdesk Phone: +49 691 7537 4271
Helpdesk E-mail: [email protected]
Live chat: Chat now!
Web:www.jfdbrokers.com
SUPPORTCONTACT US