health status indicators 3.
74
HEALTH S TATUS I NDICATORS 3. 3.1 Morbidity and Mortality 3.1.1 Communicable Diseases - State/UT wise Cases and Deaths Due to 3.1.1.1 Malaria 2004-2008(Provisional) 3.1.1.2 Chikungunya Fever 2007-2008(Provisional) 3.1.1.3 Kala-Azar 2004-2008(Provisional) 3.1.1.4 Japanese Encephalitis 2004-2008(Provisional) 3.1.1.5 Dengue 2004-20088(Provisional) 3.1.1.6 Cholera 2008(Provisional) 3.1.1.7 Acute Diarrhoeal Disease 2007 - 2008(Provisional) 3.1.1.8 Enteric Fever (Typhoid) 2007 - 2008(Provisional) 3.1.1.9 Acute Respiratory Infection 2007 - 2008(Provisional) 3.1.1.10 Tetanus Neonatal 2007 - 2008(Provisional) 3.1.1.11 Tetanus other than Neonatal 2007 - 2008(Provisional) 3.1.1.12 Diphtheria 2007 - 2008(Provisional) 3.1.1.13 Whooping Cough 2007 - 2008(Provisional) 3.1.1.14 Measles 2007 - 2008(Provisional) 3.1.1.15 Viral Hepatitis (All Causes) 2007 - 2008(Provisional) 3.1.1.16 Rabies 2007 - 2008(Provisional) 3.1.1.17 Polio 2007-2008, AFP Cases and Key Surveillance Indicators, 2008 3.1.1.18 Pnenumonia 2007 - 2008(Provisional) 3.1.1.19 Meningococcal Meningitis 2007 - 2008 (Provisional) 3.1.1.20 Syphilis 2007 - 2008(Provisional) 3.1.1.21 Gonococcal Infection 2007 - 2008(Provisional) 3.1.1.22 State/UT wise Performance of RNTCP-TB Case Detection, Deaths and Treatment Outcome During 2007 and TB Case Detection 2008* 3.1.1.23 State/UT wise Observed HIV Prevalence Levels 2002-2007 (Provisional) 3.1.1.24 State/UT wise Patients on Ever Started ART in India till October 2008 3.1.1.25 State/UT wise Leprosy Case Detection, Treatment and Discharge 2007-08 3.1.2 Non Communicable Diseases 3.1.2.1 Number of Estimated Cases of Coronary Heart Disease 2000 and 2005 (Latest) 3.1.2.2 Number of Estimated Cases of Diabetes 2000 and 2005 (Latest) 3.1.2.3 Burden of Stroke 1998 and 2004 (Latest) Contd...
-
Upload
khangminh22 -
Category
Documents
-
view
0 -
download
0
Transcript of health status indicators 3.

HealtH StatuS IndIcatorS3.3.1 Morbidity and Mortality
3.1.1 Communicable Diseases - State/UT wise Cases and Deaths Due to
3.1.1.1 Malaria 2004-2008(Provisional)
3.1.1.2 Chikungunya Fever 2007-2008(Provisional)
3.1.1.3 Kala-Azar 2004-2008(Provisional)
3.1.1.4 Japanese Encephalitis 2004-2008(Provisional)
3.1.1.5 Dengue 2004-20088(Provisional)
3.1.1.6 Cholera 2008(Provisional)
3.1.1.7 Acute Diarrhoeal Disease 2007 - 2008(Provisional)
3.1.1.8 Enteric Fever (Typhoid) 2007 - 2008(Provisional)
3.1.1.9 Acute Respiratory Infection 2007 - 2008(Provisional)
3.1.1.10 Tetanus Neonatal 2007 - 2008(Provisional)
3.1.1.11 Tetanus other than Neonatal 2007 - 2008(Provisional)
3.1.1.12 Diphtheria 2007 - 2008(Provisional)
3.1.1.13 Whooping Cough 2007 - 2008(Provisional)
3.1.1.14 Measles 2007 - 2008(Provisional)
3.1.1.15 Viral Hepatitis (All Causes) 2007 - 2008(Provisional)
3.1.1.16 Rabies 2007 - 2008(Provisional)
3.1.1.17 Polio 2007-2008, AFP Cases and Key Surveillance Indicators, 2008
3.1.1.18 Pnenumonia 2007 - 2008(Provisional)
3.1.1.19 Meningococcal Meningitis 2007 - 2008 (Provisional)
3.1.1.20 Syphilis 2007 - 2008(Provisional)
3.1.1.21 Gonococcal Infection 2007 - 2008(Provisional)
3.1.1.22 State/UT wise Performance of RNTCP-TB Case Detection, Deaths and Treatment Outcome During 2007 and TB Case Detection 2008*
3.1.1.23 State/UT wise Observed HIV Prevalence Levels 2002-2007 (Provisional)
3.1.1.24 State/UT wise Patients on Ever Started ART in India till October 2008
3.1.1.25 State/UT wise Leprosy Case Detection, Treatment and Discharge 2007-08
3.1.2 Non Communicable Diseases
3.1.2.1 Number of Estimated Cases of Coronary Heart Disease 2000 and 2005 (Latest)
3.1.2.2 Number of Estimated Cases of Diabetes 2000 and 2005 (Latest)
3.1.2.3 Burden of Stroke 1998 and 2004 (Latest)
Contd...

3.1.2.4 Meta Analysis of Epidemiological Studies on Hypertension (Latest)
3.1.2.5 State/UT wise Prevalence of Tobacco Smoking and Chewing in India by Sex (age 15years and above) (Latest)
3.1.2.6 State/UT wise Estimated Prevalence of Blindness 2004(Latest)
3.1.2.7 State/UT wise Estimated Incidences of Blindness 2004(Latest)
3.1.2.8 Estimated Incidence of Common Cancers with Truncated rate and Cumulative risk at (0-74 years), 2007(Latest)
3.1.2.9 State/UT wise Cases and Deaths Due to Snake Bite 2007 - 2008(Provisional)
3.1.3 Incidence of Deaths due to Accidents 2001-2007(Latest)
3.1.4 Major Outbreaks Investigated by NICD during the Year 2008
3.2 Reproductive and Child Health - State/UT wise
3.2.1 Ante Natal Care
3.2.2 Percentage of Deliveries Attended by Trained Personnel
3.2.3 Percentage of couples using Contraceptives
3.2.4 Percentage of Children Immunized
3.2.5 Percentage of Children Breastfed and their Nutritional Status
3.2.6 Nutritional Status of Women and Men
3.2.7 Percentage of Anaemia among Children and Adults
3.2.8 Incidence of Foeticide and Infanticide 2001-2007
3.2.9 Targets and Achievement of Maternity and Child Health Activities 1991-92 and 2007-08
3.3 Disability
3.3.1 State/UT wise Proportion of Disabled Population by Type of Disability 2001(Census)
3.4 Mental Health
3.4.1 Mental Health Care Load in India July 2002 (Latest)

National Health Profile 2008 51
3. Health Status Indicators
Health status includes a set of indicators used to provide important health and health-related data regarding incidence and prevalence of disease, health risks and performance of health systems. Health status provides a broad overview of morbidity and Mortality patterns in communicable and non-communicable diseases. Besides, it provides an overview of reproductive and child health as well as disability prevailing in the country.
Morbidity among communicable diseases include incidence, prevalence, deaths and performance of disease control programme for malaria, tuberculosis, AIDS, leprosy, dengue, cholera, kala azar, Japanese Encephalitis, measles, whooping cough, viral hepatitis, diphtheria, ARI, tetanus and neonatal tetanus.
Since the reported Data is by and large from Government Health Facilities, it may have limitations in terms of its completeness as Private Medical & Health Care Institution still need to strengthen their reporting to their respective Government Health units.
3.1 Among the various communicable diseases reported by the States/UTs during the year 2008 (Provisional), while taking a cut off one lakh cases; the following communicable diseases accounted for the maximum number of cases reported.

National Health Profile 200852
3.1.1 The Morbidity trend (2000-2007) based on the information received in the past [& revised in succeeding year (s)] from States/UTs, in respect of these eight communicable diseases reporting around one lakh or more cases and corresponding cases per Lakh of Projected Population for the year are shown here under. Since figures for 2008 are still provisional / incomplete, have not been included in the Following trend analysis:

National Health Profile 2008 53

National Health Profile 200854
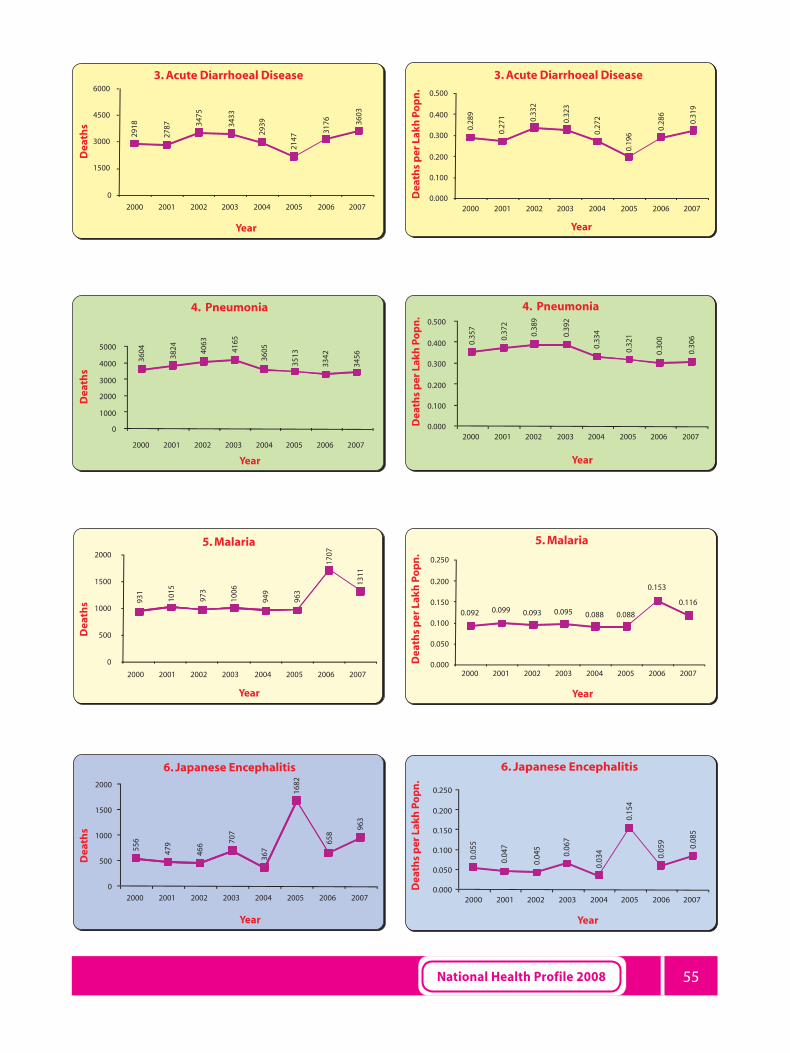
3.2 Among the various communicable diseases reported by the States/UTs during the year 2008, while taking a cut off one hundred deaths; the following communicable diseases accounted for the maximum number of deaths reported.
3.2.1 The Mortality trend (2000-2007) based on the information received in the past [& revised in succeeding years (s)] from States/UTs, in respect of these thirteen communicable diseases reporting 100 or more total deaths are and corresponding Deaths per Lakh of Projected Population for the year are shown here under. Since figures for 2008 are still provisional / incomplete, have not been included in the Following trend analysis:
National Health Profile 2008 55

National Health Profile 200856

National Health Profile 2008 57
3.3 Disease with High Case Fatality Rate (About 1% and above) during 2008, as reported by the States/UTs.
S. No. Name of the Diseases Cases Deaths Case Fatality Rate(%)
1 RABIES 262 262 100.00
2 JAPANESE ENCEPHALITIS 3868 642 17.96
3 MENINGOCCAL MENINGITIS 5924 534 9.01
4 TETANUS - OTHERS 2903 253 8.72
5 TETANUS - NEONATAL 811 56 6.91
6 POLIO 559 30 5.37
7 PULMONARY TUBERCULOSIS 1517602 64824* 4.27
8 DIPHTHERIA 6081 65 1.07
* Data Belongs to 2007

National Health Profile 200858
3.4 Cholera data are being compiled on the basis on weekly reports from States/UTs. The annual Cases and deaths due to Cholera in 1991 were 7088 and 150, respectively which now have reduced to 2671 and 1, respectively during the year 2008.
(P): ProvisionalSource: Weekly Report from Directorate of Health Services of States/UTs.

National Health Profile 2008 59
3.5 In 2008, all Districts of the Country were covered under the Revised National Tuberculosis Programme
(RNTCP) in India:
3.6 According to National AIDS Control Organization, 263423 patient have ever started ART in the country
till 31st October 2008.
3.7 Morbidity indicators for non-communicable diseases include incidence, prevalence, deaths and
performance of disease control programme for Blindness, Cancers, Coronary Heart Disease and
Diabetes. This accounts for the second largest share of the disease burden in India after Communicable
diseases.
The number of cases of coronary heart disease was estimated to be nearly 3.6 crore for the year 2005, which is expected to reach a figure of nearly 6.1 crore cases in the year 2015. This pattern is nearly same across age groups. More than half of this rise can be accredited to demographic change but the contribution of increased prevalence of risk factors is also substantial.
l According to estimates for 2007 based on cancer registries across the country, cervix and breast
cancers accounted for more than 36% of cancer incidence in the country.
l Estimated prevalence of blindness in 2004 was 11.2 (10.2 among male and 12.2 among female)
per thousand population and is expected to remain more or less the same during the next two
decades
l There were 340794 accidental deaths reported in the country in the year 2007.
3.8 Reproductive and Child Health, the key finding of the latest National Health Family Survey (NHFS-3), 2005-06, is already attached in this NHP.
l According to National Family Health Survey - 3 (2005-06) only 52% of Indian mothers received three or more ante natal checkups, 38.7% of deliveries were conducted in medical institution while another 46.6% deliveries were assisted by medical professional.
l 43.5% of children in India received all vaccinations as per National Family Health Survey - 3 (2005-06).

National Health Profile 200860
3.1 Morbidity and Mortality
3.1.1 Communicable diseases
3.1.1.1 State/UT wise Cases and Deaths due to Malaria 2004-2008 (Provisional)
S. No.
State/UT 2004 2005 2006 2007 2008*
Cases Deaths Cases Deaths Cases Deaths Cases Deaths Cases Deaths
1 2 3 4 5 6 7 8 9 10 11
1 Andhra Pradesh 35427 2 39099 0 34081 0 27803 2 26165 0
2 Arunachal Pradesh 29849 0 31215 0 39182 196 32072 36 2658 7
3 Assam 58134 54 67885 113 126178 304 94853 152 87566 84
4 Bihar 1872 0 2733 1 2744 1 1595 1 1707 1
5 Chhattisgarh 194256 4 187950 3 190590 3 147525 0 63384 0
6 Goa 7839 7 3747 1 5010 7 9755 11 9822 21
7 Gujarat 222759 89 179023 54 89835 45 71121 73 50884 36
8 Haryana 10064 0 33262 0 47142 0 30895 0 35403 0
9 Himachal Pradesh 126 0 129 0 114 0 104 0 144 0
10 Jammu & Kashmir 250 0 268 0 164 0 240 1 200 1
11 Jharkhand 143722 40 193144 21 193888 4 184878 31 184007 17
12 Karnataka 80961 27 83181 26 62842 32 49355 18 44370 7
13 Kerala 2790 12 2554 6 2131 6 1927 6 1804 3
14 Madhya Pradesh 132094 36 104317 44 96160 56 90829 41 105265 0
15 Maharashtra 68988 61 47608 104 54420 133 67850 182 67321 164
16 Manipur 2736 8 2071 3 2709 8 1194 4 708 2
17 Meghalaya 18080 29 16816 41 29924 167 36337 237 27713 56
18 Mizoram 7830 72 10741 74 10668 120 6081 75 7306 91
19 Nagaland 2486 1 2987 0 3361 75 4976 26 5674 0
20 Orissa 416732 283 396573 255 380216 257 371879 221 323872 187
21 Punjab 1643 0 1883 0 1888 0 2017 0 2494 0
22 Rajasthan 105022 20 52286 22 99529 58 55043 46 57482 54
23 Sikkim 160 3 69 0 93 0 48 0 38 0
24 Tamil Nadu 41732 0 39678 0 28219 0 22389 1 27373 0
25 Tripura 17453 16 18008 20 23375 31 18474 51 25451 46
26 Uttarakhand 1255 0 1242 0 1108 0 953 0 1059 0
27 Uttar Pradesh 87022 0 105303 0 91566 0 82538 0 93383 0
28 West Bengal 220871 184 185964 175 159646 203 87754 96 104757 101
29 A. & N. Islands 745 1 3954 0 2993 1 3973 0 4688 0
30 Chandigarh 199 0 432 0 449 0 340 0 347 0
31 D & N Haveli 787 0 1166 0 3786 0 3780 0 3037 0
32 Daman & Diu 118 0 104 0 140 0 99 0 110 0
33 Delhi 1316 0 1133 0 928 0 182 0 253 0
34 Lakshadweep 2 0 0 0 0 0 0 0 0 0
35 Puducherry 43 0 44 0 50 0 68 0 72 0
India 1915363 949 1816569 963 1785129 1707 1508927 1311 1366517 878
Notes:
* Provisional
Source: Directorate of National Vector Borne Disease Control Programme

National Health Profile 2008 61
3.1.1.2 State/UT wise Status of Chikungunya Fever in India, 2007-2008 (Provisional)
S. No.
State/UT No. of districts affected
2007* 2008*
Total fever cases/
suspected cases
No. of samples sent to NIV/NICD
No. of confirmed
cases
No. of deaths
Total fever cases/
suspected cases
No. of samples
sent to NIV/NICD
No. of confirmed
cases
No. of deaths
1 2 3 4 5 6 7 8 9 10
1 Andhra Pradesh 23 39 39 11 0 5 2 1 0
2 Goa 2 93 93 18 0 52 14 21 0
3 Gujarat 25 3223 238 122 0 246 122 31 0
4 Haryana 20 20 13 0 31 0 9 0
5 Karnataka 27 1705 641 133 0 46486 2933 984 0
6 Kerala 14 24052 4732 909 0 24685 1356 492 0
7 Madhya Pradesh 21 0 0 0 0 0 0 0 0
8 Maharashtra 34 1762 297 135 0 730 303 222 0
9 Orissa 13 4065 423 90 0 4676 238 11 0
10 Rajasthan 1 2 2 2 0 3 3 3 0
11 Tamil Nadu 35 45 13 10 0 46 0 0 0
12 Utter Pradesh 4 4 4 0 11 11 7 0
13 West Bengal 1 19138 1135 347 0 17898 2789 593 0
14 A&N Islands 2 0 0 0 0 0 0 0 0
15 Delhi 12 203 203 22 0 14 14 14 0
16 Lakshadweep 1 5184 10 10 0 0 0 0 0
17 Puducherry 1 0 0 0 0 0 0 0 0
Total 212 59535 7850 1826 0 94883 7785 2388 0
Notes:
* Provisional
Source: Directorate of National Vector Borne Disease Control Programme

National Health Profile 200862
3.1.1.3 State/UT wise Cases and Deaths Due to Kala-Azar 2004-2008 (Provisional)
S. No.
State/ UT 2004 2005 2006 2007* 2008*
Cases Deaths Cases Deaths Cases Deaths Cases Deaths Cases Deaths
1 2 3 4 5 6 7 8 9 10 11
1 Assam 0 0 1 0 0 0 0 0 96 0
2 Bihar 17324 107 23383 124 29711 162 37819 172 26972 132
3 Gujarat^ 0 0 0 0 2 0 4 1 0 0
4 Jharkhand** 4028 14 6578 12 7508 11 4803 20 3368 5
5 Sikkim 0 0 0 0 0 0 0 0 4 1
6 Madhya pradesh 0 0 0 0 0 0 0 0 1 0
7 Uttar Pradesh 34 2 73 2 83 0 69 1 25 0
8 West Bengal 3015 23 2706 15 1843 10 1817 9 1099 3
9 Uttrakhand 0 0 0 0 0 0 2 0 0 0
10 Delhi ^ 78 9 62 4 31 4 19 0 26 0
India 24479 155 32803 157 39178 187 44533 203 31591 141
Notes:
* Provisional
** In April 2006 one migrated case in Deoghar District so, total no of cases is 7509
^ All cases are imported.
Source: Directorate of National Vector Borne Disease Control Programme

National Health Profile 2008 63
3.1.1.4 State/UT wise Cases and Deaths Due to Japanese Encephalitis 2004-2008(Provisional)
S. No.
State/UT 2004 2005 2006 2007 2008$
Cases Death Cases Death Cases Death Cases Death Cases Death
1 2 3 4 5 6 7 8 9 10 11
1 Andhra Pradesh 7 3 34 0 11 0 22 0 6 0
2 Assam 235 64 145 52 392 119 424 133 266 78
3 Bihar 85 28 192 64 21 3 336 164 178* 41*
4 Goa 0 0 4 0 0 0 27 0 36 3
5 Haryana 37 27 46 39 2 1 32 18 13 3
6 Karnataka 181 6 122 10 73 3 32 1 3 0
7 Kerala 9 1 1 0 3 3 2 0 2 0
8 Maharashtra 22 0 0 0 14 0 0 0 23 0
9 Manipur 0 0 1 0 0 0 65 0 4 0
10 Tamilnadu 88 9 51 11 18 1 37 0 73 0
11 Utrrakhand 0 0 0 0 0 0 0 0 12 0
12 Uttar Pradesh 1030 228 6061^ 1500^ 2320# 528# 3024@ 645@ 3012** 537**
13 West Bengal 3 1 12 6 0 0 16 2 58 0
14 Nagaland 0 0 0 0 0 0 7 0 0 0
Total 1697 367 6669 1682 2854 658 4024 963 3686 662
Notes:
$ Provisional
* Including 4 cases and 4 Deaths from Jharkhand (Palamu & Chatra districts till 31.10.2008)
^ Including 448 cases and 109 Deaths from Bihar and 31 cases and 4 Deaths from Nepal and 1 case & nil Death from Madhya Pradesh reported from BDR medical college, Gorakhpur
# Including 237 cases and 51 Deaths from Bihar and 10 cases and 1 Deaths from Nepal reported from BDR medical college, Gorakhpur
@ Including 331 Cases and 63 Deaths from Bihar and 18 Cases and 5 Deaths from Nepal.
** including 277 cases and 52 deaths from Bihar and 5 cases and 2 deaths from Nepal
Source: Directorate of National Vector Borne Disease Control Programme
National Health Profile 200864
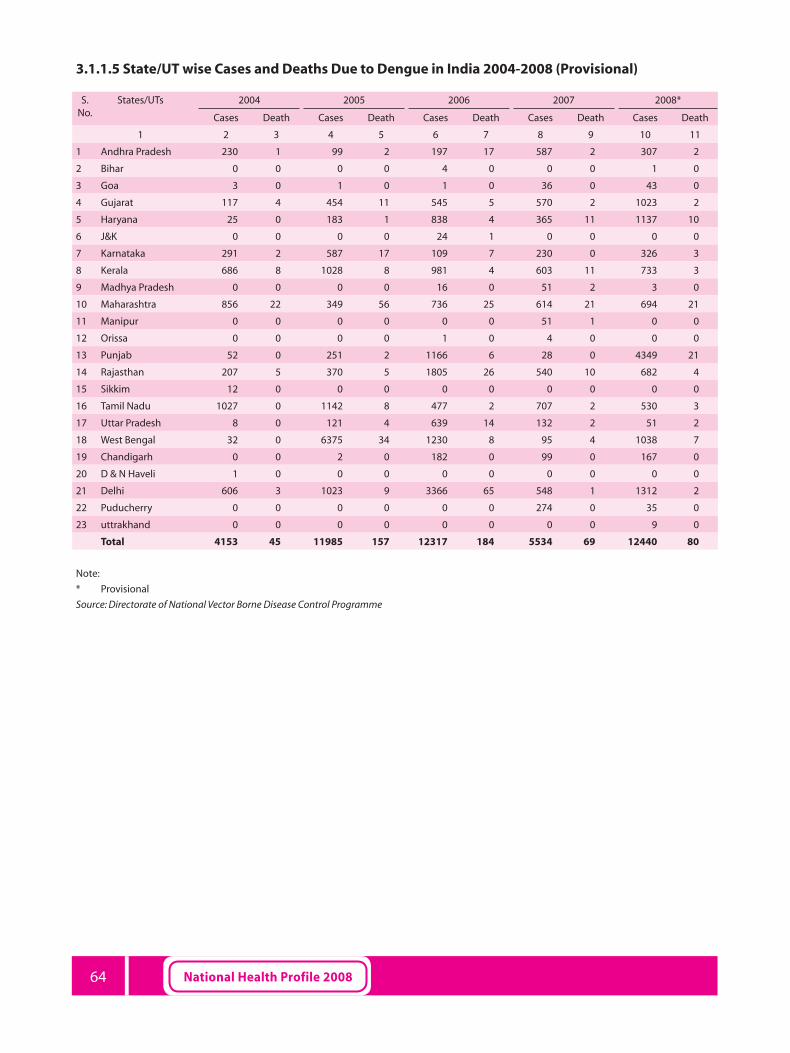
3.1.1.5 State/UT wise Cases and Deaths Due to Dengue in India 2004-2008 (Provisional)
S. No.
States/UTs 2004 2005 2006 2007 2008*
Cases Death Cases Death Cases Death Cases Death Cases Death
1 2 3 4 5 6 7 8 9 10 11
1 Andhra Pradesh 230 1 99 2 197 17 587 2 307 2
2 Bihar 0 0 0 0 4 0 0 0 1 0
3 Goa 3 0 1 0 1 0 36 0 43 0
4 Gujarat 117 4 454 11 545 5 570 2 1023 2
5 Haryana 25 0 183 1 838 4 365 11 1137 10
6 J&K 0 0 0 0 24 1 0 0 0 0
7 Karnataka 291 2 587 17 109 7 230 0 326 3
8 Kerala 686 8 1028 8 981 4 603 11 733 3
9 Madhya Pradesh 0 0 0 0 16 0 51 2 3 0
10 Maharashtra 856 22 349 56 736 25 614 21 694 21
11 Manipur 0 0 0 0 0 0 51 1 0 0
12 Orissa 0 0 0 0 1 0 4 0 0 0
13 Punjab 52 0 251 2 1166 6 28 0 4349 21
14 Rajasthan 207 5 370 5 1805 26 540 10 682 4
15 Sikkim 12 0 0 0 0 0 0 0 0 0
16 Tamil Nadu 1027 0 1142 8 477 2 707 2 530 3
17 Uttar Pradesh 8 0 121 4 639 14 132 2 51 2
18 West Bengal 32 0 6375 34 1230 8 95 4 1038 7
19 Chandigarh 0 0 2 0 182 0 99 0 167 0
20 D & N Haveli 1 0 0 0 0 0 0 0 0 0
21 Delhi 606 3 1023 9 3366 65 548 1 1312 2
22 Puducherry 0 0 0 0 0 0 274 0 35 0
23 uttrakhand 0 0 0 0 0 0 0 0 9 0
Total 4153 45 11985 157 12317 184 5534 69 12440 80
Note:
* Provisional
Source: Directorate of National Vector Borne Disease Control Programme

National Health Profile 2008 65
3.1.1.6 State/UT wise Cases and Deaths Due to Cholera in India 2008 (Provisional)
S. No.
State/UTJan. to Mar. Apr. to June July to Sept. Oct. to Dec. Progressive Total
Cases Deaths
C D C D C D C D Male Female Total Male Female Total
1 2 3 4 5 6 7 8 9 10 11 12 13 14 15
1 Andhra Pradesh 8 0 23 0 83 0 39 0 93 60 153 0 0 0
2 Arunachal Pradesh 0 0 0 0 0 0 0 0 0 0 0 0 0 0
3 Assam .. .. .. .. .. .. .. .. .. .. .. .. .. ..
4 Bihar .. .. .. .. .. .. .. .. .. .. .. .. .. ..
5 Chhattisgarh 0 0 0 0 0 0 0 0 0 0 0 0 0 0
6 Goa 0 0 0 0 0 0 0 0 0 0 0 0 0 0
7 Gujarat 7 0 11 0 17 0 15 0 50 0 50 0 0 0
8 Haryana 0 0 0 0 27 0 0 0 20 7 27 0 0 0
9 Himachal Pradesh 0 0 0 0 0 0 0 0 0 0 0 0 0 0
10 Jammu Division 0 0 0 0 0 0 0 0 0 0 0 0 0 0
Kashmir Division 0 0 0 0 0 .. .. .. .. .. 0 .. .. 0
11 Jharkhand .. .. .. .. .. .. .. .. .. .. .. .. .. ..
12 Karnataka 38 0 94 0 71 1 51 0 151 103 254 1 0 1
13 Kerala 4 0 3 0 0 0 0 0 5 2 7 0 0 0
14 Madhya Pradesh 5 0 8 0 0 0 1 0 14 0 14 0 0 0
15 Maharashtra 20 0 32 0 35 0 9 0 96 0 96 0 0 0
16 Manipur .. .. .. .. .. .. .. .. .. .. .. .. .. ..
17 Meghalaya 0 0 .. .. 0 0 .. .. 0 0 0 0 0 0
18 Mizoram 0 0 0 0 0 0 0 0 0 0 0 0 0 0
19 Nagaland 0 0 0 0 0 0 0 0 0 0 0 0 0 0
20 Orissa .. .. .. .. .. .. .. .. .. .. .. . .. ..
21 Punjab 0 0 0 0 11 0 1 0 7 5 12 0 0 0
22 Rajasthan 0 0 0 0 0 0 0 0 0 0 0 0 0 0
23 Sikkim 0 0 0 0 0 .. 0 0 0 0 0 0 0 0
24 Tamil Nadu 253 0 148 0 258 0 331 0 588 402 990 0 0 0
25 Tripura 0 0 0 0 0 0 0 0 0 0 0 0 0 0
26 Uttar Pradesh 0 0 0 0 0 0 0 0 0 0 0 0 0 0
27 Uttarakhand 0 0 0 0 0 0 0 0 0 0 0 0 0 0
28 West Bengal 11 0 16 0 146 0 63 0 130 106 236 0 0 0
29 A& N Islands 0 0 0 0 0 0 0 0 0 0 0 0 0 0
30 Chandigarh 0 0 0 0 15 0 0 0 7 8 15 0 0 0
31 D & N Haveli 0 0 0 0 0 0 0 0 0 0 0 0 0 0
32 Daman & Diu 0 0 0 0 0 0 0 0 0 0 0 0 0 0
33 Delhi 0 0 82 0 572 0 170 0 824 0 824 0 0 0
34 Lakshadweep 0 0 0 0 0 0 0 0 0 0 0 0 0 0
35 Puducherry 0 0 0 0 0 0 2 0 1 1 2 0 0 0
Total 346 0 417 0 1235 1 682 0 1986 694 2680 1 0 1
Notes:
= C: Cases D: Deaths
.. Not Reported
= The sum of male and female may not tally with the total figure as some States/UTs have not reported genderwise information separately.
Source: Weekly reports from Directorate of Health Services of States/UTs.
National Health Profile 200866
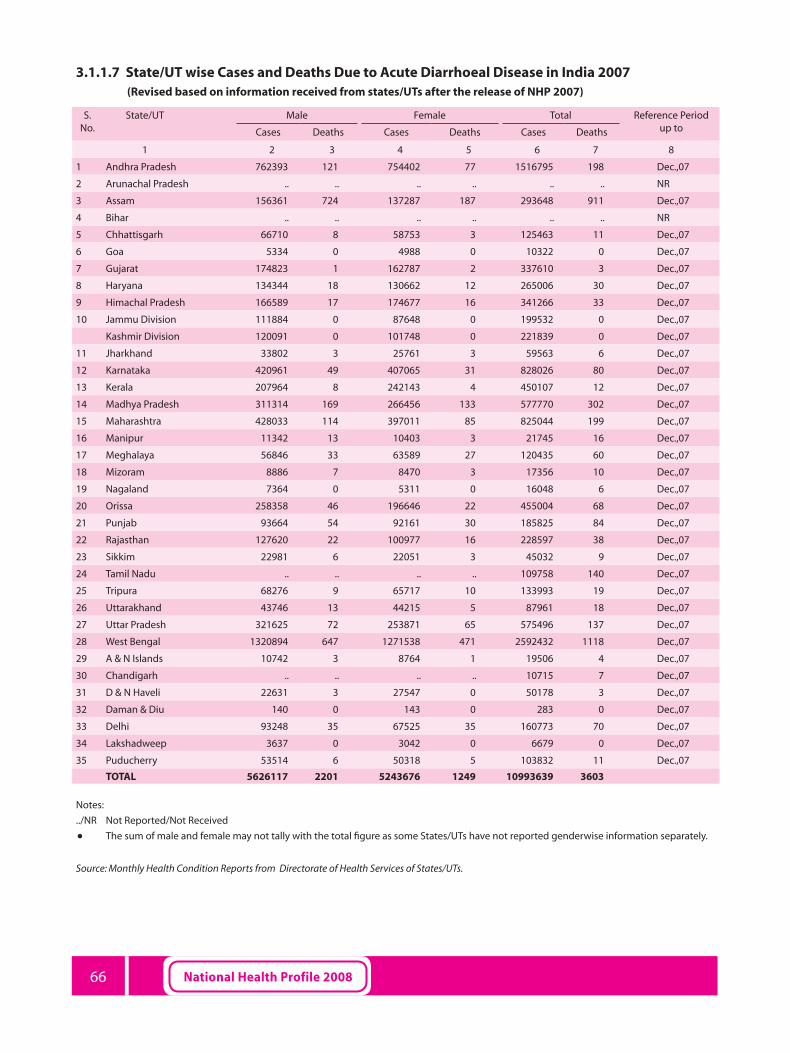
3.1.1.7 State/UT wise Cases and Deaths Due to Acute Diarrhoeal Disease in India 2007 (Revised based on information received from states/UTs after the release of NHP 2007)
S. No.
State/UT Male Female Total Reference Period up toCases Deaths Cases Deaths Cases Deaths
1 2 3 4 5 6 7 8
1 Andhra Pradesh 762393 121 754402 77 1516795 198 Dec.,07
2 Arunachal Pradesh .. .. .. .. .. .. NR
3 Assam 156361 724 137287 187 293648 911 Dec.,07
4 Bihar .. .. .. .. .. .. NR
5 Chhattisgarh 66710 8 58753 3 125463 11 Dec.,07
6 Goa 5334 0 4988 0 10322 0 Dec.,07
7 Gujarat 174823 1 162787 2 337610 3 Dec.,07
8 Haryana 134344 18 130662 12 265006 30 Dec.,07
9 Himachal Pradesh 166589 17 174677 16 341266 33 Dec.,07
10 Jammu Division 111884 0 87648 0 199532 0 Dec.,07
Kashmir Division 120091 0 101748 0 221839 0 Dec.,07
11 Jharkhand 33802 3 25761 3 59563 6 Dec.,07
12 Karnataka 420961 49 407065 31 828026 80 Dec.,07
13 Kerala 207964 8 242143 4 450107 12 Dec.,07
14 Madhya Pradesh 311314 169 266456 133 577770 302 Dec.,07
15 Maharashtra 428033 114 397011 85 825044 199 Dec.,07
16 Manipur 11342 13 10403 3 21745 16 Dec.,07
17 Meghalaya 56846 33 63589 27 120435 60 Dec.,07
18 Mizoram 8886 7 8470 3 17356 10 Dec.,07
19 Nagaland 7364 0 5311 0 16048 6 Dec.,07
20 Orissa 258358 46 196646 22 455004 68 Dec.,07
21 Punjab 93664 54 92161 30 185825 84 Dec.,07
22 Rajasthan 127620 22 100977 16 228597 38 Dec.,07
23 Sikkim 22981 6 22051 3 45032 9 Dec.,07
24 Tamil Nadu .. .. .. .. 109758 140 Dec.,07
25 Tripura 68276 9 65717 10 133993 19 Dec.,07
26 Uttarakhand 43746 13 44215 5 87961 18 Dec.,07
27 Uttar Pradesh 321625 72 253871 65 575496 137 Dec.,07
28 West Bengal 1320894 647 1271538 471 2592432 1118 Dec.,07
29 A & N Islands 10742 3 8764 1 19506 4 Dec.,07
30 Chandigarh .. .. .. .. 10715 7 Dec.,07
31 D & N Haveli 22631 3 27547 0 50178 3 Dec.,07
32 Daman & Diu 140 0 143 0 283 0 Dec.,07
33 Delhi 93248 35 67525 35 160773 70 Dec.,07
34 Lakshadweep 3637 0 3042 0 6679 0 Dec.,07
35 Puducherry 53514 6 50318 5 103832 11 Dec.,07
TOTAL 5626117 2201 5243676 1249 10993639 3603
Notes:
../NR Not Reported/Not Received
= The sum of male and female may not tally with the total figure as some States/UTs have not reported genderwise information separately.
Source: Monthly Health Condition Reports from Directorate of Health Services of States/UTs.

National Health Profile 2008 67
3.1.1.7 State/UT wise Cases and Deaths Due to Acute Diarrhoeal Disease in India 2008 (Provisional)
S. No.,
State/UT Male Female Total Reference Period up toCases Deaths Cases Deaths Cases Deaths
1 2 3 4 5 6 7 8
1 Andhra Pradesh 885566 12 863417 4 1748983 16 Dec.,08
2 Arunachal Pradesh .. .. .. .. .. .. NR
3 Assam 49942 471 43770 274 93712 745 Apr.,08
4 Bihar .. .. .. .. .. .. NR
5 Chhattisgarh 73551 25 69368 11 142919 36 Dec.,08
6 Goa 6084 0 5588 0 11672 0 Sept.,08
7 Gujarat 165644 0 166335 2 331979 2 Dec.,08
8 Haryana 115495 30 108708 15 224203 45 Dec.,08
9 Himachal Pradesh 166276 8 176594 9 342870 17 Dec.,08
10 Jammu Division 140588 3 118792 1 259380 4 Dec.,08
Kashmir Division 83205 0 74140 0 157345 0 Dec.,08
11 Jharkhand 37193 2 33312 2 70505 4 Dec.,08
12 Karnataka 367060 55 356068 29 723128 84 Dec.,08
13 Kerala 171345 1 192802 0 364147 1 Dec.,08
14 Madhya Pradesh 280299 73 269122 75 549421 148 Dec.,08
15 Maharashtra 375897 124 614402 277 990299 401 Dec.,08
16 Manipur 5794 2 6342 1 12136 3 Sept.,08
17 Meghalaya 63010 19 68495 19 131505 38 Dec.,08
18 Mizoram 10281 24 9862 17 20143 41 Dec.,08
19 Nagaland 8132 0 7411 0 15543 0 Dec.,08
20 Orissa 264950 40 193626 29 458576 69 Dec.,08
21 Punjab 90097 13 90623 18 180720 31 Dec.,08
22 Rajasthan 194508 27 160291 11 354799 38 Dec.,08
23 Sikkim 21145 2 21361 1 42506 3 Dec.,08
24 Tamil Nadu 213094 7 214766 9 427860 16 Dec.,08
25 Tripura 64736 34 61735 5 126471 39 Dec.,08
26 Uttarakhand 45315 20 40276 9 85591 29 Dec.,08
27 Uttar Pradesh 222481 61 183958 46 406439 107 Dec.,08
28 West Bengal 1375796 467 1305903 362 2681699 829 Dec.,08
29 A & N Islands 14295 0 10182 0 24477 0 Dec.,08
30 Chandigarh .. .. .. .. .. .. NR
31 D & N Haveli 28751 1 31997 0 60748 1 Dec.,08
32 Daman & Diu 2341 0 1380 0 3721 0 Nov.,08
33 Delhi 58381 50 42538 29 100919 79 Dec.,08
34 Lakshadweep 2511 0 2190 0 4701 0 Nov.,08
35 Puducherry 42703 12 39219 3 81922 15 Dec.,08 except Mar.
TOTAL 5646466 1583 5584573 1258 11231039 2841
Notes:
../NR Not Reported/Not Received
= The sum of male and female may not tally with the total figure as some States/UTs have not reported genderwise information separately.
Source: Monthly Health Condition Reports from Directorate of Health Services of States/UTs.

National Health Profile 200868
3.1.1.8 State/UT wise Cases and Deaths Due to Enteric Fever (Typhoid) in India 2007 (Revised based on information received from states/UTs after the release of NHP 2007)
S. No.
State/UTMale Female Total Reference Period
up toCases Deaths Cases Deaths Cases Deaths
1 2 3 4 5 6 7 8
1 Andhra Pradesh 63605 10 61039 8 124644 18 Dec.,07
2 Arunachal Pradesh .. .. .. .. .. .. NR
3 Assam 2989 22 1177 15 4166 37 Dec.,07
4 Bihar .. .. .. .. .. .. NR
5 Chhattisgarh 21782 0 17072 0 38854 0 Dec.,07
6 Goa 216 0 209 0 425 0 Dec.,07
7 Gujarat 3004 0 2720 1 5724 1 Dec.,07
8 Haryana 3529 1 3109 0 6638 1 Dec.,07
9 Himachal Pr. 10099 0 11261 0 21360 0 Dec.,07
10 Jammu Div. 24962 0 16498 0 41460 0 Dec.,07
Kashmir Div. 11071 0 8554 0 19625 0 Dec.,07
11 Jharkhand 6823 0 5386 0 12209 0 Dec.,07
12 Karnataka 32409 3 29201 2 61610 5 Dec.,07
13 Kerala 2350 4 1911 0 4261 4 Dec.,07
14 Madhya Pradesh 25325 23 21538 15 46863 38 Dec.,07
15 Maharashtra 37499 10 30162 4 67661 14 Dec.,07
16 Manipur 2679 1 2599 0 5278 1 Dec.,07
17 Meghalaya 17856 1 19268 1 37124 2 Dec.,07
18 Mizoram 460 2 449 0 909 2 Dec.,07
19 Nagaland 3453 0 1300 0 6458 5 Dec.,07
20 Orissa 15973 12 10761 10 26734 22 Dec.,07
21 Punjab 10335 4 9520 2 19855 6 Dec.,07
22 Rajasthan 3648 0 2424 0 6072 0 Dec.,07
23 Sikkim 196 0 119 0 315 0 Dec.,07
24 Tamil Nadu .. .. .. .. 24037 128 Dec.,07
25 Tripura 1449 4 1169 0 2618 4 Dec.,07
26 Uttarakhand 5179 0 5268 0 10447 0 Dec.,07
27 Uttar Pradesh 47283 35 35104 18 82387 53 Dec.,07
28 West Bengal 63472 53 55468 29 118940 82 Dec.,07
29 A & N Islands 346 1 343 0 689 1 Dec.,07
30 Chandigarh .. .. .. .. 422 3 Dec.,07
31 D & N Haveli 324 0 364 0 688 0 Dec.,07
32 Daman & Diu 26 0 24 0 50 0 Dec.,07
33 Delhi 12603 13 8595 11 21198 24 Dec.,07
34 Lakshadweep 2 0 0 0 2 0 Dec.,07
35 Puducherry 374 0 263 1 637 1 Dec.,07
TOTAL 431321 199 362875 117 820360 452
Notes:
../NR Not Reported/Not Received
= The sum of male and female may not tally with the total figure as some States/UTs have not reported genderwise information separately.
Source: Monthly Health Condition Reports from Directorate of Health Services of States/UTs.
National Health Profile 2008 69
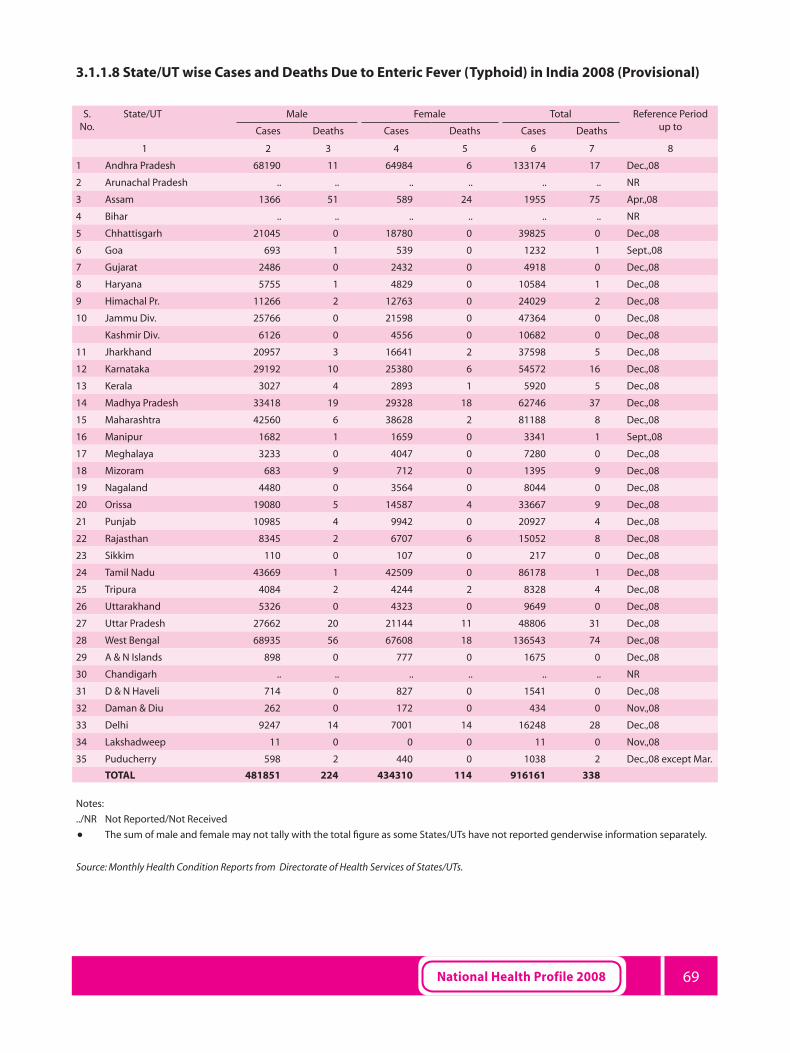
3.1.1.8 State/UT wise Cases and Deaths Due to Enteric Fever (Typhoid) in India 2008 (Provisional)
S. No.
State/UT Male Female Total Reference Period up toCases Deaths Cases Deaths Cases Deaths
1 2 3 4 5 6 7 8
1 Andhra Pradesh 68190 11 64984 6 133174 17 Dec.,08
2 Arunachal Pradesh .. .. .. .. .. .. NR
3 Assam 1366 51 589 24 1955 75 Apr.,08
4 Bihar .. .. .. .. .. .. NR
5 Chhattisgarh 21045 0 18780 0 39825 0 Dec.,08
6 Goa 693 1 539 0 1232 1 Sept.,08
7 Gujarat 2486 0 2432 0 4918 0 Dec.,08
8 Haryana 5755 1 4829 0 10584 1 Dec.,08
9 Himachal Pr. 11266 2 12763 0 24029 2 Dec.,08
10 Jammu Div. 25766 0 21598 0 47364 0 Dec.,08
Kashmir Div. 6126 0 4556 0 10682 0 Dec.,08
11 Jharkhand 20957 3 16641 2 37598 5 Dec.,08
12 Karnataka 29192 10 25380 6 54572 16 Dec.,08
13 Kerala 3027 4 2893 1 5920 5 Dec.,08
14 Madhya Pradesh 33418 19 29328 18 62746 37 Dec.,08
15 Maharashtra 42560 6 38628 2 81188 8 Dec.,08
16 Manipur 1682 1 1659 0 3341 1 Sept.,08
17 Meghalaya 3233 0 4047 0 7280 0 Dec.,08
18 Mizoram 683 9 712 0 1395 9 Dec.,08
19 Nagaland 4480 0 3564 0 8044 0 Dec.,08
20 Orissa 19080 5 14587 4 33667 9 Dec.,08
21 Punjab 10985 4 9942 0 20927 4 Dec.,08
22 Rajasthan 8345 2 6707 6 15052 8 Dec.,08
23 Sikkim 110 0 107 0 217 0 Dec.,08
24 Tamil Nadu 43669 1 42509 0 86178 1 Dec.,08
25 Tripura 4084 2 4244 2 8328 4 Dec.,08
26 Uttarakhand 5326 0 4323 0 9649 0 Dec.,08
27 Uttar Pradesh 27662 20 21144 11 48806 31 Dec.,08
28 West Bengal 68935 56 67608 18 136543 74 Dec.,08
29 A & N Islands 898 0 777 0 1675 0 Dec.,08
30 Chandigarh .. .. .. .. .. .. NR
31 D & N Haveli 714 0 827 0 1541 0 Dec.,08
32 Daman & Diu 262 0 172 0 434 0 Nov.,08
33 Delhi 9247 14 7001 14 16248 28 Dec.,08
34 Lakshadweep 11 0 0 0 11 0 Nov.,08
35 Puducherry 598 2 440 0 1038 2 Dec.,08 except Mar.
TOTAL 481851 224 434310 114 916161 338
Notes:
../NR Not Reported/Not Received
= The sum of male and female may not tally with the total figure as some States/UTs have not reported genderwise information separately.
Source: Monthly Health Condition Reports from Directorate of Health Services of States/UTs.

National Health Profile 200870
3.1.1.9 State/UT wise Cases and Deaths Due to Acute Respiratory Infection in India 2007 (Revised based on information received from states/UTs after the release of NHP 2007)
S. No.
State/UT Male Female Total Reference Period up toCases Deaths Cases Deaths Cases Deaths
1 2 3 4 5 6 7 8
1 Andhra Pradesh 1182081 329 1183188 208 2365269 537 Dec.,07
2 Arunachal Pradesh .. .. .. .. .. .. NR
3 Assam 197789 1947 157625 930 355414 2877 Dec.,07
4 Bihar .. .. .. .. .. .. NR
5 Chhattisgarh 127122 7 112006 6 239128 13 Dec.,07
6 Goa 22661 0 25912 1 48573 1 Dec.,07
7 Gujarat 307455 17 302046 3 609501 20 Dec.,07
8 Haryana 563688 117 563683 51 1127371 168 Dec.,07
9 Himachal Pr. 707833 129 758203 74 1466036 203 Dec.,07
10 Jammu Div. 58514 0 43237 0 101751 0 Dec.,07
Kashmir Div. 153377 0 134491 0 287868 0 Dec.,07
11 Jharkhand 43521 8 32309 3 75830 11 Dec.,07
12 Karnataka 1248921 151 1166742 67 2415663 218 Dec.,07
13 Kerala 3474161 132 4283039 42 7757200 174 Dec.,07
14 Madhya Pradesh 500915 110 411544 76 912459 186 Dec.,07
15 Maharashtra 380965 91 372264 154 753229 245 Dec.,07
16 Manipur 11520 7 11126 6 22646 13 Dec.,07
17 Meghalaya 101313 24 117813 19 219126 43 Dec.,07
18 Mizoram 17798 13 18218 15 36016 28 Dec.,07
19 Nagaland 12553 0 7664 0 23665 0 Dec.,07
20 Orissa 479188 48 361264 36 840452 84 Dec.,07
21 Punjab 256773 31 271600 19 528373 50 Dec.,07
22 Rajasthan 487153 44 388318 29 875471 73 Dec.,07
23 Sikkim 33524 11 34809 11 68333 22 Dec.,07
24 Tamil Nadu .. .. .. .. 431040 653 Dec.,07
25 Tripura 125537 32 114501 21 240038 53 Dec.,07
26 Uttarakhand 50148 18 60692 6 110840 24 Dec.,07
27 Uttar Pradesh 675025 159 495967 105 1170992 264 Dec.,07
28 West Bengal 1062472 415 1011518 337 2073990 752 Dec.,07
29 A & N Islands 16546 2 15056 1 31602 3 Dec.,07
30 Chandigarh .. .. .. .. 16305 21 Dec.,07
31 D & N Haveli 34502 0 41648 0 76150 0 Dec.,07
32 Daman & Diu 0 0 0 0 0 0 Dec.,07
33 Delhi 177399 168 126904 41 304303 209 Dec.,07
34 Lakshadweep 22042 0 19156 0 41198 0 Dec.,07
35 Puducherry 273238 3 272426 0 545664 3 Dec.,07
TOTAL 12805734 4013 12914969 2261 26171496 6948
Notes:
../NR Not Reported/Not Received
= The sum of male and female may not tally with the total figure as some States/UTs have not reported genderwise information separately.
Source: Monthly Health Condition Reports from Directorate of Health Services of States/UTs.

National Health Profile 2008 71
3.1.1.9 State/UT wise Cases and Deaths Due to Acute Respiratory Infection in India 2008 (Provisional)
S. No.
State/UT Male Female Total Reference Period up toCases Deaths Cases Deaths Cases Deaths
1 2 3 4 5 6 7 8
1 Andhra Pradesh 1367999 452 1372083 267 2740082 719 Dec.,08
2 Arunachal Pradesh .. .. .. .. .. .. NR
3 Assam 50974 987 43240 470 94214 1457 Apr.,08
4 Bihar .. .. .. .. .. .. NR
5 Chhattisgarh 159092 10 148876 8 307968 18 Dec.,08
6 Goa 22423 1 23897 0 46320 1 Sept.,08
7 Gujarat 278164 16 279907 2 558071 18 Dec.,08
8 Haryana 504551 125 505188 50 1009739 175 Dec.,08
9 Himachal Pradesh 748475 81 799627 52 1548102 133 Dec.,08
10 Jammu Div. 54309 0 44789 0 99098 0 Dec.,08
Kashmir Div. 92354 0 82542 0 174896 0 Dec.,08
11 Jharkhand 49209 0 42212 0 91421 0 Dec.,08
12 Karnataka 981603 81 941021 31 1922624 112 Dec.,08
13 Kerala 3110290 133 3980215 59 7090505 192 Dec.,08
14 Madhya Pradesh 435822 130 368129 104 803951 234 Dec.,08
15 Maharashtra 440774 296 435034 324 875808 620 Dec.,08
16 Manipur 8291 1 7799 3 16090 4 Sept.,08
17 Meghalaya 95864 5 115321 2 211185 7 Dec.,08
18 Mizoram 16356 20 17825 11 34181 31 Dec.,08
19 Nagaland 11970 0 12622 0 24592 0 Dec.,08
20 Orissa 433739 45 331011 29 764750 74 Dec.,08
21 Punjab 263931 14 262850 7 526781 21 Dec.,08
22 Rajasthan 677648 151 556330 77 1233978 228 Dec.,08
23 Sikkim 35868 3 36560 6 72428 9 Dec.,08
24 Tamil Nadu 1218565 1 1298159 3 2516724 4 Dec.,08
25 Tripura 123842 20 118958 23 242800 43 Dec.,08
26 Uttarakhand 69299 27 61579 14 130878 41 Dec.,08
27 Uttar Pradesh 441258 92 357189 45 798447 137 Dec.,08
28 West Bengal 325629 138 309751 125 635380 263 Dec.,08
29 A & N Islands 13553 1 12527 0 26080 1 Dec.,08
30 Chandigarh .. .. .. .. .. .. NR
31 D & N Haveli 48919 0 51633 0 100552 0 Dec.,08
32 Daman & Diu 9632 1 5737 0 15369 1 Nov.,08
33 Delhi 178010 96 129978 37 307988 133 Dec.,08
34 Lakshadweep 13083 0 11057 0 24140 0 Nov.,08
35 Puducherry 248025 1 248478 4 496503 5 Dec.,08 except Mar.
TOTAL 12529521 2928 13012124 1753 25541645 4681
Notes:
../NR Not Reported/Not Received
= The sum of male and female may not tally with the total figure as some States/UTs have not reported genderwise information separately.
Source: Monthly Health Condition Reports from Directorate of Health Services of States/UTs.

National Health Profile 200872
3.1.1.10 State/UT wise Cases and Deaths Due to Tetanus Neonatal in India 2007 (Revised based on information received from states/UTs after the release of NHP 2007)
S. No.
State/UT Male Female Total Reference Period up toCases Deaths Cases Deaths Cases Deaths
1 2 3 4 5 6 7 8
1 Andhra Pradesh 49 2 82 3 131 5 Dec.,07
2 Arunachal Pradesh .. .. .. .. .. .. NR
3 Assam 0 0 0 0 0 0 Dec.,07
4 Bihar .. .. .. .. .. .. NR
5 Chhattisgarh 126 0 80 0 206 0 Dec.,07
6 Goa 0 0 0 0 0 0 Dec.,07
7 Gujarat 31 2 0 0 31 2 Dec.,07
8 Haryana 8 1 0 0 8 1 Dec.,07
9 Himachal Pr. 0 0 0 0 0 0 Dec.,07
10 Jammu Div. 0 0 0 0 0 0 Dec.,07
Kashmir Div. 0 0 0 0 0 0 Dec.,07
11 Jharkhand 78 1 68 0 146 1 Dec.,07
12 Karnataka 2 0 0 0 2 0 Dec.,07
13 Kerala 0 0 0 0 0 0 Dec.,07
14 Madhya Pradesh 81 20 53 12 134 32 Dec.,07
15 Maharashtra 64 0 76 1 140 1 Dec.,07
16 Manipur 0 0 0 0 0 0 Dec.,07
17 Meghalaya 0 0 0 0 0 0 Dec.,07
18 Mizoram 0 0 0 0 0 0 Dec.,07
19 Nagaland 0 0 4 0 16 0 Dec.,07
20 Orissa 7 0 5 1 12 1 Dec.,07
21 Punjab 5 3 2 0 7 3 Dec.,07
22 Rajasthan 15 3 5 1 20 4 Dec.,07
23 Sikkim 0 0 0 0 0 0 Dec.,07
24 Tamil Nadu .. .. .. .. 0 0 Dec.,07
25 Tripura 1 0 1 1 2 1 Dec.,07
26 Uttarakhand 8 1 5 1 13 2 Dec.,07
27 Uttar Pradesh 61 29 22 4 83 33 Dec.,07
28 West Bengal 47 3 38 7 85 10 Dec.,07
29 A & N Islands 0 0 0 0 0 0 Dec.,07
30 Chandigarh .. .. .. .. 0 0 Dec.,07
31 D & N Haveli 0 0 0 0 0 0 Dec.,07
32 Daman & Diu 0 0 0 0 0 0 Dec.,07
33 Delhi 26 2 14 2 40 4 Dec.,07
34 Lakshadweep 0 0 0 0 0 0 Dec.,07
35 Puducherry 0 0 0 0 0 0 Dec.,07
TOTAL 609 67 455 33 1076 100
Notes:
../NR Not Reported/Not Received
The sum of male and female may not tally with the total figure as some States/UTs have not reported genderwise information separately.
Source: Monthly Health Condition Reports from Directorate of Health Services of States/UTs.

National Health Profile 2008 73
3.1.1.10 State/UT wise Cases and Deaths Due to Tetanus Neonatal in India 2008(Provisional)
S. No.
State/UT Male Female Total Reference Period up toCases Deaths Cases Deaths Cases Deaths
1 2 3 4 5 6 7 8
1 Andhra Pradesh 14 4 26 1 40 5 Dec.,08
2 Arunachal Pradesh .. .. .. .. .. .. NR
3 Assam 0 0 0 0 0 0 Apr.,08
4 Bihar .. .. .. .. .. .. NR
5 Chhattisgarh 0 0 0 0 0 0 Dec.,08
6 Goa 0 0 0 0 0 0 Sept.,08
7 Gujarat 6 1 0 0 6 1 Dec.,08
8 Haryana 1 0 0 0 1 0 Dec.,08
9 Himachal Pr. 1 1 0 0 1 1 Dec.,08
10 Jammu Div. 0 0 0 0 0 0 Dec.,08
Kashmir Div. 0 0 0 0 0 0 Dec.,08
11 Jharkhand 68 1 26 1 94 2 Dec.,08
12 Karnataka 11 1 3 0 14 1 Dec.,08
13 Kerala 0 0 0 0 0 0 Dec.,08
14 Madhya Pradesh 63 3 47 2 110 5 Dec.,08
15 Maharashtra 75 1 38 0 113 1 Dec.,08
16 Manipur 0 0 0 0 0 0 Sept.,08
17 Meghalaya 0 0 0 0 0 0 Dec.,08
18 Mizoram 0 0 0 0 0 0 Dec.,08
19 Nagaland 56 0 145 0 201 0 Dec.,08
20 Orissa 30 1 21 0 51 1 Dec.,08
21 Punjab 1 1 1 1 2 2 Dec.,08
22 Rajasthan 17 4 13 5 30 9 Dec.,08
23 Sikkim 0 0 0 0 0 0 Dec.,08
24 Tamil Nadu 0 0 0 0 0 0 Dec.,08
25 Tripura 3 0 7 5 10 5 Dec.,08
26 Uttarakhand 0 0 0 0 0 0 Dec.,08
27 Uttar Pradesh 37 12 13 4 50 16 Dec.,08
28 West Bengal 14 3 28 2 42 5 Dec.,08
29 A & N Islands 0 0 0 0 0 0 Dec.,08
30 Chandigarh .. .. .. .. .. .. NR
31 D & N Haveli 0 0 0 0 0 0 Dec.,08
32 Daman & Diu 0 0 0 0 0 0 Nov.,08
33 Delhi 32 1 14 1 46 2 Dec.,08
34 Lakshadweep 0 0 0 0 0 0 Nov.,08
35 Puducherry 0 0 0 0 0 0 Dec.,08 except Mar.
TOTAL 429 34 382 22 811 56
Notes:
../NR Not Reported/Not Received
= The sum of male and female may not tally with the total figure as some States/UTs have not reported genderwise information separately.
Source: Monthly Health Condition Reports from Directorate of Health Services of States/UTs.

National Health Profile 200874
3.1.1.11 State/UT wise Cases and Deaths Due to Tetanus Other than Neonatal in India 2007 (Revised based on information received from states/UTs after the release of NHP 2007)
S. No.
State/UT Male Female Total Reference Period up toCases Deaths Cases Deaths Cases Deaths
1 2 3 4 5 6 7 8
1 Andhra Pradesh 2430 23 2185 11 4615 34 Dec.,07
2 Arunachal Pradesh .. .. .. .. .. .. NR
3 Assam 0 0 0 0 0 0 Dec.,07
4 Bihar .. .. .. .. .. .. NR
5 Chhattisgarh 14 0 15 0 29 0 Dec.,07
6 Goa 0 0 0 0 0 0 Dec.,07
7 Gujarat 47 0 36 1 83 1 Dec.,07
8 Haryana 10 0 2 1 12 1 Dec.,07
9 Himachal Pr. 0 0 0 0 0 0 Dec.,07
10 Jammu Div. 0 0 0 0 0 0 Dec.,07
Kashmir Div. 0 0 0 0 0 0 Dec.,07
11 Jharkhand 89 1 74 0 163 1 Dec.,07
12 Karnataka 19 9 7 3 26 12 Dec.,07
13 Kerala 2 0 2 0 4 0 Dec.,07
14 Madhya Pradesh 169 18 106 10 275 28 Dec.,07
15 Maharashtra 356 6 363 2 719 8 Dec.,07
16 Manipur 1 0 1 1 2 1 Dec.,07
17 Meghalaya 1 0 0 0 1 0 Dec.,07
18 Mizoram 0 0 0 0 0 0 Dec.,07
19 Nagaland 3 0 1 0 15 0 Dec.,07
20 Orissa 147 3 29 3 176 6 Dec.,07
21 Punjab 15 4 12 3 27 7 Dec.,07
22 Rajasthan 280 18 142 12 422 30 Dec.,07
23 Sikkim 0 0 0 0 0 0 Dec.,07
24 Tamil Nadu .. .. .. .. 0 0 Dec.,07
25 Tripura 13 3 8 1 21 4 Dec.,07
26 Uttarakhand 0 0 1 0 1 0 Dec.,07
27 Uttar Pradesh 214 48 114 32 328 80 Dec.,07
28 West Bengal 324 61 206 46 530 107 Dec.,07
29 A & N Islands 0 0 1 0 1 0 Dec.,07
30 Chandigarh .. .. .. .. 9 3 Dec.,07
31 D & N Haveli 2 0 2 0 4 0 Dec.,07
32 Daman & Diu 0 0 0 0 0 0 Dec.,07
33 Delhi 17 1 9 1 26 2 Dec.,07
34 Lakshadweep 0 0 0 0 0 0 Dec.,07
35 Puducherry 2 0 0 0 2 0 Dec.,07
TOTAL 4155 195 3316 127 7491 325
Notes:
../NR Not Reported/Not Received
= The sum of male and female may not tally with the total figure as some States/UTs have not reported genderwise information separately.
Source: Monthly Health Condition Reports from Directorate of Health Services of States/UTs.

National Health Profile 2008 75
3.1.1.11 State/UT wise Cases and Deaths Due to Tetanus Other than Neonatal in India 2008 (Provisional)
S. No.
State/UT Male Female Total Reference Period up toCases Deaths Cases Deaths Cases Deaths
1 2 3 4 5 6 7 8
1 Andhra Pradesh 111 26 109 13 220 39 Dec.,08
2 Arunachal Pradesh .. .. .. .. .. .. NR
3 Assam 0 0 0 0 0 0 Apr.,08
4 Bihar .. .. .. .. .. .. NR
5 Chhattisgarh 0 0 0 0 0 0 Dec.,08
6 Goa 0 0 0 0 0 0 Sept.,08
7 Gujarat 15 2 15 2 30 4 Dec.,08
8 Haryana 6 0 3 0 9 0 Dec.,08
9 Himachal Pr. 3 0 1 0 4 0 Dec.,08
10 Jammu Div. 0 0 0 0 0 0 Dec.,08
Kashmir Div. 0 0 0 0 0 0 Dec.,08
11 Jharkhand 267 0 293 0 560 0 Dec.,08
12 Karnataka 41 10 11 2 52 12 Dec.,08
13 Kerala 7 1 2 0 9 1 Dec.,08
14 Madhya Pradesh 325 6 231 5 556 11 Dec.,08
15 Maharashtra 234 5 133 2 367 7 Dec.,08
16 Manipur 0 0 0 0 0 0 Sept.,08
17 Meghalaya 0 0 1 0 1 0 Dec.,08
18 Mizoram 2 1 0 0 2 1 Dec.,08
19 Nagaland 3 0 6 0 9 0 Dec.,08
20 Orissa 67 12 28 2 95 14 Dec.,08
21 Punjab 20 5 10 2 30 7 Dec.,08
22 Rajasthan 151 17 101 12 252 29 Dec.,08
23 Sikkim 0 0 0 0 0 0 Dec.,08
24 Tamil Nadu 11 0 3 1 14 1 Dec.,08
25 Tripura 11 3 4 0 15 3 Dec.,08
26 Uttarakhand 1 0 1 0 2 0 Dec.,08
27 Uttar Pradesh 128 25 99 26 227 51 Dec.,08
28 West Bengal 256 41 162 28 418 69 Dec.,08
29 A & N Islands 0 0 1 0 1 0 Dec.,08
30 Chandigarh .. .. .. .. .. .. NR
31 D & N Haveli 0 0 0 0 0 0 Dec.,08
32 Daman & Diu 0 0 0 0 0 0 Nov.,08
33 Delhi 17 2 12 2 29 4 Dec.,08
34 Lakshadweep 0 0 0 0 0 0 Nov.,08
35 Puducherry 1 0 0 0 1 0 Dec.,08 except Mar.
TOTAL 1677 156 1226 97 2903 253
Notes:
../NR Not Reported/Not Received
= The sum of male and female may not tally with the total figure as some States/UTs have not reported genderwise information separately.
Source: Monthly Health Condition Reports from Directorate of Health Services of States/UTs.

National Health Profile 200876
3.1.1.12 State/UT wise Cases and Deaths Due to Diphtheria in India 2007 (Revised based on information received from state/UT after the release of NHP 2007)
S. No.
State/UT Male Female Total Reference Period up toCases Deaths Cases Deaths Cases Deaths
1 2 3 4 5 6 7 8
1 Andhra Pradesh 804 6 967 4 1771 10 Dec.,07
2 Arunachal Pradesh .. .. .. .. .. .. NR
3 Assam 0 0 0 0 0 0 Dec.,07
4 Bihar .. .. .. .. .. .. NR
5 Chhattisgarh 135 0 98 0 233 0 Dec.,07
6 Goa 1 0 0 0 1 0 Dec.,07
7 Gujarat 146 10 22 1 168 11 Dec.,07
8 Haryana 5 0 5 0 10 0 Dec.,07
9 Himachal Pr. 0 0 0 0 0 0 Dec.,07
10 Jammu Div. 0 0 0 0 0 0 Dec.,07
Kashmir Div. 0 0 0 0 0 0 Dec.,07
11 Jharkhand 18 0 15 0 33 0 Dec.,07
12 Karnataka 0 0 2 0 2 0 Dec.,07
13 Kerala 2 1 1 0 3 1 Dec.,07
14 Madhya Pradesh 0 0 0 0 0 0 Dec.,07
15 Maharashtra 147 0 106 0 253 0 Dec.,07
16 Manipur 0 0 0 0 0 0 Dec.,07
17 Meghalaya 0 0 0 0 0 0 Dec.,07
18 Mizoram 0 0 0 0 0 0 Dec.,07
19 Nagaland 19 0 0 0 56 0 Dec.,07
20 Orissa 2 0 1 0 3 0 Dec.,07
21 Punjab 0 0 0 0 0 0 Dec.,07
22 Rajasthan 125 10 75 3 200 13 Dec.,07
23 Sikkim 0 0 0 0 0 0 Dec.,07
24 Tamil Nadu .. .. .. .. 0 0 Dec.,07
25 Tripura 0 0 0 0 0 0 Dec.,07
26 Uttarakhand 1 0 0 0 1 0 Dec.,07
27 Uttar Pradesh 238 1 145 0 383 1 Dec.,07
28 West Bengal 303 12 370 21 673 33 Dec.,07
29 A & N Islands 0 0 0 0 0 0 Dec.,07
30 Chandigarh .. .. .. .. 0 0 Dec.,07
31 D & N Haveli 0 0 0 0 0 0 Dec.,07
32 Daman & Diu 0 0 0 0 0 0 Dec.,07
33 Delhi 16 0 6 0 22 0 Dec.,07
34 Lakshadweep 0 0 0 0 0 0 Dec.,07
35 Puducherry 0 0 0 0 0 0 Dec.,07
TOTAL 1962 40 1813 29 3812 69
Notes:
../NR Not Reported/Not Received
= The sum of male and female may not tally with the total figure as some States/UTs have not reported genderwise information separately.
Source: Monthly Health Condition Reports from Directorate of Health Services of States/UTs.

National Health Profile 2008 77
3.1.1.12 State/UT wise Cases and Deaths Due to Diphtheria in India 2008(Provisional)
S. No.
State/UT Male Female Total Reference Period up toCases Deaths Cases Deaths Cases Deaths
1 2 3 4 5 6 7 8
1 Andhra Pradesh 324 0 494 3 818 3 Dec.,08
2 Arunachal Pradesh .. .. .. .. .. .. NR
3 Assam 0 0 0 0 0 0 Apr.,08
4 Bihar .. .. .. .. .. .. NR
5 Chhattisgarh 106 0 91 0 197 0 Dec.,08
6 Goa 11 0 2 0 13 0 Sept.,08
7 Gujarat 32 0 26 1 58 1 Dec.,08
8 Haryana 2 0 0 0 2 0 Dec.,08
9 Himachal Pr. 0 0 0 0 0 0 Dec.,08
10 Jammu Div. 0 0 0 0 0 0 Dec.,08
Kashmir Div. 7 0 3 0 10 0 Dec.,08
11 Jharkhand 132 0 63 0 195 0 Dec.,08
12 Karnataka 1060 0 1079 0 2139 0 Dec.,08
13 Kerala 6 1 11 3 17 4 Dec.,08
14 Madhya Pradesh 0 0 0 0 0 0 Dec.,08
15 Maharashtra 184 0 192 0 376 0 Dec.,08
16 Manipur 0 0 0 0 0 0 Sept.,08
17 Meghalaya 63 0 55 0 118 0 Dec.,08
18 Mizoram 26 0 20 0 46 0 Dec.,08
19 Nagaland 319 0 232 0 551 0 Dec.,08
20 Orissa 0 0 1 0 1 0 Dec.,08
21 Punjab 1 1 0 0 1 1 Dec.,08
22 Rajasthan 379 0 344 0 723 0 Dec.,08
23 Sikkim 0 0 0 0 0 0 Dec.,08
24 Tamil Nadu 4 0 4 0 8 0 Dec.,08
25 Tripura 0 0 0 0 0 0 Dec.,08
26 Uttarakhand 25 0 19 0 44 0 Dec.,08
27 Uttar Pradesh 21 0 20 0 41 0 Dec.,08
28 West Bengal 266 15 261 9 527 24 Dec.,08
29 A & N Islands 0 0 0 0 0 0 Dec.,08
30 Chandigarh .. .. .. .. .. .. NR
31 D & N Haveli 0 0 0 0 0 0 Dec.,08
32 Daman & Diu 0 0 0 0 0 0 Nov.,08
33 Delhi 116 21 80 11 196 32 Dec.,08
34 Lakshadweep 0 0 0 0 0 0 Nov.,08
35 Puducherry 0 0 0 0 0 0 Dec.,08 except Mar.
TOTAL 3084 38 2997 27 6081 65
Notes:
../NR Not Reported/Not Received
= The sum of male and female may not tally with the total figure as some States/UTs have not reported genderwise information separately.
Source: Monthly Health Condition Reports from Directorate of Health Services of States/UTs.

National Health Profile 200878
3.1.1.13 State/UT wise Cases and Deaths Due to Whooping Cough in India 2007 (Revised based on information received from state/UT after the release of NHP 2007)
S. No.
State/UT Male Female Total Reference Period up toCases Deaths Cases Deaths Cases Deaths
1 2 3 4 5 6 7 8
1 Andhra Pradesh 3246 0 2842 0 6088 0 Dec.,07
2 Arunachal Pradesh .. .. .. .. .. .. NR
3 Assam 0 0 0 0 0 0 Dec.,07
4 Bihar .. .. .. .. .. .. NR
5 Chhattisgarh 1029 0 966 0 1995 0 Dec.,07
6 Goa 16 0 14 0 30 0 Dec.,07
7 Gujarat 25 0 0 0 25 0 Dec.,07
8 Haryana 396 0 335 0 731 0 Dec.,07
9 Himachal Pr. 0 0 0 0 0 0 Dec.,07
10 Jammu Div. 1002 0 514 0 1516 0 Dec.,07
Kashmir Div. 157 0 113 0 270 0 Dec.,07
11 Jharkhand 897 0 509 0 1406 0 Dec.,07
12 Karnataka 2026 0 1535 0 3561 0 Dec.,07
13 Kerala 77 0 70 0 147 0 Dec.,07
14 Madhya Pradesh 9371 0 3062 0 12433 0 Dec.,07
15 Maharashtra 0 0 0 0 0 0 Dec.,07
16 Manipur 353 0 364 0 717 0 Dec.,07
17 Meghalaya 523 0 546 0 1069 0 Dec.,07
18 Mizoram 7 0 6 0 13 0 Dec.,07
19 Nagaland 256 0 60 0 569 0 Dec.,07
20 Orissa 579 0 387 0 966 0 Dec.,07
21 Punjab 0 0 0 0 0 0 Dec.,07
22 Rajasthan 32 0 36 0 68 0 Dec.,07
23 Sikkim 0 0 0 0 0 0 Dec.,07
24 Tamil Nadu .. .. .. .. 0 0 Dec.,07
25 Tripura 182 0 112 0 294 0 Dec.,07
26 Uttarakhand 268 0 366 0 634 0 Dec.,07
27 Uttar Pradesh 6375 3 4812 2 11187 5 Dec.,07
28 West Bengal 1610 7 1265 3 2875 10 Dec.,07
29 A & N Islands 42 0 32 0 74 0 Dec.,07
30 Chandigarh .. .. .. .. 0 0 Dec.,07
31 D & N Haveli 0 0 0 0 0 0 Dec.,07
32 Daman & Diu 0 0 0 0 0 0 Dec.,07
33 Delhi 1 0 5 0 6 0 Dec.,07
34 Lakshadweep 0 0 0 0 0 0 Dec.,07
35 Puducherry 0 0 0 0 0 0 Dec.,07
TOTAL 28470 10 17951 5 46674 15
Notes:
../NR Not Reported/Not Received
= The sum of male and female may not tally with the total figure as some States/UTs have not reported genderwise information separately.
Source: Monthly Health Condition Reports from Directorate of Health Services of States/UTs.

National Health Profile 2008 79
3.1.1.13 State/UT wise Cases and Deaths Due to Whooping Cough in India 2008(Provisional)
S. No.
State/UT Male Female Total Reference Period up toCases Deaths Cases Deaths Cases Deaths
1 2 3 4 5 6 7 8
1 Andhra Pradesh 1276 0 1364 0 2640 0 Dec.,08
2 Arunachal Pradesh .. .. .. .. .. .. NR
3 Assam 0 0 0 0 0 0 Apr.,08
4 Bihar .. .. .. .. .. .. NR
5 Chhattisgarh 2316 0 2180 0 4496 0 Dec.,08
6 Goa 8 0 9 0 17 0 Sept.,08
7 Gujarat 0 0 0 0 0 0 Dec.,08
8 Haryana 491 0 663 0 1154 0 Dec.,08
9 Himachal Pr. 0 0 0 0 0 0 Dec.,08
10 Jammu Div. 349 0 171 0 520 0 Dec.,08
Kashmir Div. 186 0 128 0 314 0 Dec.,08
11 Jharkhand 3961 0 3471 0 7432 0 Dec.,08
12 Karnataka 722 0 487 0 1209 0 Dec.,08
13 Kerala 53 0 64 0 117 0 Dec.,08
14 Madhya Pradesh 5879 0 4547 0 10426 0 Dec.,08
15 Maharashtra 0 0 0 0 0 0 Dec.,08
16 Manipur 326 0 370 0 696 0 Sept.,08
17 Meghalaya 2488 0 2845 0 5333 0 Dec.,08
18 Mizoram 9 0 5 0 14 0 Dec.,08
19 Nagaland 963 0 843 0 1806 0 Dec.,08
20 Orissa 1052 0 695 0 1747 0 Dec.,08
21 Punjab 0 0 0 0 0 0 Dec.,08
22 Rajasthan 465 0 401 0 866 0 Dec.,08
23 Sikkim 0 0 0 0 0 0 Dec.,08
24 Tamil Nadu 6 0 8 0 14 0 Dec.,08
25 Tripura 64 0 48 0 112 0 Dec.,08
26 Uttarakhand 7 0 5 0 12 0 Dec.,08
27 Uttar Pradesh 1260 0 964 0 2224 0 Dec.,08
28 West Bengal 561 8 380 4 941 12 Dec.,08
29 A & N Islands 89 0 72 0 161 0 Dec.,08
30 Chandigarh .. .. .. .. .. .. NR
31 D & N Haveli 0 0 0 0 0 0 Dec.,08
32 Daman & Diu 0 0 0 0 0 0 Nov.,08
33 Delhi 939 3 990 2 1929 5 Dec.,08
34 Lakshadweep 0 0 0 0 0 0 Nov.,08
35 Puducherry 0 0 0 0 0 0 Dec.,08 except Mar.
TOTAL 23470 11 20710 6 44180 17
Notes:
../NR Not Reported/Not Received
= The sum of male and female may not tally with the total figure as some States/UTs have not reported genderwise information separately.
Source: Monthly Health Condition Reports from Directorate of Health Services of States/UTs.

National Health Profile 200880
3.1.1.14 State/UT wise Cases and Deaths due to Measles in India 2007 (Revised based on information received from state/UT after the release of NHP 2007)
S. No.
State/UT Male Female Total Reference Period up toCases Deaths Cases Deaths Cases Deaths
1 2 3 4 5 6 7 8
1 Andhra Pradesh 831 0 689 0 1520 0 Dec.,07
2 Arunachal Pradesh .. .. .. .. .. .. NR
3 Assam 945 39 582 11 1527 50 Dec.,07
4 Bihar .. .. .. .. .. .. NR
5 Chhattisgarh 123 0 70 0 193 0 Dec.,07
6 Goa 17 0 17 0 34 0 Dec.,07
7 Gujarat 461 0 88 0 549 0 Dec.,07
8 Haryana 10 0 7 0 17 0 Dec.,07
9 Himachal Pr. 322 2 262 1 584 3 Dec.,07
10 Jammu Div. 212 0 180 0 392 0 Dec.,07
Kashmir Div. 696 0 538 0 1234 0 Dec.,07
11 Jharkhand 576 0 540 0 1116 0 Dec.,07
12 Karnataka 1376 0 1290 0 2666 0 Dec.,07
13 Kerala 1377 1 1297 1 2674 2 Dec.,07
14 Madhya Pradesh 921 10 415 5 1336 15 Dec.,07
15 Maharashtra 3260 0 2506 0 5766 0 Dec.,07
16 Manipur 439 1 392 0 831 1 Dec.,07
17 Meghalaya 175 0 167 0 342 0 Dec.,07
18 Mizoram 32 0 30 0 62 0 Dec.,07
19 Nagaland 229 0 31 0 445 0 Dec.,07
20 Orissa 465 2 366 2 831 4 Dec.,07
21 Punjab 34 0 17 0 51 0 Dec.,07
22 Rajasthan 197 0 110 0 307 0 Dec.,07
23 Sikkim 102 0 82 0 184 0 Dec.,07
24 Tamil Nadu .. .. .. .. 259 0 Dec.,07
25 Tripura 180 1 119 0 299 1 Dec.,07
26 Uttarakhand 32 0 22 0 54 0 Dec.,07
27 Uttar Pradesh 3791 0 3318 2 7109 2 Dec.,07
28 West Bengal 5479 11 4452 7 9931 18 Dec.,07
29 A & N Islands 160 0 134 0 294 0 Dec.,07
30 Chandigarh .. .. .. .. 26 0 Dec.,07
31 D & N Haveli 40 0 44 0 84 0 Dec.,07
32 Daman & Diu 0 0 0 0 0 0 Dec.,07
33 Delhi 159 0 58 0 217 0 Dec.,07
34 Lakshadweep 0 0 0 0 0 0 Dec.,07
35 Puducherry 96 0 114 0 210 0 Dec.,07
TOTAL 22737 67 17937 29 41144 96
Notes:
../NR Not Reported/Not Received
= The sum of male and female may not tally with the total figure as some States/UTs have not reported genderwise information separately.
Source: Monthly Health Condition Reports from Directorate of Health Services of States/UTs.

National Health Profile 2008 81
3.1.1.14 State/UT wise Cases and Deaths Due to Measles in India 2008 (Provisional)
S. No.
State/UT Male Female Total Reference Period up toCases Deaths Cases Deaths Cases Deaths
1 2 3 4 5 6 7 8
1 Andhra Pradesh 625 1 540 1 1165 2 Dec.,08
2 Arunachal Pradesh .. .. .. .. .. .. NR
3 Assam 519 58 320 20 839 78 Apr.,08
4 Bihar .. .. .. .. .. .. NR
5 Chhattisgarh 51 0 42 0 93 0 Dec.,08
6 Goa 24 0 28 0 52 0 Sept.,08
7 Gujarat 226 0 205 0 431 0 Dec.,08
8 Haryana 157 0 141 0 298 0 Dec.,08
9 Himachal Pr. 185 0 170 0 355 0 Dec.,08
10 Jammu Div. 147 0 134 0 281 0 Dec.,08
Kashmir Div. 428 0 296 0 724 0 Dec.,08
11 Jharkhand 1024 0 928 0 1952 0 Dec.,08
12 Karnataka 710 0 643 0 1353 0 Dec.,08
13 Kerala 1800 0 1622 0 3422 0 Dec.,08
14 Madhya Pradesh 1722 1 550 2 2272 3 Dec.,08
15 Maharashtra 2519 0 1870 0 4389 0 Dec.,08
16 Manipur 279 0 231 0 510 0 Sept.,08
17 Meghalaya 265 1 279 1 544 2 Dec.,08
18 Mizoram 195 0 113 0 308 0 Dec.,08
19 Nagaland 471 0 547 0 1018 0 Dec.,08
20 Orissa 4179 16 3488 17 7667 33 Dec.,08
21 Punjab 49 0 40 0 89 0 Dec.,08
22 Rajasthan 329 0 220 0 549 0 Dec.,08 except May & Oct.
23 Sikkim 328 0 233 0 561 0 Dec.,08
24 Tamil Nadu 250 1 241 0 491 1 Dec.,08
25 Tripura 171 0 133 0 304 0 Dec.,08
26 Uttarakhand 386 0 3496 0 3882 0 Dec.,08
27 Uttar Pradesh 746 0 549 2 1295 2 Dec.,08
28 West Bengal 5447 28 4473 27 9920 55 Dec.,08
29 A & N Islands 27 0 31 0 58 0 Dec.,08
30 Chandigarh .. .. .. .. .. .. NR
31 D & N Haveli 17 0 9 0 26 0 Dec.,08
32 Daman & Diu 0 0 0 0 0 0 Nov.,08
33 Delhi 1813 9 1466 3 3279 12 Dec.,08
34 Lakshadweep 0 0 0 0 0 0 Nov.,08
35 Puducherry 28 0 26 0 54 0 Dec.,08 except Mar.
TOTAL 25117 115 23064 73 48181 188
Notes:
../NR Not Reported/Not Received
= The sum of male and female may not tally with the total figure as some States/UTs have not reported genderwise information separately.
Source: Monthly Health Condition Reports from Directorate of Health Services of States/UTs.
National Health Profile 200882
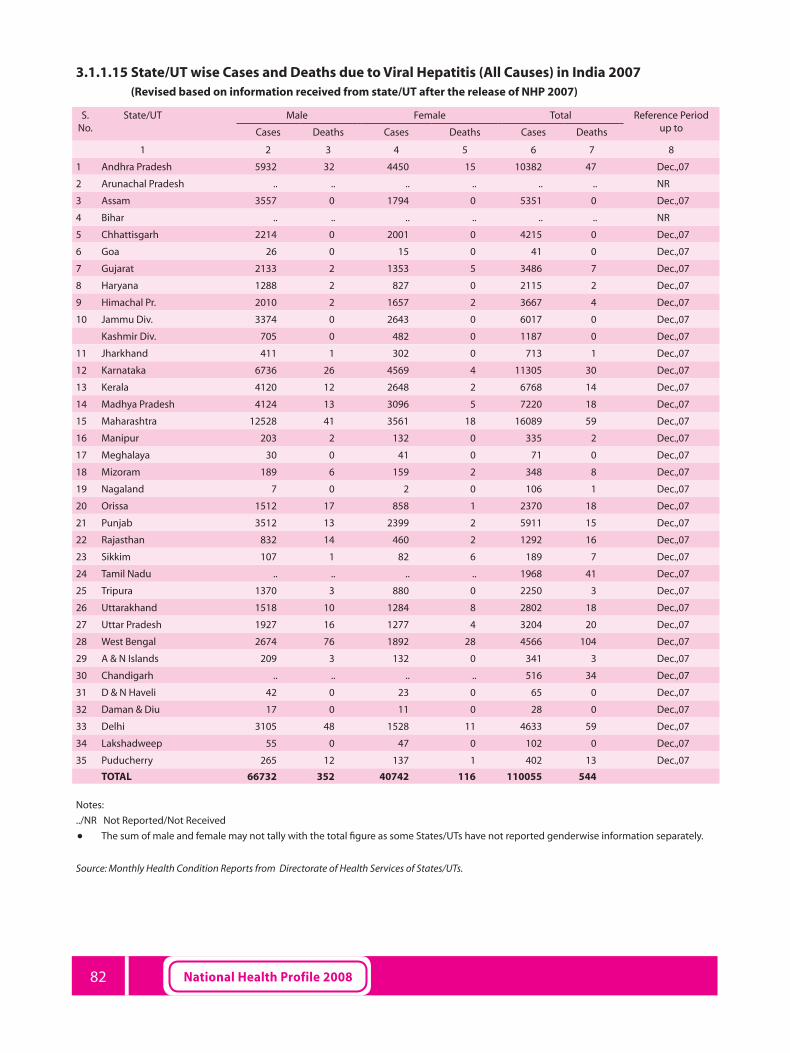
3.1.1.15 State/UT wise Cases and Deaths due to Viral Hepatitis (All Causes) in India 2007 (Revised based on information received from state/UT after the release of NHP 2007)
S. No.
State/UT Male Female Total Reference Period up toCases Deaths Cases Deaths Cases Deaths
1 2 3 4 5 6 7 8
1 Andhra Pradesh 5932 32 4450 15 10382 47 Dec.,07
2 Arunachal Pradesh .. .. .. .. .. .. NR
3 Assam 3557 0 1794 0 5351 0 Dec.,07
4 Bihar .. .. .. .. .. .. NR
5 Chhattisgarh 2214 0 2001 0 4215 0 Dec.,07
6 Goa 26 0 15 0 41 0 Dec.,07
7 Gujarat 2133 2 1353 5 3486 7 Dec.,07
8 Haryana 1288 2 827 0 2115 2 Dec.,07
9 Himachal Pr. 2010 2 1657 2 3667 4 Dec.,07
10 Jammu Div. 3374 0 2643 0 6017 0 Dec.,07
Kashmir Div. 705 0 482 0 1187 0 Dec.,07
11 Jharkhand 411 1 302 0 713 1 Dec.,07
12 Karnataka 6736 26 4569 4 11305 30 Dec.,07
13 Kerala 4120 12 2648 2 6768 14 Dec.,07
14 Madhya Pradesh 4124 13 3096 5 7220 18 Dec.,07
15 Maharashtra 12528 41 3561 18 16089 59 Dec.,07
16 Manipur 203 2 132 0 335 2 Dec.,07
17 Meghalaya 30 0 41 0 71 0 Dec.,07
18 Mizoram 189 6 159 2 348 8 Dec.,07
19 Nagaland 7 0 2 0 106 1 Dec.,07
20 Orissa 1512 17 858 1 2370 18 Dec.,07
21 Punjab 3512 13 2399 2 5911 15 Dec.,07
22 Rajasthan 832 14 460 2 1292 16 Dec.,07
23 Sikkim 107 1 82 6 189 7 Dec.,07
24 Tamil Nadu .. .. .. .. 1968 41 Dec.,07
25 Tripura 1370 3 880 0 2250 3 Dec.,07
26 Uttarakhand 1518 10 1284 8 2802 18 Dec.,07
27 Uttar Pradesh 1927 16 1277 4 3204 20 Dec.,07
28 West Bengal 2674 76 1892 28 4566 104 Dec.,07
29 A & N Islands 209 3 132 0 341 3 Dec.,07
30 Chandigarh .. .. .. .. 516 34 Dec.,07
31 D & N Haveli 42 0 23 0 65 0 Dec.,07
32 Daman & Diu 17 0 11 0 28 0 Dec.,07
33 Delhi 3105 48 1528 11 4633 59 Dec.,07
34 Lakshadweep 55 0 47 0 102 0 Dec.,07
35 Puducherry 265 12 137 1 402 13 Dec.,07
TOTAL 66732 352 40742 116 110055 544
Notes:
../NR Not Reported/Not Received
= The sum of male and female may not tally with the total figure as some States/UTs have not reported genderwise information separately.
Source: Monthly Health Condition Reports from Directorate of Health Services of States/UTs.

National Health Profile 2008 83
3.1.1.15 State/UT wise Cases and Deaths Due to Viral Hepatitis (All Causes) in India 2008 (Provisional)
S. No.
State/UT Male Female Total Reference Period up toCases Deaths Cases Deaths Cases Deaths
1 2 3 4 5 6 7 8
1 Andhra Pradesh 4754 50 3441 21 8195 71 Dec.,08
2 Arunachal Pradesh .. .. .. .. .. .. NR
3 Assam 1537 0 638 0 2175 0 Apr.,08
4 Bihar .. .. .. .. .. .. NR
5 Chhattisgarh 949 0 775 0 1724 0 Dec.,08
6 Goa 63 0 25 0 88 0 Sept.,08
7 Gujarat 1702 3 1238 0 2940 3 Dec.,08
8 Haryana 1239 4 633 1 1872 5 Dec.,08
9 Himachal Pr. 979 4 804 3 1783 7 Dec.,08
10 Jammu Div. 3307 0 1955 0 5262 0 Dec.,08
Kashmir Div. 411 0 327 0 738 0 Dec.,08
11 Jharkhand 232 1 163 2 395 3 Dec.,08
12 Karnataka 4747 14 4581 11 9328 25 Dec.,08
13 Kerala 6033 18 3997 6 10030 24 Dec.,08
14 Madhya Pradesh 4533 26 3796 16 8329 42 Dec.,08
15 Maharashtra 4194 26 3013 8 7207 34 Dec.,08
16 Manipur 202 0 154 0 356 0 Sept.,08
17 Meghalaya 148 0 127 0 275 0 Dec.,08
18 Mizoram 287 9 202 2 489 11 Dec.,08
19 Nagaland 57 0 70 0 127 0 Dec.,08
20 Orissa 1165 15 647 6 1812 21 Dec.,08
21 Punjab 4025 5 2855 5 6880 10 Dec.,08
22 Rajasthan 1219 4 781 2 2000 6 Dec.,08
23 Sikkim 77 0 76 2 153 2 Dec.,08
24 Tamil Nadu 1087 7 852 6 1939 13 Dec.,08
25 Tripura 723 4 423 1 1146 5 Dec.,08
26 Uttarakhand 1539 6 1119 9 2658 15 Dec.,08
27 Uttar Pradesh 716 8 420 4 1136 12 Dec.,08
28 West Bengal 2614 90 1592 32 4206 122 Dec.,08
29 A & N Islands 142 1 87 0 229 1 Dec.,08
30 Chandigarh .. .. .. .. .. .. NR
31 D & N Haveli 232 1 221 1 453 2 Dec.,08
32 Daman & Diu 47 0 29 0 76 0 Nov.,08
33 Delhi 3637 45 2123 9 5760 54 Dec.,08
34 Lakshadweep 60 0 52 0 112 0 Nov.,08
35 Puducherry 350 20 217 2 567 22 Dec.,08 except Mar.
TOTAL 53007 361 37433 149 90440 510
Notes:
../NR Not Reported/Not Received
= The sum of male and female may not tally with the total figure as some States/UTs have not reported genderwise information separately.
Source: Monthly Health Condition Reports from Directorate of Health Services of States/UTs.

National Health Profile 200884
3.1.1.16 State/UT wise Cases and Deaths Due to Rabies in India 2007 (Revised based on information received from states/UTs after the release of NHP 2007)
S. No.
State/UT Male Female Total Reference Period up to
Cases/Deaths Cases/Deaths Cases/Deaths
1 2 3 4 5
1 Andhra Pradesh 26 14 40 Dec.,07
2 Arunachal Pradesh .. .. .. NR
3 Assam 0 0 0 Dec.,07
4 Bihar .. .. .. NR
5 Chhattisgarh 5 1 6 Dec.,07
6 Goa 0 0 0 Dec.,07
7 Gujarat 0 0 0 Dec.,07
8 Haryana 0 0 0 Dec.,07
9 Himachal Pr. 1 0 1 Dec.,07
10 Jammu Div. 0 0 0 Dec.,07
Kashmir Div. 0 0 0 Dec.,07
11 Jharkhand 0 0 0 Dec.,07
12 Karnataka 7 8 15 Dec.,07
13 Kerala 9 4 13 Dec.,07
14 Madhya Pradesh 11 3 14 Dec.,07
15 Maharashtra 28 13 41 Dec.,07
16 Manipur 0 0 0 Dec.,07
17 Meghalaya 0 0 0 Dec.,07
18 Mizoram 0 0 0 Dec.,07
19 Nagaland 0 0 0 Dec.,07
20 Orissa 1 1 2 Dec.,07
21 Punjab 0 0 0 Dec.,07
22 Rajasthan 7 1 8 Dec.,07
23 Sikkim 0 0 0 Dec.,07
24 Tamil Nadu .. .. 1 Dec.,07
25 Tripura 2 2 4 Dec.,07
26 Uttarakhand 0 0 0 Dec.,07
27 Uttar Pradesh 0 0 0 Dec.,07
28 West Bengal 64 32 96 Dec.,07
29 A & N Islands 0 0 0 Dec.,07
30 Chandigarh .. .. 0 Dec.,07
31 D & N Haveli 0 0 0 Dec.,07
32 Daman & Diu 0 0 0 Dec.,07
33 Delhi 0 0 0 Dec.,07
34 Lakshadweep 0 0 0 Dec.,07
35 Puducherry 3 0 3 Dec.,07
TOTAL 164 79 244
Notes:
../NR Not Reported/Not Received
= The sum of male and female may not tally with the total figure as some States/UTs have not reported genderwise information separately.
Source: Monthly Health Condition Reports from Directorate of Health Services of States/UTs.

National Health Profile 2008 85
3.1.1.16 State/UT wise Cases and Deaths Due to Rabies in India 2008 (Provisional)
S. No.
State/UT Male Female Total Reference Period up to
Cases/Deaths Cases/Deaths Cases/Deaths
1 2 3 4 5
1 Andhra Pradesh 18 10 28 Dec.,08
2 Arunachal Pradesh .. .. .. NR
3 Assam 0 0 0 Apr.,08
4 Bihar .. .. .. NR
5 Chhattisgarh 0 1 1 Dec.,08
6 Goa 0 0 0 Sept.,08
7 Gujarat 8 2 10 Dec.,08
8 Haryana 0 0 0 Dec.,08
9 Himachal Pr. 0 1 1 Dec.,08
10 Jammu Div. 0 0 0 Dec.,08
Kashmir Div. 0 0 0 Dec.,08
11 Jharkhand 0 0 0 Dec.,08
12 Karnataka 8 9 17 Dec.,08
13 Kerala 14 2 16 Dec.,08
14 Madhya Pradesh 11 2 13 Dec.,08
15 Maharashtra 19 13 32 Dec.,08
16 Manipur 0 0 0 Sept.,08
17 Meghalaya 0 0 0 Dec.,08
18 Mizoram 0 0 0 Dec.,08
19 Nagaland 0 0 0 Dec.,08
20 Orissa 1 0 1 Dec.,08
21 Punjab 0 0 0 Dec.,08
22 Rajasthan 6 2 8 Dec.,08
23 Sikkim 0 0 0 Dec.,08
24 Tamil Nadu 4 3 7 Dec.,08
25 Tripura 4 0 4 Dec.,08
26 Uttarakhand 1 0 1 Dec.,08
27 Uttar Pradesh 0 0 0 Dec.,08
28 West Bengal 72 30 102 Dec.,08
29 A & N Islands 0 0 0 Dec.,08
30 Chandigarh .. .. .. NR
31 D & N Haveli 0 0 0 Dec.,08
32 Daman & Diu 0 0 0 Nov.,08
33 Delhi 16 5 21 Dec.,08
34 Lakshadweep 0 0 0 Nov.,08
35 Puducherry 0 0 0 Dec.,08 except Mar.
TOTAL 182 80 262
Notes:
../NR Not Reported/Not Received
= The sum of male and female may not tally with the total figure as some States/UTs have not reported genderwise information separately.
Source: Monthly Health Condition Reports from Directorate of Health Services of States/UTs.

National Health Profile 200886
3.1.1.17 State/UT wise Cases and Deaths Due to Polio in India 2007 - 2008
S. No.
State/UT 2007 2008
Cases Deaths Cases Deaths
1 2 3 4 5
1 Andhra Pradesh 5 0 1 0
2 Arunachal Pradesh NA NA NA NA
3 Assam 0 0 1 0
4 Bihar 503 14 233 9
5 Chhattisgarh NA NA NA NA
6 Goa NA NA NA NA
7 Gujarat 1 0 0 0
8 Haryana 6 1 2 0
9 Himachal Pradesh NA NA NA NA
10 Jammu & Kashmir NA NA NA NA
11 Jharkhand NA NA NA NA
12 Karnataka 1 0 0 0
13 Kerala NA NA NA NA
14 Madhya Pradesh 0 0 1 0
15 Maharashtra 2 1 2 0
16 Manipur NA NA NA NA
17 Meghalaya NA NA NA NA
18 Mizoram NA NA NA NA
19 Nagaland NA NA NA NA
20 Orissa 1 0 2 0
21 Punjab 1 0 2 0
22 Rajasthan 3 0 2 0
23 Sikkim NA NA NA NA
24 Tamil Nadu NA NA NA NA
25 Tripura NA NA NA NA
26 Uttarakhand 6 0 1 0
27 Uttar Pradesh 341 18 305 21
28 West Bengal 2 0 2 0
29 A & N Islands NA NA NA NA
30 Chandigarh NA NA NA NA
31 D & N Haveli NA NA NA NA
32 Daman & Diu NA NA NA NA
33 Delhi 2 1 5 0
34 Lakshadweep NA NA NA NA
35 Puducherry NA NA NA NA
TOTAL 874 35 559 30
Note:
NA Not Available
Source: National Polio Surveillance unit of India (website http://www.npsuindia.org)

National Health Profile 2008 87
3.1.1.17 State/UT wise Classification of AFP cases and Key surveillance indicatiors, 2008
S. No.
State/UT 2008
AFP Surveillance Indicators
AFP Cases
Case Cllasification Annualized Rates Specimen
Pending
Confirmed Polio1
Compatible Discarded (non- polio
AFP)
Total 90 Days
AFP rate
Non-polio AFP
rate
% with 2 spec. w/in
14 days
% with any specimen
1 2 3 4 5 6 7 8 9 10 11
1 Andhra Pradesh 756 1 2 702 51 35 2.62 2.43 83 98
2 Andaman & Nicobar 3 0 0 3 0 0 2.42 2.42 100 100
3 Arunachal Pradesh 49 0 0 48 1 0 9.57 9.38 82 98
4 Assam 475 1 4 454 16 13 3.91 3.74 87 97
5 Bihar 11629 233 133 10614 649 508 29.60 27.01 85 97
6 Chandigarh 15 0 0 14 1 0 3.28 3.06 87 100
7 Chhattisgarh 495 0 0 433 62 53 5.25 4.59 71 96
8 D & N Haveli 1 0 0 1 0 0 0.87 0.87 100 100
9 Daman & Diu 1 0 0 1 0 0 1.03 1.03 0 0
10 Delhi 262 5 0 227 30 26 3.46 3.00 77 96
11 Goa 23 0 0 19 4 4 4.74 3.92 74 91
12 Gujarat 703 0 1 673 29 23 3.42 3.28 85 95
13 Haryana 566 2 2 519 43 29 5.57 5.11 80 98
14 Himachal Pradesh 90 0 0 85 5 5 3.36 3.17 87 98
15 Jammu & Kashmir 140 0 0 139 1 0 2.93 2.91 99 100
16 Jharkhand 1535 0 8 1458 69 54 12.10 11.49 84 96
17 Karnataka 751 0 1 706 44 36 4.01 3.77 83 97
18 Kerala 289 0 0 273 16 10 2.85 2.69 75 97
19 Lakshadweep 0 0 0 0 0 0 0.00 0.00 0 0
20 Madhya Pradesh 2281 1 7 2135 138 113 7.89 7.38 83 97
21 Maharashtra 1909 2 3 1789 115 89 5.04 4.72 84 97
22 Manipur 24 0 0 24 0 0 2.39 2.39 88 92
23 Meghalaya 38 0 0 38 0 0 3.51 3.51 89 100
24 Mizoram 7 0 0 7 0 0 1.74 1.74 86 100
25 Nagaland 18 0 0 18 0 0 1.64 1.64 100 100
26 Orissa 1222 2 4 1129 87 66 7.56 6.99 78 96
27 Puducherry 18 0 0 17 1 1 5.50 5.20 89 100
28 Punjab 389 2 3 359 25 18 4.00 3.69 79 97
29 Rajasthan 1351 2 3 1212 134 105 5.07 4.55 74 96
30 Sikkim 5 0 0 5 0 0 2.08 2.08 80 100
31 Tamil Nadu 556 0 0 538 18 14 3.05 2.95 88 99
32 Tripura 60 0 0 58 2 2 4.37 4.22 95 100
33 Uttarakhand 372 1 2 352 17 13 9.79 9.26 86 97
34 Uttar Pradesh 17603 305 98 16145 1055 826 22.65 20.78 85 97
35 West Bengal 1853 2 2 1791 58 36 6.07 5.87 87 97
TOTAL 45489 559 273 41986 2671 2079 10.48 9.68 84 97
Notes:
NA AFP cases > 15 years of age of missing age information are excluded1 Includeds 13 index cases (type 1 - 1 in Bihar, 2 in Uttar pradesh: type 3 - 7 in Bihar, 3 in Uttar pradesh) with contact specimen positive for wild
poliovirus in 2008.
Source: National Polio Surveillance unit of India (website http://www.npsuindia.org)

National Health Profile 200888
3.1.1.18 State/UT wise Cases and Deaths Due to Pneumonia in India 2007 (Revised based on information received from state/UT after the release of NHP 2007)
S. No.
State/UT Male Female Total Reference Period up toCases Deaths Cases Deaths Cases Deaths
1 2 3 4 5 6 7 8
1 Andhra Pradesh 38121 130 37396 83 75517 213 Dec.,07
2 Arunachal Pradesh .. .. .. .. .. .. NR
3 Assam 6403 46 4829 31 11232 77 Dec.,07
4 Bihar .. .. .. .. .. .. NR
5 Chhattisgarh 15282 18 5899 11 21181 29 Dec.,07
6 Goa 40 1 37 0 77 1 Dec.,07
7 Gujarat 3252 84 2631 56 5883 140 Dec.,07
8 Haryana 4599 29 3743 13 8342 42 Dec.,07
9 Himachal Pr. 16023 51 15042 28 31065 79 Dec.,07
10 Jammu Div. 43748 0 29155 0 72903 0 Dec.,07
Kashmir Div. 7268 0 5384 0 12652 0 Dec.,07
11 Jharkhand 4119 3 2955 2 7074 5 Dec.,07
12 Karnataka 19184 91 17968 43 37152 134 Dec.,07
13 Kerala 8324 51 7335 37 15659 88 Dec.,07
14 Madhya Pradesh 25137 26 23057 19 48194 45 Dec.,07
15 Maharashtra 20738 61 19404 54 40142 115 Dec.,07
16 Manipur 963 19 810 6 1773 25 Dec.,07
17 Meghalaya 1952 27 1628 17 3580 44 Dec.,07
18 Mizoram 2256 65 2059 42 4315 107 Dec.,07
19 Nagaland 299 0 141 0 844 6 Dec.,07
20 Orissa 9931 83 7761 49 17692 132 Dec.,07
21 Punjab 4471 41 3566 24 8037 65 Dec.,07
22 Rajasthan 40148 64 30933 50 71081 114 Dec.,07
23 Sikkim 913 3 462 3 1375 6 Dec.,07
24 Tamil Nadu .. .. .. .. 7380 52 Dec.,07
25 Tripura 2384 71 1919 54 4303 125 Dec.,07
26 Uttarakhand 4235 4 6302 8 10537 12 Dec.,07
27 Uttar Pradesh 63618 206 51343 168 114961 374 Dec.,07
28 West Bengal 39400 530 35807 391 75207 921 Dec.,07
29 A & N Islands 620 6 653 3 1273 9 Dec.,07
30 Chandigarh .. .. .. .. 3377 53 Dec.,07
31 D & N Haveli 43 0 32 0 75 0 Dec.,07
32 Daman & Diu 7 1 6 0 13 1 Dec.,07
33 Delhi 19188 258 12589 160 31777 418 Dec.,07
34 Lakshadweep 12 0 11 1 23 1 Dec.,07
35 Puducherry 1216 15 802 8 2018 23 Dec.,07
TOTAL 403894 1984 331659 1361 746714 3456
Notes:
../NR Not Reported/Not Received
= The sum of male and female may not tally with the total figure as some States/UTs have not reported genderwise information separately.
Source: Monthly Health Condition Reports from Directorate of Health Services of States/UTs.

National Health Profile 2008 89
3.1.1.18 State/UT wise Cases and Deaths Due to Pneumonia in India 2008 (Provisional)
S. No.
State/UT Male Female Total Reference Period up toCases Deaths Cases Deaths Cases Deaths
1 2 3 4 5 6 7 8
1 Andhra Pradesh 35917 143 32199 105 68116 248 Dec.,08
2 Arunachal Pradesh .. .. .. .. .. .. NR
3 Assam 2083 82 1443 49 3526 131 Apr.,08
4 Bihar .. .. .. .. .. .. NR
5 Chhattisgarh 4011 4 3613 0 7624 4 Dec.,08
6 Goa 153 2 74 0 227 2 Sept.,08
7 Gujarat 4349 67 3723 35 8072 102 Dec.,08
8 Haryana 3488 26 2896 11 6384 37 Dec.,08
9 Himachal Pr. 18479 49 18385 31 36864 80 Dec.,08
10 Jammu Div. 35486 1 30269 6 65755 7 Dec.,08
Kashmir Div. 3369 0 2753 0 6122 0 Dec.,08
11 Jharkhand 2823 0 2278 2 5101 2 Dec.,08
12 Karnataka 14577 119 12813 70 27390 189 Dec.,08
13 Kerala 7603 58 6843 23 14446 81 Dec.,08
14 Madhya Pradesh 30473 41 25638 20 56111 61 Dec.,08
15 Maharashtra 21193 54 19392 38 40585 92 Dec.,08
16 Manipur 484 1 427 1 911 2 Sept.,08
17 Meghalaya 2589 14 2308 25 4897 39 Dec.,08
18 Mizoram 2665 69 2309 52 4974 121 Dec.,08
19 Nagaland 1242 0 1215 0 2457 0 Dec.,08
20 Orissa 13087 127 9677 81 22764 208 Dec.,08
21 Punjab 3403 24 2578 19 5981 43 Dec.,08
22 Rajasthan 52599 145 39902 84 92501 229 Dec.,08
23 Sikkim 477 5 434 2 911 7 Dec.,08
24 Tamil Nadu 20678 21 20575 16 41253 37 Dec.,08
25 Tripura 2008 77 1903 70 3911 147 Dec.,08
26 Uttarakhand 5326 5 5010 3 10336 8 Dec.,08
27 Uttar Pradesh 44326 241 34891 104 79217 345 Dec.,08
28 West Bengal 38946 618 34398 474 73344 1092 Dec.,08
29 A & N Islands 656 3 693 6 1349 9 Dec.,08
30 Chandigarh .. .. .. .. .. .. NR
31 D & N Haveli 88 1 66 1 154 2 Dec.,08
32 Daman & Diu 15 0 9 1 24 1 Nov.,08
33 Delhi 17399 263 10112 153 27511 416 Dec.,08
34 Lakshadweep 22 0 17 0 39 0 Nov.,08
35 Puducherry 1014 12 583 11 1597 23 Dec.,08 except Mar.
TOTAL 391028 2272 329426 1493 720454 3765
Notes:
../NR Not Reported/Not Received
= The sum of male and female may not tally with the total figure as some States/UTs have not reported genderwise information separately.
Source: Monthly Health Condition Reports from Directorate of Health Services of States/UTs.

National Health Profile 200890
3.1.1.19 State/UT wise Cases and Deaths Due to Meningococcal Meningitis in India 2007 (Revised based on information received from states/UTs after the release of NHP 2007)
S. No.
State/UT Male Female Total Reference Period up toCases Deaths Cases Deaths Cases Deaths
1 2 3 4 5 6 7 8
1 Andhra Pradesh 283 8 462 9 745 17 Dec.,07
2 Arunachal Pradesh .. .. .. .. .. .. NR
3 Assam 0 0 0 0 0 0 Dec.,07
4 Bihar .. .. .. .. .. .. NR
5 Chhattisgarh 27 0 13 0 40 0 Dec.,07
6 Goa 0 0 0 0 0 0 Dec.,07
7 Gujarat 41 15 22 10 63 25 Dec.,07
8 Haryana 1 0 3 0 4 0 Dec.,07
9 Himachal Pr. 0 0 0 0 0 0 Dec.,07
10 Jammu Div. 0 0 0 0 0 0 Dec.,07
Kashmir Div. 0 0 0 0 0 0 Dec.,07
11 Jharkhand 29 0 6 0 35 0 Dec.,07
12 Karnataka 377 5 278 2 655 7 Dec.,07
13 Kerala 11 0 12 2 23 2 Dec.,07
14 Madhya Pradesh 523 3 385 2 908 5 Dec.,07
15 Maharashtra 128 8 77 1 205 9 Dec.,07
16 Manipur 16 0 3 0 19 0 Dec.,07
17 Meghalaya 3 1 1 0 4 1 Dec.,07
18 Mizoram 28 8 23 7 51 15 Dec.,07
19 Nagaland 0 0 0 0 4 0 Dec.,07
20 Orissa 23 1 21 1 44 2 Dec.,07
21 Punjab 40 6 25 7 65 13 Dec.,07
22 Rajasthan 31 1 15 0 46 1 Dec.,07
23 Sikkim 3 1 0 0 3 1 Dec.,07
24 Tamil Nadu .. .. .. .. 31 0 Dec.,07
25 Tripura 10 1 5 0 15 1 Dec.,07
26 Uttarakhand 31 2 34 3 65 5 Dec.,07
27 Uttar Pradesh 53 5 58 3 111 8 Dec.,07
28 West Bengal 807 121 517 46 1324 167 Dec.,07
29 A & N Islands 13 1 4 2 17 3 Dec.,07
30 Chandigarh .. .. .. .. 21 2 Dec.,07
31 D & N Haveli 26 0 21 0 47 0 Dec.,07
32 Daman & Diu 0 0 0 0 0 0 Dec.,07
33 Delhi 309 15 52 4 361 19 Dec.,07
34 Lakshadweep 0 0 0 0 0 0 Dec.,07
35 Puducherry 120 3 51 1 171 4 Dec.,07
TOTAL 2933 205 2088 100 5077 307
Notes:
../NR Not Reported/Not Received
= The sum of male and female may not tally with the total figure as some States/UTs have not reported genderwise information separately.
Source: Monthly Health Condition Reports from Directorate of Health Services of States/UTs.

National Health Profile 2008 91
3.1.1.19 State/UT wise Cases and Deaths Due to Meningococcal Meningitis in India 2008 (Provisional)
S. No.
State/UTMale Female Total Reference Period
up toCases Deaths Cases Deaths Cases Deaths
1 2 3 4 5 6 7 8
1 Andhra Pradesh 329 7 280 2 609 9 Dec.,08
2 Arunachal Pradesh .. .. .. .. .. .. NR
3 Assam 0 0 0 0 0 0 Apr.,08
4 Bihar .. .. .. .. .. .. NR
5 Chhattisgarh 9 0 4 0 13 0 Dec.,08
6 Goa 1 0 0 0 1 0 Sept.,08
7 Gujarat 1 0 4 1 5 1 Dec.,08
8 Haryana 16 1 6 0 22 1 Dec.,08
9 Himachal Pr. 0 0 0 0 0 0 Dec.,08
10 Jammu Div. 0 0 0 0 0 0 Dec.,08
Kashmir Div. 0 0 0 0 0 0 Dec.,08
11 Jharkhand 83 0 7 0 90 0 Dec.,08
12 Karnataka 694 9 524 4 1218 13 Dec.,08
13 Kerala 139 0 91 0 230 0 Dec.,08
14 Madhya Pradesh 197 8 113 4 310 12 Dec.,08
15 Maharashtra 83 3 118 0 201 3 Dec.,08
16 Manipur 1 0 1 0 2 0 Sept.,08
17 Meghalaya 230 29 159 17 389 46 Dec.,08
18 Mizoram 47 11 20 8 67 19 Dec.,08
19 Nagaland 0 0 0 0 0 0 Dec.,08
20 Orissa 73 0 69 1 142 1 Dec.,08
21 Punjab 64 3 40 4 104 7 Dec.,08
22 Rajasthan 2 1 3 0 5 1 Dec.,08
23 Sikkim 3 1 3 0 6 1 Dec.,08
24 Tamil Nadu 40 0 29 0 69 0 Dec.,08
25 Tripura 7 1 2 0 9 1 Dec.,08
26 Uttarakhand 45 6 31 4 76 10 Dec.,08
27 Uttar Pradesh 24 2 21 3 45 5 Dec.,08
28 West Bengal 1155 250 755 119 1910 369 Dec.,08
29 A & N Islands 6 2 3 1 9 3 Dec.,08
30 Chandigarh .. .. .. .. .. .. NR
31 D & N Haveli 3 1 3 1 6 2 Dec.,08
32 Daman & Diu 3 2 9 0 12 2 Nov.,08
33 Delhi 249 16 47 3 296 19 Dec.,08
34 Lakshadweep 0 0 0 0 0 0 Nov.,08
35 Puducherry 45 6 33 3 78 9 Dec.,08 except Mar.
TOTAL 3549 359 2375 175 5924 534
Notes:
../NR Not Reported/Not Received
= The sum of male and female may not tally with the total figure as some States/UTs have not reported genderwise information separately.
Source: Monthly Health Condition Reports from Directorate of Health Services of States/UTs.

National Health Profile 200892
3.1.1.20 State/UT wise Cases and Deaths Due to Syphilis in India 2007 (Revised based on information received from states/UTs after the release of NHP 2007)
S. No.
State/UT Male Female Total Reference Period up toCases Deaths Cases Deaths Cases Deaths
1 2 3 4 5 6 7 8
1 Andhra Pradesh 17672 5 14031 1 31703 6 Dec.,07
2 Arunachal Pradesh .. .. .. .. .. .. NR
3 Assam 0 0 0 0 0 0 Dec.,07
4 Bihar .. .. .. .. .. .. NR
5 Chhattisgarh 1033 0 931 0 1964 0 Dec.,07
6 Goa 0 0 0 0 0 0 Dec.,07
7 Gujarat 564 0 921 0 1485 0 Dec.,07
8 Haryana 135 0 110 0 245 0 Dec.,07
9 Himachal Pr. 67 0 98 0 165 0 Dec.,07
10 Jammu Div. 11 0 4 0 15 0 Dec.,07
Kashmir Div. 0 0 0 0 0 0 Dec.,07
11 Jharkhand 191 0 54 0 245 0 Dec.,07
12 Karnataka 2749 0 2587 0 5336 0 Dec.,07
13 Kerala 19 0 17 0 36 0 Dec.,07
14 Madhya Pradesh 1223 0 890 0 2113 0 Dec.,07
15 Maharashtra 463 0 3603 0 4066 0 Dec.,07
16 Manipur 39 0 10 0 49 0 Dec.,07
17 Meghalaya 0 0 0 0 0 0 Dec.,07
18 Mizoram 52 0 55 0 107 0 Dec.,07
19 Nagaland 11 0 12 0 45 0 Dec.,07
20 Orissa 92 1 44 1 136 2 Dec.,07
21 Punjab 46 0 78 0 124 0 Dec.,07
22 Rajasthan 131 0 117 0 248 0 Dec.,07
23 Sikkim 0 0 0 0 0 0 Dec.,07
24 Tamil Nadu .. .. .. .. 977 0 Dec.,07
25 Tripura 122 0 66 0 188 0 Dec.,07
26 Uttarakhand 19 0 1 0 20 0 Dec.,07
27 Uttar Pradesh 281 0 187 0 468 0 Dec.,07
28 West Bengal 323 0 280 0 603 0 Dec.,07
29 A & N Islands 0 0 0 0 0 0 Dec.,07
30 Chandigarh .. .. .. .. 16 0 Dec.,07
31 D & N Haveli 46 0 87 0 133 0 Dec.,07
32 Daman & Diu 0 0 0 0 0 0 Dec.,07
33 Delhi 61 0 39 0 100 0 Dec.,07
34 Lakshadweep 0 0 0 0 0 0 Dec.,07
35 Puducherry 3 0 3 0 6 0 Dec.,07
TOTAL 25353 6 24225 2 50593 8
Notes:
../NR Not Reported/Not Received
= The sum of male and female may not tally with the total figure as some States/UTs have not reported genderwise information separately.
Source: Monthly Health Condition Reports from Directorate of Health Services of States/UTs.
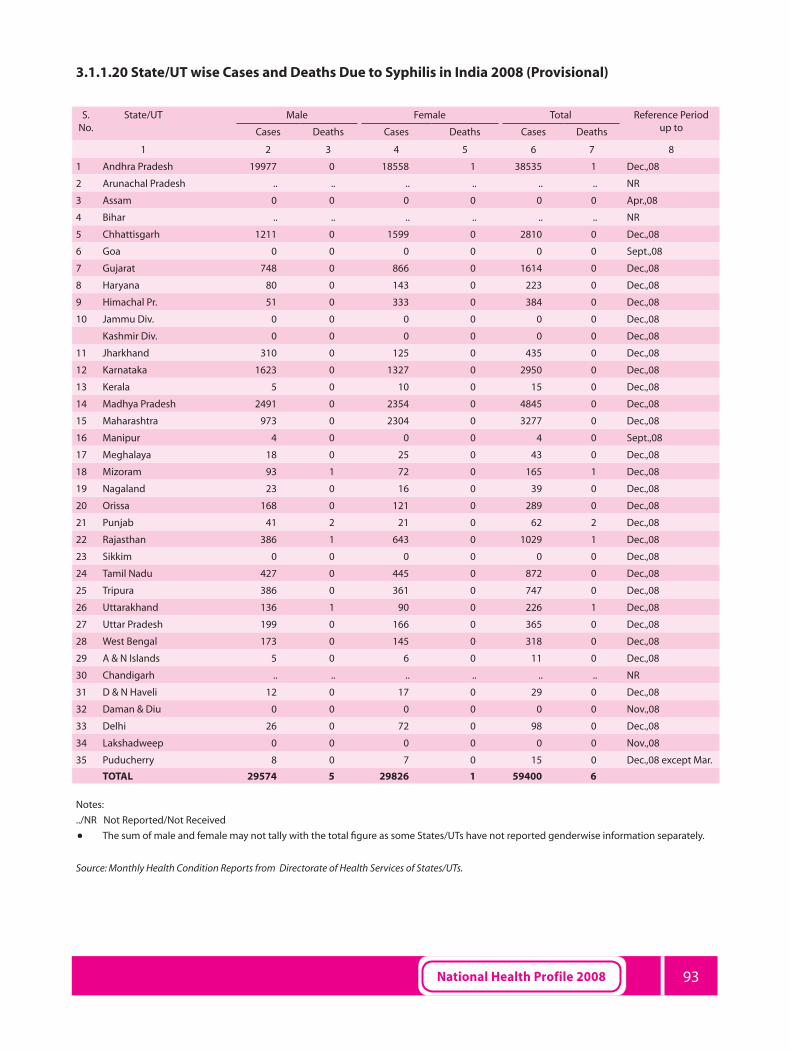
National Health Profile 2008 93
3.1.1.20 State/UT wise Cases and Deaths Due to Syphilis in India 2008 (Provisional)
S. No.
State/UT Male Female Total Reference Period up toCases Deaths Cases Deaths Cases Deaths
1 2 3 4 5 6 7 8
1 Andhra Pradesh 19977 0 18558 1 38535 1 Dec.,08
2 Arunachal Pradesh .. .. .. .. .. .. NR
3 Assam 0 0 0 0 0 0 Apr.,08
4 Bihar .. .. .. .. .. .. NR
5 Chhattisgarh 1211 0 1599 0 2810 0 Dec.,08
6 Goa 0 0 0 0 0 0 Sept.,08
7 Gujarat 748 0 866 0 1614 0 Dec.,08
8 Haryana 80 0 143 0 223 0 Dec.,08
9 Himachal Pr. 51 0 333 0 384 0 Dec.,08
10 Jammu Div. 0 0 0 0 0 0 Dec.,08
Kashmir Div. 0 0 0 0 0 0 Dec.,08
11 Jharkhand 310 0 125 0 435 0 Dec.,08
12 Karnataka 1623 0 1327 0 2950 0 Dec.,08
13 Kerala 5 0 10 0 15 0 Dec.,08
14 Madhya Pradesh 2491 0 2354 0 4845 0 Dec.,08
15 Maharashtra 973 0 2304 0 3277 0 Dec.,08
16 Manipur 4 0 0 0 4 0 Sept.,08
17 Meghalaya 18 0 25 0 43 0 Dec.,08
18 Mizoram 93 1 72 0 165 1 Dec.,08
19 Nagaland 23 0 16 0 39 0 Dec.,08
20 Orissa 168 0 121 0 289 0 Dec.,08
21 Punjab 41 2 21 0 62 2 Dec.,08
22 Rajasthan 386 1 643 0 1029 1 Dec.,08
23 Sikkim 0 0 0 0 0 0 Dec.,08
24 Tamil Nadu 427 0 445 0 872 0 Dec.,08
25 Tripura 386 0 361 0 747 0 Dec.,08
26 Uttarakhand 136 1 90 0 226 1 Dec.,08
27 Uttar Pradesh 199 0 166 0 365 0 Dec.,08
28 West Bengal 173 0 145 0 318 0 Dec.,08
29 A & N Islands 5 0 6 0 11 0 Dec.,08
30 Chandigarh .. .. .. .. .. .. NR
31 D & N Haveli 12 0 17 0 29 0 Dec.,08
32 Daman & Diu 0 0 0 0 0 0 Nov.,08
33 Delhi 26 0 72 0 98 0 Dec.,08
34 Lakshadweep 0 0 0 0 0 0 Nov.,08
35 Puducherry 8 0 7 0 15 0 Dec.,08 except Mar.
TOTAL 29574 5 29826 1 59400 6
Notes:
../NR Not Reported/Not Received
= The sum of male and female may not tally with the total figure as some States/UTs have not reported genderwise information separately.
Source: Monthly Health Condition Reports from Directorate of Health Services of States/UTs.

National Health Profile 200894
3.1.1.21 State/UT wise Cases and Deaths Due to Gonococcal Infection in India 2007 (Revised based on information received from states/UTs after the release of NHP 2007)
S. No.
State/UTMale Female Total Reference Period
up toCases Deaths Cases Deaths Cases Deaths
1 2 3 4 5 6 7 8
1 Andhra Pradesh 28512 0 56535 0 85047 0 Dec.,07
2 Arunachal Pradesh .. .. .. .. .. .. NR
3 Assam 2484 0 831 0 3315 0 Dec.,07
4 Bihar .. .. .. .. .. .. NR
5 Chhattisgarh 1702 0 2647 0 4349 0 Dec.,07
6 Goa 0 0 0 0 0 0 Dec.,07
7 Gujarat 273 0 613 0 886 0 Dec.,07
8 Haryana 322 0 925 0 1247 0 Dec.,07
9 Himachal Pr. 373 0 1105 0 1478 0 Dec.,07
10 Jammu Div. 336 0 2583 0 2919 0 Dec.,07
Kashmir Div. 6 0 3972 0 3978 0 Dec.,07
11 Jharkhand 354 0 517 0 871 0 Dec.,07
12 Karnataka 3036 1 5335 0 8371 1 Dec.,07
13 Kerala 44 0 66 0 110 0 Dec.,07
14 Madhya Pradesh 3098 0 3064 0 6162 0 Dec.,07
15 Maharashtra 3485 0 264 0 3749 0 Dec.,07
16 Manipur 231 0 481 0 712 0 Dec.,07
17 Meghalaya 1 0 36 0 37 0 Dec.,07
18 Mizoram 111 0 50 0 161 0 Dec.,07
19 Nagaland 96 0 58 0 256 0 Dec.,07
20 Orissa 535 2 799 2 1334 4 Dec.,07
21 Punjab 36 0 110 0 146 0 Dec.,07
22 Rajasthan 225 0 997 0 1222 0 Dec.,07
23 Sikkim 9 0 27 0 36 0 Dec.,07
24 Tamil Nadu .. .. .. .. 2146 7 Dec.,07
25 Tripura 106 0 86 0 192 0 Dec.,07
26 Uttarakhand 65 0 810 0 875 0 Dec.,07
27 Uttar Pradesh 6722 0 19755 0 26477 0 Dec.,07
28 West Bengal 470 0 381 0 851 0 Dec.,07
29 A & N Islands 4 0 13 0 17 0 Dec.,07
30 Chandigarh .. .. .. .. 0 0 Dec.,07
31 D & N Haveli 0 0 0 0 0 0 Dec.,07
32 Daman & Diu 0 0 0 0 0 0 Dec.,07
33 Delhi 61 1 140 1 201 2 Dec.,07
34 Lakshadweep 0 0 0 0 0 0 Dec.,07
35 Puducherry 0 0 77 0 77 0 Dec.,07
TOTAL 52697 4 102277 3 157222 14
Notes:
../- NR Not Reported/Not Received
= The sum of male and female may not tally with the total figure as some States/UTs have not reported genderwise information separately
Source: Monthly Health Condition Reports from Directorate of Health Services of States/UTs.

National Health Profile 2008 95
3.1.1.21 State/UT wise Cases and Deaths Due to Gonococcal Infection in India 2008 (Provisional)
S. No.
State/UTMale Female Total Reference Period
up toCases Deaths Cases Deaths Cases Deaths
1 2 3 4 5 6 7 8
1 Andhra Pradesh 24352 0 54018 0 78370 0 Dec.,08
2 Arunachal Pradesh .. .. .. .. .. .. NR
3 Assam 0 0 0 0 0 0 Apr.,08
4 Bihar .. .. .. .. .. .. NR
5 Chhattisgarh 1072 1 1947 0 3019 1 Dec.,08
6 Goa 12 0 27 0 39 0 Sept.,08
7 Gujarat 212 0 589 0 801 0 Dec.,08
8 Haryana 190 0 791 0 981 0 Dec.,08
9 Himachal Pr. 59 0 1120 0 1179 0 Dec.,08
10 Jammu Div. 225 0 423 0 648 0 Dec.,08
Kashmir Div. 0 0 0 0 0 0 Dec.,08
11 Jharkhand 277 0 610 0 887 0 Dec.,08
12 Karnataka 2954 0 6692 0 9646 0 Dec.,08
13 Kerala 54 0 100 0 154 0 Dec.,08
14 Madhya Pradesh 9231 0 8561 0 17792 0 Dec.,08
15 Maharashtra 1054 0 656 0 1710 0 Dec.,08
16 Manipur 16 0 51 0 67 0 Sept.,08
17 Meghalaya 958 0 143 0 1101 0 Dec.,08
18 Mizoram 63 0 60 0 123 0 Dec.,08
19 Nagaland 18 0 22 0 40 0 Dec.,08
20 Orissa 956 0 920 0 1876 0 Dec.,08
21 Punjab 16 0 78 0 94 0 Dec.,08
22 Rajasthan 846 0 2041 0 2887 0 Dec.,08
23 Sikkim 1 0 4 0 5 0 Dec.,08
24 Tamil Nadu 677 0 1070 0 1747 0 Dec.,08
25 Tripura 78 0 51 0 129 0 Dec.,08
26 Uttarakhand 0 0 538 0 538 0 Dec.,08
27 Uttar Pradesh 2171 0 4323 0 6494 0 Dec.,08
28 West Bengal 598 0 578 0 1176 0 Dec.,08
29 A & N Islands 0 0 2 0 2 0 Dec.,08
30 Chandigarh .. .. .. .. .. .. NR
31 D & N Haveli 256 0 998 0 1254 0 Dec.,08
32 Daman & Diu 0 0 0 0 0 0 Nov.,08
33 Delhi 443 0 422 0 865 0 Dec.,08
34 Lakshadweep 0 0 0 0 0 0 Nov.,08
35 Puducherry 4 0 31 0 35 0 Dec.,08 except Mar.
TOTAL 46793 1 86866 0 133659 1
Notes:
../- NR Not Reported/Not Received
= The sum of male and female may not tally with the total figure as some States/UTs have not reported genderwise information separately.
Source: Monthly Health Condition Reports from Directorate of Health Services of States/UTs.

National Health Profile 200896
3.1.1.22 State/UT wise Performance of RNTCP-TB Case Detection, Deaths and Treatment Outcome During 2007 and TB Case Detection 2008*
S. No.
State/UT Population (in lakh)
covered by RNTCP1
2007 2008
January to December January to December
TB Cases Detected and
Registered for Treatment
(DOTS)
TB Deaths among
reported Cases
Treatment (DOTS)
success rate of new smear
positive patients
No. of TB suspects
examined
No of Smear positive patients
diagnosed2
% of +ve TB Cases among
suspects
TB patients declared and registered for
treatment3 (DOTS)
New smear positive TB
patients registered
for treatment (DOTS)
1 2 3 4 5 6 7 8 9 10
1 Andaman & Nicobar 4 777 34 85% 3887 373 10% 748 269
2 Andhra Pradesh 822 111299 5772 88% 510805 75093 15% 114624 49759
3 Arunachal Pradesh 12 2729 92 87% 10767 1149 11% 2450 819
4 Assam 299 36756 1572 87% 148014 21900 15% 38454 16466
5 Bihar 938 79362 2612 86% 327206 44592 14% 84404 33505
6 Chandigarh 11 2413 56 89% 13937 1815 13% 2492 837
7 Chhatisgarh 236 27514 1012 87% 108439 12700 12% 27280 10470
8 D & N Haveli 3 390 8 87% 1923 300 16% 443 152
9 Daman & Diu 2 337 11 86% 2594 172 7% 224 57
10 Delhi 171 49205 1241 87% 154825 24860 16% 49505 14000
11 Goa 16 2102 103 80% 11986 1076 9% 1996 641
12 Gujarat 564 80399 4323 87% 378332 61645 16% 79365 35375
13 Haryana 238 35719 1568 85% 152022 23171 15% 35348 13063
14 Himachal Pradesh 66 13606 607 89% 61927 8259 13% 13618 5091
15 Jammu & Kashmir 124 12515 494 89% 72914 7435 10% 12521 5643
16 Jharkhand 300 36797 1300 89% 137407 21110 15% 38395 16821
17 Karnataka 574 68070 4871 79% 419401 41530 10% 66159 25537
18 Kerala 342 24339 1230 84% 263152 14424 5% 24935 11045
19 Lakshadweep 1 15 0 100% 235 5 2% 11 5
20 Madhya Pradesh 693 80928 3121 86% 298291 47390 16% 80929 29689
21 Maharashtra 1069 142400 7668 86% 596831 76398 13% 139641 52509
22 Manipur 26 4886 155 84% 14196 1329 9% 4293 976
23 Meghalaya 25 4855 186 85% 15158 2198 14% 4639 1474
24 Mizoram 10 2158 73 93% 8811 1025 12% 2827 807
25 Nagaland 22 3100 87 90% 10372 1456 15% 2984 1149
26 Orissa 399 49536 2529 87% 211688 28987 14% 51031 22505
27 Puducherry 11 1383 91 85% 13332 1703 13% 1333 635
28 Punjab 266 35512 1585 86% 164595 22864 14% 37076 14707
29 Rajasthan 646 111696 4069 89% 366138 71581 19% 112192 41700
30 Sikkim 6 1538 68 85% 7666 764 10% 1641 483
31 Tamil Nadu 664 86089 4140 85% 566948 45268 8% 84610 33245
32 Tripura 35 2577 130 91% 22673 1901 8% 2846 1584
33 Uttar Pradesh 1909 247037 8456 87% 1134609 171858 15% 278044 119884
34 Uttarakhand 95 13408 346 86% 65463 9034 14% 13331 5152
35 West Bengal 879 107226 5214 86% 540300 66374 12% 107213 49999
Total 11477 1478673 64824 87% 6816844 911739 13% 1517602 616053
Notes:* 4th quarter 2008 data is provisional.1 Projected population based on census population of 2008 is used for calculation of case-detection rate, 1 lakh=100,000 population.2 Smear positive patients diagnosed include new smear positive cases and smear positive retreatment cases.
3 Total patients registered for treatment includes new sputum smear positive cases, new smear negative cases, new extra-pulmonary cases, smear positive retreatment cases and ‘Others’
= Detailed state/district wise annual and quarterly performance reports available at www.tbcindia.org
Source: Revised National TB Control Programme, MOHFW/GOI.

National Health Profile 2008 97
3.1.1.23 State/UT wise Observed HIV Prevalence Levels in India 2002 - 2007 (Provisional)
S. No.
State/UT Number of sites in 2007
HIV Prevalence Levels (Percentage)
2002 2003 2004 2005 2006 2007
1 2 3 4 5 6 7 8
1 Andhra Pradesh ANC 26 1.25 1.25 1.63 1.75 1.26 1.00
STD 11 21.65 21.47 16.40 22.80 24.40 17.20
2 Arunachal Pradesh ANC 6 0.00 0.00 0.20 0.46 0.00 0.00
STD 7 0.17 0.45 0.00 0.00 0.42 0.00
3 Assam ANC 16 0.00 0.00 0.00 0.00 0.00 0.00
STD 9 0.49 1.20 0.80 0.89 0.50 0.50
4 Bihar ANC 23 0.25 0.00 0.00 0.00 0.50 0.25
STD 24 1.60 0.40 1.20 0.00 0.40 0.40
5 Chattisgarh ANC 17 0.25 0.58 0.00 0.25 0.00 0.25
STD 5 0.82 2.13 2.80 2.77 2.58 3.33
6 Delhi ANC 5 0.25 0.13 0.38 0.25 0.00 0.25
STD 5 3.24 6.52 7.98 9.15 2.00 5.20
7 Goa ANC 2 1.38 0.50 1.13 0.00 0.50 0.18
STD 2 12.73 14.62 16.02 14.01 8.60 5.60
8 Gujarat ANC 25 0.38 0.25 0.13 0.25 0.50 0.25
STD 10 5.08 4.47 3.60 2.00 3.31 2.40
9 Haryana ANC 12 0.38 0.26 0.00 0.13 0.13 0.00
STD 9 1.48 1.20 0.93 1.30 0.81 0.00
10 Himachal Pradesh ANC 9 0.00 0.00 0.13 0.13 0.00 0.00
STD 5 0.40 0.40 0.00 0.40 0.60 0.00
11 Jammu & Kashmir ANC 15 0.08 0.00 0.08 0.00 0.00 0.00
STD 6 0.93 2.60 0.16 0.00 0.00 0.20
12 Jharkhand ANC 15 0.00 0.00 0.00 0.13 0.00 0.00
STD 11 0.15 0.13 0.13 0.00 0.40 0.40
13 Karnataka ANC 27 1.63 1.25 1.25 1.00 1.00 0.50
STD 7 13.55 10.40 12.00 13.60 7.57 8.40
14 Kerala ANC 6 0.25 0.00 0.33 0.25 0.13 0.38
STD 5 4.20 1.88 2.78 2.82 1.23 1.60
15 Madhya Pradesh ANC 36 0.00 0.00 0.25 0.25 0.00 0.00
STD 13 1.19 1.81 1.80 0.47 0.47 1.72
16 Maharashtra ANC 40 1.00 0.75 0.75 1.00 0.75 0.50
STD 10 7.82 12.00 10.80 12.80 10.00 11.62
17 Manipur ANC 10 1.00 1.00 1.38 1.00 1.25 0.75
STD 2 9.60 13.00 7.20 12.20 4.80 4.08
18 Meghalaya ANC 1 0.00 0.35 0.00 0.00 0.00 0.00
STD 3 0.28 0.26 0.00 0.00 1.18 2.21
19 Mizoram ANC 8 1.51 0.97 1.50 0.88 1.00 0.75
STD 3 2.61 3.80 1.00 3.00 3.07 7.13
20 Nagaland ANC 11 1.26 1.13 0.95 1.50 0.93 0.60
STD 1 2.43 0.98 1.72 3.48 0.00 3.42
21 Orissa ANC 31 0.13 0.00 0.50 0.25 0.50 0.00
STD 7 0.80 2.40 2.80 4.00 2.80 1.60
22 Punjab ANC 8 0.38 0.00 0.25 0.13 0.00 0.00
STD 3 1.61 1.60 1.16 1.07 0.27 1.60
Contd...

National Health Profile 200898
3.1.1.23 State/UT wise Observed HIV Prevalence Levels in India 2002 - 2007 (Provisional) (Concl.)
S. No.
State/UT Number of sites in 2007
HIV Prevalence Levels
2002 2003 2004 2005 2006 2007
1 2 3 4 5 6 7 8
23 Rajasthan ANC 26 0.50 0.00 0.00 0.13 0.00 0.00
STD 15 4.80 6.08 2.92 5.60 1.60 2.00
24 Sikkim ANC 3 0.18 0.21 0.00 0.25 0.10 0.09
STD 1 0.00 0.00 0.00 0.86 0.00 0.00
25 Tamil Nadu ANC 34 0.88 0.50 0.67 0.50 0.25 0.25
STD 11 14.80 9.64 8.40 9.20 8.00 8.00
26 Tripura ANC 2 0.00 0.00 0.25 0.00 0.42 0.25
STD 7 1.40 2.80 0.73 1.26 0.45 0.40
27 Uttar Pradesh ANC 47 0.00 0.00 0.25 0.00 0.00 0.00
STD 28 0.40 0.55 0.80 0.40 0.62 0.48
28 Uttarakhand ANC 9 0.00 0.00 0.00 0.00 0.00 0.00
STD 7 0.00 0.00 0.37 0.00 0.00 0.00
29 West Bengal ANC 3 0.25 0.50 0.50 0.84 0.00 0.00
STD 11 0.47 1.61 0.88 2.16 1.01 0.80
30 A & N Islands ANC 3 0.00 0.50 0.00 0.00 0.17 0.25
STD 2 2.60 1.80 1.60 0.40 0.80 1.33
31 Chandigarh ANC 1 0.25 0.50 0.50 0.00 0.25 0.25
STD 2 1.53 0.80 1.80 1.00 1.66 0.42
32 D & N Haveli ANC 1 0.00 0.13 0.00 0.25 0.00 0.50
STD 0 NA NA NA NA NA NA
33 Daman & Diu ANC 2 0.25 0.33 0.38 0.13 0.00 0.13
STD 0 NA NA NA NA NA NA
34 Lakshdweep ANC 2 0.00 0.00 0.00 0.00 0.00 0.00
STD 1 0.00 0.00 0.00 0.00 0.00 0.00
35 Puducherry ANC 2 0.25 0.13 0.25 0.25 0.25 0.00
STD 3 2.22 2.45 5.74 4.22 4.03 3.22
Notes:
* NA : Not Available
*HIV Prevalence values in States with more than 3 sites are median values, while in States/UTs with 3 or less than 3 sites, the values are mean values.
* Sites with 75% coverage of desired sample size (STD: 250 & ANC:400) are included for analysis.
Source: National AIDS Control Organisation (Latest).

National Health Profile 2008 99
3.1.1.24 State/UT wise Patients on Ever Started ART in India till October 2008
S. No.
State/UT No of ART No of Patient
1 2 3
India 179 263423
1 Andhra Pradesh* 25 61239
2 Arunachal Pradesh 1 36
3 Assam 3 749
4 Bihar 4 3623
5 Chattisgarh 1 1565
6 Goa 1 947
7 Gujarat 6 11251
8 Haryana 1 1551
9 Himachal Pradesh 1 669
10 Jammu & Kashmir 2 622
11 Jharkhand 2 1135
12 Karnataka* 27 28310
13 Kerala 5 4407
14 Madhya Pradesh 3 3676
15 Maharashtra* 28 59513
16 Manipur* 6 5997
17 Meghalaya 1 41
18 Mizoram 1 331
19 Nagaland* 4 1176
20 Orissa 1 1544
21 Punjab 3 3570
22 Rajasthan 4 6649
23 Sikkim 1 41
24 Tamil Nadu* 25 40038
25 Tripura 1 61
26 Uttar Pradesh 6 9921
27 Uttarakhand 1 440
28 West Bengal 4 4656
29 A & N Islands - -
30 Chandigarh 1 2462
31 Dadra & Nagar Haveli - -
32 Daman & Diu - -
33 Delhi* 9 6557
34 Lakshadweep - -
35 Puducherry 1 646
Notes :
Data As on 31st October 2008
* GFATM States
Source: National AIDS Control Organization.

National Health Profile 2008100
3.1.1.25 State/UT Leprosy Case Detection, Treatment and Discharge in India 2007-08
S. No.
State/ UTEstimated Population March 2008
Total New Cases Detected
Cases Discharged as
Cured
Cases on record under
treatment
Prevalence Rate/10,000 Population
1 2 3 4 5 6
1 Andhra Pradesh 82893403 10047 9568 5817 0.70
2 Arunachal Pradesh 1282012 45 57 52 0.41
3 Assam 30036654 1268 1157 1137 0.38
4 Bihar 98516843 19041 18937 10262 1.04
5 Chattisgarh 23336171 7808 5675 5465 2.34
6 Goa 1480349 156 158 112 0.76
7 Gujarat 58239804 7228 6808 4752 0.82
8 Haryana 25009748 379 534 319 0.13
9 Himachal Pradesh 6800819 246 235 201 0.30
10 Jharkhand 31101898 6799 7575 3460 1.11
11 Jammu & Kashmir 12010899 209 308 201 0.17
12 Karnataka 58890750 4522 4397 3059 0.52
13 Kerala 33899428 778 763 775 0.23
14 Madhya Pradesh 70224912 6058 5256 4799 0.68
15 Maharashtra 111443362 12397 11180 7870 0.71
16 Manipur 2864639 54 38 43 0.15
17 Meghalaya 2763735 14 39 13 0.05
18 Mizoram 1063535 26 21 18 0.17
19 Nagaland 2792619 54 41 70 0.25
20 Orissa 40682830 5685 5036 3283 0.81
21 Punjab 27520060 964 916 897 0.33
22 Rajasthan 67082964 1201 1217 1278 0.19
23 Sikkim 657992 27 16 26 0.40
24 Tamil Nadu 66868808 5511 5380 3665 0.55
25 Tripura 3531942 85 89 65 0.18
26 Uttar Pradesh 194704448 31028 30878 18254 0.94
27 Uttarakhand 9581049 763 828 535 0.56
28 West Bengal 89899615 13551 12916 9358 1.04
29 A & N Islands 420315 18 17 24 0.57
30 Chandigarh 1137712 190 221 140 1.23
31 Dadra & Nagar Haveli 303029 150 154 57 1.88
32 Daman & Diu 213946 2 2 1 0.05
33 Delhi 17906774 1331 2777 1195 0.67
34 Lakshadweep 67669 0 2 1 0.15
35 Puducherry 1108681 50 65 24 0.22
Total 1176339414 137685 133261 87228 0.74
Note:
=All detected cases are initiated treatment with MDT
Source: National Leprosy Eradication Programme

National Health Profile 2008 101
3.1.2 Non Communicable Diseases
3.1.2.1 Number of Estimated Cases of Coronary Heart Disease in India 2000 & 2005 (Latest)
S. No.
Age in years 2000 2005
Rural Urban Total Rural Urban Total
1 2 3 4 5 6 7
1 20-29 1799691 2711501 4511192 2012363 4138045 6150408
2 30-39 2854247 2635019 5489266 3383816 3869904 7253720
3 40-49 3342472 2776974 6119446 4217201 4116830 8334032
4 50-59 3590885 2288412 5879296 4544974 3171320 7716294
5 60-69 3153512 1888199 5041711 3849544 2582790 6432334
Total 14740808 12300104 27040912 18007899 17878889 35886789
Source: Centre for Cronic Disease Control, NCMH Background Papers- Burden of Disease in India, 2005 (Latest)
3.1.2.2 Number of Estimated Cases of Diabetes in India 2000 & 2005 (Latest)
S. No.
Age in years 2000 2005
Rural Urban Total Rural Urban Total
1 2 3 4 5 6 7
1 20-29 549102 1003310 1552412 609128 1209725 1818853
2 30-39 1425108 2567970 3993077 1518041 3126311 4644352
3 40-49 2232090 3882005 6114095 2488845 4968478 7457323
4 50-59 2628455 4188171 6816626 2966586 5394860 8361446
5 60-69 2053095 2783100 4836195 2237319 3445602 5682920
6 70+ 1100412 1401300 2501712 1267086 1807951 3075038
Total 9988262 15825855 25814117 11087005 19952927 31039932
Source: Centre for Cronic Disease Control, NCMH Background Papers- Burden of Disease in India, 2005 (Latest)

National Health Profile 2008102
3.1.2.3 Burden of Stroke (Latest)
S. No.
1998 2004
1 2 3
1 NO. OF CASES OF STROKE 7,92,628 9,30,985
2 NO. OF DEATHS 5,93,362 6,39,455
3 NO. OF YLL 48,18,740 52,89,357
4 NO. OF DALY 58,02,295 63,68,970
Source: Assessment of Burden of Non - Communicable Disease, Indian Council of Medical Research 2006.
3.1.2.4 Meta Analysis of Epidemiological Studies on Hypertension (Latest)
S. No.
Investigator Sample Size Age group PR/1000
1 2 3 4
I URBAN
1 Gupta R et al (1995) 2212 20-80 109.09
2 Chadha SL et al (1998) 13134 25-69 115.90
3 Thakur k et al (1999) 1727 30-80 131.10
4 Ahlawat SK et al (2002) 937 35+ 449.00
5 Misra A et al (2001) 532 18+ 116.00
6 Mohan V et al (2001) 1175 20-75 140.00
7 Swami HM et al (2002) 362 65+ 580.00
8 Beegom R et al (1995) 1497 25-64 184.00
Weighetd prevalence rate 164.20
II RURAL
9 Reddy NK et al (2002) 3307 20+ 280.00
10 Gupta R et al (1995) 1982 20+ 273.00
11 Chadha SL et al (1998) 1732 25-69 35.80
Weighted prevalence rate 157.44
Note:
= Prevalence rate of hypertension in india (Urban + Rural) among adults (20 Year+) = 159.46 per thousand.
Source: Assessment of Burden of Non - Communicable Disease, Indian Council of Medical Research 2006.

National Health Profile 2008 103
3.1.2.5 State/UT wise Prevalence of Tobacco Smoking and Chewing in India by sex (age 15 Years and above) (Latest)
S. No.
State/UT Smoking Chewing
Men Women Men Women
% 95%CI % 95%CI % 95%CI % 95%CI
1 2 3 4 5 6 7 8 9
North 11.5-14.9
1 New Delhi 23.9 22.0-25.9 1.8 1.4-2.2 13.1 6.7-9.8 2.5 1.9-3.2
2 Haryana 40.4 37.7-43.1 3.5 2.8-4.3 8.1 6.7-9.1 0.9 0.6-1.3
3 Himachal Pradesh 38.6 36.6-40.6 2.4 1.8-3.1 7.8 5.8-9.1 0.5 0.3-0.8
4 Jammu & Kashmir 44.3 42.0-46.6 8.3 7.1-9.7 7.3 8.0-10.8 0.9 0.6-1.3
5 Punjab 13.9 12.2-15.8 0.3 0.2-0.5 9.3 17.7-20.4 0.2 0.1-0.4
6 Rajasthan 37.8 35.7-39.9 4.1 3.2-5.2 19.0 38.7-42.0 3.8 2.9-4.9
7 Central
8 Madhya Pradesh 29.4 27.6-31.1 0.9 0.6-1.2 40.3 34.6-38.0 14.4 12.7-16.2
9 Uttar Pradesh 33.8 32.5-35.2 3.0 2.6-3.5 36.3 50.1-53.5 10.9 10.1-11.8
East
10 Bihar 26.3 24.8-27.9 6.2 5.5-7.0 51.8 46.7-51.4 6.7 6.0-7.6
11 Orissa 25.2 23.2-27.2 0.9 0.7-1.2 49.0 20.9-25.6 34.3 31.9-36.9
12 West Bengal 39.4 37.4-41.5 2.5 2.0-3.2 23.2 44.7-51.0 15.1 13.5-17.0
North-East
13 Assam 31.5 28.4-34.9 2.6 2.0-3.4 47.8 47.9-55.3 24.3 22.1-26.6
14 Arunachal Pradesh 25.6 23.1-28.2 5.6 4.2-7.3 51.6 31.1-37.3 33.1 29.6-36.7
15 Manipur 35.0 32.0-38.1 12.0 10.0-14.2 34.1 13.8-20.5 19.2 15.5-23.5
16 Meghlaya 55.2 50.6-59.7 6.7 4.2-10.6 16.9 56.5-63.8 27.6 23.8-31.7
17 Mizoram 59.4 57.0-61.8 22.0 19.6-24.6 60.2 41.3-48.8 60.7 57.2-64.0
18 Nagaland 38.0 34.3-41.8 2.4 1.3-4.5 45.0 36.5-42.7 16.5 13.7-19.7
19 Sikkim 19.4 17.1-22.0 8.2 6.9-9.7 39.5 8.9-13.1 18.6 16.2-21.2
20 Tripura 48.5 44.9-52.2 9.7 6.7-13.9 10.8 6.0-9.9 5.2 3.3-8.1
West
21 Goa 17.8 16.1-19.6 2.0 1.2-3.2 7.7 22.8-26.4 8.0 6.3-10.2
22 Gujrat 25.3 23.5-27.2 1.4 1.0-1.8 24.6 32.3-36.0 8.0 7.0-9.2
23 Maharashtra 13.3 12.1-14.6 0.2 0.1-0.4 34.1 9.4-12.0 18.0 16.1-20.0
South
24 Andhra Pradesh 35.4 33.4-37.5 4.2 3.5-4.9 10.7 12.1-15.6 4.9 -
25 Karnataka 25.7 24.1-27.4 0.3 0.2-0.4 13.8 12.7-15.7 14.1 12.7-15.7
26 Kerala 28.2 26.5-30.0 0.4 0.3-0.7 9.4 9.1-11.2 10.1 9.1-11.2
27 Tamil Nadu 27.0 25.4-28.8 0.3 0.2-0.6 12.9 9.3-12.2 10.7 9.3-12.2
=CI: confidence interval
Source: Rani et al. 2003
Notes:
1. Male tobacco use prevalence in 1995-1996 was 51.3% and in 1998-1999 it was 46.5% according to the National Sample Survey 52nd Round and National Family Health Survey2. The Prevalence of tobacco use among females was 10.3% and 13.8% in the two successive surveys.
2. The National Household Surveys of Drug and Alcohol Abuse conducted in 25 states (excluding Jammu & Kashmir) in 2002 reports that 55.8% of males 12-60 Years of age currently use tobacco.
3. Geographic area is a determinant of the type of tobacco use and prevalence of usage; overall tobacco use increases towards the centre, the Andhra Pradesh and Kerala. north and east. Chewing follows this pattern. Smoking has an increasing gradient towards the north, northwest and in the two states Andhra Pradesh and Kerala.
Source: Report on Tobacco Control in India, edited by K Srinath Realy Prakash C . Gupta, MOHFW/GOI
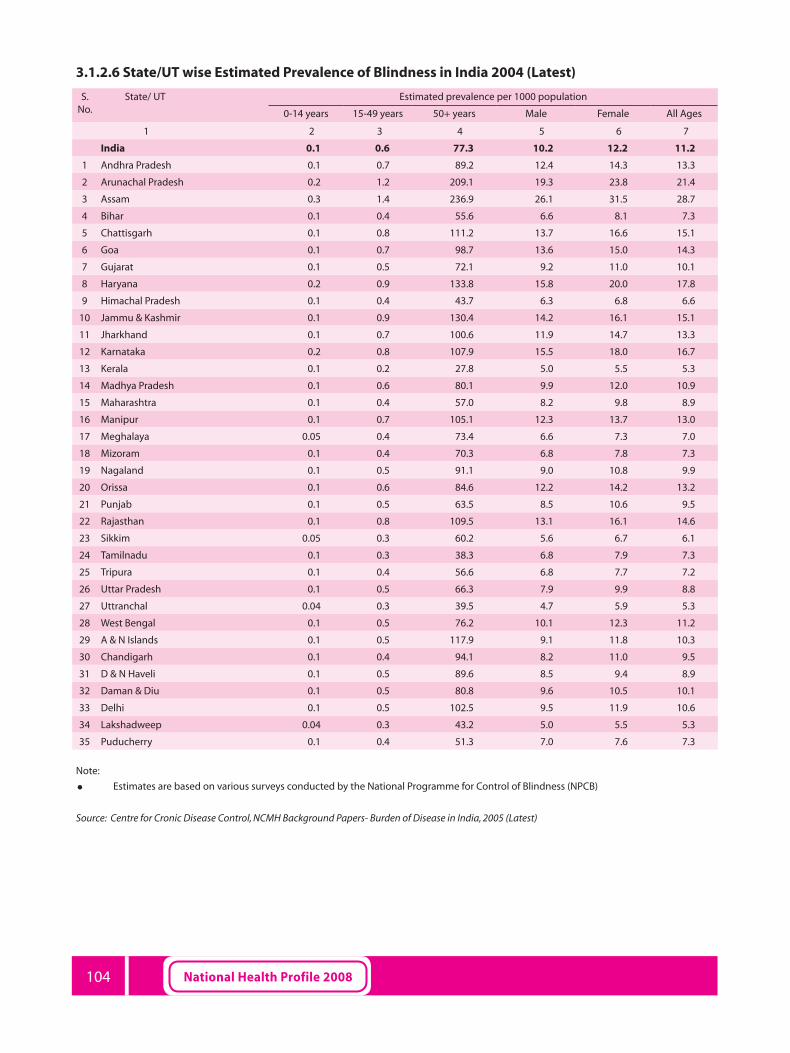
National Health Profile 2008104
3.1.2.6 State/UT wise Estimated Prevalence of Blindness in India 2004 (Latest)
S. No.
State/ UT Estimated prevalence per 1000 population
0-14 years 15-49 years 50+ years Male Female All Ages
1 2 3 4 5 6 7
India 0.1 0.6 77.3 10.2 12.2 11.2
1 Andhra Pradesh 0.1 0.7 89.2 12.4 14.3 13.3
2 Arunachal Pradesh 0.2 1.2 209.1 19.3 23.8 21.4
3 Assam 0.3 1.4 236.9 26.1 31.5 28.7
4 Bihar 0.1 0.4 55.6 6.6 8.1 7.3
5 Chattisgarh 0.1 0.8 111.2 13.7 16.6 15.1
6 Goa 0.1 0.7 98.7 13.6 15.0 14.3
7 Gujarat 0.1 0.5 72.1 9.2 11.0 10.1
8 Haryana 0.2 0.9 133.8 15.8 20.0 17.8
9 Himachal Pradesh 0.1 0.4 43.7 6.3 6.8 6.6
10 Jammu & Kashmir 0.1 0.9 130.4 14.2 16.1 15.1
11 Jharkhand 0.1 0.7 100.6 11.9 14.7 13.3
12 Karnataka 0.2 0.8 107.9 15.5 18.0 16.7
13 Kerala 0.1 0.2 27.8 5.0 5.5 5.3
14 Madhya Pradesh 0.1 0.6 80.1 9.9 12.0 10.9
15 Maharashtra 0.1 0.4 57.0 8.2 9.8 8.9
16 Manipur 0.1 0.7 105.1 12.3 13.7 13.0
17 Meghalaya 0.05 0.4 73.4 6.6 7.3 7.0
18 Mizoram 0.1 0.4 70.3 6.8 7.8 7.3
19 Nagaland 0.1 0.5 91.1 9.0 10.8 9.9
20 Orissa 0.1 0.6 84.6 12.2 14.2 13.2
21 Punjab 0.1 0.5 63.5 8.5 10.6 9.5
22 Rajasthan 0.1 0.8 109.5 13.1 16.1 14.6
23 Sikkim 0.05 0.3 60.2 5.6 6.7 6.1
24 Tamilnadu 0.1 0.3 38.3 6.8 7.9 7.3
25 Tripura 0.1 0.4 56.6 6.8 7.7 7.2
26 Uttar Pradesh 0.1 0.5 66.3 7.9 9.9 8.8
27 Uttranchal 0.04 0.3 39.5 4.7 5.9 5.3
28 West Bengal 0.1 0.5 76.2 10.1 12.3 11.2
29 A & N Islands 0.1 0.5 117.9 9.1 11.8 10.3
30 Chandigarh 0.1 0.4 94.1 8.2 11.0 9.5
31 D & N Haveli 0.1 0.5 89.6 8.5 9.4 8.9
32 Daman & Diu 0.1 0.5 80.8 9.6 10.5 10.1
33 Delhi 0.1 0.5 102.5 9.5 11.9 10.6
34 Lakshadweep 0.04 0.3 43.2 5.0 5.5 5.3
35 Puducherry 0.1 0.4 51.3 7.0 7.6 7.3
Note:
= Estimates are based on various surveys conducted by the National Programme for Control of Blindness (NPCB)
Source: Centre for Cronic Disease Control, NCMH Background Papers- Burden of Disease in India, 2005 (Latest)

National Health Profile 2008 105
3.1.2.7 State/UT wise Estimated Incidences of Blindness in India 2004 (Latest)
S. No.
State/ UTEstimated number of new cases per year
0-14 years 15-49 years 50+ years Male Female All Ages
1 2 3 4 5 6 7
India 6396 57565 2068087 1002063 1129985 2132048
1 Andhra Pradesh 453 4075 146404 70938 79994 150932
2 Arunachal Pradesh 8 72 2574 1247 1407 2654
3 Assam 165 1486 53399 25874 29177 55050
4 Bihar 438 3946 141750 68683 77451 146134
5 Chattisgarh 175 1571 56450 27352 30844 58196
6 Goa 11 95 3430 1662 1874 3536
7 Gujarat 306 2757 99058 47997 54125 102122
8 Haryana 126 1134 40740 19740 22260 42000
9 Himachal Pradesh 44 393 14104 6834 7706 14540
10 Jammu & Kashmir 64 579 20789 10073 11359 21432
11 Jharkhand 206 1857 66705 32321 36447 68768
12 Karnataka 328 2953 106104 51411 57975 109386
13 Kerala 200 1802 64728 31363 35367 66730
14 Madhya Pradesh 339 3050 109577 53094 59872 112966
15 Maharashtra 569 5121 183993 89151 100533 189684
16 Manipur 17 151 5428 2630 2966 55596
17 Meghalaya 16 146 5248 2543 2867 5410
18 Mizoram 6 57 2058 997 11125 2122
19 Nagaland 11 102 3655 1771 1997 3768
20 Orissa 223 2003 71957 34866 39316 74182
21 Punjab 147 1325 47600 23064 26008 49072
22 Rajasthan 345 3103 111480 54016 6912 111928
23 Sikkim 4 34 1207 558 659 1244
24 Tamilnadu 383 3443 123689 59932 67582 127514
25 Tripura 25 227 8152 3950 4454 8404
26 Uttar Pradesh 1118 10060 361416 175119 197475 372594
27 Uttarakhand 56 503 18069 8755 9873 18628
28 West Bengal 498 4486 161177 78096 88066 166162
29 A & N Islands 3 23 832 403 455 858
30 Chandigarh 6 53 1921 931 1049 1980
31 D & N Haveli 1 11 411 199 225 424
32 Daman & Diu 1 8 301 146 164 310
33 Delhi 96 866 31129 15083 17009 32092
34 Lakshadweep 0 4 153 74 84 158
35 Puducherry 7 67 2398 1162 1310 2472
Note:
= Estimates are based on the National Programme for Control of Blindness (NPCB).
Source: Centre for Cronic Disease Control, NCMH Background Papers- Burden of Disease in India, 2005 (Latest)

National Health Profile 2008106
3.1.2.8 Estimated Incidence of Common Cancers with Truncated rate and Cumulative risk at (0-74 years) in india 2007 (Latest)
S. No.
Site of Cancer Incident Cases (%)
CIR/105 ASR/105 Ratio at Risk
All Ages 35-64 years All Ages 35-64 years 0-74 years
1 2 3 4 5 6 7
Males
1 Oral Cavity 47947(11.1) 7.5 18.4 10.8 22.2 1:79
2 Lung 41019(09.5) 6.8 13.8 10.9 18.3 1:72
3 Pharynx 26834(06.2) 4.1 9.0 6.3 11.5 1:128
4 Oesophagus 29512(06.8) 4.5 10.2 7.1 13.1 1:116
5 Stomach 25482(05.9) 4.1 9.0 6.3 11.4 1:128
All India 432702(100.0) 71.9 140.0 105.8 174.7 1:8.5
Females
6 Cervix 90708*(19.1) 12.9 35.6 17.0 40.5 1:52
7 Breast 82011*(17.3) 21.2 56.8 27.2 63.9 1:33
8 Ovary 30335(06.4) 5.4 12.9 6.8 14.8 1:133
9 Oral Cavity 24391(05.1) 4.0 9.4 5.6 11.3 1:148
10 Oesophagus 20127(04.2) 3.3 7.5 4.8 9.1 1:168
All India 475136(100.0 ) 83.8 196.8 110.0 227.0 1:8.5
Note:
= CIR: Crude Incidence Rate= ASR: Age Standardized rate= Oral Cavity includes lip, tongue, gum, floor of the mouth, cheek & palate (C00-C06)= Pharynx includes oro-, naso-& hypo pharynx (C10-C14)= Using the incidence rate of Barshi PBCR for Rural areas
Source: Two - Year Report of the Population Based Cancer Registeries (2001-04): Two - Year Report of the Population Based Cancer Registeries under Northern Eastern Regional Cancer Registry (2003-04) of NCRP Bangolore.

National Health Profile 2008 107
3.1.2.9 State/UT wise Cases and Deaths Due to Snake Bite in India 2007 (Revised based on information received from states/UTs after the release of NHP 2007)
S. No.
State/UT Male Female Total Reference Period up to
Cases Deaths Cases Deaths Cases Deaths
1 2 3 4 5 6 7 8
1 Andhra Pradesh 10177 135 8044 64 18221 199 Dec., 07
2 Arunachal Pradesh .. .. .. .. .. .. NR
3 Assam 79 11 56 6 135 17 May,07
4 Bihar .. .. .. .. .. .. NR
5 Chhattisgarh 1574 17 1295 19 2869 36 Dec., 07
6 Goa 301 0 184 0 485 0 Dec., 07
7 Gujarat 714 10 565 8 1376 20 Dec., 07
8 Haryana .. .. .. .. .. .. NR
9 Himachal Pradesh 496 3 435 4 931 7 Dec., 07
10 Jammu Div. 853 1 526 1 1379 2 Dec., 07
Kashmir Div. 4 0 2 0 6 0 Dec., 07
11 Jharkhand 138 7 181 4 319 11 July,07
12 Karnataka 3946 97 2377 69 6323 166 Dec., 07
13 Kerala .. .. .. .. 3042 19Oct.,07 except
Aug.
14 Madhya Pradesh 620 33 460 14 1080 47 Dec., 07
15 Maharashtra 5959 100 4162 66 10121 166Dec.,07 except
Jan. to Mar.
16 Manipur 0 0 0 0 15 1 Dec., 07
17 Meghalaya 0 0 0 0 0 0Sept.,07 except
Aug.
18 Mizoram 35 3 17 4 52 7 Dec., 07
19 Nagaland .. .. .. .. 217 0 Dec., 07
20 Orissa 591 18 464 17 3088 94 Dec., 07
21 Punjab 412 10 122 1 534 11 Dec., 07
22 Rajasthan 2440 50 1815 32 4255 82Dec.,07 except
May
23 Sikkim 35 0 22 0 57 0 Dec., 07
24 Tamil Nadu .. .. .. .. .. .. NR
25 Tripura 58 0 41 0 99 0 Dec., 07
26 Uttarakhand 185 9 208 8 393 17 Dec., 07
27 Uttar Pradesh 513 29 443 22 956 51Nov.,07 except
May & June
28 West Bengal 10621 179 6999 161 17620 340 Dec., 07
29 A & N Islands 56 0 31 1 87 1 Dec., 07
30 Chandigarh .. .. .. .. .. .. NR
31 D & N Haveli 313 0 385 4 698 4 Dec.,07
32 Daman & Diu 20 0 14 0 34 0Dec.,07 except
July
33 Delhi 78 10 21 3 99 13 Dec.,07
34 Lakshadweep .. .. .. .. .. .. NR
35 Puducherry 1403 14 822 6 2225 20 Dec., 07
TOTAL 41621 736 29691 514 76716 1331
Notes:
../NR Not Reported/Not Received =The sum of male and female may not tally with the total figure as some States/UTs have not reported genderwise information separately.
Source: Monthly Health Condition Reports from Directorate of Health Services of States/UTs.

National Health Profile 2008108
3.1.2.9 State/UT wise Cases and Deaths Due to Snake Bite in India 2008 (Provisional)
S. No.
State/UT Male Female Total Reference Period up to
Cases Deaths Cases Deaths Cases Deaths
1 2 3 4 5 6 7 8
1 Andhra Pradesh 17202 82 12699 42 29901 124 Dec.,08
2 Arunachal Pradesh .. .. .. .. .. .. NR
3 Assam .. .. .. .. .. .. NR
4 Bihar .. .. .. .. .. .. NR
5 Chhattisgarh 449 20 361 11 810 31 Dec.,08
6 Goa 266 0 157 0 423 0 Sept.,08
7 Gujarat 1281 44 1055 60 2336 104 Dec.,08
8 Haryana 766 13 344 3 1110 16 Dec.,08
9 Himachal Pr. 540 14 686 11 1226 25 Dec.,08
10 Jammu Div. 769 4 467 2 1236 6 Dec.,08
Kashmir Div. 0 0 0 0 0 0 Dec.,08
11 Jharkhand 97 1 70 0 167 1 Dec.,08
12 Karnataka .. .. .. .. 7693 164 Dec.,08
13 Kerala .. .. .. .. 4646 23 Dec.,08
14 Madhya Pradesh 987 43 707 31 1694 74 Dec.,08
15 Maharashtra 7542 176 5431 125 12973 301 Dec.,08
16 Manipur 12 1 7 0 19 1 Oct.,08
17 Meghalaya 0 0 20 0 20 0 Dec.,08
18 Mizoram 65 0 22 1 87 1 Dec.,08
19 Nagaland 197 0 132 0 329 0 Dec.,08
20 Orissa 366 1 223 1 589 2 Apr.,08
21 Punjab 361 8 146 7 507 15 Dec.,08
22 Rajasthan 2673 43 1867 26 4540 69Nov.,08 except May
23 Sikkim 34 0 20 0 54 0 Dec.,08
24 Tamil Nadu 2795 45 2089 18 4884 63 Dec.,08
25 Tripura 33 0 28 0 61 0 July,08
26 Uttarakhand 502 1 426 1 928 2 Dec.,08
27 Uttar Pradesh .. .. .. .. .. .. NR
28 West Bengal 11561 171 8434 142 19995 313 Dec.,08
29 A & N Islands 72 0 36 0 108 0 Dec.,08
30 Chandigarh .. .. .. .. .. .. NR
31 D & N Haveli 383 1 498 0 881 1 Dec.,08
32 Daman & Diu 14 1 15 0 29 1Sept.,08 except Aug.
33 Delhi 57 4 19 1 76 5 Nov.,08
34 Lakshadweep .. .. .. .. .. .. NR
35 Puducherry 1522 14 863 8 2385 22 Dec.,08
TOTAL 50546 687 36822 490 99707 1364
Notes:
../- NR Not Reported/Not Received
= The sum of male and female may not tally with the total figure as some States/UTs have not reported genderwise information separately
Source: Monthly Health Condition Reports from Directorate of Health Services of States/UTs.

National Health Profile 2008 109
3.1.3 Incidence of Deaths Due to Accidents in India 2001-2007 (Latest)
S. No.
Causes No. of Deaths
2001 2002 2003 2004 2005 2006 2007
1 2 3 4 5 6 7 8
1 A. Natural Causes 36651 16723 14954 18937 22415 21502 25153
2 B. Un-Natural Causes 234368 243399 244671 258326 271760 293202 315641
1. Air-Crash 30 37 51 23 6 2 11
2. Collapse of Structures 3119 2216 2376 2169 2718 2399 2623
3. Drowning 20739 19853 20960 21190 23571 25571 27064
4. Electrocution 5641 5361 6336 6224 6987 7619 8076
5. Explosions 575 636 722 601 643 824 669
6. Falls 7446 7826 8800 8448 9132 9821 10497
7. Factory/Machine accidents 641 674 712 715 671 869 836
8. Fire 22449 21004 19278 18445 19093 19222 20772
9. Fire Arms 2688 2597 1993 2283 2254 2161 2046
10. Sudden Deaths 15065 15230 16749 17413 18519 19450 21311
11. Killed by Animals 770 760 798 788 847 864 1007
12. Mines or quarry disaster 499 625 550 456 456 409 435
13. Poisoning 24077 21886 21172 22035 20800 23434 25447
14. Stampede 30 44 83 31 346 18 75
15. Suffocation 892 1481 1144 1218 1549 1696 1313
16. Traffic accidents 99516 101958 102951 111794 118265 131652 140560
17. Other Causes 14266 25801 27591 30409 31389 32478 35992
18. Causes Not Known 15925 15410 12405 14084 14514 14713 16907
Total (Natural+Unnatural) 271019 260122 259625 277263 294175 314704 340794
Source: Accident Deaths and suicides in India report, National Crime Records Bureau, Ministry of Home Affairs (Latest).

National Health Profile 2008110
3.1.4 Major Outbreaks Investigated by NICD during the year 2008 in India
S. No.
Outbreak Areas affected Period Diagnosis
1. Deaths following measles vaccinationThiruvallur District, Tamil Nadu
24 - 26 April 2008.
AEFI
2. Outbreak of rash and fever Karnal, Haryana July, 2008 Measles outbreak
3. Encephalitis among childrenDinajpur (West Bengal)
July, 2008 Encephalitis
4. Meningococcemia / Meningococcal meningitis cases Maghalaya July, 2008Meningococcemia / Meningococcal meningitis
5. JE outbreak Gorakhpur, UP 21-25 July 2008. JE
6. Deaths reported from high grade fever of 4-7 days with mild abdominal discomfort and bodyache.
Kanpur Dehat21 - 23 August 2008
Malaria (P. vivax)
7. Acute encephalitis Gorakhpur, Uttar Pradesh
August 2008.Acute encephalitis syndrome
8. Suspected leptospirosis Surat, Gujarat27 – 30 August 2008
Leptospirosis
9. Outbreak of fever , acute respiratory distress and pain abdomen Dehrudun, Uttarakhand
12 - 14 August 2008.
Scrub Typhus
10. Review of health situation arisen out of flood in Bihar State Patna, Bihar5 - 7 September 2008.
Floods
11. Deaths in children due to encephalitis Gorakhpur, UP26th August – 2nd September, 2008
AES / JE
12. Oversee public health intervention in flood affected areas – multiple teams constituted by Director, EMR
BiharSeptember – October, 2008
Floods
13. Suspected deaths following measles vaccination Aurangabad District, Maharashtra
September - October 2008.
AEFI
14. Deaths of children following measles vaccination Barpeta district of Assam
25 - 27 October 2008.
AEFI
15. Respiratory infections & deaths among children. District Murshidabad, West Bengal
Oct-08Respiratory Syncitial Virus
16. Unusual deaths of poultry Kamrup District, Assam
28th November 2008
Avian Influenza in poultry
17. Unusual deaths of poultry - multiple teams constituted by Director, EMRVarious districts of Assam, West Bengal and Sikkim
28th November 2008 to date.
Avian Influenza in poultry
Source: National Institute of Communicable Diseases (NICD), Directorate General of Health Services, GOI.
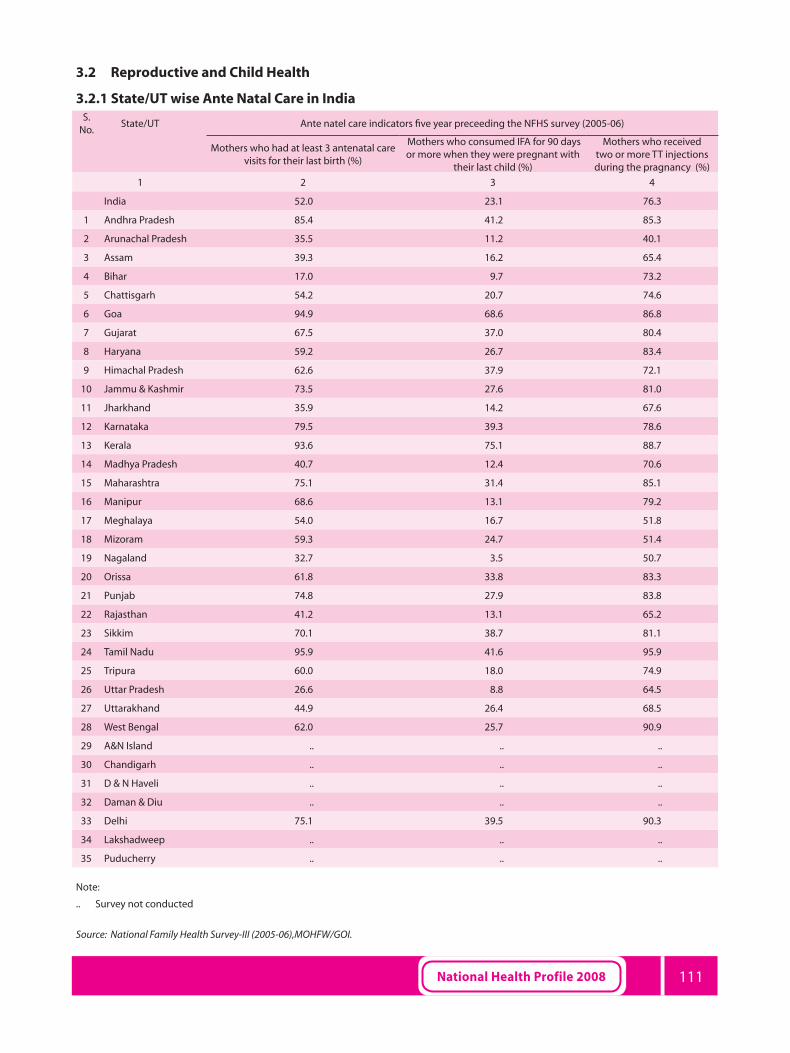
National Health Profile 2008 111
3.2 Reproductive and Child Health
3.2.1 State/UT wise Ante Natal Care in India S.
No.State/UT Ante natel care indicators five year preceeding the NFHS survey (2005-06)
Mothers who had at least 3 antenatal care visits for their last birth (%)
Mothers who consumed IFA for 90 days or more when they were pregnant with
their last child (%)
Mothers who received two or more TT injections during the pragnancy (%)
1 2 3 4
India 52.0 23.1 76.3
1 Andhra Pradesh 85.4 41.2 85.3
2 Arunachal Pradesh 35.5 11.2 40.1
3 Assam 39.3 16.2 65.4
4 Bihar 17.0 9.7 73.2
5 Chattisgarh 54.2 20.7 74.6
6 Goa 94.9 68.6 86.8
7 Gujarat 67.5 37.0 80.4
8 Haryana 59.2 26.7 83.4
9 Himachal Pradesh 62.6 37.9 72.1
10 Jammu & Kashmir 73.5 27.6 81.0
11 Jharkhand 35.9 14.2 67.6
12 Karnataka 79.5 39.3 78.6
13 Kerala 93.6 75.1 88.7
14 Madhya Pradesh 40.7 12.4 70.6
15 Maharashtra 75.1 31.4 85.1
16 Manipur 68.6 13.1 79.2
17 Meghalaya 54.0 16.7 51.8
18 Mizoram 59.3 24.7 51.4
19 Nagaland 32.7 3.5 50.7
20 Orissa 61.8 33.8 83.3
21 Punjab 74.8 27.9 83.8
22 Rajasthan 41.2 13.1 65.2
23 Sikkim 70.1 38.7 81.1
24 Tamil Nadu 95.9 41.6 95.9
25 Tripura 60.0 18.0 74.9
26 Uttar Pradesh 26.6 8.8 64.5
27 Uttarakhand 44.9 26.4 68.5
28 West Bengal 62.0 25.7 90.9
29 A&N Island .. .. ..
30 Chandigarh .. .. ..
31 D & N Haveli .. .. ..
32 Daman & Diu .. .. ..
33 Delhi 75.1 39.5 90.3
34 Lakshadweep .. .. ..
35 Puducherry .. .. ..
Note:
.. Survey not conducted
Source: National Family Health Survey-III (2005-06),MOHFW/GOI.

National Health Profile 2008112
3.2.2 State/UT wise Percentage of Deliveries Attended by Trained Personnel in India
S. No.
State/UT Maternity care (for births in the preceding 5 years of the survey)
Births assisted by a doctor/nurse/LHV/ANM/other health personnel (%)
Institutional births (%)
1 2 3
India 46.6 38.7
1 Andhra Pradesh 74.9 64.4
2 Arunachal Pradesh 30.2 28.5
3 Assam 31.0 22.4
4 Bihar 29.3 19.9
5 Chattisgarh 41.6 14.3
6 Goa 94.0 92.3
7 Gujarat 63.0 52.7
8 Haryana 48.9 35.7
9 Himachal Pradesh 47.8 43.0
10 Jammu & Kashmir 56.5 50.2
11 Jharkhand 27.8 18.3
12 Karnataka 69.7 64.7
13 Kerala 99.4 99.3
14 Madhya Pradesh 32.7 26.2
15 Maharashtra 68.7 64.6
16 Manipur 59.0 45.9
17 Meghalaya 31.1 29.0
18 Mizoram 65.4 59.8
19 Nagaland 24.7 11.6
20 Orissa 44.0 35.6
21 Punjab 68.2 51.3
22 Rajasthan 41.0 29.6
23 Sikkim 53.7 47.2
24 Tamil Nadu 90.6 87.8
25 Tripura 48.8 46.9
26 Uttar Pradesh 27.2 20.6
27 Uttarakhand 38.5 32.6
28 West Bengal 47.6 42.0
29 A&N Island .. ..
30 Chandigarh .. ..
31 D & N Haveli .. ..
32 Daman & Diu .. ..
33 Delhi 64.1 58.9
34 Lakshadweep .. ..
35 Puducherry .. ..
Notes:
=The same table in NHP 2007 was for the births in the last 3 years but inadventantly printed for the births in the last 5 years
.. Survey not conducted
Source: National Family Health Survey-III (2005-06),MOHFW/GOI

National Health Profile 2008 113
3.2.3 State/UT wise Percentage of Couples using Contraceptives in India
S. No.
State/UT Family Planning (currently married women, age 15–49)
Any method (%)
Any modern method (%)
Female sterilization
(%)
Male sterilization
(%)
IUD (%) Pill (%) Condom (%)
1 2 3 4 5 6 7 8
India 56.3 48.5 37.3 1.0 1.7 3.1 5.2
1 Andhra Pradesh 67.6 67.0 62.9 2.9 0.5 0.3 0.5
2 Arunachal Pradesh 43.2 37.3 22.5 0.1 3.4 8.1 2.8
3 Assam 56.5 27.0 13.0 0.2 1.3 10.3 2.3
4 Bihar 34.1 28.8 23.8 0.6 0.6 1.3 2.3
5 Chattisgarh 53.2 49.1 40.7 3.3 0.8 1.4 2.9
6 Goa 48.2 37.2 25.8 0.1 2.2 1.5 7.5
7 Gujarat 66.6 56.5 42.9 0.6 4.4 2.6 5.8
8 Haryana 63.4 58.3 38.2 0.7 4.7 2.8 11.8
9 Himachal Pradesh 72.6 71.0 49.0 6.3 1.4 2.7 11.5
10 Jammu & Kashmir 52.6 44.9 26.3 2.6 2.7 4.7 8.0
11 Jharkhand 35.7 31.1 23.4 0.4 0.6 3.8 2.7
12 Karnataka 63.6 62.5 57.4 0.2 2.5 0.8 1.7
13 Kerala 68.6 57.9 48.7 1.0 2.3 0.4 5.5
14 Madhya Pradesh 55.9 52.8 44.3 1.3 0.7 1.7 4.8
15 Maharashtra 66.9 64.9 51.1 2.1 3.0 2.4 6.2
16 Manipur 48.7 23.6 8.2 0.5 5.3 5.3 4.1
17 Meghalaya 24.3 18.5 9.5 0.1 1.5 4.9 2.4
18 Mizoram 59.9 59.6 42.9 0.0 4.7 10.6 1.4
19 Nagaland 29.7 22.5 9.9 0.0 5.2 4.7 2.6
20 Orissa 50.7 44.7 33.1 1.0 0.5 7.0 3.0
21 Punjab 63.3 56.1 30.8 1.2 5.5 2.9 15.5
22 Rajasthan 47.2 44.4 34.2 0.8 1.6 2.0 5.7
23 Sikkim 57.6 48.7 21.2 4.5 3.0 12.8 4.1
24 Tamil Nadu 61.4 60.0 55.0 0.4 2.1 0.2 2.3
25 Tripura 65.7 44.9 17.6 0.5 0.9 21.8 3.2
26 Uttar Pradesh 43.6 29.3 17.3 0.2 1.4 1.7 8.6
27 Uttarakhand 59.3 55.5 32.1 1.8 1.5 4.2 15.7
28 West Bengal 71.2 49.9 32.2 0.7 0.6 11.7 4.3
29 A&N Island .. .. .. .. .. .. ..
30 Chandigarh .. .. .. .. .. .. ..
31 D & N Haveli .. .. .. .. .. .. ..
32 Daman & Diu .. .. .. .. .. .. ..
33 Delhi 66.9 56.5 23.0 0.8 5.0 4.5 22.9
34 Lakshadweep .. .. .. .. .. .. ..
35 Puducherry .. .. .. .. .. .. ..
Note:
.. Survey not conducted
Source: National Family Health Survey-III (2005-06),MOHFW/GOI.

National Health Profile 2008114
3.2.4 State/UT wise Percentage of Children Immunized In India
S. No.
State/UT Immunization of Child between 12-23 months old
Fully immunized (BCG, measles, and
3 doses each of polio/DPT) (%)
Received BCG (%)
Received 3 doses of polio
vaccine (%)
Received 3 doses of DPT vaccine (%)
Received measles
vaccine (%)
No Immunisation
1 2 3 4 5 6 7
India 43.5 78.1 78.2 55.3 58.8 5.1
1 Andhra Pradesh 46.0 92.9 79.2 61.4 69.4 3.8
2 Arunachal Pradesh 28.4 57.7 55.8 39.3 38.3 24.1
3 Assam 31.4 62.4 59.0 44.9 37.4 15.2
4 Bihar 32.8 64.7 82.4 46.1 40.4 7.0
5 Chattisgarh 48.7 84.6 85.1 62.8 62.5 2.5
6 Goa 78.6 96.8 87.2 87.5 91.2 0.0
7 Gujarat 45.2 86.4 65.3 61.4 65.7 4.5
8 Haryana 65.3 84.9 82.8 74.2 75.5 7.8
9 Himachal Pradesh 74.2 97.2 88.6 85.1 86.3 1.9
10 Jammu & Kashmir 66.7 90.9 82.2 84.5 78.3 4.5
11 Jharkhand 34.2 72.7 79.3 40.3 47.6 4.4
12 Karnataka 55.0 87.8 73.8 74.0 72.0 6.9
13 Kerala 75.3 96.3 83.1 84.0 82.1 1.8
14 Madhya Pradesh 40.3 80.5 75.6 49.8 61.4 5.0
15 Maharashtra 58.8 95.3 73.4 76.1 84.7 2.8
16 Manipur 46.8 80.0 77.5 61.2 52.8 6.5
17 Meghalaya 32.9 65.9 56.6 47.3 43.8 16.5
18 Mizoram 46.4 86.4 63.5 66.8 69.5 7.0
19 Nagaland 21.0 46.3 46.2 28.7 27.3 18.4
20 Orissa 51.8 83.6 65.1 67.9 66.5 11.6
21 Punjab 60.1 88.0 75.9 70.5 78.0 6.6
22 Rajasthan 26.5 68.5 65.2 38.7 42.7 5.5
23 Sikkim 69.6 95.9 85.6 84.3 83.1 3.2
24 Tamil Nadu 80.9 99.5 87.8 95.7 92.5 0.0
25 Tripura 49.7 81.1 65.3 60.2 59.9 14.7
26 Uttar Pradesh 23.0 61.0 87.6 30.0 37.7 2.7
27 Uttarakhand 60.0 83.5 80.3 67.1 71.6 9.1
28 West Bengal 64.3 90.1 80.7 71.5 74.7 5.9
29 A&N Island .. .. .. .. .. ..
30 Chandigarh .. .. .. .. .. ..
31 D & N Haveli .. .. .. .. .. ..
32 Daman & Diu .. .. .. .. .. ..
33 Delhi 63.2 87.0 79.1 71.7 78.2 9.1
34 Lakshadweep .. .. .. .. .. ..
35 Puducherry .. .. .. .. .. ..
Note:
.. Survey not conducted
Source: National Family Health Survey-III (2005-06),MOHFW/GOI

National Health Profile 2008 115
3.2.5 State/UT wise Percentage of Children Breastfed in India and their Nutritional Status
S. No.
State/UT Child Feeding Practices and Nutritional Status of Children
Children breastfed within one hour of
birth (%)
Children age 0-5 months exclusively
breastfed (%)
Children age 6-9 months
receiving solid or semi-solid
food and breastmilk
(%)
Children under 5 years
who are stunted (%)
Children under 5 years
who are wasted (%)
Children under 5 years who are
underweight (%)
1 2 3 4 5 6 7
India 24.5 46.3 55.8 48.0 19.8 42.5
1 Andhra Pradesh 24.6 62.7 63.7 42.2 12.2 32.5
2 Arunachal Pradesh 58.6 60.0 77.6 43.3 15.3 32.5
3 Assam 50.9 63.1 59.6 46.5 13.7 36.4
4 Bihar 3.7 27.9 57.3 55.6 27.1 55.9
5 Chattisgarh 25.0 82.0 54.5 52.9 19.5 47.1
6 Goa 59.4 17.7 69.8 25.6 14.1 25.0
7 Gujarat 27.8 47.8 57.1 51.7 18.7 44.6
8 Haryana 22.1 16.9 44.8 45.7 19.1 39.6
9 Himachal Pradesh 45.4 27.1 66.0 38.6 19.3 36.5
10 Jammu & Kashmir 31.6 42.3 58.3 35.0 14.8 25.6
11 Jharkhand 10.7 57.8 65.3 49.8 32.3 56.5
12 Karnataka 35.7 58.0 72.5 43.7 17.6 37.6
13 Kerala 56.5 56.2 93.6 24.5 15.9 22.9
14 Madhya Pradesh 15.9 21.6 51.9 50.0 35.0 60.0
15 Maharashtra 52.0 53.0 47.8 46.3 16.5 37.0
16 Manipur 57.8 61.7 78.1 35.6 9.0 22.1
17 Meghalaya 57.8 26.3 76.3 55.1 30.7 48.8
18 Mizoram 66.4 46.1 84.6 39.8 9.0 19.9
19 Nagaland 54.2 29.2 71.0 38.8 13.3 25.2
20 Orissa 54.8 50.2 67.5 45.0 19.5 40.7
21 Punjab 12.7 36.0 50.0 36.7 9.2 24.9
22 Rajasthan 14.1 33.2 38.7 43.7 20.4 39.9
23 Sikkim 42.9 37.2 89.6 38.3 9.7 19.7
24 Tamil Nadu 58.8 33.3 77.9 30.9 22.2 29.8
25 Tripura 34.6 36.1 59.8 35.7 24.6 39.6
26 Uttar Pradesh 7.3 51.3 45.5 56.8 14.8 42.4
27 Uttarakhand 33.5 31.2 51.6 44.4 18.8 38.0
28 West Bengal 23.5 58.6 55.9 44.6 16.9 38.7
29 A&N Island .. .. .. .. .. ..
30 Chandigarh .. .. .. .. .. ..
31 D & N Haveli .. .. .. .. .. ..
32 Daman & Diu .. .. .. .. .. ..
33 Delhi 21.0 34.5 59.8 42.2 15.4 26.1
34 Lakshadweep .. .. .. .. .. ..
35 Puducherry .. .. .. .. .. ..
Note:
.. Survey not conducted
Source: National Family Health Survey-III (2005-06),MOHFW/GOI.

National Health Profile 2008116
3.2.6 State/UT wise Nutritional Status of Women and Men in India
S. No.
State/UT Women whose Body Mass Index is below
normal (%)
Men whose Body Mass Index is
below normal (%)
Women who are overweight or
obese (%)
Men who are overweight or
obese (%)
1 2 3 4 5
India 35.6 34.2 12.6 9.3
1 Andhra Pradesh 33.5 30.8 15.6 13.6
2 Arunachal Pradesh 16.4 15.2 8.8 7.1
3 Assam 36.5 35.6 7.8 5.0
4 Bihar 45.1 35.3 4.6 6.3
5 Chattisgarh 43.4 38.5 5.6 4.9
6 Goa 27.9 24.6 20.2 15.4
7 Gujarat 36.3 36.1 16.7 11.3
8 Haryana 31.3 30.9 17.4 10.8
9 Himachal Pradesh 29.9 29.7 13.5 10.6
10 Jammu & Kashmir 24.6 28.0 16.7 6.2
11 Jharkhand 43.0 38.6 5.4 4.9
12 Karnataka 33.5 33.9 15.3 10.9
13 Kerala 18.0 21.5 28.1 17.8
14 Madhya Pradesh 41.7 41.6 7.6 4.3
15 Maharashtra 36.2 33.5 14.5 11.9
16 Manipur 14.8 16.3 13.3 9.2
17 Meghalaya 14.6 14.1 5.3 5.9
18 Mizoram 14.4 9.2 10.6 11.4
19 Nagaland 17.4 14.2 6.4 5.7
20 Orissa 41.4 35.7 6.6 6.0
21 Punjab 18.9 20.6 29.9 22.2
22 Rajasthan 36.7 40.5 8.9 6.2
23 Sikkim 11.2 12.2 15.4 11.9
24 Tamil Nadu 28.4 27.1 20.9 14.5
25 Tripura 36.9 41.7 7.1 4.8
26 Uttar Pradesh 36.0 38.3 9.2 7.3
27 Uttarakhand 30.0 28.4 12.8 7.9
28 West Bengal 39.1 35.2 11.4 5.5
29 A&N Island .. .. .. ..
30 Chandigarh .. .. .. ..
31 D & N Haveli .. .. .. ..
32 Daman & Diu .. .. .. ..
33 Delhi 14.8 15.7 26.4 16.8
34 Lakshadweep .. .. .. ..
35 Puducherry .. .. .. ..
Note:
.. Survey not conducted
Source: National Family Health Survey-III (2005-06),MOHFW/GOI

National Health Profile 2008 117
3.2.7 State/UT wise Percentage of Anaemia Children among and Adults in India
S. No.
State/UT Children age 6-59 months who are
anaemic (%)
Ever-married women age 15-49 who are anaemic
(%)
Pregnant women age 15-49 who are
anaemic (%)
Ever-marrried men age 15-49 who are
anaemic (%)
1 2 3 4 5
India 69.5 55.3 57.8 24.2
1 Andhra Pradesh 70.8 62.9 56.4 23.3
2 Arunachal Pradesh 56.9 50.6 49.2 28.0
3 Assam 69.6 69.5 72.0 39.6
4 Bihar 78.0 67.4 60.2 34.3
5 Chattisgarh 71.2 57.5 63.1 27.0
6 Goa 38.2 38.0 36.9 10.4
7 Gujarat 69.7 55.3 60.8 22.2
8 Haryana 72.3 56.1 69.7 19.2
9 Himachal Pradesh 54.7 43.3 37.0 18.9
10 Jammu & Kashmir 58.6 52.1 54.0 19.5
11 Jharkhand 70.3 69.5 68.4 36.5
12 Karnataka 70.4 51.5 59.5 19.1
13 Kerala 44.5 32.8 33.1 8.0
14 Madhya Pradesh 74.1 56.0 57.9 25.6
15 Maharashtra 63.4 48.4 57.8 16.8
16 Manipur 41.1 35.7 36.4 11.4
17 Meghalaya 64.4 47.2 56.1 36.7
18 Mizoram 44.2 38.6 49.3 19.4
19 Nagaland .. .. .. ..
20 Orissa 65.0 61.2 68.1 33.9
21 Punjab 66.4 38.0 41.6 13.6
22 Rajasthan 69.7 53.1 61.2 23.6
23 Sikkim 59.2 60.0 53.1 25.0
24 Tamil Nadu 64.2 53.2 53.3 16.5
25 Tripura 62.9 65.1 57.6 35.5
26 Uttar Pradesh 73.9 49.9 51.6 24.3
27 Uttarakhand 61.4 55.2 45.2 29.2
28 West Bengal 61.0 63.2 62.6 32.3
29 A&N Island .. .. .. ..
30 Chandigarh .. .. .. ..
31 D & N Haveli .. .. .. ..
32 Daman & Diu .. .. .. ..
33 Delhi 57.0 44.3 29.9 17.8
34 Lakshadweep .. .. .. ..
35 Puducherry .. .. .. ..
Note:
.. Survey not conducted
Source: National Family Health Survey-III (2005-06),MOHFW/GOI.
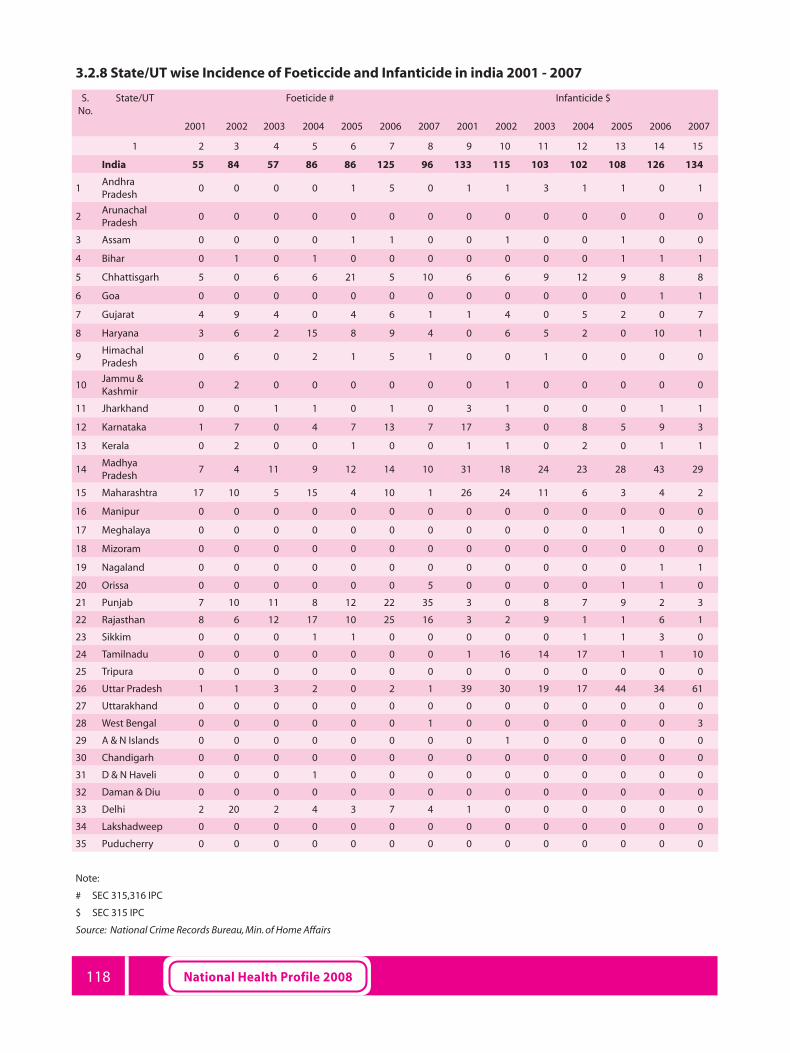
National Health Profile 2008118
3.2.8 State/UT wise Incidence of Foeticcide and Infanticide in india 2001 - 2007
S. No.
State/UT Foeticide # Infanticide $
2001 2002 2003 2004 2005 2006 2007 2001 2002 2003 2004 2005 2006 2007
1 2 3 4 5 6 7 8 9 10 11 12 13 14 15
India 55 84 57 86 86 125 96 133 115 103 102 108 126 134
1Andhra Pradesh
0 0 0 0 1 5 0 1 1 3 1 1 0 1
2Arunachal Pradesh
0 0 0 0 0 0 0 0 0 0 0 0 0 0
3 Assam 0 0 0 0 1 1 0 0 1 0 0 1 0 0
4 Bihar 0 1 0 1 0 0 0 0 0 0 0 1 1 1
5 Chhattisgarh 5 0 6 6 21 5 10 6 6 9 12 9 8 8
6 Goa 0 0 0 0 0 0 0 0 0 0 0 0 1 1
7 Gujarat 4 9 4 0 4 6 1 1 4 0 5 2 0 7
8 Haryana 3 6 2 15 8 9 4 0 6 5 2 0 10 1
9Himachal Pradesh
0 6 0 2 1 5 1 0 0 1 0 0 0 0
10Jammu & Kashmir
0 2 0 0 0 0 0 0 1 0 0 0 0 0
11 Jharkhand 0 0 1 1 0 1 0 3 1 0 0 0 1 1
12 Karnataka 1 7 0 4 7 13 7 17 3 0 8 5 9 3
13 Kerala 0 2 0 0 1 0 0 1 1 0 2 0 1 1
14Madhya Pradesh
7 4 11 9 12 14 10 31 18 24 23 28 43 29
15 Maharashtra 17 10 5 15 4 10 1 26 24 11 6 3 4 2
16 Manipur 0 0 0 0 0 0 0 0 0 0 0 0 0 0
17 Meghalaya 0 0 0 0 0 0 0 0 0 0 0 1 0 0
18 Mizoram 0 0 0 0 0 0 0 0 0 0 0 0 0 0
19 Nagaland 0 0 0 0 0 0 0 0 0 0 0 0 1 1
20 Orissa 0 0 0 0 0 0 5 0 0 0 0 1 1 0
21 Punjab 7 10 11 8 12 22 35 3 0 8 7 9 2 3
22 Rajasthan 8 6 12 17 10 25 16 3 2 9 1 1 6 1
23 Sikkim 0 0 0 1 1 0 0 0 0 0 1 1 3 0
24 Tamilnadu 0 0 0 0 0 0 0 1 16 14 17 1 1 10
25 Tripura 0 0 0 0 0 0 0 0 0 0 0 0 0 0
26 Uttar Pradesh 1 1 3 2 0 2 1 39 30 19 17 44 34 61
27 Uttarakhand 0 0 0 0 0 0 0 0 0 0 0 0 0 0
28 West Bengal 0 0 0 0 0 0 1 0 0 0 0 0 0 3
29 A & N Islands 0 0 0 0 0 0 0 0 1 0 0 0 0 0
30 Chandigarh 0 0 0 0 0 0 0 0 0 0 0 0 0 0
31 D & N Haveli 0 0 0 1 0 0 0 0 0 0 0 0 0 0
32 Daman & Diu 0 0 0 0 0 0 0 0 0 0 0 0 0 0
33 Delhi 2 20 2 4 3 7 4 1 0 0 0 0 0 0
34 Lakshadweep 0 0 0 0 0 0 0 0 0 0 0 0 0 0
35 Puducherry 0 0 0 0 0 0 0 0 0 0 0 0 0 0
Note:
# SEC 315,316 IPC
$ SEC 315 IPC
Source: National Crime Records Bureau, Min. of Home Affairs

National Health Profile 2008 119
3.2.9 Targets and Achievement of Maternity and Child Health Activities (Immunisation) in India 1991-92 to 2007-08
(Figures in Million Nos.)
Year Target Achievement % Achievement Target Achievement PercentageT.T. ( Preg. Women) D.P.T.
1 2 3 4 5 6 71991-92 26.13 20.27 77.60 23.33 21.21 90.901992-93 27.01 21.45 79.40 24.29 22.00 90.601993-94 27.56 22.75 82.60 24.79 23.09 93.201994-95 27.53 23.07 83.80 24.77 23.40 94.501995-96 27.53 22.12 80.40 24.86 22.56 90.701996-97 28.11 22.98 81.80 25.40 23.25 91.501997-98 28.29 23.37 82.60 25.55 23.74 92.901998-99 27.75 23.28 83.90 25.12 23.55 93.701999-00 29.24 23.78 81.30 24.72 23.56 95.302000-01 28.81 24.73 85.80 24.35 24.58 100.902001-02 28.85 25.09 87.00 24.43 24.81 101.502002-03 29.76 24.22 81.40 25.20 24.53 97.402003-04 30.29 23.66 78.10 25.69 23.51 91.542004-05 30.25 23.88 78.94 25.69 24.10 93.832005-06 30.31 24.41 80.54 25.79 24.74 95.922006-07 30.50 24.44 80.12 26.03 25.28 97.102007-08* 30.10 23.96 79.59 25.77 24.19 93.87
D.T. POLIO1991-92 17.66 13.75 77.80 23.33 21.30 91.301992-93 18.16 14.13 77.80 24.29 22.12 91.001993-94 18.54 13.42 72.40 24.79 23.21 93.61994-95 21.45 14.56 67.90 24.77 23.58 95.21995-96 21.79 10.49 48.10 24.86 22.78 91.61996-97 22.17 13.77 62.10 25.40 23.55 92.71997-98 22.55 10.52 46.60 25.55 23.98 93.91998-99 23.59 12.69 53.80 25.12 23.93 95.31999-00 23.93 12.56 52.50 24.72 23.71 95.92000-01 24.32 17.58 72.40 24.35 24.87 102.12001.02 24.83 14.50 71.50 24.43 24.75 101.32002-03 23.04 15.95 69.20 25.20 24.57 97.52003-04 23.57 15.12 64.20 25.69 23.98 93.352004-05 26.42 16.81 63.60 25.69 24.22 94.282005-06 24.57 18.61 75.70 25.79 24.70 95.772006-07 27.26 19.00 69.70 26.03 25.27 97.072007-08* 27.67 15.24 55.10 25.77 23.83 92.48
B.C.G. (Below 1 year) MEASLES (Below 1 year)1991-92 23.33 21.67 92.9 23.33 19.83 85.01992-93 24.29 23.46 96.6 24.29 20.86 85.91993-94 24.79 24.09 97.2 24.79 21.95 88.51994-95 24.77 24.70 99.8 24.77 21.60 87.21995-96 24.86 24.13 97.1 24.86 20.54 82.61996-97 25.40 24.95 98.2 25.40 21.14 83.21997-98 25.55 25.42 99.5 25.55 21.92 85.81998-99 25.12 24.54 97.7 25.12 22.13 88.11999-00 24.72 25.12 101.6 24.72 22.20 89.82000-01 24.35 25.97 106.7 24.35 23.48 96.42001-02 24.43 26.03 106.5 24.43 23.45 96.02002-03 25.20 25.93 102.9 25.20 23.35 92.72003-04 25.69 25.80 100.46 25.69 21.99 85.62004-05 25.69 25.71 100.08 25.69 23.24 90.52005-06 25.79 26.77 103.79 25.79 24.04 93.22006-07 26.03 26.68 102.47 26.03 24.11 92.62007-08* 25.77 25.76 99.94 25.77 23.37 90.7
Note* ProvisionalSource: Monitoring & Evaluation Division, Ministry of Health & Family Welfare/GOI

National Health Profile 2008120
3.3 Disability
3.3.1 State/UT wise Proportion of Disabled Population by Type of Disability in India 2001 (Census)
S. No.
State/UT Visual Disability Speech Disability
Hearing disability
Locomotor disability only
Mental Disability
Total
1 2 3 4 5 6 7
India 10634881 1640868 1261722 6105477 2263821 21906769
1 Andhra Pradesh 581587 138974 73373 415848 155199 1364981
2 Arunachal Pradesh 23079 2429 3072 3474 1261 33315
3 Assam 282056 56974 51825 91970 47475 530300
4 Bihar 1005605 130471 73970 512246 165319 1887611
5 Chattisgarh 160131 30438 34093 151611 43614 419887
6 Goa 4393 1868 1000 4910 3578 15749
7 Gujarat 494624 66534 70321 310765 103221 1045465
8 Haryana 201358 24920 27682 151485 49595 455040
9 Himachal Pradesh 64122 12762 15239 46512 17315 155950
10 Jammu & Kashmir 208713 16956 14157 37965 24879 302670
11 Jharkhand 186216 39683 28233 138323 55922 448377
12 Karnataka 440875 90717 49861 266559 92631 940643
13 Kerala 334622 67066 79713 237707 141686 860794
14 Madhya Pradesh 63614 75825 85354 495878 115257 1408528
15 Maharashtra 580930 113043 92390 56945 213274 1569582
16 Manipur 11713 2769 2994 6177 4723 28376
17 Meghalaya 13381 3431 3668 5127 3196 28803
18 Mizoram 6257 2006 2421 2476 2851 16011
19 Nagaland 9968 4398 5245 4258 2630 26499
20 Orissa 514104 68673 84115 250851 103592 1021335
21 Punjab 170853 22756 17348 149758 63808 424523
22 Rajasthan 753962 73147 75235 400577 109058 1411979
23 Sikkim 10790 3174 3432 2172 799 20367
24 Tamil Nadu 964063 124479 72636 353798 127521 1642497
25 Tripura 27505 5105 5699 13970 6661 58940
26 Uttar Pradesh 1852071 255951 128303 930580 286464 3453369
27 Uttarakhand 85668 16749 15990 56474 19888 194769
28 West Bengal 862073 170022 131579 412658 270842 1847174
29 A&N Island 3321 652 545 1870 669 7057
30 Chandigarh 8422 882 607 3828 1799 15538
31 D & N Haveli 2346 295 337 795 275 4048
32 Daman & Diu 1898 189 120 690 274 3171
33 Delhi 120712 15505 8741 64885 26043 235886
34 Lakshadweep 603 207 147 505 216 1678
35 Puducherry 10646 1818 2277 8830 2286 25857
Note:= India and Manipur figures exclude those of the three sub-divisions viz. Mao Maram, Paomata and Purul of Senapati district of Manipur as
census results of 2001 in these three sub-divisions were cancelled due to technical and administrative reasons.
Source: Registrar General of India

National Health Profile 2008 121
3.4 Mental Health
3.4.1 Mental Health Care Load in India July 2002 (Latest)
S. No.
State Population @ Density/Sq. Km. $ Estimated Case Load #
Mental Disorders
Major Minor
1 2 3 4 5
1 Andhra Pradesh 75727541 275 757275 3766375
2 Arunachal Pradesh 1091117 13 10911 54555
3 Assam 26638407 340 266384 1331720
4 Bihar 82878796 880 828787 4143935
5 Chhattishgarh 20795956 154 207959 1049795
6 Goa 1343998 363 13439 77195
7 Gujarat 50596992 258 505969 2529845
8 Haryana 21082989 477 210829 1054145
10 Himachal Pradesh 6077248 109 60772 303860
11 Jharkhand 26909428 338 269094 1345470
12 Jammu & Kashmir 10069917 99 100699 503495
13 Karnatka 52733958 275 527339 2636695
14 Kerala 31838619 819 318386 1591930
15 Madhya Pradesh 60388118 196 603881 3019405
16 Maharashtra 96752247 314 967522 4837610
17 Manipur 2388634 107 23886 119430
18 Meghalya 2306069 103 23060 115300
19 Mizoram 891058 93 8910 44550
20 Nagaland 1988636 120 19886 99430
21 Orrisa 36706920 236 367069 1835345
22 Punjab 24289296 482 242892 1114460
23 Rajsthan 56473122 165 564731 2823655
24 Sikkim 540493 78 5404 27020
25 Tamil Nadu 62110839 478 621108 3105540
26 Tripura 3191168 304 31911 159555
27 Uttarakhand 8479562 159 84795 423975
28 Uttat pradesh 166052859 689 1660528 8302640
29 West Bengal 80221171 904 802211 4011055
30 A & N islands 356265 43 3562 18810
31 Chandigarh 900914 7903 9009 45045
32 Daman & Diu, Dadra & Nagar Haveli 158059, 220451 1411, 449 3785 18925
33 Delhi 13782976 9294 137829 689145
34 Lakshdweep 60595 1894 605 3025
35 Pudducherry 973829 2029 9738 48690
Total 10270165 51251625
Notes :@ The population figures haven been taken from the Census of India-2001 as published in Provisional Population Totals (Registar General Census Commissioner, India).
$ Population density per sqare Kilometre together with geographical terrain is a useful input in planning deployment of mental health resources.
# Case-load in respect to major mental disorders has been calculated at the rate of 1% of the population and that of minor mental disorders at the rate of 5 % of population .Source: National Survey of Mental Health Resources carried out by the Directorate General of Helth Services, Minsitry of Health and Family Welfare, Government of India, during May and July 2002 and published in Mental Health An Indian Perspective 1946-2003 DteGHS/MOHFW/GOI

National Health Profile 2008122
ww
w.cb
hidghs.n
ic.in