NEPAL IN TRANSITION: UNDERSTANDING CONFLICT PREVENTION IN NEPAL
Upload
khangminh22Category
view
1download
0
Socioeconomic Status and Health Behavior in Nepal
Chelsie Porter
A thesis
submitted in partial fulfillment of the
requirements for the degree of
Master of Public Health
University of Washington
2016
Committee:Annette Fitzpatrick
Maya MagaratiAnjum Hajat
Program Authorized to Offer Degree:
Epidemiology

© Copyright 2016
Chelsie Porter
2

University of Washington
Abstract
Socioeconomic Status and Health Behavior in Nepal
Chelsie Monet Porter
Chair of the Supervisory Committee:Annette Fitzpatrick, PhD
Assistant Dean, School of Public HealthResearch Professor, Family Medicine
Research Professor, EpidemiologyResearch Professor, Global Health
Background: Socioeconomic status (SES) is an important determinant of healthoutcomes, but more research is needed to improve our understanding of the relationship between SES, behavior and health, particularly in low- and middle-income countries (LMICs). Efforts to improve our understanding are limited by the difficulty of measuring economic status in low-resource settings where income may be seasonal and informal employment is common. The debate over how to accurately measure economic wellbeing is pertinent in Nepal, where more than 25% of the population lives in poverty and subsistence farming is an important source of livelihood. Additionally, studies suggest a growing burden of noncommunicable disease (NCDs) in Nepal, many of which are impacted by behavioral risk factors.
Objectives: This study aimed to construct an asset-based wealth index to estimatehousehold wealth; and to develop and test prediction models for tobacco use and physical activity in a community-based sample of adults in Dhulikhel, central Nepal.
Methods: We conducted a cross-sectional study using data from 863 adult participants of the Dhulikhel Heart Study in Dhulikhel, Nepal. Household characteristics, individual sociodemographic characteristics and individual health behaviors were assessed using
3

standard questionnaires completed during in-home interviews. The Demographic and Health Surveys (DHS) wealth index model was used to construct an asset-based measure of household wealth. The wealth index used information collected in the DHS, including access to utilities and infrastructure (e.g. source of drinking water), durable asset ownership, and housing characteristics (e.g. number of rooms for sleeping), to produce a measure household wealth. The wealth index was constructed using principal components analysis (PCA) of these measures.
Backwards stepwise logistic regression was used to develop and test prediction models for tobacco use and physical activity using the developed wealth index and other SES variables. Tobacco use was categorized as ever (lifetime) or never. Participants were categorized as those who met the WHO guidelines for recommended level of physical activity (600 MET-minutes per week) and those who did not. Area under the Receiver Operating Characteristic curve (AUC) was used to assess the performance of the predictive models; an average AUC of 0.70 was considered acceptable.
Results: Of 863 participants included in this study, 59% were female. The average agewas 40.6 years and nearly a quarter of participants were in the highest quintile of household wealth. On average, study participants had 6.7 years of formal education; approximately one-third of the study population had no formal education.
The first component of the PCA, designated as the wealth index, found that households with the following characteristics had higher loadings: use of liquid petroleum gas (LPG) as fuel for cooking; had a toilet that flushed to piped sewerage system; had drinking water piped into the dwelling; owned a TV; owned a nonmobile phone; owned a refrigerator; owned a table; owned a chair; owned a sofa; owned a cupboard; owned a computer; owned a clock; owned a fan; owned a bike or rickshaw; owned a motorcycle or scooter; had internet; had a bank account; had cement floors; and had a cement roof. The wealth index accounted for 17% of the variability across all wealth indicators.
Approximately 32% of participants reported lifetime tobacco use, and 40% of participants did not meet the recommendation for physical activity. After adjustment for sociodemographic characteristics, males were found to have significantly higher odds of tobacco use (OR=6.22, 95%C CI: 3.7-10.45, p<0.001) compared to females. No significant differences in physical activity were seen by sex. The prediction model for tobacco use included sex, age, and education; wealth was not a significant covariate in this model. The average AUC associated with the performance of the model was 0.829. The prediction model for physical activity included age, education, wealth, ethnicity and work status in the past twelve months. The average AUC associated with the performance of the model was 0.649 which is below the cut-off of 0.70 traditionally used for evaluating such models.
4

Conclusions: This study contributes to the existing literature on socioeconomic status,behavior and health in Nepal. With approximately 30% of participants reporting tobacco use, tobacco prevalence was similar to recent national estimates of tobacco use. As seen in previous studies, tobacco use was significantly higher among men compared to women as well as among older, less educated participants. Considering that approximately 40% of participants did not meet recommendations for physical activity, the prevalence of physical inactivity in this study greatly exceeds national estimates. We found that wealth as indicated by household assets did not predict use of tobacco after consideration of age, sex, and education. While wealth, along with age, education, ethnicity, and work status, was significantly associated with physical activity, the model overall did not predict physical activity well. Increased disease surveillance and stronger national strategies are needed to better understand determinants of behavioral risk factors for NCDs and to improve health in Nepal.
5
Introduction
Globally, socioeconomic status (SES) is an important determinant of health
outcomes.1–4
Although the relationship between SES and health has been studied
extensively, the mechanism by which economic and social status act to influence health
is not well understood. In addition to differences in environmental exposures and access
to resources, many researchers have considered the relationship between SES,
behavior and health. In high-income countries, low SES is associated with behavioral
risk factors including tobacco use and physical inactivity; however, more research is
needed to improve our understanding of the social determinants of behavior in low- and
middle-income countries. 5–8
Considering the potential influence of SES on behavior, accurate measures of
economic status are vital to examining the relationship between socioeconomic posit ion,
behavior and health. SES is commonly measured by income, education or occupation;
wealth, another measure of economic status, is less often used.5,9–11
Though related,
income and wealth are distinct economic indicators: income refers to the flow of
financial resources into a household, while wealth is defined as total financial resources
and assets amassed over a lifetime.10,12
Research suggests that the domain chosen to measure SES has implications for
results, and debate exists about which domain is best. Researchers, however, have
identified a number of advantages to using wealth as a measure of SES.10,13,14
Studies
show wealth is significantly associated with important health outcomes, including obesity,
smoking and mortality.10,11,15
Because wealth is a reflection of the lifetime accumulation of
resources and therefore less subjective to fluctuations over time, wealth may provide a
more stable measure of SES than income.10,16
This may be particularly
6
true for health behaviors, which are likely more closely related to long-term financial
status, rather than short-term estimates of income.16
Furthermore, because wealth
reflects a variety of social constructs, including prestige and political power, as well as
financial resources, wealth may be a better measure of socioeconomic position than
income.10,12
Wealth as an economic indicator may be particularly useful in low- and middle-
income countries (LMICs), where estimating household economic status has proven
difficult.16
While indicators of SES in high-income countries have traditionally relied on
monetary measures, income-based measures may not be appropriate for use in LMICs,
where income is often seasonal or dependent on a variety of agricultural and
nonagricultural sources.8,17
Consumption expenditure, another commonly-used
measure, is difficult to collect and requires accurate information about cash expenditure,
reducing its utility in low-income settings where transactions may not involve cash
exchange.1
In response to these difficulties, many researchers have advocated for the use of
asset-based indices, suggesting that such measures provide a more accurate picture of
long-term wealth.8,18
Asset-based indices have been shown to produce results
comparable to consumption or expenditure.14,16,19
The Demographic and Health
Surveys (DHS) wealth index, a widely-used asset-based index, was developed to
measure a household’s economic status in the absence of reliable income and
expenditure data.16
The index uses household information gathered by the DHS,
including access to utilities and infrastructure (e.g. source of drinking water), durable
7

asset ownership, and housing characteristics (e.g. number of rooms for sleeping),
to construct a measure of household wealth.
Health and behavioral risk factors in Nepal
The debate over how to accurately measure wealth is pertinent in Nepal, where
more than 25% of the population lives in poverty and subsistence farming is an
important source of livelihood.20
To date, few studies have developed a standardized
method of measuring wealth in Nepal.21–24
Recent studies also suggest that Nepal is
experiencing a growing burden of noncommunicable diseases (NCDs): deaths
attributable to NCDs rose from 51% in 2011 to 60% in 2014.25,26
Cardiovascular
disease, respiratory diseases, cancer, and diabetes are among the most common
causes of death from NCDs in Nepal.26–28
Globally, modifiable behavioral risk factors contribute substantially to disability and
death from NCDs.29
In Nepal, five of the ten leading risk factors contributing to the burden
of disease are behavioral risks, including tobacco use.30
In 2013, the prevalence of adult
tobacco use in Nepal was 30.8%, with nearly half of men ages 15-69 years (48.1%)
reporting tobacco use.31
Physical inactivity is another key risk factor for NCDs, including
cardiovascular diseases, diabetes and cancer.32
While estimates of physical activity vary
widely, especially between urban and rural areas, multiple studies report nearly 50%
prevalence of physical inactivity among Nepalese adults.31,33,34
In order to improve our understanding of the relationship between socioeconomic
status and health behavior in Nepal, this study aimed to construct a measure of household
wealth using the DHS wealth index. It also aimed to develop and test
8

prediction models for tobacco use and physical activity in a community-based sample of
adults in Dhulikhel, central Nepal.
Methods
Study design and participants
We conducted a cross-sectional analysis using data collected as part of the
Dhulikhel Health Study, a study of cardiovascular disease risk factors among adult
residents (n=1073) of Dhulikhel, Kavrepalanchok district, Nepal in 2013-2014.35
Located approximately 15 miles southeast of Kathmandu, Dhulikhel is a suburban town
with a population of about 16,000 people.28,36
Prior to initiation of the study,
households in Dhulikhel were enumerated (n=2225) and one-third of households in
each of nine administrative districts were randomly selected for inclusion in the study.
All eligible members of selected households were then invited to participate. Members
of a household were eligible to participate if they were at least 18 years of age and a
resident of Dhulikhel for a minimum of six months. Individuals living in institutionalized
settings (e.g. hostels and motels), pregnant women, individuals unable to respond due
to a cognitive or physical disability, and those who refused to participate were excluded
from the study.
Data collection
Data was collected by trained study staff hired by Dhulikhel Hospital in Dhulikhel,
Nepal. The study staff administered two electronic, tablet-based questionnaires using
Open Data Kit. One questionnaire was completed at the household level by a head of
9

household (usually female); a second questionnaire was completed at the
individual level. Both questionnaires are included in the appendix.
The household questionnaire was administered to obtain information on
household characteristics, including asset ownership, property ownership, basic
facilities and housing condition. The personal questionnaire was administered to obtain
additional information about each eligible individual in the household, including
sociodemographic characteristics and health behaviors. Sociodemographic questions
were based on the Nepal Demographic Health Survey 2011.37
Birth date of the
respondents was used to calculate age in years.
Construction of an asset-based wealth index
Data from the household questionnaire, including possession of durable goods,
ownership of agricultural land and animals, and materials used for housing
construction, were used to develop the index. First, descriptive analyses of household
data were performed, and any indicator variable with a cell count less than 10 was
excluded from the analysis. A complete list of the indicators included in the wealth index
can be found in Table 1-1. Following the method used by the DHS wealth index,
principal components analysis (PCA) was used to produce component scores for each
household. Only the first component was used to develop the wealth index. The first
component score was divided into five quintiles to create the household wealth index.
Household data was merged with data from the personal questionnaire, and each
individual was assigned the wealth score of her/his household. Participants who did not
complete both the household and personal questionnaire were excluded from the
analysis.
10
Measures: exposure, outcomes and covariates of interest
The primary exposure evaluated in this study was household wealth.
Household wealth was defined as quintile of household wealth, based on the wealth
index constructed following the method used to create the DHS wealth index
(described above).38
Study outcomes
The outcomes evaluated in this study were tobacco use and physical activity.
Tobacco use was measured using the World Health Organization (WHO) STEPS
Surveillance Manual adapted for use in Nepal.39
The tobacco use variable was
derived from the question, “Have you ever used tobacco such as cigarettes, bidi, pipe,
cigars, khaini, surti, jarda paan, hukka, chilim, tamakhu?” Participants’ tobacco use
was categorized as ever (lifetime) or never.
Physical activity was assessed using the WHO Global Physical Activity
Questionnaire (GPAQ).40
The questionnaires collects information about three domains
of physical activity: activity at work, travel to and from places (amount of time spent
walking or biking), and recreational activity. Vigorous-intensity activities were defined as
activities that require hard physical effort and cause large increases in breathing or
heart rate. Moderate-intensity activities were defined as activities that require moderate
physical effort and cause small increases in breathing or heart rate. The total duration of
activity was then converted into metabolic equivalents (METs); METs are used to
11

express the intensity of physical activities. To calculate MET-minutes per week, MET
values were applied to reported activity levels in each domain; four METs were
assigned to time spent engaged in moderate activities and travel, and eight METs
were assigned to time spent in vigorous activity. After summing the total activity
reported for each domain, participants were categorized as those that met the WHO
guidelines for recommended level of physical activity (600 MET-minutes per week) and
those that did not meet the recommended level of physical activity.41
Analysis followed
existing guidelines.40
Covariates of interest
Covariates of interest included sex, age (years), education (years), ethnicity
(Newar, Brahmin/Chettri/Thakuri/Sanyasi, other), religion (Hindu, Buddhist, other),
marital status (never married, currenty married, separated/widowed), main lifetime
occupation (housewife, student, agriculture, sales and service, other) and main work
status in the past 12 months (unemployed, employed, student).
Data analysis
All analyses were performed using Stata version 13.1 and SPSS version 21.
Descriptive statistics were calculated; sociodemographic characteristics were
summarized by frequency and percentage for categorical variables and by mean and
standard deviations for continuous variables. We then analyzed the association of each
sociodemographic characteristic (wealth, age, sex, ethnicity, years of formal education,
religion, lifetime occupation and work status in the past year) with tobacco use and
physical activity in unadjusted logistic regression models. The sampling unit was set at
the household level to account for clustering at the household level. Multivariate logistic
12

regressions adjusted for household cluster were completed separately for tobacco
and physical activity; the sociodemographic variables listed above were included in
the models. Odds ratios (OR), 95% confidence intervals, and p-values were reported.
Backwards stepwise logistic regression was then used to develop prediction
models for physical activity and tobacco use. Sociodemographic variables considered
for inclusion in the models were sex, age, household wealth, education, ethnicity,
religion, marital status, main lifetime occupation and main work status in the past 12
months.
The prediction model was developed in two steps: the model was first developed
in a random subsample of half of the participants and subsequently tested for fit in the
second half. After the regression analysis was performed on the initial half -sample,
variables with significance levels greater than 0.2 were removed from the model. The
resulting model for each outcome was then tested in the remaining half of the data.
After the model was developed and tested in subsamples of the data, the final model
was run using the full dataset. Area under the Receiver Operating Characteristic curve
(AUC) was calculated to assess the performance of the model in each subsample of
the data; an average AUC of 0.70 was considered acceptable.42,43
Results
Of 1372 eligible participants enumerated in the first wave of the Dhulikhel Heart
Study, study staff were able to contact 1103 (80.4%) participants.28
1073 participants
(78.1%) provided informed consent and were recruited into the study. Of those who
provided consent, 863 (62.9%) participants from 318 households completed both the
household and personal questionnaires. All participants were included in the tobacco
13

analysis; based on the GPAQ Analysis Guide,40
850 participants were included in
the physical activity analysis.40
Table 1-1 provides a summary of household characteristics of the sample.
Approximately 60% of households used a toilet that flushed to a septic tank, and 59%
lived in nuclear families. Approximately 80% of households owned agricultural land,
and nearly half owned livestock. More than 90% of households owned at least one of
the following assets: a radio, a television, a mobile phone, a table, a chair, and a watch.
Less than 10% owned a car or truck, or a dhiki or jaato. Natural materials, including
earth and sand, were the most common materials used for flooring in houses, and
galvanized sheet was the most common material used for roofing.
The component loadings from the first component of the PCA are shown in Table
1-2. A total of 48 variables were included in the PCA. Following the method used to
construct the DHS wealth index, only the first component was used to develop the
wealth quintiles.38
The first component explained 17% of the variation in household
wealth. Households with the following characteristics had higher scores in the wealth
index (score coefficient > 0.4): used LPG as fuel for cooking; had a toilet that flushed to
piped sewerage system; had drinking water piped into the dwelling; owned a TV; owned
a nonmobile phone; owned a refrigerator; owned a table; owned a chair; owned a sofa;
owned a cupboard; owned a computer; owned a clock; owned a fan; owned a bike or
rickshaw; owned a motorcycle or scooter; had internet; had a bank account; had
cement floors; and had a cement roof. Households that owned livestock, owned goats,
had natural floors and had galvanized sheet roofs had lower scores in the wealth index.
14

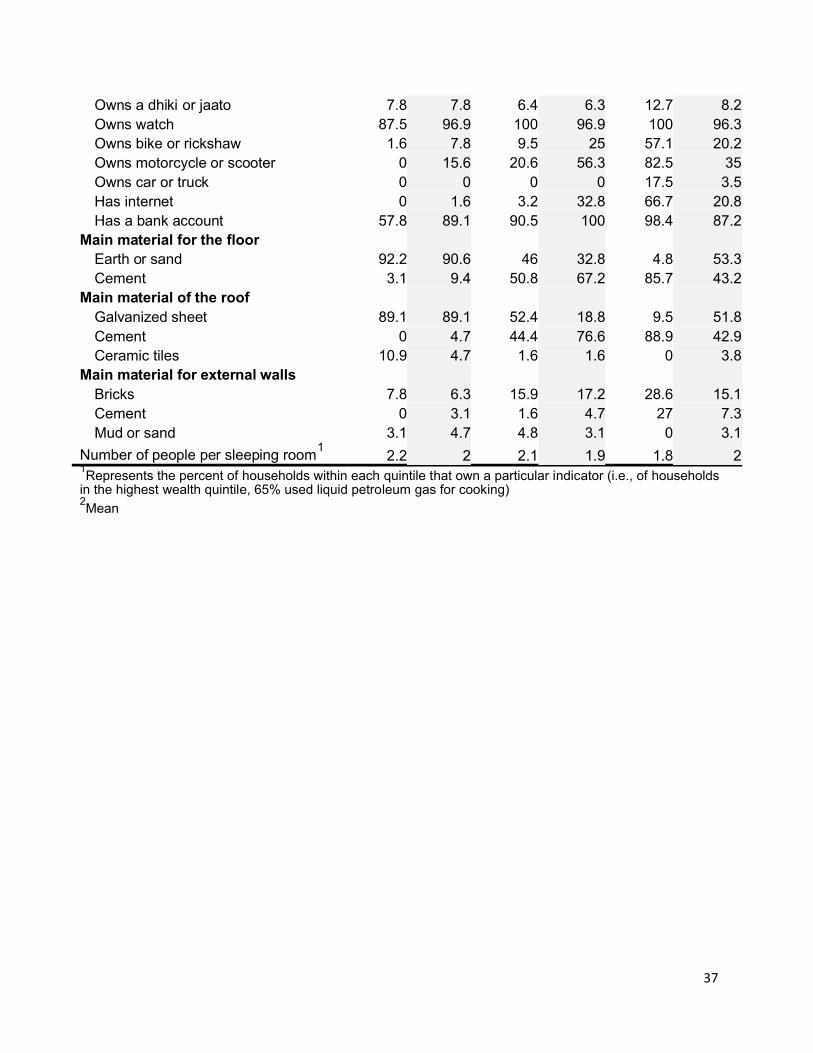
Table 1-3 shows all the assets used to construct the wealth index tabulated by
quintile of the wealth distribution. Of note, nearly 70% of households in the highest
quintile of household wealth used a toiled that flushed to a piped sewerage system,
compared to only 6% of households in the poorest quintile. While the percentage of
households in each quintile that owned agricultural land was similar, households in the
poorest quintile were more likely to own livestock than households in the highest wealth
quintile (84.4% versus 12.7%). Approximately 67% of households in the highest wealth
quintile had internet, compared to 0% of those in the lowest wealth quintile. Natural
floors and galvanized sheet roofs were more common in the poorest households than
the wealthiest households, while cement floors and cement roofs were most common
in the richest households than in the poorest.
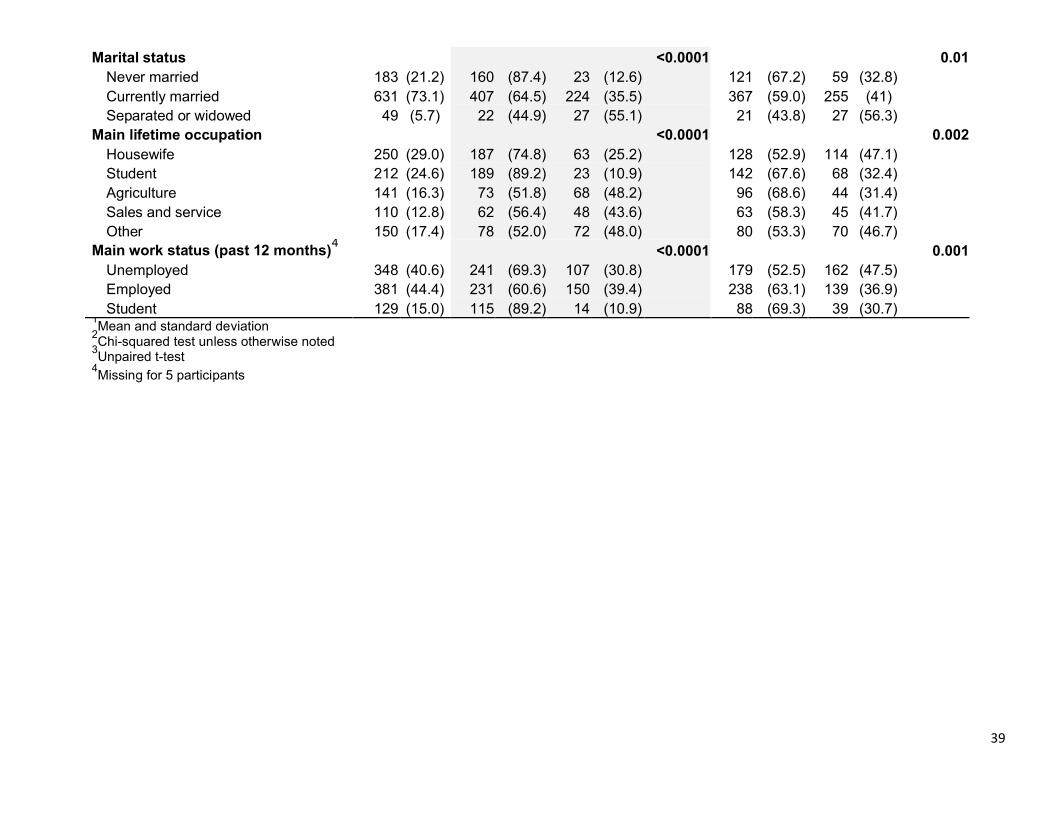
Table 2 shows the sociodemographic characteristics of study participants. The
majority of study participants were female (59%), and the average age was 40.6 years
(SD: 16.4 years). Nearly a quarter of participants were in the highest quintile of
household wealth, compared to approximately 15% in the lowest quintile. On average,
study participants had 6.7 years of formal education (SD: 5.6); however, nearly one-
third of the study population had no formal education. The majority of study participants
identified as Newar (52%) and Hindu (87%). Housewife was the most common lifetime
occupation (29%), and nearly half of the study population was employed during the
past twelve months.
Tobacco use
Of 863 participants, 274 (31.8%) reported lifetime tobacco use (Table 2). Males
had a significantly higher prevalence of lifetime tobacco use (48.6%) compared to
15
females (19.9%) (p<0.0001). On average, participants who reported tobacco use were
significantly older than participants who did not report tobacco use (50.3 years and 36
years, respectively; p<0.0001). Tobacco use was also significantly different by
categories of household wealth, education, ethnicity, religion, marital status, main
lifetime occupation and main work status in the past 12 months (p<0.01). Notably,
participants in the lowest quintile of household wealth and those with no formal
education had the highest prevalence of tobacco use.
Table 3-1 shows the crude and adjusted associations of sociodemographic
characteristics with tobacco use. In univariate analysis, significant associations were
found between tobacco use and sex, age, household wealth, education, ethnicity (other
versus Newar only), religion (Buddhist versus Hindu only), marital status, main lifetime
occupation and main work status in the past twelve months. In the multivariate model,
sex (OR: 6.22, 95% CI: 3.70-10.45, p<0.001 for males), age (OR: 1.06, 95% CI: 1.03-
1.08, p<0.001 per year increase), household wealth (middle and highest quintiles versus
lowest quintile only), education (OR: 0.91, 95% CI: 0.86-0.96, p<0.001 per year
increase), ethnicity (other versus Newar only), and main lifetime occupation (other
versus housewife only) were significantly associated with tobacco use.
Using backward stepwise logistic regression, the final prediction model for
tobacco use included sex (OR=8.36, 95% CI: 5.45-12.48, p<0.001 for males), age
(OR=1.04, 95% CI: 1.03-1.06, p<0.001 per year increase), and education (OR=0.89,
95% CI: 0.84-0.92, p<0.001 per year increase) as significant predictors of tobacco use
(Table 3-2). The average AUC associated with the performance of the model was 0.829
(Figure 1-1).
16

Physical activity
Of 850 participants, 341 (40.1%) did not meet physical activity recommendations
(600 MET-minutes per week) (Table 2). The prevalence of physical inactivity was not
significantly different between males and females. On average, participants who did not
meet physical activity recommendations were significantly older than participants who
engaged in sufficient physical activity (43.2 years and 38.8 years, p=0.0001). Significant
differences in physical activity were also seen within categories of household wealth,
marital status, main lifetime occupation and main work status in the past 12 months
(p<0.05).
Table 4-1 shows the crude and adjusted associations of sociodemographic
characteristics with physical activity. In univariate analysis, significant associations were
found between physical activity and age, household wealth (middle, fourth and highest
quintiles versus lowest quintile only), marital status, main lifetime occupation (student
and agriculture versus housewife only), and main work status in the past twelve months.
In the multivariate model, age (OR: 1.02, 95% CI: 1.00-1.03, p<0.05 per year increase),
household wealth (middle, fourth and highest quintiles versus lowest quintile only), and
work status in the past twelve months (employed versus unemployed only) were
significantly associated with physical activity.
Using backward stepwise logistic regression, the final prediction model for
physical activity included age (OR: 1.02, 95% CI: 1.00-1.03, p<0.01 per year increase),
education (OR: 1.03, 95% CI: 0.99-1.07, p=0.122 per year increase), wealth, ethnicity
and work status in the past 12 months as significant predictors of physical activity
(Table 4-2). The average AUC associated with performance of the prediction model for
17

physical activity was 0.649 (Figure 1-2); thus, the model was determined to
be unacceptable at the 0.70 level.
Discussion
This study provides important insights into relationships between SES and the
prevalence of tobacco use and physical inactivity in Nepal. The majority of households
included in this study lived in nuclear families, owned agricultural land, and owned at
least one of the following assets: a radio, a television, a mobile phone, a table, a chair,
and a watch. In this study, sex, age, and education were significant predictors of
tobacco use. Despite substantial evidence of wealth as a predictor of tobacco use in
LMICs globally, including Nepal, household wealth did not predict tobacco use in this
study.44–47
Age, education, wealth, ethnicity and work status in the past 12 months
were identified as significant predictors of physical activity.
In this study, approximately 32% of participants reported any tobacco use,
including nearly 50% of men and 20% of women. These results are consistent with
recent national estimates of tobacco use that reported the prevalence of tobacco use
near 30%.26,37
Tobacco use estimates ranged from 37-52% for males and 13-25% for
females.26,31,37
In all of these studies, the prevalence of tobacco use among women
was significantly lower than the prevalence reported by men; despite these differences,
a comparison of South Asian countries found that women in Nepal had the highest
prevalence of tobacco use.48
Though the prevalence of tobacco use among Nepali
men clearly demands a public health solution, this comparison highlights the need to
aggressively address tobacco use among Nepali women as well.
18

While this study measured lifetime history of tobacco use rather than current
tobacco use, participants who reported ever using tobacco were also asked about use
in the past month. Of those who reported ever using tobacco, the majority (69%)
reported using tobacco in the past month; approximately 72% of men and 65% of
women who had ever used tobacco reported use in the last month. Of the entire
sample, 22% of participants used tobacco in the last month, including 35% of all men
and 13% of all women. These results suggest that most people who initiate tobacco use
will continue using tobacco, highlighting the need for prevention efforts. Furthermore,
this evidence supports the need for an increase in tobacco cessation programs in
Nepal.49
In addition to differences by sex, this study found significant associations
between age and tobacco use. After adjustment for other sociodemographic
characteristics, the odds of tobacco use increased by 6% per each year increase in age.
We also found that smoking was most common among participants in the lowest wealth
quintile and those with no formal education. Again, these findings are consistent with
existing literature.37
The final prediction model for tobacco use included sex, age, and educat ion as
significant predictors of tobacco use. Studies regarding the predictors of tobacco use in
other South Asian countries show similar results. A study of adults in Bangladesh found
that male gender, older age, less education, and low SES were significant predictors of
smoking.46
A study of tobacco use in thirteen LMICs found that male gender was a
significant predictor of tobacco use in every country, while age was a significant predictor
of tobacco use in all but two countries.57
Generally, prevalence of tobacco use
19
was higher among participants living in urban areas, those who were less educated,
and those belonging to low economic groups.57
While our study found that the odds of tobacco use were highest among
participants in the lowest quintile of household wealth, the results were not statistically
significant. Though our study benefitted from a large sample size, the sample size in
the comparison studies ranged from 10,000 to 316,000 participants.46,57
Our ability to
detect associations between wealth and tobacco use may have been limited by sample
size; alternatively, these results may reflect true variation in the relationship between
sociodemographic characteristics and tobacco use globally.
In this study, we found that wealth as indicated by household assets did not
predict tobacco use after consideration of age, sex, and education. These findings
contradict previous research from LMICs, including Nepal, that indicate wealth as a
significant predictor of tobacco use.44–47
The method used to measure tobacco use in
this study may have impacted the relationship between wealth and tobacco use. While
this study did not differentiate between smoking and smokeless tobacco, other studies
of tobacco use in Nepal suggest that the relationship between wealth and tobacco use
may depend on the type of tobacco consumed. A study by Sreeramareddy et al. found
that while individuals from the poorest wealth quintile were more likely than wealthier
individuals to use all forms of tobacco, gradients of the prevalence rates of tobacco use
according to wealth were less prominent for chewing tobacco than smoking.45
While
the type of tobacco used by each participant was not measured in this study, a study of
tobacco consumption among Nepalese men found that chewable tobacco use was
more prevalent than smoking.58
Considering the high prevalence of smokeless tobacco
20
use and the potential for differing relationships by type of tobacco use, type of tobacco
consumed should be considered in future studies of wealth and tobacco use in Nepal.
While our findings regarding the prevalence of tobacco use echo the results of
earlier research in Nepal, the prevalence of physical inactivity in this study was much
higher than recent national estimates. Compared to the 40% prevalence of physical
inactivity found in our study, recent nationwide estimates reported that 3.5%-4% of
Nepalis had low levels of physical activity; physical inactivity was more common among
men than women.25,31
Substantial geographic variation in physical activity in Nepal may explain the
difference between our results and the results of other studies of physical activity in
Nepal. While nationwide reports have estimated less than 5% physical inactivity, a study
of a peri-urban community in the Bhaktapur district near Kathmandu showed a high
prevalence of low physical activity (43%).25,31,33
Similar to our results, this study also
reported greater prevalence of low physical activity among older, more educated
respondents.33
A study of an urban poor population in Kathmandu found that one third
of the study population reported low physical activity. In contrast to national reports, the
prevalence of physical inactivity was higher among women than men in both
studies.33,50
Rapid urbanization may contribute to the high prevalence of physical inactivity in
urban and suburban areas of Nepal. Despite its status as the least urbanized country in
South Asia, with 18% of the population living in urban areas, Nepal is also the fastest-
urbanizing country in the region.51,52
Urbanization has been associated with decreased
physical activity, unhealthy diet, hypertension and obesity.28,53–55
A study of Sherpa
21

women in urban and rural Nepal found that women living in urban areas had
significantly higher BMI than women in rural areas; furthermore, the study found
that prevalence of BMI was correlated with reduced energy exposure, rather than
an increase in consumed calories.56
In addition to increased affluence and a decline in occupational physical activity,
access to motorized transportation contributes to decreased physical activity in urban
settings.55,56
The 2011 Nepal DHS reported that approximately 40% of households
nationwide owned a bicycle or rickshaw, 11% of households owned a motorcycle or
rickshaw, and 2.3% owned a car or truck.37
In our study, 20% of households owned a
bike or rickshaw, 35% owned a motorcycle or scooter, and 3.5% owned a car or truck.
Greater access to motorized transportation in Dhulikhel may help explain the increased
prevalence of physical inactivity reported in our study.
The prediction model for physical activity included age, education, wealth,
ethnicity and work status in the past 12 months as significant predictors of physical
activity. A review by Trost et al. found that age and gender were the two most consistent
predictors of physical activity in adults; socioeconomic status, occupational status and
education were also consistent determinants of physical activity.59
A review by Bauman
et al. found that males had a higher prevalence of physical activity than females in 17 of
20 studies reviewed.60
Older age was associated with lower physical activity in males in
about half of the studies; however, only three studies saw a similar t rend in females.
Importantly, the vast majority of studies included in both reviews were conducted in
high-income countries. While many studies have examined the determinants of physical
activity in high-income countries, research regarding the determinants of physical
22
activity in LMICs is limited.60
The WHO estimates that nearly three quarters of
NCDs deaths occur in LMICs.32
As physical activity is a key risk factor for NCDs,
there is a critical need for more research regarding the determinants of physical
activity in low-resource settings.
While wealth was not a predictor of tobacco use in this study, wealth, along with
age, education, ethnicity, and work status, was a predictor of physical activity. In our
study, the percent of participants who reported engaging in vigorous physical activity at
work decreased as wealth increased: 51% of people in the lowest quintile of household
wealth engaged in vigorous work, compared to 7% of people in the highest quintile. In
addition to differences in physical activity at work, wealth may enable investments that
reduce activity related to domestic life as well. For example, 65% of households in the
highest wealth quintile had drinking water piped into their dwelling, compared to only
6% of households in the lowest wealth quintile. In our study, differences in work and
domestic activities by people in different categories of household wealth may help
explain the role of wealth as a predictor of physical activity. Future studies of physical
activity should consider time spent in different domains of activity to inform strategies
aimed at increasing healthy behaviors.
In order to test the ability of our predictive models to discriminate between
participants who reported healthy behaviors (i.e. no tobacco use and sufficient physical)
and those who reported unhealthy behaviors (i.e. tobacco use and physical inactivity),
we determined the AUC of each model. The discriminatory ability of the model was
considered acceptable if the AUC associated with the model was 0.70 or greater. While
23
the prediction model for tobacco use was deemed acceptable (AUC: 0.829), the AUC
for the prediction model for physical activity was 0.649.
A possible explanation for the limited discriminatory ability of the model for
physical activity is the distribution of the outcome in the population. While tobacco use
was vastly more prevalent among certain groups, such as men compared to women,
physical inactivity was highly prevalent among all sociodemographic categories. The
high prevalence of physical inactivity in every category of the study population may limit
the ability of the model to accurately discern physical activity status based on the
sociodemographic characteristics included in this study. Furthermore, the use of a
binary indicator to represent physical activity may have been too crude of a measure to
detect variability across categories of socioeconomic status. The use of multiple
categories or a continuous measure of physical activity may have improved our ability to
detect underlying relationships between SES and physical activity.
The difficulty of measuring physical activity may have also impacted the
performance of the prediction model. Previous research has found that measuring
physical activity by self-report without objective measuring devices often results in
inaccurate measurements of activity. Prince et al. found that correlations between self -
report measures of physical activity and direct methods of assessment (e.g.
accelerometry, doubly labeled water) were low to moderate. Furthermore, self-reported
measures of physical activity were both higher and lower than directly measured
activity, making it difficult to determine the impact of inaccurate measurements on
outcomes.61
Misclassification of study participants’ physical activity level may have
contributed to the poor performance of the prediction model for physical activity.
24

This study has several limitations. Because this study uses cross-sectional data,
we cannot make statements regarding causality in the relationship between SES and
health behavior. The exposures and outcomes in the study are self -reported, which may
have resulted in measurement error. As Dhulikhel is a suburban community with close
proximity to healthcare provided by Dhulikhel Hospital, the results of this study may not
be generalizable to other communities in Nepal, particularly those in rural areas where
access to healthcare is limited. Additionally, researchers have criticized PCA as a
subjective methodology because the procedure is reliant on data specific to each study
and may not be replicated in other data sets. In addition, the variables included in the
analysis are determined by the investigator. Despite these criticisms, previous research
has found that asset indices constructed using PCA, like the DHS wealth index, produce
results comparable to consumption or expenditure.14,16,19
Despite these limitations, this study contributes to our understanding of
socioeconomic status, behavior and health in Nepal. To our knowledge, this is the
first study to develop prediction models of tobacco use and physical activity in a
Nepalese population. This study also demonstrated the use of asset-based wealth
indices in Nepal, a method of wealth measurement that requires fewer questions than
either consumption expenditure or income, reducing the burden on both participants
and researchers.16
The large sample size, random sampling technique and use of
standardized questionnaires are additional strengths of this study.
This study further confirms that tobacco use and physical inactivity are significant
behavioral health risks in Nepal. In 2013, Nepal developed a national action plan for
NCDs; the plan aims to significantly reduce mortality from the four leading NCDs, the
25

prevalence of current tobacco use, and the prevalence of insufficient physical activity.62
While a national tobacco control program has been implemented, cessation programs
for the treatment of tobacco dependence and taxation are two areas that require
improvement in order to effectively address tobacco use in Nepal.49
As highlighted by
this study, efforts to increase physical activity should target urban and suburban
areas, where the prevalence of inactivity is highest. It is especially important that
future research is conducted to understand how increased wealth might affect health
behaviors in the context of low-income countries. As LMICs continue to face a growing
burden of NCDs, understanding the role of SES in the formation of health behaviors is
critical to developing policies to reduce the burden of disease. Finally, improving
surveillance to increase the volume and accuracy of information regarding NCDs and
relevant risk factors is crucial to improving health in Nepal.
26
References
1. Gwatkin DR, Rutstein S, Johnson K, Suliman E, Wagstaff A, Amouzou A. Socio-economic differences in health, nutrition, and population within developing countries: an overview. Niger J Clin Pract. 2007;10(4):272-282. http://www.ncbi.nlm.nih.gov/pubmed/18293634.
2. Braveman P, Gottlieb L. The Social Determinants of Health: It’s Time to Consider the Causes of the Causes. Public Health Rep. 2014;129(Suppl 2):19-31. http://www.ncbi.nlm.nih.gov/pmc/articles/PMC3863696/.
3. Po JYT, Subramanian S V. Mortality burden and socioeconomic status in India. van Baal P, ed. PLoS One. 2011;6(2):e16844. doi:10.1371/journal.pone.0016844.
4. Woodward M, Peters SAE, Batty GD, et al. Socioeconomic status in relation to cardiovascular disease and cause-specific mortality: a comparison of Asian and Australasian populations in a pooled analysis. BMJ Open. 2015;5(3):e006408. doi:10.1136/bmjopen-2014-006408.
5. Adler NE, Newman K. Socioeconomic disparities in health: Pathways and policies. Health Aff. 2002;21(2):60-76. doi:10.1377/hlthaff.21.2.60.
6. Nandi A, Glymour MM, Subramanian S. Association among socioeconomic status, health behaviors, and all-cause mortality in the United States. Epidemiology. 2014;25(2):170-177. doi:10.1097/EDE.0000000000000038.
7. Pampel FC, Krueger PM, Denney JT. Socioeconomic Disparities in Health Behaviors. Annu Rev Sociol. 2010;36:349-370. doi:10.1146/annurev.soc.012809.102529.
8. Howe LD, Galobardes B, Matijasevich A, et al. Measuring socio-economic position for epidemiological studies in low- and middle-income countries: a methods of measurement in epidemiology paper. Int J Epidemiol. 2012;41(3):871-886. doi:10.1093/ije/dys037.
9. Centers for Disease Control and Prevention. NCHHSTP Social Determinants of Health. 2014. http://www.cdc.gov/nchhstp/socialdeterminants/definitions.html.
10. Hajat A, Kaufman JS, Hamoudi A, Rose K, Siddiqi A, Thomas J. Do the wealthy have a health advantage? An investigation of wealth as a measure of socioeconomic status. ProQuest Diss Theses. 2010.
11. Pollack CE, Chideya S, Cubbin C, Williams B, Dekker M, Braveman P. Should Health Studies Measure Wealth?. A Systematic Review. Am J Prev Med. 2007;33(3):250-264. doi:10.1016/j.amepre.2007.04.033.
12. Keister LA, Moller S. Wealth inequality in the United States. Annu Rev Sociol. 2000;26(2000):63-81. doi:10.1146/annurev.soc.26.1.63.
13. Braveman PA, Cubbin C, Egerter S, et al. Socioeconomic status in health
27

research: one size does not fit all. JAMA. 2005;294(22):2879-2888. doi:10.1001/jama.294.22.2879.
14. Filmer D, Pritchett LH. Estimating wealth effects without expenditure data--or tears: an application to educational enrollments in states of India. Demography. 2001;38(1):115-132. http://www.ncbi.nlm.nih.gov/pubmed/11227840.
15. Hajat A, Kaufman JS, Rose KM, Siddiqi A, Thomas JC. Long-term effects of wealth on mortality and self-rated health status. Am J Epidemiol. 2011;173(2):192-200. doi:10.1093/aje/kwq348.
16. Rutstein SO, Johnson K. The DHS Wealth Index. DHS Comparative Reports No. 6. Calverton, Maryland; 2004.
17. Howe LD, Hargreaves JR, Huttly SRA. Issues in the construction of wealth indices for the measurement of socio-economic position in low-income countries. EmergThemes Epidemiol. 2008;5:3. doi:10.1186/1742-7622-5-3.
18. Vyas S, Kumaranayake L. Constructing socio-economic status indices: How to use principal components analysis. Health Policy Plan. 2006;21(6):459-468. doi:10.1093/heapol/czl029.
19. Wagstaff A, Watanabe N. What difference does the choice of SES make in health inequality measurement? Health Econ. 2003;12(10):885-890. doi:10.1002/hec.805.
20. Government of Nepal. Nepal Human Development Report 2014. Kathmandu; 2014.
21. Ghosh A, Ghosh T. Modification of Kuppuswamys socioeconomic status scale in context to Nepal. Indian Pediatr. 2009;46(12):1104-1105. http://www.ncbi.nlm.nih.gov/pubmed/20061591.
22. Alkire S, Santos ME. Acute Multidimensional Poverty: A New Index forDeveloping Countries.; 2010.
23. Psaki SR, Seidman JC, Miller M, et al. Measuring socioeconomic status in multicountry studies: results from the eight-country MAL-ED study. Popul Health Metr. 2014;12(1):8. doi:10.1186/1478-7954-12-8.
24. Gerlitz J, Apablaza M, Hoermann B, Hunzai K, Bennett L. A Multidimensional Poverty Measure for the Hindu Kush–Himalayas, Applied to Selected Districts in Nepal. Mt Res Dev. 2015;35(3):278-288. doi:10.1659/MRD-JOURNAL-D-14-00027.1.
25. World Health Organization. Noncommunicable Diseases (NCD) Country Profiles,2011: Nepal. World Health Organization; 2011.http://www.who.int/nmh/countries/2011/npl_en.pdf?ua=1.
26. World Health Organization. Noncommunicable Diseases (NCD) Country Profiles,
28

2014: Nepal.; 2014. http://www.who.int/nmh/countries/npl_en.pdf?ua=1.
27. Bhandari G, Angdembe M, Dhimal M, Neupane S, Bhusal C. State of non-communicable diseases in Nepal. BMC Public Health. 2014;14(1):23. doi:10.1186/1471-2458-14-23.
28. Karmacharya BM. Epidemiology of Cardiovascular Diseases Risk Factors and Hypertension in a Community-Based Suburban Population in Nepal. 2015.
29. World Health Organization. Noncommunicable Diseases Fact Sheet. Geneva; 2015. http://www.who.int/mediacentre/factsheets/fs355/en/#.
30. Institute for Health Metrics and Evaluation. Country Profiles: Nepal. http://www.healthdata.org/nepal.
31. Government of Nepal, Nepal Health Research Council, World Health Organization. Non Communicable Diseases Risk Factors : STEPS Survey Nepal2013. Kathmandu; 2013.http://www.searo.who.int/nepal/mediacentre/non_communicable_diseases_risk_f actors_steps_survey_nepal_2013..pdf.
32. World Health Organization. Physical Activity Fact Sheet. Geneva; 2016. http://www.who.int/mediacentre/factsheets/fs385/en/#.
33. Vaidya A, Krettek A. Physical activity level and its sociodemographic correlates in a peri-urban Nepalese population: a cross-sectional study from the Jhaukhel-Duwakot health demographic surveillance site. Int J Behav Nutr Phys Act. 2014;11(1):39. doi:10.1186/1479-5868-11-39.
34. Dhungana RR, Devkota S, Khanal MK, et al. Prevalence of cardiovascular health risk behaviors in a remote rural community of Sindhuli district, Nepal. BMC Cardiovasc Disord. 2014;14(1):92. doi:10.1186/1471-2261-14-92.
35. Koju RP, Karmacharya BM, Shrestha A, et al. Design of the Dhulikhel Heart Study (DHS): The epidemiology of emerging cardiovascular disease in Nepal. Ann Glob Heal. 2014;80(3):204-205. doi:10.1016/j.aogh.2014.08.119.
36. Central Bureau of Statistics. National Population and Housing Census 2011. Vol 02. Kathmandu; 2012. http://cbs.gov.np/?p=2017.
37. Government of Nepal, New ERA, ICF International. Nepal Demographic and Health Survey 2011. Kathmandu; 2012.
38. Rutstein SO. Steps to constructing the new DHS Wealth Index. http://dhsprogram.com/programming/wealth index/Steps_to_constructing_the_new_DHS_Wealth_Index.pdf.
39. World Health Organization. WHO STEPS Surveillance Manual: The WHOSTEPwise Approach to Chronic Disease Risk Factor Surveillance. Geneva; 2005.
29
40. World Health Organization. Global Physical Activity Questionnaire (GPAQ)Analysis Guide. Genevahttp://www.who.int/chp/steps/resources/GPAQ_Analysis_Guide.pdf.
41. World Health Organization. Global Recommendations on Physical Activity forHealth. Geneva; 2010.
42. Fang J, Ayala C, Loustalot F. Association of birthplace and self -reported hypertension by racial/ethnic groups among US adults – National Health Interview Survey, 2006–2010. J Hypertens. 2012;30(12):2285-2292. doi:10.1097/HJH.0b013e3283599b9a.
43. Roelen CA, Bültmann U, van Rhenen W, van der Klink JJ, Twisk JW, Heymans MW. External validation of two prediction models identifying employees at risk of high sickness absence: cohort study with 1-year follow-up. BMC Public Health. 2013;13(1):105. doi:10.1186/1471-2458-13-105.
44. Sinha DN, Suliankatchi RA, Amarchand R, Krishnan A. Prevalence and Sociodemographic Determinants of Any Tobacco Use and Dual Use in Six Countries of the WHO South-East Asia Region: Findings From the Demographic and Health Surveys. Nicotine Tob Res. 2016;18(5):750-756. doi:10.1093/ntr/ntv286.
45. Sreeramareddy CT, Ramakrishnareddy N, Harsha Kumar H, Sathian B, Arokiasamy JT. Prevalence, distribution and correlates of tobacco smoking and chewing in Nepal: a secondary data analysis of Nepal Demographic and Health Survey-2006. Subst Abuse Treat Prev Policy. 2011;6(33). doi:10.1186/1747-597X-6-33.
46. Palipudi K, Sinha D, Choudhury S, et al. Predictors of tobacco smoking and smokeless tobacco use among adults in Bangladesh. Indian J Cancer. 2012;49(4):387-392. doi:10.4103/0019-509X.107745.
47. Fleischer NL, Diez Roux A V., Hubbard AE. Inequalities in Body Mass Index and Smoking Behavior in 70 Countries: Evidence for a Social Transition in Chronic Disease Risk. Am J Epidemiol. 2012;175(3):167-176. doi:10.1093/aje/kwr314.
48. Engelgau M, El-Saharty S, Kudesia P, Rajan V, Rosenhouse S, Okamoto K.Capitalizing on the Demographic Transition Tackling Noncommunicable Diseases in South Asia.; 2011. papers2://publication/uuid/4B8865DB-5866-4285-A74D-168F45ED1109.
49. World Health Organization. WHO Report on the Global Tobacco Epidemic, 2015.Country Profile: Nepal. Geneva; 2015.
50. Oli N, Vaidya A, Thapa G. Behavioural Risk Factors of Noncommunicable Diseases among Nepalese Urban Poor: A Descriptive Study from a Slum Area of Kathmandu. Epidemiol Res Int. 2013;2013:1-13. doi:10.1155/2013/329156.
30

51. Muzzini E, Aparicio G. Urban Growth and Spatial Transition in Nepal. The World Bank; 2013. doi:10.1596/978-0-8213-9659-9.
52. United Nations, Department of Economic and Social Affairs PD. WorldUrbanization Prospects: The 2014 Revision, Highlights (ST/ESA/SER.A/352).United Nations; 2014. doi:10.4054/DemRes.2005.12.9.
53. Vaidya A, Shakya S, Krettek A. Obesity prevalence in Nepal: public health challenges in a low-income nation during an alarming worldwide trend. Int JEnviron Res Public Health. 2010;7(6):2726-2744. doi:10.3390/ijerph7062726.
54. Patel RB, Burke TF. Urbanization - An Emerging Humanitarian Disaster. N Engl JMed. 2009;361(8):741-743. doi:10.1056/NEJMp0810878.
55. Wu Y, Benjamin EJ, MacMahon S. Prevention and Control of Cardiovascular Disease in the Rapidly Changing Economy of China. Circulation. 2016;133(24):2545-2560. doi:10.1161/CIRCULATIONAHA.115.008728.
56. Smith C. Prevalence of obesity and contributing factors among Sherpa women in urban and rural Nepal. Am J Hum Biol. 1998;10(4):519-528. doi:10.1002/(SICI)1520-6300(1998)10:4<519::AID-AJHB12>3.0.CO;2-B.
57. Palipudi KM, Gupta PC, Sinha DN, Andes LJ, Asma S, McAfee T. Social Determinants of Health and Tobacco Use in Thirteen Low and Middle Income Countries: Evidence from Global Adult Tobacco Survey. Barengo NC, ed. PLoS One. 2012;7(3):e33466. doi:10.1371/journal.pone.0033466.
58. Khanal V, Adhikari M, Karki S. Social determinants of tobacco consumption among Nepalese men: findings from Nepal Demographic and Health Survey 2011. Harm Reduct J. 2013;10(1):40. doi:10.1186/1477-7517-10-40.
59. Trost SG, Owen N, Bauman AE, Sallis JF, Brown W. Correlates of adults’ participation in physical activity: review and update. Med Sci Sport Exerc. 2002;34(12):1996-2001. doi:10.1249/01.MSS.0000038974.76900.92.
60. Macniven R, Bauman A, Abouzeid M. A review of population-based prevalence studies of physical activity in adults in the Asia-Pacific region. BMC Public Health. 2012;12(41). doi:10.1186/1471-2458-12-41.
61. Prince SA, Adamo KB, Hamel M, Hardt J, Connor Gorber S, Tremblay M. A comparison of direct versus self-report measures for assessing physical activity in adults: a systematic review. Int J Behav Nutr Phys Act. 2008;5(1):56. doi:10.1186/1479-5868-5-56.
62. World Health Organization, Government of Nepal. Multisectoral Action Plan forthe Prevention and Control of Non Communicable Diseases (2014-2020).; 2014.http://www.searo.who.int/nepal/mediacentre/ncd_multisectoral_action_plan.pdf.
31

Table 1-1. Household characteristics by wealth indicator (N=318)N or
Wealth indicator mean (% or SD)
Type of fuel used for cooking2
Liquid petroleum gas 85Wood 11
Cooks with improved stove 13Type of toilet
Flush to septic tank 192Flush to piped sewerage system 107Flush to pit latrine 11
Uses a shared toilet 69Main source of drinking water
2
Drinking water piped into dwelling 90Treats drinking water 34
Water treatment method: Waterfilter 18
Water treatment method: Boil 16Family type
Nuclear 186Joint 132
Owns agricultural land 259
Amount of land owned (sq. ft)1
25555.8 (103125.2)Owns livestock 151
Number of buffalo owned1
0.2
Number of cows owned1
0.4
Number of goats owned1
1.2
Number of sheep owned1
0
Number of chickens owned1
1.4
Numbers of ducks owned1
0.2Number of pigs owned
10.1
Durable goodsOwns a radio 290Owns a TV 290Owns a mobile phone 300Owns a nonmobile phone 89 (28)Owns a refrigerator 102Owns a table 289Owns a chair 293Owns a sofa 194 (61)Owns a cupboard 281Owns a computer 115Owns a clock 260Owns a fan 139Owns a dhiki or jaato 26
32

Owns watch 306Owns bike or rickshaw 64Owns motorcycle or scooter 111Owns car or truck 11Has internet 66Has a bank account 277
Main material for the floorEarth or sand 170Cement 137
Main material of the roofGalvanized sheet 165Cement 136Ceramic tiles 12
Main material for external walls2
Bricks 48Cement 23Mud or sand 10
Number of people per sleepingroom
12.0
1Mean and standard deviation
2Missing for 221 households
33

Table 1-2. Score coefficients derived from principal components analysis of household characteristics
ComponentWealth indicatorType of fuel used for cooking
Liquid petroleum gasWood
Cooks with improved stoveType of toilet
Flush to septic tankFlush to piped sewerage systemFlush to pit latrine
Uses a shared toiletMain source of drinking water
Drinking water piped into dwellingTreats drinking water
Water treatment method: Water filterWater treatment method: Boil
Family typeNuclearJoint
Owns agricultural landAmount of land owned (sq. ft)
Owns livestockNumber of buffalo ownedNumber of cows ownedNumber of goats ownedNumber of sheep ownedNumber of chickens ownedNumbers of ducks ownedNumber of pigs owned
Durable goodsOwns a radioOwns a TVOwns a mobile phoneOwns a nonmobile phoneOwns a refrigeratorOwns a tableOwns a chairOwns a sofaOwns a cupboardOwns a computerOwns a clockOwns a fanOwns a dhiki or jaatoOwns watch
34

Owns bike or rickshaw 0.455Owns motorcycle or scooter 0.612Owns car or truck 0.283Has internet 0.613Has a bank account 0.429
Main material for the floorEarth or sand -0.654Cement 0.633
Main material of the roofGalvanized sheet -0.655Cement 0.707Ceramic tiles -0.158
Main material for external wallsBricks 0.227Cement 0.325Mud or sand -0.049
Number of people per sleeping room -0.143Extraction method: Principal components analysisScore coefficients > 0.4 are bold
35

Table 1-3. Percentage of households with specific wealth indicators by wealth quintile (N=318)
Quintile (percent or number)1
Indicator Lowest Second Middle Fourth Highest AverageType of fuel used for cooking
Liquid petroleum gas 3.1 9.4 30.2 26.6 65.1 26.9Wood 7.8 7.8 1.6 0 0 3.4
Cooks with improved stove 14.1 3.1 3.2 0 0 4.1Type of toilet
Flush to septic tank 76.6 68.8 61.9 64.1 30.2 60.3Flush to piped sewerage system 6.3 23.4 34.9 34.4 69.8 33.8Flush to pit latrine 9.4 4.7 1.6 1.6 0 3.4
Uses a shared toilet 28.1 23.4 22.2 17.2 17.5 21.7Main source of drinking water
Drinking water piped into dwelling 6.3 14.1 30.2 26.6 65.1 28.4Treats drinking water 3.1 1.6 11.1 14.1 23.8 10.7
Water treatment method: Water filter 0 0 6.4 6.3 15.9 5.7Water treatment method: Boil 3.1 1.6 4.8 7.8 7.9 5
Family typeNuclear 87.5 59.4 50.8 56.3 38.1 58.4Joint 12.5 40.6 49.2 43.8 61.9 41.6
Owns agricultural land 78.1 89.1 74.6 85.9 79.4 81.4Amount of land owned (sq. ft)
241872.2 23765 17359.1 15949.9 28602.4 25509.7
Owns livestock 84.4 70.3 39.7 29.7 12.7 47.4Number of buffalo owned
20.4 0.3 0 0 0 0.2
Number of cows owned2
0.6 0.6 0.5 0.2 0 0.4
Number of goats owned2
2.8 2 0.7 0.5 0.1 1.2
Number of sheep owned2
0 0.2 0.1 0 0 0
Number of chickens owned2
2.1 1.7 1.8 0.9 0.3 1.4
Numbers of ducks owned2
0.1 0.5 0 0 0.1 0.2
Number of pigs owned2
0.3 0.3 0 0.1 0 0.1Durable goods
Owns a radio 76.6 93.8 93.7 96.9 95.2 91.2Owns a TV 59.4 96.9 100 100 100 91.3Owns a mobile phone 81.3 96.9 95.2 98.4 100 94.4Owns a nonmobile phone 6.3 3.1 11.1 48.4 71.4 28.1Owns a refrigerator 0 6.3 14.3 46.9 93.7 32.2Owns a table 64.1 92.2 98.4 100 100 90.9Owns a chair 67.2 95.3 98.4 100 100 92.2Owns a sofa 6.3 37.5 68.3 93.8 100 61.2Owns a cupboard 53.1 93.8 96.8 98.4 100 88.4Owns a computer 0 7.8 23.8 59.4 90.5 36.3Owns a clock 40.6 79.7 88.9 100 100 81.8Owns a fan 0 20.3 33.3 78.1 87.3 43.8
36
Owns a dhiki or jaato 7.8 7.8 6.4 6.3 12.7 8.2Owns watch 87.5 96.9 100 96.9 100 96.3Owns bike or rickshaw 1.6 7.8 9.5 25 57.1 20.2Owns motorcycle or scooter 0 15.6 20.6 56.3 82.5 35Owns car or truck 0 0 0 0 17.5 3.5Has internet 0 1.6 3.2 32.8 66.7 20.8Has a bank account 57.8 89.1 90.5 100 98.4 87.2
Main material for the floorEarth or sand 92.2 90.6 46 32.8 4.8 53.3Cement 3.1 9.4 50.8 67.2 85.7 43.2
Main material of the roofGalvanized sheet 89.1 89.1 52.4 18.8 9.5 51.8Cement 0 4.7 44.4 76.6 88.9 42.9Ceramic tiles 10.9 4.7 1.6 1.6 0 3.8
Main material for external wallsBricks 7.8 6.3 15.9 17.2 28.6 15.1Cement 0 3.1 1.6 4.7 27 7.3Mud or sand 3.1 4.7 4.8 3.1 0 3.1
Number of people per sleeping room1
2.2 2 2.1 1.9 1.8 21Represents the percent of households within each quintile that own a particular indicator (i.e., of households
in the highest wealth quintile, 65% used liquid petroleum gas for cooking)2Mean
37

Table 2. Sociodemographic characteristics of study participants by health behavior
Meets physical activityTobacco use (N=863)
No Yes Yes Non n (%) n p-value
2n % (%) p-value
2
Sex <0.0001 0.11Female 507 (58.8) 406 101 287 211 (42.4)Male 356 (41.3) 183 173 222 130 (36.9)
Age1,3
40.6 (16.4) 36.0 50.3 <0.0001 38.8 43.2 (18.1) 0.0001Age (years) <0.0001 <0.0001
18-27 245 (28.4) 220 25 155 88 (36.2)28-37 151 (17.5) 121 30 87 63 (42.0)38-47 182 (21.1) 123 59 123 52 (29.7)48-57 136 (15.8) 70 66 81 53 (39.6)58-67 89 (10.3) 35 54 41 47 (53.4)68+ 60 (7.0) 20 40 22 38 (63.3)
Household wealth quintile 0.0001 0.01Q1 133 (15.4) 69 66 97 33 (25.4)Q2 161 (18.7) 109 50 99 59 (37.3)Q3 171 (19.8) 120 49 94 73 (43.7)Q4 190 (22.0) 132 60 98 91 (48.2)Q5 208 (24.1) 159 49 121 85 (41.3)
Years of formal education1,3
6.7 (5.6) 7.8 4.4 <0.0001 6.9 6.44 0.21Education <0.0001 0.21
No formal education 274 (31.8) 143 131 149 118 (44.2)Less than high school 375 (43.5) 261 114 225 146 (39.4)High school or more 214 (24.8) 185 29 135 77 (36.3)
Ethnicity 0.0002 0.68Newar 448 (51.9) 314 134 259 181 (41.1)Brahmin/Chettri/Thakuri/Sanyasi 231 (26.8) 171 60 136 93 (40.6)Other 184 (21.3) 104 80 114 67 (37)
Religion 0.0034 0.21Hindu 748 (86.7) 524 224 433 304 (41.3)Buddhist 95 (11.0) 53 42 61 33 (35.1)Other 20 (2.3) 12 8 15 4 (21.1)
38
Marital status <0.0001 0.01Never married 183 (21.2) 160 (87.4) 23 (12.6) 121 (67.2) 59 (32.8)Currently married 631 (73.1) 407 (64.5) 224 (35.5) 367 (59.0) 255 (41)Separated or widowed 49 (5.7) 22 (44.9) 27 (55.1) 21 (43.8) 27 (56.3)
Main lifetime occupation <0.0001 0.002Housewife 250 (29.0) 187 (74.8) 63 (25.2) 128 (52.9) 114 (47.1)Student 212 (24.6) 189 (89.2) 23 (10.9) 142 (67.6) 68 (32.4)Agriculture 141 (16.3) 73 (51.8) 68 (48.2) 96 (68.6) 44 (31.4)Sales and service 110 (12.8) 62 (56.4) 48 (43.6) 63 (58.3) 45 (41.7)Other 150 (17.4) 78 (52.0) 72 (48.0) 80 (53.3) 70 (46.7)
Main work status (past 12 months)4
<0.0001 0.001Unemployed 348 (40.6) 241 (69.3) 107 (30.8) 179 (52.5) 162 (47.5)Employed 381 (44.4) 231 (60.6) 150 (39.4) 238 (63.1) 139 (36.9)Student 129 (15.0) 115 (89.2) 14 (10.9) 88 (69.3) 39 (30.7)
1Mean and standard deviation
2Chi-squared test unless otherwise noted
3Unpaired t-test
4Missing for 5 participants
39

Table 3-1. Multivariate logistic regression analysis of tobacco use (N=863)Univariate Multivariate Model
n OR 95% CI p-value OR 95% CI p-valueSex
Female 507 ref refMale 356 3.80 (2.85-5.06) <0.001 6.22 (3.70-10.45) <0.001
Age (years)1
40.6 1.06 (1.05-1.07) <0.001 1.06 (1.03-1.08) <0.001Age categories (years)
3
18-27 245 ref - - -28-37 151 2.18 (1.20-3.98) 0.011 - - -38-47 182 4.22 (2.38-7.49) <0.001 - - -48-57 136 8.30 (4.55-15.12) <0.001 - - -58-67 89 13.58 (7.08-26.04) <0.001 - - -68+ 60 17.60 (7.87-39.34) <0.001 - - -
Household wealth quintileQ1 (Lowest quintile) 133 ref refQ2 161 0.48 (0.30-0.76) 0.002 0.63 (0.35-1.17) 0.145Q3 171 0.43 (0.27-0.66) <0.001 0.46 (0.20-0.79) 0.018Q4 190 0.48 (0.29-0.78) 0.003 0.62 (0.28-1.20) 0.177Q5 208 0.32 (0.20-0.51) <0.001 0.38 (0.16-0.77) 0.013
Years of formal education1
6.7 0.89 (0.87-0.92) <0.001 0.91 (0.86-0.96) 0.001Education
3
No formal education 274 ref - - -
Less than high school 375 0.48 (0.34-0.66) <0.001 - - -
High school or more 214 0.17 (0.10-0.28) <0.001 - - -
EthnicityNewar 448 ref refBrahmin/Chettri/Thakuri/Sanyasi 231 0.82 (0.58-1.17) 0.28 0.68 (0.40-1.13) 0.133Other 184 1.80 (1.29-2.52) 0.001 1.99 (1.17-3.41) 0.012
Religion
40

Hindu 748 ref refBuddhist 95 1.85 (1.24-2.78) 0.003 0.85 (0.40-1.13) 0.598Other 20 1.56 (0.77-3.17) 0.218 1.99 (1.17-3.41) 0.938
Marital statusNever married 183 ref refCurrently married 631 3.83 (2.28-6.43) <0.001 0.94 (0.47-1.90) 0.865Separated or widowed 49 8.54 (4.02-18.15) <0.001 1.59 (0.59-4.32) 0.361
Main lifetime occupationHousewife 250 ref refStudent 212 0.36 (0.20-0.65) 0.001 1.93 (0.74-5.02) 0.18Agriculture 141 2.76 (1.79-4.28) <0.001 1.26 (0.69-2.29) 0.453Sales and service 110 2.30 (1.47-3.60) <0.001 1.63 (0.73-3.62) 0.231Other 150 2.74 (1.77-4.23) <0.001 2.41 (1.20-4.86) 0.014
Main work status (past 12 months)2
Unemployed 348 ref refEmployed 381 1.46 (1.08-1.99) 0.015 0.97 (0.58-1.62) 0.899Student 129 0.27 (0.13-0.56) <0.001 0.84 (0.28-2.50) 0.756
1Mean and standard deviation
2Missing for 5 participants
3Because this variable is included in the multivariate model as a continuous variable, no ORs are provided.
41

Table 3-2. Variables in the prediction model for tobacco use using backward stepwise logistic regressionTraining (N=431)
1
OR (95% CI) p-value OR (95% CI) p-valueSex
Female ref - ref - -Male (3.93-12.62) <0.001 (5.45-12.84) <0.001
Age (per year increase) (1.02-1.06) <0.001 (1.03-1.06) <0.001Education (per year increase) (0.84-0.95) <0.001 (0.84-0.92) <0.0011AUC (mean): 0.829
2AUC: 0.829 (95% CI: 0.80-0.86)
42

A
B
C
Figure 1-1. ROC curve of the model containing sex, age and education as predictors of tobacco use
(A) Training dataset (N=431); AUC=0.8065 (95% CI: 0.766-0.847(B) Validation dataset (N=432); AUC=0.8507 (95% CI: 0.816-0.886)(C) Full dataset (N=863); AUC=0.8286 (95% CI: 0.802-0.855)
43
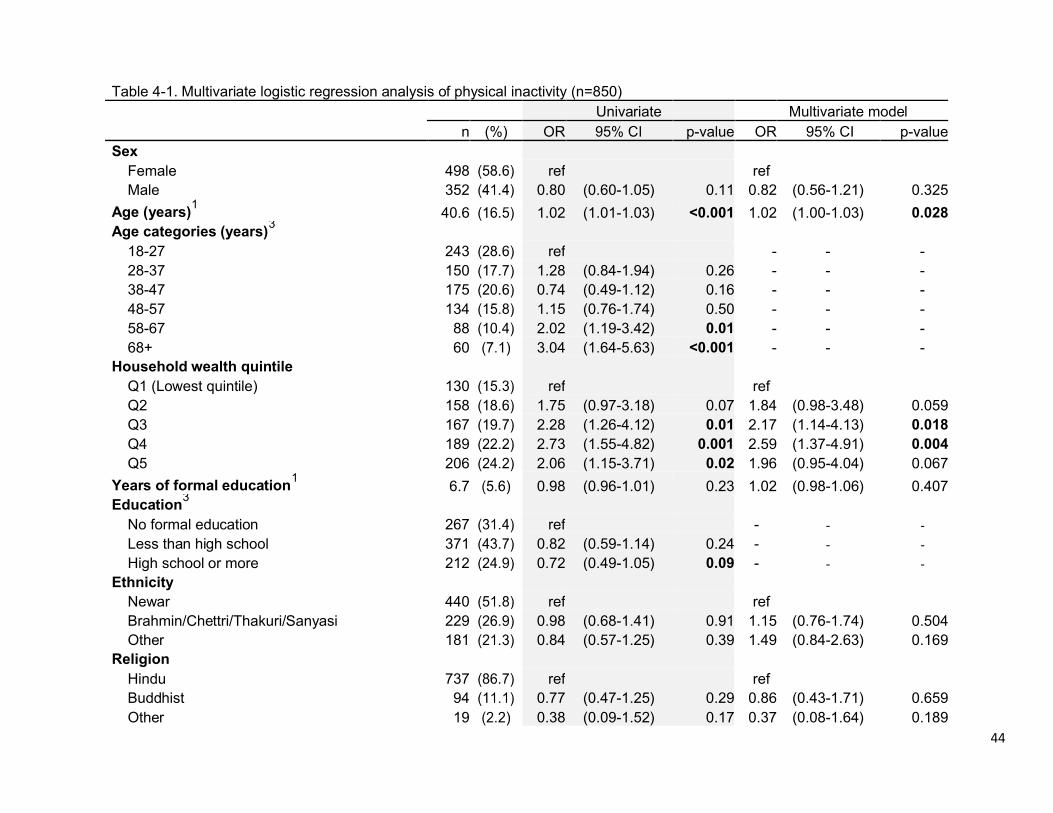
Table 4-1. Multivariate logistic regression analysis of physical inactivity (n=850)Univariate Multivariate model
n (%) OR p-value OR 95% CI p-valueSex
Female 498 ref refMale 352 0.80 (0.60-1.05) 0.11 0.82 (0.56-1.21) 0.325
Age (years)1
40.6 1.02 (1.01-1.03) <0.001 1.02 (1.00-1.03) 0.028Age categories (years)
3
18-27 243 ref - - -28-37 150 1.28 (0.84-1.94) 0.26 - - -38-47 175 0.74 (0.49-1.12) 0.16 - - -48-57 134 1.15 (0.76-1.74) 0.50 - - -58-67 88 2.02 (1.19-3.42) 0.01 - - -68+ 60 3.04 (1.64-5.63) <0.001 - - -
Household wealth quintileQ1 (Lowest quintile) 130 ref refQ2 158 1.75 (0.97-3.18) 0.07 1.84 (0.98-3.48) 0.059Q3 167 2.28 (1.26-4.12) 0.01 2.17 (1.14-4.13) 0.018Q4 189 2.73 (1.55-4.82) 0.001 2.59 (1.37-4.91) 0.004Q5 206 2.06 (1.15-3.71) 0.02 1.96 (0.95-4.04) 0.067
Years of formal education1
6.7 0.98 (0.96-1.01) 0.23 1.02 (0.98-1.06) 0.407Education
3
No formal education 267 ref - - -
Less than high school 371 0.82 (0.59-1.14) 0.24 - - -
High school or more 212 0.72 (0.49-1.05) 0.09 - - -
EthnicityNewar 440 ref refBrahmin/Chettri/Thakuri/Sanyasi 229 0.98 (0.68-1.41) 0.91 1.15 (0.76-1.74) 0.504Other 181 0.84 (0.57-1.25) 0.39 1.49 (0.84-2.63) 0.169
ReligionHindu 737 ref refBuddhist 94 0.77 (0.47-1.25) 0.29 0.86 (0.43-1.71) 0.659Other 19 0.38 (0.09-1.52) 0.17 0.37 (0.08-1.64) 0.189
44

Marital statusNever married 180 ref refCurrently married 622 1.42 (1.01-2.00) 0.041 0.98 (0.59-1.63) 0.94Separated or widowed 48 2.64 (1.39-4.99) 0.003 1.33 (0.58-3.03) 0.502
Main lifetime occupationHousewife 242 ref refStudent 210 0.54 (0.37-0.78) 0.001 1.00 (0.52-1.91) 0.996Agriculture 140 0.51 (0.33-0.80) 0.003 0.69 (0.41-1.16) 0.165Sales and service 108 0.80 (0.49-1.33) 0.388 1.24 (0.63-2.45) 0.539Other 150 0.98 (0.67-1.43) 0.926 1.68 (0.95-2.98) 0.073
Main work status (past 12 months)2
Unemployed 341 ref refEmployed 377 0.65 (0.49-0.86) 0.003 0.61 (0.41-0.90) 0.014Student 127 0.49 (0.32-0.76) 0.001 0.64 (0.33-1.23) 0.177
1Mean and standard deviation
2Missing for 5 participants
3Because this variable is included in the multivariate model as a continuous variable, no ORs are provided.
45
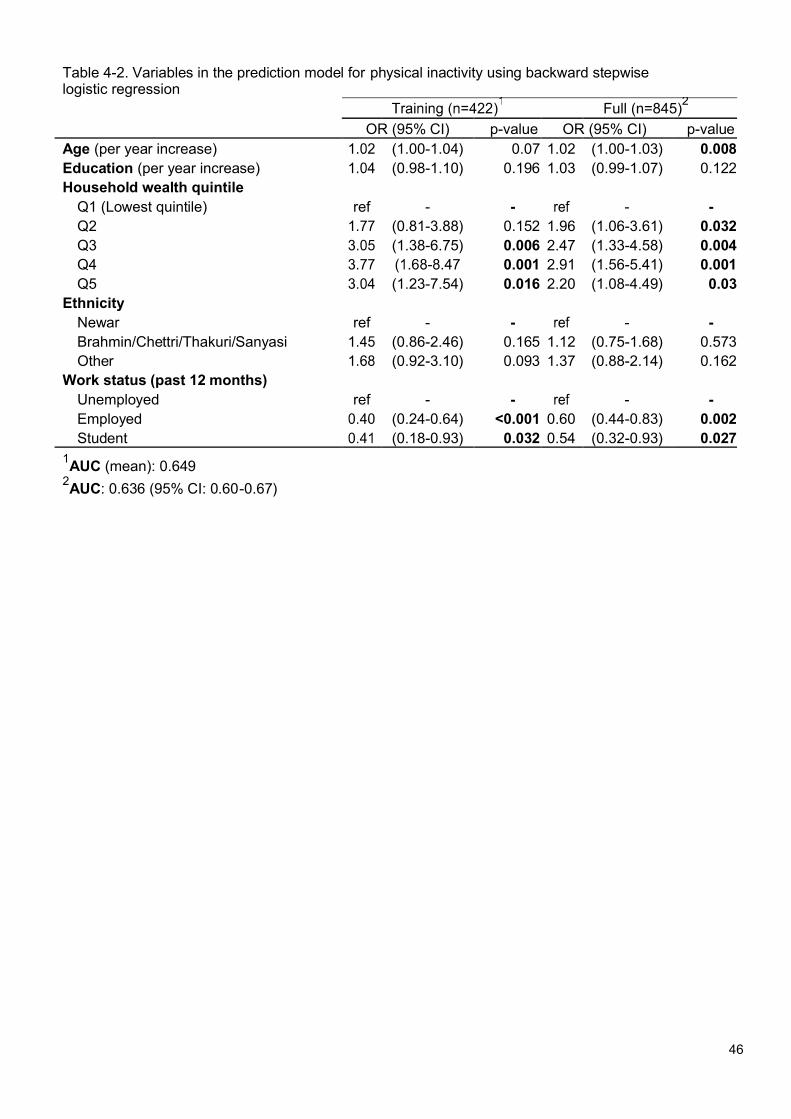
Table 4-2. Variables in the prediction model for physical inactivity using backward stepwise logistic regression
Full (n=845)2
OR (95% CI) p-value OR (95% CI) p-valueAge (per year increase) (1.00-1.04) 0.07 1.02 (1.00-1.03) 0.008Education (per year increase) (0.98-1.10) 0.196 1.03 (0.99-1.07) 0.122Household wealth quintile
Q1 (Lowest quintile) ref - - - -Q2 (0.81-3.88) 0.152 1.96 (1.06-3.61) 0.032Q3 (1.38-6.75) 0.006 2.47 (1.33-4.58) 0.004Q4 0.001 2.91 (1.56-5.41) 0.001Q5 (1.23-7.54) 0.016 2.20 (1.08-4.49) 0.03
EthnicityNewar ref - - - -Brahmin/Chettri/Thakuri/Sanyasi (0.86-2.46) 0.165 1.12 (0.75-1.68) 0.573Other (0.92-3.10) 0.093 1.37 (0.88-2.14) 0.162
Work status (past 12 months)Unemployed ref - - - -Employed (0.24-0.64) <0.001 0.60 (0.44-0.83) 0.002Student (0.18-0.93) 0.032 0.54 (0.32-0.93) 0.027
1AUC (mean): 0.649
2AUC: 0.636 (95% CI: 0.60-0.67)
46

A
B
C
Figure 1-2. ROC curve of the model containing age, education, household wealth, ethnicity and work status in the past twelve months as predictors of physical inactivity
(A) Training dataset (N=422); AUC=0.6731 (95% CI: 0.622-0.725(B) Validation dataset (N=423); AUC=0.6255 (95% CI: 0.571-0.680)(C) Full dataset (N=845); AUC=0.6361 (95% CI: 0.598-0.674)
47

Appendix
48

DHULIKHEL HEART STUDYHOUSEHOLD QUESTIONNAIRE
Interviewer code: ___ ___
GEOGRAPHICAL INFORMATIONDistrict: KAVREPALANCHWOK Municipality: DHULIKHEL Ward no:__ __Tole name: ____________________ Household number: __ __ __ __ __ __ __
RESPONDENT INFORMATIONName of the respondent: _________________ __________________Name of Household Head: _________________ __________________Interview Language: (a) Nepal __ (b) Newari __Date of interview: __ __ / __ __ / __ __ __ __ Interview start time: __ __ | __ __
4.1 Total number of visits: (a.) First time __ (b) Second time __ (c) Third time _
RESULT OF INTERVIEW(a) Started __ (b) Absent at time of visit __ [ Next visit date __/__/____}(c) Absent for extended time __ [ Next visit date __/__/____] (e) Refused __
CONSENT (Enumerator reads the consent sheet, makes sure the participants understand}
HOUSEHOLD INFORMATION5. Number family members in the household
(c) Total __ __
6. Details of the household membersS Nam Relationshi Se Dat Ag Physical Fall ill in If yes, How Visited Visitedn e p with head x e of e disabilit last 6 name long the doctor shama
of birth y (Y/N) months the illness (Y/N) nshousehold (Y/N) illness last (Y/N)
(Write ‘Self ‘ in the relationship if the respondent is the head of the household)
MIGRATION7.1. Are there any members of your household who lived here in the past 10 years but who has since moved away (at
least six months ago)? (a) Yes __ (b) No __ ‡
Go to 8
7.2 How many family members have migrated? __ __7.3. Detail information of the migrants
Relation to the Sex Age when migrated Main Country Name of the citythe head of the (if age less than 1 reason of in case of Nepalmigrant household year write 00) migration and India
7.4 Does your household receive remittances? (a) Yes __ (b) No __ ‡
Go to 87.5 What are the remittance primarily spent on?
(a) Daily consumption___ (b) Education ___ (c) Health ___ (d) Household asset __(e) Saving __ (f) Repay loan ___ (g) Other (Specify) __________________
MORTALITY
8.1 Has anyone in your family died in the last year? (a) Yes __ (b) No __ ‡
Go to 98.2 Detail information of the deceased member (Be sensitive)
49

SN Name of the Sex Date when died Completed Cause If does not know the reason,deceased (DD/MM/YYYY) age when of death write the symptoms before
died dying
ENVIRONMENT
9 What type of fuel does your household mainly use for cooking?(a) Electricity __ (b) LPG __ (d) Biogas __ (e) Kerosene __(f) Coal, lignite __ (g) Wood __ (h) Straw__ (i) Crop __ (j) Animal dung __
10 Do you use improved stove to cook? (a) Yes __ (b) No __
11 Is cooking usually done in the house, in separate building or outdoors? (Outside the house)(a) In the house __
12 What type of toilet does your household have?(a) Flushed to piped sewerage __ (b) Flush to septic tank __ (c) Flush to pit latrine __(d) Flush to somewhere else __ (e) Flush, unknown__ (f) Ventilated improved pit latrine(g) Pit latrine with slab __ (h) Pit latrine without slab __ (i) Composting toilet __(j) Bucket toilet __ (k) No facility/ bush/ field __
13 Do you share this toilet with other household? (a) Yes __ (b) No __
14 What is the main source of drinking water?(a) Piped into dwelling __ (b) Piped to yard __ (c) Public tap __ (d) Tube well __(e) Protected dug well __ (f) Unprotected dug well __ (g) Rain water ___ (h) Tanker __(i) Protected spring __ (j) Unprotected spring __ (k) Surface water__ (l) Bottle __
15 Do you treat drinking water? (a) Yes __ (b) No __ ‡
Go to 17
16 If yes, how do you treat drinking water?(a) Boil __ (b) Add bleach/chlorine __ (c) Strain through cloth __(e) Solar disinfection __ (g) Don’t know __
SOCIO ECONOMIC STATUS
(a) Nuclear __ (b) Joint __
18 Does any member of this household own following? (Y/N)(a) A watch __ (b) A bicycle/rickshaw __ (c) A motor cycle/scooter __(d) A three wheel tampo __ (e) A car/truck __ (f) A tractor __
19 Does any member of this household own any agricultural land? (a) Yes __ (b) No __ ‡
Go to 2120. How much of Agriculture land do members of this household own? __ __ (unit ___________)
21. Does this household own any livestock, herds, other farm animals or poultry? (a) Yes __ (b) No __ ‡
Go to 2322. If yes, how many of following livestock do you own?
(a) Buffalo __ (b) Cow __ (c) Goats __ (d) Sheep __ (e) Chicken __ (f) Ducks__
23. Does any member or this household have a bank account/cooperative/or other savings account ?(a) Yes __ (b) No __
24. What is the head of house's income per month (NRs)?(a) No income __ (b) Less than 5000 __ (c) 5001-10000 __ (d) 10001-20000 __
(f) 30001-40000 __ (g) 40001-50000 __ (h) 50001-60000 __(i) 60001-70000 __ (j) 70001-100000 __ (k) more than 100000 __(l) Do not know __ (m) Refused __
HOUSEHOLD OBSERVATION
25. Main material for the floor(a) Earth/ sand __ (b) Dung __ (c) Wood planks __ (d) Cement __ (e) Wood __(h) Venyl or asphalt strips __ (i) Ceramic tiles __ (h) Palm/bamboo __ (h) Others(Specify) _____
26. Main Material on the Roof
50

(a) No roof __ (b) thatch/palm leaf __ (c) rustic mat __ (d) palm/bamboo __(e) Woodplanks __ (f) Cardboard __ (g) Ceramic tiles __ (h) Cement __(i) Galvanized sheet __ (j) Others (Specify) __________
27. Main Material on the external wall(a) No walls __ (b) Mud/Sand __ (c) Bamboo with mud __ (d) Stone with mud __(e) Ply wood __ (f) Cardboard __ (g) Cement __ (h) Stone with cement __(i) Bricks __ (j) Cement blocks __ (k) Wood planks/ Shinles __ (l) Others (Specify) _________
28. How many rooms does the house has? (Do not count the toilet and the rented rooms) __ __
29. How many rooms in the house are used for sleeping? __ __
51

DHULIKHEL HEART STUDYPersonal questionnaire
Interviewer code : __ __
A. ELIGIBILITY CRITERIA1. Are you resident of Dhulikhel ? (a) Yes ___ (b) No ___2. Have you been living in Dhulikhel for past 6 months? (a) Yes ___ (b) No ___3. Are you 18 years or above (a) Yes ___ (b) No ___
4. (If female), are you currently pregnant? (a) Yes ___ (b) No ___5. Does participant appear to be cognitively able to conduct the interview?6. (Enumerator will observe the condition of the respondent) (a) Yes ___ (Specify) ________________(b) No ___
CONSENT(a) Agree ___ (b) Disagree ___
‡Interview ends
Interview start time………………….. Date of interview (DD/MM/YYYY)……………………………
B. PARTICIPANT’S INTERVIEWWard number: __ __ 2. Tole Name ___________________ 3. Household number __ __ __ __ __ __Family number: __ __ 5. Serial Number of the person from form1 __ __
6. Identification Number: __ __ __ __ __ __ __ __ __ (DH-ward no.-household no.-family no.-personal serial no in the family.)
C. DEMOGRAPHIC CHARACTERISTICS1. What is your full name ? ________________ _________________2. Sex (Observe): (a) Male __ (b) Female __ (c) Third gender __3. What is your mobile number? __ __ __ __ __ __ __ __ __ __4. What is your email address? (If not available write NA) ___________@ ______. com5. What is your age? (Completed years) __ __ years6. What is your birth date ? __ __ / __ __ / __ __ __ __7. What is your citizenship number? __ __ __ __ __ __ __ __8. What is your ethnic group?
(a) Brahmin __ (b) Chettri/Thakuri/Sanyasi __ (c) Newar __(d) Magar/Tamang/Rai/Limbu __ (e) Sherpa/Bhote ___ (f) Kami/Damai/Sarki/Gaaine/Baadi __
9. What is your mother tongue? (a) Nepai __ (b) Newari __10. What is your marital status?
(a) Never married __ (b) Currently married __ (c) Separated __(d) Widowed __ (e) Cohabiting__ (f) Refused__
11. What was your age when you got married? __ __ years12. What was age of your spouse when you got married? __ __ years13. What is your religion?
(a) Hindu __ (b) Buddhist __ (c) Muslim __ (d) Kirat __ (e) Christian14. What is the highest grade or year of school you have ever completed, including college? ___ __ years15. For How long did you have Vocational Training? __ __ months16. Which one best describes the kind of work you have done most of your life?
(a) Professional ___ (b) Clerical __ (c) Sales and services __ (d) Skilled manual __(e) Unskilled manual __ (f) Agriculture __ (g) Student __ (h) Housewife __(i) Military / Police __
17. Which of the following describes your main status over the past 12 months?(a) Government employee __ (b) Non-government employee __ (c) Self-employed __(d) Non-paid __ (e) Home maker __ (f) Unemployed __ (g) Student __
18. Talking about the past year, what was your average earning? ____________ (per day / per month / per year)19. Give me the name and contact number of three people with who you expect to be in close contact in future
SN Name Relation Phone number Email ID__ ____________ ___________ _______________ ____________ ___________ _______________ ____________ ___________ _____________
D. WOMEN EMPOWERMENT20. Does the wife own property under her own name? (a) Yes __ (b) No __
52
21. Does the wife have her own bank account? (a) Yes __ (b) No __
E. SMOKINGNow I will ask you some smoking related questions, okay?
22.(a) Yes __ (b) No __
23. At what age did you start tobacco use? __ __ years24. Have you used tobacco in the last month? (a) Yes __ (b) No __25. At what age did you stop tobacco use? ____ years26. Have you ever smoked cigarettes? (a) Yes __ (b) No __27. How many days do you smoke in a typical month? __ __ days28. The day when you smoke, on an average how many cigarettes do you smoke?................( number of
cigarettes smoked per day)29. Do you usually smoke filter cigarettes or non-filter cigarettes? ((Show Card; Picture
Number) filter cigarettes have filter i.e. a small sponge at the end of the cigarettes)(a) Filter cigarettes __ (b) Non-filter cigarettes __ (c) Don’t know __
30. Have you ever smoked bidi? (Asking about only bidi) (a) Yes __ (b) No __31. How many days do you smoke in a typical month? ______days32. The day when you smoke, on an average how many cigarettes do you smoke? ___33. Have you ever smoked pipe or cigar? (a) Yes __ (b) No __34. How many days do you smoke in a typical month? __ __ days35. The day when you smoke, on an average how many cigarettes do you smoke? ___
Smoking quit36. Have you ever tried to quit smoking? (a) Yes ___ (b) No ___37. How many times did you try to quit smoking? __ __38. What was the longest duration you didn't smoke after you attempted quitting? __ __39. Would you be interested in quitting smoking if we could help you with quitting? (a) Yes __ (b) No __40. Have you ever used khaini, surti, jarda paan? (Asking about only khaini, surti jarda paan) (a) Yes __ (b) No __41. How many days do you use in a typical month? ____ days /weeks/months/year42. The day when you use Khaini Surti, Jarda, Paan, on an average how many amount of these do you use? ____43. Have you ever smoked hukka, chilim or tamakhu? (asking about only hukka, chilim, tamakhu) (a) Yes __ (b) No__44. How many days do you smoke in a typical month? ___ days/weeks/months/year45. The day when you smoke, on an average how many cigarettes do you smoke? ___
Second hand smoking46. Does anyone living with you smoke cigarettes,/bidi/cigar/pipe/hukka/ chilim when you are present?
(a) Yes __ (b) No __47. During past 7 days, on how many days did someone in your home smoke when you were present? ____48. During past 7 days, on how many days did someone smoked in close areas in your workplace such as building, work
area or specific office when you were present? _____
F. ALCOHOL DRINKING49. Do you ever drunk any alcoholic drink such as beer, wine, jaad, chhyang, tongba, ningaar, raksi, soltyang, whiskey,
brandy, rum, vodka, sherry, champagne? (a) Yes __ (b) No __ (c) Refused __50. At what age did you start drinking alcoholic drink? ___ years51. Do you ever drink beer? (Currently or in the past, ask only of beer) (a) Yes __ (b) No __52. How many days do you drink beer in a typical month? __ __(Week/ Month)53. The days when you drink, how many bottles (650 ml) of beer do you normally drink in one day? ______ml54. What is the maximum number of drinks in one occasion you had in the past month? ______55. Do you ever drink jaad, chhyang, tongba or nigaar? (a) Yes __ (b) No __ (9) Refused56. How many days do you drink jaad, chhyang, tongba or nigaar in a typical month? ________ (Week/ Month)57. The days when you drink, how many glassess of jaad, chhyang, tongba or ningaar do you normally drink in one day?
(Show picture of glasses and write in ml from the booklet) _______ml58. What is the maximum number of drinks in one occassion you had in the past month? (Show picture of glasses and
write in ml from the booklet) ______mlDo you ever drink wine, sheery or champagne? (a) Yes (b) No__How many days do you drink wine in a typical month? …………… (Week/ Month)
53

61. The days when you drink, how many glasses of or champagne do you normally drink in one day? (Show picture of glasses -picture number 28) _______ml
62. What is the maximum number of drinks in one occasion you had in the past month? (Show picture of glasses -picture number 28) _______ml
63. Do you ever drink raksi, aila or soltyang (hard liquor)? (a) Yes __ (b) No __ (c) Refused__64. How many days do you drink raksi, aila or soltyang in a typical month? ___(Week/ Month)65. The days when you drink, how many glasses of rakshi, aila or soltyang do you normally drink in one day? ? (Show
picture of glasses -picture number 28______ml66. What is the maximum number of drinks in one occasion you had in the past month? Show picture of glasses -picture
number 28) _____ml67. Do you ever drink whisky, scotch, brandy, rum or vodka? (a) Yes __ (b) No __ (c) Refused68. How many days do you drink whisky, scotch, brandy, rum or vodka in a typical month? ____(Week/ Month)69. The days when you drink, how many glasses of whisky, scotch, brandy, rum or vodka do you normally drink in one day?
___ml70. What is the maximum number of drinks in one occasion you had in the past month? ____ ml71. In the past five years, has your alcohol intake increased, decreased or remained the same?
(a) No__ (b) Increased intake __ (c) Decreased intake __If you do not drink alcohol now, did you ever drink alcohol regularly? (for former drinker)(a) Yes __At what age did you start drinking? ____ yearsAt what age did you stop drinking alcohol regularly? ___yearsHow many drinks per week did you usually drink? ____What is the maximum number of drinks that you ever had on one occasion? ____
F. MEDICAL HISTORY Cardiovascular health
(Now I am going to ask you about diseases or procedures that you may have had in the past. If you do not know the answer, just say 'don't know')
77. Has your doctor ever told you had a myocardial infarction or heart attack? (a) Yes __ (b) No __ (c) Don’t know__78. Where was it diagnosed? (Name of the hospital/ nursing home/ clinic) _____79. Were you hospitalized for your myocardial infarction or heart attack? (a) Yes __ (b) No __ (c) Don’t know__80. Has your doctor ever told you that you had congestive heart failure? (a) Yes __ (b) No __ (c) Don’t know__81. Where was it diagnosed? (Name of the hospital/ nursing home/ clinic) ___________________82. Were you hospitalized for your congestive heart failure? (a) Yes __ (b) No __ (c) Don’t know__83. Has your doctor ever told you that you had rheumatic heart or valve problems? (a) Yes __ (b) No __ (c) Don’t know__84. Has your doctor ever told you that you had atrial fibrillation? (a) Yes __ (b) No __ (c) Don’t know__85. Has your doctor ever told you that you had deep venous thrombosis or blood clots in your leg?
Yes __ (b) No __ (c) Don’t know__86. Has your doctor ever told you that you had pulmonary embolus or blood clots in your lungs (fokso ma ragat jameko)?
a) Yes __ (b) No __ (c) Don’t know__87. Has your doctor ever told you that you had other heart or circulatory problems? a) Yes __ (b) No __ (c) Don’t88. Please specify which heart or circulatory problems you had _________________89. Have you ever had cardiac bypass surgery? (a) Yes __ (b) No __ (c) Don’t know __90. Have you ever had any other heart surgery? (a) Yes __ (b) No __ (c) Don’t know __91. Have you ever had surgery on the blood vessels in your neck (carotid arteries)?
(a) Yes __ (b) No __ (c) Don’t know __92. What side did you have the surgery on ? (a) Right __ (b) Left __ (c) Both __93. Have you ever had surgery on the blood vessels in your legs?
(a) Yes __ (b) No __ (c) Don’t know __94. What side did you have the surgery on? (a) Right __ (b) Left __ (c) Both __95. Have you ever had a repair of an aortic aneurysm ? (a) Right __ (b) Left __ (c) Both __96. Have you ever had a pacemaker implant ? (a) Yes __ (b) No __ (c) Don’t know __97.
(a) Yes __ (b) No __ (c) Don’t know __98.
(a) Yes __ (b) No __ (c) Don’t know __
Rose Angina87. Have you ever had a pain or discomfort in your chest ? (a) Yes __ (b) No __
54

Do you get it when you walk uphill or hurry? (a) Yes __ (b) No __Do you get it when you walk at an ordinary pace on the level? (a) Yes __ (b) No __What do you do if you get it while you are walking? (Probe)(a) Stop or slow down, or continue at same pace after taking nitroglycerine __If you stand still, what happens to it ? (Probe) (a) Relieved __ (b) Not relieved __How soon is it relieved? (a) 10 (b) More than 10 minutes __Where do you get this pain or discomfort? (Write the code of the region)(a) A __ (b) B__ (c) C __ (f) F __
94. Have you ever had a severe pain across the front of your chest lasting for half an hour or more?(a) Yes __ (b) No __If you answered yes, did you see a doctor because of this pain? (a) Yes __ (b) No __If you saw a doctor, what did your doctor say it was? (a) Angina __Have you ever had to sleep on 2 or more pillows to help you breathe? (a) Yes __ (b) No __Have you ever had been awakened at night by trouble breathing? (a) Yes __ (b) No __
99. Have you ever had swelling of your feet or ankles? (Excluding during pregnancy)? (a) Yes __ (b) No __If you answered yes, did it tend to come on during the day and go down overnight? (a) Yes __ (b) No __Do you get pain in either leg on walking? (a) Yes __ (b) No __Do you get this pain in your calf or calves? (a) Yes __ (b) No __Do you get it when you walk uphill or hurry? (a) Yes __ (b) No __Do you get it when you walk at an ordinary pace on the level? (a) Yes __ (b) No __Does this pain ever disappear while you are walking? (a) Yes __ (b) No __
106. What do you do if you get it while you are walking? (a) stop or slow down __ (b) Continue at same pace __If you stand still, what happens to it? (a) Relieved __ (b) Not relieved __Have you ever had pneumonia? (a) Yes __ (b) No __Have you ever had emphysema (fokso fulne)? (a) Yes __ (b) No __Have you ever had asthma? (a) Yes __ (b) No __ (c) Do not know __Have you ever had chronic bronchitis? (a) Yes __ (b) No __ (c) Do not know __
112. Are you troubled by shortness of breath when hurrying on level or walking up a slight hill?(a) Yes __ (b) No __ (c) Do not know __
113. Do you have to walk slower than people of your age on the level because of breathlessness?(a) Yes __(b) No __
114. Do you ever have to stop for breath when walking at your own pace on the level? (a) Yes __ (b) No __115. Do you ever have to stop for breath after walking about 100 yards or 91 meters (or after a few minutes) on the
level? (a) Yes __ (b) No __116. Have you ever had Chronic Obstructive Pulmonary Disease (COPD)? (a) Yes __(b) No __ (c) Don’t know
Stroke related questions117. Have you ever had sudden painless weakness on one side of your body?
(a) Yes __ (b) No __ (c) Do not know __118. Have you ever had sudden numbness or a dead feeling on one side of your body?
(a) Yes __ (b) No __ (c) Do not know __119. Have you ever had sudden painless loss of vision in one or both eyes?
(a) Yes __ (b) No __ (c) Do not know __120. Have you ever suddenly lost the ability to understand what people are saying?
(a) Yes __ (b) No __ (c) Do not know __121. Have you ever suddenly lost the ability to express yourself verbally or in writing?
(a) Yes __ (b) No __ (c) Do not know __
High blood pressure122. Have you ever had your Blood Pressure checked? (a) Yes __ (b) No __ (c) Do not know __123. If yes, why did you have your blood pressure checked?
a) I had some symptoms, which I thought were related to high blood pressure__b) Blood pressure was checked as a part of a regular check up__c) Because there was an opportunity for a free check up __d) My family advised me __e) My friends/relatives advised me __f) It was checked while I had gone in for some other health problems __
124. Were you ever diagnosed or told by a doctor/health official that you had high blood pressure or hypertension?
55

(a) Yes __ (b) No __ (c) Do not know __125. If yes, when was it diagnosed? _________________________126. Are you currently receiving any of the following advice for hypertension by a doctor or other health worker?
(a) Special prescribed diet ___ (b) Advice or treatment to lose weight __(c) Advice or treatment to stop smoking __ (d) Advice to start to do more exercise __(e) Have you ever seen a traditional healer for hypertension? __(f) Are you currently taking any herbal or traditional remedy for your hypertension?
127. Were you advised to start medicine to reduce high blood pressure? (a) Yes __ (b) No __128. When were you first advised to take medicine for High Blood Pressure? __ __/ __ __ / __ __ __ __129. If yes, Did you start taking medicine for high blood pressure? (a) Yes __ (b) No __130. If not started to take medicines, what is the main reason that you decided not to start your medicine? (Do not read
the list to the respondent and do not prompt. Check all that he/she mentions)a. My doctor advised me to stop the medicine because I didn’t need them any longer. __b. I did not know (I was not told) that I had to continue the medicine. __c. I could not afford (the medicine). __d. I got side effects (from the medicine). __e. The medicine didn’t control my blood pressure and so I decided to stop taking them. __f. I was afraid that I might be dependent on the medicines and would need to take it life-long. __g. I did not have any symptoms of the disease and hence did not feel like I needed the medicine. __h. I do not believe that the medicine will help to control my high blood pressure. __i. My friends or family members suggested stopping the medicine. __j. I started alternative medicines (e.g., herbal, homeopathy, etc) and decided to stop the medicine. __k. I started alternative approaches like yoga, regular exercise, etc. and thus decided to stop the medicines.l. The medicines were not easily available. __m. I was too sick to continue taking medicine and there was nobody to help me with that. __n. The number of medicines and timing was too confusing__
o. The regimens were changed very frequently which really upset me. __p. I lost trust on my health care provider and thus stopped the medicine. __
131. Now I am going to read a list of reasons that may have played a part in your stopping to take your high blood pressure medicine. Which of the following are related to your decision to stop taking your medicine?
a. I could not afford (the medicine). __b. I got side effects (from the medicine). __c. The medicine didn’t control my blood pressure and so I decided to stop taking them. __d. I was afraid that I might be dependent on the medicines and would need to take it life-long. __e. I did not have any symptoms of the disease and hence did not feel like I needed the medicine. __f. My friends or family members suggested stopping the medicine. __g. I started alternative medicines (e.g., herbal, homeopathy, yoga, regular exercise etc) and decided to
stop the medicine. __h. The number of medicines and timing was too confusing __i. Is there any other reason for which you stopped medicine? __j. What alternative medicine did you start?
(a) Herbal __ (b) Homeopathy __ (c) Yoga __ (d) Ayurvedic __ (e) Regular exercise __
Morisky Medication Adherence Scale (Eight Item) for hypertension132. Do you sometimes forget to take your [hypertension] pills? __133. People sometimes miss taking their medications for reasons other than forgetting. Thinking over the past
two weeks, were there any days when you did not take your [hypertension] medicine? __134. Have you ever cut back or stopped taking your medication without telling your doctor, because you felt
worse when you took it? __135. When you travel or leave home, do you sometimes forget to bring along your [hypertension] medication? __136. Did you take your [hypertension] medicine yesterday? __137. When you feel like your [hypertension] is under control, do you sometimes stop taking your medicine? __138. Taking medication everyday is a real inconvenience for some people. Do you ever feel hassled about sticking
to your [hypertension] treatment plan? __139. How often do you have difficulty remembering to take all your blood pressure medication? __140. If forget to take medicine, what is the main reason that you miss taking your medicines? _________
a. I simply forget. __
56

b. I did not know (I was not told) that I had to take medicine regularly. __c. It is too expensive to take it regularly. __d. I get side effects (from the medicine) if I take regularly. __e. I am afraid that if I take it regularly I might be dependent on the medicine and would need to take life.__f. I do not have any symptoms of the disease and hence do not feel like I need to take it every day. I take it
only when I get symptoms (like headache, dizziness) __g. I do not believe that the medicine will help to control my disease. So, I don’t mind taking it irregularly. __h. My friends or family members suggested not to take it regularly. __i. I started alternative medicines (e.g., herbal, homeopathy, etc) and decided to be irregular with the medicine.
__j. I started alternative approaches like yoga, regular exercise, etc. and thus decided to be irregular with
the medicine. __k. The medicines are not easily available. __l. I am too sick to remember taking the medicine regularly and there is nobody to help me with it. __m. The number of medicines and timing is too confusing. __n. The regimens were changed very frequently which really upset me. __o. I lost trust on my health care provider and thus miss taking the medicine. __
141. Now I am going to read a list of reasons that may have played a part in your missing your medications. Which of the following are related to missing your medicine? Reasonsa. It is too expensive to take it regularly. ___b. I get side effects (from the medicine) if I take regularly. ___c. I am afraid that if I take it regularly I might be dependent on the medicine and would need to take life _d. I do not have any symptoms of the disease and hence do not feel like I need to take it every day __e. My friends or family members suggested not to take it regularly __f. I started alternative medicines (e.g., herbal, homeopathy, etc) and decided to be irregular with the medicine__
142. What alternative medicine did you start?(a) Herbal __ (b) Homeopathy __ (c) Yoga __ (d) Ayurveda __ (e) Regular exercise __
Knowledge on high blood pressure (Now I am going to ask you some questions about high blood pressure)143. Please tell me what you think are the reasons we develop high blood pressure. (Do not read the list to the
respondent and do not prompt. Check all that he/she mentions)(a) From family (heredity) __ (b) Unknown reasons __ (c) High salt intake __(d) Smoking __ (e) Excess alcohol consumption __ (f) High fat diet __(g) Obesity __ (h) Lack of exercise __ (i) Stress __
144. Please tell me what you think might happen if our blood pressure is not properly controlled?(a) Stroke __ (b) Heart Disease __ (c) Kidney problem __ (d) Eye problem __(e) Diabetes __(f) Don’t know _
145. Please tell me what you think are the ways we can control our blood pressure.(a) Reduce salt intake __ (b) Reduce weight __ (c) Exercise regularly __(e) Reduce intake of fatty food __ (f) Start medicine __ (g) Stop smoking __(h) Stop/Reduce alcohol consumption __(i) Follow up for check up every three months__ (j) Don't know __
146. Which of the following is the most desirable blood pressure reading?(a) 130/90 __ (b) 180/110 __ (c) 140/80 __ (d) 120/80 __ (e) Lower than 120/80 __ (f) Don’t know __
147. The main cause of high blood pressure is:(a) Stress __ (b) Obesity __ (c) Unknown __ (d) Aging __ (e) Don’t know __
148. A person with high blood pressure has:(a) High cholesterol __ (b) High risk of heart attack and stroke __ (c) Nervous condition __ (e) Don’t know __
149. High blood pressure medication is usually prescribed to be taken under:(a) under stressful situation __ (b) as a lifelong way to manage high blood pressure __(c) When activities require physical exertion __ (d) whenever a patient feels bad (e) Don’t know__
150. Which of the following is more likely to contribute to your high blood pressure?(a) Physical Activity__(b) Salt/sodium intake __ (c) High cholesterol level __ (d) Icecream __(e)Don’t know __
151. Major risk factors other than high blood pressure for heart disease and stroke is(a) High cholesterol __(b) Smoking __ (c) Family history of heart disease __ (d) All of above __ (e) Don’t know
152. Has your doctor ever told you that you had diabetes (chini-rog/ sugar)? (a) Yes __ (b) No __If yes, when was it diagnosed? __ __ / __ __/__ __ __ __
153. Are you currently receiving any of the following treatments/advice for diabetes prescribed by a doctor or other health worker?
57

Treatment or Advices154. What advices have you received?
(a) Insulin injection __ (b) Drugs (medication) that you have taken in the past two weeks___(c) Special prescribed diet __ (d) Advice or treatment to lose weight __(e) Advice or treatment to stop smoking_ (f)Advice to start or do more exercise __
155. Have you ever seen a traditional healer for diabetes or raised blood sugar? __156. Are you currently taking any herbal or traditional remedy for your diabetes? __157. When the medicines were first prescribed? __ __ __ __ / __ __ / __ __158. Have you been taking the medicines regularly? (a) Yes __ (b) No __ (c) Refused __159. If you have not been taking medicines regularly, how often do you miss the doses?
(a) Daily __ (b) Every 2 to 3 days __ (c) Once a week __ (d) Every 15 days __160. What are the main reasons for not taking the medicines? (list top 3)
1 __________________ 2 ___________________ 3______________________
FOOD FREQUENCY161. How many times do you usually eat in a day? (Times of eating) __162. Do you regularly take any vitamin supplementation? (Vitamin supplement) (a) Yes __ (b) No __163. If yes, which vitamins do you take? _____________164. How many months ago did you start taking vitamin supplementation? _____ Months165. Do you take calcium supplementation? (a) Yes __ (b) No __166. How many months ago did you start taking calcium supplementation? _____ Months167. Do you take iron supplementation? (a) Yes __ (b) No __168. How many months ago did you start taking iron supplementation? ____ Months169. Do you take fish oil or omega-3 supplementation? (a) Yes __ (b) No __170. How many month ago did you start taking fish oil or omega-3 supplementation? ____ Months
Do you usually add table salt to food or fruit before eating? (Add table salt) (a) Yes __Do you usually add sugar to your tea or coffee? (Add sugar) (a) Yes __ (b) No __Do you use artificial sugar instead of sugar? (Artificial sweetener) (a) Yes __ (b) No __Have you changed your eating pattern/food due to any disease? (a) Yes __ (b) No __
175. If yes, Name the disease _____________ ____________ ______________176. How many times in a week do you eat out of home? (in a restaurant or hotel? ____177. Do you usually eat animal fats with meat? (eat boso) (a) Yes __ (b) No __178. Last year, what did you eat and how often (Show portion size picture)
UnitFrequency of eatin Never Week Mont Year A B C D
hRice 0 1 2 3 4 1 2 3 4Beaten rice 0 1 2 3 4 1 2 3 4Wheat 0 1 2 3 4 1 2 3 4Choumin 0 1 2 3 4 1 2 3 4pasta macaroni spaghetti 0 1 2 3 4 1 2 3 4Sooji 0 1 2 3 4 1 2 3 4atta roti 0 1 2 3 4 1 2 3 4bhuteko maize 0 1 2 3 4 1 2 3 4white bread 0 1 2 3 4 1 2 3 4brown bread 0 1 2 3 4 1 2 3 4kodo fapar bajra 0 1 2 3 4 1 2 3 4whole pulse 0 1 2 3 4 1 2 3 4Washed pulse 0 1 2 3 4 1 2 3 4Sprout 0 1 2 3 4 1 2 3 4Cheakpeas dry peas beans 0 1 2 3 4 1 2 3 4Soyabean 0 1 2 3 4 1 2 3 4Broccoli Cauliflower 0 1 2 3 4 1 2 3 4cabbage kohlrabi 0 1 2 3 4 1 2 3 4Pumpkin 0 1 2 3 4 1 2 3 4Potato 0 1 2 3 4 1 2 3 4
58

Greenveg 0 1 2 3 4 1 2 3 4 0Radish Turnip 0 1 2 3 4 1 2 3 4 0Parwal 0 1 2 3 4 1 2 3 4 0Green Beans Peas 0 1 2 3 4 1 2 3 4 0Karela 0 1 2 3 4 1 2 3 4 0Egg Plant 0 1 2 3 4 1 2 3 4 0Tomato 0 1 2 3 4 1 2 3 4 0Lauka 0 1 2 3 4 1 2 3 4 0Schoos 0 1 2 3 4 1 2 3 4 0lady's finger 0 1 2 3 4 1 2 3 4 0Ghiraula 0 1 2 3 4 1 2 3 4 0Rukhkatahar 0 1 2 3 4 1 2 3 4 0YAM 0 1 2 3 4 1 2 3 4 0Sweet Potato 0 1 2 3 4 1 2 3 4 0Taamaa 0 1 2 3 4 1 2 3 4 0Gundruk 0 1 2 3 4 1 2 3 4 0Mushroom 0 1 2 3 4 1 2 3 4 0Garlic 0 1 2 3 4 1 2 3 4 0onion_shallot 0 1 2 3 4 1 2 3 4 0Carrot 0 1 2 3 4 1 2 3 4 0Cucumber 0 1 2 3 4 1 2 3 4 0Orange 0 1 2 3 4 1 2 3 4 0grape_fruti 0 1 2 3 4 1 2 3 4 0pine_apple_freq 0 1 2 3 4 1 2 3 4 0jujube_aaru 0 1 2 3 4 1 2 3 4 0apple_pear 0 1 2 3 4 1 2 3 4 0Guava 0 1 2 3 4 1 2 3 4 0Alubakhada 0 1 2 3 4 1 2 3 4 0Lychee 0 1 2 3 4 1 2 3 4 0Grapes 0 1 2 3 4 1 2 3 4 0Lemon 0 1 2 3 4 1 2 3 4 0Banana 0 1 2 3 4 1 2 3 4 0Mango 0 1 2 3 4 1 2 3 4 0Pomegranate 0 1 2 3 4 1 2 3 4 0Watermelon 0 1 2 3 4 1 2 3 4 0Papaya 0 1 2 3 4 1 2 3 4 0Mutton 0 1 2 3 4 1 2 3 4 0chicken_with_skin 0 1 2 3 4 1 2 3 4 0chicken_without_skin 0 1 2 3 4 1 2 3 4 0chicken_mo_mo 0 1 2 3 4 1 2 3 4 0Sausage 0 1 2 3 4 1 2 3 4 0Buff 0 1 2 3 4 1 2 3 4 0buff_mo_mo 0 1 2 3 4 1 2 3 4 0buff_sausage 0 1 2 3 4 1 2 3 4 0Pork 0 1 2 3 4 1 2 3 4 0pork_mo_mo 0 1 2 3 4 1 2 3 4 0fried_fish 0 1 2 3 4 1 2 3 4 0nonfried_fish 0 1 2 3 4 1 2 3 4 0Egg 0 1 2 3 4 1 2 3 4 0whole_milk 0 1 2 3 4 1 2 3 4 0low_fat_milk 0 1 2 3 4 1 2 3 4 0Yogurt 0 1 2 3 4 1 2 3 4 0milk_tea 0 1 2 3 4 1 2 3 4 0black_tea 0 1 2 3 4 1 2 3 4 0milk_coffee 0 1 2 3 4 1 2 3 4 0black_coffee 0 1 2 3 4 1 2 3 4 0
59

coke_pepsi_mountain_dew 0 1 2 3 4 1 2 3 4 0fanta_sprite 0 1 2 3 4 1 2 3 4 0fruit_juice 0 1 2 3 4 1 2 3 4 0canned_juice 0 1 2 3 4 1 2 3 4 0Paneer 0 1 2 3 4 1 2 3 4 0Pizza 0 1 2 3 4 1 2 3 4 0Cheese 0 1 2 3 4 1 2 3 4 0Biscuit 0 1 2 3 4 1 2 3 4 0Noodles 0 1 2 3 4 1 2 3 4 0canned_food 0 1 2 3 4 1 2 3 4 0Peanut 0 1 2 3 4 1 2 3 4 0Cashew 0 1 2 3 4 1 2 3 4 0Almonds 0 1 2 3 4 1 2 3 4 0Walnut 0 1 2 3 4 1 2 3 4 0Pistachio 0 1 2 3 4 1 2 3 4 0Dried fruit 0 1 2 3 4 1 2 3 4 0Bhujiya 0 1 2 3 4 1 2 3 4 0veg_burger 0 1 2 3 4 1 2 3 4 0chicken_burger 0 1 2 3 4 1 2 3 4 0Potato chips 0 1 2 3 4 1 2 3 4 0Donought 0 1 2 3 4 1 2 3 4 0ice_cream 0 1 2 3 4 1 2 3 4 0Chocolate 0 1 2 3 4 1 2 3 4 0Sweets 0 1 2 3 4 1 2 3 4 0Malpa 0 1 2 3 4 1 2 3 4 0Swaari 0 1 2 3 4 1 2 3 4 0Pakauda 0 1 2 3 4 1 2 3 4 0french_fries 0 1 2 3 4 1 2 3 4 0mustard_oil 0 1 2 3 4 1 2 3 4 0sunflower_oil 0 1 2 3 4 1 2 3 4 0soyabean_oil 0 1 2 3 4 1 2 3 4 0Butter 0 1 2 3 4 1 2 3 4 0Ghee 0 1 2 3 4 1 2 3 4 0Sugar 0 1 2 3 4 1 2 3 4 0Jaggary 0 1 2 3 4 1 2 3 4 0Jam 0 1 2 3 4 1 2 3 4 0Pickels 0 1 2 3 4 1 2 3 4 0
PHYSICAL ACTIVITY(In answering the following questions 'vigorous-intensity activities' are activities that require hard physical effort and cause large increases in breathing or heart rate, 'moderate-intensity activities' are activities that require moderate physical effort and cause small increases in breathing or heart rate.)
Activity at work179. Does your work involve vigorous-intensity activity that causes large increase in breathing or heart rate like
carrying or lifting heavy loads, digging or construction work, etc.. for at least 10 minutes continuously?(a) Yes _ (b) No
180. If Yes, In a typical week, on how many days do you do vigorous- intensity activities as part of your work? (no.of days) _____ (days/ month/year)
181. How much time do you spend doing vigorous-intensity activities at work on a typical day?_____ (minutes/ hour)182. In a typical year, how many months are you involved in this activity? ______ months183. Does your work involve moderate-intensity activity that causes small increases in breathing or heart rate such as
brisk walking [or carrying light loads] for at least 10 minutes continuously? (a) Yes __ (b) No __184. In a typical week, on how many days do you do moderate- intensity activities as part of your work?
___ (days/month/year)185. How much time do you spend doing moderate-intensity activities at work on a typical day? ___ (mins/ hour)186. In a typical year, how many months are you involved in this activity? ______
60

Travel to and from places (The next questions exclude the physical activities at work that you have already mentioned.Now I would like to ask you about the usual way you travel to and from places. For example to work, for shopping, to market, to place of worship)187. Do you walk or use a bicycle (pedal cycle) for at least 10 minutes continuously to get to and from places?
(a) Yes __ (b) No __188. If yes, 10. In a typical week, on how many days do you walk or bicycle for at least 10 minutes continuously to get
to and from places? _____ (days/ month/year)189. How much time do you spend walking or bicycling for travel on a typical day? ___ (minutes/ hour)
Recreational activities190. Do you do any vigorous-intensity sports, fitness or recreational (leisure) activities that cause large increases in
breathing or heart rate like [running or football,] for at least 10 minutes continuously? (a) Yes __ (b) No __191. If yes,13. In a typical week, on how many days do you do vigorous-intensity sports, fitness or recreational (leisure)
activities? (number of days) _____ (days/ month/year)192. How much time do you spend during vigorous-intensity sports, fitness or recreational activities on a typical day?
___ (minutes/ hour)193. In a typical year, how many months do you do vigorous-intensity sports, fitness or recreational activities?
____ months194. Do you do any moderate-intensity sports, fitness or recreational (leisure) activities that causes a small increase in
breathing or heart rate such as brisk walking,(cycling, swimming, volleyball)for at least 10 minutes continuously?(a) Yes __ (b) No __
195. If yes, 17 In a typical week, on how many days do you do moderate-intensity sports, fitness or recreational (leisure) activities? (Number of days) _____ (days/ month/year)
196. 18 How much time do you spend doing moderate-intensity sports, fitness or recreational (leisure) activities on a typical day? ___ (minutes/ hour)
197. In a typical year, how many months do you do moderate-intensity sports, fitness or recreational activities?____ months
Sedentary behavior198. 20 How much time do you usually spend sitting or reclining on a typical day? ___ (minutes/ hour)
SF8
199. Overall, how would you rate your health in the past 4 weeks?(a) excellent__ (b) Very good__ (c) good__ (d) fair __ (e)poor __ (f) Very poor__
200. During the past 4 weeks, how much did physical health problems limit your usual physical activities (such as walking or climbing stairs)?(a) Not at all__ (b) Very little__ (c) Somewhat__ (d) Quite a lot__ (e)Could not do physical activites __
201. During the past 4 weeks, how much difficulty did you have doing your daily work, both at home and away from home, because of your physical health? (give options)(a) Not at all__ (b) Very little__ (c) Somewhat__ (d) Quite a lot__ (e)Could not do physical activites __
202. How much bodily pain have you had in the past 4 weeks?(a) None __ (b) Very mild__ (c) Mild__ (d) Moderate__ (e) Severe__ (f) Very severe
203. During the past 4 weeks, how much energy did you have?(a) Very much __ (b) Quite a lot __ (c) Some __ (d) A little__ (e) None __
204. During the past 4 weeks, how much did your physical health or emotional problems limit your usual social activities with family or friends?(a) Not at all__ (b) Very little__ (c) Somewhat__ (d) Quite a lot__ (e)Could not do physical activites __
205. During the past 4 weeks, how much have you been bothered by emotional problems (such as feeling anxious, depressed or irritable)?(a) Not at all__ (b) Very little__ (c) Somewhat__ (d) Quite a lot__ (e)Could not do physical activites __
206. During the past 4 weeks, how much did personal or emotional problems keep you from doing your usual work, school or other daily activities?(a) Not at all__ (b) Very little__ (c) Somewhat__ (d) Quite a lot__ (e)Could not do physical activites __
PHYSICAL FUNCTION
61

I canPhysical Functions help or Unknown
208. Do you have difficulty walking 1 kilometer? 1 9209. Do you have difficulty walking inside your home? 1 9210. Do you have difficulty getting out of a bed or 1 9chair?211. Do you have difficulty walking up 10 steps? 1 9212. Because of health or physical problems, do youhave any difficulty or are you unable to…..a…do heavy housework like scrubbing floors or 1 9washing windows, or yardb….do light housework, for example:- wiping table, 1 9clear dish, dusting, brooming etcc… shop for personal items like toothepaste, soap, 1 9brush etc?d….eat including feeding yourself? 1 9e….dress yourself 1 9f….bathe or shower? 1 9g….use the toilet including walking to the toilet? 1 9h….lifting or carrying something about 5 kg? 1 9i…reaching out (stretch upper arm) ? 1 9j….gripping with your hands? 1 9
DEPRESSION213. Below is the list of the ways you might have felt or behaved. Please tell me how often you have felt this way during the past week)
Labels Some (1-2 Occasionallythan 1 day) (3-4 days)
a. I was bothered by things that usually don’t bother 2me.b. I did not feel like eating; my appetite was poor. 2c. I felt that I could not shake off the blues even with 2help from my family or friends.d. I felt I was just as good as other people. 2e. I had trouble keeping my mind on what I was doing. 2f. I felt depressed. 2g. I felt that everything I did was an effort. 2h. I felt hopeful about the future. 2i. I thought my life had been a failure. 2j. I felt fearful. 2k. My sleep was restless. 2l. I was happy. 2m. I talked less than usual. 2n. I felt lonely. 2o. People were unfriendly. 2p. I enjoyed life. 2q. I had crying spells. 2r. I felt sad. 2s. I felt that people dislike me. 2t. I could not get "going." 2
STRESS62
been a problem for you:Do you have serious ongoing health problem (yourself)? (a) Yes __ (b) No __ (c) Refused __Has this been a problem for six months or more? (a) Yes __ (b) No __ (c) Refused __
216. Would you say this problem has been: (a) Not very stressful __ (b) Moderately stressful __ (c) Very stressful_Does someone close to you have serious ongoing health problem? (a) Yes __ (b) No __Has this been a problem for six months or more? (a) Yes __ (b) No __
219. Would you say this problem has been (a) Not very stressful __ (b) Moderately stressful __ (c) Very stressful_Do you have ongoing difficulties with your job or ability to work ? (a) Yes __Has this been a problem for six months or more? (a) Yes __ (b) No __
222. Would you say this problem has been (a) Not very stressful __ (b) Moderately stressful __ (c) Very stressful_Do you have ongoing financial strain? (a) Yes __ (b) No __ (c) Refused __Has this been a problem for six months or more? (a) Yes __
225. Would you say this problem has been(a) Not very stressful __ (b) Moderately stressful __ (c) Very stressful_226. Do you have ongoing difficulties in a relationship with someone close to you? (a) Yes __ (b) No__(c) Refused227. Has this been a problem for six months or more? (a) Yes __ (b) No __ (c) Refused __228. Would you say this problem has been (a) Not very stressful __ (b) Moderately stressful __ (c) Very stressful_
MMSE229. What is the year ? _____230. What is the date (yyyyy-mm-dd) ?__ __ __ __ / __ __ / __ __231. What is the day ? ___________232. What is the month? __________
Where are we? Name of the country (a) Nepal __
235. District (a) Kavrepalanchwok __ (b) Don’t know__236. Municipality/Village Development Committee (a) Dhulikhel __ (b) Don’t know__237. Tole : _______________(I am going to name 3 objects. There will be 1 second interval to name each object. Please repeat the names of the objects
after I have said them: (Give one point for each correct answer. Then repeat them until the participant learns all three.) (Y/N)238. Repeat the names: (a) Ball __ (b) Car __ (c) Comb __ (d) Times taken to say all 3 objects ___239. Please spell this word backwards: "DHU-LI-KHE-LA" ___240. I had named 3 objects to you. Can you please repeat the names of the three objects?
(a) Ball __ (b) Car __ (c) Comb __(d) Times taken to say all 3 objects ___I am going to show two objects to you. Can you please name them? (a) Pen __Can you name it please? (notebook) (a) Notebook __ (b) Other __Please repeat the following: "No ifs, ands or buts" (a) Repeat __ (b) Can not repeat __
244. I am going to give you a three stage command. Please follow it. Here is the command:Take a paper in your hand (a) Yes __Fold it in half (a) Yes __Put it on the floor (a) Yes __
248. There is a command written here. Please read it and obey the following: "Close your eyes."(a) Closed eyes __ (b) Did not close eyes __ (c) Can not read__
249. Please write a sentence. (Give one point if the sentence has a subject and a verb and can be understood. Spelling mistakes are permissible)(a) can write a sentence__ (b) cannot write a sentence__ (c) cannot write (illiterate) __
250. Show a picture of pentagon. Please copy the design given below (Give one point if the design has two figures with five sides and five and angles each and shows a four sided intersection.).(a) Correct design__ (b) Incorrect design __ (c) Refused __
251. Digit Span Substitution taskPlace the task sheet before the participant and pointing to the task say: Look at these boxes across the top of the page. On the top of each box are number one through nine. On the bottom part of each box there is a symbol. Each symbol is paired with a number. Point to the four rows of the boxes. Down here are boxes with numbers on the top, but the bottom part is blank. I want you to put the correct symbol in each box like this. Fill in the first three sample boxes. Now I want you to fill in all boxes up to this line. After demonstration and practice is complete, point to the first box following the sample items and say. When I tell you to begin, start here and fill in the boxes in these four rows. Do them in order and don’t skip any, please try to work as quickly as possible. Let’s begin. If the participant
63
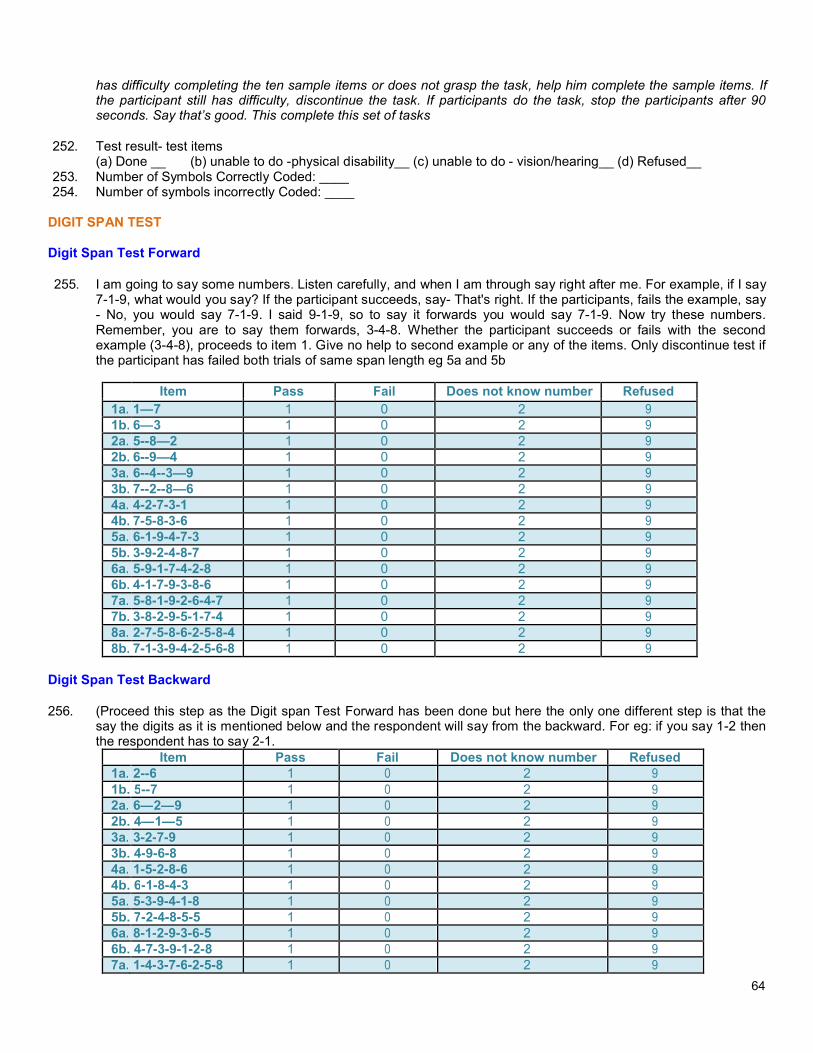
has difficulty completing the ten sample items or does not grasp the task, help him complete the sample items. If the participant still has difficulty, discontinue the task. If participants do the task, stop the participants after 90 seconds. Say that’s good. This complete this set of tasks
252. Test result- test items(a) Done __ (b) unable to do -physical disability__ (c) unable to do - vision/hearing__ (d) Refused__
253. Number of Symbols Correctly Coded: ____254. Number of symbols incorrectly Coded: ____
DIGIT SPAN TEST
Digit Span Test Forward
255. I am going to say some numbers. Listen carefully, and when I am through say right after me. For example, if I say 7-1-9, what would you say? If the participant succeeds, say- That's right. If the participants, fails the example, say - No, you would say 7-1-9. I said 9-1-9, so to say it forwards you would say 7-1-9. Now try these numbers. Remember, you are to say them forwards, 3-4-8. Whether the participant succeeds or fails with the second example (3-4-8), proceeds to item 1. Give no help to second example or any of the items. Only discontinue test if the participant has failed both trials of same span length eg 5a and 5b
Item Pass Does not know number1a. 1—7 1 0 21b. 6—3 1 0 22a. 5--8—2 1 0 22b. 6--9—4 1 0 23a. 6--4--3—9 1 0 23b. 7--2--8—6 1 0 24a. 4-2-7-3-1 1 0 24b. 7-5-8-3-6 1 0 25a. 6-1-9-4-7-3 1 0 25b. 3-9-2-4-8-7 1 0 26a. 5-9-1-7-4-2-8 1 0 26b. 4-1-7-9-3-8-6 1 0 27a. 5-8-1-9-2-6-4-7 1 0 27b. 3-8-2-9-5-1-7-4 1 0 28a. 2-7-5-8-6-2-5-8-4 1 0 28b. 7-1-3-9-4-2-5-6-8 1 0 2
Digit Span Test Backward
256. (Proceed this step as the Digit span Test Forward has been done but here the only one different step is that the say the digits as it is mentioned below and the respondent will say from the backward. For eg: if you say 1-2 then the respondent has to say 2-1.
Item Does not know number1a. 2--6 1 21b. 5--7 1 22a. 6—2—9 1 22b. 4—1—5 1 23a. 3-2-7-9 1 23b. 4-9-6-8 1 24a. 1-5-2-8-6 1 24b. 6-1-8-4-3 1 25a. 5-3-9-4-1-8 1 25b. 7-2-4-8-5-5 1 26a. 8-1-2-9-3-6-5 1 26b. 4-7-3-9-1-2-8 1 27a. 1-4-3-7-6-2-5-8 1 2
64

7b. 7-2-8-1-9-6-4-3 1 0 2 9
HEALTH KNOWLEDGE, ATTITUDE AND BEHAVIOR
257. What does birth control pill not do?(a) Prevent unplanned pregnancy__ (b) Regulate a women's menstrual cycle__(c) Prevent STD and HIV transmission (d) Planned for number of children you want __(e) Don't know__ (f) Refused __
258. Which of the following is not the way that HIV is transmitted?(a) Sexual contact or intercourse __ (b) Injection drug use __(c) Pregnancy__ (d) Planned for number of children you want __(e) Don't know__ (f) Refused __
259. Which is not the risk factor of diabetes?(a) Family member has diabetes __ (b) Being overweight __ (c) Eating too many sweets __(d) Walking everyday __ (e) Don't know__ (f) Refused __
260. 16_4 Which of the following is not the way to get diarrhea?(a) Contact from friend __ (b) Untreated water __ (c) Food __(d) Washing hands __ (e) Don't know__ (f) Refused __
261. On the past 30 days, do you hear or see a health related (family planning, HIV, diarrhea, etc) public serviceannouncement on? (a) Radio __ (b) TV __ (c) Newspaper __
262. How many times in the past six months have you been hospitalized? __________263. How many times in the past six months have you personally visited a doctor or a nurse for a health issue? ___
GEOGRAPHICAL ASSESIBILITY
264. What is the nearest health center, Dhulikhel Hospital or a different one? (a) Dhulikhel hospital __ (b) PHCC__265. How do you normally travel to nearest health center? (a) On foot __ (b) Bicycle __ (c) Mortor __266. How long does it take you to travel to the health center in minutes for your typical mode of transport? ___267. How do you normally travel to Dhulikhel hospital? a) On foot __ (b) Bicycle __ (c) Mortor __268. How long does it take you to travel to Dhulikhel Hospital in minutes for your typical mode of transport? ___
SOCIAL NETWORK
269. In the past month, how many times have you visited a family members and a friend’s house? _____270. Do you participate in an organization or cooperative in your community? For instance, a water committee, women’s
group, forest group, or NGO. (a) Yes __ (b) No __
HEALTH INSURANCE
Let me give you some brief information about health insurance. Health insurance is a product that you can purchase for yourself or someone in your family that will reduce the payments you would make to the doctor and/or health center/hospital when it is visited. The insurance covers some but not all illnesses and payments associated with treatment. Which services are covered depends on the insurance plan.
271. Have you heard of health insurance before today? (a) Yes __ (b) No __
Possible costs of insurance include a:-Premium: This is a set amount of money you have to pay every month. Even if you do not get sick or go to the health center/hospital during that month you will still have to pay the fee regularly and you will not get your money back. A family premium covers five members in your family of your choosing. If you have more than five members, not all five people can be covered and the insurance cannot switch between insured and uninsured members. Copayment: Some health insurance plans will require the member to pay part of their own fees in addition to the monthly premium.
272. Who is covered by the health insurance? Mark all that apply. (If whole family is selected, proceed to the nextquestion)(a) Whole family __ (b) head of the household __ (c) Husband __ (d) Wife __ (e) Father __(f) Mother __ (g) Son __(k) Brother __ (l) Sister __
65
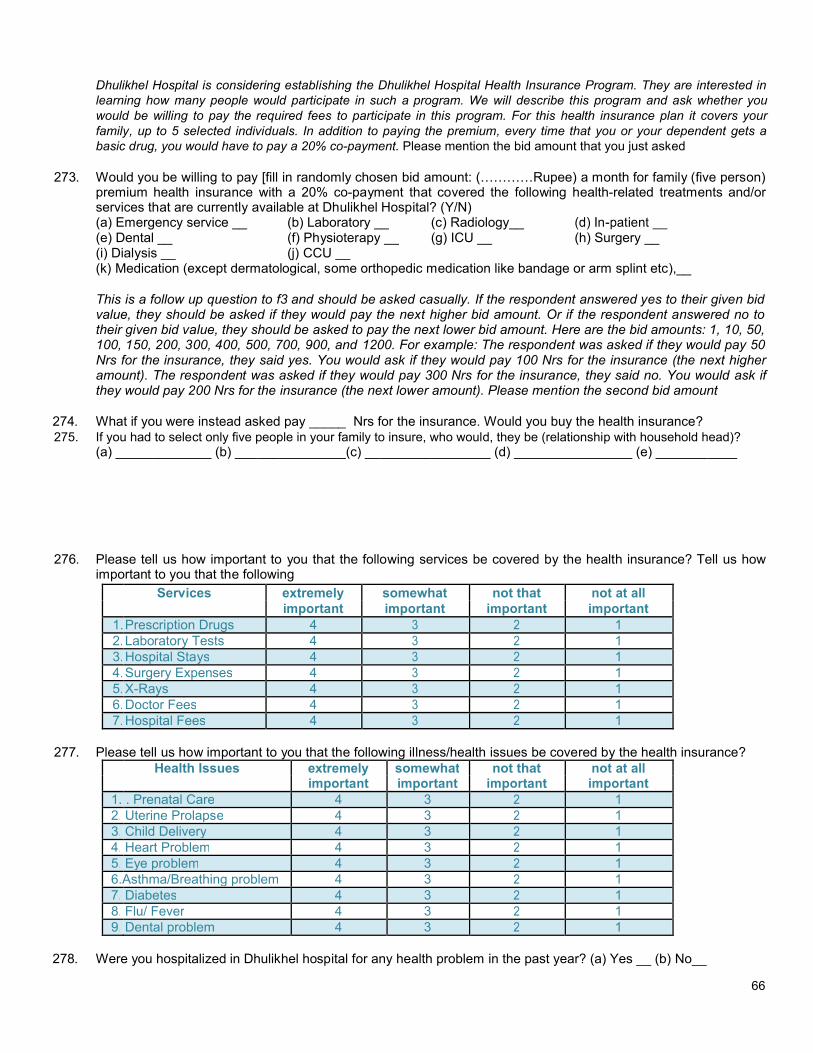
Dhulikhel Hospital is considering establishing the Dhulikhel Hospital Health Insurance Program. They are interested in learning how many people would participate in such a program. We will describe this program and ask whether you would be willing to pay the required fees to participate in this program. For this health insurance plan it covers your family, up to 5 selected individuals. In addition to paying the premium, every time that you or your dependent gets a basic drug, you would have to pay a 20% co-payment. Please mention the bid amount that you just asked
273. Would you be willing to pay [fill in randomly chosen bid amount: (…………Rupee) a month for family (five person) premium health insurance with a 20% co-payment that covered the following health-related treatments and/or services that are currently available at Dhulikhel Hospital? (Y/N)(a) Emergency service __ (b) Laboratory __ (c) Radiology__(e) Dental __ (f) Physioterapy __ (g) ICU __ (h) Surgery __(i) Dialysis __ (j) CCU __(k) Medication (except dermatological, some orthopedic medication like bandage or arm splint etc),__
This is a follow up question to f3 and should be asked casually. If the respondent answered yes to their given bid value, they should be asked if they would pay the next higher bid amount. Or if the respondent answered no to their given bid value, they should be asked to pay the next lower bid amount. Here are the bid amounts: 1, 10, 50, 100, 150, 200, 300, 400, 500, 700, 900, and 1200. For example: The respondent was asked if they would pay 50 Nrs for the insurance, they said yes. You would ask if they would pay 100 Nrs for the insurance (the next higher amount). The respondent was asked if they would pay 300 Nrs for the insurance, they said no. You would ask if they would pay 200 Nrs for the insurance (the next lower amount). Please mention the second bid amount
274. What if you were instead asked pay _____ Nrs for the insurance. Would you buy the health insurance?275. If you had to select only five people in your family to insure, who would, they be (relationship with household head)?
(a) _____________ (b) _______________(c) _________________ (d) ________________ (e) ___________
276. Please tell us how important to you that the following services be covered by the health insurance? Tell us how important to you that the following
Services extremely somewhat not that
1.Prescription Drugs 4 12.Laboratory Tests 4 13.Hospital Stays 4 14.Surgery Expenses 4 15.X-Rays 4 16.Doctor Fees 4 17.Hospital Fees 4 1
277. Please tell us how important to you that the following illness/health issues be covered by the health insurance?Health Issues somewhat not that
1. . Prenatal Care 4 3 12. Uterine Prolapse 4 3 13. Child Delivery 4 3 14. Heart Problem 4 3 15. Eye problem 4 3 16.Asthma/Breathing problem 4 3 17. Diabetes 4 3 18. Flu/ Fever 4 3 19. Dental problem 4 3 1
278. Were you hospitalized in Dhulikhel hospital for any health problem in the past year? (a) Yes __ (b) No__
66
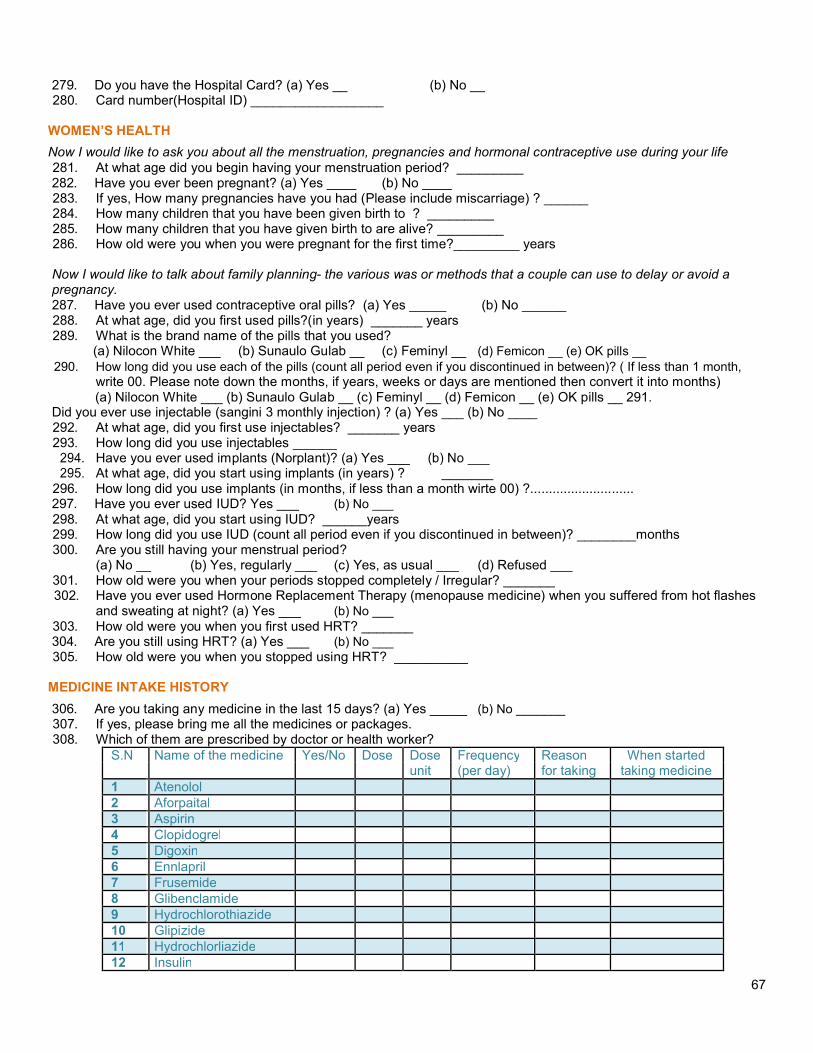
279. Do you have the Hospital Card? (a) Yes __ (b) No __280. Card number(Hospital ID) __________________
WOMEN’S HEALTH
Now I would like to ask you about all the menstruation, pregnancies and hormonal contraceptive use during your life281. At what age did you begin having your menstruation period? _________282. Have you ever been pregnant? (a) Yes ____ (b) No ____283. If yes, How many pregnancies have you had (Please include miscarriage) ? ______284. How many children that you have been given birth to ? _________285. How many children that you have given birth to are alive? _________286. How old were you when you were pregnant for the first time?_________ years
Now I would like to talk about family planning- the various was or methods that a couple can use to delay or avoid apregnancy.287. Have you ever used contraceptive oral pills? (a) Yes _____ (b) No ______288. At what age, did you first used pills?(in years) _______ years289. What is the brand name of the pills that you used?
(a) Nilocon White ___ (b) Sunaulo Gulab __ (c) Feminyl __ (d) Femicon __ (e) OK pills __290. How long did you use each of the pills (count all period even if you discontinued in between)? ( If less than 1 month,
write 00. Please note down the months, if years, weeks or days are mentioned then convert it into months)(a) Nilocon White ___ (b) Sunaulo Gulab __ (c) Feminyl __ (d) Femicon __ (e) OK pills __ 291.
Did you ever use injectable (sangini 3 monthly injection) ? (a) Yes ___ (b) No ____292. At what age, did you first use injectables? _______ years293. How long did you use injectables ______
Have you ever used implants (Norplant)? (a) Yes ___At what age, did you start using implants (in years) ? _______
296. How long did you use implants (in months, if less than a month wirte 00) ?............................297. Have you ever used IUD? Yes ___ (b) No ___298. At what age, did you start using IUD? ______years299. How long did you use IUD (count all period even if you discontinued in between)? ________months300. Are you still having your menstrual period?
(a) No __ (b) Yes, regularly ___ (c) Yes, as usual ___ (d) Refused ___301. How old were you when your periods stopped completely / Irregular? _______302. Have you ever used Hormone Replacement Therapy (menopause medicine) when you suffered from hot flashes
and sweating at night? (a) Yes ___ (b) No ___303. How old were you when you first used HRT? _______304. Are you still using HRT? (a) Yes ___ (b) No ___305. How old were you when you stopped using HRT? __________
MEDICINE INTAKE HISTORY
306. Are you taking any medicine in the last 15 days? (a) Yes _____ (b) No _______307. If yes, please bring me all the medicines or packages.308. Which of them are prescribed by doctor or health worker?
S.N Name of the medicine Yes/No Dose Dose Frequency Reasonunit (per day) for taking
1 Atenolol2 Aforpaital3 Aspirin4 Clopidogrel5 Digoxin6 Ennlapril7 Frusemide8 Glibenclamide9 Hydrochlorothiazide10 Glipizide11 Hydrochlorliazide12 Insulin
67

13 Losartan14 Metformin15 Metoprolol16 Ramipril17 Spironolactone
18 Telmisartan
309. What side effects you had, if any?(a) Depressin __ (b) Dizziness __ (c) Dry cough __ (d) Headache __ (e) Impotence __(f) Nausea __ (g) Vomiting __ (h) Vomiting __ (i) No side effects __
310. In the past 15 days, did you take any herbal, ayurvedic medicine or homemade medicine?(b) No __
311. If yes, what are they ?S.N Dose Dose Frequency Reason When started taking
unit (per day) for taking medicine (yyyy/mm/dd)
312. What side effects you had, if any?(a) Depressin __ (b) Dizziness __ (c) Dry cough __ (d) Headache __ (e) Impotence __
313. (f) Nausea __ (g) Vomiting __ (h) Vomiting __ (i) No side effects __
MEASUREMENT
Now we are going to take some measurements314. Blood Pressure (three measurements)
Systolic blood pressure (1st
) __ Systolic blood pressure (2nd
) __Diastolic blood pressure (1
st) __ Diastolic blood pressure (2
nd) __
Pulse (1st
) Pulse (2nd
) ___
Systolic blood pressure (3rd
) __ Diastolic blood pressure (3
rd)
__ Pulse (3rd
) ___
315. Anthropometry(a) Height :____ cm (b) Weight :___ pounds (c)Waist :___ cm (d) Hip: ___ cm(e) Neck to middle finger: ___ cm
316. Interview end time: ________
Thank you.This is the end of the interview.
68
Copyright © 2022 FDOKUMEN