Race and Socioeconomic Status Influence Outcomes of Unrelated Donor Hematopoietic Cell...
24
Race and Socioeconomic Status Influence Outcomes of Unrelated Donor Hematopoietic Cell Transplantation K. Scott Baker 1 , Stella M. Davies 2 , Navneet S. Majhail 3,4 , Anna Hassebroek 4 , John P. Klein 5 , Karen K. Ballen 6 , Carolyn L. Bigelow 7 , Haydar A. Frangoul 8 , Cheryl L. Hardy 7 , Christopher Bredeson 9 , Jason Dehn 10 , Debra Friedman 7 , Theresa Hahn 11 , Gregory Hale 12 , Hillard M. Lazarus 13 , C.F. LeMaistre 14 , Fausto Loberiza 15 , Dipnarine Maharaj 16 , Philip McCarthy 11 , Michelle Setterholm 10 , Stephen Spellman 4 , Michael Trigg 16 , Richard T. Maziarz 17 , Galen Switzer 18 , Stephanie J. Lee 1 , and J. Douglas Rizzo 5 1 Fred Hutchinson Cancer Research Center, Seattle WA 2 Cincinnati Children’s Hospital Medical Center, Cincinnati OH 3 University of Minnesota, Minneapolis MN 4 Center for International Blood and Marrow Transplant Research, Minneapolis MN 5 Center for International Blood and Marrow Transplant Research, Milwaukee WI 6 Massachusetts General Hospital, Boston MA 7 University of Mississippi Medical Center, Jackson MS 8 Vanderbilt University Medical Center, Nashville TN 9 Medical College of Wisconsin, Milwaukee WI 10 National Marrow Donor Program, Minneapolis MN 11 Roswell Park Cancer Institute, Buffalo NY 12 St. Jude Children's Research Hospital, Memphis TN 13 University Hospitals Case Medical Center, Cleveland OH 14 Texas Transplant Institute, San Antonio TX 15 University of Nebraska Medical Center, Omaha NE 16 South Florida Bone Marrow/Stem Cell Transplant Institute, Boynton Beach FL; 16 Merck & Co. Inc., Wilmington DE 17 Oregon Health & Science University, Portland OR 18 University of Pittsburgh, Pittsburgh PA. Abstract © 2009 The American Society for Blood and Marrow Transplantation. Published by Elsevier Inc. All rights reserved. Address correspondence to: K. Scott Baker, MD, MS, Director, Survivoship Program, Fred Hutchinson Cancer Research Center, 1100 Fairview Ave N, Mailstop D5-280, Seattle, WA 98109, Phone: 206-667-5594, Fax: 206-661-5899, [email protected]. Publisher's Disclaimer: This is a PDF file of an unedited manuscript that has been accepted for publication. As a service to our customers we are providing this early version of the manuscript. The manuscript will undergo copyediting, typesetting, and review of the resulting proof before it is published in its final citable form. Please note that during the production process errors may be discovered which could affect the content, and all legal disclaimers that apply to the journal pertain. Presented in part at the Annual Meeting of the American Society of Hematology, 2007 NIH Public Access Author Manuscript Biol Blood Marrow Transplant. Author manuscript; available in PMC 2010 December 1. Published in final edited form as: Biol Blood Marrow Transplant. 2009 December ; 15(12): 1543–1554. doi:10.1016/j.bbmt.2009.07.023. NIH-PA Author Manuscript NIH-PA Author Manuscript NIH-PA Author Manuscript
-
Upload
independent -
Category
Documents
-
view
0 -
download
0
Transcript of Race and Socioeconomic Status Influence Outcomes of Unrelated Donor Hematopoietic Cell...
Race and Socioeconomic Status Influence Outcomes of UnrelatedDonor Hematopoietic Cell Transplantation
K. Scott Baker1, Stella M. Davies2, Navneet S. Majhail3,4, Anna Hassebroek4, John P.Klein5, Karen K. Ballen6, Carolyn L. Bigelow7, Haydar A. Frangoul8, Cheryl L. Hardy7,Christopher Bredeson9, Jason Dehn10, Debra Friedman7, Theresa Hahn11, GregoryHale12, Hillard M. Lazarus13, C.F. LeMaistre14, Fausto Loberiza15, Dipnarine Maharaj16,Philip McCarthy11, Michelle Setterholm10, Stephen Spellman4, Michael Trigg16, Richard T.Maziarz17, Galen Switzer18, Stephanie J. Lee1, and J. Douglas Rizzo51Fred Hutchinson Cancer Research Center, Seattle WA2Cincinnati Children’s Hospital Medical Center, Cincinnati OH3University of Minnesota, Minneapolis MN4Center for International Blood and Marrow Transplant Research, Minneapolis MN5Center for International Blood and Marrow Transplant Research, Milwaukee WI6Massachusetts General Hospital, Boston MA7University of Mississippi Medical Center, Jackson MS8Vanderbilt University Medical Center, Nashville TN9Medical College of Wisconsin, Milwaukee WI10National Marrow Donor Program, Minneapolis MN11Roswell Park Cancer Institute, Buffalo NY12St. Jude Children's Research Hospital, Memphis TN13University Hospitals Case Medical Center, Cleveland OH14Texas Transplant Institute, San Antonio TX15University of Nebraska Medical Center, Omaha NE16South Florida Bone Marrow/Stem Cell Transplant Institute, Boynton Beach FL; 16 Merck & Co.Inc., Wilmington DE17Oregon Health & Science University, Portland OR18University of Pittsburgh, Pittsburgh PA.
Abstract
© 2009 The American Society for Blood and Marrow Transplantation. Published by Elsevier Inc. All rights reserved.Address correspondence to: K. Scott Baker, MD, MS, Director, Survivoship Program, Fred Hutchinson Cancer Research Center, 1100Fairview Ave N, Mailstop D5-280, Seattle, WA 98109, Phone: 206-667-5594, Fax: 206-661-5899, [email protected]'s Disclaimer: This is a PDF file of an unedited manuscript that has been accepted for publication. As a service to our customerswe are providing this early version of the manuscript. The manuscript will undergo copyediting, typesetting, and review of the resultingproof before it is published in its final citable form. Please note that during the production process errors may be discovered which couldaffect the content, and all legal disclaimers that apply to the journal pertain.Presented in part at the Annual Meeting of the American Society of Hematology, 2007
NIH Public AccessAuthor ManuscriptBiol Blood Marrow Transplant. Author manuscript; available in PMC 2010 December 1.
Published in final edited form as:Biol Blood Marrow Transplant. 2009 December ; 15(12): 1543–1554. doi:10.1016/j.bbmt.2009.07.023.
NIH
-PA Author Manuscript
NIH
-PA Author Manuscript
NIH
-PA Author Manuscript

Success of hematopoietic-cell transplantation (HCT) can vary by race, but the impact ofsocioeconomic-status (SES) is not known. To evaluate the role of race and SES, we studied 6207unrelated-donor myeloablative HCT recipients transplanted between 1995–2004 for acute or chronicleukemia or myelodysplastic syndrome. Patients were reported by transplant center to be White(n=5253), African-American (n=368), Asian/Pacific-Islander (n=141), or Hispanic (n=445). Patientincome was estimated from residential ZIP Code at time of HCT. Cox-regression analysis adjustingfor other significant factors showed that African-American (but not Asian or Hispanic) recipientshad worse overall survival (OS) (relative-risk [RR] 1.47 (95% CI 1.29–1.68), P<0.001) comparedto Whites. Treatment-related mortality (TRM) was higher in African-Americans (RR 1.56, (1.34–1.83), P<0.001) and in Hispanics (RR 1.30, (1.11–1.51), P=0.001). Across all racial groups, patientswith median incomes in the lowest quartile (<$34,700) had worse OS (RR 1.15 (1.04–1.26), P=0.005)and higher risks of TRM (RR 1.21 (1.07–1.36), P=0.002). Inferior outcomes among African-Americans are not fully explained by transplant-related factors or SES. Potential other mechanismssuch as genetic polymorphisms that impact drug metabolism or unmeasured co-morbidities,socioeconomic factors and health behaviors may be important. Low SES, regardless of race, has anegative impact on unrelated donor HCT outcomes.
KeywordsAllogeneic hematopoietic cell transplantation; unrelated donor; race; socioeconomic status; survival
INTRODUCTIONThe use of hematopoietic cell transplantation (HCT) is increasing worldwide. The prognosticimpact of patient and donor specific demographic factors has been well described, but thereare limited data regarding the impact of race and socioeconomic status (SES) on outcome ofHCT. Many studies have described racial differences in tumor presentation, histology, stageat diagnosis and response to therapy in cancer patients, including prostate cancer1–3, carcinomaof the breast4,5, colon4, oral cancers5, acute myeloid leukemia (AML)6 and Hodgkinlymphoma7. Possible explanations for these differences might include cultural attitudes inseeking medical care, treatment variability as well as potential lack of access to primary care(and subsequently delayed diagnosis). SES has also been considered as a contributing factorto racial differences in outcome for cancer patients. However, even controlling for stage ofdisease, most studies suggest that SES alone cannot explain a racial difference in outcome8–11.
Until recently, differences in the outcome of ethnic minorities undergoing HCT have not beendescribed in detail. A previous study from the Center for International Blood and MarrowTransplant Research (CIBMTR) compared trends in survival rates in ethnic minorities afterHCT from human leukocyte antigen (HLA)-identical sibling donors12. The study found thatHispanics had lower 1-year and 3-year survival rates compared with Whites, while nodifferences were identified between Whites and African-Americans or Asians12. A follow-upstudy found that the decrease in overall survival among Hispanics was primarily related tohigher risks of treatment failure (death or relapse) and higher risk of overall mortality13.Mielcarek et al, in a cohort of sibling and unrelated donor HCT recipients, have also reporteda significantly higher risk of mortality among African-American HCT recipients compared toWhite recipients.14.
Increased genetic disparity at both the HLA locus and at minor transplantation antigens mayimportantly influence the outcome of HCT. In addition, polymorphism in cytokine genes canalso influence HCT outcomes15,16. These genetic factors might be expected to vary betweenethnicities and may contribute to disparate outcomes. A previous CIBMTR study among
Baker et al. Page 2
Biol Blood Marrow Transplant. Author manuscript; available in PMC 2010 December 1.
NIH
-PA Author Manuscript
NIH
-PA Author Manuscript
NIH
-PA Author Manuscript

recipients of sibling donor HCT, performed in collaboration with transplant registries in Japan,Scandinavia and Ireland, showed reduced risk of graft-versus-host disease (GVHD) in the lessgenetically diverse Japanese and Scandinavian populations compared with White-Americanand African-American populations17. However, the risks of GVHD were similar between theIrish and the White-American and African-American populations. The study concluded thatthe etiology of ethnic disparities in GVHD are complex and may include differences in HLAand minor antigen diversity, frequencies of cytokine polymorphisms, and non-genetic variablessuch as diet, environment and differences in GVHD diagnosis and management.
Available studies investigating race in HCT are largely limited to recipients of sibling donorHCT and suggest important and as yet unexplained racial differences. Also, the impact of socio-cultural factors on outcomes of HCT has not been well described14. In the current study weexplore the association of race and SES with outcomes in unrelated HCT recipients.
METHODSData source
The CIBMTR is a research affiliation of the International Bone Marrow Transplant Registry(IBMTR), Autologous Blood and Marrow Transplant Registry (ABMTR) and the NationalMarrow Donor Program (NMDP) that comprises a voluntary working group of more than 450transplantation centers worldwide that contribute detailed data on consecutive allogeneic andautologous hematopoietic SCT to a Statistical Center at the Medical College of Wisconsin inMilwaukee and the NMDP Coordinating Center in Minneapolis. Participating centers arerequired to report all transplants consecutively; compliance is monitored by on-site audits.Patients are followed longitudinally, with yearly follow-up. The overall follow-up of the cohortwas 100% at 1 year and 95% overall and did not differ significantly among the various racialcategories. Computerized checks for errors, physicians’ review of submitted data and on-siteaudits of participating centers ensure data quality. Observational studies conducted by theCIBMTR are done so with a waiver of informed consent and in compliance with HIPAAregulations as determined by the Institutional Review Board and the Privacy Officer of theMedical College of Wisconsin.
ParticipantsThe study included patients who received an unrelated donor allogeneic HCT with amyeloablative preparative regimen using either a bone marrow or peripheral blood stem-cellsource for AML, acute lymphoblastic leukemia (ALL), chronic myeloid leukemia (CML) ormyelodysplastic syndrome (MDS) between 1995 and 2004. Only patients transplanted in acenter in the USA and with available residential postal ZIP Codes were eligible for this analysis;8 patients with missing ZIP Code information were excluded. Patients who received unrelatedumbilical cord blood as donor source (n=163) or had previously undergone HCT (n=516) werealso excluded from the study. Information about patient race was reported by transplant centersand was categorized according to the US Office of Management and Budget classification asWhite, African-American, Hispanic or Asian/Pacific-Islander. Patient income was estimatedby the mean household income of their ZIP Code from the 2004 US Census. Distances betweenthe center of a patient’s residence and the transplant center were approximated using theHaversine approximation on the latitude and longitude of the ZIP Code18. The package “ZIPCode deluxe”19 was used to obtain income and location data from the ZIP Code. All survivingrecipients included in this analysis were retrospectively contacted and provided informedconsent for participation in the National Marrow Donor Program (NMDP) research program.Informed consent was waived by the NMDP Institutional Review Board for all deceasedrecipients. Approximately 10% of surviving patients would not provide consent for use ofresearch data. To adjust for the potential bias introduced by exclusion of non-consenting
Baker et al. Page 3
Biol Blood Marrow Transplant. Author manuscript; available in PMC 2010 December 1.
NIH
-PA Author Manuscript
NIH
-PA Author Manuscript
NIH
-PA Author Manuscript

surviving patients, a corrective action plan modeling process randomly excluded appropriatelythe same percentage of deceased patients (n=532) using a biased coin randomization withexclusion probabilities based on characteristics associated with not providing consent for useof the data in survivors20. The final study cohort consisted of 6207 patients (Table 1). Thefollowup completeness index from time of HCT, which is the ratio of total observed person-time and the potential person-time of followup in a study,21 was 98% at 1-year and 90% at 5-years post-HCT.
Outcomes and study definitionsThe primary objective of this study was to determine the impact of race and household incomeon overall survival (OS), disease-free survival (DFS), relapse, and treatment-related mortality(TRM). DFS was defined as survival in complete remission after HCT. For OS, death fromany cause was considered an event. Relapse was defined as disease recurrence at any site. TRMwas defined as death in complete remission. OS, DFS, relapse and TRM were assessed fromthe date of HCT. All patients were assessed for acute and chronic GVHD by standardcriteria22,23.
Based on previous CIBMTR publications of disease specific outcomes and differentialoutcomes in ethnic minorities with related donor transplants,12,13,24–27 disease status wasclassified as early, intermediate or advanced. Early disease included AML and ALL in firstcomplete remission, CML in first chronic phase, and MDS with refractory anemia or refractoryanemia with ringed sideroblasts. AML and ALL in second or greater remission or CML inaccelerated phase or second or greater chronic phase was categorized as intermediate disease.Patients with advanced disease had AML and ALL in relapse or primary induction failure,CML in blast phase, or MDS with refractory anemia with excess blasts or excess blasts intransformation.
The NMDP classification of HLA matching status that allows adequate adjustment for donor-recipient HLA compatibility while accounting for best available resolution of typing was usedto categorize HLA matching status as well-matched, partially-matched or mismatched25.Briefly, well-matched patients had no identified mismatches at HLA-A, -B, -C and -DRB1with low/intermediate or high resolution data available at HLA-A, -B and high resolution -DRB1. Partially-matched patients had a single locus mismatch at any of the 4 loci and/ormissing HLA-C data. Mismatched patients had 2 or more allele or antigen mismatches.
Statistical analysisPatient, disease and HCT related characteristics were compared by Chi-square statistic forcategorical variables and the Kruskal-Wallis test for continuous variables. Probabilities of OSand DFS were calculated using the Kaplan-Meier method. Probabilities of TRM, relapse,neutrophil engraftment and acute and chronic GVHD were calculated by the cumulative-incidence function method.
To adjust for differences in baseline characteristics, multivariate Cox proportional-hazardsregression models were used. Household income was correlated with outcome using a seriesof threshold models in the Cox model framework. These models were then constructed to findcut points that best described impact of income on outcome by picking the model with thelargest partial likelihood28. Associations between each outcome and potential prognosticvariables (Table 2) were evaluated using a stepwise approach. Variables significantlyassociated with each outcome event (P<0.05) were included as covariate factors in subsequentcomparisons. The assumption of proportional hazards was tested in a time-dependent covariatefashion. Results were expressed as relative risks (RR) of each outcome. The models for OS,DFS, relapse and TRM were stratified on Karnofsky Score. The models for acute GVHD and
Baker et al. Page 4
Biol Blood Marrow Transplant. Author manuscript; available in PMC 2010 December 1.
NIH
-PA Author Manuscript
NIH
-PA Author Manuscript
NIH
-PA Author Manuscript
chronic GVHD were stratified on patient age. For engraftment, logistic regression was used tomodel the chance of neutrophil recovery at day 28. A similar analysis to the Cox analysis wasperformed; the results are reported as the odds in favor of engraftment. For each outcome themain effects of race and household income were tested for an interaction with each of the othercovariates (including gender) that entered the models. This was done for each outcome. Noneof these were found to be significant at a 5% significance level.
The analysis found a significant transplant center effect using a random effects test on thesurvival times29. To adjust for center, a stepwise regression model was used which includedat each step the main effects as well as all covariates adjusted for in the model for the givenevent. The centers found to enter and stay in the model at a 5% significance level were includedin the final model.
To examine the robustness of our results in patients with high-resolution HLA typing, a subsetanalysis limited to patients with allele-level typing at the HLA-A, -B, -C and -DRB1 loci(n=3864) was performed for the endpoints of OS, DFS, relapse and TRM.
All p-values are two-sided and, to account for multiple comparisons, a p-value <0.01 wasconsidered to be significant. Analyses were performed using SAS software, version 9.1 (SASInstitute, Cary, NC).
RESULTSPatient characteristics
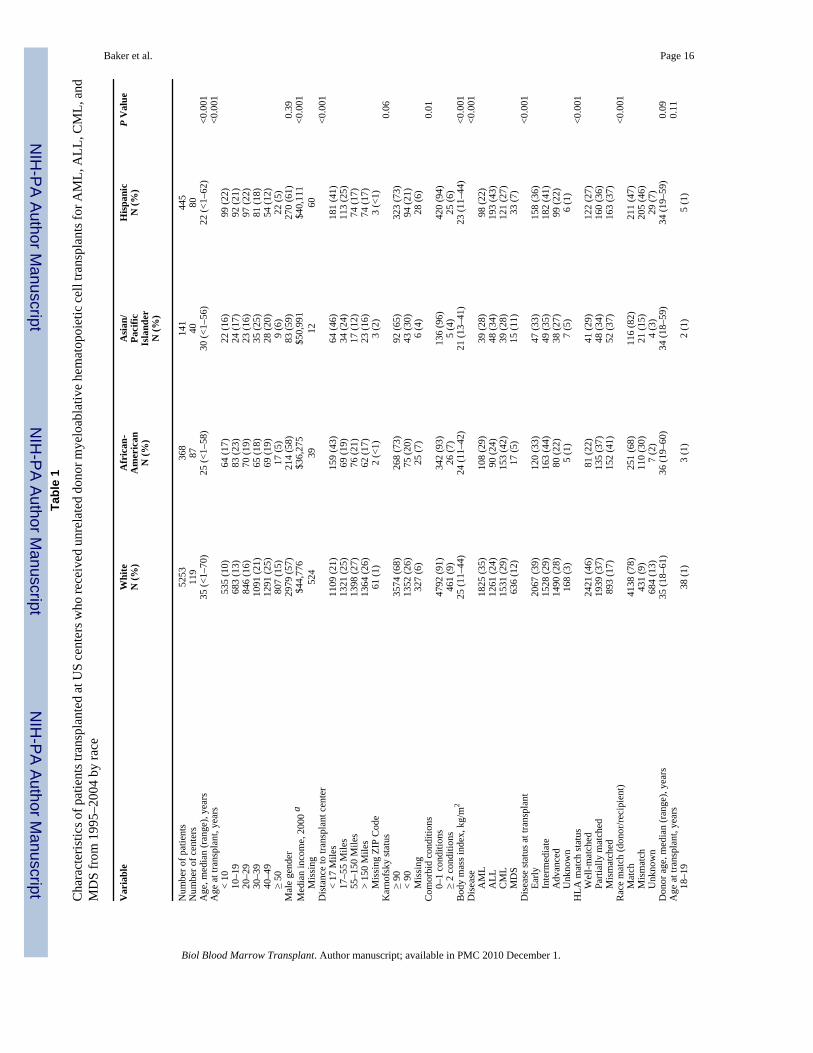
Table 1 describes patient, disease and treatment characteristics by race. Asian/Pacific Islandershad the highest median household income ($50,991) while African-Americans had the lowest($36,275).
Table 3 describes our cohort’s characteristics by socioeconomic status. A greater proportionof African-Americans (45%) belonged to the lowest income quartile (median income <$34,700), compared to Hispanics (35%), Whites (21%) or Asian/Pacific-Islanders (9%).
Race and outcomesIn univariate analyses, African-Americans had the lowest probability of OS and DFS and thehighest rates of TRM (Figure 1 and Figure 2). Cumulative incidence of relapse was similaramong all four racial groups.
In a multivariate analysis adjusting for other prognostic variables (including annual income),African-American race was associated with significantly worse OS and DFS and higher TRMthan Whites (Table 4). Risk of TRM was also increased in Hispanics, but OS and DFS wascomparable. The risk for relapse was similar among the four racial groups. Race had no impacton neutrophil engraftment or risks of grades 2–4 acute GVHD. The RR of grade 3–4 acuteGVHD was slightly higher in African-Americans (1.26 [1.03–1.54], P=NS) while that forchronic GVHD was higher in African-Americans (1.34 [1.10–1.63], P=0.003) and Hispanics(1.25 [1.06–1.48], P=0.008). A subset analysis limited to 3,864 recipients with allele-leveltyping at the HLA-A, -B, -C and -DRB1 loci showed risks for OS, DFS, relapse and TRMsimilar to those observed in analyses that included the whole cohort (data not shown).
Income and outcomesPatients with a median annual income in the lowest quartile (<$37,400) had lower probabilityof OS and DFS and higher rates of TRM (Figure 3 and Figure 4). Relapse was similar in allincome categories.
Baker et al. Page 5
Biol Blood Marrow Transplant. Author manuscript; available in PMC 2010 December 1.
NIH
-PA Author Manuscript
NIH
-PA Author Manuscript
NIH
-PA Author Manuscript

In a multivariate analysis adjusting for other prognostic variables (including race), patientswith incomes in the lowest quartile (<$37,400) had significantly worse OS (RR 1.15 [1.04–1.26], P=0.005) and TRM (RR 1.21 [1.07–1.36], P=0.002) than those with incomes in thehighest quartile (>$56,000) (Table 4). Household income had no impact on risks of DFS,relapse, acute GVHD or chronic GVHD. A subset analysis limited to patients with allele-leveltyping again showed risks similar to those observed for the whole cohort (data not shown).
Causes of deathFor the whole cohort, the principal causes of death included recurrence of primary malignancy(25%), infection (20%), organ failure (18%) acute or chronic GVHD (14%) and interstitialpneumonitis (12%), and these did not differ when compared by race or SES. Table 5 describesthe causes of death within and after 100 days following transplantation by race and SES.
DISCUSSIONOur study shows notably decreased survival in African-American unrelated donor HCTrecipients compared with White, Asian and Hispanic recipients, despite adjustment inmultivariate analysis for HLA matching, disease status, family income and other variableslikely to influence outcome. Reduced survival was due to increased TRM in African-Americanrecipients with no increased risk of acute GVHD or relapse detected. There are many possiblereasons for reduced survival in African-American HCT recipients, including biology (e.g.polymorphism at non-HLA loci), access to care including post-HCT follow-up, disparities intreatment or follow-up practices, environmental factors (that may also be influenced by SES),and health behaviors. Additionally there were several differences in baseline patientcharacteristics between the groups. However, the analysis was adjusted for the potential patient,disease, and center characteristics that differ between the groups. If the survival differencesfound were caused by these baseline differences, this adjustment would actually tend to lower,not increase, the reported effect of race. Additionally, there was no evidence of an interactionbetween these factors in the model with race or income.
Biological factors, such as increased genetic polymorphism in African-American recipients,could impact outcomes. It is clear that improved HLA matching improves HCT outcome, andit is known that there is greater diversity at HLA loci in the African-American populationcompared with other races and ethnicities17. In our study, however, outcomes were inferior inAfrican-American recipients even after adjustment for HLA matching with the donor. Thisraises the possibility that genetic variation at other loci may be modifying outcomes. At apopulation level, African-Americans show significantly higher levels of nucleotideheterozygosity compared with Americans of European origin30. Polymorphisms that modifyexpression of cytokine genes have been shown to modify a number of HCT endpoints and itis possible that less favorable alleles may occur more frequently in African-American HCTrecipients12,15,16,31. In agreement with our study, reduced graft survival and OS have beenreported in African-American recipients of renal transplants32, with a similar finding reportedafter liver transplantation in African-American recipients secondary to chronic rejection33. Incancer patients, pharmacogenetic variation in drug metabolism has been reported forcyclophosphamide, methotrexate and busulfan, all of which impacted HCT outcomes34–38.Frequencies of many pharmacogenetic variants influencing metabolism of these drugs vary byrace, and future pharmacogenetic studies, which would likely need to be multi-center to achieveadequate sample size, might determine whether this is an important variable, as personalizeddrug dosing might improve outcomes39–41.
Racial disparities exist in health care access and outcomes and are related to SES. It has beenreported that African-American patients with a myocardial infarction and heart failure receiveless intensive and poorer-quality care Whites42,43–45. In a study of Medicare beneficiaries,
Baker et al. Page 6
Biol Blood Marrow Transplant. Author manuscript; available in PMC 2010 December 1.
NIH
-PA Author Manuscript
NIH
-PA Author Manuscript
NIH
-PA Author Manuscript

who are presumed to have no financial obstacle to care, treatment and outcomes of heart failurewere similar among White and African-American patients46. All of the patients in our studyreceived HCT so therefore had access to high-cost, technologically demanding care, althoughit is unknown whether their overall insurance coverage was similar. Despite this, survival waslower in those with the lowest income, even after adjustment for race and measured co-morbidities, and the excess mortality was treatment related It is still possible though thatreduced access to or utilization of post-HCT follow-up care might contribute to the inferioroutcomes seen in our study.
The mechanism for the excess mortality seen in African-American recipients seems likely tobe complex. Additional contributors may include unmeasured co-morbidities such as poornutrition, inability to comply with medication regimens, and poor access to follow-up care. Inaddition, the National Health and Nutrition Examination Survey reports increased frequencyof high blood pressure, high body mass index, physical inactivity and diabetes in African-American women, all of which, as unmeasured co-morbidities, might contribute to increasedlate mortality after HCT47. Addressing and improving such issues is challenging, as some aresocietal rather than medical issues. However, awareness of the problem is an important firststep so that care providers can consider the issues and perhaps provide specific resources forthis high-risk population after leaving the transplant center.
Similar to the findings in our study, low SES, assessed independently of race, has been reportedto have an adverse impact on outcomes of many diseases, including cancer, chronic renaldisease and solid organ transplantation38,48,49. Mackillop et al. studied the impact of SES onoutcome of treatment of cancer in Ontario, Canada, where the heath system is designed toprovide equitable access to healthcare for all50. Their study demonstrated higher mortality ratesfrom cancer among poorer communities compared with wealthier areas. Recipients of renaland liver transplants with private insurance have been reported to have better survival thanMedicare recipients, but SES measured by census tract was not associated with outcome.51
The difference in these observations may reflect the dominant influence of the quality of thesurgical procedure and inpatient hospital care on long-term outcomes of solid organtransplantation, in contrast to HCT where the period of immune reconstitution is long (lastingmonths to years) and the incidence of late mortality after the patient has left the transplantcenter is significant51. Clearly, low SES has a significant negative impact on the unrelateddonor HCT outcomes and transplant centers need to carefully examine and optimize theresources available to these individuals during the peri-HCT time period as well as duringongoing long-term follow-up.
Despite the large size of this study and the meaningful cohorts of racial minority groups, thereare limitations that should be considered. Our study only included patients who actuallyreceived HCT and thus we could not address the impact of race or SES on access totransplantation. A challenge for our study, in common with all studies of race, is a lack ofprecision in the definition of race. In our study race was reported by the transplant center, andmay not reflect accurately persons of mixed heritage. While the relative proportions of minorityracial groups in this study do not match that of the US population we feel this is less of an issuerelated to access to care, or to misclassification of race, but rather due to the fact that minoritiesare underrepresented in the unrelated donor pool making it more difficult to obtain a donor forminority patients. Additionally, cancer incidence rates for acute leukemia have been shown tovary by race with a higher incidence being found in Whites compared to Blacks.52 Also, wedo not have data to reflect the insurance status of patients represented in the study. Also, ourstudy could not address other important factors that may impact access to transplant and accessto and quality of post-transplant care. Some of these factors, for instance insurance coverage,lack of adequate support services and cultural biases, are potentially modifiable. In addition,socioeconomic status was estimated from Zip code of residence and was not self-reported by
Baker et al. Page 7
Biol Blood Marrow Transplant. Author manuscript; available in PMC 2010 December 1.
NIH
-PA Author Manuscript
NIH
-PA Author Manuscript
NIH
-PA Author Manuscript

patients. Despite these limitations, we believe our data indicate importantly inferior outcomesin African-American unrelated donor HCT recipients that are not explicable by reduced familyincome, and should lead to future biological, sociological and epidemiological studies toaddress and improve this disparity. In addition, we show that reduced family income reducedsurvival in recipients of all races, indicating the need for careful support and follow-up of suchpatients.
AcknowledgmentsThe CIBMTR is supported by Public Health Service Grant/Cooperative Agreement U24-CA76518 from the NationalCancer Institute (NCI), the National Heart, Lung and Blood Institute (NHLBI) and the National Institute of Allergyand Infectious Diseases (NIAID); a Grant/Cooperative Agreement 5U01HL069294 from NHLBI and NCI; a contractHHSH234200637015C with Health Resources and Services Administration (HRSA/DHHS); two GrantsN00014-06-1-0704 and N00014-08-1-0058 from the Office of Naval Research; and grants from AABB; Aetna;American Society for Blood and Marrow Transplantation; Amgen, Inc.; Anonymous donation to the Medical Collegeof Wisconsin; Association of Medical Microbiology and Infectious Disease Canada; Astellas Pharma US, Inc.; BaxterInternational, Inc.; Bayer HealthCare Pharmaceuticals; BloodCenter of Wisconsin; Blue Cross and Blue ShieldAssociation; Bone Marrow Foundation; Canadian Blood and Marrow Transplant Group; Celgene Corporation;CellGenix, GmbH; Centers for Disease Control and Prevention; ClinImmune Labs; CTI Clinical Trial and ConsultingServices; Cubist Pharmaceuticals; Cylex Inc.; CytoTherm; DOR BioPharma, Inc.; Dynal Biotech, an InvitrogenCompany; Enzon Pharmaceuticals, Inc.; European Group for Blood and Marrow Transplantation; Gambro BCT, Inc.;Gamida Cell, Ltd.; Genzyme Corporation; Histogenetics, Inc.; HKS Medical Information Systems; Hospira, Inc.;Infectious Diseases Society of America; Kiadis Pharma; Kirin Brewery Co., Ltd.; Merck & Company; The MedicalCollege of Wisconsin; MGI Pharma, Inc.; Michigan Community Blood Centers; Millennium Pharmaceuticals, Inc.;Miller Pharmacal Group; Milliman USA, Inc.; Miltenyi Biotec, Inc.; National Marrow Donor Program; NaturePublishing Group; New York Blood Center; Novartis Oncology; Oncology Nursing Society; Osiris Therapeutics, Inc.;Otsuka Pharmaceutical Development & Commercialization, Inc.; Pall Life Sciences; PDL BioPharma, Inc; Pfizer Inc;Pharmion Corporation; Saladax Biomedical, Inc.; Schering Plough Corporation; Society for Healthcare Epidemiologyof America; StemCyte, Inc.; StemSoft Software, Inc.; Sysmex; Teva Pharmaceutical Industries; The MarrowFoundation; THERAKOS, Inc.; Vidacare Corporation; Vion Pharmaceuticals, Inc.; ViraCor Laboratories;ViroPharma, Inc.; and Wellpoint, Inc. The views expressed in this article do not reflect the official policy or positionof the National Institute of Health, the Department of the Navy, the Department of Defense, or any other agency ofthe U.S. Government.
References1. Asbell SO, Vijayakumar S. Racial differences in prostate-specific antigen levels in patients with local-
regional prostate cancer. Prostate 1997;31:42–46. [PubMed: 9108885]2. Iselin CE, Box JW, Vollmer RT, Layfield LJ, Robertson JE, Paulson DF. Surgical control of clinically
localized prostate carcinoma is equivalent in African-American and white males. Cancer1998;83:2353–2360. [PubMed: 9840535]
3. Kim JA, Kuban DA, el-Mahdi AM, Schellhammer PF. Carcinoma of the prostate: race as a prognosticindicator in definitive radiation therapy. Radiology 1995;194:545–549. [PubMed: 7529936]
4. Mayberry RM, Coates RJ, Hill HA, et al. Determinants of black/white differences in colon cancersurvival. J Natl Cancer Inst 1995;87:1686–1693. [PubMed: 7473817]
5. Arbes SJ, Slade GD. Racial differences in stage at diagnosis of screenable oral cancers in NorthCarolina. J Public Health Dent 1996;56:352–354. [PubMed: 9089532]
6. Rubnitz JE, Lensing S, Razzouk BI, Pounds S, Pui CH, Ribeiro RC. Effect of race on outcome of whiteand black children with acute myeloid leukemia: the St. Jude experience. Pediatr Blood Cancer2007;48:10–15. [PubMed: 16642489]
7. Metzger ML, Castellino SM, Hudson MM, et al. Effect of race on the outcome of pediatric patientswith Hodgkin's lymphoma. J Clin Oncol 2008;26:1282–1288. [PubMed: 18323551]
8. Bain RP, Greenberg RS, Whitaker JP. Racial differences in survival of women with breast cancer. JChronic Dis 1986;39:631–642. [PubMed: 3734019]
9. Moul JW, Douglas TH, McCarthy WF, McLeod DG. Black race is an adverse prognostic factor forprostate cancer recurrence following radical prostatectomy in an equal access health care setting. JUrol 1996;155:1667–1673. [PubMed: 8627850]
Baker et al. Page 8
Biol Blood Marrow Transplant. Author manuscript; available in PMC 2010 December 1.
NIH
-PA Author Manuscript
NIH
-PA Author Manuscript
NIH
-PA Author Manuscript

10. Lannin DR, Mathews HF, Mitchell J, Swanson MS, Swanson FH, Edwards MS. Influence ofsocioeconomic and cultural factors on racial differences in late-stage presentation of breast cancer.Jama 1998;279:1801–1807. [PubMed: 9628711]
11. Franzini L, Williams AF, Franklin J, Singletary SE, Theriault RL. Effects of race and socioeconomicstatus on survival of 1,332 black, Hispanic, and white women with breast cancer. Ann Surg Oncol1997;4:111–118. [PubMed: 9084846]
12. Serna DS, Lee SJ, Zhang MJ, et al. Trends in survival rates after allogeneic hematopoietic stem-celltransplantation for acute and chronic leukemia by ethnicity in the United States and Canada. J ClinOncol 2003;21:3754–3760. [PubMed: 14551294]
13. Baker KS, Loberiza FR Jr, Yu H, et al. Outcome of ethnic minorities with acute or chronic leukemiatreated with hematopoietic stem-cell transplantation in the United States. J Clin Oncol 2005;23:7032–7042. [PubMed: 16145067]
14. Mielcarek M, Gooley T, Martin PJ, et al. Effects of race on survival after stem cell transplantation.Biol Blood Marrow Transplant 2005;11:231–239. [PubMed: 15744242]
15. Cavet J, Middleton PG, Segall M, Noreen H, Davies SM, Dickinson AM. Recipient tumor necrosisfactor-alpha and interleukin-10 gene polymorphisms associate with early mortality and acute graft-versus-host disease severity in HLA-matched sibling bone marrow transplants. Blood 1999;94:3941–3946. [PubMed: 10572111]
16. Dickinson AM, Harrold JL, Cullup H. Haematopoietic stem cell transplantation: can our genes predictclinical outcome? Expert Rev Mol Med 2007;9:1–19. [PubMed: 17976248]
17. Oh H, Loberiza FR Jr, Zhang MJ, et al. Comparison of graft-versus-host-disease and survival afterHLA-identical sibling bone marrow transplantation in ethnic populations. Blood 2005;105:1408–1416. [PubMed: 15486071]
18. Sinnott R. Virtures of the Haversine. Sky and Telescope 1984:159.19. Zip-Codes.com. Zip Code Database-Deluxe Database specifications.20. Farag SSBA, Eapen M, Hurley C, Dupont B, Caligiuri MA, Boudreau C, Nelson G, Oudshoorn M,
van Rood J, Velardi A, Maiers M, Setterholm M, Confer D, Posch PE, Anasetti C, Kamani N, MillerJS, Weisdorf D, Davies SM. KIR Study Group. Center for International Blood and MarrowTransplantation Research. The Effect of KIR Ligand Incompatibility on the Outcome of UnrelatedDonor Transplants: A report from the Center for International Blood and Marrow TransplantResearch, the European Blood and Marrow Transplant Registry and the Dutch Registry. Biology ofBlood and Marrow Transplantation 2006;12:876–884. [PubMed: 16864058]
21. Clark TG, Altman DG, De Stavola BL. Quantification of the completeness of follow-up. Lancet2002;359:1309–1310. [PubMed: 11965278]
22. Przepiorka D, Weisdorf D, Martin P, et al. 1994 Consensus Conference on Acute GVHD Grading.Bone Marrow Transplant 1995;15:825–828. [PubMed: 7581076]
23. Sullivan KM, Agura E, Anasetti C, et al. Chronic graft-versus-host disease and other latecomplications of bone marrow transplantation. Semin Hematol 1991;28:250–259. [PubMed:1887253]
24. Ringden O, Pavletic SZ, Anasetti C, et al. The graft-versus-leukemia effect using matched unrelateddonors is not superior to HLA-identical siblings for hematopoietic stem cell transplantation. Blood2009;113:3110–3118. [PubMed: 19059878]
25. Weisdorf D, Spellman S, Haagenson M, et al. Classification of HLA-matching for retrospectiveanalysis of unrelated donor transplantation: revised definitions to predict survival. Biol BloodMarrow Transplant 2008;14:748–758. [PubMed: 18541193]
26. Szydlo R, Goldman JM, Klein JP, et al. Results of allogeneic bone marrow transplants for leukemiausing donors other than HLA-identical siblings. J Clin Oncol 1997;15:1767–1777. [PubMed:9164184]
27. Pasquini M, Wang Z. CIBMTR summary slides - 2007 (Part 2). CIBMTR Newsletter 2008;14:6–13.28. Klein JaW, JT. Handbook of Statistics. Advances in Survival Analysis. Vol. Vol. 25. Elsevier Science;
2004. Chapter 2 Discretizing a Continuous Covariate in Survival Studies.29. Andersen CA. Score Tests Of Homogeneity For Survival Data. Lifetime Data Analysis 1:145–156.
[PubMed: 9385097]
Baker et al. Page 9
Biol Blood Marrow Transplant. Author manuscript; available in PMC 2010 December 1.
NIH
-PA Author Manuscript
NIH
-PA Author Manuscript
NIH
-PA Author Manuscript

30. Lohmueller KE, Indap AR, Schmidt S, et al. Proportionally more deleterious genetic variation inEuropean than in African populations. Nature 2008;451:994–997. [PubMed: 18288194]
31. Kim DH, Park JY, Sohn SK, Lee NY, Suh JS, Lee KB. The association between multidrug resistance-1gene polymorphisms and outcomes of allogeneic HLA-identical stem cell transplantation.Haematologica 2006;91:848–851. [PubMed: 16769591]
32. Chesney RW, Wyatt RJ. Racial disparities in renal transplantation in children. Pediatrics2003;112:409–411. [PubMed: 12897294]
33. Nair S, Eustace J, Thuluvath PJ. Effect of race on outcome of orthotopic liver transplantation: a cohortstudy. Lancet 2002;359:287–293. [PubMed: 11830194]
34. McDonald GB, Slattery JT, Bouvier ME, et al. Cyclophosphamide metabolism, liver toxicity, andmortality following hematopoietic stem cell transplantation. Blood 2003;101:2043–2048. [PubMed:12406916]
35. Robien K, Schubert MM, Bruemmer B, Lloid ME, Potter JD, Ulrich CM. Predictors of oral mucositisin patients receiving hematopoietic cell transplants for chronic myelogenous leukemia. J Clin Oncol2004;22:1268–1275. [PubMed: 15051775]
36. Srivastava A, Poonkuzhali B, Shaji RV, et al. Glutathione S-transferase M1 polymorphism: a riskfactor for hepatic venoocclusive disease in bone marrow transplantation. Blood 2004;104:1574–1577. [PubMed: 15142875]
37. Robien K, Bigler J, Yasui Y, et al. Methylenetetrahydrofolate reductase and thymidylate synthasegenotypes and risk of acute graft-versus-host disease following hematopoietic cell transplantationfor chronic myelogenous leukemia. Biol Blood Marrow Transplant 2006;12:973–980. [PubMed:16920564]
38. McCune JS, Batchelder A, Deeg HJ, et al. Cyclophosphamide following targeted oral busulfan asconditioning for hematopoietic cell transplantation: pharmacokinetics, liver toxicity, and mortality.Biol Blood Marrow Transplant 2007;13:853–862. [PubMed: 17580264]
39. Suarez-Kurtz G, Pena SD. Pharmacogenomics in the Americas: the impact of genetic admixture. CurrDrug Targets 2006;7:1649–1658. [PubMed: 17168840]
40. Spielman RS, Bastone LA, Burdick JT, Morley M, Ewens WJ, Cheung VG. Common genetic variantsaccount for differences in gene expression among ethnic groups. Nat Genet 2007;39:226–231.[PubMed: 17206142]
41. Zhang W, Duan S, Kistner EO, et al. Evaluation of genetic variation contributing to differences ingene expression between populations. Am J Hum Genet 2008;82:631–640. [PubMed: 18313023]
42. Popescu I, Vaughan-Sarrazin MS, Rosenthal GE. Differences in mortality and use of revascularizationin black and white patients with acute MI admitted to hospitals with and without revascularizationservices. Jama 2007;297:2489–2495. [PubMed: 17565083]
43. Stafford RS, Saglam D, Blumenthal D. National patterns of angiotensin-converting enzyme inhibitoruse in congestive heart failure. Arch Intern Med 1997;157:2460–2464. [PubMed: 9385297]
44. Ayanian JZ, Weissman JS, Chasan-Taber S, Epstein AM. Quality of care by race and gender forcongestive heart failure and pneumonia. Med Care 1999;37:1260–1269. [PubMed: 10599607]
45. Kahn KL, Pearson ML, Harrison ER, et al. Health care for black and poor hospitalized Medicarepatients. Jama 1994;271:1169–1174. [PubMed: 8151874]
46. Rathore SS, Foody JM, Wang Y, et al. Race, quality of care, and outcomes of elderly patientshospitalized with heart failure. Jama 2003;289:2517–2524. [PubMed: 12759323]
47. Winkleby MA, Kraemer HC, Ahn DK, Varady AN. Ethnic and socioeconomic differences incardiovascular disease risk factors: findings for women from the Third National Health and NutritionExamination Survey, 1988–1994. Jama 1998;280:356–362. [PubMed: 9686553]
48. Zell JA, Cinar P, Mobasher M, Ziogas A, Meyskens FL Jr, Anton-Culver H. Survival for patientswith invasive cutaneous melanoma among ethnic groups: the effects of socioeconomic status andtreatment. J Clin Oncol 2008;26:66–75. [PubMed: 18165642]
49. Zell JA, Rhee JM, Ziogas A, Lipkin SM, Anton-Culver H. Race, socioeconomic status, treatment,and survival time among pancreatic cancer cases in California. Cancer Epidemiol Biomarkers Prev2007;16:546–552. [PubMed: 17372250]
50. Mackillop WJ, Zhang-Salomons J, Groome PA, Paszat L, Holowaty E. Socioeconomic status andcancer survival in Ontario. J Clin Oncol 1997;15:1680–1689. [PubMed: 9193369]
Baker et al. Page 10
Biol Blood Marrow Transplant. Author manuscript; available in PMC 2010 December 1.
NIH
-PA Author Manuscript
NIH
-PA Author Manuscript
NIH
-PA Author Manuscript

51. Yoo HY, Thuluvath PJ. Outcome of liver transplantation in adult recipients: influence ofneighborhood income, education, and insurance. Liver Transpl 2004;10:235–243. [PubMed:14762861]
52. SEER Cancer Statistics Review. 1975–2006 [accessed 07-21-2009].http://www.seer.cancer.gov/csr/1975_2006/browse_csr.php?section=13&page=sect_13_table.07.html
Baker et al. Page 11
Biol Blood Marrow Transplant. Author manuscript; available in PMC 2010 December 1.
NIH
-PA Author Manuscript
NIH
-PA Author Manuscript
NIH
-PA Author Manuscript

Figure 1.Probability of overall survival by race.
Baker et al. Page 12
Biol Blood Marrow Transplant. Author manuscript; available in PMC 2010 December 1.
NIH
-PA Author Manuscript
NIH
-PA Author Manuscript
NIH
-PA Author Manuscript

Figure 2.Cumulative incidence of treatment-related mortality by race.
Baker et al. Page 13
Biol Blood Marrow Transplant. Author manuscript; available in PMC 2010 December 1.
NIH
-PA Author Manuscript
NIH
-PA Author Manuscript
NIH
-PA Author Manuscript

Figure 3.Probability of overall survival by income.
Baker et al. Page 14
Biol Blood Marrow Transplant. Author manuscript; available in PMC 2010 December 1.
NIH
-PA Author Manuscript
NIH
-PA Author Manuscript
NIH
-PA Author Manuscript

Figure 4.Cumulative incidence of treatment-related mortality by income.
Baker et al. Page 15
Biol Blood Marrow Transplant. Author manuscript; available in PMC 2010 December 1.
NIH
-PA Author Manuscript
NIH
-PA Author Manuscript
NIH
-PA Author Manuscript
NIH
-PA Author Manuscript
NIH
-PA Author Manuscript
NIH
-PA Author Manuscript
Baker et al. Page 16Ta
ble
1
Cha
ract
eris
tics o
f pat
ient
s tra
nspl
ante
d at
US
cent
ers w
ho re
ceiv
ed u
nrel
ated
don
or m
yelo
abla
tive
hem
atop
oiet
ic c
ell t
rans
plan
ts fo
r AM
L, A
LL, C
ML,
and
MD
S fr
om 1
995–
2004
by
race
Var
iabl
eW
hite
N (%
)A
fric
an-
Am
eric
anN
(%)
Asi
an/
Paci
ficIs
land
erN
(%)
His
pani
cN
(%)
P V
alue
Num
ber o
f pat
ient
s52
5336
814
144
5N
umbe
r of c
ente
rs11
987
4080
Age
, med
ian
(ran
ge),
year
s35
(<1–
70)
25 (<
1–58
)30
(<1–
56)
22 (<
1–62
)<0
.001
Age
at t
rans
plan
t, ye
ars
<0.0
01
< 1
053
5 (1
0)64
(17)
22 (1
6)99
(22)
1
0–19
683
(13)
83 (2
3)24
(17)
92 (2
1)
20–
2984
6 (1
6)70
(19)
23 (1
6)97
(22)
3
0–39
1091
(21)
65 (1
8)35
(25)
81 (1
8)
40–
4912
91 (2
5)69
(19)
28 (2
0)54
(12)
≥
50
807
(15)
17 (5
)9
(6)
22 (5
)M
ale
gend
er29
79 (5
7)21
4 (5
8)83
(59)
270
(61)
0.39
Med
ian
inco
me,
200
0 a
$44,
776
$36,
275
$50,
991
$40,
111
<0.0
01
Mis
sing
524
3912
60D
ista
nce
to tr
ansp
lant
cen
ter
<0.0
01
< 1
7 M
iles
1109
(21)
159
(43)
64 (4
6)18
1 (4
1)
17–
55 M
iles
1321
(25)
69 (1
9)34
(24)
113
(25)
5
5–15
0 M
iles
1398
(27)
76 (2
1)17
(12)
74 (1
7)
> 1
50 M
iles
1364
(26)
62 (1
7)23
(16)
74 (1
7)
Mis
sing
ZIP
Cod
e61
(1)
2 (<
1)3
(2)
3 (<
1)K
arno
fsky
stat
us0.
06
≥ 9
035
74 (6
8)26
8 (7
3)92
(65)
323
(73)
<
90
1352
(26)
75 (2
0)43
(30)
94 (2
1)
Mis
sing
327
(6)
25 (7
)6
(4)
28 (6
)C
omor
bid
cond
ition
s0.
01
0–1
con
ditio
ns47
92 (9
1)34
2 (9
3)13
6 (9
6)42
0 (9
4)
≥ 2
con
ditio
ns46
1 (9
)26
(7)
5 (4
)25
(6)
Bod
y m
ass i
ndex
, kg/
m2
25 (1
1–44
)24
(11–
42)
21 (1
3–41
)23
(11–
44)
<0.0
01D
isea
se<0
.001
A
ML
1825
(35)
108
(29)
39 (2
8)98
(22)
A
LL12
61 (2
4)90
(24)
48 (3
4)19
3 (4
3)
CM
L15
31 (2
9)15
3 (4
2)39
(28)
121
(27)
M
DS
636
(12)
17 (5
)15
(11)
33 (7
)D
isea
se st
atus
at t
rans
plan
t<0
.001
E
arly
2067
(39)
120
(33)
47 (3
3)15
8 (3
6)
Int
erm
edia
te15
28 (2
9)16
3 (4
4)49
(35)
182
(41)
A
dvan
ced
1490
(28)
80 (2
2)38
(27)
99 (2
2)
Unk
now
n16
8 (3
)5
(1)
7 (5
)6
(1)
HLA
mat
ch st
atus
<0.0
01
Wel
l-mat
ched
2421
(46)
81 (2
2)41
(29)
122
(27)
P
artia
lly m
atch
ed19
39 (3
7)13
5 (3
7)48
(34)
160
(36)
M
ism
atch
ed89
3 (1
7)15
2 (4
1)52
(37)
163
(37)
Rac
e m
atch
(don
or/re
cipi
ent)
<0.0
01
Mat
ch41
38 (7
8)25
1 (6
8)11
6 (8
2)21
1 (4
7)
Mis
mat
ch43
1 (9
)11
0 (3
0)21
(15)
205
(46)
U
nkno
wn
684
(13)
7 (2
)4
(3)
29 (7
)D
onor
age
, med
ian
(ran
ge),
year
s35
(18–
61)
36 (1
9–60
)34
(18–
59)
34 (1
9–59
)0.
09A
ge a
t tra
nspl
ant,
year
s0.
11
18–
1938
(1)
3 (1
)2
(1)
5 (1
)
Biol Blood Marrow Transplant. Author manuscript; available in PMC 2010 December 1.

NIH
-PA Author Manuscript
NIH
-PA Author Manuscript
NIH
-PA Author Manuscript
Baker et al. Page 17V
aria
ble
Whi
teN
(%)
Afr
ican
-A
mer
ican
N (%
)
Asi
an/
Paci
ficIs
land
erN
(%)
His
pani
cN
(%)
P V
alue
2
0–29
1475
(28)
102
(28)
46 (3
3)12
5 (2
8)
30–
3920
29 (3
9)11
5 (3
1)51
(36)
184
(41)
4
0–49
1354
(26)
120
(33)
32 (2
3)10
0 (2
2)
≥ 5
035
7 (7
)28
(8)
10 (7
)31
(7)
Gen
der m
atch
(don
or/re
cipi
ent)
<0.0
01
Mal
e/m
ale
2050
(39)
103
(28)
42 (3
0)14
6 (3
3)
Mal
e/fe
mal
e12
62 (2
4)72
(20)
34 (2
4)81
(18)
F
emal
e/m
ale
929
(18)
111
(30)
41 (2
9)12
4 (2
8)
Fem
ale/
fem
ale
1012
(19)
82 (2
2)24
(17)
94 (2
1)C
MV
mat
ch (d
onor
/reci
pien
t)<0
.001
N
egat
ive/
nega
tive
1945
(37)
63 (1
7)8
(6)
59 (1
3)
Neg
ativ
e/po
sitiv
e15
14 (2
9)94
(26)
36 (2
6)13
1 (2
9)
Pos
itive
/neg
ativ
e82
0 (1
6)69
(19)
20 (1
4)72
(16)
P
ositi
ve/p
ositi
ve88
7 (1
7)13
3 (3
6)75
(53)
176
(40)
U
nkno
wn
87 (2
)9
(2)
2 (1
)7
(2)
Yea
r of t
rans
plan
t<0
.001
1
995–
1999
2716
(52)
181
(49)
71 (5
0)17
7 (4
0)
200
0–20
0425
37 (4
8)18
7 (5
1)70
(50)
268
(60)
Con
ditio
ning
regi
men
<0.0
01
Bu
+ C
y ±
othe
r10
66 (2
0)50
(14)
16 (1
1)52
(12)
C
y +
TBI ±
oth
er37
20 (7
1)27
9 (7
6)12
0 (8
5)33
6 (7
6)
TB
I ± o
ther
183
(3)
10 (3
)5
(4)
26 (6
)
Oth
er28
4 (6
)29
(8)
031
(7)
GV
HD
pro
phyl
axis
b
CsA
+ M
TX ±
oth
er26
81 (5
1)16
7 (4
5)86
(61)
187
(42)
T
acro
limus
+ M
TX ±
oth
er12
00 (2
3)85
(23)
25 (1
8)14
4 (3
2)
T-c
ell d
eple
tion
± ot
her
941
(18)
88 (2
4)16
(11)
73 (1
6)
CsA
or t
acro
limus
± o
ther
371
(7)
27 (7
)13
(9)
37 (8
)
Oth
er60
(1)
1 (<
1)1
(<1)
4 (<
1)G
raft
type
0.02
B
one
mar
row
4298
(82)
321
(87)
109
(77)
358
(80)
P
erip
hera
l blo
od95
5 (1
8)47
(13)
32 (2
3)87
(20)
Infu
sed
cell
dose
b
BM
> 2
× 1
0826
59 (6
2)17
3 (5
4)61
(56)
219
(61)
B
M ≤
2 ×
108
1601
(37)
146
(45)
43 (3
9)13
9 (3
9)
BM
mis
sing
38 (<
1)2
(<1)
5 (5
)0
P
B >
5 ×
108
592
(62)
28 (6
0)18
(56)
62 (7
1)
PB
≤ 5
× 1
0829
2 (3
1)19
(40)
12 (3
8)22
(25)
P
B m
issi
ng71
(7)
02
(6)
3 (3
)Ti
me
from
dia
gnos
is to
tran
spla
nt,
med
ian
(ran
ge),
mon
ths
10 (1
–309
)15
(2–2
73)
13 (2
–179
)16
(2–1
70)
<0.0
01
Don
or se
arch
tim
e, m
edia
n(r
ange
), m
onth
s c
Dia
gnos
is to
pre
limin
ary
sear
ch3
(<1–
303)
5 (<
1–26
8)5
(<1–
134)
5 (<
1–16
4)<0
.001
P
relim
inar
y se
arch
to fo
rmal
sear
ch<1
(<1–
116)
<1 (<
1–51
)<1
(<1–
85)
<1 (<
1–41
)0.
03
F
orm
al se
arch
to tr
ansp
lant
3 (<
1–12
5)4
(1–9
1)3
(<1–
89)
4 (1
–58)
<0.0
01Fo
llow
-up
of su
rviv
ors,
med
ian
(ran
ge),
mon
ths
66 (3
–138
)48
(3–1
30)
64 (1
1–12
7)48
(11–
132)
<0.0
01
Biol Blood Marrow Transplant. Author manuscript; available in PMC 2010 December 1.

NIH
-PA Author Manuscript
NIH
-PA Author Manuscript
NIH
-PA Author Manuscript
Baker et al. Page 18A
bbre
viat
ions
: AM
L, A
cute
mye
loid
leuk
emia
; ALL
, Acu
te ly
mph
obla
stic
leuk
emia
; MD
S, M
yelo
dysp
last
ic sy
ndro
me;
CM
L, C
hron
ic m
yelo
id le
ukem
ia; H
LA, h
uman
-leuk
ocyt
e an
tigen
; CM
V,
cyto
meg
alov
irus;
Cy,
Cyc
loph
osph
amid
e; B
u, B
usul
fan;
TB
I, To
tal b
ody
radi
atio
n; C
sA, C
yclo
spor
ine;
MTX
, Met
hotre
xate
; GV
HD
, gra
ft-ve
rsus
-hos
t dis
ease
; BM
, bon
e m
arro
w; P
B, p
erip
hera
l blo
od
a Bas
ed o
n 20
04 C
ensu
s tra
ct d
ata
linki
ng in
com
e to
resi
dent
ial Z
IP C
ode.
b Uni
varia
te c
ompa
rison
not
don
e du
e to
smal
l cel
l cou
nts
c Prel
imin
ary
sear
ch p
rovi
des a
list
of p
oten
tial d
onor
s at a
giv
en ti
me
but d
oes n
ot in
itiat
e co
ntac
t with
nor
furth
er te
stin
g of
the
dono
rs. I
f the
tran
spla
nt c
ente
r dec
ides
to p
roce
ed w
ith u
nrel
ated
don
orH
CT,
form
al se
arch
is in
itiat
ed o
n be
half
of th
e pa
tient
. Thi
s inc
lude
s con
firm
ator
y H
LA ty
ping
of t
he p
atie
nt a
nd d
onor
and
con
firm
atio
n of
the
avai
labi
lity
of th
e do
nor f
or o
btai
ning
hem
atop
oiet
icst
em c
ells
.
Biol Blood Marrow Transplant. Author manuscript; available in PMC 2010 December 1.

NIH
-PA Author Manuscript
NIH
-PA Author Manuscript
NIH
-PA Author Manuscript
Baker et al. Page 19
Table 2
Variables tested in multivariate analysis
Main effect variableRace/ethnicity: White* vs. African-American vs. Asian/Pacific Islander vs. HispanicPatient-related variablesAge: ≤ 10* vs. 11–20 vs. 21–30 vs. 31–40 vs. 41–50 vs. > 50Gender: Male* vs. femaleKarnofsky performance status at transplant: < 90% vs. ≥ 90%* vs. missingMedian income: above* vs. below median vs. missingCo-morbid medical conditions: 0–1* vs. ≥ 2 comorbiditiesDistance to transplant center: above* vs. below median vs. missingDisease-related variablesDisease: AML* vs. ALL vs. CML vs. MDSDisease status: early* vs. intermediate vs. advanced diseaseTime from diagnosis to transplant: continuousTransplant-related variablesSource of stem cells: bone marrow* vs. peripheral bloodHLA match: well-matched* vs. partially matched vs. mismatchedDonor age: 18–20* vs. 21–30 vs. 31–40 vs. 41–50 vs. > 50Donor-recipient gender match: F-M vs. M-F vs. M-M* vs. F-FDonor-recipient CMV status: −/−* vs. −/+ vs. +/− vs. +/+ vs. unknownYear of transplant: 1995–1999 vs. 2000–2004*
Conditioning regimen: Bu + Cy ± others vs. Cy + TBI ± others * vs. TBI ± others vs. otherDonor-recipient race match: same ethnicity* vs. disparate ethnicity vs. unknownInfused cell dose: ≤ 2 × 10⁸ vs. > 2 × 10⁸* nucleated cells/kg for bone marrow and ≤ 5 × 10⁸ vs. > 5 × 10⁸ * nucleated cells/kg for peripheral bloodDonor search time (months) (diagnosis to preliminary search, preliminary search to formal search and formal search to transplant): above* vs. below median
Abbreviations: AML, Acute myeloid leukemia; ALL, Acute lymphoblastic leukemia; MDS, Myelodysplastic syndrome; CML, Chronic myeloid leukemia;HLA, human-leukocyte antigen; F, female; M, male; CMV, cytomegalovirus; Cy, Cyclophosphamide; Bu, Busulfan; TBI, Total body radiation
*Reference group
Biol Blood Marrow Transplant. Author manuscript; available in PMC 2010 December 1.

NIH
-PA Author Manuscript
NIH
-PA Author Manuscript
NIH
-PA Author Manuscript
Baker et al. Page 20Ta
ble
3
Cha
ract
eris
tics o
f pat
ient
s tra
nspl
ante
d at
US
cent
ers w
ho re
ceiv
ed u
nrel
ated
don
or m
yelo
abla
tive
hem
atop
oiet
ic c
ell t
rans
plan
ts fo
r AM
L, A
LL, C
ML,
and
MD
S fr
om 1
995–
2004
by
soci
oeco
nom
ic st
atus
Var
iabl
e
Med
ian
Inco
me
a
<$34
,700
N (%
)$3
4,70
0–43
,600
N (%
)
$43,
600–
56,3
00N
(%)
>$56
,300
N (%
)P
Val
ue
Num
ber o
f pat
ient
s14
1415
4115
1715
59N
umbe
r of c
ente
rs10
711
611
110
7A
ge, m
edia
n (r
ange
), ye
ars
31 (<
1–65
)33
(<1–
67)
34 (<
1–70
)35
(<1–
67)
<0.0
01A
ge a
t tra
nspl
ant,
year
s<0
.001
<
10
172
(12)
189
(12)
167
(11)
177
(11)
1
0–19
234
(17)
215
(14)
216
(14)
191
(12)
2
0–29
264
(19)
264
(17)
245
(16)
233
(15)
3
0–39
298
(21)
316
(21)
303
(20)
316
(20)
4
0–49
293
(21)
351
(23)
370
(24)
388
(25)
≥
50
153
(11)
206
(13)
216
(14)
254
(16)
Mal
e ge
nder
814
(58)
889
(58)
849
(56)
885
(57)
0.76
Rac
e<0
.001
W
hite
1091
(77)
1308
(85)
1321
(87)
1383
(89)
A
fric
an-A
mer
ican
160
(11)
89 (6
)53
(3)
54 (3
)
Asi
an/P
acifi
c Is
land
er12
(1)
37 (2
)28
(2)
57 (4
)
His
pani
c15
1 (1
1)10
7 (7
)11
5 (8
)65
(4)
Dis
tanc
e to
tran
spla
nt c
ente
r<0
.001
<
20
Mile
s27
4 (1
9)31
2 (2
0)41
4 (2
7)50
0 (3
2)
20–
70 M
iles
157
(11)
331
(21)
464
(31)
558
(36)
7
0–17
5 M
iles
509
(36)
505
(33)
353
(23)
169
(11)
>
175
Mile
s47
4 (3
4)39
3 (2
6)28
6 (1
9)33
2 (2
1)K
arno
fsky
stat
us0.
29
≥ 9
095
9 (6
8)10
70 (6
9)10
47 (6
9)10
63 (6
8)
< 9
037
8 (2
7)38
6 (2
5)37
1 (2
4)38
4 (2
5)
Mis
sing
77 (5
)85
(6)
99 (7
)11
2 (7
)C
omor
bid
cond
ition
s0.
21
0–1
con
ditio
ns12
92 (9
1)14
14 (9
2)13
78 (9
1)14
48 (9
3)
≥ 2
con
ditio
ns12
2 (9
)12
7 (8
)13
9 (9
)11
1 (7
)B
ody
mas
s ind
ex, k
g/m
224
(11–
44)
25 (1
2–44
)25
(13–
44)
24 (1
3–43
)0.
008
Dis
ease
0.91
A
ML
471
(33)
508
(33)
511
(34)
520
(33)
A
LL38
2 (2
7)39
0 (2
5)38
4 (2
5)39
1 (2
5)
CM
L41
7 (2
9)46
1 (3
0)44
3 (2
9)46
7 (3
0)
MD
S14
4 (1
0)18
2 (1
2)17
9 (1
2)18
1 (1
2)D
isea
se st
atus
at t
rans
plan
t0.
37
Ear
ly51
5 (3
6)58
8 (3
8)60
2 (4
0)60
8 (3
9)
Int
erm
edia
te46
4 (3
3)48
2 (3
1)44
5 (2
9)47
7 (3
1)
Adv
ance
d40
3 (2
9)42
4 (2
8)41
7 (2
7)42
4 (2
7)
Unk
now
n32
(2)
47 (3
)53
(3)
50 (3
)H
LA m
atch
stat
us0.
009
W
ell-m
atch
ed58
2 (4
1)63
0 (4
1)67
5 (4
4)70
5 (4
5)
Par
tially
mat
ched
523
(37)
584
(38)
531
(35)
586
(38)
M
ism
atch
ed30
9 (2
2)32
7 (2
1)31
1 (2
1)26
8 (1
7)R
ace
mat
ch (d
onor
/reci
pien
t)0.
54
Mat
ch18
7 (1
3)18
0 (1
2)18
8 (1
2)19
0 (1
2)
Mis
mat
ch10
69 (7
6)11
84 (7
7)11
63 (7
7)11
68 (7
5)
Unk
now
n15
8 (1
1)17
7 (1
1)16
6 (1
1)20
1 (1
3)
Biol Blood Marrow Transplant. Author manuscript; available in PMC 2010 December 1.

NIH
-PA Author Manuscript
NIH
-PA Author Manuscript
NIH
-PA Author Manuscript
Baker et al. Page 21
Var
iabl
e
Med
ian
Inco
me
a
<$34
,700
N (%
)$3
4,70
0–43
,600
N (%
)
$43,
600–
56,3
00N
(%)
>$56
,300
N (%
)P
Val
ue
Don
or a
ge, m
edia
n (r
ange
), ye
ars
35 (1
8–60
)35
(18–
60)
36 (1
8–60
)35
(18–
61)
0.01
1G
ende
r mat
ch (d
onor
/reci
pien
t)0.
89
Mal
e/m
ale
535
(38)
573
(37)
573
(38)
592
(38)
M
ale/
fem
ale
321
(23)
354
(23)
364
(24)
379
(24)
F
emal
e/m
ale
279
(20)
316
(21)
276
(18)
293
(19)
F
emal
e/fe
mal
e27
9 (2
0)29
8 (1
9)30
4 (2
0)29
5 (1
9)C
MV
mat
ch (d
onor
/reci
pien
t)0.
002
N
egat
ive/
nega
tive
417
(29)
511
(33)
543
(36)
546
(35)
N
egat
ive/
posi
tive
456
(32)
412
(27)
416
(27)
434
(28)
P
ositi
ve/n
egat
ive
207
(15)
250
(16)
228
(15)
267
(17)
P
ositi
ve/p
ositi
ve30
8 (2
2)34
2 (2
2)30
4 (2
0)28
8 (1
8)
Unk
now
n26
(2)
26 (2
)26
(2)
24 (2
)Y
ear o
f tra
nspl
ant
0.19
1
995–
1999
741
(52)
761
(49)
783
(52)
766
(49)
2
000–
2004
673
(48)
780
(51)
734
(48)
793
(51)
Con
ditio
ning
regi
men
0.00
3
Bu
+ C
y ±
othe
r23
4 (1
7)30
4 (2
0)33
7 (2
2)28
8 (1
8)
Cy
+ TB
I ± o
ther
1022
(72)
1118
(73)
1045
(69)
1129
(72)
T
BI ±
oth
er72
(5)
47 (3
)51
(3)
50 (3
)
Oth
er86
(6)
72 (5
)84
(6)
92 (6
)G
VH
D p
roph
ylax
is0.
10
CsA
+ M
TX ±
oth
er71
3 (5
0)77
7 (5
0)78
3 (5
2)77
0 (4
9)
Tac
rolim
us +
MTX
± o
ther
300
(21)
356
(23)
342
(23)
404
(26)
T
-cel
l dep
letio
n ±
othe
r27
9 (2
0)28
9 (1
9)26
3 (1
7)25
9 (1
7)
CsA
or t
acro
limus
± o
ther
112
(8)
101
(6)
114
(7)
107
(7)
O
ther
10 (1
)18
(1)
14 (1
)19
(2)
Gra
ft ty
pe0.
007
B
one
mar
row
1201
(85)
1262
(82)
1232
(81)
1251
(80)
P
erip
hera
l blo
od21
3 (1
5)27
9 (1
8)28
5 (1
9)30
8 (2
0)In
fuse
d ce
ll do
se
BM
> 2
× 1
0874
4 (6
2)74
8 (5
9)75
6 (6
1)78
6 (6
3)
BM
≤ 2
× 1
0844
5 (3
7)50
1 (4
0)46
6 (3
8)45
6 (3
6)
BM
mis
sing
12 (1
)13
(1)
10 (1
)9
(1)
P
B >
5 ×
108
132
(62)
181
(65)
178
(62)
190
(62)
0.36
P
B ≤
5 ×
108
68 (3
2)86
(31)
85 (3
0)89
(29)
P
B m
issi
ng13
(6)
12 (4
)22
(8)
29 (9
)Ti
me
from
dia
gnos
is to
tran
spla
nt,
med
ian
(ran
ge),
mon
ths
Don
or se
arch
tim
e, m
edia
n(r
ange
), m
onth
s
12 (2
–309
)11
(1–3
09)
11 (2
–242
)10
(<1–
232)
0.04
D
iagn
osis
to p
relim
inar
yse
arch
4 (<
1–30
0)3
(<1–
303)
3 (<
1–23
1)3
(<1–
192)
0.06
P
relim
inar
y se
arch
to fo
rmal
sear
ch<1
(<1–
69)
<1 (<
1–77
)<1
(<1–
116)
<1 (<
1–10
6)0.
33
F
orm
al se
arch
to tr
ansp
lant
3 (<
1–81
)3
(<1–
94)
3 (<
1–12
1)3
(<1–
125)
0.81
Follo
w-u
p of
surv
ivor
s, m
edia
n(r
ange
), m
onth
s60
(5–1
33)
60 (5
–135
)69
(3–1
38)
64 (3
–137
)<0
.001
Abb
revi
atio
ns: A
ML,
Acu
te m
yelo
id le
ukem
ia; A
LL, A
cute
lym
phob
last
ic le
ukem
ia; M
DS,
Mye
lody
spla
stic
synd
rom
e; C
ML,
Chr
onic
mye
loid
leuk
emia
; HLA
, hum
an-le
ukoc
yte
antig
en; C
MV
,cy
tom
egal
oviru
s; C
y, C
yclo
phos
pham
ide;
Bu,
Bus
ulfa
n; T
BI,
Tota
l bod
y ra
diat
ion;
CsA
, Cyc
losp
orin
e; M
TX, M
etho
trexa
te; G
VH
D, g
raft-
vers
us-h
ost d
isea
se; B
M, b
one
mar
row
; PB
, per
iphe
ral b
lood
Biol Blood Marrow Transplant. Author manuscript; available in PMC 2010 December 1.

NIH
-PA Author Manuscript
NIH
-PA Author Manuscript
NIH
-PA Author Manuscript
Baker et al. Page 22a B
ased
on
2004
Cen
sus t
ract
dat
a lin
king
inco
me
to re
side
ntia
l ZIP
Cod
e.
Biol Blood Marrow Transplant. Author manuscript; available in PMC 2010 December 1.

NIH
-PA Author Manuscript
NIH
-PA Author Manuscript
NIH
-PA Author Manuscript
Baker et al. Page 23
Table 4
Multivariate analysis for overall survival, disease-free survival, relapse and transplant-related mortality
VariableRelative risk (95% confidence intervals) a
Overall survival Disease-freesurvival Relapse Transplant-
related mortality
Race White b 1.00 1.00 1.00 1.00 African-American 1.47 (1.29–1.68) d 1.48 (1.30–1.69) d 1.32 (1.03–1.68) 1.56 (1.34–1.83) d Asian/Pacific Islander 0.96 (0.76–1.20) 1.04 (0.83–1.31) 1.13 (0.80–1.61) 0.99 (0.75–1.32) Hispanic 1.15 (1.01–1.30) 1.14 (1.00–1.29) 0.87 (0.70–1.09) 1.30 (1.11–1.51) d
Income c
> $56,300 b 1.00 1.00 1.00 1.00 $43,600–56,300 1.06 (0.97–1.16) 1.03 (0.94–1.13) 0.94 (0.81–1.10) 1.11 (0.99–1.24) $34,700–43,600 1.06 (0.97–1.16) 1.02 (0.93–1.12) 0.97 (0.83–1.13) 1.11 (0.99–1.24) <$34,700 1.15 (1.04–1.26) d 1.12 (1.01–1.23) 1.07 (0.92–1.26) 1.21 (1.07–1.36) d Missing 1.10 (0.86–1.39) 1.08 (0.85–1.38) 0.97 (0.63–1.48) 1.16 (0.87–1.55)
aModels were stratified on Karnofsky performance status prior to hematopoietic cell transplant
bReference group; Table 2 lists variables tested in multivariate analysis
cBased on 2004 Census data linking income to residential ZIP Code
dP<0.01
Biol Blood Marrow Transplant. Author manuscript; available in PMC 2010 December 1.

NIH
-PA Author Manuscript
NIH
-PA Author Manuscript
NIH
-PA Author Manuscript
Baker et al. Page 24Ta
ble
5
Impo
rtant
cau
ses o
f dea
th b
y ra
ce a
nd so
cioe
cono
mic
stat
us
Var
iabl
eT
otal
deat
hs
Cau
se o
f dea
th
Rel
apse
Infe
ctio
nG
VH
DO
rgan
toxi
city
a
Cau
ses o
f dea
th <
100
day
sR
ace
W
hite
1531
167
(11%
)33
9 (2
2%)
236
(15%
)59
3 (3
9%)
A
fric
an-A
mer
ican
147
10 (7
%)
24 (1
6%)
28 (1
9%)
57 (3
9%)
A
sian
/Pac
ific
Isla
nder
512
(4%
)10
(20%
)8
(16%
)25
(49%
)
His
pani
c13
98
(6%
)32
(23%
)31
(22%
)51
(37%
)In
com
e
> $
56,3
0041
747
(11%
)95
(23%
)69
(17%
)15
1 (3
6%)
$
43,6
00–5
6,30
043
843
(10%
)84
(19%
)75
(17%
)18
0 (4
1%)
$
34,7
00–4
3,60
045
844
(10%
)10
0 (2
2%)
66 (1
4%)
188
(41%
)
< $
34,7
0049
050
(10%
)10
8 (2
2%)
80 (1
6%)
182
(37%
)C
ause
s of d
eath
≥10
0 da
ysR
ace
W
hite
1969
735
(37%
)35
7 (1
8%)
266
(14%
)45
7 (2
3%)
A
fric
an-A
mer
ican
132
40 (3
0%)
30 (2
3%)
22 (1
7%)
27 (2
1%)
A
sian
/Pac
ific
Isla
nder
4621
(46%
)8
(17%
)6
(13%
)10
(22%
)
His
pani
c17
460
(35%
)31
(18%
)25
(14%
)40
(23%
)In
com
e
> $
56,3
0055
021
3 (3
9%)
83 (1
5%)
77 (1
4%)
142
(26%
)
$43
,600
–56,
300
580
207
(36%
)11
3 (2
0%)
77 (1
3%)
131
(23%
)
$34
,700
–43,
600
598
221
(37%
)11
6 (1
9%)
83 (1
4%)
125
(21%
)
<$3
4,70
052
819
3 (3
7%)
103
(20%
)67
(13%
)12
4 (2
4%)
a Incl
udes
pat
ient
s with
cau
se o
f dea
th re
porte
d as
org
an fa
ilure
or i
nter
stiti
al p
neum
oniti
s
Biol Blood Marrow Transplant. Author manuscript; available in PMC 2010 December 1.