Designing Mobile Snack Application for Low Socioeconomic Status Families
8
2012 6th Inteational Conference on Pervasive Computing Technologies for Healthcare (PervasiveHealth) and Workshops Designing Mobile Snack Application for Low Socioeconomic Status Families Danish U. Khan, Swamy Ananthanarayan, An T. Le, Christopher L. Schaeauer, and Katie A. Siek Department of Computer Science, University of Colorado Boulder Boulder, Colorado 80309-0430 Email: {khand, ananthas, anle9371, christopher.schaefbauer, ksiek}@colorado.edu Abstract-We developed four mobile phone prototype appli- cations informed by theoretical models of behavior change to improve the snacking habits of low socioeconomic status (SES) families. Eight primary caregivers and 18 secondary caregivers from low SES backgrounds used the applications to evaluate their usability and usefulness. We found a schism between primary and secondary caregivers regarding whether the applications should be based on games, indicating a need to reconcile these differences to develop a system to support healthy family snacking. In addition, social context, understandable health abstractions, and sensitivity to health values are all important considerations when creating applications in a low SES context. This research contributes design implications for future applications intended to improve snacking habits in low SES families. I. INTRODUCTION Low socioeconomic status (SES) populations are at risk for obesity, chronic illness and disease [1], in part because of their poor lifestyle habits. As a result, they can benefit om timely, preventative technological interventions that promote healthy behavior practices. While there are many technological interventions for monitoring, sharing, and reflecting on health practices for mid-to-high SES populations [2, 3, 4], there is little for the underserved, where health literacy levels are lower [5] and health care is less accessible [6]. Many dietary monitoring applications from commercial (calorieking.com), government (ChooseMyPlate.gov), and academic sectors [7] rely on textual input and technological literacy to capture dietary information. These applications do not account for the sociotechnical and cultural needs of low SES populations. Research interventions for low SES populations range om public electronic kiosks that provide healthy living tailored pamphlets [8] to interactive multimedia education programs motivating better nutrition [9, 10]. Notable projects include Pempek et al.'s work on using advergames to motivate healthy eating habits in low-income Aican American children [11] and Grimes et al.'s work where low SES individuals shared audio memories through mobile phones about healthy eating within their neighborhood [12]. We are encouraged by the success of these previous works, which used technology to improve health and wellness in the underserved. We focus on the specific issue of snacking by designing and evaluating four mobile phone application prototypes that help individuals improve their snacking habits. We employ a family-based approach, because we observed in this population that even though ethnic culture sometimes 57 shifts based on the living environment, family is a constant influence [13]. Moreover, many studies affirm the positive in- fluence that family has on individual health. Gillman et al. [14] showed that children who ate dinner with their family included more uits and vegetables in their diets. Similarly, Taveras et al. [15] found that the frequency of eating family dinner was inversely related with children's overweight prevalence. Given these benefits, researchers explored how technology can leverage the family-based context to improve individuals' health [16, 17, 18]. Colineau et al. [16] designed a family- based health portal to study how family members reflected on their lifestyles to improve their health. Results showed that families were more motivated when they were presented with a collective goal paired with appropriate feedback. We leverage this research by empowering families to compare, communi- cate, and collaborate through the mobile phone applications to gradually improve their snacking. In this paper, we explore both gaming and non-gaming designs to identify which kind of mobile applications would engage low SES caregivers, the gateways to family health, to improve their own and families' snacking. The specific contributions to Pervasive Healthcare research include: • Four mobile phone application designs based on applied psychology theories to promote healthier snacking. • An evaluation of these designs that show the benefits and pitfalls of gaming and non-gaming applications. • An in-depth discussion about design considerations for low SES mobile snacking applications. II. STUDY OVERVIEW This study was influenced by our prior research where we showed that low SES populations wanted low-cost and accessible technological interventions [19]. We also found that caregivers wanted to manage their family health with technol- ogy [20]. Our subsequent study examined their everyday health habits where we found that snacking was an issue [13]. A. The Bridge Project We conducted this study in collaboration with the Bridge Project, a community outreach program that provides aca- demic support to K-12 children in 500 ethnically diverse families in Denver public housing neighborhoods. In 2011, 80% of the children qualified for free and reduced lunch. We selected this population because a study showed that 87% 978-1-936968-43-5 © 2012 ICST DOl 10.4108/icst.pervasivehealth.2012.248692
Transcript of Designing Mobile Snack Application for Low Socioeconomic Status Families
2012 6th International Conference on Pervasive Computing Technologies for Healthcare (PervasiveHealth) and Workshops
Designing Mobile Snack Application for Low Socioeconomic Status Families
Danish U. Khan, Swamy Ananthanarayan, An T. Le, Christopher L. Schaefbauer, and Katie A. Siek Department of Computer Science, University of Colorado Boulder
Boulder, Colorado 80309-0430 Email: {khand, ananthas, anle9371, christopher.schaefbauer, ksiek}@colorado.edu
Abstract-We developed four mobile phone prototype applications informed by theoretical models of behavior change to improve the snacking habits of low socioeconomic status (SES) families. Eight primary caregivers and 18 secondary caregivers from low SES backgrounds used the applications to evaluate their usability and usefulness. We found a schism between primary and secondary caregivers regarding whether the applications should be based on games, indicating a need to reconcile these differences to develop a system to support healthy family snacking. In addition, social context, understandable health abstractions, and sensitivity to health values are all important considerations when creating applications in a low SES context. This research contributes design implications for future applications intended to improve snacking habits in low SES families.
I. INTRODUCTION
Low socioeconomic status (SES) populations are at risk for obesity, chronic illness and disease [1], in part because of their poor lifestyle habits. As a result, they can benefit from timely, preventative technological interventions that promote healthy behavior practices. While there are many technological interventions for monitoring, sharing, and reflecting on health practices for mid-to-high SES populations [2, 3, 4], there is little for the underserved, where health literacy levels are lower [5] and health care is less accessible [6]. Many dietary monitoring applications from commercial (calorieking.com), government (ChooseMyPlate.gov), and academic sectors [7] rely on textual input and technological literacy to capture dietary information. These applications do not account for the sociotechnical and cultural needs of low SES populations.
Research interventions for low SES populations range from public electronic kiosks that provide healthy living tailored pamphlets [8] to interactive multimedia education programs motivating better nutrition [9, 10]. Notable projects include Pempek et al.'s work on using advergames to motivate healthy eating habits in low-income African American children [11] and Grimes et al.'s work where low SES individuals shared audio memories through mobile phones about healthy eating within their neighborhood [12]. We are encouraged by the success of these previous works, which used technology to improve health and wellness in the underserved. We focus on the specific issue of snacking by designing and evaluating four mobile phone application prototypes that help individuals improve their snacking habits.
We employ a family-based approach, because we observed in this population that even though ethnic culture sometimes
57
shifts based on the living environment, family is a constant influence [13]. Moreover, many studies affirm the positive influence that family has on individual health. Gillman et al. [14] showed that children who ate dinner with their family included more fruits and vegetables in their diets. Similarly, Taveras et al. [15] found that the frequency of eating family dinner was inversely related with children's overweight prevalence. Given these benefits, researchers explored how technology can leverage the family-based context to improve individuals' health [16, 17, 18]. Colineau et al. [16] designed a familybased health portal to study how family members reflected on their lifestyles to improve their health. Results showed that families were more motivated when they were presented with a collective goal paired with appropriate feedback. We leverage this research by empowering families to compare, communicate, and collaborate through the mobile phone applications to gradually improve their snacking.
In this paper, we explore both gaming and non-gaming designs to identify which kind of mobile applications would engage low SES caregivers, the gateways to family health, to improve their own and families' snacking. The specific contributions to Pervasive Healthcare research include:
• Four mobile phone application designs based on applied psychology theories to promote healthier snacking.
• An evaluation of these designs that show the benefits and pitfalls of gaming and non-gaming applications.
• An in-depth discussion about design considerations for low SES mobile snacking applications.
II. STUDY OVERVIEW
This study was influenced by our prior research where we showed that low SES populations wanted low-cost and accessible technological interventions [19]. We also found that caregivers wanted to manage their family health with technology [20]. Our subsequent study examined their everyday health habits where we found that snacking was an issue [13].
A. The Bridge Project
We conducted this study in collaboration with the Bridge Project, a community outreach program that provides academic support to K-12 children in 500 ethnically diverse families in Denver public housing neighborhoods. In 2011, 80% of the children qualified for free and reduced lunch. We selected this population because a study showed that 87%
978-1-936968-43-5 © 2012 ICST DOl 10.4108/icst.pervasivehealth.2012.248692
Add a Family Member
Enter a SneeR
View My Snad'ing History
View Family's SnaeRing
History
View Shopping List
(a) Home Screen
To improve your snoeRing,
try pretzels or apples
imtead of candy:
App le
Pretzels
Q;>
Price, $t/lbs *****
Price: $1.251 serving *****
Candy Cane
,/ :i* �5/:Z*
(b) Snack Suggestion
SnaeRing History
Av.roge Snoclif H.olthlneu
(c) Snack History
lulia * * * * *
Sam ***** Send Message
Alice * * * * * Send Message
Family Average
***** _I
(d) Family Snacking
Fig. 1. Snack Manager
of the children in this community were at risk for a chronic illness [21J. We volunteered over 100 hours tutoring children at the Bridge Project to build a rapport with the community.
B. Prototypes
We designed the HTML and Flash based prototypes for Internet-enabled touchscreen-based mobile phones because the low SES caregivers wanted mobile phone-based technological interventions. The prototype designs were informed by applied psychology behavioral-change theories. Each prototype provided users with the ability to: (1) enter snacks; (2) receive feedback on snack healthiness; (3) view an individual's snacking history; and (4) view family snacking healthiness. The first two prototypes discussed are non-gaming, while the last two are gaming applications. The prototypes were internally evaluated and modified using multiple cognitive walkthrough iterations [22].
1) Snack Manager: Snack manager was based on social cognitive theory (SCT) that describes how individuals' perceived self-efficacies, coupled with socio-structural factors and outcome expectations, affect the individuals in achieving their goals and inducing behavioral change [23]. The Snack Manager design incorporated SCT by providing users the ability to view the snack healthiness of their family members and send messages to each other to encourage healthy snacking habits. The Snack Manager prototype design was informed by our prior work where we found that the low SES families did not want to waste food and risk money on new food items [19, 13]. Based on these findings, the prototype provided suggestions to users within a price threshold to replace their current snack with a healthier snack. The healthier snack was either within the same product category as the current snack, or it was a snack that the low SES families preferred.
The home screen, shown in Figure la, lets users navigate to different screens of Snack Manager. First, the users selected the family member whose snacks they wanted to manage and then they entered a snack for that profile. If the snack was unhealthy, the snack suggestion screen (Figure 1 b) displayed the healthiness of the current snack and suggested snacks in
58
a star rating system. The stars, which were paired with the snack prices, were used to abstract health information since prior work showed that participants did not understand dietary nutritional values (e.g., proteins, carbohydrates). Finally, the users could view their snack history (Figure 1c), their family's snacking healthiness (Figure 1d), and a convenient shopping list with all the snack suggestions provided by Snack Manager.
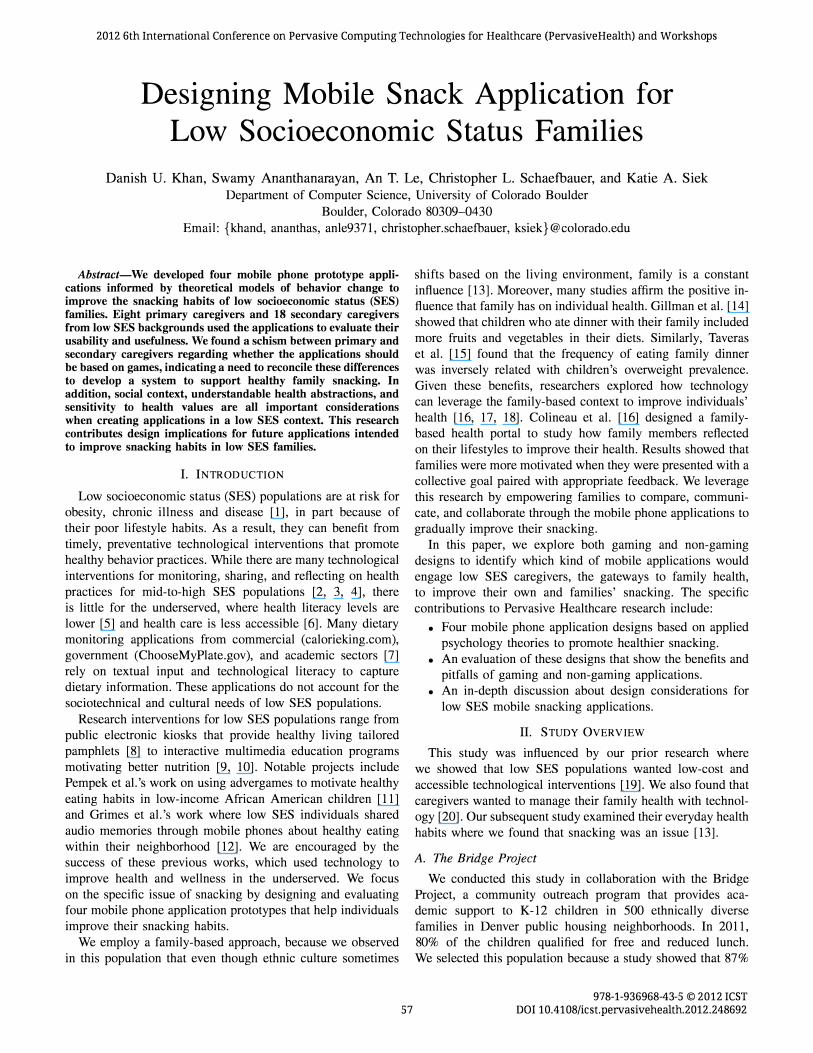
2) Snack Educator: The Snack Educator prototype, shown in Figure 2 was based on SCT, the health belief model (HBM), and elaboration likelihood model (ELM). According to HBM, individuals change their health behavior based on four beliefs: perceived susceptibility of acquiring an adverse health condition; perceived condition severity; perceived barriers to adopt a healthy behavior; and perceived benefits of acquiring the healthy behavior. The Snack Educator incorporated HBM by displaying unhealthy snack's potential negative impact on the user's heart, body, and teeth, and comparing it with a healthier snack. The Snack Educator also used ELM which suggests that individuals are persuaded by peripheral and central routes. Central route decisions are long-lasting and take place after much reflection about the message contents. Peripheral route decisions are short-lived, include little deliberation about the message, and are often triggered by message attributes. We designed the Snack Educator to capitalize on central route decision-making by visually categorizing an individual's longterm snack consumption into healthy, average, and unhealthy.
In Snack Educator, after the user entered a snack, the system displayed the snack's potential impact on the user's heart, body, and teeth. The following screen, shown in Figure 2a, suggested a healthier snack and compared the three health indicators for both the entered snack and the suggested snack. The user could view his overall snack history (Figure 2b) and compare his snack healthiness with his family members (Figure 2c). The aggregated snack healthiness in the family snack comparison screen was represented by a bar that consisted of different colors corresponding to the healthiness of the snack with green and red being healthy and unhealthy, respectively.
3) Lifespan: The Lifespan prototype, shown in Figure 3, was a gaming application based on SCT, transportation theory
For a better health, next time try oranges instead of
potato chips Snacks eaten dnring 11/16/2011 - 11/22/2011 Family Snack Healthiness
• Apple. Banana
-
Pretzels
�potalochips r- H calthy !
b��;::'��I�: . .i
Julia
Alice .......... ·�==��I--
r························,
� Prev Week ) [ Next week ) r-Hcalthy I ! Average I , ,
r:::.��:����.J
(a) Snack Suggestion (b) Snack History (c) Family Snacking
Fig. 2. Snack Educator
Potato Chips = -3 points My Snacking History
/ Candy cane (·2)
Potato Chips (·3)
Total Score = -5 points Apple (10)
Banana (10)
' Carrots (10)
(a) Game character reacts to unhealthy snack selection
(b) Snack History (c) Family Snacking
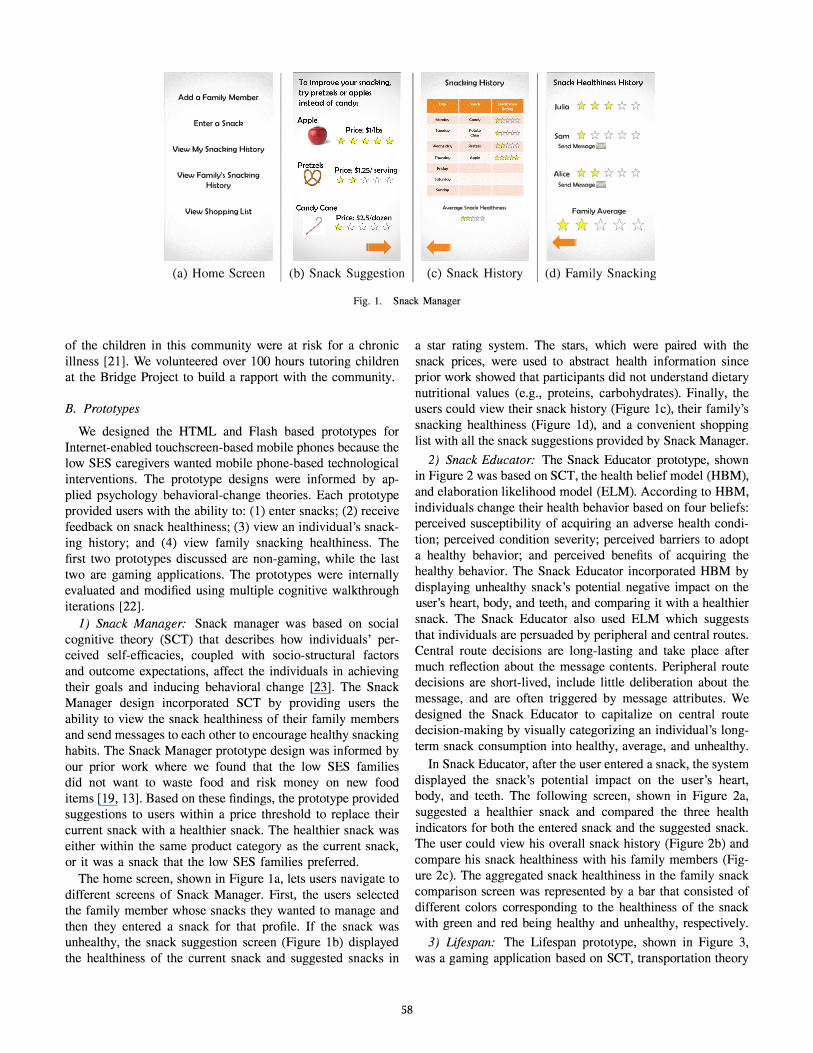
Fig. 3. Lifespan
[24], and the precaution adoption process model (PAPM) [23]. Transportation theory suggests that narratives can affect individuals' beliefs. When an individual experiences an immersive narration, she makes some decisions in the narrative world that induces a change when she returns to her origin world. The Lifespan prototype used an animation-based narration to encourage healthy eating where the player selected a game character whose progress in life was related to the healthiness of a player's snacks. The character went through different stages of life, which was informed by the stage-based PAPM that categorizes an individual's behavior in seven different stages: (1) unaware; (2) unengaged; (3) deciding about acting; (4) decided not to act; (5) decided to act; (6) acting; and (7) maintenance.
In the Lifespan game, we translated the PAPM stages to the game character's progressive life stages. The game goal was to gain enough health points to have the character get an education, job, house, and car. Since past study participants were African Muslims, we designed culturally sensitive characters, such as one wearing a hijab. Once the player entered a snack, she would view the game character's reactions (Figure 3a) followed by an animation highlighting the character's progress in life. Players moved to the next stage by eating healthy snacks and gaining a predetermined amount of health points. Once the players reached the final stage, they had to maintain healthy snacking; otherwise they would fall back to the previous stage. As shown in Figure 3b, players could view their snacking history with pictures of snacks and health points. Players could also compare the snack healthiness of different family members by viewing the snapshots of their family members' characters (Figure 3c).
59
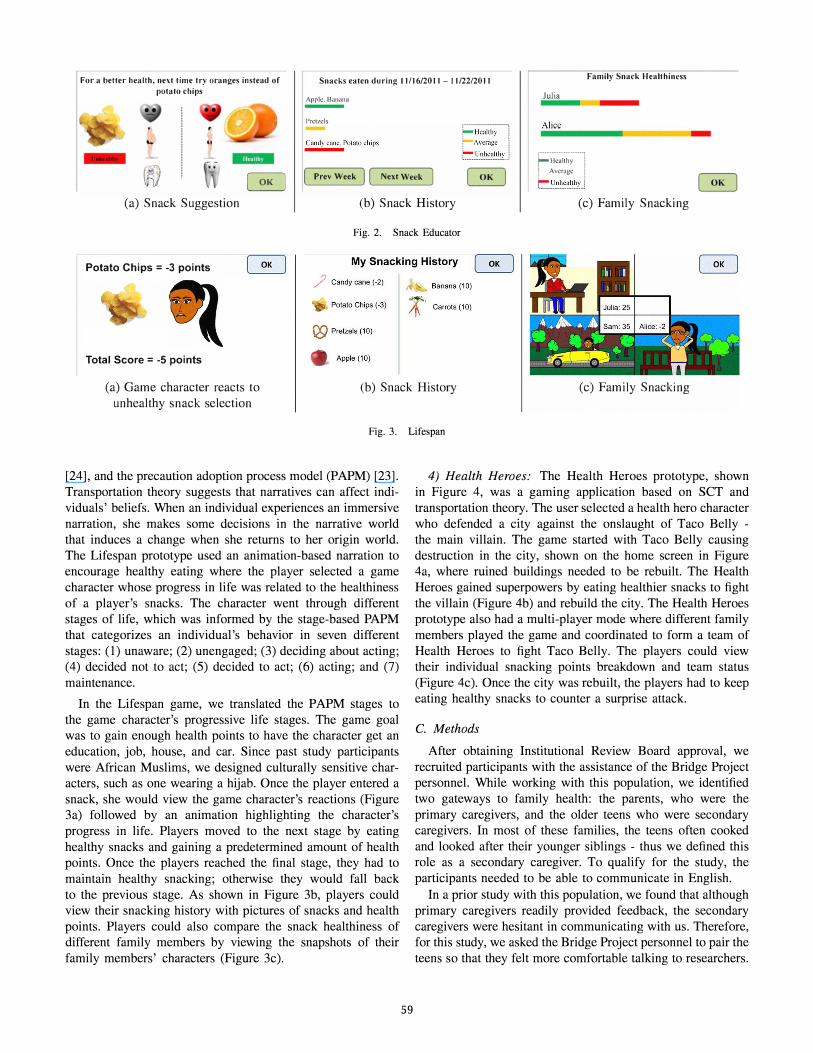
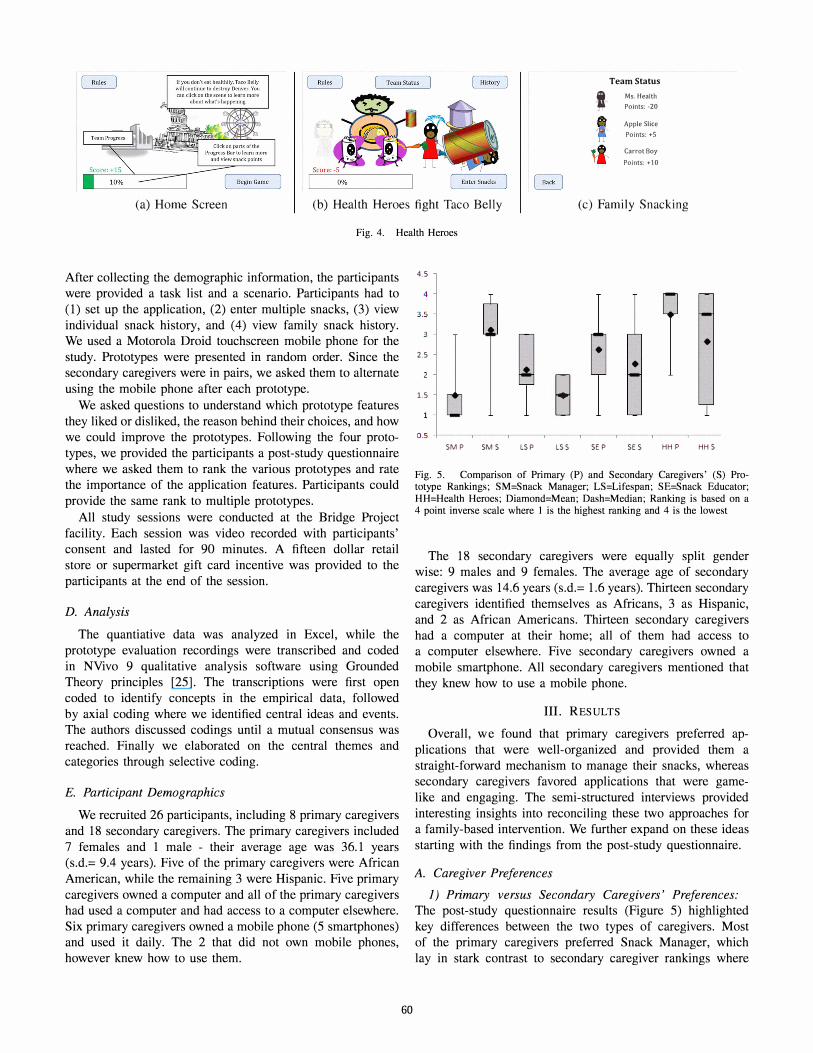
4) Health Heroes: The Health Heroes prototype, shown in Figure 4, was a gaming application based on SeT and transportation theory. The user selected a health hero character who defended a city against the onslaught of Taco Belly -the main villain. The game started with Taco Belly causing destruction in the city, shown on the home screen in Figure 4a, where ruined buildings needed to be rebuilt. The Health Heroes gained superpowers by eating healthier snacks to fight the villain (Figure 4b) and rebuild the city. The Health Heroes prototype also had a multi-player mode where different family members played the game and coordinated to form a team of Health Heroes to fight Taco Belly. The players could view their individual snacking points breakdown and team status (Figure 4c). Once the city was rebuilt, the players had to keep eating healthy snacks to counter a surprise attack.
C. Methods
After obtaining Institutional Review Board approval, we recruited participants with the assistance of the Bridge Project personnel. While working with this population, we identified two gateways to family health: the parents, who were the primary caregivers, and the older teens who were secondary caregivers. In most of these families, the teens often cooked and looked after their younger siblings - thus we defined this role as a secondary caregiver. To qualify for the study, the participants needed to be able to communicate in English.
In a prior study with this population, we found that although primary caregivers readily provided feedback, the secondary caregivers were hesitant in communicating with us. Therefore, for this study, we asked the Bridge Project personnel to pair the teens so that they felt more comfortable talking to researchers.
Team Status
t Ms. Health Points: -20
Apple Slice Points: +5 J
tl' Carrot Boy Points: +10
(a) Home Screen (b) Health Heroes fight Taco Belly (c) Family Snacking
Fig. 4. Health Heroes
After collecting the demographic information, the participants were provided a task list and a scenario. Participants had to (1) set up the application, (2) enter mUltiple snacks, (3) view individual snack history, and (4) view family snack history. We used a Motorola Droid touchscreen mobile phone for the study. Prototypes were presented in random order. Since the secondary caregivers were in pairs, we asked them to alternate using the mobile phone after each prototype.
We asked questions to understand which prototype features they liked or disliked, the reason behind their choices, and how we could improve the prototypes. Following the four prototypes, we provided the participants a post-study questionnaire where we asked them to rank the various prototypes and rate the importance of the application features. Participants could provide the same rank to multiple prototypes.
All study sessions were conducted at the Bridge Project facility. Each session was video recorded with participants' consent and lasted for 90 minutes. A fifteen dollar retail store or supermarket gift card incentive was provided to the participants at the end of the session.
D. Analysis
The quantiative data was analyzed in Excel, while the prototype evaluation recordings were transcribed and coded in NVivo 9 qualitative analysis software using Grounded Theory principles [25]. The transcriptions were first open coded to identify concepts in the empirical data, followed by axial coding where we identified central ideas and events. The authors discussed codings until a mutual consensus was reached. Finally we elaborated on the central themes and categories through selective coding.
E. Participant Demographics
We recruited 26 participants, including 8 primary caregivers and 18 secondary caregivers. The primary caregivers included 7 females and 1 male - their average age was 36.1 years (s.d.= 9.4 years). Five of the primary caregivers were African American, while the remaining 3 were Hispanic. Five primary caregivers owned a computer and all of the primary caregivers had used a computer and had access to a computer elsewhere. Six primary caregivers owned a mobile phone (5 smartphones) and used it daily. The 2 that did not own mobile phones, however knew how to use them.
60
4.5
4
3.5
• 2.5 •
•
1.5 B 0.5
SM P SM S LS P LSS SE P SE S HH P HH S
Fig. 5. Comparison of Primary (P) and Secondary Caregivers' (S) Prototype Rankings; SM=Snack Manager; LS=Lifespan; SE=Snack Educator; HH=Health Heroes; Diamond=Mean; Dash=Median; Ranking is based on a 4 point inverse scale where I is the highest ranking and 4 is the lowest
The 18 secondary caregivers were equally split gender wise: 9 males and 9 females. The average age of secondary caregivers was 14.6 years (s.d.= 1.6 years). Thirteen secondary caregivers identified themselves as Africans, 3 as Hispanic, and 2 as African Americans. Thirteen secondary caregivers had a computer at their home; all of them had access to a computer elsewhere. Five secondary caregivers owned a mobile smartphone. All secondary caregivers mentioned that they knew how to use a mobile phone.
III. RESULT S
Overall, we found that primary caregivers preferred applications that were well-organized and provided them a straight-forward mechanism to manage their snacks, whereas secondary caregivers favored applications that were gamelike and engaging. The semi-structured interviews provided interesting insights into reconciling these two approaches for a family-based intervention. We further expand on these ideas starting with the findings from the post-study questionnaire.
A. Caregiver Preferences
1) Primary versus Secondary Caregivers' Preferences:
The post-study questionnaire results (Figure 5) highlighted key differences between the two types of caregivers. Most of the primary caregivers preferred Snack Manager, which lay in stark contrast to secondary caregiver rankings where
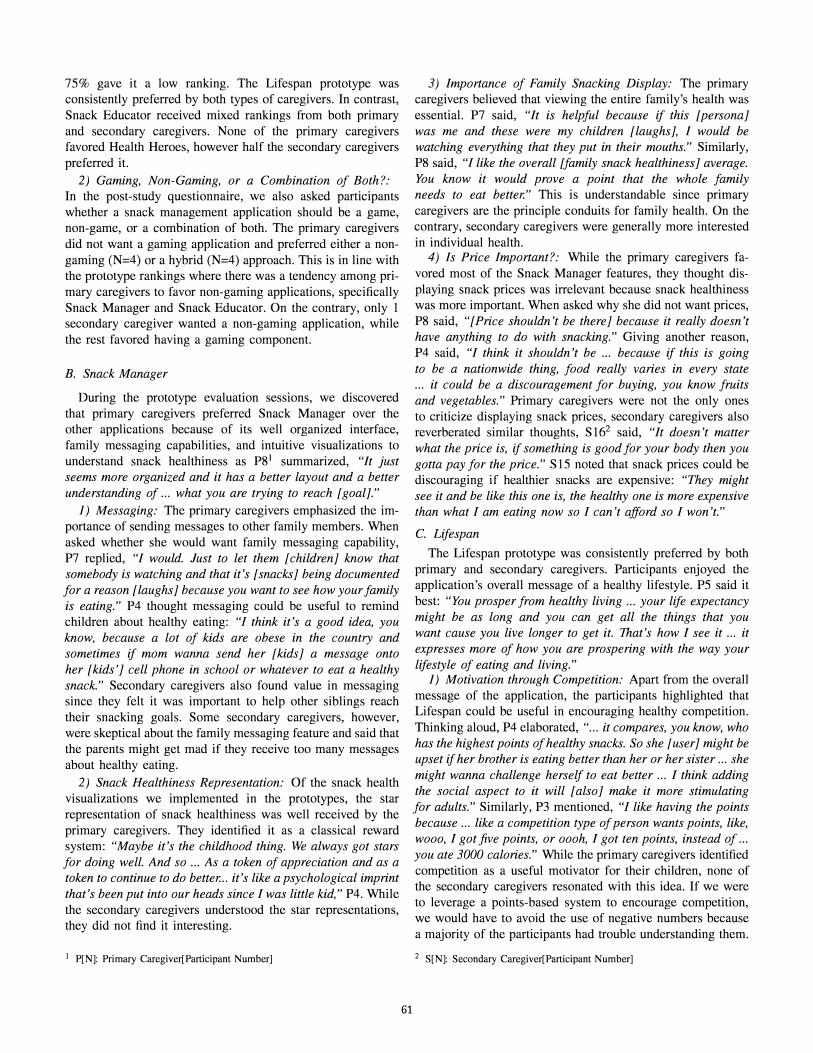
75% gave it a low ranking. The Lifespan prototype was consistently preferred by both types of caregivers. In contrast, Snack Educator received mixed rankings from both primary and secondary caregivers. None of the primary caregivers favored Health Heroes, however half the secondary caregivers preferred it.
2) Gaming, Non-Gaming, or a Combination of Both?:
In the post-study questionnaire, we also asked participants whether a snack management application should be a game, non-game, or a combination of both. The primary caregivers did not want a gaming application and preferred either a nongaming (N=4) or a hybrid (N=4) approach. This is in line with the prototype rankings where there was a tendency among primary caregivers to favor non-gaming applications, specifically Snack Manager and Snack Educator. On the contrary, only I secondary caregiver wanted a non-gaming application, while the rest favored having a gaming component.
B. Snack Manager
During the prototype evaluation sessions, we discovered that primary caregivers preferred Snack Manager over the other applications because of its well organized interface, family messaging capabilities, and intuitive visualizations to understand snack healthiness as pgi summarized, "It just
seems more organized and it has a better layout and a better
understanding of ... what you are trying to reach [goal}."
I) Messaging: The primary caregivers emphasized the importance of sending messages to other family members. When asked whether she would want family messaging capability, P7 replied, "I would. Just to let them [children] know that
somebody is watching and that it's [snacks] being documented
for a reason [laughs] because you want to see how your family
is eating." P4 thought messaging could be useful to remind children about healthy eating: "I think it's a good idea, you
know, because a lot of kids are obese in the country and
sometimes if mom wanna send her [kids] a message onto
her [kids'] cell phone in school or whatever to eat a healthy
snack." Secondary caregivers also found value in messaging since they felt it was important to help other siblings reach their snacking goals. Some secondary caregivers, however, were skeptical about the family messaging feature and said that the parents might get mad if they receive too many messages about healthy eating.
2) Snack Healthiness Representation: Of the snack health visualizations we implemented in the prototypes, the star representation of snack healthiness was well received by the primary caregivers. They identified it as a classical reward system: "Maybe it's the childhood thing. We always got stars
for doing well. And so ... As a token of appreciation and as a
token to continue to do better. .. it's like a psychological imprint
that's been put into our heads since I was little kid," P4. While the secondary caregivers understood the star representations, they did not find it interesting.
1 P[N]: Primary Caregiver[Participant Number]
61
3) Importance of Family Snacking Display: The primary caregivers believed that viewing the entire family's health was essential. P7 said, "It is helpful because if this [persona]
was me and these were my children [laughs], I would be
watching everything that they put in their mouths." Similarly, pg said, "I like the overall [family snack healthiness] average.
You know it would prove a point that the whole family
needs to eat better." This is understandable since primary caregivers are the principle conduits for family health. On the contrary, secondary caregivers were generally more interested in individual health.
4) Is Price Important?: While the primary caregivers favored most of the Snack Manager features, they thought displaying snack prices was irrelevant because snack healthiness was more important. When asked why she did not want prices, pg said, "[Price shouldn't be there] because it really doesn't
have anything to do with snacking." Giving another reason, P4 said, "I think it shouldn't be ... because if this is going
to be a nationwide thing, food really varies in every state
... it could be a discouragement for buying, you know fruits
and vegetables." Primary caregivers were not the only ones to criticize displaying snack prices, secondary caregivers also reverberated similar thoughts, SI62 said, "It doesn't matter
what the price is, if something is good for your body then you
gotta pay for the price." SI5 noted that snack prices could be discouraging if healthier snacks are expensive: "They might
see it and be like this one is, the healthy one is more expensive
than what I am eating now so I can't afford so I won't."
C. Lifespan
The Lifespan prototype was consistently preferred by both primary and secondary caregivers. Participants enjoyed the application's overall message of a healthy lifestyle. P5 said it best: "You prosper from healthy living ... your life expectancy
might be as long and you can get all the things that you
want cause you live longer to get it. That's how I see it ... it
expresses more of how you are prospering with the way your
lifestyle of eating and living." I) Motivation through Competition: Apart from the overall
message of the application, the participants highlighted that Lifespan could be useful in encouraging healthy competition. Thinking aloud, P4 elaborated, " ... it compares, you know, who
has the highest points of healthy snacks. So she [user] might be
upset if her brother is eating better than her or her sister ... she
might wanna challenge herself to eat better ... I think adding
the social aspect to it will [also] make it more stimulating
for adults." Similarly, P3 mentioned, "I like having the points
because ... like a competition type of person wants points, like,
wooo, I got five points, or oooh, I got ten points, instead of ...
you ate 3000 calories." While the primary caregivers identified competition as a useful motivator for their children, none of the secondary caregivers resonated with this idea. If we were to leverage a points-based system to encourage competition, we would have to avoid the use of negative numbers because a majority of the participants had trouble understanding them.
2 S[N]: Secondary Caregiver[Participant Number]

2) Game Character's Traits: Primary caregivers mentioned that the determination shown by the Lifespan character could be related to real life: "If somebody was having health
problems or was as determined as she [game character] is
to get what she wants, they will probably use this one," PI. The secondary caregivers also corroborated on relating to
the game character - S5 said, " ... It's kind of like watching
a video. It shows you emotions, what's happening, reactions,
and everything." S5 further described how he could see people relating to the game character: "I think she is wearing hijab
and her name is Amna, she is Muslim If you're Muslim you'll
be able to relate to that." S9 also felt a connection with the character and described how he would eat healthy to make sure that the game character was successful in his life. Although most of the secondary caregivers preferred Lifespan, some complained that the game character was too demanding as she continued to ask the user to eat healthier snacks to get to the next level. The participants may have perceived the application as demanding because we accelerated the game progress to demonstrate the major game milestones within the user study. Normally, users would achieve these milestones over an extended period of time.
D. Snack Educator
The Snack Educator prototype received mixed reviews from both primary and secondary caregivers.
I) Realistic Application: The participants described Snack Educator as realistic since it displayed implications of eating healthy or unhealthy snacks on their bodies. In P8's words: "It gives you a better understanding of what the consequences
are." We heard similar opinions from other primary caregivers. P6 elaborated, "... it gives you the difference. Like, the thing
with the potato chips and then how bad it is for you and it
does the comparison with oranges over here and sees how
healthy they are for you. So that's very good." The secondary caregivers also preferred the Snack Educator's realism as S5 said, "I think this one ... like it educates you more. It gives you
the side effects. The ones [prototypes] we did before showed
you unrealistic things. Like if you eat unhealthy, and some guy
will take over the world [referring to Health Heroes]. That's
not realistic."
2) Differences over Health Metrics and Visualizations:
Some primary caregivers showed concern over the Snack Educator visualizations that depicted potential obesity risk associated with a snack. P3 said, "If I see a fat person [Snack
Educator image] next to me [in the application] and a skinny
person next to Allison [example person], that makes me feel
worse." Some secondary caregivers also mirrored the same sentiment at the obese person's picture. When S4 laughed at it, S3 said, "that's not funny, that's somebody's body, I would
never make fun of it."
The primary caregivers were divided on visualizations of nutritional details. P3 did not want to know the nutritional details or how the application calculated a snack's healthiness. She stated, "I'm glad it didn't add calories. Like, that's a
bad thing. I don't want to see the calories. So I like how
62
they calculated to what's good and what's bad. I liked that.
It wasn't like you had to add in how much you weigh and
all that other embarrassing stuff. So I liked it was pretty
self-explanatory. It was pretty simple to understand." On the contrary, P7 wanted to understand why a particular snack was healthy or unhealthy by tracking calories. When asked what would she modify in the application, P7 replied, "Ummm
maybe the calories. So that way when you compare them, you
can have this has this many calories and that has that many
calories and, you know, that's why it would be a better snack."
Similarly PI also wanted to view nutritional details: "No it is
not useless cause one bag of chips might have more salt than
the other ... I don't know if they are telling the truth. I want
to see everything [nutritional}."
3) Snack Healthiness Bar Interpretation: We observed that while evaluating the Snack Educator's family snacking screen (Figure 2c), the participants immediately identified Alice as eating healthier than Julia because the green portion of her bar was larger. The participants also noticed that Alice's healthiness bar was longer than Julia's bar because Alice ate more snacks. However, despite this observation, they still held the belief that Alice was eating healthier than Julia -neglecting snack quantity in their assessment. This ambiguity was intentionally designed to determine if users could account for quantity in snack healthiness evaluations.
E. Health Heroes
The Health Heroes prototype was not preferred by primary caregivers because they thought it was childish and difficult to understand. The primary caregivers could not relate to the Health Heroes game and did not find it motivating to adopt healthy behaviors. They further complained that Health Heroes had cluttered action screens. PTs feedback sums up the collective sentiment: "Ummm, I didn't like that one [Health
Heroes], it's a little funny looking. And it's for kids."
/) Fun for Young Teenagers: While primary caregivers did not prefer Health Heroes, there was a split within the secondary caregivers. Mostly young males preferred Health Heroes because they thought the application was cool and found the game action exciting. For example, S 12 said, "It's
showing ... healthy people beating up unhealthy people. So
that means you're starting to eat healthy and I kind of like it
better. So I understand it, so I think that's why I like this one."
Similarly, when asked which was his favorite application, S4 said, "This one [Health Heroes] ... cause Taco Belly is kind
of like a funny name and all of them [Health Heroes] work
together to defeat him."
The older teens, however found Health Heroes too childish for their liking. S5 said, "Like this would just make you
think that you're a kid. I don't like that." Another secondary caregiver mentioned that she wanted to view how food affected her body, S8 said, "I don't like this one [Health Heroes] as
much as the first one [Snack Educator] because it doesn't
really tell me how much I've grown and ... it didn't show the
bar like the other one [Figure 2c]."

IV. DISCUSSION
We acknowledge there are external factors such as income, environment, and education that impact improving health in low SES populations. We focus on the small tractable issue of snacking that could gradually lead towards healthier eating habits. This is challenging because we must make technology accessible and useful to two different caregiver groups. Particularly, we explore how differences in primary and secondary caregivers' preferences can be incorporated into an effective family-based application. We also discuss how a flexible health metrics tracking system can abstract nutritional details. Finally, we explore how individuals' sensitivities affect the application design and the importance of considering the holistic application message.
A. Management and Engagement
Our results showed that the primary caregivers wanted an application that provided them with the ability to effectively manage their snacks. They had an intrinsic motivation to view and maintain healthy snacking for their entire family. They were not interested in spending time in gaming activities, that would serve as an extrinsic motivation to support snack management. This idea was highlighted by P8 when she used Snack Educator after using the gaming applications, "Ummm,
it [Snack Educator] just seems to flow better. Didn't have too
many graphics and it was straight to point." Furthermore, the primary caregivers found the gaming applications childish.
In contrast, secondary caregivers found non-gaming applications monotonous and redundant as underscored by S9 while using Snack Educator: "It's lame because you have to go back
and forth and [see] the same pictures over and over again."
SlO continued, "It's boring because you have to do this click
and we have to just see who's getting healthy and who's
not getting healthy like that." This highlights that secondary caregivers want some form of engaging, fun interaction as an incentive in their snack management application.
We also found that while primary caregivers preferred the familiar stars as the reward mechanism, secondary caregivers were excited by the dynamic rewards that unfolded as they progressed through different stages of the game. Based on these findings, we suggest that applications be designed with (1) basic snack management features with familiar metaphors for primary caregivers, and (2) engaging game-like applications to encourage secondary caregivers' usage. The backend of these applications should be a common multimodal platform that tailors data for various front ends. This would allow for a family based solution that would accommodate both types of caregivers. Indeed, researchers have responded by developing backend architectures, such as Salud! [26] - a common platform for consumer health applications. Using a similar platform, we can implement useful features such as messaging between family members to encourage healthy eating habits.
63
B. Healthiness Visualization Needs
During the study, we identified two types of health visualization needs, those for (1) uninformed health metrics and for (2) informed health metrics. An uniformed health metric was one where participants were not aware of how the particular metric affected their health, whereas participants were aware of the informed health metrics' effects.
In our study, we found that food quantity was an uninformed metric that the participants did not consider while deciding the healthiness of their snacks. This was evident in Snack Educator, where participants did not consider quantity when viewing the snack healthiness bar (Section III-D3). Indeed, research has shown that while the average portion size of snacks have remained relatively constant, the snacking frequency has increased significantly, resulting in an increase in the daily energy intake from snacks [27]. We need to address this issue by helping participants visualize the effects of snack quantity on an individual's health. We acknowledge that this is a challenging problem that requires an accurate measurement of a user's height, weight, and other health parameters, however, a good starting point could be categorizing healthy and unhealthy snacks with a predefined snack-entry threshold per day. For example, in a gaming application, if a user enters more than a predefined threshold for a particular snack, the application can deduct points to discourage overeating.
While it is important to educate users about how the uninformed metrics affect their health, we also identified informed health metrics where users provided feedback about their tracking preferences. For example, P3 and P7 had opposite views on tracking caloric intake, and PI wanted to track sodium in her snacks. While we acknowledge that the snack healthiness visualizations did not account for specific nutritional information, they were intuitive and could gradually move the user towards healthy eating. Moreover, a majority of the participants were satisfied with the abstracted healthiness representations and did not ask for nutritional information. If nutritional details are needed, stars could be a good representation for each nutrient needed in the healthiness visualization.
C. Price: The Changing Requirement
Our prior studies have shown that low SES populations considered price an influential factor while making dietary decisions [19, 13]. We implemented price in Snack Manager to determine whether it was beneficial for the target population, but an overwhelming majority of the caregivers did not find it valuable. This change in requirements highlights a key aspect of the iterative user-centered design process where the users often reflect and reevaluate their design recommendations after viewing a particular implementation.
D. Designing for Sensitivity and Nurturing Health Values
We must design applications that are not only usable, but also are sensitive to the target population's needs. As highlighted in our findings (Section III-D2), some caregivers were sensitive to the obese person graphic in Snack Educator (Figure 2a). It made them aware of their own issues with
obesity and body image. This is especially relevant for low SES populations since they are at a higher risk for obesity [1]. Therefore, if we are to induce healthy behavior change, our designs must accommodate for these perceptions of selfimage. This may in turn increase adoption of health and wellness technologies in low SES populations.
Another important design consideration was the overall application message. The caregivers indicated how Lifespan propagated a hidden message of well being that would encourage them in using the application. In particular, the secondary caregivers related to Lifespan and inferred that healthy eating leads to successful life outcomes. This unanticipated result of health as a value [28] can be fostered to establish healthy lifestyles in secondary caregivers. Therefore, while researchers should have traditional design goals to motivate users to adopt healthy habits, we must also reflect on how the overall application message can nurture health values in the population.
V. LIMITATIONS
We acknowledge that the primary caregiver partICIpants were predominately female - with only 1 male and 7 females. While this does not account for different gender perspectives, we and other researchers [29] found that in low SES families, primary caregivers are predominately female.
ACKNOW LEDGMENT S
We thank the Bridge Project based in Denver's public housing neighborhoods. Funding for this research was provided by National Science Foundation Award No IIS-0846024.
REFERENCES
[1] N. E. Adler and K. Newman, "Socioeconomic Disparities In Health: Pathways And Policies," Health Aff, vol. 21, no. 2, pp. 60--76, 2002.
[2] S. Consolvo, D. W. McDonald, T. Toscos, M. Y. Chen, J. Froehlich, B. Harrison, P. Klasnja, A. LaMarca, L. LeGrand, R. Libby, I. Smith, and J. A. Landay, "Activity sensing in the wild: a field trial of ubifit garden," in CHI, 2008, pp. 1797-1806.
[3] S. Kim, J. A. Kientz, S. N. Patel, and G. D. Abowd, "Are you sleeping?: sharing portrayed sleeping status within a social network," in CSCW,
2008, pp. 619--628. [4] T. Denning, A. Andrew, R. Chaudhri, C. Hartung, J. Lester, G. Borriello,
and G. Duncan, "BALANCE: towards a usable pervasive wellness application with accurate activity inference," in HotMobile, 2009, pp. 5:1-5:6.
[5] S. Somnath, "Improving literacy as a means to reducing health disparities," J Gen Intern Med, vol. 21, no. 8, pp. 893-895, 2006.
[6] National Healthcare Quality Report, 2003. Rockville, MD: Agency for Healthcare Research and Quality, 2003.
[7] C. C. Tsai, G. Lee, F. Raab, G. J. Norman, T. Sohn, W. G. Griswold, and K. Patrick, "Usability and feasibility of PmEB: A mobile phone application for monitoring real time caloric balance," in Pervasive Health, 2006, pp. 1-10.
[8] D. F. Lobach, G. M. Silvey, 1. M. Willis, K. R. Kooy, K. Kawamoto, K. 1. Anstrom, E. L. Eisenstein, and F. Johnson, "Coupling direct collection of health risk information from patients through kiosks with decision support for proactive care management," AMIA Annu Symp Proc, pp. 429-33, 2008.
64
[9] C. Jantz, J. Anderson, and S. M. M. Gould, "Using computer-based assessments to evaluate interactive multimedia nutrition education among low-income predominantly hispanic participants," J Nutr Educ Behav,
vol. 34, no. 5, pp. 252-260, 2002. [10] M. K. Campbell, L. Honess-Morreale, D. Farrell, E. Carbone, and
M. Brasure, "A tailored multimedia nutrition education pilot program for low-income women receiving food assistance," Health Educ. Res.,
vol. 14, no. 2, pp. 257-267, 1999. [11] T. A. Pempek and S. L. Calvert, "Tipping the balance: Use of ad
vergames to promote consumption of nutritious foods and beverages by Low-Income african american children," Arch Pediatr Adolesc Med, vol. 163, no. 7, pp. 633--637, 2009.
[12] A. Grimes, M. Bednar, J. D. Bolter, and R. E. Grinter, "Eatwell: sharing nutrition-related memories in a low-income community," in CSCW, 2008, pp. 87-96.
[13] D. U. Khan, S. Ananthanarayan, and K. A. Siek, "Exploring everyday health routines of a low socioeconomic population through multimedia elicitations," J Participat Med., vol. 3, no. e39, 2011.
[14] M. W. Gillman, S. L. Rifas-Shiman, A. L. Frazier, H. R. Rockett, C. A. Camargo, A. E. Field, C. S. Berkey, and G. A. Colditz, "Family dinner and diet quality among older children and adolescents," Arch Fam Med, vol. 9, no. 3, pp. 235-240, 2000.
[15] E. M. Taveras, S. L. Rifas-Shiman, C. S. Berkey, H. R. H. Rockett, A. E. Field, A. L. Frazier, G. A. Colditz, and M. W. Gillman, "Family dinner and adolescent overweight," Obesity, vol. 13, no. 5, pp. 900-906, 2005.
[16] N. Colineau and C. Paris, "Motivating reflection about health within the family: the use of goal setting and tailored feedback," User Modeling and User-Adapted Interaction, vol. 21, pp. 341-376, 2011.
[17] N. Colineau, C. Paris, P. Marendy, D. Bhandari, and Y. Shu, "Supporting family engagement in weight management," in CHI, 2009, pp. 3991-3996.
[18] A. Grimes, D. Tan, and D. Morris, "Toward technologies that support family reflections on health," in GROUP, 2009, pp. 311-320.
[19] J. Maitland, M. Chalmers, and K. Siek, "Persuasion not required improving our understanding of the sociotechnical context of dietary behavioural change," in Pervasive Health, 2009, pp. 1-8.
[20] K. A. Siek, J. S. LaMarche, and 1. Maitland, "Bridging the information gap: Collaborative technology design with low-income at-risk families to engender healthy behaviors," in OZCHI, 2009, pp. 89-96.
[21] A. J. Barton, L. Gilbert, J. Baramee, and T. Granger, "Cardiovascular risk in hispanic and non-hispanic preschoolers," Nurs Res, vol. 55, no. 3, pp. 172-179,2006.
[22] C. Lewis, P. G. Polson, C. Wharton, and J. Rieman, "Testing a walkthrough methodology for theory-based design of walk-up-and-use interfaces," in CHI, 1990, pp. 235-242.
[23] M. Conner and P. Norman, Predicting Health Behaviour: Second Edition. Open University Press, 2005.
[24] M. C. Green and T. C. Brock, "The role of transportation in the persuasiveness of public narratives," J Pers Soc Psycho I, vol. 79, no. 5, pp. 701-721, 2000.
[25] A. Adams, P. Lunt, and P. Cairns, "A qualitative approach to hci research," in Research Methods for Human-Computer Interaction, P. Cairns and A. L. Cox, Eds. Cambridge: Cambridge University Press, 2008, pp. 138-157.
[26] Y. Medynskiy and E. Mynatt, "Salud!: An open infrastructure for developing and deploying health self-management applications," in Pervasive Health, 2010, pp. 1-8.
[27] L. Jahns, A. M. Siega-Riz, and B. M. Popkin, "The increasing prevalence of snacking among us children from 1977 to 1996," The Journal of
Pediatrics, vol. 138, no. 4, pp. 493 - 498, 2001. [28] R. R. Lau, K. A. Hartman, and J. E. Ware, "Health as a value:
methodological and theoretical considerations," Health Psycho I, vol. 5, no. 1, pp. 25-43, 1986.
[29] J. Coveney, "What does research on families and food tell us? Implications for nutrition and dietetic practice," Nutrition and Dietetics, vol. 59, no. 2, pp. 113-119,2002.