Rapid Determination of Sugar and Salt Levels in Snack Products
72
Rapid Determination of Sugar and Salt Levels in Snack Products Using Infrared Spectroscopy Thesis Presented in Partial Fulfillment of the Requirements for the Degree Master of Sciencein the Graduate School of The Ohio State University By Ting Wang Graduate Program in Food Science and Technology The Ohio State University 2011 Master’s Examination Committee: Dr. Luis Rodriguez-Saona, Advisor Dr. W. James Harper Dr. Mike Mangino
-
Upload
khangminh22 -
Category
Documents
-
view
2 -
download
0
Transcript of Rapid Determination of Sugar and Salt Levels in Snack Products

Rapid Determination of Sugar and Salt Levels in Snack Products
Using Infrared Spectroscopy
Thesis
Presented in Partial Fulfillment of the Requirements for the Degree
Master of Sciencein the Graduate School of The
Ohio State University
By
Ting Wang
Graduate Program in Food Science and Technology
The Ohio State University
2011
Master’s Examination Committee:
Dr. Luis Rodriguez-Saona, Advisor
Dr. W. James Harper
Dr. Mike Mangino

Abstract
Fourier transform infrared (FT-IR) spectroscopy is a simple, rapid, and
reliable technique that has been widely researched and applied for analysis of
food components, which can identify types of chemical bonds in a molecule by
producing an infrared absorption spectrum that is like a molecular "fingerprint".
FTIR combined with chemometrics, including SIMCA and PLS, makes it a
strong technique to identify unknown materials, determine the quality or
consistency of a sample, and determine the amount of components in a
mixture.
The world snack food market reached an estimated $66 billion in 2003,
with the United States accounting for about a third of it. However the sensor
devices currently available are not suitable in a food processing operation.
There is an urging demand for rapid, high through-put, and real-time
instruments for the food industry. The objective of this research was to
evaluate the feasibility of infrared systems combined with chemometric
analysis for rapid quality assessment in applications to Ohio’s snack industry.
Snack products samples were grounded and spectra were collected using
MIR and NIR equipped with 3-bounce ZnSe MIRacle attenuated total
reflectance accessory or a diffuse reflection-integrating sphere separately.
Partial Least Square Regression (PLSR) was used to construct prediction
ii

models. The spectra showed characteristic absorption bands for sugars (MIR
and NIR) and the salt-induced changes in the NIR water spectrum as affected
by salt content. Best performance PLSR models for salt content were
generated from NIR reflectance (SECV=0.016% and r = 0.96) whereas similar
statistics were obtained for sugar levels (SEP ~0.02mg/g cereal and r > 0.98).
FTIR combined with PLSR analysis provided a rapid quality assessment
technique, which can finally improve the quality control of snack food industry
by saving testing time, decreasing investment and providing reliable results.
iii

Dedication
Dedicated to my mom
iv

Acknowledgments
I would like to thank Dr. Luis Rodriguez-Saona for his excellent
guidance and endless patience. Without your encouragement and
help, this would be impossible.
I would like to thank Dr. W. James Harper and Dr. Mike Mangino
for their consideration and guidance.
I would like to thank the warm and sweet laboratory group for
the help they gave me during the past three years.
I would like to thank my family for their support of every thing in
my life, in every minute.
I would like to specially thank my husband for always standing
beside me, giving me happiness, and love.
v
Vita
2005............................................. B.S. Bioengineering, South
China University of
Technology
2008............................................. M.S. Food Science and
Technology, The Ohio State
University
2009 to present ...............................Graduate Research Associate,
The Ohio State University
Fields of Study
Major Field: Food Science and Technology
vi
Table of Contents
Abstract .....................................................................................................ii
Dedication .................................................................................................iii
Acknowledgments......................................................................................iv
Vita ............................................................................................................v
List of Tables..............................................................................................vii
List of Figures.............................................................................................viii
Chapter 1: Literature Review......................................................................1
Chapter 2: Rapid Determination of Sugar and Salt Levels in Snack Products
Using Infrared Spectroscopy................................................... 30
References ................................................................................................60
vii

List of Tables
Table 1.1 UV absorbance cutoffs of various common solvents....................17
Table 1.2 Three different types of cuvettes commonly used with different
usable wavelengths......................................................................18
Table 2.1 Assignment of Bands in the NIR and MIR-FT Spectra..................43
Table 2.2 PLSR model results for salt, moisture and fat content prediction with
NIR and MIR................................................................................44
Table 2.3 Sugar contents in cereal tested by enzymatic assay kit and HPLC
method...........................................................................................49
Table 2.4 Average sugar content in coated and uncoated base cereal
according to type of flavor............................................................. 50
Table 2.5 Performance statistics for PLSR calibration and validation
models............................................................................................51
viii

ix
List of Figures
Figure 1.1 Instrumentation of high performance liquid chromatography........12
Figure 1.2 Enzymatic determination of sucrose.............................................20
Figure 2.1 Typical Near infrared (A) and ATR-Mid infrared Spectrum of tortilla
chip samples..................................................................................40
Figure 2.2 Partial Least Squares Regression (PLSR) cross-validation plots for
salt, moisture, and oil determination in tortilla chip samples from
Wyandot Inc................................................................................. 46
Figure 2.3 Partial Least Squares Regression (PLSR) cross-validation plots for
sugar determination in cereal samples from Wyandot Inc........... 53
Figure 2.4 Partial Least Squares loading spectra for the first 2 latent variables
for the calibration set measured by FT-NIR reflectance and
ATR-MRI spectroscopy.................................................................55
CHAPTER 1
LITERATURE REVIEW
1.1 Snack food
The world snack food market reached an estimated $66 billion in 2003,
with the United States accounting for about a third of it (Anonymous 2004). As
lifestyles in other parts of the world become more westernized, the global
demand for snack foods continues to increase and evolve (Nikolaou 2006).
According to the U.S. Census Bureau, “the snack food industry comprises
establishments primarily engaged in one or more of the following: (1) salting,
roasting, drying, cooking, or canning nuts; (2) processing grains or seeds into
snacks; (3) manufacturing peanut butter; and (4) manufacturing potato chips,
corn chips, popped popcorn, pretzels (except soft), pork rinds, and similar
snacks (U.S. Census Bureau 2002).” The snack food industry sector also
includes “consumer-ready packaged chocolate and non-chocolate candies,
cookies and crackers, unpopped popcorn and meat snacks (Anonymous
2004).” The list of snack food products is growing steadily, as competition, new
knowledge in nutrition science (Willett and others 2002; Anonymous 2004)
regulatory mandate, and self-imposed guidelines for healthful public nutrition
force companies to introduce snacks with refined features, such as new raw
material basis, improved texture, shape, color, flavor, and nutritional content
1
(Shukla 1994; 2000). The last factor, in particular, has had a significant effect in
recent years, as Americans’ dietary habits fluctuate, in response to scientific
advances, governmental guidelines, commercial offerings, social fads or
personal preferences (Nikolaou 2006).
Along with technology for the manufacture of snack foods, food science is
obviously of paramount importance for this field. By including elements of
physical, chemical and biological sciences, food science is a truly
interdisciplinary field of remarkable complexity and considerable breadth, and
has frequently contributed, rather than simply benefited from its constitutive
scientific fields (Nikolaou 2006).
The technology for the manufacture of snack foods involves a relatively
small number of processes that appear most frequently in snack food
manufacturing plants, including extrusion, frying, baking, and drying (Nikolaou
2006). While the above processes constitute the heart of most snack food
manufacturing lines, where practically all cooking occurs, there are additional
processes and equipment that are important for the operation of an entire line.
For example, oil, powder, and granule applicators, including oil and cheese
sprayers, powder dispensers, electrostatic salters, and coating tumblers. This
equipment is used for snack flavoring, often creating a variety of products from
the same basic substrate (Nikolaou 2006).
One of the main issues associated with the snack foods is the health
concern of adding abundant sugar and salt. When it comes to the American
2
diet, people tend to get too much of the two ingredients. A high-sugar,
high-calorie diet can lead to obesity and to diabetes, both of which put people
at greater risk for heart disease (Roberts 2009). Many studies show a direct
link between sodium intake and high blood pressure (Roberts 2009); the more
salt was consumed, the higher the blood pressure will be (Roberts 2009). This
is because the kidneys cannot process and eliminate salt beyond a certain
amount, which influences blood pressure in the arteries (Roberts 2009). If not
properly controlled, high blood pressure can lead to kidney failure as well as
heart failure, heart attack, and stroke (Roberts 2009).
1.2 Cereal
The grass family has five subfamilies with approximately 10,000 species
(Chapman 1996). Grass species can be found living in a wide range of
altitudes (edge of the sea to 1000's of feet above sea level), temperatures
(equatorial belt to arctic and Antarctic regions), moisture conditions, soil types
and salinity concentrations (Arber 1934; Pool 1948). The grass family offers
many important economic and ecological features including food, forage, cane
sugar, fiber (paper and rope), renewable energy, habitat, development of
ecologically disturbed areas (prevention of soil erosion, extraction of salt and
bioremediation), timber, lawns, ornamentals, and aromatic oils (Arber 1934;
Pool 1948; Chapman 1996).
Cereals such as rice, wheat and maize are members of the grass family
and they are particularly important to humans because of their role as staple
3
food crops in many areas of the world. Cereals are also used to produce
animal feed, oils, starch, flour, sugar, syrup, processed foods, malt, alcoholic
beverages, gluten and renewable energy (Pomeranz and others 1981).
Approximately 50% of the world's calories are provided by rice, wheat and
maize, but in many parts of Africa and Asia, people rely mainly on grains such
as sorghum or millet. Maize, sorghum and barley are important sources of
livestock feed and barley and rice are used in the brewing industry (Chopra
and others 2002). The United States Department of Agriculture recommends
that Americans eat 6-11 servings of grains per day (United States Department
of Agriculture 1996). Grains of all kinds, oats in particular, have been shown to
contain chemical compounds that help to reduce the chance of certain types of
cancer and coronary heart disease (Marquart and others 2002).
Cereal processing technology constitutes a strategic industry worldwide
delivering a range of products from finished items, to raw materials used in
baking, brewing, etc (Solís-Morales and other 2009). An important sector of
the cereal processing industry is formed by the products generally known as
Ready To Eat (RTE breakfast) cereals (Solís-Morales and other 2009). It is a
food made more or less from processed grains often, but not always, eaten
with the first meal of the day or sometimes as a snack later in the day. It is
often eaten cold, usually mixed with milk, water, or yogurt, and sometimes fruit
but sometimes eaten dry. RTE cereals have their beginnings in the vegetarian
movement in the last quarter of the nineteenth century, which influenced
4
members of the Seventh-day Adventist Church in the United States (The
History of Breakfast Cereals 2008).
RTE cereals may be broadly classified into five categories: flaked, puffed,
extruded, whole grain and granolas (Valentas and others 1991). To produce
RTE cereals several unit operations are employed (Solís-Morales and other
2009). In most processes raw grains are first cooked in some manner to
gelatinise the starches present (Culbertson 2004). The grains are then
flattened (flaked), formed (extruded), shredded or expanded (puffed) (Solí
s-Morales and other 2009). Texture in RTE cereals is fundamental for product
acceptance by consumers (Solís-Morales and other 2009). Crisp and crunchy
textures are generally expected, which can be imparted to raw materials in a
number of ways (Solís-Morales and other 2009). Texturising (i.e. controlled
change of texture) processes will provide crispness or crunchiness by
changing, basically, the surface/volume ratio and thickness (Solís-Morales
and other 2009). Texture alteration can be achieved by different operations
such as flaking, puffing or extruding (Solís-Morales and other 2009). Rice and
wheat are the two main cereals whose granules can be processed individually
in order to expand them or inflate them, as to obtain the RTE products known
as puffed cereals (Fast 2000; 2001). Some other grain formulations can be
also expanded to obtain puffed products using extrusion technology (Sevatson
others 2000).
A number of RTE cereals are covered with coats aimed at improving
5

functionality in some manner (Solís-Morales and other 2009). Coating of foods,
also called encapsulation, can be defined as the application of a liquid and/or a
powder in a required pattern onto a food piece in order to enhance
preservation, palatability, nutritional value or some other specific property
(Denoyelle 2008). Coating or encapsulation of food pieces, granules or
particulates, can be carried out by a number of unit operations (Solís-Morales
and other 2009). Some of the operations used for mixing or dry powders can
be equally applied for coating (Solís-Morales and other 2009). Equipment that
can be used for the purpose of mixing powders/coating food pieces include
rotating drums, ribbon mixers and fluidised beds (Ortega- Rivas 2005).
Edible coating has been used in RTE puffed cereals to obtain advantages
such as to enhance flavor, protect the food particulate from oxygen and
moisture, control the release of active ingredients or improve quality
(Torres-Martínez 2001). RTE puffed wheat is normally coated with sweet
coverings to make it more appealing to different tastes and consumers (Solí
s-Morales and other 2009). The coating may also be added with colored
ingredients, such as chocolate or strawberry color (Solís-Morales and other
2009). A typical method to apply sweet coatings in puffed wheat is by using
rotating drums (Solís-Morales and other 2009). Normally, the puffed granules
of wheat are loaded into a tumbling, rotating heated vessel of conical shape
(Solís-Morales and other 2009). The syrup mostly used is prepared from
sucrose, and it may be simply poured onto the puffed granules within the
6

rotating vessel (Solís-Morales and other 2009). In powder coating, the size,
density and charge of particles and air velocity have a significant effect on
coating transfer efficiency and evenness ((Chen and others 1995; Mazumder
and others 1997). Report shows that transfer efficiency increased as particle
size, density or charge increased or as air velocity decreased (Yousuf and
others 2007). Evenness increased as particle size or density decreased, as
velocity increased, or as charge increased to a peak (Yousuf and others 2007).
Electrostatic coating produced higher transfer efficiency and evenness than
nonelectrostatic coating (Yousuf and others 2007).
Since sucrose is normally used as the coating material, it is necessary to
measure the amount remaining on the food after coating processing. Sensory
assessment and instrumental analysis are two methods mostly conducted by
the food industry for quality control purpose.
Sensory evaluation has been defined as a scientific method used to evoke,
measure, analyze and interpret those responses to products as perceived
through the senses of sight, smell, touch, taste, and hearing (Stone and others
1993). The most important criteria that define the quality of a sensory program
are: the training/qualifications of panelists, the type of established
specifications, and the use of controlled test conditions (Mun˜oz 2002). The
quality of a sensory program is to be questioned if any of these components is
only marginal or inappropriate (Mun˜oz 2002). While the sensory program
delivers strong ability to detect sensory problems/issues and control the quality
7
of food products in a comprehensive way, it might show the disadvantages of
time consuming, high expenses, and well trained panelists requirement. Some
companies have preferred to establish analytical/instrumental based sensory
programs to reduce the uncertainty and risks in decision making.
1.3 Instrumental analysis
1.3.1 HPLC
High performance liquid chromatography (HPLC) is today the premier
technique for chemical analysis and related applications, with an ability to
separate, analyze, and/or purify virtually any sample (Snyder and others 2009).
Compared to other separation procedures, HPLC is exceptional in terms of the
following characteristics:
1. Almost universal applicability; Few samples are excluded from the
possibility of HPLC separation.
2. Remarkable assay precision (0.5% or better in many cases)
3. A wide range of equipment, columns, and other materials is commercially
available, allowing the use of HPLC for almost every application.
4. Most laboratories that deal with a need for analyzing chemical mixtures are
equipped for HPLC; It is often the first choice of technique (Snyder and
others 2009).
The underlying principle of chromatography is that molecules not only
dissolve in liquids but can also "dissolve" (absorb) on to or interact with the
surface of solids (Bird 1989). If a molecule dissolved in a liquid is passed down
8
a column of solid particles with which it interacts it will move more slowly than
the solvent, spending some time dissolved in the liquid (liquid phase) and
some on the solid (solid phase) (Bird 1989). As such molecules take longer to
pass down the column than molecules that do not interact with the solid phase
they emerge from the bottom of the column later (Bird 1989). The separation of
molecules by chromatography depends on exploiting the subtle differences in
certain physical properties of the molecules in samples: their solubility in water,
solubility in organic solvents, net positive or negative charge, and size (Bird
1989).
Depending on the HPLC mode, the different types of the adsorption forces
may be included in the retention process: Hydrophobic (non-specific)
interactions are the main ones in reversed-phase (RP) separations
(Anonymous 2011). Dipole-dipole (polar) interactions are dominant in normal
phase (NP) (Anonymous 2011). Ionic interactions are responsible for the
retention in ion-exchange chromatography (Anonymous 2011). All these
interactions are competitive (Anonymous 2011). Analyte molecules are
competing with the eluent molecules for the adsorption sites (Anonymous
2011). So, the stronger analyte molecules interact with the surface, the weaker
the eluent interaction, the longer the analyte will be retained on the surface
(Anonymous 2011). SEC (size-exclusion chromatography) is another case. It
is the separation of the mixture by the molecular size of its components
(Anonymous 2011). The basic principle of SEC separation is that the bigger
9

the molecule, the less possibility there is for it to penetrate into the adsorbent
pore space (Anonymous 2011). So, the bigger the molecule the less it will be
retained (Anonymous 2011).
HPLC instrumentation includes a pump, injector, column, detector and data
system (Anonymous 2011). The heart of the system is the column where
separation occurs (Anonymous 2011). Since the stationary phase is composed
of micrometre size porous particles, a high pressure pump is required to move
the mobile phase through the column (Anonymous 2011). The
chromatographic process begins by injecting the solute onto the top of the
column (Anonymous 2011). Separation of components occurs as the analytes
and mobile phase are pumped through the column (Anonymous 2011).
Eventually, each component elutes from the column as a narrow band (or peak)
on the recorder. Detection of the eluting components is important, and this can
be either selective or universal, depending upon the detector used
(Anonymous 2011). The response of the detector to each component is
displayed on a chart recorder or computer screen and is known as a
chromatogram (Anonymous 2011). To collect, store and analyse the
chromatographic data, computer, integrator, and other data processing
equipment are frequently used (Anonymous 2011).
10

Figure1.1 Instrumentation of High Performance Liquid Chromatography (Clark
2007).
Advances in high performance liquid chromatography (HPLC) systems
have made this technique the method of choice for many researchers
interested in sugar determinations (Conrad and others 1976; Binder 1980).
Picha conducted the quantitative analysis of sugars in raw and baked
sweet potato roots using HPLC (Picha 1985). The major sugars in raw roots:
sucrose, glucose, and fructose, were quantitated with a cation exchange resin
column (Aminex HPX-87C) heated to 75°C using HPLC-grade Hz0 as the
mobile phase and refractive index detection (Picha 1985). The major sugars in
baked roots (convection oven or microwaved) were maltose, sucrose, glucose,
and fructose (Picha 1985). They were quantitated with an aminopropyl bonded
phase column (Bio-Sil Amino 5s) at 21°C using a 70% CHaCN:30% Hz0
mobile phase and refractive index detection (Picha 1985).
11

Lee and others conducted a research to determine the total sugar content
in onions, using an HPLC system with a refractive index detector (LC 25) and a
700CH carbohydrate column (Alltech, Deerfield, Ill., U.S.A.) with a guard
cartridge (Lee and others 2009). Total sugar content was calculated by
summing the sucrose, glucose, and fructose contents. They also identified
glucose as the major sugar content in onions (Lee and others 2009).
Another research focused on the detection of apple juice concentration
(Gomis and others 2004). HPLC method for sugar analyses in cider was used
in order to detect the presence of apple juice concentrate (Gomis and others
2004). Sugars were analyzed by reversed-phase liquid chromatography using
a C8 column and a mobile phase of citrate buffer pH
5.5/tetrahydrofuran/acetonitrile, operated in gradient mode (Gomis and others
2004).
Aminex HPLC columns are one type of normally used analytical columns
for sugar identification. Recent literature suggests that the Aminex
polystyrene-divinylbenzene ion exchange resins are applicable to a wide
variety of water soluble and partially water soluble small organic compounds.
The columns are packed with a polymer-based matrix, offer many advantages
for the analysis of carbohydrates, alcohols, and organic acids in food and
beverage. These columns allow the use of simple isocratic methods, eluting
with water or dilute acid. There is minimal sample preparation, usually just
filtering through a 0.45μm filter with no derivatization necessary.
12

1.3.2 Ultraviolet-visible spectroscopy
Ultraviolet-visible (UV-vis) spectroscopy is used to obtain the absorbance
spectra of a compound in solution or as a solid (Sibilia 1996; Harris 2007;
Skoog and others 2007). What is actually being observed spectroscopically is
the absorbance of light energy or electromagnetic radiation, which excites
electrons from the ground state to the first singlet excited state of the
compound or material (Sibilia 1996; Harris 2007; Skoog and others 2007). The
UV-vis region of energy for the electromagnetic spectrum covers 1.5 - 6.2 eV
which relates to a wavelength range of 800 - 200 nm (Sibilia 1996; Harris 2007;
Skoog and others 2007). The Beer-Lambert Law is the principle behind
absorbance spectroscopy (Sibilia 1996; Harris 2007; Skoog and others 2007).
For a single wavelength, A is absorbance (unitless, usually seen as arbitrary
units), ε is the molar absorptivity of the compound or molecule in solution
(M-1cm-1), b is the path length of the cuvette or sample holder (usually 1 cm),
and c is the concentration of the solution (M) (Sibilia 1996; Harris 2007; Skoog
and others 2007).
A = εbc
UV-vis spectroscopic data can give qualitative and quantitative information
of a given compound or molecule (Sibilia 1996; Harris 2007; Skoog and others
2007). Irrespective of whether quantitative or qualitative information is required
it is important to use a reference cell to zero the instrument for the solvent the
compound is in (Sibilia 1996; Harris 2007; Skoog and others 2007). For
13
quantitative information on the compound, calibrating the instrument using
known concentrations of the compound in question in a solution with the same
solvent as the unknown sample would be required (Sibilia 1996; Harris 2007;
Skoog and others 2007). If the information needed is just proof that a
compound is in the sample being analyzed, a calibration curve will not be
necessary; however, if a degradation study or reaction is being performed, and
concentration of the compound in solution is required, thus a calibration curve
is needed (Sibilia 1996; Harris 2007; Skoog and others 2007).
UV/Vis spectroscopy is routinely used in analytical chemistry for
the quantitative determination of different analytes, such as transition metal
ions, highly conjugated organic compounds, and biological macromolecules.
Solutions of transition metal ions can be colored and absorb visible
light. Organic compounds, especially those with a high degree of conjugation,
also absorb light in the UV or visible regions of the electromagnetic spectrum.
The solvents for these determinations are often water for water soluble
compounds, or ethanol for organic-soluble compounds.
UV-visible spectroscopy does have some limitations when applied to the
practical experiment.
UV-vis spectroscopy works well on liquids and solutions, but if the sample
is more of a suspension of solid particles in liquid, the sample will scatter the
light more than absorb the light and the data will be much skewed (Sibilia 1996;
Harris 2007; Skoog and others 2007). Most UV-vis instruments can analyze
14
solid samples or suspensions with a diffraction apparatus, but this is not
common (Sibilia 1996; Harris 2007; Skoog and others 2007). UV-vis
instruments generally analyze liquids and solutions most efficiently (Sibilia
1996; Harris 2007; Skoog and others 2007).
A blank reference will be needed at the very beginning of the analysis of
the solvent to be used (water, hexanes, etc), and if concentration analysis
needs to be performed, calibration solutions need to be made accurately
(Sibilia 1996; Harris 2007; Skoog and others 2007). If the solutions are not
made accurately enough, the actual concentration of the sample in question
will not be accurately determined (Sibilia 1996; Harris 2007; Skoog and others
2007).
Every solvent has a UV-vis absorbance cutoff wavelength. The solvent
cutoff is the wavelength below which the solvent itself absorbs all of the light
(Sibilia 1996; Harris 2007; Skoog and others 2007).
15
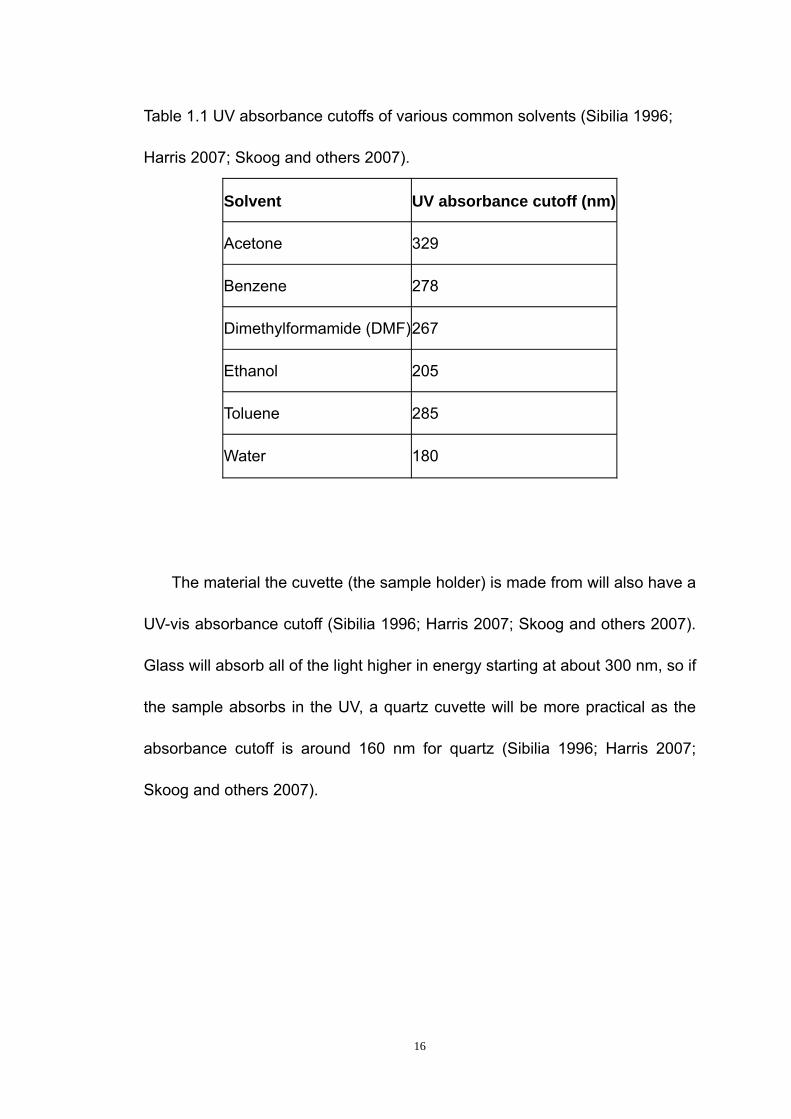
Table 1.1 UV absorbance cutoffs of various common solvents (Sibilia 1996;
Harris 2007; Skoog and others 2007).
Solvent UV absorbance cutoff (nm)
Acetone 329
Benzene 278
Dimethylformamide (DMF)267
Ethanol 205
Toluene 285
Water 180
The material the cuvette (the sample holder) is made from will also have a
UV-vis absorbance cutoff (Sibilia 1996; Harris 2007; Skoog and others 2007).
Glass will absorb all of the light higher in energy starting at about 300 nm, so if
the sample absorbs in the UV, a quartz cuvette will be more practical as the
absorbance cutoff is around 160 nm for quartz (Sibilia 1996; Harris 2007;
Skoog and others 2007).
16

Table 1.2 Three different types of cuvettes commonly used with different
usable wavelengths (Sibilia 1996; Harris 2007; Skoog and others 2007).
Material Wavelength range (nm)
Glass 380 - 780
Plastic 380 - 780
Fused quartzbelow 380
To obtain reliable data, the peak of absorbance of a given compound
needs to be at least three times higher in intensity than the background noise
of the instrument (Sibilia 1996; Harris 2007; Skoog and others 2007).
Obviously using higher concentrations of the compound in solution can combat
this (Sibilia 1996; Harris 2007; Skoog and others 2007). Also, if the sample is
very small and diluting it would not give an acceptable signal, there are
cuvettes that hold smaller sample sizes than the 2.5 mL of a standard cuvettes
(Sibilia 1996; Harris 2007; Skoog and others 2007). Some cuvettes are made
to hold only 100 μL, which would allow for a small sample to be analyzed
without having to dilute it to a larger volume, lowering the signal to noise ratio
(Sibilia 1996; Harris 2007; Skoog and others 2007).
Sugars can be measured by UV-visible spectroscopy via the aids of single
or a series of enzyme catalyzed reactions. Enzymes, as analytical tools, have
found widespread use in the food, biochemical, and pharmaceutical industries
17

(Bergmeyer and others 1974). Enzymatic methods are specific, reproducible,
sensitive, rapid, and therefore, idea for analytical purpose (Bergmeyer and
others 1974). Due to the high specificity and sensitivity of enzymes,
quantitative assays may be done on crude materials with little or no sample
preparation (Bergmeyer and others 1974). In the quantitative, enzymatic
determination of sucrose in food and other materials, Sucrose is hydrolyzed to
glucose and fructose by invertase (Bergmeyer and others 1974). Glucose and
fructose are phosphorylated by adenosine triphosphate (ATP) in the reaction
catalyzed by hexokinase (Bergmeyer and others 1974). Glucose -6-phosphate
(G6P) is then oxidized to 6-phosphogluconate in the presence of nicotinamide
adenine dinucleotide (NAD) in a reaction catalyzed by glucose-6-phosphate
dehydrogenase (G6PDH) (Bergmeyer and others 1974). During this oxidation,
an equimolar amount of NAD is reduced to NADH (Bergmeyer and others
1974). The consequent increase in absorbance at 340nm is directly
proportional to sucrose concentration (Bergmeyer and others 1974).
Sucrose Glucose + fructose
Glucose +2ATP+Fructose Glucose-6-phosphate + Fructose-6-phosphate+2ADP
G6P+NAD NADH + 6-Phosphogluconate
Invertase
Hexokinase
G6PDH
Sucrose Glucose + fructose
Glucose +2ATP+Fructose Glucose-6-phosphate + Fructose-6-phosphate+2ADP
G6P+NAD NADH + 6-Phosphogluconate
Invertase
Hexokinase
G6PDH
Figure 1.2 Enzymatic determination of sucrose (Bergmeyer and others 1974).
18

However in practical experiment, enzymatic assay of sugar does have
some disadvantages. Take sucrose enzymatic assay as an example, sucrose
needs to be extracted from solid samples, filter or deproteinize of extracted
solution is sometimes required to clarify; if glucose amount in the sample is too
large (ratio of glucose to sucrose is larger than 5:1), then the glucose must be
removed before the testing of sucrose.
1.3.3 Fourier transform infrared spectroscopy
Infrared spectroscopy has been a workhorse technique for materials
analysis in the laboratory for over seventy years (Anonymous 2001). An
infrared spectrum represents a fingerprint of a sample with absorption peaks
which correspond to the frequencies of vibrations between the bonds of the
atoms making up the material (Anonymous 2001). Because each different
material is a unique combination of atoms, no two compounds produce the
exact same infrared spectrum (Anonymous 2001). Therefore, infrared
spectroscopy can result in a positive identification (qualitative analysis) of
every different kind of material. In addition, the size of the peaks in the
spectrum is a direct indication of the amount of material present (Anonymous
2001). With modern software algorithms, infrared is an excellent tool for
quantitative analysis (Anonymous 2001).
Fourier transform infrared (FT-IR) spectroscopy is a simple, rapid, and
reliable technique that has been widely researched and applied for analysis of
food components (Subramanian and others 2009). It is based on the principle
19
that different chemical functional groups require different amounts of energy
(different wavelengths) for excitation (Subramanian and others 2009). Fourier
transform infrared spectroscopy is preferred over dispersive or filter methods
of infrared spectral analysis for several reasons:
1. It is a non-destructive technique
2. It provides a precise measurement method which requires no external
calibration
3. It can increase speed, collecting a scan every second
4. It can increase sensitivity – one second scans can be co-added together to
ratio out random noise
5. It has greater optical throughput
6. It is mechanically simple with only one moving part (Anonymous 2001).
FTIR spectroscopy has become an alternative technique for the analysis of
sugars in food samples, having the attractive features of being noninvasive
and potentially more rapid than the methods of HPLC and enzymatic analysis
(Duarte and others 2002).
FTIR was used for quantification of sugars in mango juices as a function of
ripening (Duarte and others 2002). Glucose, fructose, and sucrose are the
most abundant components of mango juice (Duarte and others 2002).
Throughout ripening, sucrose and fructose can be accurately quantified,
whereas the accuracy of glucose determination decreased at later stages,
when concentrations fell to 0.6-1.5 g/L (Duarte and others 2002). The bands
20

related to sucrose were successfully identified as 1149, 1080, 1062, 1024,
1008, 956, and 937 cm-1 (Duarte and others 2002). The researchers
suggested that FTIR can be used as a rapid indicator of ripening degree, which
would help to establish suitable conditions for transport and storage (Duarte
and others 2002).
Another experiment used FTIR as a replacement instrument to
Chromatography, which are time consuming and require skilled operators, for
the determination of beet medium invert sugar adulteration in three different
varieties of honey (Sivakesava and others 2001). The spectra in the region
between 950 and 1500 cm-1 were selected for the quantitative analysis and
classification of beet medium invert sugar, most likely due to sugar had highest
negative correlation in this region (Sivakesava and others 2001). The results
demonstrated the potential to distinguish different levels of beet sugar invert in
honey, which is a major problem in the honey industry (Sivakesava and others
2001).
21

1.4 References
1. Anonymous. 2001. Introduction to Fourier transform infrared Spectrometry.
Thermo nicolet corporation.
2. Anonymous. 2004. Global Snack Food Industry Trends. Snack Food &
Wholesale Bakery 93:64.
3. Anonymous. 2004. Snacking, the All-American pastime. Snack Food &
Wholesale Bakery 93:SI-34.
4. Anonymous. 2011. High performance liquid chromatography.
Standardbase techniques. Drenthe College. The Netherlands.
5. Arber A. 1934. The Gramineae: a study of cereal, bamboo, and grass.
University Press, Cambridge.
6. Bergmeyer HU, Bernt E. 1974. Methods of Enzymatic Analysis, 2nd edition.
Bergmeyer HU, eds., Academic Press (New York), 1177-1179.
7. Binder H. 1980. Separation of monosaccharides by high-performance
liquid chromatography: comparison of ultraviolet and refractive index
detection. J. Chromatog 189: 414.
8. Bird IM. 1989. High performance liquid chromatography: principles and
clinical applications. British Medical Journal 299:783-787.
9. Chapman GP. 1996. The Biology of Grasses. CAB International, UK.
10. Chen H, Gatlin B, Burnside G, Reddy RN, Kandarpa VK, Mazumder MK.
22
1995. A transfer efficiency model for powder coating process. In
Conference record of the 1995 IEEE 2:1280 –1283.
11. Chopra VL, Prakash S, eds. 2002. Evolution and Adaptation of Cereal
Crops. Science Publishers Inc, NH, USA.
12. Clark J. 2007. High performance liquid chromatography-HPLC. Chemguid.
Available at
http://www.chemguide.co.uk/analysis/chromatography/hplc.html.
13. Conrad EC, Palmer JK. 1976. Rapid analysis of carbohydrates by
high-pressure liquid chromatography. Food. Technol 30: 84.
14. Culbertson JD. 2004. Grain, cereal: ready-to-eat breakfast cereals. In:
Scott Smith, J., Hui, Y.H. (Eds.), Food Processing: Principles and
Applications. Blackwell Publishing, Oxford, UK, pp. 239–248.
15. Denoyelle L. 2008. Coating processes in food: a rational approach to the
selection and development of a process. AgroFood Industry Hi-Tech 19:28
–30.
16. Duarte IF, Barros AN, Delgadillo I, Almeida CU, Gil AM. 2002. Application
of FTIR spectroscopy for the quantification of sugars in mango juice as a
function of ripening. Journal of agricultural and food chemistry
50:3104-3111.
17. Fast RB. 2000. Manufacturing technology of ready-to-eat breakfast cereals.
In:Fast, R.B., Caldwell, E.F. (Eds.), Breakfast Cereals and How They are
Made. American Association of Cereal Chemists, Paul MN, USA, pp. 29–
23

34.
18. Fast RB. 2001. Breakfast cereals. In: Owen, G. (Ed.), Cereals Processing
Technology. Woodheal Publishing, Cambridge, UK, pp. 158–172.
19. Gomis DB, Tamayo DM, Valles BS, Mangas Alonso JJ. 2004. Detection of
apple juice concentrate in the manufacture of natural and sparkling cider
by means of HPLC chemometric sugar analyses. Journal of agricultural
and food chemistry 52:201-203.
20. Harris DC. 2007. Quantitative chemical analysis, 7th Ed. Freeman, New
York.
21. Lee EJ, Yoo KS, Jifon J, Patil BS. 2009. Characterization of shortday onion
cultivars of 3 pungency levels with flavor precursor, free amino acid, sulfur,
and sugar contents. Journal of food science 74:475-480.
22. Marquart L and others eds. 2002. Whole grain foods in health and disease.
American Association of Cereal Chemists, St. Paul, MN.
23. Mazumder MK, Wankum DL, Sims RA, Mountain JR, Chen H, Pettit P.
1997. Influence of powder properties on the performance of electrostatic
coating process. Journal of Electrostatics 40–41:369–374.
24. Mun˜oz AM. 2002. Sensory evaluation in quality control: an overview, new
developments and future opportunities. Food Quality and Preference
13:329–339.
25. Nikolaou M. 2006. Control of snack food manufacturing systems. Control
Systems, IEEE 26:40-53.
24

26. Ortega-Rivas E. 2005. Handling and processing of food powders and
particulates. In: Onwulata C. (Ed.), Encapsulated and Powdered Foods.
CRC Taylor & Francis, Boca Raton FL, USA, pp. 75–144.
27. Picha DH. 1985. HPLC determination of sugars in raw and baked sweet
potatoes. Journal of food science 50:1189-1190.
28. Pool R. 1948. Marching with the grasses. University of Nebraska Press,
USA.
29. Pomeranz Y, Munck L, eds. 1981. Cereals: A Renewable Resource.
American Association of Cereal Chemists. St. Paul, MN.
30. Roberts E. 2009. The Facts on Heart Disease, Sodium, and Sugar.
EverydayHealth.com.http://www.everydayhealth.com/heart-health/salt-and
-sugar.aspx
31. Sevatson E, Huber GR. 2000. Extruders in the food industry. In: Riaz, M.N.
(Ed.), Extruders in Food Applications. CRC Taylor & Francis, Boca Raton
FL, USA, pp. 167–204.
32. Shukla TP. 1994. Future snacks and snack food-technology. Cereal Foods
World 39:704-705.
33. Shukla TP. 2000. Modern snack foods. Cereal Foods World 45: 477-477.
34. Sibilia JP. 1996. Materials Characterization and chemical analysis, 2nd Ed.
Wiley-VCH, New York.
35. Sivakesava S, Irudayaraj J. 2001. Detection of inverted beet sugar
adulteration of honey by FTIR spectroscopy. Journal of the science of food
25

and agriculture 81:683-690.
36. Skoog DA, Holler FJ, Crouch SR. 2007. Principles of instrumental analysis,
6th Ed. Thomson brooks/cole.
37. Snyder LR, Kirkland JJ, Dolan JW. 2009. Introduction to Modern Liquid
Chromatography. New Jersey:John Wiley & Sons, Inc.
38. Solís-Morales D, Sáenz-Hernández CM, Ortega-Rivas E. 2009. Attrition
reduction and quality improvement of coated puffed wheat by fluidised bed
technology. Journal of Food Engineering 93:236-241.
39. Stone H, Sidel JL. 1993. Sensory evaluations practices, California:
Academic Press.
40. Subramanian A, Harper WJ, Rodriguez-Saona LE. 2009. Cheddar cheese
classification based on flavor quality using a novel extraction method and
Fourier transform infrared spectroscopy. Journal of dairy science
92:87–94.
41. The History of Breakfast Cereals. 2008.
Iventors.about.com. http://inventors.about.com/library/inventors/blcereal.ht
onomous
Available
m.
42. Torres-Mart í nez JL. 2001. Coating of Puffed Wheat Cereal with a
Chocolate Flavoured Cover Using Tumbling. MSc Thesis. Aut
University of Chihuahua (in Spanish), Chihuahua, Chih, Mexico.
43. U.S. Census Bureau. 2002. 2002 Economic Census Industry Series
Report.
26

at http://www.census.gov/epcd/ec97/industry/E311919.HTM.
44. United States Department of Agriculture, 1996. Food Guide Pyramid
ood Processing Operations and
e
cfm?articleID=000A97BD-80FC-1DF6-973
d electrostatic
powder coating. Journal of Food Engineering 83:550–561.
Booklet.
45. Valentas KJ, Levine L, Clark JP. 1991. F
Scale-up. Marcel Dekker, New York, NY.
46. Willett WC, Stampfer MJ. 2002. Rebuilding the Food Pyramid: Overview /
The Food Guide Pyramid (Sidebar). Availabl
at http://www.sciam.com/article.
809EC588EEDF&sc=I100322.
47. Yousuf S, Barringer SA. 2007. Modeling nonelectrostatic an
27

CHAPTER 2
Rapid Determinati Snack Products
Using Infrared Spectroscopy
Ting Wang and Luis E. Rodriguez-Saona
e and Technology
d Science and Technology
olumbus, OH, USA
on of Sugar and Salt Levels in
Department of Food Scienc
The Ohio State University
110 Parker Foo
2015 Fyffe Rd
C
28

2.1 Abstract
The US snack food industry generates billions of dollars in revenue each
year. There is a need for cutting edge sensor technology directed at improving
efficiency, throughput and reliability of critical processes. The aim of the
research was to evaluate the feasibility of infrared systems combined with
chemometric analysis for rapid quality assessment in applications to Ohio’s
snack industry. Samples were ground and spectra were collected using a
mid-IR spectrometer equipped with a 3-bounce ZnSe MIRacle attenuated total
reflectance accessory or FT-NIR system equipped with a diffuse
reflection-integrating sphere. Sugars (cereal) and salt (tortilla chips) content
were determined using a reference HPLC or titrimetric methods, respectively.
Partial least squares regression (PLSR) was used to create cross-validated
calibration models. The prediction ability of the models was evaluated on an
independent set of samples and compared with reference techniques. The
spectra showed characteristic absorption bands for sugars (MIR and NIR) and
the salt-induced changes in the NIR water spectrum as affected by salt content.
Best performance PLSR models for salt content were generated from NIR
reflectance (SECV=0.016% and r = 0.96) whereas similar statistics were
obtained for sugar levels (SEP ~0.02mg/g cereal and r > 0.98). Multivariate
models accurately and precisely predicted the salt and sugar levels in snacks
allowing for rapid (<1 min analysis time) analysis. This simple technique allows
29

for reliable prediction of quality parameters, and automation enabling food
manufacturers for early corrective actions that will ultimately save time and
lishing a uniform quality.
2.2
ironment, and regulatory requirements
(Ca
money while estab
Introduction
The snack food market alone is estimated to be roughly $20 billion (USD)
per year with the worldwide market approximately double this amount (U.S.
Census Bureau). Business challenges for food manufacturers are increasing
due to increased regulatory and monitoring requirements, increased economic
pressures, more stringent environmental regulations, and more discriminating
and changing consumer preferences. Cutting edge sensor technologies are
directed at improving efficiency, throughput and reliability of critical processes
(Holm 2003). While many Ohio food processors understand the value of
sensor technology and its potential economic benefits to their businesses, the
sensor devices currently available to them, as well as many under
development, will simply not work in a food processing operation. The food
industry has unique requirements that cannot be met by devices designed for
the processes and products of other industry fields. Food applications
introduce challenges related to unique performance, accuracy, safety, product
composition, processing env
selunghe and others 2000).
Methods available to the food industry are often time-consuming,
expensive, the precision is strongly dependent on the operation of skilled
30

personnel, and they are difficult to adapt into a quality assurance setting
(Halim and others 2006). In addition, unwanted interference from the sample
matrix often requires the use of extensive sample preparation and clean-up
(Halim and others 2006). Field-based devices can streamline quality
assurance, protecting consumers against the risk of purchasing and
consuming nutritionally inadequate, deceptively mislabeled or misbranded,
imp
fiths and others 1986; McKelvy and others 1996; Wilson and
othe
perform to the
target process by the industry.
d Methods
2.3.
ure, or unsafe foods.
Advances in Fourier transform infrared (FT-IR) spectroscopic
instrumentation combined with multivariate data analysis have made this
technology ideal for large volume, rapid screening and identification of various
analytes. Infrared spectroscopy provides valuable information of the
biochemical composition of the samples, especially in the fingerprint region,
which have been used for numerous food applications related to quality control
and safety (Grif
rs 1999).
The objective was to develop rapid methods for the determination of
sugars and salt content in snacks by combining infrared (NIR and mid-IR) and
chemometrics. Also, to validate the infrared technology to
specifications required by the
2.3 Materials an
1 Samples
Tortilla chips samples were obtained from the Snack Foods (Wyandot Inc.)
31

industries, a leading Ohio food manufacturer. Four different types of tortilla
chips were evaluated, PC 035 Yellow Tortilla, PC 349 White Tortilla, PC 231
Dipper Corn Chips, and PC 089 Yellow & White Corn Tortilla, and each type
contained multiple samples. Samples were compressed by using a manual
hydraulic carver press (model 3851 from Carver Inc., Wabash, IN). Ground
chips (10g) were placed in a stainless steel cylinder container, then placed in
the press and pressure was applied at a rate of about one stroke every two
seconds until reaching a final pressure of 15000 pounds. The final tortilla
“coo
terizer
ec. to obtain a homogenous particle size.
2.3.
he reference values for moisture, oil and salt
con
ed through 13 mm Whatman filters
(Ke
kies” were used for spectral data acquisition.
Cereal base and sucrose coated samples were provided by Wyandot Inc.
Two different cereal shapes, puff and round, and flavors, strawberry, banana,
sweet potato, apple cinnamon, peach, apple, and cherry, were included in the
study. The samples were blended using the pulse setting of an Os
blender (Oster 6646) for 8 s
2 Reference Methods
Wyandot Inc provided t
tent of the tortilla chips.
Quantitation of Sugars: Cereal aliquots (0.5g) were mixed with water (5
mL), vortexed and the eluate was filter
nt, England) with 0.2 µm pore size.
High performance liquid chromatography (HPLC): Sucrose, glucose and
fructose contents were analyzed using a Shimadzu high performance liquid
32

chromatography (HPLC) system equipped with LC-6AD pumps, SIL-20AHT
autosampler, CTO-20A column oven, and RID-10A refractive index detector
(Shimadzu Scientific Instruments, Inc. Columbia, MD). Twenty-five microliters
of each filtrate were injected into the HPLC system. The sugars were
separated on a stainless steel, 7.8 mm ID x 300 mm Aminex® HPX-87C
carbohydrate column coupled with a 4.6 mm ID x 30 mm micro-guard Carbo-C
cartridge (Bio-Rad Laboratories, Hercules, CA). Isocratic separation of the
sugars was achieved at 80°C using HPLC grade water with a flow rate of 0.6
mL/min for 30 minutes. LC Solutions software version 3.0 (Shimadzu
Scientific Instruments, Inc. Columbia, MD) was used to collect and analyze the
chromatograms. Sucrose, glucose and fructose were identified by comparing
the peak retention times with those of pure sugar standards (Fisher Scientific,
Fair Lawn, NJ). Calibration curves were prepared for each sugar in
concentrations ranging from 2.5 to 20 mg/ml. Finally, quantitation of sugars
present in each sample was calculated from the computed peak areas and the
corr
esponding standard curves.
Enzymatic Determination of Sugars: Samples for analysis were diluted
with distilled water (1:80 v/v) and analyzed according to the technical product
information provided by Sigma for each enzymatic kit. Sucrose levels were
quantified using Sigma Aldrich enzymatic assay kits (Saint Louis, MO).
Sucrose assay (SCA20-1KT) is based on the hydrolysis of sucrose to glucose
and fructose by invertase. A kexokinase then phosphorylates glucose and
33

fructose to form glucose-6-phosphate that is then oxidized to
6-phosphogluconate in the presence of NAD in a reaction catalyzed by
glucose-6-phosphate dehydrogenase. During this oxidation, an equimolar
amount of NAD is reduced to NADH. The consequent increase in absorbance
at 340 nm is directly proportional to sucrose concentration. Absorbance was
monitored using a UV/Visible spectrophotometer 2450 (Shimadzu, Columbia,
isposable cells.
2.3.
al were placed onto the different spectrometers and spectra were
acq
inst that of the background, a highly reflective gold-coated
refe
MD) with 1-cm path length d
3 FT-IR Spectroscopy
Samples were analyzed by Fourier transform Near-infrared (FT-NIR) and
Fourier transform mid-infrared (FT-IR) spectroscopy. Tortilla cookies and
blended cere
uired.
FT-NIR measurements were collected using an integrating sphere diffuse
reflectance accessory (Integrat IRTM, Pike Technologies, Madison, WI). An
Excalibur 3500 Fourier-Transform IR spectrometer (Varian Inc, Palo Alto, CA)
with a quartz beam splitter and Lead Selenide (PbSe) detector operating at 8
cm-1 resolution were used for all the reading. The spectra were collected in the
range from 10000 to 4000 cm-1, and displayed in terms of absorbance.
Interferograms of 64 scans will be co-added followed by Beer-Norton
apodization. The absorbance spectrum was obtained by ratioing the single
beam spectrum aga
rence material.
34

Ground tortilla cookies (~1g) were pressed onto a 3-bounce ATR-IR
diamond crystal using a high-pressure clamp (Pike Technologies, Madison WI).
An aliquot (0.5g) of the homogenized cereal was mixed with water (1.5mL) and
then placed onto the ATR-IR ZnSe crystal. FT-IR measurements were
collected using a range between 4000 and 700 cm-1 at a resolution of 8 cm-1
on a FTS Excalibur 3500GX FTIR spectrometer (Varian, Randolph, MA).
Interferograms of 64 scans were co-added. The absorbance spectrum was
obtained by ratioing the sample spectrum against that of a blank optical path
(ref
otte, NC). For each sample, a total of 2 independent spectra were
2.3.
erence spectrum).
Spectra of reference blanks and samples were processed using Win-IR
Pro Software 4.05 (Varian Inc, Palo Alto, CA). All the instruments were
continuously purged with CO2 free dry air from a CO2RP140 dryer (Domnick
Hunter, Charl
measured.
4 Multivariate Analysis
Samples spectra collected were analyzed using Multivariate regression
analysis (Partial least squares regression, PLSR), which built calibration
models to simultaneously correlate the reference compositional values to the
infrared spectral information. Partial Least Squares Regression (PLSR) was
cross-validated (leave-one-out approach) to generate calibration models.
PLSR is a bi-linear regression analysis method that extracts a small number of
orthogonal factors that are linear combinations of the spectral (X) variables,
35

and uses these factors as regressors for the analyte’s concentration
(Y-variable). These orthogonal factors (latent variables) explain as much as
possible of the covariance of the X and Y variables. PLSR has been
particularly successful in developing multivariate calibration models for the
spectroscopy field because it uses the concentration information (Y-variable)
actively in determining how the regression factors are computed from the
spectral data matrix (X), reducing the impact of irrelevant X-variations in the
calibration model. This capability provides a more information-rich data set of
reduced dimensionality and eliminates data noise resulting in more accurate
odels (Wold and others 2001).
2.4.
s, resolving overlapping peaks, and reducing variability between
plicates.
and reproducible calibration m
2.4 Results and Discussion
1 Spectral Analysis of Tortilla Chips
The Near- and mid- infrared spectra (Figure 1) were collected from tortilla
chip samples obtained from Wyandot Inc. NIR spectra were collected from
tortilla cookies while for ATR-IR the samples were grounded in order to
improve contact of the sample with the diamond crystal. Mathematical
processing of the raw spectra using a Savitzky-Golay second derivative
algorithm (15-pt gap size) enhanced spectral features through removing of
baseline shift
re
36

Figure 2.1 Typical Near infrared (A) and ATR-Mid infrared Spectrum of tortilla
chip samples.
Figure 1A shows the characteristic NIR spectrum of tortilla chip “cookies”
with bands representative of specific functional groups associated mainly to
their protein, moisture, carbohydrate and residual oil components. The spectral
bands were matched with the corresponding functional groups that absorbs in
the near infrared region (Table 1). The NIR reflectance spectral features
(Figure 1A) showed the absorption bands at 7190, 5855, 5790, 5680, 4340
37
and 4269 cm-1 associated with C-H structural overtones of aliphatic groups of
oils. Bands near 6960 and 5200 cm-1 were assigned to the first overtones and
combination absorption modes of OH, respectively (Kays and others 1997;
Espinoza and others 1999). Bands in the 5000-4550 cm-1 region have been
related to amides modes (Liu and others 1994) with bands near 4850 and
4600 cm-1 assigned to combinations of amide A/I and amide B/II, respectively
(Wang and others 1994; Robert and others 1999). In addition, bands at 5190
cm-1 and in the region from 4400 - 4033 cm-1 have been related to OH
stretching/HOH deformation modes and C-H groups of carbohydrates,
respectively (Kays and others 1997).
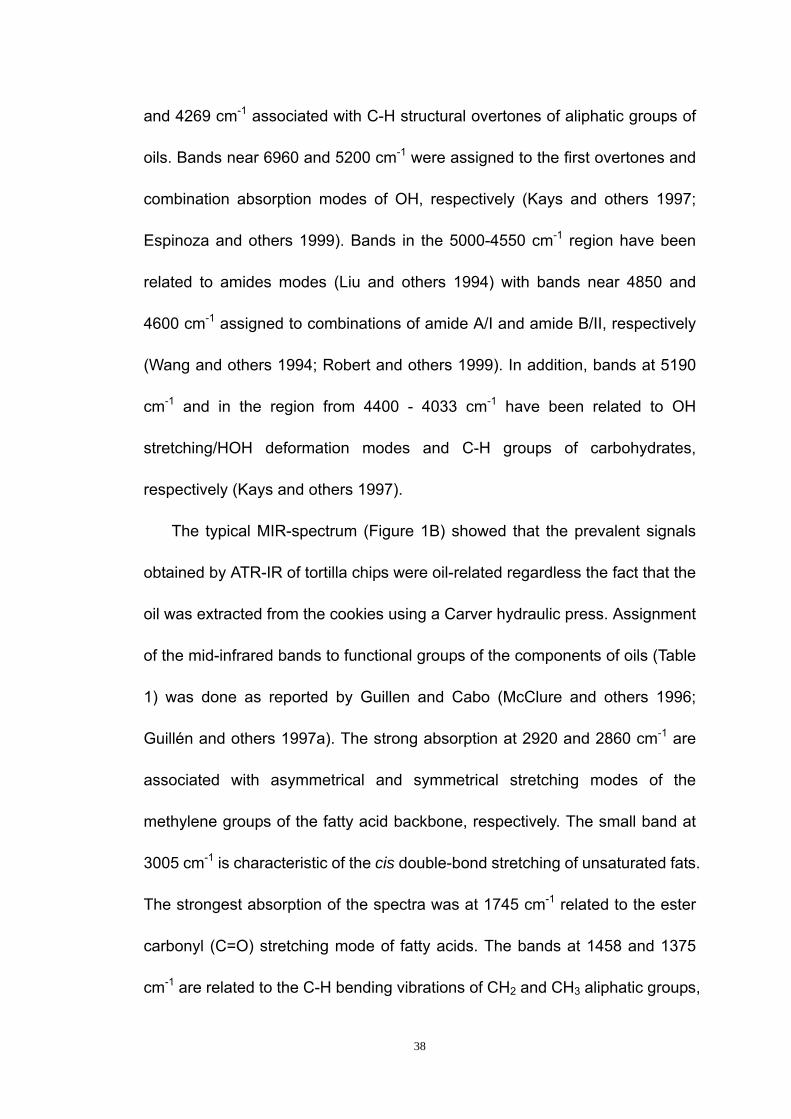
The typical MIR-spectrum (Figure 1B) showed that the prevalent signals
obtained by ATR-IR of tortilla chips were oil-related regardless the fact that the
oil was extracted from the cookies using a Carver hydraulic press. Assignment
of the mid-infrared bands to functional groups of the components of oils (Table
1) was done as reported by Guillen and Cabo (McClure and others 1996;
Guillén and others 1997a). The strong absorption at 2920 and 2860 cm-1 are
associated with asymmetrical and symmetrical stretching modes of the
methylene groups of the fatty acid backbone, respectively. The small band at
3005 cm-1 is characteristic of the cis double-bond stretching of unsaturated fats.
The strongest absorption of the spectra was at 1745 cm-1 related to the ester
carbonyl (C=O) stretching mode of fatty acids. The bands at 1458 and 1375
cm-1 are related to the C-H bending vibrations of CH2 and CH3 aliphatic groups,
38

whereas bands near 1654 cm-1 corresponds to the amide I (N-H) stretching
vibration of proteins and in the fingerprint region (1200 – 900 cm-1) containing
unique and complex information related to C-O, C-C stretching and C-O-H and
C-O-C deformation of carbohydrates.
Table 2.1 Assignment of Bands in the NIR and MIR-FT Spectra
Frequency (cm-1)
Functional Group Assignment
Near Infrared Region
≈ 8600 – 8150
≈ 7200 – 6850
≈ 5950 - 5600
≈ 5200 - 5100
≈ 5000 - 4800
≈ 4350 - 4150
C-H 2nd overtone of -CH3; Fatty acids.
O-H 1st overtone of H2O; water.
C-H 1st overtone of –CH3 and CH2, Fatty acids.
O-H combination of H2O; water.
C-H stretch and C=O stretching; protein.
C-H combination; fatty acids and C-H / C-C stretch;
fatty acids having cis double bonds.
C-H stretch / CH2 deformation combination; starch
Mid Infrared Region
≈ 3040 – 2850
≈ 1744
≈ 1654
≈ 1546
≈ 1500 - 1300
≈ 1480 - 1440
≈ 1400
≈ 1240 - 1180
≈ 1200 – 900
(Fingerprint region)
≈ 750
C-H asymmetrical and symmetrical stretching of CH2
and CH3; Fatty acids.
C=O stretching of esters; free fatty acids
Amide I
Amide II
O-H bending vibration, water
C-H bending vibrations of CH2 and CH3; proteins
C-H bending vibrations of CH2 and CH3; fatty acids
C=O symmetric stretching; COO-
C-O stretching vibration; esters
C-O, C-C stretching and C-O-H and C-O-C deformation
of carbohydrates.
C-H overlapping of CH2 rocking vibration, and out of
plane vibration of cis-disubstituted olefins.
39
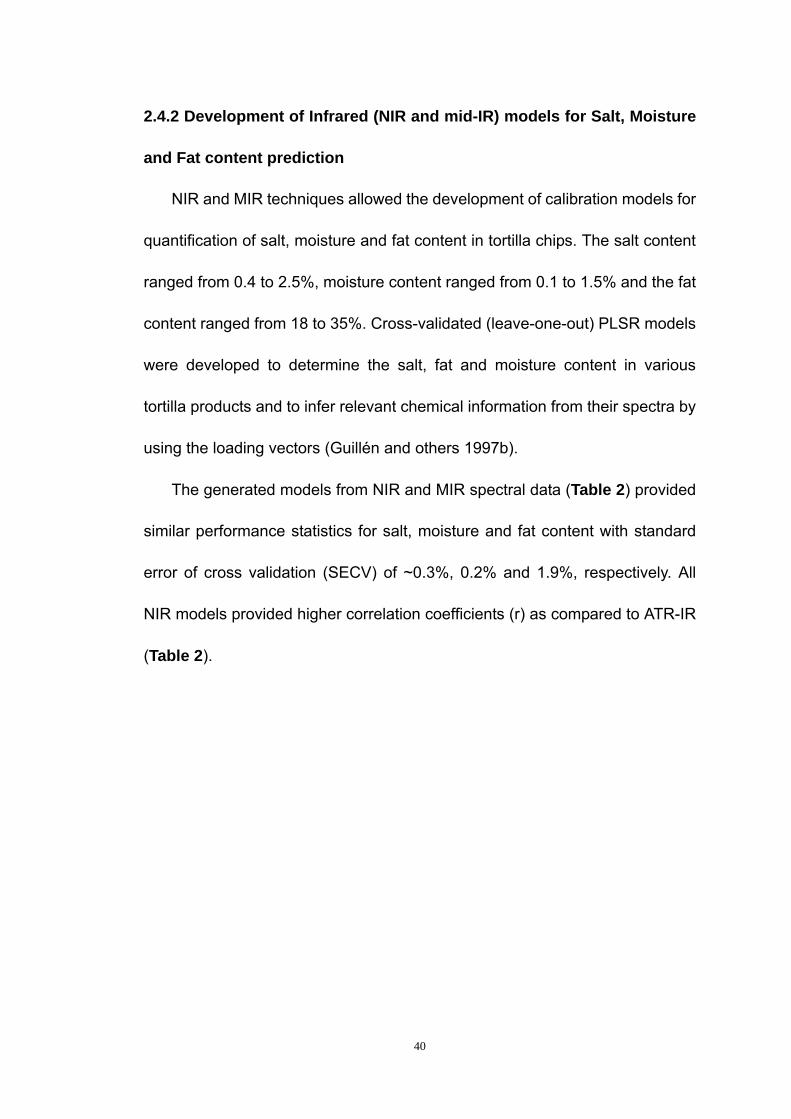
2.4.2 Development of Infrared (NIR and mid-IR) models for Salt, Moisture
and Fat content prediction
NIR and MIR techniques allowed the development of calibration models for
quantification of salt, moisture and fat content in tortilla chips. The salt content
ranged from 0.4 to 2.5%, moisture content ranged from 0.1 to 1.5% and the fat
content ranged from 18 to 35%. Cross-validated (leave-one-out) PLSR models
were developed to determine the salt, fat and moisture content in various
tortilla products and to infer relevant chemical information from their spectra by
using the loading vectors (Guillén and others 1997b).
The generated models from NIR and MIR spectral data (Table 2) provided
similar performance statistics for salt, moisture and fat content with standard
error of cross validation (SECV) of ~0.3%, 0.2% and 1.9%, respectively. All
NIR models provided higher correlation coefficients (r) as compared to ATR-IR
(Table 2).
40
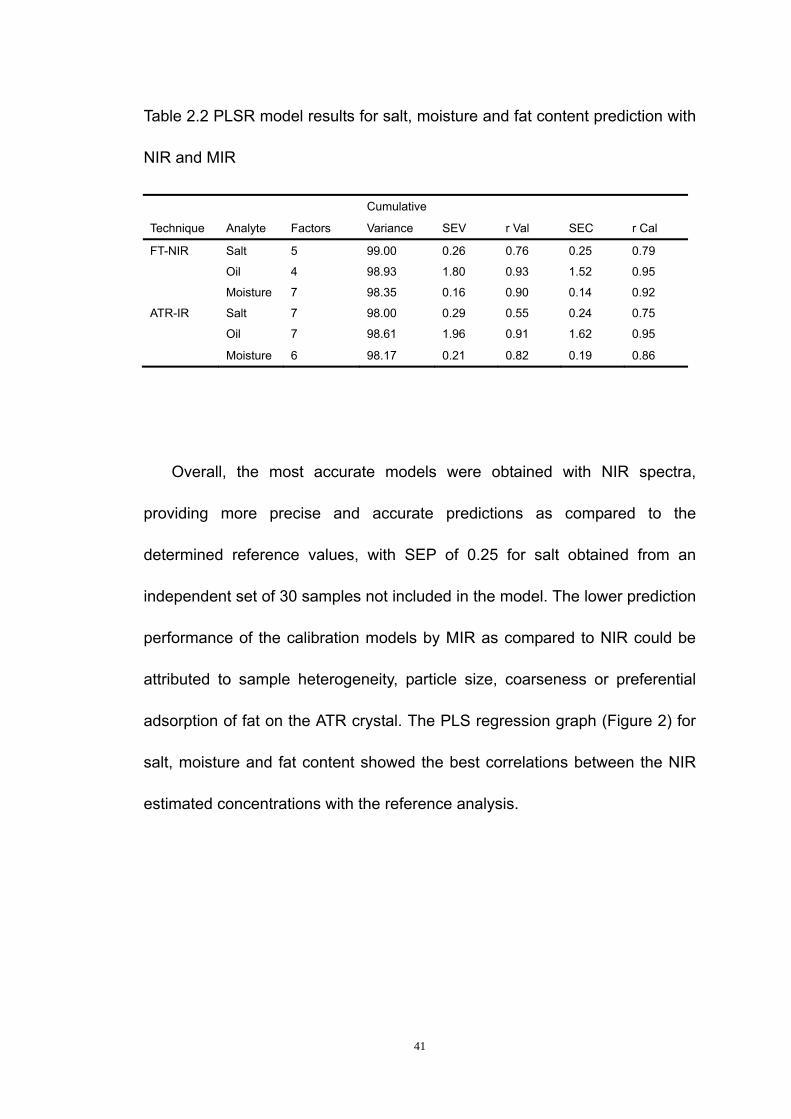
Table 2.2 PLSR model results for salt, moisture and fat content prediction with
NIR and MIR
Cumulative
Technique Analyte Factors Variance SEV r Val SEC r Cal
FT-NIR Salt 5 99.00 0.26 0.76 0.25 0.79
Oil 4 98.93 1.80 0.93 1.52 0.95
Moisture 7 98.35 0.16 0.90 0.14 0.92
ATR-IR Salt 7 98.00 0.29 0.55 0.24 0.75
Oil 7 98.61 1.96 0.91 1.62 0.95
Moisture 6 98.17 0.21 0.82 0.19 0.86
Overall, the most accurate models were obtained with NIR spectra,
providing more precise and accurate predictions as compared to the
determined reference values, with SEP of 0.25 for salt obtained from an
independent set of 30 samples not included in the model. The lower prediction
performance of the calibration models by MIR as compared to NIR could be
attributed to sample heterogeneity, particle size, coarseness or preferential
adsorption of fat on the ATR crystal. The PLS regression graph (Figure 2) for
salt, moisture and fat content showed the best correlations between the NIR
estimated concentrations with the reference analysis.
41

Figure 2.2 Partial Least Squares Regression (PLSR) cross-validation plots for
salt, moisture, and oil determination in tortilla chip samples from Wyandot Inc.
Examination of the loading spectra indicated which bands of the spectrum
were associated with the highest variation in the calibration set. Frequencies of
high variation reflect contributions of spectral resolution elements that can be
correlated with combinations of different chemical and physical phenomena
(Bjorsvik and others 1992; Kays and others 1998). The NIR loadings showed
42

that the highest variation in the calibration set for salt content was associated
with the dominant and broad peaks centered at 5181 cm-1. Even though
sodium chloride has no specific absorption bands in the NIR region, salt
analysis is possible because of the effect of the chloride ion on the shift in the
water spectrum. In addition, prediction of fat content was associated with
broad bands at 5945, 5752, and 4344 cm-1 due to C-H overtones and
combination bands of lipids, while moisture content was related with NIR
absorbance near 5200 cm-1 associated to broad OH absorption combination
bands of water (Espinoza and others 1999). Examination of the loadings for
the PLSR models generated with MIR second derivatized spectra showed the
predominance of the fat bands in all models that limited the predictive ability for
salt and moisture content.
2.4.3 Sugar content in Cereals
Addition of sucrose to cereal base resulted in a distinct FT-NIR
absorbance peak at 6955 cm-1 related to the first overtone of the O-H structural
vibration of sucrose (Kays and others 1998). Most of the changes in the
spectrum however, were barely noticeable and chemometric models are
needed to extract the relevant information for quantitative analysis. PLSR was
used to extract pertinent information from complex spectra of several
chemicals by describing the main types of spectral variations and relating it to
the chemical data to generate the calibration models.
The sugar composition of the cereal (coated and uncoated bases) is
43

presented in Table 3. We found discrepancies between the enzymatic sucrose
methods and HPLC analysis (Table 3). Average sucrose contents in coated
cereal of 20.8 g/100g (SD 7.2 and range of 37.7-8.9 g/100g) and 18.4 g/100g
(SD 3.3 and range of 25.7-10.5 g/100g) were determined by enzymatic assays
and HPLC, respectively. Uncoated cereal base showed an average sucrose
content of 6.6 g/100g (SD 5.6 and range of 17.8-1.4 g/100g) by enzymatic kits
and 4.3 g/100g (SD 2.2 and range of 10.0-0.7 g/100g) by HPLC analysis.
Overall, enzymatic determination of sucrose in cereal bases showed higher
data variability as evidenced by the higher standard deviation and range of
values as compared to HPLC analysis. HPLC methods have shown to give
better quantification of sucrose because the enzymatic procedure uses a
two-stage process that introduces more analytical variation (Ashurst 2005).
Table 2.3 Sugar contents in cereal tested by enzymatic assay kit and HPLC
method
44
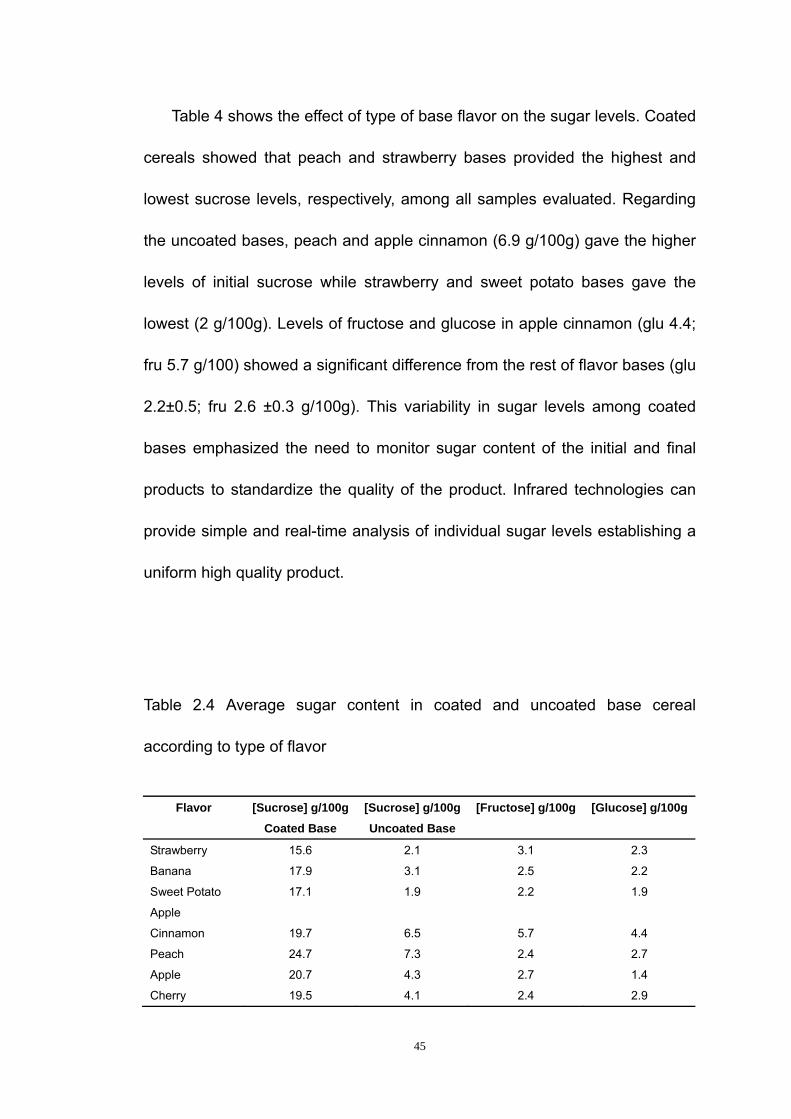
Table 4 shows the effect of type of base flavor on the sugar levels. Coated
cereals showed that peach and strawberry bases provided the highest and
lowest sucrose levels, respectively, among all samples evaluated. Regarding
the uncoated bases, peach and apple cinnamon (6.9 g/100g) gave the higher
levels of initial sucrose while strawberry and sweet potato bases gave the
lowest (2 g/100g). Levels of fructose and glucose in apple cinnamon (glu 4.4;
fru 5.7 g/100) showed a significant difference from the rest of flavor bases (glu
2.2±0.5; fru 2.6 ±0.3 g/100g). This variability in sugar levels among coated
bases emphasized the need to monitor sugar content of the initial and final
products to standardize the quality of the product. Infrared technologies can
provide simple and real-time analysis of individual sugar levels establishing a
uniform high quality product.
Table 2.4 Average sugar content in coated and uncoated base cereal
according to type of flavor
Flavor [Sucrose] g/100g [Sucrose] g/100g [Fructose] g/100g [Glucose] g/100g Coated Base Uncoated Base
Strawberry 15.6 2.1 3.1 2.3
Banana 17.9 3.1 2.5 2.2
Sweet Potato 17.1 1.9 2.2 1.9
Apple
Cinnamon 19.7 6.5 5.7 4.4
Peach 24.7 7.3 2.4 2.7
Apple 20.7 4.3 2.7 1.4
Cherry 19.5 4.1 2.4 2.9
45

The calibration results for determination of sugars in cereals are presented
in Table 5.
Table 2.5 Performance statistics for PLSR calibration and validation models
The optimal number of factor to retain in the calibration model should not be
too few that can leave important structure un-modeled, and it should not be too
46

many that draws too much measurement noise. In general, mid-infrared (MIR)
PLSR models incorporated higher number of factors as compared to FT-NIR.
FT-NIR and MIR techniques allowed the quantification of individual sugars in
cereals. The cross-validated calibration models from derivatized spectral data
gave SECV of ~0.4% for glucose and fructose and ~1.3% for sucrose
determinations, explaining > 99% of the variability. Overall, FT-NIR and MIR
gave accurate predictions from an independent set of samples not included in
the development of the calibration model. MIR (SEP 1.4%) showed a slightly
improved sucrose prediction compared to FT-NIR (1.7%) probably because by
incorporating more factors is able to include more relevant information-rich
data and eliminates data noise resulting in robust calibration models. PLS
correlation graph for individual sugar content are presented in Figure 3,
showing the good correlation of the models with the reference HPLC analysis,
both with NIR and MIR.
47

Figure 2.3 Partial Least Squares Regression (PLSR) cross-validation plots for
sugar determination in cereal samples from Wyandot Inc.
Examination of the loadings for cereals coated with sugars (Figure 4), the
FT-NIR spectral features were associated the characteristic absorbances of
carbohydrate O-H and C-H groups. The FT-NIR spectrum of crystalline sugar
was very similar to that reported by McClure et al. (McClure and others 1996)
with a sharp band at 6963 cm-1 dominated the first loading, which is indicative
of the importance of O-H groups in crystalline sucrose, as previously reported
48

by Kays et al. (Kays and others 1998). The bands near 6960, 6595 and 6325
cm-1 has been assigned to the first overtones of stretching modes of free OH,
intramolecular hydrogen-bonded OH, and intermolecular hydrogen-bonded
OH groups, respectively (McClure and others 1996). Bands in the 5900-5700
cm-1 region have been associated with first overtones of CH stretching modes.
In addition, bands in the information-rich region from 4600-4000 cm-1 can be
ascribed to combinations of O-H bend/ hydrogen-bonded O-H stretch (~ 4428
cm-1), O-H stretch/C-C stretch (~ 4393 cm-1) and combinations of C-H/C-C
(4385-4063 cm-1) vibrations of the sugar molecules (Osborne and others
1986).
For MIR, first and second PC loadings obtained showed many of the
features that can be attributed to C–O and C–C stretching modes in the
900–1150 cm-1 region, with a band around 1020-1060 cm-1 due to O-H
vibrations. Bands appearing between 1150-1470cm-1 are attributed to bending
modes of C-C-H, C-O-H and O-C-H groups while more intense peaks in the
region between 900 and 1150 cm-1 arise mainly from C-O and C-C stretching
modes (Sivakesava and others 2002).
49

Figure 2.4 Partial Least Squares loading spectra for the first 2 latent variables
for the calibration set measured by FT-NIR reflectance and ATR-MRI
spectroscopy.
2.5 Conclusions
FT-NIR and MIR spectroscopy and multivariate techniques (PLSR)
allowed for rapid, accurate and non-destructive determination of salt, fat and
moisture content in tortilla chips and sugar levels in cereals. Overall, near
infrared results were convenient for quantification purposes due to the faster
50

sample preparation and ease of use. The total time required for sample
preparation and analysis was less than 2 minutes per sample. The infrared
technology can provide sensing capabilities for rapid monitoring of quality
assurance, providing the industry with a tool for timely correction measures
during manufacture. Handheld portable infrared systems could provide
greater versatility, ruggedness, and portability as a real-time infrared sensor for
direct fingerprinting strategies of food components for the reliable assessment
of quality and safety
51

2.6 References
1. Ashurst PR. 2005. Chemistry and technology of soft drinks and fruit juices.
2. Bjorsvik HR, Martens H. 1992. Data analysis: Calibration of NIR
instruments by PLS regression. In:Burns D, Ciurczak E, editors.
Handbook of Near-Infrared Analysis. New York:Marcel Dekker, Inc.
3. Caselunghe M, Lindeberg J. 2000. Biosensor-based determination of folic
acid in fortified food. Food Chem 70:523-532.
4. Espinoza LH, Lucas D, Littlejohn D. 1999. Characterization of hazardous
aqueous samples by Near-IR spectroscopy. Appl. Spectrosc 53:97-102.
5. Griffiths PR, De Haseth JA.1986. Chemical Analysis 83: Fourier
Transform Infrared Spectrometry. 656 p.
6. Guillén MD, Cabo N. 1997a. Infrared spectroscopy in the study of edible
oils and fats. Journal of the Science of Food and Agriculture 75:1-11.
7. Guillén MD, Cabo N. 1997b. Characterization of edible oils and lard by
Fourier transform infrared spectroscopy. Relationships between
composition and frequency of concrete bands in the fingerprint region.
Journal of the American Oil Chemists’ Society 74:1281-1286.
8. Halim Y, Schwartz S, Francis D, Baldauf N, Rodriguez-Saona L. 2006.
Direct determination of lycopene content in tomatoes (Lycopersicon
52
esculentum) by attenuated total reflectance infrared spectroscopy and
multivariate analysis. J AOAC Int 89:1257-1262.
9. Holm F. 2003. Food Quality Sensors. Institut National de la Recherche
Agronomique. Paris, France. ISBN : 2-7380-1076-8.
10. Kays SE, Windham WR, Barton II FE. 1997. Effect of cereal product
residual moisture content on total dietary fiber determined by near-infrared
reflectance spectroscopy. J. Agric. Food Chem 45:140-144.
11. Kays SE, Windham WR, Barton II FE. 1998. Prediction of total dietary fiber
by Near-Infrared reflectance spectroscopy in high-fat- and
high-sugar-containing cereal. J. Agric. Food Chem 46:854-861.
12. Liu Y, Cho R, Sakurai K, Miura T, Ozaki Y. 1994. Studies on
spectra/structure correlations in Near-Infrared spectra of proteins and
polypeptides. Part I. A marker for hydrogen bonds. Appl. Spectrosc
48:1249-1254.
13. McClure WF, Maeda H, Dong J, Liu Y, Ozaki Y. 1996. Two-Dimensional
correlation of Fourier Transform Near-Infrared and Fourier Transform
Raman spectra I: Mixtures of sugar and protein. Appl. Spectrosc
50:467-475.
14. McKelvy M, Britt T, Davis B, Gillie J, Lentz L, Leugers A, Nyquist R, Putzig
C. 1996. Infrared spectroscopy. Analytical Chemistry 68:93R-160R.
53
15. Osborne BG, Fearn T. 1986. Theory of near infrared spectrophotometry. In:
Osborne BG, Fearn T, editors. Near Infrared Spectroscopy in Food
Analysis. Essex :Longman Scientific & Technical.
16. Robert P, Devaux MF, Mouhous N, Dufour E. 1999. Monitoring the
secondary structure of proteins by Near-Infrared spectroscopy. Appl.
Spectrosc 53:226-232.
17. Sivakesava S, Irudayaraj J. 2002. Classification of simple and complex
sugar adulterants in honey by mid-infrared spectroscopy. International
Journal of Food Science and Technology 37:351–360.
18. U.S. Census Bureau, Company Statistics Division, Statistics of U.S.
Businesses, Tabulations by Enterprise Size, U.S. all industries.
19. Wang J, Sowa MG, Ahmed MK, Mantsch HH. 1994. Photoacustic
Near-Infrared investigation of homo-polypeptides. J. Phys. Chem
98:4748-4755.
20. Wilson RH, Tapp HS. 1999. Trends in Analytical Chemistry. 18:85-93(9).
21. Wold S, Sjostrom M, Eriksson L. 2001. PLS-regression: a basic tool of
chemometrics. Chem and Intell Lab Systems 58:109-30.
54
References
1. Anonymous. 2001. Introduction to Fourier transform infrared Spectrometry.
Thermo nicolet corporation.
2. Anonymous. 2004. Global Snack Food Industry Trends. Snack Food &
Wholesale Bakery 93:64.
3. Anonymous. 2004. Snacking, the All-American pastime. Snack Food &
Wholesale Bakery 93:SI-34.
4. Anonymous. 2011. High performance liquid chromatography.
Standardbase techniques. Drenthe College. The Netherlands.
5. Arber A. 1934. The Gramineae: a study of cereal, bamboo, and grass.
University Press, Cambridge.
6. Ashurst PR. 2005. Chemistry and technology of soft drinks and fruit juices.
7. Bergmeyer HU, Bernt E. 1974. Methods of Enzymatic Analysis, 2nd edition.
Bergmeyer HU, eds., Academic Press (New York), 1177-1179.
8. Binder H. 1980. Separation of monosaccharides by high-performance
liquid chromatography: comparison of ultraviolet and refractive index
detection. J. Chromatog 189: 414.
9. Bird IM. 1989. High performance liquid chromatography: principles and
clinical applications. British Medical Journal 299:783-787.
55
10. Bjorsvik HR, Martens H. 1992. Data analysis: Calibration of NIR
instruments by PLS regression. In:Burns D, Ciurczak E, editors.
Handbook of Near-Infrared Analysis. New York:Marcel Dekker, Inc.
11. Caselunghe M, Lindeberg J. 2000. Biosensor-based determination of folic
acid in fortified food. Food Chem 70:523-532.
12. Chapman GP. 1996. The Biology of Grasses. CAB International, UK.
13. Chen H, Gatlin B, Burnside G, Reddy RN, Kandarpa VK, Mazumder MK.
1995. A transfer efficiency model for powder coating process. In
Conference record of the 1995 IEEE 2:1280 –1283.
14. Chopra VL, Prakash S, eds. 2002. Evolution and Adaptation of Cereal
Crops. Science Publishers Inc, NH, USA.
15. Clark J. 2007. High performance liquid chromatography-HPLC. Chemguid.
http://www.chemguide.co.uk/analysis/chromatography/hplc.html.
16. Conrad EC, Palmer JK. 1976. Rapid analysis of carbohydrates by
high-pressure liquid chromatography. Food. Technol 30: 84.
17. Culbertson JD. 2004. Grain, cereal: ready-to-eat breakfast cereals. In:
Scott Smith, J., Hui, Y.H. (Eds.), Food Processing: Principles and
Applications. Blackwell Publishing, Oxford, UK, pp. 239–248.
18. Denoyelle L. 2008. Coating processes in food: a rational approach to the
selection and development of a process. AgroFood Industry Hi-Tech 19:28
–30.
19. Duarte IF, Barros AN, Delgadillo I, Almeida CU, Gil AM. 2002. Application
56
of FTIR spectroscopy for the quantification of sugars in mango juice as a
function of ripening. Journal of agricultural and food chemistry
50:3104-3111.
20. Espinoza LH, Lucas D, Littlejohn D. 1999. Characterization of hazardous
aqueous samples by Near-IR spectroscopy. Appl. Spectrosc 53:97-102.
21. Fast RB. 2000. Manufacturing technology of ready-to-eat breakfast cereals.
In:Fast, R.B., Caldwell, E.F. (Eds.), Breakfast Cereals and How They are
Made. American Association of Cereal Chemists, Paul MN, USA, pp. 29–
34.
22. Fast RB. 2001. Breakfast cereals. In: Owen, G. (Ed.), Cereals Processing
Technology. Woodheal Publishing, Cambridge, UK, pp. 158–172.
23. Gomis DB, Tamayo DM, Valles BS, Mangas Alonso JJ. 2004. Detection of
apple juice concentrate in the manufacture of natural and sparkling cider
by means of HPLC chemometric sugar analyses. Journal of agricultural
and food chemistry 52:201-203.
24. Griffiths PR, De Haseth JA.1986. Chemical Analysis 83: Fourier
Transform Infrared Spectrometry. 656 p.
25. Guillén MD, Cabo N. 1997a. Infrared spectroscopy in the study of edible
oils and fats. Journal of the Science of Food and Agriculture 75:1-11.
26. Guillén MD, Cabo N. 1997b. Characterization of edible oils and lard by
Fourier transform infrared spectroscopy. Relationships between
57

composition and frequency of concrete bands in the fingerprint region.
Journal of the American Oil Chemists’ Society 74:1281-1286.
27. Halim Y, Schwartz S, Francis D, Baldauf N, Rodriguez-Saona L. 2006.
Direct determination of lycopene content in tomatoes (Lycopersicon
esculentum) by attenuated total reflectance infrared spectroscopy and
multivariate analysis. J AOAC Int 89:1257-1262.
28. Harris DC. 2007. Quantitative chemical analysis, 7th Ed. Freeman, New
York.
29. Holm F. 2003. Food Quality Sensors. Institut National de la Recherche
Agronomique. Paris, France. ISBN : 2-7380-1076-8.
30. Kays SE, Windham WR, Barton II FE. 1997. Effect of cereal product
residual moisture content on total dietary fiber determined by near-infrared
reflectance spectroscopy. J. Agric. Food Chem 45:140-144.
31. Kays SE, Windham WR, Barton II FE. 1998. Prediction of total dietary fiber
by Near-Infrared reflectance spectroscopy in high-fat- and
high-sugar-containing cereal. J. Agric. Food Chem 46:854-861.
32. Lee EJ, Yoo KS, Jifon J, Patil BS. 2009. Characterization of shortday onion
cultivars of 3 pungency levels with flavor precursor, free amino acid, sulfur,
and sugar contents. Journal of food science 74:475-480.
33. Liu Y, Cho R, Sakurai K, Miura T, Ozaki Y. 1994. Studies on
spectra/structure correlations in Near-Infrared spectra of proteins and
58
polypeptides. Part I. A marker for hydrogen bonds. Appl. Spectrosc
48:1249-1254.
34. Marquart L and others eds. 2002. Whole grain foods in health and disease.
American Association of Cereal Chemists, St. Paul, MN.
35. Mazumder MK, Wankum DL, Sims RA, Mountain JR, Chen H, Pettit P.
1997. Influence of powder properties on the performance of electrostatic
coating process. Journal of Electrostatics 40–41:369–374.
36. McClure WF, Maeda H, Dong J, Liu Y, Ozaki Y. 1996. Two-Dimensional
correlation of Fourier Transform Near-Infrared and Fourier Transform
Raman spectra I: Mixtures of sugar and protein. Appl. Spectrosc
50:467-475.
37. McKelvy M, Britt T, Davis B, Gillie J, Lentz L, Leugers A, Nyquist R, Putzig
C. 1996. Infrared spectroscopy. Analytical Chemistry 68:93R-160R.
38. Mun˜oz AM. 2002. Sensory evaluation in quality control: an overview, new
developments and future opportunities. Food Quality and Preference
13:329–339.
39. Nikolaou M. 2006. Control of snack food manufacturing systems. Control
Systems, IEEE 26:40-53.
40. Osborne BG, Fearn T. 1986. Theory of near infrared spectrophotometry. In:
Osborne BG, Fearn T, editors. Near Infrared Spectroscopy in Food
Analysis. Essex :Longman Scientific & Technical.
41. Ortega-Rivas E. 2005. Handling and processing of food powders and
59
particulates. In: Onwulata C. (Ed.), Encapsulated and Powdered Foods.
CRC Taylor & Francis, Boca Raton FL, USA, pp. 75–144.
42. Picha DH. 1985. HPLC determination of sugars in raw and baked sweet
potatoes. Journal of food science 50:1189-1190.
43. Pool R. 1948. Marching with the grasses. University of Nebraska Press,
USA.
44. Pomeranz Y, Munck L, eds. 1981. Cereals: A Renewable Resource.
American Association of Cereal Chemists. St. Paul, MN.
45. Roberts E. 2009. The Facts on Heart Disease, Sodium, and Sugar.
EverydayHealth.com.http://www.everydayhealth.com/heart-health/salt-and
-sugar.aspx
46. Robert P, Devaux MF, Mouhous N, Dufour E. 1999. Monitoring the
secondary structure of proteins by Near-Infrared spectroscopy. Appl.
Spectrosc 53:226-232.
47. Sevatson E, Huber GR. 2000. Extruders in the food industry. In: Riaz, M.N.
(Ed.), Extruders in Food Applications. CRC Taylor & Francis, Boca Raton
FL, USA, pp. 167–204.
48. Shukla TP. 1994. Future snacks and snack food-technology. Cereal Foods
World 39:704-705.
49. Shukla TP. 2000. Modern snack foods. Cereal Foods World 45: 477-477.
50. Sibilia JP. 1996. Materials Characterization and chemical analysis, 2nd Ed.
Wiley-VCH, New York.
60
51. Sivakesava S, Irudayaraj J. 2001. Detection of inverted beet sugar
adulteration of honey by FTIR spectroscopy. Journal of the science of food
and agriculture 81:683-690.
52. Sivakesava S, Irudayaraj J. 2002. Classification of simple and complex
sugar adulterants in honey by mid-infrared spectroscopy. International
Journal of Food Science and Technology 37:351–360.
53. Skoog DA, Holler FJ, Crouch SR. 2007. Principles of instrumental analysis,
6th Ed. Thomson brooks/cole.
54. Snyder LR, Kirkland JJ, Dolan JW. 2009. Introduction to Modern Liquid
Chromatography. New Jersey:John Wiley & Sons, Inc.
55. Solís-Morales D, Sáenz-Hernández CM, Ortega-Rivas E. 2009. Attrition
reduction and quality improvement of coated puffed wheat by fluidised bed
technology. Journal of Food Engineering 93:236-241.
56. Stone H, Sidel JL. 1993. Sensory evaluations practices, California:
Academic Press.
57. Subramanian A, Harper WJ, Rodriguez-Saona LE. 2009. Cheddar cheese
classification based on flavor quality using a novel extraction method and
Fourier transform infrared spectroscopy. Journal of dairy science
92:87–94.
58. The History of Breakfast Cereals. 2008.
Iventors.about.com. http://inventors.about.com/library/inventors/blcereal.ht
m.
61
59. Torres-Mart í nez JL. 2001. Coating of Puffed Wheat Cereal with a
Chocolate Flavoured Cover Using Tumbling. MSc Thesis. Autonomous
Series
s of U.S.
tates Department of Agriculture, 1996. Food Guide Pyramid
ood Processing Operations and
investigation of homo-polypeptides. J. Phys. Chem
e
cfm?articleID=000A97BD-80FC-1DF6-973
: a basic tool of
d electrostatic
University of Chihuahua (in Spanish), Chihuahua, Chih, Mexico.
60. U.S. Census Bureau. 2002. 2002 Economic Census Industry
Report. http://www.census.gov/epcd/ec97/industry/E311919.HTM.
61. U.S. Census Bureau, Company Statistics Division, Statistic
Businesses, Tabulations by Enterprise Size, U.S. all industries.
62. United S
Booklet.
63. Valentas KJ, Levine L, Clark JP. 1991. F
Scale-up. Marcel Dekker, New York, NY.
64. Wang J, Sowa MG, Ahmed MK, Mantsch HH. 1994. Photoacustic
Near-Infrared
98:4748-4755.
65. Willett WC, Stampfer MJ. 2002. Rebuilding the Food Pyramid: Overview /
The Food Guide Pyramid (Sidebar). Availabl
at http://www.sciam.com/article.
809EC588EEDF&sc=I100322.
66. Wilson RH, Tapp HS. 1999. Trends in Analytical Chemistry. 18:85-93(9).
67. Wold S, Sjostrom M, Eriksson L. 2001. PLS-regression
chemometrics. Chem and Intell Lab Systems 58:109-30.
68. Yousuf S, Barringer SA. 2007. Modeling nonelectrostatic an
62

63 63
powder coating. Journal of Food Engineering 83:550–561.