PSYCHOLOGICAL CORRELATES OF SUGAR CONSUMPTION
14
PSYCHOLOGICAL CORRELATES OF SUGAR CONSUMPTION' HOWARD R. MOSKOWITZ MPi Sensory Testing,Znc. 770 Lexington Avenue New York, New York 10021 ABSTRACT This paper reviews some of the research on the sweet taste which has been published during the past several decades. It stresses the division of our understanding of sweetness into three sections: quality (type of taste, and the role of sweetness), measurement of sweetness intensity or strength of the perception and the correlation with physical measure- ments, and finally the hedonics of sweetness which represents the af- fective portion. Data is presented from a real-world study on the sweet- ness and liking of a beverage which illustrates that although children and adults may perceive the sensory characteristics of sweetness in similar manners, nonetheless their hedonic reactions are quite different to the same sweetened beverage. INTRODUCTION - THE SWEET TASTE A substantial stream of current research, as well as historical anec- dotal evidence, suggests that human beings are innately sensitive to, and prefer or accept, the sweet taste. Physiological studies of newborn infants by Jacob Steiner in Israel (Steiner 1974,1977) suggest that even children as young as 6 hr old exhibit reflex reactions (the so-called gustofacial reflex) which strongly suggest that they differentiate between sweet tasting solutions, sour, and bitter ones. Other evidence comes from consumption studies of sweetened solutions (Desor et al. 1973), showing differential ingestion of varying sweetened solutions and the increased ingestion of these solutions compared to tasteless (or insipid) water solutions containing no taste material. Finally, Geoffrey Nowlis and colleagues (Nowlis 1977) discovered that there are reflexive tongue movements to sweeteners that can be correlated with the con- centration of these sweeteners, and which parallel previously published 'Part of this paper was presented at the International Conference on Sugar Sub- stitutes, Geneva, Switzerland, October 30, November 1, 1977 Journal of Food Quality 2 (1978) 27-40. All Rights Reserved @Copyright 1978 by Food & Nutrition Press, Inc., Westport, Connecticut 27
-
Upload
independent -
Category
Documents
-
view
2 -
download
0
Transcript of PSYCHOLOGICAL CORRELATES OF SUGAR CONSUMPTION

PSYCHOLOGICAL CORRELATES OF SUGAR CONSUMPTION'
HOWARD R. MOSKOWITZ
MPi Sensory Testing, Znc. 770 Lexington Avenue
New York, New York 10021
ABSTRACT
This paper reviews some o f the research on the sweet taste which has been published during the past several decades. I t stresses the division of our understanding of sweetness into three sections: quality (type of taste, and the role o f sweetness), measurement o f sweetness intensity or strength of the perception and the correlation with physical measure- ments, and finally the hedonics of sweetness which represents the af- fective portion. Data is presented from a real-world study on the sweet- ness and liking of a beverage which illustrates that although children and adults may perceive the sensory characteristics o f sweetness in similar manners, nonetheless their hedonic reactions are quite different to the same sweetened beverage.
INTRODUCTION - THE SWEET TASTE
A substantial stream of current research, as well as historical anec- dotal evidence, suggests that human beings are innately sensitive to, and prefer or accept, the sweet taste. Physiological studies of newborn infants by Jacob Steiner in Israel (Steiner 1974, 1977) suggest that even children as young as 6 hr old exhibit reflex reactions (the so-called gustofacial reflex) which strongly suggest that they differentiate between sweet tasting solutions, sour, and bitter ones. Other evidence comes from consumption studies of sweetened solutions (Desor et al. 1973), showing differential ingestion of varying sweetened solutions and the increased ingestion of these solutions compared to tasteless (or insipid) water solutions containing no taste material. Finally, Geoffrey Nowlis and colleagues (Nowlis 1977) discovered that there are reflexive tongue movements to sweeteners that can be correlated with the con- centration of these sweeteners, and which parallel previously published
'Part of this paper was presented at the International Conference on Sugar Sub- stitutes, Geneva, Switzerland, October 30, November 1, 1977
Journal of Food Quality 2 (1978) 27-40. All Rights Reserved @Copyright 1978 by Food & Nutrition Press, Inc., Westport, Connecticut 27

28 HOWARD R. MOSKOWITZ
data on the perceived sweetness of these sugar stimuli (Moskowitz 1971).
Faced with this early acceptance of sweetness, and with the large industrial applications of sweeteners as flavoring agents and as non- tasted functionality agents, let us consider the three basic aspects of sweetness: quality, intensity and hedonics. Each of these aspects will be critical to an understanding of why we consume sugared products.
Quality
A century ago Fick (1864) (Boring 1942) suggested that there are four primary tastes: sweetness, saltiness, sourness and bitterness. We have accepted this classification, with the realization that no single substance excites simply one taste, but that each chemical taste stimulus excites a spectrum of taste perceptions. Sucrose, for instance, stimulates the perception of bitterness, especially at low concentra- tions. Other sweeteners in the carbohydrate family (e.g. fructose, glucose, etc. ) also may stimulate bitterness as well.
Tied in with the notion of sweet quality is the general recognition that sweeteners provoke different spectra of taste perception. No sweet- ener provokes the pure sensation of sweetness, nor in fact, has any researcher, with the exception of the Nobel laureate Georg von Bdkdsy, ever reported the isolation of a “pure sweetness” perception. For sugars as well as for the sweet sugar substitutes, sweetness is mixed with other taste/smell/touch sensations. Saccharin produces an intrinsic bitter taste along with its sweet quality (Rader et al. 1967), even when efforts are made to ensure its purity. Cyclamate does so as well. Aspartame (aspartyl phenyl alanine methyl ester), the dipeptide currently under study in the U.S., provokes a slight off-taste, but one which is clearly not sweetness. Finally, the many other sweeteners that have been con- sidered at one time or another as potential sugar substitutes (e.g. glycyrhizzin, the neohesperidin and neonaringen dihydrochalcones, stevioside, dulcin, etc.) have all been reported to taste different than sugar.
Within the sugar family, the quality of sugar sweetness also varies. Glucose, galactose, fructose, sorbitol, sorbose, mannitol, etc., are all qualitatively different from sucrose. The qualitative difference is hard to define, and may be the presence of various levels of odor perception, textural differences, heats of solution (especially for xylitol), viscosity, etc. (A discussion of these differences and a geometric representation of how perceptually similar/dissimilar sugars are to each other appears in Moskowitz 1972.) The qualitative differences in sugar substitutes (be they carbohydrate or non-carbohydrate) show up both in model

PSYCHOLOGICAL CORRELATES OF SUGAR CONSUMPTION 29
aqueous solutions which lack a background taste and in actual food products. Table 1 shows the degree of “off-aftertaste” and sweetness present in cola beverages sweetened with various levels of saccharin, cyclamate, aspartame and their combinations (Moskowitz et al. 1978). The instructive point about Table 1 is that the sugar substitutes in- fluence the sweetness of the cola, its off-aftertaste, as well as the hedonics response.
Table 1. Sweetness, off-taste and hedonics of cola beverages sweetened
Cyclamate Saccharin Aspartame After- Sample (Amount)’ (Amount)’ (Amount)’ Sweetness Liking taste
1 2 3 4 5 6 7 8
9 10 11 12 13 14 15 16
17 18 19 20 21 22
23 24 25 26 27 28 29 30
0 0 0 0 0 0 0 0
0 0 6.2 8.1 7.6 7.7 6.9 7.7
6.6 7.4
13.4 16.5 14.7 16.3
16.3 0 0 0 8.3
13.4 7.9
16.8
0 0 0 2.6 2.6 2.9 5.2 4.8
11.2 12.1 0 0 5.5 5.5 5.0
11.0
9.5 10.6
0 0 0 2.9
5.9 0 3.3
11.9 0 0
11.4 7.1
3.8 6.6
16.0 3.5 7.0
15.5 3.5 6.4
3.7 16.1
3.0 7.8 3.6 7.4
13.3 3.7
6.3 14.1
3.2 7.9
14.1 3.9
7.8 9.8 0 0 0 0 0 2.4
6.3 29.3 75.0 56.7 92.0
128.5 72.0
109.0
103.6 133.3
73.3 100.0 115.0 140.0 127.7
149.0 157.7
43.0 78.0
126.7 100.1
158.5 33.3 33.3 62.3
1.5 7.4
100.0 106.0
18.0
- 40.0 - 44.7 -t 38.0 -t 13.3 + 57.0
14.8 + 40.0 + 44.7
4- 24.0 - 40.5 - 83.3 + 33.3 + 42.3 + 50.0 - 20.0 4- 22.3
- 25.0 - 50.0 - 26.7 -I- 55.6 -I- 16.7 + 44.3
- 53.3 -113.3 - 75.0 - 22.0 -179.7 -122.3 4- 60.0 - 49.0
44.7 44.3 37.3 52.3 40.0 65.7 35.0 50.0
70.3 66.7 46.7 43.3 65.0 44.7 71.7 70.7
73.3 86.5 42.3 46.7 67.5 36.7
83.3 44.7 53.3 58.3 48.7 46.7 45.3 36.7
’ Amount = mg/oz

30 HOWARD R. MOSKOWITZ
Despite the accumulating evidence pertaining to the qualitative dif- ferences between sucrose and other sweeteners (both carbohydrate and non-carbohydrate) we still do not know that specific moiety of the molecule for a given sweetener which gives rise to the off-taste. Nor, in fact, are we aware of the general structural/activity relations which are necessary and sufficient for the perception of the sweet taste. Con- sequently, we are still in the beginning stages of our attempts to syn- thesize molecules with the appropriate sweet taste. We can synthesize specific molecules which will taste sweet, but we cannot selectively block the concomitant off-tastes. Hence, we may be able to engineer sweetness on a molecular level, but we must be content with the con- tinued presence of unwanted side-tastes.
Intensity
Since 1953, psychophysicists have begun to work with scales of sensory measurement which possess ratio properties. (A ratio scale, whether in physics, chemistry or perception, is a measurement scale wherein ratios of numbers reflect physical or sensory ratios. Examples from the physical sciences include mass, heat, and absolute temperature in degrees Kelvin.)
By the scaling method of magnitude estimation (Stevens 1953,1975) human judges in both expert taste panels and in consumer panels can generate numerical ratings to reflect perceived sweetness. Magnitude estimation is a specific, widely applied method of subjective sensory measurement which allows the test panelist to assign numbers so that ratios of numbers (the so-called magnitude estimates) reflect ratios of sweetness. If two solutions are rated for sweetness and A is assigned a magnitude estimate of 96 and B a value of 16, we can conclude that A is perceived to be 6 times sweeter than B. Furthermore, if we know the physical concentrations of solutions A and B (assuming that they come from the same chemical) we could generate a psychophysical function relating ratios of perceived sweetness to ratios of physical stimulus levels.
Magnitude estimation has been widely used by psychophysicists to map the relation between perceived sweetness and physical concentra- tion (either in percent weight by volume or molarity). The general result for carbohydrate sweeteners (e.g. sucrose, glucose, sorbitol, etc.) is that the equation relating sweetness and concentration is a power function of the form:
Sweetness (Magnitude Estimate) = k (Concentration)" (1)

PSYCHOLOGICAL CORRELATES OF SUGAR CONSUMPTION 31
The best estimates of n for carbohydrate sweeteners are:
(1) Approximately 1.3 if the taste solution is evaluated by sipping the sweetener and swirling it in the mouth.
(2) Approximately 0.5 if the taste solution is flowed over the tongue in a continuous stream.
This psychophysical relation for sweetness versus concentration does not generalize to the so-called “artificial sweeteners”. The perceived sweetness of saccharin, for instance, grows as a decelerating function of concentration (power function exponent of 0.65 or so, half that of sucrose for the identical sip and spit procedure). The underlying reason for this difference in growth rates of sweetness versus concentration for carbohydrate versus non-carbohydrate sweeteners is not apparent. There is the possibility that the observed or phenotypical sweetness generated by the artificial sweeteners may be a compromise sensory percept, generated as the result of suppression by bitter. The artificial sweeteners generate perceptions both of bitterness and of sweetness. The observed bitterness and sweetness is the final outcome, or per- ceptual equilibrium which results from an ongoing competition between the sweetness of artificial sweetener (which may well grow according to a power function of exponent 1.3) and the underlying bitterness which suppresses that sweetness.
Sweetness Mixtures
One of the most important areas for psychophysical research is the accurate measurement of the perceived sweetness of mixtures of sweet- eners, or mixtures of a sweetener with a non-sweet taste substance (e.g. sodium chloride, citric acid, quinine sulfate, etc.). The general rules which these studies have yielded can be summarized as follows:
(1) Sweeteners add together to produce increased sweetness inten- sity. The exact nature of the additivity is still not fully determined. There are suggestions that the sensory system adds together the phys- ical concentrations of both sweeteners (after first converting the disparate concentrations into a commensurate unit), and then trans- forms the higher concentration into a judgment of sweetness (Moskowitz 1973).
(2) Ad hoc equations can be developed to relate perceived sweetness to component sweetnesses or to component concentrations. These equations are linear in nature for predictions relating mixture sweetness to component sweetness (as shown in Table 2 for mixtures of aspar- tame and either sucrose, fructose or glucose).

32 HOWARD R. MOSKOWITZ
Table 2a. Sweetness power functions €or unmixed sweeteners C = 7% by weight in aqueous solution (Moskowitz and Dubose 1977)
Aspartame (all experiments combined) Log sweetness = 2.09 f 1.17 (log C) Sweetness = 123.OC1.l7 Standard error of estimate = 0.17 Correlation = 0.95 F(1. 12)
Glucose
Sucrose
Fructose
= 111.59 ( P < .001)
Log sweetness = -2.03 f 2.42 (log C): Sweetness = .0093C2.42
Log sweetness = -1.05 f 1.79 (log C): Sweetness = .089C1.79
Log sweetness = -0.50 f 1.49 (log C): Sweetness = .32C1e4’
Table 2b. Mixture equations €or sweetness (Moskowitz and lkbose 1977)
~~
Exp. 1: Glucose (G) f Aspartame (A) Sweetness= O.63(SG) f 0.90(SA) 4- 3.97
(R = 0.94, F = 161.11, df = 2,45) Sweetness= .0058(C,)2-42 f 110.7(CA) 1*17 4- 3.97
Sweetness = 0.79(Ss) f 0.86(SA) f 3.44
Sweetness = 0.70(Cs)1.79 f 1O5.78(CA)l.l7 + 3.44
Sweetness = O.74(SF) 4- 0.69(SA) -k 5.32 (R = 0.93, F = 152.97, df = 2,45)
Sweetness = .24(C,)1-49 f 84.87(CA)l.l7 f 5.32
Exp. 2: Sucrose (S) f Aspartame (A)
(R = 0.95, F = 223.3, df = 2,45)
Exp. 3: Fructose (F) f Aspartame (A)
S = Sweetness C = % concentration (w/v) G = Glucose S = Sucrose F = Fructose A = Aspartame
(3) In mixtures of sweeteners with non-sweet substances, the per- ceived sweetness is suppressed by the other taste, and sweetness sup- presses the other taste as well. This means that the taste of the mixture of different tasting materials is lower than would be expected on the basis of additivity.

PSYCHOLOGICAL CORRELATES OF SUGAR CONSUMPTION 33
(4) In commercial food products (e.g. cola beverages) similar equations hold.
Sweetness Hedonics
Sweetness occupies a unique position in our sensations of taste because it is a positive, pleasing sensation. Researchers have shown that even during early childhood, an infant will suck more from a sweetened drink than from a less sweetened one (Desor e t al. 1973).
To a great extent, the food industry possesses substantially more information on what sweet things are accepted, and what are rejected, as compared to data in the open scientific literature. Published scien- tific studies reveal that:
(1) In the absence of any food-like attributes, sweet tasting solutions of sugars in water are liked. In the presence of a food, however, the same sweet tasting solution is disliked. Cognitive factors thus play an important role in sweetness hedonics (Halpern, personal commu- nication).
(2) The acceptability of sweetness varies with the concentration and type of sweetener. For carbohydrate sweeteners, research going back more than 50years continues to suggest that as the sweetness of a solution is systematically increased from 0 to that imparted by 9% sucrose (or equally sweet 18% glucose), acceptability of the taste rises measured either by direct ratings of how much people like what they are tasting, or measured by the number of individuals in the test popu- lation who find the taste to be acceptable (Moskowitz 1974).
(3) At a concentration approximately 9% w/v, the acceptability peaks, and further on, acceptability diminishes with increased sweetness concentration.
(4) The same general rules govern products which are usually sweetened as well as applying to sugar solutions. Examples are bev- erages, puddings and cakes (Moskowitz et al. 1974).
(5) Artificial sweeteners in aqueous solution show somewhat differ- ent and more variable relations between acceptability of taste and either concentration or subjective sweetness.
(6) There is some suggestion that an artificial sweetener must be more sweet than a carbohydrate sweetener to achieve equal pleas- antness.
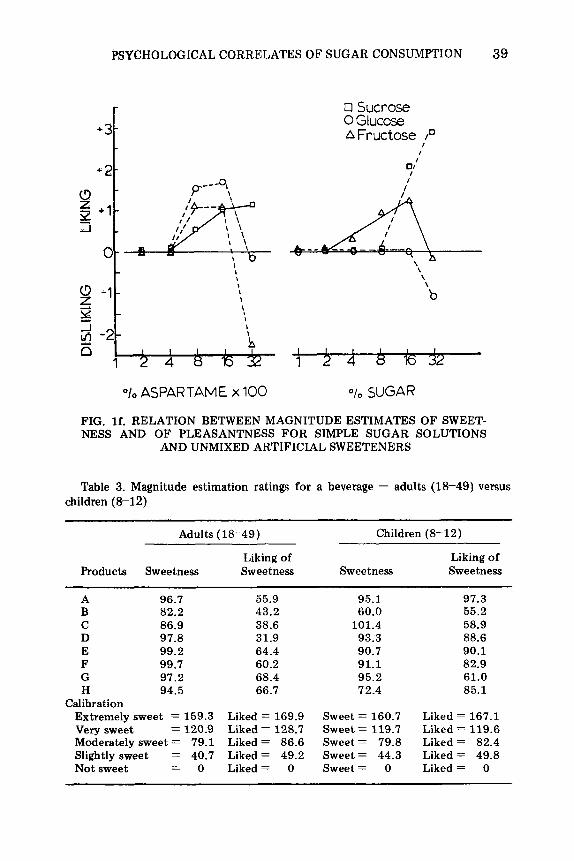
Figure 1 shows the relation between the magnitude estimations of sweetness and of pleasantness for unmixed sugar solutions (glucose, sucrose, fructose), and for unmixed artificial sweeteners (saccharin, cyclamate, aspartame). This means that in some fashion our sensory systems can differentiate both quality and hedonics of artificial

34 HOWARD R. MOSKOWITZ
MOLARlTY
FIG. la . THE SWEETNESS AND PLEASANTNESS OF SIMPLE SUGARS, PLOTTED IN LOG-LOG COORDINATES. STRAIGHT LINES SUGGEST POWER FUNCTIONS RELATING THE SUBJEC- TIVE CONTINUA TO THE OBJECTIVE CONTINUUM OF CON-
CENTRATION
sweeteners, and compensate for the change in carbohydrate to non- carbohydrate materials by modifying the basic, underlying hedonic function for sweetness.
Age is often influential in sweetness hedonics. Table 3 presents a comparison of adults’ and children’s hedonic ratings for several varia- tions of a beverage product. The children were 8-12 years old or less, and the adults were women. All panelists tested 1 of the beverages at home for 2-3 weeks and rated liking of sweetness as well as sweetness itself by magnitude estimation. Note that the children tend to prefer a sweeter product than the adults do. This does not imply, however, that within the wide range of sweetness there will be levels all of which are

PSYCHOLOGICAL CORRELATES OF SUGAR CONSUMPTION 35
T SIMPLE SUGARS
. . .@ . 4
a !i 1 . .*
,. ' .* - 0.
FIG. l b . THE RELATION BETWEEN PLEASANT- NESS OF SUGARS AND SWEETNESS O F SUGARS. EACH POINT IS THE MEDIAN JUDGMENT OF BOTH SWEETNESS AND PLEASANTNESS OF A SINGLE CONCENTRATION OF SUGAP. THE CO- ORDINATES ARE LOG-LOG, AND THE SLOPES
RANGE BETWEEN .3 AND .5

36
I n . w . + -
2 1 -
t-
Q tor" I :
HOWARD R. MOSKOWITZ
*SWEETNESS
OBITTEANESS ,
-4
I
cl - 1 )
d a. a /
TASTE OF ARTIF IC IAL SWEETENERS
LOG MOLARITY (a1
a T O T A L I X 10)
I i I I I I I I ! A ,; b .i 1.2 115 1.8 0 .3 6 .9 1.2 15 1.8 Na Saccharin Ca Saccharin
LOG MOLARITY ( b ~
FIG. lc . THE SWEETNESS, BITTERNESS AND TOTAL TASTE INTENSITY (MEDIAN SWEETNESS i- MEDIAN BITTERNESS) OF ARTIFICIAL SWEETENERS AS A FUNC- TION OF CONCENTRATION. THE COOR-
DINATES ARE LOG-LOG

PSYCHOLOGICAL CORRELATES OF SUGAR CONSUMPTION 37
t- z 2 3%
Ca Cycbmata
R E L A T I V E M O L A R I T Y (LOG UNITS)
FIG. Id. RELATION BETWEEN MAGNITUDE
ANTNESS FOR SIMPLE SUGAR SOLUTIONS AND UNMIXED ARTIFICIAL SWEETENERS
ESTIMATES OF SWEETNESS AND OF PLEAS-
equally acceptable to children. Just as approximately 9% w/v sucrose is optimally acceptable by adults, so there is probably a region of optimal acceptability for children, albeit probably a higher concentration.
Sweetness hedonics can be influenced by health and body state. Previously published observations by a number of researchers suggest that in the case of obese individuals there is no longer a peak liking or preference point at approximately 9% weight/volume sucrose, either in aqueous solution or in beverages, etc. Rather, in some instances, obese individuals will report that they like the sweeter tasting products, and

38 HOWARD R. MOSKOWITZ
W I- d 2 In W
Z Q n w t
-
Dissimilarity to 17.2 “lo Sucrose 10
n Sucrose
10 -
1: Sweetness
1 2 4 8 16 32 1 2 4 8 1 6 9
0
I . I I I I l l l i
O l 0 AS PARTAM E x 100 o/o SUGAR
FIG. le. RELATION BETWEEN MAGNITUDE ESTIMATES OF SWEET- NESS AND OF PLEASANTNESS FOR SIMPLE SUGAR SOLUTIONS AND
UNMIXED ARTIFICIAL SWEETENERS
exhibit a breakpoint in liking at a concentration approximately 18% w/v sucrose (or 36% w/v glucose). In other instances, when the obese individual is cued to state “disliking” for sweet substances, the individ- ual will report that he or she dislikes all sweet substances. In those instances, disliking of sweetness is proportional to sweetness of the sugar stimulus.
AN OVERVIEW AND SOME UNANSWERED QUESTIONS
As the foregoing paper shows, psychologists, physiologists, chemists, food scientists and a variety of other researchers have assembled a substantial amount of information during the past century pertaining to human perceptions of sweet things. The research appears to form a consistent whole in terms of the findings which emerge. Psychophysical analyses of sweet sensations tell us how to describe aspects of the quality of sweeteners, how to assess sweetness intensity, and how to measure sweetness hedonics. We have learned what are the expected
PSYCHOLOGICAL CORRELATES OF SUGAR CONSUMPTION 39
+3F t
0
p--"\\
o Sucrose 0 Gluccse AFructose lo
I I
I 0 1
I I
I
\
'0
I I I I I I
1 2 4 8 7 6 3 2
" l o ASPARTAME x 100 oto SUGAR
FIG. If, RELATION BETWEEN MAGNITUDE ESTIMATES OF SWEET- NESS AND OF PLEASANTNESS FOR SIMPLE SUGAR SOLUTIONS
AND UNMIXED ARTIFICIAL SWEETENERS
Table 3. Magnitude estimation ratings for a beverage - adults (18-49) versus children (8-12)
Adults (18-49) Children (8-12)
Liking of Liking of Products Sweetness Sweetness Sweetness Sweetness
A 96.7 B 82.2 C 86.9 D 97.8 E 99.2 F 99.7 G 97.2 H 94.5
Calibration Extremely sweet = 159.3 Very sweet = 120.9 Moderately sweet = 79.1 Slightly sweet = 40.7 Not sweet - 0 -
55.9 43.2 38.6 31.9 64.4 60.2 68.4 66.7
Liked = 169.9 Liked = 128.7 Liked = 86.6 Liked = 49.2 Liked = 0
95.1 60.0 101.4 93.3 90.7 91.1 95.2 72.4
Sweet = 160.7 Sweet = 119.7 Sweet= 79.8 Sweet = 44.3 Sweet= 0
97.3 55.2 58.9 88.6 90.1 82.9 61.0 85.1
Liked = 167.1 Liked = 119.6 Liked = 82.4 Liked = 49.8 Liked = 0

40 HOWARD R. MOSKOWITZ
effects of changes in structure (at least for known sweeteners), the relations between concentration and perceived sweetness, and the hedonic consequences of those changes for simple and complex stimuli.
REFERENCES
BORING, E. G. 1942. Sensation and Perception in the History of Experimental Psychology, Appleton-Century Crofts, New York.
DESOR, J. A., MALLER, 0. and TURNER, J. 1973. Taste in acceptance of sugars by human infants. J. Comp. Physiol. Psychol. 84,406.
MOSKOWITZ, H. R. 1971. The sweetness and pleasantness of sugars. Amer. J. Psychol. 84, 387.
MOSKOWITZ, H. R. 1972. Perceptual attributes of the tastes of sugars. J. Food Sci. 37, 624.
MOSKOWITZ, H. R. 1973. Models of sweetness additivity. J. Exper. Psychol. 99, 88.
MOSKOWITZ, H. R. 1974. The psychology of sweetness. In Sugars in Nutrition (H. Sipple and K. McNutt, eds.), p. 37, Academic Press, New York.
MOSKOWITZ, H. R. and DUBOSE, C. 1977. Taste intensity, pleasantness and quality of aspartame, sugars and their mixtures. Can. J. Food Sci. Technol. 10, 126.
MOSKOWITZ, H. R., KLUTER, R. A., WESTERLING, J. and JACOBS, H. L. 1974. Sugar sweetness and pleasantness: Evidence for different psychological laws. Sci. 184, 583.
MOSKOWITZ, H. R., WOLFE, K. and BELL, C. 1978. Cost estimates, sweeteners and acceptance of cola-flavored beverages formulated with combinations of non- nutritive sweeteners. Food Prod. Devel. (in press).
NOWLISS, G. H. 1977. From reflex to representation: Taste elicited tongue move- ments in the human newborn. In Taste and Development, (J. Welffenbach, ed.), Government Printing Office, Washington, D.C., 190.
RADER, C. P., TIHANYI, S. G. and ZIENTY, F. B. 1967. A study of the true taste of saccharin. J. Food Sci. 32, 357.
STEINER, J. 1974. Innate, discriminative human facial expressions to taste and smell stimulation. Ann. N. Y. Acad. Sci. 237,229.
STEINER, J. 1977. Facial expressions of the neonate infant indicating the hedonics of food-related chemical stimuli. In Taste and Development, (J. Welffenbach, ed.), Government Printing Office, Washington, D.C., 173.
STEVENS, S. S. 1953. On the brightness of lights and the loudness of sounds. Sci. 11 8, 573.
STEVENS, S. S. 1975. Psychophysics: An Introduction to its Perceptual, Neural and Social Prospects, John Wiley & Sons, New York.