Anabolic Sugar - 14 days replacement of fat with starch/sugar
14
Replacement of dietary fat by sucrose or starch: Effects on 14 d ad libitum energy intake, energy expenditure and body weight in formerly obese and never-obese subjects A Raben 1 , I Macdonald 2 and A Astrup 1 1 Research Department of Human Nutrition, Centre for Food Research, The Royal Veterinary and Agricultural University, Frederiksberg, Denmark and 2 Department of Physiology and Pharmacology, Queen’s Medical Centre, University of Nottingham Medical School, Nottingham, UK OBJECTIVE: To investigate the impact of a high-sucrose diet vs a high-starch and a high-fat diet on 14 d ad libitum energy intake, body weight, energy expenditure and sympathoadrenal activity. MEASURMENTS: Food intake; body weight and composition (bioelectrical impedance); 24 h energy expenditure, substrate oxidation rates, spontaneous physical activity, heart rate and appetite sensations in a respiration chamber (VAS scores); plasma catecholamine concentration and blood pressure. SUBJECTS: Twenty normal-weight, healthy women, 9 post-obese (body mass index (BMI): 22.9 0.7 kg/m 2 ) and 11 closely matched controls (BMI: 22.6 0.4 kg/m 2 ). RESULTS: Average 14 d ad libitum energy intake was 13% and 12% lower on the starch diet compared with the sucrose and fat diets, respectively (P < 0.05). In both post-obese and normal-weight subjects, body weight and fat mass decreased significantly on the starch diet (by 0.7 0.2 kg and 0.4 0.1 kg, respectively, P < 0.05). No changes were observed on the fat or sucrose diets. After 14 d on the sucrose diet, 24 h energy expenditure as well as postprandial plasma adrenaline and noradrenaline concentrations, were significantly increased compared with the other two diets. Overall satiety and palatability ratings were also highest on the sucrose diet. CONCLUSION: Intake of a 14-d ad libitum high-starch diet decreased energy intake and body weight compared with a high-fat or high-sucrose diet. The increased energy expenditure observed on the sucrose-rich diet can probably be explained both by the increased intake of energy and fructose (mainly from sucrose) on this diet. Keywords: recommended diet; post-obese; indirect calorimetry; macronutrient balance; sympathetic nervous system; appetite ratings Introduction The prevalence of obesity is high and still increasing in the Western world. 1,2 Two major reasons are the decrease in the level of physical activity as well as a dietary consumption pattern favouring a too high fat intake. 2,3 The latter trend is in striking contrast to the dietary recommendations which suggest that fat intake is kept below 30% of total energy (E%) and carbohy- drate intake between 55 E% and 60 E%. 4 Further- more, it is recommended to keep sucrose intake below 10 E%. 4 In practice, however, this advice may be difficult to combine with the recommendations of a low fat intake. Thus a certain level of sweetness of the diet may be necessary to achieve the recommended carbohydrate-rich diet. 5 Data from several food sur- veys have shown a negative relation between daily fat intake (E%) and sucrose intake (E%). 6–8 Furthermore, cross-sectional and epidemiological studies (exclud- ing the studies with obvious underreporting of energy intake) have shown a negative association between sucrose intake and obesity. 9,10 A high sucrose intake seems therefore to be associated with a low dietary fat intake and a low prevalence of obesity and vice versa. The above types of studies suffer, however, from their observational nature and the shortcomings of dietary records, with the ensuing risk of macro- nutrient-specific underreporting. Although actively debated, the role of sucrose in the development of obesity is therefore still not clarified. 11–13 The purpose of the present study was to investigate the ad libitum energy intake, changes in body weight, 24 h energy expenditure and sympathoadrenal activity when replacing dietary fat with sucrose or starch during a 14 d period. Normal-weight subjects with or without a history of obesity were included in the study. Correspondence: Anne Raben, Research Department of Human Nutrition, Centre for Food Research, The Royal Veterinary and Agricultural University, 30 Rolighedsvej, DK-1958 Frederiksberg C. Denmark. Received 10 February 1997; revised 6 June 1997; accepted 9 June 1997 International Journal of Obesity (1997) 21, 846–859 ß 1997 Stockton Press All rights reserved 0307–0565/97 $12.00
-
Upload
independent -
Category
Documents
-
view
1 -
download
0
Transcript of Anabolic Sugar - 14 days replacement of fat with starch/sugar
Replacement of dietary fat by sucrose or starch:Effects on 14 d ad libitum energy intake, energyexpenditure and body weight in formerly obeseand never-obese subjects
A Raben1, I Macdonald2 and A Astrup1
1Research Department of Human Nutrition, Centre for Food Research, The Royal Veterinary and Agricultural University, Frederiksberg,Denmark and 2Department of Physiology and Pharmacology, Queen's Medical Centre, University of Nottingham Medical School,Nottingham, UK
OBJECTIVE: To investigate the impact of a high-sucrose diet vs a high-starch and a high-fat diet on 14 d ad libitumenergy intake, body weight, energy expenditure and sympathoadrenal activity.MEASURMENTS: Food intake; body weight and composition (bioelectrical impedance); 24 h energy expenditure,substrate oxidation rates, spontaneous physical activity, heart rate and appetite sensations in a respiration chamber(VAS scores); plasma catecholamine concentration and blood pressure.SUBJECTS: Twenty normal-weight, healthy women, 9 post-obese (body mass index (BMI): 22.9� 0.7 kg/m2) and 11closely matched controls (BMI: 22.6� 0.4 kg/m2).RESULTS: Average 14 d ad libitum energy intake was 13% and 12% lower on the starch diet compared with thesucrose and fat diets, respectively (P< 0.05). In both post-obese and normal-weight subjects, body weight and fatmass decreased signi®cantly on the starch diet (by 0.7� 0.2 kg and 0.4� 0.1 kg, respectively, P< 0.05). No changeswere observed on the fat or sucrose diets. After 14 d on the sucrose diet, 24 h energy expenditure as well aspostprandial plasma adrenaline and noradrenaline concentrations, were signi®cantly increased compared with theother two diets. Overall satiety and palatability ratings were also highest on the sucrose diet.CONCLUSION: Intake of a 14-d adlibitum high-starch diet decreased energy intake and body weight compared with ahigh-fat or high-sucrose diet. The increased energy expenditure observed on the sucrose-rich diet can probably beexplained both by the increased intake of energy and fructose (mainly from sucrose) on this diet.
Keywords: recommended diet; post-obese; indirect calorimetry; macronutrient balance; sympathetic nervous system;appetite ratings
Introduction
The prevalence of obesity is high and still increasingin the Western world.1,2 Two major reasons are thedecrease in the level of physical activity as well as adietary consumption pattern favouring a too high fatintake.2,3 The latter trend is in striking contrast to thedietary recommendations which suggest that fat intakeis kept below 30% of total energy (E%) and carbohy-drate intake between 55 E% and 60 E%.4 Further-more, it is recommended to keep sucrose intake below10 E%.4 In practice, however, this advice may bedif®cult to combine with the recommendations of alow fat intake. Thus a certain level of sweetness of the
diet may be necessary to achieve the recommendedcarbohydrate-rich diet.5 Data from several food sur-veys have shown a negative relation between daily fatintake (E%) and sucrose intake (E%).6±8 Furthermore,cross-sectional and epidemiological studies (exclud-ing the studies with obvious underreporting ofenergy intake) have shown a negative associationbetween sucrose intake and obesity.9,10 A high sucroseintake seems therefore to be associated with a lowdietary fat intake and a low prevalence of obesity andvice versa.
The above types of studies suffer, however, fromtheir observational nature and the shortcomings ofdietary records, with the ensuing risk of macro-nutrient-speci®c underreporting. Although activelydebated, the role of sucrose in the development ofobesity is therefore still not clari®ed.11±13 The purposeof the present study was to investigate the ad libitumenergy intake, changes in body weight, 24 h energyexpenditure and sympathoadrenal activity whenreplacing dietary fat with sucrose or starch duringa 14 d period. Normal-weight subjects with or withouta history of obesity were included in the study.
Correspondence: Anne Raben, Research Department of HumanNutrition, Centre for Food Research, The Royal Veterinary andAgricultural University, 30 Rolighedsvej, DK-1958 FrederiksbergC. Denmark.Received 10 February 1997; revised 6 June 1997; accepted9 June 1997
International Journal of Obesity (1997) 21, 846±859ß 1997 Stockton Press All rights reserved 0307±0565/97 $12.00

Methods
Subjects
Twenty healthy, normal-weight women, 9 post-obese(PO) and 11 controls (C), closely matched for age,weight, height, fat mass, and fat-free mass participatedin the study (Table 1). The PO women had a familyhistory of obesity (at least one obese parent orsibling), had been more than 10% overweight (aver-age � s.e.m; 44� 10%) and had been weight-stablefor at least 2 months. None had undergone surgicaloperations to become normal-weight. As assessed by7 d weighed food records (performed 1±4 weeksbefore the ®rst test diet), habitual energy and fatintake was lower and carbohydrate intake higher inPO than in C (P< 0.05) (Table 1). The study wasapproved by the Municipal Ethical Committee ofCopenhagen and Frederiksberg to be in accordancewith the Helsinki-II declaration. All subjects gavewritten consent after the experimental procedure hadbeen explained to them.
Experimental design
Each subject completed the three 14 d dietary periods, asucrose-rich (sucrose), a starch-rich (starch) and a fat-rich (fat). The order of the periods differed, but subjectsin the PO and C groups were `paired' (except for twocontrols) so that the diet order was similar in the twogroups (see appendix 1). Each subject was measured atthe same time in her menstrual cycle. Before eachexperimental period, subjects were given a standar-dized, weight-maintenance diet for 3 d. The third daywas spent in a respiration chamber (day 0). Subjectswere not allowed to engage in strenuous physicalactivity on the day before the respiration chamberstay. After the standard diet, the experimental diets
were supplied in ad libitum amounts (see below) to beconsumed at home for 14 d. On day 14, the subjectsspent another day in the respiration chamber. In themorning on day 15, blood samples were taken in thefasted state and postprandially after breakfast andlunch. Body weight and composition were measuredbefore and after each stay in the respiration chamber(days 1 and 15). At least 2 weeks and no more than 6weeks separated the dietary periods. The subjects wereinstructed not to change their physical activity patternduring or between the three experimental diets.Furthermore, they were told not to weigh themselvesduring the experimental period. Data on blood concen-trations of glucose, lipids and different hormones willbe published separately.
Diets
The planned macronutrient composition of the sucroseand starch diet was similar with 59 energy-percent(E%) carbohydrate, 28 E% fat, and 13 E% protein,while the fat diet contributed 45±50 E% fat, 37±42E% carbohydrate and 13 E% protein. Sucrose con-tributed 23 E% on the sucrose diet and 2 E% on thestarch and fat diets. (Energy contribution from carbo-hydrate is expressed as metabolizable monosaccharideequivalents, with 17 kJ/g. Energy contribution fromfat and protein was set at 38 kJ/g and 17 kJ/g, respec-tively). Dietary ®ber amounted to 2.0 g/MJ on thesucrose and fat diet and 3.6 g/MJ on the starch diet.The ratio between polyunsaturated and saturated fattyacids (P/S-ratio) was 0.4 on the fat diet and 0.7 onboth the sucrose and starch diets.
The diets were ad libitum up to a ceiling of 15 MJ/dfor the ®rst ®ve subjects and 18 MJ/d for the last 15subjects. The change was made after one of the ®rst Csubjects had been able to consume all of the 15 MJ/dversion (starch diet). Thereafter no subject consumedall the foods delivered (18 MJ/d), but one more C and®ve PO consumed more than 15 MJ/d (on average15.6 MJ/d). The C subject was on the sucrose diet,while the PO's were on the fat and/or sucrose diet.The subjects also received two extra sandwiches of0.5 MJ/d at the beginning of each dietary period, andeach day a piece of fresh fruit to be eaten if desired.The subjects collected the food at the departmenttwice a week. At the same time, they returned allleft-overs (including packing) for weighing andrecording by the dietician. The subjects were told toeat as much as they liked until they were pleasantlysatis®ed.
A 4 d rotating menu was given for each diet.Breakfast, lunch, dinner and snacks contributed25%, 30%, 35% and 10%, respectively, of the dailyenergy load. Each meal had the same energy compo-sition as the whole diet. The three diets containedsimilar food items and dishes, whenever possible (see`menu 1' in appendix 2). This was done both to hidethe different energy compositions from the subjectsand to eliminate differences in energy intake due to
Table 1 Subject characteristicsa
Post-obese (PO)women
Control (C)women
(n�9) (n�11)Age (y) 39� 3 38� 3Height (m) 1.67�0.01 1.66�0.01Weight (kg) 63.9� 1.8 61.9� 1.2Body mass index (kg/m2) 22.9� 0.7 22.6� 0.4Maximal weight (kg) 90� 4 63� 1Fat mass (kg) 16.7� 1.2 17.0� 0.8Fat mass (%) 27.5� 1.6 28.4� 1.0Fat-free mass (kg) 47.2� 1.0 44.9� 0.8Fat-free mass (%) 72.5� 1.6 71.5� 1.0
Reported habitual dietb
Energy (MJ) 7930� 725 10 084�559*Carbohydrate (E%) 54.7� 2.4 45.5�2.6*Fat (E%) 29.0� 1.6 35.7�1.1*Protein (E%) 15.5� 1.1 13.7� 0.6Alcohol (E%) 1.0�0.5 5.2�2.0Sucrose (E%) 10.4� 4.6 8.4�1.6Dietary ®ber (g) 22� 3 21� 2
Data are means � s.e.m. a Measured on day 1 of the ®rst of threead libitum diets. b From 7 d weighed food records. E%: Energy-percent. * Post-obese vs controls, P<0.05 by unpaired t-test.
Ad libitum sucrose intakeA Raben et al
847

the different palatability of the diets. During theplanning of the diets, great care was taken to makeall the meals as palatable as possible, taking intoconsideration that a major part of the meals wouldbe frozen, thawed and often heated before consump-tion. When preparing the different foods and dishes(for example, sandwiches, warm dishes, pasta or ricesalads), an even distribution of all the ingredientswithin the dish was aimed at. Most of the mealsconsisted of 2±3 different items (for example, dinneron the sucrose diet� pizza� sweet drink). In order toachieve the correct energy composition in each mealand over the day, the subjects were very carefullyinstructed in how to consume the prepacked foods (forexample, if half the pizza was eaten, half of the drinkshould be drunk). After the dietary periods, the actualamount consumed by each subject was recorded andthe energy content and composition subsequentlycalculated by a dietician. A multiple-choice question-naire was given to the subjects after the dietaryperiods to investigate whether they had identi®ed themacronutrient composition of the three diets.
The standard diet contributed 13 E% protein, 37E% fat, 50 E% carbohydrate (9 E% sucrose), 2.9 g/MJdietary ®ber and had a P/S-ratio of 0.40. The diet wasprepared according to each subjects' individualenergy needs (adjusted to the nearest 0.5 MJ) deter-mined from WHO-tables according to age, weight,height, and gender.14 To allow for a slightly higherlevel of physical activity outside the respiration cham-bers a surplus of 0.5 MJ/d was given during the ®rsttwo days of the standard diet. The subjects wereinstructed to adhere strictly to the diet. In case theycould not consume all foods, they had to bring theleft-overs to the department for weighing and record-ing. The same amount was deducted during thefollowing two dietary periods. The computer databaseof foods from the National Food Agency of Denmark(Dankost 2.0) was used in the calculations of energyand nutrient intake of the diets.15
Anthropometric measurements
Body weight was measured (blinded for the subjects)in the morning of days 1 and 15 after 10 h fasting andafter voiding. The same digital scale was used eachtime (Seca model 707, Copenhagen, Denmark). Bodycomposition was subsequently estimated by electricalbioimpedance using an Animeter (HTS-EngineeringInc, Odense, Denmark). Fat mass (FM) and fat-freemass (FFM) were calculated using the equations byHeitmann.16 Blood pressure was measured using anautomatically in¯ating cuff (UA-743, A & D Com-pany Ltd, Tokyo, Japan).
Respiration chamber
Two open-circuit respiration chambers were used tomeasure 24 h energy expenditure (EE) and substrateoxidation rates. The chambers have been described indetail elsewhere.17,18 Protein oxidation was calculated
from 24 h urinary nitrogen excretion. Energy expen-diture and oxidation of lipid and carbohydrate werecalculated using the equations of Brouwer.19 Heartrates and electrocardiograms were continuously mon-itored by a telemetry system (Dialogue 2000, DanicaElectronics, Denmark). Heart rate, blood pressure andcatecholamines were measured to estimate sympa-thetic nervous activity. Spontaneous physical activity(SPA) was assessed by two microwave radars (ZettlerGHz-Doppler Mime 15, Munich, Germany). Subjectswere kept under surveillance by a laboratory techni-cian in the daytime and by trained medical studentsduring the night time.
A ®xed protocol for the chamber measurements wasfollowed for all subjects. The subjects arrived at thedepartment at 22.00 h on the evening before themeasurements. The next morning they were awakenedat 07.45 h, they measured (rectally) their body tem-peratures, they voided and anthropometric measure-ments were subsequently performed. The 24 hmeasurement started at 09.00 h and ®nished the nextmorning at 09.00 h. Basal metabolic rate (BMR) wasmeasured on the second day from 08.00±09.00 h.Diet-induced thermogenesis (DIT) was measured onthe ®rst day from 06.00±22.00 h, where the subjectswere sedentary:
DIT (kJ) � EE from 06.00 22.00 h (kJ/4 h)
ÿ�BMR�kJ=h�*4 �h��DIT (%) � DIT (kJ)
Energy consumed at dinner (kJ)� 100
Three meals were given during the stay, breakfast at09.00 h, lunch� snack at 13.00 h and dinner at18.00 h. The meals were eaten within one hour. Theamount of food in the meals was ®xed on day 0, butad libitum on day 14. The menu given on day 13 (theday before the chamber stay) and day 14 (in thechamber) was always menu `day 1'. Two bicyclebouts of 75 watt and 15 min duration were performedat 11.00 h and 16.00 h and two periods of walking(forward and back in the chamber 25 times) at 9.30 hand 14.30 h. Otherwise the subjects could read, write,phone, watch television or listen to the radio.Consumption of water, tea, coffee and smoking(only `light'cigarettes) during the day was allowed,but the total amount drunk and smoked during the ®rststay was noted and repeated during the ensuing®ve respiration chamber stays. Three PO and one Csubject smoked on average 10.3� 1.7 and 11cigarettes/d, respectively. The in¯uence of smokingon O2 consumption and CO2 production in thechambers has previously been analyzed. Five PrinceLight cigarettes were combusted, leading to a CO2
production of 0.31 1/cigarette and an O2 consumptionof 0.29 1/cigarette. For all smokers, O2 consumptionand CO2 production were corrected for these values inthe subsequent analyses.
Every hour from 09.00 h (fasting) until 23.00 h,subjects recorded their sensations of hunger, fullness,
Ad libitum sucrose intakeA Raben et al
848

desire to eat and prospective food consumption on10 cm visual analogue scales (VAS) with wordsanchored at each end, expressing the most positive(for example, good, pleasant) or the most negativerating (for example bad, unpleasant).20 Overall pala-tability, taste, aftertaste, smell, and visual appeal ofthe 3 test meals were also recorded by the subjects(n� 8 PO, n� 10 C).20
Blood sampling
On day 15 the subjects left the respiration chamber at09.00 h. After voiding and weighing, the subjects layon a bed in the supine position and a Ven¯on catheter(Viggo, Gothenborg, Sweden) was inserted into anantecubital vein in the arm. After 10 min rest, a fastingblood sample was taken. Breakfast was eaten at10.00 h and lunch at 14.00 h. Blood samples weretaken after 15, 30, 60, 120 and 240 min from initiationof breakfast and lunch. The subjects rested in thesupine position for 10 min before each blood sample.During the day the subjects could sit, walk quietly orgo to the toilet. The amount of food given for break-fast and lunch was similar to the amounts consumedon day 14 in the chamber. Coffee, tea and waterconsumption as well as smoking (two PO and oneC) were allowed, but the amount and time werecopied from the ®rst respiration chamber stay. Thetype of activity during the day was noted. Smokinghas been found to increase sympathetic nervous activ-ity and catecholamine concentrations.21 However,since the number, type and timing of cigarettessmoked was identical on the three blood samplingdays, the effect was assumed to be the same on thethree occasions.
Blood sampling was not possible for one PO sub-ject. In order to keep the groups matched, one controlsubject was therefore removed from the analyses ofblood parameters. One PO subject developed a feverin the evening on day 14 of the sucrose diet. Bloodsampling was therefore postponed by a few days onthe ad libitum diet until the fever had disappeared (day17).
Laboratory analyses
Blood was sampled without stasis through the indwel-ling catheter. Blood for determination of plasmacatecholamines was collected in iced tubes containingethylene glycol-bis(b-aminoethyl ether)-N,N,N0,N0-tetraacetic acid (EGTA) and glutathione. Within 30min, samples were centrifuged for 10 min at 3000 gand 4�C and the plasma stored at 780�C untildetermination by an electrochemical detectionmethod.22 Urinary nitrogen concentration was mea-sured using a nitrogen analyzer (NA 1500, Carlo ErbaStrumentazione, Milan, Italy). The energy content of10 MJ versions of each diet was analyzed from dupli-cate collections of one day (standard diet) or 7 dmenus (experimental diets). The diets were mixed,homogenized, freeze-dried and ground before deter-
mination by adiabatic bomb calorimetry (IKA, Janke& Kunkel GmbH, Staufen, Germany).
Statistical analyses
All results are given as means � s.e.m. Initial groupdifferences were tested by a t-test (Table 1). Otherdifferences between the three diets and two groupswere tested by parametric analysis of variance(ANOVA) (`split-plot' design) using the GLM proce-dure in SAS (SAS Institute, Cary, NC, USA). Factorswere group, diet and group*diet, using subject (group)as error term for group effects. In case of signi®cancea t-test on least squares means (for unbalanceddesigns) was used to test for differences betweengroups or diets. Differences in postprandial catecho-lamine responses were tested by an analysis of var-iance (ANOVA) with time, diet, group, diet*group,time*group, diet*time, and diet* time*group as fac-tors and subject (group) as error term for groupeffects. The areas under the curves (d-AUC) werecalculated separately for each subject as the differencebetween the integrated area of the response curve andthe rectangular area determined by the basal values.Negative areas were included. Where data adjustmentwas performed, this was done between groups on eachof the three diets separately, as described by Ravussinand Bogardus.23 For 24 h energy expenditure adjust-ments for differences in fat-free mass were thusperformed using the equation: EEadj�EEact� a(FFMmean7FFMact), where EEact is the measuredunadjusted EE, FFMmean the total group mean(n� 20), FFMact the actual FFM, a the slope and bthe intercept derived from linear regression analysisbetween FFM and EE in both groups (on each diet):EE� b� a6FFM. Simple linear regression analyseswere performed within each diet (n� 20). The sig-ni®cance level was set at P< 0.05. Statgraphics Soft-ware version 4.2 (Graphic Software Systems, Inc,Rockville, MD, USA) and the Statistical AnalysisPackage were used in the statistical calculations.
Results
Ad libitum energy and macronutrient intake
Average 14 d energy intake (EI) for all subjects waslowest on the starch diet (9.1� 0.4 MJ/d) comparedwith both the sucrose (10.3� 0.4 MJ/d) and fat diet(10.2� 0.4 MJ/d) (P< 0.05) (Figure 1). Comparedwith data from 7 d food records, PO consumed moreon the fat (P< 0.05) and sucrose diets (P< 0.001), butthe same on the starch diet. Conversely, C consumedless on the starch diet (P< 0.05), but the same on thefat and sucrose diets compared with 7 d food records.
The macronutrient composition of the ingested food(delivered minus left-overs) on the three diets wasvery similar to the planned macronutrient composi-tion. Thus on the fat, starch and sucrose diet the intake
Ad libitum sucrose intakeA Raben et al
849

of carbohydrate averaged 40.8, 59.1 and 58.6 E%(P< 0.0001), of sucrose 2.2, 2.6 and 23.2 E%(P< 0.0001), of fat 46.1, 28.0 and 28.6 E% (P<0.0001) and of protein 13.1, 13.4, and 13.2 E%(P< 0.05), respectively (Table 2). The weight offoods consumed was signi®cantly higher on thesucrose diet (1512� 60 g/d) compared with thestarch diet (1411� 55 g/d) (P< 0.05) and lowest onthe fat diet (1228� 51 g/d) (P< 0.05 vs sucrose orstarch) (Table 2). Compared with the C group the POsubjects consumed signi®cantly more energy on the
sucrose and fat diets (Figure 1). Compared with thecontrols, the PO subjects consumed signi®cantly more(in grams) carbohydrate and sucrose on the sucrosediet (Table 2). No other signi®cant group differenceswere observed.
The pattern of ad libitum 24 h energy and macro-nutrient intake during the respiration chamber stay(day 14) showed similar differences as during theprevious 13 d period (Table 3). However, the Cgroup consumed approximately 1 MJ/d more on thesucrose diet (P< 0.05), and approximately 0.5 MJ/dless on the fat and starch diets (0.05<P< 0.1). POonly consumed less on the starch diet (approximately1.2 MJ/d, P� 0.07) when in the chamber (Table 2and 3).
The questionnaire given to the subjects after thedietary periods revealed that a majority of the subjectswere able to tell whether the diets had a low, mediumor high content of fat, carbohydrate, protein, dietary®bre, sucrose or arti®cial sweetener. Interestingly,however, several subjects (especially in the POgroup) thought that the sucrose diet was also rich in fat.
Food analyses of the fat, starch, sucrose and stan-dard diet showed a 4.3%, 2.3%, 0.8% and 2.7% higherenergy content, respectively, compared with the cal-culated energy content. These values were consideredwithin the range of uncertainty in recording of foodconsumption. The calculated values were thereforenot corrected.
Figure 1 Mean (� s.e.m.) 14 d ad libitum energy intake in post-obese (PO, n�9) and matched controls (C, n� 11) on a fat-rich, astarch-rich and a sucrose-rich diet. Signi®cant by ANOVA,P< 0.05: Diet6group interaction and diet effect. Differentletter: Signi®cant difference between diets, P< 0.05. *: Differ-ences between PO and C, P< 0.05.
Table 2 Average daily food and macronutrient intake during 14 d ad libitum intake of a diet rich in fat, starch or sucrose
Fat Starch Sucrose ANOVAP-value
d6g diet group
Energy, kJ/d PO 10 684�721a 9229�606b 11 166�615a 0.05 0.0001 0.21C 9803� 388* 8934�473 9576�491*
Energy-%:Carbohydrate PO 41.1�0.7a 59.1�0.2b 58.7�0.2b 0.84 0.0001 0.60
C 40.6�0.6 59.1�0.3 58.6�0.2Sucrose PO 2.2� 0.2a 2.3�0.2a 23.4�0.2b 0.06 0.0001 0.99
C 2.2� 0.1 2.7�0.2 23.0�0.2Fat PO 45.9�0.7a 27.9�0.2b 28.6�0.1b 0.90 0.0001 0.48
C 46.3�0.6 28.1�0.2 28.6�0.1Protein PO 13.1�0.1a 13.4�0.1b 13.1�0.1 0.66 0.02 0.46
C 13.2�0.1 13.4�0.1 13.3�0.1
Carbohydrate, g/d PO 259�19a 320�20b 385� 21c 0.05 0.0001 0.17C 233� 7 310�16 330�17*
Sucrose, g/d PO 14�1a 13�1a 153�8b 0.01 0.0001 0.17C 13�1 14�1 130�7*
Dietary ®ber, g/d PO 23�2a 32�2b 22�1a 0.57 0.0001 0.24C 21�1 31�2 19�1
Fat, g/d PO 129� 8a 68�5b 84� 5c 0.19 0.0001 0.28C 120� 6 66�3 72�4
P/S-ratio PO 0.40� 0.01a 0.71� 0.00b 0.69�0.00c 1.00 0.0001 0.93C 0.40� 0.01 0.71�0.00 0.69�0.01
Protein, g/d PO 82�6a 73�5b 87�5a 0.09 0.0001 0.28C 76�3 71�4 75�4
Weight of food, g/d PO 1302� 91a 1443�84b 1624� 90c 0.16 0.0001 0.21C 1169� 52 1385� 76 1420� 72
Energy density, kJ/g PO 8.2� 0.1a 6.4� 0.1b 6.9�0.1c 0.15 0.0001 0.57C 8.4� 0.1 6.5�0.1 6.7�0.1
Data are means� s.e.m. PO: Post-obese (n�9). C: Controls (n�11). d6g�diet6group interaction. Results in the same row withdifferent superscript are signi®cantly different (per diet, n�20) (P<0.05). * PO vs C, P< 0.05.
Ad libitum sucrose intakeA Raben et al
850

Body weight and composition
There were no signi®cant differences between the 2groups in changes of body weight or composition(Figure 2). Compared to a change of 0.0 kg, totalbody weight decreased on the starch diet by0.7� 0.2 kg (P< 0.05), but was unchanged on thefat (70.3� 0.3 kg) and sucrose diet (0.2� 0.2 kg).The changes were signi®cantly different between thestarch and sucrose diets (P< 0.05) (Figure 2). Fat-freemass did not change signi®cantly on the starch and fatdiet, but tended to increase on the sucrose diet(0.3� 0.1 kg) (P� 0.08). Again the differencebetween the starch and sucrose diet was signi®cant(P< 0.05) (Figure 2). Fat mass decreased on thestarch diet (70.4� 0.1 kg) (P< 0.05), but wasunchanged on the sucrose and fat diet (Figure 2).There were no differences in fat mass changesbetween the three diets.
Energy expenditure (EE)
Before the three experimental diets 24 h EE adjustedfor group differences in FFM (day 0) was similar
between groups and diets (average PO: 8271 kJ/d, C:8192 kJ/d). After the intervention periods, however,24 h EE adjusted for differences between groups inFFM and EI was 3% and 4.5% higher on the sucrosediet (8453� 128 kJ/d) compared with the fat diet(8207� 99 kJ/d) and starch diet (8082� 121 kJ/d)(P< 0.05), respectively (Figure 3). This was mainlydue to an increase in the PO group (8625� 112 kJ/d)compared with the C group (8311� 162 kJ/d) (Figure3). The diet differences persisted after removing thePO subject who developed a fever on the sucrose dietfrom the analysis (8600� 123 kJ/d, n� 8). Basalmetabolic rate adjusted for differences in FFMbetween groups was not signi®cantly differentbetween groups or diets (Table 3). Diet-inducedthermogenesis (6±10 pm) expressed in percent of EIat dinner was also not signi®cantly different betweendiets or groups (Table 3). However, when comparing24 h EE with EI over the whole day, some differencesappeared. Using 24 h EE on the starch diet as baseline,we observed an increase in 24 h EE of 4.6% on thesucrose diet and of 1.5% on the fat diet (P< 0.05),
Table 3 Energy and macronutrient intake and oxidations on day 14 of 14 d ad libitum intake of a diet rich in fat, starch or sucrose
ANOVAP value
Fat Starch Sucrose d6g diet group
BMR adjusted1, kJ/h PO 271�8 270� 5 277�7 0.29 0.68 0.17C 268�7 262� 4 260�3
DIT, % PO 9.6� 1.6 12.0� 1.9 10.3� 0.8 0.70 0.09 0.44C 11.4�1.5 13.9� 2.1 10.2� 0.7
24 h NP-RQ adjusted2 PO 0.843� 0.006a 0.865�0.006b 0.914� 0.009c 0.68 0.0001 0.93C 0.842� 0.004 0.871�0.004 0.911�0.005
24 h energyExpenditure, kJ/d PO 8354�151a 8190� 183a 8770� 129b 0.14 0.002 0.09
C 8087�124 7994� 163 8194� 174Intake, kJ/d PO 10 543� 753a 8073�745b 11 276� 940c 0.06 0.0001 0.45
C 9282�345 8309� 342 10 517� 456Balance, kJ/d PO 2188�682a 7117�718b 2506�842c 0.07 0.0001 0.72
C 1194�376 314�268 2323� 328
24 h carbohydrateOxidation, g/d PO 197�16a 219�15b 301�26c 0.27 0.0001 0.50
C 176�6 228� 10 278� 13Intake, g/d PO 259�21a 281�25b 391�32c 0.10 0.0001 0.53
C 225�8 294� 12 366� 15Balance, g/d PO 63� 12a 62�17a 90�13b 0.56 0.0001 0.73
C 49�5 66� 7 88� 8
24 h fatOxidation, g/d PO 90�7a 84�7b 54� 11c 0.24 0.0001 0.84
C 95�4 74� 4 54� 4Intake, g/d PO 126�8a 59�6b 85�7c 0.06 0.0001 0.37
C 112�5 60� 2 79� 4Balance, g/d PO 36� 14a 725�12b 31�18a 0.07 0.0001 0.73
C 17�8 714� 6 25� 7
24 h proteinOxidation, g/d PO 72�6a 56�4b 74� 6a 0.04 0.0001 0.35
C 67� 2* 57� 2 64�4*Intake, g/d PO 81�6a 63�3b 89�8c 0.12 0.0001 0.42
C 71�3 64� 3 83� 4Balance, g/d PO 9� 3a 8�3a 15� 4b 0.27 0.0001 0.87
C 4� 3 7�1 18� 2
Data are means � s.e.m. BMR: Basal metabolic rate (day 15, 8±9 am). DIT: Diet-induced thermogenesis (6±10 pm). NP-RQ: non-proteinrespiratory quotient. PO: Post-obese (n�9). C: Controls (n�11). d6g�diet6group interaction. 1Adjusted for differences betweengroups in fat-free mass. 2Adjusted for differences in energy balance and 14 d weight changes. Results in the same row with differentsuperscript are signi®cantly different (per diet, n� 20) (P< 0.05). *PO vs C, P<0.05.
Ad libitum sucrose intakeA Raben et al
851

thus a three-fold difference between the two diets.Expressed in relation to the increase in EI on the diets(starch diet still used as baseline) the increase in 24 hEE amounted to 14.0% (PO: 18.1% and C: 9.0%) onthe sucrose diet, but to only 7.6% (PO: 5.4% and C:8.5%) on the fat diet.
On the starch diet 24 h energy balance was closeto 0 kJ/d (120� 348 kJ/d), while it was positive onboth the fat (1642� 377 kJ/d) and sucrose diets
(2405� 421 kJ/d) (P< 0.05 between all three diets)(Table 3). Simple regression analyses between 24 hEE and EI on day 14 showed a signi®cant correlationonly on the sucrose diet (r� 0.69, P� 0.0008). Theregression line (y� b� a*x) was 24 h EE (kJ/d)�6484 (kJ/d)� 0.18 * 24 h EI (kJ/d). On the two otherdiets, the correlation was not signi®cant (fat: r� 0.38,P� 0.09, starch: r� 0.37, P� 0.11). When analyzingthe groups separately, a signi®cant correlation wasalso observed for C on the starch diet (r� 0.64,P� 0.03).
Macronutrient oxidation rates
On the standard diet, before the experimental diets,24 h non-protein respiratory quotient (NP-RQ) wassimilar between groups and diets (average NP-RQ� 0.843). After the three ad libitum diets NP-RQwas highest on the sucrose diet (0.913� 0.021) com-pared with the starch diet (0.868� 0.016) and loweston the fat diet (0.842� 0.015) (P< 0.05). There wereno differences in NP-RQ between the two groups,even after adjusting for differences in 14 d bodyweight changes and energy balance (Table 3). Carbo-hydrate oxidation was highest on the sucrose diet andlowest on the fat diet compared with the starch diet(P< 0.05) (Table 3). Conversely, fat oxidation washighest on the fat diet and lowest on the sucrose dietcompared with the starch diet (P< 0.05) (Table 3).There were no differences in carbohydrate or fatoxidation between the two groups. Protein oxidationhowever, was signi®cantly increased in PO comparedwith C on the fat and sucrose diet (P< 0.05) (Table3). A negative fat balance was observed on the starchdiet compared with sucrose and fat diets (P< 0.05),while carbohydrate and protein balances were morepositive on the sucrose diet compared with the othertwo diets (P< 0.05) (Table 3). These differencespersisted after adjusting for differences betweengroups in 24 h energy balance (Figure 4).
Figure 2 Mean (� s.e.m.) changes in body weight, fat-free massand fat mass in 9 post-obese (PO) and 11 matched controls (C)after 14 d ad libitum of a fat-rich, a starch-rich and a sucrose-richdiet. Signi®cant by ANOVA, P< 0.05; Changes in body weightand fat-free mass: diet effect. Different letter: difference betweendiets, P< 0.05. $: Different from 0.0 kg (n�20), P<0.05. Therewere no differences between PO and C.
Figure 3 Mean (� s.e.m.) 24 h energy expenditure (adjusted fordifferences between groups in energy intake and fat-free mass)in a respiration chamber after 14 d ad libitum intake of a fat-rich, astarch-rich and a sucrose-rich diet. Subjects were 9 post-obese(PO) and 11 matched controls (C). Signi®cant by ANOVA,P< 0.05; Adjusted 24 h energy expenditure: diet effect. Differentletter: Difference between diets, P<0.05.
Ad libitum sucrose intakeA Raben et al
852

Plasma noradrenaline (NA) and adrenaline (A)
On day 15, fasting and total postprandial NA werehigher on the sucrose diet compared with the fat andstarch diet (P< 0.05) (Figure 5). A higher concentra-tion was observed for PO compared with C both onthe sucrose and fat diets (P< 0.05) (Figure 5). Thearea under the curve after subtracting fasting values(d-AUC) was 2±3 times larger on the sucrose dietcompared with the fat and starch diets (P< 0.05).There were no signi®cant differences between groups ind-AUC's (Figure 5). This was also true after adjustingfor group differences in energy balance (day 14).
After 14 d on the ad libitum diets, fasting as well astotal postprandial A concentrations were signi®cantlyhigher on the sucrose diet compared with the starchand the fat diet (P< 0.05) (Figure 6). The d-AUC'swere higher on the sucrose diet (P< 0.05) and tendedto be likewise after the starch diet (P� 0.055) com-pared with the fat diet. There were no differencesbetween the groups in d-AUC's, even after adjustingfor differences between groups in energy balance (day14) (Figure 6).
There were no correlations (for each diet separately,n� 20) between energy balance (day 14) or energyintake in breakfast and lunch (day 15) and d-AUC forNA or A. For both NA and A, the diet differences ind-AUC's persisted after dividing the d-AUC's by theamount of kJ consumed during breakfast and lunch onday 15 (data not shown).
Figure 4 Mean (� s.e.m.) 24 h fat and carbohydrate balances(adjusted for differences in energy balance within diets) in arespiration chamber after 14 d ad libitum intake of a fat-rich, astarch-rich and a sucrose-rich diet. Subjects were 9 post-obese(PO) and 11 matched controls (C). Signi®cant by ANOVA,P<0.05; Both fat and carbohydrate balance: diet effect. Differentletter: Difference between diets, P< 0.05.
Figure 5 Mean plasma noradrenaline concentrations in : A, 8post-obese (PO) and B, 10 controls (C) after 14 d ad libitum intakeof a fat-rich, a starch-rich and a sucrose-rich diet.Brkf.�Breakfast. Signi®cant by ANOVA, P< 0.05: diet*time,diet (sucrose> fat� starch) and time. Within each diet: Signi®-cant difference between PO and C on the fat and sucrose diets,P< 0.05. C, mean (� s.e.m.) areas under the curves above fastinglevels (d-AUC). Signi®cant by ANOVA, P<0.05: Diet effect.Different letter: difference between diets, P<0.05.
Ad libitum sucrose intakeA Raben et al
853

Spontaneous physical activity (SPA)
On the standard diet, PO had signi®cantly lower 24 hSPA values than C before all three diets (6.1� 0.2%vs 7.6� 0.3%) (P< 0.05). After 14 d on the diets,signi®cantly lower values were still observed in PO(P< 0.05) and there were no differences between thediets (Table 4).
Heart rate and blood pressure
Heart rate in the chamber on day 0 was not differentbetween diets or groups (average for PO: 70.6 b/minand C: 69.3 b/min). On day 14 a diet*group interac-tion was found (P< 0.05) due to an increase on thesucrose diet in the PO subjects compared with the Csubjects (Table 4). When the PO subject who had aslight fever was removed from the analyses, thisdiet*group interaction disappeared, however.
No signi®cant differences in fasting diastolic orsystolic blood pressure were observed in the morningafter the standard diet (day 1) or after the ad libitumdiets (day 15) (Table 4).
Appetite and palatability ratings
Comparison of mean appetite ratings (from 09.00±23.00 h) on day 14 showed that the subjects felt lessdesire to eat (prospective consumption) and greaterfullness on the sucrose diet compared with the fat diet(P< 0.05) (Table 5). Furthermore, the subjects feltmore satis®ed on the sucrose diet compared with boththe fat and starch diet (P< 0.05) (Table 5). On allthree diets PO felt less hungry, more satis®ed and lessdesire to eat that C (P< 0.05) (Table 5). Whendividing each of the four appetite scores by theamount of kJ consumed over the day, the resultschanged slightly (Table 5). The subjects felt lesshungry and less desire to eat on the sucrose dietcompared with the other two diets (P< 0.05) (Table5), but satiety and fullness were now signi®cantlyhigher on the starch diet compared with the other twodiets (P< 0.05) (Table 5). An overall group differencewas still observed.
Average subjective ratings of breakfast, lunch anddinner showed that the subjects estimated overallpalatability to be the best on the sucrose diet com-pared with the other two diets (P< 0.05) (Table 6).There were no other signi®cant diet differences.Between the groups, PO found overall palatabilityand taste of the diets better than C (P< 0.05) (Table6).
Discussion
Ad libitum 14 d EI
The present study showed that a diet composedaccording to the Nordic nutrition recommendations(<30 E% fat, 55±60 E% carbohydrate,> 3 g/MJ/ddietary ®ber) resulted in a signi®cantly lower energyintake and a small but signi®cant reduction in bodyweight and fat mass after 14 d ad libitum intake inboth PO and normal subjects than a sucrose-rich orfat-rich diet. These ®ndings are therefore in accor-dance with previous studies of similar or longerduration in normal-weight and overweight subjectsshowing a spontaneous reduction in EI anda weightloss on an ad libitum starch-rich, ®ber-rich diet.24±26
Figure 6 Mean plasma concentrations in: A, post-obese (PO)and B, 10 controls (C) after 14 d ad libitum intake of a fat-rich, astarch-rich and a sucrose-rich diet. Brkf.�Breakfast. Signi®cantby ANOVA, P<0.05: time*group, diet (sucrose> fat� starch)and time. C, mean (� s.e.m.) areas under the curves abovefasting levels (d-AUC). Signi®cant by ANOVA, P<0.05: Dieteffect. Different letter: difference between diets, P<0.05.
Ad libitum sucrose intakeA Raben et al
854
Substituting a large part of the starch with sucrose(approximately 20 E%) did not result in a similardecrease in EI or body weight. On the other hand,neither body weight nor fat mass increased on this oron the fat diet. Thus 14 d energy balance was appar-ently maintained on these two diets, while the subjects
were not able to maintain EI at a level correspondingto EE on the starch diet.
The reason for the reduction in EI on the starch- and®ber-rich diets must be either an increased satiatingpower or reduced palatability compared with thesucrose and fat diets. In comparison with a fat-rich
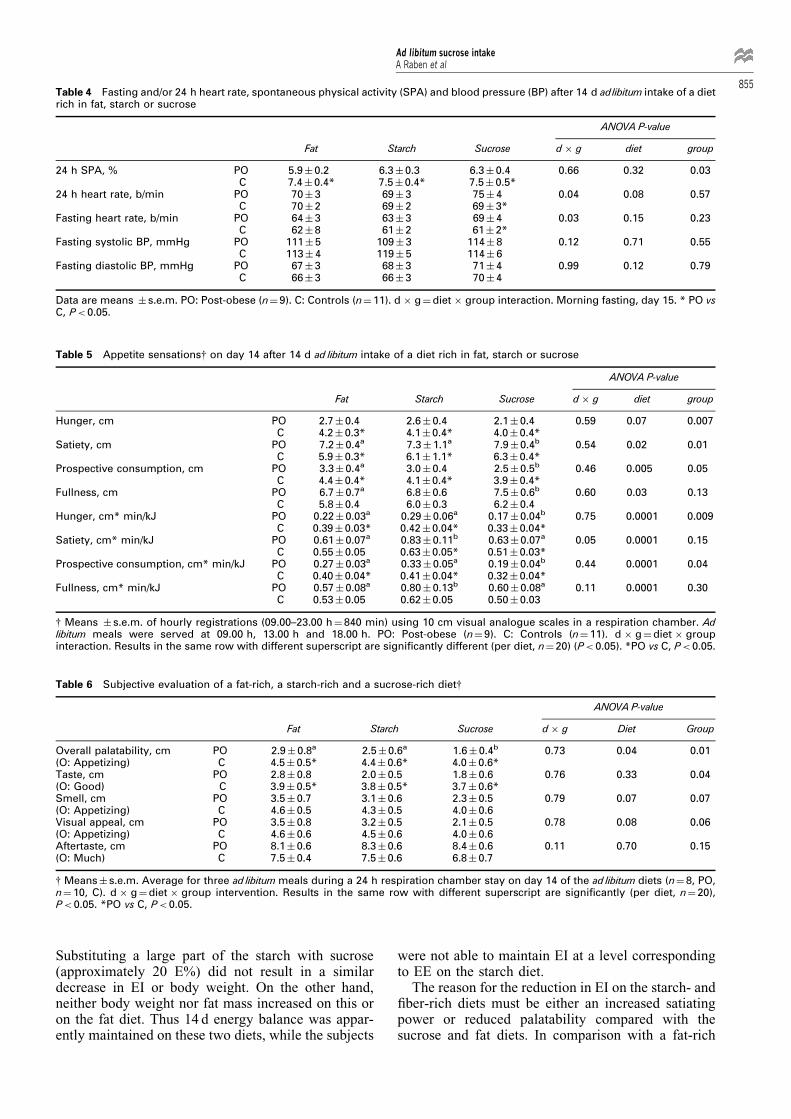
Table 4 Fasting and/or 24 h heart rate, spontaneous physical activity (SPA) and blood pressure (BP) after 14 d adlibitum intake of a dietrich in fat, starch or sucrose
ANOVAP-value
Fat Starch Sucrose d6g diet group
24 h SPA, % PO 5.9�0.2 6.3�0.3 6.3�0.4 0.66 0.32 0.03C 7.4� 0.4* 7.5�0.4* 7.5� 0.5*
24 h heart rate, b/min PO 70�3 69� 3 75�4 0.04 0.08 0.57C 70�2 69� 2 69�3*
Fasting heart rate, b/min PO 64�3 63� 3 69�4 0.03 0.15 0.23C 62�8 61� 2 61�2*
Fasting systolic BP, mmHg PO 111� 5 109�3 114� 8 0.12 0.71 0.55C 113� 4 119�5 114� 6
Fasting diastolic BP, mmHg PO 67�3 68� 3 71�4 0.99 0.12 0.79C 66�3 66� 3 70�4
Data are means � s.e.m. PO: Post-obese (n�9). C: Controls (n�11). d6g�diet6group interaction. Morning fasting, day 15. * PO vsC, P<0.05.
Table 5 Appetite sensations{ on day 14 after 14 d ad libitum intake of a diet rich in fat, starch or sucrose
ANOVAP-value
Fat Starch Sucrose d6g diet group
Hunger, cm PO 2.7�0.4 2.6�0.4 2.1� 0.4 0.59 0.07 0.007C 4.2� 0.3* 4.1�0.4* 4.0�0.4*
Satiety, cm PO 7.2�0.4a 7.3�1.1a 7.9�0.4b 0.54 0.02 0.01C 5.9� 0.3* 6.1�1.1* 6.3�0.4*
Prospective consumption, cm PO 3.3�0.4a 3.0�0.4 2.5�0.5b 0.46 0.005 0.05C 4.4� 0.4* 4.1�0.4* 3.9�0.4*
Fullness, cm PO 6.7�0.7a 6.8�0.6 7.5�0.6b 0.60 0.03 0.13C 5.8�0.4 6.0�0.3 6.2� 0.4
Hunger, cm* min/kJ PO 0.22�0.03a 0.29�0.06a 0.17�0.04b 0.75 0.0001 0.009C 0.39� 0.03* 0.42�0.04* 0.33�0.04*
Satiety, cm* min/kJ PO 0.61�0.07a 0.83�0.11b 0.63� 0.07a 0.05 0.0001 0.15C 0.55�0.05 0.63�0.05* 0.51�0.03*
Prospective consumption, cm* min/kJ PO 0.27�0.03a 0.33�0.05a 0.19�0.04b 0.44 0.0001 0.04C 0.40� 0.04* 0.41�0.04* 0.32�0.04*
Fullness, cm* min/kJ PO 0.57�0.08a 0.80�0.13b 0.60� 0.08a 0.11 0.0001 0.30C 0.53�0.05 0.62�0.05 0.50� 0.03
{ Means � s.e.m. of hourly registrations (09.00±23.00 h�840 min) using 10 cm visual analogue scales in a respiration chamber. Adlibitum meals were served at 09.00 h, 13.00 h and 18.00 h. PO: Post-obese (n�9). C: Controls (n� 11). d6g�diet6groupinteraction. Results in the same row with different superscript are signi®cantly different (per diet, n�20) (P< 0.05). *PO vs C, P<0.05.
Table 6 Subjective evaluation of a fat-rich, a starch-rich and a sucrose-rich diet{
ANOVAP-value
Fat Starch Sucrose d6g Diet Group
Overall palatability, cm PO 2.9�0.8a 2.5�0.6a 1.6� 0.4b 0.73 0.04 0.01(O: Appetizing) C 4.5� 0.5* 4.4� 0.6* 4.0� 0.6*Taste, cm PO 2.8�0.8 2.0�0.5 1.8�0.6 0.76 0.33 0.04(O: Good) C 3.9� 0.5* 3.8� 0.5* 3.7� 0.6*Smell, cm PO 3.5�0.7 3.1�0.6 2.3�0.5 0.79 0.07 0.07(O: Appetizing) C 4.6�0.5 4.3�0.5 4.0�0.6Visual appeal, cm PO 3.5�0.8 3.2�0.5 2.1�0.5 0.78 0.08 0.06(O: Appetizing) C 4.6�0.6 4.5�0.6 4.0�0.6Aftertaste, cm PO 8.1�0.6 8.3�0.6 8.4�0.6 0.11 0.70 0.15(O: Much) C 7.5�0.4 7.5�0.6 6.8�0.7
{ Means� s.e.m. Average for three ad libitum meals during a 24 h respiration chamber stay on day 14 of the ad libitum diets (n�8, PO,n�10, C). d6g�diet6group intervention. Results in the same row with different superscript are signi®cantly (per diet, n�20),P<0.05. *PO vs C, P<0.05.
Ad libitum sucrose intakeA Raben et al
855

diet, a carbohydrate-rich diet may induce greatersatiety due to its larger carbohydrate content.13,27,28
However, since the amount of energy from carbohy-drate was similar on the sucrose and starch diets thereason for the different EI between these two dietsmust be looked for in the type of carbohydrate and/orthe different food items used on the diets. It is likelythat the higher dietary ®ber intake on the starch diet(approximately 30 g/d) induced a greater satiationcompared with the sucrose diet (approximately 20 g/d).29,30 This was found to be the case when comparingsatiety and fullness per kJ consumed on the two diets(Table 5). Although the energy density of the starchdiet (6.5 kJ/d) was quite similar to the energy densityon the sucrose diet (6.8 kJ/d), the weight consumedwas lower on the starch diet compared with thesucrose diet. The volume of the starch diet (notindicated by the energy density values) may, however,have been larger, giving rise to greater stomach ®llingand satiety and therefore lower EI compared with theother two diets.
Another major reason for the higher energy intakeon the sucrose diet may be the quite large amountsof sucrose-containing drinks (fruit syrup and softdrinks) on this diet. Since ¯uids in general havebeen shown to be less ef®cient in increasing satietyand suppressing food intake compared with solidfoods,31,32 this may also explain the difference in EIbetween the two carbohydrate-rich diets. Still, asmentioned above, overeating did not take place onthe sucrose diet ± a ®nding similar to a previousstudy in humans.33 In contrast to these studies inhumans, overeating has been observed in rats on asucrose-rich diet.34
The subjects liked the sucrose diet better than thestarch diet, in spite of the sucrose diet being muchhigher in sucrose content (23 E%) than the subjects'habitual diet (8.4±10.4 E%) and the Danish popula-tion average (10 E%).6 Increased palatability andthereby stimulation of appetite can therefore alsoexplain why EI was higher on the sucrose dietcompared with the starch diet.35 Still, it cannotexplain why EI was also high on the fat diet.From short-term studies in humans we might haveexpected EI to be lower on the sucrose diet com-pared with the fat diet.36 That this was not the casemay be due to the fact that the subjects in thepresent study did not overeat on the fat diet. Thus,it has previously been shown that EI and bodyweight increases on a fat-rich diet (45±60 E% fat)when consumed ad libitum for 7±14 d.37,38 A differ-ence in energy density of the diets used in thedifferent studies cannot explain these discrepancies.In the study by Lissner et al37 energy density in thehigh-fat diet (45±50 E%) was 8.0 kJ/g vs 6.7 kJ/g inthe medium-fat (30±35 E%) diet and in the study byStubbs et al,38 energy density amounted to 7.0 kJ/gon a 60 E% fat, 5.6 kJ/g on a 40 E% fat and 4.8 kJ/gon a 20 E% fat diet. These differences in energydensity are therefore very similar to the differences
in energy densities in the present study. It is possi-ble that the palatability of the fat diet used here waspoorer compared with the diets used in other stu-dies. A more plausible explanation is, however, thatour subjects were more diet-concerned and/or betterat detecting fat in the diet. This would result in areduced tendency to overconsume on the fat diet.
Compared with C, PO consumed approximately1.6 MJ/d more on the sucrose diet and approximately0.9 MJ/d more on the fat diet. A plausible explanationfor this is that PO subjects are more prone to overeaton energy-dense diets than C subjects. This maycontribute to the PO's greater susceptibility to obe-sity.
The fact that the PO subjects reported greatersatiety, fullness and less hunger and prospectiveconsumption, compared with C on each of the threead libitum diets in the chamber, cannot be explainedby their increased energy intake only, since this wasnot the case on the starch diet. In general, however,we suspect that obesity-prone and diet-concernedsubjects are less likely to report their true sensations(unconsciously or consciously) or actually have dif-ferent appetite sensations than normal subjects. If thelatter is the case it is apparently not macronutrient-speci®c, as judged from the results in the presentstudy.
Compared with their recorded habitual diet the POsubjects consumed ca. 3 MJ/d more during the fat andsucrose diet (Tables 1 and 2). Since this occurredwithout a concomitant increase in body weight, anunderreporting of almost 30% must have taken placeduring the PO's recording of habitual food intake.This should be considered in future studies of habitualdiet in such study groups. In contrast to this, a minoroverreporting was observed in the controls (400 kJ/d� 4%) when comparing with their energy intake onthe fat and sucrose diets where no weight changesoccurred.
24 h EE
A signi®cantly increased 24 h EE was observed after14 d on the sucrose diet compared with both the fatand starch diets (Figure 3). This was particularly so inPO. In contrast, the estimate of diet-induced thermo-genesis in the chambers (6±10 pm) was not differentbetween diets or groups. This may, however, be due tothe dif®culties of picking up small meal-induceddifferences in EE in a respiration chamber becauseof the generally non-resting situation here comparedwith, for example, a ventilated hood system. Thus,when using the whole 24 h measurement period, thedifference in 24 h energy expenditure expressed as apercentage of the difference in 24 h EI (compared withthe starch diet), was twice as high (14.0%) on thesucrose diet as on the fat diet (6.7%) indicating lessstorage and larger dissipation of the extra energyconsumed on the sucrose diet. Again this was muchmore pronounced in PO (18%) than in C (9%).
Ad libitum sucrose intakeA Raben et al
856
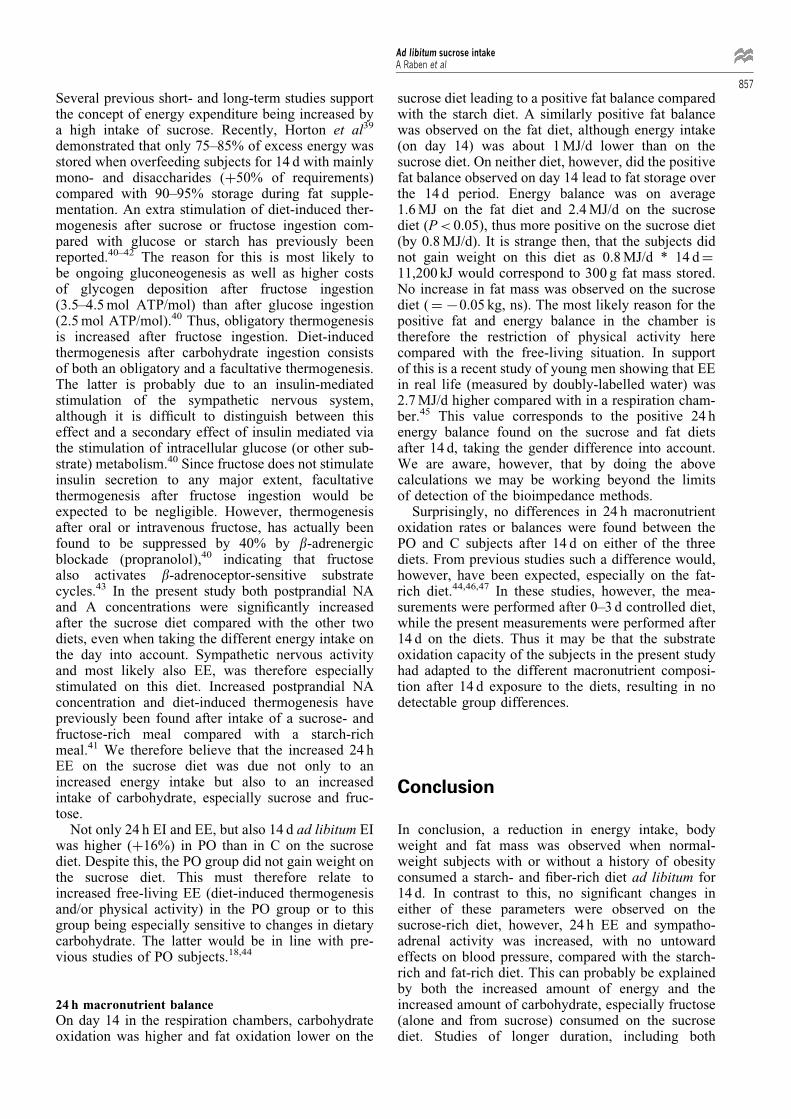
Several previous short- and long-term studies supportthe concept of energy expenditure being increased bya high intake of sucrose. Recently, Horton et al39
demonstrated that only 75±85% of excess energy wasstored when overfeeding subjects for 14 d with mainlymono- and disaccharides (�50% of requirements)compared with 90±95% storage during fat supple-mentation. An extra stimulation of diet-induced ther-mogenesis after sucrose or fructose ingestion com-pared with glucose or starch has previously beenreported.40±42 The reason for this is most likely tobe ongoing gluconeogenesis as well as higher costsof glycogen deposition after fructose ingestion(3.5±4.5 mol ATP/mol) than after glucose ingestion(2.5 mol ATP/mol).40 Thus, obligatory thermogenesisis increased after fructose ingestion. Diet-inducedthermogenesis after carbohydrate ingestion consistsof both an obligatory and a facultative thermogenesis.The latter is probably due to an insulin-mediatedstimulation of the sympathetic nervous system,although it is dif®cult to distinguish between thiseffect and a secondary effect of insulin mediated viathe stimulation of intracellular glucose (or other sub-strate) metabolism.40 Since fructose does not stimulateinsulin secretion to any major extent, facultativethermogenesis after fructose ingestion would beexpected to be negligible. However, thermogenesisafter oral or intravenous fructose, has actually beenfound to be suppressed by 40% by b-adrenergicblockade (propranolol),40 indicating that fructosealso activates b-adrenoceptor-sensitive substratecycles.43 In the present study both postprandial NAand A concentrations were signi®cantly increasedafter the sucrose diet compared with the other twodiets, even when taking the different energy intake onthe day into account. Sympathetic nervous activityand most likely also EE, was therefore especiallystimulated on this diet. Increased postprandial NAconcentration and diet-induced thermogenesis havepreviously been found after intake of a sucrose- andfructose-rich meal compared with a starch-richmeal.41 We therefore believe that the increased 24 hEE on the sucrose diet was due not only to anincreased energy intake but also to an increasedintake of carbohydrate, especially sucrose and fruc-tose.
Not only 24 h EI and EE, but also 14 d ad libitum EIwas higher (�16%) in PO than in C on the sucrosediet. Despite this, the PO group did not gain weight onthe sucrose diet. This must therefore relate toincreased free-living EE (diet-induced thermogenesisand/or physical activity) in the PO group or to thisgroup being especially sensitive to changes in dietarycarbohydrate. The latter would be in line with pre-vious studies of PO subjects.18,44
24 h macronutrient balance
On day 14 in the respiration chambers, carbohydrateoxidation was higher and fat oxidation lower on the
sucrose diet leading to a positive fat balance comparedwith the starch diet. A similarly positive fat balancewas observed on the fat diet, although energy intake(on day 14) was about 1 MJ/d lower than on thesucrose diet. On neither diet, however, did the positivefat balance observed on day 14 lead to fat storage overthe 14 d period. Energy balance was on average1.6 MJ on the fat diet and 2.4 MJ/d on the sucrosediet (P< 0.05), thus more positive on the sucrose diet(by 0.8 MJ/d). It is strange then, that the subjects didnot gain weight on this diet as 0.8 MJ/d * 14 d�11,200 kJ would correspond to 300 g fat mass stored.No increase in fat mass was observed on the sucrosediet (�70.05 kg, ns). The most likely reason for thepositive fat and energy balance in the chamber istherefore the restriction of physical activity herecompared with the free-living situation. In supportof this is a recent study of young men showing that EEin real life (measured by doubly-labelled water) was2.7 MJ/d higher compared with in a respiration cham-ber.45 This value corresponds to the positive 24 henergy balance found on the sucrose and fat dietsafter 14 d, taking the gender difference into account.We are aware, however, that by doing the abovecalculations we may be working beyond the limitsof detection of the bioimpedance methods.
Surprisingly, no differences in 24 h macronutrientoxidation rates or balances were found between thePO and C subjects after 14 d on either of the threediets. From previous studies such a difference would,however, have been expected, especially on the fat-rich diet.44,46,47 In these studies, however, the mea-surements were performed after 0±3 d controlled diet,while the present measurements were performed after14 d on the diets. Thus it may be that the substrateoxidation capacity of the subjects in the present studyhad adapted to the different macronutrient composi-tion after 14 d exposure to the diets, resulting in nodetectable group differences.
Conclusion
In conclusion, a reduction in energy intake, bodyweight and fat mass was observed when normal-weight subjects with or without a history of obesityconsumed a starch- and ®ber-rich diet ad libitum for14 d. In contrast to this, no signi®cant changes ineither of these parameters were observed on thesucrose-rich diet, however, 24 h EE and sympatho-adrenal activity was increased, with no untowardeffects on blood pressure, compared with the starch-rich and fat-rich diet. This can probably be explainedby both the increased amount of energy and theincreased amount of carbohydrate, especially fructose(alone and from sucrose) consumed on the sucrosediet. Studies of longer duration, including both
Ad libitum sucrose intakeA Raben et al
857

normal, obesity-prone and obese subjects are, how-ever, still needed to evaluate the long-term healthconsequences of a high sucrose content in the diet.
Acknowledgements
The study was supported by the Danish Research andDevelopment Programme for Food Technology 1990±1994, Danisco Sugar and the Danish Medical ResearchCouncil, grant number 12-9537-3. MasterFoods a.s.and Toms Chokolade A/S generously sponsoredfoods for the study. The authors gratefully thank thetechnicians Bente Knap, Inge Timmermann, John Lind,Bente Mathiasen, David Forster, Lis Kristoffersen, MajKristensen, Charlotte Kostecki, Karina Graff, LoneLarsen, Pia Freundlich and Mette Knop for experttechnical assistance. Nina Due Jensen, Tina GlargaardHost, Berit Lavik and Britta éstergaard are thanked forhelp with the practical parts of the experiment.
References1 Kuczmarski RJ, Flegal K, Campbell SM, Johnson CL. Increas-
ing prevalence of overweight among US adults. JAMA 1994;272: 205±211.
2 Prentice AM, Jebb SA. Obesity in Britain: Gluttony or sloth?Br Med J 1995; 311: 437±439.
3 Pietinen P, Vartiainen E, MaÈnnistoÈs. Trends in body massindex and obesity among adults in Finland from 1972 to 1992.Int J Obes 1996; 20: 114±120.
4 Nordic Committee on Foods, Nordic Council of Ministers.Nordic Nutrition Recommendations 2nd edn. Report 1989:2.Nordic Council of Ministers: Copenhagen 1989.
5 Drewnowski A. Human preferences for sugar and fat. In:Fernstrom JD, Miller GD, (eds). Appetite and body weightregulation: sugar, fat, and macronutrient substitutions. CRCPress, Boca Raton: 1994: 137±147.
6 Andersen NL, Fagt S, Groth MV, Hartkopp HB, Mùller A,Ovesen L, Warming DL. Danskernes Kostvaner 1995. Hoved-resultater. Levnedsmiddelstyrelsen, Sundhedsministeriet, pub-likation nr. 235, Quickly Tryk A/S, 1995.
7 Lewis CJ, Park YK, Dexter PB, Yetley EA. Nutrient intakesand body weights of persons consuming high and moderatelevels of added sugars. J Am Diet Assoc 1992; 92: 708±713.
8 Gibney M, Sigman-Grant M, Stanton JL, Keast DR. Con-sumption of sugars. Am J Clin Nutr 1995; 62(suppl): 178S±194S.
9 Romieu I, Walter CW, Stampfer MJ, Corditz GA, Sampson L,Rosner B et al. Energy intake and other determinants ofrelative weight. Am J Clin Nutr 1988; 67: 406±412.
10 Bolton-Smith C, Woodward M. Dietary composition and fat tosugar ratios in relation to obesity. Int J Obesity 1994; 18: 820±828.
11 Emmett PM, Heaton KW. Is extrinsic sugar a vehicle fordietary fat? Lancet 1995; 345: 1537±1540.
12 Hill JO, Prentice AM. Sugar and body weight regulation. Am JClin Nutr 1995; 62(suppl): 264S±274S.
13 Astrup A, Raben A. Carbohydrate and obesity. Int J Obes1995; 19(suppl 5): S27±S37.
14 FAO/WHO/UNU. Energy and protein requirements. Report ofa joint FAO/WHO/UNU Expert Consultation, 1985. Tech ReptSer No 74. World Health Organization: Geneva.
15 Mùller A. Danish Food Tables (Levnedsmiddeltabeller), 1989.Storkùkken-centeret, Levnedsmiddelstyrelsen.
16 Heitmann BL. Prediction of body water and fat in adult Danesfrom measurement of electrical impedance. A validationstudy. Int J Obes 1990; 14: 789±802.
17 Astrup A, Thorbek G, Lind J, Isaksson B. Prediction of 24-henergy expenditure and its components from physical cha-racteristics and body composition in normal-weight humans.Am J Clin Nutr 1990; 52: 777±783.
18 Astrup A, Buemann B, Christensen NJ, Madsen J. 24-hourenergy expenditure and sympathetic activity in post-obesewomen consuming a high-carbohydrate diet. Am J Physiol1992; 262: E282±E288.
19 Brouwer E. Report on subcommittee of constants and factors.In: Blaxter KL (ed). Energy metabolism. Proceedings of the3rd Symposium on Energy Metabolism, EAAP Publ. 77.Academic Press: London, 1965, pp 441±443.
20 Hill AJ, Magson LD, Blundell JE. Hunger and palatability:tracking ratings of subjective experience before, during andafter the consumption of preferred and less preferred food.Appetite 1984; 5: 361±371.
21 Cryer PE, Haymond MW, Santiago JV, Shah SD. Noradrena-line and adrenaline release and adrenergic mediation ofsmoking-associated hemodynamic and metabolic events.NEJM 1976; 295: 573±577.
22 Forster CD, Taylor JY, Macdonald IA. The assay of thecatecholamine content of small volumes of human plasma.In: Rollema H, Westerink BHC, Drijfhout WJ (eds). Monitor-ing molecules in neuroscience. Proceedings of the 5th Inter-national Conference on in vivo methods. University Centre forPharmacy, Groningen 1991, pp 173±174.
23 Ravussin E, Bogardus C. Relationship of genetics, age, andphysical ®tness to daily energy expenditure and fuel utiliza-tion. Am J Clin Nutr 1989; 54: 968±975.
24 Sheppard L, Kristal AR, Kushi LH. Weight loss in womenparticipating in a randomized trial of low-fat diets. Am J ClinNutr 1991; 54: 821±828.
25 Raben A, Jensen ND, Marckmann P, SandstroÈm B, Astrup A.Spontaneous weight loss during 11 weeks' ad libitum intake ofa low-fat/high-®ber diet in young, normal-weight subjects. IntJ Obes 1995; 19: 916±923.
26 Siggard R, Raben A, Astrup A. Weight loss during 12 weeks' adlibitum carbohydrate-rich diet in overweight and normal-weightsubjects at a Danish work site. Obes Res 1996; 4: 347±356.
27 Mayer J. Glucostatic mechanism of regulation of food intake.NEJM 1953; 249: 13±16.
28 Raben A, Holst JJ, Christensen NJ, Astrup A. Determinants ofpostprandial appetite sensations: Macronutrient intake andglucose metabolism. Int J Obesity 1996; 20: 161±169.
29 Burley VJ, Blundell JE. Action of dietary ®ber on the satietycascade. In: Kritchevsky D, Bon®eld C, Anderson JW (eds).Dietary ®ber. Chemistry, physiology, and health effects. NewYork, Plenum Press: 1990, pp 227±246.
30 Raben A, Christensen NJ, Madsen J, Holst JJ, Astrup A.Decreased postprandial thermogenesis and fat oxidation, butincreased fullness after a high-®ber meal compared with a low-®ber meal. Am J Clin Nutr 1994; 59: 1386±1394.
31 Mattes R. Dietary compensation by humans for supplementalenergy provided as ethanol or carbohydrate in ¯uids. Physiol& Behav 1996; 59: 179±187.
32 de Castro JM. The effects of the spontaneous ingestion of parti-cular foods or beverages on the meal pattern and overall nutrientintake of humans. Physiol & Behav 1996; 53: 1133±1144.
33 Schiffman SS, Warwich ZS, Mackey M. Sweetness andappetite in normal, overweight and elderly persons. In: Fern-strom JD, Miller GD (eds). Appetite and body weight regula-tion: sugar, fat, and macronutrient substitutions. CRC Press:Boca Raton, 1994, pp 99±112.
34 Hirsch E, Walsh M. Effect of limited access to sucrose onovereating and patterns of feeding., Physiol Behav 25: 129±134.
35 Anderson GH. Sugars, sweetness, and food intake. Am J ClinNutr 1995; 62(suppl): 195S±202S.
36 Green SM, Burley VJ, Blundell JE. Effect of fat- and sucrose-containing foods on the size of eating episodes and energyintake in lean males: Potential for causing overconsumption.Eur J Clin Nutr 1994; 48: 547±555.
Ad libitum sucrose intakeA Raben et al
858

37 Lissner L, Levitsky DA, Strupp BJ, Kalkwarf HJ, Roe DA.Dietary fat and the regulation of energy intake in humansubjects. Am J Clin Nutr 1987; 46: 886±892.
38 Stubbs RJ, Harbron CG, Murgatroyd PR, Prentice AM. Theeffect of covert manipulation of the dietary fat and energydensity on food intake and substrate ¯ux in ad libitum feedingmen. Am J Clin Nutr 1995; 62: 316±329.
39 Horton TJ, Drougas H, Brachey A, Reed GW, Peters JC,Hill JO. Fat and carbohydrate overfeeding in humans:different effects on energy storage. Am J Clin Nutr 1995;62: 19±29.
40 Tappy L, Randin J-P, Felber J-P, Chiolero R, Simonson DC,JeÂquier E, De Fronzo RA. Comparison of thermogenic effectof fructose and glucose in normal humans. Am J Physiol 1986;250: E718±E724.
41 Raben A, Kiens B, Richter EA. Differences in glycemia,hormonal response and energy expenditure after a meal richin mono- and disaccharides compared to a meal rich inpolysaccharides in physically ®t and sedentary subjects. ClinPhysiol 1994; 14: 267±280.
42 Blaak EE, Saris WHM. Postprandial thermogenesis and sub-strate utilization after ingestion of different dietary carbohy-drates. Int J Obes 1995; 19(suppl 2): O32.
43 Tappy L, JeÂquier E. Fructose and dietary thermogenesis., Am JClin Nutr 1993; 58: 766S±770S.
44 Lean MEJ, James WPT. Metabolic effects of isoenergeticnutrient exchange over 24 hours in relation to obesity inwomen. Int J Obes 1988; 12: 15±27.
45 Stubbs RJ, Ritz P, Coward WA, Prentice AM. Covert manip-ulation of the ratio of dietary fat to carbohydrate and energydensity: effect on food intake and energy balance in free-livingmen eating ad libitum. Am J Clin Nutr 1995; 62:330±337.
46 Astrup A, Buemann B, Christensen NJ, Toubro S, Raben A.Failure to increase lipid oxidation in response to increasingdietary fat content in formerly obese women. Am J Physiol1994; 266: E592±E599.
47 Raben A, Andersen HB, Christensen NJ, Madsen J, Holst JJ,Astrup A. Evidence for an abnormal postprandial response inwomen predisposed to obesity. Am J Physiol 1994; 267: E549±E559.
Appendix 1 Diet order
1st period 2nd period 3rd period
Post-obese (no)1, 3 A B C4 C B A5±7 B A C2, 8, 9 C A BControls (no)11±13 A B C14 C B A15±17 B A C18±21 C A B
A� Fat diet. B�Starch diet. C�Sucrose diet.
Appendix 2 Day 1 menu for each of the three ad libitum diets.
Meal Fat Starch Sucrose
Breakfast Sandwich-bread with margarine,60% fat cheese and marmalade.Medium-fat milk.
Whole-meal sandwich with low-fatmargarine and 30% fat cheese.Juice.
Low-fat sour-milk product withsugar-sweetened muesli.Fruit syrup.
Lunch Salad with pasta, corn, peas, 60% fatcheese, dressing.Sandwich-bread with pate andcucumber.
Salad with pasta, corn, peas,dressing.Wholemeal sandwich with eggmayonnaise ®lling
Salad with rice, corn, green beans,peas, 30% fat cheese, dressing.Sandwich bread with tuna ®shspread.Soft drink.Liquorice.
Dinner Risotto with beef, sausages,vegetables and double cream.
Risotto with tender loin, vegetablesand milk.
Pasta dish with vegetables and 45%fat cheese. Fruit syrup.Chocolate (`Raider')
Pear. Pear. Pear.Snack Almond cake*. Almond cake*. Almond cake*.
*Different for each diet. %Fat�percentage of dry matter. The rest of the menus used can be given on request.
Ad libitum sucrose intakeA Raben et al
859