The Identity of the New Testament Text Dr Wilbur N Pickering ...
Upload
khangminh22Category
view
0download
0
LUND UNIVERSITY
PO Box 117221 00 Lund+46 46-222 00 00
Starch stabilized Pickering emulsions
Colloidal starch particles and their effects on emulsion propertiesSaari, Hisfazilah
2017
Document Version:Publisher's PDF, also known as Version of record
Link to publication
Citation for published version (APA):Saari, H. (2017). Starch stabilized Pickering emulsions: Colloidal starch particles and their effects on emulsionproperties. (2017 ed.). Department of Food Technology, Engineering and Nutrition, Lund University.
Total number of authors:1
Creative Commons License:Unspecified
General rightsUnless other specific re-use rights are stated the following general rights apply:Copyright and moral rights for the publications made accessible in the public portal are retained by the authorsand/or other copyright owners and it is a condition of accessing publications that users recognise and abide by thelegal requirements associated with these rights. • Users may download and print one copy of any publication from the public portal for the purpose of private studyor research. • You may not further distribute the material or use it for any profit-making activity or commercial gain • You may freely distribute the URL identifying the publication in the public portal
Read more about Creative commons licenses: https://creativecommons.org/licenses/Take down policyIf you believe that this document breaches copyright please contact us providing details, and we will removeaccess to the work immediately and investigate your claim.

HISFA
ZILAH
SAA
RI
Starch stabilized Pickering em
ulsions – Colloidal starch particles and their effects on em
ulsion properties
9789174
225365Lund University
Faculty of EngineeringDepartment of Food Technology,
Engineering and Nutrition ISBN 978-91-7422-536-5
Starch stabilized Pickering emulsions Colloidal starch particles and their effects on emulsion properties
HISFAZILAH SAARI
FACULTY OF ENGINEERING | LUND UNIVERSITY
Hisfazilah Saari is a doctoral candidate at the Department of Food Technology, Engineering and Nutrition at Lund University. She was born and received her early education in Malaysia. In this thesis, she is investigating the functional properties of cereal starches for the application of food stabilizing products. Previously, she had 6 years working experiences in oil & fats industry in Malaysia and The Netherlands. In parallel, she had experience in protein chemistry and specializing in ingredients functionality during her MSc in Food Technology at Wageningen University, The Netherlands. From the diversity of food knowledge and combines with industrial experience, she hopes to contribute in research and development of more natural and highest quality of food products in the future.
2017

Starch stabilized Pickering emulsions Colloidal starch particles and their effects on emulsion properties
Hisfazilah Saari
DOCTORAL DISSERTATION by due permission of the Faculty of Engineering, Lund University, Sweden.
To be defended on Friday the 29th September 2017, at 10.15 am in lecture hall B at the Centre of Chemistry and Chemical Engineering.
Faculty opponent Professor Fotios Spyropoulos
School of Chemical Engineering, College of Engineering and Physical Sciences University of Birmingham, UK.

2
Organization LUND UNIVERSITY Department of Food Technology, Engineering and Nutrition P.O. Box 124, SE-22100 Lund, Sweden
Document name
DOCTORAL DISSERTATION
Date of issue :2017-09-29
Author: Hisfazilah Saari Sponsoring organization:
Swedish research council (VR grant number Drn: 2010-5393)
Starch stabilized Pickering emulsions: Colloidal starch particles and their effects on emulsion properties
Particles can be used to stabilize multi-phase systems known as Pickering emulsions. The aim of this thesis was to investigate how starch particles affect emulsion properties. Starch granules were used individually as well as in binary mixtures. To obtain a wide variety of starch properties granules were selected based on botanic variation (quinoa, oat, waxy barley, waxy maize and potato). The properties of the starch particles were furthermore changed by size fractionation by sedimentation, acid hydrolysis, cold gelatinization, or dissolution-precipitation, which resulted in different particle sizes and shapes. Almost all samples were modified with octenyl succinic anhydride (OSA) to 1.7%-3%. The particle size was found to be important, since decreased particle sizes lead to decreasing emulsion drop size and increased stabilization against creaming. Decreased particle size up to 89% (potato), 64% (waxy maize) and 62% (waxy barley) by acid hydrolysis, and from 15μm to 120nm (waxy maize) by dissolution-precipitation, had a strong impact on decreasing emulsion drop size. The shape also influenced the affinity for the oil/water interface. Smooth rounded particles (waxy barley <10μm) seemed to provide smaller emulsion drops than smaller/similar sizes of polyhedral particles (quinoa and oat). Starch particles from ~120nm (nanoparticles) to <10μm (granules) were suitable for stabilization of emulsions, and the smaller the particle, the lesser weight of starch was needed for droplets stabilization. The best emulsifying capacity and stability was obtained with the nanoparticles (~120nm particle size) which gave emulsions that were stable for up to 1 year. Mixtures of starch granules in emulsion systems showed that when two types of starch granules are mixed, one is more likely to dominate on the interface but when the starch content is low both starches might adsorb. In the case of oat starch, it was seen that Pickering emulsion could be formed also with granules that had not been OSA-modified and that these adsorbed granules could be gelatinized in situ using CaCl2. Cold gelatinization of oat resulted in an increase in particle size and at a minimum level of gelatinization these swelled granules increased the emulsion index for the emulsions they were stabilizing. The work in this thesis shows the potential and versatility of starch granules and its derivatives as emulsifiers.
Key words: starch granules, Pickering emulsions, starch, colloidal particles, sedimentation, acid hydrolysis, cold gelatinization, dissolution, non-solvent precipitation, nanoparticles
Classification system and/or index terms (if any)
Supplementary bibliographical information Language: English
ISSN and key title ISBN (print) 978-91-7422-536-5
ISBN (digital) 978-91-7422-537-2
Recipient’s notes Number of pages: 89 Price
Security classification
I, the undersigned, being the copyright owner of the abstract of the above-mentioned dissertation, hereby grant to all reference sources permission to publish and disseminate the abstract of the above-mentioned dissertation.
Signature Date: 2017-08-21

Starch stabilized Pickering emulsions Colloidal starch particles and their effects on emulsion properties
Hisfazilah Saari
Department of Food Technology, Engineering and Nutrition Faculty of Engineering
Lund University, Sweden

4
Cover photo by Hisyalina Saari
Copyright Hisfazilah Saari
Faculty of Engineering, Lund University Department of Food Technology, Engineering and Nutrition ISBN (print) 978-91-7422-536-5 ISBN (digital) 978-91-7422-537-2 Printed in Sweden by Media-Tryck, Lund University Lund 2017


6

To Luqman and Luthfia The PhD babies, whom I carried in my womb during this 5years+ journey.
May this journey will inspires you in your future undertaking.
“There are better starters than me but I’m a strong finisher.” —Usain Bolt Strength and growth come only through continuous effort and struggle.
Never stop learning, never give up.

8

Abstract
Particles can be used to stabilize multi-phase systems known as Pickering emulsions. The aim of this thesis was to investigate how starch particles affect emulsion properties. Starch granules were used individually as well as in binary mixtures. To obtain a wide variety of starch properties granules were selected based on botanic variation (quinoa, oat, waxy barley, waxy maize and potato). The properties of the starch particles were furthermore changed by size fractionation by sedimentation, acid hydrolysis, cold gelatinization, or dissolution-precipitation, which resulted in different particle sizes and shapes. Almost all samples were modified with octenyl succinic anhydride (OSA) to 1.7%-3%. The particle size was found to be important, since decreased particle sizes lead to decreasing emulsion drop size and increased stabilization against creaming. Decreased particle size up to 89% (potato), 64% (waxy maize) and 62% (waxy barley) by acid hydrolysis, and from 15μm to 120nm (waxy maize) by dissolution-precipitation, had a strong impact on decreasing emulsion drop size. The shape also influenced the affinity for the oil/water interface. Smooth rounded particles (waxy barley <10μm) seemed to provide smaller emulsion drops than smaller/similar sizes of polyhedral particles (quinoa and oat). Starch particles from ~120nm (nanoparticles) to <10μm (granules) were suitable for stabilization of emulsions, and the smaller the particle, the lesser weight of starch was needed for droplets stabilization. The best emulsifying capacity and stability was obtained with the nanoparticles (~120nm particle size) which gave emulsions that were stable for up to 1 year. Mixtures of starch granules in emulsion systems showed that when two types of starch granules are mixed, one is more likely to dominate on the interface but when the starch content is low both starches might adsorb. In the case of oat starch, it was seen that Pickering emulsion could be formed also with granules that had not been OSA-modified and that these adsorbed granules could be gelatinized in situ using CaCl2. Cold gelatinization of oat resulted in an increase in particle size and at a minimum level of gelatinization these swelled granules increased the emulsion index for the emulsions they were stabilizing. The work in this thesis shows the potential and versatility of starch granules and its derivatives as emulsifiers.

10
Popular Science Summary
Do you realize that starch is everywhere in our daily life? Starch is not just foods to satisfy our hungry belly. It is part of the cloths we wear, medicine we eat, cream lotion for our face, the paper that we write on, the glue to stick things, to thicken our delicious puddings or soups and it is even useful when preparing our salad dressing. Starch is the most common carbohydrate in human food intake. It is abundant, cheap, naturally existing and easily found among our staple foods. As mentioned, starch is not only served as foods, but has wide applications in other industries such as textile, pharmaceuticals, paper making, printing, adhesive, bioplastic and many more. The highlight of starch application in this thesis is in food processing where it can act as stabilizer or emulsifier in food products. Different types of starches such as quinoa, oat, barley, potato and maize have been studied to evaluate their potential as emulsifiers based on the important characteristics of size, shape and structure.
Investigating these starches is mainly to improve the quality of food products. The challenge in food industry today is how to produce foods that are not only nutritious, but also fresh looking, have longer shelf life and stay in good structure or stability from production until it reaches consumer’s hand. Furthermore, and maybe most important of all, it should also be cheap. When we buy food products in the supermarket, the appearance of the products is what we perceive the most, as well as the expiry date. The appearance is based on freshness, good condition, structure and the stability. Stability is the condition when the ingredients do not get separated individually resulting in collapsed structure, which is very important especially for oil- and water based food products like mayonnaise, vinaigrette, salad dressing, butter, margarine but also for non-food products like body lotion and moisturizers. Oil and water is not mixed by nature except in milk that was created naturally stable with protein (casein) present around fat droplets that disperse in the liquid. As we do not favour our mayonnaise when it becomes oily on top layer or when our salad dressing gets separated into individual components of oil, water and herbs it is very important for oil and water to be mixed and stable for a certain period of time. That is why an emulsifier is needed.
12
Emulsifier holds both oil and water phase together and form a structure called emulsion. The most common emulsifying agent that we use in food is egg yolk, mainly in making homemade mayonnaise. Egg yolk contains lecithin, a substance called a surfactant that has two different characteristics: one part is loving oil (hydrophobic) and the other part is loving water (hydrophilic). Emulsifier is therefore actually a ‘middle-man’ between two different parties and is also called amphiphilic, it stays in between the interface of oil and water and bind both components. To mix all components well, energy from mixing, blending, or homogenization processes is often required to form emulsions. This emulsion is the building block of all oil-water based products. The capacity in stabilizing emulsions highly depends on certain emulsifiers. Most emulsifiers are amphiphilic due to dual characteristics.
Starch is neutral by nature, not favouring either oil or water. Modification is sometimes needed to make it more oil-loving either by heat treatment or patching the outer part with hydrophobic element. This will enable starch to sit in between the oil/water interface. To be able to emulsify certain products, the classical way is to use emulsifiers that contain both the ‘loving oil- and loving water’ parts. Depending on the amount of oil (O) and water (W), we can produce O/W emulsions when oil is dispersed in water as background liquid or vice versa. In this case, starch particles will sit around oil droplets and act as a barrier layer and prevent meetings with other oil droplets. Due to this, coalescence, a process where two oil droplets meet and combine can be avoided which in turn will inhibit separation of oil and water. This type of emulsion is also known as a Pickering emulsion named after S.U. Pickering, who is among the first scientists that found this phenomenon of solid particle stabilization in emulsions around 1907, although record mentioned Walter Ramsden as discoverer already in 1903.
Starch shows strong attachment between the O/W phases that is found to be irreversible due to high energy of detachment. The energy is defined as the amount of work that is required to take away starch particles from the interface that is subjected to the particle size. The bigger the particles, the higher the energy needed to remove the emulsifier. This is an indication of how stable an emulsion is and the higher energy needed for detachment the higher is the stability. However, this stabilization energy does not only dependent on the size, it is also subjected to the properties of the starch particles. Starches at a certain level, even with or without addition of hydrophobic elements, could position themselves in between both the oil and water phase due to the presence of protein on the surface, or due to favourable sizes and shapes. This study has revealed a great deal of information about the feasibility of starches. Quinoa with the size of 1-2 microns has been an interesting particle to explore due to their small and edgy shape that can maximize the packing at the interface of oil and water with higher volume and

create strong binding. Also, oat with the average size of 7-8 microns and a round edgy shape may stabilize emulsions even without hydrophobic treatment since it has a naturally occurring thin protein layer. Barley has bimodal sized particles with the size of less than 10- but up to 30 microns. The particles have round and smooth surfaces with a size less than 10 microns that have been found to sufficiently stabilize emulsions. However bigger barley particles seem to sediment by gravity and not be able to stay successfully at the interface. Maize particles on the other hand have slightly larger sizes than oat with rough surfaces and sharp edges and were observed to have less affinity to attach at the interface unlike most of the other starches investigated.
There are many interesting aspects to look at starches as they naturally exist in such uniqueness and variations. We can use it as it is after applying slightly hydrophobic elements and it is already good to go. Another step in current research work is to generate starch nanoparticles through a process of dissolving starch in high temperature and regenerate it by precipitation methods using alcohol. This will result in extremely small starch particles (less than 1 micron) that highly maximize packing in volume and bind effectively the interface of emulsions. Starch is not only a naturally existing ingredient but the application as emulsifier is regarded as novel and new innovation. By understanding starch characteristics, functions, mechanisms and its potential as stabilizer, the technology used will hopefully be implemented in all emulsion based products to benefit the use of starch as a natural ingredient in replacing synthetic and chemically processed stabilizers in the future.

14
Rumusan Kajian Saintifik
To my family with love so that you also can understand what I have done.
Adakah anda sedar bahawa unsur-unsur bersumberkan kanji wujud di mana-mana sahaja dipersekitaran kita? Realitinya, kanji bukan sekadar makanan untuk mengalas perut, malah ia terdapat pada fabrik kain, ubat-ubatan, losen penjagaan muka, alat-alat tulis seperti kertas dan gam, juga sebagai bahan penstabil dalam produk makanan khususnya. Kanji adalah sumber karbohidrat yang paling umum dalam sajian makanan manusia. Ia amat mudah untuk didapati, berasaskan bahan semulajadi, murah, dan mudah dijumpai di dalam makanan ruji kita. Seperti yang disebutkan, kanji bukan sahaja berfungsi sebagai makanan, tetapi mempunyai aplikasi yang luas dalam industri lain seperti tekstil, farmaseutikal, pembuatan kertas, percetakan, pelekat, bioplastik dan banyak lagi. Tujuan utama penyelidikan tesis ini adalah untuk meneroka potensi kanji dalam pemprosesan makanan di mana ia boleh bertindak sebagai penstabil atau pengemulsi dalam produk makanan. Pelbagai jenis kanji seperti quinoa, oat, barli, kentang dan jagung telah dinilai berpotensi sebagai pengemulsi berdasarkan ciri-ciri penting seperti saiz, bentuk dan struktur.
Penyelidikan berkaitan kanji ini tujuannya untuk meningkatkan kualiti produk makanan. Cabaran dalam industri makanan hari ini adalah bagaimana menghasilkan makanan yang bukan sahaja berkhasiat, tetapi juga kelihatan segar, mempunyai jangka hayat yang lebih lama, kekal strukturnya, dan stabil dari pengeluaran sehingga ia sampai ke tangan pengguna. Tambahan pula dari semua faktor yang disebutkan ianya juga harus dihasilkan pada kos yang rendah. Apabila kita membeli produk makanan di pasar raya, penampilan sesuatu produk adalah apa yang paling kita perhatikan, berserta tarikh luput. Penampilan ini berdasarkan kesegaran, keadaannya yang baik, struktur dan kestabilan. Kestabilan adalah keadaan di mana bahan kandungannya tidak terpisah secara berasingan mengakibatkan strukturnya rosak, terutamanya bagi produk makanan berasaskan minyak dan air seperti mayones, sos vinaigret, kuah salad, mentega, marjerin tetapi juga untuk produk bukan makanan seperti losen dan krim pelembap. Minyak dan air tidak boleh bersatu secara semulajadi kecuali dalam susu yang distabilkan dengan kewujudan protein (kasein). Pengguna tidak mahu membeli mayonis yang apabila disimpan pada tempoh tertentu, struktur minyak dan airnya terpisah atau sos (dressing) untuk salad yang terpisah menjadi beberapa komponen berbeza seperti minyak, air dan herba. Disebabkan itu, adalah sangat penting bagi minyak dan air untuk bersatu dan stabil untuk jangka masa tertentu. Itulah sebabnya pengemulsi diperlukan.

Bahan pengemulsi berfungsi untuk menggabungkan kedua-dua fasa minyak dan air bagi membentuk struktur yang di kenali sebagai emulsi. Ejen pengemulsi yang paling biasa kita gunakan dalam makanan adalah kuning telur yang boleh digunakan sebagai bahan pengemulsi bagi menghasilkan mayonis buatan sendiri. Kuning telur mengandungi lesitin, suatu bahan yang disebut surfaktan dengan dua ciri yang berbeza: satu bahagian yang menyukai minyak (hidrofobik) dan bahagian lain yang menyukai air (hidrofilik). Oleh itu, pengemulsi sebenarnya adalah penghubung antara dua komponen ini – yang juga dipanggil `amphifilik’, di mana ia kekal di antara minyak dan air bagi mengikat kedua-dua komponen. Untuk menggabungkan semua komponen dengan baik, proses homogenisasi sering diperlukan untuk membentuk emulsi. Keupayaan menstabilkan emulsi adalah bergantung kepada bahan pengemulsi itu sendiri. Kebanyakan pengemulsi adalah amphipilik di sebabkan oleh dwi-cirinya di antara minyak dan air.
Kelebihan kanji adalah kerana bersifat neutral, tidak memihak kepada minyak atau air. Kadang kala pengubahsuaian di perlukan bagi menjadikannya lebih mudah bergabung dengan minyak. Sama ada melalui rawatan haba atau melekatkan bahagian luarnya dengan unsur hidrofobik (sukakan minyak). Ini akan membolehkan kanji berada di antara permukaan minyak/air. Bagi mengemulsikan produk tertentu, kaedah klasik adalah dengan menggunakan pengemulsi yang mengandungi kedua-dua bahagian 'menyukai minyak dan menyukai air'. Ini akan membolehkan kanji menjadi penghubung di antara permukaan minyak dan air.
Bergantung pada jumlah minyak dan air, kita boleh menghasilkan satu produk emulsi minyak-dalam-air apabila minyak tersebar di dalam air atau sebaliknya. Dalam kes ini, zarah kanji akan duduk di sekitar titisan minyak dan bertindak sebagai lapisan penghalang dan mengelakkan pertemuan dengan titisan minyak yang lain. Oleh kerana itu, proses penggabungan, satu proses di mana dua titisan minyak bertemu dan bergabung menjadi lebih besar dapat dielakkan. Emulsi jenis ini juga dikenali sebagai emulsi Pickering yang dinamakan bersempena seorang saintis yang menemui kaedah penstabilan zarah pepejal dalam emulsi sekitar 1907, S.U. Pickering. Untuk rekod, Walter Ramsden telah menemuinya lebih awal pada tahun 1903.
Kajian ini membuktikan bahawa kanji dapat mengikat dengan kuat di antara fasa minyak-air yang tidak dapat diceraikan kerana memerlukan tenaga yang tinggi untuk memisahkannya. Tenaga pemisah ini ditakrifkan sebagai jumlah tenaga yang diperlukan untuk memisahkan zarah kanji dari permukaan antara dua fasa yang tertakluk kepada saiz zarah. Semakin besar zarah, semakin tinggi tenaga yang diperlukan untuk mengeluarkan pengemulsi
Ini adalah petunjuk betapa stabil emulsi dan tenaga yang lebih tinggi diperlukan untuk memisahkannya dalam menggambarkan kuasa kestabilannya. Walau bagaimanapun,

16
tenaga penstabilan ini tidak hanya bergantung kepada saiz, ia juga tertakluk pada sifat-sifat zarah kanji. Kanji di peringkat tertentu, walaupun dengan atau tanpa tambahan unsur hidrofobik, dapat meletakkan dirinya di antara kedua-dua fasa minyak dan air kesan dari kehadiran protein di permukaan kanji, atau disebabkan saiz dan bentuk kecenderungannya.
Kajian ini telah mendedahkan banyak maklumat tentang potensi kanji. Quinoa dengan saiz 1-2 mikron telah menjadi zarah yang menarik untuk diterokai kerana bentuknya yang kecil dan sedikit berkotak dapat memaksimumkan penyelaputan pada titisan minyak di antara 2 fasa emulsi minyak/air dengan jumlah yang lebih tinggi dan mewujudkan pengikatan yang kuat. Oat juga yang bersaiz purata 7-8 mikron dan bentuk bulat yang rata boleh menstabilkan emulsi walaupun tanpa rawatan hidrofobik kerana ia mempunyai lapisan protein nipis yang semulajadi. Barli mempunyai zarah berukuran bimodal dengan saiz kurang daripada 10 hingga 30 mikron. Zarahnya mempunyai permukaan bulat dan halus dengan saiz yang kurang dari 10 mikron yang didapati berpotensi menstabilkan emulsi, manakala zarah barli yang lebih besar dibantu graviti untuk mudah termendap dan menjadikannya kurang efektif untuk mengikat dua fasa air/minyak. Zarah jagung pula, mempunyai saiz yang lebih besar daripada oat dengan permukaan kasar dan tepinya tajam dan diperhatikan kurang berpotensi untuk melekap di antara 2 fasa minyak/air.
Terdapat banyak aspek menarik yang boleh dilihat pada kanji kerana ia wujud secara semula jadi dengan keunikan dan variasi tertentu. Kita boleh menggunakannya selepas pengubahsuaian dengan sedikit unsur hidrofobik atau mengaplikasinya secara semulajadi kerana ciri-cirinya yang unik. Selain itu, terdapat juga kaedah semasa dengan penghasilan nanopartikel kanji melalui proses mencairkan kanji dalam suhu tinggi dan membentukkan semula dengan kaedah pemendakan (precipitation) menggunakan alkohol. Ini akan menghasilkan zarah kanji yang sangat kecil (kurang daripada 1 mikron) dalam memaksimumkan penyelaputan dalam jumlah yang tinggi serta dapat mengikat dengan berkesan pada permukaan emulsi. Kanji bukan sahaja merupakan bahan semulajadi yang sedia ada, tetapi aplikasinya sebagai pengemulsi dianggap sebagai novel dan suatu inovasi yang terbaru. Dengan memahami cirian, fungsi, mekanisma dan potensi kanji sebagai penstabil produk, di harap hasil kajian ini dapat digunapakai dalam semua produk berasaskan emulsi untuk memanfaatkan kanji sebagai bahan semulajadi dalam menggantikan penstabil sintetik dan berasakan kimia yang diproses pada masa akan datang.

List of Papers
This thesis is based on the following papers which will be referred to in the text by their Roman numerals. The papers are appended in the end of the thesis.
Paper I Saari, H., Heravifar, K., Rayner, M., Wahlgren, M., & Sjöö, M. (2016). Preparation and characterization of starch particles for use in Pickering emulsions. Cereal Chemistry, 93(2), 116-124.
Paper II Saari, H., Rayner, M., & Wahlgren, M. (2017). Study of mixed starch granules for used in Pickering emulsion. Submitted to Carbohydrate Polymers.
Paper III Saari, H., Johansson, D.B., Sjöö, M., Rayner, M., & Wahlgren, M. (2017). Pickering emulsions based on CaCl2 gelatinized oat starch. Submitted to Colloids and Polymer Science.
Paper IV Saari, H., Fuentes, C., Sjöö, M., Rayner, M., & Wahlgren, M. (2017). Production of starch nanoparticles by dissolution and non-solvent precipitation for use in food-grade Pickering emulsions. Carbohydrate Polymers, 157, 558-566.
Paper V Saari, H., Rayner, M., Wahlgren, M., Sjöö, M., & M. Matos. (2017). A comparison of emulsion stability for different OSA-modified waxy maize emulsifiers: Granules, dissolved starch, and non-solvent precipitates. Submitted to PLOS One.
Paper VI Fuentes, C., Saari, H., Choi, J., Lee, S., Sjöö, M., Wahlgren, M., and Nilsson. L., (2017). Characterization of non-solvent precipitated starch using AF4 coupled with multiple detectors. Manuscript.
Related paper, not included in the thesis:
Paper VII Saari, H. Review paper: An insight on starch granules size, morphology, properties and functionalities. Manuscript

18
Author’s contributions to the papers
Paper I Author performed all practical work except acid hydrolysis (done by 2nd author) and wrote the first draft of the paper.
Paper II Author participated fully in the design of the experiments, performed all experiments and wrote the paper.
Paper III Author participated fully in the design of the experiments, performed the experiments with the exception of cold gelatinization in optimized conditions (done by 2nd author) and participated in writing the paper.
Paper IV Author choose the experimental methods used. Designed the plan for the
study. Performed the experimental work with exception of AFM and AF4. Wrote the first draft of the paper and refined it with co-authors.
Paper V Author choose the experimental methods used. Designed the plan for the study. Performed the experimental work. Wrote the first draft of the paper and refined it with co-authors.
Paper VI Author of this thesis suggested that this study should be done and prepared the starch samples. The first author of the paper did design the experimental characterisation strategy and performed the analytical work. The first draft of the paper was written by the 1st author but 2nd author collaborated on the refinement of the manuscript.
Contributions to conferences and workshops
Saari, H., Rayner, M., Wahlgren, M., & Sjöö, M. (2012). ‘Starch granules: Potential stabilizing agents in food-grade Pickering emulsion’ at Nordic Starch Network 2012 Conference, 22 November 2012, Copenhagen, Denmark. (Poster Presentation)
Saari, H., Heravifar, K., Rayner, M., Wahlgren, M., & Sjöö, M. (2013). ‘Size reduction of starch granules for use in Pickering emulsion’ at AACC International Annual Meeting 2013, 29 Sept- 2 Oct 2013, New Mexico, USA. (Poster Presentation)
Saari, H., Rayner, M., Wahlgren, M., & Sjöö, M. (2014)."Starch nanoparticles for use in Pickering emulsions", at Realizing Reformulation conference 2014, 22-24th October 2014, Lund, Sweden. (Poster presentation)
Saari, H., Rayner, M., Wahlgren, M., & Sjöö, M. (2014). “Preparation and characterization of nanoparticle for use in Pickering emulsion by dissolution and nano-precipitation" at 28th EFFoST International Conference, 25-28th November 2014, Uppsala, Sweden. (Oral presentation)
Saari, H., Rayner, M., Sjöö, M Wahlgren, M., (2015). “The influence of size, shape and hydrophobicity of starch for Pickering emulsion stabilization” at AACCI International Annual meeting, 22-24 Oct 2015, Minneapolis, USA. (Oral presentation) Best Student Paper Award 2015 in Engineering and Processing division (3rd)/ Student Travel Awards 2015.
Saari, H., Rayner, M., Sjöö, M Wahlgren, M., (2016). "Stability of waxy maize starch based emulsion; a comparison of granules, molecules and nanoparticles", EU Starch Round Table 2016, 17-18 Nov 2016, Lille, France. (Oral presentation)
Saari, H., Rayner, M., Sjöö, M Wahlgren, M., (2017). "Design of colloidal starch particles to stabilize Pickering emulsions and investigation of their effects on the emulsions", 31th EFFoST International Conference 2017, 13-16 Nov 20176, Sitges, Spain. (Accepted for oral presentation)
20
Contents
Introduction .............................................................................................................. 1 Thesis outline and objectives ........................................................................... 2
Starch ........................................................................................................................ 5 Size, shape and morphology of starch .............................................................. 5 Starch components and structure ..................................................................... 8 Dissolution of starch and its behaviour in solution ........................................ 10
Pickering emulsions ................................................................................................. 13 Principle of Pickering emulsions .................................................................... 14 Formulation of emulsions .............................................................................. 17 Emulsion stability .......................................................................................... 18 Characterization of emulsions and emulsion stability ..................................... 20
Overview of the design of thesis work ...................................................................... 23
Approach to obtain starch particles for use as emulsifiers .......................................... 25 Modification of Starch ................................................................................... 26 Size fractionation ........................................................................................... 27 Milling .......................................................................................................... 29 Acid hydrolysis .............................................................................................. 31 Chemical Gelatinization ................................................................................ 34 Dissolution and non-solvent precipitation ..................................................... 36 Investigation of structure and size of non-solvent precipitated starch using AF4......................................................................... 40
Starch stabilized emulsions ....................................................................................... 43 Native granules .............................................................................................. 43 Mixed starch granules .................................................................................... 43 Size reduction ................................................................................................ 45

Stability study ................................................................................................ 48 Overview of results ........................................................................................ 49 Application of Pickering emulsions ................................................................ 51
Conclusions ............................................................................................................. 53
Comments and suggestions for the future ................................................................ 55
Acknowledgement ................................................................................................... 57
References ................................................................................................................ 61


1
Introduction
Emulsions are the basic microstructure of many common products in our daily life such as milk and margarine in food, cream and lotion in skincare, to mention some. Emulsion consists of two or more immiscible liquids: for example, oil dispersed in water or vice versa. The main challenges in emulsion stability are to prevent phase separation due to coalescence and Ostwald ripening. To facilitate stabilization, an emulsifier is needed. Emulsifiers are adsorbed at the interface, decrease the interfacial tension of two phases and increase the steric hindrance and/or electrostatic repulsion between the droplets, which increase the stability of the emulsion [1]. Two common food emulsifiers are proteins and low molecular/non-ionic surfactants such as lecithin. Nowadays, particle based emulsifiers are becoming popular due to their unique performance and strong adsorption at the oil/water interface which gives high stability to these emulsions. The most common particles are synthetic based such as silica and latex or food-based particles such as fat crystals [2].
Using starch as stabilizing particles has been increasingly explored especially for the purpose of food-based products, since it is a natural ingredient, abundant, inexpensive and it exists in different size, shape and composition [2-4]. In this thesis starch particles of specific sizes, morphology and properties are designed and used as colloidal particles to stabilize emulsions. The aim is to understand their functions in relation to the interface they are adsorbed to. This has included investigation of natural starch granules as well generation of new particles. These different particles have been characterised primarily concerning size and morphology and then been used to produce Pickering emulsions. The Pickering emulsions have been characterised concerning droplet size and stability towards creaming and coalescence. The use of starch nanocrystals as emulsion stabilizers is novel, and finds practical use not only in food and pharmaceutical applications, but could also be a “green chemical” for formulated products in general. Furthermore, the almost irreversible adsorption of colloidal particles creates very stable emulsions in contrast to surfactant molecules.

2
Thesis outline and objectives
The overall aim of this research is to design starch colloidal particles and investigate the effect of starch and its properties for stabilizing Pickering emulsions. The work has especially been focused on the size of the particles, but also partly on the morphology and other properties of the starch granules or starch particles. The specific research objectives are listed in Table 1 for each of the research topics.
Table 1 Specific research objectives Overview of the specific research objective in Paper I to VI
Publications Research Area Starch Research objectives Paper I Natural granules
Quinoa (very small)
To study intact starch granules from different botanic variation and class size and their potential in stabilizing emulsions Oat (small)
Waxy maize (medium) Waxy barley (bimodal) Potato (large)
Size reduction Quinoa, waxy maize, waxy barley and potato
To reduce starch size particle and study its impact on emulsion stabilization capacity.
Paper II Mixture of granules
Quinoa, oat, waxy maize
To study emulsions produced using mixed starch granules with different class size.
Paper III Size reduction, properties and encapsulation
Oat To study potential effects on emulsions of oat starch that has been subjected to cold gelatinization. To use cold gelatinization to encapsulate liquid oil.
Paper IV Re-generate/ Break up and reform
Waxy maize To generate starch nanoparticles using waxy maize that contain mostly amylopectin.
Paper V Stability study Waxy maize To investigate the long term emulsion stability different starch structures (granuels, non-solvent precipitated starch and dissolved starch).
Paper VI Study of starch conformations
Waxy maize To characterize conformation and size of different types of non-solvent precipitated waxy maize starch using AF4.

3
The thesis is divided in the following parts:
• Characterization of starch particles chosen based on the natural size of the granules and fabrication of smaller starch particles with reduced size from micron to nano-size.
• Investigation of the impact of different type of starch particles, class, size and morphology, individually as well as mixed starch systems on the stability and droplet size of emulsions.
• Study of the long-term emulsion stability based on 3 different forms of starch; granules, dissolved starch molecules and precipitated starch particles as a representative of each different class size and properties.

4

5
Starch
Starch is an important food source for humans, animals, and of course for the plants themselves, providing energy for the germination of seeds. Starch that is produced by green plants can be found in fruits, seeds, steams, leaves, roots, tubers and pollen and are mainly used by the plants for energy storage [5, 6]. Starch grains collected from plants undergo milling processes to remove husk, fibre, protein and other impurities [6-8]. Isolation methods include dry or wet milling to obtain the starch granules [6, 7]. Starch content of the final product comprise up to 75% - 95% of starch dependent on the nature of the botanical source [5, 7].
Size, shape and morphology of starch
Starch granules are found in various sizes and shapes specific to their botanical origin [9]. Sources of extremely small starch granules, 0.3-2 μm, are quinoa, amaranth, cow cockle, and pig weed [5, 10-12]. Small starch granules, 2-10 μm, are found in oat, rice, and buckwheat [9, 10, 13, 14] while medium-size starches, 5-30 μm, include tapioca, barley, maize and sorghum [9, 14]. Large starch granules are found in tubers such as potato and canna, with sizes up to 100 μm [5, 9, 10, 15].
Figure 1 Starch granules with different structure, morphogy and size. Credit photos from wiki common images: quinoa (blairingmedia), oat (yonygg), barley (ltyoppyawit) and maize (hiltomilanese).

6
Some examples of starch are shown in Figure 1 as representatives of starch variations. Some botanical starch sources, mainly cereals, are bimodal, like barley, sorghum, and wheat [5, 9-11, 14, 16-19]. Starches have unique morphology and are found in different sizes and shapes: smooth, rough, sharp and flat surfaces or round/spherical, sharp-edged, irregular, ellipsoidal and disc-shaped [5, 9, 10, 12-16]. Table 2 listed various types of starch classes based on the size of the granules; very small size to large starch granules and general information on the morphology or shape of starch granules are provided.
Tabel 2 List of starches General information about starch with different size and shape.
Class Starch Type Dimension/Size Shape Very small Quinoa Submicron - 2μm [5] (0.7-2.2
μm) [13] 0.5-3 [10]
Smooth edges, irregular polygonal [1] Small & uniform size [1]
Amaranth Submicrons - 2 μm [1] 1-2 μm [5] 0.5-2 μm [7]
Irregular and polygonal-shaped granules [7]
Cow cockle Submicrons - 2 μm [1] 0.3-1.5 μm [5] 0.5-2 μm [7]
Irregular and polygonal [7] and round polygons edges but distinct Polygonal and has tendency to aggregates [8]
Pig weed Submicrons - 2 μm [1] 1.5-4 μm [5] 1-2 μm [7]
Irregular and polygonal-shaped granules [7]
Taro Submicrons - 2 μm [1] 2-3 μm [5]
Irregular and polygonal shape [7]
Small granule
Rice 4.5 μm [2] 3-8 μm [3,7] 2-10 μm [5]
Slightly larger than quinoa, irregular polygonal and sharp edges.Smallest in the cereal range [3]
Waxy Rice 5.4μm [2] 3-8 μm [7]
Sharp edges, shows some compound or fused granules [7]
Buckwheat 2-14 μm [5] 5-10 μm [7]
Polygonal [7]
Oat 2-14 μm [5] 2-15 μm [7]
Seen in compound cluster. Outside cluster is round, interior granule is polygonal [3] Irregular shape and polygonal granules [7]
Medium Tapioca 5-25 μm [7] Smooth and irregular shape. [7]

7
Medium/ Bimodal
Sorghum 5 μm (small) & 10-30 μm (large) [7]
Polygonal, round edges with flat surfaces [3]
Maize Normal : 7.7 μm (small) and 13.2 μm (large) [2] / 5-20 μm [4,7] Waxy : 6.3 μm (small) and 13.9 μm (large) [2]/ 5-18 μm [7]
Normal: Irregular and sharp edges [6,7] Waxy: Irregular depression on surface of some granules and additional graininess and pin holes [1]
Bimodal Wheat 2-3 μm (small) [1] 22-36 μm (large) [1] <2.8 μm (very small) [4] <9.9 μm (small) [4] >9.9 μm (large) [4] <10 & 10 -35 μm [5] 22-36 μm [7]
Bimodal [5]/trimodal distribution [4] Round (small granule) to disc shape (large) [3]
Barley Bimodal size distribution [1]-[8]10-30μm (Large) and 1-5 μm [2] Small (<10 μm) and Large (>10 μm) [3] 2-10 μm (small) and 12-26 μm (large) [4] 2-5 μm (small) and 15-25 μm (large) [5] Average size: 16 μm [6] 2-3 μm (small) and 12-32 μm (large) [7] 2-3 μm (small) and 15-32 μm (large) [8]
Majority in oval and irregular shape. Most surfaces appear smooth (not entirely) [1] Oval to round shape [4] Smooth edges, oblate spheroids [6] Large disk-shaped granules [8] No holes or hilum observed and has uniform depression [1] Higher proportion of large granules [5]
Large granule
Potato 15-75 μm [1,7] 20-100 μm [6]
Smooth granules [7]
Canna Up to 100 μm [5] 30-100 μm [7]
Smooth, ellipsoidal and spherically shaped granules [5,7]

8
Starch components and structures
The physical properties of starch granules are complex depending on their botanical sources. Amylose/amylopectin ratio highly affects the physical properties of starch [20]. The two major components of starch are amylose and amylopectin. Normal starch consists of 15-33% amylose [5, 7, 21] and 70-82% amylopectin by weight (dry matter) of total starch [5, 21]. Waxy starches contain less than 1% of amylose whereas high amylose starches contain between 35-70% [7, 21]. Both amylose and amylopectin consist of polymer of α-D-glucose units. Amylose consists of long linear chains of (1,4)-D-glucose units with some branches in the large molecules. Amylopectin has branched chains consisting of around 5% of 1,6 bonds linkage with a backbone of linear chains of (1,4)- D-glucose backbone. The degree of branching is very important for the physical and biological properties of different starches [5, 6, 22, 23]. The size of the starch polymers can be described by referring to degree of polymerization (DP) which is in the range from 480-22400 glucose units depending on plant origin [5, 7]. The average molecular mass of amylose and amylopectin are in the order of 105 to 106 and 106 to 109 g/mole, respectively [6, 7, 21]. Other minor components in starch comprise of proteins (0.1-0.7%) that is found on starch surfaces and interior, lipids (up to 1.5%) making lipid-complexes with starch and phosphorus that is highest in potato starch [5, 21]. A representative of amylose and amylopectin structure is given in Figure 2.
Figure 2 Chemical structure of amylose and amylopectin

9
Amylopectin has 3 unit chains as illustrated in Figure 3; the A-chain is the outer part and is the shortest, the inner B-chains and one C-chain that contains the only reducing sugar group in the molecule [5, 7]. Amylopectin is dominating in the crystalline parts of the granules and the crystallinity of the granule is mainly ascribed to double helices formed by amylopectin branches [20]. Starch contain around 15% and 45% of crystallite material and X-ray diffraction patterns reveals that there are two limiting polymorphs (A or B) and an intermediate form (C) [19, 20].
Figure 3 Lamella structure of starch granule The representative diagram of crystalline layer separated from amorphous layer in growth ring, alternating layers of crystaline and amorphous containing chain of amylopectin and branch points respectively in both regions.
Crystallinity in the starch granule is related to the interlinking of outer chains of amylopectin that is forming double helixes in cluster structures [24, 25]. The 'cluster arrangement' of the amylopectin branches is characterized by alternating regions of ordered, tightly packed, parallel pattern of chains and less-ordered regions at the branch points. A unit of an amylopectin cluster comprises an amorphous region containing most of the tightly spaced branches (amorphous lamella) and a thin crystalline region containing the parallel glucans (crystalline lamella) [21]. Starch granules contain radial growth of amylopectin with 120 nm- 400 nm thickness and 16 clusters per growth ring [24].
Layers of alternating amorphous and semi-crystalline lamellas build up the granule structure in so called ‘growth ring’ [5, 7, 21, 24]. These growth rings develop from a periodicity in the biosynthesis. A periodicity of 9-11 nm is the repeat distances of crystalline and amorphous lamellae.

10
Dissolution of starch and its behaviour in solution
When starch is dissolved in water, it first gelatinizes and then the molecules leaks out from the gelatinized starch granules. In fact it is very difficult to fully dissolve the starch granule and thus special protocols needs to be applied to obtain a starch solution without residual ghosts of the granules [26, 27]. One way to obtain fully dissolved starch granules are pro-long heating at 140oC which results in starch being completely gelatinized and solubilized [28]. This process of dissolution was an important part of the method used in preparing nano-size particles followed by non-solvent precipitation as discussed in Paper IV.
In solution, amylose forms unstable random coil structure which with time can form double helices and recrystallize (see retrogradation below). In the presence of complexing agents such as alcohols, fatty acids, mono-glycerides etc. they can also form single helixes. Dissolved amylopectin on the other hand behave as a hyper- branched polymer.[29]
Gelatinization and dissolution occur primarily due to heating of starch in excess water. This leads to the breakage of the ordered structure of starch, where amorphous parts of the granule take up water and the granule swells. The double helixes start to uncoil, crystalline structure is lost and amylose is leached from the granule to the continuous phase. The whole process leads to increased viscosity and change morphological structure [7, 20, 30, 31]. In general, starch gelatinization occurs between 60-90oC [26]. During gelatinization starch granules swell in all direction, mostly following similar shape as the original granule and approximately double the size of the original form when heated in excess water [26, 32]. Amylopectin contributes to water adsorption, swelling and pasting of starch granules meanwhile amylose more likely hinder these processes [30, 32].
Gelatinization can also occur, at room temperature without heating, when the water phase contains high amount of salts such as CaCl2 or LiCl. This is known as cold gelatinization. The mechanisms involved in salt-induced gelatinization are still not fully understood, but it has been reported that gelatinization of starch is affected by salts, and that the effect follows the Hofmeister series. The salting-in ions have been reported to reduce particle size, swelling and transparency, and lead to an increase in the gelatinization temperature, while salting-out ions, had the opposite effects [33, 34]. Cold gelatinization will be discussed further in Paper III.
Retrogradation happens due to re-arrangement of amylose-amylopectin during cooling and storage. This process is described as changes occurring in gelatinized starch from the amorphous phase to the more ordered crystalline phase due to thermodynamically

11
driven reorganization of gelatinized starch [20, 26, 35]. These changes includes re-association of double helixes that lead to partial recrystallization of the starch [36]. Rheological properties changes due to recrystallization and this is triggering firmness, rigidity, loss of water holding capacity and this increases during aging of the starch gels [26]. In solution, the recrystallization of starch leads to aggregation and precipitation of the starch molecules. Recrystallization occurs differently in amylose and amylopectin. Amylose has a high tendency to recrystallize and produce hard gels and films while amylopectin recrystallizes slower and create soft gels and films. The rate of crystallization for amylose gels reach a limit after 2 days while amylopectin gels will continue up to 30-40 days. Retrogradation has been shown to be responsible for both undesirable and desirable effects in starch-based products for example the process significantly contribute to staling of bread and other baked product. In the case of emulsion stability, starch recrystallization has been observed for starch in solution when longer term studies were conducted e.g. up to 1 year and as discussed in Paper V this might affect the stability of emulsions.
Non-solvent precipitation is the process of transforming starch molecules from a dissolved state in molecular form to precipitated particles after addition of a non-solvent that is miscible with the solvent that the starch is dissolved in [37]. This process of creating new particles is also known as nanoprecipitation as describe by Hornig et al. (2009) [37]. It has been shown that very small starch particles can be obtained with the non-solvent precipitation method [38]. Factors that control the particle size during precipitation include; the technique used, the initial concentration of the polymer (starch), the ratio of the polymer solution to the non-solvent solution, whether the polymer is added to the solvent or vice versa, and the type of solvent used [37-41]. Various kinds of precipitation techniques have been described for the production of nanoparticles, including dialysis and the dropping technique. The initial polymer concentration has been found to be crucial, and a narrow size distributions could be obtained from low polymer concentrations, in the range of 1-8 mg/mL. The size distribution may increase rapidly with increasing polymer concentration, and aggregation occurred at >20 mg/mL [38]. Low polymer concentrations are desirable to ensure that the molecules are in a dispersed state, and that they can be separated into nano-domains upon the addition of the non-solvent, as described by Hornig et al. (2009). Ratio of polymer solution and solvent has also been found to affect particle size and shape, and could lead to particles with different shapes, such as elongated fibers, spherical particles or a mixture of spherical particles and elongated fibres [39]. Finally, the order of adding polymer solution and non-solvent has been seen to affect the final particle size. [40].

12
13
Pickering emulsions
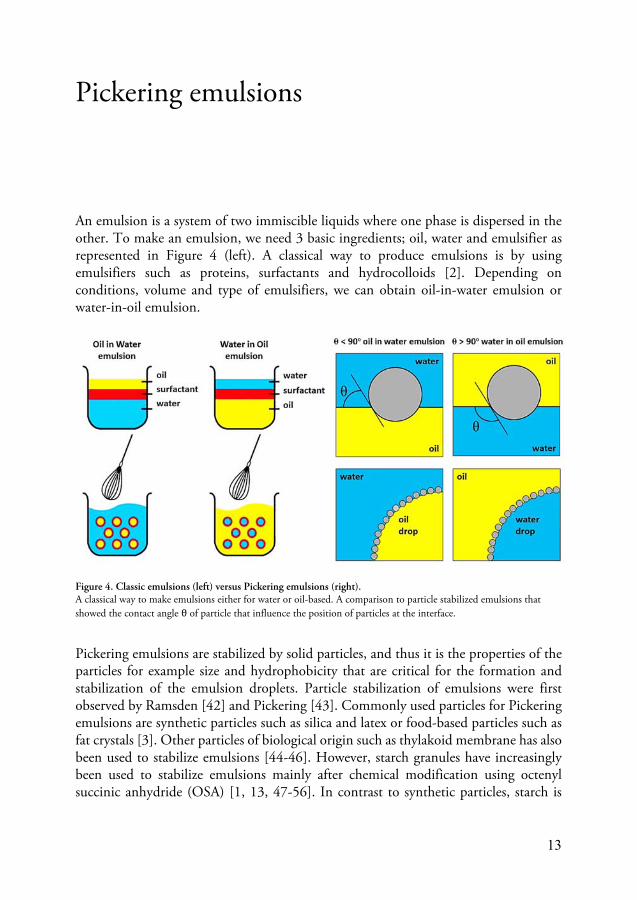
An emulsion is a system of two immiscible liquids where one phase is dispersed in the other. To make an emulsion, we need 3 basic ingredients; oil, water and emulsifier as represented in Figure 4 (left). A classical way to produce emulsions is by using emulsifiers such as proteins, surfactants and hydrocolloids [2]. Depending on conditions, volume and type of emulsifiers, we can obtain oil-in-water emulsion or water-in-oil emulsion.
Figure 4. Classic emulsions (left) versus Pickering emulsions (right). A classical way to make emulsions either for water or oil-based. A comparison to particle stabilized emulsions that showed the contact angle θ of particle that influence the position of particles at the interface.
Pickering emulsions are stabilized by solid particles, and thus it is the properties of the particles for example size and hydrophobicity that are critical for the formation and stabilization of the emulsion droplets. Particle stabilization of emulsions were first observed by Ramsden [42] and Pickering [43]. Commonly used particles for Pickering emulsions are synthetic particles such as silica and latex or food-based particles such as fat crystals [3]. Other particles of biological origin such as thylakoid membrane has also been used to stabilize emulsions [44-46]. However, starch granules have increasingly been used to stabilize emulsions mainly after chemical modification using octenyl succinic anhydride (OSA) [1, 13, 47-56]. In contrast to synthetic particles, starch is

14
mainly a natural ingredient which is accepted in food and also has nutritional value. Food based particles are preferred in the food and pharma-industries and particles like starch have been successfully used to stabilize emulsions [1, 3, 13, 48-58].
Principle of Pickering emulsions
The principal of Pickering emulsions is simply defined as particles being accumulated at the oil-water interface mainly acting as physical barriers that prevent the contact between droplets. Stable oil in water Pickering emulsions can be observed when particles have a size above 10 nm and are adsorbed to the oil-water interface with contact angle of θ < 90°, as illustrated in Figure 4 (right) [59]. In this case the particles have the appropriate wettability and a tendency to adsorb irreversibly at the oil-water interface. The position of particle at the interface is described by contact angle. Since the desorption energy per particle is very high, there is a significant energy barrier to droplet shrinkage [47]. The energy of desorption,∆ can be calculated according to equation 1 [3]. ∆ = (1 − | |) (eqn.1)
Where is the interfacial tension at the oil/water interface, r is the particle radius and θ is the contact angle. Therefore, when θ is not very close to 0° or 180° and ∆ per particle is extremely high, the particle can be irreversibly adsorbed at the interface and this would result in stability against coalescence and in some cases Oswald ripening [2] [3]. The desorption energy per particle can be as high as ~106-108 kT, in comparison to surfactant (~0.5-1kT) and protein (~1-20kT) when the size of the particle is in between 500nm to 30μm [1]. Figure 5, shows how the energy of detachment changes with size and contact angle. Pickering emulsions have also resulted in improved oxidative stability when silica and food-grade particles acted not only as excellent emulsifiers but also as physical barriers to inhibit lipid oxidation [60-62].

15
Figure 5 Energy of detachment The effect of particle size, contact angle and the energy detachment in stabilizing emulsions.
Another instability problem in emulsions is creaming or sedimentation. This is reduced when emulsion droplets size or the density difference between the dispersed and continuous phase decreases. By reducing the particle size of starch more surface area of drops is covered per unit mass starch. Normally, leading to a reduction in the droplet size of the emulsions. To clarify the effect of starch particle size, the maximum surface coverage possible for constant starch concentration as a function of particle size can be calculated. The theoretical maximum coverage, ΓM is estimated using the equation 2 [1]: Γ = . 10 (eqn.2)
Where is starch density (approximately 1500 kg. m-3), is the surface mean diameter of starch particles ( ) andφis the packing density (φ=0.907, theoretical maximum coverage with tight packing); i.e. the droplet surface area that is covered by the starch particles. The contact angle (θ) of 90◦ is assumed for all attached particles to the oil-water interface. It should be noted that the assumption that = is highly simplified, that in many cases φ is not close to 1, and that starch granules are not perfect spheres.
110
102
103
104
105
106
107
108
1091010
1,E-01
1,E+00
1,E+01
1,E+02
1,E+03
1,E+04
1,E+05
1,E+06
1,E+07
1,E+08
1,E+09
1,E+10
1 10 100 1000 10000
Ene
rgy
of d
etac
hmen
t / k
T
Particle size [nm]
θ = 90°θ = 60°θ = 45°θ = 30°

16
According to equation 2, more surface area can be covered per unit mass with smaller particles. This is one of the main reasons for reducing the starch granule size. The maximum surface coverage possible for each starch with a given particle size was calculated in order to examine the effect of the type of added starch and starch particle size, see Table 3.
Table 3. Maximum surface coverage The calculation of theoretical and measured surface coverage for different starch particles.
The theoretical surface coverage calculated in Table 3 shows for example for quinoa, oat and waxy maize given the value of roughly ~1000, ~8000 and ~15,000 mg/m2 respectively based on their particle sizes which explains why smaller particles need smaller amount of starch to cover the surface compare to larger starch particles. This explains why quinoa starch granules even in small amounts is sufficient for stabilizing emulsion droplets compare to larger starch granules. However, it should be noted that adsorption of starch granules does not always give monolayer coverage. Instead there are cases when the starch form aggregates or is adsorbed to the oil/water interface in multilayers. In addition, it has been observed that full coverage of the droplets as calculated based on a closed packed monolayer is not a prerequisite for stable emulsion and emulsions with sub monolayer coverage has been found to be stable for long periods [58, 63]. Finally, one should be aware that all starch does not adsorb to the interface and as discussed in paper I and II, there can sometimes be considerable amounts of free starch in the emulsions.
The focus of this work was to characterize starch particles (either obtained from the botanical sources with naturally small granule size or with reduced granule sizes) and to investigate their potential as stabilizers of Pickering emulsions.
STARCH SIZE Theoretical Γm (mg/m2)
Theoretical,D32 (emulsion drops)
Measured D32/D43
(μm) Waxy maize precipitates
~60-400nm 260nm (OSA)
56-375 243 (OSA)
1.68μm 4.62μm/9μm 1.66 (mode)
Quinoa 1-2μm 1033-1874 31-56μm 8μm/41μm Rice 2-10μm 1874-9372 56-281μm - Maize 9-17μm 8435-15,933 253-478μm 14μm/47μm Barley 2-30μm 1874-28,117 56-843μm 22μm/85μm Potato 2-100μm 1874-103,000 56-3089μm 34μm/107μm

17
Formulation of emulsions
An emulsion is a thermodynamically unfavourable system where energy is needed to disperse oil in water. This emulsification process is the transfer of mechanical energy to generate the interfacial area of newly created emulsion droplets. High energy emulsification (as shown in Figure 6) involves; mechanical energy to mix the disperse phase with the continuous phase in the presence of emulsifier to create emulsion drops at the premixing stage of emulsions. Then, intense mechanical input is needed that deform and disrupt the emulsion to smaller and fine droplets that can go through fast or slow destabilization depending on the efficiency of the emulsifiers. This will further lead to either stabilization or coalescence of the emulsion droplets.
Figure 6 Emulsification process High energy of emulsification process adapted from Rayner & Dejmek, 2015 [64]
Emulsification can be done by different types of equipment such as stirred tanks, colloid mills, high pressure homogenizer, ultrasonic emulsification equipment, micro fluidizations and high speed mixer [64]. Emulsification parameters were varied in Paper II where longer duration of mixing and shearing from 60-300 s were carried out to see the changes in droplets size. Meanwhile, in the rest of the papers, the emulsification time was fixed to 60 s to limit the parameters in the experimental studies.

18
Prolonged emulsification time has been seen to reduce drop size especially for the larger starch granules which needed more time to adsorb at the interface compared to the smaller starch granules (Paper II). One possible explanation for this difference in effect of emulsification time, is the difference in kinetics of transport of the granules to the droplet interface. The transfer of starch granules to the oil-water interface from the bulk continuous phase is governed by convective transport. This differs from the case of surfactants, protein molecules, and nanoparticles < 2 nm, where Brownian motion is the main transport mechanism overcoming adsorption barriers [4]. Convective transport during emulsification is subjected to the size and inertia of the emulsifier relative to the turbulent eddies created by the homogenization device used. This will govern the rate of adsorption of emulsifier to the emulsion droplets and thus the optimal emulsification time. Turbulence is characterized by the energy dissipation rate (power density) of eddies in the flow. In this study, a rotor-stator type homogenizer operating at 22000 RPM was used, generating turbulent flow that acts to break up the droplets and transports starch particles in order to stabilize the interface. This results in a power density of = 6.6 ∙ 10 and a minimum eddy size (Kolmogorov scale) of =3.5 μm [53]. The rate of these collisions is determined by several factors including: the size and number concentration of the particles. This has been described for emulsions by Walstra (1993). In this work, it is obvious that at the same weight of emulsifier, the smaller the particle is the more frequent the collisions and thus the system becomes less sensitive to the time of emulsification compared to the larger ones.
Emulsion stability
Processing and composition of emulsions are designed with the aim to create emulsions with preferred stability. Emulsions are thermodynamically instable and the instability is caused by different mechanisms such as creaming/sedimentation, flocculation, coalescence and Ostwald ripening [65-67]. The most common instability mechanism observed in this study is creaming/sedimentation and coalescence.
Creaming/sedimentation is described as the separation of the oil droplets due to gravity, where the less dense phase will move upward and the denser phase goes downward for example oil droplets are separated upward in a water phase. Creaming/sedimentation may cause changes in space concentration that could lead to further instabilities such as phase separation and coalescence. Increasing the viscosity of the continuous phase will decrease the rate of creaming. The volume fraction of the dispersed phase will also influence creaming as it at high concentrations (above space fill) will restrict the movements of the droplets. Thus, at low concentration of the dispersed phase, there will with time, be a separation of the emulsion in to a concentrated emulsion layer and a liquid phase. This can be described by the emulsifying index (EI), equation 3. At low

19
volume fraction of the dispersed phase a cream layer will be formed on top of the emulsion as seen in Figure 7. = . % (eqn 3.)
Figure 7 Emulsifying capacity of an emulsion, called the emulsion index (EI) Image of an emulsion with volume fraction of 5% oil and 200mg/ml starch as emulsifier. The volume of the emulsion is indicating that the layer contained emulsion droplets stabilized by starch particles.
The emulsions investigated in this thesis (Paper I –V), have all a concentration of the disperse phase, ranging from 5-10% volume fractions of oil, which is below space fill. and thus, forms an emulsion layer on top or for heavy droplets sediment at the bottom of the container. However, full space filling of an emulsion was observed when the emulsion was stabilized by nano-size particles/dissolved molecule starch as presented in Paper IV and V.
Coalescence is the most common instability mechanism leading to increase in droplet size. The process is highly dependent on the film stability between the two droplets, collision, degree of flocculation of the system and concentration of dispersed phase. Factors that effects coalescence in traditional emulsions are, surface interaction, interfacial tension, interfacial viscosity, emulsifiers solubility, phase transition in the emulsifier layers and presence of solid particles In the case for Pickering emulsions, coalescence depend on the type of starch particles that stabilize the interface, for example granules or nano-size particles, size or surface morphology of these particles, and degree of surface coverage of the particles such as sub-monolayer coverage, close packed monolayer or aggregated multi-layers.
Coalescence has been one of the main factors of destabilization in our studies and it can be seen for most of the systems that there is an increase in droplet size over time indicated both by static and multiple light scattering as well as microscopy images. The stability of emulsions has been seen to vary between 24h up to 1 year depending on the starch particles used which is described in Paper I-V.

20
Characterization of emulsions and emulsion stability
Characterization of emulsion is of course an important step in evaluating the efficiency of starch as an emulsifier. Key parameters are the initial mean droplet size and droplet size distribution after emulsification as well as the change in these parameters during storage. The most common way to characterize emulsions is by measuring the size distribution with light scattering or microscopy.
The size distribution of emulsion is commonly calculated based on volume frequency average diameter, d43 or surface average diameter, d32 (known as Sauter mean diameter). These two means are functions based on the total number of particles in the emulsions with a given particle size according to equation. 4-5.
=∑∑ (eqn.4) = ∑∑ (eqn.5)
Where is the diameter of the ith droplet and n is total number of drops measured.
In this study, mode and span are also used in characterizing size distribution of emulsion. Mode is defined as the peak of the frequency distribution. The highest peak representing the most common particle size seen in the distribution. This can be used when more than one population of particles is present in the distributions (for example oil droplets and granules) and thus using mean size of all particles is not anymore relevant. Span is used to define dispersion width that could be applied to all distributions as per equation 6: = % %% (eqn.6)
Another important parameter to highlight in relation to droplet size distribution is the surface area of the emulsion, S: = (eqn.7)
Where, is the volume fraction of the disperse phase (droplets), and is the Sauter mean droplet diameter of the emulsion droplets. This calculation is important in producing emulsions as it relates to the energy to be put in the system in creating new

21
droplets and the amount of emulsifiers that is required to stabilize the emulsion which is further discussed in Paper II. Characterization of the size distribution of starch particles and emulsion droplets was mainly carried out using light scattering (i.e., Malvern Mastersizer) as well as microscope observations in Paper I-IV.
The stability study of emulsions was investigated in Paper V for short and longer term by Turbiscan Lab Expert (Formulation Co., France) using static multiple light scattering (MLS). The transmitted and backscattered light was monitored as a function of time and cell height. The backscattering (BS) measurement is directly dependent on the particle mean diameter and volume fraction. The main instability phenomenon observed in colloidal systems are: particle migration (bottom and top) and particle size increase (measured in the middle of the sample) [57]. The BS profile of the emulsions gives useful information of droplet size change, the formation of cream layer or sedimentation and makes it possible to calculate the velocity of these events [54].
Turbiscan stability index (TSI) was obtained using Turbisoft software (2.0.0.33) by computing it mathematically based on the scan to scan difference of the intensity of light over the height of the cell. Sums of the variations detected in the samples with respect to size/concentrations are calculated using the following equation: =∑ ∑ | |(eqn. 8)
where H represents the total height of the cell. The higher the TSI value is, the higher the instability of the emulsion will be.

22

23
Overview of the design of thesis work
This PhD project has been carried out using several different approaches and methodologies. A wide literature study was done at an early stage to determine the best strategies to achieve the research objectives. The initial start was to select starches from different botanic variation to obtain granules that naturally varied in size and morphology. Next, an experimental plan was designed to achieve the research objectives and to decide on the wanted starch properties to be investigated.
Figure 8 Overview of methods Overview of methodology,approach, and the experimental design of this thesis.
The overview of this PhD project is presented briefly in Figure 8 above. A critical part in the start of the thesis work was the selection of suitable method for size reduction of the starch granules. The methods were; size fractionation by sedimentation, milling, acid hydrolysis, cold gelatinization, dissolution and non-solvent precipitation. All these

24
methods were studied and investigated as listed in Table 4. Normally the starches underwent different level of modifications before being used as emulsifiers. Emulsification and characterization of the obtained emulsions were also included in all studies in order to see the potential of starch as stabilizing agent. This section will first describe how the different starch materials was obtained and then the next section will discuss their effect on production of starch Pickering emulsions.

25
Approach to obtain starch particles for use as emulsifiers
Starch has been carefully studied and selected in this research based on the size, morphology and properties. Each project has different research objectives and selection of starch materials used is listed in Table 4.
Table 4 Selection of starch List of selected starch used based on the research objectives.
Publications Subject areas Starch Research topics & methods
Paper I Size (very small to large granules)
Quinoa Oat Waxy maize Waxy barley Potato
Affect of size and morphology (1) Natural granules (2) Size fractionation (sedimentation) (3) Acid hydrolysis
Paper II Mixed granules
QuinoaOat Waxy maize
(4) Study of how mixed granules from different botanical sources affect the formation of emulsions.
Paper III Shape/structure/Properties
Oat (5) Cold gelatinization
Paper IV Size (small particles) Waxy maize
(6) Studies on how to obtain starch particles by non-solvent precipitation and if these could be used for Pickering emulsion
Paper V Stability of emulsions
Waxy maize granules, dissolved starch, non-solvent precipitates
(7) Stability study of emulsions made by the three different waxy maize starch emulsifiers
Paper VI Starch conformations
Waxy maizeacid hydrolyzed, precipitate, nanoprecipitates and OSA-precipitates
(8) Characterization of acid hydrolyzed starch granuels and starch non-solvent precipitated particles by AF4

26
In paper I, very small, small, medium and large starch granules were selected to study the influence of granule size on emulsion stabilization. The granules were used in original form and made more hydrophobic by reactions with octenyl succinic anhydride (OSA). Some starches were modified using acid hydrolysis to reduce the size of the particle and to see if this improved their emulsifying capacity.
In paper II, 3 types of starches ranging from very small, small and medium size were selected to study the effect of mixing different size classes of granules on emulsion formation and short-term stabilization.
In paper III, oat starch granules had shown interesting properties from previous projects and were therefore selected to be studied in detail regarding surface activity by investigating granules with and without OSA-modification. It was also investigated how cold gelatinization using CaCl2 could be used both to affect emulsification properties of the starch granules and for encapsulation of oil droplets.
In paper IV-VI, waxy maize was used to produce non-solvent precipitate particles. The emulsification properties of these species were investigated and a thorough investigation of the structure of non-solvent precipitated starch was conducted.
Modification of Starch
To enhance the functionality of starch it is sometimes needed to be modify, for example to increase solubility, or as in the case in this thesis to make the granules more hydrophobic. Chemical modification involves, esterification, crosslinking, oxidation, cationization and grafting [68-70]. Physical modification includes processes such as annealing and pre-gelatinization and are often preferred as they are perceived as safe as it constitutes a chemical-free way to modify the starch. The advantages of modification of starch is that it provides desirable functional attributes that is controllable and predictable, gives value added properties, ensure product consistency, improve product aesthetic and extend shelf-life of products [68, 70, 71].

27
In this study, starch has undergone chemical modifications to increase its hydrophobicity. This was done using a chemical compound called octenyl succinic anhydrate (OSA) which modified starch through substitution with dicarboxylic acids and the method was first discovered by Caldwell and Wurzburg in 1953 [72]. The substitution of OSA is known to preferentially occur in and around the amorphous branch point of amylopectin at carbon 2,3, and OSA reacts with the glucose unit as seen in Figure 9 [73].
Figure 9 OSA starch The representation of esterification reaction between starch and OSA [74]
Size fractionation
The objective of obtaining smaller sized starch particles is to facilitate better stabilizing effect in emulsions. Thus, several methods were tested to obtain and reduce particle size. A size fractionation method based on sedimentation was used to separate granules with different sizes. Sedimentation according to Stokes’ Law and pipette method [75] were used to obtain small and large particle fractions of both starches. Duration of sedimentation was calculated based on the following equation; = ( ) (eqn.9)
Where is the viscosity of the liquid media, i.e. water (kg/ms), is the acceleration due to gravity (9.8 m/s), ℎ is the sedimentation height (m), is the density of starch,
is the density of water and is the diameter of the particle (m).
Waxy barley has a bimodal size ranging from 2 -32 μm [10] and a fraction of small granules of <5 μm and large size of >10 μm [11, 17] and potato has a broad size ranging from 20-100nm [15]. For this reason, starch granules from waxy barley and potato

28
were chosen for separation into individual size fractions. It was observed that potato starch sediment faster than waxy barley maybe due to higher amounts of granules in the larger particle size range and that sedimentation does not fully follow Stokes’ law at the concentrations used for the experiments. Potato starch showed almost complete sedimentation after 15.3 min compared to waxy barley where sediment occurred after 1 hour making it more difficult to harvest small size particle from the potato starch. This is probably the reason waxy barley has higher yield of small particle than potato starch. The sedimentation of barley granules at different times can be seen in Figure 10 and the cloudiness is an indication of the amount of particles available. Due to the low yield of small particles from potato starch, the study was only continued with starch from waxy barley.
Figure 10. Sedimentation of waxy barley Sedimentation of waxy barley at certain time (minutes) and at expected particle size.
Table 5 lists the sedimentation times needed to obtain fractions of the desired particle size, as calculated by stokes law as well as the average sized obtained experimentally when these sedimentation times where used.
Table 5 Sedimentation time Calculation of sedimentation time to obtain certain diameter of the particle size and the experimenatly obtained avarge sizes.
Diameter range of particle
(μm)
Theoretical Sedimentation time, t (min)
Theoretical Average size
(μm)
Measure average particle size
D[3,2] (μm)
D [4,3] (μm)
≤20 15.3 16 9.2 15.2
≤15 27.2 14 8.3 13.5
≤10 61.2 9.5 7.9 9.17
≤5 245 6.2 - -

29
The amount of sample obtained after 244.8 min of sedimentation was too small to be further analysed. Due to that sedimentation for 61.2 min were selected which gave <10μm sized granules. This method was successfully used to separate waxy barley with 2 groups of different sized particles, <10μm and >10μm. The method is simple however it was time consuming and resulted in low yield of granules.
Milling
Milling was considered as an option to achieve smaller particles. The objective was to reduce granule size by various types of milling methods as described in Table 6. However, the outcome was not as straight forward as expected. The first step in this study was to do a survey of the milling machine that might be purchased for the project. Inquiries were sent to at least 12 suppliers, only 3/4 responded that they could obtain the desired particle size (<0.1 μm) and 1 supplier offered free lab trial. Another issue was to select the right conditions to run trials, such as solvent for grinding and pre-treatment. Water and isopropyl alcohol were used as solvent for grinding. Pre-treatment were conducted with acid hydrolysis: 30% (w/w) starch in 4% HCL solution for 24h at constant temperature, 45oC.
Lab trial was conducted using Planetary Ball Mills from Fristch. However, the desired particle size was not achieved (0.1μm). 4 trials using this milling machine gave an unwanted outcome and instead of dry powder with reduced particle size was not obtained. In the case of waxy barley milled in a dry the samples become a sticky glue and the colour changed from bright white to clear grey and the particle size achieved was a d50<20 μm. In the case of quinoa, a white paste was formed with a particle size of 1.74μm<d50<6μm and the starch became solid after 40 min of grinding. This was most likely due to effects on the starch by the heat that was produced by the process due to friction during dry grinding. Thus, grinding in solvent was carried out to solve overheating during the milling process. However even if no discoloration was shown using this method, the particle was still too large after 60 min of treatment. Thus, this method did not look promising and it was decided that the line of investigation should be discontinued. List of milling methods that was reviewed part of the literature review are given in Table 6.

30
Table 6. The list of milling equiments that was reviewed in the literature study. The type of milling machine that were used reported in work by others in milling area.
*The chosen method in the study was highlighted in grey
Type of Milling/ Producer
Description Starch Performance (% Size reduction)
Sources
Planetary Ball Mill (NanDa, Nanjing, China)
QM-DK Low Temperature planetary ball mill and 4 ceramic milling cylinders.
Maize Median diameter of granules after 3h 19.23 μm from 13.81 μm.
[76]
Centrifugal Ball Mill (Retsch S1000, Hann, Germany)
Mill with agate balls (10mm diameter, 8% w/v). Duration: 1,2,3h.
Cassava Initial size: 3-30μm. Slight reduction after 3h milling: 8.6% < 6 μm. % reduction: 10%.
[77]
Hammer Mill (WEG, model FK71439, Brazil) Food processor Cryomilling ( Freezer/Mill 6850 SPEX)
Paddy grains de-straw and dehusked. Milling rice starch after starch extraction from rice flour. Using Freezer/Mill 6850 SPEX with liquid nitrogen. Duration: 0,15, 30, 45, 60 min.
Rice grain to rice flour Rice flour to rice starch
Median diameter:9.2±0.4 μm (11% amylose) and 8.4±0.1μm (21% amylose). Average size: 7-14 μm. (error in determining size reported).
[78]
Cryogenic Milling (CM) (Dry & Wet) Freezer/Mill 6850 SPEX (Metuchen, New Jersey, USA)
Using Freezer/Mill 6850 SPEX in liquid nitrogen bath. Duration: 20 min.
Potato (PS) Normal Maize (MS) Gelose 50 (G50) & 80 (G80)
Size (median diameter in μm): PS; 35.2, PSCM; 35.9 (-2%). MS;16.8, MSCM; 13.7 (19%). G50; 17.5, G50CM; 14.7 (16%). G80; 16.0, G80CM; 13.3 (17%). Average reduction: 12.5%.
[79]
Vacuum Ball-Mill (QM-1SPO4, Instrument company of Nanjing University, China)
Capacity 50mL, diameter of balls 10mm and 6mm. Duration: 0h to 54h.
Cassava Size: d50 value reduce from 24μm to 7.9μm after milling time 0h to 54h. % reduction: 67%.
[80]

31
Acid hydrolysis
Another established method to reduce size is the use of acid hydrolysis and there are several different methods described in the literature as listed in Table 7. It has been shown that acid treatment affects the amorphous layer of starch granules which are partially removed during the treatment leaving crystalline starch layer producing starch crystals with different shapes and sizes [81]. The results of acid hydrolysis can be affected by several factors such as the botanic origin of the starch granules, crystalline polymorphs, amylopectin content, morphology of the granules, and the conditions used during the acid hydrolysis [82]. Amylopectin rich starch (waxy starch) was claimed to be a good candidate for acid hydrolysis due to its high content of crystalline regions that can be converted to starch particles of different sizes [82].
In Paper I, potato, waxy maize, waxy barley and quinoa underwent acid hydrolysis treatment using a method, adapted from Angellier (2004). This includes, using 3.16M H2SO4 at 40oC and stirring at 100rpm for a time of 5 days [82]. Using this method, potato underwent the highest reduction of particle size giving a decrease of size by 89% followed by waxy maize and waxy barley that had a size reduction of 64% and 62%, respectively. However, quinoa doubled in size when subjected to acid hydrolysis and it was observed that the outcome of hydrolysation was aggregates and not individual starch particle. The size reduction has impact on the emulsion stabilization as will be discussed further in the section on starch stabilized emulsions.

32
Table 7. List of acid hydrolysis methods found in the literature. The different outcomes of starch granules after the acid treatment at various conditions.
Starch Description Size/Shape/Info Sources Maize -Starch pre-treated with enzymes for 2h; α-amylase, β-amylase and glucoamylase.
- Hydrolysis using sulphuric acid (3.16M) of 1 L volume mixed with 146g native starches.
Shape: - α-amylase-hydrolyzed starch; least porous and smallest. Enzyme hydrolyzed granules from external layers and reduced size without creating much porosity. - β-amylase-hydrolyzed starch; intermediate size and porosity. - glucoamylase; biggest size and porosity. - attack the outer layers and create channels through the granules. Size : Initial size: 14.4 μm. α-amylase hydrolysis – 12.8μm (11%). β-amylase hydrolysis – 13.7μm (5%). glucoamylase hydrolysis – 14.1μm (2%). Hydrolysis after 2h enzyme pre-treatment for 45h produced nanoparticles size of ~100nm.
[83]
Waxy maize
-147g waxy maize starch mixed with 1 L diluted sulphuric acid (3M). -Suspension was kept under 400rpm mechanical stirring at 40oC using silicon oil bath. -Experiments were carried out for 1, 3 and 5 days. -Final suspensions were washed by successive centrifugation at 10000rpm in deionized water until neutral pH. -In between centrifugation, suspensions redispersed using Ultra turrax for 1 min at 14000rpm to ensure homogeneity. -The obtained suspensions were filtered on coarse filter tissue to remove granules’s ghost. -Sodium azide was added to suspension before storage at 4oC to avoid microbial growth.
Shape: -Irregular shape, multimodal size with some sharp edges. Smaller individual granules look round and smooth. -Small nanocrystals aggregated into bigger particles after day 5. Size: -After 1 day; 25-70nm, average length of 50nm and width of 35nm.
[84]

33
*The methods chosen in the study were highlighted in grey colour.
Waxy maize starch
-Acid hydrolysis of waxy maize starch granules for 5 days at 40oC in 3.16M aqueous sulphuric acids. -Obtained suspensions were washed with distilled water by successive centrifugations at 10000rpm and 10oC for 20 min until neutral pH. -Solvent exchange from distilled water to acetaone, then to tolune by successive centrifugation at 10000 rpm, 10oC for 45 min. - Homogenous dispersion of starch nanocrystal in tolune using Ultra Turrax for 3 min at 13500 rpm.
Shape & Size: - Platelet-like nanoparticles around 6-8nm thick, 20-40nm long, and 15-30nm wide. -Found to occur as aggregates and barrets.
[85]
Waxy Maize
-Acid hydrolysis of starch nanocrystals with 3.16M sulphuric acid for 5 days at 40oC, 100rpm with starch concentration of 14.96 wt% and yield of 15.7wt %.
Shape: - Parallelepiped nanoplatelet - Observed in aggregates or in barrets of several platelets. Size: -Aggregates (1-5μm).
[82]
Waxy Maize
-36.725g of native waxy maize granules was mixed with 250mL of 3.16M H2SO4 for 5 days at 40oC at 100rpm stirring speed. -Suspension washed by successive centrifugation with distilled water until neutrality.
Shape: - Crystalline nanoplatlet. -tend to aggregate in aqueous medium but not sufficiently to induce sedimentation. - Surface ununiformed. Size: -Platlets 6-8nm thick, 40-6-nm long and 15-30nm wide. -Average size in aggregates form around 4.4μm.
[86]
Waxy Maize
-Starch nanocrystals were obtained by acid hydrolysis for 5 days at 40°C in a 3.16M aqueous H2SO4 solution while stirring constantly. -A homogeneous dispersion of starch. Nanocrystals was obtained by using an Ultra Turrax T25 homogenizer for 3 min at 13 500 rpm. -This dispersion was frozen immediately by immersing the container in liquid nitrogen. Subsequent lyophilization of the frozen dispersion resulted in dried nanocrystals.
Shape: -Aggregates with a large specific area due to a porous structure and a fractal-like base structure. -loose aggregates of nanocrystals in the dried state. Size: -not determined.
[87]

34
Chemical Gelatinization
Chemical gelatinization or as in some literature referred to as surface gelatinization is another possible method to reduce the size of starch granules. The initial idea behind this method is to reduce size by peeling the surface of the granule using chemical or salt like calcium chloride or lithium chloride. The outcome of this method is dependent on the type of starch granules studied as listed in Table 8.
The principle of this method is that in the presence of some substances, for example high amounts of CaCl2, the surface of the granules will gelatinize at room temperature (cold gelatinization) and this gelatinized surface layer can then be removed mechanically by high shear stirring of the dispersion [88-91]. Some of the previous studies were conducted targeting cold gelatinization of potato and maize/corn and this generated starch granules with rough surfaces and reduced size [88, 90, 92].It was seen that small granules where more sensitive to this treatment than larger ones [91].
In paper III, the effect of chemical gelatinization with CaCl2 on oat starch was studied but in this case, there was no surface gelatinization as have been seen in the literature for other types of starches. Instead oat granules swelled/expanded in size during the gelatinization time used in our experiments. The gelatinization time used where 0.5h, 1, 2, 3, 6, 12 and 24h. After each gelatinization time, the gelatinized starch was removed using shearing and washing by cold water. The remaining solid material were collected and the size of the obtained particles was measured. In order to remove dissolved starch and to obtain a smaller particle size, blending (by commercial blender) was more effective in removing the gelatinized starch compared to ultra turrax. The yield of remaining oat granules decreased drastically from 0.5h to 24h of gelatinization time. This as gelatinization and dissolution of starch increase over time and that the dissolved starch is removed during washing step. There were only small changes in size of the remaining starch particles even after a duration of gelatinization of 6, 12, and 24 h and in general the size of the cold gelatinized starch was larger than for the native granule.

35
Table 8. Methods of chemical gelatinization found in the literature. The effect after the gelatinization varied where the granule size were reduced with certain shape and structure
*The methods chosen in the study were highlighted in grey colour.
Starch Description Size/Shape/Info Sources Potato Chemical gelatinization using aqueous
calcium chloride (4M) at 23oC. -Initial size of starch of uniform size with diameter 30- 52 μm.
Shape: Undefined shape. Showed rough surfaces with reductions in the granular size. Size (estimation from SEM): Average initial size: 42μm. Average size reduction: 22 μm. % of size reduction after chemical gelatinization: 52.4%.
[90]
Maize Large (>5μm) Small (<5μm)
-Starches defatted by refluxing with an aqueous methanol solution (85% v/v) for 24h. -Chemical gelatinization for large and small granules using LiCl solution (13M) and stirred at 22-23oC. -Large granules were gelatinized using CaCl2 solution for comparison.
Shape: -periphery starch removed. -rough surface with lamella structure. -evenly surface gelatinized using 13M LiCl than 4 M CaCl2. Size: -Surface gelatinized starch degree (%) is from 8 % up to 27%. -Size reduction is not determined.
[88]
Corn starch
-20g native corn starch was suspended in 150mL of 13M LiCl. - The gelatinization was stopped by adding 1200mL of chilled (4oC) deionized water with quick mixing. - The mixture centrifuged at 3480g for 15 min, and supernatant discarded. -The surface-gelatinized starch washed twice with 1500mL of chilled deionized water.
Shape: -rough appearance was observed in all remaining granules, indicating the granule was peeled from the surface. -erosion occurred to large and small granules, confirming the uniformity of surface gelatinization. Size: -Surface removal is up to 40%. -Size reduction is not determined.
[92]
Potato
-Chemical gelatinization profile monitored by home-made temperature-programmed light intensity meter (LIM). - Starch suspension (5% in 5M CaCl2) was put in microscope slide and heated at 1oC/min.
Shape: - not mentioned. Size: At highest degree of gelatinization (81.3%), particle size from small and large granules are 14.1 and 15.7μm respectively. Initial sizes are 28 and 54μm respectively
[93]
Acetylated waxy Potato
2.0g (dry basis) starch suspended in 4mol/L CaCl2 at 20oC and low stirring. Degree of gelatinization monitored using polarized light microscope.
Degree of gelatinization: 26-54% depending of type of potato starch.
[89]
Rice 20g starch suspended in 150mL of 13M aqueous LiCl and stirred at room temperature.Treated sample blended at 22000rpm, and centrifuged. Re-suspend with chill deionised water and precipitated with ethanol.
Starch periphery may not be responsible for maintaining starch granule integrity.
[94]

36
Dissolution and non-solvent precipitation
Another approach used to produce smaller particles was to dissolve starch granuels and then induce precipitation of the starch to obtain particles. The chosen method was a combination of dissolution of starch by autoclave and non-solvent precipitation using ethanol as the non-solvents. Such methods are often referd to in the literature as nanoprecipitation. Listed in Table 9 are some of the previous works done using non-solvent precipitation.
Table 9. List of precipitation methods found in the literature. Several methods of precipitation were studied to design starch nano-size particles. These have also been used to produce nano particles from other polymers.
Materials Methods Size/Shape Reference
Polymer
Adding polymer solution drop wise under stirring into distilled water (PW) or vice versa; (WP) dropping water into polymer solution Method: 10mg polymer dissolved in 2.5ml acetone add dropwise under stirring to 10ml distilled water/deuterated water or vice versa. Acetone evaporated at 40o C overnight.
Particle size (DLS): 5.8nm-100nm (PW). 190nm -680nm (WP) Shape: Spherical shaped.
[40]
Polymer
Method: 4mg/ml polymer solution underwent dropping method of dissolving polymer in acetone and drop wise into water. (PW)
Particle size: 106-313nm. (PW) Shape: Ideally globe shape and more uniform nanoparticles/more spherical depends on polymers. (PW)
[37]
Starch acetate
Method: 100mg starch acetate was dissolved in 20ml acetone distilled water was added dropwise to polymer solution (WP) and vice versa (PW). Stirred and evaporated.
Particle size: 249-720nm as concentration of polymer increase in acetone from 1-20mg/ml. Shape: Sphere shape and uniform.
[38]

37
Sago starch
Method: 1 wt% of sago starch was dissolved in NaOh/Urea (NU) –[Dissolution]. 1mL of starch solution was added dropwise into abs ethanol (10,15,20ml) which stirred continuously 30 min more. The resulting mixture was centrifuged and supernatant removed. Pellet was rinsed 3x with abs ethanol to remove N/U. DissolutionStarchEthanol
Particle size: Between 300-400nm With surfactant limited the growth of starch particles. -Tween 80 – 150-200 nm, -CTAB – 250-300 nm Shape: Ratio starch solution: ethanol -1:10 (5 ml/ml) fibrous shape. -1:15 (10 ml/ml) mixture of spherical and elongated fiber. -1:20 (20 ml/ml) spherical shape..
[39]
Corn
Method: 8 g corn starch was added into 150 ml distilled water and heated 90 oC for 1 h [Gelatinization] by stirring. Etanol was added dropwise into the gelatinized starch solution. During cooling, another 150 ml ethanol was added. Centrifuged at 8000 rpm for 20 min and the pellet was washed with ethanol to remove water. After washing, drying at 50 oC to remove ethanol. GelatinizationEthanolStarch
Particle Size: Between 50-300nm. Shape: Spherical shape.
[95]
Starch-ester
Method: 20 mg starch mixed ester was dissolved in tetrahydrofuran. Alkaline distilled water was added dropwise into polymer solution (WP). Resulting nanoparticles was stirred until all tetrahydrofuran vaporized.
Particle Size: 270 nm. Shape: Spherical shape.
[41]
Starch-ester
Method: Dropwise addition of water into tetrahydrofuran solution of starch mixed ester (WP) in different starch concentrations of 2,5,8,10 and 15 mg/ml in tetrahydrofuran.
Particle Size: 260nm – 1um. Shape: Spherical shape.
[96]
Acylated allylic starch
Method: 0.5g of acylated allylic starch (AAS) was dissolved in acetone and 10 ml distilled water was added dropwise into the polymer solution (WP). Stirred until completely vaporized.
Particle Size: Ca. 300 nm. Shape: Spherical shape.
[97]
*The methods chosen in the study were highlighted in grey colour.
In paper VI, the method was adapted from previous studies as listed in Table 9. During the adaption of the method the following issues where investigated: method of dissolution of the waxy maize starch using either autoclavation at 140 oC for 20 min or DMSO/LiBr 0.05% (w/v), optimiztion of the starch concentrations, choosing the ratio of solvent, finding the right condition of mixing the solvents and evaluation of the effect of added surfactants. Figure 11 shows some of the experimental set-ups.

38
Figure 11 Dissolution by autoclavation and precipitation processes by dropping technique The preparation of non-solvent precipitation steps to produce nano-size particles; (left) dissolution of starch using autoclave and (right) the precipitation method using ethanol by dropping technique.
During the development of the non-solvent precipitation method it was found that the dissolution step which was adapted from Perez-Rea et al (2015) using autoclavation of an aqueous solution at 140 °C for 20 minutes produced smaller particles than dissolving the starch in DMSO/LiBr [98]. The starting point for selection of precipitation conditions regarding starch concentration and ratio of starch:ethanol was the work done by Tan et al (2009) [38]. The optimum starch concentration resulting in the smallest particles was 8 mg/mL, and this concentration was used for studying all other parameters. As seen in Table 9 the starch concentration has been seen to affect the not only the size of the particles but also the shape. The method used in paper IV generated spherical starch particles.
This precipitation method was adapted from work by Hornig et al (2009) and Chin et al (2011) who initially used the dropping technique which was later optimized to direct mixing [37, 39]. In the optimization of the method, both these methods were compared for ethanol: starch solution ratios of 1:1 and 1:10. The direct mixing technique generated precipitates with smaller particles compared to the dropping and was less time consuming. If the ethanol was added to the starch suspension or the starch solution was added to the ethanol also affected the precipitation, and ethanol added directly to the dissolved starch was found to produce the smallest particles. The two ratios of starch to ethanol tested produced similar particle distribution and thus the 1:1 ratio was preferred as this reduce the consumption of ethanol.

39
Other parameters investigated were the addition of surfactants of SDS and Tween 80. The hypothesis was that addition of surfactants could reduce aggregation of the formed nanoparticles. However, this was not the case and in fact the addition of surfactants led to larger particles than when surfactant free solutions were used. Particles were produced ranging from 30μm to 170μm by addition of 4% SDS while particles with 25μm - 780μm were seen when 4% Tween 80 was used. Thus at least at concentrations of 8 mg/ml starch, solutions without addition of surfactant seemed to be better which is in contrast to the studies performed by Chin et al (2011) [39] who found that surfactants like CTAB and Tween 80 successfully limit the particle growth for production of their nanoparticles. Atomic force microscopy (AFM) and Asymmetric field flow fractionation (AF4) were used to characterize the particles obtained (OSA and non-OSA modified samples). Using these methods, it was found that the main particle size was in the range 100-200 nm. However, larger particles and aggregates of non-solvent precipitates were also observed using methods such as light scattering, light microscopy and AFM. The average size distribution of the smaller particles in the precipitates was measured by AF4 and the result was a radius of gyration (rms radius) around 60 nm for the non-modified starch particles and 260 nm for OSA-modified nanoparticles which indicates that the particles are more strongly aggregated due to the OSA modification. This size is smaller than what has been seen for dissolved waxy maize molecules [99, 100] and further studies of the precipitate was carried out in Paper VI. AFM were used to analyse OSA modified particles, and the average ferret diameter (measure of an object size along a specific direction) of these particles were 182 nm with a span of 14-7000 nm showing large variations but close to the particle size of the non-modified starch as measured by AF4. This indicates that there is a large fraction of nano-precipitated starch that is in the range of 100 nm when not aggregated. Thus, the larger size observed for the OSA modified starch in AF4 is most likely due to aggregation. The size is also in the same range as the smallest particles detected by light scattering. Non-solvent precipitation in ethanol using the optimised method developed in this thesis work produced smaller particles compares to the acid hydrolysis method with particles less than 1μm and the particles were considerably smaller than the waxy maize starch granules d43~13μm (granules) to ~200nm for non-solvent precipitated starch.
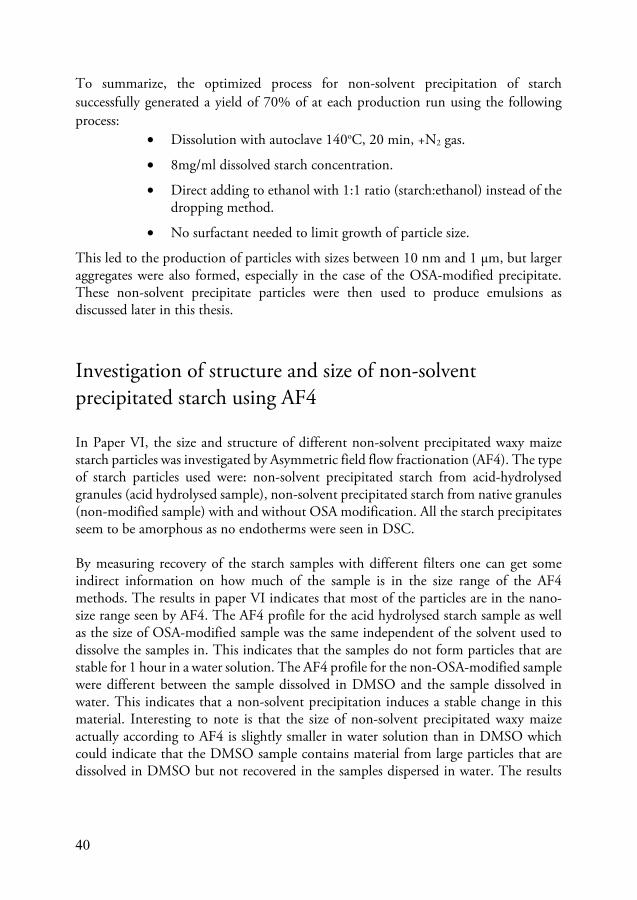
40
To summarize, the optimized process for non-solvent precipitation of starch successfully generated a yield of 70% of at each production run using the following process:
• Dissolution with autoclave 140oC, 20 min, +N2 gas.
• 8mg/ml dissolved starch concentration.
• Direct adding to ethanol with 1:1 ratio (starch:ethanol) instead of the dropping method.
• No surfactant needed to limit growth of particle size.
This led to the production of particles with sizes between 10 nm and 1 μm, but larger aggregates were also formed, especially in the case of the OSA-modified precipitate. These non-solvent precipitate particles were then used to produce emulsions as discussed later in this thesis.
Investigation of structure and size of non-solvent precipitated starch using AF4
In Paper VI, the size and structure of different non-solvent precipitated waxy maize starch particles was investigated by Asymmetric field flow fractionation (AF4). The type of starch particles used were: non-solvent precipitated starch from acid-hydrolysed granules (acid hydrolysed sample), non-solvent precipitated starch from native granules (non-modified sample) with and without OSA modification. All the starch precipitates seem to be amorphous as no endotherms were seen in DSC.
By measuring recovery of the starch samples with different filters one can get some indirect information on how much of the sample is in the size range of the AF4 methods. The results in paper VI indicates that most of the particles are in the nano-size range seen by AF4. The AF4 profile for the acid hydrolysed starch sample as well as the size of OSA-modified sample was the same independent of the solvent used to dissolve the samples in. This indicates that the samples do not form particles that are stable for 1 hour in a water solution. The AF4 profile for the non-OSA-modified sample were different between the sample dissolved in DMSO and the sample dissolved in water. This indicates that a non-solvent precipitation induces a stable change in this material. Interesting to note is that the size of non-solvent precipitated waxy maize actually according to AF4 is slightly smaller in water solution than in DMSO which could indicate that the DMSO sample contains material from large particles that are dissolved in DMSO but not recovered in the samples dispersed in water. The results

41
are in line with observation in literature that also found precipitated particles that was smaller than the amylopectin molecules of the original material [101],
Based on AF4 theory, the molecular conformation of the samples disperse in water was determined. Acid hydrolysed sample had a conformation that was close to a homogeneous sphere (average rrms/rh = 0.70), whereas the OSA-modified sample is very close to the values seen for amylopectin [102]. Finally, the non-modified sample have a changed structure compared to what is expected for amylopectin (average rrms/rh = 2.06). This value indicate that the structure is more rod like. This cannot be due to a preferential precipitation of starch having a very different molecular structure compared to the waxy maize amylopectin as the OSA modified sample does not display this high average ratio and this material are produced from the non-modified material. Thus, there are strong indications that non-solvent precipitation leads to starch structures that are changed compared to the structure of the native amylopectin. In non OSA-modified starch these structures survives when the sample is dispersed in water. This is not the case for the OSA-modified starch sample at least not after 1 hour of dispersion. The reason could be that the OSA modified starch have been hydrolysed to some extent and that this increases the solubility of the material. The time between the dispersion of starch in water and emulsification is much shorter than 1 hour thus it cannot be ruled out that at least during emulsification the OSA-modified starch still contains some of the changed structure seen for the non OSA-modified material, and that this, as discussed in the starch stabilized emulsion section, can be beneficial for the emulsions produced from this material.

42

43
Starch stabilized emulsions
Native granules
Starch particles have been seen to successfully stabilize emulsions and the properties of the emulsions are strongly dependent on the size but also other properties of the used starch particles such as morphology. In Paper I, quinoa (1-2 μm), oat (7-8 μm), and waxy barley (bimodal, 5-30 μm) were studied and the emulsions produced from these granules were investigated to evaluate their potential for stabilizing emulsions. All granules were modified with octenyl succinic anhydride (OSA) to increase their hydrophobicity and the level of OSA substitution varied between 1.7 and 3.1%. Sedimentation of waxy barley made it possible to separate granules of different size: small (<10 μm) and large (> 10 μm). Smaller size starches (<10 μm) are favourable in stabilizing emulsions and provide smaller droplets. Larger size of starch (> 10 μm) has restricted ability to stabilize emulsions and cause aggregates that will sediment by gravity. The stability of emulsions observed after at least 24h of storage was seen to decrease in the order quinoa > waxy barley (small) > oat > waxy barley (bimodal) following the size of the starch granules. Granules that are either round or smoother contributed to the higher stabilizing capacity compared to similar size but sharp/edgy granules. The droplet size was also strongly influenced by starch concentration leading to a decrease in droplet size with increasing starch concentrations.
Mixed starch granules
After investigation of the effect of size of individual starch granules on emulsion properties, the next research topic was to study mixed starch granule emulsion systems. The objective in Paper II was to understand how mixtures of starch granules from different botanic sources affected starch Pickering emulsions and which types of granules that would dominate at the oil-water interface. Pickering emulsions were prepared using mixtures of starch granules based on 3 types of starches. Quinoa was mixed with either waxy maize or oat at ratios based on either at similar weight (400mg/mg oil for both starches, called in this thesis for weight), or constant surface area either based on a quinoa weight of 400 mg which is the same as in the weight

44
system (called in this thesis for area) or a total weight of starch of 800 mg/ml oil which is the same as the total mass of starch in the weight system (called constant). The effects of individual as well as mixed starch on the stability and drop size of emulsions were investigated as a function of concentration and emulsification time.
In mixed granule emulsions, there were a difference between the two systems investigated. In mixed systems quinoa and oat seems to work well together with the larger oat granules dominating at the surface when present in high concentrations. This is in difference to quinoa/waxy maize emulsion where quinoa is dominating at the interface. Waxy maize was observed to be a weak stabilizer, even at higher starch mass in the system compared to oat. Oat is an interesting granule in the mixed system it dominates at the surface even if the emulsion droplets obtained are larger than thus obtained by pure quinoa. As discussed previously it does in paper III it does not need to be OSA-modified to stabilize emulsions. It gives a rather non-compact creaming layer even when the droplets are large probably because oat granules seem to form an aggregated network of particles between the emulsion droplets.
The emulsion index (EI) increased as the starch amount in the system was increased. It was seen that the quinoa/waxy maize system have almost similar EI with quinoa/oat (both at weight and constant) probably due to the fact that they have similar total mass of starch in the system. This shows that the total starch concentration in the system has a strong affect on the EI, independent of the size of individual starch particle.
The emulsification time (60 – 300s) did influence the droplet size of the emulsions made when waxy maize and oat starches were used for stabilization but not for quinoa starch. Longer emulsification time decreased drop size in all mixed samples but more notably for quinoa/oat emulsions where longer homogenization times (5 min) decrease the mean droplet size by up to 80%. Quinoa/waxy maize emulsions did not change as much since the system was dominated by quinoa that gave small drops already at 60 s of emulsification.
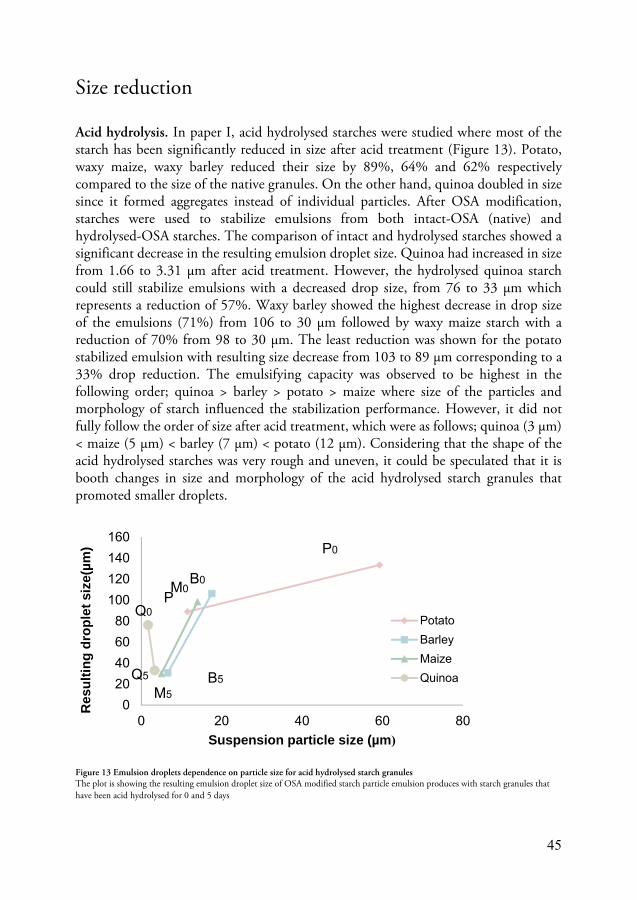
45
Size reduction
Acid hydrolysis. In paper I, acid hydrolysed starches were studied where most of the starch has been significantly reduced in size after acid treatment (Figure 13). Potato, waxy maize, waxy barley reduced their size by 89%, 64% and 62% respectively compared to the size of the native granules. On the other hand, quinoa doubled in size since it formed aggregates instead of individual particles. After OSA modification, starches were used to stabilize emulsions from both intact-OSA (native) and hydrolysed-OSA starches. The comparison of intact and hydrolysed starches showed a significant decrease in the resulting emulsion droplet size. Quinoa had increased in size from 1.66 to 3.31 μm after acid treatment. However, the hydrolysed quinoa starch could still stabilize emulsions with a decreased drop size, from 76 to 33 μm which represents a reduction of 57%. Waxy barley showed the highest decrease in drop size of the emulsions (71%) from 106 to 30 μm followed by waxy maize starch with a reduction of 70% from 98 to 30 μm. The least reduction was shown for the potato stabilized emulsion with resulting size decrease from 103 to 89 μm corresponding to a 33% drop reduction. The emulsifying capacity was observed to be highest in the following order; quinoa > barley > potato > maize where size of the particles and morphology of starch influenced the stabilization performance. However, it did not fully follow the order of size after acid treatment, which were as follows; quinoa (3 μm) < maize (5 μm) < barley (7 μm) < potato (12 μm). Considering that the shape of the acid hydrolysed starches was very rough and uneven, it could be speculated that it is booth changes in size and morphology of the acid hydrolysed starch granules that promoted smaller droplets.
Figure 13 Emulsion droplets dependence on particle size for acid hydrolysed starch granules The plot is showing the resulting emulsion droplet size of OSA modified starch particle emulsion produces with starch granules that have been acid hydrolysed for 0 and 5 days
0
20
40
60
80
100
120
140
160
0 20 40 60 80
Res
ultin
g dr
ople
t siz
e(µm
)
Suspension particle size (µm)
Potato
Barley
Maize
Quinoa
P0
PB0
B5
M5
Q5
Q0
M0

46
Cold gelatinization. Another possible method to reduce particle size is by using the cold gelatinization process. The aim of the study presented in paper III was to investigate calcium chloride induced gelatinization of oat starch and how this affects the properties of oat starch based particle stabilized emulsion. As discussed previously cold gelatinization did not lead to a reduction of the size of the oat granules. Instead it did change the morphology of the starch. This was seen to affect the creaming layer of the starch based emulsions. All studied emulsions creamed after one day but the creaming layer differed due to the length of cold gelatinization of the starch, giving the least dense layer after 0.5 h of cold gelatinization.
Another interesting observation was that oat starch granules where found to stabilize emulsions both without and with OSA (octenyl succinic anhydride) modification of the granules. OSA modification of oat granules does not to any larger degree change the macroscopic properties of the emulsions compared to the corresponding non OSA modified oat starch, but the average size of the droplets was slightly smaller. This is in contradiction to most starch based Pickering emulsions that normally show very poor emulsification properties for native granules due to high hydrophilicity.
It was also investigated if emulsions formed from non-gelatinized granules could be cold gelatinized in situ. The results show that this was possible and that this leads to an encapsulation of oil. The gelatinized emulsions can be dialyzed and lyophilized without loss of oil. Upon reconstitution with water, the emulsion is reformed.
Non-solvent precipitation. In paper IV, the aim of the study was to investigate non-solvent precipitation of starch to produce nano-size particles that could be used in Pickering emulsions. It has been shown previously that modified starch particles could be successfully used to stabilize Pickering emulsions. Therefore, it was interesting to further investigate how to produce particles that were smaller than the granules traditionally used, in order to study how these, affect the size of the emulsion droplets.
It was shown that the non-solvent precipitation method produced starch structures that mainly was below ~200nm. However, larger aggregates of precipitates were also observed by light scattering and light micrographs. During emulsification with a high-shear homogenizer, these aggregates seemed to be partly de-aggregated into individual nanostructures, which resulted in a narrow droplet size distribution in the resulting Pickering emulsions.
The particles obtained subsequently influenced the emulsion droplet size in Pickering emulsions. Initially the emulsions had a size distribution from 0.5 to 45 μm (d4,3, including free starch particles) with an average droplet size of 10±0.7μm and at day zero they had an emulsion index (EI) of 1 with as low amount of oil as 5%. An EI of 1 means that the emulsion is a space filling system with no observed creaming or

47
sedimentation. As comparison, OSA modified waxy maize granules at the same concentration as the non-solvent precipitated particles (200 mg starch/g oil) gave a droplet size of 76±10 μm and an EI of 0.25 for 5% oil. This showed that non-solvent precipitates can produced emulsions with much smaller droplet size than the granular waxy maize starch.
To understand the amount of starch needed to produce Pickering emulsions from non-solvent precipitated starch, a series of starch concentration from 200 mg/ml to 0.01 mg/ml were investigated. A starch concentration of 1mg/ml is able to create emulsion drops with 35 μm drops size whereas a starch concentration of 0.5mg/ml and below is not sufficient in covering oil droplets and oiling off. The highest concentration 200 mg/ml gave a droplet size around 10 μm which is thought to be around the limiting size for the emulsification equipment used.
The emulsions produced have been observed to be stable maintaining EI = 1 after 24hours and up to 1 week. It can thus be concluded that non-solvent-precipitation gave starch particles in the nano- to submicron range, and that these particles could be used to produce Pickering emulsions with smaller droplets sizes and higher emulsion index than Pickering emulsions based on starch granules.

48
Stability study
In Paper V, the stability of emulsions prepared by using octenyl succinic anhydride (OSA)-modified waxy maize in the form of granules, dissolved starch (molecules), and non-solvent precipitated starch (nanoparticles) as emulsion stabilizers were investigated. The aim of this study was to understand how starch in different forms affect the stability of the emulsions and this was studied using light microscopy, light scattering, and static multiple light scattering (Turbiscan). All three samples were prepared according to the previous studies in Paper I & IV. The results from light microscopy, and Turbiscan measurements indicated that coalescence occurred for all three types of emulsions. The coalescence was fast within days for the granule stabilized systems while it was considerably slower both for the dissolved starch and non-solvent precipitate-based emulsions. The latter showing the least degree of coalescence over time. Thus, it was concluded that differences in starch size and molecular structure influenced the resulting emulsion droplet size and stability, Table 10. The decrease in droplet size and the increase in stability towards coalescence and creaming were found to follow the order: granules (largest, least stable), dissolved starch, and non-solvent precipitated starch (smallest, most stable).
Table 10 Stability study Stability data resulted from different starch structures in stabilizing emulsions.
Starch forms Droplets size Emulsion index (EI) Turbiscan stability index (TSI)
Granules 45 - 74μm 0.47 0.28 (0h -24h)
31
Dissolved starch
19 - 86μm 0.87 0.41 (5-6 weeks)
21
Non-solvent precipitates
10 - 40μm 0.91 0.62 (up to 1 year)
16

49
Overview of results
The overview of the results in designing starch as colloidal particles and investigating starch and its potential in emulsion stabilization are given in Table 11.
Table 11 An overview of the results Brief overview of the results from each paper listed for comparison and the further developement to achieve research goals.
Paper Starch Size/methods Results
Paper I Potato, waxy maize, waxy barley, oat, quinoa
OSA modified granules -Starch (1-100μm).
Particles (1-10 μm) are able to create emulsions. Bigger particles (>15 μm) gravity & sedimentation .
Waxy barley Size fractionated granules -Starch (<10μm).
Particles (1-10 μm) are able to create emulsions – hydrophobicity and shape. EI: waxy barley (small)> Quinoa> oat>waxy barley.
Potato, waxy maize, waxy barley, quinoa, oat
Size reduction of the particles. -up to 89% by acid hydrolysis.
Reduced droplet size and increased emulsifying capacity. EI: quinoa>waxy barley>waxy maize>potato
Paper II Quinoa Oat Waxy maize
OSA modified granules in binerysystems
Oat dominates over quinoa at the surface. Quinoa dominates over waxy maize Waxy maize is a poor stabilizer.
Paper III Oat Cold gelatinization Starch dissolved and formed a corona of barrier to stabilize emulsions. Non- OSA modified oat still stabilizes emulsions.
Paper IV
Waxy maize Non-solvent precipitation (~60nm-1μm).
Reduced droplet size and increased emulsifying capacity.
Paper V Waxy maize granules
OSA modifies granules -Starch (15μm)
Bigger particles (>15 μm) gravity & sedimentation. Stability up to 24h.
Waxy maize dissolved (molecules)
Dissolve starch molecules
Reduced droplet size and increased emulsifying capacity compared to granuels. Coalesence and creaming. Stability up to 5-6 weeks.
Waxy maize Precipitates (nanoparticles)
Precipitate particles (~120nm -1μm)
Reduced droplet size and increased emulsifying capacity. Slow coalesence. The best emulsifying capacity is up to 1 year.
Paper VI Waxy maize Non-solvent precipitation
Non-solvent precipitation of waxy maize produces starch structures that are different from dissolved waxy maize amylopectin.

50

51
Application of Pickering emulsions
Starch is inexpensive and abundant which makes it a great choice as an ingredient in many application and products. Although they are mainly used in foods, such as in soups, sauces, gravies, bakery products, dairy, snacks, there are also application in non-food applications such as in pharmaceuticals, textiles, bioplastic, cosmetics and many more [70, 71]. Starch stabilized Pickering emulsions is a novel and new innovation where modification of starch particles show great potential for certain applications such as topical creams, encapsulation of oil, and stabilization of oxidation sensitive oils. The work done in this thesis shows several ways to improve starch based emulsions:
• Employing starch granule in natural size is one of the simplest way to obtain emulsions with different properties when it comes to droplet size and emulsion stability.
• Starch particles in nano-size range can function as good emulsifiers, fillers or coatings ingredients. Non-solvent precipitation produced nano-size material has potential for product that needs long term stability as they have been seen to improve emulsion stability.
• Mixing different type of starch granules maybe a good way to create product that need different ingredients functionalities.
• The cold gelatinization process may help in treating starch and other food ingredients that are heat sensitive but need stabilization properties in addition to the normal Pickering stabilization. Encapsulation of heat sensitive product can also be produce using this technique.

52

53
Conclusions
In this thesis, different methods to designing starch colloidal particles were developed in order to study the potential of starch particles as stabilizing agents for emulsions. The function of the starch particles as emulsifiers were seen to be dependent on their size, morphology and chemical and physical modifications applied to the granules. The following main conclusion could be drawn based on the work in the thesis;
• Investigation on starch granules size, morphology and properties of the starch granules shown that starch granules has potential as emulsifiers and small to medium size, round, slightly edgy, and smooth shaped granules such as for example quinoa, oat, and waxy barley (small fraction) show better performance as emulsifying agent than larger granules such as waxy maize and potato.
• The competition between different granules for the emulsion interface was investigated in binary systems. The conclusion is that size alone does not explain which granule will dominate at the interface. In the case of quinoa and oat, the larger oat granules dominate on the interface. However, for the waxy maize/quinoa system largest granules tested (waxy maize) the competing power was low and quinoa dominate at the interface. Future studies are needed to understand if this was due to a non-optimal size of the waxy maize or to other properties of waxy maize starch granules.
• Starch at reduced size has been an important factor in stabilizing emulsion as the smaller the particle, contributes to smaller emulsion droplets and this gives a higher emulsification index. New starch particles at reduced size from micron to nano-size has been successfully generated using several different methods such as size fractionation of native starch granules, acid hydrolysis, cold gelatinization, and dissolution followed by non-solvent precipitation.
• A method for producing non-solvent precipitated starch was developed and the material formed was characterized using a range of methods. It was seen using AF4 measurements that even if some of the particles produced by this method was not stable when re-dispersed in water for 1 hour, the structure of particles produced from unmodified waxy maize differed substantially from dissolved amylopectin.

54
• Increased emulsion stability was achieved for non-solvent precipitated starch compared to larger granules from the same botanical source obtaining reasonable good stability towards coalescence for up to a year for the non-solvent precipitated particles.
This study reveals another potential of starch besides functioning as our staple food to be useful as natural food ingredients for formulated products as well as the ability to use starch for emulsion stabilization in non-food products.

55
Comments and suggestions for the future
The works presented in this thesis mainly cover topics on the utilization of the starch with regards to its size and morphology. Only a few starches were selected or were able to be studied in this thesis, despite the facts that there are a number of botanic variations. Although experiments were always designed based on previous work found in the literature, the aim to create novel technologies and new innovations are the main key for research and development. Selection of the starch to be investigated is very crucial and if more research is done on uncommon starches, it will help to fill up gaps in the research field instead of studying the common starch that can already be found in the literature.
The main recommendations for studies that can be explored in the future are;
• A standard method could be set up to evaluate as many starch variations as possible, i.e., data collection of different varieties of starch standard analysis/methods/emulsions characterization and records in a starch database for future use within the group or to be compiled as review papers.
• Size had an important impact on stabilizing the emulsions. It can be seen that smaller particles contribute to high emulsifying capacity. Fabrication method for the nanoparticle can be improved and different kinds of starches can be explored beside waxy maize in order to produce novel starch nanoparticles. Extensive work has been done in finding the right method for production of starch nanoparticles by dissolution & precipitation and this method can also be used to produce bioplastic which was accidently produced during drying of the smallest fraction of the precipitates. It could be a very interesting research area to explore and study further.
• Morphology – shape, structure and morphology of the starch are unique and different at the surface as well as the internal structure. Unlike size, this thesis did not cover much on the shape/morphology and its effect on emulsion stability. More detailed studies could be done by a more systematic classifying starch shape, dividing the starch into categories based on shape as alternatives for studying the effect of shape based on individual starch material.

56
• Hydrophobicity – The OSA modification was applied to all starch in a similar standard method. However, because of the titration method the level of OSA varies between 1.7-3% depending on the morphology of the starch even though a fix amount of 3% of OSA is added based on the starch dry weight. A closer study could be done to investigate how and why OSA levels are not similar from one to another starch. Measurement by NMR to evaluate the levels of OSA by another method than titration could also be a possible alternative to validate the results. Other aspects to be studied is the distribution of OSA elements at the surface of the starch which could explain or give information on the wettability and how the stabilization occurs in certain ways for different starches.
• Contact angle is also an important parameter to be studied as it will explain how the starch positions at the interface. At the beginning of the research, we have tried to discover contact angles by confocal microscopy by taking the picture of the starch at the interface using 3D images. However, emulsions are large complex system and the attempt to measure relevant angles from microscopic images was not successful. Other methods of contact angle measurements or other methods which is related to the wettability of the starch particle itself can be investigated.
• Properties – A thorough study on a range of properties of different varieties of starch would also be an interesting area to explore. Starch occurs in various forms and there are more properties than studied in this thesis that can influence or determine how they work as emulsifiers. This includes knowledge of other components in starch such as protein, lipids, minerals, amylose/amylopectin as well as and contaminants, detailed surface structure, porosity of the starch granule to mention some important issues.
• The emulsification process effects the droplet size distribution. Different type of homogenizers used for the emulsification process were not studied which can be useful in order to understand how to generate the smallest droplet possible.

57
Acknowledgements
“Being told you’re appreciated is one of the simplest and most uplifting things you can hear.”
Here it comes, no words could ever describe enough on how thankful I am and that I really appreciate all the efforts and your contributions to this journey in any possible way.
First and foremost, I want to thank my main supervisor, Marie Wahlgren for your daily guidance, encouragement, endless support; intellectually, mentally, and emotionally throughout this journey. You are true inspirations as I always amazed on how diverse and knowledgeable you are in any fields you venture yourself into. Thank you for offering your hands when I am at my lowest. I will never forget when you say “I will make sure you will finish in time” and here we are finally. It was very emotional yet satisfying feeling to reach the end. Thank you for the flexibility to work on my pace, for being so understanding of my everyday struggle as a mother of 2, for your concern and being thoughtful to my family, showering us with love, gifts esp for the kids and visits during festive occasions. I truly enjoyed our work meetings at the comfort of my home and thank you for always offering to come over whenever I work from home. Our home is always welcomes you.
To Marilyn Rayner, my co-supervisor who is always an inspirations, very ambitious, motivating and productive. I admire your success and your work ethic for always being consistent, precise, punctual and organized. It is an honour to have been working with you, though I start to fear the sophisticated equations and calculations spilled out by you. Thank you for all your supports and guidance throughout the whole journey especially so patiently teaching the mathematical part of our projects. .I truly enjoyed our cooking Turkey session together and all the Turkey Christmas dinners that we were invited too. Spending time at your beautiful summer house was truly an amazing experience for us the whole family. We appreciated your company, Fred and Alfie for the visits to our humble home and as always gifts for the kids in so many occasions. Thank you for always being there and I will always remember when you say this “no matter what, you know I will always support you”. Indeed you are until the end!
To Malin Sjöö, thank you for your supervision, sharing your expertise and broad knowledge on starch, intellectual ideas, creative and always brilliant solutions to any issues when designing/solving our experimental works. It was really a pleasure to work

58
with you, and you are the mastermind with all the fruitful discussions for the successful of the projects. I admire your personality, professionality and always a beautiful smile on your face. It was really fun making gingerbread every year with Saga and Selma, and Luqman truly enjoyed this yearly tradition at our department and would be the last gingerbread year for us. Thank you for the time we have been sharing together.
To Maria Matos, thank you for your guidance and sharing knowledge especially on Turbiscan, contribution and supervision on my paper 5. I always admire your energy and your ninja-action in the lab. Amazingly productive! Thank you for always coming over for visits/dinners whenever you are back in Lund. To Åsa Hakansson , thank you for being another pair of eyes to proof read the whole thesis and of course the struggle to understand another area other than yours. Also thank you for the time we had at fika/department. Thanks to Federico, I declared you as my unofficial mentor for who I always ask for advice about anything in regards to study, admin or fun life. Every day during fika is full of laughs and so much things to talk about and of course how we enjoy our tea, my tea-buddy. Thank you for your precious time and you made it fun to go to work every day.
To Petr Dejmek, for the intellectual challenge that build my critical thinking in viewing thing differently. To Björn, thanks for always open your door whenever I knock to ask about anything. It was really nice to attend both Powder course and Formulation course lectured by you and Marie. To all other seniors, Yvonne, Eva, Ingegerd, Siv, Maria Glantz, Pållan for amazing time together in the department and I always amazed how sporting you are to participate in team competitions that I planned when we had department trip during team competitions by the beach. Fun!
To Dan and Hans, the most important people in the lab that we can’t live without. For providing support in technical issues and in providing lab materials at the lab. Thank you for your efficient service and help! To Aniko and Peter, for the help with administration and financial matters.
A deepest thanks directed to all wonderful friends at the departments;
Special thanks to Ali and Diana, the very few first persons I know in the department, who have been teaching me a lot on the experiments in Pickering project, being so caring especially when I had my first pregnancy during my first year when I arrived at the department. I truly missed our lunch at the Ideon with the 3 of us. To Emma and Borje, I missed knocking on your door asking for help with anything, especially when I first came. You both are just like google in this department and mostly know rules, regulations, or the person I always ask to read my letter in Swedish including taxes. Thank you! To my officemate, Claudia Zielke, it has been wonderful time sharing wisdom, jokes, funny and crazy moments together; remember the tin foil hat? Endless cookie session over chat. And be proud cos we can consider ourselves as ‘genius’ like Einstein as we had office room just like him. I truly appreciate the ‘emergency letter’

59
you left for me before leaving for Korea. I was truly touch, thanks for your love, friendship, good laugh and support needed! To Karolina, you are my inspirations of a mommy with PhD. I truly enjoyed cooking Asian foods with you and not only enjoy our laugh during lunch but amazed by looking at your lunch box with different kind of menus, from cooking western to Asians food, beside also your sewing skill! Awesome supermommy!
To all the girls; Kati, Yana, Eda, Kasia, Shohreh, Claudita, Isilay, Daisy, Madeleine, Marianick for the time, laughter, fun time during dinners, birthdays, brunch, outings, picnics, party, wedding, cooking Asian foods together and many more. Too many memories, how can I list out? I enjoyed being photographer for all of you and if you miss any of it, go and search the fb album for our moments together. Thank you spending time my kids and being aunties for them. To floor 0 friends; Randi, who is always an inspiring person to me, I always love the energy coming from you as it uplift my motivation. I love our cooking session together. To Pamela and Elisabeth, I enjoyed our sauna session and dip in cold sea water during winter, crazy!! It was very therapeutic and yes we should do this more often. I love the bonding session we had there during sauna. To Klara, I truly enjoyed our cooking session and fun run with the kids! To my Bolivians friends that we have share laughter and talk about Bolivia, of course eating and cooking sessions; Vanesa, Atma, Cecy, Sanders, Daniel, Gabriel and of course Catalina, I am so happy to work with you with the last project. Hopefully to visit you guys there! To the new bunch; Kajsa, Stina, Ida-Marie, Yi, Nabila, Afina, Maria Hedlund, David, Zishan, it has been wonderful time together at fika/department events sharing laugh and talks. Wishing you all the very best for your journey! To all the old bunch; Andreas, Alejandra, Lars, Jeannette, Karin, Ray, Frida, Borges, Lucas, Eulalia for the time and laugh we have shared together and inspirations to keep going and finishing the phd. Thank you all again for making this phd journey and wonderful and joyous one!
To all my other friends around the world;
To all struggling mothers & single mothers that I know especially to my dearest friend Rozie Ahmad who is always an inspiration to me on how strong you are facing the challenges. Stay strong, make them wonder how you are still smiling. Hats off! This is dedicated to you too; Izan, Wan Nurfadilah, Azah, Qay, kerana pernah menjadi sahabat rapat ketika berjuang menuntut ilmu di setiap peringkat hidup ini.
To my dearest friend, June Minnhagen & family, for always being there whenever we need family for support. For babysitting our kids, and for taking care when I was sick for a month while hubby was offshore. For all the support during hard time and good times. To Kak Radhlinah, thank you for your support, advice and positive energy to keep on going. My inspiration to achieve my goal and keep my motivation. Juga untuk semua sahabat warga Lund/Copenhagen yang terlalu ramai untuk disebutkan nama disini; terutama pada Amir/Tiha & Fauzan, yang telah membantu semak baca

60
rumusan dalam BM yang terabadi dalam thesis ini. Tempat kami menumpang kasih di perantauan ini, terima kasih atas program/makan-makan dan get together yang dapat mengubat rindu keluarga yang jauh. To my extended family when I was in NL; Uncle Joe, Uncle Alan & Aunty Tonny and Arwah Ali & Iskandar (al-fatihah) and many more who I shared my life with when living abroad and accepted me as part of family. Juga untuk semua kawan-kawan yang dikenali. Terima kasih semuanya atas sokongan, kata-kata semangat dan berkongsi masa menghadapi hari-hari yang mencabar.
Untuk keluarga tersayang; Mak, Abah, Mama (mertua), adik beradik dan semua ahli keluarga yang tak pernah jemu mendoakan kejayaan kami dari jauh. Yang memahami cita-cita dan impian saya yang cintakan ilmu dari bangku sekolah kini ke peringkat university. Jasa Mak ,Abah, mama takkan dapat saya balas hanya doa agar Allah panjangkan umur, murahkan rezeki dan berikan kesihatan yang baik serta memberi peluang saya untuk menabur bakti pada keluarga. Kejayaan saya hari ini bukanlah untuk saya, tapi untuk semua yang sentiasa menyokong dan memberi dorongan. Moga ini menjadi titik tolak dan inspirasi pada semua ahli keluarga untuk berjaya dalam apa jua bidang yang diceburi. Terima kasih semua, juga yang pernah datang menolong membantu menjaga Luqman di Sweden sepanjang pengajian phd ini.
Buat suami tersayang, terima kasih kerana mengorbankan segalanya, cita-cita, kerjaya dan masa menguruskan anak-anak dan keluarga, untuk memastikan isterimu mengejar cita-cita demi sekeping ijazah phd ini. Terima kasih kerana bersabar dan tabah dalam sama-sama mengharungi ujian getir ini. Moga Allah berkati usaha kita. Love you till Jannah!
To Luqman & Luthfia, this is dedicated to you my love. When one day you can read this, you will understand why I had to steal these ‘precious time’ from you while writing this little ‘book’. The time when you cry for attentions but I have to focus myself in finishing this work. You are the strength I have to keep on going. May this hardships we have gone through together will inspire you to be the best person you can be in the future.

61
References
1. Rayner, M., et al., Quinoa starch granules: A candidate for stabilizing food-grade Pickering emulsions. Journal of the Science of Food and Agriculture, 2012. 92(9): p. 1841-1847.
2. Dickinson, E., Hydrocolloids as emulsifiers and emulsion stabilizers. Food Hydrocolloids, 2009. 23(6): p. 1473-1482.
3. Aveyard, R., B.P. Binks, and J.H. Clint, Emulsions stabilized solely by colloidal particles. Advances in Colloid and Interface Science, 2003. 100–102(0): p. 503-546.
4. Tcholakova, S., N. Denkov, and A. Lips, Comparison of solid particles, globular proteins and surfactants as emulsifiers. Physical Chemistry Chemical Physics, 2008. 10(12): p. 1608-1627.
5. Pérez, S. and E. Bertoft, The molecular structures of starch components and their contribution to the architecture of starch granules: A comprehensive review. Starch - Stärke, 2010. 62(8): p. 389-420.
6. Wang, K., et al., Variation in amylose fine structure of starches from different botanical sources. Journal of Agricultural and Food Chemistry.
7. Hoover, R., et al., Composition, molecular structure, properties, and modification of pulse starches: A review. Food research international. 43(2): p. 399-413.
8. Ovando-Martínez, M., et al., Starch characteristics of bean (Phaseolus vulgaris L.) grown in different localities. Carbohydrate Polymers. 85(1): p. 54-64.
9. Jane, J.-L., et al., Anthology of Starch Granule Morphology by Scanning Electron Microscopy. Starch - Stärke, 1994. 46(4): p. 121-129.
10. Lindeboom, N., P.R. Chang, and R.T. Tyler, Analytical, Biochemical and Physicochemical Aspects of Starch Granule Size, with Emphasis on Small Granule Starches: A Review. Starch - Stärke, 2004. 56(3-4): p. 89-99.
11. Li, J.H., et al., Starch from hull-less barley: V. In-vitro susceptibility of waxy, normal, and high-amylose starches towards hydrolysis by alpha-amylases and amyloglucosidase. Food Chemistry, 2004. 84(4): p. 621-632.
12. Hall, D.M. and J.G. Sayre, A Scanning Electron-Microscope Study of Starches: PART III: Miscellaneous Starches. Textile Research Journal, 1971. 41(11): p. 880-894.

62
13. Timgren, A., et al., Emulsion stabilizing capacity of intact starch granules modified by heat treatment or octenyl succinic anhydride. Food Science & Nutrition, 2013. 1(2): p. 157-171.
14. Hall, D.M. and J.G. Sayre, A Scanning Electron-Microscope Study of Starches: Part II : Cereal Starches. Textile Research Journal, 1970. 40(3): p. 256-266.
15. French, D., Chemical and Physical Properties of Starch. Journal of Animal Science, 1973. 37(4): p. 1048-1061.
16. Li, W.-y., et al., Comparison of Starch Granule Size Distribution Between Hard and Soft Wheat Cultivars in Eastern China. Agricultural Sciences in China, 2008. 7(8): p. 907-914.
17. Chmelík, J., et al., Comparison of Size Characterization of Barley Starch Granules Determined by Electron and Optical Microscopy, Low Angle Laser Light Scattering and Gravitational Field-Flow Fractionation. Journal of the Institute of Brewing, 2001. 107(1): p. 11-17.
18. Song, Y. and J. Jane, Characterization of barley starches of waxy, normal, and high amylose varieties. Carbohydrate Polymers, 2000. 41(4): p. 365-377.
19. Ao, Z. and J.-l. Jane, Characterization and modeling of the A- and B-granule starches of wheat, triticale, and barley. Carbohydrate Polymers, 2007. 67(1): p. 46-55.
20. Fredriksson, H., et al., The influence of amylose and amylopectin characteristics on gelatinization and retrogradation properties of different starches. Carbohydrate Polymers, 1998. 35(3): p. 119-134.
21. Buléon, A., et al., Starch granules: structure and biosynthesis. International journal of biological macromolecules, 1998. 23(2): p. 85-112.
22. Hassid, W.Z. and R.M. McCready, The Molecular Constitution of Amylose and Amylopectin of Potato Starch. Journal of the American Chemical Society, 1943. 65(6): p. 1157-1161.
23. Xie, F., et al., Advanced Nano-biocomposites Based on Starch. Polysaccharides: Bioactivity and Biotechnology, 2015: p. 1467-1553.
24. Tester, R.F., J. Karkalas, and X. Qi, Starch—composition, fine structure and architecture. Journal of Cereal Science, 2004. 39(2): p. 151-165.
25. Zobel, H., Molecules to granules: a comprehensive starch review. Starch‐Stärke, 1988. 40(2): p. 44-50.
26. Eliasson, A.-C., Carbohydrates in food. Vol. 159. 2006: CRC Press. 27. Atkin, N., R. Abeysekera, and A. Robards, The events leading to the formation of
ghost remnants from the starch granule surface and the contribution of the granule surface to the gelatinization endotherm. Carbohydrate Polymers, 1998. 36(2): p. 193-204.

63
28. Ortega‐Ojeda, F.E., H. Larsson, and A.C. Eliasson, On the Dispersion and Small‐Amplitude Oscillation Measurements of High Amylopectin Potato Starch. Starch‐Stärke, 2003. 55(3‐4): p. 121-130.
29. Witt, T. and R.G. Gilbert, Causal relations between structural features of amylopectin, a semicrystalline hyperbranched polymer. Biomacromolecules, 2014. 15(7): p. 2501-2511.
30. Tester, R.F. and W.R. Morrison, Swelling and gelatinization of cereal starches. I. Effects of amylopectin, amylose, and lipids. Cereal Chem, 1990. 67(6): p. 551-557.
31. Biliaderis, C., T. Maurice, and J. Vose, Starch gelatinization phenomena studied by differential scanning calorimetry. Journal of food science, 1980. 45(6): p. 1669-1674.
32. Cai, C. and C. Wei, In situ observation of crystallinity disruption patterns during starch gelatinization. Carbohydrate polymers, 2013. 92(1): p. 469-478.
33. Zhou, H., et al., Effects of salts on physicochemical, microstructural and thermal properties of potato starch. Food Chemistry, 2014. 156: p. 137-143.
34. Ahmad, F.B. and P.A. Williams, Effect of salts on the gelatinization and rheological properties of sago starch. Journal of Agricultural and Food Chemistry, 1999. 47(8): p. 3359-3366.
35. Gudmundsson, M., Retrogradation of starch and the role of its components. Thermochimica Acta, 1994. 246(2): p. 329-341.
36. Liu, H., et al., Retrogradation of corn starch after thermal treatment at different temperatures. Carbohydrate polymers, 2007. 69(4): p. 756-762.
37. Hornig, S., et al., Synthetic polymeric nanoparticles by nanoprecipitation. Journal of Materials Chemistry, 2009. 19(23): p. 3838-3840.
38. Tan, Y., et al., Fabrication of size-controlled starch-based nanospheres by nanoprecipitation. ACS applied materials & interfaces, 2009. 1(4): p. 956-959.
39. Chin, S.F., S.C. Pang, and S.H. Tay, Size controlled synthesis of starch nanoparticles by a simple nanoprecipitation method. Carbohydrate Polymers, 2011. 86(4): p. 1817-1819.
40. Perevyazko, I., et al., Characterization of Poly(methyl methacrylate) Nanoparticles Prepared by Nanoprecipitation Using Analytical Ultracentrifugation, Dynamic Light Scattering, and Scanning Electron Microscopy. Journal of Polymer Science Part a-Polymer Chemistry, 2010. 48(18): p. 3924-3931.
41. Tan, Y., et al., Fabrication of starch-based nanospheres to stabilize pickering emulsion. Carbohydrate Polymers, 2012. 88(4): p. 1358-1363.
42. Ramsden, W., Separation of Solids in the Surface-Layers of Solutions and 'Suspensions' (Observations on Surface-Membranes, Bubbles, Emulsions, and Mechanical Coagulation). -- Preliminary Account. Proceedings of the Royal Society of London, 1903. 72: p. 156-164.

64
43. Pickering, S.U., Cxcvi.—emulsions. Journal of the Chemical Society, Transactions, 1907. 91: p. 2001-2021.
44. Östbring, K., et al., Heat-induced aggregation of thylakoid membranes affect their interfacial properties. Food & function, 2015. 6(4): p. 1310-1318.
45. Rayner, M., et al., Chloroplast thylakoid membrane‐stabilized emulsions. Journal of the Science of Food and Agriculture, 2011. 91(2): p. 315-321.
46. Tenorio, A.T., et al., Interfacial properties and emulsification performance of thylakoid membrane fragments. Soft matter, 2017. 13(3): p. 608-618.
47. Yusoff, A. and B.S. Murray, Modified starch granules as particle-stabilizers of oil-in-water emulsions. Food Hydrocolloids, 2011. 25(1): p. 42-55.
48. Timgren, A., et al., Starch particles for food based Pickering emulsions. Procedia Food Science, 2011. 1: p. 95-103.
49. Li, C., P. Sun, and C. Yang, Emulsion stabilized by starch nanocrystals. Starch‐Stärke, 2012. 64(6): p. 497-502.
50. Marefati, A., et al., Freezing and freeze-drying of Pickering emulsions stabilized by starch granules. Colloids and Surfaces A: Physicochemical and Engineering Aspects, 2013. 436: p. 512-520.
51. Marefati, A., et al., Fabrication of encapsulated oil powders from starch granule stabilized W/O/W Pickering emulsions by freeze-drying. Food Hydrocolloids, 2015. 51: p. 261-271.
52. Marku, D., et al., Characterization of starch Pickering emulsions for potential applications in topical formulations. International Journal of Pharmaceutics, 2012. 428(1-2): p. 1-7.
53. Matos, M., et al., Combined emulsifying capacity of polysaccharide particles of different size and shape. Carbohydrate Polymers, 2017.
54. Matos, M., et al., Preparation and encapsulation properties of double Pickering emulsions stabilized by quinoa starch granules. Colloids and Surfaces A: Physicochemical and Engineering Aspects, 2013. 423: p. 147-153.
55. Rayner, M., et al., Quinoa starch granules as stabilizing particles for production of Pickering emulsions. Faraday Discussions, 2012. 158: p. 139-155.
56. Sjöö, M., et al., Barrier properties of heat treated starch Pickering emulsions. Journal of colloid and interface science, 2015. 450: p. 182-188.
57. Matos, M., et al., Comparative Emulsifying Properties of Octenyl Succinic Anhydride (OSA)-Modified Starch: Granular Form vs Dissolved State. PloS one, 2016. 11(8): p. e0160140.
58. Wahlgren, M., et al., The use of micro-and nanoparticles in the stabilization of Pickering-type emulsions for topical delivery. Current pharmaceutical biotechnology, 2013. 14(15): p. 1222-1234.

65
59. Binks, B.P. and S.O. Lumsdon, Influence of Particle Wettability on the Type and Stability of Surfactant-Free Emulsions. Langmuir, 2000. 16: p. 8622-8631.
60. Kargar, M., F. Spyropoulos, and I.T. Norton, The effect of interfacial microstructure on the lipid oxidation stability of oil-in-water emulsions. Journal of colloid and interface science, 2011. 357(2): p. 527-533.
61. Kargar, M., F. Spyropoulos, and I.T. Norton, Microstructural design to reduce lipid oxidation in oil-inwater emulsions. Procedia Food Science, 2011. 1: p. 104-108.
62. Kargar, M., et al., Investigation into the potential ability of Pickering emulsions (food-grade particles) to enhance the oxidative stability of oil-in-water emulsions. Journal of Colloid and Interface Science, 2012. 366(1): p. 209-215.
63. Rayner, M., et al., Biomass-based particles for the formulation of Pickering type emulsions in food and topical applications. Colloids and Surfaces A: Physicochemical and Engineering Aspects, 2014.
64. Rayner, M. and P. Dejmek, Engineering aspects of food emulsification and homogenization. 2015: CRC Press.
65. McClements, D.J., Food Emulsions: Principles, Practices, and Techniques, Second Edition. 2004: Taylor & Francis.
66. Walstra, P., Principles of emulsion formation. Chemical Engineering Science, 1993. 48(2): p. 333-349.
67. Walstra, P., Physical chemistry of foods. 2002: CRC Press. 68. Chiu, C.-w. and D. Solarek, Modification of starches. Starch: Chemistry and
technology, 2009: p. 629-655. 69. Eliasson, A. and M. Gudmundsson, Starch: physicochemical and functional
aspects. Food Science and Technology-New York-Marcel Dekker, 1996: p. 431-504.
70. Kaur, B., et al., Progress in starch modification in the last decade. Food Hydrocolloids, 2012. 26(2): p. 398-404.
71. Tharanathan, R.N., Starch—value addition by modification. Critical reviews in food science and nutrition, 2005. 45(5): p. 371-384.
72. Caldwell, C.G. and O.B. Wurzburg, Polysaccharide derivatives of substituted dicarboxylic acids. 1953, Google Patents.
73. Randa, L. and A.V. Shogren, Distribution of Oc-tenyl Succinate Groups in Octenyl Succinic. Starch, 2000. 50(5): p. 196-204.
74. Chen, Q., et al., Recent progress in chemical modification of starch and its applications. RSC Advances, 2015. 5(83): p. 67459-67474.

66
75. Dhital, S., A.K. Shrestha, and M.J. Gidley, Relationship between granule size and in vitro digestibility of maize and potato starches. Carbohydrate Polymers, 2010. 82(2): p. 480-488.
76. Liu, T.Y., et al., The effect of ball milling treatment on structure and porosity of maize starch granule. Innovative Food Science & Emerging Technologies, 2011. 12(4): p. 586-593.
77. Sanguanpong, V., et al., Preparation and structural properties of small‐particle cassava starch. Journal of the Science of Food and Agriculture, 2003. 83(8): p. 760-768.
78. Devi, A.F., et al., Physical properties of cryomilled rice starch. Journal of Cereal Science, 2009. 49(2): p. 278-284.
79. Dhital, S., A.K. Shrestha, and M.J. Gidley, Effect of cryo-milling on starches: Functionality and digestibility. Food Hydrocolloids, 2010. 24(2–3): p. 152-163.
80. Che, L.-M., et al., Micronization and hydrophobic modification of cassava starch. International Journal of Food Properties, 2007. 10(3): p. 527-536.
81. Song, S., et al., Preparation and characterization of amphiphilic starch nanocrystals. Journal of Applied Polymer Science, 2008. 107(1): p. 418-422.
82. Angellier, H., et al., Optimization of the preparation of aqueous suspensions of waxy maize starch nanocrystals using a response surface methodology. Biomacromolecules, 2004. 5(4): p. 1545-1551.
83. Le Corre, D., et al., Optimization of the batch preparation of starch nanocrystals to reach daily time-scale. Starch-Starke, 2012. 64(6): p. 489-496.
84. LeCorre, D., J. Bras, and A. Dufresne, Evidence of Micro- and Nanoscaled Particles during Starch Nanocrystals Preparation and Their Isolation. Biomacromolecules, 2011. 12(8): p. 3039-3046.
85. Labet, M., W. Thielemans, and A. Dufresne, Polymer grafting onto starch nanocrystals. Biomacromolecules, 2007. 8(9): p. 2916-2927.
86. Angellier, H., et al., Processing and structural properties of waxy maize starch nanocrystals reinforced natural rubber. Macromolecules, 2005. 38(9): p. 3783-3792.
87. Thielemans, W., M.N. Belgacem, and A. Dufresne, Starch nanocrystals with large chain surface modifications. Langmuir, 2006. 22(10): p. 4804-4810.
88. Pan, D. and J.L. Jane, Internal structure of normal maize starch granules revealed by chemical surface gelatinization. Biomacromolecules, 2000. 1(1): p. 126-132.
89. Huang, J., et al., Characterization of remaining granules of acetylated starch after chemical surface gelatinization. Carbohydrate Polymers, 2010. 80(1): p. 215-221.
90. Jane, J.l. and J.J. Shen, Internal structure of the potato starch granule revealed by chemical gelatinization. Carbohydrate Research, 1993. 247(C): p. 279-290.

67
91. Koch, K. and J.L. Jane, Morphological changes of granules of different starches by surface gelatinization with calcium chloride. Cereal Chemistry, 2000. 77(2): p. 115-120.
92. Kuakpetoon, D. and Y.J. Wang, Internal structure and physicochemical properties of corn starches as revealed by chemical surface gelatinization. Carbohydrate Research, 2007. 342(15): p. 2253-2263.
93. Steeneken, P.A.M. and A.J.J. Woortman, Surface effects in the acetylation of granular potato starch. Carbohydrate Research, 2008. 343(13): p. 2278-2284.
94. Wang, Y.J., et al., Chemical composition and structure of granule periphery and envelope remnant of rice starches as revealed by chemical surface gelatinization. Starch-Starke, 2007. 59(9): p. 445-453.
95. Ma, X., et al., Fabrication and characterization of citric acid-modified starch nanoparticles/plasticized-starch composites. Biomacromolecules, 2008. 9(11): p. 3314-3320.
96. Tan, Y., et al., A robust route to fabricate starch esters vesicles. Chemical Communications, 2010. 46(25): p. 4523-4525.
97. Tan, Y., et al., Designing Starch‐Based Nanospheres to Make Hydrogels with High Mechanical Strength. Macromolecular Materials and Engineering, 2009. 294(12): p. 855-859.
98. Perez-Rea, D., B. Bergenståhl, and L. Nilsson, Development and evaluation of methods for starch dissolution using asymmetrical flow field-flow fractionation. Part I: Dissolution of amylopectin. Analytical and bioanalytical chemistry, 2015. 407(15): p. 4315-4326.
99. Naguleswaran, S., et al., Molecular characterisation of waxy corn and barley starches in different solvent systems as revealed by MALLS. Food Chemistry, 2014. 152: p. 297-299.
100. Juna, S., P.A. Williams, and S. Davies, Determination of molecular mass distribution of amylopectin using asymmetrical flow field-flow fractionation. Carbohydrate Polymers, 2011. 83(3): p. 1384-1396.
101. Qin, Y., et al., Characterization of starch nanoparticles prepared by nanoprecipitation: Influence of amylose content and starch type. Industrial Crops and Products, 2016. 87: p. 182-190.
102. Roger, P. and P. Colonna, The influence of chain length on the hydrodynamic behaviour of amylose. Carbohydrate Research, 1992. 227: p. 73-83.


Paper I


Preparation and Characterization of Starch Particles for Use in Pickering Emulsions
Hisfazilah Saari,† Katayoun Heravifar, Marilyn Rayner, Marie Wahlgren, and Malin Sjoo
ABSTRACT Cereal Chem. 93(2):116–124
Particle-stabilized emulsions, called Pickering emulsions, can be producedby using starch particles. In this work we studied how the properties of thestarch particles affect the droplet size and creaming of such emulsions. In thestudy, various sizes of starch particles were generated by two different methodsand used to stabilize Pickering emulsions. Sedimentation according to Stokes’law was used to separate small and large starch granules. Acid hydrolysis wasanother method used to obtain smaller particles. All samples were modifiedwith octenyl succinic anhydride (OSA) to increase their hydrophobicity with alevel of OSA substitution between 1.8 and 3.1%. The size of starch particles
was the main factor influencing emulsion droplet sizes. Furthermore, thedroplet size decreased as the starch concentration increased. Using small starchparticles with sizes <10 µm produced stable emulsions with smaller dropletsize compared with larger sizes of starch particles, >10 µm.When subjected toacid hydrolysis, smaller starch particles were generally obtained, which couldsubsequently create smaller emulsion droplets. The emulsion index increasedfor the acid-hydrolyzed starch owing to the size reduction of starch particles.The shape of the starch seemed to have a minor impact on the droplet size andthe creaming of Pickering emulsions.
Emulsions are important structures in many everyday products,such as food, creams, and skincare lotions. Emulsifiers are adsorbedat the interface, decrease the interfacial tension of the two phases,and increase steric hindrance and electrostatic repulsion betweendroplets, thereby decreasing the droplet size and increasing the sta-bility of the emulsion against creaming but also against coalescence.There is growing demand for natural nontoxic emulsifiers forstabilizing emulsions, which has led to an interest in new emulsionsystems such as particle-stabilized emulsions. Particles have beensuccessfully used to stabilize emulsions known as Pickeringemulsions. These emulsions have shown excellent long-term sta-bility against Ostwald ripening and coalescence. Pickering emul-sions was first described by Pickering (1907) and Ramsden (1903)at the beginning of the 20th century. However, they have justrecently gained a considerable interest when it comes to applica-tions that use particles accepted for food and other life scienceapplications (Rayner et al. 2014). The particles mainly act as aphysical barrier that prevents contact between droplets, and theadsorption of particles is irreversible once they attach at the in-terface, which are the main reasons for the high stability seen forthese emulsions (Tcholakova et al. 2008; Dickinson 2010; Rayneret al. 2014; Wahlgren et al. 2014).Previous works have reported the use of synthetic particles in
emulsion stabilization, such as silica, latex, and clay, or food-basedparticles such as fat crystals, globular proteins, and hydrocolloids(Dickinson 2009). Starches are being increasingly used to stabilizeemulsions, mainly after chemical modification with octenyl suc-cinic anhydride (OSA) (Timgren et al. 2011; Yusoff and Murray2011). Unlike synthetic particles, starch is a natural ingredient withnutritional value, and as long as the OSA modification is below 3%,it is an accepted food ingredient (Rayner et al. 2012b).It has been shown that starch particle size plays a key role in
forming stable emulsions with small droplet size. Especially quinoastarch has been reported to successfully stabilize emulsions owing toits small size (Timgren et al. 2011; Rayner et al. 2012a, 2012b). Thedroplet size decreases with decreased particle size, provided thatother properties such as wettability, shape, and surface remain thesame (Timgren et al. 2013). It is the aim of this investigation to furtherstudy how starch particle character affects Pickering emulsions.
Starches are found in various sizes and shapes specific to thebotanical origin (Jane et al. 1994). Sources of extremely smallstarch granules (0.3–2 µm) are quinoa, amaranth, cow cockle, andpig weed (Hall and Sayre 1971; Perez and Bertoft 2010). Smallstarch granules (2–10 µm) are found in oats, rice, and buckwheat,and medium-size starches (5–30 µm) include most starches such astapioca, barley, maize, and sorghum (Hall and Sayre 1970; Janeet al. 1994). Large starch granules are mainly found in tubers suchas potato and canna, with sizes up to 100 µm (French 1973;Lindeboom et al. 2004). Some starch sources, mainly cereals, arebimodal, such as barley, sorghum, and wheat (Hall and Sayre1970; Jane et al. 1994); they have a large (A-type) and a small (B-type) granule fraction that can be separated through selective sedi-mentation. In addition to the size, starches have unique morphologyand are found in different shapes: smooth, rough, sharp, and flatsurfaces or round/spherical, sharp-edged, irregular, ellipsoidal, anddisc-shaped (Jane et al. 1994; Lindeboom et al. 2004).Starch size can also be reduced through several methods, such as
chemical gelatinization (Jane and Shen 1993; Wang et al. 2007),starch dissolution (Stevenson et al. 2007; Syahariza et al. 2010),nanoprecipitation (Hornig et al. 2009; Chin et al. 2011; Tan et al.2012), and acid hydrolysis (Putaux et al. 2003; Angellier et al.2004). There is evidence in the literature that acid hydrolysismethods have been successfully used to reduce particle size. Forexample, Battista prepared starch crystals of sizes varying fromnano to micron size by dispersing starch granules into HCl. How-ever, this classic procedure involved a long process (40 days oftreatment) and produced a low yield (0.5 w/w %) (Battista 1975).Angellier et al. (2004) optimized the method and produced starchcrystals by H2SO4 treatment within five days. During acidic treat-ment, the amorphous region of starch is hydrolyzed and removed,whereas the crystalline part is converted to starch crystals of differentsizes (Song et al. 2008). The result of acid hydrolysis can also beaffected by factors such as the botanic origin, crystalline type, amy-lopectin content, morphology, and the conditions during acid hydro-lysis (Angellier et al. 2004). Amylopectin-rich starch (waxy starch)has been claimed to be a more appropriate candidate for acid hydro-lysis (Angellier et al. 2004), owing to its higher content of crystallineregions that can be converted to starch particles of different sizes.The present study explored various types of starch particles for
formulating starch particle-stabilized emulsions. Another focus hasbeen on studying the effect of shape on emulsion stability. Thesamples for native starch were selected on the basis of differences innatural granule sizes: extremely small (quinoa), small (oats), andbimodal size (waxy barley). As a comparison, reduced-size starcheswere obtained from acidic treatment, and quinoa and waxy barleywere compared with the more commonly studied waxy maize(medium size) and potato starches (large and nonwaxy).
†Corresponding author. Phone: +46462228307. E-mail: [email protected]
Department of Food Technology, Engineering and Nutrition, Lund University, Box124, SE22100 Lund, Sweden.
http://dx.doi.org/10.1094/CCHEM-05-15-0107-R© 2016 AACC International, Inc.
116 CEREAL CHEMISTRY
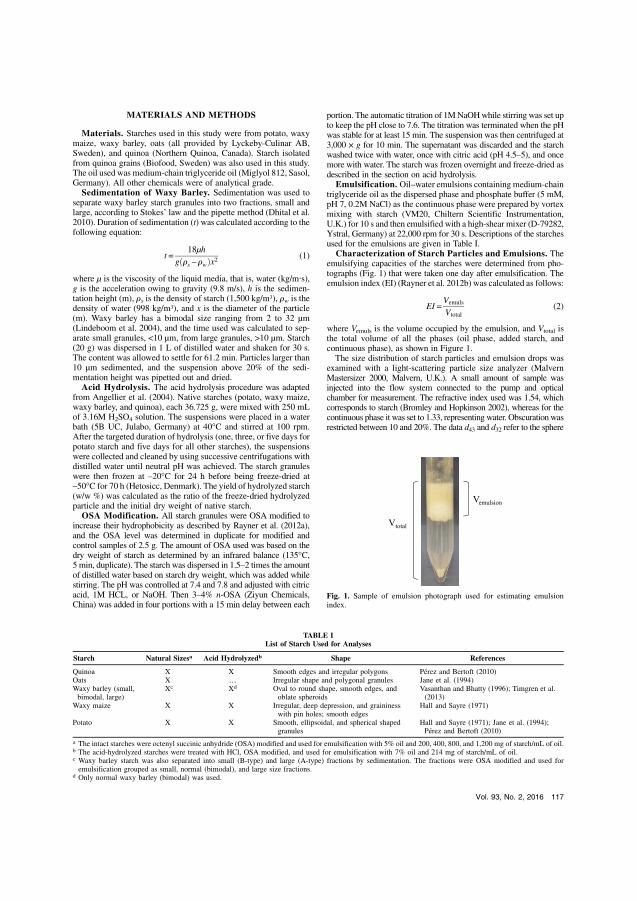
MATERIALS AND METHODS
Materials. Starches used in this study were from potato, waxymaize, waxy barley, oats (all provided by Lyckeby-Culinar AB,Sweden), and quinoa (Northern Quinoa, Canada). Starch isolatedfrom quinoa grains (Biofood, Sweden) was also used in this study.The oil used was medium-chain triglyceride oil (Miglyol 812, Sasol,Germany). All other chemicals were of analytical grade.Sedimentation of Waxy Barley. Sedimentation was used to
separate waxy barley starch granules into two fractions, small andlarge, according to Stokes’ law and the pipette method (Dhital et al.2010). Duration of sedimentation (t) was calculated according to thefollowing equation:
t =18µh
gðrs _ rwÞx2(1)
where µ is the viscosity of the liquid media, that is, water (kg/m·s),g is the acceleration owing to gravity (9.8 m/s), h is the sedimen-tation height (m), rs is the density of starch (1,500 kg/m3), rw is thedensity of water (998 kg/m3), and x is the diameter of the particle(m). Waxy barley has a bimodal size ranging from 2 to 32 µm(Lindeboom et al. 2004), and the time used was calculated to sep-arate small granules, <10 µm, from large granules, >10 µm. Starch(20 g) was dispersed in 1 L of distilled water and shaken for 30 s.The content was allowed to settle for 61.2 min. Particles larger than10 µm sedimented, and the suspension above 20% of the sedi-mentation height was pipetted out and dried.Acid Hydrolysis. The acid hydrolysis procedure was adapted
from Angellier et al. (2004). Native starches (potato, waxy maize,waxy barley, and quinoa), each 36.725 g, were mixed with 250 mLof 3.16M H2SO4 solution. The suspensions were placed in a waterbath (5B UC, Julabo, Germany) at 40�C and stirred at 100 rpm.After the targeted duration of hydrolysis (one, three, or five days forpotato starch and five days for all other starches), the suspensionswere collected and cleaned by using successive centrifugations withdistilled water until neutral pH was achieved. The starch granuleswere then frozen at –20�C for 24 h before being freeze-dried at–50�C for 70 h (Hetosicc, Denmark). The yield of hydrolyzed starch(w/w %) was calculated as the ratio of the freeze-dried hydrolyzedparticle and the initial dry weight of native starch.OSA Modification. All starch granules were OSA modified to
increase their hydrophobicity as described by Rayner et al. (2012a),and the OSA level was determined in duplicate for modified andcontrol samples of 2.5 g. The amount of OSA used was based on thedry weight of starch as determined by an infrared balance (135�C,5 min, duplicate). The starch was dispersed in 1.5–2 times the amountof distilled water based on starch dry weight, which was added whilestirring. The pH was controlled at 7.4 and 7.8 and adjusted with citricacid, 1M HCL, or NaOH. Then 3–4% n-OSA (Ziyun Chemicals,China) was added in four portions with a 15 min delay between each
portion. The automatic titration of 1MNaOHwhile stirring was set upto keep the pH close to 7.6. The titration was terminated when the pHwas stable for at least 15 min. The suspension was then centrifuged at3,000 × g for 10 min. The supernatant was discarded and the starchwashed twice with water, once with citric acid (pH 4.5–5), and oncemore with water. The starch was frozen overnight and freeze-dried asdescribed in the section on acid hydrolysis.Emulsification. Oil–water emulsions containingmedium-chain
triglyceride oil as the dispersed phase and phosphate buffer (5 mM,pH 7, 0.2M NaCl) as the continuous phase were prepared by vortexmixing with starch (VM20, Chiltern Scientific Instrumentation,U.K.) for 10 s and then emulsified with a high-shear mixer (D-79282,Ystral, Germany) at 22,000 rpm for 30 s. Descriptions of the starchesused for the emulsions are given in Table I.Characterization of Starch Particles and Emulsions. The
emulsifying capacities of the starches were determined from pho-tographs (Fig. 1) that were taken one day after emulsification. Theemulsion index (EI) (Rayner et al. 2012b) was calculated as follows:
EI =Vemuls
Vtotal(2)
where Vemuls is the volume occupied by the emulsion, and Vtotal isthe total volume of all the phases (oil phase, added starch, andcontinuous phase), as shown in Figure 1.The size distribution of starch particles and emulsion drops was
examined with a light-scattering particle size analyzer (MalvernMastersizer 2000, Malvern, U.K.). A small amount of sample wasinjected into the flow system connected to the pump and opticalchamber for measurement. The refractive index used was 1.54, whichcorresponds to starch (Bromley and Hopkinson 2002), whereas for thecontinuous phase it was set to 1.33, representing water. Obscurationwasrestricted between 10 and 20%. The data d43 and d32 refer to the sphere
TABLE IList of Starch Used for Analyses
Starch Natural Sizesa Acid Hydrolyzedb Shape References
Quinoa X X Smooth edges and irregular polygons Perez and Bertoft (2010)Oats X … Irregular shape and polygonal granules Jane et al. (1994)Waxy barley (small,bimodal, large)
Xc Xd Oval to round shape, smooth edges, andoblate spheroids
Vasanthan and Bhatty (1996); Timgren et al.(2013)
Waxy maize X X Irregular, deep depression, and graininesswith pin holes; smooth edges
Hall and Sayre (1971)
Potato X X Smooth, ellipsoidal, and spherical shapedgranules
Hall and Sayre (1971); Jane et al. (1994);Perez and Bertoft (2010)
a The intact starches were octenyl succinic anhydride (OSA) modified and used for emulsification with 5% oil and 200, 400, 800, and 1,200 mg of starch/mL of oil.b The acid-hydrolyzed starches were treated with HCl, OSA modified, and used for emulsification with 7% oil and 214 mg of starch/mL of oil.c Waxy barley starch was also separated into small (B-type) and large (A-type) fractions by sedimentation. The fractions were OSA modified and used foremulsification grouped as small, normal (bimodal), and large size fractions.
d Only normal waxy barley (bimodal) was used.
Fig. 1. Sample of emulsion photograph used for estimating emulsionindex.
Vol. 93, No. 2, 2016 117

of equivalent volume and surface area of real-size droplets, respectively.All emulsions were analyzed 24 h after the emulsification process.Light microscopy was used to analyze emulsion droplets and
starch particles. Emulsions were observed under an optical micro-scope (BX50, Olympus, Japan) equipped with a live video camera.The samples were examined under Plan 2×, UMPlanFL 5× and 10×,and LMPplanFl 20× and 50× objectives (Olympus). Emulsionswere diluted five times with buffer, and one drop was placed un-covered on the glass plate for microscopic observation.A scanning electron microscope (SEM) was used to capture the
morphology and size of the starch granules. The starch granulesamples were coated with gold and examined under SEM (fieldemission SEM, JSM-6700F, JEOL, Japan) operated at 5 kV with aworking distance of 8 mm. Lower detection imaging (LEI) modewas used to give clear three-dimensional images of the samplesurface. The LEI detector combined both signals from secondaryand back-scattered electrons during operation.
RESULTS AND DISCUSSION
Starch Particle Characteristics. The starches selected forthis study were chosen because of their unique sizes and shapes, aslisted in Table I. To obtain even larger variations in the starch ma-terial, waxy barley starch also underwent sedimentation to separateA-type (large) from B-type (small) granules, because the nativestarch was bimodal. The yield obtained after separation was low(0.39%) for the small fraction (<10 µm) of waxy barley. The re-mainder was considered as the large fraction (>10 µm). The particlesize of intact starches can be seen in Table II. The sizes of starchparticles were found to be similar before and after OSA modification.Selected starches (i.e., from quinoa, waxy barley, waxy maize,
and potato) underwent acid hydrolysis treatment that generated parti-cles of various sizes and shapes. The yield of starch and the particle sizeof the acid-hydrolyzed starches are presented in Table III. The resultsshow that waxy maize starch had the highest yield (14.8%), which wascomparable to the findings of Angellier et al. (2004), followed by waxybarley (10.0%), potato (9.1%), and quinoa (6.8%) starch.
Only potato starch particles were produced after one and threedays of hydrolysis treatment, and as can be seen in the Table III, theyield decreased drastically with time. The increase of hydrolysistime caused a higher degree of acid degradation of starch andresulted, for all cases except quinoa starch, in mean particles ofsmaller sizes than the original starch (Table III). However, theparticle size distribution of the hydrolyzed starches was consider-ably wider than the original starch, and in some cases aggregateswith larger particle size than the native starch were formed. Thepotato starch showed a wide distribution in which the size variedwith a range of 5–120 µm with a peak at 50 µm, 0.7–200 µm afterone day of hydrolysis with a peak at 16 µm, 0.5–350 µm after threedays of hydrolysis with a peak at 6 µm, and 0.4–40 µm after fivedays of hydrolysis with a peak at 5.6 µm. Five days of hydrolysistreatment reduced the particle size by up to 89% (potato), 64%(waxy maize), and 62% (waxy barley). This result corresponds witha previous study in which starches with high amylopectin content(waxy type) were prone to particle formation upon acid disruptionowing to a higher content of crystalline regions that could be con-verted to starch particles of different sizes (Angellier et al. 2004).During acidic treatment, the amorphous region of starch is hydro-lyzed and removed, whereas the crystalline part is converted tostarch crystals of different sizes (Song et al. 2008). However, quinoa(as shown in Table III) did not follow the trend with reduced particlesize after hydrolysis; instead, there was an increase in the measuredparticle size that probably could be attributed to aggregation.Figure 2 shows SEM pictures of quinoa starch and potato starch,illustrating the difference in behavior upon acid hydrolysis betweenthe two starches. Potato starch goes from round well-definedgranules to smaller disrupted structures, whereas the main particlesize of quinoa starch seems to be intact but aggregated, probablyowing to leached starch. The effect of hydrolysis on the starchstructure is further illustrated in Figure 3, which shows light mi-croscopy images of intact and acid-hydrolyzed starch particles. Allintact starches show the characteristic birefringence under polar-ized light, whereas after acid hydrolysis birefringence was lost forall starches except for quinoa, for which the starch particles havebeen reduced in size and lost their well-defined rounded structure.
TABLE IIParticle Size of Intact Starchesa
Starch OSA Level (%) d32, Surface-Weighted Mean (mm) d43, Volume-Weighted Mean (mm)
Quinoa starch … 1.40 ± 0.00 1.61 ± 0.00Quinoa OSA starch 3.18 1.38 ± 0.01 1.52 ± 0.00Oat starch … 4.69 ± 0.02 8.76 ± 0.09Oat OSA starch 2.51 5.32 ± 0.42 23.57 ± 6.72Waxy barley (S) starch … 6.16 ± 0.01 10.14 ± 0.04Waxy barley OSA (S) starch 1.91 6.04 ± 5.17 9.63 ± 8.74Waxy barley starch … 9.43 ± 0.00 16.79 ± 0.01Waxy barley OSA starch 2.79 10.21 ± 0.01 17.87 ± 0.02Waxy barley (L) starch … 10.42 ± 0.00 18.19 ± 0.00Waxy barley OSA (L) starch 1.84 9.67 ± 0.02 17.63 ± 0.02
a OSA = octenyl succinic anhydride; S = small; and L = large.
TABLE IIIParticle Size of Native and Acid-Hydrolyzed Starchesa
Starch/Hydrolysis Duration (days) OSA Level (%) d32, Surface-Weighted Mean (mm) d43, Volume-Weighted Mean (mm) Yield (%)
Quinoa (0) 1.94 1.59 ± 0.01 1.74 ± 0.28 …Quinoa (5) 1.93 1.59 ± 0.45 3.22 ± 0.46 6.8Waxy barley (0) 2.02 10.7 ± 0.18 17.9 ± 0.40 …Waxy barley (5) 1.98 5.02 ± 0.08 16.9 ± 0.81 10.0Waxy maize (0) 1.98 7.83 ± 0.31 13.6 ± 5.37 …Waxy maize (5) 1.81 3.78 ± 0.00 6.77 ± 0.00 14.8Potato (0) 2.10 24.9 ± 1.29 53.5 ± 2.43 …Potato (1) 1.97 8.33 ± 0.42 28.1 ± 3.02 20.1Potato (3) 1.90 5.02 ± 0.92 16.9 ± 0.31 14.1Potato (5) 1.86 3.87 ± 0.38 6.77 ± 0.42 9.1
a OSA = octenyl succinic anhydride.
118 CEREAL CHEMISTRY

In the case of quinoa, the light microscopy confirmed the presenceof larger aggregates, as measured by light scattering (Table III).Previous studies have shown that acid hydrolysis is an efficient
method for reducing particle size, but our starch particles weregenerated primarily in micron size, ranging from 2 to 7 µm, com-pared with the smaller particle sizes seen in previous studies.
Putaux et al. (2003) produced starch particles 5–7 nm thick,20–40 nm long, and 15–30 nm wide by acid hydrolysis of waxymaize starch with HCl. Meanwhile, Song et al. (2008) used H2SO4
for hydrolyzing maize starch and prepared starch particles with asize of 50 nm. It is generally believed that the effect of acid hy-drolysis may differ and is affected by factors such as the botanic
Fig. 2. Scanning electron micrograph of starches before and after acid hydrolysis treatment: A, intact quinoa starch granules; B, hydrolyzed quinoa starch afterfive days of acid treatment; C, the largest starch, nonhydrolyzed potato starch, for comparison; and D, hydrolyzed potato starch (five days). Scale bar: 10 µm.
Fig. 3. Polarized light micrographs of starch particles before treatment (A–D) and after five days of acid hydrolysis treatment (E–H). Intact starches: A, potato; B,waxy barley; C, waxy maize; and D, quinoa starch. Hydrolyzed starches: E, potato; F, waxy barley; G, waxy maize; and H, quinoa starch. Scale bar: 20 µm.
Vol. 93, No. 2, 2016 119
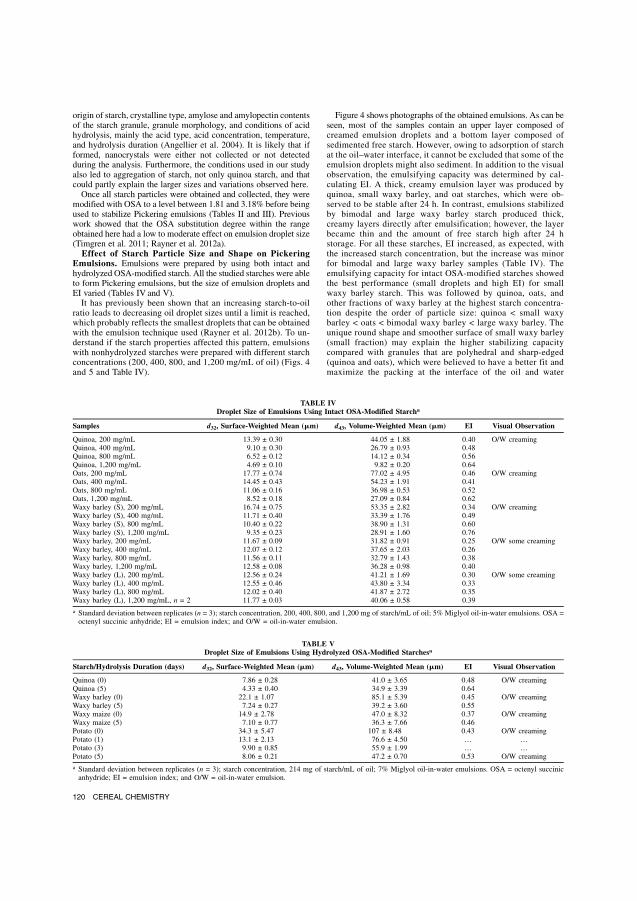
origin of starch, crystalline type, amylose and amylopectin contentsof the starch granule, granule morphology, and conditions of acidhydrolysis, mainly the acid type, acid concentration, temperature,and hydrolysis duration (Angellier et al. 2004). It is likely that ifformed, nanocrystals were either not collected or not detectedduring the analysis. Furthermore, the conditions used in our studyalso led to aggregation of starch, not only quinoa starch, and thatcould partly explain the larger sizes and variations observed here.Once all starch particles were obtained and collected, they were
modified with OSA to a level between 1.81 and 3.18% before beingused to stabilize Pickering emulsions (Tables II and III). Previouswork showed that the OSA substitution degree within the rangeobtained here had a low to moderate effect on emulsion droplet size(Timgren et al. 2011; Rayner et al. 2012a).Effect of Starch Particle Size and Shape on Pickering
Emulsions. Emulsions were prepared by using both intact andhydrolyzed OSA-modified starch. All the studied starches were ableto form Pickering emulsions, but the size of emulsion droplets andEI varied (Tables IV and V).It has previously been shown that an increasing starch-to-oil
ratio leads to decreasing oil droplet sizes until a limit is reached,which probably reflects the smallest droplets that can be obtainedwith the emulsion technique used (Rayner et al. 2012b). To un-derstand if the starch properties affected this pattern, emulsionswith nonhydrolyzed starches were prepared with different starchconcentrations (200, 400, 800, and 1,200 mg/mL of oil) (Figs. 4and 5 and Table IV).
Figure 4 shows photographs of the obtained emulsions. As can beseen, most of the samples contain an upper layer composed ofcreamed emulsion droplets and a bottom layer composed ofsedimented free starch. However, owing to adsorption of starchat the oil–water interface, it cannot be excluded that some of theemulsion droplets might also sediment. In addition to the visualobservation, the emulsifying capacity was determined by cal-culating EI. A thick, creamy emulsion layer was produced byquinoa, small waxy barley, and oat starches, which were ob-served to be stable after 24 h. In contrast, emulsions stabilizedby bimodal and large waxy barley starch produced thick,creamy layers directly after emulsification; however, the layerbecame thin and the amount of free starch high after 24 hstorage. For all these starches, EI increased, as expected, withthe increased starch concentration, but the increase was minorfor bimodal and large waxy barley samples (Table IV). Theemulsifying capacity for intact OSA-modified starches showedthe best performance (small droplets and high EI) for smallwaxy barley starch. This was followed by quinoa, oats, andother fractions of waxy barley at the highest starch concentra-tion despite the order of particle size: quinoa < small waxybarley < oats < bimodal waxy barley < large waxy barley. Theunique round shape and smoother surface of small waxy barley(small fraction) may explain the higher stabilizing capacitycompared with granules that are polyhedral and sharp-edged(quinoa and oats), which were believed to have a better fit andmaximize the packing at the interface of the oil and water
TABLE IVDroplet Size of Emulsions Using Intact OSA-Modified Starcha
Samples d32, Surface-Weighted Mean (mm) d43, Volume-Weighted Mean (mm) EI Visual Observation
Quinoa, 200 mg/mL 13.39 ± 0.30 44.05 ± 1.88 0.40 O/W creamingQuinoa, 400 mg/mL 9.10 ± 0.30 26.79 ± 0.93 0.48Quinoa, 800 mg/mL 6.52 ± 0.12 14.12 ± 0.34 0.56Quinoa, 1,200 mg/mL 4.69 ± 0.10 9.82 ± 0.20 0.64Oats, 200 mg/mL 17.77 ± 0.74 77.02 ± 4.95 0.46 O/W creamingOats, 400 mg/mL 14.45 ± 0.43 54.23 ± 1.91 0.41Oats, 800 mg/mL 11.06 ± 0.16 36.98 ± 0.53 0.52Oats, 1,200 mg/mL 8.52 ± 0.18 27.09 ± 0.84 0.62Waxy barley (S), 200 mg/mL 16.74 ± 0.75 53.35 ± 2.82 0.34 O/W creamingWaxy barley (S), 400 mg/mL 11.71 ± 0.40 33.39 ± 1.76 0.49Waxy barley (S), 800 mg/mL 10.40 ± 0.22 38.90 ± 1.31 0.60Waxy barley (S), 1,200 mg/mL 9.35 ± 0.23 28.91 ± 1.60 0.76Waxy barley, 200 mg/mL 11.67 ± 0.09 31.82 ± 0.91 0.25 O/W some creamingWaxy barley, 400 mg/mL 12.07 ± 0.12 37.65 ± 2.03 0.26Waxy barley, 800 mg/mL 11.56 ± 0.11 32.79 ± 1.43 0.38Waxy barley, 1,200 mg/mL 12.58 ± 0.08 36.28 ± 0.98 0.40Waxy barley (L), 200 mg/mL 12.56 ± 0.24 41.21 ± 1.69 0.30 O/W some creamingWaxy barley (L), 400 mg/mL 12.55 ± 0.46 43.80 ± 3.34 0.33Waxy barley (L), 800 mg/mL 12.02 ± 0.40 41.87 ± 2.72 0.35Waxy barley (L), 1,200 mg/mL, n = 2 11.77 ± 0.03 40.06 ± 0.58 0.39
a Standard deviation between replicates (n = 3); starch concentration, 200, 400, 800, and 1,200 mg of starch/mL of oil; 5% Miglyol oil-in-water emulsions. OSA =octenyl succinic anhydride; EI = emulsion index; and O/W = oil-in-water emulsion.
TABLE VDroplet Size of Emulsions Using Hydrolyzed OSA-Modified Starchesa
Starch/Hydrolysis Duration (days) d32, Surface-Weighted Mean (mm) d43, Volume-Weighted Mean (mm) EI Visual Observation
Quinoa (0) 7.86 ± 0.28 41.0 ± 3.65 0.48 O/W creamingQuinoa (5) 4.33 ± 0.40 34.9 ± 3.39 0.64Waxy barley (0) 22.1 ± 1.07 85.1 ± 5.39 0.45 O/W creamingWaxy barley (5) 7.24 ± 0.27 39.2 ± 3.60 0.55Waxy maize (0) 14.9 ± 2.78 47.0 ± 8.32 0.37 O/W creamingWaxy maize (5) 7.10 ± 0.77 36.3 ± 7.66 0.46Potato (0) 34.3 ± 5.47 107 ± 8.48 0.43 O/W creamingPotato (1) 13.1 ± 2.13 76.6 ± 4.50 … …Potato (3) 9.90 ± 0.85 55.9 ± 1.99 … …Potato (5) 8.06 ± 0.21 47.2 ± 0.70 0.53 O/W creaming
a Standard deviation between replicates (n = 3); starch concentration, 214 mg of starch/mL of oil; 7% Miglyol oil-in-water emulsions. OSA = octenyl succinicanhydride; EI = emulsion index; and O/W = oil-in-water emulsion.
120 CEREAL CHEMISTRY

phases. This result corresponds to the previous study on theeffect of the smooth, round shape of starch that efficiently sta-bilizes Pickering emulsions (Timgren et al. 2011).Figure 5 and Table IV show how the droplet size of Pickering
emulsions varied with starch-to-oil ratio for the intact starches. Ascan be seen, the droplet size of emulsions produced from quinoa,small waxy barley, and oat starches decreased with an increasingstarch-to-oil ratio. This was, however, not the case for bimodal andlarge waxy barley starch, which showed more or less the sameaverage droplet size for all starch-to-oil ratios. This differencemay be because the smaller-sized starches (<10 µm) seemed to befavorable for providing smaller droplets, as seen under micro-scope (Fig. 6) and in Table IV. It can further be seen that forstarches with a reduction in droplet size with increasing starch-to-oil ratio, the EI also increases with the starch-to-oil ratio.These results indicate that the behavior of the waxy barley starchis dominated by the large particles. Further studies are needed toverify whether this is because this is the dominating fraction innumber or because large particles are favored over small particlesduring the emulsion process.Microscopic observations made it clear that quinoa, small waxy
barley, and oat starch formed aggregates of emulsion droplets withfree starch attached (Fig. 6). However, a substantial amount of freestarch was present in the bulk of all samples. The amount of freestarch was larger in the bimodal and large waxy barley samples. Thisresult corresponds to previous works in which the particle size wasfound to highly influence the emulsifying effect (Timgren et al. 2011;Rayner et al. 2012a, 2012b). It is possible that larger-sized starchgranules (>10 µm) have restricted ability to adhere to the oil–waterinterfaces, causing particles to sediment as seen in Figure 4.The emulsions made with smaller starch particles showed a highdegree of flocculation at low starch-to-oil ratios, which decreasedwith increased starch-to-oil ratio. This decrease in flocculationcould be indicative of higher close packing of starch at the in-terface as the starch-to-oil ratio increases. The higher coverage ofoil droplets with starch in combination with the decrease indroplet size explained the lower amount of free starches in thesesamples.The emulsion characteristic was greatly dependent on the
particle sizes but also on the shape of the starch granules. Be-cause oat starch and small waxy barley starch are similar in size,the results (Fig. 4 and Table IV) indicated that the more roundedand smooth shape of waxy barley starch is more favorable forstabilization than the edgy shape of oat starch. However, thesesamples also seemed to have more free starch in the emulsions(Fig. 4). A previous study has shown that small particles withsmooth and round or edgy structure have shown better emulsionstability compared with large particles. The small size of smoothwaxy barley and round-edged quinoa and oats explain their supe-rior ability to position themselves at the interface, thereby stabilizingsmall emulsion droplets (Fig. 4). The small fraction of waxy barleyshowed some sedimentation but less than bimodal and large fractions(Fig. 4). Overall, the smaller particle size had a larger influence thanthe shape on emulsion stabilization.As discussed previously, the hydrolysis of starch affected both
the size and morphology of the particles. By comparing emul-sions from both hydrolyzed and nonhydrolyzed samples it wouldbe possible to further understand to what extent these parameters,size, and shape affect the emulsions. The effect of acid hydrolysison the droplet size and EI of these emulsions is seen in Table V.All Pickering emulsions that were based on acid-hydrolyzedstarch had smaller droplets and higher EI values than those basedon intact starch. This effect on droplets and EI value was also truefor quinoa starch, which, as previously discussed, had an in-creased particle size after hydrolysis that was probably owingto aggregation. The difference between hydrolyzed and non-hydrolyzed starch could indicate that other factors, such as changes insurface properties by removal of, for example, proteins adsorbed to
Fig. 4. Emulsion of 5% oil in buffer solution with different types of intactoctenyl succinic anhydride modified starch at different starch concentrations.Starch samples: A, quinoa; B, oats; C, small fraction of waxy barley; D,bimodal waxy barley; and E, large fraction of waxy barley. Samples from leftto right: oil with buffer, emulsions with 200, 400, 800, and 1,200 mg ofstarch/mL of oil, and samples containing starch with buffer only (i.e., no oil)as a comparison.
Vol. 93, No. 2, 2016 121
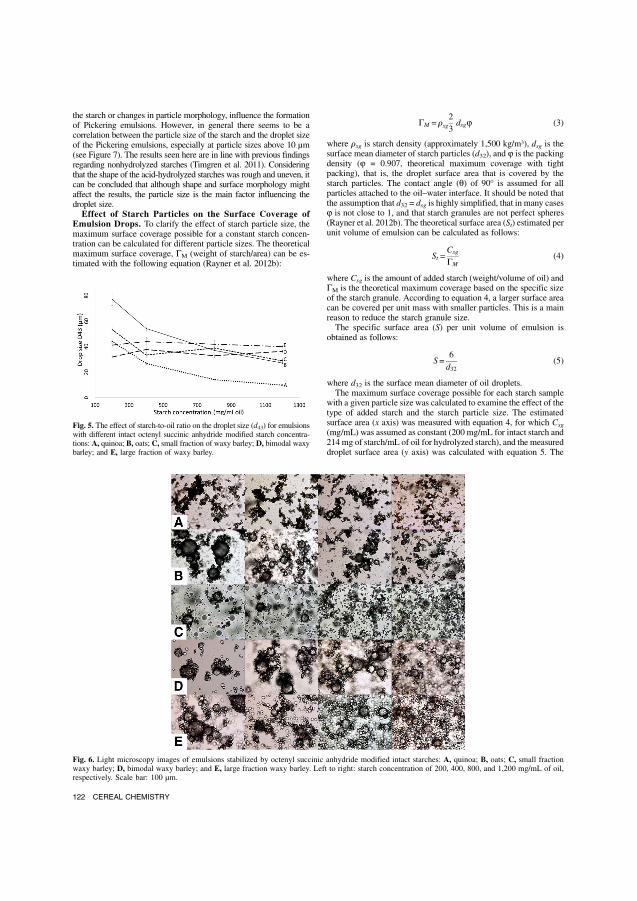
the starch or changes in particle morphology, influence the formationof Pickering emulsions. However, in general there seems to be acorrelation between the particle size of the starch and the droplet sizeof the Pickering emulsions, especially at particle sizes above 10 µm(see Figure 7). The results seen here are in line with previous findingsregarding nonhydrolyzed starches (Timgren et al. 2011). Consideringthat the shape of the acid-hydrolyzed starches was rough and uneven, itcan be concluded that although shape and surface morphology mightaffect the results, the particle size is the main factor influencing thedroplet size.Effect of Starch Particles on the Surface Coverage of
Emulsion Drops. To clarify the effect of starch particle size, themaximum surface coverage possible for a constant starch concen-tration can be calculated for different particle sizes. The theoreticalmaximum surface coverage, GM (weight of starch/area) can be es-timated with the following equation (Rayner et al. 2012b):
GM = rsg2
3dsgj (3)
where rsg is starch density (approximately 1,500 kg/m3), dsg is thesurface mean diameter of starch particles (d32), and j is the packingdensity (j = 0.907, theoretical maximum coverage with tightpacking), that is, the droplet surface area that is covered by thestarch particles. The contact angle (q) of 90� is assumed for allparticles attached to the oil–water interface. It should be noted thatthe assumption that d32 = dsg is highly simplified, that in many casesj is not close to 1, and that starch granules are not perfect spheres(Rayner et al. 2012b). The theoretical surface area (St) estimated perunit volume of emulsion can be calculated as follows:
St =Csg
GM(4)
where Csg is the amount of added starch (weight/volume of oil) andGM is the theoretical maximum coverage based on the specific sizeof the starch granule. According to equation 4, a larger surface areacan be covered per unit mass with smaller particles. This is a mainreason to reduce the starch granule size.The specific surface area (S) per unit volume of emulsion is
obtained as follows:
S=6
d32(5)
where d32 is the surface mean diameter of oil droplets.The maximum surface coverage possible for each starch sample
with a given particle size was calculated to examine the effect of thetype of added starch and the starch particle size. The estimatedsurface area (x axis) was measured with equation 4, for which Csg
(mg/mL) was assumed as constant (200 mg/mL for intact starch and214 mg of starch/mL of oil for hydrolyzed starch), and the measureddroplet surface area (y axis) was calculated with equation 5. The
Fig. 5. The effect of starch-to-oil ratio on the droplet size (d43) for emulsionswith different intact octenyl succinic anhydride modified starch concentra-tions: A, quinoa; B, oats; C, small fraction of waxy barley; D, bimodal waxybarley; and E, large fraction of waxy barley.
Fig. 6. Light microscopy images of emulsions stabilized by octenyl succinic anhydride modified intact starches: A, quinoa; B, oats; C, small fractionwaxy barley; D, bimodal waxy barley; and E, large fraction waxy barley. Left to right: starch concentration of 200, 400, 800, and 1,200 mg/mL of oil,respectively. Scale bar: 100 µm.
122 CEREAL CHEMISTRY

results, seen in Figure 8, show that samples above the line had alarger drop size than predicted, whereas those below the line weresmaller than predicted. Using an average d32 to estimate the dropletsize when there is free starch in the system will lead to an un-derestimation of droplet size. However, this underestimation will inmost cases only strengthen the trends seen. The reason for a surfacearea below the predicted is most likely that all starch was notadsorbed to the interface, thus leading to larger drops. This differ-ence between theoretical and measured droplet size could either bebecause all starch did not adsorb to the drop interface or because thestarch formed aggregates or adsorbed in multilayers. On the otherhand, a larger surface area than predicted could indicate that thedroplets were stabilized by a particle layer that is not close packed.Non-close-packed particle layers have also been observed pre-viously for Pickering emulsions (Rayner et al. 2014; Wahlgren et al.2014).With the exception of quinoa, both intact OSA-modified starch
and hydrolyzed starch provided droplets that were close to thepredicted size or, in some cases, slightly larger than predicted. In
the case of quinoa (for both the intact and hydrolyzed starch), asmaller area was generated than predicted. Because the quinoastarch had round, flat-edged particles and also the smallest size,these could adsorb on the drop surface with fewer spaces andgaps. Even though the acid treatment generated quinoa starchparticles with larger size and more irregular shape, they werefound to perform efficiently as a stabilizer, which was believed tobe because of breakage into fine particles by strong forces duringemulsification. One interesting observation is that when theparticle size of the starch is taken into account, acid-hydrolyzedstarches seem to have a higher tendency to create smaller droplets(larger surface area) than nonhydrolyzed starch. One reason forthese smaller droplets could be that the structure formed by acidhydrolysis is less round and thus will not form a close packedlayer on the surface.
CONCLUSIONS
This study showed that starches with sizes <10 µm producedstable Pickering emulsions with small droplet sizes. Microscopicimages and data on drop sizes (d43) confirmed that the emulsiondroplet size decreased with increasing starch concentration, from200 to 1,200 mg/mL of oil, for most starches except for waxybarley. The emulsifying capacity for intact OSA-modifiedstarches based on EI was best for small waxy barley starch fol-lowed by quinoa, oats, and the other fractions of waxy barleystarch, at the highest starch concentration. It was obvious that thelarger barley starch had a lower emulsifying capacity than thesmall particles. The volumes of nonadsorbed starch were alsolarger than for the smaller starches.Reduction of particle size by acid hydrolysis helped to reduce
droplet size and increase the emulsifying capacity. Quinoa starchstabilized emulsions had the smallest droplet size, followed bywaxymaize, waxy barley, and potato starch, but the difference betweenthe droplet sizes of quinoa, waxy maize, and waxy barley starchemulsion was small. The EI increased as expected owing to the sizereduction of starch particles; the overall emulsifying capacity ofquinoa starch was definitely the best, followed by waxy barley,potato, and waxy maize starches.
ACKNOWLEDGMENTS
The authors thank Gunnel Karlsson at Polymer and Material Chemistryat Lund University for scanning electron microscopy images and AnnaTimgren for practical help in the laboratory. The study was supported by theSwedish Research Council (Vetenskapsradet).
LITERATURE CITED
Angellier, H., Choisnard, L., Molina-Boisseau, S., Ozil, P., and Dufresne,A. 2004. Optimization of the preparation of aqueous suspensions ofwaxy maize starch nanocrystals using a response surface methodology.Biomacromolecules 5:1545-1551.
Battista, O. A. 1975. Microcrystal Polymer Science. McGraw-Hill: NewYork, NY.
Bromley, E. H., and Hopkinson, I. 2002. Confocal microscopy of a denseparticle system. J. Colloid Interface Sci. 245:75-80.
Chin, S. F., Pang, S. C., and Tay, S. H. 2011. Size controlled synthesis ofstarch nanoparticles by a simple nanoprecipitation method. Carbohydr.Polym. 86:1817-1819.
Dhital, S., Shrestha, A. K., and Gidley, M. J. 2010. Relationship betweengranule size and in vitro digestibility of maize and potato starches.Carbohydr. Polym. 82:480-488.
Dickinson, E. 2009. Hydrocolloids as emulsifiers and emulsion stabi-lizers. Food Hydrocolloids 23:1473-1482.
Dickinson, E. 2010. Food emulsions and foams: Stabilization by particles.Curr. Opin. Colloid Interface Sci. 15:40-49.
French, D. 1973. Chemical and physical properties of starch. J. Anim.Sci. 37:1048-1061.
Hall, D. M., and Sayre, J. G. 1970. A scanning electron-microscope studyof starches: Part II: Cereal starches. Text. Res. J. 40:256-266.
Fig. 7. Pickering emulsion droplet size as a function of starch particle sizefor potato (d), waxy barley (n), waxy maize (:), and quinoa (♦). Opensymbols are nonhydrolyzed starches.
Fig. 8. Measured droplet surface area versus the estimated surface areafor both intact starch and hydrolyzed octenyl succinic anhydride modifiedstarch. Samples: potato (d), waxy barley (n), waxy maize (:), quinoa(♦), and oats (×). Open symbols are nonhydrolyzed starches. For hy-drolyzed potato starch, darkness indicates duration of hydrolysis: lightgray (day 1), dark gray (day 3), and black (day 5). The difference in sizeof the waxy barley is indicated by the size of the marker from small tolarge.
Vol. 93, No. 2, 2016 123

Hall, D. M., and Sayre, J. G. 1971. A scanning electron-microscope studyof starches: Part III: Miscellaneous starches. Text. Res. J. 41:880-894.
Hornig, S., Heinze, T., Becer, C. R., and Schubert, U. S. 2009. Syntheticpolymeric nanoparticles by nanoprecipitation. J. Mater. Chem. 19:3838-3840.
Jane, J.-L., Kasemsuwan, T., Leas, S., Zobel, H., and Robyt, J. F. 1994.Anthology of starch granule morphology by scanning electron mi-croscopy. Starch/Starke 46:121-129.
Jane, J. L., and Shen, J. J. 1993. Internal structure of the potato starchgranule revealed by chemical gelatinization. Carbohydr. Res. 247:279-290.
Lindeboom, N., Chang, P. R., and Tyler, R. T. 2004. Analytical, bio-chemical and physicochemical aspects of starch granule size, withemphasis on small granule starches: A review. Starch/Starke 56:89-99.
Perez, S., and Bertoft, E. 2010. The molecular structures of starch com-ponents and their contribution to the architecture of starch granules: Acomprehensive review. Starch/Starke 62:389-420.
Pickering, S. U. 1907. Emulsions. J. Chem. Soc. Trans. 91:2001-2021.Putaux, J. L., Molina-Boisseau, S., Momaur, T., and Dufresne, A. 2003.
Platelet nanocrystals resulting from the disruption of waxy maizestarch granules by acid hydrolysis. Biomacromolecules 4:1198-1202.
Ramsden, W. 1903. Separation of solids in the surface-layers of solutionsand “suspensions” (Observations on surface-membranes, bubbles, emulsions,and mechanical coagulation).—Preliminary account. Proc. R. Soc. London72:156-164.
Rayner, M., Marku, D., Eriksson, M., Sjoo, M., Dejmek, P., andWahlgren, M. 2014. Biomass-based particles for the formulation ofPickering type emulsions in food and topical applications. ColloidsSurf. A Physicochem. Eng. Asp. 458:48-62.
Rayner, M., Sjoo, M., Timgren, A., and Dejmek, P. 2012a. Quinoa starchgranules as stabilizing particles for production of Pickering emulsions.Faraday Discuss. 158:139-155.
Rayner, M., Timgren, A., Sjoo, M., and Dejmek, P. 2012b. Quinoa starchgranules: A candidate for stabilising food-grade Pickering emulsions.J. Sci. Food Agric. 92:1841-1847.
Song, S., Wang, C., Pan, Z., and Wang, X. 2008. Preparation and char-acterization of amphiphilic starch nanocrystals. J. Appl. Polym. Sci.107:418-422.
Stevenson, D. G., Biswas, A., Jane, J. L., and Inglett, G. E. 2007. Changesin structure and properties of starch of four botanical sources dispersedin the ionic liquid, 1-butyl-3-methylimidazolium chloride. Carbohydr.Polym. 67:21-31.
Syahariza, Z. A., Li, E., and Hasjim, J. 2010. Extraction and dissolutionof starch from rice and sorghum grains for accurate structural analysis.Carbohydr. Polym. 82:14-20.
Tan, Y., Xu, K., Liu, C., Li, Y. L., Lua, C. G., and Wang, P. X. 2012.Fabrication of starch-based nanospheres to stabilize Pickering emul-sion. Carbohydr. Polym. 88:1358-1363.
Tcholakova, S., Denkov, N. D., and Lips, A. 2008. Comparison of solidparticles, globular proteins and surfactants as emulsifiers. Phys. Chem.Chem. Phys. 10:1608-1627.
Timgren, A., Rayner, M., Dejmek, P., Marku, D., and Sjoo, M. 2013.Emulsion stabilizing capacity of intact starch granules modified byheat treatment or octenyl succinic anhydride. Food Sci. Nutr. 1:157-171.
Timgren, A., Rayner, M., Sjoo, M., and Dejmek, P. 2011. Starch particlesfor food based Pickering emulsions. Procedia Food Sci. 1:95-103.
Vasanthan, T., and Bhatty, R. 1996. Physicochemical properties of small-and large-granule starches of waxy, regular, and high-amylose barleys.Cereal Chem. 73:199-207.
Wahlgren, M., Engblom, J., Sjoo, M., and Rayner, M. 2014. The use ofmicro- and nanoparticles in the stabilisation of Pickering-type emul-sions for topical delivery. Curr. Pharm. Biotechnol. 14:1222-1234.
Wang, Y. J., Kuo, M. I., Wang, L. F., and Patindol, J. 2007. Chemicalcomposition and structure of granule periphery and envelope remnantof rice starches as revealed by chemical surface gelatinization.Starch/Starke 59:445-453.
Yusoff, A., and Murray, B. S. 2011. Modified starch granules as particle-stabilizers of oil-in-water emulsions. Food Hydrocolloids 25:42-55.
[Received May 27, 2015. Accepted August 17, 2015.]
124 CEREAL CHEMISTRY


Paper II


Paper II 1
Mixed starch particles for use in Pickering emulsions
Hisfazilah Saari, Marilyn Rayner, Marie Wahlgren
Department of Food Technology, Engineering and Nutrition, Lund University, PO Box 124, SE-221 00 Lund, Sweden
Corresponding author: [email protected]
Tel: +46 46 222 8307
KEYWORDS: Pickering emulsion, starch granules, adsorption from
mixed systems, emulsification time

2 Paper II
Abstract
The aim of this work was to investigate how mixtures of starch granules from different botanic sources affect starch-stabilized Pickering emulsions, and which type of granules that dominate at the interface of the emulsion droplets. Pickering emulsions were prepared by combining quinoa starch with waxy maize or oat starch. The effects of the individual starches as well as the mixtures on the stability and drop size of the emulsion were investigated as a function of concentration and emulsification time. The size of the starch particles influenced emulsion droplet sizes in emulsions of the individual starches. The droplet size was also strongly influenced by starch concentration, showing a decrease in droplet size with increasing starch concentration. The emulsification time (1–5 minutes) influenced emulsions containing waxy maize or oat starch, but not quinoa. In the quinoa/waxy maize system, quinoa dominated at the surface of the droplets, while in the quinoa/oat system, oat is more likely to dominate on the interface but when the starch content is low both might adsorb. Increasing the emulsification time led to a decrease in drop size in all samples, but more notably for quinoa/oat emulsions where the mean droplet size was decreased by up to 80% at the longest emulsification time (5 minutes). The emulsion index increased as the starch concentration in the system was increased.

Paper II 3
Introduction
Pickering [1] and Ramsden [2] were the first to discover that emulsions could be stabilized by solid particles. These became known as Pickering emulsions. Synthetic particles such as silica and latex , are commonly used in Pickering emulsions, while fat crystals, globular proteins and hydrocolloids are common food-based particles [3]. Recently, starches have gained in popularity in Pickering emulsions. Normally, the starch is chemically modified using, for example, octenyl succinic anhydride (OSA) to increase its hydrophobicity [4, 5], and thus its tendency to adsorb to oil/water interfaces. The level of OSA for starch modification is restricted to 3%, for the starch to be an accepted food ingredient (E1450)[5].
The two main reasons for the high stability of Pickering emulsions towards coalescence are the irreversible adsorption of particles at the oil/water interface due to the high desorption energy, and that the solid particles act as a physical barrier between the droplets [6, 7 ]. Since the desorption energy in most Pickering emulsions per particle is very high, there is significant resistance to droplet shrinkage (Yusoff et al., 2010). It has been shown that a contact angle of the particle at the oil water interface of 90° gives the highest energy of detachment [8] and that large particles have higher energy of detachment than small. Slightly counter intuitive it has been shown that small starch particle seems to promote stability and small droplet size [9]. This could be due to emulsion conditions and packing at the surface. Especially quinoa starch has been reported to successfully stabilize emulsions and promote small emulsion droplets [10-12].
Very few investigations have been carried out on the stabilization of Pickering emulsions using combinations of different particles. One study has been carried out using a mixture of synthetic particles (silica and calcite). In this study, it was shown that while silica particles did adsorb from the mixture to the droplet interface, their high tendency to desorb due to high hydrophilicity (low contact angle) led to low emulsion stability. It was also seen that the larger the silica particles was the lower the stability became probably because the dominate over calcite at the interface but did not give long term stability [13]. The order of addition of the components can also have an importance as shown by Matos et al [14]. Who showed that nano-crystalline cellulose had to be added before starch to end up at the interface but in that case the two types of particles gave a synergetic affect promoting small stable emulsion droplets. Competition between surfactants and particles has also been studied to understand the effects of interfacial tension, interaction and contact angle. Conflicting results have been reported, in that the emulsifiers has been reported both to compete with the particles at the interface and worked together with the particles in stabilizing the emulsion [15, 16]. Finally, we have recently studied the competition between dissolved starch and starch granules from the same botanic source and found that a tendency for preferential adsorption of the dissolved molecules compared to the starch granules and that this led to less stable emulsions than the one obtained when only starch granules

4 Paper II
where used [17]. To the best of our knowledge, no study has been reported on the effect of mixed starch granules from different botanic sources on Pickering emulsion properties.
Starch granules can have different shapes and sizes specific to their botanical origin [18]. In this study, we used starch granules from different botanic origin giving granules with a natural difference in particle: quinoa starch granules, regarded as extremely small, with sizes of about 0.3-2 µm, small size starch, oat with oat roughly 2-10 µm, and medium-sized waxy maize starch granules with sizes of 5-30 µm [18, 19]. In addition to their different sizes, they differ in shape and morphology. Quinoa has been reported to have an polyhedral shape [20]. Oat starch, on the other hand, has a round shape [18, 21]. Waxy maize has been reported to have deep depressions on the surface of some granules, smooth edges with graininess, and pin holes [9, 18, 21, 22].
Our previous study has been focusing on the effect of size and shape on emulsion stability when using granules from individual starches [23]. In the work presented in this paper we will study how mixed starch granules affects Pickering emulsions. The starches used were quinoa, oat and waxy maize. The effect on droplet size and the architecture of the adsorbed layer by emulsion time, amount of starch and ratio between the two starches in the mixture. The results were compared to the behaviour of emulsions from the individual starches.
Hypothesis
We hypothesize that today’s knowledge cannot predict which component dominates at the interface of the oil droplets and that there are several plausible scenarios.
• Large granules dominate at the interface due to their higher energy of detachment or because they have higher energy of collision
• Small granules dominate as they diffuse more rapidly to the interface.
• There is a mixture of granules at the interface that depends on the ratio between the two kinds of granules used (either the ratio based on available surface area or the number of particles available).

Paper II 5
Materials and methods
Materials The starches used in this study were waxy maize and oat starch provided by Lyckeby-Culinar AB, Sweden, and quinoa starch supplied by Northern Quinoa Corp., Canada. The oil used was the medium-chain triglyceride (MCT) oil, Miglyol 812, with a density of 945 kg/m3 (Sasol Germany), and the continuous phase used was 5 mM phosphate buffer containing 0.2 M NaCl, with a density of 1009.6 kg/m3. The n-octenyl succinyl anhydride used to modify the starch granules was obtained from Ziyun Chemicals Co. Ltd, China. All other chemicals were of analytical grade.
Starch modification with OSA All starch granules were OSA modified to increase their hydrophobicity, and the degree of OSA modification was determined using titration. The modification and determination methods used have been described previously [5].

6 Paper II
Mix granules emulsification
Oil/water emulsions consisting of MCT oil as the dispersed phase and phosphate buffer (5 mM, pH 7, 0.2 M NaCl) as the continuous phase, were prepared by vortex mixing with starch (VM20, UK) for 10 s, and then emulsified using a high-shear mixer (Ystral D-79282, Germany) at 22 000 rpm, for 1 min, 3 and 5 min. The compositions of the emulsions are given in Table 1, and the total amount of oil used was 5 weight% on a total volume of 7 ml emulsion. The primary model system was based on a starch to oil ratio of 400 mg starch/g oil of each starch type in the system.
Table 1. Composition of the emulsions studied Sample Starch to oil ratio
(mg/g oil) Starch mass (g)
Quinoa Oat Waxy maize
Quinoa, 200 mg emulsion 200 0.07 - -
Quinoa, 400 mg emulsion 400 0.14 - -
Quinoa, 800 mg emulsion 800 0.28 - -
Quinoa, 1200 mg emulsion 1200 0.42 - -
Oat, 200 mg emulsion 200 - 0.07 -
Oat, 400 mg emulsion 400 - 0.14 -
Oat, 800 mg emulsion 800 - 0.28 -
Oat, 1200 mg emulsion 1200 - 0.42 -
Waxy maize, 200 mg emulsion 200 - - 0.07
Waxy maize, 400 mg emulsion 400 - - 0.14
Waxy maize, 800 mg emulsion 800 - - 0.28
Waxy maize, 1600 mg emulsion 1600 - - 0.56
Waxy maize, 3200 mg emulsion 3200 - - 1.12
Quinoa/waxy maize (weight1) 800 0.14 - 0.14
Quinoa/waxy maize (area2) 2909 0.14 - 0.88
Quinoa/waxy maize (constant3) 800 0.04 - 0.24
Quinoa/oat (weight1) 800 0.14 0.14 -
Quinoa/oat (area2) 1769 0.14 0.48 -
Quinoa/ oat (constant3) 800 0.06 0.22 -
1 Both starches have the same weight. 2 Both starches have the same surface area with the same amount of Quinoa as in 1. 3 Both starches have the same surface area with constant total weight as in 1.

Paper II 7
Characterization of starch particles and emulsions
The emulsifying capacity of each starch or mixture of starches was determined from photographs taken one day after emulsification by measuring the emulsion index, EI, which is defined as follows [10]: = (Eqn. 1)
where Vemuls is, the volume occupied by the creamed or sedimented emulsion including sedimented free starch, and Vtotal is the total volume of all the phases (oil phase, added starch, and continuous phase).
The size distributions of the starch particles and emulsion drops were examined using static light-scattering (Malvern Mastersizer 2000, Malvern, UK). A small amount of sample was injected into the flow system connected to the pump and the optical measurement chamber. The values of refractive index used were 1.54 for starch [24] and 1.33 for the continuous phase which was assumed to have the same refractive index as water. Obscuration was restricted to between 10 and 20%. All droplet size measurements were performed on the same day as the emulsifications were made.
Light microscopy was used to analyse emulsion droplets. Emulsions were observed under an optical microscope (Olympus BX50, Japan) equipped with a live video camera. The samples were examined under Plan 2x, UMPlanFL 5x and 10x, and LMPlanFL 20x and 50x objectives (Olympus). Emulsions were diluted 5 times with buffer and one drop was placed uncovered on the glass slide for microscope observation.
A scanning electron microscope (SEM) was used to image the morphology and size of the starch granules. The starch granule samples were coated with gold and examined under SEM (FegSEM, JEOL JSM-6700F, Japan) operated at 5 kV with a working distance of 8 mm. Low secondary electron imaging (LEI) mode was used to give clear 3D images of the sample surface. The LEI detector combined the signals from both secondary and back-scattered electrons during operation.
Results and discussion
The starches used in this study, quinoa, oat and waxy maize, were chosen because of their different size classes. The starch granules were modified with OSA before being used to stabilize Pickering emulsions and the degree of OSA modification was 3.2%, 2.5% and 2.0% for quinoa, oat and waxy maize, respectively. We have previously worked with waxy maize with a degree of modification that was 3% and the droplet size after one day of storage was in the same size range as seen in this study. This is in-line with previous work has shown that variation of the degree of OSA modification in the range used here have a low to moderate effect on variation in emulsion droplet size

8 Paper II
[5, 11, 12]. This could be because it is the surface modification not the total modification of the starch granule that is a key parameter for the emulsification. It is likely that as the surface is readily available for the OSA- reaction it will not vary to the same degree as the total degree of modification which will be affected by factors such as porosity and size of the granules.
Emulsions stabilised with single type of starch granules
The primary model system of 400 mg starch/ml oil
The three types of starch granules were used to produce emulsions with specific concentrations of 400 mg starch /ml oil which were emulsified for 1 min, Figure 1. The particle size distribution was measured using static light scattering. This distribution will show both the emulsion droplets and any free starch in the system and as can be seen in Figure 2 there can be some free starch observed.
Emulsions stabilized with starch often shows two peaks or a peak with a shoulder. In this case, the peak with the smallest size is normally related to starch. Quinoa starch granules with a granule size of 1-2 µm showed a size distribution with a peak related to the oil droplets around 25 μm. Oat starch granules, with an average size of about 7-8 µm showed a peak at 70 µm, while waxy maize granules with an average particle size of 15 µm showed a peak at 140 µm indicative of large oil droplets (Figure 1) but the smaller peak at 23 µm could also contain some small oil droplets as this deviates from the light scattering data for dispersed granules. Thus, the granule size seems to affect the droplet size, and in line with previous observations, larger granules give larger droplets which partially could be due to a lower amount of granules for the same weight [5, 23]. Quinoa, with the smallest particle size, leads to emulsions with the smallest drops, followed by oat and waxy maize. However, it cannot be ruled out that other factors, such as the shape of the starch granules, differences in surface properties including the difference in OSA-modification, or presence of other components in the starch used such as proteins and lipids, may influence stabilization. The SEM images of the starches used here (Figure 2) where in agreement with previous studies [18, 19, 22] and showed that quinoa and waxy maize granules had prominent edges, while oat granules were more round and smooth. We found in a previous study that small particles with smooth and round structure provide better emulsion stability than large particles [23]. This could explain the difference between oat and other starch granular based emulsions.

Paper II 9
Figure 1. Left column: Size distributions of emulsion at 400 mg starch/ml oil ratio, Right column: Volume weighted mean emulsion droplet size as a function of starch concentration and SEM images of each type of starch granules investigated: (Upper row) quinoa, (middle row) oat and (lower row) waxy maize
0
2
4
6
8
10
0,1 10 1000
Vo
lum
e, d
4,3
(%)
Drop size (µm)
Quinoa 400mg/ml oil
0
10
20
30
40
50
60
70
80
90
0 500 1000
d4
,3 (µ
m)
Starch concentration (mg/ml oil)
0
2
4
6
8
10
0,1 10 1000
Vo
lum
e, d
4,3
(%)
Drop size (µm)
Oat 400 mg/ml oil
0
10
20
30
40
50
60
70
80
90
0 500 1000
d4
,3 (µ
m)
Starch concentration (mg/ml oil)
0
1
2
3
4
5
6
7
8
9
10
1 10 100 1000
Vo
lum
e, d
4,3
(%)
Droplet size (µm)
Waxy maize 400 mg/ml oil
0
10
20
30
40
50
60
70
80
90
0 500 1000 1500 2000
d4
,3 (µ
m)
Starch concentration (mg/ml oil)

10 Paper II
For the primary systems, we also studied the effect of emulsification time since the transport of granules to the interface of the droplets could be a key component that affects the droplet size and also could be of importance for the outcome in a mixed system. As the emulsification time was increased, the droplet size did decrease to some extent and the effect of emulsification time varied between the three types of granules. The quinoa-stabilized emulsion showed only a minor change in droplet size, being reduced by only 3-5 µm when increasing the emulsification time from 1 to 2 min., and then remained constant at longer emulsifications times. When the droplet size decreases for waxy maize and oat starch, it is no longer possible to differentiate between the peak for the oil droplets and the free starch granules. Thus, we have chosen to look at the change in average d4,3 values. The oat-stabilized emulsion exhibited a slight decrease in average d4,3 value, from around 70 µm at one minute to 60 µm after 3 min., after which it remains unchanged. The waxy maize-stabilized emulsion showed a greater reduction, from 70 µm to 30 µm in average d4,3 value and changes where noted both after 3 and 5 minutes of emulsification. These results show that extending the period of emulsification had a greater effect on emulsions with larger starch granules than with smaller granules and that this could partly be the reason for differences seen previous on the effect of granular size on droplet size [23]. One possible explanation to this difference in effect by emulsification time is the kinetics of transport of the granules to the droplet interface. The transfer of large particles such as starch granules to the oil-water interface from the bulk continuous phase is governed by convective transport. This is different from surfactants, protein molecules, and nanoparticles < 2nm, where Brownian motion is the main transport mechanism for overcoming adsorption barriers [7]. Thus, it is the convective transport during emulsification, i.e. their size and inertia relative to the turbulent eddies created by the homogenization device used that governs the rate of adsorption and thus the optimal emulsification time. The rate of these collisions is determined by several factors including: the size and number concentration of the particles. This has been described for emulsions by Walstra (1993). In our case, it is obvious that at the same weight of emulsifier the smaller the particle is the more frequent the collisions and thus the system becomes less sensitive to the time of emulsification.

Paper II 11
Figure 2. SEM images of (A) quinoa, (B) oat and (C) waxy maize starch granules (top row) and emulsions (bottom row).
Effect of starch concentration
To compare our mixed system with systems based on single starch type, we also need to understand how the concentration of starch granules affect the droplet size. Again, due to overlap between the size of starch granules and small emulsion droplets, the average particle size from the static light scattering does not represent the emulsion droplets alone. As discussed previously all system showed aggregates of emulsion droplets with some free starch attached (Figure 2) and a substantial amount of free starch was present in the continuous phase of all samples. The amount of free starch was higher in waxy maize emulsions. The emulsions made using smaller starch particles showed a high degree of flocculation at low starch/oil ratios, which decreased with increasing starch/oil ratio. This is in agreement with previous studies in which the particle size was found to highly influence the droplet size of the emulsions [10-12]. Thus, the change in average size will be affected both by the increase in free starch and a decrease in droplet size. The average d4,3 size was seen to decrease for all three starch granules investigated as the concentration was increased from 200 to 2400 mg starch/ml oil, Figure 1 and Table 2. This is in agreement with our previous study, where the stabilizing effect of individual starches at different concentrations was investigated in Pickering emulsions [23].
50µm 100µm 100µm

12 Paper II
Table 2. Description of starch based emulsions series
Starch emulsions
d4,3 (µm)
d3,2 (µm)
Mode (µm) Span Total amount
of starch/
oil (mg/g)
Starch mass (g)
Peak 1 Peak 2 Quinoa Oat Waxy maize
Quinoa 28.1 ± 1.5 9.0 ± 0.2 26.3 ± 0.1 - 1.8 400 0.14 0 0
Oat 61.2 ± 7.4 17.2 ± 0.6 69.2 ± 0.1 - 1.9 400 0 0.14 0
Waxy maize 67.8 ± 6.4 16.6 ± 0.6 17.8 ± 1.1 109.8 ± 8.0 2.0 400 0 0 0.14
Quinoa 44.0 ± 1.9 13.4 ± 0.3 29.3 ± 0.3 - 2.6 200 0.07 0 0
Quinoa 26.8 ± 0.9 9.1 ± 0.3 21.9 ± 0.3 - 1.7 400 0.14 0 0
Quinoa 14.1 ± 0.3 6.5 ± 0.1 14.3 ± 0.3 - 1.6 800 0.28 0 0
Quinoa 9.8 ± 0.2 4.7 ± 0.1 10.5 ± 0.2 - 1.7 1200 0.42 0 0
Oat 77.0 ± 5.0 17.8 ± 0.7 100.7 ± 6.3 - 2.0 200 0 0.07 0
Oat 54.2 ± 1.9 14.4 ± 0.4 64.8 ± 1.2 - 2.1 400 0 0.14 0
Oat 37.0 ± 0.5 11.1 ± 0.2 34.6 ± 0.4 - 2.2 800 0 0.28 0
Oat 27.1 ± 0.8 8.5 ± 0.2 26.1 ± 0.6 - 2.5 1200 0 0.42 0
Waxy maize 75.9 ± 10.6 18.2 ± 3.3 20.0 ± 1.8 120.2 ± 0.1 3.2 200 0 0 0.07
Waxy maize 69.2 ± 7.6 16.3 ± 0.4 18.7 ± 1.8 112.5 ± 11 2.8 400 0 0 0.14
Waxy maize 38.2 ± 1.0 11.9 ± 0.2 17.4 ± 0 69.2 ± 0 3.4 800 0 0 0.28
Waxy maize 34.2 ± 6.7 10.4 ± 0.7 17.7 ± 0 85.3 ± 8.3 4.0 1600 0 0 0.56
Waxy maize 23.2 ± 0.4 8.8 ± 0.1 17.4 ± 0 98.0 ± 9.5 2.11 3200 0 0 1.12

Paper II 13
Emulsions stabilized with mixtures of starch granules Emulsions were prepared using OSA-modified starches denoted: weight, area and constant. Weight – combinations of different starch granules based on similar starch mass 400 mg/g oil of each granules. Area – combinations of different starch granules with similar surface area, and the same amount of quinoa starch as in the systems denoted weight. Constant –combinations of different starch granules with similar surface area, but constant total starch mass, as in the systems denoted weight.
Figure 3 and Table 3 show the droplet size distributions of Pickering emulsions for mixed granule emulsions, where it can be seen that most emulsions showed 2 major peaks (one for emulsion droplets and one with primarily free starch). Figure 4 shows pictures of the macroscopic emulsions and Figure 5 and 6 show microscopic observations on how the two types of granules position themselves differently at the interface.

14
P
aper
II
Tabl
e 3.
Des
crip
tion
of c
ombi
ned
star
ch e
mul
sion
s St
arch
sam
ple
d4,3
d3
,2
Mod
e 1
Mod
e 2
Sp
an
Tota
l am
ount
of
sta
rch/
oi
l (g/
g)
Star
ch a
mou
nt (g
) W
eigh
t st
arch
/ w
eigh
t qu
inoa
Are
a st
arch
/ ar
ea
quin
oa
Num
ber
star
ch/
num
ber
quin
oa
Qui
noa
Oat
W
axy
mai
ze
Qui
noa/
wax
y m
aize
(wei
ght)
1 m
in
27
.1 ±
1.4
8
.2 ±
0.2
2
8.8
± 6
.8
- 1
.98
80
0 0
.14
0
0.1
4 1
.00
0.1
6 0
.00
Qui
noa/
wax
y m
aize
(wei
ght)
3 m
in
18
.6 ±
1.2
6
.7 ±
0.4
1
7.5
± 2
.4
- 1
.92
Qui
noa/
wax
y m
aize
(wei
ght)
5 m
in
18
.2 ±
0.5
5
.5 ±
0.1
1
5.1
± 0
-
2.2
0
Qui
noa/
wax
y m
aize
(are
a) 1
min
2
2.2
± 3
.8
8.0
± 0
.2
19
.1 ±
1.5
-
2.0
9 2
909
0
.14
0
0.8
8 6
.27
1.0
0 0
.03
Qui
noa/
wax
y m
aize
(are
a) 3
min
1
6.5
± 1
.1
6.9
± 0
.0
15
.1 ±
0
- 1
.75
Qui
noa/
wax
y m
aize
(are
a) 5
min
1
5.1
± 0
.1
4.3
± 3
.7
15
.1 ±
0
- 1
.74
Qui
noa/
wax
y m
aize
(con
stan
t) 1
min
2
5.8
± 4
.5
8.6
± 0
.3
17
.4 ±
0
94
± 6
.8
2.6
5 8
00
0.0
4 0
0
.24
6.3
7 1
.02
0.0
3
Qui
noa/
wax
y m
aize
(con
stan
t) 3
min
1
8.9
± 0
.9
4.9
± 4
.1
16
.3 ±
1.6
-
1.7
2
Qui
noa/
wax
y m
aize
(con
stan
t) 5
min
1
3.5
± 0
.1
5.4
± 1
.2
15
.1 ±
0.0
-
1.6
5
Qui
noa/
oat (
wei
ght)
1 m
in
36
.3 ±
5.1
5
.8 ±
0.1
3
9.6
± 2
0 -
3.2
2 8
00
0.1
4 0
.14
0
1.0
0 0
.29
0.0
2
Qui
noa/
oat (
wei
ght)
3 m
in
17
.7 ±
1.2
3
.7 ±
0.1
1
5.1
± 0
-
2.7
0
Qui
noa/
oat (
wei
ght)
5 m
in
19
.5 ±
1.0
3
.1 ±
3.1
1
1.5
± 0
-
4.3
2
Qui
noa/
oat (
area
) 1 m
in
73
.1 ±
5.7
5
.9 ±
0.2
2
8.9
± 1
6 -
12
.9
17
69
0.1
4 0
.48
0
3.4
2 1
.00
0.0
8
Qui
noa/
oat (
area
) 3 m
in
29
.4 ±
2.5
5
.7 ±
0.2
1
7.4
± 0
-
3.5
8
Qui
noa/
oat (
area
) 5 m
in
18
.3 ±
0.1
4
.3 ±
0.1
1
1.5
± 0
-
3.7
5
Qui
noa/
oat (
cons
tant
) 1 m
in
53
.4 ±
1.0
8
.6 ±
0.2
4
9.7
± 1
8 -
3.4
6 8
00
0.0
6 0
.22
0
0
3.4
4 1
.00
Qui
noa/
oat (
cons
tant
) 3 m
in
37
.7 ±
2.5
6
.4±
0.1
1
7.4
± 0
-
5.2
3
Qui
noa/
oat (
cons
tant
) 5 m
in
28
.7 ±
1.1
5
.4 ±
0.2
1
1.5
± 0
-
5.4
7

Paper II 15
Figure 3. Size distributions from light scattering for emulsions produced with mixtures of starch granules from different botanic source. Upper panels Quinoa and waxy maize, lower panels Quinoa and Oat. Different times for emulsification 1 min. (full black line) 3 min. (full grey line) and 5 min (Dashed grey line). A and D mixture of the two granules based on 50/50 by weight, B and E mixture of the two granules based on 50/50 by area same weight of Quinoa as in A and B (400 mg/ml of Oil), C and F mixture of the two granules based on 50/50 by area same total weight of starch as in A and B (800 mg/ml of oil).
General observations of mixed particle systems
Figure 4 shows photographs of the emulsions obtained with mixed starch granules. All the mixed systems were able to form Pickering emulsions, but the size of the emulsion droplets and the EI varied (Table 3). For all the combinations of starch investigated in this study, it was observed that the emulsion was homogeneous immediately after emulsification and that there was no free oil on top of the emulsion. However, the emulsion did separate into a serum phase and an emulsion phase upon storage for 24 hours, Figure 4. In all cases, it was observed both a top layer and a sediment layer. The microscope pictures show that there are some small oil droplets with coverage of starch granules. As starch is heavier than water these might sediment according to previous observations by [10]. Thus, the sediment could contain both free starch and small heavy starch laden droplets. The EI increased as expected, with increasing amount of starch in the system. Thus, the Area based systems has the highest EI, 0.75 and 0.6, for quinoa/oat and quinoa/waxy maize respectively. Mixtures of quinoa/oat and quinoa/waxy maize based on the same Weight and Constant system had similar values of EI around 0.2-0.25. Indicating that the EI is mainly affected by the total amount of dispersed phase (granules and oil droplets together).

16 Paper II
Quinoa/waxy maize emulsions
Weight – This quinoa/waxy maize emulsion showed droplets with a small, rather uniform size of about 27 µm, mostly dominated by quinoa. It can be seen in Figure 5A that quinoa starch covered the emulsion droplets, and the drop size was similar to the one for the reference systems containing only the same amount of quinoa. The waxy maize was observed mostly as free starch, not attached to the droplets. There was very little change in the drop size when emulsification time was increased from 1 min to 3, and then to 5 min, showing values around 18-19 µm and a slightly sharper particle size distribution (Figure 3 A and Table 3). The decrease is slightly more pronounced than for the pure quinoa system but much smaller than was seen for the pure waxy maize system, see section 4.1.1. The prolonged emulsification also showed an increase in the number of particles indicative of free quinoa starch. This could be due to a replacement of quinoa by waxy maize at the interface but the microscopy pictures do not substantiate such an interpretation. The other reason could be a brake-up of aggregated quinoa granules.
Area - In this emulsion system, the surface area of both starches was similar at a total weight of quinoa starch which is the same as for the mass based system (weight). Similar microscope observations were made as for the mass-based systems, where quinoa dominated at the interface on small uniform drops (Figure 5B). As the emulsification time increased, the size of the drops decreased from 22 to 15 µm (Table 3, Figure 3 B). The light scattering data indicates that this is primarily due to reduction of the larger droplets in the size distribution as can be seen by a less tailing in the sized distribution. The effect could both be due to that the prolongation of emulsification time decreases the droplet size but could also lead to a combination of more aggregated oil droplets and more free starch which would increase the volume % around the size of the starch. The microscope pictures indicate that both might occur but that there is an indication of smaller droplets.

Paper II 17
Figure 4. Photographs of the emulsions formed with the various combinations of starch granules. A (Quinoa and waxy maize) B (Quinoa and oat) the mixture of granules based on 50/50 by weight (400 mg/ml Oil of each starch), C (Quinoa and waxy maize) and D (Quinoa and oat) mixture of the two granules based on 50/50 by area same weight of Quinoa as in A and B), E (Quinoa and waxy maize) and F (Quinoa and oat) mixture of the two granules based on 50/50 by area same total weight of starch as in A and B (800 mg/ml total amount of starch per mg of oi
Constant - In this emulsion system, the surface area of both starches was the same at a total weight of starch that was the same as for the mass-based system. Thus, the weight of quinoa decreases substantially. However, the decrease in the amount of quinoa did not change that the fact that in waxy maize/quinoa based systems quinoa is dominating at the interface. The size of the drops was similar to that in the other quinoa/waxy maize systems around an average of 25 µm but the light scattering also showed a large peak probably related to larger emulsion droplets of a size around 94 µm. The large droplet peak is absent after longer emulsification times and the droplet size decreased after longer emulsification times to the same as for the other systems which was around 15 µm (Figure 3 C). Looking at the microscopy pictures in Figure 5C, there seems to be a shift from more waxy maize at the droplet interface at short times going towards larger dominance of quinoa after longer emulsification time. This is however not in line with the light scattering results where we see an increase of the peak around 1 µm indicative of free quinoa granules. As discussed previously this could be due to that the system is heavily aggregated as can be seen in the microscopy pictures and that prolonged emulsification changes the aggregate structure giving a higher amount of free individual starch granules.

18 Paper II
Figure 5. Microscope images of mixed quinoa/waxy maize starch emulsions, effect of ratio between the two starches, emulsification time and average droplets size.
A
C
B

Paper II 19
It is obvious that although quinoa is substantially smaller than waxy maize starch. it still dominates at the interface. This could either be because the quinoa granules are more surface active than the waxy maize granules or that quinoa granules as discussed for the individual granules has a higher collision frequency with the oil droplets and that when they are adsorbed to the interface waxy maize cannot displace them. For the systems containing 400 mg of quinoa granules, the effect on the emulsion by emulsification time is as for the single system using quinoa rather small giving only minor changes in droplet size.
Quinoa/oat emulsions
Weight - The microscope images show that the droplets were covered with both types of starch granules. Furthermore, this system was highly aggregated with starch granules forming bridges between different oil droplets (Figure 6A). All of the system contains aggregated droplets but these aggregated droplets are more frequently seen in the emulsions containing quinoa/oat, especially for the shorter times of emulsification. The starch granules seem in this case to form a network that keeps the droplets together. With similar starch mass, there seems to be a mixture of quinoa and oat granules at the interface after 1 min of emulsification. When the emulsification time was extended from 1 min to 3 and 5 min, the drop size decreased by almost half, from an average of 36 to 18-20 µm, Figure 3D. The drop size in quinoa/oat emulsions is slightly larger than in quinoa/waxy maize emulsions, indicating that when oat starch adsorbs on the surface of the droplets, the size increases although there is enough quinoa to be able to produce smaller droplets. Thus, it is likely that oat is the dominant species at the interface.
Area – In this emulsion systems, the drops had larger sizes around 73 µm after 1 minute of emulsification. This size is actually larger than both droplets produced using only oat granules or only quinoa. At longer emulsification times, the size of the drops decreased by almost 80% to 18µm after 5min. The reason could be that large aggregates were formed in this emulsion at short emulsification time, as seen under the light microscope. Oat starch not only stabilized the droplets, but excess granules formed a network instead of remaining in the form of free starch (Figure 6B). The network might explain the high EI exhibited by this emulsion system, despite the larger droplet size. There where considerable amounts of clusters also at the longer emulsification times but the droplet size did decrease and maybe the clusters was easier broken during light scattering measurements Figure 3E. The microscopy pictures show a clear dominance of oat granules at the interface of the oil droplets.

20 Paper II
Constant – In this emulsion system, which contains a lower total amount of starch by volume, the drops were fully covered with oat starch, Figure 6C. Thus, it’s interesting to note the decrease of quinoa starch in the system had an effect even though the oat/quinoa ratio was the same. The average particle size was 53 µm, which decreased to around 29 µm after longer emulsification times, Figure 3F. It was seen that quinoa and oat work both adsorbed to the interface and that the size was in the range of the single system for oat.
Overall, the emulsions containing combinations of quinoa and oat starch showed results that are quite different from the waxy maize/quinoa system. From the light scattering data, we can see that, the amount of free quinoa starch granules is considerable larger than for the quinoa/waxy maize systems and it increases quite drastically with time indicating that oat granules are the species that would dominate at the interface and that it to some extent displaces quinoa at the interface as the emulsification time increases (Figure 6). This could be a case of ideal particle size and shape. However, it cannot be ruled out that other factors, such as the fact that oat granules are more hydrophobic than waxy maize due to higher degree of OSA modification as well as the fact that oat contains quite high amounts lipids ~1-2.5%. This could be the reason that oat dominates at the interface when mixed with quinoa in difference to waxy maize.
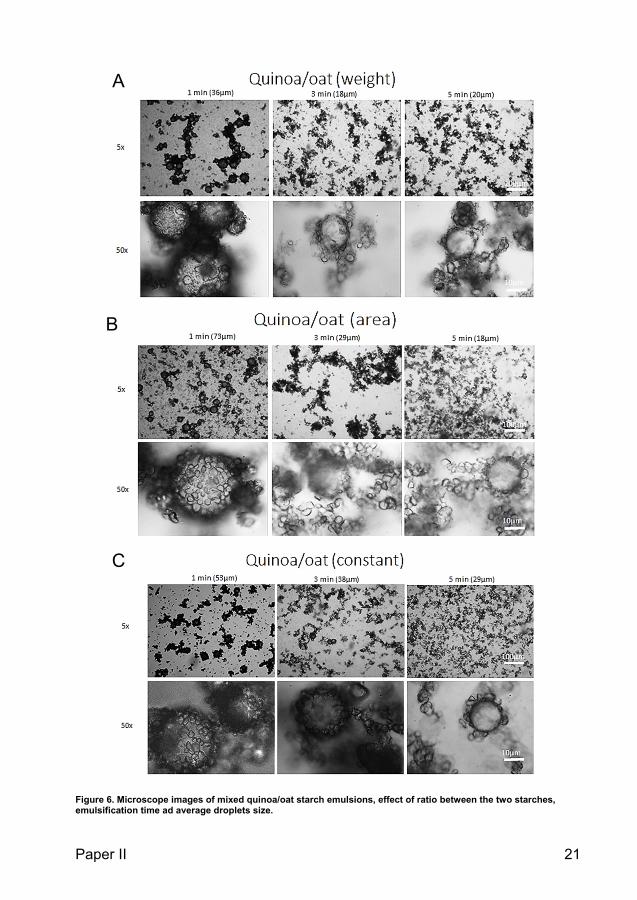
Paper II 21
Figure 6. Microscope images of mixed quinoa/oat starch emulsions, effect of ratio between the two starches, emulsification time ad average droplets size.
A
C
B

22 Paper II
Comparison between theoretical and measured particle sizes The effect of the type of added starch and the starch particle size can be considered by calculating the theoretical droplet size from maximum surface coverage of starch at the oil droplet for each starch type. The theoretical maximum surface coverage, ΓM (weight starch/area) can be estimated using equation 2: Γ = φ (Eqn. 2)
where is the density of starch (approximately 1500 kg m-3), is the surface mean diameter of the starch particles (inthiscaseassumedtobed ) and φ is the packing density (φ=0.907, theoretical maximum coverage with tight packing). A contact angle (θ) of 90° is assumed for all particles attached to the oil-water interface. It should be noted that the assumption that = is a simplification, as in many cases the starch granules are not perfectly closed packed and thus φ deviates from 0.907, and furthermore starch granules are not perfect spheres [10]. Despite these simplifications, the size of the emulsion droplet can be estimated for a given size and concentration of starch granules by performing a mass balance over the number of particles available to stabilize the emulsion droplets, and assuming, that there is no free starch in the limited coalescence regime, the theoretical diameter of emulsion droplets can be estimated by: = (Eqn. 3).
where D is the estimated emulsion droplet size, mp is the mass of the starch granules added, and Vdisp is the volume of the dispersed phase [25]. The sizes of the starch granules are given in Table 4.
Table 4. Characteristics of the starch particles Starch Size (µm) Mode Γm, surface
coverage (mg/m2) Protein
content (%) d4,3 d3,2 µm
Quinoa 1.56 ± 0.09 1.40 ± 0.03 1.45 1260 0.04
Oat 8.77 ± 0.11 4.69 ± 0.02 8.36 7893 0.28
Waxy maize 16.8 ± 5.67 8.00 ± 0.31 13.99 15120 0.15
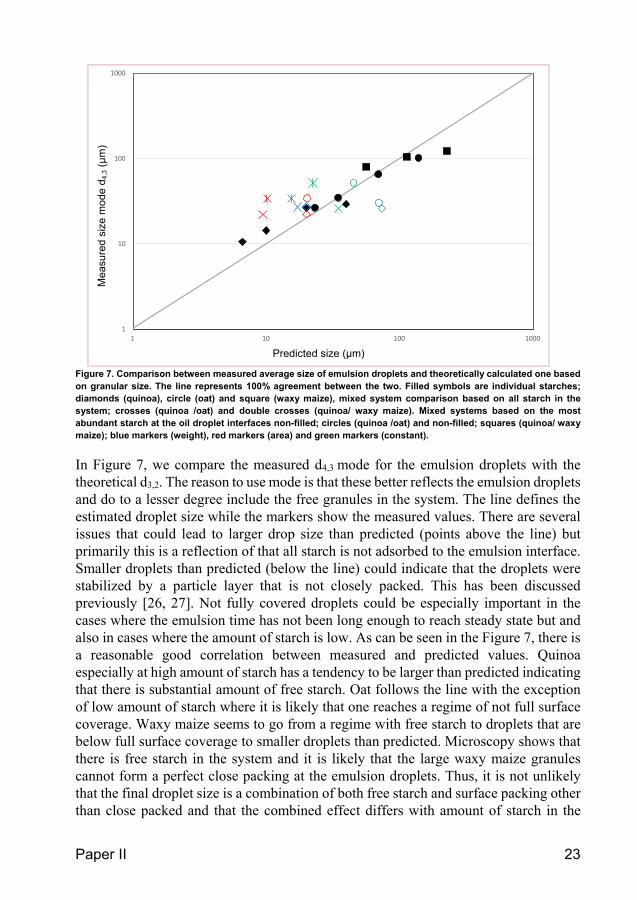
Paper II 23
Figure 7. Comparison between measured average size of emulsion droplets and theoretically calculated one based on granular size. The line represents 100% agreement between the two. Filled symbols are individual starches; diamonds (quinoa), circle (oat) and square (waxy maize), mixed system comparison based on all starch in the system; crosses (quinoa /oat) and double crosses (quinoa/ waxy maize). Mixed systems based on the most abundant starch at the oil droplet interfaces non-filled; circles (quinoa /oat) and non-filled; squares (quinoa/ waxy maize); blue markers (weight), red markers (area) and green markers (constant).
In Figure 7, we compare the measured d4,3 mode for the emulsion droplets with the theoretical d3,2. The reason to use mode is that these better reflects the emulsion droplets and do to a lesser degree include the free granules in the system. The line defines the estimated droplet size while the markers show the measured values. There are several issues that could lead to larger drop size than predicted (points above the line) but primarily this is a reflection of that all starch is not adsorbed to the emulsion interface. Smaller droplets than predicted (below the line) could indicate that the droplets were stabilized by a particle layer that is not closely packed. This has been discussed previously [26, 27]. Not fully covered droplets could be especially important in the cases where the emulsion time has not been long enough to reach steady state but and also in cases where the amount of starch is low. As can be seen in the Figure 7, there is a reasonable good correlation between measured and predicted values. Quinoa especially at high amount of starch has a tendency to be larger than predicted indicating that there is substantial amount of free starch. Oat follows the line with the exception of low amount of starch where it is likely that one reaches a regime of not full surface coverage. Waxy maize seems to go from a regime with free starch to droplets that are below full surface coverage to smaller droplets than predicted. Microscopy shows that there is free starch in the system and it is likely that the large waxy maize granules cannot form a perfect close packing at the emulsion droplets. Thus, it is not unlikely that the final droplet size is a combination of both free starch and surface packing other than close packed and that the combined effect differs with amount of starch in the
1
10
100
1000
1 10 100 1000
Mea
sure
d si
ze m
ode
d3,4
(∝m
)
Predicted size (∝m)
Mea
sure
d si
ze m
ode
d4,
3 (
µm
)
Predicted size (µm)

24 Paper II
system. For the mixed systems, the measured sizes are above the line in all cases except for quinoa/waxy maize (constant) indicating a high amount of free starch. To further investigate the system, we also plotted the predicted size of the droplets only using the most dominant species of the two granules in the mixed system as identified from the microscopy pictures. As can be seen in Figure 7, the adherence to the line was better with two exceptions quinoa/oat (weight) and quinoa/waxy maize (constant). Indicative of these two out layers are that the amount of the starch for which the predicted value is based on is the lowest and thus one could speculate that at low amounts of the dominating starch, the less dominating one also adsorbs to the interface. There are some synergistic effects of the two starches that are not seen at higher concentration of the dominating starch.
Conclusions
The results of this study show that starch particle size has an influence on Pickering emulsions, where smaller starch granules seem to lead to smaller droplet size, especially in the case of quinoa and oat, compared to waxy maize starch.
In references to the hypothesis for this work we can conclude:
• That at high enough amount of starch granules, the large granules do not automatically dominate at the interface due to their higher energy of detachment or because they have higher energy of collision. This as quinoa and oat dominates over waxy maize at the interface.
• Small granules do not necessarily dominate at the interface as oat dominates over quinoa.
There might be a mixture of granules at the interface but this is not straight forward dependent on the ratio between the two kinds of granules used (either the ratio based on available surface area or the number of particles available)
Thus, what granule that dominates at the interface is more complex than this and could be a combination between an optimal size, shape and surface hydrophobicity.
The emulsifying capacity (expressed as the EI) was found to be increased in emulsion systems with mixed starches. It was found that the quinoa/waxy maize (weight and constant based) systems had similar EIs to quinoa/oat systems (weight and constant) due to the similar total weight of starch in the system. This shows that the total starch concentration in the system affects the EI.
Increasing the emulsification time from 1 to 5 min helped to reduce the droplet size in all samples. The droplet size in quinoa/waxy maize emulsions did not change as much since the system was dominated by quinoa, which led to small drops already from the beginning. A gradual effect of the emulsification time can be seen in quinoa/oat

Paper II 25
samples, especially at higher concentration, where an 80% decrease in droplet size was seen after emulsification for 5 min. This may be due to the higher starch mass in the system, which needed more time to cover the surface droplets.
Acknowledgements
The study was supported by the Swedish Research Council (Vetenskapsrådet).
References
1. Pickering, S.U., Cxcvi.—emulsions. Journal of the Chemical Society, Transactions, 1907. 91: p. 2001-2021.
2. Ramsden, W., Separation of Solids in the Surface-Layers of Solutions and 'Suspensions' (Observations on Surface-Membranes, Bubbles, Emulsions, and Mechanical Coagulation). -- Preliminary Account. Proceedings of the Royal Society of London, 1903. 72(ArticleType: research-article / Full publication date: 1903 - 1904 / Copyright © 1903 The Royal Society): p. 156-164.
3. Dickinson, E., Hydrocolloids as emulsifiers and emulsion stabilizers. Food Hydrocolloids, 2009. 23(6): p. 1473-1482.
4. Yusoff, A. and B.S. Murray, Modified starch granules as particle-stabilizers of oil-in-water emulsions. Food Hydrocolloids, 2011. 25(1): p. 42-55.
5. Timgren, A., et al., Starch particles for food based Pickering emulsions. Procedia Food Science, 2011. 1(0): p. 95-103.
6. Dickinson, E., Food emulsions and foams: Stabilization by particles. Current Opinion in Colloid & Interface Science, 2010. 15(1-2): p. 40-49.
7. Tcholakova, S., N.D. Denkov, and A. Lips, Comparison of solid particles, globular proteins and surfactants as emulsifiers. Physical Chemistry Chemical Physics, 2008. 10(12): p. 1608-1627.
8. Binks, B.P. and S.O. Lumsdon, Influence of Particle Wettability on the Type and Stability of Surfactant-Free Emulsions. Langmuir, 2000. 16: p. 8622-8631.
9. Timgren, A., et al., Emulsion stabilizing capacity of intact starch granules modified by heat treatment or octenyl succinic anhydride. Food Science & Nutrition, 2013. 1(2): p. 157-171.
10. Rayner, M., et al., Quinoa starch granules: A candidate for stabilising food-grade Pickering emulsions. Journal of the Science of Food and Agriculture, 2012. 92(9): p. 1841-1847.
11. Rayner, M., et al., Quinoa starch granules as stabilizing particles for production of Pickering emulsions. Faraday Discussions, 2012. 158: p. 139-155.
12. Timgren, A., et al., Starch particles for food based Pickering emulsions. 11th International Congress on Engineering and Food (Icef11), 2011. 1: p. 95-103.

26 Paper II
13. Wang, S., Y. He, and Y. Zou, Study of Pickering emulsions stabilized by mixed particles of silica and calcite. Particuology, 2010. 8(4): p. 390-393.
14. Matos, M., et al., Combined emulsifying capacity of polysaccharide particles of different size and shape. Carbohydrate Polymers, 2017. 169: p. 127-138.
15. Nesterenko, A., et al., Influence of a mixed particle/surfactant emulsifier system on water-in-oil emulsion stability. Colloids and Surfaces A: Physicochemical and Engineering Aspects, 2014. 457: p. 49-57.
16. Pichot, R., F. Spyropoulos, and I. Norton, Competitive adsorption of surfactants and hydrophilic silica particles at the oil–water interface: interfacial tension and contact angle studies. Journal of colloid and interface science, 2012. 377(1): p. 396-405.
17. Matos, M., et al., Comparative Emulsifying Properties of Octenyl Succinic Anhydride (OSA)-Modified Starch: Granular Form vs Dissolved State. PLoS One, 2016. 11(8): p. e0160140.
18. Jane, J.-L., et al., Anthology of Starch Granule Morphology by Scanning Electron Microscopy. Starch - Stärke, 1994. 46(4): p. 121-129.
19. Hall, D.M. and J.G. Sayre, A Scanning Electron-Microscope Study of Starches: Part II : Cereal Starches. Textile Research Journal, 1970. 40(3): p. 256-266.
20. Pérez, S. and E. Bertoft, The molecular structures of starch components and their contribution to the architecture of starch granules: A comprehensive review. Starch - Stärke, 2010. 62(8): p. 389-420.
21. Hall, D.M. and J.G. Sayre, A Scanning Electron-Microscope Study of Starches: PART III: Miscellaneous Starches. Textile Research Journal, 1971. 41(11): p. 880-894.
22. Lindeboom, N., P.R. Chang, and R.T. Tyler, Analytical, Biochemical and Physicochemical Aspects of Starch Granule Size, with Emphasis on Small Granule Starches: A Review. Starch - Stärke, 2004. 56(3-4): p. 89-99.
23. Saari, H., et al., Preparation and Characterization of Starch Particles for Use in Pickering Emulsions. Cereal Chemistry, 2016. 93(2): p. 116-124.
24. Bromley, E.H. and I. Hopkinson, Confocal microscopy of a dense particle system. J Colloid Interface Sci, 2002. 245(1): p. 75-80.
25. Arditty, S., et al., Materials based on solid-stabilized emulsions. Journal of Colloid and Interface Science, 2004. 275(2): p. 659-664.
26. Rayner, M., et al., Biomass-based particles for the formulation of Pickering type emulsions in food and topical applications. Colloids and Surfaces A: Physicochemical and Engineering Aspects, 2014.
27. Wahlgren, M., et al., The use of micro- and nanoparticles in the stabilisation of Pickering-type emulsions for topical delivery. Current Pharmaceutical Biotechnology, 2013. 14: p. 1222-1234.

Paper III


Paper III 1
Pickering emulsions based on CaCl2-gelatinized oat starch
Hisfazilah Saari, David Björten Johansson, Nathalie Knopp, Malin Sjöö, Marilyn Rayner and Marie Wahlgren
Department of Food Technology, Engineering and Nutrition, Lund University
Box 124, SE 221 00 Lund, Sweden
Corresponding author: [email protected]
Tel: +46 46 222 8307
KEYWORDS: Pickering emulsion, cold gelatinization, oat starch, dry emulsions
2 Paper III
Abstract
The aim of this study was to investigate calcium chloride-induced gelatinization of oat starch, and its effects on the properties of an oat starch-based Pickering emulsion. The effect of CaCl2 gelatinization on oat starch granules was studied over 24 h. The results indicate that, in contrast to many other starches, the salt-induced gelatinization of oat granules is not primarily a surface phenomenon, as gelatinization and dissolution of the whole starch granule was observed. This could be because oat starch is more porous than most other cereal starches. Oat starch granules were found to stabilize emulsions both with and without modification of the granules using octenyl succinic anhydride (OSA). The hydrophobization of starch by OSA modification did not significantly change the macroscopic properties of the emulsions compared to the corresponding unmodified system, but the average size of the droplets was slightly smaller. This is in contrast to most starch-based Pickering emulsions, which normally show very poor emulsification properties when using native starch granules due to high hydrophilicity. All the emulsions studied had creamed after one day, but the creaming layer differed depending on the length of salt-induced gelatinization of the starch; the least dense layer being observed following 30 minutes of gelatinization. It was also investigated whether emulsions made from non-gelatinized oat starch could be gelatinized in situ. This was found to be possible and led to encapsulation of the oil. The gelatinized emulsions could be dialysed and lyophilized without loss of oil. Leading to dry emulsions that was reformed upon reconstitution with water.

Paper III 3
Introduction
In this study, we investigated how salt-induced gelatinization (commonly called cold gelatinization) affected the properties of oat-starch-based Pickering emulsions. Pickering emulsions, as described by Pickering [1] and Ramsden [2], are emulsions that are stabilized by particles instead of traditional surface-active molecules such as surfactants, polymers or proteins [3-6]. In recent years, numerous articles have been published describing the use of starch granules in the formulation of Pickering emulsions [7-12]. One advantage of using starch as a stabilizer for Pickering emulsions is that the oil droplets can be encapsulated by heat-induced gelatinization of the starch, and that this can be followed by freeze-drying to produce dry emulsions of liquid oils [7, 13-15]. Dry emulsions are of interest in numerous applications within the pharmaceutical and food industries, for example, the controlled delivery of oil-soluble substances, the taste masking of oil, and the protection of oils from oxidation. However, one drawback is that heat-induced gelatinization may damage other heat-sensitive substances in the formulation.
We have previously studied the use of oat starch as a stabilizer of Pickering emulsions, and found that emulsions could be produced with droplet sizes varying from 20 to 80 μm using oat starch modified with octenyl succinic anhydride (OSA); the size depending on the amount of starch in the emulsion [10]. We also noted that, in contrast to several other starches, oat starch has a good ability to stabilize emulsions without OSA modification. We therefore used oat starch in the current study. Oat starch is characterized by a high lipid content (~1-2.5%), a low protein content (usually below 0.5%), particle sizes between 8 and 15 μm, a gelatinization temperature in the interval 60-70°C and an amylopectin content between 18 and 34% [16]. It has also been reported that oat starch granules contain pores about 10 nm in size, and that the pore volume and specific surface area of oat starch are higher than in most other cereal starches [17]. During swelling, oat starch granules initially swell along all three axes, but the swelling does result in the formation of flattened discs [18], also in contrast to other cereal starches. The structure of oat starch granules is also more sensitive to heat and acid than other starches, and starts to break down below 100°C, or due to mild acid hydrolysis [16].
In our previous study, we found that the properties of starch-based Pickering emulsions, such as droplet size and stability, are influenced by the size and, to some extent, by the morphology of the starch granules or starch particles used [10]. The present study was carried out in order to investigate how salt-induced gelatinization of oat starch granules affected Pickering emulsions. It has been shown that salts such as lithium chloride and calcium chloride can be used to gelatinize the surface of numerous cereal and non-cereal starches, changing both the size and morphology of the surface of the granules [19-22]. In these studies, it was seen that for several although not all starches studied, that salt induced gelatinization occurred at the surface of the granules. For potato and maize starch, salt-induced gelatinization led to granules with a rough surface and a reduction in the size of the granules [23-25]. This size reduction could be considerable, for example, the size of potato starch granules was reduced by up to 50% [23, 26]. It was also reported that small granules were more sensitive to this treatment than large ones [22]. Some starches, such as rice, waxy barley and maize starch, could not be separated into individual granules after salt gelatinization [22].
The mechanisms involved in salt-induced gelatinization are still not fully understood, but it has been reported that heat-induced gelatinization of starch is affected by salts, and that the effect follows the Hofmeister series. The salting-in ions have been reported to reduce particle size, swelling and transparency, and lead to an increase in the gelatinization temperature, while salting-out ions, had the opposite effects [27, 28]. To the best of our knowledge, salt-induced gelatinization of oat starch has not yet been studied.

4 Paper III
We investigated whether salt-induced gelatinization could be used as a means of reducing the size of oat starch granules, as small granules have been found to produce stable emulsions with small droplets. We also wished to ascertain whether cold gelatinization could be used to produce starch-encapsulated oil droplets.
Material and methods
Materials Oat starch was kindly provided by Lyckeby Starch (Kristianstad, Sweden). Medium-chain triglyceride oil, Miglyol 812, was obtained from Sasol Germany GmbH (Hamburg,Germany). OSA was obtained from Trigon Chemie GmbH (Schluechtern, Germany), and CaCl2 from Sigma Aldrich (St. Louis, Missouri, United States).
Salt-induced gelatinization of starch Starch granules (20 g) were mixed with 150 ml of a 3.3 M CaCl2 solution. The mixture was stirred at room temperature for 0.5, 1, 2, 3, 6, 12 and 24 h, to achieve different levels of gelatinization. Gelatinization was stopped using 1200 ml chilled deionized water while mixing. The solution was then centrifuged at 3850 g for 15 min. The supernatant containing CaCl2 was discarded, and the starch was washed twice with 1200 ml deionized water. To remove dissolved starch, the washed starch was diluted with 120 ml chilled deionized water transferred to a kitchen blender and blended for 4 min. The sample was then centrifuged at 3840 g for 20 minutes, and the supernatant was discarded. This washing procedure was repeated three to eight times until the supernatant was clear. The sample was then collected and freeze-dried at -50oC for 4 days in a Hetosic freeze dryer.
OSA modification Native and CaCl2-treated oat starch granules were modified using OSA to increase their hydrophobicity. The degree of OSA modification was determined using titration, according to the method described by Rayner et al. [11]. The amount of OSA used for modification was 3 % of weight based on dry starch, and the degree of modification was about 2.5%. The OSA-modified starch was freeze-dried at described above.
Preparation of emulsions Emulsions were made by mixing starch, oil and deionized water in a vortex mixer for 10 s or longer, and then emulsifying the suspension for a preset time using a high-shear mixer (Ystral GmbH, model D-79282 Ballrechten-Dottingen, Germany) at 22 000 rpm. In the initial experi-ments, the emulsion time was 60 s, and the proportions of starch, oil and water were 70 mg starch, 0.35 g oil and 6.65 g water. In later experiments the emulsion time was increased to 180 s to obtain as small droplets as possible. In these optimized experiments the proportions of starch, oil and water were 204 mg starch, 0.5 g oil and 5 g water.
In situ gelatinization of emulsions In the initial experiments, an emulsion was produced as described above using native oat starch, and the emulsion layer was transferred to another tube after 1 day. Deionized water was added to give a final volume of 1.5 ml, and this was mixed with 1.5 ml of either 4 M or 6 M CaCl2. Gelatinization was allowed to proceed for 0.5, 2, 3, 6, 12 or 24 h. Gelatinization was stopped by adding twice the sample volume of chilled deionized water.

Paper III 5
In the optimized experiments, a 10% emulsion was produced and diluted with 6 M CaCl2. The ratio between emulsion and CaCl2 solution was 2:1 giving a final concentration of 4 M CaCl2 and a 6.7% oil in water emulsion. Gelatinization over a shorter period, 10 to 120 minutes, was investigated. The system was stirred continuously during gelatinization and the temperature was controlled at 20°C using a water bath.
A larger sample of the emulsion (33 ml) was produced for freeze-drying. This was transferred to a mantled stirred glass vessel at 20°C to which 66 ml 6 M CaCl2 was added. Gelatinization was continued for 10 minutes, after which it was stopped with 200 ml chilled deionized water. The sample was then dialysed for 2.5 days against distilled water, and then freeze-dried at -50oC for 4 days.
Characterization of starch and emulsions Starch granules and emulsions were observed with an optical microscope (Olympus BX50, Tokyo Japan) equipped with a video camera also providing still images. The sample was diluted 5 times and one drop of the diluted sample was placed uncovered on the glass slide for microscopic observation using Plan 2x, UMPlanFL 5x and 10x, and LMPplanFl 20x and 50x objectives (Olympus).
Dried gelatinized starch granules were also investigated using scanning electron microscopy (SEM). The starch granule samples were coated with gold and examined with a field emission gun microscope (JSM-6700F, JEOL, Tokyo Japan) operated at 5 kV, with a working distance of 8 mm. Low secondary electron imaging (LEI) mode was used to give clear 3D images of the sample surface. The LEI detector combined the signals from both secondary and back-scattered electrons.
The size distributions of the starch granules and the drops in the emulsions were measured using static light scattering (Mastersizer 2000, Malvern Instruments, Malvern, UK), with a refractive index of the dispersed phase of 1.54 (corresponding to the refractive index of starch [29]), and 1.33 (the refractive index of water) for the continuous phase. A small amount of sample was injected into the flow system with a pump circulating at 2000 rpm to give an obscuration of 10-20%.
The protein content of the oat starch was determined by measuring the nitrogen content using a FlashEA® 1112 N elemental analyzer (Thermo Fisher Scientific, Waltham, MA, USA). A sample of about 25-32 mg was combusted in a sealed furnace, and the nitrogen content was determined with thermal conductivity detection. Aspartic acid was used as standard and the nitrogen factor was set to 6.25 in the calculations. All samples were measured in triplicate.
Emulsions were photographed after 24 h to document the degree of creaming and the visual appearance of the creaming layer.

6 Paper III
Results and discussions
Cold gelatinization of oat starch using calcium chloride Several different conditions were tested for the cold gelatinization of starch. As can be seen from Table 1, none of these conditions reduced the particle size of the granules compared to native oat starch. The cold-gelatinized starch granules as measured by static light scattering were actually somewhat larger than the native oat starch, and the particle size distributions were broad (see Figure 1), indicating that the individual granules are swollen, and that these swollen granules have a high tendency to aggregate in solution. Aggregation is probably due to leakage of dissolved starch into solution.
Table 1. Effect of cold induced gelatinization with 4 M calcium chloride on oat starch granules and the droplet size of Pickering emulsions based on these starch particles
Duration of reaction (h) Yield (%) Starch granule size (d4,3) (µm)
Protein content in starch sample (%)1 Emulsion droplets Mode d4,3 (µm)
0 h - 9.24±0.04 0.35±0.01 144±12
0.5 h 68 14.03±0.03 0.34±0.03 126±10
0.5 h (Ultra Turrax) 56 16.18±0.02 - -
6 h 30 13.38±0.02 0.47±0.02 132±10
12 h 12 13.93±0.00 0.68±0.01 -
24 h 8. 15.58±0.15 1.16±0.01 115±9
OSA 0 h - 12.96±1.57 0.28±0.01 77±5
OSA 0.5 h - - 62±7
OSA 1 h - - 96±20
OSA 24 h - - - 113±10
1The mean and SD of three measurements.
Figure 1. Granule size as measured by static light scattering for different samples of cold gelatinized starch after treatment with 4 M CaCl2 at room temperature during the following times 0 h (black line), 0.5 h (black interrupted line) , 1 h (black dotted line), 2 h (light grey line), 3 h (light grey interrupted line) , 6 h (light grey dotted line), 12 h (dark grey line), 24 h (dark grey interrupted line). It was also observed that after applying high-shear homogenization using an Ultra Turrax for 60 s, the average particle size decreased somewhat, probably due to a reduction in the aggregation of the starch, although all the aggregates were not broken up. The starch granule size increased
-2
0
2
4
6
8
10
12
14
0,5 5 50
Volu
me
(%)
Particle size distribution (µm)

Paper III 7
from 9 μm before cold gelatinization to 16 µm after 24 h salt-induced gelatinization*. However, the amount of starch granules decreased drastically, from 68% after 0.5 h cold gelatinization with 4 M CaCl2, to only 8% after 24 h. Observations during the experiments showed that the starch was almost completely gelatinized after 24 h of salt-induced gelatinization, and subsequent treatment, including shearing in the kitchen blender and washing, removed the dissolved starch.
It can be seen from the light microscopy and SEM images in Figures 2 and 3 that the starch granules swelled and ruptured, rather than gelatinizing from the surface inwards. The structures seen in the SEM images indicate that the amount of dissolved dried starch increased with time. This shows that although the washing removes most of the dissolved starch, as evidenced by the decrease in yield, the samples still contain some dissolved starch molecules. None of the starch granules observed with SEM in the present study appeared to show structures of the type reported previously for surface-gelatinized starch [24, 25]. Rather, the present results are more in line with those reported by Koch and Jane [22] for starches such as waxy barley, waxy maize, and normal rice, who could not identify any individual granules after cold gelatinization with 4 M CaCl2. One reason why oat starch granules swell and are not gelatinized at the surface might be their high porosity. A further indication that swelling occurs within the whole granule is similar to heat induced gelatinization where the starch granule swells in such a way that the result is a flattened discs (Figure 3). It is interesting to note that oat starch has many properties in common with rice starch [16], and similarities in the way in which these two starches react to cold gelatinization could, therefore, be expected.
Figure 2. Light microscopy images of emulsions produced from oat starch gelatinized in 4 M CaCl2. Native starch is shown on the left. Upper row: non-OSA-modified gelatinized starch after 0.5, 6 and 24 hours. Lower row: OSA-modified gelatinized starch after 0.5, 1 and 24 hours (200x magnification).
OSA modification was carried out on some of the gelatinized oat starch samples, and this probably led to further destruction of the granules, as the SEM images showed only an aggregated structure with no visible granules (Figure 3). OSA modification of the 24 h cold-gelatinized starch gave a product with a brownish colour, which could indicate some type of Maillard reaction between oat proteins and low-molecular-weight carbohydrates that could have been formed due to the presence of acid during OSA modification. However, some granules can be seen in the light microscope images of dried OSA-modified starch (Figure 2). It is likely that the sample preparation for SEM increased the dissolution of the starch. Based on the size distributions of the starch granules in the emulsion, the size of the gelatinized and OSA-modified starch particles was around 18 μm, which is slightly larger than the non-OSA modified gelatinized starch particles, which were about 13-16 μm.
Native
0,5 h 6h 24 h
OSA 0,5 h OSA 1h OSA 24 h

8 Paper III
p
Figure 3. Electron microscopy images of dried oat starch granules: after cold gelatinization for 0.5 hours (left column) and 24 hours (right column) with 4 mM CaCl2. The upper row shows the results for non-OSA-modified gelatinized oat starch and the lower row OSA-modified gelatinized oat starch.
Cold gelatinization with CaCl2 removes starch, but the treatment does not remove the proteins associated with the starch granules to the same extent, and the content of proteins in the starch sample thus increased (Table 1). This could affect the emulsions as proteins are surface active and, as discussed in the case of the OSA-modified starch, this will increase the risk of Maillard reactions.
Emulsions based on oat starch that have been cold gelatinized by CaCl2 A selection of the cold-gelatinized oat starch samples was freeze-dried and then used to produce starch-based Pickering emulsions. Light microscopy images of these emulsions are also shown in Figure 2, and the sizes of the starch granules and droplets are presented in Table 1. All the starch granules were not adsorbed to the oil-water interface in the emulsion, and a considerable amount of free starch granules can be seen in the light microscope images in Figure 2. This free starch will be included in the particle size distribution determined by light scattering. The peak in the size distribution corresponding to starch may also contain some smaller emulsion droplets. However, the light microscope images indicate that most of the emulsion droplets are larger, and will be included with the larger particles in the light scattering measurements.
As can be seen in Figure 2, the surface of the emulsion droplets in Pickering emulsions made with native oat starch is covered with starch granules, and the light scattering measurements indicate that the droplet size is large, around 148 μm. The emulsion layer is rather compact, and light microscopy indicates that the droplets are aggregated. There is also quite a large amount of sediment, which is most likely free starch. When using cold-gelatinized starch in the emulsions, the microscope images show swollen, but more or less intact, granules at the surface of the oil droplets for the shorter periods of cold gelatinization, whereas only a small amount of very distorted particles is seen on the surface of the oil droplets after longer periods of gelatinization. This is especially apparent in the case of gelatinization for 24 h. The emulsion layer is less compact in the emulsions produced from cold-gelatinized starch than from native starch, and the droplet size decreases somewhat. The amount of sediment also decreases. The largest volume of the emulsion layer was seen for emulsions made with starch that was cold-gelatinized for 0.5 h. The thickness of the adsorbed layer of starch at the oil droplet interface deceases with time, as can be seen in Figure 4. The size of the droplets in the Pickering emulsions is slightly smaller in
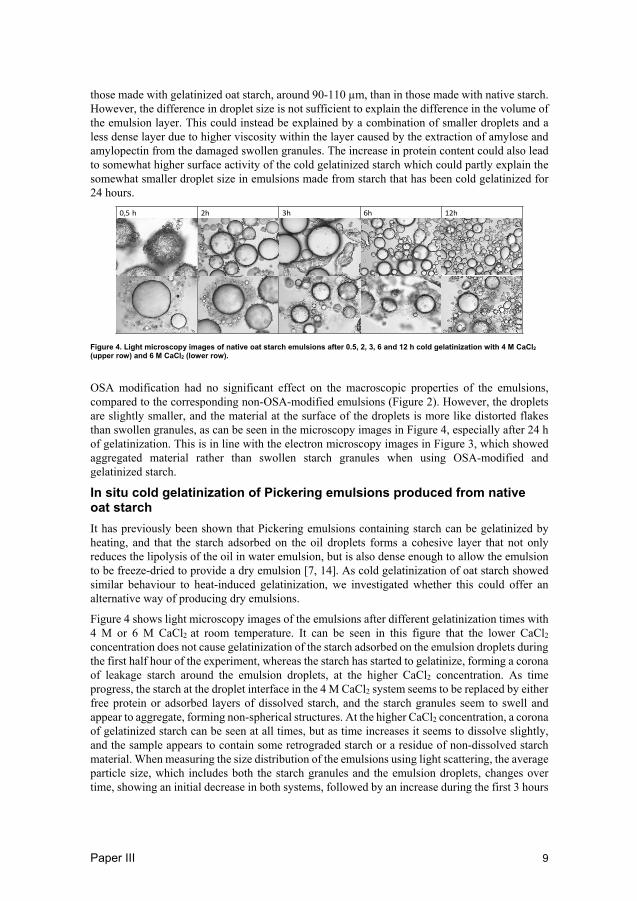
Paper III 9
those made with gelatinized oat starch, around 90-110 µm, than in those made with native starch. However, the difference in droplet size is not sufficient to explain the difference in the volume of the emulsion layer. This could instead be explained by a combination of smaller droplets and a less dense layer due to higher viscosity within the layer caused by the extraction of amylose and amylopectin from the damaged swollen granules. The increase in protein content could also lead to somewhat higher surface activity of the cold gelatinized starch which could partly explain the somewhat smaller droplet size in emulsions made from starch that has been cold gelatinized for 24 hours.
Figure 4. Light microscopy images of native oat starch emulsions after 0.5, 2, 3, 6 and 12 h cold gelatinization with 4 M CaCl2 (upper row) and 6 M CaCl2 (lower row).
OSA modification had no significant effect on the macroscopic properties of the emulsions, compared to the corresponding non-OSA-modified emulsions (Figure 2). However, the droplets are slightly smaller, and the material at the surface of the droplets is more like distorted flakes than swollen granules, as can be seen in the microscopy images in Figure 4, especially after 24 h of gelatinization. This is in line with the electron microscopy images in Figure 3, which showed aggregated material rather than swollen starch granules when using OSA-modified and gelatinized starch.
In situ cold gelatinization of Pickering emulsions produced from native oat starch It has previously been shown that Pickering emulsions containing starch can be gelatinized by heating, and that the starch adsorbed on the oil droplets forms a cohesive layer that not only reduces the lipolysis of the oil in water emulsion, but is also dense enough to allow the emulsion to be freeze-dried to provide a dry emulsion [7, 14]. As cold gelatinization of oat starch showed similar behaviour to heat-induced gelatinization, we investigated whether this could offer an alternative way of producing dry emulsions.
Figure 4 shows light microscopy images of the emulsions after different gelatinization times with 4 M or 6 M CaCl2 at room temperature. It can be seen in this figure that the lower CaCl2
concentration does not cause gelatinization of the starch adsorbed on the emulsion droplets during the first half hour of the experiment, whereas the starch has started to gelatinize, forming a corona of leakage starch around the emulsion droplets, at the higher CaCl2 concentration. As time progress, the starch at the droplet interface in the 4 M CaCl2 system seems to be replaced by either free protein or adsorbed layers of dissolved starch, and the starch granules seem to swell and appear to aggregate, forming non-spherical structures. At the higher CaCl2 concentration, a corona of gelatinized starch can be seen at all times, but as time increases it seems to dissolve slightly, and the sample appears to contain some retrograded starch or a residue of non-dissolved starch material. When measuring the size distribution of the emulsions using light scattering, the average particle size, which includes both the starch granules and the emulsion droplets, changes over time, showing an initial decrease in both systems, followed by an increase during the first 3 hours
0,5 h 2h 3h 6h 12h

10 Paper III
(Figure 5). After 3 hours the size decreases again; more in the 4 M CaCl2 system than in the 6 M CaCl2 system. In the case of the 4 M CaCl2 system, the increase up to 3 hours could be due to an increase in starch granule size, and the decrease seen thereafter could be due to the exchange of starch on the surface of the emulsion with other surface-active, low-molecular-weight substances. In the system with the higher concentration of CaCl2, the swelling between 0.5 and 3 hours could be due to an increase in the size of adsorbed and non-adsorbed starch due to swelling during cold gelatinization, and the decrease afterwards could be due to the dissolution of the swollen starch.
Figure 5. Changes in average droplet size over time during cold gelatinization of the oat starch solution, using CaCl2 concentrations of 4 M (pink) and 6 M (green).
Optimization of gelatinization of oat starch In order to gain better control over the gelatinization process, an attempt was made to optimize the system. It was found that the emulsification time should be increased to 180 s to achieve the smallest droplet size, of about 60 μm, in the non-OSA-modified system. In this part of the study, cold gelatinization was investigated for both OSA-modified and non-modified oat starch. Gelatinization was studied for 2 h (Figure 6) as the previous experiments had shown that the starch did not aggregate or become retrograded during this time. The emulsion was mixed with a high concentration of CaCl2 (6 M) giving a final concentration of 4 M in the emulsion. This was observed to be sufficient to induce cold gelatinization, and it can be seen in Figure 6 that gelatinization occurred rapidly. The native oat starch granules were only partly gelatinized during the first 10 minutes, but a corona of gelatinized starch was seen around the oil droplet after only 20 minutes. There may be a slight decrease in the thickness of the corona, but it is obvious from Figure 6 that a considerable amount of starch is attached to the surface of the droplets even after 120 minutes. The addition of the CaCl2 triggered an exothermic reaction leading to an increase in temperature to about 40-45°C. To ensure that this did not cause heat-induced gelatinization, the temperature was controlled during the emulsification. No decrease in the degree of gelatinization was seen when cooling the emulsion to 20°C.
0
10
20
30
40
50
60
70
80
0 0,5 2 3 6 12 24
Mea
n pa
rticl
e si
ze d
4,3
mm
Duration of cold gelatinization (hours)

Paper III 11
Figure 6. Light microscopy images of emulsions made using native oat starch (upper row) and OSA-modified oat starch (lower row) after 10, 20, 40, 60 and 120 min of cold gelatinization with 4 M CaCl2. The oil is stained with Sudan red. A slight difference was observed when using OSA-modified and non-modified oat starch granules for the in situ gelatinization. Firstly, OSA modification leads to slightly smaller droplets in the emulsion since these are more hydrophobic, and they will thus have a higher tendency to adsorb on the oil–water interface. Secondly, gelatinization occurred after only 10 minutes when using OSA-modified starch. OSA modification probably leads to partial acid hydrolysation of the oat starch as the process includes some acidic steps. A third difference was seen, in the swelling of the starch layer. OSA-modified starch appeared to exhibit a slightly denser layer of gelatinized starch than the non-modified starch (Figure 6). Finally, the non-modified oat starch adsorbed to the oil droplets swells, which is seen as an increase in particle size, from around 60 to 85 μm, while no such size increase was seen for the OSA-modified sample. It is possible that the higher hydrophobicity of the OSA-modified starch leads to higher cohesion of the swollen layer, leading to less uptake of water and thus a denser structure.
It was possible to stop gelatinization by diluting the sample and then removing the salt by dialysis. The dialysed sample was freeze-dried and this material contained the oil without leakage. The sample was not in powder form, but rather a network of gelatinized starch. This is probably due to the aggregation of free starch. However, the freeze-drying process was not optimized, and the sample became less aggregated by mixing the sample vigorously after gelatinization. Strategies to avoid aggregation during freeze-drying may include the addition of protective agents such as mannitol, optimization of the amount of starch used, etc. The freeze-dried emulsion was dissolved in water and investigated using light microscopy, and it was concluded that an emulsion was formed upon re-dispersion of the dried emulsions in water (Figure 7). As can be seen both emulsions based on in situ gelatinized OSA modified oat starch and non-modified starch can form dried emulsions that can be redispersed.
Figure 7. Light microscopy images of re-dispersed freeze-dried emulsions of native oat starch (left panel) and OSA-modified oat starch (right panel). The emulsion was produced using 400 mg starch/g oil and allowed to cold gelatinize for 10 minutes, after which it was dialysed and lyophilized.
10 min 20 min 40 min 60 min 120 min

12 Paper III
Conclusions
Oat starch can be cold-gelatinized using 4 M CaCl2, but, in contrast to other cereal starches such as maize and potato, gelatinization is not localized at the surface. Both OSA-modified and non-OSA-modified oat starch can form Pickering emulsions both prior to and after gelatinization. The droplet sizes obtained for non OSA modified starch granules were quite large, around 150 μm. The droplet size decreased slightly when cold-gelatinized oat starch was used, and the emulsion layer became less dense, especially in the case of starch granules that had been gelatinized for 0.5-1 hour. The volume of the emulsion layer measured after 24 hours storage decreased as the gelatinization time was further increased. OSA modification of oat starch led to a slight decrease in the droplet size in the resulting emulsion, but the macroscopic properties of the emulsions made with OSA-modified and non-OSA-modified oat starch granules were similar. It was shown that Pickering emulsions of native and OSA-modified oat starch could be gelatinized with 4 M CaCl2 in situ, and that the layer of gelatinized starch formed could protect the emulsion during freeze-drying in such a way that a dry emulsion could be formed.
Acknowledgement
This study was supported by the Swedish Research Council.
References
1. Pickering, S.U., Emulsions. Emulsions. J. Chem Soc, 1907. 91: p. 2001–2021. 2. Ramsden, W., Separation of Solids in the Surface-layers of Solutions and 'Suspensions'. Proc. R.
Soc. London 1903. 72: p. 156. 3. Tcholakova, S., N.D. Denkov, and A. Lips, Comparison of solid particles, globular proteins and
surfactants as emulsifiers. Physical Chemistry Chemical Physics, 2008. 10(12): p. 1608-1627. 4. Rayner, M., et al., Biomass-based particles for the formulation of Pickering type emulsions in food
and topical applications. Colloids and Surfaces A: Physicochemical and Engineering Aspects, 2014. 458: p. 48-62.
5. Wahlgren, M., et al., The use of micro- and nanoparticles in the stabilisation of Pickering-type emulsions for topical delivery. Current Pharmaceutical Biotechnology, 2013. 14: p. 1222-1234.
6. Dickinson, E., Exploring the frontiers of colloidal behaviour where polymers and particles meet. Food Hydrocolloids, 2016. 52: p. 497-509.
7. Marefati, A., et al., Fabrication of encapsulated oil powders from starch granule stabilized W/O/W Pickering emulsions by freeze-drying. Food Hydrocolloids, 2015. 51: p. 261-271.
8. Marto, J., et al., Design of novel starch-based Pickering emulsions as platforms for skin photoprotection. J Photochem Photobiol B, 2016. 162: p. 56-64.
9. Nikfarjam, N., N. Taheri Qazvini, and Y. Deng, Cross-linked starch nanoparticles stabilized Pickering emulsion polymerization of styrene in w/o/w system. Colloid and Polymer Science, 2013. 292(3): p. 599-612.
10. Saari, H., et al., Preparation and Characterization of Starch Particles for Use in Pickering Emulsions. Cereal Chemistry Journal, 2016. 93(2): p. 116-124.
11. Rayner, M., et al., Quinoa starch granules as stabilizing particles for production of Pickering emulsions. Faraday discussions, 2012. 158: p. 139.

Paper III 13
12. Timgren, A., et al., Emulsion stabilizing capacity of intact starch granules modified by heat treatment or octenyl succinic anhydride. Food Science & Nutrition 2013. 1(2): p. 157-171.
13. Marefati, A., et al., Storage and digestion stability of encapsulated curcumin in emulsions based on starch granule Pickering stabilization. Food Hydrocolloids, 2017. 63: p. 309-320.
14. Marefati, A., et al., Freezing and Freeze-Drying of Pickering Emulsions Stabilized by Starch Granules. Colloids and Surfaces A: Physicochemical and Engineering Aspects, 2013. 436: p. 512-520.
15. Sjöö, M., et al., Barrier properties of heat treated starch Pickering emulsions. Journal of Colloid and Interface Science, 2015.
16. Autio, K. and A.-C. Eliasson, Chapter 15 - Oat Starch, in Starch (Third Edition). 2009, Academic Press: San Diego. p. 589-599.
17. Juszczak, L., T. Fortuna, and K. Wodnicka, Characteristics of cereal starch granules surface using nitrogen adsorption. Journal of Food Engineering, 2002. 54(2): p. 103-110.
18. Williams, M.R. and P. Bowler, Starch Gelatinization: A Morphological Study of Triticeae and Other Starches. Starch - Stärke, 1982. 34(7): p. 221-223.
19. Pan, D. and J.L. Jane, Internal structure of normal maize starch granules revealed by chemical surface gelatinization. Biomacromolecules, 2000. 1(1): p. 126-132.
20. Huang, J., et al., Characterization of remaining granules of acetylated starch after chemical surface gelatinization. Carbohydrate Polymers, 2010. 80(1): p. 215-221.
21. Jane, J.l. and J.J. Shen, Internal structure of the potato starch granule revealed by chemical gelatinization. Carbohydrate Research, 1993. 247(C): p. 279-290.
22. Koch, K. and J.L. Jane, Morphological changes of granules of different starches by surface gelatinization with calcium chloride. Cereal Chemistry, 2000. 77(2): p. 115-120.
23. Jane, J.L. and J.J. Shen, Internal Structure of the Potato Starch Granule Revealed by Chemical Gelatinization. Carbohydrate Research, 1993. 247: p. 279-290.
24. Kuakpetoon, D. and Y.J. Wang, Internal structure and physicochemical properties of corn starches as revealed by chemical surface gelatinization. Carbohydrate Research, 2007. 342(15): p. 2253-2263.
25. Pan, D.D. and J.-l. Jane, Internal Structure of Normal Maize Starch Granules Revealed by Chemical Surface Gelatinization†. Biomacromolecules, 2000. 1(1): p. 126-132.
26. Steeneken, P.A.M. and A.J.J. Woortman, Surface effects in the acetylation of granular potato starch. Carbohydrate Research, 2008. 343(13): p. 2278-2284.
27. Zhou, H., et al., Effects of salts on physicochemical, microstructural and thermal properties of potato starch. Food Chemistry, 2014. 156: p. 137-143.
28. Ahmad, F.B. and P.A. Williams, Effect of salts on the gelatinization and rheological properties of sago starch. Journal of Agricultural and Food Chemistry, 1999. 47(8): p. 3359-3366.
29. Bromley, E.H. and I. Hopkinson, Confocal microscopy of a dense particle system. J Colloid Interface Sci, 2002. 245(1): p. 75-80.


Paper IV

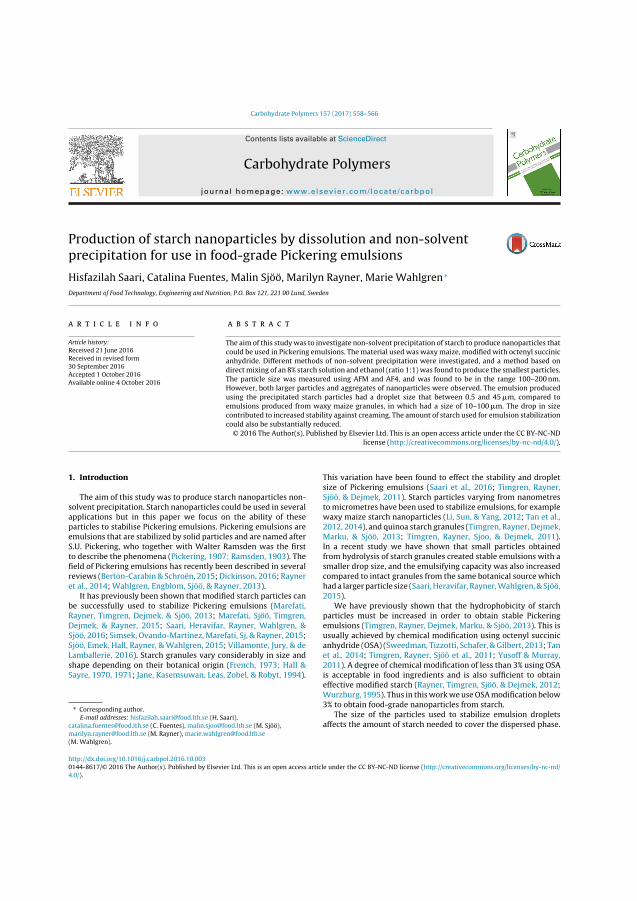
Produpreci
HisfazDepartmen
a r t i
Article histReceived 2Received i30 SeptemAccepted 1Available o
1. Intro
The asolvent papplicatparticlesemulsionS.U. Pickto descrifield of Previews
et al., 20It has
be succeRayner,
Dejmek,Sjöö, 201Sjöö, EmLamballeshape dSayre, 19
∗ CorresE-mail
catalina.fumarilyn.ra(M. Wahlg
http://dx.d0144-86174.0/).
Carbohydrate Polymers 157 (2017) 558–566
Contents lists available at ScienceDirect
Carbohydrate Polymers
j ourna l ho me pa g e: www.elsev ier .com/ locate /carbpol
ction of starch nanoparticles by dissolution and non-solventpitation for use in food-grade Pickering emulsions
ilah Saari, Catalina Fuentes, Malin Sjöö, Marilyn Rayner, Marie Wahlgren ∗
t of Food Technology, Engineering and Nutrition, P.O. Box 121, 221 00 Lund, Sweden
c l e i n f o a b s t r a c t
n of stary maize inves
found tfound
were ob betwee
a size
of starc
n accesecomm
d to efaari et
partic to sta
les (Li,
granuln, Rayown tles crelsifyinm the
Heravi
that
n ordeejmekmodifi
ory:1 June 2016
n revised formber 2016
October 2016nline 4 October 2016
The aim of this study was to investigate non-solvent precipitatiocould be used in Pickering emulsions. The material used was waxanhydride. Different methods of non-solvent precipitation werdirect mixing of an 8% starch solution and ethanol (ratio 1:1) wasThe particle size was measured using AFM and AF4, and was
However, both larger particles and aggregates of nanoparticles
using the precipitated starch particles had a droplet size thatemulsions produced from waxy maize granules, in which hadcontributed to increased stability against creaming. The amount
could also be substantially reduced.© 2016 The Author(s). Published by Elsevier Ltd. This is an ope
license (http://creativ
duction
im of this study was to produce starch nanoparticles non-recipitation. Starch nanoparticles could be used in several
ions but in this paper we focus on the ability of these to stabilise Pickering emulsions. Pickering emulsions ares that are stabilized by solid particles and are named after
ering, who together with Walter Ramsden was the firstbe the phenomena (Pickering, 1907; Ramsden, 1903). Theickering emulsions has recently been described in several(Berton-Carabin & Schroën, 2015; Dickinson, 2016; Rayner14; Wahlgren, Engblom, Sjöö, & Rayner, 2013).
previously been shown that modified starch particles canssfully used to stabilize Pickering emulsions (Marefati,
Timgren, Dejmek, & Sjöö, 2013; Marefati, Sjöö, Timgren, & Rayner, 2015; Saari, Heravifar, Rayner, Wahlgren, &6; Simsek, Ovando-Martinez, Marefati, Sj, & Rayner, 2015;
This variation have been founsize of Pickering emulsions (SSjöö, & Dejmek, 2011). Starchto micrometres have been usedwaxy maize starch nanopartic2012, 2014), and quinoa starchMarku, & Sjöö, 2013; TimgreIn a recent study we have shfrom hydrolysis of starch granusmaller drop size, and the emucompared to intact granules frohad a larger particle size (Saari,2015).
We have previously shownparticles must be increased iemulsions (Timgren, Rayner, Dusually achieved by chemical
ek, Hall, Rayner, & Wahlgren, 2015; Villamonte, Jury, & derie, 2016). Starch granules vary considerably in size and
epending on their botanical origin (French, 1973; Hall &70, 1971; Jane, Kasemsuwan, Leas, Zobel, & Robyt, 1994).
ponding author. addresses: [email protected] (H. Saari),[email protected] (C. Fuentes), [email protected] (M. Sjöö),[email protected] (M. Rayner), [email protected]).
anhydride (OSA) (Sweedman, Tizzottiet al., 2014; Timgren, Rayner, Sjöö e2011). A degree of chemical modificatis acceptable in food ingredients aneffective modified starch (Rayner, TimWurzburg, 1995). Thus in this work w3% to obtain food-grade nanoparticle
The size of the particles used toaffects the amount of starch needed
oi.org/10.1016/j.carbpol.2016.10.003/© 2016 The Author(s). Published by Elsevier Ltd. This is an open access article under the CC BY-NC-ND license (http://creat
ch to produce nanoparticles thate, modified with octenyl succinictigated, and a method based ono produce the smallest particles.
to be in the range 100–200 nm.served. The emulsion producedn 0.5 and 45 �m, compared to
of 10–100 �m. The drop in sizeh used for emulsion stabilization
s article under the CC BY-NC-NDons.org/licenses/by-nc-nd/4.0/).
fect the stability and droplet al., 2016; Timgren, Rayner,
les varying from nanometresbilize emulsions, for exampleSun, & Yang, 2012; Tan et al.,es (Timgren, Rayner, Dejmek,ner, Sjoo, & Dejmek, 2011).hat small particles obtainedated stable emulsions with a
g capacity was also increased same botanical source whichfar, Rayner, Wahlgren, & Sjöö,
the hydrophobicity of starchr to obtain stable Pickering, Marku, & Sjöö, 2013). This iscation using octenyl succinic, Schafer, & Gilbert, 2013; Tant al., 2011; Yusoff & Murray,ion of less than 3% using OSAd is also sufficient to obtain
gren, Sjöö, & Dejmek, 2012;e use OSA modification belows from starch.
stabilize emulsion droplets
to cover the dispersed phase.ivecommons.org/licenses/by-nc-nd/

The relatdroplet si
d3,2 = (1
where d3,fraction oour case sbuffer), �1500 kg/mparticles (maximum
As canper unit mit is impoto smaller
Severaas recentlwork we
sized stardissolve tthen re-crprecipitattheir interstarch graintramolethe crysta& Xie, 201ther proceharsh conthe starchplete disscan be usence of noven, whisulphoxid& Huber,
Rea, BergWilpiszewclave metthe starch
After dbe produprecipitat(2009). Ndissolvednon-solveThe conceoverlap cohas been
with the n& Sun, 20during noinitial conmer solutadded to
(Chin, PanHornig, Pous kindsproductiotechniquecrucial, antions, in thsize districoncentrapolymer c
d statethe add9). Ratffect p
variatlongates and
tigatedoduce
ons prd thus
also id usin-solvee amo
ld be a
aize,
was aerman
from
o (Belgality (
e (SDS) were o
ssolvedtion of
15).
e starcedfordave. Thonnecmany)r 5 min
suspeC for 1mers
(20 mgL befor
rch (dr mL eth–5 minhe saming (16olutiong/mL
H. Saari et al. / Carbohydrate Polymers 157 (2017) 558–566
ionship between the amount of starch added and theze can be described by Eq. (1):
− �)C��
where � = �sg23ϕdp (1)
2* is the surface mean diameter of the droplets, � is thef oil, C is the amount of emulsifier/stabilizing agent (intarch) added to the continuous phase (weight/volume ofs is the density of the stabilizing agent (approximately
3 for starch), dp is the average mean diameter of starchd4,3, and � is the packing density (� = 0.907, is theoretical
coverage with tight packing and has been used here)). be seen from Eq. (1), a larger surface area can be coveredass when using smaller particles. This is one reason why
rtant to reduce the starch granule size as this could lead droplets of the dispersed phase.l methods can be used to obtain nanoparticles of starch,y reviewed by Kim, Park, and Lim (2015). In the presentinvestigated non-solvent precipitation to obtain nano-ch. The first step in such a method is to completely
he starch granules (dissolution). New smaller particles areeated from the dissolved starch molecules by non-solvention. Starch granules are insoluble in cold water due to-chain hydrogen bonding. During the dissolution process,nules disintegrate completely and the intermolecular andcular hydrogen bonds are disrupted, thereby destroyinglline structure of the granule (Gao, Luo, & Luo, 2012; Wang0). The dissolution of starch makes it accessible for fur-ssing, and the method should be carefully chosen as tooditions may lead to changes in the molecular weight of, while too mild conditions may not be sufficient for com-olution (Gidley et al., 2010). Several dissolution methodsed; such as heating of starch in water either in the pres-itrogen gas in an autoclave, or heating in a microwavele other methods use other solvents such DMSO (dimethyle), ionic solvent or urea/KOH to dissolve the starch (Kim2006; Ortega-Ojeda, Larsson, & Eliasson, 2003; Perez-
enståhl, & Nilsson, 2015; Syahariza, Li, & Hasjim, 2010;ska & Spychaj, 2011). The DMSO method and the auto-
hod have been shown not to alter the molecular size of (Perez-Rea et al., 2015).issolving the starch granules, new starch particles can
ced by non-solvent precipitation (also known as nano-ion as described by Hornig, Heinze, Becer, and Schuberton-solvent precipitation involves the transition from the
state to the solid state of a polymer after addition of ant that is miscible with a solvent (Hornig et al., 2009).ntration of polymer (in this case starch) should be abovencentration for particles to form (Hornig et al., 2009). It
shown that very small starch particles can be obtainedon-solvent precipitation method (Qin, Liu, Jiang, Xiong,
16; Tan et al., 2009). Factors that control the particle sizen-solvent precipitation include; the technique used, thecentration of the polymer (starch), the ratio of the poly-ion to the non-solvent solution, whether the polymer isthe solvent or vice versa, and the type of solvent usedg, & Tay, 2011; Hornig et al., 2009; Perevyazko, Vollrath,avlov, & Schubert, 2010; Tan et al., 2009, 2012). Vari-
of non-solvent precipitation have been described for then of nanoparticles, including dialysis and the dropping. The initial polymer concentration has been found to bed Tan et al. (2009) found that low polymer concentra-e range of 1–8 mg/mL, gave starch particles with narrow
butions, which increased rapidly with increasing polymertion, and that aggregation occurred at >20 mg/mL. Low
the molecules are in a disperserated into nano-domains upon
described by Hornig et al. (200solvent has also been found to aet al. (2011) observed that suchwith different shapes, such as eor a mixture of spherical particl
2. Hypothesis
One of the hypothesis invesnanoparticles can be used to prsmaller droplet size than emulsiof the same botanic source, andencies of such emulsions. Wenanoparticles could be produceof starch with ethanol as the nonthat the size of particles and thobtained using this method coucess parameters.
3. Materials and methods
3.1. Materials
The source of starch, waxy mCulinar AB, Sweden. The oil usedoil (MCT), Miglyol 812 (Sasol, Ganhydride (OSA) was obtainedDMSO 99.6% from VWR Prolab99% European pharmacopeia qu80 and sodium dodecyl sulphatAldrich, and all other chemicals
3.2. Dissolution of the starch
The starch samples were distarch water solution or dissoludescribed by Perez-Rea et al. (20
3.2.1. AutoclavingA sample of 4 g waxy maiz
MilliQ water (Millipore Corp., Bhigh-pressure laboratory autoclwith a magnetic stirrer and was cunit (Withernm WRX 2000, Gerwas flushed with nitrogen gas fodation of the starch. The starchfrom room temperature to 140 ◦
for 20 min, and then cooled by iman ice bath. The starch solution
trations of 1, 2, 4, 8 and 10 mg/m
3.2.2. DMSO methodTwo grams of waxy maize sta
a glass flask and dispersed in 6v/v) with magnetic stirring for 3ing 0.5% w/v LiBr) was added. Twater bath with magnetic stirrroom temperature. The starch sconcentrations of 1, 2, 4, 8, 10 m
oncentrations will probably be required to ensure that tation.
559
, and that they can be sepa-ition of the non-solvent, asio of polymer solution andarticle size and shape, Chinions could lead to particles
ed fibres, spherical particles elongated fibres.
in this study is that starchPickering emulsions with aoduced from intact granules
reduce the creaming ten-nvestigated whether starchg non-solvent precipitationnt. It was also hypothesizedunt of submicron particles
ffected by changing the pro-
was supplied by Lyckeby – medium-chain triglyceridey). The n-octenyl succinateTrigon Chemie (Germany),ium), and the ethanol was
Sigma Aldrich, USA). Tween were obtained from Sigmaf PA quality.
either by autoclaving of astarch in DMSO, as previous
h was dispersed in 200 mL, MA, USA) and heated in ais instrument was equippedted to a temperature control. Before heating, the system
to prevent oxidative degra-nsion was gradually heated4 min, maintained at 140 ◦C
ing the autoclave cylinder in/mL) was diluted to concen-e non-solvent precipitation.
y weight) was weighed intoanol (80% ethanol in water. Sixty mL of DMSO (includ-ple was boiled for 1 h in a0 rpm) and then cooled to
(20 mg/mL) was diluted tobefore non-solvent precipi-

560
3.3. Non
Non-ferent sstarch soThe prodparticleswas carror by thof starcheffects oconcentrthe nanocipitatioSection 3(2000 G,were colfine paralso addsolutionto evapoovernighdryer (Dtempera
3.4. Moddegree o
A powere dirModificaof the staanalyzed
3.5. Prod
The eas the dNaCl) as(equallinof 0.35 gThe suspD-79282observedafter 24
the emuwhole vthere is
A 200to 6, 2, 1produce
3.6. Chaoptical m
3.6.1. StThe s
drops weyser (Maamount
system cfor mea(Bromlerefractivto betweof samp
icles, a
h nanolympules we
LMPlane was ded samservat
copef the stannin
h goldscope,of 8 m
D imagack-sc
atomi, freshtarch p
subseoscopehe surfact mo
NT-M
analyserom wrmined
w fractt preciow fra
ously d, the st
ion of 18, St, LQ wateness o
AF4 sgy, US
inlet aeratednd a cuid wasnd 0.0
wate: constl at afocusincus floal crostime toer elutny cro
ureme
H. Saari et al. / Carbohydrate Polymers 157 (2017) 558–566
-solvent precipitation of starch
solvent precipitation was carried out using ethanol at dif-tarch solution-to-ethanol ratios, 1:1 and 1:10, and thelutions obtained with the two techniques described above.uction technique was optimized to produce as small starch
as possible. Non-solvent precipitation of nanoparticlesied out by mixing ethanol and the starch solution directly,e slow addition of one to the other drop-wise. The effect
concentration on nanoparticle size was investigated. Thef adding 4% surfactant (Tween 80 and SDS) based on starchation, on particle production were also studied. The size ofparticles was determined directly after non-solvent pre-
n using static light scattering and light microscopy (see.6). The solvent was removed by batch-wise centrifugation
10 min), and all the particles from the same productionlected together. For the last stage solutions containing veryticles that could not be harvested by centrifugation wased to the collection of precipitated starch and the collected
was left in the fume hood overnight to allow the ethanolrate. The nano-precipitates were then frozen at −20 ◦Ct, after which they were freeze-dried in a Hetosicc freeze-
enmark), starting the process at −20 ◦C and increasing theture to 20 ◦C with 1 ◦C/min over a period of 4–5 days.
ification of starch with OSA and determination of thef modification
rtion of the wet nanoparticles obtained by precipitationectly modified by OSA to increase their hydrophobicity.tion was performed using 3% OSA (based on the dry weightrch nanoparticles) and the degree of OSA substitution were. The methods are described by Saari et al. (2015).
uction of pickering emulsions
mulsions were 5% oil in water emulsions using MCT oilispersed phase, and phosphate buffer (5 mM, pH 7, 0.2 M
continuous phase. Seventy mg of modified nanoparticlesg 200 mg starch per mL oil) was dispersed in a mixture
oil/6.65 g buffer, and mixed with a vortex mixer for 10 s.ensions were emulsified using a high-shear mixer (Ystral, Germany) at 22 000 rpm, for 60 s. The emulsions were
directly and after 24 h. The emulsion index was measuredh. The emulsion index EI is measured from a photograph oflsion and is the ratio of the emulsion phase divided by theolume of the sample. An emulsion index of 1 means thatno visual segregation of the sample.
mg/mL starch suspension of was prepared and was diluted, 0.5 and 0.01 mg/mL (in 6.65 mL buffer) and was used to
series of emulsions containing 0.35 g oil (5%).
racterization of nanoparticles and emulsions usingethods
atic light scatteringize distributions of the starch nanoparticles and emulsionre characterized using a light-scattering particle size anal-lvern Mastersizer 2000, Malvern instruments, UK). A smallof sample (starch or emulsion) was injected into the flowonnected to a pump (2000 rpm) and the optical chamber
surement. The refractive index of starch was set to 1.54y & Hopkinson, 2002), and for the continuous phase, thee was set to that of water, 1.33. Obscuration was restricteden 10 and 20% for emulsions. Due to the small amounts
when characterizing nanopartobstruction due to their size.
3.6.2. Light microscopeEmulsion droplets and starc
using an optical microscope (Oa live-video camera. The sampUMPlanFL 5× and 10×, and
(Olympus). One drop of samplsolution and, one drop of diluta glass slide for microscopic ob
3.6.3. Scanning electron microsThe morphology and size o
cles were investigated using scThe samples were coated wit6700F scanning electron micro5 kV with a working distance
mode was used to give clear 3signals from secondary and bbined during operation.
3.6.4. Atomic force microscopySamples were prepared for
follows. A 1 × 1 cm2 mica platea 20 �L drop of OSA-modified spended in water for 3 min andgas. A Ntegra atomic force micrsoftware, was used to analyse tmen was scanned in semi-contusing an NSG01cantilever (fromand a stiffness of 5.1 N/m.
The images obtained were
660 particles were measured, faverage particle size were deteconditions.
3.6.5. Asymmetric flow field-floThe size of the non-solven
using asymmetric flow field-flmethod used for starch previ(2015). After nanoprecipitationin MilliQ water at a concentratserum albumin (Sigma, A437centration of 1 mg/mL in Millideterminate the channel thickvalidate the performance of theshort channel (Wyatt Technolo(tip-to-tip length 17.4 cm and0.37 cm, respectively) A regennominal thickness of 350 �m acomposition of the carrier liquA3125, Darmstadt, Germany) aPoole, UK), dissolved in MilliQusing the following parametersand injection into the channe4 min. After injection, a 3 min
duced prior to elution with a foflow. Elution started at an initidecreased exponentially with
constant from 3 to 20 min. Aftwith buffer solution without anext analysis. Triplicate meas
le available, the obscuration was reduced to less than 5% starch nanoparticle sample.
s these give a low amount of
particles were also analyseds BX50, Japan) equipped withre examined under Plan 2×,Fl 20× and 50× objectivesiluted with 5 drops of bufferple was placed uncovered onion.
arch granules and nanoparti-g electron microscopy (SEM).
and inspected using a JSM- (JEOL inc, Japan) operated atm. Lower detection imaginges of the sample surface. Theattered electrons were com-
c force microscopy (AFM) asly cleaved, was covered withrecipitate that had been sus-quently dried with nitrogen
(NT-MDT, Russia), with Novaace of the samples. The speci-de with a frequency of 1.01 HzDT) at a frequency of 150 kHz
d using Image J. The sizes ofhich the size distribution and
for each set of experimental
ionationpitated starch was analysedctionation (AF4) based on aescribed by Perez-Rea et al.arch particles were dispersed
mg/mL. A solution of bovineouis, MO, USA) with a con-r was prepared and used tof the AF4 equipment and to
ystem. The AF4 channel was aA) with trapezoidal geometrynd outlet widths of 2.17 and
cellulose membrane with at-off of 10 kDa was used. The
10 mM NaNO3 (AppliChem,2% sodium azid (BDH, 10369,r. Separation was performedant detector flow of 1 mL/min
flow rate of 0.2 mL/min forg/relaxation step was intro-
w identical to the initial crosss-flow of 0.5 mL/min and was
0.07 mL/min, and then keption the channel was flushedss-flow for 3 min before the
nts were performed on each

H. Saari et al. / Carbohydrate Polymers 157 (2017) 558–566 561
s8
D
Starch to
Fig. 1. The m tarch nathe method
4. Result
4.1. Methnanoparti
The mwith smacles. The
in Fig. 1.
two prevnon-solveinvestigatthe effectway in wsolvent prof starch:method a
4.1.1. EffeTwo m
from Pereby autoclato form mmers. Thewho showstarch gramolecular
The relight scattusing autoprecipitatmethod f(d3,2) of leless than
as large asmall parin the soluwater/ethtransitionslower prlarger parnuclei for
onboth wnd noconcenen in Tas founitated
e small variedd at inh, wit
er parts. For str at lows arouns only 1g at an, and pthe smrticles
ation wnt star
establrying s
precien in t
re in car rela
increacrease
les of ach con
arch cobutiont higheions >2ticle simL sta
reasont low cleculesdomai
Waxy MaiseEffect of starch
conce ntra�on
Technique of addi�on
Surfac tantSDS, TWEEN
Starch solu�on:
ethano l ra�o
Dissolu�on in autoc lave
Dissolu�onBy DMSO
1
208
4
10
2
ethano l
Ethano l to starch
Droppin g
Direct mix
1:1
1:10
ethods and experimental conditions used to determine the optimal method of producing non-solvent-precipitated s/conditions not chosen for further experiments.
s and discussion
od development for the production of starchcles
ethods employed were developed to generate particlesll sizes and low amounts of aggregated starch parti-
different steps in this method development are outlinedThe starting point for this development was based on
ious studies on dissolution (Perez-Rea et al., 2015) andnt precipitation (Hornig et al., 2009). The parametersed were the method of dissolving the starch granules,
of starch concentration on particle size, the effect of thehich the ethanol and starch solution were mixed in non-ecipitation, the effect of adding surfactants, and the effectethanol ratio. Based on this screening process the finalnd condition were decided upon, as described in Fig. 1.
ct of method of starch dissolutionethods of dissolution were studied. These were adaptedz-Rea et al. (2015) who studied starch granule dissolutionving at 140 ◦C and dissolution in DMSO at 100 ◦C in orderolecular dissolved starch without degrading the poly-
method has been verified by Ortega-Ojeda et al. (2003)ed that this was sufficient to completely dissolve the
nules. Both methods resulted in dissolved starch in the state, which then underwent non-solvent precipitation.sults obtained for starch nanoparticle size using staticering are given in Table 1. It can be seen that dissolutionclaving leads to smaller starch particles after non-solvention than dissolution in DMSO. Using the autoclavingor starch dissolution gave particles with an average sizess than 18 �m, where almost 70% of the particles had sizes
1 �m. Particles precipitated from DMSO dissolution weres 200 �m, including some aggregates, and only 17% wereticles, <1 �m. One reason for this could be that the DMSOtion gives a solution that is a better solvent than the pureanol mixture, and it is thus a less effective medium in the
from the molecular state to the solid state, leading to aecipitation which could allow for the formation of fewerticles compared to a fast precipitation that induces many
4.1.2. Effect of starch concentratiDissolved starch, produced
lution in DMSO, were diluted acarried out at different starch
20 mg/mL. Particles sizes are givimages are shown in Fig. 2. It wstarch concentration and precipThe average particle size and thminima as the concentration issmaller particles were observebetween 4 and 10 mg/mL starcbeing less than 1 �m, while largand higher starch concentrationprecipitated particles were largesmaller at higher concentrationume of particles below 1 �m wasolution obtained by autoclavin(8 mg/mL) gave the best resultsan average size of about 1 �m;
about 0.3 �m and 66% of the paIt should be noted that precipitto-ethanol ratio of 1:10. Differe20 mg/mL were investigated todifference in particle size with vacentrations above 1 mg/mL, theform agglomerates, as can be sein Fig. 2.
The results discussed above aTan et al. (2009) who found a linesize of starch nanoparticles andin the solvent. Rather than an inimages indicate that more particthat they aggregate at higher star(2009) suggested that lower stwere preferable as the size distrinarrower, and widened rapidly aaggregation at starch concentratour observations, of a wider paraverage value of d3,2 for a 20 mg/tive of aggregated particles. Theout by Hornig et al. (2009) thato ensure that the polymer moand able to separate into nano-non-solvent.
the precipitating starch.
Final elec�on mg/ml
irect mix1:1
noparticles. Grey shading indicates
ith autoclaving and disso-n-solvent precipitation wastrations: 1, 2, 4, 8, 10 andable 1, and light microscopyd that the relation betweenparticle size was not linear.est particles observed show. For autoclaved solutions,termediate concentrations
h 47%–66% of the particlesicles were observed at lowerarch dissolved in DMSO, the
starch concentrations andd 10%, but the highest vol-7%. It was found that starch
intermediate concentrationroduced nanoparticles withallest particle detected waswere less than 1 �m in size.
as carried out at a starch-ch concentrations from 1 toish whether there was anytarch concentration. At con-
pitated particles seemed tohe light microscopy images
ontrast to those reported bytion between the increase insing polymer concentrationin size, the light microscopy
similar size are formed, andcentrations (Fig. 2). Tan et al.ncentrations of 1–8 mg/mL
of precipitated particles wasr concentrations, leading to0 mg/mL. This is in line withze distribution and a higherrch solution, which is indica-
for this could be, as pointedoncentrations are required
are in the dispersed state,ns following the addition of

562 H. Saari et al. / Carbohydrate Polymers 157 (2017) 558–566
Table 1Particle size (d3,2) of starch nanoparticles determined by static light scattering using different methods of starch dissolution and experimental conditions during non-solventprecipitation. All the experiments were conducted by adding starch to ethanol dropwise at a starch: ethanol ratio of 1:10 unless otherwise stated.
Samples (Different starchconcentration precipitatewith ethanol)
n d3,2 (�m) %<1 �m Smallest detectedparticle (�m)
Dissolution byAutoclave
1 mg/mL starch 9a 11.9 ± 7.2 0.0 ± 0.0 1.7 ± 0.12 mg/mL starch 6a 8.2 ± 2.1 0.0 ± 0.0 2.2 ± 0.34 mg/mL starch 3 3.8 ± 1.2 46.8 ± 33.1 0.4 ± 0.18 mg/mL starch 3 1.2 ± 0.3 66.4 ± 4.2 0.3 ± 0.010 mg/mL starch 6a 3.8 ± 2.2 52.4 ± 14.1 0.3 ± 0.020 mg/mL starch 6a 17.6 ± 33.8 68.9 ± 34.6 0.7 ± 1.1
Dissolution byDMSO/LiBr
1 mg/mL starch 3 231.1 ± 276.2 0.0 ± 0.0 20.6 ± 27.12 mg/mL starch 2a 48.2 ± 62.8 4.6 ± 8.0 1.6 ± 1.04 mg/mL starch 3 6.2 ± 0.9 2.0 ± 0.6 0.7 ± 0.08 mg/mL starch 3 4.6 ± 1.4 13.5 ± 2.0 0.7 ± 0.110 mg/mL starch 3 5.1 ± 3.6 17.0 ± 15.6 0.5 ± 0.220 mg/mL starch 2a 4.0 ±1.5 68.1 ± 1.0 0.3 ± 0.0
Surfactant (4% SDS) 1 mg/mL starch 3 103.8 ± 27.9 0.0 ± 0.0 40.1 ± 5.52 mg/mL starch 3 66.5 ± 24.7 0.0 ± 0.0 10.7 ± 13.14 mg/mL starch 3 143.0 ± 233.8 2.7 ± 2.7 12.1 ± 19.68 mg/mL starch 3 170.7 ± 111.1 0.0 ± 0.0 34.9 ± 4.810 mg/mL starch 3 38.7 ± 44.0 19.5 ± 25.9 10.4 ± 17.220 mg/mL starch 3 26.7 ± 8.2 46.3 ± 14.4 0.4 ± 0.1
Surfactant (4% Tween80)
1 mg/mL starch 1a 776.4 ± 0.0 0.0 ± 0.0 363.1 ± 0.02 mg/mL starch 3 24.8 ± 21.0 2.2 ± 2.8 1.0 ± 0.44 mg/mL starch 3 84.0 ± 120.3 13.5 ± 12.4 1.8 ± 2.28 mg/mL starch 3 125.0 ± 3.1 0.0 ± 0.0 50.2 ± 3.910 mg/mL starch 3 248.0 ± 147.5 0.0 ± 0.0 72.6 ± 5.920 mg/mL starch 3 13.8 ± 2.5 63.1 ± 5.9 0.3 ± 0.0
Technique & ratio 8 mg/mL starch dropwise in ethanol (1:10) 3 1.2 ± 0.3 66.4 ± 4.2 0.3 ± 0.08 mg/mL starch dropwise in ethanol (1:1) 3 2.4 ± 2.2 65.0 ± 22.0 0.3 ± 0.08 mg/mL starch mixed with ethanol (1:1) 3 2.0 ± 1.4 71.5 ± 10.4 0.3 ± 0.08 mg/mL starch concentration, ethanol mixed into starch (1:1) 3 0.9 ± 0.0 81.6 ± 0.8 0.2 ± 0.0
a The samples were prepared and normally measured at least in triplicate, or for some cases more especially at the initial steps. Some measurements were not obtained/notincluded due to technical problem of the instruments, insufficient samples to reach detection limit or detection of air bubble.
Fig. 2. Effect of starch concentration on particle size and aggregation (scale bar: 100 �m).

H. Saari et al. / Carbohydrate Polymers 157 (2017) 558–566 563
Table 2Determinati
Structure
aced mean
Native stagranules fwaxy mai
e: 2.0.31(nativ
.07 (OSANanoparti e: 0.63
: 0.92 + 0
OSA-modnanoparti
e: ∼2.0.05 (shea8ear)
a Native sb OSA mo
Thus afor produsmallest dbased ona more coadditiona
4.1.3. EffeWe ex
(Table 1)factant wthe additifactant wadding 4%4% Tweenat a starchproducedThese res(2011), wited partiof surfactsion comOlofsson,
ficult to pdid not fu
4.1.4. Effenon-solve
After dand dissowas studicipitationtechniquestarting pdrop-wiseHowever,were usedstarch nanInitially, 1The possiwas therethe droppTable 1, ttwo mixinmixing, th(71%) thasmallest d
e achieng direal met
of ethaanol soh ratio
to ethalts, in tstingl
siderab%) than
static
conclthe rat
ethodent anduction
ion meas autoconcenol to s
ed usi using
for tharticle
2.erizati
due tocts of
ven bywhichple wharticlesblem wd the
ll as particleng to p
substaOSA-ms is pro
on of size distribution using various optical techniques.
SEM AFM Light Scattering
Average Diameter Ferret diameter d4,3 Volumeweighted mean(�m)
d3,2 Surfweighte(�m)
rchromze
10–20 �m – Top mode: 13.9816.8 ± 5.37(native)a
14.7 ± 0.08 (OSA)b
Top mod8.00 ± 0a
8.12 ± 0cles 10 nm–400 nm – Top Mode: 0.83
Average:9.87 ± 1.75
Top ModAverage
ifiedcles
Aggregates formed 182 ± 0.44 nm Top mode: ∼4–524.4 ± 1.52 (shear)∼60–90(non-shear)
Top mod4.81 ± 0∼7.5–7.(non-sh
tarch means non-OSA modified.dified native starch granule.
starch concentration of 8 mg/mL was the optimal choicecing the highest fraction of submicron particles and theetected particles. In these screening steps the data was
static light scattering data and light microscope. Formplete picture of the nano-precipitate characteristics,
l methods are needed.
ct of adding surfactant to the starch solutionamined the effect of two surfactants on the particle size. In order to ascertain whether the addition of a sur-ould reduce aggregation of the nanoparticles. However,on of surfactants led to larger particles than when sur-as not added. The size of the particles produced when
SDS ranged from 30 �m to 170 �m and when adding even larger particles were seen, 25 �m to 780 �m. Thus,
concentration of 8 mg/mL, solutions without surfactant smaller particles than solutions containing surfactants.ults seem to be in contrast to those reported by Chin et al.ho found that surfactants such as CTAB and Tween 80 lim-cle growth when producing nanoparticles. The additionants will most likely lead to formation of starch inclu-plex (Eliasson & Wahlgren, 2004; Lundqvist, Eliasson, &2002). The effect of these inclusion complex could be dif-redict and as the effect in our case was non beneficial werther investigate this issue.
ct of solvent: non-solvent ratio and how solvent andnt are mixedetermining the optimal starch concentration (8 mg/mL)
lution method (autoclaving) the precipitation conditionsed. Hornig et al. (2009) proposed two non-solvent pre-
methods dialysis using a membrane and the dropping under stirring. The dropping technique was selected as aoint for our work due to its simplicity. Starch was added
to the ethanol to a final starch:ethanol ratio of 1:10. this technique was time-consuming when large samples. Thus, the next step towards improving the production ofoparticles was to reduce the amount of solvent required.0 L of ethanol was used for every litre of starch solution.
bility of reducing the amount of ethanol to 1 L (ration 1:1)fore investigated. Furthermore, both direct mixing anding technique were investigated. As can be seen from
he particle size did not differ significantly between theg techniques and the two ratios. However, after directe fraction of small particles (<1 �m) was slightly highern when using the dropping technique (65–66%). The
non-solvent precipitation can bbetter quality of the particles usiratio of 1:1 than using the origin
Finally, the effect of mixing
or mixing of starch into the ethwas found that dropping at starcmixing of the starch solution inof 1:1 gave almost the same resuof the particles produced. Interesolution into starch gave a concles in the submicron range (81The smallest particle detected inFrom the above results it can beethanol into starch solution, at
duction of nanoparticles. This mof solvent, was most time-efficiit was thus chosen for the prodlarger scale.
To summarize, the productfor producing nanoparticles wdispersed in water, a starch
direct mixing by adding ethanstarch:ethanol ratio of 1:1.
4.2. Characterization of particles
The starch particles producmethod were then investigatedterization methods The resultsgranules, precipitated starch pparticles are presented in Table
As can be seen, the charactferent results. This is probablymethods analyse different aspethe particle size distribution giover emphasize large particles
of the average size of the samon the other hand the largest ppre-filtration step. A further prothat both the measured size anby the underlying models as wesuch as refractive index of the pring the measured light scatteridistribution. The differences areitated starch, especially for the
the original starch granules. Thi
etected particle in both cases was about 300 nm. Thus, ticles are partially aggregated, in contrAF4*
(rms radius)
e)
) b
–
.1∼60 nm
r)∼260 nm
ved in a shorter time with act mixing at a starch:ethanolhod.nol into the starch solutionlution were investigated. Its of 1:10 and 1;1, and directnol at a starch:ethanol ratioerms of the amount and sizey, direct addition of ethanolly higher fraction of parti-
the other mixing methodslight scattering was 200 nm.uded that direct addition ofio 1:1 was best for the pro-
required the least amount gave small particles. Thus,
of starch nanoparticles on a
thod found to be the bestclaving at 140 ◦C of starchtration of 8 mg/mL, using
tarch, for precipitation at a
ng the optimal production a range of optical charac-
e initial native waxy starchs and OSA-modified starch
on methods give quite dif- the fact that the differentthe samples. For examples
static light scattering will leads to an overestimationile in the AF4 experiments
have been removed thru aith static light scattering is
size distribution is affectedarameters for these models,s, that are used for transfer-article size and particle sizentially larger for the precip-odified precipitate, than forbably because the nanopar-
ast to the original granules,
564 H. Saari et al. / Carbohydrate Polymers 157 (2017) 558–566
Fig. 3. Effect of non-solvent precipitation on size, shape and structure during the production of starch nanoparticles. (A) Native starch granules from waxy maize, (B) starchnanoparticles, and (C) Aggregation of OSA-modified starch nanoparticles.
Fig. 4. (A) Particle size distribution for native starch granules, non-solvent precipitated nanoparticles and OSA-modified nanoparticles using the optimal production method.(B) Size di (volumephotograp
and theiused. Bugives a bgranule
ment wi
�m (tocal. SEM. 3B &
ile valu
stribution of an emulsion stabilized by nanoparticles is explained in d3,2 (surface weighted mean, �m)) and d4,3
h of the emulsion.
r size is less optimal for the static light scattering techniquet it is also an indication that the non-solvent precipitationroad size distribution. The SEM images show that the nativesize is around 10–20 �m (Fig. 3A), which is in good agree-
a size distribution around 14
the particles formed are spheriOSA-modified precipitate (Figing from 10 nm to 400 nm, wh
th the static light scattering measurements which showed light scattering were between 5 �m a
weighted mean, �m). Inserted is a
p mode). It also shows that of starch nanoparticles and
C) gave particles sizes vary-es of d3,4in obtained by static
nd ∼0.25 �m (Fig. 4A). It can
565
be seen inmodified
wider parsubstantigation is f(which is
cles or agsheared o60–90 �m
AF4 wnon-solvegyration (nanopartinanopartithe particcation. Ththan thatstudies ofprecipitatwell knowand thus
seen by lgates obsexperime
These
total of 6the averaof 14–700tate, but athe non-mcates thatabout 100observed
probably
the small
4.3. Starc
The restarch-staparticles
be stabilizstarch/g oan averagand had acompared5% (Fig. 4system, wto previouules from214 mg st7% oil (Sa
Thus,
study cansize than
in line witbe reduceet al., 201a result oarea per ustarch canis translalimit on tmore staris set by temulsion
134 .67.92
o concent
(based
T oil in
dropl, and is (Saa1. Thuh nandy at t
of sta using E
in beives thcoveraanules
theors howeded b
be in thm dropto 6, 2,e of paws thaat decs size eis pumound 1
emulstion ofet. Ther 24 h u
ing na the or
of sta min, w
ation. Tas addecipita
ction orger a
atmenition of the p
H. Saari et al. / Carbohydrate Polymers 157 (2017) 558–566
Fig. 4A that aggregation was more pronounced for OSA-particles than for non-modified particles, as seen by theticle size distribution and secondary peaks. This was alsoated by the SEM images Fig. 3C. The high degree of aggre-urther substantiated by the fact that the mean d4,3 valuethe value that best represents the fraction of large parti-gregates) varied depending on whether the sample wasr not, the values being ∼25 �m for sheared samples and
for unsheared ones.as used to measure the average size distribution of thent precipitated starch. This method gave a radius ofrms radius) of about 60 nm for the non-modified starchcles, while the corresponding value for the OSA-modifiedcles was about 240 nm (Table 2). This could indicate thatles are more strongly aggregated as a result of OSA modifi-is size measured for the non-solvent precipitate is smaller
seen for dissolved waxy maize molecules and further the precipitate are required to determine whether thise is a mixture of particles and molecules. However, it isn that particles can be denser than dissolved polymers,
have a smaller radius. The size is smaller than what isight-scattering and it is possible that the larger aggre-erved in light-scattering was not measured in the AF4nts.OSA-modified particles were also analysed using AFM. A60 particles from four AFM images were analysed, andge Feret diameter of these particles was 182 nm (range0 nm), again showing the large variations in the precipi-lso having an average diameter that is close to the that ofodified starch particles, as measured by AF4. This indi-
there is a large fraction of nanoparticles with a size of nm when they are not aggregated. Thus, the higher valuefor the OSA-modified starch particles using AF4 most isdue to aggregation. The size is also in the same range asest particles detected by static light scattering.
h nanoparticle-stabilized emulsions
ason for producing starch nanoparticles is for use inbilized Pickering emulsions. As can be seen in Fig. 4B, the
produced using the method developed in this work cane emulsions. The initial emulsions produced with 200 mgil have a size distribution from 0.5 to 45 �m (d4,3) withe droplet size of 10 ± 0.7 �m (triplicate measurementsn emulsion index (EI, the volume of the emulsion phase
to total volume)) on day zero of 1 with as little oil asB). An EI of 1 means that the emulsion is a space-fillingith no creaming or sedimentation. This can be compareds results for an emulsion of OSA-modified starch gran-
waxy maize which, at a slightly higher starch to oil ratioarch/g oil gave a droplet size of 47 �m and a EI of 0.37 forari et al., 2015).we have shown that the nanoparticles produced in this
be used to form emulsions with a much smaller dropletis possible with starch granules from waxy maize. This ish studies that have shown that emulsion droplet size cand by using smaller starch particles (Li et al., 2012; Saari5; Timgren, Rayner, Sjöö et al., 2011). This is probably
f that as the particle size decreases the available surfacenit mass of starch increases. Thus, the same amount of
be used to cover a larger surface area of emulsion whichted to smaller droplets There will, however, be a lowerhe droplet size of the emulsion, where the addition ofch particles will not decrease the droplet size. This limithe equipment and conditions used for the production of
0 0.0 1 0.5 d4, 3 102.69 102 .63 100 .26d3, 2 40.39 26.99 17.19
1.00
10.00
100.00
Volu
me/
Surf
ace
area
aver
age
(μm
)
Starch to oil ra�
Fig. 5. The effect of starch concentrationsize of emulsions produced using 5% MC
the present study, the minimumon quinoa starch is about 10 �mstarch/mL oil in 5% oil emulsionbe sufficient to obtain an EI of
at the present study using starcthe minimum droplet size alreastarch/g oil.
Calculating surface coveragenon-solvent precipitated starchticle size of ∼150 nm, which isAFM and AF4 measurements) grequired per m2 for full surface
the amount needed for starch grwhere 12,700 mg per m2 wouldthe same surface area. This showreduces the amount of starch ne
As the droplet size seems to
of production limits the minimution of starch (from 200 mg/mL
used to determine the influencemulsion (Fig. 5). The result shodrops size, from 10 to 100 �m
until it reaches maximum dropseen that free oil gives when it
scattering equipment. This is artion of 1 mg/mL is able to createsize whereas a starch concentrasufficient in covering oil droplstable, maintaining an EI of 1 fo
4. Conclusions
Precipitate of starch containproduced after optimisation ofidentified here was dissolutionaqueous solution at 140 ◦C for 20gas followed by ethanol precipittration was 8 mg/mL. Ethanol wstarch to achieve non-solvent prof 1:1. This led to the produbetween 10 nm and 1 �m, but laespecially after hydrophobic trecles formed were spherical. Addlimit the growth or aggregation o
s. We have previously shown that, using the same set up in were then used to produce emulsions w
2 6 2008 21 .21 20 .54 10 .18 7.06 6.55 4.07
ra�on (mg/m l)
on oil fraction) on the mean dropletwater.
et size in an emulsion baseds reached at about 1200 mgri et al., 2016). This will nots, the droplet size obtainedoparticles is in the range ofhe modest amount of 200 g
rch of a 10 �m droplet byq. (1) (assuming a nanopar-tween the values given byat 140 mg starch would bege. This can be compared to
from waxy maize (∼14 �m)etically be needed to cover
decreasing the particle sizey a factor of over 103.e region where the methodlet size limit, a series of dilu-
1, 0.5 and 0.01 mg/mL) wasrticle size on the Pickeringt the emulsions increase in
rease starch concentrationsquivalent to what we haveped through the static light00 �m. A starch concentra-ion drops with 35 �m drops
0.5 mg/mL and below is not emulsions produced werep to 1 week.
noparticles was successfuliginal method. The processrch using autoclaving of an
hile flushing with nitrogenhe optimum starch concen-ed directly to the dissolvedtion, at starch:ethanol ratiof nanoparticles with sizes
ggregates were also formed,t with OSA. The starch parti-f surfactant was not able toarticles. These nanoparticlesith an emulsion droplet size

566
of aboutmL oil.
Acknow
We wthe AFMfunding
Referen
Berton-CaapplicScience
Bromley, Esystem
Chin, S. F.,
nanop86(4),
Dickinson,and pa
Eliasson, Ain foodapplica
French, D.
ScienceGao, J., Luo
corn stcatalys
Gidley, M.Reliabsolutio79(2),
Hall, D. M.Part II:
Hall, D. M.PART I
Hornig, S.,nanop3838–
Jane, J.-L.,
starch46(4),
Kim, H. S.,
microwAgricu
Kim, H. Y.,utiliza607–6
Li, C., Sun,
StarchLundqvist,
hexadSurfac
Marefati, AfreezeSurface
Marefati, Aencapsemuls
Ortega-Ojesmall-Starch
Pavlov, Gethacry
ultracenicrosco
–3931.n, L. (20ng asymf amylop
lsions Jo
, Q. (201ecipitatid Produ
ids in thyal Soci
jmek, P.
e Picker–1847.ö, M., D
rmulatioids and
hlgren, Mticles for
lgren, Ms for use.fati, A., Slsificati
search In., & Wahulsions
r, C., & Genyl succ(1), 905–0). Extrate struc
., & Wanspheres
9.., & Wanlize pick
ng, P., eted nano
jmek, P.
ternatio
jmek, P.
ia Food Sarku, D.,
granulecience &ie, M. (2
. Food HyRayner, M
H. Saari et al. / Carbohydrate Polymers 157 (2017) 558–566
10–30 �m already at the modest amount of 1 mg starch per
ledgements
ould like to acknowledge Romaine Borders for performing measurements, and The Swedish Research Foundation forthis project.
ces
rabin, C. C., & Schroën, K. (2015). Pickering emulsions for foodations: Background, trends, and challenges. Annual Review of Food
and Technology, 6, 263–297.. H., & Hopkinson, I. (2002). Confocal microscopy of a dense particle. Journal of Colloid and Interface Science, 245(1), 75–80.Pang, S. C., & Tay, S. H. (2011). Size controlled synthesis of starcharticles by a simple nanoprecipitation method. Carbohydrate Polymers,1817–1819.
E. (2016). Exploring the frontiers of colloidal behaviour where polymersrticles meet. Food Hydrocolloids, 52, 497–509..-C., & Wahlgren, M. (2004). Starch-lipid interactions and their relevance
products. In A.-C. Eliasson (Ed.), Starch in food: Structure, function andtions (pp. 441–460). Cambridge: Wood Head Publishing Limited.(1973). Chemical and physical properties of starch. Journal of Animal, 37(4), 1048–1061., Z.-G., & Luo, F.-X. (2012). Ionic liquids as solvents for dissolution ofarch and homogeneous synthesis of fatty-acid starch esters withoutts. Carbohydrate Polymers, 89(4), 1215–1221.
J., Hanashiro, I., Hani, N. M., Hill, S. E., Huber, A., Jane, J.-L., et al. (2010).le measurements of the size distributions of starch molecules inn: Current dilemmas and recommendations. Carbohydrate Polymers,255–261., & Sayre, J. G. (1970). A scanning electron-microscope study of starches:
Cereal starches. Textile Research Journal, 40(3), 256–266., & Sayre, J. G. (1971). A scanning electron-microscope study of starches:II: Miscellaneous starches. Textile Research Journal, 41(11), 880–894.
Heinze, T., Becer, C. R., & Schubert, U. S. (2009). Synthetic polymericarticles by nanoprecipitation. Journal of Materials Chemistry, 19(23),3840.Kasemsuwan, T., Leas, S., Zobel, H., & Robyt, J. F. (1994). Anthology of
granule morphology by scanning electron microscopy. Starch – Stärke,121–129.& Huber, K. C. (2006). Alkaline dissolution of starch facilitated by
ave heating for analysis by size-exclusion chromatography. Journal ofltural and Food Chemistry, 54(26), 9664–9669.
Park, S. S., & Lim, S. T. (2015). Preparation, characterization andtion of starch nanoparticles. Colloids Surface B: Biointerfaces, 126,20.P., & Yang, C. (2012). Emulsion stabilized by starch nanocrystals.–Stärke, 64(6), 497–502.
H., Eliasson, A.-C., & Olofsson, G. (2002). Binding ofecyltrimethylammonium bromide to starch polysaccharides. Part I.e tension measurements. Carbohydrate Polymers, 49(1), 43–55.., Rayner, M., Timgren, A., Dejmek, P., & Sjöö, M. (2013). Freezing and
Perevyazko, I., Vollrath, A., Hornig, S.,
Characterization of poly(methyl mnanoprecipitation using analyticalscattering, and scanning electron mA—Polymer Chemistry, 48(18), 3924
Perez-Rea, D., Bergenståhl, B., & Nilssomethods for starch dissolution usifractionation. Part I: Dissolution oChemistry, 407(15), 4315–4326.
Pickering, S. U. (1907). Emulsions. Emu2001–2021.
Qin, Y., Liu, C., Jiang, S., Xiong, L., & Sunnanoparticles prepared by nanoprand starch type. Industrial Crops an
Ramsden, W. (1903). Separation of sol‘Suspensions’. Proceedings of the Ro
Rayner, M., Timgren, A., Sjöö, M., & Decandidate for stabilising food-gradof Food and Agriculture, 92(9), 1841
Rayner, M., Marku, D., Eriksson, M., SjöBiomass-based particles for the fofood and topical applications. ColloEngineering Aspects, 458, 48–62.
Saari, H., Heravifar, K., Rayner, M., Waand characterization of starch parChemistry (ja).
Saari, H., Heravifar, K., Rayner, M., Wahcharacterization of starch particleChemistry,. CCHEM-05-15-0107-R
Simsek, S., Ovando-Martinez, M., Marecomposition, digestibility and emuesters of various starches. Food Re
Sjöö, M., Emek, S. C., Hall, T., Rayner, Mof heat treated starch Pickering emScience.
Sweedman, M. C., Tizzotti, M. J., Schafephysicochemical properties of octreview. Carbohydrate Polymers, 92
Syahariza, Z. A., Li, E., & Hasjim, J. (201rice and sorghum grains for accuraPolymers, 82(1), 14–20.
Tan, Y., Xu, K., Li, L. L., Liu, C., Song, C. Lsize-controlled starch-based nanoMaterials & Interfaces, 1(4), 956–95
Tan, Y., Xu, K., Liu, C., Li, Y. L., Lua, C. Gstarch-based nanospheres to stabiPolymers, 88(4), 1358–1363.
Tan, Y., Xu, K., Niu, C., Liu, C., Li, Y., Waemulsions stabilised by starch-bas70–75.
Timgren, A., Rayner, M., Sjoo, M., & Debased Pickering emulsions. 11th In(Icef11), 1, 95–103.
Timgren, A., Rayner, M., Sjöö, M., & Debased Pickering emulsions. Proced
Timgren, A., Rayner, M., Dejmek, P., Mstabilizing capacity of intact starchoctenyl succinic anhydride. Food S
Villamonte, G., Jury, V., & de Lamballerhigh-pressure-treated corn starch
Wahlgren, M., Engblom, J., Sjöö, M., &
-drying of Pickering emulsions stabilized by starch granules. Colloids ands A: Physicochemical and Engineering Aspects, 436, 512–520.., Sjöö, M., Timgren, A., Dejmek, P., & Rayner, M. (2015). Fabrication ofulated oil powders from starch granule stabilized W/O/W Pickering
ions by freeze-drying. Food Hydrocolloids, 51, 261–271.da, F. E., Larsson, H., & Eliasson, A. C. (2003). On the dispersion and
amplitude oscillation measurements of high amylopectin potato starch.–Stärke, 55(3–4), 121–130.
nanoparticles in the stabilisation of Pickeridelivery. Current Pharmaceutical Biotechnol
Wang, Y. B., & Xie, W. L. (2010). Synthesis of casubstitution in an ionic liquid. Carbohydrat
Wilpiszewska, K., & Spychaj, T. (2011). Ionic liqplasticization and modification. Carbohydr
Wurzburg, O. B. (1995). Modified food starches.Yusoff, A., & Murray, B. S. (2011). Modified star
oil-in-water emulsions. Food Hydrocolloids
. M., & Schubert, U. S. (2010).late) nanoparticles prepared bytrifugation, dynamic static lightpy. Journal of Polymer Science Part
15). Development and evaluation ofmetrical flow field-flowectin. Analytical and Bioanalytical
urnal of the Chemical Society, 91,
6). Characterization of starchon: Influence of amylose contentcts, 87, 182–190.e surface-layers of solutions andety of London, 72, 156.(2012). Quinoa starch granules: Aing emulsions. Journal of the Science
ejmek, P., & Wahlgren, M. (2014).n of Pickering type emulsions inSurfaces A: Physicochemical and
., & Sjöö, M. E. (2015). Preparation use in pickering emulsions. Cereal
., & Sjöö, M. (2016). Preparation and in pickering emulsions. Cereal
j, M., & Rayner, M. (2015). Chemicalon properties of octenyl succinicternational, 75, 41–49.lgren, M. (2015). Barrier properties
. Journal of Colloid and Interface
ilbert, R. G. (2013). Structure andinic anhydride modified starches: A920.ction and dissolution of starch fromtural analysis. Carbohydrate
g, P. X. (2009). Fabrication ofby nanoprecipitation. ACS Applied
g, P. X. (2012). Fabrication ofering emulsion. Carbohydrate
al. (2014). Triglyceride-waterparticles. Food Hydrocolloids, 36,
(2011). Starch particles for foodnal Congress on Engineering and Food
(2011). Starch particles for foodcience, 1(0), 95–103.
& Sjöö, M. (2013). Emulsions modified by heat treatment or
Nutrition, 1(2), 157–171.016). Stabilizing emulsions usingdrocolloids, 52, 581–589.
. (2013). The use of micro- andng-type emulsions for topical
ogy, 14, 1222–1234.tionic starch with a high degree ofe Polymers, 80(4), 1172–1177.uids: Media for starch dissolution,ate Polymers, 86(2), 424–428. New York: Marcel Dekker Inc.ch granules as particle-stabilizers of, 25(1), 42–55.

Paper V


Paper V 1
A comparison of emulsion stability for different OSA-modified waxy maize
emulsifiers: Granules, dissolved starch, and non-solvent precipitates
Hisfazilah Saari1*, Marie Wahlgren1, Marilyn Rayner1, Malin Sjöö1, María Matos2
1 Department of Food Technology, Engineering and Nutrition, Lund University, Box 124, SE22100 Lund, Sweden
2 Department of Chemical and Environmental Engineering, University of Oviedo, Julian Claveria 8, 33006 Oviedo, Spain
* Corresponding author [email protected]
Tel: +46 46 222 8307
KEYWORDS: Starch granules, dissolution, solvent precipitation, OSA modification, Pickering emulsion

2 Paper V
Abstract
This work investigated the stability of emulsions prepared by using octenyl succinic anhydride (OSA)-modified waxy maize in the form of granules, dissolved starch, and non-solvent precipitated starch as emulsion stabilisers. The aim of this study was to investigate how starch in different forms affects emulsifying capacity using light microscopy, light scattering, and static multiple light scattering (Turbiscan). All starch samples were modified with 3% (w/w) OSA to increase the hydrophobicity. Dissolved starch was prepared by dissolving OSA- modified starch in water, in an autoclave at 140°C. Non-solvent precipitates where obtained by ethanol precipitation of dissolved waxy maize. The stability of the oil/water emulsions was different for the three forms of starch used. The granule-based emulsions were unstable, with only a small proportion of the granules attached on oil droplets, as seen under a light microscope. The emulsions where seen to cream after 2 hours. The dissolved starch and non-solvent precipitate-based emulsions were seen to be stable towards creaming for months, and they had a 100% emulsifying index (EI). The results from light microscopy, and Turbiscan measurements indicated that coalescence was occurring for all three types of emulsions. The coalescence was fast within days for the granule stabilised system, while it was considerably slower both for the dissolved starch and non-solvent precipitate-based emulsions. The latter showing the least degree of coalescence over time. Thus, it was concluded that differences in starch size and molecular structure influenced the resulting emulsion droplet size and stability. A decreased particle size contributes to a decreasing droplet size, thus increasing stabilisation against creaming. The stability towards coalescence was seen to be low for the large granules but best for the non-solvent precipitate starch indicating that there is a window of optimal particle size for stability. The best emulsifying properties was thus obtained with the non-solvent precipitates (~ 120 nm particle size) where the emulsions were reasonable stable also after one year of storage. This study revealed the potential of starch non-solvent precipitates for use as emulsifiers.

Paper V 3
Introduction
The aim of this study was to compare the long-term emulsion stability of emulsions stabilised by octenyl succinic anhydride (OSA)-modified waxy maize starch in different physical forms, specifically intact granules (Pickering emulsions), dissolved starch (polymer stabilised emulsion), and non-solvent precipitated starch (stabilisation principle unknown). Emulsions are widely used formulations that consist of two immiscible liquids dispersed in one another in the presence of emulsifiers or stabilisers. Emulsions are thermodynamically unstable, and to improve the instability and production of emulsions, controlling the hydrodynamic conditions, decreasing the interfacial tension, and/or increasing steric hindrance or electrostatic repulsion are of importance [1, 2]. Surfactants and polymers including natural polymers such as polysaccharides and proteins are traditionally used to stabilise emulsions. Recently, particle-based emulsifiers have shown good performance, and are increasingly of interest in further research and technological applications [3-10]. This type of emulsion is known as a Pickering emulsion and was first reported by Pickering and Ramsden, and can be obtained using different types of particle such as silica, latex, and clay (synthetic/inorganic) [11, 12], as well as a range of bio-based particles [13, 14].
It has been concluded that solid particles create a physical barrier between droplets and that particles have a high desorption energy especially related to large particle size (10 nm–5 µm), and thus adsorb irreversibly to the interface to a higher degree than other emulsifiers such as surfactants [2, 15]. The Pickering emulsions have also shown better stability than other emulsions towards coalescence and Ostwald ripening [2]. However, due to their large size, they have slower kinetics of adsorption and the amount of particles (weight per volume of oil) needed for emulsification are larger than for traditional emulsifiers. These differences between particles and other stabilisers are strongly dependent on size, and it has been observed that nanoparticles around 1–5 nm display similar behaviour to globular protein because of comparable size and desorption energy [2]. One difference between polymers, proteins and particles should as we see it be in how they are affected by adsorption to the water/oil interface. The structure of a particle should be rather unchanged while polymers and proteins could have a considerable flexibility leading to changed structure when adsorbed to the interface compared to in solution. In this respect, we do not know if the nano precipitated starch used in this study is a Pickering emulsion or not, most likely the material consist of both dissolved molecules and some particles [16].
Starches have some general characteristics, such as possessing low toxicity, originating from a renewable recourse, and being tasteless, which make them interesting in a wide range of formulation applications such as in foods, beverages, cosmetics, pharmaceuticals, paints, and coatings [9, 17, 18]. Starch is in its natural state found as granules which are particles in the size range of 1- 100 µm. However, by extensive heating combined with mechanical treatment or by using solvents such as DMSO the granules can be dissolved and starch in its molecular form can be obtained. Both these physical forms of starch have been used as an emulsifier for oil in water emulsions. However, to our knowledge these forms have only been compared in one previous study [6] and in that case for quinoa starch and only for shorter times – 24 hours. Dissolved OSA-modified starch has been seen to be a good emulsifier [19-25]. The emulsifying capacity of OSA starches are dependent on a range of properties, such as molecular weight, where increased molecular weight improves stability but can increase droplet size; rigidity of the hydrophilic parts of the polymer chain, which increases steric stability; and higher amounts of amylopectin and a low hydrodynamic radius, which decrease droplet size [17]. During emulsification with OSA starches, there is a preferential adsorption of high molecular species on the emulsion droplets [23]. High shear rate emulsification has been shown to decrease the starches’ molecular weight [20].

4 Paper V
It has been seen that some emulsions stabilised using starch granules show long-term stability [15, 26, 27], for example, particle-stabilised emulsion from quinoa with 1–2 µm size was able to perform up to 2 years during storage [27]. The character of starch Pickering emulsions has been seen to be influenced by the size, morphology, and hydrophobicity of the starch [28, 29], as well as the starch concentration [2, 15]. In general, smaller starch granules produce more stable emulsions with a smaller droplet size [26, 27, 29].
In order to have a good adsorption to the oil/water interface, starch granules as well as dissolved starch have to be made more hydrophobic, and this has primarily been done by chemical modification with octenyl succinate anhydride [24]. The effect on the emulsion droplet size was found not to be linear with higher degree of OSA substitution, and the level of modification used in this study (3%) was found to be more than sufficient to stabilise emulsions and is also the limit for modification allowed within food applications [21].
Many research groups have been using waxy maize as a subject material, and it is widely studied, which makes this starch a popular source for comparison. Waxy maize has irregular and sharp edges, with graininess, pin-holes, and deep depressions on the surface of some granules [30, 31]. It has two populations of granules one in the size range between 1-7 µm and one in the range of 15–20 µm [30, 32]. In a previous study, waxy maize was used as a sole emulsifier and was able to stabilise the emulsion with a mean droplet size (d4,3) of 47 µm and an emulsifying index (EI) of 0.37, which improved to 0.47 when the granule size was reduced to half the initial size after acid hydrolysis treatment [29].
Since small particle size has been seen to decrease droplet size with other parameters being constant, and at least in some cases to increase stability, it could be of interest to produce Pickering emulsions using starch particles in the nano size range. Nano-sized starch particles have been produced using non-solvent precipitation [33-36], and a recent study from our research group has revealed that non-solvent precipitation gave material in the sizes range between 10 nm -1 µm[16]. This non-solvent precipitate was seen to stabilise emulsions having an EI of 1. In the present study, we investigated the long-term stability of these non-solvent precipitated starches and compared them with dissolved OSA-modified waxy maize and OSA-modified granules, thus comparing how emulsion stability is affected by the configuration of the starch using starch with the same botanical origin and degree of hydrophobic modification.
Materials and methods
The native waxy maize starch used was supplied by Lyckeby Culinar, Sweden. The oil used was the medium-chain triglyceride (MCT) oil, Miglyol 812, density 945 kg/m3 (Sasol Germany), and the water phase used was a 5 mM phosphate buffer with 0.2 M NaCl, density 1009.6 kg/m3. The n-octenyl succinyl anhydride used was from Trigon Chemie, Germany.
Emulsions were made based on three different starch emulsifiers; Starch granules based emulsions (SGE); Dissolved starch based emulsions (DSE); Non-solvent precipitate starch based emulsions (NPSE). How these emulsifiers were prepared are described below. All emulsifiers were OSA-modified.

Paper V 5
OSA-Modification The amount of OSA to be used was based on the dry weight of starch determined by an IR-balance (135oC, 5 min, duplicate). The starch was dispersed in 1.5 to 2 times amount of distilled water which was added during stirring. The pH was controlled at 7.4 and 7.8 and adjusted with citric acid, 1M HCL or NaOH. 3-4% n-octenyl succinyl anhydride (Ziyun Chemicals co. Ltd, China) was added in 4 portions with 15 min delay between each portion. The automatic titration of 1M NaoH while stirring was set up to control the pH near 7.6. The titration was terminated when the pH was stable for at least 15 min. The suspension was then centrifuged at 3000g for 10 min. The supernatant was discarded and the starch washed twice with water, once with citric acid (pH 4.5-5) and once more with water. The starch was frozen overnight and freeze dried.
Determination of OSA level was carried out in duplicate for modified and control samples. 2.5g of starch (dry weight) was wetted with few drops of ethanol before adding 25ml 0.1M hydrochloric acid and stirred for 30 minutes. The suspension was later centrifuged (3000g, 10 min) where the supernatant discarded. The pellet containing the starch was washed with 25ml ethanol once, and with distilled water twice before being dissolved in 150ml distilled water and heated in hot bath at 90oC for 10 min. The solution was rapidly cooled to 25oC using an ice bath, and the suspension was titrated while stirring with 0.1M NaOH until pH 8.3 was reached. The volume of NaOH used was noted for the calculation of % OSA below: (%) = ( − ) × × 210 × 100
Where V is volume of NaOH required in titration (ml), M is the molarity of NaOH (0.1M), 210 is the molecular weight (g/mol) of octenyl succinate anhydride group (OSA) and W is the dry weight of sample used.
Preparation of starch granules (SG) Starch granules as obtained by the supplier Lyckeby Starch were modified by OSA to increase the hydrophobicity using 3% of OSA based on dry weight of starch following the method described above. After OSA modification, the wet samples were then put into a freezer overnight and freeze-dried (Hetosic, Denmark) starting at -20°C and reaching 20°C with 1°C/min over 4–5 days. The degree of OSA modification for starch granule was 3.1%
Preparation of dissolved starch solutions (DS) The starting material for the dissolved starch was the OSA-modified starch granules prepared as described above. Thus, the OSA-modification was the same as above. OSA-modified starch granules were dissolved by adapting the dissolution methods reported by Perez-Rea et al. using an autoclave [38]. A sample of OSA-modified waxy maize starch (4 g dry weight) was dispersed in 200 ml milliQ water and heated with a high-pressure laboratory autoclave equipped with a magnetic stirrer and coupled with a temperature control unit (WRX 2000, Withernm, Germany). The heating was carried out for 20 min at 140°C. Before heating, the system was flushed with nitrogen gas for 5 min, to prevent oxidative degradation of the starch. The starch suspension was gradually heated from room temperature to 140oC for almost 14 min, kept in 140°C for 20 min, and then cooled by immersing the autoclave cylinder in an ice bath. After the autoclave dissolution, the dissolved starch solution was diluted to 8 mg/mL from the initial concentration of 20 mg/ml before being used in emulsions.

6 Paper V
Preparation of non-solvent precipitation starch (NPS) Non-OSA modified starch was dissolved as described in the previous section. Non-solvent precipitation starch was carried out using ethanol by direct mixing of the ethanol into dissolved starch (8 mg/ml concentration) at a ratio of 1:1 (starch solution: ethanol). The precipitated starch was collected after centrifugation (2000 g, 10 min). The solvent was removed after centrifugation, and all precipitated particles were left in the fume hood overnight to evaporate the ethanol until no layer of solvent was seen on top of the precipitate samples. Detail procedure of preparing NPS was described in our previous work [16].The wet precipitates were then OSA modified with similar method in preparing OSA starch granule as described above and the OSA value was 2.03%.
Preparation of emulsions The emulsions produced were 5% (w/w) of oil/water emulsions containing an MCT oil as the dispersed phase and a phosphate buffer (5 mM, pH 7, 0.2 M NaCl) as the continuous phase, with 200 mg of starch emulsifier per ml of oil. The emulsions were produced by mixing 70 mg of modified granule/non-solvent precipitate (in dry form) or dissolved starch (in solution) into the 0.35 g oil/6.65 g buffer (total of 7 g emulsion composition) and prepared by vortex mixing for 10 s. The suspensions were emulsified using a high-shear mixer (D-79282, Ystral, Germany) at 22,000 rpm, for 60 s. Emulsions were observed directly, after 24 hours, and weekly for up to six weeks and then also after a year for those emulsions that had not phase separated.
Characterisation of emulsions Static light scattering
The particle size distribution of all emulsions was examined using static light scattering (Mastersizer 2000, Malvern Instruments, UK). A small quantity of sample was injected into the flow system connected to the pump circulating at 2,000 rpm. The refractive index (RI) used was 1.54, which corresponded to starch [39], while for the continuous phase, it was set to 1.33 which is the RI of water. Obscuration was restricted between 10% and 20% for the emulsions. Due to the low amount of the sample, the obscuration was reduced to less than 5% when measuring on emulsions based non-solvent precipitated/dissolved starch, since their size gives a low degree of obstruction. The data, d4,3 and dv,0.5, refer to the sphere of equivalent volume and the median size of the system based on d4,3 distribution, respectively, of the particles or droplets. The mean 4,3 size of the systems based on the distribution was also determined. This includes all particles in the system. That is for emulsions both emulsion droplets and free starch particles. All samples were measured in triplicates and the average and standard deviations of the 4,3 mean was calculated. These averages were compared using two sided student t-test.
Light microscope
Emulsions were further observed with an optical microscope (BX50, Olympus, Japan) equipped with a video camera. The samples were examined under Plan 2x, UMPlanFL 5x and 10x, and LMPlanFL 20x and 50x objectives (Olympus). One drop of sample was diluted with five drops of buffer solution, and depending on the sample, one drop of the diluted sample was placed uncovered on the glass plate for microscopic observation.

Paper V 7
Stability of emulsions studied by static multiple light scattering A sample of 4 ml of starch-based emulsions was prepared to study stability during storage. The dispersion of OSA-modified starches (granule, dissolved starch, and non-solvent precipitate in buffer) and the MCT oil dispersion (oil in buffer) were also measured for reference and for comparison with the emulsions. The stability study of the emulsions was evaluated by Turbiscan Lab® Expert (Formulation Inc., France) using static multiple light scattering. The instrument operates by sending a light beam through a cylindrical glass cell containing 4 ml of the sample (12 mm height). The light source is an electroluminescent diode in the near infrared with a wavelength of 880 nm. Part of the incident light is then backscattered by the sample or transmitted through it, and received by two sensors with different locations: the sensor that receives the transmitted light is located 180º from the incident radiation, while the sensor that receives the backscattered light (BS) is located 45º from the incident light. The transmitted light and the backscattered light were monitored as a function of time and cell height at 30oC. The transmission (TS) and backscattering (BS) data were measured every 40 µm in % relative to standards (suspension of monodisperse spheres and silicone oil) as a function of the sample height (in mm).
The backscattering measurement is directly dependent on the particles’ mean diameter and on their volume fraction. The main instability phenomena observed in colloidal systems are: particle migration (i.e., local variation of the concentration of particles, which causes local variation of the transmission or backscattering level measured at the bottom and top of the sample); and particle size increase (i.e., global variation of the particle size, which causes global variation of the transmission or backscattering level measured in the middle of the sample) [6]. BS profiles build up a macroscopic fingerprint of the emulsions at a given time, providing useful information related to changes in droplet size and the appearance of a creaming layer or clarification front, and makes it possible to calculate the velocity with which these processes happen [4].
The Turbiscan stability index (TSI) was obtained using Turbisoft software (2.0.0.33) by computing mathematically based on the sum of scan-to-scan difference of the intensity of lights (∑ℎ | − ) towards the cell height. The sum of the variations (∑ ) detected in the samples in respect of the size/concentration was calculated using the following equation: = ∑ℎ| − |
with H as the total height of the cell. The higher the TSI, the higher was the instability of the emulsion.
Emulsifying index
The emulsifying index is the ratio between the volume of the emulsion layer and the volume of the whole sample. In the present study, the EI was calculated by measuring the height of the cell containing the emulsion layer (showing the backscattering peak) vs. the time from the Turbiscan profile. The emulsifying index was calculated as follows: = ℎ ℎ ℎ ℎ ℎ (12 )

8 Paper V
Results and discussions
As described in detail in material and methods, three different emulsion systems were investigated based on the same waxy maize starch; OSA modified starch granules based emulsions (SGE); OSA modified dissolved starch based emulsions (DSE); and OSA modified non-solvent precipitate starch based emulsions (NPSE). SGE is a Pickering emulsion based on waxy maize granules that has a size 5-18 µm with average size around 15 µm [30] while DSE is a polymer stabilised emulsion that predominately contains amylopectin with a radius of gyration of around 250 nm [38]. The structure of the NPS is not yet fully understood but previous studies shows that it contains a broad range of different particles including some larger micro-particles; however, the bulk of the material is small, with an average radius of gyration of 260 nm as measured by AF4. In some cases, we have also studied the behaviour of MCT oil and dispersions or solutions of the starch emulsifier. This is done to understand how these components effect the measurements.
The macroscopic appearance of these emulsions at day 1 is seen in FIG 1. As can be seen SGE phase separates while the DSE and NPSE gives emulsions that are space filled. The phase separated SGE shows both creaming and sedimentation and this is because large oil droplets will cream while small droplets covered with starch granules and granules themselves will sediment. The degree of phase separation can be followed using multiple light scattering that also determined EI. There was a significant difference in the EI values, which showed the highest values for non-solvent precipitate (0.92), followed by dissolved starch (0.88), and the least for granule (0.47). As can be seen in Table 1 the EI decreases fastest for SGE and slowest for NPSE. In the case of SGE, there were also observed an oil layer on top of the emulsion layer already after 24 hours. This was not observed for the other emulsions. There are also according to student t-test a significant difference between the droplet sizes (Table 1) for the three emulsions and this difference can of course to some extent explain the difference in the macroscopic behaviour of the emulsions such as a higher tendency for the larger droplets of the SGE to cream.
The TSI-value (Table 1) is a measurement that includes all type of changes in a dispersion that changes the scattering profile. Thus, in our case it includes both creaming, sedimentation and coalescence. The higher the TSI the less stable is the emulsions. The TSI values is in line with the other results showing that NPSE are the most stable system and SGE is the most unstable one. As expected it also increases with time.
FIG 1. Macroscopic and microscope images 20x magnification, bar scale: 50 µm appearances of the emulsions at day 1 (A) SGE, (B) DSE, and (C) NPSE.
A B C

Paper V 9
Table 1. Emulsion properties; size measured by static light scattering in terms of mean volume diameter , (n=3), median value of size distribution dv, 0.5 (n=3), emulsifying index (EI n=2), and Turbiscan stability index (TSI n=2). The values marked with * is according to student t-test significantly different from the previous time point with a 90% confidentiality.
Emulsions Days , (µm) dv, 0.5(µm) ∆BS (%) EI TSI
SGE 0 45.8 ± 7.9 26.0 ± 4.1 11.0 0.47±0.00 -
1 74.0 ± 10* 56.4 ± 20.0 13.6 0.27±0.02 30.0±3.2
DSE
0 18.9 ± 5.3 15.2 ± 0.9 27.0 0.88±0.02 -
1 20.2 ± 3.1 16.4 ± 1.0 45.4 0.85±0.04 7.5±7.0
7 22.9 ± 6.0 17.2 ± 0.7 45.4 0.70±0.01* 14.2±2.5
14 27.2 ± 6.0 17.7 ± 1.1 49.3 0.63±0.01* 16.2±0.6
21 32.6 ± 4.2 18.3 ± 0.9 50.2 0.58±0.00* 17.8±0.8
28 42.8 ± 7.0* 24.8 ± 6.1* 49.8 0.51±0.04* 18.8±1.5
35 51.0 ± 4.0* 37.2 ± 4.0* 49.9 0.45±0.01* 19.5±1.6
42 86.4 ± 0.6* 83.1 ± 1.0* 51.0 0.42±0.01* 19.8±1.3
365 55.6 ± 10.2* 42.0 ± 19.0* 59.9 0.35±0.10 –
NPSE
0 10.6 ± 0.6 9.3 ± 0.7 39.4 0.92±0.01 -
1 10.4 ± 0.8 9.0 ± 0.9 47.4 0.88±0.02* 5.7±7.0
7 16.3 ± 4.2* 9.2 ± 1.0 49.6 0.76±0.01* 8.4±3.4
14 19.1 ± 2.4 7.9 ± 1.5 53.0 0.75±0.01 12.5±0.6
21 21.2 ± 5.0 7.3 ± 1.5 52.0 0.70±0.00* 14.9±0.4
28 23.2 ± 9.6 6.7 ± 1.6 52.3 0.67±0.01* 15.8±0.4
35 27.8 ± 8.0 5.7 ± 2.1 54.5 0.63±0.01* 16.5±0.6
42 39.8 ± 10.3 8.3 ± 3.5 53.4 0.63±0.01 17.0±1.0
365 48.9 ± 10.7 36.1 ± 16 44.6* 0.47±0.00* –
MCT oil 0 123.8 ± 15.4 117.2 ± 14.5 – – –
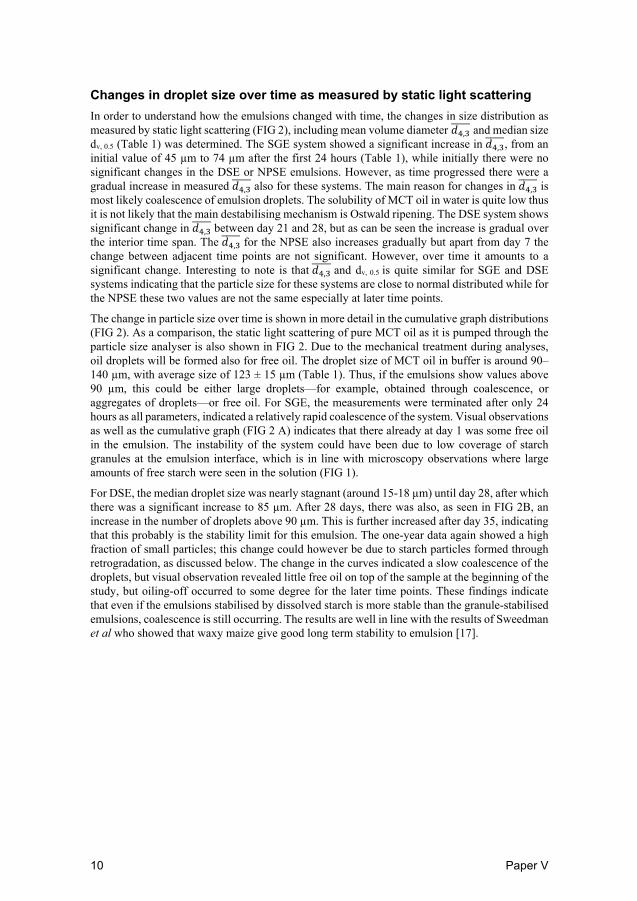
10 Paper V
Changes in droplet size over time as measured by static light scattering In order to understand how the emulsions changed with time, the changes in size distribution as measured by static light scattering (FIG 2), including mean volume diameter , and median size dv, 0.5 (Table 1) was determined. The SGE system showed a significant increase in , , from an initial value of 45 µm to 74 µm after the first 24 hours (Table 1), while initially there were no significant changes in the DSE or NPSE emulsions. However, as time progressed there were a gradual increase in measured , also for these systems. The main reason for changes in , is most likely coalescence of emulsion droplets. The solubility of MCT oil in water is quite low thus it is not likely that the main destabilising mechanism is Ostwald ripening. The DSE system shows significant change in , between day 21 and 28, but as can be seen the increase is gradual over the interior time span. The , for the NPSE also increases gradually but apart from day 7 the change between adjacent time points are not significant. However, over time it amounts to a significant change. Interesting to note is that , and dv, 0.5 is quite similar for SGE and DSE systems indicating that the particle size for these systems are close to normal distributed while for the NPSE these two values are not the same especially at later time points.
The change in particle size over time is shown in more detail in the cumulative graph distributions (FIG 2). As a comparison, the static light scattering of pure MCT oil as it is pumped through the particle size analyser is also shown in FIG 2. Due to the mechanical treatment during analyses, oil droplets will be formed also for free oil. The droplet size of MCT oil in buffer is around 90–140 µm, with average size of 123 ± 15 µm (Table 1). Thus, if the emulsions show values above 90 µm, this could be either large droplets—for example, obtained through coalescence, or aggregates of droplets—or free oil. For SGE, the measurements were terminated after only 24 hours as all parameters, indicated a relatively rapid coalescence of the system. Visual observations as well as the cumulative graph (FIG 2 A) indicates that there already at day 1 was some free oil in the emulsion. The instability of the system could have been due to low coverage of starch granules at the emulsion interface, which is in line with microscopy observations where large amounts of free starch were seen in the solution (FIG 1).
For DSE, the median droplet size was nearly stagnant (around 15-18 µm) until day 28, after which there was a significant increase to 85 µm. After 28 days, there was also, as seen in FIG 2B, an increase in the number of droplets above 90 µm. This is further increased after day 35, indicating that this probably is the stability limit for this emulsion. The one-year data again showed a high fraction of small particles; this change could however be due to starch particles formed through retrogradation, as discussed below. The change in the curves indicated a slow coalescence of the droplets, but visual observation revealed little free oil on top of the sample at the beginning of the study, but oiling-off occurred to some degree for the later time points. These findings indicate that even if the emulsions stabilised by dissolved starch is more stable than the granule-stabilised emulsions, coalescence is still occurring. The results are well in line with the results of Sweedman et al who showed that waxy maize give good long term stability to emulsion [17].

Paper V 11
FIG 2. Size distribution of emulsions stabilised by (A) granules, SGE (day 0 to day 1), (B) dissolved starch, DSE (day 0 to day 365), and (C) precipitated starch, NPSE (day 0 to day 365).
0102030405060708090
100
0,1 1 10 100 1000
Cum
ulat
ive
sum
(%)
Particle size distribution (µm)
day 0
day 1
MCT oil
0
10
20
30
40
50
60
70
80
90
100
0,1 1 10 100 1000
Cum
ulat
ive
sum
(%)
Particle size distribution (µm)
day 0day 1day 7day 14day 21day 28day 35day 42day 365MCT oil
0
10
20
30
40
50
60
70
80
90
100
0,1 1 10 100 1000
Cum
ulat
ive
sum
(%)
Particle size distribution (µm)
day 0day 1day 7day 14day 21day 28day 35day 42day 365MCT oil
A
C
B

12 Paper V
For NPSE, the cumulative graph distributions (FIG 2C), show that emulsion droplets stabilised by non-solvent precipitated starch had a median droplet size of around 6–9 µm for 42 days. Thus, in difference to DSE these emulsions did not show any significant change in median droplet size for this time period. However, the number of droplets above 90 µm increased more rapidly for NPSE than for the DSE, and a gradual increase in this fraction of droplets was seen during the first 42 days, from 0% to around 40%. As can be seen from FIG 2C, the overall droplet size distribution is not shifting towards larger droplets instead it seems as if it is the fraction of droplets above 10 µm that is coalescing. Thus, there is a clear difference in the coalescence pattern between non-solvent precipitate starch and dissolved starch. As discussed previously non-solvent precipitated starch has a wide population of particles, from nanoparticles to micron-size particles. It is likely that this wide distribution also translates to a wide population of emulsion droplets stabilised by different entities of the precipitated starch. It can be speculated that some of these droplets are more stable than others towards coalescence and thus are the ones that make up the non-changing fraction of the emulsions, while droplets predominantly covered by other fractions of the non-solvent precipitate—for example, dissolved starch—are more susceptible to coalescence. Another explanation for the two populations seen could be that droplets that are larger have creamed to the top of the emulsions and the higher density of droplets in this region promoted coalescence. Finally, it was seen that even after 1 year of storage, this emulsion had a large fraction of small droplets.
Multiple light scatter measurements
The static multiple light scattering was measured by Turbiscan Lab® Expert and the changes in backscattering during the first two hours is shown in FIG 3, while the long term stability investigations is shown in FIG 4.
To better understand the results for the emulsions, multiple light scattering data were also obtained for samples containing only the starch emulsifiers (FIG 3B-3E) and for oil alone (FIG 3A). In the case of oil alone, the backscattering is low over the whole height of the cell but showing a small “bump” at the top indicative of the free oil. For the dispersed granules (FIG 3B) showed high initial values in backscattering (in the range of 2–15%) at the bottom of the cell (from 1–2 mm), indicating that sedimentation had already occurred from the beginning for the samples in this region.
When fresh dissolved OSA-modified starch was investigated (FIG 3C), backscattering decreased at the bottom of the cell (0–4 mm), indicating that clarification had occurred at the bottom. However, backscattering increased in the middle of the cell (4–8 mm), most likely owing to aggregation of the molecules. Initially the system did not change with time. The solution of dissolved starch was measured again after year of storage (FIG 3D). It had a similar profile to that of the fresh sample, but in this case, changes in backscattering were seen during the time of the measurement. The changes may well have been due to continuous aggregation of particles in the solution. The likely explanation for the formation of aggregates that are large enough to scatter light is that the dissolved starch molecules recrystallize in solution, a process referred to as retrogradation. During cooling and storage, both amylose and amylopectin crystalizes in solution [40, 41] but the rate of crystallization for amylose is fast within a couple of hours or days, in contrast amylopectin crystallization is slow occurring after a time span of as much as 30–40 days. Since waxy maize, which mostly contains an amylopectin fraction, the difference between the fresh sample and the stored sample could be attributed to long-term crystallization of the amylopectin fraction, which could then lead to long-term structural changes [40, 42, 43].

Paper V 13
FIG 3. Turbiscan profiles for (A) MCT oil profile as reference, starches in buffer: (B) OSA –modified granules, (C) dissolved starch at day 0, (D) dissolved starched (DS) after 1 year, and (E) Non-solvent precipitated starch (NPS); and starch based emulsions samples:(F) SGE, (G) DSE, (H) NPSE.
H
Creaming
Migration
Aggregation
A B
F E
DC
G
Coalescence
Sedimentation
Sedimentation
No changes
No changes

14 Paper V
The backscattering profiles of samples containing only non-solvent precipitated starch (NPS) showed that there were very small changes in the profile (FIG 3E). This indicates that the particles obtained with non-solvent precipitation are small enough to be subjected to Brownian motion and could thus stay suspended, not resulting in any clarification zones in the sample. Interesting to note is that they did not show any major changes over time that could be linked to crystallisation as was seen for the dissolved starch. Indicating that the non-solvent precipitation creates particles or starch molecules that differ in properties from the dissolved starch.
FIG 4. Turbiscan profiles for starch-stabilised emulsions: (A) SGE after 1 day, (B) DSE, and (C) NSPE from 0 to 6 weeks.

Paper V 15
In terms of stability, SGE were very unstable, as seen in the backscattering profiles (FIG 3F and FIG 4A). At the top of the cell for SGE (FIG 3F), larger backscattering values (around 16%) were obtained at the beginning of the monitoring time resulting from the creaming of the emulsion droplets and in the bottom of the cell, high initial values in backscattering (in the range of 8–16%). In the latter case, the sedimentation may have resulted from the presence of free starch granules in the continuous phase. This process lasted until the end of the monitoring time, and even an increase in backscattering in the middle part of the cell (4–8 mm) was seen because of the presence of either starch or emulsion sediment. Similar behaviour had been obtained with starch Pickering emulsions in previous studies [6]. The cream layer on the other hand becomes thinner, with time and the appearance of a free oil layer, which is another indication of the low stability of these emulsions (FIG 4A).
The backscattering profiles obtained for the DSE (FIG 3G and FIG 4B) show large variations over time in the middle part of the cell as a result of a combination of both clarification and creaming processes. Creaming was noticed at the top resulting from droplet migration promoted by density differences between the oil droplets and the continuous phase, which explains the large changes in backscattering from 27% to 51% (Table 1).
The backscattering profiles of the non-solvent precipitate emulsion, NPSE (FIG 3H and FIG 4C) showed a similar trend as for DSE, with similar variations in the middle of the cell. These variations were promoted by a clarification process that took place at the bottom/middle of the cell accompanied by simultaneous creaming at the top. However, the change in the middle of the cell related to coalescence was slower than for DSE.
Based on the results above, a comparison of the three forms of starch can be made. The stability of the emulsion systems seems to increase in the order of SGE << DSE < NPSE. This was true for stability towards both creaming and coalescence. The SGE showed clear phase separation and release of oil after 24 hours, while the emulsions stabilised by dissolved starch (DSE) were stable in this respect for 6 weeks and the emulsions based on precipitated starch (NPSE) were stable for at least one year.
Since all the particles studied originated from the same starting material, the difference in the structure of the emulsifiers is most likely what gives the difference in emulsion stability. Especially, the difference in OSA-modification that is slightly higher for starch granules (3%) than for non-solvent precipitate starch (2%), it would be expected to promote smaller droplet sizes for the SGE systems compared to the NPSE, however it is not the case as seen from Table 1. Thus, the likely key properties that effect emulsion stability are size and morphology of the emulsifier. The most likely reason for the granules’ low stability is that the particle size is not small enough to create small emulsion droplets, as indicated by the droplet size of the initial emulsion, and as seen in both the rapid creaming and the low stability towards coalescence. It is also obvious that the affinity of the starch granules for the oil/water interface is low, as can be seen in the high amount of free starch in the samples.
The dissolved starch (DS) and the non-solvent precipitate (NPS) are in the same size range, but obviously, the stability of the two emulsifiers differs from each other. Dissolved OSA waxy starch has been seen by other researchers to be a good emulsifier, which they have attributed to the adsorbed amylopectin inducing steric repulsion at the interface, as well as increased viscosity in the solution that to some extent hinders creaming [21, 22, 24, 44]. These previous observations are in line with our results, but as mentioned, we saw a loss in stability after 35 days, which we have attributed to slow retrogradation of the dissolved amylopectin. Retrogradation is a common phenomenon for dissolved starch [40, 42, 43] and is driven by the formation of starch double helixes that are further aggregated into ordered structures that lead to the formation of semi-crystalline arrays of these helixes [45]. Retrogradation can then in turn lead to the formation of

16 Paper V
aggregates, and the reduction of free OSA starch can probably decrease the amount of starch available to stabilise the emulsion.
The lack of aggregates seen in the Turbiscan profile for the non-solvent precipitation (NPS) compared with the profile of the dissolved starch (DS) indicates that the NPS at least affects the tendency for any free amylopectin to later retrograde and form new aggregates in solution. This could be one of the reasons that non-solvent precipitate is stable for a longer time than dissolved starch. The fact that the NPSE has a smaller initial droplet size than DSE indicates either that NPS contains smaller particles than the dissolved starch and thus can cover a larger surface area, or that it has higher affinity to the surface. One further explanation could be that the particles do not have to be closely packed at the surface in order to stabilise the emulsion. It has previously been seen that for the Pickering type of emulsions, the stability can be obtained below full surface coverage [8]. However, for this to work, we probably need preferential adsorption of larger particles or aggregates of particles at the oil/water interface. The transport of molecules and particles to an interface can be either through diffusion or through convection; when convection dominates, it has been shown that the larger molecules are preferentially adsorbed to the interface [46, 47]. In the system used here, the larger particles could be in a size range of 1µm where they are transported through convection, and the presence of these larger particles could help to stabilise the emulsion. When large particles have been adsorbed to the interface, it is highly unlikely that they will desorb [2]. Thus, it is likely that the larger particles from the NPS will be preferentially adsorbed and the droplets that have enough of these particles will be more stable than, for example, drops only covered by dissolved amylopectin. This situation could explain the coalescence profile for the NPSE, since two fractions of droplets appear to exist: small droplets that are very stable over time and slightly larger droplets that appear to coalesce with time.
Conclusion
For emulsions using different types of waxy maize–based emulsifiers—granules, dissolved starch, and precipitated starch—it was found that the differences in the size and structure of the emulsifiers influenced the resulting emulsion droplet size and stability. The decrease in droplet size and the increase in stability towards coalescence and creaming were found to follow the order granules (largest, least stable), dissolved starch, and non-solvent precipitated starch (smallest most stable). If we take the formation of a substantial number of droplets that are larger than those seen in emulsions formed without emulsifiers as an indication of stability, the stability for emulsions using OSA starch-based emulsifiers was 2 days for granules, 35 days for dissolved starch, and more than 42 days and up to a year for starch non-solvent precipitates. Based on the droplet size, size distribution, microscopic images, and Turbiscan stability, the stabilisation of emulsion is clearly shown to be the best for starch non-solvent precipitates, followed by dissolved starch, and finally granules. Therefore, this study revealed the high potential of starch non-solvent precipitates as emulsifiers.
Acknowledgment
We would like to acknowledge funding from the Swedish research council.

Paper V 17
References
1. Dickinson E. Food emulsions and foams: Stabilization by particles. Current Opinion in Colloid and Interface Science. 2010;15(1-2):40-9. doi: 10.1016/j.cocis.2009.11.001.
2. Tcholakova S, Denkov N, Lips A. Comparison of solid particles, globular proteins and surfactants as emulsifiers. Physical Chemistry Chemical Physics. 2008;10(12):1608-27.
3. Tang J, Quinlan PJ, Tam KC. Stimuli-responsive Pickering emulsions: recent advances and potential applications. Soft Matter. 2015;11(18):3512-29. doi: 10.1039/c5sm00247h. PubMed PMID: 25864383.
4. Matos M, Timgren A, Sjöö M, Dejmek P, Rayner M. Preparation and encapsulation properties of double Pickering emulsions stabilized by quinoa starch granules. Colloids and Surfaces A: Physicochemical and Engineering Aspects. 2013;423:147-53.
5. Marku D, Wahlgren M, Rayner M, Sjöö M, Timgren A. Characterization of starch Pickering emulsions for potential applications in topical formulations. International journal of pharmaceutics. 2012;428(1):1-7.
6. Matos M, Marefati A, Gutiérrez G, Wahlgren M, Rayner M. Comparative Emulsifying Properties of Octenyl Succinic Anhydride (OSA)-Modified Starch: Granular Form vs Dissolved State. PloS one. 2016;11(8):e0160140.
7. Sjöö M, Emek SC, Hall T, Rayner M, Wahlgren M. Barrier properties of heat treated starch Pickering emulsions. Journal of colloid and interface science. 2015;450:182-8.
8. Wahlgren M, Engblom J, Sjöö M, Rayner M. The use of micro- and nanoparticles in the stabilisation of Pickering-type emulsions for topical delivery. Current Pharmaceutical Biotechnology. 2013;14:1222-34.
9. Yusoff A, Murray BS. Modified starch granules as particle-stabilizers of oil-in-water emulsions. Food Hydrocolloids. 2011;25(1):42-55. doi: 10.1016/j.foodhyd.2010.05.004.
10. Berton-Carabin CC, Schroen K. Pickering emulsions for food applications: background, trends, and challenges. Annu Rev Food Sci Technol. 2015;6:263-97. doi: 10.1146/annurev-food-081114-110822. PubMed PMID: 25705932.
11. Pickering SU. Emulsions. Journal of the Chemical Society, Transactions. 1907;91:2001-21. 12. Ramsden W. Separation of Solids in the Surface-Layers of Solutions and 'Suspensions' (Observations on
Surface-Membranes, Bubbles, Emulsions, and Mechanical Coagulation). -- Preliminary Account. Proceedings of the Royal Society of London. 1903;72(ArticleType: research-article / Full publication date: 1903 - 1904 / Copyright © 1903 The Royal Society):156-64. doi: 10.2307/116458.
13. Rayner M, Marku D, Eriksson M, Sjöö M, Dejmek P, Wahlgren M. Biomass-based particles for the formulation of Pickering type emulsions in food and topical applications. Colloids and Surfaces A: Physicochemical and Engineering Aspects. 2014;458(1):48-62. doi: 10.1016/j.colsurfa.2014.03.053.
14. Dickinson E. Biopolymer-based particles as stabilizing agents for emulsions and foams. Food Hydrocolloids. 2016. doi: 10.1016/j.foodhyd.2016.06.024.
15. Rayner M, Sjöö M, Timgren A, Dejmek P. Quinoa starch granules as stabilizing particles for production of Pickering emulsions. Faraday discussions. 2012;158:139. doi: 10.1039/c2fd20038d.
16. Saari H, Fuentes C, Sjöö M, Rayner M, Wahlgren M. Production of starch nanoparticles by dissolution and non-solvent precipitation for use in food-grade Pickering emulsions. Carbohydrate Polymers. 2017;157:558-66.
17. Sweedman MC, Hasjim J, Schäfer C, Gilbert RG. Structures of octenylsuccinylated starches: Effects on emulsions containing β-Carotene. Carbohydrate Polymers. 2014;112:85-93. doi: 10.1016/j.carbpol.2014.05.067.
18. Sweedman MC, Tizzotti MJ, Schäfer C, Gilbert RG. Structure and physicochemical properties of octenyl succinic anhydride modified starches: A review. Carbohydrate polymers. 2013;92(1):905-20.
19. Magnusson E, Nilsson L. Interactions between hydrophobically modified starch and egg yolk proteins in solution and emulsions. Food Hydrocolloids. 2011;25(4):764-72. doi: 10.1016/j.foodhyd.2010.09.006. PubMed PMID: WOS:000287309700026.
20. Modig G, Nilsson L, Bergenståhl B, Wahlund KG. Homogenization-induced degradation of hydrophobically modified starch determined by asymmetrical flow field-flow fractionation and multi-angle light scattering. Food Hydrocolloids. 2006;20(7):1087-95. doi: 10.1016/j.foodhyd.2005.12.011.

18 Paper V
21. Nilsson L, Bergenståhl B. Adsorption of hydrophobically modified starch at oil/water interfaces during emulsification. Langmuir. 2006;22(21):8770-6.
22. Nilsson L, Bergenståhl B. Emulsification and adsorption properties of hydrophobically modified potato and barley starch. Journal of Agricultural and Food Chemistry. 2007;55(4):1469-74. doi: 10.1021/jf062087z.
23. Nilsson L, Leeman M, Wahlund KG, Bergenståhl B. Competitive adsorption of a polydisperse polymer during emulsification: Experiments and modeling. Langmuir. 2007;23(5):2345-51. doi: 10.1021/la062483b.
24. Tesch S, Gerhards C, Schubert H. Stabilization of emulsions by OSA starches. Journal of Food Engineering. 2002;54(2):167-74.
25. Viswanathan A. Effect of degree of substitution of octenyl succinate starch on the emulsification activity on different oil phases. Journal of Environmental Polymer Degradation. 1999;7(4):191-6.
26. Timgren A, Rayner M, Sjöö M, Dejmek P. Starch particles for food based Pickering emulsions. Procedia Food Science. 2011;1(0):95-103. doi: http://dx.doi.org/10.1016/j.profoo.2011.09.016.
27. Timgren A, Rayner M, Dejmek P, Marku D, Sjöö M. Emulsion stabilizing capacity of intact starch granules modified by heat treatment or octenyl succinic anhydride. Food Science & Nutrition. 2013;1(2):157-71. doi: 10.1002/fsn3.17.
28. Li C, Sun P, Yang C. Emulsion stabilized by starch nanocrystals. Starch‐Stärke. 2012;64(6):497-502. 29. Saari H, Heravifar K, Rayner M, Wahlgren M, Sjöö M. Preparation and Characterization of Starch Particles
for Use in Pickering Emulsions. Cereal Chemistry. 2016;93(2):116-24. 30. Jane J-L, Kasemsuwan T, Leas S, Zobel H, Robyt JF. Anthology of Starch Granule Morphology by
Scanning Electron Microscopy. Starch - Stärke. 1994;46(4):121-9. doi: 10.1002/star.19940460402. 31. Hall DM, Sayre JG. A Scanning Electron-Microscope Study of Starches: PART III: Miscellaneous
Starches. Textile Research Journal. 1971;41(11):880-94. doi: 10.1177/004051757104101102. 32. Singh N, Kaur A, Shevkani K. Maize: Grain Structure, Composition, Milling, and Starch Characteristics.
2014:65-76. doi: 10.1007/978-81-322-1623-0_5. 33. Tan Y, Xu K, Li L, Liu C, Song C, Wang P. Fabrication of size-controlled starch-based nanospheres by
nanoprecipitation. ACS applied materials & interfaces. 2009;1(4):956-9. 34. Qin Y, Liu C, Jiang S, Xiong L, Sun Q. Characterization of starch nanoparticles prepared by
nanoprecipitation: Influence of amylose content and starch type. Industrial Crops and Products. 2016;87:182-90. doi: 10.1016/j.indcrop.2016.04.038.
35. Kim HY, Park SS, Lim ST. Preparation, characterization and utilization of starch nanoparticles. Colloids Surf B Biointerfaces. 2015;126:607-20. doi: 10.1016/j.colsurfb.2014.11.011. PubMed PMID: 25435170.
36. Chin SF, Pang SC, Tay SH. Size controlled synthesis of starch nanoparticles by a simple nanoprecipitation method. Carbohydrate Polymers. 2011;86(4):1817-9. doi: DOI 10.1016/j.carbpol.2011.07.012. PubMed PMID: ISI:000294941100053.
37. Rayner M, Timgren A, Sjöö M, Dejmek P. Quinoa starch granules: A candidate for stabilising food-grade Pickering emulsions. Journal of the Science of Food and Agriculture. 2012;92(9):1841-7.
38. Perez-Rea D, Bergenståhl B, Nilsson L. Development and evaluation of methods for starch dissolution using asymmetrical flow field-flow fractionation. Part I: Dissolution of amylopectin. Analytical and bioanalytical chemistry. 2015;407(15):4315-26.
39. Bromley EH, Hopkinson I. Confocal microscopy of a dense particle system. J Colloid Interface Sci. 2002;245(1):75-80. Epub 2005/11/18. doi: 10.1006/jcis.2001.8005. PubMed PMID: 16290337.
40. Fredriksson H, Silverio J, Andersson R, Eliasson A-C, Åman P. The influence of amylose and amylopectin characteristics on gelatinization and retrogradation properties of different starches. Carbohydrate Polymers. 1998;35(3):119-34.
41. Hoover R, Hughes T, Chung H, Liu Q. Composition, molecular structure, properties, and modification of pulse starches: A review. Food research international. 2010;43(2):399-413.
42. Eliasson A-C. Carbohydrates in food. Boca Raton (FL): CRC Press; 2006. 43. Gudmundsson M. Retrogradation of starch and the role of its components. Thermochimica Acta.
1994;246(2):329-41.

Paper V 19
44. Dokić L, Krstonošić V, Nikolić I. Physicochemical characteristics and stability of oil-in-water emulsions stabilized by OSA starch. Food Hydrocolloids. 2012;29(1):185-92. doi: 10.1016/j.foodhyd.2012.02.008.
45. Liu H, Yu L, Chen L, Li L. Retrogradation of corn starch after thermal treatment at different temperatures. Carbohydrate polymers. 2007;69(4):756-62.
46. Walstra P. Principles of emulsion formation. Chemical Engineering Science. 1993;48(2):333-49. 47. Walstra P. 8 Emulsions. Fundamentals of interface and colloid science. 2005;5:1-94.

20 Paper V
Supporting information
S1 FIG. Microscope images of emulsions.
Day 0
Day 1
Day 7
Day 14
Day 21
Day 28
Day 35
Day 42
Day 0
Day 1
Day 7
Day 14
Day 21
Day 28
Day 35
Day 42

Paper VI


Paper VI 1
Characterization of non-solvent precipitated starch using AF4 coupled with multiple
detectors
Catalina Fuentesa,b*, Hisfazilah Saaria, Jaeyeong Choic, Seungho Leec, Malin Sjööa, Marie Wahlgrena and Lars Nilssona
a Food Technology, Engineering and Nutrition, Faculty of Engineering LTH, Lund University, PO Box 124, S-221 00 Lund, Sweden.
b School of Chemistry, Faculty of Pure and Natural Sciences, San Andrés University, PO Box 303, La Paz, Bolivia
c Department of Chemistry, Hannam University, Daejeon 305811, Republic of Korea
*Corresponding author:
Catalina Fuentes, Food Technology, Lund University, P.O. Box 124, SE-22100 Lund, Sweden, Fax no. +46 46 2224622
E-mail: [email protected] (C. Fuentes)
E-mail: [email protected] (H. Saari)
E-mail: [email protected] (J. Choi)
E-mail: [email protected] (S. Lee)
E-mail: [email protected] (M. Sjöö)
E-mail: [email protected] (M. Wahlgren)
E-mail: [email protected] (L. Nilsson)

2 Paper VI
Abstract
The aim of this paper was to investigate size and molecular conformation of non-solvent precipitated starch. The non-solvent precipitated starch is a novel component for starch based emulsions. Previous studies have shown that the non-solvent precipitated starch gives particles in the nano-size range and one key question is if the starch structures obtained are different from dissolved amylopectin. Non-solvent precipitated starch was produced using ethanol precipitation of waxy maize starch granules. The granules were either unmodified (WMNSP) or acid hydrolysed (AHNSP). The non-solvent precipitated starch was also modified with 3% (w/w) OSA to increase the hydrophobicity (OSAWMNSP). The molar mass and conformation of the non-solvent precipitated starch was investigated using asymmetric flow field-flow fractionation (AF4). Prior to AF4 measurements, the non-solvent precipitated starches were re-dispersed in DMSO, aqueous solution at 100°C and aqueous solution at room temperature. This was in order to study possible changes in the size, molar mass, apparent density and conformation induced by different dissolution methods. The results show that molar mass, size and density depend on the type of starch samples studied with the molar mass decreasing in the order of WMNSP>OSAWMNSP>AHNSP. It was also showed that the acid hydrolyzed and OSA-modified samples where most likely dissolved after 1 hour of dissolution in water at room temperature while the non-acid hydrolyzed waxy maize sample still have a different AF4 profile compared to the same material dissolved in DMSO. The results show that we observe different conformation between the samples when they are re-solubilized in aqueous solution at room temperature.
Keywords: starch nanoparticles, size, molar mass, conformation

Paper VI 3
Introduction
Starch is the principal carbohydrate reserve in plants. It is a major source of energy in human diet, animal feed and has many applications in industry. It often contributes to characteristic properties of foods, and is added as a functional ingredient in many products. Non-solvent precipitation of dissolved starch has been claimed to generate starch nanoparticles. Such particles could have several interesting uses, one of these are as stabilizer of Pickering emulsions. In a previous study, we have investigated the stabilization of emulsions using octenyl succinic anhydride (OSA)-modified non-solvent precipitated waxy maize starch and compered this to OSA modified dissolved starch and granules [1]. It was seen that the non-solvent precipitated starch gave emulsions that were more stable towards coalescence than OSA-modified dissolved starch and granules. The question is to what extent especially the non-solvent precipitated starch and the dissolved starch differs. This is one of the main question for the study presented in this paper.
There is a large interest in producing nanostructures from starch as starch is a green renewable source of material and, as described in some recent reviews, there are several methods to obtain starch nanoparticles and the method used will affect the structure of the obtained particles for example if they are crystalline or amorphous [2, 3]. Nano starch can be prepared principally in three different ways: i) hydrolysis, either acidic or enzymatic, leads to nanocrystals, ii) from solution through a precipitation step which can give both amorphous and crystalline particles and iii) mechanical treatment such as microfluidizer leads to so called nano-colloids [4]. The method used in this study is non-solvent precipitation by mixing a starch water solution with a non-solvent in this case ethanol [1]. To obtain starch non-solvent precipitated starch the first step consists on dissolving the starch granules completely. During this process, the granules are disintegrating and inter and intramolecular hydrogen bonds are disrupted thereby destroying the crystalline structure of the granule and leaving only the amorphous region. Then new smaller particles are re-created by precipitation through the addition of a non-solvent such as ethanol. There has been extensive work done on methods to produce non-solvent precipitated starch or as also commonly describes as nanoprecipitation [5-13]. The size range reported for these starch nanoparticles are around 10-400 nm. The obtained structures reported both include crystalline and amorphous particles. The size range reported is interesting since the hydrodynamic radius of amylopectin from waxy maize starch is in the range of 140-175 nm depending on method for characterisation and dissolution media and method [14, 15].
AF4 has been used to determine the size, molar mass and conformation of the starch nanoparticles (NPs) during their preparation process [16-18] as well as to determine the molar mass and size of starch [14, 19, 20]. As mention above, most of the research work was focused on nano-starch characterization as final product in dried samples or during preparation; however, there is a lack of information about the behaviour of starch NPs when they are re-dispersed in an aqueous environment. Therefore, the present study has the purpose to investigate the effect on size, molar mass, apparent density (ρapp) and conformation of different re–solubilized procedures for starch nanoparticles (NPs) using AF4 couplepd with multiple detectors.

4 Paper VI
Material and methods
Materials
Waxy maize (WM) starch was supplied by Lyckeby Culinar AB (Lyckeby Culinar AB, Malmö, Sweden), n-octenyl succinic anhydride (OSA) from Trigon Chemie (TRIGON ChemieGmbH, Hesse, Germany), dimethyl sulfoxide from VWR chemicals (DMSO ≥ 99.5%,VWR, Leuven, Belgium), ethanol from Sigma Aldrich (C2H5OH 99%, Sigma Aldrich, MO, USA), NaOH from Merk (Frankfurter, Germany), HCl from VWR chemicals (Leuven, Belgium), NaNO3 from AppliChem (A3125, Darmstadt, Germany) and NaN3 from BDH (10369, Poole, UK).
Production of precipitate starch nanoparticle
The experiments were performed on three different types of starch NPs shown in Table 1.
Table 1 Overview of samples
Samples Sample ID
Acid Hydrolysed non-solvent Precipitate AHNSP
Waxy Maize non-solvent precipitate WMNSP
OSA Modified Waxy Maize non-solvent Precipitate OSAWMNSP
The WMNSP sample was produced using an optimized method developed previously [1]. The method can be briefly summarized as follows: WM starch was dispersed in Milli-Q water, with a concentration of 8 mg/mL and autoclaving at 140 °C for 20 min in the presence of N2 in a laboratory autoclave (Roth Model II, 200ml, Karlsruhe, Germany) coupled with a temperature control unit. In order to precipitate the starch, ethanol was added in a ratio of 1:1 and mixed. The particles were obtained by batch-wise centrifugation at 2000 g for 10 min, and all batches were pooled. The collected particles were left in the fume hood overnight to allow the ethanol to evaporate completely. The precipitated starches were then frozen at -20 °C overnight, and freeze-dried in a Hetosicc freeze-dryer (Heto, Birkerød, Denmark), over a period of 4 - 5 days.
The AHNSP sample was prepared in similar as above with the addition of an acid pre-treatment. The procedure was performed as described elsewhere [21] with slight modifications. 50 g of WM starch was dispersed in 250 ml of HCl (1 M) with continuous stirring (200 rpm) at 40 °C for 120 minutes. The dispersion was neutralized to pH 5.5 with NaOH (1 M). The suspension was washed three times with Milli-Q water followed by centrifugation at 3500 rpm for 10 min. The precipitated solids were air-dried at room temperature for 3 days.
In order to produce an OSAWMNSP sample, a portion of the wet WMNSP obtained as described above, was modified with OSA. Modification was performed using 3% (w/w) OSA based on the dry weight of the starch WMNSP and the degree of OSA substitution was analysed. The procedure used for the modification was described previously [22]. The method can be briefly summarized as follows: WM starch was dispersed with continues stirring in 1.5 times of the distilled water (w/w) based on dry weight starch. The pH was keep between 7.4 - 7.8 and adjusted with HCl (1M), or NaOH (1M). Then OSA (Ziyun Chemicals, China) was added in four portions with a 15 minutes delay between each portion. The titration was terminated when the pH was stable for at least 15 min. The suspension was then, centrifuged at 3500 rpm for 10 min. The

Paper VI 5
supernatant was discarded and washed, once with citric acid (pH 4.5–5), and once more with distilled water. The starch was freeze-dried.
The degree of OSA substitution was carried out in duplicate as is described as follow: 2.5 g of OSAWMNSP and a control sample were weight and wetted with few drops of ethanol then 25 mL of HCl (1M) was added and stirred for 30 min. The suspension was centrifuged at 3500 rpm for 10 min. The supernatant was discarded and washed with 25 mL of ethanol once and twice with distilled water. The residue was dissolved in 150 mL distilled water, heated in a bath at 90 °C for 10 min, and then rapidly cooled to 25 °C in an ice bath. The suspension was titrated while stirring with NaOH (0.1M) until pH 8.2. The volume of NaOH was used for calculation of % OSA substitution using the follow equation. % = · · · 100 (1)
Where V is volume of NaOH, M is concentration of NaOH, 210 is the molar mass (g/mol) of octenyl succinate anhydride group (OSA) and w is the dry weight of sample. The level of OSA substitution was about 2.0 %.
Chemical analysis of starch nanoparticle samples
Moisture content was determined using a moisture analyzer (MAC 110/WH, Radwag, Radom, Poland). Total starch content was determined enzymatically using a commercial kit for total starch analysis (Megazyme amyloglucosidase/ α-amylase, Megazyme International, Bray, Ireland) subtracting the free glucose value.
Total protein content was determined by measuring nitrogen content using the elemental analyzer Flash EA 1112 N (Thermo Fisher Scientific, Waltham, MA, USA). The sample (25 - 32 mg) was combusted in a sealed furnace and the nitrogen content was determined with thermal conductivity detection. Aspartic acid was used as standard. Nitrogen to protein factor of 6.25 was used in the calculations. Each analysis was made in triplicate.
Thermal properties
The thermal properties were determined by using differential scanning calorimetry (DSC 6200, Seiko instruments Inc., Japan). The samples (20 mg) were weighed into a small tube, and MilliQ water (60 µL) was added in a 1:3 (w/w) ratio and left for 1 hour to equilibrate. Approx. 8 mg of these mixtures were weighed into an aluminium pan and lid (TA Instruments, Newcastle, Delaware, USA) using a micro balance (CAHN, C-30, Samotronic Microbalance, USA). The pan was hermetically sealed. Analyses were performed over a temperature range of 10 – 160 °C with a scanning rate of 10 °C/min with an empty sealed pan as reference. Thermo-gravimetric curves were recorded on the Exstar 6000 Thermal Analyses System equipped with the Muse Standard Analysis software, version 6.4 (SII Nano Technology Inc., Chiba, Japan).
Samples preparation for AF4
The samples were treated in three different ways i) dissolution at 100 °C in DMSO, ii) dissolution through boiling in aqueous media (carrier liquid) and iii) dispersion at room temperature in aqueous media (carrier liquid).

6 Paper VI
The samples in DMSO were prepared as described elsewhere [19] with modifications from [23]. When using aqueous media, samples (1 mg/mL) were heated at 100 °C (boiling) for 1 hour with continuous stirring. The aqueous sample solutions at room temperature were obtained by dispersing the sample (1 mg/mL) for 1 hour with continuous stirring. All samples, including the DMSO dissolved sample, were diluted to a final concentration of 0.25 g/mL using the aqueous media. The composition of aqueous solution was 10mM NaNO3 and 0.02 % NaN3 dissolved in Milli–Q water.
In addition, the filtration effect before injected the sample onto the AF4 system, was investigated using cellulose acetate filters (VWR Syringe Filter, 25 mm diameter, Leuven, Belgium) with different pore sizes: 1.2, 0.45, 0.2 and 0.1 µm. The radius, molar mass, apparent density and mass recovery, were investigated by injecting the unfiltered sample
AF4-MALS-dRI and online DLS
The samples were separated using an AF4 system (Eclipse 3+, Wyatt Technology, Dernbach, Germany) and characterized using online multiangle light scattering (MALS, Dawn Heleos II, Wyatt Technology) and differential refractive index (dRI) detection (Wyatt Technology). Both detectors operated at a wavelength of 658 nm.
An Agilent 1100 series isocratic pump (Agilent Technologies, Waldbronn, Germany) with an in-line vacuum degasser and an Agilent 1100 series auto-sampler delivered the carrier flow and handled sample injection onto the AF4 separation channel. Between the pump and the channel, a 100 nm pore size polyvinylidene fluoride membrane (Millipore Corp., Bedford, MA, USA) was placed to ensure that particle-free carrier entered the separation channel.
The AF4 channel was a short channel (Wyatt Technology, Dernbach, Germany) with trapezoidal geometry (tip-to-tip length of 17.4 cm and inlet and outlet widths of 2.17 and 0.37 cm, respectively) and with a nominal thickness of 350 µm. The ultra-filtration membrane forming the accumulation wall was made of regenerated cellulose (RC) with a cut-off of 10 kDa (Merck KGaA, Darmstadt, Germany).
Validation of the performance of the AF4 system and experimental determination of the channel thickness was carried out with bromophenol blue (BPB) and bovine serum albumin (BSA) (Sigma, A4378, St, Lois, MO, USA) (1 mg/mL, w/v) according to the procedure described in literature [24], using a MATLAB-based software (FFFHydRad 2.2) [25, 26]. The channel height was experimentally determined to 266 µm.
The separation method applied used a constant detector flow of 1 mL/min. Injection onto the channel was performed with a flow rate of 0.2 mL/min for 6 min. The sample volume injected onto the channel was between 5 - 80 µl for an injected sample mass of approximately 1.25 – 20 µg. The injected amount was optimized in order to ensure no overloading occurred i.e. retention time independence of the injected amount. After injection, a 4 minutes focusing/relaxation step prior to elution with a focus flow identical to the initial cross flow was performed. The cross-flow rate was programmed to decay exponentially using the following equation
= 0 / (2)
where Qc (t) is the crossflow rate as a function of time t after elution starts, Qc (0) is the initial crossflow rate and t1/2 is the half-life of the decay. For all samples, the elution started with an initial cross-flow of 2.5 mL/min and decreased exponentially over time to 0.13 mL/min, with t1/2

Paper VI 7
= 4 min, and then kept constant for 22 min. Finally, the channel was flushed without any cross-flow for 11 min before the next analysis.
Data was recorded using Astra software version 6.1.5.22 (Wyatt Technology). Molar mass (M) and root mean square radius (rrms) were obtained using the Berry method [27, 28] by performing a 1st order fit to the data obtained from the scattering detectors 8 – 17 (angles 60.0° - 152.5°), second virial coefficient (A2) was neglected. The specific refractive index (dn/dc) of 0.146 was used for amylopectin in water [29]. The apparent density (ρapp) were calculated from M and rrms [30], whereas the radius of hydration (rh ) was calculated using the MATLAB add-on FFFHydRad 2.2.
In order to run the samples with an online DLS detector, an Eclipse 2 separation system (Wyatt Technology) was used coupled with a DAWN EOS MALS detector (Wyatt technology) operating at the wavelength of 690 nm. The MALS detector 13 (i.e. 110.7°) was connected to the DLS apparatus (DynaPro NanoStar, Wyatt Technology) via a glass fibre. For this experiment, the channel height was determined to 258 µm.
Results and discussion
Chemical analysis of starch nanoparticle samples
The results from moisture content, total starch and total protein analyses are shown in Table 2. The moisture content in all samples were similar (11 - 13%). Total starch content ranges between 91 and 95%, with sample WMNSP having the highest value and WM the lowest. It is possible that, due to the addition of ethanol into the WM solution during the precipitation step, impurities were removed which could be reflected in slightly a higher starch content compared to the WM sample. In the case of AHNSP, the hydrolysis applied could affect the total starch content due to the formation of low molecular weight sugars and this could as discussed later also be the case for OSAWMNSP. Another reason for a lower starch content in OSAWMNSP sample is that OSA modification as the substituents could interfere somewhat with the enzymatic degradation to glucose. The protein content of starch NPs was similar (0.12 - 0.15%), but a bit higher than for WM. These results agree with the suggestion above that some impurities are removed during the precipitation step.
Table 2 Results obtained for moisture content, total starch, total protein
Sample Moisture (%) Total starch (%) Total protein (%)
AHNSP 13.1 ± 0.7 93.7 ± 0.7 0.13 ± 0.00
WMNSP 12.9 ± 0.9 95.1 ± 0.6 0.12 ± 0.00
OSAWMNSP 12.1 ± 1.1 89.9 ± 0.7 0.15 ± 0.01
WM 11.1 ± 1.6 90.9 ± 1.4 0.07 ± 0.03
a Values reported on dry basis, ± standard error of the mean
Thermal transition properties
The results of the DSC analysis for WM sample were as follows: onset temperature (To) = 64.1 ± 1°C, peak temperature (Tp) = 70.0 ± 0.5°C, conclusion temperature (Tc) = 75.6 ± 1.4°C and
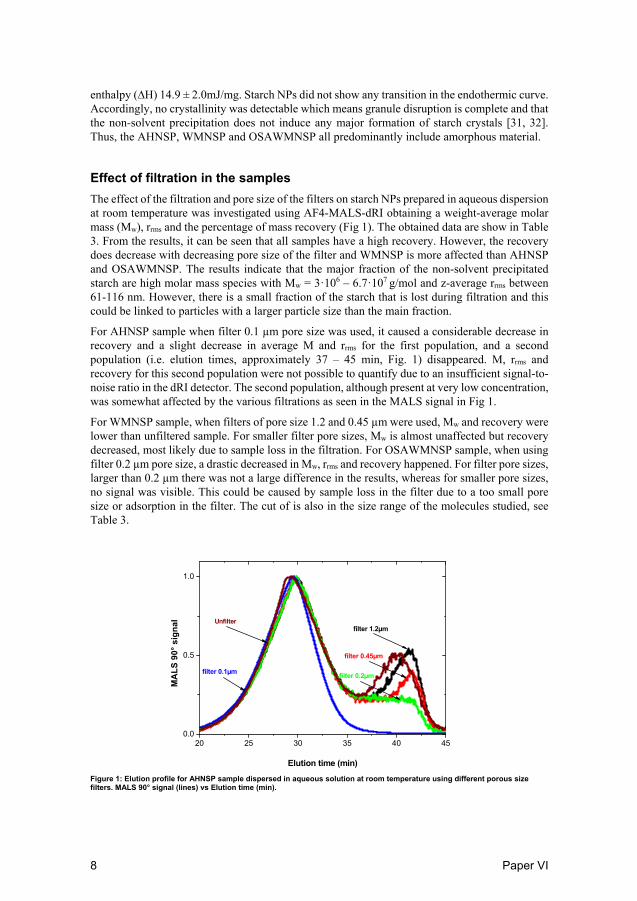
8 Paper VI
enthalpy (∆H) 14.9 ± 2.0mJ/mg. Starch NPs did not show any transition in the endothermic curve. Accordingly, no crystallinity was detectable which means granule disruption is complete and that the non-solvent precipitation does not induce any major formation of starch crystals [31, 32]. Thus, the AHNSP, WMNSP and OSAWMNSP all predominantly include amorphous material.
Effect of filtration in the samples
The effect of the filtration and pore size of the filters on starch NPs prepared in aqueous dispersion at room temperature was investigated using AF4-MALS-dRI obtaining a weight-average molar mass (Mw), rrms and the percentage of mass recovery (Fig 1). The obtained data are show in Table 3. From the results, it can be seen that all samples have a high recovery. However, the recovery does decrease with decreasing pore size of the filter and WMNSP is more affected than AHNSP and OSAWMNSP. The results indicate that the major fraction of the non-solvent precipitated starch are high molar mass species with Mw = 3·106 – 6.7·107 g/mol and z-average rrms between 61-116 nm. However, there is a small fraction of the starch that is lost during filtration and this could be linked to particles with a larger particle size than the main fraction.
For AHNSP sample when filter 0.1 µm pore size was used, it caused a considerable decrease in recovery and a slight decrease in average M and rrms for the first population, and a second population (i.e. elution times, approximately 37 – 45 min, Fig. 1) disappeared. M, rrms and recovery for this second population were not possible to quantify due to an insufficient signal-to-noise ratio in the dRI detector. The second population, although present at very low concentration, was somewhat affected by the various filtrations as seen in the MALS signal in Fig 1.
For WMNSP sample, when filters of pore size 1.2 and 0.45 µm were used, Mw and recovery were lower than unfiltered sample. For smaller filter pore sizes, Mw is almost unaffected but recovery decreased, most likely due to sample loss in the filtration. For OSAWMNSP sample, when using filter 0.2 µm pore size, a drastic decreased in Mw, rrms and recovery happened. For filter pore sizes, larger than 0.2 µm there was not a large difference in the results, whereas for smaller pore sizes, no signal was visible. This could be caused by sample loss in the filter due to a too small pore size or adsorption in the filter. The cut of is also in the size range of the molecules studied, see Table 3.
20 25 30 35 40 450.0
0.5
1.0
filter 0.2µm
filter 0.45µm
filter 1.2µm
filter 0.1µm
MA
LS
90°
sig
na
l
Elution time (min)
Unfilter
Figure 1: Elution profile for AHNSP sample dispersed in aqueous solution at room temperature using different porous size filters. MALS 90° signal (lines) vs Elution time (min).

Paper VI 9
Table 3 Average values obtained from AF4-MALS-dRI with different porous size filter for AHNSP, WMNSP and OSAWMNSP disperse in aqueous solution a
Filter porous size (µm)
AHNSP WMNSP OSAWMNSP
Mw·107 (g/mol)
rrms
(nm)
Recovery (%)b
Mw·107 (g/mol)
rrms
(nm)
Recovery (%)b
Mw·107 (g/mol)
rrms
(nm)
Recovery (%)b
Unfiltered 2.2 70 92 6.7 116 85 4.5 101 96
Filter 1.2 2.2 69 91 5.5 113 81 4.4 110 97
Filter 0.45 2.2 69 89 4.7 114 79 4.4 105 97
Filter 0.2 2.1 69 90 4.7 112 66 0.3 65 32
Filter 0.1 2.0 61 45 4.4 100 52 - - -
a Mw is the average molar mass, rrms z-averages root-mean-square radius.
b The mass recovery was determined from the ratio of the mass eluted from the separation channel (integration of the dRI signal taking the complete peak) to the injected mass (based on the analysed starch content of the sample)
Effect of the sample preparation procedure in molar mass, size, and apparent density
AF4 fractograms of the samples after the 1 hour of dissolution/dispersion in the chosen solvent are shown in Fig 2A–C and the rrms and molar mass is presented in Table 4. From the result, it showns that all samples have high M species with Mw from 3•106 g/mol to 1.2 • 108 g/mol, z-average rrms between 38 - 148 nm and recoveries are equal or higher than 85%. It can be seen that the sample preparation methods do not to any larger extent change the fractograms for AHNSP and OSAWMNSP, but that the samples dispersed in water at room temperature for WMNSP is distinctly different from the ones that have gone through a more intense dissolution procedure. It is in our experience that the DMSO method will dissolve the starch samples and thus give difference in the molar mass and size of dissolved molecules [19]. Thus, difference from the DMSO samples indicates aggregation and maybe some particles formation. Thus 1 hour is enough to dissolve the AHNSP and OSAWMNSP in water solutions but not to fully dissolve the WMNSP. This does not rule out that at shorter times of dissolution which is often used in emulsification there are still particles present in the other samples. The acid hydrolysis had been conducted to see if this favored particle formation and especially if it favored crystalline formation as this has been seen to be the case for larger micro particles [33]. As can be seen this was not the case for the conditions used to produce these non-solvent precipitated particles.

10 Paper VI
20 25 30 35 40 450.0
0.4
0.8
1.2
Time (min)
0.0
0.4
0.8
1.2
(A)
Dif
fere
nti
al r
efr
act
ive
ind
ex
Ray
leig
h r
atio
20 25 30 35 40 45
50
100
150
200
250
rrm
s (nm
)
20 25 30 35 40 450.0
0.4
0.8
1.2
Time (min)
0.0
0.4
0.8
1.2
(B)
Dif
fere
nti
al r
efr
ac
tiv
e in
de
x
Ra
yle
igh
ra
tio
20 25 30 35 40 45
50
100
150
200
250
300
rrm
s (nm
)
20 25 30 35 40 450.0
0.4
0.8
1.2
Time (min)
0.0
0.4
0.8
1.2
(C)
Dif
fere
nti
al r
efr
act
ive
ind
ex
Ra
ylei
gh
ra
tio
20 25 30 35 40 45
50
100
150
200
rrm
s (nm
)
Figure 2: Fractograms from AF4 showing root-mean-squeare radius (rrms), MALS-signal at 90¤ scattering angle, dRI-signal vs Elution time of AHNSP (A), WMNSP (B) and OSAWMNSP (C) samples considering different preparation method after the first hour. Samples illustrated in the plots; sample dispersed in aquous solution at room temperature (Red), dissolved in DMSO (Blue) and boiling in aquous solution (Green) respectively.

Paper VI 11
For AHNSP sample, after an hour of preparation shows a slight decreased in rrms distribution as well as a second population in aqueous solution at room temperature (see Fig 2B). This second population at longer retention times (i.e. elution times, approximately 37 – 45 min) could corresponds to either a relatively dense starch nanoparticles or an aggregated structures. but the concentration in the population is very low. The aggregate formation was also observed in other studies [31, 34]. On the other hand, the recovery value in DMSO is higher (97%) which may be an indicator that the entire sample was dissolved. The acid hydrolysis has as expected decreases the molar mass and the size of the molecules.
For WMNSP sample, when was prepared in aqueous solution at room temperature, after 1 hour of preparation showed a considerable decreased in M and rrms distribution (see Fig 2B, Table 4). In addition, the recovery varies between preparation procedures, being lower at room temperature (85%) and higher in DMSO (95%) having a loss of about 10%. Considering that the sample was completely dissolve in DMSO, it could be possible that some materials (possibly larger molecules or particles because the M is also lower), were immobilized at the accumulation wall and then eluted as a release peak when the crossflow is turn off. However, a release peak was not observed. The WMNSP still have the highest starch molar mass of the three investigated systems and the molar mass is in line with what have previously been reported for amylopectin from waxy maize [14, 15]. Thus, it is likely that the nanoprecipitation method does not to a larger extent changes the size range of molecules in the nanoprecipitate compared to the native starch. It can also be noted that the small particle size observed for precipitated waxy maize is in line with what has been seen by others [7]. The comparison with WMNSP dissolved with DMSO shows that the nanoprecipitate and dissolved molecules are in the same size range but still have quite different AF4 profiles.
In OSAWMNSP sample, the molar mass has been reduced compared to WMNSP (see Fig 2C and Table 4). In addition, the recovery value in boiling aqueous solution is slight low (92 %) than in the other preparation procedures (96 %). Those results are in contrast to the ones reported by Jiang, S et al [35] who found that OSA starch nanoparticles from Taro increased after modification with OSA as measured by DLS. This could be due to that OSA-modification of the WMNSP particles could have induced some hydrolyses of the starch as acid is used in the OSA-modification procedure. This have produced a dry non-solvent precipitated powder that are easier dissolved than the non-OSA modified WMNSP.
Table 4 Average values obtained from AF4-MALS-dRI with different methods of preparation for AHNSP, WMNSP and OSAWMNSP
Sample Mw·107 (g/mol)
rrms
(nm) ρapp
(kg/m3) Recovery (%)b
AHNSP sample DMSO 1.8 60 21.6 97
AHNSP sample boiling aqueous solution 2.0 63 21.2 94
AHNSP sample aqueous solution at room temp. 2.2 70 16.2 92
WMNSP sample DMSO 9.4 148 7.9 95
WNMSP sample boiling aqueous solution 12.4 153 11.2 89
WMNSP sample aqueous solution at room temp. 6.7 116 8.3 85
OSAWMNSP sample DMSO 4.4 98 10.5 96
OSAWMNSP sample boiling aqueous solution 4.8 109 9.0 92
OSAWMNSP sample aqueous solution at room temp. 4.5 101 10.1 96

12 Paper VI
Conformation using hydrodynamic radius obtained from online DLS and AF4 theory
To further understand the samples’ conformational properties, samples of different starches dissolved at room temperature were investigated. A conformational parameter is given by the ratio between rrms and rh, where rh used for the calculations was obtained in two different ways: online DLS and applying AF4 theory for calculating the values. The results are shown in Table 5. From the results, it can be seen that AHNSP sample (average rrms/rh = 0.70) appears to be close to a homogeneous spherical conformation (rrms/rh = 0.77). However, it should be noted that the value of 0.7 may also correspond to an object with microgel properties [24]. This is in line with the work of Juna et al who describes amylopectin as a compact, spherical structure [14] but a lower value compared to the ratio of around 1.2 measured by Roger et al [36] for corn amylopectin. It has been seen that acid hydrolysis have an impact on the structure of waxy maize amylopectin making the chain length distribution more narrow compared to native waxy maize with chain lengths with a degree of polymerization between 13-33 being the more dominating species [37]. This could of course also influence the conformation of the molecule.
The results for OSAWMNSP sample (average rrms/rh = 1.43) is a bit imprecise because when the comparison means test was done in the values obtained by online DLS and AF4 theory were significantly different. Nevertheless, the test with 0.01 significance level result in not significance difference from the statistical point of view. For that, it is important to consider when online DLS is used some challenges could be present. High concentration of the sample is typically required to obtain reliable scattering data. Furthermore, for large molecules, the diffusion is slow and the residence time in the measurement cell may be too low for adequate data collection and a stop – flow measurement could be necessary [38]. However, these deviations do not appear for the other samples where the agreement between the different methods is good. The conformation value for OSAWMNSP is in the range of starch [24] which could be mean that is more like hyper-branched polymer such as amylopectin with a typical values of 1.02 – 1.29 [36]. This indicates that the OSAWMNSP probably is dissolved into individual amylopectin molecules during the time used for dissolution.
For WMNSP sample (average rrms/rh = 2.06) which indicates that this structure differs seems that the conformation is substantially more elongated [39]. Thus, the structure is not the same as for dissolved amylopectin molecules even if the molecular size range is in the same range. This means that there is a structural change in non-solvent precipitated that still exist after 1 hour of dispersion in water at room temperature. This cannot be due to a preferential precipitation of starch having a very different molecular structure compared to the waxy maize amylopectin as the OSAWMNSP does not display this high average ratio and the OSAWMNSP are produced from WMNSP.

Paper VI 13
Table 5 Average values of rrms, hydrodynamic radius and calculated values for the quotient rrms/rh obtained from online DLS, AF4 theory and batch DLS a
Conclusion
In this study, three different non-solvent precipitated waxy maize starches were studied and it was found that they differed in molar mass and behavior upon dissolution in different media. These changes depend on the treatment of starch used (acid hydrolyzed or not) as well as post non-solvent precipitation OSA modification. All the three non-solvent precipitated materials where amorphous. The acid hydrolyzed and OSA-modified samples where most likely dissolved after 1 hour of dissolution in water at room temperature while the non-acid hydrolyzed waxy maize sample still have a different AF4 profile compared to the same material dissolved in DMSO. The results show that we observe different conformations between the samples when they are re-solubilized in aqueous solution at room temperature.
Acknowledgements
The present study was supported by the Swedish International Development Agency (SIDA/SAREC) in a collaborative project between the Higher University of San Andres UMSA (Bolivia) and Lund University (Sweden), National Research Foundation (NRF) of Korea (NRF-2013K2A3A1000086, NRF-2016R1A2B012105) and the Swedish Foundation for International Cooperation in Research and Higher Education (STINT).
We want to thank Dorine Vataire and Claudi Zielke, for the help during the preparation of OSAWMNSP sample.
References
1. Saari, H., et al., Production of starch nanoparticles by dissolution and non-solvent precipitation for use in food-grade Pickering emulsions. Carbohydrate Polymers, 2017. 157: p. 558-566.
2. Ali Razavi, S.M. and A.M. Amini, Starch nanomaterials: a state-of-the-art review and future trends, in Novel Approaches of Nanotechnology in Food. 2016, Academic Press. p. 237-269.
3. Kim, H.Y., S.S. Park, and S.T. Lim, Preparation, characterization and utilization of starch nanoparticles. Colloids Surf B Biointerfaces, 2015. 126: p. 607-20.
4. Le Corre, D., J. Bras, and A. Dufresne, Starch Nanoparticles: A Review. Biomacromolecules, 2010. 11(5): p. 1139-1153.
Sample rrms (nm) online DLS AF4 theory
rh (nm) rrms/rh b rh (nm) rrms/rh b
AHNSP 57 ± 0.2 80± 5.7 0.73 ± 0.10 86 ± 4.7 0.67 ± 0.10
WMNSP 167 ± 6.1 79± 3.7 2.10 ± 0.30 82 ± 0.1 2.03 ± 0.10
OSAWMNSP 117 ± 1.5 73 ± 3.5 1.57 ± 0.10 88 ± 0.8 1.29 ± 0.10
a Values include standard error of the mean (±) based on three replicates b According to comparison means test at 5% (critical value tratio = 2.78, P = 0.05), OSAWMNSP (tOSAWMNSP = 3.55) was significant difference, AHNSP (tAHNSP = 0.81) and WMNSP (tWMNSP = 0.94) were not significant difference Otherwise, OSAWMNSP was not significant difference at 1% (critical value tratio = 4.6, P = 0.01) based on triplicate analysis.

14 Paper VI
5. Chang, Y., et al., Influence of ultrasonic treatment on formation of amylose nanoparticles prepared by nanoprecipitation. Carbohydrate Polymers, 2017. 157: p. 1413-1418.
6. Chin, S.F., S.C. Pang, and S.H. Tay, Size controlled synthesis of starch nanoparticles by a simple nanoprecipitation method. Carbohydrate Polymers, 2011. 86(4): p. 1817-1819.
7. Qin, Y., et al., Characterization of starch nanoparticles prepared by nanoprecipitation: Influence of amylose content and starch type. Industrial Crops and Products, 2016. 87: p. 182-190.
8. Qiu, C., et al., Preparation and characterization of size-controlled starch nanoparticles based on short linear chains from debranched waxy corn starch. LWT - Food Science and Technology, 2016. 74: p. 303-310.
9. Sadeghi, R., et al., Effects of starch composition and type of non-solvent on the formation of starch nanoparticles and improvement of curcumin stability in aqueous media. Journal of Cereal Science, 2017. 76: p. 122-130.
10. Tan, Y., et al., Fabrication of size-controlled starch-based nanospheres by nanoprecipitation. ACS Applied Materials and Interfaces, 2009. 1(4): p. 956-959.
11. Tan, Y., et al., Fabrication of starch-based nanospheres to stabilize pickering emulsion. Carbohydrate Polymers, 2012. 88(4): p. 1358-1363.
12. Uzun, S. and J.L. Kokini. Preparation and characterization of starch nanoparticles by desolvation method. in Technical Proceedings of the 2014 NSTI Nanotechnology Conference and Expo, NSTI-Nanotech 2014. 2014.
13. Wu, X., et al., Effects of non-solvent and starch solution on formation of starch nanoparticles by nanoprecipitation. Starch/Staerke, 2016. 68(3-4): p. 258-263.
14. Juna, S., P.A. Williams, and S. Davies, Determination of molecular mass distribution of amylopectin using asymmetrical flow field-flow fractionation. Carbohydrate Polymers, 2011. 83(3): p. 1384-1396.
15. Naguleswaran, S., et al., Molecular characterisation of waxy corn and barley starches in different solvent systems as revealed by MALLS. Food Chemistry, 2014. 152: p. 297-299.
16. Juna, S., et al., Treatment of wx corn starch dispersions in a microwave reactor and their hydrodynamic properties determined using asymmetrical flow field-flow fractionation. Starch/Staerke, 2012. 64(8): p. 652-656.
17. Juna, S. and A. Huber, Formation of nano‐ and micro‐structures of various botanical sources of native starches investigated employing asymmetrical flow field‐flow fractionation. Starch ‐ Stärke, 2013. 65(11-12): p. 1029-1037.
18. Juna, S., et al., Microwave mediated preparation of nanoparticles from wx corn starch employing nanoprecipitation. Starch/Staerke, 2014. 66(3-4): p. 316-325.
19. Perez-Rea, D., B. Bergenståhl, and L. Nilsson, Development and evaluation of methods for starch dissolution using asymmetrical flow field-flow fractionation. Part I: Dissolution of amylopectin. Analytical & Bioanalytical Chemistry, 2015. 407(15): p. 4315-4326.
20. Van Bruijnsvoort, M., et al., Retention behavior of amylopectins in asymmetrical flow field-flow fractionation studied by multi-angle light scattering detection. Journal of Chromatography A, 2001. 925: p. 171-182.
21. Wang, Y.-J., V.-D. Truong, and L. Wang, Structures and rheological properties of corn starch as affected by acid hydrolysis. Carbohydrate Polymers, 2003. 52(3): p. 327-333.
22. Saari, H., et al., Preparation and Characterization of Starch Particles for Use in Pickering Emulsions. Cereal Chemistry Journal, 2015. 93(2): p. 116-124.
23. Fuentes, C., et al., The effect of baking and enzymatic treatment on the structural properties of wheat starch. Food Chemistry, 2016. 213: p. 768-774.
24. Nilsson, L., Separation and characterization of food macromolecules using field-flow fractionation: A review. Food Hydrocolloids, 2013. 30(1): p. 1-11.
25. Håkansson, A., et al., Hydrodynamic radius determination with asymmetrical flow field-flow fractionation using decaying cross-flows. Part I. A theoretical approach. Journal of Chromatography A, 2012. 1253(0): p. 120-126.

Paper VI 15
26. Magnusson, E., et al., Hydrodynamic radius determination with asymmetrical flow field-flow fractionation using decaying cross-flows. Part II. Experimental evaluation. Journal of Chromatography A, 2012. 1253: p. 127-133.
27. Berry, G.C., Thermodynamic and Conformational Properties of Polystyrene. I. Light‐Scattering Studies on Dilute Solutions of Linear Polystyrenes. The Journal of Chemical Physics, 1966. 44(12): p. 4550-4564.
28. Andersson, M., B. Wittgren, and K.-G. Wahlund, Accuracy in Multiangle Light Scattering Measurements for Molar Mass and Radius Estimations. Model Calculations and Experiments. Analytical Chemistry, 2003. 75(16): p. 4279-4291.
29. Brandrup, J., E.H. Immergut, and E.A. Grulke, Polymer handbook. A Wiley-Interscience publication. 1999: New York : Wiley, cop. 1999, 4. ed.
30. Nilsson, L., et al., Mechanical Degradation and Changes in Conformation of Hydrophobically Modified Starch. Biomacromolecules, 2006. 7(9): p. 2671-2679.
31. Kim, H.Y., et al., Characterization of nanoparticles prepared by acid hydrolysis of various starches. Starch / Stärke, 2012. 64(5): p. 367.
32. Xiaofei, M., et al., Fabrication and Characterization of Citric Acid-Modified Starch Nanoparticles/Plasticized-Starch Composites. Biomacromolecules, 2008. 9(11): p. 3314-3320.
33. Elfstrand, L., A.C. Eliasson, and M. Wahlgren, The effect of starch material, encapsulated protein and production conditions on the protein release from starch microspheres. Journal of pharmaceutical sciences, 2009. 98(10): p. 3802-3815.
34. Chakraborty, S., et al., Solution properties of starch nanoparticles in water and DMSO as studied by dynamic light scattering. Carbohydrate Polymers, 2005. 60(4): p. 475-481.
35. Jiang, S., et al., Preparation and Characterization of Octenyl Succinic Anhydride Modified Taro Starch Nanoparticles. PLOS ONE, 2016. 11(2): p. 1-11.
36. Roger, P. and P. Colonna, The influence of chain length on the hydrodynamic behaviour of amylose. Carbohydrate Research, 1992. 227: p. 73-83.
37. Miao, M., et al., Impact of mild acid hydrolysis on structure and digestion properties of waxy maize starch. Food Chemistry, 2011. 126(2): p. 506-513.
38. Bertoft, E. and L. Nilsson, Chapter 9 Starch: Analytical and Structural Aspects, in Carbohydrates in Food. 2016, CRC Press Taylor & Francis Group. p. 377-478.
39. Hansen, S., Translational friction coefficients for cylinders of arbitrary axial ratios estimated by Monte Carlo simulation. Journal of Chemical Physics, 2004. 121(18): p. 9111-9115.


HISFA
ZILAH
SAA
RI
Starch stabilized Pickering em
ulsions – Colloidal starch particles and their effects on em
ulsion properties
9789174
225365Lund University
Faculty of EngineeringDepartment of Food Technology,
Engineering and Nutrition ISBN 978-91-7422-536-5
Starch stabilized Pickering emulsions Colloidal starch particles and their effects on emulsion properties
HISFAZILAH SAARI
FACULTY OF ENGINEERING | LUND UNIVERSITY
Hisfazilah Saari is a doctoral candidate at the Department of Food Technology, Engineering and Nutrition at Lund University. She was born and received her early education in Malaysia. In this thesis, she is investigating the functional properties of cereal starches for the application of food stabilizing products. Previously, she had 6 years working experiences in oil & fats industry in Malaysia and The Netherlands. In parallel, she had experience in protein chemistry and specializing in ingredients functionality during her MSc in Food Technology at Wageningen University, The Netherlands. From the diversity of food knowledge and combines with industrial experience, she hopes to contribute in research and development of more natural and highest quality of food products in the future.
2017
Copyright © 2022 FDOKUMEN