quaternary environmental change in the Vale of pickering, Yorkshire, England
30
Laboratory Report submitted as an integral part of the assessment of Geography Course GG2041 (Environmental Change), Department of Geography, Royal Holloway University of London, March 2014 A 7multi-proxy reconstruction of the Holocene’s environmental history in Star Carr Candidate Number: 1400342 Word Count: 4320
-
Upload
royalholloway -
Category
Documents
-
view
2 -
download
0
Transcript of quaternary environmental change in the Vale of pickering, Yorkshire, England
Laboratory Report submitted as an integral part of the assessment of Geography Course GG2041 (Environmental Change), Department of Geography, Royal Holloway University of London, March 2014
A 7multi-proxy reconstruction of the Holocene’s environmental history in StarCarr
Candidate Number: 1400342
Word Count: 4320

Abstract
A multi-proxy environmental record for the Late Glacial and early Holoceneperiod, including pollen, plant macrofossil and stratigraphy data, is describedfrom a site at the Vale of Pickering, Yorkshire, UK. The methods are outlinedand the results are described. Thereafter these are interpreted in relation toquaternary environmental change. In doing so, the processes and climaticpatterns responsible for such changes are outlined. The major changes in theenvironment are compared to wider global climate change experienced in theNorthern Hemisphere during the Holocene. Findings include a period of warmerconditions recorded shortly after the last glaciation. Thereafter, coolingtakes place at about 12,500 Cal yrs BP, probably the result of the Youngerdryas. Finally, temperatures rise again at the beginning of the Holocene(11,500 Cal yrs BP). The characteristic of the landscape including those ofPalaeolake Lake Flixton are described at each stage and connections to climateand environmental processes are made.

Contents Page
Chapter 1: Introduction p1 & 2
Chapter 2: Methodology p2 & 3
Chapter 3: Results p3-13
Chapter 4: Data interpretation p14 & 15
Chapter 5: Conclusion p16
References p17
Appendices p18

Introduction
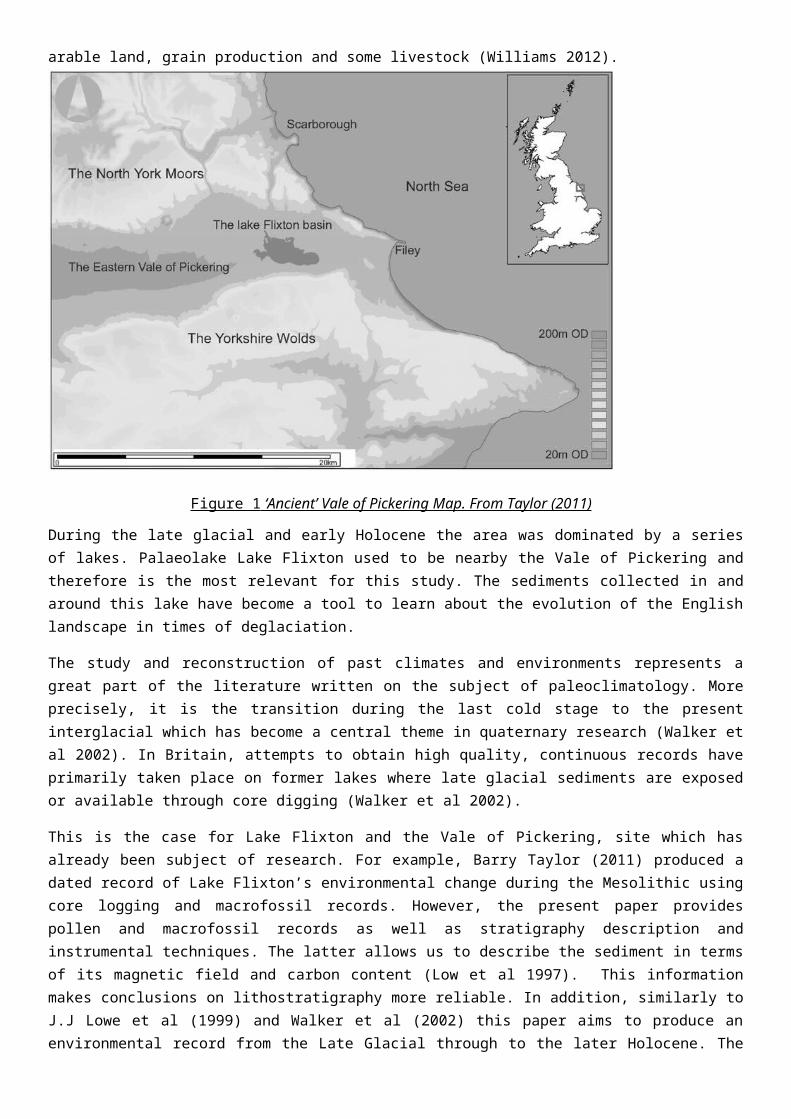
The Vale of Pickering is a gently undulating, low-lying basin renowned for thearchaeological site of Star Carr (Williams 2012). This site is of internationalsignificance for its completeness of record of human habitation. The Vale ofPickering also represents a very valuable site for the study ofpaleoclimatology. Different environmental proxies used for reconstructing pastclimates are found in the sediment stratigraphy records. This is possible dueto the exceptional preservation materials experience buried in anoxicconditions. For this reason Star Carr is very suited to study past variationsin climate and the environment.
The site of study is located in North Yorkshire, England, as can be seen in themap below. In the present day, the Vale of Pickering landscape is one of riversand wetlands which have been artificially drained for farming and for water control management purposes. This includes straightened and embanked channels,
arable land, grain production and some livestock (Williams 2012).
During the late glacial and early Holocene the area was dominated by a seriesof lakes. Palaeolake Lake Flixton used to be nearby the Vale of Pickering andtherefore is the most relevant for this study. The sediments collected in andaround this lake have become a tool to learn about the evolution of the Englishlandscape in times of deglaciation.
The study and reconstruction of past climates and environments represents agreat part of the literature written on the subject of paleoclimatology. Moreprecisely, it is the transition during the last cold stage to the presentinterglacial which has become a central theme in quaternary research (Walker etal 2002). In Britain, attempts to obtain high quality, continuous records haveprimarily taken place on former lakes where late glacial sediments are exposedor available through core digging (Walker et al 2002).
This is the case for Lake Flixton and the Vale of Pickering, site which hasalready been subject of research. For example, Barry Taylor (2011) produced adated record of Lake Flixton’s environmental change during the Mesolithic usingcore logging and macrofossil records. However, the present paper providespollen and macrofossil records as well as stratigraphy description andinstrumental techniques. The latter allows us to describe the sediment in termsof its magnetic field and carbon content (Low et al 1997). This informationmakes conclusions on lithostratigraphy more reliable. In addition, similarly toJ.J Lowe et al (1999) and Walker et al (2002) this paper aims to produce anenvironmental record from the Late Glacial through to the later Holocene. The
Figure 1 ‘Ancient’ Vale of Pickering Map. From Taylor (2011)

environmental sequence produced from Star Carr will be the tool through whichto achieve this.
The objectives of this paper are to investigate the stratigraphical record of shallow and deep lake cores, compare this data and produce a chronology for therecords; and finally, compare this to wider palaeoenvironmental and archaeological evidence with the ultimate purpose of understanding environmental change in England.
As Walker et al (2002) points out, the research undertaken in quaternaryscience and thereby this paper is more relevant than ever before becauseatmospheric scientists turn to late glacial records to better understandnatural analogues of climate change. This is done under the purpose of applyingthis knowledge to present climatic change and therefore better understand itspace and consequences.
Methodology
Lithostratigraphy
Each group was assigned a 50cm long section of the 7 meter long core extractedfrom Star Carr. To begin with the core was carefully unwrapped of its plasticfilm and cleaned using a scalpel. Thereafter the core was classified intohorizons. The boundaries were selected where there were significant changes insediment colour or texture. In order to interpret the sediment’s texture small1cm by 1cm cubes were extracted from each boundary using the scalpel. Thesewere analysed for particle size, dryness and elasticity. To address the colourof the soil a Munsell colour book was used.
A full core stratigraphy diagram was developed following the data from eachcore. Stratigraphy is extremely important for our research purpose as allother techniques used material taken from different stratigraphic levels fromthe sampled borehole.
The advantages of this method are: It provides the researcher with an insightto the formation processes of the environment, such as depositional rate. Inaddition, the study of the sediment properties enforces this understanding andallows placing boundaries of environmental shift in the landscape. Theweaknesses of this method include the low availability of long, undisruptedcores; and these may be distorted during recovery or extrusion from thesampling chamber, in particular in looser sediments (J.J Lowe et al 1997). Inaddition, having only extracted one borehole, it is more difficult to ascertainthe history of a site.

Magnetic Susceptibility
Cores were passed through a magnetic susceptibility loop at 3cm intervals andthe values were recorded for each interval. This method allows us todifferentiate between buried soils and windblown silts, which would not becharacteristic of the site of study. More broadly, it serves as a tool toindicate changes in sediment composition for magnetic-susceptible minerals.
Loss on Ignition
On this practical samples from each core were analysed for organic andinorganic carbon content. A 1cm by 1cm cube was extracted 4 cm into the core,and further samples were collected in 8cm intervals. The samples were firstweighed to determine the total weight. Then they were placed in a furnace wherecarbon was combusted and thereafter reweighed to determine the loss of organiccontent. This determines the ratio of organic to inorganic sediments in thesample. In addition, it is useful for our research purposes as organic contentis a measure of biological productivity which in turn depends on the characterof the environment (J.J Lowe et al 1997).
Pollen Analysis
Pollen analysis is one of the principal techniques used by quaternaryscientists to reconstruct past environments. Pollen-Stratigraphical resultshave greatly shaped ideas on the nature of the environment and climate duringthe quaternary glacial-interglacial cycles (Seppa 2007).
For the present paper, pollen recovered from the Vale of Pickering sedimentswas chemically treated to remove cellulose and organic material. Thereafter itwas prepared for slide analysis. Slides were distributed and analysed bycounting and classifying pollen grains. General size and shape, aperture,configuration and surface texture were looked for. Finally, a pollen diagramwas produced plotted on the basis of % of each major taxon per level.
There are some limitations with this method. Firstly, wind pollinated speciesproduce more pollen so they dominate the quaternary record. Secondly, thespread of airborne pollen results in difficulty to know whether small portionsof a given pollen grain represent a small group of plants from a local area ora larger population growing further away (Seppa 2007). In addition, the lack oftaxonomic precision weakens the quality of palaeoenvironmental reconstructions.
The main advantage of this method is that it provides with an Insight into longterm ecological patterns and processes such as dispersal dynamics anddistribution variations in tree species. In addition, layers of sediment laiddown annually leave high-resolution records. Moreover, under anoxic conditions,due to the hard and chemically resistant exines, pollen grains remain wellpreserved.

Macrofossils
Macrofossils are best preserved in low energy environments and are most oftenstudied from lakes or peat sediments (Birks 2007). The study of macrofossilsworks as a complimentary or alternative tool for studying past environments.These can be seeds, fruits, vegetative parts and animal remains (particularlyinsects) (Birks 2007).
Firstly, 4cm³ samples were taken and sieved through a 125µm sieve using 5litres of water, into a clean washing up bowl. Thereafter, the remaining plantmatter was transferred to a petri dish, which was placed under a low magnifyingmicroscope lens and analysed for macrofossil remains.
This method is useful for our research purpose because it provides withreliable data at the local level as macroremains are relatively heavy. Inaddition, these can be identified to a higher taxonomic resolution than pollen(Birks 2007). Similarly to pollen, with the assumption these species have thesame ecological requirements they do today, we can interpret what the climatemust have been like to support them. Disadvantages include under and overrepresentation of species due to their capacity to produce seeds and theirposition in the landscape (i.e species near a lake may have more data thanthose growing further away).
Age Modelling
Radio carbon dating works on the basis of measuring 14C isotope half-lives.Samples used for radiocarbon dating were identified macrofossil samples fromterrestrial species removed from the core and cleared of contamination. Thesesamples represent 5cm core intervals. This method is very useful for ourresearch because it allows us to date the changes in the environment that wesee through the use of the other methods. By dating these changes we can relatethem to other chronologies found in the wider literature. In doing so, if theevents from our records match the main geological records our conclusionsbecome more reliable.
Results
Stratigraphy: Depth, Colour and ComponentsFigure 2 Troels-Smith classification of sediments

Depth (cm) Colour/Main Components
220-225 BrownishBlack
Tb2/th2
225-250 BrownishBlack
Th3/th1
250-260 Brownish Th4
Depth (Cm)

Black260-293 Black Sh2/Th2
293-295 Olive Brown As3/Lc1
295-297 Dark GreyishBrown
As3/Ag1
297-300 Olive Brown As4
300-302 Dark GreyishBrown
Lc4
302-305 Darkyellowish
Brown
As4
305-310 Very darkyellowish
brown
Lc4
310-315 Light olivebrown
As3/Dh1
315-325 Brown As4
325-330 Olive Brown Lc3/Dh1
330-332 LightYellowish
Brown
As3/Lc1
332-340 Olive Brown Ld3/Lc1
340-342 Olive Brown Th4
342-344 Black Lc4
344-350 Greyish Brown Ld2/Lc2
350-356 Dark GreyishBrown
Lc3/Ag1
356-364 Dark GreyishBrown
As2/Ag2
364-366 Dark Grey As3/Ag1
366-385 Dark Grey As3/Ag1
385-400 Dark Grey As3/Ag1
400-420 Dark Grey As4
420-430 Brown As3/Gg1

2.5Y 3/2 DarkGreyish Brown
As4
2.5Y 4/2 DarkGreyish Brown
As3/Lc1
2.5Y 3/1 VeryDark Grey
As4
10Y 4/4 Dark Yellowish Brown
As2/Lc2
2.5Y 3/2 VeryDark Greyish
Brown
As4
2.5Y 4/1 DarkGrey
Ag3/As1
5Y 3/1 Very DarkGrey
Ag3/As1
2.5Y 4/2 DarkGreyish Brown
Ag3/As1
5Y 3/2 Ag4
5Y 2/2 As4
2.5Y 4/2 DarkGreyish Brown
Ag3/Lc1
5Y 4/2 Olive Grey Ag2/Lc2
5Y 4/1 Dark Grey Ag3/Lc1
2.5Y 4/2 DarkGreyish Brown
(580cm)
Ag2/Lc2
2.5Y 4/2 DarkGreyish Brown
Ag3/Lc1

(585cm)
2.5Y 4/4 OliveBrown (590cm)
Ag2/Lc2
Lc2/As2
As4
Lc2/As2
Lc3/As1
As2/Ac2
Th4
As4
Lc4
As2/Lc2 (675-676cm)
As4 (676-680cm)
As2/Lc2 (680-687cm)
Lc3/As1 (687-690cm)
As2/Lc2 (690-697cm)
As4 (697-710cm)

10 YR 4/3 Brown
As4
2.5 Y 2.5/1 Black
Lc3/As1
5Y 2.5/1 Black
As2(Lc2
10YR 4/3 Brown
As4
2.5/N Black Lc4
2.5Y 3/3 Dark Olive Brown
As4
2.5/1 Black Lc4
10YR 2/1 Black
Lc4
10YR 2/1 Black
As2/Lc2
10YR 5/4 Yellowish Brown
Lc3/As1 (858-870cm)
25Y 4/2 DarkGreyish Brown
Lc4 (870-895cm)
10YR 2/1 Black
Lc4 (895-906cm)
10YR 4/1 Dark Grey
Lc4 (906-910cm)
Description
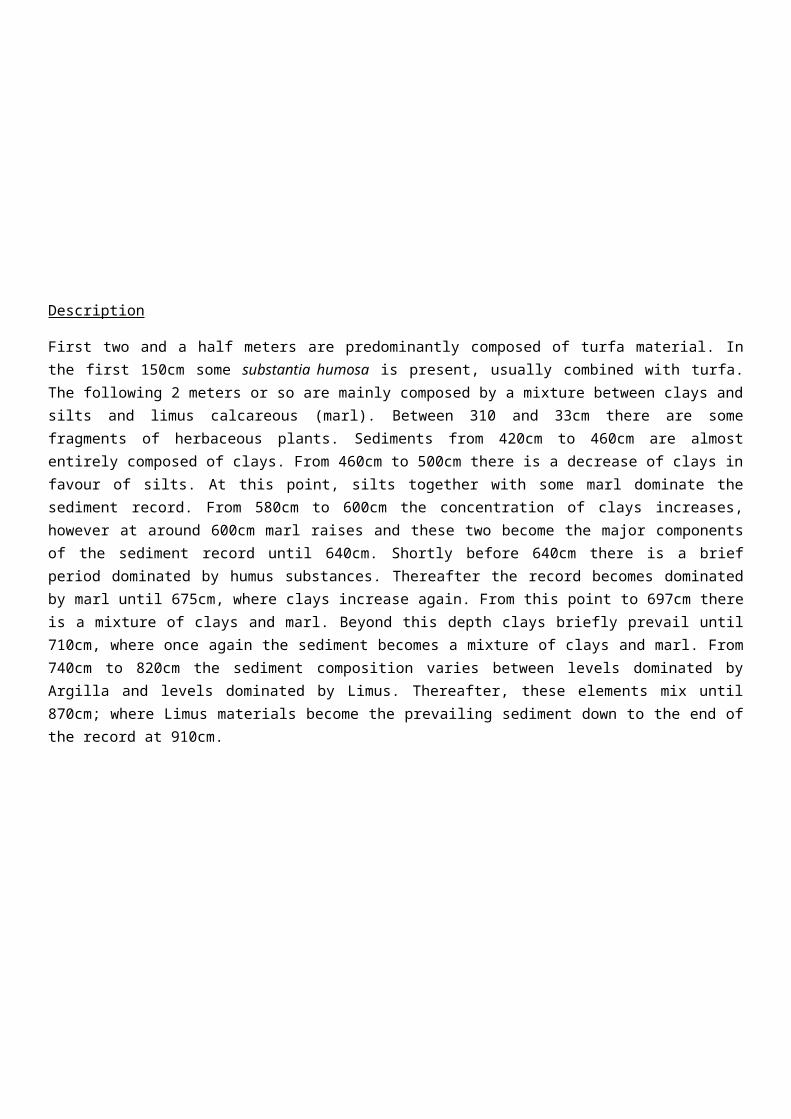
First two and a half meters are predominantly composed of turfa material. Inthe first 150cm some substantia humosa is present, usually combined with turfa.The following 2 meters or so are mainly composed by a mixture between clays andsilts and limus calcareous (marl). Between 310 and 33cm there are somefragments of herbaceous plants. Sediments from 420cm to 460cm are almostentirely composed of clays. From 460cm to 500cm there is a decrease of clays infavour of silts. At this point, silts together with some marl dominate thesediment record. From 580cm to 600cm the concentration of clays increases,however at around 600cm marl raises and these two become the major componentsof the sediment record until 640cm. Shortly before 640cm there is a briefperiod dominated by humus substances. Thereafter the record becomes dominatedby marl until 675cm, where clays increase again. From this point to 697cm thereis a mixture of clays and marl. Beyond this depth clays briefly prevail until710cm, where once again the sediment becomes a mixture of clays and marl. From740cm to 820cm the sediment composition varies between levels dominated byArgilla and levels dominated by Limus. Thereafter, these elements mix until870cm; where Limus materials become the prevailing sediment down to the end ofthe record at 910cm.
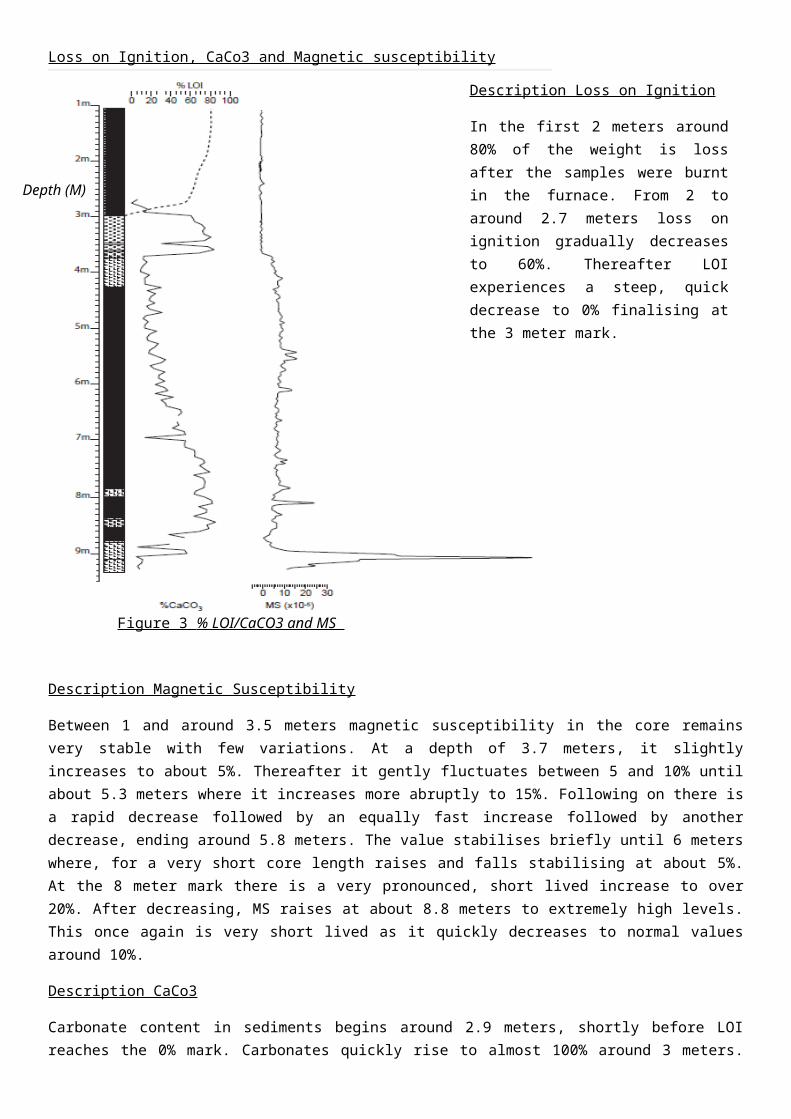
Loss on Ignition, CaCo3 and Magnetic susceptibility
Description Magnetic Susceptibility
Between 1 and around 3.5 meters magnetic susceptibility in the core remainsvery stable with few variations. At a depth of 3.7 meters, it slightlyincreases to about 5%. Thereafter it gently fluctuates between 5 and 10% untilabout 5.3 meters where it increases more abruptly to 15%. Following on there isa rapid decrease followed by an equally fast increase followed by anotherdecrease, ending around 5.8 meters. The value stabilises briefly until 6 meterswhere, for a very short core length raises and falls stabilising at about 5%.At the 8 meter mark there is a very pronounced, short lived increase to over20%. After decreasing, MS raises at about 8.8 meters to extremely high levels.This once again is very short lived as it quickly decreases to normal valuesaround 10%.
Description CaCo3
Carbonate content in sediments begins around 2.9 meters, shortly before LOIreaches the 0% mark. Carbonates quickly rise to almost 100% around 3 meters.
Description Loss on Ignition
In the first 2 meters around80% of the weight is lossafter the samples were burntin the furnace. From 2 toaround 2.7 meters loss onignition gradually decreasesto 60%. Thereafter LOIexperiences a steep, quickdecrease to 0% finalising atthe 3 meter mark.
Figure 3 % LOI/CaCO3 and MS
Depth (M)

There is a pronounced, short lived decrease at about 3.4 meters to about 30%,followed by a quick increase to around 90% followed by another abrupt fall;this time to 20%. At this point carbonate content slowly increases between 4and 6.9 meters and in doing so it constantly fluctuates up and down. At thedepth of 7 meters carbonate content rapidly falls and increases once again,becoming fairly stable with small fluctuations until about 8.5 meters. Here itexperiences a rapid decrease to minimum levels followed by a short lived riseas it falls once again around the 9 meter mark.
Pollen (See Pollen diagram below)
Zone 1: From 900cm to 800cm, this zone is characterised by a large yetfluctuating presence of Poaceae grass. There are also important and steadylevels of Cyperaceae sedges and Betula trees. Herbs populate the landscape toless extent but still to significant levels (Artimisia, Rumex).
Zone 2: From 800cm to 540cm, the biozone is characterised by the dominance ofherbaceous taxa and rise of new taxa. Furthermore, Betula is present insignificant amounts but it rapidly decreases between 720cm and 660cm where itrises again. Pine tree is present in low but consistent frequencies. Shrubs andaquatic species appear for the first time in significant numbers but theyfluctuate and disappear towards the borderline with zone 3. Similarly,Filipendula, Populus and Juniperus are introduced in the landscape but decreaseshortly after.
Zone 3: From 540cm to 360cm, the landscape is very much dominated by grasses andherbaceous taxa. There are fewer types of taxa present in the landscape. Pineagain remains fairly stable whereas other taxa like Betula and Cyperacea varyin different amounts.
Zone 4: From 360cm to 240cm. The abundance of open habitat taxa comes to an endwith Poacea and Cyperaceae suffering important decreases and fluctuating duringthe record. Artemisia and Caryophyllaceae disappear whereas Filipendula andsome semi aquatic species increase their numbers. The main characteristic ofzone 4 is the increase and dominant presence of Betula and Pine woodland. Inaddition, Juniperus and Salix once again raise to meaningful numbers as so doesPopulus. This builds a landscape which is predominantly consisting of woodland.
Zone 5: From 240cm to 150cm. Zone 5 is marked by the fall in Betula and Pinusand the raise in Alnus and other new tree species. These include Corylus, Ulmusand Quercus. In addition, there is an important increase in Corylus towards theend of zone 4, and these new high concentrations remain fairly stable duringzone 5. Sedges experience a rise in Cyperaceae whereas grasses, especially forPoaceae, remain poor. Between zone 4 and 5 Typha latifolia appears in theenvironment for its first and last time, disappearing around 180cm. Dryopterishowever, raises once more and stays in the landscape until the end of thesequence.

Z6: From 150cm to 0cm. Poaceae, early impoverished, increases and Cyperaceaewhich was abundant now falls. Ulmus, although still present in the landscapestarts to decrease alike Corylus. Quercus, Filipendula and Dryopteris fluctuateacross the record. Moreover, Plantago Lanceolata flourishes for its first timein the landscape where it occupies over 10% of the pollen grains over most ofzone 6.
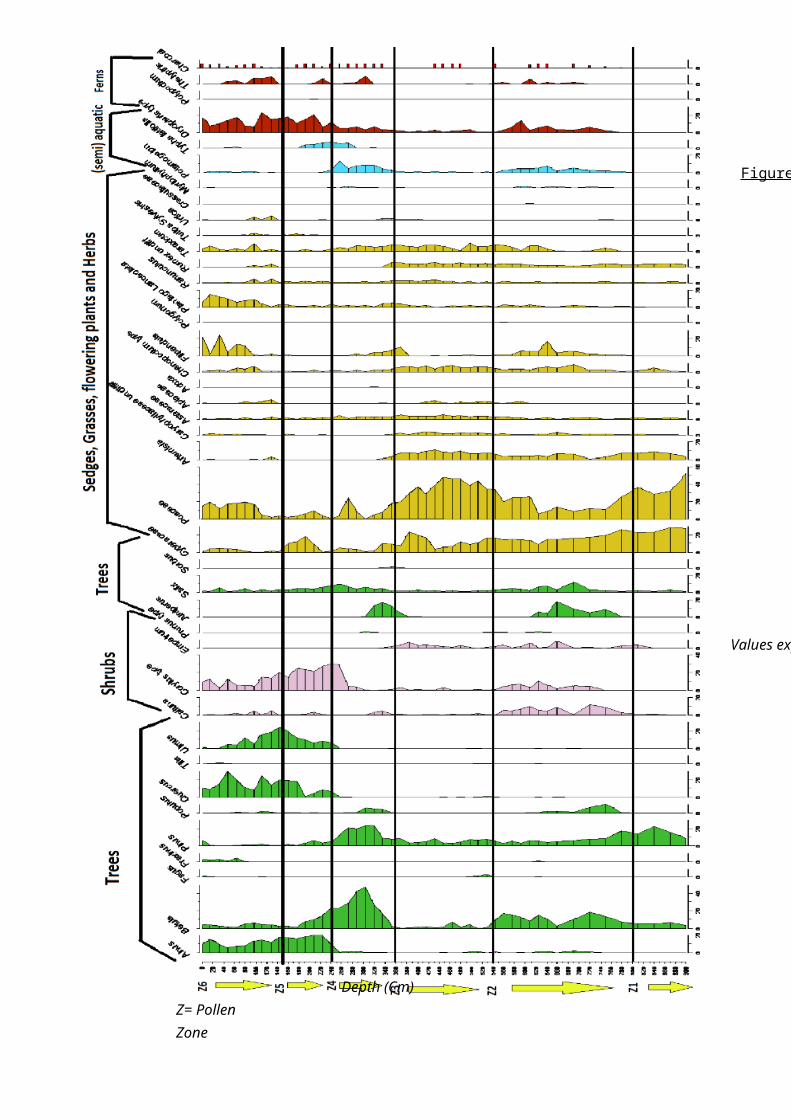
Figure 4
Depth (Cm)Z= Pollen Zone
Values expressed as % of Total Land Pollen

Macrofossils (see diagram below)
Although subject to fluctuations, herbaceous components dominate the record.However, organic matter practically occupies the entire record during the first50cm. Thereafter, alike the other components it is subject to variation. Insectremains are predominantly found between 400 and 650cm. Chironomid Sergentia-type is present at the end and towards the middle of the record. Chironomusanthricinus-type rises when the latter falls around the end of the record andonce again above 425cm. This leaves a gap between 400 and 550cm which isdominated by Paradadius type. Aquatic macrofossils are present in two clearsections of the core. These are between 700 and 625cm and between 400 and225cm.

0 50
100
150
200
250
300
350
400
450
500
550
600
650
700
Depth (cm)
020
4060
801000
2040
020
4060
801000
2040
020
020
400
020
00
00
020
00
00
2040
00
00
020
00
020
020
0
Comp
onent d
ataTre
esShrub
s and
herbs
Aquat
icsInsect
sCh
ironom
ids
Figure 5 Macofossil record Vale of Pickering
Values Expressed as % of TotalLand Macrofossil
Values expressed as individual fossil remains
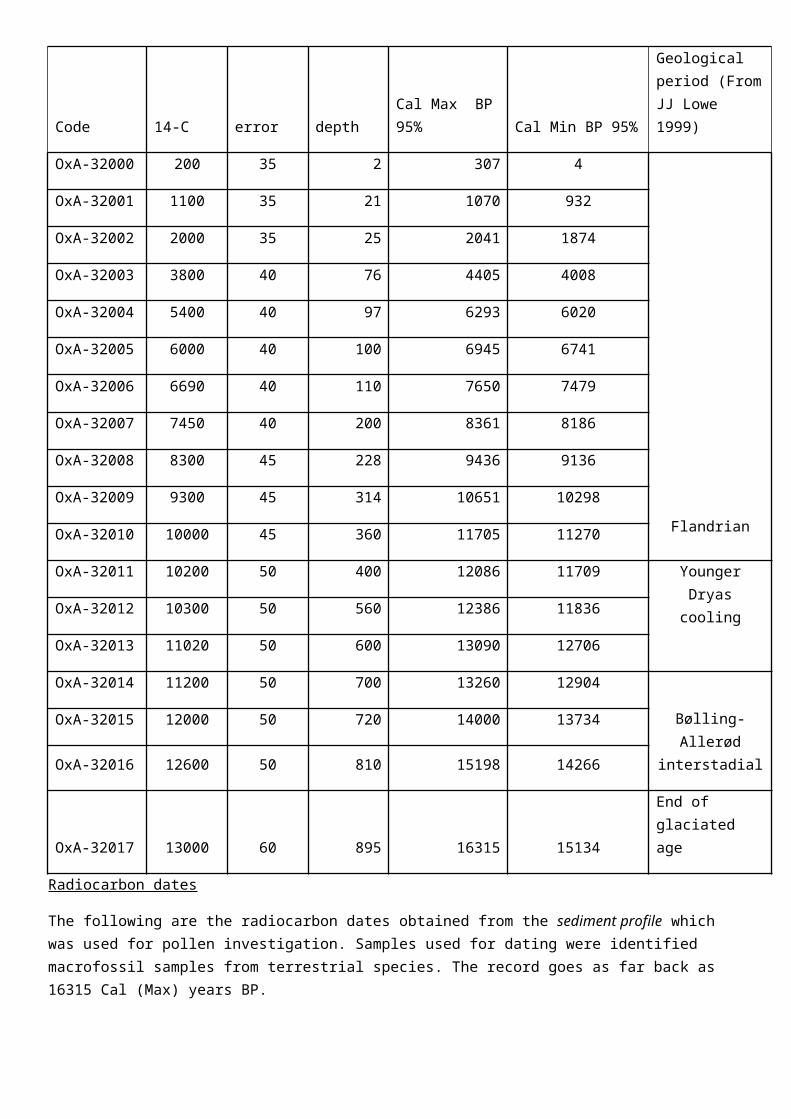
Code 14-C error depthCal Max BP95% Cal Min BP 95%
Geological period (FromJJ Lowe 1999)
OxA-32000 200 35 2 307 4
Flandrian
OxA-32001 1100 35 21 1070 932
OxA-32002 2000 35 25 2041 1874
OxA-32003 3800 40 76 4405 4008
OxA-32004 5400 40 97 6293 6020
OxA-32005 6000 40 100 6945 6741
OxA-32006 6690 40 110 7650 7479
OxA-32007 7450 40 200 8361 8186
OxA-32008 8300 45 228 9436 9136
OxA-32009 9300 45 314 10651 10298
OxA-32010 10000 45 360 11705 11270
OxA-32011 10200 50 400 12086 11709 YoungerDryascoolingOxA-32012 10300 50 560 12386 11836
OxA-32013 11020 50 600 13090 12706
OxA-32014 11200 50 700 13260 12904
Bølling-Allerød
interstadial
OxA-32015 12000 50 720 14000 13734
OxA-32016 12600 50 810 15198 14266
OxA-32017 13000 60 895 16315 15134
End of glaciated age
Radiocarbon dates
The following are the radiocarbon dates obtained from the sediment profile which was used for pollen investigation. Samples used for dating were identified macrofossil samples from terrestrial species. The record goes as far back as 16315 Cal (Max) years BP.
Data interpretation
After having observed the results, the following chapter will go through themain findings. This analytical work is the core of the report as it will givemeaning in the background of quaternary science to the results. In order to doso the environmental record produced has to be studied and data from allmethods has to be linked to produce the larger picture of what environmentalchanges took place, when they did and what were the driving forces involved. Inaddition, these changes observed in the results will be compared to the widerliterature on quaternary climatic change.
To begin with, major global climate change events such as the younger dryas andthe Allerod interstadial (Figure 6) should affect the landscape at the Vale ofPickering. Therefore, according to the radiocarbon dates this should bereflected in our record by an initial warming around 8 meters, followed bycooling at 6 meters and warming from 4 meters onwards.
Evidence from the core suggests that earlier sediments (9 to 8 meters) werecharacteristic of a landscape composed by open habitat taxa with some woodland;predominantly pine and some birch (figure 4). This suggests a colderenvironment which didn’t support the wide range of species which habitat theecosystem on more recent times. Pine dominates the tree species at this stage.According to the British and Irish atlas of flora, it grows in relatively coldenvironments, with average summer temperatures of 11.7 °C and winter averagetemperatures of 0.8 °C. Sediment composition during this period is almostentirely made of marl. This is reflected by increasing values of CaCo3 infigure 3. This suggests the presence of a lake, which Taylor (2011) suggested,was formed after the retreat of glaciers. In addition, magnetic susceptibilityabruptly increases around 9 meters and quickly stabilises. This could suggestan increase in soil erosion resulting in a large transfer of minerogenicmaterial; process which is common in cold environments where processes of soilbreakdown are more vigorous (JJ Lowe 1997).
As we approach the 8 meter mark sediment composition varies from marl to clayand back to marl. Under the presence of aquatic taxa this suggests two things,firstly, material low in organic content is being washed into a waterbody andsecondly, pondweeds such as Potamogeton, which appears around this core depth,precipitate lime and marl, hence the high marl content (JJ Lowe 1997). In

addition, magnetic susceptibility increases around this level of the core, thusreinforces the idea of inorganic material being carried into the water. Furthermore, the pollen diagram suggests warmer conditions represented by anincrease in Betula, Populus and particularly Juniperus, which tends to be thefirst coloniser when temperatures become warmer (Walker et al 2003). Thereforesome tree species would have expanded to sites previously occupied byherbaceous taxa. This, together with the gentle decrease in Artemisia, speciesthat is encouraged by disturbed landscapes; points to the direction of a morestable and developed soil supporting a wider range of taxa during a warmerperiod of time. This could be representative for the beginning of the Bølling-Allerød interstadial.
Between 7 and 6 meters sediments continue to vary between clays and marls. Theshort lived Turfa Lignosa material in the record (639cm) could be the result ofa warmer more productive environment. The macrofossil record supports this withan increase in organic matter and wood. In addition, the presence of Characeaecospore indicates the continuity of the water system. For vegetation, there isa short-lived decrease in trees (Betula, Alnus, Salix). During this shortperiod (around 660cm) Empetrum increases, a shrub which grows well after forestfires; and there is a presence of charcoal both in the pollen and macrofossilrecord. Therefore a fire could have caused a decrease in certain taxa, some ofwhich recovered shortly after.
Around six meters herbaceous taxa begins to rise (Poaceae, Filipendula,Taraxicum). This appears in the macrofossil record too. The presence of Rumexand the increasing frequency of grasses suggests the landscape began to open upand there was a loss in woodland. The significant loss of Betula at 550cmsupports this, and similarly, other tree species become less abundant ordisappear. This is most likely the result of cooling climate. Moreover, thedisappearance of aquatic species in the pollen and macrofossil record inclinesthe environment to colder and dryer conditions. The stratigraphic record showsa shift from predominantly clay to silt (600/480cm). This may represent thesilting or infilling of the lake hence the disappearance of aquatic taxa.
Furthermore, higher erosion should follow colder conditions however; magneticsusceptibility only varies very slightly and does not seem enough to supportthis. Nevertheless, a drop in temperature is definitely supported by evidencecoming from other proxies. Besides pollen it is also supported by macrofossildata; according to Van Asch (2012), the introduction of Chirominid Paracladiussuggests a reduction in temperatures. This is the case for our core at 575cm(figure 5).
This cooling event could be the consequence of the Younger dryas, whichaccording to the GRIP record began around 12,560 years ago (Walker et al 2003).This matches the radiocarbon dates for the described period of cooling (figure6).

The period of colder conditions comes to an end around 350cm into our core.This translates to about 11,500 Cal years BP (Figure 6) thus it corresponds tothe beginning of the Holocene set at around 11,400 years BP according to Walker(2003). The lithological changes involve a higher presence of detritus materialin comparison to the older records. This may be the result of a higherbiological productivity set by higher temperatures. There is also a trendtowards marls, perhaps suggesting the return of an aquatic environment (Taylor2011). This is supported by the pollen and macrofossil records. Firstly,frequency of Potamogeton and Typha latifolia (Figure 4) increases tosignificant levels. Secondly, the concentration of Characeae oospores risesaround the same depth (Figure 5).
Similarly to the warmer period before the Younger dryas, an increase inwoodland cover around 3 meters leads to the subsequent loss of grass andsedges. This resembles the succession pattern reconstructed in Walker et al(2003) from Llanilid, Wales. Nevertheless, macrofossil data suggest woodlandcover was low until about 225cm and herbaceous taxa dominated the landscape atthe depth of 300cm (figure 5). This is in conflict with the data from thepollen record and therefore makes it harder to establish an accurate core depthor time line for vegetation succession. Nevertheless, macrofossils can be lessreliable as they do not often preserve as well and there is a smaller recordcompared to pollen.
Magnetic susceptibility throughout the Holocene remains stable and low. Thiscould be the result of less erosion of minerogenic materials and a higheruptake by plants (JJ Lowe et al 1997). In addition, a more stable environmentwould also contribute to these values.
Between 3 and 2 meters the water system experiences a new infilling, this timeby humus substances or peat (Figure 2 and Figure3-LOI). The succession processis reflected by the disappearance of aquatic taxa and its replacement by Typhalatifolia, which grows best in swamps and fens (OABIF 2014). Thereafter, around2 meters, Typha latifolia disappears. This is probably due to the swampbecoming further in filled with peat making the habitat no longer suitable.Macrofossils, LOI and stratigraphy corroborate an increase in organic content.This is supported by Taylor (2011) study of Lake Flixton during the Mesolithic,where he argues “an environment of open water existed at the site until 8700Cal BC, when the transition to organic sediments marks the point when aquaticand emergent plants began to colonise the area”.
Nevertheless, whether these changes are of climatic importance or merely theresult of succession processes is difficult to establish.
Finally, similar conditions prevail until the beginning of the core. These arepredominantly high organic, rich soils supporting a variety of tree species,mainly Alnus, Quercus and Corylus; and some open habitat taxa including

grasses, perennial herbs and some ferns. In addition, according toarchaeological evidence, at this point humans would have lived in the landscapeand exerted an influence upon it. This may be reflected by the regular amountsof charcoal in the pollen record.
Conclusions
In conclusion, the main findings are 4 periods of climatic shift. Firstly,there is an initial warming shortly after the last glacial which according tothe records coincides with the Bølling-Allerød interstadial, supported by theradio carbon dates between 8 and 7 meters. Thereafter, there is a coolingassociated to the Younger dryas where the landscape loses woodland in favour ofopen taxa and the watercourse may become infilled, dried out or no longersuitable for aquatic vegetation. Radio carbon dates corroborate the timescaleat which this occurs (11,500 BP). Following on, the climate becomes warmeragain marking the beginning of the Holocene. At this point the vegetationexperiences a shift in woodland composition by introducing Quercus and Ulmus,and aquatic species return suggesting wetter or/and warmer conditions. Thesehowever are brought to an end as the lake fills with peat and plants begin tocolonise the area (Taylor 2011).
Further research on the Vale of Pickering could include the extraction of morethan one core to increase the reliability, accuracy and scope of the results.In addition, macrofossil data for the entire core would have proven useful inthe study of the oldest sediments.

References
-H H Birks (2007) Plant Macrofossils introduction, University of Bergen, Norway
-H Seppa (2007) Pollen Analysis, Principles. University of Helsinki, Finland
-J.J Lowe and MJC Walker (1997) Reconstructing Quaternary Environments 2nd Edition
-J.J Lowe, H.H Birks, S.J Brooks, G.R Coope, D.D Harkness, F.E Mayle,C.Sheldrick, C.S.M Turney and M.J.C Walker (1999) The chronology ofpalaeoenvironmental changes during the Last Glacial-Holocene Transition: Towards an event stratigraphyfor the British Isles. Journal of the Geological Society, London, Vol 156 pp 397-410
-Mike Williams, Nancy Stedman and Robert Goodison (2012) Vale of Pickering ProfileAccessed from [www.naturalengland.org.uk ] Last accessed 9th March
-M.J.C. Walker, G.R. Coope, C. Sheldrick, C.S.M. Turney, J.J. Lowe, S.P.E.Blockley, D.D. Harkness (2002) Devensian Lateglacial environmental changes in Britain: a multi-proxy environmental record from Llanilid, South Wales, UK. Quaternary Science Reviews 22
- Nelleke van Asch, Arthur F. Lutz, Miriam C.H. Duijkers, Oliver Heiri, StephenJ. Brooks, Wim Z. Hoek (2012) Rapid climate change during the Weichselian Lateglacial inIreland: Chironomid-inferred summer temperatures from Fiddaun, Co. Galway. Palaeogeography,Palaeoclimatology, Palaeoecology
-Online Atlas of The British and Irish Flora (OABIF) (2014) [Availableat:http://www.brc.ac.uk/plantatlas/] Last Accessed 11th March.

Appendices
Vegetation Data Table produced from The Online Atlas of The British and IrishFlora
GenusName
Mean temp January
MeanTempJuly
Annual Precipitation
Category
Other information
Alnus 3.5 14.5 1100 Deciduous Tree
Seedlings drought and shade sensitive, little regeneration on woodland
Betula
3.3 14.6 1073 Deciduous Tree
rapidly colonise open ground, particularly burned areas
Fagus 3.5 14.7 1061 TreeFraxinus
3.6 14.7 1069 Deciduous Tree
It can tolerate periodically waterlogged soils, rapid coloniser of waste ground
Pinus 0.8 11.7 1930 Conifer Tree
It prefers sandy and stony, acidic soils, though will also grow on waterlogged peats.
Populus
Broad Habitat
tree grows by watercourses, by ponds and in hedgerows, especially on lowland flood plains
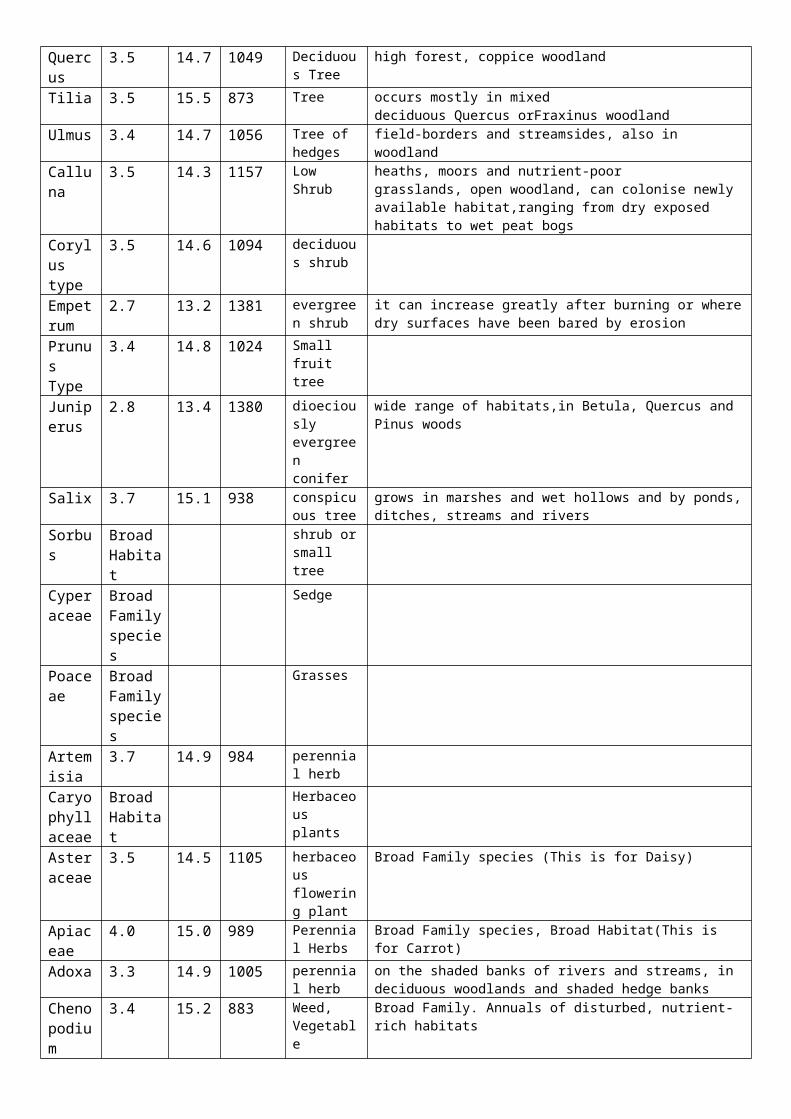
Quercus
3.5 14.7 1049 Deciduous Tree
high forest, coppice woodland
Tilia 3.5 15.5 873 Tree occurs mostly in mixed deciduous Quercus orFraxinus woodland
Ulmus 3.4 14.7 1056 Tree of hedges
field-borders and streamsides, also in woodland
Calluna
3.5 14.3 1157 Low Shrub
heaths, moors and nutrient-poor grasslands, open woodland, can colonise newly available habitat,ranging from dry exposed habitats to wet peat bogs
Corylus type
3.5 14.6 1094 deciduous shrub
Empetrum
2.7 13.2 1381 evergreen shrub
it can increase greatly after burning or wheredry surfaces have been bared by erosion
Prunus Type
3.4 14.8 1024 Small fruit tree
Juniperus
2.8 13.4 1380 dioeciously evergreen conifer
wide range of habitats,in Betula, Quercus and Pinus woods
Salix 3.7 15.1 938 conspicuous tree
grows in marshes and wet hollows and by ponds,ditches, streams and rivers
Sorbus
Broad Habitat
shrub orsmall tree
Cyperaceae
Broad Familyspecies
Sedge
Poaceae
Broad Familyspecies
Grasses
Artemisia
3.7 14.9 984 perennial herb
Caryophyllaceae
Broad Habitat
Herbaceous plants
Asteraceae
3.5 14.5 1105 herbaceous flowering plant
Broad Family species (This is for Daisy)
Apiaceae
4.0 15.0 989 Perennial Herbs
Broad Family species, Broad Habitat(This is for Carrot)
Adoxa 3.3 14.9 1005 perennial herb
on the shaded banks of rivers and streams, in deciduous woodlands and shaded hedge banks
Chenopodium
3.4 15.2 883 Weed, Vegetable
Broad Family. Annuals of disturbed, nutrient-rich habitats

typeFilipendula
3.6 15.8 776 Herb/Flowering plant
Polygonum
Broad Habitat
Herbaceous plants
Plantago Lanceolata
Broad (3.5)
14.5 1105 perennial herb
It occurs in meadows and pastures, in upland grasslands,sand dunes and cliffs (Broad)
Ranunculus
Broad Habitat
perennial herb
Broad Habitats, Broad Family. Some prefer slightly warmer conditions (aroudn 4 and 16 like Ranunculus sardous and tripartitus)
Rumexundiff
Broad Habitat/Family
Perennial herb
Some grow on disturbed grounds, river banks, streamsides and lake shores, open grasslands
Taraxicum
Broad Habitats
perennial herbs
prefer disturbed sites such as pastures, roadside verges, lawns, tracks, paths and waste ground
Tulipa Sylvestris
Broad Habitats
Perennial herb
perennial herb of open woodlands, hedgerows, riversides. Plants often flower poorly and setlittle seed, but populations can be very long-lived
Urtica
3.6 14.5 1102 perennial herb
wide range of habitats, woods, scrub, grasslands, fens, It prefers damp, nutrient-rich soils.
Crassulaceae
No information
Flowering plant
typically in dry and/or cold areas where watermay be scarce
Myriophyllum
3.8 15.7 765 (Aquatic) perennial plant
Most species grow in wide range of meso-eutrophic or eutrophic and often calcareous waters. These include lakes, ponds, rivers, canals and ditches
Potamogeton
3.4 15.9 697 (Aquatic) perennial plant
lakes, sluggish rivers, ditches, fens, marsh, pond weed
Typhalatifolia
3.8 15.1 958 rhizomatous perennial
growing in shallow water or on exposed mud at the edge of lakes( Fen, marsh and swamp (not wooded))
Dryopteristype
3.5 14.5 1096 DecidousFern
Broadleaved, mixed and yew woodland (250 species)
Polypodium
Broad Habitats
perennial rhizomatous fern
Thelyptris
3.9 15.5 869 perennial fern
Broadleaved, mixed and yew woodlandFen, marsh and swamp (not wooded), soil is

permanently wet and organic