Stabilized Emulsions by EO-PO Copolymers By Zhen Niu A thes
172
Demulsification Mechanism of Asphaltene Model Compounds- or Bitumen- Stabilized Emulsions by EO-PO Copolymers By Zhen Niu A thesis submitted in partial fulfillment of the requirements for the degree of Doctor of Philosophy in Chemical Engineering Department of Chemical and Materials Engineering University of Alberta © Zhen Niu, 2019
-
Upload
khangminh22 -
Category
Documents
-
view
2 -
download
0
Transcript of Stabilized Emulsions by EO-PO Copolymers By Zhen Niu A thes

Demulsification Mechanism of Asphaltene Model Compounds- or Bitumen-
Stabilized Emulsions by EO-PO Copolymers
By
Zhen Niu
A thesis submitted in partial fulfillment of the requirements for the degree of
Doctor of Philosophy
in
Chemical Engineering
Department of Chemical and Materials Engineering
University of Alberta
© Zhen Niu, 2019

ii
Abstract
The formation of stable water-in-oil (W/O) emulsions in the oil sands industry is highly
undesirable because it poses great threats to the downstream operations, such as downstream
upgrader corrosion, catalyst fouling, increased pumping cost, etc. To break the stable emulsions
and to assist the separation of water from diluted bitumen, ethylene oxide-propylene oxide (EO-
PO) polymeric demulsifiers are widely used. Understanding factors that affect emulsion stability
and the role played by the demulsifiers in demulsification is of considerable importance to the oil
industry. However, studying molecular mechanisms of stabilizing or destabilizing water-in-
heavy oil emulsions is challenging due to the non-transparent nature of crude oil or bitumen even
in diluted systems, as most measurements are based on visualization of the experimental systems.
In comparison, measurement of interfacial properties using the oil-in-water (O/W) system is
much easier, which is often practiced.
We aim to uncover the relationship between the measured interfacial properties of W/O and O/W
systems using asphaltene model compounds C5Pe or C5PeC11, as their solutions have better
optical transparency. The measured interfacial tension of the W/O system was always lower than
that of the O/W system, indicating a larger amount of surface-active components adsorbed at the
oil−water interface in W/O systems. The different amount of surface-active components
adsorbed due to the reservoir effect (more C5Pe molecules are available for adsorption when oil
is used as the continuous phase) affected the arrangement of molecules at the interface and hence
the measured crumpling ratio, dilatational rheology, and coalescence time that could not be
observed using flat oil−water interfaces. Although similar trends were observed in most
situations, the O/W configuration could only give qualitative results for the W/O system.
iii
The features of the W/O and O/W systems were also investigated when demulsifier is introduced.
Specifically, the effect of the EO-PO demulsifier on the interfacial properties of the asphaltene
model compounds C5Pe or C5PeC11 in xylene solution−water interface was studied, with the
aim to understand the demulsification mechanism and investigate whether the EO-PO
demulsifier could work similarly through adsorption replacement (the W/O system) and
competitive adsorption (the O/W system). It was found the surface active EO-PO molecules
could decrease the interfacial tension and interfacial film rigidity of the C5Pe/C5PeC11−water
interface for both W/O and O/W systems. Interfacial pressure-area isotherm, AFM imaging, and
shear rheology measurements were also carried out using diffusion (simulating adsorption
displacement in the W/O system) and spreading (simulating competitive adsorption in the O/W
system) protocols. The results confirmed that C5Pe molecules were responsible for the high
interfacial film rigidity and the EO-PO demulsifier was able to destroy or avoid the formation of
the C5Pe network interfacial film. Molecular dynamics simulation revealed that EO-PO
molecules were more competitive for the interface and could replace most of the adsorbed C5Pe
molecules, which made the interfacial film unstable. In addition, the adsorbed EO-PO molecules
could form a new barrier at the interface, which inhibited the adsorption of the C5Pe molecules.
The demulsification performance of the EO-PO demulsifier on the water-in-diluted bitumen
emulsions at elevated temperatures was investigated, while the reversed O/W emulsion systems
were used for characterizing interfacial properties. Generally, better demulsification efficiency of
the W/O emulsions by EO-PO copolymers was achieved at higher temperatures. As indicated by
the interfacial tension results of the O/W system, the adsorption of the EO-PO molecules at the
oil−water interface was enhanced at elevated temperatures. The droplet contraction experiment
of the interfacial film using the O/W system revealed that EO-PO copolymers could significantly

iv
soften the interfacial film formed at the oil−water interface, especially at elevated temperatures.
The breakage of the interfacial film was observed with Brewster angle microscopy. Overall, the
enhanced EO-PO adsorption could greatly soften and even break the interfacial diluted bitumen
film at the oil−water interface at high temperatures, therefore promoting the coalescence of water
droplets for efficient emulsion breakup.
v
Preface
Below is a statement of contributions to co-authored papers contained in this thesis that are either
published or in preparation.
1. Niu, Z; Manica, R; Li, Z; He, X; Sjoblom, J; Xu, Z. Interfacial Properties Pertinent to W/O
and O/W Emulsion Systems Prepared Using Polyaromatic Compounds. Colloids Surf. A 2019,
575, 283-291. (Chapter 4)
I was responsible for designing and performing the experiments, data analysis, and
drafting/revising the paper. Dr. Manica was involved in data interpretation and paper editing. Dr.
Li was responsible for coalescence time measurement. Xiao He provided some helpful
suggestions. Dr. Xu was involved in paper proofreading and editing.
2. Niu, Z; Yue, T; He, X; Manica, R. Changing the Interface Between an Asphaltene Model
Compound and Water by Addition of an EO-PO Demulsifier through Adsorption Competition or
Adsorption Replacement. Energy Fuels 2019, 33, 5035-5042. (Chapter 5)
I was responsible for designing and performing the experiments, data analysis, and
drafting/revising the paper. Tong Yue was involved in the experimental design. Xiao He was
responsible for interfacial pressure-area isotherm measurement. Dr. Manica was involved in
paper proofreading and editing.
3. Niu, Z; Ma, X; Manica, R. Yue, T. Molecular Destabilization Mechanism of Asphaltene
Model Compound C5Pe Interfacial Film by EO-PO Copolymer: Experiments and MD
Simulation. J. Phys. Chem. C 2019, 123, 10501-10508. (Chapter 6)
I was responsible for designing and performing the experiments, data analysis, and
drafting/revising the paper. Xiaomin Ma performed MD simulation. Dr. Manica and Tong Yue
were responsible for paper proofreading and editing.
4. Effect of Temperature on Demulsification of Water-in-Heavy Oil Emulsions Using EO-PO
Copolymer. In preparation. (Chapter 7)
I was responsible for designing and performing the experiments, data analysis, and
drafting/revising the paper. Dr. Manica, Dr. Yan, and Dr. Xu were involved in paper
proofreading and editing.

vi
Acknowledgments
My deep gratitude goes first to my supervisor Prof. Zhenghe Xu for his professional guidance
and support of the project. I appreciate all his contributions of ideas, funding, and time, which
have allowed me to explore this topic in depth. Many times when I felt frustrated and unsure of
my own work, it was Prof. Xu who never failed to offer advice and encouragement. I am also
very thankful for the excellent model he has provided as a successful scientist and professor,
which will influence me greatly on my scientific career in the future.
I appreciate Dr. Rogerio Manica, Dr. Zuoli Li, Dr. Ci Yan, and Dr. Zifu Li for their support on
this project. Dr. Manica has provided numerous great suggestions for the improvement of all the
papers and thesis writing. Dr. Zuoli Li has offered me not only countless valuable research
advice but also generous help in my daily life. Her homemade sausage and Zongzi really made
me feel warm in the cold Edmonton. Dr. Yan and Dr. Zifu Li have enlightened me on how to
write a good paper.
I would also like to thank Mr. James Skwarok, Ms. Lisa Carreiro, Ms. Jie Ru, and Ms. Ni Yang
for maintaining our great labs and providing timely help all the time. Great thanks also go to all
members in the Oil Sands Research Group for their great help and suggestions on my work.
I would also like to thank the committee members for my candidacy exam, Dr. Qingxia Liu, Dr.
Tony Yeung, Dr. Peichun Amy Tsai, and Dr. William McCaffrey, for their insightful questions
during the exam, which gave me a good start of my PhD study.
I am grateful to the funding sources for my PhD work. Engineering Research Council of Canada
(NSERC)-Industry Research Chair program in Oil Sands Engineering and Alberta Innovates-
Energy and Environment Solutions have financially supported me during my whole PhD life.
Finally, I want to express my sincere appreciation to my family members. My parents have
raised me with love and they are always supportive of all my pursuits. My sister has always been
my best friend and tried her best to lessen the pressure in my life. I also appreciate my boyfriend
for his faithful support and patience during the final stages of my PhD study. Without their
strong support and selfless love, I would not have achieved what I have.
I will cherish this unforgettable experience at University of Alberta for my whole life.
vii
Table of Contents
Abstract ........................................................................................................................................... ii
Preface............................................................................................................................................. v
Acknowledgments.......................................................................................................................... vi
Table of Contents .......................................................................................................................... vii
List of Figures ............................................................................................................................... xii
List of Tables ............................................................................................................................... xix
Chapter 1 Introduction .................................................................................................................... 1
1.1 Importance of unconventional oil ......................................................................................... 1
1.2 Oil sand ................................................................................................................................. 1
1.2.1 Oil sands formation ........................................................................................................ 1
1.2.2 Oil sands processing ....................................................................................................... 2
1.3 Bitumen ................................................................................................................................. 3
1.3.1 Basics of bitumen ........................................................................................................... 3
1.3.2 Bitumen extraction ......................................................................................................... 5
1.4 Emulsion ................................................................................................................................ 7
1.4.1 Basics of emulsion .......................................................................................................... 7
1.4.2 Emulsions in the oil industry .......................................................................................... 7
1.4.3 Stability of emulsions ..................................................................................................... 8
1.4.4 Demulsification and demulsifiers ................................................................................... 9
1.5 Objectives and outline of the thesis ..................................................................................... 11
Chapter 2 Literature Review ......................................................................................................... 15
2.1 Emulsion stabilization mechanisms .................................................................................... 15
2.1.1 Electrostatic repulsion .................................................................................................. 15
2.1.2 Steric repulsion ............................................................................................................. 15
2.1.3 Marangoni-Gibbs effect ................................................................................................ 15
2.1.4 Thin film stabilization .................................................................................................. 16

viii
2.2 Emulsion destabilization ..................................................................................................... 18
2.2.1 Chemical demulsifier.................................................................................................... 18
2.2.2 Effect of temperature on demulsification ..................................................................... 22
2.3 Asphaltene and asphaltene model compound ..................................................................... 24
2.3.1 Asphaltene .................................................................................................................... 24
2.3.2 Asphaltene model compound ....................................................................................... 27
2.4 Summary of the literature review ........................................................................................ 30
Chapter 3 Experimental Techniques ............................................................................................. 32
3.1 Emulsion droplet size and counts determination by Focused Beam Reflectance
Measurement (FBRM) .............................................................................................................. 32
3.1.1 FBRM probe working principle ................................................................................... 33
3.1.2 FBRM probe data collection119 .................................................................................... 33
3.1.3 FBRM used at high temperature and pressure ............................................................. 35
3.2 Coalescence time measurement by integrated thin film drainage apparatus (ITFDA) ....... 36
3.3 Static interfacial tension measurement by Du Noüy ring method....................................... 36
3.4 Dynamic interfacial tension (DIFT) measurement by Theta Optical Tensiometer ............. 38
3.5 Crumpling ratio measurement by Theta Optical Tensiometer ............................................ 38
3.6 Dilatational rheology measurement by Theta Optical Tensiometer .................................... 39
3.7 Interfacial shear rheology measurement by Rheometer ...................................................... 40
3.8 Pressure−area isotherm measured by Langmuir trough ...................................................... 42
3.9 Surface topography studied by atomic force microscope (AFM) ....................................... 43
3.10 Morphology of the interfacial film studied by Brewster angle microscopy (BAM) ......... 44
3.11 Water content measurement by Karl Fisher Titration ....................................................... 45
Chapter 4 Interfacial Properties Pertinent to W/O and O/W Emulsion Systems Prepared Using
Polyaromatic Compounds ............................................................................................................. 46
4.1 Introduction ......................................................................................................................... 46

ix
4.2 Materials and Methods ........................................................................................................ 48
4.2.1 Materials ....................................................................................................................... 48
4.2.2 Methods ........................................................................................................................ 48
4.3 Experimental Results ........................................................................................................... 51
4.3.1 Interfacial tension measurement ................................................................................... 51
4.3.2 Crumpling ratio ............................................................................................................ 56
4.3.3 Dilatational rheology .................................................................................................... 58
4.3.4 Coalescence time .......................................................................................................... 60
4.4 Conclusions ......................................................................................................................... 62
Chapter 5 Changing the Interface Between an Asphaltene Model Compound and Water by
Addition of an EO-PO Demulsifier through Adsorption Competition or Adsorption Replacement
....................................................................................................................................................... 64
5.1 Introduction ......................................................................................................................... 64
5.2 Materials and Methods ........................................................................................................ 66
5.2.1 Materials ....................................................................................................................... 66
5.2.2 Methods ........................................................................................................................ 66
5.3 Results and Discussion ........................................................................................................ 70
5.3.1 Interfacial tension ......................................................................................................... 70
5.3.2 Crumpling ratio ............................................................................................................ 72
5.3.3 Interfacial pressure-area isotherm ................................................................................ 73
5.3.4 Morphology of the C5Pe interfacial film ..................................................................... 75
5.3.5 Interfacial shear rheology ............................................................................................. 77
5.4 Conclusions ......................................................................................................................... 79
Chapter 6 Molecular Destabilization Mechanism of Asphaltene Model Compound C5Pe
Interfacial Film by EO-PO Copolymer: Experiments and MD Simulation .................................. 81
6.1 Introduction ......................................................................................................................... 81

x
6.2 Materials and Methods ........................................................................................................ 82
6.2.1 Materials ....................................................................................................................... 82
6.2.2 Methods ........................................................................................................................ 83
6.3 Results and Discussion ........................................................................................................ 86
6.3.1 Interfacial tension ......................................................................................................... 86
6.3.2 Interfacial morphology ................................................................................................. 87
6.3.3 MD simulation .............................................................................................................. 89
6.4 Conclusions ......................................................................................................................... 94
Chapter 7 Effect of Temperature on Demulsification of Water-in-Heavy Oil Emulsions Using
EO-PO Copolymers ...................................................................................................................... 95
7.1 Introduction ......................................................................................................................... 95
7.2 Materials and Methods ........................................................................................................ 96
7.2.1 Demulsifiers ................................................................................................................. 96
7.2.2 Solvent and water ......................................................................................................... 96
7.2.3 Preparation of water in naphtha diluted bitumen emulsion .......................................... 96
7.2.4 Demulsification study using FBRM and Karl Fisher Titrator ...................................... 97
7.2.5 Analysis from a pendant drop....................................................................................... 98
7.2.6 Brewster angle microscopy .......................................................................................... 99
7.3 Demulsification performance of the EO-PO copolymers on dewatering water-in-naphtha
diluted bitumen emulsions ........................................................................................................ 99
7.3.1 Performance of demulsifier C .................................................................................... 102
7.3.2 Performance of demulsifier B .................................................................................... 111
7.3.3 Comparison between demulsifier B and C ................................................................. 119
7.4 Interfacial properties ......................................................................................................... 122
7.4.1 Dynamic interfacial tension ........................................................................................ 122
7.4.2 Morphology of diluted bitumen−water interfacial film.............................................. 124
xi
7.4.3 Contraction behavior .................................................................................................. 126
7.5 Conclusions ....................................................................................................................... 128
Chapter 8 Conclusions and Future Work .................................................................................... 130
8.1 Conclusions ....................................................................................................................... 130
8.2 Future work ....................................................................................................................... 132
Reference ................................................................................................................................... 134
xii
List of Figures
Figure 1-1 Composition of oil sands. .............................................................................................. 1
Figure 1-2 Basic flow sheet of SARA analysis. ............................................................................. 3
Figure 1-3 Schematic of the bitumen production process for mineable oil sands4. ........................ 5
Figure 1-4 Bitumen froth treatment process. .................................................................................. 6
Figure 1-5 Water-in-oil (left) and oil-in-water emulsions (right). .................................................. 7
Figure 1-6 Interfacial film formation process. ................................................................................ 9
Figure 1-7 Emulsion destabilization. ............................................................................................ 10
Figure 2-1 Effects of solvent composition and resin concentration on the surface activity and
solvency of asphaltene. 47 ............................................................................................................. 16
Figure 2-2 Effect of the solubility of asphaltenes in resin on particle modification.47 ................. 17
Figure 2-3 Basic molecular structure of commercial demulsifiers: (a) linear, (b) star, and (c)
branched. ....................................................................................................................................... 21
Figure 2-4 Effect of temperature on interfacial shear viscosity of a shale oil−water interface. ... 24
Figure 2-5 Molecular structure of polyaromatic surfactant C5Pe (MW=689 g/mol) and C5PeC11
(MW=827.12 g/mol). .................................................................................................................... 27
Figure 2-6 Molecular structure of PAP (MW=723 g/mol) and BiSA (MW=755 g/mol). ............ 28
Figure 3-1 Front view (left) and side view (right) of the FBRM system ...................................... 32
Figure 3-2 Front view and side view of the fixed beaker stand .................................................... 32
Figure 3-3 Cutaway view of the Lasentec in-process probe ......................................................... 33
Figure 3-4 Working principle: probe detects pulses of backscattered light and records measured
chord lengths ................................................................................................................................. 34
Figure 3-5 Autoclave with a 45° angled branch for FBRM ......................................................... 35
Figure 3-6 Schematic view of the integrated thin film drainage apparatus. ................................. 36
Figure 3-7 Cutaway view of the Du Noüy ring method. .............................................................. 37
Figure 3-8 Pendant drop.126........................................................................................................... 38
Figure 3-9 Skin formation (steric layer) at water droplet surfaces in (a) 0.1 wt.% bitumen and (b)
0.001 wt.% bitumen ...................................................................................................................... 39
Figure 3-10 (a) Interfacial tension (grey circles) follows the change in droplet area (turquoise
squares) and (b) deformation to the adsorbed molecular layer is caused by dilation or
compression of the droplet. ........................................................................................................... 40

xiii
Figure 3-11 Schematic cross section of the DWR setup............................................................... 41
Figure 3-12 Langmuir interfacial trough set up. ........................................................................... 42
Figure 3-13 AFM imaging ............................................................................................................ 43
Figure 3-14 Brewster angle microscope ....................................................................................... 44
Figure 3-15 Karl Fisher titrator ..................................................................................................... 45
Figure 4-1 Two water (or oil) droplets are placed close to each other before the coalescence time
measurement for aging of the droplets. The square and horizontal lines are used to make sure the
size of the droplets and initial distance are the same throughout different experiments. The radii
of the droplets are R1∼1.3 mm (measured by the maximum horizontal dimension of the top
droplet) and R2∼2.8 mm (calculated from the curvature of the semicircular bottom droplet). .... 50
Figure 4-2 Effect of the droplet volume on interfacial tension of the 30 mg/L C5Pe
solution−water interface. .............................................................................................................. 51
Figure 4-3 Interfacial tension as a function of C5Pe concentration for pH 7 water−C5Pe in
xylene solution: (a) aged for 10 min and (b) aged for 30 min; pH 5.5 water−C5Pe in xylene
solution: (c) aged for 10 min and (d) aged for 30 min. ................................................................. 52
Figure 4-4 Interfacial tension as a function of C5PeC11 concentration for pH 7 water−C5PeC11
in xylene solution: (a) aged for 10 min and (b) aged for 30 min. ................................................. 53
Figure 4-5 (a) dynamic IFT of C5Pe−water (pH 5.5) interface and (b) dynamic IFT of
C5PeC11−water (pH 7) interface. ................................................................................................ 54
Figure 4-6 Zeta potential of xylene diluted C5Pe in water emulsions as a function of pH. ......... 54
Figure 4-7 Comparison of interfacial tensions measured using the pendant drop and Du Noüy
ring methods: (a) for water−C5Pe in xylene solution and (b) for water−C5PeC11 in xylene
solution, both aged for up to 30 min. Note: Vwater:Voil=4:3 for Du Noüy ring method;
Vwater:Voil=1:300 in W/O case and 300:1 in O/W case for the pendant drop method. .................. 55
Figure 4-8 Crumpling ratio of water−C5Pe in xylene systems as a function of C5Pe
concentration with the droplets of pH 7 being aged for 10 min (a) and 30 min (b). ..................... 57
Figure 4-9 (a) Frequency dependence of elastic modulus of the interface for DI water in 100
mg/L C5Pe in xylene solution at different aging time; (b) Effect of amplitude (volume change)
on the measured elastic modulus for DI water in 100 mg/L C5Pe in xylene solution: aging time
60 min; frequency 0.1 Hz. ............................................................................................................. 58

xiv
Figure 4-10 Dilatational modulus of water−C5Pe in xylene solution system as a function of
measurement time. ........................................................................................................................ 59
Figure 4-11 Experimental observations of coalescence time for (a) C5Pe, (b) C5PeC11 of various
concentrations in the W/O and O/W systems. The viscosity of oil and water is 0.8 and 1 mPa⋅s,
respectively, and (c) schematics showing steric repulsion for the W/O system and EDL repulsion
for the O/W system, respectively (slightly colored molecules are used to demonstrate the
stacking of polyaromatic cores). ................................................................................................... 60
Figure 5-1 (a) DIFT of the DI water droplet in xylene diluted C5Pe solution (30 mg/L) with the
addition of EO-PO demulsifier at different concentrations and (b) DIFT of the xylene diluted
C5Pe droplet (30 mg/L) mixed with the EO-PO demulsifier at varied dosages in water. ............ 70
Figure 5-2 (a) DIFT of the DI water droplet in xylene diluted C5PeC11 solution (30 mg/L) with
the addition of the EO-PO demulsifier at different dosages and (b) DIFT of the xylene diluted
C5PeC11 droplet (30 mg/L) mixed with the EO-PO demulsifier at different dosages in water. . 72
Figure 5-3 Crumpling ratio of (a, b) W/O system, DI water droplet in xylene diluted C5Pe
solution at 30 mg/L with the addition of the EO-PO demulsifier at 0 and 2 ppm, and (c, d) O/W
system, xylene diluted C5Pe droplet at 30 mg/L mixed with the EO-PO demulsifier at 0 and 2
ppm in water. ................................................................................................................................ 73
Figure 5-4 Interfacial pressure−area isotherm for the C5Pe-only, C5Pe with the EO-PO
demulsifier, and EO-PO demulsifier-only system: (a) diffusion protocol and (b) spreading
protocol. ........................................................................................................................................ 74
Figure 5-5 AFM image of the LB film: (a) C5Pe interfacial film; (b) and (c) films prepared by
diffusing the EO-PO demulsifier at different concentrations (2 and 5 ppm) to the already formed
C5Pe interfacial film; (d) and (e) films prepared by spreading the mixture of C5Pe solution and
the EO-PO demulsifier (2 and 5 ppm) at the interface; and (f) 5 ppm demulsifier-only film (2
ppm demulsifier-only film was similar to 5 ppm demulsifier-only system and is not shown here).
The scale of all images is 5 μm. .................................................................................................... 76
Figure 5-6 G″ (loss or viscous moduli) and G′ (storage or elastic moduli) of C5Pe layers with
EO-PO demulsifier addition at varied dosages. ............................................................................ 77
Figure 6-1 EO-PO copolymer model used in the MD simulation. ............................................... 84

xv
Figure 6-2. Initial configuration of systems (a) A, (b) B, (c) C, and (d) D. The C5Pe and EO-PO
copolymer model are displayed in parts (e) and (f). (g) Color scheme: C, gray; H, white; N, blue;
O, red............................................................................................................................................. 85
Figure 6-3 Interfacial tension of 30 mg/L xylene diluted C5Pe−water interface and pure
demulsifier−water interface as a function of the EO-PO dosage. ................................................. 86
Figure 6-4 BAM images of xylene diluted C5Pe−water interface: (a) no EO-PO added; (b) 2 ppm,
(c) 5 ppm, and (d) 10 ppm EO-PO added in the oil phase; in comparison with (e) 10 ppm EO-PO
film and (f) clean xylene−water interface. The scale bar is 200 μm for all BAM images............ 88
Figure 6-5 Density profiles of systems A, B, C, and D. Water, C5Pe, EO-PO copolymer, and
solvent are shown in gray, red, blue, and green colors, respectively. ........................................... 89
Figure 6-6 Radical distribution between the C5Pe/EO-PO molecules and water for system A, B,
C, and D after 10,000 ps simulation. ............................................................................................ 91
Figure 6-7 Hydrogen bonding energy for system A, B, C, and D. ............................................... 92
Figure 6-8 Final configurations and distributions of the hydrophobic and hydrophilic groups at
the interface of systems A, B, C, and D. ....................................................................................... 93
Figure 6-9 Proportion of hydrophilic or hydrophobic groups at the oil−water interface ............. 94
Figure 7-1 Size distribution of water droplets in diluted bitumen emulsions detected by FBRM.
....................................................................................................................................................... 97
Figure 7-2 Counts number of the water droplets in emulsions as a function of time, detected by
FBRM (100 ppm of demulsifier C). The dashed line represents the point when the demulsifier
was added to the system. The inset shows the counts number of the droplet with size ranging
from 50 to 150 µm. ..................................................................................................................... 100
Figure 7-3 UWT CLD during demulsification of the water-in-naphtha diluted bitumen emulsions
using 100 ppm demulsifier C at different demulsification time. ................................................ 101
Figure 7-4 SWT CLD during demulsification of the water-in-naphtha diluted bitumen emulsions
using 100 ppm demulsifier C at different demulsification time. ................................................ 101
Figure 7-5 (a) SWT CL during demulsification of the water-in-naphtha diluted bitumen
emulsions at different dosages of demulsifier C as a function of the demulsification time and (b)
microscopy pictures of the emulsion droplets at the bottom of the autoclave vessel. ................ 102
Figure 7-6 UWT CLD at the steady state of the demulsification process at different dosages of
demulsifier C. .............................................................................................................................. 103

xvi
Figure 7-7 SWT CLD at the steady state of the demulsification process at different dosages of
demulsifier C. .............................................................................................................................. 104
Figure 7-8 Water content remained in the water-in-naphtha diluted bitumen emulsions after the
demulsification process at different dosages of demulsifier C. .................................................. 105
Figure 7-9 SWT CL during demulsification of the water-in-naphtha diluted bitumen emulsions
using 50 ppm demulsifier C as a function of the demulsification time at different pH. ............. 106
Figure 7-10 UWT CLD at steady state of the demulsification process using 50 ppm demulsifier
C at different pH. ........................................................................................................................ 107
Figure 7-11 SWT CLD at steady state of the demulsification process using 50 ppm demulsifier C
at different pH. ............................................................................................................................ 107
Figure 7-12 Water content remained in the water-in-naphtha diluted bitumen emulsions after the
demulsification process by 50 ppm demulsifier C at different pH. ............................................ 108
Figure 7-13 SWT CL during demulsification of water-in-naphtha diluted bitumen emulsions
using 50 ppm demulsifier C as a function of the demulsification time at different temperatures
(Blank represents the condition when the experiment was run at room temperature without
demulsifier addition). .................................................................................................................. 109
Figure 7-14 UWT CLD at steady state of the demulsification process using 50 ppm demulsifier
C at different temperatures. ......................................................................................................... 110
Figure 7-15 SWT CLD at steady state of the demulsification process using 50 ppm demulsifier C
at different temperatures. ............................................................................................................ 110
Figure 7-16 Water content remained in the water-in-naphtha diluted bitumen emulsions after the
demulsification process by 50 ppm demulsifier C at different temperatures. ............................ 111
Figure 7-17 SWT CL during demulsification of the water-in-naphtha diluted bitumen emulsions
using 100 ppm demulsifier B as a function of the demulsification time. ................................... 112
Figure 7-18 UWT CL during demulsification of the water-in-naphtha diluted bitumen emulsions
using 100 ppm demulsifier B as a function of the demulsification time. ................................... 112
Figure 7-19 Counts number of the emulsion droplets with size less than 10 μm during
demulsification of the water-in-naphtha diluted bitumen emulsions using 100 ppm demulsifier B
as a function of the demulsification time. ................................................................................... 113

xvii
Figure 7-20 Counts number of emulsion droplets with size ranging from 10 to 50 μm during
demulsification of the water-in-naphtha diluted bitumen emulsions using 100 ppm demulsifier B
as a function of the demulsification time. ................................................................................... 114
Figure 7-21 Counts number of emulsion droplets of size ranging from 50 to 150 μm during
demulsification of the water-in-naphtha diluted bitumen emulsions using 100 ppm demulsifier B
as a function of the demulsification time. ................................................................................... 114
Figure 7-22 UWT CLD during demulsification of the water-in-naphtha diluted bitumen
emulsions using 100 ppm demulsifier B at different demulsification time. ............................... 115
Figure 7-23 SWT CLD during demulsification of the water-in-naphtha diluted bitumen
emulsions using 100 ppm demulsifier B at different demulsification time. ............................... 115
Figure 7-24 Water content remained in the water-in-naphtha diluted bitumen emulsions after the
demulsification process at different dosages of demulsifier B. .................................................. 116
Figure 7-25 SWT CL during demulsification of the water-in-naphtha diluted bitumen emulsions
using 50 ppm demulsifier B as a function of the demulsification time at different temperatures.
..................................................................................................................................................... 116
Figure 7-26 View of the emulsion sample at the bottom of autoclave after dewatering by 50 ppm
demulsifier B at 80 °C. ............................................................................................................... 117
Figure 7-27 UWT CLD at steady state of the demulsification process using 50 ppm demulsifier
B at different temperatures. ......................................................................................................... 118
Figure 7-28 SWT CLD at steady state of the demulsification process using 50 ppm demulsifier B
at different temperatures. ............................................................................................................ 118
Figure 7-29 Water content remained in the water-in-naphtha diluted bitumen emulsions after the
demulsification process by 50 ppm demulsifier B at different temperatures. ............................ 119
Figure 7-30 SWT CL during demulsification of the water-in-naphtha diluted bitumen emulsions
using 50 ppm demulsifier B or C as a function of the demulsification time at different
temperatures. ............................................................................................................................... 120
Figure 7-31 UWT CLD at steady state of the demulsification process using 50 ppm demulsifier
B or C at different temperatures.................................................................................................. 120
Figure 7-32 SWT CLD at steady state of the demulsification process using 50 ppm demulsifier B
or C at different temperatures. .................................................................................................... 121

xviii
Figure 7-33 Water content remained in the water-in-naphtha diluted bitumen emulsions after
demulsification by 50 ppm demulsifier B or C at different temperatures. ................................. 121
Figure 7-34 Dynamic oil−water interfacial tension of diluted bitumen, demulsifier C solution,
and their mixture in naphtha at different temperatures. Note that DB denotes diluted bitumen. 123
Figure 7-35 BAM images of diluted bitumen film (a) No demulsifier added, (b) 0.5 ppm, (c) 1
ppm, and (d) 5 ppm demulsifier added in the oil phase. The scale bar is 200 µm for all BAM
images. ........................................................................................................................................ 125
Figure 7-36 Crumpling of oil droplets measured by the pendant drop technique. Oil droplets aged
for 1 h without demulsifier (A and B), with 50 ppm demulsifier C (C and D), with 100 ppm
demulsifier C (E and F), and 50 ppm pure demulsifier C (N and O), respectively. ................... 127
Figure 7-37 Crumpling ratio of naphtha diluted bitumen with and without demulsifier addition
(DB denotes diluted bitumen, DB+50 ppm C denotes diluted bitumen containing 50 ppm
demulsifier C, and so on) ............................................................................................................ 128

xix
List of Tables
Table 1-1 Elemental composition of typical Alberta Athabasca bitumen (weight percent of the
element; data from Speight). ........................................................................................................... 4
Table 1-2 Elemental compositions (wt.%) of Athabasca asphaltenes7 ........................................... 4
Table 2-1 Density and viscosity of diluted Athabasca coker-feed bitumen. ................................ 23
Table 6-1 Simulation parameters of different systems ................................................................. 85
Table 7-1 Physical properties of EO-PO copolymers. .................................................................. 96
Table 7-2 Experimental conditions used in autoclave demulsification tests ................................ 98

1
Chapter 1 Introduction
1.1 Importance of unconventional oil
Conventional oil is defined as the oil that can be economically extracted from deposits simply
using standard drilling techniques. Because of this simplicity and relatively low-cost, the world
has relied on the production of the conventional oil over the past several decades.1-3 Decades of
oil production have resulted in the extensive use of conventional resources, therefore, the less
desirable unconventional oil has come to force as important resources. Unconventional oil such
as heavy oil and bitumen resources is much more difficult to extract as specialized techniques
and tools are needed. Although these materials are more expensive to produce and process than
the most conventional petroleum reservoirs, they are available in abundance.4 Alberta’s oil sand
resource is estimated at 1.7 trillion barrels, or 270 billion m3 (ERCB ST98-2008) of crude
bitumen, which represents one of the largest single deposit of oil in the world.
1.2 Oil sand
1.2.1 Oil sands formation
Figure 1-1 Composition of oil sands.

2
Oil sand is composed of quartz sand grains, covered by a film of water and clay, and embedded
in the heavy oil called bitumen,5 as schematically shown in Figure 1-1. It is widely accepted that
the oil sands were formed many millions of years ago when Alberta was covered by a warm
tropical sea. Marine life, mainly plankton and other marine animals, died and fell to the bottom
of the sea and were embedded by sedimentary materials. Through pressure, heat, and time, their
tiny bodies were transformed into bitumen products, which then seeped into the surrounding
sands, forming oil sands.4
The bitumen content in deposits varies from 1% to 18%. More than 10 wt.% bitumen content is
considered rich, while less than 6%-8% is considered poor and not economically feasible to mine,
although it may be mined with a blended stock of higher grade oil sand.
1.2.2 Oil sands processing
There are three major oil sands areas in Alberta: Athabasca, Cold Lake, and Peace River. Each
area is covered by a layer of overburden consisting of muskeg, glacial tills, sandstone, and shale.
Based on the thickness of the overburden, two main methods are currently used to recover
bitumen from oil sands: open pit mining and in situ5 mining.
Open pit mining operations are applied to deposits of the overburden thickness less than 75
meters. It is estimated that among the oil sands deposits in Alberta, about 20% can be
economically recovered by open pit mining technology.4
If the oil sand formation is deeper than 75 meters from the surface, the in situ technique is used.
Since the oil sand content varies considerably from different deposits as well as within each
deposit, no single method of in situ recovery can be applied to all oil sand deposits. Steam
Assisted Gravity Drainage (SAGD) is the most common in situ process currently used. In this
process, two parallel L-shaped wells are drilled into the deposit. Steam is injected through the top
well. The injected steam heats the oil sand and reduces the viscosity of bitumen. The bitumen,
together with the condensed steam, flows downwards into the bottom well and then pumped to
the surface for further processing. Other in situ methods include Cold Heavy Oil Production with
Sands (CHOPS), Vapour Extraction (VAPEX), and Cyclic Steam Stimulation (CSS), etc. CHOPS
involves the deliberate initiation of sand influx into a perforated oil well, sustaining of sand
influx during the productive life of the well, and separation of sand from the oil for disposal.

3
VAPEX is the same process as SAGD, except that a solvent vapor is injected to reduce the
viscosity of the heavy oil. The diluted heavy oil will drain to the lower horizontal well by gravity,
to be produced. CCS is predominately a vertical well process, involving the alternating injection
of steam and production of oil with condensed steam from the same well. In the initial stage,
steam is injected into a well. This is followed by a “steam soaking” period to heat the oil in the
area, after which production is commenced. Then the cycle is repeated until production
diminishes to noneconomic level.
1.3 Bitumen
1.3.1 Basics of bitumen
Bitumen is a kind of extra-heavy oil in the oil sands and contains thousands of different
hydrocarbon components. Bitumen is one of the most complex mixtures of molecules found in
nature. The data in Table 1-1 show the typical elemental compositions for some Alberta
Figure 1-2 Basic flow sheet of SARA analysis.
Soluble Precipitates
n-pentane
Bitumen
Asphaltenes
Maltenes
Saturates Aromatics Resins
Adsorb on chromatography
column and elute with:
Aromatic Alkane Polar solvent
4
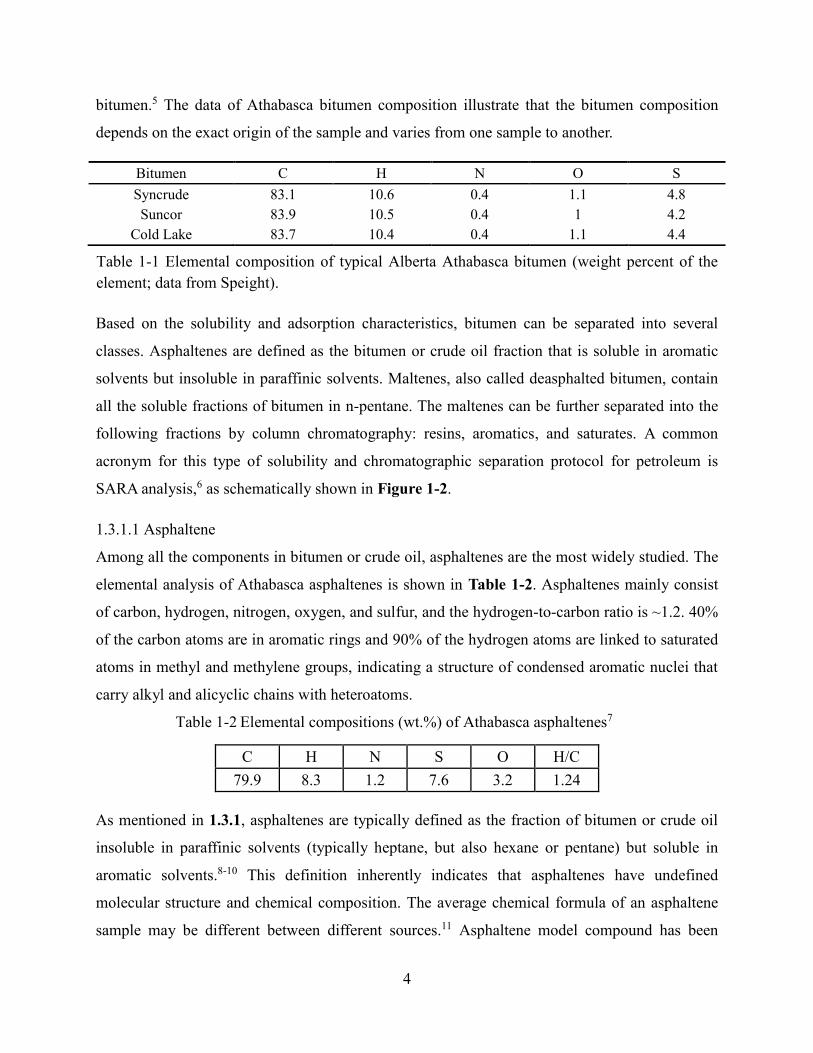
bitumen.5 The data of Athabasca bitumen composition illustrate that the bitumen composition
depends on the exact origin of the sample and varies from one sample to another.
Based on the solubility and adsorption characteristics, bitumen can be separated into several
classes. Asphaltenes are defined as the bitumen or crude oil fraction that is soluble in aromatic
solvents but insoluble in paraffinic solvents. Maltenes, also called deasphalted bitumen, contain
all the soluble fractions of bitumen in n-pentane. The maltenes can be further separated into the
following fractions by column chromatography: resins, aromatics, and saturates. A common
acronym for this type of solubility and chromatographic separation protocol for petroleum is
SARA analysis,6 as schematically shown in Figure 1-2.
1.3.1.1 Asphaltene
Among all the components in bitumen or crude oil, asphaltenes are the most widely studied. The
elemental analysis of Athabasca asphaltenes is shown in Table 1-2. Asphaltenes mainly consist
of carbon, hydrogen, nitrogen, oxygen, and sulfur, and the hydrogen-to-carbon ratio is ~1.2. 40%
of the carbon atoms are in aromatic rings and 90% of the hydrogen atoms are linked to saturated
atoms in methyl and methylene groups, indicating a structure of condensed aromatic nuclei that
carry alkyl and alicyclic chains with heteroatoms.
Table 1-2 Elemental compositions (wt.%) of Athabasca asphaltenes7
C H N S O H/C
79.9 8.3 1.2 7.6 3.2 1.24
As mentioned in 1.3.1, asphaltenes are typically defined as the fraction of bitumen or crude oil
insoluble in paraffinic solvents (typically heptane, but also hexane or pentane) but soluble in
aromatic solvents.8-10 This definition inherently indicates that asphaltenes have undefined
molecular structure and chemical composition. The average chemical formula of an asphaltene
sample may be different between different sources.11 Asphaltene model compound has been
Bitumen C H N O S
Syncrude 83.1 10.6 0.4 1.1 4.8
Suncor 83.9 10.5 0.4 1 4.2
Cold Lake 83.7 10.4 0.4 1.1 4.4
Table 1-1 Elemental composition of typical Alberta Athabasca bitumen (weight percent of the
element; data from Speight).

5
widely used to investigate the mechanism of asphaltene behavior and emulsion stability,12-14
where single and well-defined systems are used to have much higher control over the interfacial
behavior and concentrations. Properties of asphaltene and asphaltene model compounds will be
discussed in detail in Chapter 2.
1.3.2 Bitumen extraction
Bitumen from mineable oil sands ore can be recovered using the hot water extraction technique.4
A typical bitumen extraction scheme is shown in Figure 1-3, where the mined oil sands ore is
first crushed and then mixed with hot process water and chemical additives, such as caustic soda,
to form the oil sands slurry. Usually, the slurry has a temperature of 35-55 °C and a pH of 8-8.5.
The slurry is transported to the extraction plant to liberate bitumen. Air is then introduced into
the slurry to aerate the liberated bitumen. The aerated bitumen has an apparent lower density
than process water and hence floats to the top of the slurry to form a froth layer “rich” in
bitumen. The recovered bitumen froth, on average, contains 60 wt.% bitumen, 30 wt.% water,
and 10 wt.% solids. Most of the water is in a free form. The solids are entrained in the bitumen
phase or accumulated at the oil−water interface.15, 16 Most of the water and solids are then
removed in the bitumen froth treatment plant prior to upgrading.
Figure 1-3 Schematic of the bitumen production process for mineable oil sands4.
Raw water import
Utilities Steam
Hot/warm water
Recycled
water
Tailings pond/thickeners
Tailings slurry
Extraction plant
Oil sands
Open pit mine
Additives Air
Chemical
Rejects
Recovered
Bitumen Froth treatment &
Solvent recovery
Upgrading To refineries
Bitumen
Make-up
solvent
Bitumen froth
To tailings

6
1.3.2.1 Bitumen froth treatment
Bitumen has almost the same density as water, therefore, a diluent is usually needed to create a
density difference and reduce the viscosity of overall oil mixture. Based on the types of diluents
used, two main technologies are currently used in commercial froth treatment operations:
naphthenic froth treatment and paraffinic froth treatment, as shown in Figure 1-4.
Paraffinic froth treatment involves the addition of a paraffinic solvent, such as hexanes and
pentanes, to reduce the viscosity and density of bitumen.17 It usually requires a S/B (solvent to
bitumen) ratio of about 2. Due to the low solubility of asphaltenes in paraffinic solvents,
asphaltenes precipitate from bitumen, together with the dispersed water droplets and fine solids
to form complex floccules or clusters of water-solids-asphaltene precipitates. The aggregates
settle down quickly due to gravity to produce diluted bitumen with a negligible amount of water
and solids. Thus, a very clean and dry oil product is obtained.
Naphthenic froth treatment uses hydrotreated or untreated naphtha, ranging from short-chain
alkanes to aromatic hydrocarbons,18 as the froth diluent. A S/B ratio of about 0.65-0.7 (by
weight) is used. Mechanical separation equipment, such as hydrocyclone or centrifuge, is
1.5-2.5 wt.% water
0.4-0.8 wt.% solids
Water in oil
emulsion
Bitumen froth
Middling
Paraffinic
Solvent
Centrifuge
Water
Solids
Asphaltenes
Settling
Naphtha
Tailing
Figure 1-4 Bitumen froth treatment process.

7
employed to assist the separation of solids and water from diluted bitumen. After centrifugation,
about 1.5 to 2.5 wt.% water and 0.4 to 0.8 wt.% solids remain in the diluted bitumen product.4
The remaining water is in the form of stable emulsified water droplets (W/O emulsion) of several
micrometers in size, which is very difficult to remove.
1.4 Emulsion
1.4.1 Basics of emulsion
An emulsion is a mixture of two immiscible liquids, one of which, the disperse phase, is
suspended as stable droplets in the other, the continuous phase. Emulsions can be found in a
variety of industries, such as food, pharmaceuticals, cosmetics, and petroleum. Two common
types of emulsions are water-in-oil (W/O) and oil-in-water (O/W) emulsions (Figure 1-5).
1.4.2 Emulsions in the oil industry
In particular, W/O emulsions are often encountered during the production of crude oils and
bitumen. In the crude oil industry, water-in-crude oil emulsions (W/CO) are usually formed
when crude oil and water are intimately mixed at the wellhead, production well, valves, and
pumps. The same is true in bitumen recovery by both in situ and open pit mining recovery
methods. As mentioned in 1.3.2, bitumen is first extracted using warm water, followed by a
naphtha-based froth treatment and then a two-stage centrifugation, after which 1.5 to 2.5 wt.%
Figure 1-5 Water-in-oil (left) and oil-in-water emulsions (right).
Water
Oil

8
water remains in the final diluted bitumen product. The remaining water exists as emulsified
water droplets that are hard to remove.
The formation of stable W/O emulsions in petroleum industry is highly undesirable because salts
and fines carried with the emulsified water cause corrosion, poison catalysts, reduce throughput,
and lead to equipment failure in downstream operations.19 W/O emulsions can also significantly
increase the pumping costs as a result of the dramatic increase in viscosity.20-22 Understanding
the emulsion stability and demulsification mechanisms is thus very important in petroleum
industry.
1.4.3 Stability of emulsions
Emulsions are thermodynamically unstable because their formation creates a large specific
interfacial area, with the total energy change given by Equation (1-1),
ΔG = γo/w ΔA (1-1)
where γo/w is the oil−water interfacial tension. Since the interfacial tension is positive in general,
an increase in the interfacial area by emulsification increases the total system energy, making the
system thermodynamically less stable. Consequently, phase separation, or what we call emulsion
breaking, should occur spontaneously, because it can reduce the system energy. Generally, an
emulsifier or emulsifying agent is needed to stabilize the emulsion. These components may
stabilize the emulsion by preventing direct emulsion droplet contact or drainage of the thin liquid
film between emulsion droplets.23, 24 There are three general types of emulsifiers:
macromolecules (such as synthesized polymers, natural proteins, and so on), colloidal solids, and
surfactants. One of the most important properties of a surfactant is its amphiphilicity. Surfactant
is known to have two well-defined regions: a hydrophilic head group and a hydrophobic tail. The
most common emulsion stabilization is due to the adsorption of surfactants at the oil−water
interface. When adsorbed, the hydrophilic part of the surfactants stays in the polar phase (such as
water) while the hydrophobic part remains in the hydrocarbon phase (such as bitumen or crude
oil). The adsorbed surfactants will change the properties of the interfacial film significantly, such
as reducing the interfacial tension, the film rigidity, and viscoelasticity, etc., thereby altering the
emulsion stability. Water-in-diluted bitumen emulsions in the petroleum industry are very stable.
It is widely accepted that the emulsion stability is due to the formation of a mechanically strong,
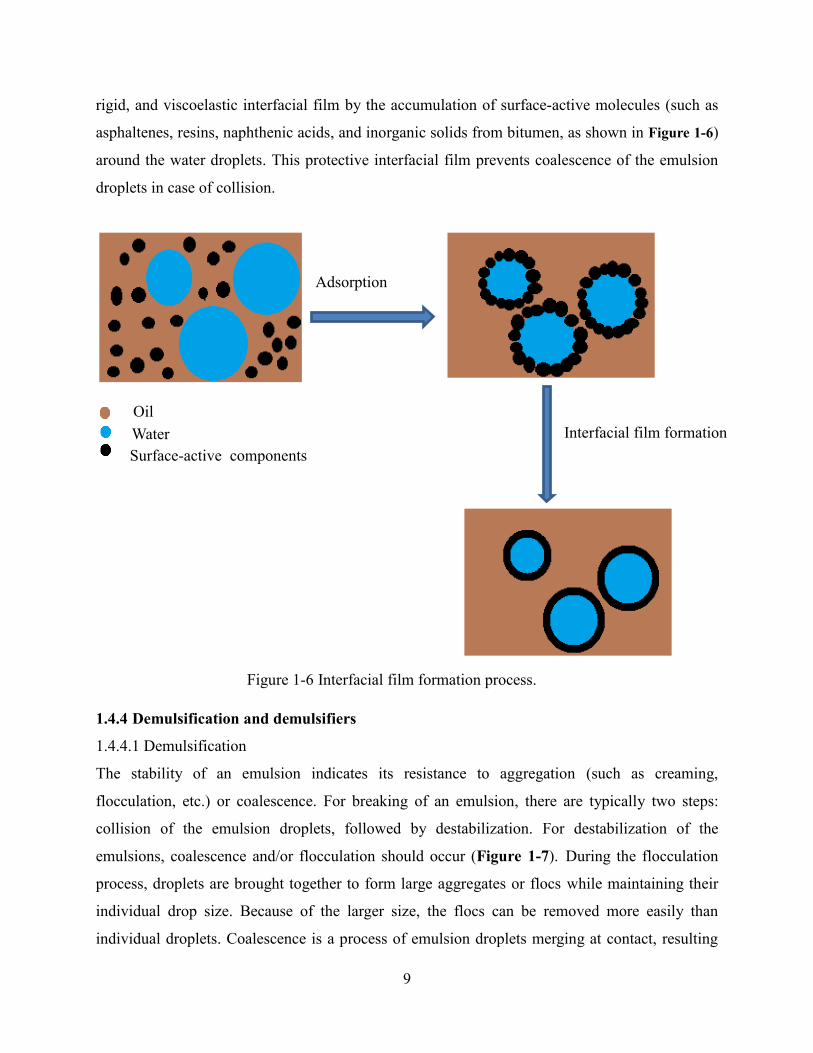
9
rigid, and viscoelastic interfacial film by the accumulation of surface-active molecules (such as
asphaltenes, resins, naphthenic acids, and inorganic solids from bitumen, as shown in Figure 1-6)
around the water droplets. This protective interfacial film prevents coalescence of the emulsion
droplets in case of collision.
1.4.4 Demulsification and demulsifiers
1.4.4.1 Demulsification
The stability of an emulsion indicates its resistance to aggregation (such as creaming,
flocculation, etc.) or coalescence. For breaking of an emulsion, there are typically two steps:
collision of the emulsion droplets, followed by destabilization. For destabilization of the
emulsions, coalescence and/or flocculation should occur (Figure 1-7). During the flocculation
process, droplets are brought together to form large aggregates or flocs while maintaining their
individual drop size. Because of the larger size, the flocs can be removed more easily than
individual droplets. Coalescence is a process of emulsion droplets merging at contact, resulting
Adsorption
Interfacial film formation
Oil
Water
Surface-active components
Figure 1-6 Interfacial film formation process.

10
in an increase of droplet size and a decrease in droplet counts, which is always desirable if we
want to break the emulsion.
To achieve efficient breakup of W/O emulsion, heat, electricity, and chemicals are usually used
to enhance gravity settling of the emulsified water in industry. The use of heat is very effective in
breaking W/O emulsions by reducing the viscosity of the oil and changing the solubility of the
natural emulsifiers in the oil.25 Usually, interfacial materials such as solids still stay in the treated
oil after evaporation of water, which lowers bitumen quality. Alternatively, electrical approaches
apply an electrical field in the emulsion system.26 Electrostatic coalescence causes charge
separation at the droplet surface and the droplets act as dipoles. The aligning of the dipoles
brings the droplets together. The dipole in a droplet also causes the droplet to elongate, which
stretches the interface and potentially creating pathways for rupture.27 Either of these two ways
can enhance the coalescence of water droplets. Chemical demulsification consists of the addition
of a small amount of demulsifiers (usually 1-1000 ppm), usually surfactants, polymers, pure
solvents, or their mixture,26 to enhance phase separation. It works mainly by weakening the
interfacial layer on water droplet surfaces. The use of demulsifiers to break W/O emulsions has
been regarded as an economical and efficient method and is widely applied in petroleum
industry.28, 29
Figure 1-7 Emulsion destabilization.

11
1.4.4.2 Demulsifier
To break W/O emulsions successfully, demulsifiers must have:30-35 1) strong affinity to the
oil−water interface with the ability to destroy or at least substantially weaken the protective film
around the droplets and/or change the wettability of solids; 2) the ability to flocculate or coalesce
the droplets.
Chemical demulsifiers destabilize emulsions by three major mechanisms: (1) They exhibit
greater interfacial activity compared with the stabilizing species and can thus penetrate
stabilizing films at the oil−water interface.36, 37 (2) They disrupt and soften (i.e., lower the
viscoelastic moduli) the stabilizing interfacial film.36, 38, 39 (3) They suppress the interfacial
tension gradient and the Marangoni-Gibbs stabilizing effect, thus accelerating the rate of film
drainage and promoting coalescence.33
Modern demulsifiers are usually mixtures of surface-active macromolecular chemicals, such as
acid- or base-catalyzed phenol-formaldehyde polymers, ethoxylated and/or propyloxylated
polyamines, di-epoxides, polyols, and silicone copolymers.40, 41 Most of the active ingredients in
the chemicals used as demulsifiers are copolymers of ethylene oxide (EO) and propylene oxide
(PO) of various molecular weights and EO-to-PO ratios.30, 42-46 Three different molecular
structures are shown in Figure 2-3, representing the linear, star, and branched structures. It is
reported that the best demulsification performance was achieved by demulsifiers of branched
molecular structures.44 For EO-PO copolymers, the EO groups in the structure confer hydrophilic
properties and the PO groups add hydrophobic properties to the demulsifier molecule. Therefore,
increasing the EO content makes the polymer more hydrophilic, while increasing the PO content
makes it more hydrophobic. The amphiphilicity of the EO-PO copolymer enables it to adsorb at
the oil−water interface, thus affecting the properties of the interfacial film.
1.5 Objectives and outline of the thesis
The research performed in this thesis has four goals: (1) To investigate the relationship between
W/O and O/W systems using asphaltene model compounds as the oil samples, which have better
optical transparency for both systems. (2) To study the effect of the EO-PO copolymer on the
water−xylene diluted asphaltene model compound interface, in order to reveal the
demulsification mechanism and provide some information on the feasibility of using the reverse
O/W system to study the interfacial properties of the W/O system when demulsifier is

12
introduced. (3) To provide insights into the destabilization mechanism of the C5Pe interfacial
film by the EO-PO copolymer and to study how different groups of the EO-PO demulsifier
behaved at the interface using molecular dynamics simulation, so as to provide information on
how to design efficient demulsifier for dewatering. (4) To understand the influence of the
demulsifier dosage, water pH, and temperature on breaking water-in-diluted bitumen emulsions
using EO-PO copolymer as the demulsifier and to uncover the corresponding destabilizing
mechanisms using the reverse diluted bitumen-in-water system. To realize those goals, an array
of experimental techniques was used, including focused beam reflectance measurement (FBRM),
interfacial film drainage apparatus (ITFDA), Theta Optical Tensiometer (T200), rheometer,
Brewster angle microscope (BAM), atomic force microscope (AFM), Langmuir trough, and Karl
Fisher titrator. Among these techniques, FBRM allows in situ and real-time particle size
measurement, which helps us to gain insight into the kinetics of demulsification. ITFDA is an in-
house apparatus that allows us to measure the film drainage time under a well-controlled external
force. Tensiometer can be used for the interfacial tension, film rigidity, and interfacial dilatational
rheology measurements. An AR-G2 rheometer is used to investigate the interfacial shear
rheology of the interfacial film. BAM and AFM can image the morphological changes of films at
the oil−water interfaces with demulsifier addition. Langmuir trough can be used to investigate
the compressional behavior of the interfacial film by measuring the interfacial pressure−area
isotherm. The remaining water content in the emulsion sample can be measured by the Karl
Fisher titrator. In addition, molecular dynamics simulation was used to model the demulsification
mechanism at the molecular level.
The theme of this research is presented in the following chapters.
Chapter 1: This chapter provides the background and objectives of this study. A brief
introduction is given on how oil sands ore is processed, how stable emulsions are formed, and
how to get rid of the emulsions.
Chapter 2: Several mechanisms by which W/O emulsions are stabilized and destabilized are
briefly reviewed in this chapter. The correlation between chemical demulsifier performance and
properties such as molecular weight (MW), relative solubility number (RSN), hydrophile-
lipophile balance (HLB), molecular structure, etc., are also presented. Properties of asphaltene
and asphaltene model compounds are also reviewed.

13
Chapter 3: A detailed description of the related techniques used in this work is presented. The
introduction of the pendant drop technique for the dynamic interfacial tension measurement and
Du Noüy ring method for the static interfacial tension measurement is given. Characterization of
the skin formation at the oil−water interface is conducted by crumpling ratio and dilatational
rheology measurements using Tensiometer and the corresponding principles are provided.
Rheometer, BAM, and AFM, which are used for characterizing the shear rheology and
morphology of the interfacial film, are introduced. Techniques to evaluate the efficiency of
demulsification, such as droplet size and count measurement by FBRM, coalescence time
measurements by ITFDA, and remaining water content measurement by Karl Fisher Titrator, are
also provided. This chapter aims to provide theoretical background information for the following
chapters.
Chapter 4: In this chapter, the relationship between W/O and O/W systems is studied, to obtain
the conditions where we can perform optical measurements using the reverse system, i.e., diluted
bitumen or crude oil in water, which has better visualization.
Chapter 5: In this chapter, the effect of the EO-PO demulsifier on the interfacial properties of the
C5Pe/C5PeC11−water interface is studied to provide new insights into the molecular mechanism
of emulsion destabilization. This chapter also provides information on the feasibility of using
reverse O/W system to study the interfacial properties of the W/O system when demulsifier is
introduced. In addition, this chapter provides further justification for using C5Pe as the
asphaltene model compound by investigating whether asphaltene model compound could interact
with demulsifier molecules in a similar way as that of real asphaltenes and demulsifier
molecules.
Chapter 6: Molecular dynamics simulation was used to study the effect of the EO-PO copolymer
on the C5Pe interfacial film to provide a perspective of the demulsification mechanism at the
molecular level. In addition, the behavior of different groups of the demulsifier at the interface
was also studied.
Chapter 7: In this chapter, EO-PO copolymers are added to a water-in-naphtha diluted bitumen
emulsion, and the effectiveness of the copolymers in dewatering water-in-naphtha diluted

14
bitumen emulsions at high temperature is investigated, while the reverse O/W emulsion systems
were used for characterization of the interfacial properties.
Chapter 8: This chapter draws the overall conclusions and provides recommendations for future
work.

15
Chapter 2 Literature Review
2.1 Emulsion stabilization mechanisms
There are at least four mechanisms by which emulsions are stabilized: (1) electrostatic repulsion;
(2) steric repulsion; (3) the Marangoni Gibbs effect, which retards film drainage; and (4) thin
film stabilization. A brief review of each of these mechanisms is given below.47
2.1.1 Electrostatic repulsion
Electrostatic repulsion refers to two particles or droplets of the same charge that repel each other.
For W/O emulsions, electrostatic forces do not play a significant role in the emulsion
stabilization because that ions are not soluble in the oil phase.47
2.1.2 Steric repulsion
Steric repulsion is known as the resistance of the interactions between the adsorbed species on
different droplet interfaces. In other words, steric repulsion arises from the fact that each atom
within a molecule occupies a certain amount of space. If atoms are brought too close to each
other, there is an associated energy cost due to the overlapping of the electron clouds. In W/O
emulsions, the dispersed water droplets are covered by surfactant molecules and the surfactant
tail adsorbed at the interface prevents the close contact of the droplets. Therefore, steric repulsion
may play a significant role in stabilizing W/O emulsions.
2.1.3 Marangoni-Gibbs effect
When the continuous liquid phase between the emulsion droplets drains out, an interfacial
tension gradient (a surfactant concentration gradient) is produced as the surfactants at the droplet
interface are pulled outward with the draining liquid. Because of the surfactant depletion, a
diffusion flux is then generated in the opposite direction of the drainage to slow this process.
This phenomenon is called the Marangoni-Gibbs effect.47-49 In other words, the Marangoni-
Gibbs effect can stabilize emulsions by preventing the drainage of the continuous phase from
between two nearby droplets. To enhance coalescence by the demulsifier, the interfacial activity
of the adsorbed demulsifier molecules at the interface must be high enough to suppress or even
reverse this interfacial tension gradient so as to enhance the liquid drainage.49-53 It has been
reported by Mukherjee et al.54 that the interfacial shear viscosity must be low to achieve efficient
emulsion breakage. Since the formation of the viscoelastic interfacial film results in the high
16
interfacial viscosity of the asphaltene-containing systems, this stabilization mechanism is
unlikely to be significant for water-in-crude oil or water-in-diluted bitumen systems.47
2.1.4 Thin film stabilization
It is widely accepted that emulsion stability is mainly due to the formation of the mechanically
strong, viscoelastic, and rigid interfacial film around the emulsion droplets, and this film is
produced by the accumulation of the surface-active molecules and inorganic solids from crude
oil or bitumen.47, 55-59 The presence of surface-active chemical species (such as asphaltenes,
resins, and acids as well as fine solid particles) at the oil−water interface on water droplets has
been reported extensively. This film has been proven to be able to resist droplet coalescence.60
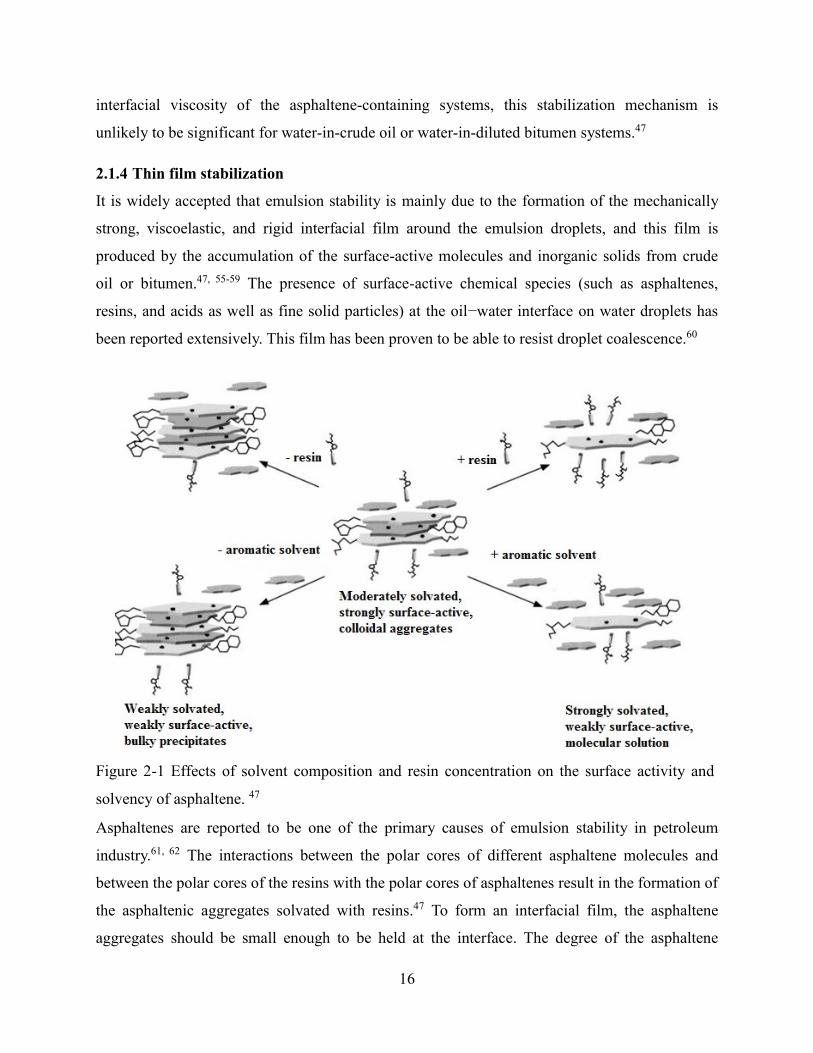
Asphaltenes are reported to be one of the primary causes of emulsion stability in petroleum
industry.61, 62 The interactions between the polar cores of different asphaltene molecules and
between the polar cores of the resins with the polar cores of asphaltenes result in the formation of
the asphaltenic aggregates solvated with resins.47 To form an interfacial film, the asphaltene
aggregates should be small enough to be held at the interface. The degree of the asphaltene
Figure 2-1 Effects of solvent composition and resin concentration on the surface activity and
solvency of asphaltene. 47

17
aggregation depends on both the resin concentration and the aromaticity of the crude oil medium
or diluted bitumen. Reduced aromatic solvent content or resin concentration encourages
asphaltene aggregation. Under the condition of moderate asphaltene solvation, a cross-linked
interfacial network of asphaltenes can be formed at the oil−water interface, leading to the
maximum emulsion stability, as shown in Figure 2-1.47
Acids in crude oil and bitumen are also known to play an important role in W/O emulsion
stabilization. The adsorption of carboxylic acids and their anions, depending upon conditions of
pH, can dramatically lower the interfacial tension, thus stabilizing the W/O emulsion.
Naphthenic acids are reported to stabilize W/O emulsions through the formation of a lamellar
liquid crystalline phase.63 ARN acids, which are tetra-acids of roughly 1227-1235 molecular
weight64 appear to stabilize W/O emulsions through the formation of a cohesive film. This film is
firmly anchored at the interface by binding with divalent cations (such as calcium ions). Acidic
components of asphaltenes are found to be very interfacial active and can dramatically stabilize
W/O emulsion films after adsorbing at oil−water interfaces.65
Figure 2-2 Effect of the solubility of asphaltenes in resin on particle modification.47

18
An enhancement mechanism for the stabilization of crude oil emulsions has also been brought up.
The W/O emulsion stability can be significantly enhanced by the adsorption of very small
inorganic solid particles (with only a few µm or even less in size) at the interfaces. It has been
reported that silica, clay fines, iron oxides, and some other inorganics are capable of enhancing
W/O emulsion stability.47 Sullivan et al.47 concluded that these fine inorganic particles can lead
to dramatically enhanced emulsion stability when suitably modified through the adsorption of
polar species, such as resins or asphaltenes from crude oil. The adsorption of the organic
components changes the wettability of these inorganic particles and makes them interfacially
active.56, 57, 59 The wettability of the particles plays an essential role in stabilizing W/O emulsions
and the most stable emulsions can be yielded with the smallest particles. The effect of the
resin/asphaltene ratio on the adsorption ability of asphaltene on the fine particles was also
demonstrated (Figure 2-247).
2.2 Emulsion destabilization
Chemical demulsification has been regarded as an economical and efficient method and is widely
used in petroleum industry. Correlations between demulsifier performance and properties such as
molecular weight (MW), hydrophile-lipophile balance (HLB), relative solubility number (RSN),
demulsifier structure, and EO/PO ratio are reviewed here. HLB of surfactant is a measure of its
hydrophilicity or hydrophobicity and higher HLB indicates higher hydrophilicity of the
surfactant. Similar to HLB, higher RSN value represents greater hydrophilicity of the surfactant.
2.2.1 Chemical demulsifier
2.2.1.1 Effect of MW on demulsification efficiency
MW shows a significant effect on the demulsification performance. In general, polymeric
demulsifiers with low MW are highly interfacial active and can adsorb irreversibly at the
oil−water interface, resulting in the coalescence of the emulsion water droplets. Polymeric
demulsifiers with low MW destabilize emulsions by flocculating nearby water droplets.66 From
the flocculation point of view, an increase in the MW of the demulsifier will increase the
flocculation opportunities of the water droplets, resulting in better dewatering efficiency. Pelssers
et al. reported that poly (ethylene oxide) flocculants must have a MW higher than 106 g/mol for
successful flocculation of the polystyrene latex particles in water.67
19
Kailey et al.68 systematically studied the effect of MW of EO-PO copolymers on dewatering of
water-in-diluted bitumen emulsions. They concluded that by increasing the MW of EO-PO
copolymers, the demulsification efficiency increased. Wu et al.30 found that when the MW of a
demulsifier is less than 4000, the demulsifier is not effective regardless of the RSN values. High
performance of the demulsifier was achieved for an RSN between 7.5 and 12.5 and a MW
between 7500 and 15000 g/mol, which is consistent with Kailey’s work as the MW of the
demulsifier that Kailey et al. used was all under 15000 g/mol. It should be noted that the
demulsifiers with a MW higher than 15000 g/mol were not tested in Wu’s study. Ethylcellulose
(EC) is also effective in breaking water-in-diluted bitumen emulsions. Feng et al.69 found that
over the MW range of 40000 to 180000 g/mol, a better demulsification efficiency was obtained
for EC with a higher MW. Therefore, it is safe to say that the dewatering efficiency of the
demulsifier is directly correlated with the MW of the demulsifier. At least for commonly used
demulsifiers, such as EO-PO copolymers and EC, an increase in the MW results in a higher
demulsification performance.
2.2.1.2 Effect of HLB or RSN on demulsification efficiency
HLB is an important parameter for the characterization of nonionic surfactants. Because HLB is
difficult to determine experimentally, RSN is usually used to characterize HLB. Wu et al.70 found
that within the same surfactant family, RSN value has a good linear relationship with classic
HLB value. Wu et al. established an empirical relationship (Equation (2-1)) between RSN and
HLB values for the Brij (PEO alkyl ether), Igepal (PEO alkyl phenyl ether), Span (sorbitan
ester), and Tween (PEO sorbitan ester) surfactant families:70
HLB=A×RSN+B (2-1)
where A and B are empirical constants varying with the surfactant family.
Similar to HLB, RSN demonstrates the hydrophilic and hydrophobic properties of the surfactant.
The higher the RSN value, the greater the hydrophilicity of the surfactant. The correlation
between the demulsification efficiency and the RSN value of a demulsifier has been widely
investigated. Kailey et al.68 proved that demulsification efficiency increased as the RSN value
increased. Xu et al.29 concluded that for EO-PO copolymers which contain a fixed number of the
PO units, the demulsification efficiency increased when increasing the EO number in the

20
molecules. Wu et al.70 reported an optimal RSN value for the demulsification efficiency of the
surfactant in the same family. For polymerized polyol, oxyalkylated alkylphenol-formaldehyde
resin, and oxyalkylated alkyl resin, a significant relationship between the percentage of water
removed and the RSN value in each of the given demulsifier families was reported by Wu et al.30
For polymerized polyols, demulsifiers with low RSN values from 4 to 5 showed no effect on
dewatering, while the one with RSN values in the range of 7 to 8 removed water effectively. For
the alkylphenol-formaldehyde resin family, a bell-shaped curve was obtained, indicating an
optimum RSN value for dewatering. Similar results were also obtained for the oxyalkylated alkyl
resin family.
The results discussed above show that there is no overall correlation between water removal and
the RSN values of the demulsifiers when taking all types of surfactants into consideration.
However, a noticeable correlation is observed between dewatering performance and RSN values
within a given demulsifier family. An optimal RSN range exists in which dewatering efficiency
reaches its maximum.
2.2.1.3 Effect of demulsifier structure on demulsification efficiency
The effect of the demulsifier structure on the dewatering efficiency of W/O emulsions has been
extensively investigated from different aspects.
Ramalho et al.44 found that for PEO-b-PPO demulsifiers, the demulsifier with a branched
molecular structure showed the best dewatering performance, followed by the star and the linear
structures, as shown in Figure 2-3. They also concluded that compared with the star and linear
structures, the branched demulsifiers had higher interfacial activity and could decrease the
interfacial tension to the lowest value. Kailey et al.68 reported that the higher the branching, the
more efficient the dewatering. EO-PO demulsifiers with five EO-PO branches showed better
performance on dewatering than that with three EO-PO branches. Sun et al.34 demonstrated that
the demulsifiers with branched structures were more effective than the linear demulsifiers
because they left smaller vacancies at the oil−water interface, making it hard for the surface-
active components in the crude oil or bitumen to adsorb at the interface again. Abdel et al.45
synthesized two types of EO-PO demulsifiers based the structure of the amines used for the
synthesis and systematically studied the effect of the structural changes in the prepared
demulsifiers on their dewatering efficiency of W/O emulsions. They concluded that the

21
demulsification efficiency could be enhanced by increasing the number of EO-PO branches. In
addition, the disubstituted EO-PO aromatic amine was superior to their monosubstituted
counterparts in dewatering water-in-benzene emulsions.
Wu et al. investigated the effect of position isomerism of the nonionic surfactants on
demulsification performance.43 They reported that the sequential block copolymers containing
more than 40% EO were effective in breaking W/O emulsions and the demulsifier with higher
EO percentage performed better on emulsion breakage. The reverse sequential copolymers,
regardless of EO percentage, merely showed little effect on breaking the W/O emulsions. The
difference in the demulsification performance of the sequential and the reverse sequential
copolymers should be attributed to the different HLB (RSN), interfacial properties, and steric
effect between them.
Xu et al.29 used polyoxyalkylenated diethylenetriamine (DETA) based demulsifiers with various
EO to PO ratios to destabilize W/O emulsions. They found that the performance of the
demulsifier is closely correlated with its EO and PO numbers: 1) If the number of PO >> EO, the
(b)
HO-CH2CH
2[-O-CH
2CH
2]
n-1[-O-CH(CH
3)CH
2]
m-O-CH(CH
3)CH
2-O-[CH
2(CH
3)CH-O-]
m[CH
2CH
2-O-]
n-1CH
2CH
2-OH
CH
2
H
O-[CH2(CH
3)CH-O-]
m[CH
2CH
2-O-]
n-1CH
2CH
2-OH
O-[CH2(CH
3)CH-O-]
m[CH
2CH
2-O-]
n-1CH
2CH
2-OH
C9H
18 C
9H
18
X
(c)
Figure 2-3 Basic molecular structure of commercial demulsifiers: (a) linear, (b) star, and (c)
branched.
(a)
22
demulsifier was only effective at high dosage for breaking W/O emulsions; 2) If the number of
EO > PO, only a low demulsifier dosage was required for efficient emulsion breakage. However,
the demulsification performance decreased at high demulsifier dosage, showing an overdose
effect; 3) If the number of PO ≈ EO, the demulsifier could break the emulsion quickly and
effectively at a low dosage and no overdosing was observed.
2.2.1.4 Effect of demulsifier concentration
An increase in the bulk concentration of the demulsifier can affect the interfacial properties of
the oil−water interface in two ways: one is to increase the interfacial demulsifier concentration,
and the other is to enhance the diffusion of the demulsifier molecules from bulk to new interfaces.
Abel-Azim et al.45 studied the influence of PPPEA concentration on its demulsification
efficiency. An optimum concentration existed at which the PPPEA demulsifier showed the best
demulsification performance. At the optimum concentration, the demulsifier molecules could
replace the asphaltene molecules at the benzene−water interface, which made the protecting film
around the water droplets to thin and eventually to rupture, providing opportunities for the
coalescence of the water droplets. A higher concentration may result in the aggregation of the
demulsifier molecules at the interface, forming a new protective film with greater mechanical
strength. Pensini et al.71 also reported that overdose of the EO-PO copolymer appeared when
increasing the demulsifier dosage from 2.3 ppm to 28.8 ppm for the destabilization of the
asphaltene stabilized W/O emulsions. By investigating the morphology of the interfacial film
using Brewster angle microscopy, they concluded that the large irregular structures at the
toluene−water interface, which indicates the presence of steric repulsion, are responsible for the
overdose effect.
2.2.2 Effect of temperature on demulsification
2.2.2.1 Effect of temperature on viscosity and density
It is reported that increasing temperature results in a significant decrease in the bulk viscosity
and density of the diluted bitumen. Romanova et al.72 studied the viscosity and density of diluted
bitumen (Athabasca coker-feed bitumen) at elevated temperatures. As shown in Table 2-172, a
decrease of both the viscosity and density is observed at elevated temperatures, which is
favorable for the settling of the water droplets. In fact, the settling process depends on the

23
balance between the forces of gravity and viscosity, which can be expressed as Rgv72 (Equation
(2-2)):
where d is the diameter of the settling particle or droplet, a is the acceleration, ρp is the density of
the particle or droplet, ρm is the density of the medium, μ is the viscosity of the medium, and u is
the velocity of the particle or droplet. A higher Rgv means that it is much easier to obtain an
effective separation. When evaluating the effect of temperature on demulsification, the varied
parameters are ρ and μ. Assuming that the changes of other parameters are negligible, Equation
(2-2) can be simplified to Equation (2-3):
Density
(g/mL)
Viscosity
(mPa·s)
S/B, wt/wt 60 °C 23 °C 60 °C 23 °C
Toluene
0.09 0.9861 0.9923 486 1381
0.43 0.9242 0.9592 9.4 24.6
0.61 0.9214 0.9478 4.4 9.8
0.87 0.9079 0.9357 1.4 3.4
1.30 0.8926 0.925 0.6 1.5
1.73 0.8825 0.9128 0.6 0.9
n-heptane
0.07 0.9574 0.975 188.6 8615
0.27 0.8987 0.9137 20.4 167.8
0.41 0.8703 0.8841 7.8 58.8
0.62 0.8392 0.8518 2.8 23.6
0.82 0.8176 0.8292 1.3 12.8
1.16 0.7644 0.8025 0.5 4.8
S/B indicates solvent to bitumen ratio
2.2.2.2 Effect of temperature on interfacial properties
Menon et al.73 found that the interfacial shear viscosity of the shale oil−water interface can be
reduced by increasing temperature, as shown in Figure 2-4.73 The reduction in the interfacial
(2-3)
Table 2-1 Density and viscosity of diluted Athabasca coker-feed bitumen.
(2-2)

24
shear viscosity could accelerate the film drainage rate between nearby droplets, thereby making
it possible for coalescence.
2.2.2.3 Effect of temperature on collision rate of dispersed droplets
Increasing temperature also increases the number of collisions between two dispersed water
droplets. This should be due to the increased intensity of Brownian motion at high temperature.
2.3 Asphaltene and asphaltene model compound
2.3.1 Asphaltene
2.3.1.1 Molecular weight of asphaltene
The determination of the molecular weight (MW) of asphaltenes has been a controversial object
for decades.74 The obtained results vary from a few hundred to several hundreds of thousands of
g/mol. Previous reported asphaltene molecular weight is in the range of 1,000 to 30,000 g/mol.
Techniques such as vapor pressure osmometry (VPO),75 gel permeation chromatography
(GPC),76 and mass spectrometry (MS)75, 77 have been used for the characterization of the MW of
asphaltenes. However, both VPO and GPC suffer from large uncertainties. It is known that
asphaltene molecules tend to aggregate in their solutions to form dimers, trimers, and so on. To
20 30 40 50 600.020
0.022
0.024
0.026
0.028
0.030
0.032
Inte
rfac
ial
vis
co
sity
(sp
)
Temperature C
Figure 2-4 Effect of temperature on interfacial shear viscosity of a shale oil−water interface.

25
estimate the ‘true’ MW of the asphaltene in VPO, the solutions should be highly diluted so that
the degree of association can be regarded as zero.75 However, large experimental errors are
introduced at high dilutions as the vapor pressure of the highly diluted solution is very close to
that of the pure solvent. GPC can be used to estimate the molecule size distribution based on the
elution time of the studied material from a porous column. GPC also suffers from asphaltene
aggregation as the association of asphaltene makes the molecules bigger. The results at infinite
dilution can be obtained by extrapolating the results for more concentrated solutions, which also
results in large experimental errors. It was not until 1999 that reliable results, accounting for the
molecular aggregation at low dilution, became available. Mass spectrometry75, 77 (MS) is used
based on the mechanism that the mass-to-charge ratio is measured directly. Fluorescence
depolarization technique78, 79 is able to deal with highly diluted asphaltene solutions. Asphaltene
molecular mass obtained using these modern techniques are in the range of 400 to 1500 g/mol,
with an average value of around 750 g/mol.
2.3.1.2 Asphaltene structure
Two main models of asphaltene structure exist in the literature, known as archipelago and island
models. According to the archipelago model, asphaltenes should have several poly-condensed
aromatic rings which are connected together via alkyl chains or sulfide bridges.80 All the
molecular values based on this model are close to those obtained for the acetone-extracted
Athabasca asphaltenes.81 In the island model, asphaltenes are believed to have a polyaromatic
core containing condensed aromatic rings with side chains attached.82 The polyaromatic part of
the island structure contains about seven fused aromatic rings, which is supported by direct
molecular imaging with high-resolution transmission electron microscopy83 and by studying the
UV-visible spectra of asphaltenes coupled with molecular orbital calculations.84
2.3.1.3 Asphaltene aggregation
Asphaltenes are known to self-associate both in crude oils85 and in model solvents such as
toluene. The self-association properties of asphaltenes have been extensively studied. It was
reported that the self-association behavior of asphaltenes depends on thermodynamic conditions
such as the nature of solvents, temperature, pressure, and the presence of co-solute such as
resins,86-89 and so on. Several molecular association models have been proposed previously to

26
explain the observed self-association of asphaltenes molecules and some models are briefly
discussed here.
Yen90 and later Mullins et al.91 proposed a hierarchical asphaltene aggregation model. The “Yen
model”90 was developed at a relatively early stage involving structures of different length scales.
Yen et al.90 assumed that asphaltene molecules firstly aggregate into “particle” by π-π stacking of
the polyaromatic parts. Several asphaltene particles further self-associate to form micelles. The
Yen model has been very useful for most contributors in the field. With the improvement in the
understanding of asphaltenes, a much-refined asphaltene model, “the modified Yen model”,91
has been proposed. The main asphaltene structure is described as a single condensed aromatic
ring of moderate-size with peripheral alkyl chains. The asphaltene molecules can form
asphaltene nanoaggregates with aggregation numbers of ∼6 asphaltene molecules and the
asphaltene nanoaggregates can further aggregate to form clusters with aggregation numbers of
∼8 asphaltene nanoaggregates. The modified Yen model provides a framework to treat large
numbers of diverse asphaltene studies.
Agrawala et al216 reported a linear polymerization-like asphaltene association model. They
described the polymerization-like association “reactions” in terms of terminators and propagators.
The key concept in this model is that molecules with multiple active sites act as propagators,
which is capable of linking with other molecules, and molecules with single active sites act as
terminators. Asphaltenes are primarily composed of propagators. Resins, which are known to
affect asphaltene association,47 consist primarily of terminators.
Recently, Gray et al.92 proposed a “supramolecular assembly model”, in which multiple
interactions, such as π-π stacking, metal coordination complexes, hydrogen bonding, cooperative
binding by Brønsted acid-base interactions, and interactions between alkyl and cycloalkyl groups
to form hydrophobic pockets, etc., are believed to lead to a range of architectures of asphaltene
aggregates, including host-guest complexes and porous networks. From their perspective, the
ionic association represents (acid-base interaction) the strongest driving force for asphaltene
aggregation.
In a recent review, Yarranton et al.93 discussed an array of experimental techniques to investigate
the possible size and structure distributions of asphaltene monomers and aggregates. They

27
reported that asphaltenes nanoaggregates have a loose and highly polydisperse structure with
sizes ranging from 2 to 20 nm.
2.3.2 Asphaltene model compound
Asphaltenes are widely reported to be polyaromatic hydrocarbons with amphiphilic properties,
which consist of fused aromatic rings with alkyl branches attached to the periphery.94-97 Based on
this structure, several polyaromatic surfactants have been synthesized as the asphaltene model
compounds by attaching hydrophobic chain(s) to one and alkyl chain(s) of hydrophilic groups to
the other end of a perylene core.98-100 The synthesized model compounds exhibit similar
interfacial activities as asphaltenes and Norfgard et al. have reported that both W/O and O/W
emulsions can be stabilized by the polyaromatic surfactants.98-100
C5Pe (Figure 2-5, N-(1-hexylheptyl)-N´-(5-carboxylicpentyl) perylene-3,4,9,10-tetracarboxylic
bisimide), as one of the model compounds, is composed of fused aromatic rings connected via
cyclic rings containing heteroatoms of O and N. A pentyl carboxylic acid chain and a hexyl-
heptyl double chain are attached to the fused aromatic rings through nitrogen atoms. The
molecular weight (MW) of C5Pe (MW of 689 g/mol) falls into the well-accepted MW range of
asphaltenes. The amphiphilic nature and polyaromatic structure of C5Pe simplify the
complicated asphaltene nature and structure.101, 102 Both C5Pe and C5PeC11 (Figure 2-5) are
reported to be suitable asphaltene model compounds.99, 103-106 These model compounds have
been extensively studied and their properties are briefly reviewed here.
Figure 2-5 Molecular structure of polyaromatic surfactant C5Pe (MW=689 g/mol) and C5PeC11
(MW=827.12 g/mol).
2.3.2.1 Interfacial properties
The interfacial properties of C5Pe molecules can be assessed by measuring the interfacial tension
of the C5Pe in toluene solution−water (pH=9) interface. C5Pe molecules (1-20 µM) can
significantly reduce the interfacial tension of the toluene−water interface, indicating high
C5Pe
C5PeC11
(a)
(b)

28
interfacial activity of C5Pe.98, 106 As indicated by the fluorescence spectroscopy results of the
Langmuir-Blodgett films, C5Pe adopts a head-on conformation at the interface with a face-to-
face packing of the molecules,98 which accounts for the high interfacial activity of the C5Pe
model compound. C5PeC11 exhibits pH-dependent surface activity. Increasing pH could
deprotonate the carboxylate functional group of C5PeC11, thereby increasing surface activity.
The deprotonation could also decrease the molecular tilt at the interface.107 C5Pe also shows pH-
dependent surface activity.
2.3.2.2 Asphaltene model compound as the emulsion stabilizer
Figure 2-6 Molecular structure of PAP (MW=723 g/mol) and BiSA (MW=755 g/mol).
Nordgård et al.98 compared the stability of emulsions stabilized by C5Pe, PAP, and BisA. The
structures of PAP and BiSA are shown in Figure 2-6. BisA was not able to form stable
emulsions while PAP and C5Pe showed good performance on emulsion stabilization, though
PAP was shown to stabilize emulsions to a less extent than C5Pe. Grimes et al.108 reported that
when the concentration of C5Pe was more than 0.08 mM, the prepared emulsions were very
stable and only a very small amount of water was separated even over a long period of about
6500 min. They also measured the equilibrium interfacial tension as a function of the C5Pe
concentration and found that the data could be well-fitted by the Gibbs adsorption equation109
and Langmuir isotherm. Jiebin et al.106 systematically investigated the interfacial properties of
the C5Pe interfacial film and its role in the stabilization of the W/O emulsions. BAM and AFM
images showed that the C5Pe aggregates would accumulate at the interface and form a thick
interfacial layer. The continual accumulation and the time-dependent rearrangement of the C5Pe
aggregates contributed to form an elastic and rigid interfacial layer, which is essential to prevent
coalescence of the emulsion droplet.
BiSA
PAP (a)
(b)

29
2.3.2.3 Molecular association and interaction
Wang et al.104 studied the interfacial behavior of C5Pe molecules on mica surfaces and the
interactions between the adsorbed C5Pe layers in different organic solvents. They reported the
formation of the C5Pe aggregates and the irreversible nature of the aggregation. In addition, it
was also found that the organic solvents can dramatically influence the aggregation behavior and
molecular interactions of the C5Pe molecules. Weaker or even no adhesion was detected in
toluene, whereas strong adhesion forces were measured in heptane for the interactions of C5Pe
films.
Wang et al.105 investigated the influence of the solution conditions including pH, salinity
(electrolyte), and cation (Ca2+) addition on the molecular behavior of C5Pe. In basic solutions,
the carboxylic acid (–COOH) head group of C5Pe will be ionized. The ionization of the -COOH
group increased the hydrophilicity of the adsorbed C5Pe films, thereby reducing the attractive
hydrophobic force. In addition, at high salinity, the electric double layer was compressed and the
hydrophobic forces were weakened, which led to the reduction in. Ca2+ ion could bine strongly
with two –COOH groups and bridge two small C5Pe aggregates, which resulted in the formation
of large aggregates.
Liu et al.110 studied the nanoaggregation behavior of the asphaltene model compounds. They
found that the aggregation number (n) of C5Pe in solution fell into the range of 1 to 31, with a
large fraction of relatively small nanoaggregates (2 ≤ n ≤ 11). Compared to that in toluene, C5Pe
molecules tended to form smaller aggregates in xylene (n=2, 3, 5, and 6), which should be
attributed to the stronger interactions between C5Pe and xylene via π-π stacking and the larger
steric effect of xylene. Naphthenic acids could interact with C5Pe to reduce its aggregation level,
and the strength of the interaction depended on the size and structure of the naphthenic acid
molecules.
Pradilla et al.107 investigated the sorption of C5PeC11 at the interface. The adsorption of the
C5PeC11 molecules at the decane−water interface was found to be reversible. In addition, the
presence of interactions (aggregation) among the C5PeC11 molecules at both the oil−water and
air−water interfaces was confirmed by the surface pressure−area (Π-A) isotherms. These
interactions are most likely due to the π−π stacking and hydrogen bonding forces.

30
2.3.2.4 Molecular dynamics simulation
Molecular dynamics (MD) simulation has been widely used to study the self-association
properties of the asphaltene model compounds.111-114 Teklebrhan et al.111 studied the adsorption
and association behavior of five uncharged polyaromatic surfactants (C5Pe, PAP, TP, PCH, and
BisA) at the oil−water interface using MD simulation. In both toluene−water and heptane−water
systems, C5Pe molecules tend to predominantly concentrate and position at the interface,
forming large nanoaggregates. Gao et al.115 reported the formation of the hydrogen bonding
between the oxygen atom in the carboxyl groups of C5Pe and the hydrogen atoms, which lead to
aggregation of C5Pe molecules. Jian et al116 investigated the adsorption behavior of the
polycyclic aromatic compounds (PAC) molecules onto the water droplet in different organic
solvents. In heptane, the adsorbed PAC aggregates render a straight one-dimensional (1D) rod-
like structure on the small water droplet (radius of 1.86 nm) and a bent 1D structure on the large
droplet (radius of 1.86 nm). In toluene, evident adsorption of the PAC molecules could only be
observed in the case of large PAC concentration and large water droplet.
The orientation of the polyaromatic molecules at the oil−water interface was also studied
extensively. Teklebrhan et al.111 reported a side-on or head-on orientation of the uncharged
polyaromatic molecules at the oil−water interface. Jian et al.116 reported that the aggregates of
the PAC molecules tend to have a perpendicular orientation to the water surface where contact
occurs. Andrews et al.117 also observed a perpendicular orientation of the polyaromatic cores of
Violanthrone-78 at the solvent−water interface.
2.4 Summary of the literature review
Previous studies revealed that the stability of W/O emulsions in petroleum industry is most likely
due to the formation of a mechanically strong, rigid, and viscoelastic interfacial film by the
accumulation of surface-active molecules and inorganic solids from crude oil or bitumen47, 55-59
at the interface. Chemical demulsification is both an effective and economy-efficient method to
break emulsions. The molecular weight, HLB, relative solubility number, structure, and
concentration of the demulsifier play important roles in breaking emulsions. Among all the
demulsifiers, EO-PO copolymer has been extensively investigated29, 30, 42-46 and previously
reported as an effective additive in breaking asphaltene-stabilized W/O emulsions.71
Temperature can also affect the demulsification efficiency by lowering the viscosity and density

31
of the oil, changing the interfacial properties of the oil−water interface, and increasing the
collision rate of dispersed droplets. It is meaningful to study whether chemical demulsification
can be combined with temperature treatment to induce better demulsification efficiency. The
effect of temperature on the demulsification performance of EO-PO copolymers is therefore
studied in this thesis.
C5Pe is considered as a suitable asphaltene model compound, which resembles asphaltene in
terms of structure, molecular weight, interfacial activity, self-association behavior, etc. The use
of C5Pe asphaltene model compound simplifies the original bitumen system, which is helpful in
providing a deep understanding of the demulsification mechanism. It should be noted that there
remains a gap between the two model systems and real crude oils comprising a mixture of
different types of hydrocarbons.

32
Chapter 3 Experimental Techniques
3.1 Emulsion droplet size and counts determination by Focused Beam
Reflectance Measurement (FBRM)
FBRM is designed to provide in situ particle or droplet size determination in real time. It can be
used at operating pressures from vacuum to 150 psi over the operating temperatures of 41°F to
194 °F. In this study, FBRM was employed to measure the size of the emulsion droplets as a
function of time under different experimental conditions. The emulsion droplet count in specific
size range was also given by FBRM.
Figure 3-1 Front view (left) and side view (right) of the FBRM system
Figure 3-2 Front view and side view of the fixed beaker stand

33
All Lasentec S400 probe systems include a Fixed Beaker Stand (FBS) and overhead mixer for
instrument calibration verification. The whole system is shown in Figure 3-1.
The fixed beaker stand comes in four separate parts: the base, the support bar with a mixer
attached, bushings for the probes, and the probe itself (Figure 3-2).
3.1.1 FBRM probe working principle
A cut-away schematic of the FBRM probe is shown in Figure 3-3.118 The probe is inserted into a
flowing process medium. A laser source in the field unit travels down through a set of fiber
optics into the probe and another set of optics at the tip of the probe focuses the laser beam to a
very small spot. This is how the focused beam is defined. A motor is used to rotate the set of
optics at the probe tip so that the focused beam scans a circular path at a constant speed. The
focused beam usually moves at a high speed between 2 m/s to 8 m/s, depending on the
application. In this manner, the motion of droplets or particles is insignificant to the
measurement.
3.1.2 FBRM probe data collection119
When a particle or droplet flows across the window, the focused beam intersects the edge of a
particle or droplet. The particle or droplet then start to backscatter laser light until the focused
beam reaches the opposite edge (Figure 3-4118). The pulses of backscattered light are collected
Figure 3-3 Cutaway view of the Lasentec in-process probe

34
and then converted to chord lengths based on the simple calculation of the pulse width (time)
multiplied by the scan speed (velocity). A chord length120-122 is simplify defined as the straight-
line distance between any two points on the edge of a particle or droplet. This chord length, in
general, is not equal to the true particle or droplet size. However, with thousand times
measurements of the chord lengths per second, it is a still good representation of the particle or
droplet size statically.
Two kinds of chord length from FBRM can be obtained: unweighted chord length (UWT CL)
and square weighted chord length (SWT CL), which can be calculated using Equations (3-1) and
(3-2).123
(3-1)
(3-2)
Figure 3-4 Working principle: probe detects pulses of backscattered light and records measured
chord lengths

35
where k is the channel number (the data detected by FBRM are split into 90 channels of different
size ranges in a logarithmic progression.), ni is the counts in each individual channel, and Mi is
the midpoint chord length of each individual channel.
The UWT chord length is number sensitive, which emphasizes the presence of fines in the
studied samples. On the other hand, a SWT chord length distribution accentuates the contribution
of larger particles or droplets of a dispersion system.
3.1.3 FBRM used at high temperature and pressure
The autoclave was employed to create a high-temperature and high-pressure emulsion system.
With the help of the autoclave, solvent evaporation is avoided and the high-pressure condition is
achieved. In order to mount the probe in the autoclave reactor, a branch was made on the side of
the reactor (Figure 3-5). The best orientation is achieved when the angle of the probe window is
between 30° and 60° to the flow, though 45° is the optimum angle. Therefore, a 45° angled
branch was used to mount the probe.
Figure 3-5 Autoclave with a 45° angled branch for FBRM

36
3.2 Coalescence time measurement by integrated thin film drainage apparatus
(ITFDA)
To investigate the drainage of the thin liquid film between two droplets, a custom-built
integrated thin film drainage apparatus (ITFDA) was used to measure the drop-drop coalescence
time. Figure 3-6124 shows a schematic view of the instrument. Details on the instrument setup
and applications have been provided in other literature.124 The operating procedures will be
explained in detail in related chapters.
3.3 Static interfacial tension measurement by Du Noüy ring method
The static interfacial tension (IFT) of the oil−water interface can be measured using the Du Noüy
ring method. Figure 3-7125 is a cutaway view, which explains the mechanism of the Du Noüy
ring method (1919). The water phase is loaded in the cell first (liquid 1) and the ring is immersed
in it. Then the water phase is covered by the oil phase (liquid 2). The immersed ring is gradually
directed towards the interface by lowering or raising the sample holder while monitoring the
force applied on the ring. At the point when the liquid interface is vertical (as shown by the
dotted lines in Figure 3-7), the largest detachment force can be detected by the electronic
Figure 3-6 Schematic view of the integrated thin film drainage apparatus.
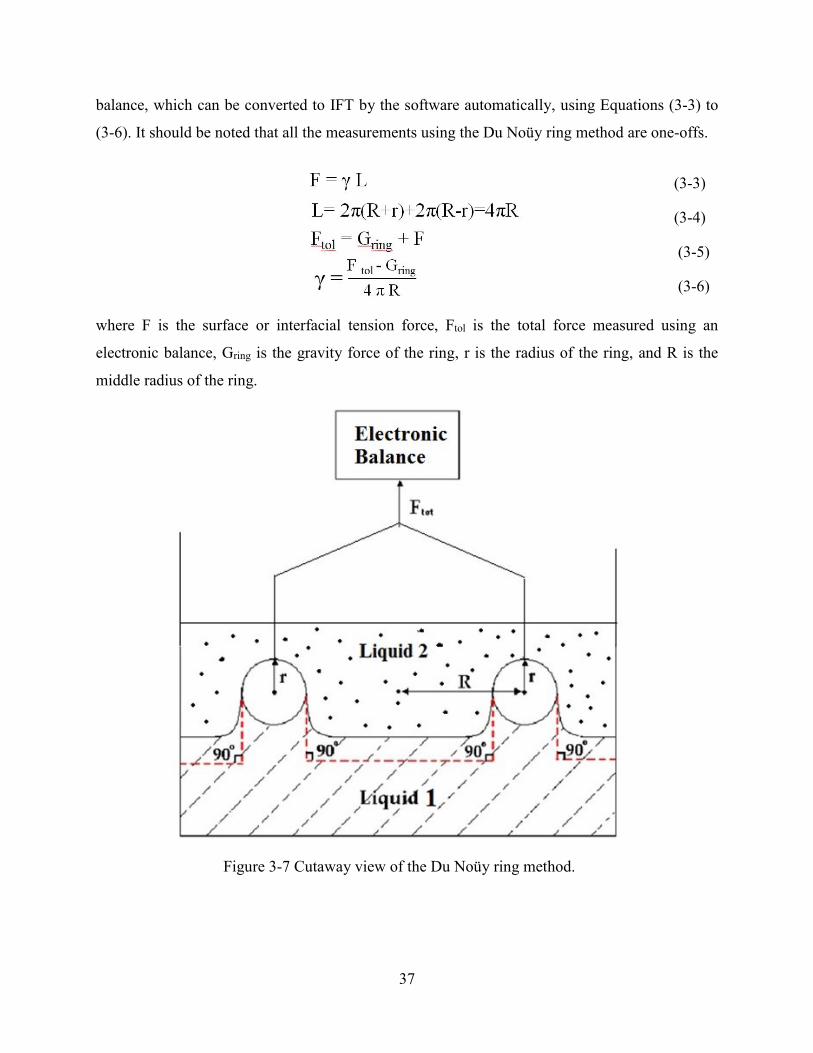
37
balance, which can be converted to IFT by the software automatically, using Equations (3-3) to
(3-6). It should be noted that all the measurements using the Du Noüy ring method are one-offs.
where F is the surface or interfacial tension force, Ftol is the total force measured using an
electronic balance, Gring is the gravity force of the ring, r is the radius of the ring, and R is the
middle radius of the ring.
Figure 3-7 Cutaway view of the Du Noüy ring method.
(3-3)
(3-4)
(3-5)
(3-6)

38
3.4 Dynamic interfacial tension (DIFT) measurement by Theta Optical
Tensiometer
Using the pendant drop technique, the DIFT of the oil−water interface can be measured. The IFT
is calculated using the Young-Laplace equation:
where γ is the IFT, Δρ is the density difference between the fluids, g is the gravitational constant,
R0 is the radius of the droplet at the apex, and β is the shape factor obtained by comparing the
solution of the Young-Laplace equation with the shape of the drop. The Young-Laplace equation
can be expressed as a system of dimensionless first-order equations as shown in Figure 3-8.126
3.5 Crumpling ratio measurement by Theta Optical Tensiometer
The stability of water-in-diluted bitumen emulsions has been attributed to the skin formation at
the interface. The existence of this steric layer has been observed experimentally (Figure 3-9)55,
58, 127-129 and can be quantitatively characterized using the volume contraction experiment.
(3-7)
(3-8)
Figure 3-8 Pendant drop.126
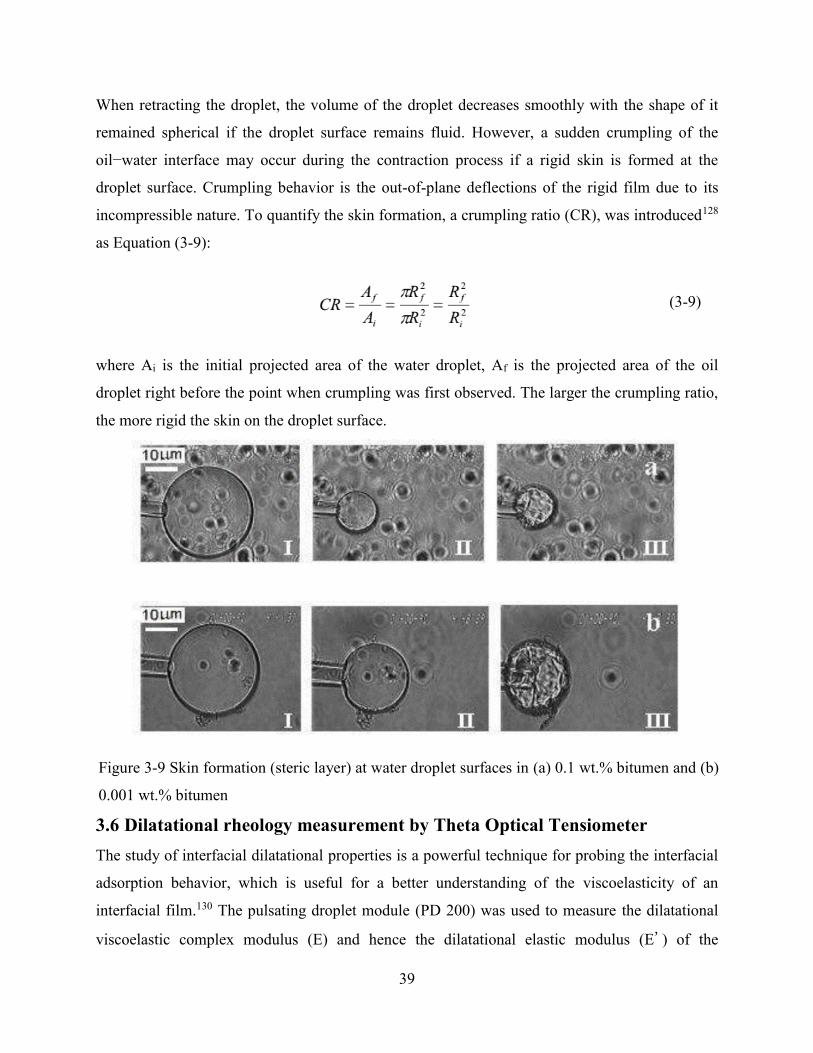
39
When retracting the droplet, the volume of the droplet decreases smoothly with the shape of it
remained spherical if the droplet surface remains fluid. However, a sudden crumpling of the
oil−water interface may occur during the contraction process if a rigid skin is formed at the
droplet surface. Crumpling behavior is the out-of-plane deflections of the rigid film due to its
incompressible nature. To quantify the skin formation, a crumpling ratio (CR), was introduced128
as Equation (3-9):
where Ai is the initial projected area of the water droplet, Af is the projected area of the oil
droplet right before the point when crumpling was first observed. The larger the crumpling ratio,
the more rigid the skin on the droplet surface.
3.6 Dilatational rheology measurement by Theta Optical Tensiometer
The study of interfacial dilatational properties is a powerful technique for probing the interfacial
adsorption behavior, which is useful for a better understanding of the viscoelasticity of an
interfacial film.130 The pulsating droplet module (PD 200) was used to measure the dilatational
viscoelastic complex modulus (E) and hence the dilatational elastic modulus (E') of the
Figure 3-9 Skin formation (steric layer) at water droplet surfaces in (a) 0.1 wt.% bitumen and (b)
0.001 wt.% bitumen
(3-9)

40
oil−water interface. The complex surface dilatational modulus is related to the change of surface
area (A) and interfacial tension (γ) of the pendant drop, which is defined as Equation (3-10):
|E| =dγ
d ln A
This complex surface dilatational modulus can be decomposed into the elastic and viscous
moduli as shown in Equation (3-11), and δ is the phase angle.
E’ = |E| sin 𝛿 E” = |E| cos 𝛿
When measuring the surface dilatational modulus by the oscillating drop technique, a small drop
was formed at the end of the capillary tip and harmonically oscillated by a membrane in the PD
200 module. Figure 3-10131 shows sample responses of the bubble surface area and surface
tension for a sinusoidal perturbation of a pendant drop and sample adsorption kinetics of
surfactant on the surface of a pulsating drop.
Figure 3-10 (a) Interfacial tension (grey circles) follows the change in droplet area (turquoise
squares) and (b) deformation to the adsorbed molecular layer is caused by dilation or
compression of the droplet.
3.7 Interfacial shear rheology measurement by Rheometer
Interfacial rheology studies the flow behavior of liquid interfaces, which determines the stability
and behavior of emulsions, suspensions, foams, and froth, etc. A rheometer is normally used for
interfacial shear rheology characterization and the basic principle of an oscillatory rheometer is
to induce a sinusoidal shear deformation of an interface and measure the resultant stress response.
(3-10)
(3-11)
b a

41
132 The double wall ring (DWR) setup that is depicted in Figure 3-11133 was used in this study.
The trough, which contained the samples, was directly placed on the bottom plate and the
circulation water flowed through the plate to control the experimental temperature. There are
stepwise edges at the outer and inner sides of the trough to pin the interface and reduce the
meniscus effect. After injecting the heavy phase in the trough (liquid 1), the double wall ring that
is connected to the rheometer was positioned at the oil−water interface.39 After washing the ring
using acetone, toluene, and water, the organic contaminants on the ring were thoroughly
removed with a flame prior to use. The trough has an outer radius of 39.5 mm and an inner
radius of 31.0 mm. The outer and inner radii of the ring are 35.5 mm and 34.5 mm, respectively,
with a thickness of 1 mm. The ring has a square-shaped cross-section with sharp edges in order
to create a planar interface.
Figure 3-11 Schematic cross section of the DWR setup.
In interfacial shear rheology, shear deformation is applied at the interface while keeping the
interfacial area constant. During the oscillation test, the functional relationship between shear
stress (γ (t)) and shear strain (σ (t)) as a function of time is established. Shear stress is the force
applied on the interface and shear strain is the deformation of the interface:39
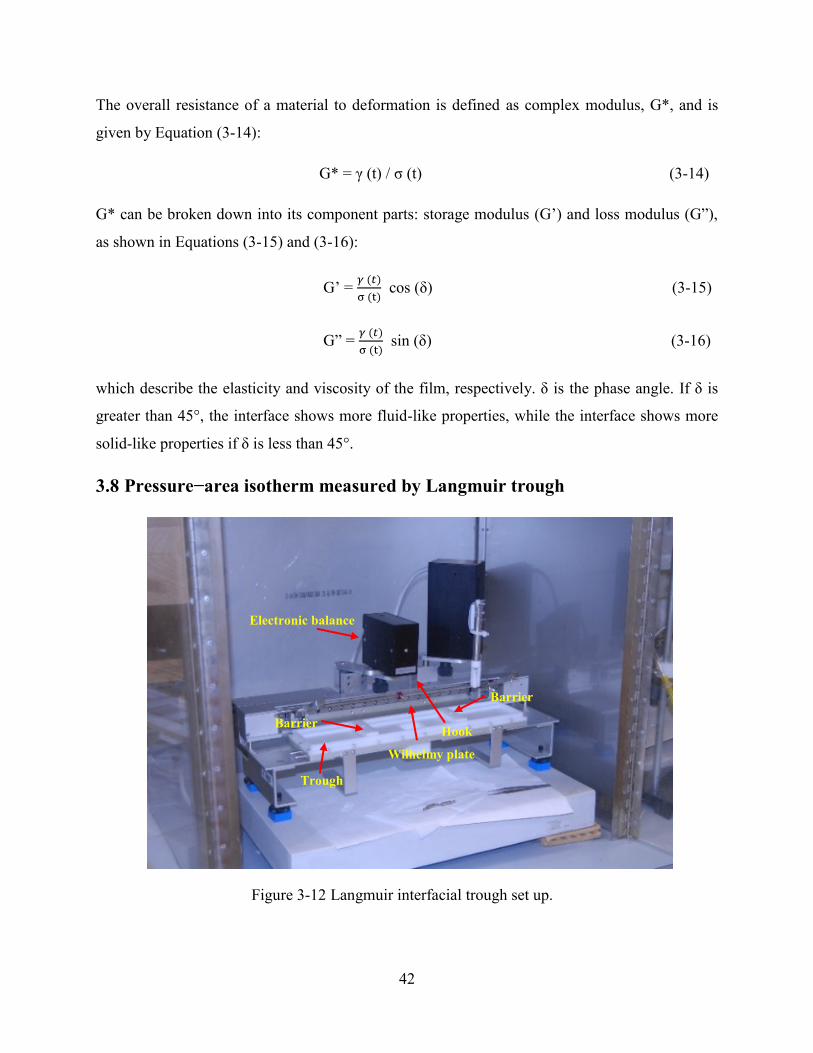
42
The overall resistance of a material to deformation is defined as complex modulus, G*, and is
given by Equation (3-14):
G* = γ (t) / σ (t) (3-14)
G* can be broken down into its component parts: storage modulus (G’) and loss modulus (G”),
as shown in Equations (3-15) and (3-16):
G’ = 𝛾 (𝑡)
σ (t) cos (δ) (3-15)
G” = 𝛾 (𝑡)
σ (t) sin (δ) (3-16)
which describe the elasticity and viscosity of the film, respectively. δ is the phase angle. If δ is
greater than 45°, the interface shows more fluid-like properties, while the interface shows more
solid-like properties if δ is less than 45°.
3.8 Pressure−area isotherm measured by Langmuir trough
Figure 3-12 Langmuir interfacial trough set up.
Electronic balance
Wilhelmy plate
Barrier
Barrier
Trough
Hook

43
Langmuir trough (KSV M1200) with a trough area of 243 cm2, which is shown in Figure 3-12,
was used in this study to investigate the compressional behavior of the interfacial films at the
oil−water interface. The instrument consists of a two-compartment trough and two symmetrical
barriers for compression of the interface or surface. The oil−water interface is located at the
intersection between the two compartments. The interfacial pressure was measured using a
Wilhelmy plate hang on the hook connected on the electrobalance. The Wilhelmy plate was
partially immersed in the subphase. The interfacial pressure (π) is defined as the difference
between the interfacial tension of the clean interface (σ0) and the interfacial tension of the
interface with surface-active materials (σ), which is given by π = σ0 – σ.
3.9 Surface topography studied by atomic force microscope (AFM)
Figure 3-13 AFM imaging
AFM images of the interfacial films deposited on silicon wafers were obtained using a
Dimension Icon Atomic Force Microscope (Bruker Dimension Icon-PT, Bruker Corporation)
under tapping mode in air at 23 ˚C. Silica tips (NCHV) were used for imaging.
Figure 3-13 shows the basic mechanism for AFM imaging under tapping mode. In this mode,
the cantilever is driven to oscillate up and down at or near its resonance frequency. When the
spring-like cantilever is brought into proximity of a sample surface, the amplitude of the
cantilever's oscillation will change due to the interaction forces between the cantilever tip and
sample. A piezo is used to adjust the height of the cantilever above the sample to keep the

44
oscillation amplitude of the cantilever constant. The surface topography of the sample is
therefore obtained by recording the height of the cantilever that corresponds to the constant
cantilever tip−sample interaction.
3.10 Morphology of the interfacial film studied by Brewster angle microscopy
(BAM)
Brewster angle microscopy as shown in Figure 3-14 (Model EP3, Accurion GmbH, Goettingen,
Germany) is used in this study to investigate the morphology of the oil−water interface. An
advantage of this technique is that BAM is capable of determining the morphological changes of
the interfacial films at the oil−water interface by demulsifier addition in real time and without
transferring the film to a solid substrate. At the Brewster angle, θB, the p-polarized light is not
reflected from the clean interface, while once the interface supports a film, the light will be
reflected to the detector. Capture of this reflected light provides an image of the film, which
serves as a representation of the interface. Further details about this technique and its application
for interface imaging can be found elsewhere.134, 135
BAM used in this study was equipped with a CCD camera to image the morphology of the
interfacial films at the oil−water interface at a 5X magnification. A wedge-shaped reflection
plate in black was placed at the bottom of the trough to eliminate the influence of the refracted
light from the surface and the reflected light from the bottom of the trough. All the images were
collected using the EP3View2.x software (Accurion GmbH, Germany).
Figure 3-14 Brewster angle microscope
θ
B θB

45
3.11 Water content measurement by Karl Fisher Titration
The demulsification efficiency of EO-PO demulsifiers was evaluated by measuring the water
content at a depth of 2.5 cm from the emulsion surface. In this study, a Karl Fisher titrator (Cou-
Lo 2000, GR Scientific Canada), as shown in Figure 3-15, was used to determine the water
content. An average value of three measurements was reported.
Figure 3-15 Karl Fisher titrator

46
Chapter 4 Interfacial Properties Pertinent to W/O and O/W
Emulsion Systems Prepared Using Polyaromatic Compounds
4.1 Introduction
Water-in-crude oil or diluted bitumen (W/O) emulsions encountered during crude oil production
and bitumen processing are known to be very stable and the emulsified small water droplets are
hard to remove. Such emulsions are undesirable for a number of reasons, such as additional
volume (cost) for transportation, equipment corrosion, and catalyst fouling at downstream
refineries.136 Therefore, these emulsions have to be treated to remove the dispersed water
droplets and associated inorganic salts to meet the specifications for transportation, further
refining, upgrading, storage, and export.
Unlike microemulsions, macroemulsions are generally anticipated to be thermodynamically
unstable and hence to be phase separated with time.137, 138 Persistent stability of W/O emulsions
encountered in the oil industry is often attributed to a rigid, viscoelastic, and mechanically strong
interfacial film that surrounds water droplets and prevents their coalescence.128, 137, 139-141
Destabilization of the emulsions can be realized by the use of chemical, heating, mechanical,
and/or electrical treatments. Among these methods, chemical demulsification is considered to be
the most efficient and cost-effective, which has been widely used in the oil industry.28, 142, 143
However, the excess use of the chemicals is a serious concern that not only increases the cost of
operations but is also sensitive to process conditions that may not always be effective.
The interfacial properties of emulsions and coalescence mechanisms of the water droplets have
been investigated with the aim to improve the design of efficient and robust demulsifier
chemicals.71, 144-146 Through interfacial tension measurement, X-ray photoelectron spectroscopy
characterization, micropipette experiment, and shear rheology measurement, Pensini et al.71
proved that the ethylene oxide-propylene oxide (EO-PO)-based polymeric demulsifier is more
interfacially active than asphaltenes (0.25 g/L) and can compete effectively with asphaltenes at
the interface, penetrating and softening interfacial asphaltene films. The dilatational viscoelastic
behavior of the W/O interface formed with 0.044 wt.% surface-active fractions extracted from an
Iranian heavy oil was studied by Sun et al.144 Their results showed that the adsorption of
demulsifier molecules at the oil−water interface leaves small voids at the interface of water

47
droplets, providing opportunity for droplet coalescence. Ese et al.145 investigated surface
pressure−area isotherms and concluded that increased compressibility (reduced rigidity of the
film) after demulsifier addition seems to be an important feature when breaking a stable
emulsion.
In fact, interfacial tension has been widely studied in the oil industry147, 148 as a good indicator of
the adsorption of surface-active molecules at the oil−water interface. While the crumpling ratio
(CR) of the droplets reflects the degree of steric layer (skin) formation at the interface,128
dilatational rheology characterizes the viscoelasticity of the interfacial film.149, 150 Studying
interfacial dilatational rheology is a powerful tool to probe the adsorption and association of
surface-active molecules at the oil−water interface, providing a better understanding of the
microscopic properties of an interfacial film.130 The stability of the thin liquid film between two
liquid droplets is reported to be critical for emulsion stability,151 while the coalescence time
characterizes the stability of this thin liquid film.152, 153
Investigations using optical methods are normally performed on an oil droplet in an aqueous
phase as the measurements require the continuous phase to be transparent for good optical
visibility of studied objects and non-transparent crude oil prohibits the measurement of water
droplets in crude oil, which is more relevant to W/O petroleum emulsions. Asphaltenes of
polyaromatic cores are recognized as the main components to stabilize W/O petroleum
emulsions. However, the asphaltene solutions are non-transparent even at low asphaltene
concentrations. Perylene family compounds such as C5Pe and C5PeC11 are of similar structural
characteristics (containing a fused polyaromatic core) of asphaltene molecules and exhibit
similar interfacial activities.101, 102 Since the transparent solutions of C5Pe and C5PeC11 can be
made to reasonable concentrations, they are used in this study as asphaltene model compounds.99,
103-106 It should be noted that there remains a gap between the two model systems and real crude
oils comprising a mixture of different types of hydrocarbons.
The current study aims to uncover the relationship between the measured interfacial properties
using W/O and O/W systems. The objective of this study is to confirm whether the measurement
of interfacial properties using the reverse (O/W) system could provide insights on stabilization
mechanisms of W/O emulsions. To achieve this goal, interfacial tension, crumpling ratio,
dilatational rheology, and coalescence time measurements were conducted using xylene

48
containing surface-active polyaromatic compounds C5Pe and C5PeC11 as the oil phase which is
of good optical transparency.
4.2 Materials and Methods
4.2.1 Materials
C5Pe (N-(1-hexylheptyl)-N´-(5-carboxylicpentyl) perylene-3,4,9,10-tetracarboxylic bisimide)
and C5PeC11 (N-(1-undecyldodecyl)-N´-(5-carboxylicpentyl) perylene-3,4,9,10-tetracarboxylic
bisimide) were used as asphaltene model compounds (Figure 2-5). The only difference in
molecular structure between C5Pe and C5PeC11 is longer aliphatic chains of C5PeC11 that
enhances its solubility in xylene. The protocols utilized to synthesize C5Pe and C5PeC11 have
been described in detail elsewhere.154
Solutions of C5Pe or C5PeC11 in xylene (≥98.5%, ACS grade, Fisher Scientific, Canada) were
used as model oil in this study. C5Pe or C5PeC11 in xylene solutions were prepared by
sonicating (Crest 275DA Ultrasonic Cleaner, 50/60 Hz) a given amount of C5Pe or C5PeC11 in
xylene for 30 min. Deionized (DI) water of resistivity > 18.5 MΩ⋅cm was purified with a
Millipore system and used throughout this study. Buffer solutions of pH 7 were provided by
Fisher Scientific and used as received.
4.2.2 Methods
A Theta Optical Tensiometer T200 (Attention, Biolin Scientific, Finland) was used to study the
interfacial properties of the C5Pe or C5PeC11 in xylene solutions (oil)−water interface by
measuring the interfacial tension, crumpling ratio, and interfacial dilatational rheology. An
integrated thin film drainage apparatus (ITFDA)124 was used to determine the coalescence time
of water droplets in oil or oil droplets in water, which provides information on the rupture of the
thin liquid film.
4.2.2.1 Interfacial tension
The pendant drop technique was used to determine the dynamic interfacial tension of W/O
(water droplets in C5Pe or C5PeC11 in xylene solution) and O/W (droplets of C5Pe or C5PeC11
in xylene solution in water) systems. For W/O systems, a water droplet of 10 μL in volume
generated by a gastight syringe (Hamilton Co., USA) was immersed in 3 mL C5Pe or C5PeC11
in xylene solution placed in a quartz cuvette. For O/W systems, an oil droplet of 10 μL in volume

49
was immersed in 3 mL water. The interfacial tension was recorded after the droplets were in
contact with the continuous phase for 10 min and 30 min, respectively.
For comparison, the interfacial tension of the oil−water interface was also measured using the Du
Noüy ring method. In this case, 20 mL of water was loaded in the measurement cell first while
the ring was immersed in water. The water phase was then covered by 15 mL of the oil phase.
After aging the interface for a desired period of time, the immersed ring was gradually pulled
towards the interface while monitoring the force exerting on the ring. At the point when the
liquid interface was vertical, the largest detachment force was detected by the electronic balance,
which was converted to the interfacial tension.
4.2.2.2 Crumpling ratio
Similar to interfacial tension measurements, the size of the water (or oil) droplets was controlled
to 10 μL in volume for crumpling ratio measurements. After aging of the droplets for a desired
period of time, the water (or oil) droplet was retracted steadily into the syringe while the whole
process was recorded. The crumpling ratio was quantified by dividing the projected area of the
droplet at the point when wrinkles (crumpling) were first observed on this droplet (Af) by the
projected area of the initial droplet (Ai). The point where the crumpling began was determined
by analyzing the video frame by frame.
4.2.2.3 Dilatational Rheology
The pulsating droplet module (PD 200) was used to measure the dilatational viscoelastic
complex modulus (E) and hence the dilatational elastic modulus (E’) of the oil−water interface.
A water (oil) droplet of 5 μL in volume was generated at the tip of the syringe needle and
immersed in 3 mL of oil (water) placed in a quartz cuvette. The droplet was sinusoidally
oscillated and the change in the interfacial tension and surface area was recorded. In this study,
the maximum change in droplet volume was set to be 10% and the oscillation frequency was set
at 0.1 Hz, which is in the linear viscoelastic region as shown by the results in Figure 4-9. This
frequency was used to avoid the loss of accuracy at higher frequencies.155 Each measurement
was set to include ten oscillations with a 10 s delay between consecutive measurements.
4.2.2.4 Coalescence time
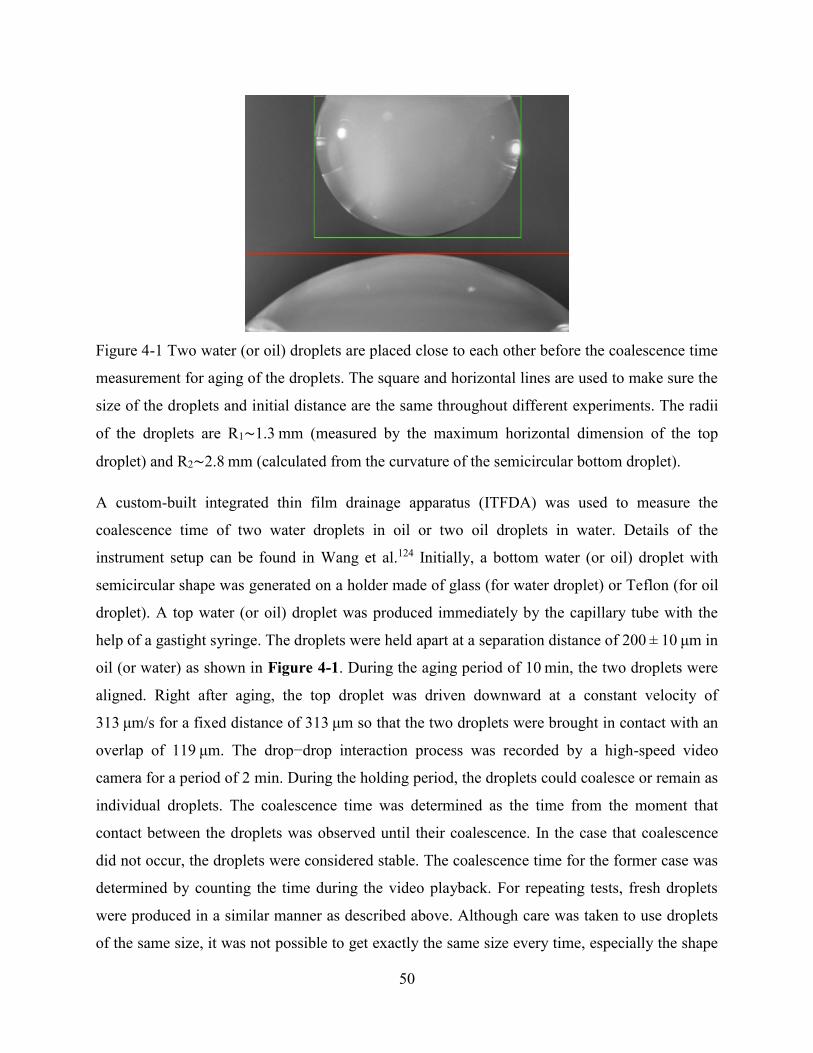
50
Figure 4-1 Two water (or oil) droplets are placed close to each other before the coalescence time
measurement for aging of the droplets. The square and horizontal lines are used to make sure the
size of the droplets and initial distance are the same throughout different experiments. The radii
of the droplets are R1∼1.3 mm (measured by the maximum horizontal dimension of the top
droplet) and R2∼2.8 mm (calculated from the curvature of the semicircular bottom droplet).
A custom-built integrated thin film drainage apparatus (ITFDA) was used to measure the
coalescence time of two water droplets in oil or two oil droplets in water. Details of the
instrument setup can be found in Wang et al.124 Initially, a bottom water (or oil) droplet with
semicircular shape was generated on a holder made of glass (for water droplet) or Teflon (for oil
droplet). A top water (or oil) droplet was produced immediately by the capillary tube with the
help of a gastight syringe. The droplets were held apart at a separation distance of 200 ± 10 μm in
oil (or water) as shown in Figure 4-1. During the aging period of 10 min, the two droplets were
aligned. Right after aging, the top droplet was driven downward at a constant velocity of
313 μm/s for a fixed distance of 313 μm so that the two droplets were brought in contact with an
overlap of 119 μm. The drop−drop interaction process was recorded by a high-speed video
camera for a period of 2 min. During the holding period, the droplets could coalesce or remain as
individual droplets. The coalescence time was determined as the time from the moment that
contact between the droplets was observed until their coalescence. In the case that coalescence
did not occur, the droplets were considered stable. The coalescence time for the former case was
determined by counting the time during the video playback. For repeating tests, fresh droplets
were produced in a similar manner as described above. Although care was taken to use droplets
of the same size, it was not possible to get exactly the same size every time, especially the shape

51
of these large drops could change considerably when the interfacial tension was low due to the
addition of surface-active molecules such as C5Pe or C5PeC11.
4.3 Experimental Results
4.3.1 Interfacial tension measurement
The optimum volume of droplets for IFT measurement using Theta Optical Tensiometer is the
largest volume of the droplet that does not fall down from the tip of the syringe needle. In
general, the lower, the IFT, the smaller, the optimum droplet volume. A droplet of 10 µL is the
upper size limit for the largest concentration of 150 mg/L C5Pe with the lowest IFT in our case.
This is the basis for us to use 10 µL volume of droplets in all IFT measurements in this study. To
confirm that the measurements were consistent, we investigated the effect of volume on the IFT
for the cases of lower concentrations (30 mg/L) and obtained the same results at different
volumes as shown in Figure 4-2.
Figure 4-2 Effect of the droplet volume on interfacial tension of the 30 mg/L C5Pe
solution−water interface.
The results of interfacial tension measurements using the pendant drop technique as a function of
C5Pe/C5PeC11 concentration in xylene are shown in Figure 4-3 and Figure 4-4. The pH of the
aqueous phase and droplet aging time were varied in this set of measurements. To improve the
0 400 800 120020
30
40
10 L
18 L
38 L
Inte
rfac
ial
ten
sio
n (
mN
/m)
Time (s)
30 mg/L C5Pe in DI water

52
confidence of the results, each experiment was repeated for at least three times, and the
interfacial tension difference between different measurements under the same condition was less
than 0.2 mN/m.
In Figure 4-3 and Figure 4-4, a decrease in interfacial tension with increasing the concentration
of C5Pe or C5PeC11 in xylene is observed, which implies that more C5Pe or C5PeC11
molecules can be adsorbed at the oil−water interface at higher C5Pe or C5PeC11 concentrations.
The interfacial tension of water droplet in C5PeC11 solutions shows almost no changes upon
aging from 10 min to 30 min, while the interfacial tension of the water droplet in C5Pe continues
to decrease with aging from 10 min to 30 min, indicating further adsorption of C5Pe molecules at
the interface with aging. The dynamic interfacial tension changes of the W/O and O/W systems
are shown in Figure 4-5.
Figure 4-3 Interfacial tension as a function of C5Pe concentration for pH 7 water−C5Pe in
xylene solution: (a) aged for 10 min and (b) aged for 30 min; pH 5.5 water−C5Pe in xylene
solution: (c) aged for 10 min and (d) aged for 30 min.

53
Figure 4-3 (a) and (b) shows that over the C5Pe concentration range in xylene from 30 mg/L to
150 mg/L, the interfacial tension of the W/O system is always lower by 1∼4 mN/m than that of
the O/W system (at water pH of 7), indicating that the oil−water interface in the W/O system can
accommodate more C5Pe molecules and/or lead to a tighter packing of C5Pe molecules as the
surface area is the same for W/O and O/W systems. Despite small, such difference between the
two systems may have a significant impact on film rigidity of the two systems as will be seen
from the crumpling ratio and dilatational modulus discussed in the following sections. The same
trend of the interfacial tension is obtained in Figure 4-3 (c) and (d) for the same systems but at
pH 5.5 of the aqueous phase, although the interfacial tension values are much higher than that for
the systems at pH 7. The Zeta potential of the xylene diluted C5Pe in water emulsions at
different pH was also measured in this study and the results are shown in Error! Reference s
ource not found.. The pKa of C5Pe (at 30 mg/L) is at pH 6, which agrees with Wang et al.156 In
addition, it was found that the zeta potential of the xylene diluted C5Pe in water emulsions at
water pH of 7 did not change with C5Pe concentrations (i.e., at 60, 100, and 150 mg/L). It can be
inferred that C5Pe is fully protonated at pH 5.5 while it is probably partially or even fully ionized
at pH 7. The ionized C5Pe molecules are clearly much more interfacially active as anticipated,
leading to the observed lower interfacial tension at higher pH.
Figure 4-4 Interfacial tension as a function of C5PeC11 concentration for pH 7 water−C5PeC11
in xylene solution: (a) aged for 10 min and (b) aged for 30 min.
As shown in Figure 4-4 for C5PeC11, the interfacial tension becomes constant after 10 min of
aging for both W/O and O/W systems for all C5PeC11 concentrations examined. This result

54
suggests that the interface in the C5PeC11 system reaches equilibrium after 10 min, which is
much faster than that in the corresponding C5Pe system. However, the xylene−water interfacial
tension in the C5PeC11 system is much higher than that in the C5Pe system, indicating less
surface-active nature of C5PeC11 than C5Pe. More interestingly, the interfacial tensions for a
given C5PeC11 concentration are the same for W/O and O/W systems, which is different from
the C5Pe case. The same interfacial tension for O/W and W/O in C5PeC11 system appears to be
the result of less C5PeC11 molecules at the xylene−water interface due to its better solubility in
xylene. In this case, the amount of surface-active C5PeC11 molecules at the oil−water interface
is essentially the same for the two systems.
Figure 4-5 (a) dynamic IFT of C5Pe−water (pH 5.5) interface and (b) dynamic IFT of
C5PeC11−water (pH 7) interface.
Figure 4-6 Zeta potential of xylene diluted C5Pe in water emulsions as a function of pH.

55
The observed difference in interfacial tensions of C5Pe systems in Figure 4-3 obtained using the
pendant drop method might be attributed to the reservoir effect, i.e., more C5Pe molecules are
available for adsorption in the W/O system than in the O/W system. To check this hypothesis,
interfacial tension measurements were also performed using the Du Noüy ring method for planer
oil−water interface. The measured interfacial tensions match well with that measured using the
W/O case (Figure 4-7 (a)), showing that the larger amount of C5Pe in the continuous phase
indeed provides more material to attach to the interface. For C5PeC11, the interfacial tensions
measured using Du Noüy ring method for planer oil−water interface match well with that
measured using O/W and W/O systems (Figure 4-7 (b)), as anticipated. In fact, by studying 12
different ionic and non-ionic surfactants, Miller et al.157 reported that in solutions of highly
surface-active surfactants (especially at low concentration), the concentration within the drop
becomes essentially lower as compared to the initial concentration due to the adsorption of the
surfactant molecules at the drop surface, while surfactant depletion due to adsorption does not
occur with the bubble profile (or Du Nouy ring, or Wilhelmy plate method), where the volume of
the studied solution is large. In addition, for surfactant of low surface activity, no difference is
found, as in the case of C5PeC11 in this research. Overall, the reservoir effect leads to the
difference in the interfacial tensions of W/O and O/W systems.
Figure 4-7 Comparison of interfacial tensions measured using the pendant drop and Du Noüy
ring methods: (a) for water−C5Pe in xylene solution and (b) for water−C5PeC11 in xylene
solution, both aged for up to 30 min. Note: Vwater:Voil=4:3 for Du Noüy ring method;
Vwater:Voil=1:300 in W/O case and 300:1 in O/W case for the pendant drop method.

56
4.3.2 Crumpling ratio
The contraction behavior of asphaltene films at the oil−water interface has been shown to shed
light on the role of asphaltene films in stabilizing water droplets from coalescence in
emulsions.58, 158, 159 Similarly, the adsorption of C5Pe or C5PeC11 molecules at the xylene−water
interface was investigated by crumpling experiments. The arrangement of surface-active species,
such as asphaltenes, resins, and inorganic solids, at the liquid−liquid interface, can create a ‘skin-
like’ interfacial layer around the droplet. Upon removal of the liquid inside the droplet, the area
of the skin becomes larger than the area of a Laplacian droplet of the reduced volume and the
interface crumples as a result of irreversible adsorption and/or assembling of adsorbed species at
the interface. The projected area of the droplet surface when crumpling becomes visually evident
divided by the projected area of the initial droplet is defined as the crumpling ratio.
The results of volume contraction experiments are summarized in Figure 4-8. Each data point in
Figure 4-8 is an average of at least three independent measurements and the error bars represent
the standard deviation of all the measurements. Only crumpling ratio of C5Pe−water system is
shown here as no crumpling was detected for C5PeC11−water system up to 150 mg/L C5PeC11
concentration for both W/O and O/W systems. The absence of the crumpling of water−C5PeC11
in xylene solution interface indicates the absence of C5PeC11 skins at the xylene−water
interface, most likely as a result of more reversible nature of C5PeC11 adsorption and/or
minimal molecular association between C5PeC11 molecules at the interface due to steric
hindrance of longer aliphatic tails160 and its high solubility in xylenes. Compared with C5PeC11,
less bulky hydrophobic tails of C5Pe molecules which has weaker steric repulsion in xylene
allows stronger association with each other by attractive forces such as π-π stacking, forming an
inter-linked crumpling C5Pe interfacial film.156
It is interesting to note a much higher crumpling ratio for the W/O system than that for the O/W
system (Figure 4-8), despite the same chemistry of both systems. Such a significant difference in
the crumpling ratio of the two systems is most likely linked to the amount and irreversible nature
of the adsorption that leads to different packing patterns of C5Pe molecules at the oil−water
interfaces. According to interfacial tension results, more C5Pe molecules are adsorbed at the
oil−water interface for W/O systems than for O/W systems due to the reservoir effect, leading to
tighter packing of the C5Pe molecules at the interface. The tighter packing results in a stronger

57
association of C5Pe molecules of the W/O systems. As the film is contracted during the
retraction of the water droplets as in the W/O system, the bulky hydrophobic tails of C5Pe
molecules are more easily jammed up (squeezed), leading to crumpling at relatively small
volume reduction of the droplet (i.e., large crumpling ratio) due to the irreversible nature of the
interfacial film. For the O/W system, the relatively loose packing allows more contraction of the
droplets before the steric repulsion among the hydrophobic tails in xylene comes into play,
leading to a smaller crumpling ratio. Such differences in crumpling ratio also confirm the
formation of interfacial layers of elastic nature as illustrated by the results of interfacial rheology
shown in Figure 4-10. It is not surprising to see higher crumpling ratio at higher C5Pe
concentrations in xylene as more C5Pe molecules are expected to adsorb at the xylene−water
interface as shown in Figure 4-3. When much less reversibly adsorbed molecules are at the
O/W interface, which is the case for C5PeC11, crumpling will not occur. Overall, the difference
in the C5Pe adsorption amount at the oil−water interface plays a big role in the crumpling of the
interface.
In addition, an obvious increase in the crumpling ratio is observed with increasing aging from
10 min to 30 min for the W/O system, while the crumpling ratio increases slightly for the O/W
system. This trend corresponds well with the change in interfacial tension as shown in Figure
4-3: the interfacial tension of the O/W system almost reaches equilibrium after 10 min aging
whereas the interfacial tension of the W/O system continues to decrease. Therefore, the more
adsorbed C5Pe molecules at the interface for longer aging lead to the higher crumpling ratio.
Figure 4-8 Crumpling ratio of water−C5Pe in xylene systems as a function of C5Pe
concentration with the droplets of pH 7 being aged for 10 min (a) and 30 min (b).

58
4.3.3 Dilatational rheology
Dilatational rheology is an important physicochemical property of oil−water interfaces. By
inducing a change in the interfacial area while measuring the interfacial tension, dilatational
measurement provides important information on the dilatational viscoelasticity (viscoelastic
modulus) of the interface, which arises in response to surface expansions and compressions.149
For dilatational measurements, experiments should be conducted in the linear viscoelastic
regions where the viscoelastic properties observed are independent of the imposed frequency and
amplitude levels. We measured the modulus as a function of frequency and amplitude as shown
in Figure 4-9. The elastic modulus remains unchanged for amplitude between 8% and 16% and
frequency between 0.1 to 0.4 Hz. Based on these results, the amplitude and frequency in
dilatational rheology measurement were set at 10% and 0.1 Hz, respectively.
Figure 4-9 (a) Frequency dependence of elastic modulus of the interface for DI water in 100
mg/L C5Pe in xylene solution at different aging time; (b) Effect of amplitude (volume change)
on the measured elastic modulus for DI water in 100 mg/L C5Pe in xylene solution: aging time
60 min; frequency 0.1 Hz.
Similar to crumpling ratio, only dilatational rheology of the C5Pe system was measurable and no
viscoelasticity was detected for the C5PeC11 system up to a C5PeC11 concentration of
150 mg/L. The measured viscoelasticity of the W/O and O/W systems of C5Pe is shown in
Figure 4-10. Each experiment was repeated for three times which showed the same trend. It is
interesting to note a rapid increase in viscoelasticity of the interfacial films for the W/O system,
followed by a gradual increase. In contrast, only a much slower and gradual increase in the
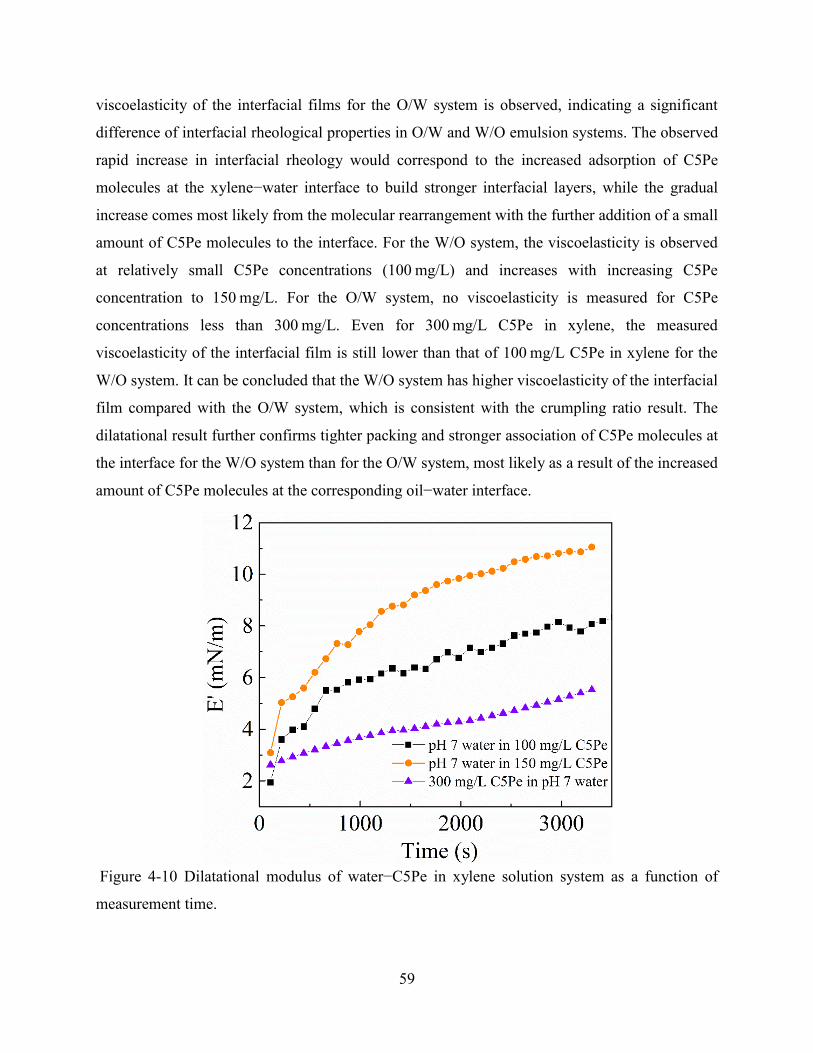
59
viscoelasticity of the interfacial films for the O/W system is observed, indicating a significant
difference of interfacial rheological properties in O/W and W/O emulsion systems. The observed
rapid increase in interfacial rheology would correspond to the increased adsorption of C5Pe
molecules at the xylene−water interface to build stronger interfacial layers, while the gradual
increase comes most likely from the molecular rearrangement with the further addition of a small
amount of C5Pe molecules to the interface. For the W/O system, the viscoelasticity is observed
at relatively small C5Pe concentrations (100 mg/L) and increases with increasing C5Pe
concentration to 150 mg/L. For the O/W system, no viscoelasticity is measured for C5Pe
concentrations less than 300 mg/L. Even for 300 mg/L C5Pe in xylene, the measured
viscoelasticity of the interfacial film is still lower than that of 100 mg/L C5Pe in xylene for the
W/O system. It can be concluded that the W/O system has higher viscoelasticity of the interfacial
film compared with the O/W system, which is consistent with the crumpling ratio result. The
dilatational result further confirms tighter packing and stronger association of C5Pe molecules at
the interface for the W/O system than for the O/W system, most likely as a result of the increased
amount of C5Pe molecules at the corresponding oil−water interface.
Figure 4-10 Dilatational modulus of water−C5Pe in xylene solution system as a function of
measurement time.
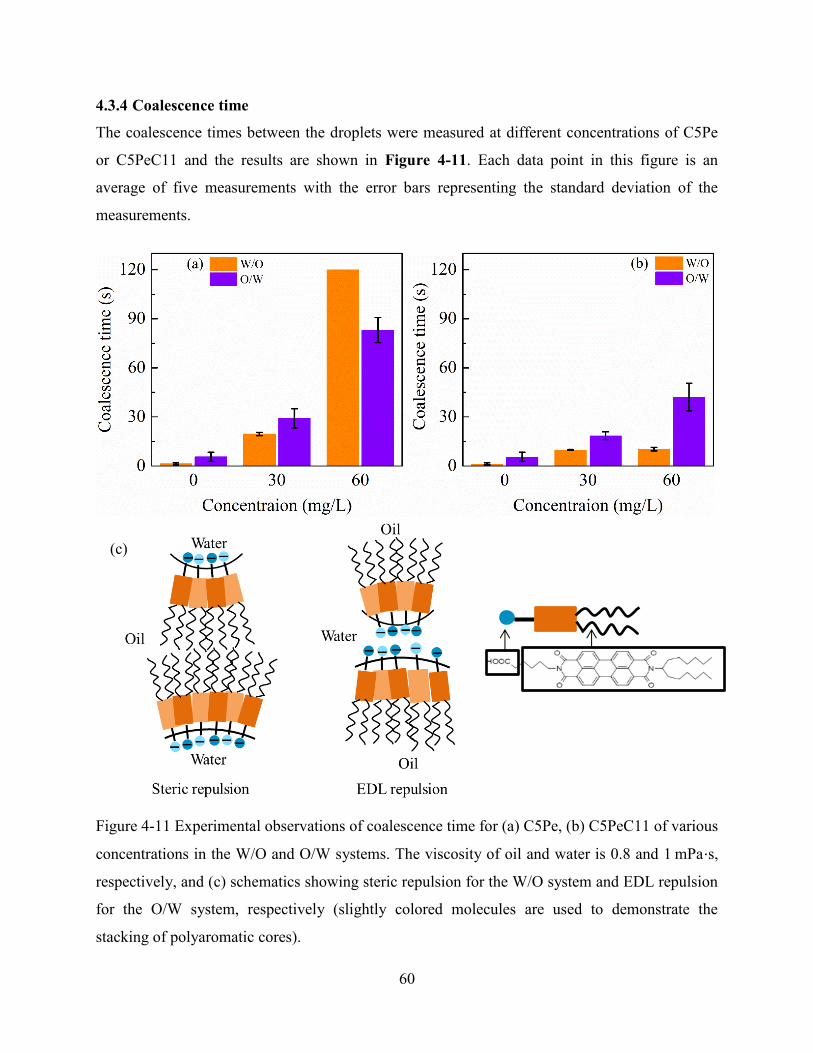
60
4.3.4 Coalescence time
The coalescence times between the droplets were measured at different concentrations of C5Pe
or C5PeC11 and the results are shown in Figure 4-11. Each data point in this figure is an
average of five measurements with the error bars representing the standard deviation of the
measurements.
Figure 4-11 Experimental observations of coalescence time for (a) C5Pe, (b) C5PeC11 of various
concentrations in the W/O and O/W systems. The viscosity of oil and water is 0.8 and 1 mPa⋅s,
respectively, and (c) schematics showing steric repulsion for the W/O system and EDL repulsion
for the O/W system, respectively (slightly colored molecules are used to demonstrate the
stacking of polyaromatic cores).
(c)

61
In general, the coalescence time increases with increasing the concentration for both
polyaromatic compounds. However, the droplets in C5PeC11−water system can coalesce much
easier than in C5Pe−water system as shown by a shorter coalescence time for both W/O and
O/W emulsion systems. The finding correlates well with the observed absence of droplet
crumpling and low viscoelasticity of C5PeC11−water system. Interestingly, the coalescence of
water droplets in the W/O emulsion system is always faster than that of oil droplets in the O/W
emulsion system for C5PeC11−water system. The absence of electrostatic repulsion of water
droplets in oil along with favorable migration of C5PeC11 molecules on water droplets into the
oil phase than oil droplets into water seem to be responsible for such difference.
For C5Pe − water system, the advantage of W/O system is diminished with the increasing
concentration of C5Pe (60 mg/L), as shown by the longer coalescence time of water droplets
(W/O system) than the oil droplets (O/W system), when the steric repulsion as well as film
rigidity and viscoelasticity, become so significant (as indicated by the crumpling ratio (Figure
4-8) and dilatational rheology results (Figure 4-10)) to hinder coalescence. Specifically, the
coalescence time for O/W system at 60 mg/L C5Pe concentration was around 80 s, while for
W/O case coalescence did not happen during the experimental time of 120 s. As the
measurement limit for ITFDA is 120s, systems with coalescence time higher than 120 s are
considered stable. It should be noted that at higher concentration (i.e., 100 mg/L and 150 mg/L),
the coalescence times for both W/O and O/W systems were all over 120 s.
Theoretically, the coalescence time is related to the time it takes for the thin liquid film between
the droplets to drain to a critical thickness where surface forces become relevant for the film to
thin and rupture. The disjoining pressure (Π),161-163 which generally arises from electric double
layer (EDL) interaction, van der Waals (vdW) interaction, steric interaction, hydrophobic (HB)
interaction, and so on, is system dependent and is responsible for the liquid film rupture when the
film is sufficiently thin to make an attractive disjoining pressure. It should be noted that the
forces contributing to the disjoining pressure are not exactly the same in the two systems. In the
O/W system, the electrostatic double layer force (Figure 4-11 (c)) and steric repulsion that
stabilize the oil droplets are overcome by the attractive vdW force to realize the rupture of the
thin liquid film. The hydrophobic attraction between oil droplets in the current systems is
negligible due to the orientation of polar groups facing the aqueous phase to impart hydrophilic
62
nature of the oil droplet surface. Therefore, vdW force is considered to be the driving force to
induce the film rupture between the oil droplets. On the other hand, steric interaction is the main
repulsive force in the W/O system, attributed to the adsorption of C5Pe molecules (Figure 4-11
(c)). This steric force originated from the adsorbed C5Pe or C5PeC11 molecules at the
xylene−water interfaces should be much weaker in the O/W system due to the orientation and
compaction of polyaromatic molecules at the interface.164 Similar to the O/W system, the
attractive vdW force in the W/O system is responsible for the film rupture at low concentrations.
At high concentrations, the larger steric repulsive force due to the formation of a steric layer
from stacking of molecules at the interface would override the attractive surface force and
prevent the droplets from coalescence.
By investigating O/W and W/O configurations of the same chemistry, it becomes evident that the
different adsorption amount due to the reservoir effect that affects the arrangement of molecules
at the interface is important and has effects on measurements such as crumpling ratio,
dilatational rheology and coalescence time that could have not been observed using flat
oil−water interfaces. In general, though similar trends are observed in most situations, the O/W
configuration does not quantitatively represent the W/O system in terms of crumpling ratio,
dilatational rheology and coalescence time. In particular, due to different film drainage process
as well as the different interfacial film rigidity and viscoelasticity, coalescence time of the W/O
system cannot be represented by the reversed O/W system.
4.4 Conclusions
A systematic study of O/W and W/O systems has been performed to understand their difference
using asphaltene model compounds. Interfacial tension measurements indicated that the used
asphaltene model compounds are very interfacially active and the adsorption amounts of C5Pe
molecules at the oil−water interface for W/O and O/W systems are different due to the reservoir
effect when oil is used as the continuous phase. The measurements of the crumpling ratio of the
W/O system showed the presence of ‘skin-like’ structures around the droplet, which became
more pronounced with increased concentration. On the other hand, the reversed O/W system
showed less pronounced crumpling, which was attributed to less adsorption amount and
therefore loose packing of the C5Pe molecules at the interface. A similar trend was found for

63
interfacial dilatational rheology measurement, further confirming tighter and stronger molecular
packing at the oil−water interface of the W/O system.
Regarding the coalescence time, a longer coalescence time of oil droplets in water than that of
water droplets in oil for both C5PeC11−water and C5Pe−water systems at low C5Pe
concentration was observed. The role of film rigidity, film viscoelasticity, and steric repulsion on
the coalescence time was especially significant for the high concentration of C5Pe model
compound (60 mg/L), leading to longer coalescence time of water droplets in oil for the
C5Pe−water system.
In summary, our results are consistent with previous literature about the accepted understanding
that asphaltenes cause stabilization of the emulsion by creating a ‘skin’ around the water drops,
which prevents coalescence. We have shown that many characteristics change for the reversed
W/O system. Results obtained in this work indicate that the investigation of the stability of W/O
emulsions by using O/W emulsions that have much better visualization features can only give
qualitative trends.

64
Chapter 5 Changing the Interface Between an Asphaltene Model
Compound and Water by Addition of an EO-PO Demulsifier
through Adsorption Competition or Adsorption Replacement
5.1 Introduction
Emulsions widely exist in various industries, such as food, cosmetics, medicines, and
petroleum.165-167 The production of viscous emulsions in petroleum industry causes various
problems, such as increased pumping costs, equipment or pipework corrosion, and poisoning of
the downstream refinery catalysts.168 Efficient emulsion breakup is usually realized by the
addition of chemical demulsifiers. Consequently, factors that affect the emulsion stability and the
role played by the demulsifiers in demulsification are of great significance to the oil industry.
It has been reported that a rigid film, which is formed around a water droplet, is the determining
factor for the stability of W/O emulsions169, 170 and asphaltenes are widely accepted as the major
components of this rigid film.11, 137, 171-174 Based on SARA analysis, asphaltenes are defined as a
solubility class. They are soluble in aromatic solvents but insoluble in paraffinic solvents. This
definition inherently indicates that the properties of crude oil or bitumen and the components of
asphaltene samples may not be the same between different oil fields and even different wells.
Nowadays, asphaltenes are widely reported to be the polyaromatic hydrocarbons (PAH) with
amphiphilic properties, which consist of fused aromatic rings with alkyl branches attached on
both sides.95, 175, 176 Based on this, several PAH surfactants have been synthesized as the
asphaltene models, which are characterized by a central perylene core with the lipophilic
branch(es) to one and hydrophilic alkyl branch(es) to the other side.99, 100, 154
Nordgård and coauthors reported that both W/O and O/W emulsions can be stabilized by the
synthesized PAH surfactants.99, 100, 154 C5Pe and C5PeC11, as a kind of the PAH surfactants,
were reported to be suitable asphaltene model compounds103-107, 177, 178 as they behave similarly
as asphaltenes. For the synthesized C5Pe asphaltene model compound, its interfacial activities,99
adsorption behavior at interfaces,100 Langmuir films, and fluorescent properties154 have all been
reported. The intermolecular forces between the C5Pe molecules in solvents and the adsorption
behavior of the C5Pe molecules on a mica surface were similar to that of asphaltenes, despite the
quantitative differences between them. Simon and coauthors reported the association of
C5PeC11 molecules.179 By isothermal titration calorimetry and nuclear magnetic resonance

65
investigations, they concluded that the aggregation of C5PeC11 molecules was mainly due to the
π−π stacking of the polyaromatic rings and hydrogen bonding of the carboxylic groups.
Molecular dynamics simulations were also used to study the aggregation behavior of the PAH
surfactants in organic solvents and their adsorption behavior at the toluene or heptane−water
interface. Teklebrhan et al.180 showed that C5Pe molecules aggregated into large particles in both
heptane and toluene, although their self-aggregation behavior was weaker in toluene because the
aromatic solvent weakened the π−π stacking between C5Pe molecules for the molecular
association. Although the interfacial activity of asphaltene model compounds has been
thoroughly studied, no investigation has been conducted on the interaction between demulsifier
molecules and asphaltene model compounds.
W/O (crude oil or bitumen) emulsions are black in nature; therefore, the reverse crude oil or
bitumen in water system (O/W) has been used for the investigations of most interfacial properties.
When studying the demulsification mechanism, it is essential to know whether the demulsifier
would work similarly on the oil−water interfacial film for both systems. In a real dewatering
process of W/O emulsions, the demulsifier diffusion through the continuous oil phase to the
interface of the dispersed aqueous droplet indicates the adsorption replacement of the emulsifier
molecules by the demulsifier molecules at the interface. When using the reverse O/W system, we
have to premix the emulsifier and demulsifier molecules as the oil phase, indicating the
adsorption competition between them. Therefore, an investigation on the adsorption replacement
and competitive adsorption between emulsifier and demulsifier molecules should be conducted.
Asphaltene model compounds C5Pe and C5PeC11, which have better visibility when used as the
oil sample, enable us to study the interfacial properties of both W/O and O/W systems, as
discussed in Chapter 4. This study aimed to investigate how the properties of the C5Pe or
C5PeC11−water interface were changed by an EO-PO copolymer demulsifier, which would
enhance the understanding of the dewatering of emulsions from the molecular perspective. The
EO-PO block copolymer has been chosen as the demulsifier as it has been extensively
investigated45, 181 and previously reported to be an effective chemical in the dewatering of W/O
emulsions stabilized by asphaltenes.71
Within the main goal, there are three sub-goals: (1) compare the similarities and differences of
the oil−water interfaces for water droplet in xylene diluted C5Pe or C5PeC11 solution (W/O) and
66
xylene diluted C5Pe or C5PeC11 droplet in water (O/W) systems with EO-PO demulsifier
addition by interfacial tension (IFT) and crumpling ratio measurements; (2) study how the flat
C5Pe−water interface was changed by the addition of the EO-PO demulsifier using Langmuir
trough, atomic force microscopy (AFM), and Rheometer techniques through spreading
(simulating competitive adsorption in O/W system) and diffusion (simulating adsorption
replacement in the W/O system) protocols; and (3) investigate whether the asphaltene model
compound C5Pe could interact with demulsifier molecules in a similar way as that of real
asphaltenes and demulsifier molecules.
5.2 Materials and Methods
5.2.1 Materials
The chemical structures of the PAH surfactants C5Pe and C5PeC11 are shown in Figure 2-5.
As can be seen, two types of alkyl chains are attached to the condensed polyaromatic rings
through nitrogen atoms. Specifically, a hydrophilic carboxylic acid alkyl chain is bonded to one
end and the other end is bonded to a hydrophobic double alkyl chain. The longer alkyl chains of
the C5PeC11 molecule make it more soluble in organic solvents than the C5Pe molecule. The
detailed synthetic procedures for the C5Pe and C5PeC11 molecules have been reported
elsewhere.154, 182 For the preparation of the xylene diluted C5Pe or C5PeC11 solution, C5Pe or
C5PeC11 was dissolved in xylene and sonicated for 30 min.
The EO-PO demulsifier supplied by Baker Hughes was used in this study, and its chemical
properties have been reported elsewhere in detail.183 The purification of the deionized (DI) water
was conducted by the Barnstead Nanopure Millipore system. Xylene (assay: ≥98.5%, Certified
ACS, Fisher Chemical) used in this study is composed of m-, o-, and p-xylene with the ratio of
each compound around 60, 20, and 20%, respectively.
5.2.2 Methods
5.2.2.1 Tensiometer (Biolin Scientific, Sweden)
The Tensiometer T200 was applied in this study for the interfacial tension and crumpling ratio
measurements for both W/O and O/W systems (xylene diluted C5Pe or C5PeC11 solution was
used as the oil sample) in the presence or absence of the EO-PO demulsifier.
67
Interfacial tension
For W/O and O/W systems, dynamic interfacial tensions (DIFT) were measured using the
pendant drop technique to investigate the competitive adsorption and adsorption replacement
between C5Pe (or C5PeC11) molecules and the EO-PO demulsifier molecules at different
concentrations of the EO-PO demulsifier. For the W/O system, 3 mL of C5Pe or C5PeC11
xylene solution (30 mg/L) was added to a quartz cuvette as the oil sample. After that, a DI water
droplet with a volume of 18 μL was produced by a gastight syringe and immersed in the oil
solution. The IFT of the W/O system was monitored for 1200 s in total at 23 °C. After aging the
water droplet in the C5Pe or C5PeC11 xylene solution for 600 s, the EO-PO demulsifier was
injected in the continuous oil phase. The IFT was monitored for another 600 s after EO-PO
demulsifier addition. For the O/W system, the oil sample was prepared by mixing the EO-PO
copolymer with xylene diluted C5Pe or C5PeC11. A droplet of the oil mixture with a volume of
18 μL was immersed in DI water, and the IFT was recorded for 1200 s in total. The IFT of the
EO-PO demulsifier-only solution was also measured for comparison.
Crumpling ratio
The contraction behavior of the asphaltene film around the surface of the water droplet in
emulsions could demonstrate the role of this film in preventing the coalescence of the emulsion
droplets.58, 158, 159 Crumpling ratio (CR), which characterizes the extent of the interfacial steric
layer (film) formation,128 can be obtained by comparing the projected area of an oil droplet right
before ‘crumpling’ was observed (Af ) on this droplet with the area at initial state (Ai). Similar to
that for IFT measurement, the volume of the oil (or water) droplet for the CR measurements was
also maintained at 18 μL. The oil samples used in this measurement were xylene diluted C5Pe
solution with and without the EO-PO copolymer. The oil (or water) droplet was contracted
steadily after aging it for 3600 s, and a simultaneous recording of the whole retracting process
was initiated. It should be noted that for the W/O system, the demulsifier was added after aging
the droplet for 1800 s, and demulsifier diffusion was allowed for 1800 s before contraction.
Through a frame-by-frame video playback, the points at the initial state and right before
crumpling of the droplet were determined.
5.2.2.2 Interfacial pressure−area isotherm
To investigate the compressional properties of the C5Pe interfacial layer in the presence or
absence of the EO-PO demulsifier, the interfacial pressure of this layer was measured by a KSV

68
Langmuir trough in terms of the trough area. The IFT difference between the clean interface (σ0)
and the interface with the adsorption of interfacially active materials (σ) is defined as the
interfacial pressure (π), which can be expressed as π = σ0 − σ. 120 mL of aqueous subphase was
filled in the bottom of the trough. A pressure increase of less than 0.2 mN/m indicated that the
trough is well cleaned by compressing the water surface to the minimum trough area (25 cm2).
Both diffusion and spreading protocols184 were adopted to study the compressibility of the C5Pe
interfacial films in the presence of the EO-PO demulsifier. The diffusion method allowed us to
elucidate whether the EO-PO demulsifier could break the C5Pe interfacial layer that is already
formed prior to the introduction of the EO-PO demulsifier, whereas the spreading protocol
enabled us to probe the inhibition of the complete C5Pe interfacial layer formation by the EO-PO
demulsifier. In other words, the diffusion protocol aimed to investigate the replacement of C5Pe
molecules by the EO-PO demulsifier, whereas the spreading protocol studied the competitive
adsorption between the EO-PO demulsifier and C5Pe molecules. In the diffusion protocol, the
EO-PO demulsifier diffused from the continuous oil phase to the interface to mimic a real
demulsification process, which is also the case for the IFT and CR measurements for the W/O
system. In the spreading protocol, the mixture of the C5Pe molecule and EO-PO demulsifier was
used as the oil phase, which is the same as that of the O/W case.
For the diffusion protocol, 100 mL of xylene diluted C5Pe solution (30 mg/L) was covered on
the aqueous subphase. Then, the EO-PO demulsifier at different concentrations was injected into
the top oil phase after equilibrating the system for 1800 s. The EO-PO demulsifier was allowed
to diffuse for 1800 s prior to compression. For the spreading protocol, xylene diluted C5Pe
solution was premixed with the EO-PO demulsifier at the desired concentrations. A total of 100
mL of the mixture of the C5Pe solution and EO-PO demulsifier was placed on the water
subphase. The interfacial layer was compressed after spreading the molecules for 3600 s. For
comparison, the interfacial pressure−area isotherm of the demulsifier-only solution−water
interface was collected. The isotherm of a clean xylene−water interface was also determined. A
low compression rate of 10 mm/min was used in our work as it is commonly used in the
interfacial pressure isotherm measurement for the asphaltene system. 185, 186
5.2.2.3 Atomic Force Microscopy (AFM) Imaging
69
The C5Pe interfacial films in the presence and absence of the EO-PO demulsifier under both
diffusion and spreading protocols were prepared using the Langmuir−Blodgett (LB) technique. A
silicon wafer, which was thoroughly cleaned by piranha solution and DI water, was the substrate
for film deposition. While maintaining the interfacial pressure at 2 mN/m, the LB films were
transferred on the clean wafers and pulled up through the oil−water interface at a rate of 8.6
mm/min. The topography of the dried LB films was acquired by the Dimension Icon AFM
(Bruker Dimension Icon-PT, Bruker Corporation) under tapping mode in air at 23 °C. The LB
films were imaged using an AFM silica probe (NCHV-A) at the scan rate of 1 Hz. The
NanoScope Software V8.15 was used to control the sample imaging process. The demulsifier-
only LB film and silicon wafer surface were also imaged by AFM.
5.2.2.4 Rheology
Interfacial shear rheology, which is measured by a rheometer, is used to study the flow and
deformation behavior of liquid interfaces by external forces. In other words, the shear rheology
consists of measuring how much the sample deforms or how fast the sample flows after inducing
a shear stress on it.132 An AR-G2 rheometer was used in this study to measure the interfacial
viscoelastic properties of the C5Pe interfacial layer, monitoring its formation and breakdown by
the addition of the EO-PO demulsifier. The double wall ring (DWR) setup used in this study has
been illustrated in Chapter 3 3.7.133 The Pt/Ir ring was flamed to remove organic contaminants
on it prior to use.
The experimental procedure is described as following. After instrument calibration, 19.2 mL of
the aqueous subphase was injected into the lower part of the rheometer trough, and the DWR
was then lowered and positioned at the water surface. Similar to Langmuir trough experiments,
both diffusion and spreading protocols were adopted. For diffusion protocol, 15 mL of 30 mg/L
freshly prepared C5Pe in xylene solution was injected into the trough as the top phase and a
Teflon cap was used to avoid evaporation. After equilibrating the interface for 3600 s, the EO-
PO demulsifier at different concentrations was added dropwise to the top C5Pe in xylene
solution. Meanwhile, the changes of G″ (loss or viscous modulus) and G′ (storage or elastic
modulus) were measured. For spreading protocol, 15 mL of the mixture of the EO-PO
demulsifier and xylene diluted C5Pe solution was injected into the trough as the top phase. The
duration of all the experiments was set to 7200 s in total. The shear rheology of the demulsifier-

70
only system was also measured. The frequency and strain in the interfacial shear rheology
measurement were set at 0.5 Hz and 0.8%, respectively. The experimental temperature was
controlled by a water bath at 23 C. Detailed procedures of the experiments can be found
elsewhere.187
5.3 Results and Discussion
5.3.1 Interfacial tension
Figure 5-1 (a) DIFT of the DI water droplet in xylene diluted C5Pe solution (30 mg/L) with the
addition of EO-PO demulsifier at different concentrations and (b) DIFT of the xylene diluted
C5Pe droplet (30 mg/L) mixed with the EO-PO demulsifier at varied dosages in water.
To study the difference between adsorption competition and adsorption replacement, the changes
in the dynamic interfacial tension (DIFT) for both W/O and O/W systems were recorded, and the
results are shown in Figure 5-1. Three parallel experiments were conducted for each
measurement, and the difference in IFT between different measurements was less than 0.2 mN/m
under the same condition. Figure 5-1 (a) shows the DIFT of the W/O system (DI water droplet
in C5Pe xylene solution at 30 mg/L) at varied EO-PO demulsifier dosages. Different
concentrations of the EO-PO demulsifier were added at the 600th s. The addition of the EO-PO
demulsifier at 1, 2, and 5 ppm all led to rapid reduction of the IFTs, showing faster kinetics at
higher EO-PO demulsifier concentration. When 5 ppm EO-PO demulsifier was added, the IFT
decreased rapidly to a very low value that the droplet could not remain at the tip of the syringe
100 s after EO-PO demulsifier addition. The slope of the DIFT curve of the C5Pe/EO-PO system
was very similar to that of the DIFT curve for the demulsifier-only system (for example, the

71
slope of C5Pe + 5 ppm EO-PO demulsifier system was almost the same as that of the 5 ppm EO-
PO demulsifier), suggesting the dominant adsorption of the EO-PO demulsifier at the interface.
It should be noted that the IFT of the EO-PO demulsifier/C5Pe system fell between the EO-PO
demulsifier-only and C5Pe-only system, implying that the interface was occupied by both C5Pe
molecules and the EO-PO demulsifier, which agreed well with that of the asphaltene/demulsifier
system.71 The asphaltene/demulsifier−water or diluted bitumen/demulsifier−water systems were
also reported to have lower IFTs than those of the asphaltene−water or diluted bitumen−water
systems.71, 184, 188
Figure 5-1 (b) shows the IFT of the O/W system (the mixture of the EO-PO demulsifier and
xylene diluted C5Pe solution was used as the oil phase). Compared with that of C5Pe molecules,
the adsorption of the EO-PO demulsifier at the interface was much easier, which led to a further
decrease in the IFT compared with the C5Pe-only system. The more the EO-PO demulsifier
added, the lower the IFT measured, which is very similar to the case of the W/O system. The
C5Pe/EO-PO system and EO-PO demulsifier-only system showed similar adsorption kinetics, as
indicated by the similar slope of their IFT curves. It should be noted that at the same C5Pe or
EO-PO concentration, for the corresponding W/O and O/W systems, the IFTs were
quantitatively different, whereas the reservoir effect157 should be responsible for this difference.
Similar to that of the C5Pe system, the measurement of the IFT for the C5PeC11 system was also
conducted. The IFT of the DI water droplet in xylene diluted C5PeC11 solution (30 mg/L) was
measured for 1200 s, and the EO-PO demulsifier at different concentrations was added into this
system at the 600th s (Figure 5-2 (a)). Generally, rapid decrease for all IFTs after EO-PO
demulsifier addition was observed at all used demulsifier dosages (0.5, 1, and 2 ppm), showing
faster kinetics at higher EO-PO concentrations. For the C5PeC11 droplet in water (Figure 5-2
(b)), EO-PO demulsifier addition could further decrease the IFT in contrast with the C5PeC11-
only system. By comparing the slopes of the IFT curves, it can be seen that the C5PeC11/EO-PO
system had almost the same adsorption kinetics as that of the demulsifier-only system, which
implied much better surface-active properties of the EO-PO demulsifier than that of the
C5PeC11 molecules.
Overall, EO-PO molecules can compete with (indicated by the IFT decrease of the O/W system)
and replace (indicated by the IFT decrease of the W/O system) the asphaltene model compounds

72
C5Pe or C5PeC11 at the interface. It should be noted that no synergistic effect, i.e., further
reduction of the IFT for the EO-PO/C5Pe−water system compared with that of the EO-PO−water
system, was found between the EO-PO demulsifier and C5Pe molecules.
Figure 5-2 (a) DIFT of the DI water droplet in xylene diluted C5PeC11 solution (30 mg/L) with
the addition of the EO-PO demulsifier at different dosages and (b) DIFT of the xylene diluted
C5PeC11 droplet (30 mg/L) mixed with the EO-PO demulsifier at different dosages in water.
5.3.2 Crumpling ratio
Crumpling experiments were conducted to investigate the adsorption and interaction of C5Pe
molecules at the interface. No crumpling of the C5PeC11 interfacial film was observed. Each
crumpling ratio (CR) value in Figure 5-3 corresponds to an average of three independent
experimental results, and the difference between the measurements is around 0.05. DI water
droplets (or oil droplets) of approximately 18 μL in volume were aged in the oil solution (or DI
water) for 3600 s. The oil samples consisted of xylene diluted C5Pe solution (30 mg/L) with the
EO-PO demulsifier at different concentrations. The CR results for the C5Pe/EO-PO−water
interface are summarized in Figure 5-3. When the liquid inside the water droplets was retracted,
the presence of the C5Pe interfacial films could be observed as wrinkles outside these water
droplets. For the W/O system, the CR was around 0.30 after aging for 3600 s, whereas it
decreased to 0 with 2 ppm EO-PO demulsifier addition (Figure 5-3 (a), (b)). The EO-PO
demulsifier was also capable of reducing the interfacial film rigidity for the O/W system, as
indicated by the absence of the CR with the EO-PO demulsifier addition (Figure 5-3 (c), (d)). As
indicated by the IFT and CR results, the EO-PO demulsifier was more surface-active when
compared to the C5Pe molecules and capable of softening the C5Pe interfacial film after

73
adsorption. It should be noted that the CRs of the C5Pe-only system for both W/O and O/W
systems were different (Figure 5-3 (a), (c)), which should be due to the larger adsorption amount
of C5Pe molecules for the W/O system that led to denser molecular packing at the interface of
the same interfacial area as discussed in 4.3.2. Overall, the EO-PO demulsifier worked similarly
through adsorption competition and adsorption replacement for both W/O and O/W systems to
soften and weaken the C5Pe interfacial film.
Figure 5-3 Crumpling ratio of (a, b) W/O system, DI water droplet in xylene diluted C5Pe
solution at 30 mg/L with the addition of the EO-PO demulsifier at 0 and 2 ppm, and (c, d) O/W
system, xylene diluted C5Pe droplet at 30 mg/L mixed with the EO-PO demulsifier at 0 and 2
ppm in water.
5.3.3 Interfacial pressure-area isotherm
It has been reported that the compressional behavior of the interface is linked to the emulsion
stability.185 The interfacial pressure−area isotherm of the C5Pe−water interface was measured
with and without EO-PO demulsifier addition to demonstrate the interfacial pressure in terms of
the trough area (Figure 5-4). Both diffusion and spreading protocols were used for the interfacial
pressure measurements. The higher the increase of the interfacial pressure upon compression, the
less compressible the interfacial film. Three parallel experiments were conducted to ensure the
reproducibility of the measurement.

74
The clean xylene−water interface without surface-active materials has a stable interfacial
pressure of 11 mN/m, which remained almost unchanged under the whole compression process.
As can be observed in Figure 5-4, at the largest trough area (243 cm2), adding the EO-PO
demulsifier (2 and 5 ppm) to the xylene−water system resulted in significant growth of the
interfacial pressure, which was consistent with the reduction in IFT (Figure 5-1).
Figure 5-4 Interfacial pressure−area isotherm for the C5Pe-only, C5Pe with the EO-PO
demulsifier, and EO-PO demulsifier-only system: (a) diffusion protocol and (b) spreading
protocol.
For the demulsifier-only system, the growth of the interfacial pressure under compression was
negligible, indicating the formation of a demulsifier film with high compressibility. The C5Pe
interfacial film was characterized by the dramatic growth of the interfacial pressure upon
compression, which indicated low compressibility of this film. Generally, the interfacial film for
the C5Pe/EO-PO system became much more compressible than that of the C5Pe-only system,
indicated by the smaller interfacial pressure increase with EO-PO demulsifier addition. Similarly,
it has been widely reported that the asphaltene−water interfacial film becomes more
compressible by adding chemical demulsifiers.11, 71, 145, 189 In the diffusion protocol, the isotherm
slope of the C5Pe xylene solution with the EO-PO demulsifier of 2 ppm was similar to that of the
EO-PO demulsifier-only system at low compression (larger interfacial area). At high
compression, a slight increase in the slope of the isotherm was observed, implying that some
C5Pe film structures remained at the interface. After adding 5 ppm EO-PO demulsifier into the
C5Pe xylene solution, the shape of the isotherm was similar to that of the isotherm of the pure
75
EO-PO demulsifier at 5 ppm, indicating that EO-PO demulsifier molecules had dominantly
occupied the oil−water interface, which corresponded well with the IFT measured for the W/O
system in Figure 5-1. It can be inferred that the C5Pe interfacial layer was almost completely
broken. In the spreading protocol, the isotherm resembled that of the EO-PO system at low
compression and the C5Pe system at high compression, a similar trend as in the diffusion
protocol that was mentioned above. It should be noted that the diffusion and spreading protocols
show results that appeared to be inconsistent, which should be attributed to the difference
between competitive adsorption and adsorption replacement. In the diffusion protocol, the
demulsifier works on breaking the already formed C5Pe interfacial film. Once cracks appear on
the C5Pe interfacial film, EO-PO molecules would accumulate along the fissure, to further widen
and extend the fissure until the whole film breakage occurs. In the spreading protocol, EO-PO
demulsifier molecules compete with the C5Pe molecules and adsorb relatively evenly at the
interface, which prevents the whole C5Pe interfacial film formation but does not introduce
severe cracks on the C5Pe film as in the diffusion protocol.
5.3.4 Morphology of the C5Pe interfacial film
The LB films of the C5Pe-only, C5Pe with the EO-PO demulsifier, and EO-PO demulsifier-only
systems were investigated by AFM imaging to visually observe their morphological changes.
The films were prepared by both diffusion and spreading protocols. The AFM image of the LB
film for the C5Pe−water interface is shown in Figure 5-5 (a). The C5Pe interfacial film was
found to be composed of tightly packed nanoaggregates, and similar AFM images for the
asphaltene or bitumen LB films have been reported elsewhere.184, 190
The AFM images formed by the diffusion method are shown in Figure 5-5 (b) and (c). With 2
ppm EO-PO addition, many cracks appeared on the C5Pe interfacial film. On increasing the EO-
PO concentration to 5 ppm, film pieces were sporadically distributed on the interface. The
surface area that is not covered by the C5Pe interfacial film provides the opportunity for two
water droplets to coalesce in the case of emulsions. Obviously, the EO-PO demulsifier was
capable of destroying the C5Pe interfacial layer and performed better at high concentration. The
observed breakage of the C5Pe interfacial film from the AFM images agreed well with the high
compressibility of this film with EO-PO addition as shown by the surface pressure results in
Figure 5-4. Figure 5-5 (d) and (e) shows the morphological characteristics of the LB films
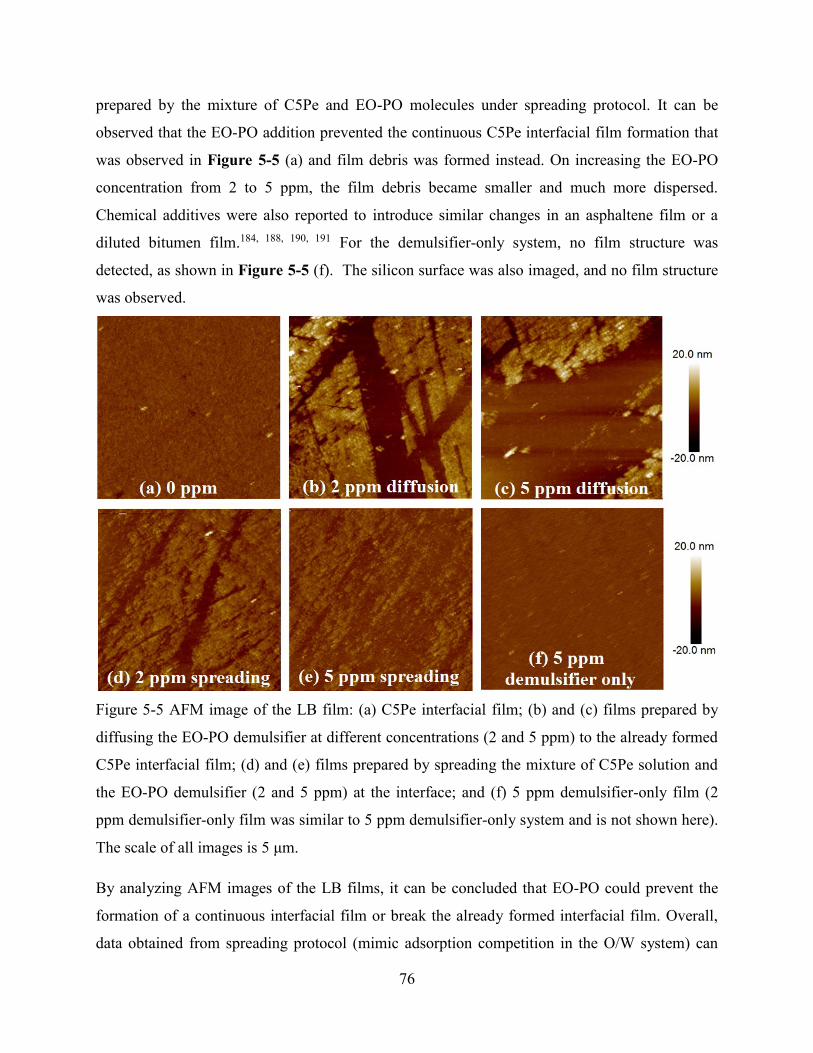
76
prepared by the mixture of C5Pe and EO-PO molecules under spreading protocol. It can be
observed that the EO-PO addition prevented the continuous C5Pe interfacial film formation that
was observed in Figure 5-5 (a) and film debris was formed instead. On increasing the EO-PO
concentration from 2 to 5 ppm, the film debris became smaller and much more dispersed.
Chemical additives were also reported to introduce similar changes in an asphaltene film or a
diluted bitumen film.184, 188, 190, 191 For the demulsifier-only system, no film structure was
detected, as shown in Figure 5-5 (f). The silicon surface was also imaged, and no film structure
was observed.
Figure 5-5 AFM image of the LB film: (a) C5Pe interfacial film; (b) and (c) films prepared by
diffusing the EO-PO demulsifier at different concentrations (2 and 5 ppm) to the already formed
C5Pe interfacial film; (d) and (e) films prepared by spreading the mixture of C5Pe solution and
the EO-PO demulsifier (2 and 5 ppm) at the interface; and (f) 5 ppm demulsifier-only film (2
ppm demulsifier-only film was similar to 5 ppm demulsifier-only system and is not shown here).
The scale of all images is 5 μm.
By analyzing AFM images of the LB films, it can be concluded that EO-PO could prevent the
formation of a continuous interfacial film or break the already formed interfacial film. Overall,
data obtained from spreading protocol (mimic adsorption competition in the O/W system) can

77
represent the diffusion protocol (mimic adsorption replacement in the W/O system) to a certain
degree.
5.3.5 Interfacial shear rheology
In this study, the rheological properties of the C5Pe/EO-PO system were measured by DWR
rheometer geometry. Both spreading and diffusion protocols were applied for the shear rheology
measurements. Here, only diffusion results are shown because the moduli measured for the
spreading protocol were similar to those of the clean xylene−water interface or demulsifier-only
system. In the diffusion protocol, the variations of G″ (loss or viscous modulus) and G′ (storage
or elastic modulus) were measured for C5Pe, C5Pe/EO-PO, EO-PO, and clean xylene−water
interfaces (Figure 5-6). The interfacial shear rheology measurements were repeated three times,
and the reproducibility was adequate because for all measurements either the storage modulus or
the loss modulus of the C5Pe interfacial film overlapped before demulsifier addition, as shown in
Figure 5-6.
Figure 5-6 G″ (loss or viscous moduli) and G′ (storage or elastic moduli) of C5Pe layers with
EO-PO demulsifier addition at varied dosages.

78
Without the EO-PO demulsifier, the C5Pe interfacial film was dominantly viscous at the very
beginning and the viscous modulus G″ started at around 10-3 N/m. The elastic modulus G′ began
to develop afterward. The growth of the elastic modulus was faster than that of the viscous
contribution because C5Pe molecules gradually accumulated at the interface, leading to a
crossover at around the 600th s (G″ = G′). Then, G′ became greater than G″ and both moduli kept
increasing slowly with time, indicating that the interface exhibited more elastic properties rather
than viscous properties. It has been reported that the elastic modulus can be considered as a good
indicator of the strong interaction and cross-linking of interfacial molecules. In addition, the
intensive interaction and cross-linking of interfacial molecules change the interfacial film from
soft to rigid.192, 193
After aging the C5Pe−water interface for 3600 s, the EO-PO demulsifier was added to the top
C5Pe xylene solution. Reductions of the elastic and viscous moduli were observed for all
dosages used (1, 2, and 5 ppm) as shown in Figure 5-6, although to a different extent. After 1
ppm EO-PO addition, both G′ and G″ decreased immediately. After 3600 s of diffusion, G″ and
G′ decreased to values that were still higher than those of the clean xylene−water interface,
representing a small change of viscoelastic properties of the C5Pe/1 ppm EO-PO film with aging.
Moreover, G′ was still higher than G″ after 3600 s demulsifier addition, indicating the
insufficient amount of the EO-PO demulsifier. When 2 ppm EO-PO demulsifier was added, both
G′ and G″ decreased rapidly, although G′ declined much more rapidly and a crossover was found
at around the 5200th s (1600 s after EO-PO copolymer addition). Further increasing the
demulsifier dosage to 5 ppm made the crossover of G′ and G″ appear much faster, at around the
700th s after EO-PO demulsifier addition. G′ of the C5Pe layer with the addition of EO-PO
demulsifier at 2 and 5 ppm could finally reduce to an unmeasurable value, suggesting that the
strong network of C5Pe molecules was almost completely disrupted, which is consistent with the
interfacial pressure−area results. G″ of the C5Pe layer with 2 ppm EO-PO demulsifier was still
measurable and higher than those of the clean xylene−water interface, indicating that some
residual C5Pe molecules were still active at the xylene−water interface, even though they could
no longer form a rigid film because of the weak interactions. For 5 ppm EO-PO demulsifier
addition, G″ reduced to a value similar to that of the demulsifier-only or clean xylene−water
system, illustrating that the EO-PO demulsifier was dominant at the interface.
79
By summarizing the results of interfacial tension, crumpling ratio, surface pressure, AFM images,
and interfacial shear rheology, it is clear that the EO-PO demulsifier was capable of destroying
the interfacial C5Pe film after adsorbing at the interface. In addition, it can be inferred that
although residual C5Pe molecules and the EO-PO demulsifier co-existed at the interface they did
not interact with each other to form a strong interfacial film network. The decrease of the moduli
after EO− PO demulsifier addition in the diffusion protocol and the fact that moduli measured in
the spreading protocol are equivalent to those of the clean xylene−water system or demulsifier-
only system further confirmed that the EO-PO molecules performed similarly through adsorption
competition and adsorption replacement. The absence of G′ and the decrease of G″ for the
asphaltene/demulsifier−water interfacial film compared with the asphaltene−water interfacial
film were also observed by other researchers.39
5.4 Conclusions
This study revealed a consistent destabilization mechanism of the stable C5Pe interfacial film by
the EO-PO demulsifier. In addition, the changes in the asphaltene model compound−water
interface due to the EO-PO demulsifier addition through adsorption competition or adsorption
replacement were compared.
Due to its high interfacial activity, the EO-PO demulsifier was able to further reduce the
interfacial tension by competing with or replacing the C5Pe or C5PeC11 molecules at the
interface for both W/O and O/W systems. The interfacial characteristics of the C5Pe−water
interface were changed dramatically by adding the EO-PO demulsifier in the C5Pe xylene
solution. The EO-PO demulsifier could cause the reduction or even elimination of the
C5Pe−water interfacial film rigidity, for both W/O and O/W systems. Interfacial pressure−area
isotherm, AFM imaging, and shear rheology studied using diffusion (simulate adsorption
replacement in the W/O system) and spreading (simulate adsorption competition in the O/W
system) protocols further confirmed that the EO-PO demulsifier could introduce similar changes
on the C5Pe interfacial film through adsorption competition or adsorption replacement.
Overall, C5Pe compound, as one of the important polyaromatic asphaltene models, stabilized
the interfacial film and the EO-PO demulsifier was capable of disrupting this stable C5Pe
interfacial film through adsorption replacement or adsorption competition. This research should
enhance our understanding of the feasibility of using the reverse O/W system to represent the
80
W/O system when a demulsifier is introduced. In addition, the interaction between the
demulsifier and C5Pe molecules was similar to that of the asphaltene/demulsifier system,
providing further justification for using C5Pe as the asphaltene model compound.
81
Chapter 6 Molecular Destabilization Mechanism of Asphaltene
Model Compound C5Pe Interfacial Film by EO-PO Copolymer:
Experiments and MD Simulation
6.1 Introduction
In the crude oil industry, water-in-oil emulsions (W/O) are usually formed when crude oil and
water are intimately mixed at the wellhead, production well, valves, and pumps. The same is
true in bitumen recovery by both in situ and open pit mining recovery methods. However, the
formation of the stable W/O emulsions in the petroleum industry is highly undesirable because
salts and brine carried with the emulsified water cause corrosion, poison catalysts, reduce
throughput, and lead to equipment failure in downstream operation.19, 168 Understanding the
emulsion stability and demulsification mechanisms is thus fundamental in the petroleum
industry.
It is widely accepted that the emulsion stability is due to the formation of a mechanically strong,
rigid, and viscoelastic interfacial film by the accumulation of surface-active components, such as
asphaltenes, resins, naphthenic acids and inorganic solids from the bitumen or crude oil.169, 194, 195
These components stabilize the emulsion by preventing the direct contact between droplets or the
drainage of the thin film between them.23, 24 Asphaltenes are believed to be the main components
that contribute to the formation of the rigid film which stabilizes W/O emulsions.171-173, 196, 197
For efficient breakup of the W/O emulsions, the use of demulsifier has been regarded as an
economical and efficient method that is widely used in the petroleum industry.28, 29 Modern
demulsifiers are usually mixtures of surface-active macromolecular chemicals, such as acid- or
base-catalyzed phenol-formaldehyde polymers, ethoxylated and/or propyloxylated polyamines,
di-epoxides, polyols, and silicone copolymers.40, 41, 198 Most of the active ingredients in the
chemicals used as demulsifiers are copolymers of ethylene oxide (EO) and propylene oxide (PO)
of different molecular weight and EO-to-PO ratio.42-44
However, investigations of the demulsification mechanism at the molecular level are still lacking.
Therefore, we aim to reveal the molecular demulsification mechanism by both experiments and
molecular dynamics (MD) simulations. EO-PO copolymer was used as the demulsifier because it
has been extensively investigated42, 44-46 and reported as an effective additive in breaking

82
asphaltene/bitumen-stabilized W/O emulsions.44, 71 As asphaltenes are merely a solubility class
having undefined chemical composition and molecular structure, different asphaltene model
compounds have been used as models in MD simulations.199-201 C5Pe is a suitable model
compound as it shows very similar interfacial activities as asphaltenes. Nenningsland et al.200
have extensively investigated factors affecting the emulsion stability by an array of techniques
and concluded that the formation of a rigid network/layer of polycyclic aromatic compounds,
such as asphaltene model compound C5Pe, was responsible for enhancing the emulsion stability.
Jiebin et al.106 have systematically studied the interfacial layer properties of the polyaromatic
asphaltene model compound C5Pe and its role in stabilizing W/O emulsions. Their findings
confirmed that the formation of an elastically dominant interfacial microstructure by the
continuous accumulation of C5Pe molecules and rearrangement of C5Pe aggregates are
requirements to prevent the rupture of the intervening liquid film that results in droplet
coalescence. It should be noted that there still remains a gap between the model system and the
real heavy oil in which a mixture of different types of hydrocarbons is likely present.
In this paper, the interfacial tension was measured to investigate the interfacial activity of EO-PO
copolymer and C5Pe molecules at the oil−water interface. Brewster angle microscopy was used
to study the effect of EO-PO molecules on the morphology of the C5Pe interfacial film. The
experimental results were confirmed by MD simulations. In addition, the MD simulations
provided new insights into the molecular mechanism of interfacial film destabilization and how
different groups of the EO-PO demulsifier behaved at the interface, so as to provide information
on how to design efficient demulsifiers for dewatering.
6.2 Materials and Methods
6.2.1 Materials
C5Pe (N-(1-hexylheptyl)-N´-(5-carboxylicpentyl) perylene-3,4,9,10-tetracarboxylic bisimide), as
one of the model compounds, consists of four aromatic rings fused together with three cyclic
rings containing heteroatoms of O and N (Figure 2-5).
Solutions of C5Pe in xylene (≥98.5%, ACS grade, Fisher Scientific, Canada) were prepared by
dissolving C5Pe in xylene and sonicating for 30 min. The EO-PO block copolymer demulsifier
(provided by Bake Hughes) had a star-like structure of three arms, a molecular weight of 6145

83
g/mol, an EO content of 35% (weight percent) and the relative solubility number of the
demulsifier was 16.92. Deionized (DI) water of a resistivity > 18.5 MΩ·cm was purified with a
Millipore system and used throughout this study.
6.2.2 Methods
6.2.2.1 Interfacial tension
The static interfacial tension of oil−water interface can be measured using Du Noüy ring
method.125 20 mL DI water was loaded in the cell first and the ring is immersed in the water
phase. The water phase is then covered by 15 mL xylene diluted C5Pe solution. After aging the
interface for 600 s, EO-PO copolymer with different concentrations was added into this system
through the top oil phase. After the demulsifier diffusion for 600 s, the immersed ring is
gradually directed towards the interface while monitoring force applied to the ring. At the point
when the oil−water interface is vertical, the largest detachment force can be detected by the
electronic balance, which can be converted to interfacial tension.
6.2.2.2 Brewster Angle Microscopy (BAM)
Brewster Angle Microscopy (Model EP3, Accurion GmbH, Goettingen, Germany) was used to
study the morphological changes of the interfacial film. BAM is an imaging method that is
particularly well-suited to study liquid-liquid interfaces71, 134, 135 without transferring the film to a
solid substrate. At the Brewster angle θB, the p-polarized light is not reflected for the clean
interface, while the light will be reflected to the detector once the interface supports a film. The
reflected light provides an image of the film, which is a good characterization of the interface.
The following procedure was used when running BAM experiments: 28.5 mL of water was
poured into the trough, and 80 mL of 30 mg/L xylene diluted C5Pe was then added on top of the
aqueous phase. After aging for 3600 s, the interfacial films were imaged at the angle of incidence
(AOI) of 41.6° (Brewster Angle) with the polarizer and analyzer set to around 2° and 10°,
respectively. 2, 5, and 10 ppm of EO-PO copolymer were added dropwise from the top oil phase
and images were taken after demulsifier diffusion for 600 s. The EO-PO copolymer film and
clean xylene−water were also imaged to elucidate a possible dependence between demulsifier
concentration (or xylene) and film structure.

84
6.2.2.3 Simulation Method
To understand the interactions at the molecular level, molecular dynamics (MD) simulations
were performed. The Material Studio 8.0 package was adopted, using the COMPASS
(condensed-phase optimized molecular potentials for atomistic simulation studies) force field.202
The COMPASS force field is widely used in exploring the molecular dynamics at the oil−water
interface.203, 204 All calculations were performed with the Forcite module in the Material Studio
software package.
Molecular Models
C5Pe is a typical asphaltene model that was reported in several studies.115, 180 Xylene model was
based on the proportion of each component (60% of m-xylene, 20% of o-xylene, and 20% of p-
xylene). The EO-PO copolymer was modeled as a star-like structure with three arms44 (Figure
6-1). Glycerol was used as the base compound with 35% of EO percent in total weight. All
models were built using built-in modeling tools in the Material Studio software package.
Figure 6-1 EO-PO copolymer model used in the MD simulation.
Initial Simulation Configuration
In this work, simulations were performed for four different configurations, named as systems A,
B, C, and D (Figure 6-2). The initial configuration for each system was defined as follows:
System A: Molecules of C5Pe placed near the oil−water interface.
System B: Mixture of EO-PO and C5Pe molecules placed near the oil−water interface.
System C: Separate layers of C5Pe and EO-PO, with C5Pe near water.
System D: Separate layers of C5Pe and EO-PO, with C5Pe near oil.
The simulation details are summarized in Table 6-1 and Figure 6-2. In the simulation of system
A, xylene molecules were randomly put into a cubic box of 5×5×1.5 nm3. C5Pe molecules were

85
assumed at the vicinity of the oil−water interface since it was shown that C5Pe molecules tend to
aggregate at the oil−water interface.115, 205 Then NVT ensemble (N, conserved number of
particles; V, constant volume; T, constant temperature) was carried out to obtain a reasonable
density. Systems B, C, and D were explored to study the interaction of EO-PO molecules with
C5Pe molecules at the oil−water interface. For all systems, a vacuum layer of 40 Å in thickness
was introduced at the top of the oil layer.
Table 6-1 Simulation parameters of different systems
System No-xylene : Nm-xylene : Nm-xylene NC5Pe NWater NEO-PO
A 240:80:80 18 2000 0
B, C, D 240:80:80 18 2000 9
Figure 6-2. Initial configuration of systems (a) A, (b) B, (c) C, and (d) D. The C5Pe and EO-PO
copolymer model are displayed in parts (e) and (f). (g) Color scheme: C, gray; H, white; N, blue;
O, red.

86
Details of Molecular Dynamics
The initial configurations were minimized by the steepest descent and conjugate gradient
methods. After the models were geometrically optimized, MD simulations were performed to
obtain the final model structures for analysis.
During the geometry optimization, the cut off of the Coulomb and van der Waals interactions
was 15.5 Å. When the maximum force of the system was converged to a threshold of less than
5×10⁻³ kJ·mol−1·Å−1 and the maximum energy of the system was converged to less than 1×10⁻⁴
kcal·mol−1, the system was considered to be stabilized. Finally, 10,000 ps NVT simulations were
carried out at 298 K with a time step of 1 fs. In the NVT ensembles, the periodic boundary
condition was applied in all directions. The Nose-Hoover thermostat temperature control with a
Q ratio of 0.01 was used. The reciprocal space particle−particle−particle−mesh (PPPM)
method206, 207 was adopted to calculate the electrostatic interactions while the van der Waals
interaction was calculated by the atom-based method. The hydrogen-bonding interaction is
considered as a form of electrostatic interactions in molecular modeling.
6.3 Results and Discussion
6.3.1 Interfacial tension
Figure 6-3 Interfacial tension of 30 mg/L xylene diluted C5Pe−water interface and pure
demulsifier−water interface as a function of the EO-PO dosage.

87
The xylene−water interfacial tension in the presence of C5Pe or EO-PO copolymer was
measured to study the adsorption behavior of C5Pe and EO-PO copolymer at the oil−water
interface. Figure 6-3 shows the interfacial tensions of the xylene-diluted C5Pe−water interface at
different demulsifier dosages. It was found that EO-PO addition could decrease the interfacial
tensions at all selected concentrations (1, 2, and 5 ppm). The higher the EO-PO copolymer
dosage, the more the interfacial tension decreased. The decrease of the interfacial tension after
EO-PO addition indicated that EO-PO molecules could compete and replace the asphaltene
model compound C5Pe at the interface. The interfacial tensions of the C5Pe + EO-PO/water
system were always lower than those of the C5Pe/water system, but higher than the EO-
PO/water system, indicating the coexistence of the EO-PO copolymer with C5Pe molecules at
the oil−water interface when EO-PO molecules were added in the oil phase.
6.3.2 Interfacial morphology
The morphological changes of the xylene diluted C5Pe−water interfacial film after demulsifier
addition were characterized in real time without disturbing the films by Brewster angle
microscopy (BAM). In the current study, C5Pe interfacial film was diffused and aged for 3600 s
in order to have high rigidity.
The BAM images in Figure 6-4 provide the characteristics of C5Pe films at the xylene−water
interface and changes of morphological features in situ during the demulsification by EO-PO
addition. Figure 6-4 (a) shows a typical BAM image of the demulsifier-free xylene diluted
C5Pe−water interface with the structure being indicated by the pale gray color. The film did not
show different gray levels, indicating the same thickness of structures at the interface. Therefore,
it can be inferred that a uniform, immobile, and interconnected interfacial layer was formed at
the interface after aging the interface for 3600 s.
With the addition of 2 ppm of EO-PO copolymer from the oil phase to the formed xylene diluted
C5Pe film, small cracks appeared on the C5Pe films, as shown in Figure 6-4 (b). At this
concentration, the C5Pe film appeared to be partially broken by the EO-PO copolymer as the
majority of the C5Pe film remained unchanged, indicating insufficient EO-PO copolymer to act
on the entire area of the C5Pe film at the interface. When the EO-PO copolymer concentration
was increased to 5 ppm, the whole C5Pe interfacial film started to fall apart to chunks of variable
sizes and shapes at the oil−water interface (Figure 6-4 (c)). Increasing EO-PO dosage to 10 ppm

88
further ruptured large C5Pe chunks to small C5Pe pieces (Figure 6-4 (d)). Note that for a clean
interface, the BAM image should appear as a dark field as shown by Figure 6-4 (e). The
interfacial film with only 10 ppm demulsifier (Figure 6-4 (f)) appeared similarly as clean
xylene−water interface (Figure 6-4 (e)). The trend of the C5Pe interfacial film breakage is
consistent with the interfacial tension results: more EO-PO molecules were adsorbed at the
oil−water interface at higher demulsifier dosage (as indicated by the lower interfacial tension in
Figure 6-3), thereby leading to considerable film breakage.
Figure 6-4 BAM images of xylene diluted C5Pe−water interface: (a) no EO-PO added; (b) 2 ppm,
(c) 5 ppm, and (d) 10 ppm EO-PO added in the oil phase; in comparison with (e) 10 ppm EO-PO
film and (f) clean xylene−water interface. The scale bar is 200 μm for all BAM images.
In conclusion, C5Pe molecules would penetrate the interfacial network, and hence break the film
into micro chunks. The color of the remaining structure at the interface did not change,
indicating the same film thickness before and after demulsifier addition. It is inferred that the
C5Pe molecules would no longer stay at the interface once the demulsifiers are present, but
would move to the oil phase. The properties of the C5Pe interfacial film are similar to those of
the diluted bitumen film,208 which further proved the representativeness and reasonability of this
model compound. In an emulsion system, it can be inferred that the reduced coverage of the

89
interfacial protective film of the emulsion droplets increased the possibility for the coalescence
of the droplets upon their collision.
6.3.3 MD simulation
The behavior of C5Pe molecules at the oil−water interface with and without EO-PO molecules
was also investigated by MD simulations. Examination of the density profile (Figure 6-5)
revealed the trend of C5Pe and EO-PO molecules adsorbing at the interface. Initially, water
molecules are placed in the left-hand side and the solvent is placed in the right-hand side in each
system with C5Pe and/or EO-PO in the middle as shown in Figure 6-5. The horizontal axis
represents the position of each component while the vertical axis represents the relevant
concentration of each component. Time starts from the back and increases toward the front,
showing how each component evolves at the oil−water interface.
Figure 6-5 Density profiles of systems A, B, C, and D. Water, C5Pe, EO-PO copolymer, and
solvent are shown in gray, red, blue, and green colors, respectively.

90
For system A, the solvation of water and xylene occurred during the simulation process, forming
the xylene−water interface. C5Pe molecules were found to be adsorbed at the interface instead of
totally dissolving in bulk xylene or water phase, as shown for system A.
System B is similar to system A, apart from replacing the C5Pe layer with a coexisting C5Pe and
EO-PO layer. Initially, C5Pe and EO-PO molecules were distributed evenly in their colayer.
Over time (from the very beginning until 10,000 ps of the simulation process), the density peak
of EO-PO molecules gradually moved closer to the xylene−water interface compared to that of
C5Pe molecules, indicating higher interfacial activity of EO-PO molecules, though both C5Pe
and EO-PO molecules showed a preference to be adsorbed at the xylene−water interface.
Systems C and D showed that both EO-PO and C5Pe molecules have a tendency to move toward
the interface, similar to system B. EO-PO molecules can penetrate the C5Pe layer at the interface
step by step and even replace the C5Pe molecules at the xylene−water interface as shown in
system C, while C5Pe molecules did not show much influence on the EO-PO layer at the
interface as observed in system D, with EO-PO layer firmly absorbed at the interface and C5Pe
dissolved back in xylene. The penetration of the C5Pe layer by the EO-PO molecules
corresponded to the breakage of the C5Pe interfacial film in BAM images.
System B and C demonstrated that EO-PO molecules were more competitive for the oil−water
interface than C5Pe molecules, which agreed well with the interfacial tension results. In addition,
system D suggested that the adsorption of EO-PO molecules at the interface was very strong and
was not affected by C5Pe molecules. Overall, the results imply that if we perform the simulation
for a much longer time, the EO-PO molecules instead of the C5Pe molecules will take
compelling advantage at the oil−water interface for all the systems.
Figure 6-6 depicts the radial distribution between the surface-active molecules and water. The
results showed a monotonic increase of g(r) between C5Pe/EO-PO molecules and water as the
separation between them was increased. For systems containing both EO-PO and C5Pe
molecules, EO-PO showed a sharper increase/or stronger interaction with increasing the distance
than that of C5Pe molecules, indicating that EO-PO is more interfacially active and tends to
concentrate much near the oil−water interface, which is consistent with the interfacial tension
results.

91
Figure 6-6 Radical distribution between the C5Pe/EO-PO molecules and water for system A, B,
C, and D after 10,000 ps simulation.
A hypothesis is proposed that stronger hydrogen bonds can be formed between EO-PO
molecules and water and that is the reason why the adsorption of EO-PO molecules is more
favorable at the oil−water interface. To check this hypothesis, the hydrogen bonding energies for
all the four systems were calculated using Dreiding force field209 and the results are shown in
Figure 6-7. It was found that the hydrogen bonding energy between EO-PO and water molecules
was lower than that between C5Pe and water molecules in all relevant cases. Compared with
C5Pe-only system (system A), the hydrogen bonding energy between C5Pe and water molecules
was generally higher in the systems containing both C5Pe and EO-PO molecules. Indeed, the
stronger hydrogen bonding interaction between EO-PO and water molecules would be one of the
reasons for the higher interfacial activities of EO-PO molecules than C5Pe molecules.

92
Figure 6-7 Hydrogen bonding energy for system A, B, C, and D.
The final configurations of systems A, B, C, and D are shown in Figure 6-8, which correspond
to the density profiles in Figure 6-5 at 10,000 ps. C5Pe molecules tended to be close to or
adsorbed at the oil−water interface, as shown in Figure 6-8, system A. For systems with EO-PO
addition (systems B, C, and D), EO-PO molecules are preferentially adsorbed at the interface,
while C5Pe molecules are more likely to dissolve in the oil phase, especially for system D.
The distributions of the hydrophobic and hydrophilic groups of C5Pe or EO-PO molecules
under different conditions are also shown in Figure 6-8, which demonstrates how different
groups of the interfacial active molecules behave at the interface, therefore providing some
information on how to design the demulsifier molecules. The interface is defined as the shared
area for both oil and water. In system A, the hydrophilic groups of C5Pe molecules tended to
stay at the interface, while most of the hydrophobic groups stayed in xylene. For the mixture of
C5Pe and EO-PO layer, while most of the hydrophobic groups of C5Pe preferred to dissolve in
xylene, a large portion of both EO and PO units appeared at the interface, with some EO units
even dissolving in water. Results for systems C and D showed that EO units have stronger
affinity to water than that of the hydrophilic groups of C5Pe molecules and PO units have much
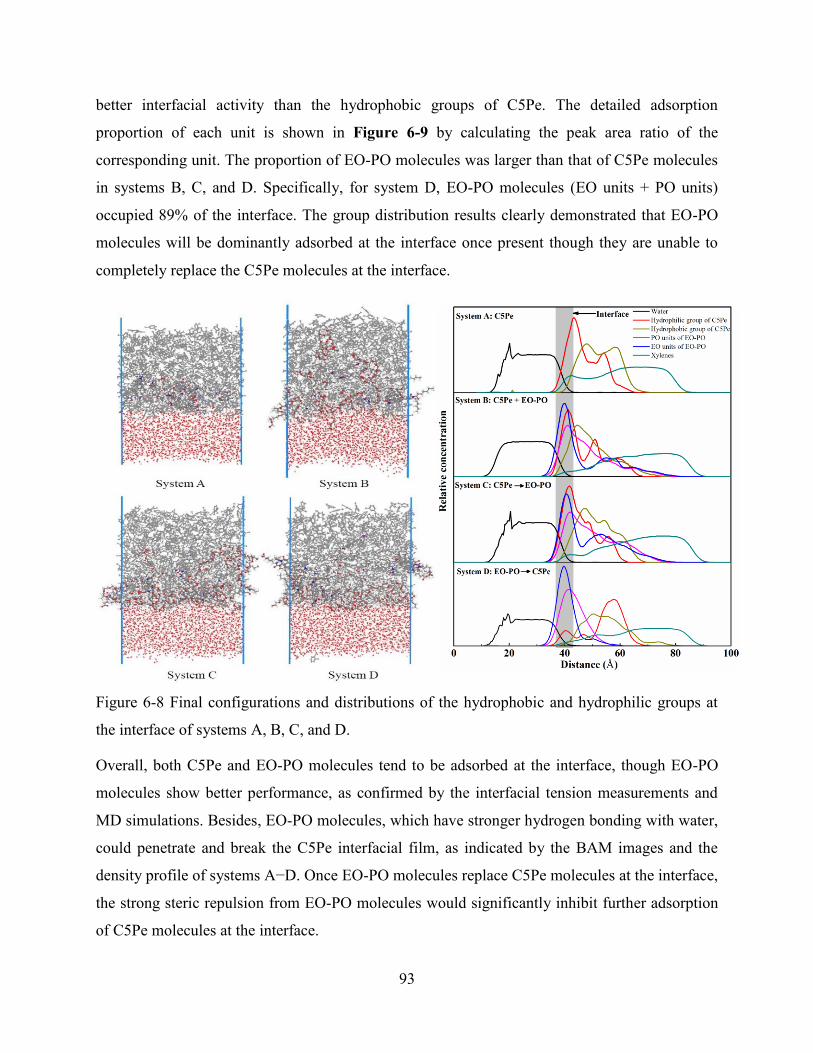
93
better interfacial activity than the hydrophobic groups of C5Pe. The detailed adsorption
proportion of each unit is shown in Figure 6-9 by calculating the peak area ratio of the
corresponding unit. The proportion of EO-PO molecules was larger than that of C5Pe molecules
in systems B, C, and D. Specifically, for system D, EO-PO molecules (EO units + PO units)
occupied 89% of the interface. The group distribution results clearly demonstrated that EO-PO
molecules will be dominantly adsorbed at the interface once present though they are unable to
completely replace the C5Pe molecules at the interface.
Figure 6-8 Final configurations and distributions of the hydrophobic and hydrophilic groups at
the interface of systems A, B, C, and D.
Overall, both C5Pe and EO-PO molecules tend to be adsorbed at the interface, though EO-PO
molecules show better performance, as confirmed by the interfacial tension measurements and
MD simulations. Besides, EO-PO molecules, which have stronger hydrogen bonding with water,
could penetrate and break the C5Pe interfacial film, as indicated by the BAM images and the
density profile of systems A−D. Once EO-PO molecules replace C5Pe molecules at the interface,
the strong steric repulsion from EO-PO molecules would significantly inhibit further adsorption
of C5Pe molecules at the interface.

94
Figure 6-9 Proportion of hydrophilic or hydrophobic groups at the oil−water interface
6.4 Conclusions
Interfacial tension results, BAM images, and MD simulations have consistently revealed the
destabilization mechanism of the rigid interfacial film formed by the asphaltene model
compound C5Pe by EO-PO copolymer. EO-PO copolymer is more interfacially active and can
replace most of the C5Pe molecules at the interface. Once adsorbed at the interface, EO-PO
molecules could break the complete networked interfacial film, making the interfacial film
unstable. MD simulation has confirmed that EO-PO molecules could replace the C5Pe molecules
at the oil−water interface by forming stronger hydrogen bonding, penetrating the C5Pe
interfacial film. The adsorbed EO-PO molecules at the interface form a new surface barrier and
prevent further adsorption of C5Pe molecules, finally destroying the C5Pe interfacial film and
making coalescence of two droplets possible. Both EO and PO units have strong interfacial
activity and even affinity to water. Overall, as C5Pe has a known structure, the study of
demulsification mechanism of water in asphaltene-stabilized emulsions is therefore simplified by
MD simulation. This research provides an improved understanding of the demulsification
mechanism at the molecular level as well as how to design efficient demulsifiers for better
dewatering.
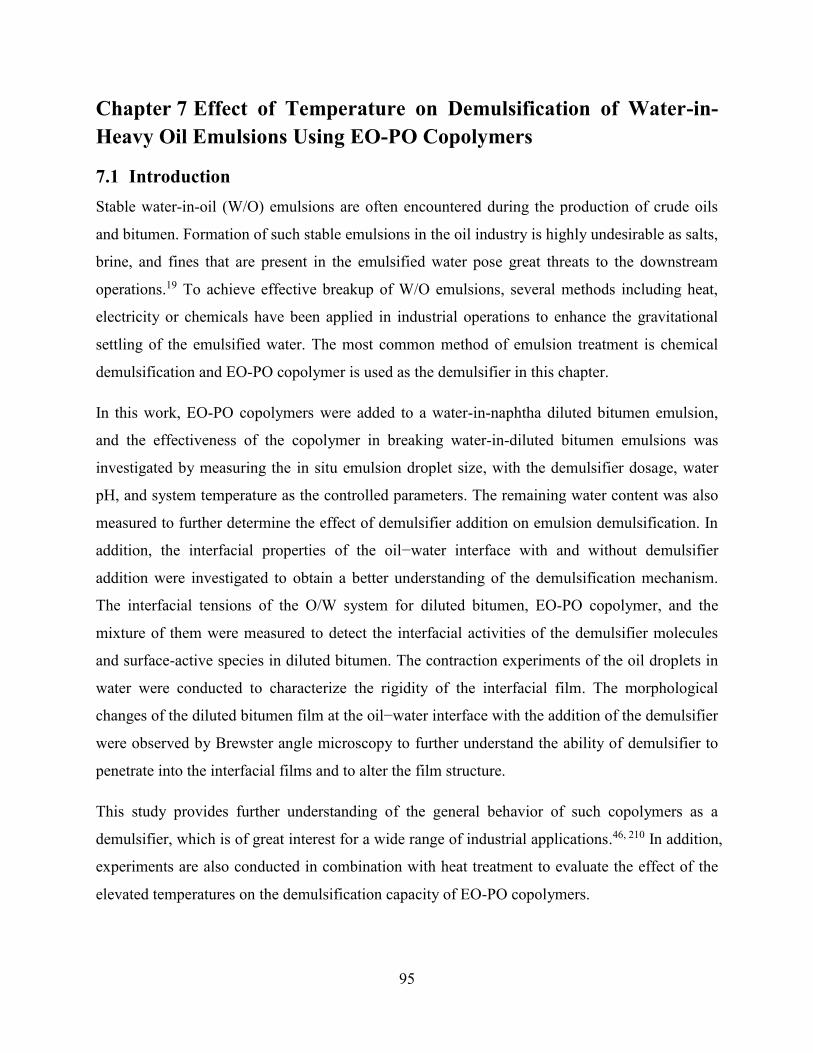
95
Chapter 7 Effect of Temperature on Demulsification of Water-in-
Heavy Oil Emulsions Using EO-PO Copolymers
7.1 Introduction
Stable water-in-oil (W/O) emulsions are often encountered during the production of crude oils
and bitumen. Formation of such stable emulsions in the oil industry is highly undesirable as salts,
brine, and fines that are present in the emulsified water pose great threats to the downstream
operations.19 To achieve effective breakup of W/O emulsions, several methods including heat,
electricity or chemicals have been applied in industrial operations to enhance the gravitational
settling of the emulsified water. The most common method of emulsion treatment is chemical
demulsification and EO-PO copolymer is used as the demulsifier in this chapter.
In this work, EO-PO copolymers were added to a water-in-naphtha diluted bitumen emulsion,
and the effectiveness of the copolymer in breaking water-in-diluted bitumen emulsions was
investigated by measuring the in situ emulsion droplet size, with the demulsifier dosage, water
pH, and system temperature as the controlled parameters. The remaining water content was also
measured to further determine the effect of demulsifier addition on emulsion demulsification. In
addition, the interfacial properties of the oil−water interface with and without demulsifier
addition were investigated to obtain a better understanding of the demulsification mechanism.
The interfacial tensions of the O/W system for diluted bitumen, EO-PO copolymer, and the
mixture of them were measured to detect the interfacial activities of the demulsifier molecules
and surface-active species in diluted bitumen. The contraction experiments of the oil droplets in
water were conducted to characterize the rigidity of the interfacial film. The morphological
changes of the diluted bitumen film at the oil−water interface with the addition of the demulsifier
were observed by Brewster angle microscopy to further understand the ability of demulsifier to
penetrate into the interfacial films and to alter the film structure.
This study provides further understanding of the general behavior of such copolymers as a
demulsifier, which is of great interest for a wide range of industrial applications.46, 210 In addition,
experiments are also conducted in combination with heat treatment to evaluate the effect of the
elevated temperatures on the demulsification capacity of EO-PO copolymers.

96
7.2 Materials and Methods
7.2.1 Demulsifiers
Ethylene oxide (EO) and propylene oxide (PO) copolymers were purchased from Baker Hughes
and used as received. The detailed physical properties of the demulsifiers are shown in Table 7-1.
In this work, EO-PO copolymer samples were freshly prepared at the concentration of 1 wt.% in
naphtha as a stock solution and diluted to desired concentrations prior to its use.
Demulsifier EO (%) Molecular weight
(Dalton) Arm number RSN
C (16 H) 35 6145 3 16.92
B (E 20) 20 10003 5 10.59
RSN (relative solubility number): the higher the RSN value, the greater the hydrophilicity
of the surfactant.31, 68
7.2.2 Solvent and water
Heavy reformate, which is named as “naphtha” throughout this work, was provided by
Champion Technologies, Ltd. and used as received. The Deionized water (DI water) was purified
with a Millipore system.
7.2.3 Preparation of water in naphtha diluted bitumen emulsion
The vacuum distillation feed bitumen was provided by Syncrude Canada Ltd. It was mixed with
naphtha to obtain a naphtha to bitumen mass ratio of 0.65 as the naphtha diluted bitumen oil
samples, to mimic conditions of practical operations. After dilution, the mixture was shaken in a
mechanical shaker overnight at 200 cycles/min. The diluted bitumen solution prepared by this
protocol was used throughout this chapter.
5 wt.% deionized (DI) water was added into the diluted bitumen solution placed in the autoclave
vessel and the mixture was homogenized by a PowerGen 1000 homogenizer at 30,000 rpm for 3
min. The emulsion prepared freshly each day using the procedure above was used in all
experiments reported here. The resulting emulsified water droplets were found stable with
several micrometers in size, as shown in Figure 7-1.
Table 7-1 Physical properties of EO-PO copolymers.

97
7.2.4 Demulsification study using FBRM and Karl Fisher Titrator
The effectiveness of the EO-PO demulsifier can be evaluated by measuring the emulsion droplet
size during the demulsification process. Focused Beam Reflectance Measurement (FBRM) is a
powerful technique which gives an online and in situ measurement of the particle/droplet size
distribution over a wide range of concentrations.211
The effects of dosage, pH, and temperature were investigated. All demulsification tests were
repeated for at least three times. Table 7-2 lists all experimental conditions used in these tests.
The same amount of water-in-naphtha diluted bitumen emulsion (90 g) was used in each
demulsification tests. For each measurement, the emulsion sample was stirred for 5 min at the
beginning. At the 5th min, a desired amount of demulsifier was injected into the reactor and the
size of emulsion droplets was monitored by FBRM for another 55 min. The blank test (room
temperature without demulsifier addition) was also conducted for comparison. When running
experiments at high temperature, a heating mantle and an external water bath were used to keep
the temperature constant.
Figure 7-1 Size distribution of water droplets in diluted bitumen emulsions detected by FBRM.

98
Demulsifier C (16H) Demulsifier B (E20)
Dosage (ppm) 20, 50, 100, 125, 150 50, 100
pH 4.5, 6.5, 8.5, 10.5 6.5
Temperature (°C) 23, 40, 50, 60, 80 23, 50, 80
In addition, the amount of water that remained in the system after the demulsification process
was measured using titration method with a Karl Fisher Titrator (Cou-Lo 2000, GR Scientific
Canada). Emulsion samples were transferred to the 11cm Pyrex glass 35 tubes (16×100 mm)
after demulsification process for gravity settling. The water content of the emulsion sample was
measured at 2.5 cm below the top surface of the emulsion sample as a function of the settling
time. At least three measurements were performed for each sample and the average was taken for
data analysis.
7.2.5 Analysis from a pendant drop
In order to study the adsorption of the demulsifier at the water-diluted bitumen interface, the
interfacial tension of this system was measured using the pendant drop technique (Theta Optical
Tensiometer T200). The effects of concentrations of the EO-PO copolymers (0, 20, 50, and 100
ppm) and temperatures (23 °C to 80 °C) were studied. The naphtha diluted bitumen mixed with
different dosages of EO-PO copolymers was used as the oil sample. An oil drop of 18 L in
volume was immersed in 3 mL DI water placed in a quartz cuvette. The interfacial tension was
recorded for 3,600 s.
In addition, the pendant drop shape analysis allows us to study the degree of steric layer (skin)
formation at the interface, by analyzing the crumpling ratio (CR) of the droplets.128 In general,
larger crumpling ratio indicates a more rigid skin on the surface of an oil droplet. In this study,
the naphtha diluted bitumen was mixed with different dosages of EO-PO copolymers (0, 50, and
100 ppm) and the aging time of the oil droplets was set to 3,600 s for all measurements. Similar
to interfacial tension measurement, the crumpling ratio was also measured for the oil droplets of
18 L in volume in water at both 23°C and 50 °C. Each data point was obtained as an average of
four measurements with the error bar representing the standard deviation.
Table 7-2 Experimental conditions used in autoclave demulsification tests

99
7.2.6 Brewster angle microscopy
The morphology of the interfacial film was studied by Brewster angle microscopy (Model EP3,
Accurion GmbH, Goettingen, Germany). The following procedures were used when running
BAM experiments: 28.5 mL of DI water was poured into the trough, then 50 μL of diluted
bitumen was added on the water phase, followed by gently pipetting 80 mL of naphtha along the
sidewall of the trough to cover the water subphase. After equilibrating for 3,600 s, the interfacial
films were imaged at the angle of incidence of 41.8° (Brewster Angle) with the polarizer and
analyzer set to around 2° and 10°, respectively. The EO-PO copolymer at concentrations of 0.5,
1, and 5 ppm was added dropwise and images were taken after demulsifier diffusion. EO-PO
copolymer film at 5 ppm was also imaged to elucidate a possible dependence between
demulsifier concentration and film structure.
7.3 Demulsification performance of the EO-PO copolymers on dewatering
water-in-naphtha diluted bitumen emulsions
EO-PO copolymer was proven to be effective in breaking asphaltene-stabilized W/O emulsions
by Pensini et al.71 Since the diluted bitumen−water interface is much more complicated than the
asphaltene−water interface, the study of the diluted bitumen system allows us to further
investigate the effectiveness of EO-PO copolymers in breaking emulsions of more practical
relevance. The overall demulsification performance of EO-PO copolymers was firstly evaluated
by measuring the size of the emulsion droplets during the demulsification process. After the
demulsification process, the remaining water content in the emulsion was measured to further
evaluate the demulsification efficiency.
An example is given when demulsifier dosage is 100 ppm (demulsifier C) to show the results of
FBRM measurements. Figure 7-2 shows that the number of droplet counts as a function of time.
The dotted line denotes the point when demulsifier was added into the system. It is evident that
the number of the droplet counts with droplet size smaller than 10 µm decreased dramatically
after the demulsifier was added into the system. However, for the droplets with size ranging from
10 to 50 µm, a noticeable increase in the number of droplet counts was detected, which indicates
rapid droplet coalescence or flocculation after the addition of the demulsifier. An increase in
counts number of the droplets with sizes ranging from 50 to 150 µm was also observed as shown
in the inset of Figure 7-2. Although the counts number in this size range was not as high as that

100
of the droplets with size ranging from 10 to 50 µm, it was still a good indication of effective
emulsion breaking.
The chord length distributions were plotted in Figure 7-3 and Figure 7-4. Figure 7-3 shows the
unweighted chord length distribution (UWT CLD) at different demulsification periods. As can
be seen, the percentage of small droplets continued to decrease while the percentage of large
droplets kept increasing, which led to the increase in the average emulsion droplet size during the
dewatering process as observed by FBRM. Square weighted chord length distribution (SWT
CLD) is provided to analyze the influence of the presence of large droplets on the emulsion
droplet size (Figure 7-4). A significant shift of the droplet size distribution, from small droplet
area (peak at around 7 µm) to large droplet area (peak at around 50 µm), is observed. It is also
evident that demulsifier C (100 ppm) worked immediately after its addition (added at the 5th
min). At the 5th min, the SWT CLD showed a significant increase with the addition of 100 ppm
demulsifier C.
Figure 7-2 Counts number of the water droplets in emulsions as a function of time, detected by
FBRM (100 ppm of demulsifier C). The dashed line represents the point when the demulsifier
was added to the system. The inset shows the counts number of the droplet with size ranging
from 50 to 150 µm.

101
Figure 7-3 UWT CLD during demulsification of the water-in-naphtha diluted bitumen emulsions
using 100 ppm demulsifier C at different demulsification time.
Figure 7-4 SWT CLD during demulsification of the water-in-naphtha diluted bitumen emulsions
using 100 ppm demulsifier C at different demulsification time.

102
7.3.1 Performance of demulsifier C
7.3.1.1 Effect of dosage
Using FBRM, droplet sizes of the water-in-naphtha diluted bitumen emulsions were measured
for 3,600 s upon addition of the EO-PO copolymer at the 5th min. As shown in Figure 7-5,
increased droplet sizes can be found for all copolymer added systems, which clearly indicates
coalescence or flocculation of the emulsion droplets (i.e., demulsification). For the system
without the addition of the demulsifier (blank), the chord length was nearly unchanged over this
period due to inhibited coalescence or flocculation of the emulsion droplets.
By comparing the ‘chord length’ at the end of the demulsification process (3, 600 s) for systems
in Figure 7-5, the effectiveness of the demulsifier at different dosage can be evaluated as
indicated by the increased final chord length. We can conclude that the demulsification
performance of the EO-PO copolymer can be enhanced with increasing dosage up to 100 ppm.
As shown by the microscopy pictures of the emulsion sample which was obtained from the
bottom of the vessel, the amount of the water droplets was notably more significant at high
Figure 7-5 (a) SWT CL during demulsification of the water-in-naphtha diluted bitumen
emulsions at different dosages of demulsifier C as a function of the demulsification time and (b)
microscopy pictures of the emulsion droplets at the bottom of the autoclave vessel.
a

103
demulsifier concentration (100 ppm). However, at higher polymer dosages (125 and 150 ppm),
smaller emulsion droplets were obtained at the end of the demulsification process, which seemed
to suggest an overdose effect, as previously reported.29, 71 At the overdosed concentrations, it is
plausible that the adsorption of polymer molecules at the oil−water interface leads to larger steric
repulsion and thus prevents coalescence between the emulsion droplets.
An increase in the droplet size after demulsification was observed from the UWT CLD (Figure
7-6). It should be noted that large droplets between 20 to 60 μm in size were not detected when
the demulsifier dosage was at 125 or 150 ppm while these large droplets can be found when the
demulsifier dosage was below 100 ppm. The SWT CLD of the emulsion droplets after the
demulsification process is shown in Figure 7-7. Similarly, relatively large droplets (20−100 µm)
can only be observed when the demulsifier dosage was lower than 100 ppm.
As is well known, flocculation is a very fast process while coalescence is a relatively slow
process. The overdose effect might be explained as 1) at high dosage, coalescence occurs to form
relatively large droplets but the steric repulsion caused by demulsifier adsorption between
Figure 7-6 UWT CLD at the steady state of the demulsification process at different dosages of
demulsifier C.

104
droplets prevents further coalescence; 2) at high dosage, large droplet did form during the
demulsification process but the droplet was too large that it settled very fast before it could be
detected by FBRM.
The water-in-naphtha diluted bitumen emulsions remained stable without EO-PO copolymer
addition. The remaining water content in the water-in-naphtha diluted bitumen emulsions after
demulsification is presented as a function of settling time in Figure 7-8. The comparison in
Figure 7-8 shows a general enhancement of water removal from systems with increased dosage
of the demulsifier. In particular, with the demulsifier dosage at 100 ppm, a significant 60%
reduction of the water content (5wt.% at the origin) was achieved after 2 h of settling.
Interestingly, the water removal at this settling time was found to be very similar even for those
systems with an ‘overdosed’ demulsifier content (125-150 ppm) as suggested by the FBRM
measurements (Figure 7-5). This appeared to confirm the fact that at overdosed concentrations,
the extra copolymers merely offer a weak steric stabilization to the colloidal droplets, which
becomes less effective at a longer time. Nevertheless, the result seems to agree that 100 ppm was
the optimum demulsifier dosage since the water removal was significantly more effective as
Figure 7-7 SWT CLD at the steady state of the demulsification process at different dosages of
demulsifier C.

105
compared to systems with lower demulsifier dosage, and the water removal was notably
enhanced with further increased dosage.
Moreover, with a further extended period of settling (~4 h), the system with 50 ppm demulsifier
dosage, which was initially less effective in water removal during the period of 1-2 h, also
achieved an over 75% water removal, comparable to systems with a higher demulsifier dosage.
Such increase in the resolved water at an extended period of settling is actually a reasonable
observation, as emulsions are thermodynamically unstable systems and phase separation should
eventually occur if sufficient time is given for the settling. This process, as also confirmed by our
results, can be significantly accelerated with the addition of an effective demulsifier (e.g. the EO-
PO copolymer as applied in this study).
7.3.1.2 pH effect
Experiments were also conducted at various pH with 50 ppm demulsifier C addition to study the
pH effect. FBRM results in Figure 7-9 shows that demulsifier C performed the best over the
neutral pH range. When the pH was equal to 4.5 or 8.5, demulsifier C was less effective than that
Figure 7-8 Water content remained in the water-in-naphtha diluted bitumen emulsions after the
demulsification process at different dosages of demulsifier C.

106
at pH 6.5. At pH 10.5, the EO-PO demulsifier merely showed little effect. Obviously, the
maximum demulsification efficiency was obtained at a neutral pH whereas it decreased in both
directions. We speculate that this trend may happen as follows: more surface-active components
in bitumen adsorb at the interface to make the interfacial film much more stable at high pH,
making it harder for the demulsifier to penetrate or weaken the interfacial film.
The UWT CLD in Figure 7-10 shows the formation of large droplets when pH was at 6.5. When
pH was at 10.5, the CLD remained almost the same as that of the original case. From SWT CLD
shown in Figure 7-11, it could be further confirmed that demulsifier C performed the best in the
neutral environment.
To confirm the demulsification performance of demulsifier C determined by the FBRM
measurements, the remaining water contents were also measured. The results in Figure 7-12
showed that even allowing the emulsion sample to settle for a long period (up to 24 h), the water
content of emulsions at aqueous pH of 10.5 remained higher than that at other pH values. The
optimum pH for demulsification was found to be 6.5, which was consistent with the results from
the CLD measurement.
Figure 7-9 SWT CL during demulsification of the water-in-naphtha diluted bitumen emulsions
using 50 ppm demulsifier C as a function of the demulsification time at different pH.

107
Figure 7-11 SWT CLD at steady state of the demulsification process using 50 ppm demulsifier
C at different pH.
Figure 7-10 UWT CLD at steady state of the demulsification process using 50 ppm
demulsifier C at different pH.
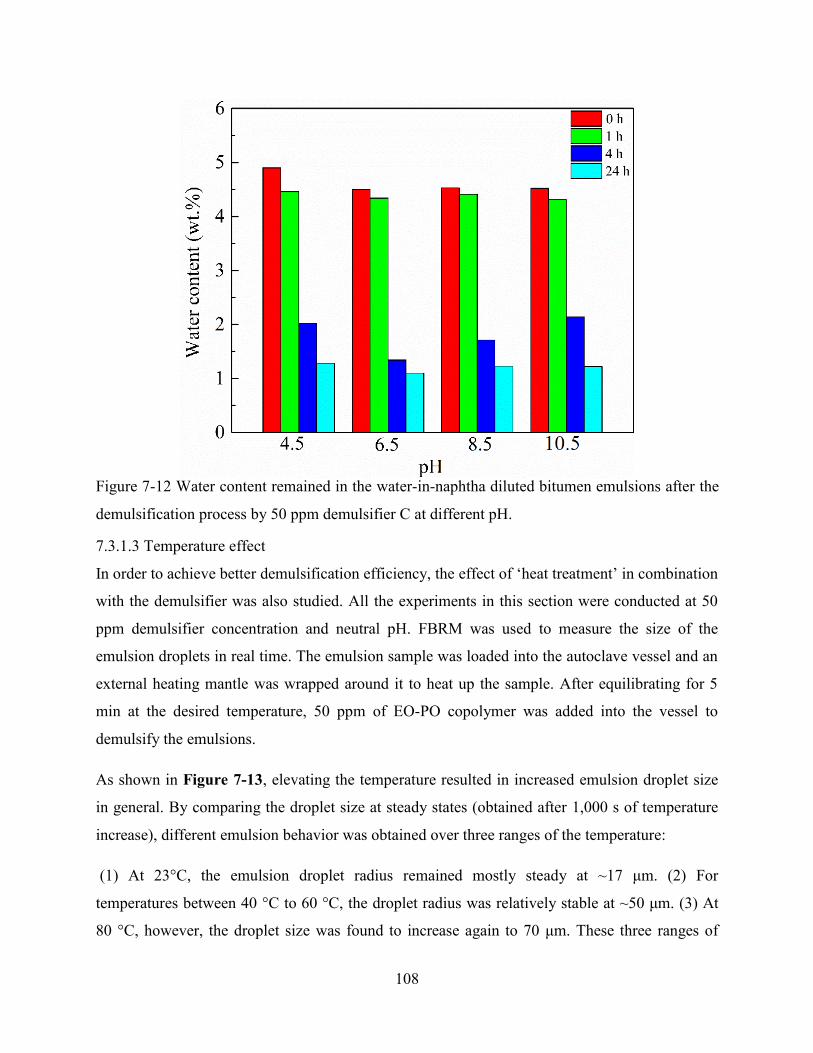
108
7.3.1.3 Temperature effect
In order to achieve better demulsification efficiency, the effect of ‘heat treatment’ in combination
with the demulsifier was also studied. All the experiments in this section were conducted at 50
ppm demulsifier concentration and neutral pH. FBRM was used to measure the size of the
emulsion droplets in real time. The emulsion sample was loaded into the autoclave vessel and an
external heating mantle was wrapped around it to heat up the sample. After equilibrating for 5
min at the desired temperature, 50 ppm of EO-PO copolymer was added into the vessel to
demulsify the emulsions.
As shown in Figure 7-13, elevating the temperature resulted in increased emulsion droplet size
in general. By comparing the droplet size at steady states (obtained after 1,000 s of temperature
increase), different emulsion behavior was obtained over three ranges of the temperature:
(1) At 23°C, the emulsion droplet radius remained mostly steady at ~17 μm. (2) For
temperatures between 40 °C to 60 °C, the droplet radius was relatively stable at ~50 μm. (3) At
80 °C, however, the droplet size was found to increase again to 70 μm. These three ranges of
Figure 7-12 Water content remained in the water-in-naphtha diluted bitumen emulsions after the
demulsification process by 50 ppm demulsifier C at different pH.

109
temperature corresponding to the different behaviors of emulsion droplets may indicate two
demulsification mechanisms: (1) From 23 to 60 °C, the demulsification process is dominated by
flocculation, which can be enhanced by elevating temperature up to 60 °C for the maximum
effect; (2) At temperatures close to 80 ºC or higher, coalescence becomes the dominant effect,
where droplet with larger size appears.
As shown in Figure 7-14, a less significant difference in UWT CLD was observed for the
demulsification at elevated temperatures. As long as the temperature was increased, even only to
40 °C, an obvious decrease in the percentage of small droplets and an increase in the percentage
of large droplets were seen. In contrast, a clear increase in the size of the droplets was found at
80 °C from SWT CLD (Figure 7-15). This finding indicates the formation of much larger
droplets of around 100 μm at 80 °C, though the number of such larger droplets is much smaller.
Figure 7-13 SWT CL during demulsification of water-in-naphtha diluted bitumen emulsions
using 50 ppm demulsifier C as a function of the demulsification time at different temperatures
(Blank represents the condition when the experiment was run at room temperature without
demulsifier addition).

110
Figure 7-15 SWT CLD at steady state of the demulsification process using 50 ppm demulsifier C
at different temperatures.
Figure 7-14 UWT CLD at steady state of the demulsification process using 50 ppm demulsifier C
at different temperatures.
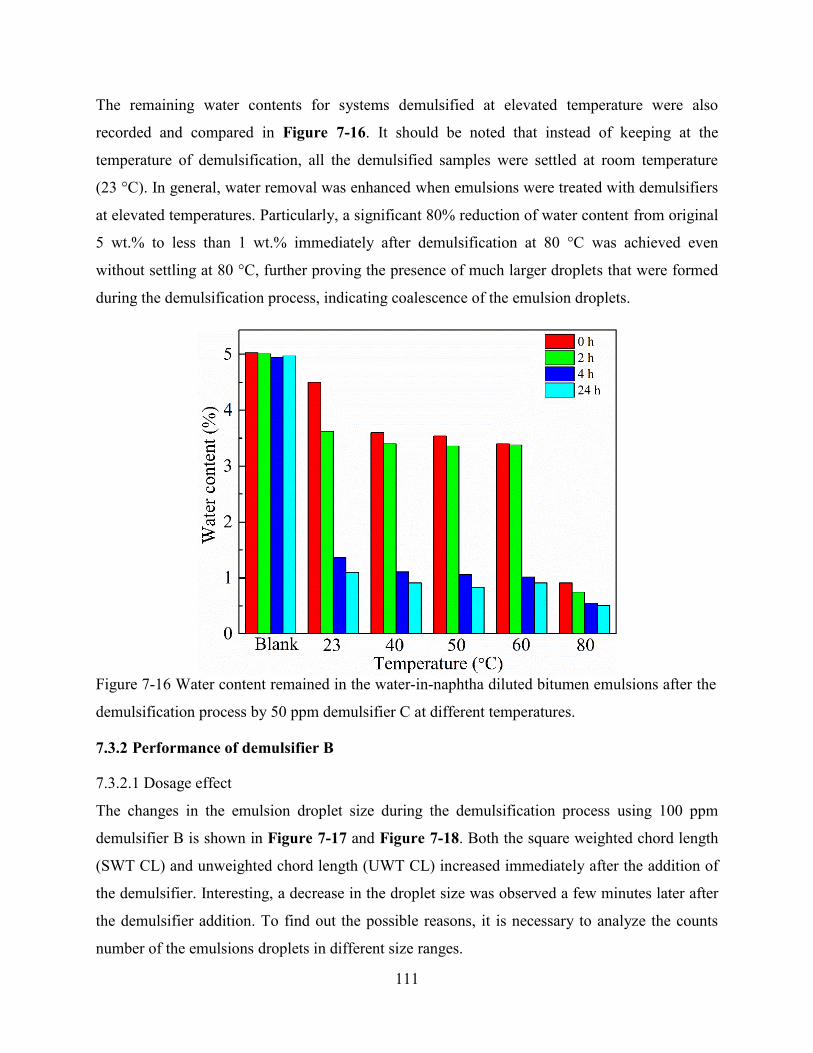
111
The remaining water contents for systems demulsified at elevated temperature were also
recorded and compared in Figure 7-16. It should be noted that instead of keeping at the
temperature of demulsification, all the demulsified samples were settled at room temperature
(23 °C). In general, water removal was enhanced when emulsions were treated with demulsifiers
at elevated temperatures. Particularly, a significant 80% reduction of water content from original
5 wt.% to less than 1 wt.% immediately after demulsification at 80 °C was achieved even
without settling at 80 °C, further proving the presence of much larger droplets that were formed
during the demulsification process, indicating coalescence of the emulsion droplets.
7.3.2 Performance of demulsifier B
7.3.2.1 Dosage effect
The changes in the emulsion droplet size during the demulsification process using 100 ppm
demulsifier B is shown in Figure 7-17 and Figure 7-18. Both the square weighted chord length
(SWT CL) and unweighted chord length (UWT CL) increased immediately after the addition of
the demulsifier. Interesting, a decrease in the droplet size was observed a few minutes later after
the demulsifier addition. To find out the possible reasons, it is necessary to analyze the counts
number of the emulsions droplets in different size ranges.
Figure 7-16 Water content remained in the water-in-naphtha diluted bitumen emulsions after the
demulsification process by 50 ppm demulsifier C at different temperatures.

112
Figure 7-18 UWT CL during demulsification of the water-in-naphtha diluted bitumen emulsions
using 100 ppm demulsifier B as a function of the demulsification time.
Figure 7-17 SWT CL during demulsification of the water-in-naphtha diluted bitumen emulsions
using 100 ppm demulsifier B as a function of the demulsification time.

113
The counts number of the emulsion droplets as a function of time is given in Figure 7-19,
Figure 7-20, and Figure 7-21, respectively. The counts number of small droplets (1<size<10
µm) decreased first and then increased (Figure 7-19). It is speculated that smaller droplets
(size<1µm), which are below the detection limit of FBRM, can flocculate or coalesce at high
demulsifier dosage (100 ppm of demulsifier B) to form relatively larger droplets (size>1 µm).
Figure 7-19 Counts number of the emulsion droplets with size less than 10 μm during
demulsification of the water-in-naphtha diluted bitumen emulsions using 100 ppm demulsifier B
as a function of the demulsification time.
As discussed in 3.1.2, the change of the counts number in much larger droplets (10<size<50 µm
or 50<size<150 µm) would influence the SWT CL dramatically. As can be seen in Figure 7-20,
the counts number of the emulsion droplets (10<size<50 µm) shows an overall increasing trend,
reaching an equilibrium of around 4000 counts/s, though a decrease was observed a few minutes
after the demulsifier addition. The counts number of the emulsion droplets with the size larger
than 50 µm (Figure 7-21) increased first, followed by a dramatic decrease. Therefore, the
decrease in the counts number of droplets with sizes ranging from 10 to 150 µm led to the
observed decrease in the SWT CL. As for why the counts number of droplets in this size range
decreased over time, a possible reason is that the large droplets are consumed to form even larger
droplets, which can settle down quickly and are not detected by FBRM.
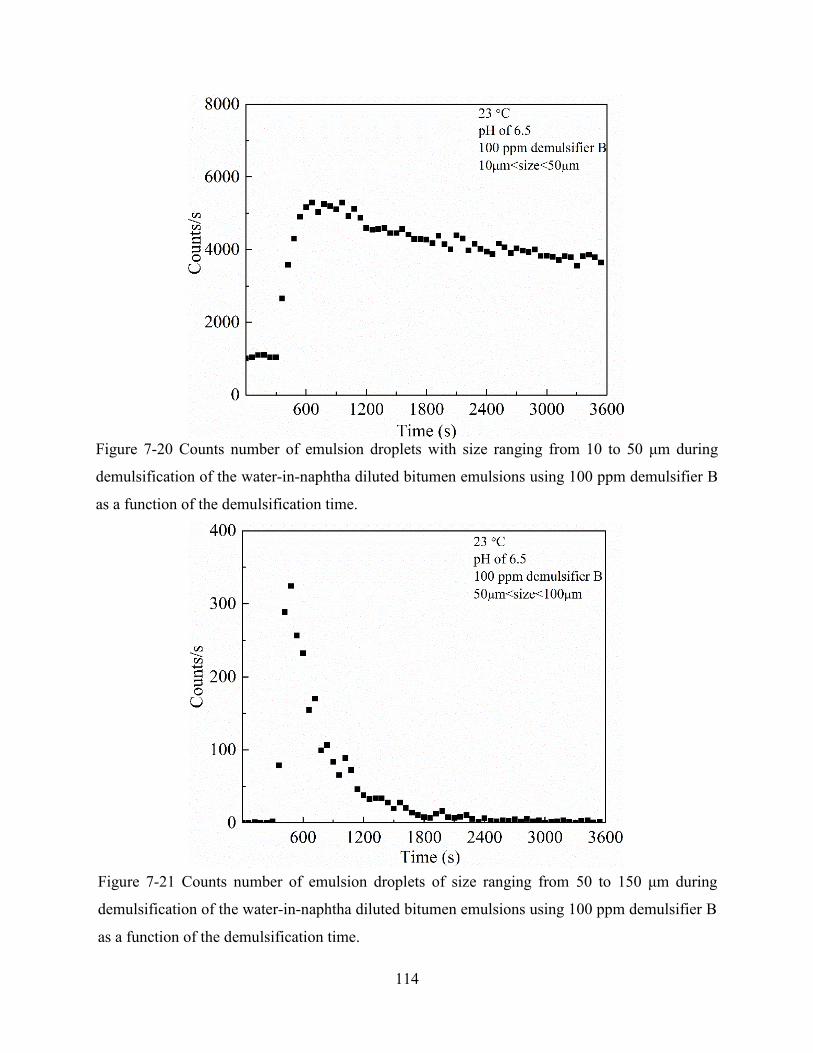
114
Figure 7-20 Counts number of emulsion droplets with size ranging from 10 to 50 μm during
demulsification of the water-in-naphtha diluted bitumen emulsions using 100 ppm demulsifier B
as a function of the demulsification time.
Figure 7-21 Counts number of emulsion droplets of size ranging from 50 to 150 μm during
demulsification of the water-in-naphtha diluted bitumen emulsions using 100 ppm demulsifier B
as a function of the demulsification time.

115
The CLDs in Figure 7-22 and Figure 7-23 appear to show that large droplets disappeared while
the percentage of small droplets increased during the demulsification process. This, to some
extent, proved the hypothesis that large droplets became further flocculated or coalesced to form
even larger ones which cannot be detected by FBRM due to gravity settling. The increase of
small droplets was mainly due to the flocculation or coalescence of smaller droplets originally
below 1 μm.
Figure 7-23 SWT CLD during demulsification of the water-in-naphtha diluted bitumen
emulsions using 100 ppm demulsifier B at different demulsification time.
Figure 7-22 UWT CLD during demulsification of the water-in-naphtha diluted bitumen
emulsions using 100 ppm demulsifier B at different demulsification time.

116
The results of the remaining water content (Figure 7-24) show that for each given settling time,
100 ppm of demulsifier B performed better than 50 ppm in dewatering the emulsions.
Figure 7-24 Water content remained in the water-in-naphtha diluted bitumen emulsions after the
demulsification process at different dosages of demulsifier B.
Figure 7-25 SWT CL during demulsification of the water-in-naphtha diluted bitumen emulsions
using 50 ppm demulsifier B as a function of the demulsification time at different temperatures.

117
7.3.2.2 Temperature effect
As can be seen from Figure 7-25, the emulsion droplet size increased from 25 to 60 μm when
increasing temperature from 23 °C to 50 °C. At 80 °C, very large water droplets, which can be
seen even with naked eyes (Figure 7-26), were formed during the demulsification process. The
large droplets settled so fast to the bottom of the sample after formation that they were not
detected by FBRM. The chord length at 80 °C given by FBRM was therefore not representative
for the system. However, it is safe to say that demulsifier B exhibited better performance in
breaking the emulsion at 80 °C than lower temperatures (23 °C and 50 °C).
From the UWT CLD and SWT CLD that are shown in Figure 7-27 and Figure 7-28, it can be
seen that there were more large droplets in the system after demulsification at 50 °C than that at
23 °C, indicating better dewatering efficiency at elevated temperature.
By analyzing the water content remained in the emulsions (Figure 7-29), it is clear that the water
content of the emulsion sample at 80 °C was the lowest, further confirming that high temperature
can improve the demulsification performance of demulsifier B.
Figure 7-26 View of the emulsion sample at the bottom of autoclave after dewatering by 50 ppm
demulsifier B at 80 °C.

118
Figure 7-27 UWT CLD at steady state of the demulsification process using 50 ppm demulsifier
B at different temperatures.
Figure 7-28 SWT CLD at steady state of the demulsification process using 50 ppm demulsifier
B at different temperatures.

119
7.3.3 Comparison between demulsifier B and C
To compare the demulsification performance of demulsifier B and C, the emulsion droplet size
measured by FBRM are compared in Figure 7-30. At each given temperature, the emulsion
samples with the addition of demulsifier B always had larger droplet size than that of demulsifier
C.
The UWT CLD and SWT CLD of the emulsion samples with the addition of demulsifier B or C
are shown in Figure 7-31 and Figure 7-32, respectively. It is observed that the emulsion samples
with the addition of demulsifier B had less small droplets and more big droplets. The water
content is compared in Figure 7-33, and the emulsion samples with the addition of demulsifier B
always had lower water content than that with the addition of demulsifier C, as expected. Overall,
demulsifier B showed better performance in emulsion breakup than demulsifier C. It was
reported in the literature that demulsifier with higher molecular weight and larger arm number
usually performs better in breaking emulsions (Chapter 2). As can be seen from Table 7-1,
demulsifier B does have a higher molecular weight and larger arm number, which appears to be
the reason for its better dewatering performance than that of demulsifier C.
Figure 7-29 Water content remained in the water-in-naphtha diluted bitumen emulsions after the
demulsification process by 50 ppm demulsifier B at different temperatures.

120
Figure 7-31 UWT CLD at steady state of the demulsification process using 50 ppm demulsifier
B or C at different temperatures.
Figure 7-30 SWT CL during demulsification of the water-in-naphtha diluted bitumen emulsions
using 50 ppm demulsifier B or C as a function of the demulsification time at different
temperatures.

121
Figure 7-33 Water content remained in the water-in-naphtha diluted bitumen emulsions after
demulsification by 50 ppm demulsifier B or C at different temperatures.
Figure 7-32 SWT CLD at steady state of the demulsification process using 50 ppm demulsifier
B or C at different temperatures.

122
7.4 Interfacial properties
Having demonstrated that in a water-in-naphtha diluted bitumen system, the stability of the
colloidal droplets can be significantly affected by adding EO-PO copolymer and increasing
temperature, experiments were carried out to further investigate the interfacial properties of the
systems with both the demulsifier concentration and temperature as the controlled parameters.
The interfacial properties were studied in three different aspects: interfacial tension, crumpling
ratio, and morphology of the water−diluted bitumen interfacial film. All the experiments
discussed in this section were conducted on droplets of oil in water medium, as the
measurements require good optical visibility of studied objects, and due to the dark and non-
transparent nature of bitumen even in diluted samples, these measurements cannot be conducted
in the reversed system (i.e., a water droplet in diluted bitumen). The feasibility of using the
reversed O/W system to represent the original W/O system has been discussed in Chapter 4 and
Chapter 5. For interfacial tension and crumpling ratio measurements, the reversed O/W system
can provide valuable qualitative information (Chapter 4) and the results obtained can be
accepted as a demonstration of the general properties of the water−diluted bitumen interface. The
effects of EO-PO molecules on the interfacial properties of the oil−water interface using
asphaltene model compound as the oil phase have also been investigated and the results showed
that EO-PO copolymer can work similarly to reduce the interfacial tension and crumpling ratio
for both O/W and W/O systems (Chapter 5).
7.4.1 Dynamic interfacial tension
It is believed that the demulsification performance of EO-PO copolymers should arise from their
interfacial activity at the diluted bitumen films, which competes against and displace the pre-
adsorbed materials (i.e., asphaltene) at the interface to reduce the interfacial tension of the
system.15, 184, 212 To further probe the action of EO-PO copolymers at the interface between water
and diluted bitumen, dynamic interfacial tension measurements were conducted using the
pendant drop method and the dynamic interfacial tensions of the oil drop in DI water at 23 °C
and 50 °C are shown in Figure 7-34. The naphtha diluted bitumen mixed with EO-PO
copolymer at different dosage was used as the oil sample. Notable reduction of the interfacial
tension was obtained with the increase in the demulsifier dosage, which was attributed to the
effective penetration of the EO-PO molecules into the diluted bitumen films at the oil−water

123
interface. It should be noted that interfacial tensions that were obtained at elevated temperature
(50 °C) were lower in general. The reduction of the interfacial tension became relatively less
significant with the addition of demulsifier at high temperature (the equilibrium interfacial
tension decrease by ~ 10 and 7 mN/m at 23 °C and 50 °C with 100 ppm demulsifier addition,
respectively, in comparison with the demulsifier-free systems). This can be attributed to the
enhanced interfacial activity of the active species in diluted bitumen, which in turn became more
competitive at the interface and thus inhibited the adsorption of EO-PO copolymers. Furthermore,
the results show a small decline in the interfacial tension within the first few minutes for all
samples, indicating the diffusion process of the interfacial active species to the interface.
However, for the samples with demulsifiers, such decline occurred within a relatively short time,
as indicated by the larger slope at the initial stage. This observation corresponds to a faster
adsorption kinetic at the interface, which further confirms the preferential adsorption of EO-PO
copolymers at the oil−water interface. It should be noted that for bitumen-free systems with only
the demulsifier as the interfacial active material, the interfacial tension was much lower as
compared to the mixed system (diluted bitumen with demulsifier), which seems to imply that the
adsorption of surface-active species from bitumen cannot be fully prevented by the demulsifier
molecules at the interface, and hence these two species always coexist in a mixed system.
Figure 7-34 Dynamic oil−water interfacial tension of diluted bitumen, demulsifier C solution,
and their mixture in naphtha at different temperatures. Note that DB denotes diluted bitumen.
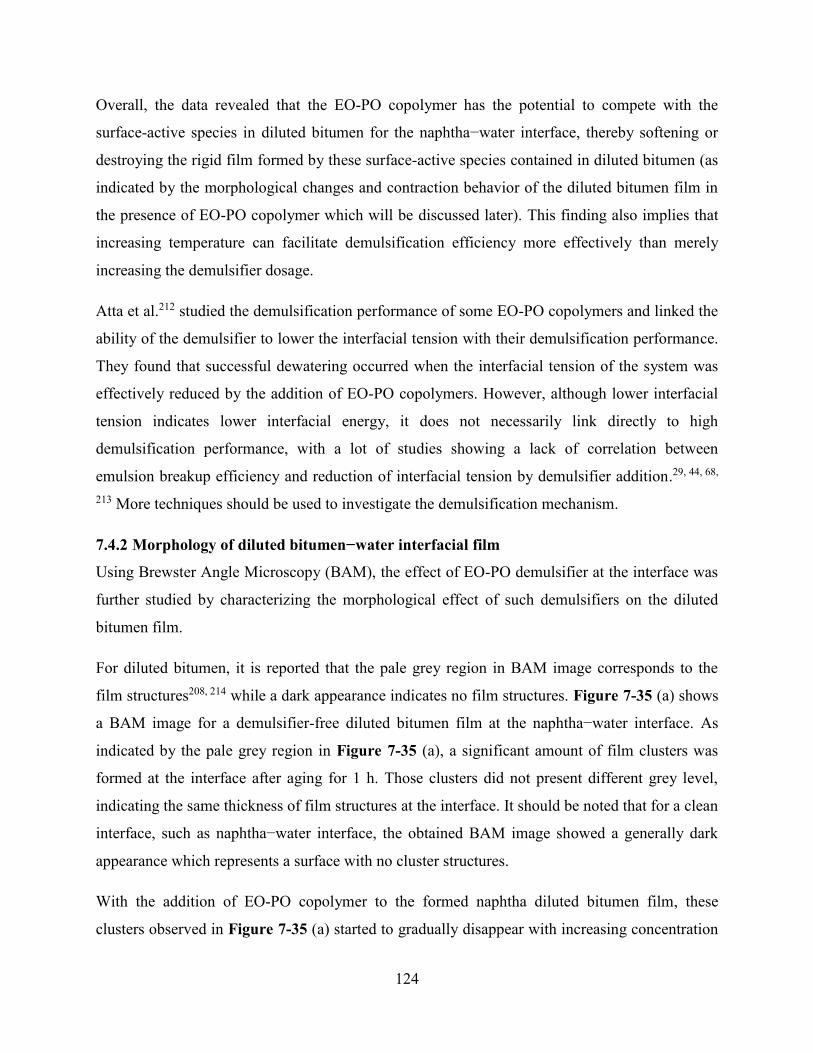
124
Overall, the data revealed that the EO-PO copolymer has the potential to compete with the
surface-active species in diluted bitumen for the naphtha−water interface, thereby softening or
destroying the rigid film formed by these surface-active species contained in diluted bitumen (as
indicated by the morphological changes and contraction behavior of the diluted bitumen film in
the presence of EO-PO copolymer which will be discussed later). This finding also implies that
increasing temperature can facilitate demulsification efficiency more effectively than merely
increasing the demulsifier dosage.
Atta et al.212 studied the demulsification performance of some EO-PO copolymers and linked the
ability of the demulsifier to lower the interfacial tension with their demulsification performance.
They found that successful dewatering occurred when the interfacial tension of the system was
effectively reduced by the addition of EO-PO copolymers. However, although lower interfacial
tension indicates lower interfacial energy, it does not necessarily link directly to high
demulsification performance, with a lot of studies showing a lack of correlation between
emulsion breakup efficiency and reduction of interfacial tension by demulsifier addition.29, 44, 68,
213 More techniques should be used to investigate the demulsification mechanism.
7.4.2 Morphology of diluted bitumen−water interfacial film
Using Brewster Angle Microscopy (BAM), the effect of EO-PO demulsifier at the interface was
further studied by characterizing the morphological effect of such demulsifiers on the diluted
bitumen film.
For diluted bitumen, it is reported that the pale grey region in BAM image corresponds to the
film structures208, 214 while a dark appearance indicates no film structures. Figure 7-35 (a) shows
a BAM image for a demulsifier-free diluted bitumen film at the naphtha−water interface. As
indicated by the pale grey region in Figure 7-35 (a), a significant amount of film clusters was
formed at the interface after aging for 1 h. Those clusters did not present different grey level,
indicating the same thickness of film structures at the interface. It should be noted that for a clean
interface, such as naphtha−water interface, the obtained BAM image showed a generally dark
appearance which represents a surface with no cluster structures.
With the addition of EO-PO copolymer to the formed naphtha diluted bitumen film, these
clusters observed in Figure 7-35 (a) started to gradually disappear with increasing concentration

125
of demulsifier C (Figure 7-35 (b) to Figure 7-35 (d)). A clean interface was eventually obtained
with 5 ppm demulsifier C added into the oil phase, as indicated by the entirely diminished light
area from the dark background in Figure 7-35 (d). These morphological changes of the interface
with the addition of demulsifier C implied that the surface-active species, such as asphaltenes or
resins in the diluted bitumen, would no longer stay at the interface once they were replaced. The
interfacial film with 5 ppm demulsifier C-only system appeared to be the same as compared with
clean naphtha−water interface (Figure 7-35 (d)). No EO-PO aggregates could be observed at this
concentration.
As indicated by the interfacial tension results, both surface-active molecules from diluted
bitumen and EO-PO molecules should coexist at the interface. However, it should be noted that
the interface studied in BAM experiments was different from those in other experiments
discussed above. A flat oil−water interface was investigated in BAM experiments while the
interface of an oil droplet in water was studied in all other experiments. Also, the concentration
of the diluted bitumen was adjusted (~0.06 vol%) in order to optimize the contrast for BAM
Figure 7-35 BAM images of diluted bitumen film (a) No demulsifier added, (b) 0.5 ppm, (c) 1
ppm, and (d) 5 ppm demulsifier added in the oil phase. The scale bar is 200 µm for all BAM
images.

126
images and therefore was very different from the systems discussed earlier. However, with the
distinctively different morphology at the interface, results clearly demonstrated the presence of a
protective film formed by the surface-active species from bitumen even at a very low
concentration (~0.06 vol%), and also the ability of EO-PO copolymer to disrupt such species
from the interface. This effect can be considered as a general interfacial behavior for both
bitumen and the EO-PO copolymer, which should not be limited to the current studied system.
Therefore, the same effect is also expected for much smaller structures, such as emulsion
droplets. Nevertheless, it can be inferred that the displacement of surface-active species from
diluted bitumen at the interface by EO-PO copolymer would reduce the coverage of the
protective film of the emulsion droplets, and hence increase the possibility for the coalescence of
emulsion droplets upon their collision. It is also possible that the EO-PO copolymer adsorbed at
the interface could bridge two nearby droplets, enhancing the chance for coalescence.
7.4.3 Contraction behavior
Measurements of the dynamic interfacial tension proved that both surface-active species in
diluted bitumen and EO-PO copolymers could adsorb at the oil−water interface though EO-PO
copolymers exhibited a better interfacial activity. For the flat diluted bitumen−water interface,
BAM was employed to observe the morphology of interfacial films with EO-PO copolymer
addition. However, the effect of the EO-PO copolymer on the mechanical properties of the
interfacial film around the emulsion water droplets has not been investigated. Volume
contraction experiments were used to study the rigidity of the interfacial film of emulsion
droplets. It is reported that by contracting the asphaltene films at the oil−water interface, an
interfacial film of elastic nature was observed, which could prevent coalescence of emulsion
droplets.58, 215 Similarly, by studying the crumpling ratio obtained from volume contraction
experiments on a pendant drop of naphtha diluted bitumen in water, we could further develop a
better understanding on the behavior of diluted bitumen films and the effect of EO-PO polymers
at interfaces.
In Figure 7-36, photos of the oil droplet captured in the crumping experiments are shown, in
which I represents the initial state of an equilibrated oil droplet after aging for a desired time, II
is the status right before crumpling, and III shows the first visible sign of crumpling for systems
A−F. For systems N and O, no crumpling was detected and the droplet detached from the needle.
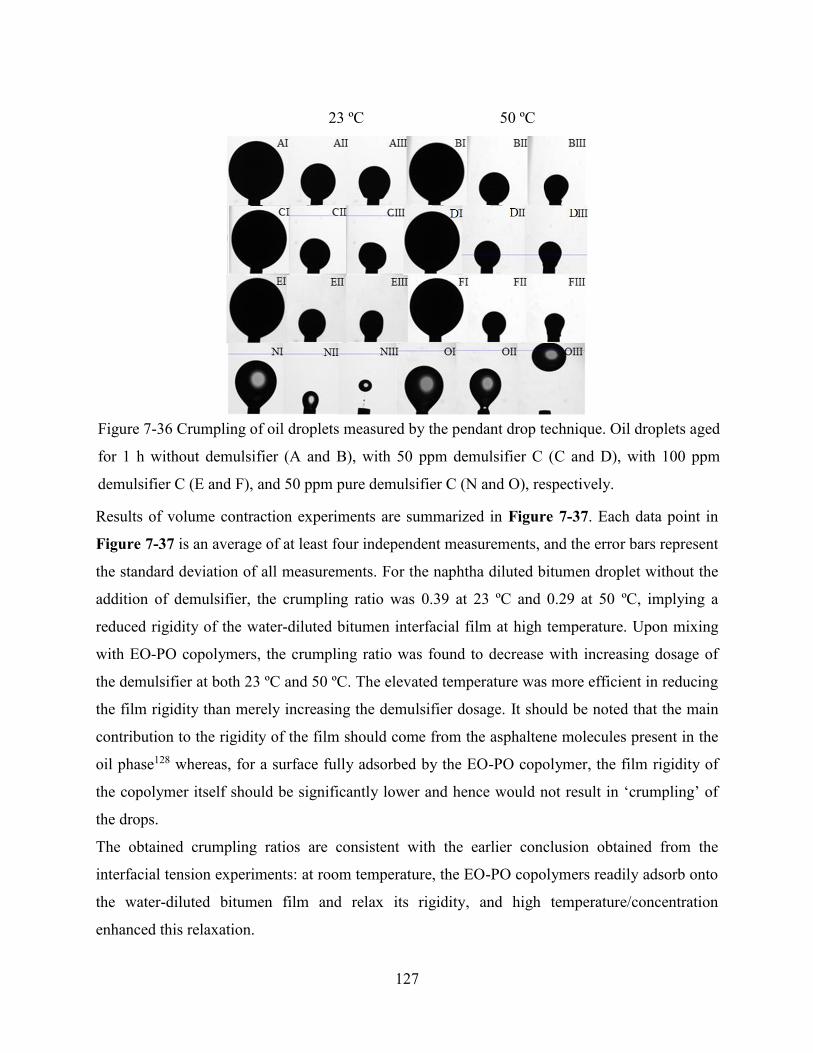
127
Results of volume contraction experiments are summarized in Figure 7-37. Each data point in
Figure 7-37 is an average of at least four independent measurements, and the error bars represent
the standard deviation of all measurements. For the naphtha diluted bitumen droplet without the
addition of demulsifier, the crumpling ratio was 0.39 at 23 ºC and 0.29 at 50 ºC, implying a
reduced rigidity of the water-diluted bitumen interfacial film at high temperature. Upon mixing
with EO-PO copolymers, the crumpling ratio was found to decrease with increasing dosage of
the demulsifier at both 23 ºC and 50 ºC. The elevated temperature was more efficient in reducing
the film rigidity than merely increasing the demulsifier dosage. It should be noted that the main
contribution to the rigidity of the film should come from the asphaltene molecules present in the
oil phase128 whereas, for a surface fully adsorbed by the EO-PO copolymer, the film rigidity of
the copolymer itself should be significantly lower and hence would not result in ‘crumpling’ of
the drops.
The obtained crumpling ratios are consistent with the earlier conclusion obtained from the
interfacial tension experiments: at room temperature, the EO-PO copolymers readily adsorb onto
the water-diluted bitumen film and relax its rigidity, and high temperature/concentration
enhanced this relaxation.
Figure 7-36 Crumpling of oil droplets measured by the pendant drop technique. Oil droplets aged
for 1 h without demulsifier (A and B), with 50 ppm demulsifier C (C and D), with 100 ppm
demulsifier C (E and F), and 50 ppm pure demulsifier C (N and O), respectively.
23 ºC 50 ºC
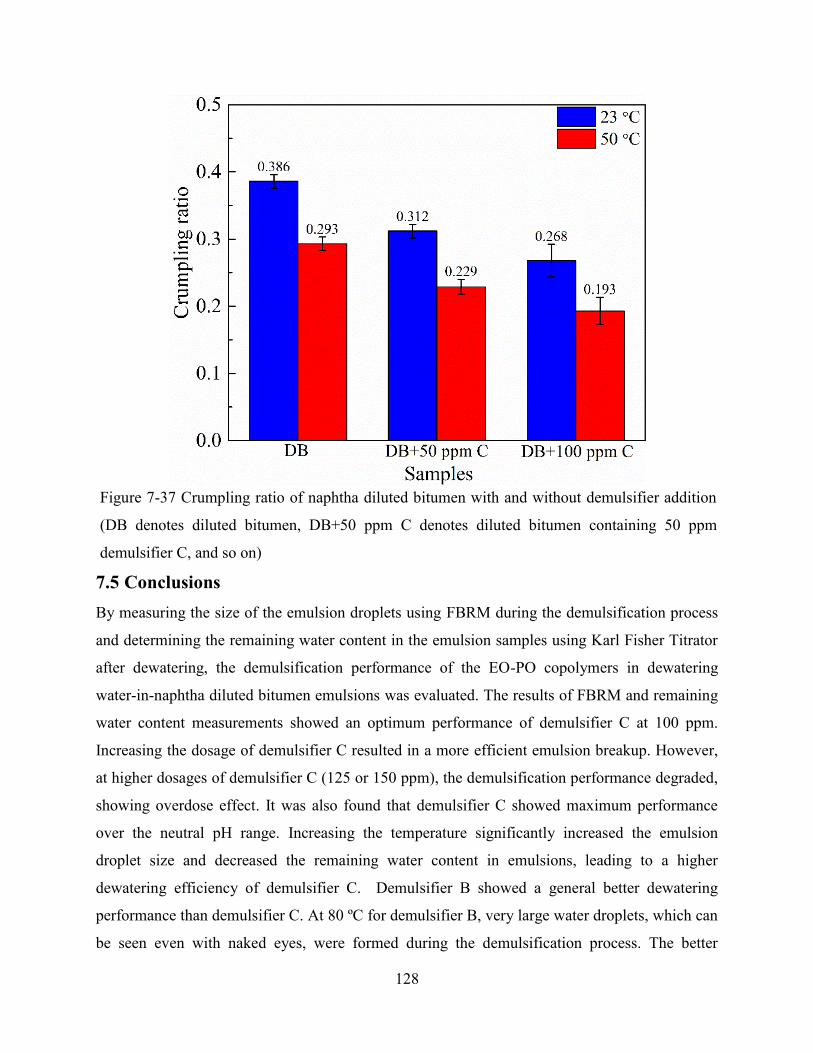
128
7.5 Conclusions
By measuring the size of the emulsion droplets using FBRM during the demulsification process
and determining the remaining water content in the emulsion samples using Karl Fisher Titrator
after dewatering, the demulsification performance of the EO-PO copolymers in dewatering
water-in-naphtha diluted bitumen emulsions was evaluated. The results of FBRM and remaining
water content measurements showed an optimum performance of demulsifier C at 100 ppm.
Increasing the dosage of demulsifier C resulted in a more efficient emulsion breakup. However,
at higher dosages of demulsifier C (125 or 150 ppm), the demulsification performance degraded,
showing overdose effect. It was also found that demulsifier C showed maximum performance
over the neutral pH range. Increasing the temperature significantly increased the emulsion
droplet size and decreased the remaining water content in emulsions, leading to a higher
dewatering efficiency of demulsifier C. Demulsifier B showed a general better dewatering
performance than demulsifier C. At 80 ºC for demulsifier B, very large water droplets, which can
be seen even with naked eyes, were formed during the demulsification process. The better
Figure 7-37 Crumpling ratio of naphtha diluted bitumen with and without demulsifier addition
(DB denotes diluted bitumen, DB+50 ppm C denotes diluted bitumen containing 50 ppm
demulsifier C, and so on)

129
demulsification performance of demulsifier B should be attributed to its higher molecular weight
and larger arm number.
The properties of the diluted bitumen interfacial film and the effect of EO-PO demulsifiers on
this film were probed by the dynamic interfacial tension, Brewster angle morphology, and
volume contraction measurements. Reversed O/W system was used for the study of the
interfacial properties. The results of interfacial tension measurement proved that EO-PO
copolymers were more interfacially active than surface-active species in diluted bitumen and
could compete effectively for the interface, especially at elevated temperatures. The results also
indicated the co-existence of EO-PO copolymer and surface-active species in diluted bitumen at
the oil−water interface. Brewster Angle Microscope results suggested the formation of interfacial
film structures after aging and those film structures can be destroyed by EO-PO copolymers.
Crumpling ratio measurements showed that the film rigidity reduced with the increase in the
demulsifier dosage, indicating the ability of the EO-PO molecules to soften the interfacial film,
and high temperature improved the performance of the EO-PO copolymer.

130
Chapter 8 Conclusions and Future Work
8.1 Conclusions
Establishing interfacial science to understand molecular mechanisms of stabilizing water in
heavy crude oil (W/O) emulsions is challenging due to non-transparent nature of crude oil even
in diluted systems, as most of the interfacial property measurements are based on visualization of
the experimental systems. This study investigated whether interfacial properties measured using
transparent O/W emulsion systems could be used to understand the stability of W/O emulsion
systems. With the same chemistry of interfacially active polyaromatic compounds (C5Pe and
C5PeC11) in xylene as the model oil, the interfacial tension, crumpling ratio, dilatational
rheology, and coalescence time of W/O and O/W systems were measured. For less surface-active
C5PeC11, the interfacial tensions for W/O and O/W systems were similar. For more surface-
active C5Pe, the interfacial tension of the W/O system was always lower than that of the O/W
system, while the film rigidity and viscoelasticity of the W/O system were higher than that of the
O/W system. At low C5Pe concentration, the coalescence time for the W/O system was lower
than that for the O/W system with the coalescence time for the W/O system being higher at
higher C5Pe concentrations. The results revealed that even though the interfacial properties
measured using reverse O/W system exhibit similar qualitative trends, care should be taken when
quantitatively studying W/O emulsions using interfacial property measurements of the O/W
emulsions due to the difference in most of the interfacial properties.
The effect of the EO-PO copolymer on the interfacial properties of the water−asphaltene model
compound C5Pe/C5PeC11 interface was also investigated. By adding the EO-PO demulsifier,
the interface between the asphaltene model compounds and water was changed. This study
focused on investigating the adsorption replacement of C5Pe or C5PeC11 molecules by the EO-
PO demulsifier molecules and the competitive adsorption between them. A reduction of the
interfacial tension of the C5Pe or C5PeC11−water interface by EO-PO demulsifier addition for
the W/O and O/W systems was observed, suggesting higher interfacial activities of the EO-PO
demulsifier, especially at high EO-PO demulsifier concentrations. Crumpling ratios of the flat
C5Pe−water interfacial film for W/O and O/W systems were also measured, and the results
showed that the EO-PO demulsifier was capable of softening and weakening the interfacial films
for both systems. The EO-PO demulsifier showed similar performance on changing the C5Pe
131
interfacial film through both diffusion (simulating the W/O system) and spreading (simulating
the O/W system) protocols. By investigating the Langmuir interfacial−area isotherms, it was
found that the C5Pe−water interfacial film became much more compressible with the addition of
the EO-PO demulsifier. The EO-PO demulsifier could also destroy the integrity of the C5Pe
interfacial film or avoid a networked film formation as indicated by atomic force microscopy
images. In addition, shear rheology measurements showed that the rigidity of the C5Pe
interfacial film was dramatically reduced or even absent in the presence of the EO-PO
demulsifier. Moreover, the changes in the C5Pe−water interface by the EO-PO demulsifier were
similar to those of the EO-PO/asphaltene system, providing further justification for using C5Pe
as the asphaltene model compound.
In order to investigate the demulsification mechanism at the molecular level, molecular
dynamics (MD) simulation was used to investigate the destabilization mechanism of the
interfacial film. Asphaltene model compound C5Pe and EO-PO block copolymer were used as
the emulsifier and demulsifier, respectively. Numerical results showed that C5Pe molecules are
adsorbed at the oil−water interface in the form of C5Pe aggregates and EO-PO molecules could
replace some of the adsorbed C5Pe molecules at the interface. In addition, the adsorbed EO-PO
molecules could form a new surface barrier at the interface, which inhibited the adsorption of
C5Pe molecules. The investigation of the EO-PO behavior at the oil−water interface in this study
also provided information on how to design efficient demulsifiers.
In order to confirm if the demulsification performance could be enhanced by combining thermal
energy and chemical treatment together, the demulsification performance of the EO-PO
demulsifiers in dewatering the water-in-diluted bitumen emulsions at high temperature was
studied. The naphtha diluted bitumen system was used as it is relatively close to the conditions in
the oil industry. EO-PO copolymer was used as a demulsifier because it is a promising additive
in breaking W/O emulsions. By applying FBRM and water content measurement, results have
clearly demonstrated the effectiveness of the EO-PO copolymer as demulsifier in the diluted
bitumen system, and with heat treatment applied in combination, the demulsification power can
be further enhanced. The interfacial properties of the diluted bitumen droplets in water were
studied by Theta Optical Tensiometer T200 and Brewster Angle Microscopy. In general, results
confirmed that the surface-active species from bitumen formed a rigid film at the water−oil

132
interface that inhibited the coalescence of emulsion droplets. With the addition of the EO-PO
copolymer, such surface-active species could be displaced from the interface and are no longer
effective in stabilizing the emulsions. Furthermore, with elevated temperature, two possible
demulsification mechanisms have been proposed regarding the different behaviors of the
demulsifier: 1. A flocculation dominated process at low temperature, and 2. A coalescence
dominated process at high temperature (above 80 °C), or for a long time scale (> 2 h) at low
temperature.
Overall, by using asphaltene model compounds that have much better optical transparency as the
oil samples, it was found that the interfacial properties of the W/O emulsions had the same
qualitative trends as that of the O/W emulsions. When adding the EO-PO demulsifier to the W/O
and O/W systems, similar changes were introduced to the stable C5Pe interfacial films by the
EO-PO molecules through adsorption replacement or adsorption competition. Thus, our
understanding regarding the feasibility of using the reverse O/W system to represent the W/O
system was enhanced, especially when demulsifier is introduced. This enabled us to perform the
demulsification tests using the water in diluted bitumen emulsions while studying the interfacial
properties using the diluted bitumen droplets in water. The demulsification process could be
greatly improved by high temperature as the adsorption of EO-PO molecules at the oil−water
interface were enhanced at elevated temperatures. Through this study, a relationship between
demulsification efficiency and operational factors is established that allows us to better design
real industrial operations.
8.2 Future work
To distinguish between flocculation and coalescence of the droplets, interactions of the water
droplets should be investigated by the micropipette technique.184 In the case of flocculation, when
separating two water droplets after bringing them into contact, the stretching and deformation of
the water droplets due to the adhesion force between them can be observed before final
separation. While in the case of coalescence, two water droplets will coalesce into one large
droplet.
Experiment results showed that demulsifier B always shows better demulsification performance
than demulsifier C. It is worth investigating the reason behind in order to design more effective

133
demulsifiers. EO-PO copolymers with various molecular weight, arm number, and EO content
should be tested to achieve this objective.
Additionally, it is interesting to study the effect of pressure on dewatering efficiency, which can
help to optimize the operational factors in the real industry. Pressure can be increased by
increasing the demulsification temperature in a closed vessel or by injecting compressed air into
a closed vessel.

134
Reference
1. Deffeyes K.S. Hubbert's Peak: The Impending World Oil Shortage (New Edition).
Princeton University Press 2008.
2. Hallock, J.L.; Tharakan, P.J.; Hall, C.A.S.; Jefferson, M.; Wu, W. Forecasting the Limits
to the Availability and Diversity of Global Conventional Oil Supply. Energy 2004,
29(11), 1673-1696.
3. Bentley, R.W. Global Oil & Gas Depletion: an Overview. Energy Policy 2002, 30(3),
189-205.
4. Masliyah, J.H.; Czarnecki, J.; Xu, Z. Handbook on Theory and Practice of Bitumen
Recovery From Athabasca Oil Sands, Volume 1: Theoretical Basis. Canada: Kingsley
Knowledge Publishing 2011, 1-39.
5. Alberta Culture and Tourism. Available at: http://www.history.alberta.ca.
6. Solovyev, A.; Zhang, L.Y.; Xu, Z.; Masliyah J. H. Langmuir Films of Bitumen at
Oil/Water Interfaces. Energy Fuels 2006, 20(4), 1572-1578.
7. Strausz, O. P. Bitumen and Heavy Oil chemistry. AOSTRA Technical Handbook on Oil
Sands, Bitumens and Heavy Oils. Alberta Oil Sands Technology and Research Authority,
1989.
8. Sjoblom, J.; Aske, N.; Auflem, I.H.; Brandala, Ø.; Havrea, T.E.; Sæthera, Ø.; Westvikb,
A.; Johnsenb, E.E.; Kallevikb, H. Our Current Understanding of Water-in-Crude Oil
Emulsions. Recent characterization techniques and high pressure performance. Adv.
Colloid Interface Sci. 2003, 100, 399-473.
9. Speight J.G. Petroleum Asphaltenes-Part 1: Asphaltenes, Resins and the Structure of
Petroleum. Oil Gas Sci. Technol. 2004, 59(5), 467-477.
10. Speight J.G. The Chemistry and Technology of coal. CRC Press 2012.
11. Ortiz, D.P.; Baydak, E.N.; Yarranton, H.W. Effect of Surfactants on Interfacial Films and
Stability of Water-in-Oil Emulsions Stabilized by Asphaltenes. J. Colloid Interface Sci.
2010, 351(2), 542-555.
12. Akbarzadeh, K.; Bressler, D.C.; Wang, J.N.; Gawrys, K.L.; Gray, M.R.; Kilpatrick, P.K.;
Yarranton, H.W. Association Behavior of Pyrene Compounds as Models for Asphaltenes.
Energy Fuels 2005, 19(4), 1268-1271.
135
13. Lopez-Linares, F.; Carbognani, L.; Gonzalez, M.F.;, Sosa-Stull, C.; Figueras, M.;
Pereira-Almao, P. Quinolin 65 and Violanthrone-79 as Model Molecules for the Kinetics
of the Adsorption of C7 Athabasca Asphaltene on Macroporous Solid Surfaces. Energy
Fuels, 2006, 20(6), 2748-2750.
14. Rakotondradany, F.; Fenniri, H.; Rahimi, P.; Gawrys, K.L.; Kilpatrick, P.K.; Gray, M.R.
Hexabenzocoronene Model Compounds for Asphaltene Fractions: Synthesis &
Characterization. Energy Fuels 2006, 20(6), 2439-2447.
15. Masliyah, J.H.; Czarnecki, J.; Xu, Z. Handbook on Theory and Practice of Bitumen
Recovery From Athabasca Oil Sands, Volume 1: Theoretical Basis. Canada: Kingsley
Knowledge Publishing 2011, 349-386.
16. Saadatmand, M.; Yarranton, H.W.; Moran, K. Rag Layers in Oil Sand Froths. Ind. Eng.
Chem. Res. 2008, 47(22), 8828-8839.
17. Masliyah, J.H.; Czarnecki, J.; Xu, Z. Handbook on Theory and Practice of Bitumen
Recovery From Athabasca Oil Sands, Volume 1: Theoretical Basis. Canada: Kingsley
Knowledge Publishing 2011, 211-250.
18. Pandey, S.C.; Ralli, D.K.; Saxena, A.K.; Alamkhan, W.K. Physicochemical
Characterization and Applications of Naphtha. J. Sci. Ind. Res. India 2004, 63(3), 276-
282.
19. McLean, J.D.; Kilpatrick, P.K. Effects of Asphaltene Solvency on Stability of Water-in-
Crude-Oil Emulsions. J. Colloid Interface Sci. 1997, 189(2), 242-253.
20. Farah, M.A.; Oliveira, R.C.; Caldas, J.N.; Rajagopal, K. Viscosity of Water-in-Oil
Emulsions: Variation with Temperature and Water Volume Fraction. J. Petrol. Sci. Eng.
2005, 48(3-4), 169-184.
21. Aomari, N.; Gaudu, R.; Cabioc'h, F.; Omari, A. Rheology of Water in Crude Oil
Emulsions. Colloid Surf. A-Physicochem. Eng. Asp. 1998, 139(1), 13-20.
22. Eley, D.D.; Hey, M.J.; Symonds, J.D. Emulsions of Water in Asphaltene-Containing Oils
2. Rheology. Colloids Surf. 1988, 32(1-2), 103-112.
23. Hunter, R.J. Foundations of Colloid Science. Clarendon, Oxford 1987.
24. Everett, D. Basic Principles of Colloid Science. Royal Soc. Chem. 1988.
25. Lissant, K.J. Demulsification Industrial Applications. Marcel Dekker, New York 1983.

136
26. Sjöblom, J.; Johnsen, E.; Westvik, A.; Ese, M.; Djuve, J.; Auflem, I.; Kallevik, H.
Demulsifiers in the Oil Industry. Encyclopedic handbook of emulsion technology, CRC
Press 2001, 595-620.
27. Schramm, L.L. Emulsions: Fundamentals and Applications in the Petroleum Industry.
ACS, Washington 1992,1-49.
28. Zhang, L.Y.; Xu, Z.; Mashyah, J.H. Langmuir and Langmuir-Blodgett Films of Mixed
Asphaltene and a Demulsifier. Langmuir 2003, 19(23), 9730-9741.
29. Xu, Y.M.; Wu, J.Y.; Dabros, T.; Hamza, H.; Venter, J. Optimizing the Polyethylene
Oxide and Polypropylene Oxide Contents in Diethylenetriamine-Based Surfactants for
Destabilization of a Water-in-Oil Emulsion. Energy Fuels 2005, 19(3), 916-921.
30. Wu, J.; Xu, Y.; Dabros, T.; Hamza, H. Effect of Demulsifier Properties on
Destabilization of Water-in-Oil Emulsion. Energy Fuels 2003, 17(6), 1554-1559.
31. Xu, Y.; Wu, J.; Dabros, T.; Hamza, H.; Wang, S.; Bidal, M.; Venter, J. Tran, T. Breaking
Water-in-Bitumen Emulsions Using Polyoxyalkylated DETA Demulsifier. Can. J.
Chem. Eng. 2004, 82(4), 829-835.
32. Feng, J.; Fang, H.B.; Zong, H.; Zhang, L.; Zhang, L.; Zhao, S.; Yu, J.Y. Interfacial
Dilational Properties of Two Different Structure Demulsifiers at Oil−Water Interfaces. J.
Dispersion Sci. Technol. 2011, 32(10), 1416-1421.
33. Kim, Y.H.; Wasan, D.T. Effect of Demulsifier Partitioning on the Destabilization of
Water-in-Oil Emulsions. Ind. Eng. Chem. Res. 1996, 35(4), 1141-1149.
34. Sun, T.; Zhang, L.; Wang, Y.; Zhao, S.; Peng, B.; Li, M.; Yu, J. Influence of
Demulsifiers of Different Structures on Interfacial Dilational Properties of an Oil−Water
Interface Containing Surface-Active Fractions from Crude Oil. J. Colloid Interface Sci.
2002, 255(2), 241-247.
35. Feng, X.; Xu, Z.; Masliyah, J.H. Biodegradable Polymer for Demulsification of Water-in-
Bitumen Emulsions. Energy Fuels 2008, 23(1), 451-456.
36. Hou, J.; Feng, X.; Masliyah, J.H.; Xu, Z. Understanding Interfacial Behavior of
Ethylcellulose at the Water-Diluted Bitumen Interface. Energy Fuels 2012, 26(3):1740-
1745.

137
37. Fan, Y.R.; Simon, S.; Sjoblom, J. Chemical Destabilization of Crude Oil Emulsions:
Effect of Nonionic Surfactants as Emulsion Inhibitors. Energy Fuels 2009, 23(9), 4575-
4583.
38. Ese, M.H. Sjoblom, J.; Djuve, J.; Pugh, R. An Atomic Force Microscopy Study of
Asphaltenes on Mica Surfaces. Influence of Added Resins and Demulsifiers. Colloid
Polym. Sci. 2000, 278(6), 532-538.
39. Fan, Y.R.; Simon, S.; Sjoblom, J. Interfacial Shear Rheology of Asphaltenes at
Oil−Water Interface and its Relation to Emulsion Stability: Influence of Concentration,
Solvent Rromaticity and Nonionic surfactant. Colloid Surf. A-Physicochem. Eng. Asp.
2010, 366(1-3), 120-128.
40. Rondon, M.; Bouriat, P.; Lachaise, J.; Salager, J.L. Breaking of Water-in-Crude Oil
Emulsions. 1. Physicochemical Phenomenology of Demulsifier Action. Energy Fuels
2006, 20(4), 1600-1604.
41. Nguyen, D.; Sadeghi, N.; Houston, C. Chemical Interactions and Demulsifier
Characteristics for Enhanced Oil Recovery Applications. Energy Fuels 2012, 26(5),
2742-2750.
42. Angle, C.W.; Dabros, T.; Hamza, H.A. Demulsifier Effectiveness in Treating Heavy Oil
Emulsion in The Presence of Fine Sands in the Production Fluids. Energy Fuels 2007,
21(2), 912-919.
43. Wu, J.Y.; Xu, Y.M.; Dabros, T.; Hamza, H. Effect of EO and PO Positions in Nonionic
Surfactants on Surfactant Properties and Demulsification Performance. Colloid Surf. A-
Physicochem. Eng. Asp. 2005, 252(1), 79-85.
44. Ramalho, J.B.; Ramos, N.; Lucas, E. The Influence of Some Interfacial Properties of
PEO-b-PPO Copolymers on Dewatering of Water-in-Oil Asphaltene Model Emulsions.
Chem. Chem. Technol. 2009, 3, 53-58.
45. Abdel-Azim, A.-A. A.; Zaki, N. N.; Maysour, N. E. S. Polyoxyalkylenated Amines for
Breaking Water-in-Oil Emulsions: Effect of Structural Variations on the Demulsification
Efficiency. Polym. Adv. Technol. 1998, 9(2), 159-166.
46. Zaki, N.; Abdel-Raouf, M. E.; Abdci-Azim, A.-A. A. Propylene Oxide-Ethylene Oxide
Block Copolymers as Demulsifiers for Water-in-Oil Emulsions, II. Effects of

138
Temperature, Salinity, pH-Value, and Solvents on the Demulsification Efficiency.
Monatsh. Chem. 1996, 127 (12), 1239−1245.
47. Sullivan, A.P. Kilpatrick, P.K. The Effects of Inorganic Solid Particles on Water and
Crude Oil Emulsion Stability. Ind. Eng. Chem. Res. 2002, 41(14), 3389-3404.
48. Shetty, C.S.; Nikolov, A.D.; Wasan, D.T.; Bhattacharyya, B.R. Demulsification of Water
in Oil-Emulsions Using Water-Soluble Demulsifiers. J. Dispersion Sci. Technol. 1992,
13(2), 121-133.
49. Krawczyk, M.A.; Wasan, D.T.; Shetty, C.S. Chemical Demulsification of Petroleum
Emulsions Using Oil-Soluble Demulsifiers. Ind Eng Chem Res 1991, 30(2), 367-375.
50. Wasan D. Destabilization of Water-in-Oil Emulsions. Emulsions: A Fundamental and
Practical Approach, Springer 1992, 283-295.
51. Kim, Y.H.; Wasan, D.T.; Breen, P.J. A Study of Dynamic Interfacial Mechanisms for
Demulsification of Water-in-Oil Emulsions. Colloid Surf. A-Physicochem. Eng. Asp.
1995, 95(2-3), 235-247.
52. Hirato, T.; Koyama, K.; Tanaka, T.; Awakura, Y.; Majima, H. Demulsification of Water-
in-Oil Emulsion by an Electrostatic Coalescence Method. Mater. Trans. 1991, 32(3),
257-263.
53. Malhotra, A.K.; Wasan, D.T. Stability of Foam and Emulsion Films - Effects of the
Drainage and Film Size on Critical Thickness of Rupture. Chem. Eng. Commun. 1986,
48(1-3), 35-56.
54. Mukherjee, S.; Kushnick, A.P. Effect of Demulsifiers on the Interfacial Rheological
Properties Governing Crude-Oil Demulsification. Prepr.-Am. Chem. Soc., Div. Pet. Chem.
1988, 33 (1), 205.
55. Moran, K.; Czarnecki, J. Competitive Adsorption of Sodium Naphthenates and Naturally
Occurring Species at Water-in-Crude Oil Emulsion Droplet Surfaces. Colloid Surf. A-
Physicochem. Eng. Asp. 2007, 292(2-3), 87-98.
56. Gelot, A.; Friesen, W.; Hamza, H.A. Emulsification of Oil and Water in the Presence of
Finely Divided Solids and Surface-Active Agents. Colloids Surf. 1984, 12(3-4), 271-303.
57. Tambe, D.E.; Sharma, M.M. Factors Controlling the Stability of Colloid-Stabilized
Emulsions: I. An Experimental Investigation. J. Colloid Interface Sci. 1993, 157(1), 244-
253.

139
58. Tsamantakis, C.; Masliyah, J.h.; Yeung, A.; Gentzis, T. Investigation of the Interfacial
Properties of Water-in-Diluted-Bitumen Emulsions Using Micropipette Techniques. J.
Colloid Interface Sci. 2005, 284(1), 176-183.
59. Menon, V.; Wasan, D. Particle-Fluid Interactions With Application to Solid-Stabilized
Emulsions Part I. The Effect of Asphaltene Adsorption. Colloid Surf. 1986, 19(1), 89-105.
60. Kimbler, O.K.; Reed, R.; Silberberg, I. Physical Characteristics of Natural Films Formed
at Crude Oil−Water Interfaces. SPE J. 1966, 6(02), 153-165.
61. Pfeiffer, J.P.; Saal R.N.J. Asphaltic Bitumen as Colloid System. J. Phys. Chem. 1940,
44(2), 139-165.
62. Sjoblom, J.; Urdahl, O.; Borve, K.G.N.; Li, M.Y.; Saeten, J.O.; Christy, A.A.; Gu, T.R.
Stabilization and Destabilization of Water-in-Crude Oil-Emulsions from the Norwegian
Continental-Shelf - Correlation with Model Systems. Adv. Colloid Interface Sci. 1992, 41,
241-271.
63. Ese, M.H.; Kilpatrick, P.K. Stabilization of Water-in-Oil Emulsions by Naphthenic Acids
and Their Salts: Model Compounds, Role of pH, and Soap: Acid Ratio. J. Dispersion Sci.
Technol. 2004, 25(3), 253-261.
64. Mediaas, H.; Wolf, N.O.; Baugh, T.D.; Grande, K.V.; Vinstad, J.E. The Discovery of
High Molecular Weight Naphthenic Acids (ARN Acid) Responsible for Calcium
Naphthenate Deposits. Proceedings of the 7th Society of Petroleum Engineers (SPE)
Oilfield Scale Symposium; Aberdeen, U.K., 2005.
65. Verruto, V.J.; Le, R.K.; Kilpatrick, P.K. Adsorption and Molecular Rearrangement of
Amphoteric Species at Oil−Water Interfaces. J. Phys. Chem. B 2009, 113(42), 13788-
13799.
66. Pena, A.A.; Hirasaki, G.J.; Miller, C.A. Chemically Induced Destabilization of Water-in-
Crude Oil Emulsions. Ind. Eng. Chem. Res. 2005, 44(5), 1139-1149.
67. Pelssers, E.G.M.; Stuart, M.A.C.; Fleer, G.J. Kinetic Aspects of Polymer Bridging -
Equilibrium Flocculation and Nonequilibrium Flocculation. Colloid Surf. 1989, 38(1-3),
15-25.
68. Kailey, I.; Feng, X. Influence of Structural Variations of Demulsifiers on their
Performance. Ind Eng Chem Res 2013, 52(2), 785-793.

140
69. Feng, X.; Wang, S.Q.; Hou, J.; Wang, L.X.; Cepuch, C.; Masliyah, J.H.; Xu, Z. Effect of
Hydroxyl Content and Molecular Weight of Biodegradable Ethylcellulose on
Demulsification of Water-in-Diluted Bitumen Emulsions. Ind. Eng. Chem. Res. 2011,
50(10), 6347-6354.
70. Wu, H.Y.; Xu, Y.M.; Dabros, T.; Hamza, H. Development of a Method for Measurement
of Relative Solubility of Nonionic Surfactants. Colloid Surf. A-Physicochem. Eng. Asp.
2004, 232(2-3), 229-237.
71. Pensini, E.; Harbottle, D.; Yang, F.; Tchoukov,P.; Li, Z.; Kailey, I.; Behles, J. Masliyah,
J.H.; Xu, Z. Demulsification Mechanism of Asphaltene-Stabilized Water-in-Oil
Emulsions by a Polymeric Ethylene Oxide Propylene Oxide Demulsifier. Energy Fuels
2014, 28(11), 6760-6771.
72. Romanova, U.G.; Yarranton, H.W.; Schramm, L.L.; Shelfantook, W.E. Investigation of
Oil Sands Froth Treatment. Can. J. Chem. Eng. 2004, 82(4), 710-721.
73. Menon, V.B.; Wasan, D.T. Characterization of Oil−Water Interfaces Containing Finely
Divided Solids with Applications to the Coalescence of Water-in-Oil Emulsions: a
Review. Colloid Surf. 1988, 29(1), 7-27.
74. Barre, L.; Espinat, D.; Rosenberg, E.; Scarsella, M. Colloidal Structure of Heavy Crudes
and Asphaltene Solutions. Rev. Inst. Fr. Pet. 1997, 52(2), 161-175.
75. Acevedo, S.; Gutierrez, L.B.; Negrin, G.; Pereira, J.C.; Mendez, B.; Delolme, F.;
Dessalces, G.; Broseta, D. Molecular Weight of Petroleum Asphaltenes: A Comparison
Between Mass Spectrometry and Vapor Pressure Osmometry. Energy Fuels 2005, 19(4),
1548-1560.
76. Sato, S.; Takanohashi, T.; Tanaka, R. Molecular Weight Calibration of Asphaltenes
Using Gel Permeation Chromatography/Mass Spectrometry. Energy Fuels 2005, 19(5),
1991-1994.
77. Pomerantz, A.E.; Hammond, M.R.; Morrow, A.L.; Mullins, O.C. Zare, R.N. Asphaltene
Molecular-Mass Distribution Determined by Two-Step Laser Mass Spectrometry. Energy
Fuels 2008, 23(3), 1162-1168.
78. Andrews, A.B.; Shih, W.C.; Mullins, O.C.; Norinaga, K. Molecular Size Determination
of Coal-Derived Asphaltene by Fluorescence Correlation Spectroscopy. Appl. Spectrosc.
2011, 65(12), 1348-1356.

141
79. Schneider, M.H.; Andrews, A.B.; Mitra-Kirtley, S.; Mullins, O.C. Asphaltene Molecular
Size by Fluorescence Correlation Spectroscopy. Energy Fuels 2007, 21(5), 2875-2882.
80. Strausz, O.P.; Mojelsky, T.W.; Lown, E.M. The Molecular-Structure of Asphaltene: an
Unfolding Story. Fuel 1992, 71(12), 1355-1363.
81. Mojelsky, T.W.; Ignasiak, T.M.; Frakman, Z.; Mcintyre, D.D.; Lown, E.M.; Montgomery,
D.S.; Strausz, O.P. Structural Features of Alberta Oil Sand Bitumen and Heavy Oil
Asphaltenes. Energy Fuels 1992, 6(1), 83-96.
82. Groenzin, H.; Mullins, O.C. Asphaltene Molecular Size and Weight by Time-Resolved
Fluorescence Depolarization. Asphaltenes, Heavy oils, and Petroleomics, Springer 2007,
17-62.
83. Sharma, A.; Groenzin, H.; Tomita, A.; Mullins, O.C. Probing Order in Asphaltenes and
Aromatic Ring Systems by HRTEM. Energy Fuels 2002, 16(2), 490-496.
84. Ruiz-Morales, Y.; Mullins, O.C. Measured and Simulated Electronic Absorption and
Emission Spectra of Asphaltenes. Energy Fuels 2009, 23(3-4), 1169-1177.
85. Betancourt, S.S.; Ventura, G.T.; Pomerantz, A.E.; Viloria, O.; Dubost, F.X.; Zuo, J.;
Monson, G.; Bustamant, D.; Purcell, J.M.; Nelson, R.K.; Rodgers, R.P.; Reddy, C.M.;
Marshall, A.G.; Mullins, O.C. Nanoaggregates of Asphaltenes in a Reservoir Crude oil
and Reservoir Connectivity. Energy Fuels 2008, 23(3), 1178-1188.
86. Fenistein, D.; Barre, L.; Experimental Measurement of the Mass Distribution of
Petroleum Asphaltene Aggregates Using Ultracentrifugation and Small-Angle X-ray
Scattering. Fuel 2001, 80(2), 283-287.
87. Simon, S.B.; Jestin, J.; Palermo, T.; Barre, L.C. Relation Between Solution and
Interfacial Properties of Asphaltene Aggregates. Energy Fuels 2008, 23(1), 306-313.
88. Espinat, D.; Fenistein, D.; Barre, L.; Frot, D.; Briolant, Y. Effects of Temperature and
Pressure on Asphaltenes Agglomeration in Toluene. A light, X-ray, and Neutron
Scattering Investigation. Energy Fuels 2004, 18(5), 1243-1249.
89. Spiecker, P.M.; Gawrys, K.L.; Trail, C.B.; Kilpatrick, P.K. Effects of Petroleum Resins
on Asphaltene Aggregation and Water-in-Oil Emulsion Formation. Colloid Surf. A-
Physicochem. Eng. Asp 2003, 220(1-3), 9-27.
90. Dickie, J.P.; Yen, T.F. Macrostructures of the Asphaltic Fractions by Various
Instrumental Methods. Anal. Chem. 1967, 39(14), 1847-1852.

142
91. Mullins, O.C. The Modified Yen Model. Energy Fuels 2010, 24(4), 2179-2207.
92. Gray, M.R.; Tykwinski, R.R.; Stryker, J.M.; Tan, X.L. Supramolecular Assembly Model
for Aggregation of Petroleum Asphaltenes. Energy Fuels 2011, 25(7), 3125-3134.
93. Yarranton, H.W.; Ortiz, D.P.; Barrera, D.M.; Baydak, E. N.; Barr é , L.; Frot, D.;
Eyssautier, J.; Zeng, H.; Xu, Z.; Dechaine, G.; Becerra, M.; Shaw, J. M.; McKenna, A.
M.; Mapolelo, M. M.; Bohne, C. ; Yang, Z.; Oake, J. On the Size Distribution of Self-
Associated Asphaltenes. Energy Fuels 2013, 27(9), 5083-5106.
94. Liu, J.J.; Zhang, L.Y.; Xu, Z.; Masliyah, J.H. Colloidal Interactions Between Asphaltene
Surfaces in Aqueous Solutions. Langmuir 2006, 22(4), 1485-1492.
95. Wang, S.; Liu, J.; Zhang, L.; Masliyah, J.H.; Xu, Z. Interaction Forces Between
Asphaltene Surfaces in Organic Solvents. Langmuir 2009, 26(1), 183-190.
96. Sheremata, J.M.; Gray, M.R.; Dettman, H.D.; McCaffrey, W.C. Quantitative Molecular
Representation and Sequential Optimization of Athabasca Asphaltenes. Energy Fuels
2004, 18(5), 1377-1384.
97. Boek, E.S.; Yakovlev, D.S.; Headen, T.F. Quantitative Molecular Representation of
Asphaltenes and Molecular Dynamics Simulation of their Aggregation. Energy Fuels
2009, 23(3-4), 1209-1219.
98. Nordgard, E.L.; Landsem, E.; Sjoblom, J. Langmuir Films of Asphaltene Model
Compounds and their Fluorescent Properties. Langmuir 2008, 24(16), 8742-8751.
99. Nordgård E.L.; Sjöblom, J. Model Compounds for Asphaltenes and C80 Isoprenoid
Tetraacids. Part I: Synthesis and Interfacial Activities. J. Dispersion Sci. Technol. 2008,
29(8), 1114-1122.
100. Nordgård, E.L.; Sørland, G.; Sjoblom, J. Behavior of Asphaltene Model Compounds at
W/O Interfaces. Langmuir 2009, 26(4), 2352-2360.
101. Rogel, E. Asphaltene Aggregation: A Molecular Thermodynamic Approach. Langmuir,
2002, 18(5), 1928-1937.
102. Gawrys, K.L.; Spiecker, P.M.; Kilpatrick, P.K. The Role of Asphaltene Solubility and
Chemical Composition on Asphaltene Aggregation. Pet. Sci. Technol. 2003, 21(3-4),
461-489.
143
103. Pradilla, D.; Subramanian, S.; Simon, S.; Sjoblom. J.; Beurroies, I.; Denoyel, R.
Microcalorimetry Study of the Adsorption of Asphaltenes and Asphaltene Model
Compounds at the Liquid-Solid Surface. Langmuir 2016, 32(29), 7294-7305.
104. Wang, J.; Opedal, N.V.D.T.; Lu, Q.; Xu, Z.; Zeng. H.; Sjoblom, J. Probing Molecular
Interactions of an Asphaltene Model Compound in Organic Solvents Using a Surface
Forces Apparatus (SFA). Energy Fuels 2011, 26(5), 2591-2599.
105. Wang, J.; Lu, Q.; Harbottle, D.; Sjoblom, J.; Xu, Z.; Zeng, H. Molecular Interactions of a
Polyaromatic Surfactant C5Pe in Aqueous Solutions Studied by a Surface Forces
Apparatus. J. Phys. Chem. B 2012, 116(36), 11187-11196.
106. Bi, J.; Yang, F.; Harbottle, D.; Pensini, E.; Tchoukov, P. Simon, S.; Sjöblom, J.; Dabros,
T.; Czarnecki, J.; Liu, Q.; Xu, Z. Interfacial Layer Properties of a Polyaromatic
Compound and its Role in Stabilizing Water-in-Oil Emulsions. Langmuir 2015, 31(38),
10382-10391.
107. Pradilla, D.; Simon, S.; Sjoblom, J.; Samaniuk, J.; Skrzypiec, M.; Vermant, J. Sorption
and Interfacial Rheology Study of Model Asphaltene Compounds. Langmuir 2016,
32(12), 2900-2911.
108. Grimes, B.; Dorao, C.; Simon, S.; Nordgård, E.; Sjöblom, J. Analysis of Dynamic
Surfactant Mass Transfer and its Relationship to the Transient Stabilization of Coalescing
Liquid–Liquid Dispersions. J. Colloid Interface Sci. 2010, 348(2), 479-490.
109. Barre, L.; Jestin, J.; Morisset, A.; Palermo, T.; Simon, S. Relation Between Nanoscale
Structure of Asphaltene Aggregates and their Macroscopic Solution Properties. Oil Gas
Sci. Technol. 2009, 64(5), 617-628.
110. Liu, L.; Sjoblom, J.; Xu, Z. Nanoaggregation of Polyaromatic Compounds Probed by
Electrospray Ionization Mass Spectrometry. Energy Fuels 2016, 30(5), 3742-3751.
111. Teklebrhan, R.B.; Ge, L.L.; Bhattacharjee, S.; Xu, Z.; Sjoblom, J. Initial Partition and
Aggregation of Uncharged Polyaromatic Molecules at the Oil−Water Interface: A
Molecular Dynamics Simulation Study. J. Phys. Chem. B 2014, 118(4), 1040-1051.
112. Jian, C.Y.; Tang, T.; Bhattacharjee, S. Probing the Effect of Side-Chain Length on the
Aggregation of a Model Asphaltene Using Molecular Dynamics Simulations. Energy
Fuels 2013, 27(4), 2057-2067.

144
113. Kuznicki, T.; Masliyah, J.H.; Bhattacharjee, S. Aggregation and Partitioning of Model
Asphaltenes at Toluene−Water Interfaces: Molecular Dynamics Simulations. Energy
Fuels 2009, 23(10), 5027-5035.
114. Kuznicki, T.; Masliyah, J.H.; Bhattacharjee, S. Molecular Dynamics Study of Model
Molecules Resembling Asphaltene-Like Structures in Aqueous Organic Solvent Systems.
Energy Fuels 2008, 22(4), 2379-2389.
115. Gao, F.; Xu, Z.; Liu, G.; Yuan, S. Molecular Dynamics Simulation: the Behavior of
Asphaltene in Crude Oil and at the Oil/Water Interface. Energy Fuels 2014, 28(12),
7368-7376.
116. Jian, C.Y.; Zeng, H.; Liu, Q.; Tang, T. Probing the Adsorption of Polycyclic Aromatic
Compounds onto Water Droplets Using Molecular Dynamics Simulations. J. Phys. Chem.
C 2016, 120(26), 14170-4179.
117. Andrews, A.B.; McClelland, A.; Korkeila, O.; Demidov, A.; Krummel, A.; Mullins, O.C.;
Chen, Z. Molecular Orientation of Asphaltenes and PAH Model Compounds in
Langmuir−Blodgett Films Using Sum Frequency Generation Spectroscopy. Langmuir
2011; 27(10), 6049-6058.
118. FBRM. Available at: www.mt.com/distribution/fbrm
119. Li, M.; Wilkinson, D.; Patchigolla, K. Comparison of Particle Size Distributions
Measured Using Different Techniques. Part. Sci. Technol. 2005, 23(3), 265-284.
120. Ruf, A.; Worlitschek, J.; Mazzotti, M. Modeling and Experimental Analysis of PSD
Measurements through FBRM. Part. Part. Syst. Char. 2000, 17(4), 167-179.
121. Worlitschek. J.; Hocker, T.; Mazzotti, M. Restoration of PSD From Chord Length
Distribution Data Using the Method of Projections onto Convex Sets. Part. Part. Syst.
Char. 2005, 22(2), 81-98.
122. Hu. X.; Cunningham, J.C.; Winstead, D. Study Growth Kinetics in Fluidized Bed
Granulation with at-Line FBRM. Int. J. Pharm. 2008, 347(1), 54-61.
123. Chen, Z.; Peng, J.; Ge, L.; Xu, Z. Demulsifying Water-in-Oil Emulsions by Ethyl
Cellulose Demulsifiers Studied Using Focused Beam Reflectance Measurement. Chem.
Eng. Sci. 2015, 130, 254-263.

145
124. Wang, L.; Sharp, D.; Masliyah, J.H.; Xu, Z. Measurement of Interactions Between Solid
Particles, Liquid Droplets, and/or Gas Bubbles in a Liquid Using an Integrated Thin Film
Drainage Apparatus. Langmuir 2013, 29(11), 3594-3603.
125. Gao, S. Stability of Water-in-Diluted Bitumen Emulsion Droplets. University of Alberta
2010.
126. Stauffer, C.E. The Measurement of Surface Tension by the Pendant Drop Technique. J.
Phys. Chem. 1965, 69(6), 1933-1938.
127. Yeung, A.; Dabros, T.; Masliyah, J.H.; Czarnecki, J. Micropipette: a New Technique in
Emulsion Research. Colloid Surf. A-Physicochem. Eng. Asp 2000, 174(1-2), 169-181.
128. Yeung, A.; Dabros, T.; Czarnecki, J.; Masliyah, J.H. On the Interfacial Properties of
Micrometre–Sized Water Droplets in Crude Oil. Proceedings of the Royal Society of
London. Series A: Mathematical, Physical and Engineering Sciences 455 1990, 3709-
3723.
129. Shaw, R.C.; Schramm, L.L.; Czarnecki, J. Suspensions in the Hot Water Flotation
Process for Canadian Oil sands. Adv. Chem. Ser. 1996, 251(251), 639-675.
130. Liggieri, L.; Ferrari, M.; Mondelli, D.; Ravera, F. Surface Rheology as a Tool For the
Investigation of Processes Internal to Surfactant Adsorption Layers. Faraday Discuss.
2005, 129, 125-140.
131. Myrvold, R.; Hansen, F.K. Surface Elasticity and Viscosity from Oscillating Bubbles
Measured by Automatic Axisymmetric Drop Shape Analysis. J. Colloid Interface Sci.
1998, 207(1), 97-105.
132. Kragel, J.; Derkatch, S.R. Interfacial Shear Rheology. Curr. Opin. Colloid Interface Sci.
2010, 15(4), 246-255.
133. Vandebril, S.; Franck, A.; Fuller, G.G.; Moldenaers, P.; Vermant, J. A double Wall-Ring
Geometry for Interfacial Shear Rheometry. Rheol. Acta 2010, 49(2), 131-144.
134. Xu, R.; Dickinson, E.; Murray, B.S. Morphological Changes in Adsorbed Protein Films
at the Oil−Water Interface Subjected to Compression, Expansion, and Heat Processing.
Langmuir 2008, 24(5), 1979-1988.
135. Murray, B.S.; Xu, R,.; Dickinson, E. Brewster Angle Microscopy of Adsorbed Protein
Films at Air–Water and Oil–Water Interfaces After Compression, Expansion and Heat
Processing. Food Hydrocolloids 2009, 23(4), 1190-1197.

146
136. Yan, Z.; Elliott, J.A.; Masliyah, J.H. Roles of Various Bitumen Components in the
Stability of Water-in-Diluted-Bitumen Emulsions. J. Colloid Interface Sci. 1999, 220(2),
329-337.
137. Yarranton, H.W.; Hussein, H.; Masliyah, J.H. Water-in-Hydrocarbon Emulsions
Stabilized by Asphaltenes at Low Concentrations. J. Colloid Interface Sci. 2000, 228(1),
52-63.
138. Angle, C.W. Chemical Demulsification of Stable Crude Oil and Bitumen Emulsions in
Petroleum Recovery: a Review. Encyclopedic handbook of emulsion technology: CRC
Press 2001, 541-594.
139. Siffert, B.; Bourgeois, C.; Papirer, E. Structure and Water—Oil Emulsifying Properties of
Asphaltenes. Fuel 1984, 63(6), 834-837.
140. Nordli, K.G.; Sjöblom, J.; Kizling, J.; Stenius, P. Water-in-Crude Oil Emulsions From
the Norwegian Continental Shelf 4. Monolayer Properties of the Interfacially Active
Crude Oil Fraction. Colloids Surf. 1991, 57(1), 83-98.
141. Sheu, E.Y.; Maureen, M.; Storm, D.A.; DeCanio, S.J. Aggregation and Kinetics of
Asphaltenes in Organic Solvents. Fuel 1992, 71(3), 299-302.
142. Mohammed, R.; Bailey, A.; Luckham, P.; Taylor, S. Dewatering of Crude Oil Emulsions
2. Interfacial Properties of the Asphaltic Constituents of Crude Oil. Colloid Surf. A-
Physicochem. Eng. Asp. 1993, 80(2), 237-242.
143. Mohammed, R.; Bailey, A.; Luckham, P.; Taylor, S. Dewatering of Crude Oil Emulsions
3. Emulsion Resolution by Chemical Means. Colloid Surf. A-Physicochem. Eng. Asp
1994, 83(3), 261-271.
144. Sun, T.; Zhang, L.; Wang, Y.; Zhao, S.; Peng. B.; Li, M.; Yu, J. Influence of
Demulsifiers of Different Structures on Interfacial Dilational Properties of an Oil–Water
Interface Containing Surface-Active Fractions from Crude Oil. J. Colloid Interface Sci.
2002, 255(2), 241-247.
145. Ese M-H, Galet L, Clausse D, Sjöblom J. Properties of Langmuir Surface and Interfacial
Films Built up by Asphaltenes and Resins: Influence of Chemical Demulsifiers. J.
Colloid Interface Sci. 1999, 220(2), 293-301.
146. Fan, Y.; Simon, S.; Sjoblom, J. Chemical Destabilization of Crude Oil Emulsions: Effect
of Nonionic Surfactants as Emulsion Inhibitors. Energy Fuels 2009, 23(9), 4575-4583.

147
147. Rane, J.P.; Harbottle, D.; Pauchard, V.; Couzis, A.; Banerjee, S. Adsorption Kinetics of
Asphaltenes at the Oil–Water Interface and Nanoaggregation in the Bulk. Langmuir 2012,
28(26), 9986-9995.
148. Firoozabadi, A.; Ramey, Jr. H.J. Surface Tension of Water-Hydrocarbon Systems at
Reservoir Conditions. J. Can. Pet. Technol. 1988, 27(03).
149. Ravera, F.; Loglio, G.; Kovalchuk, V.I. Interfacial Dilational Rheology by Oscillating
Bubble/Drop Methods. Curr. Opin. Colloid Interface Sci. 2010, 15(4), 217-228.
150. Noskov, B.A. Dilational Surface Rheology of Polymer and Polymer/Surfactant Solutions.
Curr. Opin. Colloid Interface Sci. 2010, 15(4), 229-236.
151. Ivanov I. Thin Liquid Films. CRC Press 1988.
152. Liang, Y. Dynamic Demulsification Mechanism of Asphaltene-stabilized Water-in-oil
Emulsions by Ethylcellulose. University of Alberta 2015.
153. Zhang, X.; Tchoukov, P.; Manica, R.; Wang, L.; Liu, Q.; Xu, Z. Simultaneous
Measurement of Dynamic Force and Spatial Thin Film Thickness Between Deformable
and Solid Surfaces by Integrated Thin Liquid Film Force Apparatus. Soft Matter 2016,
12(44), 9105-9114.
154. Nordgård, E.L.; Landsem, E.; Sjoblom, J. Langmuir Films of Asphaltene Model
Compounds and their Fluorescent Properties. Langmuir 2008, 24(16), 8742-8751.
155. Rane, J.P.; Pauchard, V.; Couzis, A.; Banerjee, S. Interfacial Rheology of Asphaltenes at
Oil–Water Interfaces and Interpretation of the Equation of State. Langmuir 2013, 29(15),
4750-4759.
156. Wang, J.; Lu, Q.; Harbottle, D.; Sjoblom, J.; Xu, Z.; Zeng, H. Molecular Interactions of a
Polyaromatic Surfactant C5Pe in Aqueous Solutions Studied by a Surface Forces
Apparatus. J. Phys. Chem. B 2012, 116(36), 11187-11196.
157. Kairaliyeva, T.; Aksenenko, E.; Mucic, N.; Makievski, A.; Fainerman, V.; Miller, R.
Surface Tension and Adsorption Studies by Drop Profile Analysis Tensiometry. J.
Surfactants Deterg. 2017, 20(6), 1225-1241.
158. Yeung, A.; Dabros, T.; Masliyah, J.; Czarnecki, J. Micropipette: a New Technique in
Emulsion Research. Colloid Surf. A-Physicochem. Eng. Asp 2000, 174(1), 169-181.
159. Moran, K.; Yeung, A.; Masliyah, J. The Viscoplastic Properties of Crude Oil–Water
Interfaces. Chem. Eng. Sci. 2006, 61(18), 6016-6028.

148
160. Wang, X.; Zhang, R.; Liu, L.; Qiao, P.; Simon, S.; Sjoblom, J.; Xu, Z.; Jiang, B.
Interactions of Polyaromatic Compounds. Part 2. Flocculation Probed by Dynamic Light
Scattering and Molecular Dynamics Simulation. Energy Fuels 2017, 31(9), 9201-9212.
161. Israelachvili, J.N. Intermolecular and surface forces. Academic Press 2015.
162. Tabor, R.F.; Wu, C.; Grieser, F.; Dagastine, R.R.; Chan, D.Y. Measurement of the
Hydrophobic Force in a Soft Matter System. J. Phys. Chem. Lett. 2013, 4(22), 3872-3877.
163. Shi, C.; Chan, D.Y.; Liu, Q.; Zeng, H. Probing the Hydrophobic Interaction Between Air
Bubbles and Partially Hydrophobic Surfaces Using Atomic Force Microscopy. J. Phys.
Chem. C 2014, 118(43), 25000-25008.
164. Shi, C.; Zhang, L.; Xie, L.; Lu, X.; Liu, Q.; Mantilla, C.A.; van den Berg. F.G.A.; Zeng,
H. Interaction Mechanism of Oil-in-Water Emulsions with Asphaltenes Determined
Using Droplet Probe AFM. Langmuir 2016, 32(10), 2302-2310.
165. Mikula, R.; Munoz, V. Characterization of Emulsions and Suspensions in the Petroleum
Industry Using Cryo-SEM and CLSM. Colloid Surf. A-Physicochem. Eng. Asp. 2000,
174(1), 23-36.
166. Ghosh, S.; Rousseau, D. Fat Crystals and Water-in-Oil Emulsion Stability. Curr. Opin.
Colloid Interface Sci. 2011, 16(5), 421-431.
167. Reed, S. G.; Bertholet, S.; Coler, R. N.; Friede, M. New Horizons in Adjuvants for
Vaccine Development. Trends Immunol. 2009, 30(1), 23-32.
168. Li, X.; He, L.; Wu, G.; Sun, W.; Li, H.; Sui, H. Operational Parameters, Evaluation
Methods, and Fundamental Mechanisms: Aspects of Nonaqueous Extraction of Bitumen
From Oil Sands. Energy Fuels 2012, 26(6), 3553-3563.
169. Little R. C. Breaking Emulsions of Water in Navy Fuel Oils. Fuel 1974, 53(4), 246-252.
170. Shetty, C.; Nikolov, A.; Wasan, D.; Bhattacharyya, B. Demulsification of Water in Oil
Emulsions Using Water Soluble Demulsifiers. J. Dispersion Sci. Technol. 1992, 13(2),
121-133.
171. Tchoukov, P.; Czarnecki, J.; Dabros, T. Study of Water-in-Oil Thin Liquid Films:
Implications for the Stability of Petroleum Emulsions. Colloid Surf. A-Physicochem. Eng.
2010, 372(1), 15-21.
172. Czarnecki, J; Tchoukov, P.; Dabros, T. Possible Role of Asphaltenes in the Stabilization
of Water-in-Crude Oil Emulsions. Energy Fuels 2012, 26(9), 5782-5786.
149
173. Gafonova, O. V.; Yarranton H. W. The Stabilization of Water-in-Hydrocarbon Emulsions
by Asphaltenes and Resins. J. Colloid Interface Sci. 2001, 241(2), 469-478.
174. Kang, W.; Xu, B.; Wang, Y.; Li, Y.; Shan, X.; An, F.; Liu, J. Stability Mechanism of
W/O Crude Oil Emulsion Stabilized by Polymer and Surfactant. Colloid Surf. A-
Physicochem. Eng. 2011, 384(1-3), 555-560.
175. Mullins, O. C.; Sabbah, H.; Eyssautier, J.; Pomerantz, A. E.; Barre, L.; Andrews, A. B.;
Ruiz-Morales, Y.; Mostowfi, F.; McFarlane, R.; Goual, L.; Lepkowicz, R.; Cooper, T.;
Orbulescu, J.; Leblanc, R. M.; Edwards, J.; Zare, R. N. Advances in Asphaltene Science
and the Yen–Mullins Model. Energy Fuels 2012, 26(7), 3986-4003.
176. Hosseini-Dastgerdi, Z.; Tabatabaei-Nejad, S.; Khodapanah, E.; Sahraei, E. A
Comprehensive Study on Mechanism of Formation and Techniques to Diagnose
Asphaltene Structure; Molecular and Aggregates: a Review. Asia-Pac. J. Chem. Eng.
2015, 10(1), 1-14.
177. Xiong Y.; Cao, T.; Chen, Q.; Li, Z.;, Yang, Y.; Xu, S.; Yuan, S.; Sjöblom, J.; Xu, Z.
Adsorption of a Polyaromatic Compound on Silica Surfaces from Organic Solvents
Studied by Molecular Dynamics Simulation and AFM Imaging. J. Phys. Chem. C 2017,
121(9), 5020-5028.
178. Xiong, Y.; Li, Z.; Cao, T.; Xu, S.; Yuan, S.; Sjoblom, J.; Xu, Z. Synergistic Adsorption
of Polyaromatic Compounds on Silica Surfaces Studied by Molecular Dynamics
Simulation. J. Phys. Chem. C 2018, 122(8), 4290-4299.
179. Simon, S.; Wei, D.; Barriet, M.; Sjöblom, J. An ITC and NMR Study of Interaction and
Complexation of Asphaltene Model Compounds in Apolar Solvent I: Self-association
Pattern. Colloid Surf. A-Physicochem. Eng. 2016, 494, 108-115.
180. Teklebrhan, R. B.; Ge, L.; Bhattacharjee, S.; Xu, Z.; Sjoblom, J. Probing Structure-
Nanoaggregation Relations of Polyaromatic Surfactants: a Molecular Dynamics
Simulation and Dynamic Light Scattering Study. J. Phys. Chem. B 2012, 116(20), 5907-
5918.
181. Zhang, W.; Dong, G.; Yang, H.; Sun, J.; Zhou, J.; Wang, J. Synthesis, Surface and
Aggregation Properties of a Series of Amphiphilic Dendritic Copolymers. Colloid Surf.
A-Physicochem. Eng. 2009, 348(1-3), 45-48.

150
182. Pradilla, D.; Simon, S.; Sjoblom, J.; Samaniuk, J.; Skrzypiec, M.; Vermant, J. Sorption
and Interfacial Rheology Study of Model Asphaltene Compounds. Langmuir 2016,
32(12), 2900-2911.
183. Niu, Z.; Ma, X.; Manica, R.; Yue, T. Molecular Destabilization Mechanism of
Asphaltene Model Compound C5Pe Interfacial Film by EO-PO Copolymer: Experiments
and MD Simulation. The J. Phys. Chem. C 2019, 123, 10501-10508.
184. Feng, X.; Mussone, P.; Gao, S.; Wang, S.; Wu, S-Y.; Masliyah, J. H.; Xu, Z. Mechanistic
Study on Demulsification of Water-in-Diluted Bitumen Emulsions by Ethylcellulose.
Langmuir 2009, 26(5), 3050-3057.
185. Zhang, L. Y.; Xu, Z.; Masliyah, J. H. Characterization of Adsorbed Athabasca
Asphaltene Films at Solvent−Water Interfaces Using a Langmuir Interfacial Trough. Ind.
Eng. Chem. Res. 2005, 44(5), 1160-1174.
186. Zhang, L. Y.; Lawrence, S.; Xu, Z.; Masliyah, J. H. Studies of Athabasca Asphaltene
Langmuir films at air–water interface. J. Colloid Interface Sci. 2003, 264(1), 128-140.
187. Harbottle, D.; Chen, Q.; Moorthy, K.; Wang, L.; Xu, S.; Liu, Q.; Sjoblom, J.; Xu, Z.
Problematic Stabilizing Films in Petroleum Emulsions: Shear Rheological Response of
Viscoelastic Asphaltene Films and the Effect on Drop Coalescence. Langmuir 2014,
30(23), 6730-6738.
188. Feng, X.; Wang, S.; Hou, J.; Wang, L.; Cepuch, C.; Masliyah, J.; Xu, Z. Effect of
Hydroxyl Content and Molecular Weight of Biodegradable Ethylcellulose on
Demulsification of Water-in-Diluted Bitumen Emulsions. Ind. Eng. Chem. Res. 2011,
50(10), 6347-6354.
189. Zhang L. Y.; Xu, Z.; Masliyah, J. H. Langmuir and Langmuir-Blodgett Films of Mixed
Asphaltene and a Demulsifier. Langmuir 2003, 19(23), 9730-9741.
190. Ese, M-H.; Sjöblom, J.; Djuve, J.; Pugh, R. An Atomic Force Microscopy Study of
Asphaltenes on Mica Surfaces. Influence of Added Resins and Demulsifiers. Colloid
Polym. Sci. 2000, 278(6), 532-538.
191. Daniel-David, D.; Le Follotec, A.; Pezron, I.; Dalmazzone, C. N.; Noïk, C.; Barré, L.;
Komunjer, L. Destabilisation of Water-in-Crude Oil Emulsions by Silicone Copolymer
Demulsifiers. Oil Gas Sci. Technol. 2008, 63(1), 165-173.

151
192. Spiecker P. M.; Kilpatrick, P. K. Interfacial Rheology of Petroleum Asphaltenes at the
Oil−Water Interface. Langmuir 2004, 20(10), 4022-4032.
193. Freer, E.; Radke, C. Relaxation of Asphaltenes at the Toluene/Water Interface: Diffusion
Exchange and Surface Rearrangement. J. Adhes. 2004, 80(6), 481-496.
194. He, L.; Li, X.; Wu, G.; Lin, F.; Sui, H. Distribution of Saturates, Aromatics, Resins, and
Asphaltenes Fractions in the Bituminous Layer of Athabasca Oil Sands. Energy Fuels
2013, 27, 4677−4683.
195. Qiao, P.; Harbottle, D.; Tchoukov, P.; Masliyah, J.; Sjoblom, J.; Liu, Q.; Xu, Z.
Fractionation of Asphaltenes in Understanding Their Role in Petroleum Emulsion
Stability and Fouling. Energy Fuels 2017, 31, 3330−3337.
196. Yang, X.; Hamza, H.; Czarnecki, J. Investigation of Subfractions of Athabasca
Asphaltenes and Their Role in Emulsion Stability. Energy Fuels 2004, 18, 770−777.
197. Papirer, E.; Bourgeois, C.; Siffert, B.; Balard, H. Chemical Nature and Water/Oil
Emulsifying Properties of Asphaltenes. Fuel 1982, 61, 732−734.
198. Phukan, M.; Koczo, K.; Falk, B.; Palumbo, A. New Silicon Copolymers for Efficient
Demulsification. SPE Oil and Gas India Conference and Exhibition 2010, SPE-128553-
MS.
199. Wu, G.; He, L.; Chen, D. Sorption and Distribution of Asphaltene, Resin, Aromatic and
Saturate Fractions of Heavy Crude Oil on Quartz Surface: Molecular Dynamic
Simulation. Chemosphere 2013, 92, 1465−1471.
200. Nenningsland, A. L.; Gao, B.; Simon, S.; Sjoblom, J. Comparative Study of Stabilizing
Agents for Water-in-Oil Emulsions. Energy Fuels 2011, 25, 5746−5754.
201. Bai, Y.; Sui, H.; Liu, X.; He, L.; Li, X.; Thormann, E. Effects of the N, O, and S
Heteroatoms on the Adsorption and Desorption of Asphaltenes on Silica Surface: A
Molecular Dynamics Simulation. Fuel 2019, 240, 252−261.
202. Sun, H. Compass: An Ab Initio Force-Field Optimized for Condensed-Phase
Applications Overview with Details on Alkane and Benzene Compounds. J. Phys. Chem.
B 1998, 102, 7338−7364.
203. Deguillard, E.; Pannacci, N.; Creton, B.; Rousseau, B. Interfacial Tension in
Oil−Water−Surfactant Systems: On the Role of Intra-Molecular Forces on Interfacial
Tension Values Using Dpd Simulations. J. Chem. Phys. 2013, 138, 144102.

152
204. Dong, F.-L.; Li, Y.; Zhang, P. Mesoscopic Simulation Study on the Orientation of
Surfactants Adsorbed at the Liquid/Liquid Interface. Chem. Phys. Lett. 2004, 399,
215−219.
205. Teklebrhan, R.B.; Ge, L.; Bhattacharjee, S.; Xu, Z.; Sjoblom, J. Initial Partition and
Aggregation of Uncharged Polyaromatic Molecules at the Oil–Water Interface: a
Molecular Dynamics Simulation Study. J. Phys. Chem. B 2014, 118(4), 1040-1051.
206. Jang, S.S.; Lin, S.-T.; Maiti, P.K.; Blanco, M.; Goddard, W.A.; Shuler, P.; Tang, Y.
Molecular Dynamics Study of a Surfactant-Mediated Decane−Water Interface: Effect of
Molecular Architecture of Alkyl Benzene Sulfonate. J. Phys. Chem. B 2004, 108(32),
12130-12140.
207. Hockney R.; Eastwood, J. Computer Simulations Using Particles Mcgraw-Hill. New York
1981.
208. Fan, Y.; Simon, S.; Sjoblom, J. Influence of Nonionic Surfactants on the Surface and
Interfacial Film properties of Asphaltenes Investigated by Langmuir Balance and
Brewster Angle Microscopy. Langmuir 2010, 26(13), 10497-10505.
209. Mayo, S. L.; Olafson, B. D.; Goddard, W. A. Dreiding: A Generic Force Field for
Molecular Simulations. J. Phys. Chem. 1990, 94, 8897−8909.
210. Peña, A.A.; Hirasaki, G.J.; Miller, C.A. Chemically Induced Destabilization of Water-in-
Crude Oil Emulsions. Ind. Eng. Chem. Res. 2005, 44(5), 1139-1149.
211. Heath, A.R.; Fawell, P.D.; Bahri, P.A.; Swift, J.D. Estimating Average Particle Size by
Focused Beam Reflectance Measurement (FBRM). Part. Part. Syst. Char. 2002, 19(2),
84-95.
212. Atta, A.M.; Fadda, A.A.; Abdel-Rahman, A.A.H.; Ismail, H.S.; Fouad, R.R. Application
of New Modified Poly(ethylene Oxide)-Block-Poly(propylene oxide)-Block-
Poly(ethylene oxide) Copolymers as Demulsifier for Petroleum Crude Oil Emulsion. J.
Dispersion Sci. Technol. 2012, 33(6), 775-785.
213. Singh, B.P. Performance of Demulsifiers−Prediction Based on Film Pressure-Area
Isotherms and Solvent Properties. Energ Sources 1994, 16(3), 377-385.
214. A lvarez, L.; Díaz, M. E.; Montes, F. J.; Galan, M. A. Langmuir Technique and Brewster
Angle Microscope Studies of the Interfacial Behavior of Bitumen, Asphaltenes and

153
Maltenes at the Air−Water Interface. I. Effect of Different Spreading Solution Volumes.
Fuel 2010, 89, 691−702.
215. Moran, K.; Yeung, A.; Masliyah, J. The Viscoplastic Properties of Crude Oil−Water
Interfaces. Chem. Eng. Sci. 2006, 61(18), 6016-6028.
216. Agrawala, M.; Yarranton, H.W. An asphaltene association model analogous to linear
polymerization. Ind. Eng. Chem. Res. 2001, 40(21), 4664-4672.