Rheology and droplet size distribution of emulsions stabilized by crayfish flour
11
FOOD HYDROCOLLOIDS Food Hydrocolloids 22 (2008) 1033–1043 Rheology and droplet size distribution of emulsions stabilized by crayfish flour Alberto Romero a , Felipe Cordobe´s a , Maria Cecilia Puppo b , Antonio Guerrero a, , Carlos Bengoechea a a Departamento de Ingenierı´a Quı´mica, Universidad de Sevilla, Facultad de Quı´mica, 41012 Sevilla, Spain b Centro de Investigacio´n y Desarrollo en Criotecnologı´a de Alimentos (CIDCA), CONICET, Universidad Nacional de La Plata, 47 y 116, 1900 La Plata, Argentina Received 15 January 2007; accepted 23 May 2007 Abstract Highly concentrated oil-in-water (o/w) emulsions stabilized by crayfish flour at high pH were characterized by means of linear dynamic viscoelasticity and droplet size distribution (DSD) analysis. Power consumption and temperature were recorded as a function of emulsification time at different agitation speeds. The emulsions studied followed a gel-like behavior, characterized by G 0 being about one order of magnitude higher than G 00 within the experimental frequency range. This behavior was characteristic of highly concentrated emulsions with a well-developed plateau region. Increase in both energy input and crayfish flour concentration yielded higher values of linear viscoelasticity functions and lower droplet size, which suggested an enhancement of the elastic network and an increase in emulsion stability. The evolution of plateau modulus and Sauter diameter was studied at different concentrations of crayfish flour (0.25–6.25 wt%) over storage time at 5 1C. The microstructure of these emulsions was characterized by using confocal laser scanning microscopy (CLSM). r 2007 Elsevier Ltd. All rights reserved. Keywords: Oil-in-water emulsions; Crayfish protein; Backscattering; Linear viscoelasticity; Droplet size distribution; CLSM 1. Introduction Food industry usually generates a big amount of by- products that may have some undesirable environmental impact. A way to get benefits from these by-products is to explore the functional properties of protein concentrates in order to obtain some added value products, as has been proposed for low-value by-products generated in the fish industry, or extract-specific protein fractions that could be utilized as functional ingredients in foods (Finch, 1977; Spinelli, Groninger, Koury, & Miller, 1975). Crayfish flour from red crayfish (Procambarus clarkii) is an interesting source of high-quality protein (about 65%), rich in essential amino acids and lipids (ca. 19%), including long-chain polyunsaturated fatty acids from o-3 and o-6 series, and also containing other components of functional value such as astaxanthin that posses a high antioxidant capacity. The potentials of crayfish proteins as a functional ingredient in food products has been recently explored (Cremades, 2004). Three major groups of proteins are found in crustaceans: water-soluble sarcoplasmic proteins (about 30 wt%), which consist of albumins and lower amounts of myoglobin and enzymes; salt-soluble myofi- billar proteins (60–70 wt%), containing myosin, actin and less amount of tropomyosin and troponin (Suzuki, 1981); and insoluble stromal proteins, which represent only between 3 and 10 wt% of total proteins. Crayfish flour may be obtained as a by-product in the red crayfish industry, which typically produces important crayfish surpluses. Unfortunately, the manufacture of the crayfish flour produces a high degree of protein denatura- tion, which reduces its functional properties (i.e. emulsifi- cation ability). In food emulsions, such as mayonnaise and salad dressings, egg yolk is the most widely used emulsifier. ARTICLE IN PRESS www.elsevier.com/locate/foodhyd 0268-005X/$ - see front matter r 2007 Elsevier Ltd. All rights reserved. doi:10.1016/j.foodhyd.2007.05.019 Corresponding author. Tel.: +34 9545 57179; fax: +34 9545 56447. E-mail address: [email protected] (A. Guerrero).
-
Upload
independent -
Category
Documents
-
view
0 -
download
0
Transcript of Rheology and droplet size distribution of emulsions stabilized by crayfish flour

ARTICLE IN PRESS
FOODHYDROCOLLOIDS
0268-005X/$ - s
doi:10.1016/j.fo
�CorrespondE-mail addr
Food Hydrocolloids 22 (2008) 1033–1043
www.elsevier.com/locate/foodhyd
Rheology and droplet size distribution of emulsionsstabilized by crayfish flour
Alberto Romeroa, Felipe Cordobesa, Maria Cecilia Puppob,Antonio Guerreroa,�, Carlos Bengoecheaa
aDepartamento de Ingenierıa Quımica, Universidad de Sevilla, Facultad de Quımica, 41012 Sevilla, SpainbCentro de Investigacion y Desarrollo en Criotecnologıa de Alimentos (CIDCA), CONICET,
Universidad Nacional de La Plata, 47 y 116, 1900 La Plata, Argentina
Received 15 January 2007; accepted 23 May 2007
Abstract
Highly concentrated oil-in-water (o/w) emulsions stabilized by crayfish flour at high pH were characterized by means of linear dynamic
viscoelasticity and droplet size distribution (DSD) analysis. Power consumption and temperature were recorded as a function of
emulsification time at different agitation speeds. The emulsions studied followed a gel-like behavior, characterized by G0 being about one
order of magnitude higher than G00 within the experimental frequency range. This behavior was characteristic of highly concentrated
emulsions with a well-developed plateau region. Increase in both energy input and crayfish flour concentration yielded higher values of
linear viscoelasticity functions and lower droplet size, which suggested an enhancement of the elastic network and an increase in emulsion
stability. The evolution of plateau modulus and Sauter diameter was studied at different concentrations of crayfish flour (0.25–6.25wt%)
over storage time at 5 1C. The microstructure of these emulsions was characterized by using confocal laser scanning microscopy (CLSM).
r 2007 Elsevier Ltd. All rights reserved.
Keywords: Oil-in-water emulsions; Crayfish protein; Backscattering; Linear viscoelasticity; Droplet size distribution; CLSM
1. Introduction
Food industry usually generates a big amount of by-products that may have some undesirable environmentalimpact. A way to get benefits from these by-products is toexplore the functional properties of protein concentrates inorder to obtain some added value products, as has beenproposed for low-value by-products generated in the fishindustry, or extract-specific protein fractions that could beutilized as functional ingredients in foods (Finch, 1977;Spinelli, Groninger, Koury, & Miller, 1975).
Crayfish flour from red crayfish (Procambarus clarkii) isan interesting source of high-quality protein (about 65%),rich in essential amino acids and lipids (ca. 19%), includinglong-chain polyunsaturated fatty acids from o-3 and o-6series, and also containing other components of functional
ee front matter r 2007 Elsevier Ltd. All rights reserved.
odhyd.2007.05.019
ing author. Tel.: +349545 57179; fax: +34 9545 56447.
ess: [email protected] (A. Guerrero).
value such as astaxanthin that posses a high antioxidantcapacity. The potentials of crayfish proteins as a functionalingredient in food products has been recently explored(Cremades, 2004). Three major groups of proteins arefound in crustaceans: water-soluble sarcoplasmic proteins(about 30wt%), which consist of albumins and loweramounts of myoglobin and enzymes; salt-soluble myofi-billar proteins (60–70wt%), containing myosin, actin andless amount of tropomyosin and troponin (Suzuki, 1981);and insoluble stromal proteins, which represent onlybetween 3 and 10wt% of total proteins.Crayfish flour may be obtained as a by-product in the
red crayfish industry, which typically produces importantcrayfish surpluses. Unfortunately, the manufacture of thecrayfish flour produces a high degree of protein denatura-tion, which reduces its functional properties (i.e. emulsifi-cation ability).In food emulsions, such as mayonnaise and salad
dressings, egg yolk is the most widely used emulsifier.

ARTICLE IN PRESSA. Romero et al. / Food Hydrocolloids 22 (2008) 1033–10431034
However, many efforts have been devoted for decades toreplace egg yolk as emulsifier in order to avoid the presenceof cholesterol from yolk or the development of salmonellain yolk-containing food products. Mixtures of macromo-lecular and low-molecular weight emulsifiers have beenused in some cases (Clark, Wilde, Wilson, & Wunsteck,1992; Franco, Guerrero, & Gallegos, 1995). Otherauthors have used alternative protein systems to replacethe traditional egg yolk such as vegetable proteins(Bengoechea, Cordobes, & Guerrero, 2006; Elizalde,Bartholomai, & Pilosof, 1996; Gallegos, Franco, Madiedo,Raymundo, & Sousa, 2002; Tornberg, 1978). Fish proteinscan also be used to stabilize oil-in-water (o/w) emulsionsunder certain conditions. Thus, for example, Cofrades,Carballo, Careche, and Colmenero (1996) showed thatacto-myosin from hake had higher emulsifying activity andstability than the acto-myosin from chicken and pork,whereas Petursson, Decker, and McClements (2004) usedprotein fractions extracted from cod as emulsifiers to formfairly stable emulsions.
The main objective of the present work was to producestable o/w emulsions containing crayfish protein as theonly emulsifier. A previous requirement, particularlyimportant in this product as a consequence of previousdenaturation, was to establish the conditions necessary toenhance the interactions among droplets in order to obtainlong-term emulsion stability. Characterization of bothlinear viscoelastic properties and particle size distribution(droplet size distribution (DSD)) was carried out inorder to accomplish this objective. The microstructureof the emulsions obtained was also characterized at thecolloidal level by means of confocal laser scanningmicroscopy (CLSM).
2. Experimental
Different o/w emulsions were prepared using 75wt%sunflower oil (Koipesol S.A., Spain) in relation to the totalweight, crayfish flour (0.25–6.25wt%) and water. Crayfishflour (ca. 65wt% protein content) was obtained fromALFOCAN S.L. (Isla Mayor, Sevilla, Spain). Beforeemulsification process, flour was sifted at 600 mm. Thevolume fraction of droplets is always about 0.77.
Emulsions were prepared in an Ultra Turrax T-50homogenizer from IKA (Germany) at different agitationspeeds (3000–10,000 rpm) and an emulsification time of7min. All the emulsions in this study were prepared at highpH, being far from the isoelectric point (pI ¼ 3.4). Thevalue selected for the pH was 11.5, obtained by addingNaOH 2M to the corresponding protein dispersion. At pHlower than 11, it was not possible to produce any stableemulsion by direct emulsification. The emulsions werestored at 5 1C and were placed at 20 1C 1h before takingany measurement.
Measurements of backscattering (BS) for some selectedemulsions, prepared with an Ultra Turrax T-25 homo-genizer from IKA (Germany) at 6000 rpm, were performed
by means of a Vertical Scan Analyzer (QuickScan,Beckman Coulter). Each sample was put in a cylindricalglass measurement cell and the BS profile was recorded at20 1C as a function of the sample height. Destabilizationmechanism was analyzed from the evolution of BS profilesas a function of time. Determinations were conducted induplicate. A description of the technique is reported byMengual, Meunier, Cayre, Puech, and Snabre (1999) andPan, Tomas, and Anon (2002).Measurements of DSD were performed in a Malvern
Mastersizer X (Malvern Instruments, UK). For thispurpose, 0.5ml of emulsion was taken and diluted in11.5mL of 0.05M, pH 8 Tris–HCl buffer with 1% SDS,since previous results using water as solvent showedremarkably higher droplet sizes due to flocculation. Therole of SDS is to produce displacement of proteinmolecules from the interface (Chen & Dickinson, 1998;Puppo et al., 2005). Each sample was carefully dispersedstep-by-step applying gentle agitation in order to disruptdroplets flocs. Values of the Sauter mean diameter, d3,2,which is inversely proportional to the specific surface areaof droplets, were obtained as follows:
dx;y ¼
PniPni
dxi
dyi
, (1)
where ni is the number of droplets with a diameter di.The uniformity ratio is an index of polydispersity of the
different droplet sizes, defined by the following expression:
U ¼
PVi dðv; 0; 5Þ � di
�� ��dðv; 0; 5Þ
PV i
, (2)
where d(v,0,5) is the median for the distribution, and Vi isthe volume of droplets with a diameter di.Dynamic viscoelasticity measurements were performed
in a controlled-strain rheometer (ARES) from TA Instru-ments (USA) in the linear viscoelasticity region, so strainsweep were performed to establish the linear viscoelasticrange. The geometry used was a plate and plate geometry(25mm) with a rough surface and a gap between plates of1mm. Rheological tests were carried out at 20 1C, and atleast two replicates were made. All the systems studiedhave the same thermorheological history.Selected undiluted protein emulsions were analyzed by
means of a CLSM (Leica Mycrosystems, Heidelberg,Germany). The CLSM was used in the fluorescent mode,and a wavelength of 488 nm from the laser was used.Wavelengths above 500 nm were analyzed. This techniqueprovided images of dark, fat droplets and a bright waterphase where proteins were found. A � 100 objectivewas used. It was not necessary to stain the aqueousphase due to the autoflourescent properties shown by theproteins used.A statistical analysis (ANOVA) was done in order to
establish the influence of the different variables. This studywas also performed using P-value. The significance levelwas established at 95%.

ARTICLE IN PRESSA. Romero et al. / Food Hydrocolloids 22 (2008) 1033–1043 1035
3. Results and discussion
3.1. Emulsification process
The emulsification process was carried out by addingsunflower oil to an aqueous dispersion of the emulsifier, at20 1C, while processing at constant agitation speed. Theaddition of oil took always the same time (ca. 6min) andfollowed by 1min further processing. Power consumptionand temperature were monitored along emulsification time.Fig. 1 shows the evolution of both variables at differentagitation speed values. The percentage of oil to be added isalso plotted as a function of emulsification time. Thisparameter was calculated as follows:
Yoð%Þ ¼ 1�MoðtÞ
Mo;T
� �� 100, (3)
where Mo(t) is the mass of oil added at time t to acontinuous phase containing a mass Mc of crayfishaqueous dispersion and Mo,T is the total amount of oil inthe final emulsion.
0
0
.
W (
w)
3000 r.p.m. 4000 r.p.m.6000 r.p.m. 8000 r.p.m.
10000 r.p.m.
3000 r.p.m. 4000 r.p.m.
6000 r.p.m. 8000 r.p.m.
10000 r.p.m.
600
550
500
450
400
350
300
250
200100
Time (s)
200 300 400 500
0 100
Time (s)
200 300 400 500
Y0 (
%)
120
100
80
60
40
20
0
Y0 (
%)
120
100
80
60
40
20
Tª
(ºC
)
65
60
55
50
45
40
35
30
25
20
15
Fig. 1. Influence of emulsification time for emulsions containing 75wt%
oil and 5wt% crayfish flour processed at different agitation speeds (3000,
4000, 6000, 8000 and 10,000 rpm): (A) evolution of power consumption
and oil addition; and (B) evolution of Sauter diameter d3,2 and oil
addition.
An apparent increase in power consumption took placewhile the sunflower oil was added (Fig. 1A). After theaddition of oil a plateau was typically obtained. Anincrease in the agitation speed used for the emulsificationgave rise to a relevant increase in power consumption. Theplateau obtained is more remarkable at the lowest values ofthe agitation speed. The total amount of energy suppliedalong the emulsification process is typically used toproduce convective flow of oil and aqueous phases, highdeformation and break-up of oil droplets, as well asdissipation of mechanical energy.The emulsification process was carried out within a
constant temperature bath. However, the energy dissipa-tion taking place along the emulsification process was soimportant that a continuous increase in temperature wasobtained. Furthermore, this increase became more pro-nounced as energy input was raised (Fig. 1B).
3.2. Short-term stability
Once the emulsification process was finished and thetemperature was set at 20 1C, BS measurements wereobtained in order to analyze the destabilization mechanismof crayfish flour emulsions. Fig. 2A shows BS profilesobtained as a function of time for emulsions stabilized by asmall amount of crayfish flour (0.25 and 1wt%). Anapparent coalescence process, characterized by a reductionin the value of BS along time, is shown in both cases. At thelowest emulsifier concentration, an increase in the size ofthe aqueous layer, which displays a low BS value, takesplace at the bottom part of the tube along time (Mengual etal., 1999; Palazolo, Sorgentini, & Wagner, 2005). Thiscreaming process is not observed at the experimental timescale when the concentration of protein was raised. Fig. 2Bshows the evolution of the relative BS as a function of timeobtained within the middle part of the tube defined asfollows:
BSrel ¼ BSðtÞ=BS0, (4)
where BS0 and BS(t) are the mean values for the BS profileobtained at the initial time and time t, respectively. Aninitial dramatic decrease followed by decaying up to aplateau value in relative BS takes place along time. Thisreduction is more relevant at the lowest concentration atwhich the coalescence among oil droplets is evident. Anincrease in concentration is followed by a remarkablereduction in the coalescence mechanism. Nevertheless, thecoalescence mechanism seems to be limited to the firststorage stage after emulsification.Short-term emulsion stability was also analyzed by
means of linear viscoelastic properties and DSD of theemulsions, obtained as a function of storage time for thefirst hours.Fig. 3 shows the values obtained for the storage and loss
moduli (G0(o) and G00(o)) and DSD as a function ofstorage time at 20 1C. Emulsions stabilized by crayfish flour

ARTICLE IN PRESS
0 10
0
0 m in
15 min
30 min
0
0
0
Tube length (mm)
10 20 30 40 50 60 70
BS
(%
)
40
30
20
10
30
BS
(%
)
20
10
Tube length (mm)
706050403020
1.00 %wt
0 min
30 min
15 min
670 h
400 h
167 h
0.25 %wt
1.00
0.95
0.90
BS
rel
0.85
0.80
0.75
0.70
1.00%
0.25%
4000030000
Time (min)
2000010000
90 h
20 h
Fig. 2. Evolution of backscattering results obtained at 20 1C for emulsions
containing 75wt% oil and 0.25 or 1wt% crayfish flour prepared at
6000 rpm (UT-T25) as a function of time: (A) BS% profiles; (B) BSrelresults. The arrows indicate the evolution of time.
0
2
4
6
8
G',G
''/(P
a)
103
102
30 min
2 h 6 h 8 h
24 h
Time G' G''
10–2 10–1 100 101 102
10–1 100 101 102
ω / (rad/s)
16
14
12
10
% (
V/V
)
Diameter / (μm)
24 h
6 h
2 h
30 min
Time DSD
Fig. 3. Influence of time after emulsification for emulsions containing
75wt% oil and 5wt% crayfish flour prepared at 6000 rpm and 20 1C: (A)
evolution of storage and loss moduli as a function of frequency; and (B)
evolution of droplet size distribution.
A. Romero et al. / Food Hydrocolloids 22 (2008) 1033–10431036
followed a gel-like behavior, characterized by G0 beingabout one order of magnitude higher than G00 within theexperimental frequency range. This behavior has beengenerally found for highly flocculated o/w emulsions suchas mayonnaise (Gallegos, Berjano, & Choplin, 1992;Guerrero & Ball, 1994), salad dressing stabilized byegg proteins (Franco et al., 1995; Moros, Cordobes,Franco, & Gallegos, 2003; Munoz & Sherman, 1992) andconcentrated emulsions stabilized by vegetable proteins(Bengoechea et al., 2006; Franco, Partal, Ruız, Conde, &Gallegos, 2000; Franco, Raymundo, Sousa & Gallegos,1998; Raymundo, Franco, Empis, & Sousa, 2002).Occurrence of a well-developed plateau region, where avery low-frequency dependence for G0 can be observed, hasbeen related to the formation of an elastic structuralnetwork that confers a high stability to the emulsion(Dickinson, 1989; Franco et al., 1995). As may be seen inthis figure, the values of G0 follows a power-law dependence
on frequency while G00passes through a minimum withfrequency. The loss tangent also showed a minimum, whichwas used to calculate an approximate value of the plateaumodulus (GN0) as reported by Wu (1989).Fig. 3B displays DSD profiles obtained after emulsifica-
tion, showing a log-normal unimodal distribution. Muchhigher sizes were obtained when the emulsions were dilutedin the buffer without SDS. In fact, the ratio between thevolume mean diameter, d4,3 in the absence of SDS and d4,3in 1% SDS buffer, defined as a flocculation index by Puppoet al. (2005), is in the order of 10 for 5wt% CF emulsions.As may be observed in Fig. 3B, the DSD profiles arenarrower at shorter time. A displacement toward highersizes due to the above-mentioned coalescence mechanismas well as an increase in polydispersity may also be noted(i.e. the uniformity ratio undergoes an increase from 0.59to 0.76 within 6 h after emulsification and storage at 20 1C).Moreover, this evolution seems to be restricted to a short

ARTICLE IN PRESSA. Romero et al. / Food Hydrocolloids 22 (2008) 1033–1043 1037
period of storage time since no further modification inDSD took place after a few hours.
Fig. 4shows the evolution of GN0 and d3,2 at 20 1C fortwo different storage temperatures. The emulsion wasdivided into two parts immediately after emulsification.The first part was stored at 5 1C. Aliquots of the emulsionstored at 5 1C were taken after different storage timelengths and kept at 20 1C for an equilibrium time (15min)before the linear dynamic viscoelasticity measurement wasperformed. The second part was stored and measureddirectly at 20 1C. A sudden decrease up to a minimum valuein GN0 took place simultaneously to the above-mentionedDSD evolution for the two storage conditions. Thisdecrease was followed by a significant increase in GN0 , inabsence of any further evolution of DSD, as well as anasymptotical evolution toward an equilibrium value.
Storage at low temperature may promote the develop-ment of a three-dimensional connective network amongmyofibrillar proteins, which eventually would prevent anyfurther coalescence. Proteins from the bulk and from theo/w interface can participate in this process. As shown inFig. 4, the evolution is similar when the emulsion wasstored at 5 1C instead of 20 1C. However, the decrease instorage temperature lead to a significant decrease inparameter U (shifting from 0.76 to 0.67) as well as in thevolumetric mean diameter (d4,3). A slight decrease in theSauter mean diameter was also found although was notstatistically significant. Therefore, a reduction in the rate ofcoalescence was obtained by decreasing the storagetemperature, leading to a larger specific interface areaand to an increase in the number of droplet interactions. Asa consequence, an enhancement of network structures wasobserved giving rise to a higher plateau modulus.
A consequence of the above-mentioned results is that theconditions for storage and measurements have to bepreviously established for each emulsion. The storagetemperature selected for this study was 5 1C and theviscoelasticity measurements were carried out 24 h after
0 1600
2800
3000
3200
3400
3600
GN
0 (
Pa
)
Time (min)
200 400 600 800 1000 1200 1400
d3
.2 (
μm
)
2.2
2.1
2.0
1.9
1.8
5ºC
20ºC
20ºC
5ºC
GN0 20ºC
GN0 5ºC
d3.2 20ºC
d3.2 5ºC
Fig. 4. Evolution of the plateau modulus and the Sauter mean diameter at
20 1C as a function of time after emulsification at different storage
temperatures (5 and 20 1C). The emulsions contain 75wt% oil and 5wt%
crayfish flour and were prepared at 6000 rpm.
emulsification, to allow enough time to finish the short-term evolution of the system.
3.3. Energy input
In order to obtain meaningful oscillatory shear data, thestrain range for linear viscoelasticity has been defined bymeans of a dynamic strain sweep test performed atconstant frequency. No significant differences for thecritical strain value (gc) of emulsions processed at differentagitation speeds were found (i.e. the critical strain is about11% at 6.3 rad/s).Fig. 5 shows the viscoelastic properties and DSD profiles
for emulsions stabilized by 5% crayfish flour as a functionof energy input, which may be expressed in terms ofrotational agitation speed for the rotor element of theemulsifying equipment. An increase in energy input did notproduce any change in the shape of the mechanicalspectrum but led to an increase in both G0 and G00. Thus,Fig. 5C shows an apparent increase in the plateau modulus,which is almost linear. Only the emulsion prepared at thehighest agitation speed deviates from this tendency. Anevolution toward smaller droplets was also found as can bededuced from the evolution of DSD curves (Fig. 5B) andfrom the values of the Sauter mean diameter (Fig. 5C). Nosignificant differences were observed for the uniformityratio, except at the lowest energy input conditions at whicha higher polydispersity was obtained.The widest used method to characterize the energy
efficiency of homogenizers consists of evaluating therelationship between the Sauter mean diameter obtainedafter emulsification and the amount of energy supplied(McClements, 2004; Schubert & Engel, 2004; Walstra,1983, Chapter 2).The total amount of energy supplied to an emulsion
during the homogenization process is often referred to as theenergy density, which has been defined as the energy inputper unit volume of emulsion, or the power input per unitvolume flow rate of emulsion (Schubert, Ax, & Behrend,2003). In general, the energy density is given by thefollowing function (Walstra & Smulder, 1998, Chapter 2):
Ev ¼
ZPvðtÞdt, (5)
where Pv is the net power density and t is the emulsificationtime.Droplet disruption does not take place unless Pv exceeds
some critical value, which depends on the Laplace pressureof the droplets. If the net power density is below thiscritical value in any region within the homogenizer, thendroplet disruption cannot occur and the energy is wasted(McClements, 2004).In the present analysis, the energy density (Ev) has been
calculated as follows:
Ev ¼
Z _W ðc;N; tÞ
Mc=rcðc; tÞ þMoðtÞ=roðtÞdt, (6)

ARTICLE IN PRESS
1
2
3
d3.2 = a*Ev–b
d3
.2 / (
μm
)
2.5
1.5
0.6 0.7 0.8 0.9
Ev / (GJ/m3)
Fig. 6. Relationship between the Sauter mean diameter and energy density
for emulsions containing 75wt% oil and 5wt% crayfish flour processed in
Ultra-Turrax device at different rotation velocities (3000, 4000, 6000, 8000
and 10,000 rpm).
0
2
4
6
8
1.5
2.0
2.5
G',G
''/(P
a)
104
103
102
101
10–2 10–1 100 101 102
10–1 100 101 102
ω / (rad/s)
10000
8000
6000
4000
3000
N (r.p.m.) DSD
N (r.p.m.) G' G''
3000
4000
6000
8000
10000
12
10
% (
V/V
)
Diameter / (μm)
5000
4500
4000
GN
0 (
Pa)
3500
3000
2500
2000
1500
d3.2
GN0
N (r.p.m.)
100008000600040002000
d3
.2 (
μm
)
Fig. 5. Influence of the agitation speed for emulsions containing 75wt%
oil and 5wt% crayfish flour: (A) evolution of the storage and loss moduli
with frequency; (B) evolution of droplet size distribution; and (C)
evolution of the plateau modulus and the Sauter mean diameter.
A. Romero et al. / Food Hydrocolloids 22 (2008) 1033–10431038
where c is the crayfish flour concentration, N is theagitation speed, _W ðc;N; tÞ is the power consumption andrc(c, t) and ro(t) are the densities of the continuous andoil phases, respectively. Both densities are time dependentdue to the increase in temperature along emulsification.A volume additivity assumption was taken in Eq. (6).
A plot of the mean droplet diameter produced by theemulsification device as a function of energy density isshown in Fig. 6. As can be observed, a power-lawrelationship fits the results fairly well at constant proteincontent:
d3:2 ¼ aE�bv (7)
with the constants a and b depending on the type ofemulsifier, the properties of the continuous and the dispersephase and the emulsification equipment used. This power-law equation has been used by other authors for a varietyof mechanical homogenizers (Schubert & Engel, 2004;Walstra, 1983)The value obtained for the power-law exponent, b, was
0.6 which is a little bit higher than the value of 0.4 reportedby Walstra (1983) for batch emulsification using a rotor-stator homogenizer; however, much higher emulsificationtime was used in the present study.The size of droplets in an emulsion is reduced by
increasing the intensity or duration of disruptive energysupplied during homogenization as long as there issufficient emulsifier available to cover the interfacesgenerated in the emulsification process (McClements,2004). The final DSD of any emulsion results from thedynamic equilibrium between droplet disruption andcoalescence, both of which are favored by an intenseagitation (Walstra, 1983). An increase in energy inputgenerally produces a displacement toward smaller sizessince droplet disruption becomes predominant over coales-cence, although coalescence is also promoted (Sanchez,Berjano, Brito, Guerrero, & Gallegos, 1998). As aconsequence, an increase in specific interface area takesplace leading to a greater number of droplet interactions(Rahalkar, 1992) and to the spread of the plateau regionbecause of enhancement of entangled network structures(Bengoechea et al., 2006; Franco et al., 1995).

ARTICLE IN PRESS
0
2
4
6
8
G',G
'' /
(Pa
)
104
103
102
101
100
ω / (rad/s)
10–2 10–1 100 101 102 103
6.25% 5.00% 3.75% 2.50% 1.25% 0.50% 0.37% 0.25% % wt G' G''
% (
V/V
)
22
20
18
16
14
12
10
Diameter / (μm)
100 101 102
% wt DSD
0.25%
0.37%
0.50%
1.25%
2.50%
3.75%
5.00%
6.25%
Fig. 7. Influence of crayfish flour concentration for emulsions containing
75wt% oil processed at 6000 rpm: (A) evolution of the storage and loss
moduli with frequency; and (B) evolution of droplet size distribution.
A. Romero et al. / Food Hydrocolloids 22 (2008) 1033–1043 1039
3.4. Crayfish flour concentration
The emulsions studied showed a wide linear viscoelasticrange, which depends on the protein concentration level.The critical strain values for the onset of the linearviscoelasticity region, which are shown in Table 1,remained almost constant excepting for the two lowestprotein contents which showed much lower values. As maybe noted, it was possible to stabilize 75wt% o/w emulsionsby using a small amount of protein, under the experimentalconditions. The minimum concentration of crayfish flourrequired for stabilization was 0.25wt% that corresponds toca. 0.16wt% protein.
The influence of crayfish flour concentration on linearviscoelastic properties of the emulsion studied may beobserved in Fig. 7A, which shows the evolution of themechanical spectrum, and Fig. 8A, which displays theevolution of the plateau modulus. These figures show anapparent increase in both moduli as well as in the plateaumodulus with increasing protein concentration. Fig. 7Aalso shows an initial decrease in the slope of G0 vs.frequency, with CF concentration, up to a roughlyconstant value (ca. 0.04, starting at 0.5wt%). A remark-able flattening in G00 at high frequencies also takes place asprotein content increases, which suggests an enhancementof the plateau region. Fig. 7B shows an evolution frombimodal to unimodal emulsions, with the first peak locatedat 1–2 mm. A growth of this peak may be observed asprotein content is raised. A displacement toward smallersizes may be clearly detected for the second peak. Bothpeaks eventually overlap to give an unimodal DSD profile.Fig. 8B displays the evolution of the Sauter mean diameter,which reflects a change of behavior at 0.50wt%. Thelowest polydispersity corresponds to this value (U�0.4). Atconcentrations lower than 0.50wt% a dramatic increase indroplet size takes place. Thus, 80% of the total reduction indiameter d3,2 (from 0.25 to 6.25wt%) takes place byduplicating the crayfish flour concentration from 0.25 to0.50wt%. Fig. 8B also shows the evolution of the energydensity with crayfish flour concentration. As may be seen,an increase in energy density is required to produceemulsions with higher protein content as a consequenceof the higher viscosity of the continuous phase. Thisincrease in energy density corresponds to higher values inthe plateau modulus and lower droplet sizes.
Some attempts of correlating rheology and microstruc-tural parameters of high internal phase ratio emulsionsmay be found in the literature. Princen and Kiss (1986)proposed an equation that related the small-strain elastic
Table 1
Critical strain values, gc, for emulsions stabilized by crayfish flour at
different concentrations for emulsions containing 75wt% oil processed at
6000 rpm
Concentration (wt%) 0.25 0.375 0.50 1.25 2.50 3.75 5.00 6.25
gc (%) 4.21 4.34 9.68 10.03 10.02 9.89 11.16 10.07
shear modulus to the interfacial tension, the volumefraction of the dispersed phase, and the Sauter meandiameter, for highly concentrated polydispersed emulsions.Some authors have successfully used this equation tocorrelate structural and rheological parameters for emul-sions stabilized by surfactants (Pal, 2006; Pons, Solans, &Tadros, 1995; Princen & Kiss, 1986; Sanchez et al., 1998)or polymeric surfactants (Perrin, 2000). Mason et al. (1997)working on monodisperse concentrated emulsions stabi-lized by SDS have obtained a universal master curve for theevolution of G0 that obeyed the following relationship:
G0 /2sd3;2
fðf� foÞ, (8)
where fo is the close packing volume fraction that has avalue of 0.64 for randomly packed monodisperse spheres.The rheology of emulsions is governed by a three-dimensional network of interfacial films when Princen
ARTICLE IN PRESS
0 1 2 3 4 5 6 7
0
1
2
3
4
5
6
7
8
9
10
Ev
GN
0 / (
Pa
) 103
102
Experimental GN0
Mason Model
CE (wt%)
d3.2
d3.2
0.8E
V (G
J/m
3)0.7
0.6
0.5
CE (wt%)
Fig. 8. Evolution of the plateau modulus, the Sauter mean diameter and
energy density for emulsions containing 75wt% oil processed at 6000 rpm,
as a function of crayfish flour concentration (CE).
G'
G''
ω (rad/s)
G',G
'' / (P
a)
103
102
101
100
10–2 10–1 100 101 102
(mg/g emul.) 0 0.25 1.00 2.00 5.00 SDS
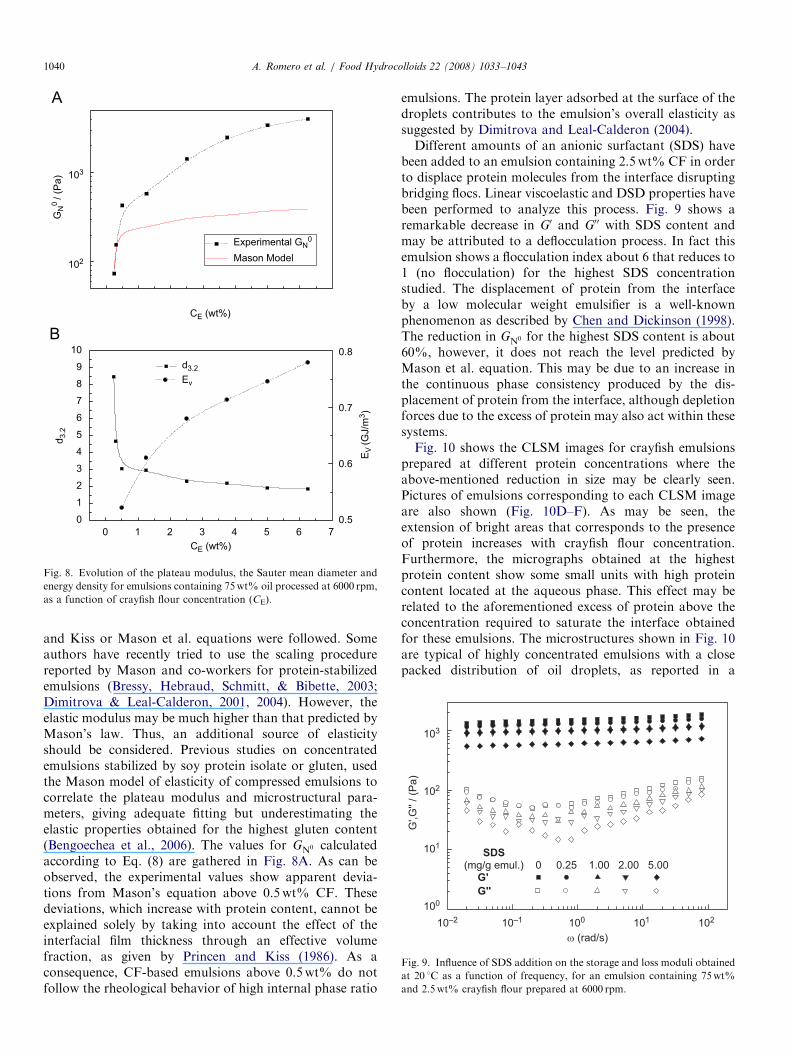
Fig. 9. Influence of SDS addition on the storage and loss moduli obtained
at 20 1C as a function of frequency, for an emulsion containing 75wt%
and 2.5wt% crayfish flour prepared at 6000 rpm.
A. Romero et al. / Food Hydrocolloids 22 (2008) 1033–10431040
and Kiss or Mason et al. equations were followed. Someauthors have recently tried to use the scaling procedurereported by Mason and co-workers for protein-stabilizedemulsions (Bressy, Hebraud, Schmitt, & Bibette, 2003;Dimitrova & Leal-Calderon, 2001, 2004). However, theelastic modulus may be much higher than that predicted byMason’s law. Thus, an additional source of elasticityshould be considered. Previous studies on concentratedemulsions stabilized by soy protein isolate or gluten, usedthe Mason model of elasticity of compressed emulsions tocorrelate the plateau modulus and microstructural para-meters, giving adequate fitting but underestimating theelastic properties obtained for the highest gluten content(Bengoechea et al., 2006). The values for GN0 calculatedaccording to Eq. (8) are gathered in Fig. 8A. As can beobserved, the experimental values show apparent devia-tions from Mason’s equation above 0.5wt% CF. Thesedeviations, which increase with protein content, cannot beexplained solely by taking into account the effect of theinterfacial film thickness through an effective volumefraction, as given by Princen and Kiss (1986). As aconsequence, CF-based emulsions above 0.5wt% do notfollow the rheological behavior of high internal phase ratio
emulsions. The protein layer adsorbed at the surface of thedroplets contributes to the emulsion’s overall elasticity assuggested by Dimitrova and Leal-Calderon (2004).Different amounts of an anionic surfactant (SDS) have
been added to an emulsion containing 2.5wt% CF in orderto displace protein molecules from the interface disruptingbridging flocs. Linear viscoelastic and DSD properties havebeen performed to analyze this process. Fig. 9 shows aremarkable decrease in G0 and G00 with SDS content andmay be attributed to a deflocculation process. In fact thisemulsion shows a flocculation index about 6 that reduces to1 (no flocculation) for the highest SDS concentrationstudied. The displacement of protein from the interfaceby a low molecular weight emulsifier is a well-knownphenomenon as described by Chen and Dickinson (1998).The reduction in GN0 for the highest SDS content is about60%, however, it does not reach the level predicted byMason et al. equation. This may be due to an increase inthe continuous phase consistency produced by the dis-placement of protein from the interface, although depletionforces due to the excess of protein may also act within thesesystems.Fig. 10 shows the CLSM images for crayfish emulsions
prepared at different protein concentrations where theabove-mentioned reduction in size may be clearly seen.Pictures of emulsions corresponding to each CLSM imageare also shown (Fig. 10D–F). As may be seen, theextension of bright areas that corresponds to the presenceof protein increases with crayfish flour concentration.Furthermore, the micrographs obtained at the highestprotein content show some small units with high proteincontent located at the aqueous phase. This effect may berelated to the aforementioned excess of protein above theconcentration required to saturate the interface obtainedfor these emulsions. The microstructures shown in Fig. 10are typical of highly concentrated emulsions with a closepacked distribution of oil droplets, as reported in a

ARTICLE IN PRESS
D
E
F
B
C
A
20 µm
20 µm
20 µm
Fig. 10. Images for emulsions containing 75wt% oil processed at
6000 rpm at different crayfish flour concentrations: CLSM images at (A)
0.5wt% flour; (B) 2.5wt% flour; (C) 5.0wt% flour; Pictures at (D)
0.5wt% flour; (E) 2.5wt% flour; and (F) 5.0wt% flour.
0 150
0.31% 0.50% 1.25%
2.50% 3.75% 5.00%0
2
4
6
8
10
GN
0 /(P
a)
104
103
102
101
SeparationPhase
(Creaming)
Phase
Separation
(Creaming)
d3.2
(μ
m)
Time (days)
50 100 0 150
Time (days)
50 100
0.25%
Fig. 11. Evolution of the plateau modulus and the Sauter mean diameter
for emulsions containing 75wt% oil, processed at 6000 rpm at different
crayfish flour concentration, as a function of storage time at 5 1C.
A. Romero et al. / Food Hydrocolloids 22 (2008) 1033–1043 1041
previous paper in which gluten or soya protein isolate wasused as the emulsifier (Bengoechea et al., 2006). Langton,Jordansson, Altskar, Sorensen, and Hermansson (1999)reported similar CLSM images of undiluted samples ofhighly concentrated emulsions stabilized by yolk in whichthe morphology of the water phase was described in termsof a network of yolk aggregates.
A remarkable evolution in visual appearance of theemulsion may be also noted (Fig. 10D–F). The modifica-tions associated with this change in visual appearance arean increase in GN0 (about 1 order of magnitude) and adecrease in d3,2 (about 50%).
3.5. Long-term stability
Physical stability is the most important property ofemulsions. In order to study long-term stability, emulsionsprepared at different crayfish flour concentrations werestored at 5 1C. Linear viscoelastic properties and DSDmeasurements were carried out along storage time for theseemulsions. The parameters selected to follow the evolution
along time were the plateau modulus and the Sauter meandiameter, which represent linear viscoelastic properties andDSD, respectively.Fig. 11shows a long-term stability diagram in terms of
the evolution of GN0 and d3,2over storage time. Bothparameters provide a fairly consistent information. Thus,as can be observed, the emulsions studied are highly stableabove a critical concentration (ca. 1.25%) since nosignificant evolution for GN0 and d3,2took place after 5months. Any physical instability was also detected.Conversely, below the critical crayfish flour concentrationa decrease in GN0 as well as an increase in d3,2over timeoccurred followed by the appearance of two phases due toa creaming process. As protein concentration decreases, adisplacement toward lower values in GN0 and higher valuesin d3,2 takes place and as a consequence the creamingprocess becomes faster. Fig. 11 also shows a region wherethe probability of creaming is very high.
4. Concluding remarks
Crayfish flour was checked as a new emulsifier in thestabilization of highly concentrated o/w emulsions, show-ing fairly good ability to produce long-term stability athigh pH provided that the flour content is above a criticalvalue. Thus, these emulsions followed a gel-like behavior,characterized by G0 being about one order of magnitudehigher than G00 within the experimental frequency range.This behavior was characteristic of highly concentratedemulsions showing bridging flocculation with a well-developed plateau region.An increase in energy input yielded higher values of
linear viscoelasticity functions and lower droplet size as hasbeen generally found in the literature on emulsionrheology. This behavior leads to an enhancement of theelastic network as well as an increase in emulsion stability.A remarkable change in behavior was obtained for
emulsions above 0.50wt% CF, which suggests that asaturation of the oil–water interface takes place. This

ARTICLE IN PRESSA. Romero et al. / Food Hydrocolloids 22 (2008) 1033–10431042
change is reflected by the values of critical strain, dropletsize and linear viscoelastic functions.Moreover, significantdeviations from the Mason et al. model of elasticity ofcompressed emulsions were found. Above this concentra-tion, the amount of protein exceeding the concentrationnecessary to saturate the interface tends to be located at theaqueous continuous phase, as may be deduced from CLSMimages.
From the long-term stability diagram it may beconcluded that crayfish flour-based emulsions withGN041 kPa and d3,2o3 mm show long-term stability (atleast over 5 months). In terms of energy efficiency, thismeans that highly stable crayfish flour emulsions may beproduced even at the lowest energy input studied at whichthe aforementioned conditions were fulfilled. Thus, theexperimental values obtained were GN0X1.6 kPa; andd3,2p2.2 mm.
Further processing would be required in order toestablish the actual potentials of these emulsions for foodapplications. Thus, these emulsions cannot be directly usedas a food product due to the high pH value. Although somealkaline food products may be found the pH is alwayslower than 8.5. Therefore, future research on theseemulsions should focus on the study of the modificationsthat would allow industrial commercialization of crayfishflour-stabilized emulsions for food applications (change inthe pH of the final emulsion, thermal processing to enhancegel strength, processing conditions for the crayfish flourmanufacture, etc.).
Acknowledgments
The authors acknowledge the financial support from theMEC (FPU grant). Part of this work was carried out inCIDCA (La Plata, Argentina) supported by a mobilitygrant from the Spanish MEC.
References
Bengoechea, C., Cordobes, F., & Guerrero, A. (2006). Rheology and
microstructure of gluten and soya-based o/w emulsions. Rheologica
Acta, 46, 13–21.
Bressy, L., Hebraud, P., Schmitt, V., & Bibette, J. (2003). Rheology of
emulsions stabilized by solid interfaces. Langmuir, 19, 598–604.
Chen, J., & Dickinson, E. (1998). Viscoelastic properties of protein-
stabilized emulsions: Effect of protein–surfactant interactions. Journal
of Agricultural and Food Chemistry, 46, 91–97.
Clark, D. C., Wilde, P. J., Wilson, D. R., & Wunsteck, R. C. (1992). The
interaction of esters with b-lactoglobulin and b-casein form bovine
milk. Food Hydrocolloids, 6, 173–186.
Cofrades, S., Carballo, J., Careche, M., & Colmenero, F. J. (1996).
Emulsifying properties of actomyosin from several species. Food
Science and Technology-Lebensmittel-Wissemscaft Technologie, 29,
379–383.
Cremades, O. (2004). Caracterizacion y produccion de carotenoproteınas de
P. Clarkii. Thesis, Universidad de Sevilla.
Dickinson, E. (1989). Food colloids—An overview. Colloids and Surfaces,
42, 191–204.
Dimitrova, T. D., & Leal-Calderon, F. (2001). Bulk elasticity of
concentrated protein-stabilized emulsions. Langmuir, 17, 3235–3244.
Dimitrova, T. D., & Leal-Calderon, F. (2004). Rheological properties of
highly concentrated protein-stabilized emulsions. Advances in Colloid
and Interface Science, 108–109, 49–61.
Elizalde, B. E., Bartholomai, G. B., & Pilosof, A. M. R. (1996). The effect
of pH on the relationship between hydrophilic/lipophilic character-
istics and emulsification properties of soy proteins. Food Science and
Technology-Lebensmittel-Wissemscaft Technologie, 29, 334–339.
Finch, R. (1977). Whatever happened to fish protein concentrate.
Prospects for success still not very bright. Food Technology, 31 44,
46–47, 49, 52–53.
Franco, J. M., Guerrero, A., & Gallegos, C. (1995). Rheology and
processing of salad dressing emulsions. Rheologica Acta, 34, 513–524.
Franco, J. M., Partal, P., Ruız, D., Conde, B., & Gallegos, C. (2000).
Influence of pH and protein thermal treatment on the rheology of pea-
protein-stabilized emulsions. Journal of the American Oil of Chemists
Society, 77, 975–983.
Franco, J. M., Raymundo, A., Sousa, I., & Gallegos, C. (1998). Influence
of processing variables on the rheological and textural properties of
lupin protein-stabilized emulsions. Journal of Agricultural Food
Chemistry, 46, 3109–3115.
Gallegos, C., Berjano, M., & Choplin, L. (1992). Linear viscoelastic
behaviour of commercial and model mayonnaise. Journal of Rheology,
36, 465–478.
Gallegos, C., Franco, J. M., Madiedo, J. M., Raymundo, A., & Sousa, I.
(2002). In J. Welti-Chanes, G. V. Barbosa-Canovas, & J. M. Aguilera
(Eds.), Engineering and food for the 21st century. Boca Raton, FL:
CRC Press.
Guerrero, A., & Ball, H. (1994). Effect of spray-dried or reduced-
cholesterol yolk and temperature on the linear viscoelastic properties
of mayonnaise. Journal of Texture Studies, 25, 363–381.
Langton, M., Jordansson, E., Altskar, A., Sorensen, C., & Hermansson,
A. M. (1999). Microstructure and image analysis of mayonnaises. Food
Hydrocolloids, 13, 113–125.
Mason, T. G., Lacasse, M. D., Levine, D., Grest, G. S., Bibette, J., &
Weiltz, D. A. (1997). Osmotic pressure and viscoelastic shear moduli of
monodisperse emulsions. Physical Review, 56, 3150–3166.
McClements, D. J. (2004). Food emulsions. Principles, practices and
techniques. Boca Raton, USA: CRC Press.
Mengual, O., Meunier, G., Cayre, I., Puech, K., & Snabre, P. (1999).
TURBISCAN MA 2000: Multiple Light scattering measurement for
concentrated emulsion and suspension instability analysis. Talanta, 50,
445–456.
Moros, J. E., Cordobes, F., Franco, J. M., & Gallegos, C. (2003).
Enhancement of gel strength by application of thermal treatments in
highly flocculated emulsions. Food Hydrocolloids, 17(2), 199–206.
Munoz, J., & Sherman, P. (1992). Dynamic viscoelastic properties of some
commercial salad dressings. Journal of Texture Studies, 21, 411–426.
Pal, R. (2006). Rheology of high internal phase ratio emulsions. Food
Hydrocolloids, 20, 997–1005.
Palazolo, G. G., Sorgentini, D. A., & Wagner, J. R. (2005). Coalescence
and flocculation in o/w emulsions of native and denatured whey soy
proteins in comparison with soy protein isolates. Food Hydrocolloids,
19, 595–604.
Pan, L. G., Tomas, M. C., & Anon, M. C. (2002). Effect of sunflower
lecithins on the stability of water-in-oil and oil-in-water emulsions.
Journal of Surfactants and Detergents, 5(2), 135–143.
Perrin, P. (2000). Droplet-droplet interactions in both direct and inverse
emulsions stabilized by a balanced amphiphilic polyelectrolyte.
Langmuir, 16, 881–884a.
Petursson, S., Decker, E. A., & McClements, D. J. (2004). Stabilization of
oil-in-water emulsions by cod protein extracts. Journal of Agricultural
and Food Chemistry, 52, 3996–4001.
Pons, R., Solans, C., & Tadros, Th. F. (1995). Rheological behaviour of
highly concentrated oil-in-water emulsions (o/w) emulsions. Langmuir,
11, 1966–1971.
Princen, H. M., & Kiss, A. D. (1986). Rheology of foams and highly
concentrated emulsions. Journal of Colloid and Interface Science, 112,
427–437.

ARTICLE IN PRESSA. Romero et al. / Food Hydrocolloids 22 (2008) 1033–1043 1043
Puppo, M. C., Speroni, F., Chapleau, N., de Lamballerie, M.,
Anon, M. C., & Anton, M. (2005). Food Hydrocolloids, 19,
289–296.
Rahalkar, R. R. (1992). Viscoelastic properties of oil–water emulsions. In
M. A. Rao, & J. F. Steffe (Eds.), Viscoelastic properties of foods
(pp. 317–354). London: Elvesier.
Raymundo, A., Franco, J. M., Empis, J., & Sousa, I. (2002). Optimization
of the composition of low-fat o/w emulsions stabilized by white lupin
protein. Journal of the American Oil of Chemists Society, 79,
783–790.
Sanchez, M. C., Berjano, M., Brito, E., Guerrero, A., & Gallegos, C.
(1998). Evolution of the microstructure and rheology of o/w emulsions
during the emulsification process. Canadian Journal of Chemical
Engineering, 76, 479–485.
Schubert, H., Ax, K., & Behrend, O. (2003). Product engineering of
dispersed systems. Trends in Food Science and Technology, 14,
9–16.
Schubert, H., & Engel, R. (2004). Product and formulation engineering of
emulsions. Trans IChemE, Part A. Chemical Engineering Research and
Design, 82, 1137–1143.
Spinelli, J., Groninger, H., Koury, B., & Miller, R. (1975). Functional protein
isolates and derivatives from fish muscle. Process Biochemistry, 31–35.
Suzuki, T. (1981). Fish and krill processing technology. London: Applied
Science Publishers.
Tornberg, E. (1978). Functional characteristics of protein stabilized
emulsions: Emulsifying behaviour of proteins in a valve homogenizer.
Journal of Food Science, 29, 97–106.
Walstra, P. (1983). Formation of emulsions. In P. Becher (Ed.), Encyclopedia
of emulsion technology, Vol. 1. New York, NY: Marcel Dekker.
Walstra, P., & Smulder, P. E. A. (1998). Emulsion Formation. In B. P.
Binks (Ed.), Modern aspects of emulsion science. Cambridge, Reino
Unido: The Royal Society of Chemistry.
Wu, S. (1989). Chain structure and entanglement. Journal of Polymer
Science, 27, 723–741.