Droplet size prediction model based on the upper limit log ...
11
Original Article Droplet size prediction model based on the upper limit log-normal distribution function in venturi scrubber Sang Won Lee a , Hee Cheon No b, * a Korea Hydro and Nuclear Power- Central Research Institute, 70 Gil, Yuseong-daero 1312, Yuseong-gu, Daejeon, 305-343, Republic of Korea b Department of Nuclear and Quantum Engineering, Korea Advanced Institute of Science and Technology, Yuseong-gu, Daejeon, 305-701, Republic of Korea article info Article history: Received 24 January 2019 Received in revised form 11 March 2019 Accepted 18 March 2019 Available online 19 March 2019 Keywords: Droplet size ULLN Breakup model Critical Weber number abstract Droplet size and distribution are important parameters determining venturi scrubber performance. In this paper, we proposed physical models for a maximum stable droplet size prediction and upper limit log-normal (ULLN) distribution parameters. For the proposed maximum stable droplet size prediction model, a Eulerian-Lagrangian framework and a Reitz-Diwakar breakup model are solved simultaneously using CFD calculations to reflect the effect of multistage breakup and droplet acceleration. Then, two ULLN distribution parameters are suggested through best fitting the previously published experimental data. Results show that the proposed approach provides better predictions of maximum stable droplet diameter and Sauter mean diameter compared to existing simple empirical correlations including Boll, Nukiyama and Tanasawa. For more practical purpose, we developed the simple, one dimensional (1-D) calculation of Sauter mean diameter. © 2019 Korean Nuclear Society, Published by Elsevier Korea LLC. This is an open access article under the CC BY-NC-ND license (http://creativecommons.org/licenses/by-nc-nd/4.0/). 1. Introduction The venturi scrubber is used to collect contaminated, fine par- ticle laden material from a gas flow before it is released into the environment. The main advantages of venturi scrubber are its high filtering efficiency and low installation and maintenance costs. Accordingly, it has been widely used in various engineering fields that require the efficient filtering of fine particles. The venturi scrubber consists of three components: a converging, throat, and diffuser section. The particle-laden gas flows into the convergent section and is accelerated in the throat. Generally, a liquid is introduced into the throat in the form of jets perpendicular to the gas flow, injected by an external pump through small orifices located in the throat side wall. These liquid jets interact with the high-velocity gas in the throat, causing breakup and atomization and generating fine droplets along the throat and diffuser. The main filtering mechanism of a venturi scrubber is inertial impaction, in which fine particles in the gas stream adhere to the surface of the atomized droplets, collecting the contaminated particles. In the diffuser section, the gas velocity decelerates for pressure recovery to minimize pumping cost [1]. Recently, venturi scrubber design has been actively considered in the nuclear field to minimize the release of aerosol-type radioactive material into the environment following a severe accident, such as the Fukushima accident [2]. The main difference between the typical application of a venturi scrubber and a nuclear industry application is that the scrubber be operated without electricity under the accident condition. To provide this capability, it has been proposed that the venturi scrubber be submerged inside the pool where water can passively flow into the scrubber throat under the effects of gravity head, compared the forced jet feeding used in a conventional venturi scrubber [3,4] as shown in Fig. 1 . The performance of the venturi scrubber has been extensively investigated for several decades to determine the optimal filtering efficiency for the lowest operating cost. Several major parameters influencing the collection efficiency and pressure drop have been identified, including droplet size and distribution inside the venturi scrubber. Therefore, accurate prediction of the size and distribution of droplets is important in enhancing the performance of a venturi scrubber. Many factors affect the droplet size inside a venturi scrubber depending on the operating conditions, including gas velocity, the ratio of liquid flow to gas flow (L/G), and orifice geometry. These conditions affect physical phenomena such as primary and sec- ondary atomization, coalescence of droplets, the sizes of droplets, and droplets deposition on the interior walls of the scrubber [1]. Therefore, the purpose of this study is to propose and evaluate an improved method for determining the droplet size and its * Corresponding author. E-mail address: [email protected] (H.C. No). Contents lists available at ScienceDirect Nuclear Engineering and Technology journal homepage: www.elsevier.com/locate/net https://doi.org/10.1016/j.net.2019.03.014 1738-5733/© 2019 Korean Nuclear Society, Published by Elsevier Korea LLC. This is an open access article under the CC BY-NC-ND license (http://creativecommons.org/ licenses/by-nc-nd/4.0/). Nuclear Engineering and Technology 51 (2019) 1261e1271
-
Upload
khangminh22 -
Category
Documents
-
view
0 -
download
0
Transcript of Droplet size prediction model based on the upper limit log ...

Original Article
Droplet size prediction model based on the upper limit log-normaldistribution function in venturi scrubber
Sang Won Lee a, Hee Cheon No b, *
a Korea Hydro and Nuclear Power - Central Research Institute, 70 Gil, Yuseong-daero 1312, Yuseong-gu, Daejeon, 305-343, Republic of Koreab Department of Nuclear and Quantum Engineering, Korea Advanced Institute of Science and Technology, Yuseong-gu, Daejeon, 305-701, Republic of Korea
a r t i c l e i n f o
Article history:Received 24 January 2019Received in revised form11 March 2019Accepted 18 March 2019Available online 19 March 2019
Keywords:Droplet sizeULLNBreakup modelCritical Weber number
a b s t r a c t
Droplet size and distribution are important parameters determining venturi scrubber performance. Inthis paper, we proposed physical models for a maximum stable droplet size prediction and upper limitlog-normal (ULLN) distribution parameters. For the proposed maximum stable droplet size predictionmodel, a Eulerian-Lagrangian framework and a Reitz-Diwakar breakup model are solved simultaneouslyusing CFD calculations to reflect the effect of multistage breakup and droplet acceleration. Then, twoULLN distribution parameters are suggested through best fitting the previously published experimentaldata. Results show that the proposed approach provides better predictions of maximum stable dropletdiameter and Sauter mean diameter compared to existing simple empirical correlations including Boll,Nukiyama and Tanasawa. For more practical purpose, we developed the simple, one dimensional (1-D)calculation of Sauter mean diameter.© 2019 Korean Nuclear Society, Published by Elsevier Korea LLC. This is an open access article under the
CC BY-NC-ND license (http://creativecommons.org/licenses/by-nc-nd/4.0/).
1. Introduction
The venturi scrubber is used to collect contaminated, fine par-ticle laden material from a gas flow before it is released into theenvironment. The main advantages of venturi scrubber are its highfiltering efficiency and low installation and maintenance costs.Accordingly, it has been widely used in various engineering fieldsthat require the efficient filtering of fine particles.
The venturi scrubber consists of three components: aconverging, throat, and diffuser section. The particle-laden gasflows into the convergent section and is accelerated in the throat.Generally, a liquid is introduced into the throat in the form of jetsperpendicular to the gas flow, injected by an external pumpthrough small orifices located in the throat side wall. These liquidjets interact with the high-velocity gas in the throat, causingbreakup and atomization and generating fine droplets along thethroat and diffuser. The main filtering mechanism of a venturiscrubber is inertial impaction, in which fine particles in the gasstream adhere to the surface of the atomized droplets, collectingthe contaminated particles. In the diffuser section, the gas velocitydecelerates for pressure recovery to minimize pumping cost [1].Recently, venturi scrubber design has been actively considered in
the nuclear field tominimize the release of aerosol-type radioactivematerial into the environment following a severe accident, such asthe Fukushima accident [2]. The main difference between thetypical application of a venturi scrubber and a nuclear industryapplication is that the scrubber be operated without electricityunder the accident condition. To provide this capability, it has beenproposed that the venturi scrubber be submerged inside the poolwhere water can passively flow into the scrubber throat under theeffects of gravity head, compared the forced jet feeding used in aconventional venturi scrubber [3,4] as shown in Fig. 1.
The performance of the venturi scrubber has been extensivelyinvestigated for several decades to determine the optimal filteringefficiency for the lowest operating cost. Several major parametersinfluencing the collection efficiency and pressure drop have beenidentified, including droplet size and distribution inside the venturiscrubber. Therefore, accurate prediction of the size and distributionof droplets is important in enhancing the performance of a venturiscrubber.
Many factors affect the droplet size inside a venturi scrubberdepending on the operating conditions, including gas velocity, theratio of liquid flow to gas flow (L/G), and orifice geometry. Theseconditions affect physical phenomena such as primary and sec-ondary atomization, coalescence of droplets, the sizes of droplets,and droplets deposition on the interior walls of the scrubber [1].Therefore, the purpose of this study is to propose and evaluate animproved method for determining the droplet size and its
* Corresponding author.E-mail address: [email protected] (H.C. No).
Contents lists available at ScienceDirect
Nuclear Engineering and Technology
journal homepage: www.elsevier .com/locate/net
https://doi.org/10.1016/j.net.2019.03.0141738-5733/© 2019 Korean Nuclear Society, Published by Elsevier Korea LLC. This is an open access article under the CC BY-NC-ND license (http://creativecommons.org/licenses/by-nc-nd/4.0/).
Nuclear Engineering and Technology 51 (2019) 1261e1271

distribution in a venturi scrubber.
2. Literature review
Various studies have been performed to determine the repre-sentative size of droplets in a venturi scrubber. Most of these pre-vious studies have used the sauter mean diameter (D32) as arepresentative droplet size [5]. A number of empirical correlationshave been proposed to adjust the D32 obtained using experimentalmeasurements [6]. Widely used empirical correlations were pro-vided by Nukiyama and Tanasawa [7], and by Boll et al. [8]. TheNukiyama and Tanasawa (NT) correlation was developed based ondata collected from annular flow in plain tubes with an experi-mental range of gas velocity from 73 to 230 m/s and an L/G of0.8e1.0 liter/m3, and can be described as follows:
D32 ¼ 0:585ug
ffiffiffiffis
rl
rþ 1:683 � 10�3
�mlffiffiffiffiffiffiffisrl
p�0:45
ðL=GÞ1:5 (1)
Boll's correlation was derived using commercial-scale venturiscrubber geometry with an experimental range of gas throat ve-locity of 30e90 m/s and an L/G of 0.6e2.5 liter/m3 as follows:
D32 ¼ 4:22� 10�2 þ 5:77� 10�3ðL=GÞ1:922u1:602g
(2)
Both correlations are typically written as two-term equationsin which the first term reflects the decrease in droplet size as thegas velocity increases due to the breakup mechanism and thesecond term reflects the effect of L/G due to coalescence [9].
Another important physical parameter affecting droplet size isthe maximum stable droplet diameter, Dmax. The representativenon-dimensional parameter related to Dmax is the critical Webernumber. The initial Weber number can be expressed as a balancebetween disruptive hydro-dynamic forces and the stabilizing sur-face tension force at the droplet injection location as follows:
We ¼ rgU2r;0D0
s(3)
where Ur,o is the initial relative velocity and Do is the initial dropletdiameter.
The critical Weber number Wecrit has been experimentallystudied and determined to be approximately 12 [10]. Based on thedefinition of the initialWeber number, themaximum stable dropletdiameter can thus be expressed as:
Dmax ¼ Wecrits
rgU2r;0
(4)
Pilch and Erdman [11] argued that the value of Dmax calculatedusing Eq. (4) is significantly underestimated compared to experi-mental data because it assumes instantaneous, complete breakupof the droplet at its initial position. Indeed, experimental evidencehas shown that breakup actually occurs over a specific period oftime called the total breakup time. The breakup of a droplet with alarge Weber number occurs through a multistage process in whichthe droplet undergoes continued breakup until its Weber numberdecreases below the critical Weber number. Accordingly, Pilch andErdman [11] suggested an expression for Dmax that reflects the ef-fects of droplet acceleration and the decrease in relative velocitybetween the droplet and gas flow during breakup considering thelocal Weber number as follows:
Dmax ¼ Wecrits
rgU2r;0
�1� Ud
Ur;0
��2
¼ Wecrits
rg�Ur;0 � Ud
�2 (5)
where Ud is the velocity of the droplet once all breakup processeshave terminated. To obtain Ud, Pilch and Erdman [11] suggested acorrelation between total breakup time and droplet accelerationbased on a modified momentum equation. Results show that thisapproach provides a better prediction capability of droplet size forlarge Weber numbers.
Another important research area is the droplet size distribution.Various experimental results show that the droplet size has its owndistribution. Information on droplet size distribution is useful infundamental analyses of the transport of mass or heat in adispersed flow [12]. Another advantage of knowing the droplet sizedistribution is that various information on droplet size, includingthe mass mean diameter and volume mean diameter, can be ob-tained using mathematical relationships. The use of a D32 instead ofdroplet size distribution inside the venturi scrubber has beenreviewed by Bayvel [13], who concluded that the calculated overallcollection efficiency would be different if the size distribution wasused instead of the D32.
Several theoretical droplet distribution functions have beenaccordingly proposed to fit experimentally obtained droplet dis-tribution data. Widely used distributions are the Rosin-Rammler(RR) distribution and the upper limit log-normal (ULLN) distribu-tion [14].
The RR distribution is a single-peaked distribution functionutilized when analyzing sprays [15]. In its cumulative form, thisvolume distribution function is expressed as:
F3ðdÞ ¼ 1� exph�
d ⁄ d�qi
(6)
Where d is the diameter that 63.2% of the total mass is in smallerthan, and q is the distribution parameter. The higher the value of q,the more uniform the droplet size distribution. The D32 can beobtained using RR distribution parameter and mathematicalgamma function:
D32 ¼ dG�1� 1 =q
�(7)
Mugele and Evans [12] reviewed several size distribution func-tions for dispersed flow and their application to experimental data,proposing a modification of the existing log-normal probabilitydistribution function, called the ULLN distribution, for the distri-bution of droplet size in sprays. The ULLN distribution for atomizingjets has been applied by several investigators to their experimental
Fig. 1. Schematics of forced feed and self-priming mode of venturi scrubber [2,3].
S.W. Lee, H.C. No / Nuclear Engineering and Technology 51 (2019) 1261e12711262

data in annular dispersed flow [14]. This distribution is given in thefollowing equation in a probabilistic distribution form:
f3ðdÞ ¼dDmaxffiffiffi
pp
dðDmax � dÞ exp� d2
�ln�
adDmax � d
��2 (8)
where, a ¼ dmaxdv50
� 1, d ¼ 0:394
logn
dv90=ðdmax�dv90Þdv50=ðdmax�dv50Þ
o, dv50 is the volume median
diameter, and d is the distribution parameter.The expression in Eq. (8) introduced three distribution param-
eters, including a new and physically significant parameterDmax. Allthe distribution functions except for the ULLN distribution have aninfinite Dmax, but it remains physically reasonable to include theDmax to maintain theoretical completeness.
Mugele and Evans [12] found that d and awould only be weaklydependent on the flow variables of annular flows by comparing theexperimental results. The sensitivities of d and a are shown inFig. 2. In this figure, x axis is the normalized droplet diameterrepresenting the ratio of droplet diameter to Dmax and y axis is theprobabilistic distribution. Several researchers have proposed ULLNdistribution parameters based on existing experimental data, assummarized in Table 1.
The relationship between Dmax and D32 can be easily derivedmathematically as:
D32
Dmax¼ 1�
1þ ae1�
4d2� (9)
3. Droplet size prediction model for CFD with ULLNdistribution parameters
We developed a calculation methodology for Dmax using acomputational fluid dynamic (CFD) approach with Lagrangianparticle tracking coupled with a particle breakup model. Also, weproposed ULLN distribution parameters using the best fit ofexperimentally determined D32 values.
3.1. CFD model
Computational fluid dynamicmethods have beenwidely used topredict complex thermo-hydraulic behavior and to optimizecomponent design. To calculate venturi scrubber performance, twocomponents, the gas flow and the droplet, should be analyzed. Forthe gas flow, the Eulerian approach is used as a continuous phase.The methods used to calculate droplet behavior are divided into
two types. The first type is the Eulerian approach, which has beenused in some researches [22] as it can predict the average proper-ties of droplets such as velocity, mass, temperature, and volumefraction using partial differential equations. The advantage of thismethod is its relatively simple modeling and fast running timewithreasonable prediction results. However, this approach does notpredict detailed particle behaviors, such as the breakup of thedroplet, interfacial area, and filtering efficiency. The second type ofdroplet behavior calculation is the Lagrangian particle trackingmethod, which tracks all the droplets injected into the domain asmoving mass points using ordinary differential equations. No vol-ume is occupied by the droplets in the continuous field; theyinstead work as momentum sinks [23]. The calculation of thebehavior of all the droplets is nearly impossible and even unnec-essary. So the parcel concept of using one representative particle foreach tracking path has been introduced. Using this concept, for acertain particle tracking path, the mass flow rate is conserved whileboth the representative droplet diameter and particle number ratecan change. The particle momentum sources consist of severalterms including drag force, buoyancy force, and virtual mass force.In this calculation, only drag force is considered because it isdominant in the breakup using the following equations [24]:
Ud ¼ dxidt
(10)
_nd ¼ _md
md(11)
dSdt
¼ �FD ¼ �12CDrdAd
��Ug � Ud���Ug � Ud
�_nd (12)
where, for a single droplet mass, md ¼ 43pr
3rd, and _md is thedroplet mass flow-rate for an individual particle tracking path.The momentum source term in Eq. (12) is coupled to the mo-mentum equation for the Eulerian gas flow field and a fullycoupled calculation scheme is used for the convergence criteria.In this paper, a combined Eulerian-Lagrangian approach is usedin which the gas flow field is solved using the Eulerian frame-work and the droplet behaviors are solved based on the
Fig. 2. Sensitivity of ULLN distribution parameters.
Table 1Suggested ULLN distribution parameters.
Study a d Experimental data used
Tatterson [16] 1.9 0.72 Wicks [17], Cousins [18], Tatterson [16]Kocanustafaogullari [20] 1.93 0.75 Wicks [17], Cousins [18], Lopes [19]Hay [21] 2.6 0.84 Hay [21]
S.W. Lee, H.C. No / Nuclear Engineering and Technology 51 (2019) 1261e1271 1263

Lagrangian framework.The droplet breakup model is divided into primary and sec-
ondary breakup stages. Primary breakup represents the breakup ofthe liquid jet at the nozzle exit that initially generates droplets,after which secondary breakup occurs downstream. If the orificegeometry is pressure swirl atomizer or nozzle cavitation is ex-pected, the initial droplet size might be different to the orifice size.In this calculation we assume the simple orifice geometry.
So, the blob model, one of the simplest models, which assumethe nozzle diameter as the initial droplet diameter, is used to
describe primary breakup.The secondary breakup model considers the deformation of the
initial spherical shape of the droplet and its atomization due to theturbulence of the gas and external aerodynamic forces acting on thedroplet. The main objective of the secondary breakup model is todetermine the stable droplet size. There are several models available,including those proposed by Reitz and Diwakar [25] and Schmehlet al. [26], aswell as theCascade atomization andbreakupmodel [27].
Stability criteria for Reitz-Diwakar model is exactly same as acritical Weber number definition. This means that the Reitz-Diwakar model is physically reasonable for predicting Dmax ratherthan D32. Therefore, we use Reitz-Diwakar model to calculate Dmax.This model assumes the breakup to be a multistage process inwhich the droplets undergo further breakup until their local Webernumber decreases below the critical Weber number as indicated byPilch and Erdman [11]:
dDddt
¼ �Dd � Dd;stable
tb(13)
The RD model was developed based on the experiments ofReinecke and Waldman [28] on the breakup of isolated drops andthe correlations given by Nicholls [29]. Breakup mechanisms areclassified as either stripping breakup or bag breakup based on thelocal Weber number. In stripping breakup, liquid is sheared fromthe periphery of the deforming drop surface in a high Webernumber. In bag breakup, a thin hollow bag is blown downstream
Table 2Reitz-Diwakar breakup model.
Bag Breakup Stripping Breakup
Criterion for breakup mechanism We> Wecrit ¼ 12 We. ffiffiffiffiffiffiffiffi
Redp > 0:5
Life time of unstable droplet
tb ¼ p
ffiffiffiffiffiffiffiffiffiffiffiffiffiffiffiffiffiffiffiffiffiffiffird
�Dd
=2
�3
2sd
vuuut tb ¼ 20Dd
=2
Vr
ffiffiffiffiffirdrg
s
Stable droplet diameter Dd; stable ¼ Wecrits
rgU2r
ðWecrit ¼ 12; defaultÞ Dd;stable ¼s2
rgU3r mg
(We. ffiffiffiffiffiffiffiffi
Redp ¼ 0:5
�
Table 3Problem setup for CFD calculations.
Parameter Value
Pressure/temperature 0.1 MPa, 25 �CGeometry Pipe diameter: 0.095 m
Pipe length: 3 mInjection location: 0.5 m
Working fluid Water/airFluid modeling method Gas: Eulerian
Droplet: Lagrangian particle trackingInitial droplet diameter 2 mm (orifice diameter)Total Lagrangian particle path 10,000Primary breakup model BlobSecondary breakup model Reitz-DiwakarInitial droplet rate 10 per particle pathTurbulent modeling SSTNo. of elements in mesh 970,000
Fig. 3. Droplet breakup behavior over the particle tracking path.
S.W. Lee, H.C. No / Nuclear Engineering and Technology 51 (2019) 1261e12711264

while it is attached to a toroidal rim. The bag eventually bursts,forming a large number of small droplets. It occurs at relatively alow Weber number [11].
In the CFD calculation, each cell has information on the gasvelocity, droplet velocity, and droplet size. So, the local Webernumber can be easily calculated.
The criterion for breakup mechanism selection is checked foreach drop parcel at each time step, and the droplet diameter iscalculated against each mechanism using Eq. (13) based on thecalculation of the lifetime of an unstable droplet and the stabledroplet diameter as summarized in Table 2.
As shown in Table 2, according to the definition of stable dropletdiameter under bag breakup, the final droplet size is determinedwhen the local Weber number converges to the critical Weber
number. This means that the RD model is physically reasonable forpredicting Dmax rather than D32. Therefore, in the CFD calculation ofthis study, the calculated droplet diameter is defined as Dmax.
In this study, particles are assumed to be spherical. The dragcoefficient of a spherical particle has been extensively studied andis proposed to be a function of the droplet Reynolds number. Thewidely used Shiller-Naumann correlation is applied in this study asfollows:
CD ¼ 24Red
�1þ 0:15Re0:687d
�(14)
where the droplet Reynolds number Red ¼ rgDdjUg�Udjmg
Fig. 4. Droplet velocity and diameter in the axial direction.
S.W. Lee, H.C. No / Nuclear Engineering and Technology 51 (2019) 1261e1271 1265

There are various kinds of different geometry used for theventuri scrubber. However, droplet breakup is mainly influenced bythe relative velocity between the gas and the droplet. The objectiveof this CFD calculation is to determine the Dmax during multistagebreakup and to reflect the effect of droplet acceleration consideringbreakup time and local Weber number. For this general application,a simple straight pipe is modeled to predict Dmax for isolateddroplet breakup. Gas velocity at the throat inlet is used as an initialcondition to calculate the local gas velocity and local droplet ve-locity inside venturi scrubber considering droplet breakup. Thenrelative velocity obtained are used to determine the Dmax.
A three-dimensional straight pipe was generated using theANSYS CFX 16 software package. The hybrid meshes, consisting oftetrahedrons and prisms, contained 970,000 elements. Theconvergence criteria for simulations were 10�5 RMS for the re-siduals. For turbulence modeling, the well-known SST was used.The turbulence increases due to the relative velocity between gasand droplet due to interfacial drag and breakup. In respect to theturbulence in particle tracking in CFX, the instantaneous fluid ve-locity is decomposed into mean velocity and fluctuating compo-nent. The particle has no volume occupied and just work as amomentum source. Particle follows separate trajectories due to therandom nature of the instantaneous fluid velocity. It is the fluctu-ating component of the fluid velocity that causes the dispersion ofparticles in a turbulent flow [24]. For the boundary condition at theinlet, the mass flow rate of the gas was applied. The droplet wasinjected as a particle transport fluid with amass flow rate boundarycondition and a total of 10,000 parcels. At the outlet, the pressureboundary condition was used. The detailed problem setup issummarized in Table 3.
3.2. Calculation results by CFD
Fig. 3 shows the representative Lagrangian particle tracking be-haviors of a droplet. Two gas velocity cases are compared: a low gasvelocity Vg of 30m/s and high gas velocity Vg of 75m/s. The breakupof each droplet diameter along the particle tracking paths is shownover a time span of 0.001 s. The first circle that leaves the orifice isprimary breakup, and the rest of them are all secondary breakup. Inthe case shown in Fig. 3(a), the droplet diameter reaches its stablecondition almost instantaneously. The case shown in Fig. 3(b), incontrast, shows continuous breakup occurring further downstreamof the injection location until reaching stable condition.
Fig. 4 shows the droplet velocity and diameter along the z di-rection. In the case shown in Fig. 4(a), the droplet reaches its stablecondition within 0.02 m beyond the injection location because thelocal Weber number reaches the critical Weber number. At thatlocation, the droplet velocity is ~4 m/s (indicated by the verticalline). However, in the case shown in Fig. 4(b), the droplet reaches itsstable conditionwithin 0.12m beyond the injection location, wherethe droplet velocity is ~20 m/s (indicated by the vertical line). Meshsensitivity studies are performed on 0.54 and 1.98 million meshes.Results show that the error range is within 0.44% and showsreasonable prediction capability.
Comparisons between the two cases are summarized in Table 4,in which the droplet diameter calculation based on the conven-tional initialWeber number is clearly under-estimated compared tothe Eulerian-Lagrangian method proposed in this study. Especiallyin the high gas velocity case, the difference between the Dmax
predicted using the initial Weber number and the proposedmethod is almost two-fold.
To confirm the validity of the proposed approach, three methodsfor predicting Dmax, the initial Weber number, the Pilch model [11],and the approachproposed in this study,were compared against fourreferenced experimental data sets with the results shown in Fig. 5.
The experimental data itself exhibits some scattering mainly dueto the different hydraulic conditions, measurement techniques, andexperimental setups of each referenced data set. In general, themethod proposed in this study shows a reasonable predictivecapability over the considered range compared to the other models.In particular, this study predicts the Dmax relatively well in the high-gas velocity region, while the other models significantly underesti-mate the Dmax. This indicates that in order to obtain a better estimateof Dmax during breakup under high Weber numbers, multistagebreakup and droplet acceleration need to be carefully considered.
To determine the ULLN distribution, three parameters, Dmax, a,and d, need to be determined. For Dmax, the CFD calculation results
Fig. 5. Comparison of different calculations of maximum droplet size.
Table 4Comparison of predicted Dmax results.
Vg (m/s) Dmax (micron)
Initial Weber number This study
30 m/s 819 97075 m/s 131 260
Fig. 6. Effect of L/G on droplet size distribution [21].
S.W. Lee, H.C. No / Nuclear Engineering and Technology 51 (2019) 1261e12711266

were used. The value of d, as described in Fig. 2 and Table 1, wasdetermined based on existing experimental data, but was notsignificantly sensitive to droplet size distribution. As a result, agenerally acceptable value of 0.75 was used. For the value of a, thebest fit of the experimental results of D32 was applied. It is impor-tant to note that many results show that as L/G increases, thedroplet size distribution becomes more uniform. That means thevolume median droplet size (Dv50) increased mainly due to coa-lescence because of higher probability of collision as L/G increases.A typical trend was shown by Hay et al. [21] and can be seen inFig. 6.
To reflect this experimental results, correlation factor that bestfit the ULLN distribution parameter of a, that representing the ratioof Dv50/Dmax, is suggested as shown in Eq. (15).:
a ¼ dmax
dv50� 1 ¼ a0=ð1þ f Þ (15)
where a0 ¼ 2:5 and f ¼ 0:6ðL=G� 1Þ if L/G > 1.0.The final proposed ULLN distribution and its relationship to
several other representative droplet diameters is shown in Fig. 7.
3.3. Comparisons of the proposed ULLN CFD model with Boll andNukiyama Tanasawa model
The proposed methodology for determining the droplet size in aventuri scrubber was validated by existing experimental data forthe venturi scrubber. Table 5 summarizes the published experi-mental data available for D32 in the venturi scrubber.
Among the experiments listed in Table 5, Costa et al. [31] andGuerra et al. [33] performed experiments using a relatively small L/G range. Their experimental results showed a large scattering of D32
against the value of L/G. In some data, the droplet size decreased asL/G increased, against the general trend. Guerra [33] pointed outthat their values for L/G were smaller than those of other studies,thus the results from these studies could not be directly compared.Therefore, in the comparison in this study, the data from Costa et al.[31] and Guerra et al. [33] for values of L/G < 0.15 were excluded.
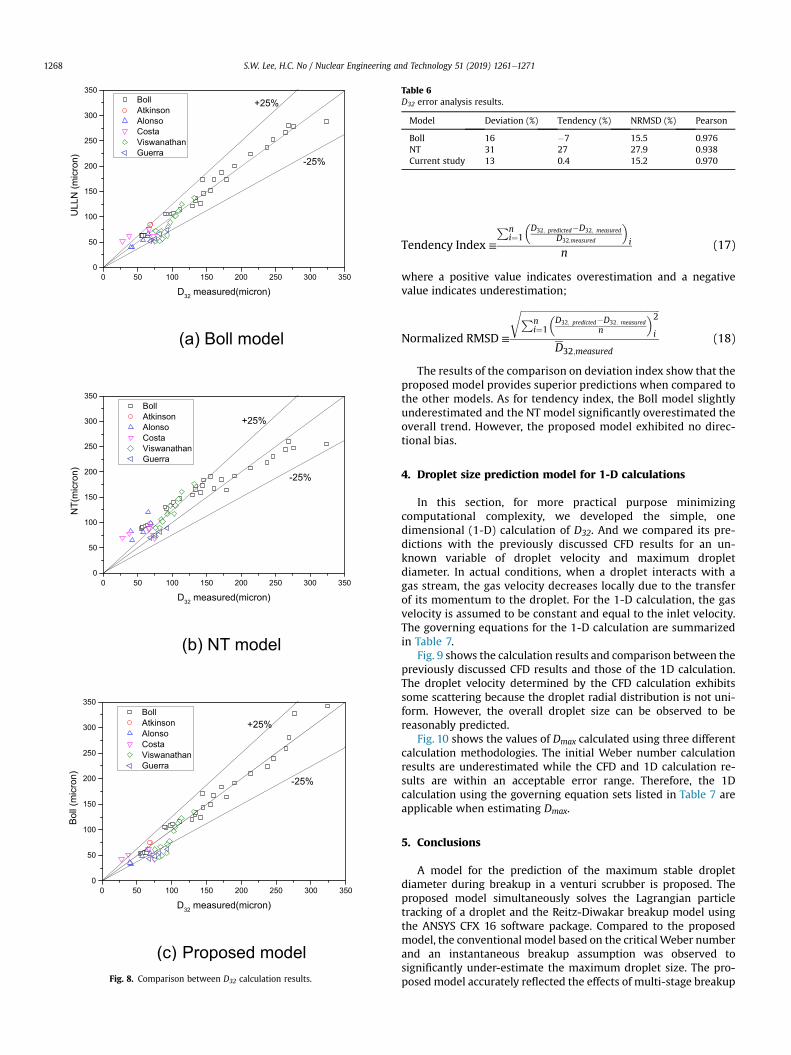
Comparisons of the resulting D32 were then performed betweenthe Boll model, the NT model, and the proposed model, shown inFig. 8 and summarized in Table 6.
The deviation index and tendency index, defined by Gonçalves[5], and the normalized root mean square difference (RMSD) werethen analyzed as follows, with the results as shown in Table 6
Fig. 7. Proposed normalized ULLN distribution.
Table 5Venturi scrubber experimental D32 data.
Study Gas velocity (m/s) L/G (liter/m3) Throat size (m) Throat length (m)
Boll et al. (1974) [8] 30e90 0.6e2.5 0.35ⅹ0.305 0.305Atkinson and Strauss (1978) [30] 50 0.2 0.016ⅹ0.04 0.026Alonso et al. (2001) [15] 70e90 0.5e1.0 0.019 diameter 0.064Costa et al. (2004) [31] 60e75 0.1e0.3 0.035ⅹ0.024 0.14Viswanathan et al. (2005) [32] 45e75 0.4e1.8 0.152ⅹ0.076 0.267Guerra et al. (2009) [33] 60e75 0.07e0.3 0.04ⅹ0.027 0.24
Deviation Index ≡
Pni¼1
�abs�D32; predicted � D32; measured
�.D32;measured
�i
n(16)
S.W. Lee, H.C. No / Nuclear Engineering and Technology 51 (2019) 1261e1271 1267
Tendency Index ≡
Pni¼1
�D32; predicted�D32; measured
D32;measured
�i
n(17)
where a positive value indicates overestimation and a negativevalue indicates underestimation;
Normalized RMSD ≡
ffiffiffiffiffiffiffiffiffiffiffiffiffiffiffiffiffiffiffiffiffiffiffiffiffiffiffiffiffiffiffiffiffiffiffiffiffiffiffiffiffiffiffiffiffiffiffiffiffiffiffiffiffiffiffiffiffiPni¼1
�D32; predicted�D32; measured
n
�2i
rD32;measured
(18)
The results of the comparison on deviation index show that theproposed model provides superior predictions when compared tothe other models. As for tendency index, the Boll model slightlyunderestimated and the NT model significantly overestimated theoverall trend. However, the proposed model exhibited no direc-tional bias.
4. Droplet size prediction model for 1-D calculations
In this section, for more practical purpose minimizingcomputational complexity, we developed the simple, onedimensional (1-D) calculation of D32. And we compared its pre-dictions with the previously discussed CFD results for an un-known variable of droplet velocity and maximum dropletdiameter. In actual conditions, when a droplet interacts with agas stream, the gas velocity decreases locally due to the transferof its momentum to the droplet. For the 1-D calculation, the gasvelocity is assumed to be constant and equal to the inlet velocity.The governing equations for the 1-D calculation are summarizedin Table 7.
Fig. 9 shows the calculation results and comparison between thepreviously discussed CFD results and those of the 1D calculation.The droplet velocity determined by the CFD calculation exhibitssome scattering because the droplet radial distribution is not uni-form. However, the overall droplet size can be observed to bereasonably predicted.
Fig. 10 shows the values of Dmax calculated using three differentcalculation methodologies. The initial Weber number calculationresults are underestimated while the CFD and 1D calculation re-sults are within an acceptable error range. Therefore, the 1Dcalculation using the governing equation sets listed in Table 7 areapplicable when estimating Dmax.
5. Conclusions
A model for the prediction of the maximum stable dropletdiameter during breakup in a venturi scrubber is proposed. Theproposed model simultaneously solves the Lagrangian particletracking of a droplet and the Reitz-Diwakar breakup model usingthe ANSYS CFX 16 software package. Compared to the proposedmodel, the conventional model based on the critical Weber numberand an instantaneous breakup assumption was observed tosignificantly under-estimate the maximum droplet size. The pro-posed model accurately reflected the effects of multi-stage breakupFig. 8. Comparison between D32 calculation results.
Table 6D32 error analysis results.
Model Deviation (%) Tendency (%) NRMSD (%) Pearson
Boll 16 �7 15.5 0.976NT 31 27 27.9 0.938Current study 13 0.4 15.2 0.970
S.W. Lee, H.C. No / Nuclear Engineering and Technology 51 (2019) 1261e12711268

Table 7Summary of governing equations for the 1-D calculations.
Unknown variables Governing equation Remark
vdðzÞ Force balanceFD ¼ d
dt
pD3
d6
rdvd
!¼ CD
pD2
d4
!rgðvg � vdÞ2
2
Constant Vg
Drag coefficientCD ¼ 24
Redð1þ 0:15Re0:687d Þ Shiller-Naumann
DdðzÞ Breakup model dDd
dt¼ � Dd � Dd;stable
tb
Reitz-Diwakar
Weber number Dd;stable ¼ Wecrits
rgðVg � VdÞ2Wecrit ¼ 12
D32ðzÞ ULLN distribution D32
Dd¼ 1�
1þ ae1.4d2
�
Fig. 9. Comparison of the results of CFD and 1D calculations.
S.W. Lee, H.C. No / Nuclear Engineering and Technology 51 (2019) 1261e1271 1269

and droplet acceleration during breakup. Results demonstrate thatthe proposed model for stable droplet diameter provides betterpredictions using existing experimental data, especially under ahigh Weber number.
As a well-known droplet size distribution function, the ULLNdistribution function requires three distribution parameters: Dmax,a, and d. For Dmax, the calculation results using the proposedmethod were used, while the values of a and d were selected usingvalues that best fit the existing experimental data. Furthermore, theeffects of L/G were considered. The comparison of results againstexperimental data for D32 in venturi scrubber geometry indicatedthat the proposed model provides better predictions than existingempirical correlations, such as those proposed by Boll et al. [8] andNukiyama and Tanasawa [7].
In this works, effect of liquid film on droplet size is notconsidered. So, in future work, the effect of liquid film fraction andthe entrainment-induced droplet size need to be further examinedfor technical completeness.
Conflicts of interest
All authors have no conflicts of interest to declare.
Acknowledgement
This research is supported by Korea Hydro & Nuclear Power Co.,under the R&D program supervised by KHNP Central researchinstitute.
Nomenclature
Ad cross-sectional area of droplet [m2�a Upper Limit Log Normal distribution parameter [�]Cd drag coefficient [-]
d Rosin Rammler distribution parameter that dropletdiameter that 63.2% of the total mass is in smallerdiameter [m]
D0 Initial droplet diameter [m]D10 Arithmetic mean diameter [m]D30 Volume mean diameter [m]D32 Sauter mean diameter [m]Dd Droplet diameter during breakup [m]Dd;stable Stable droplet diameter assuming instantaneous
breakup [m]
Dmax Maximum stable droplet diameter [m]dv10 droplet diameter for 10th percentiles of total droplet
volume [m]dv50 droplet diameter for 50th percentiles of total droplet
volume, volume median diameter [m]dv90 droplet diameter for 90th percentiles of total droplet
volume [m]L/G Liquid to gas ratio [liter=m3]md Single droplet mass [kg]_md Droplet mass flowrate [kg/s]_nd droplet number rate [#/s]NT Nukiyama and Tanasawaq Rosin Rammler distribution parameterRed Droplet Reynolds numberRR Rosin RammlerS Momentum source term [Ns]ULLN Upper Limit Log NormalU Velocity ½m=s�Ur Relative velocity ½m=s�F3 cumulative volume distribution function [�]f3 probabilistic volume distribution function [�]x traveling distance of droplet [m]
Greek lettersm viscosity ½N s=m2�r density ½kg=m3�s surface tension ½N=m�d ULLN distribution parameter [�]tb Lifetime of unstable droplet [s]G Gamma function [�]
Subscriptd dropletl liquidg gas0 initial
References
[1] V.G. Guerra, J.A.S. Gonçalves, J.R. Coury, Experimental verification of the effectof liquid deposition on droplet size measured in a rectangular venturiscrubber, Chem. Eng. Process: Process Intensification 50 (11e12) (2011)1137e1142.
[2] M. Ali, C.Q. Yan, Z.N. Sun, H. Gu, K. Mehboob, Iodine removal efficiency in non-submerged and submerged self-priming venturi scrubber, Nucl. Eng. Technol.45 (2013) 203e210.
[3] M. Lehner, Aerosol separation efficiency of a venturi scrubber working in self-priming mode, Aerosol Sci. Technol. 28 (5) (1998) 389e402.
[4] J.C. Lee, W.H. Jung, H.C. Lee, G.T. Kim, D.Y. Lee, Experimental study on aerosolscrubbing efficiency of self-priming venturi scrubber submerged in waterpool, Ann. Nucl. Energy 114 (2018) 571e585.
[5] J.A.S. Gonçalves, et al., Evaluation of the models available for the prediction ofpressure drop in venturi scrubbers, J. Hazard Mater. 81 (1e2) (2001) 123e140.
[6] C. Berna, et al., Review of droplet entrainment in annular flow: character-ization of the entrained droplets, Prog. Nucl. Energy 79 (2015) 64e86.
[7] S. Nukiyama, Y. Tanasawa, An experiment on the atomization of liquid bymeans of an air stream (1. Report), Trans. Jap. Soc. Mech. Eng. Ser. A 4 (14)(1938) 128e135.
[8] R. Boll, et al., Mean drop size in a full scale venturi scrubber via trans-missometer, J. Air Pollut. Control Assoc. 24 (10) (1974) 934e938.
[9] B. Azzopardi, Drop sizes in annular two-phase flow, Exp. Fluid 3 (1) (1985)53e59.
[10] L.-P. Hsiang, G. Faeth, Drop deformation and breakup due to shock wave andsteady disturbances, Int. J. Multiph. Flow 21 (4) (1995) 545e560.
[11] M. Pilch, C. Erdman, Use of breakup time data and velocity history data topredict the maximum size of stable fragments for acceleration-inducedbreakup of a liquid drop, Int. J. Multiph. Flow 13 (6) (1987) 741e757.
[12] R. Mugele, H. Evans, Droplet size distribution in sprays, Ind. Eng. Chem. 43 (6)(1951) 1317e1324.
[13] L.P. Bayvel, The effect of the polydispersity of drops on the efficiency of aventuri scrubber, Trans. Inst. Chem. Eng. 60 (1) (1982) 31e34.
[14] B. Azzopardi, Drops in annular two-phase flow, Int. J. Multiph. Flow 23 (1997)1e53.
Fig. 10. Comparison of Dmax prediction for different gas velocities Vg.
S.W. Lee, H.C. No / Nuclear Engineering and Technology 51 (2019) 1261e12711270

[15] D. Fern�andez Alonso, et al., Drop size measurements in venturi scrubbers,Chem. Eng. Sci. 56 (16) (2001) 4901e4911.
[16] D.F. Tatterson, J.C. Dallman, T.J. Hanratty, Drop sizes in annular gas-liquidflows, AIChE 23 (1) (1977) 68e76.
[17] M. Wicks, A. Dukler, In situ measurements of drop size distribution in 2-phaseflow-A newmethod for electrically conducting liquids, Chem. Eng. Prog. 62 (8)(1966).
[18] L.B. Cousins, G.F. Hewitt, Liquid Phase Mass Transfer in Annular Two-phaseFlow, Atomic Energy Research Establishment, Harwell, 1968.
[19] J.C. Lopes, A. Dukler, Droplet Sizes, Dynamics and Deposition in VerticalAnnular Flow, Dept. of Chemical Engineering, TX (USA), 1985. Houston Univ.
[20] G. Kocamustafaogullari, S. Smits, J. Razi, Maximum and mean droplet sizes inannular two-phase flow, Int. J. Heat Mass Transf. 37 (6) (1994) 955e965.
[21] K. Hay, Z.-C. Liu, T. Hanratty, Relation of deposition to drop size when the ratelaw is nonlinear, Int. J. Multiph. Flow 22 (5) (1996) 829e848.
[22] V.G. Guerra, et al., Pressure drop and liquid distribution in a venturi scrubber:experimental data and CFD Simulation, Ind. Eng. Chem. Res. 51 (23) (2012)8049e8060.
[23] S.I. Pak, K.S. Chang, Performance estimation of a venturi scrubber using acomputational model for capturing dust particles with liquid spray, J. HazardMater. 138 (3) (2006) 560e573.
[24] CFX 16.1 Solver Theory Guide - Particle Transport I, ANSYS, 2015.
[25] R.D. Reitz, R. Diwakar, Structure of High-Pressure Fuel Sprays, 1987. SAETechnical Paper Series 870598.
[26] R. Schmehl, G. Maier, S. Wittig, CFD analysis of fuel atomization, secondarydroplet breakup and spray dispersion in the premix duct of a LPP combustor,in: ICLASS 2000: 8th International Conference on Liquid Atomization andSpray Systems, ILASS, Pasadena, CA, USA, 2000, 16-20 July 2000.
[27] F.X. Tanner, Development and validation of a cascade atomization and dropbreakup model for high-velocity dense sprays, Atomization Sprays 14 (3)(2004).
[28] W. Reinecke, G. Waldman, A Study of Drop Breakup behind Strong Shockswith Applications to Flight, AVCO SYSTEMS DIV WILMINGTON MA, 1970.
[29] J. Nicholls, Steam and droplet breakup by shock waves, NASA SP 194 (1972).[30] D. Atkinson, W. Strauss, Droplet size and surface tension in venturi scrubbers,
J. Air Pollut. Control Assoc. 28 (11) (1978) 1114e1118.[31] M. Costa, et al., Droplet size in a rectangular venturi scrubber, Braz. J. Chem.
Eng. 21 (2) (2004) 335e343.[32] S. Viswanathan, D.S. Lim, M.B. Ray, Measurement of drop size and distribution
in an annular two-phase, two-component flow occurring in a venturiscrubber, Ind. Eng. Chem. Res. 44 (19) (2005) 7458e7468.
[33] V.G. Guerra, J.A.S. Gonçalves, J.R. Coury, Experimental investigation on theeffect of liquid injection by multiple orifices in the formation of droplets in aVenturi scrubber, J. Hazard Mater. 161 (1) (2009) 351e359.
S.W. Lee, H.C. No / Nuclear Engineering and Technology 51 (2019) 1261e1271 1271