Method Abstracts | Pickering Laboratories
96
HPLC Post-Column Derivatization Method Abstracts Amino Acids / Glyphosate / Supplements / Contaminants & Residues / Antibiotics / Pharmaceuticals / Mycotoxins / Cannabis & Hemp / Sugars & Sweeteners
-
Upload
khangminh22 -
Category
Documents
-
view
6 -
download
0
Transcript of Method Abstracts | Pickering Laboratories

HPLC Post-Column Derivatization
Method Abstracts
Amino Acids / Glyphosate / Supplements /
Contaminants & Residues / Antibiotics / Pharmaceuticals /
Mycotoxins / Cannabis & Hemp / Sugars & Sweeteners

Table of Contents
Analysis of Amino Acids30-minute Amino Acids Analysis of Hydrolyzed Samples Hydrolyzed Samples (MA-380) 3
Amino Acids According to European Pharmacopeia (MA-391) 5
Amino Acids Analysis of Cell Culture Media (MA-371) 9
Amino Acids Analysis of Monoclonal Antibodies (MA-373) 11
Amino Acids in Oxidized and Unoxidized Feed Samples (MA-374) 13
Amino Acids in Supplements (MA-393) 15
Amino Acids in Dietary Ingredients and Supplements (MA-397) 19
PKU and MSUD Screening Methods (MA-385) 21
70-min Amino Acids Analysis of Physiological Samples (MA-382) 23
Analysis of GlyphosateAnalysis of Glufosinate and Glyphosate in Water by HPLC With Post-Column Derivatization (MA-296) 25
Glyphosate Analysis in Foods by HPLC With Post-Column Derivatization and Fluorescence Detection (MA-211) 27
Glyphosate in Soy Beans, Corn and Sunflower Seeds (MA-207) 29
Glyphosate and AMPA Analysis in Crops (MA-206) 31
Analysis of Contaminants and ResiduesAnalysis of N-Methyl Carbamate Pesticides in Food (MA-472) 33
Highly Sensitive Analysis of Chromium (VI) in Drinking Water by Ion Chromatography (IC) with Post-Column Derivatization and UV/VIS Detection (MA-388) 35
Simultaneous Determination of Nitrite and Nitrate in Baby Food (MA-121) 37
Sensitive and Selective Analysis of Nitrite and Nitrate in Drinking Water by Ion Chromatography (IC) With Post-Column Derivatization and UV/VIS Detection (MA-129) 39
Simultaneous Determination of Nitrite and Nitrate in Processed Foods (MA-123) 41
Analysis of Paralytic Shellfish Toxins in Bivalve Mollusks using HPLC Method with Post-Column Derivatization and Fluorescence Detection (MA-105) 43
Analysis of Formaldehyde (MA-325) 45
Analysis of Biogenic Amines (MA-102) 47
Analysis of N-Nitroso-diethanolamine (NDELA) in Cosmetics (MA-386) 48
Analysis of SupplementsAnalysis of Theanine in Tea by HPLC With Post-ColumnDerivatization (MA-378) 50
Simultaneous Analysis of Vitamins B1, B2, B3 and B6 in Protein Powders and Supplements (MA-239) 51
Analysis of Antioxidants in Foods and Dietary Supplements Using HPLC With Post-Column Derivatization (MA-231) 53
Analysis of Bioavailable Niacin (Vitamin B3) by HPLC With Post-Column Photochemical Derivatization in Foods and Supplements (MA-237) 55
Analysis of Vitamin B1 in Foods and Dietary Supplements by HPLC With Post-Column Derivatization and Fluorescence Detection (MA-233) 57
Analysis of Antibiotics and Other PharmaceuticalsAnalysis of Alprostadil by HPLC With Post-Column Derivatization (MA-334) 60
Aminoglycoside Antibiotics in Feeds (MA-205) 61
Analysis of Polyether Antibiotics in Animal Feeds by HPLC With Post-Column Derivatization (MA-264) 63
Analysis of Voglibose in Pharmaceutical Formulations (MA-327) 65
Analysis of Apramycin Sulfate According to British Veterinary Pharmacopeia (MA-267) 67
Analysis of MycotoxinsClean-Up and Analysis of Aflatoxins and Ochratoxin A in Herbs and Spices (MA-218) 69
Clean-Up and Determination of Aflatoxins in Peanuts and Peanut Butter (MA-215) 71
Aflatoxins (MA-110) 73
Analysis of Fumonisins FB1, FB2 and FB3 Using HPLC With Post-Column Derivatization (MA-249) 74
Analysis of Fumonisins in Grains and Feed (MA-252) 75
Multi-Residue Mycotoxin Analysis—Single Run Analysis of Deoxynivalenol, Aflatoxins, Ochratoxin A, Zearalenone and Fumonisin by HPLC and Post-Column Derivatization (MA-203) 77
Analysis of Cannabis and HempAnalysis of Cannabinoids in Hemp and Hemp-Containing Products Using HPLC With Post-Column Derivatization (MA-242) 80
Analysis of Cannabinoids Using HPLC With Post-Column Derivatization (MA-243) 82
Analysis of Mycotoxins in Cannabis Plant and Cannabis-Containing Products (MA-241) 84
Analysis of Mycotoxins in Hemp and Hemp- Containing Edible Products (MA-244) 86
Analysis of Sugars and SweetenersAnalysis of Sugars in Feeds (MA-223) 89
Sulfonamide Artificial Sweeteners in Food Products (MA-124) 91
1 / Pickering Laboratories Method Abstracts

Analysis of Amino Acids
2Pickering Laboratories Method Abstracts /

Analysis of Amino Acids / MA-380
30-minute Amino Acids Analysis of Hydrolyzed Samples Hydrolyzed Samples (MA-380)
Pickering Laboratories specializes in the manufacturing of cation-exchange columns and eluants for Amino Acids analysis. No other technique has been shown to match the reproducibility and selectivity of ion-exchange analysis with post-column Ninhydrin detection. Nor is there a chromatography technique that provides as much information; the 570/440 nm signal ratio for each amino acid is a constant and so offers information about peak purity.
Onyx PCX post-column derivatization system provides a unique opportunity to combine eluant gradient capabilities of modern HPLC instruments with column temperature gradients. As might be expected, this capability also reduces the analysis time.
We introduce an accelerated Amino Acids analysis method for hydrolyzed samples that utilizes temperature and eluant gradients.
Method
Analytical ConditionsColumn: High-efficiency Sodium cation-exchange column,
4.6 x 110 mm, Catalog Number 1154110T
Guard: Cation-exchange GARD™, Catalog Number 1700-3102
Flow Rate: 0.6 mL/min
Mobile Phase: See method
Post-Column ConditionsPost-Column System: Onyx PCX or Pinnacle PCX
Reactor Volume: 0.5 mL
Temperature: 130 ˚C
Reagent: Trione Ninhydrin reagent
Flow Rate: 0.3 mL/min
Detection: UV/VIS 570 nm for primary amino acids 440 nm for secondary amino acids
Column Oven Program
Time Temp ºC
0 55
12 55
17 70
32 70
33 55
Method for Oxidized Feeds Hydrolysate Samples
Time Na270 % Na425 % Na640 % RG011 %
0 100 0 0 0
4.0 100 0 0 0
15.0 0 100 0 0
16.0 0 0 100 0
31.0 0 0 100 0
31.1 0 0 0 100
33.0 0 0 0 100
33.1 100 0 0 0
40.0 100 0 0 0
1 Aspartic Acid
2 Threonine
3 Serine
4 Glutamic Acid
5 Proline
6 Glycine
7 Alanine
8 Cystine
9 Valine
10 Methionine
11 Isoleucine
12 Leucine
13 Norleucine
14 Tyrosine
15 Phenylalanine
16 Histidine
17 Lysine
18 Tryptophan
19 Ammonia
20 Arginine
21 Cysteic Acid
22 Methionine Sulfone
Fig 1. Chromatogram of oxidized feeds hydrolysate standard
0 5 10 15 20 25 30 min
21
22
1 2 3
4
5
6
7
8
910
1112
13
14
15
16
17
18
20
3 / Pickering Laboratories Method Abstracts

Analysis of Amino Acids / MA-380
1 Aspartic Acid
2 Threonine
3 Serine
4 Glutamic Acid
5 Proline
6 Glycine
7 Alanine
8 Cystine
9 Valine
10 Methionine
11 Isoleucine
12 Leucine
13 Norleucine
14 Tyrosine
15 Phenylalanine
16 Histidine
17 Lysine
18 Tryptophan
19 Ammonia
20 Arginine
21 Cysteic Acid
22 Methionine Sulfone
Fig 2. Chromatogram of protein hydrolysate standard
0 5 10 15 20 25 30
1 2 3
4
5
6
7
8
910
1112
1314
15
16
17
18
20
19
Column Oven Program
Time Temp ºC
0 46
4 46
9 70
32 70
33 46
Method for Protein Hydrolysate Samples
Time Na315 % Na425 % Na640 % RG011 %
0 100 0 0 0
4.0 100 0 0 0
15.0 0 100 0 0
16.0 0 0 100 0
31.0 0 0 100 0
31.1 0 0 0 100
33.0 0 0 0 100
33.1 100 0 0 0
40 100 0 0 0
4Pickering Laboratories Method Abstracts /

Analysis of Amino Acids / MA-391
Amino Acids According to European Pharmacopeia (MA-391)
The European Pharmacopoeia (Ph. Eur.) defines requirements for the qualitative and quantitative composition of medicines, as well as the tests to be carried out on medicines and on substances and materials used in their production.
It covers active substances, excipients and preparations of chemical, animal, human or herbal origin, homoeopathic preparations and homoeopathic stocks, antibiotics, as well as dosage forms and containers. It also includes tests on biologicals, blood and plasma derivatives, vaccines and radiopharmaceutical preparations. The European Pharmacopoeia and its requirements are legally binding in the member states of the European Pharmacopoeia Convention and the European Union.
All manufacturers of medicines or substances for pharmaceutical use therefore must apply the Ph. Eur. quality standards in order to be able to market and use these products in Europe.
Amino Acids analysis can be used for:
- Identification tests on biopharmaceutical active ingre-dients (e.g. peptides, proteins) by means of amino acids composition analysis;
- Impurities and related substances determination on APIs (Active Pharmaceutical Ingredients, e.g. free amino acids) and intermediates;
- Single or total amino acids quantification in drug products, including markers determination in complex matrixes (e. g. phytopharmaceuticals).
The following Ph. Eur. monographs have already officially introduced the Amino Acids analysis method with post-column Ninhydrin derivatization as the analytical procedure required for the determination of the
Ninhydrin-positive substances, and additional papers are expected to be published in upcoming months:
- Cysteine HCl Monohydrate 01/2014:0895
- Isoleucine 07/2013:0770
- Leucine 07/2013:0771
- Lysine HCl 07/2013:0930
- Serine 01/2014:0788
- Proline 01/2014:0785
- Threonine 01/2014:1049
- Valine 01/2014:0796
- Arginine 07/2014:0806
Pickering Laboratories, Inc. offers a complete solution for Amino Acids Analysis according to European Pharmacopoeia. This includes the Onyx PCX post-column derivatization instrument, analytical columns and GARD, buffers and Trione® Ninhydrin reagent. The Onyx PCX is capable of performing column temperature gradients that allow easily modified conditions and improved run times and amino acids separations. The methods presented in this application note were optimized to comply with system suitability requirements of Pharmacopoeia methods.
Each Pharmacopoeia monograph describes the preparation of the test and reference solutions specific for each amino acid. The solutions are used for calculations of percentage contents, impurity levels as well as parameters of system suitability. Resolution of 1.5 is required between Leucine and Isoleucine peaks.
Table 1 summarizes the solutions used in each monograph.
5 / Pickering Laboratories Method Abstracts
Reference Solutions, ug/mL
Amino acids Test solutions ug/mL Cys CSSC Lys Ser Thr Val Arg Leu Ile Ile and Leu Pro NH4
Valine 600 1.2 1.2 3 each 1.2 0.12
Proline 600 0.6 3 each 1.2 0.12
Leucine 600 and 24 1.2 0.12 3 each 1.2 0.12
Threonine 600 1.2 3 each 1.2 0.12
Serine 600 1.2 3 each 1.2 0.12
Lysine 600 1.2 3 each 1.2 0.12
Isoleucine 600 1.2 1.2 1.2 3 each 1.2 0.12
Arginine 600 1.2 1.2 3 each 1.2 0.12
Cysteine 600 1.2 1.2 3 each 1.2 0.12
Cys = Cysteine, CSSC = Cystine, Lys = Lysine, Ser = Serine, Thr = Threonine, Val = Valine, Ala = Alanine, Arg = Arginine, Ile = Isoleucine, Leu = Leucine, Pro = Proline, NH4 = ammonia
Table 1. Reference guide for Pharmacopoeia methods

For all amino acids, except Cysteine, Sodium-based and Lithium-based methods are available. For Cysteine analysis, only Lithium-based methods are suitable. Sodium-based methods have shorter run times and are preferable for all amino acids except Cysteine.
Methods using High-efficiency Sodium column for analysis of following Amino Acids:
Valine, Proline, Leucine, Isoleucine, Serine, Threonine, Lysine, Arginine
Analytical ConditionsColumn: High-efficiency Sodium cation-exchange column,
4.6 x 110 mm, Catalog Number 1154110T
Guard: Cation-exchange GARD™, Catalog Number 1700-3102
Flow Rate: 0.6 mL/min
Mobile Phase: See method in Table 2
Injection Volume: 50 uL
Post-Column ConditionsPost-Column System: Onyx PCX or Pinnacle PCX
Reactor Volume: 0.5 mL
Reagent: Trione®
Reagent Temperature: 130 ºC
Column Temperature: See method in Table 3
Flow Rate: 0.3 mL/min
Detection: UV/VIS 570 nm for primary amino acids, 440 nm for secondary amino acids
Analysis of Amino Acids / MA-391
Time Na315 % Na425 % Na640 % RG011 %
0 100 0 0 0
4 100 0 0 0
23 10 90 0 0
24 0 0 100 0
42 0 0 100 0
42.1 0 0 0 100
45 0 0 0 100
45.1 100 0 0 0
55 100 0 0 0
Time Temp ºC
0 42
4 42
12 60
23 60
35 70
43 70
44 42
Table 2. HPLC program for column 1154110T
Table 3. Column oven program
Fig 1. Sodium chromatogram of amino acids analyzed using Pharmacopeia methods (3 ug/mL each, 50 uL injection).
Thr
eoni
neS
erin
e
Pro
line
Am
mon
ia
Arg
inin
eLysi
ne
Isol
euci
neLe
ucin
e
Val
ine
Cys
tineA
lani
ne
0 10 20 30 40 min
Fig 2. Sodium chromatogram of alternative amino acids analyzed using Pharmacopeia methods (3 ug/mL each, 50 uL injection).
Thr
eoni
ne
Pro
line
Am
mon
iaLy
sine
Isol
euci
neLe
ucin
e
Val
ine
0 10 20 30 40 min
Phe
nyla
lani
ne
Met
hion
ine
Fig 3. Sodium chromatogram of amino acids used for calculations and system suitability check in Pharma-copeia methods (refer to Table 1). Proline – 1.2 ug/mL; Isoleucine – 3 ug/mL; Leucine – 3 ug/mL; Ammonia – 0.12 ug/mL. Injection volume – 50 uL.
0 10 20 30 40 min
Pro
line A
mm
onia
Isol
euci
neLe
ucin
e
6Pickering Laboratories Method Abstracts /

Analysis of Amino Acids / MA-391
Fig 4. Sodium chromatogram of low level Isoleucine reference solution – 0.12 ug/mL. Injection volume 50 uL
Isol
euci
ne0 10 20 30 40 min
Fig 5. Sodium chromatogram of Isoleucine test solution 600 ug/mL (zoomed). Injection volume 50 uL
Thr
eoni
ne
Am
mon
ia
Isol
euci
ne
Leuc
ine
Val
ine
Ala
nine
0 10 20 30 40 min
Fig 6. Sodium chromatogram of Proline test solution 600 ug/mL (zoomed). Injection volume 50 uL
Pro
line
Cys
tine
0 10 20 30 40 min
Fig 7. Sodium chromatogram of Leucine test solution 600 ug/mL (zoomed). Injection volume 50 uL
Thr
eoni
ne
Am
mon
ia
Isol
euci
neLe
ucin
e
Val
ine
0 10 20 30 40 min
Fig. 8: Sodium chromatogram of Valine test solution 600 ug/mL (zoomed). Injection volume 50 uL
Am
mon
iaLy
sine
Isol
euci
neLe
ucin
e
Val
ine
Cys
tine
Ala
nine
0 10 20 30 40 min
Fig 9. Sodium chromatogram of Lysine test solution 600 ug/mL (zoomed). Injection volume 50 uL
Am
mon
ia
Lysi
ne
0 10 20 30 40 min
Due to the poor separation of Cysteine and Proline peaks with the Sodium-based method, the Lithium High-efficiency column needs to be used for Cysteine analysis according to Pharmacopeia. The same Lithium method can be used for all other amino acids, though analysis time is longer than with the Sodium method.
Methods using High-efficiency Lithium column for analysis of following amino acids:
Cysteine, Valine, Proline, Leucine, Isoleucine, Serine, Threonine, Lysine, Arginine
Analytical ConditionsColumn: High-efficiency Lithium cation-exchange column,
4.6 x 75 mm, Catalog Number 0354675T
Guard: Cation-exchange GARD™, Catalog Number 1700-3102
Flow Rate: 0.55 mL/min
Mobile Phase: See method in Table 4
Injection Volume: 50 uL
Post-Column ConditionsPost-Column System: Onyx PCX or Pinnacle PCX
Reactor Volume: 0.5 mL
Reagent: Trione®
Reagent Temperature: 130 ºC
Column Temperature: See method in Table 5
Flow Rate: 0.3 mL/min
Detection: UV/VIS 570 nm for primary amino acids, 440 nm for secondary amino acids
7 / Pickering Laboratories Method Abstracts

Time 1700-1125 % Li365 % Li375 % RG003 %
0 100 0 0 0
15 100 0 0 0
35 40 60 0 0
38 0 100 0 0
43 0 100 0 0
43.1 0 0 100 0
57 0 0 100 0
57.1 0 0 0 100
60 0 0 0 100
60.1 100 0 0 0
72 100 0 0 0
Table 4. HPLC Program for column 0354675T
Time Temp ºC
0 34
6 34
30 45
32 70
59 70
60 34
Table 5. Column oven program
Fig 10. Lithium chromatogram of amino acids used as reference solutions for Cysteine analysis (3 ug/mL each, 50 uL injection).
Cys
tein
e
Am
mon
ia
Isol
euci
neLe
ucin
e
Pro
line Cys
tine
0 10 20 30 40 min50
Fig 11. Lithium chromatogram of amino acids analyzed using Pharmacopeia methods (3 ug/mL each, 50 uL injection).
Thr
eoni
ne
Pro
line
Am
mon
ia
Lysi
ne
Isol
euci
neLe
ucin
e
Val
ine
Met
hion
ine
Phe
nyla
lani
ne
0 10 20 30 40 min50
Part No. Description
0352-0057 30-Minute High Efficiency Protein Hydrolysate Kit (for Sodium methods):
1154110T 30-Minute Sodium Cation-exchange Column 4.6 x 110 mm & 1700-0070 amino acid test mixture
1700-3102 Cation-exchange GARD™ assembly: Holder w/ 2 replaceable GARD™
Na220 Sodium Diluent, pH 2.20, 4 x 250 mL
Na315 Sodium Eluant, pH 3.15, 4 x 950 mL
Na425 Sodium Eluant, pH 4.25
Na640 Sodium Eluant, pH 6.40
RG011 Sodium Column Regenerant, 950 mL
T100C TRIONE® Ninhydrin Reagent, 4 x 950 mL (4-month shelf life)
012506H Sodium Calibration Standard, for protein hydrolysate, 0.25 µmole/mL, 5 mL
0352-0058 Kit Identical to 0352-0057 with T200 replacing T100C:
T200 TRIONE® Two-part Ninhydrin Reagent, prepares 4 x 900 mL (12-month shelf life)
0352-0006 70-minute Physiologic Fluid/Native Sample Kit (for Lithium methods):
0354675T Lithium Ion-exchange Column, 4.6 x 75 mm (with test mixture 1700-0070)
1700-3102 Cation-exchange GARD™ assembly: Holder w/ 2 replaceable GARD™
1700-1125 Lithium Eluant, pH 2.80, 4 x 950 mL
Li220 Lithium Diluent, pH 2.20, 4 x 250 mL
Li365 Lithium Diluent, pH 3.65, 4 x 950 mL
Li375 Lithium Diluent, pH 3.75, 4 x 950 mL
RG003 Lithium Column Regenerant, 950 mL
1700-0170 Lithium Calibration Standard, without Norleucine and AGPA, 0.25 µmole/mL, 5 mL
SP100 SERAPREP™, 250 mL
UP100 URIPREP™, 250 mL
T100C TRIONE® Ninhydrin Reagent, 4 x 950 mL (3-month shelf life)
0352-0007 Kit Identical to 0352-0006 with T200 replacing T100C:
T200 TRIONE® Two-part Ninhydrin Reagent, prepares 4 x 900 mL (12-month shelf life)
Pickering Laboratories will keep updating its Pharmacopeia 8.0 methods as new monographs are released. Please contact [email protected]
for the latest methods and chromatograms.
To make it easier to start using Pickering Laboratories methods, we offer chemistry kits that include: analytical column, GARD, buffers, reagents and analytical standards for Amino Acids analysis. All items in the kit could be ordered individually if needed. Please contact Pickering Laboratories if you have any questions regarding this application.
Analysis of Amino Acids / MA-391
8Pickering Laboratories Method Abstracts /

Analysis of Amino Acids / MA-371
Amino Acids Analysis of Cell Culture Media (MA-371)
Cell cultures are widely used to produce biopharmaceuticals and other biologically active compounds. The composition of the cell culture media affects the yield and structure of the desired products and must be carefully optimized. Cell culture media is typically composed of mixtures of amino acids, vitamins, carbohydrates, inorganic salts as well as different peptides, proteins and other compounds. As the cells grow, they consume nutrients and release target biopharmaceuticals as well as waste products.
Amino acids serve as the building blocks of proteins, as well as intermediates in many metabolic pathways. Amino acids are typically added to cell culture media to provide nutritional requirements for the cells. Monitoring and adjusting amino acids composition is an essential part of optimizing the manufacturing process to ensure high quality and optimum yield of the final product.
Amino Acids analysis using cation-exchange chromatography with post-column Ninhydrin derivatization allows for easy determination of amino acids concentrations in many complex matrices, including cell culture media. The post-column method is very sensitive, reproducible and rugged. It has been and continues to be a method of choice for laboratories running biological samples, protein, peptides and foods analysis. Most chemical compounds present in the media do not interfere with analysis, so the majority of samples only need diluting with citric buffer and filtering before analysis. If serum is added to the media, then the proteins need to be precipitated using either Seraprep™ solution or ultrafiltration.
Pickering Laboratories, Inc. offers the complete solution for Amino Acids analysis, including post-column derivatization instruments, columns, eluants, reagents and standards. The Onyx PCX derivatization system has a programmable column oven to allow for shorter run times and easy method optimization.
Method
Analytical ConditionsColumn: High-efficiency Lithium cation-exchange column,
4.6 x 75 mm, Catalog Number 0354675T
Guard: Cation-exchange GARD™, Catalog Number 1700-3102
Flow Rate: 0.55 mL/min
Mobile Phase: See method in Table 1
Injection Volume: 10-50 uL
Post-Column ConditionsPost-Column System: Onyx PCX or Pinnacle PCX
Reactor Volume: 0.5 mL
Reactor Temperature: 130 °C
Flow Rate: 0.3 mL/min
Detection: UV/VIS 570 nm for primary amino acids, 440 nm for secondary amino acids
Table 1. HPLC Program
Time 1700-1125 % Li365 % Li375 % RG003 %
0 100 0 0 0
10 100 0 0 0
19.0 40 60 0 0
32.0 0 100 0 0
43.0 0 100 0 0
43.1 0 0 100 0
57.0 0 0 100 0
57.1 0 0 70 30
72.0 0 0 70 30
72.1 100 0 0 0
84.0 100 0 0 0
Table 2. Column Oven Program
Time Temp ºC
0 34
6 34
17 65
25 70
70 70
71 34
9 / Pickering Laboratories Method Abstracts

Analysis of Amino Acids / MA-371
Fig 1. Chromatogram of Amino Acids standard
Fig 2. Chromatogram of cell culture media sample
Pho
spho
serin
eT
aurin
eU
rea
Asp
artic
Aci
d
Pho
spho
etha
nola
min
eG
luco
sam
inoc
Aci
d
Hyd
roxy
prol
ine
Thr
eoni
neS
erin
eA
spar
agin
e Glu
tam
ic A
cid G
luta
min
eS
arco
sine
a-A
min
oadi
pic
Aci
d
Pro
line
Gly
cine
Ala
nine Citr
ullin
eV
alin
ea-
Am
ino-
n-bu
tyric
Aci
dC
ystin
eM
ethi
onin
eA
llo-I
sole
ucin
eIs
oleu
cine
Leuc
ine
Tyr
osin
e
Phe
nyla
lani
ne
Cys
tath
ioni
ne
b-A
lani
ne
b-A
min
o-i-b
utyr
ic A
cid
Hom
ocys
tine
gam
ma-
Am
inob
utyr
ic A
cid
Try
ptop
han
Eth
anol
amin
e
Am
mon
ia Hyd
roxy
lysi
nes
Orn
ithin
e
Lysi
ne1-
Met
hylh
istid
ine
3-M
ethy
lhis
tidin
e
His
tidin
e
Ans
erin
e
Car
nosi
ne
Arg
inin
e
AE
C
0 10 20 30 40 50 60 70
0 10 20 30 40 50 60 70
Asp
artic
Aci
d
Thr
eoni
neS
erin
e
Asp
arag
ine
Glu
tam
ic A
cid
Pro
line
Ala
nine
Val
ine
Cys
tine
Isol
euci
neLe
ucin
e
Tyr
osin
e
Phe
nyla
lani
ne
Try
ptop
han
Am
mon
ia
His
tidin
e
Arg
inin
e
Gly
cine
Met
hion
ine
Lysi
ne
10Pickering Laboratories Method Abstracts /

Analysis of Amino Acids / MA-373
Amino Acids Analysis of Monoclonal Antibodies (MA-373)
The peptide and protein based pharmaceuticals are a rapidly expanding class of therapeutical agents that are used to treat a wide variety of health conditions, including cancer, metabolic and auto-immune diseases, HIV and more. Biologic drugs, such as monoclonal antibodies, are derived from living organisms and are usually very expensive. As many biologics are coming off of patents, the market is ready for cost-saving biogenerics. But all proteins, including monoclonal antibodies, have complex structures that determine their function. Differences in structure would alter biological activity leading to changes in safety and efficacy of the drug.
ICH Q6B is a guidance document that provides a set of internationally accepted specifications for biotechnological and biological products to support new marketing applications. It establishes the set of criteria to which a drug substance, drug product or material should conform to be considered acceptable for intended use.
Determining amino acid composition following hydrolysis is listed in ICH Q6B as a way to characterize the protein and to confirm its identity by comparing with Amino Acid composition deduced from the gene sequence of the desired product. Amino Acids analysis data is also used to accurately determine the protein content.
The Amino Acids analysis with post-column derivatization is a very sensitive, reproducible and rugged method and it has been a preferred approach for laboratories running biological samples, protein, peptides and foods analysis. Pickering Laboratories Inc. offers many Amino Acids analysis products including post-column derivatization instruments, columns, eluants, reagents and standards. All products are designed to work together to deliver optimum results for any chosen sample.
Method
Analytical ConditionsColumn: High-efficiency Sodium cation-exchange column,
4.6 x 110 mm, Catalog Number 1154110T
Guard: Cation-exchange GARD™, Catalog Number 1700-3102
Flow Rate: 0.6 mL/min
Mobile Phase: See method in Table 1
Injection Volume: 10-50 uL
Post-Column ConditionsPost-Column System: Onyx PCX or Pinnacle PCX
Reactor Volume: 0.5 mL
Reactor Temperature: 130 °C
Flow Rate: 0.3 mL/min
Detection: UV/VIS 570 nm for primary amino acids, 440 nm for secondary amino acids
Table 2. Column Oven Program
Time Temp ºC
0 46
4 46
9 70
32 70
33 46
Table 1. HPLC Program
Time Na315 % Na425 % Na640 % RG011 %
0 100 0 0 0
4.0 100 0 0 0
15.0 0 100 0 0
16.0 0 0 100 0
31.0 0 0 100 0
31.1 0 0 0 100
33.0 0 0 0 100
33.1 100 0 0 0
40.0 100 0 0 0
11 / Pickering Laboratories Method Abstracts

Analysis of Amino Acids / MA-373
Fig 1. Chromatogram of Amino Acids standard
Fig 2. Chromatogram of hydrolyzed sample of IL-17F monoclonal antibody
12
3
4
5
6
7
8
9
10
1112
1314
15
16
17
18 19
20
21
22
0 5 1510 20 25 30 min
0 5 1510 20 25 30 min
1
23
4
5
6
7
8
9
10
11
12
13
14
1516
17
19
20
AcknowledgementsWe would like to thank Frank N. Konstantinides and AminoAcids.com for their contribution to this project.
1 Aspartic Acid
2 Threonine
3 Serine
4 Glutamic Acid
5 Proline
6 Glycine
7 Alanine
8 Cystine
9 Valine
10 Methionine
11 Isoleucine Alanine
12 Leucine
13 Norleucine
14 Tyrosine
15 Phenylalanine
16 Histidine
17 Lysine
18 Tryptophan
19 Ammonia
20 Arginine
21 Cysteic Acid
22 Taurine
12Pickering Laboratories Method Abstracts /

Analysis of Amino Acids / MA-374
Amino Acids in Oxidized and Unoxidized Feed Samples (MA-374)
Commission Regulation (EC) No 152-2009 published in Official Journal of European Union laid down the methods of sampling and analysis for the official control of feed. The Regulation describes methods of analysis to control the composition of feed materials and compound feed products. Establishing the amino acids profile is an important way to control quality and nutritional value of feeds. This regulation specifies HPLC with post-column derivatization with Ninhydrin reagent as the method of analysis for total and free amino acids. Pickering Laboratories developed the analytical method to comply with all the chromatographic requirements of Commission Regulation (EC) No 152-2009. The same method is used to analyze oxidized and unoxidized feed samples.
Method
Analytical ConditionsColumn: High-efficiency Sodium cation-exchange column,
4.0 x 150 mm, Catalog Number 1154150T
Guard: Cation-exchange GARD™, Catalog Number 1700-3102
Flow Rate: 0.4 mL/min
Mobile Phase: Na270, Na740, RG011. See method in Table 1
Injection Volume: 10 uL
Post-Column ConditionsPost-Column system: Onyx PCX or Pinnacle PCX
Reactor Volume: 0.5 mL
Reagent: Trione®
Column Temperature: See Method in Table 2
Reactor Temperature: 130 °C
Flow Rate: 0.25 mL/min
Detection: UV/VIS 570 nm for primary amino acids, 440 nm for secondary amino acidsCalibration
Table 1. HPLC Program
Time Na270 % Na740 % RG011 %
0 100 0 0
16 100 0 0
40 54 46 0
45 0 100 0
66 0 100 0
66.1 0 0 100
70 0 0 100
70.1 100 0 0
80 100 0 0
Table 2. Column Oven Program
Time Temp ºC
0 55
32 55
33 65
41 65
42 55
13 / Pickering Laboratories Method Abstracts
Fig 1. Chromatogram of a standard solution of amino acids
0 10 20 30 40 50 60 min
Taur
ine
Asp
artic
Aci
dTh
reon
ine
Ser
ine
Glu
tam
ic A
cid
Pro
line
Ala
nine
Gly
cine
Tyro
sine
Phe
nyla
lani
ne
Lysi
neH
istid
ine
Am
mon
ia
Arg
inin
e
Nor
leuc
ine
Isol
euci
neLe
ucin
e
Valin
eC
ystin
e Met
hion
ine
Met
hion
ine
Sul
fone
Cys
teic
Aci
d
Orn
ithin
e
Tryp
toph
an
Fig 2. Chromatogram of an oxidized feed sample
0 10 20 30 40 50 60 min
Cys
teic
Aci
dTa
urin
e
Met
hion
ine
Sul
fone
Asp
artic
Aci
dTh
reon
ine
Ser
ine
Glu
tam
ic A
cid
Pro
line
Ala
nine
Gly
cine
Tyro
sine
Phe
nyla
lani
ne
Lysi
ne
His
tidin
e
Am
mon
ia
Arg
inin
e
Nor
leuc
ine
Isol
euci
neLe
ucin
e
Valin
e
Fig 3. Chromatogram of a non-oxidized feed sample
0 10 20 30 40 50 60 min
Taur
ine
Asp
artic
Aci
dTh
reon
ine
Ser
ine
Glu
tam
ic A
cid
Pro
line
Ala
nine
Gly
cine
Tyro
sine
Phe
nyla
lani
ne
Lysi
neH
istid
ineA
mm
onia
Arg
inin
e
Nor
leuc
ine
Isol
euci
neLe
ucin
e
Valin
eC
ystin
eM
ethi
onin
e
Analysis of Amino Acids / MA-374
14Pickering Laboratories Method Abstracts /

Analysis of Amino Acids / MA-393
Amino Acids in Supplements (MA-393)
Amino acids are building blocks of proteins and essential amino acids need to be obtained from diet as they cannot be synthesized by our bodies. Amino acids supplements are popular among athletes and bodybuilders and are sold in the form of pills, powders and drinks. They usually also contain vitamins, electrolytes, herbs, flavorings and other additives.
Analysis of these supplements is important to confirm the label claims and to maintain industry standards.
Amino Acids analysis with post-column derivatization is a very sensitive, reproducible and rugged method and it has been a preferred approach for laboratories running biological samples, protein, peptides and foods analysis. Pickering Laboratories’ products for Amino Acids analysis include post-column derivatization instruments, columns, eluants, reagents and standards. All products are designed to work together to deliver optimum results for any chosen sample.
The amino acids present in the product determine if Sodium or Lithium columns and buffers need to be used. Lithium columns have longer run time but have higher selectivity and are able to separate more amino acids than Sodium columns. Pickering Laboratories will help you to identify the best method for your Amino Acids analysis.
Sample PreparationGrind 10 pills to fine powder before taking a sample for analysis. Mix all the powdered supplements thoroughly. Sample size depends on concentrations of amino acids present.
To finely ground sample (0.05 g – 0.2 g) add 100 mL of Na220. Mix well and sonicate for 10 min. Filter through 0.45 um filter and inject.
Method
Analytical ConditionsColumn: High-efficiency Sodium cation-exchange
column, 4.6 x 110 mm, Catalog Number 1154110T
Guard: Cation-exchange GARD™, Catalog Number 1700-3102
Flow rate: 0.6 mL/min
Mobile Phase: See method in Table 1
Injection Volume: 10-50 uL
Post-Column ConditionsPost-Column System: Onyx PCX or Pinnacle PCX
Reactor Volume: 0.5 mL
Reactor Temperature: 130 ºC
Column Temperature: See method in Table 2
Flow Rate: 0.3 mL/minTable 2. Column Oven Program
Time Temp ºC
0 46
4 46
9 70
32 70
33 46
Table 1. HPLC Program for Column 1154110T
Time Na315 % Na425 % Na640 % RG011 %
0 100 0 0 0
4.0 100 0 0 0
15.0 0 100 0 0
16.0 0 0 100 0
31.0 0 0 100 0
31.1 0 0 0 100
33.0 0 0 0 100
33.1 100 0 0 0
40 100 0 0 0
15 / Pickering Laboratories Method Abstracts

Analysis of Amino Acids / MA-393
Fig 1. Chromatogram of amino acids standard using sodium column 1154110T
Fig 2. Chromatogram of a sample of commercial training supplement using sodium column 1154110T
Fig 3. Chromatogram of the a sample of sports recovery drink using sodium column 1154110T
Thr
eoni
ne
Val
ine
Met
hion
ine
Isol
euci
neLe
ucin
e
Phe
nyla
lani
ne
Arg
inin
e
His
tidin
e
Lysi
ne
0 5 10 15 20 25 30 min
Ser
ine
Asp
artic
Aci
d
Glu
tam
ic A
cid
Tyro
sine
Try
ptop
han
Am
mon
ia
Gly
cine
Ala
nine
Cys
tine
Pro
line
Thr
eoni
ne
Val
ine
Met
hion
ine
Isol
euci
neLe
ucin
e
Phe
nyla
lani
ne
Arg
inin
e
His
tidin
e Lysi
ne
0 5 10 15 20 25 30 min
Citr
ullin
e
Isol
euci
neLe
ucin
e
0 5 10 15 20 25 30 min
Glu
tam
ine
Val
ine
16Pickering Laboratories Method Abstracts /
Analysis of Amino Acids / MA-393
Method for Lithium Column
Analytical ConditionsColumn: High-efficiency Lithium cation-exchange column,
4.6 x 75 mm, Catalog Number 0354675T
Guard: Cation-exchange GARD™, Catalog Number 1700-3102
Flow rate: 0.55 mL/min
Mobile Phase: See method in Table 3
Injection Volume: 50 uL
Post-Column ConditionsPost-Column System: Onyx PCX or Pinnacle PCX
Reactor Volume: 0.5 mL
Reagent: Trione®
Reactor Temperature: 130 ºC
Column Temperature: See method in Table 4
Flow Rate: 0.3 mL/min
Detection: UV/VIS 570 nm for primary amino acids, 440 nm for secondary amino acids
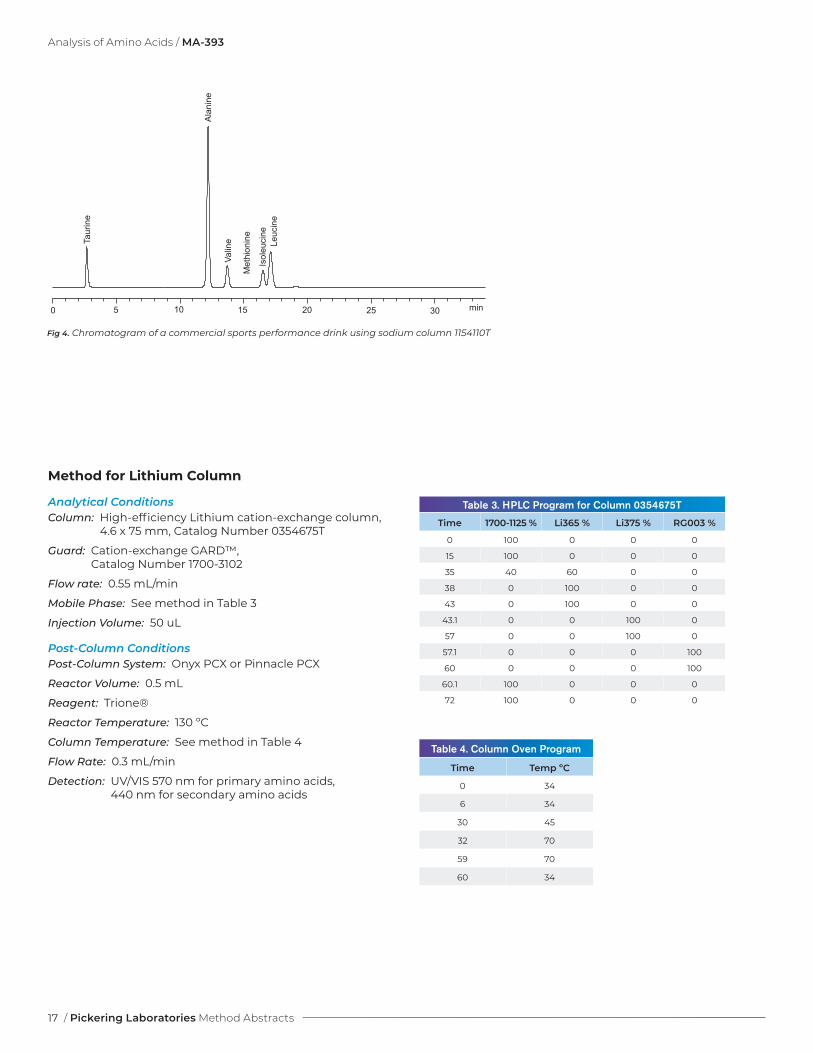
Fig 4. Chromatogram of a commercial sports performance drink using sodium column 1154110T
Taur
ine
Val
ine
Met
hion
ine
Isol
euci
neLe
ucin
e
0 5 10 15 20 25 30 min
Ala
nine
Table 4. Column Oven Program
Time Temp ºC
0 34
6 34
30 45
32 70
59 70
60 34
Table 3. HPLC Program for Column 0354675T
Time 1700-1125 % Li365 % Li375 % RG003 %
0 100 0 0 0
15 100 0 0 0
35 40 60 0 0
38 0 100 0 0
43 0 100 0 0
43.1 0 0 100 0
57 0 0 100 0
57.1 0 0 0 100
60 0 0 0 100
60.1 100 0 0 0
72 100 0 0 0
17 / Pickering Laboratories Method Abstracts

Analysis of Amino Acids / MA-393
Fig 6. Chromatogram of a pre-workout amino acids supplement drink using lithium column 0354675T
Taur
ine
Thr
eoni
ne
Glu
tam
ine
Isol
euci
ne Leuc
ine
Tyro
sine
Phe
nyla
lani
ne
Ala
nine
b-A
lani
ne Arg
inin
e
His
tidin
e
Lysi
ne
Val
ine
Met
hion
ine
Citr
ullin
e
0 10 20 30 5040 60 70 min
Pho
spho
serin
eT
aurin
eU
rea
Asp
artic
Aci
d
Pho
spho
etha
nola
min
eG
luco
sam
inoc
Aci
d
Hyd
roxy
prol
ine
Thr
eoni
neS
erin
eA
spar
agin
e Glu
tam
ic A
cid
Glu
tam
ine
Sar
cosi
ne
a-A
min
oadi
pic
Aci
d
Pro
line
Gly
cine
Ala
nine
Citr
ullin
eV
alin
ea-
Am
ino-
n-bu
tyric
Aci
dC
ystin
eM
ethi
onin
eA
llo-I
sole
ucin
e
Isol
euci
neLe
ucin
eT
yros
ine
Phe
nyla
lani
ne
Cys
tath
ioni
ne
b-A
lani
ne
b-A
min
o-i-b
utyr
ic A
cid
Hom
ocys
tine
gam
ma-
Am
inob
utyr
ic A
cid
Try
ptop
han
Eth
anol
amin
e
Am
mon
ia
Hyd
roxy
lysi
nes
Orn
ithin
e
Lysi
ne1-
Met
hylh
istid
ine
3-M
ethy
lhis
tidin
e
His
tidin
e
Ans
erin
e
Car
nosi
ne
Arg
inin
e
AE
C
0 10 20 30 40 50 60 70 min
Fig 5. Chromatogram of amino acids standard using lithium column 0354675T
18Pickering Laboratories Method Abstracts /

Analysis of Amino Acids / MA-397
Amino Acids in Dietary Ingredients and Supplements (MA-397)
Supplements containing Amino Acids are widely used as part of the treatment of a number of medical conditions, including ALS, some brain conditions caused by liver disease, muscle degeneration and movement disorders. Amino Acids supplements are also used by athletes to improve performance and prevent muscle breakdown. These supplements are available in variety of forms and dosages, and they often contain other ingredients like vitamins, minerals, herbal extracts and flavorings.
Manufacturers are responsible for supporting label claims. The testing of dietary ingredients as well as finished products for active components is an important part of any quality assurance program.
Analysis of amino acids using cation-exchange columns and Ninhydrin post-column reagent is a well-establish methodology that is recommended by European Pharmacopeia. Pickering Laboratories developed and validated a post-column method for amino acids analysis of supplements that is sensitive, selective and can be used without modification to analyze capsules, tablets, drinks and other samples. Accelerated methods are available for samples with a limited number of amino acids.
Method
Analytical ConditionsColumn: High-efficiency Lithium cation-exchange column,
4.6 x 75 mm (Catalog Number 0354675T)
Guard: Cation-exchange GARD™, Catalog Number 1700-3102
Flow Rate: 0.55 mL/min
Mobile Phase: See method in Table 1
Post-Column ConditionsPost-Column System: Onyx PCX or Pinnacle PCX
Reactor Volume: 0.5 mL
Reactor Temperature: 130 ºC
Flow Rate: 0.3 mL/min
Detection: UV/VIS 570 nm for primary amino acids, 440 nm for secondary amino acids
Injection Volume: 10–50 µL
Sample PreparationPlace 100 mg of homogenized sample into a 25 mL volumetric flask. Bring to volume with Li220 Diluent. Sonicate for 30 min and filter through a glass microfiber filter if the solution is cloudy. Dilute the sample to fit within calibration curve as necessary. More than one dilution may be needed if concentrations of amino acids differ by more than 10 times. Filter the final solution though 0.45 um Nylon filter before injecting.
Table 1. HPLC Program
Time 1700-1125 % Li365 % Li375 % RG003 %
0 100 0 0 0
10 100 0 0 0
19 40 60 0 0
32 0 100 0 0
43 0 100 0 0
43.1 0 0 100 0
57 0 0 100 0
57.1 0 0 70 30
72 0 0 70 30
72.1 100 0 0 0
Table 2. Column Oven ProgramTime Temp ºC
0 34
6 34
17 65
25 70
70 70
71 34
19 / Pickering Laboratories Method Abstracts

Analysis of Amino Acids / MA-397
Taur
ine
Aspa
rtic
Acid
Thre
onin
eSe
rine
Aspa
ragi
ne Glu
tam
ic A
cid
Glu
tam
ine
Pro
line
Gly
cine
Alan
ine
Valin
eM
ethi
onin
e
Isol
euci
neLe
ucin
e
Tyro
sine
Phe
nyla
lani
ne
Lysi
ne
His
tidin
e
Cys
tein
e
Arg
inin
e
0 10 20 4030 50 60 min
Fig 1. Amino Acids Standard
Fig 2. Chromatogram of powdered drink mix
Fig 3. Chromatogram of encapsulated amino acids supplement
0 10 20 4030 50 60 min
Pho
spho
serin
eTa
urin
eU
rea
Asp
artic
Aci
d
Pho
spho
etha
nola
min
e
Hyd
roxy
prol
ine
Thre
onin
eS
erin
eA
spar
agin
eG
luta
mic
Aci
dG
luta
min
e
Cys
tein
e
Pro
line
Gly
cine
Ala
nine C
itrul
line
Val
inea-
Am
ino-
n-bu
tyric
Aci
dC
ystin
eM
ethi
onin
e
Isol
euci
neLe
ucin
eTy
rosi
ne
Phe
nyla
lani
ne
Cys
tath
ioni
ne
b-A
lani
ne
b-A
min
o-i-b
utyr
ic A
cid
Hom
ocys
tine
gam
ma-
Am
inob
utyr
ic A
cid
Tryp
toph
an
Eth
anol
amin
e
Am
mon
ia
Hyd
roxy
lysi
nes
Orn
ithin
e
Lysi
ne1-
Met
hylh
istid
ine
3-M
ethy
lhis
tidin
e
His
tidin
e
Ans
erin
e
Car
nosi
ne Arg
inin
e
Taur
ine
Thre
onin
e
Glu
tam
ic A
cid
Glu
tam
ine
Alan
ine
Valin
e
Met
hion
ine
Isol
euci
neLe
ucin
e
Tyro
sine
Phe
nyla
lani
ne
Lysi
ne
His
tidin
e
Arg
inin
e0 10 20 4030 50 60 min
Citr
ullin
e
20Pickering Laboratories Method Abstracts /

Analysis of Amino Acids / MA-385
PKU and MSUD Screening Methods (MA-385)
Phenylketonurea (PKU) and Maple Syrup Urine Disease (MSUD) are amino acid disorders – rare inherited conditions that prevent people from digesting certain amino acids in food proteins. Untreated, these serious conditions lead to mental and physical disability and even death. PKU and MSUD are part of newborn screening program and are detected and monitored through Amino Acids analysis of blood samples.
Pickering Laboratories offers full range of products for post-column Amino Acids analysis of physiological fluids. The same column and buffers can be used for running full amino acid profile as well as accelerated screening methods for specific medical conditions. This application note describes PKU and MSUD screening methods for Pickering 0354100T and 0354675T columns.
PKU MSUD Screening Method for Column 0354100T
Analytical ConditionsColumn: High-efficiency Lithium cation-exchange column,
4x100 mm, Catalog Number 0354100T
Guard: Cation-exchange GARD™, Catalog Number 1700-3102
Flow Rate: 0.4 mL/min
Mobile Phase: 1700-1125, Li265, Li375, RG003
Post-Column ConditionsPost-Column System: Onyx PCX or Pinnacle PCX
Reactor Volume: 0.5 mL
Reactor Temperature: 130 ˚C
Reagent: Trione Ninhydrin reagent
Reagent Flow Rate: 0.3 mL/min
Detection: UV/VIS 570 nm for primary amino acids 440 nm for secondary amino acids
Run Time: 33 min
Equilibration Time: 10 min
Contact Pickering Laboratories for information about full amino acid profile method for this column.
HPLC Program
Time 1700-1125 % Li365 % Li375 % RG003 %
0 70 30 0 0
20 0 100 0 0
30 0 0 100 0
30.1 0 0 0 100
33 0 0 0 100
33.1 70 30 0 0
Column Oven Program
Time Temp ºC
0 50
20 61
30 61
30.1 50
Ala
nine
a-A
min
o-n-
buty
ric A
cid
Val
ine
Cys
tath
ioni
ne
Met
hion
ine
allo
-Iso
leuc
ine
Isol
euci
ne
Leuc
ine
Tyro
sine
Phe
nyla
lani
ne
0 5 2010 15 min25 30
21 / Pickering Laboratories Method Abstracts

Analysis of Amino Acids / MA-385
PKU MSUD Screening Method for Column 0354675T
Analytical ConditionsColumn: High-efficiency Lithium cation-exchange column,
4.6x75 mm, Catalog Number 0354675T
Guard: Cation-exchange GARD™, Catalog Number 1700-3102
Flow Rate: 0.55 mL/min
Mobile Phase: 1700-1125, Li265, Li375, RG003
Post-Column ConditionsPost-Column System: Onyx PCX or Pinnacle PCX
Reactor Volume: 0.5 mL
Reactor Temperature: 130 ˚C
Reagent: Trione Ninhydrin reagent
Reagent Flow Rate: 0.5 mL/min
Detection: UV/VIS 570 nm for primary amino acids 440 nm for secondary amino acids
Run Time: 16 min
Equilibration Time: 10 min
Contact Pickering Laboratories for information about full amino acid profile method for this column.
HPLC Program
Time 1700-1125 % Li365 % Li375 % RG003 %
0 60 40 0 09 0 100 0 014 0 30 70 0
14.1 0 0 0 10016 0 0 0 100
16.1 60 40 0 0
Column Oven Program
Time Temp ºC
0 50
14 61
15 50
30.1 50
min0 2 4 6 8 10 12 14
a-A
min
o-n-
buty
ric A
cid
Val
ine
Cys
tath
ioni
ne
Met
hion
ine
allo
-Iso
leuc
ine
Isol
euci
ne
Leuc
ine
Tyro
sine
Phe
nyla
lani
ne
22Pickering Laboratories Method Abstracts /

Analysis of Amino Acids / MA-382
70-min Amino Acids Analysis of Physiological Samples (MA-382)
Pickering Laboratories specializes in the manufacturing of cation-exchange columns and eluants for Amino Acids analysis. Post-column derivatization with Ninhydrin offers unmatched selectivity and reproducibility of the analysis of the most challenging matrices.
Onyx PCX post-column derivatization system allows analysts to combine eluant gradient capabilities of modern HPLC instruments with column temperature gradients. We introduce the new accelerated Amino Acids analysis method for physiological samples that utilizes temperature and eluant gradients.
Method
Analytical ConditionsColumn: High-efficiency Lithium cation-exchange column,
4.6 x 75 mm, 5 µm Catalog Number 0354675T
Flow Rate: 0.55 mL/min
Mobile Phase: 1700-1125, Li365, Li375, RG003
Post-Column ConditionsPost-Column System: Onyx PCX or Pinnacle PCX
Reactor Volume: 0.5 mL
Temperature: 130 ˚C
Reagent: Trione
Flow Rate: 0.5 mL/min
Detection: UV/VIS 570 nm for primary amino acids 440 nm for secondary amino acids
Runtime: 72 min
Equilibration Time: 15 min
Column Oven Program
Time Temp ºC
0 34
6 34
17 65
25 70
70 70
71 34
HPLC Program
Time 1700-1125 % Li365 % Li375 % RG003 %
0 100 0 0 0
10 100 0 0 0
19 40 60 0 0
32 0 100 0 0
43 0 100 0 0
43.1 0 0 100 0
57 0 0 100 0
57.1 0 0 70 30
72 0 0 70 30
72.1 100 0 0 0
1 Phosphoserine
2 Taurine
3 Phosphoethanolamine
4 Urea
5 Aspartic acid
6 Hydroxyproline
7 Threonine
8 Serine
9 Asparagine
10 Glutamic acid
11 Glutamine
12 Sarcosine
13 a-Aminoadipic acid
14 Proline
15 Glycine
16 Alanine
17 Citrulline
18 a-Amino-n-butyric acid
19 Valine
20 Cystine
21 Methionine
22 Cystathionine
23 Isoleucine
24 Leucine
25 Tyrosine
26 Phenylalanine
27 b-Alanine
28 b-Amino-i-butyric acid
29 Homocystine
30 g-Aminobutyric acid
31 Tryptophan
32 Ethanolamine
33 Ammonia
34 Hydroxylysines
35 Ornitine
36 Lysine
37 1-Methylhistidine
38 Histidine
39 3-Methylhistidine
40 Anserine
41 Carnosine
42 Arginine
43 Glucosaminic Acid*
min0 10 20 30 40 50 60 70
:
1
2
3
4
5
6
78
9
10
11
12
13
14
15
1617
18
19
20
21
22
2324
2526
27 28
29
30
31
32
33
34
35
36
3738
39
40 41
42
43
*Internal Standard
23 / Pickering Laboratories Method Abstracts

Analysis of Glyphosate
24Pickering Laboratories Method Abstracts /
Analysis of Glyphosate / MA-296
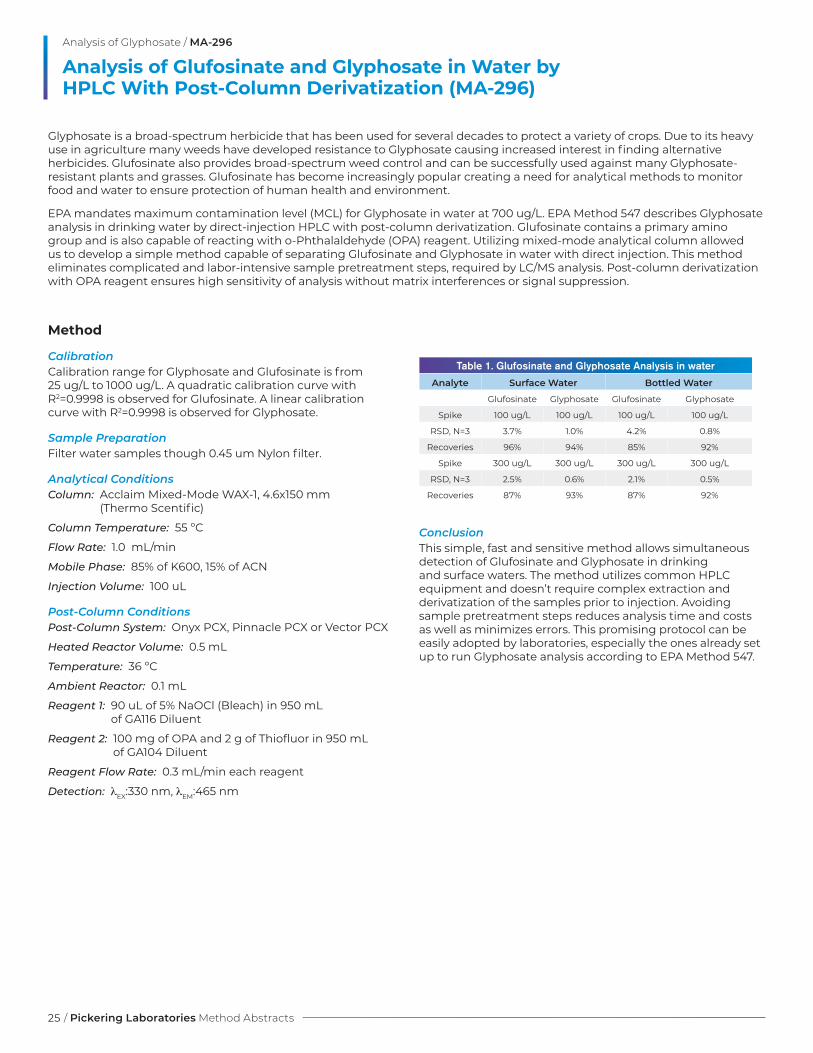
Analysis of Glufosinate and Glyphosate in Water by HPLC With Post-Column Derivatization (MA-296)
Glyphosate is a broad-spectrum herbicide that has been used for several decades to protect a variety of crops. Due to its heavy use in agriculture many weeds have developed resistance to Glyphosate causing increased interest in finding alternative herbicides. Glufosinate also provides broad-spectrum weed control and can be successfully used against many Glyphosate-resistant plants and grasses. Glufosinate has become increasingly popular creating a need for analytical methods to monitor food and water to ensure protection of human health and environment.
EPA mandates maximum contamination level (MCL) for Glyphosate in water at 700 ug/L. EPA Method 547 describes Glyphosate analysis in drinking water by direct-injection HPLC with post-column derivatization. Glufosinate contains a primary amino group and is also capable of reacting with o-Phthalaldehyde (OPA) reagent. Utilizing mixed-mode analytical column allowed us to develop a simple method capable of separating Glufosinate and Glyphosate in water with direct injection. This method eliminates complicated and labor-intensive sample pretreatment steps, required by LC/MS analysis. Post-column derivatization with OPA reagent ensures high sensitivity of analysis without matrix interferences or signal suppression.
Method
CalibrationCalibration range for Glyphosate and Glufosinate is from 25 ug/L to 1000 ug/L. A quadratic calibration curve with R2=0.9998 is observed for Glufosinate. A linear calibration curve with R2=0.9998 is observed for Glyphosate.
Sample PreparationFilter water samples though 0.45 um Nylon filter.
Analytical ConditionsColumn: Acclaim Mixed-Mode WAX-1, 4.6x150 mm
(Thermo Scentific)
Column Temperature: 55 ºC
Flow Rate: 1.0 mL/min
Mobile Phase: 85% of K600, 15% of ACN
Injection Volume: 100 uL
Post-Column ConditionsPost-Column System: Onyx PCX, Pinnacle PCX or Vector PCX
Heated Reactor Volume: 0.5 mL
Temperature: 36 ºC
Ambient Reactor: 0.1 mL
Reagent 1: 90 uL of 5% NaOCl (Bleach) in 950 mL of GA116 Diluent
Reagent 2: 100 mg of OPA and 2 g of Thiofluor in 950 mL of GA104 Diluent
Reagent Flow Rate: 0.3 mL/min each reagent
Detection: λEX:330 nm, λEM:465 nm
ConclusionThis simple, fast and sensitive method allows simultaneous detection of Glufosinate and Glyphosate in drinking and surface waters. The method utilizes common HPLC equipment and doesn’t require complex extraction and derivatization of the samples prior to injection. Avoiding sample pretreatment steps reduces analysis time and costs as well as minimizes errors. This promising protocol can be easily adopted by laboratories, especially the ones already set up to run Glyphosate analysis according to EPA Method 547.
Table 1. Glufosinate and Glyphosate Analysis in water
Analyte Surface Water Bottled Water
Glufosinate Glyphosate Glufosinate Glyphosate
Spike 100 ug/L 100 ug/L 100 ug/L 100 ug/L
RSD, N=3 3.7% 1.0% 4.2% 0.8%
Recoveries 96% 94% 85% 92%
Spike 300 ug/L 300 ug/L 300 ug/L 300 ug/L
RSD, N=3 2.5% 0.6% 2.1% 0.5%
Recoveries 87% 93% 87% 92%
25 / Pickering Laboratories Method Abstracts

Gly
phos
ate
Glu
fosi
nate
0 5 10 min
AM
PA
Fig 1. Chromatogram of 50 ug/L calibration standard of Glufosinate and Glyphosate
Fig 2. Chromatogram of 500 ug/L calibration standard of Glufosinate, Glyphosate and AMPA
Fig 4. Chromatogram of bottled water spiked with Glufosinate, Glyphosate and AMPA at 300 ug/L
Fig 3. Chromatogram of surface water spiked with Glufosinate and Glyphosate at 100 ug/L
Gly
phos
ate
Glu
fosi
nate
0 5 10 min
Gly
phos
ate
Glu
fosi
nate
0 5 10 min
AM
PA
Gly
phos
ate
Glu
fosi
nate
0 5 10 min
Analysis of Glyphosate / MA-296
26Pickering Laboratories Method Abstracts /

Analysis of Glyphosate / MA-211
Glyphosate Analysis in Foods by HPLC With Post-Column Derivatization and Fluorescence Detection (MA-211)
Glyphosate, the active ingredient in Roundup®, is the most widely used herbicide in the world. In the United States, the Environmental Protection Agency (EPA) regulates Glyphosate and sets the maximum amount of herbicide allowed to be present in assorted crops as well as drinking water. Recent research, however, has raised concerns about Glyphosate safety and its prevalence in the environment. In response to the evidence of increased human exposure to this herbicide, the Food and Drug Administration (FDA) announced it will begin testing Glyphosate in foods including soybeans, corn, milk, and eggs.
Pickering Laboratories has over 35 years of experience manufacturing and selling instruments and reagents for Glyphosate analysis in accordance to the US-EPA Method 547 for Glyphosate Analysis in Drinking Water as well as the AOAC Method 991.08 for Glyphosate Analysis in Environmental Waters. These HPLC methods are based on post-column derivatization technology with florescence detection. The AOAC Official Method 2000.05 for Analysis of Glyphosate in Crops describes an easy clean-up procedure using cation-exchange cartridges that was successfully combined with Pickering Laboratories’ post-column derivatization for analysis of Glyphosate in crops such as soy, corn, alfalfa, and sunflower seeds as well as vegetables such as tomatoes and broccoli (1, 2). The downside of this sample preparation technique is the fairly high volume of the water-based solution used to elute Glyphosate from the clean-up cartridge and consequently long evaporation times.
The presented post-column derivatization method for Glyphosate analysis utilizes an accelerated sample preparation procedure to quickly and efficiently analyze Glyphosate in a wide range of foods. The analytical method is sensitive and selective, and it can be easily implemented in any laboratory.
Method
Analytical ConditionsColumn: Cation-exchange Column for Glyphosate analysis,
4 x 150 mm, Catalog Number 1954150
Guard: Cation-exchange GARD™, Catalog Number 1700-3102
Column Temperature: 55 ºC
Flow Rate: 0.4 mL/min
Mobile Phase: K200, RG019
Injection Volume: 100 uL
Post-Column ConditionsPost-Column System: Onyx PCX, Pinnacle PCX or Vector PCX
Heated Reactor Volume: 0.5 mL
Temperature: 36 ºC
Ambient Reactor: 0.1 mL
Reagent 1: 100 uL of 5% NaOCl (Bleach) in 950 mL of GA116 Diluent
Reagent 2: 100 mg of OPA and 2 g of Thiofluor in 950 mL of GA104 Diluent
Reagent Flow Rate: 0.3 mL/min each reagent
Detection: λex : 330 nm, λem : 465 nm
Supplies for Sample PreparationMethylene Chloride, HPLC Grade
Methanol, HPLC Grade
Elution Solution (90% Methanol – 10% 1N HCl)
RESTORE™ solution (P/N 1700-0140)
SAX cartridges, 500 mg, 6 mL (Agilent Bond Elut, P/N 12102144)
HPLC Gradient
Time K200 % RG019 %
0 100 0
15 100 0
15.1 0 100
17 0 100
17.1 100 0
25 100 0
27 / Pickering Laboratories Method Abstracts

Analysis of Glyphosate / MA-211
Sample PreparationExtractionTo 25 g of homogenized sample, add enough water (after estimating moisture content) such that the total volume of water is 125 mL. Blend at high speed for 3-5 min and centrifuge for 10 min. Transfer 20 mL of the aqueous extract into a centrifuge tube and add 15 mL of Methylene Chloride. Shake for 2-3 min and centrifuge for 10 min. Use the upper layer for SPE clean-up.
Matrix-Specific Modifications1) For samples that absorb large amounts of water, reduce
test portion to 12.5 g while keeping water volume the same.
2) For samples with high fat content, do the Methylene Chloride partitioning twice.
SPE CleanupCondition the SAX cartridge with 5 mL of Methanol followed by 5 mL of D.I. water draining the liquid to the top of the sorbent bed. Transfer 1 mL of extract and elute to the top of the sorbent bed. Wash with 5 mL of Methanol. Elute Glyphosate with 5 mL of Elution Solution. Evaporate to dryness at 55 ºC. Dissolve the residue in 1.5 mL of a solution of 10% RESTORE™ in water, filter through a 0.45 um syringe filter and inject onto the HPLC column.
Recoveries for Glyphosate
Matrix EPA Tolerances Spike Level 1 Recoveries RSDr Spike Level 2 Recoveries RSDr
Rolled Oats 20 ug/g 0.1 ug/g 85% 1.6% 0.2 ug/g 87% 4.9%
Wheat Flour NA 0.1 ug/g 88% 4.6% 0.2 ug/g 87% 1.3%
Whole Milk NA 0.025 ug/g 99% 3.9% 0.05 ug/g 92% 2.9%
Eggs 0.05 ug/g 0.025 ug/g 75% 2.8% 0.05 ug/g 77% 5.1%
Soybeans 20 ug/g 0.1 ug/g 77% 6.7% 0.2 ug/g 74% 5.5%
Corn 5 ug/g 0.1 ug/g 94% 3.7% 0.2 ug/g 99% 3.6%
Beer NA 0.025 ug/g 78% 6.9% 0.05 ug/g 73% 3.6%
Fig 1. Chromatogram of whole milk sample spiked with Glyphosate at 0.025 ppm level
Gly
phos
ate
0 4 8 minFig 2. Chromatogram of egg sample spiked with Glyphosate at 0.025 ppm level
Gly
phos
ate
0 4 8 min
Fig 3. Chromatogram of corn sample spiked with Glyphosate at 0.1 ppm level
Gly
phos
ate
0 4 8 minFig 4. Chromatogram of wheat flour samples spiked with Glyphosate at 0.1 ppm level
Gly
phos
ate
0 4 8 min
ConclusionThe simple and robust post-column method was shown to be suitable for analysis of Glyphosate on sub-ppm levels in many types of foods. Accelerated sample preparation improves throughput of samples and reduces cost of testing for busy laboratories. The sensitivity of the method allows for detection of Glyphosate well within residue tolerances set by regulatory agencies.
References1. Pickering Laboratories method abstract MA207 “Glyphosate Analysis in soy beans, corn and sunflower seeds”2. Pickering Laboratories method abstract MA206 “Glyphosate and AMPA Analysis in crops”
28Pickering Laboratories Method Abstracts /

Analysis of Glyphosate / MA-207
Glyphosate in Soy Beans, Corn and Sunflower Seeds (MA-207)By HPLC With Post-Column Derivatization and Fluorescence Detection
Glyphosate is a broad spectrum herbicide widely used around the world. Monitoring of Glyphosate in crops and water is mandated in many countries. We describe a sensitive and robust HPLC method for analysis of Glyphosate in soy beans, corn and sunflower seeds. This method utilizes a simplified sample preparation procedure that has proven to be effective even for challenging matrices.
Method
Analytical ConditionsColumn: Cation-exchange Column for Glyphosate analysis,
4 x 150 mm, Catalog Number 1954150
Guard: Cation-exchange GARD™, Catalog Number 1700-3102
Column Temperature: 55 ºC
Flow Rate: 0.4 mL/min
Mobile Phase: K200, RG019
Injection Volume: 100 uL
Post-Column ConditionsPost-Column System: Onyx PCX, Pinnacle PCX or Vector PCX
Heated Reactor Volume: 0.5 mL
Temperature: 36 °C
Ambient Reactor: 0.1 mL
Reagent 1: 100 uL of 5% NaOCl (Bleach) in 950 mL of GA116 Diluent
Reagent 2: 100 mg of OPA and 2 g of Thiofluor in 950 mL of GA104 Diluent
Reagent Flow Rate: 0.3 mL/min each reagent
Detection: FLD Detector λex: 330 nm, λem: 465 nm
Supplies for Sample Preparation - Methylene Chloride, HPLC Grade
- Acidic Modifier Solution (16 g KH2PO4, 160 mL of water, 40 mL of Methanol, 13.4 mL of conc. HCl)
- Elution Solution (160 mL of water, 40 mL of Methanol, 2.7 mL of HCl)
- RESTORE™
- SPE sample clean-up cartridges P/N 1705-0001
Sample PreparationExtractionTo 25 g of homogenized sample, add enough water (after estimating moisture content) such that the total volume of water is 125 mL. Blend at high speed for 3-5 min and centrifuge for 10 min. Transfer 20 mL of the aqueous extract into a centrifuge tube and add 15 mL of Methylene Chloride. Shake for 2-3 min and centrifuge for 10 min. Transfer 4.5 mL of aqueous layer to another centrifuge tube and add 0.5 mL of Acidic Modifier Solution. Shake and centrifuge for 10 min. Filter through a 0.45 um filter.
Matrix-Specific Modifications1) For samples that absorb large amounts of water, reduce
test portion to 12.5 g while keeping water volume the same.
2) For samples with high protein content, add 100 uL of concentrated HCl to 20 mL of crude extract. Shake and centrifuge for 10 min.
3) For samples with high fat content, do the Methylene Chloride partitioning twice.
HPLC Gradient
TIME K200 % RG019 %
0 100 0
15 100 0
15.1 0 100
17 0 100
17.1 100 0
25 100 0
29 / Pickering Laboratories Method Abstracts

Analysis of Glyphosate / MA-207
SPE CleanupRemove the top cap first, then the bottom cap of the SPE columns and place them into the manifold. Drain the solution to the top of the resin bed. Transfer 1 mL of extract into the column and elute to the top of the resin bed. Add 0.7 mL of the Elution Solution and discard the effluent. Repeat with a second 0.7 mL portion of the Elution Solution and discard the effluent. Elute Glyphosate with 12 mL of the Elution Solution and collect the effluent in a round bottom flask. Evaporate to dryness at 40 ºC using a rotary evaporator. Dissolve the residue in 2.0 mL of a solution of 10% RESTORE™ in water (use 1.5 mL for dry samples), filter through a 0.45 um syringe filter and inject onto the HPLC column. Extracts can be stored refrigerated for up to 7 days before the evaporation step.
Recoveries for Glyphosate
Spike Level Soy Beans Corn Sunflower Seeds
0.2 ug/g 109% 102% 70%
0.1 ug/g 90% 93% 82%
0.05 ug/g 93% 93% 71%
Chromatogram of soy beans sample spiked with Glyphosate at 0.1 ppm level
0 2 4 6 8 10 min
Glyphosate
Chromatogram of corn sample spiked with Glyphosate at 0.1 ppm level
Glyphosate
0 2 4 6 8 10 min
Chromatogram of sunflower seeds sample spiked with Glyphosate at 0.1 ppm level
Glyphosate
0 2 4 6 8 10 min
30Pickering Laboratories Method Abstracts /

Analysis of Glyphosate / MA-206
Glyphosate and AMPA Analysis in Crops (MA-206)A Simple and Reproducible Extraction and Clean-up for HPLC Post-Column Derivatization
The recently practiced method1 for analysis of Glyphosate and AMPA in crops suffers from an expensive, time consuming clean-up procedure that has less than ideal recoveries. Although the analysis (after clean up) by ion-exchange chromatography with post-column derivatization is rugged and sensitive, a new method was sought to improve the sample preparation. This resulted in AOAC Method 2000.522 which has a streamlined cleanup followed by pre-column derivatization and GC/MS analysis. We show how this simplified sample preparation is suitable for the classic ion-exchange/post-column analytical protocol.
Method
Analytical ConditionsColumn: Cation-exchange Column for Glyphosate analysis,
4 x 150 mm, Catalog Number 1954150
Guard: Cation-exchange GARD™, Catalog Number 1700-3102
Column Temperature: 55 ºC
Flow Rate: 0.4 mL/min
Mobile Phase: K200, RG019
Injection Volume: 100 uL
Post-Column ConditionsPost-Column System: Onyx PCX, Pinnacle PCX or Vector PCX
Heated Reactor Volume: 0.5 mL
Temperature: 36 ºC
Ambient Reactor: 0.1 mL
Reagent 1: 100 uL of 5% NaOCl (Bleach) in 950 mL of GA116 Diluent
Reagent 2: 100 mg of OPA and 2 g of Thiofluor in 950 mL of GA104 Diluent
Reagent Flow Rate: 0.3 mL/min each reagent
Detection: Fluorescence detector λex : 330 nm, λem : 465 nm
Sample PreparationExtraction: To 25 g of a homogenous sample add enough water (after estimation of moisture content) to make the total volume of water 125 mL. Blend at high speed for 3–5 min. and centrifuge for 10 min. Transfer 20 mL of the aqueous extract into a centrifuge tube and add 15 mL of methylene chloride (to remove nonpolar co-extractives). Shake for 2–3 min. and centrifuge for 10 min. Transfer 4.5 mL of the aqueous layer into a vial and add 0.50 mL acidic modifier solution (16g KH2PO4, 160 mL H2O, 40 mL Methanol, 13.4 mL HCl). Shake and centrifuge for 10 min.
Matrix Specific Modification:1) For crops that absorb large amounts of water, reduce test
portion to 12.5 g keeping water volume the same.
2) For crops that have high protein content add 100 µL HCl to 20 mL aliquot of crude extract. Cap, shake and centrifuge for 10 min.
3) For crops that have high oil content, do the methylene chloride partition twice.
Cation-Exchange Cleanup:Transfer 1 mL of extract (representing 0.18 g normal crop or 0.09 g dry crop) to the column reservoir and elute to the top of the resin bed. Add 0.70 mL of the elution solution (160 mL H20, 2.7 mL HCl, 40 mL Methanol) and discard the effluent. Repeat with a second 0.70 mL portion and discard effluent. Elute with 12 mL of the elution solution and collect in a round-bottomed flask. Evaporate to dryness in a water bath set at 40 ˚C using a rotary evaporator. Or collect in a centrifuge tube and evaporate using a vacuum vortex evaporator. Dissolve residue in 2.0 mL of the elution solution (use 1.5 mL for dry crops). Extracts before evaporation can be stored refrigerated for up to 7 days.
Chromatograms of Alfalfa and Tomato matrix spiked with glyphosate and AMPA
20 4 6 8 10 12 14 16 18 20 22 24Time [min]
GlyphosateAMPA
Alfalfa spiked with 0.2 ppm glyphosate
Tomato spiked with 0.15 ppm glyphosate
References:4. “Validation of an Analytical Residue Method for Analysis of Glyphosate and Metabolite: An Interlaboratory Study.” J. Agric. Food Chem. 34, (1986) 955–960.5. P.L. Alferness and L.A. Wiebe, “Determination of Glyphosate and Aminomethylphos-phonic Acid in Crops by Capillary Gas Chromatography with Mass-Selective
Detection: Collaborative Study.” Journal of AOAC International, 2001 84, 823–846.
HPLC Gradient
TIME K200 % RG019 %
0 100 0
15 100 0
15.1 0 100
17 0 100
17.1 100 0
25 100 0
31 / Pickering Laboratories Method Abstracts

Analysis of Contaminants and Residues
32Pickering Laboratories Method Abstracts /

Analysis of Contaminants and Residues / MA-472
Analysis of N-Methyl Carbamate Pesticides in Food (MA-472)By HPLC With Post-Column Derivatization and Fluorescence Detection
Carbamate pesticides are widely used around the world to protect agricultural produce. The main route of exposure for people to N-Methyl Carbamates is through food pathways, so pesticide use in food crops is strictly regulated.
As part of FDA’s pesticide monitoring program, individual lots of domestic and imported foods and feeds are sampled and tested for pesticide residues in order to enforce the tolerances set by the EPA. Methyl carbamates are separated using a reversed-phase column and then reacted with o-Phthalaldehyde and a mercaptan after hydrolysis to form a highly fluorescent derivative. This post-column reaction is the basis for EPA Method 531.2 and AOAC official Method 985.23.
The “QuEChERS” (Quick, Easy, Cheap, Effective, Rugged, and Safe) method is a single step sample extraction and salting out technique that is combined with dispersive SPE clean-up for multi-residue pesticide analysis. AOAC official Method 2007.01 utilizes QuEChERS extraction and clean-up for wide range of pesticides in food matrices. This method abstract demonstrates that dispersive SPE can be successfully used in combination with post-column derivatization and fluorescence detection for analysis of carbamates in food.
Method
Sample PreparationPlace 15 g (5 g for spices or other challenging matrices) of homogenized sample into 50 mL centrifuge tube and add 15 mL of 1% Acetic Acid in Acetonitrile (v/v). Mix well. Add one Q-sep packet (Cat. # 26238, Restek), containing 6.0 g Magnesium Sulfate and 1.5 g of Sodium Acetate, to the mixture and immediately shake or vortex for 1 min. Centrifuge for 1 min to separate solid material.
Take 1 mL of supernatant and place into Q-sep d-SPE tube and shake vigorously for 2 min.
To clean-up samples containing fats and waxes, 50 mg PSA, 150 mg MgSO4, and 50 mg C18 (Q-sep Cat # 26125, Restek).
To clean-up intensely colored extracts, 50 mg PSA, 150 mg MgSO4, 50 mg C18 and 50 mg graphitized carbon (Q-sep Cat # 26219, Restek). Centrifuge the tube for 1 min to separate the solid material, filter through 0.45 um filter and place into injection vial for HPLC analysis.
Analytical ConditionsColumn: Carbamate Column
P/N 0846250 (250 x 4.6 mm), C8, 5 um
Guard: Reversed-phase guard cartridge, P/N 18ECG001
Flow Rate: 1 mL/min
Column Temperature: 42 ºC
Mobile Phase: see Table 1
Injection Volume: 10-20 uL
Post-Column ConditionsPost-Column System: Onyx PCX, Pinnacle PCX or Vector PCX
Reactor 1: 100 ºC, 0.5 mL
Reactor 2: Ambient, 0.1 mL
Reagent 1: Hydrolysis Reagent CB130 or CB130.2
Reagent 2: 100 mg of OPA, 2 g of Thiofluor in 950 mL of CB910
Detection: FLD, λex : 330 nm, λem : 465 nm
Table 1. HPLC Conditions
Time Water % Methanol %
0 100 0
1 100 0
1.1 82 18
36 30 70
39 30 70
39.1 0 100
41 0 100
41.1 100 0
55 100 0
33 / Pickering Laboratories Method Abstracts

Fig 1. Carbamates standard solution, 5 ng/mL
Fig 2. Banana sample spiked with 10 ng/g of carbamates Fig 4. Brown rice sample spiked with 25 ng/g of carbamates
Fig 3. Ginger powder spiked with 25 ng/g of carbamates
Table 2. Recoveries of N-Methyl Carbamates in Food Matrices
Sample Apples Banana Ginger powder Brown rice Blueberries
Spike Concentration 10 ng/g 10 ng/g
25 ng/g; sample is contaminated with 62
ng/g of Carbofuran25 ng/g 10 ng/g
Aldicarb Sulfoxide 99.6% 109.4% 91.1% 87.1% 92.8%
Aldicarb Sulfone 107.0% 98.4% 79.8% 81.8% 92.5%
Oxamyl 73.1% 73.3% 76.8% 80.8% 68.7%
Methomyl 98.5% 84.2% 83.1% 86.9% 115.4%
3-Hydroxycarbofuran 84.1% 107.0% 87.4% 72.1% 80.8%
Aldicarb 89.7% 99.8% 77.8% 87.2% 87.5%
Propoxur 101.5% 91.0% 72.3% 88.4% 86.5%
Carbofuran 103.4% 100.3% 97.0% 84.1% 89.2%
Carbaryl 76.2% 111.8% 81.8% 83.4% 82.2%
Naphthol 61.6% 82.3% 75.0% 75.8% 37.2%
Methiocarb 86.8% 93.1% 49.8% 88.4% 83.5%
5 10 15 20 25 30 35 40 min
Ald
icar
b
Ald
icar
b su
lfone
Ald
icar
b su
lfoxi
de
Met
hom
yl
3-H
ydro
xyca
rbof
uran
Pro
poxu
r
Car
bary
l1-
Nap
htho
l
Met
hioc
arb
Oxa
myl
Car
bofu
ran
5 10 15 20 25 30 35 40
Ald
icar
b
Ald
icar
b su
lfone
Ald
icar
b su
lfoxi
de
Met
hom
yl
3-H
ydro
xyca
rbof
uran
Pro
poxu
r
Car
bary
l1-
Nap
htho
l
Met
hioc
arb
Oxa
myl
Car
bofu
ran
min
Ald
icar
b
Ald
icar
b su
lfone
Ald
icar
b su
lfoxi
de
Met
hom
yl
3-H
ydro
xyca
rbof
uran
Pro
poxu
r
Car
bary
l1-
Nap
htho
l
Met
hioc
arb
Oxa
myl
Car
bofu
ran
5 10 15 20 25 30 35 40 min
5 10 15 20 25 30 35 40
Ald
icar
b
Ald
icar
b su
lfone
Ald
icar
b su
lfoxi
de
Met
hom
yl
3-H
ydro
xyca
rbof
uran
Pro
poxu
r
Car
bary
l1-
Nap
htho
l
Met
hioc
arb
Oxa
myl
Car
bofu
ran
min
Analysis of Contaminants and Residues / MA-472
34Pickering Laboratories Method Abstracts /

Analysis of Contaminants and Residues / MA-388
Highly Sensitive Analysis of Chromium (VI) in Drinking Water by Ion Chromatography (IC) with Post-Column Derivatization and UV/VIS Detection (MA-388)
Chromium is widely used in the manufacturing of metal alloys, surface coatings, pigments and other products. It is also present naturally in soil. Chromium (VI) is the most toxic form of Chromium and is a possible human carcinogen. Due to its high solubility, Hexavalent Chromium can easily contaminate drinking and ground water sources and its levels must be monitored.
In July 2011, the Office of Environmental Health Hazard Assessment (OEHHA) established a Public Health Goal (PHG) for Chromium (VI) at a concentration of 0.02 ug/L. Based on the PHG, the California Department of Public Health is developing a primary drinking water standard (Maximum Contaminant Level, MCL) that is specific for Chromium (VI).
EPA Method 218.7 uses post-column derivatization with diphenylcarbazide under highly acidic conditions and UV/VIS detection to analyze Chromium (VI) in drinking water. Injection volumes of 1000 uL and 1250 uL were used in the method but Pickering Laboratories was able to meet method requirements with as low as 100 uL injections. Modern IC systems and columns can successfully separate Chromium (VI) from other ions with short run times. Pickering Laboratories’ post-column system is uniquely suitable for delivering aggressive derivatizing reagents with unmatched flow precision and low noise level in order to consistently provide highly sensitive detection of Hexavalent Chromium.
Method
Sample PreparationClean all glassware and containers with 1:1 H2O/HNO3. Rinse well with deionized water.
Adjust all samples and standards to pH 9.0-9.5 using Sample Adjustment Buffer (250 mM Ammonium Sulfate, 500 mM Ammonium Hydroxide in water). For most samples, no more than 1 mL of Adjustment Buffer is used per 100 mL of water sample. Correct final results for dilution. Store all samples and standards in the refrigerator and analyze within 24 hours.
An injection volume of 100 uL is sufficient to detect levels as low as 0.01 ppb. Injection volume can be increased up to 1000 uL if needed.
Analytical ConditionsIC System: ICS 900 or equivalent IC system
(Thermo Scientific)
Analytical Column: IonPac AS22, 4x250 mm (Thermo Scientific)
Guard: IonPac AG22, 4x50 mm (Thermo Scientific)
Flow Rate: 1 mL/min
Column Temperature: 30 ºC
Mobile Phase: 250 mM Ammonium Sulfate, 50 mM Ammonium Hydroxide in water
Injection Volume: 100 uL
Post-Column ConditionsPost-Column System: Onyx PCX or Pinnacle PCX for
Chromium (VI) Analysis
Reactor Volume: 1.0 mL
Reactor Temperature: 30 ºC
Reagent: 2 mM Diphenylcarbazide, 1 N Sulfuric Acid, 10% Methanol
Reagent Flow Rate: 0.33 mL/min
Detection: UV/VIS, 530 nm
Table 1. Recoveries Data for Tap Water Spiked With Chromium (Vi).
Spike Concentration Recoveries RSD N=3
0.1 ppb 104% 10.6%
0.5 ppb 96% 4.3%
35 / Pickering Laboratories Method Abstracts

Fig 1. Calibration curve for Chromium (VI) 0.01 – 5 ppb range
R² = 0.9999
0
0.5
1
1.5
2
2.5
0 1 2 3 4 5 6
Pea
k H
eig
ht
Chromium (VI) concentration, ppb
Fig 3. Chromatogram of tap water spiked with 0.5 ppb of Chromium (VI)
0 1 2 3 4 5 6 min
Cr-6
Fig 2. Calibration curve for Chromium (VI) 0.01 – 100 ppb range
R² = 1
0
5
10
15
20
25
30
35
40
45
0 20 40 60 80 100 120
Pea
k H
eig
ht
Chromium (VI) concetration, ppb
Fig 4. Chromatogram of 0.02 ppb standard solution of Chromium (VI)
Cr-6
0 1 2 3 4 5 6 min
Analysis of Contaminants and Residues / MA-388
36Pickering Laboratories Method Abstracts /

Analysis of Contaminants and Residues / MA-121
Simultaneous Determination of Nitrite and Nitrate in Baby Food (MA-121)
Nitrite and Nitrate are added to food to preserve color and taste, and to prevent foods from becoming rancid. They are also used in food for their anti-microbial properties. Higher levels in vegetables and leafy greens are possible from the use of Nitrate fertilizers and/or livestock manure. Nitrite levels in food could also be produced by reduction of Nitrate to Nitrite during processing.
AOAC official method 993.031 for the analysis of Nitrate involves reduction using spongy Cadmium, which is toxic and carcinogenic. FDA improved on this method by using Vanadium (III) chloride and heat for the post-column reduction of Nitrate to Nitrite. Nitrite reacts with this modified Griess reagent to produce a red chromophore with maximal absorbance at 535 nm. Pickering Laboratories Inc. has further improved this method by substituting the corrosive Hydrochloric Acid with Methanesulfonic Acid.
Method
Analytical ConditionsAnalytical Column: Thermo Scientific Ion Pac™ AS9-HC
Column (Cat. No. 051786) or AS22 (Cat. No. 064137)
Column Temperature: 50 °C
Flow Rate: 1 mL/min
Mobile Phase: 1.8 mM Na2CO3 / 1.7 mM NaHCO3 for AS9 - HC Column or 4.5 mM Na2CO3 / 1.4 mM NaHCO3 for AS22 Column
Injection Volume: 10 µL
Post-Column ConditionsPost-Column System: Onyx PCX or Pinnacle PCX
Reactor Volume: 0.5 mL
Reactor Temperature: 100 °C
Reagent Flow Rate: 0.1 mL/min
Reagent: (i) 1% Vanadium (III) chloride in 20% Methanesulfonic Acid
(ii) 1% wm-Nitro aniline in 20% Methanesulfonic Acid
(iii) 1% N-(1-Naphthyl)ethylenediamine
dihydrochloride in 20% Methanesulfonic Acid
Mix 50 mL of (i) and (ii), and 1.25 mL of (iii) and dilute to 250 mL using 20% Methanesulfonic Acid
Detection: UV/VIS, λmax = 535 nm
Sample PreparationTo 5 g of baby food in a 50 mL centrifuge tube, add 25 mL of 50-60 °C water (for vegetables) or 15 mM Sodium acetate (for fruits) and shake for 10 min. Add 12.5 mL of acetonitrile and make up the volume to 50 mL using water (for vegetables) or Sodium acetate (for fruits). Centrifuge the mixture for 15 mins at 5000 rpm. Filter the supernatant through a 0.45 μm nylon filter and dilute to fall within the linear range.NotesPost-column reagent solutions are stored in plastic or Teflon containers.All solutions are filtered through 0.45 μm nylon filter before use.Nitrate/Nitrite standards should be checked prior to use for oxidation.Sample pH should be checked to determine the choice of extraction solution since acidic pH facilitates the conversion of Nitrite to Nitrate.
Recovery Data
Sample Spiked Conc. (ppm) Cal. Conc. (ppm) % Recovery
Nitrite Nitrate Nitrite Nitrate Nitrite Nitrate
Sweet Potato50 50 57.3 58.0 115 116
250 250 271.4 266.7 109 107
Pears 50 50 54.4 55.0 109 110
250 250 280.8 271.0 112 108
Apple Sauce50 50 56.5 54.6 113 109
250 250 283.9 265.7 114 106
37 / Pickering Laboratories Method Abstracts

AcknowledgmentsJohn A. Casanova, Food and Drug Administration, 60 8th Street, Atlanta, GA 30309References1. AOAC- Official Methods of Analysis of AOAC International (2000) 17th Ed.,
Section 50.1.11.2. Use of Griess Reagents Containing Vanadium (III) for the Post-Column
Derivatization and Simultaneous Determination of Nitrite and Nitrite in Baby Food, John A. Casanova, Lois K. Gross, Sarah E. McMullen and Frank Schenck, Food and Drug Administration, 60 8th Street, Atlanta, GA 30309.
AU
0.00
0.02
0.04
0.06
0.08
0.10
0.12
min
Nitrite
Nitrate
2.00 4.00 6.00 8.00 10.00 12.00 14.00
20 ppm Nitrite and Nitrate Standard
Analysis of Contaminants and Residues / MA-121
Calibration Curve for Nitrite and Nitrate
0
500000
1000000
1500000
2000000
2500000
0 5 10 15 20 25 30Conc. (ppm)
Are
a
Nitrite
Nitrate
38Pickering Laboratories Method Abstracts /

Analysis of Contaminants and Residues / MA-129
Sensitive and Selective Analysis of Nitrite and Nitrate in Drinking Water by Ion Chromatography (IC) With Post-Column Derivatization and UV/VIS Detection (MA-129)
Nitrite and Nitrate are formed naturally in soil and water when bacteria break down waste and organic material from plants, humans and animals. Nitrate is also one of the main components of chemical fertilizers. Contamination of the drinking water supply with Nitrite and Nitrate occurs due to runoff and seepage into ground water from farms, golf courses, landfields, improperly managed animal feedlots and sewage systems.
Under certain conditions, the human body converts Nitrate to Nitrite, which can react with hemoglobin in blood and decrease its ability to carry oxygen. Nitrite can also form a variety of N-Nitroso compounds, many of which are known carcinogens. Elevated concentrations of Nitrite and Nitrate in water are especially dangerous to infants younger than 6 months old and pregnant women. To prevent harmful health effects from Nitrite and Nitrate contamination of drinking water, the USEPA has established Maximum Contamination Levels (MCLs) at 10 ppm for Nitrate and 1 ppm for Nitrite.
The USFDA method for Nitrite and Nitrate calls for post-column derivatization using a Vanadium (III) Chloride reagent containing HCl. Pickering Laboratories has improved this method by substituting the volatile and corrosive Hydrochloric Acid with Methanesulfonic Acid. When coupled with modern IC systems and columns, the Pickering post-column derivatization systems allow for fast, sensitive and selective analysis of Nitrite and Nitrate in drinking water, and additionally in food matrices*.
Method
Analytical ConditionsIC System: ICS 900 or equivalent IC system
(Thermo Scientific)
Analytical Column: IonPac AS9-HC, 4 x 250 mm (Thermo Scientific)
Flow Rate: 1 mL/min
Column Temperature: 30 ºC
Mobile Phase: 9.0 mM Sodium Carbonate
Injection Volume: 20 uL
Post-Column ConditionsPost-Column System: Onyx PCX, Pinnacle PCX or Vector PCX
Reactor Volume: 0.5 mL
Reactor Temperature: 100 °C
Reagent Flow Rate: 0.1 mL/min
Detection: UV/VIS, 535 nm
Reagent : Mix 50 mL of (i) and (ii) and 1.25 mL of (iii) in 250 mL volumetric flask. Bring to volume with 20/80 Methanesulfonic Acid / Water.
(i) 1% Vanadium (III) Chloride in 20/80 Methanesulfonic Acid / Water.
(ii) 1% m-Nitro Aniline in 20/80 Methanesulfonic Acid / Water.
(iii) 1% N-(1-Naphthyl)ethylenediamine Dihydrochloride in 20/80 Methanesulfonic Acid / Water.
*Inquire about Pickering Laboratories Method Abstract 123 “Simultaneous Determination of Nitrite and Nitrate in Processed Foods” and Method Abstract 121 “Nitrite and Nitrate Analysis in Baby Food”
Table 1. Recoveries Data for Nitrite and Nitrate
Spike Concentration Nitrite % Nitrate %
10 ppm 100.6 102.4
0.5 ppm 97.5 85.5
0.5 ppm in 100 ppm NaCl 100.1 87.1
39 / Pickering Laboratories Method Abstracts

Analysis of Contaminants and Residues / MA-129
Fig 1
Fig 2
R² = 0.9999
0
20
40
60
80
100
120
140
160
180
200
0 10 20 30 40 50 60
Pea
k A
rea
Nitrate Concetration, ppm
R² = 0.9992
0
10
20
30
40
50
60
70
80
90
100
0 2 4 6 8 10 12
Pea
k A
rea
Nitrite Concentration, ppm
Fig 1
Fig 2
R² = 0.9999
0
20
40
60
80
100
120
140
160
180
200
0 10 20 30 40 50 60
Pea
k A
rea
Nitrate Concetration, ppm
R² = 0.9992
0
10
20
30
40
50
60
70
80
90
100
0 2 4 6 8 10 12
Pea
k A
rea
Nitrite Concentration, ppm
Nitrite
Nitrate
min0.0 4.0 6.0 8.0 10.0 12.0 14.0 16.0 18.02.0
Nitrite
Nitrate
min0.0 4.0 6.0 8.0 10.0 12.0 14.0 16.0 18.02.0
Fig 1. Calibration Curve for Nitrate 0.05-50 ppm range
Fig 3. Chromatogram of 0.05 ppm Nitrite and 0.05 Nitrate solution.
Fig 2. Calibration Curve for Nitrite 0.05-10 ppm range
Fig 4. Chromatogram of 0.5 ppm Nitrite and 0.5 ppm Nitrate solution in presence of 100 ppm NaCl.
References1. Official Methods of Analysis of AOAC International (2000) 17th Ed, Section 50.1.112. Use of Griess Reagents Containing Vanadium (III) for Post-Column Derivatization
and Simultaneous Determination of Nitrite and Nitrate in Baby Food. John A. Casanova, Lois K. Gross, Sarah E. McMullen and Frank Schenk, Food and Drug Administartion, 60 8th Street, Atlanta, GA 30309
40Pickering Laboratories Method Abstracts /

Analysis of Contaminants and Residues / MA-123
Simultaneous Determination of Nitrite and Nitrate in Processed Foods (MA-123)
Nitrite either alone or in combination with nitrate is added to food to preserve color and taste and to prevent foods from becoming rancid. They are also used in food for their anti-microbial properties. Higher levels in vegetables and leafy greens are possible from the use of nitrate fertilizers and/or livestock manure.
Nitrate can be reduced to nitrite at certain physiological conditions in the human body. Nitrite however can oxidize Fe (II) in hemoglobin to methemoglobin, an Fe (III) product. The oxidized product is incapable of binding molecular oxygen and high concentrations of methemoglobin can result in methemoglobinemia especially in infants. Nitrite can also react with secondary amines present in food products or in the digestive system to form nitrosamines, a class of carcinogenic compounds. Nitrite levels in food could also be produced by reduction of nitrate to nitrite during processing.
The AOAC Official Method 993.031 for the analysis of nitrate involves reduction using spongy Cadmium which is toxic and carcinogenic. The USFDA improved on this method by using Vanadium (III) chloride and heat for the post-column reduction of nitrate to nitrite. Nitrite reacts with this modified Griess reagent to produce a red chromophore with maximal absorbance at 535 nm. Pickering Laboratories Inc. has further improved this method by substituting the corrosive and volatile hydrochloric acid with methane sulfonic acid.
Method
Analytical ConditionsIC System: ICS 900 or equivalent IC system
(Thermo Scientific)
Analytical Column: IonPac AS9-HC, 4 x 250 mm (Thermo Scientific)
Flow Rate: 1 mL/min
Column Temperature: 30 ºC
Mobile Phase: 9.0 mM Sodium Carbonate
Injection Volume: 20 uL
Post-Column ConditionsPost-Column System: Onyx PCX, Pinnacle PCX or Vector PCX
Reactor Volume: 0.5 mL
ReactorTemperature: 100 °C
Reagent Flow Rate: 0.1 mL/min
Detection: UV/VIS, 535 nm
Reagent : Mix 50 mL of (i) and (ii) and 1.25 mL of (iii) in 250 mL volumetric flask. Bring to volume with 20/80 Methanesulfonic Acid / Water.
(i) 1% Vanadium (III) Chloride in 20/80 Methanesulfonic Acid / Water.
(ii) 1% m-Nitro Aniline in 20/80 Methanesulfonic Acid / Water.
(iii) 1% N-(1-Naphthyl)ethylenediamine Dihydrochloride in 20/80 Methanesulfonic Acid / Water.
Extraction ProcedureFruits and VegetablesTo 5 g of baby food in a 50 mL centrifuge tube add 25 mL of 50-60 ºC water (for vegetables) or 15 mM Sodium acetate (for fruits) and shake for 10 min. Add 12.5 mL of acetonitrile and make up the volume to 50 mL using water (for vegetables) and sodium acetate (for fruits). Centrifuge the mixture for 15 mins at 5000 rpm. Filter the supernatant through a 0.45 µ nylon filter and dilute to fall within the linear range.
Processed MeatTo 5 g of homogenized processed meat in a blender add 25 mL of 50-60 ºC water and blend for 2 min. Add 25 mL of acetonitrile and blend for an additional 2 min. Transfer into a beaker and make up the volume to 100 mL using warm water. Filter the mixture using Whatman filter paper. Filter further through a 0.45 µ nylon filter and dilute to fall within the linear range.NotesPost-column reagent solutions are stored in plastic or Teflon containers.All solutions are filtered through 0.45 µ nylon filter before use.Nitrate/Nitrite standards should be checked prior to use for oxidation.Sample pH should be checked to determine the choice of extraction solution since acidic pH facilitates the conversion of nitrite to nitrate.
41 / Pickering Laboratories Method Abstracts

Analysis of Contaminants and Residues / MA-123
Calibration Curve for Nitrite-Nitrate (0.05 ppm – 50 ppm)
min0 10 20
a)
b)
Nitrite
Nitrate
10 ppm nitrite-nitrate standard using (a) 20% methane-sulfonic acid , (b) 20% hydrochloric acid
a)
b)
Nitrite
Nitrate
0.0 5.0 10.0 15.0 min
(a) 0.05 ppm, (b) 0.01 ppm nitrite-nitrate standard
AcknowledgmentsJohn A. Casanova, Food and Drug Administration, 60 8th Street, Atlanta, GA 30309References1. AOAC- Official Methods of Analysis of AOAC International (2000) 17th Ed., Section 50.1.11.2. Use of Griess Reagents Containing Vanadium (III) for the Post-Column Derivatization and Simultaneous Determination of Nitrite and Nitrite in Baby Food,
John A. Casanova, Lois K. Gross, Sarah E. McMullen and Frank Schenck, Food and Drug Administration, 60 8th Street, Atlanta, GA 30309.
Nitrite
Nitratea)
b)
0.0 5.0 10.0 15.0 min
Banana (baby food): (a) spiked with 100 ppm nitrite-nitrate solution, (b) blank
a)
b)
Nitrite
Nitrate
0.0 5.0 10.0 15.0 min
Carrot (baby food): (a) spiked with 100 ppm nitrite-nitrate solution, (b) blank
Nitrite
Nitrate
a)
b)
0.0 5.0 10.0 15.0 min
Corned Beef: (a) spiked with 50 ppm nitrite and 500 ppm nitrate solution, (b) blank
Recovery Data
Nitrite Nitrate
SampleSpiked Conc.(ppm)
Cal. Conc. (ppm)
Recovery (%)
Spiked Conc. (ppm)
Cal. Conc. (ppm)
Recovery (%)
Baby Food
Carrot 100 92.25 92 100 79.3 79
Banana 100 94.6 95 100 102.5 103
Processed Food
Corned Beef 50 54.4 109 500 478.9 96
25000000
20000000
15000000
10000000
5000000
NitriteR2 = 0.9986
NitrateR2 = 0.9985
00
10 20 30 40 50 60
42Pickering Laboratories Method Abstracts /
Analysis of Contaminants and Residues / MA-105
Analysis of Paralytic Shellfish Toxins in Bivalve Mollusks using HPLC Method with Post-Column Derivatization and Fluorescence Detection (MA-105)
The paralytic shellfish toxins are a group of 18 secondary metabolites deposited in bivalve mollusks by dinoflagelates. Dinoflagelate blooms are seasonal, occurring during warm months. Since it is unpredictable whether the infestation will occur, the shellfish population should be regularly monitored for toxins. Ingestion of contaminated shellfish can lead to paralytic shellfish poisoning: a life-threatening illness.
The Mouse Bioassay method used to detect dinoflagelate-derived neurotoxins has major drawbacks, which led to exploration of chromatographic methods of analysis. Recently, HPLC method that utilizes post-column oxidation of the toxins under alkaline conditions has been approved as a new official AOAC method – OMA 2011.02. Three groups of toxins are separated on a C18 column using a single step-gradient method. The products of post-column derivatization of the toxins can be detected with high sensitivity using a fluorescence detector, leading to the determination of toxin type and concentration. We describe the use of Pickering Laboratories’ post-column derivatization system for analysis of paralytic shellfish toxins according to AOAC Method 2011.02.
Method
Sample Preparation - Transfer 5 g of homogenized shellfish tissue into a 50 mL
centrifuge tube and add 5 mL of 0.1 N HCl
- Vortex the mixture, adjust the pH to be in range of pH 2-4 as necessary
- Heat the mixture in the boiling water bath for 5 min, cool to room temperature, and recheck the pH, adjusting if necessary
- Centrifuge the mixture and transfer 500 uL of supernatant into a microcentrifuge tube
- Add 25 uL of 30% trichloroacetic acid (TCA) to deproteinate the extract, mix well and centrifuge
- Adjust pH with 1 M NaOH to optimum range of pH 2-4
- Filter through 0.2 um filter and inject
Analytical ConditionsColumn: Zorbax Bonus RP column, 3.5 um, 4.6 x 150 mm
(Agilent Technologies)
Flow Rate: 0.8 mL/min
Mobile Phase A: 11 mM heptane sulfonate, 5.5 mM phosphoric acid, adjusted to pH 7.1 with ammonium hydroxide
Mobile Phase B: 11 mM heptane sulfonate, 16.5 mM phosphoric acid, 11.5% acetonitrile, adjusted to pH 7.1 with ammonium hydroxide
Post-Column ConditionsPost-Column System: Onyx PCX, Pinnacle PCX or Vector PCX
Reactor Volume: 1.0 mL
Reactor Temperature: 85 °C
Reagent 1: 100 mM phosphoric acid, 5 mM periodic acid, adjusted to pH 7.8 with 5 M sodium hydroxide
Reagent 2: 0.75 M nitric acid
Reagent Flow Rates: 0.4 mL/min
Detection: Fluorescence detector, λex : 330 nm, λem : 390 nm
43 / Pickering Laboratories Method Abstracts

Acknowledgements:We would like to thank Jeffrey van de Riet and Ryan Gibbs (Canadian Food Inspection Agency) for their help with this project.References:1. van de Riet, J.M., Gibbs, R.S., Chou, F.W., Muggah, P.M., Rourke,
W.A., Burns, G., Thomas, K, Quilliam, M.A. (2009) J. AOAC Int. 92, 1690-1704.
2. AOAC Official Method 2011.02. Paralytic Shellfish Toxins in Mussels, Clams, Oysters, and Scallops. Post-Column Oxidation (PCOX) Method.
Chromatogram of GTX and STX mixed toxins standard
Chromatogram of mussels sample naturally contaminated with paralytic shellfish toxins
0.00 2.00
GT
X4
GT
X1
dcG
TX
3
GT
X3
ST
X
neoS
TX
GT
X2
dcG
TX
2G
TX
5
dcS
TX
4.00 6.00 8.00 10.00 12.00 14.00 16.00 18.00 20.00
neoS
TXG
TX
1
GT
X4
GT
X3
ST
X
Mat
rix P
eak
0.00 2.00 4.00 6.00 8.00 10.00 12.00 14.00 16.00 18.00 20.00
Analysis of Contaminants and Residues / MA-105
44Pickering Laboratories Method Abstracts /

Analysis of Contaminants and Residues / MA-325
Analysis of Formaldehyde (MA-325)
Formaldehyde is widely used in manufacturing of building materials, cars, plywood, polymers, glues and adhesives. It is also commonly used in household items as a preservative and disinfectant. Due to high toxicity and suspected carcinogenicity products are tested to determine free formaldehyde content and ensure the safety of personal care products and other items. Free formaldehyde testing is also important to monitor production of resins and other polymers and to ensure the quality of final materials.
The HPLC method with post-column derivatization allows for quantifying free formaldehyde in a wide range of products and materials, from shampoos to emulsion polymers and phenolic resins. The method is simple, selective and very sensitive. Potential interferences are either separated from formaldehyde on the HPLC column or don’t react with post-column reagent and so are not interfering with the detection.
Sample PreparationLeather samples (According to ISO 177226-1)Weigh approximately 2 g of leather pieces to the nearest 0.01 g into a 100 ml glass Erlenmeyer flask. Add 50 ml of 0.1% sodium dodecylsulfonate or sodium dodecylsulfate solution (previously preheated at 40 °C) and fit the Erlenmeyer flask with a glass stopper. Shake the contents of the flask in the water bath for 60 min at 40 °C. Immediately filter the warm extract solution by vacuum through a glass fiber filter into a flask. Cool the filtrate and analyze.
Fabric Samples (According to ISO 14184-1)Cut specimens into small pieces, and weigh approximately 1 g of the pieces to an accuracy of 10 mg. If the formaldehyde content is low, increase the test specimen weight to 2.5 g in order to achieve a sufficient accuracy. Put the weighed pieces into a 250 ml flask with a stopper and add 100 ml of water. Cap tightly and place in a water bath at 40 °C for 60 min. Shake the flask at least every 5 min. Filter the solution into another flask through a glass filter and analyze.
Resins and Other SamplesExtract samples with water by shaking for 60 min at 40 °C. Choose sample/extraction solution ratio based on expected Formaldehyde content. Use additional dilutions as necessary.
Method
Analytical ConditionsColumn: Waters Atlantis® HILIC Silica, 5 um, 4.6 x 250 mm
Column Temperature: 40 ºC
Flow Rate: 0.5 mL/min
Mobile Phase: 15% 0.05 M Ammonium Acetate in water 85% Acetonitrile
Injection Volume: 10-50 uL
Post-Column ConditionsPost-Column System: Onyx PCX, Pinnacle PCX or Vector PCX
Reactor Volume: 0.5 mL
Reactor Temperature: 100 ºC
Reagent: 0.81 M Ammonium Acetate 0.12 M Glacial Acetic Acid 0.05 M 2,4-Pentanedione
Reagent Flow Rate: 0.4 mL/min
Detection: FLD, λEX : 412 nm, λEM : 510 nm Or UV/Vis 410 nm
Fig 1. Calibration curve for Formaldehyde (0.5 – 50 ppm)
R² = 0.9997
0
200
400
600
800
1000
1200
1400
0 10 20 30 40 50 60
Fig 2. Chromatogram of phenolic resin sample containing 0.02% of Formaldehyde
Formaldehyde
min0 5 10
45 / Pickering Laboratories Method Abstracts

Fig 3. Chromatogram of phenolic resin containing 0.1% of Formaldehyde
Formaldehyde
min0 5 10
Fig 4. Chromatogram of shampoo sample spiked with 0.01% of Formaldehyde
Formaldehyde
min0 5 10
Fig 5. Chromatogram of leather sample containing 5 ppm of Formaldehyde
Formaldehyde
0 5 10 min
Formaldehyde
0 5 10 min
Fig 6. Chromatogram of fabric sample containing 160 ppm of Formaldehyde
Analysis of Contaminants and Residues / MA-325
46Pickering Laboratories Method Abstracts /

Analysis of Contaminants and Residues / MA-102
Analysis of Biogenic Amines (MA-102)Food and Physiological Samples
Histamine and other polyamines such as Putrescine, Cadaverine, Spermidine and Spermine are products of decomposition. The level of histamine, in particular, has been used as a regulatory guideline for degree of decomposition in fish. Also, Histamine and Tyramine levels are of interest to producers of wine and cheese.
The polyamines, Spermidine, Spermine and Putrescine are elevated in neoplastic and damaged, e.g., burned tissue. In fact, the level of circulating and urinary polyamines is an indicator of total body damage. The levels can be monitored for the effect of diet and other modalities on recovery.
This method employs ion-exchange chromatography so, after extraction, centrifugation/filtration are the only sample preparations necessary.
Method
Analytical ConditionsAnalytical Column: ALKION™ cation-exchange, K+ form,
4 x 150 mm, Catalog No. 9410917
Guard: ALKION™ Guard column, 3 x 20 mm, Catalog No. 9493020
Column Temperature: 45 °C
Flow Rate: 0.8 mL/min
Mobile Phase: K600, K563, K130
Extraction ProcedureWeigh 10 g of sample into a small glass blender cup (any fortifications should be added at this time). Add 50 mL of extraction solution, (80% HPLC Methanol and 20% 0.1N HCl) and homogenize for two minutes. Centrifuge for five minutes. Mix equal portions of the supernatant with the mobile phase (K600). Allow to coagulate at -4 °C for 15 minutes, then centrifuge for five minutes. The clear supernatant is filtered (0.45 µm Nylon) and placed in an autosampler vial.
Post-Column ConditionsPost-Column System: Onyx PCX, Pinnacle PCX or Vector PCX
Reactor Volume: 0.15 mL
Reactor Temperature: 45 °C
Reagent: 300 mg of OPA, 2 g of Thiofluor™, 3 mL of 30% Brij® 35 in 950 mL of OD104
Flow Rate: 0.3 mL/min
Detection: Fluorometer λex : 330 nm, λem : 465 nm
Conditions
Time K600 % K563 % K130 %
0 100 0 0
6 100 0 0
15 0 100 0
21 0 100 0
21.1 0 0 100
23 0 0 100
23.1 100 0 0
29 100 0 0
Flow Rate: 0.8 mL/min, Column Temp.: 45 ºC, Injection Volume: 10 mL
Chromatogram of calibration standard, 100 µM
min0 5 10 15 20
Tyra
min
e
His
tam
ine
Put
resc
ine
Cad
aver
ine
Spe
rmid
ine
Spe
rmin
e
Chromatogram of fish sampleH
ista
min
e
Put
resc
ine
Cad
aver
ine
Spe
rmid
ine
min0 5 10 15 20
Chromatogram of fish sauce sample
min0 5 10 15 20
His
tam
ine
Put
resc
ine
Cad
aver
ine
Spe
rmid
ine
47 / Pickering Laboratories Method Abstracts

Analysis of Contaminants and Residues / MA-386
Analysis of N-Nitroso-diethanolamine (NDELA) in Cosmetics (MA-386)
Nitrosamines are chemical contaminants that could be present in food, pharmaceuticals, tobacco, toys and personal care products. They are classified as human carcinogens and limits are established for different products. Cosmetics containing more than 50 ug/kg of nitrosamines, including NDELA, are banned in European Union.
Analysis of NDELA by HPLC with photolysis and post-column derivatization has high specificity and sensitivity and allows for accurate quantification of NDELA in cosmetics and raw materials used in cosmetics. The procedure is described in Official Method DIN EN ISO 10130:2009. Pickering Laboratories’ UVE™ photochemical reactor and Onyx PCX post-column derivatization system are uniquely suited for NDELA analysis.
Method
Analytical ConditionsAnalytical Column: Spherisorb ODS-2, 4.6 x 150 mm
Guard Column: Reversed-phase C18, 4.6 x 20 mm
Temperature: 30 °C
Flow Rate: 0.5 mL/min
Mobile Phase: 0.02 M Ammonium Acetate in water, pH 6.8
Injection Volume: 10 – 50 μL
Post-Column ConditionsPost-Column System: Onyx PCX, Pinnacle PCX or Vector PCX
Photochemical Reactor: UVE™
Reactor Volume: 1.0 mL
Reactor Temperature: 50 °C
Reagent: Dissolve 0.25 g of N-(1-naphthyl) ethylenediamine dihydrochloride in 250 mL of water. Dissolve 4.0 g of sulfanilamide in 250 mL of a 5% (w/v) aqueous solution of 85% orthophosphoric acid. Mix the reagents together in an amber glass bottle and keep the mixture away from light.
Reagent Flow Rate: 0.5 mL/min
Detection: UV/Vis 540 nm
Fig 1. Chromatograms of NDELA standard: a. 4.8 ppb; b. 16 ppb
ND
ELA
ND
ELA
0.00 2.00 4.00 6.00 8.00 10.00 12.00 14.00Minutes
a
b
Flow diagram for NDELA analysis according to DIN EN ISO 10130:2009
HPLC
UV/VisUVE™
References1. DIN EN ISO 10130:2009Cosmetics - Analytical methods - Nitrosamines: Detection and determination of N-nitrosodiethanolamine (NDELA) in cosmetics by HPLC, post-column photolysis and derivatization.2. A method for the determination of N-Nitrosodiethanolamine (NDELA) in Personal Care Products – Collaboratively evaluated by the CTPA Nitrosamines Working Group: Chris Flower, Stephen Carter, Andy Earls, Richard Fowler, Stewart Hewlins, Sam Lalljie, Mark Lefebvre, Jacqueline Mavro, David Small, and Nathalie Volpe
48Pickering Laboratories Method Abstracts /

Analysis of Supplements
49 / Pickering Laboratories Method Abstracts

Analysis of Supplements / MA-378
Analysis of Theanine in Tea by HPLC With Post-Column Derivatization (MA-378)
Theanine is a neurologically active amino acid found in tea plants. Theanine is a dominant amino acid in green tea and is responsible for its unique pleasant taste as well as known relaxation effect. Theanine also has been proven to reduce physical and mental stress, and improve cognition and mood.
Cation-exchange chromatography using post-column Ninhydrin reagent Trione and UV detection has shown unmatched reproducibility and selectivity in the analysis of free amino acids in complex matrices. The Pinnacle PCX post-column derivatization system allows shortening run times by utilizing column temperature gradients.
We introduce a simple, fast and robust method for analysis of Theanine. The same column and solutions could be used for extended analysis to determine other free amino acids in tea leaves.
Method
Sample PreparationHomogenize 2 g of dry tea leaves with 25 mL of Li220 for 5 min. Centrifuge and filter through 0.45 um Nylon filter.
Analytical ConditionsColumn: High-efficiency Lithium cation-exchange column,
4.6x75 mm, Catalog number 0354675T
Flow Rate: 0.55 mL/min
Mobile Phase: see method
Injection Volume: 10 uL
Post-Column ConditionsPost-Column System: Onyx PCX or Pinnacle PCX
Reactor Volume: 0.5 mL
Reactor Temperature: 130 °C
Reagent: Trione Ninhydrin reagent
Flow Rate: 0.3 mL/min
Detection: UV/VIS 570 nm for primary amino acids, 440 nm for secondary amino acids
HPLC Gradient
Time 1700-1125 % Li365 % RG003 %
0 100 0 0
10 100 0 0
19 40 60 0
19.1 0 0 100
24 0 0 100
24.1 100 0 0
36 100 0 0
Column Oven Program
Time Temperature °C
0 34
6 34
17 65
19 34
Run Time: 24 Min Equilibration Time: 12 Min
Fig 1. Calibration curve for Theanine. Concentration range 0.05-2 umole/mL
Fig 2. Chromatogram of green tea sample
Fig 3. Chromatogram of white tea sample
0 20.010.0
Asp
artic
Aci
dTh
reon
ine
Ser
ine
Asp
arag
ine
Glu
tam
ic A
cid
Glu
tam
ine
Thea
nine
Pro
line
Gly
cine
Asp
artic
Aci
dTh
reon
ine
Ser
ine Asp
arag
ine
Glu
tam
ic A
cid
Glu
tam
ine
Thea
nine
Pro
line
Gly
cine
0 20.010.00
20
40
60
80
100
120
140
160
0 0.5 1 1.5 2 2.5
Concentration, ug/mL
Area
R2 = 0.9997
50Pickering Laboratories Method Abstracts /

Analysis of Supplements / MA-239
Simultaneous Analysis of Vitamins B1, B2, B3 and B6 in Protein Powders and Supplements (MA-239)
B vitamins are a group of water soluble vitamins that play an important role in cell metabolism. This group consists of a number of compounds including Thiamine (Vitamin B1), Riboflavin (Vitamin B2), Niacin and Nicotinamide (Vitamin B3) and Pyridoxine and Pyridoxal (Vitamin B6). B vitamins are found in plant and animal food sources, such as legumes, nuts, green leafy vegetables, red meat and poultry. Many commercial food products are fortified with vitamin B complex and supplementation with multi-vitamins is common to fight deficiencies.
Pickering Laboratories offers a method for simultaneous determination of Vitamins B1, B2, B3 and B6 in supplements and protein powders. The method uses chemical and photochemical post-column derivatization with Fluorescence detection that increases sensitivity and selectivity of analysis. Photochemical derivatization is required for Niacin and Nicotinamide and chemical derivatization is needed for Thiamine. Vitamins B2 and B6 have natural fluorescence.
Method
Calibration Calibration Ranges:Thiamine: 0.03 – 10 ug/mL; Niacin: 0.125-10 ug/mL; Nicotinamide: 0.3 – 100 ug/mL; Riboflavin: 0.03-10 ug/mL; Pyridoxal: 0.125-10 ug/mL, Pyridoxine: 0.125-10 ug/mL.
To Make Riboflavin Stock Solution:Dissolve 20 mg of Riboflavin in 5 mL of 0.1 M NaOH and immediately add 50 mL of 0.1 M HCl and make up the solution with DI water to 500 mL. Make working standards by diluting the stock solution with 0.01 M HCl. Store protected from light.
Stock and working standards for Thiamine, Niacin, Nicotinamide, Ryridoxal and Pyridoxine are made in 0.01 M HCl and stored protected from light.
Instrument Set UpConnect the Instruments in the Following Order:Onyx PCX post-column derivatization instrument
- UVE™ photochemical reactor – Fluorescence detector.
Sample Preparation For Protein Powders: To 0.5 g of samples add 50 mL of extraction buffer (0.1 N NaOH adjusted to pH 2 with Phosphoric acid). Homogenize using hand held homogenizer for 30 sec and heat on a water bath at 100 ºC for 30 min. Cool the solution down, filter through 0.45 um nylon filter and inject. Protect from light.
For Multi-Vitamins Supplements Tablets: Blend at least 10 tablets to a fine powder and mix the entire sample thoroughly. Weight 250 mg of sample and add 90 mL of DI water acidified to pH 2.6 with 0.1 N HCl. Stir using magnetic stirring plate for 2 hours, protecting from light. Make the volume up to 100 mL with acidified water. Filter the sample through 0.45 um nylon filter and inject.
Analytical ConditionsAnalytical Column: Thermo Hypersil, Aquasil C18 (4.6x150 mm)
Column Temperature: 40 ºC
Flow Rate: 1 mL/min
Mobile Phase: Solvent A: Dissolve 4.77 g of Potassium Phosphate
Monobasic in 900 mL of DI water, adjust pH to 5.9 with KOH. Bring volume to 1 L with DI water.
Solvent B: Acetonitrile. See Table 1 for gradient conditions.
Injection Volume: 20 uL
Post-Column ConditionsPost-Column Derivatization System: Onyx PCX, Pinnacle PCX
Reactor Volume: 0.5 mL
Reactor Temperature: 30 ºC
Reagent: Dissolve 10 g of Sodium Hydroxide in 500 mL of DI water, add 2 g of Sodium Sulfite, mix till fully dissolved
Reagent Flow Rate: Initial flow rate 0 mL/min. See Table 2 for pump program
Detection: FLD, see Table 3 for detector program UVE™ Photochemical Reactor
51 / Pickering Laboratories Method Abstracts

Table 1. HPLC Gradient
Time Solvent A % Solvent B %
0 100 0
8 100 0
15 90 10
22 90 10
30 40 60
35 40 60
35.1 100 0
45 100 0
Table 3. FLD Program
Time Excitation (nm) Emission (nm)
0 322 400
17.9 322 400
18 370 440
25 370 440
25.1 350 470
35 350 470
Table 2. Post-Column Pump Program
Time Flow Rate (mL/min)
0 0
16.9 0
17 0.5
23 0.5
23.1 0
35 0Run time: 35 min
Equilibration time: 10 min
Table 4. Analysis of NIST Samples
CompoundsFound in Protein Powder
RSD n=3
NIST Value for Protein
Powder
Found in Vitamins Tablets
RSD n=3
NIST Value for Vitamins Tablets
Nicotinamide 282 ug/g 4.5% 258 ug/g 15288 ug/g 0.8% 13907 ug/g
Thiamine 12.6 ug/g 9.0% 15.8 ug/g 1145 ug/g 0.6% 1045 ug/g
Riboflavin 25.9 ug/g 11.2% 26.9 ug/g 1204 ug/g 1.8% 1302 ug/g
Fig 1. Chromatogram of mixed B Vitamins standard solution. Niacin, Riboflavin, Pyridoxine, Pyridoxal, Thiamine – 1 ug/mL; Nicotinamide – 10 ug/mL
Pyr
idox
ine
Thia
min
e
Rib
ofla
vin
Nic
otin
amid
e
min0 5 10 15 20 25 30
Nia
cin
Pyr
idox
al
Fig 2. Chromatogram of NIST Multivitamin tablets sample
Fig 3. Chromatogram of soy protein shake powder sample
Pyr
idox
ine
Thia
min
e
Rib
ofla
vin
Nic
otin
amid
e
min0 5 10 15 20 25 30
Pyr
idox
ine
Thia
min
e
Rib
ofla
vin
Nic
otin
amid
e
min0 5 10 15 20 25 30
Fig 4. Chromatogram of NIST chocolate protein drink mix sample
Thia
min
e
Rib
ofla
vin
Nic
otin
amid
e
min0 5 10 15 20 25 30
Analysis of Supplements / MA-239
52Pickering Laboratories Method Abstracts /

Analysis of Supplements / MA-231
Analysis of Antioxidants in Foods and Dietary Supplements Using HPLC With Post-Column Derivatization (MA-231)
Antioxidants protect cells from the damaging effects of free radicals and offer numerous benefits for human health. Many phenolic compounds found in plants, as well as some vitamins, exhibit antioxidant activity. Several colorimetric assays exist to measure the total antioxidant capacity, typically expressed as Trolox or Gallic acid equivalents.
An increased interest in antioxidants has created a demand for methods that are not only capable of determining the total antioxidant activity of the sample, but also are able to identify and quantify individual compounds known for their biological benefits. Our method abstract demonstrates that the well-known colorimetric reagents, such as Folin-Ciocalteu and 2,2’- azinobis(3-ethylbenzothiazoline)-6-sulfonate (ABTS), can be successfully used for analysis of antioxidants in foods and dietary supplements by HPLC with post-column derivatization.
Reagents OverviewFolin-Ciocalteu Reagent (FCR) reacts with reducing compounds to form a chromophore that can be detected using UV/Vis detection. Phenolic and non-phenolic antioxidants, including Vitamin C, Vitamin B1 and Folic acid, can be analyzed using this reagent with high sensitivity. Many antioxidants can be easily detected in solution at levels as low as 1 ug/mL.
The ABTS reagent is used in the Trolox-equivalent antioxidant capacity (TEAC) assay. The reaction is based on suppression of the absorbance of radical cations by antioxidants, and can be detected by UV/Vis detection as negative peaks on the chromatograms. This indirect detection method allows for analyzing common antioxidants at levels between 40 and 200 ug/mL.
Using both reagents, it is possible both to identify and quantify specific target compounds, as well as to calculate the total antioxidant capacity of the sample by comparing the total area of all the peaks on the chromatogram with Trolox or Gallic Acid calibration curves.
Method
Sample Preparation- Fresh Fruit: Homogenize 10 g of fresh fruit with 20 mL
of water/methanol (50:50) extraction solution for 5 min. Centrifuge and filter through 0.45 um Nylon filter
- Dried Fruit: Mix 4 g of finely ground dried fruit with 20 mL of 100% Methanol. Shake for 1 h on a mechanical shaker. Centrifuge and filter through 0.45 um Nylon filter.
- Dietary Supplements: Mix 100 mg of finely ground sample with 10 mL of 100% Methanol. Shake for 30 min on a mechanical shaker. Centrifuge and filter through 0.45 um Nylon filter.
- Dry Tea Leaves: Homogenize 1 g of dry tea leaves with 25 mL of water/methanol (50:50) extraction solution for 5 min. Centrifuge and filter through 0.45 um Nylon filter. Alternatively, mix 1 g of dry tea leaves with 25 mL of hot water, stir on a hot plate for 5 min. Cool down, centrifuge and filter through 0.45 um Nylon filter.
- All extracts can be diluted if needed with water/methanol (50:50).
Analytical ConditionsColumn: Reversed-phase C18 column, 4.6x150 mm
Temperature: 40 ºC
Flow Rate: 1 mL/min
Mobile Phase: 4.8% Acetic acid in water, Methanol
Injection Volume: 10-50 uL
Post-Column ConditionsPost-Column System: Onyx PCX, Pinnacle PCX or Vector PCX
Reactor Volume: 1.4 mL
Reactor Temperature: 130 °C
Reagents:
Option 1: 40% of Folin-Ciocalteu reagent in water
Option 2: 15% of ABTS stock in Methanol. ABTS stock solution: 7 mmole/L of 2,2’- azinobis(3-ethylbenzothiazoline)-6-sulfonate is dissolved in a 2.45 mmole/L solution of Sodium Persulphate in water. Stock solution should be stored in the dark for at least 12 h before making a working reagent.
Flow Rate: 0.1 mL/min
Detection: UV/Vis 635 nm
53 / Pickering Laboratories Method Abstracts

Analysis of Supplements / MA-231
HPLC Gradient
Time Acetic Acid / water % Methanol %
0 95 5
3 95 5
25 40 60
30 40 60
30.1 95 5
40 95 5
Calculated Total Antioxidant Capacity of Selected Samples
Matrix Trolox Equivalent, ABTS Reagent
Gallic Acid Equivalent, Folin-Ciocalteu Reagent
Fresh Raspberries 1.03 mg/g 0.63 mg/g
Fresh Blueberries 0.66 mg/g 0.35 mg/g
Dry Goji berries 2.39 mg/g 3.30 mg/g
Green tea - 50.0 mg/g
Antioxidant Dietary Supplement 477.24 mg/g 120.0 mg/g
Fig 1. Mixture of 10 common antioxidants, analyzed using Folin-Ciocalteu reagent
Fig 3. Hot water extract of green tea, analyzed using Folin-Ciocalteu reagent
Fig 2. Fresh raspberries extract, analyzed using Folin-Ciocalteu reagent
Fig 4. Extract of dietary supplement, analyzed using ABTS reagent
0 5 10 15 20 25
Asc
orbi
c ac
idG
allic
aci
d Cat
echi
n
Chl
orog
enic
aci
d
Cya
nidi
n-3-
gluc
osid
eC
yani
din-
3-ga
lact
osid
e
Cya
nidi
n
Tro
lox
Mor
in
Res
vera
trol
min 0 5 10 15 20
Gal
lic A
cid
Cat
echi
nC
hlor
ogen
ic A
cid
Cya
nidi
n-3-
gala
ctos
ide
Cya
nidi
n-3-
gluc
osid
e
Cya
nidi
nR
esve
ratr
ol
min
0 5 10 15 20 min
Asc
orbi
c ac
id
Gal
lic a
cid
Cat
echi
n
Cya
nidi
n-3-
gluc
osid
eC
yani
din-
3-ga
lact
osid
e
0 5 10 15 20 25 min
Cat
echi
n Res
vera
trol
Chl
orog
enic
aci
d
Cya
nidi
n-3-
-gal
acto
side
Asc
orbi
c ac
id
References:Barbara Kusznierewicz, Anita Piasek, Agnieszka Bartoszek, Jacek Namiesnik, “The Optimization of Analytical Parameters for Routine Profiling of Antioxidants in Complex Mixtures by HPLC Couples with Post-column Derivatization,” Phytochem. Anal. 2011, 22, 392-402
54Pickering Laboratories Method Abstracts /

Analysis of Supplements / MA-237
Analysis of Bioavailable Niacin (Vitamin B3) by HPLC With Post-Column Photochemical Derivatization in Foods and Supplements (MA-237)
Niacin (Nicotinic acid) is an essential nutrient important to human health. Free Nicotinic Acid and Nicotinamide have similar biological activity and both are used as dietary supplements to prevent Vitamin B3 deficiency. In supplements, the use of Nicotinamide is often preferred due to absence of common side effects of Nicotinic Acid, such as skin flushing.
The European Committee for Standardization has approved the HPLC method with post-column photochemical derivatization to measure Vitamin B3 in foodstuff. UV irradiation converts Nicotinic Acid and Nicotinamide into highly fluorescent derivatives. The addition of Pickering Laboratories’ UVE™ Photochemical reactor to any HPLC system allows for highly sensitive and selective analysis of both Nicotinic Acid and Nicotinamide in a variety of different matrices.
Method
Calibration- Calibration Range: Nicotinic Acid: 0.1 – 50 ug/mL, R2=0.999;
Nicotinamide: 0.1 – 50 ug/mL, R2=0.998
Sample Preparation The sample preparation described below is designed to measure bioavailable (or free) Nicotinic Acid and Nicotinamide in foods. Different procedures can be employed to prepare samples for the analysis of total Niacin.
- Food Samples: To 5 g of sample, add 30 mL of 0.1 N HCl. Blend at high speed for 2-3 min and heat the mixture at 100 ºC for 1 h. Cool the mixture to room temperature, transfer into a graduated cylinder and adjust the volume to 50 mL with DI water. Dilute further with water to fit the calibration curve as needed. Filter the solution through a 0.45 um filter.
- For High Protein / High Fat Matrices: Proceed as directed above. After filtering, pipette 4 mL of the solution into a centrifuge tube. Add 1 mL of 50% (w/v) solution of Trichloroacetic Acid in water to precipitate proteins. Cool the mixture in an ice water bath for 5 min. Centrifuge and filter through a 0.45 um syringe filter.
- Dietary Supplement: Thoroughly mix the content of at least 10 finely ground capsules / tablets. Dissolve 100 mg portion in 100 mL of DI water. Dilute further with water to fit the calibration curve as needed. Filter through a 0.45 um filter.
Analytical ConditionsAnalytical Column: ThermoHypersil, Aquasil C18 (150 x 4.6 mm)
Temperature: 40 ºC
Flow Rate: 1 mL/min
Mobile Phase: Methanol / Phosphate buffer (0.035 mol/L of Potassium Phosphate Monobasic adjusted to pH 4.45). See Table 1 for gradient conditions.
Injection Volume: 20 uL
Post-Column ConditionsUVETM Photochemical Reactor
Detection: FLD, λex : 322 nm, λem : 370 nm
Table 1. Niacin Analysis in Foods
Sample Fresh Peas Fresh Tomatoes Raw Ground Pork Oat Cereal
Nicotinic Acid Nicotinamide Nicotinic Acid Nicotinamide Nicotinic Acid Nicotinamide Nicotinic Acid Nicotinamide
Found in the sample 2.77 ug/g 5.35 ug/g 1.30 ug/g 3.33 ug/g 2.48 ug/g 60.95 ug/g 7.91 ug/g 243.30 ug/g
RSD, N=4 1.8% 1.5% 1.6% 2.0% 2.3% 0.7% 3.8% 0.6%
Spike 10 ug/g 10 ug/g 10 ug/g 10 ug/g 10 ug/g 50 ug/g 20 ug/g 300 ug/g
Recoveries 93% 94% 98% 92% 70% 102% 109% 96%
RSD, N=3 3.8% 2.0% 1.1% 1.4% 0.8% 1.5% 3.2% 2.1%
Table 1. HPLC Gradient
Time Phosphate Buffer % Methanol %
0 100 0
25 100 0
25.1 0 100
29 0 100
29.1 100 0
35 100 0
55 / Pickering Laboratories Method Abstracts

Analysis of Supplements / MA-237
0 5 10 15 20 25 min
Nicotinic Acid
Nicotinamide
ENLARGED
0 5 10 15 20 25 min
Nicotinic Acid
Nicotinamide
ENLARGED
0 5 10 15 20 25 min
Nicotinic Acid
Nicotinamide
0 5 10 15 20 25 min
Nicotinic Acid
Nicotinamide
0 5 10 15 20 25 min
Nicotinic Acid
Nicotinamide
Fig 1. Chromatogram of 1 ug/mL calibration standard of Nicotinic Acid and Nicotinamide
Fig 3. Chromatogram of fresh tomatoes sample
Fig 2. Chromatogram of fresh peas sample
Fig 4. Chromatogram of raw pork sample
Fig 5. Chromatogram of oat cereal sample
Fig 6. Chromatogram of Vitamin B Complex dietary supplement
Nicotinamide
0 5 10 15 20 25 min
56Pickering Laboratories Method Abstracts /

Analysis of Supplements / MA-233
Analysis of Vitamin B1 in Foods and Dietary Supplements by HPLC With Post-Column Derivatization and Fluorescence Detection (MA-233)
Thiamine (vitamin B1) plays important role in many cellular processes and its deficiency can quickly lead to serious health problems. Since humans and animals can’t synthesize vitamin B1, they must obtain a sufficient amount through their diet. The requirements of nutritional labeling have led to increased demand for methods to analyze vitamin B1 in different matrices.
This application note describes a sensitive and accurate HPLC method capable of measuring Thiamine and its biologically active phosphorylated derivatives in foods and dietary supplements. Thiamine and its derivatives are separated on a reversed-phase column and converted using post-column derivatization into highly fluorescent compounds. To determine total vitamin B1 content in foods, an enzymatic reaction with Taka-diastase was employed to convert all Thiamine esters to free Thiamine.
Method
Sample Preparation- Food Samples: To 5 g of sample add 60 mL of 0.1 N HCl,
blend at high speed for 2-3 min and heat the mixture at 100 ºC for 1 h. Cool the mixture to room temperature and adjust pH to 4.0 – 4.5 using 2.5 M Sodium Acetate solution. Add 200 mg of Taka-diastase, shake well and incubate for 18 h at 45 ºC. After enzymatic hydrolysis is complete add 2 mL of 50% Trichloroacetic acid solution in water and heat at 100 ºC for 15 min to precipitate proteins. Adjust pH to 2.6 – 2.8 with Sodium Acetate and bring the volume to 100 mL with DI water. Filter through 0.45 um filter.
- Dietary Supplements: Mix the contents of at least 10 capsules. Take 250 mg portion and dissolve in 100 mL of DI water acidified to pH 2.6-2.8 with 0.1 N HCl. Dilute the solution further with acidified water to fit the calibration curve as needed. Filter through 0.45 um filter.
Standards Preparation- Standard solutions: Prepare standard solutions of Thiamine
and its derivatives in water acidified to pH 2.6 – 2.8 with HCl. Make fresh daily.
- Calibration Range: Thiamine: 0.1 – 25 ug/mL, R2=0.999; Thiamine Pyrophosaphate: 0.02 – 5 ug/mL, R2=0.999; Thiamine Monophosphate: 0.02 – 5 ug/mL, R2=0.999.
Analytical ConditionsAnalytical Column: ThermoHypersil, Aquasil C18
Flow Rate: 1 mL/min
Column Temperature: 40 ºC
Mobile Phase: 10% Acetonitrile - 90% Phosphate Buffer (6 g/L of Phosphoric Acid adjusted to pH 5.9 with NaOH)
Injection Volume: 10 uL
Post-Column ConditionsPost-Column System: Onyx PCX, Pinnacle PCX or Vector PCX
Reactor Volume: 0.5 mL
Reactor Temperature: 55 °C
Reagent: 40 g/L NaOH, 600 mg/L Potassium Ferricyanide in water
Reagent Flow Rate: 0.5 mL/min
Detection: FLD, λex : 375 nm, λem : 430 nm
Table 1. Thiamine Analysis in Foods
Sample Thiamine Found in the Sample RSD, N=4 Thiamine Spike
Concentration Recoveries RSD, N=4
Whole Yellow Peas 13 ug/g 1.5% 50 ug/g 92% 7.8%
Cereal 21.5 ug/g 3.6% 50 ug/g 102% 2.8%
Pork Sausages 5.0 ug/g 2.2% 50 ug/g 108% 1.6%
57 / Pickering Laboratories Method Abstracts
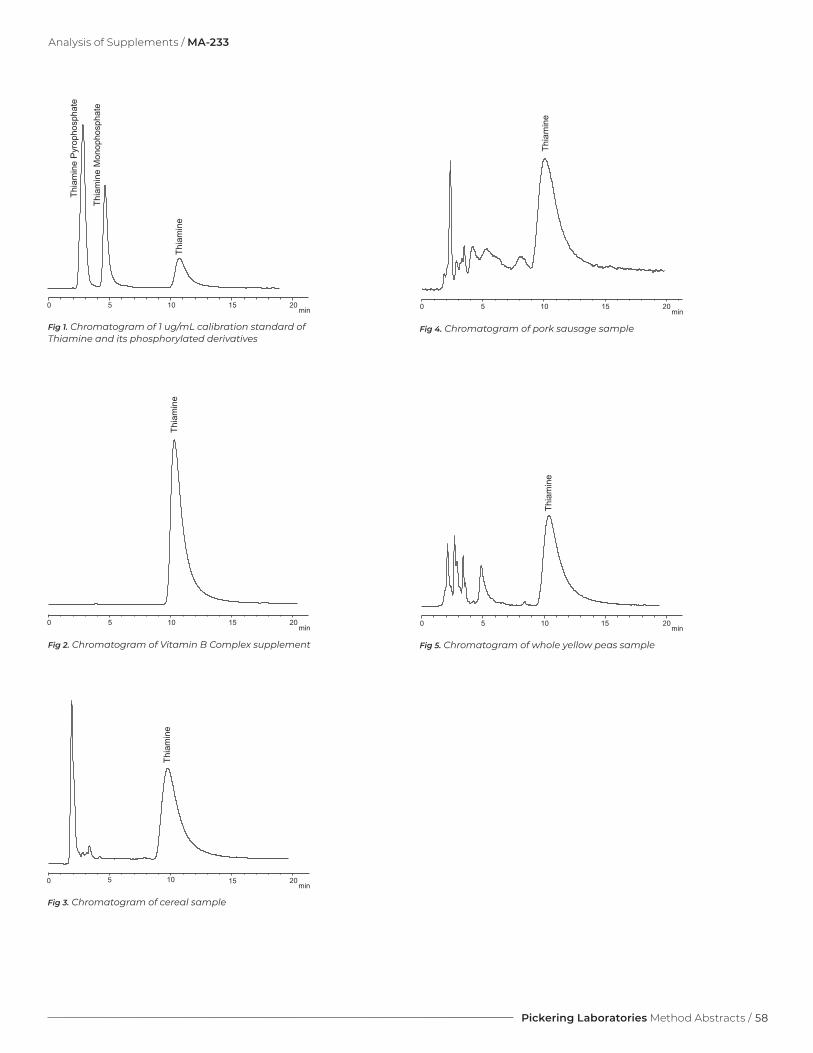
0 5 10 15 20
Thi
amin
e
min
0 5 10 15 20
Thi
amin
e
min
0 5 10 15 20min
Thi
amin
e
0 5 10 15 20min
Thi
amin
e
Thi
amin
e P
yrop
hosp
hate
Thi
amin
e M
onop
hosp
hate
0 5 10 15 20
Thi
amin
e
min
Fig 1. Chromatogram of 1 ug/mL calibration standard of Thiamine and its phosphorylated derivatives
Fig 3. Chromatogram of cereal sample
Fig 2. Chromatogram of Vitamin B Complex supplement
Fig 4. Chromatogram of pork sausage sample
Fig 5. Chromatogram of whole yellow peas sample
Analysis of Supplements / MA-233
58Pickering Laboratories Method Abstracts /

Analysis of Antibiotics and Other Pharmaceuticals
59 / Pickering Laboratories Method Abstracts

Analysis of Antibiotics and Other Pharmaceuticals / MA-334
Analysis of Alprostadil by HPLC With Post-Column Derivatization (MA-334)
Alprostadil (Prostaglandin E1) is a drug that has vasodilation properties and is used to treat erectile dysfunction (ED) and other medical conditions. This medication is available in injectable form and in suppository form.
Since Prostaglandin E1 has low UV absorbance, the analysis of the formulations could be difficult. The addition of post-column derivatization increases the sensitivity and specificity of the analysis.
Method
Analytical ConditionsAnalytical Column: Reversed-phase C18 column
(150 x 4.6 mm)
Temperature: 37 °C
Flow Rate: 1 mL/min
Mobile Phase: 30% Acetonitrile – 70% of 0.02 M Potassium Phosphate monobasic (adjusted to pH 3)
Or alternative conditions:
Mobile Phase: 25% Acetonitrile – 75% of 0.0067 M Potassium Phosphate buffer pH 6.3
Injection Volume: 20 uL
Post-Column ConditionsPost-Column System: Onyx PCX or Pinnacle PCX
Reactor Volume: 2 mL
Reactor Temperature: 60 °C
Reagent: 1 mol/L Potassium Hydroxide
Reagent Flow Rate: 1 mL/min
Detection: UV 278 nm
CalibrationAlprostadil: 0.1 ug/mL – 10 ug/mL
β-Naphthol (Internal Standard): 0.25 ug/mL – 10 ug/mL
Make stock solutions of Alprostadil and b-Naphthol in anhydrous Ethanol. Prepare working standards by appropriate dilution of stock solution with mobile phase.
min
b-Naphthol
Alprostadil
0 5 10 15 20
Fig 3. Chromatogram of Alprostadil and β-Naphthol (Internal Standard)
Fig 1. Calibration curve for Alprostadil
R² = 1
0
1
2
3
4
5
6
0 2 4 6 8 10 12
Are
a
ppm
Fig 2. Calibration curve for β-Naphthol
R² = 0.9999
0
0.5
1
1.5
2
2.5
3
3.5
4
0 2 4 6 8 10 12
Are
a
ppm
60Pickering Laboratories Method Abstracts /

Analysis of Antibiotics and Other Pharmaceuticals / MA-205
Aminoglycoside Antibiotics in Feeds (MA-205)Apramycin, Gentamicin, Neomycin
Aminoglycoside antibiotics are among those commonly used in animal feeds to manage intestinal microorganisms. The beneficial effects include improved growth and generally healthier animal populations. Use of antibiotics creates a demand for analytical procedures to verify concentrations in pre-mixes and feeds and in some instances for residue analysis in animal products.
This note describes a simple, robust analytical method for the family of Aminoglycoside antibiotics in feeds and animal products. The sample is homogenized with a generic extraction solution and the crude soluble portion is directly injected into an HPLC ion-exchange column. The column effluent is then mixed with an OPA/Thiofluor™ reagent which forms highly fluorescent derivatives with the primary amine moieties of the antibiotics.
Method
Extraction ProcedureTake one part feed: 10 parts Extraction solution (30 g/L of Sulfosalicylic Acid) and homogenize for five minutes. Centrifuge for 10 minutes. Three layers will form: the pellet, a supernatant emulsion and a soft layer of floating fat. Carefully lift the floating fatty layer with a spatula and discard. Transfer the emulsion to a sealable vial. Coagulate the emulsion by placing the vial in a boiling water bath for 15 minutes. Centrifuge for 10 minutes. The clear supernate is filtered (0.45 um Nylon) and placed in an autosampler vial.
Analytical ConditionsAnalytical Column: ALKION™ cation-exchange, 4 x 150 mm,
Catalog No. 9410917
Guard Column: ALKION™, 3 x 20 mm, Catalog No. 9493020
Column Temperature: 40 °C
Flow Rate: 0.8 mL/min
Mobile Phase: 1700-1101, Potassium buffer, K01 1700-1102, Potassium titrant, K02 1700-1103, Potassium ionic strength adjuster, K03
Post-Column ConditionsPost-Column System: Onyx PCX, Pinnacle PCX or Vector PCX
Reactor Volume: 0.15 mL
Reactor Temperature: 45 °C
Reagent: 300 mg of OPA, 2 g Thiofluor™, 3 mL of 30% Brij® 35 in 950 mL of OD104
Flow Rate: 0.3 mL/min
Detection: FLD, λex : 330 nm, λem : 465 nm
Conditions for Apramycin Analysis
Time 1700-1101 % 1700-1102 % 1700-1103 %
0 67 33 0
5 67 33 0
15 14.7 7.3 78
20 14.7 7.3 78
20.1 0 22 78
21 0 22 78
21.1 67 33 0
28 67 33 0
5 10 15 20 25 300min
Apramycin
61 / Pickering Laboratories Method Abstracts

Analysis of Antibiotics and Other Pharmaceuticals / MA-205
Conditions for Gentamicin Analysis
Time 1700-1101 % 1700-1102 % 1700-1103 %
0 43 31 26
20 9 13 78
30 9 13 78
30.1 0 22 78
31 0 22 78
31.1 43 31 26
38 43 31 26
Conditions for Neomycin Analysis
Time 1700-1101 % 1700-1102 % 1700-1103 %
0 60 40 0
15 13.2 8.8 78
25 11 11 78
25.1 0 22 78
26 0 22 78
26.1 60 40 0
32 60 40 0
GentamicinComplex
5 10 15 20 25 300min
Neomycin
5 10 15 20 25 300min
Conditions for Separation of Apramycin Gentamicin and Neomycin
Time 1700-1101 % 1700-1102 % 1700-1103 %
0 60 40 0
15 13.2 8.8 78
15.1 12 10 78
30 12 10 78
30.1 0 22 78
31 0 22 78
31.1 60 40 0
37 60 40 0
Apramycin
Neomycin
GentamicinComplex
5 10 15 20 25 300min
“ALKION” and Thiofluor are trademarks of Pickering Laboratories, Inc.“Brij 35” is a registered trademark of ICI Americas, Inc.
62Pickering Laboratories Method Abstracts /

Analysis of Antibiotics and Other Pharmaceuticals / MA-264
Analysis of Polyether Antibiotics in Animal Feeds by HPLC With Post-Column Derivatization (MA-264)
Polyether Antibiotics are commonly used for preventing coccidiosis and other infections in poultry and for improving feed efficiency for beef cattle and swine. The use of Polyether Antibiotics is strictly regulated, with only specific ionophores approved for use in feeds intended for different animals.
Analysis of Polyether Antibiotics by HPLC with post-column derivatization and UV/Vis detection has been proven to successfully identify and quantify Monensin, Narasin and Salinomycin in medicated feeds, supplements and premixes as well as to determine trace contamination levels in non-medicated feeds [1, 2].
Post-column derivatization of Polyether Antibiotics is done using highly acidic Vanillin or DMAB reagents. The Pinnacle PCX derivatization system (Pickering Laboratories, Inc.) has an inert flow path and automated system wash capabilities that make it uniquely suitable for handling corrosive reagents. The two-pump system is recommended to extend reagent stability, but the single-pump system for this application is also available.
Adding a Fluorescence detector to the instrumentation allows for using the same extraction procedure and HPLC conditions to also determine Lasalocid, which doesn’t require post-column derivatization.
Method
Sample PreparationTo 25 g of finely ground feed sample, add 100 mL of extraction solution (90% Methanol - 10% water). Shake for 1 hour at high speed using mechanical shaker. Let the solids settle and filter an aliquot of the extract for injection. Dilute with extraction solution if needed to fit the calibration curve. Use 2.5 g portion when testing premixes.
Analytical ConditionsAnalytical Column: Polyether Column, C18, 4.6 x 250 mm,
Catalog No 2381750
Guard Column: Reversed-phase guard cartridge, Catalog No 18ECG001
Temperature: 40 ºC
Flow Rate: 0.7 mL/min
Mobile Phase: 90% Methanol, 10% of 5% Acetic Acid solution in water, isocratic
Injection volume: 20 µL
Post-Column ConditionsPost-Column System: Onyx PCX, Pinnacle PCX or Vector PCX
Reactor Volume: 1.4 mL
Reactor Temperature: 90 °C
Reagent 1: Concentrated Sulfuric acid / Methanol (4:96 v/v)
Reagent 2: 60 g of Vanillin in 950 mL of Methanol
Reagents Flow Rate: 0.3 mL/min
Detection: UV/VIS 570 nm (for Lasalocid – FLD, λex : 322 nm, λem : 370 nm)
CalibrationMonensin A: 0.1 ppm – 50 ppm, R2 = 0.999
Monensin B: 0.0035 ppm – 0.7 ppm, R2 = 0.999
Lasalocid Acid: 0.25 ppm – 50 ppm, R2 = 0.999
Table 1. Polyether Antibiotics in Certified Medicated Feeds
Antibiotic Feed Type
Certified Amount
Found In Sample Recoveries RSD, N=4
Monensin Beef feed 267 g/ton 275 g/ton 103% 0.7%
Lasalocid Milk Replacer 72 g/ton 69 g/ton 96% 3.3%
Table 2. Spike Recoveries for Monensin
Non-Medicated Bird Feed Non-Medicated Rabbit Feed
Antibiotic Monensin A Monensin B Monensin A Monensin B
Spike Level 172 g/ton 8 g/ton 86 g/ton 4 g/ton
Recoveries 100% 100% 101% 102%
RSD, N=3 1.9% 2.1% 1.1% 0.6%
Spike Level 3.44 g/ton 0.16 g/ton 3.44 g/ton 0.16 g/ton
Recoveries 96% 95% 94% 88%
RSD, N=3 0.7% 3.1% 0.9% 1.6%
63 / Pickering Laboratories Method Abstracts

Analysis of Antibiotics and Other Pharmaceuticals / MA-264
Fig 1. Standard mixture of Monensin, Salinomycin and Narasin
Fig 2. Certified medicated beef feed sample containing 267 g/ton of Monensin
Fig 3. Non-medicated bird feed sample spiked with Monensin A (3.44 ug/g) and Monensin B (0.16 ug/g)
Fig 4. Certified medicated milk replacer containing 72 g/ton of Lasalocid
0 5 10 15 20 25 min
Mon
ensi
n A
Mon
ensi
n B
Sal
inom
ycin
Nar
asin
0 5 10 15 min
Mon
ensi
n A
Mon
ensi
n B
0 5 10 15 min
Mon
ensi
n A
Mon
ensi
n B
0 5 10 15 min
Lasa
loci
d
References1. Campbell, H., Nayeri, G. (2006) J. AOAC Int. 89, 1229-1242, Determination of
Monensin, Narasin, and Salinomycin in Mineral Premixes, Supplements, and Animal Feeds by Liquid Chromatography and Post-Column Derivatization: Collaborative Study
2. AOAC Official Method 997.04. Monensin in Premix and Animal Feeds
ConclusionAnalysis of Polyether Antibiotics by HPLC with post-column derivatization is a robust and sensitive method that utilizes standard equipment and could easily be adopted by testing laboratories. It allows for testing of different ionophores at wide range of concentrations, including at trace levels. Using Pickering Laboratories’ post-column derivatization system, factory configured for the analysis, guarantees stable and reproducible results.
64Pickering Laboratories Method Abstracts /
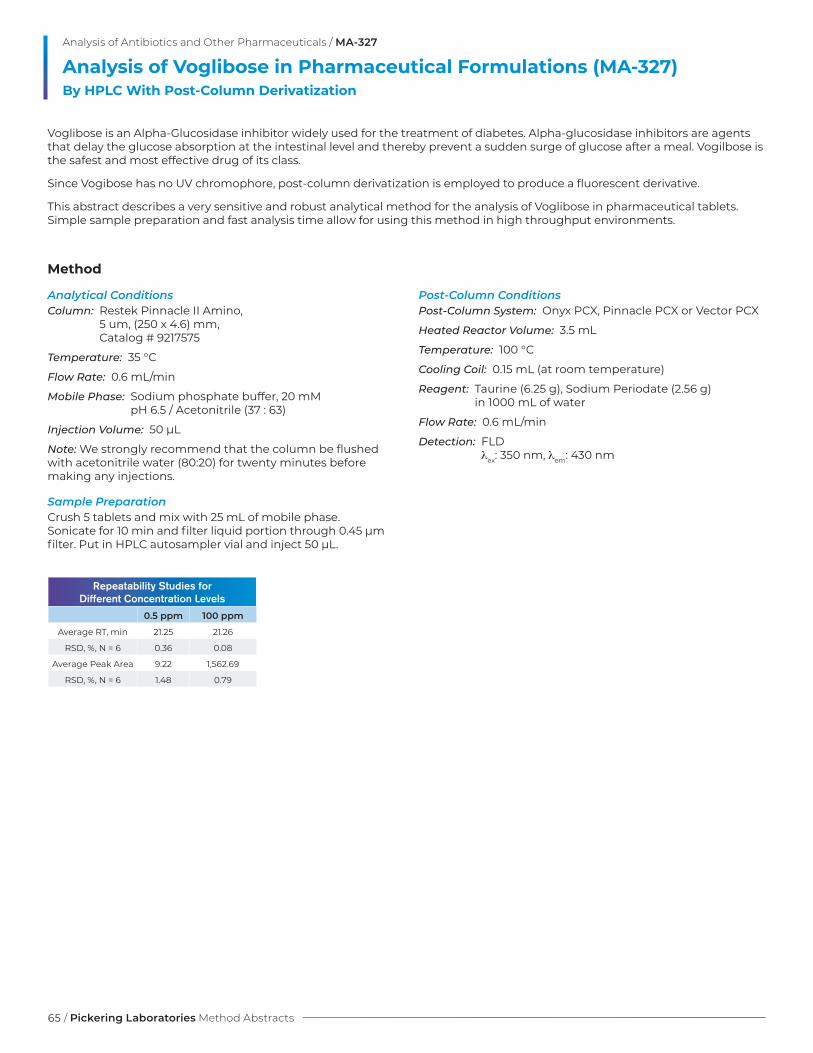
Analysis of Antibiotics and Other Pharmaceuticals / MA-327
Analysis of Voglibose in Pharmaceutical Formulations (MA-327) By HPLC With Post-Column Derivatization
Voglibose is an Alpha-Glucosidase inhibitor widely used for the treatment of diabetes. Alpha-glucosidase inhibitors are agents that delay the glucose absorption at the intestinal level and thereby prevent a sudden surge of glucose after a meal. Vogilbose is the safest and most effective drug of its class.
Since Vogibose has no UV chromophore, post-column derivatization is employed to produce a fluorescent derivative.
This abstract describes a very sensitive and robust analytical method for the analysis of Voglibose in pharmaceutical tablets. Simple sample preparation and fast analysis time allow for using this method in high throughput environments.
Method
Analytical ConditionsColumn: Restek Pinnacle II Amino,
5 um, (250 x 4.6) mm, Catalog # 9217575
Temperature: 35 °C
Flow Rate: 0.6 mL/min
Mobile Phase: Sodium phosphate buffer, 20 mM pH 6.5 / Acetonitrile (37 : 63)
Injection Volume: 50 µL
Note: We strongly recommend that the column be flushed with acetonitrile water (80:20) for twenty minutes before making any injections.
Sample PreparationCrush 5 tablets and mix with 25 mL of mobile phase. Sonicate for 10 min and filter liquid portion through 0.45 µm filter. Put in HPLC autosampler vial and inject 50 µL.
Post-Column ConditionsPost-Column System: Onyx PCX, Pinnacle PCX or Vector PCX
Heated Reactor Volume: 3.5 mL
Temperature: 100 °C
Cooling Coil: 0.15 mL (at room temperature)
Reagent: Taurine (6.25 g), Sodium Periodate (2.56 g) in 1000 mL of water
Flow Rate: 0.6 mL/min
Detection: FLD λex: 350 nm, λem: 430 nm
Repeatability Studies for Different Concentration Levels
- 0.5 ppm 100 ppm
Average RT, min 21.25 21.26
RSD, %, N = 6 0.36 0.08
Average Peak Area 9.22 1,562.69
RSD, %, N = 6 1.48 0.79
65 / Pickering Laboratories Method Abstracts

Vog
libos
e
min0 10 155 20 25
Chromatogram of Voglibose Standard, 50 ppm, 50 µL Injection
0
500
1000
1500
2000
2500
3000
3500
0 50 100 150 200 250
Concentration, ppm
R2 = 0.9998
Pea
k A
rea
Calibration Curve for Analytical Range 0.5-200 ppm
min0 10 155 20 25
Vog
libos
e
Chromatogram of Voglibose Standard, 0.5 ppm, 50 uL Injection
Analysis of Antibiotics and Other Pharmaceuticals / MA-327
min0 10 155 20 25
Vog
libos
e
Chromatogram of Voglibose Tablets (VolixTM, 0.2 mg), 50 µL Injection
66Pickering Laboratories Method Abstracts /
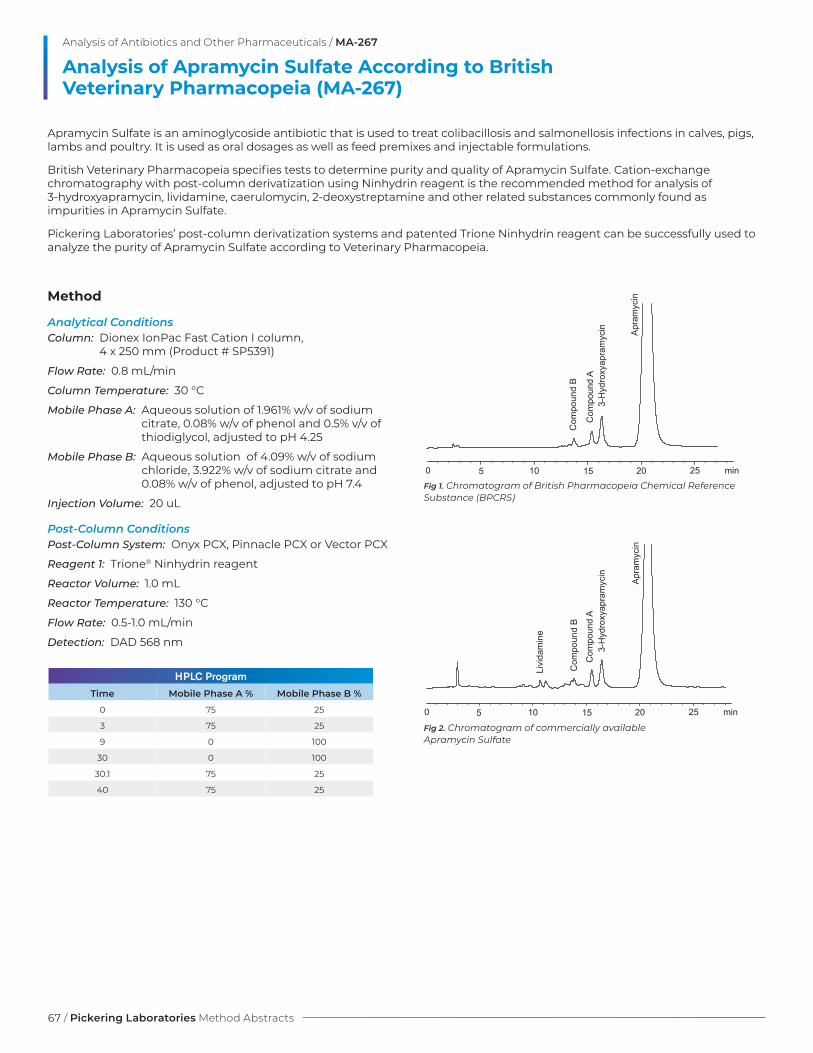
Analysis of Antibiotics and Other Pharmaceuticals / MA-267
Analysis of Apramycin Sulfate According to British Veterinary Pharmacopeia (MA-267)
Apramycin Sulfate is an aminoglycoside antibiotic that is used to treat colibacillosis and salmonellosis infections in calves, pigs, lambs and poultry. It is used as oral dosages as well as feed premixes and injectable formulations.
British Veterinary Pharmacopeia specifies tests to determine purity and quality of Apramycin Sulfate. Cation-exchange chromatography with post-column derivatization using Ninhydrin reagent is the recommended method for analysis of 3-hydroxyapramycin, lividamine, caerulomycin, 2-deoxystreptamine and other related substances commonly found as impurities in Apramycin Sulfate.
Pickering Laboratories’ post-column derivatization systems and patented Trione Ninhydrin reagent can be successfully used to analyze the purity of Apramycin Sulfate according to Veterinary Pharmacopeia.
Method
Analytical ConditionsColumn: Dionex IonPac Fast Cation I column,
4 x 250 mm (Product # SP5391)
Flow Rate: 0.8 mL/min
Column Temperature: 30 °C
Mobile Phase A: Aqueous solution of 1.961% w/v of sodium citrate, 0.08% w/v of phenol and 0.5% v/v of thiodiglycol, adjusted to pH 4.25
Mobile Phase B: Aqueous solution of 4.09% w/v of sodium chloride, 3.922% w/v of sodium citrate and 0.08% w/v of phenol, adjusted to pH 7.4
Injection Volume: 20 uL
Post-Column ConditionsPost-Column System: Onyx PCX, Pinnacle PCX or Vector PCX
Reagent 1: Trione® Ninhydrin reagent
Reactor Volume: 1.0 mL
Reactor Temperature: 130 °C
Flow Rate: 0.5-1.0 mL/min
Detection: DAD 568 nm
HPLC Program
Time Mobile Phase A % Mobile Phase B %
0 75 25
3 75 25
9 0 100
30 0 100
30.1 75 25
40 75 25
0 5 10 15 20 min25
Apr
amyc
in
3-H
ydro
xyap
ram
ycin
Com
poun
d A
Com
poun
d B
Fig 1. Chromatogram of British Pharmacopeia Chemical Reference Substance (BPCRS)
0 5 10 15 20 min25
Apr
amyc
in
3-H
ydro
xyap
ram
ycin
Com
poun
d A
Com
poun
d B
Livi
dam
ine
Fig 2. Chromatogram of commercially available Apramycin Sulfate
67 / Pickering Laboratories Method Abstracts

Analysis of Mycotoxins
68Pickering Laboratories Method Abstracts /

Analysis of Mycotoxins / MA-218
Clean-Up and Analysis of Aflatoxins and Ochratoxin A in Herbs and Spices (MA-218)
The production of herbal supplements and spices is a fast growing industry. Unfortunately, the raw materials are often imported from countries that lack adequate quality control and whose weather conditions during the growing season, along with improper harvesting and storage practices, can cause toxic mold contamination. There are numerous reports on the presence of Mycotoxins in commercially available herbs and spices such as chamomile, black and white tea leaves, ginkgo leaves, paprika and cumin.
We developed a simple, sensitive and robust HPLC method for analyzing Aflatoxins B1, B2, G1, G2 and Ochratoxin A in herbs and spices. AflaOTAClean™ Immunoaffinity columns contain antibodies specific for both classes of Mycotoxins and allow for fast and efficient sample clean-up. We used the AcceClean™ automated workstation, which processes three samples simultaneously.
Post-column photochemical derivatization was used to increase the sensitivity of detection of Aflatoxins B1 and G1. The UVE™ (LCTech, Germany) photochemical reactor requires no additional reagents and is easy to install between the HPLC column and fluorescence detector. Ochratoxin A is a naturally fluorescent compound that does not require derivatization and can be analyzed together with all four Aflatoxins.
Method
Isolation of Aflatoxins B1, B2, G1, G2 and Ochratoxin AMix 5 g of finely ground sample with extraction solution (25 mL of Methanol:water 80:20, 12.5 mL of Hexane, 0.5 g of NaCl) and shake on a mechanical shaker for 1 hour. Filter the extract through fluted paper. Dilute 14 mL of the aqueous layer with 86 mL of PBS buffer (pH 7.2), filter and apply 11 mL of solution to AflaOTAClean™ Immunoaffinity column at a flow rate of 2 mL/min. Wash the column with 10 mL of water at a flow rate of 2 mL/min. Elute the toxins with two 1 mL portions of Methanol at a flow rate of 0.3 mL/min. Allow 5 min before applying the second portion of the Methanol to ensure complete breaking of the antibody-toxin bond.
Analytical ConditionsAnalytical Column: MYCOTOX™ Reversed-phase Column,
4.6 x 250 mm, P/N 1612124
Guard Column: Reversed-phase guard cartridge, P/N 18ECG001
HPLC Eluent: Sodium Phosphate buffer (Cat #1700-1108), Methanol, Acetonitrile
Flow Rate: 1 mL/min
Post-Column Photochemical Reactor: UVE™ (Cat # 10519 (240V), Cat # 10742 (120 V)
Injection Volume: 30 μL
FLD: λex : 365 nm, λem : 430 nm for Aflatoxins λex : 335 nm, λem : 455 nm for Ochratoxin A
HPLC Gradient:
Equilibration: 10 min
HPLC
FLD
UVE™
Time 1700-1108 % Methanol % Acetonitrile %
0 57 28 15
13 57 28 15
13.1 40 60 0
23 40 60 0
23.1 0 100 0
28 0 100 0
Flow Diagram for UVETM Photochemical Reactor
69 / Pickering Laboratories Method Abstracts
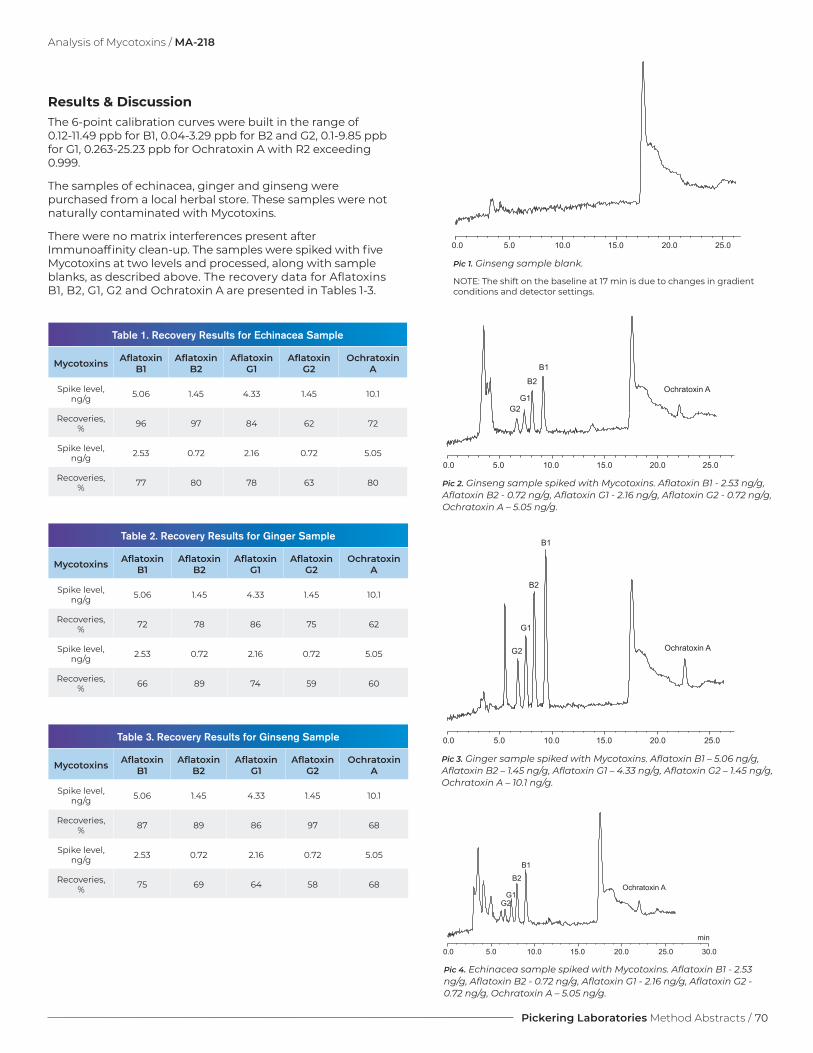
Results & DiscussionThe 6-point calibration curves were built in the range of 0.12-11.49 ppb for B1, 0.04-3.29 ppb for B2 and G2, 0.1-9.85 ppb for G1, 0.263-25.23 ppb for Ochratoxin A with R2 exceeding 0.999.
The samples of echinacea, ginger and ginseng were purchased from a local herbal store. These samples were not naturally contaminated with Mycotoxins.
There were no matrix interferences present after Immunoaffinity clean-up. The samples were spiked with five Mycotoxins at two levels and processed, along with sample blanks, as described above. The recovery data for Aflatoxins B1, B2, G1, G2 and Ochratoxin A are presented in Tables 1-3.
Analysis of Mycotoxins / MA-218
Table 1. Recovery Results for Echinacea Sample
Mycotoxins Aflatoxin B1
Aflatoxin B2
Aflatoxin G1
Aflatoxin G2
Ochratoxin A
Spike level, ng/g 5.06 1.45 4.33 1.45 10.1
Recoveries, % 96 97 84 62 72
Spike level, ng/g 2.53 0.72 2.16 0.72 5.05
Recoveries, % 77 80 78 63 80
Table 2. Recovery Results for Ginger Sample
Mycotoxins Aflatoxin B1
Aflatoxin B2
Aflatoxin G1
Aflatoxin G2
Ochratoxin A
Spike level, ng/g 5.06 1.45 4.33 1.45 10.1
Recoveries, % 72 78 86 75 62
Spike level, ng/g 2.53 0.72 2.16 0.72 5.05
Recoveries, % 66 89 74 59 60
Table 3. Recovery Results for Ginseng Sample
Mycotoxins Aflatoxin B1
Aflatoxin B2
Aflatoxin G1
Aflatoxin G2
Ochratoxin A
Spike level, ng/g 5.06 1.45 4.33 1.45 10.1
Recoveries, % 87 89 86 97 68
Spike level, ng/g 2.53 0.72 2.16 0.72 5.05
Recoveries, % 75 69 64 58 68
Pic 4. Echinacea sample spiked with Mycotoxins. Aflatoxin B1 - 2.53 ng/g, Aflatoxin B2 - 0.72 ng/g, Aflatoxin G1 - 2.16 ng/g, Aflatoxin G2 - 0.72 ng/g, Ochratoxin A – 5.05 ng/g.
B1
B2
G1G2
Ochratoxin A
0.0 5.0 10.0 15.0 20.0 25.0 30.0
min
Pic 3. Ginger sample spiked with Mycotoxins. Aflatoxin B1 – 5.06 ng/g, Aflatoxin B2 – 1.45 ng/g, Aflatoxin G1 – 4.33 ng/g, Aflatoxin G2 – 1.45 ng/g, Ochratoxin A – 10.1 ng/g.
B1
B2
G1
G2 Ochratoxin A
0.0 5.0 10.0 15.0 20.0 25.0
Pic 2. Ginseng sample spiked with Mycotoxins. Aflatoxin B1 - 2.53 ng/g, Aflatoxin B2 - 0.72 ng/g, Aflatoxin G1 - 2.16 ng/g, Aflatoxin G2 - 0.72 ng/g, Ochratoxin A – 5.05 ng/g.
B1
B2
G1G2
Ochratoxin A
0.0 5.0 10.0 15.0 20.0 25.0
0.0 5.0 10.0 15.0 20.0 25.0
Pic 1. Ginseng sample blank.
NOTE: The shift on the baseline at 17 min is due to changes in gradient conditions and detector settings.
70Pickering Laboratories Method Abstracts /

Analysis of Mycotoxins / MA-215
Clean-Up and Determination of Aflatoxins in Peanuts and Peanut Butter (MA-215)
Aflatoxins occur naturally in peanuts, cottonseed, corn, and dried chili pepper as well as many mixed or processed foods and feeds. Of significant assistance is the cleanup of extracts by an Immunoaffinity column containing antibodies specific to the Mycotoxin of interest. We used a simple, sensitive and robust HPLC method with post-column photochemical derivatization and fluorescence detection to analyze Aflatoxins B1, B2, G1, G2 in peanut butter and ground peanuts. The UVE™ (LCTech, Germany) photochemical reactor requires no additional reagents and is easy to install between the HPLC column and FLD detector. This method and instrumentation allows for quick and interferencefree detection of Aflatoxins at the low ppb level.
Project OverviewAs participants in an NIST study, we analyzed samples of peanuts and peanut butter (table 1, 2). Four other laboratories that use other HPLC methods for analysis of Aflatoxins participated in this study. Community results for peanuts are presented in table 2. The extracts were cleaned up using the AflaCLEAN™ (LCTech, Germany) Immunoaffinity columns for Aflatoxin B1, B2, G1, G2. The prepared samples were analyzed by HPLC with post-column photochemical derivatization using the UVE™ Photochemical Reactor.
Method
Isolation of Aflatoxins B1, G1, B2, G2To 20 g of sample add 2 g of NaCl, 100 mL of extraction solution (80/20 Methanol/water) and 50 mL of Hexane. Blend at high speed and filter through fluted paper. To 14 mL of aqueous layer add 86 mL of PBS buffer pH 7, mix well and filter. Open the AflaClean Immunoaffinity column and drain the storage buffer. Load 11 mL of extract/PBS mixture and drain to the top of the sorbent bed. Wash the column with 10 mL of water. Elute Aflatoxins with 2 portions of 1 mL Methanol. Leave the first portion of Methanol in the column for 5 min before adding the second portion to ensure the breaking of the Aflatoxins bond with the antibodies. Analyze Aflatoxins as described below.
Analytical ConditionsAnalytical Column: MYCOTOX™ Reversed-phase Column,
4.6 x 250 mm, P/N 1612124
Guard Column: Reversed-phase guard cartridge, P/N 18ECG001
HPLC Eluent: Sodium Phosphate buffer (Cat #1700-1108)/Methanol/Acetonitrile (57/28/15)
Flow Rate: 1 mL/min
Injection Volume: 30 μL
FLD: λex : 365 nm, λem : 430 nm
Results & Discussion
Isolation of Aflatoxins B1, G1, B2, G2The 6-point calibration curves were built in a range of 11.49 – 0.24 ppb for B1, 3.29 – 0.07 ppb for B2 and G2, 9.85 – 0.21 ppb for G1 with R2 exceeding 0.999. There were no matrix interferences present after the sampleclean-up using the Immunoaffinity columns.
The results for all Aflatoxins are in good agreement with certified NIST values and with the results obtained by other methods.
Using the IAC columns, and the UVE reactor to derivatize, we were able to detect low levels of Aflatoxin quickly and efficiently.
HPLC
FLD
UVE™
Flow diagram for UVE™ Photochemical Reactor
71 / Pickering Laboratories Method Abstracts

Aflatoxin B1 Aflatoxin B2 Total Aflatoxins
Target value, ng/g 4.2 ± 0.9 0.7 ± 0.3 5.0 ± 0.5
Packet A, ng/g 4.47 0.73 5.2
Packet B, ng/g 4.76 0.96 5.72
Packet C, ng/g 4.74 0.8 5.54
Table 1. Peanut butter (NIST SRM2387) – control sample
Aflatoxin B1 Aflatoxin B2 Aflatoxin G1 Aflatoxin G2 Total Aflatoxins
Packet A, ng/g 6.21 1.82 1.74 1.24 11.01
Packet B, ng/g 6.45 1.65 2.02 1.3 11.42
Packet C, ng/g 5.73 1.78 2.07 1.52 11.1
Mean, ng/g 6.1 1.8 1.9 1.4 11.2
RSDr % 6.5 5.6 10.5 7.1 1.8
Community results* 4.02-6.48 1.38-1.75 1.54-2.22 1.34-1.45 8.4-11.6
NIST assessed value**, ng/g 7.47 ± 3.28 1.82 ± 0.79 2.57 ± 1.13 1.64 ± 0.72 13.5 ± 5.9
* Results from 5 participating laboratories are presented as (minimum reported value – maximum reported value), ng/g
** ± 95% confidence interval about the NIST assessed value
Table 2. Ground peanut sample
0 2 4 6 8 10 12
B1
B2
G1G2
min
a)
min0 102 4 6 8 12
B1
B2
b)
Fig 1. Chromatograms of a) Ground peanuts; b) NIST SRM2387 peanut butter sample. All samples are part of NIST Exercise E (April 2010).
Analysis of Mycotoxins / MA-215
72Pickering Laboratories Method Abstracts /

Analysis of Mycotoxins / MA-110
Aflatoxins (MA-110)Toxins in Peanuts, Vegetable Matter, and Milk
Aflatoxins occur naturally in peanuts, peanut meal, cottonseed meal, corn, dried chili pepper, etc. However, the growth of mold does not always indicate the presence of toxin since the yield of Aflatoxins is dependent on growth conditions such as moisture, temperature, and aeration. The Aflatoxins are characterized as B for blue fluorescence and G for green fluorescence. The numerical subscripts indicate relative chromatographic mobility. Besides the toxins commonly found in vegetable matter (B1, B2, G1, and G2), Aflatoxins M (for milk) are found in milk of cows fed toxic meals. The highly toxic M metabolites are 4-hydroxylated Bs.
The most important feature of the post-column method described here is that all four Aflatoxins are detectable at the same fluorescence emission wavelength in a single run.
Method
Analytical ConditionsColumn: MYCOTOX™ Reversed-phase Column,
4.6 x 250 mm, P/N 1612124
Guard Column: Reversed-phase guard cartridge, P/N 18ECG001
Column Temperature: 42 °C
Flow Rate: 1.0 mL/min
Mobile Phase: MeOH, CH3CN, H2O; 22:22:56, Isocratic
Injection Volume: 10-50 uL
Post-Column ConditionsPost-Column System: Onyx PCX, Pinnacle PCX or Vector PCX
Reactor Volume: 1.4 mL
Reactor Temperature: 95 °C
Reagent: Iodine 100 mg/L in water
Flow Rate: 0.3 mL/min
Detection: FLD Detector, λex : 365 nm, λem : 430 nm
References1. R. Buchi in “Aflatoxins,” L. Goldblat, Ed., Academic Press, New York, NY (1969)2. C.W. Thorp, G.M. Ware, and A.E. Pohland,“Proceedings of the 5th
International IUPAC Symposium on Mycotoxins and Phycotoxins,” W. Pfannhauser and P.B. Czedic-Eysenberg (Eds.), Technical University, Vienna (1982) 52–55
3. J.W. Dorner & R.J. Cole, J.A.O.A.C., 71 (1988) 43–474. M.J. Shepherd and J. Gilbert, Food Additives Contaminants, 1 (1984) 325–335
min8 10 12 1462 40
M2M1
G2
G1 B2
B1
with derivatization
without derivatization
73 / Pickering Laboratories Method Abstracts

HPLC Gradient
TIME Eluent A % Eluent B %
0 45 55
2 45 55
9 30 70
14 10 90
16 10 90
16.1 45 55
22 45 55
Analysis of Mycotoxins / MA-249
Analysis of Fumonisins FB1, FB2 and FB3 Using HPLC With Post-Column Derivatization (MA-249)
Fumonisins are a group of naturally occurring Mycotoxins produced by Fusarium moniliforme fungi species that grow on corn and other commodities. Fumonisins are suspected human carcinogens and are toxic to pigs, poultry and horses. Environmental factors, such as temperature and humidity, affect the occurrence of Mycotoxins and contamination can happen in the field as well as during storage. Many countries set limits on the presence of Fumonisins in foods and feeds and testing of raw crops as well as finished products is done on a regular basis.
A simple and sensitive method to detect Fumonisins involves using an HPLC to separate the toxins and then converting them using post-column derivatization with OPA into highly fluorescent derivatives.
Method
Analytical ConditionsAnalytical Column: MYCOTOX™ Reversed-phase Column,
4.6 x 250 mm, P/N 1612124
Guard Column: Reversed-phase guard cartridge, P/N 18ECG001
Temperature: 40 ºC
Flow Rate: 0.8 mL/min
Mobile Phase: Eluant A: Dilute 1 mL of formic acid to 1 L with D.I. water Eluant B: MeOH
Injection Volume: 10–50 µL
Post-Column ConditionsPost-Column System: Onyx PCX, Pinnacle PCX or Vector PCX
Reactor Volume: 1.4 mL
Reactor Temperature: 65 ˚C
Flow Rate: 0.4 mL/min
Reagent: 300 mg o-Phthalaldehyde, 2g Thiofluor and 3 mL of 30% Brij 35 solution in 950 mL OD104 Diluent
Detection: FLD detector, λex : 335 nm, λem : 440 nm
0 4 8 12 16 min
FB1FB2
FB3
Fig 1. Chromatogram of Fumonisins standard (25 ppb)
74Pickering Laboratories Method Abstracts /

Analysis of Mycotoxins / MA-252
Analysis of Fumonisins in Grains and Feed (MA-252)
Fumonisins are naturally occurring Mycotoxins produced by Fusarium mold species. Fumonisins contamination happens worldwide in many agricultural commodities, especially in corn, and is usually associated with dry and hot weather followed by periods of high humidity. Out of more than ten types of Fumonisins, Fumonisin FB1 is the most prevalent and toxic, followed by Fumonisins FB2 and FB3. Fumonisins are classified as possibly carcinogenic for humans and also cause health problems in animals, especially in equids and swine. FDA sets total Fumonisins limits in human foods between 2-4 ug/g and in animal feed between 5-100 ug/g.
Since Fumonisins don’t have a chromophore and don’t fluoresce derivatization is needed to achieve the required sensitivity of detection. We developed a fast and sensitive HPLC method with post-column derivatization that is capable of analyzing Fumonisins in grains and animal feed at levels as low as 0.01 ug/g.
Method
Analytical ConditionsAnalytical Column: MYCOTOX™ Reversed-phase Column,
4.6 x 250 mm, P/N 1612124
Guard Column: Reversed-phase guard cartridge, P/N 18ECG001
Temperature: 40 ºC
Flow Rate: 0.8 mL/min
Mobile Phase: Eluant A: Dilute 1 mL of formic acid to 1 L with D.I. water Eluant B: MeOH
Injection Volume: 10–50 µL
Post-Column ConditionsPost-Column System: Onyx PCX, Pinnacle PCX or Vector PCX
Heated Reactor Volume: 1.4 mL
Temperature: 65 ºC
Reagent: 950 mL GA 104, 300 mgs OPA, 2 g Thiofluor, 3 mL of 30% Brij 35 solution
Detection: FLD, λex : 335 nm, λem : 440 nm
Sample Extraction and Clean-Up
Immunoaffinity Clean-Up Columns: FumonitestTM WB (Vicam)Extraction Solution: Water/Methanol (20/80)
PBS Solution: Dilute 100 mL of 10X PBS (Vicam, P/N G1113 to 1 L with DI water
To 25 g of finely ground sample add 2.5 g of NaCl and 50 mL of extraction solution. Blend at high speed for 5 min, filter through fluted filter. Take 10 mL of extract and add 40 mL of PBS solution, mix well, filter through microfiber filter. Load 10 mL of diluted extract to Immunoaffinity column, let the solution pass through at the flow rate about 1-2 drops/sec. Wash the column with 10 mL of PBS solution, elute with 1 mL of Methanol followed by 1 mL of DI water. Evaporate the solution to dryness under the stream of Nitrogen, reconstitute in 1 mL of Methanol/water (50/50). Inject 10–50 uL.
HPLC Gradient
TIME Eluent A % Eluent B %
0 45 55
2 45 55
9 30 70
14 10 90
16 10 90
16.1 45 55
22 45 55
Analysis of Fumonisins
Sample FB1 Found in Sample
FB2 Found in Sample
FB1 Spike Concentration
FB2 Spike Concentration
FB1 Recoveries
FB2 Recoveries
Barley 0 ug/g 0 ug/g 0.2 ug/g 0.07 ug/g 92.3% 87.5%
Milo 0.04 ug/g 0.01 ug/g 0.2 ug/g 0.07 ug/g 85.4% 81.8%
Saf-flower seeds
0 ug/g 0 ug/g 0.2 ug/g 0.07 ug/g 92.0% 80.8%
Corn 0.17 ug/g 0.03 ug/g 0.4 ug/g 0.13 ug/g 91.7% 88.7%
Oats 0 ug/g 0 ug/g 0.2 ug/g 0.07 ug/g 91.5% 83.3%
Mixed feed 0.08 ug/g 0.02 ug/g 0.3 ug/g 0.1 ug/g 88.0% 80.6%
75 / Pickering Laboratories Method Abstracts

Fig 1. Chromatogram of corn sample contaminated with 0.17 ug/g of FB1 and 0.03 ug/g of FB2
FB1
FB2
0 2 4 6 8 10 12 14 min
Fig 2. Chromatogram of mixed feed sample contaminated with 0.08 ug/g of FB1 and 0.02 ug/g of FB2
.
FB1
FB2
0 2 4 6 8 10 12 14 min
Fig 3. Chromatogram of barley sample spiked with 0.2 ug/g of FB1 and 0.07 ug/g of FB2
FB1
FB2
0 2 4 6 8 10 12 14 min
Fig 4. Chromatogram of safflower seeds sample spiked with 0.2 ug/g of FB1 and 0.07 ug/g of FB2
FB1
FB2
0 2 4 6 8 10 12 14 min
Analysis of Mycotoxins / MA-252
76Pickering Laboratories Method Abstracts /

Analysis of Mycotoxins / MA-203
Multi-Residue Mycotoxin Analysis—Single Run Analysis of Deoxynivalenol, Aflatoxins, Ochratoxin A, Zearalenone and Fumonisin by HPLC and Post-Column Derivatization (MA-203)
Although Aspergillus (Aflatoxins, Ochratoxin A) are generally associated with peanuts and Fusarium (Deoxynivalenol, Zearalenone) with wheat, these fungi and those that produce other toxins are not host selective and so can cross plant species. This situation is complicated by the fact that the microscopic mold may not be visible to the naked eye. Also, when infected grains are processed, any visible mold is lost but the toxic metabolites carry over into the finished products. Thus, multi-residue analytical screens for toxins in grain and finished goods are a wiser choice than single-family protocols. We present a single screen to cover five families of toxins. This method is suitable for analyzing beverages, grains and feeds.
Sample Extraction and Clean Up25 g of finely grounded sample is extracted with 150 mL of water/Methanol mixture (30/70). 20 mL of filtered extract is diluted with 70 mL of Phosphate Buffered Saline (PBS). Aflatoxins, Zearealenone and Ochratoxin A are isolated using AOZ Immunoaffinity column (Vicam, USA) according to the procedure from the column manufacture. Toxins are eluted with 2 x 2 mL of Methanol. Fumonisins are isolated using FumoniTest Immunoaffinity column (Vicam, USA) according to the procedure from the column manufacture. Toxins are eluted with 2 x 1.5 mL of Methanol.
To isolate DON 3 mL of filtered extract is mixed with 6 mL of Acetonitrile and cleaned with MycoSep 277 column (Romer Labs, USA) according to the manufacture’s instructions. The cleaned solution is filtered and 5.5 mL of it is combined with eluants from AOZ and FumoniTest columns. The solution is evaporated to 0.5 mL and final volume is adjusted to 1 mL with Methanol.
Method
Analytical ConditionsAnalytical Column: MYCOTOX™ Reversed-phase Column,
4.6 x 250 mm, P/N 1612124
Guard Column: Reversed-phase guard cartridge, P/N 18ECG001
Temperature: 40 ºC
Flow Rate: 1 mL/min
Mobile Phase: Sodium Phosphate buffer, pH 3.5 Catalog No 1700-1108/MeOH/ACN
Post-Column ConditionsPost-Column System: Onyx PCX and Pinnacle PCX
Reactor Volume: 1.4 mL
Temperature: 60 ºC
Reagent: OPA, Thiofluor, Brij 35® in GA104
Photochemical Reactor: UVE™
Detection: Fluorescence Aflatoxins (photochemical derivatization) λex = 365 nm; λem = 455 nm
Fumonisins (post-column derivatization with OPA) λex = 330 nm; λem = 465 nm
Ochratoxin A λex = 335 nm; λem = 455 nm
Zearalenone λex = 275 nm; λem = 455 nm
UV/Vis Deoxynivalenol λ=218 nm
HPLC Program
Time 1700-1108 % Methanol % Acetonitrile %
0.0 85 0 15
5.0 85 0 15
5.1 57 28 15
20.0 57 28 15
23.0 40 60 0
40.0 40 60 0
50.0 20 0 80
60.0 20 0 80
References:Ofitserova, M., Nerkar, S., Pickering, M., Torma, L., Thiex, N., Multiresidue Mycotoxin Analysis in Corn Grain by Column High-performance Liquid Chromatography with Post-column Photochemical and Chemical Derivatization: Single-Laboratory Validation., (2009), J AOAC Int., 92, 15-25
77 / Pickering Laboratories Method Abstracts

Fig 1. Chromatogram of a standard solution of mycotoxins. Concentrations of toxins (ng/mL): deoxynivalenol (DON) - 930, aflatoxin B1 - 4.5, aflatoxin B2 - 1.6, aflatoxin G1 - 4.7, aflatoxin G2 - 2, ochratoxin A - 92, zearalenone - 481, fumonisin B1 - 474, and fumonisin B2 - 627.
Fig 2. Chromatogram of a corn grain sample naturally contaminated with fumonisins FB1 and FB2 and spiked with DON; aflatoxins B1, B2, G1, and G2; ochratoxin A; and zearalenone. Concentrations of toxins in the sample (ng/g): deoxynivalenol - 930, aflatoxin B1 - 5.0, aflatoxin B2 - 1.7, aflatoxin G1 - 5.1, aflatoxin G2 - 2.2, ochratoxin A - 102, zearalenone - 529, fumonisin B1 - 1838, and fumonisin B2 - 1107.
UV signal
DON
FLD Signal
B1B2G1
G2ZON
Ochra
FB1 FB2
reagent ON
reagent OFF
reagent ON
0 10 20 30 40 50 min
UV signal
DON
FLD Signal
B1B2G1
G2ZON
Ochra
FB1
FB2
reagent ON
reagent OFF
reagent ON
0 10 20 30 40 50 min
Analysis of Mycotoxins / MA-203
78Pickering Laboratories Method Abstracts /

Analysis of Cannabis and Hemp
79 / Pickering Laboratories Method Abstracts

Analysis of Cannabis and Hemp / MA-242
Analysis of Cannabinoids in Hemp and Hemp-Containing Products Using HPLC With Post-Column Derivatization (MA-242)
The legalization of hemp under the 2018 Farm Bill brought new opportunities as well as new challenges to both growers of industrial hemp and manufacturers of hemp-containing products. The Farm Bill classifies hemp as the plant Cannabis sativa L. and all its derivatives with delta-9 tetrahydrocannabinol (THC) of not more than 0.3% concentration. To comply with Federal laws, all producers need to test their products to determine THC content as well as the concentration of other cannabinoids, particularly CBD, that are associated with pharmacological activity of Cannabis sativa L. plant.
A new HPLC method with post-column derivatization was developed to analyze cannabinoids in hemp and hemp-containing edible products. This post-column method is based on reaction with Fast Blue Salt reagent under basic conditions. Detection at 475 nm is performed using a UV/Vis detector.
The method utilizes a simple extraction procedure with no additional sample clean-up and is suitable for analysis of the major neutral cannabinoids as well as cannabinoid acids with high sensitivity and selectivity of detection.
Method
Analytical ConditionsAnalytical Column: C18 Reversed-phase Column, 4.6 x 150 mm
Guard Column: Reversed-phase guard cartridge, P/N 18ECG001
Column Temperature: 45 ºC
Flow Rate: 1 mL/min
Mobile Phase: 70% acetonitrile – 30% sodium phosphate buffer (6 mM) at pH 3.5
Injection Volume: 20 uL
Post-Column ConditionsPost-Column System: Onyx PCX, Pinnacle PCX or Vector PCX
Heated Reactor Volume: 1.4 mL
Temperature: 45 ºC
Reagent 1: Dissolve 0.1 g of Fast Blue Salt in 240 mL of DI water.Add 40 mL of 1 N HCl and 720 mL of Acetonitrile. Protect the reagent from light and use within 3 days.
Reagent 2: Dissolve 8 g of NaOH in 1 L of DI water
Detection: UV/VIS at 475 nm
To avoid precipitation of the reagent as it ages, flush the postcolumn system regularly with water/methanol/0.1N HCl (49:49:2)
Sample Extraction
Dried Plant Material and Edible Products1
Weigh 0.5 g of a thoroughly homogenized sample into a 50-mL centrifuge tube. Add 20 mL of ethanol, then shake for 30 minutes using a horizontal shaker at 250 rpm. Centrifuge the tube for 5 minutes and filter the supernatant through filter paper into a 50-mL volumetric flask. Repeat extraction of the sample following the steps above. Combine both extracts in 50-mL volumetric flask and bring to volume with ethanol. Filter the extract through a 0.22 um PFTE syringe filter into an injection vial.
Resins, Tinctures and Oils1
Reduce the sample size to 0.05 g – 0.1 g. Extraction steps above are used except no re-extraction is needed. Dilute the extracts if needed.
CalibrationThe following cannabinoids were analyzed: delta-9 tetrahydrocannabinol (9-THC), delta-8 tetrahydrocannabinol (8-THC), cannabinol (CBN), cannabidiol (CBD), cannabigerol (CBG), tetrahydrocannabivarin (THCV), delta-9 tetrahydrocannabinolic acid A (THCA-A), cannabidiolic acid (CBDA), cannabigerolic acid (CBGA).
The calibrators were prepared by diluting commercially available cannabinoids standards with methanol. The calibration range from 5 ppm to 75 ppm was used. Correlation coefficient R2 exceeded 0.999 for all calibration curves.
80Pickering Laboratories Method Abstracts /

Analysis of Cannabis and Hemp / MA-242
Fig 1. Chromatogram of hemp pre-roll0 5 10 15 min
CB
DA
CB
D
9-TH
C
THC
A
CB
NCB
G
Fig 2. Chromatogram of CBD-containing chocolate
0 5 10 15 min
CB
DA
CB
D
Fig 3. Chromatogram of CBD oil supplements
0 5 10 15 min
CB
DA
CB
D
THC
A
CB
G
Fig 4. Chromatogram of CBD-containing chews
0 5 10 15 min
CB
DA
CB
D
CB
N
References1. AOAC Official Method 2018.11
Analysis of Cannabinoids in Hemp and Hemp-containing Products
Sample CBD 9-THC 8-THC CBG CBN THCV CBDA THCA CBGA
Hemp Pre-Rolls 9.12 mg/g 1.53 mg/g ND 6.63 mg/g 0.96 mg/g ND 114.69 mg/g 3.62 mg/g ND
CBD-Containing Tincture 14.82 mg/g 0.15 mg/g ND ND 0.42 mg/g ND ND ND ND
CBD-Containing Chocolate 14.89 ND ND ND ND ND ND ND ND
CBD Oil 6.78 mg/g 0.32 mg/g ND ND ND ND ND ND ND
CBD-Containing Chews 4.75 mg/g ND ND ND ND ND 0.77 mg/g ND ND
81 / Pickering Laboratories Method Abstracts

Analysis of Cannabis and Hemp / MA-243
Analysis of Cannabinoids Using HPLC With Post-Column Derivatization (MA-243)
Cannabinoids are a class of terpenophenolic compounds that are associated with the pharmacological activity of cannabis. Broader acceptance of medical cannabis use increases the need for analytical methods capable of determining the active compounds of cannabis. Cannabinoids exist in the plant mainly as carboxylic acids and are converted to neutral analogs by light and heat while in storage or during the preparation of edible products. Acids are also converted to neutral analogs during GC analysis, which often causes differences in results when comparing with HPLC methods.
A new HPLC method with post-column derivatization was developed to analyze cannabinoids in cannabis plants as well as in cannabis containing edible products. This post-column method is based on reaction with Fast Blue Salt reagent under basic conditions, a well-known colorforming reaction that is used in drug tests to detect cannabinoids via test-tube methods and thin-layer chromatography. Detection at 475 nm is performed using a UV/Vis detector.
Our method implements a simple extraction with acidified water/acetonitrile followed by QuEChERS sample clean-up. The same procedure is applicable to both plant materials and edible products containing cannabis. The method is suitable for analysis of the major neutral cannabinoids such as THC, CBD, CBN and CBG as well cannabinoid acids THCA-A and CBDA with high sensitivity and selectivity of detection.
Method
Analytical ConditionsAnalytical Column: C18 reversed-phase column, 4.6 x 150 mm
Guard Column: Reversed-phase guard cartridge, P/N 18ECG001
Column Temperature: 45 ºC
Flow Rate: 1 mL/min
Mobile Phase: 70% acetonitrile – 30% sodium phosphate buffer (6 mM) pH 3.5
Injection Volume: 20 uL
Post-Column ConditionsPost-Column System: Onyx PCX, Pinnacle PCX or Vector PCX
Heated Reactor Volume: 1.4 mL
Temperature: 30 ºC
Ambient Reactor: 0.1 mL
Reagent 1: Dissolve 0.1 g of Fast Blue Salt in 240 mL of DI water. Add 40 mL of 1 N HCl and 720 mL of Acetonitrile. Protect the reagent from light. Use within 3 days.
Reagent 2: Dissolve 8 g of NaOH in 1L of DI water
Reagents Flow Rate: 0.25 mL/min
Detection: UV/VIS 475 nm
To avoid precipitation of aging reagents flush post-column system regularly with 49 : 49 : 2 – water : Methanol : 0.1N HCl
Supplies for Sample PreparationExtraction Solution: Acetonitrile containing 1% of
Acetic Acid / Water (50:50)
Q-SEP QuEChERS extraction salts: Restek, Cat # 26238 (AOAC 2007.01 Method)
Sample Extraction and CleanupUse 0.1 – 0.2 g sample size to analyze plant material and 0.2 – 0.5g sample size to analyze edible products. Place homogenized sample into 50 mL centrifuge tube and add 30 mL of Extraction Solution. Blend using a hand held blender for 1 min. For candies, chews and other products hard or viscous products let the solution sit for 30 min before blending. Shake blended extracts for 30 min using a mechanical shaker.
Centrifuge the samples for 10 min at 4,000 rpm, decant and save the extract. Repeat the extraction with fresh 30 mL of extraction solution. Centrifuge, decant the extract and combine it with the first portion.
Place 30 mL of combined extract in 50 mL centrifuge tube. Add Q-Sep QuEChERS extraction salts to each centrifuge tube according to the manufacture instructions. Vigorously shake for 1 min. Centrifuge the sample for 10 min at 4,000 rpm. Use upper layer for analysis. Filter through 0.45 Nylon filter before injecting. If needed, dilute the sample with Methanol to fit the calibration curve.
Extraction Efficiency StudyDue to availability and price constraints of cannabinoids standards, spike-recoveries studies are not practical to evaluate extraction efficiency. We performed three re-extractions of each sample to validate the extraction procedure. It was found that extraction with two 30-mL portions of extraction solution is sufficient to extract more that 97.5% of cannabinoids. Due to relatively high levels of cannabinoids in the samples and high sensitivity of the method, additional dilution of the extract due to repeated extraction didn’t negatively affect the analysis.
CalibrationThe following cannabinoids were analyzed: delta-9 tetrahydrocannabinol (THC), cannabinol (CBN), cannabidiol (CBD), cannabigerol (CBG), cannabichromene (CBC), delta-9 tetrahydrocannabinolic acid A (THCA-A) and cannabidiolic acid (CBDA).
The calibrators were prepared by diluting commercially available cannabinoids standards with methanol. The following calibration ranges were used: 1 ppm to 75 ppm for CBG, CBD, CBN, THC and CBDA; 5 ppm to 75 ppm for THCA-A and CBC. Correlation coefficient R2 for all calibration curves exceeded 0.999 value.
82Pickering Laboratories Method Abstracts /
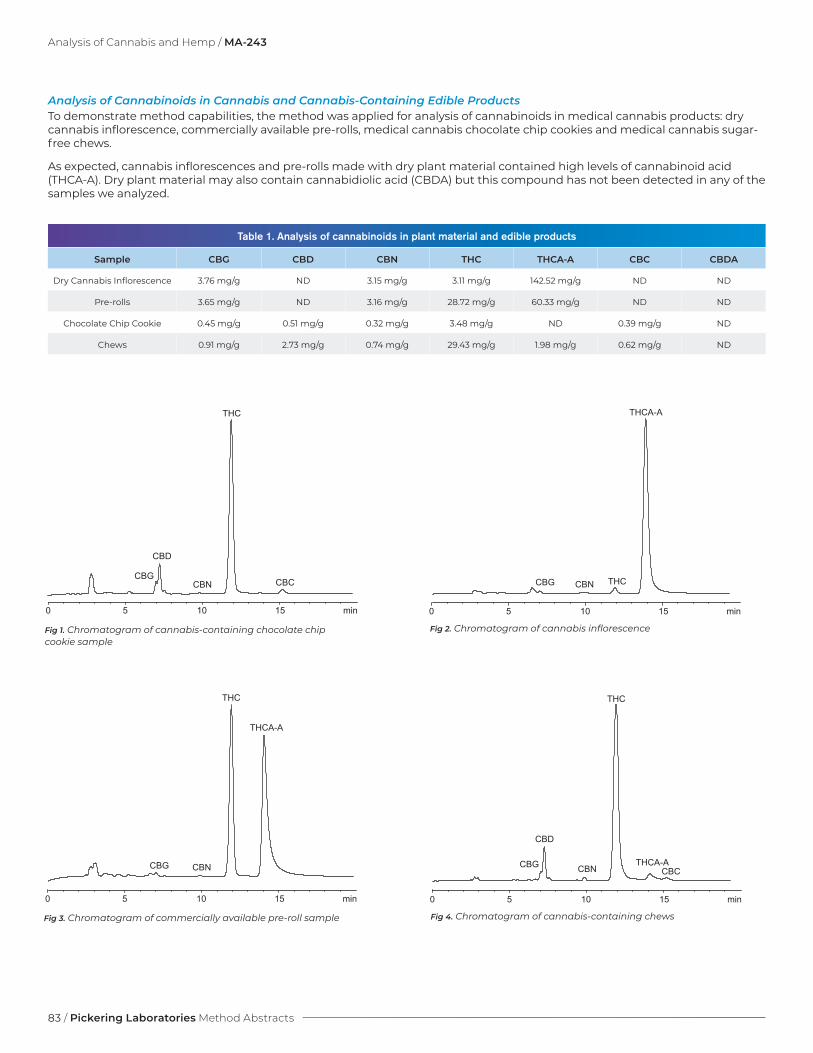
Analysis of Cannabinoids in Cannabis and Cannabis-Containing Edible ProductsTo demonstrate method capabilities, the method was applied for analysis of cannabinoids in medical cannabis products: dry cannabis inflorescence, commercially available pre-rolls, medical cannabis chocolate chip cookies and medical cannabis sugar-free chews.
As expected, cannabis inflorescences and pre-rolls made with dry plant material contained high levels of cannabinoid acid (THCA-A). Dry plant material may also contain cannabidiolic acid (CBDA) but this compound has not been detected in any of the samples we analyzed.
Table 1. Analysis of cannabinoids in plant material and edible products
Sample CBG CBD CBN THC THCA-A CBC CBDA
Dry Cannabis Inflorescence 3.76 mg/g ND 3.15 mg/g 3.11 mg/g 142.52 mg/g ND ND
Pre-rolls 3.65 mg/g ND 3.16 mg/g 28.72 mg/g 60.33 mg/g ND ND
Chocolate Chip Cookie 0.45 mg/g 0.51 mg/g 0.32 mg/g 3.48 mg/g ND 0.39 mg/g ND
Chews 0.91 mg/g 2.73 mg/g 0.74 mg/g 29.43 mg/g 1.98 mg/g 0.62 mg/g ND
Fig 1. Chromatogram of cannabis-containing chocolate chip cookie sample
0 5 10 15 min
THC
CBCCBN
CBD
CBG
Fig 2. Chromatogram of cannabis inflorescence
0 5 10 15 min
THC
THCA-A
CBNCBG
Fig 3. Chromatogram of commercially available pre-roll sample
THC
THCA-A
CBNCBG
0 5 10 15 min
Fig 4. Chromatogram of cannabis-containing chews
0 5 10 15 min
THC
THCA-ACBC
CBD
CBNCBG
Analysis of Cannabis and Hemp / MA-243
83 / Pickering Laboratories Method Abstracts

Analysis of Cannabis and Hemp / MA-241
Analysis of Mycotoxins in Cannabis Plant and Cannabis- Containing Products (MA-241)
As medical and recreational Cannabis use gains broader acceptance, regulations are being put in place to mandate the testing of consumer products containing Cannabis. Legally available Cannabis plant and cannabis-containing edible products are tested for presence of pesticides, heavy metals, residual solvents and other harmful substances. Mycotoxins is another group of contaminates that state regulations have established maximum allowed levels for. In cannabis products sold to consumers the maximum allowed levels for total Aflatoxins G1, G2, B1 and B2 are set at < 20 ppb and for Ochratoxin A at < 20 ppb.
Pickering developed an easy and sensitive method to analyze Aflatoxins B1, B2, G1, G2 and Ochratoxin A in cannabis plant and edible products. Mycotoxins are isolated using immunoaffinity clean-up columns and analyzed with fluorescence detection. To increase sensitivity of Aflatoxins B1 and G1, an in-line photochemical reactor is installed before the detector. This method utilizes standard HPLC equipment and allows laboratories to easily determine Mycotoxins at levels below the limits established by state regulations.
Method
Isolation of Aflatoxins B1, B2, G1, G2 and Ochratoxin ABlend 1 g of finely ground sample with extraction solution (10 mL of Methanol/water 80:20, 5 mL of Hexane, 0.1 g of NaCl) using a handheld homogenizer. Centrifuge for 10 min. Mix 2 mL of the aqueous layer with 12 mL of PBS buffer (pH 7.2) containing 4% of Tween 20. Apply the solution to AflaOTAClean™ Immunoaffinity column at a flow rate of 1-2 drops/sec.
Wash the column with 10 mL of water at a flow rate of 1-2 drops/sec. Elute the toxins with two 1 mL portions of Methanol at a flow rate of 1 drop/sec. Allow 5 min before applying the second portion of the Methanol to ensure complete breaking of the antibody-toxin bond.
Evaporate to dryness at 55 ºC. Reconstitute in 1 mL of Methanol/water 50:50.
Other immunoaffinity columns, such as Vicam’s AflaOchra HPLC, could be used for sample clean up as well.
Analytical ConditionsAnalytical Column: MYCOTOX™ Reversed-phase Column,
4.6 x 250 mm, P/N 1612124
Guard Column: Reversed-phase guard cartridge, P/N 18ECG001
HPLC Eluent: Sodium Phosphate buffer (Cat #1700-1108), Methanol, Acetonitrile
Flow Rate: 1 mL/min
Injection Volume: 100 μL
FLD: λex : 365 nm, λem : 430 nm for Aflatoxins λex : 333 nm, λem : 477 nm for Ochratoxin A
CalibrationThe 5-point calibration curves were built in the ranges of 0.25-5 ppb for B1, 0.075-1.5 ppb for B2, 0.248-4.95 ppb for G1, 0.075-1.5 ppb for G2 and 1-10 ppb for Ochratoxin A. Correlation coefficient R2 >0.999 for all toxins. All calibration standards were prepared in Methanol/Water 50:50
RecoveriesFor all tested samples the recoveries for toxins exceeded 77% for G2, 88% for G1, 73% for B2, 78% for B1 and 80% for Ochratoxin A
HPLC Gradient
TIME 1700-1108 % Methanol % Acetonitrile %
0 57 28 15
13 57 28 15
16 30 45 25
25 30 45 25
Equilibration time: 10 min
HPLC
FLD
UVE™
Flow Diagram for UVETM Photochemical Reactor
84Pickering Laboratories Method Abstracts /

Analysis of Cannabis and Hemp / MA-241
Fig 5. Chromatogram of cannabis inflorescence sample spiked with 6 ng/g of Aflatoxin B1; 1.8 ng/g of Aflatoxin B2; 5.94 ng/g of Aflatoxin G1; 1.8 ng/g of Aflatoxins G2 and 20 ng/g of Ochratoxin A
B2
B1
0 105 15 20 min
Ochratoxin A
G1
G2
Fig 6. Chromatogram of cannabis-containing chocolate chip cookie sample spiked with 6 ng/g of Aflatoxin B1; 1.8 ng/g of Aflatoxin B2; 5.94 ng/g of Aflatoxin G1; 1.8 ng/g of Aflatoxins G2 and 20 ng/g of Ochratoxin A
B2
B1
0 105 15 20 min
Ochratoxin A
G1
G2
Fig 1. Chromatogram of cannabis-containing peanut butter cookie sample naturally contaminated with 1.58 ng/g of Aflatoxins B1 and 0.26 ng/g of B2
B2
B1
0 105 15 20 min
Fig 2. Chromatogram of cannabis-containing peanut butter cook-ie sample spiked with additional 6 ng/g of Aflatoxin B1; 1.8 ng/g of Aflatoxin B2; 5.94 ng/g of Aflatoxin G1; 1.8 ng/g of Aflatoxins G2 and 20 ng/g of Ochratoxin A
B2
B1
0 105 15 20 min
Ochratoxin A
G1
G2
Fig 3. Chromatogram of cannabis pre-roll sample spiked with 6 ng/g of Aflatoxin B1; 1.8 ng/g of Aflatoxin B2; 5.94 ng/g of Aflatoxin G1; 1.8 ng/g of Aflatoxins G2 and 20 ng/g of Ochratoxin A
B2
B1
0 105 15 20 min
Ochratoxin A
G1
G2
Fig 4. Cannabis inflorescence sample blank
0 105 15 20 min
85 / Pickering Laboratories Method Abstracts

Analysis of Cannabis and Hemp / MA-244
Analysis of Mycotoxins in Hemp and Hemp-Containing Edible Products (MA-244)
The Agriculture Improvement Act (2018 Farm Bill) makes hemp production and distribution legal under federal law. Hemp has wide range of possible applications, including production of fibers, paper, certain foods, supplements, cosmetics and even the recently FDA-approved drug Epidiolex. Legally available hemp and hemp products need to be tested for presence of pesticides, heavy metals, residual solvents and other harmful substances. Similarly classified crops are routinely tested for Mycotoxins, including Aflatoxins and Ochratoxin A.
Pickering Laboratories developed an easy and sensitive method to analyze Aflatoxins B1, B2, G1, G2 and Ochratoxin A in hemp and hemp-containing edible products. Mycotoxins are isolated using immunoaffinity clean-up columns and analyzed with fluorescence detection. To increase sensitivity of Aflatoxins B1 and G1, an in-line photochemical reactor (UVETM) is installed before the detector. This method utilizes standard HPLC equipment and allows laboratories to easily determine these Mycotoxins at low ppb levels.
Method
Isolation of Aflatoxins B1, B2, G1, G2 and Ochratoxin ABlend 1 g of finely ground sample with extraction solution (10 mL of methanol/water 80:20) using a handheld homogenizer. Centrifuge for 10 min. Mix 2 mL of the extract with 10 mL of PBS buffer (containing 2% Tween 20).
Load 10 mL of diluted extract on AflaOchra HPLC immunoaffinity column at a flow rate of 1-2 drops/sec. Wash the column with 10 mL of PBS buffer (containing 2% Tween 20) followed by 10 mL of DI water at a flow rate of 1-2 drops/sec. Elute the toxins with two 1 mL portions of methanol at a flow rate of 1 drop/sec.
Evaporate the solution to about 0.3 mL at 55 ºC and bring the volume to 1.5 mL with water/methanol solution (50:50). Filter into an injection vial.
Analytical ConditionsAnalytical Column: MYCOTOX™ Reversed-phase Column,
4.6 x 250 mm, P/N 1612124
Guard Column: Reversed-phase guard cartridge, P/N 18ECG001
HPLC Eluant: Sodium Phosphate Buffer (Cat #1700-1108), Methanol, Acetonitrile
Flow Rate: 1 mL/min
Injection Volume: 100 uL
Post-Column Photochemical Reactor: UVE™ (Cat # 10519 (240V), Cat # 10742 (120 V))
FLD: λex : 365 nm, λem : 430 nm for Aflatoxins λex : 333 nm, λem : 477 nm for Ochratoxin A
CalibrationThe 5-point calibration curves were built in the ranges of 0.325-3.25 ppb for B1, 0.088- 0.882 ppb for B2, 0.310-3.099 ppb for G1, 0.099-0.996 ppb for G2 and 1-10 ppb for Ochratoxin A. Correlation coefficient was R2 >0.999 for all toxins. All calibration standards were prepared in methanol/water (50:50).
HPLC Gradient
Time 1700-1108 % Methanol % Acetonitrile %
0 57 28 15
13 57 28 15
16 30 45 25
25 30 45 25
Equilibration time: 10 min
HPLC
FLD
UVE™
Flow Diagram for UVETM Photochemical Reactor
86Pickering Laboratories Method Abstracts /

Fig 3. Chromatogram of full spectrum hemp tincture spiked with 6.5 ng/g of Aflatoxin B1; 1.8 ng/g of Aflatoxin B2; 6.1 ng/g of Aflatoxin G1; 1.9 ng/g of Aflatoxins G2 and 20.1 ng/g of Ochratoxin A
0 10 20 min
G1
G2
B1
B2
Ochratoxin A
Fig 4. Low-level Mycotoxins standard containing 0.81 ppb of Aflatoxin B1; 0.22 ppb of Aflatoxin B2; 0.31 ppb of Aflatoxin G1; 0.24 ppb of Aflatoxins G2 and 2.52 ppb of Ochratoxin A
0 10 20 min
G1
G2
B1
B2
Ochratoxin A
Toxins Spike Levels, ng/g
CBD-Containing Tincture
CBD-Containing Chocolate CBD Oil Hemp Pre-Rolls Full-Spectrum
CBD Chews
Recoveries % RSD % Recoveries % RSD % Recoveries % RSD % Recoveries % RSD % Recoveries % RSD %
Aflatoxin G2 1.932 91.85 2.54 78.89 1.42 88.67 7.32 84.66 10.82 93.90 6.85
Aflatoxin G1 6.198 92.50 7.86 85.89 1.21 96.35 1.24 93.56 7.05 97.93 2.42
Aflatoxin B2 1.764 92.99 5.30 88.73 2.88 99.31 1.84 94.28 6.77 101.63 1.72
Aflatoxin B1 6.498 84.73 3.51 87.88 0.56 91.62 3.08 85.78 7.50 91.97 1.99
Ochratoxin A 20.16 92.31 4.50 91.86 4.17 89.75 2.26 85.68 5.08 86.97 5.27
Fig 1. Chromatogram of hemp pre-roll spiked with 6.5 ng/g of Aflatoxin B1; 1.8 ng/g of Aflatoxin B2; 6.1 ng/g of Aflatoxin G1; 1.9 ng/g of Aflatoxins G2 and 20.1 ng/g of Ochratoxin A
0 10 20 min
G1
G2
B1
B2
Ochratoxin A
Fig 2. Chromatogram of hemp-containing chews spiked with 6.5 ng/g of Aflatoxin B1; 1.8 ng/g of Aflatoxin B2; 6.1 ng/g of Aflatoxin G1; 1.9 ng/g of Aflatoxins G2 and 20.1 ng/g of Ochratoxin A
0 10 20 min
G1
G2
B1
B2
Ochratoxin A
Recoveries
Analysis of Cannabis and Hemp / MA-244
87 / Pickering Laboratories Method Abstracts

Analysis of Sugars and Sweeteners
88Pickering Laboratories Method Abstracts /

Analysis of Sugars and Sweeteners / MA-223
Analysis of Sugars in Feeds (MA-223)By HPLC With Post-Column Derivatization and Fluorescence Detection
The types and amounts of sugar in animal feeds are as important as the amount of protein, minerals and fats in the determination of nutritive value. We developed a simple and sensitive HPLC method for analyzing six sugars in animal feeds - Sucrose, Fructose, Glucose, Galactose, Maltose and Lactose. Post-column derivatization reagents convert reducing and non-reducing sugars into fluorescent derivatives, which greatly improves the sensitivity and selectivity of the detection.
The blends of feed examined varied from grains/vegetable products (live stock feeds) to meat/vegetable products (pet food).
Method
Sample PreparationMix 2.5 g of feed sample with 50 mL of water. Heat using a water bath while constantly mixing for 1 hour at 65 °C. Centrifuge and filter through 0.45 um filter.
Analytical ConditionsColumn: Carbohydrate column, 4.6x150 mm
Temperature: 30 °C
Flow Rate: 1 mL/min
Mobile Phase: Acetonitrile/Water
Injection Volume: 10 uL – 50 uL
Post-Column ConditionsPost-Column System: Onyx PCX, Pinnacle PCX or Vector PCX
Reactor Volume: 1.4 mL
Temperature: 130 °C
Reagent 1: Guanidine hydrochloride 60 mM in 200 mM Boric acid adjusted to pH 11.5 with KOH
Reagent 2: 1.5 mM periodic acid adjusted to pH 11.5 with KOH
Flow Rate: 0.15 mL/min each reagent
Detection: FLD; λex : 325 nm, λem : 465 nm
CalibrationA quadratic calibration curve with correlation > 0.999 is observed for monosaccharides such as Fructose, Glucose and Galactose. A linear calibration curve with correlation > 0.999 is observed for disaccharides such as Maltose, Lactose and Sucrose. Examples of calibration curves presented in Fig. 1 and Fig. 2.
Fig 1. Calibration curve for Frucrose.
Amount [ppm]0 500 1000
Area
0
50
100
150
200
250
300
350
400
72 54
3
6
1
Fig 2. Calibration curve for Maltose.
Amount [ppm]0 500 1000
Area
0
25
50
75
100
125
150
175
200
725
4
3
6
1
HPLC Gradient
Time Water % ACN %
0.0 20 80
20.0 20 80
20.1 50 50
30.0 50 50
30.1 20 80
89 / Pickering Laboratories Method Abstracts

Fructose Glucose Galactose Sucrose Maltose Lactose
Feed Matrix 1
Content in feed, % 0.54 0.52 0.09 4.02 1.12 ND*
Spike Concentration, % 0.60 0.58 0.60 2.02 0.58 0.59
Recoveries, n=3, % 105 107 110 91 103 114
Spike Concentration, % 1.21 1.20 1.19 4.05 1.22 1.21
Recoveries, n=3, % 108 106 110 85 85 103
Feed Matrix 2
Content in feed, % 0.23 0.46 ND* 3.21 0.59 ND*
Spike Concentration, % 0.42 0.57 0.56 2.50 0.57 0.58
Recoveries, n=3, % 98 101 104 106 106 107
Spike Concentration, % 0.81 1.14 1.12 4.80 1.11 1.15
Recoveries, n=3, % 103 101 101 102 102 106
Feed Matrix 3
Content in feed, % 0.14 0.11 ND* 0.51 0.02 ND*
Spike Concentration, % 0.38 0.56 0.57 2.40 0.55 0.56
Recoveries, n=3, % 95 101 116 102 95 101
Feed Matrix 4
Content in feed, % 0.17 0.13 ND* 1.35 0.21 ND*
Spike Concentration, % 0.41 0.57 0.58 2.43 0.56 0.56
Recoveries, n=3, % 92 97 116 101 95 102
*Not Detected
Fig 3. Chromatogram of standard solution of sugars. Fructose 500 ppm, Glucose 500 ppm, Galactose 500 ppm, Sucrose 3000 ppm, Maltose 500 ppm, Lactose 500 ppm.
0 5 10 15 20
Fru
ctos
e
Glu
cose
Gal
acto
se
Suc
rose
Mal
tose
Lact
ose
Fig 5. Chromatogram of Feed Matrix 1 spiked with sugars. Total levels for sugars: Fructose 1.14%, Glucose 1.52%, Galac-tose 0.69%, Sucrose 6.02%, Maltose 1.72%, Lactose 0.6%.
0 5 10 15 20
Fru
cto
seG
luco
seG
alac
tose
Sucr
ose
Mal
tose
Lact
ose
Fig 4. Chromatogram of Feed Matrix 1. Levels of sugars present in the sample: Fructose 0.54%, Glucose 0.52%, Galactose 0.09%, Sucrose 4.02%, Maltose 1.12%.
0 5 10 15 20
Fru
ctos
eG
luco
se
Suc
rose
Mal
tose
Analysis of Sugars and Sweeteners / MA-223
90Pickering Laboratories Method Abstracts /

Analysis of Sugars and Sweeteners / MA-124
Sulfonamide Artificial Sweeteners in Food Products (MA-124)Analysis of Acesulfame, Saccharin and Cyclamate by HPLC With Post-Column Derivatization
Non-nutritive sweeteners are widely used in foods and beverages. Since some studies raised questions about long-term safety of these compounds, their concentration in food products is regulated. Among the artificial sweeteners used worldwide Saccharin and Cyclamate cause most controversy and their use is restricted in many countries, including the US. Liquid chromatography is a method of choice for artificial sweeteners but Cyclamate analysis is complicated by the fact that this compound does not exhibit noticeable UV absorbance.
This method allows for simultaneous analysis of Acesulfame, Saccharin and Cyclamate by LC with post-column derivatization followed by fluorescence detection. Since the sweeteners are commonly used in combination, a single method of analysis is preferred.
Method
Analytical ConditionsAnalytical Column: Reversed-phase column, C18, 2x100 mm
Temperature: 50 ˚C
Flow Rate: 0.2 mL/min
Mobile Phase: 0.02 M Potassium Phosphate Monobasic in water. Isocratic for 8 min, followed by washing the column with 70% ACN – 30% 0.02 M KH2PO4
Injection Volume: 10-50 uL
Post-Column ConditionsPost-Column System: Onyx PCX, Pinnacle PCX or Vector PCX
Reagent: Hexadecyltrimethyl ammonium bromide (10-3 M), 1,6 Diphenyl-1,3,5-hexatriene (4x10⁻⁶ M)
Reagent Preparation: To 250 mL of DI water add 0.09 g of Hexadecyltrimethylammonium bromide and sonicate until fully dissolved. Add 300 uL of 1,6-diphenyl-1,3,5-hexatriene (DPH) stock solution (i), mix well. Protect the reagent from light.
(i) Dissolve 0.007 g of 1,6-diphenyl-1,3,5-hexatriene (DPH) in 10 mL of dry THF. Store the stock solution in refrigerator, protected from light.
Reactor Volumn: 0.15 mL
Reactor Temperature: 40 ˚C
Flow Rate: 0.3 mL/min
Detection: FLD Detector, λex : 365 nm, λem : 460 nm
ReferencesJames F. Lawrence, Analyst, vol. 112, No 6 (1987), 879-881James F. Lawrence, Claudette F. Charbonneau, J. Assoc. Anal. Chem., vol. 71, No 5 (1988), 934-937
Acesulfame K
Saccharin
Cyclamate
0 52.5 7.5 min
a
b
Chromatograms of a) Diet cola containing Acesulfame K; b) Soft drink spiked with 60 ppm of artificial sweeteners.
91 / Pickering Laboratories Method Abstracts

HPLC Post-Column Derivatization / Method Abstracts
Notes
92Pickering Laboratories Method Abstracts /

HPLC Post-Column Derivatization / Method Abstracts
Notes
93 / Pickering Laboratories Method Abstracts

HPLC Post-Column Derivatization / Method Abstracts
Notes
94Pickering Laboratories Method Abstracts /

Pickering Laboratories, Inc. 1280 Space Park Way / Mountain View, CA 94043
[email protected] / [email protected] / 650-694-6700 / Pickeringlabs.com