
REVISED HMIS INDICATORS - District Public Health Office ...
36
1 Health Management Information System [HMIS] September 2013 REVISED HMIS INDICATORS Government of Nepal Ministry of Health and Population Department of Health Services Management Division
-
Upload
khangminh22 -
Category
Documents
-
view
4 -
download
0
Transcript of REVISED HMIS INDICATORS - District Public Health Office ...

1
HealthManagementInformationSystem[HMIS]
September2013
REVISEDHMISINDICATORS
Government of Nepal
Ministry of Health and Population Department of Health Services
Management Division

2
CONTENTS CONTENTS ...................................................................................................................................................................................................................... 2 FOREWORD .................................................................................................................................................................................................................... 3 ACRONYMS .................................................................................................................................................................................................................... 4 INTRODUCTION .............................................................................................................................................................................................................. 6 1. Safe Motherhood .............................................................................................................................................................................................. 9 2. Family Planning ............................................................................................................................................................................................... 12 3. Female Community Health Volunteers (FCHV) ............................................................................................................................................... 12 4. Primary Health Care Outreach Services .......................................................................................................................................................... 13 5. Immunization .................................................................................................................................................................................................. 13 6. Integrated Management of Childhood Illnesses (IMCI) .................................................................................................................................. 15 7. Nutrition .......................................................................................................................................................................................................... 18 8. HIV/AIDS .......................................................................................................................................................................................................... 20 9. Tuberculosis .................................................................................................................................................................................................... 23 10. Epidemiology and Disease Control ................................................................................................................................................................. 25 11. Leprosy ............................................................................................................................................................................................................ 26 12. Curative Services ............................................................................................................................................................................................. 27 13. Health Facilities ............................................................................................................................................................................................... 29 Annex 1: List of HMIS recording and reporting forms ................................................................................................................................................. 32 Annex 2: NHSP2 logical framework indicators in HMIS ............................................................................................................................................... 33 Annex 3: HMIS indicators disaggregated by caste/ethnicity ....................................................................................................................................... 34 Annex 4: Indicators to be reported annually ............................................................................................................................................................... 34 Annex 5: Malaria high risk districts .............................................................................................................................................................................. 35 Annex 6: Kalaazar high risk districts ............................................................................................................................................................................. 35
DEPARTMENT OF HEALTH SERVICES
Government ofMinistry of Health &
Nepal
Population
Tel. '.4261436'. 42617 12
Fax :4262238
Pachali, TekuKathmandu, Nepal
Ref. No. Date l-,,, u,,.,..,...,...,.,,.,,,,,.,
FOREWORD
Health Management lnformation System (HMIS) is one of the key routine management informationsystems within the Ministry of Health and Population (MoHP). ln an effort to strengthen HMIS, theManagement Division is in the process of implementing a revised system, which will be active across all
75 districts from March/April2}ta (i.e. from the start of the last quarter of the fiscalyear 20t3/L4l.fherevised HMIS will address the information needs of NHSP-ll at policy level as well as the data needs ofvarious programmes. ln the course of the HMIS revision, Management Division, in consultation withprogramme divisions and centers, development partners, academicians and researchers reviewed and
revised the HMIS indicators. The revised indicators are expected to address the needs of Nepal HealthSector Programme-2 (NHSP-2)and specific needs of different programmes.
It gives me immense satisfaction to introduce a booklet, which presents all of the revised indicators that
will be included in the revised HMIS system. This booklet also defines numerator and denominator for
each indicator and shows the HMIS tool number from which the related data originates. I am hopeful
that it will be a useful reference document for the planners, decision makers, programme.managers,
health service providers and researchers.
The review and revision of the indicators along with the concept, design and preparation of the HMIS
booklet was possible with the support from Nepal Health Sector Support Programme (NHSSP). I would
like to thank all of those who contributed to the review and revision of the indicators and the successful
publication of this document.
Dr Bhim Acharya
Director
4
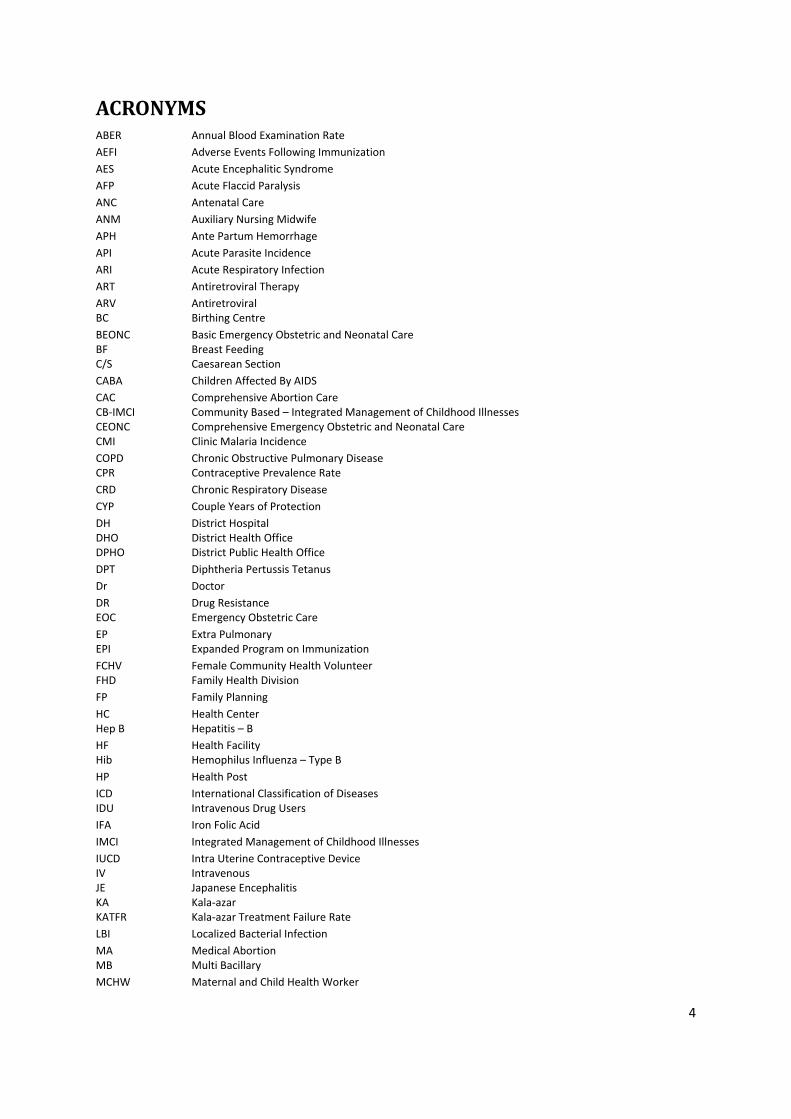
ACRONYMSABER Annual Blood Examination Rate AEFI Adverse Events Following Immunization AES Acute Encephalitic Syndrome AFP Acute Flaccid Paralysis ANC Antenatal Care ANM Auxiliary Nursing Midwife APH Ante Partum Hemorrhage API Acute Parasite Incidence ARI Acute Respiratory Infection ART Antiretroviral Therapy ARV Antiretroviral BC Birthing Centre BEONC Basic Emergency Obstetric and Neonatal Care BF Breast Feeding C/S Caesarean Section CABA Children Affected By AIDS CAC Comprehensive Abortion Care CB‐IMCI Community Based – Integrated Management of Childhood Illnesses CEONC Comprehensive Emergency Obstetric and Neonatal Care CMI Clinic Malaria Incidence COPD Chronic Obstructive Pulmonary Disease CPR Contraceptive Prevalence Rate CRD Chronic Respiratory Disease CYP Couple Years of Protection DH District Hospital DHO District Health Office DPHO District Public Health Office DPT Diphtheria Pertussis Tetanus Dr Doctor DR Drug Resistance EOC Emergency Obstetric Care EP Extra Pulmonary EPI Expanded Program on Immunization FCHV Female Community Health Volunteer FHD Family Health Division FP Family Planning HC Health Center Hep B Hepatitis – B HF Health Facility Hib Hemophilus Influenza – Type B HP Health Post ICD International Classification of Diseases IDU Intravenous Drug Users IFA Iron Folic Acid IMCI Integrated Management of Childhood Illnesses IUCD Intra Uterine Contraceptive Device IV Intravenous JE Japanese Encephalitis KA Kala‐azar KATFR Kala‐azar Treatment Failure Rate LBI Localized Bacterial Infection MA Medical Abortion MB Multi Bacillary MCHW Maternal and Child Health Worker

5
MDR Multi Drug Resistance MNP Micro‐multi Nutrient Powder MSC Matri Surakchya Chhakki MSM Men who have sex with men MVA Manual Vacuum Aspiration MWRA Married Women of Reproductive Age NCASC National Center for AIDS and STDs Control NGO Non‐Governmental Organization NHSP2 LF Nepal Health Sector Programme 2 Logical Framework NHTC National Health Training Center NRH Nutrition Rehabilitation Home NSP Needle and Syringe Programme NT Neonatal Tetanus NTP National Tuberculosis Program OC Outcome OP Output OPD Out‐Patient Department OPV Oral Polio Vaccine ORC Outreach Clinic ORS Oral Rehydration Solution ORS Oral Rehydration Solution OST Opioid Substitution Therapy OTP Outpatient Therapeutic Center PAC Post Abortion Care PAL Practical Approach to Lungs Health PB Pauci Bacillary PCV Pneumococcal Conjugate Vaccine PHC Primary Health Care PHCC Primary Health Care Centre PLHIV People Living with Human Immunodeficiency Virus PMTCT Prevention of Mother‐to‐Child Transmission PNC Postnatal Care PPH Postpartum Hemorrhage PSBI Possible Severe Bacterial Infection PWID People Who Inject Drugs RFT Released From Treatment RHD Regional Health Directorate SAG Sodium Astivo Gluconate SAM Severe Acute Malnutrition SBA Skilled Birth Attendant SHP Sub Health Post SPR Slide Positivity Rate TAD Treatment after Default TAF Treatment after Failure Td Tetanus Diphtheria TT Tetanus Toxoid VHW Village Health Worker VVM Vaccine Vial Monitor WRA Women of Reproductive Age
6
INTRODUCTION The first Nepal Health Sector Programme (NHSP‐1) (2004‐09) envisioned strengthening and integrating routine information systems. In response to this, the Government of Nepal (GoN) initiated the piloting of the health sector information system (HSIS) in three districts. However, the piloting was designed to collect information related to different management information systems in the same tools rather than keeping the systems separate but enabling the data to be linked. As a result, currently two incompatible systems are running simultaneously: HMIS in 72 districts and HSIS in 3 districts. HMIS should be strengthened and continue to function as one system within a linked HSIS, not replaced by HSIS.
Realizing the urgent need to strengthen HMIS in line with original HSIS concept, the Management Information System (MIS) Section, Management Division, Department of Health Services (DoHS), under the guidance of Public Health Administration, Monitoring and Evaluation Division (PHAM&ED) and Policy, Planning and International Cooperation Division (PPICD), Ministry of Health and Population (MoHP), with support from Nepal Health Sector Support Programme (NHSSP), is revising the Health Management Information System (HMIS). The revised HMIS has been designed to:
bring HMIS in line with the HSIS National Strategy, in regards to: enabling selected indicators to be disaggregated by caste/ethnicity revising the reporting process to enable facility level data reporting ensuring they are suited to both public and non‐public facilities
enable reporting on all NHSP‐2 logframe indicators for which HMIS is cited as a data source. This will enable the end of NHSP‐2 to be effectively monitored and help set targets for NHSP‐3.
ensure indicators and tools meet the needs of all programmes (family health, child health, epidemiology and disease control, HIV/AIDS, leprosy, tuberculosis, health laboratory and curative services)
integrate vertical reporting systems (Aama Programme, Emergency Obstetric Care (EOC) monitoring, community based neonatal care programme (CB‐NCP), nutrition, HIV/AIDS and tuberculosis programmes) into HMIS
ensure the reporting process is efficient and effective to minimise the burden on staff and any duplication of work
ensure the same recording and reporting tools and reporting processes are used in all 75 districts
enable electronic data entry at district and hospital level and web‐based reporting to central level
disaggregate 10 selected indicators by caste / ethnicity disaggregate hospital mortality and morbidity data by age, sex and cause make the tools more user‐friendly improve data quality improve use of HMIS data at different levels for monitoring and planning purposes provide evidence to inform strategic and policy level decisions, such as the design of the
forthcoming sectoral plan (NHSP‐3)
7
The following process is being followed for revision of HMIS:
Revision of indicators; recording and reporting forms Field‐testing of the revised HMIS forms and the reporting process Development of DHIS2 Ensure effective IT system is in place nationwide Preparation of comprehensive user guidelines Preparation of standard training modules for use in the training for maintaining uniformity in
all training across the country Conduct master training of trainers (MTOT) and training of trainers (TOT) Train staff involved in data generation and management at all levels of system across 75
districts Printing and supply of revised forms across the country Implementation of revised system across 75 districts simultaneously
Management Division, with support from National Health Training Centre, programme divisions and centers; and development partners will train all staff engaged in data management and implement the revised system from last quarter of the fiscal year 2013/14. This will enable effective monitoring of the end of Nepal Health Sector Programme‐2 (fiscal year 2014/15) and to inform the design of NHSP‐3. The rationale for implementing the revised system from last quarter of the fiscal year 2013/14 is as follows:
The new system will need to start in all 75 districts simultaneously. Each district will need two months for sub‐district level training. We should aim to minimise the gap between training and implementation of the revised
tools/system. To implement from the first month of a new fiscal year, training would need to be
conducted during the last two months of the previous fiscal year. This is not considered a good timing for training, given the staff (both trainers and trainees) workload at this time of year.

8
Training from mid January ‐ mid March 2014 would enable implementation of the revised HMIS to start in all 75 districts simultaneously from the start of the last quarter of that fiscal year.
The revised system generates all of the key indicators included in the existing system so its introduction in the last quarter of the fiscal year would not affect the compilation of the data for that fiscal year.
The first fiscal year with complete data from the revised system would be 2071/72 (2014/15), i.e. still within the NHSP‐2 timeframe.
Structure of the booklet This booklet presents all revised HMIS indicators by programme. It includes 13 sections with a total of 303 indicators. The numerator and denominator for each indicator are defined showing the number of the HMIS form/tool that generates the data. It also explains the level and type of disaggregation available for each indicator. SN Programme No. of indicators 1 Safe Motherhood 38 2 Family Planning 3 3 Female Community Health Volunteer 13 4 Primary Health Care Outreach Services 4 5 Immunization 31 6 Integrated Management of Childhood Illnesses 31 7 Nutrition 25 8 HIV/AIDS 32 9 Tuberculosis 33 10 Epidemiology and Disease Control 21 11 Leprosy 12 12 Curative Services 31 13 Health Facilities 29 Total 303
9
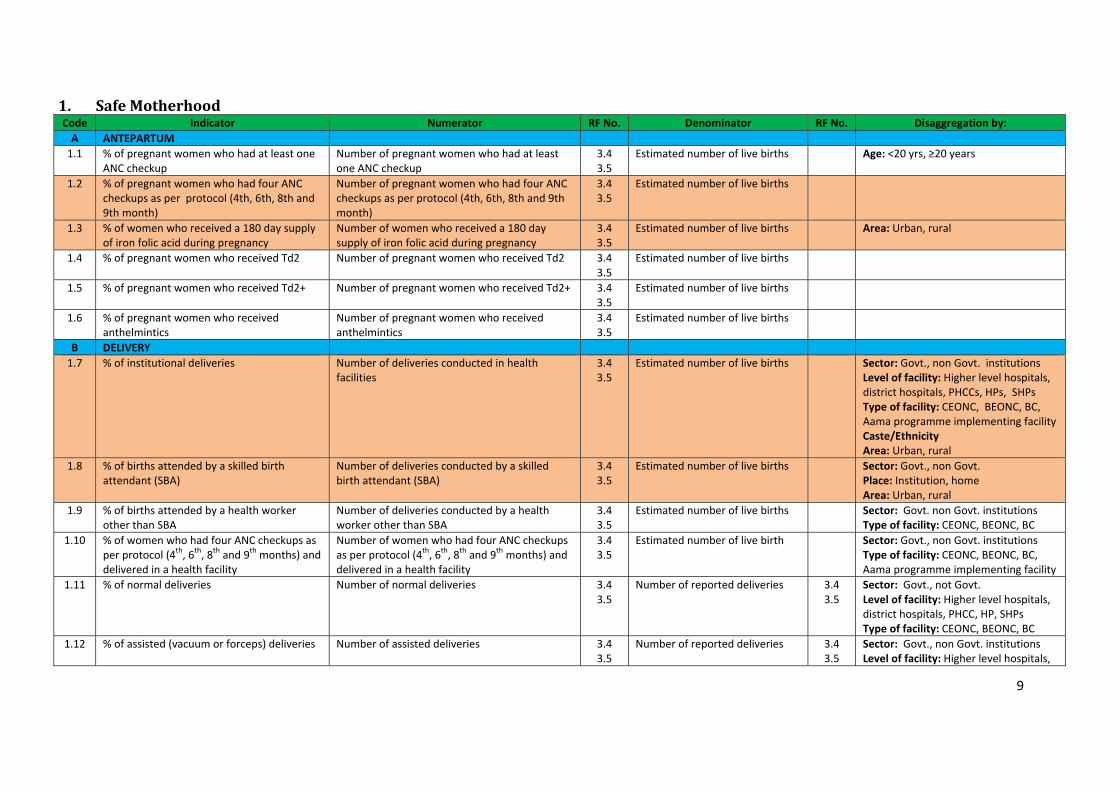
1. SafeMotherhoodCode Indicator Numerator RF No. Denominator RF No. Disaggregation by: A ANTEPARTUM 1.1 % of pregnant women who had at least one
ANC checkup Number of pregnant women who had at least one ANC checkup
3.4 3.5
Estimated number of live births Age: <20 yrs, ≥20 years
1.2 % of pregnant women who had four ANC checkups as per protocol (4th, 6th, 8th and 9th month)
Number of pregnant women who had four ANC checkups as per protocol (4th, 6th, 8th and 9th month)
3.4 3.5
Estimated number of live births
1.3 % of women who received a 180 day supply of iron folic acid during pregnancy
Number of women who received a 180 day supply of iron folic acid during pregnancy
3.4 3.5
Estimated number of live births Area: Urban, rural
1.4 % of pregnant women who received Td2 Number of pregnant women who received Td2 3.4 3.5
Estimated number of live births
1.5 % of pregnant women who received Td2+ Number of pregnant women who received Td2+ 3.4 3.5
Estimated number of live births
1.6 % of pregnant women who received anthelmintics
Number of pregnant women who received anthelmintics
3.4 3.5
Estimated number of live births
B DELIVERY 1.7 % of institutional deliveries Number of deliveries conducted in health
facilities 3.4 3.5
Estimated number of live births Sector: Govt., non Govt. institutions Level of facility: Higher level hospitals, district hospitals, PHCCs, HPs, SHPs Type of facility: CEONC, BEONC, BC, Aama programme implementing facility Caste/Ethnicity Area: Urban, rural
1.8 % of births attended by a skilled birth attendant (SBA)
Number of deliveries conducted by a skilled birth attendant (SBA)
3.4 3.5
Estimated number of live births Sector: Govt., non Govt. Place: Institution, home Area: Urban, rural
1.9 % of births attended by a health worker other than SBA
Number of deliveries conducted by a health worker other than SBA
3.4 3.5
Estimated number of live births Sector: Govt. non Govt. institutions Type of facility: CEONC, BEONC, BC
1.10 % of women who had four ANC checkups as per protocol (4th, 6th, 8th and 9th months) and delivered in a health facility
Number of women who had four ANC checkups as per protocol (4th, 6th, 8th and 9th months) and delivered in a health facility
3.4 3.5
Estimated number of live birth Sector: Govt., non Govt. institutions Type of facility: CEONC, BEONC, BC, Aama programme implementing facility
1.11 % of normal deliveries Number of normal deliveries 3.4 3.5
Number of reported deliveries 3.4 3.5
Sector: Govt., not Govt. Level of facility: Higher level hospitals, district hospitals, PHCC, HP, SHPs Type of facility: CEONC, BEONC, BC
1.12 % of assisted (vacuum or forceps) deliveries Number of assisted deliveries 3.4 3.5
Number of reported deliveries 3.4 3.5
Sector: Govt., non Govt. institutions Level of facility: Higher level hospitals,

10
Code Indicator Numerator RF No. Denominator RF No. Disaggregation by: district hospitals, PHCC, HP, SHPs Type: CEONC, BEONC, BC
1.13 % of deliveries by caesarean section Number of caesarean section deliveries 3.4 3.5
Number of deliveries 3.4 3.5
Sector: Govt. non‐Govt institutions Type: Higher level government hospitals, district hospitals
C POSTPARTUM 1.14 % of postpartum women who received a
PNC checkup within 24 hours of delivery Number of postpartum women who received a PNC checkup within 24 hours of delivery
3.4 3.5
Estimated number of live births
1.15 % of women who had three postnatal check‐ups as per protocol (1st within 24 hours, 2nd within 72 hours and 3rd within 7 days of delivery)
Number of postpartum women who received three PNC checkups as per protocol (within 24 hours, on 3rd day and 7th day)
3.4 3.5
Estimated number of live births
1.16 % of postpartum women who received a 45 day supply of iron folic acid (IFA)
Number of postpartum women who received a 45 day supply of IFA
3.4 Estimated number of live births
1.17 % of postpartum women who received Vitamin A supplementation
Number of postpartum women who received Vitamin A supplementation
3.4 Estimated number of live births
D MATERNAL COMPLICATIONS 1.18 Met need for emergency obstetric care
[% of women with a direct obstetric complication who were treated at a EONC (basic or comprehensive) site]
Number of women with a direct obstetric complication who were treated in a EONC (basic or comprehensive) site
3.4 3.5
Estimated number of women with a direct obstetric complication (15% of estimated number of live birth)
Level of facility: Higher level hospitals, district hospitals, PHCC, HP, SHPs Type of facility: CEOC, BEOC, BC
1.19 Number of women treated for haemorrhage 3.4 3.5
Type: APH, PPH Blood: With and without blood transfusion Level of facility: Higher level hospitals, district hospitals, PHCC, HP, SHPs
1.20 Number of women treated for ectopic pregnancy
3.4 3.5
1.21 Number of women treated for prolonged/ obstructed labor
3.4 3.5
1.22 Number of women treated for ruptured uterus
3.4 3.5
1.23 Number of women treated for pre‐eclampsia 3.4 3.5
1.24 Number of women treated for eclampsia 3.4 3.5
1.25 Number of women treated for retained 3.4 Method: MRP
11
Code Indicator Numerator RF No. Denominator RF No. Disaggregation by: placenta 3.5
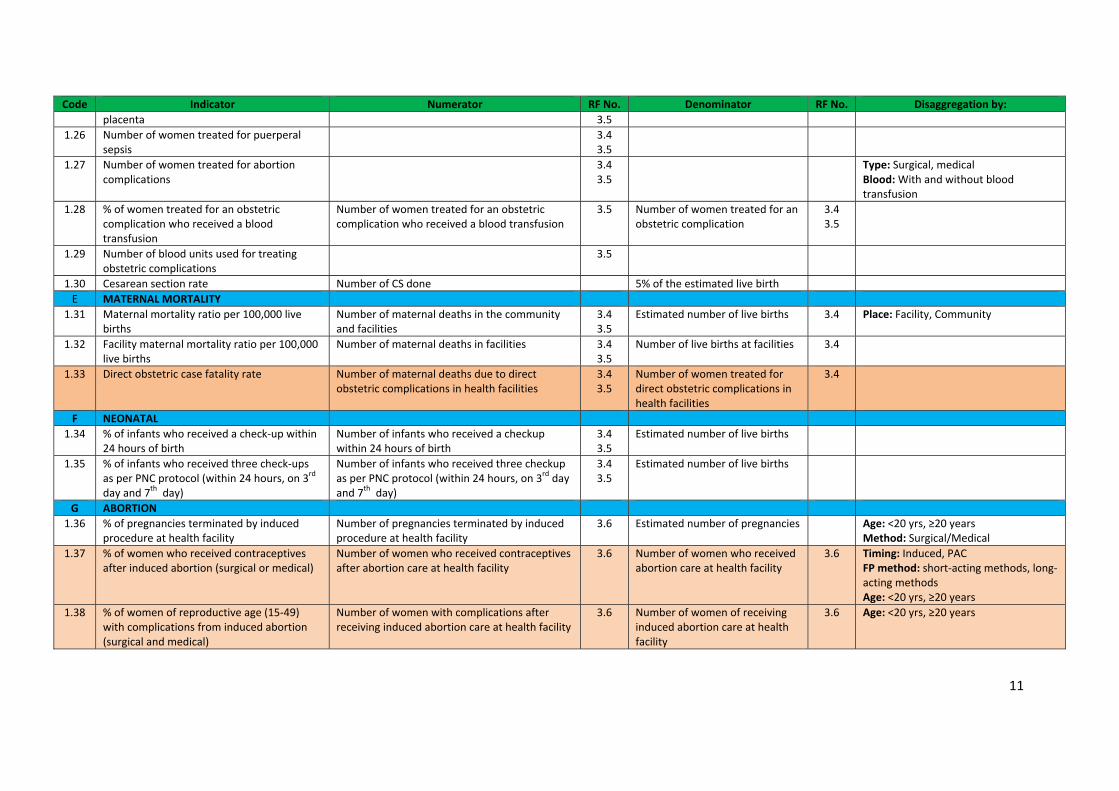
1.26 Number of women treated for puerperal sepsis
3.4 3.5
1.27 Number of women treated for abortion complications
3.4 3.5
Type: Surgical, medical Blood: With and without blood transfusion
1.28 % of women treated for an obstetric complication who received a blood transfusion
Number of women treated for an obstetric complication who received a blood transfusion
3.5 Number of women treated for an obstetric complication
3.4 3.5
1.29 Number of blood units used for treating obstetric complications
3.5
1.30 Cesarean section rate Number of CS done 5% of the estimated live birth E MATERNAL MORTALITY
1.31 Maternal mortality ratio per 100,000 live births
Number of maternal deaths in the community and facilities
3.4 3.5
Estimated number of live births 3.4 Place: Facility, Community
1.32 Facility maternal mortality ratio per 100,000 live births
Number of maternal deaths in facilities 3.4 3.5
Number of live births at facilities 3.4
1.33 Direct obstetric case fatality rate Number of maternal deaths due to direct obstetric complications in health facilities
3.4 3.5
Number of women treated for direct obstetric complications in health facilities
3.4
F NEONATAL 1.34 % of infants who received a check‐up within
24 hours of birth Number of infants who received a checkup within 24 hours of birth
3.4 3.5
Estimated number of live births
1.35 % of infants who received three check‐ups as per PNC protocol (within 24 hours, on 3rd day and 7th day)
Number of infants who received three checkup as per PNC protocol (within 24 hours, on 3rd day and 7th day)
3.4 3.5
Estimated number of live births
G ABORTION 1.36 % of pregnancies terminated by induced
procedure at health facility Number of pregnancies terminated by induced procedure at health facility
3.6 Estimated number of pregnancies Age: <20 yrs, ≥20 years Method: Surgical/Medical
1.37 % of women who received contraceptives after induced abortion (surgical or medical)
Number of women who received contraceptives after abortion care at health facility
3.6 Number of women who received abortion care at health facility
3.6 Timing: Induced, PAC FP method: short‐acting methods, long‐acting methods Age: <20 yrs, ≥20 years
1.38 % of women of reproductive age (15‐49) with complications from induced abortion (surgical and medical)
Number of women with complications after receiving induced abortion care at health facility
3.6 Number of women of receiving induced abortion care at health facility
3.6 Age: <20 yrs, ≥20 years
12
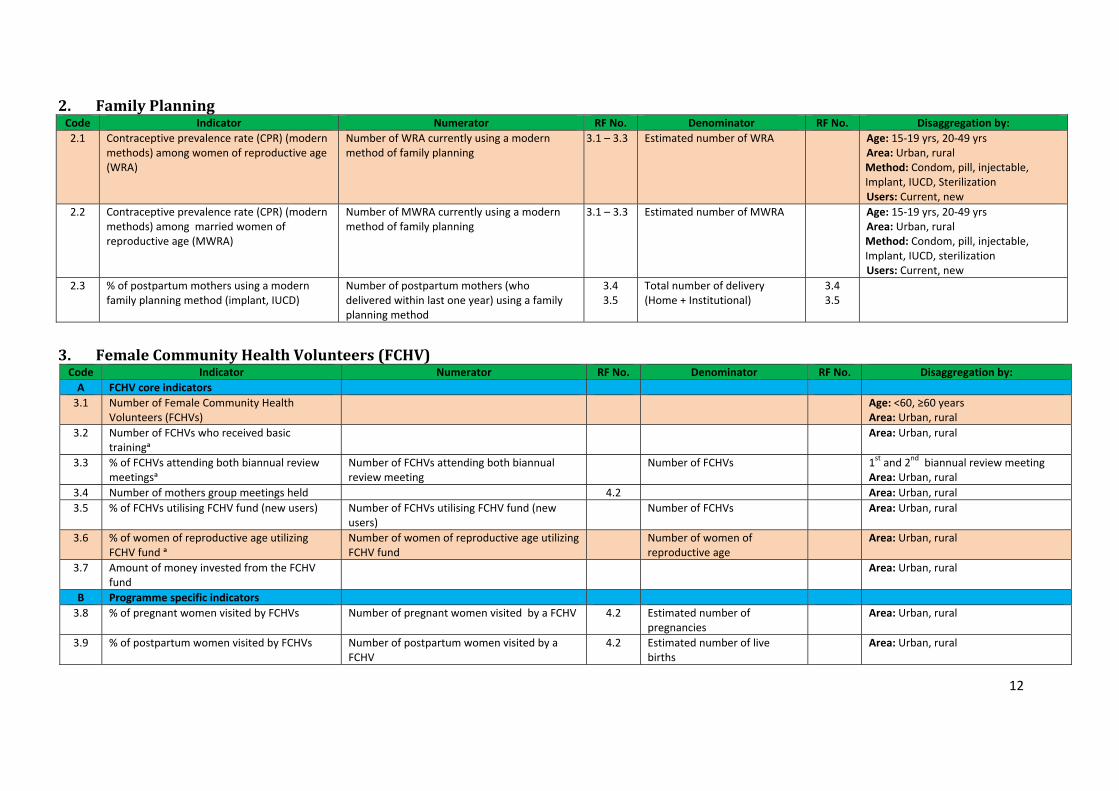
2. FamilyPlanning
3. FemaleCommunityHealthVolunteers(FCHV)Code Indicator Numerator RF No. Denominator RF No. Disaggregation by: A FCHV core indicators 3.1 Number of Female Community Health
Volunteers (FCHVs) Age: <60, ≥60 years
Area: Urban, rural 3.2 Number of FCHVs who received basic
trainingᵃ Area: Urban, rural
3.3 % of FCHVs attending both biannual review meetingsᵃ
Number of FCHVs attending both biannual review meeting
Number of FCHVs 1st and 2nd biannual review meeting Area: Urban, rural
3.4 Number of mothers group meetings held 4.2 Area: Urban, rural 3.5 % of FCHVs utilising FCHV fund (new users) Number of FCHVs utilising FCHV fund (new
users) Number of FCHVs Area: Urban, rural
3.6 % of women of reproductive age utilizing FCHV fund ᵃ
Number of women of reproductive age utilizing FCHV fund
Number of women of reproductive age
Area: Urban, rural
3.7 Amount of money invested from the FCHV fund
Area: Urban, rural
B Programme specific indicators 3.8 % of pregnant women visited by FCHVs Number of pregnant women visited by a FCHV 4.2 Estimated number of
pregnancies Area: Urban, rural
3.9 % of postpartum women visited by FCHVs Number of postpartum women visited by a FCHV
4.2 Estimated number of live births
Area: Urban, rural
Code Indicator Numerator RF No. Denominator RF No. Disaggregation by: 2.1 Contraceptive prevalence rate (CPR) (modern
methods) among women of reproductive age (WRA)
Number of WRA currently using a modern method of family planning
3.1 – 3.3
Estimated number of WRA Age: 15‐19 yrs, 20‐49 yrs Area: Urban, rural Method: Condom, pill, injectable, Implant, IUCD, Sterilization Users: Current, new
2.2 Contraceptive prevalence rate (CPR) (modern methods) among married women of reproductive age (MWRA)
Number of MWRA currently using a modern method of family planning
3.1 – 3.3
Estimated number of MWRA Age: 15‐19 yrs, 20‐49 yrs Area: Urban, rural Method: Condom, pill, injectable, Implant, IUCD, sterilization Users: Current, new
2.3 % of postpartum mothers using a modern family planning method (implant, IUCD)
Number of postpartum mothers (who delivered within last one year) using a family planning method
3.4 3.5
Total number of delivery (Home + Institutional)
3.4 3.5
13
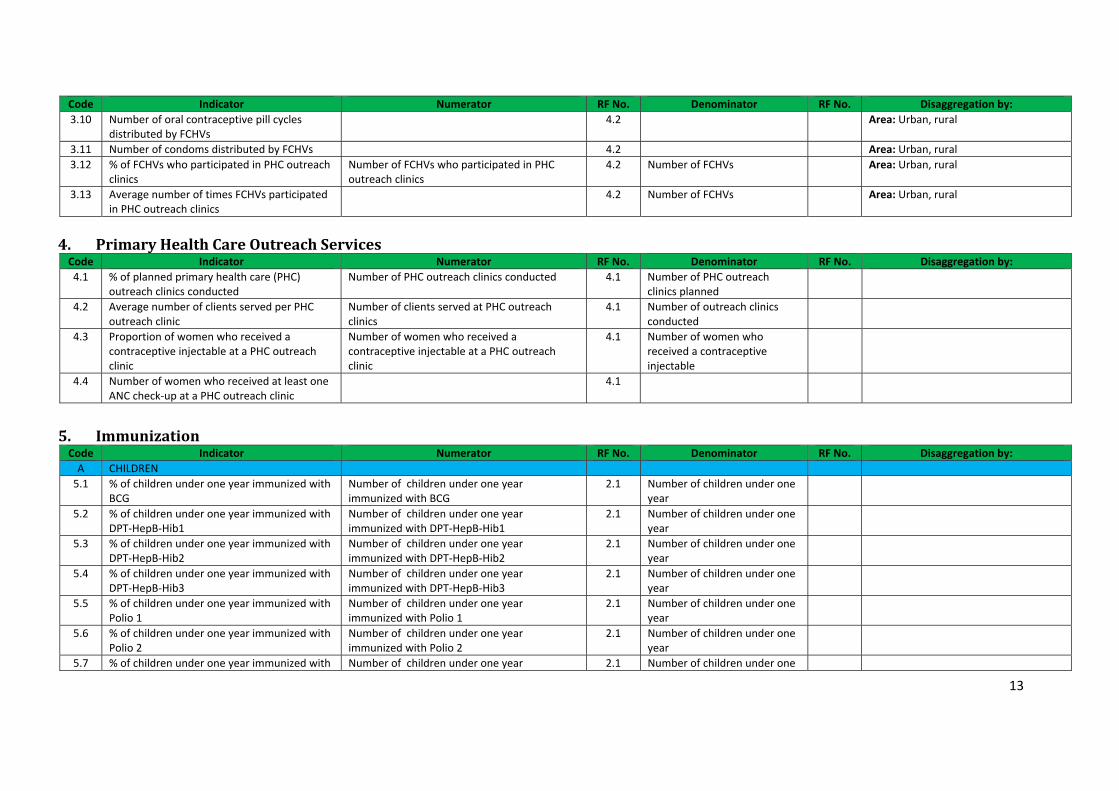
Code Indicator Numerator RF No. Denominator RF No. Disaggregation by: 3.10 Number of oral contraceptive pill cycles
distributed by FCHVs 4.2 Area: Urban, rural
3.11 Number of condoms distributed by FCHVs 4.2 Area: Urban, rural3.12 % of FCHVs who participated in PHC outreach
clinics Number of FCHVs who participated in PHC outreach clinics
4.2 Number of FCHVs Area: Urban, rural
3.13 Average number of times FCHVs participated in PHC outreach clinics
4.2 Number of FCHVs Area: Urban, rural
4. PrimaryHealthCareOutreachServicesCode Indicator Numerator RF No. Denominator RF No. Disaggregation by: 4.1 % of planned primary health care (PHC)
outreach clinics conducted Number of PHC outreach clinics conducted 4.1 Number of PHC outreach
clinics planned
4.2 Average number of clients served per PHC outreach clinic
Number of clients served at PHC outreach clinics
4.1 Number of outreach clinics conducted
4.3 Proportion of women who received a contraceptive injectable at a PHC outreach clinic
Number of women who received a contraceptive injectable at a PHC outreach clinic
4.1 Number of women who received a contraceptive injectable
4.4 Number of women who received at least one ANC check‐up at a PHC outreach clinic
4.1
5. ImmunizationCode Indicator Numerator RF No. Denominator RF No. Disaggregation by: A CHILDREN 5.1 % of children under one year immunized with
BCG Number of children under one year immunized with BCG
2.1 Number of children under one year
5.2 % of children under one year immunized with DPT‐HepB‐Hib1
Number of children under one year immunized with DPT‐HepB‐Hib1
2.1 Number of children under one year
5.3 % of children under one year immunized with DPT‐HepB‐Hib2
Number of children under one year immunized with DPT‐HepB‐Hib2
2.1 Number of children under one year
5.4 % of children under one year immunized with DPT‐HepB‐Hib3
Number of children under one year immunized with DPT‐HepB‐Hib3
2.1 Number of children under one year
5.5 % of children under one year immunized with Polio 1
Number of children under one year immunized with Polio 1
2.1 Number of children under one year
5.6 % of children under one year immunized with Polio 2
Number of children under one year immunized with Polio 2
2.1 Number of children under one year
5.7 % of children under one year immunized with Number of children under one year 2.1 Number of children under one
14
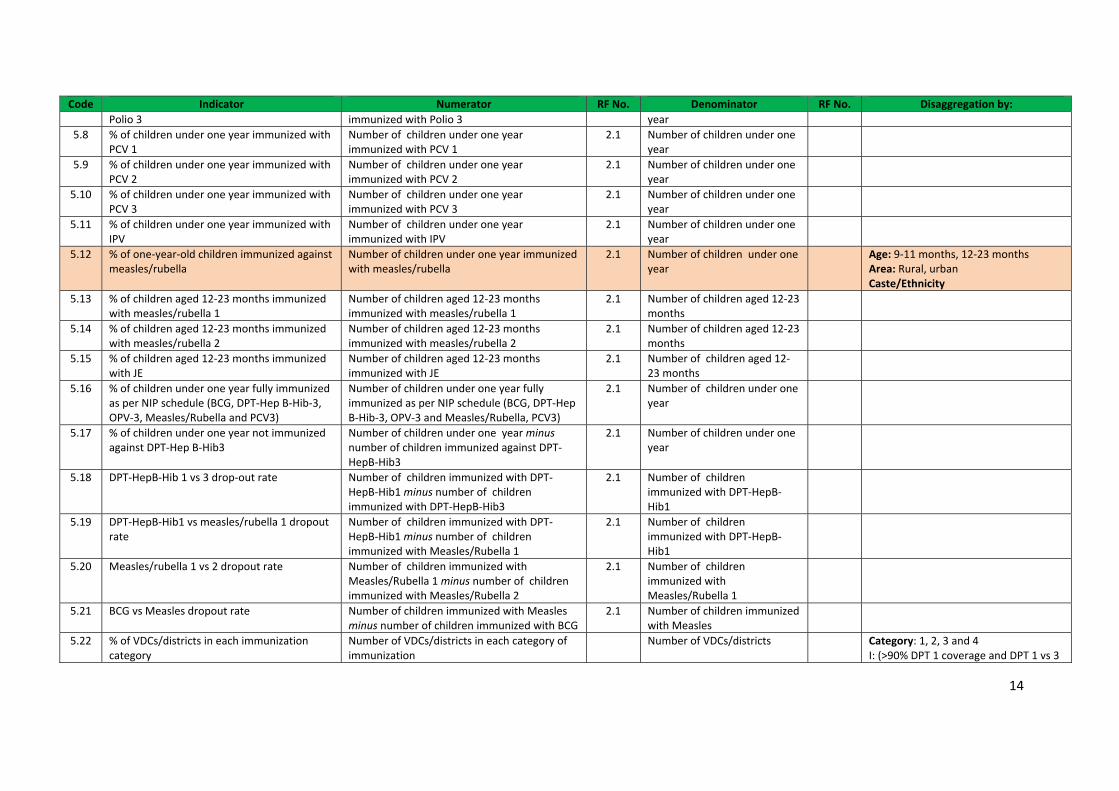
Code Indicator Numerator RF No. Denominator RF No. Disaggregation by: Polio 3 immunized with Polio 3 year
5.8 % of children under one year immunized with PCV 1
Number of children under one year immunized with PCV 1
2.1 Number of children under one year
5.9 % of children under one year immunized with PCV 2
Number of children under one year immunized with PCV 2
2.1 Number of children under one year
5.10 % of children under one year immunized with PCV 3
Number of children under one year immunized with PCV 3
2.1 Number of children under one year
5.11 % of children under one year immunized with IPV
Number of children under one year immunized with IPV
2.1 Number of children under one year
5.12 % of one‐year‐old children immunized against measles/rubella
Number of children under one year immunized with measles/rubella
2.1 Number of children under one year
Age: 9‐11 months, 12‐23 months Area: Rural, urban Caste/Ethnicity
5.13 % of children aged 12‐23 months immunized with measles/rubella 1
Number of children aged 12‐23 months immunized with measles/rubella 1
2.1 Number of children aged 12‐23 months
5.14 % of children aged 12‐23 months immunized with measles/rubella 2
Number of children aged 12‐23 months immunized with measles/rubella 2
2.1 Number of children aged 12‐23 months
5.15 % of children aged 12‐23 months immunized with JE
Number of children aged 12‐23 months immunized with JE
2.1 Number of children aged 12‐23 months
5.16 % of children under one year fully immunized as per NIP schedule (BCG, DPT‐Hep B‐Hib‐3, OPV‐3, Measles/Rubella and PCV3)
Number of children under one year fully immunized as per NIP schedule (BCG, DPT‐Hep B‐Hib‐3, OPV‐3 and Measles/Rubella, PCV3)
2.1 Number of children under one year
5.17 % of children under one year not immunized against DPT‐Hep B‐Hib3
Number of children under one year minus number of children immunized against DPT‐HepB‐Hib3
2.1 Number of children under one year
5.18 DPT‐HepB‐Hib 1 vs 3 drop‐out rate Number of children immunized with DPT‐HepB‐Hib1 minus number of children immunized with DPT‐HepB‐Hib3
2.1 Number of children immunized with DPT‐HepB‐Hib1
5.19 DPT‐HepB‐Hib1 vs measles/rubella 1 dropout rate
Number of children immunized with DPT‐HepB‐Hib1 minus number of children immunized with Measles/Rubella 1
2.1 Number of children immunized with DPT‐HepB‐Hib1
5.20 Measles/rubella 1 vs 2 dropout rate Number of children immunized with Measles/Rubella 1 minus number of children immunized with Measles/Rubella 2
2.1 Number of children immunized with Measles/Rubella 1
5.21 BCG vs Measles dropout rate Number of children immunized with Measles minus number of children immunized with BCG
2.1 Number of children immunized with Measles
5.22 % of VDCs/districts in each immunization category
Number of VDCs/districts in each category of immunization
Number of VDCs/districts Category: 1, 2, 3 and 4 I: (>90% DPT 1 coverage and DPT 1 vs 3
15
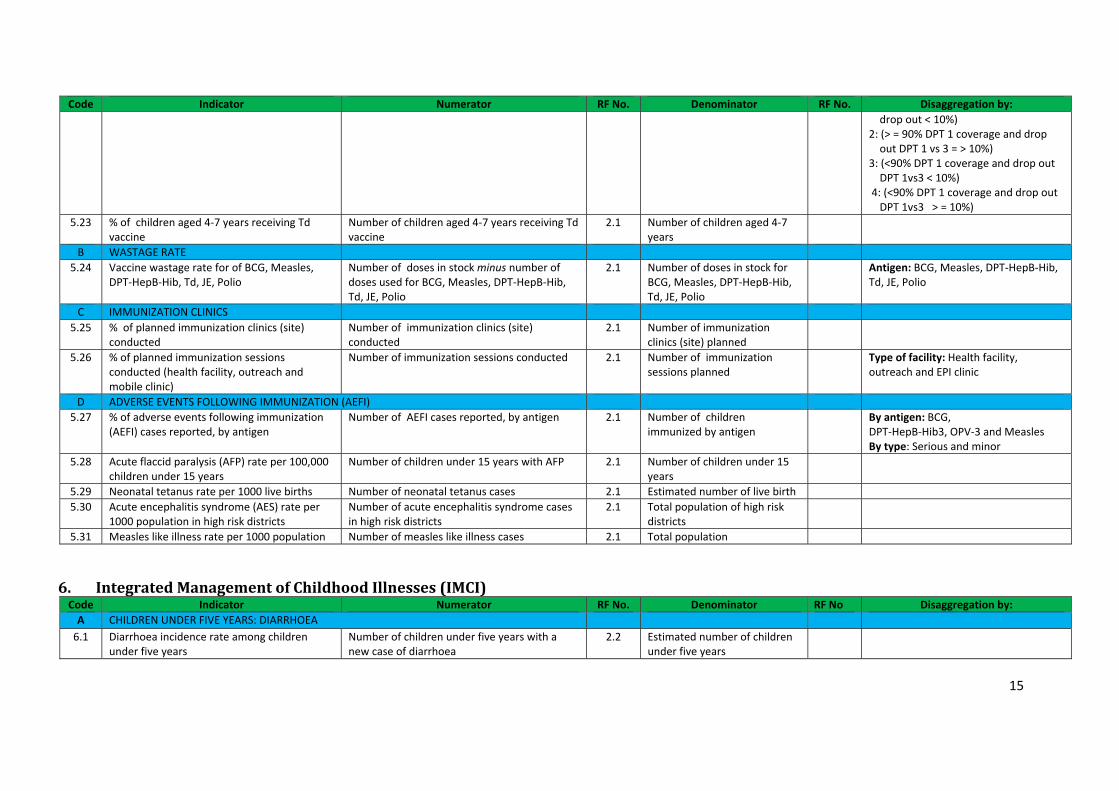
Code Indicator Numerator RF No. Denominator RF No. Disaggregation by: drop out < 10%)
2: (> = 90% DPT 1 coverage and drop out DPT 1 vs 3 = > 10%)
3: (<90% DPT 1 coverage and drop out DPT 1vs3 < 10%)
4: (<90% DPT 1 coverage and drop out DPT 1vs3 > = 10%)
5.23 % of children aged 4‐7 years receiving Td vaccine
Number of children aged 4‐7 years receiving Td vaccine
2.1 Number of children aged 4‐7 years
B WASTAGE RATE 5.24 Vaccine wastage rate for of BCG, Measles,
DPT‐HepB‐Hib, Td, JE, Polio Number of doses in stock minus number of doses used for BCG, Measles, DPT‐HepB‐Hib, Td, JE, Polio
2.1 Number of doses in stock for BCG, Measles, DPT‐HepB‐Hib, Td, JE, Polio
Antigen: BCG, Measles, DPT‐HepB‐Hib, Td, JE, Polio
C IMMUNIZATION CLINICS 5.25 % of planned immunization clinics (site)
conducted Number of immunization clinics (site) conducted
2.1 Number of immunization clinics (site) planned
5.26 % of planned immunization sessions conducted (health facility, outreach and mobile clinic)
Number of immunization sessions conducted 2.1 Number of immunization sessions planned
Type of facility: Health facility, outreach and EPI clinic
D ADVERSE EVENTS FOLLOWING IMMUNIZATION (AEFI) 5.27 % of adverse events following immunization
(AEFI) cases reported, by antigen Number of AEFI cases reported, by antigen 2.1 Number of children
immunized by antigen By antigen: BCG,
DPT‐HepB‐Hib3, OPV‐3 and Measles By type: Serious and minor
5.28 Acute flaccid paralysis (AFP) rate per 100,000 children under 15 years
Number of children under 15 years with AFP 2.1 Number of children under 15 years
5.29 Neonatal tetanus rate per 1000 live births Number of neonatal tetanus cases 2.1 Estimated number of live birth 5.30 Acute encephalitis syndrome (AES) rate per
1000 population in high risk districts Number of acute encephalitis syndrome cases in high risk districts
2.1 Total population of high risk districts
5.31 Measles like illness rate per 1000 population Number of measles like illness cases 2.1 Total population
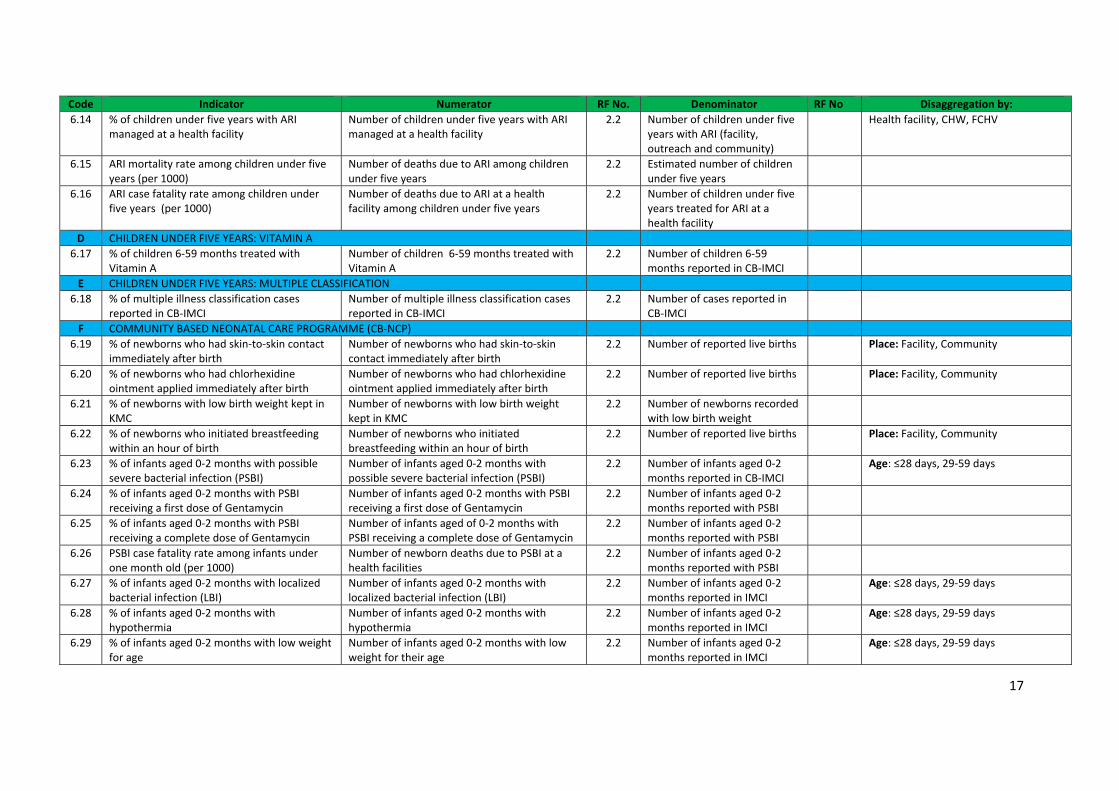
6. IntegratedManagementofChildhoodIllnesses(IMCI)Code Indicator Numerator RF No. Denominator RF No Disaggregation by: A CHILDREN UNDER FIVE YEARS: DIARRHOEA 6.1 Diarrhoea incidence rate among children
under five years Number of children under five years with a new case of diarrhoea
2.2 Estimated number of children under five years
16
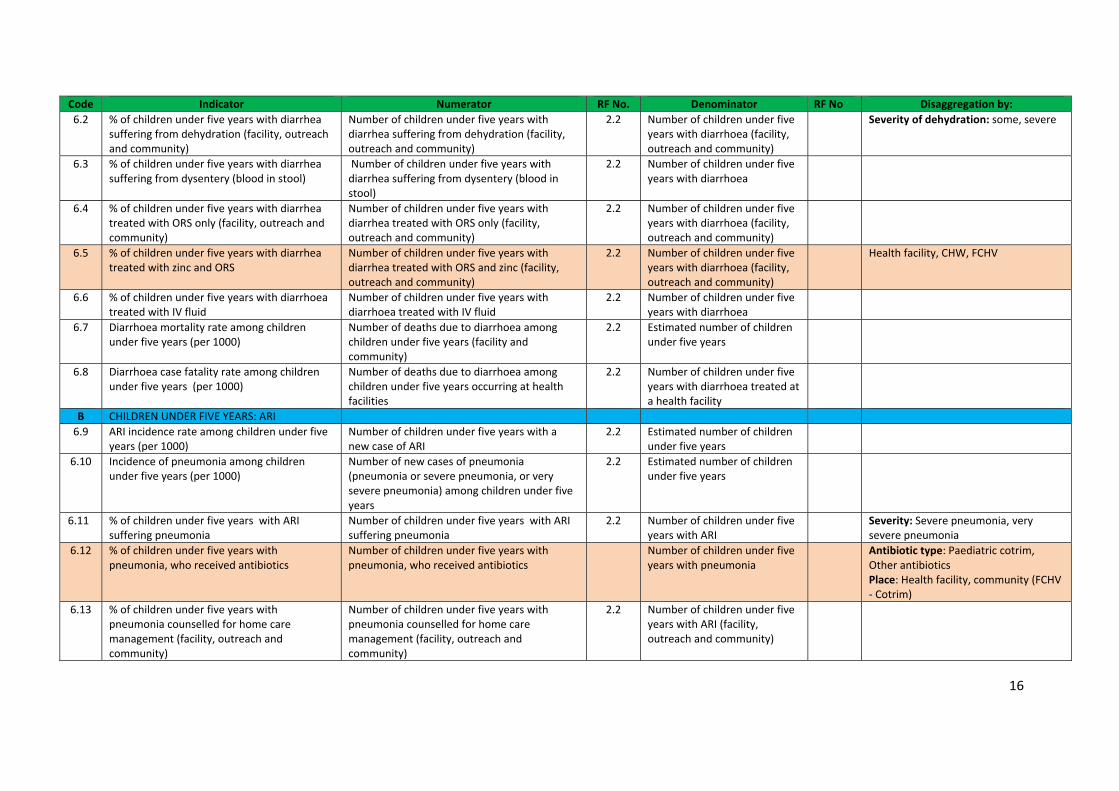
Code Indicator Numerator RF No. Denominator RF No Disaggregation by: 6.2 % of children under five years with diarrhea
suffering from dehydration (facility, outreach and community)
Number of children under five years with diarrhea suffering from dehydration (facility, outreach and community)
2.2 Number of children under five years with diarrhoea (facility, outreach and community)
Severity of dehydration: some, severe
6.3 % of children under five years with diarrhea suffering from dysentery (blood in stool)
Number of children under five years with diarrhea suffering from dysentery (blood in stool)
2.2 Number of children under five years with diarrhoea
6.4 % of children under five years with diarrhea treated with ORS only (facility, outreach and community)
Number of children under five years with diarrhea treated with ORS only (facility, outreach and community)
2.2 Number of children under five years with diarrhoea (facility, outreach and community)
6.5 % of children under five years with diarrhea treated with zinc and ORS
Number of children under five years with diarrhea treated with ORS and zinc (facility, outreach and community)
2.2 Number of children under five years with diarrhoea (facility, outreach and community)
Health facility, CHW, FCHV
6.6 % of children under five years with diarrhoea treated with IV fluid
Number of children under five years with diarrhoea treated with IV fluid
2.2 Number of children under five years with diarrhoea
6.7 Diarrhoea mortality rate among children under five years (per 1000)
Number of deaths due to diarrhoea among children under five years (facility and community)
2.2 Estimated number of children under five years
6.8 Diarrhoea case fatality rate among children under five years (per 1000)
Number of deaths due to diarrhoea among children under five years occurring at health facilities
2.2 Number of children under five years with diarrhoea treated at a health facility
B CHILDREN UNDER FIVE YEARS: ARI 6.9 ARI incidence rate among children under five
years (per 1000) Number of children under five years with a new case of ARI
2.2 Estimated number of children under five years
6.10 Incidence of pneumonia among children under five years (per 1000)
Number of new cases of pneumonia (pneumonia or severe pneumonia, or very severe pneumonia) among children under five years
2.2 Estimated number of children under five years
6.11 % of children under five years with ARI suffering pneumonia
Number of children under five years with ARI suffering pneumonia
2.2 Number of children under five years with ARI
Severity: Severe pneumonia, very severe pneumonia
6.12 % of children under five years with pneumonia, who received antibiotics
Number of children under five years with pneumonia, who received antibiotics
Number of children under five years with pneumonia
Antibiotic type: Paediatric cotrim, Other antibiotics Place: Health facility, community (FCHV ‐ Cotrim)
6.13 % of children under five years with pneumonia counselled for home care management (facility, outreach and community)
Number of children under five years with pneumonia counselled for home care management (facility, outreach and community)
2.2 Number of children under five years with ARI (facility, outreach and community)
17
Code Indicator Numerator RF No. Denominator RF No Disaggregation by: 6.14 % of children under five years with ARI
managed at a health facility Number of children under five years with ARI managed at a health facility
2.2 Number of children under five years with ARI (facility, outreach and community)
Health facility, CHW, FCHV
6.15 ARI mortality rate among children under five years (per 1000)
Number of deaths due to ARI among children under five years
2.2 Estimated number of children under five years
6.16 ARI case fatality rate among children under five years (per 1000)
Number of deaths due to ARI at a health facility among children under five years
2.2 Number of children under five years treated for ARI at a health facility
D CHILDREN UNDER FIVE YEARS: VITAMIN A 6.17 % of children 6‐59 months treated with
Vitamin A Number of children 6‐59 months treated with Vitamin A
2.2 Number of children 6‐59 months reported in CB‐IMCI
E CHILDREN UNDER FIVE YEARS: MULTIPLE CLASSIFICATION 6.18 % of multiple illness classification cases
reported in CB‐IMCI Number of multiple illness classification cases reported in CB‐IMCI
2.2 Number of cases reported in CB‐IMCI
F COMMUNITY BASED NEONATAL CARE PROGRAMME (CB‐NCP) 6.19 % of newborns who had skin‐to‐skin contact
immediately after birth Number of newborns who had skin‐to‐skin contact immediately after birth
2.2 Number of reported live births Place: Facility, Community
6.20 % of newborns who had chlorhexidine ointment applied immediately after birth
Number of newborns who had chlorhexidine ointment applied immediately after birth
2.2 Number of reported live births Place: Facility, Community
6.21 % of newborns with low birth weight kept in KMC
Number of newborns with low birth weight kept in KMC
2.2 Number of newborns recorded with low birth weight
6.22 % of newborns who initiated breastfeeding within an hour of birth
Number of newborns who initiated breastfeeding within an hour of birth
2.2 Number of reported live births Place: Facility, Community
6.23 % of infants aged 0‐2 months with possible severe bacterial infection (PSBI)
Number of infants aged 0‐2 months with possible severe bacterial infection (PSBI)
2.2 Number of infants aged 0‐2 months reported in CB‐IMCI
Age: ≤28 days, 29‐59 days
6.24 % of infants aged 0‐2 months with PSBI receiving a first dose of Gentamycin
Number of infants aged 0‐2 months with PSBI receiving a first dose of Gentamycin
2.2 Number of infants aged 0‐2 months reported with PSBI
6.25 % of infants aged 0‐2 months with PSBI receiving a complete dose of Gentamycin
Number of infants aged of 0‐2 months with PSBI receiving a complete dose of Gentamycin
2.2 Number of infants aged 0‐2 months reported with PSBI
6.26 PSBI case fatality rate among infants under one month old (per 1000)
Number of newborn deaths due to PSBI at a health facilities
2.2 Number of infants aged 0‐2 months reported with PSBI
6.27 % of infants aged 0‐2 months with localized bacterial infection (LBI)
Number of infants aged 0‐2 months with localized bacterial infection (LBI)
2.2 Number of infants aged 0‐2 months reported in IMCI
Age: ≤28 days, 29‐59 days
6.28 % of infants aged 0‐2 months with hypothermia
Number of infants aged 0‐2 months with hypothermia
2.2 Number of infants aged 0‐2 months reported in IMCI
Age: ≤28 days, 29‐59 days
6.29 % of infants aged 0‐2 months with low weight for age
Number of infants aged 0‐2 months with low weight for their age
2.2 Number of infants aged 0‐2 months reported in IMCI
Age: ≤28 days, 29‐59 days
18
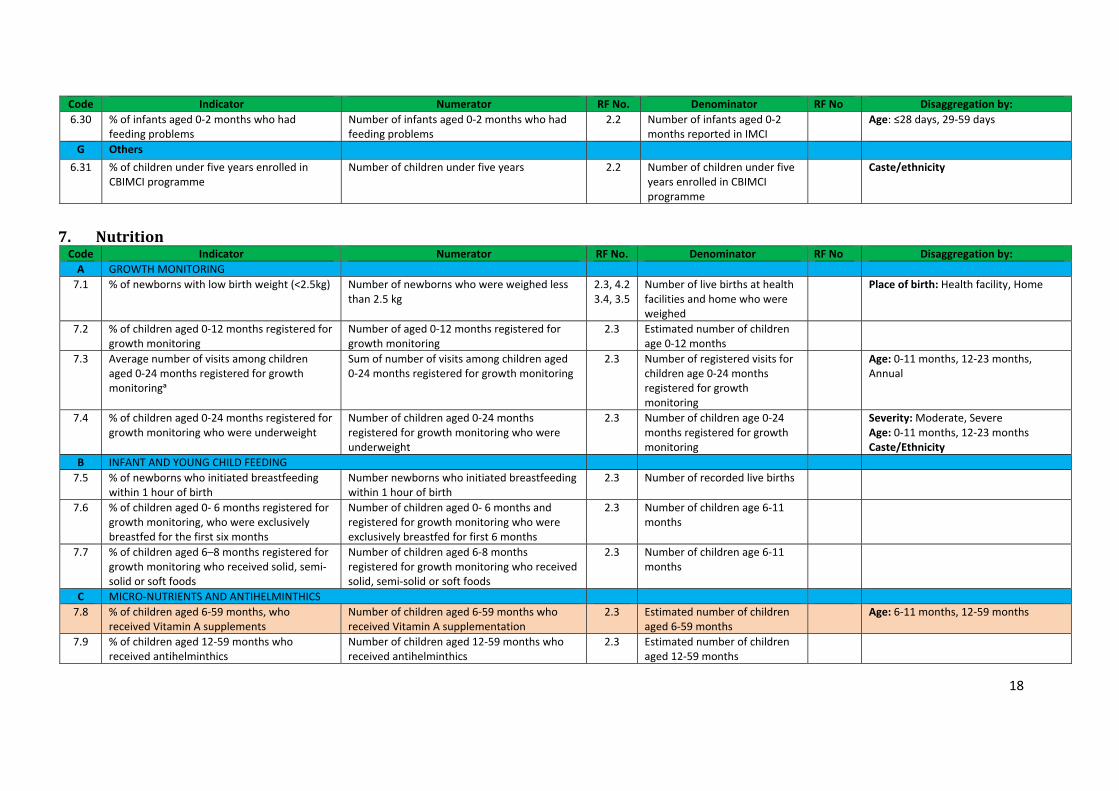
Code Indicator Numerator RF No. Denominator RF No Disaggregation by: 6.30 % of infants aged 0‐2 months who had
feeding problems Number of infants aged 0‐2 months who had feeding problems
2.2 Number of infants aged 0‐2 months reported in IMCI
Age: ≤28 days, 29‐59 days
G Others 6.31 % of children under five years enrolled in
CBIMCI programme Number of children under five years 2.2 Number of children under five
years enrolled in CBIMCI programme
Caste/ethnicity
7. NutritionCode Indicator Numerator RF No. Denominator RF No Disaggregation by: A GROWTH MONITORING 7.1 % of newborns with low birth weight (<2.5kg) Number of newborns who were weighed less
than 2.5 kg 2.3, 4.2 3.4, 3.5
Number of live births at health facilities and home who were weighed
Place of birth: Health facility, Home
7.2 % of children aged 0‐12 months registered for growth monitoring
Number of aged 0‐12 months registered for growth monitoring
2.3 Estimated number of children age 0‐12 months
7.3 Average number of visits among children aged 0‐24 months registered for growth monitoringᵃ
Sum of number of visits among children aged 0‐24 months registered for growth monitoring
2.3 Number of registered visits for children age 0‐24 months registered for growth monitoring
Age: 0‐11 months, 12‐23 months, Annual
7.4 % of children aged 0‐24 months registered for growth monitoring who were underweight
Number of children aged 0‐24 months registered for growth monitoring who were underweight
2.3 Number of children age 0‐24 months registered for growth monitoring
Severity: Moderate, Severe Age: 0‐11 months, 12‐23 months Caste/Ethnicity
B INFANT AND YOUNG CHILD FEEDING 7.5 % of newborns who initiated breastfeeding
within 1 hour of birth Number newborns who initiated breastfeeding within 1 hour of birth
2.3 Number of recorded live births
7.6 % of children aged 0‐ 6 months registered for growth monitoring, who were exclusively breastfed for the first six months
Number of children aged 0‐ 6 months and registered for growth monitoring who were exclusively breastfed for first 6 months
2.3 Number of children age 6‐11 months
7.7 % of children aged 6–8 months registered for growth monitoring who received solid, semi‐solid or soft foods
Number of children aged 6‐8 months registered for growth monitoring who received solid, semi‐solid or soft foods
2.3 Number of children age 6‐11 months
C MICRO‐NUTRIENTS AND ANTIHELMINTHICS 7.8 % of children aged 6‐59 months, who
received Vitamin A supplements Number of children aged 6‐59 months who received Vitamin A supplementation
2.3 Estimated number of children aged 6‐59 months
Age: 6‐11 months, 12‐59 months
7.9 % of children aged 12‐59 months who received antihelminthics
Number of children aged 12‐59 months who received antihelminthics
2.3 Estimated number of children aged 12‐59 months
19
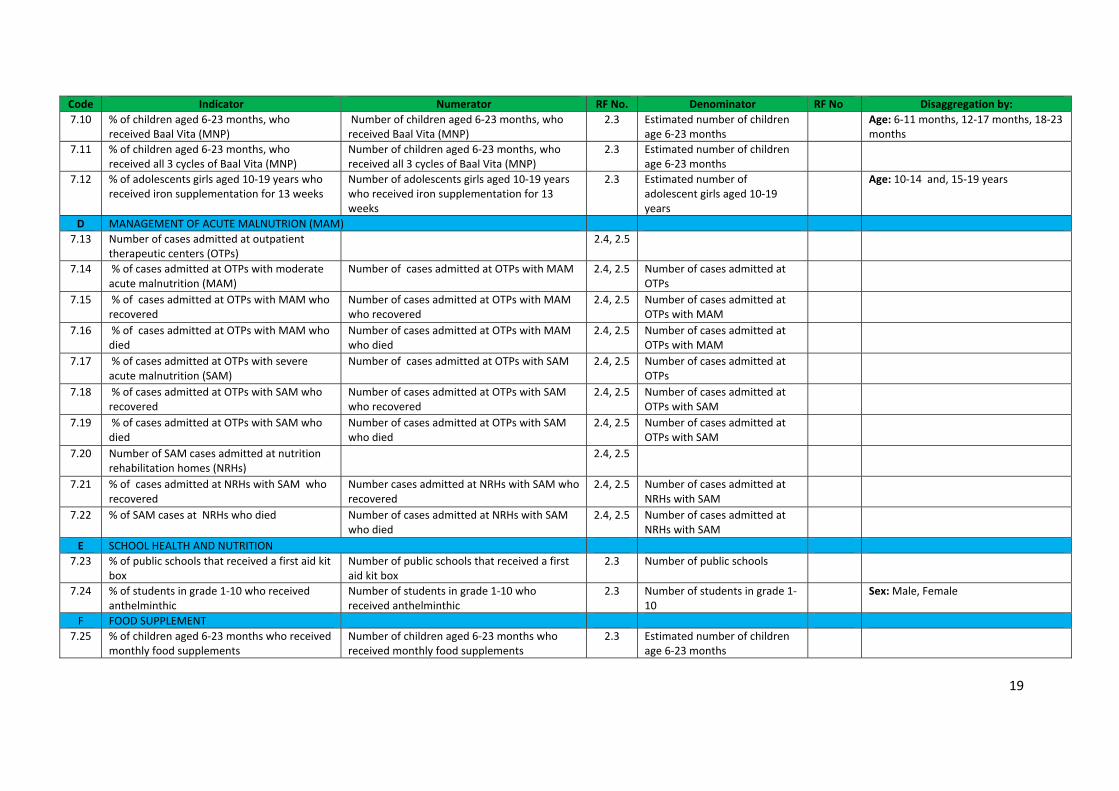
Code Indicator Numerator RF No. Denominator RF No Disaggregation by: 7.10 % of children aged 6‐23 months, who
received Baal Vita (MNP) Number of children aged 6‐23 months, who received Baal Vita (MNP)
2.3 Estimated number of children age 6‐23 months
Age: 6‐11 months, 12‐17 months, 18‐23 months
7.11 % of children aged 6‐23 months, who received all 3 cycles of Baal Vita (MNP)
Number of children aged 6‐23 months, who received all 3 cycles of Baal Vita (MNP)
2.3 Estimated number of children age 6‐23 months
7.12 % of adolescents girls aged 10‐19 years who received iron supplementation for 13 weeks
Number of adolescents girls aged 10‐19 years who received iron supplementation for 13 weeks
2.3 Estimated number of adolescent girls aged 10‐19 years
Age: 10‐14 and, 15‐19 years
D MANAGEMENT OF ACUTE MALNUTRION (MAM) 7.13 Number of cases admitted at outpatient
therapeutic centers (OTPs) 2.4, 2.5
7.14 % of cases admitted at OTPs with moderate acute malnutrition (MAM)
Number of cases admitted at OTPs with MAM 2.4, 2.5 Number of cases admitted at OTPs
7.15 % of cases admitted at OTPs with MAM who recovered
Number of cases admitted at OTPs with MAM who recovered
2.4, 2.5 Number of cases admitted at OTPs with MAM
7.16 % of cases admitted at OTPs with MAM who died
Number of cases admitted at OTPs with MAM who died
2.4, 2.5 Number of cases admitted at OTPs with MAM
7.17 % of cases admitted at OTPs with severe acute malnutrition (SAM)
Number of cases admitted at OTPs with SAM 2.4, 2.5 Number of cases admitted at OTPs
7.18 % of cases admitted at OTPs with SAM who recovered
Number of cases admitted at OTPs with SAM who recovered
2.4, 2.5 Number of cases admitted at OTPs with SAM
7.19 % of cases admitted at OTPs with SAM who died
Number of cases admitted at OTPs with SAM who died
2.4, 2.5 Number of cases admitted at OTPs with SAM
7.20 Number of SAM cases admitted at nutrition rehabilitation homes (NRHs)
2.4, 2.5
7.21 % of cases admitted at NRHs with SAM who recovered
Number cases admitted at NRHs with SAM who recovered
2.4, 2.5 Number of cases admitted at NRHs with SAM
7.22 % of SAM cases at NRHs who died Number of cases admitted at NRHs with SAM who died
2.4, 2.5 Number of cases admitted at NRHs with SAM
E SCHOOL HEALTH AND NUTRITION 7.23 % of public schools that received a first aid kit
box Number of public schools that received a first aid kit box
2.3 Number of public schools
7.24 % of students in grade 1‐10 who received anthelminthic
Number of students in grade 1‐10 who received anthelminthic
2.3 Number of students in grade 1‐10
Sex: Male, Female
F FOOD SUPPLEMENT 7.25 % of children aged 6‐23 months who received
monthly food supplements Number of children aged 6‐23 months who received monthly food supplements
2.3 Estimated number of children age 6‐23 months
20
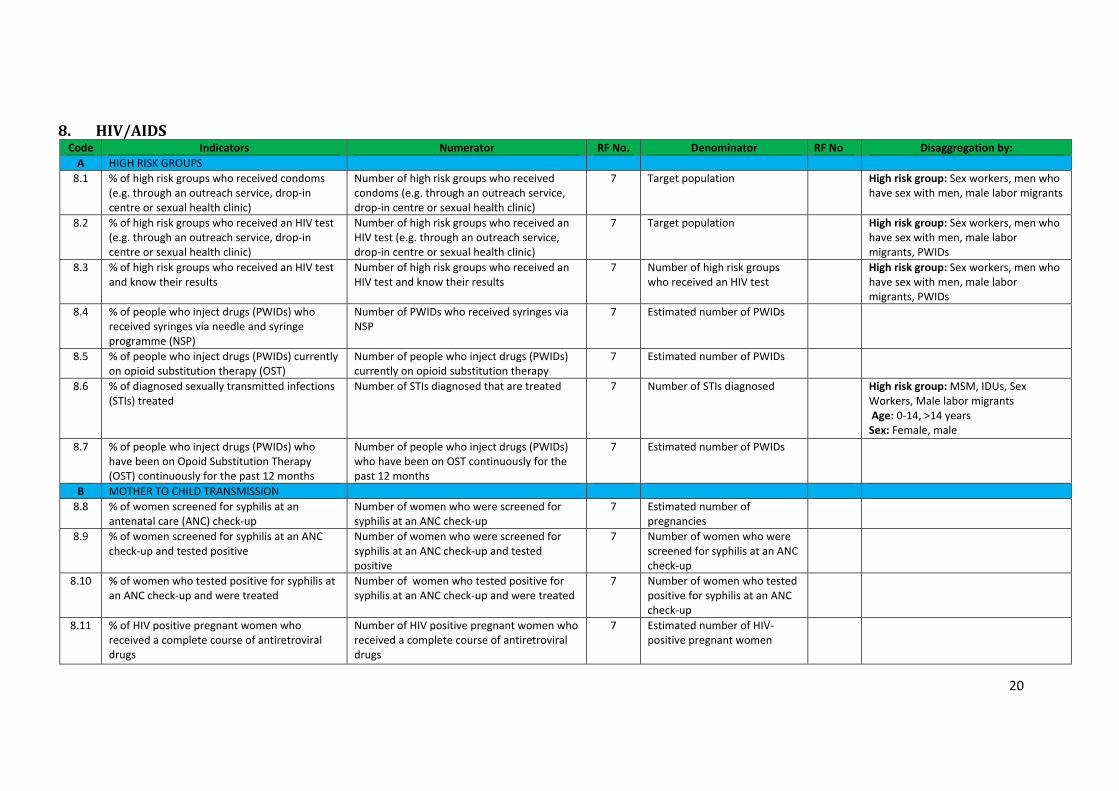
8. HIV/AIDS Code Indicators Numerator RF No. Denominator RF No Disaggregation by: A HIGH RISK GROUPS 8.1 % of high risk groups who received condoms
(e.g. through an outreach service, drop‐in centre or sexual health clinic)
Number of high risk groups who received condoms (e.g. through an outreach service, drop‐in centre or sexual health clinic)
7 Target population High risk group: Sex workers, men who have sex with men, male labor migrants
8.2 % of high risk groups who received an HIV test (e.g. through an outreach service, drop‐in centre or sexual health clinic)
Number of high risk groups who received an HIV test (e.g. through an outreach service, drop‐in centre or sexual health clinic)
7 Target population High risk group: Sex workers, men who have sex with men, male labor migrants, PWIDs
8.3 % of high risk groups who received an HIV test and know their results
Number of high risk groups who received an HIV test and know their results
7 Number of high risk groups who received an HIV test
High risk group: Sex workers, men who have sex with men, male labor migrants, PWIDs
8.4 % of people who inject drugs (PWIDs) who received syringes via needle and syringe programme (NSP)
Number of PWIDs who received syringes via NSP
7 Estimated number of PWIDs
8.5 % of people who inject drugs (PWIDs) currently on opioid substitution therapy (OST)
Number of people who inject drugs (PWIDs) currently on opioid substitution therapy
7 Estimated number of PWIDs
8.6 % of diagnosed sexually transmitted infections (STIs) treated
Number of STIs diagnosed that are treated 7 Number of STIs diagnosed High risk group: MSM, IDUs, Sex Workers, Male labor migrants Age: 0‐14, >14 years Sex: Female, male
8.7 % of people who inject drugs (PWIDs) who have been on Opoid Substitution Therapy (OST) continuously for the past 12 months
Number of people who inject drugs (PWIDs) who have been on OST continuously for the past 12 months
7 Estimated number of PWIDs
B MOTHER TO CHILD TRANSMISSION 8.8 % of women screened for syphilis at an
antenatal care (ANC) check‐up Number of women who were screened for syphilis at an ANC check‐up
7 Estimated number of pregnancies
8.9 % of women screened for syphilis at an ANC check‐up and tested positive
Number of women who were screened for syphilis at an ANC check‐up and tested positive
7 Number of women who were screened for syphilis at an ANC check‐up
8.10 % of women who tested positive for syphilis at an ANC check‐up and were treated
Number of women who tested positive for syphilis at an ANC check‐up and were treated
7 Number of women who tested positive for syphilis at an ANC check‐up
8.11 % of HIV positive pregnant women who received a complete course of antiretroviral drugs
Number of HIV positive pregnant women who received a complete course of antiretroviral drugs
7 Estimated number of HIV‐positive pregnant women
21
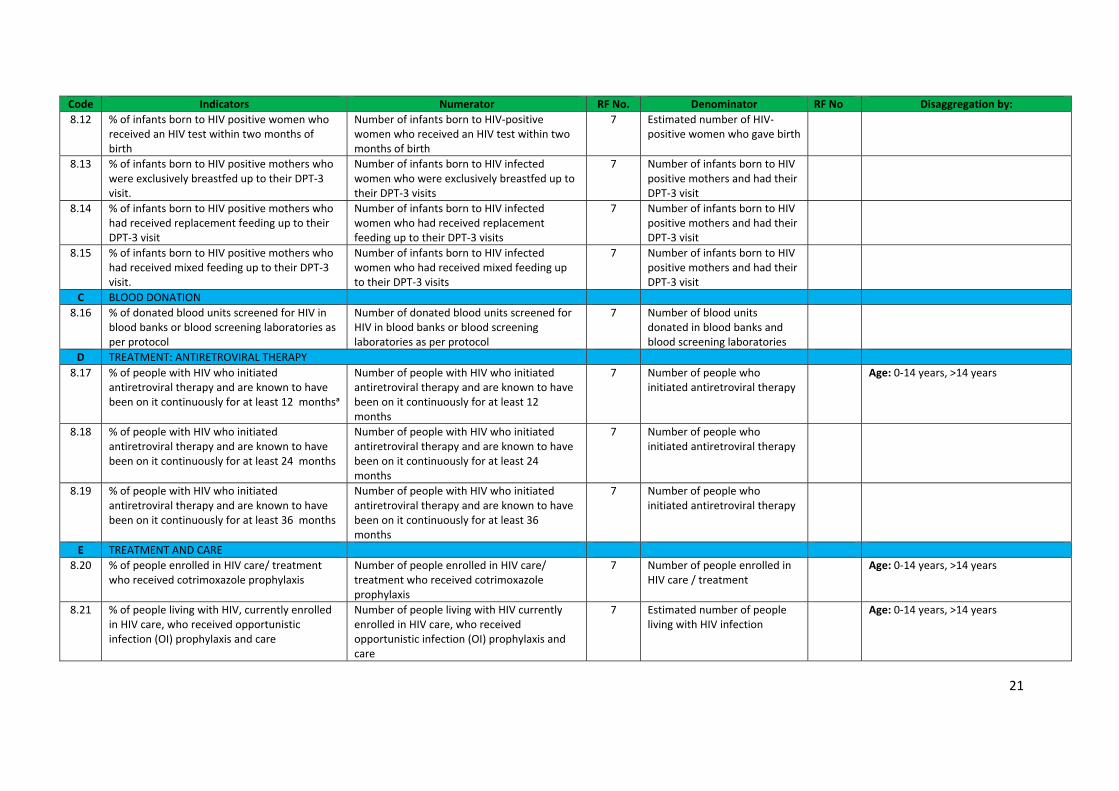
Code Indicators Numerator RF No. Denominator RF No Disaggregation by: 8.12 % of infants born to HIV positive women who
received an HIV test within two months of birth
Number of infants born to HIV‐positive women who received an HIV test within two months of birth
7 Estimated number of HIV‐positive women who gave birth
8.13 % of infants born to HIV positive mothers who were exclusively breastfed up to their DPT‐3 visit.
Number of infants born to HIV infected women who were exclusively breastfed up to their DPT‐3 visits
7 Number of infants born to HIV positive mothers and had their DPT‐3 visit
8.14 % of infants born to HIV positive mothers who had received replacement feeding up to their DPT‐3 visit
Number of infants born to HIV infected women who had received replacement feeding up to their DPT‐3 visits
7 Number of infants born to HIV positive mothers and had their DPT‐3 visit
8.15 % of infants born to HIV positive mothers who had received mixed feeding up to their DPT‐3 visit.
Number of infants born to HIV infected women who had received mixed feeding up to their DPT‐3 visits
7 Number of infants born to HIV positive mothers and had their DPT‐3 visit
C BLOOD DONATION 8.16 % of donated blood units screened for HIV in
blood banks or blood screening laboratories as per protocol
Number of donated blood units screened for HIV in blood banks or blood screening laboratories as per protocol
7 Number of blood units donated in blood banks and blood screening laboratories
D TREATMENT: ANTIRETROVIRAL THERAPY 8.17 % of people with HIV who initiated
antiretroviral therapy and are known to have been on it continuously for at least 12 monthsᵃ
Number of people with HIV who initiated antiretroviral therapy and are known to have been on it continuously for at least 12 months
7 Number of people who initiated antiretroviral therapy
Age: 0‐14 years, >14 years
8.18 % of people with HIV who initiated antiretroviral therapy and are known to have been on it continuously for at least 24 months
Number of people with HIV who initiated antiretroviral therapy and are known to have been on it continuously for at least 24 months
7 Number of people who initiated antiretroviral therapy
8.19 % of people with HIV who initiated antiretroviral therapy and are known to have been on it continuously for at least 36 months
Number of people with HIV who initiated antiretroviral therapy and are known to have been on it continuously for at least 36 months
7 Number of people who initiated antiretroviral therapy
E TREATMENT AND CARE 8.20 % of people enrolled in HIV care/ treatment
who received cotrimoxazole prophylaxis Number of people enrolled in HIV care/ treatment who received cotrimoxazole prophylaxis
7 Number of people enrolled in HIV care / treatment
Age: 0‐14 years, >14 years
8.21 % of people living with HIV, currently enrolled in HIV care, who received opportunistic infection (OI) prophylaxis and care
Number of people living with HIV currently enrolled in HIV care, who received opportunistic infection (OI) prophylaxis and care
7 Estimated number of people living with HIV infection
Age: 0‐14 years, >14 years
22
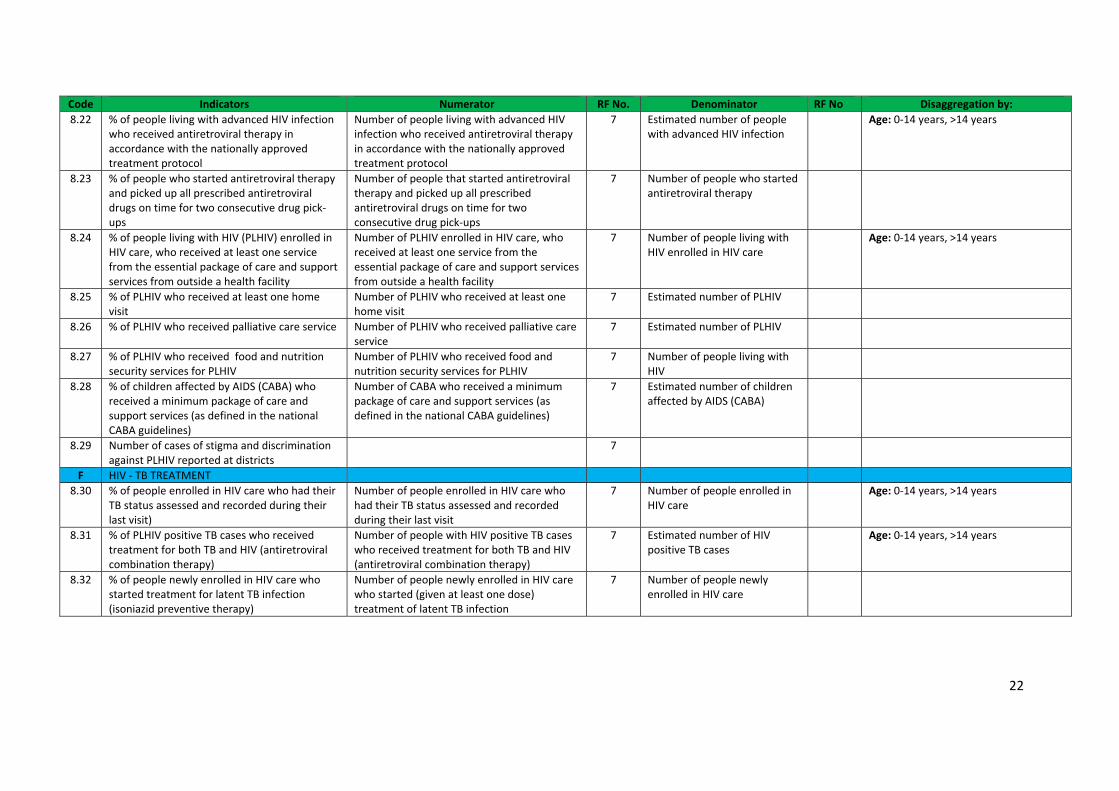
Code Indicators Numerator RF No. Denominator RF No Disaggregation by: 8.22 % of people living with advanced HIV infection
who received antiretroviral therapy in accordance with the nationally approved treatment protocol
Number of people living with advanced HIV infection who received antiretroviral therapy in accordance with the nationally approved treatment protocol
7 Estimated number of people with advanced HIV infection
Age: 0‐14 years, >14 years
8.23 % of people who started antiretroviral therapy and picked up all prescribed antiretroviral drugs on time for two consecutive drug pick‐ups
Number of people that started antiretroviral therapy and picked up all prescribed antiretroviral drugs on time for two consecutive drug pick‐ups
7 Number of people who started antiretroviral therapy
8.24 % of people living with HIV (PLHIV) enrolled in HIV care, who received at least one service from the essential package of care and support services from outside a health facility
Number of PLHIV enrolled in HIV care, who received at least one service from the essential package of care and support services from outside a health facility
7 Number of people living with HIV enrolled in HIV care
Age: 0‐14 years, >14 years
8.25 % of PLHIV who received at least one home visit
Number of PLHIV who received at least one home visit
7 Estimated number of PLHIV
8.26 % of PLHIV who received palliative care service Number of PLHIV who received palliative care service
7 Estimated number of PLHIV
8.27 % of PLHIV who received food and nutrition security services for PLHIV
Number of PLHIV who received food and nutrition security services for PLHIV
7 Number of people living with HIV
8.28 % of children affected by AIDS (CABA) who received a minimum package of care and support services (as defined in the national CABA guidelines)
Number of CABA who received a minimum package of care and support services (as defined in the national CABA guidelines)
7 Estimated number of children affected by AIDS (CABA)
8.29 Number of cases of stigma and discrimination against PLHIV reported at districts
7
F HIV ‐ TB TREATMENT 8.30 % of people enrolled in HIV care who had their
TB status assessed and recorded during their last visit)
Number of people enrolled in HIV care who had their TB status assessed and recorded during their last visit
7 Number of people enrolled in HIV care
Age: 0‐14 years, >14 years
8.31 % of PLHIV positive TB cases who received treatment for both TB and HIV (antiretroviral combination therapy)
Number of people with HIV positive TB cases who received treatment for both TB and HIV (antiretroviral combination therapy)
7 Estimated number of HIV positive TB cases
Age: 0‐14 years, >14 years
8.32 % of people newly enrolled in HIV care who started treatment for latent TB infection (isoniazid preventive therapy)
Number of people newly enrolled in HIV care who started (given at least one dose) treatment of latent TB infection
7 Number of people newly enrolled in HIV care
23
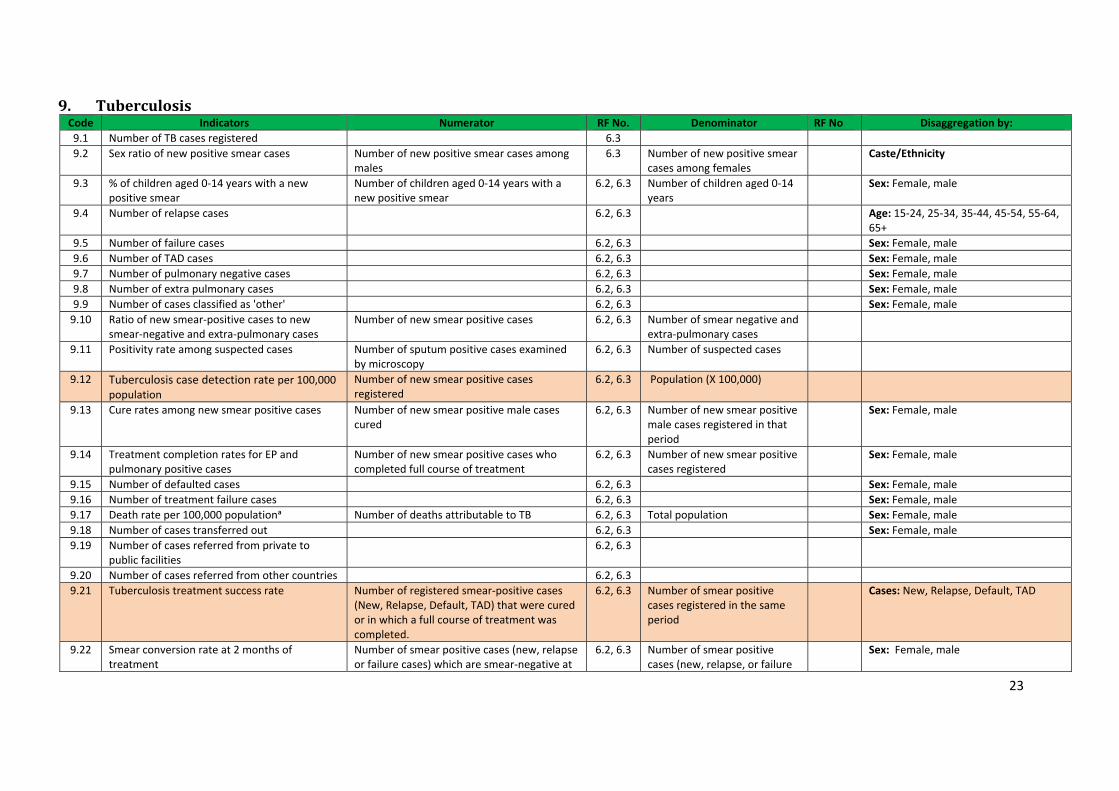
9. Tuberculosis Code Indicators Numerator RF No. Denominator RF No Disaggregation by: 9.1 Number of TB cases registered 6.3 9.2 Sex ratio of new positive smear cases Number of new positive smear cases among
males 6.3 Number of new positive smear
cases among females Caste/Ethnicity
9.3 % of children aged 0‐14 years with a new
positive smear Number of children aged 0‐14 years with a new positive smear
6.2, 6.3 Number of children aged 0‐14 years
Sex: Female, male
9.4 Number of relapse cases 6.2, 6.3 Age: 15‐24, 25‐34, 35‐44, 45‐54, 55‐64, 65+
9.5 Number of failure cases 6.2, 6.3 Sex: Female, male 9.6 Number of TAD cases 6.2, 6.3 Sex: Female, male 9.7 Number of pulmonary negative cases 6.2, 6.3 Sex: Female, male 9.8 Number of extra pulmonary cases 6.2, 6.3 Sex: Female, male 9.9 Number of cases classified as 'other' 6.2, 6.3 Sex: Female, male 9.10 Ratio of new smear‐positive cases to new
smear‐negative and extra‐pulmonary cases Number of new smear positive cases 6.2, 6.3 Number of smear negative and
extra‐pulmonary cases
9.11 Positivity rate among suspected cases Number of sputum positive cases examined by microscopy
6.2, 6.3 Number of suspected cases
9.12 Tuberculosis case detection rate per 100,000 population
Number of new smear positive cases registered
6.2, 6.3 Population (X 100,000)
9.13 Cure rates among new smear positive cases Number of new smear positive male cases cured
6.2, 6.3 Number of new smear positive male cases registered in that period
Sex: Female, male
9.14 Treatment completion rates for EP and pulmonary positive cases
Number of new smear positive cases who completed full course of treatment
6.2, 6.3 Number of new smear positive cases registered
Sex: Female, male
9.15 Number of defaulted cases 6.2, 6.3 Sex: Female, male 9.16 Number of treatment failure cases 6.2, 6.3 Sex: Female, male 9.17 Death rate per 100,000 populationᵃ Number of deaths attributable to TB 6.2, 6.3 Total population Sex: Female, male 9.18 Number of cases transferred out 6.2, 6.3 Sex: Female, male 9.19 Number of cases referred from private to
public facilities 6.2, 6.3
9.20 Number of cases referred from other countries 6.2, 6.3 9.21 Tuberculosis treatment success rate
Number of registered smear‐positive cases (New, Relapse, Default, TAD) that were cured or in which a full course of treatment was completed.
6.2, 6.3 Number of smear positive cases registered in the same period
Cases: New, Relapse, Default, TAD
9.22 Smear conversion rate at 2 months of treatment
Number of smear positive cases (new, relapse or failure cases) which are smear‐negative at
6.2, 6.3 Number of smear positive cases (new, relapse, or failure
Sex: Female, male

24
Code Indicators Numerator RF No. Denominator RF No Disaggregation by: 2(3) months of treatment cases) registered during the
same period 9.23 Reported incidence rate for new smear
positive cases per 100,000 populationᵃ Number of reported new smear positive cases
6.2, 6.3 Total population (X 100,000)
9.24 Quality assurance of smear examination: percentage agreement
Number of smears read the same by the sending laboratory and the reference laboratory
6.2, 6.3 Number of slides sent by the sending laboratory to the reference laboratory for quality assurance
9.25 % of TB cases with HIV infection Number of TB cases with HIV infection 6.2, 6.3 Number of TB cases Sex: Female, male 9.26 Number of MDR TB cases per 10000
population 6.2, 6.3 Cases: New, relapse, TAD, TAF Cat‐I,
TAF Cat‐II Transfer: In, out Age: 0‐14, 15‐24, 25‐34, 35‐44, 45‐54, 55‐64, 65+ Sex : Female, male
9.27 Number of X‐DR TB cases per 10000 population 6.2, 6.3 9.28 % of drug resistant TB patients who completed
full course of treatment Number of drug resistant TB patients who completed full course of treatment
6.2, 6.3 Number of drug resistant TB patients
Cases: New, relapse, TAD, TAF Cat‐I, TAF Cat‐II Transfer: In, out Outcome: Cured, treatment completed, failure, defaulted, died Sex : Female, male
9.29 Number of chronic respiratory disease (CRD) cases per 10000 population
6.2, 6.3
9.30 % of CRD cases who underwent a sputum examination
Number of CRD cases who underwent a sputum examination
6.2, 6.3 Number of CRD cases
9.31 % of examined CRD cases who were sputum positive
Number of sputum positive cases among examined CRD cases
6.2, 6.3 Number of examined CRD cases
9.32 % of pulmonary TB cases identified as smokers Number of smokers identified among pulmonary TB cases
6.2, 6.3 Number of pulmonary TB cases
9.33 % of pulmonary TB smokers who quit smoking after counselling
Number of pulmonary TB smokers who quit smoking after counselling
6.2, 6.3 Number of smokers identified among pulmonary TB cases

25
10. EpidemiologyandDiseaseControl Code Indicators Numerator RF No. Denominator RF No. Disaggregation by: A MALARIA
10.1 Annual blood examination rate (ABER) of malaria in high risk districtsᵃ
Number of slides examined in high risk districts
5.2, 5.3 Population in high risk districts
10.2 Slide positivity rate (SPR) of malaria in high risk districts
Number of positive slides in high risk districts 5.2, 5.3 Number of slides examined Level of facility: District Hospital, PHC, HP, SHP
10.3 Malaria annual parasite incidence (per 1000 population in high risk districts) ᵃ
Number of positive cases in high risk districts 5.2, 5.3 Population in high risk districts (*1000 population)
10.4 Clinical malaria incidence (CMI) in high risk districts
Number of new cases of clinical malaria in high risk districts
5.2, 5.3 Population in high risk districts
10.5 % of P. Falciparum (PF) cases in high risk districts
Number of PF cases in high risk districts 5.2, 5.3 Number of positive cases in high risk districts
10.6 % of imported cases among positive cases of malaria
Number of imported cases 5.2, 5.3 Number of positive cases (suspected + confirmed)
10.7 % of malaria cases by target group Number of malaria cases by target group 5.2, 5.3 Number of positive cases (suspected + confirmed)
Age: Children <5 Sex: Girls, Boys Client: Pregnant women
10.8 Case fatality rate of malaria Number of deaths due to malaria (suspected and confirmed)
5.2, 5.3 Number of positive cases (suspected + confirmed)
Cases: Suspected, confirmed
10.9 % of pregnant women receiving a LLIN from an ANC clinic
Number of pregnant women receiving a LLIN from an ANC clinic
5.2, 5.3 Number of pregnant women
10.10 % of confirmed cases of uncomplicated malaria treated with antimalarials as per national guidelines
Number of confirmed cases of uncomplicated malaria treated with antimalarials as per national guidelines
5.2, 5.3 Number of confirmed cases of uncomplicated malaria
10.11 % of confirmed cases of severe malaria treated with antimalarials as per national guidelines
Number of confirmed cases of severe malaria treated with antimalarials as per national guidelines
5.2, 5.3 Number of confirmed cases of severe malaria
10.12 % of blood slide collected that were examined and tested positive
Number of blood slides examined + slide positive
5.2, 5.3 Target for malaria slide collection
10.13 Number of health facilities designated at sentinel surveillance sites that are functioning as sentinel surveillance sitesᵃ
Number of health facilities designated as sentinel surveillance sites that are functioning as sentinel surveillance sites
5.2, 5.3 Number of health facilities designated as sentinel surveillance sites
B KALA‐AZAR 10.14 Number of kala‐azar cases in at risk districts 5.2, 5.3 10.15 Incidence of kala‐azar (KA) per 10,000
population in at risk districts Number of new KA cases in at risk districts 5.2, 5.3 Population in at risk districts
(*10,000)
10.16 % of kala‐azar cases that were treated by Number of kala‐azar cases treated by SAG in 5.2, 5.3 Number of kala‐azar cases in at
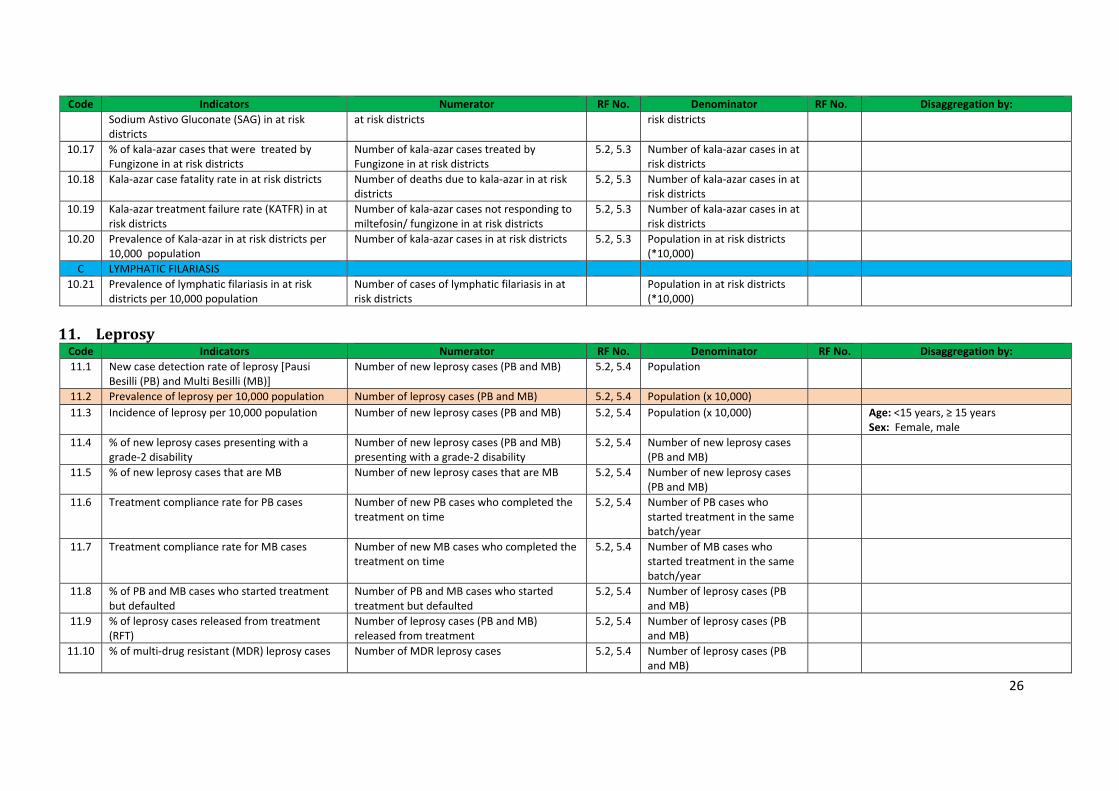
26
Code Indicators Numerator RF No. Denominator RF No. Disaggregation by: Sodium Astivo Gluconate (SAG) in at risk districts
at risk districts risk districts
10.17 % of kala‐azar cases that were treated by Fungizone in at risk districts
Number of kala‐azar cases treated by Fungizone in at risk districts
5.2, 5.3 Number of kala‐azar cases in at risk districts
10.18 Kala‐azar case fatality rate in at risk districts Number of deaths due to kala‐azar in at risk districts
5.2, 5.3 Number of kala‐azar cases in at risk districts
10.19 Kala‐azar treatment failure rate (KATFR) in at risk districts
Number of kala‐azar cases not responding to miltefosin/ fungizone in at risk districts
5.2, 5.3 Number of kala‐azar cases in at risk districts
10.20 Prevalence of Kala‐azar in at risk districts per 10,000 population
Number of kala‐azar cases in at risk districts 5.2, 5.3 Population in at risk districts (*10,000)
C LYMPHATIC FILARIASIS 10.21 Prevalence of lymphatic filariasis in at risk
districts per 10,000 population Number of cases of lymphatic filariasis in at risk districts
Population in at risk districts (*10,000)
11. Leprosy Code Indicators Numerator RF No. Denominator RF No. Disaggregation by: 11.1 New case detection rate of leprosy [Pausi
Besilli (PB) and Multi Besilli (MB)] Number of new leprosy cases (PB and MB) 5.2, 5.4 Population
11.2 Prevalence of leprosy per 10,000 population Number of leprosy cases (PB and MB) 5.2, 5.4 Population (x 10,000) 11.3 Incidence of leprosy per 10,000 population Number of new leprosy cases (PB and MB) 5.2, 5.4 Population (x 10,000) Age: <15 years, ≥ 15 years
Sex: Female, male 11.4 % of new leprosy cases presenting with a
grade‐2 disability Number of new leprosy cases (PB and MB) presenting with a grade‐2 disability
5.2, 5.4 Number of new leprosy cases (PB and MB)
11.5 % of new leprosy cases that are MB Number of new leprosy cases that are MB 5.2, 5.4 Number of new leprosy cases (PB and MB)
11.6 Treatment compliance rate for PB cases Number of new PB cases who completed the treatment on time
5.2, 5.4 Number of PB cases who started treatment in the same batch/year
11.7 Treatment compliance rate for MB cases Number of new MB cases who completed the treatment on time
5.2, 5.4 Number of MB cases who started treatment in the same batch/year
11.8 % of PB and MB cases who started treatment but defaulted
Number of PB and MB cases who started treatment but defaulted
5.2, 5.4 Number of leprosy cases (PB and MB)
11.9 % of leprosy cases released from treatment (RFT)
Number of leprosy cases (PB and MB) released from treatment
5.2, 5.4 Number of leprosy cases (PB and MB)
11.10 % of multi‐drug resistant (MDR) leprosy cases Number of MDR leprosy cases 5.2, 5.4 Number of leprosy cases (PB and MB)
27
Code Indicators Numerator RF No. Denominator RF No. Disaggregation by: 11.11 % of relapse cases of leprosy Number of relapse cases of leprosy 5.2, 5.4 Number of leprosy cases (PB
and MB)
11.12 % of leprosy cases under rehabilitation Number of leprosy cases under rehabilitation 5.2, 5.4 Number of leprosy cases (PB and MB)
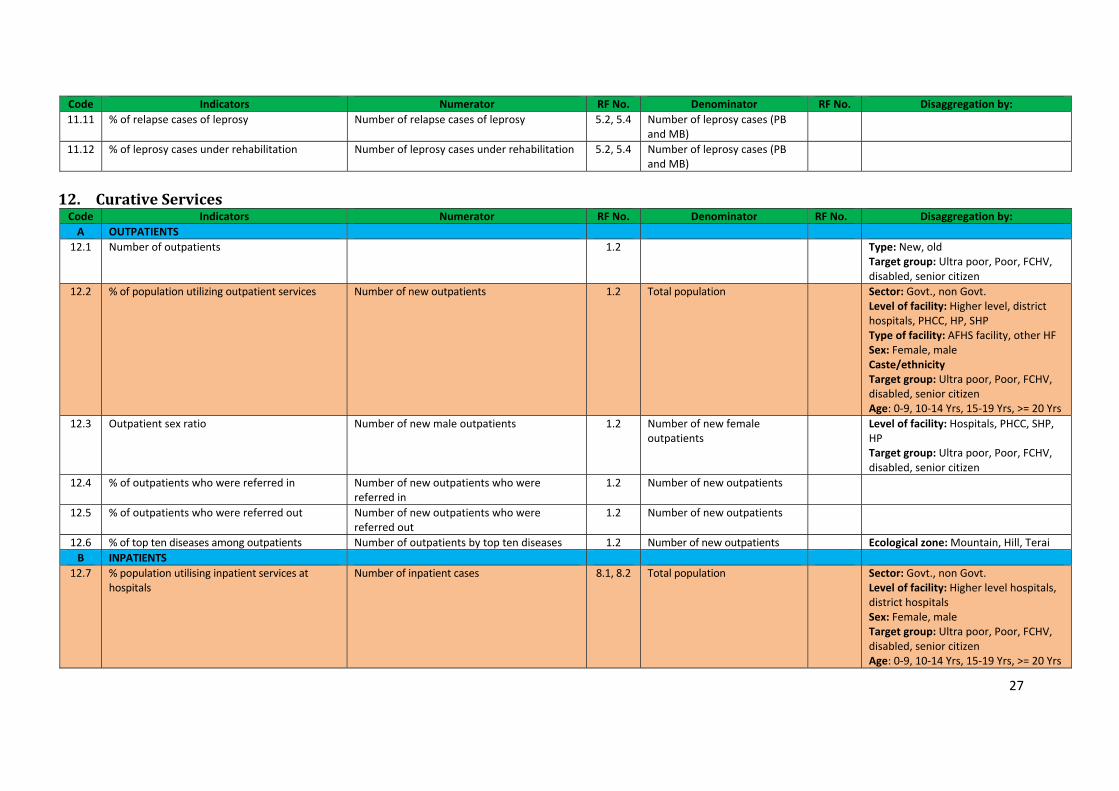
12. CurativeServices Code Indicators Numerator RF No. Denominator RF No. Disaggregation by: A OUTPATIENTS
12.1 Number of outpatients 1.2 Type: New, old Target group: Ultra poor, Poor, FCHV, disabled, senior citizen
12.2 % of population utilizing outpatient services Number of new outpatients 1.2 Total population Sector: Govt., non Govt. Level of facility: Higher level, district hospitals, PHCC, HP, SHP Type of facility: AFHS facility, other HF Sex: Female, male Caste/ethnicity Target group: Ultra poor, Poor, FCHV, disabled, senior citizen Age: 0‐9, 10‐14 Yrs, 15‐19 Yrs, >= 20 Yrs
12.3 Outpatient sex ratio Number of new male outpatients 1.2 Number of new female outpatients
Level of facility: Hospitals, PHCC, SHP, HP Target group: Ultra poor, Poor, FCHV, disabled, senior citizen
12.4 % of outpatients who were referred in Number of new outpatients who were referred in
1.2 Number of new outpatients
12.5 % of outpatients who were referred out Number of new outpatients who were referred out
1.2 Number of new outpatients
12.6 % of top ten diseases among outpatients Number of outpatients by top ten diseases 1.2 Number of new outpatients Ecological zone: Mountain, Hill, Terai B INPATIENTS
12.7 % population utilising inpatient services at hospitals
Number of inpatient cases
8.1, 8.2 Total population Sector: Govt., non Govt. Level of facility: Higher level hospitals, district hospitals Sex: Female, male Target group: Ultra poor, Poor, FCHV, disabled, senior citizen Age: 0‐9, 10‐14 Yrs, 15‐19 Yrs, >= 20 Yrs
28
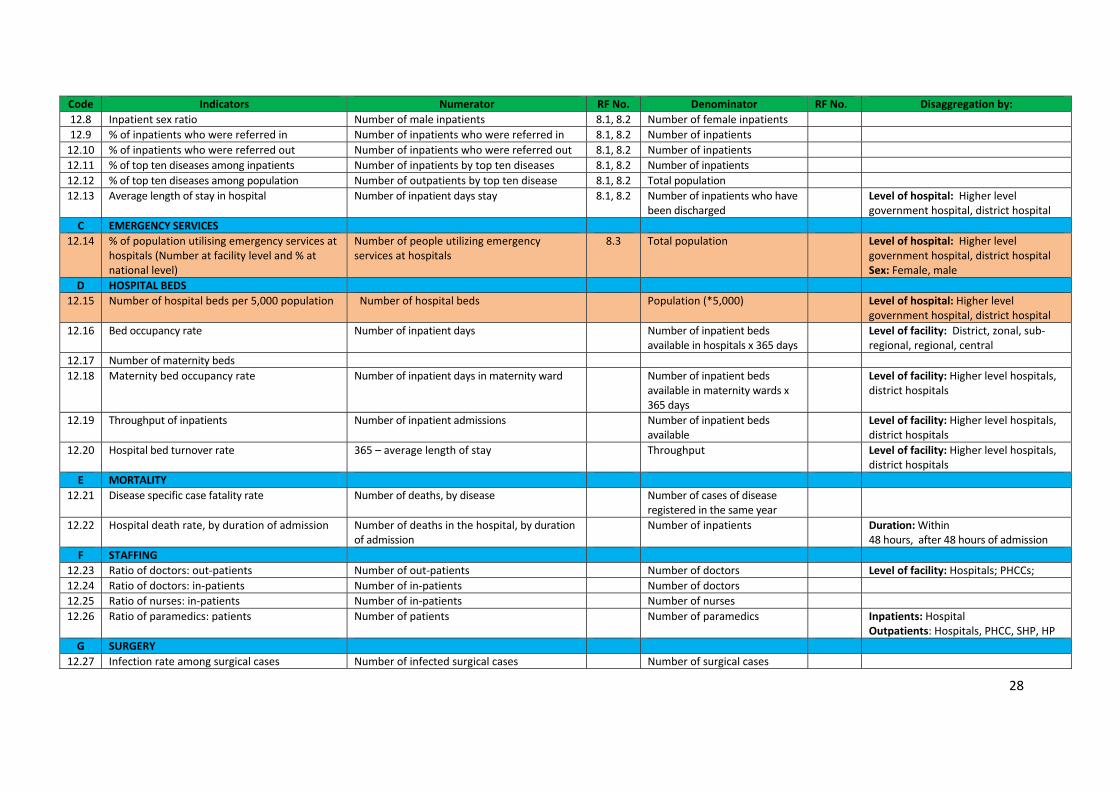
Code Indicators Numerator RF No. Denominator RF No. Disaggregation by: 12.8 Inpatient sex ratio Number of male inpatients 8.1, 8.2 Number of female inpatients 12.9 % of inpatients who were referred in Number of inpatients who were referred in 8.1, 8.2 Number of inpatients 12.10 % of inpatients who were referred out Number of inpatients who were referred out 8.1, 8.2 Number of inpatients 12.11 % of top ten diseases among inpatients Number of inpatients by top ten diseases 8.1, 8.2 Number of inpatients 12.12 % of top ten diseases among population Number of outpatients by top ten disease 8.1, 8.2 Total population 12.13 Average length of stay in hospital Number of inpatient days stay 8.1, 8.2 Number of inpatients who have
been discharged Level of hospital: Higher level
government hospital, district hospital C EMERGENCY SERVICES
12.14 % of population utilising emergency services at hospitals (Number at facility level and % at national level)
Number of people utilizing emergency services at hospitals
8.3 Total population Level of hospital: Higher level government hospital, district hospital Sex: Female, male
D HOSPITAL BEDS 12.15 Number of hospital beds per 5,000 population Number of hospital beds Population (*5,000) Level of hospital: Higher level
government hospital, district hospital 12.16 Bed occupancy rate Number of inpatient days Number of inpatient beds
available in hospitals x 365 days Level of facility: District, zonal, sub‐
regional, regional, central 12.17 Number of maternity beds 12.18 Maternity bed occupancy rate Number of inpatient days in maternity ward Number of inpatient beds
available in maternity wards x 365 days
Level of facility: Higher level hospitals, district hospitals
12.19 Throughput of inpatients Number of inpatient admissions Number of inpatient beds available
Level of facility: Higher level hospitals, district hospitals
12.20 Hospital bed turnover rate 365 – average length of stay Throughput Level of facility: Higher level hospitals, district hospitals
E MORTALITY 12.21 Disease specific case fatality rate Number of deaths, by disease Number of cases of disease
registered in the same year
12.22 Hospital death rate, by duration of admission Number of deaths in the hospital, by duration of admission
Number of inpatients Duration: Within 48 hours, after 48 hours of admission
F STAFFING 12.23 Ratio of doctors: out‐patients Number of out‐patients Number of doctors Level of facility: Hospitals; PHCCs; 12.24 Ratio of doctors: in‐patients Number of in‐patients Number of doctors 12.25 Ratio of nurses: in‐patients Number of in‐patients Number of nurses 12.26 Ratio of paramedics: patients Number of patients Number of paramedics Inpatients: Hospital
Outpatients: Hospitals, PHCC, SHP, HP G SURGERY
12.27 Infection rate among surgical cases Number of infected surgical cases Number of surgical cases

29
Code Indicators Numerator RF No. Denominator RF No. Disaggregation by: 12.28 Surgery related death rate Number of deaths among surgical cases Number of surgical cases 12.29 Ratio of surgeons: surgeries Number of surgeries Number of surgeons H DIAGNOSTIC SERVICES
12.30 Average number of radiographic images per day
Number of radiographic images/x‐rays Number of days Type: X‐ray, ultrasound, USG, MRI, CT Scan
12.31 Average number of laboratory tests per day Number of laboratory tests Number of days
13. HealthFacilities Code Indicator Numerator RF No. Denominator RF No. Disaggregation by: A CEONC
13.1 % of hospitals that are certified CEONC sites Number of hospitals that are certified CEONC sites
9.4, 9.5 Number of hospitals Sector: Govt., non Govt. Level of facility: Higher level hospitals, district hospitals
13.2 % of CEONC facilities providing all CEONC signal functions 24/7
Number of CEONC facilities providing all CEONC signal functions 24/7
9.4, 9.5 Number of CEONC facilities Sector: Govt., non Govt. Level of facility: Higher level hospitals, district hospitals
13.3 Number of CEONC facilities per 500,000 populationᵃ
Number of CEONC facilities 9.4, 9.5 Total population (*500,000) Ecological zone: Mountain, Hills, Terai
13.4 % of districts with at least one CEONC public facility ᵃ
Number of districts with at least one CEONC public facility
9.4, 9.5 Number of districts
13.5 % of districts with at least one public facility providing all CEONC signal functionsᵃ
Number of districts with at least one public facility providing all CEONC signal functions
9.4, 9.5 Number of districts
B BEONC 13.6 % of district/district level hospitals and PHCCs
that are certified BEONC sitesᵃ Number of district/district level hospitals that are BEONC
9.3, 9.4, 9.5
Number of District and district level hospitals and PHCCs
Level of facility: District/district level hospitals, PHCCs
13.7 Number of BEONC facilities per 100,000 populationᵃ
Number of BEONC facilities 9.3, 9.4, 9.5
Total population (*100,000) Ecological zone: Mountain, Hills, Terai
13.8 % of PHCCs providing all BEONC signal functions 24/7
Number of PHCCs providing all BEONC signal functions
9.3 Number of PHCCs Availability: 24/7, not 24/7
C BIRTHING CENTRES 13.9 % of PHCCs, health posts and sub‐health posts
that are certified birthing centers Number of PHCCs, health posts and sub‐health posts that are certified birthing centers
9.3 Number of PHCCs, health posts and sub‐health posts
Level of facility: PHCCs, HPs, SHPs Availability: 24/7, not 24/7
D SAFE ABORTION SITES 13.10 % of government health facilities that are
certified safe abortion sitesᵃ Number of government health facilities that are certified safe abortion sites
9.3, 9.4, 9.5
Number of government health facilities
Level of facility: Higher level hospitals, district hospitals, PHCCs, HPs, SHPs Method: Surgical, medical
13.11 % of safe abortion (surgical and medical) Number of safe abortion (surgical and 9.3, 9.4, Number of safe abortion Level of facility: Higher level hospitals,
30
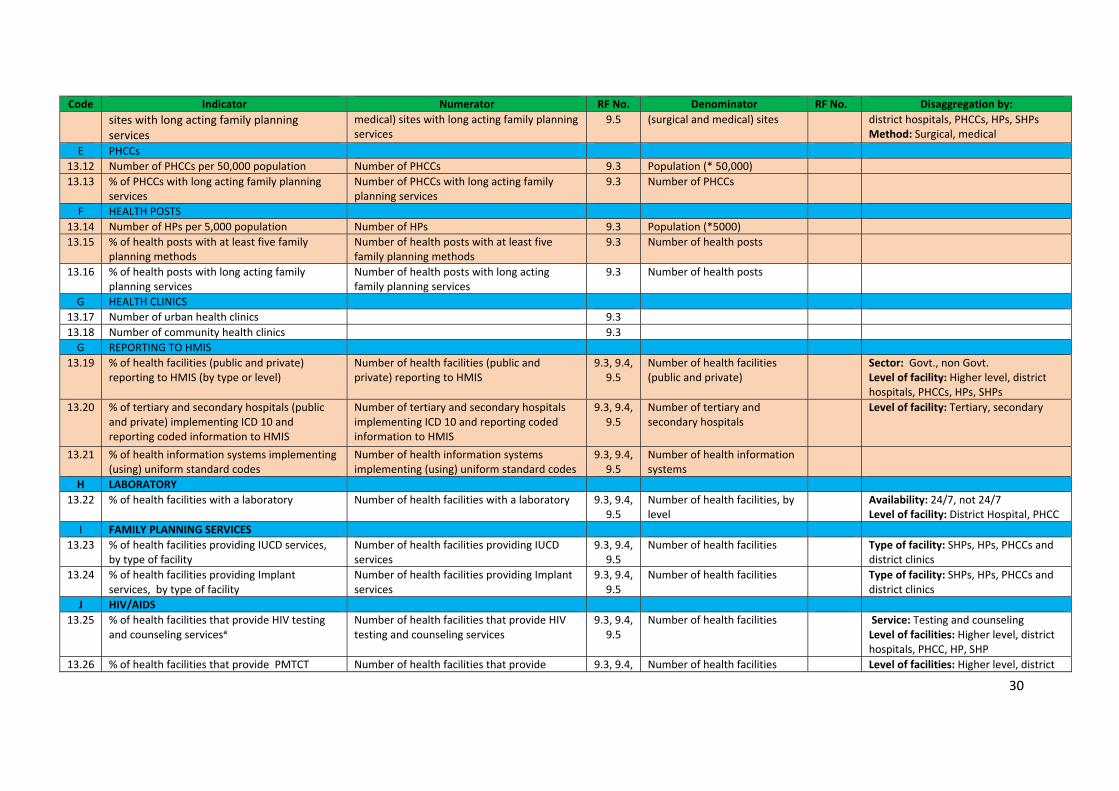
Code Indicator Numerator RF No. Denominator RF No. Disaggregation by: sites with long acting family planning services
medical) sites with long acting family planning services
9.5 (surgical and medical) sites district hospitals, PHCCs, HPs, SHPs Method: Surgical, medical
E PHCCs 13.12 Number of PHCCs per 50,000 population Number of PHCCs 9.3 Population (* 50,000) 13.13 % of PHCCs with long acting family planning
services Number of PHCCs with long acting family planning services
9.3 Number of PHCCs
F HEALTH POSTS 13.14 Number of HPs per 5,000 population Number of HPs 9.3 Population (*5000) 13.15 % of health posts with at least five family
planning methods Number of health posts with at least five family planning methods
9.3 Number of health posts
13.16 % of health posts with long acting family planning services
Number of health posts with long acting family planning services
9.3 Number of health posts
G HEALTH CLINICS 13.17 Number of urban health clinics 9.3 13.18 Number of community health clinics 9.3 G REPORTING TO HMIS
13.19 % of health facilities (public and private) reporting to HMIS (by type or level)
Number of health facilities (public and private) reporting to HMIS
9.3, 9.4, 9.5
Number of health facilities (public and private)
Sector: Govt., non Govt. Level of facility: Higher level, district hospitals, PHCCs, HPs, SHPs
13.20 % of tertiary and secondary hospitals (public and private) implementing ICD 10 and reporting coded information to HMIS
Number of tertiary and secondary hospitals implementing ICD 10 and reporting coded information to HMIS
9.3, 9.4, 9.5
Number of tertiary and secondary hospitals
Level of facility: Tertiary, secondary
13.21 % of health information systems implementing (using) uniform standard codes
Number of health information systems implementing (using) uniform standard codes
9.3, 9.4, 9.5
Number of health information systems
H LABORATORY 13.22 % of health facilities with a laboratory Number of health facilities with a laboratory 9.3, 9.4,
9.5 Number of health facilities, by level
Availability: 24/7, not 24/7 Level of facility: District Hospital, PHCC
I FAMILY PLANNING SERVICES 13.23 % of health facilities providing IUCD services,
by type of facility Number of health facilities providing IUCD services
9.3, 9.4, 9.5
Number of health facilities Type of facility: SHPs, HPs, PHCCs and district clinics
13.24 % of health facilities providing Implant services, by type of facility
Number of health facilities providing Implant services
9.3, 9.4, 9.5
Number of health facilities Type of facility: SHPs, HPs, PHCCs and district clinics
J HIV/AIDS 13.25 % of health facilities that provide HIV testing
and counseling servicesᵃ Number of health facilities that provide HIV testing and counseling services
9.3, 9.4, 9.5
Number of health facilities Service: Testing and counseling Level of facilities: Higher level, district hospitals, PHCC, HP, SHP
13.26 % of health facilities that provide PMTCT Number of health facilities that provide 9.3, 9.4, Number of health facilities Level of facilities: Higher level, district

31
Code Indicator Numerator RF No. Denominator RF No. Disaggregation by: servicesᵃ PMTCT services 9.5 hospitals, PHCC, HP, SHP
13.27 % of health facilities that provide ART servicesᵃ Number of health facilities that provide ART services
9.3, 9.4, 9.5
Number of health facilities Level of facilities: Higher level, district hospitals, PHCC, HP, SHP
13.28 % of health facilities dispensing antiretroviral therapy that experienced a stock‐out of at least one required antiretroviral drug
Number of health facilities dispensing antiretroviral therapy that experienced a stock‐out of at least one required antiretroviral drug
9.3, 9.4, 9.5
Number of health facilities dispensing antiretroviral therapy
Level of facilities: Higher level, district hospitals, PHCC, HP, SHP
K Adolescence sexual and reproductive health services 13.29 % of health facilities with adolescent friendly
servicesᵃ Number of health facilities with adolescent friendly services
9.3, 9.4, 9.5
Number of health facilities Sector: Govt., non govt. Level of facility: Higher level govt. hospitals, district hospitals, PHCCs, HPs, SHPs
Note: a = Indicators to be reported annually (see Annex 4)
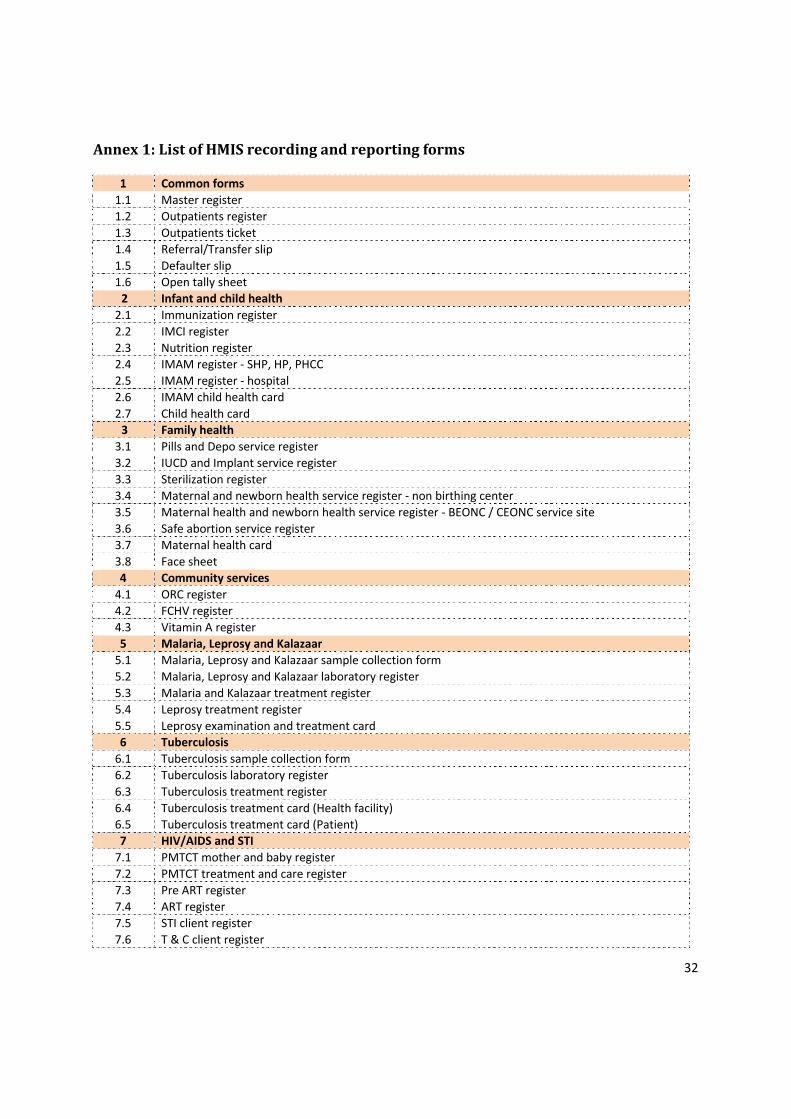
32
Annex1:ListofHMISrecordingandreportingforms
1 Common forms1.1 Master register1.2 Outpatients register 1.3 Outpatients ticket 1.4 Referral/Transfer slip 1.5 Defaulter slip 1.6 Open tally sheet 2 Infant and child health 2.1 Immunization register 2.2 IMCI register 2.3 Nutrition register 2.4 IMAM register ‐ SHP, HP, PHCC 2.5 IMAM register ‐ hospital 2.6 IMAM child health card 2.7 Child health card 3 Family health3.1 Pills and Depo service register 3.2 IUCD and Implant service register3.3 Sterilization register 3.4 Maternal and newborn health service register ‐ non birthing center3.5 Maternal health and newborn health service register ‐ BEONC / CEONC service site 3.6 Safe abortion service register 3.7 Maternal health card 3.8 Face sheet 4 Community services 4.1 ORC register 4.2 FCHV register4.3 Vitamin A register 5 Malaria, Leprosy and Kalazaar 5.1 Malaria, Leprosy and Kalazaar sample collection form5.2 Malaria, Leprosy and Kalazaar laboratory register5.3 Malaria and Kalazaar treatment register5.4 Leprosy treatment register 5.5 Leprosy examination and treatment card6 Tuberculosis 6.1 Tuberculosis sample collection form6.2 Tuberculosis laboratory register6.3 Tuberculosis treatment register6.4 Tuberculosis treatment card (Health facility)6.5 Tuberculosis treatment card (Patient)7 HIV/AIDS and STI 7.1 PMTCT mother and baby register 7.2 PMTCT treatment and care register 7.3 Pre ART register 7.4 ART register 7.5 STI client register 7.6 T & C client register
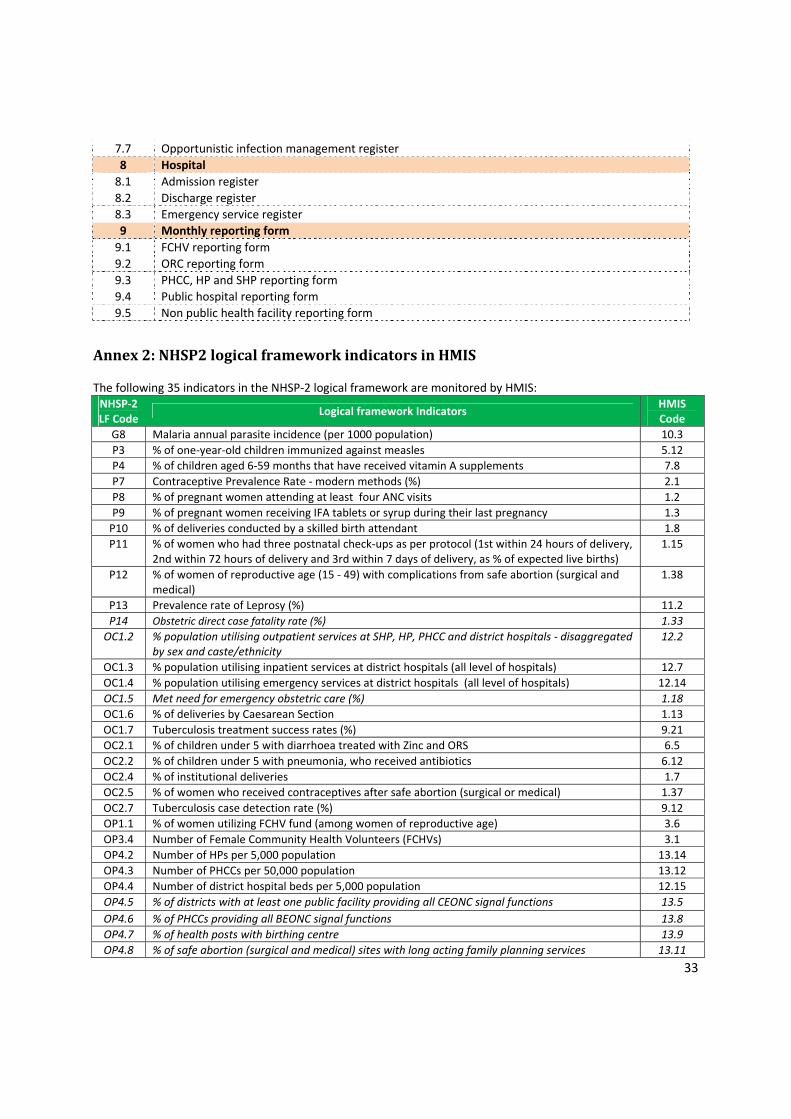
33
7.7 Opportunistic infection management register 8 Hospital 8.1 Admission register 8.2 Discharge register 8.3 Emergency service register 9 Monthly reporting form 9.1 FCHV reporting form 9.2 ORC reporting form 9.3 PHCC, HP and SHP reporting form 9.4 Public hospital reporting form 9.5 Non public health facility reporting form
Annex2:NHSP2logicalframeworkindicatorsinHMIS The following 35 indicators in the NHSP‐2 logical framework are monitored by HMIS: NHSP‐2 LF Code Logical framework Indicators HMIS
Code G8 Malaria annual parasite incidence (per 1000 population) 10.3 P3 % of one‐year‐old children immunized against measles 5.12 P4 % of children aged 6‐59 months that have received vitamin A supplements 7.8 P7 Contraceptive Prevalence Rate ‐ modern methods (%) 2.1P8 % of pregnant women attending at least four ANC visits 1.2 P9 % of pregnant women receiving IFA tablets or syrup during their last pregnancy 1.3 P10 % of deliveries conducted by a skilled birth attendant 1.8 P11 % of women who had three postnatal check‐ups as per protocol (1st within 24 hours of delivery,
2nd within 72 hours of delivery and 3rd within 7 days of delivery, as % of expected live births) 1.15
P12 % of women of reproductive age (15 ‐ 49) with complications from safe abortion (surgical and medical)
1.38
P13 Prevalence rate of Leprosy (%) 11.2 P14 Obstetric direct case fatality rate (%) 1.33
OC1.2 % population utilising outpatient services at SHP, HP, PHCC and district hospitals ‐ disaggregated by sex and caste/ethnicity
12.2
OC1.3 % population utilising inpatient services at district hospitals (all level of hospitals) 12.7 OC1.4 % population utilising emergency services at district hospitals (all level of hospitals) 12.14 OC1.5 Met need for emergency obstetric care (%) 1.18
OC1.6 % of deliveries by Caesarean Section 1.13 OC1.7 Tuberculosis treatment success rates (%) 9.21OC2.1 % of children under 5 with diarrhoea treated with Zinc and ORS 6.5 OC2.2 % of children under 5 with pneumonia, who received antibiotics 6.12OC2.4 % of institutional deliveries 1.7 OC2.5 % of women who received contraceptives after safe abortion (surgical or medical) 1.37 OC2.7 Tuberculosis case detection rate (%) 9.12 OP1.1 % of women utilizing FCHV fund (among women of reproductive age) 3.6 OP3.4 Number of Female Community Health Volunteers (FCHVs) 3.1 OP4.2 Number of HPs per 5,000 population 13.14 OP4.3 Number of PHCCs per 50,000 population 13.12 OP4.4 Number of district hospital beds per 5,000 population 12.15 OP4.5 % of districts with at least one public facility providing all CEONC signal functions 13.5
OP4.6 % of PHCCs providing all BEONC signal functions 13.8
OP4.7 % of health posts with birthing centre 13.9
OP4.8 % of safe abortion (surgical and medical) sites with long acting family planning services 13.11
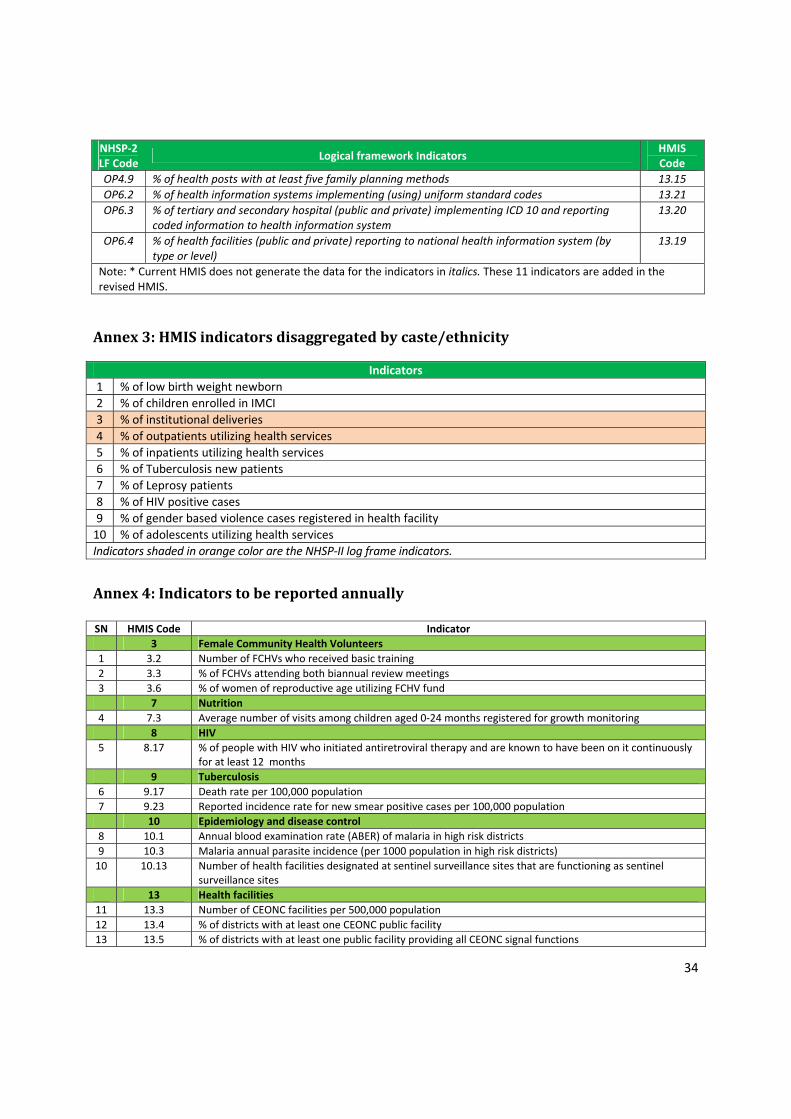
34
NHSP‐2 LF Code Logical framework Indicators HMIS
Code OP4.9 % of health posts with at least five family planning methods 13.15
OP6.2 % of health information systems implementing (using) uniform standard codes 13.21
OP6.3 % of tertiary and secondary hospital (public and private) implementing ICD 10 and reporting coded information to health information system
13.20
OP6.4 % of health facilities (public and private) reporting to national health information system (by type or level)
13.19
Note: * Current HMIS does not generate the data for the indicators in italics. These 11 indicators are added in the revised HMIS. Annex3:HMISindicatorsdisaggregatedbycaste/ethnicity
Indicators1 % of low birth weight newborn 2 % of children enrolled in IMCI 3 % of institutional deliveries 4 % of outpatients utilizing health services 5 % of inpatients utilizing health services 6 % of Tuberculosis new patients 7 % of Leprosy patients 8 % of HIV positive cases 9 % of gender based violence cases registered in health facility10 % of adolescents utilizing health services Indicators shaded in orange color are the NHSP‐II log frame indicators.
Annex4:Indicatorstobereportedannually SN HMIS Code Indicator 3 Female Community Health Volunteers 1 3.2 Number of FCHVs who received basic training 2 3.3 % of FCHVs attending both biannual review meetings 3 3.6 % of women of reproductive age utilizing FCHV fund 7 Nutrition 4 7.3 Average number of visits among children aged 0‐24 months registered for growth monitoring 8 HIV 5 8.17 % of people with HIV who initiated antiretroviral therapy and are known to have been on it continuously
for at least 12 months 9 Tuberculosis 6 9.17 Death rate per 100,000 population 7 9.23 Reported incidence rate for new smear positive cases per 100,000 population 10 Epidemiology and disease control 8 10.1 Annual blood examination rate (ABER) of malaria in high risk districts 9 10.3 Malaria annual parasite incidence (per 1000 population in high risk districts) 10 10.13 Number of health facilities designated at sentinel surveillance sites that are functioning as sentinel
surveillance sites 13 Health facilities
11 13.3 Number of CEONC facilities per 500,000 population 12 13.4 % of districts with at least one CEONC public facility 13 13.5 % of districts with at least one public facility providing all CEONC signal functions
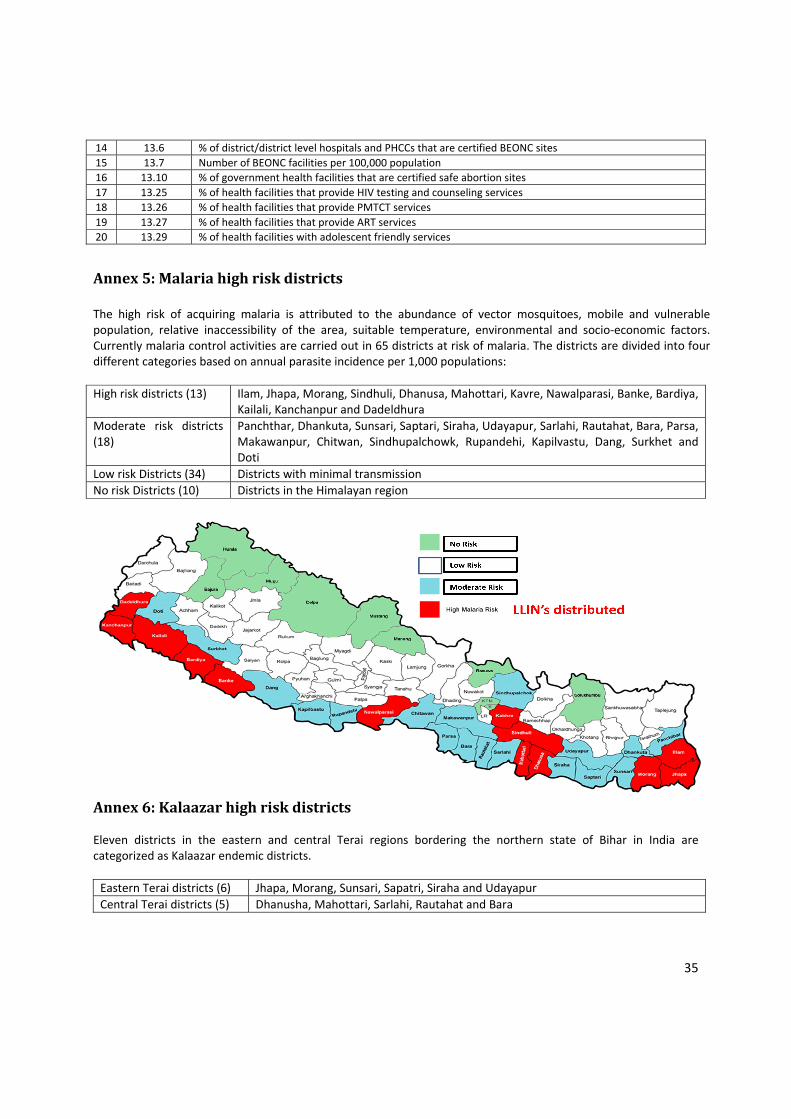
35
14 13.6 % of district/district level hospitals and PHCCs that are certified BEONC sites 15 13.7 Number of BEONC facilities per 100,000 population 16 13.10 % of government health facilities that are certified safe abortion sites 17 13.25 % of health facilities that provide HIV testing and counseling services 18 13.26 % of health facilities that provide PMTCT services 19 13.27 % of health facilities that provide ART services 20 13.29 % of health facilities with adolescent friendly services
Annex5:Malariahighriskdistricts The high risk of acquiring malaria is attributed to the abundance of vector mosquitoes, mobile and vulnerable population, relative inaccessibility of the area, suitable temperature, environmental and socio‐economic factors. Currently malaria control activities are carried out in 65 districts at risk of malaria. The districts are divided into four different categories based on annual parasite incidence per 1,000 populations: High risk districts (13) Ilam, Jhapa, Morang, Sindhuli, Dhanusa, Mahottari, Kavre, Nawalparasi, Banke, Bardiya,
Kailali, Kanchanpur and Dadeldhura Moderate risk districts (18)
Panchthar, Dhankuta, Sunsari, Saptari, Siraha, Udayapur, Sarlahi, Rautahat, Bara, Parsa, Makawanpur, Chitwan, Sindhupalchowk, Rupandehi, Kapilvastu, Dang, Surkhet and Doti
Low risk Districts (34) Districts with minimal transmissionNo risk Districts (10) Districts in the Himalayan region
Annex6:Kalaazarhighriskdistricts Eleven districts in the eastern and central Terai regions bordering the northern state of Bihar in India are categorized as Kalaazar endemic districts. Eastern Terai districts (6) Jhapa, Morang, Sunsari, Sapatri, Siraha and UdayapurCentral Terai districts (5) Dhanusha, Mahottari, Sarlahi, Rautahat and Bara


![Kabasilas 20120206 revised[1]](https://static.fdokumen.com/doc/165x107/6312229a706da55dc20bc86d/kabasilas-20120206-revised1.jpg)


