Use of Sub-national Indicators to Improve Public Health in ...
285
U se of Sub-n ational I ndicators to Improve P ublic H ealth in E urope (UNIPHE) ANNEX 11: WP4 – UPDATED WP4 REPORT (D3)
-
Upload
khangminh22 -
Category
Documents
-
view
5 -
download
0
Transcript of Use of Sub-national Indicators to Improve Public Health in ...

Use of Sub-national Indicators to Improve Public Health in Europe (UNIPHE)
ANNEX 11: WP4 – UPDATED WP4 REPORT (D3)

1
Use of Sub-national Indicators to Improve Public Health in Europe (UNIPHE)
WP4 Work Package 4 Report (D3)
I Zurlytė and A Laukaitienė, Centre for Health Education and Disease Prevention
WP Lead Partner
Centre for Health Education and Disease Prevention (SMLPC) Lithuania
WP Associate Partners
NRW Institute of Health and Work (LIGA.NRW) Germany
National Institute of Environmental Health (NIEH) Hungary
National Institute of Public Health (INSP) Romania
National Institute of Public Health (IVZ RS) Slovenia
Instituto De Salud Carlos III (ISCIII) Spain
Health Protection Agency United Kingdom
Funding and disclaimer
This report arises the project, Use of sub-national indicators to improve public health in Europe (UNIPHE), which has received funding from the European Union, in the framework of the Health Programme. Sole responsibility for this publication lies with the authors and the Executive Agency for Health and Consumers is not responsible for any use that may be made of the information contained therein.

i
EXECUTIVE SUMMARY
Good quality and reliable information on the environment, population health and their linkages is essential to identify and prioritize issues, develop and evaluate policies and actions in order to reduce the burden of disease via control of hazardous environmental exposures and their effects. Given this, the European Commission identified as a priority the need to establish a group of experts to develop a sustainable health information system to monitor and review the quality and consistency of health information across Europe thereby generating and disseminating information and knowledge. Through the use of such a system it will be possible to identify health inequalities among regions within European countries. Within the framework of Work Plan 2008 for the implementation of the “Second programme for community action in the field of public health (2008-2013)”, this project aims to develop a sustainable environmental health monitoring system consisting of a set of sub-national indicators to improve public health across Europe. The creation of a consistent and common framework within Europe will provide policy makers and other interested parties with a tool to facilitate quick comparisons between the health statuses of different regions within European countries. The scope of the project, to develop a sustainable harmonised environmental health system of a set of sub-national indicators, is supported by a total of 3 mandatory (coordination, evaluation and dissemination) and 6 core work packages. Each work package has a specific objective and the work described herein relates to work package 4. The overall objective of work package 4 (WP4) is to assemble a core set of sub-national environmental health indicators to be used for the establishment of a harmonized environmental health system. This entails engaging public health professionals working at a regional level to inform the assembly of a set of sub-national indicators, literature reviews and feasibility testing of an initial set of indicators using a list of agreed criteria. These activities contributed to the selection of the core set of indicators and culminated in the development of methodological sheets and fact-sheets for each indicator. This report descibes the work undertaken from March 2009 to August 2010 and follwing professional recommendations until the end of the Project, in order to accomplish the tasks related to the core set of indicators for use at a sub-national level.
An initial list of 71 indicators was assembled for feasibility testing at sub-national level within partner countries. Basic information relating to the definition of each of the 71 indicators selected for inclusion in the initial list was collated in order to undertake the feasibility study. Each indicator was assessed against a set of criteria which included data availability, level of spatial disaggregation, spatial coverage, and periodicity of reporting, data source, quality control and usefulness.
The feasibility study, undertaken in partner countries, resulted in the selection of a core set of twenty-seven indicators. Eighteen indicators were proposed for inclusion in the extended set and the remaining twenty-six were excluded as they were considered not applicable or data did not exist at a sub-national level. Indicators were considered for inclusion based on the modified DPSEEA model and most of those in the core set were attributable to exposure or effect.

EXECUTIVE SUMMARY
ii
Further activities within WP4 focused on development of methodological sheets. Each partner developed methodological sheets for 3 – 4 indicators. During the process of development of methodological sheets, five indicators were excluded from the core set. This was due to (1) the existence of varying definitions in partner countries; (2) overlapping with some other indicators; or (3) doubtful relevance and validity for sub-national level. This resulted in a core set of 22 indicators for which further data collection would be undertaken.
However, following comments and recommendations from the Harmonised System Workshop in Budapest (February 2011), the Project Steering Group members and evaluators, the core set was further reduced from 22 to 20 indicators. Spreadsheets for data collection were developed by WP6. All partners collected data on agreed sub-national level for the core set of indicators. The format of the fact sheet template was agreed. Due to the issue of missing data the consensus was that seven indicators from a variety of categories would be selected for the development of fact-sheets in all partner countries, namely, life expectancy at birth, infant mortality rate, annual mortality due to respiratory diseases in children older than one month and under one year of age, mortality due to respiratory diseases (total population), injury rate due to traffic accidents, incidence of melanoma, population weighted particulate matter (PM10) concentration (this indicator was later replaced by annual mean ambient air pollutants concentration in urban areas in the core set). Given the replacement of the indicator relating to particulate matter, the number of fact sheets developed was reduced to six. In order to avoid duplication in efforts, each partner was responsible for preparation of common sections of one fact-sheet such as rationale, policy context, and assessment on European level.
Depending on data availability, each partner developed a maximum of six national fact sheets with attention to data analysis and assessment on sub-national level within the respective country.
Fact sheet templates with common sections were later developed for the remaining fourteen indicators and example compiled separately..
In the process of project implementation additional attempts have been made to collect additional data to allow standardization of mortality indicators. For countries and sub-national levels for which it was feasible data are presented in the harmonised environmental health system (http://data.uniphe.eu).
This report is presented in two parts. Part 1 is a description of the technical work undertaken within work package 4 and Part 2 provides a regional assessment for the six indicators mentioned above. This report replaces the previous version and includes the updated fact sheets; however, part 1 is mainly unchanged.

iii
CONTENTS Executive Summary i
1 TECHNICAL REPORT 5 1.1 Selection of a core set of indicators 6 1.2 Production of methodological sheets 9 1.3 Data collection for the core set of indicators 11 1.4 Development of national fact-sheets 11
2 REGIONAL ASSESSMENT FOR SELECTED INDICATORS 14 2.1 Regional Assessment for Life expectancy at birth 15
Germany 15 Hungary 22 Lithuania 28 Romania 34 Slovenia 42 Spain 47 United Kingdom 55
2.2 Regional Assessment for Infant Mortality 61 Germany 61 Hungary 68 Lithuania 74 Romania 80 Slovenia 87 Spain 95 United Kingdom 104
2.3 Regional Assessment for Infant Mortality Rate due to Respiratory Diseases 110
Germany 110 Hungary 115 Lithuania 121 Romania 125 Slovenia 131 Spain 137 United Kingdom 144
2.4 Regional Assessment for Mortality due to Respiratory Diseases 148 Germany 148 Hungary 155 Lithuania 161 Romania 166 Slovenia 171 Spain 179 United Kingdom 184
2.5 Regional Assessment for Road Traffic Injury Rate 190 Germany 190 Hungary 198 Lithuania 206 Slovenia 212 Spain 221 United Kingdom 229
2.6 Regional Assessment for Incidence of Melanoma 235 Germany 235 Hungary 240 Lithuania 246

CONTENTS
iv
Romania 253 Slovenia 261 United Kingdom 269
Appendix 1: List of indicators for feasibility testing 274
Appendix 2 List of indicators proposed for extended set 277
Appendix 3 List of excluded indicators 278
Appendix 4 Final core set of indicators 280
Appendix 5 Methodological Sheet Template 281
Appendix 6 Fact Sheet Template 282

SELECTED INDICATORS REPORT
5
1 TECHNICAL REPORT
Environmental health indicators are useful tools for the assessment of the health status of a population as it relates to our environment at all levels; from the more discrete local to the larger national level. They can also support the monitoring and evaluation of policies as well as identify areas in which there is the need for policy discussions or development. Within the framework of Work Plan 2008 for the implementation of the second programme for community action in the field of public health (2008-2013), this project aims to develop a sustainable environmental health monitoring system consisting of a set of sub-national indicators to improve public health across Europe. The creation of a consistent and common framework within Europe will facilitate the comparability of health status data and help to identify those policies and interventions which deliver positive health outcomes and encourage their transfer to other regions. The aim of work package 4 (WP4) is to assemble a core set of sub-national environmental health indicators to be used for the establishment of a harmonized environmental health system. A number of activities are included in this work package, however, the main tasks included:
1. Engagement of public health professionals working at a regional level to ensure that indicators are informed by regional intelligence and experience;
2. Review of existing lists of (environmental) health indicators (ENHIS, ENHIS2, ECHI, ECHIM and others) and related meta-data for their sub-national relevance;
3. Agreement of the types of indicators to be included in the set; 4. Preparation of a protocol for feasibility testing of initial selection of sub-national indicators
which included assessing:- the quality of the data in the individual partners’ countries, the availability of data, format of the data, spatial coverage and other criteria which were agreed by the group during the kick-off meeting;
5. Use of the criteria mentioned above to undertake an initial assessment of agreed indicators in partner countries;
6. Selection of a set of sub-national indicators based on the feasibility study; and 7. Development of fact-sheets for each indicator
This part of the report descibes the work undertaken from 2 March 2009 to 31 August 2010 in order to accomplish activities 1-7. This included detailed discussions at three project meetings (kick-off meeting, 16-17 March 2009, Luxembourg, 1st interim meeting, 20-21 July 2009, Oxford, United Kingdom and additional project meeting, 23 – 24 March 2010, Dusseldorf, Germany) and monthly teleconferences. Activites and deliverables of WP4 were also discussed at Steering Group meetings. Partners involved in WP4 are as follows: Centre for Health Education and Diseases Prevention (SMLPC formerly VASC until 31 March
2010)), Lithuania (WP Lead) NRW Institute of Health and Work (LIGA.NRW), Germany National Institute of Environmental Health (NIEH), Hungary

SELECTED INDICATORS REPORT
6
National Institute of Public Health (INSP formerly IPHB until 21 December 2009), Romania Institute of Public Health of the Republic of Slovenia (IVZ RS), Slovenia Institute of Health Carlos III (ISCIII), Spain Health Protection Agency (HPA), United Kingdom Collaborative work was undertaken with World Health Organization, European Centre for Environment and Health, Bonn, Germany (Collabourating partner) and the project Steering Group . The methodology for achieving objectives and tasks of the WP4 was an expanded version of that outlined in the contract. The main tasks of this work package included: I. Selection of a core set of indicators II. Production of methodological sheets for each indicator III. Data collection for the indicators in all partner countries (undertaken in collaboration with WP6) IV. Development of fact sheets for each indicator in partner countries.
1.1 Selection of a core set of indicators There are a number of indicator sets which are available within the European Community to facilitate the national assessment of health status of a population. Given this the project partners carried out a preliminary review of such projects inclusive of: Environmental and Health Information System (ENHIS)1, ENHIS2, European Community Health Indicators (ECHI)2, European Community Health Indicators Monitoring (ECHIM), Development of Environment and Health Indicators for Europe (ECOEHIS)3 4
and Health Indicators in European Regions (ISARE). Partners also reviewed national indicator sets available within their country to identify potential indicators for inclusion.
Indicators were considered for inclusion in the feasibility study based on the modified DPSEEA (Drivers, Pressures, State, Exposure, Effects and Actions) model which enables the mapping of a wide spectrum of environmental health issues including social, cultural and behavioural aspects. The use of this selection criteria enabled indicators to be described as drivers, pressures, state, exposure, effects or actions and in some cases a combination of more than one. Given that this project builds on and compliments the work of ENHIS and ENHIS2 projects, the core set of 26 indicators as well as extended set (from ENHIS) were included in the initial list of indicators for feasibility testing. Indicators from other related projects, such as ECOEHIS and ECHI were also included as were a few identified in partner countries’ national indicator sets. In addition, much effort was given to the identification of indicators which addressed the social, cultural and economic issues within populations. After several discussions, a list of 71 indicator (refer to Appendix 1) was proposed for feasibility testing at sub-national level in partner countries.
1 http://www.enhis.org 2 http://ec.europa.eu/health/ph_information/dissemination/echi/echi_en.htm), 3 http://ec.europa.eu/health/ph_projects/2002/monitoring/fp_monitoring_2002_a1_frep_01_en.pdf 4 http://www.euro.who.int/EHindicators/Methodology/20030527_5

SELECTED INDICATORS REPORT
7
Basic information relating to the definition of each of the 71 indicators selected for inclusion in the initial list was assembled in order to undertake feasibility testing in partner countries. The methodological sheets developed in ENHIS project were used for the core and extended ENHIS indicators. If available, methodological sheets from ECOEHIS and ECHIM projects were used for relevant indicators. The methodological sheets for some indicators were developed based on the UK experience gleaned from their participation in national projects/programs relating to indicator sets. The group had to agree a set of criteria in order to assess the applicability for the inclusion of indicators in the initial set. Discussions which primarily took place during the kick-off meeting facilitated the assembly of the set of criteria against which each indicator would be assessed. The list of criteria agreed by the partners is listed in Table 1. TABLE 1: List of criteria for feasibility testing No of criterion
Name of criterion Data entry
1 Data availability 0 = no; 1 = obtainable with effort; 2 = yes, . = missing/not applicable
2 Data source Indicate where the data can be found 3 Quality assurance/quality control of data 0 = none performed/unknown; 1 =
performed 4 Level of spatial disaggregation Indicate: region; municipality; or other
(please specify) 5 Spatial coverage No. of sub-national units with data out of
total; given by x/y where x = No. of units with data, y = total no of units
6 Year of start indicate numeric value of year 7 Last year available indicate numeric value of year 8 Periodicity/regularity of reporting Indicate the frequency of data update eg.
1 year, 2 years etc. 9 Usefulness/interpretability 1 = not useful; 2 = some utility; 3 = very
useful / interpretable 10 Remarks Indicate any other relevant information
As a results of the initial discussions it was realized that in each country sub-national level can be and may be defined differently, thus it was decided to defer defining sub-national level until a later stage. Feasibility testing could be used for the identification of the most appropriate level for each country (partner) to be defined as sub-national. World Health Organization Regions for Health Network5 and ISARE6
5
projects (Health Indicators in European Region) were identified as including activities which may inform or support further work in this project with regards to defining sub-national levels in European countries.
http://www.euro.who.int/rhn 6 http://www.isare.org

SELECTED INDICATORS REPORT
8
The consortium reviewed the results of the study in detail at the 1st interim meeting in July 2009 to decide which indicators would be included in the core set. In addition, the group considered those indicators which would be beneficial for assessing the health status of a population but were currently not adequately developed to be included in the core set. This set is designated as the extended set and further work will be undertaken to try to facilitate their inclusion at a later stage.
Following detailed discussions at the 1st interim meeting, twenty-seven indicators were selected for the core set of indicators. Eighteen indicators were proposed for inclusion in the extended set and the remaining twenty-six were excluded as they were not applicable or data did not exist at a sub-national level. The results of the feasibility study also emphasized the differences which exist in countries with regards to spatial disaggregation. Hence the group had to agree the definition of sub-national level to be used in this project.
Nomenclature of Territorial Units for Statistics (NUTS)7
NUTS 1: 3 – 7 million inhabitants
uses the following thresholds as guidelines for establishing the regions:
NUTS 2: 800 thousand – 3 million inhabitants
NUTS 3: 150 – 800 thousand inhabitants
Sub-national level addressed in the feasibility testing by each country is presented in Table 2. TABLE 2: Distribution of feasibility testing results by NUTS by country Countries NUTS1 NUTS2 NUTS3
Germany DE States (Länder or Bundesländer)
16 Regierungsbezirke 22 Districts (Kreise)
429
Spain ES Groups of autonomous communities
7 Autonomous communities
17 Provinces 59
Ceuta and Melilla 2 -
Hungary HU Groups of Regions
3 Regions 7 Counties and Budapest
20
Lithuania LT - 1 - 1 Counties 10
Romania RO Macro-region 4 Regions 8 Counties and Bucharest
42
Slovenia SL - 1 Groups of Regions 2 Statistical Regions
12
7 http://ec.europa.eu/eurostat/ramon/nuts/basicnuts_regions_en.html

SELECTED INDICATORS REPORT
9
United Kingdom
UK Region of England
9 Groups of Counties; Inner and Outer London
30 Unitary authorities or groups of districts
93
Wales 1 Groups of unitary authorities
2 Groups of unitary authorities
12
Scotland 1 Groups of unitary authorities
4 Groups of unitary authorities
23
Northern Ireland 1 Northern Ireland 1 Groups of Districts
5
The final consensus was that Germany, Spain and the United Kingdom would collect data at a regional level (NUTS18
) and each would select a pilot region at which to collect local level (NUTS3) data for the core set of indicators. In German and the United Kingdom one pilot NUTS3 area has been selected for data collation (North Rhine Westphalia in Germany and West Midlands in UK). However, Hungary, Lithuania, Romania and Slovenia would collect data at a local level (NUTS3) as these were smaller less populated countries.
The first phase of this work package was successfully completed with the assembly of a total of seventy-one indicators for feasibility testing in each partner country. The results of the feasibility study are as follows:
• The selection of twenty-seven indicators inclusion in the core set; • The selection of eighteen indicators for inclusion in the extended set; and • The exclusion of twenty-six proposed indicators.
The indicators selected for the core set are attributable mainly to exposure and effects. The use of the modified DPSEEA model ensured that consideration was given to social, behavioral and cultural aspects which may also impact on the health status of a population.
Details of the selection of core set of indicators and process of feasibility study were provided in the report on Selection of core set of indicators (D1).
1.2 Production of methodological sheets
The next phase in this work package focused on the development of methodological sheets for each indicator selected for inclusion in the core set. A template for the methodological sheet was agreed by all partners and this was an adaptation of those developed for the ENHIS project with appropriate amendments for the purposes of data collection, analysis and interpretation and reporting on sub-national level (Appendix 5).
8 http://ec.europa.eu/eurostat/ramon/nuts/overview_maps_en.cfm?list=nuts (Overview maps of the NUTS and Statistical Regions of Europe)

SELECTED INDICATORS REPORT
10
All partners of UNIPHE project participated in the development of the methodological sheets for the core set of indicators (27 indicators) which were selected in the feasibility testing stage of the WP4. However, after development of methodology sheets, five indicators were excluded from the core set due to: (1) non-uniform data collection methods in partner countries (indicator on proportion of households living in crowded housing conditions); (2) some overlaps with other indicators (indicators on exceedance of recreational water limit values for microbiological parameters and indicator on exceedance of WHO drinking water guidance for microbiological parameters); and (3) uncertainty about the reliability and feasibility for sub-national level data collection (indicators on prevalence of excess body weight and obesity in children and percentage of children who meet the moderate-to-vigorous physical activity guidelines, defined as 60 minutes or more of at least moderate intensity activity on 5 or more days a week). Hence there was a reduction in the core set of indicators from 27 to 22. Indicators on prevalence of excess body weight and obesity in children, percentage of children who meet the moderate-to-vigorous physical activity guidelines and over-crowding were transferred to the extended set of indicators. The resulting list of the extended set of indicators is presented in Appendix 2 and list of those excluded are presented in Appendix 3. Given this, the core set of indicators was reduced from 27 to 22 (Appendix 4) and methodological sheets were developed for this revised list (of 22 indicators). At a later date during the project implementation the list of core set indicators was reduced to twenty; transferring population exposure to PM10 indicator to the extended set, reformulating the indicator on ambient air quality and combining two indicators on children mortality due to unintentional injuries (falls, drowning, fires and poisoning) in two age groups (0-4 and 0-19years) into one indicator with two sub-indicators. TABLE 3: Core set of indicators in categories
Air quality & Noise • Infant mortality due to respiratory
diseases • Mortality due to respiratory
diseases • Mortality due to circulatory diseases • Ambient air pollutants annual mean
concentration in urban areas • Exposure to noise pollution Water & Food Safety • Outbreaks of waterborne diseases • Outbreaks of food-borne diseases • Incidence rate of food-borne
diseases • Bathing water quality • Drinking water quality:
microbiological
Socio-economic • Life expectancy at birth • Total unemployment • Infant mortality rate • Living floor area per person Chemicals, UV& Ionizing
radiation • Incidence of childhood leukaemia • Incidence of melanoma Accident, mobility & transport • Mortality due road traffic injuries in
children • Mortality due to unintentional
injuries (falls, drowning, fires and poisoning) in children
• Injury rate due to road traffic accidents

SELECTED INDICATORS REPORT
11
The indicators were grouped into five categories based risk factors and possible health effects in most cases: socio-economic, air quality and noise, water and food safety, chemicals, UV and ionizing radiation, accident, mobility and transport (refer to Table 3). Methodological sheets for the core set of indicators are presented in the report on Compilation of methodological sheets for indicators (D2). 1.3 Data collection for the core set of indicators
Data collation was a collaborative effort between WP4 and WP6. Guidance on the definition of the data required for the computation of the indicators was provided by WP4. In addition attempt was made to collect data necessary for standardisation of some indicators. Where it was feasible standardised data are presented in the UNIPHE System. Data collation was a very time consuming process in which all partners participated and further details of this activity is provided in the Interim Technical Report (D5). 1.4 Development of national fact sheets
The next series of activities focused on the development of national fact sheets for regional assessment of data within participating countries.
Given this, the template agreed was an adaptation of the fact sheets template of ENHIS project and that used by United Kingdom within the CEHAPE Indicator project. An example of the UNIPHE fact-sheet template is presented in Appendix 6.
The results of data collection were discussed at Additional Meeting on 23 – 24 March 2010. The problem of missing data was encountered for some indicators in partner countries hence it was agreed that seven indicators from a variety of categories would be selected for the development of fact-sheets in all partner countries; namely, life expectancy at birth, infant mortality rate, annual mortality due to respiratory diseases in children older than one month and under one year of age, mortality due to respiratory diseases (total population), injury rate due to traffic accidents, incidence of melanoma, population weighted particulate matter (PM10) concentration. The latter is omitted from the final report as during project implementation it was replaced by another indicator on ambient air quality (ambient air pollutants annual mean concentration in urban areas) due to interpretability on sub-national level.
To avoid duplication of effort, common sections of each fact sheet such as rationale, policy context, assessment on European level were prepared by a nominated partner (see Table 4).
TABLE 4: Development of common sections for national fact sheets for seven indicators by country
No of indicator
Name of indicator Partner country developing common sections
1. Life expectancy at birth Romania

SELECTED INDICATORS REPORT
12
2. Infant mortality Spain 3. Infant mortality rate due to respiratory
diseases Slovenia
4. Mortality due to respiratory diseases United Kingdom 5. Injury rate due to road traffic accidents Germany 6. Incidence of melanoma Lithuania 7. Population weighted particulate matter
(PM10) concentration – REPLACED Hungary
Each partner country was then required to prepare fact sheets for the seven indicators except in the case of missing data. Graphs, bar charts and time trends were produced by WP6 for inclusion in the data presentation section in the fact-sheets. Further details of the fact sheets are provided in the Technical Interim Report (D5).
Each partner provided input for key message, additional national/sub-national policy relevance information, national and sub-national assessment of data presented and references, where required, for the developed national fact-sheets. Table 5 shows the fact sheets which were developed by partners for sub-national analyses within their country. That country in which there was the issue of missing data was unable to prepare a fact sheet for the indicator (with missing data).
TABLE 5: National fact sheets developed by country
No of indicator
Name of indicator for which fact-sheet was developed
DE HU LT RO SI SP UK
1. Life expectancy at birth √ √ √ √ √ √ √ 2. Infant mortality √ √ √ √ √ √ √ 3. Infant mortality rate due to respiratory
diseases √ √ √ √ √ √ √
4. Mortality due to respiratory diseases √ √ √ √ √ √ √ 5. Injury rate due to road traffic accidents √ √ √ √ √ √ 6. Incidence of melanoma √ √ √ √ √ √
All national fact sheets developed for selected six indicators are presented in the Part 2 of this report.
Fact sheets developed for remaining core set indicators are compiled in a separate document.
The main achievements of WP4 are as follows:
• Selection of core set of indicators through feasibility testing procedure
• Development of methodological sheet template
• Development of methodological sheets for the core set
• Identification of indicators for inclusion in the extended set (of indicators)
• Development of fact sheet template

SELECTED INDICATORS REPORT
13
• Development of national fact sheets in all partner countries for selected six indicators
• Development of example fact sheets for other (fourteen) core set indicators

SELECTED INDICATORS REPORT
14
2 REGIONAL ASSESSMENT FOR SELECTED INDICATORS
The final stage of the work package included the development of national fact-sheets for each indicator with focus on sub-national comparisons within the countries. Due to the problem of missing data it was agreed that six indicators from a variety of categories would be selected for the development of fact-sheets in all partner countries, namely;
• Life expectancy at birth • infant mortality • infant mortality due to respiratory diseases • mortality due to respiratory diseases • injury rate due to road traffic accidents • incidence of melanoma
The template agreed was an adaptation of the fact sheet template of ENHIS project and that used by United Kingdom within the CEHAPE Indicator project.
Subject to data availability each partner country produced national fact-sheets for each of seven indicators. The intended outcome of these assessments is to provide information on situation on relevant sub-national level (NUTS1/NUTS2/NUTS3) for the selected indicator, identify differences, trends within the country and in comparison to European and international situation (if applicable). The fact-sheets provide information on definition of indicator, key message of the findings including trends and comparison to national and/or international guideline or target values/standards/objectives. The section on rationale explains the reasons for selecting the indicator with reference to its importance for human health outlining links between the environment and health, magnitude and severity of the problem, evidence base available. In policy relevance and context link of the indicator to current relevant European Union and World Health Organization policies as well as relevant national and/or sub-national policies is provided. Visualization of situation is achieved through the presentation of data in maps, bar charts and graphs. For indicators with small number of cases on sub-national level three–year moving averages were used for time trends. The assessment section includes the overall status for each indicator on European level and globally and most importantly on the sub-national level.
This part of the report describes the regional assessments of the six indicators in partner countries (subject to data availability).
For regional assessment such methods as time trends, comparison with national average, comparison with international/national/sub-national targets and goals were used.
Data is presented in tables, lines, bars and maps. Where feasible fact sheets were updated and standardized data presented.
SELECTED INDICATORS REPORT
15
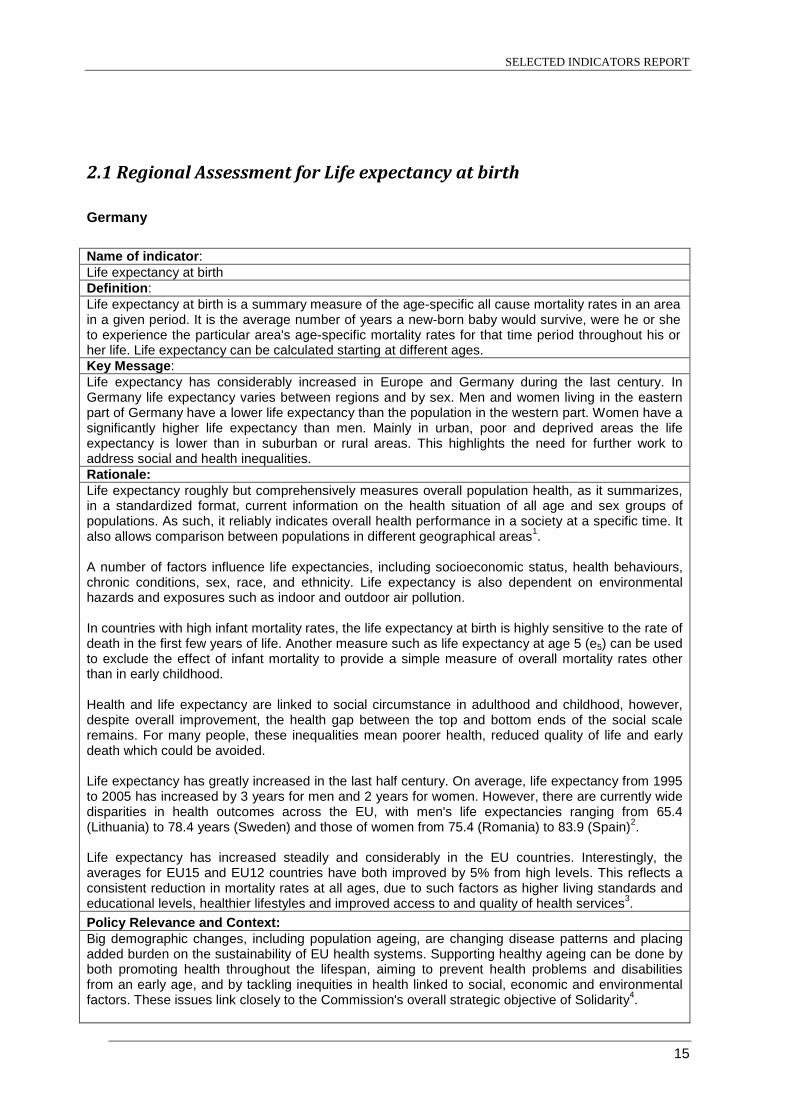
2.1 Regional Assessment for Life expectancy at birth
Germany Name of indicator: Life expectancy at birth Definition: Life expectancy at birth is a summary measure of the age-specific all cause mortality rates in an area in a given period. It is the average number of years a new-born baby would survive, were he or she to experience the particular area's age-specific mortality rates for that time period throughout his or her life. Life expectancy can be calculated starting at different ages. Key Message: Life expectancy has considerably increased in Europe and Germany during the last century. In Germany life expectancy varies between regions and by sex. Men and women living in the eastern part of Germany have a lower life expectancy than the population in the western part. Women have a significantly higher life expectancy than men. Mainly in urban, poor and deprived areas the life expectancy is lower than in suburban or rural areas. This highlights the need for further work to address social and health inequalities. Rationale: Life expectancy roughly but comprehensively measures overall population health, as it summarizes, in a standardized format, current information on the health situation of all age and sex groups of populations. As such, it reliably indicates overall health performance in a society at a specific time. It also allows comparison between populations in different geographical areas1. A number of factors influence life expectancies, including socioeconomic status, health behaviours, chronic conditions, sex, race, and ethnicity. Life expectancy is also dependent on environmental hazards and exposures such as indoor and outdoor air pollution. In countries with high infant mortality rates, the life expectancy at birth is highly sensitive to the rate of death in the first few years of life. Another measure such as life expectancy at age 5 (e5) can be used to exclude the effect of infant mortality to provide a simple measure of overall mortality rates other than in early childhood. Health and life expectancy are linked to social circumstance in adulthood and childhood, however, despite overall improvement, the health gap between the top and bottom ends of the social scale remains. For many people, these inequalities mean poorer health, reduced quality of life and early death which could be avoided. Life expectancy has greatly increased in the last half century. On average, life expectancy from 1995 to 2005 has increased by 3 years for men and 2 years for women. However, there are currently wide disparities in health outcomes across the EU, with men's life expectancies ranging from 65.4 (Lithuania) to 78.4 years (Sweden) and those of women from 75.4 (Romania) to 83.9 (Spain)2. Life expectancy has increased steadily and considerably in the EU countries. Interestingly, the averages for EU15 and EU12 countries have both improved by 5% from high levels. This reflects a consistent reduction in mortality rates at all ages, due to such factors as higher living standards and educational levels, healthier lifestyles and improved access to and quality of health services3. Policy Relevance and Context: Big demographic changes, including population ageing, are changing disease patterns and placing added burden on the sustainability of EU health systems. Supporting healthy ageing can be done by both promoting health throughout the lifespan, aiming to prevent health problems and disabilities from an early age, and by tackling inequities in health linked to social, economic and environmental factors. These issues link closely to the Commission's overall strategic objective of Solidarity4.

SELECTED INDICATORS REPORT
16
Demographic change in Europe presents further economic, budgetary and social challenges in coming decades owing to people living longer and a potential drop in the workforce from the falling birth rate. In the western part of the Region, the number of people over 64 years has more than doubled since the 1950s, while the number of those over 80 years has quadrupled. While in many ways this can be seen as a triumph for public health, it also poses a particular challenge for the health and social sector. Predictions are that the ratio of elderly, economically inactive people (> 65 years) to people of working age could more than double between 2005 to 2050 in the European Union. It is more important than ever that people remain healthy and independent to as late in life as possible, so that premature deaths among the middle-aged working population are avoided and morbidity is “compressed” towards the end of life4. The European Commission outlines five directions to meet the demographic challenge over the coming years: • promoting demographic renewal in Europe by improving the balance between professional,
private and working life (parental leave, more flexible working arrangements, implementation of the commitments on childcare made at the Barcelona European Council);
• promoting employment in Europe through more jobs and longer working lives: the EU seeks to improve education systems and wants to prioritize "flexicurity" systems which facilitate the transition between the different stages in the life cycle (increased flexibility on the labour market combined with lifelong learning). Work enhancement also entails combating discriminatory prejudices against older workers and promoting a genuine European public health policy (tackling smoking, alcoholism and obesity) in order to reduce differences in life expectancy (which are directly related to the standard of living and level of education);
• a more productive and dynamic Europe thanks to the refocusing of the Lisbon strategy since 2005. This revised strategy will give the different economic operators the chance to take full advantage of the opportunities presented by demographic change;
• receiving and integrating immigrants in Europe: given the attraction of Europe, the EU is working with the Member States to develop a common policy on legal immigration. Over the next 20 years, Europe will in fact have to attract a qualified labour force from outside in order to meet the needs of its labour market. It is also the task of the Union to promote diversity and combat prejudice in order to facilitate the economic and social integration of immigrants;
• sustainable public finances in Europe: to guarantee adequate social protection and equity between the generations in most Member States, budgetary restraint is absolutely essential, particularly when reforming the pensions system. There will also be a need to link the coverage of these systems and the level of contributions to the development of private saving and funded systems5.
Several improvements in living condition and health care have led towards an increasing life expectancy. All effective preventive or health promoting measures are in general concerning life expectancy due to improving the state of health. Therefore the development of a health-conscious lifestyle due to nutrition, exercise, occupational safety etc. is indispensable. Studies show that life expectancy is influenced by regionally differing life situations7. Particularly people living in poor areas, such as the Ruhr area in North Rhine-Westphalia, Germany, show lower life expectancy than people in suburban regions. Avoidable deaths due to lung cancer, ischemic heart disease, liver disease, hypertension and cerebrovascular disease, being able to diminish by primary or secondary prevention, mainly have taken place in poor and deprived areas. This can be seen particularly in urban regions of the Ruhr area8, with its high amounts of unemployment and people with migration background. Therefore several programs aimed at reducing social and health inequalities have been established in Germany, eg. programs for integration of immigrants. In 2007 a “National Integration Plan” was published9. In 2005, a “Concept of Prevention in North Rhine-Westphalia”10 was founded which developed a coordinated and target-orientated approach for all initiatives and programs. For promoting a demographic renewal some policies have been established to support young families and to enable flexible jobs and safe employment. One of these measures is a law regarding parental allowances and parental leave11. As health promotion and prevention preferably should begin in the early childhood, other laws concerning childcare (eg. kindergarten) have been adopted in

SELECTED INDICATORS REPORT
17
the respective federal states12. Furthermore, adequate social protection for elderly people is currently assured by a national pension guarantee. Since 2002 a privately financed pension with state funding, the so called Riester-Rente, has been additionally introduced13. Nevertheless, there have been discussions in Germany about reducing level of pensions or raising the age of retirement due to the demographic challenges. Presentation of Data:
71
72
73
74
75
76
77
78
79
1999 2000 2001 2002 2003 2004 2005 2006 2007 2008
life
expe
ctan
cy a
t bir
th (y
ears
of a
ge)
Life expectancy at birth of males by federal states (NUTS1), Germany
Baden-Württemberg (DE1) Bayern (DE2) Berlin (DE3)Brandenburg (DE4) Bremen (DE5) Hamburg (DE6)Hessen (DE7) Mecklenburg-Vorpommern (DE8) Niedersachsen (DE9)Nordrhein-Westfalen (DEA) Rheinland-Pfalz (DEB) Saarland (DEC)Sachsen (DED) Sachsen-Anhalt (DEE) Schleswig-Holstein (DEF)Thüringen (DEG) national value
79
80
81
82
83
84
1999 2000 2001 2002 2003 2004 2005 2006 2007 2008
life
expe
ctan
cy a
t bir
th (y
ears
of a
ge)
Life expectancy at birth of females by federal states (NUTS1), Germany
Baden-Württemberg (DE1) Bayern (DE2) Berlin (DE3)
Brandenburg (DE4) Bremen (DE5) Hamburg (DE6)
Hessen (DE7) Mecklenburg-Vorpommern (DE8) Niedersachsen (DE9)
Nordrhein-Westfalen (DEA) Rheinland-Pfalz (DEB) Saarland (DEC)
Sachsen (DED) Sachsen-Anhalt (DEE) Schleswig-Holstein (DEF)
Thüringen (DEG) national value

SELECTED INDICATORS REPORT
18
72
73
74
75
76
77
78
79
80
1999 2000 2001 2002 2003 2004 2005 2006 2007 2008
life
expe
ctan
cy a
t bir
th (y
ears
of a
ge)
Life expectancy at birth of males by NUTS3 in region Düsseldorf, North Rhine-Westphalia, Germany
Düsseldorf (DEA11) Duisburg (DEA12) Essen (DEA13) Krefeld (DEA14)
Mönchengladbach (DEA15) Mülheim an der Ruhr (DEA16) Oberhausen (DEA17) Remscheid (DEA18)
Solingen (DEA19) Wuppertal (DEA1A) Kleve (DEA1B) Mettmann (DEA1C)
Rhein-Kreis Neuss (DEA1D) Viersen (DEA1E) Wesel (DEA1F) Nordrhein-Westfalen (DEA)
78
79
80
81
82
83
84
1999 2000 2001 2002 2003 2004 2005 2006 2007 2008
life
expe
ctan
cy a
t bir
th (y
ears
of a
ge)
Life expectancy at birth of females by NUTS3 in region Düsseldorf, North Rhine-Westphalia, Germany
Düsseldorf (DEA11) Duisburg (DEA12) Essen (DEA13) Krefeld (DEA14)
Mönchengladbach (DEA15) Mülheim an der Ruhr (DEA16) Oberhausen (DEA17) Remscheid (DEA18)
Solingen (DEA19) Wuppertal (DEA1A) Kleve (DEA1B) Mettmann (DEA1C)
Rhein-Kreis Neuss (DEA1D) Viersen (DEA1E) Wesel (DEA1F) Nordrhein-Westfalen (DEA)
72
73
74
75
76
77
78
79
80
1999 2000 2001 2002 2003 2004 2005 2006 2007 2008
life
exp
ect
ancy
at
bir
th (y
ear
s o
f age
)
Life expectancy at birth of males by NUTS3 in region Köln,North Rhine-Westphalia, Germany
Aachen (DEA21) Bonn (DEA22) Köln (DEA23)Leverkusen (DEA24) Aachen, Kreis (DEA25) Düren (DEA26)Rhein-Erft-Kreis (DEA27) Euskirchen (DEA28) Heinsberg (DEA29)Oberbergischer Kreis (DEA2A) Rheinisch-Bergischer Kreis (DEA2B) Rhein-Sieg-Kreis (DEA2C)Nordrhein-Westfalen (DEA)
78
79
80
81
82
83
84
1999 2000 2001 2002 2003 2004 2005 2006 2007 2008
life
exp
ect
ancy
at
bir
th (y
ear
s o
f age
)
Life expectancy at birth of females by NUTS3 in region Köln,North Rhine-Westphalia, Germany
Aachen (DEA21) Bonn (DEA22) Köln (DEA23)Leverkusen (DEA24) Aachen, Kreis (DEA25) Düren (DEA26)Rhein-Erft-Kreis (DEA27) Euskirchen (DEA28) Heinsberg (DEA29)Oberbergischer Kreis (DEA2A) Rheinisch-Bergischer Kreis (DEA2B) Rhein-Sieg-Kreis (DEA2C)Nordrhein-Westfalen (DEA)
72
73
74
75
76
77
78
79
80
1999 2000 2001 2002 2003 2004 2005 2006 2007 2008
life
expe
ctan
cy a
t bir
th (y
ears
of a
ge)
Life expectancy at birth of males by NUTS3 in region Münster, North Rhine-Westphalia, Germany
Bottrop (DEA31) Gelsenkirchen (DEA32) Münster (DEA33)
Borken (DEA34) Coesfeld (DEA35) Recklinghausen (DEA36)
Steinfurt (DEA37) Warendorf (DEA38) Nordrhein-Westfalen (DEA)
78
79
80
81
82
83
84
1999 2000 2001 2002 2003 2004 2005 2006 2007 2008
life
expe
ctan
cy a
t bir
th (y
ears
of a
ge)
Life expectancy at birth of females by NUTS3 in region Münster, North Rhine-Westphalia, Germany
Bottrop (DEA31) Gelsenkirchen (DEA32) Münster (DEA33)
Borken (DEA34) Coesfeld (DEA35) Recklinghausen (DEA36)
Steinfurt (DEA37) Warendorf (DEA38) Nordrhein-Westfalen (DEA)

SELECTED INDICATORS REPORT
19
72
73
74
75
76
77
78
79
80
1999 2000 2001 2002 2003 2004 2005 2006 2007 2008
life
expe
ctan
cy a
t bir
th (y
ears
of a
ge)
Life expectancy at birth of males by NUTS3 in region Detmold, North Rhine-Westphalia, Germany
Bielefeld (DEA41) Gütersloh (DEA42) Herford (DEA43)
Höxter (DEA44) Lippe (DEA45) Minden-Lübbecke (DEA46)
Paderborn (DEA47) Nordrhein-Westfalen (DEA)
78
79
80
81
82
83
84
1999 2000 2001 2002 2003 2004 2005 2006 2007 2008
life
expe
ctan
cy a
t bir
th (y
ears
of a
ge)
Life expectancy at birth of females by NUTS3 in region Detmold, North Rhine-Westphalia, Germany
Bielefeld (DEA41) Gütersloh (DEA42) Herford (DEA43)
Höxter (DEA44) Lippe (DEA45) Minden-Lübbecke (DEA46)
Paderborn (DEA47) Nordrhein-Westfalen (DEA)
72
73
74
75
76
77
78
79
80
1999 2000 2001 2002 2003 2004 2005 2006 2007 2008
life
expe
ctan
cy a
t bir
th (y
ears
of a
ge)
Life expectancy at birth of males by NUTS3 in region Arnsberg, North Rhine-Westphalia, Germany
Bochum (DEA51) Dortmund (DEA52) Hagen (DEA53) Hamm (DEA54)
Herne (DEA55) Ennepe-Ruhr-Kreis (DEA56) Hochsauerlandkreis (DEA57) Märkischer Kreis (DEA58)
Olpe (DEA59) Siegen-Wittgenstein (DEA5A) Soest (DEA5B) Unna (DEA5C)
Nordrhein-Westfalen (DEA)
78
79
80
81
82
83
84
1999 2000 2001 2002 2003 2004 2005 2006 2007 2008
life
expe
ctan
cy a
t bir
th (y
ears
of a
ge)
Life expectancy at birth of females by NUTS3 in region Arnsberg, North Rhine-Westphalia, Germany
Bochum (DEA51) Dortmund (DEA52) Hagen (DEA53)Hamm (DEA54) Herne (DEA55) Ennepe-Ruhr-Kreis (DEA56)Hochsauerlandkreis (DEA57) Märkischer Kreis (DEA58) Olpe (DEA59)Siegen-Wittgenstein (DEA5A) Soest (DEA5B) Unna (DEA5C)Nordrhein-Westfalen (DEA)
Assessment: Life expectancy has been gradually increasing for both men and women in Europe, like in other world regions, and this trend is expected to continue. EU-27 life expectancy of a boy at birth was 75.8 years in 2006, while the life expectancy of a newborn girl was just over six years higher at 82.0 years6. This constant increasing trend in the EU may, at least in part, be attributed to higher standards of living, advances in medicine, better healthcare, as well as more general awareness of health issues. Although many Europeans enjoy a longer and healthier life than previous generations, major inequalities still exist between countries and regions; for example, life expectancy at birth for men varied by 14.2 years between Member States in 2007, while the corresponding figure among women was 8.3 years. The lowest male life expectancy was recorded in Lithuania (64.9 years) and the highest in Sweden (79.0 years), while for women, the range varied between a low of 76.5 years in Latvia and a high of 84.8 years in France (6). Life expectancy at birth (LEB) has continuously increased in Germany with approximately 30 years in the last century and a consistent gain of more than 2 years per decade. In 2008 German men had a life expectancy of 77.2 years, women of 82.4 years. During the reporting period (1999 – 2008) the life expectancy on national level increased by 3.3% for men and 2.3% for women. On sub-national level, life expectancy varies between the federal states (NUTS1) as well as by sex. People living in the eastern part of Germany have a lower life expectancy than the population in the western federal states. All eastern federal states show a lower life expectancy than the national average, apart from Saxony where life expectancy for women in 2008 was 82.7 years. In 2008, the difference between the highest (Baden-Württemberg) and lowest (Mecklenburg-Western Pomerania for men, Saarland for female) life expectancy in German federal states is 3.8 for men and 2.2 years for women.

SELECTED INDICATORS REPORT
20
Three federal states in Germany are city states: Berlin, Bremen and Hamburg. In these city states the life expectancy for men is close to the national average. Men living in Hamburg had a slightly higher (77.3) and in Berlin a slightly lower (76.9) life expectancy, while the life expectancy in Bremen (76.0) is more than one year lower than the national average in 2008. L life expectancy for women in city states was comparable (between the city states), however lower than the national average. The life expectancy in North Rhine-Westphalia (f: 82.0; m: 77.0) was in 2008 slightly lower than the national value, comparable to Lower Saxony (f: 82.1; m: 76.8), Rhineland-Palatinate (f: 82.0; m: 77.1) and Schleswig-Holstein (f: 82.1; m: 77.1). In North Rhine-Westphalia the increase in life expectancy during the reporting period for men (3.4%) is comparable to the national value (3.3%). The increase in life expectancy of North Rhine-Westphalian women (1.7%) is however lower than the national increase (2.3%). In North Rhine-Westphalia life expectancy at birth varies between counties and cities (NUTS3). In 2008, life expectancy ranged from 80.0 to 83.3 years for women and 74.3 to 77.5 years for men on regional level in North Rhine-Westphalia, which equates to a difference of 3.3 years for women and 3.2 years for men. In the counties (NUTS3), wide year-to-year variations were observed, but in general life expectancy showed an increasing trend. A lower life expectancy was observed for people from poorer cities, especially in the urban and industrial Ruhr areas, such as Gelsenkirchen (f: 80.0; m: 74.8), Oberhausen (f: 80.5; m: 74.9) and Duisburg (f: 80.7; m: 75.2) than for those from wealthy cities like Münster (f: 83.2; m: 77.5). The situation was similar in previous years. Over the last years Bonn, Rheinisch-Bergischer Kreis, Rhein-Sieg-Kreis and Münster were the regions with the highest life expectancy. In particular, women in Münster (83.6 and 83.2) and in Bonn (82.7 and 83.1) led the table in 2007 and 2008 and were so during the last years. Data underlying the indicator:
• Primary source: National/regional mortality statistics • Date last published: 2008 (Stat. Bundesamt), 2008 (LIGA.NRW) • Time period of analysis: 1990-2008 (LIGA.NRW, Stat. Bundesamt) • Numerator definition: Number of age specific deaths • Source of numerator: national/regional mortality statistics • Denominator definition: Total population in age specified age group • Source of denominator: national/regional statistics, National census • Geographic coverage: Germany (NUTS1), North Rhine-Westphalia (NUTS3) • Timeliness: Annually, 31.12., data online available • Accuracy and completeness of data set: Data on life expectancy at birth are valid and
complete (calculated using (abridged) life tables presenting age specific mortality rates) • Disclosure control: none
References: 1. Smits J and Monden C. (2009). Length of life inequality around the globe. Social Science and
Medicine, 68:1114–1123 2. Joint Report on Social Protection and Social Inclusion (2007). Available at
http://europa.eu/rapid/pressReleasesAction.do?reference=MEMO/07/66. (accessed on 30 July 2010)
3. World Health Statistics Report. World Health Organization (2009). Available at http://www.who.int/whosis/whostat/EN_WHS09_Full.pdf. (accessed on 30 July 2010)
4. Together for Health: A Strategic Approach for the EU 2008-2013. Available at http://ec.europa.eu/health-eu/doc/whitepaper_en.pdf (accessed 30 July 2010)
5. The demographic future of Europe – from challenge to opportunity. Available at http://europa.eu/legislation_summaries/employment_and_social_policy/situation_in_europe/c10160_en.htm (accessed 30 July 2010)
6. Eurostat (2010): Life expectancy statistics. http://epp.eurostat.ec.europa.eu/statistics_explained/index.php/Life_expectancy_statistics (accessed 30 July 2010)

SELECTED INDICATORS REPORT
21
7. Landesinstitut für den Öffentlichen Gesundheitsdienst NRW (lögd) (2005): Regionale Unterschiede ausgewählter Gesundheitsindikatoren. LIGA kurz und informativ. lögd NRW, Bielefeld. http://www.liga.nrw.de/_media/pdf/gesundheitberichtedaten/nrw-kurz-und-informativ/regionale-unterschiede-indikatoren_0512.pdf. (accessed 18 July 2010)
8. Landesinstitut für Gesundheit und Arbeit NRW (LIGA.NRW) (2008): Vermeidbare Sterbefälle in Nordrhein-Westfalen. LIGA kurz und informativ. LIGA.NRW, Düsseldorf. http://www.liga.nrw.de/_media/pdf/gesundheitberichtedaten/nrw-kurz-und-informativ/vermeidbare-sterbefaelle-2006_0807.pdf. (accessed 17 August 2010)
9. Presse- und Informationsamt der Bundesregierung; Die Beauftragte der Bundesregierung für Migration, Flüchtlinge und Integration (2007): Der nationale Integrationsplan. Berlin. http://www.bundesregierung.de/Content/DE/Publikation/IB/Anlagen/nationaler-integrationsplan,property=publicationFile.pdf. (accessed 2 September 2010)
10. Landesinstitut für Gesundheit und Arbeit NRW (LIGA.NRW) (2009): Das Präventionskonzept Nordrhein-Westfalen - eine Investition in Lebensqualität. LIGA.NRW, Düsseldorf. http://www.praeventionskonzept.nrw.de/fileadmin/Dokumente/0_Allgmein/handlungsgrundlage_praeventionskonzept1109.pdf. (accessed 2 September 2010)
11. Bundesministerium der Justiz (2006): Gesetz zum Elterngeld und zur Elternzeit. BMJ, Berlin. http://www.gesetze-im-internet.de/bundesrecht/beeg/gesamt.pdf. (accessed 2 September 2010)
12. Ministerium für Gesundheit Emanzipation, Pflege und Alter des Landes Nordrhein-Westfalen (MGEPA) (2004): Gesetz über Tageseinrichtungen für Kinder. MGEPA, Düsseldorf. http://www.mgepa.nrw.de/kinder-und-jugend/kinder-nrw/index-gesetz-tageseinrichtungen/index.php. (accessed 2 September 2010)
13. Deutsche Rentenversicherung Bund (2008): Riester Rente. Berlin. http://www deutsche-rentenversicherung-bund de/nn_12292/SharedDocs/de/Navigation/Rente/Riester__Rente__node html__nnn=true. (accessed 2 September 2010)
Further Information: Author: Odile Mekel, Linda Tacke, Florian Fischer, LIGA.NRW, Germany Date of production: 6 October 2010

SELECTED INDICATORS REPORT
22
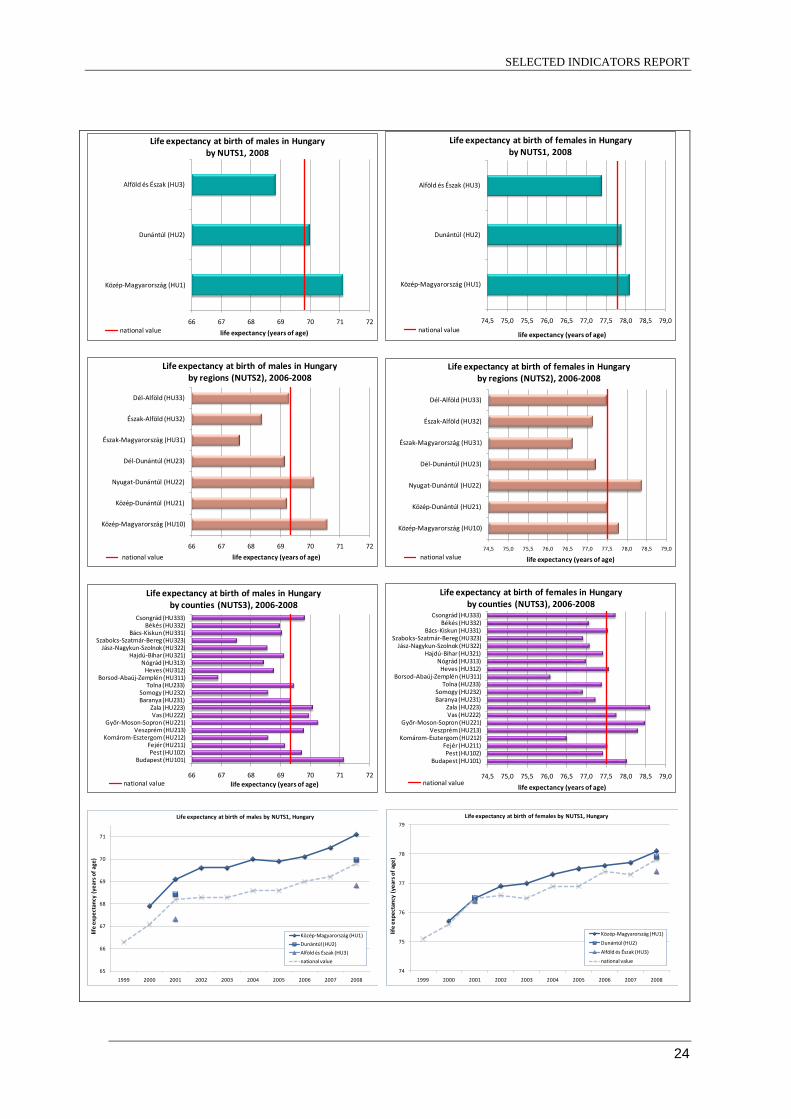
Hungary Name of indicator: Life expectancy at birth Definition: Life expectancy at birth is a summary measure of the age-specific all cause mortality rates in an area in a given period. It is the average number of years a new-born baby would survive, were he or she to experience the particular area's age-specific mortality rates for that time period throughout his or her life. Life expectancy can be calculated starting at different ages. Key Message: Life expectancy at birth in Hungary is lower than the EU average by 6 years for males (70 years) and by 4 years for females (78 years) in 2008. However, an upward trend has being observed over the last 10 years. In addition to the gender inequalities, there is also a spatial difference: life expectancy is lower in the more deprived eastern part of the country (especially in the north-eastern part) and higher in the western part and in the capital, Budapest. Rationale: Life expectancy roughly but comprehensively measures overall population health, as it summarizes, in a standardized format, current information on the health situation of all age and sex groups of populations. As such, it reliably indicates overall health performance in a society at a specific time. It also allows comparison between populations in different geographical areas1. A number of factors influence life expectancies, including socioeconomic status, health behaviours, chronic conditions, sex, race, and ethnicity. Life expectancy is also dependent on environmental hazards and exposures such as indoor and outdoor air pollution. In countries with high infant mortality rates, the life expectancy at birth is highly sensitive to the rate of death in the first few years of life. Another measure such as life expectancy at age 5 (e5) can be used to exclude the effect of infant mortality to provide a simple measure of overall mortality rates other than in early childhood. Health and life expectancy are linked to social circumstance in adulthood and childhood, however, despite overall improvement, the health gap between the top and bottom ends of the social scale remains. For many people, these inequalities mean poorer health, reduced quality of life and early death which could be avoided. Life expectancy has greatly increased in the last half century. On average, life expectancy from 1995 to 2005 has increased by 3 years for men and 2 years for women. However, there are currently wide disparities in health outcomes across the EU, with men's life expectancies ranging from 65.4 (Lithuania) to 78.4 years (Sweden) and those of women from 75.4 (Romania) to 83.9 (Spain)2. Life expectancy has increased steadily and considerably in the EU countries. Interestingly, the averages for EU15 and EU12 countries have both improved by 5% from high levels. This reflects a consistent reduction in mortality rates at all ages, due to such factors as higher living standards and educational levels, healthier lifestyles and improved access to and quality of health services3. Policy Relevance and Context: Big demographic changes, including population ageing, are changing disease patterns and placing added burden on the sustainability of EU health systems. Supporting healthy ageing can be done by both promoting health throughout the lifespan, aiming to prevent health problems and disabilities from an early age, and by tackling inequities in health linked to social, economic and environmental factors. These issues link closely to the Commission's overall strategic objective of Solidarity4. Demographic change in Europe presents further economic, budgetary and social challenges in coming decades owing to people living longer and a potential drop in the workforce from the falling

SELECTED INDICATORS REPORT
23
birth rate. In the western part of the Region, the number of people over 64 years has more than doubled since the 1950s, while the number of those over 80 years has quadrupled. While in many ways this can be seen as a triumph for public health, it also poses a particular challenge for the health and social sector. Predictions are that the ratio of elderly, economically inactive people (> 65 years) to people of working age could more than double between 2005 to 2050 in the European Union. It is more important than ever that people remain healthy and independent to as late in life as possible, so that premature deaths among the middle-aged working population are avoided and morbidity is “compressed” towards the end of life4. The European Commission outlines five directions to meet the demographic challenge over the coming years: • promoting demographic renewal in Europe by improving the balance between professional,
private and working life (parental leave, more flexible working arrangements, implementation of the commitments on childcare made at the Barcelona European Council);
• promoting employment in Europe through more jobs and longer working lives: the EU seeks to improve education systems and wants to prioritize "flexicurity" systems which facilitate the transition between the different stages in the life cycle (increased flexibility on the labour market combined with lifelong learning). Work enhancement also entails combating discriminatory prejudices against older workers and promoting a genuine European public health policy (tackling smoking, alcoholism and obesity) in order to reduce differences in life expectancy (which are directly related to the standard of living and level of education);
• a more productive and dynamic Europe thanks to the refocusing of the Lisbon strategy since 2005. This revised strategy will give the different economic operators the chance to take full advantage of the opportunities presented by demographic change;
• receiving and integrating immigrants in Europe: given the attraction of Europe, the EU is working with the Member States to develop a common policy on legal immigration. Over the next 20 years, Europe will in fact have to attract a qualified labour force from outside in order to meet the needs of its labour market. It is also the task of the Union to promote diversity and combat prejudice in order to facilitate the economic and social integration of immigrants;
• sustainable public finances in Europe: to guarantee adequate social protection and equity between the generations in most Member States, budgetary restraint is absolutely essential, particularly when reforming the pensions system. There will also be a need to link the coverage of these systems and the level of contributions to the development of private saving and funded systems (5).
The Hungarian National Public Health Programme7 contains several sub-programs that can be grouped in 4 categories:
1. Establishing a health supporting environment (includes actions on the health of youth and children, health of the elderly, reducing health inequalities etc.)
2. Program on healthy life style (actions on reducing tobacco smoke, alcohol and drug prevention, healthy diet, promoting physical activity, environmental health etc.)
3. Prevention of avoidable diseases (actions on prevention of diseases of the circulatory system/malignant neoplasm, strengthening mental health, HIV prevention etc.)
4. Health care and public health infrastructure Presentation of Data:
MALES FEMALES
SELECTED INDICATORS REPORT
24
66 67 68 69 70 71 72
Közép-Magyarország (HU1)
Dunántúl (HU2)
Alföld és Észak (HU3)
life expectancy (years of age)
Life expectancy at birth of males in Hungary by NUTS1, 2008
national value
74,5 75,0 75,5 76,0 76,5 77,0 77,5 78,0 78,5 79,0
Közép-Magyarország (HU1)
Dunántúl (HU2)
Alföld és Észak (HU3)
life expectancy (years of age)
Life expectancy at birth of females in Hungary by NUTS1, 2008
national value
66 67 68 69 70 71 72
Közép-Magyarország (HU10)
Közép-Dunántúl (HU21)
Nyugat-Dunántúl (HU22)
Dél-Dunántúl (HU23)
Észak-Magyarország (HU31)
Észak-Alföld (HU32)
Dél-Alföld (HU33)
life expectancy (years of age)
Life expectancy at birth of males in Hungary by regions (NUTS2), 2006-2008
national value 74,5 75,0 75,5 76,0 76,5 77,0 77,5 78,0 78,5 79,0
Közép-Magyarország (HU10)
Közép-Dunántúl (HU21)
Nyugat-Dunántúl (HU22)
Dél-Dunántúl (HU23)
Észak-Magyarország (HU31)
Észak-Alföld (HU32)
Dél-Alföld (HU33)
life expectancy (years of age)
Life expectancy at birth of females in Hungary by regions (NUTS2), 2006-2008
national value
66 67 68 69 70 71 72
Budapest (HU101)Pest (HU102)
Fejér (HU211)Komárom-Esztergom (HU212)
Veszprém (HU213)Győr-Moson-Sopron (HU221)
Vas (HU222)Zala (HU223)
Baranya (HU231)Somogy (HU232)
Tolna (HU233)Borsod-Abaúj-Zemplén (HU311)
Heves (HU312)Nógrád (HU313)
Hajdú-Bihar (HU321)Jász-Nagykun-Szolnok (HU322)
Szabolcs-Szatmár-Bereg (HU323)Bács-Kiskun (HU331)
Békés (HU332)Csongrád (HU333)
life expectancy (years of age)
Life expectancy at birth of males in Hungary by counties (NUTS3), 2006-2008
national value 74,5 75,0 75,5 76,0 76,5 77,0 77,5 78,0 78,5 79,0
Budapest (HU101)Pest (HU102)
Fejér (HU211)Komárom-Esztergom (HU212)
Veszprém (HU213)Győr-Moson-Sopron (HU221)
Vas (HU222)Zala (HU223)
Baranya (HU231)Somogy (HU232)
Tolna (HU233)Borsod-Abaúj-Zemplén (HU311)
Heves (HU312)Nógrád (HU313)
Hajdú-Bihar (HU321)Jász-Nagykun-Szolnok (HU322)
Szabolcs-Szatmár-Bereg (HU323)Bács-Kiskun (HU331)
Békés (HU332)Csongrád (HU333)
life expectancy (years of age)
Life expectancy at birth of females in Hungary by counties (NUTS3), 2006-2008
national value
65
66
67
68
69
70
71
1999 2000 2001 2002 2003 2004 2005 2006 2007 2008
life
expe
ctan
cy (
year
s of a
ge)
Life expectancy at birth of males by NUTS1, Hungary
Közép-Magyarország (HU1)
Dunántúl (HU2)
Alföld és Észak (HU3)
national value
74
75
76
77
78
79
1999 2000 2001 2002 2003 2004 2005 2006 2007 2008
life
expe
ctan
cy (
year
s of a
ge)
Life expectancy at birth of females by NUTS1, Hungary
Közép-Magyarország (HU1)
Dunántúl (HU2)
Alföld és Észak (HU3)
national value

SELECTED INDICATORS REPORT
25
65
66
67
68
69
70
71
1999-2001 2000-2002 2001-2003 2002-2004 2003-2005 2004-2006 2005-2007 2006-2008
life
expe
ctan
cy (
year
s of a
ge)
Life expectancy at birth of males by regions (NUTS2), Hungary
Közép-Magyarország (HU10) Közép-Dunántúl (HU21)Nyugat-Dunántúl (HU22) Dél-Dunántúl (HU23)Észak-Magyarország (HU31) Észak-Alföld (HU32)Dél-Alföld (HU33) national value
74
75
76
77
78
79
1999-2001 2000-2002 2001-2003 2002-2004 2003-2005 2004-2006 2005-2007 2006-2008
life
expe
ctan
cy (
year
s of a
ge)
Life expectancy at birth of females by regions (NUTS2), Hungary
Közép-Magyarország (HU10) Közép-Dunántúl (HU21)
Nyugat-Dunántúl (HU22) Dél-Dunántúl (HU23)
Észak-Magyarország (HU31) Észak-Alföld (HU32)
Dél-Alföld (HU33) national value
65
66
67
68
69
70
71
1999-2001 2000-2002 2001-2003 2002-2004 2003-2005 2004-2006 2005-2007 2006-2008
life
expe
ctan
cy (
year
s of a
ge)
Life expectancy at birth of males by counties (NUTS3) in region Közép-Magyarország, Hungary
Budapest (HU101)
Pest (HU102)
national value
74
75
76
77
78
79
1999-2001 2000-2002 2001-2003 2002-2004 2003-2005 2004-2006 2005-2007 2006-2008
life
expe
ctan
cy (
year
s of a
ge)
Life expectancy at birth of females by counties (NUTS3) in region Közép-Magyarország, Hungary
Budapest (HU101)
Pest (HU102)
national value
65
66
67
68
69
70
71
1999-2001 2000-2002 2001-2003 2002-2004 2003-2005 2004-2006 2005-2007 2006-2008
life
expe
ctan
cy (
year
s of a
ge)
Life expectancy at birth of males by counties (NUTS3) in region Közép-Dunántúl, Hungary
Fejér (HU211)
Komárom-Esztergom (HU212)
Veszprém (HU213)
national value
74
75
76
77
78
79
1999-2001 2000-2002 2001-2003 2002-2004 2003-2005 2004-2006 2005-2007 2006-2008
life
expe
ctan
cy (
year
s of a
ge)
Life expectancy at birth of females by counties (NUTS3) in region Közép-Dunántúl, Hungary
Fejér (HU211)
Komárom-Esztergom (HU212)
Veszprém (HU213)
national value
65
66
67
68
69
70
71
1999-2001 2000-2002 2001-2003 2002-2004 2003-2005 2004-2006 2005-2007 2006-2008
life
expe
ctan
cy (
year
s of a
ge)
Life expectancy at birth of males by counties (NUTS3) in region Nyugat-Dunántúl, Hungary
Győr-Moson-Sopron (HU221)
Vas (HU222)
Zala (HU223)
national value
74
75
76
77
78
79
1999-2001 2000-2002 2001-2003 2002-2004 2003-2005 2004-2006 2005-2007 2006-2008
life
expe
ctan
cy (
year
s of a
ge)
Life expectancy at birth of females by counties (NUTS3) in region Nyugat-Dunántúl, Hungary
Győr-Moson-Sopron (HU221)
Vas (HU222)
Zala (HU223)
national value

SELECTED INDICATORS REPORT
26
65
66
67
68
69
70
71
1999-2001 2000-2002 2001-2003 2002-2004 2003-2005 2004-2006 2005-2007 2006-2008
life
expe
ctan
cy (
year
s of a
ge)
Life expectancy at birth of males by counties (NUTS3) in region Dél-Dunántúl, Hungary
Baranya (HU231)
Somogy (HU232)
Tolna (HU233)
national value
74
75
76
77
78
79
1999-2001 2000-2002 2001-2003 2002-2004 2003-2005 2004-2006 2005-2007 2006-2008
life
expe
ctan
cy (
year
s of a
ge)
Life expectancy at birth of females by counties (NUTS3) in region Dél-Dunántúl, Hungary
Baranya (HU231)
Somogy (HU232)
Tolna (HU233)
national value
65
66
67
68
69
70
71
1999-2001 2000-2002 2001-2003 2002-2004 2003-2005 2004-2006 2005-2007 2006-2008
life
expe
ctan
cy (
year
s of a
ge)
Life expectancy at birth of males by counties (NUTS3) in region Észak-Magyarország, Hungary
Borsod-Abaúj-Zemplén (HU311)
Heves (HU312)
Nógrád (HU313)
national value
74
75
76
77
78
79
1999-2001 2000-2002 2001-2003 2002-2004 2003-2005 2004-2006 2005-2007 2006-2008
life
expe
ctan
cy (
year
s of a
ge)
Life expectancy at birth of females by counties (NUTS3) in region Észak-Magyarország, Hungary
Borsod-Abaúj-Zemplén (HU311)
Heves (HU312)
Nógrád (HU313)
national value
65
66
67
68
69
70
71
1999-2001 2000-2002 2001-2003 2002-2004 2003-2005 2004-2006 2005-2007 2006-2008
life
expe
ctan
cy (
year
s of a
ge)
Life expectancy at birth of males by counties (NUTS3) in region Észak-Alföld, Hungary
Hajdú-Bihar (HU321)Jász-Nagykun-Szolnok (HU322)Szabolcs-Szatmár-Bereg (HU323)national value
74
75
76
77
78
79
1999-2001 2000-2002 2001-2003 2002-2004 2003-2005 2004-2006 2005-2007 2006-2008
life
expe
ctan
cy (
year
s of a
ge)
Life expectancy at birth of females by counties (NUTS3) in region Észak-Alföld, Hungary
Hajdú-Bihar (HU321)
Jász-Nagykun-Szolnok (HU322)
Szabolcs-Szatmár-Bereg (HU323)
national value
65
66
67
68
69
70
71
1999-2001 2000-2002 2001-2003 2002-2004 2003-2005 2004-2006 2005-2007 2006-2008
life
expe
ctan
cy (
year
s of a
ge)
Life expectancy at birth of males by counties (NUTS3) in region Dél-Alföld, Hungary
Bács-Kiskun (HU331)
Békés (HU332)
Csongrád (HU333)
national value
74
75
76
77
78
79
1999-2001 2000-2002 2001-2003 2002-2004 2003-2005 2004-2006 2005-2007 2006-2008
life
expe
ctan
cy (
year
s of a
ge)
Life expectancy at birth of females by counties (NUTS3) in region Dél-Alföld, Hungary
Bács-Kiskun (HU331)
Békés (HU332)
Csongrád (HU333)
national value
Assessment: Life expectancy has been gradually increasing for both men and women in Europe, like in other world regions, and this trend is expected to continue. EU-27 life expectancy of a boy at birth was 75.8 years in 2006, while the life expectancy of a newborn girl was just over six years higher at 82.0 years6. This constant increasing trend in the EU may, at least in part, be attributed to higher standards of living, advances in medicine, better healthcare, as well as more general awareness of health issues.

SELECTED INDICATORS REPORT
27
Although many Europeans enjoy a longer and healthier life than previous generations, major inequalities still exist between countries and regions; for example, life expectancy at birth for men varied by 14.2 years between Member States in 2007, while the corresponding figure among women was 8.3 years. The lowest male life expectancy was recorded in Lithuania (64.9 years) and the highest in Sweden (79.0 years), while for women, the range varied between a low of 76.5 years in Latvia and a high of 84.8 years in France6. Life expectancy at birth in Hungary is lower than the EU average by 6 years for males (70 years) and by 4 years for females (78 years) in 20088. It has been increased in Hungary during the last decade. The national values increased between 1999 and 2008 from 66 years of age to 70 for males and from 75 to almost 78 for females. In addition to the gender inequality, there is a significant spatial difference: For males it approximates to the national value in the western part (Dunántúl, HU2), it is lower than the national value by 1 year in the eastern part of the country (Alföld és Észak, HU3) and it is higher by 1 year in Central Hungary (HU1) in 2008. The difference is much lower for females. There is also inequality between the regions: life expectancy is the highest in region Central Hungary (HU10) for males and in Western Transdanubia (HU22) for females and it is the lowest in Northern Hungary (HU31) for both genders. Regarding the counties, it is the lowest in the most deprived county, Borsod-Abaúj-Zemplén, and it is the highest in the capital, Budapest for males and in county Zala for females. Data underlying the indicator:
• Primary source: Hungarian Central Statistical Office • Date last published: 2009 • Time period of analysis: 1999–2008 • Numerator definition: Average number of years a new-born baby would survive, were he or
she to experience the particular area's age-specific mortality rates for that time period throughout his or her life.
• Source of numerator: Hungarian Central Statistical Office • Denominator definition: • Source of denominator: • Geographic coverage: Complete for the country. • Timeliness: The database is updated annually. • Accuracy and completeness of data set: • Disclosure control
References: 1. Smits J and Monden C. (2009). Length of life inequality around the globe. Social Science and Medicine, 68:1114–1123 2. Joint Report on Social Protection and Social Inclusion (2007). Available at http://europa.eu/rapid/pressReleasesAction.do?reference=MEMO/07/66. (accessed on 30 July 2010) 3. World Health Statistics Report. World Health Organization (2009). Available at http://www.who.int/whosis/whostat/EN_WHS09_Full.pdf. (accessed on 30 July 2010) 4. Together for Health: A Strategic Approach for the EU 2008-2013. Available at http://ec.europa.eu/health-eu/doc/whitepaper_en.pdf (accessed 30 July 2010) 5. The demographic future of Europe – from challenge to opportunity. Available at http://europa.eu/legislation_summaries/employment_and_social_policy/situation_in_europe/c10160_en.htm (accessed 30 July 2010) 6. Eurostat – Life expectancy statistics. Available at http://epp.eurostat.ec.europa.eu/statistics_explained/index.php/Life_expectancy_statistics (accessed 30 July 2010) 7. National Public Health Programme of Hungary: No. 46/2003. (IV. 16.) Decree of the Parliament 8. WHO Health for All Database http://data.euro.who.int/hfadb/ (accessed 14 September 2010) Further Information: Author: Tibor Malnasi, Anna Paldy, National Institute of Environmental Health, Hungary Date of production: 14 September 2010

SELECTED INDICATORS REPORT
28
Lithuania Name of indicator: Life expectancy at birth Definition: Life expectancy at birth is a summary measure of the age-specific all cause mortality rates in an area in a given period. It is the average number of years a new-born baby would survive, were he or she to experience the particular area's age-specific mortality rates for that time period throughout his or her life. Life expectancy can be calculated starting at different ages. Key Message: Average life expectancy from 1999 till 2008 increased from 71.76 years to 73.1 years in Lithuania, but decreases in 2001 and in the period 2004–2007 were observed. There are big differences between males and females, but on average life expectancy has increased for both sexes from 1999 till 2008. There are big differences of average life expectancy among counties, comparing three year average data (2006–2008). The highest average life expectancy among females and males was in Kaunas and Panavėžys counties, the lowest in Tauragė county among females and in Utena county among males. Rationale: Life expectancy roughly but comprehensively measures overall population health, as it summarizes, in a standardized format, current information on the health situation of all age and sex groups of populations. As such, it reliably indicates overall health performance in a society at a specific time. It also allows comparison between populations in different geographical areas1. A number of factors influence life expectancies, including socioeconomic status, health behaviors, chronic conditions, sex, race, and ethnicity. Life expectancy is also dependent on environmental hazards and exposures such as indoor and outdoor air pollution. In countries with high infant mortality rates, the life expectancy at birth is highly sensitive to the rate of death in the first few years of life. Another measure such as life expectancy at age 5 (e5) can be used to exclude the effect of infant mortality to provide a simple measure of overall mortality rates other than in early childhood. Health and life expectancy are linked to social circumstance in adulthood and childhood, however, despite overall improvement, the health gap between the top and bottom ends of the social scale remains. For many people, these inequalities mean poorer health, reduced quality of life and early death which could be avoided. Life expectancy has greatly increased in the last half century. On average, life expectancy from 1995 to 2005 has increased by 3 years for men and 2 years for women. However, there are currently wide disparities in health outcomes across the EU, with men's life expectancies ranging from 65.4 (Lithuania) to 78.4 years (Sweden) and those of women from 75.4 (Romania) to 83.9 (Spain)2. Life expectancy has increased steadily and considerably in the EU countries. Interestingly, the averages for EU15 and EU12 countries have both improved by 5% from high levels. This reflects a consistent reduction in mortality rates at all ages, due to such factors as higher living standards and educational levels, healthier lifestyles and improved access to and quality of health services3. Policy Relevance and Context: Big demographic changes, including population ageing, are changing disease patterns and placing added burden on the sustainability of EU health systems. Supporting healthy ageing can be done by both promoting health throughout the lifespan, aiming to prevent health problems and disabilities from an early age, and by tackling inequities in health linked to social, economic and environmental

SELECTED INDICATORS REPORT
29
factors. These issues link closely to the Commission's overall strategic objective of Solidarity4. Demographic change in Europe presents further economic, budgetary and social challenges in coming decades owing to people living longer and a potential drop in the workforce from the falling birth rate. In the western part of the Region, the number of people over 64 years has more than doubled since the 1950s, while the number of those over 80 years has quadrupled. While in many ways this can be seen as a triumph for public health, it also poses a particular challenge for the health and social sector. Predictions are that the ratio of elderly, economically inactive people (> 65 years) to people of working age could more than double between 2005 to 2050 in the European Union. It is more important than ever that people remain healthy and independent to as late in life as possible, so that premature deaths among the middle-aged working population are avoided and morbidity is “compressed” towards the end of life4. The European Commission outlines five directions to meet the demographic challenge over the coming years: • promoting demographic renewal in Europe by improving the balance between professional,
private and working life (parental leave, more flexible working arrangements, implementation of the commitments on childcare made at the Barcelona European Council);
• promoting employment in Europe through more jobs and longer working lives: the EU seeks to improve education systems and wants to prioritize "flexicurity" systems which facilitate the transition between the different stages in the life cycle (increased flexibility on the labour market combined with lifelong learning). Work enhancement also entails combating discriminatory prejudices against older workers and promoting a genuine European public health policy (tackling smoking, alcoholism and obesity) in order to reduce differences in life expectancy (which are directly related to the standard of living and level of education);
• a more productive and dynamic Europe thanks to the refocusing of the Lisbon strategy since 2005. This revised strategy will give the different economic operators the chance to take full advantage of the opportunities presented by demographic change;
• receiving and integrating immigrants in Europe: given the attraction of Europe, the EU is working with the Member States to develop a common policy on legal immigration. Over the next 20 years, Europe will in fact have to attract a qualified labour force from outside in order to meet the needs of its labour market. It is also the task of the Union to promote diversity and combat prejudice in order to facilitate the economic and social integration of immigrants;
• sustainable public finances in Europe: to guarantee adequate social protection and equity between the generations in most Member States, budgetary restraint is absolutely essential, particularly when reforming the pensions system. There will also be a need to link the coverage of these systems and the level of contributions to the development of private saving and funded systems5.
Lithuanian Health Programme 1997−2010 adopted by the Parliament, Resolution No.VIII -833 in 1998, set the target by the year 2010 to reduce mortality rates and to increase the average life expectancy up to 73 years, reducing mortality from main causes, i.e., cardiovascular diseases, accidents and cancers. National Strategy for Sustainable Development, adopted by the Government of the Republic of Lithuania in 2003, Resolution No.1160 (Official Gazette, 2003, No. 89-4029; 2009, No. 121-5215) defined a Vision of National Strategy for Sustainable Development − in 2020 to achieve the average level of 2003 EU-15 according to economic, social and eco-efficiency indicators. One of the main long-term objectives in public health is to increase the average of life expectancy, EU-15 average of life expectancy in 2003 was 78,85 years, female – 81,8 and male – 75,9. Presentation of Data:

SELECTED INDICATORS REPORT
30
Life expectancy at birth of males by counties (NUTS3), Lithuania, 2006-2008
Life expectancy at birth of females by counties (NUTS3), Lithuania, 2006-2008

SELECTED INDICATORS REPORT
31
62,5 63,0 63,5 64,0 64,5 65,0 65,5 66,0 66,5 67,0
Alytaus apskritis (LT001)
Kauno apskritis (LT002)
Klaipedos apskritis (LT003)
Marijampoles apskritis (LT004)
Panevezio apskritis (LT005)
Siauliu apskritis (LT006)
Taurages apskritis (LT007)
Telsiu apskritis (LT008)
Utenos apskritis (LT009)
Vilniaus apskritis (LT00A)
life expectancy at birth (years of age)
Life expectancy at birth, males, Lithuania by counties (NUTS3), 2006-2008
national value
63,5
64,0
64,5
65,0
65,5
66,0
66,5
67,0
67,5
68,0
1999-2001 2000-2002 2001-2003 2002-2004 2003-2005 2004-2006 2005-2007 2006-2008
life
expe
ctan
cy a
t bir
th (y
ears
of a
ge)
Life expectancy at birth, males, Lithuania by counties (NUTS3) I.
Alytaus apskritis (LT001)
Kauno apskritis (LT002)
Klaipedos apskritis (LT003)
Marijampoles apskritis (LT004)
Panevezio apskritis (LT005)
national value
75,0
75,5
76,0
76,5
77,0
77,5
78,0
78,5
79,0
1999-2001 2000-2002 2001-2003 2002-2004 2003-2005 2004-2006 2005-2007 2006-2008
life
expe
ctan
cy a
t bir
th (y
ears
of a
ge)
Life expectancy at birth, females, Lithuania by counties (NUTS3) II.
Siauliu apskritis (LT006)
Taurages apskritis (LT007)
Telsiu apskritis (LT008)
Utenos apskritis (LT009)
Vilniaus apskritis (LT00A)
national value
75,5 76,0 76,5 77,0 77,5 78,0 78,5
Alytaus apskritis (LT001)
Kauno apskritis (LT002)
Klaipedos apskritis (LT003)
Marijampoles apskritis (LT004)
Panevezio apskritis (LT005)
Siauliu apskritis (LT006)
Taurages apskritis (LT007)
Telsiu apskritis (LT008)
Utenos apskritis (LT009)
Vilniaus apskritis (LT00A)
life expectancy at birth (years of age)
Life expectancy at birth, females, Lithuania by counties (NUTS3), 2006-2008
national value
63,5
64,0
64,5
65,0
65,5
66,0
66,5
67,0
67,5
68,0
1999-2001 2000-2002 2001-2003 2002-2004 2003-2005 2004-2006 2005-2007 2006-2008
life
expe
ctan
cy a
t bir
th (y
ears
of a
ge)
Life expectancy at birth, males, Lithuania by counties (NUTS3) II.
Siauliu apskritis (LT006)
Taurages apskritis (LT007)
Telsiu apskritis (LT008)
Utenos apskritis (LT009)
Vilniaus apskritis (LT00A)
national value
75,0
75,5
76,0
76,5
77,0
77,5
78,0
78,5
79,0
1999-2001 2000-2002 2001-2003 2002-2004 2003-2005 2004-2006 2005-2007 2006-2008
life
expe
ctan
cy a
t bir
th (y
ears
of a
ge)
Life expectancy at birth, females, Lithuania by counties (NUTS3) I.
Alytaus apskritis (LT001)
Kauno apskritis (LT002)
Klaipedos apskritis (LT003)
Marijampoles apskritis (LT004)
Panevezio apskritis (LT005)
national value
Assessment: Life expectancy has been gradually increasing for both men and women in Europe, like in other world regions, and this trend is expected to continue. EU-27 life expectancy of a boy at birth was 75.8 years in 2006, while the life expectancy of a newborn girl was just over six years higher at 82.0 years6. This constant increasing trend in the EU may, at least in part, be attributed to higher standards of living, advances in medicine, better healthcare, as well as more general awareness of health issues.

SELECTED INDICATORS REPORT
32
Although many Europeans enjoy a longer and healthier life than previous generations, major inequalities still exist between countries and regions; for example, life expectancy at birth for men varied by 14.2 years between Member States in 2007, while the corresponding figure among women was 8.3 years. The lowest male life expectancy was recorded in Lithuania (64.9 years) and the highest in Sweden (79.0 years), while for women, the range varied between a low of 76.5 years in Latvia and a high of 84.8 years in France6. Average life expectancy from 1999 to 2008 increased from 71.8 years to 73.1 years in Lithuania. There are big differences between males and females, but average life expectancy increased for both from 1999 to 2008: among males from 66.4 to 67.5, respectively and females from 77.0 to 78.6, respectively. Comparing average life expectancy from 1999 to 2008, there was observed decreases in 2001 (more obviously among men) and in the period 2004–2007, however, from 2008 started to increase. The main cause of the decrease of average life expectancy in Lithuania during these period, were premature deaths especially among men (reduced 12 years of average life expectancy) and also among females (reduced by 6 years)8. Lithuanian Health Programme 1997−2010 adopted by the Parliament, Resolution No.VIII -833 in 1998, set the target by the year 2010 to increase the average life expectancy up to 73 years. The latest data from Lithuanian Statistics showed, that in 2009 average life expectancy increased and reached 73.1 years. This indicates that the target of Lithuanian Health Programme was achieved in 2009, but it is by 5.8 years still lower than average life expectancy for EU-15. For males there is 8.4 years difference (EU-15 – 75.9 years in 2003, and LTU – 67.51 years in 2009), for female 3.2 years difference (EU-15 – 81,8 years in 2003, and LTU – 78,56 years in 2009). In 2008 differences in average life expectancy at birth in different counties had decreased with that between the highest and the lowest (those of Kaunas and Panevėžys, and Utena and Tauragė counties) being 1.7 years. The highest average life expectancy of female at 78.1 years was in Alytus, and that of male at 66.2 years in Panevėžys counties. However, the difference between the male and female average life expectancy indicators was of the order of 12–13 years in all counties, except for Panevėžys county, where this difference was slightly lower at 11.2 years, and Alytus and Utena counties, where it exceeded 13.5 years7. On average, life expectancy among females has increased in all counties for the period 1999 to 2008. However, among males there was a general decrease in life expectancy in all counties, except Marijampolė, from 1999 until 2007. It was encouraging to observe a reverse in the trend in 2008, however, in Alytus and Utena counties the average life expectancy among males was lower in 2008 than in 1999 (65.6 and 64.2 in 2008 compared to 67.2 and 65.7 in 1999, respectively). Data underlying the indicator:
• Primary source: Data base of Statistics Lithuania • Date last published: 2008 • Time period of analysis: 1999–2008 • Numerator definition: Number of age-specific deaths • Source of numerator: Statistics Lithuania • Denominator definition: Total population in specified age group • Source of denominator: Statistics Lithuania • Geographic coverage: National (Lithuania) and 10 Lithuanian counties (apskritys; NUTS 3
level) • Timeliness: annual data are available from 1999. • Accuracy and completeness of data set: data accurate and complete • Disclosure control: aggregated data can be used.
References: 1. Smits J and Monden C. (2009). Length of life inequality around the globe. Social Science and Medicine, 68:1114–1123 2. Joint Report on Social Protection and Social Inclusion (2007). Available at
SELECTED INDICATORS REPORT
33
http://europa.eu/rapid/pressReleasesAction.do?reference=MEMO/07/66. (accessed on 30 July 2010) 3. World Health Statistics Report. World Health Organization (2009). Available at http://www.who.int/whosis/whostat/EN_WHS09_Full.pdf. (accessed on 30 July 2010) 4. Together for Health: A Strategic Approach for the EU 2008-2013. Available at http://ec.europa.eu/health-eu/doc/whitepaper_en.pdf (accessed 30 July 2010) 5. The demographic future of Europe – from challenge to opportunity. Available at http://europa.eu/legislation_summaries/employment_and_social_policy/situation_in_europe/c10160_en.htm (accessed 30 July 2010) 6. Eurostat – Life expectancy statistics. Available at http://epp.eurostat.ec.europa.eu/statistics_explained/index.php/Life_expectancy_statistics (accessed 30 July 2010) 7. Statistics Lithuania report (2008). Development of the regions of Lithuania Availiable at http://regionai.stat.gov.lt/pdf/Development_of_the_regions_2008_11_25_.pdf (accessed 31 August 2010) 8. Nacionalinės sveikatos tarybos metinis pranešimas 2007. Sveikata ir saugumas: protrūkiai ir krizės. – Vilnius: UAB „Baltijos kopija“, 2008. – 176 p. Further Information: Author: Aida Laukaitienė, Center for Health Education and Disease Prevention, Lithuania Date of production: 15 October 2010

SELECTED INDICATORS REPORT
34
Romania Name of indicator: Life Expectancy at Birth Definition: Life expectancy at birth is a summary measure of the age-specific all cause mortality rates in an area in a given period. It is the average number of years a new-born baby would survive, were he or she to experience the particular area's age-specific mortality rates for that time period throughout his or her life. Life expectancy can be calculated starting at different ages. Key Message: Life expectancy at birth has continuously improved in Romania over the last decade, similarly to the other EU Member States. However, life expectancy at birth in Romania is about 6 years less than the EU average (EU average was of 79.2 years in 2007, while in Romania it was 73.0 years; WHO-EURO HFA database 2010). On average, LEB was 69.7 years in 1997, increasing to 73.03 in 2007. Over the period 1997-2007 there was a marginal difference in the increase for the 2 genders: for males the increase of was 3.4 years, from 66.1 (1997) to 69.5 (2007), while for females the increase was of 3 years from 73.7 (1997) to 76.7 (2007). Rationale: Life expectancy roughly but comprehensively measures overall population health, as it summarizes, in a standardized format, current information on the health situation of all age and sex groups of populations. As such, it reliably indicates overall health performance in a society at a specific time. It also allows comparison between populations in different geographical areas1. A number of factors influence life expectancies, including socioeconomic status, health behaviors, chronic conditions, sex, race, and ethnicity. Life expectancy is also dependent on environmental hazards and exposures such as indoor and outdoor air pollution. In countries with high infant mortality rates, the life expectancy at birth is highly sensitive to the rate of death in the first few years of life. Another measure such as life expectancy at age 5 (e5) can be used to exclude the effect of infant mortality to provide a simple measure of overall mortality rates other than in early childhood. Health and life expectancy are linked to social circumstance in adulthood and childhood, however, despite overall improvement, the health gap between the top and bottom ends of the social scale remains. For many people, these inequalities mean poorer health, reduced quality of life and early death which could be avoided. Life expectancy has greatly increased in the last half century. On average, life expectancy from 1995 to 2005 has increased by 3 years for men and 2 years for women. However, there are currently wide disparities in health outcomes across the EU, with men's life expectancies ranging from 65.4 (Lithuania) to 78.4 years (Sweden) and those of women from 75.4 (Romania) to 83.9 (Spain)2. Life expectancy has increased steadily and considerably in the EU countries. Interestingly, the averages for EU15 and EU12 countries have both improved by 5% from high levels. This reflects a consistent reduction in mortality rates at all ages, due to such factors as higher living standards and educational levels, healthier lifestyles and improved access to and quality of health services3. *Policy Relevance and Context: Big demographic changes, including population ageing, are changing disease patterns and placing added burden on the sustainability of EU health systems. Supporting healthy ageing can be done by both promoting health throughout the lifespan, aiming to prevent health problems and disabilities from an early age, and by tackling inequities in health linked to social, economic and environmental factors. These issues link closely to the Commission's overall strategic objective of Solidarity4.

SELECTED INDICATORS REPORT
35
Demographic change in Europe presents further economic, budgetary and social challenges in coming decades owing to people living longer and a potential drop in the workforce from the falling birth rate. In the western part of the Region, the number of people over 64 years has more than doubled since the 1950s, while the number of those over 80 years has quadrupled. While in many ways this can be seen as a triumph for public health, it also poses a particular challenge for the health and social sector. Predictions are that the ratio of elderly, economically inactive people (> 65 years) to people of working age could more than double between 2005 to 2050 in the European Union. It is more important than ever that people remain healthy and independent to as late in life as possible, so that premature deaths among the middle-aged working population are avoided and morbidity is “compressed” towards the end of life4. The European Commission outlines five directions to meet the demographic challenge over the coming years: • promoting demographic renewal in Europe by improving the balance between professional,
private and working life (parental leave, more flexible working arrangements, implementation of the commitments on childcare made at the Barcelona European Council);
• promoting employment in Europe through more jobs and longer working lives: the EU seeks to improve education systems and wants to prioritize "flexicurity" systems which facilitate the transition between the different stages in the life cycle (increased flexibility on the labour market combined with lifelong learning). Work enhancement also entails combating discriminatory prejudices against older workers and promoting a genuine European public health policy (tackling smoking, alcoholism and obesity) in order to reduce differences in life expectancy (which are directly related to the standard of living and level of education);
• a more productive and dynamic Europe thanks to the refocusing of the Lisbon strategy since 2005. This revised strategy will give the different economic operators the chance to take full advantage of the opportunities presented by demographic change;
• receiving and integrating immigrants in Europe: given the attraction of Europe, the EU is working with the Member States to develop a common policy on legal immigration. Over the next 20 years, Europe will in fact have to attract a qualified labour force from outside in order to meet the needs of its labour market. It is also the task of the Union to promote diversity and combat prejudice in order to facilitate the economic and social integration of immigrants;
• sustainable public finances in Europe: to guarantee adequate social protection and equity between the generations in most Member States, budgetary restraint is absolutely essential, particularly when reforming the pensions system. There will also be a need to link the coverage of these systems and the level of contributions to the development of private saving and funded systems5.
In Romania, the National Public Health Strategy adopted in 2004 has established a set of 6 objectives:
- Reducing the burden of non-communicable diseases - Increasing the capacity of the communicable disease control system - Improving the mental health status of the population - Assuring an optimum level of health and quality of life for the Romanian population in each
stage of the life cycle - Enhancing the control of behavioural and environmental risk factors and early detection of
diseases - Improving the health system management (National Public Health Strategy)
All these objectives are contributing to the final outcome to increase the life expectancy of the Romanian population. Presentation of Data: Life expectancy at birth of males in Romania by counties (NUTS3), 2007

SELECTED INDICATORS REPORT
36

SELECTED INDICATORS REPORT
37
63 64 65 66 67 68 69 70 71 72
Bihor (RO111)
Bistrita-Nasaud (RO112)
Cluj (RO113)
Maramures (RO114)
Satu Mare (RO115)
Salaj (RO116)
Alba (RO121)
Brasov (RO122)
Covasna (RO123)
Harghita (RO124)
Mures (RO125)
Sibiu (RO126)
Bacau (RO211)
Botosani (RO212)
Iasi (RO213)
Neamt (RO214)
Suceava (RO215)
Vaslui (RO216)
Braila (RO221)
Buzau (RO222)
Constanta (RO223)
Galati (RO224)
Tulcea (RO225)
Vrancea (RO226)
Arges (RO311)
Calarasi (RO312)
Dambovita (RO313)
Giurgiu (RO314)
Ialomita (RO315)
Prahova (RO316)
Teleorman (RO317)
Bucuresti (RO321)
Ilfov (RO322)
Dolj (RO411)
Gorj (RO412)
Mehedinti (RO413)
Olt (RO414)
Valcea (RO415)
Arad (RO421)
Caras-Severin (RO422)
Hunedoara (RO423)
Timis (RO424)
life expectancy at birth (years of age)
Life expectacy at birth, males, in Romania by counties (NUTS3), 2007
national value

SELECTED INDICATORS REPORT
38
Life expectancy at birth of females in Romania by counties (NUTS3), 2007

SELECTED INDICATORS REPORT
39
72 73 74 75 76 77 78 79
Bihor (RO111)
Bistrita-Nasaud (RO112)
Cluj (RO113)
Maramures (RO114)
Satu Mare (RO115)
Salaj (RO116)
Alba (RO121)
Brasov (RO122)
Covasna (RO123)
Harghita (RO124)
Mures (RO125)
Sibiu (RO126)
Bacau (RO211)
Botosani (RO212)
Iasi (RO213)
Neamt (RO214)
Suceava (RO215)
Vaslui (RO216)
Braila (RO221)
Buzau (RO222)
Constanta (RO223)
Galati (RO224)
Tulcea (RO225)
Vrancea (RO226)
Arges (RO311)
Calarasi (RO312)
Dambovita (RO313)
Giurgiu (RO314)
Ialomita (RO315)
Prahova (RO316)
Teleorman (RO317)
Bucuresti (RO321)
Ilfov (RO322)
Dolj (RO411)
Gorj (RO412)
Mehedinti (RO413)
Olt (RO414)
Valcea (RO415)
Arad (RO421)
Caras-Severin (RO422)
Hunedoara (RO423)
Timis (RO424)
life expectancy at birth (years of age)
Life expectacy at birth, females, in Romania by counties (NUTS3), 2007
national value
Assessment: Life expectancy has been gradually increasing for both men and women in Europe, like in other world regions, and this trend is expected to continue. EU-27 life expectancy of a boy at birth was 75.8

SELECTED INDICATORS REPORT
40
years in 2006, while the life expectancy of a newborn girl was just over six years higher at 82.0 years6. This constant increasing trend in the EU may, at least in part, may be attributed to higher standards of living, advances in medicine, better healthcare, as well as more general awareness of health issues. Although many Europeans enjoy a longer and healthier life than previous generations, major inequalities still exist between countries and regions; for example, life expectancy at birth for men varied by 14.2 years between Member States in 2007, while the corresponding figure among women was 8.3 years. The lowest male life expectancy was recorded in Lithuania (64.9 years) and the highest in Sweden (79.0 years), while for women, the range varied between a low of 76.5 years in Latvia and a high of 84.8 years in France6. Life expectancy at birth has constantly increased in Romania over the last decade, similarly to the other EU Member States. Nevertheless, life expectancy at birth in Romania is about 6 years smaller than the EU average (EU average was of 79.2 years in 2007, while in Romania it was 73.0 years; WHO-EURO HFA database 2010). Life expectancy at birth was of 69.7 years in 1997, increasing to 73.03 in 2007. Over the period 1997-2007 there was a marginal difference in the increase for the 2 genders: for males the increase of was 3.4 years, from 66.1 (1997) to 69.5 (2007), while for females the increase was of 3 years from 73.7 (1997) to 76.7 (2007). Better life standards (especially after 2000) as well as advances in medicine have contributed to this positive trend in Romania, similar to the situation in other European countries. It is noteworthy that the gap between LEB in Romania compared with the EU average was approximately 7.5 years in 1997, while in 2007 it had reduced to 6 years. In addition to gender inequalities, there are also geographic disparities. So, life expectancy for males varies from 65.8 (Satu Mare county) to 71.3 (Valcea county), while for females the said ranges from 74.1 (Satu Mare county) and 78.1 (Bucharest). The maps illustrating LEB for males and females in 2007 show some clusters of higher values than the national average, for both males and females in North-West part of Romania and Bucharest, where the economic standard is higher. Similar clusters can be noticed for lower values than the national average in the most economic deprived parts of Romania (North East and South) Data underlying the indicator: Provide the following information:
• Primary source: Health Statistics Institute • Date last published: 2009 • Time period of analysis: 1997-2007 • Numerator definition • Source of numerator • Denominator definition • Source of denominator • Geographic coverage: • Timeliness: annually • Accuracy and completeness of data set: Mortality data are accurate (there are quality control
mechanisms in place) and complete (cover more than 90% of the population) • Disclosure control: n/a
References: 1. Smits J and Monden C. (2009). Length of life inequality around the globe. Social Science and Medicine, 68:1114–1123 2. Joint Report on Social Protection and Social Inclusion (2007). Available at http://europa.eu/rapid/pressReleasesAction.do?reference=MEMO/07/66. (accessed on 30 July 2010) 3. World Health Statistics Report. World Health Organization (2009). Available at http://www.who.int/whosis/whostat/EN_WHS09_Full.pdf. (accessed on 30 July 2010) 4. Together for Health: A Strategic Approach for the EU 2008-2013. Available at

SELECTED INDICATORS REPORT
41
http://ec.europa.eu/health-eu/doc/whitepaper_en.pdf (accessed 30 July 2010) 5. The demographic future of Europe – from challenge to opportunity. Available at http://europa.eu/legislation_summaries/employment_and_social_policy/situation_in_europe/c10160_en.htm (accessed 30 July 2010) 6. Eurostat – Life expectancy statistics. Available at http://epp.eurostat.ec.europa.eu/statistics_explained/index.php/Life_expectancy_statistics (accessed 30 July 2010) Further Information: Author: Adriana Galan, National Institute of Public Health, Romania Date of production: 23 July 2010

SELECTED INDICATORS REPORT
42
Slovenia Name of indicator: Life expectancy at birth Definition: Life expectancy at birth is a summary measure of the age-specific all cause mortality rates in an area in a given period. It is the average number of years a new-born baby would survive, were he or she to experience the particular area's age-specific mortality rates for that time period throughout his or her life. Life expectancy can be calculated starting at different ages. Key Message: Life expectancy is gradually increasing in Slovenia. There are differences between regions, however, it has been noted that life expectancy is higher in western parts of Slovenia. Rationale: Life expectancy roughly but comprehensively measures overall population health, as it summarizes, in a standardized format, current information on the health situation of all age and sex groups of populations. As such, it reliably indicates overall health performance in a society at a specific time. It also allows comparison between populations in different geographical areas1. A number of factors influence life expectancies, including socioeconomic status, health behaviors, chronic conditions, sex, race, and ethnicity. Life expectancy is also dependent on environmental hazards and exposures such as indoor and outdoor air pollution. In countries with high infant mortality rates, the life expectancy at birth is highly sensitive to the rate of death in the first few years of life. Another measure such as life expectancy at age 5 (e5) can be used to exclude the effect of infant mortality to provide a simple measure of overall mortality rates other than in early childhood. Health and life expectancy are linked to social circumstance in adulthood and childhood, however, despite overall improvement, the health gap between the top and bottom ends of the social scale remains. For many people, these inequalities mean poorer health, reduced quality of life and early death which could be avoided. Life expectancy has greatly increased in the last half century. On average, life expectancy from 1995 to 2005 has increased by 3 years for men and 2 years for women. However, there are currently wide disparities in health outcomes across the EU, with men's life expectancies ranging from 65.4 (Lithuania) to 78.4 years (Sweden) and those of women from 75.4 (Romania) to 83.9 (Spain)2. Life expectancy has increased steadily and considerably in the EU countries. Interestingly, the averages for EU15 and EU12 countries have both improved by 5% from high levels. This reflects a consistent reduction in mortality rates at all ages, due to such factors as higher living standards and educational levels, healthier lifestyles and improved access to and quality of health services3. Policy Relevance and Context: Big demographic changes, including population ageing, are changing disease patterns and placing added burden on the sustainability of EU health systems. Supporting healthy ageing can be done by both promoting health throughout the lifespan, aiming to prevent health problems and disabilities from an early age, and by tackling inequities in health linked to social, economic and environmental factors. These issues link closely to the Commission's overall strategic objective of Solidarity4. Demographic change in Europe presents further economic, budgetary and social challenges in coming decades owing to people living longer and a potential drop in the workforce from the falling birth rate. In the western part of the Region, the number of people over 64 years has more than doubled since the 1950s, while the number of those over 80 years has quadrupled. While in many ways this can be seen as a triumph for public health, it also poses a particular challenge for the

SELECTED INDICATORS REPORT
43
health and social sector. Predictions are that the ratio of elderly, economically inactive people (> 65 years) to people of working age could more than double between 2005 to 2050 in the European Union. It is more important than ever that people remain healthy and independent to as late in life as possible, so that premature deaths among the middle-aged working population are avoided and morbidity is “compressed” towards the end of life4. The European Commission outlines five directions to meet the demographic challenge over the coming years: • promoting demographic renewal in Europe by improving the balance between professional,
private and working life (parental leave, more flexible working arrangements, implementation of the commitments on childcare made at the Barcelona European Council);
• promoting employment in Europe through more jobs and longer working lives: the EU seeks to improve education systems and wants to prioritize "flexicurity" systems which facilitate the transition between the different stages in the life cycle (increased flexibility on the labour market combined with lifelong learning). Work enhancement also entails combating discriminatory prejudices against older workers and promoting a genuine European public health policy (tackling smoking, alcoholism and obesity) in order to reduce differences in life expectancy (which are directly related to the standard of living and level of education);
• a more productive and dynamic Europe thanks to the refocusing of the Lisbon strategy since 2005. This revised strategy will give the different economic operators the chance to take full advantage of the opportunities presented by demographic change;
• receiving and integrating immigrants in Europe: given the attraction of Europe, the EU is working with the Member States to develop a common policy on legal immigration. Over the next 20 years, Europe will in fact have to attract a qualified labour force from outside in order to meet the needs of its labour market. It is also the task of the Union to promote diversity and combat prejudice in order to facilitate the economic and social integration of immigrants;
• sustainable public finances in Europe: to guarantee adequate social protection and equity between the generations in most Member States, budgetary restraint is absolutely essential, particularly when reforming the pensions system. There will also be a need to link the coverage of these systems and the level of contributions to the development of private saving and funded systems5.
There are not special policies for increasing life expectancy in Slovenia. All policies which results in reducing morbidity and mortality rates contributes to increasing life expectancy. Presentation of Data:

SELECTED INDICATORS REPORT
44
Figure 1: Life expectancy at birth for males in Slovenia by NUTS2, 2008
70
71
72
73
74
75
76
77
78
1999 2000 2001 2002 2003 2004 2005 2006 2007 2008
life
expe
ctan
cy a
t bir
th (y
ears
of a
ge)
Life expectancy at birth of males in Slovenia by regions (NUTS2)
Vzhodna Slovenija (SI01)
Zahodna Slovenija (SI02)
national value
Figure 2: Life expectancy at birth for males in Slovenia by NUTS2 for the period 1999-2008

SELECTED INDICATORS REPORT
45
Figure 3: Life expectancy at birth for females in Slovenia by NUTS2 in 2008
77
78
79
80
81
82
83
84
1999 2000 2001 2002 2003 2004 2005 2006 2007 2008
life
expe
ctan
cy a
t bir
th (y
ears
of a
ge)
Life expectancy at birth of females in Slovenia by regions (NUTS2)
Vzhodna Slovenija (SI01)
Zahodna Slovenija (SI02)
national value
Figure 4: Life expectancy at birth for females in Slovenia by NUTS2 for 1999-2008 Source of data: Statistical Office of the Republic of Slovenia Assessment: Life expectancy has been gradually increasing for both men and women in Europe, like in other world regions, and this trend is expected to continue. EU-27 life expectancy of a boy at birth was 75.8 years in 2006, while the life expectancy of a newborn girl was just over six years higher at 82.0 years6. This constant increasing trend in the EU may, at least in part, be attributed to higher standards of living, advances in medicine, better healthcare, as well as more general awareness of health issues.

SELECTED INDICATORS REPORT
46
Although many Europeans enjoy a longer and healthier life than previous generations, major inequalities still exist between countries and regions; for example, life expectancy at birth for men varied by 14.2 years between Member States in 2007, while the corresponding figure among women was 8.3 years. The lowest male life expectancy was recorded in Lithuania (64.9 years) and the highest in Sweden (79.0 years), while for women, the range varied between a low of 76.5 years in Latvia and a high of 84.8 years in France6. Life expectancy is gradually increasing in Slovenia. There are differences between regions, however, it has been noted that life expectancy is higher in western parts of Slovenia. Life expectancy is the shortest in Pomurska region and the longest in Osrednjeslovenska region in years 1995-1999 (SORS). Data underlying the indicator:
• Date last published: 2009 • Time period of analysis: 1999-2008 (NUTS 1), 2005-2008 (NUTS2) • Numerator definition: Number of age-specific deaths • Source of numerator: National Institute of Public Health, Slovenia • Denominator definition: Total population in specified age group • Source of denominator: Statistical Office of the Republic of Slovenia • Geographic coverage: NUTS1, NUTS2 • Timeliness: annually • Accuracy and completeness of data set: life expectancy at birth NUTS 2: 2005-2008 • Disclosure control: According to national legislation
*References: 1. Smits J and Monden C. (2009). Length of life inequality around the globe. Social Science and Medicine, 68:1114–1123 2. Joint Report on Social Protection and Social Inclusion (2007). Available at http://europa.eu/rapid/pressReleasesAction.do?reference=MEMO/07/66. (accessed on 30 July 2010) 3. World Health Statistics Report. World Health Organization (2009). Available at http://www.who.int/whosis/whostat/EN_WHS09_Full.pdf. (accessed on 30 July 2010) 4. Together for Health: A Strategic Approach for the EU 2008-2013. Available at http://ec.europa.eu/health-eu/doc/whitepaper_en.pdf (accessed 30 July 2010) 5. The demographic future of Europe – from challenge to opportunity. Available at http://europa.eu/legislation_summaries/employment_and_social_policy/situation_in_europe/c10160_en.htm (accessed 30 July 2010) 6. Eurostat – Life expectancy statistics. Available at http://epp.eurostat.ec.europa.eu/statistics_explained/index.php/Life_expectancy_statistics (accessed 30 July 2010) Further Information: Author: Ana Hojs, National Institute of Public Health, Slovenia Date of production: August 2010

SELECTED INDICATORS REPORT
47
Spain Name of indicator: Life expectancy at birth Definition:
Life expectancy at birth is a summary measure of the age-specific all cause mortality rates in an area in a given period. It is the average number of years a new-born baby would survive, were he or she to experience the particular area's age-specific mortality rates for that time period throughout his or her life. Life expectancy can be calculated starting at different ages.
Key Message:
Spain is among the countries is southern Europe that have most improved their life expectancy since the 1960s. Spanish women, with almost 84 years old, have the highest life expectancy in the EU-25. Spanish men, with 77.2 year old are in second positions, after Swedish men. Since 2001, life expectancy increased in Spain at an annual rate of approximately 0.2 years. The rate of increase was lower than in previous years because the decrease in mortality occurred primarily in the most advanced age, so it effect on the life expectancy at birth is not so significant.
Rationale: Life expectancy roughly but comprehensively measures overall population health, as it summarizes, in a standardized format, current information on the health situation of all age and sex groups of populations. As such, it reliably indicates overall health performance in a society at a specific time. It also allows comparison between populations in different geographical areas1. A number of factors influence life expectancies, including socioeconomic status, health behaviors, chronic conditions, sex, race, and ethnicity. Life expectancy is also dependent on environmental hazards and exposures such as indoor and outdoor air pollution. In countries with high infant mortality rates, the life expectancy at birth is highly sensitive to the rate of death in the first few years of life. Another measure such as life expectancy at age 5 (e5) can be used to exclude the effect of infant mortality to provide a simple measure of overall mortality rates other than in early childhood. Health and life expectancy are linked to social circumstance in adulthood and childhood, however, despite overall improvement, the health gap between the top and bottom ends of the social scale remains. For many people, these inequalities mean poorer health, reduced quality of life and early death which could be avoided. Life expectancy has greatly increased in the last half century. On average, life expectancy from 1995 to 2005 has increased by 3 years for men and 2 years for women. However, there are currently wide disparities in health outcomes across the EU, with men's life expectancies ranging from 65.4 (Lithuania) to 78.4 years (Sweden) and those of women from 75.4 (Romania) to 83.9 (Spain)2.
Life expectancy has increased steadily and considerably in the EU countries. Interestingly, the averages for EU15 and EU12 countries have both improved by 5% from high levels. This reflects a consistent reduction in mortality rates at all ages, due to such factors as higher living standards and educational levels, healthier lifestyles and improved access to and quality of health services3.
Policy Relevance and Context: Big demographic changes, including population ageing, are changing disease patterns and placing added burden on the sustainability of EU health systems. Supporting healthy ageing can be done by both promoting health throughout the lifespan, aiming to prevent health problems and disabilities from

SELECTED INDICATORS REPORT
48
an early age, and by tackling inequities in health linked to social, economic and environmental factors. These issues link closely to the Commission's overall strategic objective of Solidarity4. Demographic change in Europe presents further economic, budgetary and social challenges in coming decades owing to people living longer and a potential drop in the workforce from the falling birth rate. In the western part of the Region, the number of people over 64 years has more than doubled since the 1950s, while the number of those over 80 years has quadrupled. While in many ways this can be seen as a triumph for public health, it also poses a particular challenge for the health and social sector. Predictions are that the ratio of elderly, economically inactive people (> 65 years) to people of working age could more than double between 2005 to 2050 in the European Union. It is more important than ever that people remain healthy and independent to as late in life as possible, so that premature deaths among the middle-aged working population are avoided and morbidity is “compressed” towards the end of life4. The European Commission outlines five directions to meet the demographic challenge over the coming years: • Promoting demographic renewal in Europe by improving the balance between professional,
private and working life (parental leave, more flexible working arrangements, implementation of the commitments on childcare made at the Barcelona European Council);
• Promoting employment in Europe through more jobs and longer working lives: the EU seeks to improve education systems and wants to prioritize "flexicurity" systems which facilitate the transition between the different stages in the life cycle (increased flexibility on the labour market combined with lifelong learning). Work enhancement also entails combating discriminatory prejudices against older workers and promoting a genuine European public health policy (tackling smoking, alcoholism and obesity) in order to reduce differences in life expectancy (which are directly related to the standard of living and level of education);
• A more productive and dynamic Europe thanks to the refocusing of the Lisbon strategy since 2005. This revised strategy will give the different economic operators the chance to take full advantage of the opportunities presented by demographic change;
• Receiving and integrating immigrants in Europe: given the attraction of Europe, the EU is working with the Member States to develop a common policy on legal immigration. Over the next 20 years, Europe will in fact have to attract a qualified labour force from outside in order to meet the needs of its labour market. It is also the task of the Union to promote diversity and combat prejudice in order to facilitate the economic and social integration of immigrants;
• Sustainable public finances in Europe: to guarantee adequate social protection and equity between the generations in most Member States, budgetary restraint is absolutely essential, particularly when reforming the pensions system. There will also be a need to link the coverage of these systems and the level of contributions to the development of private saving and funded systems5.
Presentation of Data:

SELECTED INDICATORS REPORT
49
74 75 76 77 78 79
Galicia (ES11)
Principado de Asturias (ES12)
Cantabria (ES13)
País Vasco (ES21)
Comunidad Foral de Navarra (ES22)
La Rioja (ES23)
Aragón (ES24)
Comunidad de Madrid (ES30)
Castilla y León (ES41)
Castilla-La Mancha (ES42)
Extremadura (ES43)
Cataluña (ES51)
Comunidad Valenciana (ES52)
Illes Balears (ES53)
Andalucía (ES61)
Región de Murcia (ES62)
Ciudad Autónoma de Ceuta (ES63)
Ciudad Autónoma de Melilla (ES64)
Canarias (ES70)
life expectancy (years of age)
Life expectancy at birth of males in Spain by NUTS2, 2005
80 81 82 83 84 85
Galicia (ES11)
Principado de Asturias (ES12)
Cantabria (ES13)
País Vasco (ES21)
Comunidad Foral de Navarra (ES22)
La Rioja (ES23)
Aragón (ES24)
Castilla y León (ES41)
Castilla-La Mancha (ES42)
Extremadura (ES43)
Cataluña (ES51)
Comunidad Valenciana (ES52)
Illes Balears (ES53)
Región de Murcia (ES62)
Ciudad Autónoma de Ceuta (ES63)
Canarias (ES70)
life expectancy (years of age)
Life expectancy at birth of females in Spain by NUTS2, 2005

SELECTED INDICATORS REPORT
50
80,5
81,0
81,5
82,0
82,5
83,0
83,5
84,0
84,5
85,0
1999 2000 2001 2002 2003 2004 2005
life
expe
ctan
cy (y
ears
of a
ge)
Life expectancy at birth of females by NUTS2 in the north-western part of Spain (Noroeste)
Galicia (ES11)
Principado de Asturias (ES12)
Cantabria (ES13)

SELECTED INDICATORS REPORT
51
80,5
81,0
81,5
82,0
82,5
83,0
83,5
84,0
84,5
85,0
1999 2000 2001 2002 2003 2004 2005
life
expe
ctan
cy (y
ears
of a
ge)
Life expectancy at birth of females by NUTS2 in the north-eastern part of Spain (Noreste)
País Vasco (ES21)
Comunidad Foral de Navarra (ES22)
La Rioja (ES23)
Aragón (ES24)
80,5
81,0
81,5
82,0
82,5
83,0
83,5
84,0
84,5
85,0
1999 2000 2001 2002 2003 2004 2005
life
expe
ctan
cy (y
ears
of a
ge)
Life expectancy at birth of females by NUTS2 in Madrid and in the central part (Centro) of Spain
Comunidad de Madrid (ES30)
Castilla y León (ES41)
Castilla-La Mancha (ES42)
Extremadura (ES43)
80,5
81,0
81,5
82,0
82,5
83,0
83,5
84,0
84,5
85,0
1999 2000 2001 2002 2003 2004 2005
life
expe
ctan
cy (y
ears
of a
ge)
Life expectancy at birth of females by NUTS2 in the eastern part of Spain (Este)
Cataluña (ES51)
Comunidad Valenciana (ES52)
Illes Balears (ES53)
80,5
81,0
81,5
82,0
82,5
83,0
83,5
84,0
84,5
85,0
1999 2000 2001 2002 2003 2004 2005
life
expe
ctan
cy (y
ears
of a
ge)
Life expectancy at birth of females by NUTS2 in Canarias and in the southern part (Sur) of Spain
Andalucía (ES61)
Región de Murcia (ES62)
Ciudad Autónoma de Ceuta (ES63)
Canarias (ES70)

SELECTED INDICATORS REPORT
52
74,0
74,5
75,0
75,5
76,0
76,5
77,0
77,5
78,0
78,5
1999 2000 2001 2002 2003 2004 2005
life
expe
ctan
cy (y
ears
of a
ge)
Life expectancy at birth of males by NUTS2 in the north-western part of Spain (Noroeste)
Galicia (ES11)
Principado de Asturias (ES12)
Cantabria (ES13)
74,0
74,5
75,0
75,5
76,0
76,5
77,0
77,5
78,0
78,5
1999 2000 2001 2002 2003 2004 2005
life
expe
ctan
cy (y
ears
of a
ge)
Life expectancy at birth of males by NUTS2 in the north-eastern part of Spain (Noreste)
País Vasco (ES21)
Comunidad Foral de Navarra (ES22)
La Rioja (ES23)
Aragón (ES24)
74,0
74,5
75,0
75,5
76,0
76,5
77,0
77,5
78,0
78,5
1999 2000 2001 2002 2003 2004 2005
life
expe
ctan
cy (y
ears
of a
ge)
Life expectancy at birth of males by NUTS2 in Madrid and in the central part (Centro) of Spain
Comunidad de Madrid (ES30)
Castilla y León (ES41)
Castilla-La Mancha (ES42)
Extremadura (ES43)
74,0
74,5
75,0
75,5
76,0
76,5
77,0
77,5
78,0
78,5
1999 2000 2001 2002 2003 2004 2005
life
expe
ctan
cy (y
ears
of a
ge)
Life expectancy at birth of males by NUTS2 in the eastern part of Spain (Este)
Cataluña (ES51)
Comunidad Valenciana (ES52)
Illes Balears (ES53)

SELECTED INDICATORS REPORT
53
72,5
73,0
73,5
74,0
74,5
75,0
75,5
76,0
76,5
77,0
77,5
78,0
78,5
1999 2000 2001 2002 2003 2004 2005
life
expe
ctan
cy (y
ears
of a
ge)
Life expectancy at birth of males by NUTS2 in Canarias and in the southern part (Sur) of Spain
Andalucía (ES61)
Región de Murcia (ES62)
Ciudad Autónoma de Ceuta (ES63)
Ciudad Autónoma de Melilla (ES64)
Canarias (ES70)
Assessment:
Life expectancy has been gradually increasing for both men and women in Europe, like in other world regions, and this trend is expected to continue. EU-27 life expectancy of a boy at birth was 75.8 years in 2006, while the life expectancy of a newborn girl was just over six years higher at 82.0 years8. This constant increasing trend in the EU may, at least in part, be attributed to higher standards of living, advances in medicine, better healthcare, as well as more general awareness of health issues. Although many Europeans enjoy a longer and healthier life than previous generations, major inequalities still exist between countries and regions; for example, life expectancy at birth for men varied by 14.2 years between Member States in 2007, while the corresponding figure among women was 8.3 years. The lowest male life expectancy was recorded in Lithuania (64.9 years) and the highest in Sweden (79.0 years), while for women, the range varied between a low of 76.5 years in Latvia and a high of 84.8 years in France8.
Spain is among the countries of Southern Europe that has most improved its life expectancy from the 1960s, along with Italy, Greece and Portugal. Spanish women, with almost 84 years of life expectancy, have the highest life expectancy of the EU-25. Spanish men, with 77.2 years, are in the second position, after the Swedish.
An important contribution to the improved life expectancy was made by the decreasing infant mortality rate. During the period 1980-2004, this rate fell by 69% in the EU-25, from 14.8 to 4.6. From 2001, life expectancy in Spain has increased at an annual rate of 0.2 years per year. The rate of increase is lower than in the preceding periods because the decrease in mortality is concentrated in the higher ages, so its effect on the life expectancy at birth is not so significant.
Life expectancy in the Autonomous Communities also show improvement in all of them. All NUTS3 and NUTS2 regions show an increase in life expectancy from 1999 to 2008. Among the Autonomous Communities, Navarra, Castilla y León, and the Comunidad de Madrid, are the regions with a better pattern of life expectancy at an advanced age, reaching a life expectancy at 65 years old above 22.5 years in the case of women and 18.3 years in the case of men.
Data underlying the indicator: • Primary source: National Institute of Statistics • Date last published:2009 • Time period of analysis:1999-2009 • Numerator definition: • Source of numerator • Denominator definition • Source of denominator • Geographic coverage • Timeliness • Accuracy and completeness of data set: Complete • Disclosure control

SELECTED INDICATORS REPORT
54
References:
1. Smits J and Monden C. (2009). Length of life inequality around the globe. Social Science and Medicine, 68:1114–1123 2. Joint Report on Social Protection and Social Inclusion (2007). Available at http://europa.eu/rapid/pressReleasesAction.do?reference=MEMO/07/66. (accessed on 30 July 2010) 3. World Health Statistics Report. World Health Organization (2009). Available at http://www.who.int/whosis/whostat/EN_WHS09_Full.pdf. (accessed on 30 July 2010) 4. Together for Health: A Strategic Approach for the EU 2008-2013. Available at http://ec.europa.eu/health-eu/doc/whitepaper_en.pdf (accessed 30 July 2010) 5. The demographic future of Europe – from challenge to opportunity. Available at http://europa.eu/legislation_summaries/employment_and_social_policy/situation_in_europe/c10160_en.htm (accessed 30 July 2010) 6. Graham H, Kelly M (2004). Health inequalities: concepts, frameworks and policy. Briefing paper, NHS Health Development Agency. 7. Department of Health (2001). National service framework for older people. Available at http://www.dh.gov.uk/prod_consum_dh/groups/dh_digitalassets/@dh/@en/documents/digitalasset/dh_4071283.pdf. (accessed 22 September 2010).
8. Eurostat – Life expectancy statistics. Available at http://epp.eurostat.ec.europa.eu/statistics_explained/index.php/Life_expectancy_statistics (accessed 30 July 2010)
National references:
Intituto Nacional de Estadística. INE. Spain. Notas de Prensa. Tablas de Mortalidad en España. Año 2007. Date of Publication: 22 December 2009.
Boletín Informativo del Instituto Nacional de Estadística. La salud de los Españoles. 2/2005.
Intituto Nacional de Estadística. INE. Spain. Notas de Prensa. Tablas de Mortalidad en España. 1992-2005. Date of Publication: 29 October 2007.
Instituto Nacional de Estadística. INE. Spain. Notas de Prensa. Defunciones según la causa de muerte. Año 2008. Date of Publication: 2 March 2010.
Instituto Nacional de Estadística. INE. Spain. Notas de Prensa. Defunciones según la causa de muerte 2007. Date of Publication: 6 April 2009.
Instituto Nacional de Estadística. INE. Spain. Notas de Prensa. Defunciones según la causa de muerte 2005. Date of Publication: 29 January 2007.
Instituto Nacional de Estadística. INE. Spain. Notas de Prensa. Defunciones según la causa de muerte. Año 2004. Date of Publication: 10 April 2006.
Instituto Nacional de Estadística. INE. Spain. Notas de Prensa. Defunciones según la causa de muerte 2003. Date of Publication: 24 november 2005.
Instituto Nacional de Estadística. INE. Spain. Notas de Prensa. Defunciones según la causa de muerte 2001. Date of Publication: 26 december 2003.
Instituto Nacional de Estadística. INE. Spain. Notas de Prensa. Defunciones según la causa de muerte 2000. Date of Publication: 30 diciembre 2002.
Eurostat. Causes of death and infant mortality. Statistics explained. http://epp.eurostat.ec.europa.eu/statistics_explained/index.php/Causes_of_death_and_infant_mortality. accessed 10 October 2010.
Further Information: Author: María José Carroquino. ISCIII, Spain Date of production: October 2010

SELECTED INDICATORS REPORT
55
United Kingdom Name of indicator: Life expectancy at birth Definition: Life expectancy at birth is a summary measure of the age-specific all cause mortality rates in an area in a given period. It is the average number of years a new-born baby would survive, were he or she to experience the particular area's age-specific mortality rates for that time period throughout his or her life. Life expectancy can be calculated starting at different ages. Key Message: Life expectancy at birth has continued to increase in Europe and also in the UK, with that for females higher than that for males. Differences in life expectancy between and within EU countries may be associated with deprivation and existing health inequalities. Rationale: Life expectancy is a rough measure of overall population health. It summarizes, in a standardized format, current information on the health situation of all age and sex groups of populations. As such, it reliably indicates overall health performance in a society at a specific time. It also allows comparison between populations in different geographical areas1. A number of factors influence life expectancies, including socioeconomic status, health behaviors, chronic conditions, sex, race, and ethnicity. Life expectancy is also dependent on environmental hazards and exposures such as indoor and outdoor air pollution. In countries with high infant mortality rates, the life expectancy at birth is highly sensitive to the rate of death in the first few years of life. Another measure such as life expectancy at age 5 (e5) can be used to exclude the effect of infant mortality to provide a simple measure of overall mortality rates other than in early childhood. Health and life expectancy are linked to social circumstances in adulthood and childhood, however, despite overall improvement, the health gap between the top and bottom ends of the social scale remains. For many people, these inequalities mean poorer health, reduced quality of life and avoidable early death. Life expectancy has greatly increased in the last half century. On average, life expectancy from 1995 to 2005 has increased by 3 years for men and 2 years for women. However, there are currently wide disparities in health outcomes across the EU, with men's life expectancies ranging from 65.4 (Lithuania) to 78.4 years (Sweden) and those of women from 75.4 (Romania) to 83.9 (Spain)2. There has been a significant gradual increase in life expectancy in the EU countries. Interestingly, the averages for EU15 and EU12 countries have both improved by 5% from high levels. This reflects a consistent reduction in mortality rates at all ages, due to such factors as higher living standards and educational levels, healthier lifestyles and improved access to and quality of health services3. Policy Relevance and Context: Big demographic changes, including population ageing, are changing disease patterns and placing added burden on the sustainability of EU health systems. Supporting healthy ageing can be done by both promoting health throughout the lifespan, aiming to prevent health problems and disabilities from an early age, and by tackling inequities in health linked to social, economic and environmental factors. These issues link closely to the Commission's overall strategic objective of Solidarity4. Demographic change in Europe presents further economic, budgetary and social challenges in coming decades owing to people living longer and a potential drop in the workforce from the falling birth rate. In the western part of the Region, the number of people over 64 years has more than doubled since the 1950s, while the number of those over 80 years has quadrupled. While in many

SELECTED INDICATORS REPORT
56
ways this can be seen as a triumph for public health, it also poses a particular challenge for the health and social sector. Predictions are that the ratio of elderly, economically inactive people (> 65 years) to people of working age could more than double between 2005 to 2050 in the European Union. It is more important than ever that people remain healthy and independent to as late in life as possible, so that premature deaths among the middle-aged working population are avoided and morbidity is “compressed” towards the end of life4. The European Commission outlines five directions to meet the demographic challenge over the coming years: • Promoting demographic renewal in Europe by improving the balance between professional,
private and working life (parental leave, more flexible working arrangements, implementation of the commitments on childcare made at the Barcelona European Council);
• Promoting employment in Europe through more jobs and longer working lives: the EU seeks to improve education systems and wants to prioritize "flexicurity" systems which facilitate the transition between the different stages in the life cycle (increased flexibility on the labour market combined with lifelong learning). Work enhancement also entails combating discriminatory prejudices against older workers and promoting a genuine European public health policy (tackling smoking, alcoholism and obesity) in order to reduce differences in life expectancy (which are directly related to the standard of living and level of education);
• A more productive and dynamic Europe thanks to the refocusing of the Lisbon strategy since 2005. This revised strategy will give the different economic operators the chance to take full advantage of the opportunities presented by demographic change;
• Receiving and integrating immigrants in Europe: given the attraction of Europe, the EU is working with the Member States to develop a common policy on legal immigration. Over the next 20 years, Europe will in fact have to attract a qualified labour force from outside in order to meet the needs of its labour market. It is also the task of the Union to promote diversity and combat prejudice in order to facilitate the economic and social integration of immigrants;
• Sustainable public finances in Europe: to guarantee adequate social protection and equity between the generations in most Member States, budgetary restraint is absolutely essential, particularly when reforming the pensions system. There will also be a need to link the coverage of these systems and the level of contributions to the development of private saving and funded systems5.
A number of initiatives have been developed in the UK to reduce health inequalities (with the added benefit of increasing overall life expectancy) and to cater for the ageing population. A briefing paper on health inequalities produced by the National Health Service describes two policy responses addressing determinants of health inequalities6. The first focuses on people in the poorest circumstances including the poorest health, exposure to the largest numbers of risk factors and social exclusion. This policy and intervention attempts to remove the ‘worst off’ out of their desperate situations. Such interventions targeted interventions help only a specific group of people. The second approach targets a broader social gradient such as those who are relatively disadvantaged in health terms. The current trend in life expectancy results in an increasingly aging population. This resulted in the release of the National service framework for older people by the Department of Health7. This document outlines standards to provide person centred care, remove age discrimination, promote older people’s health and independence and to fit the current health service around the population’s needs. Presentation of Data:

SELECTED INDICATORS REPORT
57
Figure 1: Life expectancy at birth of males by NUTS1, United Kingdom
Figure 2: Life expectancy at birth of females by NUTS1, United Kingdom,

SELECTED INDICATORS REPORT
58
Life expectancy at birth by NUTS1 in the United Kingdom
72.5
73.5
74.5
75.5
76.5
77.5
78.5
79.5
80.5
81.5
82.5
83.5
1999-2001 2000-2002 2001-2003 2002-2004 2003-2005 2004-2006 2005-2007 2006-2008
life
expe
ctan
cy (y
ears
of a
ge)
malesNorth East (UKC)North West (UKD)Yorkshire and the Humber (UKE)East Midlands (UKF)West Midlands (UKG)East of England (UKH)London (UKI)South East (UKJ)South West (UKK)Wales (UKL)Scotland (UKM)Northern Ireland (UKN)national value (UK)femalesNorth East (UKC)North West (UKD)Yorkshire and the Humber (UKE)East Midlands (UKF)West Midlands (UKG)East of England (UKH)London (UKI)South East (UKJ)South West (UKK)Wales (UKL)Scotland (UKM)Northern Ireland (UKN)national value (UK)
Figure 3: Life expectancy at birth for females by NUTS3 in the West Midlands for the reporting period 1999 – 2008.
Life expectancy at birth by NUTS3 in West Midlands, UK
72.5
73.5
74.5
75.5
76.5
77.5
78.5
79.5
80.5
81.5
82.5
83.5
1999-2001 2000-2002 2001-2003 2002-2004 2003-2005 2004-2006 2005-2007 2006-2008
life
expe
ctan
cy (y
ears
of a
ge)
malesHerefordshire, County of (UKG11)Worcestershire (UKG12)Warwickshire (UKG13)Telford and Wrekin (UKG21)Shropshire CC (UKG22)Stoke-on-Trent (UKG23)Staffordshire CC (UKG24)Birmingham (UKG31)Solihull (UKG32)Coventry (UKG33)Dudley and Sandwell (UKG34)Walsall & Wolverhampton (UKG35)West Midlands (UKG)national value (UK)femalesHerefordshire, County of (UKG11)Worcestershire (UKG12)Warwickshire (UKG13)Telford and Wrekin (UKG21)Shropshire CC (UKG22)Stoke-on-Trent (UKG23)Staffordshire CC (UKG24)Birmingham (UKG31)Solihull (UKG32)Coventry (UKG33)Dudley and Sandwell (UKG34)Walsall & Wolverhampton (UKG35)West Midlands (UKG)national value (UK)
Figure 4: Life expectancy at birth for males by NUTS3 in the West Midlands for the reporting period 1999 – 2008 Assessment: Life expectancy has been gradually increasing for both men and women in Europe, like in other world regions, and this trend is expected to continue. EU-27 life expectancy of a boy at birth was 75.8 years in 2006, while the life expectancy of a newborn girl was just over six years higher at 82.0

SELECTED INDICATORS REPORT
59
years8. This constant increasing trend in the EU may, at least in part, be attributed to higher standards of living, advances in medicine, better healthcare, as well as more general awareness of health issues. Although many Europeans enjoy a longer and healthier life than previous generations, major inequalities still exist between countries and regions; for example, life expectancy at birth for men varied by 14.2 years between Member States in 2007, while the corresponding figure among women was 8.3 years. The lowest male life expectancy was recorded in Lithuania (64.9 years) and the highest in Sweden (79.0 years), while for women, the range varied between a low of 76.5 years in Latvia and a high of 84.8 years in France8. Life expectancy in the UK has increased for both males and females in the last decade, although the life expectancy at births for females remains higher than that of males. In 2008, it was 81.7 years for females and 77.5 years for males. Life expectancy at birth in the UK is indirectly proportional to deprivation. Deprivation in the North is higher than in the South, hence life expectancy at birth is higher in the South than in the North (Figures 1 & 2). For both males and females, people living in Scotland have consistently had the lowest life expectancy at birth in comparison to those living in the South East and South West. The relationship between life expectancy and deprivation has also been observed in the West Midlands where the most deprived areas have the lowest life expectancy at birth. Life expectancy at birth in both males and females in the West Midlands is consistently lower than the national average for the reporting period. Data underlying the indicator: Provide the following information:
• Primary source: Office of National Statistics • Date last published: 2008 • Time period of analysis: 1999 - 2008 • Numerator definition: N/A • Source of numerator: N/A • Denominator definition: N/A • Source of denominator: N/A • Geographic coverage: United Kingdom • Timeliness: Annually • Accuracy and completeness of data set: Accurate and complete • Disclosure control
References: 1. Smits J and Monden C. (2009). Length of life inequality around the globe. Social Science and Medicine, 68:1114–1123 2. Joint Report on Social Protection and Social Inclusion (2007). Available at http://europa.eu/rapid/pressReleasesAction.do?reference=MEMO/07/66. (accessed on 30 July 2010) 3. World Health Statistics Report. World Health Organization (2009). Available at http://www.who.int/whosis/whostat/EN_WHS09_Full.pdf. (accessed on 30 July 2010) 4. Together for Health: A Strategic Approach for the EU 2008-2013. Available at http://ec.europa.eu/health-eu/doc/whitepaper_en.pdf (accessed 30 July 2010) 5. The demographic future of Europe – from challenge to opportunity. Available at http://europa.eu/legislation_summaries/employment_and_social_policy/situation_in_europe/c10160_en.htm (accessed 30 July 2010) 6. Graham H, Kelly M (2004). Health inequalities: concepts, frameworks and policy. Briefing paper, NHS Health Development Agency. 7. Department of Health (2001). National service framework for older people. Available at http://www.dh.gov.uk/prod_consum_dh/groups/dh_digitalassets/@dh/@en/documents/digitalasset/dh_4071283.pdf. (accessed 22 September 2010). 8. Eurostat – Life expectancy statistics. Available at http://epp.eurostat.ec.europa.eu/statistics_explained/index.php/Life_expectancy_statistics (accessed 30 July 2010)

SELECTED INDICATORS REPORT
60
Further Information: Author: Adedoyin Awofisayo and Lorraine Stewart, Health Protection Agency, UK Date of production: 22 September 2010

SELECTED INDICATORS REPORT
61
2.2 Regional Assessment for Infant Mortality
Germany Name of indicator: Infant mortality Definition: Death of infants aged less than 1 year per 1000 live births (crude rate) Key Message: A significant and continuously decreasing trend in infant mortality has been observable in Germany. This trend seems to diminish in the last decade, nevertheless by comparison to other European states on a low level. Significant regional variability in infant mortality rates in several federal states in Germany (NUTS1) in “Regierungsbezirke” (NUTS2), and in counties and cities (NUTS3) exist. North Rhine-Westphalia with one of the highest infant mortality rates in Germany has set up policies to reduce infant mortality. Preventive measures for women concerning their behaviour during pregnancy and child care are consequently needed. Rationale: Infant mortality gives an indirect assessment of the adverse impact on health of environmental factors in a vulnerable age group. It not only indicates the current health status of the population but also predicts the health of the next generation1. Mortality rate depends of many different factors, including direct and indirect impact of environmental pollution and hygienic life conditions.
Infant mortality is associated with several health determinants, such as maternal health, access to health care and socio-economic well-being. It is an important indicator of health-related socio-economic and cultural conditions. Infant mortality tends to be higher in countries with greater social and health-related inequalities, and to rise in countries that have suffered substantial socioeconomic, cultural and political disruption.
Infant mortality may indirectly reflect adverse environmental and hygienic conditions, or the inadequate disease prevention policies. For example, approximately 4,000 children die every day from illnesses caused by poor drinking water or inadequate hygiene practices. One of the most frequent causes of death in children under the age of 5 is diarrhoea: 1.4 million children under 5 fall victim to it and die each year. 88% of these deaths can be directly attributed to problems with water. Insufficient clean water, even for hand-washing, can be linked to the spread of other illnesses such as intestinal worms that infect many children and increase their vulnerability to malnutrition, and anaemia2.
Air pollution may exacerbate asthma symptoms and could potentially increase infant mortality. An increase in respiratory mortality may indicate higher indoor or outdoor air pollution levels.
In developed countries/regions, congenital malformations, deformations and chromosomal abnormalities are among the main causes of infant mortality. Studies have shown that there is a positive association between proximity to toxic waste dump sites and number of children with congenital abnormalities3. Disorders related to short gestation and low birth weight, as well as Sudden Infant Death Syndrome (SIDS) are also leading causes. SIDS can be linked to exposure to environmental tobacco smoke. Air pollution may exacerbate asthma symptoms and could potentially increase infant mortality. Thus, mortality may reflect adverse environmental conditions.
Studies in different parts of the world have shown that ethnicity and socioeconomic factors impact on childhood mortality rates in the population. Maternal socio-economic status is a possible contributing factor given that the leading cause of death was related to congenital malformations,

SELECTED INDICATORS REPORT
62
which in some cases can be eliminated with appropriate nutritional intake and prenatal vitamins. Lack of prenatal care could also contribute to maternal complications which are the fourth largest cause of infant death. Many other industrialized countries have a socialized system of health care, which offers better access to prenatal care thereby helping to reduce country-wide infant mortality rates.
In the European Union there are large differences in infant mortality among and within countries. Despite an overall decline, infant mortality continues to be higher in lower social-economic groups. In some countries the gap between low and high socioeconomic groups has increased4. Given the great potential to prevent infant mortality through standard public health practices and elemental primary care, it is of utmost importance to monitor both the rate of infant mortality in infant mortality and it’s socioeconomic and health related determinants.
Nearly 9 million children under five die every year. Almost 90% of all child deaths are attributable to just six conditions: neonatal causes, pneumonia, diarrhoea, malaria, measles, and HIV/AIDS. During 1960-1990, child mortality in developing regions was halved to one child in 10 dying before age five5. Policy Relevance and Context: Reducing infant mortality is one of the Millennium Development Goals. MDG 4 aims to reduce by two-thirds, by 2015, the mortality of children under five5.
There are large differences in infant mortality in the European Union. The European Commission has announced a series of actions to help EU Member States to tackle the gaps in health which exist between and within countries in the UE. In October 2009, the European Commission launched the Communication: Solidarity in Health: Reducing Health Inequalities in the EU. Among the proposals to tackle inequalities, the Background Paper for the Communication encourages the building of information through development of regular monitoring of health indicators. The Commission supports the use of existing EU surveys such as the EU Survey on Income and Living Conditions (EU-SILC), European Health Interview Survey and others to create measures of health inequalities, and will support the further development and collection of data and health inequalities indicators by age, sex, socio-economic status and geographic dimension6.
Several measures have been established in Germany to reduce the infant mortality rate. Regular preventive checkups for infants and information for parents have resulted in lower infant mortality rates. In 2006 the Federal Joint Committee published a declaration as regards measures for quality management concerning health care of premature births and newborn16. Campaigns aimed at providing information and prevention strategies have contributed to a decreasing trend in infant mortality due to Sudden Infant Death Syndrome (SIDS)14. National and international experts have released recommendations for preventing SIDS. These guidelines provide advice to parents regarding positioning of babies during sleep and avoidance of duvets. As a result of the preceding, a prevention campaign called "Safe Sleep for my Baby" was launched as part of the Prevention Concept North Rhine-Westphalia began in 2008. It was initiated by the NRW Ministry of Health and the hospital association and proposes the usage of sleeping bags for infants15. Since 2006 the topic “Health of mother and child” is pronounced to be a main focus of the health policy in North Rhine-Westphalia17. Deprived families and pregnant women with migration background are therein defined as target groups. The aim of prevention measures is focussed on tobacco and alcohol consumption during pregnancy. Information brochures and video clips are provided in multiple languages. The theme of 18th Health Conference North Rhine-Westphalia in December 2009 was “For a good start in life: improving children’s health in North Rhine-Westphalia”18. It aims to reduce the infant mortality in North Rhine-Westphalia to the national average until 2014. Presentation of Data:

SELECTED INDICATORS REPORT
63
Figure 1: Infant mortality rate by NUTS1 in Germany, 2006-2008
2,0
2,5
3,0
3,5
4,0
4,5
5,0
5,5
6,0
6,5
7,0
1999-2001 2000-2002 2001-2003 2002-2004 2003-2005 2004-2006 2005-2007 2006-2008
num
ber
of d
eath
s /
1000
live
bir
ths
Infant mortality rate by federal states (NUTS1) in Germany
Baden-Württemberg (DE1) Bayern (DE2) Berlin (DE3)Brandenburg (DE4) Bremen (DE5) Hamburg (DE6)Hessen (DE7) Mecklenburg-Vorpommern (DE8) Niedersachsen (DE9)Nordrhein-Westfalen (DEA) Rheinland-Pfalz (DEB) Saarland (DEC)Sachsen (DED) Sachsen-Anhalt (DEE) Schleswig-Holstein (DEF)Thüringen (DEG) national value
Figure 2: Infant mortality by NUTS1 in Germeny for the period 1999-2008

SELECTED INDICATORS REPORT
64
Figure 3: Infant mortality by NUTS3 in North-Rhine Westphalia, 2006-2008
2,0
2,5
3,0
3,5
4,0
4,5
5,0
5,5
6,0
6,5
7,0
7,5
8,0
8,5
1999-2001 2000-2002 2001-2003 2002-2004 2003-2005 2004-2006 2005-2007 2006-2008
num
ber
of d
eath
s /
1000
live
bir
ths
Infant mortality rate by NUTS3 in region Düsseldorf, North Rhine-Westphalia, Germany
Düsseldorf (DEA11) Duisburg (DEA12) Essen (DEA13)Krefeld (DEA14) Mönchengladbach (DEA15) Mülheim an der Ruhr (DEA16)Oberhausen (DEA17) Remscheid (DEA18) Solingen (DEA19)Wuppertal (DEA1A) Kleve (DEA1B) Mettmann (DEA1C)national value
2,0
2,5
3,0
3,5
4,0
4,5
5,0
5,5
6,0
6,5
7,0
7,5
8,0
8,5
1999-2001 2000-2002 2001-2003 2002-2004 2003-2005 2004-2006 2005-2007 2006-200
num
ber
of d
eath
s /
1000
live
bir
ths
Infant mortality rate by NUTS3 in region Köln, North Rhine-Westphalia, Germany
Aachen (DEA21) Bonn (DEA22) Köln (DEA23)Leverkusen (DEA24) Aachen, Kreis (DEA25) Düren (DEA26)Rhein-Erft-Kreis (DEA27) Euskirchen (DEA28) Heinsberg (DEA29)Oberbergischer Kreis (DEA2A) Rheinisch-Bergischer Kreis (DEA2B) Rhein-Sieg-Kreis (DEA2C)national value
2,0
2,5
3,0
3,5
4,0
4,5
5,0
5,5
6,0
6,5
7,0
7,5
8,0
8,5
1999-2001 2000-2002 2001-2003 2002-2004 2003-2005 2004-2006 2005-2007 2006-2008
num
ber
of d
eath
s /
1000
live
bir
ths
Infant mortality rate by NUTS3 in region Münster, North Rhine-Westphalia, Germany
Bottrop (DEA31) Gelsenkirchen (DEA32) Münster (DEA33)
Borken (DEA34) Coesfeld (DEA35) Recklinghausen (DEA36)
Steinfurt (DEA37) Warendorf (DEA38) national value
2,0
2,5
3,0
3,5
4,0
4,5
5,0
5,5
6,0
6,5
7,0
7,5
8,0
8,5
1999-2001 2000-2002 2001-2003 2002-2004 2003-2005 2004-2006 2005-2007 2006-200
num
ber
of d
eath
s /
1000
live
bir
ths
Infant mortality rate by NUTS3 in region Detmold, North Rhine-Westphalia, Germany
Bielefeld (DEA41) Gütersloh (DEA42) Herford (DEA43)
Höxter (DEA44) Lippe (DEA45) Minden-Lübbecke (DEA46)
Paderborn (DEA47) national value

SELECTED INDICATORS REPORT
65
2,0
2,5
3,0
3,5
4,0
4,5
5,0
5,5
6,0
6,5
7,0
7,5
8,0
8,5
1999-2001 2000-2002 2001-2003 2002-2004 2003-2005 2004-2006 2005-2007 2006-2008
num
ber
of d
eath
s /
1000
live
bir
ths
Infant mortality rate by NUTS3 in region Arnsberg, North Rhine-Westphalia, Germany
Bochum (DEA51) Dortmund (DEA52) Hagen (DEA53)Hamm (DEA54) Herne (DEA55) Ennepe-Ruhr-Kreis (DEA56)Hochsauerlandkreis (DEA57) Märkischer Kreis (DEA58) Olpe (DEA59)Siegen-Wittgenstein (DEA5A) Soest (DEA5B) Unna (DEA5C)national value
Figure 4: Infant mortality by NUTS3 in North-Rhine Westphalia for the period 1999-2008 Assessment: Generally, infant mortality has decreased substantially on a global level as well as in almost every country. A study undertaken in the United States stated that the number of deaths occurring in children worldwide fell from 11.9 million in 1990 to 7.7 million in 20107. A United Nation's Children's fund report8 showed improved malaria prevention and drugs to protect newborns of mothers with AIDS had helped lower infant mortality from 12.5 million in 1990 to 8.8 million in 2008.
In general, the European Union has witnessed a significant reduction in mortality during the last century due to a reduction in both infant mortality and infectious and degenerative diseases. Mortality during the first year of life has decreased considerably in all EU Member States, with current levels among the world‘s lowest. However, there are still persistent differences in rates across different social groups or geographical regions.
The progress made in medical health care services in Europe is reflected in the decreasing infant mortality rate. Mortality during the first year of life has decreased considerably in all EU Member States, with current levels among the world‘s lowest. Substantial differences are found in infant mortality among EU countries, with higher infant mortality rates in Central and Eastern Europe, and there are persistent differences in rates across different social groups or geographical regions. In the last four decades, the infant mortality rate in the EU fell from 28.6 deaths per 1000 live births in 1965 to 4.7 deaths in 2007. From 1980 to 2004, infant mortality rate fell by 69% in the EU-25, from 14.8 to 4.6. The relative decrease in the new Member States was greater (72% from 22.5 to 6.39) than that in the former EU-15 (66%; from 12.7 to 4.3)9.
In 2006, the highest mortality rates were in Romania, Bulgaria, followed by Latvia, Lithuania, Slovakia and Poland which were at or above 6 per 1000. Fortunately, infant mortality continues to decrease in some countries and in Lithuania mortality rate was 4.9 in 2008. Globally, the lowest infant mortality rates are found among the EU Member States – for example 1.8 per 1000 live births in Luxemburg or less than 3 per 1000 live births in Slovenia, Sweden, Finland or the Czech Republic. These levels are close to the supposed biological minimum which lies between 2 and 3 per 1000 live births10. Infant mortality rates have remained constant in some countries in recent years, but have increased in Cyprus and Malta, although the relatively small population in these two countries so results of trend analysis is less stable. However, this observation may partly be due to factors such as an increasing number of women deferring childbirth or a higher number of multiple births as a result of the more common use of fertility treatments.
In Germany 3.8 children per 1,000 live births died in their first year of life in 2006/08. This national average is the intermediate result of a continually decreasing trend. In North Rhine-Westphalia the annual average value of 1980 showed 14.6 children aged less than one year per 1,000 live births dying (19). In 2006/08, 4.6 infant deaths per 1,000 live births in North Rhine-Westphalia were observed. Nevertheless, the infant mortality rate in North Rhine-Westphalia is significantly higher than the national value (3.8) in 2006/08. The infant mortality is varied between 2.5 in Saxony and 5.2 in Bremen in 2006/08. The western federal states have comparable high rates (between 3.7 and 4.6).

SELECTED INDICATORS REPORT
66
In the last decade the decreasing trend appears to have tapered off. This is more noteworthy in federal states like North Rhine-Westphalia and Lower Saxony. A positive exception is Saxony, where a clear decrease is has continued since 2003/05. Significant changes have taken place in Bremen during the last decade, but it still has the highest rate of infant mortality in Germany. The regional distribution shows that poor regions such as the Ruhr area including bordering areas and heterogeneous cities have a high infant mortality rate. In 2006/08 Mülheim an der Ruhr had the highest infant mortality in North Rhine-Westphalia (7.8 children per 1,000 live births). Until 2004/06 the rate of infant mortality in Mülheim an der Ruhr (4.3) was comparable to other regions. Since then an increase has taken place. Other cities in the Ruhr area show a similar negative trend, such as Herne (5.6 in 2004/06; 6.4 in 2006/08) and Oberhausen (5.6 in 2004/06; 5.8 in 2006/08). Before the increase of infant mortality in Mühlheim an der Ruhr, Gelsenkirchen had the highest infant mortality rate in North Rhine-Westphalia. Hiwever, 2004/06 there was a reverse in the trend. There are more positive examples for cities in this area that show decreasing trends: Wuppertal, Bottrop and Bielefeld. However, there are also counties in which the infant mortality rate seems to increase. Infant mortality seems to be associated with the nationality of the parents. The annual average value 2008 of the infant mortality for German live births in North Rhine-Westpahlia was at about 4.2, whereas in the same year it was for foreign live births at 6.019. Data underlying the indicator:
• Primary source: Statistic Institutes • Date last published: 2009 (Stat. Bundesamt), 2009 (IT.NRW), 2008 (LIGA.NRW) • Time period of analysis: 1970-2008 (IT.NRW), 1980-2008 (LIGA.NRW) • Numerator definition: Number of deaths of children under 1 year of age (in the reporting
period) • Source of numerator: National/regional health statistics, (Age specific) mortality statistics • Denominator definition: Total number of life births (in the reporting period) • Source of denominator: National/regional health statistics, National census • Geographic coverage: whole country • Timeliness: annually, 31.12., data online available • Accuracy and completeness of data set: Infant mortality data are valid and complete (due to
obligations to disclose) • Disclosure control: none
References:
1. NCHS. 2001. Healthy People 2000 Final Revie. Hyattsville, MD. Public Health Service. Available at http://www.cdc.gov/nchs/data/hp2000/hp2k01-acc.pdf. (accessed on 30 August 2010)
2. C Corinne J. Schuster-Wallace, Velma I. Grover, Zafar Adeel, Ulisses Confalonieri, Susan Elliot. Safe Water as the Key to Global Health. United Nations University. International Network on Water Environment and Health (UNU-INWEH). 2008. Available at http://www.inweh.unu.edu/documents/SafeWater_Web_version.pdf. (accessed on 30 August 2010)
3. H Dolk, M Vrijheid, B Armstrong, L Abramsky, F Bianchi, E Garne, V Nelen, E Robert, J E S Scott, D Stone, R Tenconi. Risk of congenital anomalies near hazardous-waste landfill sites in Europe: the EUROHAZCON study. The Lancet, Volume 352, Issue 9126, Pages 423 - 427, 8 August 1998.
4. European Commission. Background Document for Press Pack-Launch of commission Communication. Solidarity in Health: Reducing Health Inequalities in the EU. Brussles, 20 October 2009.
5. World Health Organization Web Page. Millenium Development Goals. MDG 4. http://www.who.int/topics/millennium_development_goals/child_mortality/en/index.html
6. Communication from the Commission to the European Parliament, the Council, the European Economic and Social Committee and the Committee of the Regions. Solidarity in Health: Reducing Health Inequalities in the EU. Brussles, 20 October 2009. COM(2009) 567 final
7. Rajaratnam, JK, Marcus JR, Flaxman AD, HAidong W, Levin-Recto A, Dwyer L, Costa M, Lopez A, Murray C JL. Neonatal, postneonatal, childhood, and under-5 mortality for 187 countries, 1970—2010: a systematic analysis of progress towards Millennium Development Goal 4. The Lancet,

SELECTED INDICATORS REPORT
67
Volume 375, Issue 9730, Pages 1988 - 2008, 5 June 2010. 8. United Nations Children´s Fund. UNICEF. The State of the World’s Children. Special
Edition. 2009. New York. http://www.unicef.org/rightsite/sowc/fullreport.php 9. European Commission. Eurostat. 2009. Causes of death and infant mortality.
http://epp.eurostat.ec.europa.eu/statistics_explained/index.php/Causes_of_death_and_infant_mortality 10. European Commission. European. Luxembourg, Office of Official Publications of the
European Community. Eurostat Publication. Population Statistics. Chaper E. Mortality. http://epp.eurostat.ec.europa.eu/cache/ITY_OFFPUB/KS-EH-06-001/EN/KS-EH-06-001-EN.PDF
11. Black RE, Morris SS, Bryce J. Where and why are 10 million children dying every year? Lancet, 2003; 361:2226–2234.
12. WHO estimates of the causes of death in children Bryce J, Boschi-Pinto C, Shibuya K, Black RE. WHO estimates of the causes of death in children. Lancet, 2005, 365:1147–1152.
13. Anon (2006). Editorial. Environmental influences on children`s health, Lancet, 367 (9508), 4 February-10 February 2006, 369.
14. Robert Koch-Institut (RKI) in Zusammenarbeit mit dem Statistischen Bundesamt (2006): Gesundheit in Deutschland. RKI, Berlin. .
15. Landesinstitut für Gesundheit und Arbeit NRW (LIGA.NRW) (2009): Gesundheit von Mutter und Kind. In: Das Präventionskonzept in Nordrhein-Westfalen – eine Investition in Lebensqualität, 17-22, LIGA.NRW, Düsseldorf. http://www.praeventionskonzept.nrw.de/fileadmin/Dokumente/0_Allgmein/handlungsgrundlage_praeventionskonzept1109.pdf (accessed 2 September 2010)
16. Gemeinsamer Bundesausschuss (2010): Vereinbarungen des Gemeinsamen Bundesausschusses über Maßnahmen zur Qualitätssicherung der Versorgung von Früh- und Neugeborenen. In: Bundesanzeiger 2009, 4450, Berlin. http://www.g-ba.de/downloads/62-492-404/2009-08-20-VB-NICU.pdf (accessed 2 September 2010)
17. Ministerium für Arbeit Gesundheit und Soziales Nordrhein-Westfalen (MAGS) (2009): Gesundheit von Mutter und Kind - Informationen für Multiplikatoren. MAGS, Düsseldorf http:// https://services.nordrheinwestfalendirekt.de/broschuerenservice/download/70622/ gesundheit_mutter_kind_multiplikationen.pdf (accessed 2 September 2010)
18. Ministerium für Arbeit Gesundheit und Soziales Nordrhein-Westfalen (2009): Für einen guten Start ins Leben: Kindergesundheit in Nordrhein-Westfalen verbessern. Düsseldorf. http://www.mags.nrw.de/08_PDF/002/landesgesundheitskonferenz-2009-entschliessung.pdf. (accessed 2 September 2010)
19. Landesinstitut für Gesundheit und Arbeit NRW (LIGA.NRW) (2009): Säuglingssterblichkeit in Nordrhein-Westfalen. LIGA kurz und informativ. LIGA.NRW, Düsseldorf. http://www.liga.nrw.de/_media/pdf/gesundheitberichtedaten/nrw-kurz-und-informativ/saeuglingssterblichkeit_nrw_0904.pdf (accessed 8 September 2010)
Additional References WHO European Centre for Environment and Health. Effects of air pollution on children’s health and development - a review of the evidence. Copenhagen, WHO Regional Office for Europe, 2005 (http://www.euro.who.int/document/E86575.pdf ). WHO European Centre for Environment and Health. Exposure of children to air pollution (particulate matter) in outdoor air. Copenhagen, WHO Regional Office for Europe, 2007 (ENHIS-2 fact sheet No. 3.3). Public health and environment [web site]. Geneva, World Health Organization, 2007 (www.who.int/phe). Author: Momchil Sidjimov, National Centre for Public Health Protection, Sofia, Bulgaria. Black RE, Morris SS, Bryce J. Where and why are 10 million children dying every year? Lancet, 2003; 361:2226–2234. WHO estimates of the causes of death in children Bryce J, Boschi-Pinto C, Shibuya K, Black RE. WHO estimates of the causes of death in children. Lancet, 2005, 365:1147–1152. Anon (2006). Editorial. Environmental influences on children`s health, Lancet, 367 (9508), 4 February-10 February 2006, 369. Author: Odile Mekel, Linda Tacke, Florian Fischer (LIGA.NRW), Germany Date of production: 6 October 2010
SELECTED INDICATORS REPORT
68
Hungary Name of indicator: Infant mortality Definition: Death of infants aged less than 1 year per 1000 live births (crude rate) Key Message: Infant mortality rate showed a decreasing trend in Hungary in the last decade, although it is still more than the EU average (5.6 and 4.4% in 2008). The spatial inequality is very high: the situation is better in the western and central part and it is worse in the eastern part. There is an extreme difference between the most deprived eastern county Borsod (9.7%) and Győr-Moson-Sopron (in the western part, 2.6%) and the rate showed an increasing tendency in Borsod. Rationale: Infant mortality gives an indirect assessment of the adverse impact on health of environmental factors in a vulnerable age group. It not only indicates the current health status of the population but also predicts the health of the next generation1. Mortality rate depends of many different factors, including direct and indirect impact of environmental pollution and hygienic life conditions.
Infant mortality is associated with several health determinants, such as maternal health, access to health care and socio-economic well-being. It is an important indicator of health-related socio-economic and cultural conditions. Infant mortality tends to be higher in countries with greater social and health-related inequalities, and to rise in countries that have suffered substantial socioeconomic, cultural and political disruption.
Infant mortality may indirectly reflect adverse environmental and hygienic conditions, or the inadequate disease prevention policies. For example, approximately 4,000 children die every day from illnesses caused by poor drinking water or inadequate hygiene practices. One of the most frequent causes of death in children under the age of 5 is diarrhoea: 1.4 million children under 5 fall victim to it and die each year. 88% of these deaths can be directly attributed to problems with water. Insufficient clean water, even for hand-washing, can be linked to the spread of other illnesses such as intestinal worms that infect many children and increase their vulnerability to malnutrition, and anaemia2.
Air pollution may exacerbate asthma symptoms and could potentially increase infant mortality. An increase in respiratory mortality may indicate higher indoor or outdoor air pollution levels.
In developed countries/regions, congenital malformations, deformations and chromosomal abnormalities are among the main causes of infant mortality. Studies have shown that there is a positive association between proximity to toxic waste dump sites and number of children with congenital abnormalities3. Disorders related to short gestation and low birth weight, as well as Sudden Infant Death Syndrome (SIDS) are also leading causes. SIDS can be linked to exposure to environmental tobacco smoke. Air pollution may exacerbate asthma symptoms and could potentially increase infant mortality. Thus, mortality may reflect adverse environmental conditions.
Studies in different parts of the world have shown that ethnicity and socioeconomic factors impact on childhood mortality rates in the population. Maternal socio-economic status is a possible contributing factor given that the leading cause of death was related to congenital malformations, which in some cases can be eliminated with appropriate nutritional intake and prenatal vitamins. Lack of prenatal care could also contribute to maternal complications which are the fourth largest cause of infant death. Many other industrialized countries have a socialized system of health care, which offers better access to prenatal care thereby helping to reduce country-wide infant mortality

SELECTED INDICATORS REPORT
69
rates.
In the European Union there are large differences in infant mortality among and within countries. Despite an overall decline, infant mortality continues to be higher in lower social-economic groups. In some countries the gap between low and high socioeconomic groups has increased4. Given the great potential to prevent infant mortality through standard public health practices and elemental primary care, it is of utmost importance to monitor both the rate of infant mortality in infant mortality and it’s socioeconomic and health related determinants.
Nearly 9 million children under five die every year. Almost 90% of all child deaths are attributable to just six conditions: neonatal causes, pneumonia, diarrhoea, malaria, measles, and HIV/AIDS. During 1960-1990, child mortality in developing regions was halved to one child in 10 dying before age five5. Policy Relevance and Context: Reducing infant mortality is one of the Millennium Development Goals. MDG 4 aims to reduce by two-thirds, by 2015, the mortality of children under five5.
There are large differences in infant mortality in the European Union. The European Commission has announced a series of actions to help EU Member States to tackle the gaps in health which exist between and within countries in the UE. In October 2009, the European Commission launched the Communication: Solidarity in Health: Reducing Health Inequalities in the EU. Among the proposals to tackle inequalities, the Background Paper for the Communication encourages the building of information through development of regular monitoring of health indicators. The Commission supports the use of existing EU surveys such as the EU Survey on Income and Living Conditions (EU-SILC), European Health Interview Survey and others to create measures of health inequalities, and will support the further development and collection of data and health inequalities indicators by age, sex, socio-economic status and geographic dimension6.
The Hungarian National Public Health Programme7 contains several sub-programs that can be grouped in 4 categories:
1. Establishing a health supporting environment (includes actions on the health of youth and children, health of the elderly, reducing health inequalities etc.)
2. Program on healthy life style (actions on reducing tobacco smoke, alcohol and drug prevention, healthy diet, promoting physical activity, environmental health etc.)
3. Prevention of avoidable diseases (actions on prevention of diseases of the circulatory system/malignant neoplasm, strengthening mental health, HIV prevention etc.)
4. Health care and public health infrastructure13.
The “Children, our common treasure” National Infant and Child Health Program14 includes strategic priorities on the prevention on maternal and newborn health and specific objectives on children's health and the infant and child health care system.
A multi dimensional index has been developed in Hungary to provide information about socio-economic deprivation and to analyse the association between health and socio-economic status. The deprivation index integrates seven aspects of socio-economic status: income, qualification, unemployment, one-parent families, large families, crowding and car ownership15.

SELECTED INDICATORS REPORT
70
Presentation of Data:
0 1 2 3 4 5 6 7 8 9
Közép-Magyarország (HU1)
Dunántúl (HU2)
Alföld és Észak (HU3)
number of deaths / 1000 live births
Infant mortality in Hungary by NUTS1, 2006-2008
national value
0 1 2 3 4 5 6 7 8 9 10
Közép-Magyarország (HU10)
Közép-Dunántúl (HU21)
Nyugat-Dunántúl (HU22)
Dél-Dunántúl (HU23)
Észak-Magyarország (HU31)
Észak-Alföld (HU32)
Dél-Alföld (HU33)
number of deaths / 1000 live births
Infant mortality in Hungary by regions (NUTS2), 2006-2008
national value
0 1 2 3 4 5 6 7 8 9 10
Budapest (HU101)Pest (HU102)
Fejér (HU211)Komárom-Esztergom (HU212)
Veszprém (HU213)Győr-Moson-Sopron (HU221)
Vas (HU222)Zala (HU223)
Baranya (HU231)Somogy (HU232)
Tolna (HU233)Borsod-Abaúj-Zemplén (HU311)
Heves (HU312)Nógrád (HU313)
Hajdú-Bihar (HU321)Jász-Nagykun-Szolnok (HU322)
Szabolcs-Szatmár-Bereg (HU323)Bács-Kiskun (HU331)
Békés (HU332)Csongrád (HU333)
number of deaths / 1000 live births
Infant mortality in Hungary by counties (NUTS3,) 2006-2008
national value 3
4
5
6
7
8
9
10
11
1999-2001 2000-2002 2001-2003 2002-2004 2003-2005 2004-2006 2005-2007 2006-2008
nu
mb
er
of
de
ath
s /
10
00
live
bir
ths
Infant mortality by NUTS1, Hungary
Közép-Magyarország (HU1)
Dunántúl (HU2)
Alföld és Észak (HU3)
national value
3
4
5
6
7
8
9
10
11
1999-2001 2000-2002 2001-2003 2002-2004 2003-2005 2004-2006 2005-2007 2006-2008
num
ber
of d
eath
s /
1000
live
bir
ths
Infant mortality by regions (NUTS2), Hungary
Közép-Magyarország (HU10)Közép-Dunántúl (HU21)Nyugat-Dunántúl (HU22)Dél-Dunántúl (HU23)Észak-Magyarország (HU31)Észak-Alföld (HU32)Dél-Alföld (HU33)national value
3
4
5
6
7
8
9
10
11
1999-2001 2000-2002 2001-2003 2002-2004 2003-2005 2004-2006 2005-2007 2006-2008
num
ber
of d
eath
s /
1000
live
bir
ths
Infant mortality by NUTS3 in the region Közép-Magyarország, Hungary
Budapest (HU101)
Pest (HU102)
national value

SELECTED INDICATORS REPORT
71
3
4
5
6
7
8
9
10
11
1999-2001 2000-2002 2001-2003 2002-2004 2003-2005 2004-2006 2005-2007 2006-2008
num
ber
of d
eath
s /
1000
live
bir
ths
Infant mortality by counties (NUTS3) of region Közép-Dunántúl, Hungary
Fejér (HU211)
Komárom-Esztergom (HU212)
Veszprém (HU213)
national value
3
4
5
6
7
8
9
10
11
1999-2001 2000-2002 2001-2003 2002-2004 2003-2005 2004-2006 2005-2007 2006-2008
num
ber
of d
eath
s /
1000
live
bir
ths
Infant mortality by counties (NUTS3) of region Nyugat-Dunántúl, Hungary
Győr-Moson-Sopron (HU221)
Vas (HU222)
Zala (HU223)
national value
3
4
5
6
7
8
9
10
11
1999-2001 2000-2002 2001-2003 2002-2004 2003-2005 2004-2006 2005-2007 2006-2008
num
ber
of d
eath
s /
1000
live
bir
ths
Infant mortality by counties (NUTS3) of region Dél-Dunántúl, Hungary
Baranya (HU231)
Somogy (HU232)
Tolna (HU233)
national value
3
4
5
6
7
8
9
10
11
1999-2001 2000-2002 2001-2003 2002-2004 2003-2005 2004-2006 2005-2007 2006-2008
num
ber
of d
eath
s /
1000
live
bir
ths
Infant mortality by counties (NUTS3) of region Észak-Magyarország, Hungary
Borsod-Abaúj-Zemplén (HU311)
Heves (HU312)
Nógrád (HU313)
national value
3
4
5
6
7
8
9
10
11
1999-2001 2000-2002 2001-2003 2002-2004 2003-2005 2004-2006 2005-2007 2006-2008
num
ber
of d
eath
s /
1000
live
bir
ths
Infant mortality by counties (NUTS3) of region Észak-Alföld, Hungary
Hajdú-Bihar (HU321)
Jász-Nagykun-Szolnok (HU322)
Szabolcs-Szatmár-Bereg (HU323)
national value
3
4
5
6
7
8
9
10
11
1999-2001 2000-2002 2001-2003 2002-2004 2003-2005 2004-2006 2005-2007 2006-2008
num
ber
of d
eath
s /
1000
live
bir
ths
Infant mortality by counties (NUTS3) of region Dél-Alföld, Hungary
Bács-Kiskun (HU331)
Békés (HU332)
Csongrád (HU333)
national value
Assessment: Generally, infant mortality has decreased substantially on a global level as well as in almost every country. A study undertaken in the United States stated that the number of deaths occurring in children worldwide fell from 11.9 million in 1990 to 7.7 million in 20107. A United Nation's Children's fund report8 showed improved malaria prevention and drugs to protect newborns of mothers with AIDS had helped lower infant mortality from 12.5 million in 1990 to 8.8 million in 2008.
In general, the European Union has witnessed a significant reduction in mortality during the last century due to a reduction in both infant mortality and infectious and degenerative diseases. Mortality during the first year of life has decreased considerably in all EU Member States, with current levels among the world‘s lowest. However, there are still persistent differences in rates across different social groups or geographical regions.
The progress made in medical health care services in Europe is reflected in the decreasing infant mortality rate. Mortality during the first year of life has decreased considerably in all EU Member States, with current levels among the world‘s lowest. Substantial differences are found in infant mortality among EU countries, with higher infant mortality rates in Central and Eastern Europe, and there are persistent differences in rates across different social groups or geographical regions. In the last four decades, the infant mortality rate in the EU fell from 28.6 deaths per 1000 live births in 1965 to

SELECTED INDICATORS REPORT
72
4.7 deaths in 2007. From 1980 to 2004, infant mortality rate fell by 69% in the EU-25, from 14.8 to 4.6. The relative decrease in the new Member States was greater (72% from 22.5 to 6.39) than that in the former EU-15 (66%; from 12.7 to 4.3)9.
In 2006, the highest mortality rates were in Romania, Bulgaria, followed by Latvia, Lithuania, Slovakia and Poland which were at or above 6 per 1000. Fortunately, infant mortality continues to decrease in some countries and in Lithuania mortality rate was 4.9 in 2008. Globally, the lowest infant mortality rates are found among the EU Member States – for example 1.8 per 1000 live births in Luxemburg or less than 3 per 1000 live births in Slovenia, Sweden, Finland or the Czech Republic. These levels are close to the supposed biological minimum which lies between 2 and 3 per 1000 live births10. Infant mortality rates have remained constant in some countries in recent years, but have increased in Cyprus and Malta, although the relatively small population in these two countries so results of trend analysis is less stable. However, this observation may partly be due to factors such as an increasing number of women deferring childbirth or a higher number of multiple births as a result of the more common use of fertility treatments.
Infant mortality rate is decreasing in Hungary, it decreased from 8.4‰ to 5.6‰ between 1999 and 2008. Although it is above the EU average (2008: 4.4%), the difference is much lower than it was 10 years ago. There is a considerable spatial inequity: the rate is higher in the eastern part of the country compared to the western and central parts (6.5% and less than 5%). Regarding the regional (NUTS2) level, the infant mortality rate was the highest in the Northern Hungarian region (HU31: 8.8% and the tendency is increasing), and it was higher than the national value in Southern Great Plain (HU33: 6.9% but the trend is decreasing), and it was the lowest in Western Transdanubia (HU22: 4.5%). The inequity between the counties is extreme: in the most deprived county, Borsod, it was 9.7%, while in the western part, in county Győr-Moson-Sopron it was 2.6% in 2008, and the tendency is increasing in Borsod in the last decade. There is an increasing trend in Vas and in Komárom as well in the last few years. Data underlying the indicator: Primary source: Hungarian Central Statistical Office
• Date last published: 2009 • Time period of analysis: 1999–2008 • Numerator definition: Number of deaths in infants (under 1 year of age) • Source of numerator: Hungarian Central Statistical Office • Denominator definition: Number of live births • Source of denominator: Hungarian Central Statistical Office • Geographic coverage: Complete for the country • Timeliness: The database is updated annually • Accuracy and completeness of data set • Disclosure control References:
1. NCHS. 2001. Healthy People 2000 Final Revie. Hyattsville, MD. Public Health Service. Available at http://www.cdc.gov/nchs/data/hp2000/hp2k01-acc.pdf. (accessed on 30 August 2010)
2. C Corinne J. Schuster-Wallace, Velma I. Grover, Zafar Adeel, Ulisses Confalonieri, Susan Elliot. Safe Water as the Key to Global Health. United Nations University. International Network on Water Environment and Health (UNU-INWEH). 2008. Available at http://www.inweh.unu.edu/documents/SafeWater_Web_version.pdf. (accessed on 30 August 2010)
3. H Dolk, M Vrijheid, B Armstrong, L Abramsky, F Bianchi, E Garne, V Nelen, E Robert, J E S Scott, D Stone, R Tenconi. Risk of congenital anomalies near hazardous-waste landfill sites in Europe: the EUROHAZCON study. The Lancet, Volume 352, Issue 9126, Pages 423 - 427, 8 August 1998.
4. European Commission. Background Document for Press Pack-Launch of commission Communication. Solidarity in Health: Reducing Health Inequalities in the EU. Brussles, 20 October 2009.
5. World Health Organization Web Page. Millenium Development Goals. MDG 4. http://www.who.int/topics/millennium_development_goals/child_mortality/en/index.html

SELECTED INDICATORS REPORT
73
6. Communication from the Commission to the European Parliament, the Council, the European Economic and Social Committee and the Committee of the Regions. Solidarity in Health: Reducing Health Inequalities in the EU. Brussles, 20 October 2009. COM(2009) 567 final
7. Rajaratnam, JK, Marcus JR, Flaxman AD, HAidong W, Levin-Recto A, Dwyer L, Costa M, Lopez A, Murray C JL. Neonatal, postneonatal, childhood, and under-5 mortality for 187 countries, 1970—2010: a systematic analysis of progress towards Millennium Development Goal 4. The Lancet, Volume 375, Issue 9730, Pages 1988 - 2008, 5 June 2010.
8. United Nations Children´s Fund. UNICEF. The State of the World’s Children. Special Edition. 2009. New York. http://www.unicef.org/rightsite/sowc/fullreport.php
9. European Commission. Eurostat. 2009. Causes of death and infant mortality. http://epp.eurostat.ec.europa.eu/statistics_explained/index.php/Causes_of_death_and_infant_mortality
10. European Commission. European. Luxembourg, Office of Official Publications of the European Community. Eurostat Publication. Population Statistics. Chaper E. Mortality. http://epp.eurostat.ec.europa.eu/cache/ITY_OFFPUB/KS-EH-06-001/EN/KS-EH-06-001-EN.PDF
11. Black RE, Morris SS, Bryce J. Where and why are 10 million children dying every year? Lancet, 2003; 361:2226–2234.
12. WHO estimates of the causes of death in children Bryce J, Boschi-Pinto C, Shibuya K, Black RE. WHO estimates of the causes of death in children. Lancet, 2005, 365:1147–1152.
13. Anon (2006). Editorial. Environmental influences on children`s health, Lancet, 367 (9508), 4 February-10 February 2006, 369.
14. National Public Health Programme of Hungary: No. 46/2003. (IV. 16.) Decree of the Parliament
15. Children, our common treasure”, the National Infant and Child Health Program of the Republic of Hungary, Ministry of Health, 2005 http://www.eum.hu/national-infant-and
16. A. Juhasz, Cs. Nagy, A. Paldy, L. Beale: Development of a Deprivation Index and its relation to premature mortality due to diseases of the circulatory system in Hungary, 1998–2004
Further information:
WHO European Centre for Environment and Health. Effects of air pollution on children’s health and development - a review of the evidence. Copenhagen, WHO Regional Office for Europe, 2005 (http://www.euro.who.int/document/E86575.pdf ). WHO European Centre for Environment and Health. Exposure of children to air pollution (particulate matter) in outdoor air. Copenhagen, WHO Regional Office for Europe, 2007 (ENHIS-2 fact sheet No. 3.3). Public health and environment [web site]. Geneva, World Health Organization, 2007 (www.who.int/phe). Author: Momchil Sidjimov, National Centre for Public Health Protection, Sofia, Bulgaria. Black RE, Morris SS, Bryce J. Where and why are 10 million children dying every year? Lancet, 2003; 361:2226–2234. WHO estimates of the causes of death in children Bryce J, Boschi-Pinto C, Shibuya K, Black RE. WHO estimates of the causes of death in children. Lancet, 2005, 365:1147–1152. Anon (2006). Editorial. Environmental influences on children`s health, Lancet, 367 (9508), 4 February-10 February 2006, 369. Author: Tibor Malnasi, Anna Paldy, National Institute of Environmental Health, Hungary Date of production: 14 September 2010

SELECTED INDICATORS REPORT
74
Lithuania Name of indicator: Infant mortality Definition: Death of infants aged less than 1 year per 1000 live births (crude rate) Key Message: During the past decade infant mortality has reduced globally, in Europe and in Lithuania. In Lithuania it has decreased significantly from 8.9 to 5.9 per 1000 births. Infant mortality has decreased in all counties; however in Alytus county it is still 1.5 times higher than in Panevezys county. Rationale: Infant mortality gives an indirect assessment of the adverse impact on health of environmental factors in a vulnerable age group. It not only indicates the current health status of the population but also predicts the health of the next generation1. Mortality rate depends of many different factors, including direct and indirect impact of environmental pollution and hygienic life conditions.
Infant mortality is associated with several health determinants, such as maternal health, access to health care and socio-economic well-being. It is an important indicator of health-related socio-economic and cultural conditions. Infant mortality tends to be higher in countries with greater social and health-related inequalities, and to rise in countries that have suffered substantial socioeconomic, cultural and political disruption.
Infant mortality may indirectly reflect adverse environmental and hygienic conditions, or the inadequate disease prevention policies. For example, approximately 4,000 children die every day from illnesses caused by poor drinking water or inadequate hygiene practices. One of the most frequent causes of death in children under the age of 5 is diarrhoea: 1.4 million children under 5 fall victim to it and die each year. 88% of these deaths can be directly attributed to problems with water. Insufficient clean water, even for hand-washing, can be linked to the spread of other illnesses such as intestinal worms that infect many children and increase their vulnerability to malnutrition, and anaemia2.
Air pollution may exacerbate asthma symptoms and could potentially increase infant mortality. An increase in respiratory mortality may indicate higher indoor or outdoor air pollution levels.
In developed countries/regions, congenital malformations, deformations and chromosomal abnormalities are among the main causes of infant mortality. Studies have shown that there is a positive association between proximity to toxic waste dump sites and number of children with congenital abnormalities3. Disorders related to short gestation and low birth weight, as well as Sudden Infant Death Syndrome (SIDS) are also leading causes. SIDS can be linked to exposure to environmental tobacco smoke. Air pollution may exacerbate asthma symptoms and could potentially increase infant mortality. Thus, mortality may reflect adverse environmental conditions.
Studies in different parts of the world have shown that ethnicity and socioeconomic factors impact on childhood mortality rates in the population. Maternal socio-economic status is a possible contributing factor given that the leading cause of death was related to congenital malformations, which in some cases can be eliminated with appropriate nutritional intake and prenatal vitamins. Lack of prenatal care could also contribute to maternal complications which are the fourth largest cause of infant death. Many other industrialized countries have a socialized system of health care, which offers better access to prenatal care thereby helping to reduce country-wide infant mortality rates.
In the European Union there are large differences in infant mortality among and within countries.

SELECTED INDICATORS REPORT
75
Despite an overall decline, infant mortality continues to be higher in lower social-economic groups. In some countries the gap between low and high socioeconomic groups has increased4. Given the great potential to prevent infant mortality through standard public health practices and elemental primary care, it is of utmost importance to monitor both the rate of infant mortality in infant mortality and it’s socioeconomic and health related determinants.
Nearly 9 million children under five die every year. Almost 90% of all child deaths are attributable to just six conditions: neonatal causes, pneumonia, diarrhoea, malaria, measles, and HIV/AIDS. During 1960-1990, child mortality in developing regions was halved to one child in 10 dying before age five5. Policy Relevance and Context: Reducing infant mortality is one of the Millennium Development Goals. MDG 4 aims to reduce by two-thirds, by 2015, the mortality of children under five5.
There are large differences in infant mortality in the European Union. The European Commission has announced a series of actions to help EU Member States to tackle the gaps in health which exist between and within countries in the UE. In October 2009, the European Commission launched the Communication: Solidarity in Health: Reducing Health Inequalities in the EU. Among the proposals to tackle inequalities, the Background Paper for the Communication encourages the building of information through development of regular monitoring of health indicators. The Commission supports the use of existing EU surveys such as the EU Survey on Income and Living Conditions (EU-SILC), European Health Interview Survey and others to create measures of health inequalities, and will support the further development and collection of data and health inequalities indicators by age, sex, socio-economic status and geographic dimension6.
Lithuanian Health Programme adopted by the Parliament in 1998 aimed at reduction of infant mortality by 30 per cent by 2010. Presentation of Data:
Figure 1: Infant mortality rate in Lithuania by NUTS3 for 2006-2008

SELECTED INDICATORS REPORT
76
0 1 2 3 4 5 6 7 8 9
Alytaus apskritis (LT001)
Kauno apskritis (LT002)
Klaipedos apskritis (LT003)
Marijampoles apskritis (LT004)
Panevezio apskritis (LT005)
Siauliu apskritis (LT006)
Taurages apskritis (LT007)
Telsiu apskritis (LT008)
Utenos apskritis (LT009)
Vilniaus apskritis (LT00A)
number of deaths / 1000 live births
Infant mortality in Lithuania by counties (NUTS3), 2006-2008
national value
Figure 2: Infant mortality rate in Lithuania by NUTS3 for 2006-2008

SELECTED INDICATORS REPORT
77
3
4
5
6
7
8
9
10
11
1999-2001 2000-2002 2001-2003 2002-2004 2003-2005 2004-2006 2005-2007 2006-2008
num
ber o
f dea
ths
/ 10
00 li
ve b
irth
s
Infant mortality in selected counties (NUTS3) of Lithuania I.
Alytaus apskritis (LT001)
Kauno apskritis (LT002)
Klaipedos apskritis (LT003)
Marijampoles apskritis (LT004)
Panevezio apskritis (LT005)
national value
Figure 3a: Infant mortality by NUTS3 in Lithuania for the period 1999-2008
3
4
5
6
7
8
9
10
11
1999-2001 2000-2002 2001-2003 2002-2004 2003-2005 2004-2006 2005-2007 2006-2008
num
ber o
f dea
ths
/ 10
00 li
ve b
irth
s
Infant mortality in selected counties (NUTS3) of Lithuania II.
Siauliu apskritis (LT006)
Taurages apskritis (LT007)
Telsiu apskritis (LT008)
Utenos apskritis (LT009)
Vilniaus apskritis (LT00A)
national value
Figure 3b: Infant mortality by NUTS3 in Lithuania for the period 1999-2008
Data underlying the indicator:
• Primary source: Department of Statistics • Date last published: 2008 • Time period of analysis: 1999-2008 • Numerator definition: The number of deaths of children under 1 year of age (0–364 days) in
the reporting period • Source of numerator: Department of Statistics. • Denominator definition: infants aged 0–364 days • Source of denominator: Department of Statistics. • Geographic coverage: National (Lithuania) and 10 Lithuanian countries (apskritys, NUTS 3
level). • Timeliness: annual data are available from 1995. • Accuracy and completeness of data set: data accurate and complete.

SELECTED INDICATORS REPORT
78
• Disclosure control: only aggregated data can be used; personal data use restrictions. Assessment: Generally, infant mortality has decreased substantially on a global level as well as in almost every country. A study undertaken in the United States stated that the number of deaths occurring in children worldwide fell from 11.9 million in 1990 to 7.7 million in 20107. A United Nation's Children's fund report8 showed improved malaria prevention and drugs to protect newborns of mothers with AIDS had helped lower infant mortality from 12.5 million in 1990 to 8.8 million in 2008.
In general, the European Union has witnessed a significant reduction in mortality during the last century due to a reduction in both infant mortality and infectious and degenerative diseases. Mortality during the first year of life has decreased considerably in all EU Member States, with current levels among the world‘s lowest. However, there are still persistent differences in rates across different social groups or geographical regions.
The progress made in medical health care services in Europe is reflected in the decreasing infant mortality rate. Mortality during the first year of life has decreased considerably in all EU Member States, with current levels among the world‘s lowest. Substantial differences are found in infant mortality among EU countries, with higher infant mortality rates in Central and Eastern Europe, and there are persistent differences in rates across different social groups or geographical regions. In the last four decades, the infant mortality rate in the EU fell from 28.6 deaths per 1000 live births in 1965 to 4.7 deaths in 2007. From 1980 to 2004, infant mortality rate fell by 69% in the EU-25, from 14.8 to 4.6. The relative decrease in the new Member States was greater (72% from 22.5 to 6.39) than that in the former EU-15 (66%; from 12.7 to 4.3)9.
In 2006, the highest mortality rates occurred in Romaniaand Bulgaria, followed by Latvia, Lithuania, Slovakia and Poland (approximately 6 deaths per 1000 live births). Fortunately, infant mortality continues to decrease in some countries and in Lithuania mortality rate was 4.9 in 2008. Globally, the lowest infant mortality rates are found among the EU Member States – for example 1.8 per 1000 live births in Luxemburg or less than 3 per 1000 live births in Slovenia, Sweden, Finland or the Czech Republic. These levels are close to the supposed biological minimum which lies between 2 and 3 per 1000 live births10. Infant mortality rates have remained constant in some countries in recent years, but have increased in Cyprus and Malta, although the relatively small population in these two countries so results of trend analysis is less stable. However, this observation may partly be due to factors such as an increasing number of women deferring childbirth or a higher number of multiple births as a result of the more common use of fertility treatments.
In 2007 infant mortality rate in Lithuania (5.9 per 1000 births) was better than the European average (8.9 per 1000 births) and approaching the EU average (4.9 per 1000 births). To gain further improvement in infant mortality rates or maintain the current level will require efforts not restricted to the health care system but also that from other sectors as well as close collaborative working.
Achievements in reducing infant mortality are significant, because the Lithuanian Health Programme (LHP) for 2010 the aim of reducing the rate of 30 per cent was almost fully achieved in 2003. However, in 2004, it increased by 1.1 deaths per 1000 live births compared to 2003. Since 2005 infant mortality rate started to decline sharply, in 2007 it was 5.9 cases per 1000 live births, which is 17 per cent better than the goal in LHP. In 2007 the majority (37.4 per cent) babies died from diseases in perinatal period, 33.7 per cent - the congenital anomalies and 6.8 per cent - from external causes of death.
Infant mortality has decreased in all counties, however in Alytus county it is 1.5 times higher than in Panevezhys county. References:
1. NCHS. 2001. Healthy People 2000 Final Revie. Hyattsville, MD. Public Health Service. Available at http://www.cdc.gov/nchs/data/hp2000/hp2k01-acc.pdf. (accessed on 30 August 2010)
2. C Corinne J. Schuster-Wallace, Velma I. Grover, Zafar Adeel, Ulisses Confalonieri, Susan

SELECTED INDICATORS REPORT
79
Elliot. Safe Water as the Key to Global Health. United Nations University. International Network on Water Environment and Health (UNU-INWEH). 2008. Available at http://www.inweh.unu.edu/documents/SafeWater_Web_version.pdf. (accessed on 30 August 2010)
3. H Dolk, M Vrijheid, B Armstrong, L Abramsky, F Bianchi, E Garne, V Nelen, E Robert, J E S Scott, D Stone, R Tenconi. Risk of congenital anomalies near hazardous-waste landfill sites in Europe: the EUROHAZCON study. The Lancet, Volume 352, Issue 9126, Pages 423 - 427, 8 August 1998.
4. European Commission. Background Document for Press Pack-Launch of commission Communication. Solidarity in Health: Reducing Health Inequalities in the EU. Brussles, 20 October 2009.
5. World Health Organization Web Page. Millenium Development Goals. MDG 4. http://www.who.int/topics/millennium_development_goals/child_mortality/en/index.html
6. Communication from the Commission to the European Parliament, the Council, the European Economic and Social Committee and the Committee of the Regions. Solidarity in Health: Reducing Health Inequalities in the EU. Brussles, 20 October 2009. COM(2009) 567 final
7. Rajaratnam, JK, Marcus JR, Flaxman AD, HAidong W, Levin-Recto A, Dwyer L, Costa M, Lopez A, Murray C JL. Neonatal, postneonatal, childhood, and under-5 mortality for 187 countries, 1970—2010: a systematic analysis of progress towards Millennium Development Goal 4. The Lancet, Volume 375, Issue 9730, Pages 1988 - 2008, 5 June 2010.
8. United Nations Children´s Fund. UNICEF. The State of the World’s Children. Special Edition. 2009. New York. http://www.unicef.org/rightsite/sowc/fullreport.php
9. European Commission. Eurostat. 2009. Causes of death and infant mortality. http://epp.eurostat.ec.europa.eu/statistics_explained/index.php/Causes_of_death_and_infant_mortality
10. European Commission. European. Luxembourg, Office of Official Publications of the European Community. Eurostat Publication. Population Statistics. Chaper E. Mortality. http://epp.eurostat.ec.europa.eu/cache/ITY_OFFPUB/KS-EH-06-001/EN/KS-EH-06-001-EN.PDF
11. Regulation (EC) No 1888/2005 of the European Parliament and of the Council of 26 October 2005 amending Regulation (EC) No 1059/2003 on the establishment of a common classification of territorial units for statistics (NUTS) by reason of the accession of the Czech Republic, Estonia, Cyprus, Latvia, Lithuania, Hungary, Malta, Poland, Slovenia and Slovakia to the European Union, Official Journal, L 309, 25/11/2005 P. 0001 – 0008.
Further information:
WHO European Centre for Environment and Health. Effects of air pollution on children’s health and development - a review of the evidence. Copenhagen, WHO Regional Office for Europe, 2005 (http://www.euro.who.int/document/E86575.pdf ). WHO European Centre for Environment and Health. Exposure of children to air pollution (particulate matter) in outdoor air. Copenhagen, WHO Regional Office for Europe, 2007 (ENHIS-2 fact sheet No. 3.3). Public health and environment [web site]. Geneva, World Health Organization, 2007 (www.who.int/phe). Author: Momchil Sidjimov, National Centre for Public Health Protection, Sofia, Bulgaria. Black RE, Morris SS, Bryce J. Where and why are 10 million children dying every year? Lancet, 2003; 361:2226–2234. WHO estimates of the causes of death in children Bryce J, Boschi-Pinto C, Shibuya K, Black RE. WHO estimates of the causes of death in children. Lancet, 2005, 365:1147–1152. Anon (2006). Editorial. Environmental influences on children`s health, Lancet, 367 (9508), 4 February-10 February 2006, 369. Further Information: Author: Viktorija Andreikėnaitė, Center for Health Education and Disease Prevention, Lithuania Date of production: 15 September 2010

SELECTED INDICATORS REPORT
80
Romania Name of indicator: Infant mortality Definition: Death of infants aged less than 1 year per 1000 live births (crude rate) Key Message: Despite a favourable trend, from 22.0 (1997) to 11.0 (2008) infant deaths per 1000 live births, infant mortality rate in Romnaia is about 2.5 higher than the EU average (4.44 deaths per 1000 live births in 2008 – WHO HFA database 2010). The reduction of infant mortality rate might represent a major opportunity to increase the life expectancy at birth as well as to decrease the level of the crude mortality rate. A very high level of the postneonatal mortalily rate represents a specific feature for Romania. While the EU average of the postneonatal rate was 1.51 infant deaths per 1000 live births in 2007, the level was of 5.11 in Romania in 2007 (WHO HFA database 2010). Targeted interventions might contribute to the decline of the postneonatal mortality, and consequently to the reduction of the infant mortality in Romania. Rationale: Infant mortality gives an indirect assessment of the adverse impact on health of environmental factors in a vulnerable age group. It not only indicates the current health status of the population but also predicts the health of the next generation1. Mortality rate depends of many different factors, including direct and indirect impact of environmental pollution and hygienic life conditions.
Infant mortality is associated with several health determinants, such as maternal health, access to health care and socio-economic well-being. It is an important indicator of health-related socio-economic and cultural conditions. Infant mortality tends to be higher in countries with greater social and health-related inequalities, and to rise in countries that have suffered substantial socioeconomic, cultural and political disruption.
Infant mortality may indirectly reflect adverse environmental and hygienic conditions, or the inadequate disease prevention policies. For example, approximately 4,000 children die every day from illnesses caused by poor drinking water or inadequate hygiene practices. One of the most frequent causes of death in children under the age of 5 is diarrhoea: 1.4 million children under 5 fall victim to it and die each year. 88% of these deaths can be directly attributed to problems with water. Insufficient clean water, even for hand-washing, can be linked to the spread of other illnesses such as intestinal worms that infect many children and increase their vulnerability to malnutrition, and anaemia2.
Air pollution may exacerbate asthma symptoms and could potentially increase infant mortality. An increase in respiratory mortality may indicate higher indoor or outdoor air pollution levels.
In developed countries/regions, congenital malformations, deformations and chromosomal abnormalities are among the main causes of infant mortality. Studies have shown that there is a positive association between proximity to toxic waste dump sites and number of children with congenital abnormalities3. Disorders related to short gestation and low birth weight, as well as Sudden Infant Death Syndrome (SIDS) are also leading causes. SIDS can be linked to exposure to environmental tobacco smoke. Air pollution may exacerbate asthma symptoms and could potentially increase infant mortality. Thus, mortality may reflect adverse environmental conditions.
Studies in different parts of the world have shown that ethnicity and socioeconomic factors impact on childhood mortality rates in the population. Maternal socio-economic status is a possible contributing factor given that the leading cause of death was related to congenital malformations, which in some cases can be eliminated with appropriate nutritional intake and prenatal vitamins. Lack of prenatal care could also contribute to maternal complications which are the fourth largest cause of infant death. Many

SELECTED INDICATORS REPORT
81
other industrialized countries have a socialized system of health care, which offers better access to prenatal care thereby helping to reduce country-wide infant mortality rates.
In the European Union there are large differences in infant mortality among and within countries. Despite an overall decline, infant mortality continues to be higher in lower social-economic groups. In some countries the gap between low and high socioeconomic groups has increased4. Given the great potential to prevent infant mortality through standard public health practices and elemental primary care, it is of utmost importance to monitor both the rate of infant mortality in infant mortality and it’s socioeconomic and health related determinants.
Nearly 9 million children under five die every year. Almost 90% of all child deaths are attributable to just six conditions: neonatal causes, pneumonia, diarrhoea, malaria, measles, and HIV/AIDS. During 1960-1990, child mortality in developing regions was halved to one child in 10 dying before age five5. Policy Relevance and Context: Reducing infant mortality is one of the Millennium Development Goals. MDG 4 aims to reduce by two-thirds, by 2015, the mortality of children under five5.
There are large differences in infant mortality in the European Union. The European Commission has announced a series of actions to help EU Member States to tackle the gaps in health which exist between and within countries in the UE. In October 2009, the European Commission launched the Communication: Solidarity in Health: Reducing Health Inequalities in the EU. Among the proposals to tackle inequalities, the Background Paper for the Communication encourages the building of information through development of regular monitoring of health indicators. The Commission supports the use of existing EU surveys such as the EU Survey on Income and Living Conditions (EU-SILC), European Health Interview Survey and others to create measures of health inequalities, and will support the further development and collection of data and health inequalities indicators by age, sex, socio-economic status and geographic dimension6.
There are several national policy documents and programmes that address the issue of infant mortality such as: National Health Programme for Mother and Child, having as main objectives:
a) increase of access and quality of specific reproductive health services to prevent unwanted pregnancy, to decrease maternal morbidity and mortality;
b) improve the perinatal services at local level provided for low-weight at birth children or having severe pathologie during he perinatal period; c) perfom screening at birth for several diseases with a high invalidity potential; d) improve the nutrition status of pregnant women and children; e) early diagnosis and secondary prevention of chronic diseases complications in children. The National Strategy of Public Health adopted in 2004 has a special priority area related to mother and child health, and one of its the general objectives is to improve the health status of pregnant woman and infant, having a direct impact on infant mortality rate level. Presentation of Data:

SELECTED INDICATORS REPORT
82
Figure 1: Infant mortality rate in Romania by NUTS3 in 2008

SELECTED INDICATORS REPORT
83
0 1 2 3 4 5 6 7 8 9 10 11 12 13 14 15 16 17 18 19
Bihor (RO111)
Bistrita-Nasaud (RO112)
Cluj (RO113)
Maramures (RO114)
Satu Mare (RO115)
Salaj (RO116)
Alba (RO121)
Brasov (RO122)
Covasna (RO123)
Harghita (RO124)
Mures (RO125)
Sibiu (RO126)
Bacau (RO211)
Botosani (RO212)
Iasi (RO213)
Neamt (RO214)
Suceava (RO215)
Vaslui (RO216)
Braila (RO221)
Buzau (RO222)
Constanta (RO223)
Galati (RO224)
Tulcea (RO225)
Vrancea (RO226)
Arges (RO311)
Calarasi (RO312)
Dambovita (RO313)
Giurgiu (RO314)
Ialomita (RO315)
Prahova (RO316)
Teleorman (RO317)
Bucuresti (RO321)
Ilfov (RO322)
Dolj (RO411)
Gorj (RO412)
Mehedinti (RO413)
Olt (RO414)
Valcea (RO415)
Arad (RO421)
Caras-Severin (RO422)
Hunedoara (RO423)
Timis (RO424)
number of deaths / 1000 live births
Infant mortality in Romania by counties (NUTS3), 2008
national value
Figure 2: Infant mortality rate by NUTS3 in 2008

SELECTED INDICATORS REPORT
84
0
2
4
6
8
10
12
14
16
18
20
22
24
26
28
30
1999 2000 2001 2002 2003 2004 2005 2006 2007 2008
num
ber o
f dea
ths
/ 10
00 li
ve b
irth
s
Infant mortality by counties (NUTS3) of region Nord-Est, Romania
Bacau (RO211)Botosani (RO212)Iasi (RO213)Neamt (RO214)Suceava (RO215)Vaslui (RO216)national value
Figure 3: Infant mortality rate by NUTS3 for the perion 1999-2008 Assessment: Generally, infant mortality has decreased substantially on a global level as well as in almost every country. A study undertaken in the United States stated that the number of deaths occurring in children worldwide fell from 11.9 million in 1990 to 7.7 million in 20107. A United Nation's Children's fund report8 showed improved malaria prevention and drugs to protect newborns of mothers with AIDS had helped lower infant mortality from 12.5 million in 1990 to 8.8 million in 2008.
In general, the European Union has witnessed a significant reduction in mortality during the last century due to a reduction in both infant mortality and infectious and degenerative diseases. Mortality during the first year of life has decreased considerably in all EU Member States, with current levels among the world‘s lowest. However, there are still persistent differences in rates across different social groups or geographical regions.
The progress made in medical health care services in Europe is reflected in the decreasing infant mortality rate. Mortality during the first year of life has decreased considerably in all EU Member States, with current levels among the world‘s lowest. Substantial differences are found in infant mortality among EU countries, with higher infant mortality rates in Central and Eastern Europe, and there are persistent differences in rates across different social groups or geographical regions. In the last four decades, the infant mortality rate in the EU fell from 28.6 deaths per 1000 live births in 1965 to 4.7 deaths in 2007. From 1980 to 2004, infant mortality rate fell by 69% in the EU-25, from 14.8 to 4.6. The relative decrease in the new Member States was greater (72% from 22.5 to 6.39) than that in the former EU-15 (66%; from 12.7 to 4.3)9.
In 2006, the highest mortality rates occurred in Romaniaand Bulgaria, followed by Latvia, Lithuania, Slovakia and Poland (approximately 6 deaths per 1000 live births). Fortunately, infant mortality continues to decrease in some countries and in Lithuania mortality rate was 4.9 in 2008. Globally, the lowest infant mortality rates are found among the EU Member States – for example 1.8 per 1000 live births in Luxemburg or less than 3 per 1000 live births in Slovenia, Sweden, Finland or the Czech Republic. These levels are close to the supposed biological minimum which lies between 2 and 3 per 1000 live births10.

SELECTED INDICATORS REPORT
85
Infant mortality rates have remained constant in some countries in recent years, but have increased in Cyprus and Malta, although the relatively small population in these two countries so results of trend analysis is less stable. However, this observation may partly be due to factors such as an increasing number of women deferring childbirth or a higher number of multiple births as a result of the more common use of fertility treatments.
Despite a favourable trend, from 22.0 (1997) to 11.0 (2008) infant deaths per 1000 live births, infant mortality rate in Romnaia is about 2.5 times higher than the EU average (4.44 infant deaths per 1000 live births in 200811. The reduction of infant mortality rate might represent a major opportunity to increase the life expectancy at birth as well as to decrease the level of the crude mortality rate. A very high level of the postneonatal mortalily rate represents a specific feature for Romania. While the EU average of the postneonatal rate was 1.51 infant deaths per 1000 live births in 2007, the level was of 5.11 in Romania in 200711. Targeted interventions might contribute to the decline of the postneonatal mortality, and consequently to the reduction of the infant mortality in Romania. There are important geographical disparities. As noticed in Figure 1, there is a cluster of high infant mortality rates in the North-East region of Romania, the most economically deprived area of Romania. Nevertheless, as shown in Figure 3, there is a decreasing trend in all districts of North East region, even if the present level is rather high. The highest level of the indicator (about 19%) was encountered in Caras Severin district that was experiencing the highest levels for long time. This is mainly due to the poor socio-economic level of the district, as well as to the low educational level of mothers. The lowest levels of the indicator can be seen in the most economically developed parts of Romania, especially in the districts having university hospitals such as Bucharest, Timisoara or Brasov. Data underlying the indicator:
• Primary source: Health Statistics Institute • Date last published: 2009 • Time period of analysis: 1997-2008 • Numerator definition: Annual number of deaths of children aged less than 1 year • Source of numerator: Deaths certificates (vital statistics) • Denominator definition: Total number of live births in a given year • Source of denominator: National Institute of Statistics (vital statistics) • Geographic coverage: National • Timeliness: annually • Accuracy and completeness of data set: Mortality and population data are accurate (there are
quality control mechanisms in place) and complete (cover more than 90% of the population) • Disclosure control
References: 1. NCHS. 2001. Healthy People 2000 Final Revie. Hyattsville, MD. Public Health Service. Available
at http://www.cdc.gov/nchs/data/hp2000/hp2k01-acc.pdf. (accessed on 30 August 2010) 2. C Corinne J. Schuster-Wallace, Velma I. Grover, Zafar Adeel, Ulisses Confalonieri, Susan Elliot.
Safe Water as the Key to Global Health. United Nations University. International Network on Water Environment and Health (UNU-INWEH). 2008. Available at http://www.inweh.unu.edu/documents/SafeWater_Web_version.pdf. (accessed on 30 August 2010)
3. H Dolk, M Vrijheid, B Armstrong, L Abramsky, F Bianchi, E Garne, V Nelen, E Robert, J E S Scott, D Stone, R Tenconi. Risk of congenital anomalies near hazardous-waste landfill sites in Europe: the EUROHAZCON study. The Lancet, Volume 352, Issue 9126, Pages 423 - 427, 8 August 1998.
4. European Commission. Background Document for Press Pack-Launch of commission Communication. Solidarity in Health: Reducing Health Inequalities in the EU. Brussles, 20 October 2009.
5. World Health Organization Web Page. Millenium Development Goals. MDG 4. http://www.who.int/topics/millennium_development_goals/child_mortality/en/index.html
6. Communication from the Commission to the European Parliament, the Council, the European

SELECTED INDICATORS REPORT
86
Economic and Social Committee and the Committee of the Regions. Solidarity in Health: Reducing Health Inequalities in the EU. Brussles, 20 October 2009. COM(2009) 567 final
7. Rajaratnam, JK, Marcus JR, Flaxman AD, HAidong W, Levin-Recto A, Dwyer L, Costa M, Lopez A, Murray C JL. Neonatal, postneonatal, childhood, and under-5 mortality for 187 countries, 1970—2010: a systematic analysis of progress towards Millennium Development Goal 4. The Lancet, Volume 375, Issue 9730, Pages 1988 - 2008, 5 June 2010.
8. United Nations Children´s Fund. UNICEF. The State of the World’s Children. Special Edition. 2009. New York. http://www.unicef.org/rightsite/sowc/fullreport.php
9. European Commission. Eurostat. 2009. Causes of death and infant mortality. http://epp.eurostat.ec.europa.eu/statistics_explained/index.php/Causes_of_death_and_infant_mortality
10. European Commission. European. Luxembourg, Office of Official Publications of the European Community. Eurostat Publication. Population Statistics. Chaper E. Mortality. http://epp.eurostat.ec.europa.eu/cache/ITY_OFFPUB/KS-EH-06-001/EN/KS-EH-06-001-EN.PDF
11. World Health Organization HFA databases 2010. Available at http://www.euro.who.int/en/what-we-do/data-and-evidence/databases
Further information: WHO European Centre for Environment and Health. Effects of air pollution on children’s health and development - a review of the evidence. Copenhagen, WHO Regional Office for Europe, 2005 (http://www.euro.who.int/document/E86575.pdf ). WHO European Centre for Environment and Health. Exposure of children to air pollution (particulate matter) in outdoor air. Copenhagen, WHO Regional Office for Europe, 2007 (ENHIS-2 fact sheet No. 3.3). Public health and environment [web site]. Geneva, World Health Organization, 2007 (www.who.int/phe). Author: Momchil Sidjimov, National Centre for Public Health Protection, Sofia, Bulgaria. Black RE, Morris SS, Bryce J. Where and why are 10 million children dying every year? Lancet, 2003; 361:2226–2234. WHO estimates of the causes of death in children Bryce J, Boschi-Pinto C, Shibuya K, Black RE. WHO estimates of the causes of death in children. Lancet, 2005, 365:1147–1152. Anon (2006). Editorial. Environmental influences on children`s health, Lancet, 367 (9508), 4 February-10 February 2006, 369. Further Information: Author: Adriana Galan, National Institute of Public Health, Romania Date of production: 15 September 2010

SELECTED INDICATORS REPORT
87
Slovenia Name of indicator: Infant mortality Definition: Death of infants aged less than 1 year per 1000 live births (crude rate) Key Message: Infant mortality in Slovenia decreased from 4.5 deaths per 1000 live births in year 1999 to 2.8 per 1000 live births in year 2007 Rationale: Infant mortality gives an indirect assessment of the adverse impact on health of environmental factors in a vulnerable age group. It not only indicates the current health status of the population but also predicts the health of the next generation1. Mortality rate depends of many different factors, including direct and indirect impact of environmental pollution and hygienic life conditions.
Infant mortality is associated with several health determinants, such as maternal health, access to health care and socio-economic well-being. It is an important indicator of health-related socio-economic and cultural conditions. Infant mortality tends to be higher in countries with greater social and health-related inequalities, and to rise in countries that have suffered substantial socioeconomic, cultural and political disruption.
Infant mortality may indirectly reflect adverse environmental and hygienic conditions, or the inadequate disease prevention policies. For example, approximately 4,000 children die every day from illnesses caused by poor drinking water or inadequate hygiene practices. One of the most frequent causes of death in children under the age of 5 is diarrhoea: 1.4 million children under 5 fall victim to it and die each year. 88% of these deaths can be directly attributed to problems with water. Insufficient clean water, even for hand-washing, can be linked to the spread of other illnesses such as intestinal worms that infect many children and increase their vulnerability to malnutrition, and anaemia2.
Air pollution may exacerbate asthma symptoms and could potentially increase infant mortality. An increase in respiratory mortality may indicate higher indoor or outdoor air pollution levels.
In developed countries/regions, congenital malformations, deformations and chromosomal abnormalities are among the main causes of infant mortality. Studies have shown that there is a positive association between proximity to toxic waste dump sites and number of children with congenital abnormalities3. Disorders related to short gestation and low birth weight, as well as Sudden Infant Death Syndrome (SIDS) are also leading causes. SIDS can be linked to exposure to environmental tobacco smoke. Air pollution may exacerbate asthma symptoms and could potentially increase infant mortality. Thus, mortality may reflect adverse environmental conditions.
Studies in different parts of the world have shown that ethnicity and socioeconomic factors impact on childhood mortality rates in the population. Maternal socio-economic status is a possible contributing factor given that the leading cause of death was related to congenital malformations, which in some cases can be eliminated with appropriate nutritional intake and prenatal vitamins. Lack of prenatal care could also contribute to maternal complications which are the fourth largest cause of infant death. Many other industrialized countries have a socialized system of health care, which offers better access to prenatal care thereby helping to reduce country-wide infant mortality rates.
In the European Union there are large differences in infant mortality among and within countries. Despite an overall decline, infant mortality continues to be higher in lower social-economic groups. In some countries the gap between low and high socioeconomic groups has increased4. Given the great potential

SELECTED INDICATORS REPORT
88
to prevent infant mortality through standard public health practices and elemental primary care, it is of utmost importance to monitor both the rate of infant mortality in infant mortality and it’s socioeconomic and health related determinants.
Nearly 9 million children under five die every year. Almost 90% of all child deaths are attributable to just six conditions: neonatal causes, pneumonia, diarrhoea, malaria, measles, and HIV/AIDS. During 1960-1990, child mortality in developing regions was halved to one child in 10 dying before age five5. Policy Relevance and Context: Reducing infant mortality is one of the Millennium Development Goals. MDG 4 aims to reduce by two-thirds, by 2015, the mortality of children under five5.
There are large differences in infant mortality in the European Union. The European Commission has announced a series of actions to help EU Member States to tackle the gaps in health which exist between and within countries in the UE. In October 2009, the European Commission launched the Communication: Solidarity in Health: Reducing Health Inequalities in the EU. Among the proposals to tackle inequalities, the Background Paper for the Communication encourages the building of information through development of regular monitoring of health indicators. The Commission supports the use of existing EU surveys such as the EU Survey on Income and Living Conditions (EU-SILC), European Health Interview Survey and others to create measures of health inequalities, and will support the further development and collection of data and health inequalities indicators by age, sex, socio-economic status and geographic dimension6.
Policies and programmes in Slovenia whaich are targeted at reducing infant mortality include: • injury accident prevention programmes; • regular follow up during pregnancy; and • child medical prevention programs.
Presentation of Data:
Figure 1a: Infant mortality rate in Slovenia by NUTS2 in 2006-2008

SELECTED INDICATORS REPORT
89
0 1 2 3 4
Vzhodna Slovenija (SI01)
Zahodna Slovenija (SI02)
number of deaths / 1000 live births
Infant mortality in Slovenia by regions (NUTS2), 2006-2008
national value
Figure 1b: Infant mortality in Slovenia by NUTS2 for the period 2006-2008
Figure 2: Infant mortality rate in Slovenia by NUTS3 for the period 2006-2008

SELECTED INDICATORS REPORT
90
0 1 2 3 4 5 6
Pomurska (SI011)
Podravska (SI012)
Koroska (SI013)
Savinjska (SI014)
Zasavska (SI015)
Spodnjeposavska (SI016)
Jugovzhodna Slovenija (SI017)
Notranjsko-kraska (SI018)
Osrednjeslovenska (SI021)
Gorenjska (SI022)
Goriska (SI023)
Obalno-kraska (SI024)
number of deaths / 1000 live births
Infant mortality in Slovenia by counties (NUTS3), 2006-2008
national value
Figure 2b: Infant mortality rate in Slovenia by NUTS3 for the period 2006-2008
SELECTED INDICATORS REPORT
91
0
1
2
3
4
5
6
1999-2001 2000-2002 2001-2003 2002-2004 2003-2005 2004-2006 2005-2007 2006-2008
num
ber o
f dea
ths
/ 10
00 li
ve b
irth
s
Infant mortality by counties (NUTS2) of region Vzhodna Slovenija, Slovenia
Vzhodna Slovenija (SI01)Zahodna Slovenija (SI02)national value
Figure 3: Infant mortality rate in Slovenia by NUTS2 for the period 1999-2008
0
1
2
3
4
5
6
7
8
1999-2001 2000-2002 2001-2003 2002-2004 2003-2005 2004-2006 2005-2007 2006-2008
num
ber o
f dea
ths
/ 10
00 li
ve b
irth
s
Infant mortality by counties (NUTS3) in region Vzhodna Slovenija, Slovenia
Pomurska (SI011) Podravska (SI012) Koroska (SI013)
Savinjska (SI014) Zasavska (SI015) Spodnjeposavska (SI016)
Jugovzhodna Slovenija (SI017) Notranjsko-kraska (SI018) national value
Figure 4a: Infant mortality rate in Slovenia by NUTS3 for the period 1999-2008

SELECTED INDICATORS REPORT
92
0
1
2
3
4
5
6
7
8
1999-2001 2000-2002 2001-2003 2002-2004 2003-2005 2004-2006 2005-2007 2006-2008
num
ber o
f dea
ths
/ 10
00 li
ve b
irth
s
Infant mortality by counties (NUTS3) in region Zahodna Slovenija, Slovenia
Osrednjeslovenska (SI021)
Gorenjska (SI022)
Goriska (SI023)
Obalno-kraska (SI024)
national value
Figure 4b: Infant mortality rate in Slovenia by NUTS3 for the period 1999-2008
Assessment: Generally, infant mortality has decreased substantially on a global level as well as in almost every country. A study undertaken in the United States stated that the number of deaths occurring in children worldwide fell from 11.9 million in 1990 to 7.7 million in 20107. A United Nation's Children's fund report8 showed improved malaria prevention and drugs to protect newborns of mothers with AIDS had helped lower infant mortality from 12.5 million in 1990 to 8.8 million in 2008.
In general, the European Union has witnessed a significant reduction in mortality during the last century due to a reduction in both infant mortality and infectious and degenerative diseases. Mortality during the first year of life has decreased considerably in all EU Member States, with current levels among the world‘s lowest. However, there are still persistent differences in rates across different social groups or geographical regions.
The progress made in medical health care services in Europe is reflected in the decreasing infant mortality rate. Mortality during the first year of life has decreased considerably in all EU Member States, with current levels among the world‘s lowest. Substantial differences are found in infant mortality among EU countries, with higher infant mortality rates in Central and Eastern Europe, and there are persistent differences in rates across different social groups or geographical regions. In the last four decades, the infant mortality rate in the EU fell from 28.6 deaths per 1000 live births in 1965 to 4.7 deaths in 2007. From 1980 to 2004, infant mortality rate fell by 69% in the EU-25, from 14.8 to 4.6. The relative decrease in the new Member States was greater (72% from 22.5 to 6.39) than that in the former EU-15 (66%; from 12.7 to 4.3)9.
In 2006, the highest mortality rates occurred in Romaniaand Bulgaria, followed by Latvia, Lithuania, Slovakia and Poland (approximately 6 deaths per 1000 live births). Fortunately, infant mortality continues to decrease in some countries and in Lithuania mortality rate was 4.9 in 2008. Globally, the lowest infant mortality rates are found among the EU Member States – for example 1.8 per 1000 live births in Luxemburg or less than 3 per 1000 live births in Slovenia, Sweden, Finland or the Czech Republic. These levels are close to the supposed biological minimum which lies between 2 and 3 per 1000 live births10.

SELECTED INDICATORS REPORT
93
Infant mortality rates have remained constant in some countries in recent years, but have increased in Cyprus and Malta, although the relatively small population in these two countries so results of trend analysis is less stable. However, this observation may partly be due to factors such as an increasing number of women deferring childbirth or a higher number of multiple births as a result of the more common use of fertility treatments.
Infant mortality in Slovenia decreased from 4.5 per 1000 live births in 1999 to 2.8 per 1000 live births in year 2007. The highest was observed in Koroška region and the lowest in Obalno - kraška region. Data underlying the indicator: Primary source: National Institute of Public Health: Statistical Office of the Republic of Slovenia Date last published: 2008 Time period of analysis 1999-2008 Numerator definition: Annual number of deaths of children aged 0–364 days due to all causes
multiplied by 1000 Source of numerator: National Institute of Public Health, Slovenia Denominator definition: Total number of live births in the survey year. Source of denominator: National Institute of Public Health, Slovenia Geographic coverage: NUTS1, NUTS2, NUTS3 Timeliness: annually Accuracy and completeness of data set Disclosure control: According to national legislation References:
1. NCHS. 2001. Healthy People 2000 Final Revie. Hyattsville, MD. Public Health Service. Available at http://www.cdc.gov/nchs/data/hp2000/hp2k01-acc.pdf. (accessed on 30 August 2010)
2. C Corinne J. Schuster-Wallace, Velma I. Grover, Zafar Adeel, Ulisses Confalonieri, Susan Elliot. Safe Water as the Key to Global Health. United Nations University. International Network on Water Environment and Health (UNU-INWEH). 2008. Available at http://www.inweh.unu.edu/documents/SafeWater_Web_version.pdf. (accessed on 30 August 2010)
3. H Dolk, M Vrijheid, B Armstrong, L Abramsky, F Bianchi, E Garne, V Nelen, E Robert, J E S Scott, D Stone, R Tenconi. Risk of congenital anomalies near hazardous-waste landfill sites in Europe: the EUROHAZCON study. The Lancet, Volume 352, Issue 9126, Pages 423 - 427, 8 August 1998.
4. European Commission. Background Document for Press Pack-Launch of commission Communication. Solidarity in Health: Reducing Health Inequalities in the EU. Brussles, 20 October 2009.
5. World Health Organization Web Page. Millenium Development Goals. MDG 4. http://www.who.int/topics/millennium_development_goals/child_mortality/en/index.html
6. Communication from the Commission to the European Parliament, the Council, the European Economic and Social Committee and the Committee of the Regions. Solidarity in Health: Reducing Health Inequalities in the EU. Brussles, 20 October 2009. COM(2009) 567 final
7. Rajaratnam, JK, Marcus JR, Flaxman AD, HAidong W, Levin-Recto A, Dwyer L, Costa M, Lopez A, Murray C JL. Neonatal, postneonatal, childhood, and under-5 mortality for 187 countries, 1970—2010: a systematic analysis of progress towards Millennium Development Goal 4. The Lancet, Volume 375, Issue 9730, Pages 1988 - 2008, 5 June 2010.
8. United Nations Children´s Fund. UNICEF. The State of the World’s Children. Special Edition. 2009. New York. http://www.unicef.org/rightsite/sowc/fullreport.php
9. European Commission. Eurostat. 2009. Causes of death and infant mortality. http://epp.eurostat.ec.europa.eu/statistics_explained/index.php/Causes_of_death_and_infant_mortality
10. European Commission. European. Luxembourg, Office of Official Publications of the European Community. Eurostat Publication. Population Statistics. Chaper E. Mortality. http://epp.eurostat.ec.europa.eu/cache/ITY_OFFPUB/KS-EH-06-001/EN/KS-EH-06-001-EN.PDF

SELECTED INDICATORS REPORT
94
Further information:
WHO European Centre for Environment and Health. Effects of air pollution on children’s health and development - a review of the evidence. Copenhagen, WHO Regional Office for Europe, 2005 (http://www.euro.who.int/document/E86575.pdf ). WHO European Centre for Environment and Health. Exposure of children to air pollution (particulate matter) in outdoor air. Copenhagen, WHO Regional Office for Europe, 2007 (ENHIS-2 fact sheet No. 3.3). Public health and environment [web site]. Geneva, World Health Organization, 2007 (www.who.int/phe). Author: Momchil Sidjimov, National Centre for Public Health Protection, Sofia, Bulgaria. Black RE, Morris SS, Bryce J. Where and why are 10 million children dying every year? Lancet, 2003; 361:2226–2234. WHO estimates of the causes of death in children Bryce J, Boschi-Pinto C, Shibuya K, Black RE. WHO estimates of the causes of death in children. Lancet, 2005, 365:1147–1152. Anon (2006). Editorial. Environmental influences on children`s health, Lancet, 367 (9508), 4 February-10 February 2006, 369. Author: Peter Otorepec, Ana Hojs, Katarina Bitenc, National Institute of Public Health, Slovenia Date of production: August 2010

SELECTED INDICATORS REPORT
95
Spain Name of indicator: Infant mortality Definition: Death of infants aged less than 1 year per 1000 live births (crude rate) Key Message: Infant mortality has decreased dramatically in Spain during the last few decades (1960 – 2010). The decrease during every decade from 1960 to the beginning of this decade is similar to the average of the EU-15 and EU25 countries. In 2003, only Finland and Sweden had mortality rates lower than Spain. Infant mortality rates in some regions of Spain are close to the biological minimum which lies between 2 and 3. Given these low mortality rates already achieved by the early 2000s, improvement in infant mortality has slowed in recent years. Further improvement may be achieved by addressing disparities in infant mortality rates among social groups. Rationale: Infant mortality gives an indirect assessment of the adverse impact on health of environmental factors in a vulnerable age group. It not only indicates the current health status of the population but also predicts the health of the next generation1. Mortality rate depends of many different factors, including direct and indirect impact of environmental pollution and hygienic life conditions.
Infant mortality is associated with several health determinants, such as maternal health, access to health care and socio-economic well-being. It is an important indicator of health-related socio-economic and cultural conditions. Infant mortality tends to be higher in countries with greater social and health-related inequalities, and to rise in countries that have suffered substantial socioeconomic, cultural and political disruption.
Infant mortality may indirectly reflect adverse environmental and hygienic conditions, or the inadequate disease prevention policies. For example, approximately 4,000 children die every day from illnesses caused by poor drinking water or inadequate hygiene practices. One of the most frequent causes of death in children under the age of 5 is diarrhoea: 1.4 million children under 5 fall victim to it and die each year. 88% of these deaths can be directly attributed to problems with water. Insufficient clean water, even for hand-washing, can be linked to the spread of other illnesses such as intestinal worms that infect many children and increase their vulnerability to malnutrition, and anaemia2.
Air pollution may exacerbate asthma symptoms and could potentially increase infant mortality. An increase in respiratory mortality may indicate higher indoor or outdoor air pollution levels.
In developed countries/regions, congenital malformations, deformations and chromosomal abnormalities are among the main causes of infant mortality. Studies have shown that there is a positive association between proximity to toxic waste dump sites and number of children with congenital abnormalities3. Disorders related to short gestation and low birth weight, as well as Sudden Infant Death Syndrome (SIDS) are also leading causes. SIDS can be linked to exposure to environmental tobacco smoke. Air pollution may exacerbate asthma symptoms and could potentially increase infant mortality. Thus, mortality may reflect adverse environmental conditions.
Studies in different parts of the world have shown that ethnicity and socioeconomic factors impact on childhood mortality rates in the population. Maternal socio-economic status is a possible contributing factor given that the leading cause of death was related to congenital malformations, which in some cases can be eliminated with appropriate nutritional intake and prenatal vitamins. Lack of prenatal care could also contribute to maternal complications which are the fourth largest cause of infant death. Many other industrialized countries have a socialized system of health care,

SELECTED INDICATORS REPORT
96
which offers better access to prenatal care thereby helping to reduce country-wide infant mortality rates.
In the European Union there are large differences in infant mortality among and within countries. Despite an overall decline, infant mortality continues to be higher in lower social-economic groups. In some countries the gap between low and high socioeconomic groups has increased4. Given the great potential to prevent infant mortality through standard public health practices and elemental primary care, it is of utmost importance to monitor both the rate of infant mortality in infant mortality and it’s socioeconomic and health related determinants.
Nearly 9 million children under five die every year. Almost 90% of all child deaths are attributable to just six conditions: neonatal causes, pneumonia, diarrhoea, malaria, measles, and HIV/AIDS. During 1960-1990, child mortality in developing regions was halved to one child in 10 dying before age five5. Policy Relevance and Context: Reducing infant mortality is one of the Millennium Development Goals. MDG 4 aims to reduce by two-thirds, by 2015, the mortality of children under five5.
There are large differences in infant mortality in the European Union. The European Commission has announced a series of actions to help EU Member States to tackle the gaps in health which exist between and within countries in the UE. In October 2009, the European Commission launched the Communication: Solidarity in Health: Reducing Health Inequalities in the EU. Among the proposals to tackle inequalities, the Background Paper for the Communication encourages the building of information through development of regular monitoring of health indicators. The Commission supports the use of existing EU surveys such as the EU Survey on Income and Living Conditions (EU-SILC), European Health Interview Survey and others to create measures of health inequalities, and will support the further development and collection of data and health inequalities indicators by age, sex, socio-economic status and geographic dimension6.
Presentation of Data:
Figure 1a(i): Infant mortality rate in Spain by NUTS2 in 2005

SELECTED INDICATORS REPORT
97
0 1 2 3 4 5 6 7 8 9
Galicia (ES11)
Principado de Asturias (ES12)
Cantabria (ES13)
País Vasco (ES21)
Comunidad Foral de Navarra (ES22)
La Rioja (ES23)
Aragón (ES24)
Comunidad de Madrid (ES30)
Castilla y León (ES41)
Castilla-La Mancha (ES42)
Extremadura (ES43)
Cataluña (ES51)
Comunidad Valenciana (ES52)
Illes Balears (ES53)
Andalucía (ES61)
Región de Murcia (ES62)
Ciudad Autónoma de Ceuta (ES63)
Ciudad Autónoma de Melilla (ES64)
Canarias (ES70)
number of deaths / 1000 live births
Infant mortality in Spain by NUTS2, 2005
national value
Figure 1a(ii): Infant mortality rate in Spain by NUTS2 in 2005
Figure 1b(i): Infant mortality in Spain bu NUTS3 in 2005

SELECTED INDICATORS REPORT
98
0 1 2 3 4 5 6 7 8 9
A Coruña (ES111)Lugo (ES112)
Ourense (ES113)Pontevedra (ES114)
Asturias (ES120)Cantabria (ES130)
Álava (ES211)Guipúzcoa (ES212)
Vizcaya (ES213)Navarra (ES220)La Rioja (ES230)Huesca (ES241)Teruel (ES242)
Zaragoza (ES243)Madrid (ES300)
Ávila (ES411)Burgos (ES412)
León (ES413)Palencia (ES414)
Salamanca (ES415)Segovia (ES416)
Soria (ES417)Valladolid (ES418)
Zamora (ES419)Albacete (ES421)
Ciudad Real (ES422)Cuenca (ES423)
Guadalajara (ES424)Toledo (ES425)
Badajoz (ES431)Cáceres (ES432)
Barcelona (ES511)Girona (ES512)Lleida (ES513)
Tarragona (ES514)Alicante / Alacant (ES521)
Castellón / Castelló (ES522)Valencia / València (ES523)
Almería (ES611)Cádiz (ES612)
Córdoba (ES613)Granada (ES614)
Huelva (ES615)Jaén (ES616)
Málaga (ES617)Sevilla (ES618)
Murcia (ES620)Ceuta (ES630)
Melilla (ES640)Gran Canaria (ES705)
Tenerife (ES709)
number of deaths / 1000 live births
Infant mortality in Spain by NUTS3, 2005
national value
Figure 1b(ii): Infant mortality rate in Spain by NUTS3 in 2005
0
1
2
3
4
5
6
7
8
9
10
11
1999 2000 2001 2002 2003 2004 2005
num
ber o
f dea
ths
/ 10
00 li
ve b
irth
s
Infant mortality by NUTS2 in the north-western part of Spain (Noroeste)
Galicia (ES11)
Principado de Asturias (ES12)
Cantabria (ES13)
national value

SELECTED INDICATORS REPORT
99
0
1
2
3
4
5
6
7
8
9
10
11
1999 2000 2001 2002 2003 2004 2005
num
ber o
f dea
ths
/ 10
00 li
ve b
irth
s
Infant mortality by NUTS2 in the north-eastern part of Spain (Noreste)
País Vasco (ES21)
Comunidad Foral de Navarra (ES22)
La Rioja (ES23)
Aragón (ES24)
national value
0
1
2
3
4
5
6
7
8
9
10
11
1999 2000 2001 2002 2003 2004 2005
num
ber o
f dea
ths
/ 10
00 li
ve b
irth
s
Infant mortality by NUTS2 in Madrid and in the central part (Centro) of Spain
Comunidad de Madrid (ES30)
Castilla y León (ES41)
Castilla-La Mancha (ES42)
Extremadura (ES43)
national value
0
1
2
3
4
5
6
7
8
9
10
11
1999 2000 2001 2002 2003 2004 2005
num
ber o
f dea
ths
/ 10
00 li
ve b
irth
s
Infant mortality by NUTS2 in the eastern part of Spain (Este)
Cataluña (ES51)
Comunidad Valenciana (ES52)
Illes Balears (ES53)
national value
0
1
2
3
4
5
6
7
8
9
10
11
1999 2000 2001 2002 2003 2004 2005
num
ber o
f dea
ths
/ 10
00 li
ve b
irth
s
Infant mortality by NUTS2 in Canarias and in the southern part (Sur) of Spain
Andalucía (ES61)
Región de Murcia (ES62)
Ciudad Autónoma de Ceuta (ES63)
Ciudad Autónoma de Melilla (ES64)
Canarias (ES70)
national value
Figure 2: Infant mortality rate in Spain by NUTS 2 for the period 1999-2008

SELECTED INDICATORS REPORT
100
0
1
2
3
4
5
6
7
8
1999 2000 2001 2002 2003 2004 2005
num
ber o
f dea
ths
/ 10
00 li
ve b
irth
s
Infant mortality by provinces (NUTS3) in País Vasco, Spain
Álava (ES211)
Guipúzcoa (ES212)
Vizcaya (ES213)
national value
0
1
2
3
4
5
6
7
8
1999 2000 2001 2002 2003 2004 2005
num
ber o
f dea
ths
/ 10
00 li
ve b
irth
s
Infant mortality by provinces (NUTS3) in Cataluña, Spain
Barcelona (ES511)
Girona (ES512)
Lleida (ES513)
Tarragona (ES514)
national value
0
1
2
3
4
5
6
7
8
1999 2000 2001 2002 2003 2004 2005
num
ber o
f dea
ths
/ 10
00 li
ve b
irth
s
Infant mortality by provinces (NUTS3) in Galicia, Spain
A Coruña (ES111)
Lugo (ES112)
Ourense (ES113)
Pontevedra (ES114)
national value
Figure 3: Infant mortality rate in Spain by NUTS3 for the perion 1999-2008
0
5
10
15
20
25
30
35
40
1960
1965
1970
1975
1980
1985
1990
1995
2000
2004
SpainEU-25EU-15EEA-28
Figure 4: Average of infant mortality rates in the EU-15, EU-25 and EU-28 countries

SELECTED INDICATORS REPORT
101
Assessment: Generally, infant mortality has decreased substantially on a global level as well as in almost every country. A study undertaken in the United States stated that the number of deaths occurring in children worldwide fell from 11.9 million in 1990 to 7.7 million in 20107. A United Nation's Children's fund report8 showed improved malaria prevention and drugs to protect newborns of mothers with AIDS had helped lower infant mortality from 12.5 million in 1990 to 8.8 million in 2008.
In general, the European Union has witnessed a significant reduction in mortality during the last century due to a reduction in both infant mortality and infectious and degenerative diseases. Mortality during the first year of life has decreased considerably in all EU Member States, with current levels among the world‘s lowest. However, there are still persistent differences in rates across different social groups or geographical regions.
The progress made in medical health care services in Europe is reflected in the decreasing infant mortality rate. Mortality during the first year of life has decreased considerably in all EU Member States, with current levels among the world‘s lowest. Substantial differences are found in infant mortality among EU countries, with higher infant mortality rates in Central and Eastern Europe, and there are persistent differences in rates across different social groups or geographical regions. In the last four decades, the infant mortality rate in the EU fell from 28.6 deaths per 1000 live births in 1965 to 4.7 deaths in 2007. From 1980 to 2004, infant mortality rate fell by 69% in the EU-25, from 14.8 to 4.6. The relative decrease in the new Member States was greater (72% from 22.5 to 6.39) than that in the former EU-15 (66%; from 12.7 to 4.3)9.
In 2006, the highest mortality rates occurred in Romaniaand Bulgaria, followed by Latvia, Lithuania, Slovakia and Poland (approximately 6 deaths per 1000 live births). Fortunately, infant mortality continues to decrease in some countries and in Lithuania mortality rate was 4.9 in 2008. Globally, the lowest infant mortality rates are found among the EU Member States – for example 1.8 per 1000 live births in Luxemburg or less than 3 per 1000 live births in Slovenia, Sweden, Finland or the Czech Republic. These levels are close to the supposed biological minimum which lies between 2 and 3 per 1000 live births10. Infant mortality rates have remained constant in some countries in recent years, but have increased in Cyprus and Malta, although the relatively small population in these two countries so results of trend analysis is less stable. However, this observation may partly be due to factors such as an increasing number of women deferring childbirth or a higher number of multiple births as a result of the more common use of fertility treatments.
The decrease in infant mortality rates in Spain is similar to that for the EU averages (Fig ure 3). Infant mortality rate is indicative of national developments as well as improved health care services. The decrease in infant mortality rates in Spain in the past decades reflects the enormous change both in health care and economic improvement experienced. Infant mortality rates have declined throughout the last decades with rates of 35.4 per 1000 live births in 1960, 20.7 in 1970, 12.3 in 1980 and 3.57 in 2003. In 2003 only Finland and Sweden had mortality rates (3.1) lower than Spain. It is noteworthy that in 1985, one year before entering the European Union, infant mortality rate was 8.9, having decreased progressively to 3.62 in 2006.
However, given the low rates of infant mortality rates already reached by the year 2000, the improvement of this indicator has slowed in recent years. A moderate decrease in the infant mortality can be observed in most of the regions except for the northwest and the Canary Islands (Figure 2). Infant mortality rates are higher in boys than in girls, with 3.7 boys in 1000 dying before the age of 1 year compared tot 3.0 girls in 2007.
There are some geographical differences in mortality rates, which are more evident at NUTS3 level (Figure 1). It is interesting that some regions are close to the biological minimum of infant mortality, which lies between 2 and 3. On the other hand, there remain countries in which the infant mortality rate is relatively high such as in the case of La Rioja. The reasons for this are unknown. La Rioja is an Autonomous Community composed only of one province and 300,000 inhabitants it has been postulated that below certain minimum, the size of the administrative and health care areas may be

SELECTED INDICATORS REPORT
102
inversely associated with infant mortality. However, due to the small sample size (17 Autonomous Communities) and the fact that some Autonomous Communities contradict this hypothesis, it could be not demonstrated empirically.
The decrease in infant mortality rate has contributed substantially to the great improvement in life expectancy in Spain. Of the EU-25 countries, Spain and Sweden rank first (80.5) followed by France (80.3) in life expectancy. When life expectancies for males and females are considered separately, Spain and France are the most “favourable” countries for girls to be born in (83.4 in 2004), followed by Sweden (82.6) and Italy (82.4 in 2003). For newborn boys, Spain is the second preferred countryin which to be born (78.3) following Sweden. Data underlying the indicator:
• Primary source: National Institute • Date last published: 2009 • Time period of analysis: 1999-2008 • Numerator definition: Annual number of deaths of children aged less than 1 year • Source of numerator: Deaths certificate (vital statistics) • Denominator definition: Total number of live births in a given year • Source of denominator: National Institute of Statistics (vital statistics) • Geographic coverage: national • Timeliness: annually • Accuracy and completeness of data set: Mortality and population data are accurate (there
are quality control mechanisms in place) and complete (cover more than 90% of the population)
• Disclousure control: no References:
1. NCHS. 2001. Healthy People 2000 Final Revie. Hyattsville, MD. Public Health Service. http://www.cdc.gov/nchs/data/hp2000/hp2k01-acc.pdf
2. C Corinne J. Schuster-Wallace, Velma I. Grover, Zafar Adeel, Ulisses Confalonieri, Susan Elliot. Safe Water as the Key to Global Health. United Nations University. International Network on Water Environment and Health (UNU-INWEH). 2008. Available at http://www.inweh.unu.edu/documents/SafeWater_Web_version.pdf. (accessed on 30 August 2010)
3. H Dolk, M Vrijheid, B Armstrong, L Abramsky, F Bianchi, E Garne, V Nelen, E Robert, J E S Scott, D Stone, R Tenconi. Risk of congenital anomalies near hazardous-waste landfill sites in Europe: the EUROHAZCON study. The Lancet, Volume 352, Issue 9126, Pages 423 - 427, 8 August 1998.
4. European Commission. Background Document for Press Pack-Launch of commission Communication. Solidarity in Health: Reducing Health Inequalities in the EU. Brussles, 20 October 2009.
5. World Health Organization Web Page. Millenium Development Goals. MDG 4. http://www.who.int/topics/millennium_development_goals/child_mortality/en/index.html
6. Communication from the Commission to the European Parliament, the Council, the European Economic and Social Committee and the Committee of the Regions. Solidarity in Health: Reducing Health Inequalities in the EU. Brussles, 20 October 2009. COM(2009) 567 final
7. Rajaratnam, JK, Marcus JR, Flaxman AD, HAidong W, Levin-Recto A, Dwyer L, Costa M, Lopez A, Murray C JL. Neonatal, postneonatal, childhood, and under-5 mortality for 187 countries, 1970—2010: a systematic analysis of progress towards Millennium Development Goal 4. The Lancet, Volume 375, Issue 9730, Pages 1988 - 2008, 5 June 2010.
8. United NAtions Children´s Fund. UNICEF. The State of the World’s CHidlren. Special Edition. 2009. New York. http://www.unicef.org/rightsite/sowc/fullreport.php
9. European Commission. Eurostat. 2009. Causes of death and infant mortality. http://epp.eurostat.ec.europa.eu/statistics_explained/index.php/Causes_of_death_and_infant_mortality
10. European Commission. European. Luxembourg, Office of Official Publications of the European Community. Eurostat Publication. Population Statistics. Chaper E. Mortality.

SELECTED INDICATORS REPORT
103
http://epp.eurostat.ec.europa.eu/cache/ITY_OFFPUB/KS-EH-06-001/EN/KS-EH-06-001-EN.PDF
Additional References WHO European Centre for Environment and Health. Effects of air pollution on children’s health and development - a review of the evidence. Copenhagen, WHO Regional Office for Europe, 2005 (http://www.euro.who.int/document/E86575.pdf ). WHO European Centre for Environment and Health. Exposure of children to air pollution (particulate matter) in outdoor air. Copenhagen, WHO Regional Office for Europe, 2007 (ENHIS-2 fact sheet No. 3.3). Public health and environment [web site]. Geneva, World Health Organization, 2007 (www.who.int/phe). Author: Momchil Sidjimov, National Centre for Public Health Protection, Sofia, Bulgaria. Black RE, Morris SS, Bryce J. Where and why are 10 million children dying every year? Lancet, 2003; 361:2226–2234. WHO estimates of the causes of death in children Bryce J, Boschi-Pinto C, Shibuya K, Black RE. WHO estimates of the causes of death in children. Lancet, 2005, 365:1147–1152. Anon (2006). Editorial. Environmental influences on children`s health, Lancet, 367 (9508), 4 February-10 February 2006, 369. Further Information: Author: Maria Jose Carroquino, ISCIII, Spain Date of production: August 2010

SELECTED INDICATORS REPORT
104
United Kingdom
Name of indicator: Infant mortality Definition: Death of infants aged less than 1 year per 1000 live births (crude rate) Key Message: During the past decade infant mortality has reduced globally, in Europe and in the United Kingdom. Rationale: Infant mortality gives an indirect assessment of the adverse impact on health of environmental factors in a vulnerable age group. It not only indicates the current health status of the population but also predicts the health of the next generation1. Mortality rate depends of many different factors, including direct and indirect impact of environmental pollution and hygienic life conditions.
Infant mortality is associated with several health determinants, such as maternal health, access to health care and socio-economic well-being. It is an important indicator of health-related socio-economic and cultural conditions. Infant mortality tends to be higher in countries with greater social and health-related inequalities, and to rise in countries that have suffered substantial socioeconomic, cultural and political disruption.
Infant mortality may indirectly reflect adverse environmental and hygienic conditions, or the inadequate disease prevention policies. For example, approximately 4,000 children die every day from illnesses caused by poor drinking water or inadequate hygiene practices. One of the most frequent causes of death in children under the age of 5 is diarrhoea: 1.4 million children under 5 fall victim to it and die each year. 88% of these deaths can be directly attributed to problems with water. Insufficient clean water, even for hand-washing, can be linked to the spread of other illnesses such as intestinal worms that infect many children and increase their vulnerability to malnutrition, and anaemia2.
Air pollution may exacerbate asthma symptoms and could potentially increase infant mortality. An increase in respiratory mortality may indicate higher indoor or outdoor air pollution levels.
In developed countries/regions, congenital malformations, deformations and chromosomal abnormalities are among the main causes of infant mortality. Studies have shown that there is a positive association between proximity to toxic waste dump sites and number of children with congenital abnormalities3. Disorders related to short gestation and low birth weight, as well as Sudden Infant Death Syndrome (SIDS) are also leading causes. SIDS can be linked to exposure to environmental tobacco smoke. Air pollution may exacerbate asthma symptoms and could potentially increase infant mortality. Thus, mortality may reflect adverse environmental conditions.
Studies in different parts of the world have shown that ethnicity and socioeconomic factors impact on childhood mortality rates in the population. Maternal socio-economic status is a possible contributing factor given that the leading cause of death was related to congenital malformations, which in some cases can be eliminated with appropriate nutritional intake and prenatal vitamins. Lack of prenatal care could also contribute to maternal complications which are the fourth largest cause of infant death. Many other industrialized countries have a socialized system of health care, which offers better access to prenatal care thereby helping to reduce country-wide infant mortality rates.
In the European Union there are large differences in infant mortality among and within countries. Despite an overall decline, infant mortality continues to be higher in lower social-economic groups. In some

SELECTED INDICATORS REPORT
105
countries the gap between low and high socioeconomic groups has increased4. Given the great potential to prevent infant mortality through standard public health practices and elemental primary care, it is of utmost importance to monitor both the rate of infant mortality in infant mortality and it’s socioeconomic and health related determinants.
Nearly 9 million children under five die every year. Almost 90% of all child deaths are attributable to just six conditions: neonatal causes, pneumonia, diarrhoea, malaria, measles, and HIV/AIDS. During 1960-1990, child mortality in developing regions was halved to one child in 10 dying before age five5. Policy Relevance and Context: Reducing infant mortality is one of the Millennium Development Goals. MDG 4 aims to reduce by two-thirds, by 2015, the mortality of children under five5.
There are large differences in infant mortality in the European Union. The European Commission has announced a series of actions to help EU Member States to tackle the gaps in health which exist between and within countries in the UE. In October 2009, the European Commission launched the Communication: Solidarity in Health: Reducing Health Inequalities in the EU. Among the proposals to tackle inequalities, the Background Paper for the Communication encourages the building of information through development of regular monitoring of health indicators. The Commission supports the use of existing EU surveys such as the EU Survey on Income and Living Conditions (EU-SILC), European Health Interview Survey and others to create measures of health inequalities, and will support the further development and collection of data and health inequalities indicators by age, sex, socio-economic status and geographic dimension6.
There are a number of UK initiatives aimed at reducing health inequalities and infant mortality. Some of these include:
• SureStart programme which commenced in 1999 and aims to increase the availability of childcare for all children
• Programme for action whose plan of action is to meet the 2004 Public Service Agreement target to reduce health inequalities.
Presentation of Data:
Figure 1: Infant mortality rate in the United Kingdom by NUTS1, 2006-2008

SELECTED INDICATORS REPORT
106
0 1 2 3 4 5 6 7 8 9
Herefordshire, County of (UKG11)
Worcestershire (UKG12)
Warwickshire (UKG13)
Telford and Wrekin (UKG21)
Shropshire CC (UKG22)
Stoke-on-Trent (UKG23)
Staffordshire CC (UKG24)
Birmingham (UKG31)
Solihull (UKG32)
Coventry (UKG33)
Dudley and Sandwell (UKG34)
Walsall and Wolverhampton (UKG35)
number of deaths / 1000 live births
Infant mortality by NUTS3 in West Midlands, United Kingdom, 2006-2008
national value (UK)
West Midlands (UKG)
Figure 2: Infant mortality rate in the UK by NUTS 3 (West Midlands) for 2006-2008
3,5
4,0
4,5
5,0
5,5
6,0
6,5
7,0
1999-2001 2000-2002 2001-2003 2002-2004 2003-2005 2004-2006 2005-2007 2006-2008
num
ber o
f dea
ths
/ 10
00 li
ve b
irth
s
Infant mortality in the United Kingdom by NUTS1
North East (UKC) North West (UKD) Yorkshire and the Humber (UKE)
East Midlands (UKF) West Midlands (UKG) East of England (UKH)
London (UKI) South East (UKJ) South West (UKK)
Wales (UKL) Scotland (UKM) Northern Ireland (UKN)
United Kingdom (UK)
Figure 3: Infant mortality rate in the UK by NUTS1 for the period 1999-2008
SELECTED INDICATORS REPORT
107
Assessment: Generally, infant mortality has decreased substantially on a global level as well as in almost every country. A study undertaken in the United States stated that the number of deaths occurring in children worldwide fell from 11.9 million in 1990 to 7.7 million in 20107. A United Nation's Children's fund report8 showed improved malaria prevention and drugs to protect newborns of mothers with AIDS had helped lower infant mortality from 12.5 million in 1990 to 8.8 million in 2008.
In general, the European Union has witnessed a significant reduction in mortality during the last century due to a reduction in both infant mortality and infectious and degenerative diseases. Mortality during the first year of life has decreased considerably in all EU Member States, with current levels among the world‘s lowest. However, there are still persistent differences in rates across different social groups or geographical regions.
The progress made in medical health care services in Europe is reflected in the decreasing infant mortality rate. Mortality during the first year of life has decreased considerably in all EU Member States, with current levels among the world‘s lowest. Substantial differences are found in infant mortality among EU countries, with higher infant mortality rates in Central and Eastern Europe, and there are persistent differences in rates across different social groups or geographical regions. In the last four decades, the infant mortality rate in the EU fell from 28.6 deaths per 1000 live births in 1965 to 4.7 deaths in 2007. From 1980 to 2004, infant mortality rate fell by 69% in the EU-25, from 14.8 to 4.6. The relative decrease in the new Member States was greater (72% from 22.5 to 6.39) than that in the former EU-15 (66%; from 12.7 to 4.3)9.
In 2006, the highest mortality rates occurred in Romaniaand Bulgaria, followed by Latvia, Lithuania, Slovakia and Poland (approximately 6 deaths per 1000 live births). Fortunately, infant mortality continues to decrease in some countries and in Lithuania mortality rate was 4.9 in 2008. Globally, the lowest infant mortality rates are found among the EU Member States – for example 1.8 per 1000 live births in Luxemburg or less than 3 per 1000 live births in Slovenia, Sweden, Finland or the Czech Republic. These levels are close to the supposed biological minimum which lies between 2 and 3 per 1000 live births10. Infant mortality rates have remained constant in some countries in recent years, but have increased in Cyprus and Malta, although the relatively small population in these two countries so results of trend analysis is less stable. However, this observation may partly be due to factors such as an increasing number of women deferring childbirth or a higher number of multiple births as a result of the more common use of fertility treatments.
Within the UK, infant mortality has reduced from 5.8 per 1000 live births in 1999 to 4.7 per 1000 live births in 2008 and this pattern was mirrored across all regions (refer to Figure 3). There is strong evidence of health inequalities with infant being 50% higher in the more deprived groups of people11.
The Department of Health (DH) introduced a number of targets as a result of the Acheson Report12, one of which was “By 2010 reduce inequality in health outcomes by 10% as measured by infant mortality and life expectancy at birth”. This is supported by two targets, the first of which is “Starting with children under 1 year, by 2010 to reduce the gap in mortality by at least 10% between routine and manual groups and the population as a whole”. The update on this target in 2006 reported that over the period since the target baseline (1997-99), the gap had widened13.
Infant mortality is a proxy for level of deprivation and socio-economic status. Figure 1 demonstrates that infant mortality is higher in the West Midlands than the other UK regions. However the small numbers in particularly at the smaller local levels render analyses unstable hence three years’ data has been pooled and presented as shown above.
Some of the most deprived areas in the West Midlands are found in Birmingham and Stoke-on-Trent14. Data underlying the indicator:
Primary source: Office of National Statistics (ONS) and West Midlands Public Health Observatory (WMPHO)
Date last published: 2008 Time period of analysis: 1999 - 2008

SELECTED INDICATORS REPORT
108
Numerator definition: Number of deaths due to all cause in children aged 0 – 364 days Source of numerator: ONS and WMPHO Denominator definition: Number of live births Source of denominator: ONS Geographic coverage: United Kingdom Timeliness: Annually Accuracy and completeness of data set: Data accurate and complete Disclosure control: Information is in the public domain but rates including fewer than 5 deaths are
withheld to protect the identity of the individuals References: 1. NCHS. 2001. Healthy People 2000 Final Revie. Hyattsville, MD. Public Health Service. Available
at http://www.cdc.gov/nchs/data/hp2000/hp2k01-acc.pdf. (accessed on 30 August 2010) 2. C Corinne J. Schuster-Wallace, Velma I. Grover, Zafar Adeel, Ulisses Confalonieri, Susan Elliot.
Safe Water as the Key to Global Health. United Nations University. International Network on Water Environment and Health (UNU-INWEH). 2008. Available at http://www.inweh.unu.edu/documents/SafeWater_Web_version.pdf. (accessed on 30 August 2010)
3. H Dolk, M Vrijheid, B Armstrong, L Abramsky, F Bianchi, E Garne, V Nelen, E Robert, J E S Scott, D Stone, R Tenconi. Risk of congenital anomalies near hazardous-waste landfill sites in Europe: the EUROHAZCON study. The Lancet, Volume 352, Issue 9126, Pages 423 - 427, 8 August 1998.
4. European Commission. Background Document for Press Pack-Launch of commission Communication. Solidarity in Health: Reducing Health Inequalities in the EU. Brussles, 20 October 2009.
5. World Health Organization Web Page. Millenium Development Goals. MDG 4. http://www.who.int/topics/millennium_development_goals/child_mortality/en/index.html
6. Communication from the Commission to the European Parliament, the Council, the European Economic and Social Committee and the Committee of the Regions. Solidarity in Health: Reducing Health Inequalities in the EU. Brussles, 20 October 2009. COM(2009) 567 final
7. Rajaratnam, JK, Marcus JR, Flaxman AD, HAidong W, Levin-Recto A, Dwyer L, Costa M, Lopez A, Murray C JL. Neonatal, postneonatal, childhood, and under-5 mortality for 187 countries, 1970—2010: a systematic analysis of progress towards Millennium Development Goal 4. The Lancet, Volume 375, Issue 9730, Pages 1988 - 2008, 5 June 2010.
8. United Nations Children´s Fund. UNICEF. The State of the World’s Children. Special Edition. 2009. New York. http://www.unicef.org/rightsite/sowc/fullreport.php
9. European Commission. Eurostat. 2009. Causes of death and infant mortality. http://epp.eurostat.ec.europa.eu/statistics_explained/index.php/Causes_of_death_and_infant_mortality
10. European Commission. European. Luxembourg, Office of Official Publications of the European Community. Eurostat Publication. Population Statistics. Chaper E. Mortality. http://epp.eurostat.ec.europa.eu/cache/ITY_OFFPUB/KS-EH-06-001/EN/KS-EH-06-001-EN.PDF
11. The Poverty Site: United Kingdom Infant Death. Available at: http://www.poverty.org.uk/21/index.shtml (accessed 21/09/2010)
12. Acheson D. (1998). Independent inquiry into inequalities in health (the Acheson Report). Available at; http://www.archive.official-documents.co.uk/document/doh/ih/ih.htm (accessed 05/10/2010)
13. Department of Health (2009). Tackling Health Inequalities: 10 years On – A review of developments in tackling health inequalities in England over the last 10 years. Available at: http://www.dh.gov.uk/prod_consum_dh/groups/dh_digitalassets/documents/digitalasset/dh_098934.pdf. (accessed 05/10/2010)
14. West Midlands Public Health Observatory (2007). Indices of Deprivation 2007; West Midlands Local Authorities. Available at: http://www.wmro.org/resources/res.aspx/CmsResource/resourceFilename/1927/IMD-2007_WM-LADs_V2.1_report_JW.pdf. (accessed 21/09/2010)
Further information: WHO European Centre for Environment and Health. Effects of air pollution on children’s health and development - a review of the evidence. Copenhagen, WHO Regional Office for Europe, 2005 (http://www.euro.who.int/document/E86575.pdf ). WHO European Centre for Environment and Health. Exposure of children to air pollution (particulate matter) in outdoor air. Copenhagen, WHO Regional Office for Europe, 2007 (ENHIS-2 fact sheet No. 3.3). Public health and environment [web site]. Geneva, World Health Organization, 2007 (www.who.int/phe).

SELECTED INDICATORS REPORT
109
Author: Momchil Sidjimov, National Centre for Public Health Protection, Sofia, Bulgaria. Black RE, Morris SS, Bryce J. Where and why are 10 million children dying every year? Lancet, 2003; 361:2226–2234. WHO estimates of the causes of death in children Bryce J, Boschi-Pinto C, Shibuya K, Black RE. WHO estimates of the causes of death in children. Lancet, 2005, 365:1147–1152. Anon (2006). Editorial. Environmental influences on children`s health, Lancet, 367 (9508), 4 February-10 February 2006, 369. Author: Adedoyin Awofisayo and Lorraine Stewart, Health Protection Agency, United Kingdom Date of production: 22 September 2010

SELECTED INDICATORS REPORT
110
2.3 Regional Assessment for Infant Mortality Rate due to Respiratory Diseases
Germany Name of indicator: Infant mortality rate due to respiratory diseases Definition: Annual mortality rate due to respiratory diseases in children older than one month and under one year of age Key Message: Respiratory diseases with its different kinds (like influenza, asthma or bronchitis) are belonging to the most common diseases in Germany. Very often they occur in the early childhood. Almost 12% of the children under 1 year of age in North Rhine-Westphalia were indicated of having a chronically disease of the lower respiratory system11. Fortunately the mortality rate due to respiratory diseases in children under 1 year of age is comparatively low in Germany, due to early detection and precaution programmes.9
Rationale:
Respiratory illnesses are the most common cause of childhood morbidity in developed countries. In developing and emerging economies, acute lower respiratory infections (ALRI), particularly pneumonia, are common causes of death and serious morbidity in young children and infants. Causative infective agents differ between developed and developing regions and municipalities of countries: bacterial infections are common in developing regions while viral infections cause most ALRIs in developed regions. In temperate European regions there is a marked variation with the seasons in ALRI, with a significant rise in incidence in the winter months falling to relatively low levels in the summer1. Recent studies in different countries have found associations between ambient air pollution (especially particulates and/or carbon monoxide) and postneonatal infant mortality (attributable to respiratory causes and possibly sudden infant death syndrome (SIDS)), low birth weight, and preterm birth2. The evidence is sufficient to infer a causal relationship between air pollutants (particulate matter, sulphur dioxide (SO2), NO2, CO, ozone) and respiratory deaths and SIDS in the post-neonatal period3,
4, 5, 6 . Consequently, an increase in infant respiratory mortality rates may indicate higher indoor or outdoor air pollution levels, and conversely, decreasing mortality may indicate improved air quality. However, caution should be exercised in such interpretations as the association between infant respiratory mortality and ambient air pollution is not simple. Many forms of respiratory illness occur, and there are numerous causes, including outdoor air pollution, pollutants and allergens, in the home (such as the use of solid fuel for cooking and heating, tobacco smoke and dust) as well as infectious agents. Diet, lifestyle, the environment and social factors may also be important, possibly having a synergistic effect1. Policy Relevance and Context: At the Fifth Ministerial Conference on Environment and Health commitment was made to intensify efforts to implement the commitments made in CEHAPE. RPG III aims to prevent and reduce respiratory diseases due to outdoor and indoor air pollution, thereby contributing to a reduction in the frequency of asthma attacks and ensuring that children can live in an environment with clean air7.
The following new EU directive (Directive 2008/50/EC of the European Parliament and of the Council of the 21 May on ambient air quality and cleaner air for Europe)8 aim to achieve the ultimate goal of European clean air policy, which is to attain levels of air quality that do not give rise to significant negative effects on or risks to human health and the environment. The Directive replaces all other
* The national assessment for Germany refers to children aged 0-364 days.

SELECTED INDICATORS REPORT
111
Directives on air pollution. It introduced new targets for air quality and requires a gradual reduction in population exposure to particulate matter. In addition, the Sixth Community Environment Action Programme called for the development of a thematic strategy on air pollution with the objective of attaining "levels of air quality that do not give rise to significant negative impacts on and risks to human health and the environment"9. This strategy, prepared by the Clean Air for Europe programme, was adopted in September 2005.
The EU Directive is implemented in German legislation in the BImSchG (see PM10 fact sheet). In addition to national and sub-national policies on outdoor air quality (see PM10 fact sheet), preventive measures especially targeted to parents of young children are in place. Preventive measures have been established in Germany concerning smoking cessation of the parents in particular addressing pregnant and breast feeding women. During the last decade especially the Federal Centre for Health Education (BZgA) has published several brochures and information material for parent education, paediatricians and midwifes, which are all belonging to the campaign “Smokeless”12, 13. The National Breastfeeding Committee strongly recommends mothers to breast feeding their babies. The recommendations of the Committee of 2001 contain the advice for women who do not manage to quit smoking, to take a smoking break of at least 1 hour before breast feeding14. Specific immunisations against respiratory diseases, such as pertussis and diphtheria, are provided for infants due to the early detection and precaution programmes during their third and fourth months of life15. These immunisations are part of the recommendations from the German Standing Vaccination Committee16. Presentation of Data:
Figure 1: Mortality due to respiratory diseases in children under 1 year of age in Germany by NUTS1, 2006-2008

SELECTED INDICATORS REPORT
112
0,00
0,05
0,10
0,15
0,20
0,25
1999-2001 2000-2002 2001-2003 2002-2004 2003-2005 2004-2006 2005-2007 2006-2008
num
ber
of d
eath
s /
1000
live
bir
ths
y g y ( ) y
Baden-Württemberg (DE1) Bayern (DE2) Berlin (DE3)Brandenburg (DE4) Bremen (DE5) Hamburg (DE6)Hessen (DE7) Mecklenburg-Vorpommern (DE8) Niedersachsen (DE9)Nordrhein-Westfalen (DEA) Rheinland-Pfalz (DEB) Saarland (DEC)Sachsen (DED) Sachsen-Anhalt (DEE) Schleswig-Holstein (DEF)Thüringen (DEG) national value
Figure 2: Mortality due to respiratory diseases in children under 1 year of age in Germany by NUTS1 for the period 1999-2008 Assessment: On average, 12.9% of post-neonatal deaths in European countries are due to respiratory diseases and these diseases cause 0.5 deaths per 1000 live births. This average rate, however, masks wide variations ranging from zero deaths per 1000 live births in Austria, Finland, Luxembourg and Slovenia to 4.6 per 1000 live births in Kyrgyzstan. In general, rates are considerably higher in eastern than in western Europe1. Mortality rate due to respiratory diseases is on a downward trend in European Union. It has decreased by almost 40% in last 10 years. This pattern was observed in many countries with higher rates such as: Romania and Bulgaria. Even so, rates in these countries still remain a bit higher than the rest of Europe10. A major cause of the high infant death rates seen in eastern Europe is the relatively worse economic and environmental situation in those countries. These conditions may also contribute to the severity of a greater proportion of acute respiratory infections. In general Europe has low infant mortality rates from respiratory diseases, most probably because of more effective medical services and advanced environmental protection policies. Current infant death rates from respiratory diseases, though very low, are more likely to be associated with increasing antimicrobial resistance, the emergence of novel pathogens or the lack of effective antiviral medications. In general, however, respiratory illness is detected early and treatment instituted rapidly1.
Fortunately in Germany mortality due to respiratory diseases in children under one year of age is very rare. Some differences on a national scale can be seen. The southern federal states show low mortality rates, the highest rates are observed in the eastern federal states and Schleswig-Holstein. Especially in Saxony-Anhalt the rates seem to increase: from 0.07 in 1999/2001 to 0.23 deaths per 1,000 live births in 2006/08. In Mecklenburg-Western Pomerania the rates seem to increase too from 0.07 in 2001/03 to 0.21 in 2006/08. In 2006/08 the average mortality rate North Rhine-Westphalia is slightly below the national average of 0.03. In Hamburg and Bremen no children died of respiratory diseases in the time period between 2006 and 2008. During the time frame of 1999 till 2008 in 24 out of 54 regions in North Rhine-Westphalia no children under one year of age died due to respiratory diseases. In the NUTS2-district "Düsseldorf" 5 out of 15 regions showed zero deaths in this time period. Corresponding zero incidence was registered in 7 of

SELECTED INDICATORS REPORT
113
12 regions in the district Cologne, 1 out of 7 in the district Detmold, 3 out of 8 regions in the district Münster and 8 out of 12 regions in the district Arnsberg. Fortunately deaths due to respiratory diseases in children under one year of age are rare events on NUTS 3 level. Time trends cannot be interpreted in any meaningful way and are therefore not displayed and discussed further. Data underlying the indicator:
• Primary source: National/regional health statistics • Date last published: 2008 • Time period of analysis: 1999-2008 (LIGA.NRW) • Numerator definition: Number of deaths due to respiratory diseases (in children aged 0-364
days) • Source of numerator: National/regional health statistics • Denominator definition: Total number of children aged 0-364 days (in a specific region) • Source of denominator: National/regional statistics, National census • Geographic coverage: National • Timeliness: Annually • Accuracy and completeness of data set: data is accurate and complete (but low number of
cases) • Disclosure control: none
References: 1. Infant mortality from respiratory diseases, an ENHIS fact sheet (2009). Available at
http://www.euro.who.int/__data/assets/pdf_file/0004/96997/enhis_factsheet09_3_2.pdf. (accessed July 2010).
2. Infant mortality from respiratory diseases. Copenhagen, WHO Regional Office for Europe, 2007 (ENHIS fact sheet 3.2). Available at http://www.euro.who.int/__data/assets/pdf_file/0004/96997/enhis_factsheet09_3_2.pdf. ( accessed July 2010).
3. WHO European Centre for Environment and Health. Effects of air pollution on children’s health and development - a review of the evidence. Copenhagen, WHO Regional Office for Europe, 2005. Available at http://www.euro.who.int/document/E86575.pdf. (accessed July 2010).
4. Woodruff T, Darrow LA, Parker JD. Air pollution and postneonatal infant mortality in the United States, 1999-2002. Environ Health Perspect 2008; 116:110-5.
5. Hajat s, Armstrong B, Wilkinson P, Busby A, Dolk H. Outdoor air pollution and infant mortality: analysis of daily time-series data in 10 English cities. J Epidemiol Community Health. 2007;61:719-22.
6. Koranteng S, Osornio Vargas AR, Buka I. Ambient air pollution and children’s health: A systematic review of Canadian epidemiological studies. Pediatr Child Health 2007;12: 225-33.
7. Parma Declaration on Environment and Health. WHO; 2010. Available at http://www.euro.who.int/__data/assets/pdf_file/0011/78608/E93618.pdf. ( accessed July 2010).
8. Directive 2008/50/EC of the European Parliament and of the Council of the 21 May on ambient air quality and cleaner air for Europe. Available at http://eur-lex.europa.eu/LexUriServ/LexUriServ.do?uri=OJ:L:2008:152:0001:0044:EN:PDF. (accessed August 2010).
9. The Sixth Environment Action Programme of the European Community. Available at http://ec.europa.eu/environment/newprg/strategies_en.htm. (accessed August 2010).
10. Causes of death. Available at http://epp.eurostat.ec.europa.eu/cache/ITY_SDDS/en/hlth_cdeath_esms.htm (accessed August 2010).
11. Grunwald B (2006): Gesundheitsbericht über Kinder und Jugendliche. Gesundheitsamt Märkischer Kreis, Lüdenscheid. http://www.maerkischer-kreis.de/buergerservice/infosystem/berichte/gesundheit/GesundheitsberichtKinderJugendliche.pdf (accessed 2 September 2010)
12. Bundeszentrale für gesundheitliche Aufklärung (BzgA) (2008): Gesund aufwachsen in rauchfreier Umgebung. Köln. http://www.bzga.de/botmed_31520200.html (accessed 2 September 2010)
13. Bundeszentrale für gesundheitliche Aufklärung (BzgA) (2010): Ihr Kind raucht mit. BzGA, Köln.

SELECTED INDICATORS REPORT
114
http://www.bzga.de/botmed_31540000.html (accessed 2 September 2010) 14. Nationale Stillkommission (2001): Stillen und Rauchen, In: Kinderärztliche Praxis, 72, p.378-
379. 15. Bundeszentrale für gesundheitliche Aufklärung (BzgA) (2008): Früherkennungs- und
Vorsorgeplan für das Kinder- und Jugendalter. BzgA, Köln. http://www.kindergesundheit-info.de/fileadmin/user_upload/kindergesundheit-info.de/Download/Fr_herkennungs-_und_Vorsorgeplan_f_r_das_Kindes-_und_Jugendalter.pdf (accessed 2 September 2010)
16. Robert Koch-Institut (RKI) (2010): Empfehlungen der Ständigen Impfkommission (STIKO) am Robert Koch-Institut. Epidemiologisches Bulletin, 30, p. 279-298.
Further Information: Author: Odile Mekel, Linda Tacke, Florian Fischer (LIGA.NRW), Germany Date of production: 6 October 2010

SELECTED INDICATORS REPORT
115
Hungary Name of indicator: Infant mortality rate due to respiratory diseases Definition: Annual mortality rate due to respiratory diseases in children older than one month and under one year of age Key Message: Infant mortality due to respiratory diseases is decreasing in Hungary. It is higher in the eastern part and it is the lowest in Central Hungary, however it shows a more diverse picture at the regional and county level: it is the lowest in South Great Plain (HU33), Western Transdanubia (HU22) and Central Hungary (HU10) and it is the highest in the Northern Hungarian region (HU31). There were no registered cases in several counties (Békés, Bács, Jász, Baranya, Zala, Győr), while the rate was the highest in Borsod. Rationale: Respiratory illnesses are the most common cause of childhood morbidity in developed countries. In developing and emerging economies, acute lower respiratory infections (ALRI), particularly pneumonia, are common causes of death and serious morbidity in young children and infants. Causative infective agents differ between developed and developing regions and municipalities of countries: bacterial infections are common in developing regions while viral infections cause most ALRIs in developed regions. In temperate European regions there is a marked variation with the seasons in ALRI, with a significant rise in incidence in the winter months falling to relatively low levels in the summer1. Recent studies in different countries have found associations between ambient air pollution (especially particulates and/or carbon monoxide) and postneonatal infant mortality (attributable to respiratory causes and possibly sudden infant death syndrome (SIDS)), low birth weight, and preterm birth2. The evidence is sufficient to infer a causal relationship between air pollutants (particulate matter, sulphur dioxide (SO2), NO2, CO, ozone) and respiratory deaths and SIDS in the post-neonatal period3,
4, 5, 6 . Consequently, an increase in infant respiratory mortality rates may indicate higher indoor or outdoor air pollution levels, and conversely, decreasing mortality may indicate improved air quality. However, caution should be exercised in such interpretations as the association between infant respiratory mortality and ambient air pollution is not simple. Many forms of respiratory illness occur, and there are numerous causes, including outdoor air pollution, pollutants and allergens, in the home (such as the use of solid fuel for cooking and heating, tobacco smoke and dust) as well as infectious agents. Diet, lifestyle, the environment and social factors may also be important, possibly having a synergistic effect1. Policy Relevance and Context: At the Fifth Ministerial Conference on Environment and Health commitment was made to intensify efforts to implement the commitments made in CEHAPE. RPG III aims to prevent and reduce respiratory diseases due to outdoor and indoor air pollution, thereby contributing to a reduction in the frequency of asthma attacks and ensuring that children can live in an environment with clean air7.
The following new EU directive (Directive 2008/50/EC of the European Parliament and of the Council of the 21 May on ambient air quality and cleaner air for Europe)8 aim to achieve the ultimate goal of European clean air policy, which is to attain levels of air quality that do not give rise to significant negative effects on or risks to human health and the environment. The Directive replaces all other Directives on air pollution. It introduced new targets for air quality and requires a gradual reduction in population exposure to particulate matter. In addition, the Sixth Community Environment Action Programme called for the development of a thematic strategy on air pollution with the objective of attaining "levels of air quality that do not give rise to significant negative impacts on and risks to human

SELECTED INDICATORS REPORT
116
health and the environment"9. This strategy, prepared by the Clean Air for Europe programme, was adopted in September 2005.
The Hungarian national policy on ambient air quality primarily follows the EU legislation (it includes regulations on additional pollutants as well). The key policy aspects are the following: compliance with air quality standards, control/reduction/abatement of emissions of pollutants at the source, compliance with international and national commitments, health risk reduction/prevention, provision of updated information to the public about the situation of air pollution, emergency response (e.g. smog alert).
The “Children, our common treasure” National Infant and Child Health Program11 does not address directly the respiratory mortality of infants, but has strategic priorities on the prevention on maternal and newborn health and specific objectives on children's health and the infant and child health care system.
Presentation of Data:
0,00 0,05 0,10 0,15
Közép-Magyarország (HU1)
Dunántúl (HU2)
Alföld és Észak (HU3)
number of deaths / 1000 live births
national value
Figure 1: Mortality due to respiratory diseases in children under 1 year of age in Hungary by NUTS1, 2006-2008
0,00 0,05 0,10 0,15 0,20 0,25 0,30
Közép-Magyarország (HU10)
Közép-Dunántúl (HU21)
Nyugat-Dunántúl (HU22)
Dél-Dunántúl (HU23)
Észak-Magyarország (HU31)
Észak-Alföld (HU32)
Dél-Alföld (HU33)
number of deaths / 1000 live births
national value
Figure 2: Mortality due to respiratory diseases in children under 1 year of age in Hungary by NUTS2, 2006-2008

SELECTED INDICATORS REPORT
117
0,00 0,05 0,10 0,15 0,20 0,25 0,30
Budapest (HU101)Pest (HU102)
Fejér (HU211)Komárom-Esztergom (HU212)
Veszprém (HU213)Győr-Moson-Sopron (HU221)
Vas (HU222)Zala (HU223)
Baranya (HU231)Somogy (HU232)
Tolna (HU233)Borsod-Abaúj-Zemplén (HU311)
Heves (HU312)Nógrád (HU313)
Hajdú-Bihar (HU321)Jász-Nagykun-Szolnok (HU322)
Szabolcs-Szatmár-Bereg (HU323)Bács-Kiskun (HU331)
Békés (HU332)Csongrád (HU333)
number of deaths / 1000 live births
y g g y y ( ),
national value Figure 3: Mortality due to respiratory diseases in children under 1 year of age in Hungary by NUTS3, 2006-2008
0,0
0,1
0,2
0,3
0,4
0,5
0,6
1999-2001 2000-2002 2001-2003 2002-2004 2003-2005 2004-2006 2005-2007 2006-2008
num
ber
of d
eath
s /
1000
live
bir
ths
Annual mortality rate due to respiratory diseases in children under one year of age by NUTS1, Hungary
Közép-Magyarország (HU1)Dunántúl (HU2)Alföld és Észak (HU3)national value
0,0
0,1
0,2
0,3
0,4
0,5
0,6
0,7
0,8
1999-2001 2000-2002 2001-2003 2002-2004 2003-2005 2004-2006 2005-2007 2006-2008
num
ber
of d
eath
s /
1000
live
bir
ths
Annual mortality rate due to respiratory diseases in children under one year of age by regions (NUTS2), Hungary
Közép-Magyarország (HU10)Közép-Dunántúl (HU21)Nyugat-Dunántúl (HU22)Dél-Dunántúl (HU23)Észak-Magyarország (HU31)Észak-Alföld (HU32)Dél-Alföld (HU33)national value
0,0
0,1
0,2
0,3
0,4
0,5
0,6
0,7
0,8
0,9
1999-2001 2000-2002 2001-2003 2002-2004 2003-2005 2004-2006 2005-2007 2006-2008
num
ber
of d
eath
s /
1000
live
bir
ths
Annual mortality rate due to respiratory diseases in children under one year of age by counties (NUTS3) in region Közép-Magyarország, Hungary
Budapest (HU101)
Pest (HU102)
national value

SELECTED INDICATORS REPORT
118
0,0
0,1
0,2
0,3
0,4
0,5
0,6
0,7
0,8
0,9
1999-2001 2000-2002 2001-2003 2002-2004 2003-2005 2004-2006 2005-2007 2006-2008
num
ber
of d
eath
s /
1000
live
bir
ths
Annual mortality rate due to respiratory diseases in children under one year of age by counties (NUTS3) in region Közép-Dunántúl, Hungary
Fejér (HU211)Komárom-Esztergom (HU212)Veszprém (HU213)national value
0,0
0,2
0,4
0,6
0,8
1,0
1,2
1999-2001 2000-2002 2001-2003 2002-2004 2003-2005 2004-2006 2005-2007 2006-2008
num
ber
of d
eath
s /
1000
live
bir
ths
Annual mortality rate due to respiratory diseases in children under one year of age by counties (NUTS3) in region Nyugat-Dunántúl, Hungary
Győr-Moson-Sopron (HU221)
Vas (HU222)
Zala (HU223)
national value
0,0
0,1
0,2
0,3
0,4
0,5
0,6
0,7
0,8
0,9
1999-2001 2000-2002 2001-2003 2002-2004 2003-2005 2004-2006 2005-2007 2006-2008
num
ber
of d
eath
s /
1000
live
bir
ths
Annual mortality rate due to respiratory diseases in children under one year of age by counties (NUTS3) in region Dél-Dunántúl, Hungary
Baranya (HU231)
Somogy (HU232)
Tolna (HU233)
national value
0,0
0,1
0,2
0,3
0,4
0,5
0,6
0,7
0,8
0,9
1999-2001 2000-2002 2001-2003 2002-2004 2003-2005 2004-2006 2005-2007 2006-2008
num
ber
of d
eath
s /
1000
live
bir
ths
Annual mortality rate due to respiratory diseases in children under one year of age by counties (NUTS3) in region Észak-Magyarország, Hungary
Borsod-Abaúj-Zemplén (HU311)
Heves (HU312)
Nógrád (HU313)
national value

SELECTED INDICATORS REPORT
119
0,0
0,1
0,2
0,3
0,4
0,5
0,6
0,7
0,8
0,9
1999-2001 2000-2002 2001-2003 2002-2004 2003-2005 2004-2006 2005-2007 2006-2008
num
ber
of d
eath
s /
1000
live
bir
ths
Annual mortality rate due to respiratory diseases in children under one year of age by counties (NUTS3) in region Észak-Alföld, Hungary
Hajdú-Bihar (HU321)Jász-Nagykun-Szolnok (HU322)Szabolcs-Szatmár-Bereg (HU323)national value
0,0
0,1
0,2
0,3
0,4
0,5
0,6
0,7
0,8
0,9
1999-2001 2000-2002 2001-2003 2002-2004 2003-2005 2004-2006 2005-2007 2006-2008
num
ber
of d
eath
s /
1000
live
bir
ths
Annual mortality rate due to respiratory diseases in children under one year of age by counties (NUTS3) in region Dél-Alföld, Hungary
Bács-Kiskun (HU331)
Békés (HU332)
Csongrád (HU333)
national value
Figure 4: Mortality due to respiratory diseases in children under 1 year of age in Hungary by NUTS3 for the period 1999-2008 Source of data: Hungarian Central Statistical Office Assessment: On average, 12.9% of post-neonatal deaths in European countries are due to respiratory diseases and these diseases cause 0.5 deaths per 1000 live births. This average rate, however, masks wide variations ranging from zero deaths per 1000 live births in Austria, Finland, Luxembourg and Slovenia to 4.6 per 1000 live births in Kyrgyzstan. In general, rates are considerably higher in eastern than in western Europe1. Mortality rate due to respiratory diseases is on a downward trend in European Union. It has decreased by almost 40% in last 10 years. This pattern was observed in many countries with higher rates such as: Romania and Bulgaria. Even so, rates in these countries still remain a bit higher than the rest of Europe10. A major cause of the high infant death rates seen in eastern Europe is the relatively worse economic and environmental situation in those countries. These conditions may also contribute to the severity of a greater proportion of acute respiratory infections. In general Europe has low infant mortality rates from respiratory diseases, most probably because of more effective medical services and advanced environmental protection policies. Current infant death rates from respiratory diseases, though very low, are more likely to be associated with increasing antimicrobial resistance, the emergence of novel pathogens or the lack of effective antiviral medications. In general, however, respiratory illness is detected early and treatment instituted rapidly1.
The assessment of the Hungarian situation is based on data of infant mortality due to respiratory diseases (0–1 year of age). It shows a decreasing tendency in the last decade: it decreased from 0.45% (1999) to 0.07% (2008). It is above the national value in the eastern part (HU3), approximately equal to the national value in the western part (HU2) and at its lowest in Central Hungary (HU1). There is a regional inequity: it was the highest in Northern Hungary (HU31) it exceed the national value in the Central Transdanubian region

SELECTED INDICATORS REPORT
120
(HU21) and it was less than the national value in Southern Great Plain (HU33), in Western Transdanubia (HU22) and in Central Hungary (HU10) in the average of last three years. There were no registered cases in the following counties: Békés, Bács-Kiskun, Jász-Nagykun-Szolnok, Baranya, Zala and Győr-Moson-Sopron. The mortality rate was the highest in Borsod and it was high in Heves, Somogy and Komárom. The time trend was variable in the counties of region Central Transdanubia (HU21) and in counties Zala, Vas, Hajdú-Bihar, Nógrád, but the tendency seems decreasing in the last few years in every county (except in Somogy, where the rate remained constant).
Data underlying the indicator:
• Primary source: Hungarian Central Statistical Office • Date last published: 2009 • Time period of analysis: 1999–2008 • Numerator definition: Number of infant (0–1 year of age) deaths due to respiratory diseases
(ICD10: J00–J99) • Source of numerator: Hungarian Central Statistical Office • Denominator definition: Total number of live births • Source of denominator: Hungarian Central Statistical Office • Geographic coverage: National. • Timeliness: Annually. • Accuracy and completeness of data set: • Disclosure control
References: 1. Infant mortality from respiratory diseases, an ENHIS fact sheet (2009). Available at http://www.euro.who.int/__data/assets/pdf_file/0004/96997/enhis_factsheet09_3_2.pdf. (accessed July 2010). 2. Infant mortality from respiratory diseases. Copenhagen, WHO Regional Office for Europe, 2007 (ENHIS fact sheet 3.2). Available at http://www.euro.who.int/__data/assets/pdf_file/0004/96997/enhis_factsheet09_3_2.pdf. ( accessed July 2010). 3. WHO European Centre for Environment and Health. Effects of air pollution on children’s health and development - a review of the evidence. Copenhagen, WHO Regional Office for Europe, 2005. Available at http://www.euro.who.int/document/E86575.pdf. (accessed July 2010). 4. Woodruff T, Darrow LA, Parker JD. Air pollution and postneonatal infant mortality in the United States, 1999-2002. Environ Health Perspect 2008; 116:110-5. 5. Hajat s, Armstrong B, Wilkinson P, Busby A, Dolk H. Outdoor air pollution and infant mortality: analysis of daily time-series data in 10 English cities. J Epidemiol Community Health. 2007;61:719-22. 6. Koranteng S, Osornio Vargas AR, Buka I. Ambient air pollution and children’s health: A systematic review of Canadian epidemiological studies. Pediatr Child Health 2007;12: 225-33. 7. Parma Declaration on Environment and Health. WHO; 2010. Available at http://www.euro.who.int/__data/assets/pdf_file/0011/78608/E93618.pdf. ( accessed July 2010). 8. Directive 2008/50/EC of the European Parliament and of the Council of the 21 May on ambient air quality and cleaner air for Europe. Available at http://eur-lex.europa.eu/LexUriServ/LexUriServ.do?uri=OJ:L:2008:152:0001:0044:EN:PDF. (accessed August 2010). 9. The Sixth Environment Action Programme of the European Community. Available at http://ec.europa.eu/environment/newprg/strategies_en.htm. (accessed August 2010). 10. Causes of death. Available at http://appsso.eurostat.ec.europa.eu/nui/print.do?print=true. (accessed August 2010). 11. “Children, our common treasure”, the National Infant and Child Health Program of the Republic of Hungary, Ministry of Health, 2005 http://www.eum.hu/national-infant-and Further Information: Author: Tibor malnasi, Anna Paldy, National Institute of Environmental Health, Hungary Date of production: 14 September 2010

SELECTED INDICATORS REPORT
121
Lithuania Name of indicator: Infant mortality rate due to respiratory diseases Definition: Annual mortality rate due to respiratory diseases in children older than one month and under one year of age Key Message: During the past decade mortality due to respiratory diseases in children older than one month and under one year of age has decreased in Lithuania and was 0.2 per 1000 live births in 2006-2008. Though tendency of reduction is observed in all counties, mortality rate due to respiratory diseases in children older than one month and under one year of age in Utena county is the highest in the country and is as 3.5 times higher than national average. Rationale: Respiratory illnesses are the most common cause of childhood morbidity in developed countries. In developing and emerging economies, acute lower respiratory infections (ALRI), particularly pneumonia, are common causes of death and serious morbidity in young children and infants. Causative infective agents differ between developed and developing regions and municipalities of countries: bacterial infections are common in developing regions while viral infections cause most ALRIs in developed regions. In temperate European regions there is a marked variation with the seasons in ALRI, with a significant rise in incidence in the winter months falling to relatively low levels in the summer1. Recent studies in different countries have found associations between ambient air pollution (especially particulates and/or carbon monoxide) and postneonatal infant mortality (attributable to respiratory causes and possibly sudden infant death syndrome (SIDS)), low birth weight, and preterm birth2. The evidence is sufficient to infer a causal relationship between air pollutants (particulate matter, sulphur dioxide (SO2), NO2, CO, ozone) and respiratory deaths and SIDS in the post-neonatal period3,
4, 5, 6 . Consequently, an increase in infant respiratory mortality rates may indicate higher indoor or outdoor air pollution levels, and conversely, decreasing mortality may indicate improved air quality. However, caution should be exercised in such interpretations as the association between infant respiratory mortality and ambient air pollution is not simple. Many forms of respiratory illness occur, and there are numerous causes, including outdoor air pollution, pollutants and allergens, in the home (such as the use of solid fuel for cooking and heating, tobacco smoke and dust) as well as infectious agents. Diet, lifestyle, the environment and social factors may also be important, possibly having a synergistic effect1. Policy Relevance and Context: At the Fifth Ministerial Conference on Environment and Health commitment was made to intensify efforts to implement the commitments made in CEHAPE. RPG III aims to prevent and reduce respiratory diseases due to outdoor and indoor air pollution, thereby contributing to a reduction in the frequency of asthma attacks and ensuring that children can live in an environment with clean air7.
The following new EU directive (Directive 2008/50/EC of the European Parliament and of the Council of the 21 May on ambient air quality and cleaner air for Europe)8 aim to achieve the ultimate goal of European clean air policy, which is to attain levels of air quality that do not give rise to significant negative effects on or risks to human health and the environment. The Directive replaces all other Directives on air pollution. It introduced new targets for air quality and requires a gradual reduction in population exposure to particulate matter. In addition, the Sixth Community Environment Action Programme called for the development of a thematic strategy on air pollution with the objective of attaining "levels of air quality that do not give rise to significant negative impacts on and risks to human health and the environment"9. This strategy, prepared by the Clean Air for Europe programme, was

SELECTED INDICATORS REPORT
122
adopted in September 2005.
Lithuania follows requirements of EU directives. They are transposed into a number of legal acts. Ambient air quality policy mainly focuses on air quality monitoring and assessment, compliance with ambient air limit values, development and implementation of pollution reduction plans in case of exccedance, public information and managment of emergency situations. In addition, hygiene standards set for indoor environment for residential and public buildings ought to ensure clean air in children environment.
Lithuanian Health Program adopted in 1998 aimed at overall reduction of infant mortality by 30 percent till 2010. Though this policy objective is not specific for respiratory mortality, it looked for improving health care services and adequate treatment and nursering conditions. Objectives of the National Children Health Promotion Program include creation of health promoting environment for children and improvment of uqality of primary prevention of diseases.
Presentation of Data:
0,0 0,1 0,2 0,3 0,4 0,5 0,6 0,7 0,8
Alytaus apskritis (LT001)
Kauno apskritis (LT002)
Klaipedos apskritis (LT003)
Marijampoles apskritis (LT004)
Panevezio apskritis (LT005)
Siauliu apskritis (LT006)
Taurages apskritis (LT007)
Telsiu apskritis (LT008)
Utenos apskritis (LT009)
Vilniaus apskritis (LT00A)
number of deaths / 1000 live births
2006 2008
national value Figure 1: Mortality rate due to respiratory diseases in children under 1 year of ge in Lithuania by NUTS3, 2006-2008
0,0
0,2
0,4
0,6
0,8
1,0
1,2
1,4
1999-2001 2000-2002 2001-2003 2002-2004 2003-2005 2004-2006 2005-2007 2006-2008
num
ber o
f dea
ths
/ 10
00 li
ve b
irth
s
Annual mortality rate due to respiratory diseases in children older than one month and under one year of age in Lithuania by counties (NUTS3), I.
Alytaus apskritis (LT001)
Kauno apskritis (LT002)
Klaipedos apskritis (LT003)
Marijampoles apskritis (LT004)
Panevezio apskritis (LT005)
national value

SELECTED INDICATORS REPORT
123
0,0
0,2
0,4
0,6
0,8
1,0
1,2
1,4
1999-2001 2000-2002 2001-2003 2002-2004 2003-2005 2004-2006 2005-2007 2006-2008
num
ber o
f dea
ths
/ 10
00 li
ve b
irth
s
Annual mortality rate due to respiratory diseases in children older than one month and under one year of age in Lithuania by counties (NUTS3), II.
Siauliu apskritis (LT006)
Taurages apskritis (LT007)
Telsiu apskritis (LT008)
Utenos apskritis (LT009)
Vilniaus apskritis (LT00A)
national value
Figure 2: Mortality due to respiratory diseases in children under 1 year of age in Lithuania by NUTS3 for the period 1999-2008 Assessment: On average, 12.9% of post-neonatal deaths in European countries are due to respiratory diseases and these diseases cause 0.5 deaths per 1000 live births. This average rate, however, masks wide variations ranging from zero deaths per 1000 live births in Austria, Finland, Luxembourg and Slovenia to 4.6 per 1000 live births in Kyrgyzstan. In general, rates are considerably higher in eastern than in western Europe1. Mortality rate due to respiratory diseases is on a downward trend in European Union. It has decreased by almost 40% in last 10 years. This pattern was observed in many countries with higher rates such as: Romania and Bulgaria. Even so, rates in these countries still remain a bit higher than the rest of Europe10. A major cause of the high infant death rates seen in eastern Europe is the relatively worse economic and environmental situation in those countries. These conditions may also contribute to the severity of a greater proportion of acute respiratory infections. In general Europe has low infant mortality rates from respiratory diseases, most probably because of more effective medical services and advanced environmental protection policies. Current infant death rates from respiratory diseases, though very low, are more likely to be associated with increasing antimicrobial resistance, the emergence of novel pathogens or the lack of effective antiviral medications. In general, however, respiratory illness is detected early and treatment instituted rapidly1.
During the past decade mortality due to respiratory diseases in children older than one month and under one year of age has decreased in Lithuania and was 0.2 per 1000 live births in 2006-2008. Though tendency of reduction is observed in all counties, mortality rate due to respiratory diseases in children older than one month and under one year of age in Utena county is the highest in the country and is as 3.5 times higher than national average. Data underlying the indicator:
• Primary source: Department of Statistics • Date last published: 2008 • Time period of analysis: 1999-2008 • Numerator definition: The number of deaths of children aged 28–364 days due to respiratory
diseases for the reporting period. • Source of numerator: Department of Statistics • Denominator definition: Total number of live births • Source of denominator: Department of Statistics • Geographic coverage: National (Lithuania) and 10 Lithuanian countries (apskritys, NUTS 3
level). • Timeliness: annual data are available from 1999. • Accuracy and completeness of data set: data accurate and complete. • Disclosure control: only aggregated data can be used; personal data use restrictions.
References: 1. Infant mortality from respiratory diseases, an ENHIS fact sheet (2009). Available at

SELECTED INDICATORS REPORT
124
http://www.euro.who.int/__data/assets/pdf_file/0004/96997/enhis_factsheet09_3_2.pdf. (accessed July 2010). 2. Infant mortality from respiratory diseases. Copenhagen, WHO Regional Office for Europe, 2007 (ENHIS fact sheet 3.2). Available at http://www.euro.who.int/__data/assets/pdf_file/0004/96997/enhis_factsheet09_3_2.pdf. ( accessed July 2010). 3. WHO European Centre for Environment and Health. Effects of air pollution on children’s health and development - a review of the evidence. Copenhagen, WHO Regional Office for Europe, 2005. Available at http://www.euro.who.int/document/E86575.pdf. (accessed July 2010). 4. Woodruff T, Darrow LA, Parker JD. Air pollution and postneonatal infant mortality in the United States, 1999-2002. Environ Health Perspect 2008; 116:110-5. 5. Hajat s, Armstrong B, Wilkinson P, Busby A, Dolk H. Outdoor air pollution and infant mortality: analysis of daily time-series data in 10 English cities. J Epidemiol Community Health. 2007;61:719-22. 6. Koranteng S, Osornio Vargas AR, Buka I. Ambient air pollution and children’s health: A systematic review of Canadian epidemiological studies. Pediatr Child Health 2007;12: 225-33. 7. Parma Declaration on Environment and Health. WHO; 2010. Available at http://www.euro.who.int/__data/assets/pdf_file/0011/78608/E93618.pdf. ( accessed July 2010). 8. Directive 2008/50/EC of the European Parliament and of the Council of the 21 May on ambient air quality and cleaner air for Europe. Available at http://eur-lex.europa.eu/LexUriServ/LexUriServ.do?uri=OJ:L:2008:152:0001:0044:EN:PDF. (accessed August 2010). 9. The Sixth Environment Action Programme of the European Community. Available at http://ec.europa.eu/environment/newprg/strategies_en.htm. (accessed August 2010). 10. Causes of death. Available at http://appsso.eurostat.ec.europa.eu/nui/print.do?print=true. (accessed August 2010). 11. Regulation (EC) No 1888/2005 of the European Parliament and of the Council of 26 October 2005 amending Regulation (EC) No 1059/2003 on the establishment of a common classification of territorial units for statistics (NUTS) by reason of the accession of the Czech Republic, Estonia, Cyprus, Latvia, Lithuania, Hungary, Malta, Poland, Slovenia and Slovakia to the European Union. Official Journal L 309, 25/11/2005 P. 0001 – 0008. Further Information: Author: Viktorija Andreikėnaitė, Centre for Health Education and Disease Prevention, Lithuania Date of production: 15 October 2010

SELECTED INDICATORS REPORT
125
Romania Name of indicator: Infant mortality rate due to respiratory diseases Definition: Annual mortality rate due to respiratory diseases in children older than one month and under one year of age Key Message: Between 1999 and 2008 mortality rate due to respiratory diseases in children older than one month and under one year of age, has slightly declined in Romania, remaining still one of the highest value in WHO Europe Region, ranging between 1.3 to 6.3 cases per 1000 live births. Mortality rate due to respiratory diseases in children older than one month and under one year of age varies among macro-regions, regions and districts; the highest values of the indicator is registered in the macro-region 2 (RO2), region South East and Teleorman district and the lowest values in macro-region 1 (RO1), region Bucuresti –Ilfov, and Timis district. Rationale: Respiratory illnesses are the most common cause of childhood morbidity in developed countries. In developing and emerging economies, acute lower respiratory infections (ALRI), particularly pneumonia, are common causes of death and serious morbidity in young children and infants. Causative infective agents differ between developed and developing regions and municipalities of countries: bacterial infections are common in developing regions while viral infections cause most ALRIs in developed regions. In temperate European regions there is a marked variation with the seasons in ALRI, with a significant rise in incidence in the winter months falling to relatively low levels in the summer1. Recent studies in different countries have found associations between ambient air pollution (especially particulates and/or carbon monoxide) and postneonatal infant mortality (attributable to respiratory causes and possibly sudden infant death syndrome (SIDS)), low birth weight, and preterm birth2. The evidence is sufficient to infer a causal relationship between air pollutants (particulate matter, sulphur dioxide (SO2), NO2, CO, ozone) and respiratory deaths and SIDS in the post-neonatal period3,
4, 5, 6 . Consequently, an increase in infant respiratory mortality rates may indicate higher indoor or outdoor air pollution levels, and conversely, decreasing mortality may indicate improved air quality. However, caution should be exercised in such interpretations as the association between infant respiratory mortality and ambient air pollution is not simple. Many forms of respiratory illness occur, and there are numerous causes, including outdoor air pollution, pollutants and allergens, in the home (such as the use of solid fuel for cooking and heating, tobacco smoke and dust) as well as infectious agents. Diet, lifestyle, the environment and social factors may also be important, possibly having a synergistic effect1. Policy Relevance and Context: At the Fifth Ministerial Conference on Environment and Health commitment was made to intensify efforts to implement the commitments made in CEHAPE. RPG III aims to prevent and reduce respiratory diseases due to outdoor and indoor air pollution, thereby contributing to a reduction in the frequency of asthma attacks and ensuring that children can live in an environment with clean air7.
The following new EU directive (Directive 2008/50/EC of the European Parliament and of the Council of the 21 May on ambient air quality and cleaner air for Europe)8 aim to achieve the ultimate goal of European clean air policy, which is to attain levels of air quality that do not give rise to significant negative effects on or risks to human health and the environment. The Directive replaces all other Directives on air pollution. It introduced new targets for air quality and requires a gradual reduction in population exposure to particulate matter. In addition, the Sixth Community Environment Action Programme called for the development of a thematic strategy on air pollution with the objective of

SELECTED INDICATORS REPORT
126
attaining "levels of air quality that do not give rise to significant negative impacts on and risks to human health and the environment"9. This strategy, prepared by the Clean Air for Europe programme, was adopted in September 2005.
In Romania, the National Strategy of Public Health adopted in 2004 has among its' objectives the decrease of mortality due to respiratory diseases of children 1-14 years age. The national health programs budgeted by the Ministry of Health include within the child health program, specific interventions for respiratory diseases (respiratory distress syndrome and asthma). Human respiratory syncytial virus prophylaxis is also addressed in the child health program. Presentation of Data:
0,0 0,5 1,0 1,5 2,0 2,5 3,0 3,5 4,0
Macroregiunea unu (RO1)
Macroregiunea doi (RO2)
Macroregiunea trei (RO3)
Macroregiunea patru (RO4)
number of deaths / 1000 live births
Annual mortality rate due to respiratory diseases in children older than one month and under one year of age in Romania by NUTS1, 2008
national value Figure 1: Annual mortality rate due to respiratory diseases in children in Romania by NUTS1, 2008 Figure 2: Annual mortality rate due to respiratory diseases in children in Romania by NUTS2, 2008
0,0 0,5 1,0 1,5 2,0 2,5 3,0 3,5 4,0
Nord - Vest (RO11)
Centru (RO12)
Nord - Est (RO21)
Sud - Est (RO22)
Sud - Muntenia (RO31)
Bucuresti - Ilfov (RO32)
Sud - Vest Oltenia (RO41)
Vest (RO42)
number of deaths / 1000 live
Annual mortality rate due to respiratory diseases in children older than
month and under one year of age in Romania by regions (NUTS2),
national

SELECTED INDICATORS REPORT
127
0 1 2 3 4 5 6 7
Bihor (RO111)Bistrita-Nasaud (RO112)
Cluj (RO113)Maramures (RO114)
Satu Mare (RO115)Salaj (RO116)Alba (RO121)
Brasov (RO122)Covasna (RO123)Harghita (RO124)
Mures (RO125)Sibiu (RO126)
Bacau (RO211)Botosani (RO212)
Iasi (RO213)Neamt (RO214)
Suceava (RO215)Vaslui (RO216)Braila (RO221)Buzau (RO222)
Constanta (RO223)Galati (RO224)
Tulcea (RO225)Vrancea (RO226)
Arges (RO311)Calarasi (RO312)
Dambovita (RO313)Giurgiu (RO314)
Ialomita (RO315)Prahova (RO316)
Teleorman (RO317)Bucuresti (RO321)
Ilfov (RO322)Dolj (RO411)Gorj (RO412)
Mehedinti (RO413)Olt (RO414)
Valcea (RO415)Arad (RO421)
Caras-Severin (RO422)Hunedoara (RO423)
Timis (RO424)
number of deaths / 1000 live births
Annual mortality rate due to respiratory diseases in children older than one month and under one year of age in Romania by counties (NUTS3), 2008
national value Figure 3: Annual mortality rate due to respiratory diseases in children in Romania by NUTS3, 2008
0
1
2
3
4
5
6
7
8
1999 2000 2001 2002 2003 2004 2005 2006 2007 2008
num
ber o
f dea
ths
/ 10
00 li
ve b
irth
s
Annual mortality rate due to respiratory diseases in children older than one month and under one year of age in Romania by NUTS1
Macroregiunea unu (RO1)
Macroregiunea doi (RO2)
Macroregiunea trei (RO3)
Macroregiunea patru (RO4)
national value
0
1
2
3
4
5
6
7
8
1999 2000 2001 2002 2003 2004 2005 2006 2007 2008
num
ber o
f dea
ths
/ 10
00 li
ve b
irth
s
Annual mortality rate due to respiratory diseases in children older than one month and under one year of age in Romania by NUTS2
Nord-Vest (RO11)Centru (RO12)Nord-Est (RO21)Sud-Est (RO22)Sud-Muntenia (RO31)Bucuresti-Ilfov (RO32)Sud-Vest Oltenia (RO41)Vest (RO42)national value
0
1
2
3
4
5
6
7
8
9
10
11
1999 2000 2001 2002 2003 2004 2005 2006 2007 2008
num
ber o
f dea
ths
/ 10
00 li
ve b
irth
s
Annual mortality rate due to respiratory diseases in children older than one month and under one year of age in Romania by counties (NUTS3) in region Nord-Vest, Romania
Bihor (RO111)
Bistrita-Nasaud (RO112)
Cluj (RO113)
Maramures (RO114)
Satu Mare (RO115)
Salaj (RO116)
national value

SELECTED INDICATORS REPORT
128
0
1
2
3
4
5
6
7
8
9
10
11
1999 2000 2001 2002 2003 2004 2005 2006 2007 2008
num
ber o
f dea
ths
/ 10
00 li
ve b
irth
s
Annual mortality rate due to respiratory diseases in children older than one month and under one year of age in Romania by counties (NUTS3) in region Centru, Romania
Alba (RO121)
Brasov (RO122)
Covasna (RO123)
Harghita (RO124)
Mures (RO125)
Sibiu (RO126)
national value
0
1
2
3
4
5
6
7
8
9
10
11
1999 2000 2001 2002 2003 2004 2005 2006 2007 2008
num
ber o
f dea
ths
/ 10
00 li
ve b
irth
s
Annual mortality rate due to respiratory diseases in children older than one month and under one year of age in Romania by counties (NUTS3) in region Nord-Est, Romania
Bacau (RO211) Botosani (RO212)
Iasi (RO213) Neamt (RO214)
Suceava (RO215) Vaslui (RO216)
national value
0
1
2
3
4
5
6
7
8
9
10
11
1999 2000 2001 2002 2003 2004 2005 2006 2007 2008
num
ber o
f dea
ths
/ 10
00 li
ve b
irth
s
Annual mortality rate due to respiratory diseases in children older than one month and under one year of age in Romania by counties (NUTS3) in region Sud-Est, Romania
Braila (RO221)
Buzau (RO222)
Constanta (RO223)
Galati (RO224)
Tulcea (RO225)
Vrancea (RO226)
national value
0
1
2
3
4
5
6
7
8
9
10
11
1999 2000 2001 2002 2003 2004 2005 2006 2007 2008
num
ber o
f dea
ths
/ 10
00 li
ve b
irth
s
Annual mortality rate due to respiratory diseases in children older than one month and under one year of age in Romania by counties (NUTS3) in region Sud-Muntenia, Romania
Arges (RO311) Calarasi (RO312)
Dambovita (RO313) Giurgiu (RO314)
Ialomita (RO315) Prahova (RO316)
Teleorman (RO317) national value

SELECTED INDICATORS REPORT
129
0
1
2
3
4
5
6
7
8
9
10
11
1999 2000 2001 2002 2003 2004 2005 2006 2007 2008
num
ber o
f dea
ths /
100
0 liv
e bi
rths
Annual mortality rate due to respiratory diseases in children older than one month and under one year of age in Romania by counties (NUTS3) in region Bucuresti-Ilfov, Romania
Bucuresti (RO321)
Ilfov (RO322)
national value
0
1
2
3
4
5
6
7
8
9
10
11
1999 2000 2001 2002 2003 2004 2005 2006 2007 2008
num
ber o
f dea
ths /
100
0 liv
e bi
rths
Annual mortality rate due to respiratory diseases in children older than one month and under one year of age in Romania by counties (NUTS3) in region Sud-Vest Oltenia , Romania
Dolj (RO411)
Gorj (RO412)
Mehedinti (RO413)
Olt (RO414)
Valcea (RO415)
national value
0
1
2
3
4
5
6
7
8
9
10
11
1999 2000 2001 2002 2003 2004 2005 2006 2007 2008
num
ber o
f dea
ths /
100
0 liv
e bi
rths
Annual mortality rate due to respiratory diseases in children older than one month and under one year of age in Romania by counties (NUTS3) in region Vest, Romania
Arad (RO421)
Caras-Severin (RO422)
Hunedoara (RO423)
Timis (RO424)
national value
Figure 4: Annual mortality rate due to respiratory diseases in children in Romania by NUTS3 for the period 1999 - 2008 Source of data: Ministry of Health (National Centre for Organisation and Implementation of Health Information System and Health Yearbook), Romania Assessment: On average, 12.9% of post-neonatal deaths in European countries are due to respiratory diseases and these diseases cause 0.5 deaths per 1000 live births. This average rate, however, masks wide variations ranging from zero deaths per 1000 live births in Austria, Finland, Luxembourg and Slovenia to 4.6 per 1000 live births in Kyrgyzstan. In general, rates are considerably higher in eastern than in western Europe1. Mortality rate due to respiratory diseases is on a downward trend in European Union. It has decreased by almost 40% in last 10 years. This pattern was observed in many countries with higher rates such as: Romania and Bulgaria. Even so, rates in these countries still remain a bit higher than the rest of Europe10. A major cause of the high infant death rates seen in eastern Europe is the relatively worse economic and environmental situation in those countries. These conditions may also contribute to the severity of a greater proportion of acute respiratory infections. In general Europe has low infant mortality rates from respiratory diseases, most probably because of more effective medical services and advanced

SELECTED INDICATORS REPORT
130
environmental protection policies. Current infant death rates from respiratory diseases, though very low, are more likely to be associated with increasing antimicrobial resistance, the emergence of novel pathogens or the lack of effective antiviral medications. In general, however, respiratory illness is detected early and treatment instituted rapidly1.
In Romania, the distribution of annual mortality rate due to respiratory diseases in children older than one month and under one year of age by macro-regions (NUTS1) in 2008 illustrates un unequal distribution with the highest incidence in the macro-region 2, followed by the macro- regions 3 and 4, the only one with the incidence under national value being macro-region 1 (Figure 1). The distribution of the values of the indicator in the same year, by regions (NUTS2) shows the highest values in South East, North East, South Muntenia and Centre, all with values higher than the national value, followed by those under value: South West Oltenia, West, Northwest and Bucharest Ilfov (Figure 2). The distribution of the values of indicator by counties in 2008 shows a higher incidence than the national value in 23 of 42 counties (Figure 3). The evolution of the indicator during 1999-2008, comparing with the national values by macro regions (NUTS 1), regions (NUTS2) and counties is illustrated in Figure 4. Data underlying the indicator:
• Primary source Ministry of Health National Health Statistics Office • Date last published: 2009 • Time period of analysis: 1999-2008 • Numerator definition: Annual number of deaths of children 28-365 days due to respiratory
diseases • Source of numerator: • Denominator definition: Number of live births • Source of denominator: • Geographic coverage: National • Timeliness: • Accuracy and completeness of data set • Disclosure control
References: 1. American academy of pediatrics. Policy statement. Ambient air pollution: Health hazards to children. Pediatrics 2004;114:1699-707. 2. Hajat s, Armstrong B, Wilkinson P, Busby A, Dolk H. Outdoor air pollution and infant mortality: analysis of daily time-series data in 10 English cities. J Epidemiol Community Health. 2007;61:719-22. 3. Woodruff T, Darrow LA, Parker JD. Air pollution and postneonatal infant mortality in the United States, 1999-2002. Environ Health Perspect2008;116:110-5. 4. Koranteng S, Osornio Vargas AR, Buka I. Ambient air pollution and children’s health: A systematic review of Canadian epidemiological studies. Pediatr Child Health 2007;12: 225-33. 5. Infant mortality from respiratory diseases. Copenhagen, WHO Regional Office for Europe, 2007 (ENHIS fact sheet 3.2) (http://www.euro.who.int/__data/assets/pdf_file/0004/96997/enhis_factsheet09_3_2.pdf, accessed July 2010) 6. WHO European Centre for Environment and Health. Effects of air pollution on children’s health and development - a review of the evidence. Copenhagen, WHO Regional Office for Europe, 2005 (http://www.euro.who.int/document/E86575.pdf, accessed July 2010). 7. Infant mortality from respiratory diseases, an ENHIS fact sheet;2009 (http://www.euro.who.int/__data/assets/pdf_file/0004/96997/enhis_factsheet09_3_2.pdf, accessed July 2010) 8. Parma Declaration on Environment and Health. WHO; 2010 ( http://www.euro.who.int/__data/assets/pdf_file/0011/78608/E93618.pdf , accessed July 2010) 9. Operativni program varstva zunanjega zraka pred onesnaževanjem s PM10 (OP PM10), Republika Slovenija, Vlada Republike Slovenije (2009) 10. Ministry of Health of Romania, Health Statistic Centre –Yearly Health Statistics Book, 2009 Further Information: Author: Alexandra Cucu, Claudia Dima, National Institute of Public Health, Romania Date of production 23 July 2010

SELECTED INDICATORS REPORT
131
Slovenia Name of indicator: Infant mortality rate due to respiratory diseases Definition: Annual mortality rate due to respiratory diseases in children older than one month and under one year of age Key Message: There is very low infant mortality due to respiratory diseases in the country with the highest number in Pomurje region and slightly noticeable number in Gorenjska region. The average level is very low. Data for 1999-2008 reveal a decline in the postneonatal mortality rates for nearly all the regions. Rationale: Respiratory illnesses are the most common cause of childhood morbidity in developed countries. In developing and emerging economies, acute lower respiratory infections (ALRI), particularly pneumonia, are common causes of death and serious morbidity in young children and infants. Causative infective agents differ between developed and developing regions and municipalities of countries: bacterial infections are common in developing regions while viral infections cause most ALRIs in developed regions. In temperate European regions there is a marked variation with the seasons in ALRI, with a significant rise in incidence in the winter months falling to relatively low levels in the summer1. Recent studies in different countries have found associations between ambient air pollution (especially particulates and/or carbon monoxide) and postneonatal infant mortality (attributable to respiratory causes and possibly sudden infant death syndrome (SIDS)), low birth weight, and preterm birth2. The evidence is sufficient to infer a causal relationship between air pollutants (particulate matter, sulphur dioxide (SO2), NO2, CO, ozone) and respiratory deaths and SIDS in the post-neonatal period3,
4, 5, 6 . Consequently, an increase in infant respiratory mortality rates may indicate higher indoor or outdoor air pollution levels, and conversely, decreasing mortality may indicate improved air quality. However, caution should be exercised in such interpretations as the association between infant respiratory mortality and ambient air pollution is not simple. Many forms of respiratory illness occur, and there are numerous causes, including outdoor air pollution, pollutants and allergens, in the home (such as the use of solid fuel for cooking and heating, tobacco smoke and dust) as well as infectious agents. Diet, lifestyle, the environment and social factors may also be important, possibly having a synergistic effect1. Policy Relevance and Context: At the Fifth Ministerial Conference on Environment and Health commitment was made to intensify efforts to implement the commitments made in CEHAPE. RPG III aims to prevent and reduce respiratory diseases due to outdoor and indoor air pollution, thereby contributing to a reduction in the frequency of asthma attacks and ensuring that children can live in an environment with clean air7.
The following new EU directive (Directive 2008/50/EC of the European Parliament and of the Council of the 21 May on ambient air quality and cleaner air for Europe)8 aim to achieve the ultimate goal of European clean air policy, which is to attain levels of air quality that do not give rise to significant negative effects on or risks to human health and the environment. The Directive replaces all other Directives on air pollution. It introduced new targets for air quality and requires a gradual reduction in population exposure to particulate matter. In addition, the Sixth Community Environment Action Programme called for the development of a thematic strategy on air pollution with the objective of attaining "levels of air quality that do not give rise to significant negative impacts on and risks to human health and the environment"9. This strategy, prepared by the Clean Air for Europe programme, was adopted in September 2005.

SELECTED INDICATORS REPORT
132
In Slovenia we have adopted all the relevant EU Directives and transposed into the national legislation. The commitments from Parma declaration will be fulfilled and actions regularly followed. In 2009 the government approved air pollution abatement plan with aim to reduce air pollution in towns where the levels exceed EU requirements. In the plan there is a demand that each town takes action to improve air quality. A smoking ban was adopted in public indoor places (2007). Presentation of Data:

SELECTED INDICATORS REPORT
133
0,0335 0,0335 0,0336 0,0336 0,0337 0,0337 0,0338
Vzhodna Slovenija (SI01)
Zahodna Slovenija (SI02)
number of deaths / 1000 live births
Annual mortality rate due to respiratory diseases in children older than one month and under one year of age in Slovenia
by regions (NUTS2), 2006-2008
national value
0,00 0,05 0,10 0,15 0,20 0,25 0,30 0,35 0,40
Pomurska (SI011)
Podravska (SI012)
Koroska (SI013)
Savinjska (SI014)
Zasavska (SI015)
Spodnjeposavska (SI016)
Jugovzhodna Slovenija (SI017)
Notranjsko-kraska (SI018)
Osrednjeslovenska (SI021)
Gorenjska (SI022)
Goriska (SI023)
Obalno-kraska (SI024)
number of deaths / 1000 live births
Annual mortality rate due to respiratory diseases in children older than one month and under one year of age in Slovenia
by counties (NUTS3), 2006-2008
national value

SELECTED INDICATORS REPORT
134
0,00
0,02
0,04
0,06
0,08
0,10
0,12
0,14
0,16
1999-2001 2000-2002 2001-2003 2002-2004 2003-2005 2004-2006 2005-2007 2006-2008
num
ber o
f dea
ths
/ 10
00 li
ve b
irth
s
Annual mortality rate due to respiratory diseases in children older than one month and under one year of age in Slovenia by regions (NUTS2)
Vzhodna Slovenija (SI01)
Zahodna Slovenija (SI02)
Slovenija
0,00
0,10
0,20
0,30
0,40
0,50
0,60
1999-2001 2000-2002 2001-2003 2002-2004 2003-2005 2004-2006 2005-2007 2006-2008
num
ber o
f dea
ths
/ 10
00 li
ve b
irth
s
Annual mortality rate due to respiratory diseases in children older than one month and under one year of age by counties (NUTS3) in region Vzhodna Slovenija, Slovenia
Pomurska (SI011) Podravska (SI012) Koroska (SI013)
Savinjska (SI014) Zasavska (SI015) Spodnjeposavska (SI016)
Jugovzhodna Slovenija (SI017) Notranjsko-kraska (SI018) Slovenija

SELECTED INDICATORS REPORT
135
0,00
0,05
0,10
0,15
0,20
0,25
0,30
0,35
1999-2001 2000-2002 2001-2003 2002-2004 2003-2005 2004-2006 2005-2007 2006-2008
num
ber o
f dea
ths
/ 10
00 li
ve b
irth
s
Annual mortality rate due to respiratory diseases in children older than one month and under one year of age by counties (NUTS3) in region Zahodna Slovenija, Slovenia
Osrednjeslovenska (SI021)
Gorenjska (SI022)
Goriska (SI023)
Obalno-kraska (SI024)
Slovenija
Source of data: National Institute of Public Health; Statistical Office of the Republic of Slovenia Assessment: On average, 12.9% of post-neonatal deaths in European countries are due to respiratory diseases and these diseases cause 0.5 deaths per 1000 live births. This average rate, however, masks wide variations ranging from zero deaths per 1000 live births in Austria, Finland, Luxembourg and Slovenia to 4.6 per 1000 live births in Kyrgyzstan. In general, rates are considerably higher in eastern than in western Europe1. Mortality rate due to respiratory diseases is on a downward trend in European Union. It has decreased by almost 40% in last 10 years. This pattern was observed in many countries with higher rates such as: Romania and Bulgaria. Even so, rates in these countries still remain a bit higher than the rest of Europe10. A major cause of the high infant death rates seen in eastern Europe is the relatively worse economic and environmental situation in those countries. These conditions may also contribute to the severity of a greater proportion of acute respiratory infections. In general Europe has low infant mortality rates from respiratory diseases, most probably because of more effective medical services and advanced environmental protection policies. Current infant death rates from respiratory diseases, though very low, are more likely to be associated with increasing antimicrobial resistance, the emergence of novel pathogens or the lack of effective antiviral medications. In general, however, respiratory illness is detected early and treatment instituted rapidly1.
On average, 0.03 per 100000 live births (2006-2008) of post-neonatal mortality in Slovenia is due to respiratory diseases. This average variations range from 0.000 per 1000 live births in most of the regions to 0.33 per 1000 live births in Pomurska region. In general, rates are low; the only exception is Pomurje region. A fall in infant respiratory mortality has been evident in recent years in almost all regions with high rates. Mortality data from 2006-2008 show that respiratory diseases contributed to the overall post-neonatal infant mortality rate in Pomurje region. Regions in Slovenia show low infant mortality rates from respiratory diseases, most probably because of high economic development.
Data underlying the indicator:
• Primary source: National Institute of Public Health, Slovenia

SELECTED INDICATORS REPORT
136
• Date last published: 2008 • Time period of analysis 1999-2008 • Numerator definition: Annual number of deaths of children aged 28–364 days due to
respiratory diseases • Source of numerator: National Institute of Public Health, Slovenia • Denominator definition: Total number of live births • Source of denominator: National Institute of Public Health, Slovenia • Geographic coverage: NUTS1, NUTS2, NUTS3 • Timeliness: Annually • Accuracy and completeness of data set • Disclosure control: According to national legislation
References: 1. Infant mortality from respiratory diseases, an ENHIS fact sheet (2009). Available at http://www.euro.who.int/__data/assets/pdf_file/0004/96997/enhis_factsheet09_3_2.pdf. (accessed July 2010). 2. Infant mortality from respiratory diseases. Copenhagen, WHO Regional Office for Europe, 2007 (ENHIS fact sheet 3.2). Available at http://www.euro.who.int/__data/assets/pdf_file/0004/96997/enhis_factsheet09_3_2.pdf. ( accessed July 2010). 3. WHO European Centre for Environment and Health. Effects of air pollution on children’s health and development - a review of the evidence. Copenhagen, WHO Regional Office for Europe, 2005. Available at http://www.euro.who.int/document/E86575.pdf. (accessed July 2010). 4. Woodruff T, Darrow LA, Parker JD. Air pollution and postneonatal infant mortality in the United States, 1999-2002. Environ Health Perspect 2008; 116:110-5. 5. Hajat s, Armstrong B, Wilkinson P, Busby A, Dolk H. Outdoor air pollution and infant mortality: analysis of daily time-series data in 10 English cities. J Epidemiol Community Health. 2007;61:719-22. 6. Koranteng S, Osornio Vargas AR, Buka I. Ambient air pollution and children’s health: A systematic review of Canadian epidemiological studies. Pediatr Child Health 2007;12: 225-33. 7. Stewart L, Saunders P and Kemm J (2008). Children’s Environment and Health Action Plan (CEHAP): Pilot Environmental Health Indicators ToolkitConsultation Document 8. United Nations Regional Information Centre for Western Europe (2010). Twenty years of environmental and health in Europe: trends and gaps. Available at http://www.unric.org/en/latest-news/26121. (accessed 7 July 2010). 9. Hawker JI, Olowokure B, Sufi F, et al, (2003). Social deprivation and hospital admission for respiratory infection: an ecological study. Respiratory Medicine 97 (11): 1219-1224. 10. Clinch JP and Healy JD (2000). Housing standards and excess winter mortality. J Epidemiol Community Health 2000; 54:719-720. 11. Parma Declaration on Environment and Health. WHO; 2010. Available at http://www.euro.who.int/__data/assets/pdf_file/0011/78608/E93618.pdf. ( accessed July 2010). 12. Directive 2008/50/EC of the European Parliament and of the Council of the 21 May on ambient air quality and cleaner air for Europe. Available at http://eur-lex.europa.eu/LexUriServ/LexUriServ.do?uri=OJ:L:2008:152:0001:0044:EN:PDF. (accessed August 2010). 13. The Sixth Environment Action Programme of the European Community. Available at http://ec.europa.eu/environment/newprg/strategies_en.htm. (accessed August 2010). 14. Causes of death. Available at http://appsso.eurostat.ec.europa.eu/nui/print.do?print=true. (accessed August 2010). Further Information: Author: Peter Otorepec, Ana Hojs, Katarina Bitenc, Pia vračko, Irena Jeraj, National Institute of Public Health, Slovenia Date of production: August 2010

SELECTED INDICATORS REPORT
137
Spain Name of indicator: Infant mortality rate due to respiratory diseases Definition: Annual mortality rate due to respiratory diseases in children older than one month and under one year of age Key Message: Infant mortality from respiratory diseases in Spain are among the lowest in off the EU 25. While there is an unequal distribution of mortality, it is important to note that no more than 2 deaths would occur in 10,000 births. Even such a small number of deaths may be avoidable, so research should aim at dilucidating the fraction of these deaths that can be prevented. An analysis of the unequal distribution of mortality rates among regions, may shed some light into the potential for further reducing infant mortality rates from respiratory diseases. Rationale: Respiratory illnesses are the most common cause of childhood morbidity in developed countries. In developing and emerging economies, acute lower respiratory infections (ALRI), particularly pneumonia, are common causes of death and serious morbidity in young children and infants. Causative infective agents differ between developed and developing regions and municipalities of countries: bacterial infections are common in developing regions while viral infections cause most ALRIs in developed regions. In temperate European regions there is a marked variation with the seasons in ALRI, with a significant rise in incidence in the winter months falling to relatively low levels in the summer1. Recent studies in different countries have found associations between ambient air pollution (especially particulates and/or carbon monoxide) and postneonatal infant mortality (attributable to respiratory causes and possibly sudden infant death syndrome (SIDS)), low birth weight, and preterm birth2.
The evidence is sufficient to infer a causal relationship between air pollutants (particulate matter, sulphur dioxide (SO2), NO2, CO, ozone) and respiratory deaths and SIDS in the post-neonatal period3, 4, 5, 6 . Consequently, an increase in infant respiratory mortality rates may indicate higher indoor or outdoor air pollution levels, and conversely, decreasing mortality may indicate improved air quality. However, caution should be exercised in such interpretations as the association between infant respiratory mortality and ambient air pollution is not simple. Many forms of respiratory illness occur, and there are numerous causes, including outdoor air pollution, pollutants and allergens, in the home (such as the use of solid fuel for cooking and heating, tobacco smoke and dust) as well as infectious agents. Diet, lifestyle, the environment and social factors may also be important, possibly having a synergistic effect1.
Policy Relevance and Context: At the Fifth Ministerial Conference on Environment and Health commitment was made to intensify efforts to implement the commitments made in CEHAPE. RPG III aims to prevent and reduce respiratory diseases due to outdoor and indoor air pollution, thereby contributing to a reduction in the frequency of asthma attacks and ensuring that children can live in an environment with clean air7.
The following new EU directive (Directive 2008/50/EC of the European Parliament and of the Council of the 21 May on ambient air quality and cleaner air for Europe)8 aim to achieve the ultimate goal of European clean air policy, which is to attain levels of air quality that do not give rise to significant negative effects on or risks to human health and the environment. The Directive replaces all other Directives on air pollution. It introduced new targets for air quality and requires a gradual reduction in population exposure to particulate matter. In addition, the Sixth Community Environment Action

SELECTED INDICATORS REPORT
138
Programme called for the development of a thematic strategy on air pollution with the objective of attaining "levels of air quality that do not give rise to significant negative impacts on and risks to human health and the environment"9. This strategy, prepared by the Clean Air for Europe programme, was adopted in September 2005.
Presentation of Data:
Figure 1a: Annual mortality due to respiratory diseases in children in Spain by NUTS2, 2005
0,00 0,02 0,04 0,06 0,08 0,10 0,12 0,14 0,16
Galicia (ES11)
Principado de Asturias (ES12)
Cantabria (ES13)
País Vasco (ES21)
Comunidad Foral de Navarra (ES22)
La Rioja (ES23)
Aragón (ES24)
Comunidad de Madrid (ES30)
Castilla y León (ES41)
Castilla-La Mancha (ES42)
Extremadura (ES43)
Cataluña (ES51)
Comunidad Valenciana (ES52)
Illes Balears (ES53)
Andalucía (ES61)
Región de Murcia (ES62)
Ciudad Autónoma de Ceuta (ES63)
Ciudad Autónoma de Melilla (ES64)
Canarias (ES70)
number of deaths / 1000 live births
Annual mortality rate due to respiratory diseases in children older than one month and under one year of age in Spain by NUTS2, 2005
national value Figure 1b: Annual mortality due to respiratory diseases in children in Spain by NUTS2, 2005

SELECTED INDICATORS REPORT
139
0,00 0,01 0,02 0,03 0,04 0,05 0,06 0,07 0,08 0,09 0,10 0,11
Noroeste (ES1)
Noreste (ES2)
Comunidad de Madrid (ES3)
Centro (ES4)
Este (ES5)
Sur (ES6)
Canarias (ES7)
number of deaths / 1000 live births
national value Figure 2: Annual mortality due to respiratory diseases in children in Spain by NUTS1, 2005
0,00
0,02
0,04
0,06
0,08
0,10
0,12
0,14
0,16
1999 2000 2001 2002 2003 2004 2005 2006
num
ber o
f dea
ths
/ 10
00 li
ve b
irth
s
Noroeste (ES1)Noreste (ES2)Comunidad de Madrid (ES3)Centro (ES4)Este (ES5)Sur (ES6)Canarias (ES7)national value
Figure 3: Annual mortality rate due to respiratory diseases in children in Spain bu NUTS1 for the period 1999-2008

SELECTED INDICATORS REPORT
140
0,00
0,05
0,10
0,15
0,20
0,25
0,30
0,35
0,40
0,45
0,50
1999 2000 2001 2002 2003 2004 2005 2006
num
ber o
f dea
ths
/ 10
00 li
ve b
irth
s
Annual mortality rate due to respiratory diseases in children older than one month and under one year of age by NUTS2 in the north-western part of Spain (Noroeste)
Galicia (ES11)
Principado de Asturias (ES12)
Cantabria (ES13)
Noroeste (ES1)
national value
0,00
0,05
0,10
0,15
0,20
0,25
0,30
0,35
0,40
1999 2000 2001 2002 2003 2004 2005 2006
num
ber o
f dea
ths
/ 10
00 li
ve b
irth
s
Annual mortality rate due to respiratory diseases in children older than one month and under one year of age by NUTS2 in the north-eastern part of Spain (Noreste)
País Vasco (ES21)
Comunidad Foral de Navarra (ES22)
La Rioja (ES23)
Aragón (ES24)
Noreste (ES2)
national value
0,00
0,02
0,04
0,06
0,08
0,10
0,12
0,14
0,16
0,18
1999 2000 2001 2002 2003 2004 2005 2006
num
ber o
f dea
ths
/ 10
00 li
ve b
irth
s
Annual mortality rate due to respiratory diseases in children older than one month and under one year of age by NUTS2 in Madrid and in the central part (Centro) of Spain
Comunidad de Madrid (ES30)
Castilla y León (ES41)
Castilla-La Mancha (ES42)
Extremadura (ES43)
Centro (ES4)
national value
0,00
0,01
0,02
0,03
0,04
0,05
0,06
0,07
0,08
1999 2000 2001 2002 2003 2004 2005 2006
num
ber o
f dea
ths
/ 10
00 li
ve b
irth
s
Annual mortality rate due to respiratory diseases in children older than one month and under one year of age by NUTS2 in the eastern part of Spain (Este)
Cataluña (ES51)
Comunidad Valenciana (ES52)
Illes Balears (ES53)
Este (ES5)
national value

SELECTED INDICATORS REPORT
141
0,00
0,10
0,20
0,30
0,40
0,50
0,60
0,70
0,80
1999 2000 2001 2002 2003 2004 2005 2006
num
ber o
f dea
ths
/ 10
00 li
ve b
irth
s
Annual mortality rate due to respiratory diseases in children older than one month and under one year of age by NUTS2 in Canarias and in the southern part (Sur) of Spain
Andalucía (ES61)Región de Murcia (ES62)Ciudad Autónoma de Ceuta (ES63)Ciudad Autónoma de Melilla (ES64)Canarias (ES70)Sur (ES6)national value
Figure 4: Annual mortality rate due to respiratory diseases in Spain by NUTS2 for the reporting period 1999 - 2008
0,00
0,02
0,04
0,06
0,08
0,10
0,12
0,14
0,16
0,18
0,20
1999 2000 2001 2002 2003 2004 2005 2006
num
ber o
f dea
ths
/ 10
00 li
ve b
irth
s
Annual mortality rate due to respiratory diseases in children older than one month and under one year of age by NUTS3 in Cataluña, Spain
Barcelona (ES511)
Girona (ES512)
Lleida (ES513)
Tarragona (ES514)
Cataluña (ES51)
national value
0,00
0,03
0,05
0,08
0,10
0,13
0,15
0,18
0,20
0,23
0,25
1999 2000 2001 2002 2003 2004 2005 2006
num
ber o
f dea
ths
/ 10
00 li
ve b
irth
s
Annual mortality rate due to respiratory diseases in children older than one month and under one year of age by NUTS3 in Galicia, Spain
A Coruña (ES111)
Lugo (ES112)
Ourense (ES113)
Pontevedra (ES114)
Galicia (ES11)
national value
Figure 3: Annual mortality rate due to respiratory diseases in Spain by NUTS3 for the period 1999 - 2008
Assessment: On average, 12.9% of post-neonatal deaths in European countries are due to respiratory diseases and these diseases cause 0.5 deaths per 1000 live births. This average rate, however, masks wide variations ranging from zero deaths per 1000 live births in Austria, Finland, Luxembourg and Slovenia to 4.6 per 1000 live births in Kyrgyzstan. In general, rates are considerably higher in eastern than in western Europe1. Mortality rate due to respiratory diseases is on a downward trend in European Union. It has decreased by almost 40% in last 10 years. This pattern was observed in many countries with higher rates such as: Romania and Bulgaria. Even so, rates in these countries still remain a bit higher than the rest of Europe10.

SELECTED INDICATORS REPORT
142
A major cause of the high infant death rates seen in eastern Europe is the relatively worse economic and environmental situation in those countries. These conditions may also contribute to the severity of a greater proportion of acute respiratory infections. In general Europe has low infant mortality rates from respiratory diseases, most probably because of more effective medical services and advanced environmental protection policies. Current infant death rates from respiratory diseases, though very low, are more likely to be associated with increasing antimicrobial resistance, the emergence of novel pathogens or the lack of effective antiviral medications. In general, however, respiratory illness is detected early and treatment instituted rapidly1.
Infant mortality from respiratory diseases in Spain are among the lowest in the EU 25, with only Germany, Netherlands, France Czech Republic and Sweden having had lower post-neonatal rates.
In Spain, the distribution of annual mortality rate due to respiratory diseases in children older than one month and under one year of age by macro regions (NUTS1) in 2005 illustrates ununequal distribution with the highest incidence in macro-region 7 (Canary Islands), followed by the macro regions 3 and 5. There are three regions (6, 4 and 2) which are under the national value. The distribution of the values of the indicator in the same year, by regions (NUTS2) shows the highest values in the Comunidad Foral de Navarra, Extremadura and Canarias, followed by Murcia Valencia and Madrid.
While there is an unequal distribution of mortality, it is important to note that infant mortality in 2005 ws lower than 0.2 per 1,000 live births in all regions. That is, no more than 2 deaths would occur in 10,000 live births. Although the numbers of deaths are small if they are avoidable, research should aim to redress the situation. An investigatin of the unequal distribution of mortality may shed light on the possible risk factors.
Data underlying the indicator: • Primary source: National Institute of Statistics • Date last published: 2009 • Time period of analysis: 1999-2008 • Numerator definition: Number of deaths from respiratory diseases of children between 28
days and 365 days. • Source of numerator: National Statistics • Denominator definition: Number of life births • Source of denominator: National Statistics • Geographic coverage: whole country • Timeliness: • Accuracy and completeness of data set: Complete
References:
1. American academy of pediatrics. Policy statement. Ambient air pollution: Health hazards to children. Pediatrics 2004;114:1699-707.
2. Hajat s, Armstrong B, Wilkinson P, Busby A, Dolk H. Outdoor air pollution and infant mortality: analysis of daily time-series data in 10 English cities. J Epidemiol Community Health. 2007;61:719-22.
3. Woodruff T, Darrow LA, Parker JD. Air pollution and postneonatal infant mortality in the United States, 1999-2002. Environ Health Perspect2008;116:110-5.
4. Koranteng S, Osornio Vargas AR, Buka I. Ambient air pollution and children’s health: A systematic review of Canadian epidemiological studies. Pediatr Child Health 2007;12: 225-33.
5. Infant mortality from respiratory diseases. Copenhagen, WHO Regional Office for Europe, 2007 (ENHIS fact sheet 3.2) (http://www.euro.who.int/__data/assets/pdf_file/0004/96997/enhis_factsheet09_3_2.pdf, accessed July 2010)
6. WHO European Centre for Environment and Health. Effects of air pollution on children’s health and development - a review of the evidence. Copenhagen, WHO Regional Office for Europe, 2005 (http://www.euro.who.int/document/E86575.pdf, accessed July 2010).

SELECTED INDICATORS REPORT
143
7. Infant mortality from respiratory diseases, an ENHIS fact sheet;2009 (http://www.euro.who.int/__data/assets/pdf_file/0004/96997/enhis_factsheet09_3_2.pdf, accessed July 2010)
8. Parma Declaration on Environment and Health. WHO; 2010
( http://www.euro.who.int/__data/assets/pdf_file/0011/78608/E93618.pdf , accessed July 2010)
9. Operativni program varstva zunanjega zraka pred onesnaževanjem s PM10 (OP PM10), Republika Slovenija, Vlada Republike Slovenije (2009)
Further Information: Author: Maria Jose Carroquino. ISCIII, Spain. Date of production: September 2010

SELECTED INDICATORS REPORT
144
United Kingdom Name of indicator: Infant mortality rate due to respiratory diseases Definition: Annual mortality rate due to respiratory diseases in children older than one month and under one year of age Key Message: The trend for mortality rate due to respiratory diseases is declining in the EU by approximately 40% in last the 10 years. Likewise, the trend decreasing in England, particularly in London. Rationale: Respiratory illnesses are the most common cause of childhood morbidity in developed countries. In developing and emerging economies, acute lower respiratory infections (ALRI), particularly pneumonia, are common causes of death and serious morbidity in young children and infants. Causative infective agents differ between developed and developing regions and municipalities of countries: bacterial infections are common in developing regions while viral infections cause most ALRIs in developed regions. In temperate European regions there is a marked variation with the seasons in ALRI, with a significant rise in incidence in the winter months falling to relatively low levels in the summer1. Recent studies in different countries have found associations between ambient air pollution (especially particulates and/or carbon monoxide) and postneonatal infant mortality (attributable to respiratory causes and possibly sudden infant death syndrome (SIDS)), low birth weight, and preterm birth2. The evidence is sufficient to infer a causal relationship between air pollutants (particulate matter, sulphur dioxide (SO2), NO2, CO, ozone) and respiratory deaths and SIDS in the post-neonatal period3, 4, 5, 6 . Consequently, an increase in infant respiratory mortality rates may indicate higher indoor or outdoor air pollution levels, and conversely, decreasing mortality may indicate improved air quality. However, caution should be exercised in such interpretations as the association between infant respiratory mortality and ambient air pollution is not simple. Many forms of respiratory illness occur, and there are numerous causes, including outdoor air pollution, pollutants and allergens, in the home (such as the use of solid fuel for cooking and heating, tobacco smoke and dust) as well as infectious agents. Diet, lifestyle, the environment and social factors may also be important, possibly having a synergistic effect1. Policy Relevance and Context: At the Fifth Ministerial Conference on Environment and Health commitment was made to intensify efforts to implement the commitments made in CEHAPE. RPG III aims to prevent and reduce respiratory diseases due to outdoor and indoor air pollution, thereby contributing to a reduction in the frequency of asthma attacks and ensuring that children can live in an environment with clean air7.
The following new EU directive (Directive 2008/50/EC of the European Parliament and of the Council of the 21 May on ambient air quality and cleaner air for Europe)8 aim to achieve the ultimate goal of European clean air policy, which is to attain levels of air quality that do not give rise to significant negative effects on or risks to human health and the environment. The Directive replaces all other Directives on air pollution. It introduced new targets for air quality and requires a gradual reduction in population exposure to particulate matter. In addition, the Sixth Community Environment Action Programme called for the development of a thematic strategy on air pollution with the objective of attaining "levels of air quality that do not give rise to significant negative impacts on and risks to human health and the environment"9. This strategy, prepared by the Clean Air for Europe programme, was adopted in September 2005.

SELECTED INDICATORS REPORT
145
Several initiatives on air quality have been developed by the UK Government. These include ‘cleaner vehicles’ which promotes the reduction of vehicle emissions, ‘integrated pollution prevention and control (IPPC)’ which aims to achieve a high level of protection of the environment, and the ‘cleaner air act’ which controls domestic and industrial smoke emissions. Presentation of Data:
0,04
0,06
0,08
0,10
0,12
0,14
0,16
0,18
0,20
0,22
1999-2001 2000-2002 2001-2003 2002-2004 2003-2005 2004-2006 2005-2007 2006-2008
num
ber
of d
eath
s /
1000
live
bir
ths
North East (UKC) North West (UKD) Yorkshire and the Humber (UKE)
East Midlands (UKF) West Midlands (UKG) East of England (UKH)
London (UKI) South East (UKJ) South West (UKK) Figure 1: Mortality due to respiratory diseases in children under 1 year of age in England by NUTS1 for the period 1999-2008
0,00 0,02 0,04 0,06 0,08 0,10 0,12 0,14 0,16
North East (UKC)
North West (UKD)
Yorkshire and the Humber (UKE)
East Midlands (UKF)
West Midlands (UKG)
East of England (UKH)
London (UKI)
South East (UKJ)
South West (UKK)
number of deaths / 1000 live births
g , g y ,
Figure 2: Mortality due to respiratory diseases in children under 1 year of age in England by NUTS1, 2006-208 Assessment:

SELECTED INDICATORS REPORT
146
On average, 12.9% of post-neonatal deaths in European countries are due to respiratory diseases and these diseases cause 0.5 deaths per 1000 live births. This average rate, however, masks wide variations ranging from zero deaths per 1000 live births in Austria, Finland, Luxembourg and Slovenia to 4.6 per 1000 live births in Kyrgyzstan. In general, rates are considerably higher in eastern than in western Europe1. Mortality rate due to respiratory diseases is on a downward trend in European Union. It has decreased by almost 40% in last 10 years. This pattern was observed in many countries with higher rates such as: Romania and Bulgaria. Even so, rates in these countries still remain a bit higher than the rest of Europe10. A major cause of the high infant death rates seen in eastern Europe is the relatively worse economic and environmental situation in those countries. These conditions may also contribute to the severity of a greater proportion of acute respiratory infections. In general Europe has low infant mortality rates from respiratory diseases, most probably because of more effective medical services and advanced environmental protection policies. Current infant death rates from respiratory diseases, though very low, are more likely to be associated with increasing antimicrobial resistance, the emergence of novel pathogens or the lack of effective antiviral medications. In general, however, respiratory illness is detected early and treatment instituted rapidly1.
In general, mortality rates have decreased in England as well as within all its regions. The largest decrease was observed in London (from 0.21 per 1000 live births in 1999 to 0.06 per 1000 live births in 2008) as demonstrated by Figure 1. A similar trend was observed in mortality rates due to respiratory diseases in all ages. Mortality rates were highest in North West and West Midlands from 2006 – 2008 (Figure 2). Deprivation and social inequality may be reasons for the high rates in the West Midlands, whereas in the North West the higher rates maybe attributed to the cold temperature.
Data underlying the indicator: • Primary source: Office of National Statistics (ONS) and West Midlands Public Health
Observatory (WMPHO) • Date last published: 2009 • Time period of analysis: 1999 - 2008 • Numerator definition: Number of deaths due to respiratory diseases in children aged 28 –
364 days per year. ICD-10 code: J00 – J99 • Source of numerator: WMPHO • Denominator definition: Number of live births per year • Source of denominator: ONS • Geographic coverage: England • Timeliness: Annually • Accuracy and completeness of data set: Accurate • Disclosure control
References: 1. Infant mortality from respiratory diseases, an ENHIS fact sheet (2009). Available at http://www.euro.who.int/__data/assets/pdf_file/0004/96997/enhis_factsheet09_3_2.pdf. (accessed July 2010). 2. Infant mortality from respiratory diseases. Copenhagen, WHO Regional Office for Europe, 2007 (ENHIS fact sheet 3.2). Available at http://www.euro.who.int/__data/assets/pdf_file/0004/96997/enhis_factsheet09_3_2.pdf. ( accessed July 2010). 3. WHO European Centre for Environment and Health. Effects of air pollution on children’s health and development - a review of the evidence. Copenhagen, WHO Regional Office for Europe, 2005. Available at http://www.euro.who.int/document/E86575.pdf. (accessed July 2010). 4. Woodruff T, Darrow LA, Parker JD. Air pollution and postneonatal infant mortality in the United States, 1999-2002. Environ Health Perspect 2008; 116:110-5. 5. Hajat s, Armstrong B, Wilkinson P, Busby A, Dolk H. Outdoor air pollution and infant mortality: analysis of daily time-series data in 10 English cities. J Epidemiol Community Health. 2007;61:719-22.
SELECTED INDICATORS REPORT
147
6. Koranteng S, Osornio Vargas AR, Buka I. Ambient air pollution and children’s health: A systematic review of Canadian epidemiological studies. Pediatr Child Health 2007;12: 225-33. 7. Parma Declaration on Environment and Health. WHO; 2010. Available at http://www.euro.who.int/__data/assets/pdf_file/0011/78608/E93618.pdf. ( accessed July 2010). 8. Directive 2008/50/EC of the European Parliament and of the Council of the 21 May on ambient air quality and cleaner air for Europe. Available at http://eur-lex.europa.eu/LexUriServ/LexUriServ.do?uri=OJ:L:2008:152:0001:0044:EN:PDF. (accessed August 2010). 9. The Sixth Environment Action Programme of the European Community. Available at http://ec.europa.eu/environment/newprg/strategies_en.htm. (accessed August 2010). 10. Causes of death. Available at http://appsso.eurostat.ec.europa.eu/nui/print.do?print=true. (accessed August 2010). Further Information: UK Air Quality Archive http://www.airquality.co.uk/what_are_we_doing.php (accessed 8 September 2010) Author: Lorraine Stewart and Adedoyin Awofisayo, Health Protection Agency, United Kingdom Date of production: 16 September 2010

SELECTED INDICATORS REPORT
148
2.4 Regional Assessment for Mortality due to Respiratory Diseases
Germany Name of indicator: Mortality due to respiratory diseases Definition: Mortality rate per 100,000 population for which the primary cause is defined as respiratory disease (ICD-10 codes J00 - J99). Key Message: Respiratory diseases are the most common diseases in Germany. In contrary to the decreasing trend in Europe, in Germany the rate of mortality due to respiratory diseases has slightly increased in the last decade (61.5 deaths per 100,000 population in 1999/2001; 69.7 in 2006/08). Poor quality of indoor and outdoor air is pointed out as the most important risk factor for the occurrence of respiratory diseases. On local level the mortality rate due to respiratory diseases shows a high variation. The highest mortality rates in North Rhine-Westphalia (NRW) are observed in the Ruhr area, an urban and industrial area. Further strengthening prevention measures both for indoor and outdoor air quality are required. Rationale: More than 6% of the global burden of disease is attributable to respiratory infections and it causes more morbidity and mortality than all cancers. Respiratory illness accounts for 13% of all hospital admissions1. Respiratory diseases may be triggered/exacerbated by risks factors such as air pollution, overcrowding and poor (unfit) housing conditions. Research has shown that long-term exposure to air pollutants increases the risk of respiratory illnesses such as allergies, asthma, chronic obstructive pulmonary disease (COPD) and lung cancer particularly in children and the elderly 2. A projection made in the United States in 2003 predicted that by the enactment of the ‘Clear Skies Act 2003’, which aims to reduce the concentrations of particulate matter (PM) and ozone 3, premature deaths due to long- and short-term exposures will be reduced by 2010 and a further decrease will be observed by 2020. Deaths from respiratory diseases of all types contribute to all-age and all-cause death rates as well as health inequalities. High prevalence of smoking (environmental tobacco smoke) and low uptake of influenza and pneumococcal vaccines are also contributing factors to mortality due to respiratory diseases. Some of the above factors have been strongly linked with deprivation. Increased morbidity is associated with an increase in socio-economic deprivation. In addition, poverty is associated with a greater than 20-fold increase in the relative burden of lung infections, which disproportionately affect the very young and very old 4. Studies carried out in European countries have found that children in low-income households are twice as likely to be exposed to environmental tobacco smoke (ETS) that their wealthier peers 5. Furthermore, an ecological study carried out in the United Kingdom showed that an increased admission rate due to respiratory illness was strongly linked to social inequalities 6. Poor housing conditions, including inadequate thermal efficiency and heating systems, poor ventilation and overcrowding are also major causal factors. Poor insulation contributes to high rates of excess winter mortality due to respiratory illness 7. Inadequate ventilation and overcrowding encourage the spread of respiratory diseases such as influenza and Tuberculosis, thereby increasing the burden of disease. Policy Relevance and Context: There are a number of EU policies on Ambient air quality which:
• Sets guidelines to ambient air quality assessment and management • Sets threshold values for the amount of some particles and chemicals in ambient air

SELECTED INDICATORS REPORT
149
• Enforces reciprocal exchange of information and data from monitoring stations in participating countries, and
• Obligates member states to submit plans and programmes for air zones that exceed threshold. A new legislation was adopted under the EC treaty in May 2008 on ambient air quality and cleaner air for Europe 8. The directive lays down measure aimed at the following:
• Establishing objectives for ambient air quality to reduce harmful effects on human health, • Assessing the ambient air quality in member states on the basis of common methods and
criteria, • Obtaining information on air quality to help monitor long term trends and improvement, • Ensuring information is available to the public • Maintaining and improving air quality where necessary • Promoting cooperation between member states.
The WHO also provides guidelines on both indoor and outdoor air quality based on the latest scientific evidence. In Germany, policies are in place to help to improve both indoor and outdoor air quality. There is ongoing work to improve outdoor air quality, in particular reduction of particulate matter concentration, and includes the establishment of “Low Emission Zones” in 2008 (see PM10 fact sheet). Particular efforts of establishing policies towards reducing tobacco consumption have taken place in Germany. Several awareness campaigns were run – one of them on national level by Federal Centre for Health Education (BZgA) called “Smokeless” (Rauchfrei)16. But also on sub-national level initiatives such as “Life without smoke” (Leben ohne Qualm)17 18 as a part of the “Concept of Prevention in North Rhine-Westphalia”19 were established. Other measures to reduce tobacco consumption include warnings labels on cigarette packets20 and the ban on tobacco advertising firstly on television and radio in 1974 and later in print media and internet in 200721. Furthermore in most federal states in Germany smoking bans have been implemented. In North Rhine-Westphalia these smoking bans have been implemented for schools, hospitals and pubs due to the “Bill for protection of non-smokers” in 20082. However, in June 2009 these restrictions were relaxed for pubs with only one room, if they are indicated as special pubs for smokers. Several associations in Germany are dealing with respiratory diseases. In 1979 the “German Respiratory Tract League”23 was founded. It aims to improve the treatment of and care for patients with respiratory diseases: evidence based guidelines for diagnosis and therapy of asthma, COPD and bronchial infections have been compiled. Furthermore, training programs for patients with chronic respiratory diseases have been developed and distributed. The “German Lung Foundation”24 founded in 1994, is an initiative of members of the “German Association for Pneumology”25. It aims as well to improve the situation of patients with lung diseases26. Presentation of Data:

SELECTED INDICATORS REPORT
150
Figure 1: Mortality due to respiratory diseases in Germany by NUTS1, 2006-2008
40
50
60
70
80
90
100
110
120
1999-2001 2000-2002 2001-2003 2002-2004 2003-2005 2004-2006 2005-2007 2006-2008
num
ber
of d
eath
s /
1000
00 p
opul
atio
n
Mortality due to respiratory diseases by federal states (NUTS1), Germany
Baden-Württemberg (DE1) Bayern (DE2) Berlin (DE3)Brandenburg (DE4) Bremen (DE5) Hamburg (DE6)Hessen (DE7) Mecklenburg-Vorpommern (DE8) Niedersachsen (DE9)Nordrhein-Westfalen (DEA) Rheinland-Pfalz (DEB) Saarland (DEC)Sachsen (DED) Sachsen-Anhalt (DEE) Schleswig-Holstein (DEF)Thüringen (DEG) national value
Figure 2: Mortality due to respiratory diseases in Germany by NUTS1 for the period 1999-2008

SELECTED INDICATORS REPORT
151
Figure 3: Mortality due to respiratory diseases in Germany by NUTS3 (North Rhine Westphalia), 2006- 2008
40
50
60
70
80
90
100
110
120
1999-2001 2000-2002 2001-2003 2002-2004 2003-2005 2004-2006 2005-2007 2006-2008
num
ber
of d
eath
s /
1000
00 p
opul
atio
n
Mortality due to respiratory diseases by NUTS3 in region Düsseldorf, North Rhine-Westphalia, Germany
Düsseldorf (DEA11) Duisburg (DEA12) Essen (DEA13)Krefeld (DEA14) Mönchengladbach (DEA15) Mülheim an der Ruhr (DEA16)Oberhausen (DEA17) Remscheid (DEA18) Solingen (DEA19)Wuppertal (DEA1A) Kleve (DEA1B) Mettmann (DEA1C)Rhein-Kreis Neuss (DEA1D) Viersen (DEA1E) Wesel (DEA1F)Nordrhein-Westfalen (DEA)
40
50
60
70
80
90
100
110
120
1999-2001 2000-2002 2001-2003 2002-2004 2003-2005 2004-2006 2005-2007 2006-2008
num
ber
of d
eath
s /
1000
00 p
opul
atio
n
Mortality due to respiratory diseases by NUTS3 in region Köln,North Rhine-Westphalia, Germany
Aachen (DEA21) Bonn (DEA22) Köln (DEA23)Leverkusen (DEA24) Aachen, Kreis (DEA25) Düren (DEA26)Rhein-Erft-Kreis (DEA27) Euskirchen (DEA28) Heinsberg (DEA29)Oberbergischer Kreis (DEA2A) Rheinisch-Bergischer Kreis (DEA2B) Rhein-Sieg-Kreis (DEA2C)Nordrhein-Westfalen (DEA)
40
50
60
70
80
90
100
110
120
1999-2001 2000-2002 2001-2003 2002-2004 2003-2005 2004-2006 2005-2007 2006-2008
num
ber
of d
eath
s /
1000
00 p
opul
atio
n
Mortality due to respiratory diseases by NUTS3 in region Münster, North Rhine-Westphalia, Germany
Bottrop (DEA31) Gelsenkirchen (DEA32) Münster (DEA33)Borken (DEA34) Coesfeld (DEA35) Recklinghausen (DEA36)Steinfurt (DEA37) Warendorf (DEA38) Nordrhein-Westfalen (DEA)
40
50
60
70
80
90
100
110
120
1999-2001 2000-2002 2001-2003 2002-2004 2003-2005 2004-2006 2005-2007 2006-2008
num
ber
of d
eath
s /
1000
00 p
opul
atio
n
Mortality due to respiratory diseases by NUTS3 in region Detmold, North Rhine-Westphalia, Germany
Bielefeld (DEA41) Gütersloh (DEA42) Herford (DEA43)
Höxter (DEA44) Lippe (DEA45) Minden-Lübbecke (DEA46)
Paderborn (DEA47) Nordrhein-Westfalen (DEA)

SELECTED INDICATORS REPORT
152
Figure 4: Mortality due to respiratory diseases in Germany by NUTS3 (NRW) for the period 1999-2008
40
50
60
70
80
90
100
110
120
1999-2001 2000-2002 2001-2003 2002-2004 2003-2005 2004-2006 2005-2007 2006-2008
num
ber
of d
eath
s /
1000
00 p
opul
atio
n
Mortality due to respiratory diseases by NUTS3 in region Arnsberg, North Rhine-Westphalia, Germany
Bochum (DEA51) Dortmund (DEA52) Hagen (DEA53)Hamm (DEA54) Herne (DEA55) Ennepe-Ruhr-Kreis (DEA56)Hochsauerlandkreis (DEA57) Märkischer Kreis (DEA58) Olpe (DEA59)Siegen-Wittgenstein (DEA5A) Soest (DEA5B) Unna (DEA5C)Nordrhein-Westfalen (DEA)
Assessment: Mortality rate due to respiratory diseases is on a downward trend in Europe. It has decreased by 23% from 62.9 per 100,000 in 1999 to 48.5 per 100,000 in 2008 9. This pattern was observed in many countries with higher rates such as: Kyrgyzstan, Ireland, Kazakhstan, United Kingdom and Tajikistan. Even so, rates in these countries remain considerably higher than the rest if Europe. According to the World Health Statistics by WHO, Kazakhstan has the lowest total expenditure on health in Europe and Tajikistan has the lowest per capita expenditure on health in Europe 10. Ireland has also been identified as one of the countries with the highest rates of excess winter mortality 11. Although this could be due to other factors such as hypothermia and poor housing conditions, extreme weather conditions has been observed to exacerbate respiratory illnesses such as asthma and pneumonia thereby increasing mortality. In 2008, the highest mortality rate due to respiratory diseases was seen in Republic of Moldova with 74.4 per 100,000, and the lowest in Finland with 22.3 per 100,000 population. Mortality due to respiratory diseases has been strongly linked with air pollution with fine particles, including sulphates 12
at concentrations up to 74μg/m3 13. A study carried out in the UK found that a 10μg/m3 increase in atmospheric sulphur dioxide was associated with a 102% risk of infant deaths 14. In 1999, a directive was released to limit the values of sulphur dioxide, nitrogen dioxide, particulate matter and lead in ambient air 15. Subsequently, a decrease of 9.0 per 100,000 was observed in the mortality rate from 1999 (62.9) to 2001 (53.9). Although this decrease could be due to other factors, the implementation of the directive may have been a major contributing factor. The mortality rate due to respiratory diseases has slightly increased in the last decade in Germany. In 1999/2001 the national average was approximately 61.5 deaths per 100,000 population, in 2006/08 it was 69.7. Contrary to the national trend, the mortality rate in Hamburg and Saarland decreased. In 2006/08 the highest mortality rates due to respiratory diseases were found in Bremen (91.2), followed by Schleswig Holstein (81.2), North Rhine-Westphalia (80.0) and Rhineland-Palatinate (79.7). The lowest rates were observed in Baden-Württemberg (55.7), Hamburg (57.1) and Saxony (58.1). The mortality rates vary widely in several regions of North Rhine-Westphalia (NUTS3). Such variation is noted in the Ruhr area wherethe amount of deaths due to respiratory diseases is very high. Nearly all the regions which are located either in or closely to the Ruhr area, show rates above the average value of North Rhine-Westphalia. The highest rates in 2006/08 can be found in three cities in the Ruhr area: Essen (113.3), Gelsenkirchen (109.4) and Herne (105.0). The rural areas, mainly situated in “Regierungsbezirk” Cologne, show rates that are below the average of North Rhine-Westphalia. The lowest rates in 2006/08 were found in the rural areas of Rhein-Sieg-Kreis (55.6), Paderborn (58.7) and Rhein-Erft-Kreis (60.2). At NUTS3 level the slightly increasing trend of North Rhine-Westphalia becomes more evident in most of the regions. Especially in the Ruhr area the mortality rates are increasing in almost all places. For

SELECTED INDICATORS REPORT
153
example, in Essen the mortality rate increased from 87.1 in 1999/2001 to 113.3 in 2006/08. But similar trends can also be found in rural areas such as Rhein-Kreis Neuss and Minden-Lübbecke. In Rhein-Kreis Neuss it increased obviously from 51.5 in 1999/2001 to 74.0 in 2006/08. In Minden-Lübbecke the increase was comparable, with 63.0 in 1999/2001 and 84.0 in 2006/08. Nevertheless, there are some exceptions. Herne, being situated in Ruhr area, shows a decreasing trend since 2002/04 from 121.8 deaths due to respiratory diseases per 100,000 population to 105.0 in 2006/08. Similar decreasing trends can be found for the same years in Cologne and Bottrop. The mortality rate decreased in Cologne from 85.6 in 2002/04 to 69.0 in 2006/08 and in Bottrop from 96.4 to 81.1. Data underlying the indicator:
• Primary source: National/regional health statistics, mortality statistics (Destatis, IT.NRW) • Date last published: 2008 • Time period of analysis: 1999-2008 (LIGA.NRW), 2001-2008 (LIGA.NRW), 2008 (IT.NRW) • Numerator definition: Annual number of deaths due to respiratory diseases • Source of numerator: National/regional statistics, mortality statistics (Destatis, IT.NRW) • Denominator definition: Total number of population • Source of denominator: National/regional statistics, national census • Geographic coverage: National • Timeliness: Annual data is online available • Accuracy and completeness of data set: Due to an unicausal analysis of mortality data
inaccuracies (mostly for older people) may arise • Disclosure control: none
References: 1. British Thoracic Society (2006). The burden of lung disease – A statistics report 2nd Edition.
London: British Thoracic Society. 2. National Institute of Environmental Health Sciences (2007). Air pollution and Respiratory
diseases. Available at http://www.niehs.nih.gov/health/impacts/respiratory.cfm. (accessed 24 June 2010).
3. US Environmental Protection Agency (2003). Technical Addendum: Methodologies for the benefit analysis of the clear skies act 2003. Available at http://www.epa.gov/air/clearskies/tech_addendum.pdf. (accessed 24 June 2010).
4. Stewart L, Saunders P and Kemm J (2008). Children’s Environment and Health Action Plan (CEHAP): Pilot Environmental Health Indicators Toolkit. Consultation Document
5. United Nations Regional Information Centre for Western Europe (2010). Twenty years of environmental and health in Europe: trends and gaps. Available at http://www.unric.org/en/latest-news/26121. (accessed 7 July 2010).
6. Hawker JI, Olowokure B, Sufi F, et al, (2003). Social deprivation and hospital admission for respiratory infection: an ecological study. Respiratory Medicine 97 (11): 1219-1224.
7. Clinch JP and Healy JD (2000). Housing standards and excess winter mortality. J Epidemiol Community Health 2000; 54:719-720.
8. Directives 2008/50/EC of the European Parliament and of the Council of 21 May 2008 on ambient air quality and cleaner air for Europe. Official Journal of the European Union, Vol. 51, 11 June 2008. Available at http://eur-lex.europa.eu/JOHtml.do?uri=OJ:L:2008:152:SOM:EN:HTML. (accessed 25 June 2010).
9. European mortality database, 2009. Standardised death rate, diseases of the respiratory system per 100,000. Available at http://data.euro.who.int/hfamdb/. (accessed on 25 June 2010).
10. World Health Organisation. World Health Statistics 2008, Part 2: Global health indicators. Available at http://www.who.int/whosis/whostat/EN_WHS08_Table4_HSR.pdf. (accessed on 7 July 2010).
11. Healy JD. (2002). Excess winter mortality in Europe: a cross country analysis identifying key risk factors. J Epidemiol Community Health 2003; 57:784-789.
12. Dockery DW, Pope CA, Xu X, Spengler JD et al, 1993. An association between air pollution and mortality in six US cities. NEJM 329 (24): 1753 – 1759
13. Air quality guidelines. Global update 2005. Particulate matter, ozone, nitrogen dioxide and sulfur dioxide. Available at

SELECTED INDICATORS REPORT
154
http://www.euro.who.int/__data/assets/pdf_file/0005/78638/E90038.pdf. (accessed 28 July 2010).
14. Hajat S, Armstrong B, Wilkinson P et al, (2007). Outdoor air pollution and infant mortality: analysis of daily time-series data in Ten English Cities. J Epidemiol Community Health 61:719- 22.
15. Council Directive 1999/30/EC of 22 April 1999 relating to limit values for sulphur dioxide, nitrogen and oxides of nitrogen, particulate matter and lead in ambient air. Available at http://eur-lex.europa.eu/LexUriServ/LexUriServ.do?uri=CELEX:31999L0030:EN:NOT. (accessed 24 June 2010).
16. Bundeszentrale für gesundheitliche Aufklärung (BzgA) (2010): Rauchfrei. http://www.rauchfrei-info.de (accessed 8 September 2010) 17. ginko Stiftung für Prävention -Landeskoordinierungsstelle Suchtvorbeugung NRW (LSN) (2010): Leben ohne Qualm. http://www.loq.de (accessed 8 September 2010) 18. Ministerium für Arbeit, Gesundheit und Soziales Nordrhein-Westfalen (2008):
Nichtraucherschutz in Nordrhein-Westfalen. http://gesundheit.nrw.de/gesundheit/content/e5231/e5256/e2077/e2092/object2094/Broschuere
Nichtraucherschutz_vom_Gesundheitsministerium_NRW_4788.pdf (accessed 8 September 2010)
19. Landesinstitut für Gesundheit und Arbeit NRW (LIGA.NRW) (2009): Das Präventionskonzept Nordrhein-Westfalen - eine Investition in Lebensqualität. Düsseldorf. http://www.praeventionskonzept.nrw.de/fileadmin/Dokumente/0_Allgmein/ handlungsgrundlage_p raeventionskonzept1109.pdf (accessed 2 September 2010)
20. Bundesministerium der Justiz (2002): Tabakprodukt-Verordnung. Berlin 21. Deutscher Bundestag (2010): Entwurf eines Zweiten Gesetzes zur Änderung des
Vorläufigen Tabakgesetzes. Gesetzentwurf der Bundesregierung. Drucksache 17/719. Berlin
22. Ministerium für Arbeit, Gesundheit und Soziales Nordrhein-Westfalen (2007): Gesetz zur Verbesserung des Nichtraucherschutzes in Nordrhein-Westfalen. Düsseldorf.
23. Deutsche Atemwegsliga e.V. (2010) http://www.atemwegsliga.de (accessed 2 September 2010)
24. Deutsche Lungenstiftung e.V. (2010) http://lungenstiftung.de (accessed 2 September 2010)
25. Deutsche Gesellschaft für Pneumologie und Beatmungsmedizin e.V. (2010) http://www.pneumologie.de (accessed 2 September 2010)
26. Patientenliga Atemwegserkrankungen e.V. (2010) http://www.patientenliga- atemwegserkrankungen.de (accesssed 2 September 2010) Further Information: Loddenkemper R. Gibson G. and Sibille Y. (2003). The burden of lung disease in Europe: why a European White Book on lung disease? Eur Respir J 2003; 22:869-69. Available at http://www.ersj.org.uk/cgi/content/full/22/6/869. (accessed 30 July 2010). Loddenkemper R. (2008). The burden of lung disease in Europe. European Respiratory Disease 2006. Available at http://www.touchrespiratory.com/articles/burden-lung-disease-europe?page=0%2C0. (accessed 30 July 2010). National Institute of Environmental Health Sciences http://www.niehs.nih.gov/health/impacts/respiratory.cfm. (accessed 30 July 2010). Cho B., Choi J. and Yum Y. (2000). Air pollution and hospital admissions for respiratory disease in certain areas of Korea. J Occup Health 42:185-191. Available at http://joh.med.uoeh-u.ac.jp/pdf/E42/E42_4_04.pdf. (accessed 30 July 2010). National resources defense council http://www.nrdc.org/health/effects/fasthma.asp. (accessed 30 July 2010). Author: Odile Mekel, Linda Tacke, Florian Fischer (LIGA.NRW), Germany Date of production: 6 october 2010

SELECTED INDICATORS REPORT
155
Hungary
Name of indicator: Mortality due to respiratory diseases Definition: Mortality rate per 100,000 population for which the primary cause is defined as respiratory disease (ICD-10 codes J00 - J99). Key Message: Mortality due to respiratory diseases showed an increasing trend in Hungary in the last decade. However, in the last few years it appears to be roughly constant. There is a considerable difference between the regions and counties. Mortality rate is the highest in county Nógrád and Borsod-Abaúj-Zemplén (110 and 86 deaths / 100,000 population as the average of the last 3 years of the analysis). It is the lowest in county Győr-Moson-Sopron and Hajdú-Bihar (40 and 45). Rationale: More than 6% of the global burden of disease is attributable to respiratory infections and it causes more morbidity and mortality than all cancers. Respiratory illness accounts for 13% of all hospital admissions1. Respiratory diseases may be triggered/exacerbated by risks factors such as air pollution, overcrowding and poor (unfit) housing conditions. Research has shown that long-term exposure to air pollutants increases the risk of respiratory illnesses such as allergies, asthma, chronic obstructive pulmonary disease (COPD) and lung cancer particularly in children and the elderly 2. A projection made in the United States in 2003 predicted that by the enactment of the ‘Clear Skies Act 2003’, which aims to reduce the concentrations of particulate matter (PM) and ozone 3, premature deaths due to long- and short-term exposures will be reduced by 2010 and a further decrease will be observed by 2020. Deaths from respiratory diseases of all types contribute to all-age and all-cause death rates as well as health inequalities. High prevalence of smoking (environmental tobacco smoke) and low uptake of influenza and pneumococcal vaccines are also contributing factors to mortality due to respiratory diseases. Some of the above factors have been strongly linked with deprivation. Increased morbidity is associated with an increase in socio-economic deprivation. In addition, poverty is associated with a greater than 20-fold increase in the relative burden of lung infections, which disproportionately affect the very young and very old 4. Studies carried out in European countries have found that children in low-income households are twice as likely to be exposed to environmental tobacco smoke (ETS) that their wealthier peers 5. Furthermore, an ecological study carried out in the United Kingdom showed that an increased admission rate due to respiratory illness was strongly linked to social inequalities 6. Poor housing conditions, including inadequate thermal efficiency and heating systems, poor ventilation and overcrowding are also major causal factors. Poor insulation contributes to high rates of excess winter mortality due to respiratory illness 7. Inadequate ventilation and overcrowding encourage the spread of respiratory diseases such as influenza and Tuberculosis, thereby increasing the burden of disease. Policy Relevance and Context: There are a number of EU policies on Ambient air quality which:
• Sets guidelines to ambient air quality assessment and management • Sets threshold values for the amount of some particles and chemicals in ambient air • Enforces reciprocal exchange of information and data from monitoring stations in participating
countries, and • Obligates member states to submit plans and programmes for air zones that exceed threshold.

SELECTED INDICATORS REPORT
156
A new legislation was adopted under the EC treaty in May 2008 on ambient air quality and cleaner air for Europe 8. The directive lays down measure aimed at the following:
• Establishing objectives for ambient air quality to reduce harmful effects on human health, • Assessing the ambient air quality in member states on the basis of common methods and criteria, • Obtaining information on air quality to help monitor long term trends and improvement, • Ensuring information is available to the public • Maintaining and improving air quality where necessary • Promoting cooperation between member states.
The WHO also provides guidelines on both indoor and outdoor air quality based on the latest scientific evidence. The Hungarian national policy on ambient air quality follows mostly the EU legislation (it includes regulations on additional pollutants as well). The key policy aspects are the following: compliance with air quality standards, control/reduction/abatement of emissions of pollutants at the source, compliance with international and national commitments, health risk reduction/prevention, provision of updated information to the public about the situation of air pollution, emergency response (e.g. smog alert). Several local measures are implemented to prevent the population from excessive exposure to air pollutants (e.g. smog alert in the capital city). Building construction regulations cover the indoor air quality requirements. Education of the public and information about health risks of indoor air pollutants also plays an important role in prevention of respiratory diseases. Hungary implemented a strict regulation to prevent non-smokers from second-hand tobacco smoke. Several local regulations ensure stricter restrictions (e.g. smoke-free settlements where smoking is prohibited in every public place; in the capital city smoking is prohibited in underpasses and bus/tram stations). Presentation of Data:
Figure 1: Mortality due to respiratory diseases in Figure 2: Mortality due to respiratory diseases in Hungary by NUTS2, 2008 Hungary by NUTS3, 2008

SELECTED INDICATORS REPORT
157
0 20 40 60 80
Közép-Magyarország (HU1)
Dunántúl (HU2)
Alföld és Észak (HU3)
number of deaths / 1000 live births
Mortality due to respiratory diseases in Hungary by NUTS1, 2006-2008
national value
0 10 20 30 40 50 60 70 80 90
Közép-Magyarország (HU10)
Közép-Dunántúl (HU21)
Nyugat-Dunántúl (HU22)
Dél-Dunántúl (HU23)
Észak-Magyarország (HU31)
Észak-Alföld (HU32)
Dél-Alföld (HU33)
number of deaths / 100000 population
Mortality due to respiratory diseases in Hungary by regions (NUTS2), 2006-2008
national value
Figure 3: Mortality due to respiratory diseases in Figure 4: Mortality due to respiratory diseases in Hungary by NUTS1, 2006-2008 Hungary by NUTS2, 2006-2008
0 10 20 30 40 50 60 70 80 90 100 110
Budapest (HU101)Pest (HU102)
Fejér (HU211)Komárom-Esztergom (HU212)
Veszprém (HU213)Győr-Moson-Sopron (HU221)
Vas (HU222)Zala (HU223)
Baranya (HU231)Somogy (HU232)
Tolna (HU233)Borsod-Abaúj-Zemplén (HU311)
Heves (HU312)Nógrád (HU313)
Hajdú-Bihar (HU321)Jász-Nagykun-Szolnok (HU322)
Szabolcs-Szatmár-Bereg (HU323)Bács-Kiskun (HU331)
Békés (HU332)Csongrád (HU333)
number of deaths / 100000 population
Mortality due to respiratory diseases in Hungary by counties (NUTS3), 2006-2008
national value
30
35
40
45
50
55
60
65
70
75
1999-2001 2000-2002 2001-2003 2002-2004 2003-2005 2004-2006 2005-2007 2006-2008
num
ber
of d
eath
s /
1000
00 p
opul
atio
n
Mortality due to respiratory diseases by NUTS1, Hungary
Közép-Magyarország (HU1)
Dunántúl (HU2)
Alföld és Észak (HU3)
national value
Figure 5: Mortality due to respiratory diseases in Figure 6: Mortality due to respiratory diseases in Hungary by NUTS3, 2006-2008 Hungary by NUTS1 for the period 1999-2008
0
10
20
30
40
50
60
70
80
90
1999-2001 2000-2002 2001-2003 2002-2004 2003-2005 2004-2006 2005-2007 2006-2008
num
ber
of d
eath
s /
1000
00 p
opul
atio
n
Mortality due to respiratory diseases by regions (NUTS2), Hungary
Közép-Magyarország (HU10)Közép-Dunántúl (HU21)Nyugat-Dunántúl (HU22)Dél-Dunántúl (HU23)Észak-Magyarország (HU31)Észak-Alföld (HU32)Dél-Alföld (HU33)national value
20
30
40
50
60
70
80
90
100
110
1999-2001 2000-2002 2001-2003 2002-2004 2003-2005 2004-2006 2005-2007 2006-2008
num
ber
of d
eath
s /
1000
00 p
opul
atio
n
Mortality due to respiratory diseases by counties (NUTS3) in region Közép-Magyarország, Hungary
Budapest (HU101)
Pest (HU102)
national value
Figure 7: Mortality due to respiratory diseases in Figure 8a: Mortality due to respiratory diseases in Hungary by NUTS2 for the period 1999-2008 Hungary by NUTS3 for the period 1999-2008

SELECTED INDICATORS REPORT
158
20
30
40
50
60
70
80
90
100
110
1999-2001 2000-2002 2001-2003 2002-2004 2003-2005 2004-2006 2005-2007 2006-2008
num
ber
of d
eath
s /
1000
00 p
opul
atio
n
Mortality due to respiratory diseases by counties (NUTS3) in region Közép-Dunántúl, Hungary
Fejér (HU211)
Komárom-Esztergom (HU212)
Veszprém (HU213)
national value
20
30
40
50
60
70
80
90
100
110
1999-2001 2000-2002 2001-2003 2002-2004 2003-2005 2004-2006 2005-2007 2006-2008
num
ber
of d
eath
s /
1000
00 p
opul
atio
n
Mortality due to respiratory diseases by counties (NUTS3) in region Nyugat-Dunántúl, Hungary
Győr-Moson-Sopron (HU221)
Vas (HU222)
Zala (HU223)
national value
20
30
40
50
60
70
80
90
100
110
1999-2001 2000-2002 2001-2003 2002-2004 2003-2005 2004-2006 2005-2007 2006-2008
num
ber
of d
eath
s /
1000
00 p
opul
atio
n
Mortality due to respiratory diseases by counties (NUTS3) in region Dél-Dunántúl, Hungary
Baranya (HU231)
Somogy (HU232)
Tolna (HU233)
national value
20
30
40
50
60
70
80
90
100
110
1999-2001 2000-2002 2001-2003 2002-2004 2003-2005 2004-2006 2005-2007 2006-2008
num
ber
of d
eath
s /
1000
00 p
opul
atio
n
Mortality due to respiratory diseases by counties (NUTS3) in region Észak-Magyarország, Hungary
Borsod-Abaúj-Zemplén (HU311)
Heves (HU312)
Nógrád (HU313)
national value
20
30
40
50
60
70
80
90
100
110
1999-2001 2000-2002 2001-2003 2002-2004 2003-2005 2004-2006 2005-2007 2006-2008
num
ber
of d
eath
s /
1000
00 p
opul
atio
n
Mortality due to respiratory diseases by counties (NUTS3) in region Észak-Alföld, Hungary
Hajdú-Bihar (HU321)
Jász-Nagykun-Szolnok (HU322)
Szabolcs-Szatmár-Bereg (HU323)
national value
20
30
40
50
60
70
80
90
100
110
1999-2001 2000-2002 2001-2003 2002-2004 2003-2005 2004-2006 2005-2007 2006-2008
num
ber
of d
eath
s /
1000
00 p
opul
atio
n
Mortality due to respiratory diseases by counties (NUTS3) in region Dél-Alföld, Hungary
Bács-Kiskun (HU331)Békés (HU332)Csongrád (HU333)national value
Source of data: Hungarian Central Statistical Office
Assessment: Mortality rate due to respiratory diseases is on a downward trend in Europe. It has decreased by 23% from 62.9 per 100,000 in 1999 to 48.5 per 100,000 in 2008 9. This pattern was observed in many countries with higher rates such as: Kyrgyzstan, Ireland, Kazakhstan, United Kingdom and Tajikistan. Even so, rates in these countries remain considerably higher than the rest if Europe. According to the World Health Statistics by WHO, Kazakhstan has the lowest total expenditure on health in Europe and Tajikistan has the lowest per capita expenditure on health in Europe 10. Ireland has also been identified as one of the countries with the highest rates of excess winter mortality 11. Although this could be due to other factors such as hypothermia and poor housing conditions, extreme weather conditions has been observed to exacerbate respiratory illnesses such as asthma and pneumonia thereby increasing mortality. In 2008, the highest mortality rate due to respiratory diseases was seen in Republic of Moldova with 74.4 per 100,000, and the lowest in Finland with 22.3 per 100,000 population. Mortality due to respiratory diseases has been strongly linked with air pollution with fine particles, including sulphates 12 at concentrations up to 74μg/m3 13. A study carried out in the UK found that a 10μg/m3 increase in

SELECTED INDICATORS REPORT
159
atmospheric sulphur dioxide was associated with a 102% risk of infant deaths 14. In 1999, a directive was released to limit the values of sulphur dioxide, nitrogen dioxide, particulate matter and lead in ambient air 15. Subsequently, a decrease of 9.0 per 100,000 was observed in the mortality rate from 1999 (62.9) to 2001 (53.9). Although this decrease could be due to other factors, the implementation of the directive may have been a major contributing factor. Mortality due to respiratory diseases showed an increasing trend in Hungary in the last decade. From 51 deaths / 100,000 population (average of 1999–2001), it increased to more than 63 (average of 2006–2008). However, in the last few years the rate has remained approximately constant. It was above the national value in the eastern part of the country (HU3) and it was below in the central (HU1) and western parts (HU2). There is a difference between the regions (NUTS2): it is the highest in Northern Hungary (HU31), it is also above the national value in Southern Transdanubia (HU23) and in Southern Great Plain (HU33). In the other regions it was less than the national value in the last decade. Considerable differences have also been observed between the counties (NUTS3). It is the highest in Nógrád (110 deaths / 100,000 population in 2006–2008), in Borsod-Abaúj-Zemplén and in Bács-Kiskun. It is the lowest in Győr-Moson-Sopron (40 deaths / 100,000) and in Hajdú-Bihar. It shows a substantial increase in Szabolcs-Szatmár-Bereg, in Fejér and in Bács-Kiskun. Data underlying the indicator:
• Primary source: Hungarian Central Statistical Office • Date last published: 2009 • Time period of analysis: 1999–2008 • Numerator definition: Number of deaths for which the primary cause is defined as respiratory
disease (ICD-10 codes: J00–J99). • Source of numerator: Hungarian Central Statistical Office • Denominator definition: Total number of population • Source of denominator: Hungarian Central Statistical Office • Geographic coverage: Complete for the whole territory of Hungary • Timeliness: Annually. Not available online at sub-national levels. • Accuracy and completeness of data set: The data set is complete and accurate for the time period
of analysis. Mortality registration can be considered as reliable in Hungary. • Disclosure control:
References: 1. British Thoracic Society (2006). The burden of lung disease – A statistics report 2nd Edition.
London: British Thoracic Society. 2. National Institute of Environmental Health Sciences (2007). Air pollution and Respiratory diseases.
Available at http://www.niehs.nih.gov/health/impacts/respiratory.cfm. (accessed 24 June 2010) 3. US Environmental Protection Agency (2003). Technical Addendum: Methodologies for the benefit
analysis of the clear skies act 2003. Available at http://www.epa.gov/air/clearskies/tech_addendum.pdf. Accessed 24 June 2010.
4. Stewart L, Saunders P and Kemm J (2008). Children’s Environment and Health Action Plan (CEHAP): Pilot Environmental Health Indicators Toolkit Consultation Document
5. United Nations Regional Information Centre for Western Europe (2010). Twenty years of environmental and health in Europe: trends and gaps. Available at http://www.unric.org/en/latest-news/26121. (accessed 7 July 2010).
6. Hawker JI, Olowokure B, Sufi F, et al, (2003). Social deprivation and hospital admission for respiratory infection: an ecological study. Respiratory Medicine 97 (11): 1219-1224.
7. Clinch JP and Healy JD (2000). Housing standards and excess winter mortality. J Epidemiol Community Health 2000; 54:719-720.
8. Directives 2008/50/EC of the European Parliament and of the Council of 21 May 2008 on ambient air quality and cleaner air for Europe. Official Journal of the European Union, Vol. 51, 11 June 2008. Available at http://eur-lex.europa.eu/JOHtml.do?uri=OJ:L:2008:152:SOM:EN:HTML. (accessed 25 June 2010).
9. European mortality database, 2009. Standardised death rate, diseases of the respiratory system

SELECTED INDICATORS REPORT
160
per 100,000. Available at http://data.euro.who.int/hfamdb/. (accessed on 25 June 2010). 10. World Health Organization. World Health Statistics 2008, Part 2: Global health indicators. Available
at http://www.who.int/whosis/whostat/EN_WHS08_Table4_HSR.pdf. (accessed on 7 July 2010). 11. Healy JD. (2002). Excess winter mortality in Europe: a cross country analysis identifying key risk
factors. J Epidemiol Community Health 2003;57:784-789. 12. Dockery DW, Pope CA, Xu X, Spengler JD et al, 1993. An association between air pollution and
mortality in six US cities. NEJM 329 (24): 1753 – 1759 13. Air quality guidelines. Global update 2005. Particulate matter, ozone, nitrogen dioxide and sulfur
dioxide. Available at http://www.euro.who.int/__data/assets/pdf_file/0005/78638/E90038.pdf. (accessed 28 July 2010).
14. Hajat S, Armstrong B, Wilkinson P et al, (2007). Outdoor air pollution and infant mortality: analysis of daily time-series data in Ten English Cities. J Epidemiol Community Health 61:719- 22.
15. Council Directive 1999/30/EC of 22 April 1999 relating to limit values for sulphur dioxide, nitrogen and oxides of nitrogen, particulate matter and lead in ambient air. Available at http://eur-lex.europa.eu/LexUriServ/LexUriServ.do?uri=CELEX:31999L0030:EN:NOT. (accessed 24 June 2010).
Further Information: Loddenkemper R. Gibson G. and Sibille Y. (2003). The burden of lung disease in Europe: why a European White Book on lung disease? Eur Respir J 2003; 22:869-69. Available at http://www.ersj.org.uk/cgi/content/full/22/6/869 (accessed 30 July 2010). Loddenkemper R. (2008). The burden of lung disease in Europe. European Respiratory Disease 2006. Available at http://www.touchrespiratory.com/articles/burden-lung-disease-europe?page=0%2C0 (accessed 30 July 2010). National Institute of Environmental Health Sciences http://www.niehs.nih.gov/health/impacts/respiratory.cfm (accessed 30 July 2010). Cho B., Choi J. and Yum Y. (2000). Air pollution and hospital admissions for respiratory disease in certain areas of Korea. J Occup Health 42:185-191. Available at http://joh.med.uoeh-u.ac.jp/pdf/E42/E42_4_04.pdf (accessed 30 July 2010). National resources defense council http://www.nrdc.org/health/effects/fasthma.asp (accessed 30 July 2010). Author: Tibor Malnasi, Anna Paldy, National Institute of Environmental Health, Hungary Date of production: 14 September 2010

SELECTED INDICATORS REPORT
161
Lithuania
Name of indicator: Mortality due to respiratory diseases Definition: Mortality rate per 100,000 population for which the primary cause is defined as respiratory disease (ICD-10 codes J00 - J99). Key Message: During the past decade mortality due to respiratory diseases has increased in Lithuania from 43.3 in 1999 to 50.2 in 2008. It is the fifth most prevailing cause of death since 2004. The highest mortality due to respiratory diseases is observed in Utena county (over 80 for 2006-2008), and the lowest in Kaunas county (slightly more than 40 in 2006-2008). Rationale: More than 6% of the global burden of disease is attributable to respiratory infections and it causes more morbidity and mortality than all cancers. Respiratory illness accounts for 13% of all hospital admissions1. Respiratory diseases may be triggered/exacerbated by risks factors such as air pollution, overcrowding and poor (unfit) housing conditions. Research has shown that long-term exposure to air pollutants increases the risk of respiratory illnesses such as allergies, asthma, chronic obstructive pulmonary disease (COPD) and lung cancer particularly in children and the elderly 2. A projection made in the United States in 2003 predicted that by the enactment of the ‘Clear Skies Act 2003’, which aims to reduce the concentrations of particulate matter (PM) and ozone 3, premature deaths due to long- and short-term exposures will be reduced by 2010 and a further decrease will be observed by 2020. Deaths from respiratory diseases of all types contribute to all-age and all-cause death rates as well as health inequalities. High prevalence of smoking (environmental tobacco smoke) and low uptake of influenza and pneumococcal vaccines are also contributing factors to mortality due to respiratory diseases. Some of the above factors have been strongly linked with deprivation. Increased morbidity is associated with an increase in socio-economic deprivation. In addition, poverty is associated with a greater than 20-fold increase in the relative burden of lung infections, which disproportionately affect the very young and very old 4. Studies carried out in European countries have found that children in low-income households are twice as likely to be exposed to environmental tobacco smoke (ETS) that their wealthier peers 5. Furthermore, an ecological study carried out in the United Kingdom showed that an increased admission rate due to respiratory illness was strongly linked to social inequalities 6. Poor housing conditions, including inadequate thermal efficiency and heating systems, poor ventilation and overcrowding are also major causal factors. Poor insulation contributes to high rates of excess winter mortality due to respiratory illness 7. Inadequate ventilation and overcrowding encourage the spread of respiratory diseases such as influenza and Tuberculosis, thereby increasing the burden of disease. Policy Relevance and Context: There are a number of EU policies on Ambient air quality which:
• Sets guidelines to ambient air quality assessment and management • Sets threshold values for the amount of some particles and chemicals in ambient air • Enforces reciprocal exchange of information and data from monitoring stations in participating
countries, and • Obligates member states to submit plans and programmes for air zones that exceed threshold.
A new legislation was adopted under the EC treaty in May 2008 on ambient air quality and cleaner air for

SELECTED INDICATORS REPORT
162
Europe 8. The directive lays down measure aimed at the following: • Establishing objectives for ambient air quality to reduce harmful effects on human health, • Assessing the ambient air quality in member states on the basis of common methods and criteria, • Obtaining information on air quality to help monitor long term trends and improvement, • Ensuring information is available to the public • Maintaining and improving air quality where necessary • Promoting cooperation between member states.
The WHO also provides guidelines on both indoor and outdoor air quality based on the latest scientific evidence. Presentation of Data:
Figure 1a: Mortality due to respiratory diseases in Lithuania by NUTS3, 2006-2008
0 10 20 30 40 50 60 70 80 90
Alytaus apskritis (LT001)
Kauno apskritis (LT002)
Klaipedos apskritis (LT003)
Marijampoles apskritis (LT004)
Panevezio apskritis (LT005)
Siauliu apskritis (LT006)
Taurages apskritis (LT007)
Telsiu apskritis (LT008)
Utenos apskritis (LT009)
Vilniaus apskritis (LT00A)
number of deaths / 100000 population
Mortality due to respiratory diseases by in Lithuania by counties (NUTS3), 2006-2008
national value Figure 1b: Mortality due to respiratory diseases in Lithuania by NUTS3, 2006-2008

SELECTED INDICATORS REPORT
163
0
10
20
30
40
50
60
70
80
90
1999-2001 2000-2002 2001-2003 2002-2004 2003-2005 2004-2006 2005-2007 2006-2008
num
ber o
f dea
ths
/ 10
0000
pop
ulat
ion
Mortality due to respiratory diseases by counties (NUTS3) , Lithuania I.
Alytaus apskritis (LT001)
Kauno apskritis (LT002)
Klaipedos apskritis (LT003)
Marijampoles apskritis (LT004)
Panevezio apskritis (LT005)
national value
Figure 2a: Mortality due to respiratory diseases in Lithuania by NUTS3 for the period 1999-2008
0
10
20
30
40
50
60
70
80
90
1999-2001 2000-2002 2001-2003 2002-2004 2003-2005 2004-2006 2005-2007 2006-2008
num
ber o
f dea
ths
/ 10
0000
pop
ulat
ion
Mortality due to respiratory diseases by counties (NUTS3), Lithuania II.
Siauliu apskritis (LT006)
Taurages apskritis (LT007)
Telsiu apskritis (LT008)
Utenos apskritis (LT009)
Vilniaus apskritis (LT00A)
national value
Figure 2b: Mortality due to respiratory diseases in Lithuania by NUTS3 for the period 1999-2008 Assessment: Mortality rate due to respiratory diseases is on a downward trend in Europe. It has decreased by 23% from 62.9 per 100,000 in 1999 to 48.5 per 100,000 in 2008 9. This pattern was observed in many countries with higher rates such as: Kyrgyzstan, Ireland, Kazakhstan, United Kingdom and Tajikistan. Even so, rates in

SELECTED INDICATORS REPORT
164
these countries remain considerably higher than the rest if Europe. According to the World Health Statistics by WHO, Kazakhstan has the lowest total expenditure on health in Europe and Tajikistan has the lowest per capita expenditure on health in Europe 10. Ireland has also been identified as one of the countries with the highest rates of excess winter mortality 11. Although this could be due to other factors such as hypothermia and poor housing conditions, extreme weather conditions has been observed to exacerbate respiratory illnesses such as asthma and pneumonia thereby increasing mortality. In 2008, the highest mortality rate due to respiratory diseases was seen in Republic of Moldova with 74.4 per 100,000, and the lowest in Finland with 22.3 per 100,000 population. Mortality due to respiratory diseases has been strongly linked with air pollution with fine particles, including sulphates 12 at concentrations up to 74μg/m3 13. A study carried out in the UK found that a 10μg/m3 increase in atmospheric sulphur dioxide was associated with a 102% risk of infant deaths 14. In 1999, a directive was released to limit the values of sulphur dioxide, nitrogen dioxide, particulate matter and lead in ambient air 15. Subsequently, a decrease of 9.0 per 100,000 was observed in the mortality rate from 1999 (62.9) to 2001 (53.9). Although this decrease could be due to other factors, the implementation of the directive may have been a major contributing factor. Mortality due to respiratory diseases has increased during the past decade from 43.3 in 1999 to 50.2 in 2008 in Lithuania. It was the fourth most prevailing cause of death until 2004 when it was surpassed by digestive system diseases. The highest mortality due to respiratory diseases is observed in Utena county (over 80 for 2006-2008), and the lowest in Kaunas county (a bit more than 40 in 2006-2008). In Utena country mortality form respiratory diseases is increasing more sharply from 2002 than in other counties. Data underlying the indicator:
• Primary source: Department of Statistics • Date last published: 2008 • Time period of analysis: 1999-2008 • Numerator definition: Number of deaths due to respiratory diseases (ICD-10 codes J00-J99) for the
reporting period • Source of numerator: Department of Statistics • Denominator definition: Total number of population • Source of denominator: Department of Statistics • Geographic coverage: National (Lithuania) and 10 Lithuanian countries (apskritys, NUTS 3 level). • Timeliness: Annually since 2000 • Accuracy and completeness of data set: Data accurate and complete. • Disclosure control: only aggregated data can be used; personal data use restrictions.
References: 1. British Thoracic Society (2006). The burden of lung disease – A statistics report 2nd Edition.
London: British Thoracic Society. 2. National Institute of Environmental Health Sciences (2007). Air pollution and Respiratory
diseases. Available at http://www.niehs.nih.gov/health/impacts/respiratory.cfm. (accessed 24 June 2010) 3. US Environmental Protection Agency (2003). Technical Addendum: Methodologies for the
benefit analysis of the clear skies act 2003. Available at http://www.epa.gov/air/clearskies/tech_addendum.pdf. Accessed 24 June 2010.
4. Stewart L, Saunders P and Kemm J (2008). Children’s Environment and Health Action Plan (CEHAP): Pilot Environmental Health Indicators ToolkitConsultation Document
5. United Nations Regional Information Centre for Western Europe (2010). Twenty years of environmental and health in Europe: trends and gaps. Available at http://www.unric.org/en/latest-news/26121. (accessed 7 July 2010).
6. Hawker JI, Olowokure B, Sufi F, et al, (2003). Social deprivation and hospital admission for respiratory infection: an ecological study. Respiratory Medicine 97 (11): 1219-1224.
7. Clinch JP and Healy JD (2000). Housing standards and excess winter mortality. J Epidemiol Community Health 2000; 54:719-720.
8. Directives 2008/50/EC of the European Parliament and of the Council of 21 May 2008 on ambient air quality and cleaner air for Europe. Official Journal of the European Union, Vol. 51, 11 June

SELECTED INDICATORS REPORT
165
2008. Available at http://eur-lex.europa.eu/JOHtml.do?uri=OJ:L:2008:152:SOM:EN:HTML. (accessed 25 June 2010).
9. European mortality database, 2009. Standardised death rate, diseases of the respiratory system per 100,000. Available at http://data.euro.who.int/hfamdb/. (accessed on 25 June 2010).
10. World Health Organisation. World Health Statistics 2008, Part 2: Global health indicators. Available at http://www.who.int/whosis/whostat/EN_WHS08_Table4_HSR.pdf. (accessed on 7 July 2010).
11. Healy JD. (2002). Excess winter mortality in Europe: a cross country analysis identifying key risk factors. J Epidemiol Community Health 2003;57:784-789.
12. Dockery DW, Pope CA, Xu X, Spengler JD et al, 1993. An association between air pollution and mortality in six US cities. NEJM 329 (24): 1753 – 1759
13. Air quality guidelines. Global update 2005. Particulate matter, ozone, nitrogen dioxide and sulfur dioxide. Available at http://www.euro.who.int/__data/assets/pdf_file/0005/78638/E90038.pdf. (accessed 28 July 2010).
14. Hajat S, Armstrong B, Wilkinson P et al, (2007). Outdoor air pollution and infant mortality: analysis of daily time-series data in Ten English Cities. J Epidemiol Community Health 61:719- 22.
15. Council Directive 1999/30/EC of 22 April 1999 relating to limit values for sulphur dioxide, nitrogen and oxides of nitrogen, particulate matter and lead in ambient air. Available at http://eurlex.europa.eu/LexUriServ/LexUriServ.do?uri=CELEX:31999L0030:EN:NOT. (accessed 24 June 2010).
16. Regulation (EC) No 1888/2005 of the European Parliament and of the Council of 26 October 2005 amending Regulation (EC) No 1059/2003 on the establishment of a common classification of territorial units for statistics (NUTS) by reason of the accession of the Czech Republic, Estonia, Cyprus, Latvia, Lithuania, Hungary, Malta, Poland, Slovenia and Slovakia to the European Union. Official Journal L 309, 25/11/2005 P. 0001 - 0008 Further Information: Loddenkemper R. Gibson G. and Sibille Y. (2003). The burden of lung disease in Europe: why a European White Book on lung disease? Eur Respir J 2003; 22:869-69. Available at http://www.ersj.org.uk/cgi/content/full/22/6/869 (accessed 30 July 2010). Loddenkemper R. (2008). The burden of lung disease in Europe. European Respiratory Disease 2006. Available at http://www.touchrespiratory.com/articles/burden-lung-disease-europe?page=0%2C0 (accessed 30 July 2010). National Institute of Environmental Health Sciences http://www.niehs.nih.gov/health/impacts/respiratory.cfm (accessed 30 July 2010). Cho B., Choi J. and Yum Y. (2000). Air pollution and hospital admissions for respiratory disease in certain areas of Korea. J Occup Health 42:185-191. Available at http://joh.med.uoeh-u.ac.jp/pdf/E42/E42_4_04.pdf (accessed 30 July 2010). National resources defense council http://www.nrdc.org/health/effects/fasthma.asp (accessed 30 July 2010). Author: Viktorija Andreikėnaitė, Centre for Health Education and Disease Prevention, Lithuania Date of production: 15 October 2010

SELECTED INDICATORS REPORT
166
Romania
Name of indicator: Mortality due to respiratory diseases Definition: Mortality rate per 100,000 population for which the primary cause is defined as respiratory disease (ICD-10 codes J00 - J99). Key Message: Between 2005 and 2008 mortality due to respiratory disease for all ages has declined both in Europe and Romania. Mortality due to respiratory disease for all ages varies among districts, 19 out of 42 ditricts having rates higher than the national value; Arad is the county with the highest mortality rate while Salaj is the district with the lowest mortality rate. Rationale: More than 6% of the global burden of disease is attributable to respiratory infections and it causes more morbidity and mortality than all cancers. Respiratory illness accounts for 13% of all hospital admissions1. Respiratory diseases may be triggered/exacerbated by risks factors such as air pollution, overcrowding and poor (unfit) housing conditions. Research has shown that long-term exposure to air pollutants increases the risk of respiratory illnesses such as allergies, asthma, chronic obstructive pulmonary disease (COPD) and lung cancer particularly in children and the elderly 2. A projection made in the United States in 2003 predicted that by the enactment of the ‘Clear Skies Act 2003’, which aims to reduce the concentrations of particulate matter (PM) and ozone 3, premature deaths due to long- and short-term exposures will be reduced by 2010 and a further decrease will be observed by 2020. Deaths from respiratory diseases of all types contribute to all-age and all-cause death rates as well as health inequalities. High prevalence of smoking (environmental tobacco smoke) and low uptake of influenza and pneumococcal vaccines are also contributing factors to mortality due to respiratory diseases. Some of the above factors have been strongly linked with deprivation. Increased morbidity is associated with an increase in socio-economic deprivation. In addition, poverty is associated with a greater than 20-fold increase in the relative burden of lung infections, which disproportionately affect the very young and very old 4. Studies carried out in European countries have found that children in low-income households are twice as likely to be exposed to environmental tobacco smoke (ETS) that their wealthier peers 5. Furthermore, an ecological study carried out in the United Kingdom showed that an increased admission rate due to respiratory illness was strongly linked to social inequalities 6. Poor housing conditions, including inadequate thermal efficiency and heating systems, poor ventilation and overcrowding are also major causal factors. Poor insulation contributes to high rates of excess winter mortality due to respiratory illness 7. Inadequate ventilation and overcrowding encourage the spread of respiratory diseases such as influenza and Tuberculosis, thereby increasing the burden of disease. Policy Relevance and Context: There are a number of EU policies on Ambient air quality which:
• Sets guidelines to ambient air quality assessment and management • Sets threshold values for the amount of some particles and chemicals in ambient air • Enforces reciprocal exchange of information and data from monitoring stations in participating
countries, and • Obligates member states to submit plans and programmes for air zones that exceed threshold.
A new legislation was adopted under the EC treaty in May 2008 on ambient air quality and cleaner air for

SELECTED INDICATORS REPORT
167
Europe 8. The directive lays down measure aimed at the following: • Establishing objectives for ambient air quality to reduce harmful effects on human health, • Assessing the ambient air quality in member states on the basis of common methods and criteria, • Obtaining information on air quality to help monitor long term trends and improvement, • Ensuring information is available to the public • Maintaining and improving air quality where necessary • Promoting cooperation between member states.
The WHO also provides guidelines on both indoor and outdoor air quality based on the latest scientific evidence. In Romania, one of the objectives of the National Strategy of Public Health adopted in 2004 is to decrease mortality due to respiratory diseases in children 1-14 years age. The national health programs budgeted by the Ministry of Health include within the child health program, specific interventions for respiratory diseases (respiratory distress syndrome and asthma). Presentation of Data:
0 10 20 30 40 50 60 70 80 90 100
Bihor (RO111)
Bistrita-Nasaud (RO112)
Cluj (RO113)
Maramures (RO114)
Satu Mare (RO115)
Salaj (RO116)
Alba (RO121)
Brasov (RO122)
Covasna (RO123)
Harghita (RO124)
Mures (RO125)
Sibiu (RO126)
Bacau (RO211)
Botosani (RO212)
Iasi (RO213)
Neamt (RO214)
Suceava (RO215)
Vaslui (RO216)
Braila (RO221)
Buzau (RO222)
Constanta (RO223)
Galati (RO224)
Tulcea (RO225)
Vrancea (RO226)
Arges (RO311)
Calarasi (RO312)
Dambovita (RO313)
Giurgiu (RO314)
Ialomita (RO315)
Prahova (RO316)
Teleorman (RO317)
Bucuresti (RO321)
Ilfov (RO322)
Dolj (RO411)
Gorj (RO412)
Mehedinti (RO413)
Olt (RO414)
Valcea (RO415)
Arad (RO421)
Caras-Severin (RO422)
Hunedoara (RO423)
Timis (RO424)
number of deaths / 100000 population
Mortality due to respiratory diseases in Romania by counties (NUTS3), 2008
national value Figure 1: Mortality due to respiratory diseases in Romania by NUTS3, 2008
0
10
20
30
40
50
60
70
80
90
100
110
120
2005 2006 2007 2008
number of deaths /
Mortality due to respiratory diseases by counties (NUTS3) in region Nord - Vest, Romania
Bihor
Bistrit
- Nasaud
Cluj
Maramures
Satu Mare (RO115) Salaj (RO116) national
0
10
20
30
40
50
60
70
80
90
100
110
120
2005 2006 2007 2008
num
ber o
f dea
ths
/ 10
0000
pop
ulat
ion
Mortality due to respiratory diseases by counties (NUTS3) in region Centru, Romania
Alba (RO121) Brasov (RO122)
Covasna (RO123) Harghita (RO124)
Mures (RO125) Sibiu (RO126)
national value

SELECTED INDICATORS REPORT
168
0
10
20
30
40
50
60
70
80
90
100
110
120
2005 2006 2007 2008
num
ber o
f dea
ths
/ 10
0000
pop
ulat
ion
Mortality due to respiratory diseases by counties (NUTS3) in region Nord-Est, Romania
Bacau (RO211)
Botosani (RO212)
Iasi (RO213)
Neamt (RO214)
Suceava (RO215)
Vaslui (RO216)
national value
0
10
20
30
40
50
60
70
80
90
100
110
120
2005 2006 2007 2008
num
ber o
f dea
ths
/ 10
0000
pop
ulat
ion
Mortality due to respiratory diseases by counties (NUTS3) in region Sud-Est, Romania
Braila (RO221) Buzau (RO222)
Constanta (RO223) Galati (RO224)
Tulcea (RO225) Vrancea (RO226)
national value
0
10
20
30
40
50
60
70
80
90
100
110
120
2005 2006 2007 2008
num
ber o
f dea
ths
/ 10
0000
pop
ulat
ion
Mortality due to respiratory diseases by counties NUTS3 of region Sud-Muntenia, Romania
Arges (RO311) Calarasi (RO312)
Dambovita (RO313) Giurgiu (RO314)
Ialomita (RO315) Prahova (RO316)
Teleorman (RO317) national value
0
10
20
30
40
50
60
70
80
90
100
110
120
2005 2006 2007 2008
num
ber o
f dea
ths
/ 10
0000
pop
ulat
ion
Mortality due to respiratory diseases in the region Bucuresti-Ilfov
Bucuresti (RO321)
Ilfov (RO322)
national value
0
10
20
30
40
50
60
70
80
90
100
110
120
2005 2006 2007 2008
num
ber o
f dea
ths
/ 10
0000
pop
ulat
ion
Mortality due to respiratory diseases by counties (NUTS3) in region Sud-Vest Oltenia, Romania
Dolj (RO411)
Gorj (RO412)
Mehedinti (RO413)
Olt (RO414)
Valcea (RO415)
national value
0
10
20
30
40
50
60
70
80
90
100
110
120
2005 2006 2007 2008
num
ber o
f dea
ths
/ 10
0000
pop
ulat
ion
Mortality due to respiratory diseases by counties (NUTS3) in region Vest, Romania
Arad (RO421)
Caras-Severin (RO422)
Hunedoara (RO423)
Timis (RO424)
national value
Figure 2: Mortality due to respiratory diseases in Romania by NUTS3 in Romania for the period 2005-2008 Source of data: Ministry of Health (Health Yearbook), Romania Assessment: Mortality rate due to respiratory diseases is on a downward trend in Europe. It has decreased by 23% from 62.9 per 100,000 in 1999 to 48.5 per 100,000 in 2008 9. This pattern was observed in many countries with higher rates such as: Kyrgyzstan, Ireland, Kazakhstan, United Kingdom and Tajikistan. Even so, rates in these countries remain considerably higher than the rest if Europe. According to the World Health Statistics by WHO, Kazakhstan has the lowest total expenditure on health in Europe and Tajikistan has the lowest per capita expenditure on health in Europe 10. Ireland has also been identified as one of the countries with the highest rates of excess winter mortality 11. Although this could be due to other factors such as hypothermia and poor housing conditions, extreme weather conditions has been observed to exacerbate respiratory illnesses such as asthma and pneumonia thereby increasing mortality. In 2008, the highest mortality rate due to respiratory diseases was seen in Republic of Moldova with 74.4 per 100,000, and the lowest in Finland with 22.3 per 100,000 population. Mortality due to respiratory diseases has been strongly linked with air pollution with fine particles, including sulphates 12 at

SELECTED INDICATORS REPORT
169
concentrations up to 74μg/m3 13. A study carried out in the UK found that a 10μg/m3 increase in atmospheric sulphur dioxide was associated with a 102% risk of infant deaths 14. In 1999, a directive was released to limit the values of sulphur dioxide, nitrogen dioxide, particulate matter and lead in ambient air 15. Subsequently, a decrease of 9.0 per 100,000 was observed in the mortality rate from 1999 (62.9) to 2001 (53.9). Although this decrease could be due to other factors, the implementation of the directive may have been a major contributing factor. In Romania, the distribution of annual mortality rate due to respiratory diseases by counties (NUTS3) in 2008 illustrates an unequal distribution, with 19 of 42 counties having a higher incidence than the national value (Figure 1). The evolution of the indicator during 2005-2008, comparing with the national values by and counties (NUTS3) is illustrated in Figure 4.
Data underlying the indicator:
• Primary source: Ministry of Health National Health Statistics Office • Date last published: 2009 • Time period of analysis: 2005-2008 • Numerator definition: Number of death due to respiratory diseases • Source of numerator: • Denominator definition: Total number of population • Source of denominator • Geographic coverage: National • Timeliness: Annually • Accuracy and completeness of data set • Disclosure control
References: 1. British Thoracic Society (2006). The burden of lung disease – A statistics report 2nd Edition.
London: British Thoracic Society. 2. National Institute of Environmental Health Sciences (2007). Air pollution and Respiratory
diseases. Available at http://www.niehs.nih.gov/health/impacts/respiratory.cfm. (accessed 24 June 2010) 3. US Environmental Protection Agency (2003). Technical Addendum: Methodologies for the
benefit analysis of the clear skies act 2003. Available at http://www.epa.gov/air/clearskies/tech_addendum.pdf. Accessed 24 June 2010.
4. Stewart L, Saunders P and Kemm J (2008). Children’s Environment and Health Action Plan (CEHAP): Pilot Environmental Health Indicators Toolkit Consultation Document
5. United Nations Regional Information Centre for Western Europe (2010). Twenty years of environmental and health in Europe: trends and gaps. Available at http://www.unric.org/en/latest-news/26121. (accessed 7 July 2010).
6. Hawker JI, Olowokure B, Sufi F, et al, (2003). Social deprivation and hospital admission for respiratory infection: an ecological study. Respiratory Medicine 97 (11): 1219-1224.
7. Clinch JP and Healy JD (2000). Housing standards and excess winter mortality. J Epidemiol Community Health 2000; 54:719-720.
8. Directives 2008/50/EC of the European Parliament and of the Council of 21 May 2008 on ambient air quality and cleaner air for Europe. Official Journal of the European Union, Vol. 51, 11 June 2008. Available at http://eur-lex.europa.eu/JOHtml.do?uri=OJ:L:2008:152:SOM:EN:HTML. (accessed 25 June 2010).
9. European mortality database, 2009. Standardised death rate, diseases of the respiratory system per 100,000. Available at http://data.euro.who.int/hfamdb/. (accessed on 25 June 2010).
10. World Health Organization. World Health Statistics 2008, Part 2: Global health indicators. Available at http://www.who.int/whosis/whostat/EN_WHS08_Table4_HSR.pdf. (accessed on 7 July 2010).
11. Healy JD. (2002). Excess winter mortality in Europe: a cross country analysis identifying key risk factors. J Epidemiol Community Health 2003;57:784-789.
12. Dockery DW, Pope CA, Xu X, Spengler JD et al, 1993. An association between air pollution and mortality in six US cities. NEJM 329 (24): 1753 – 1759
13. Air quality guidelines. Global update 2005. Particulate matter, ozone, nitrogen dioxide and sulfur dioxide. Available at http://www.euro.who.int/__data/assets/pdf_file/0005/78638/E90038.pdf. (accessed 28 July 2010).
14. Hajat S, Armstrong B, Wilkinson P et al, (2007). Outdoor air pollution and infant mortality:

SELECTED INDICATORS REPORT
170
analysis of daily time-series data in Ten English Cities. J Epidemiol Community Health 61:719- 22. 15. Council Directive 1999/30/EC of 22 April 1999 relating to limit values for sulphur dioxide,
nitrogen and oxides of nitrogen, particulate matter and lead in ambient air. Available at http://eur-lex.europa.eu/LexUriServ/LexUriServ.do?uri=CELEX:31999L0030:EN:NOT. (accessed 24 June 2010).
16. Ministry of Health of Romania, Health Statistic Centre –Yearly Health Statistics Book, 2009 Further Information: Loddenkemper R. Gibson G. and Sibille Y, 2003. The burden of lung disease in Europe: why a European White Book on lung disease? Eur Respir J 2003; 22:869-69. Available from http://www.ersj.org.uk/cgi/content/full/22/6/869 Loddenkemper R, 2008. The burden of lung disease in Europe. European Respiratory Disease 2006. Available from http://www.touchrespiratory.com/articles/burden-lung-disease-europe?page=0%2C0 National Institute of Environmental Health Sciences http://www.niehs.nih.gov/health/impacts/respiratory.cfm Cho B., Choi J., Yum Y., 2000. Air pollution and hospital admissions for respiratory disease in certain areas of Korea. J Occup Health 2000; 42:185-191. Available from http://joh.med.uoeh-u.ac.jp/pdf/E42/E42_4_04.pdf National resources defence council http://www.nrdc.org/health/effects/fasthma.asp Author: Alexandra Cucu, Claudia Dima, National Institute of Public Health, Romania Date of production: 23 July 2010

SELECTED INDICATORS REPORT
171
Slovenia
Name of indicator: Mortality due to respiratory diseases Definition: Mortality rate per 100,000 population for which the primary cause is defined as respiratory disease (ICD-10 codes J00 - J99). Key Message: One of the main causes of mortality due to respiratory diseases in the country is chronic obstructive pulmonary disease (COPD). The highest mortality due to respiratory diseases is in Notranjsko-kraška and the lowest in Jugovzhodna Slovenija region (2006-2008). Mortality rate due to respiratory diseases is on a downward trend. It has decreased by 23% from 74/100 000 in 1999 to 57/100 000 in 2008.
Rationale: More than 6% of the global burden of disease is attributable to respiratory infections and it causes more morbidity and mortality than all cancers. Respiratory illness accounts for 13% of all hospital admissions1. Respiratory diseases may be triggered/exacerbated by risks factors such as air pollution, overcrowding and poor (unfit) housing conditions. Research has shown that long-term exposure to air pollutants increases the risk of respiratory illnesses such as allergies, asthma, chronic obstructive pulmonary disease (COPD) and lung cancer particularly in children and the elderly 2. A projection made in the United States in 2003 predicted that by the enactment of the ‘Clear Skies Act 2003’, which aims to reduce the concentrations of particulate matter (PM) and ozone 3, premature deaths due to long- and short-term exposures will be reduced by 2010 and a further decrease will be observed by 2020. Deaths from respiratory diseases of all types contribute to all-age and all-cause death rates as well as health inequalities. High prevalence of smoking (environmental tobacco smoke) and low uptake of influenza and pneumococcal vaccines are also contributing factors to mortality due to respiratory diseases. Some of the above factors have been strongly linked with deprivation. Increased morbidity is associated with an increase in socio-economic deprivation. In addition, poverty is associated with a greater than 20-fold increase in the relative burden of lung infections, which disproportionately affect the very young and very old 4. Studies carried out in European countries have found that children in low-income households are twice as likely to be exposed to environmental tobacco smoke (ETS) that their wealthier peers 5. Furthermore, an ecological study carried out in the United Kingdom showed that an increased admission rate due to respiratory illness was strongly linked to social inequalities 6. Poor housing conditions, including inadequate thermal efficiency and heating systems, poor ventilation and overcrowding are also major causal factors. Poor insulation contributes to high rates of excess winter mortality due to respiratory illness 7. Inadequate ventilation and overcrowding encourage the spread of respiratory diseases such as influenza and Tuberculosis, thereby increasing the burden of disease. Policy Relevance and Context: There are a number of EU policies on Ambient air quality which:
• Sets guidelines to ambient air quality assessment and management • Sets threshold values for the amount of some particles and chemicals in ambient air • Enforces reciprocal exchange of information and data from monitoring stations in participating
countries, and • Obligates member states to submit plans and programmes for air zones that exceed threshold.

SELECTED INDICATORS REPORT
172
A new legislation was adopted under the EC treaty in May 2008 on ambient air quality and cleaner air for Europe 8. The directive lays down measure aimed at the following:
• Establishing objectives for ambient air quality to reduce harmful effects on human health, • Assessing the ambient air quality in member states on the basis of common methods and criteria, • Obtaining information on air quality to help monitor long term trends and improvement, • Ensuring information is available to the public • Maintaining and improving air quality where necessary • Promoting cooperation between member states.
The WHO also provides guidelines on both indoor and outdoor air quality based on the latest scientific evidence. Slovenia has adopted all the relevant EU Directives and transposed them into national legislation. The commitments from Parma declaration will be fulfilled and actions regularly followed. In 2009 the government approved an air pollution abatement plan which aims to reduce air pollution in towns where the levels exceed EU requirements. In the plan there is a demand that each town takes action to improve air quality. Given that COPD is one of the most important causes of death in the respiratory mortality group, some policies were adopted in recent years. The most important cause of COPD is smoking and air pollution. A ban on smoking in public indoor places was adopted in 2007. Presentation of Data:
Figure 1a: Mortality due to respiratory diseases in Slovenia by NUTS2, 2006-2008

SELECTED INDICATORS REPORT
173
50 52 54 56 58 60 62
Vzhodna Slovenija (SI01)
Zahodna Slovenija (SI02)
number of deaths / 100000 population
Mortality due to respiratory diseases in Sloveniaby regions (NUTS2), 2006-2008
national value
Figure 1b: Mortality due to respiratory diseases in Slovenia by NUTS2, 2006-2008
Figure 2a: Mortality due to respiratory diseases in Slovenia by NUTS3, 2006-2008

SELECTED INDICATORS REPORT
174
0 10 20 30 40 50 60 70 80 90 100
Pomurska (SI011)
Podravska (SI012)
Koroska (SI013)
Savinjska (SI014)
Zasavska (SI015)
Spodnjeposavska (SI016)
Jugovzhodna Slovenija (SI017)
Notranjsko-kraska (SI018)
Osrednjeslovenska (SI021)
Gorenjska (SI022)
Goriska (SI023)
Obalno-kraska (SI024)
number of deaths / 100000 population
Mortality due to respiratory diseases in Sloveniaby counties (NUTS3), 2006-2008
national value
Figure 2b: Mortality due to respiratory diseases in Slovenia by NUTS3, 2006-2008

SELECTED INDICATORS REPORT
175
40
50
60
70
80
90
100
1999-2001 2000-2002 2001-2003 2002-2004 2003-2005 2004-2006 2005-2007 2006-2008
num
ber o
f dea
ths
/ 10
0000
pop
ulat
ion
Mortality due to respiratory diseases by regions (NUTS2), Slovenia
Vzhodna Slovenija (SI01)
Zahodna Slovenija (SI02)
national value
Figure 3: Mortality due to respiratory diseases in Slovenia by NUTS2 for the period 1999-2008
40
50
60
70
80
90
100
1999-2001 2000-2002 2001-2003 2002-2004 2003-2005 2004-2006 2005-2007 2006-2008
num
ber o
f dea
ths
/ 10
0000
pop
ulat
ion
Mortality due to respiratory diseases by counties (NUTS3) in region Vzhodna Slovenija, Slovenia
Pomurska (SI011) Podravska (SI012) Koroska (SI013)
Savinjska (SI014) Zasavska (SI015) Spodnjeposavska (SI016)
Jugovzhodna Slovenija (SI017) Notranjsko-kraska (SI018) national value
Figure 4a: Mortality due to respiratory diseases in Slovenia by NUTS3 for the period 1999-2008

SELECTED INDICATORS REPORT
176
40
50
60
70
80
90
100
1999-2001 2000-2002 2001-2003 2002-2004 2003-2005 2004-2006 2005-2007 2006-2008
num
ber o
f dea
ths
/ 10
0000
pop
ulat
ion
Mortality due to respiratory diseases by counties (NUTS3) in region Zahodna Slovenija, Slovenia
Osrednjeslovenska (SI021)
Gorenjska (SI022)
Goriska (SI023)
Obalno-kraska (SI024)
national value
Figure 4b: Mortality due to respiratory diseases in Slovenia by NUTS3 for the period 1999-2008 Source of data: National Institute of Public Health; Statistical Office of the Republic of Slovenia Assessment: Mortality rate due to respiratory diseases is on a downward trend in Europe. It has decreased by 23% from 62.9 per 100,000 in 1999 to 48.5 per 100,000 in 2008 9. This pattern was observed in many countries with higher rates such as: Kyrgyzstan, Ireland, Kazakhstan, United Kingdom and Tajikistan. Even so, rates in these countries remain considerably higher than the rest if Europe. According to the World Health Statistics by WHO, Kazakhstan has the lowest total expenditure on health in Europe and Tajikistan has the lowest per capita expenditure on health in Europe 10. Ireland has also been identified as one of the countries with the highest rates of excess winter mortality 11. Although this could be due to other factors such as hypothermia and poor housing conditions, extreme weather conditions has been observed to exacerbate respiratory illnesses such as asthma and pneumonia thereby increasing mortality. In 2008, the highest mortality rate due to respiratory diseases was seen in Republic of Moldova with 74.4 per 100,000, and the lowest in Finland with 22.3 per 100,000 population. Mortality due to respiratory diseases has been strongly linked with air pollution with fine particles, including sulphates 12 at concentrations up to 74μg/m3 13. A study carried out in the UK found that a 10μg/m3 increase in atmospheric sulphur dioxide was associated with a 102% risk of infant deaths 14. In 1999, a directive was released to limit the values of sulphur dioxide, nitrogen dioxide, particulate matter and lead in ambient air 15. Subsequently, a decrease of 9.0 per 100,000 was observed in the mortality rate from 1999 (62.9) to 2001 (53.9). Although this decrease could be due to other factors, the implementation of the directive may have been a major contributing factor. One of the main causes of mortality due to respiratory diseases in country is chronic obstructive pulmonary disease (COPD). The highest mortality due to respiratory diseases is in Notranjsko-kraška and the lowest in Jugovzhodna Slovenija region (2006-2008). Mortality rate due to respiratory diseases is on a downward trend in Slovenia. It has decreased by 23% from 74/100 000 in 1999 to 57/100 000 in 2008.
Data underlying the indicator:
• Primary source: National Institute of Public Health, Slovenia

SELECTED INDICATORS REPORT
177
• Date last published: 2008 • Time period of analysis: 1999-2008 • Numerator definition: Number of deaths due to respiratory diseases for the reporting period (and
multiplied by 100000) • Source of numerator: National Institute of Public Health, Slovenia • Denominator definition: Total number of population • Source of denominator: Statistical Office of the Republic of Slovenia • Geographic coverage: NUTS1, NUTS2, NUTS3 • Timeliness: Annually • Accuracy and completeness of data set • Disclosure control: According to national legislation
References: 1. British Thoracic Society (2006). The burden of lung disease – A statistics report 2nd Edition.
London: British Thoracic Society. 2. National Institute of Environmental Health Sciences (2007). Air pollution and Respiratory
diseases. Available at http://www.niehs.nih.gov/health/impacts/respiratory.cfm. (accessed 24 June 2010) 3. US Environmental Protection Agency (2003). Technical Addendum: Methodologies for the
benefit analysis of the clear skies act 2003. Available at http://www.epa.gov/air/clearskies/tech_addendum.pdf. Accessed 24 June 2010.
4. Stewart L, Saunders P and Kemm J (2008). Children’s Environment and Health Action Plan (CEHAP): Pilot Environmental Health Indicators ToolkitConsultation Document
5. United Nations Regional Information Centre for Western Europe (2010). Twenty years of environmental and health in Europe: trends and gaps. Available at http://www.unric.org/en/latest-news/26121. (accessed 7 July 2010).
6. Hawker JI, Olowokure B, Sufi F, et al, (2003). Social deprivation and hospital admission for respiratory infection: an ecological study. Respiratory Medicine 97 (11): 1219-1224.
7. Clinch JP and Healy JD (2000). Housing standards and excess winter mortality. J Epidemiol Community Health 2000; 54:719-720.
8. Directives 2008/50/EC of the European Parliament and of the Council of 21 May 2008 on ambient air quality and cleaner air for Europe. Official Journal of the European Union, Vol. 51, 11 June 2008. Available at http://eur-lex.europa.eu/JOHtml.do?uri=OJ:L:2008:152:SOM:EN:HTML. (accessed 25 June 2010).
9. European mortality database, 2009. Standardised death rate, diseases of the respiratory system per 100,000. Available at http://data.euro.who.int/hfamdb/. (accessed on 25 June 2010).
10. World Health Organization. World Health Statistics 2008, Part 2: Global health indicators. Available at http://www.who.int/whosis/whostat/EN_WHS08_Table4_HSR.pdf. (accessed on 7 July 2010).
11. Healy JD. (2002). Excess winter mortality in Europe: a cross country analysis identifying key risk factors. J Epidemiol Community Health 2003;57:784-789.
12. Dockery DW, Pope CA, Xu X, Spengler JD et al, 1993. An association between air pollution and mortality in six US cities. NEJM 329 (24): 1753 – 1759
13. Air quality guidelines. Global update 2005. Particulate matter, ozone, nitrogen dioxide and sulfur dioxide. Available at http://www.euro.who.int/__data/assets/pdf_file/0005/78638/E90038.pdf. (accessed 28 July 2010).
14. Hajat S, Armstrong B, Wilkinson P et al, (2007). Outdoor air pollution and infant mortality: analysis of daily time-series data in Ten English Cities. J Epidemiol Community Health 61:719- 22.
15. Council Directive 1999/30/EC of 22 April 1999 relating to limit values for sulphur dioxide, nitrogen and oxides of nitrogen, particulate matter and lead in ambient air. Available at http://eur-lex.europa.eu/LexUriServ/LexUriServ.do?uri=CELEX:31999L0030:EN:NOT. (accessed 24 June 2010). Further Information: Loddenkemper R. Gibson G. and Sibille Y. (2003). The burden of lung disease in Europe: why a European White Book on lung disease? Eur Respir J 2003; 22:869-69. Available at http://www.ersj.org.uk/cgi/content/full/22/6/869 (accessed 30 July 2010). Loddenkemper R. (2008). The burden of lung disease in Europe. European Respiratory Disease 2006. Available at http://www.touchrespiratory.com/articles/burden-lung-disease-europe?page=0%2C0 (accessed 30 July 2010).

SELECTED INDICATORS REPORT
178
National Institute of Environmental Health Sciences http://www.niehs.nih.gov/health/impacts/respiratory.cfm (accessed 30 July 2010). Cho B., Choi J. and Yum Y. (2000). Air pollution and hospital admissions for respiratory disease in certain areas of Korea. J Occup Health 42:185-191. Available at http://joh.med.uoeh-u.ac.jp/pdf/E42/E42_4_04.pdf (accessed 30 July 2010). National resources defense council http://www.nrdc.org/health/effects/fasthma.asp (accessed 30 July 2010). Author: Peter Otorepec, Ana Hojs, Katarina Bitenc, Pia Vračko, Irena Jeraj, National Institute of Public Health, Slovenia Date of production: August 2010

SELECTED INDICATORS REPORT
179
Spain
Name of indicator: Mortality due to respiratory diseases Definition: Mortality rate per 100,000 population for which the primary cause is defined as respiratory disease (ICD-10 codes J00 - J99). Key Message: Respiratory diseases are the third cause of infant mortality in Spain. During the years analysed in this factsheet, mortality from respiratory diseases remained quite stable, except for a few regions where mortality decreased slightly. From 2006 to 2007, deaths from respiratory diseases increased by 11,4%, and were the main causing agent of the increase in overall mortality in Spain. Rationale: More than 6% of the global burden of disease is attributable to respiratory infections and it causes more morbidity and mortality than all cancers. Respiratory illness accounts for 13% of all hospital admissions1. Respiratory diseases may be triggered/exacerbated by risks factors such as air pollution, overcrowding and poor (unfit) housing conditions. Research has shown that long-term exposure to air pollutants increases the risk of respiratory illnesses such as allergies, asthma, chronic obstructive pulmonary disease (COPD) and lung cancer particularly in children and the elderly 2. A projection made in the United States in 2003 predicted that by the enactment of the ‘Clear Skies Act 2003’, which aims to reduce the concentrations of particulate matter (PM) and ozone 3, premature deaths due to long- and short-term exposures will be reduced by 2010 and a further decrease will be observed by 2020. Deaths from respiratory diseases of all types contribute to all-age and all-cause death rates as well as health inequalities. High prevalence of smoking (environmental tobacco smoke) and low uptake of influenza and pneumococcal vaccines are also contributing factors to mortality due to respiratory diseases. Some of the above factors have been strongly linked with deprivation. Increased morbidity is associated with an increase in socio-economic deprivation. In addition, poverty is associated with a greater than 20-fold increase in the relative burden of lung infections, which disproportionately affect the very young and very old 4. Studies carried out in European countries have found that children in low-income households are twice as likely to be exposed to environmental tobacco smoke (ETS) that their wealthier peers 5. Furthermore, an ecological study carried out in the United Kingdom showed that an increased admission rate due to respiratory illness was strongly linked to social inequalities 6. Poor housing conditions, including inadequate thermal efficiency and heating systems, poor ventilation and overcrowding are also major causal factors. Poor insulation contributes to high rates of excess winter mortality due to respiratory illness 7. Inadequate ventilation and overcrowding encourage the spread of respiratory diseases such as influenza and Tuberculosis, thereby increasing the burden of disease. Policy Relevance and Context: There are a number of EU policies on Ambient air quality which:
• Sets guidelines to ambient air quality assessment and management • Sets threshold values for the amount of some particles and chemicals in ambient air • Enforces reciprocal exchange of information and data from monitoring stations in participating countries, and • Obligates member states to submit plans and programmes for air zones that exceed threshold.
A new legislation was adopted under the EC treaty in May 2008 on ambient air quality and cleaner air for Europe 8. The directive lays down measure aimed at the following:
• Establishing objectives for ambient air quality to reduce harmful effects on human health, • Assessing the ambient air quality in member states on the basis of common methods and criteria, • Obtaining information on air quality to help monitor long term trends and improvement, • Ensuring information is available to the public

SELECTED INDICATORS REPORT
180
• Maintaining and improving air quality where necessary • Promoting cooperation between member states.
The WHO also provides guidelines on both indoor and outdoor air quality based on the latest scientific evidence. Presentation of Data:
0
20
40
60
80
100
120
140
160
1999 2000 2001 2002 2003 2004 2005 2006
num
ber
of d
eath
s /
1000
00 p
opul
atio
n
Mortality due to respiratory diseases by NUTS2 in the north-western part of Spain (Noroeste)
Galicia (ES11)
Principado de Asturias (ES12)
Cantabria (ES13)
0
20
40
60
80
100
120
140
160
1999 2000 2001 2002 2003 2004 2005 2006
num
ber
of d
eath
s /
1000
00 p
opul
atio
n
Mortality due to respiratory diseases by NUTS2 in the north-eastern part of Spain (Noreste)
País Vasco (ES21)Comunidad Foral de Navarra (ES22)La Rioja (ES23)Aragón (ES24)
Figure 1a: Mortality due to respiratory diseases in Figure 1b: Mortality due to respiratory diseases in Spain by NUTS2 for the period 1999-2008 Spain by NUTS2 for the period 1999-2008
0
20
40
60
80
100
120
140
160
1999 2000 2001 2002 2003 2004 2005 2006
num
ber
of d
eath
s /
1000
00 p
opul
atio
n
Mortality due to respiratory diseases by NUTS2 in Madrid and in the central part (Centro) of Spain
Comunidad de Madrid (ES30)
Castilla y León (ES41)
Castilla-La Mancha (ES42)
Extremadura (ES43)
0
20
40
60
80
100
120
140
160
1999 2000 2001 2002 2003 2004 2005 2006
num
ber
of d
eath
s /
1000
00 p
opul
atio
n
Mortality due to respiratory diseases by NUTS2 in the eastern part of Spain (Este)
Cataluña (ES51)
Comunidad Valenciana (ES52)
Illes Balears (ES53)
Figure 1c: Mortality due to respiratory diseases in Figure 1d: Mortality due to respiratory diseases in Spain by NUTS2 for the period 1999-2008 Spain by NUTS2 for the period 1999-2008
0
20
40
60
80
100
120
140
160
1999 2000 2001 2002 2003 2004 2005 2006
num
ber
of d
eath
s /
1000
00 p
opul
atio
n
Mortality due to respiratory diseases by NUTS2 in Canarias and in the southern part (Sur) of Spain
Andalucía (ES61)Región de Murcia (ES62)Ciudad Autónoma de Ceuta (ES63)Ciudad Autónoma de Melilla (ES64)Canarias (ES70)
Figure 1e: Mortality due to respiratory diseases in Spain by NUTS2 for the period 1999-2008.

SELECTED INDICATORS REPORT
181
0 20 40 60 80 100 120 140
Galicia (ES11)
Principado de Asturias (ES12)
Cantabria (ES13)
País Vasco (ES21)
Comunidad Foral de Navarra (ES22)
La Rioja (ES23)
Aragón (ES24)
Comunidad de Madrid (ES30)
Castilla y León (ES41)
Castilla-La Mancha (ES42)
Extremadura (ES43)
Cataluña (ES51)
Comunidad Valenciana (ES52)
Illes Balears (ES53)
Andalucía (ES61)
Región de Murcia (ES62)
Ciudad Autónoma de Ceuta (ES63)
Ciudad Autónoma de Melilla (ES64)
Canarias (ES70)
number of deaths / 100000 population
Mortality due to respiratory diseases in Spain by NUTS2, 2006
Figure 2: Mortality due to respiratory diseases in Spain by NUTS2, 2006
Assessment: Mortality rate due to respiratory diseases is on a downward trend in Europe. It has decreased by 23% from 62.9 per 100,000 in 1999 to 48.5 per 100,000 in 2008 9. This pattern was observed in many countries with higher rates such as: Kyrgyzstan, Ireland, Kazakhstan, United Kingdom and Tajikistan. Even so, rates in these countries remain considerably higher than the rest if Europe. According to the World Health Statistics by WHO, Kazakhstan has the lowest total expenditure on health in Europe and Tajikistan has the lowest per capita expenditure on health in Europe 10. Ireland has also been identified as one of the countries with the highest rates of excess winter mortality 11. Although this could be due to other factors such as hypothermia and poor housing conditions, extreme weather conditions has been observed to exacerbate respiratory illnesses such as asthma and pneumonia thereby increasing mortality. In 2008, the highest mortality rate due to respiratory diseases was seen in Republic of Moldova with 74.4 per 100,000, and the lowest in Finland with 22.3 per 100,000 population. Mortality due to respiratory diseases has been strongly linked with air pollution with fine particles, including sulphates 12 at concentrations up to 74μg/m3 13. A study carried out in the UK found that a 10μg/m3 increase in atmospheric sulphur dioxide was associated with a 102% risk of infant deaths 14. In 1999, a directive was released to limit the values of sulphur dioxide, nitrogen dioxide, particulate matter and lead in ambient air 15. Subsequently, a decrease of 9.0 per 100,000 was observed in the mortality rate from 1999 (62.9) to 2001 (53.9). Although this decrease could be due to other factors, the implementation of the directive may have been a major contributing factor. Respiratory diseases are the third cause of infant mortality in Spain. During the years analysed in this factsheet, mortality from respiratory diseases remained quite estable, except for a few regions where mortality decreased slightly. From 2006 to 2007, deaths from respiratory diseases increased by 11,4%, and were the main causing agent of the increase in overall mortality in Spain. In 2007, there were 44.029 deaths from respiratory diseases. However, it is important to note that mortality from respiratory diseases had decreased in 2006 with respect to 2005

SELECTED INDICATORS REPORT
182
when a high mortality from the influenza epidemic had occurred. When respiratory mortality in 2007 is compared with the average mortality between 2002 and 2006, the increment is about 4%. As demonstrated in the graphs, a decrease in mortality from respiratory disease occurred in all regions in the year 2000. This may be due to an increase in the population during the year caused by an increment in births, or low mortality from other causes. However, the number of absolute deaths from mortality from respiratory diseases also decreased sharply in 2000. The reasons for this decrease cannot be ascertained without an analysis of the risk factors and demographic changes during that year. There are some differences among mortality rates among regions. In particular, there was an overall slight decline in the central, eastern and southern parts of the country, whereas this slight decrease cannot be observed in the northern parts of the country (northeast and northwest). The reasons for this difference are unknown. Data underlying the indicator:
• Primary source: National Institute of Statistics • Date last published: 2009 • Time period of analysis: 1999-2008 • Numerator definition: Number of death due to respiratory diseases • Source of numerator: National Statistics • Denominator definition: Total population • Source of denominator: Census of the population • Geographic coverage: National • Timeliness: Annually • Accuracy and completeness of data set: Complete • Disclosure control
References: 1. British Thoracic Society (2006). The burden of lung disease – A statistics report 2nd Edition. London:
British Thoracic Society. 2. National Institute of Environmental Health Sciences (2007). Air pollution and Respiratory diseases.
Available at http://www.niehs.nih.gov/health/impacts/respiratory.cfm. (accessed 24 June 2010) 3. US Environmental Protection Agency (2003). Technical Addendum: Methodologies for the benefit
analysis of the clear skies act 2003. Available at http://www.epa.gov/air/clearskies/tech_addendum.pdf. Accessed 24 June 2010.
4. Stewart L, Saunders P and Kemm J (2008). Children’s Environment and Health Action Plan (CEHAP): Pilot Environmental Health Indicators Toolkit Consultation Document
5. United Nations Regional Information Centre for Western Europe (2010). Twenty years of environmental and health in Europe: trends and gaps. Available at http://www.unric.org/en/latest-news/26121. (accessed 7 July 2010).
6. Hawker JI, Olowokure B, Sufi F, et al, (2003). Social deprivation and hospital admission for respiratory infection: an ecological study. Respiratory Medicine 97 (11): 1219-1224.
7. Clinch JP and Healy JD (2000). Housing standards and excess winter mortality. J Epidemiol Community Health 2000; 54:719-720.
8. Directives 2008/50/EC of the European Parliament and of the Council of 21 May 2008 on ambient air quality and cleaner air for Europe. Official Journal of the European Union, Vol. 51, 11 June 2008. Available at http://eur-lex.europa.eu/JOHtml.do?uri=OJ:L:2008:152:SOM:EN:HTML. (accessed 25 June 2010).
9. European mortality database, 2009. Standardised death rate, diseases of the respiratory system per 100,000. Available at http://data.euro.who.int/hfamdb/. (accessed on 25 June 2010).
10. World Health Organization. World Health Statistics 2008, Part 2: Global health indicators. Available at http://www.who.int/whosis/whostat/EN_WHS08_Table4_HSR.pdf. (accessed on 7 July 2010).
11. Healy JD. (2002). Excess winter mortality in Europe: a cross country analysis identifying key risk factors. J Epidemiol Community Health 2003;57:784-789.
12. Dockery DW, Pope CA, Xu X, Spengler JD et al, 1993. An association between air pollution and mortality in six US cities. NEJM 329 (24): 1753 – 1759
13. Air quality guidelines. Global update 2005. Particulate matter, ozone, nitrogen dioxide and sulfur dioxide. Available at http://www.euro.who.int/__data/assets/pdf_file/0005/78638/E90038.pdf. (accessed 28 July 2010).
14. Hajat S, Armstrong B, Wilkinson P et al, (2007). Outdoor air pollution and infant mortality: analysis of daily time-series data in Ten English Cities. J Epidemiol Community Health 61:719- 22.

SELECTED INDICATORS REPORT
183
15. Council Directive 1999/30/EC of 22 April 1999 relating to limit values for sulphur dioxide, nitrogen and oxides of nitrogen, particulate matter and lead in ambient air. Available at http://eur-lex.europa.eu/LexUriServ/LexUriServ.do?uri=CELEX:31999L0030:EN:NOT. (accessed 24 June 2010). Further Information: Loddenkemper R. Gibson G. and Sibille Y, 2003. The burden of lung disease in Europe: why a European White Book on lung disease? Eur Respir J 2003; 22:869-69. Available from http://www.ersj.org.uk/cgi/content/full/22/6/869 Loddenkemper R, 2008. The burden of lung disease in Europe. European Respiratory Disease 2006. Available from http://www.touchrespiratory.com/articles/burden-lung-disease-europe?page=0%2C0 National Institute of Environmental Health Sciences http://www.niehs.nih.gov/health/impacts/respiratory.cfm Cho B., Choi J., Yum Y., 2000. Air pollution and hospital admissions for respiratory disease in certain areas of Korea. J Occup Health 2000; 42:185-191. Available from http://joh.med.uoeh-u.ac.jp/pdf/E42/E42_4_04.pdf National resources defence council http://www.nrdc.org/health/effects/fasthma.asp Author: Maria José Carroquino. ISCIII. Spain Date of production: September 2010

SELECTED INDICATORS REPORT
184
United Kingdom
Name of indicator: Mortality due to respiratory diseases Definition: Mortality rate per 100,000 population for which the primary cause is defined as respiratory disease (ICD-10 codes J00 - J99). Key Message: Between 1999 and 2008 mortality due to respiratory disease for all ages has declined in both Europe and the United Kingdom (UK). High mortality rates have been observed in deprived European countries and districts in the West Midlands. Rationale: More than 6% of the global burden of disease is attributable to respiratory infections and it causes more morbidity and mortality than all cancers. Respiratory illness accounts for 13% of all hospital admissions1. Respiratory diseases may be triggered/exacerbated by risks factors such as air pollution, overcrowding and poor (unfit) housing conditions. Research has shown that long-term exposure to air pollutants increases the risk of respiratory illnesses such as allergies, asthma, chronic obstructive pulmonary disease (COPD) and lung cancer particularly in children and the elderly 2. A projection made in the United States in 2003 predicted that by the enactment of the ‘Clear Skies Act 2003’, which aims to reduce the concentrations of particulate matter (PM) and ozone 3, premature deaths due to long- and short-term exposures will be reduced by 2010 and a further decrease will be observed by 2020. Deaths from respiratory diseases of all types contribute to all-age and all-cause death rates as well as health inequalities. High prevalence of smoking (environmental tobacco smoke) and low uptake of influenza and pneumococcal vaccines are also contributing factors to mortality due to respiratory diseases. Some of the above factors have been strongly linked with deprivation. Increased morbidity is associated with an increase in socio-economic deprivation. In addition, poverty is associated with a greater than 20-fold increase in the relative burden of lung infections, which disproportionately affect the very young and very old 4. Studies carried out in European countries have found that children in low-income households are twice as likely to be exposed to environmental tobacco smoke (ETS) that their wealthier peers 5. Furthermore, an ecological study carried out in the United Kingdom showed that an increased admission rate due to respiratory illness was strongly linked to social inequalities 6. Poor housing conditions, including inadequate thermal efficiency and heating systems, poor ventilation and overcrowding are also major causal factors. Poor insulation contributes to high rates of excess winter mortality due to respiratory illness 7. Inadequate ventilation and overcrowding encourage the spread of respiratory diseases such as influenza and Tuberculosis, thereby increasing the burden of disease. Policy Relevance and Context: There are a number of EU policies on Ambient air quality which:
• Sets guidelines to ambient air quality assessment and management • Sets threshold values for the amount of some particles and chemicals in ambient air • Enforces reciprocal exchange of information and data from monitoring stations in participating
countries, and • Obligates member states to submit plans and programmes for air zones that exceed threshold.
A new legislation was adopted under the EC treaty in May 2008 on ambient air quality and cleaner air for Europe 8. The directive lays down measure aimed at the following:
• Establishing objectives for ambient air quality to reduce harmful effects on human health,

SELECTED INDICATORS REPORT
185
• Assessing the ambient air quality in member states on the basis of common methods and criteria, • Obtaining information on air quality to help monitor long term trends and improvement, • Ensuring information is available to the public • Maintaining and improving air quality where necessary • Promoting cooperation between member states.
The WHO also provides guidelines on both indoor and outdoor air quality based on the latest scientific evidence. Several initiatives on air quality have been developed by the UK Government. These include ‘cleaner vehicles’ which promotes the reduction of vehicle emissions, ‘integrated pollution prevention and control (IPPC)’ which aims to achieve a high level of protection of the environment, and the ‘cleaner air act’ which controls domestic and industrial smoke emissions. There is also a planning policy statement on housing which aims to which aims at ensuring everyone has the opportunity of living in a decent home. Presentation of Data:
Figure 1: Mortality due to respiratory diseases in the United Kingdom by NUTS1 for the period 1999-2008

SELECTED INDICATORS REPORT
186
Figure 2: Mortality due to respiratory diseases in the United Kingdom by NUTS1, 2006-2008
Figure 3: Mortality due to respiratory diseases in the United Kingdom by NUTS3 (West Midlands) for the period 1999-2008

SELECTED INDICATORS REPORT
187
Figure 4: Mortality due to respiratory diseases in the United Kingdom by NUTS3 (West Midlands): 2006-2008 Assessment: Mortality rate due to respiratory diseases is on a downward trend in Europe. It has decreased by 23% from 62.9 per 100,000 in 1999 to 48.5 per 100,000 in 2008 9. This pattern was observed in many countries with higher rates such as: Kyrgyzstan, Ireland, Kazakhstan, United Kingdom and Tajikistan. Even so, rates in these countries remain considerably higher than the rest of Europe. According to the World Health Statistics by WHO, Kazakhstan has the lowest total expenditure on health in Europe and Tajikistan has the lowest per capita expenditure on health in Europe 10. Ireland has also been identified as one of the countries with the highest rates of excess winter mortality 11. Although this could be due to other factors such as hypothermia and poor housing conditions, extreme weather conditions has been observed to exacerbate respiratory illnesses such as asthma and pneumonia thereby increasing mortality. In 2008, the highest mortality rate due to respiratory diseases was seen in Republic of Moldova with 74.4 per 100,000, and the lowest in Finland with 22.3 per 100,000 population. Mortality due to respiratory diseases has been strongly linked with air pollution with fine particles, including sulphates 12 at concentrations up to 74μg/m3 13. A study carried out in the UK found that a 10μg/m3 increase in atmospheric sulphur dioxide was associated with a 102% risk of infant deaths 14. In 1999, a directive was released to limit the values of sulphur dioxide, nitrogen dioxide, particulate matter and lead in ambient air 15. Subsequently, a decrease of 9.0 per 100,000 was observed in the mortality rate from 1999 (62.9) to 2001 (53.9). Although this decrease could be due to other factors, the implementation of the directive may have been a major contributing factor. In the United Kingdom, there has been a marginal decrease in age standardised mortality due to respiratory diseases from 1999 to 2008. A similar trend has been observed in the regions; however, Figure 1 shows that the largest decrease in mortality rates was observed in the city of London. In general, the greatest reduction was seen from 1999 to 2001 and may have been due to a combination of air quality legislation/regulations implemented during the 1990s. Many more measures have been introduced since the 1990s but it may be the case that no sufficient time has elapsed to observe any improvements resulting from their implementation.

SELECTED INDICATORS REPORT
188
In 2006 – 2008, mortality rates in the UK displayed a north-south divide with the higher rates observed in the north of England and Scotland and the lower rates observed in the south (Figure 2). The temperatures in the north of England and Scotland are lower than that in the south and this could be one of the reasons for the north-south divide. Amongst other factors such as socio-economic status, hypothermia and extreme weather conditions have been seen to exacerbate respiratory illness. Figure 3 shows that similar to the trend observed nationally, that in the West Midlands has been considerably stable for the latter two thirds of the time period after an initial decline. The reasons for the observed trend regionally are likely to be similar to that for the national (trend) stated previously. Stoke-on-Trent consistently had the highest mortality rates from 1999 – 2008 followed by Dudley and Sandwell. Figure 4 demonstrates that for the 2008-2010 (rolling average) Stoke-on-Trent was the only area in the West Midlands with an age-standardised mortality rate exceeding 100 per 100,000 population. Herefordshire and Warwickshire had aged standardised rates which were much less than that for the West Midlands (72 per 100,000 population). According to the Office of National Statistics 16, age standardised death rate for respiratory diseases in England and Wales increases with deprivation. Stoke on Trent and Sandwell have been identified as the second and third most deprived districts in the West Midlands 17. Deprivation in these districts could be one of the reasons for the consistent high mortality rates. However, Holgate (2007) alluded to access to and expectations of the health services as a potential factor which impacts on mortality due to respiratory diseases. Data underlying the indicator:
• Primary source: Office of National Statistics (ONS) and West Midlands Public Health Observatory (WMPHO), Welsh Government Statistical Directorate, General Register Office for Scotland, Northern Ireland Statistics & Research Agency
• Date last published: 2010 • Time period of analysis: 1999 - 2008 • Numerator definition: Number of deaths due to respiratory diseases per year. ICD-10 code: J00 –
J99 • Source of numerator: WMPHO, Welsh Government Statistical Directorate, General Register Office
for Scotland, Northern Ireland Statistics & Research Agency • Denominator definition: Total Population • Source of denominator: ONS • Geographic coverage: United Kingdom • Timeliness: Annually • Accuracy and completeness of data set: Accurate • Disclosure control: Information is in the public domain but rates including fewer than 5 deaths are
withheld to protect the identity of the individuals References:
1. British Thoracic Society (2006). The burden of lung disease – A statistics report 2nd Edition. London: British Thoracic Society.
2. National Institute of Environmental Health Sciences (2007). Air pollution and Respiratory diseases. Available at http://www.niehs.nih.gov/health/impacts/respiratory.cfm. (accessed 24 June 2010)
3. US Environmental Protection Agency (2003). Technical Addendum: Methodologies for the benefit analysis of the clear skies act 2003. Available at http://www.epa.gov/air/clearskies/tech_addendum.pdf. Accessed 24 June 2010.
4. Stewart L, Saunders P and Kemm J (2008). Children’s Environment and Health Action Plan (CEHAP): Pilot Environmental Health Indicators Toolkit Consultation Document
5. United Nations Regional Information Centre for Western Europe (2010). Twenty years of environmental and health in Europe: trends and gaps. Available at http://www.unric.org/en/latest-news/26121. (accessed 7 July 2010).
6. Hawker JI, Olowokure B, Sufi F, et al, (2003). Social deprivation and hospital admission for respiratory infection: an ecological study. Respiratory Medicine 97 (11): 1219-1224.
7. Clinch JP and Healy JD (2000). Housing standards and excess winter mortality. J Epidemiol Community Health 2000; 54:719-720.
8. Directives 2008/50/EC of the European Parliament and of the Council of 21 May 2008 on

SELECTED INDICATORS REPORT
189
ambient air quality and cleaner air for Europe. Official Journal of the European Union, Vol. 51, 11 June 2008. Available at http://eur-lex.europa.eu/JOHtml.do?uri=OJ:L:2008:152:SOM:EN:HTML. (accessed 25 June 2010).
9. European mortality database, 2009. Standardised death rate, diseases of the respiratory system per 100,000. Available at http://data.euro.who.int/hfamdb/. (accessed on 25 June 2010).
10. World Health Organization. World Health Statistics 2008, Part 2: Global health indicators. Available at http://www.who.int/whosis/whostat/EN_WHS08_Table4_HSR.pdf. (accessed on 7 July 2010).
11. Healy JD. (2002). Excess winter mortality in Europe: a cross country analysis identifying key risk factors. J Epidemiol Community Health 2003;57:784-789.
12. Dockery DW, Pope CA, Xu X, Spengler JD et al, 1993. An association between air pollution and mortality in six US cities. NEJM 329 (24): 1753 – 1759
13. Air quality guidelines. Global update 2005. Particulate matter, ozone, nitrogen dioxide and sulfur dioxide. Available at http://www.euro.who.int/__data/assets/pdf_file/0005/78638/E90038.pdf. (accessed 28 July 2010).
14. Hajat S, Armstrong B, Wilkinson P et al, (2007). Outdoor air pollution and infant mortality: analysis of daily time-series data in Ten English Cities. J Epidemiol Community Health 61:719- 22.
15. Council Directive 1999/30/EC of 22 April 1999 relating to limit values for sulphur dioxide, nitrogen and oxides of nitrogen, particulate matter and lead in ambient air. Available at http://eur-lex.europa.eu/LexUriServ/LexUriServ.do?uri=CELEX:31999L0030:EN:NOT. (accessed 24 June 2010).
16. Romeri A, Baker A and Griffiths C for Office of National Statistics (2006). Mortality by deprivation and cause of death in England and Wales, 1999- 2003.
17. West Midlands Regional Observatory (2008). Indices of deprivation 2007: West Midlands’ performance. Available at: http://www.wmro.org/standardTemplate.aspx/Home/OurResearch/Populationandsociety/Indicesofdeprivation2007. (accessed on 12 December 2010). Further Information: Loddenkemper R. Gibson G. and Sibille Y. (2003). The burden of lung disease in Europe: why a European White Book on lung disease? Eur Respir J 2003; 22:869-69. Available at http://www.ersj.org.uk/cgi/content/full/22/6/869 (accessed 30 July 2010). Loddenkemper R. (2008). The burden of lung disease in Europe. European Respiratory Disease 2006. Available at http://www.touchrespiratory.com/articles/burden-lung-disease-europe?page=0%2C0 (accessed 30 July 2010). National Institute of Environmental Health Sciences http://www.niehs.nih.gov/health/impacts/respiratory.cfm (accessed 30 July 2010). Cho B., Choi J. and Yum Y. (2000). Air pollution and hospital admissions for respiratory disease in certain areas of Korea. J Occup Health 42:185-191. Available at http://joh.med.uoeh-u.ac.jp/pdf/E42/E42_4_04.pdf (accessed 30 July 2010). National resources defense council http://www.nrdc.org/health/effects/fasthma.asp (accessed 30 July 2010). UK Air Quality Archive http://www.airquality.co.uk/what_are_we_doing.php (accessed 8 September 2010) Author: Lorraine Stewart, Health Protection Agency, UK Date of production: 12 December 2011 Remarks: Charts for the West Midlands have calculated standardised rates which will be not be available when using the information in the system as the underlying figures are too small to permit public disclosure

SELECTED INDICATORS REPORT
190
2.5 Regional Assessment for Road Traffic Injury Rate
Germany Name of indicator: Injury rate due to road traffic accidents Definition: Injury rate due to road traffic accidents Key Message: The total number of road traffic injuries (RTIs) is decreasing constantly in Europe; with a decrease of about 17% in Germany during the last decade. This downward trend however seems to diminish. The occurrence of road traffic injuries is influenced by regional circumstances and by sex. Mainly young adults are involved into road traffic accidents. RTI are the leading cause for deaths in age group 5-29 years in the WHO European Region in 2004. Especially children are endangered and vulnerable due to these RTIs. Efforts to prevent road traffic injuries especially in children are therefore further needed. Rationale: Road traffic injuries are major public health problem with annually 2.4 million injuries in the WHO European Region. In the European Union about 43 000 people died in road accidents in 2006, which is more than 20 times the combined total of fatalities in rail and air transport for that year1. Road traffic injuries (RTIs) represent the leading cause of death among adolescents and young adults. Approximately four fifths of these deaths occur in the group aged 15-24 years. In the event of an accident the head-to-body ratio increases the risk of head injuries for children, and their height increases the likelihood that vital body parts are hit when collisions occur2. Furthermore, evidence shows that up to 33% of children involved in road traffic injuries develop post-traumatic stress disorder3, 4. The most vulnerable road users are pedestrians, cyclists and users of motorized two wheelers who constitute 39% of all deaths in road crashes. Some of 80% of those aged 0-24 years involved in road crashes are male3, 5. For young adults the lack of experience in driving is the leading cause of road traffic injuries, especially in males6. The social and (mental) health impact, as well as the economic impact of road traffic injuries is substantial. Supplementary to the individual health burden, the economic costs of road traffic injuries are immensely high: estimates suggest that they cost about 2-3% of the gross domestic product due to the service costs of treating injured and disabled people and the forgone production for a society3,
5. For the European Union RTIs alone amount of more than € 180 billion each year. This is twice of the EU budget allocated for all its activities3. The reduction of traffic-related deaths over the last two decades shows that these injuries and deaths are preventable. Unfortunately, this downward trend has stopped in those countries in the East of the WHO Region in the last 10 years. This shows the requirement for further actions in the field of public health in relation to RTIs5. Policy Relevance and Context: Strong political commitment and evidence-based policies are required for the adoption of a comprehensive approach to road safety. Indicators based on mortality from RTIs support policy evaluation with respect to the desired final outcome (reduction of RTI mortality) by providing benchmarks and setting a baseline against which progress can be monitored over time. In 2001, the European Commission released the Transport White Paper, which proposed the goal to save yearly 25.000 lives on European roads by 20107. In 2003, the European Commission adopted the Road Safety Action Programme8. According to its

SELECTED INDICATORS REPORT
191
announcements in the White Paper, the Action Programme pointed out main determinants of RTIs and identified six main areas to combat the problems:
• Encouraging road users to improve their behaviour • Using technical progress to make vehicles safer • Encouraging the improvement of road infrastructure • Safe commercial goods and passenger transport • Emergency services and care for road accident victims • Accident data collection, analysis and dissemination.
In 2004, the Fourth Ministerial Conference on Environment and Health adopted the CEHAPE (Children’s Environment and Health Action Plan for Europe). The prevention and reduction of health consequences from accidents and injuries are part of the CEHAPE RPG II. Overall morbidity and mortality should be addressed by “b.) advocating the strengthened implementation of road safety measure, including adequate speed limits as well as education for drivers and children, and enforcement of the corresponding legislation (…); c.) advocating, supporting and implementing children-friendly urban planning und development as well as sustainable transport and planning management, by promoting cycling, walking and public transport in order to provide safer and healthier mobility within the community”9. The Resolution EUR/RC55/R9 on the prevention of injuries in the WHO European Region (September 2005)12 and the European Council Recommendation on the prevention of injury and the promotion of safety (May 2007)10 provide a public health framework for action that includes the support of Member States in addressing the problem more comprehensively. These have placed injury and violence prevention firmly on the public health agenda. The implementation of the resolution and the Recommendation led to higher injury prevention activities in the EU and the WHO European Region4. In Germany policies addressing road construction (e.g. roundabouts) as well as intensified speed controls have been developed in the last decades. The federal republic is responsible for highways, country roads are the duty of the states and all the other streets are under the remit of the counties or cities. The establishment of children-friendly traffic systems (e.g. due to traffic calmed areas and development of safer child seats) has taken place. Current policies of preventing injuries due to road traffic accidents in Germany focus on traffic education, especially for children and young drivers. These policies are intended to educate the public both at school and extra-curricular14. In 2002 the Federal Association “More safety for kids” was founded to support prevention of accidents involving children in Germany, concerning the aims of CEHAPE RPG II. This consortium aims to cross-link and exchange of experiences. The public perception should be strengthened, for instance by the “Day of Safe Kids”. In 2006 the Federal Centre for Health Education (BZgA) in cooperation with the above mentioned Federal Association produced a guidebook for parents about accident prevention in childhood in general15. In September 2010 the German automobile association (ADAC) distributed safety vests to 750,000 first graders at school without charge to help to lower the risk of RTIs especially in the beginning of the dark season for these inexperienced and endangered road users. Another attempt of reducing RTIs is focussed on young driving beginners. Since April 2004 the possibility of purchasing the driving licence at the age of 17 years was given in Lower Saxony. Since 2008 this is possible in all German federal states. For this so called “Accompanied Driving at 17” the driving beginners have to be accompanied during their driving by an experienced driver until they attain majority at the age of 18. First results show that participants of this program violate less traffic regulations than non-participating driving beginners. This has resulted in a decline of that the total number of accidents for new drivers who have participated in the sheme16.

SELECTED INDICATORS REPORT
192
Presentation of Data:
Figure 1: Injury rate due to traffic accidents in Germany by NUTS1, 2006-2008
450
500
550
600
650
700
750
1999-2001 2000-2002 2001-2003 2002-2004 2003-2005 2004-2006 2005-2007 2006-2008
num
ber
of in
juri
es /
100
000
popu
latio
n
Baden-Württemberg (DE1) Bayern (DE2) Berlin (DE3)Brandenburg (DE4) Bremen (DE5) Hamburg (DE6)Hessen (DE7) Mecklenburg-Vorpommern (DE8) Niedersachsen (DE9)Nordrhein-Westfalen (DEA) Rheinland-Pfalz (DEB) Saarland (DEC)Sachsen (DED) Sachsen-Anhalt (DEE) Schleswig-Holstein (DEF)Thüringen (DEG) national value
Figure 2: Injury rate due to traffic accidents in Germany by NUTS1 for the period 1999 - 2008

SELECTED INDICATORS REPORT
193
Figure 3: Injury rate due to traffic accident by NUTS3 (NRW), 2006 - 2008
300
350
400
450
500
550
600
650
700
750
1999-2001 2000-2002 2001-2003 2002-2004 2003-2005 2004-2006 2005-2007 2006-2008
num
ber
of in
juri
es /
100
000
popu
latio
n
Injury rate due to traffic accidents by NUTS3 in region Düsseldorf, North Rhine-Westphalia, Germany
Düsseldorf (DEA11) Duisburg (DEA12) Essen (DEA13)Krefeld (DEA14) Mönchengladbach (DEA15) Mülheim an der Ruhr (DEA16)Oberhausen (DEA17) Remscheid (DEA18) Solingen (DEA19)Wuppertal (DEA1A) Kleve (DEA1B) Mettmann (DEA1C)Rhein-Kreis Neuss (DEA1D) Viersen (DEA1E) Wesel (DEA1F)Nordrhein-Westfalen (DEA)
300
350
400
450
500
550
600
650
700
750
1999-2001 2000-2002 2001-2003 2002-2004 2003-2005 2004-2006 2005-2007 2006-
num
ber
of in
juri
es /
100
000
popu
latio
n
Injury rate due to traffic accidents by NUTS3 in region Köln,North Rhine-Westphalia, Germany
Aachen (DEA21) Bonn (DEA22) Köln (DEA23)Leverkusen (DEA24) Aachen, Kreis (DEA25) Düren (DEA26)Rhein-Erft-Kreis (DEA27) Euskirchen (DEA28) Heinsberg (DEA29)Oberbergischer Kreis (DEA2A) Rheinisch-Bergischer Kreis (DEA2B) Rhein-Sieg-Kreis (DEA2CNordrhein-Westfalen (DEA)
300
350
400
450
500
550
600
650
700
750
1999-2001 2000-2002 2001-2003 2002-2004 2003-2005 2004-2006 2005-2007 2006-2008
num
ber
of in
juri
es /
100
000
popu
latio
n
Injury rate due to traffic accidents by NUTS3 in region Münster, North Rhine-Westphalia, Germany
Bottrop (DEA31) Gelsenkirchen (DEA32) Münster (DEA33)Borken (DEA34) Coesfeld (DEA35) Recklinghausen (DEA36)Steinfurt (DEA37) Warendorf (DEA38) Nordrhein-Westfalen (DEA)
300
350
400
450
500
550
600
650
700
750
1999-2001 2000-2002 2001-2003 2002-2004 2003-2005 2004-2006 2005-2007 2006-2
num
ber
of in
juri
es /
100
000
popu
latio
n
Injury rate due to traffic accidents by NUTS3 in region Detmold, North Rhine-Westphalia, Germany
Bielefeld (DEA41) Gütersloh (DEA42) Herford (DEA43)
Höxter (DEA44) Lippe (DEA45) Minden-Lübbecke (DEA46)
Paderborn (DEA47) Nordrhein-Westfalen (DEA)

SELECTED INDICATORS REPORT
194
300
350
400
450
500
550
600
650
700
750
1999-2001 2000-2002 2001-2003 2002-2004 2003-2005 2004-2006 2005-2007 2006-2008
num
ber
of in
juri
es /
100
000
popu
latio
n
Injury rate due to traffic accidents by NUTS3 in region Arnsberg, North Rhine-Westphalia, Germany
Bochum (DEA51) Dortmund (DEA52) Hagen (DEA53)Hamm (DEA54) Herne (DEA55) Ennepe-Ruhr-Kreis (DEA56)Hochsauerlandkreis (DEA57) Märkischer Kreis (DEA58) Olpe (DEA59)Siegen-Wittgenstein (DEA5A) Soest (DEA5B) Unna (DEA5C)Nordrhein-Westfalen (DEA)
Figure 4: Injury rate due to traffic accidents in Germany by NUTS3 (NRW) for the reporting period 1999 -2008
Assessment: Road traffic injuries are still a leading cause of death in the WHO European Region and therefore a major public health topic. By 2020 RTIs are predicted to be the third leading contributor to the global burden of disease and injuries because of an increased rate of RTIs in low- and middle income countries due to an increasing motorization in these countries6. Despite the significant growth in European road traffic volumes, it has been possible to reduce the total road death toll by 44% between 1991 and 2006. While this positive trend can be seen across all countries in the European Union, there are significant variations between the different regions. Geographically, the highest rates of road deaths are to be found in eastern and south-eastern Member States of the European Union. Given the still lower level of vehicle ownership in most of these countries, the reasons behind these high values, compared to western Europe, can probably be found in the quality of infrastructure supply and less-developed awareness of road safety issues in these countries1. Therefore rates of deaths due to road traffic accidents are twice as high in low- and middle-income countries as in high income countries. Children in deprived areas may have a four times higher risk for pedestrian injuries than children in affluent areas. Overall, the most important risk factors for road traffic injuries are: unsafe road environments, speed, alcohol, and not using protective equipment such as seat belts, child car restraints and motorcycle helmets3. Nevertheless, death rates from road traffic injuries have been falling consistently in the WHO European Region and the EU since the early 1990s. This shows that different types of prevention aspects, such as legislations on speeding or improving road environments, can contribute to a decrease in road traffic injuries1, 3, 11. However, the high percentage of deaths and injuries due to RTIs still gives cause for concern. Therefore it is important to implement a comprehensive strategy to redress RTIs. The fact that many states in the EU and WHO European Region have no national, multisectoral strategy on road safety demonstrates a lack for public health awareness and the existing need for adequate measures. Moreover it is unfortunately evident that many countries have inadequate legislation to control speed in urban areas, drink-driving and the use of helmets, seat-belts and child car restraints. Also it is important to consider, that the existence of legislations for the abatement of RTIs does not automatically prevent road traffic injuries: Even well-designed legislation has no effect if it is not properly enforced5. Moreover there are still a few promising interventions for preventing RTIs which are not implemented yet, e.g. the increase of licensing age for driving motorcycles from 16 to 18 years. Nevertheless, these measures need to be more widely implemented in the Region4. Another important aspect for the improvement of road safety is to create safe environments. Neighbourhood characteristics of the built environment, like the existence of sidewalks and walking and jogging trails, are associated with increased physical activity and decreased RTIs3. Furthermore, the WHO recommends for a greater investment in and use of safer modes of transport. That would contribute to reducing both road traffic injuries and the other adverse health effects of car transport4. Application of Health Impact Assessment (HIA) on transport plans and policies12 may support the

SELECTED INDICATORS REPORT
195
demands of the WHO, that implemented transport policies should “integrate road safety with environmental and health concerns”5. The total number of road traffic injuries (RTIs) decreased constantly in the WHO European Region and the EU, despite the significant growth of European traffic volumes. The German national value of injury rates due to road traffic accidents decreased from 616 injuries per 100,000 population in 1999/2001 to 512 in 2006/08. This is a decrease of almost 17%. This decreasing trend can be seen in nearly all German federal states. Especially in Brandenburg the injury rate due to traffic accidents shows a steep decrease of 33% in the last decade. Since 2004/06 the decreasing trend for Germany seems to stand still. In two of the three federal states which are city states, namely Berlin and Hamburg, the injury rate is slightly increasing since 2003/05. In North Rhine-Westphalia the total number of people injured in road traffic accidents decreased from 99,667 in 1999 to 80,848 in 2008. Although this is the highest amount in Germany, in relation to its population North Rhine-Westphalia and Brandenburg have the lowest rates with 459 injuries per 100,000 population in 2006/08. The number of people being injured due to road traffic accidents in North Rhine-Westphalia and Brandenburg is comparable to Saxony (463) and Baden-Württemberg (482). The highest injury rate in 2006/08 can be found in Hamburg (595); Saarland (595) and Bavaria (584) are on the same level. Mecklenburg-Western Pomerania, Hesse and Rhineland-Palatine are very close to the national average (512) in 2006/08. In 2006/08 “Regierungsbezirk” Detmold (NUTS2) was very close to the average of North Rhine-Westphalia. The “Regierungsbezirke” Arnsberg and Düsseldorf were below and Cologne and Münster above the average of North Rhine-Westphalia. RTIs by NUTS3 vary in North Rhine-Westphalia in 2006/2008 between 304 injuries per 100,000 population in Herne and 593 in Münster respectively 592 in Cologne. The RTIs of the cities Münster and Cologne are therefore much higher than the national value. Nevertheless, a decreasing trend can be seen in nearly all counties. Especially Bottrop has shown a steep decrease in the last decade. Some exceptions are Münster, Aachen and Bonn. Münster is stagnant in its comparatively high level of RTIs. Aachen and Bonn show a slightly increasing and afterwards unchanging trend since 2004/06. In spite of the overall decreasing trend of RTIs, the total amount of people with minor injuries varied extremely from year to year17. The amount of seriously injured person is still decreasing. In 1985 in North Rhine-Westphalia 29,342 people were seriously injured, while a decreasing trend can be shown with 16,447 seriously injured persons in 2003 and 13,803 in 2008. The main part of road traffic accidents occurred at urban centres. Nevertheless, the serious injuries and also avoidable traffic deaths mainly have taken place in rural areas, whereas in urban regions the rate is lower than the average. This can be seen in several areas of North Rhine-Westphalia, with some exceptions such as Lippe and Cologne. Most of the injured persons due to traffic accidents were aged 18-21 years. In North Rhine-Westphalia 19,443 children and young adults aged 15-24 years were injured due to road traffic accidents merely in 2008. That is nearly 25% of the total number of injured persons. With rising age the amount of injured persons due to road traffic accidents decreases. Beginning in the age of 60 years the number of seriously injured or killed people increases, whereas the amount of slightly injured persons decreases furthermore. All the facts described above are the total amounts of injured men and women. Regarding to a sex-specific view, in 2006/08 there were 384 injuries per 100,000 population for women and 542 for men in North Rhine-Westphalia. These facts illustrate the huge difference between injury rates for men and women in general. The regional view separated by sex shows comparable results in its proportion of RTIs for men and women.

SELECTED INDICATORS REPORT
196
Data underlying the indicator: • Primary source: Policy statistics, Statistic Institutes • Date last published: 2009 (IT.NRW) • Time period of analysis: 1980, 1985-2001, 2000-2008 (LIGA.NRW), 1955, 1960, 1965, 1970,
1975, 1980, 1985, 1990-2009 (IT.NRW) • Numerator definition: Total number of injuries due to road traffic injuries • Source of numerator: Police statistics, Health Statistic Institutes • Denominator definition: Total resident population (by gender and age) • Source of denominator: National/regional statistics, national census • Geographic coverage: National • Timeliness: Annual data online available • Accuracy and completeness of data set: information about dead people due to RTI are
relative reliable, whereas information quality about injured people is deviate (due to severity, mode of transport etc.); there might be an underestimation of slightly injured people
• Disclosure control: none References:
1. Eurostat (2010): Road safety at regional level. http://epp.eurostat.ec.europa.eu/statistics_explained/index.php/Road_safety_at_regional_level (accessed 2 September 2010)
2. World Health Organization, United Nations Economic Commission for Europe (2010): Transport, Health and Environment Pan-European Programme - The PEP. Transport-related health effects with a particular focus on children. http://www.euro.who.int/__data/assets/pdf_file/0006/97818/PEPBrochureFeb08v8_A3.pdf (accessed 5 October 2010)
3. World Health Organization (WHO) (2010): Health and Environment in Europe: Progress Assessment.
4. WHO Regional Office for Europe (2010): Preventing injuries in Europe - From international collaboration to local implementation. Copenhagen. http://www.euro.who.int/__data/assets/pdf_file/0011/96455/E93567.pdf (accessed 5 October 2010)
5. WHO Regional Office for Europe (2009): European status report on road safety – Toward safer roads and healthier transport. http://www.euro.who.int/__data/assets/pdf_file/0015/43314/E92789.pdf (accessed 5 July 2010)
6. World Health Organization (2004): World report on road traffic injury prevention. Geneva
7. European Commission (2010): White paper - European transport policy for 2010: time to decide. Luxembourg. http://ec.europa.eu/transport/strategies/doc/2001_white_paper/lb_com_2001_0370_en.pdf. (accessed 5 October 2010)
8. European Commission (2004): Communication from the Commission concerning Commission recommendation of 21 October 2003 on enforcement in the field of road safety (2004/C 93/04):
9. World Health Organization (WHO) (2004): Children's Environment and Health Action Plan for Europe (CEHAPE). http://www euro who int/document/e83338 pdf (accessed 15 July 2010)
10. European Council (2007): Council recommendation of 31 May 2007 on the prevention of injury and promotion of safety. Official Journal of the European Union C 164, p. 1-2.
11. Pulido J, Lardelli P, de la Fuente L, Flores V, Vallejo F, Regidor E. (2010): Impact of the demerit point system on road traffic accident mortality in Spain. Journal of Epidemiology and Community Health 64, p. 274-276.
12. Davis A. (2010): Health impact assessment. In: Campbell F, editor. The social determinants of health and the role of local government. London: Improvement and development agency; 2010. p. 70-1.
13. WHO Regional Office for Europe (2005): Prevention of injuries in the WHO European Region. WHO Regional Committee for Europe resolution EUR/RC55/R9. Bucharest. http://www.euro.who.int/__data/assets/pdf_file/0017/88100/RC55_eres09.pdf (accessed 26 July 2010)
14. Bundesministerium für Gesundheit, Bundesministerium für Umwelt, Naturschutz und Reaktorsicherheit: (2007): Eine lebenswerte Umwelt für unsere Kinder.

SELECTED INDICATORS REPORT
197
http://www.bmg.bund.de/cln_160/SharedDocs/Downloads/DE/Neu/Eine-lebenswerte- Umwelt-f_C3_BCr-unsere-Kinder__Aktionsplan-CEHAPE-de,templateId=raw,property=publicationFile.pdf/Eine-lebenswerte-Umwelt-für-unsere-Kinder_Aktionsplan-CEHAPE-de.pdf (accessed 2 September 2010)
15. Bundeszentrale für gesundheitliche Aufklärung (BzgA) (2006): Kinder schützen – Unfälle verhüten.BzGA, Köln. http://www.bzga.de/botmed_11050000.html (accessed 2 September 2010)
16. Stiensmeier-Pelzer J (2007): Abschlussbericht zum Niedersächsischen Modellversuch Begleitetes Fahren ab 17. Justus-Liebig-Universität Gießen, Gießen. http://www.begleitetes-fahren.de/fileadmin/downloads/Begleitetes_Fahren/BF17_Abschlussbericht.pdf (accessed 2 September 2010)
17. Landesinstitut für den Öffentlichen Gesundheitsdienst des Landes NRW (lögd) (2005): Verkehrsunfälle in NRW. LIGA kurz und informativ. lögd NRW, Bielefeld. http://www.liga.nrw.de/_media/pdf/gesundheitberichtedaten/nrw-kurz-und-informativ/verkehrsunfaelle_0504.pdf (accessed 2 September 2010)
Further Information: European Commission: Road safety (http://ec.europa.eu/transport/road_safety/index_en.htm, accessed 13 July 2010) European Road Safety Observatory (http://ec.europa.eu/transport/wcm/road_safety/erso/index.html, accessed 13 July 2010) European Commission: Mobility and Transport: Statistics (http://ec.europa.eu/transport/publications/statistics/statistics_en.htm, accessed 13 July 2010) European Commission: CARE (Community Road Accident Database) (http://ec.europa.eu/idabc/en/document/2281/5926, accessed 6 July 2010) World Health Organization: Road traffic injuries (http://www.who.int/violence_injury_prevention/road_traffic/en/, accessed 5 July 2010) Author: Odile Mekel, Linda Tacke, Florian Fischer (LIGA.NRW), Germany Date of production: 06 October 2010

SELECTED INDICATORS REPORT
198
Hungary Name of indicator: Injury rate due to road traffic accidents Definition: Injury rate due to road traffic accidents Key Message: The number of injuries showed an increasing tendency in Hungary in the last decade, but this trend began to decrease in the last years. This can be a result of the preventive regulations that have been implemented in the last few years (e.g. enforcement of the rule of objective responsibility, zero tolerance on driving under the influence of alcohol and drugs). The situation is better in the eastern part of the country; the best performing counties are Borsod, Nógrád, Heves and Csongrád while the most injuries happen in Fejér, Vas, Hajdú-Bihar and Somogy. Rationale: Road traffic injuries are major public health problem with annually 2.4 million injuries in the WHO European Region. In the European Union about 43 000 people died in road accidents in 2006, which is more than 20 times the combined total of fatalities in rail and air transport for that year1. Road traffic injuries (RTIs) represent the leading cause of death among adolescents and young adults. Approximately four fifths of these deaths occur in the group aged 15-24 years. In the event of an accident the head-to-body ratio increases the risk of head injuries for children, and their height increases the likelihood that vital body parts are hit when collisions occur2. Furthermore, evidence shows that up to 33% of children involved in road traffic injuries develop post-traumatic stress disorder3, 4. The most vulnerable road users are pedestrians, cyclists and users of motorized two wheelers who constitute 39% of all deaths in road crashes. Some of 80% of those aged 0-24 years involved in road crashes are male3, 5. For young adults the lack of experience in driving is the leading cause of road traffic injuries, especially in males6. The social and (mental) health impact, as well as the economic impact of road traffic injuries is substantial. Supplementary to the individual health burden, the economic costs of road traffic injuries are immensely high: estimates suggest that they cost about 2-3% of the gross domestic product due to the service costs of treating injured and disabled people and the forgone production for a society3,
5. For the European Union RTIs alone amount of more than € 180 billion each year. This is twice of the EU budget allocated for all its activities3. The reduction of traffic-related deaths over the last two decades shows that these injuries and deaths are preventable. Unfortunately, this downward trend has stopped in those countries in the East of the WHO Region in the last 10 years. This shows the requirement for further actions in the field of public health in relation to RTIs5. Policy Relevance and Context: Strong political commitment and evidence-based policies are required for the adoption of a comprehensive approach to road safety. Indicators based on mortality from RTIs support policy evaluation with respect to the desired final outcome (reduction of RTI mortality) by providing benchmarks and setting a baseline against which progress can be monitored over time. In 2001, the European Commission released the Transport White Paper, which proposed the goal to save yearly 25.000 lives on European roads by 20107. In 2003, the European Commission adopted the Road Safety Action Programme8. According to its announcements in the White Paper, the Action Programme pointed out main determinants of RTIs and identified six main areas to combat the problems:

SELECTED INDICATORS REPORT
199
• Encouraging road users to improve their behaviour • Using technical progress to make vehicles safer • Encouraging the improvement of road infrastructure • Safe commercial goods and passenger transport • Emergency services and care for road accident victims • Accident data collection, analysis and dissemination.
In 2004, the Fourth Ministerial Conference on Environment and Health adopted the CEHAPE (Children’s Environment and Health Action Plan for Europe). The prevention and reduction of health consequences from accidents and injuries are part of the CEHAPE RPG II. Overall morbidity and mortality should be addressed by “b.) advocating the strengthened implementation of road safety measure, including adequate speed limits as well as education for drivers and children, and enforcement of the corresponding legislation (…); c.) advocating, supporting and implementing children-friendly urban planning und development as well as sustainable transport and planning management, by promoting cycling, walking and public transport in order to provide safer and healthier mobility within the community”9. The Resolution EUR/RC55/R9 on the prevention of injuries in the WHO European Region (September 2005)12 and the European Council Recommendation on the prevention of injury and the promotion of safety (May 2007)10 provide a public health framework for action that includes the support of Member States in addressing the problem more comprehensively. These have placed injury and violence prevention firmly on the public health agenda. The implementation of the resolution and the Recommendation led to higher injury prevention activities in the EU and the WHO European Region4. In Hungary, the Strategy on Injury Prevention was adopted in 2010. It includes good practices and recommendations on intervention. The first intervention concerns prevention of road traffic accidents14. The National Child and Youth Safety Action Plan has been accepted in 2009. The fist objective of the action plan is to significantly decrease the number of serious and fatal road traffic injuries within the 0-24 years age group. It includes general objectives for the time period 2010–2019 as well as specific actions for children aged under 14 years and for young drivers aged 15–24 years for the period 2010–201215. The Action Plan for Road Traffic Safety of the police formulates the priority actions to implement up to and including 2010. It emphasizes among others the traffic safety education of school-children, the improved education and training of drivers and more effective enforcement of the current policies16. Traffic safety regulations17 have been updated several times in the last decade. Some stricter regulations are proved to be effective (e.g. enforcement of the rule of objective responsibility, zero tolerance on driving under the influence of alcohol and drugs). Presentation of Data:
Figure 1a: Injury rate due to traffic accidents in Hungary by NUTS2, 2008

SELECTED INDICATORS REPORT
200
0 50 100 150 200 250 300 350
Közép-Magyarország (HU10)
Közép-Dunántúl (HU21)
Nyugat-Dunántúl (HU22)
Dél-Dunántúl (HU23)
Észak-Magyarország (HU31)
Észak-Alföld (HU32)
Dél-Alföld (HU33)
number of injuries / 100,000 population
by regions (NUTS2), 2006 2008
national value
Figure 1b: Injury rate due to traffic accidents in Hungary by NUTS2, 2006 - 2008
Figure 2a: Injury rate due to traffic accidents in Hungary by NUTS3, 2006 - 2008
0 50 100 150 200 250 300 350
Budapest (HU101)Pest (HU102)
Fejér (HU211)Komárom-Esztergom (HU212)
Veszprém (HU213)Győr-Moson-Sopron (HU221)
Vas (HU222)Zala (HU223)
Baranya (HU231)Somogy (HU232)
Tolna (HU233)Borsod-Abaúj-Zemplén (HU311)
Heves (HU312)Nógrád (HU313)
Hajdú-Bihar (HU321)Jász-Nagykun-Szolnok (HU322)
Szabolcs-Szatmár-Bereg (HU323)Bács-Kiskun (HU331)
Békés (HU332)Csongrád (HU333)
number of injuries / 100,000 population
by counties (NUTS3), 006 008
national value
Figure 2b: Injury rate due to traffic accidents in Hungary by NUTS3, 2006 - 2008

SELECTED INDICATORS REPORT
201
175
200
225
250
275
300
325
1999-2001 2000-2002 2001-2003 2002-2004 2003-2005 2004-2006 2005-2007 2006-2008
num
ber
of in
juri
es /
100
,000
pop
ulat
ion
Injury rate due to traffic accidents by NUTS1, Hungary
Közép-Magyarország (HU1)
Dunántúl (HU2)
Alföld és Észak (HU3)
national value
Figure 3: Injury rate due to traffic accidents in Hungary by NUTS1 for the period 1999 - 2008
175
200
225
250
275
300
325
1999-2001 2000-2002 2001-2003 2002-2004 2003-2005 2004-2006 2005-2007 2006-2008
num
ber
of in
juri
es /
100
,000
pop
ulat
ion
Injury rate due to traffic accidents by regions NUTS2, Hungary
Közép-Magyarország (HU10) Közép-Dunántúl (HU21)
Nyugat-Dunántúl (HU22) Dél-Dunántúl (HU23)
Észak-Magyarország (HU31) Észak-Alföld (HU32)
Dél-Alföld (HU33) national value
Figure 4: Injury rate due to traffic accidents in Hungary by NUTS2 for the period 1999 - 2008
175
200
225
250
275
300
325
1999-2001 2000-2002 2001-2003 2002-2004 2003-2005 2004-2006 2005-2007 2006-2008
num
ber
of in
juri
es /
100
,000
pop
ulat
ion
Injury rate due to traffic accidents by counties (NUTS3) in region Közép-Magyarország, Hungary
Budapest (HU101)
Pest (HU102)
national value
175
200
225
250
275
300
325
1999-2001 2000-2002 2001-2003 2002-2004 2003-2005 2004-2006 2005-2007 2006-2008
num
ber
of in
juri
es /
100
,000
pop
ulat
ion
Injury rate due to traffic accidents by counties (NUTS3) in region Közép-Dunántúl, Hungary
Fejér (HU211)Komárom-Esztergom (HU212)Veszprém (HU213)national value

SELECTED INDICATORS REPORT
202
175
200
225
250
275
300
325
1999-2001 2000-2002 2001-2003 2002-2004 2003-2005 2004-2006 2005-2007 2006-2008
num
ber
of in
juri
es /
100
,000
pop
ulat
ion
Injury rate due to traffic accidents by counties (NUTS3) in region Nyugat-Dunántúl, Hungary
Győr-Moson-Sopron (HU221)
Vas (HU222)
Zala (HU223)
national value
175
200
225
250
275
300
325
1999-2001 2000-2002 2001-2003 2002-2004 2003-2005 2004-2006 2005-2007 2006-2008
num
ber
of in
juri
es /
100
,000
pop
ulat
ion
Injury rate due to traffic accidents by counties (NUTS3) in region Dél-Dunántúl, Hungary
Baranya (HU231)
Somogy (HU232)
Tolna (HU233)
national value
175
200
225
250
275
300
325
1999-2001 2000-2002 2001-2003 2002-2004 2003-2005 2004-2006 2005-2007 2006-2008
num
ber
of in
juri
es /
100
,000
pop
ulat
ion
Injury rate due to traffic accidents by counties (NUTS3) in region Észak-Magyarország, Hungary
Borsod-Abaúj-Zemplén (HU311)Heves (HU312)Nógrád (HU313)national value
175
200
225
250
275
300
325
1999-2001 2000-2002 2001-2003 2002-2004 2003-2005 2004-2006 2005-2007 2006-2008
num
ber
of in
juri
es /
100
,000
pop
ulat
ion
Injury rate due to traffic accidents by counties (NUTS3) in region Észak-Alföld, Hungary
Hajdú-Bihar (HU321)
Jász-Nagykun-Szolnok (HU322)
Szabolcs-Szatmár-Bereg (HU323)
national value

SELECTED INDICATORS REPORT
203
175
200
225
250
275
300
325
1999-2001 2000-2002 2001-2003 2002-2004 2003-2005 2004-2006 2005-2007 2006-2008
num
ber
of in
juri
es /
100
,000
pop
ulat
ion
Injury rate due to traffic accidents by counties (NUTS3) in region Dél-Alföld, Hungary
Bács-Kiskun (HU331)
Békés (HU332)
Csongrád (HU333)
national value
Figure 5: Injury rate due to traffic accidents in Hungary by NUTS3 for the period 1999 - 2008
Source of data: Hungarian Central Statistical Office
Assessment: Road traffic injuries are still a leading cause of death in the WHO European Region and therefore a major public health topic. By 2020 RTIs are predicted to be the third leading contributor to the global burden of disease and injuries because of an increased rate of RTIs in low- and middle income countries due to an increasing motorization in these countries6. Despite the significant growth in European road traffic volumes, it has been possible to reduce the total road death toll by 44% between 1991 and 2006. While this positive trend can be seen across all countries in the European Union, there are significant variations between the different regions. Geographically, the highest rates of road deaths are to be found in eastern and south-eastern Member States of the European Union. Given the still lower level of vehicle ownership in most of these countries, the reasons behind these high values, compared to western Europe, can probably be found in the quality of infrastructure supply and less-developed awareness of road safety issues in these countries1. Therefore rates of deaths due to road traffic accidents are twice as high in low- and middle-income countries as in high income countries. Children in deprived areas may have a four times higher risk for pedestrian injuries than children in affluent areas. Overall, the most important risk factors for road traffic injuries are: unsafe road environments, speed, alcohol, and not using protective equipment such as seat belts, child car restraints and motorcycle helmets3. Nevertheless, death rates from road traffic injuries have been falling consistently in the WHO European Region and the EU since the early 1990s. This shows that different types of prevention aspects, such as legislations on speeding or improving road environments, can contribute to a decrease in road traffic injuries1, 3, 11. However, the high percentage of deaths and injuries due to RTIs still gives cause for concern. Therefore it is important to implement a comprehensive strategy to redress RTIs. The fact that many states in the EU and WHO European Region have no national, multisectoral strategy on road safety demonstrates a lack for public health awareness and the existing need for adequate measures. Moreover it is unfortunately evident that many countries have inadequate legislation to control speed in urban areas, drink-driving and the use of helmets, seat-belts and child car restraints. Also it is important to consider, that the existence of legislations for the abatement of RTIs does not automatically prevent road traffic injuries: Even well-designed legislation has no effect if it is not properly enforced5. Moreover there are still a few promising interventions for preventing RTIs which are not implemented yet, e.g. the increase of licensing age for driving motorcycles from 16 to 18 years. Nevertheless, these measures need to be more widely implemented in the Region4. Another important aspect for the improvement of road safety is to create safe environments. Neighbourhood characteristics of the built environment, like the existence of sidewalks and walking and jogging trails, are associated with increased physical activity and decreased RTIs3. Furthermore, the WHO recommends for a greater investment in and use of safer modes of transport. That would contribute to reducing both road traffic injuries and the other adverse health effects of car transport4.

SELECTED INDICATORS REPORT
204
Application of Health Impact Assessment (HIA) on transport plans and policies12 may support the demands of the WHO, that implemented transport policies should “integrate road safety with environmental and health concerns”5. The total number of road traffic injuries (RTIs) decreased constantly in the WHO European Region and the EU, despite the significant growth of European traffic volumes. In Hungary, the number of road traffic injuries showed an increasing trend in the last decade, however there was a reverse in the trend in the last few yearswhich may be attributed to the introduction of the latest interventions. There is a spatial difference: the number of injuries is under the national value in the eastern part of Hungary (HU3) and it is above the national value in the western part (HU2) and in Central Hungary (HU1). In the eastern part, the situation is the best in Northern Hungary (HU31) and is better than the national situation in region Southern Great Plain (HU33). The number of injuries is the highest in region Central Transdanubia (HU21). Regarding the counties, the 3 counties of the region Northern Hungary (Borsod, Heves, Nógrád) and the southern county Csongrád are in the best category. The worst performing counties are Fejér, Vas, Hajdú-Bihar, Somogy and the capital, Budapest. There is an increasing tendency in Somogy and Vas, while in the other counties the trend stagnates or turned to decrease in the last years. Data underlying the indicator:
• Primary source: Police • Date last published: 2009. • Time period of analysis: 1999–2008 • Numerator definition: Number of injuries due to road traffic accidents (based on the status
within 30 days after the accident) • Source of numerator: Hungarian Central Statistical Office • Denominator definition: Total population • Source of denominator: Hungarian Central Statistical Office • Geographic coverage: National • Timeliness: Data are updated annually. • Accuracy and completeness of data set: Data are based on the registration of police. As
every traffic accident involving injury has to be registered by the police, data can be considered as accurate and complete.
• Disclosure control References:
1. Road safety at regional level, Luxembourg, Eurostat, 2010 (http://epp.eurostat.ec.europa.eu/statistics_explained/index.php/Road_safety_at_regional_level, accessed 5 July 2010)
2. Transport, Health and Environment Pan-European Programme – The PEP. Transport-related health effects with a particular focus on children. Geneva, World Health Organization and United Nations Economic Commission for Europe, 2004 (http://www.euro.who.int/__data/assets/pdf_file/0006/97818/PEPBrochureFeb08v8_A3.pdf, accessed 14 July 2010)
3. Health and Environment in Europe: Progress Assessment. Copenhagen. WHO Regional Office for Europe, 2010
4. Preventing injuries in Europe – From international collaboration to local implementation. Copenhagen. WHO Regional Office for Europe, 2010
5. European status report on road safety – Toward safer roads and healthier transport. Copenhagen. WHO Regional Office for Europe, 2009.
6. World report on road traffic injury prevention: Summary. Geneva. World Health Organization, 2004 (http://www.who.int/violence_injury_prevention/publications/road_traffic/world_report/summary_en_rev.pdf, accessed 14 July 2010)
7. White paper - European transport policy for 2010: time to decide. Brussels. Commission of the European Communities, 2010
http://ec.europa.eu/transport/strategies/doc/2001_white_paper/lb_com_2001_0370_en.pdf, accessed 26 July 2010)

SELECTED INDICATORS REPORT
205
8. Communication from the Commission concerning Commission recommendation of 21 October 2003 on enforcement in the field of road safety (2004/C 93/04). European Commission, 2003. Official Journal C 093 , p.5-8.
(http://eur-lex.europa.eu/LexUriServ/LexUriServ.do?uri=CELEX:52004XC0417(03):EN:HTML, accessed 26 July 2010)
9. Children’s Environment and Health Action Plan for Europe. Fourth Ministerial Conference on Environment and Health, Budapest, 23-25, June 2004 (http://www.euro.who.int/document/e83338.pdf, accessed 5 July 2010)
10. European Council. Council recommendation of 31 May 2007 on the prevention of injury and promotion of safety. Official Journal of the European Union, 2007, C 164:1– 2
11. Pulido, J. et al.: Impact of the demerit point system on road traffic accident mortality in Spain. J Epidemiol Community Health, 2010, p. 274-276
12. Davis, A.: Health impact assessment. In: The social determinants of health and the role of local government (Ed: Campbell, F.), London, Improvement and development agency, 2010, p. 70-71
13. Prevention of injuries in the WHO European Region. WHO Regional Committee for Europe resolution EUR/RC55/R9. Copenhagen, WHO Regional Office for Europe, 2005 (http://www.euro.who.int/__data/assets/pdf_file/0017/88100/RC55_eres09.pdf, accessed 26 July 2010)
14. Injury prevention. Situation analysis, policy – Good practices. OSZMK 2010. Available in English at: http://193.225.50.35/dokumentum/2009/ANG_0602.pdf
15. National Action Plan on Child and Youth Safety. Programme for Preventing Unintentional Injuries of 0–24-year-olds, 2010–2019. OGYEI 2009. Available in English at: http://www.ogyei.hu/anyagok/ogyei_a.pdf
16. The Action Plan for Road Traffic Safety of the police. Available only in Hungarian at: http://www.police.hu/megelozes/balesetmegelozes/altalanos060103/program060103.html
17. Rules of the road traffic: Joint regulation of KPM-BM No. 1/1975. (II. 5.) (modified and amended many times). Available only in Hungarian at: http://www.complex.hu/jr/gen/hjegy_doc.cgi?docid=97500001.KPM Further Information: European Commission: Road safety (http://ec.europa.eu/transport/road_safety/index_en.htm, accessed 13 July 2010) European Road Safety Observatory (http://ec.europa.eu/transport/wcm/road_safety/erso/index.html, accessed 13 July 2010) European Commission: Mobility and Transport: Statistics (http://ec.europa.eu/transport/publications/statistics/statistics_en.htm, accessed 13 July 2010) European Commission: CARE (Community Road Accident Database) (http://ec.europa.eu/idabc/en/document/2281/5926, accessed 6 July 2010) World Health Organization: Road traffic injuries (http://www.who.int/violence_injury_prevention/road_traffic/en/, accessed 5 July 2010) Author: Tibor Malnasi, Anna Paldy, National Institute of Environmental Health, Hungary Date of production: 14 September 2010

SELECTED INDICATORS REPORT
206
Lithuania Name of indicator: Injury rate due to road traffic accidents Definition: Injury rate due to road traffic accidents Key Message: Three year average rates from 2000 to 2005 demonstrated that road traffic injuries rate was increasing in all counties and since 2005, after adoption of Road Safety Programme and implementation of other important road safety measures, road traffic injury rates started to decrease. In 2008 road traffic injury rate was lower than in 2000. Significant reductions in the rates were observed in two counties (Vilnius and Utena) and road traffic injury rates are lower than national average in these two counties. The highest road traffic injury rate is in Marijampolė county and the lowest in Utena county in 2006-2008. Road traffic injury rates in Lithuania still remain among the highest in the European Region. Rationale: Road traffic injuries are major public health problem with annually 2.4 million injuries in the WHO European Region. In the European Union about 43 000 people died in road accidents in 2006, which is more than 20 times the combined total of fatalities in rail and air transport for that year1. Road traffic injuries (RTIs) represent the leading cause of death among adolescents and young adults. Approximately four fifths of these deaths occur in the group aged 15-24 years. In the event of an accident the head-to-body ratio increases the risk of head injuries for children, and their height increases the likelihood that vital body parts are hit when collisions occur2. Furthermore, evidence shows that up to 33% of children involved in road traffic injuries develop post-traumatic stress disorder3, 4. The most vulnerable road users are pedestrians, cyclists and users of motorized two wheelers who constitute 39% of all deaths in road crashes. Some of 80% of those aged 0-24 years involved in road crashes are male3, 5. For young adults the lack of experience in driving is the leading cause of road traffic injuries, especially in males6. The social and (mental) health impact, as well as the economic impact of road traffic injuries is substantial. Supplementary to the individual health burden, the economic costs of road traffic injuries are immensely high: estimates suggest that they cost about 2-3% of the gross domestic product due to the service costs of treating injured and disabled people and the forgone production for a society3,
5. For the European Union RTIs alone amount of more than € 180 billion each year. This is twice of the EU budget allocated for all its activities3. The reduction of traffic-related deaths over the last two decades shows that these injuries and deaths are preventable. Unfortunately, this downward trend has stopped in those countries in the East of the WHO Region in the last 10 years. This shows the requirement for further actions in the field of public health in relation to RTIs5. Policy Relevance and Context: Strong political commitment and evidence-based policies are required for the adoption of a comprehensive approach to road safety. Indicators based on mortality from RTIs support policy evaluation with respect to the desired final outcome (reduction of RTI mortality) by providing benchmarks and setting a baseline against which progress can be monitored over time. In 2001, the European Commission released the Transport White Paper, which proposed the goal to save yearly 25.000 lives on European roads by 20107. In 2003, the European Commission adopted the Road Safety Action Programme8. According to its

SELECTED INDICATORS REPORT
207
announcements in the White Paper, the Action Programme pointed out main determinants of RTIs and identified six main areas to combat the problems:
• Encouraging road users to improve their behaviour • Using technical progress to make vehicles safer • Encouraging the improvement of road infrastructure • Safe commercial goods and passenger transport • Emergency services and care for road accident victims • Accident data collection, analysis and dissemination.
In 2004, the Fourth Ministerial Conference on Environment and Health adopted the CEHAPE (Children’s Environment and Health Action Plan for Europe). The prevention and reduction of health consequences from accidents and injuries are part of the CEHAPE RPG II. Overall morbidity and mortality should be addressed by “b.) advocating the strengthened implementation of road safety measure, including adequate speed limits as well as education for drivers and children, and enforcement of the corresponding legislation (…); c.) advocating, supporting and implementing children-friendly urban planning und development as well as sustainable transport and planning management, by promoting cycling, walking and public transport in order to provide safer and healthier mobility within the community”9. The Resolution EUR/RC55/R9 on the prevention of injuries in the WHO European Region (September 2005)12 and the European Council Recommendation on the prevention of injury and the promotion of safety (May 2007)10 provide a public health framework for action that includes the support of Member States in addressing the problem more comprehensively. These have placed injury and violence prevention firmly on the public health agenda. The implementation of the resolution and the Recommendation led to higher injury prevention activities in the EU and the WHO European Region4. Lithuanian Health Programme 1997–2010, adopted by the Parliament in 1998, Resolution No.VIII-833, set the target by the year 2010 to reduce rate of accidents, accident-related deaths and disabilities by 30 per cent. Road safety problems are solved integrating legal, administrative, engineering, educative measures and carrying research in Lithuania. Ministry of Transport and Communication is the leading institution formulating road safety policy in Lithuania. State Road Safety Commission under the Government of Lithuania co-ordinates road safety policy implementation in the country. National Road Safety Policy is formulated in a number of policy documents. Law on Road Traffic Safety of the Republic of Lithuania, was adopted in 2000; (Official Gazette,2000, No.92-2883), the main objective of the law is to coordinate work of all institutions responsible for road safety, regulate and warrante road safety. State Injury Prevention Programme for 2000-2010 was adopted by the Government of the Republic of Lithuania in 2000, Resolution No.423 (Official gazette, 2000, No.32-903; 2008, No.58-2174). Implementation of the programme is coordinated by the Ministry of Health. The goal of the programme to reduce rate of accidents, accident-related deaths and disabilities. In the first stage of the programme (2000–2004) the highest attention was paid to mortality and injury prevention (treatment quality of injuries); in the second stage of programme implementation (2006–2007) the highest attention was paid to education of health care specialist according to EU standards. In the third stage of the programme (2008–2010) primary injury prevention measures addressing children, elderly people injuries and monitoring of injuries were planned. This programme addresses legislation, road use and vehicle safety while implementing education activities and traffic safety initiatives. National Road Taffic Rules, adopted by the Government of the Republic of Lithuania in 2002, Resolution No.1950 (Official Gazette, 2003, No.7-263), set nationally speed limits, use of motorcycle helments, seat belts and child restrain measures, drink-driving restrictions, other road safety

SELECTED INDICATORS REPORT
208
measures. State Programme for Road Safety for 2005–2010, was adopted by the Government of the Republic of Lithuania in 2005, Resolution No.759 (Official Gazette, 2005, No.84-3117). The scope of the programme is to compose preconditions for purposeful and longterm road safety improvenment, plan and implement road safety measures. According to the National Road Safety Programme strategic goal was half – and – half to reduce number of deaths due to road traffic accidents to compare with the year 2004, other goals related to road traffic injuries – till 2008 to reduce number of injured persons in traffic accidents by 10 percent and till 2010 reduce number of injured persons in traffic accidents by 20 percent. Though Law on Alcohol Control of the Republic of Lithuania was amended in 2008 (Official Gazette, 1995, No.. 44-1073) to include detailed provisions regarding the restriction of both the sale and advertisement of alcohol, alcohol use remains a serious risk factor associated with road traffic injuries in Lithuania14. Presentation of Data:
0 50 100 150 200 250 300 350
Alytaus apskritis (LT001)
Kauno apskritis (LT002)
Klaipedos apskritis (LT003)
Marijampoles apskritis (LT004)
Panevezio apskritis (LT005)
Siauliu apskritis (LT006)
Taurages apskritis (LT007)
Telsiu apskritis (LT008)
Utenos apskritis (LT009)
Vilniaus apskritis (LT00A)
number of injuries / 100000 population
Injury rate due to traffic accidents in Lithuania by counties (NUTS3), 2006-2008
national value Figure 1: Injury rate due to traffic accidents in Lithuania by NUTS3, 2006-2008
100
150
200
250
300
350
2000-2002 2001-2003 2002-2004 2003-2005 2004-2006 2005-2007 2006-2008
num
ber o
f inj
urie
s / 1
0000
0 po
pula
tion
Injury rate due to traffic accidents by counties (NUTS3), Lithuania I.
Alytaus apskritis (LT001)
Kauno apskritis (LT002)
Klaipedos apskritis (LT003)
Marijampoles apskritis (LT004)
Panevezio apskritis (LT005)
national value
Figure 2a: Injury rate due to traffic accidents in Lithuania by NUTS3 for the period 2008

SELECTED INDICATORS REPORT
209
100
150
200
250
300
350
2000-2002 2001-2003 2002-2004 2003-2005 2004-2006 2005-2007 2006-2008
num
ber o
f inj
urie
s /
100
000
popu
lati
on
Injury rate due to traffic accidents by counties (NUTS3), Lithuania II.
Siauliu apskritis (LT006)
Taurages apskritis (LT007)
Telsiu apskritis (LT008)
Utenos apskritis (LT009)
Vilniaus apskritis (LT00A)
national value
Figure 2b: Injury rate due to traffic accidents in Lithuania by NUTS3 for the period 2008 Assessment: Road traffic injuries are still a leading cause of death in the WHO European Region and therefore a major public health topic. By 2020 RTIs are predicted to be the third leading contributor to the global burden of disease and injuries because of an increased rate of RTIs in low- and middle income countries due to an increasing motorization in these countries6. Despite the significant growth in European road traffic volumes, it has been possible to reduce the total road death toll by 44% between 1991 and 2006. While this positive trend can be seen across all countries in the European Union, there are significant variations between the different regions. Geographically, the highest rates of road deaths are to be found in eastern and south-eastern Member States of the European Union. Given the still lower level of vehicle ownership in most of these countries, the reasons behind these high values, compared to western Europe, can probably be found in the quality of infrastructure supply and less-developed awareness of road safety issues in these countries1. Therefore rates of deaths due to road traffic accidents are twice as high in low- and middle-income countries as in high income countries. Children in deprived areas may have a four times higher risk for pedestrian injuries than children in affluent areas. Overall, the most important risk factors for road traffic injuries are: unsafe road environments, speed, alcohol, and not using protective equipment such as seat belts, child car restraints and motorcycle helmets3. Nevertheless, death rates from road traffic injuries have been falling consistently in the WHO European Region and the EU since the early 1990s. This shows that different types of prevention aspects, such as legislations on speeding or improving road environments, can contribute to a decrease in road traffic injuries1, 3, 11. However, the high percentage of deaths and injuries due to RTIs still gives cause for concern. Therefore it is important to implement a comprehensive strategy to redress RTIs. The fact that many states in the EU and WHO European Region have no national, multisectoral strategy on road safety demonstrates a lack for public health awareness and the existing need for adequate measures. Moreover it is unfortunately evident that many countries have inadequate legislation to control speed in urban areas, drink-driving and the use of helmets, seat-belts and child car restraints. Also it is important to consider, that the existence of legislations for the abatement of RTIs does not automatically prevent road traffic injuries: Even well-designed legislation has no effect if it is not properly enforced5. Moreover there are still a few promising interventions for preventing RTIs which are not implemented yet, e.g. the increase of licensing age for driving motorcycles from 16 to 18 years. Nevertheless, these measures need to be more widely implemented in the Region4. Another important aspect for the improvement of road safety is to create safe environments. Neighbourhood characteristics of the built environment, like the existence of sidewalks and walking and jogging trails, are associated with increased physical activity and decreased RTIs3. Furthermore, the WHO recommends for a greater investment in and use of safer modes of transport. That would contribute to reducing both road traffic injuries and the other adverse health effects of car transport4.

SELECTED INDICATORS REPORT
210
Application of Health Impact Assessment (HIA) on transport plans and policies12 may support the demands of the WHO, that implemented transport policies should “integrate road safety with environmental and health concerns”5. The total number of road traffic injuries (RTIs) decreased constantly in the WHO European Region and the EU, despite the significant growth of European traffic volumes.
Though road traffic injury rate in 2008 is lower than in 2000, observing three year average rates from 2000 till 2005 road traffic injuries rate was increasing in all counties and from 2005, after adoption of Road Safety Programme and implementation of other important road safety measures, road traffic injury rates started to decrease. In two counties (Vilnius and Utena) decrease was quite significant and road traffic injury rates are lower than national average in these two counties. There are no significant differences between regional tendencies of road traffic injury rates. The highest road traffic injury rate is in Marijampolė county and the lowest in Utena county in 2006-2008. Strategic goal of the National Road Safety Programme was half – and – half to reduce number of deaths due to road traffic accidents to compare with the year 2004, other goals related to road traffic injuries – till 2008 to reduce number of injured persons in traffic accidents by 10 percent and till 2010 reduce number of injured persons in traffic accidents by 20 percent. Reduction of number of injured in road traffic accidents by 10 percent until 2008 was achieved. However, road traffic injury rates in Lithuania remain among the highest in the European Region. Data underlying the indicator:
• Primary source: Statistics Lithuania data base • Date last published: 2008 • Time period of analysis: 2000–2008. • Numerator definition: Total number of people injured in road traffic accidents • Source of numerator: Statistics Lithuania • Denominator definition: Total resident population • Source of denominator: Statistics Lithuania • Geographic coverage: National (Lithuania) and 10 Lithuanian counties (apskritys; NUTS 3
level). • Timeliness: annual data • Accuracy and completeness of data set: data accurate and complete. • Disclosure control: only aggregated data can be used; personal data use restrictions.
References: 1. Road safety at regional level, Luxembourg, Eurostat, 2010
(http://epp.eurostat.ec.europa.eu/statistics_explained/index.php/Road_safety_at_regional_level, accessed 5 July 2010)
2. Transport, Health and Environment Pan-European Programme – The PEP. Transport-related health effects with a particular focus on children. Geneva, World Health Organization and United Nations Economic Commission for Europe, 2004 (http://www.euro.who.int/__data/assets/pdf_file/0006/97818/PEPBrochureFeb08v8_A3.pdf, accessed 14 July 2010)
3. Health and Environment in Europe: Progress Assessment. Copenhagen. WHO Regional Office for Europe, 2010
4. Preventing injuries in Europe – From international collaboration to local implementation. Copenhagen. WHO Regional Office for Europe, 2010
5. European status report on road safety – Toward safer roads and healthier transport. Copenhagen. WHO Regional Office for Europe, 2009.
6. World report on road traffic injury prevention: Summary. Geneva. World Health Organization, 2004 (http://www.who.int/violence_injury_prevention/publications/road_traffic/world_report/summary_en_rev.pdf, accessed 14 July 2010)
7. White paper - European transport policy for 2010: time to decide. Brussels. Commission of the European Communities, 2010
http://ec.europa.eu/transport/strategies/doc/2001_white_paper/lb_com_2001_0370_en.pdf, accessed 26 July 2010)

SELECTED INDICATORS REPORT
211
8. Communication from the Commission concerning Commission recommendation of 21 October 2003 on enforcement in the field of road safety (2004/C 93/04). European Commission, 2003. Official Journal C 093 , p.5-8.
(http://eur-lex.europa.eu/LexUriServ/LexUriServ.do?uri=CELEX:52004XC0417(03):EN:HTML, accessed 26 July 2010)
9. Children’s Environment and Health Action Plan for Europe. Fourth Ministerial Conference on Environment and Health, Budapest, 23-25, June 2004 (http://www.euro.who.int/document/e83338.pdf, accessed 5 July 2010)
10. European Council. Council recommendation of 31 May 2007 on the prevention of injury and promotion of safety. Official Journal of the European Union, 2007, C 164:1– 2
11. Pulido, J. et al.: Impact of the demerit point system on road traffic accident mortality in Spain. J Epidemiol Community Health, 2010, p. 274-276
12. Davis, A.: Health impact assessment. In: The social determinants of health and the role of local government (Ed: Campbell, F.), London, Improvement and development agency, 2010, p. 70-71
13. Prevention of injuries in the WHO European Region. WHO Regional Committee for Europe resolution EUR/RC55/R9. Copenhagen, WHO Regional Office for Europe, 2005 (http://www.euro.who.int/__data/assets/pdf_file/0017/88100/RC55_eres09.pdf, accessed 26 July 2010)
14. Lunevičius R., Herbert H.K., Hyder A: The epidemiology of road traffic injuries in the Republic of Lithuania, 1998–2007. European Journal of Public Health, 2010, p.1–5.
15. Regulation (EC) No 1888/2005 of the European Parliament and of the Council of 26 October 2005 amending Regulation (EC) No 1059/2003 on the establishment of a common classification of territorial units for statistics (NUTS) by reason of the accession of the Czech Republic, Estonia, Cyprus, Latvia, Lithuania, Hungary, Malta, Poland, Slovenia and Slovakia to the European Union. Official Journal L 309, 25/11/2005 P. 0001 – 0008. Further Information: European Commission: Road safety (http://ec.europa.eu/transport/road_safety/index_en.htm, accessed 13 July 2010) European Road Safety Observatory (http://ec.europa.eu/transport/wcm/road_safety/erso/index.html, accessed 13 July 2010) European Commission: Mobility and Transport: Statistics (http://ec.europa.eu/transport/publications/statistics/statistics_en.htm, accessed 13 July 2010) European Commission: CARE (Community Road Accident Database) (http://ec.europa.eu/idabc/en/document/2281/5926, accessed 6 July 2010) World Health Organization: Road traffic injuries (http://www.who.int/violence_injury_prevention/road_traffic/en/, accessed 5 July 2010) Author: Aida Laukaitienė, Centre for Health Education and Disease Control, Lithuania Date of production: 15 October, 2010

SELECTED INDICATORS REPORT
212
Slovenia Name of indicator: Injury rate due to road traffic accidents Definition: Injury rate due to road traffic accidents Key Message: According to the police records the number of injuries due to road traffic accidents decreases. More accurate hospital admission data revealed that hospital admissions decrease too. The highest number of hospital admissions is in Jugovzhodna Slovenija region and the lowest in Spodnjeposavska region. Rationale: Road traffic injuries are major public health problem with annually 2.4 million injuries in the WHO European Region. In the European Union about 43 000 people died in road accidents in 2006, which is more than 20 times the combined total of fatalities in rail and air transport for that year (1). Road traffic injuries (RTIs) represent the leading cause of death among adolescents and young adults. Approximately four fifths of these deaths occur in the group aged 15-24 years. In the event of an accident, the head-to-body ratio increases the risk of head injuries for children, and their height increases the likelihood that vital body parts are hit when collisions occur (2). Furthermore, evidence shows that up to 33% of children involved in road traffic injuries develop post-traumatic stress disorder (3, 4). The most vulnerable road users are pedestrians, cyclists and users of motorized two wheelers who constitute 39% of all deaths in road crashes. Some of 80% of those aged 0-24 years involved in road crashes are male (3, 5). For young adults the lack of experience in driving is the leading cause of road traffic injuries, especially in males (6). The social and (mental) health impact, as well as the economic impact of road traffic injuries is substantial. Supplementary to the individual health burden, the economic costs of road traffic injuries are immensely high: estimates suggest that they cost about 2-3% of the gross domestic product due to the service costs of treating injured and disabled people and the forgone production for a society (3, 5). For the European Union RTIs alone amount of more than € 180 billion each year. This is twice of the EU budget allocated for all its activities (3). The reduction of traffic-related deaths over the last two decades shows that these injuries and deaths are preventable. Unfortunately, this downward trend has stopped in those countries in the East of the WHO Region in the last 10 years. This shows the requirement for further actions in the field of public health in relation to RTIs (5). Policy Relevance and Context: Strong political commitment and evidence-supported policies are required for the adoption of a comprehensive approach to road safety. Indicators based on mortality from RTIs support policy evaluation with respect to the desired final outcome (reduction of RTI mortality) by providing benchmarks and setting a baseline against which progress can be monitored over time. In 2001, the European Commission released the Transport White Paper, which proposed the goal to save yearly 25.000 lives on European roads by 2010 (7). In 2003, the European Commission adopted the Road Safety Action Programme (8). According to its announcements in the White Paper, the Action Programme pointed out main determinants of RTIs and identified six main areas to combat the problems:
• Encouraging road users to improve their behaviour • Using technical progress to make vehicles safer • Encouraging the improvement of road infrastructure

SELECTED INDICATORS REPORT
213
• Safe commercial goods and passenger transport • Emergency services and care for road accident victims • Accident data collection, analysis and dissemination.
In 2004, the Fourth Ministerial Conference on Environment and Health adopted the CEHAPE (Children’s Environment and Health Action Plan for Europe). The prevention and reduction of health consequences from accidents and injuries are part of the CEHAPE RPG II. Overall morbidity and mortality should be addressed by “b.) advocating the strengthened implementation of road safety measure, including adequate speed limits as well as education for drivers and children, and enforcement of the corresponding legislation (…); c.) advocating, supporting and implementing children-friendly urban planning und development as well as sustainable transport and planning management, by promoting cycling, walking and public transport in order to provide safer and healthier mobility within the community” (9). The Resolution EUR/RC55/R9 on the prevention of injuries in the WHO European Region (September 2005) (12) and the European Council Recommendation on the prevention of injury and the promotion of safety (May 2007) (10) provide a public health framework for action that includes the support of Member States in addressing the problem more comprehensively. These have placed injury and violence prevention firmly on the public health agenda. The implementation of the resolution and the Recommendation led to higher injury prevention activities in the EU and the WHO European Region (4). The main Slovenian policies in the field of road traffic safety are Resolution on National Programme on Road Traffic Safety and Periodic plan for road traffic safety (2007-2011). Presentation of Data:
Figure 1: Injury rate due to traffic accidents by NUTS2, Slovenia, 2006-2008

SELECTED INDICATORS REPORT
214
Figure 2: Injury rate due to traffic accidents by counties (NUTS3), Slovenia, 2006-2008
205 210 215 220 225 230 235 240 245 250
Vzhodna Slovenija (SI01)
Zahodna Slovenija (SI02)
number of injuries / 100000 population
Injury rate due to traffic accidents in Slovenia by regions (NUTS2), 2006-2008
national value
Figure 3: Injury rate due to traffic accidents by counties (NUTS3), Slovenia, 2006-2008

SELECTED INDICATORS REPORT
215
0 50 100 150 200 250 300
Pomurska (SI011)
Podravska (SI012)
Koroska (SI013)
Savinjska (SI014)
Zasavska (SI015)
Spodnjeposavska (SI016)
Jugovzhodna Slovenija (SI017)
Notranjsko-kraska (SI018)
Osrednjeslovenska (SI021)
Gorenjska (SI022)
Goriska (SI023)
Obalno-kraska (SI024)
number of injuries / 100000 population
Injury rate due to traffic accidents in Slovenia by counties (NUTS3), 2006-2008
national value
Figure 4: Injury rate due to traffic accidents by counties (NUTS3), Slovenia, 2006-2008

SELECTED INDICATORS REPORT
216
150
175
200
225
250
275
300
325
350
2003-2005 2004-2006 2005-2007 2006-2008
num
ber o
f inj
urie
s /
1000
00 p
opul
atio
n
Injury rate due to traffic accidents by regions (NUTS2), Slovenia
Vzhodna Slovenija (SI01)Zahodna Slovenija (SI02)national value
Figure 5: Injury rate due to traffic accidents by counties (NUTS3), Slovenia, 2006-2008
150
175
200
225
250
275
300
325
350
2003-2005 2004-2006 2005-2007 2006-2008
num
ber o
f inj
urie
s /
1000
00 p
opul
atio
n
Injury rate due to traffic accidents by counties (NUTS3) in region Vzhodna Slovenija, Slovenia
Pomurska (SI011) Podravska (SI012) Koroska (SI013)
Savinjska (SI014) Zasavska (SI015) Spodnjeposavska (SI016)
Jugovzhodna Slovenija (SI017) Notranjsko-kraska (SI018) national value
Figure 6: Injury rate due to traffic accidents by counties (NUTS3), Slovenia, 2006-2008

SELECTED INDICATORS REPORT
217
150
175
200
225
250
275
300
325
350
2003-2005 2004-2006 2005-2007 2006-2008
num
ber o
f inj
urie
s /
1000
00 p
opul
atio
n
Injury rate due to traffic accidents by counties (NUTS3) in region Zahodna Slovenija, Slovenia
Osrednjeslovenska (SI021)
Gorenjska (SI022)
Goriska (SI023)
Obalno-kraska (SI024)
national value
Figure 7: Injury rate due to traffic accidents in Zahodna Slovenija, Slovenia, 2003-2008
Code Country NUTS1 NUTS2 NUTS3 SI Slovenija SI0 Slovenija SI01 Vzhodna Slovenija SI011 Pomurska SI012 Podravska SI013 Koroska SI014 Savinjska SI015 Zasavska SI016 Spodnjeposavska SI017 Jugovzhodna Slovenija SI018 Notranjsko-kraska SI02 Zahodna Slovenija SI021 Osrednjeslovenska SI022 Gorenjska SI023 Goriska SI024 Obalno-kraska
Annex 1: Territorial units of Slovenia* *Regulation (EC) No 1888/2005 of the European Parliament and of the Council of 26 October 2005 amending Regulation (EC) No 1059/2003 on the establishment of a common classification of territorial units for statistics (NUTS) by reason of the accession of the Czech Republic, Estonia, Cyprus, Latvia, Lithuania, Hungary, Malta, Poland, Slovenia and Slovakia to the European Union

SELECTED INDICATORS REPORT
218
Assessment: Road traffic injuries are still a leading cause of death in the WHO European Region and therefore a major public health topic. By 2020 RTIs are predicted to be the third leading contributor to the global burden of disease and injuries because of an increased rate of RTIs in low- and middle income countries due to an increasing motorization in these countries (6). Despite the significant growth in European road traffic volumes, it has been possible to reduce the total road death toll by 44% between 1991 and 2006. While this positive trend can be seen across all countries in the European Union, there are significant variations between the different regions. Geographically, the highest rates of road deaths are to be found in eastern and south-eastern Member States of the European Union. Given the still lower level of vehicle ownership in most of these countries, the reasons behind these high values – compared to western Europe – can probably be found in the quality of infrastructure supply and less-developed awareness of road safety issues in these countries (1). Therefore rates of deaths due to road traffic accidents are twice as high in low- and middle-income countries as in high income countries. Children in deprived areas may have a four times higher risk for pedestrian injuries than children in affluent areas. Overall, the most important risk factors for road traffic injuries are: unsafe road environments, speed, alcohol, and not using protective equipment such as seat belts, child car restraints and motorcycle helmets (3). Nevertheless, death rates from road traffic injuries have been falling consistently in the WHO European Region and the EU since the early 1990s. This shows that different types of prevention aspects, such as legislations on speeding or improving road environments, can contribute to a decrease in road traffic injuries (1, 3, 11). However, the high percentage of deaths and injuries due to RTIs is still alarming. Therefore it is important to implement a comprehensive strategy to defend RTIs. The fact that many states in the EU and WHO European Region have no national, multisectoral strategy on road safety demonstrates a lack for public health improvements and the existing need for adequate measures. Moreover it is unfortunately evident that many countries have inadequate legislation to control speed in urban areas, drink-driving and the use of helmets, seat-belts and child car restraints. Also it is important to consider, that the existence of legislations for the abatement of RTIs does not automatically prevent road traffic injuries: Even well-designed legislation has no effect if it is not properly enforced (5). Moreover there are still a few promising interventions for preventing RTIs which are not implemented yet, e.g. the increase of licensing age for driving motorcycles from 16 to 18 years. Nevertheless, these measures need to be more widely implemented in the Region (4). Another important aspect for the improvement of road safety is to create safe environments. Neighbourhood characteristics of the built environment, like the existence of sidewalks and walking and jogging trails, are associated with increased physical activity and decreased RTIs3. Furthermore, the WHO recommends for a greater investment in and use of safer modes of transport. That would contribute to reducing both road traffic injuries and the other adverse health effects of car transport (4). Application of Health Impact Assessment (HIA) on transport plans and policies (12) may support the demands of the WHO, that implemented transport policies should “integrate road safety with environmental and health concerns” (5). According to the police records the number of injuries due to road traffic accidents decreases. More accurate hospital admission data revealed that hospital admissions decrease too. The highest number of hospital admissions is in jugovzhodna Slovenija region and the lowest in Spodnjeposavska region. Data underlying the indicator:
• Primary source: National Institute of Public Health, Slovenia • Date last published: 2008 • Time period of analysis: 2003-2008 • Numerator definition Total number of injuries due to road traffic accidents • Source of numerator: National Institute of Public Health, Slovenia

SELECTED INDICATORS REPORT
219
• Denominator definition: Total resident population by gender and age • Source of denominator: Statistical Office of the Republic of Slovenia • Geographic coverage: NUTS1, NUTS2, NUTS3 • Timeliness: annually • Accuracy and completeness of data set: Only hospital admission data. • Disclosure control: According to national legislation
References: 1. Road safety at regional level, Luxembourg, Eurostat, 2010
(http://epp.eurostat.ec.europa.eu/statistics_explained/index.php/Road_safety_at_regional_level, accessed 5 July 2010)
2. Transport, Health and Environment Pan-European Programme – The PEP. Transport-related health effects with a particular focus on children. Geneva, World Health Organization and United Nations Economic Commission for Europe, 2004 (http://www.euro.who.int/__data/assets/pdf_file/0006/97818/PEPBrochureFeb08v8_A3.pdf, accessed 14 July 2010)
3. Health and Environment in Europe: Progress Assessment. Copenhagen. WHO Regional Office for Europe, 2010
4. Preventing injuries in Europe – From international collaboration to local implementation. Copenhagen. WHO Regional Office for Europe, 2010
5. European status report on road safety – Toward safer roads and healthier transport. Copenhagen. WHO Regional Office for Europe, 2009.
6. World report on road traffic injury prevention: Summary. Geneva. World Health Organization, 2004 (http://www.who.int/violence_injury_prevention/publications/road_traffic/world_report/summary_en_rev.pdf, accessed 14 July 2010)
7. White paper - European transport policy for 2010: time to decide. Brussels. Commission of the European Communities, 2010
http://ec.europa.eu/transport/strategies/doc/2001_white_paper/lb_com_2001_0370_en.pdf, accessed 26 July 2010)
8. Communication from the Commission concerning Commission recommendation of 21 October 2003 on enforcement in the field of road safety (2004/C 93/04). European Commission, 2003. Official Journal C 093 , p.5-8.
(http://eur-lex.europa.eu/LexUriServ/LexUriServ.do?uri=CELEX:52004XC0417(03):EN:HTML, accessed 26 July 2010)
9. Children’s Environment and Health Action Plan for Europe. Fourth Ministerial Conference on Environment and Health, Budapest, 23-25, June 2004 (http://www.euro.who.int/document/e83338.pdf, accessed 5 July 2010)
10. European Council. Council recommendation of 31 May 2007 on the prevention of injury and promotion of safety. Official Journal of the European Union, 2007, C 164:1– 2
11. Pulido, J. et al.: Impact of the demerit point system on road traffic accident mortality in Spain. J Epidemiol Community Health, 2010, p. 274-276
12. Davis, A.: Health impact assessment. In: The social determinants of health and the role of local government (Ed: Campbell, F.), London, Improvement and development agency, 2010, p. 70-71
13. Prevention of injuries in the WHO European Region. WHO Regional Committee for Europe resolution EUR/RC55/R9. Copenhagen, WHO Regional Office for Europe, 2005 (http://www.euro.who.int/__data/assets/pdf_file/0017/88100/RC55_eres09.pdf, accessed 26 July 2010) Further Information:

SELECTED INDICATORS REPORT
220
European Commission: Road safety (http://ec.europa.eu/transport/road_safety/index_en.htm, accessed 13 July 2010) European Road Safety Observatory (http://ec.europa.eu/transport/wcm/road_safety/erso/index.html, accessed 13 July 2010) European Commission: Mobility and Transport: Statistics (http://ec.europa.eu/transport/publications/statistics/statistics_en.htm, accessed 13 July 2010) European Commission: CARE (Community Road Accident Database) (http://ec.europa.eu/idabc/en/document/2281/5926, accessed 6 July 2010) World Health Organization: Road traffic injuries (http://www.who.int/violence_injury_prevention/road_traffic/en/, accessed 5 July 2010)
Author: Peter Otorepec, Ana Hojs, Katarina Bitenc, Pia Vračko, Irena Jeraj, national Institute of Public Health, Slovenia Date of production: March 2011

SELECTED INDICATORS REPORT
221
Spain Name of indicator: Injury rate due to road traffic accidents Definition: Injury rate due to road traffic accidents Key Message: Road traffic injuries (RTIs) are a great concern in Spain gven that it is among the highest in Europe. Policy interventions to tackle this problem since 2006 have led to a change in the behaviour of drivers and to a significant decrease in traffic accidents and injuries in the last 4 years, reducing mortality to almost half that since 2006. Injuries and accidents are however still high and continued attention is necessary in order to tackle this public health burden in Spain. Rationale: Road traffic injuries are major public health problem with annually 2.4 million injuries in the WHO European Region. In the European Union about 43 000 people died in road accidents in 2006, which is more than 20 times the combined total of fatalities in rail and air transport for that year1. Road traffic injuries (RTIs) represent the leading cause of death among adolescents and young adults. Approximately four fifths of these deaths occur in the group aged 15-24 years. In the event of an accident the head-to-body ratio increases the risk of head injuries for children, and their height increases the likelihood that vital body parts are hit when collisions occur2. Furthermore, evidence shows that up to 33% of children involved in road traffic injuries develop post-traumatic stress disorder3, 4. The most vulnerable road users are pedestrians, cyclists and users of motorized two wheelers who constitute 39% of all deaths in road crashes. Some of 80% of those aged 0-24 years involved in road crashes are male3, 5. For young adults the lack of experience in driving is the leading cause of road traffic injuries, especially in males6. The social and (mental) health impact, as well as the economic impact of road traffic injuries is substantial. Supplementary to the individual health burden, the economic costs of road traffic injuries are immensely high: estimates suggest that they cost about 2-3% of the gross domestic product due to the service costs of treating injured and disabled people and the forgone production for a society3,
5. For the European Union RTIs alone amount of more than € 180 billion each year. This is twice of the EU budget allocated for all its activities3.
The reduction of traffic-related deaths over the last two decades shows that these injuries and deaths are preventable. Unfortunately, this downward trend has stopped in those countries in the East of the WHO Region in the last 10 years. This shows the requirement for further actions in the field of public health in relation to RTIs5.
Policy Relevance and Context: Strong political commitment and evidence-based policies are required for the adoption of a comprehensive approach to road safety. Indicators based on mortality from RTIs support policy evaluation with respect to the desired final outcome (reduction of RTI mortality) by providing benchmarks and setting a baseline against which progress can be monitored over time. In 2001, the European Commission released the Transport White Paper, which proposed the goal to save yearly 25.000 lives on European roads by 20107. In 2003, the European Commission adopted the Road Safety Action Programme8. According to its announcements in the White Paper, the Action Programme pointed out main determinants of RTIs and identified six main areas to combat the problems:

SELECTED INDICATORS REPORT
222
• Encouraging road users to improve their behaviour • Using technical progress to make vehicles safer • Encouraging the improvement of road infrastructure • Safe commercial goods and passenger transport • Emergency services and care for road accident victims • Accident data collection, analysis and dissemination.
In 2004, the Fourth Ministerial Conference on Environment and Health adopted the CEHAPE (Children’s Environment and Health Action Plan for Europe). The prevention and reduction of health consequences from accidents and injuries are part of the CEHAPE RPG II. Overall morbidity and mortality should be addressed by “b.) advocating the strengthened implementation of road safety measure, including adequate speed limits as well as education for drivers and children, and enforcement of the corresponding legislation (…); c.) advocating, supporting and implementing children-friendly urban planning und development as well as sustainable transport and planning management, by promoting cycling, walking and public transport in order to provide safer and healthier mobility within the community”9. The Resolution EUR/RC55/R9 on the prevention of injuries in the WHO European Region (September 2005)12 and the European Council Recommendation on the prevention of injury and the promotion of safety (May 2007)10 provide a public health framework for action that includes the support of Member States in addressing the problem more comprehensively. These have placed injury and violence prevention firmly on the public health agenda. The implementation of the resolution and the Recommendation led to higher injury prevention activities in the EU and the WHO European Region4.
Spain has transposed European traffic policies regarding the maximum alcohol limits, use of seat belts and other retention measures etc. However, up to 4 years ago, traffic accidents and mortality in Spain have been among the highest in Europe. To address this public health, Spain undertook in 2006, a significant policy change by issuing the Law of the Driving License based on the “point system”. A point system is one in which a driver's licensing authority issues demerits, or points to drivers on conviction for road traffic offenses. Points may either be added or subtracted, depending on the particular system in use. A major offense may lead to more than the maximum allowed points being issued, but more typically, the accumulation (or loss) of too many points over a given period or time can lead to additional penalties, including fines and suspension or revocation of the driver's license. The primary purpose of such point systems is to identify and deter repeat offenders of traffic laws, whilst also streamlining the legal process. Additionally, points may be recovered totally or partially through attendance to education programs aimed and raising awareness and changing driving behaviour. Only a few years later, mortality has decreased by almost 50%.
Presentation of Data:
0
100
200
300
400
500
600
1999 2000 2001 2002 2003 2004 2005 2006 2007
num
ber
of in
juri
es /
100
000
popu
lati
on
Injury rate due to traffic accidents by NUTS2 in the north-western part of Spain (Noroeste)
Galicia (ES11)
Principado de Asturias (ES12)
Cantabria (ES13)
Figure 1a: Injury rate due to traffic accidents in Spain by NUTS2 for the period 1999 - 2008

SELECTED INDICATORS REPORT
223
0
100
200
300
400
500
600
1999 2000 2001 2002 2003 2004 2005 2006 2007
num
ber
of in
juri
es /
100
000
popu
latio
n
Injury rate due to traffic accidents by NUTS2 in the north-eastern part of Spain (Noreste)
País Vasco (ES21)
Comunidad Foral de Navarra (ES22)
La Rioja (ES23)
Aragón (ES24)
Figure 1b: Injury rate due to traffic accidents in Spain by NUTS2 for the period 1999 - 2008
0
100
200
300
400
500
600
1999 2000 2001 2002 2003 2004 2005 2006 2007
num
ber
of in
juri
es /
100
000
popu
latio
n
Injury rate due to traffic accidents by NUTS2 in Madrid and in the central part (Centro) of Spain
Comunidad de Madrid (ES30)
Castilla y León (ES41)
Castilla-La Mancha (ES42)
Extremadura (ES43)
0
100
200
300
400
500
600
1999 2000 2001 2002 2003 2004 2005 2006 2007
num
ber
of in
juri
es /
100
000
popu
latio
n
Injury rate due to traffic accidents by NUTS2 in the eastern part of Spain (Este)
Cataluña (ES51)
Comunidad Valenciana (ES52)
Illes Balears (ES53)
Figure 1c: Injury rate due to traffic accidents in Spain by NUTS2 for the period 1999 - 2008

SELECTED INDICATORS REPORT
224
0
100
200
300
400
500
600
700
800
900
1000
1100
1200
1999 2000 2001 2002 2003 2004 2005 2006 2007
num
ber
of in
juri
es /
100
000
popu
latio
n
Injury rate due to traffic accidents by NUTS2 in Canarias and in the southern part (Sur) of Spain
Andalucía (ES61)
Región de Murcia (ES62)
Ciudad Autónoma de Ceuta (ES63)
Figure 1d: Injury rate due to traffic accidents in Spain by NUTS2 for the period 1999 - 2008
0
100
200
300
400
500
600
700
800
1999 2000 2001 2002 2003 2004 2005 2006 2007
num
ber
of in
juri
es /
100
000
popu
latio
n
Injury rate due to traffic accidents by provinces NUTS3 in País Vasco, Spain
Álava (ES211)
Guipúzcoa (ES212)
Vizcaya (ES213)
País Vasco (ES21)
Figure 2: Injury rate due to traffic accidents in Spain by NUTS3 for the period 1999 - 2008

SELECTED INDICATORS REPORT
225
0 250 500 750 1000 1250
Galicia (ES11)
Principado de Asturias (ES12)
Cantabria (ES13)
País Vasco (ES21)
Comunidad Foral de Navarra (ES22)
La Rioja (ES23)
Aragón (ES24)
Comunidad de Madrid (ES30)
Castilla y León (ES41)
Castilla-La Mancha (ES42)
Extremadura (ES43)
Comunidad Valenciana (ES52)
Illes Balears (ES53)
Andalucía (ES61)
Región de Murcia (ES62)
Ciudad Autónoma de Ceuta (ES63)
number of injuries / 100000 population
Injury rate due to traffic accidents in Spain by NUTS2, 2007
Figure 4: Injury rate due to traffic accidents in Spain by NUTS2, 2007
Assessment: Road traffic injuries are still a leading cause of death in the WHO European Region and therefore a major public health topic. By 2020 RTIs are predicted to be the third leading contributor to the global burden of disease and injuries because of an increased rate of RTIs in low- and middle income countries due to an increasing motorization in these countries6. Despite the significant growth in European road traffic volumes, it has been possible to reduce the total road death toll by 44% between 1991 and 2006. While this positive trend can be seen across all countries in the European Union, there are significant variations between the different regions. Geographically, the highest rates of road deaths are to be found in eastern and south-eastern Member States of the European Union. Given the still lower level of vehicle ownership in most of these countries, the reasons behind these high values, compared to western Europe, can probably be found in the quality of infrastructure supply and less-developed awareness of road safety issues in these countries1. Therefore rates of deaths due to road traffic accidents are twice as high in low- and middle-income countries as in high income countries. Children in deprived areas may have a four times higher risk for pedestrian injuries than children in affluent areas. Overall, the most important risk factors for road traffic injuries are: unsafe road environments, speed, alcohol, and not using protective equipment such as seat belts, child car restraints and motorcycle helmets3. Nevertheless, death rates from road traffic injuries have been falling consistently in the WHO European Region and the EU since the early 1990s. This shows that different types of prevention aspects, such as legislations on speeding or improving road environments, can contribute to a decrease in road traffic injuries1, 3, 11. However, the high percentage of deaths and injuries due to RTIs still gives cause for concern. Therefore it is important to implement a comprehensive strategy to redress RTIs. The fact that many states in the EU and WHO European Region have no national,

SELECTED INDICATORS REPORT
226
multisectoral strategy on road safety demonstrates a lack for public health awareness and the existing need for adequate measures. Moreover it is unfortunately evident that many countries have inadequate legislation to control speed in urban areas, drink-driving and the use of helmets, seat-belts and child car restraints. Also it is important to consider, that the existence of legislations for the abatement of RTIs does not automatically prevent road traffic injuries: Even well-designed legislation has no effect if it is not properly enforced5. Moreover there are still a few promising interventions for preventing RTIs which are not implemented yet, e.g. the increase of licensing age for driving motorcycles from 16 to 18 years. Nevertheless, these measures need to be more widely implemented in the Region4. Another important aspect for the improvement of road safety is to create safe environments. Neighbourhood characteristics of the built environment, like the existence of sidewalks and walking and jogging trails, are associated with increased physical activity and decreased RTIs3. Furthermore, the WHO recommends for a greater investment in and use of safer modes of transport. That would contribute to reducing both road traffic injuries and the other adverse health effects of car transport4. Application of Health Impact Assessment (HIA) on transport plans and policies12 may support the demands of the WHO, that implemented transport policies should “integrate road safety with environmental and health concerns”5.
The total number of road traffic injuries (RTIs) decreased constantly in the WHO European Region and the EU, despite the significant growth of European traffic volumesTraffic accidents have been and continue to be a great problem in Spain, though a significant decrease in the number of accidents and specially in the severity of accidents and injuries have been observed in the last few years. In 1999, traffic fatalities by population in Spain were almost the highest of the EU-15, exceeded only by that of Portugal, and those of the EU12. In 2008 however, fatalities per population had decreased by approximately 50%, from 5738 in 1999, to 2605 in 2009. In 2005, just before the issuing of the legislation on the driving licence based on a point system, which entered into force on January 2006, the number of fatalities was 4442.
The graphs included in this factsheet show slight decrease in injury mortality for only a few NUTS2 regions and fails to illustrate the considerable progress made in the past 4 years through the enactment of the legislation on the driving license based on the point system which entered into force on January 1st, 2006. Although by 2007 the effect of this legislation had already started to have its impact, and fatalities had decreased from 4442 in 2005 to 3823 in 2007, this is not evident in the graphs, as they illustrate number of injured, and they include both slightly and severely injured. At national level, the number of accidents with victims was in fact higher in 2007 (100.508 accidents) than in 1999 (97.811), and the number of injured went from 148.632 in 1999 to 146.344 in 2007. However, there was a decrease in both the number of death (from 5738 to 3823) and the number of severely injured (from 31.883 to 19.294) in the same years, while the number slightly injured increased. By 2008, however, the total number of injured in the country had decreased to 130.947, and the number of severely injured was 16488, almost half of the number of severely injured in 1999.
A significant variability in injury rates among NUTS2 regions can be observed in Figure 2. The analysis of such differences is beyond the scope of this factsheet, though it should be the subject of study. Of particular focus should be the regions that have achieved to decrease the number of injured to the lowest level in the country. However, without an in-depth study of the measures taken in such regions, the population and other environmental factors that influence accident rate (such as road quality), the causes of such variability cannot be ascertained.
Data underlying the indicator: • Primary source: National Institute of Statistics • Date last publishe: 2008 • Time period of analysis: 1999-2008 • Numerator definition: Annual number of injured in traffic accidents • Source of numerator: Police reports • Denominator definition: Total population

SELECTED INDICATORS REPORT
227
• Source of denominator: national institute of statistics • Geographic coverage: national and sub-national • Timeliness: • Accuracy and completeness of data set: Injured data are accurate (there are quality control
mechanisms in place) and complete • Disclosure control
References: 1. European status report on road safety – Toward safer roads and healthier transport.
Copenhagen. WHO Regional Office for Europe, 2009. 2. Health and Environment in Europe: Progress Assessment. Copenhagen. WHO Regional
Office for Europe, 2010 3. Preventing injuries in Europe – From international collaboration to local implementation.
Copenhagen. WHO Regional Office for Europe, 2010 4. Pulido, J. et al.: Impact of the demerit point system on road traffic accident mortality in Spain.
J Epidemiol Community Health, 2010, p. 274-276 5. Davis, A.: Health impact assessment. In: The social determinants of health and the role of
local government (Ed: Campbell, F.), London, Improvement and development agency, 2010, p. 70-71 6. Children’s Environment and Health Action Plan for Europe. Fourth Ministerial Conference on
Environment and Health, Budapest, 23-25, June 2004 (http://www.euro.who.int/document/e83338.pdf, accessed 5 July 2010)
7. Road safety at regional level, Luxembourg, Eurostat, 2010 (http://epp.eurostat.ec.europa.eu/statistics_explained/index.php/Road_safety_at_regional_level, accessed 5 July 2010)
8. Transport, Health and Environment Pan-European Programme – The PEP. Transport-related health effects with a particular focus on children. Geneva, World Health Organization and United Nations Economic Commission for Europe, 2004 (http://www.euro.who.int/__data/assets/pdf_file/0006/97818/PEPBrochureFeb08v8_A3.pdf, accessed 14 July 2010)
9. World report on road traffic injury prevention: Summary. Geneva. World Health Organization, 2004 (http://www.who.int/violence_injury_prevention/publications/road_traffic/world_report/summary_en_rev.pdf, accessed 14 July 2010)
10. White paper - European transport policy for 2010: time to decide. Brussels. Commission of the European Communities, 2010
http://ec.europa.eu/transport/strategies/doc/2001_white_paper/lb_com_2001_0370_en.pdf, accessed 26 July 2010)
11. Communication from the Commission concerning Commission recommendation of 21 October 2003 on enforcement in the field of road safety (2004/C 93/04). European Commission, 2003. Official Journal C 093 , p.5-8.
(http://eur-lex.europa.eu/LexUriServ/LexUriServ.do?uri=CELEX:52004XC0417(03):EN:HTML, accessed 26 July 2010)
12. Prevention of injuries in the WHO European Region. WHO Regional Committee for Europe resolution EUR/RC55/R9. Copenhagen, WHO Regional Office for Europe, 2005 (http://www.euro.who.int/__data/assets/pdf_file/0017/88100/RC55_eres09.pdf, accessed 26 July 2010)
13. European Council. Council recommendation of 31 May 2007 on the prevention of injury and promotion of safety. Official Journal of the European Union, 2007, C 164:1– 2 Further Information:

SELECTED INDICATORS REPORT
228
European Commission: Road safety (http://ec.europa.eu/transport/road_safety/index_en.htm, accessed 13 July 2010) European Road Safety Observatory (http://ec.europa.eu/transport/wcm/road_safety/erso/index.html, accessed 13 July 2010) European Commission: Mobility and Transport: Statistics (http://ec.europa.eu/transport/publications/statistics/statistics_en.htm, accessed 13 July 2010) European Commission: CARE (Community Road Accident Database) (http://ec.europa.eu/idabc/en/document/2281/5926, accessed 6 July 2010) World Health Organization: Road traffic injuries (http://www.who.int/violence_injury_prevention/road_traffic/en/, accessed 5 July 2010)
Author: María José Carroquino. ISCIII, Spain. Date of production: September 2010

SELECTED INDICATORS REPORT
229
United Kingdom Name of indicator: Injury rate due to road traffic accidents Definition: Injury rate due to road traffic accidents Key Message: An upward trend in the rates of road traffic injuries has been observed in WHO European countries as well as in the United Kingdom. The trend is also similar in the Government Office Regions (NUTS1) of the UK; however variations are noted at a smaller local level (NUTS3) where local authorities such as Birmingham have shown a decrease in RTI rates since 2003. Rationale: Road traffic injuries are major public health problem with annually 2.4 million injuries in the WHO European Region. In the European Union about 43 000 people died in road accidents in 2006, which is more than 20 times the combined total of fatalities in rail and air transport for that year1. Road traffic injuries (RTIs) represent the leading cause of death among adolescents and young adults. Approximately four fifths of these deaths occur in the group aged 15-24 years. In the event of an accident the head-to-body ratio increases the risk of head injuries for children, and their height increases the likelihood that vital body parts are hit when collisions occur2. Furthermore, evidence shows that up to 33% of children involved in road traffic injuries develop post-traumatic stress disorder3, 4. The most vulnerable road users are pedestrians, cyclists and users of motorized two wheelers who constitute 39% of all deaths in road crashes. Some of 80% of those aged 0-24 years involved in road crashes are male3, 5. For young adults the lack of experience in driving is the leading cause of road traffic injuries, especially in males6. The social and (mental) health impact, as well as the economic impact of road traffic injuries is substantial. Supplementary to the individual health burden, the economic costs of road traffic injuries are immensely high: estimates suggest that they cost about 2-3% of the gross domestic product due to the service costs of treating injured and disabled people and the forgone production for a society3,
5. For the European Union RTIs alone amount of more than € 180 billion each year. This is twice of the EU budget allocated for all its activities3. The reduction of traffic-related deaths over the last two decades shows that these injuries and deaths are preventable. Unfortunately, this downward trend has stopped in those countries in the East of the WHO Region in the last 10 years. This shows the requirement for further actions in the field of public health in relation to RTIs5. Policy Relevance and Context: Strong political commitment and evidence-based policies are required for the adoption of a comprehensive approach to road safety. Indicators based on mortality from RTIs support policy evaluation with respect to the desired final outcome (reduction of RTI mortality) by providing benchmarks and setting a baseline against which progress can be monitored over time. In 2001, the European Commission released the Transport White Paper, which proposed the goal to save yearly 25.000 lives on European roads by 20107. In 2003, the European Commission adopted the Road Safety Action Programme8. According to its announcements in the White Paper, the Action Programme pointed out main determinants of RTIs and identified six main areas to combat the problems:
• Encouraging road users to improve their behaviour • Using technical progress to make vehicles safer

SELECTED INDICATORS REPORT
230
• Encouraging the improvement of road infrastructure • Safe commercial goods and passenger transport • Emergency services and care for road accident victims • Accident data collection, analysis and dissemination.
In 2004, the Fourth Ministerial Conference on Environment and Health adopted the CEHAPE (Children’s Environment and Health Action Plan for Europe). The prevention and reduction of health consequences from accidents and injuries are part of the CEHAPE RPG II. Overall morbidity and mortality should be addressed by “b.) advocating the strengthened implementation of road safety measure, including adequate speed limits as well as education for drivers and children, and enforcement of the corresponding legislation (…); c.) advocating, supporting and implementing children-friendly urban planning und development as well as sustainable transport and planning management, by promoting cycling, walking and public transport in order to provide safer and healthier mobility within the community”9. The Resolution EUR/RC55/R9 on the prevention of injuries in the WHO European Region (September 2005)12 and the European Council Recommendation on the prevention of injury and the promotion of safety (May 2007)10 provide a public health framework for action that includes the support of Member States in addressing the problem more comprehensively. These have placed injury and violence prevention firmly on the public health agenda. The implementation of the resolution and the Recommendation led to higher injury prevention activities in the EU and the WHO European Region4. Over the last few decades, several policies and initiatives have been implemented to address road traffic accidents in the United Kingdom. These initiatives have been primarily targeted at speeding and driving under the influence of alcohol and drugs and include:
• Implementation of 70mph speed limits for highways and 30mph for residential areas in 1965 and 1935, respectively;
• The enforcement of the use of seat belts in 1983 under the Transport Act of 1981; • The use of speed radars and speed cameras under the Road Traffic Act of 1991; • Drug driving and drink driving offences under section 4 of the 1988 Road Traffic Act; • Implementation of speed bumps in residential areas in 1999; • Penalties such as speeding fines and suspension of driving license
Authorities have also used a variety of campaigns to address road safety issues such as motorcycles safety and drug and drink driving. Presentation of Data:
250
300
350
400
450
500
550
600
1999-2001 2000-2002 2001-2003 2002-2004 2003-2005 2004-2006 2005-2007 2006-2008
rate
of i
njur
ies
/ 10
0000
pop
ulat
ion
j y y g , g
North East (UKC) North West (UKD) Yorkshire and the Humber (UKE)East Midlands (UKF) West Midlands (UKG) East of England (UKH)London (UKI) South East (UKJ) South West (UKK)England
Figure 1: Injury rate due to traffic accidents in England by NUTS 1 for the period 1999-2008

SELECTED INDICATORS REPORT
231
250
300
350
400
450
500
550
600
1999-2001 2000-2002 2001-2003 2002-2004 2003-2005 2004-2006 2005-2007 2006-2008
rate
of i
njur
ies
/ 10
0000
pop
ulat
ion
, , g
Herefordshire, County of (UKG11)
Worcestershire (UKG12)
Warwickshire (UKG13)
West Midlands (UKG)
England
Figure 2a: Injury rate due to traffic accidents in England by NUTS3 (West Midlands) for the period 1999 - 2008
250
300
350
400
450
500
550
600
1999-2001 2000-2002 2001-2003 2002-2004 2003-2005 2004-2006 2005-2007 2006-2008
rate
of i
njur
ies
/ 10
0000
pop
ulat
ion
Injury rate due to traffic accidents by NUTS3 in Shropshire and Staffordshire, England
Telford and Wrekin (UKG21)
Shropshire CC (UKG22)
Stoke-on-Trent (UKG23)
Staffordshire CC (UKG24)
West Midlands (UKG)
England
Figure 2b: Injury rate due to traffic accidents in England by NUTS3 (West Midlands) for the period 1999 - 2008
250
300
350
400
450
500
550
600
1999-2001 2000-2002 2001-2003 2002-2004 2003-2005 2004-2006 2005-2007 2006-2008
rate
of i
njur
ies
/ 10
0000
pop
ulat
ion
Injury rate due to traffic accidents by NUTS3 in West Midlands (UKG3), England
Birmingham (UKG31) Solihull (UKG32)
Coventry (UKG33) Dudley and Sandwell (UKG34)
Walsall and Wolverhampton (UKG35) West Midlands (UKG)
England
Figure 2c: Injury rate due to traffic accidents in England by NUTS3 (West Midlands) for the period 1999 - 2008 Assessment:

SELECTED INDICATORS REPORT
232
Road traffic injuries are still a leading cause of death in the WHO European Region and therefore a major public health topic. By 2020 RTIs are predicted to be the third leading contributor to the global burden of disease and injuries because of an increased rate of RTIs in low- and middle income countries due to an increasing motorization in these countries6. Despite the significant growth in European road traffic volumes, it has been possible to reduce the total road death toll by 44% between 1991 and 2006. While this positive trend can be seen across all countries in the European Union, there are significant variations between the different regions. Geographically, the highest rates of road deaths are to be found in eastern and south-eastern Member States of the European Union. Given the still lower level of vehicle ownership in most of these countries, the reasons behind these high values, compared to western Europe, can probably be found in the quality of infrastructure supply and less-developed awareness of road safety issues in these countries1. Therefore rates of deaths due to road traffic accidents are twice as high in low- and middle-income countries as in high income countries. Children in deprived areas may have a four times higher risk for pedestrian injuries than children in affluent areas. Overall, the most important risk factors for road traffic injuries are: unsafe road environments, speed, alcohol, and not using protective equipment such as seat belts, child car restraints and motorcycle helmets3. Nevertheless, death rates from road traffic injuries have been falling consistently in the WHO European Region and the EU since the early 1990s. This shows that different types of prevention aspects, such as legislations on speeding or improving road environments, can contribute to a decrease in road traffic injuries1, 3, 11. However, the high percentage of deaths and injuries due to RTIs still gives cause for concern. Therefore it is important to implement a comprehensive strategy to redress RTIs. The fact that many states in the EU and WHO European Region have no national, multisectoral strategy on road safety demonstrates a lack for public health awareness and the existing need for adequate measures. Moreover it is unfortunately evident that many countries have inadequate legislation to control speed in urban areas, drink-driving and the use of helmets, seat-belts and child car restraints. Also it is important to consider, that the existence of legislations for the abatement of RTIs does not automatically prevent road traffic injuries: Even well-designed legislation has no effect if it is not properly enforced5. Moreover there are still a few promising interventions for preventing RTIs which are not implemented yet, e.g. the increase of licensing age for driving motorcycles from 16 to 18 years. Nevertheless, these measures need to be more widely implemented in the Region4. Another important aspect for the improvement of road safety is to create safe environments. Neighbourhood characteristics of the built environment, like the existence of sidewalks and walking and jogging trails, are associated with increased physical activity and decreased RTIs3. Furthermore, the WHO recommends for a greater investment in and use of safer modes of transport. That would contribute to reducing both road traffic injuries and the other adverse health effects of car transport4. Application of Health Impact Assessment (HIA) on transport plans and policies12 may support the demands of the WHO, that implemented transport policies should “integrate road safety with environmental and health concerns”5. The total number of road traffic injuries (RTIs) decreased constantly in the WHO European Region and the EU, despite the significant growth of European traffic volumes. Injury rate due to road traffic accidents has increased slightly in England for the period 1999-2008 from approximately 340 per 100,000 to 360 per 100,000; with all regions following a similar pattern. The South-West region has consistently had the highest injury rates in England and was approximately 570 per 100,000 from 2006-2008 (Figure 1). The injury rate in the West Midlands is higher than the national average. Furthermore, age and sex specific analysis carried out by Stewart et al (2010)14 demonstrated that the rates were higher for boys than girls and continued to rise with age, peaking at 18 years. For the reporting period, Stoke-on-Trent generally had the highest injury rates and Telford and Wrekin had the lowest injury rates (Figures 2a & 2b). Although injury rates increased in all districts of the West Midlands, a decrease in

SELECTED INDICATORS REPORT
233
injury rates was observed in the city of Birmingham (Figure 2c). In 2003, it became illegal to use a hand held mobile phones while driving in the United Kingdom; this coincided with the decline in injury rates in Birmingham15. Data underlying the indicator:
• Primary Source: National Centre for Health Outcomes Development • Date last Published: 2008 • Time period of analysis: 1999 - 2008 • Numerator definition: Number of road traffic injuries • Source of numerator: National Centre for Health Outcomes Development • Denominator definition: Total population • Source of denominator: Office of National Statistics • Geographic coverage: England • Timeliness: Annually • Accuracy and completeness: Data accurate and complete • Disclosure control: Information is in the public domain
References: 1. Road safety at regional level, Luxembourg, Eurostat, 2010
(http://epp.eurostat.ec.europa.eu/statistics_explained/index.php/Road_safety_at_regional_level, accessed 5 July 2010)
2. Transport, Health and Environment Pan-European Programme – The PEP. Transport-related health effects with a particular focus on children. Geneva, World Health Organization and United Nations Economic Commission for Europe, 2004 (http://www.euro.who.int/__data/assets/pdf_file/0006/97818/PEPBrochureFeb08v8_A3.pdf, accessed 14 July 2010)
3. Health and Environment in Europe: Progress Assessment. Copenhagen. WHO Regional Office for Europe, 2010
4. Preventing injuries in Europe – From international collaboration to local implementation. Copenhagen. WHO Regional Office for Europe, 2010
5. European status report on road safety – Toward safer roads and healthier transport. Copenhagen. WHO Regional Office for Europe, 2009.
6. World report on road traffic injury prevention: Summary. Geneva. World Health Organization, 2004 (http://www.who.int/violence_injury_prevention/publications/road_traffic/world_report/summary_en_rev.pdf, accessed 14 July 2010)
7. White paper - European transport policy for 2010: time to decide. Brussels. Commission of the European Communities, 2010
http://ec.europa.eu/transport/strategies/doc/2001_white_paper/lb_com_2001_0370_en.pdf, accessed 26 July 2010)
8. Communication from the Commission concerning Commission recommendation of 21 October 2003 on enforcement in the field of road safety (2004/C 93/04). European Commission, 2003. Official Journal C 093 , p.5-8.
(http://eur-lex.europa.eu/LexUriServ/LexUriServ.do?uri=CELEX:52004XC0417(03):EN:HTML, accessed 26 July 2010)
9. Children’s Environment and Health Action Plan for Europe. Fourth Ministerial Conference on Environment and Health, Budapest, 23-25, June 2004 (http://www.euro.who.int/document/e83338.pdf, accessed 5 July 2010)
10. European Council. Council recommendation of 31 May 2007 on the prevention of injury and promotion of safety. Official Journal of the European Union, 2007, C 164:1– 2
11. Pulido, J. et al.: Impact of the demerit point system on road traffic accident mortality in Spain. J Epidemiol Community Health, 2010, p. 274-276
12. Davis, A.: Health impact assessment. In: The social determinants of health and the role of local government (Ed: Campbell, F.), London, Improvement and development agency, 2010, p. 70-71
13. Prevention of injuries in the WHO European Region. WHO Regional Committee for Europe resolution EUR/RC55/R9. Copenhagen, WHO Regional Office for Europe, 2005 (http://www.euro.who.int/__data/assets/pdf_file/0017/88100/RC55_eres09.pdf, accessed 26 July 2010)
14. Stewart L, Saunders P and Kemm J (2008). Children’s Environment and Health Action Plan

SELECTED INDICATORS REPORT
234
(CEHAP): Pilot Environmental Health Indicators Toolkit (in press) 15. Department for Transport. Road safety. Available from:
http://www.dft.gov.uk/pgr/roadsafety/. (Assessed 13 September 2010). Further Information: European Commission: Road safety (http://ec.europa.eu/transport/road_safety/index_en.htm, accessed 13 July 2010) European Road Safety Observatory (http://ec.europa.eu/transport/wcm/road_safety/erso/index.html, accessed 13 July 2010) European Commission: Mobility and Transport: Statistics (http://ec.europa.eu/transport/publications/statistics/statistics_en.htm, accessed 13 July 2010) European Commission: CARE (Community Road Accident Database) (http://ec.europa.eu/idabc/en/document/2281/5926, accessed 6 July 2010) World Health Organization: Road traffic injuries (http://www.who.int/violence_injury_prevention/road_traffic/en/, accessed 5 July 2010) Author: Adedoyin Awofisayo and Lorraine Stewart, Health Protection Agency, United Kingdom Date of production: 13 September 2010

SELECTED INDICATORS REPORT
235
2.6 Regional Assessment for Incidence of Melanoma
Germany Name of indicator: Incidence of melanoma Definition: Incidence of melanoma as defined by ICD-10 codes C43, D03 in the population aged under 55 years Key Message: The incidence rate of melanoma is increasing in Germany with variations noted in different areas of Germany and North Rhine-Westphalia. In comparison to other cancers, young people are particularly affected. Melanoma is linked to exposure to UV radiation during childhood. Specific measures and laws have been established in Germany to lower the exposure especially for children. Additionally preventive measures in form of education and information have been established for the entire population. Rationale: Acute, irregular and excessive exposure to the sun, mainly during childhood, by people with fair skins is a major risk factor for melanoma, a malignant cancer of pigment cells in the skin. Considering the 20–40-year time-lag between exposure to the sun and onset of the cancer, the incidence of melanoma among people aged under 55 years and the respective time trends will be a good indicator of the final success of action against excessive exposure to ultraviolet (UV) radiation during childhood. It is estimated that in 2002, 9219 males and 12 303 females under the age of 55 years were diagnosed with melanoma in the European Union and the accession countries (Cyprus, Czech Republic, Estonia, Hungary, Latvia, Lithuania, Malta, Poland, Slovakia and Slovenia)1 2. Melanoma is a malignant transformation of the pigmentation cell (melanocyte) of the skin3. Most cases of melanoma seem to be caused by acute, intermittent and excessive exposure to the sun, mainly during childhood, although exposure in adulthood also contributes to the risk. Fitzpatrick skin types I and II (pale white or fair skin), large numbers of naevi or atypical naevi, and a family history of skin cancer are the most important predictors of melanoma risk4. Melanoma occurring in those aged under 55 years seems to be strongly linked to exposure to UV radiationin childhood5. This type of melanoma is often localized on the trunk of the body in males and on the legs in females. The fact that melanoma in the elderly occurs on the most chronically exposed parts of the body indicates that chronic exposure is more important for melanoma occurring among elderly people. The use of sun beds is an additional risk factor for melanoma6. Melanoma is more frequent among people in the higher socioeconomic groups and among northern European populations. This is probably due to their higher excessive intermittent exposure to UV radiation combined with a light skin type. The main way to prevent melanoma is to advise people to limit their exposure to the sun by avoiding such exposure during the time of day when UV radiation is most intense (approximately two hours each side of the solar noon) and to wear appropriate clothes, headwear and sunglasses. Special attention needs to be paid to children. The use of sun-screen preparations may help to prevent sunburn and skin cancer but may also lead to increased exposure to the sun. Survival is strongly linked to the stage of the disease at diagnosis, which provides a rationale for considering organized screening programmes for melanoma. However, evidence for the reduction of melanoma mortality through organized screening programmes is not yet available. Since the incidence of melanoma is expected to increasefurther in the future, early detection remains an important means of combating the disease. Prevention campaigns carried out in north-western European countries since the 1980s have probably resulted in a decrease in the average thickness of melanomas and a stabilization of melanoma mortality in young people7. Further, there is evidence that sun protection effectively lowers the number
SELECTED INDICATORS REPORT
236
of melanocytic naevi in children8. Policy Relevance and Context: Melanoma is strongly linked with exposure to UV radiation during childhood and is therefore largely preventable. WHO has launched the ongoing INTERSUN Global UV Project to stress the importance of increasing awareness and knowledge about the potential negative health effects of exposure to UV radiation, especially during childhood9. This information should be readily available through various channels such as television, radio, campaigns and meteorological web sites and in schools. Representatives of the tourism industry can also play a crucial role in minimizing the risks associated with exposure to the sun by disseminating information to their customers and by taking essential measures in tourism facilities and services. A UV radiation index can help to identify appropriate action based on the measured UV radiation levels. Further, the use of sun beds by children should be strongly discouraged, if not forbidden. The INTERSUN Project recommendations can serve as a framework for a European action plan to reduce exposure to UV radiation. There are at present few official regulations in most European countries (see ENHIS-2 fact sheet No. 4.8 of April 2007 on policies to reduce excessive exposure of children to UV radiation10). There are thus major opportunities for developing policy as well as for harmonizing and strengthening efforts to reduce such exposure. National policies to reduce exposure to artificial UV radiation – including regulations for the use of sun beds by children and teenagers – should be implemented in more countries in the WHO European Region. Excessive exposure to solar UV radiation can best be prevented by regional and local awareness-raising and information campaigns, especially in educational institutions. The aim is to encourage schoolchildren to take measures to protect themselves against the sun1. In 2004, the Fourth Ministerial Conference on Environment and Health adopted the Children’s Environment and Health Action Plan for Europe (CEHAPE)11, which includes four regional priority goals to reduce the burden of environment-related diseases in children. RPG IV aim to reduce the proportion of children with birth defects, mental retardation and developmental disorders, and to decrease the incidence of melanoma and non-melanoma skin cancer in later life and other childhood cancers by implementing policies to raise awareness and endeavour to ensure reduction of exposure to UV radiation, particularly in children and adolescents”. Previous measures regarding prevention of melanoma in Germany have concentrated on awareness raising campaigns. In 1989, the “Commission for Early Detection and Prevention of Melanoma”, of the “German Dermatological Society” launched nation-wide campaigns which were complemented by regional campaigns in the 1990s. These measures included actions improving primary and secondary prevention and raising awareness for regular checkups of noticeable pigmentations. In 2007 a prevention campaign called “Your skin. The most important 2 m2 of your life” was launched with the aim of reducing the incidence of skin diseases in general14. It is sponsored by the statutory health insurance and statutory accident insurance. On sub-national level a prevention campaign in Ruhr area, North Rhine-Westphalia, with the theme “Save your skin” was set up in 1995. In this context more than 10,000 persons were examined. Other regional measures for improving prevention of melanoma were implemented in different federal states of Germany. The health insurances are primarily in charge for these actions. Some examples are “Give Melanoma no chance” (BKK) in North Rhine-Westphalia, “Skin OK” (BKK) in Baden-Württemberg and a screening programme in Saxony by the AOK. These all took place during the nineties. Other measures were launched by regional Federations against Cancer and dermatological clinics15. In addition to these programmes, laws were adopted to lower the incidence of melanoma. Since August 2009 the use of sun beds by people under 18 years of age is forbidden by law16. This is aimed at lowering the risk of exposure to UV radiation especially in young childhood. Another law (implemented in July 2008) encourages the voluntary participation of all people aged 35 years and older in screening programmes biannually without incurring any charges. One of the health insurance companies (DAK) in North Rhine-Westphalia established 2006 free skin cancer screenings with the

SELECTED INDICATORS REPORT
237
beginning of the 20th year of life. Annual screenings are part of this programme. This action aims at early and targeted screening of and raising awareness in the population. Presentation of Data: Graphs are under construction (06/10/2010) Assessment: The incidence of melanoma skin cancer in people under the age of 55 years in Europe varies considerably among countries. The highest incidence is found in northern and western and the lowest in southern European countries, with rates from three to eight times lower for men and women, respectively. In eastern European countries, incidence is low to intermediate. These variations are likely to be linked to specific behaviour (winter holidays, sun seeking) as well as to improved rates of diagnosis resulting from better detection of melanoma. Trends in rates differ between regions: in northern Europe, where the rates are high, they appear to have levelled off since the 1990s, particularly among people aged under 55 years. This seems to be the result of a change in sun-seeking and protective behaviour against UV radiation among the younger generations. In contrast, in southern and eastern Europe, the rates are generally still increasing steeply in all age groups12 13. Currently, in almost all European countries, the incidence is higher in women than in men. Estimates of the age-standardized (world standard population) rate for women vary from under 2 to over 16 per 100 000. There is a strong geographical correlation between the European sub-regions and the incidence of melanoma in people aged under 55 years. The highest rates are found in northern (Denmark, Norway and Sweden) and western European countries (France, the Netherlands and the United Kingdom), with an incidence of 6–9 per 100 000 for males and 8–16 per 100 000 for females. Austria and Switzerland have among the highest rates for both sexes: around 6 per 100 000 for men and around 10 per 100 000 for women. The lowest incidence is found in southern Europe (Greece, Italy, Portugal and Spain) with rates of 2–4 per 100 000 for both men and women. In eastern Europe, the rates vary from low (under 2 per 100 000 in Bulgaria, Latvia and Romania) to intermediate (up to 6 per 100 000 in Lithuania and Slovenia). The main way to prevent melanoma is to advise people to limit their exposure to the sun. National and European policies should, therefore, pay more attention to preventing excess exposure to UV radiation during childhood (following the INTERSUN Project recommendations). The previously rising incidence of melanoma, prior to the 1990s, in northern Europe among people aged under 55 years supports the notion that specific UV protection activities are being effective in these countries. The beneficial effects of UV on health, such as Vitamin D production, are not jeopardized through comprehensive actions to decrease excessive UV radiation exposure. Short daily UV exposures, well below the levels that induce sunburn, stimulate Vitamin D production during sunny seasons. During other times, and for specific population groups, Vitamin D supplementation rather than extensive UV exposure is recommended by many professional societies9. The incidence rate of melanoma in Germany has increased since the 1980s, partcurly among women. Both the absolute and age-standardized incidence for men and women has increased, whereas the mortality decreased. Regional differences have also been observed with the highest rates of incidence of melanoma found in Schleswig-Holstein, Hamburg and Saxony. The lowest rates are in Baden-Württemberg, Mecklenburg-Western Pomerania and Saarland. The incidence rate in North Rhine-Westphalia is slightly lower than the national average in 2005/06. Substantial incidences can be observed with the beginning of the age group 20-24 years, once more particularly for women17. Although especially women aged less than 55 years are showing higher incidence rates than men, their lethality is lower. In North Rhine-Westphalia the average age of diagnosis for women is perceived at 51 years in 1998/200017. For the group of people aged under 50 years, melanoma are on the third rank of the most frequent cancers for women (9.8%) and on the fourth position for men (7.5%) in the region Münster (NUTS2)17. The average of melanoma incidence and lethality in North Rhine-Westphalia varies in different areas.

SELECTED INDICATORS REPORT
238
Until 2005 the cancer registry in North Rhine-Westphalia was limited to one area, namely to the region Münster. The development of a North Rhine-Westphalia-wide cancer registry began in 2005. To date, completeness and coverage is not yet sufficient to facilitate time-trend analysis or spatial comparisons. Hence comparisons between counties or cities in North Rhine-Westphalia are not yet possible. Data underlying the indicator:
• Primary source: Cancer Registry, Health Statistic Institutes (Robert Koch Institute) • Date last published: 2007 • Time period of analysis: 1994-2007 (Regierungsbezirk Münster), 2006-2007 (Landesteil
Westfalen-Lippe) for North Rhine-Westphalia • Numerator definition: Number of new cases (during the reporting period in the population aged
0-54 years) • Source of numerator: Cancer Registry, Health Statistic Institutes • Denominator definition: Total population aged 0-54 years (in the reporting period) • Source of denominator: National/regional statistics, National census • Geographic coverage: Until 2005 the cancer registry in North Rhine-Westphalia was limited to
one region (Regierungsbezirk Münster). The new cancer registry for North Rhine-Westphalia will cover NRW completely, but is still under development
• Timeliness: Annually, data online available • Accuracy and completeness of data set: Cancer registries in Germany collect data with high
accuracy and completeness for the geographical areas they cover (18). In several sub-national regions new cancer registries were established and others started to expand the geographical coverage. Data on sub-national and national level will be available in due time which will allow robust sub-national comparisons. Mechanisms are in place to ensure comparability of the data reported by the different cancer registries
• Disclosure control: none *References:
1. Incidence of melanoma in people aged under 55 years. Copenhagen, WHO Regional Office for Europe, 2009 (ENHIS fact sheet 4.2). Available at http://www.euro.who.int/__data/assets/pdf_file/0009/97029/enhis_factsheet09_4_2.pdf. ( accessed on 10 July 2010)
2. Globocan 2002 database. Lyon, International Agency for Research on Cancer, 2002. Available at http://globocan.iarc.fr. (accessed on 10 July 2010)
3. Holman CD, Amstrong BK, Heenan PJ. A theory of the etiology and pathogenesis of human cutaneous malignant melanoma. Journal of the National Cancer Institute, 1983, 71:651–656.
4. Tucker MA, Goldstein AM. Melanoma etiology: where are we? Oncogene, 2003, 22:3042–3052.
5. Thomas NE et al. Number of nevi and early-life ambient UV exposure are associated with BRAF-mutant melanoma. Cancer Epidemiology, Biomarkers & Prevention, 2007, 16:991–997.
6. Gandini S et al. Meta-analysis of risk factors for cutaneous melanoma: II. Sun exposure. European Journal of Cancer, 2005, 41:45–60.
7. Mansson-Brahme E et al. Trends in incidence of cutaneous malignant melanoma in a Swedish population 1976–1994. Acta Oncologica, 2002, 41:138–146.
8. English DR, Milne E, Simpson JA. Sun protection and the development of melanocytic nevi in children. Cancer Epidemiology, Biomarkers & Prevention, 2005, 14:2873–2876.
9. INTERSUN – The global UV project: a guide and compendium. Geneva, World Health Organization, 2003. Available at http://www.who.int/uv/publications/intersunguide/en/index.html. (accessed on 10 July 2010).
10. Policies to reduce the excessive exposure of children to ultraviolet radiation. Copenhagen, WHO Regional Office for Europe, 2009 (ENHIS fact sheet No. 4.8). Available at www.euro.who.int/ENHIS. (accessed on 10 July 2010)
11. Children Environment and Health Action Plan for Europe. The World Health Organization Regional Office for Europe, 2004. Available at http://www.euro.who.int/__data/assets/pdf_file/0006/78639/E83338.pdf. (accessed on 10 July 2010)
12. de Vries E, Coebergh JW. Cutaneous malignant melanoma in Europe. European Journal of Cancer, 2004, 40:2355–2366.
13. de Vries E et al. Changing epidemiology of malignant cutaneous melanoma in Europe 1953–1997: rising trends in incidence and mortality but recent stabilizations in western Europe and

SELECTED INDICATORS REPORT
239
decreases in Scandinavia. International Journal of Cancer, 2003, 107:119–126. 14. Bundesministerium für Umwelt Naturschutz und Reaktorsicherheit (BMU) (2007): Eine
lebenswertere Umwelt für unsere Kinder. BMU, Bonn http://www.bmg.bund.de/cln_160/SharedDocs/Downloads/DE/Neu/Eine-lebenswerte-Umwelt-f_C3_BCr-unsere-Kinder__Aktionsplan-CEHAPE-de,templateId=raw,property=publicationFile.pdf/Eine-lebenswerte-Umwelt-für-unsere-Kinder_Aktionsplan-CEHAPE-de.pdf (accessed 8 September 2010)
15. Blum A, Garbe C, Rassner G.(1998): Prävention des malignen Melanoms. Der Hautarzt 49, p. 826-834
16. Stockrahm S. (2009): Regierung will Minderjährigen die Sonnenbank verbieten. In: Zeit Online. http://www.zeit.de/online/2009/11/sonnenstudio-verbot?page=1 (accessed 4 October 2010)
17. Epidemiologisches Krebsregister für den Regierungsbezirk Münster, Krebsgesellschaft NRW (Hrsg.) (2004): Das maligne Melanom - Krebserkrankungen im Regierungsbezirk Münster. Münster. http://www.krebsregister.nrw.de/fileadmin/user_upload/dokumente/veroeffentlichungen/12_das_maligne_melanom.pdf (accessed 19 August 2010)
18. Gesellschaft der epidemiologischen Krebsregister in Deutschland e.V.(GEKID) (2010) http://www.gekid.de/ (accessed 4 October 2010) Further Information: WHO-IARC mortality database [online database]. Lyon, International Agency for Research on Cancer 2007. Available at http://www-dep.iarc.fr. (accessed on 10 July 2010) Further information on the control and use of sun beds UV-radiation of sun beds. Common public health advice from Nordic radiation protection and health authorities. Danish National Board of Health, Finnish Radiation and Nuclear Safety Authority, Icelandic Radiation Protection Institute, Norwegian Radiation Protection Authority, Swedish Radiation Protection Authority. Available at http://www.euroskin.eu/downloads/sunbedsnordic.pdf. (accessed on 10 July 2010) Sunbeds, tanning and UV exposure. Geneva, World Health Organization, 2005 (Fact sheet No. 287). Available at http://www.who.int/mediacentre/factsheets/fs287/en/index.html. (accessed on 10 July 2010) Further information on recommendations on exposure of children to UV radiation Protecting children from ultraviolet radiation. Geneva, World Health Organization, 2001 (Fact sheet No. 261). Available at http://enhiscms.rivm.nl/object_document/o4740n27388.html (accessed on 10 July 2010) Towards the promotion and harmonization of skin cancer prevention. Recommendations from an International Conference held in Hamburg, Germany, 2–5 May 2000. European Society of Skin Cancer Prevention – EUROSKIN. Available at http://www.who.int/uv/resources/recommendations/en/1stEuroskinrec.pdf. (accessed on 10 July 2010) SunWise Program [web site]. Washington, DC, US Environmental Protection Agency, 2007. Available at http://www.epa.gov/sunwise/summary.html. (accessed on 10 July 2010)) Author::Odile Mekel, Linda Tacke, Florian Fischer (LIGA.NRW), Germany Date of production: 06 October 2010

SELECTED INDICATORS REPORT
240
Hungary Name of indicator: Incidence of melanoma Definition: Incidence of melanoma as defined by ICD-10 codes C43, D03 in the population aged under 55 years Key Message: During the last few years the incidence of melanoma under 55 years of age has been increasing in Hungary; between 2003 and 2008 it increased from 9.7 to 13.1 per 100,000. It was the highest in county Veszprém and Hajdú-Bihar, in the latter the incidence rate more than doubled in the last 6 years. The incidence was the lowest in county Tolna, Győr-Moson and Bács-Kiskun. Rationale: Acute, irregular and excessive exposure to the sun, mainly during childhood, by people with fair skins is a major risk factor for melanoma, a malignant cancer of pigment cells in the skin. Considering the 20–40-year time-lag between exposure to the sun and onset of the cancer, the incidence of melanoma among people aged under 55 years and the respective time trends will be a good indicator of the final success of action against excessive exposure to ultraviolet (UV) radiation during childhood. It is estimated that in 2002, 9219 males and 12 303 females under the age of 55 years were diagnosed with melanoma in the European Union and the accession countries (Cyprus, Czech Republic, Estonia, Hungary, Latvia, Lithuania, Malta, Poland, Slovakia and Slovenia)1 2. Melanoma is a malignant transformation of the pigmentation cell (melanocyte) of the skin3. Most cases of melanoma seem to be caused by acute, intermittent and excessive exposure to the sun, mainly during childhood, although exposure in adulthood also contributes to the risk. Fitzpatrick skin types I and II (pale white or fair skin), large numbers of naevi or atypical naevi, and a family history of skin cancer are the most important predictors of melanoma risk4. Melanoma occurring in those aged under 55 years seems to be strongly linked to exposure to UV radiationin childhood5. This type of melanoma is often localized on the trunk of the body in males and on the legs in females. The fact that melanoma in the elderly occurs on the most chronically exposed parts of the body indicates that chronic exposure is more important for melanoma occurring among elderly people. The use of sun beds is an additional risk factor for melanoma6. Melanoma is more frequent among people in the higher socioeconomic groups and among northern European populations. This is probably due to their higher excessive intermittent exposure to UV radiation combined with a light skin type. The main way to prevent melanoma is to advise people to limit their exposure to the sun by avoiding such exposure during the time of day when UV radiation is most intense (approximately two hours each side of the solar noon) and to wear appropriate clothes, headwear and sunglasses. Special attention needs to be paid to children. The use of sun-screen preparations may help to prevent sunburn and skin cancer but may also lead to increased exposure to the sun. Survival is strongly linked to the stage of the disease at diagnosis, which provides a rationale for considering organized screening programmes for melanoma. However, evidence for the reduction of melanoma mortality through organized screening programmes is not yet available. Since the incidence of melanoma is expected to increasefurther in the future, early detection remains an important means of combating the disease. Prevention campaigns carried out in north-western European countries since the 1980s have probably resulted in a decrease in the average thickness of melanomas and a stabilization of melanoma mortality in young people7. Further, there is evidence that sun protection effectively lowers the number of melanocytic naevi in children8. Policy Relevance and Context: Melanoma is strongly linked with exposure to UV radiation during childhood and is therefore largely preventable. WHO has launched the ongoing INTERSUN Global UV Project to stress the importance of

SELECTED INDICATORS REPORT
241
increasing awareness and knowledge about the potential negative health effects of exposure to UV radiation, especially during childhood9. This information should be readily available through various channels such as television, radio, campaigns and meteorological web sites and in schools. Representatives of the tourism industry can also play a crucial role in minimizing the risks associated with exposure to the sun by disseminating information to their customers and by taking essential measures in tourism facilities and services. A UV radiation index can help to identify appropriate action based on the measured UV radiation levels. Further, the use of sun beds by children should be strongly discouraged, if not forbidden. The INTERSUN Project recommendations can serve as a framework for a European action plan to reduce exposure to UV radiation. There are at present few official regulations in most European countries (see ENHIS-2 fact sheet No. 4.8 of April 2007 on policies to reduce excessive exposure of children to UV radiation10). There are thus major opportunities for developing policy as well as for harmonizing and strengthening efforts to reduce such exposure. National policies to reduce exposure to artificial UV radiation – including regulations for the use of sun beds by children and teenagers – should be implemented in more countries in the WHO European Region. Excessive exposure to solar UV radiation can best be prevented by regional and local awareness-raising and information campaigns, especially in educational institutions. The aim is to encourage schoolchildren to take measures to protect themselves against the sun1. In 2004, the Fourth Ministerial Conference on Environment and Health adopted the Children’s Environment and Health Action Plan for Europe (CEHAPE)11, which includes four regional priority goals to reduce the burden of environment-related diseases in children. RPG IV aim to reduce the proportion of children with birth defects, mental retardation and developmental disorders, and to decrease the incidence of melanoma and non-melanoma skin cancer in later life and other childhood cancers by implementing policies to raise awareness and endeavour to ensure reduction of exposure to UV radiation, particularly in children and adolescents”. In Hungary there is a national UV alert system: if the forecasted UV index is above 7.5, mass media is used to inform the public about the risks of sunbathing and suggestions are provided to prevent the potential adverse health effects. A good example on the local measures: the city Tatabanya (in county Komárom-Esztergom) developed a Local Heat and UV Alert Action Plan based on the cooperation of several sectors including the municipality, schools, nursery schools, police, ambulance, fire department, hospital, public health service etc. The municipality won the “Climate change and health good practice award” in 2008 with this action plan13. Proposal of the National Research Institute for Radiobiology and Radiohygiene on the use of sunbeds: it would be advisable to prohibit the use of sunbeds under 18 years of age and the use of sunbeds that are functioning without supervision. Presentation of Data:
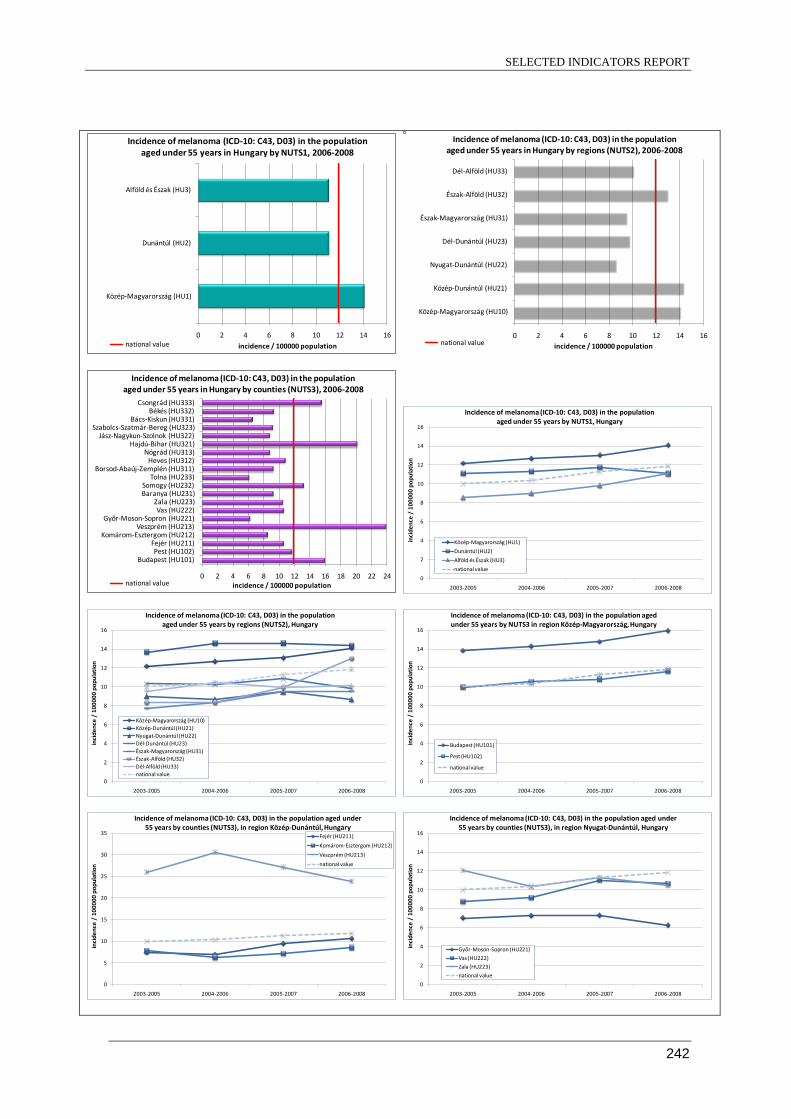
SELECTED INDICATORS REPORT
242
0 2 4 6 8 10 12 14 16
Közép-Magyarország (HU1)
Dunántúl (HU2)
Alföld és Észak (HU3)
incidence / 100000 population
Incidence of melanoma (ICD-10: C43, D03) in the population aged under 55 years in Hungary by NUTS1, 2006-2008
national value 0 2 4 6 8 10 12 14 16
Közép-Magyarország (HU10)
Közép-Dunántúl (HU21)
Nyugat-Dunántúl (HU22)
Dél-Dunántúl (HU23)
Észak-Magyarország (HU31)
Észak-Alföld (HU32)
Dél-Alföld (HU33)
incidence / 100000 population
Incidence of melanoma (ICD-10: C43, D03) in the population aged under 55 years in Hungary by regions (NUTS2), 2006-2008
national value
0 2 4 6 8 10 12 14 16 18 20 22 24
Budapest (HU101)Pest (HU102)
Fejér (HU211)Komárom-Esztergom (HU212)
Veszprém (HU213)Győr-Moson-Sopron (HU221)
Vas (HU222)Zala (HU223)
Baranya (HU231)Somogy (HU232)
Tolna (HU233)Borsod-Abaúj-Zemplén (HU311)
Heves (HU312)Nógrád (HU313)
Hajdú-Bihar (HU321)Jász-Nagykun-Szolnok (HU322)
Szabolcs-Szatmár-Bereg (HU323)Bács-Kiskun (HU331)
Békés (HU332)Csongrád (HU333)
incidence / 100000 population
Incidence of melanoma (ICD-10: C43, D03) in the population aged under 55 years in Hungary by counties (NUTS3), 2006-2008
national value 0
2
4
6
8
10
12
14
16
2003-2005 2004-2006 2005-2007 2006-2008
inci
denc
e /
1000
00 p
opul
atio
nIncidence of melanoma (ICD-10: C43, D03) in the population
aged under 55 years by NUTS1, Hungary
Közép-Magyarország (HU1)
Dunántúl (HU2)
Alföld és Észak (HU3)
national value
0
2
4
6
8
10
12
14
16
2003-2005 2004-2006 2005-2007 2006-2008
inci
denc
e /
1000
00 p
opul
atio
n
Incidence of melanoma (ICD-10: C43, D03) in the population aged under 55 years by regions (NUTS2), Hungary
Közép-Magyarország (HU10)Közép-Dunántúl (HU21)Nyugat-Dunántúl (HU22)Dél-Dunántúl (HU23)Észak-Magyarország (HU31)Észak-Alföld (HU32)Dél-Alföld (HU33)national value
0
2
4
6
8
10
12
14
16
2003-2005 2004-2006 2005-2007 2006-2008
inci
denc
e /
1000
00 p
opul
atio
n
Incidence of melanoma (ICD-10: C43, D03) in the population aged under 55 years by NUTS3 in region Közép-Magyarország, Hungary
Budapest (HU101)
Pest (HU102)
national value
0
5
10
15
20
25
30
35
2003-2005 2004-2006 2005-2007 2006-2008
inci
denc
e /
1000
00 p
opul
atio
n
Incidence of melanoma (ICD-10: C43, D03) in the population aged under 55 years by counties (NUTS3), in region Közép-Dunántúl, Hungary
Fejér (HU211)
Komárom-Esztergom (HU212)
Veszprém (HU213)
national value
0
2
4
6
8
10
12
14
16
2003-2005 2004-2006 2005-2007 2006-2008
inci
denc
e /
1000
00 p
opul
atio
n
Incidence of melanoma (ICD-10: C43, D03) in the population aged under 55 years by counties (NUTS3), in region Nyugat-Dunántúl, Hungary
Győr-Moson-Sopron (HU221)
Vas (HU222)
Zala (HU223)
national value

SELECTED INDICATORS REPORT
243
0
2
4
6
8
10
12
14
16
2003-2005 2004-2006 2005-2007 2006-2008
inci
denc
e /
1000
00 p
opul
atio
n
Incidence of melanoma (ICD-10: C43, D03) in the population aged under 55 years by counties (NUTS3), in region Dél-Dunántúl, Hungary
Baranya (HU231)
Somogy (HU232)
Tolna (HU233)
national value
0
2
4
6
8
10
12
14
16
2003-2005 2004-2006 2005-2007 2006-2008
inci
denc
e /
1000
00 p
opul
atio
n
Incidence of melanoma (ICD-10: C43, D03) in the population aged under 55 years by counties (NUTS3), in region Észak-Magyarország, Hungary
Borsod-Abaúj-Zemplén (HU311)
Heves (HU312)
Nógrád (HU313)
national value
0
2
4
6
8
10
12
14
16
18
20
2003-2005 2004-2006 2005-2007 2006-2008
inci
denc
e /
1000
00 p
opul
atio
n
Incidence of melanoma (ICD-10: C43, D03) in the population aged under 55 years by counties (NUTS3), in region Észak-Alföld, Hungary
Hajdú-Bihar (HU321)
Jász-Nagykun-Szolnok (HU322)
Szabolcs-Szatmár-Bereg (HU323)
national value
0
2
4
6
8
10
12
14
16
2003-2005 2004-2006 2005-2007 2006-2008
inci
denc
e /
1000
00 p
opul
atio
n
Incidence of melanoma (ICD-10: C43, D03) in the population aged under 55 years by counties (NUTS3), in region Dél-Alföld, Hungary
Bács-Kiskun (HU331)
Békés (HU332)
Csongrád (HU333)
national value
Source: National Cancer Registry / Hungarian Central Statistical Office Assessment: The incidence of melanoma skin cancer in people under the age of 55 years in Europe varies considerably among countries. The highest incidence is found in northern and western and the lowest in southern European countries, with rates from three to eight times lower for men and women, respectively. In eastern European countries, incidence is low to intermediate. These variations are likely to be linked to specific behaviour (winter holidays, sun seeking) as well as to improved rates of diagnosis resulting from better detection of melanoma. Trends in rates differ between regions: in northern Europe, where the rates are high, they appear to have levelled off since the 1990s, particularly among people aged under 55 years. This seems to be the result of a change in sun-seeking and protective behaviour against UV radiation among the younger generations. In contrast, in southern and eastern Europe, the rates are generally still increasing steeply in all age groups12 13. Currently, in almost all European countries, the incidence is higher in women than in men. Estimates of the age-standardized (world standard population) rate for women vary from under 2 to over 16 per 100 000. There is a strong geographical correlation between the European sub-regions and the incidence of melanoma in people aged under 55 years. The highest rates are found in northern (Denmark, Norway and Sweden) and western European countries (France, the Netherlands and the United Kingdom), with an incidence of 6–9 per 100 000 for males and 8–16 per 100 000 for females. Austria and Switzerland have among the highest rates for both sexes: around 6 per 100 000 for men and around 10 per 100 000 for women. The lowest incidence is found in southern Europe (Greece, Italy, Portugal and Spain) with rates of 2–4 per 100 000 for both men and women. In eastern Europe, the rates vary from low (under 2 per 100 000 in Bulgaria, Latvia and Romania) to intermediate (up to 6 per 100 000 in Lithuania and Slovenia). The main way to prevent melanoma is to advise people to limit their exposure to the sun. National and European policies should, therefore, pay more attention to preventing excess exposure to UV radiation during childhood (following the INTERSUN Project recommendations). The previously rising incidence of melanoma, prior to the 1990s, in northern Europe among people aged under 55 years supports the notion that specific UV protection activities are being effective in these countries. The beneficial effects of UV on health, such as Vitamin D production, are not jeopardized through comprehensive actions to decrease

SELECTED INDICATORS REPORT
244
excessive UV radiation exposure. Short daily UV exposures, well below the levels that induce sunburn, stimulate Vitamin D production during sunny seasons. During other times, and for specific population groups, Vitamin D supplementation rather than extensive UV exposure is recommended by many professional societies9. During the last few years, the incidence of melanoma under 55 years of age has been increasing in Hungary; between 2003 and 2008 it increased from 9.7 to 13.1 per 100,000. There is a spatial inequity: It was above the national value in Central Hungary (HU1) and was less than the national value in the parts of the country. Differences beween regions also exist: the incidence was the highest in the Central Transdanubian region (HU21) and in Central Hungary (HU10), while it was less than the national value in Western and Southern Transdanubia (HU22 and HU23, respectively), in Northern Hungary (HU31) and in Sothern Great Plain (HU33). In region Northern Great Plain (HU32) the incidence increased considerably in the last few years. There is a large inequity between the county level: the rate was the highest in county Veszprém (it was above 30 per 100,000 in 2004 and 2006) however it is decreasing, it was higher than the national value in county Somogy, Hajdú-Bihar, Csongrád and in Budapest, the increase is the biggest in Hajdú-Bihar (the incidence increased from 9 to 25.7 in 6 years). In the other counties, the rate is around or under the national level, it shows a decreasing tendency in Győr-Moson and Baranya. Data underlying the indicator:
• Primary source: National Cancer Registry • Date last published: 2009 • Time period of analysis: 2003–2008 • Numerator definition: Number of new cases of melanoma (ICD-10: C43 and D03) in population
aged 0–54 years • Source of numerator: National Cancer Registry • Denominator definition: Number of population aged 0–54 years • Source of denominator: Hungarian Central Statistical Office • Geographic coverage: Complete for the country. • Timeliness: Annually. • Accuracy and completeness of data set • Disclosure control
References: 1. Incidence of melanoma in people aged under 55 years. Copenhagen, WHO Regional Office for
Europe, 2009 (ENHIS fact sheet 4.2). Available at http://www.euro.who.int/__data/assets/pdf_file/0009/97029/enhis_factsheet09_4_2.pdf. (accessed on 10 July 2010)
2. Globocan 2002 database. Lyon, International Agency for Research on Cancer, 2002. Available at http://globocan.iarc.fr. (accessed on 10 July 2010)
3. Holman CD, Amstrong BK, Heenan PJ. A theory of the etiology and pathogenesis of human cutaneous malignant melanoma. Journal of the National Cancer Institute, 1983, 71:651–656.
4. Tucker MA, Goldstein AM. Melanoma etiology: where are we? Oncogene, 2003, 22:3042–3052. 5. Thomas NE et al. Number of nevi and early-life ambient UV exposure are associated with BRAF-
mutant melanoma. Cancer Epidemiology, Biomarkers & Prevention, 2007, 16:991–997. 6. Gandini S et al. Meta-analysis of risk factors for cutaneous melanoma: II. Sun exposure. European
Journal of Cancer, 2005, 41:45–60. 7. Mansson-Brahme E et al. Trends in incidence of cutaneous malignant melanoma in a Swedish
population 1976–1994. Acta Oncologica, 2002, 41:138–146. 8. English DR, Milne E, Simpson JA. Sun protection and the development of melanocytic nevi in
children. Cancer Epidemiology, Biomarkers & Prevention, 2005, 14:2873–2876. 9. INTERSUN – The global UV project: a guide and compendium. Geneva, World Health
Organization, 2003. Available at http://www.who.int/uv/publications/intersunguide/en/index.html. (accessed on 10 July 2010).
10. Policies to reduce the excessive exposure of children to ultraviolet radiation. Copenhagen, WHO Regional Office for Europe, 2009 (ENHIS fact sheet No. 4.8). Available at www.euro.who.int/ENHIS. (accessed on 10 July 2010)

SELECTED INDICATORS REPORT
245
11. Children Environment and Health Action Plan for Europe. The World Health Organization Regional Office for Europe, 2004. Available at http://www.euro.who.int/__data/assets/pdf_file/0006/78639/E83338.pdf. (accessed on 10 July 2010)
12. de Vries E, Coebergh JW. Cutaneous malignant melanoma in Europe. European Journal of Cancer, 2004, 40:2355–2366.
13. de Vries E et al. Changing epidemiology of malignant cutaneous melanoma in Europe 1953–1997: rising trends in incidence and mortality but recent stabilizations in western Europe and decreases in Scandinavia. International Journal of Cancer, 2003, 107:119–126.
13. Launch of a Local Heat and UV alert Plan in Tatabanya, Hungary: http://www.env-
health.org/IMG/pdf/Andras_Olah_Tatabanya_Hungary_Launch__of_a_local_Heat_and_UV_alert_Plan.pdf Further Information: WHO-IARC mortality database [online database]. Lyon, International Agency for Research on Cancer 2007. Available at http://www-dep.iarc.fr. (accessed on 10 July 2010) Further information on the control and use of sun beds UV-radiation of sun beds. Common public health advice from Nordic radiation protection and health authorities. Danish National Board of Health, Finnish Radiation and Nuclear Safety Authority, Icelandic Radiation Protection Institute, Norwegian Radiation Protection Authority, Swedish Radiation Protection Authority. Available at http://www.euroskin.eu/downloads/sunbedsnordic.pdf. (accessed on 10 July 2010) Sunbeds, tanning and UV exposure. Geneva, World Health Organization, 2005 (Fact sheet No. 287). Available at http://www.who.int/mediacentre/factsheets/fs287/en/index.html. (accessed on 10 July 2010) Further information on recommendations on exposure of children to UV radiation Protecting children from ultraviolet radiation. Geneva, World Health Organization, 2001 (Fact sheet No. 261). Available at http://www.who.int/mediacentre/factsheets/fs261/en/. (accessed on 10 July 2010) Towards the promotion and harmonization of skin cancer prevention. Recommendations from an International Conference held in Hamburg, Germany, 2–5 May 2000. European Society of Skin Cancer Prevention – EUROSKIN. Available at http://www.who.int/uv/resources/recommendations/en/1stEuroskinrec.pdf. (accessed on 10 July 2010) SunWise Program [web site]. Washington, DC, US Environmental Protection Agency, 2007. Available at http://www.epa.gov/sunwise/summary.html. (accessed on 10 July 2010)) Author: Tibor Malnasi, Anna Plady, National Institute of Environmental Health, Hungary Date of production: 14 September 2010

SELECTED INDICATORS REPORT
246
Lithuania Name of indicator: Incidence of melanoma Definition: Incidence of melanoma as defined by ICD-10 codes C43, D03 in the population aged under 55 years Key Message: Within the European context Lithuania is considered to have intermediate rate of melanoma incidence in population under 55. The incidence is higher in females than in males. National value slightly increased in the period of 1999−2008. There are regional differences of melanoma incidence between Eastern and Western parts of the country. The highest incidence rate is observed in Vilnius county and the lowest in Tauragė county. The incidence trend steadily increased in Vilnius county in 1999−2008; major decrease observed in Klaipėda county. Concerted policy attention is needed to reduce melanoma incidence. Rationale: Acute, irregular and excessive exposure to the sun, mainly during childhood, by people with fair skins is a major risk factor for melanoma, a malignant cancer of pigment cells in the skin. Considering the 20–40-year time-lag between exposure to the sun and onset of the cancer, the incidence of melanoma among people aged under 55 years and the respective time trends will be a good indicator of the final success of action against excessive exposure to ultraviolet (UV) radiation during childhood. It is estimated that in 2002, 9219 males and 12 303 females under the age of 55 years were diagnosed with melanoma in the European Union and the accession countries (Cyprus, Czech Republic, Estonia, Hungary, Latvia, Lithuania, Malta, Poland, Slovakia and Slovenia)1 2. Melanoma is a malignant transformation of the pigmentation cell (melanocyte) of the skin3. Most cases of melanoma seem to be caused by acute, intermittent and excessive exposure to the sun, mainly during childhood, although exposure in adulthood also contributes to the risk. Fitzpatrick skin types I and II (pale white or fair skin), large numbers of naevi or atypical naevi, and a family history of skin cancer are the most important predictors of melanoma risk4. Melanoma occurring in those aged under 55 years seems to be strongly linked to exposure to UV radiationin childhood5. This type of melanoma is often localized on the trunk of the body in males and on the legs in females. The fact that melanoma in the elderly occurs on the most chronically exposed parts of the body indicates that chronic exposure is more important for melanoma occurring among elderly people. The use of sun beds is an additional risk factor for melanoma6. Melanoma is more frequent among people in the higher socioeconomic groups and among northern European populations. This is probably due to their higher excessive intermittent exposure to UV radiation combined with a light skin type. The main way to prevent melanoma is to advise people to limit their exposure to the sun by avoiding such exposure during the time of day when UV radiation is most intense (approximately two hours each side of the solar noon) and to wear appropriate clothes, headwear and sunglasses. Special attention needs to be paid to children. The use of sun-screen preparations may help to prevent sunburn and skin cancer but may also lead to increased exposure to the sun. Survival is strongly linked to the stage of the disease at diagnosis, which provides a rationale for considering organized screening programmes for melanoma. However, evidence for the reduction of melanoma mortality through organized screening programmes is not yet available. Since the incidence of melanoma is expected to increasefurther in the future, early detection remains an important means of combating the disease. Prevention campaigns carried out in north-western European countries since the 1980s have probably resulted in a decrease in the average thickness of melanomas and a stabilization of

SELECTED INDICATORS REPORT
247
melanoma mortality in young people7. Further, there is evidence that sun protection effectively lowers the number of melanocytic naevi in children8. Policy Relevance and Context: Melanoma is strongly linked with exposure to UV radiation during childhood and is therefore largely preventable. WHO has launched the ongoing INTERSUN Global UV Project to stress the importance of increasing awareness and knowledge about the potential negative health effects of exposure to UV radiation, especially during childhood9. This information should be readily available through various channels such as television, radio, campaigns and meteorological web sites and in schools. Representatives of the tourism industry can also play a crucial role in minimizing the risks associated with exposure to the sun by disseminating information to their customers and by taking essential measures in tourism facilities and services. A UV radiation index can help to identify appropriate action based on the measured UV radiation levels. Further, the use of sun beds by children should be strongly discouraged, if not forbidden. The INTERSUN Project recommendations can serve as a framework for a European action plan to reduce exposure to UV radiation. There are at present few official regulations in most European countries (see ENHIS-2 fact sheet No. 4.8 of April 2007 on policies to reduce excessive exposure of children to UV radiation10. There are thus major opportunities for developing policy as well as for harmonizing and strengthening efforts to reduce such exposure. National policies to reduce exposure to artificial UV radiation – including regulations for the use of sun beds by children and teenagers – should be implemented in more countries in the WHO European Region. Excessive exposure to solar UV radiation can best be prevented by regional and local awareness-raising and information campaigns, especially in educational institutions. The aim is to encourage schoolchildren to take measures to protect themselves against the sun1. In 2004, the Fourth Ministerial Conference on Environment and Health adopted the Children’s Environment and Health Action Plan for Europe (CEHAPE)11, which includes four regional priority goals to reduce the burden of environment-related diseases in children. RPG IV aim to reduce the proportion of children with birth defects, mental retardation and developmental disorders, and to decrease the incidence of melanoma and non-melanoma skin cancer in later life and other childhood cancers by implementing policies to raise awareness and endeavour to ensure reduction of exposure to UV radiation, particularly in children and adolescents”. There are important national policy documents, related to cancer prevention in Lithuania, such as Lithuanian Health Programme 1997−2010 adopted by the Parliament in 1998; Cancer Prevention and Control Programme 2003−2010, adopted by the Government of Republic of Lithuania in 2003, highlighting the rise in morbidity due to skin cancer during the last decade; and National Programme Morbidity and Mortality Reduction from the Main Non-communicable Diseases in 2007−2013, adopted by Minister of Health of the Republic of Lithuania in 2007. However, these programmes do not specify target values to reduce the incidence of melanoma. There is no specific policy in place for UV exposure reduction. However, a number of hygiene regulations and standards set requirements and restrictions for sun bed operations and use; summer camps for children, pre-school, general school, informal education school health safety requirements concerning measures protecting against direct solar UV rays. Cross-Curricular Classroom Lessons about biological effects of ultraviolet radiation in schools are given according to General National Education program. During summer daily solar UV Index is reported through Lithuanian Hydrometeorological Service website (http://www.meteo.lt) and at TV and newspapers. Presentation of Data:

SELECTED INDICATORS REPORT
248
Figure 1. Incidence of melanoma in Lithuania in the population aged under 55 years by NUTS3, 2006-2008
0 1 2 3 4 5
Alytaus apskritis (LT001)
Kauno apskritis (LT002)
Klaipedos apskritis (LT003)
Marijampoles apskritis (LT004)
Panevezio apskritis (LT005)
Siauliu apskritis (LT006)
Taurages apskritis (LT007)
Telsiu apskritis (LT008)
Utenos apskritis (LT009)
Vilniaus apskritis (LT00A)
incidence / 100000 population
Incidence of melanoma (ICD-10: C43, D03) in the population aged under 55 years in Lithuania by counties (NUTS3), 2006-2008
national value
Figure 2. Incidence of melanoma in Lithuania in the population aged under 55 years by NUTS3, 2006-2008

SELECTED INDICATORS REPORT
249
0
1
2
3
4
5
6
1999-2001 2000-2002 2001-2003 2002-2004 2003-2005 2004-2006 2005-2007 2006-2008
inci
denc
e /
1000
00 p
opul
atio
n
Incidence of melanoma (ICD-10: C43, D03) in the population aged under 55 years in Lithuania by counties (NUTS3) I.
Alytaus apskritis (LT001)
Kauno apskritis (LT002)
Klaipedos apskritis (LT003)
Marijampoles apskritis (LT004)
Panevezio apskritis (LT005)
national value
Figure 3. Incidence of melanomain Lithuania in the population aged under 55 years by NUTS3 for the period 1999-2008
0
1
2
3
4
5
6
1999-2001 2000-2002 2001-2003 2002-2004 2003-2005 2004-2006 2005-2007 2006-2008
inci
denc
e /
1000
00 p
opul
atio
n
Incidence of melanoma (ICD-10: C43, D03) in the population aged under 55 years in Lithuania by counties (NUTS3) II.
Siauliu apskritis (LT006)
Taurages apskritis (LT007)
Telsiu apskritis (LT008)
Utenos apskritis (LT009)
Vilniaus apskritis (LT00A)
national value
Figure 4. Incidence of melanomain Lithuania by NUTS3 for the period 1999-2008 Assessment: The incidence of melanoma skin cancer in people under the age of 55 years in Europe varies considerably among countries. The highest incidence is found in northern and western and the lowest in southern European countries, with rates from three to eight times lower for men and women, respectively. In eastern European countries, incidence is low to intermediate. These variations are likely to be linked to specific behaviour (winter holidays, sun seeking) as well as to improved rates of diagnosis resulting from better detection of melanoma. Trends in rates differ between regions: in northern Europe, where the rates are high, they appear to have levelled off since the 1990s, particularly among people aged under 55 years. This seems to be the result of a change in sun-seeking and protective behaviour against UV radiation among the younger generations. In contrast, in southern and eastern Europe, the rates are generally still increasing steeply in all age groups12 13. Currently, in almost all European countries, the incidence is higher in women than in men. Estimates of the age-standardized (world standard population) rate for women vary from under 2 to over 16 per

SELECTED INDICATORS REPORT
250
100 000. There is a strong geographical correlation between the European sub-regions and the incidence of melanoma in people aged under 55 years. The highest rates are found in northern (Denmark, Norway and Sweden) and western European countries (France, the Netherlands and the United Kingdom), with an incidence of 6–9 per 100 000 for males and 8–16 per 100 000 for females. Austria and Switzerland have among the highest rates for both sexes: around 6 per 100 000 for men and around 10 per 100 000 for women. The lowest incidence is found in southern Europe (Greece, Italy, Portugal and Spain) with rates of 2–4 per 100 000 for both men and women. In eastern Europe, the rates vary from low (under 2 per 100 000 in Bulgaria, Latvia and Romania) to intermediate (up to 6 per 100 000 in Lithuania and Slovenia). The main way to prevent melanoma is to advise people to limit their exposure to the sun. National and European policies should, therefore, pay more attention to preventing excess exposure to UV radiation during childhood (following the INTERSUN Project recommendations). The previously rising incidence of melanoma, prior to the 1990s, in northern Europe among people aged under 55 years supports the notion that specific UV protection activities are being effective in these countries. The beneficial effects of UV on health, such as Vitamin D production, are not jeopardized through comprehensive actions to decrease excessive UV radiation exposure. Short daily UV exposures, well below the levels that induce sunburn, stimulate Vitamin D production during sunny seasons. During other times, and for specific population groups, Vitamin D supplementation rather than extensive UV exposure is recommended by many professional societies9. National value of incidence of melanoma in people under 55 shows that it is increasing from 1999 to 2008 in Lithuania. There are observed regional inequalities of incidence of melanoma trends between Lithuanian regions. The highest incidence rate is observed in Vilnius county and the lowest in Tauragės county. The trend between 1999 and 2008 was steadily increasing in Vilnius county and the rate was above the national value during this time period in Vilnius county. The major decrease of incidence trend during 1999−2008 has been observed in Klaipėda county. Higher incidence of melanoma than national value (2006−2008) in Kaunas and Alytus county are also observed, but during 1999−2008 time period a marginal but stable decrease in Kaunas county was observed. There was decreasing incidence of melanoma in Alytus county up to 2004, but thereafter (2004 – 2008) it increased and superseded the level in 1999. In three Lithuanian regions (Vilnius, Marijampolė and Šiauliai counties) were observed increasing tendency of incidence of melanoma during 1999−2008. In Tauragė apskritis opposite Alytus apskritis duri ng 1999−2004 incidence of melanoma was increasing and than during 2004−2008 suddenly decreased. In Telšiai county during all 1999−2008 time period incidence rate was lower that national value and steadily decreasing. It is difficult to explain the reasons for the variety of trends in melanoma incidence among Lithuanian regions. Increasing trend can be indicative of improvement in the early diagnostics of cancer and not be limited to the impact of environmental risk factors. Data underlying the indicator:
• Primary source: Vilnius University Institute of Oncology, Cancer Register and Department of Statistics, Lithuania.
• Date last published: 2008 • Time period of analysis: 1999−2008 • Numerator definition: Number of new cases during the reporting period in the population
aged 0-54 years • Source of numerator: Institute of Oncology, Vilnius University
• Denominator definition: Total population aged 0-54 years. • Source of denominator: Department of Statistics, Lithuania • Geographic coverage: National (Lithuania) and 10 Lithuanian counties (apskritys; NUTS 3
level). • Timeliness: annual data are available from 1978. • Accuracy and completeness of data set: data accurate and complete. • Disclosure control: only aggregated data can be used; personal data use restrictions. •

SELECTED INDICATORS REPORT
251
References: 1. Incidence of melanoma in people aged under 55 years. Copenhagen, WHO Regional Office
for Europe, 2009 (ENHIS fact sheet 4.2). Available at http://www.euro.who.int/__data/assets/pdf_file/0009/97029/enhis_factsheet09_4_2.pdf. ( accessed on 10 July 2010)
2. Globocan 2002 database. Lyon, International Agency for Research on Cancer, 2002. Available at http://globocan.iarc.fr. (accessed on 10 July 2010)
3. Holman CD, Amstrong BK, Heenan PJ. A theory of the etiology and pathogenesis of human cutaneous malignant melanoma. Journal of the National Cancer Institute, 1983, 71:651–656.
4. Tucker MA, Goldstein AM. Melanoma etiology: where are we? Oncogene, 2003, 22:3042–3052.
5. Thomas NE et al. Number of nevi and early-life ambient UV exposure are associated with BRAF-mutant melanoma. Cancer Epidemiology, Biomarkers & Prevention, 2007, 16:991–997.
6. Gandini S et al. Meta-analysis of risk factors for cutaneous melanoma: II. Sun exposure. European Journal of Cancer, 2005, 41:45–60.
7. Mansson-Brahme E et al. Trends in incidence of cutaneous malignant melanoma in a Swedish population 1976–1994. Acta Oncologica, 2002, 41:138–146.
8. English DR, Milne E, Simpson JA. Sun protection and the development of melanocytic nevi in children. Cancer Epidemiology, Biomarkers & Prevention, 2005, 14:2873–2876.
9. INTERSUN – The global UV project: a guide and compendium. Geneva, World Health Organization, 2003. Available at http://www.who.int/uv/publications/intersunguide/en/index.html. (accessed on 10 July 2010).
10. Policies to reduce the excessive exposure of children to ultraviolet radiation. Copenhagen, WHO Regional Office for Europe, 2009 (ENHIS fact sheet No. 4.8). Available at www.euro.who.int/ENHIS. (accessed on 10 July 2010)
11. Children Environment and Health Action Plan for Europe. The World Health Organization Regional Office for Europe, 2004. Available at http://www.euro.who.int/__data/assets/pdf_file/0006/78639/E83338.pdf. (accessed on 10 July 2010)
12. de Vries E, Coebergh JW. Cutaneous malignant melanoma in Europe. European Journal of Cancer, 2004, 40:2355–2366.
13. de Vries E et al. Changing epidemiology of malignant cutaneous melanoma in Europe 1953–1997: rising trends in incidence and mortality but recent stabilizations in western Europe and decreases in Scandinavia. International Journal of Cancer, 2003, 107:119–126.
14. Regulation (EC) No 1888/2005 of the European Parliament and of the Council of 26 October 2005 amending Regulation (EC) No 1059/2003 on the establishment of a common classification of territorial units for statistics (NUTS) by reason of the accession of the Czech Republic, Estonia, Cyprus, Latvia, Lithuania, Hungary, Malta, Poland, Slovenia and Slovakia to the European Union
Official Journal L 309, 25/11/2005 P. 0001 - 0008 Further Information: WHO-IARC mortality database [online database]. Lyon, International Agency for Research on Cancer 2007. Available at http://www-dep.iarc.fr. (accessed on 10 July 2010) Further information on the control and use of sun beds UV-radiation of sun beds. Common public health advice from Nordic radiation protection and health authorities. Danish National Board of Health, Finnish Radiation and Nuclear Safety Authority, Icelandic Radiation Protection Institute, Norwegian Radiation Protection Authority, Swedish Radiation Protection Authority. Available at http://www.euroskin.eu/downloads/sunbedsnordic.pdf. (accessed on 10 July 2010) Sunbeds, tanning and UV exposure. Geneva, World Health Organization, 2005 (Fact sheet No. 287). Available at http://www.who.int/mediacentre/factsheets/fs287/en/index.html. (accessed on 10 July 2010) Further information on recommendations on exposure of children to UV radiation Protecting children from ultraviolet radiation. Geneva, World Health Organization, 2001 (Fact sheet No. 261). Available at http://www.who.int/mediacentre/factsheets/fs261/en/. (accessed on 10 July 2010)

SELECTED INDICATORS REPORT
252
Towards the promotion and harmonization of skin cancer prevention. Recommendations from an International Conference held in Hamburg, Germany, 2–5 May 2000. European Society of Skin Cancer Prevention – EUROSKIN. Available at http://www.who.int/uv/resources/recommendations/en/1stEuroskinrec.pdf. (accessed on 10 July 2010) SunWise Program [web site]. Washington, DC, US Environmental Protection Agency, 2007. Available at http://www.epa.gov/sunwise/summary.html. (accessed on 10 July 2010)) Author: Aida Laukaitienė, Centre for Health Education and Disease Control, Lithuania Date of production: 20 September, 2010

SELECTED INDICATORS REPORT
253
Romania Name of indicator: Incidence of melanoma Definition: Incidence of melanoma as defined by ICD-10 codes C43, D03 in the population aged under 55 years Key Message: The incidence of melanoma skin cancer in people under the age of 55 years in Romania is lower than the worldwide estimated incidence with 1,1 cases/100000 inhabitants. It varies among macro- regions, regions and districts. The highest incidence is found in the macro-region 1, region Center (RO12) and Salaj county and the lowest in macro-region 3 (RO3), region Bucureşti Ilfov (RO32) and district Maramures (RO114). These variations might be linked to specific behaviour (sun seeking bahaviour or improved rates of diagnosis resulting from better detection of melanoma. Rationale: Acute, irregular and excessive exposure to the sun, mainly during childhood, by people with fair skins is a major risk factor for melanoma, a malignant cancer of pigment cells in the skin. Considering the 20–40-year time-lag between exposure to the sun and onset of the cancer, the incidence of melanoma among people aged under 55 years and the respective time trends will be a good indicator of the final success of action against excessive exposure to ultraviolet (UV) radiation during childhood. It is estimated that in 2002, 9219 males and 12 303 females under the age of 55 years were diagnosed with melanoma in the European Union and the accession countries (Cyprus, Czech Republic, Estonia, Hungary, Latvia, Lithuania, Malta, Poland, Slovakia and Slovenia)1 2. Melanoma is a malignant transformation of the pigmentation cell (melanocyte) of the skin3. Most cases of melanoma seem to be caused by acute, intermittent and excessive exposure to the sun, mainly during childhood, although exposure in adulthood also contributes to the risk. Fitzpatrick skin types I and II (pale white or fair skin), large numbers of naevi or atypical naevi, and a family history of skin cancer are the most important predictors of melanoma risk4. Melanoma occurring in those aged under 55 years seems to be strongly linked to exposure to UV radiationin childhood5. This type of melanoma is often localized on the trunk of the body in males and on the legs in females. The fact that melanoma in the elderly occurs on the most chronically exposed parts of the body indicates that chronic exposure is more important for melanoma occurring among elderly people. The use of sun beds is an additional risk factor for melanoma6. Melanoma is more frequent among people in the higher socioeconomic groups and among northern European populations. This is probably due to their higher excessive intermittent exposure to UV radiation combined with a light skin type. The main way to prevent melanoma is to advise people to limit their exposure to the sun by avoiding such exposure during the time of day when UV radiation is most intense (approximately two hours each side of the solar noon) and to wear appropriate clothes, headwear and sunglasses. Special attention needs to be paid to children. The use of sun-screen preparations may help to prevent sunburn and skin cancer but may also lead to increased exposure to the sun. Survival is strongly linked to the stage of the disease at diagnosis, which provides a rationale for considering organized screening programmes for melanoma. However, evidence for the reduction of melanoma mortality through organized screening programmes is not yet available. Since the incidence of melanoma is expected to increasefurther in the future, early detection remains an important means of combating the disease. Prevention campaigns carried out in north-western European countries since the 1980s have probably resulted in a decrease in the average thickness of melanomas and a stabilization of
SELECTED INDICATORS REPORT
254
melanoma mortality in young people7. Further, there is evidence that sun protection effectively lowers the number of melanocytic naevi in children8.
Policy Relevance and Context: Melanoma is strongly linked with exposure to UV radiation during childhood and is therefore largely preventable. WHO has launched the ongoing INTERSUN Global UV Project to stress the importance of increasing awareness and knowledge about the potential negative health effects of exposure to UV radiation, especially during childhood9. This information should be readily available through various channels such as television, radio, campaigns and meteorological web sites and in schools. Representatives of the tourism industry can also play a crucial role in minimizing the risks associated with exposure to the sun by disseminating information to their customers and by taking essential measures in tourism facilities and services. A UV radiation index can help to identify appropriate action based on the measured UV radiation levels. Further, the use of sun beds by children should be strongly discouraged, if not forbidden. The INTERSUN Project recommendations can serve as a framework for a European action plan to reduce exposure to UV radiation. There are at present few official regulations in most European countries (see ENHIS-2 fact sheet No. 4.8 of April 2007 on policies to reduce excessive exposure of children to UV radiation10). There are thus major opportunities for developing policy as well as for harmonizing and strengthening efforts to reduce such exposure. National policies to reduce exposure to artificial UV radiation – including regulations for the use of sun beds by children and teenagers – should be implemented in more countries in the WHO European Region. Excessive exposure to solar UV radiation can best be prevented by regional and local awareness-raising and information campaigns, especially in educational institutions. The aim is to encourage schoolchildren to take measures to protect themselves against the sun1. In 2004, the Fourth Ministerial Conference on Environment and Health adopted the Children’s Environment and Health Action Plan for Europe (CEHAPE)11, which includes four regional priority goals to reduce the burden of environment-related diseases in children. RPG IV aim to reduce the proportion of children with birth defects, mental retardation and developmental disorders, and to decrease the incidence of melanoma and non-melanoma skin cancer in later life and other childhood cancers by implementing policies to raise awareness and endeavour to ensure reduction of exposure to UV radiation, particularly in children and adolescents”. In Romania, the National Public Health Strategy adopted in 2004 has established a set of 6 objectives, among which reducing the burden of non-communicable diseases and enhancing the control of behavioural and environmental risk factors and early detection of diseases are contributing also to the final outcome of decreasing the incidence of melanoma skin cancer. The national health programs annulay budgeted by the Ministry of Health include a component of implementation of regional cencer registries as well as implementation and management of the national cancer registry. During 2010 a national campaign of prevention of skin cencer was implelemented within the national subprogram for promotion of a healthy lifestyle of the Ministry of Health, campaign coordinated by the National Institute of Public Health, National Centre for Evaluation and Promotion of Health Status. Presentation of Data:

SELECTED INDICATORS REPORT
255
0,0 0,5 1,0 1,5 2,0 2,5
Macroregiunea unu (RO1)
Macroregiunea doi (RO2)
Macroregiunea trei (RO3)
Macroregiunea patru (RO4)
incidence / 100000 population
national value
Figure 1: Incidence of melanoma in the population aged under 55 years by NUTS1 in 2007
0,0 0,5 1,0 1,5 2,0 2,5
Nord - Vest (RO11)
Centru (RO12)
Nord - Est (RO21)
Sud - Est (RO22)
Sud - Muntenia (RO31)
Bucuresti - Ilfov (RO32)
Sud - Vest Oltenia (RO41)
Vest (RO42)
incidence / 100000 population national value Figure 2: Incidence of melanoma in the population aged under 55 years by NUTS2 in 2007
0 1 2 3 4 5
Bihor (RO111)
Bistrita-Nasaud (RO112)
Cluj (RO113)
Maramures (RO114)
Satu Mare (RO115)
Salaj (RO116)
Alba (RO121)
Brasov (RO122)
Covasna (RO123)
Harghita (RO124)
Mures (RO125)
Sibiu (RO126)
Bacau (RO211)
Botosani (RO212)
Iasi (RO213)
Neamt (RO214)
Suceava (RO215)
Vaslui (RO216)
Braila (RO221)
Buzau (RO222)
Constanta (RO223)
Galati (RO224)
Tulcea (RO225)
Vrancea (RO226)
Arges (RO311)
Calarasi (RO312)
Dambovita (RO313)
Giurgiu (RO314)
Ialomita (RO315)
Prahova (RO316)
Teleorman (RO317)
Bucuresti (RO321)
Ilfov (RO322)
Dolj (RO411)
Gorj (RO412)
Mehedinti (RO413)
Olt (RO414)
Valcea (RO415)
Arad (RO421)
Caras-Severin (RO422)
Hunedoara (RO423)
Timis (RO424)
incidence / 100000 population
Incidence of melanoma (ICD-10: C43, D03) in the populationaged under 55 years in Romania by counties (NUTS3), 2007
national value Figure 3: Incidence of melanoma in the population aged under 55 years by NUTS3 in 2007

SELECTED INDICATORS REPORT
256
0,0
0,5
1,0
1,5
2,0
2,5
3,0
1999 2000 2001 2002 2003 2004 2005 2006 2007
inci
denc
e /
1000
00 p
opul
atio
n
Incidence of melanoma (ICD-10: C43, D03) in the population aged under 55 yearsby NUTS1, Romania
Macroregiunea unu (RO1)
Macroregiunea doi (RO2)
Macroregiunea trei (RO3)
Macroregiunea patru (RO4)
national value
0,0
0,5
1,0
1,5
2,0
2,5
3,0
3,5
4,0
1999 2000 2001 2002 2003 2004 2005 2006 2007
inci
denc
e / 1
0000
0 po
pula
tion
Incidence of melanoma (ICD-10: C43, D03) in the population aged under 55 yearsby regions (NUTS2), Romania
Nord-Vest (RO11) Centru (RO12)
Nord-Est (RO21) Sud-Est (RO22)
Sud-Muntenia (RO31) Bucuresti-Ilfov (RO32)
Sud-Vest Oltenia (RO41) Vest (RO42)
national value
0
1
2
3
4
5
6
7
8
9
10
11
1999 2000 2001 2002 2003 2004 2005 2006 2007
inci
denc
e /
1000
00 p
opul
atio
n
Incidence of melanoma (ICD-10: C43, D03) in the population aged under 55 yearsby counties (NUTS3) in region Nord-Vest, Romania
Bihor (RO111)
Bistrita-Nasaud (RO112)
Cluj (RO113)
Maramures (RO114)
Satu Mare (RO115)
Salaj (RO116)
national value
0
1
2
3
4
5
6
7
8
9
10
11
1999 2000 2001 2002 2003 2004 2005 2006 2007
inci
denc
e /
100
000
popu
lati
on
Incidence of melanoma (ICD-10: C43, D03) in the population aged under 55 yearsby counties (NUTS3) in region Centru, Romania
Alba (RO121)
Brasov (RO122)
Covasna (RO123)
Harghita (RO124)
Mures (RO125)
Sibiu (RO126)
national value

SELECTED INDICATORS REPORT
257
0
1
2
3
4
5
6
7
8
9
10
11
1999 2000 2001 2002 2003 2004 2005 2006 2007
inci
denc
e /
100
000
popu
lati
on
Incidence of melanoma (ICD-10: C43, D03) in the population aged under 55 yearsby counties (NUTS3) in region Nord-Est, Romania
Bacau (RO211)Botosani (RO212)Iasi (RO213)Neamt (RO214)Suceava (RO215)Vaslui (RO216)national value
0
1
2
3
4
5
6
7
8
9
10
11
1999 2000 2001 2002 2003 2004 2005 2006 2007
inci
denc
e /
100
000
popu
lati
on
Incidence of melanoma (ICD-10: C43, D03) in the population aged under 55 yearsby counties (NUTS3) in region Sud-Est, Romania
Braila (RO221)
Buzau (RO222)
Constanta (RO223)
Galati (RO224)
Tulcea (RO225)
Vrancea (RO226)
national value
0
1
2
3
4
5
6
7
8
9
10
11
1999 2000 2001 2002 2003 2004 2005 2006 2007
inci
denc
e /
100
000
popu
lati
on
Incidence of melanoma (ICD-10: C43, D03) in the population aged under 55 yearsby counties (NUTS3) in region Sud-Muntenia, Romania
Arges (RO311) Calarasi (RO312)
Dambovita (RO313) Giurgiu (RO314)
Ialomita (RO315) Prahova (RO316)
Teleorman (RO317) national value
0
1
2
3
4
5
6
7
8
9
10
11
1999 2000 2001 2002 2003 2004 2005 2006 2007
inci
denc
e /
100
000
popu
lati
on
Incidence of melanoma (ICD-10: C43, D03) in the population aged under 55 yearsby counties (NUTS3) in the region Bucuresti-Ilfov, Romania
Bucuresti (RO321)
Ilfov (RO322)
national value

SELECTED INDICATORS REPORT
258
0
1
2
3
4
5
6
7
8
9
10
11
1999 2000 2001 2002 2003 2004 2005 2006 2007
inci
denc
e /
100
000
popu
lati
on
Incidence of melanoma (ICD-10: C43, D03) in the population aged under 55 yearsby counties (NUTS3) in region Sud-Vest Oltenia, Romania
Dolj (RO411)
Gorj (RO412)
Mehedinti (RO413)
Olt (RO414)
Valcea (RO415)
national value
0
1
2
3
4
5
6
7
8
9
10
11
1999 2000 2001 2002 2003 2004 2005 2006 2007
inci
denc
e /
100
000
popu
lati
on
Incidence of melanoma (ICD-10: C43, D03) in the population aged under 55 yearsby counties (NUTS3) in region Vest, Romania
Arad (RO421)
Caras-Severin (RO422)
Hunedoara (RO423)
Timis (RO424)
national value
Figure 4: The incidence of melanoma in the population aged under 55 years by NUTS3 for the period 1999-2007 Source of data: Ministry of Health (National Centre for Organisation and Implementation of Health Information System; Health Yearbook), Romania Assessment: The incidence of melanoma skin cancer in people under the age of 55 years in Europe varies considerably among countries. The highest incidence is found in northern and western and the lowest in southern European countries, with rates from three to eight times lower for men and women, respectively. In eastern European countries, incidence is low to intermediate. These variations are likely to be linked to specific behaviour (winter holidays, sun seeking) as well as to improved rates of diagnosis resulting from better detection of melanoma. Trends in rates differ between regions: in northern Europe, where the rates are high, they appear to have levelled off since the 1990s, particularly among people aged under 55 years. This seems to be the result of a change in sun-seeking and protective behaviour against UV radiation among the younger generations. In contrast, in southern and eastern Europe, the rates are generally still increasing steeply in all age groups12 13. Currently, in almost all European countries, the incidence is higher in women than in men. Estimates of the age-standardized (world standard population) rate for women vary from under 2 to over 16 per 100 000. There is a strong geographical correlation between the European sub-regions and the incidence of melanoma in people aged under 55 years. The highest rates are found in northern (Denmark, Norway and Sweden) and western European countries (France, the Netherlands and the United Kingdom), with an incidence of 6–9 per 100 000 for males and 8–16 per 100 000 for females. Austria and Switzerland have among the highest rates for both sexes: around 6 per 100 000 for men and around 10 per 100 000 for women. The lowest incidence is found in southern Europe (Greece, Italy, Portugal and Spain) with rates of 2–4 per 100 000 for both men and women. In eastern Europe, the rates vary from low (under 2 per 100 000 in Bulgaria, Latvia and Romania) to intermediate (up to 6 per 100 000 in Lithuania and Slovenia). The main way to prevent melanoma is to advise people to limit their exposure to the sun. National

SELECTED INDICATORS REPORT
259
and European policies should, therefore, pay more attention to preventing excess exposure to UV radiation during childhood (following the INTERSUN Project recommendations). The previously rising incidence of melanoma, prior to the 1990s, in northern Europe among people aged under 55 years supports the notion that specific UV protection activities are being effective in these countries. The beneficial effects of UV on health, such as Vitamin D production, are not jeopardized through comprehensive actions to decrease excessive UV radiation exposure. Short daily UV exposures, well below the levels that induce sunburn, stimulate Vitamin D production during sunny seasons. During other times, and for specific population groups, Vitamin D supplementation rather than extensive UV exposure is recommended by many professional societies9. The estimated cancer incidence both sexes, all ages (age-standardised rates per 100,000) of melanoma skin cancer worldwide in 2008 is 2.8 while in Romania in 2007 the incidence is 1.1/100000 inhabitants. The world estimated number of new cancers (all ages) in 2008 is 19402 and in 2030 the predicted number is 322558, with an additional number of 125156 new cases. In Romania, the distribution of incidence of melanoma in the population aged under 55 years by macro regions (NUTS1) in 2007 illustrates an unequal distribution with the highest incidence in the macro region 1, followed by the 2 and 4, the only one with the incidence under national value being macro region 1 (see Figure1). The distribution of the values of the indicator in the same year, by regions (NUTS2) reveals the highest values in Centre, Northwest, South East, South West Oltenia, all with values higher than the national value, followed by those under value: North East, South Muntenia, West and Bucharest Ilfov (Figure 2). The distribution by counties in 2007, demonstrates 18 of 42 counties have an incidence higher than the national value (Figure 3). In 5 counties the incidence is more than twice higher than the national value. Figure 4 illustrates the incidence of melanoma in the population, aged under 55 years in 1999-2007, by NUTS1, NUTS 2 and NUTS3 in comparison to the national values. Data underlying the indicator:
• Primary source: Ministry of Health National Health Statistics Office • Date last published: 2009 • Time period of analysis: 1999-2007 • Numerator definition • Source of numerator • Denominator definition • Source of denominator • Geographic coverage: whole country • Timeliness • Accuracy and completeness of data set • Disclosure control
References: 1. Globocan 2002 database [online database]. Lyon, International Agency for Research on
Cancer, 2002 (http://wwwdep.iarc.fr/globocan/database.htm, accessed 11 August 2009). 2. de Vries E, Tyczynski JE, Parkin DM. Cutaneous malignant melanoma in Europe. Lyons,
International Agency for Research on Cancer, 2003 (European Network of Cancer Registries Fact Sheet No. 4) http://www.encr.com.fr/melanoma-factsheets.pdf, accessed 11 August 2009).
3. Holman CD, Amstrong BK, Heenan PJ. A theory of the etiology and pathogenesis of human cutaneous malignant melanoma. Journal of the National Cancer Institute, 1983, 71:651–656.
4. Tucker MA, Goldstein AM. Melanoma etiology: where are we? Oncogene, 2003, 22:3042–3052.
5. Mansson-Brahme E et al. Trends in incidence of cutaneous malignant melanoma in a Swedish population 1976–1994. Acta Oncologica, 2002, 41:138–146.
6. INTERSUN – The global UV project: a guide and compendium. Geneva, World Health Organization, 2003 (http://www.who.int/uv/publications/intersunguide/en/index.html, accessed 11 August 2009).
7. Policies to reduce the excessive exposure of children to ultraviolet radiation. Copenhagen, WHO Regional Office for Europe, 2009 (ENHIS fact sheet No. 4.8; www.euro.who.int/ENHIS ).
8. de Vries E et al. Changing epidemiology of malignant cutaneous melanoma in Europe 1953–

SELECTED INDICATORS REPORT
260
1997: rising trends in incidence and mortality but recent stabilizations in western Europe and decreases in Scandinavia. International Journal of Cancer, 2003, 107:119–126.
9. de Vries E, Coebergh JW. Cutaneous malignant melanoma in Europe. European Journal of Cancer, 2004, 40:2355–2366.
10. Parkin DM et al., eds. Cancer incidence in five continents. Vol. I to VIII. Lyon, International Agency for Research on Cancer, 2005 (IARC Scientific Publications No. 155; http://www-dep.iarc.fr/, accessed 11 August 2009).
11. Thomas NE et al. Number of nevi and early-life ambient UV exposure are associated with BRAF-mutant melanoma. Cancer Epidemiology, Biomarkers & Prevention, 2007, 16:991–997.
12. Gandini S et al. Meta-analysis of risk factors for cutaneous melanoma: II. Sun exposure. European Journal of Cancer, 2005, 41:45–60.
13. English DR, Milne E, Simpson JA. Sun protection and the development of melanocytic nevi in children. Cancer Epidemiology, Biomarkers & Prevention, 2005, 14:2873–2876.
14. Incidence of melanoma in people aged under 55 years. Copenhagen, WHO Regional Office for Europe, 2009 (ENHIS fact sheet 4.2) http://www.euro.who.int/__data/assets/pdf_file/0009/97029/enhis_factsheet09_4_2.pdf, accessed 10 July 2010.
15. Ministry of Health of Romania, Health Statistic Centre –Yearly Health Statistics Book, 2009 Further Information: WHO-IARC mortality database [online database]. Lyon, International Agency for Research on Cancer, 2007 (http://www-dep.iarc.fr/, accessed 11 August 2009). Further information on the control and use of sun beds UV-radiation of sun beds. Common public health advice from Nordic radiation protection and health authorities. Danish National Board of Health, Finnish Radiation and Nuclear Safety Authority, Icelandic Radiation Protection Institute, Norwegian Radiation Protection Authority, Swedish Radiation Protection Authority (http://www.euroskin.eu/downloads/sunbedsnordic.pdf, accessed 11 August 2009). Sunbeds, tanning and UV exposure. Geneva, World Health Organization, 2005 (Fact sheet No. 287) (http://www.who.int/mediacentre/factsheets/fs287/en/index.html, accessed 11 August 2009). Further information on recommendations on exposure of children to UV radiation Protecting children from ultraviolet radiation. Geneva, World Health Organization, 2001 (Fact sheet No. 261) (http://www.who.int/mediacentre/factsheets/fs261/en/, accessed 11 August 2009). Towards the promotion and harmonization of skin cancer prevention. Recommendations from an International Conference held in Hamburg, Germany, 2–5 May 2000. European Society of Skin Cancer Prevention – EUROSKIN (http://www.who.int/uv/resources/recommendations/en/1stEuroskinrec.pdf, accessed 11 August 2009). SunWise Program [web site]. Washington, DC, US Environmental Protection Agency, 2007 (http://www.epa.gov/sunwise/summary.html, accessed 11 August 2009) Author: Alexandra Cucu, Claudia Dima, National Institute of Public Health, Romania Date of production 23 July 2010

SELECTED INDICATORS REPORT
261
Slovenia Name of indicator: Incidence of melanoma Definition: Incidence of melanoma as defined by ICD-10 codes C43, D03 in the population aged under 55 years Key Message: The incidence of melanoma skin cancer in people under the age of 55 years in Slovenia varies considerably among regions. The highest incidence is found in Notranjsko Koroška region and the lowest Gorenjska region These variations are likely to be linked to specific behaviour ( sun seeking bahaviour) as well as to improved rates of diagnosis resulting from better detection of melanoma. Rationale: Acute, irregular and excessive exposure to the sun, mainly during childhood, by people with fair skins is a major risk factor for melanoma, a malignant cancer of pigment cells in the skin. Considering the 20–40-year time-lag between exposure to the sun and onset of the cancer, the incidence of melanoma among people aged under 55 years and the respective time trends will be a good indicator of the final success of action against excessive exposure to ultraviolet (UV) radiation during childhood. It is estimated that in 2002, 9219 males and 12 303 females under the age of 55 years were diagnosed with melanoma in the European Union and the accession countries (Cyprus, Czech Republic, Estonia, Hungary, Latvia, Lithuania, Malta, Poland, Slovakia and Slovenia)1 2. Melanoma is a malignant transformation of the pigmentation cell (melanocyte) of the skin3. Most cases of melanoma seem to be caused by acute, intermittent and excessive exposure to the sun, mainly during childhood, although exposure in adulthood also contributes to the risk. Fitzpatrick skin types I and II (pale white or fair skin), large numbers of naevi or atypical naevi, and a family history of skin cancer are the most important predictors of melanoma risk4. Melanoma occurring in those aged under 55 years seems to be strongly linked to exposure to UV radiationin childhood5. This type of melanoma is often localized on the trunk of the body in males and on the legs in females. The fact that melanoma in the elderly occurs on the most chronically exposed parts of the body indicates that chronic exposure is more important for melanoma occurring among elderly people. The use of sun beds is an additional risk factor for melanoma6. Melanoma is more frequent among people in the higher socioeconomic groups and among northern European populations. This is probably due to their higher excessive intermittent exposure to UV radiation combined with a light skin type. The main way to prevent melanoma is to advise people to limit their exposure to the sun by avoiding such exposure during the time of day when UV radiation is most intense (approximately two hours each side of the solar noon) and to wear appropriate clothes, headwear and sunglasses. Special attention needs to be paid to children. The use of sun-screen preparations may help to prevent sunburn and skin cancer but may also lead to increased exposure to the sun. Survival is strongly linked to the stage of the disease at diagnosis, which provides a rationale for considering organized screening programmes for melanoma. However, evidence for the reduction of melanoma mortality through organized screening programmes is not yet available. Since the incidence of melanoma is expected to increasefurther in the future, early detection remains an important means of combating the disease. Prevention campaigns carried out in north-western European countries since the 1980s have probably resulted in a decrease in the average thickness of melanomas and a stabilization of melanoma mortality in young people7. Further, there is evidence that sun protection effectively lowers the number of melanocytic naevi in children8. Policy Relevance and Context:

SELECTED INDICATORS REPORT
262
Melanoma is strongly linked with exposure to UV radiation during childhood and is therefore largely preventable. WHO has launched the ongoing INTERSUN Global UV Project to stress the importance of increasing awareness and knowledge about the potential negative health effects of exposure to UV radiation, especially during childhood9. This information should be readily available through various channels such as television, radio, campaigns and meteorological web sites and in schools. Representatives of the tourism industry can also play a crucial role in minimizing the risks associated with exposure to the sun by disseminating information to their customers and by taking essential measures in tourism facilities and services. A UV radiation index can help to identify appropriate action based on the measured UV radiation levels. Further, the use of sun beds by children should be strongly discouraged, if not forbidden. The INTERSUN Project recommendations can serve as a framework for a European action plan to reduce exposure to UV radiation. There are at present few official regulations in most European countries (see ENHIS-2 fact sheet No. 4.8 of April 2007 on policies to reduce excessive exposure of children to UV radiation10. There are thus major opportunities for developing policy as well as for harmonizing and strengthening efforts to reduce such exposure. National policies to reduce exposure to artificial UV radiation – including regulations for the use of sun beds by children and teenagers – should be implemented in more countries in the WHO European Region. Excessive exposure to solar UV radiation can best be prevented by regional and local awareness-raising and information campaigns, especially in educational institutions. The aim is to encourage schoolchildren to take measures to protect themselves against the sun1. In 2004, the Fourth Ministerial Conference on Environment and Health adopted the Children’s Environment and Health Action Plan for Europe (CEHAPE)11, which includes four regional priority goals to reduce the burden of environment-related diseases in children. RPG IV aim to reduce the proportion of children with birth defects, mental retardation and developmental disorders, and to decrease the incidence of melanoma and non-melanoma skin cancer in later life and other childhood cancers by implementing policies to raise awareness and endeavour to ensure reduction of exposure to UV radiation, particularly in children and adolescents”. Melanoma is strongly linked with exposure to UV radiation during childhood and is therefore largely preventable. Public health institutes in Slovenia have launched project Sun and safety to stress the importance of increasing awareness and knowledge about the potential negative health effects of exposure to UV radiation, especially during childhood (http://www.zzv-ce.si/unlimitpages.asp?id=552&parent=335). This information should be readily available through various channels such as radio, campaigns public health web sites and in kindergartens and schools. Representatives of the meteo service can also play a crucial role in minimizing the risks associated with exposure to the sun by disseminating information about UV radiation index A UV radiation index can help to identify appropriate action based on the measured UV radiation levels (http://www.arso.gov.si/vreme/napovedi%20in%20podatki/bio.html). UV index is currently reported on radio, TV and web and at the same time warning is issued to stay away from the sun. National policies to reduce exposure to artificial UV radiation: the use of sun beds by children should be strongly discouraged. The national canmpaign against use of sunbeds has been launched (http://www.inis.si/solariji/ ). Presentation of Data:

SELECTED INDICATORS REPORT
263
Figure 1: Incidence of melanoma in Slovenia in the population aged under 55 years by NUTS2, 2004-2006
Figure 2: Incidence of melanoma in Slovenia in the population aged under 55 years by NUTS3, 2004-2006

SELECTED INDICATORS REPORT
264
0,0 0,2 0,4 0,6 0,8 1,0 1,2 1,4 1,6
Vzhodna Slovenija (SI01)
Zahodna Slovenija (SI02)
incidence / 100000 population
Incidence of melanoma (ICD-10: C43, D03) in the populationaged under 55 years in Slovenia by regions (NUTS2), 2004-2006
national value
0 2 4 6 8 10 12
Pomurska (SI011)
Podravska (SI012)
Koroska (SI013)
Savinjska (SI014)
Zasavska (SI015)
Spodnjeposavska (SI016)
Jugovzhodna Slovenija (SI017)
Notranjsko-kraska (SI018)
Osrednjeslovenska (SI021)
Gorenjska (SI022)
Goriska (SI023)
Obalno-kraska (SI024)
incidence / 100000 population
Incidence of melanoma (ICD-10: C43, D03) in the populationaged under 55 years in Slovenia by counties (NUTS3), 2004-2006
national value

SELECTED INDICATORS REPORT
265
0,0
0,2
0,4
0,6
0,8
1,0
1,2
1,4
1,6
1,8
2,0
1999-2001 2000-2002 2001-2003 2002-2004 2003-2005 2004-2006
inci
denc
e /
1000
00 p
opul
atio
n
Incidence of melanoma (ICD-10: C43, D03) in the population aged under 55 yearsin Slovenia by regions (NUTS2)
Vzhodna Slovenija (SI01)
Zahodna Slovenija (SI02)
national value
0
2
4
6
8
10
12
1999-2001 2000-2002 2001-2003 2002-2004 2003-2005 2004-2006
inci
denc
e /
1000
00 p
opul
atio
n
Incidence of melanoma (ICD-10: C43, D03) in the population aged under 55 yearsby counties (NUTS3) in region Vzhodna Slovenija, Slovenia
Pomurska (SI011) Podravska (SI012) Koroska (SI013)
Savinjska (SI014) Zasavska (SI015) Spodnjeposavska (SI016)
Jugovzhodna Slovenija (SI017) Notranjsko-kraska (SI018) national value

SELECTED INDICATORS REPORT
266
0,0
0,2
0,4
0,6
0,8
1,0
1,2
1,4
1,6
1,8
2,0
1999-2001 2000-2002 2001-2003 2002-2004 2003-2005 2004-2006
inci
denc
e /
1000
00 p
opul
atio
n
Incidence of melanoma (ICD-10: C43, D03) in the population aged under 55 yearsby counties (NUTS3) in region Zahodna Slovenija, Slovenia
Osrednjeslovenska (SI021)
Gorenjska (SI022)
Goriska (SI023)
Obalno-kraska (SI024)
national value
Figure 3: Incidence of melanoma in Slovenia in the population aged under 55 years by NUTS3 for the period 1999-2006 Source of data: Cancer Registry of Republic of Slovenia; Statistical Office of Republic of Slovenia Assessment: The incidence of melanoma skin cancer in people under the age of 55 years in Europe varies considerably among countries. The highest incidence is found in northern and western and the lowest in southern European countries, with rates from three to eight times lower for men and women, respectively. In eastern European countries, incidence is low to intermediate. These variations are likely to be linked to specific behaviour (winter holidays, sun seeking) as well as to improved rates of diagnosis resulting from better detection of melanoma. Trends in rates differ between regions: in northern Europe, where the rates are high, they appear to have levelled off since the 1990s, particularly among people aged under 55 years. This seems to be the result of a change in sun-seeking and protective behaviour against UV radiation among the younger generations. In contrast, in southern and eastern Europe, the rates are generally still increasing steeply in all age groups12 13. Currently, in almost all European countries, the incidence is higher in women than in men. Estimates of the age-standardized (world standard population) rate for women vary from under 2 to over 16 per 100 000. There is a strong geographical correlation between the European sub-regions and the incidence of melanoma in people aged under 55 years. The highest rates are found in northern (Denmark, Norway and Sweden) and western European countries (France, the Netherlands and the United Kingdom), with an incidence of 6–9 per 100 000 for males and 8–16 per 100 000 for females. Austria and Switzerland have among the highest rates for both sexes: around 6 per 100 000 for men and around 10 per 100 000 for women. The lowest incidence is found in southern Europe (Greece, Italy, Portugal and Spain) with rates of 2–4 per 100 000 for both men and women. In eastern Europe, the rates vary from low (under 2 per 100 000 in Bulgaria, Latvia and Romania) to intermediate (up to 6 per 100 000 in Lithuania and Slovenia). The main way to prevent melanoma is to advise people to limit their exposure to the sun. National and

SELECTED INDICATORS REPORT
267
European policies should, therefore, pay more attention to preventing excess exposure to UV radiation during childhood (following the INTERSUN Project recommendations). The previously rising incidence of melanoma, prior to the 1990s, in northern Europe among people aged under 55 years supports the notion that specific UV protection activities are being effective in these countries. The beneficial effects of UV on health, such as Vitamin D production, are not jeopardized through comprehensive actions to decrease excessive UV radiation exposure. Short daily UV exposures, well below the levels that induce sunburn, stimulate Vitamin D production during sunny seasons. During other times, and for specific population groups, Vitamin D supplementation rather than extensive UV exposure is recommended by many professional societies9. Melanoma is one of the cancers with the fastest rates of increase among white people inEurope and Slovenia. Trends in rates differ between regions: in Notranjsko Kraška region the rates are highest and in Gorenjska the lowest. This seems to be the result of a change in sun-seeking and protective behaviour against UV radiation among the younger generations. Currently, in almost all European countries the incidence is higher in women than in men. Estimates of the age-standardized (world standard population) rate vary from under 0/100 000 to over 12/100 000 and the same is in our country. Data underlying the indicator:
• Primary source: Cancer Registry of Republic of Slovenia • Date last published: 2006 • Time period of analysis: 1999-2006 • Numerator definition: Number of new cases during the reporting period in the population aged
0-54 years • Source of numerator: Cancer Registry of Republic of Slovenia • Denominator definition: Total population aged 0-54 years • Source of denominator: Statistical Office of the Republic of Slovenia • Geographic coverage: NUTS1, NUTS2, NUTS3 • Timeliness: annually • Accuracy and completeness of data set • Disclosure control: According to national legislation
References: 1. Incidence of melanoma in people aged under 55 years. Copenhagen, WHO Regional Office for
Europe, 2009 (ENHIS fact sheet 4.2). Available at http://www.euro.who.int/__data/assets/pdf_file/0009/97029/enhis_factsheet09_4_2.pdf. ( accessed on 10 July 2010)
2. Globocan 2002 database. Lyon, International Agency for Research on Cancer, 2002. Available at http://globocan.iarc.fr. (accessed on 10 July 2010)
3. Holman CD, Amstrong BK, Heenan PJ. A theory of the etiology and pathogenesis of human cutaneous malignant melanoma. Journal of the National Cancer Institute, 1983, 71:651–656.
4. Tucker MA, Goldstein AM. Melanoma etiology: where are we? Oncogene, 2003, 22:3042–3052.
5. Thomas NE et al. Number of nevi and early-life ambient UV exposure are associated with BRAF-mutant melanoma. Cancer Epidemiology, Biomarkers & Prevention, 2007, 16:991–997.
6. Gandini S et al. Meta-analysis of risk factors for cutaneous melanoma: II. Sun exposure. European Journal of Cancer, 2005, 41:45–60.
7. Mansson-Brahme E et al. Trends in incidence of cutaneous malignant melanoma in a Swedish population 1976–1994. Acta Oncologica, 2002, 41:138–146.
8. English DR, Milne E, Simpson JA. Sun protection and the development of melanocytic nevi in children. Cancer Epidemiology, Biomarkers & Prevention, 2005, 14:2873–2876.
9. INTERSUN – The global UV project: a guide and compendium. Geneva, World Health Organization, 2003. Available at http://www.who.int/uv/publications/intersunguide/en/index.html. (accessed on 10 July 2010).
10. Policies to reduce the excessive exposure of children to ultraviolet radiation. Copenhagen, WHO Regional Office for Europe, 2009 (ENHIS fact sheet No. 4.8). Available at www.euro.who.int/ENHIS. (accessed on 10 July 2010)
11. Children Environment and Health Action Plan for Europe. The World Health Organization Regional Office for Europe, 2004. Available at

SELECTED INDICATORS REPORT
268
http://www.euro.who.int/__data/assets/pdf_file/0006/78639/E83338.pdf. (accessed on 10 July 2010) 12. de Vries E, Coebergh JW. Cutaneous malignant melanoma in Europe. European Journal of
Cancer, 2004, 40:2355–2366. 13. de Vries E et al. Changing epidemiology of malignant cutaneous melanoma in Europe 1953–
1997: rising trends in incidence and mortality but recent stabilizations in western Europe and decreases in Scandinavia. International Journal of Cancer, 2003, 107:119–126. Further Information: WHO-IARC mortality database [online database]. Lyon, International Agency for Research on Cancer 2007. Available at http://www-dep.iarc.fr. (accessed on 10 July 2010) Further information on the control and use of sun beds UV-radiation of sun beds. Common public health advice from Nordic radiation protection and health authorities. Danish National Board of Health, Finnish Radiation and Nuclear Safety Authority, Icelandic Radiation Protection Institute, Norwegian Radiation Protection Authority, Swedish Radiation Protection Authority. Available at http://www.euroskin.eu/downloads/sunbedsnordic.pdf. (accessed on 10 July 2010) Sunbeds, tanning and UV exposure. Geneva, World Health Organization, 2005 (Fact sheet No. 287). Available at http://www.who.int/mediacentre/factsheets/fs287/en/index.html. (accessed on 10 July 2010) Further information on recommendations on exposure of children to UV radiation Protecting children from ultraviolet radiation. Geneva, World Health Organization, 2001 (Fact sheet No. 261). Available at http://www.who.int/mediacentre/factsheets/fs261/en/. (accessed on 10 July 2010) Towards the promotion and harmonization of skin cancer prevention. Recommendations from an International Conference held in Hamburg, Germany, 2–5 May 2000. European Society of Skin Cancer Prevention – EUROSKIN. Available at http://www.who.int/uv/resources/recommendations/en/1stEuroskinrec.pdf. (accessed on 10 July 2010) SunWise Program [web site]. Washington, DC, US Environmental Protection Agency, 2007. Available at http://www.epa.gov/sunwise/summary.html. (accessed on 10 July 2010)) Author: Peter Otorepec, Ana Hojs, Katarina Bitenc, Pia Vračko, Irena Jeraj, National Institute of Public Health, Slovenia Date of production: August, 2010

SELECTED INDICATORS REPORT
269
United Kingdom Name of indicator: Incidence of melanoma Definition: Incidence of melanoma as defined by ICD-10 codes C43, D03 in the population aged under 55 years Key Message: The incidence rates of melanoma vary across European countries with the Northern and Western countries having the highest rates. The incidence is higher in females than in males. Incidence rates are increasing in the UK with the highest rates in South West of England. Rationale: Acute, irregular and excessive exposure to the sun, mainly during childhood, by people with fair skins is a major risk factor for melanoma, a malignant cancer of pigment cells in the skin. Considering the 20–40-year time-lag between exposure to the sun and onset of the cancer, the incidence of melanoma among people aged under 55 years and the respective time trends will be a good indicator of the final success of action against excessive exposure to ultraviolet (UV) radiation during childhood. It is estimated that in 2002, 9219 males and 12 303 females under the age of 55 years were diagnosed with melanoma in the European Union and the accession countries (Cyprus, Czech Republic, Estonia, Hungary, Latvia, Lithuania, Malta, Poland, Slovakia and Slovenia)1 2. Melanoma is a malignant transformation of the pigmentation cell (melanocyte) of the skin3. Most cases of melanoma seem to be caused by acute, intermittent and excessive exposure to the sun, mainly during childhood, although exposure in adulthood also contributes to the risk. Fitzpatrick skin types I and II (pale white or fair skin), large numbers of naevi or atypical naevi, and a family history of skin cancer are the most important predictors of melanoma risk4. Melanoma occurring in those aged under 55 years seems to be strongly linked to exposure to UV radiationin childhood5. This type of melanoma is often localized on the trunk of the body in males and on the legs in females. The fact that melanoma in the elderly occurs on the most chronically exposed parts of the body indicates that chronic exposure is more important for melanoma occurring among elderly people. The use of sun beds is an additional risk factor for melanoma6. Melanoma is more frequent among people in the higher socioeconomic groups and among northern European populations. This is probably due to their higher excessive intermittent exposure to UV radiation combined with a light skin type. The main way to prevent melanoma is to advise people to limit their exposure to the sun by avoiding such exposure during the time of day when UV radiation is most intense (approximately two hours each side of the solar noon) and to wear appropriate clothes, headwear and sunglasses. Special attention needs to be paid to children. The use of sun-screen preparations may help to prevent sunburn and skin cancer but may also lead to increased exposure to the sun. Survival is strongly linked to the stage of the disease at diagnosis, which provides a rationale for considering organized screening programmes for melanoma. However, evidence for the reduction of melanoma mortality through organized screening programmes is not yet available. Since the incidence of melanoma is expected to increasefurther in the future, early detection remains an important means of combating the disease. Prevention campaigns carried out in north-western European countries since the 1980s have probably resulted in a decrease in the average thickness of melanomas and a stabilization of melanoma mortality in young people7. Further, there is evidence that sun protection effectively lowers the number of melanocytic naevi in children8. Policy Relevance and Context:

SELECTED INDICATORS REPORT
270
Melanoma is strongly linked with exposure to UV radiation during childhood and is therefore largely preventable. WHO has launched the ongoing INTERSUN Global UV Project to stress the importance of increasing awareness and knowledge about the potential negative health effects of exposure to UV radiation, especially during childhood9. This information should be readily available through various channels such as television, radio, campaigns and meteorological web sites and in schools. Representatives of the tourism industry can also play a crucial role in minimizing the risks associated with exposure to the sun by disseminating information to their customers and by taking essential measures in tourism facilities and services. A UV radiation index can help to identify appropriate action based on the measured UV radiation levels. Further, the use of sun beds by children should be strongly discouraged, if not forbidden. The INTERSUN Project recommendations can serve as a framework for a European action plan to reduce exposure to UV radiation. There are at present few official regulations in most European countries (see ENHIS-2 fact sheet No. 4.8 of April 2007 on policies to reduce excessive exposure of children to UV radiation10. There are thus major opportunities for developing policy as well as for harmonizing and strengthening efforts to reduce such exposure. National policies to reduce exposure to artificial UV radiation – including regulations for the use of sun beds by children and teenagers – should be implemented in more countries in the WHO European Region. Excessive exposure to solar UV radiation can best be prevented by regional and local awareness-raising and information campaigns, especially in educational institutions. The aim is to encourage schoolchildren to take measures to protect themselves against the sun1. In 2004, the Fourth Ministerial Conference on Environment and Health adopted the Children’s Environment and Health Action Plan for Europe (CEHAPE)11, which includes four regional priority goals to reduce the burden of environment-related diseases in children. RPG IV aim to reduce the proportion of children with birth defects, mental retardation and developmental disorders, and to decrease the incidence of melanoma and non-melanoma skin cancer in later life and other childhood cancers by implementing policies to raise awareness and endeavour to ensure reduction of exposure to UV radiation, particularly in children and adolescents”. The Scottish Government has now passed a legislation prohibiting the use of tanning beds in children under 18 years, although this has not yet been implemented. There are no enforced laws on UV radiation in England and Wales but there are several initiatives, policies and a UK wide campaign, SunSmart, which aims to increase the knowledge of the public on the causes of skin cancer and actions that can be taken to help prevent it14. In 1995, sun-protection school based guidance was drafted in the United Kingdom for pre-school, primary school and secondary school children. This guidance provides information on how a school policy can help with sun protection, guidance on monitoring and evaluating school policies, suggested points to be included in the school policy and an example of a school policy. Initiatives that could be incorporated are policies such as ‘no hat no play’ and environmental supports such as shade structures, hats and availability of sun screen15. Presentation of Data:

SELECTED INDICATORS REPORT
271
0 10 20 30 40
North East (UKC)
North West (UKD)
Yorkshire and the Humber (UKE)
East Midlands (UKF)
West Midlands (UKG)
East of England (UKH)
London (UKI)
South East (UKJ)
South West (UKK)
incidence / 100000 population
Incidence of melanoma (ICD-10: C43, D03) in England, United Kingdom by NUTS1, 2004-2006
Figure 1: Incidence of melanoma in the UK by NUTS1, 2006-2008
6
9
12
15
18
21
24
27
30
33
36
1999-2001 2000-2002 2001-2003 2002-2004 2003-2005 2004-2006
inci
denc
e /
1000
00 p
opul
atio
n
Incidence of melanoma (ICD-10: C43, D03) by NUTS1 in the United Kingdom
North East (UKC) North West (UKD) Yorkshire and the Humber (UKE)East Midlands (UKF) West Midlands (UKG) East of England (UKH)London (UKI) South East (UKJ) South West (UKK)Wales (UKL) Scotland (UKM) Northern Ireland (UKN)national value
Figure 2: Incidence of melanoma in the UK by NUTS1 for the period 1999-2006 *Assessment: The incidence of melanoma skin cancer in people under the age of 55 years in Europe varies considerably among countries. The highest incidence is found in northern and western and the lowest in southern European countries, with rates from three to eight times lower for men and women, respectively. In eastern European countries, incidence is low to intermediate. These variations are likely to be linked to specific behaviour (winter holidays, sun seeking) as well as to improved rates of diagnosis resulting from better detection of melanoma. Trends in rates differ between regions: in northern Europe, where the rates are high, they appear to have levelled off since the 1990s, particularly among people aged under 55 years. This seems to be the result of a change in sun-seeking and protective behaviour against UV radiation among the younger generations. In contrast, in southern and eastern Europe, the rates are generally still increasing steeply in all age groups12 13. Currently, in almost all European countries, the incidence is higher in women than in men. Estimates of the age-standardized (world standard population) rate for women vary from under 2 to over 16 per 100 000. There is a strong geographical correlation between the European sub-regions and the

SELECTED INDICATORS REPORT
272
incidence of melanoma in people aged under 55 years. The highest rates are found in northern (Denmark, Norway and Sweden) and western European countries (France, the Netherlands and the United Kingdom), with an incidence of 6–9 per 100 000 for males and 8–16 per 100 000 for females. Austria and Switzerland have among the highest rates for both sexes: around 6 per 100 000 for men and around 10 per 100 000 for women. The lowest incidence is found in southern Europe (Greece, Italy, Portugal and Spain) with rates of 2–4 per 100 000 for both men and women. In eastern Europe, the rates vary from low (under 2 per 100 000 in Bulgaria, Latvia and Romania) to intermediate (up to 6 per 100 000 in Lithuania and Slovenia). The main way to prevent melanoma is to advise people to limit their exposure to the sun. National and European policies should, therefore, pay more attention to preventing excess exposure to UV radiation during childhood (following the INTERSUN Project recommendations). The previously rising incidence of melanoma, prior to the 1990s, in northern Europe among people aged under 55 years supports the notion that specific UV protection activities are being effective in these countries. The beneficial effects of UV on health, such as Vitamin D production, are not jeopardized through comprehensive actions to decrease excessive UV radiation exposure. Short daily UV exposures, well below the levels that induce sunburn, stimulate Vitamin D production during sunny seasons. During other times, and for specific population groups, Vitamin D supplementation rather than extensive UV exposure is recommended by many professional societies9. Incidence of melanoma is increasing in the United Kingdom, and about 1 in 75 people have developed the disease. It is one of most common cause of cancer deaths in young people (15 – 30 year age group) (16). The highest rates are found in the South West region of England and the lowest rates in London (Figure 2). Data underlying the indicator:
• Primary source: Office of National Statistics • Date last published: 2006 • Time period of analysis: 1999 - 2006 • Numerator definition: Number of new melanoma cases as defined by ICD-10 C43, D03. • Source of numerator: Office of National Statistics • Denominator definition: Total population • Source of denominator: Office of National Statistics • Geographic coverage: United Kingdom • Timeliness: Annually • Accuracy and completeness of dataset: Data accurate and complete • Disclosure control: Information is in the public domain
*References: 1. Incidence of melanoma in people aged less than 55 years. Copenhagen, WHO Regional
Office for Europe, 2009 (ENHIS fact sheet 4.2). Available at: http://www.euro.who.int/__data/assets/pdf_file/0009/97029/enhis_factsheet09_4_2.pdf. ( accessed on 10 July 2010)
2. Globocan 2002 database. Lyon, International Agency for Research on Cancer, 2002. Available at http://globocan.iarc.fr. (accessed on 10 July 2010)
3. Holman CD, Amstrong BK, Heenan PJ. A theory of the etiology and pathogenesis of human cutaneous malignant melanoma. Journal of the National Cancer Institute, 1983, 71:651–656.
4. Tucker MA, Goldstein AM. Melanoma etiology: where are we? Oncogene, 2003, 22:3042–3052.
5. Thomas NE et al. Number of nevi and early-life ambient UV exposure are associated with BRAF-mutant melanoma. Cancer Epidemiology, Biomarkers & Prevention, 2007, 16:991–997.
6. Gandini S et al. Meta-analysis of risk factors for cutaneous melanoma: II. Sun exposure. European Journal of Cancer, 2005, 41:45–60.
7. Mansson-Brahme E et al. Trends in incidence of cutaneous malignant melanoma in a Swedish population 1976–1994. Acta Oncologica, 2002, 41:138–146.
8. English DR, Milne E, Simpson JA. Sun protection and the development of melanocytic nevi in children. Cancer Epidemiology, Biomarkers & Prevention, 2005, 14:2873–2876.
9. INTERSUN – The global UV project: a guide and compendium. Geneva, World Health Organization, 2003. Available at http://www.who.int/uv/publications/intersunguide/en/index.html.

SELECTED INDICATORS REPORT
273
(accessed on 10 July 2010). 10. Policies to reduce the excessive exposure of children to ultraviolet radiation. Copenhagen,
WHO Regional Office for Europe, 2009 (ENHIS fact sheet No. 4.8). Available at www.euro.who.int/ENHIS. (accessed on 10 July 2010)
11. Children Environment and Health Action Plan for Europe. The World Health Organization Regional Office for Europe, 2004. Available at http://www.euro.who.int/__data/assets/pdf_file/0006/78639/E83338.pdf. (accessed on 10 July 2010)
12. de Vries E, Coebergh JW. Cutaneous malignant melanoma in Europe. European Journal of Cancer, 2004, 40:2355–2366.
13. de Vries E et al. Changing epidemiology of malignant cutaneous melanoma in Europe 1953–1997: rising trends in incidence and mortality but recent stabilizations in western Europe and decreases in Scandinavia. International Journal of Cancer, 2003, 107:119–126.
14. Capleton AC, O‘Connel S, Wyke SM, Duart-Davidson R (2008). Children‘s Environment and Health Action Plan for Europe; Development of a UK Children‘s Environment and Health Strategy: RPG IV: Chemical, Physical and Biological Hazards. Available from: http://www.hpa.org.uk/web/HPAwebFile/HPAweb_C/1204186222593. (assessed 13 September 2010).
15. Bowtell N, Verne J (no year). Expert paper 4: Physical activity and the school environment. Available from: http://www.nice.org.uk/nicemedia/live/11871/49666/49666.pdf. (assessed 13 September 2010).
16. The Melanoma Foundation Website. Available from: http://www.melanoma.sgul.ac.uk/. (assessed 15 September 2010). Further Information: WHO-IARC mortality database [online database]. Lyon, International Agency for Research on Cancer 2007. Available at http://www-dep.iarc.fr. (accessed on 10 July 2010) Further information on the control and use of sun beds UV-radiation of sun beds. Common public health advice from Nordic radiation protection and health authorities. Danish National Board of Health, Finnish Radiation and Nuclear Safety Authority, Icelandic Radiation Protection Institute, Norwegian Radiation Protection Authority, Swedish Radiation Protection Authority. Available at http://www.euroskin.eu/downloads/sunbedsnordic.pdf. (accessed on 10 July 2010) Sunbeds, tanning and UV exposure. Geneva, World Health Organization, 2005 (Fact sheet No. 287). Available at http://www.who.int/mediacentre/factsheets/fs287/en/index.html. (accessed on 10 July 2010) Further information on recommendations on exposure of children to UV radiation Protecting children from ultraviolet radiation. Geneva, World Health Organization, 2001 (Fact sheet No. 261). Available at http://www.who.int/mediacentre/factsheets/fs261/en/. (accessed on 10 July 2010) Towards the promotion and harmonization of skin cancer prevention. Recommendations from an International Conference held in Hamburg, Germany, 2–5 May 2000. European Society of Skin Cancer Prevention – EUROSKIN. Available at http://www.who.int/uv/resources/recommendations/en/1stEuroskinrec.pdf. (accessed on 10 July 2010) SunWise Program [web site]. Washington, DC, US Environmental Protection Agency, 2007. Available at http://www.epa.gov/sunwise/summary.html. (accessed on 10 July 2010)) Author: Adedoyin Awofisayo, Lorraine Stewart, Health Protection Agency, United Kingdom Date of production:15 September 2010

SELECTED INDICATORS REPORT
274
Appendix 1: List of indicators for feasibility testing No of indicator
Name of indicator
1. Healthy life expectancy 2. Life expectancy 3. Population by education 4. Population below poverty line and income inequality 5. Total unemployment 6. Homeless children in temporary accommodation 7. Secondary school absence rate 8. Offenders under probation supervision in employment at the end of their order or
licence 9. Infant mortality rate: infant deaths (age less than one year) per 1,000 live births
(crude rate) 10. Annual mortality rate due to respiratory diseases in children older than one month
and under one year of age 11. Mortality due to respiratory diseases 12. Mortality due to diseases of the circulatory system 13. Death rate per 100 000 population for road traffic injuries (by age groups) 14. Cause-specific death rates per 100 000 population for unintentional injuries not
related to traffic accidents (by age groups) 15. Mortality due to external causes in children under 5 years of age 16. Occupational fatality rate 17. Number of outbreaks of waterborne diseases attributable to drinking water and
bathing water each year; number of cases in the outbreaks (by age groups) 18. Number of outbreaks of communicable diseases attributable transmitted by food per
year; number of cases in the outbreaks (by age groups) 19. Hospital admission due to diaerrhoeal illness 20. Incidence rate of acute intestinal communicable diseases and bacterial food toxic
infections 21. Prevalence of excess body weight and obesity (in children, other age groups) 22. Percentage of children who meet the moderate-to-vigorous physical activity
guidelines, defined as 60 minutes or more of at least moderate intensity activity on 5 or more days a week
23. Hospital admission rates among children (0-19 years) due to acute respiratory illness (ICD10 J00 – J22)
24. The prevalence rates of symptoms of asthma and allergic rhino conjunctivitis in children aged 6-7 years and 13-14 years
25. Standardised incidence rate of leukaemia as defined by ICD-10 codes C90-C95 in children aged 0 to 14 years
26. Incidence of melanoma as defined by ICD-10 codes C43, D03 in the population aged under 55 years
27. Immunization uptake rate among young children for Diphtheria/Tetanus/Polio, Meningitis C (Men C), Heamophilus influenza B (Hib) and Measles/Mumps/Rubella

SELECTED INDICATORS REPORT
275
(MMR). This indicator therefore measures the number of children who have been immunised against these diseases by their 1st, 2nd and 5th birthdays.
28. Prevalence of STIs among under 25years 29. Injury rate due to traffic accidents per 100,000 population 30. Rates of injuries in working population 31. Standardised incidence rate of non-fatal work injuries resulting in more than three
days of absence per 100 000 employees in children (under 18 years) and young people aged 18-24 years
32. Sickness absence rate in working population 33. Rate of hospital admission related to alcohol consumption 34. Domestic violence rates 35. Serious violent crime rate 36. Drug-related offending rate 37. Percentage of children becoming a subject of child protection for more than one
time 38. Road transport fuel consumption 39. Emissions of air pollutants 40. Incidence of fire in domestic residences 41. Proportion of identified bathing waters falling under the Bathing Water Directive
definition complying with the EC mandatory standards. 42. Exceedance of recreational water limit values for microbiological parameters 43. Proportion of the drinking water samples analysed which fail to comply with the EU
Directive on the quality of water intended for human consumption 44. Exceedance of WHO drinking water guidelines for microbiological parameters 45. Exceedance of WHO drinking water guidelines for chemical parameters 46. Estimated annual mean of radon levels in dwellings and proportion of dwellings with
levels above 200 Bq.m-3 and 400 Bq.m-3 47. Hazardous waste generation 48. Proportion of population with continuous access to adequate amount of safe
drinking water at home 49. Proportion of the population served by a potable water supply covered by a ‘water
safety plan’ as described by WHO (2002) 50. Proportion of population in the community or area under consideration served by a
sewerage system connected to a wastewater treatment facility or by a safe local wastewater disposal system.
51. Exposure to ambient air pollutants (urban) 52. Population-weighted annual mean particulate matter (PM10) concentration 53. Proportion of children exposed to environmental tobacco smoke in their homes 54. Population-weighted yearly sum of max daily 8-hour mean ozone (O3)
concentration exceeding 70 μg/m3 (i.e. 35 ppb) (SOMO35) 55. Percentage of children by age groups (population by age groups) living in
households using coal, wood or dung as main source of heating and cooking fuel 56. Living floor area per person 57. Proportion of households living in crowded housing conditions 58. Data on exposure of the population to damp in the home 59. Proportion of children going to schools or day care centres with moisture damage or

SELECTED INDICATORS REPORT
276
mould growth during the year. 60. Proportion of children going to schools and day care centres with a ventilation < 7
l/s per person 61. Percentage of the population living in housing with missing hygienic amenities 62. Children living in unfit housing: the proportion of unfit dwellings in a local authority
as a percentage of the total housing stock 63. Percentage of children going to
school by different modes of transportation
64. Persistent Organic Pollutants (POP) in human milk POPs are chemicals that remain intact in the environment for long periods, become widely distributed geographically, accumulate in the fatty tissue of living organisms and are toxic to humans and wildlife.
65. Dietary exposure to potentially hazardous chemicals in children’s food 66. Level of lead in the blood of children in a community, a region or a country
expressed as the geometric mean of individual blood lead concentrations in micrograms per decilitre (μg/dl)
67. Percentage of children aged 0-4, 5-9 or 10-14 (other age groups) living in proximity to heavily trafficked roads
68. Children living in proximity to industrial sites 69. Proportion of population living in dwellings that are exposed to the noise ranges of
values from different sources of environmental noise in urban areas and along major transport infrastructures
70. Proportion of children going to primary or secondary schools located in places that are considered to be exposed to transport (road, rail and aircraft) noises above 55 dB (A) average during school hours
71. Total health care expenditure per capita

SELECTED INDICATORS REPORT
277
Appendix 2 List of indicators proposed for extended set No of indicator
Name of indicator
1. The prevalence rates of symptoms of asthma and allergic rhino conjunctivitis in children aged 6-7 years and 13-14 years
2. Incidence of fire in domestic residences
3. Estimated annual mean of radon levels in dwellings and proportion of dwellings with levels above 200 Bq.m-3 and 400 Bq.m-3
4. Proportion of population with continuous access to adequate amount of safe drinking water at home
5. Proportion of the population served by a potable water supply covered by a ‘water safety plan’ as described by WHO (2002)
6. Proportion of population in the community or area under consideration served by a sewerage system connected to a wastewater treatment facility or by a safe local wastewater disposal system.
7. Proportion of children exposed to environmental tobacco smoke in their homes
8. Population-weighted yearly sum of max daily 8-hour mean ozone (O3) concentration exceeding 70 μg/m3 (i.e. 35 ppb) (SOMO35)
9. Percentage of children by age groups (population by age groups) living in households using coal, wood or dung as main source of heating and cooking fuel
10. Data on exposure of the population to damp in the home
11. Percentage of the population living in housing with missing hygienic amenities
12. Children living in unfit housing: the proportion of unfit dwellings in a local authority as a percentage of the total housing stock
13. Percentage of children going to school by different modes of transportation
14. Persistent Organic Pollutants (POP) in human milk POPs are chemicals that remain intact in the environment for long periods, become widely distributed geographically, accumulate in the fatty tissue of living organisms and are toxic to humans and wildlife.
15. Level of lead in the blood of children in a community, a region or a country expressed as the geometric mean of individual blood lead concentrations in micrograms per decilitre (μg/dl)
16. Percentage of children aged 0-4, 5-9 or 10-14 (other age groups) living in proximity to heavily trafficked roads
17. Children living in proximity to industrial sites
18. Proportion of children going to primary or secondary schools located in places that are considered to be exposed to transport (road, rail and aircraft) noises above 55 dB (A) average during school hours.
19. Prevalence of excess body weight and obesity (in children, other age groups)
20. Percentage of children who meet the moderate-to-vigorous physical activity guidelines, defined as 60 minutes or more of at least moderate intensity activity on 5 or more days a week
21. Proportion of households living in crowded housing conditions

SELECTED INDICATORS REPORT
278
Appendix 3 List of excluded indicators No of indicator
Name of indicator
1. Healthy life expectancy
2. Population by education
3. Population below poverty line and income inequality
4. Homeless children in temporary accommodation
5. Secondary school absence rate
6. Offenders under probation supervision in employment at the end of their order or licence
7. Occupational fatality rate
8. Hospital admission due to diarrhoeal illness
9. Hospital admission rates among children (0-19 years) due to acute respiratory illness (ICD10 J00 – J22)
10. Immunization uptake rate among young children for Diphtheria/Tetanus/Polio, Meningitis C (Men C), Heampophilus influenzae B (Hib) and Measles/Mumps/Rubella (MMR).
11. Prevalence of STIs among under 25years
12. Rates of injuries in working population
13. Standardised incidence rate of non-fatal work injuries resulting in more than three days of absence per 100 000 employees in children (under 18 years) and young people aged 18-24 years
14. Sickness absence rate in working population
15. Rate of hospital admission related to alcohol consumption
16. Domestic violence rates
17. Serious violent crime rate
18. Drug-related offending rate
19. Percentage of children becoming a subject of child protection for more than one time
20. Road transport fuel consumption
21. Emissions of air pollutants
22. Hazardous waste generation
23. Proportion of children going to schools or day care centres with moisture damage or mould growth during the year.
24. Proportion of children going to schools and day care centres with a ventilation < 7 l/s per person
25. Dietary exposure to potentially hazardous chemicals in children’s food
26. Total health care expenditure per capita

SELECTED INDICATORS REPORT
279
27. Exceedance of recreational water limit values for microbiological parameters
28. Exceedance of WHO drinking water guidelines for microbiological parameters

SELECTED INDICATORS REPORT
280
Appendix 4 Final core set of indicators No. Category Name of indicator
1. Socio-economic Life expectancy at birth
2. Total unemployment
3. Infant mortality rate
4. Living floor area per person
5. Air quality and noise Infant mortality due to respiratory diseases
6. Mortality due to respiratory diseases
7. Mortality due to circulatory diseases
8. Ambient air pollutants annual mean concentration in urban areas
(PM10, NO2, O3, SO2)
9. Exposure to noise pollution
10. Water and food safety Outbreaks of waterborne diseases
11. Outbreaks of food-borne diseases; cases in the outbreaks
12. Incidence rate of acute intestinal diseases (food-borne diseases)
13. Bathing water quality
14. Drinking water quality: microbiological
15. Drinking water quality: chemical
16. Accident, mobility and
transport
Mortality due to road traffic injuries in children
17. Mortality due to unintentional injuries (falls, drowning, fires and
poisonings) in children
18. Injury rate due to road traffic accidents
19. Chemicals, UV and
ionizing radiation
Incidence of childhood leukaemia
20. Incidence of melanoma

SELECTED INDICATORS REPORT
281
Appendix 5 Methodological Sheet Template
Name of indicator DPSEEA CEHAPE
Regional Priority Goal
Category Group the indicator according to the overarching issue Justification for this indicator
Describe the importance of the indicator in terms of the priorities of environmental health considering the magnitude, the severity, the amenability, and public concerns of the problem
Definition of indicator
Provide a detailed technical definition of the indicator
Underlying definitions and concepts
Define all terms used in describing and constructing the indicator
Specification of data needed
List the data needed to construct the indicator
Data sources, availability and quality
State the sources of data. Where appropriate, indicate methods of obtaining data that are not readily available.
Computation Provide detailed technical guidance for the calculation of the indicator Units of measurement
Specify the units of measurements used in presenting this indicator
Scale of application
With relevance to sub-national levels: Local (within a city or community) and regional (within a sub-national region)
Interpretation Describe the ways the indicator may be interpreted and related to the issue(s) specified in the category section. Highlight inferences which can be made from any trends or patterns observed in data analyses
Linkage with other indicators
Linkage with other indicators from the core set of UNIPHE project
Related data, indicator sets and websites
List similar or related indicators, proposed or developed as part of other indicator sets. Give links to their sources e.g. web addresses, databases. Provide any evidence base which is available
Policy/ regulatory context
To be completed later within the WP8
Reporting obligations
Describe obligations (national or sub- national legislations or constitutions) which exist with regards to the reporting of any data used in the computation of the indicator. Where applicable, include quantitative targets on reporting the data.

SELECTED INDICATORS REPORT
282
Appendix 6 Fact Sheet Template *Name of indicator: State of the name of the indicator as it appears on the methodological sheet *Definition: Provide the technical definition of the indicator as it appears on the methodological sheet Key Message: Provide a summary of the findings. This should include
• trends • comparison to national/international guideline or target values/standards/objectives
*Rationale: Explain the reasons for selecting this indicator with reference to its importance for human health. Outline the following:
• Links between the environment and health • Magnitude and severity of the problem • Evidence base available
(expand on the justification section in the methodological sheet) *Policy Relevance and Context: Link the indicator to current policies and targets.
• *Provide a brief description of the relevant EU and WHO policy/regulation/programmes etc. • Provide a brief description of the relevant national/sub-national policies
Presentation of Data: Insert graphical presentation provided *Assessment: Provide the following where possible:
• *A general assessment of the situation in the EU • *Possible explanation for EU trend with reference to current policies etc • *Comparison of EU trend to target/limits • *Identify dimension of inequalities at EU level • Repeat the above 4 points at a national/sub-national level
Data underlying the indicator: Provide the following information:
• Primary source • Date last published • Time period of analysis • Numerator definition • Source of numerator • Denominator definition • Source of denominator • Geographic coverage • Timeliness • Accuracy and completeness of data set • Disclosure control
*References: *List references used in fact sheet *For web links include the date accessed

SELECTED INDICATORS REPORT
283
List references used in fact sheet For web links include the date accessed *Further Information: *Other useful links to information relating to the indicator Author (name, institute, country) Date of production
* indicates sections and items which will be the same for all national fact-sheets and will be prepared by one of the UNIPHE partners